As filed with the Securities and Exchange Commission on March 10, 2009
UNITED STATES
SECURITIES AND EXCHANGE COMMISSION
Washington, D.C. 20549
FORM N-CSR
CERTIFIED SHAREHOLDER REPORT OF REGISTERED
MANAGEMENT INVESTMENT COMPANIES
Investment Company Act file number 811-07685
Frontegra Funds, Inc.
(Exact name of registrant as specified in charter)
400 Skokie Blvd.
Suite 500
Northbrook, Illinois 60062
(Address of principal executive offices) (Zip code)
William D. Forsyth III
400 Skokie Blvd., Suite 500
Northbrook, Illinois 60062
(Name and address of agent for service)
(847) 509-9860
Registrant's telephone number, including area code
Date of fiscal year end: June 30, 2009
Date of reporting period: December 31, 2008
Item 1. Reports to Stockholders.
SEMI-ANNUAL REPORT
Frontegra Columbus Core Plus Fund
Frontegra Columbus Core Fund
Frontegra IronBridge Small Cap Fund
Frontegra IronBridge SMID Fund
Frontegra New Star International Equity Fund
Frontegra Netols Small Cap Value Fund
Frontegra Asset Management, Inc.
__________
December 31, 2008
TABLE OF CONTENTS
| Shareholder Letter | 1 |
| Expense Example | 2 |
| Allocation of Portfolio Holdings | 6 |
| Frontegra Columbus Core Plus Fund | |
| Frontegra Columbus Core Fund | |
| Report from Reams Asset Management Company, LLC | 9 |
| Investment Highlights | 13 |
| Schedule of Investments | 14 |
| Statement of Assets and Liabilities | 30 |
| Statement of Operations | 31 |
| Statements of Changes in Net Assets | 32 |
| Financial Highlights | 33 |
| Investment Highlights | 34 |
| Schedule of Investments | 35 |
| Statement of Assets and Liabilities | 47 |
| Statement of Operations | 48 |
| Statements of Changes in Net Assets | 49 |
| Financial Highlights | 50 |
| Frontegra IronBridge Small Cap Fund | |
| Frontegra IronBridge SMID Fund | |
| Report from IronBridge Capital Management, L.P. | 52 |
| Investment Highlights | 55 |
| Schedule of Investments | 56 |
| Statement of Assets and Liabilities | 63 |
| Statement of Operations | 64 |
| Statements of Changes in Net Assets | 65 |
| Financial Highlights | 66 |
| Investment Highlights | 67 |
| Schedule of Investments | 68 |
| Statement of Assets and Liabilities | 74 |
| Statement of Operations | 75 |
| Statements of Changes in Net Assets | 76 |
| Financial Highlights | 77 |

| Frontegra New Star International Equity Fund | |
| Report from New Star Institutional Managers Limited | 79 |
| Investment Highlights | 82 |
| Schedule of Investments | 83 |
| Portfolio Diversification | 87 |
| Statement of Assets and Liabilities | 88 |
| Statement of Operations | 89 |
| Statements of Changes in Net Assets | 90 |
| Financial Highlights | 91 |
| Frontegra Netols Small Cap Value Fund | |
| Report from Netols Asset Management, Inc. | 93 |
| Investment Highlights | 94 |
| Schedule of Investments | 95 |
| Statement of Assets and Liabilities | 100 |
| Statement of Operations | 101 |
| Statements of Changes in Net Assets | 102 |
| Financial Highlights | 103 |
| Notes to Financial Statements | 105 |
| Board of Directors’ Approval of the Advisory Agreement | 120 |
| Additional Information | |
| Foreign Tax Credit | 136 |
| Qualified Dividend Income/Dividends Received Deduction | 136 |
| Additional Information Applicable to Foreign Shareholders Only | 137 |
| Voting Results of Special Meeting of Shareholders | 137 |
This report is submitted for the general information of the shareholders of the Funds. It is not authorized for distribution to prospective investors unless accompanied or preceded by an effective Prospectus for the applicable Fund. The Prospectus may be obtained by calling 1-888-825-2100. Each Prospectus includes more complete information about management fees and expenses, investment objectives, risks and operating policies of the applicable Fund. Please read the Prospectus carefully.
Frontegra Funds, Inc. are distributed by Frontegra Strategies, LLC, 400 Skokie Blvd., Suite 500, Northbrook, IL 60062. Frontegra Strategies, LLC, member of FINRA and SIPC, is an affiliate of Frontegra Asset Management, Inc., the Funds’ investment adviser.
| | This page intentionally left blank. |
DEAR FELLOW SHAREHOLDERS:
We appreciate the opportunity to report on the progress of the Frontegra Funds for the first six months of our fiscal year (July 1, 2008, through December 31, 2008). The economy and the financial markets have experienced volatility and downswings of historic magnitudes. While many experts predict a recovery for both, that rebound might not occur for months. Non-U.S. markets, as measured by the MSCI EAFE Index, were down significantly for the six-month period, returning -36.32%. Small capitalization stocks were also down steeply, with the Russell 2000 Index returning -26.94%. Because of the turbulent markets, many investors sought the safety of U.S. Treasury securities and invested heavily in them. With its heavy weighting in Treasuries, the U.S. bond market had a stronger showing in the final six months of 2008 with the Barclays Capital U.S. Aggregate Bond Index up 4.07%.
Fund Results
The Frontegra Columbus Core Plus Fund and the Frontegra Columbus Core Fund, managed by Reams Asset Management, had net returns of -9.24% and -7.47%, respectively, for the six month period, versus the 4.07% return of the Barclays Capital U.S. Aggregate Bond Index. The underperformance came almost entirely from the increased investment in the Corporate sector as spreads were widening late in the year. Corporate spreads are more than 550 basis points above Treasuries, well above historic highs of +250 basis points and the historical average of approximately +110 bps. While the relative performance is striking, we are very confident that the Corporate sector—and the Funds—will recover and perform well in the months and quarters ahead as spreads return to more normal levels.
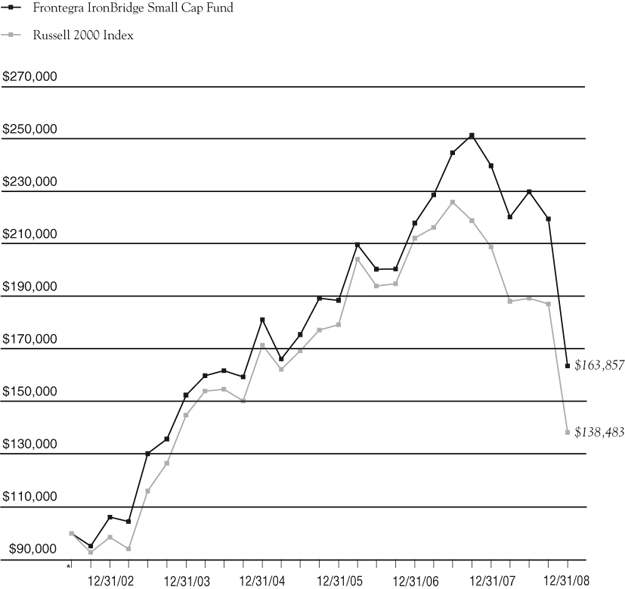
The Frontegra IronBridge Small Cap Fund, managed by IronBridge Capital Management, returned -28.82% (net of fees) versus the benchmark Russell 2000 Index return of - -26.94%. The modest underperformance came primarily from stock selection in the Healthcare sector and an underweight in Financials, which experienced relatively strong performance over the period. The Frontegra IronBridge SMID Fund returned a net -30.65%, slightly better than the benchmark Russell 2500 return of -31.21% primarily due to strong stock selection in the Consumer Discretionary sector.
The Frontegra New Star International Equity Fund, managed by New Star Institutional Managers, returned -36.46% (net of fees) for the six-month period, virtually in line with the benchmark MSCI EAFE return of -36.32%.
Finally, the Frontegra Netols Small Cap Value Fund, managed by Netols Asset Management had a net return of -23.76% versus the benchmark Russell 2000 Value Index return of -21.17% for the six-month period. While stock selection for the period was additive, an underweight in Financials and an overweight in Energy were modest detractors from relative performance.
Summary
We continue to have great confidence in the investment teams at Reams Asset Management, IronBridge Capital Management, New Star Institutional Managers and Netols Asset Management. We believe they are committed to the highest standards of investment decision-making for the shareholders of the Frontegra Funds.
As always, we greatly appreciate your investment and continued confidence in the Frontegra Funds.
Sincerely,
William D. Forsyth, CFA
Frontegra Asset Management, Inc.
Frontegra Funds
EXPENSE EXAMPLE
December 31, 2008 (Unaudited)
As a shareholder of a mutual fund, you incur two types of costs: (1) transaction costs, including redemption fees, and (2) ongoing costs, including management fees, distribution and/or service (12b-1) fees and other fund expenses. Although the Funds charge no sales loads, you will be assessed fees for outgoing wire transfers, returned checks and stop payment orders at prevailing rates charged by U.S. Bancorp Fund Services, LLC, the Funds’ transfer agent. If you request that a redemption be made by wire transfer, currently the Funds’ transfer agent charges a $15.00 fee. A redemption fee of 2.00% of the then current value of the shares redeemed may be imposed on certain redemptions of shares made within 30 days of purchase for the Frontegra New Star International Equity Fund.
This Example is intended to help you understand your ongoing costs (in dollars) of investing in the Funds and to compare these costs with the ongoing costs of investing in other mutual funds. The Example is based on an investment of $1,000 invested at the beginning of the period and held for the entire period (7/1/08 – 12/31/08).
Actual Expenses
The first line of the tables on the following pages provides information about actual account values and actual expenses. The Example includes management fees, registration fees, fee waivers/reimbursements and other expenses. However, the Example does not include portfolio trading commissions and related expenses and other extraordinary expenses as determined under generally accepted accounting principles. You may use the information in this line, together with the amount you invested, to estimate the expenses that you paid over the period. Simply divide your account value by $1,000 (for example, an $8,600 account value divided by $1,000 = 8.6), then multiply the result by the number in the first line under the heading entitled “Expenses Paid During Period’’ to estimate the expenses you paid on your account during this period.
Hypothetical Example for Comparison Purposes
The second line of the tables provides information about hypothetical account values and hypothetical expenses based on the Funds’ actual expense ratios and an assumed rate of return of 5% per year before expenses, which are not the Funds’ actual returns. The hypothetical account values and expenses may not be used to estimate the actual ending account balance or expenses you paid for the period. You may use this information to compare the ongoing costs of investing in the Funds and other funds. To do so, compare this 5% hypothetical example with the 5% hypothetical examples that appear in the shareholder reports of the other funds. Please note that the expenses shown in the tables are meant to highlight your ongoing costs only and do not reflect any transactional costs. Therefore, the second line of the table is useful in comparing ongoing costs only, and will not help you determine the relative total costs of owning different funds. In addition, if these transactional costs were included, your costs could have been higher.
Frontegra Funds
EXPENSE EXAMPLE (continued)
December 31, 2008 (Unaudited)
| Frontegra Columbus Core Plus Fund | | | | | | | | | | | | |
| | | Beginning | | | Ending | | | | | | | |
| | | Account | | | Account | | | Annualized | | | Expenses | |
| | | Value | | | Value | | | Expense | | | Paid During | |
| | | 7/1/08 | | | 12/31/08 | | | Ratio* | | | the Period* | |
| Actual Fund Return | | $ | 1,000.00 | | | $ | 907.60 | | | | 0.35 | % | | $ | 1.68 | |
| Hypothetical 5% Return | | $ | 1,000.00 | | | $ | 1,023.44 | | | | 0.35 | % | | $ | 1.79 | |
| * | Expenses are equal to each Fund’s annualized expense ratio indicated above , multiplied by the average account value over the period, multiplied by 184/365 to reflect the one-half year period. |
Frontegra Columbus Core Fund
| | | Beginning | | | Ending | | | | | | | |
| | | Account | | | Account | | | Annualized | | | Expenses | |
| | | Value | | | Value | | | Expense | | | Paid During | |
| | | 7/1/08 | | | 12/31/08 | | | Ratio* | | | the Period* | |
| Actual Fund Return | | $ | 1,000.00 | | | $ | 925.30 | | | | 0.35 | % | | $ | 1.70 | |
| Hypothetical 5% Return | | $ | 1,000.00 | | | $ | 1,023.44 | | | | 0.35 | % | | $ | 1.79 | |
| * | Expenses are equal to each Fund’s annualized expense ratio indicated above , multiplied by the average account value over the period, multiplied by 184/365 to reflect the one-half year period. |
Frontegra IronBridge Small Cap Fund
| | | Beginning | | | Ending | | | | | | | |
| | | Account | | | Account | | | Annualized | | | Expenses | |
| | | Value | | | Value | | | Expense | | | Paid During | |
| | | 7/1/08 | | | 12/31/08 | | | Ratio* | | | the Period* | |
| Actual Fund Return | | $ | 1,000.00 | | | $ | 711.80 | | | | 1.08 | % | | $ | 4.67 | |
| Hypothetical 5% Return | | $ | 1,000.00 | | | $ | 1,019.75 | | | | 1.08 | % | | $ | 5.51 | |
| * | Expenses are equal to each Fund’s annualized expense ratio indicated above , multiplied by the average account value over the period, multiplied by 184/365 to reflect the one-half year period. |
Frontegra Funds
EXPENSE EXAMPLE (continued)
December 31, 2008 (Unaudited)
Frontegra IronBridge SMID Fund
| | | Beginning | | | Ending | | | | | | | |
| | | Account | | | Account | | | Annualized | | | Expenses | |
| | | Value | | | Value | | | Expense | | | Paid During | |
| | | 7/1/08 | | | 12/31/08 | | | Ratio* | | | the Period* | |
| Actual Fund Return | | $ | 1,000.00 | | | $ | 693.50 | | | | 0.95 | % | | $ | 4.06 | |
| Hypothetical 5% Return | | $ | 1,000.00 | | | $ | 1,020.42 | | | | 0.95 | % | | $ | 4.84 | |
| * | Expenses are equal to each Fund’s annualized expense ratio indicated above , multiplied by the average account value over the period, multiplied by 184/365 to reflect the one-half year period. |
Frontegra New Star International Equity Fund
| | | Beginning | | | Ending | | | | | | | |
| | | Account | | | Account | | | Annualized | | | Expenses | |
| | | Value | | | Value | | | Expense | | | Paid During | |
| | | 7/1/08 | | | 12/31/08 | | | Ratio* | | | the Period* | |
| Actual Fund Return | | $ | 1,000.00 | | | $ | 635.40 | | | | 0.75 | % | | $ | 3.09 | |
| Hypothetical 5% Return | | $ | 1,000.00 | | | $ | 1,021.42 | | | | 0.75 | % | | $ | 3.82 | |
| * | Expenses are equal to each Fund’s annualized expense ratio indicated above , multiplied by the average account value over the period, multiplied by 184/365 to reflect the one-half year period. |
Frontegra Netols Small Cap Value Fund – Institutional Class
| | | Beginning | | | Ending | | | | | | | |
| | | Account | | | Account | | | Annualized | | | Expenses | |
| | | Value | | | Value | | | Expense | | | Paid During | |
| | | 7/1/08 | | | 12/31/08 | | | Ratio* | | | the Period* | |
| Actual Fund Return | | $ | 1,000.00 | | | $ | 762.40 | | | | 1.10 | % | | $ | 4.89 | |
| Hypothetical 5% Return | | $ | 1,000.00 | | | $ | 1,019.66 | | | | 1.10 | % | | $ | 5.60 | |
| * | Expenses are equal to each Fund’s annualized expense ratio indicated above , multiplied by the average account value over the period, multiplied by 184/365 to reflect the one-half year period. |
Frontegra Funds
EXPENSE EXAMPLE (continued)
December 31, 2008 (Unaudited)
Frontegra Netols Small Cap Value Fund – Class Y
| | | Beginning | | | Ending | | | | | | | |
| | | Account | | | Account | | | Annualized | | | Expenses | |
| | | Value | | | Value | | | Expense | | | Paid During | |
| | | 7/1/08 | | | 12/31/08 | | | Ratio* | | | the Period* | |
| Actual Fund Return | | $ | 1,000.00 | | | $ | 761.50 | | | | 1.50 | % | | $ | 6.66 | |
| Hypothetical 5% Return | | $ | 1,000.00 | | | $ | 1,017.64 | | | | 1.50 | % | | $ | 7.63 | |
| * | Expenses are equal to each Fund’s annualized expense ratio indicated above , multiplied by the average account value over the period, multiplied by 184/365 to reflect the one-half year period. |
Frontegra Funds
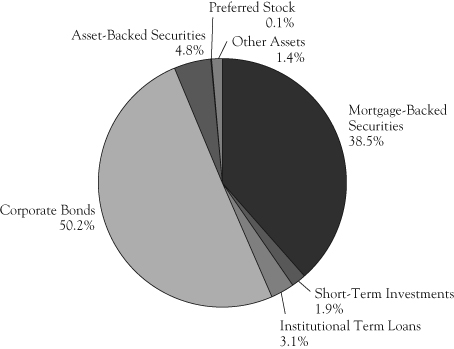
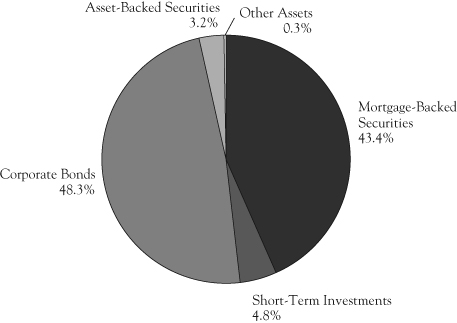
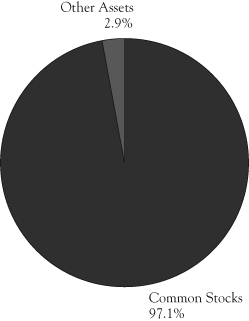
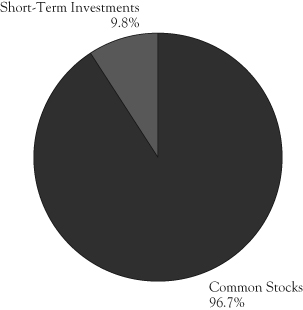
ALLOCATION OF PORTFOLIO HOLDINGS
December 31, 2008 (Unaudited)
Frontegra Columbus Core Plus Fund*
Frontegra Columbus Core Fund*
*Percentages shown are based on the Fund’s total net assets.
Frontegra Funds
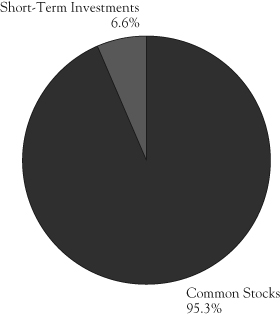
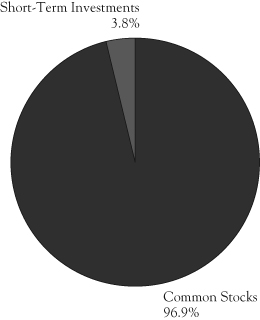
ALLOCATION OF PORTFOLIO HOLDINGS (continued)
December 31, 2008 (Unaudited)
| Frontegra IronBridge Small Cap Fund* | Frontegra IronBridge SMID Fund* |
| |
| | |
| Frontegra New Star | Frontegra Netols |
| International Equity Fund* | Small Cap Value Fund* |
| |
* Percentages shown are based on the Fund’s total net assets.
FRONTEGRA
COLUMBUS CORE PLUS FUND
FRONTEGRA
COLUMBUS CORE FUND
REPORT FROM REAMS ASSET
MANAGEMENT COMPANY, LLC:
Dear Fellow Shareholders:
The Frontegra Columbus Core Plus Fund strives to achieve a high level of total return consistent with the preservation of capital by investing in a diversified portfolio of fixed income securities of varying maturities. This objective is relative to and measured against the Barclays Capital U.S. Aggregate Bond Index (formerly the Lehman Brothers Aggregate Bond Index).
The Frontegra Columbus Core Fund strives to achieve a high level of total return consistent with the preservation of capital by investing in a diversified portfolio of investment grade bonds of varying maturities. This objective is relative to and measured against the Barclays Capital U.S. Aggregate Bond Index.
Performance Review
For the six month period ending December 31, 2008, the Frontegra Columbus Core Plus Fund had a net return of -9.24% compared to a return of 4.07% for the benchmark, the Barclays Capital U.S. Aggregate Bond Index. Duration strategy added 80 basis points to performance for the period as the portfolio duration was positioned aggressively as the Treasury yield curve fell. Yield curve strategy subtracted 58 basis points as the portfolio was underweighted on the short end of the yield curve as the curve steepened. Sector selection subtracted 1,391 basis points while security selection added 56 basis points. Within these categories, commercial mortgage backed securities (“CMBS”) subtracted 659 basis points, high yield holdings subtracted 412 basis points, investment grade credit holdings subtracted 314 basis points and asset backed securities (“ABS”) subtracted 26 basis points as all of these sectors were overweighted in the portfolio and underperformed as spreads widened significantly during the quarter. Mortgage backed securities (“MBS”) holdings also subtracted 7 basis points from performance. Government related holdings added 83 basis points to performance as the sector underperformed and was underweighted in the portfolio.
For the six month period ending December 31, 2008, the Frontegra Columbus Core Fund had a net return of -7.47% compared to a return of 4.07% for the benchmark, the Barclays Capital U.S. Aggregate Bond Index. Duration strategy added 63 basis points to performance for the period as the portfolio duration was positioned aggressively as the Treasury yield curve fell. Yield curve strategy subtracted 56 basis points as the portfolio was underweighted on the short end of the yield curve as the curve steepened. Sector selection subtracted 1,144 basis points while security selection added 1 basis point. Within these categories, CMBS subtracted 709 basis points, investment grade credit holdings subtracted 468 basis points and ABS subtracted 11 basis points as all three sectors were overweighted in the portfolio and underperformed as spreads widened significantly during the quarter. MBS holdings also subtracted 9 basis points from performance. Government related holdings added 54 basis points to performance as the sector underperformed and was underweighted in the portfolio.
Fixed Income Outlook
U.S. fixed income markets continued to experience extremely disruptive conditions during the fourth quarter of 2008. Despite some stabilization in December, spreads widened severely for the quarter in most sectors, while Treasury and government-guaranteed security yields continued to drop as Fed easing and the flight to quality pushed T-Bill rates to zero.
| • | Credit market conditions during the fourth quarter were set in motion by the Lehman, AIG, and Washington Mutual failures and the Treasury rescues of FNMA and FHLMC during September. These events froze activity in the non-government sectors of the credit market and sent yields plummeting in the Treasury and agency sectors. Similar problems spread around the world. Many financial firms were squeezed into a forced deleveraging as credit was cut off and write-offs reduced capital, creating intense pressure on asset prices and forcing spreads wider. |
| • | The fourth quarter was characterized by the rollout of a wide variety of government measures designed to stabilize financial conditions. Deposit insurance was broadened at the beginning of the quarter, money market funds were guaranteed, and the TARP was passed. Under the TARP, capital infusions were made to improve the solvency of a wide range of financial firms. Liquidity was provided through a broad selection of Fed liquidity facilities. Late in the quarter, the Fed started to make direct purchases of problem securities under the TARP. Auto loans were granted. The Fed funds rate was brought to zero, and bank reserves at the Fed were inflated. A massive fiscal stimulus plan is likely early in 2009. The Treasury and Fed have made clear their resolution to do whatever is necessary to stabilize the financial system, and as a result money growth has continued and bank credit has been prevented from falling. These are all textbook measures designed to combat a credit crisis, and they are expected to succeed in preventing deflation and further major financial failures. However, the actual application of these measures in the U.S. is unprecedented, and the timing of their effectiveness is uncertain. |
| • | Treasury yields have been pushed to historic lows. At the same time, gigantic spending and borrowing commitments have been made by the Treasury. Additionally, the extraordinary creation of liquidity by the Fed creates major questions about the government’s ability to restrain future inflation. While these measures all appear necessary to prevent current deflation and economic collapse, they create great risks of much higher interest rates when the current crisis ends. Therefore, we think it prudent to avoid the Treasury and agency market at the current extremely low yields. |
| • | Current economic trends are terrible, with layoffs accelerating, poor prospects for consumer and business spending, housing continuing to plummet, and leading indicators continuing to drop. A severe recession resulting from the credit crisis seems inevitable. Since the current situation is unprecedented, the depth and duration of the recession are unpredictable, and there are certain to be additional negative feedback effects on the credit markets as demand weakens and leveraged credits fail. The reduction in commodity prices, while negative for producers, is one positive factor for real personal income and spending. |
| • | Despite the gloomy state of the markets and economy, we think that unprecedented values are being created in sectors of the bond market that have performed poorly but have good underlying fundamentals and structure. Deleveraging has had a particularly hard impact on “AAA” securities that were purchased on a leveraged basis such as senior CMBS and nonagency mortgage securities, but these securities have little risk of ultimate loss due to highly favorable structures, and they appear to offer tremendous value at current prices. Likewise, many banks and other financial firms have been virtually guaranteed immunity from failure by government capital infusions, guarantees, and liquidity facilities, but their bonds remain at extremely high yields. We think that a portfolio invested in these sectors has the potential for excellent returns even as Treasury returns suffer. |
Core Plus Portfolio Strategy
| • | Credit exposure was increased to a more heavily overweighted position during the quarter in response to much wider spreads. Emphasis remains on investment-grade finance and industrial sector issuers. Most major finance issuers continue to replenish their capital despite heavy mortgage losses, protecting creditors at the expense of shareholders. In attempting to correct the Lehman mistake, the U.S. Treasury and Federal Reserve have shown resolution to take the steps necessary to protect key finance issuers through the required liquidity facilities, guarantees, and capital injections. Spreads are historically very wide, and we think the credit sector remains attractive. |
| • | In the mortgage market, the CMBS sector continued to be heavily overweighted. We think that these securities remain extremely attractive due to their steady underwriting standards, favorable subordination and collateralization levels, and low delinquency rates. All holdings remain at the senior-most structural level with unimpaired “AAA” ratings. Spreads in this sector narrowed in December but remain extremely attractive. |
| • | Mortgage pass-through holdings have been reduced to an underweighted position in order to make room for the overweights in corporate and CMBS holdings. |
| • | Treasury and agency holdings remain low due to the portfolio overweights in corporates and mortgages. |
| • | Due to the disconnect between Treasury rates and the rest of the fixed income market, portfolio duration strategy is being de-emphasized as we seek to avoid Treasury contributions to duration in favor of corporate and mortgage contributions. Resulting overall portfolio duration measurements are close to benchmark levels. |
| • | High yield holdings are being somewhat underemphasized in favor of investment grade holdings. High yield positions are widely diversified over many sectors and industries, with emphasis on senior term loans and auto debt. |
| • | Auto holdings are being concentrated in senior term loans and senior debt of GMAC and Ford Credit. |
Core Portfolio Strategy
| • | Credit exposure was increased to a more heavily overweighted position during the quarter in response to much wider spreads. Emphasis remains on investment-grade finance and industrial sector issuers. Most major finance issuers continue to replenish their capital despite heavy mortgage losses, protecting creditors at the expense of shareholders. In attempting to correct the Lehman mistake, the U.S. Treasury and Federal Reserve have shown resolution to take the steps necessary to protect key finance issuers through the required liquidity facilities, guarantees, and capital injections. Spreads are historically very wide, and we think the credit sector remains attractive. |
| • | In the mortgage market, the CMBS sector continued to be heavily overweighted. We think that these securities remain extremely attractive due to their steady underwriting standards, favorable subordination and collateralization levels, and low delinquency rates. All holdings remain at the senior-most structural level with unimpaired “AAA” ratings. Spreads in this sector narrowed in December but remain extremely attractive. |
| • | Mortgage pass-through holdings remain in an underweighted position in order to make room for the overweights in corporate and CMBS holdings. |
| • | Treasury and agency holdings remain low due to the portfolio overweights in corporates and mortgages. |
| • | Due to the disconnect between Treasury rates and the rest of the fixed income market, portfolio duration strategy is being de-emphasized as we seek to avoid Treasury contributions to duration in favor of corporate and mortgage contributions. Resulting overall portfolio duration measurements are close to benchmark levels. |
We appreciate your continued support as fellow shareholders in the Funds.
Regards,
 |  |
| Mark M. Egan, CFA, CPA | Robert A. Crider, CFA |
| Reams Asset Management Company, LLC | Reams Asset Management Company, LLC |
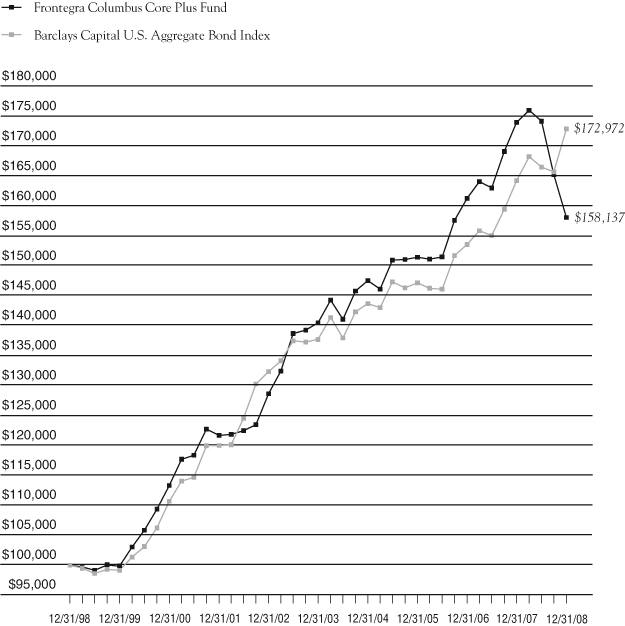
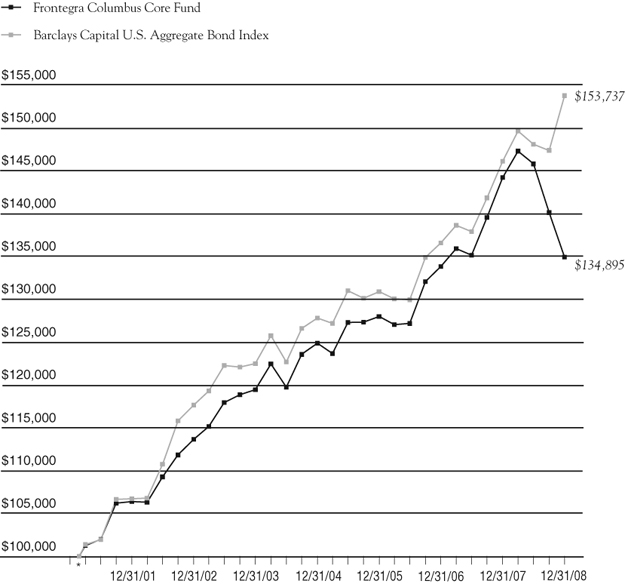
INVESTMENT HIGHLIGHTS
Growth of a $100,000 Investment (Unaudited)
| Portfolio Total Return* | | | | | | |
| FOR PERIODS ENDED 12/31/08 | | FUND | | | INDEX | |
| | | | | | | |
| SIX MONTHS | | | (9.24 | )% | | | 4.07 | % |
| | | | | | | | | |
| ONE YEAR | | | (9.15 | )% | | | 5.24 | % |
| | | | | | | | | |
| | | 2.39 | % | | | 4.65 | % |
| | | | | | | | | |
| | | 4.69 | % | | | 5.63 | % |
This chart assumes an initial gross investment of $100,000 made on 12/31/08. Returns shown include the reinvestment of all distributions. Past performance is not predictive of future results. Investment return and principal value will fluctuate so that shares, when redeemed, may be worth more or less than the original cost. In the absence of existing fee waivers, total return would be reduced. To receive current to the most recent month-end performance, please call 1-888-825-2100.
The Barclays Capital U.S. Aggregate Bond Index (formerly the Lehman Brothers Aggregate Bond Index) is an unmanaged market value-weighted performance benchmark for investment-grade fixed-rate debt issues, including government, corporate, asset backed and mortgage backed securities, with maturities of at least one year. The Index does not reflect investment management fees, brokerage commissions and other expenses associated with investing in fixed income securities. A direct investment in the index is not possible.
| * | The returns shown do not reflect the deduction of taxes that a shareholder would pay on Fund distributions or the redemption of Fund shares. |
Frontegra Columbus Core Plus Fund
SCHEDULE OF INVESTMENTS
December 31, 2008 (Unaudited)
| Principal Amount | | | | Value | |
| | | ASSET BACKED SECURITIES 4.8% | | | |
| | | Americredit Automobile Receivables Trust | | | |
| $ | 1,630,000 | | 2008-AF, Class A4, 6.960%, 10/14/2014 | | $ | 1,339,496 | |
| | | | Citibank Credit Card Issuance Trust | | | | |
| | 2,510,000 | | 2008-A1, Class A1, 5.350%, 02/07/2020 | | | 1,982,253 | |
| | | | Countrywide Asset-Backed Certificates | | | | |
| | 687,278 | | 2006-S3, Class A1, 5.460%, 06/25/2021 (c) | | | 563,730 | |
| | 590,000 | | 2006-S2, Class A2, 5.627%, 07/25/2027 | | | 455,582 | |
| | 4,555,000 | | 2006-S2, Class A3, 5.841%, 07/25/2027 | | | 1,094,452 | |
| | 1,955,000 | | 2006-S2, Class A4, 6.091%, 07/25/2027 | | | 295,140 | |
| | 1,200,880 | | 2006-S5, Class A3, 5.762%, 06/25/2035 | | | 309,408 | |
| | 2,435,000 | | 2006-S7, Class A3, 5.712%, 11/25/2035 (c) | | | 349,027 | |
| | | | Ford Credit Auto Owner Trust | | | | |
| | 1,015,000 | | 2006-C, Class A4A, 5.150%, 02/15/2012 | | | 966,571 | |
| | 1,295,000 | | 2007-A, Class A4A, 5.470%, 06/15/2012 | | | 1,201,292 | |
| | 600,000 | | 2007-B, Class A4A, 5.240%, 07/15/2012 | | | 549,117 | |
| | | | GMAC Mortgage Corporation Loan Trust | | | | |
| | 1,295,000 | | 2006-HE2, Class A3, 6.320%, 05/25/2036 | | | 742,631 | |
| | 2,270,000 | | 2006-HE3, Class A3, 5.805%, 10/25/2036 | | | 780,307 | |
| | | | GSAA Home Equity Trust | | | | |
| | 1,458,398 | | 2006-S1, Class 1A1, 2.621%, 01/25/2037 | | | 431,631 | |
| | | | Hertz Vehicle Financing LLC | | | | |
| | 704,167 | | 2004-1, Class A4, 3.230%, 05/25/2010 | | | | |
| | | | (Acquired 2/1/2008, Cost $679,231) (a) | | | 691,831 | |
| | 715,000 | | 2005-1A, Class A4, 2.711%, 11/25/2011 | | | | |
| | | | (Acquired 8/21/2008 and 12/10/2008, Cost $631,730) (a) | | | 561,274 | |
| | 880,000 | | 2005-2A, Class A5, 2.711%, 11/25/2011 | | | | |
| | | | (Acquired 8/1/2008 and 12/10/2008, Cost $797,061) (a) | | | 683,272 | |
| | 1,810,000 | | 2005-2A, Class A6, 5.080%, 11/25/2011 | | | | |
| | | | (Acquired Multiple Dates, Cost $1,749,444) (a) | | | 1,519,091 | |
| | | | Keystone Owner Trust | | | | |
| | 7,784 | | 1998-P1, Class M1, 7.530%, 05/25/2025 | | | | |
| | | | (Acquired 12/10/2008, Cost $6,620) (a) | | | 6,757 | |
| | | | Mid-State Trust | | | | |
| | 892,258 | | 11, Class A1, 4.864%, 07/15/2038 | | | 777,897 | |
| | | | Residential Funding Mortgage Securities | | | | |
| | 380,000 | | 2005-HS1, Class AI2, 4.660%, 07/25/2020 | | | 343,014 | |
| | 865,735 | | 2003-HS1, Class AI6, 3.830%, 02/25/2033 | | | 745,982 | |
| | 630,000 | | 2005-HS1, Class AI4, 5.110%, 09/25/2035 | | | 144,331 | |
The accompanying notes are an integral part of these financial statements.
Frontegra Columbus Core Plus Fund
SCHEDULE OF INVESTMENTS (continued)
December 31, 2008 (Unaudited)
| Principal Amount | | | | Value | |
| | | ASSET BACKED SECURITIES 4.8% (continued) | | | |
| | | Residential Funding Mortgage Securities (continued) | | | |
| $ | 1,350,000 | | 2006-HSA1, Class A3, 5.230%, 02/25/2036 | | $ | 383,893 | |
| | 2,300,000 | | 2006-HSA1, Class A5, 5.310%, 02/25/2036 | | | 639,047 | |
| | 1,460,000 | | 2006-HSA1, Class A4, 5.490%, 02/25/2036 | | | 242,716 | |
| | 590,000 | | 2006-HSA2, Class AI3, 5.550%, 03/25/2036 | | | 203,225 | |
| | 820,000 | | 2006-HSA2, Class AI4, 5.810%, 03/25/2036 | | | 110,055 | |
| | | | Saco I Trust | | | | |
| | 1,499,680 | | 2006-9, Class A1, 5.480%, 08/25/2036 | | | 318,104 | |
| | | | Total Asset Backed Securities | | | | |
| | | | (Cost $21,306,833) | | | 18,431,126 | |
| | | | | | | | |
| | | | CORPORATE BONDS 50.2% | | | | |
| | | | Airlines 2.5% | | | | |
| | | | Continental Airlines | | | | |
| | 4,250,000 | | 5.983%, 04/19/2022 | | | 2,847,500 | |
| | | | Delta Air Lines, Inc. | | | | |
| | 5,516,474 | | 6.718%, 07/02/2024 | | | 3,475,378 | |
| | | | United Airlines | | | | |
| | 5,323,411 | | 6.636%, 01/02/2022 (e) | | | 3,300,515 | |
| | | | | | | 9,623,393 | |
| | | | Auto Components 0.4% | | | | |
| | | | Arvinmeritor, Inc. | | | | |
| | 300,000 | | 8.125%, 09/15/2015 | | | 135,000 | |
| | | | Delphi Corp. | | | | |
| | 2,005,000 | | 6.500%, 08/15/2013 | | | 30,075 | |
| | | | Lear Corp. | | | | |
| | 2,895,000 | | 8.750%, 12/01/2016 | | | 839,550 | |
| | | | TRW Automotive Inc. | | | | |
| | 995,000 | | 7.250%, 03/15/2017 | | | | |
| | | | (Acquired Multiple Dates, Cost $863,687) (a) | | | 507,450 | |
| | | | | | | 1,512,075 | |
| | | | Building Products 0.2% | | | | |
| | | | USG Corp. | | | | |
| | 1,120,000 | | 7.750%, 01/15/2018 | | | 708,400 | |
The accompanying notes are an integral part of these financial statements.
Frontegra Columbus Core Plus Fund
SCHEDULE OF INVESTMENTS (continued)
December 31, 2008 (Unaudited)
| Principal Amount | | | | Value | |
| | | CORPORATE BONDS 50.2% (continued) | | | |
| | | Capital Markets 2.3% | | | |
| | | Goldman Sachs Group, Inc. | | | |
| $ | 1,740,000 | | 5.700%, 09/01/2012 | | $ | 1,659,154 | |
| | 3,855,000 | | 6.150%, 04/01/2018 | | | 3,704,505 | |
| | | | Morgan Stanley | | | | |
| | 4,360,000 | | 5.550%, 04/27/2017 | | | 3,600,423 | |
| | | | | | | 8,964,082 | |
| | | | Commercial Banks 7.8% | | | | |
| | | | Barclays Bank Plc | | | | |
| | 280,000 | | 6.050%, 12/04/2017 | | | | |
| | | | (Acquired 10/31/2008 and 12/10/2008, Cost $223,563) (a)(b) | | | 247,014 | |
| | 5,070,000 | | 7.434%, 12/15/2017 | | | | |
| | | | (Acquired Multiple Dates, Cost $4,489,292) (a)(b)(c) | | | 2,563,291 | |
| | | | Credit Suisse New York | | | | |
| | 60,000 | | 6.000%, 02/15/2018 (b) | | | 55,099 | |
| | | | Deutsche Bank, LLC | | | | |
| | 2,200,000 | | 5.375%, 03/02/2015 (b) | | | 1,984,596 | |
| | 1,410,000 | | 6.750%, 08/20/2018 | | | 1,429,754 | |
| | 3,270,000 | | 5.628%, 01/31/2049 | | | | |
| | | | (Acquired Multiple Dates, Cost $2,610,202) (a)(c) | | | 1,397,438 | |
| | | | Manufacturers & Traders Trust Co. | | | | |
| | 2,350,000 | | 3.850%, 04/01/2013 | | | | |
| | | | (Acquired Multiple Dates, Cost $2,135,597) (a)(c) | | | 1,962,215 | |
| | | | Marshall & Ilsley Bank | | | | |
| | 6,435,000 | | 5.413%, 12/04/2012 | | | 5,034,158 | |
| | | | Regions Bank | | | | |
| | 2,185,000 | | 7.500%, 05/15/2018 | | | 1,877,859 | |
| | | | Royal Bank of Scotland Group Plc | | | | |
| | 7,240,000 | | 6.990%, 10/29/2049 | | | | |
| | | | (Acquired Multiple Dates, Cost $5,055,503) (a)(b) | | | 3,384,961 | |
| | | | Suntrust Bank | | | | |
| | 3,455,000 | | 5.919%, 05/21/2012 (c) | | | 3,151,617 | |
| | | | Wachovia Corp. | | | | |
| | 5,110,000 | | 5.800%, 08/29/2049 (c) | | | 3,014,900 | |
| | 500,000 | | 7.980%, 12/31/2049 | | | 426,200 | |
| | | | Wells Fargo Alternative Loan Trust | | | | |
| | 4,665,000 | | 7.700%, 12/29/2049 (c) | | | 3,850,076 | |
| | | | | | | 30,379,178 | |
The accompanying notes are an integral part of these financial statements.
Frontegra Columbus Core Plus Fund
SCHEDULE OF INVESTMENTS (continued)
December 31, 2008 (Unaudited)
| Principal Amount | | | | Value | |
| | | CORPORATE BONDS 50.2% (continued) | | | |
| | | Computers & Peripherals 0.6% | | | |
| | | Tyco Electronics Group S A | | | |
| $ | 1,385,000 | | 6.000%, 10/01/2012 (b) | | $ | 1,249,413 | |
| | 1,335,000 | | 5.950%, 01/15/2014 (b) | | | 1,156,356 | |
| | | | | | | 2,405,769 | |
| | | | Consumer Finance 4.1% | | | | |
| | | | ERAC USA Finance Co. | | | | |
| | 5,680,000 | | 6.375%, 10/15/2017 | | | | |
| | | | (Acquired Multiple Dates, Cost $4,888,439) (a) | | | 3,941,988 | |
| | | | Ford Motor Credit Co. | | | | |
| | 1,330,000 | | 7.800%, 06/01/2012 | | | 933,093 | |
| | 650,000 | | 7.000%, 10/01/2013 | | | 449,103 | |
| | 5,970,000 | | 8.000%, 12/15/2016 | | | 3,888,661 | |
| | | | GMAC LLC | | | | |
| | 2,557,000 | | 6.625%, 05/15/2012 | | | 2,877,672 | |
| | 2,272,000 | | 6.750%, 12/01/2014 | | | 2,222,465 | |
| | | | Household Finance Corp. | | | | |
| | 1,105,000 | | 4.750%, 07/15/2013 | | | 1,008,065 | |
| | | | Residential Capital LLC | | | | |
| | 3,740,000 | | 6.500%, 04/17/2013 | | | 635,800 | |
| | | | | | | 15,956,847 | |
| | | | Diversified Financial Services 12.1% | | | | |
| | | | American Express Credit Co. | | | | |
| | 235,000 | | 7.300%, 08/20/2013 | | | 240,544 | |
| | | | American General Finance | | | | |
| | 3,000,000 | | 3.875%, 10/01/2009 | | | 2,127,633 | |
| | 3,680,000 | | 5.200%, 12/15/2011 | | | 1,563,411 | |
| | 1,615,000 | | 5.900%, 09/15/2012 | | | 693,956 | |
| | 210,000 | | 5.375%, 10/01/2012 | | | 87,448 | |
| | 4,790,000 | | 6.900%, 12/15/2017 | | | 2,072,983 | |
| | | | Bank of America Corp. | | | | |
| | 5,655,000 | | 8.000%, 12/29/2049 | | | 4,067,574 | |
| | | | CIT Group Inc. | | | | |
| | 1,110,000 | | 5.168%, 11/03/2010 | | | 843,284 | |
| | 265,000 | | 5.600%, 11/02/2011 (b) | | | 216,073 | |
| | 990,000 | | 5.610%, 02/13/2012 | | | 777,014 | |
| | 2,150,000 | | 7.625%, 11/30/2012 | | | 1,814,963 | |
| | 1,705,000 | | 5.638%, 12/21/2012 | | | 1,211,781 | |
The accompanying notes are an integral part of these financial statements.
Frontegra Columbus Core Plus Fund
SCHEDULE OF INVESTMENTS (continued)
December 31, 2008 (Unaudited)
| Principal Amount | | | | Value | |
| | | CORPORATE BONDS 50.2% (continued) | | | |
| | | Diversified Financial Services 12.1% (continued) | | | |
| | | Citigroup, Inc. | | | |
| $ | 8,645,000 | | 8.400%, 04/29/2049 | | $ | 5,708,207 | |
| | | | Credit Suisse Guernsey | | | | |
| | 7,894,000 | | 5.860%, 05/15/2017 (b)(c) | | | 3,684,390 | |
| | | | Genworth Global Funding | | | | |
| | 1,185,000 | | 5.200%, 10/08/2010 | | | 935,765 | |
| | 430,000 | | 5.250%, 05/15/2012 | | | 305,936 | |
| | | | International Lease Finance Corp. | | | | |
| | 3,075,000 | | 5.350%, 03/01/2012 | | | 2,132,562 | |
| | 1,025,000 | | 5.300%, 05/01/2012 | | | 719,958 | |
| | 1,630,000 | | 5.625%, 09/20/2013 | | | 1,088,472 | |
| | 2,000,000 | | 6.625%, 11/15/2013 | | | 1,347,576 | |
| | | | JP Morgan Chase & Co. | | | | |
| | 4,645,000 | | 7.900%, 10/30/2049 (c) | | | 3,863,850 | |
| | | | Lehman Brothers Holdings | | | | |
| | 7,000,000 | | 6.875%, 05/02/2018 (f) | | | 665,000 | |
| | | | Liberty Property LP | | | | |
| | 2,580,000 | | 6.625%, 10/01/2017 | | | 1,706,128 | |
| | | | Pemex Finance Ltd. | | | | |
| | 9,750 | | 9.690%, 08/15/2009 (b)(e) | | | 9,823 | |
| | | | Pricoa Global Funding I | | | | |
| | 390,000 | | 3.565%, 01/30/2012 | | | | |
| | | | (Acquired 12/18/2008, Cost $299,922) (a)(c) | | | 293,870 | |
| | 1,955,000 | | 5.400%, 10/18/2012 | | | | |
| | | | (Acquired Multiple Dates, Cost $1,944,241) (a) | | | 1,807,642 | |
| | | | Prudential Financial Inc. | | | | |
| | 2,945,000 | | 6.000%, 12/01/2017 | | | 2,362,473 | |
| | | | Simon Property Group LP | | | | |
| | 1,590,000 | | 5.100%, 06/15/2015 | | | 974,710 | |
| | 1,100,000 | | 5.750%, 12/01/2015 | | | 718,513 | |
| | 195,000 | | 6.100%, 05/01/2016 | | | 124,608 | |
| | 810,000 | | 5.250%, 12/01/2016 | | | 517,576 | |
| | | | Societe Generale | | | | |
| | 2,440,000 | | 5.922%, 04/05/2017 | | | | |
| | | | (Acquired 11/26/2008, Cost $1,269,028) (a)(b)(c) | | | 1,140,632 | |
The accompanying notes are an integral part of these financial statements.
Frontegra Columbus Core Plus Fund
SCHEDULE OF INVESTMENTS (continued)
December 31, 2008 (Unaudited)
| Principal Amount | | | | Value | |
| | | CORPORATE BONDS 50.2% (continued) | | | |
| | | Diversified Financial Services 12.1% (continued) | | | |
| | | Windsor Financing LLC | | | |
| $ | 1,116,910 | | 5.881%, 07/15/2017 | | | |
| | | | (Acquired 02/07/2006 and 08/03/2007, Cost $1,120,740) (a) | | $ | 1,178,418 | |
| | | | | | | 47,002,773 | |
| | | | Diversified Telecommunication Services 2.2% | | | | |
| | | | British Telecom plc | | | | |
| | 4,085,000 | | 5.950%, 01/15/2018 (b) | | | 3,553,815 | |
| | | | Comcast Cable Communications Holdings, Inc. | | | | |
| | 990,000 | | 8.375%, 03/15/2013 | | | 1,024,179 | |
| | | | Deutsche Telekom International Finance BV | | | | |
| | 1,170,000 | | 5.750%, 03/23/2016 (b) | | | 1,119,969 | |
| | | | Telecom Italia Capital | | | | |
| | 2,420,000 | | 5.250%, 11/15/2013 (b) | | | 1,845,250 | |
| | | | Telefonica Emisiones SAU | | | | |
| | 1,235,000 | | 6.221%, 07/03/2017 (b) | | | 1,216,718 | |
| | | | | | | 8,759,931 | |
| | | | Electric Utilities 3.0% | | | | |
| | | | Commonwealth Edison Co. | | | | |
| | 820,000 | | 5.950%, 08/15/2016 | | | 765,223 | |
| | 475,000 | | 6.150%, 09/15/2017 | | | 441,678 | |
| | | | Entergy Arkansas | | | | |
| | 785,000 | | 4.500%, 06/01/2010 | | | 755,959 | |
| | 1,300,000 | | 5.660%, 02/01/2025 | | | 1,086,121 | |
| | | | Entergy Gulf States Inc. | | | | |
| | 1,590,000 | | 4.875%, 11/01/2011 | | | 1,474,499 | |
| | | | Entergy Louisiana LLC | | | | |
| | 805,000 | | 5.500%, 04/01/2019 | | | 705,905 | |
| | | | Great River Energy | | | | |
| | 1,776,679 | | 5.829%, 07/01/2017 | | | | |
| | | | (Acquired Multiple Dates, Cost $1,758,419) (a) | | | 1,485,766 | |
| | 490,000 | | 7.233%, 07/01/2038 | | | | |
| | | | (Acquired 4/23/2008 and 12/10/2008, Cost $493,632) (a)(e) | | | 571,164 | |
| | | | Indianapolis Power & Light Co. | | | | |
| | 365,000 | | 6.300%, 07/01/2013 | | | | |
| | | | (Acquired Multiple Dates, Cost $374,495) (a) | | | 375,052 | |
| | 1,100,000 | | 6.050%, 10/01/2036 | | | | |
| | | | (Acquired Multiple Dates, Cost $1,060,607) (a) | | | 968,231 | |
The accompanying notes are an integral part of these financial statements.
Frontegra Columbus Core Plus Fund
SCHEDULE OF INVESTMENTS (continued)
December 31, 2008 (Unaudited)
| Principal Amount | | | | Value | |
| | | CORPORATE BONDS 50.2% (continued) | | | |
| | | Electric Utilities 3.0% (continued) | | | |
| | | Mackinaw Power LLC | | | |
| $ | 965,220 | | 6.296%, 10/31/2023 | | | |
| | | | (Acquired Multiple Dates, Cost $957,844) (a) | | $ | 788,111 | |
| | | | Tenaska Gateway Partners Ltd. | | | | |
| | 578,799 | | 6.052%, 12/30/2023 | | | | |
| | | | (Acquired 05/31/2007 and 8/03/2007, Cost $578,799) (a) | | | 476,479 | |
| | | | Westar Energy Inc. | | | | |
| | 1,080,000 | | 6.000%, 07/01/2014 | | | 1,043,356 | |
| | | | | | | 10,937,544 | |
| | | | Gas Utilities 0.5% | | | | |
| | | | Alliance Pipeline U.S. | | | | |
| | 301,879 | | 4.591%, 12/31/2025 | | | | |
| | | | (Acquired Multiple Dates, Cost $298,633) (a) | | | 311,630 | |
| | | | Gulfstream Natural Gas | | | | |
| | 890,000 | | 5.560%, 11/01/2015 | | | | |
| | | | (Acquired Multiple Dates, Cost $877,035) (a) | | | 746,350 | |
| | | | Source Gas LLC | | | | |
| | 765,000 | | 5.900%, 04/01/2017 | | | | |
| | | | (Acquired Multiple Dates, Cost $743,782) (a) | | | 599,548 | |
| | | | Southern Star Cent Gas | | | | |
| | 210,000 | | 6.000%, 06/01/2016 | | | | |
| | | | (Acquired Multiple Dates, Cost $204,781) (a) | | | 168,000 | |
| | | | | | | 1,825,528 | |
| | | | Health Care Providers & Services 0.4% | | | | |
| | | | United Health Group, Inc. | | | | |
| | 560,000 | | 6.000%, 02/15/2018 | | | 516,674 | |
| | | | Wellpoint, Inc. | | | | |
| | 1,080,000 | | 5.875%, 06/15/2017 | | | 982,946 | |
| | | | | | | 1,499,620 | |
| | | | Hotels, Restaurants & Leisure 0.3% | | | | |
| | | | Harrahs Operating Co., Inc. | | | | |
| | 4,105,000 | | 1.750%, 02/01/2016 | | | | |
| | | | (Acquired Multiple Dates, Cost $2,761,587) (a) | | | 1,169,925 | |
| | 830,000 | | 5.750%, 10/01/2017 | | | 128,650 | |
| | | | | | | 1,298,575 | |
The accompanying notes are an integral part of these financial statements.
Frontegra Columbus Core Plus Fund
SCHEDULE OF INVESTMENTS (continued)
December 31, 2008 (Unaudited)
| Principal Amount | | | | Value | |
| | | CORPORATE BONDS 50.2% (continued) | | | |
| | | Household Durables 0.3% | | | |
| | | Mohawk Industries, Inc. | | | |
| $ | 1,445,000 | | 6.125%, 01/15/2016 | | $ | 1,094,606 | |
| | | | | | | | |
| | | | Insurance 4.0% | | | | |
| | | | Genworth Financial, Inc. | | | | |
| | 2,830,000 | | 5.650%, 06/15/2012 | | | 1,195,137 | |
| | | | Hartford Financial Services Group | | | | |
| | 2,230,000 | | 5.375%, 03/15/2017 | | | 1,624,488 | |
| | 2,020,000 | | 6.300%, 03/15/2018 | | | 1,531,720 | |
| | 1,350,000 | | 5.950%, 10/15/2036 | | | 860,119 | |
| | | | Hartford Life Global Funding | | | | |
| | 430,000 | | 2.096%, 03/15/2011 (c) | | | 359,187 | |
| | | | Jackson National Life Global Funding | | | | |
| | 860,000 | | 5.125%, 02/10/2011 | | | | |
| | | | (Acquired Multiple Dates, Cost $855,288) (a) | | | 796,726 | |
| | 930,000 | | 5.375%, 05/08/2013 | | | | |
| | | | (Acquired 5/01/2008 and 12/10/2008, Cost $923,508) (a) | | | 840,457 | |
| | | | Met Life Global Funding | | | | |
| | 2,165,000 | | 5.125%, 04/10/2013 | | | | |
| | | | (Acquired Multiple Dates, Cost $2,152,408) (a) | | | 2,017,258 | |
| | 1,870,000 | | 6.817%, 08/15/2018 | | | 1,780,992 | |
| | | | Monumental Global Funding | | | | |
| | 1,495,000 | | 5.254%, 01/25/2013 | | | | |
| | | | (Acquired Multiple Dates, Cost $1,381,158) (a) | | | 1,064,670 | |
| | 1,605,000 | | 5.500%, 04/22/2013 | | | | |
| | | | (Acquired Multiple Dates, Cost $1,603,112) (a) | | | 1,514,170 | |
| | | | Nationwide Life Global Fund | | | | |
| | 435,000 | | 2.296%, 02/27/2012 | | | | |
| | | | (Acquired 12/19/2008, Cost $337,697) (a)(c) | | | 337,799 | |
| | 795,000 | | 5.450%, 10/02/2012 | | | | |
| | | | (Acquired 9/25/2007 and 12/10/2008, Cost $792,710) (a) | | | 620,796 | |
| | | | Protective Life Corp. | | | | |
| | 855,000 | | 5.450%, 09/28/2012 | | | 750,126 | |
| | | | Prudential Financial Inc. | | | | |
| | 390,000 | | 5.150%, 01/15/2013 | | | 316,778 | |
| | | | | | | 15,610,423 | |
The accompanying notes are an integral part of these financial statements.
Frontegra Columbus Core Plus Fund
SCHEDULE OF INVESTMENTS (continued)
December 31, 2008 (Unaudited)
| Principal Amount | | | | Value | |
| | | CORPORATE BONDS 50.2% (continued) | | | |
| | | Media 2.3% | | | |
| | | Comcast Corp. | | | |
| $ | 1,055,000 | | 6.300%, 11/15/2017 | | $ | 1,027,036 | |
| | | | Cox Communications Inc. | | | | |
| | 1,070,000 | | 9.375%, 01/15/2019 (Acquired 12/08/2008, Cost $1,061,365) (a) | | | 1,119,542 | |
| | | | Time Warner, Inc. | | | | |
| | 1,965,000 | | 6.750%, 07/01/2018 | | | 1,891,912 | |
| | 1,010,000 | | 8.750%, 02/14/2019 | | | 1,098,208 | |
| | 1,995,000 | | 7.700%, 05/01/2032 | | | 1,997,460 | |
| | | | Viacom, Inc. | | | | |
| | 2,030,000 | | 6.250%, 04/30/2016 | | | 1,682,653 | |
| | | | | | | 8,816,811 | |
| | | | Metals & Mining 1.6% | | | | |
| | | | Alcoa Inc. | | | | |
| | 2,065,000 | | 6.000%, 07/15/2013 | | | 1,867,138 | |
| | 3,275,000 | | 6.750%, 07/15/2018 | | | 2,679,392 | |
| | | | U.S. Steel Corp. | | | | |
| | 2,240,000 | | 5.650%, 06/01/2013 | | | 1,675,433 | |
| | | | | | | 6,221,963 | |
| | | | Multi-Utilities & Unregulated Power 1.8% | | | | |
| | | | Aes Eastern Energy | | | | |
| | 720,411 | | 9.000%, 01/02/2017 | | | 682,590 | |
| | | | Borger Energy Funding | | | | |
| | 2,607,861 | | 7.260%, 12/31/2022 | | | | |
| | | | (Acquired 08/14/2008 and 12/10/2008, Cost $2,551,838) (a)(e) | | | 2,281,879 | |
| | | | Homer City Funding LLC | | | | |
| | 2,156,700 | | 8.137%, 10/01/2019 | | | 2,038,082 | |
| | | | Kern River Funding Corp. | | | | |
| | 1,197,560 | | 4.893%, 04/30/2018 | | | | |
| | | | (Acquired Multiple Dates, Cost $1,165,425) (a) | | | 940,779 | |
| | | | Kiowa Power Partners LLC | | | | |
| | 783,420 | | 4.811%, 12/30/2013 | | | | |
| | | | (Acquired Multiple Dates, Cost $778,587) (a) | | | 732,497 | |
| | | | Midwest Generation LLC | | | | |
| | 237,944 | | Series 2000, 8.300%, 07/02/2009 | | | 236,755 | |
| | | | | | | 6,912,582 | |
The accompanying notes are an integral part of these financial statements.
Frontegra Columbus Core Plus Fund
SCHEDULE OF INVESTMENTS (continued)
December 31, 2008 (Unaudited)
| Principal Amount | | | | Value | |
| | | CORPORATE BONDS 50.2% (continued) | | | |
| | | Oil, Gas & Consumable Fuels 0.7% | | | |
| | | Tennessee Gas Pipeline Co. | | | |
| $ | 1,055,000 | | 7.500%, 04/01/2017 | | $ | 930,599 | |
| | | | Valero Energy Corp. | | | | |
| | 2,395,000 | | 6.625%, 06/15/2037 | | | 1,761,530 | |
| | | | | | | 2,692,129 | |
| | | | Real Estate Investment Trusts 0.7% | | | | |
| | | | AMB Property LP | | | | |
| | 2,445,000 | | 6.300%, 06/01/2013 | | | 1,539,577 | |
| | | | Prologis Trust | | | | |
| | 1,230,000 | | 5.625%, 11/15/2016 | | | 589,959 | |
| | 1,310,000 | | 6.625%, 05/15/2018 | | | 626,603 | |
| | | | | | | 2,756,139 | |
| | | | Transportation 1.9% | | | | |
| | | | Burlington North Santa Fe | | | | |
| | 251,341 | | 6.230%, 07/02/2018 (e) | | | 255,378 | |
| | 8,648 | | 6.462%, 01/15/2021 (e) | | | 8,874 | |
| | 20,109 | | 8.251%, 01/15/2021 | | | 22,502 | |
| | 12,717 | | 5.943%, 01/15/2022 | | | 12,751 | |
| | 669,665 | | 4.830%, 01/15/2023 | | | 770,114 | |
| | 1,170,383 | | 5.996%, 04/01/2024 (e) | | | 1,171,413 | |
| | | | Chicago & North | | | | |
| | 310,750 | | 8.910%, 01/01/2015 | | | 340,474 | |
| | | | CSX Transportation, Inc. | | | | |
| | 1,060,000 | | 5.750%, 03/15/2013 | | | 995,998 | |
| | 1,991,270 | | 6.251%, 01/15/2023 | | | 1,864,638 | |
| | | | Union Pacific Corp. | | | | |
| | 1,127,760 | | 6.061%, 01/17/2023 (e) | | | 1,132,756 | |
| | 327,820 | | 5.082%, 01/02/2029 (e) | | | 308,345 | |
| | 694,595 | | 5.866%, 07/02/2030 | | | 648,849 | |
| | | | | | | 7,532,092 | |
| | | | Utilities 0.5% | | | | |
| | | | Appalachian Power Co. | | | | |
| | 1,145,000 | | 5.650%, 08/15/2012 | | | 1,086,010 | |
The accompanying notes are an integral part of these financial statements.
Frontegra Columbus Core Plus Fund
SCHEDULE OF INVESTMENTS (continued)
December 31, 2008 (Unaudited)
| Principal Amount | | | | Value | |
| | | CORPORATE BONDS 50.2% (continued) | | | |
| | | Utilities 0.5% (continued) | | | |
| | | Indiantown Cogeneration | | | |
| $ | 510,363 | | 9.260%, 12/15/2010 | | $ | 465,874 | |
| | 590,000 | | 9.770%, 12/15/2020 | | | 467,386 | |
| | | | | | | 2,019,270 | |
| | | | Total Corporate Bonds | | | | |
| | | | (Cost $230,084,720) | | | 194,529,730 | |
| | | | | | | | |
| | | | MORTGAGE BACKED SECURITIES 38.5% | | | | |
| | | | Banc of America Commercial Mortgage Inc. | | | | |
| | 4,495,000 | | Series 2006-5, Class A4, 5.414%, 09/10/2016 | | | 3,553,235 | |
| | 3,365,000 | | Series 2006-3, Class A4, 5.889%, 07/10/2044 | | | 2,742,306 | |
| | 3,385,000 | | Series 2006-1, Class A4, 5.372%, 09/10/2045 | | | 2,708,911 | |
| | 1,500,000 | | Series 2006-4, Class A4, 5.634%, 07/10/2046 | | | 1,199,704 | |
| | 3,860,000 | | Series 2007-3, Class A2, 5.659%, 06/10/2049 | | | 3,048,135 | |
| | | | Bear Stearns Commercial Mortgage Securities | | | | |
| | 1,165,000 | | Series 2005-PWR10, Class A4, 5.405%, 12/11/2040 | | | 990,728 | |
| | | | Citigroup/Deutsche Bank Commercial Mortgage Trust | | | | |
| | 3,650,000 | | Series 2006-CD2, Class A4, 5.545%, 01/15/2046 | | | 2,927,487 | |
| | 8,175,000 | | Series 2006-CD3, Class A5, 5.617%, 10/15/2048 | | | 6,511,115 | |
| | 1,845,000 | | Series 2006-C5, Class A2, 5.378%, 10/15/2049 | | | 1,526,301 | |
| | 3,945,000 | | Series 2006-C5, Class A1, 5.720%, 10/15/2049 | | | 3,092,233 | |
| | 4,130,000 | | Series 2007-CD4, Class A4, 5.322%, 12/11/2049 | | | 2,883,139 | |
| | | | CitiMortgage Alternative Loan Trust | | | | |
| | 2,055,582 | | Series 2007-A4, Class 2A1, 5.500%, 04/25/2022 | | | 1,397,154 | |
| | | | Commercial Mortgage Pass-Through Certificate | | | | |
| | 8,390,000 | | Series 2006-C7, Class A4, 5.768%, 06/10/2046 | | | 6,838,028 | |
| | | | Credit Suisse First Boston Mortgage Securities Corp. | | | | |
| | 454,446 | | Pool # 2005-10, 5.000%, 09/25/2015 | | | 375,486 | |
| | 98,272 | | Pool # 2003-1, 7.000%, 02/25/2033 | | | 91,986 | |
| | 815,000 | | Pool # 2005-C5, 5.100%, 08/15/2038 | | | 666,917 | |
| | 540,000 | | Pool # 2006-C5, 5.246%, 12/15/2039 | | | 438,996 | |
| | 2,545,000 | | Pool # 2007-C2, 5.448%, 01/15/2049 | | | 1,934,804 | |
| | | | Credit Suisse Mortgage Capital Certificates | | | | |
| | 1,140,000 | | Series 2007-C1, Class A3, 5.383%, 02/15/2040 | | | 684,141 | |
The accompanying notes are an integral part of these financial statements.
Frontegra Columbus Core Plus Fund
SCHEDULE OF INVESTMENTS (continued)
December 31, 2008 (Unaudited)
| Principal Amount | | | | Value | |
| | | MORTGAGE BACKED SECURITIES 38.5% (continued) | | | |
| | | CWCapital Cobalt | | | |
| $ | 3,110,000 | | Series 2007-C3, Class A4, 6.015%, 05/15/2046 (c) | | $ | 2,286,812 | |
| | 1,575,000 | | Series 2006-C1, Class A2, 5.174%, 08/15/2048 | | | 1,290,664 | |
| | | | FHLMC Remic | | | | |
| | 21,778 | | Series 2508, Class CR, 4.500%, 03/15/2016 | | | 21,772 | |
| | | | FNMA Pool | | | | |
| | 101 | | Pool # 545121, 6.500%, 08/01/2031 | | | 105 | |
| | | | FNMA Remic | | | | |
| | 83,237 | | Series 1994-3, Class PL, 5.500%, 01/25/2024 | | | 86,660 | |
| | | | GE Capital Mortgage Corporation | | | | |
| | 2,855,000 | | Series 2005-C4, Class A4, 5.333%, 11/10/2045 (c) | | | 2,365,159 | |
| | | | GMAC Commercial Mortgage Securities Inc. | | | | |
| | 2,000,000 | | Pool # 2006-C1, 5.238%, 11/10/2045 | | | 1,593,754 | |
| | 5,721 | | Pool # 2003-C1, 9.500%, 10/15/2009 | | | 5,868 | |
| | | | Greenwich Capital Commercial Funding Corp. | | | | |
| | 2,070,000 | | Series 2005-GG5, Class A5, 5.224%, 04/10/2037 | | | 1,701,132 | |
| | 795,000 | | Series 2006-GG7, Class A2, 5.914%, 07/10/2038 | | | 686,368 | |
| | 7,565,000 | | Series 2006-GG7, Class A4, 6.110%, 07/10/2038 (c) | | | 5,904,174 | |
| | 2,250,000 | | Series 2007-GG9, Class A2, 5.381%, 03/10/2039 | | | 1,773,583 | |
| | 5,485,000 | | Series 2007-GG9, Class A4, 5.444%, 03/10/2039 | | | 4,174,809 | |
| | 1,613,378 | | Series 2007-GG11, Class A1, 5.358%, 12/10/2049 | | | 1,442,898 | |
| | | | GS Mortgage Securities Corp. II | | | | |
| | 3,341,416 | | Series 2007-EOP, Class A1, 5.410%, 03/06/2020 | | | | |
| | | | (Acquired Multiple Dates, Cost $3,246,651) (a)(c) | | | 2,458,054 | |
| | | | Home Equity Mortgage Trust | | | | |
| | 1,440,000 | | 2005-5, Class A1F2, 5.150%, 04/25/2036 | | | 530,555 | |
| | 471,310 | | 2006-5, Class A1, 5.500%, 01/25/2037 | | | 110,385 | |
| | | | JP Morgan Chase Commercial Mortgage Securities Corp. | | | | |
| | 2,205,000 | | Series 2006-LDP9, Class A3, 5.336%, 05/15/2047 | | | 1,654,139 | |
| | | | LB-UBS Commercial Mortgage Trust | | | | |
| | 84,608 | | Series 2003-C, Class A2, 3.086%, 05/15/2027 | | | 84,424 | |
| | 1,545,000 | | Series 2005-C7, Class A4, 5.197%, 11/15/2030 | | | 1,275,569 | |
| | 9,300,000 | | Series 2006-C1, Class A4, 5.156%, 02/15/2031 | | | 7,383,305 | |
| | 4,170,000 | | Series 2006-C4, Class A4, 6.080%, 06/15/2038 (c) | | | 3,430,297 | |
| | 4,075,000 | | Series 2006-C6, Class A4, 5.372%, 09/15/2039 | | | 3,196,862 | |
| | 715,000 | | Series 2007-C1, Class A2, 5.318%, 02/15/2040 | | | 570,167 | |
| | 4,270,000 | | Series 2007-C2, Class A2, 5.330%, 02/15/2040 | | | 3,367,438 | |
| | 1,650,000 | | Series 2007-C1, Class A4, 5.424%, 02/15/2040 | | | 1,224,121 | |
The accompanying notes are an integral part of these financial statements.
Frontegra Columbus Core Plus Fund
SCHEDULE OF INVESTMENTS (continued)
December 31, 2008 (Unaudited)
| Principal Amount | | | | Value | |
| | | MORTGAGE BACKED SECURITIES 38.5% (continued) | | | |
| | | LB-UBS Commercial Mortgage Trust (continued) | | | |
| $ | 5,275,000 | | Series 2007-C2, Class A3, 5.430%, 02/15/2040 | | $ | 3,791,166 | |
| | 5,340,000 | | Series 2007-C3, Class A4, 6.136%, 07/15/2044 (c) | | | 4,090,672 | |
| | | | Master Alternative Loans Trust | | | | |
| | 470,515 | | Pool # 2004-6, 4.500%, 07/25/2014 | | | 410,230 | |
| | | | Master Asset Securitization Trust | | | | |
| | 440,848 | | Pool # 2004-3, 4.750%, 01/25/2014 | | | 430,378 | |
| | | | Merrill Lynch Commercial Mortgage Trust | | | | |
| | 3,500,000 | | Series 2005-LC1, Class A4, 5.291%, 01/12/2044 | | | 2,871,121 | |
| | 2,575,000 | | Series 2006-2, Class A4, 5.910%, 06/12/2046 | | | 2,063,129 | |
| | 2,440,000 | | Series 2006-3, Class A4, 5.414%, 07/12/2046 | | | 1,919,898 | |
| | 755,000 | | Series 2007-7, Class A2, 5.693%, 06/12/2050 | | | 591,127 | |
| | 1,960,000 | | Series 2007-C1, Class A2, 5.725%, 06/12/2050 | | | 1,528,071 | |
| | | | Morgan Stanley Capital I | | | | |
| | 7,610,000 | | Series 2006-IQ11, Class A4, 5.944%, 10/15/2042 | | | 6,246,334 | |
| | 260 | | Series 2007-HQ13, Class A1, 5.357%, 12/15/2044 | | | 241 | |
| | | | NYC Mortgage Loan Trust | | | | |
| | 92 | | Series 1996, 6.750%, 09/25/2019 | | | | |
| | | | (Acquired 12/10/2008, Cost $85) (a)(e) | | | 74 | |
| | | | Residential Accredit Loans, Inc. | | | | |
| | 1,523,373 | | Series 2004-QS4, Class A1, 4.350%, 03/25/2034 | | | 1,338,541 | |
| | | | Wachovia Bank Commercial Mortgage Trust | | | | |
| | 3,790,000 | | Series 2005-C22, Class A4, 5.445%, 12/15/2044 | | | 3,036,123 | |
| | 6,555,000 | | Series 2006-C23, Class A4, 5.418%, 01/15/2045 | | | 5,111,824 | |
| | 9,870,000 | | Series 2006-C24, Class A3, 5.558%, 03/15/2045 (e) | | | 7,820,818 | |
| | 1,950,000 | | Series 2006-C27, Class A3, 5.765%, 07/15/2045 | | | 1,557,488 | |
| | 1,915,000 | | Series 2007-C34, Class A3, 5.680%, 05/15/2046 | | | 1,388,462 | |
| | 5,365,000 | | Series 2007-C31, Class A2, 5.421%, 04/15/2047 | | | 4,161,692 | |
| | 6,750,000 | | Series 2006-C29, Class A4, 5.380%, 11/15/2048 | | | 5,058,389 | |
| | | | Wells Fargo Alternative Loan Trust | | | | |
| | 1,691,427 | | Series 2007-PA3, Class 6A1, 5.500%, 07/25/2037 | | | 1,065,072 | |
| | | | Wells Fargo Mortgage Backed Securities Trust | | | | |
| | 2,514,809 | | Pool # 2006-3, 5.500%, 03/25/2036 | | | 2,196,612 | |
| | | | Total Mortgage Backed Securities | | | | |
| | | | (Cost $177,238,584) | | | 148,907,342 | |
The accompanying notes are an integral part of these financial statements.
Frontegra Columbus Core Plus Fund
SCHEDULE OF INVESTMENTS (continued)
December 31, 2008 (Unaudited)
| Principal Amount | | | | Value | |
| | | INSTITUTIONAL TERM LOANS 3.1% | | | |
| | | Chrysler LLC | | | |
| $ | 10,537,450 | | 6.467%, 11/29/2013 (e) | | $ | 2,700,221 | |
| | | | Community Health Systems, Inc. | | | | |
| | 51,353 | | 7.848%, 07/02/2014 (e) | | | 39,979 | |
| | 753,081 | | 7.570%, 07/25/2014 (e) | | | 586,273 | |
| | | | Ford Motor Co. | | | | |
| | 1,195,980 | | 8.320%, 12/15/2013 | | | 479,385 | |
| | 7,654,470 | | 8.360%, 12/15/2013 (e) | | | 3,068,141 | |
| | | | General Motors Corp. | | | | |
| | 5,325,703 | | 1.375%, 11/01/2013 | | | 2,400,986 | |
| | 360,000 | | 5.059%, 11/27/2013 (e) | | | 162,299 | |
| | | | Georgia Pacific Corp. | | | | |
| | 869,159 | | 7.800%, 12/20/2012 (e) | | | 654,042 | |
| | | | HCA Inc. | | | | |
| | 825,000 | | 4.946%, 11/17/2013 (e) | | | 643,731 | |
| | 628,736 | | 8.110%, 11/17/2013 | | | 490,590 | |
| | | | Lyondell Chemical Co. | | | | |
| | 1,241,738 | | 6.396%, 12/20/2014 (e) | | | 558,782 | |
| | | | Total Loans | | | | |
| | | | (Cost $11,821,130) | | | 11,784,429 | |
| | | | | | | | |
| | | | PREFERRED STOCKS 0.1% | | | | |
| | | | Thrifts & Mortgage Finance 0.1% | | | | |
| | | | Fannie Mae | | | | |
| | 169,732 | | 8.25%, 12/31/2010 (c) | | | 140,878 | |
| | | | Freddie Mac | | | | |
| | 141,065 | | 8.375%, 12/31/2012 (c) | | | 55,015 | |
| | | | Total Preferred Stocks | | | | |
| | | | (Cost $4,155,967) | | | 195,893 | |
The accompanying notes are an integral part of these financial statements.
Frontegra Columbus Core Plus Fund
SCHEDULE OF INVESTMENTS (continued)
December 31, 2008 (Unaudited)
| Principal Amount | | | | Value | |
| | | SHORT-TERM INVESTMENTS 1.9% | | | |
| | | Commercial Paper 0.4% | | | |
| $ | 1,740,000 | | US Bancorp 01/02/2009 | | $ | 1,739,999 | |
| | | | | | | | |
| | | | Variable Rate Demand Notes (d) 1.5% | | | | |
| | 5,114,460 | | U.S. Bank Demand Note, 2.233% | | | 5,114,460 | |
| | 591,524 | | Wisconsin Corporate Central Credit Union, 4.869% | | | 591,524 | |
| | | | | | | 5,705,984 | |
| | | | Total Short-Term Investments | | | | |
| | | | (Cost $7,445,983) | | | 7,445,983 | |
| | | | | | | | |
| | | | Total Investments 98.6% | | | | |
| | | | (Cost $452,053,217) | | | 381,294,503 | |
| | | | | | | | |
| | | | Other Assets in Excess of Liabilities 1.4% | | | 5,492,530 | |
| | | | | | | | |
| | | | TOTAL NET ASSETS 100.0% | | $ | 386,787,033 | |
| (a) | Security exempt from registration under Rule 144A of the Securities Act of 1933. These securities may be resold in transactions exempt from registration normally to qualified institutional buyers. The total value of these securities amounted to $44,272,101 (11.4% of net assets) at December 31, 2008. |
| (b) | U.S.-dollar denominated security of foreign issuer. |
| (d) | Variable rate demand notes are considered short-term obligations and are payable upon demand. Interest rates change periodically on specified dates. The rates listed are as of December 31, 2008. |
| (e) | Security is fair valued. As of December 31, 2008, the fair value of these investments was $25,765,654 or 6.7% of total net assets. |
| (f) | Security is in default. |
The accompanying notes are an integral part of these financial statements.
Frontegra Columbus Core Plus Fund
SCHEDULE OF INVESTMENTS (continued)
December 31, 2008 (Unaudited)
Credit Default Swaps
| | | | | Implied | | | | | | | | | | | |
| | | | | Credit | | | (Pay)/ | | | | | | | | |
| | | | | Spread at | | | Receive | | | | | | | Unrealized | |
| | Reference | Buy/Sell | | December | | | Fixed | | Expiration | | Notional | | | Appreciation/ | |
| Counterparty | Entity | Protection(1) | | | 31, 2008(2) | | | Rate | | Date | | Amount(3) | | | (Depreciation) | |
| JP Morgan | Ford Motor | | | | | | | | | | | | | | | |
| | Credit Co. | Sell | | | 16.50% | | | | 5.15% | | 3/20/11 | | $ | 2,250,000 | | | $ | (382,146 | ) |
| JP Morgan | Dow Jones | | | | | | | | | | | | | | | | | | |
| | North | | | | | | | | | | | | | | | | | | |
| | American | | | | | | | | | | | | | | | | | | |
| | High | | | | | | | | | | | | | | | | | | |
| | Yield Index | Sell | | | 21.00% | | | | 3.25% | | 6/20/13 | | | 23,397,500 | | | | 631,910 | |
| | | | | | | | | | | | | | $ | 25,647,500 | | | $ | 249,764 | |
| (1) | If the Fund is a seller of protection and a credit event occurs, as defined under the terms of that particular swap agreement, the Fund will either (i) pay to the buyer of protection an amount equal to the notional amount of the swap and take delivery of the referenced obligation or underlying securities comprising the referenced index or (ii) pay a net settlement amount in the form of cash or securities equal to the notional amount of the swap less the recovery value of the referenced obligation or underlying securities comprising the referenced index. |
| (2) | Implied credit spreads, represented in absolute terms, utilized in determining the market value of credit default swap agreements on corporate issues or sovereign issues of an emerging country as of period end serve as an indicator of the current status of the payment/performance risk and represent the likelihood or risk of default for the credit derivative. The implied credit spread of a particular referenced entity reflects the cost of buying/selling protection and may include upfront payments required to be made to enter into the agreement. Wider credit spreads represent a deterioration of the referenced entity’s credit soundness and a greater likelihood or risk of default or other credit event occurring as defined under the terms of the agreement. A credit spread identified as “Defaulted” indicates a credit event has occurred for the referenced entity or obligation. |
| (3) | The maximum potential amount the Fund could be required to make as a seller of credit protection or receive as a buyer of credit protection if a credit event occurs as defined under the terms of that particular swap agreement. |
The accompanying notes are an integral part of these financial statements.
Frontegra Columbus Core Plus Fund
STATEMENT OF ASSETS AND LIABILITIES
December 31, 2008 (Unaudited)
| Assets: | | | |
| Investments at value (cost $452,053,217) | | $ | 381,294,503 | |
| Cash | | | 2,236,502 | |
| Interest receivable | | | 5,051,582 | |
| Deposits with broker and custodian for swaps | | | 10,254,713 | |
| Unrealized appreciation on swaps | | | 249,764 | |
| Receivable for Fund shares sold | | | 138,630 | |
| Receivable for investments sold | | | 5,265,408 | |
| Prepaid expenses and other assets | | | 39,934 | |
| Total assets | | | 404,531,036 | |
| | | | | |
| Liabilities: | | | | |
| Payable for investments purchased | | | 11,883,371 | |
| Payable for Fund shares purchased | | | 221,521 | |
| Payable for swap agreements | | | 5,473,968 | |
| Accrued investment advisory fee | | | 80,281 | |
| Accrued expenses | | | 84,862 | |
| Total liabilities | | | 17,744,003 | |
| Net Assets | | $ | 386,787,033 | |
| | | | | |
| Net Assets Consist of: | | | | |
| Paid in capital | | $ | 461,253,134 | |
| Undistributed net investment income | | | 88,526 | |
| Accumulated net realized loss on investments sold, | | | | |
| swap contracts and foreign currency | | | (4,045,677 | ) |
| Net unrealized appreciation (depreciation) on: | | | | |
| Investments | | | (70,758,714 | ) |
| Swap contracts | | | 249,764 | |
| Net Assets | | $ | 386,787,033 | |
| | | | | |
| Capital Stock, $0.01 Par Value | | | | |
| Authorized | | | 100,000,000 | |
| Issued and outstanding | | | 14,766,346 | |
| Net Asset Value, Redemption Price and Offering Price Per Share | | $ | 26.19 | |
The accompanying notes are an integral part of these financial statements.
Frontegra Columbus Core Plus Fund
STATEMENT OF OPERATIONS
| | Six Months Ended | |
| | | December 31, 2008 | |
| | | (Unaudited) | |
| Investment Income: | | | |
| Interest | | $ | 15,676,487 | |
Dividends(1) | | | 83,337 | |
| | | | 15,759,824 | |
| | | | | |
| Expenses: | | | | |
| Investment advisory fees (Note 3) | | | 841,454 | |
| Fund administration and accounting fees | | | 78,568 | |
| Custody fees | | | 26,680 | |
| Audit fees | | | 16,560 | |
| Legal fees | | | 16,192 | |
| Federal and state registration fees | | | 15,456 | |
| Shareholder servicing fees | | | 10,304 | |
| Directors’ fees and related expenses | | | 4,232 | |
| Compliance related expenses | | | 4,048 | |
| Reports to shareholders | | | 4,048 | |
| Other | | | 8,096 | |
| Total expenses before waiver | | | 1,025,638 | |
| Waiver of expenses by Adviser (Note 3) | | | (289,366 | ) |
| Net expenses | | | 736,272 | |
| Net Investment Income | | | 15,023,552 | |
| | | | | |
| Realized and Unrealized | | | | |
| Gain on Investments: | | | | |
| Realized gain on: | | | | |
| Investments | | | 1,167,437 | |
| Swap contracts | | | 570,927 | |
| Change in net unrealized appreciation/depreciation on: | | | | |
| Investments | | | (61,898,337 | ) |
| Swap contracts | | | 1,218,326 | |
| Net Realized and Unrealized | | | | |
| Loss on Investments | | | (58,941,647 | ) |
| Net Decrease in Net Assets | | | | |
| Resulting from Operations | | $ | (43,918,095 | ) |
| (1) | Net of $40 in foreign withholding taxes. |
The accompanying notes are an integral part of these financial statements.
Frontegra Columbus Core Plus Fund
STATEMENTS OF CHANGES IN NET ASSETS
| | Six Months Ended | | | | |
| | | December 31, 2008 | | | Year Ended | |
| | | (Unaudited) | | | June 30, 2008 | |
| Operations: | | | | | | |
| Net investment income | | $ | 15,023,552 | | | $ | 21,156,499 | |
| Net realized gain on: | | | | | | | | |
| Investments | | | 1,167,437 | | | | 14,888,690 | |
| Swap contracts | | | 570,927 | | | | 513,045 | |
| Foreign currency translation | | | — | | | | 24,984 | |
| Change in net unrealized appreciation/depreciation on: | | | | | | | | |
| Investments | | | (61,898,337 | ) | | | (7,299,904 | ) |
| Swap contracts | | | 1,218,326 | | | | (1,217,325 | ) |
| Net increase (decrease) in net assets | | | | | | | | |
| resulting from operations | | | (43,918,095 | ) | | | 28,065,989 | |
| | | | | | | | | |
| Distributions | | | | | | | | |
| Paid From: | | | | | | | | |
| Net investment income | | | (15,903,564 | ) | | | (21,303,876 | ) |
| Net realized gain on investments | | | (9,661,730 | ) | | | (3,906,915 | ) |
| Net decrease in net assets resulting | | | | | | | | |
| from distributions paid | | | (25,565,294 | ) | | | (25,210,791 | ) |
| | | | | | | | | |
| Capital Share | | | | | | | | |
| Transactions: | | | | | | | | |
| Shares issued in connection with acquisition of | | | | | | | | |
| Columbus Core Plus Fund (see Note 7) | | | — | | | | 139,917,106 | |
| Shares sold | | | 77,915,090 | | | | 106,418,312 | |
| Shares issued to holders in | | | | | | | | |
| reinvestment of distributions | | | 21,068,888 | | | | 23,395,411 | |
| Shares redeemed | | | (76,628,400 | ) | | | (115,500,980 | ) |
| Net increase in net assets resulting | | | | | | | | |
| from capital share transactions | | | 22,355,578 | | | | 154,229,849 | |
| Total Increase (Decrease) in Net Assets | | | (47,127,811 | ) | | | 157,085,047 | |
| | | | | | | | | |
| Net Assets: | | | | | | | | |
| Beginning of period | | | 433,914,844 | | | | 276,829,797 | |
| End of period | | | | | | | | |
| (includes undistributed net investment | | | | | | | | |
| income of $88,526 and $968,538, respectively) | | $ | 386,787,033 | | | $ | 433,914,844 | |
The accompanying notes are an integral part of these financial statements.
Frontegra Columbus Core Plus Fund
FINANCIAL HIGHLIGHTS
| | | Six Months | | | | | | | | | | | | | | | | |
| | | Ended | | | Year | | | Year | | | Year | | | Year | | | Year | |
| | | December 31, | | | Ended | | | Ended | | | Ended | | | Ended | | | Ended | |
| | | 2008 | | | June 30, | | | June 30, | | | June 30, | | | June 30, | | | June 30, | |
| | | (Unaudited) | | | 2008 | | | 2007 | | | 2006 | | | 2005 | | | 2004 | |
| Net Asset Value, | | | | | | | | | | | | | | | | | | |
| Beginning of Period | | $ | 30.73 | | | $ | 30.40 | | | $ | 29.72 | | | $ | 31.50 | | | $ | 30.51 | | | $ | 31.92 | |
| | | | | | | | | | | | | | | | | | | | | | | | | |
| Income (Loss) | | | | | | | | | | | | | | | | | | | | | | | | |
| from Investment | | | | | | | | | | | | | | | | | | | | | | | | |
| Operations: | | | | | | | | | | | | | | | | | | | | | | | | |
| Net investment income | | | 1.01 | | | | 1.48 | | | | 1.54 | | | | 1.41 | | | | 1.13 | | | | 0.99 | |
| Net realized and unrealized | | | | | | | | | | | | | | | | | | | | | | | | |
| gain (loss) on investments | | | (3.82 | ) | | | 0.61 | | | | 0.68 | | | | (1.30 | ) | | | 0.98 | | | | (0.45 | ) |
| Total Income (Loss) from | | | | | | | | | | | | | | | | | | | | | | | | |
| Investment Operations | | | (2.81 | ) | | | 2.09 | | | | 2.22 | | | | 0.11 | | | | 2.11 | | | | 0.54 | |
| | | | | | | | | | | | | | | | | | | | | | | | | |
| Less Distributions | | | | | | | | | | | | | | | | | | | | | | | | |
| Paid: | | | | | | | | | | | | | | | | | | | | | | | | |
| From net investment income | | | (1.07 | ) | | | (1.49 | ) | | | (1.54 | ) | | | (1.45 | ) | | | (1.12 | ) | | | (0.98 | ) |
| From net realized gain on investments | | | (0.66 | ) | | | (0.27 | ) | | | — | | | | (0.44 | ) | | | — | | | | (0.97 | ) |
| Total Distributions Paid | | | (1.73 | ) | | | (1.76 | ) | | | (1.54 | ) | | | (1.89 | ) | | | (1.12 | ) | | | (1.95 | ) |
| | | | | | | | | | | | | | | | | | | | | | | | | |
| Net Asset Value, End of Period | | $ | 26.19 | | | $ | 30.73 | | | $ | 30.40 | | | $ | 29.72 | | | $ | 31.50 | | | $ | 30.51 | |
| Total Return | | | (9.24 | )%(2) | | | 6.92 | % | | | 7.52 | % | | | 0.36 | % | | | 7.00 | % | | | 1.71 | % |
| | | | | | | | | | | | | | | | | | | | | | | | | |
| Supplemental Data | | | | | | | | | | | | | | | | | | | | | | | | |
| and Ratios: | | | | | | | | | | | | | | | | | | | | | | | | |
| Net assets, end of period | | | | | | | | | | | | | | | | | | | | | | | | |
| (in thousands) | | $ | 386,787 | | | $ | 433,915 | | | $ | 276,830 | | | $ | 313,880 | | | $ | 316,474 | | | $ | 346,733 | |
| Ratio of expenses to | | | | | | | | | | | | | | | | | | | | | | | | |
| average net assets | | | | | | | | | | | | | | | | | | | | | | | | |
| Before waivers | | | | | | | | | | | | | | | | | | | | | | | | |
| and reimbursements | | | 0.49 | %(1) | | | 0.49 | % | | | 0.50 | % | | | 0.50 | % | | | 0.50 | % | | | 0.51 | % |
| Net of waivers | | | | | | | | | | | | | | | | | | | | | | | | |
| and reimbursements | | | 0.35 | %(1) | | | 0.30 | % | | | 0.20 | % | | | 0.20 | % | | | 0.41 | % | | | 0.43 | % |
| Ratio of net investment income to | | | | | | | | | | | | | | | | | | | | | | | | |
| average net assets | | | | | | | | | | | | | | | | | | | | | | | | |
| Before waivers | | | | | | | | | | | | | | | | | | | | | | | | |
| and reimbursements | | | 7.00 | %(1) | | | 4.68 | % | | | 4.65 | % | | | 4.29 | % | | | 3.21 | % | | | 2.63 | % |
| Net of waivers | | | | | | | | | | | | | | | | | | | | | | | | |
| and reimbursements | | | 7.14 | %(1) | | | 4.87 | % | | | 4.95 | % | | | 4.59 | % | | | 3.30 | % | | | 2.71 | % |
| Portfolio turnover rate | | | 252 | %(2) | | | 1,093 | % | | | 978 | % | | | 1,247 | % | | | 1,222 | % | | | 1,409 | % |
The accompanying notes are an integral part of these financial statements.
Growth of a $100,000 Investment (Unaudited)
* 2/23/01 commencement of operations.
| Portfolio Total Return** | | | | | | |
| FOR PERIODS ENDED 12/31/08 | | FUND | | | INDEX | |
| | | | | | | |
| SIX MONTHS | | | (7.47 | )% | | | 4.07 | % |
| | | | | | | | | |
| ONE YEAR | | | (6.45 | )% | | | 5.24 | % |
| | | | | | | | | |
| FIVE YEAR | | | | | | | | |
| AVERAGE ANNUAL | | | 2.47 | % | | | 4.65 | % |
| | | | | | | | | |
| SINCE COMMENCEMENT | | | | | | | | |
| AVERAGE ANNUAL | | | 3.89 | % | | | 5.63 | % |
This chart assumes an initial gross investment of $100,000 made on 2/23/01 (commencement of operations). Past performance is not predictive of future results. Investment return and principal value will fluctuate so that shares, when redeemed, may be worth more or less than the original cost. In the absence of existing fee waivers, total return would be reduced. To receive current to the most recent month-end performance, please call 1-888-825-2100.
The Barclays Capital U.S. Aggregate Bond Index (formerly the Lehman Brothers Aggregate Bond Index) is an unmanaged market value-weighted performance benchmark for investment-grade fixed-rate debt issues, including government, corporate, asset backed and mortgage backed securities, with maturities of at least one year. The Index does not reflect investment management fees, brokerage commissions and other expenses associated with investing in fixed income securities. A direct investment in the index is not possible.
| ** | The returns shown do not reflect the deduction of taxes that a shareholder would pay on Fund distributions or the redemption of Fund shares. |
Frontegra Columbus Core Fund
SCHEDULE OF INVESTMENTS
December 31, 2008 (Unaudited)
| Principal Amount | | | | Value | |
| | | ASSET BACKED SECURITIES 3.2% | | | |
| | | Americredit Automobile Receivables Trust | | | |
| $ | 148,020 | | 2007-DF, Class A2A, 5.660%, 01/06/2011 (c) | | $ | 147,949 | |
| | 355,000 | | 2008-AF, Class A4, 6.960%, 10/14/2014 | | | 291,731 | |
| | | | Citibank Credit Card Issuance Trust | | | | |
| | 550,000 | | 2008-A1, Class A1, 5.350%, 02/07/2020 | | | 434,358 | |
| | | | Ford Credit Auto Owner Trust | | | | |
| | 245,000 | | 2006-C, Class A4A, 5.150%, 02/15/2012 | | | 233,310 | |
| | 290,000 | | 2007-A, Class A4A, 5.470%, 06/15/2012 | | | 269,015 | |
| | 100,000 | | 2007-B, Class A4A, 5.240%, 07/15/2012 | | | 91,520 | |
| | | | Hertz Vehicle Financing LLC | | | | |
| | 191,667 | | 2004-1, Class A4, 3.230%, 05/25/2010 | | | | |
| | | | (Acquired 02/01/2008, Cost $184,879) (a) | | | 188,309 | |
| | 160,000 | | 2005-1A, Class A4, 2.711%, 11/25/2011 | | | | |
| | | | (Acquired 8/21/2008, Cost $142,192) (a)(c) | | | 125,600 | |
| | 200,000 | | 2005-2A, Class A5, 2.711%, 11/25/2011 | | | | |
| | | | (Acquired 8/01/2008, Cost $182,725) (a)(c) | | | 155,289 | |
| | 440,000 | | 2005-2A, Class A6, 5.080%, 11/25/2011 | | | | |
| | | | (Acquired Multiple Dates, Cost $430,302) (a) | | | 369,282 | |
| | | | Keystone Owner Trust | | | | |
| | 33,414 | | 1998-P1, Class M1, 7.530%, 05/25/2025 | | | | |
| | | | (Acquired 04/22/2003, Cost $34,839) (a) | | | 29,004 | |
| | | | Mid-State Trust | | | | |
| | 261,019 | | 11, Class A1, 4.864%, 07/15/2038 | | | 227,564 | |
| | | | Total Asset Backed Securities | | | | |
| | | | (Cost $2,905,767) | | | 2,562,931 | |
| | | | | | | | |
| | | | CORPORATE BONDS 48.3% | | | | |
| | | | Airlines 1.8% | | | | |
| | | | Continental Airlines | | | | |
| | 1,350,000 | | 5.983%, 04/19/2022 | | | 904,500 | |
| | | | Delta Air Lines, Inc. | | | | |
| | 775,991 | | 6.718%, 07/02/2024 | | | 488,875 | |
| | | | | | | 1,393,375 | |
| | | | Capital Markets 1.9% | | | | |
| | | | Goldman Sachs Group, Inc. | | | | |
| | 285,000 | | 5.700%, 09/01/2012 | | | 271,758 | |
| | 650,000 | | 6.150%, 04/01/2018 | | | 624,624 | |
The accompanying notes are an integral part of these financial statements.
Frontegra Columbus Core Fund
SCHEDULE OF INVESTMENTS (continued)
December 31, 2008 (Unaudited)
| Principal Amount | | | | Value | |
| | | CORPORATE BONDS 48.3% (continued) | | | |
| | | Capital Markets 1.9% (continued) | | | |
| | | Morgan Stanley | | | |
| $ | 685,000 | | 5.550%, 04/27/2017 | | $ | 565,663 | |
| | | | | | | 1,462,045 | |
| | | | Commercial Banks 7.9% | | | | |
| | | | Bank of America Corp. | | | | |
| | 440,000 | | 5.650%, 05/01/2018 | | | 442,611 | |
| | | | Barclays Bank Plc | | | | |
| | 1,085,000 | | 7.434%, 12/15/2017 | | | | |
| | | | (Acquired Multiple Dates, Cost $870,600) (a)(c) | | | 548,554 | |
| | | | BB&T Corp. | | | | |
| | 200,000 | | 4.900%, 06/30/2017 | | | 180,353 | |
| | | | Deutsche Bank, LLC | | | | |
| | 245,000 | | 6.750%, 08/20/2018 (b) | | | 248,433 | |
| | 1,065,000 | | 5.628%, 01/31/2049 | | | | |
| | | | (Acquired Multiple Dates, Cost $773,580) (a) | | | 455,129 | |
| | | | Marshall & Ilsley Bank | | | | |
| | 1,655,000 | | 5.413%, 12/04/2012 | | | 1,294,721 | |
| | | | Regions Bank | | | | |
| | 440,000 | | 7.500%, 05/15/2018 | | | 378,150 | |
| | | | Royal Bank of Scotland Group Plc | | | | |
| | 1,290,000 | | 6.990%, 10/29/2049 (Multiple Dates, Cost $817,205) (a)(b)(c) | | | 603,122 | |
| | | | Suntrust Bank | | | | |
| | 695,000 | | 5.919%, 05/21/2012 | | | 633,972 | |
| | | | Wachovia Corp. | | | | |
| | 1,230,000 | | 5.800%, 08/29/2049 (c) | | | 725,700 | |
| | | | Wells Fargo Alternative Loan Trust | | | | |
| | 895,000 | | 7.700%, 12/29/2049 (c) | | | 738,653 | |
| | | | | | | 6,249,398 | |
| | | | Computers & Peripherals 0.6% | | | | |
| | | | Tyco Electronics Group S A | | | | |
| | 275,000 | | 6.000%, 10/01/2012 (b) | | | 248,078 | |
| | 295,000 | | 5.950%, 01/15/2014 (b) | | | 255,524 | |
| | | | | | | 503,602 | |
The accompanying notes are an integral part of these financial statements.
Frontegra Columbus Core Fund
SCHEDULE OF INVESTMENTS (continued)
December 31, 2008 (Unaudited)
| Principal Amount | | | | Value | |
| | | CORPORATE BONDS 48.3% (continued) | | | |
| | | Consumer Finance 1.4% | | | |
| | | ERAC USA Finance Co. | | | |
| $ | 1,010,000 | | 6.375%, 10/15/2017 | | | |
| | | | (Acquired 10/21/2008 and 10/23/2008, Cost $805,118) (a) | | $ | 700,952 | |
| | | | Household Finance Corp. | | | | |
| | 230,000 | | 6.375%, 10/15/2011 | | | 226,286 | |
| | 210,000 | | 4.750%, 07/15/2013 | | | 191,578 | |
| | | | | | | 1,118,816 | |
| | | | Diversified Financial Services 10.1% | | | | |
| | | | American Express Credit Co. | | | | |
| | 600,000 | | 7.300%, 08/20/2013 | | | 614,155 | |
| | | | American General Finance | | | | |
| | 275,000 | | 5.900%, 09/15/2012 | | | 118,166 | |
| | 705,000 | | 6.900%, 12/15/2017 | | | 305,105 | |
| | | | Bank of America Corp. | | | | |
| | 1,340,000 | | 8.000%, 12/29/2049 (c) | | | 963,846 | |
| | | | Cargill, Inc. | | | | |
| | 230,000 | | 5.600%, 09/15/2012 (Acquired 9/06/2007, Cost $229,929) (a) | | | 216,575 | |
| | | | CIT Group Inc. | | | | |
| | 200,000 | | 5.168%, 11/03/2010 | | | 151,943 | |
| | 50,000 | | 5.600%, 11/02/2011 (b) | | | 40,768 | |
| | 170,000 | | 5.610%, 02/13/2012 | | | 133,427 | |
| | 425,000 | | 7.625%, 11/30/2012 | | | 358,772 | |
| | 310,000 | | 5.638%, 12/21/2012 | | | 220,324 | |
| | | | Citigroup, Inc. | | | | |
| | 140,000 | | 5.500%, 02/15/2017 | | | 127,372 | |
| | | | Credit Suisse Guernsey | | | | |
| | 1,520,000 | | 5.860%, 05/15/2017 (b)(c) | | | 709,434 | |
| | | | Genworth Global Funding | | | | |
| | 195,000 | | 5.200%, 10/08/2010 | | | 153,987 | |
| | 325,000 | | 5.875%, 05/03/2013 (Acquired 11/25/2008, Cost $190,233) (a) | | | 243,053 | |
| | | | International Lease Finance Corp. | | | | |
| | 530,000 | | 5.350%, 03/01/2012 | | | 367,563 | |
| | 175,000 | | 5.300%, 05/01/2012 | | | 122,920 | |
| | 235,000 | | 5.625%, 09/20/2013 | | | 156,927 | |
| | | | JP Morgan Chase & Co. | | | | |
| | 840,000 | | 7.900%, 10/30/2049 (c) | | | 698,737 | |
The accompanying notes are an integral part of these financial statements.
Frontegra Columbus Core Fund
SCHEDULE OF INVESTMENTS (continued)
December 31, 2008 (Unaudited)
| Principal Amount | | | | Value | |
| | | CORPORATE BONDS 48.3% (continued) | | | |
| | | Diversified Financial Services 10.1% (continued) | | | |
| | | Liberty Property LP | | | |
| $ | 745,000 | | 6.625%, 10/01/2017 | | $ | 492,661 | |
| | | | Pricoa Global Funding I | | | | |
| | 75,000 | | 3.565%, 01/30/2012 (Acquired 12/18/2008, Cost $57,677) (a)(c) | | | 56,513 | |
| | 350,000 | | 5.400%, 10/18/2012 | | | | |
| | | | (Acquired 10/11/2007 and 4/25/2008, Cost $349,441) (a) | | | 323,619 | |
| | | | Prudential Financial Inc. | | | | |
| | 530,000 | | 6.000%, 12/01/2017 | | | 425,165 | |
| | | | Simon Property Group LP | | | | |
| | 340,000 | | 5.100%, 06/15/2015 | | | 208,428 | |
| | 225,000 | | 5.750%, 12/01/2015 | | | 146,969 | |
| | 40,000 | | 6.100%, 05/01/2016 | | | 25,561 | |
| | 165,000 | | 5.250%, 12/01/2016 | | | 105,432 | |
| | | | Societe Generale | | | | |
| | 490,000 | | 5.922%, 04/05/2017 | | | | |
| | | | (Acquired 11/26/2008, Cost $254,846) (a)(b)(c) | | | 229,061 | |
| | | | Windsor Financing LLC | | | | |
| | 191,909 | | 5.881%, 07/15/2017 | | | | |
| | | | (Acquired Multiple Dates, Cost $191,882) (a) | | | 202,477 | |
| | | | | | | 7,918,960 | |
| | | | Diversified Telecommunication Services 3.1% | | | | |
| | | | AT&T Inc. | | | | |
| | 410,000 | | 6.700%, 11/15/2013 | | | 434,322 | |
| | | | British Telecom plc | | | | |
| | 830,000 | | 5.950%, 01/15/2018 (b) | | | 722,073 | |
| | | | Comcast Cable Communications Holdings, Inc. | | | | |
| | 165,000 | | 8.375%, 03/15/2013 | | | 170,697 | |
| | | | Deutsche Telekom International Finance BV | | | | |
| | 220,000 | | 5.750%, 03/23/2016 (b) | | | 210,592 | |
| | | | Telecom Italia Capital | | | | |
| | 420,000 | | 5.250%, 11/15/2013 (b) | | | 320,250 | |
| | | | Telefonica Emisiones SAU | | | | |
| | 220,000 | | 6.221%, 07/03/2017 (b) | | | 216,743 | |
| | | | Verizon Communications | | | | |
| | 400,000 | | 5.500%, 02/15/2018 | | | 384,738 | |
| | | | | | | 2,459,415 | |
The accompanying notes are an integral part of these financial statements.
Frontegra Columbus Core Fund
SCHEDULE OF INVESTMENTS (continued)
December 31, 2008 (Unaudited)
| Principal Amount | | | | Value | |
| | | CORPORATE BONDS 48.3% (continued) | | | |
| | | Electric Utilities 4.7% | | | |
| | | Commonwealth Edison Co. | | | |
| $ | 640,000 | | 4.740%, 08/15/2010 | | $ | 630,033 | |
| | 200,000 | | 5.950%, 08/15/2016 | | | 186,640 | |
| | 40,000 | | 6.150%, 09/15/2017 | | | 37,194 | |
| | | | Entergy Arkansas Inc. | | | | |
| | 195,000 | | 4.500%, 06/01/2010 | | | 187,786 | |
| | 280,000 | | 5.000%, 07/01/2018 | | | | |
| | | | (Acquired 6/18/2003 and 8/03/2007, Cost $275,509) (a) | | | 231,187 | |
| | | | Entergy Gulf States, Inc. | | | | |
| | 345,000 | | 4.875%, 11/01/2011 | | | 319,938 | |
| | 445,000 | | 5.250%, 08/01/2015 | | | 379,748 | |
| | | | Entergy Louisiana LLC | | | | |
| | 170,000 | | 5.500%, 04/01/2019 | | | 149,073 | |
| | | | FPL Energy Virgina Funding Corp. | | | | |
| | 147,221 | | 7.520%, 06/30/2019 | | | | |
| | | | (Acquired 02/10/2006 and 8/03/2007, Cost $156,715) (a) | | | 141,856 | |
| | | | Great River Energy | | | | |
| | 327,398 | | 5.829%, 07/01/2017 | | | | |
| | | | (Acquired 06/21/2007 and 8/03/2007, Cost $327,398) (a) | | | 273,790 | |
| | 100,000 | | 7.233%, 07/01/2038 (Acquired 4/23/2008, Cost $100,000) (a)(e) | | | 116,564 | |
| | | | Indianapolis Power & Light Co. | | | | |
| | 80,000 | | 6.300%, 07/01/2013 | | | | |
| | | | (Acquired 10/17/2006 and 8/03/2007, Cost $82,135) (a) | | | 82,203 | |
| | 290,000 | | 6.050%, 10/01/2036 | | | | |
| | | | (Acquired Multiple Dates, Cost $276,305) (a) | | | 255,261 | |
| | | | Mackinaw Power LLC | | | | |
| | 228,725 | | 6.296%, 10/31/2023 | | | | |
| | | | (Acquired Multiple Dates, Cost $229,085) (a) | | | 186,756 | |
| | | | Public Service Electric & Gas | | | | |
| | 105,000 | | 5.300%, 05/01/2018 | | | 101,987 | |
| | | | Virginia Electric & Power Co. | | | | |
| | 220,000 | | 5.950%, 09/15/2017 | | | 221,460 | |
| | | | Westar Energy Inc. | | | | |
| | 166,000 | | 6.000%, 07/01/2014 | | | 160,368 | |
| | | | | | | 3,661,844 | |
The accompanying notes are an integral part of these financial statements.
Frontegra Columbus Core Fund
SCHEDULE OF INVESTMENTS (continued)
December 31, 2008 (Unaudited)
| Principal Amount | | | | Value | |
| | | CORPORATE BONDS 48.3% (continued) | | | |
| | | Food & Staples Retailing 0.2% | | | |
| | | Kraft Foods, Inc. | | | |
| $ | 205,000 | | 6.125%, 02/01/2018 | | $ | 200,879 | |
| | | | | | | | |
| | | | Gas Utilities 1.9% | | | | |
| | | | Alliance Pipeline U.S. | | | | |
| | 418,527 | | 4.591%, 12/31/2025 | | | | |
| | | | (Acquired Multiple Dates, Cost $389,240) (a) | | | 432,046 | |
| | | | Gulfstream Natural Gas | | | | |
| | 195,000 | | 5.560%, 11/01/2015 | | | | |
| | | | (Acquired Multiple Dates, Cost $195,201) (a) | | | 163,526 | |
| | | | Northern Natural Gas Co. | | | | |
| | 700,000 | | 5.375%, 10/31/2012 | | | | |
| | | | (Acquired 04/05/2006 and 9/22/2008, Cost $697,803) (a) | | | 689,952 | |
| | | | Source Gas LLC | | | | |
| | 175,000 | | 5.900%, 04/01/2017 | | | | |
| | | | (Acquired 04/11/2007 and 8/03/2007, Cost $174,449) (a) | | | 137,152 | |
| | | | Southern Star Cent Gas | | | | |
| | 50,000 | | 6.000%, 06/01/2016 | | | | |
| | | | (Acquired 4/06/2006 and 8/03/2007, Cost $49,832) (a) | | | 40,000 | |
| | | | | | | 1,462,676 | |
| | | | Health Care Providers & Services 0.3% | | | | |
| | | | United Health Group, Inc. | | | | |
| | 95,000 | | 6.000%, 02/15/2018 | | | 87,650 | |
| | | | Wellpoint, Inc. | | | | |
| | 180,000 | | 5.875%, 06/15/2017 | | | 163,824 | |
| | | | | | | 251,474 | |
| | | | Insurance 5.3% | | | | |
| | | | Hartford Financial Services Group | | | | |
| | 520,000 | | 2.469%, 08/15/2013 (Acquired 8/28/2008, Cost $481,544) (a) | | | 474,871 | |
| | 280,000 | | 5.375%, 03/15/2017 | | | 203,971 | |
| | 360,000 | | 6.300%, 03/15/2018 | | | 272,980 | |
| | | | Hartford Life Global Funding | | | | |
| | 85,000 | | 2.096%, 03/15/2011 (c) | | | 71,002 | |
The accompanying notes are an integral part of these financial statements.
Frontegra Columbus Core Fund
SCHEDULE OF INVESTMENTS (continued)
December 31, 2008 (Unaudited)
| Principal Amount | | | | Value | |
| | | CORPORATE BONDS 48.3% (continued) | | | |
| | | Insurance 5.3% (continued) | | | |
| | | Jackson National Life Global Funding | | | |
| $ | 155,000 | | 5.125%, 02/10/2011 | | | |
| | | | (Acquired Multiple Dates, Cost $153,977) (a) | | $ | 143,596 | |
| | 180,000 | | 5.375%, 05/08/2013 | | | | |
| | | | (Acquired 5/01/2008 and 5/28/2008, Cost $179,526) (a) | | | 162,669 | |
| | | | Met Life Global Funding | | | | |
| | 345,000 | | 5.125%, 04/10/2013 (Acquired 4/07/2008, Cost $344,745) (a) | | | 321,457 | |
| | 355,000 | | 6.817%, 08/15/2018 | | | 338,103 | |
| | | | Monumental Global Funding | | | | |
| | 355,000 | | 5.254%, 01/25/2013 | | | | |
| | | | (Acquired Multiple Dates, Cost $327,111) (a) | | | 252,815 | |
| | 260,000 | | 5.500%, 04/22/2013 (Acquired 4/18/2008, Cost $259,888) (a) | | | 245,286 | |
| | | | Nationwide Life Global Fund | | | | |
| | 85,000 | | 2.296%, 02/27/2012 (Acquired 12/19/2008, Cost $65,987) (a)(c) | | | 66,007 | |
| | 795,000 | | 5.450%, 10/02/2012 (Acquired 9/25/2007, Cost $794,006) (a) | | | 620,796 | |
| | | | Principal Life Funding | | | | |
| | 295,000 | | 5.150%, 06/17/2011 | | | 275,433 | |
| | | | Protective Life Corp. | | | | |
| | 730,000 | | 5.450%, 09/28/2012 | | | 640,458 | |
| | | | Prudential Financial Inc. | | | | |
| | 65,000 | | 5.150%, 01/15/2013 | | | 52,797 | |
| | | | | | | 4,142,241 | |
| | | | Media 2.1% | | | | |
| | | | Comcast Corp. | | | | |
| | 215,000 | | 6.300%, 11/15/2017 | | | 209,301 | |
| | | | Cox Communications Inc. | | | | |
| | 220,000 | | 9.375%, 01/15/2019 (Acquired 12/08/2008, Cost $218,225) (a) | | | 230,186 | |
| | | | Time Warner, Inc. | | | | |
| | 345,000 | | 6.750%, 07/01/2018 | | | 332,168 | |
| | 185,000 | | 8.750%, 02/14/2019 | | | 201,157 | |
| | 350,000 | | 7.700%, 05/01/2032 | | | 350,432 | |
| | | | Viacom, Inc. | | | | |
| | 400,000 | | 6.250%, 04/30/2016 | | | 331,557 | |
| | | | | | | 1,654,801 | |
The accompanying notes are an integral part of these financial statements.
Frontegra Columbus Core Fund
SCHEDULE OF INVESTMENTS (continued)
December 31, 2008 (Unaudited)
| Principal Amount | | | | Value | |
| | | CORPORATE BONDS 48.3% (continued) | | | |
| | | Metals & Mining 1.2% | | | |
| | | Alcoa Inc. | | | |
| $ | 410,000 | | 6.000%, 07/15/2013 | | $ | 370,715 | |
| | 670,000 | | 6.750%, 07/15/2018 | | | 548,151 | |
| | | | | | | 918,866 | |
| | | | Multi-Utilities & Unregulated Power 0.9% | | | | |
| | | | Kern River Funding Corp. | | | | |
| | 269,360 | | 4.893%, 04/30/2018 | | | | |
| | | | (Acquired Multiple Dates, Cost $264,792) (a) | | | 211,604 | |
| | | | Kiowa Power Partners LLC | | | | |
| | 196,674 | | 4.811%, 12/30/2013 | | | | |
| | | | (Acquired 11/22/2004 and 8/03/2007, Cost $196,521) (a) | | | 183,890 | |
| | | | Midamerican Energy Holdings | | | | |
| | 290,000 | | 6.500%, 09/15/2037 | | | 283,082 | |
| | | | | | | 678,576 | |
| | | | Oil, Gas & Consumable Fuels 0.8% | | | | |
| | | | PF Export Receivables Master Trust | | | | |
| | 318,768 | | 3.748%, 06/01/2013 | | | | |
| | | | (Acquired Multiple Dates, Cost $318,876) (a) | | | 338,783 | |
| | | | Valero Energy Corp. | | | | |
| | 400,000 | | 6.625%, 06/15/2037 | | | 294,201 | |
| | | | | | | 632,984 | |
| | | | Real Estate Investment Trusts 2.0% | | | | |
| | | | AMB Property LP | | | | |
| | 545,000 | | 6.300%, 06/01/2013 | | | 343,178 | |
| | | | Boston Properties LP | | | | |
| | 385,000 | | 6.250%, 01/15/2013 | | | 285,808 | |
| | | | Federal Realty Investment Trust | | | | |
| | 235,000 | | 5.650%, 06/01/2016 | | | 154,441 | |
| | 235,000 | | 6.200%, 01/15/2017 | | | 149,822 | |
| | | | Prologis Trust | | | | |
| | 250,000 | | 5.625%, 11/15/2016 | | | 119,910 | |
| | 290,000 | | 6.625%, 05/15/2018 | | | 138,714 | |
| | | | Regency Centers LP | | | | |
| | 625,000 | | 5.250%, 08/01/2015 | | | 414,211 | |
| | | | | | | 1,606,084 | |
The accompanying notes are an integral part of these financial statements.
Frontegra Columbus Core Fund
SCHEDULE OF INVESTMENTS (continued)
December 31, 2008 (Unaudited)
| Principal Amount | | | | Value | |
| | | CORPORATE BONDS 48.3% (continued) | | | |
| | | Transportation 1.9% | | | |
| | | Burlington North Santa Fe | | | |
| $ | 332,946 | | 6.230%, 07/02/2018 (e) | | $ | 338,293 | |
| | 365,015 | | 4.575%, 01/15/2021 | | | 340,495 | |
| | | | CSX Transportation, Inc. | | | | |
| | 145,000 | | 6.750%, 03/15/2011 | | | 144,429 | |
| | 355,928 | | 6.251%, 01/15/2023 | | | 333,293 | |
| | | | Union Pacific Corp. | | | | |
| | 357,140 | | 5.404%, 07/02/2025 (e) | | | 344,932 | |
| | | | | | | 1,501,442 | |
| | | | Utilities 0.2% | | | | |
| | | | Appalachian Power Co. | | | | |
| | 185,000 | | 5.650%, 08/15/2012 | | | 175,469 | |
| | | | Total Corporate Bonds | | | | |
| | | | (Cost $42,419,547) | | | 37,992,947 | |
| | | | | | | | |
| | | | MORTGAGE BACKED SECURITIES 43.4% | | | | |
| | | | Banc of America Commercial Mortgage Inc. | | | | |
| | 1,005,000 | | Series 2006-5, Class A4, 5.414%, 09/10/2016 | | | 794,439 | |
| | 760,000 | | Series 2006-3, Class A4, 5.889%, 07/10/2044 | | | 619,362 | |
| | 710,000 | | Series 2006-1, Class A4, 5.372%, 09/10/2045 | | | 568,191 | |
| | 340,000 | | Series 2006-4, Class A4, 5.634%, 07/10/2046 | | | 271,933 | |
| | 805,000 | | Series 2007-3, Class A2, 5.659%, 06/10/2049 | | | 635,686 | |
| | | | Bear Stearns Commercial Mortgage Securities | | | | |
| | 280,000 | | Series 2005-PWR10, Class A4, 5.405%, 12/11/2040 | | | 238,115 | |
| | | | Citigroup/Deutsche Bank Commercial Mortgage Trust | | | | |
| | 870,000 | | Series 2006-CD2, Class A4, 5.545%, 01/15/2046 | | | 697,785 | |
| | 1,745,000 | | Series 2006-CD3, Class A5, 5.617%, 10/15/2048 | | | 1,389,834 | |
| | 280,000 | | Series 2006-C4, Class A3, 5.721%, 03/15/2049 | | | 219,557 | |
| | 390,000 | | Series 2006-C5, Class A2, 5.378%, 10/15/2049 | | | 322,633 | |
| | 785,000 | | Series 2006-C5, Class A1, 5.720%, 10/15/2049 | | | 615,311 | |
| | 955,000 | | Series 2007-CD4, Class A4, 5.322%, 12/11/2049 | | | 666,682 | |
| | | | CitiMortgage Alternative Loan Trust | | | | |
| | 1,671,847 | | Series 2007-A7, Class 3A1, 5.750%, 07/25/2022 | | | 1,149,395 | |
| | | | Commercial Mortgage Pass-Through Certificate | | | | |
| | 1,905,000 | | Series 2006-C7, Class A4, 5.768%, 06/10/2046 | | | 1,552,615 | |
The accompanying notes are an integral part of these financial statements.
Frontegra Columbus Core Fund
SCHEDULE OF INVESTMENTS (continued)
December 31, 2008 (Unaudited)
| Principal Amount | | | | Value | |
| | | MORTGAGE BACKED SECURITIES 43.4% (continued) | | | |
| | | Credit Suisse First Boston Mortgage Securities Corp. | | | |
| $ | 120,205 | | Pool # 2005-10, 5.000%, 09/25/2015 | | $ | 99,320 | |
| | 27,981 | | Pool # 2003-1, 7.000%, 02/25/2033 | | | 26,191 | |
| | 190,000 | | Pool # 2005-C5, 5.100%, 08/15/2038 | | | 155,478 | |
| | 115,000 | | Pool # 2006-C5, 5.246%, 12/15/2039 | | | 93,490 | |
| | 850,000 | | Pool # 2007-C2, 5.448%, 01/15/2049 | | | 646,202 | |
| | | | Credit Suisse Mortgage Capital Certificates | | | | |
| | 260,000 | | Series 2007-C1, Class A3, 5.383%, 02/15/2040 | | | 156,032 | |
| | | | CWCapital Cobalt | | | | |
| | 705,000 | | Series 2007-C3, Class A4, 6.015%, 05/15/2046 (c) | | | 518,393 | |
| | 350,000 | | Series 2006-C1, Class A2, 5.174%, 08/15/2048 | | | 286,814 | |
| | | | FHLMC Pools | | | | |
| | 87,672 | | Pool # 2775, 3.000%, 11/15/2013 | | | 87,611 | |
| | | | FHLMC Remic | | | | |
| | 5,967 | | Series 2508, Class CR, 4.500%, 03/15/2016 | | | 5,965 | |
| | | | GE Capital Mortgage Corporation | | | | |
| | 645,000 | | Series 2005-C4, Class A4, 5.333%, 11/10/2045 (c) | | | 534,335 | |
| | | | GMAC Commercial Mortgage Securities Inc. | | | | |
| | 440,000 | | Pool # 2006-C1, 5.238%, 11/10/2045 | | | 350,626 | |
| | | | Greenwich Capital Commercial Funding Corp. | | | | |
| | 540,000 | | Series 2005-GG5, Class A5, 5.224%, 04/10/2037 | | | 443,774 | |
| | 180,000 | | Series 2006-GG7, Class A2, 5.914%, 07/10/2038 | | | 155,404 | |
| | 1,705,000 | | Series 2006-GG7, Class A4, 6.110%, 07/10/2038 (c) | | | 1,330,683 | |
| | 480,000 | | Series 2007-GG9, Class A2, 5.381%, 03/10/2039 | | | 378,364 | |
| | 1,150,000 | | Series 2007-GG9, Class A4, 5.444%, 03/10/2039 | | | 875,302 | |
| | 388,853 | | Series 2007-GG11, Class A1, 5.358%, 12/10/2049 | | | 347,764 | |
| | | | GS Mortgage Securities Corp. II | | | | |
| | 549,014 | | Series 2007-EOP, Class A1, 5.410%, 03/06/2020 | | | | |
| | | | (Acquired 9/17/2007 and 4/22/2008, Cost $539,337) (a)(c) | | | 403,873 | |
| | | | JP Morgan Chase Commercial Mortgage Securities Corp. | | | | |
| | 510,000 | | Series 2006-LDP9, Class A3, 5.336%, 05/15/2047 | | | 382,590 | |
| | | | LB-UBS Commercial Mortgage Trust | | | | |
| | 18,590 | | Series 2003-C, Class A2, 3.086%, 05/15/2027 | | | 18,549 | |
| | 355,000 | | Series 2005-C7, Class A4, 5.197%, 11/15/2030 | | | 293,092 | |
| | 1,035,000 | | Series 2006-C4, Class A4, 6.080%, 06/15/2038 (c) | | | 851,405 | |
| | 875,000 | | Series 2006-C6, Class A4, 5.372%, 09/15/2039 | | | 686,443 | |
| | 150,000 | | Series 2007-C1, Class A2, 5.318%, 02/15/2040 | | | 119,616 | |
| | 1,274,000 | | Series 2007-C2, Class A2, 5.330%, 02/15/2040 | | | 1,004,711 | |
The accompanying notes are an integral part of these financial statements.
Frontegra Columbus Core Fund
SCHEDULE OF INVESTMENTS (continued)
December 31, 2008 (Unaudited)
| Principal Amount | | | | Value | |
| | | MORTGAGE BACKED SECURITIES 43.4% (continued) | | | |
| | | LB-UBS Commercial Mortgage Trust (continued) | | | |
| $ | 580,000 | | Series 2007-C1, Class A4, 5.424%, 02/15/2040 | | $ | 430,297 | |
| | 1,195,000 | | Series 2007-C2, Class A3, 5.430%, 02/15/2040 | | | 858,852 | |
| | 1,468,000 | | Series 2007-C3, Class A4, 6.136%, 07/15/2044 (c) | | | 1,124,552 | |
| | | | Master Alternative Loans Trust | | | | |
| | 128,794 | | Pool # 2004-6, 4.500%, 07/25/2014 | | | 112,292 | |
| | | | Master Asset Securitization Trust | | | | |
| | 116,367 | | Pool # 2004-3, 4.750%, 01/25/2014 | | | 113,603 | |
| | | | Merrill Lynch Commercial Mortgage Trust | | | | |
| | 800,000 | | Series 2005-LC1, Class A4, 5.291%, 01/12/2044 | | | 656,256 | |
| | 580,000 | | Series 2006-2, Class A4, 5.910%, 06/12/2046 (c) | | | 464,705 | |
| | 525,000 | | Series 2006-3, Class A4, 5.414%, 07/12/2046 | | | 413,093 | |
| | 155,000 | | Series 2007-7, Class A2, 5.693%, 06/12/2050 | | | 121,357 | |
| | 440,000 | | Series 2007-C1, Class A2, 5.725%, 06/12/2050 | | | 343,036 | |
| | | | Morgan Stanley Capital I | | | | |
| | 1,665,000 | | Series 2006-IQ11, Class A4, 5.944%, 10/15/2042 | | | 1,366,642 | |
| | | | Residential Accredit Loans, Inc. | | | | |
| | 319,290 | | Series 2004-QS4, Class A1, 4.350%, 03/25/2034 | | | 280,550 | |
| | | | Residential Asset Securitization Trust | | | | |
| | 285,578 | | Series 2003-A6, Class A1, 4.500%, 07/25/2033 | | | 258,011 | |
| | | | Wachovia Bank Commercial Mortgage Trust | | | | |
| | 590,000 | | Series 2006-C25, Class A4, 5.926%, 05/15/2043 (e) | | | 469,743 | |
| | 795,000 | | Series 2005-C22, Class A4, 5.445%, 12/15/2044 | | | 636,865 | |
| | 1,435,000 | | Series 2006-C23, Class A4, 5.418%, 01/15/2045 | | | 1,119,064 | |
| | 2,495,000 | | Series 2006-C24, Class A3, 5.558%, 03/15/2045 | | | 1,976,995 | |
| | 455,000 | | Series 2006-C27, Class A3, 5.765%, 07/15/2045 | | | 363,414 | |
| | 435,000 | | Series 2007-C34, Class A3, 5.680%, 05/15/2046 | | | 315,395 | |
| | 1,260,000 | | Series 2007-C31, Class A2, 5.421%, 04/15/2047 | | | 977,396 | |
| | 1,565,000 | | Series 2006-C29, Class A4, 5.380%, 11/15/2048 | | | 1,172,797 | |
| | | | Wells Fargo Mortgage Backed Securities Trust | | | | |
| | 683,361 | | Pool # 2006-3, 5.500%, 03/25/2036 | | | 596,896 | |
| | | | Total Mortgage Backed Securities | | | | |
| | | | (Cost $39,582,194) | | | 34,165,376 | |
| | | | | | | | |
| | | | U.S. TREASURY OBLIGATIONS 0.0% | | | | |
| | | | U.S. Treasury Bonds 0.0% | | | | |
| | 284 | | 1.750%, 01/15/2028 | | | 262 | |
The accompanying notes are an integral part of these financial statements.
Frontegra Columbus Core Fund
SCHEDULE OF INVESTMENTS (continued)
December 31, 2008 (Unaudited)
| Principal Amount | | | | Value | |
| | | U.S. TREASURY OBLIGATIONS 0.0% (continued) | | | |
| | | U.S. Treasury Note 0.0% | | | |
| $ | 244 | | 2.000%, 01/15/2016 | | $ | 234 | |
| | | | | | | | |
| | | | Total U.S. Treasury Obligations | | | | |
| | | | (Cost $443) | | | 496 | |
| | | | | | | | |
| | | | SHORT-TERM INVESTMENTS 4.8% | | | | |
| | | | Commercial Paper 3.9% | | | | |
| | 3,025,000 | | US Bancorp 01/02/2009 | | | 3,024,998 | |
| | | | | | | | |
| | | | Variable Rate Demand Notes (d) 0.9% | | | | |
| | 722,047 | | Wisconsin Corporate Central Credit Union, 4.869% | | | 722,047 | |
| | | | | | | | |
| | | | Total Short-Term Investments | | | | |
| | | | (Cost $3,747,045) | | | 3,747,045 | |
| | | | | | | | |
| | | | Total Investments 99.7% | | | | |
| | | | (Cost $88,654,996) | | | 78,468,795 | |
| | | | | | | | |
| | | | Other Assets in Excess of Liabilities 0.3% | | | 205,759 | |
| | | | | | | | |
| | | | TOTAL NET ASSETS 100.0% | | $ | 78,674,554 | |
| | | | | | | | |
| (a) | Security exempt from registration under Rule 144A of the Securities Act of 1933. These securities may be resold in transactions exempt from registration normally to qualified institutional buyers. The total value of these securities amounted to $10,852,665 (13.8% of net assets) at December 31, 2008. |
| (b) | U.S.-dollar denominated security of foreign issuer. |
| (d) | Variable rate demand notes are considered short-term obligations and are payable upon demand. Interest rates change periodically on specified dates. The rates listed are as of December 31, 2008. |
| (e) | Security is fair valued. As of December 31, 2008, the fair value of these investments was $1,553,218 or 2.0% of total net assets. |
The accompanying notes are an integral part of these financial statements.
Frontegra Columbus Core Fund
STATEMENT OF ASSETS AND LIABILITIES
December 31, 2008 (Unaudited)
| Assets: | | | |
| Investments at value (cost $88,654,996) | | $ | 78,468,795 | |
| Cash | | | 3,064,840 | |
| Interest receivable | | | 927,002 | |
| Receivable for investments sold | | | 1,727 | |
| Receivable for Fund shares sold | | | 208,741 | |
| Receivable from Adviser | | | 23,153 | |
| Prepaid expenses and other assets | | | 16,813 | |
| Total assets | | | 82,711,071 | |
| | | | | |
| Liabilities: | | | | |
| Payable for investments purchased | | | 3,967,286 | |
| Accrued expenses | | | 69,231 | |
| Total liabilities | | | 4,036,517 | |
| Net Assets | | $ | 78,674,554 | |
| | | | | |
| Net Assets Consist of: | | | | |
| Paid in capital | | $ | 91,967,584 | |
| Undistributed net investment income | | | 370,787 | |
| Accumulated net realized loss | | | (3,477,616 | ) |
| Net unrealized depreciation on investments | | | (10,186,201 | ) |
| Net Assets | | $ | 78,674,554 | |
| | | | | |
| Capital Stock, $0.01 Par Value | | | | |
| Authorized | | | 50,000,000 | |
| Issued and outstanding | | | 8,486,415 | |
| Net Asset Value, Redemption Price and Offering Price Per Share | | $ | 9.27 | |
The accompanying notes are an integral part of these financial statements.
Frontegra Columbus Core Fund
STATEMENT OF OPERATIONS
| | Six Months Ended | |
| | | December 31, 2008 | |
| | | (Unaudited) | |
| Investment Income: | | | |
| Interest | | $ | 2,957,534 | |
| | | | | |
| Expenses: | | | | |
| Investment advisory fees (Note 3) | | | 208,647 | |
| Fund administration and accounting fees | | | 39,928 | |
| Audit fees | | | 16,560 | |
| Custody fees | | | 14,536 | |
| Federal and state registration fees | | | 11,776 | |
| Legal fees | | | 11,040 | |
| Shareholder servicing fees | | | 4,784 | |
| Directors’ fees and related expenses | | | 4,232 | |
| Compliance related expenses | | | 4,048 | |
| Reports to shareholders | | | 1,104 | |
| Other | | | 2,208 | |
| Total expenses before waiver and reimbursement | | | 318,863 | |
| Waiver and reimbursement of expenses by Adviser (Note 3) | | | (144,991 | ) |
| Net expenses | | | 173,872 | |
| Net Investment Income | | | 2,783,662 | |
| | | | | |
| Realized and Unrealized | | | | |
| Gain on Investments: | | | | |
| Realized gain (loss) on: | | | | |
| Investments | | | (2,614,238 | ) |
| Swap contracts | | | 71,749 | |
| Change in net unrealized appreciation/depreciation on: | | | | |
| Investments | | | (9,744,090 | ) |
| Swap Contracts | | | 72,889 | |
| Net Realized and Unrealized | | | | |
| Loss on Investments | | | (12,213,690 | ) |
| Net Decrease in Net Assets | | | | |
| Resulting from Operations | | $ | (9,430,028 | ) |
The accompanying notes are an integral part of these financial statements.
Frontegra Columbus Core Fund
STATEMENTS OF CHANGES IN NET ASSETS
| | | Period Ended | | | | |
| | | December 31, 2008 | | | Year Ended | |
| | | (Unaudited) | | | June 30, 2008 | |
| Operations: | | | | | | |
| Net investment income | | $ | 2,783,662 | | | $ | 4,469,938 | |
| Net realized gain (loss) on: | | | | | | | | |
| Investments | | | (2,614,238 | ) | | | 2,827,256 | |
| Swap contracts | | | 71,749 | | | | (326,444 | ) |
| Change in net unrealized appreciation/depreciation on: | | | | | | | | |
| Investments | | | (9,744,090 | ) | | | 136,506 | |
| Swap contracts | | | 72,889 | | | | (78,950 | ) |
| Net increase (decrease) in net assets | | | | | | | | |
| resulting from operations | | | (9,430,028 | ) | | | 7,028,306 | |
| | | | | | | | | |
| Distributions | | | | | | | | |
| Paid From: | | | | | | | | |
| Net investment income | | | (2,501,648 | ) | | | (4,337,398 | ) |
| Net decrease in net assets resulting | | | | | | | | |
| from distributions paid | | | (2,501,648 | ) | | | (4,337,398 | ) |
| | | | | | | | | |
| Capital Share | | | | | | | | |
| Transactions: | | | | | | | | |
| Shares issued in connection with acquisition of | | | | | | | | |
| Columbus Core Fund (see Note 7) | | | — | | | | 14,423,390 | |
| Shares sold | | | 13,440,238 | | | | 25,991,538 | |
| Shares issued to holders in | | | | | | | | |
| reinvestment of distributions | | | 1,923,912 | | | | 3,182,396 | |
| Shares redeemed | | | (24,624,121 | ) | | | (37,193,125 | ) |
| Net increase (decrease) in net assets resulting | | | | | | | | |
| from capital share transactions | | | (9,259,971 | ) | | | 6,404,199 | |
| Total Increase (Decrease) in Net Assets | | | (21,191,647 | ) | | | 9,095,107 | |
| | | | | | | | | |
| Net Assets: | | | | | | | | |
| Beginning of period | | | 99,866,201 | | | | 90,771,094 | |
| End of period | | | | | | | | |
| (includes undistributed net investment income | | | | | | | | |
| of $370,787 and $88,773, respectively) | | $ | 78,674,554 | | | $ | 99,866,201 | |
The accompanying notes are an integral part of these financial statements.
Frontegra Columbus Core Fund
FINANCIAL HIGHLIGHTS
| | | Six Months | | | | | | | | | | | | | | | | |
| | | Ended | | | Year | | | Year | | | Year | | | Year | | | Year | |
| | | December 31, | | | Ended | | | Ended | | | Ended | | | Ended | | | Ended | |
| | | 2008 | | | June 30, | | | June 30, | | | June 30, | | | June 30, | | | June 30, | |
| | | (Unaudited) | | | 2008 | | | 2007 | | | 2006 | | | 2005 | | | 2004 | |
| Net Asset Value, | | | | | | | | | | | | | | | | | | |
| Beginning of Period | | $ | 10.30 | | | $ | 9.99 | | | $ | 9.86 | | | $ | 10.36 | | | $ | 10.22 | | | $ | 10.62 | |
| | | | | | | | | | | | | | | | | | | | | | | | | |
| Income (Loss) | | | | | | | | | | | | | | | | | | | | | | | | |
| from Investment | | | | | | | | | | | | | | | | | | | | | | | | |
| Operations: | | | | | | | | | | | | | | | | | | | | | | | | |
| Net investment income | | | 0.30 | | | | 0.48 | | | | 0.48 | | | | 0.42 | | | | 0.37 | | | | 0.31 | |
| Net realized and unrealized | | | | | | | | | | | | | | | | | | | | | | | | |
| gain (loss) on investments | | | (1.07 | ) | | | 0.30 | | | | 0.13 | | | | (0.43 | ) | | | 0.27 | | | | (0.15 | ) |
| Total Income (Loss) from | | | | | | | | | | | | | | | | | | | | | | | | |
| Investment Operations | | | (0.77 | ) | | | 0.78 | | | | 0.61 | | | | (0.01 | ) | | | 0.64 | | | | 0.16 | |
| | | | | | | | | | | | | | | | | | | | | | | | | |
| Less Distributions | | | | | | | | | | | | | | | | | | | | | | | | |
| Paid: | | | | | | | | | | | | | | | | | | | | | | | | |
| From net investment income | | | (0.26 | ) | | | (0.47 | ) | | | (0.48 | ) | | | (0.43 | ) | | | (0.37 | ) | | | (0.31 | ) |
| From net realized gain on investments | | | — | | | | — | | | | — | | | | (0.06 | ) | | | (0.13 | ) | | | (0.25 | ) |
| Total Distributions Paid | | | (0.26 | ) | | | (0.47 | ) | | | (0.48 | ) | | | (0.49 | ) | | | (0.50 | ) | | | (0.56 | ) |
| | | | | | | | | | | | | | | | | | | | | | | | | |
| Net Asset Value, End of Period | | $ | 9.27 | | | $ | 10.30 | | | $ | 9.99 | | | $ | 9.86 | | | $ | 10.36 | | | $ | 10.22 | |
| Total Return | | | (7.47 | )%(2) | | | 7.89 | % | | | 6.26 | % | | | (0.11 | )% | | | 6.32 | % | | | 1.53 | % |
| | | | | | | | | | | | | | | | | | | | | | | | | |
| Supplemental Data | | | | | | | | | | | | | | | | | | | | | | | | |
| and Ratios: | | | | | | | | | | | | | | | | | | | | | | | | |
| Net assets, end of period | | | | | | | | | | | | | | | | | | | | | | | | |
| (in thousands) | | $ | 78,675 | | | $ | 99,866 | | | $ | 90,771 | | | $ | 96,887 | | | $ | 95,719 | | | $ | 123,913 | |
| Ratio of expenses to | | | | | | | | | | | | | | | | | | | | | | | | |
| average net assets | | | | | | | | | | | | | | | | | | | | | | | | |
| Before waivers | | | | | | | | | | | | | | | | | | | | | | | | |
| and reimbursements | | | 0.64 | %(1) | | | 0.66 | % | | | 0.66 | % | | | 0.65 | % | | | 0.62 | % | | | 0.62 | % |
| Net of waivers | | | | | | | | | | | | | | | | | | | | | | | | |
| and reimbursements | | | 0.35 | %(1) | | | 0.30 | % | | | 0.20 | % | | | 0.20 | % | | | 0.40 | % | | | 0.42 | % |
| Ratio of net investment income to | | | | | | | | | | | | | | | | | | | | | | | | |
| average net assets | | | | | | | | | | | | | | | | | | | | | | | | |
| Before waivers | | | | | | | | | | | | | | | | | | | | | | | | |
| and reimbursements | | | 5.31 | %(1) | | | 4.29 | % | | | 4.31 | % | | | 3.75 | % | | | 2.85 | % | | | 2.19 | % |
| Net of waivers | | | | | | | | | | | | | | | | | | | | | | | | |
| and reimbursements | | | 5.60 | %(1) | | | 4.65 | % | | | 4.77 | % | | | 4.20 | % | | | 3.07 | % | | | 2.39 | % |
| Portfolio turnover rate | | | 261 | %(2) | | | 965 | % | | | 980 | % | | | 1,121 | % | | | 1,080 | % | | | 1,104 | % |
The accompanying notes are an integral part of these financial statements.
FRONTEGRA
IRONBRIDGE
SMALL CAP FUND
FRONTEGRA
IRONBRIDGE
SMID FUND
REPORT FROM IRONBRIDGE CAPITAL MANAGEMENT, L.P.
Dear Fellow Shareholders:
The Frontegra IronBridge Small Cap Fund strives to achieve capital appreciation by investing in a diversified portfolio of equity securities of companies with small market capitalizations. The objective is relative to and measured against the Russell 2000®(1) Index.
The Frontegra IronBridge SMID Cap Fund strives to achieve capital appreciation by investing in a diversified portfolio of equity securities of companies with small and mid market capitalizations. The objective is relative to and measured against the Russell 2500™(2) Index.
Performance Review
For the six months ending December 31, 2008, the Frontegra IronBridge Small Cap Fund returned -28.82% net of fees, versus the Russell 2000 benchmark -26.94% return for the same period.
| Small Cap Fund Best Performers | Return | Small Cap Fund Worst Performers | Return |
| CATHAY GENERAL BANCORP | 95.52% | BERRY PETROLEUM CO | -87.04% |
| NETFLIX INC | 48.83% | INTERNATIONAL COAL GROUP INC | -82.05% |
| UNITED BANKSHARES INC | 47.46% | SANGAMO BIOSCIENCES INC | -77.85% |
| STAGE STORES INC | 35.12% | TESCO CORP | -77.42% |
| METABOLIX INC | 32.18% | RTI INTERNATIONAL METALS INC | -76.28% |
| INSITUFORM TECHNOLOGIES INC | 31.57% | FIRST INDUSTRIAL | |
| SELECTIVE INSURANCE GROUP | 24.97% | REALTY TRUST INC | -72.98% |
| TRACTOR SUPPLY CO | 24.55% | OIL STATES INTERNATIONAL INC | -70.76% |
| STEWART INFORMATION | | GRAFTECH INTERNATIONAL LTD | -70.01% |
| SERVICES CORP | 21.89% | UNIT CORP | -67.92% |
| ANSYS INC | 21.43% | OCEANEERING INTERNATIONAL INC | -63.04% |
For the six month period, stock selection for the Frontegra IronBridge Small Cap Fund subtracted approximately 250 basis points, while sector allocation added approximately 50 basis points. Stock selection was strong among our Consumer Discretionary and Information Technology holdings, but weaker among our Health Care and Utilities holdings.
The Frontegra IronBridge SMID Fund returned -30.65% net of fees versus the Russell 2500 Index’s -31.21% return for the six months ending December 31, 2008.
| SMID Fund Best Performers | Return | SMID Fund Worst Performers | Return |
| BARR PHARMACEUTICALS INC | 40.87% | BERRY PETROLEUM CO | -83.53% |
| O’REILLY AUTOMOTIVE INC | 37.99% | ARCH COAL INC | -77.94% |
| CYPRESS SEMICONDUCTOR CORP | 15.62% | BE AEROSPACE INC | -72.22% |
| SANDISK CORP | 14.43% | HELMERICH & PAYNE INC | -67.72% |
| POLYCOM INC | 11.84% | AFFILIATED MANAGERS GROUP INC | -67.16% |
| JACOBS ENGINEERING GROUP INC | 8.62% | FMC TECHNOLOGIES INC | -67.03% |
| INTUIT INC | 7.05% | PRIDE INTERNATIONAL INC | -65.18% |
| CITY NATIONAL CORP/CA | 5.06% | ABERCROMBIE & FITCH CO | -63.62% |
| VIASAT INC | 5.00% | CEPHEID INC | -63.43% |
| OWENS & MINOR INC | 4.49% | GRAFTECH INTERNATIONAL LTD | -62.29% |
_______________
| (1) | Russell 2000® Index is either a registered trademark or tradename of Russell Investment Group in the U.S. and/or other countries. Indexes are unmanaged and cannot be invested in directly. |
| (2) | Russell 2500™ Index is either a registered trademark or tradename of Russell Investment Group in the U.S. and/or other countries. Indexes are unmanaged and cannot be invested in directly. |
For the six month period, stock selection for the Frontegra IronBridge SMID Fund subtracted approximately 125 basis points, while sector allocation added approximately 200 basis points. Stock selection for the year was led by Consumer Discretionary, Materials, and, Information Technology holdings. Stock selection was weak within the Utilities and Financials sectors.
As we are all painfully aware, the broad, global, decline of financial assets accelerated during the fourth quarter of 2008. Due to the continuous unwinding of financial innovation, credit markets froze and cut off the lifeblood of global investment and consumption. The U.S. government responded by upping the taxpayer’s ante and committing roughly $4 trillion of taxpayer money to various bailout programs to “take care of” the problem. This commitment is up from a shocking $800 billion last quarter in the third quarter of 2008. Like King Canute’s vain effort to hold back the ocean tide, our government leaders’ belief in their power to stem the financial tide is proving illusory.
Other than cash under the mattress, or Treasury debt, there was no place to hide. Over the fourth quarter, the Russell 2000 Index fell 26.12% and the Russell 2500 Index fell 26.25%. As participants in the overleveraged global financial system continued to sell assets in order to bring leverage down to a more manageable level, other indices and asset classes experienced similar declines.
The calendar year 2008 will go down in history as one of the worst stock market declines in over a century. The MSCI World Index declined 40.71%, the S&P 500 declined 37.00%, the Russell 2500 declined 36.79%, and the Russell 2000 declined 33.79%. Our funds declined less; however, there is not much comfort, or satisfaction, in knowing that we met our objective of outperforming the benchmark while posting a decline of this magnitude.
We need to keep in mind that bear markets are a natural, and necessary, component of investing. They are required in order to right financial wrongs, clear out excess, and remind stewards of capital of the importance of trust and integrity to the proper functioning of capital markets. They also make us ask the question, “What went wrong?” and motivate all who have a stake in the system to seek ways of doing things even better in the future.
Portfolio Outlook: Volatility
Markets will most likely remain volatile; but we view that positively. We think investors spend too much fruitless effort trying to reduce volatility. Volatility merely reflects collective uncertainty. Perhaps volatility became misunderstood when investment time horizons were so compressed. Maybe volatility is not the enemy. Maybe volatility should be viewed as the natural outcome of the competition for capital as the market sorts out winners and losers. Volatility and bear markets are a necessary part of achieving long-term investment objectives. Since starting IronBridge’s Small Cap Core strategy in April 1999, an original investment in the product has been down at least 10% within a ten-month period at least seven times over nine and a half years, while posting an 8%+ annualized return. If viewed through a short-term, twelve-month lens, the volatility is frightening and stressful. However, if viewed through a long-term lens, and a deeper understanding of the proper role of capital markets, one begins to appreciate that volatility and bear markets serve an important role in weeding and pruning the forest so new growth can occur, creating opportunities. Enron and WorldCom come to mind as a few weeds that had to go in the 2002 bear market. Google comes to mind as a new growth opportunity that rose out of the ashes of the tech bust.
In IronBridge Capital Management’s strategizing, volatility is opportunity, not a problem, because we are long term and not leveraged. We benefit from buying extremely well managed companies at distressed valuation levels, at the expense of over-levered speculators who are forced to liquidate in order
to pay off their debt. Granted, over-levered speculators are setting prices today and the economy is negatively impacted by the economic carnage left by their actions. However, we believe the ultimate long-term beneficiaries of the current financial crisis must be equities when markets settle back into “normalcy.” Long-term treasuries yielding 2.5% looked pretty smart for 2008, but we doubt they will by 2018 after nearly $5 trillion (and counting) of government bailout money hits the monetary base over the next several years.
We believe equities provide the best long-term return and provide an inflationary hedge relative to cash or bonds. This is because equities will participate in the wealth created from future human innovation and productivity increases. High-grade bond returns capture only promises to repay from existing levels of productivity (cash flow). Although they offer a more predictable return, high-grade bonds often lag behind equities over the long term because they do not participate in future wealth creation, nor do they protect against inflation. Government bonds fail to provide any real after-tax return over the long term because the source of their cash flow is not linked to any form of productivity, but rather to wealth transfer by taxing productivity, with no principal risk, due to the government’s monopoly on the power to tax and/or print money. Therefore, we think the best investment for the long term is equities, despite the anticipated near-term volatility. Buy low. Sell high. Right?
Our strategy never wavers. It is to invest in companies that are good stewards of shareholder capital and that are likely to exceed long-term expectations implied by their current share price. Today, the environment is challenging for sure, but we believe our unique economic framework and life cycle approach to investing puts us in a position to benefit from volatility for the long-term benefit of our clients.
Thank you for your continued support.
Best regards,
 |  |
| Christopher C. Faber | Jeffrey B. Madden |
| IronBridge Capital Management, L.P. | IronBridge Capital Management, L.P. |
INVESTMENT HIGHLIGHTS
Growth of a $100,000 Investment (Unaudited)
* 8/30/02 commencement of operations.
| Portfolio Total Return** | | | | | | |
| FOR PERIODS ENDED 12/31/08 | | FUND | | | INDEX | |
| | | | | | | |
| SIX MONTHS | | | (28.82 | )% | | | (26.94 | )% |
| | | | | | | | | |
| ONE YEAR | | | (31.75 | )% | | | (33.79 | )% |
| | | | | | | | | |
| FIVE YEAR | | | | | | | | |
| AVERAGE ANNUAL | | | 1.42 | % | | | (0.93 | )% |
| | | | | | | | | |
| SINCE COMMENCEMENT | | | | | | | | |
| AVERAGE ANNUAL | | | 8.10 | % | | | 5.27 | % |
This chart assumes an initial gross investment of $100,000 made on 8/30/02 (commencement of operations). Returns shown include the reinvestment of all distributions. Past performance is not predictive of future results. Investment return and principal value will fluctuate so that shares, when redeemed, may be worth more or less than the original cost. To receive current to the most recent month-end performance, please call 1-888-825-2100.
The Russell 2000 Index measures the performance of the 2,000 smallest companies in the Russell 3000 Index. The Russell 3000 Index measures the performance of the 3,000 largest U.S. companies based on total market capitalization. The Index does not reflect investment management fees, brokerage commissions and other expenses associated with investing in equity securities. A direct investment in the index is not possible.
| ** | The returns shown do not reflect the deduction of taxes that a shareholder would pay on Fund distributions or the redemption of Fund shares. |
Frontegra IronBridge Small Cap Fund
SCHEDULE OF INVESTMENTS
December 31, 2008 (Unaudited)
| Number of Shares | | | | Value | |
| | | COMMON STOCKS 95.3% | | | |
| | | Aerospace & Defense 4.2% | | | |
| | 64,068 | | Esterline Technologies Corp. (a) | | $ | 2,427,537 | |
| | 134,727 | | Moog Inc. - Class A (a) | | | 4,926,966 | |
| | 103,976 | | Orbital Sciences Corp. (a) | | | 2,030,651 | |
| | 49,057 | | Triumph Group, Inc. | | | 2,082,960 | |
| | | | | | | 11,468,114 | |
| | | | Auto Components 1.0% | | | | |
| | 156,035 | | Gentex Corp. | | | 1,377,789 | |
| | 133,823 | | Superior Industries International, Inc. | | | 1,407,818 | |
| | | | | | | 2,785,607 | |
| | | | Biotechnology 3.7% | | | | |
| | 164,470 | | Cepheid, Inc. (a) | | | 1,707,199 | |
| | 210,044 | | Exelixis, Inc. (a) | | | 1,054,421 | |
| | 103,898 | | Isis Pharmaceuticals, Inc. (a) | | | 1,473,274 | |
| | 56,910 | | Metabolix, Inc. (a) | | | 723,895 | |
| | 11,060 | | Myriad Genetics, Inc. (a) | | | 732,835 | |
| | 38,720 | | Onyx Pharmaceuticals, Inc. (a) | | | 1,322,675 | |
| | 50,327 | | Techne Corp. | | | 3,247,098 | |
| | | | | | | 10,261,397 | |
| | | | Building Products 1.9% | | | | |
| | 243,737 | | Apogee Enterprises, Inc. | | | 2,525,115 | |
| | 97,832 | | Universal Forest Products, Inc. | | | 2,632,659 | |
| | | | | | | 5,157,774 | |
| | | | Capital Markets 2.1% | | | | |
| | 259,113 | | Jefferies Group, Inc. | | | 3,643,129 | |
| | 55,410 | | Optionsxpress Holdings, Inc. | | | 740,277 | |
| | 83,054 | | Waddell & Reed Financial, Inc. | | | 1,284,015 | |
| | | | | | | 5,667,421 | |
| | | | Chemicals 4.2% | | | | |
| | 59,158 | | Arch Chemicals, Inc. | | | 1,542,249 | |
| | 82,914 | | FMC Corp. | | | 3,708,743 | |
| | 76,529 | | Lubrizol Corp. | | | 2,784,890 | |
| | 166,927 | | Methanex Corp. (b) | | | 1,876,260 | |
| | 40,460 | | Minerals Technologies Inc. | | | 1,654,814 | |
| | | | | | | 11,566,956 | |
The accompanying notes are an integral part of these financial statements.
Frontegra IronBridge Small Cap Fund
SCHEDULE OF INVESTMENTS (continued)
December 31, 2008 (Unaudited)
| Number of Shares | | | | Value | |
| | | COMMON STOCKS 95.3% (continued) | | | |
| | | Commercial Banks 4.7% | | | |
| | 63,536 | | Cullen/Frost Bankers, Inc. | | $ | 3,220,004 | |
| | 136,315 | | First Midwest Bancorp, Inc. | | | 2,722,211 | |
| | 156,086 | | Sterling Bancshares, Inc. | | | 949,003 | |
| | 40,773 | | United Bankshares, Inc. | | | 1,354,479 | |
| | 79,219 | | Westamerica Bancorporation | | | 4,052,052 | |
| | 56,190 | | Wilshire Bancorp, Inc. | | | 510,205 | |
| | | | | | | 12,807,954 | |
| | | | Commercial Services & Supplies 0.8% | | | | |
| | 10,097 | | Strayer Education, Inc. | | | 2,164,898 | |
| | | | | | | | |
| | | | Communications Equipment 2.2% | | | | |
| | 34,380 | | Comtech Telecommunications (a) | | | 1,575,292 | |
| | 90,640 | | Polycom, Inc. (a) | | | 1,224,546 | |
| | 242,239 | | Tekelec (a) | | | 3,231,468 | |
| | | | | | | 6,031,306 | |
| | | | Computers & Peripherals 0.9% | | | | |
| | 149,804 | | Synaptics Inc. (a) | | | 2,480,754 | |
| | | | | | | | |
| | | | Construction & Engineering 0.5% | | | | |
| | 62,669 | | Insituform Technologies, Inc. (a) | | | 1,233,953 | |
| | | | | | | | |
| | | | Distributors 0.4% | | | | |
| | 53,989 | | WESCO International, Inc. (a) | | | 1,038,209 | |
| | | | | | | | |
| | | | Diversified Financial Services 0.3% | | | | |
| | 24,168 | | GATX Corp. | | | 748,483 | |
| | | | | | | | |
| | | | Electric Utilities 1.5% | | | | |
| | 147,945 | | Black Hills Corp. | | | 3,988,597 | |
| | | | | | | | |
| | | | Electrical Equipment 3.2% | | | | |
| | 87,004 | | American Superconductor Corp. (a) | | | 1,419,035 | |
| | 41,808 | | Sunpower Corp. (a) | | | 1,272,636 | |
| | 127,668 | | Thomas & Betts Corp. (a) | | | 3,066,585 | |
| | 130,986 | | Woodward Governor Co. | | | 3,015,298 | |
| | | | | | | 8,773,554 | |
The accompanying notes are an integral part of these financial statements.
Frontegra IronBridge Small Cap Fund
SCHEDULE OF INVESTMENTS (continued)
December 31, 2008 (Unaudited)
| Number of Shares | | | | Value | |
| | | COMMON STOCKS 95.3% (continued) | | | |
| | | Electronic Equipment & Instruments 7.4% | | | |
| | 145,252 | | Daktronics, Inc. | | $ | 1,359,559 | |
| | 143,530 | | Flir Systems, Inc. (a) | | | 4,403,500 | |
| | 32,642 | | Itron, Inc. (a) | | | 2,080,601 | |
| | 159,955 | | National Instruments Corp. | | | 3,896,504 | |
| | 64,606 | | Rofin-Sinar Technologies, Inc. (a) | | | 1,329,591 | |
| | 75,210 | | Scansource, Inc. (a) | | | 1,449,297 | |
| | 202,798 | | Trimble Navigation Ltd. (a) | | | 4,382,465 | |
| | 212,729 | | Veeco Instruments, Inc. (a) | | | 1,348,702 | |
| | | | | | | 20,250,219 | |
| | | | Energy Equipment & Services 3.4% | | | | |
| | 48,021 | | Lufkin Industries, Inc. | | | 1,656,724 | |
| | 98,506 | | Oceaneering International, Inc. (a) | | | 2,870,465 | |
| | 112,255 | | Oil States International, Inc. (a) | | | 2,098,046 | |
| | 102,489 | | Unit Corp. (a) | | | 2,738,506 | |
| | | | | | | 9,363,741 | |
| | | | Food Products 1.1% | | | | |
| | 105,377 | | Corn Products International, Inc. | | | 3,040,127 | |
| | | | | | | | |
| | | | Gas Utilities 3.3% | | | | |
| | 137,238 | | AGL Resources, Inc. | | | 4,302,411 | |
| | 155,086 | | Southern Union Co. | | | 2,022,322 | |
| | 113,317 | | UGI Corp. | | | 2,767,201 | |
| | | | | | | 9,091,934 | |
| | | | Health Care Equipment & Supplies 6.1% | | | | |
| | 119,025 | | ABIOMED, Inc. (a) | | | 1,954,391 | |
| | 51,285 | | Analogic Corp. | | | 1,399,055 | |
| | 31,458 | | Gen-Probe, Inc. (a) | | | 1,347,661 | |
| | 123,894 | | Hansen Medical, Inc. (a) | | | 894,515 | |
| | 39,018 | | IDEXX Laboratories, Inc. (a) | | | 1,407,769 | |
| | 93,623 | | Illumina, Inc. (a) | | | 2,438,879 | |
| | 79,860 | | SonoSite, Inc. (a) | | | 1,523,729 | |
| | 129,589 | | Varian, Inc. (a) | | | 4,342,527 | |
| | 69,562 | | Zoll Medical Corp. (a) | | | 1,314,026 | |
| | | | | | | 16,622,552 | |
The accompanying notes are an integral part of these financial statements.
Frontegra IronBridge Small Cap Fund
SCHEDULE OF INVESTMENTS (continued)
December 31, 2008 (Unaudited)
| Number of Shares | | | | Value | |
| | | COMMON STOCKS 95.3% (continued) | | | |
| | | Health Care Providers & Services 3.9% | | | |
| | 135,189 | | Cerner Corp. (a) | | $ | 5,198,017 | |
| | 115,302 | | Owens & Minor, Inc. | | | 4,341,120 | |
| | 101,044 | | Phase Forward, Inc. (a) | | | 1,265,071 | |
| | | | | | | 10,804,208 | |
| | | | Hotels, Restaurants & Leisure 1.2% | | | | |
| | 120,586 | | WMS Industries, Inc. (a) | | | 3,243,763 | |
| | | | | | | | |
| | | | Household Durables 4.8% | | | | |
| | 116,406 | | AptarGroup, Inc. | | | 4,102,148 | |
| | 96,677 | | Snap-On Inc. | | | 3,807,140 | |
| | 173,360 | | Tupperware Brands Corp. | | | 3,935,272 | |
| | 74,097 | | Universal Electronics, Inc. (a) | | | 1,201,853 | |
| | | | | | | 13,046,413 | |
| | | | Industrial Conglomerates 2.4% | | | | |
| | 19,325 | | Alleghany Corp. (a) | | | 5,449,650 | |
| | 48,741 | | Raven Industries, Inc. | | | 1,174,658 | |
| | | | | | | 6,624,308 | |
| | | | Insurance 4.3% | | | | |
| | 233,644 | | American Financial Group, Inc. | | | 5,345,775 | |
| | 83,912 | | Argo Group International Holdings Ltd. (a)(b) | | | 2,846,295 | |
| | 16,289 | | FBL Financial Group, Inc. - Class A | | | 251,665 | |
| | 86,330 | | Selective Insurance Group, Inc. | | | 1,979,547 | |
| | 64,025 | | Stewart Information Services Corp. | | | 1,503,947 | |
| | | | | | | 11,927,229 | |
| | | | Internet & Catalog Retail 0.3% | | | | |
| | 28,000 | | NetFlix, Inc. (a) | | | 836,920 | |
| | | | | | | | |
| | | | IT Services 0.4% | | | | |
| | 100,099 | | Tyler Technologies, Inc. (a) | | | 1,199,186 | |
| | | | | | | | |
| | | | Leisure Equipment & Products 1.9% | | | | |
| | 457,215 | | Callaway Golf Co. | | | 4,247,527 | |
| | 287,607 | | Leapfrog Enterprises, Inc. (a) | | | 1,006,625 | |
| | | | | | | 5,254,152 | |
The accompanying notes are an integral part of these financial statements.
Frontegra IronBridge Small Cap Fund
SCHEDULE OF INVESTMENTS (continued)
December 31, 2008 (Unaudited)
| Number of Shares | | | | Value | |
| | | COMMON STOCKS 95.3% (continued) | | | |
| | | Machinery 4.5% | | | |
| | 89,317 | | Astec Industries, Inc. (a) | | $ | 2,798,302 | |
| | 64,236 | | IDEX Corp. | | | 1,551,299 | |
| | 59,446 | | Kaydon Corp. | | | 2,041,970 | |
| | 66,723 | | Lincoln Electric Holdings, Inc. | | | 3,398,202 | |
| | 42,021 | | Valmont Industries, Inc. | | | 2,578,409 | |
| | | | | | | 12,368,182 | |
| | | | Marine 1.5% | | | | |
| | 164,368 | | Alexander & Baldwin, Inc. | | | 4,119,062 | |
| | | | | | | | |
| | | | Metals & Mining 1.1% | | | | |
| | 63,897 | | Carpenter Technology | | | 1,312,444 | |
| | 216,112 | | GrafTech International Ltd. (a) | | | 1,798,052 | |
| | | | | | | 3,110,496 | |
| | | | Multi-Utilities & Unregulated Power 2.8% | | | | |
| | 397,812 | | Avista Corp. | | | 7,709,597 | |
| | | | | | | | |
| | | | Oil & Gas 1.5% | | | | |
| | 137,906 | | Cabot Oil & Gas Corp. | | | 3,585,556 | |
| | 80,550 | | Tesco Corp. (a)(b) | | | 575,127 | |
| | | | | | | 4,160,683 | |
| | | | Oil, Gas & Consumable Fuels 0.3% | | | | |
| | 402,476 | | International Coal Group, Inc. (a) | | | 925,695 | |
| | | | | | | | |
| | | | Real Estate 4.8% | | | | |
| | 22,890 | | Alexandria Real Estate Equities, Inc. | | | 1,381,183 | |
| | 176,086 | | Corporate Office Properties Trust | | | 5,405,840 | |
| | 118,522 | | Mid-America Apartment Communities, Inc. | | | 4,404,277 | |
| | 80,994 | | The St. Joe Co. (a) | | | 1,969,774 | |
| | | | | | | 13,161,074 | |
| | | | Semiconductor & Semiconductor Equipment 1.7% | | | | |
| | 324,810 | | Cypress Semiconductor Corp. (a) | | | 1,451,901 | |
| | 122,752 | | Semtech Corp. (a) | | | 1,383,415 | |
| | 35,646 | | Standard Microsystems Corp. (a) | | | 582,456 | |
| | 72,059 | | Varian Semiconductor Equipment Associates, Inc. (a) | | | 1,305,709 | |
| | | | | | | 4,723,481 | |
The accompanying notes are an integral part of these financial statements.
Frontegra IronBridge Small Cap Fund
SCHEDULE OF INVESTMENTS (continued)
December 31, 2008 (Unaudited)
| Number of Shares | | | | Value | |
| | | COMMON STOCKS 95.3% (continued) | | | |
| | | Software 1.9% | | | |
| | 69,410 | | Ansys, Inc. (a) | | $ | 1,935,845 | |
| | 101,762 | | Jack Henry & Associates, Inc. | | | 1,975,201 | |
| | 409 | | Manhattan Associates, Inc. (a) | | | 6,466 | |
| | 112,519 | | Parametric Technology Corp. (a) | | | 1,423,365 | |
| | | | | | | 5,340,877 | |
| | | | Specialty Retail 1.1% | | | | |
| | 80,925 | | Tractor Supply Co. (a) | | | 3,141,470 | |
| | | | | | | | |
| | | | Textiles, Apparel & Luxury Goods 1.4% | | | | |
| | 98,523 | | Oxford Industries, Inc. | | | 864,046 | |
| | 144,743 | | Wolverine World Wide, Inc. | | | 3,045,393 | |
| | | | | | | 3,909,439 | |
| | | | Thrifts & Mortgage Finance 0.6% | | | | |
| | 105,177 | | Washington Federal, Inc. | | | 1,573,448 | |
| | | | | | | | |
| | | | Total Common Stocks | | | | |
| | | | (Cost $312,881,497) | | | 261,723,233 | |
| | | | | | | | |
| | | | EXCHANGE TRADED FUNDS 0.0% | | | | |
| | 1,710 | | iShares Russell 2000 Index Fund | | | 84,252 | |
| | | | | | | | |
| | | | Total Exchange Traded Funds | | | | |
| | | | (Cost $83,277) | | | 84,252 | |
The accompanying notes are an integral part of these financial statements.
Frontegra IronBridge Small Cap Fund
SCHEDULE OF INVESTMENTS (continued)
December 31, 2008 (Unaudited)
| Principal Amount | | | | Value | |
| | | SHORT-TERM INVESTMENTS 6.6% | | | |
| | | Commercial Paper 4.8% | | | |
| $ | 13,000,000 | | US Bancorp 01/02/2009 | | $ | 12,999,996 | |
| | | | | | | | |
| | | | Variable Rate Demand Notes (c) 1.8% | | | | |
| | 3,746,607 | | U.S. Bank Demand Note, 2.233% | | | 3,746,607 | |
| | 1,217,885 | | Wisconsin Corporate Central Credit Union, 4.869% | | | 1,217,885 | |
| | | | | | | 4,964,492 | |
| | | | Total Short-Term Investments | | | | |
| | | | (Cost $17,964,488) | | | 17,964,488 | |
| | | | | | | | |
| | | | Total Investments 101.9% | | | | |
| | | | (Cost $330,929,262) | | | 279,771,973 | |
| | | | | | | | |
| | | | Liabilities in Excess of Other Assets (1.9)% | | | (5,216,807 | ) |
| | | | | | | | |
| | | | TOTAL NET ASSETS 100.0% | | $ | 274,555,166 | |
| (b) | U.S.-dollar denominated security of foreign issuer. |
| (c) | Variable rate demand notes are considered short-term obligations and are payable upon demand. Interest rates change periodically on specified dates. The rates listed are as of December 31, 2008. |
The accompanying notes are an integral part of these financial statements.
Frontegra IronBridge Small Cap Fund
STATEMENT OF ASSETS AND LIABILITIES
December 31, 2008 (Unaudited)
| Assets: | | | |
| Investments at value (cost $330,929,262) | | $ | 279,771,973 | |
| Cash | | | 18,137 | |
| Interest and dividends receivable | | | 330,123 | |
| Receivable for investments sold | | | 1,143,537 | |
| Receivable for Fund shares sold | | | 561,912 | |
| Prepaid expenses and other assets | | | 24,308 | |
| Total assets | | | 281,849,990 | |
| | | | | |
| Liabilities: | | | | |
| Payable for investments purchased | | | 6,982,516 | |
| Payable for Fund shares purchased | | | 43,989 | |
| Accrued investment advisory fee | | | 210,699 | |
| Accrued expenses | | | 57,620 | |
| Total liabilities | | | 7,294,824 | |
| Net Assets | | $ | 274,555,166 | |
| | | | | |
| Net Assets Consist of: | | | | |
| Paid in capital | | $ | 351,157,640 | |
| Undistributed net investment income | | | 719,057 | |
| Undistributed net realized loss | | | (26,164,242 | ) |
| Net unrealized depreciation on investments | | | (51,157,289 | ) |
| Net Assets | | $ | 274,555,166 | |
| | | | | |
| Capital Stock, $0.01 Par Value | | | | |
| Authorized | | | 50,000,000 | |
| Issued and outstanding | | | 24,198,945 | |
| Net Asset Value, Redemption Price and Offering Price Per Share | | $ | 11.35 | |
The accompanying notes are an integral part of these financial statements.
Frontegra IronBridge Small Cap Fund
STATEMENT OF OPERATIONS
| | | Six Months Ended | |
| | | December 31, 2008 | |
| | | (Unaudited) | |
| Investment Income: | | | |
Dividends(1) | | $ | 2,417,533 | |
| Interest | | | 128,475 | |
| | | | 2,546,008 | |
| | | | | |
| Expenses: | | | | |
| Investment advisory fees (Note 3) | | | 1,687,296 | |
| Fund administration and accounting fees | | | 52,072 | |
| Custody fees | | | 16,560 | |
| Audit fees | | | 15,640 | |
| Federal and state registration fees | | | 11,960 | |
| Legal fees | | | 11,592 | |
| Shareholder servicing fees | | | 9,752 | |
| Reports to shareholders | | | 5,888 | |
| Directors’ fees and related expenses | | | 4,231 | |
| Compliance related expenses | | | 4,048 | |
| Other | | | 7,912 | |
| Total expenses | | | 1,826,951 | |
| Net Investment Income | | | 719,057 | |
| | | | | |
| Realized and Unrealized | | | | |
| Gain (Loss) on Investments: | | | | |
| Net realized loss on investments | | | (26,163,958 | ) |
| Change in net unrealized appreciation/depreciation on investments | | | (87,066,108 | ) |
| Net Realized and Unrealized | | | | |
| Loss on Investments | | | (113,230,066 | ) |
| Net Decrease in Net Assets | | | | |
| Resulting from Operations | | $ | (112,511,009 | ) |
| (1) | Net of $5,775 in foreign withholding taxes. |
The accompanying notes are an integral part of these financial statements.
Frontegra IronBridge Small Cap Fund
STATEMENTS OF CHANGES IN NET ASSETS
| | Six Months Ended | | | | |
| | | December 31, 2008 | | | Year Ended | |
| | | (Unaudited) | | | June 30, 2008 | |
| Operations: | | | | | | |
| Net investment income | | $ | 719,057 | | | $ | 369,703 | |
| Net realized gain (loss) on investments | | | (26,163,958 | ) | | | 42,297,592 | |
| Change in net unrealized appreciation/ | | | | | | | | |
| depreciation on investments | | | (87,066,108 | ) | | | (68,499,235 | ) |
| Net decrease in net assets | | | | | | | | |
| resulting from operations | | | (112,511,009 | ) | | | (25,831,940 | ) |
Distributions | | | | | | | | |
| Paid From: | | | | | | | | |
| Net investment income | | | (189,366 | ) | | | (96,114 | ) |
| Net realized gain on investments | | | (16,024,635 | ) | | | (45,487,192 | ) |
| Net decrease in net assets resulting | | | | | | | | |
| from distributions paid | | | (16,214,001 | ) | | | (45,583,306 | ) |
Capital Share | | | | | | | | |
| Transactions: | | | | | | | | |
| Shares sold | | | 24,741,164 | | | | 36,326,779 | |
| Shares issued to holders in | | | | | | | | |
| reinvestment of distributions | | | 15,455,049 | | | | 43,952,221 | |
| Shares redeemed | | | (36,948,219 | ) | | | (41,234,537 | ) |
| Net increase in net assets | | | | | | | | |
| resulting from capital share transactions | | | 3,247,994 | | | | 39,044,463 | |
| Total Decrease in Net Assets | | | (125,477,016 | ) | | | (32,370,783 | ) |
Net Assets: | | | | | | | | |
| Beginning of period | | | 400,032,182 | | | | 432,402,965 | |
| End of period | | | | | | | | |
| (includes undistributed net investment | | | | | | | | |
| income of $719,057 and $189,366 respectively) | | $ | 274,555,166 | | | $ | 400,032,182 | |
The accompanying notes are an integral part of these financial statements.
Frontegra IronBridge Small Cap Fund
FINANCIAL HIGHLIGHTS
| | | Six Months | | | | | | | | | | | | | | | | |
| | | Ended | | | Year | | | Year | | | Year | | | Year | | | Year | |
| | | December 31, | | | Ended | | | Ended | | | Ended | | | Ended | | | Ended | |
| | | 2008 | | | June 30, | | | June 30, | | | June 30, | | | June 30, | | | June 30, | |
| | | (Unaudited) | | | 2008 | | | 2007 | | | 2006 | | | 2005 | | | 2004 | |
| Net Asset Value, | | | | | | | | | | | | | | | | | | |
| Beginning of Period | | $ | 17.03 | | | $ | 20.35 | | | $ | 18.25 | | | $ | 16.14 | | | $ | 15.83 | | | $ | 13.04 | |
| | | | | | | | | | | | | | | | | | | | | | | | | |
| Income (Loss) | | | | | | | | | | | | | | | | | | | | | | | | |
| from Investment | | | | | | | | | | | | | | | | | | | | | | | | |
| Operations: | | | | | | | | | | | | | | | | | | | | | | | | |
| Net investment income (loss) | | | 0.03 | | | | 0.02 | | | | — | | | | 0.03 | | | | (0.03 | ) | | | (0.04 | ) |
| Net realized and unrealized | | | | | | | | | | | | | | | | | | | | | | | | |
| gain (loss) on investments | | | (4.97 | ) | | | (1.16 | ) | | | 3.82 | | | | 2.25 | | | | 1.38 | | | | 3.17 | |
| Total Income (Loss) from | | | | | | | | | | | | | | | | | | | | | | | | |
| Investment Operations | | | (4.94 | ) | | | (1.14 | ) | | | 3.82 | | | | 2.28 | | | | 1.35 | | | | 3.13 | |
| | | | | | | | | | | | | | | | | | | | | | | | | |
| Less Distributions | | | | | | | | | | | | | | | | | | | | | | | | |
| Paid: | | | | | | | | | | | | | | | | | | | | | | | | |
| From net investment income | | | (0.01 | ) | | | (0.01 | ) | | | (0.02 | ) | | | — | | | | — | | | | — | |
| From net realized gain on investments | | | (0.73 | ) | | | (2.17 | ) | | | (1.70 | ) | | | (0.17 | ) | | | (1.04 | ) | | | (0.34 | ) |
| Total Distributions Paid | | | (0.74 | ) | | | (2.18 | ) | | | (1.72 | ) | | | (0.17 | ) | | | (1.04 | ) | | | (0.34 | ) |
| | | | | | | | | | | | | | | | | | | | | | | | | |
| Net Asset Value, End of Period | | $ | 11.35 | | | $ | 17.03 | | | $ | 20.35 | | | $ | 18.25 | | | $ | 16.14 | | | $ | 15.83 | |
| Total Return | | | (28.82 | )%(2) | | | (6.07 | )% | | | 22.11 | % | | | 14.20 | % | | | 8.47 | % | | | 24.25 | % |
| | | | | | | | | | | | | | | | | | | | | | | | | |
| Supplemental Data | | | | | | | | | | | | | | | | | | | | | | | | |
| and Ratios: | | | | | | | | | | | | | | | | | | | | | | | | |
| Net assets, end of period | | | | | | | | | | | | | | | | | | | | | | | | |
| (in thousands) | | $ | 274,555 | | | $ | 400,032 | | | $ | 432,403 | | | $ | 404,219 | | | $ | 319,081 | | | $ | 144,988 | |
| Ratio of expenses to | | | | | | | | | | | | | | | | | | | | | | | | |
| average net assets | | | | | | | | | | | | | | | | | | | | | | | | |
| Before waivers and | | | | | | | | | | | | | | | | | | | | | | | | |
| reimbursements/recapture | | | 1.08 | %(1) | | | 1.07 | % | | | 1.07 | % | | | 1.08 | % | | | 1.11 | % | | | 1.21 | % |
| Net of waivers and | | | | | | | | | | | | | | | | | | | | | | | | |
| reimbursements/recapture | | | 1.08 | %(1) | | | 1.08 | % | | | 1.10 | % | | | 1.10 | % | | | 1.10 | % | | | 1.10 | % |
| Ratio of net investment | | | | | | | | | | | | | | | | | | | | | | | | |
| income (loss) to average net assets | | | | | | | | | | | | | | | | | | | | | | | | |
| Before waivers and | | | | | | | | | | | | | | | | | | | | | | | | |
| reimbursements/recapture | | | 0.43 | %(1) | | | 0.10 | % | | | (0.01 | )% | | | 0.17 | % | | | (0.28 | )% | | | (0.40 | )% |
| Net of waivers and | | | | | | | | | | | | | | | | | | | | | | | | |
| reimbursements/recapture | | | 0.43 | %(1) | | | 0.09 | % | | | (0.08 | )% | | | 0.15 | % | | | (0.27 | )% | | | (0.29 | )% |
| Portfolio turnover rate | | | 20 | %(2) | | | 53 | % | | | 34 | % | | | 60 | % | | | 56 | % | | | 94 | % |
The accompanying notes are an integral part of these financial statements.
INVESTMENT HIGHLIGHTS
Growth of a $100,000 Investment (Unaudited)
* 12/31/04 commencement of operations.
| Portfolio Total Return** | | | | | | |
| FOR PERIODS ENDED 12/31/08 | | FUND | | | INDEX | |
| | | | | | | |
| SIX MONTHS | | | (30.65 | )% | | | (31.21 | )% |
| | | | | | | | | |
| ONE YEAR | | | (33.66 | )% | | | (36.79 | )% |
| | | | | | | | | |
| THREE YEAR | | | | | | | | |
| AVERAGE ANNUAL | | | (7.10 | )% | | | (9.37 | )% |
| | | | | | | | | |
| SINCE COMMENCEMENT | | | | | | | | |
| AVERAGE ANNUAL | | | (3.40 | )% | | | (5.29 | )% |
This chart assumes an initial gross investment of $100,000 made on 12/31/04 (commencement of operations). Returns shown include the reinvestment of all distributions. Past performance is not predictive of future results. Investment return and principal value will fluctuate so that shares, when redeemed, may be worth more or less than the original cost. In the absence of existing fee waivers, total return would be reduced. To receive current to the most recent month-end performance, please call 1-888-825-2100.
The Russell 2500 Index measures the performance of the 2,500 smallest companies in the Russell 3000 Index. The Russell 3000 Index measures the performance of the 3,000 largest U.S. companies based on total market capitalization. The Index does not reflect investment management fees, brokerage commissions and other expenses associated with investing in equity securities. A direct investment in the index is not possible.
| ** | The returns shown do not reflect the deduction of taxes that a shareholder would pay on Fund distributions or the redemption of Fund shares. |
Frontegra IronBridge SMID Fund
SCHEDULE OF INVESTMENTS
December 31, 2008 (Unaudited)
| Number of Shares | | | | Value | |
| | | COMMON STOCKS 96.9% | | | |
| | | Aerospace & Defense 2.2% | | | |
| | 50,501 | | Esterline Technologies Corp. (a) | | $ | 1,913,483 | |
| | 35,230 | | Moog Inc. - Class A (a) | | | 1,288,361 | |
| | 44,388 | | Teledyne Technologies, Inc. (a) | | | 1,977,485 | |
| | | | | | | 5,179,329 | |
| | | | Auto Components 0.4% | | | | |
| | 108,868 | | Gentex Corp. | | | 961,305 | |
| | | | | | | | |
| | | | Biotechnology 3.3% | | | | |
| | 156,395 | | Cepheid, Inc. (a) | | | 1,623,380 | |
| | 128,957 | | Isis Pharmaceuticals, Inc. (a) | | | 1,828,610 | |
| | 51,862 | | Onyx Pharmaceuticals, Inc. (a) | | | 1,771,606 | |
| | 39,068 | | Techne Corp. | | | 2,520,668 | |
| | | | | | | 7,744,264 | |
| | | | Capital Markets 1.8% | | | | |
| | 71,444 | | Jefferies Group, Inc. | | | 1,004,502 | |
| | 128,473 | | SEI Investments Co. | | | 2,018,311 | |
| | 70,126 | | Waddell & Reed Financial, Inc. | | | 1,084,148 | |
| | | | | | | 4,106,961 | |
| | | | Chemicals 6.3% | | | | |
| | 121,910 | | Albemarle Corp. | | | 2,718,593 | |
| | 71,378 | | FMC Corp. | | | 3,192,738 | |
| | 96,818 | | Lubrizol Corp. | | | 3,523,207 | |
| | 124,038 | | Methanex Corp. (b) | | | 1,394,187 | |
| | 37,135 | | Minerals Technologies, Inc. | | | 1,518,822 | |
| | 59,462 | | Sigma-Aldrich Corp. | | | 2,511,675 | |
| | | | | | | 14,859,222 | |
| | | | Commercial Banks 3.1% | | | | |
| | 65,461 | | City National Corp. | | | 3,187,950 | |
| | 82,629 | | Cullen/Frost Bankers, Inc. | | | 4,187,638 | |
| | | | | | | 7,375,588 | |
| | | | Commercial Services & Supplies 0.7% | | | | |
| | 7,481 | | Strayer Education, Inc. | | | 1,604,001 | |
| | | | | | | | |
| | | | Computers & Peripherals 0.7% | | | | |
| | 101,603 | | Synaptics Inc. (a) | | | 1,682,546 | |
The accompanying notes are an integral part of these financial statements.
Frontegra IronBridge SMID Fund
SCHEDULE OF INVESTMENTS (continued)
December 31, 2008 (Unaudited)
| Number of Shares | | | | Value | |
| | | COMMON STOCKS 96.9% (continued) | | | |
| | | Construction & Engineering 2.2% | | | |
| | 20,380 | | Jacobs Engineering Group Inc. (a) | | $ | 980,278 | |
| | 105,391 | | Quanta Services, Inc. (a) | | | 2,086,742 | |
| | 52,036 | | URS Corp. (a) | | | 2,121,508 | |
| | | | | | | 5,188,528 | |
| | | | Distributors 1.9% | | | | |
| | 116,665 | | Genuine Parts Co. | | | 4,416,937 | |
| | | | | | | | |
| | | | Diversified Financial Services 0.5% | | | | |
| | 38,622 | | GATX Corp. | | | 1,196,123 | |
| | | | | | | | |
| | | | Electric Utilities 2.5% | | | | |
| | 137,353 | | Wisconsin Energy Corp. | | | 5,766,079 | |
| | | | | | | | |
| | | | Electrical Equipment 3.1% | | | | |
| | 93,822 | | American Superconductor Corp. (a) | | | 1,530,237 | |
| | 76,642 | | AMETEK, Inc. | | | 2,315,355 | |
| | 44,139 | | Roper Industries, Inc. | | | 1,916,074 | |
| | 69,500 | | Woodward Governor Co. | | | 1,599,890 | |
| | | | | | | 7,361,556 | |
| | | | Electronic Equipment & Instruments 5.8% | | | | |
| | 82,650 | | Amphenol Corp. - Class A | | | 1,981,947 | |
| | 129,226 | | Avnet, Inc. (a) | | | 2,353,206 | |
| | 93,093 | | FLIR Systems, Inc. (a) | | | 2,856,093 | |
| | 32,256 | | Itron, Inc. (a) | | | 2,055,997 | |
| | 76,147 | | National Instruments Corp. | | | 1,854,941 | |
| | 115,584 | | Trimble Navigation Ltd. (a) | | | 2,497,770 | |
| | | | | | | 13,599,954 | |
| | | | Energy Equipment & Services 3.0% | | | | |
| | 60,335 | | FMC Technologies, Inc. (a) | | | 1,437,783 | |
| | 97,273 | | Helmerich & Payne, Inc. | | | 2,212,961 | |
| | 48,212 | | Oceaneering International, Inc. (a) | | | 1,404,897 | |
| | 130,055 | | Pride International, Inc. (a) | | | 2,078,279 | |
| | | | | | | 7,133,920 | |
| | | | Food Products 3.4% | | | | |
| | 102,173 | | Corn Products International, Inc. | | | 2,947,691 | |
The accompanying notes are an integral part of these financial statements.
Frontegra IronBridge SMID Fund
SCHEDULE OF INVESTMENTS (continued)
December 31, 2008 (Unaudited)
| Number of Shares | | | | Value | |
| | | COMMON STOCKS 96.9% (continued) | | | |
| | | Food Products 3.4% (continued) | | | |
| | 158,728 | | McCormick & Co., Inc. | | $ | 5,057,074 | |
| | | | | | | 8,004,765 | |
| | | | Gas Utilities 1.7% | | | | |
| | 159,756 | | UGI Corp. | | | 3,901,242 | |
| | | | | | | | |
| | | | Health Care Equipment & Supplies 5.3% | | | | |
| | 53,266 | | Gen-Probe, Inc. (a) | | | 2,281,915 | |
| | 109,999 | | Hansen Medical, Inc. (a) | | | 794,193 | |
| | 42,545 | | IDEXX Laboratories, Inc. (a) | | | 1,535,024 | |
| | 105,713 | | Illumina, Inc. (a) | | | 2,753,824 | |
| | 15,045 | | Intuitive Surgical, Inc. (a) | | | 1,910,564 | |
| | 225,376 | | PerkinElmer, Inc. | | | 3,134,980 | |
| | | | | | | 12,410,500 | |
| | | | Health Care Providers & Services 4.7% | | | | |
| | 89,533 | | Cerner Corp. (a) | | | 3,442,544 | |
| | 87,324 | | Henry Schein, Inc. (a) | | | 3,203,917 | |
| | 78,743 | | Owens & Minor, Inc. | | | 2,964,674 | |
| | 107,390 | | Phase Forward Inc. (a) | | | 1,344,523 | |
| | | | | | | 10,955,658 | |
| | | | Hotels, Restaurants & Leisure 1.6% | | | | |
| | 137,978 | | WMS Industries, Inc. (a) | | | 3,711,608 | |
| | | | | | | | |
| | | | Household Durables 4.3% | | | | |
| | 115,087 | | AptarGroup, Inc. | | | 4,055,666 | |
| | 64,084 | | Snap-On Inc. | | | 2,523,628 | |
| | 156,969 | | Tupperware Brands Corp. | | | 3,563,196 | |
| | | | | | | 10,142,490 | |
| | | | Industrial Conglomerates 1.8% | | | | |
| | 14,630 | | Alleghany Corp. (a) | | | 4,125,660 | |
| | | | | | | | |
| | | | Insurance 3.4% | | | | |
| | 184,199 | | American Financial Group, Inc. | | | 4,214,473 | |
| | 12,350 | | Markel Corp. (a) | | | 3,692,650 | |
| | | | | | | 7,907,123 | |
The accompanying notes are an integral part of these financial statements.
Frontegra IronBridge SMID Fund
SCHEDULE OF INVESTMENTS (continued)
December 31, 2008 (Unaudited)
| Number of Shares | | | | Value | |
| | | COMMON STOCKS 96.9% (continued) | | | |
| | | Internet Software & Services 1.1% | | | |
| | 74,022 | | Akamai Technologies, Inc. (a) | | $ | 1,116,992 | |
| | 59,500 | | F5 Networks, Inc. (a) | | | 1,360,170 | |
| | | | | | | 2,477,162 | |
| | | | Leisure Equipment & Products 0.7% | | | | |
| | 177,849 | | Callaway Golf Co. | | | 1,652,217 | |
| | | | | | | | |
| | | | Machinery 4.2% | | | | |
| | 43,278 | | Harsco Corp. | | | 1,197,935 | |
| | 53,245 | | IDEX Corp. | | | 1,285,867 | |
| | 95,782 | | Kennametal, Inc. | | | 2,125,403 | |
| | 42,125 | | Lincoln Electric Holdings, Inc. | | | 2,145,426 | |
| | 72,644 | | Pall Corp. | | | 2,065,269 | |
| | 15,100 | | Valmont Industries, Inc. | | | 926,536 | |
| | | | | | | 9,746,436 | |
| | | | Marine 1.6% | | | | |
| | 146,706 | | Alexander & Baldwin, Inc. | | | 3,676,452 | |
| | | | | | | | |
| | | | Metals & Mining 1.0% | | | | |
| | 65,237 | | Arch Coal, Inc. | | | 1,062,711 | |
| | 168,052 | | GrafTech International Ltd. (a) | | | 1,398,192 | |
| | | | | | | 2,460,903 | |
| | | | Multi-Utilities & Unregulated Power 4.1% | | | | |
| | 49,839 | | Energen Corp. | | | 1,461,778 | |
| | 198,765 | | MDU Resources Group, Inc. | | | 4,289,349 | |
| | 132,589 | | ONEOK, Inc. | | | 3,860,991 | |
| | | | | | | 9,612,118 | |
| | | | Oil & Gas 1.0% | | | | |
| | 92,274 | | Cabot Oil & Gas Corp. | | | 2,399,124 | |
| | | | | | | | |
| | | | Paper & Forest Products 1.5% | | | | |
| | 114,217 | | Rayonier Inc. | | | 3,580,703 | |
| | | | | | | | |
| | | | Real Estate 4.7% | | | | |
| | 33,579 | | Alexandria Real Estate Equities, Inc. | | | 2,026,157 | |
| | 135,798 | | Corporate Office Properties Trust | | | 4,168,999 | |
The accompanying notes are an integral part of these financial statements.
Frontegra IronBridge SMID Fund
SCHEDULE OF INVESTMENTS (continued)
December 31, 2008 (Unaudited)
| Number of Shares | | | | Value | |
| | | COMMON STOCKS 96.9% (continued) | | | |
| | | Real Estate 4.7% (continued) | | | |
| | 195,717 | | The St. Joe Co. (a) | | $ | 4,759,837 | |
| | | | | | | 10,954,993 | |
| | | | Semiconductor & Semiconductor Equipment 2.1% | | | | |
| | 101,382 | | Altera Corp. | | | 1,694,093 | |
| | 265,243 | | Cypress Semiconductor Corp. (a) | | | 1,185,636 | |
| | 84,887 | | Intersil Corp. - Class A | | | 780,112 | |
| | 68,883 | | Varian Semiconductor Equipment Associates, Inc. (a) | | | 1,248,160 | |
| | | | | | | 4,908,001 | |
| | | | Software 3.1% | | | | |
| | 31,870 | | ANSYS, Inc. (a) | | | 888,854 | |
| | 99,177 | | Citrix Systems, Inc. (a) | | | 2,337,602 | |
| | 65,600 | | Informatica Corp. (a) | | | 900,688 | |
| | 75,860 | | Intuit, Inc. (a) | | | 1,804,710 | |
| | 41,769 | | McAfee Inc. (a) | | | 1,443,954 | |
| | | | | | | 7,375,808 | |
| | | | Specialty Retail 1.6% | | | | |
| | 63,970 | | Gamestop Corp. - Class A (a) | | | 1,385,590 | |
| | 77,081 | | O’Reilly Automotive, Inc. (a) | | | 2,369,470 | |
| | | | | | | 3,755,060 | |
| | | | Textiles, Apparel & Luxury Goods 1.9% | | | | |
| | 38,875 | | VF Corp. | | | 2,129,184 | |
| | 113,670 | | Wolverine World Wide, Inc. | | | 2,391,617 | |
| | | | | | | 4,520,801 | |
| | | | Thrifts & Mortgage Finance 3.2% | | | | |
| | 227,483 | | Hudson City Bancorp, Inc. | | | 3,630,629 | |
| | 218,712 | | New York Community Bancorp, Inc. | | | 2,615,796 | |
| | 91,067 | | Washington Federal, Inc. | | | 1,362,362 | |
| | | | | | | 7,608,787 | |
| | | | Trading Companies & Distributors 1.4% | | | | |
| | 42,412 | | W.W. Grainger, Inc. | | | 3,343,762 | |
| | | | | | | | |
| | | | Total Common Stocks | | | | |
| | | | (Cost $286,545,625) | | | 227,407,686 | |
The accompanying notes are an integral part of these financial statements.
Frontegra IronBridge SMID Fund
SCHEDULE OF INVESTMENTS (continued)
December 31, 2008 (Unaudited)
| Principal Amount | | | | Value | |
| | | SHORT-TERM INVESTMENTS 3.8% | | | |
| | | Commercial Paper 3.3% | | | |
| $ | 7,690,000 | | US Bancorp, 01/02/2009 | | $ | 7,689,998 | |
| | | | | | | | |
| | | | Variable Rate Demand Notes (c) 0.5% | | | | |
| | 1,270,381 | | Wisconsin Corporate Central Credit Union, 4.869% | | | 1,270,381 | |
| | | | | | | | |
| | | | Total Short-Term Investments | | | | |
| | | | (Cost $8,960,379) | | | 8,960,379 | |
| | | | | | | | |
| | | | Total Investments 100.7% | | | | |
| | | | (Cost $295,506,004) | | | 236,368,065 | |
| | | | | | | | |
| | | | Liabilities in Excess of Other Assets (0.7)% | | | (1,605,036 | ) |
| | | | | | | | |
| | | | TOTAL NET ASSETS 100.0% | | $ | 234,763,029 | |
| (b) | U.S.-dollar denominated security of foreign issuer. |
| (c) | Variable rate demand notes are considered short-term obligations and are payable upon demand. Interest rates change periodically on specified dates. The rates listed are as of December 31, 2008. |
The accompanying notes are an integral part of these financial statements.
Frontegra IronBridge SMID Fund
STATEMENT OF ASSETS AND LIABILITIES
December 31, 2008 (Unaudited)
| Assets: | | | |
| Investments at value (cost $295,506,004) | | $ | 236,368,065 | |
| Cash | | | 16,342 | |
| Interest and dividends receivable | | | 310,416 | |
| Receivable for investments sold | | | 3,139,603 | |
| Receivable for Fund shares sold | | | 834,238 | |
| Prepaid expenses and other assets | | | 49,150 | |
| Total assets | | | 240,717,814 | |
| | | | | |
| Liabilities: | | | | |
| Payable for investments purchased | | | 5,221,838 | |
| Payable for Fund shares purchased | | | 527,970 | |
| Accrued investment advisory fee | | | 157,615 | |
| Accrued expenses | | | 47,362 | |
| Total liabilities | | | 5,954,785 | |
| Net Assets | | $ | 234,763,029 | |
| | | | | |
| Net Assets Consist of: | | | | |
| Paid in capital | | $ | 318,307,900 | |
| Undistributed net investment income | | | 739,334 | |
| Undistributed net realized loss | | | (25,146,266 | ) |
| Net unrealized depreciation on investments | | | (59,137,939 | ) |
| Net Assets | | $ | 234,763,029 | |
| | | | | |
| Capital Stock, $0.01 Par Value | | | | |
| Authorized | | | 50,000,000 | |
| Issued and outstanding | | | 30,476,120 | |
| Net Asset Value, Redemption Price and Offering Price Per Share | | $ | 7.70 | |
The accompanying notes are an integral part of these financial statements.
Frontegra IronBridge SMID Fund
STATEMENT OF OPERATIONS
| | | Six Months Ended | |
| | | December 31, 2008 | |
| | | (Unaudited) | |
| Investment Income: | | | |
Dividends(1) | | $ | 1,753,265 | |
| Interest | | | 123,053 | |
| | | | 1,876,318 | |
| | | | | |
| Expenses: | | | | |
| Investment advisory fees (Note 3) | | | 1,017,367 | |
| Fund administration and accounting fees | | | 32,016 | |
| Audit fees | | | 18,768 | |
| Legal fees | | | 14,352 | |
| Custody fees | | | 12,696 | |
| Federal and state registration fees | | | 12,512 | |
| Shareholder servicing fees | | | 6,072 | |
| Directors’ fees and related expenses | | | 4,232 | |
| Compliance related expenses | | | 4,048 | |
| Reports to shareholders | | | 2,208 | |
| Other | | | 4,048 | |
| Total expenses before recapture | | | 1,128,319 | |
| Expenses recaptured by Adviser (Note 3) | | | 8,665 | |
| Total expenses | | | 1,136,984 | |
| Net Investment Income | | | 739,334 | |
| | | | | |
| Realized and Unrealized | | | | |
| Gain (Loss) on Investments: | | | | |
| Net realized loss on investments | | | (25,108,823 | ) |
| Change in net unrealized | | | | |
| appreciation/depreciation on investments | | | (62,862,802 | ) |
| Net Realized and Unrealized | | | | |
| Loss on Investments | | | (87,971,625 | ) |
| Net Decrease in Net Assets | | | | |
| Resulting from Operations | | $ | (87,232,291 | ) |
| (1) | Net of $5,046 in foreign withholding taxes. |
The accompanying notes are an integral part of these financial statements.
Frontegra IronBridge SMID Fund
STATEMENTS OF CHANGES IN NET ASSETS
| | Six Months Ended | | | | |
| | | December 31, 2008 | | | Year Ended | |
| | | (Unaudited) | | | June 30, 2008 | |
| Operations: | | | | | | |
| Net investment income | | $ | 739,334 | | | $ | 407,274 | |
| Net realized gain (loss) on investments | | | (25,108,823 | ) | | | 11,781,369 | |
| Change in net unrealized appreciation/ | | | | | | | | |
| depreciation on investments | | | (62,862,802 | ) | | | (26,410,549 | ) |
| Net decrease in net assets | | | | | | | | |
| resulting from operations | | | (87,232,291 | ) | | | (14,221,906 | ) |
Distributions | | | | | | | | |
| Paid From: | | | | | | | | |
| Net investment income | | | (259,686 | ) | | | (329,765 | ) |
| Net realized gain on investments | | | (2,364,347 | ) | | | (17,799,377 | ) |
| Net decrease in net assets resulting | | | | | | | | |
| from distributions paid | | | (2,624,033 | ) | | | (18,129,142 | ) |
Capital Share | | | | | | | | |
| Transactions: | | | | | | | | |
| Shares sold | | | 109,870,461 | | | | 79,034,738 | |
| Shares issued to holders in | | | | | | | | |
| reinvestment of distributions | | | 2,451,437 | | | | 16,459,234 | |
| Shares redeemed | | | (21,082,243 | ) | | | (23,187,391 | ) |
| Net increase in net assets resulting | | | | | | | | |
| from capital share transactions | | | 91,239,655 | | | | 72,306,581 | |
| Total Increase in Net Assets | | | 1,383,331 | | | | 39,955,533 | |
Net Assets: | | | | | | | | |
| Beginning of period | | | 233,379,698 | | | | 193,424,165 | |
| End of period | | | | | | | | |
| (includes undistributed net investment | | | | | | | | |
| income of $739,334 and $259,686, respectively) | | $ | 234,763,029 | | | $ | 233,379,698 | |
The accompanying notes are an integral part of these financial statements.
Frontegra IronBridge SMID Fund
FINANCIAL HIGHLIGHTS
| | | Six Months | | | | | | | | | | | | | |
| | | Ended | | | Year | | | Year | | | Year | | | Period | |
| | | December 31, | | | Ended | | | Ended | | | Ended | | | Ended | |
| | | 2008 | | | June 30, | | | June 30, | | | June 30, | | | June 30, | |
| | | (Unaudited) | | | 2008 | | | 2007 | | | 2006 | | | 2005(1) | |
| Net Asset Value, | | | | | | | | | | | | | | | |
| Beginning of Period | | $ | 11.23 | | | $ | 13.36 | | | $ | 11.07 | | | $ | 10.00 | | | $ | 10.00 | |
| | | | | | | | | | | | | | | | | | | | | |
| Income (Loss) | | | | | | | | | | | | | | | | | | | | |
| from Investment | | | | | | | | | | | | | | | | | | | | |
| Operations: | | | | | | | | | | | | | | | | | | | | |
| Net investment income | | | 0.02 | | | | 0.02 | | | | 0.01 | | | | 0.06 | (4) | | | 0.04 | (4) |
| Net realized and unrealized | | | | | | | | | | | | | | | | | | | | |
| gain (loss) on investments | | | (3.46 | ) | | | (0.98 | ) | | | 2.43 | | | | 1.04 | | | | (0.04 | ) |
| Total Income (Loss) from | | | | | | | | | | | | | | | | | | | | |
| Investment Operations | | | (3.44 | ) | | | (0.96 | ) | | | 2.44 | | | | 1.10 | | | | 0.00 | |
| | | | | | | | | | | | | | | | | | | | | |
| Less Distributions | | | | | | | | | | | | | | | | | | | | |
| Paid: | | | | | | | | | | | | | | | | | | | | |
| From net investment income | | | (0.01 | ) | | | (0.02 | ) | | | — | (5) | | | (0.03 | ) | | | — | |
| From net realized gain on investments | | | (0.08 | ) | | | (1.15 | ) | | | (0.15 | ) | | | — | | | | — | |
| Total Distributions Paid | | | (0.09 | ) | | | (1.17 | ) | | | (0.15 | ) | | | (0.03 | ) | | | — | |
| | | | | | | | | | | | | | | | | | | | | |
| Net Asset Value, End of Period | | $ | 7.70 | | | $ | 11.23 | | | $ | 13.36 | | | $ | 11.07 | | | $ | 10.00 | |
| Total Return | | | (30.65 | )%(2) | | | (7.48 | )% | | | 22.25 | % | | | 11.02 | % | | | 0.00 | %(2) |
| | | | | | | | | | | | | | | | | | | | | |
| Supplemental Data | | | | | | | | | | | | | | | | | | | | |
| and Ratios: | | | | | | | | | | | | | | | | | | | | |
| Net assets, end of period (in thousands) | | $ | 234,763 | | | $ | 233,380 | | | $ | 193,424 | | | $ | 133,058 | | | $ | 41,638 | |
| Ratio of expenses to average net assets | | | | | | | | | | | | | | | | | | | | |
| Before waivers and reimbursements/recapture | | | 0.94 | %(3) | | | 0.96 | % | | | 0.98 | % | | | 1.08 | % | | | 1.49 | %(3) |
| Net of waivers and reimbursements/recapture | | | 0.95 | %(3) | | | 0.95 | % | | | 0.95 | % | | | 0.95 | % | | | 0.95 | %(3) |
| Ratio of net investment income to | | | | | | | | | | | | | | | | | | | | |
| average net assets | | | | | | | | | | | | | | | | | | | | |
| Before waivers and reimbursements/recapture | | | 0.62 | %(3) | | | 0.19 | % | | | 0.08 | % | | | 0.15 | % | | | 0.35 | %(3) |
| Net of waivers and reimbursements/recapture | | | 0.61 | %(3) | | | 0.20 | % | | | 0.10 | % | | | 0.28 | % | | | 0.89 | %(3) |
| Portfolio turnover rate | | | 23 | %(2) | | | 71 | % | | | 71 | % | | | 91 | % | | | 44 | %(2) |
| (1) | Commenced operations on December 31, 2004. |
| (4) | Per share net investment income has been calculated using the daily average share method. |
| (5) | Less than one cent per share. |
The accompanying notes are an integral part of these financial statements.
FRONTEGRA
NEW STAR INTERNATIONAL
EQUITY FUND
REPORT FROM NEW STAR
INSTITUTIONAL MANAGERS LIMITED:
Dear Shareholders:
The Frontegra New Star International Equity Fund strives to achieve capital appreciation by investing in a diversified portfolio of securities of large- and mid-cap companies located outside the United States. The objective is relative to and measured against the Morgan Stanley EAFE Index.
Performance Review
The Frontegra New Star International Equity Fund returned -36.46%, net of fees, for the six month period ending December 31, 2008. The Fund’s return slightly underperformed the -36.32% return of its benchmark, the MSCI EAFE Index.
Executive Summary
Governments and central banks in highly indebted Anglo Saxon economies have reacted to the banking seizure with unprecedented policy easing. They have cut interest rates to negligible levels, they are blowing their fiscal positions and some are printing money. Authorities in regions that are historically net savers, Japan, Continental Europe and Asia, are much less active.
The stimulus to indebted countries has been compounded as investors have flown from currencies that are being debased by aggressive policy largesse. Hence we have seen massive moves up in the Yen and Euro versus Sterling and the US$.
Cyclical liquidity measures remain misleadingly positive. Growth in narrow money measures is not feeding through into wider conditions due to the parlous state of Western banks. There is some evidence that policy action is easing tension in interbank markets, so the monetary stimulus has more chance of feeding through into asset price reflation.
News flow for equities is unremittingly grim as analysts slash profit forecasts at a record pace. This will continue in 2009 as current published expectations do not yet reflect normal recessionary profitability, far less the returns we might expect in what looks like a severe contraction.
Non-US equity valuations are low based on headline figures and average to cheap on long term, cyclically adjusted measures. Relative to government bond markets and cash, equities look enticing, as do corporate bonds.
We believe that investor de-leveraging and the associated forced selling is well advanced, based on observation of alternative asset return patterns and published open interest volumes in derivative markets. There may be a further round of selling in Q1 if recent well publicized hedge fund scandals lead to a reacceleration of redemptions.
High cash holdings and super low interest rates are likely to cause shifts towards risk assets of equities and corporate bonds this year. The resulting stronger asset prices will face periodic tests from very poor economic and corporate news, leading to volatile markets.
We believe market leadership will pass to large cap., well financed companies with the proven ability to pay dividends. The portfolio is overweight pharmaceuticals, telecoms, oils, media and insurance. Corresponding underweights are industrials, materials, consumer cyclicals and utilities.
Portfolio Outlook and Strategy
Non-US equity markets fell 30.0% in the half year, compounded by a stronger US$ to - -37.1% in US$ terms. The cyclical areas of industrials, materials, consumer discretionary and IT all fell sharply; defensives in consumer non-durables, healthcare, telecoms, big oil and utilities all proved resilient.
Public authorities in the US and the UK are desperately pulling all the policy levers to head off the dreaded debt deflation. There is absolutely no appetite for sweating off excess debt burdens, policy is aimed at creating price inflation to erode the value of debt mountains. If they are successful, commodity linked equities will have another day in the sun, possibly as part of a general move to risk-loving investments once again. If this immense policy stimulus is not sufficient to reverse de-leveraging of Anglo Saxon economies, then recent trends of ultra risk aversion will persist. So what to do in equity markets?
With cash deposit rates so low and holdings of cash in the investment community building up, there is likely to be an unholy rush into some asset class or other in the next 6 months. The likely candidates are corporate bonds and equities. We expect these two to undergo powerful rallies interspersed with periods of intense anxiety on any run of particularly bad economic news. The two opposing forces on asset prices will be super abundant liquidity on the one hand and continued poor news from the corporate sector on the other.
Liquidity as measured by narrow, policy affected money supply growth, is exploding in the US and latterly the UK, as authorities embark on quantitative easing (think: feeding up a goose for foie gras). Central bank efforts to unglue the banking mess are bearing fruit. Interbank lending rates are coming down, corporate bond spreads over governments are declining gradually.
Corporate profits have fallen in 2008 and have a considerable way to go to reach historical recessionary levels, never mind abnormally harsh recession conditions. Expectations as measured by bottom up consensus profit estimates are too high, as everyone seems to know, but that did not stop markets falling in Q4 as the printed forecasts came down. All investors, ourselves included, would feel much more comfortable if equities accepted downgrades with no more than a shrug of the shoulders, but we are not there yet.
Given these powerful opposing forces, we believe investors will move back into equities as low deposit rates push them out of cash. They will be looking for some “inflation hedge” in case policy stimulus is successful, in which case cash and government bonds will be awful asset classes. In such circumstances, perhaps they will go for large, high quality equities. Those with strong balance sheets, non-cyclical earnings streams, good cash flows and hence dividend paying capacity; the sort of companies that do not need bank support, but to whom the banks will gladly offer credit terms. This is not the exciting high beta, risk-loving, mid cap. leadership that we have become accustomed to in the noughty decade. In fact, we have to go back to the mid 1990’s to recall a period of large cap leadership in what was then called the disinflation rally.
We have added to overweight positions in healthcare and purchases in consumer non-durables have reduced the underweight. Oils are still favoured despite all the price gyrations of crude, insurance is strongly preferred to the banking sector. All three of the classic growth TMT (telecoms, media, technology, for those who have forgotten) are now overweight.
Geographically, the Anglo Saxon ease has debased their currencies and opened up a difference in monetary conditions across regions. This should favour their equity markets over Japan and Continental Europe and we will be looking to adjust portfolios accordingly.
Richard Lewis
New Star Institutional Managers Limited
INVESTMENT HIGHLIGHTS
Growth of a $100,000 Investment (Unaudited)
* 1/08/04 commencement of operations.
| Portfolio Total Return** | | | | | | |
| FOR PERIODS ENDED 12/31/08 | | FUND | | | INDEX | |
| | | | | | | |
| SIX MONTHS | | | (36.46 | )% | | | (36.32 | )% |
| | | | | | | | | |
| ONE YEAR | | | (43.04 | )% | | | (43.06 | )% |
| | | | | | | | | |
| THREE YEAR | | | (7.69 | )% | | | (6.92 | )% |
| | | | | | | | | |
| SINCE COMMENCEMENT | | | | | | | | |
| AVERAGE ANNUAL | | | (0.62 | )% | | | 1.55 | % |
This chart assumes an initial gross investment of $100,000 made on 1/08/04 (commencement of operations). Returns shown include the reinvestment of all distributions. Past performance is not predictive of future results. Investment return and principal value will fluctuate so that shares, when redeemed, may be worth more or less than the original cost. In the absence of existing fee waivers, total return would be reduced. To receive current to the most recent month-end performance, please call 1-888-825-2100.
The Morgan Stanley Capital International EAFE Index measures the overall performance of stock markets in 21 countries within Europe, Australasia and the Far East. The Index does not reflect investment management fees, brokerage commissions and other expenses associated with investing in equity securities. A direct investment in the index is not possible.
| ** | The returns shown do not reflect the deduction of taxes that a shareholder would pay on Fund distributions or the redemption of Fund shares. |
Frontegra New Star International Equity Fund
SCHEDULE OF INVESTMENTS
December 31, 2008 (Unaudited)
| Number of Shares | | | | Value | |
| | | COMMON STOCKS 97.1% | | | |
| | | Australia 4.8% | | | |
| | 574,990 | | Paladin Res Ltd. (a) | | $ | 1,010,466 | |
| | 188,505 | | QBE Insurance Group Ltd. | | | 3,406,910 | |
| | 23,364 | | Rio Tinto Ltd. | | | 626,103 | |
| | 210,026 | | Santos Ltd. | | | 2,200,636 | |
| | 190,815 | | Sonic Healthcare | | | 1,944,023 | |
| | | | | | | 9,188,138 | |
| | | | China 1.6% | | | | |
| | 2,050,000 | | Huaneng Power International, Inc. | | | 1,493,786 | |
| | 1,864,000 | | PetroChina Co. Ltd - Class H | | | 1,656,456 | |
| | | | | | | 3,150,242 | |
| | | | Finland 3.1% | | | | |
| | 59,890 | | Fortum Oyj | | | 1,301,727 | |
| | 301,520 | | Nokia Oyj | | | 4,731,563 | |
| | | | | | | 6,033,290 | |
| | | | France 9.3% | | | | |
| | 30,170 | | Alstom | | | 1,797,970 | |
| | 103,090 | | Axa | | | 2,313,916 | |
| | 38,281 | | Bouygues SA | | | 1,624,012 | |
| | 38,935 | | GDF Suez | | | 1,932,596 | |
| | 24,764 | | LVMH Moet Hennessy Louis Vuitton SA | | | 1,659,646 | |
| | 24,608 | | Technip SA | | | 755,562 | |
| | 66,286 | | Total SA | | | 3,644,346 | |
| | 7,450 | | Vallourec SA | | | 847,065 | |
| | 102,829 | | Vivendi | | | 3,351,609 | |
| | | | | | | 17,926,722 | |
| | | | Germany 9.8% | | | | |
| | 18,300 | | Allianz AG | | | 1,944,535 | |
| | 91,780 | | Bayer AG | | | 5,327,281 | |
| | 56,590 | | Deutsche Bank AG | | | 2,256,414 | |
| | 329,215 | | Deutsche Telekom AG | | | 4,968,237 | |
| | 64,031 | | E.ON AG | | | 2,477,184 | |
| | 53,671 | | Gea Group AG | | | 945,815 | |
| | 67,478 | | Symrise AG | | | 939,854 | |
| | | | | | | 18,859,320 | |
| | | | Greece 0.8% | | | | |
| | 163,072 | | Alpha Bank A.E. | | | 1,525,637 | |
The accompanying notes are an integral part of these financial statements.
Frontegra New Star International Equity Fund
SCHEDULE OF INVESTMENTS (continued)
December 31, 2008 (Unaudited)
| Number of Shares | | | | Value | |
| | | COMMON STOCKS 97.1% (continued) | | | |
| | | Hong Kong 4.7% | | | |
| | 465,800 | | The Bank of East Asia, Ltd. | | $ | 982,545 | |
| | 228,000 | | Cheung Kong (Holdings) Ltd. | | | 2,175,036 | |
| | 234,500 | | China Mobile Ltd. | | | 2,379,264 | |
| | 64 | | China Mobile (Hong Kong) Ltd. - ADR | | | 3,255 | |
| | 833,000 | | Hang Lung Properties Ltd. | | | 1,828,908 | |
| | 537,000 | | Television Broadcasts Ltd. | | | 1,760,430 | |
| | | | | | | 9,129,438 | |
| | | | Italy 1.3% | | | | |
| | 102,071 | | Eni SPA | | | 2,456,199 | |
| | | | | | | | |
| | | | Japan 20.4% | | | | |
| | 286,000 | | The Bank of Yokohama, Ltd. | | | 1,687,049 | |
| | 86,600 | | Capcom Co., Ltd. | | | 1,959,164 | |
| | 515 | | East Japan Railway Co. | | | 3,914,341 | |
| | 41,000 | | Fanuc Ltd. | | | 2,938,543 | |
| | 211,000 | | Hitachi Metals Ltd. | | | 981,356 | |
| | 249 | | Inpex Holdings, Inc. | | | 1,985,043 | |
| | 126,000 | | Kao Corp. | | | 3,827,293 | |
| | 72,400 | | Mitsubishi Corp. | | | 1,025,478 | |
| | 368,100 | | Mitsubishi Tokyo Financial Group, Inc. | | | 2,313,563 | |
| | 175,000 | | Mitsui Fudosan Co., Ltd. | | | 2,917,642 | |
| | 32,500 | | Nidec Corp. | | | 1,271,052 | |
| | 97,500 | | Nomura Holdings, Inc. | | | 811,817 | |
| | 98,700 | | Nomura Research Institute Ltd. | | | 1,882,819 | |
| | 2,154 | | NTT DoCoMo, Inc. | | | 4,239,753 | |
| | 44,100 | | Shin-Etsu Chemical Co., Ltd. | | | 2,035,284 | |
| | 72,100 | | Takeda Pharmaceutical Co. Ltd. | | | 3,758,019 | |
| | 58,600 | | Toyota Motor Corp. | | | 1,937,218 | |
| | | | | | | 39,485,434 | |
| | | | Netherlands 5.4% | | | | |
| | 105,095 | | ASML Holding NV | | | 1,894,563 | |
| | 61,480 | | Heineken NV | | | 1,882,314 | |
| | 204,700 | | ING Groep NV | | | 2,252,912 | |
| | 85,527 | | Unilever NV | | | 2,073,000 | |
| | 126,015 | | Wolters Kluwer NV | | | 2,389,310 | |
| | | | | | | 10,492,099 | |
The accompanying notes are an integral part of these financial statements.
Frontegra New Star International Equity Fund
SCHEDULE OF INVESTMENTS (continued)
December 31, 2008 (Unaudited)
| Number of Shares | | | | Value | |
| | | COMMON STOCKS 97.1% (continued) | | | |
| | | Norway 0.0% | | | |
| | 50 | | Yara International ASA | | $ | 1,100 | |
| | | | | | | | |
| | | | Russia 0.4% | | | | |
| | 24,292 | | Lukoil - ADR | | | 777,344 | |
| | | | | | | | |
| | | | Singapore 1.6% | | | | |
| | 597,000 | | Capitaland Ltd. | | | 1,302,613 | |
| | 288,000 | | Great Eastern Holdings Ltd. | | | 1,814,774 | |
| | | | | | | 3,117,387 | |
| | | | Spain 3.8% | | | | |
| | 86,176 | | Indra Sistemas, SA | | | 1,977,978 | |
| | 239,190 | | Telefonica SA | | | 5,398,916 | |
| | | | | | | 7,376,894 | |
| | | | Switzerland 12.1% | | | | |
| | 76,190 | | Credit Suisse Group | | | 2,135,192 | |
| | 30,115 | | Holcim Ltd. | | | 1,743,060 | |
| | 79,200 | | Nestle SA | | | 3,136,173 | |
| | 87,220 | | Novartis AG | | | 4,368,104 | |
| | 40,020 | | Roche Holding AG | | | 6,195,781 | |
| | 9,900 | | Syngenta AG | | | 1,923,229 | |
| | 17,777 | | Zurich Financial Services AG | | | 3,883,936 | |
| | | | | | | 23,385,475 | |
| | | | Taiwan 0.9% | | | | |
| | 211,544 | | Taiwan Semiconductor Manufacturing Co., Ltd. - ADR | | | 1,671,198 | |
| | | | | | | | |
| | | | United Kingdom 17.1% | | | | |
| | 209,672 | | Aviva plc | | | 1,188,105 | |
| | 373,051 | | BAE Systems plc | | | 2,030,196 | |
| | 136,624 | | BG Group plc | | | 1,891,093 | |
| | 77,873 | | BHP Billiton plc | | | 1,510,394 | |
| | 564,681 | | BP plc | | | 4,359,020 | |
| | 185,390 | | British Sky Broadcasting Group plc | | | 1,309,211 | |
| | 200,806 | | GlaxoSmithKline plc | | | 3,734,540 | |
| | 320,335 | | International Power plc | | | 1,116,278 | |
| | 1,297,171 | | Legal & General Group plc | | | 1,449,874 | |
The accompanying notes are an integral part of these financial statements.
Frontegra New Star International Equity Fund
SCHEDULE OF INVESTMENTS (continued)
December 31, 2008 (Unaudited)
| Number of Shares | | | | Value | |
| | | COMMON STOCKS 97.1% (continued) | | | |
| | | United Kingdom 17.1% (continued) | | | |
| | 160,280 | | National Grid plc | | $ | 1,583,800 | |
| | 147,990 | | Royal Dutch Shell plc - Class A | | | 3,888,156 | |
| | 88,550 | | SABMiller plc | | | 1,487,008 | |
| | 252,581 | | Smith & Nephew plc | | | 1,613,113 | |
| | 69,507 | | Unilever Plc | | | 1,596,562 | |
| | 2,077,909 | | Vodafone Group plc | | | 4,254,836 | |
| | | | | | | 33,012,186 | |
| | | | Total Common Stocks | | | | |
| | | | (Cost $229,572,696) | | | 187,588,103 | |
| | | | | | | | |
| | | | SHORT-TERM INVESTMENTS 0.0% | | | | |
| | | | Investment Company 0.0% | | | | |
| | 951 | | Fidelity Institutional Money Market Portfolio | | | 951 | |
| | | | | | | | |
| | | | Total Short-Term Investments | | | | |
| | | | (Cost $951) | | | 951 | |
| | | | | | | | |
| | | | Total Investments 97.1% | | | | |
| | | | (Cost $229,573,647) | | | 187,589,054 | |
| | | | | | | | |
| | | | Other Assets in Excess of Liabilities 2.9% | | | 5,565,521 | |
| | | | | | | | |
| | | | TOTAL NET ASSETS 100.0% | | $ | 193,154,575 | |
ADR - American Depositary Receipt
As of December 31, 2008, the currency diversification as a percentage of net assets was as follows:
| Euro | | | 33.5 | % |
| Japanese Yen | | | 20.4 | % |
| British Pounds | | | 17.1 | % |
| Swiss Francs | | | 12.1 | % |
| Hong Kong Dollars | | | 6.3 | % |
| Australian Dollars | | | 4.8 | % |
| Other | | | 5.8 | %* |
| | | | 100.0 | % |
| * | None of the remaining currencies (comprised of three other currencies) exceeds 5.0% each of net assets. |
The accompanying notes are an integral part of these financial statements.
Frontegra New Star International Equity Fund
PORTFOLIO DIVERSIFICATION
December 31, 2008 (Unaudited)
| | | Value | | | Percentage | |
| Aerospace/Defense | | $ | 2,030,196 | | | | 1.1 | % |
| Automobiles | | | 1,937,218 | | | | 1.0 | % |
| Beverages | | | 3,369,322 | | | | 1.7 | % |
| Capital Markets | | | 5,203,422 | | | | 2.7 | % |
| Chemicals | | | 10,226,749 | | | | 5.3 | % |
| Commercial Banks | | | 6,508,795 | | | | 3.4 | % |
| Communications Equipment | | | 4,731,563 | | | | 2.4 | % |
| Construction & Engineering | | | 1,624,012 | | | | 0.8 | % |
| Construction Materials | | | 1,743,059 | | | | 0.9 | % |
| Diversified Financial Services | | | 2,252,912 | | | | 1.2 | % |
| Diversified Telecommunication Services | | | 10,367,153 | | | | 5.4 | % |
| Electric Utilities | | | 3,778,912 | | | | 2.0 | % |
| Electronic Equipment & Instruments | | | 3,069,022 | | | | 1.6 | % |
| Energy Equipment & Services | | | 755,562 | | | | 0.4 | % |
| Food & Staples Retailing | | | 6,805,735 | | | | 3.5 | % |
| Health Care Providers & Services | | | 1,944,023 | | | | 1.0 | % |
| Health Care Equipment & Supplies | | | 1,613,113 | | | | 0.8 | % |
| Household Products | | | 3,827,293 | | | | 2.0 | % |
| Industrial Conglomerates | | | 2,524,984 | | | | 1.3 | % |
| Information Technology Services | | | 3,860,798 | | | | 2.0 | % |
| Insurance | | | 16,161,567 | | | | 8.4 | % |
| Machinery | | | 4,731,423 | | | | 2.4 | % |
| Media | | | 8,810,560 | | | | 4.6 | % |
| Metals & Mining | | | 3,117,853 | | | | 1.6 | % |
| Multi-Utilities | | | 3,516,396 | | | | 1.8 | % |
| Oil, Gas & Consumable Fuels | | | 23,868,760 | | | | 12.4 | % |
| Pharmaceuticals | | | 18,056,444 | | | | 9.3 | % |
| Real Estate Management & Development | | | 8,621,555 | | | | 4.5 | % |
| Road & Rail | | | 3,914,341 | | | | 2.0 | % |
| Semiconductors & Semiconductor Equipment | | | 3,565,760 | | | | 1.8 | % |
| Software | | | 1,959,164 | | | | 1.0 | % |
| Textiles, Apparel & Luxury Goods | | | 1,659,646 | | | | 0.9 | % |
| Trading Companies & Distributors | | | 1,025,478 | | | | 0.5 | % |
| Wireless Telecommunication Services | | | 10,405,313 | | | | 5.4 | % |
| Total Common Stocks | | | 187,588,103 | | | | 97.1 | % |
| Total Short-Term Investments | | | 951 | | | | 0.0 | % |
| Total Investments | | | 187,589,054 | | | | 97.1 | % |
| Other Assets, Less Liabilities | | | 5,565,521 | | | | 2.9 | % |
| Total Net Assets | | $ | 193,154,575 | | | | 100.0 | % |
The accompanying notes are an integral part of these financial statements.
Frontegra New Star International Equity Fund
STATEMENT OF ASSETS AND LIABILITIES
December 31, 2008 (Unaudited)
| Assets: | | | |
| Investments at value (cost $229,573,647) | | $ | 187,589,054 | |
| Foreign currencies at value (cost $1,530,719) | | | 1,497,529 | |
| Interest and dividend receivable | | | 884,652 | |
| Receivable for investments sold | | | 6,166,407 | |
| Receivable for foreign currencies sold | | | 1,404,779 | |
| Prepaid expenses and other assets | | | 25,177 | |
| Total assets | | | 197,567,598 | |
| | | | | |
| Liabilities: | | | | |
| Payable for investments purchased | | | 549,859 | |
| Payable for foreign currencies purchased | | | 1,397,496 | |
| Payable for Fund shares purchased | | | 1,700 | |
| Loans payable | | | 2,221,000 | |
| Accrued investment advisory fee | | | 107,988 | |
| Accrued custody fees | | | 76,017 | |
| Accrued expenses | | | 58,963 | |
| Total liabilities | | | 4,413,023 | |
| Net Assets | | $ | 193,154,575 | |
| | | | | |
| Net Assets Consist of: | | | | |
| Paid in capital | | $ | 321,541,787 | |
| Undistributed net investment income | | | 2,006,094 | |
| Accumulated net realized loss | | | (88,402,438 | ) |
| Net unrealized depreciation on: | | | | |
| Investments | | | (41,984,593 | ) |
| Foreign currency | | | (6,275 | ) |
| Net Assets | | $ | 193,154,575 | |
| | | | | |
| Capital Stock, $0.01 Par Value | | | | |
| Authorized | | | 50,000,000 | |
| Issued and outstanding | | | 25,212,651 | |
| Net Asset Value, Redemption Price and Offering Price Per Share | | $ | 7.66 | |
The accompanying notes are an integral part of these financial statements.
Frontegra New Star International Equity Fund
STATEMENT OF OPERATIONS
| | | Six Months Ended | |
| | | December 31, 2008 | |
| | | (Unaudited) | |
| Investment Income: | | | |
Dividends(1) | | $ | 3,238,780 | |
| Interest | | | 70,317 | |
| | | | 3,309,097 | |
| | | | | |
| Expenses: | | | | |
| Investment advisory fees (Note 3) | | | 1,626,342 | |
| Custody fees | | | 190,600 | |
| Fund administration and accounting fees | | | 56,480 | |
| Legal fees | | | 20,144 | |
| Federal and state registration fees | | | 17,296 | |
| Audit fees | | | 16,192 | |
| Reports to shareholders | | | 9,200 | |
| Shareholder servicing fees | | | 8,880 | |
| Interest expense | | | 7,373 | |
| Directors’ fees and related expenses | | | 4,232 | |
| Compliance related expenses | | | 4,048 | |
| Other | | | 12,696 | |
| Total expenses before waiver | | | 1,973,483 | |
| Waiver of expenses by Adviser (Note 3) | | | (681,463 | ) |
| Net expenses | | | 1,292,020 | |
| Net Investment Income | | | 2,017,077 | |
| | | | | |
| Realized and Unrealized | | | | |
| Gain (Loss) on Investments: | | | | |
| Realized loss on: | | | | |
| Investments | | | (84,924,795 | ) |
| Foreign currency transactions | | | (70,325 | ) |
| Change in net unrealized appreciation/depreciation on: | | | | |
| Investments | | | (85,507,111 | ) |
| Foreign currency translation | | | 69,845 | |
| Net Realized and Unrealized | | | | |
| Loss on Investments | | | (170,432,386 | ) |
| Net Decrease in Net Assets | | | | |
| Resulting from Operations | | $ | (168,415,309 | ) |
| (1) | Net of $257,633 in foreign withholding taxes. |
The accompanying notes are an integral part of these financial statements.
Frontegra New Star International Equity Fund
STATEMENTS OF CHANGES IN NET ASSETS
| | | Six Months Ended | | | | |
| | | December 31, 2008 | | | Year Ended | |
| | | (Unaudited) | | | June 30, 2008 | |
| Operations: | | | | | | |
| Net investment income | | $ | 2,017,077 | | | $ | 11,383,632 | |
| Net realized gain (loss) on: | | | | | | | | |
| Investments | | | (84,924,795 | ) | | | 26,884,421 | |
| Foreign currency transactions | | | (70,325 | ) | | | 1,271,787 | |
| Change in net unrealized appreciation/depreciation on: | | | | | | | | |
| Investments | | | (85,507,111 | ) | | | (101,010,043 | ) |
| Foreign currency translation | | | 69,845 | | | | (107,752 | ) |
| Net decrease in net assets | | | | | | | | |
| resulting from operations | | | (168,415,309 | ) | | | (61,577,955 | ) |
Distributions | | | | | | | | |
| Paid From: | | | | | | | | |
| Net investment income | | | (10,274,561 | ) | | | (10,852,936 | ) |
| Net realized gain on investments | | | (11,287,592 | ) | | | (50,797,918 | ) |
| Net decrease in net assets resulting | | | | | | | | |
| from distributions paid | | | (21,562,153 | ) | | | (61,650,854 | ) |
Capital Share | | | | | | | | |
| Transactions: | | | | | | | | |
| Shares sold | | | 22,888,380 | | | | 27,684,564 | |
| Shares issued to holders in | | | | | | | | |
| reinvestment of distributions | | | 17,427,623 | | | | 56,429,837 | |
| Shares redeemed | | | (131,271,397 | ) | | | (199,418,432 | ) |
| Net decrease in net assets resulting | | | | | | | | |
| from capital share transactions | | | (90,955,394 | ) | | | (115,304,031 | ) |
| Total Decrease in Net Assets | | | (280,932,856 | ) | | | (238,532,840 | ) |
Net Assets: | | | | | | | | |
| Beginning of period | | | 474,087,431 | | | | 712,620,271 | |
| End of period | | | | | | | | |
| (includes undistributed net investment | | | | | | | | |
| income of $2,006,094 and $10,263,578, respectively) | | $ | 193,154,575 | | | $ | 474,087,431 | |
The accompanying notes are an integral part of these financial statements.
Frontegra New Star International Equity Fund
FINANCIAL HIGHLIGHTS
| | | Six Months | | | | | | | | | | | | | | | | |
| | | Ended | | | Year | | | Year | | | Year | | | Year | | | Period | |
| | | December 31, | | | Ended | | | Ended | | | Ended | | | Ended | | | Ended | |
| | | 2008 | | | June 30, | | | June 30, | | | June 30, | | | June 30, | | | June 30, | |
| | | (Unaudited) | | | 2008 | | | 2007 | | | 2006 | | | 2005 | | | 2004(1) | |
| Net Asset Value, | | | | | | | | | | | | | | | | | | |
| Beginning of Period | | $ | 13.24 | | | $ | 16.11 | | | $ | 13.08 | | | $ | 11.07 | | | $ | 10.03 | | | $ | 10.00 | |
| | | | | | | | | | | | | | | | | | | | | | | | | |
| Income (Loss) | | | | | | | | | | | | | | | | | | | | | | | | |
| from Investment | | | | | | | | | | | | | | | | | | | | | | | | |
| Operations: | | | | | | | | | | | | | | | | | | | | | | | | |
| Net investment income | | | 0.15 | | | | 0.31 | | | | 0.25 | | | | 0.31 | (4) | | | 0.21 | (4) | | | 0.09 | (4) |
| Net realized and unrealized | | | | | | | | | | | | | | | | | | | | | | | | |
| gain (loss) on investments | | | (4.99 | ) | | | (1.75 | ) | | | 3.25 | | | | 1.81 | | | | 0.87 | | | | (0.08 | ) |
| Total Income (Loss) from | | | | | | | | | | | | | | | | | | | | | | | | |
| Investment Operations | | | (4.84 | ) | | | (1.44 | ) | | | 3.50 | | | | 2.12 | | | | 1.08 | | | | 0.01 | |
| | | | | | | | | | | | | | | | | | | | | | | | | |
| Less Distributions | | | | | | | | | | | | | | | | | | | | | | | | |
| Paid: | | | | | | | | | | | | | | | | | | | | | | | | |
| From net investment income | | | (0.35 | ) | | | (0.25 | ) | | | (0.22 | ) | | | (0.07 | ) | | | (0.01 | ) | | | — | |
| From net realized | | | | | | | | | | | | | | | | | | | | | | | | |
| gain on investments | | | (0.39 | ) | | | (1.18 | ) | | | (0.25 | ) | | | (0.04 | ) | | | (0.03 | ) | | | — | |
| Total Distributions Paid | | | (0.74 | ) | | | (1.43 | ) | | | (0.47 | ) | | | (0.11 | ) | | | (0.04 | ) | | | — | |
| | | | | | | | | | | | | | | | | | | | | | | | | |
| Payment by Affiliates | | | — | | | | — | | | | — | | | | — | | | | — | | | | 0.02 | |
| Net Asset Value, End of Period | | $ | 7.66 | | | $ | 13.24 | | | $ | 16.11 | | | $ | 13.08 | | | $ | 11.07 | | | $ | 10.03 | |
| Total Return | | | (36.46 | )%(2) | | | (9.60 | )% | | | 27.12 | % | | | 19.27 | % | | | 10.87 | % | | | 0.30 | %(2)(5) |
| | | | | | | | | | | | | | | | | | | | | | | | | |
| Supplemental Data | | | | | | | | | | | | | | | | | | | | | | | | |
| and Ratios: | | | | | | | | | | | | | | | | | | | | | | | | |
| Net assets, end of period | | | | | | | | | | | | | | | | | | | | | | | | |
| (in thousands) | | $ | 193,155 | | | $ | 474,087 | | | $ | 712,620 | | | $ | 531,321 | | | $ | 137,478 | | | $ | 12,130 | |
| Ratio of expenses to | | | | | | | | | | | | | | | | | | | | | | | | |
| average net assets | | | | | | | | | | | | | | | | | | | | | | | | |
| Before waivers | | | | | | | | | | | | | | | | | | | | | | | | |
| and reimbursements | | | 1.15 | %(3) | | | 1.06 | % | | | 1.07 | % | | | 1.09 | % | | | 1.31 | % | | | 4.41 | %(3) |
| Net of waivers | | | | | | | | | | | | | | | | | | | | | | | | |
| and reimbursements | | | 0.75 | %(3) | | | 0.75 | % | | | 0.75 | % | | | 0.75 | % | | | 0.95 | % | | | 0.95 | %(3) |
| Ratio of net investment income to | | | | | | | | | | | | | | | | | | | | | | | | |
| average net assets | | | | | | | | | | | | | | | | | | | | | | | | |
| Before waivers | | | | | | | | | | | | | | | | | | | | | | | | |
| and reimbursements | | | 0.78 | %(3) | | | 1.44 | % | | | 1.30 | % | | | 1.60 | % | | | 1.60 | % | | | (1.45 | )%(3) |
| Net of waivers | | | | | | | | | | | | | | | | | | | | | | | | |
| and reimbursements | | | 1.18 | %(3) | | | 1.75 | % | | | 1.62 | % | | | 1.94 | % | | | 1.96 | % | | | 2.01 | %(3) |
| Portfolio turnover rate | | | 23 | %(2) | | | 54 | % | | | 62 | % | | | 35 | % | | | 44 | % | | | 17 | %(2) |
| (1) | Commenced operations on January 8, 2004. |
| (4) | Per share net investment income has been calculated using the daily average share method. |
| (5) | During the period ended June 30, 2004, 0.20% of the Fund’s total return consists of a voluntary reimbursement by the Adviser. Excluding this item, total return would have been 0.10%. |
The accompanying notes are an integral part of these financial statements.
FRONTEGRA
NETOLS SMALL CAP
VALUE FUND
REPORT FROM NETOLS ASSET
MANAGEMENT:
Dear Fellow Shareholders:
For the six months ended December 31, 2008, the Frontegra Netols Small Cap Value Fund returned -23.76% for the Institutional Class and -23.85 for Class Y compared to - -21.17% for the Russell 2000 Value Index.
Portfolio Review
The dominant market factor in the second half of 2008 was severe pressure on global credit markets post the Lehman Brothers’ bankruptcy filing in mid-September. A heightened lack of confidence in the world financial system lead to a pullback in credit that restricted global trade. Additionally, general economic uncertainty drove corporations and consumers to hoard cash and reduce nonessential expenditures. This resulted in a sharp decline in prices for most asset classes, with U.S. Treasury securities being the exception. As the concern regarding the worldwide economic slowdown increased, commodity prices continued to decline and unemployment trended higher. As a result, energy, materials, and consumer discretionary sectors were the worst performers. Conversely, health care, consumer staples, and utilities outperformed on a relative basis as investors searched for perceived safe havens.
Positive Contributions to Relative Performance in the second half of 2008:
| • | Stock selection in consumer discretionary and financial sectors |
| • | Overweight in health care sector |
| • | Best performing stocks for the period: UCBH Holdings, East West Bancorp, 99 Cents Only Stores, Gentiva Health Services, ICU Medical |
Negative Contributions to Relative Performance in the second half of 2008:
| • | Stock selection in energy and materials sectors |
| • | Overweight in energy sector |
| • | Worst performing stocks for the period: Sunrise Senior Living, Champion Enterprises, North American Energy Partners, ION Geophysical, Tenneco |
Thank you for your continued support.
Jeff Netols
Netols Asset Management
INVESTMENT HIGHLIGHTS
Growth of a $100,000 Investment (Unaudited)
* 12/16/05 commencement of operations.
| Portfolio Total Return** | | | | | | |
| FOR PERIODS ENDED 12/31/08 | | FUND | | | INDEX | |
| | | | | | | |
| SIX MONTHS | | | (23.76 | )% | | | (21.17 | )% |
| | | | | | | | | |
| ONE YEAR | | | (25.65 | )% | | | (28.92 | )% |
| | | | | | | | | |
| THREE YEAR | | | | | | | | |
| AVERAGE ANNUAL | | | (2.46 | )% | | | (7.49 | )% |
| | | | | | | | | |
| SINCE COMMENCEMENT | | | | | | | | |
| AVERAGE ANNUAL | | | (2.78 | )% | | | (7.83 | )% |
This chart assumes an initial gross investment of $100,000 made on 12/16/05 (commencement of operations). Returns shown include the reinvestment of all distributions. Past performance is not predictive of future results. Investment return and principal value will fluctuate so that shares, when redeemed, may be worth more or less than the original cost. In the absence of existing fee waivers, total return would be reduced. To receive current to the most recent month-end performance, please call 1-888-825-2100.
The Russell 2000 Value Index measures the performance of those Russell 2000 companies with lower price-to-book ratios and lower forecasted growth values. The Russell 2000 Index measures the performance of the 2,000 smallest companies in the Russell 3000 Index. The Russell 3000 Index measures the performance of the 3,000 largest U.S. companies based on total market capitalization. The Index does not reflect investment management fees, brokerage commissions and other expenses associated with investing in equity securities. A direct investment in the index is not possible.
| ** | The returns shown do not reflect the deduction of taxes that a shareholder would pay on Fund distributions or the redemption of Fund shares. |
The above graph relates to Institutional Class shares of the Fund. Performance for Class Y shares will vary from the performance of the Institutional Class shares shown above due to differences in expenses.
Frontegra Netols Small Cap Value Fund
SCHEDULE OF INVESTMENTS
December 31, 2008 (Unaudited)
| Number of Shares | | | | Value | |
| | | COMMON STOCKS 96.7% | | | |
| | | Aerospace & Defense 2.7% | | | |
| | 8,571 | | American Science & Engineering, Inc. | | $ | 633,911 | |
| | 14,929 | | Ceradyne, Inc. (a) | | | 303,208 | |
| | | | | | | 937,119 | |
| | | | Auto Components 0.2% | | | | |
| | 26,672 | | Tenneco Automotive, Inc. (a) | | | 78,682 | |
| | | | | | | | |
| | | | Chemicals 1.0% | | | | |
| | 20,679 | | Terra Industries Inc. | | | 344,719 | |
| | | | | | | | |
| | | | Commercial Banks 10.8% | | | | |
| | 41,577 | | East West Bancorp, Inc. | | | 663,985 | |
| | 14,651 | | First Midwest Bancorp, Inc. | | | 292,580 | |
| | 13,012 | | Glacier Bancorp, Inc. | | | 247,488 | |
| | 47,153 | | Old National Bancorp | | | 856,299 | |
| | 115,858 | | UCBH Holdings, Inc. | | | 797,103 | |
| | 16,412 | | Westamerica Bancorporation | | | 839,474 | |
| | | | | | | 3,696,929 | |
| | | | Commercial Services & Supplies 7.1% | | | | |
| | 46,323 | | Corinthian Colleges, Inc. (a) | | | 758,308 | |
| | 12,997 | | DeVry, Inc. | | | 746,158 | |
| | 32,365 | | Fuel Tech, Inc. (a) | | | 342,745 | |
| | 13,927 | | School Specialty, Inc. (a) | | | 266,284 | |
| | 13,301 | | Tetra Tech, Inc. (a) | | | 321,219 | |
| | | | | | | 2,434,714 | |
| | | | Construction & Engineering 0.3% | | | | |
| | 30,406 | | ENGlobal Corp. (a) | | | 98,820 | |
| | | | | | | | |
| | | | Diversified Financial Services ��1.1% | | | | |
| | 12,037 | | GATX Corp. | | | 372,786 | |
| | | | | | | | |
| | | | Diversified Telecommunication Services 0.5% | | | | |
| | 19,904 | | Alaska Communications Systems Group Inc. | | | 186,700 | |
The accompanying notes are an integral part of these financial statements.
Frontegra Netols Small Cap Value Fund
SCHEDULE OF INVESTMENTS (continued)
December 31, 2008 (Unaudited)
| Number of Shares | | | | Value | |
| | | COMMON STOCKS 96.7% (continued) | | | |
| | | Electrical Apparatus And | | | |
| | | Equipment, Wiring Supplies, And 0.9% | | | |
| | 132,446 | | Smith & Wesson Holding Corp. (a) | | $ | 300,652 | |
| | | | | | | | |
| | | | Electrical Equipment 2.0% | | | | |
| | 63,137 | | C&D Technologies, Inc. (a) | | | 197,619 | |
| | 26,552 | | General Cable Corp. (a) | | | 469,705 | |
| | | | | | | 667,324 | |
| | | | Electronic Equipment & Instruments 0.5% | | | | |
| | 28,922 | | GTSI Corp. (a) | | | 173,532 | |
| | | | | | | | |
| | | | Energy Equipment & Services 0.8% | | | | |
| | 37,998 | | Ion Geophysical Corp. (a) | | | 130,333 | |
| | 41,992 | | North American Energy Partners (a)(b) | | | 140,253 | |
| | | | | | | 270,586 | |
| | | | Food & Staples Retailing 2.0% | | | | |
| | 38,494 | | United Natural Foods, Inc. (a) | | | 685,963 | |
| | | | | | | | |
| | | | Food Products 4.7% | | | | |
| | 38,167 | | Lance, Inc. | | | 875,551 | |
| | 26,954 | | Treehouse Foods, Inc. (a) | | | 734,227 | |
| | | | | | | 1,609,778 | |
| | | | Health Care Equipment & Services 2.4% | | | | |
| | 43,270 | | PSS World Medical, Inc. (a) | | | 814,341 | |
| | | | | | | | |
| | | | Health Care Equipment & Supplies 10.4% | | | | |
| | 10,103 | | Haemonetics Corp. (a) | | | 570,820 | |
| | 21,439 | | ICU Medical, Inc. (a) | | | 710,489 | |
| | 47,519 | | Medical Action Industries, Inc. (a) | | | 475,190 | |
| | 60,298 | | Merit Medical Systems, Inc. (a) | | | 1,081,143 | |
| | 11,208 | | SurModics, Inc. (a) | | | 283,226 | |
| | 12,336 | | Varian, Inc. (a) | | | 413,379 | |
| | | | | | | 3,534,247 | |
| | | | Health Care Providers & Services 3.5% | | | | |
| | 25,631 | | Gentiva Health Services, Inc. (a) | | | 749,963 | |
| | 45,738 | | Sunrise Senior Living, Inc. (a) | | | 76,840 | |
The accompanying notes are an integral part of these financial statements.
Frontegra Netols Small Cap Value Fund
SCHEDULE OF INVESTMENTS (continued)
December 31, 2008 (Unaudited)
| Number of Shares | | | | Value | |
| | | COMMON STOCKS 96.7% (continued) | | | |
| | | Health Care Providers & Services 3.5% (continued) | | | |
| | 28,550 | | U.S. Physical Therapy, Inc. (a) | | $ | 380,571 | |
| | | | | | | 1,207,374 | |
| | | | Hotels, Restaurants & Leisure 1.0% | | | | |
| | 32,121 | | The Cheesecake Factory (a) | | | 324,422 | |
| | | | | | | | |
| | | | Household Durables 0.1% | | | | |
| | 73,580 | | Champion Enterprises, Inc. (a) | | | 41,205 | |
| | | | | | | | |
| | | | Insurance 3.8% | | | | |
| | 14,528 | | Hanover Insurance Group Inc. | | | 624,268 | |
| | 28,519 | | Stewart Information Services Corp. | | | 669,911 | |
| | | | | | | 1,294,179 | |
| | | | IT Services 4.6% | | | | |
| | 17,356 | | CACI International Inc. - Class A (a) | | | 782,582 | |
| | 14,381 | | Mantech International Corp. - Class A (a) | | | 779,306 | |
| | | | | | | 1,561,888 | |
| | | | Machinery 5.4% | | | | |
| | 15,075 | | IDEX Corp. | | | 364,062 | |
| | 11,586 | | Kaydon Corp. | | | 397,979 | |
| | 11,960 | | Robbins & Myers, Inc. | | | 193,393 | |
| | 22,108 | | Wabtec Corp. | | | 878,793 | |
| | | | | | | 1,834,227 | |
| | | | Marine 0.9% | | | | |
| | 12,128 | | Alexander & Baldwin, Inc. | | | 303,928 | |
| | | | | | | | |
| | | | Media 0.7% | | | | |
| | 17,627 | | Arbitron Inc. | | | 234,087 | |
| | | | | | | | |
| | | | Metals & Mining 3.9% | | | | |
| | 31,078 | | Commercial Metals Co. | | | 368,896 | |
| | 16,457 | | Compass Minerals International, Inc. | | | 965,367 | |
| | | | | | | 1,334,263 | |
| | | | Multiline Retail 3.9% | | | | |
| | 60,075 | | 99 Cents Only Stores (a) | | | 656,620 | |
The accompanying notes are an integral part of these financial statements.
Frontegra Netols Small Cap Value Fund
SCHEDULE OF INVESTMENTS (continued)
December 31, 2008 (Unaudited)
| Number of Shares | | | | Value | |
| | | COMMON STOCKS 96.7% (continued) | | | |
| | | Multiline Retail 3.9% (continued) | | | |
| | 62,473 | | Fred’s, Inc. - Class A | | $ | 672,209 | |
| | | | | | | 1,328,829 | |
| | | | Oil & Gas 2.9% | | | | |
| | 14,505 | | Encore Acquisition Co. (a) | | | 370,167 | |
| | 18,392 | | Forest Oil Corp. (a) | | | 303,284 | |
| | 9,193 | | Whiting Petroleum Corp. (a) | | | 307,598 | |
| | | | | | | 981,049 | |
| | | | Oil, Gas & Consumable Fuels 1.4% | | | | |
| | 44,256 | | General Maritime Corp. | | | 477,965 | |
| | | | | | | | |
| | | | Personal Products 2.0% | | | | |
| | 9,594 | | Chattem, Inc. (a) | | | 686,259 | |
| | | | | | | | |
| | | | Real Estate 4.7% | | | | |
| | 34,674 | | Arbor Realty Trust, Inc. | | | 102,288 | |
| | 46,598 | | Cedar Shopping Centers Inc. | | | 329,914 | |
| | 20,842 | | First Industrial Realty Trust, Inc. | | | 157,357 | |
| | 15,570 | | Mid-America Apartment Communities, Inc. | | | 578,581 | |
| | 31,199 | | Sun Communities, Inc. | | | 436,786 | |
| | | | | | | 1,604,926 | |
| | | | Road & Rail 1.8% | | | | |
| | 19,944 | | Genesee & Wyoming, Inc. - Class A (a) | | | 608,292 | |
| | | | | | | | |
| | | | Software 1.4% | | | | |
| | 29,038 | | Fair Isaac Corp. | | | 489,581 | |
| | | | | | | | |
| | | | Specialty Retail 2.7% | | | | |
| | 12,761 | | Abercrombie & Fitch Co. - Class A | | | 294,396 | |
| | 17,089 | | Tractor Supply Co. (a) | | | 617,597 | |
| | | | | | | 911,993 | |
| | | | Textiles, Apparel & Luxury Goods 3.6% | | | | |
| | 48,968 | | Carter’s, Inc. (a) | | | 943,124 | |
| | 11,865 | | Under Armour, Inc. (a) | | | 282,861 | |
| | | | | | | 1,225,985 | |
The accompanying notes are an integral part of these financial statements.
Frontegra Netols Small Cap Value Fund
SCHEDULE OF INVESTMENTS (continued)
December 31, 2008 (Unaudited)
| Number of Shares | | | | Value | |
| | | COMMON STOCKS 96.7% (continued) | | | |
| | | Thrifts & Mortgage Finance 1.0% | | | |
| | 99,747 | | MGIC Investment Corp. | | $ | 347,120 | |
| | | | | | | | |
| | | | Total Common Stocks | | | | |
| | | | (Cost $39,604,222) | | | 33,004,464 | |
| | | | | | | | |
| | | | SHORT-TERM INVESTMENTS 9.8% | | | | |
| | | | Investment Company 9.8% | | | | |
| | 80,918 | | Fidelity Government Money Market Portfolio | | | 80,918 | |
| | 3,250,000 | | Fidelity Institutional Money Market Portfolio | | | 3,250,000 | |
| | | | | | | 3,330,918 | |
| | | | Total Short-Term Investments | | | | |
| | | | (Cost $3,330,918) | | | 3,330,918 | |
| | | | | | | | |
| | | | Total Investments 106.5% | | | | |
| | | | (Cost $42,935,140) | | | 36,335,382 | |
| | | | | | | | |
| | | | Liabilities in Excess of Other Assets (6.5)% | | | (2,219,955 | ) |
| | | | | | | | |
| | | | TOTAL NET ASSETS 100.0% | | $ | 34,115,427 | |
| (b) | U.S.-dollar denominated security of foreign issuer. |
The accompanying notes are an integral part of these financial statements.
Frontegra Netols Small Cap Value Fund
STATEMENT OF ASSETS AND LIABILITIES
December 31, 2008 (Unaudited)
| Assets: | | | |
| Investments at value (cost $42,935,140) | | $ | 36,335,382 | |
| Interest and dividends receivable | | | 23,339 | |
| Receivable for Fund shares sold | | | 16,157 | |
| Prepaid expenses and other assets | | | 2,341 | |
| Total assets | | | 36,377,219 | |
| | | | | |
| Liabilities: | | | | |
| Payable for investments purchased | | | 2,192,956 | |
| Payable for Fund shares purchased | | | 27,377 | |
| Accrued investment advisory fee | | | 14,885 | |
| Distribution and shareholder servicing fees | | | 2,129 | |
| Accrued expenses | | | 24,445 | |
| Total liabilities | | | 2,261,792 | |
| Net Assets | | $ | 34,115,427 | |
| | | | | |
| Net Assets Consist of: | | | | |
| Paid in capital | | $ | 42,021,832 | |
| Undistributed net investment income | | | 93,430 | |
| Accumulated net realized loss | | | (1,400,077 | ) |
| Net unrealized depreciation on investments | | | (6,599,758 | ) |
| Net Assets | | $ | 34,115,427 | |
| | | | | |
| Capital Stock, $0.01 Par Value | | | | |
| Institutional Class Shares Authorized | | | 50,000,000 | |
| Class Y Shares Authorized | | | 50,000,000 | |
| | | | | |
| Institutional Class: | | | | |
| Net Assets | | $ | 33,290,826 | |
| Issued and outstanding | | | 3,697,191 | |
| Net Asset Value, Redemption Price and Offering Price Per Share | | $ | 9.00 | |
| | | | | |
| Class Y: | | | | |
| Net Assets | | $ | 824,601 | |
| Issued and outstanding | | | 91,942 | |
| Net Asset Value, Redemption Price and Offering Price Per Share | | $ | 8.97 | |
The accompanying notes are an integral part of these financial statements.
Frontegra Netols Small Cap Value Fund
STATEMENT OF OPERATIONS
| | Six Months Ended | |
| | | December 31, 2008 | |
| | | (Unaudited) | |
| Investment Income: | | | |
| Dividends | | $ | 253,209 | |
| Interest | | | 16,811 | |
| | | | 270,020 | |
| | | | | |
| Expenses: | | | | |
| Investment advisory fees (Note 3) | | | 158,836 | |
| Legal fees | | | 15,088 | |
| Fund administration and accounting fees | | | 14,536 | |
| Audit fees | | | 11,776 | |
| Federal and state registration fees | | | 6,992 | |
| Custody fees | | | 6,624 | |
| Shareholder servicing fees | | | 6,624 | |
| Directors’ fees and related expenses | | | 4,232 | |
| Compliance related expenses | | | 4,048 | |
| Distribution and shareholder servicing fees - Class Y (Note ) | | | 1,872 | |
| Reports to shareholders | | | 1,104 | |
| Other | | | 920 | |
| Total expenses before waiver and reimbursement | | | 232,652 | |
| Waiver and reimbursement of expenses by Adviser (Note 3) | | | (56,062 | ) |
| Net expenses | | | 176,590 | |
| Net Investment Income | | | 93,430 | |
| | | | | |
| Realized and Unrealized | | | | |
| Gain (Loss) on Investments: | | | | |
| Net realized loss on investments | | | (633,537 | ) |
| Change in net unrealized appreciation/depreciation on investments | | | (7,910,089 | ) |
| Net Realized and Unrealized | | | | |
| Loss on Investments | | | (8,543,626 | ) |
| Net Decrease in Net Assets | | | | |
| Resulting from Operations | | $ | (8,450,196 | ) |
The accompanying notes are an integral part of these financial statements.
Frontegra Netols Small Cap Value Fund
STATEMENTS OF CHANGES IN NET ASSETS
| | | Six Months Ended | | | | |
| | | December 31, 2008 | | | Year Ended | |
| | | (Unaudited) | | | June 30, 2008 | |
| Operations: | | | | | | |
| Net investment income | | $ | 93,430 | | | $ | 16,648 | |
| Net realized loss on investments | | | (633,537 | ) | | | (762,753 | ) |
| Change in net unrealized appreciation/ | | | | | | | | |
| depreciation on investments | | | (7,910,089 | ) | | | (752,047 | ) |
| Net decrease in net assets | | | | | | | | |
| resulting from operations | | | (8,450,196 | ) | | | (1,498,152 | ) |
| | | | | | | | | |
| Distributions Paid to Institutional | | | | | | | | |
| Class Shareholders From: | | | | | | | | |
| Net investment income | | | (12,872 | ) | | | (34,466 | ) |
| Net realized gain on investments | | | — | | | | (251,672 | ) |
| Net decrease in net assets resulting | | | | | | | | |
| from distributions paid | | | (12,872 | ) | | | (286,138 | ) |
| | | | | | | | | |
| Distributions Paid to Class Y | | | | | | | | |
Shareholders From:(1) | | | | | | | | |
| Net investment income | | | — | | | | (1,500 | ) |
| Net realized gain on investments | | | — | | | | (13,294 | ) |
| Net decrease in net assets resulting | | | | | | | | |
| from distributions paid | | | — | | | | (14,794 | ) |
| | | | | | | | | |
| Capital Share | | | | | | | | |
| Transactions: | | | | | | | | |
| Shares sold | | | 11,614,651 | | | | 18,175,238 | |
| Shares issued to holders in | | | | | | | | |
| reinvestment of distributions | | | 11,142 | | | | 273,586 | |
| Shares redeemed | | | (1,426,932 | ) | | | (1,637,886 | ) |
| Net increase in net assets resulting | | | | | | | | |
| from capital share transactions | | | 10,198,861 | | | | 16,810,938 | |
| Total Increase in Net Assets | | | 1,735,793 | | | | 15,011,854 | |
| | | | | | | | | |
| Net Assets: | | | | | | | | |
| Beginning of period | | | 32,379,634 | | | | 17,367,780 | |
| End of period | | | | | | | | |
| (includes undistributed net investment | | | | | | | | |
| income of $93,430 and $12,872, respectively) | | $ | 34,115,427 | | | $ | 32,379,634 | |
| (1) | Class Y Shares commenced operations on November 1, 2007 |
The accompanying notes are an integral part of these financial statements.
Frontegra Netols Small Cap Value Fund
FINANCIAL HIGHLIGHTS
| | | Institutional Class | |
| | | Six Months | | | | | | | | | | |
| | | Ended | | | Year | | | Year | | | Period | |
| | | December 31, | | | Ended | | | Ended | | | Ended | |
| | | 2008 | | | June 30, | | | June 30, | | | June 30, | |
| | | (Unaudited) | | | 2008 | | | 2007 | | | 2006(1) | |
| Net Asset Value, | | | | | | | | | | | | |
| Beginning of Period | | $ | 11.81 | | | $ | 12.88 | | | $ | 10.29 | | | $ | 10.00 | |
| | | | | | | | | | | | | | | | | |
| Income (Loss) | | | | | | | | | | | | | | | | |
| from Investment | | | | | | | | | | | | | | | | |
| Operations: | | | | | | | | | | | | | | | | |
| Net investment income | | | 0.02 | | | | — | (4) | | | 0.03 | | | | — | (4) |
| Net realized and unrealized | | | | | | | | | | | | | | | | |
| gain (loss) on investments | | | (2.83 | ) | | | (0.90 | ) | | | 2.62 | | | | 0.29 | |
| Total Income (Loss) from | | | | | | | | | | | | | | | | |
| Investment Operations | | | (2.81 | ) | | | (0.90 | ) | | | 2.65 | | | | 0.29 | |
| | | | | | | | | | | | | | | | | |
| Less Distributions | | | | | | | | | | | | | | | | |
| Paid: | | | | | | | | | | | | | | | | |
| From net investment income | | | — | (4) | | | (0.02 | ) | | | — | | | | — | |
| From net realized gain on investments | | | — | | | | (0.15 | ) | | | (0.06 | ) | | | — | |
| Total Distributions Paid | | | — | | | | (0.17 | ) | | | (0.06 | ) | | | — | |
| | | | | | | | | | | | | | | | | |
| Net Asset Value, End of Period | | $ | 9.00 | | | $ | 11.81 | | | $ | 12.88 | | | $ | 10.29 | |
| Total Return | | | (23.76 | )%(2) | | | (7.01 | )% | | | 25.81 | % | | | 2.90 | %(2) |
| | | | | | | | | | | | | | | | | |
| Supplemental Data | | | | | | | | | | | | | | | | |
| and Ratios: | | | | | | | | | | | | | | | | |
| Net assets, end of period (in thousands) | | $ | 33,291 | | | $ | 31,346 | | | $ | 17,368 | | | $ | 7,728 | |
| Ratio of expenses to average net assets | | | | | | | | | | | | | | | | |
| Before waivers and reimbursements | | | 1.45 | %(3) | | | 1.59 | % | | | 2.10 | % | | | 4.59 | %(3) |
| Net of waivers and reimbursements | | | 1.10 | %(3) | | | 1.10 | % | | | 1.10 | % | | | 1.10 | %(3) |
| Ratio of net investment income (loss) to | | | | | | | | | | | | | | | | |
| average net assets | | | | | | | | | | | | | | | | |
| Before waivers and reimbursements | | | 0.25 | %(3) | | | 0.40 | % | | | (0.70 | )% | | | (3.44 | )%(3) |
| Net of waivers and reimbursements | | | 0.60 | %(3) | | | 0.09 | % | | | 0.30 | % | | | 0.05 | %(3) |
| Portfolio turnover rate | | | 20 | %(2) | | | 32 | % | | | 49 | % | | | 41 | %(2) |
| (1) | Commenced operations on December 16, 2005. |
| (4) | Less than one cent per share. |
The accompanying notes are an integral part of these financial statements.
Frontegra Netols Small Cap Value Fund
FINANCIAL HIGHLIGHTS
| | | Class Y | |
| | | Six Months | | | | |
| | | Ended | | | Year | |
| | | December 31, | | | Ended | |
| | | 2008 | | | June 30, | |
| | | (Unaudited) | | | 2008(1) | |
| Net Asset Value, | | | | | | |
| Beginning of Period | | $ | 11.78 | | | $ | 12.54 | |
| | | | | | | | | |
| Income (Loss) | | | | | | | | |
| from Investment | | | | | | | | |
| Operations: | | | | | | | | |
| Net investment income (loss) | | | 0.01 | | | | (0.02 | ) |
| Net realized and unrealized | | | | | | | | |
| loss on investments | | | (2.82 | ) | | | (0.57 | ) |
| Total Loss from | | | | | | | | |
| Investment Operations | | | (2.81 | ) | | | (0.59 | ) |
| | | | | | | | | |
| Less Distributions | | | | | | | | |
| Paid: | | | | | | | | |
| From net investment income | | | — | | | | (0.02 | ) |
| From net realized gain on investments | | | — | | | | (0.15 | ) |
| Total Distributions Paid | | | — | | | | (0.17 | ) |
| | | | | | | | | |
| Net Asset Value, End of Period | | $ | 8.97 | | | $ | 11.78 | |
| Total Return | | | (23.85 | )%(2) | | | (4.76 | )%(2) |
| | | | | | | | | |
| Supplemental Data | | | | | | | | |
| and Ratios: | | | | | | | | |
| Net assets, end of period (in thousands) | | $ | 825 | | | $ | 1,034 | |
| Ratio of expenses to average net assets | | | | | | | | |
| Before waivers and reimbursements | | | 1.85 | %(3) | | | 2.01 | %(3) |
| Net of waivers and reimbursements | | | 1.50 | %(3) | | | 1.55 | %(3) |
| Ratio of net investment loss to | | | | | | | | |
| average net assets | | | | | | | | |
| �� Before waivers and reimbursements | | | (0.25 | )%(3) | | | (0.80 | )%(3) |
| Net of waivers and reimbursements | | | 0.10 | %(3) | | | (0.34 | )%(3) |
| Portfolio turnover rate | | | 20 | %(2) | | | 32 | %(2) |
| (1) | Commenced operations on November 1, 2007. |
The accompanying notes are an integral part of these financial statements.
Frontegra Funds
NOTES TO FINANCIAL STATEMENTS
December 31, 2008 (Unaudited)
| | Frontegra Funds, Inc. (“Frontegra”) was incorporated on May 24, 1996 as a Maryland corporation and is registered under the Investment Company Act of 1940, as amended (the “1940 Act”), as an open-end investment company issuing its shares in series, each series representing a distinct portfolio with its own investment objectives and policies. Frontegra consists of six series: the Frontegra Columbus Core Plus Fund (formerly Frontegra Total Return Bond Fund), the Frontegra Columbus Core Fund (formerly Frontegra Investment Grade Bond Fund), the Frontegra IronBridge Small Cap Fund, the Frontegra IronBridge SMID Fund, the Frontegra New Star International Equity Fund and the Frontegra Netols Small Cap Value Fund (the “Funds”). The Frontegra Columbus Core Plus and Columbus Core Funds seek a high level of total return, consistent with the preservation of capital. The investment objective of the Frontegra IronBridge Small Cap Fund, the Frontegra IronBridge SMID Fund, the Frontegra New Star International Equity Fund and the Frontegra Netols Small Cap Value Fund is capital appreciation. The Frontegra Columbus Core Plus and Columbus Core Funds, sub-advised by Reams Asset Management Company, LLC (“Reams”), commenced operations on November 25, 1996 and February 23, 2001, respectively. The Frontegra IronBridge Small Cap and IronBridge SMID Funds, sub-advised by IronBridge Capital Management, L.P. (“IronBridge”), commenced operations on August 30, 2002 and December 31, 2004, respectively. The Frontegra New Star International Equity Fund, sub-advised by New Star Institutional Managers Limited (“New Star”), commenced operations on January 8, 2004. The Frontegra Netols Small Cap Value Fund – Institutional Class and the Netols Small Cap Value Fund – Class Y, sub-advised by Netols Asset Management, Inc. (“Netols”), commenced operations on December 16, 2005 and November 1, 2007, respectively. |
| (2) | Significant Accounting Policies |
| | The following is a summary of significant accounting policies consistently followed by the Funds in the preparation of their financial statements. |
| | Securities are stated at fair value. Debt securities (other than short-term instruments) are valued by an independent pricing service, which uses valuation methods such as matrix pricing and other analytical pricing models as well as market transactions and dealer quotations. Debt securities, such as term loans, not priced by an independent pricing service are priced by an independent dealer based on the current closing bid price. Credit default swaps are valued by a third party pricing service. Equity securities (other than short-term investments) for which market quotations are readily available are valued at the last trade price on the national securities exchange on which such securities are primarily traded. Equity securities for which there were no transactions on a given day or securities not listed on a national securities exchange are valued at the most recent bid price. With respect to all Funds, all equity securities that are traded using the National Association of Securities Dealers’ Automated Quotation System (“NASDAQ”) are valued using the NASDAQ Official |
Frontegra Funds
NOTES TO FINANCIAL STATEMENTS (continued)
December 31, 2008 (Unaudited)
| | Closing Price (“NOCP”). Shares of underlying mutual funds are valued at their respective NAVs. Most securities that are primarily traded on foreign exchanges generally are valued at the last sale price of such securities on their respective exchange. In certain countries, market maker prices, usually the mean between the bid and ask prices, are used. In certain circumstances, such as when a significant event occurs in a foreign market so that the last sale price no longer reflects actual value, the fair value of these securities may be determined using fair valuation procedures approved by the Board of Directors. The Directors have retained an independent fair value pricing service to assist in valuing foreign securities held by the Frontegra New Star International Equity Fund. In valuing assets, prices denominated in foreign currencies are converted to U.S. dollar equivalents at the current exchange rate, which approximates market value. Securities maturing within 60 days or less when purchased are valued by the amortized cost method. Any securities or other assets for which market quotations are not readily available are valued at their fair value as determined in good faith by Reams, IronBridge, New Star and Netols pursuant to guidelines established by the Board of Directors. |
| | In September 2006, the Financial Accounting Standards Board issued Standard No. 157, “Fair Value Measurements” (“FAS 157”) effective for fiscal years beginning after November 15, 2007. FAS 157 clarifies the definition of fair value for financial reporting, establishes a framework for measuring fair value and requires additional disclosure about the use of fair value measurements in an effort to make the measurement of fair value more consistent and comparable. The Fund adopted the provisions of Statement of Financial Accounting Standards No. 157, “Fair Value Measurements” (SFAS 157), effective July 1, 2008. SFAS 157 establishes a hierarchy that prioritizes the inputs to valuation techniques giving the highest priority to readily available unadjusted quoted prices in active markets for identical assets (level 1 measurements) and the lowest priority to unobservable inputs (level 3 measurements) when market prices are not readily available or reliable. A summary of the fair value hierarchy under FAS 157 is described below. |
| | Various inputs are used in determining the value of the Funds’ investments. These inputs are summarized in the three broad levels listed below: |
| Level 1 - | Quoted prices in active markets for identical securities. |
| Level 2 - | Other significant observable inputs (including quoted prices for similar securities, interest rates, prepayment speeds, credit risk, etc.) |
| Level 3 - | Significant unobservable inputs (including the Funds’ own assumptions in determining the fair value of investments) |
| | The inputs or methodology used for valuing securities are not an indication of the risk associated with investing in those securities. |
Frontegra Funds
NOTES TO FINANCIAL STATEMENTS (continued)
December 31, 2008 (Unaudited)
| | The following is a summary of the inputs used to value the Funds’ net assets as of December 31, 2008: |
| Description | | Columbus Core Plus | | | Columbus Core | | | | |
| | | Investments | | | Other | | | Investments | | | | |
| | | in Securities | | | Investments* | | | in Securities | | | | |
| Level 1 | | $ | 195,893 | | | $ | –– | | | $ | –– | | | | | |
| Level 2 | | | 381,098,610 | | | | 249,764 | | | | 78,468,795 | | | | | |
| Level 3 | | | –– | | | | –– | | | | –– | | | | | |
| Total | | $ | 381,294,503 | | | $ | 249,764 | | | $ | 78,468,795 | | | | | |
| | | IronBridge | | | IronBridge | | | New Star | | | Netols Small | |
| Description | | Small Cap | | | SMID | | | International | | | Cap Value | |
| | | Investments | | | Investments | | | Investments | | | Investments | |
| | | in Securities | | | in Securities | | | in Securities | | | in Securities | |
| Level 1 | | $ | 261,807,485 | | | $ | 227,407,686 | | | $ | 951 | | | $ | 36,335,382 | |
| Level 2 | | | 17,964,488 | | | | 8,960,379 | | | | 187,588,103 | | | | –– | |
| Level 3 | | | –– | | | | –– | | | | –– | | | | –– | |
| Total | | $ | 279,771,973 | | | $ | 236,368,065 | | | $ | 187,589,054 | | | $ | 36,335,382 | |
| * | Other financial instruments are derivative instruments not reflected in the Schedule of Investments, such as swap contracts, which are valued at the unrealized appreciation (depreciation) on the instrument. |
| | In March 2008, Statement of Financial Accounting Standards No. 161, “Disclosures about Derivative Instruments and Hedging Activities” (“SFAS 161”) was issued and is effective for fiscal years beginning after November 15, 2008. SFAS 161 is intended to improve financial reporting for derivative instruments by requiring enhanced disclosure that enables investors to understand how and why an entity uses derivatives, how derivatives are accounted for, and how derivative instruments affect an entity’s results of operations and financial position. Management is currently evaluating the implications of SFAS 161. The impact on the Funds’ financial statement disclosures, if any, is currently being assessed. |
| | Each Fund intends to comply with the requirements of Subchapter M of the Internal Revenue Code necessary to qualify as a regulated investment company and to make the requisite distributions of income and capital gains to its shareholders sufficient to relieve it from all or substantially all federal income taxes. Therefore, no federal income tax provision has been provided. |
Frontegra Funds
NOTES TO FINANCIAL STATEMENTS (continued)
December 31, 2008 (Unaudited)
| | Effective December 31, 2007, the Funds adopted Financial Accounting Standards Board (FASB) Interpretation No. 48 (FIN 48), “Accounting for Uncertainty in Income Taxes”. FIN 48 requires the evaluation of tax positions taken on previously filed tax returns or expected to be taken on future returns. These positions must meet a “more likely than not” standard that, based on the technical merits, have a more than fifty percent likelihood of being sustained upon examination. In evaluating whether a tax position has met the recognition threshold, each Fund must presume that the position will be examined by the appropriate taxing authority that has full knowledge of all relevant information. Tax positions not deemed to meet the “more-likely-than-not” threshold are recorded as a tax expense in the current year. |
| | FIN 48 requires each Fund to analyze all open tax years, as defined by the Statute of Limitations, for all major jurisdictions. Open tax years are those that are open for exam by taxing authorities. Major jurisdictions for the Funds include Federal and the state of Maryland. As of December 31, 2008, open Federal and Maryland tax years include the tax years ended December 31, 2005 through 2007. The Funds have no examination in progress. |
| | The Funds have reviewed all open tax years and major jurisdictions and concluded that the adoption of FIN 48 resulted in no effect to the Funds’ financial position or results of operations. There is no tax liability resulting from unrecognized tax benefits relating to uncertain income tax positions taken or expected to be taken on the tax return for the fiscal year-end June 30, 2008. Each of the Funds are also not aware of any tax positions for which it is reasonably possible that the total amounts of unrecognized tax benefits will significantly change in the next twelve months. |
| (c) | Distributions to Shareholders |
| | Dividends from net investment income are usually declared and paid quarterly for the Frontegra Columbus Core Plus and Frontegra Columbus Core Funds and at least annually for the Frontegra IronBridge Small Cap Fund, Frontegra IronBridge SMID Fund, Frontegra New Star International Equity Fund and the Frontegra Netols Small Cap Value Fund. Distributions of net realized gains, if any, are declared and paid at least annually for all Funds. |
| | All short-term capital gains are included in ordinary income for tax purposes. Distributions to shareholders are recorded on the ex-dividend date. |
Frontegra Funds
NOTES TO FINANCIAL STATEMENTS (continued)
December 31, 2008 (Unaudited)
| | The tax character of distributions paid during the periods ended December 31, 2008 and June 30, 2008 were as follows: |
| | | Period Ended | | | Period Ended | |
| | | December 31, 2008 | | | June 30, 2008 | |
| | | Ordinary | | | Long-Term | | | Ordinary | | | Long-Term | |
| | | Income | | | Capital Gains | | | Income | | | Capital Gains | |
| Frontegra Columbus | | | | | | | | | | | | |
| Core Plus Fund | | $ | 25,116,279 | | | $ | 449,015 | | | $ | 25,210,791 | | | $ | — | |
| Frontegra Columbus | | | | | | | | | | | | | | | | |
| Core Fund | | | 2,501,648 | | | | — | | | | 4,337,398 | | | | — | |
| Frontegra IronBridge | | | | | | | | | | | | | | | | |
| Small Cap Fund | | | 1,838,281 | | | | 14,375,720 | | | | 10,391,454 | | | | 35,191,852 | |
| Frontegra IronBridge | | | | | | | | | | | | | | | | |
| SMIDFund | | | 1,302,358 | | | | 1,321,675 | | | | 7,030,056 | | | | 11,099,086 | |
| Frontegra New Star | | | | | | | | | | | | | | | | |
| International Equity Fund | | | 10,274,560 | | | | 11,287,593 | | | | 31,026,819 | | | | 30,624,035 | |
| Frontegra Netols | | | | | | | | | | | | | | | | |
| Small Cap Value Fund | | | 12,872 | | | | — | | | | 143,320 | | | | 157,612 | |
| | As of June 30, 2008, the Funds’ most recent fiscal year end, the components of accumulated earnings (losses) for income tax purposes were as follows: |
| | | Frontegra | | | | | | Frontegra | |
| | | Columbus | | | Frontegra | | | IronBridge | |
| | | Core | | | Columbus | | | Small Cap | |
| | | Plus Fund | | | Core Fund | | | Fund | |
| Cost basis of investments for | | | | | | | | | |
| federal income tax purposes | | $ | 618,386,329 | | | $ | 136,893,641 | | | $ | 364,093,693 | |
| Gross tax unrealized appreciation | | $ | 2,469,957 | | | $ | 645,212 | | | $ | 83,153,798 | |
| Gross tax unrealized depreciation | | | (11,957,770 | ) | | | (1,212,753 | ) | | | (47,244,979 | ) |
| Net tax unrealized appreciation (depreciation) | | | (9,487,813 | ) | | | (567,541 | ) | | | 35,908,819 | |
| Undistributed ordinary income | | | 4,505,101 | | | | 15,884 | | | | 1,838,066 | |
| Undistributed long-term capital gain | | | — | | | | — | | | | 14,375,651 | |
| Total distributable earnings | | | 4,505,101 | | | | 15,884 | | | | 16,213,717 | |
| Other accumulated losses | | | — | | | | (809,697 | ) | | | — | |
| Total accumulated earnings (losses) | | $ | (4,982,712 | ) | | $ | (1,361,354 | ) | | $ | 52,122,536 | |
Frontegra Funds
NOTES TO FINANCIAL STATEMENTS (continued)
December 31, 2008 (Unaudited)
| | | | | | Frontegra | | | Frontegra | |
| | | Frontegra | | | New Star | | | Netols | |
| | | IronBridge | | | International | | | Small Cap | |
| | | SMID Fund | | | Equity Fund | | | Value Fund | |
| Cost basis of investments for | | | | | | | | | |
| federal income tax purposes | | $ | 229,681,538 | | | $ | 428,866,688 | | | $ | 30,671,822 | |
| Gross tax unrealized appreciation | | $ | 26,200,410 | | | $ | 75,029,190 | | | $ | 5,938,798 | |
| Gross tax unrealized depreciation | | | (22,512,892 | ) | | | (34,924,721 | ) | | | (4,636,397 | ) |
| Net tax unrealized appreciation (depreciation) | | | 3,687,518 | | | | 40,104,469 | | | | 1,302,401 | |
| Undistributed ordinary income | | | 1,302,341 | | | | 10,274,560 | | | | 12,872 | |
| Undistributed long-term capital gain | | | 1,321,594 | | | | 11,287,341 | | | | — | |
| Total distributable earnings | | | 2,623,935 | | | | 21,561,901 | | | | 12,872 | |
| Other accumulated gains (losses) | | | — | | | | (76,120 | ) | | | (758,610 | ) |
| Total accumulated earnings | | $ | 6,311,453 | | | $ | 61,590,250 | | | $ | 556,663 | |
| | The difference between book-basis and tax-basis unrealized appreciation is attributable primarily to the tax deferral of losses on wash sales and swaps. |
| | The Funds intend to utilize provisions of the federal income tax laws, which allow them to carry a realized capital loss forward for eight years following the year of loss and offset such losses against any future realized capital gains. At June 30, 2008, the Frontegra Columbus Core Fund had a capital loss carryover of $809,697, which expires in 2015 and the Netols Small Cap Value Fund had a capital loss carryover of $119,331, which expires in 2016. |
| | At June 30, 2008, the Frontegra Netols Small Cap Value Fund had a post-October capital loss of $639,279. This loss is treated as occurring on July 1, 2008 for tax purposes. |
| (d) | When-Issued Securities |
| | The Frontegra Columbus Core Plus and Columbus Core Funds may purchase securities on a when-issued basis. The price of securities purchased on a when-issued basis is fixed at the time the commitment to purchase is made, but delivery and payment for the securities take place at a later date, normally within 45 days of the purchase. At the time of purchase, the Funds will record the transaction and reflect the value of the security and related liability in determining their net asset value. During the period between the purchase and settlement, no payment is made by the Funds to the issuer and no interest is accrued. The Funds maintain segregated cash, U.S. government securities and liquid securities equal in value to commitments for when-issued securities. |
| | The Frontegra Columbus Core Plus and Columbus Core Funds may enter into mortgage dollar rolls, in which a Fund would sell mortgage backed securities for delivery in the current |
Frontegra Funds
NOTES TO FINANCIAL STATEMENTS (continued)
December 31, 2008 (Unaudited)
| | month and simultaneously contract to purchase similar securities on a specified future date. While a Fund would forego principal and interest paid on the mortgage-backed securities during the roll period, it would be compensated by the difference between the current sale price and the lower price for the future purchase as well as by any interest earned on the proceeds of the initial sale. A Fund also could be compensated through the receipt of fee income equivalent to a lower forward price. |
| | Each Fund may enter into futures contracts, including index and interest rate futures contracts. Upon entering into a contract, the Fund deposits and maintains as collateral such initial margin as required by the exchange on which the transaction is effected. Pursuant to the contract, the Fund agrees to receive from or pay to the broker an amount of cash equal to the daily fluctuation in value of the contract. Such receipts or payments are known as variation margin and are recorded by the Fund as unrealized gains and losses. When the contract is closed, the Fund records a realized gain or loss equal to the difference between the value of the contract at the time it was opened and the value at the time it was closed. As collateral for futures contracts, the Fund is required under the 1940 Act to maintain assets consisting of cash, cash equivalents or other liquid securities. This collateral is required to be adjusted daily to reflect the market value of the purchase obligation for long futures contracts or the market value of the instrument underlying the contract, but not less than the market price at which the futures contract was established, for short futures contracts. |
| | The risks inherent in the use of futures contracts include 1) adverse changes in the value of such instruments; and 2) the possible absence of a liquid secondary market for any particular instrument at any time. There were no futures contracts open at December 31, 2008. |
| | The Columbus Core Plus and Columbus Core Funds may enter into credit default swap agreements. The credit default swap agreement may have as a reference obligation one or more securities that are or are not currently held by a Fund. The buyer in a credit default swap agreement is obligated to pay the seller a periodic fee, typically expressed in basis points on the principal amount of the underlying obligation (the “notional” amount), over the term of the agreement in return for a contingent payment upon the occurrence of a credit event with respect to the underlying reference obligation. A credit event is typically a default. |
| | A Fund may be either the buyer or seller of protection in the transaction. As a seller, a Fund accrues for and receives a fixed rate of income throughout the term of the agreement, which typically is between one month and five years, provided that no credit event occurs. If a credit event occurs, the maximum payout amount for a sale contract is limited to the notional amount of the swap contract (“Maximum Payout Amount”). At December 31, 2008, the Frontegra Columbus Core Plus Fund had sale contracts outstanding with Maximum Payout |
Frontegra Funds
NOTES TO FINANCIAL STATEMENTS (continued)
December 31, 2008 (Unaudited)
| | Amounts aggregating $25,647,500, with net unrealized appreciation of $249,764. At December 31, 2008, the Frontegra Columbus Core Fund had no sale contracts outstanding. If a Fund is a buyer and no credit event occurs, the Fund may lose its investment and recover nothing. However, if a credit event occurs, the buyer typically receives full notional value for a reference obligation that may have little or no value. |
| | Credit default swaps may involve greater risks than if a Fund had invested in the reference obligation directly. Credit default swaps are subject to general market risk, liquidity risk, counterparty credit risk and credit risk of the issuer. As noted above, if a Fund is a buyer in a credit default swap agreement and no credit event occurs, it will lose its investment. In addition, the value of the reference obligation received by a Fund as a seller if a credit event occurs, coupled with the periodic payments previously received, may be less than the full notional value it pays to the buyer, resulting in a loss of value to the Fund. |
| | Under the Funds’ organizational documents, their officers and directors are indemnified against certain liabilities arising out of the performance of their duties to the Funds. In addition, in the normal course of business, the Funds enter into contracts that provide general indemnifications to other parties. The Funds’ maximum exposure under these arrangements is unknown as this would involve future claims that may be made against the Funds that have not yet occurred. However, the Funds have not had prior claims or losses pursuant to these contracts and expect the risk of loss to be remote. |
| | Investment transactions are accounted for on the trade date. The Funds determine the gain or loss realized from investment transactions by comparing the original cost of the specifically identified security lot sold with the net sale proceeds. Dividend income, less foreign taxes withheld, is recognized on the ex-dividend date, except that certain dividends from foreign securities are recorded as soon as the information becomes available to the Funds. Interest income is recognized on an accrual basis. All discounts/premiums are accreted/amortized using the effective interest method and are included in interest income. |
| | Income, expenses (other than expenses attributable to a specific class), and realized and unrealized gains or losses on investments attributable to the Funds are generally allocated to each respective class in proportion to the relative net assets of each class. |
| | The preparation of financial statements in conformity with U.S. generally accepted accounting principles requires management to make estimates and assumptions that affect the reported amounts of assets and liabilities and disclosure of contingent assets and liabilities at the date of the financial statements, and the reported amounts of increases and decreases in net assets from operations during the reporting period. Actual results could differ from those estimates. |
Frontegra Funds
NOTES TO FINANCIAL STATEMENTS (continued)
December 31, 2008 (Unaudited)
| | Additionally, U.S. generally accepted accounting principles require that certain components of net assets relating to permanent differences be reclassified between financial and tax reporting. These reclassifications have no effect on net assets or net asset value per share. For the year ended June 30, 2008, the following table shows the reclassifications made: |
| | | | | | | | | Frontegra | |
| | | Frontegra | | | Frontegra | | | IronBridge | |
| | | Columbus Core | | | Columbus | | | Small Cap | |
| | | Plus Fund | | | Core Fund | | | Fund | |
| Paid in capital | | $ | 2,013,734 | | | $ | 486,424 | | | $ | — | |
| Accumulated net investment income (loss) | | | 1,205,812 | | | | (67,675 | ) | | | (84,223 | ) |
| Accumulated net realized gain (loss) | | | (3,304,997 | ) | | | (417,934 | ) | | | 84,223 | |
| Unrealized gains and losses | | | 85,451 | | | | (815 | ) | | | — | |
| | | | | | | | | | | |
| | | | | | | Frontegra | | | Frontegra | |
| | | Frontegra | | | New Star | | | Netols | |
| | | IronBridge | | | International | | | Small Cap | |
| | | SMID Fund | | | Equity Fund | | | Value Fund | |
| Paid in capital | | $ | 5,554 | | | $ | — | | | $ | 3,753 | |
| Accumulated net investment income (loss) | | | (4,458 | ) | | | 1,271,599 | | | | (3,776 | ) |
| Accumulated net realized gain (loss) | | | (1,096 | ) | | | (1,271,599 | ) | | | 23 | |
| | The permanent differences primarily relate to foreign currency, paydown, swap and Real Estate Investment Trust (REIT) adjustments with differing book and tax methods. |
| | Each of the Funds has entered into an agreement with Frontegra Asset Management, Inc. (the “Adviser”), with whom certain officers and a director of the Funds are affiliated, to furnish investment advisory services to the Funds. The terms of these agreements are as follows: |
| | The Frontegra Columbus Core Plus Fund will pay the Adviser a monthly fee at the annual rate of 0.40% of the Fund’s average daily net assets. Pursuant to an expense cap agreement, the Adviser agreed to waive its management fee and/or reimburse the Fund’s operating expenses (exclusive of brokerage, interest, taxes and extraordinary expenses) to ensure that the Fund’s operating expenses do not exceed 0.35% of the Fund’s average daily net assets. The 0.35% expense cap agreement will continue in effect until October 31, 2009 with successive renewal terms of one year unless terminated by the Adviser or the Fund prior to any such renewal. |
| | The Frontegra Columbus Core Fund will pay the Adviser a monthly fee at the annual rate of 0.42% of the Fund’s average daily net assets. Pursuant to an expense cap agreement, the Adviser agreed to waive its management fee and/or reimburse the Fund’s operating expenses (exclusive of brokerage, interest, taxes and extraordinary expenses) to ensure that the Fund’s operating expenses do not exceed 0.35% of the Fund’s average daily net assets. The 0.35% expense cap agreement will continue in effect until October 31, 2009 with successive renewal terms of one year unless terminated by the Adviser or the Fund prior to any such renewal. |
Frontegra Funds
NOTES TO FINANCIAL STATEMENTS (continued)
December 31, 2008 (Unaudited)
| | The Frontegra IronBridge Small Cap Fund will pay the Adviser a monthly fee at the annual rate of 1.00% of the Fund’s average daily net assets. Pursuant to an expense cap agreement, the Adviser has agreed to waive its management fee and/or reimburse the Fund’s operating expenses (exclusive of brokerage, interest, taxes and extraordinary expenses) to ensure that the Fund’s operating expenses do not exceed 1.10% of the Fund’s average daily net assets. This expense cap agreement will continue in effect until October 31, 2009 with successive renewal terms of one year unless terminated by the Adviser or the Fund prior to any such renewal. |
| | The Frontegra IronBridge SMID Fund will pay the Adviser a monthly fee at the annual rate of 0.85% of the Fund’s average daily net assets. Pursuant to an expense cap agreement, the Adviser has agreed to waive its management fee and/or reimburse the Fund’s operating expenses (excluding brokerage, interest, taxes and extraordinary expenses) to ensure that the Fund’s operating expenses do not exceed 0.95% of the Fund’s average daily net assets. This expense cap agreement will continue in effect until October 31, 2009 with successive renewal terms of one year unless terminated by the Adviser or the Fund prior to any such renewal. |
| | The Frontegra New Star International Equity Fund will pay the Adviser a monthly fee at the annual rate of 0.95% of the Fund’s average daily net assets. Pursuant to an expense cap agreement, the Adviser has agreed to waive its management fee and/or reimburse the Fund’s operating expenses (exclusive of brokerage, interest, taxes and extraordinary expenses) to ensure that the Fund’s operating expenses do not exceed 0.75% of the Fund’s average daily net assets. This expense cap agreement will continue in effect until October 31, 2009 with successive renewal terms of one year unless terminated by the Adviser or the Fund prior to any such renewal. |
| | The Frontegra Netols Small Cap Value Fund will pay the Adviser a monthly fee at the annual rate of 1.00% of the Fund’s average daily net assets. Pursuant to an expense cap agreement, the Adviser has agreed to waive its management fee and/or reimburse the Fund’s operating expenses (excluding brokerage, interest, taxes and extraordinary expenses) to ensure that the Fund’s operating expenses do not exceed 1.10% of the Fund’s average daily net assets for Institutional Class Shares and 1.50% of the Fund’s average daily net assets for Class Y Shares. This expense cap agreement will continue in effect until October 31, 2009 with successive renewal terms of one year unless terminated by the Adviser or the Fund prior to any such renewal. |
| | Any waivers or reimbursements are subject to later adjustment to allow the Adviser to recoup amounts waived or reimbursed to the extent actual fees and expenses for a fiscal period are less than each Fund’s expense limitation cap, provided, however, that the Adviser shall only be entitled to recoup such amounts for a period of three years from the date such amount was waived or reimbursed. Expenses attributable to a specific class may only be recouped by that class. |
Frontegra Funds
NOTES TO FINANCIAL STATEMENTS (continued)
December 31, 2008 (Unaudited)
| | The following table shows the waived or reimbursed expenses subject to potential recoveryexpiring in: |
| | | Frontegra | | | | | | | | | Frontegra | | | Frontegra | |
| | | Columbus | | | Frontegra | | | Frontegra | | | New Star | | | Netols | |
| | | Core | | | Columbus | | | IronBridge | | | International | | | Small Cap | |
| | | Plus Fund | | | Core Fund | | | SMID Fund | | | Equity Fund | | | Value Fund | |
| 2009 | | $ | 965,488 | | | $ | 438,461 | | | $ | 100,504 | | | $ | 1,248,571 | | | $ | 71,972 | |
| 2010 | | $ | 874,012 | | | $ | 416,403 | | | $ | 43,079 | | | $ | 1,947,759 | | | $ | 114,909 | |
| 2011 | | $ | 802,439 | | | $ | 341,113 | | | $ | 22,812 | | | $ | 2,007,759 | | | $ | 110,227 | |
| 2012 | | $ | 289,366 | | | $ | 144,991 | | | | — | | | $ | 681,464 | | | $ | 56,062 | |
| | | $ | 2,931,305 | | | $ | 1,340,968 | | | $ | 166,395 | | | $ | 5,885,553 | | | $ | 353,170 | |
| | The Advisor recouped $8,665 of previously waived/reimbursed expenses in the Frontegra IronBridge SMID Fund during the six months ended December 31, 2008. There are currently no available expenses subject to recapture with respect to the IronBridge Small Cap Fund. |
| (4) | Capital Share Transactions |
| | Transactions in shares of the Frontegra Columbus Core Plus Fund were as follows: |
| | | Period Ended | | | Year Ended | |
| | | December 31, 2008 | | | June 30, 2008 | |
| Shares issued in connection with | | | | | | |
| acquisition of Columbus Core Plus Fund (see Note 7) | | | — | | | | 4,545,718 | |
| Shares sold | | | 2,727,653 | | | | 3,393,596 | |
| Shares issued to holders in | | | | | | | | |
| reinvestment of distributions | | | 805,653 | | | | 749,094 | |
| Shares redeemed | | | (2,885,252 | ) | | | (3,675,366 | ) |
| Net increase (decrease) in shares outstanding | | | 647,766 | | | | 5,013,042 | |
Transactions in shares of the Frontegra Columbus Core Fund were as follows: | |
| | | Period Ended | | | Year Ended | |
| | | December 31, 2008 | | | June 30, 2008 | |
| Shares issued in connection with | | | | | | | | |
| acquisition of Columbus Core Fund (see Note 7) | | | — | | | | 1,425,241 | |
| Shares sold | | | 1,317,143 | | | | 2,516,992 | |
| Shares issued to holders in | | | | | | | | |
| reinvestment of distributions | | | 203,408 | | | | 307,136 | |
| Shares redeemed | | | (2,733,334 | ) | | | (3,638,089 | ) |
| Net increase (decrease) in shares outstanding | | | (1,212,783 | ) | | | 611,280 | |
Frontegra Funds
NOTES TO FINANCIAL STATEMENTS (continued)
December 31, 2008 (Unaudited)
Transactions in shares of the Frontegra IronBridge Small Cap Fund were as follows:
| | | Period Ended | | | Year Ended | |
| | | December 31, 2008 | | | June 30, 2008 | |
| Shares sold | | | 1,935,841 | | | | 1,988,935 | |
| Shares issued to holders in | | | | | | | | |
| reinvestment of distributions | | | 1,412,710 | | | | 2,473,395 | |
| Shares redeemed | | | (2,633,067 | ) | | | (2,226,907 | ) |
| Net increase (decrease) in shares outstanding | | | 715,484 | | | | 2,235,423 | |
Transaction in shares of the Frontegra IronBridge SMID Fund were as follows: | |
| | | Period Ended | | | Year Ended | |
| | | December 31, 2008 | | | June 30, 2008 | |
| Shares sold | | | 11,810,623 | | | | 6,848,087 | |
| Shares issued to holders in | | | | | | | | |
| reinvestment of distributions | | | 328,171 | | | | 1,407,976 | |
| Shares redeemed | | | (2,447,219 | ) | | | (1,949,251 | ) |
| Net increase in shares outstanding | | | 9,691,575 | | | | 6,306,812 | |
Transaction in shares of the Frontegra New Star International Equity Fund were as follows: | |
| | | Period Ended | | | Year Ended | |
| | | December 31, 2008 | | | June 30, 2008 | |
| Shares sold | | | 2,161,692 | | | | 1,853,880 | |
| Shares issued to holders in | | | | | | | | |
| reinvestment of distributions | | | 2,311,356 | | | | 3,946,143 | |
| Shares redeemed | | | (15,068,673 | ) | | | (14,217,936 | ) |
| Net increase in shares outstanding | | | (10,595,625 | ) | | | (8,417,913 | ) |
| | Transaction in shares of the Frontegra Netols Small Cap Value Fund – Institutional Class were as follows: |
| | | Period Ended | | | Year Ended | |
| | | December 31, 2008 | | | June 30, 2008 | |
| Shares sold | | | 1,183,613 | | | | 1,401,889 | |
| Shares issued to holders in | | | | | | | | |
| reinvestment of distributions | | | 1,297 | | | | 21,388 | |
| Shares redeemed | | | (152,433 | ) | | | (117,167 | ) |
| Net increase in shares outstanding | | | 1,042,477 | | | | 1,306,110 | |
Frontegra Funds
NOTES TO FINANCIAL STATEMENTS (continued)
December 31, 2008 (Unaudited)
| | Transaction in shares of the Frontegra Netols Small Cap Value Fund – Class Y were as follows: |
| | | Period Ended | | | Period Ended | |
| | | December 31, 2008 | | | June 30, 2008(1) | |
| Shares sold | | | 8,645 | | | | 106,767 | |
| Shares issued to holders in | | | | | | | | |
| reinvestment of distributions | | | — | | | | 1,223 | |
| Shares redeemed | | | (4,489 | ) | | | (20,204 | ) |
| Net increase in shares outstanding | | | 4,156 | | | | 87,786 | |
(1) Commenced operations on November 1, 2007.
| (5) | Investment Transactions |
| | The aggregate purchases and sales of securities, excluding short-term investments and U.S.Government securities, for the Funds for the period ended December 31, 2008 are summarized below: |
| | | Frontegra | | | | | | | |
| | | Columbus | | | Frontegra | | | Frontegra | |
| | | Core | | | Columbus | | | IronBridge | |
| | | Plus Fund | | | Core Fund | | | Small Cap Fund | |
| Purchases | | $ | 1,037,715,712 | | | $ | 249,174,093 | | | $ | 70,044,588 | |
| Sales | | $ | 1,044,646,258 | | | $ | 264,407,750 | | | $ | 79,294,935 | |
| | | | | | | | | | | |
| | | | | | | Frontegra | | | Frontegra | |
| | | Frontegra | | | New Star | | | Netols | |
| | | IronBridge | | | International | | | Small Cap | |
| | | SMID Fund | | | Equity Fund | | | Value Fund | |
| Purchases | | $ | 150,798,349 | | | $ | 83,183,702 | | | $ | 16,805,748 | |
| Sales | | $ | 59,167,669 | | | $ | 192,359,886 | | | $ | 6,636,735 | |
| | Purchases and sales of long-term U.S. Government securities for the Frontegra Columbus Core Plus Fund were $182,880,092 and $183,526,724, respectively. Purchases and sales of long-term U.S. Government securities for the Frontegra Columbus Core Fund were $47,269,648 and $47,442,916, respectively. |
| | There were no purchases or sales of long-term U.S. Government securities for the Frontegra IronBridge Small Cap Fund, the Frontegra IronBridge SMID Fund, the Frontegra New Star International Equity Fund or the Frontegra Netols Small Cap Value Fund. |
| | The Independent Directors of the Funds were paid $25,000 in director fees during the six months ended December 31, 2008. The Interested Director did not receive any remuneration from the Funds. |
Frontegra Funds
NOTES TO FINANCIAL STATEMENTS (continued)
December 31, 2008 (Unaudited)
| | On August 3, 2007, Frontegra Columbus Core Plus Fund acquired all the net assets of Columbus Core Plus Fund pursuant to a plan of reorganization approved by Columbus Core Plus Fund shareholders on July 24, 2007. The acquisition was accomplished by a tax-free exchange of 4,545,718 shares of Frontegra Columbus Core Plus Fund (valued at $139,917,106) for the 14,269,548 shares of Columbus Core Plus Fund outstanding on August 3, 2007. Columbus Core Plus Fund’s net assets at that date ($139,917,106), included $85,451 of unrealized appreciation and accumulated net realized losses of $2,099,813 (of which $797,500 was available to offset future capital gains for federal income tax purposes, subject to certain limitations), were combined with those of Frontegra Columbus Core Plus Fund. The aggregate net assets of Frontegra Columbus Core Plus Fund and Columbus Core Plus Fund immediately before the acquisition were $277,318,845 and $139,917,106, respectively. The combined net assets after the acquisition were $417,235,951. |
| | On August 3, 2007, Frontegra Columbus Core Fund acquired all the net assets of Columbus Core Fund pursuant to a plan of reorganization approved by Columbus Core Fund shareholders on July 24, 2007. The acquisition was accomplished by a tax-free exchange of 1,425,241 shares of Frontegra Columbus Core Fund (valued at $14,423,390) for the 1,480,025 shares of Columbus Core Fund outstanding on August 3, 2007. Columbus Core Fund’s net assets at that date ($14,423,390), included $815 of unrealized depreciation and accumulated net realized losses of $485,611 (of which $285,222 was available to offset future capital gains for federal income tax purposes, subject to certain limitations), were combined with those of Frontegra Columbus Core Fund. The aggregate net assets of Frontegra Columbus Core Fund and Columbus Core Fund immediately before the acquisition were $91,486,920 and $14,423,390, respectively. The combined net assets after the acquisition were $105,910,310. |
| | The Frontegra New Star International Equity Fund has a $50 million unsecured line of credit with U.S. Bank, N.A., intended to provide short-term financing, if necessary, subject to certain restrictions, in connection with shareholder redemptions. Borrowings under this arrangement bear interest at the bank’s prime rate. At December 31, 2008, the Fund had $2,221,000 outstanding. Based upon balances outstanding during the six month period, the weighted average interest rate was 3.25% and the weighted average amount outstanding was $443,848. |
| (9) | Distribution Plan and Shareholder Servicing Fee |
| | Frontegra, on behalf of the Frontegra Columbus Core Plus Fund, the Frontegra IronBridge SMID Fund and the Frontegra Netols Small Cap Value Fund (collectively, the “Funds”), has adopted a distribution plan pursuant to Rule 12b-1 under the Investment Company Act of 1940 for each Fund’s Class Y shares (the “12b-1 Plan”). Pursuant to the 12b-1 Plan, each Fund pays an annual fee of up to 0.25% to Frontegra Strategies, LLC (the “Distributor”) for payments to brokers, dealers and other financial intermediaries who perform activities or incur expenses intended to result |
Frontegra Funds
NOTES TO FINANCIAL STATEMENTS (continued)
December 31, 2008 (Unaudited)
| | in the sale of Class Y shares of the Funds. For the period ended December 31, 2008, the following expenses were incurred under the 12b-1 Plan: |
| | Class Y |
| Netols Small Cap Value Fund | $1,170 |
| | Class Y shares of the Funds also pay an annual shareholder servicing fee of up to 0.20% (0.15% effective July 1, 2008) per year to the Distributor for payments to brokers, dealers, and other financial intermediaries who provide on-going account services to shareholders. Those services include establishing and maintaining shareholder accounts, mailing prospectuses, account statements and other Fund documents to shareholders, processing shareholder transactions, answering shareholder inquiries and providing other personal services to shareholders. For the period ended December 31, 2008, the Funds incurred the following shareholder servicing expenses: |
| | Class Y |
| Netols Small Cap Value Fund | $702 |
BOARD OF DIRECTORS’ APPROVAL OF NEW ADVISORY AND SUBADVISORY AGREEMENTS
Board Approval of Advisory Agreements
The Board of Directors (the “Board”) of Frontegra Funds, Inc. (the “Company”) met on July 24, 2008 at a special meeting to consider the approval of a new investment advisory agreement with Frontegra Asset Management, Inc. (the “Adviser”) and new subadvisory agreements (collectively, the “New Agreements”) for each of the following portfolios (each, a “Fund” and collectively, the “Funds”) of the Company:
| • | Frontegra Columbus Core Plus Fund; |
| • | Frontegra Columbus Core Fund; |
| • | Frontegra IronBridge Small Cap Fund; |
| • | Frontegra IronBridge SMID Fund; |
| • | Frontegra New Star International Equity Fund; |
| • | Frontegra Netols Small Cap Value Fund; and |
| • | Frontegra Sky International Value Fund. |
New investment advisory and subadvisory agreements were considered due to a change in control of the Adviser. On August 1, 2008, William D. Forsyth III acquired 100% of the ownership interest in the Adviser and Frontegra Strategies, LLC, the Funds’ principal distributor (the “Distributor”) from the former co-owner of the Adviser and the Distributor (the “Transaction”). The Transaction resulted in a change in control of the Adviser and, therefore, constituted an “assignment” of the previous investment advisory agreement between the Adviser and the Company (the “Prior Advisory Agreement”) and of the previous subadvisory agreements between the Adviser and each of the subadvisers (together with the Prior Advisory Agreement, the “Prior Agreements”). Interim advisory and subadvisory agreements went into effect on August 1, 2008 until the New Agreements were approved by shareholders of the applicable Funds at a special meeting of shareholders on October 30, 2008, as adjourned with respect to certain Funds to November 7, 2008 and November 14, 2008. The Board approved the interim agreements, which contained identical terms as the Prior Agreements with respect to services provided and fee structure, pursuant to Rule 15a-4 under the Investment Company Act of 1940, as amended, at a special meeting on July 24, 2008.
When the Board reviewed the New Agreements at a special meeting on July 24, 2008, the Board was provided materials relevant to its consideration of the New Agreements, such as the Adviser’s and each subadviser’s Form ADV and Code of Ethics, information regarding the Adviser’s and each subadviser’s compliance program, personnel and financial condition and memoranda prepared by the Company’s legal counsel. The Board also reviewed the advisory and subadvisory fees that would be payable by each Fund and the Adviser under the New Agreements, the proposed expense cap agreements between the Company and the Adviser on behalf of each Fund and comparative fee and expense information provided by an independent third party. The Board was also provided with the Adviser’s and each subadviser’s responses to detailed requests submitted by the Company’s legal counsel. The Board did not review the above information with respect to Sky Investment Counsel Inc.,
subadviser to the Frontegra Sky International Value Fund because the Fund had not commenced operations.
In reaching its decision to approve the new investment advisory agreement between the Company, on behalf of the Funds, and the Adviser (“New Advisory Agreement”), the Board, the majority of which are Independent Directors, met at a special meeting held on July 24, 2008 with the officers of the Adviser and the Company’s legal counsel. In the course of its review, the Board considered its legal responsibilities with regard to all factors deemed to be relevant to the Funds, including but not limited to the following: (1) the quality of services provided to the Funds since the Adviser first became investment adviser to the Company in 1996; (2) the performance of each Fund since the Adviser became the investment adviser to such Fund; (3) the fact that the Transaction was not expected to affect the manner in which each Fund is advised; (4) the fact that the investment management teams at each subadviser would continue to manage the applicable Funds; (5) the fee structure under the New Advisory Agreement would be identical to the fee structure under the Prior Advisory Agreement; (6) the changes to terms in the New Advisory Agreement from the Prior Advisory Agreement are generally to conform to current regulatory requirements and industry best practices; and (7) other factors deemed relevant.
The Board considered whether the New Advisory Agreement would be in the best interests of each Fund and its shareholders and the overall fairness of the New Advisory Agreement. Among other things, the Board reviewed information concerning: (1) the nature, extent and quality of the services provided by the Adviser; (2) each Fund’s investment performance; (3) the cost of the services provided and the profits realized by the Adviser and its affiliates from their relationship with the Company on behalf of each Fund; (4) the extent to which economies of scale have been or will be realized as each Fund grows; and (5) the extent to which fee levels reflect the economies of scale, if any, for the benefit of each Fund’s shareholders. In their deliberations, the Board did not identify any single factor as determinative.
In considering the New Advisory Agreement, the Board reviewed and analyzed various factors with respect to each Fund that it determined were relevant, including the factors below, and made the following conclusions.
Frontegra Columbus Core Plus Fund (the “Core Plus Fund”)
Performance Record of the Fund. The Board reviewed the Core Plus Fund’s performance record for the period ended June 30, 2008. The Board noted that the Core Plus Fund had outperformed its benchmark index for the past five-year, ten-year and since-inception periods and slightly underperformed its benchmark index for the one-year period ended June 30, 2008. The Board concluded that the Adviser has developed the necessary expertise and resources in selecting and managing Reams Asset Management, LLC to provide investment advisory services as subadviser to the Core Plus Fund in accordance with its investment objective and strategy. After considering all of the information, the Board concluded that, although past performance is not a guarantee of future results, the Core Plus Fund and its shareholders were likely to benefit from the Adviser’s continued management.
Advisory Fees. The Board compared the Core Plus Fund’s contractual advisory fee and total expense ratio to the industry data provided by an independent service with respect to other mutual funds in
the same peer group. The Board noted that the Core Plus Fund’s advisory fee was below industry averages, and that the total expense ratio of the Institutional Class shares of the Core Plus Fund, after giving effect to the contractual expense cap agreement, was well below industry averages. The Board also reviewed the total expense ratio for the Core Plus Fund’s Class Y shares, which was slightly above industry averages. The Board noted that overall, the Core Plus Fund’s total expense ratio compared favorably to industry averages. The Board concluded that the advisory fee to be paid by the Core Plus Fund to the Adviser was reasonable in light of the nature and quality of services to be provided and fees paid by comparable funds.
Costs and Profitability. The Board reviewed information concerning the Adviser’s financial condition, costs and profitability. The Board also considered the fact that the Adviser had renewed the contractual expense cap agreement on behalf of the Core Plus Fund. The Board noted that the Adviser was still waiving a portion of its fees for the Core Plus Fund. The Board concluded that the Adviser’s current level of profitability was reasonable considering the quality of management and the fact that the Adviser was waiving its fees and/or reimbursing expenses for the Core Plus Fund.
Frontegra Columbus Core Fund (the “Core Fund”)
Performance Record of the Fund. The Board reviewed the Core Fund’s performance record for the period ended June 30, 2008. The Board noted that the Core Fund had outperformed its benchmark index for the one-year and five-year periods and slightly underperformed its benchmark index for the since-inception period ended June 30, 2008. The Board concluded that the Adviser has developed the necessary expertise and resources in selecting and managing Reams Asset Management, LLC to provide investment advisory services as subadviser to the Core Fund in accordance with its investment objective and strategy. After considering all of the information, the Board concluded that, although past performance is not a guarantee of future results, the Core Fund and its shareholders were likely to benefit from the Adviser’s continued management.
Advisory Fees. The Board compared the Core Fund’s contractual advisory fee and total expense ratio to the industry data provided by an independent service with respect to other mutual funds in the same peer group. The Board noted that the Core Fund’s advisory fee was below industry averages, and that the Fund’s total expense ratio, after giving effect to the contractual expense cap agreement, was well below industry averages. The Board concluded that the advisory fee to be paid by the Core Fund to the Adviser was reasonable in light of the nature and quality of services to be provided and fees paid by comparable funds.
Costs and Profitability. The Board reviewed information concerning the Adviser’s financial condition, costs and profitability. The Board also considered the fact that the Adviser had renewed the contractual expense cap agreement on behalf of the Core Fund. The Board noted that the Adviser was still waiving a portion of its fees for the Core Fund. The Board concluded that the Adviser’s current level of profitability was reasonable considering the quality of management and the fact that the Adviser was waiving its fees and/or reimbursing expenses for the Core Fund.
Frontegra IronBridge Small Cap Fund (the “Small Cap Fund”)
Performance Record of the Fund. The Board reviewed the Small Cap Fund’s performance record for the period ended June 30, 2008. The Board noted that the Small Cap Fund had outperformed its bench-
mark index for the one-year, five-year and since-inception periods ended June 30, 2008. The Board concluded that the Adviser has developed the necessary expertise and resources in selecting and managing IronBridge Capital Management, LP to provide investment advisory services as subadviser to the Small Cap Fund in accordance with its investment objective and strategy. After considering all of the information, the Board concluded that, although past performance is not a guarantee of future results, the Small Cap Fund and its shareholders were likely to benefit from the Adviser’s continued management.
Advisory Fees. The Board compared the Small Cap Fund’s contractual advisory fee and total expense ratio to the industry data provided by an independent service with respect to other mutual funds in the same peer group. The Board noted that the Small Cap Fund’s advisory fee was above the industry average, but that the Fund’s total expense ratio, after giving effect to the contractual expense cap agreement, was well below industry averages. The Board concluded that the advisory fee to be paid by the Small Cap Fund to the Adviser was reasonable in light of the nature and quality of services to be provided and fees paid by comparable funds.
Costs and Profitability. The Board reviewed information concerning the Adviser’s financial condition, costs and profitability. The Board also considered the fact that the Adviser had renewed the contractual expense cap agreement on behalf of the Small Cap Fund, and also noted that the Adviser had recouped advisory fees from the Small Cap Fund for the fiscal year ended June 30, 2008. The Board concluded that the Adviser’s current level of profitability was reasonable considering the quality of management.
Frontegra IronBridge SMID Fund (the “SMID Fund”)
Performance Record of the Fund. The Board reviewed the SMID Fund’s performance record for the period ended June 30, 2008. The Board noted that the SMID Fund had outperformed its benchmark index for the one-year, three-year and since-inception periods ended June 30, 2008. The Board concluded that the Adviser has developed the necessary expertise and resources in selecting and managing IronBridge Capital Management, LP to provide investment advisory services as subadviser to the SMID Fund in accordance with its investment objective and strategy. After considering all of the information, the Board concluded that, although past performance is not a guarantee of future results, the SMID Fund and its shareholders were likely to benefit from the Adviser’s continued management.
Advisory Fees. The Board compared the SMID Fund’s contractual advisory fee and total expense ratio to the industry data provided by an independent service with respect to other mutual funds in the same peer group. The Board noted that the SMID Fund’s advisory fee was above the industry average, but that the total expense ratio of the Institutional Class shares of the SMID Fund, after giving effect to the contractual expense cap agreement, was well below industry averages. The Board also reviewed the total expense ratio for the SMID Fund’s Class Y shares, which was slightly above industry averages. The Board noted that overall, the SMID Fund’s total expense ratio compared favorably to industry averages. The Board concluded that the advisory fee to be paid by the SMID Fund to the Adviser was reasonable in light of the nature and quality of services to be provided and fees paid by comparable funds.
Costs and Profitability. The Board reviewed information concerning the Adviser’s financial condition, costs and profitability. The Board also considered the fact that the Adviser had renewed the contractual expense cap agreement on behalf of the SMID Fund. The Board noted that the Adviser was still
waiving a portion of its fees for the SMID Fund. The Board concluded that the Adviser’s current level of profitability was reasonable considering the quality of management and the fact that the Adviser was waiving its fees and/or reimbursing expenses for the SMID Fund.
Frontegra New Star International Equity Fund (the “International Equity Fund”)
Performance Record of the Fund. The Board reviewed the International Equity Fund’s performance record for the period ended June 30, 2008. The Board noted that the International Equity Fund had outperformed its benchmark index for the one-year period and had underperformed its benchmark index for the three-year and since-inception periods ended June 30, 2008. The Board concluded that the Adviser has developed the necessary expertise and resources in selecting and managing New Star Institutional Managers Limited to provide investment advisory services as subadviser to the International Equity Fund in accordance with its investment objective and strategy. After considering all of the information, the Board concluded that, although past performance is not a guarantee of future results, the International Equity Fund and its shareholders were likely to benefit from the Adviser’s continued management.
Advisory Fees. The Board compared the International Equity Fund’s contractual advisory fee and total expense ratio to the industry data provided by an independent service with respect to other mutual funds in the same peer group. The Board noted that the International Equity Fund’s advisory fee was above the industry average, but that the Fund’s total expense ratio, after giving effect to the contractual expense cap agreement, was well below industry averages. The Board concluded that the advisory fee to be paid by the International Equity Fund to the Adviser was reasonable in light of the nature and quality of services to be provided and fees paid by comparable funds.
Costs and Profitability. The Board reviewed information concerning the Adviser’s financial condition, costs and profitability. The Board also considered the fact that the Adviser had renewed the contractual expense cap agreement on behalf of the International Equity Fund. The Board noted that the Adviser was still waiving a portion of its fees for the International Equity Fund. The Board concluded that the Adviser’s current level of profitability was reasonable considering the quality of management and the fact that the Adviser was waiving its fees and/or reimbursing expenses for the International Equity Fund.
Frontegra Netols Small Cap Value Fund (the “Small Cap Value Fund”)
Performance Record of the Fund. The Board reviewed the Small Cap Value Fund’s performance record for the period ended June 30, 2008. The Board noted that the Small Cap Value Fund had outperformed its benchmark index for the one-year and since-inception periods ended June 30, 2008. The Board concluded that the Adviser has developed the necessary expertise and resources in selecting and managing Netols Asset Management, Inc. to provide investment advisory services as subadviser to the Small Cap Value Fund in accordance with its investment objective and strategy. After considering all of the information, the Board concluded that, although past performance is not a guarantee of future results, the Small Cap Value Fund and its shareholders were likely to benefit from the Adviser’s continued management.
Advisory Fees. The Board compared the Small Cap Value Fund’s contractual advisory fee and total expense ratio to the industry data provided by an independent service with respect to other mutual
funds in the same peer group. The Board noted that the Small Cap Value Fund’s advisory fee was above the industry average, but that the total expense ratio of the Institutional Class shares of the Small Cap Value Fund, after giving effect to the contractual expense cap agreement, was well below industry averages. The Board also reviewed the total expense ratio for the Small Cap Value Fund’s Class Y shares, which was slightly below industry averages. The Board noted that overall, the Small Cap Value Fund’s total expense ratio compared favorably to industry averages. The Board concluded that the advisory fee to be paid by the Small Cap Value Fund to the Adviser was reasonable in light of the nature and quality of services to be provided and fees paid by comparable funds.
Costs and Profitability. The Board reviewed information concerning the Adviser’s financial condition, costs and profitability. The Board also considered the fact that the Adviser had renewed the contractual expense cap agreement on behalf of the Small Cap Value Fund. The Board noted that the Adviser was still waiving a portion of its fees for the Small Cap Value Fund. The Board concluded that the Adviser’s current level of profitability was reasonable considering the quality of management and the fact that the Adviser was waiving its fees and/or reimbursing expenses for the Small Cap Value Fund.
Frontegra Sky International Value Fund (“International Value Fund”)
Performance Record of the Fund. The Board did not review the International Value Fund’s performance record for the period ended June 30, 2008 because the Fund had not commenced operations as of that date.
Proposed Fees. The Board compared the Fund’s contractual advisory fee and total expense ratio to the industry data provided by an independent service with respect to other mutual funds in the same peer group. The Board noted that the Fund’s advisory fee was slightly above the industry average and that the Fund’s total expense ratio for both Class Y and Institutional Class shares, after giving effect to the contractual expense cap agreement, was below the industry average. The Board concluded that the advisory fee and total expense ratio are competitive with those of comparable funds. The Board concluded that the fees to be paid by the Fund to the Adviser when the Fund commenced operations was reasonable in light of the nature and quality of services to be provided and fees paid by comparable funds.
Costs and Profitability. The Adviser did not provide any specific information regarding the costs of services to be provided or the profits they might realize because the Fund had not yet commenced operations.
Board Considerations Applicable to all Funds
Nature, Extent and Quality of the Services to be Provided. The Board considered the Adviser’s background and services it would continue to provide to the Funds and their shareholders under the New Advisory Agreement. The Board discussed the fact that the Adviser had chosen each Fund’s investment strategy and had selected the subadvisers to make the day-to-day investment decisions for the Funds. The Board noted that the Adviser has 13 years of experience in hiring and supervising subadvisers to portfolios in the Frontegra family of Funds. The Board discussed the Adviser’s responsibilities for overseeing the subadvisers and for monitoring each Fund’s compliance with applicable requirements under the securities laws. The Board concluded that the range of services to be provided by the Adviser was appropriate and that the Adviser was qualified to provide such services.
The Board took into account that there will be no changes (including changes to the fee structure) that will adversely impact the Adviser’s ability to provide the same quality of services as were provided under the Prior Advisory Agreement; the New Advisory Agreement is similar in most respects to the Prior Advisory Agreement; and there are no material compliance issues or material changes to compliance policies and procedures since the last renewal of the Prior Advisory Agreement.
Economies of Scale. The Board reviewed net asset growth on a per Fund and aggregate basis and considered whether there may be economies of scale in the management of each Fund if its assets were to increase significantly, except with respect to the International Value Fund, which had not yet commenced operations. However, the Board concluded that the assets of the Funds were not likely to increase to such an extent that breakpoints would be appropriate, particularly in light of the expense cap agreements in place between the Adviser and each Fund.
Benefits to the Adviser. The Board considered information presented regarding any benefits to the Adviser or its affiliates from serving as adviser to the Funds (in addition to the advisory fee). The Board noted that the Adviser’s affiliate, Frontier Partners, Inc. (“Frontier”), provides consulting services to, and is compensated by, each subadviser. However, the Board determined that the Adviser’s services to the Funds would not be compromised by this potential conflict of interest.
On the basis of its review of the foregoing information, the Board found that the terms of the New Advisory Agreement were fair and reasonable and in the best interest of each Fund’s shareholders.
On July 24, 2008, the Board also considered the approval of a new advisory agreement and a sub-advisory agreement with respect to a new portfolio of the Company, the Frontegra New Star Emerging Markets Equity Fund (the “Emerging Markets Equity Fund”).
When the Board of Directors reviewed the new advisory agreement on July 24, 2008, the Board was provided materials relevant to its consideration of the agreement, such as the Adviser’s Form ADV and Code of Ethics and information regarding the Adviser’s compliance program, organizational structure and financial condition. The Board also reviewed the fee that would be payable by the Fund under the Advisory Agreement, the proposed expense cap between the Fund and the Adviser and comparative fee and expense information provided by an independent third party.
In approving the new advisory agreement, the Directors considered the following factors and made the following conclusions:
Nature, Extent and Quality of the Services to be Provided. The Board considered the Adviser’s background and services it would provide to the Emerging Markets Equity Fund and its shareholders. The Board discussed the fact that the Adviser had chosen the Fund’s investment strategy and had selected New Star to make the day-to-day investment decisions for the Fund. The Board noted that the Adviser has 13 years of experience in hiring and supervising sub-advisers to other portfolios in the Frontegra family of funds. The Board discussed the Adviser’s responsibilities for overseeing New Star as sub-adviser to the Fund and for monitoring the Fund’s compliance with applicable requirements under the securities laws. The Board also considered that the Adviser has overseen New Star as sub-adviser to the International Equity Fund since its inception. The Board concluded that the range of services to be provided by the Adviser was appropriate.
Proposed Fees. The Board compared the Fund’s contractual advisory fee and total expense ratio to the industry data provided by an independent service with respect to other mutual funds in the same peer group. The Board noted that the Fund’s advisory fee was below the industry average and that the Fund’s total expense ratio for both Class Y and Institutional Class shares, after giving effect to the proposed expense cap agreement, was below the industry average. The Board concluded that the advisory fee and total expense ratio are competitive with those of comparable funds. The Board concluded that the proposed fee to be paid by the Fund to the Adviser was reasonable in light of the nature and quality of services to be provided and fees paid by comparable funds.
Costs and Profitability. The Adviser did not provide any specific information regarding the costs of services to be provided or the profits they might realize because the Fund had not yet commenced operations.
Economies of Scale. Because the Fund had not yet commenced operations, the Board did not consider whether any alternative fee structures, such as breakpoint fees, would be appropriate to reflect any economies of scale that may result from increases in the Fund’s assets.
Benefits to the Adviser. The Board considered information presented regarding any benefits to the Adviser or its affiliates from serving as adviser to the Fund (in addition to the advisory fee). The Board noted that the Adviser’s affiliate, Frontier, provides consulting services to, and is compensated by, New Star. However, the Board determined that the Adviser’s services to the Fund would not be compromised by this potential conflict of interest.
Board Approval of Subadvisory Agreements
Core Plus and Core Funds
When the Board reviewed the new subadvisory agreement between the Adviser and Reams Asset Management, LLC (“Reams”) on behalf of the Core Plus Fund and Core Fund (the “New Reams Subadvisory Agreement”) at a special meeting on July 24, 2008, the Board was provided materials relevant to its consideration of the New Reams Subadvisory Agreement, such as Reams’ Form ADV and Code of Ethics, information regarding Reams’ compliance program, personnel and financial condition and memoranda prepared by the Company’s legal counsel. The Board also reviewed the subadvisory fees would be payable by each Fund and the Adviser under the New Reams Subadvisory Agreement and the proposed expense cap agreement between the Company and the Adviser on behalf of each Fund. The Board was also provided with the Reams’ responses to detailed requests submitted by the Company’s legal counsel.
In approving the New Reams Subadvisory Agreement, the Board considered the following factors and made the following conclusions with respect to each Fund:
Core Plus Fund
Nature, Extent and Quality of the Services to be Provided. The Board’s analysis of the nature, extent and quality of Reams’ services to the Core Plus Fund took into account knowledge gained from Reams’ presentations to the Board at meetings throughout the year. The Board reviewed and considered Reams’ investment strategy, experience as a fixed income manager, key personnel involved in providing investment management services to the Core Plus Fund and financial condition. The Board also considered services provided by Reams under the New Reams Subadvisory Agreement, including the
selection of fixed income dealers, monitoring adherence to the Core Plus Fund’s investment restrictions and assisting with the Core Plus Fund’s compliance with applicable securities laws and regulations. The Board concluded that the nature, extent and quality of the services provided by Reams to the Core Plus Fund was appropriate and that the Core Plus Fund was likely to continue to benefit from services provided by Reams under the New Reams Subadvisory Agreement.
Investment Performance of the Fund. The Board reviewed the performance record of the Core Plus Fund. It noted that the Core Plus Fund had outperformed its benchmark index for the five-year and ten-year periods and slightly underperformed its benchmark index for the one-year period ended June 30, 2008. The Board also considered Reams’ quarterly portfolio commentary and review of the Core Plus Fund’s performance. The Board concluded that Reams would continue to provide a high level of subadvisory services to the Core Plus Fund.
Subadvisory Fees. The Board reviewed and considered the subadvisory fees payable by the Adviser to Reams under the New Subadvisory Agreement. The Board determined that the subadvisory fee payable with respect to the Core Plus Fund was appropriate in light of the Core Plus Fund’s investment style and in comparison to fees paid by separate account clients of Reams managed in the same style as the Core Plus Fund. In evaluating the subadvisory fee, the Board noted that the fee is paid by the Adviser and that therefore the overall advisory fee paid by the Core Plus Fund is not directly affected by the subadvisory fee.
Costs and Profitability. The Board did not consider the cost of services provided by Reams or the profitability to Reams from its relationship with the Core Plus Fund because it did not view these factors as relevant given that the subadvisory fee is paid by the Adviser.
Economies of Scale. Because the subadvisory fee is not paid by the Core Plus Fund, the Board did not consider whether the fee should reflect any potential economies of scale that might be realized as the Core Plus Fund assets increase.
Benefits to Reams. The Board considered information presented regarding any benefits to Reams from serving as subadviser to the Core Plus Fund (in addition to the subadvisory fee). The Board noted that Reams does not participate in soft dollar arrangements with respect to fixed income transactions. The Board also noted that Reams receives consulting services from Frontier, an affiliate of the Adviser.
Core Fund
Nature, Extent and Quality of the Services to be Provided. The Board’s analysis of the nature, extent and quality of Reams’ services to the Core Fund took into account knowledge gained from Reams’ presentations to the Board at meetings throughout the year. The Board reviewed and considered Reams’ investment strategy, experience as a fixed income manager, key personnel involved in providing investment management services to the Core Fund and financial condition. The Board also considered services provided by Reams under the New Reams Subadvisory Agreement, including the selection of fixed income dealers, monitoring adherence to the Core Fund’s investment restrictions and assisting with the Core Fund’s compliance with applicable securities laws and regulations. The Board concluded that the nature, extent and quality of the services provided by Reams to the Core Fund was appropriate and that the Core Fund was likely to continue to benefit from services provided by Reams under the New Reams Subadvisory Agreement.
Investment Performance of the Fund. The Board reviewed the performance record of the Core Fund. The Board noted that the Core Fund had outperformed its benchmark index for the one-year and five-year periods and slightly underperformed the benchmark index for the since-inception period ended June 30, 2008. The Board also considered Reams’ quarterly portfolio commentary and review of the Core Fund’s performance. The Board concluded that Reams would continue to provide a high level of subadvisory services to the Core Fund.
Subadvisory Fees. The Board reviewed and considered the subadvisory fees payable by the Adviser to Reams under the New Subadvisory Agreement. The Board determined that the subadvisory fee payable with respect to the Core Fund was appropriate in light of the Core Fund’s investment style and in comparison to fees paid by separate account clients of Reams managed in the same style as the Core Fund. In evaluating the subadvisory fee, the Board noted that the fee is paid by the Adviser and that therefore the overall advisory fee paid by the Core Fund is not directly affected by the subadvisory fee.
Costs and Profitability. The Board did not consider the cost of services provided by Reams or the profitability to Reams from its relationship with the Core Fund because it did not view these factors as relevant given that the subadvisory fee is paid by the Adviser.
Economies of Scale. Because the subadvisory fee is not paid by the Core Fund, the Board did not consider whether the fee should reflect any potential economies of scale that might be realized as the Core Fund assets increase.
Benefits to Reams. The Board considered information presented regarding any benefits to Reams from serving as subadviser to the Core Fund (in addition to the subadvisory fee). The Board noted that Reams does not participate in soft dollar arrangements with respect to fixed income transactions. The Board also noted that Reams receives consulting services from Frontier, an affiliate of the Adviser.
On the basis of its review of the foregoing information, the Board found that the terms of the New Reams Subadvisory Agreement were fair and reasonable and in the best interest of the shareholders of the Core Plus and Core Funds.
IronBridge Small Cap and SMID Funds
When the Board reviewed the new subadvisory agreement between the Adviser and IronBridge Capital Management, L.P. (“IronBridge”) on behalf of the Small Cap Fund and SMID Fund (the “New IronBridge Subadvisory Agreement”) at special meetings on July 24, 2008 and September 7, 2008, the Board was provided materials relevant to its consideration of the New IronBridge Subadvisory Agreement, such as IronBridge’ Form ADV and Code of Ethics, information regarding IronBridge’s compliance program, personnel and financial condition and memoranda prepared by the Company’s legal counsel. The Board also reviewed the subadvisory fees that would be payable by each Fund and the Adviser under the New IronBridge Subadvisory Agreement and the proposed expense cap agreement between the Company and the Adviser on behalf of each Fund. The Board was also provided with IronBridge’s responses to detailed requests submitted by the Company’s legal counsel.
In approving the New IronBridge Subadvisory Agreement between the Adviser and IronBridge, the Board considered the following factors and made the following conclusions with respect to each Fund.
Small Cap Fund
Nature, Extent and Quality of the Services Provided. The Board’s analysis of the nature, extent and quality of IronBridge’s services to the Small Cap Fund took into account knowledge gained from IronBridge’s presentations to the Board at meetings throughout the year. The Board reviewed and considered IronBridge’s proprietary investment style, key personnel involved in providing investment management services to the Small Cap Fund and financial condition. The Board also considered services provided by IronBridge under the New IronBridge Subadvisory Agreement, including the selection of broker-dealers for execution of portfolio transactions, monitoring adherence to the Small Cap Fund’s investment restrictions and assisting with the Small Cap Fund’s compliance with applicable securities laws and regulations. The Board concluded that the nature, extent and quality of the services provided by IronBridge to the Small Cap Fund was appropriate and that the Small Cap Fund was likely to continue to benefit from services provided by IronBridge under the New IronBridge Subadvisory Agreement.
Investment Performance of the Fund. The Board reviewed the performance record of the Small Cap Fund. It noted that the Small Cap Fund had outperformed its benchmark index for the one-year, five-year and since-inception periods ended June 30, 2008. The Board also considered IronBridge’s quarterly portfolio commentary and review of the Small Cap Fund’s performance. The Board also compared the Small Cap Fund’s performance for the period ended June 30, 2008 to the performance for the corresponding composite of IronBridge’s separate account clients. The Board concluded that IronBridge would continue to provide a high level of subadvisory services to the Small Cap Fund.
Subadvisory Fees. The Board reviewed and considered the subadvisory fees payable by the Adviser to IronBridge under the New IronBridge Subadvisory Agreement. The Board considered the increase in subadvisory fees payable to IronBridge and the additional compensation that IronBridge is entitled to receive from amounts recouped by the Adviser from previously waived fees and reimbursed expenses under the New IronBridge Subadvisory Agreement, as discussed above. The Board determined that the subadvisory fee payable with respect to the Small Cap Fund and additional compensation were appropriate in light of the Small Cap Fund’s investment style. In evaluating the subadvisory fee and additional compensation, the Board noted that such amounts are paid by the Adviser and that therefore the overall advisory fee paid by the Small Cap Fund is not directly affected by the subadvisory fee.
Costs and Profitability. The Board did not consider the cost of services provided by IronBridge or the profitability to IronBridge from its relationship with the Small Cap Fund because it did not view these factors as relevant given that the subadvisory fee is paid by the Adviser.
Economies of Scale. Because the subadvisory fee is not paid by the Small Cap Fund, the Board did not consider whether the fee should reflect any potential economies of scale that might be realized as Small Cap Fund assets increase.
Benefits to IronBridge. The Board considered information presented regarding any benefits to IronBridge from serving as sub-adviser to the Small Cap Fund (in addition to the subadvisory fee). The Board noted that IronBridge uses Small Cap Fund brokerage to obtain non-execution services on a limited basis. The Board also noted that IronBridge receives consulting services from Frontier, an affiliate of the Adviser.
SMID Fund
Nature, Extent and Quality of the Services Provided. The Board’s analysis of the nature, extent and quality of IronBridge’s services to the SMID Fund took into account knowledge gained from IronBridge’s presentations to the Board at meetings throughout the year. The Board reviewed and considered IronBridge’s proprietary investment style, key personnel involved in providing investment management services to the SMID Fund and financial condition. The Board also considered services provided by IronBridge under the New IronBridge Subadvisory Agreement, including the selection of broker-dealers for execution of portfolio transactions, monitoring adherence to the SMID Fund’s investment restrictions and assisting with the SMID Fund’s compliance with applicable securities laws and regulations. The Board concluded that the nature, extent and quality of the services provided by IronBridge to the SMID Fund was appropriate and that the SMID Fund was likely to continue to benefit from services provided by IronBridge under the New IronBridge Subadvisory Agreement.
Investment Performance of the Fund. The Board reviewed the performance record of the SMID Fund. The Board noted that the SMID Fund had outperformed its benchmark index for the one-year, three-year and since-inception periods ended June 30, 2008. The Board also considered IronBridge’s quarterly portfolio commentary and review of the SMID Fund’s performance. The Board also compared the SMID Fund’s performance for the period ended June 30, 2008 to the performance for the corresponding composite of IronBridge’s separate account clients. The Board concluded that IronBridge would continue to provide a high level of subadvisory services to the SMID Fund.
Subadvisory Fees. The Board reviewed and considered the subadvisory fees payable by the Adviser to IronBridge under the New IronBridge Subadvisory Agreement. The Board considered the increase in subadvisory fees payable to IronBridge and the additional compensation that IronBridge is entitled to receive from amounts recouped by the Adviser from previously waived fees and reimbursed expenses under the New IronBridge Subadvisory Agreement, as discussed above. The Board determined that the subadvisory fee payable with respect to the SMID Fund and additional compensation were appropriate in light of the SMID Fund’s investment style. In evaluating the subadvisory fee and additional compensation, the Board noted that such amounts are paid by the Adviser and that therefore the overall advisory fee paid by the SMID Fund is not directly affected by the subadvisory fee.
Costs and Profitability. The Board did not consider the cost of services provided by IronBridge or the profitability to IronBridge from its relationship with the SMID Fund because it did not view these factors as relevant given that the subadvisory fee is paid by the Adviser.
Economies of Scale. Because the subadvisory fee is not paid by the SMID Fund, the Board did not consider whether the fee should reflect any potential economies of scale that might be realized as SMID Fund assets increase.
Benefits to IronBridge. The Board considered information presented regarding any benefits to IronBridge from serving as sub-adviser to the SMID Fund (in addition to the subadvisory fee). The Board noted that IronBridge uses SMID Fund brokerage to obtain non-execution services on a limited basis. The Board also noted that IronBridge receives consulting services from Frontier, an affiliate of the Adviser.
On the basis of its review of the foregoing information, the Board found that the terms of the New IronBridge Subadvisory Agreement were fair and reasonable and in the best interest of the shareholders of the Small Cap and SMID Funds.
International Equity Fund
When the Board reviewed the new subadvisory agreement between the Adviser and New Star on behalf of the International Equity Fund (the “New NS Subadvisory Agreement”) at a special meeting on July 24, 2008, the Board was provided materials relevant to its consideration of the New NS Subadvisory Agreement, such as New Star’s Form ADV and Code of Ethics, information regarding New Star’s compliance program, personnel and financial condition and memoranda prepared by the Company’s legal counsel. The Board also reviewed the subadvisory fees that would be payable by the International Equity Fund and the Adviser under the New NS Subadvisory Agreement and the proposed expense cap agreement between the Company and the Adviser on behalf of the International Equity Fund. The Board was also provided with the New Star’s responses to detailed requests submitted by the Company’s legal counsel.
In approving the New NS Subadvisory Agreement between the Adviser and New Star regarding the International Equity Fund, the Board considered the following factors and made the following conclusions:
Nature, Extent and Quality of the Services Provided. The Board’s analysis of the nature, extent and quality of New Star’s services to the Fund took into account knowledge gained from New Star’s presentations to the Board at meetings throughout the year. The Board reviewed and considered New Star’s non-US equity (EAFE) investment strategy and experience as an international manager, key personnel involved in providing investment management services to the Fund and financial condition. The Board also considered services provided by New Star under the Subadvisory Agreement, including the selection of broker-dealers for execution of portfolio transactions, monitoring adherence to the Fund’s investment restrictions and assisting with the Fund’s compliance with applicable securities laws and regulations. The Board concluded that the nature, extent and quality of the services provided by New Star to the Fund was appropriate and that the Fund was likely to continue to benefit from services provided by New Star under the Subadvisory Agreement.
Investment Performance of New Star. The Board reviewed the performance record of the International Equity Fund and noted that the Fund had outperformed its benchmark index for the one-year period and had underperformed its benchmark index for the three-year and since-inception periods ended June 30, 2008. The Board also considered New Star’s quarterly portfolio commentary and review of the Fund’s performance, including discussions of the reasons for the Fund’s underperformance during these periods. The Board also compared the Fund’s recent performance to the performance of New Star’s composite of other accounts managed in the EAFE style. The Board concluded that the Fund’s performance was satisfactory and that New Star would continue to provide a high level of subadvisory services to the Fund.
Subadvisory Fees. The Board reviewed and considered the subadvisory fee payable by the Adviser to New Star under the Subadvisory Agreement. The Board also reviewed information regarding New Star’s fee structures for other institutional clients. The Board determined that the subadvisory fee was
appropriate. In evaluating the subadvisory fee, the Board noted that the fee is paid by the Adviser and that therefore the overall advisory fee paid by the Fund is not directly affected by the subadvisory fee.
Costs and Profitability. The Board did not consider the cost of services provided by New Star under the Subadvisory Agreement or the profitability to New Star from its relationship with the International Equity Fund because it did not view these factors as relevant given that the subadvisory fee is paid by the Adviser.
Economies of Scale. Because the subadvisory fee is not paid by the International Equity Fund, the Board did not consider whether the fee should reflect any potential economies of scale that might be realized as Fund assets increase.
Benefits to New Star. The Board considered information presented regarding any benefits to New Star from serving as subadviser to the International Equity Fund (in addition to the subadvisory fee). New Star provided information to the Board regarding its policies for the use of soft dollar commissions. The Board also noted that New Star receives consulting services from Frontier, an affiliate of the Adviser.
On the basis of its review of the foregoing information, the Board found that the terms of the New NS Subadvisory Agreement were fair and reasonable and in the best interest of the shareholders of the International Equity Fund.
Small Cap Value Fund
When the Board reviewed the new subadvisory agreement between the Adviser and Netols Asset Management, Inc. (“Netols”) on behalf of the Small Cap Fund (the “New Netols Subadvisory Agreement”) at a special meeting on July 24, 2008, the Board was provided materials relevant to its consideration of the New Netols Subadvisory Agreement, such as Netols’ Form ADV and Code of Ethics, information regarding Netols’ compliance program, personnel and financial condition and memoranda prepared by the Company’s legal counsel. The Board also reviewed the subadvisory fees that would be payable by the Small Cap Value Fund and the Adviser under the New Netols Subadvisory Agreement and the proposed expense cap agreement between the Company and the Adviser on behalf of the Small Cap Value Fund. The Board was also provided with the Netols’ responses to detailed requests submitted by the Company’s legal counsel.
In approving the New Netols Subadvisory Agreement between the Advisor and Netols, the Directors considered the following factors and made the following conclusions:
Nature, Extent and Quality of the Services to be Provided. The Board’s analysis of the nature, extent and quality of Netols’ services to the Fund took into account knowledge gained from Netols’ presentations to the Board at meetings throughout the year. The Board reviewed and considered Netols’ investment strategy and experience as a small-cap value manager, key personnel involved in providing investment management services to the Fund and financial condition. The Board also considered services provided by Netols under the Subadvisory Agreement, including the selection of broker-dealers for execution of portfolio transactions, monitoring adherence to the Fund’s investment restrictions and assisting with the Fund’s compliance with applicable securities laws and regulations. The Board concluded that the nature, extent and quality of the services provided by Netols to the Fund was appropriate and that the Fund was likely to continue to benefit from services provided by Netols under the Subadvisory Agreement.
Investment Performance of Netols. The Board reviewed the performance record of the Small Cap Value Fund and noted that the Fund had outperformed its benchmark index for the one-year and since-inception periods ended June 30, 2008. The Board also considered Netols’ quarterly portfolio commentary and review of the Fund’s performance. The Board also compared the Fund’s recent performance to the performance of Netols’ composite of other accounts managed in the small cap value style. The Board concluded that the Fund’s performance was satisfactory and that Netols would continue to provide a high level of subadvisory services to the Fund.
Subadvisory Fees. The Board reviewed and considered the subadvisory fee payable by the Adviser to Netols under the Subadvisory Agreement. The Board determined that the subadvisory fee was appropriate. In evaluating the subadvisory fee, the Board noted that the fee is paid by the Adviser and that therefore the overall advisory fee paid by the Fund is not directly affected by the subadvisory fee.
Costs and Profitability. The Board did not consider the cost of services provided by Netols under the Subadvisory Agreement or the profitability to Netols from its relationship with the Netols Small Cap Value Fund because it did not view these factors as relevant given that the subadvisory fee is paid by the Adviser.
Economies of Scale. Because the subadvisory fee is not paid by the Fund, the Board did not consider whether the fee should reflect any potential economies of scale that might be realized as Fund assets increase.
Benefits to Netols. The Board considered information presented regarding any benefits to Netols from serving as sub-adviser to the Fund (in addition to the subadvisory fee). Netols provided information to the Board regarding its policies for the use of soft dollar commissions. The Board also noted that Netols receives consulting services from Frontier, an affiliate of the Adviser.
On the basis of its review of the foregoing information, the Board found that the terms of the New Netols Subadvisory Agreement were fair and reasonable and in the best interest of the shareholders of the Small Cap Value Fund.
Emerging Markets Equity Fund
The Board of Directors reviewed the new subadvisory agreement between the Adviser and New Star on behalf of the Emerging Markets Equity Fund on July 24, 2008. At that time, the Board was provided materials relevant to its consideration of the agreement, such as New Star’s Form ADV and Code of Ethics and information regarding New Star’s compliance program, performance track record, investment strategy, trading procedures, personnel and financial condition.
In approving the subadvisory agreement between the Adviser and New Star regarding the Emerging Markets Equity Fund, the Directors considered the following factors and made the following conclusions:
Nature, Extent and Quality of the Services to be Provided. The Board’s analysis of the nature, extent and quality of New Star’s proposed services to the Fund took into account knowledge gained from New Star’s presentation at the July 24, 2008 meeting to the Board and from New Star’s presentations at meetings throughout the year in relation to the existing International Equity Fund. The Board reviewed and considered New Star’s emerging markets equity investment strategy and experience as an international manager, key personnel involved in providing investment management services to
the Fund and financial condition. The Board also considered services to be provided by New Star under the subadvisory agreement, including the selection of broker-dealers for execution of portfolio transactions, monitoring adherence to the Fund’s investment restrictions and assisting with the Fund’s compliance with applicable securities laws and regulations. The Board concluded that the nature, extent and quality of the services to be provided by New Star to the Fund was appropriate and that the Fund was likely to benefit from services provided by New Star under the subadvisory agreement.
Investment Performance of New Star. The Board reviewed the performance of the existing International Equity Fund subadvised by New Star. The Board concluded that the Fund’s performance was satisfactory.
Proposed Fee. The Board determined that the proposed sub-advisory fee was appropriate in light of the Fund’s investment style. In evaluating the sub-advisory fee, the Board noted that the fee is paid by the Adviser and that therefore the overall advisory fee paid by the Fund is not directly affected by the sub-advisory fee.
Costs and Profitability. New Star did not provide any specific information regarding the costs of services to be provided or the profits they might realize because the Fund had not yet commenced operations.
Economies of Scale. Because the sub-advisory fee is not paid by the Fund, the Board did not consider whether the fee should reflect any potential economies of scale that might be realized as Fund assets increase.
Benefits to New Star. The Board considered information presented regarding any benefits to New Star from serving as subadviser to the Emerging Markets Equity Fund (in addition to the subadvisory fee). New Star provided information to the Board regarding its policies for the use of soft dollar commissions. The Board also noted that New Star receives consulting services from Frontier, an affiliate of the Adviser.
On the basis of its review of the foregoing information, the Board of Directors found that the terms of the sub-advisory agreement with New Star were fair and reasonable and in the best interest of the Emerging Markets Equity Fund’s shareholders.
Frontegra Funds
ADDITIONAL INFORMATION
(Unaudited)
Foreign Tax Credit
For the year ended June 30, 2008 Frontegra New Star International Equity Fund earned foreign source income and paid foreign taxes, which it intends to pass through to its shareholders pursuant to Section 853 of the Internal Revenue Code as follows;
| | | Foreign Source | | | Foreign | |
| | | Income Earned | | | Taxes Paid | |
| Australia | | $ | 994,465.55 | | | $ | 75,037.90 | |
| Belgium | | | 192,122.75 | | | | 28,818.41 | |
| Britain | | | 3,753,703.72 | | | | — | |
| Canada | | | 40,652.38 | | | | 6,097.86 | |
| Finland | | | 611,762.87 | | | | 91,764.45 | |
| France | | | 2,647,444.16 | | | | 397,081.11 | |
| Germany | | | 2,119,483.35 | | | | 314,974.64 | |
| Greece | | | 233,911.91 | | | | — | |
| Hong Kong | | | 851,061.76 | | | | — | |
| India | | | 9,465.42 | | | | 918.00 | |
| Italy | | | 759,702.60 | | | | 113,955.39 | |
| Japan | | | 1,829,319.98 | | | | 127,988.08 | |
| Luxembourg | | | 102,656.15 | | | | 15,381.39 | |
| Netherlands | | | 1,145,972.97 | | | | 171,891.06 | |
| Russia | | | 174,312.42 | | | | 33,953.45 | |
| Singapore | | | 370,815.12 | | | | 13,706.85 | |
| Spain | | | 548,192.36 | | | | 82,242.46 | |
| Sweden | | | 387,036.18 | | | | 58,055.43 | |
| Switzerland | | | 1,148,297.95 | | | | 172,244.70 | |
| Taiwan | | | 2,848.78 | | | | 806.78 | |
| Turkey | | | (126.52 | ) | | | — | |
| Total | | $ | 17,923,101.86 | | | $ | 1,704,917.96 | |
Qualified Dividend Income/Dividends Received Deduction
For the fiscal year ended June 30, 2008, certain dividends paid by the Funds may be subject to a maximum tax rate of 15%, as provided for by the Jobs and Growth Tax Relief Reconciliation Act of 2003. The percentage of dividends declared from ordinary income designated as qualified dividend income was as follows:
| Frontegra IronBridge Small Cap Fund | 45.88% |
| Frontegra IronBridge SMID Fund | 38.29% |
| Frontegra New Star International Equity Fund | 51.25% |
| Frontegra Netols Small Cap Value Fund | 79.29% |
Frontegra Funds
ADDITIONAL INFORMATION (continued)
(Unaudited)
For corporate shareholders, the percent of ordinary income distributions qualifying for the corporate dividends received deduction for the fiscal year ended June 30, 2008 was as follows:
| Frontegra IronBridge Small Cap Fund | 47.01% |
| Frontegra IronBridge SMID Fund | 33.70% |
| Frontegra New Star International Equity Fund | 0.21% |
| Frontegra Netols Small Cap Value Fund | 36.85% |
Additional Information Applicable to Foreign Shareholders Only
The percent of ordinary income distributions designated as interest related dividends for the fiscal year ended June 30, 2008 was as follows:
| Frontegra Columbus Core Plus Fund | 64.72% |
| Frontegra Columbus Core Fund | 65.54% |
| Frontegra IronBridge Small Cap Fund | 5.93% |
| Frontegra IronBridge SMID Fund | 4.55% |
| Frontegra New Star International Equity Fund | 0.54% |
| Frontegra Netols Small Cap Value Fund | 5.65% |
The percent of ordinary income distributions designated as short-term capital gain distributions for the fiscal year ended June 30, 2008 was as follows:
| Frontegra Columbus Core Plus Fund | 15.49% |
| Frontegra IronBridge Small Cap Fund | 99.07% |
| Frontegra IronBridge SMID Fund | 95.31% |
| Frontegra New Star International Equity Fund | 65.02% |
| Frontegra Netols Small Cap Value Fund | 74.90% |
Voting Results of Special Meeting of Shareholders
A special meeting of shareholders (the “Special Meeting”) of Frontegra Funds, Inc. (the “Corporation”) was held on October 30, 2008. The Special Meeting was adjourned twice with respect to certain portfolios of the Corporation to November 7, 2008 and November 14, 2008 to permit further solicitation of votes. At the Special Meeting, shareholders voted on proposals to elect three current directors to serve on the Board of Directors and to approve a new investment advisory agreement between the Corporation, on behalf of the Frontegra Columbus Core Plus Fund, Frontegra Columbus Core Fund, Frontegra IronBridge Small Cap Fund, Frontegra IronBridge SMID Fund, Frontegra New Star International Equity Fund and Frontegra Netols Small Cap Value Fund (collectively, the “Funds”), and Frontegra Asset Management, Inc. (the “Adviser”) and new subadvisory agreements between the Adviser and each subadviser as described below. Further details regarding each proposal and the Special Meeting are contained in a definitive proxy statement filed with the SEC on September 26, 2008.
Frontegra Funds
ADDITIONAL INFORMATION (continued)
(Unaudited)
At the Special Meeting held on October 30, 2008, the following actions were taken:
| (1) | The following individuals were elected to serve on the Board of Directors by the shareholders of all Funds voting together in the aggregate: |
| Name of Director | Number of Votes For | Number of Votes Withheld |
| David L. Heald | 59,738,171 | 374,211 |
| James M. Snyder | 59,738,171 | 374,211 |
| William D. Forsyth III | 52,839,360 | 7,273,022 |
| (2) | A new investment advisory agreement between the Corporation on behalf of each of the following Funds and the Adviser was approved by the shareholders of each Fund (voting separately on a Fund-by-Fund basis) as follows: |
| Fund | Votes For | Votes Against | Abstained | Broker Non-Votes |
| Frontegra Columbus | | | | |
| Core Fund | 7,939,514 | 0 | 0 | 1,941,544 |
| Frontegra IronBridge | | | | |
| Small Cap Fund | 10,164,933 | 4,978 | 2,333 | 4,225,616 |
| Frontegra Netols | | | | |
| Small Cap Value Fund | 1,652,743 | 0 | 0 | 23,788 |
| (3) | A new subadvisory agreement between Reams Asset Management Company, LLC and the Adviser was approved by the shareholders of the Frontegra Columbus Core Fund as follows: |
| Votes For | Votes Against | Abstained | Broker Non-Votes |
| 7,939,514 | 0 | 0 | 1,941,544 |
| (4) | A new subadvisory agreement between IronBridge Capital Management, LP and the Adviser was approved by the shareholders of the Frontegra IronBridge Small Cap Fund as follows: |
| Votes For | Votes Against | Abstained | Broker Non-Votes |
| 10,162,771 | 7,140 | 2,333 | 4,225,616 |
| (5) | A new subadvisory agreement between Netols Asset Management, Inc. and the Adviser was approved by the shareholders of the Frontegra Netols Small Cap Value Fund as follows: |
| Votes For | Votes Against | Abstained | Broker Non-Votes |
| 1,651,201 | 1,542 | 0 | 23,788 |
Frontegra Funds
ADDITIONAL INFORMATION (continued)
(Unaudited)
At the Special Meeting held on October 30, 2008 as adjourned to November 7, 2008, the following actions were taken with respect to the Frontegra Columbus Core Plus Fund and the Frontegra New Star International Equity Fund:
| (1) | A new investment advisory agreement between the Corporation on behalf of each of the following Funds and the Adviser was approved by the shareholders of each Fund (voting separately on a Fund-by-Fund basis) as follows: |
| Fund | Votes For | Votes Against | Abstained | Broker Non-Votes |
| Frontegra Columbus | | | | |
| Core Plus Fund | 8,761,065 | 6,289 | 2,237 | 634,370 |
| Frontegra New Star | | | | |
| International Equity Fund | 16,306,182 | 0 | 1,495,550 | 0 |
| (2) | A new subadvisory agreement between Reams Asset Management Company, LLC and the Adviser was approved by the shareholders of the Frontegra Columbus Core Plus Fund as follows: |
| Votes For | Votes Against | Abstained | Broker Non-Votes |
| 8,759,106 | 8,249 | 2,237 | 634,370 |
| (3) | A new subadvisory agreement between New Star Institutional Managers Limited and the Adviser was approved by the shareholders of the Frontegra New Star International Equity Fund as follows: |
| Votes For | Votes Against | Abstained | Broker Non-Votes |
| 16,306,182 | 0 | 1,495,550 | 0 |
| At the Special Meeting held on October 30, 2008 as adjourned to November 7, 2008 and November 14, 2008, the following actions were taken with respect to the Frontegra IronBridge SMID Fund: |
| (1) | A new investment advisory agreement between the Corporation on behalf of the Frontegra IronBridge SMID Fund and the Adviser was approved by the shareholders of the Fund as follows: |
| Votes For | Votes Against | Abstained | Broker Non-Votes |
| 8,881,748 | 26,661 | 809,247 | 3,447,155 |
| (2) | A new subadvisory agreement between IronBridge Capital Management, LP and the Adviser was approved by the shareholders of the Frontegra IronBridge SMID Fund as follows: |
| Votes For | Votes Against | Abstained | Broker Non-Votes |
| 8,874,862 | 31,319 | 811,475 | 3,447,155 |
| | This page intentionally left blank. |
| | This page intentionally left blank. |
| | This page intentionally left blank. |
A Note on Forward-Looking Statements
This report includes forward-looking statements such as adviser, sub-adviser and/or portfolio manager predictions, assessments, analyses or outlooks for individual securities, industries, market sectors and/or markets. These statements involve risks and uncertainties. In addition to the general risks described for the Funds in the current Prospectuses, other factors bearing on these statements include the accuracy of the adviser’s, sub-advisers’ or portfolio manager’s forecasts and predictions, and the appropriateness of the investment programs designed by the adviser, sub-adviser or portfolio manager to implement their strategies efficiently and effectively. Any one or more of these factors, as well as other risks affecting the securities markets and investment instruments generally, could cause the actual results of the Funds to differ materially as compared to benchmarks associated with the Funds.
In addition, portfolio composition will change due to ongoing management of the Funds. Specific securities named in this report may not currently be owned by the applicable Fund, or the Fund’s position in the securities may have changed.
Additional Information
Frontegra Funds has adopted proxy voting policies and procedures that delegate to Frontegra Asset Management, Inc., the Funds’ investment adviser (the “Adviser”), the authority to vote proxies. The proxy voting policies permit the Adviser to delegate its authority to vote proxies to each Fund’s subadviser. A description of the Frontegra Funds’ proxy voting policies and procedures is available without charge, upon request, by calling the Funds toll free at 1-888-825-2100. A description of these policies and procedures is also included in the Funds’ Statement of Additional Information, which is available on the SEC’s website at http://www.sec.gov.
The actual voting records relating to each Fund’s portfolio securities during the most recent twelve months ended June 30 are available without charge by calling the Funds toll free at 1-888-825-2100 or by accessing the SEC’s website at http://www.sec.gov.
Each Fund files a complete schedule of portfolio holdings for its first and third fiscal quarters with the SEC on Form N-Q. The Form N-Q is available on the SEC’s website at http://www.sec.gov. The Form N-Q may also be reviewed and copied at the SEC’s Public Reference Room in Washington, D.C. Information on the operation of the Public Reference Room may be obtained by calling toll-free 1-800-SEC-0330.
Item 2. Code of Ethics.
Not applicable for semi-annual reports.
Item 3. Audit Committee Financial Expert.
Not applicable for semi-annual reports.
Item 4. Principal Accountant Fees and Services.
Not applicable for semi-annual reports.
Item 5. Audit Committee of Listed Registrants.
Not applicable to registrants who are not listed issuers (as defined in Rule 10A-3 under the Securities Exchange Act of 1934).
Item 6. Investments.
Schedule of Investments is included as part of the report to shareholders filed under Item 1 of this Form.
Item 7. Disclosure of Proxy Voting Policies and Procedures for Closed-End Management Investment Companies.
Not applicable to open-end investment companies.
Item 8. Portfolio Managers of Closed-End Management Investment Companies.
Not applicable to open-end investment companies.
Item 9. Purchases of Equity Securities by Closed-End Management Investment Company and Affiliated Purchasers.
Not applicable to open-end investment companies.
Item 10. Submission of Matters to a Vote of Security Holders.
Not Applicable.
Item 11. Controls and Procedures.
| (a) | Based on an evaluation of the Registrant's disclosure controls and procedures (as defined in Rule 30a-3(c) under the Investment Company Act of 1940 (the “Act”)) as of a date within 90 days prior to the filing date of this Form N-CSR, the Registrant’s President and Treasurer have concluded that the disclosure controls and procedures are effective. |
| (b) | There were no changes in the Registrant's internal control over financial reporting (as defined in Rule 30a-3(d) under the Act) that occurred during the second fiscal quarter of the period covered by this report that has materially affected, or is reasonably likely to materially affect, the Registrant's internal control over financial reporting. |
Item 12. Exhibits.
| (a) | (1) Any code of ethics or amendment thereto, that is the subject of the disclosure required by Item 2, to the extent that the registrant intends to satisfy Item 2 requirements through filing an exhibit. Not Applicable. |
(2) A separate certification for each principal executive and principal financial officer pursuant to Section 302 of the Sarbanes-Oxley Act of 2002. Filed herewith.
(3) Any written solicitation to purchase securities under Rule 23c-1 under the Act sent or given during the period covered by the report by or on behalf of the registrant to 10 or more persons. Not applicable to open-end investment companies.
| (b) | Certifications pursuant to Section 906 of the Sarbanes-Oxley Act of 2002. Furnished herewith. |
SIGNATURES
Pursuant to the requirements of the Securities Exchange Act of 1934 and the Investment Company Act of 1940, the registrant has duly caused this report to be signed on its behalf by the undersigned, thereunto duly authorized.
Frontegra Funds, Inc.
By: /s/William D. Forsyth III
William D. Forsyth III, President
(Principal Executive Officer)
Date: March 9, 2009
Pursuant to the requirements of the Securities Exchange Act of 1934 and the Investment Company Act of 1940, this report has been signed below by the following persons on behalf of the registrant and in the capacities and on the dates indicated.
By: /s/William D. Forsyth III
William D. Forsyth III, President and Secretary
(Principal Executive Officer)
Date: March 9, 2009
By: /s/Elyce D. Dilworth
Elyce D. Dilworth, Treasurer and Assistant Secretary
(Principal Financial Officer)
Date: March 9, 2009