UNITED STATES
SECURITIES AND EXCHANGE COMMISSION
Washington, D.C. 20549
FORM N-CSR
CERTIFIED SHAREHOLDER REPORT OF REGISTERED
MANAGEMENT INVESTMENT COMPANIES
Investment Company Act file number | 811-07685 |
|
Frontegra Funds, Inc. |
(Exact name of registrant as specified in charter) |
|
400 Skokie Blvd. Suite 500 Northbrook, Illinois | | 60062 |
(Address of principal executive offices) | | (Zip code) |
|
William D. Forsyth III 400 Skokie Blvd., Suite 500 Northbrook, Illinois 60062 |
(Name and address of agent for service) |
|
Registrant’s telephone number, including area code: | (847) 509-9860 | |
|
Date of fiscal year end: | June 30 | |
|
Date of reporting period: | December 31, 2012 | |
| | | | | | | | |
Item 1. Reports to Stockholders.

SEMI-ANNUAL REPORT
Frontegra RobecoSAM Global Equity Fund
Frontegra MFG Global Equity Fund
Frontegra MFG Core Infrastructure Fund
Frontegra HEXAM Emerging Markets Fund
Frontegra Timpani Small Cap Growth Fund
Frontegra Netols Small Cap Value Fund
Frontegra Phocas Small Cap Value Fund
Lockwell Small Cap Value Fund
Frontegra Asset Management, Inc.
December 31, 2012

TABLE OF CONTENTS
Shareholder Letter | | | 1 | | |
Frontegra RobecoSAM Global Equity Fund | |
Report from RobecoSAM USA, Inc. | | | 4 | | |
Investment Highlights | | | 6 | | |
Frontegra MFG Global Equity Fund | |
Report from MFG Asset Management | | | 8 | | |
Investment Highlights | | | 11 | | |
Frontegra MFG Core Infrastructure Fund | |
Report from MFG Asset Management | | | 14 | | |
Investment Highlights | | | 16 | | |
Frontegra HEXAM Emerging Markets Fund | |
Report from HEXAM Capital Partners, LLP | | | 18 | | |
Investment Highlights | | | 20 | | |
Frontegra Timpani Small Cap Growth Fund | |
Report from Timpani Capital Management LLC | | | 22 | | |
Investment Highlights | | | 24 | | |
Frontegra Netols Small Cap Value Fund | |
Report from Netols Asset Management, Inc. | | | 26 | | |
Investment Highlights | | | 27 | | |
Frontegra Phocas Small Cap Value Fund | |
Report from Phocas Financial Corporation | | | 30 | | |
Investment Highlights | | | 32 | | |
Lockwell Small Cap Value Fund | |
Report from Lockwell Investments, LLC | | | 34 | | |
Investment Highlights | | | 35 | | |
Expense Example | | | 36 | | |
Schedules of Investments | |
Frontegra RobecoSAM Global Equity Fund | | | 38 | | |
Frontegra MFG Global Equity Fund | | | 40 | | |
Frontegra MFG Core Infrastructure Fund | | | 41 | | |
Frontegra HEXAM Emerging Markets Fund | | | 44 | | |
Frontegra Timpani Small Cap Growth Fund | | | 46 | | |
Frontegra Netols Small Cap Value Fund | | | 48 | | |
Frontegra Phocas Small Cap Value Fund | | | 50 | | |
Lockwell Small Cap Value Fund | | | 53 | | |
Statements of Assets and Liabilities | | | 56 | | |
Statements of Operations | | | 58 | | |
Statements of Changes in Net Assets | | | 60 | | |
Financial Highlights | | | 64 | | |
Notes to Financial Statements | | | 73 | | |
This report is submitted for the general information of the shareholders of the Funds. It is not authorized for distribution to prospective investors unless accompanied or preceded by an effective Prospectus for the applicable Fund. The Prospectus may be obtained by calling 1-888-825-2100. Each Prospectus includes more complete information about management fees and expenses, investment objectives, risks and operating policies of the applicable Fund. Please read the Prospectus carefully.
Frontegra Funds, Inc. are distributed by Frontegra Strategies, LLC, 400 Skokie Blvd., Suite 500, Northbrook, IL 60062. Frontegra Strategies, LLC, member of FINRA and SIPC, is an affiliate of Frontegra Asset Management, Inc., the Funds' investment adviser.

DEAR FELLOW SHAREHOLDERS:
We are pleased to report on the progress of the Frontegra Funds over the past six months ending December 31, 2012. The S&P 500 Index was up 5.95%, and small capitalization stocks were also up, with the Russell 2000® Index returning 7.20%. International stocks, as measured by the MSCI EAFE Index, returned 13.95% over the six-month period.
Fund Results
For the six month period ending December 31, 2012, the Frontegra RobecoSAM Global Equity Fund, managed by RobecoSAM USA, returned 8.45% (net) versus the MSCI World Index (Net) return of 9.36%.
For the six month period ending December 31, 2012, the Frontegra MFG Global Equity Fund, managed by MFG Asset Management ("MFG"), returned 10.18% (net) versus the MSCI World Index (Net) return of 9.36%.
For the six month period ending December 31, 2012, the Frontegra MFG Core Infrastructure Fund, also managed by MFG, returned 8.52% (net) versus the UBS Developed Infrastructure & Utilities Index (Net) return of 3.04% and the MSCI World Index (Net) return of 9.36%.
For the six month period ending December 31, 2012, the Frontegra HEXAM Emerging Markets Fund, managed by HEXAM Capital Partners, returned 14.99% (net) versus the MSCI Emerging Markets Index (Net) return of 13.75%.
The Frontegra Timpani Small Cap Growth Fund, managed by Timpani Capital Management, returned 4.17% (net) versus the Russell 2000® Growth Index return of 5.31% for the six month period ending December 31, 2012.
For the six month period ending December 31, 2012, the Frontegra Netols Small Cap Value Fund — Institutional Class, managed by Netols Asset Management, returned 8.18% (net) versus the Russell 2000® Value Index return of 9.07%. The Frontegra Netols Small Cap Value Fund — Class Y, returned 8.08% (net) over the same time period.
The Frontegra Phocas Small Cap Value Fund, managed by Phocas Financial, returned 6.03% (net) versus the Russell 2000 Value Index return of 9.07% for the six month period ending December 31, 2012.
For the six month period ending December 31, 2012, the Lockwell Small Cap Value Fund, managed by Lockwell Investments, returned 11.71% (net) versus the Russell 2000 Value Index return of 9.07%.
Outlook
The markets were generally kind in the second half of 2012, but uncertainty in Europe and a skittish recovery here in the U.S. cloud our future. While U.S. stocks and Treasury yields have both risen in January 2013, Congress has yet to address spending cuts and unemployment — while easing — is still relatively high. As we enter 2013, we will work diligently to manage your assets with the skill and nimbleness necessary in these challenging times.
We will continue to oversee the investment management of the Frontegra Funds with the care and diligence that have served our shareholders well in the past. As always, we appreciate your investment and continued confidence in the Frontegra Funds.
Best regards,
William D. Forsyth, CFA
President
Frontegra Funds, Inc.
page 1
This page intentionally left blank.

FRONTEGRA
ROBECOSAM GLOBAL EQUITY FUND

REPORT FROM ROBECOSAM USA, INC.
Dear Shareholders:
The Frontegra RobecoSAM Global Equity Fund strives to achieve capital appreciation by investing in a diversified portfolio of equity and equity-related securities issued by U.S. and non-U.S. companies that combine their market and financial strategy with a high level of environmental awareness and a clearly defined social policy. The objective is measured against the MSCI World Index (Net).
Performance Review
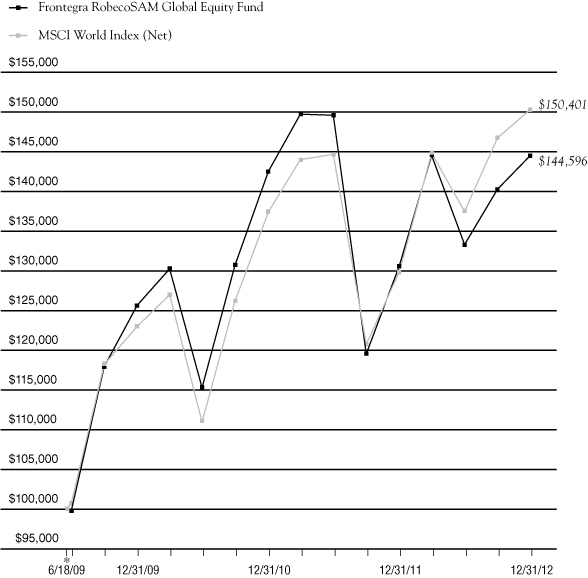
The Frontegra RobecoSAM Global Equity Fund returned 8.45%, net of fees, for the six month period ending December 31, 2012. The Fund's return underperformed the 9.36% return of its benchmark, the MSCI World Index (Net). For the year, the Fund returned 10.73%, net of fees, compared to the benchmark's return of 15.83%. The portfolio's underperformance relative to the benchmark was primarily attributable to stock selection. Stock selection was particularly weak within Materials, Consumer Discretionary and Information Technology stocks, while we outperformed within Financials, Telecommunications and Industrials.
Over the period, the portfolio was positioned as overweight (relative to the MSCI World Index) in Health Care, Consumer Staples and Telecommunications and was underweight in Financials, Industrials and Materials. In terms of performance contribution, portfolio sector allocation had a negative impact on the relative performance. In particular, negative contribution came from underweighting Financials and overweighting Telecommunications.
The largest positive contributions at the stock level included overweight positions in Total (Energy), Barclays (Financials) and Telus (Telecommunications). Not holding positions in Apple and Intel has also had a positive contribution as these stocks underperformed the sector. The largest negative contributions at the stock level came from overweight position in Stanley Electric (Consumer Discretionary), Microsoft (Information Technology) and Hewlett-Packard (Information Technology).
Portfolio Outlook and Strategy
Global equity markets were surprisingly resurgent over the period. The equity rally was fuelled by easing Euro zone stress and aggressive monetary policy actions. In the U.S., the Fed delivered what the majority of market participants had been expecting: namely a third round of quantitative easing. The Fed announced plans to buy $40 billion of mortgage-backed securities each month until they see improvement in the labour market. It also extended the zero interest rate policy into 2015. In Europe, the ECB plan to buy Euro zone government bonds was well received by investors. The so called OMT plan (Outright Monetary Transactions) will have no ex ante limits on the size of purchases, subject to certain conditions. European governments that want the ECB to buy their bonds must agree to a program of reforms and oversight by the bailout funds.
As the result of stronger appetite for risk, the best performing sectors were Financials, Materials and Consumer Discretionary. Utilities and Telecommunications underperformed in relative terms. On a regional level, European and Asian equities were among the best performing, while U.S. markets underperformed as investors reduced risk exposure in anticipation of fiscal cliff concerns. Economic data continued to show growth tilted towards the downside. The Euro zone sovereign crisis has hurt business confidence, making companies cautious to invest in new capacities. These problems have been compounded by weakening demand in key export markets such as China and by worries over tax and spending negotiations in the U.S. As a result, the Euro zone economy has entered a recession for the second time since 2009. In Germany, Europe's largest economy, manufacturing activity contracted for the tenth consecutive month, while in Spain, business conditions worsened for the twentieth month in a row.
The outlook for the world economy remains mediocre. While global GDP estimations for 2013 vary between 2.5% to 4%, we expect the lower part of the range to be more realistic. In general, we do not see a big risk of a global recession. Mainly driven by a recovery in the housing market, the U.S. is growing at a moderately positive rate, and China's leading indicators are rebounding. On the other hand, we
page 4

also struggle to detect a trigger that could stimulate global growth in a more dynamic way. We expect to remain in an environment of on-going political interventions and low interest rates. This combination will likely result in modest earnings growth and gives equities, compared to other asset classes, a favourable valuation.
Our investment strategy remains focused on investing in sustainable companies with attractive valuation and stable earnings outlook. We also continue to underweight sectors where earnings visibility is lower, namely Financials. Our outlook for the Financial sector remains cautious as a result of the tightening regulation and the ongoing de-leveraging process. Our approach in this space remains very selective with focus on companies with solid cash generation, strong balance sheets and acceptable leverage.
Sincerely,
Senior Portfolio Manager
RobecoSAM USA, Inc.
page 5

INVESTMENT HIGHLIGHTS
Growth of a $100,000 Investment (Unaudited)
* 6/18/09 commencement of operations.
This chart assumes an initial gross investment of $100,000 made on 6/18/09 (commencement of operations). Returns shown include the reinvestment of all distributions. Past performance is not predictive of future results. Investment return and principal value will fluctuate so that shares, when redeemed, may be worth more or less than the original cost. In the absence of existing fee waivers, total return would be reduced. Effective June 10, 2011, RobecoSAM USA, Inc. ("RobecoSAM") became subadviser to the Fund and Frontegra Asset Management, Inc. became adviser to the Fund. Prior to June 10, 2011, RobecoSAM served as adviser to the Fund. To receive current to the most recent month-end performance, please call 1-888-825-2100.
The MSCI World Index measures the overall performance of stock markets in 23 developed market countries in North America, Europe, and the Asia/Pacific Region. The Index does not reflect investment management fees, brokerage commissions and other expenses associated with investing in equity securities. A direct investment in the index is not possible.
** The returns shown do not reflect the deduction of taxes that a shareholder would pay on Fund distributions or the redemption of Fund shares.
Portfolio Total Return**
FOR PERIODS
ENDED 12/31/12 | | FUND | | INDEX | |
SIX MONTHS | | | 8.45 | % | | | 9.36 | % | |
ONE YEAR | | | 10.73 | % | | | 15.83 | % | |
AVERAGE ANNUAL
SINCE INCEPTION | | | 10.99 | % | | | 12.23 | % | |
page 6

FRONTEGRA
MFG GLOBAL EQUITY FUND

REPORT FROM MFG ASSET MANAGEMENT
Dear Fellow Shareholders:
The investment objective of the Frontegra MFG Global Equity Fund is capital appreciation. The objective is measured against the MSCI World Index (Net).
Performance Review
The Frontegra MFG Global Equity Fund returned 10.18%, net of fees, for the six month period ending December 31, 2012. The Fund's return outperformed the 9.36% return of its benchmark, the MSCI World Index (Net). For the year, the Fund returned 19.46%, net of fees, compared to the benchmark's return of 15.83%.
We do not manage the Fund against short-term performance metrics and it is inevitable the Fund will underperform markets at some point in the future. We aim (not guarantee) to produce absolute returns through the business cycle whilst minimizing the risk of a permanent capital loss. We will continue to focus on these objectives and will not chase short-term performance.
Portfolio Outlook and Strategy
We have seen more stable investment markets over the past six months. In our view the major contributing factor to the more stable market environment was the commitment by the ECB President, Mario Draghi, to preserve the euro. This commitment was followed up on 6 September with an announcement by the ECB of the Outright Monetary Transactions Programme or the "OMT". Under the OMT, the ECB will buy an unlimited amount of sovereign bonds (with a maturity of less than three years) of any EU country with a distressed sovereign debt market. A country must apply for help from the European Stability Mechanism and agree to any fiscal conditions applied. In our view, these commitments by the ECB have further reduced the possibility of a major financial meltdown scenario in Europe.
As at 31 December 2012, the portfolio consisted of 24 investments (in comparison with 24 investments at 30 June 2012). The top ten investments represented approximately 52% of the portfolio at 31 December 2012.
Over the six months to 31 December 2012, the three stocks with the strongest returns in local currency were Lowe's (+26.3%), Visa (+23.1%) and Google (+22.9%), and the stocks with the weakest returns were Coca-Cola (-6.0%), Wal-Mart (-1.1%) and American Express (-0.6%).
There have been a few major changes to the portfolio during the past six months. The material changes have been a new investment in General Mills, the addition of global custody banks, Bank of New York Mellon and State Street (refer U.S. interest rate discussion below), an increase in the weighting of investments in Yum! Brands and Tesco, and a decrease in the weighting of eBay, Unilever, and Lowe's.
The portfolio continues to be exposed to the following major investment themes:
• Emerging market consumption growth via investments in multinational consumer franchises. Approximately 27% of the portfolio is invested into multinational consumer franchises which have on average approximately 40% of their sales revenue generated from emerging markets. The five largest investments in multinational consumer franchises at 31 December 2012 were Danone, Yum! Brands, McDonalds, Nestle and Mondelez International (the multinational packaged foods company which spun off from Kraft in October 2012).
• U.S. interest rates. It is our view that it is likely that U.S. short and long-term interest rates will "normalise" over the next three to five years as the U.S. economy recovers. This will be as a result of the U.S. Federal Reserve lifting the Federal Deposit Rate and the Federal Reserve firstly ceasing its quantitative easing programme and then taking steps to shrink (or sterilize) its balance sheet which is likely to have a material impact on longer-term bond yields. We own four U.S. financial institutions which are likely to benefit from the change in U.S. interest rates, Wells Fargo, U.S. Bancorp, Bank of New York Mellon and State Street. These investments represented approximately 14% of the portfolio at 31 December 2012.
page 8

• A move to a cashless society. There continues to be a strong secular shift from spending via cash and cheque to cashless forms of payments such a credit cards, debit cards, electronic funds transfer and mobile payments. In our opinion, the explosion of smart mobile phones will accelerate this shift on a global basis. We believe that there are only a limited number of companies that are well positioned to benefit from this structural shift. The companies are typically highly attractive with strong network effects, low capital intensity, high barriers to entry and high returns on capital. As at 31 December 2012, approximately 16% of the portfolio was invested in the payments space through exposure to companies such as PayPal (via eBay), American Express, Visa and MasterCard.
• U.S. housing. A recovery in new housing construction should drive a strong cyclical recovery in companies exposed to the U.S. housing market and also provide a strong boost to the overall economy. Our major exposure to the U.S. housing market is via our exposure to the home improvement retailer, Lowe's, and the domestic U.S. banks, Wells Fargo and U.S. Bancorp. These investments represented approximately 13% of the portfolio at 31 December 2012.
• Internet/e-commerce. There are a number of internet enabled businesses that have very attractive investment characteristics with increasing competitive advantages. The Fund's internet investments at 31 December 2012 were eBay and Google, which represented approximately 11% of the portfolio.
Europe
As noted previously, since June the ECB has taken substantive action with Mario Draghi's "Whatever it takes" statement in July and the announcement of the OMT in September, which has further reduced the probability of a European sovereign and financial system meltdown.
There has also been some progress on the EU Banking Union, which was first announced in June. In December the EU Finance Ministers announced that the ECB will take responsibility for banks that have at least €30 billion in assets or make up more than 20% of their country's GDP or operate in at least two countries. In our view, an effective framework for regulation of EU banks is critical to break the negative feedback loop between individual countries and their banking systems. To be effective, the Banking Union will need to have consistent capital and liquidity rules, a wind up mechanism (likely to involve the mandatory "bail in" of creditors) and an EU deposit insurance scheme. This is a complex task and requires the foregoing of a certain degree of sovereignty.
In our view, many of the world's banks are still in denial about how determined global regulators are to dramatically strengthen capital and liquidity rules. Their aim is to make it prohibitively expensive for deposit-taking banks to undertake certain activities. This is designed to reduce the need for tax payers to become the guarantors of last resort to failing large deposit-taking financial institutions. There is a push by certain regulators to introduce a meaningful minimum leverage ratio (i.e. total tangible equity to total tangible assets). A number as high as 10% has been suggested by certain regulators. This would have dramatic consequences for many large banks.
Moving into 2013, we are closely watching the unfolding political processes in both Germany and Italy. In our view, Angela Merkel and Mario Monti have been absolutely critical in steering Europe through this complex and difficult period.
We continue to believe that many European countries face a prolonged period (possibly five to seven years) of sub-par economic growth (and in many instances recessions) due to the combined effects of fiscal austerity by governments, deleveraging of bank balance sheets and household deleveraging.
United States
Nothing has fundamentally changed in our views on the U.S. economy over the past six months. The meaningful events that have happened over the period include:
• The announcement by the Federal Reserve in September of QE3, which involves the purchase by the Federal Reserve of US$40 billion per month of mortgage-backed securities. The purpose of QE3 is to reduce the longer-term mortgage rate to enable households to refinance mortgages at lower rates;
page 9

• The announcement by the Federal Reserve in December of the intention to buy $US45 billion per month of longer-dated treasuries and an intention to keep the Federal Funds rate at an exceptionally low level until the U.S. unemployment rate is below 6.5%, provided forward inflation expectations are no more than 2.5%. This is the first time in recent times that the Federal Reserve has explicitly tied short-term interest rates to a specific level of unemployment;
• The re-election of Barack Obama as President, and;
• The last-minute agreement to avert the fiscal cliff by increasing tax rates for wealthier Americans and extending the Bush-era tax rates for the middle class. The agreement also involved the expiry of the temporary payroll tax cuts and pushed out the date for automatic expenditure cuts. Unfortunately, this agreement has not ended the political uncertainty.
I have stated on a number of occasions that the extraordinary policy responses in recent years, particularly by the Federal Reserve and ECB, have fuelled a number of current bubbles and distortions in certain asset markets, most notably foreign exchange and bond markets. It is inevitable that these distortions will unwind at some point, and there is a reasonable chance that bond prices and foreign exchange markets could adjust very rapidly. The longer these policy responses are held in place, the more complacent investors are likely to become, believing that this environment is the "new normal." These policy settings will not last indefinitely, and we consider the portfolio is well positioned for the eventual correction.
There continue to be signs that the U.S. is undergoing a modest economic recovery. We believe that there is unlikely to be a meaningful reduction in the unemployment rate in the short term until housing construction reverts to more normalised levels, which we consider will take another two to three years. When this happens, we believe the U.S. economy will recover significantly.
China
We continue to believe that China is engineering a relatively soft landing with slowing economic growth, albeit at healthy levels. The major event in the past six months has been the appointment of the new leadership team in China headed by Xi Jinping (President) and Li Keqiang (Premier). It would appear that the new leadership team will continue to focus on economic reform and a gradual opening up of the economy.
We believe it is unlikely that the government will again embark on a massive stimulus programme to increase the level of fixed asset investment to drive up the rate of economic growth. China appears content with the lower but healthy rate of economic growth.
Sincerely,
Hamish Douglass
Portfolio Manager
MFG Asset Management
page 10

INVESTMENT HIGHLIGHTS
Growth of a $100,000 Investment (Unaudited)

* 12/28/11 commencement of operations.
This chart assumes an initial gross investment of $100,000 made on 12/28/11 (commencement of operations). Returns shown include the reinvestment of all distributions. Past performance is not predictive of future results. Investment return and principal value will fluctuate so that shares, when redeemed, may be worth more or less than the original cost. In the absence of existing fee waivers, total return would be reduced. To receive current to the most recent month-end performance, please call 1-888-825-2100.
The MSCI World Index measures the overall performance of stock markets in 23 developed market countries in North America, Europe, and the Asia/Pacific Region. The Index does not reflect investment management fees, brokerage commissions and other expenses associated with investing in equity securities. A direct investment in the index is not possible.
** The returns shown do not reflect the deduction of taxes that a shareholder would pay on Fund distributions or the redemption of Fund shares.
Portfolio Total Return**
FOR PERIODS ENDED 12/31/12 | | FUND | | INDEX | |
SIX MONTHS | | | 10.18 | % | | | 9.36 | % | |
ONE YEAR | | | 19.46 | % | | | 15.83 | % | |
AVERAGE ANNUAL
SINCE INCEPTION | | | 18.93 | % | | | 17.13 | % | |
page 11
This page intentionally left blank.

FRONTEGRA
MFG CORE INFRASTRUCTURE FUND

REPORT FROM MFG ASSET MANAGEMENT
Dear Fellow Shareholders:
The investment objective of the Frontegra MFG Core Infrastructure Fund is long-term capital appreciation. The objective is measured against the UBS Developed Infrastructure & Utilities Index (Net).
Generally, infrastructure assets are natural monopolies that provide an essential service to the community. Infrastructure assets offer investors protection from the impacts of inflation because their earnings generally have some direct linkage to inflation. Over time the stable, reliable earnings of infrastructure assets are expected to lead to a combination of income and capital growth for investors.
The return from the infrastructure universe as defined by MFG Asset Management ("MFGAM") was more than 10% p.a. for the decade to the end of 2012. Just under half of that return was in the form of dividend income.
The universe of infrastructure assets that are held by the Fund is made up of two main sectors:
• Utilities, including both regulated energy utilities and regulated water utilities. Utilities comprise approximately 74% of the Fund. Utilities are typically subject to economic regulation. This requires the utility to efficiently provide an essential service to the community and, in return, permits the utility to earn a fair rate of return on the capital it has invested in its operations. As the utility provides a basic necessity, e.g. energy or water, there is minimal fluctuation in demanded volumes in response to the economic cycle and the price charged for the utility service can be adjusted with limited impact upon demanded volumes. As a result, the earnings of regulated utilities have been, and are expected to continue to be, stable irrespective of economic conditions; and
• Infrastructure, which includes airports, ports, toll roads and broadcast communications infrastructure. Regulation of infrastructure companies is generally less intensive than for utilities and allows companies to accrue the benefits of volume growth i.e. the returns of infrastructure companies are linked to growth in passengers, vehicles or containers. As economies develop, grow and become more inter-dependent, we expect the underlying level of aviation, shipping and vehicle traffic to increase. As a result, the revenues and earnings derived by infrastructure assets are expected to grow.
Performance Review
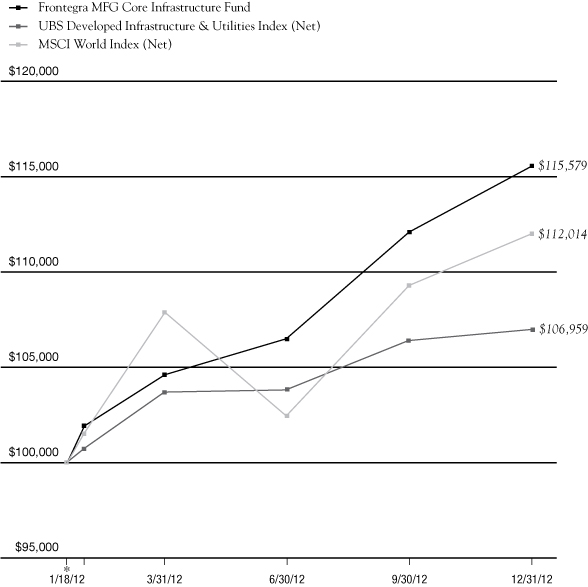
The Frontegra MFG Core Infrastructure Fund returned 8.52%, net of fees, for the six month period ending December 31, 2012. The Fund's return outperformed the 3.04% return of its benchmark, the UBS Developed Infrastructure & Utilities Index (Net). Since the Fund's inception on January 18, 2012, the Fund has returned 15.58% net of fees, whilst the benchmark has returned 6.96%.
Most sectors held in the Core Infrastructure strategy performed well during the last six months of 2012, with Airports up a weighted average 22%, Toll Roads up 20%, and Broadcast Communications up 14%. The Water Utilities sector was the worst performing in the Fund, remaining flat on average over the six months.
A number of sectors excluded from the Core Infrastructure strategy but included in the benchmark performed relatively poorly during the second half of 2012 helping to explain the relative out-performance of the portfolio. Most notably, the Competitive Power sector, which has a large weighting in the benchmark index, was up an average of 1%.
Geographically, Latin America (including Mexico) was the strongest performer, up a weighted average of 33% over the last six months of 2012. The period also saw Australian/New Zealand stocks up a weighted average of 15% and European stocks up 14%, while U.S. stocks performed relatively poorly, returning -1% for the six months on a weighted average basis.
page 14

Portfolio Outlook and Strategy
The Core Infrastructure strategy is designed to provide reliable returns in all but the most extreme market conditions. The Fund significantly exceeded that expectation during 2012, partly reflecting the recovery of stocks held by the Fund that had been over-sold in previous years. We now see the utilities market as broadly in equilibrium while infrastructure stocks remain cheap.
MFGAM believes that infrastructure and utility assets, with requisite earnings reliability and a linkage of earnings to inflation offer an attractive, long-term investment proposition. Furthermore, given the predictable nature of earnings and the structural linkage of those earnings to inflation, the investment returns generated by infrastructure assets are different from standard asset classes and offer investors valuable diversification when included in an investment portfolio. In the current uncertain economic and investment climate, the reliable financial performance of infrastructure investments makes them particularly attractive and an investment in listed infrastructure can be expected to reward patient investors with a three to five year timeframe.
Sincerely,
Dennis Eagar | |
Portfolio Manager
MFG Asset Management | |
page 15

INVESTMENT HIGHLIGHTS
Growth of a $100,000 Investment (Unaudited)
* 1/18/12 commencement of operations.
This chart assumes an initial gross investment of $100,000 made on 1/18/12 (commencement of operations). Returns shown include the reinvestment of all distributions. Past performance is not predictive of future results. Investment return and principal value will fluctuate so that shares, when redeemed, may be worth more or less than the original cost. In the absence of existing fee waivers, total return would be reduced. To receive current to the most recent month-end performance, please call 1-888-825-2100.
The MSCI World Index measures the overall performance of stock markets in 23 developed market countries in North America, Europe, and the Asia/Pacific Region. The Index does not reflect investment management fees, brokerage commissions and other expenses associated with investing in equity securities. A direct investment in the index is not possible.
The UBS Developed Infrastructure & Utilities Index (Net) is a global developed markets infrastructure and utilities benchmark, where dividends are included, dividends are reinvested after the deduction of withholding taxes and is denominated in U.S. dollars. The index is a free-float market capitalization-weighted index and inclusion criteria requires the constituents to have a free float market capitalization greater than US$500m and more than 50% of EBITDA is derived from Infrastructure or Utility businesses. Infrastructure and Utilities are defined as the permanent assets that a society requires to facilitate the orderly operation of an economy. Due to the large size and cost and often monopoly characteristics of these assets, Infrastructure and Utilities have historically been financed, built, owned and operated by the state. Infrastructure includes Transport (roads, airports, seaports, rail) and Communications (broadcast/mobile towers, satellites, fiber and copper cables). Utilities includes Energy (gas and electricity transmission, distribution and generation) and Water (irrigation, potable water, waste treatment).
** The returns shown do not reflect the deduction of taxes that a shareholder would pay on Fund distributions or the redemption of Fund shares.
Portfolio Total Return**
FOR PERIODS
ENDED 12/31/12 | | FUND | | UBS
INDEX | | MSCI
INDEX | |
SIX MONTHS | | | 8.52 | % | | | 3.04 | % | | | 9.36 | % | |
SINCE INCEPTION | | | 15.58 | % | | | 6.96 | % | | | 12.01 | % | |
page 16

FRONTEGRA
HEXAM EMERGING MARKETS FUND

REPORT FROM HEXAM CAPITAL PARTNERS, LLP
Dear Shareholders:
The Frontegra HEXAM Emerging Markets Fund aims to achieve long-term capital growth by investing at least 80% of its net assets in securities of emerging market companies. The Fund's benchmark is the MSCI Emerging Markets Index (Net).
Performance Review
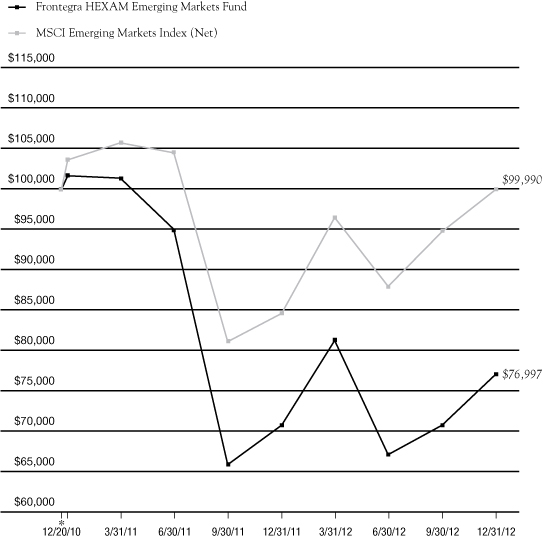
During the six months ended December 31, 2012, the Frontegra HEXAM Emerging Markets Fund returned 14.99%, net of fees, compared to 13.75% for the MSCI Emerging Markets Index (Net). For the year, the Fund returned 9.03%, net of fees, compared to 18.22% for the Index.
Portfolio Review and Strategy
Emerging markets were up 13.8% in USD terms for the reporting period, led by Turkey (+28.1%), Poland (+25.4%) and China (+18.4%). The Fund's significant overweight position in China was a strong positive contributor to the Fund's performance. Our stance that China's economy is not going to "hard land" was vindicated. The Chinese macro data has been consistently strong, indicating that the economic stimulus measures taken by the Chinese government were effective. The data points indicate a more sustained economic recovery led by fixed asset investment by businesses and increases in domestic consumption rather than excess liquidity (as witnessed in the aftermath of the 2008 crisis). The transition of power in China largely feared by investors occurred without any surprises. The new leadership pledged support for the domestic and global economy. Korea (+15.1%) also performed well as one of the biggest beneficiaries of the strength of the Chinese economy. Strong contributors to the Fund's overall performance came from the Fund's underweight positions in Chile, Malaysia, Indonesia, Taiwan and Mexico.
Brazil (+8.4%) underperformed for the period as government intervention into businesses and industries kept investors at bay. The latest blow to the utilities sector in Brazil occurred when President Rousseff capped electricity tariffs. This action led to some index heavyweights in the sector losing more than 50% of their market capitalization in a matter of days. Russia (+12.0%) also underperformed the index as flows into the market remained anemic. Despite distressed valuations (Russia is currently trading at cheaper multiples than during the Yukos crisis) and improving fundamentals, the market remains at the mercy of foreign investors, with domestic pension fund participation still in a nascent stage. Both Brazil and Russia detracted from performance as did our underweight positions in Turkey and Poland.
At a stock selection level, the biggest contributor to the Fund's positive performance came from the Fund's Chinese holdings, Nine Dragons Paper Holdings and Kingboard Chemical Holdings. Nine Dragons is the largest containerboard producer in China with an estimated 23% market share. The company is well positioned to take advantage of the industry rebound and has a falling gearing ratio and abating financing costs. Given Nine Dragons largely completed its massive capacity expansion in 2012, we expect the company to see robust volume growth in the coming years when utilization of new capacity ramps up. The stock is trading at just 0.97x P/B. Kingboard Chemical, the largest printed circuit boards manufacturer in China and the third largest global manufacturer of paper laminates, was the second biggest contributor to return. The company is trading at just 0.6x P/B and its margins are highly geared to Chinese macro environment, which is on an improving trend.
The biggest detractor from the Fund's performance also came from a Chinese stock, Baidu, a leading internet search provider with a focus on Chinese web pages. It is the number one site in China in terms of traffic volume and reach. Baidu's share price corrected significantly after it announced Q4 revenue guidance that missed consensus by 1%-4%. Despite the short-term softness, we believe secular growth of the Chinese search market is intact. Importantly, advertisers believe the market's fixation with a few percentage point gain/loss in traffic share is irrelevant to the on-the-ground perception that Baidu is the "go to" platform for search advertising. Baidu now trades at 17.0x 2013E PE and 0.65x 2013E PEG. We believe the stock is inexpensive based on potential growth.
page 18

Despite the positive return for the index, the reporting period was characterized by ongoing volatility on the back of the U.S. elections, U.S. "fiscal cliff" concerns and European debt worries. Unsurprisingly, sector-wise, defensive sectors such as Consumer Staples, Health Care and Consumer Discretionary continued to perform well, rising 15.2%, 16.6% and 14.8%, respectively. The best performing sectors, however, were Information Technology (+16.6%) and Financials (+18.0%). The Fund benefitted from its overweight position in Financials, and our Chinese and Korean technology stocks fared well too.
We continued to stay overweight China, Korea, Russia and Brazil throughout the period. We believe the re-rating of China and the China proxies has barely started, and we will see much stronger relative gains going forward. We continued to look for new stock ideas, and the Fund saw several new additions to the portfolio during the second half of 2012.
Outlook
None of the fears (e.g. the break-up of the euro and an exit of Greece, China's hard landing, U.S. fiscal cliff concerns) that resulted in the unprecedented de-rating of cyclicals and high-beta investments materialized over the past three years. The ongoing sentiment-driven rotation into bonds and defensives is unsustainable, and we believe we saw first signs of the unwinding of that trade over the past several months. Although it is possible we may see some volatility going forward, we remain strongly convinced that valuation and fundamentals arguments will prevail over unjustifiable risk aversion. We expect equities, and active emerging markets equities in particular, to see significant inflows over the next year. The Fund is well positioned to take advantage of all these changes.
Thank you for your continued support.
Bryan Collings, CFA | | Grant Shotter, CFA | |
Managing Partner and Portfolio Manager
HEXAM Capital Partners, LLP | | Partner and Portfolio Manager
HEXAM Capital Partners, LLP | |
Stuart Richards | | Marina Akopian | |
Partner and Portfolio Manager
HEXAM Capital Partners, LLP | | Partner and Portfolio Manager
HEXAM Capital Partners, LLP | |
page 19

INVESTMENT HIGHLIGHTS
Growth of a $100,000 Investment (Unaudited)
* 12/20/10 commencement of operations.
This chart assumes an initial gross investment of $100,000 made on 12/20/10 (commencement of operations). Returns shown include the reinvestment of all distributions. Past performance is not predictive of future results. Investment return and principal value will fluctuate so that shares, when redeemed, may be worth more or less than the original cost. In the absence of existing fee waivers, total return would be reduced. To receive current to the most recent month-end performance, please call 1-888-825-2100.
The MSCI Emerging Markets Index is a free float-adjusted market capitalization index that is designed to measure equity market performance in the global emerging markets. The Index does not reflect investment management fees, brokerage commissions and other expenses associated with investing in equity securities. A direct investment in the index is not possible.
** The returns shown do not reflect the deduction of taxes that a shareholder would pay on Fund distributions or the redemption of Fund shares.
Portfolio Total Return**
FOR PERIODS
ENDED 12/31/12 | | FUND | | INDEX | |
SIX MONTHS | | | 14.99 | % | | | 13.75 | % | |
ONE YEAR | | | 9.03 | % | | | 18.22 | % | |
AVERAGE ANNUAL
SINCE INCEPTION | | | (12.08 | )% | | | 0.00 | % | |
page 20

FRONTEGRA
TIMPANI SMALL CAP GROWTH FUND

REPORT FROM TIMPANI CAPITAL MANAGEMENT LLC
Dear Fellow Shareholders:
The Frontegra Timpani Small Cap Growth Fund strives to achieve capital appreciation by investing in a diversified portfolio of growth companies with small market capitalizations. Timpani seeks to:
• Invest in companies where growth is robust, sustainable and underestimated by the market.
• Anticipate positive revisions by analysts and investors by conducting fundamental research that provides unique insights into the perception gap that exists between market expectations and a company's true growth rate.
• Manage risk by continuously evaluating the size of the perception gap relative to market expectations and monitoring market sentiment.
• Act on new relevant incremental data points, both positive and negative, in an effort to exploit investor biases.
Performance Review
The Fund underperformed its benchmark, the Russell 2000® Growth Index, for the period July 1, 2012 through December 31, 2012, returning 4.17% (net of fees) vs. 5.31% for the Index. For the year, the Fund returned 17.91%, net of fees, compared to the benchmark's return of 14.59%.
Sector allocation and stock selection were both slight contributors to the underperformance. Stock selection was positive in the majority of sectors but that was more than offset by subpar performance within Technology. Good stock selection within Health Care and Financial Services were positive contributors to performance. An overweight position in Technology was a negative contributor to performance, while an underweight in Consumer Staples was a positive contributor. All other sector tilts had a negligible impact on performance.
As we expected, the individual stocks that outperformed during the period tended to be those with the largest perception gaps. The period saw modest gains for the index in Q3 followed by a flattish Q4. The markets seemed to be in a transition period as focus shifted from the macro issues in Europe to fiscal issues domestically. Economically sensitive sectors like Financials and Consumer Discretionary outperformed as the appetite for big ticket consumer purchases like autos and housing increased. Companies with strong business models and secular growth drivers such as Capital Senior Living, Lithia Motors and Tree.com contributed most to the outperformance. Stocks levered to a housing recovery such as Ryland Group, Ellie Mae and Eagle Materials were also strong performers. Kenexa was a strong contributor as it was acquired during the period, while Technology stocks Tangoe, Allot Communications and Radware hurt performance.
Portfolio Outlook
The benchmark was up slightly during Q4 as the gains from Q3 were digested by the market. In November and December, we felt we were negatively impacted by the pending increase in tax rates as strong performing stocks were sold to harvest gains and avoid taxes. Poor performing stocks were held onto for the same reasons. Despite the focus on fiscal issues in Q4, we saw many encouraging signs that the market will start to embrace and reward company specific fundamentals. Correlations among stocks have dropped, bond yields in Europe have fallen and volatility has retreated to multi-year lows. Stronger economic data in the U.S. housing market has led to a generally optimistic outlook. This may lead to a sustained increased pace of recovery within the economy. Stubbornly high unemployment, geopolitical risks, slowing growth in China and Europe's recession are issues that investors are fully aware of and have largely discounted in the market. During the last few months, the close relative performance of the portfolio versus the index was a function of the market digesting some of these concerns weighted against positive company fundamentals. We are optimistic that the tide is turning and that we should see investors start to embrace company specific secular growers as macro concerns fade and the credit crisis becomes a more distant memory.
page 22

On a micro level, companies within our portfolio maintained a constructive outlook on the economy and mostly exceeded analyst expectations. Corporate balance sheets are generally sound, and companies are generating ample cash flow which enables them to increase cash deployment in the form of dividends, share buybacks or accretive acquisitions. We believe that positive corporate fundamentals will lead to the potential for increased M&A activity which could benefit the companies we own as both buyers and potential acquisition targets. This thesis came to fruition as Kenexa and Schiff Nutrition were acquired at a significant premium. Other companies such as Stratasys, Air Methods, Acadia Healthcare, and Capital Senior Living all made strategic acquisitions that were accretive and were well received by the market. Our analysis continues to confirm our optimism regarding the fundamental strength of the companies in our portfolio. In particular, meetings with company management teams and other fundamental data points indicate that many companies continue to achieve robust growth and that significant perception gaps still exist. More attention will continue to be given to company specific fundamentals as systemic risks have lessened considerably.
We believe we are positioned in companies with secular growth tailwinds and positive company specific fundamentals that should be rewarded going forward. We are optimistic that once we clear the final fiscal hurdle of the debt ceiling debate, valuation multiples will expand. We are well positioned to outperform once the fiscal questions are answered. According to a recent industry report, the number one factor explaining outperformance once stock correlations start to drop is positive earnings revisions, which is what our disciplined approach is centered on.
During the period, we continued to focus on finding robust and sustainable growers with company-specific perception gaps. The results from our bottom-up stock picking process resulted in modest changes in portfolio sector allocation. We continue to be overweight in Consumer Discretionary, and underweight Consumer Staples, Energy and Utilities. The biggest changes included the Technology sector going from a significant overweight to a slight underweight and Materials going from a modest underweight to a modest overweight during the period. An overweight position in Financial Services grew during the period while Health Care went from a slight overweight to slight underweight. We took advantage of the declining volatility during the fourth quarter by adding and initiating positions in companies where we believe there is secular growth that the market has underestimated. This is classic perception gap investing. Looking ahead, we are confident that our bottom-up process will continue to add value for shareholders.
Thank you for your continued support.
Sincerely,
Brandon Nelson, CFA | |
Chief Investment Officer
Timpani Capital Management LLC | |
page 23

INVESTMENT HIGHLIGHTS
Growth of a $100,000 Investment (Unaudited)

* 3/23/11 commencement of operations.
This chart assumes an initial gross investment of $100,000 made on 3/23/11. Returns shown include the reinvestment of all distributions. Past performance is not predictive of future results. Investment return and principal value will fluctuate so that shares, when redeemed, may be worth more or less than the original cost. In the absence of fee waivers, total return would be reduced. To receive current to the most recent month-end performance, please call 1-888-825-2100.
The Russell 2000® Growth Index measures the performance of the small-cap growth segment of the U.S. equity universe.
** The returns shown do not reflect the deduction of taxes that a shareholder would pay on Fund distributions or the redemption of Fund shares.
Portfolio Total Return**
FOR PERIODS ENDED 12/31/12 | | FUND | | INDEX | |
SIX MONTHS | | | 4.17 | % | | | 5.31 | % | |
ONE YEAR | | | 17.91 | % | | | 14.59 | % | |
AVERAGE ANNUAL
SINCE INCEPTION | | | 4.05 | % | | | 3.70 | % | |
page 24

FRONTEGRA
NETOLS SMALL CAP VALUE FUND

REPORT FROM NETOLS ASSET MANAGEMENT, INC.
Dear Fellow Shareholders:
The Frontegra Netols Small Cap Value Fund strives to achieve capital appreciation by investing at least 80% of its assets in equity securities of small capitalization companies. The objective is relative to, and measured against, the Russell 2000® Value Index.
Performance Review
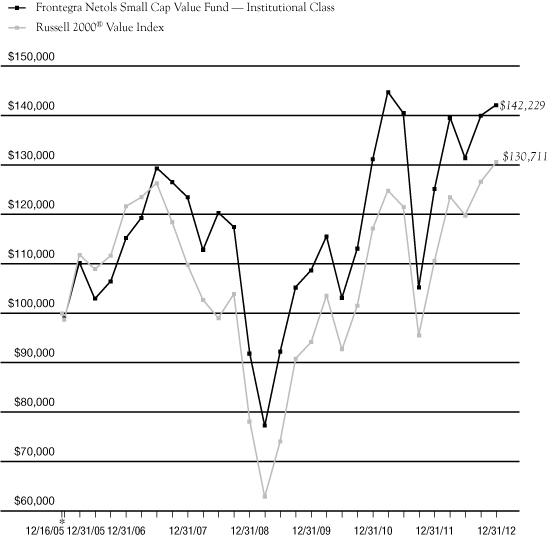
During the six month period ended December 31, 2012, the Frontegra Netols Small Cap Value Fund (Institutional Class) returned 8.18%, net of fees, compared to 9.07% for the Russell 2000 Value Index. For the year, the Fund returned 13.57%, net of fees, compared to 18.05% for the Index.
Portfolio Review
During the second half of 2012, investors began to look past the issues that previously increased market volatility and focused more on the underlying economy. The continued slowdown in Europe, drought conditions in the U.S., the presidential election, fiscal cliff, and debt ceiling did not create the same level of market anxiety as seen over the past few years. The Federal Reserve attempted to ease the markets with another round of quantitative easing ahead of the election and debt issues. Additionally, investors appeared to accept the fact that these issues are now part of the economic landscape and turned their attention to the domestic economy that continues to heal despite issues coming out of Washington D.C. These factors pushed investors into riskier assets. As a result, Materials, Consumer Discretionary, and Industrial sectors outperformed in the second half of 2012, while Health Care lagged during the period.
Positive Contributions to Relative Performance in the Second Half of 2012:
• Stock selection in Industrial and Health Care sectors
• Overweight in Health Care sector
• Best performing stocks for the period: Sunrise Senior Living, Walter Investment Management, Genesee & Wyoming, Robbins & Myers, and TriMas
Negative Contributions to Relative Performance in the Second Half of 2012:
• Stock selection in Energy and Materials sectors
• Underweight in Financials sector
• Worst performing stocks for the period: Accuride, Coinstar, Ciber, Willbros, and TreeHouse Foods
Portfolio Outlook
Overall, we believe the economy should remain on a path of modest growth. Despite many issues including higher taxes and unresolved federal budget issues, the underpinnings of the economy appear to be strengthening. Resolution of these issues could lead to increased hiring and consumer confidence. Domestically, low gas prices, lower mortgage rates, and expanding credit could provide an added uplift to the economy. Internationally, reacceleration of China's economy could once again help the economy and markets. Furthermore, it appears that resolution of any issues in Washington would only enhance the potential for improved economic growth.
Thank you for your continued support.
Jeff Netols
President
Netols Asset Management, Inc.
page 26

INVESTMENT HIGHLIGHTS
Growth of a $100,000 Investment (Unaudited)
* 12/16/05 commencement of operations.
This chart assumes an initial gross investment of $100,000 made on 12/16/05 (commencement of operations). Returns shown include the reinvestment of all distributions. Past performance is not predictive of future results. Investment return and principal value will fluctuate so that shares, when redeemed, may be worth more or less than the original cost. In the absence of existing fee waivers, total return would be reduced. To receive current to the most recent month-end performance, please call 1-888-825-2100.
The Russell 2000 Value Index measures the performance of those Russell 2000 companies with lower price-to-book ratios and lower forecasted growth values. The Russell 2000 Index measures the performance of the 2,000 smallest companies in the Russell 3000 Index. The Russell 3000 Index measures the performance of the 3,000 largest U.S. companies based on total market capitalization. The Index does not reflect investment management fees, brokerage commissions and other expenses associated with investing in equity securities. A direct investment in the index is not possible.
** The returns shown do not reflect the deduction of taxes that a shareholder would pay on Fund distributions or the redemption of Fund shares.
The above graph relates to Institutional Class shares of the Fund. Performance for Class Y shares will vary from the performance of the Institutional Class shares shown above due to differences in expenses.
Portfolio Total Return**
FOR PERIODS
ENDED 12/31/12 | | FUND | | INDEX | |
SIX MONTHS | | | 8.18 | % | | | 9.07 | % | |
ONE YEAR | | | 13.57 | % | | | 18.05 | % | |
FIVE YEAR
AVERAGE ANNUAL | | | 2.87 | % | | | 3.55 | % | |
AVERAGE ANNUAL
SINCE INCEPTION | | | 5.13 | % | | | 3.88 | % | |
page 27
This page intentionally left blank.

FRONTEGRA
PHOCAS SMALL CAP VALUE FUND

REPORT FROM PHOCAS FINANCIAL CORPORATION
Dear Fellow Shareholders:
The Frontegra Phocas Small Cap Value Fund strives to achieve capital appreciation by investing in a diversified portfolio of equity securities of companies with small market capitalizations. The objective is relative to, and measured against, the Russell 2000® Value Index.
Performance Review
During the six month period ended December 31, 2012, the Frontegra Phocas Small Cap Value Fund returned 6.03%, net of fees, compared to the 9.07% return of the benchmark, the Russell 2000 Value Index. For the year, the Fund returned 9.75%, net of fees, compared to 18.05% for the Index.
Portfolio Review and Strategy
2012 was a year fraught with challenges for investors, and nothing seemed certain. Political turmoil unfolded in Europe as certain countries such as Greece, Spain and Italy attempted to remain solvent through sizable austerity measures. Here in the United States, it was a year of political bruising between the two major political parties fighting to set America's direction, but also not being able to come to terms with tax policy until the 11th hour, literally, of New Year's Eve. Potentially frightening outcomes left investors diving for safety, then charging ahead at opportunities, then scratching their heads trying to decide which way to turn. While stocks did well in 2012, many in the more economically sensitive areas like Industrials, Technology, and Energy, are actually quite reasonably priced which means we may see some good returns here, while the safer areas in Utilities, Telecommunications, and Consumer Staples may lag.
For the third quarter of 2012, the strongest relative performers in the Fund were Health Care, Information Technology, and Energy. On the positive side, our portfolio finally realized a takeout of one of our major positions, Par Pharmaceutical, which helped to boost the performance of our Health Care sector. Though we outperformed within Information Technology, the sector still underperformed the average index return. Unfortunately, some of the other major sectors were significant relative underperformers. The worst sectors were Materials, Consumer Staples, Industrials, and Financials. Consumer Discretionary was relatively flat versus the benchmark. Though Materials represents only 5% of the benchmark, many of the stocks within the index are mining/metals related companies as well as paper companies, neither of which the Fund owned at this time. Within Industrials, our largest positions had too much international revenue exposure, which greatly penalized them relative to pure domestic companies.
As usual, earnings disappointments, no matter how small or significant, were met with share price compression inconsistent with the actual underlying financial performance — that may be because of factors including money flows affecting sector ETFs. High beta stocks and less liquid names continue to be excessively punished if on the wrong side of earnings estimates.
For the fourth quarter, there was weaker performance from the Energy, Materials and Health Care sectors. Consumer Staples, though a small weight, continued to be a drag on the Fund, due to weakness in two of our three holdings. Within Consumer Discretionary, there was negative performance, but all of that continued to be driven by lack of exposure to the homebuilding industry which ran up significantly during the quarter, as well as the year. No exposure to homebuilding stocks cost the Fund during the quarter. There was also negative performance in Financials, most of it coming from underperformance within the insurance subsector. Cash was also a drag on performance. On the brighter side, Industrials added to performance, followed closely behind by Technology which was helped by two acquisitions during the quarter. Utilities were also modestly on the positive side of the ledger.
To position for the coming year, we increased the strategy's exposure to more inexpensive names within most sectors that might benefit from an improving economy. We maintained most of our names within Energy as they remain deep value. We added additional low valuation decile names within Materials: Boise and Kaiser Aluminum. We added underperforming names within Technology and Industrials: United Online, Euronet Worldwide, ValueClick, and Coinstar. In the Financial sector, we added some of the weaker bank
page 30

stocks such as United Community Bank and Park Sterling Bank. In exchange, we sold out of positions that were in the higher decile ranks in order to take advantage of the valuation arbitrage.
Thank you for your continued support.
William Schaff, CFA | | Steve Block, CFA | |
Chief Executive Officer and Portfolio Manager
Phocas Financial Corporation | | Portfolio Manager
Phocas Financial Corporation | |
page 31

INVESTMENT HIGHLIGHTS
Growth of a $100,000 Investment (Unaudited)
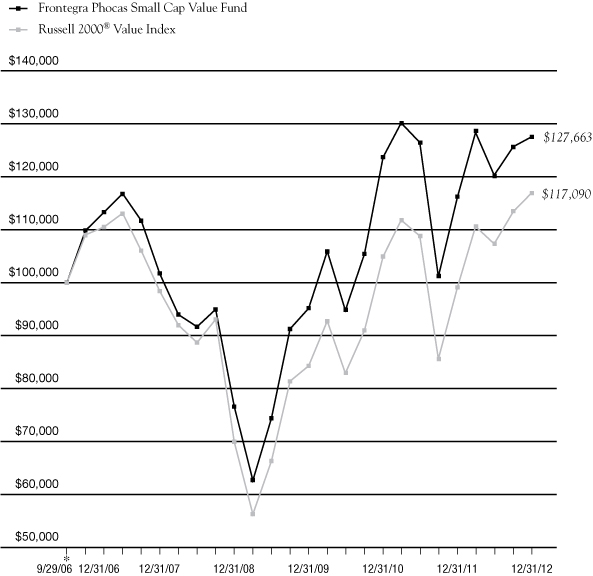
* 9/29/06 commencement of operations.
This chart assumes an initial gross investment of $100,000 made on 9/29/06. Returns shown include the reinvestment of all distributions. Past performance is not predictive of future results. Investment return and principal value will fluctuate so that shares, when redeemed, may be worth more or less than the original cost. In the absence of fee waivers, total return would be reduced. Effective October 8, 2010, Phocas Financial Corp. ("Phocas") became subadviser to the Fund and Frontegra Asset Management, Inc. became adviser to the Fund. Prior to October 8, 2010, Phocas served as adviser to the Fund. To receive current to the most recent month-end performance, please call 1-888-825-2100.
The Russell 2000® Value Index measures the performance of those Russell 2000® companies with lower price-to-book ratios and lower forecasted growth values.
** The returns shown do not reflect the deduction of taxes that a shareholder would pay on Fund distributions or the redemption of Fund shares.
Portfolio Total Return**
FOR PERIODS ENDED 12/31/12 | | FUND | | INDEX | |
SIX MONTHS | | | 6.03 | % | | | 9.07 | % | |
ONE YEAR | | | 9.75 | % | | | 18.05 | % | |
FIVE YEAR
AVERAGE ANNUAL | | | 4.65 | % | | | 3.55 | % | |
AVERAGE ANNUAL
SINCE INCEPTION | | | 3.98 | % | | | 2.55 | % | |
page 32

LOCKWELL SMALL CAP VALUE FUND

REPORT FROM LOCKWELL INVESTMENTS, LLC
Dear Fellow Shareholders:
The Lockwell Small Cap Value Fund strives to take advantage of a number of investor biases which are particularly prevalent within the small cap equity universe. These biases result in an opportunity set of high-quality companies whose valuations, in our opinion, do not accurately reflect the attractiveness of their franchises or business prospects. The strategy attempts to exploit these biases by using an intensive, bottom-up, research-focused process; seeking high-quality companies with specific catalysts; and becoming involved with company managements when appropriate.
Performance Review
The Lockwell Small Cap Value Fund returned 11.71%, net of fees, for the six months ending December 31, 2012, versus the benchmark Russell 2000® Value Index return of 9.07%.
During this period, outperformance was largely the result of strong stock selection. Specifically, stock selection within Financials contributed 4.97% to outperformance. While selection was strong across the sector with eleven stocks in the sector returning greater than 20% during the six month period, two stocks performed extremely well. Ocwen Financial, a servicer of sub-prime mortgages, returned 84.19% during the period, while Greenhill & Co, a boutique investment bank, returned 47.87%. Additionally, strong security selection in Consumer Staples and Consumer Discretionary and an overweight position to the Industrial and Materials sectors also aided performance. On the downside, security selection in Energy detracted from performance as our theses on several securities have yet to play out.
Our overall sector positioning didn't significantly change during the second half of 2012. We continue to be overweight Industrials and Materials and underweight Financials. Additionally, we continue to maintain a frictional cash position of 3-5% in the portfolio. Given the positive performance of the Fund during the second half of the year, the cash position slightly detracted from portfolio performance.
Portfolio Outlook
The second half of 2012 had many similarities to the second half of 2011, with most markets continuing to be highly correlated and focused on macroeconomic issues although to a lesser extent than in 2011. Similar to 2011, investors were still concerned about the strength of the Euro bloc, the uncertainty of how the U.S. would handle fiscal issues and slowing economic growth across regions. However, markets in general reacted better in 2012 with greater clarity on central bank policy, the outcome of the U.S. elections and improving, albeit mildly, economic data in many parts of the world. Also similar to 2011, small cap companies continued to produce strong profits and cash flow. Many companies continued to buy back stock and/or paid dividends with their excess cash. We believe small cap valuations are relatively close to fair value at this point and companies continue to be cautious with regard to their earnings forecasts for 2013. Our expectation for the first half of 2013 is that companies will deliver reasonable earnings, but without meaningful top line growth, they will likely not see much margin improvement as most cost cutting opportunities have already been realized. While merger and acquisition activity started to accelerate in the second half of 2012, we won't be surprised to see this to continue to grow during 2013 given the strength of balance sheets and still reasonable valuations. Since these events are nearly impossible to predict, we will continue to spend our efforts searching for undervalued securities that have identifiable catalysts. Over the longer-term, we believe the fundamentals of these companies will produce superior stock price performance that will benefit our shareholders.
Thank you for your continued support.
Richard Glass, CFA
Principal
Lockwell Investments, LLC
page 34

INVESTMENT HIGHLIGHTS
Growth of a $100,000 Investment (Unaudited)
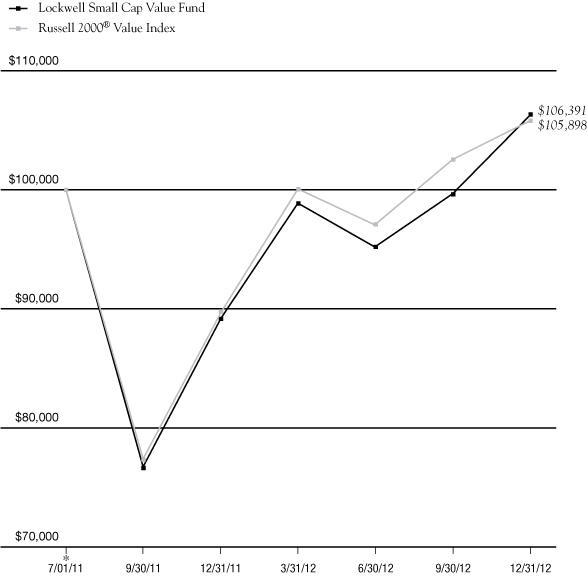
* 7/01/11 commencement of operations.
This chart assumes an initial gross investment of $100,000 made on 7/01/11. Returns shown include the reinvestment of all distributions. Past performance is not predictive of future results. Investment return and principal value will fluctuate so that shares, when redeemed, may be worth more or less than the original cost. In the absence of fee waivers, total return would be reduced. To receive current to the most recent month-end performance, please call 1-888-825-2100.
The Russell 2000® Value Index measures the performance of those Russell 2000® companies with lower price-to-book ratios and lower forecasted growth values.
** The returns shown do not reflect the deduction of taxes that a shareholder would pay on Fund distributions or the redemption of Fund shares.
Portfolio Total Return**
FOR PERIODS ENDED 12/31/12 | | FUND | | INDEX | |
SIX MONTHS | | | 11.71 | % | | | 9.07 | % | |
ONE YEAR | | | 19.23 | % | | | 18.05 | % | |
AVERAGE ANNUAL
SINCE INCEPTION | | | 4.21 | % | | | 3.89 | % | |
page 35

Frontegra Funds
EXPENSE EXAMPLE
December 31, 2012 (Unaudited)
As a shareholder of a mutual fund, you incur two types of costs: (1) transaction costs, including redemption fees, and (2) ongoing costs, including management fees, distribution and/or service (12b-1) fees and other fund expenses. Although the Funds charge no sales loads, you will be assessed fees for outgoing wire transfers, returned checks and stop payment orders at prevailing rates charged by U.S. Bancorp Fund Services, LLC, the Funds' transfer agent. If you request that a redemption be made by wire transfer, currently the Funds' transfer agent charges a $15.00 fee. A redemption fee of 2.00% of the then current value of the shares redeemed may be imposed on certain redemptions of shares made within 30 days of purchase for the Frontegra RobecoSAM Global Equity, Frontegra MFG Global Equity, Frontegra MFG Core Infrastructure, Frontegra HEXAM Emerging Markets and Lockwell Small Cap Value Funds.
This Example is intended to help you understand your ongoing costs (in dollars) of investing in the Funds and to compare these costs with the ongoing costs of investing in other mutual funds. The Example is based on an investment of $1,000 invested at the beginning of the period and held for the entire period (7/1/12 – 12/31/12).
Actual Expenses
The first line of the table on the following page for each Fund provides information about actual account values and actual expenses. The Example includes management fees, registration fees, fee waivers/reimbursements and other expenses. However, the Example does not include portfolio trading commissions and related expenses and other extraordinary expenses as determined under generally accepted accounting principles. You may use the information in this line, together with the amount you invested, to estimate the expenses that you paid over the period. Simply divide your account value by $1,000 (for example, an $8,600 account value divided by $1,000 = 8.6), then multiply the result by the number in the first line under the heading entitled "Expenses Paid During the Period" to estimate the expenses you paid on your account during this period.
Hypothetical Example for Comparison Purposes
The second line of the table for each Fund provides information about hypothetical account values and hypothetical expenses based on each of the Fund's actual expense ratios and an assumed rate of return of 5% per year before expenses, which is not the actual return. The hypothetical account values and expenses may not be used to estimate the actual ending account balance or expenses you paid for the period. You may use this information to compare the ongoing costs of investing in each of the Funds and other funds. To do so, compare this 5% hypothetical example with the 5% hypothetical examples that appear in the shareholder reports of the other funds.
Please note that the expenses shown in the table are meant to highlight your ongoing costs only and do not reflect any transactional costs, such as redemption fees. Therefore, the second line of the table is useful in comparing ongoing costs only, and will not help you determine the relative total costs of owning different funds. In addition, if these transactional costs were included, your costs could have been higher.
page 36

Frontegra Funds
EXPENSE EXAMPLE (continued)
December 31, 2012 (Unaudited)
| | | Beginning Account
Value 7/1/2012 | | Ending Account
Value 12/31/2012 | | Annualized
Expense Ratio* | | Expenses Paid
During the Period* | |
RobecoSAM Global Equity Fund | |
Actual Fund Return | | $ | 1,000.00 | | | $ | 1,084.50 | | | | 1.20 | % | | $ | 6.30 | | |
Hypothetical 5% Return | | $ | 1,000.00 | | | $ | 1,019.16 | | | | 1.20 | % | | $ | 6.11 | | |
MFG Global Equity Fund | |
Actual Fund Return | | $ | 1,000.00 | | | $ | 1,101.80 | | | | 0.80 | % | | $ | 4.24 | | |
Hypothetical 5% Return | | $ | 1,000.00 | | | $ | 1,021.17 | | | | 0.80 | % | | $ | 4.08 | | |
MFG Core Infrastructure Fund | |
Actual Fund Return* | | $ | 1,000.00 | | | $ | 1,085.20 | | | | 0.70 | % | | $ | 3.68 | | |
Hypothetical 5% Return** | | $ | 1,000.00 | | | $ | 1,021.68 | | | | 0.70 | % | | $ | 3.57 | | |
HEXAM Emerging Markets Fund | |
Actual Fund Return | | $ | 1,000.00 | | | $ | 1,149.90 | | | | 1.30 | % | | $ | 7.04 | | |
Hypothetical 5% Return | | $ | 1,000.00 | | | $ | 1,018.65 | | | | 1.30 | % | | $ | 6.61 | | |
Timpani Small Cap Growth Fund | |
Actual Fund Return | | $ | 1,000.00 | | | $ | 1,041.70 | | | | 1.10 | % | | $ | 5.66 | | |
Hypothetical 5% Return | | $ | 1,000.00 | | | $ | 1,019.66 | | | | 1.10 | % | | $ | 5.60 | | |
Netols Small Cap Value
Fund – Institutional Class | |
Actual Fund Return | | $ | 1,000.00 | | | $ | 1,081.80 | | | | 1.10 | % | | $ | 5.77 | | |
Hypothetical 5% Return | | $ | 1,000.00 | | | $ | 1,019.66 | | | | 1.10 | % | | $ | 5.60 | | |
Netols Small Cap Value
Fund – Class Y | |
Actual Fund Return | | $ | 1,000.00 | | | $ | 1,080.80 | | | | 1.50 | % | | $ | 7.87 | | |
Hypothetical 5% Return | | $ | 1,000.00 | | | $ | 1,017.64 | | | | 1.50 | % | | $ | 7.63 | | |
Phocas Small Cap Value Fund | |
Actual Fund Return | | $ | 1,000.00 | | | $ | 1,060.30 | | | | 1.03 | % | | $ | 5.36 | | |
Hypothetical 5% Return | | $ | 1,000.00 | | | $ | 1,020.00 | | | | 1.03 | % | | $ | 5.25 | | |
Lockwell Small Cap Value Fund | |
Actual Fund Return | | $ | 1,000.00 | | | $ | 1,117.10 | | | | 1.10 | % | | $ | 5.87 | | |
Hypothetical 5% Return | | $ | 1,000.00 | | | $ | 1,019.66 | | | | 1.10 | % | | $ | 5.60 | | |
* Expenses are equal to each Fund's annualized expense ratio indicated above, multiplied by the average account value over the period, multiplied by 184/365 to reflect the one-half year period.
page 37

Frontegra RobecoSAM Global Equity Fund
SCHEDULE OF INVESTMENTS
December 31, 2012 (Unaudited)
Number of Shares | | | | Value | |
COMMON STOCKS 97.1% | | | |
| | | Australia 1.9% | |
| | 6,610 | | | National Australia Bank Ltd. | | $ | 173,864 | | |
| | 5,500 | | | Westpac Banking Corp. | | | 150,699 | | |
| | | | 324,563 | | |
| | | Canada 4.4% | |
| | 1,890 | | | Canadian Imperial
Bank of Commerce | | | 151,949 | | |
| | 9,220 | | | TELUS Corp. | | | 603,420 | | |
| | | | 755,369 | | |
| | | France 5.1% | |
| | 4,300 | | | Cie de St-Gobain | | | 184,660 | | |
| | 13,500 | | | Total SA | | | 702,448 | | |
| | | | 887,108 | | |
| | | Germany 4.0% | |
| | 3,000 | | | Adidas AG | | | 267,749 | | |
| | 1,800 | | | Fresenius SE & Co. KGaA | | | 207,124 | | |
| | 2,796 | | | Henkel AG & Co. KGaA | | | 230,031 | | |
| | | | 704,904 | | |
| | | Israel 0.6% | |
| | 3,070 | | | Teva Pharmaceutical Industries
Ltd. - ADR | | | 114,634 | | |
| | | Italy 4.8% | |
| | 12,400 | | | Eni SpA | | | 303,771 | | |
| | 26,600 | | | Fiat Industrial SpA | | | 291,420 | | |
| | 50,900 | | | Snam SpA | | | 237,580 | | |
| | | | 832,771 | | |
| | | Japan 5.7% | |
| | 8,200 | | | Keihin Corp. | | | 117,614 | | |
| | 46,000 | | | Marubeni Corp. | | | 330,061 | | |
| | 37,800 | | | Stanley Electric Co. Ltd. | | | 537,257 | | |
| | | | 984,932 | | |
| | | Netherlands 3.4% | |
| | 6,700 | | | Koninklijke DSM NV | | | 408,338 | | |
| | 6,703 | | | Koninklijke Philips Electronics NV | | | 177,498 | | |
| | | | 585,836 | | |
Number of Shares | | | | Value | |
| | | Norway 2.4% | |
| | 4,900 | | | Aker Solutions ASA | | $ | 101,472 | | |
| | 24,200 | | | DnB NOR ASA | | | 309,316 | | |
| | | | 410,788 | | |
| | | Switzerland 11.8% | |
| | 8,000 | | | Noble Corp. | | | 278,560 | | |
| | 2,750 | | | Roche Holding AG | | | 555,998 | | |
| | 5,600 | | | Swiss RE AG | | | 405,993 | | |
| | 850 | | | Swisscom AG | | | 368,317 | | |
| | 1,650 | | | Zurich Insurance Group AG | | | 442,131 | | |
| | | | 2,050,999 | | |
| | | United Kingdom 7.7% | |
| | 75,670 | | | Barclays PLC | | | 328,711 | | |
| | 99,970 | | | BT Group PLC | | | 381,407 | | |
| | 166,700 | | | Legal & General Group PLC | | | 399,727 | | |
| | 52,100 | | | WM Morrison Supermarkets PLC | | | 223,701 | | |
| | | | 1,333,546 | | |
| | | United States 45.3% | |
| | 11,500 | | | Dell, Inc. | | | 116,495 | | |
| | 3,600 | | | E. I. du Pont de Nemours & Co. | | | 161,892 | | |
| | 2,500 | | | Emerson Electric Co. | | | 132,400 | | |
| | 23,830 | | | Hartford Financial Services
Group, Inc. | | | 534,745 | | |
| | 4,768 | | | Hewlett-Packard Co. | | | 67,944 | | |
| | 2,855 | | | International Business
Machines Corp. | | | 546,876 | | |
| | 6,536 | | | Kimberly-Clark Corp. | | | 551,834 | | |
| | 8,000 | | | Life Technologies Corp. (a) | | | 392,640 | | |
| | 8,636 | | | Limited Brands, Inc. | | | 406,410 | | |
| | 300 | | | MasterCard, Inc. - Class A | | | 147,384 | | |
| | 2,806 | | | McDonald's Corp. | | | 247,517 | | |
| | 19,190 | | | Microsoft Corp. | | | 512,949 | | |
| | 8,631 | | | Occidental Petroleum Corp. | | | 661,221 | | |
| | 18,400 | | | Oracle Corp. | | | 613,088 | | |
| | 2,450 | | | Parker-Hannifin Corp. | | | 208,397 | | |
| | 27,006 | | | Pfizer, Inc. | | | 677,311 | | |
| | 10,850 | | | Reynolds American, Inc. | | | 449,516 | | |
The accompanying notes are an integral part of these financial statements.
page 38

Frontegra RobecoSAM Global Equity Fund
SCHEDULE OF INVESTMENTS (continued)
December 31, 2012 (Unaudited)
Number of Shares | | | | Value | |
| COMMON STOCKS 97.1% (continued) | | | |
| | | United States 45.3% (continued) | |
| | 6,800 | | | SanDisk Corp. (a) | | $ | 296,208 | | |
| | 12,800 | | | The Kroger Co. | | | 333,056 | | |
| | 8,692 | | | The Procter & Gamble Co. | | | 590,100 | | |
| | 1,700 | | | UnitedHealth Group, Inc. | | | 92,208 | | |
| | 3,500 | | | Wells Fargo & Co. | | | 119,630 | | |
| | | | 7,859,821 | | |
| | | Total Common Stocks | |
| | | | | (Cost $14,229,892) | | | 16,845,271 | | |
SHORT-TERM INVESTMENTS 2.8% | | | |
| | | Investment Company 2.8% | |
| | 476,639 | | | STIT-STIC Prime Portfolio -
Institutional Class, 0.09% | | | 476,639 | | |
| | | Total Short-Term Investments | |
| | | | | (Cost $476,639) | | | 476,639 | | |
| | | Total Investments 99.9% | |
| | | | | (Cost $14,706,531) | | | 17,321,910 | | |
| | | | | Other Assets in Excess
of Liabilities 0.1% | | | 19,789 | | |
| | | | | TOTAL NET ASSETS 100.0% | | $ | 17,341,699 | | |
(a) Non-Income Producing.
ADR - American Depositary Receipt.
PORTFOLIO DIVERSIFICATION
Sectors | | Percentage | |
Financials | | | 17.4 | % | |
Consumer Staples | | | 13.7 | | |
Information Technology | | | 13.3 | | |
Energy | | | 11.8 | | |
Health Care | | | 11.7 | | |
Consumer Discretionary | | | 9.1 | | |
Telecommunication Services | | | 7.8 | | |
Industrials | | | 7.6 | | |
Materials | | | 3.3 | | |
Utilities | | | 1.4 | | |
Total Common Stocks | | | 97.1 | | |
Total Short-Term Investments | | | 2.8 | | |
Total Investments | | | 99.9 | | |
Other Assets in Excess of Liabilities | | | 0.1 | | |
Total Net Assets | | | 100.0 | % | |
The accompanying notes are an integral part of these financial statements.
page 39

Frontegra MFG Global Equity Fund
SCHEDULE OF INVESTMENTS
December 31, 2012 (Unaudited)
Number of Shares | | | | Value | |
COMMON STOCKS 96.8% | | | |
| | | France 4.7% | |
| | 90,316 | | | Danone | | $ | 5,968,949 | | |
| | | Netherlands 1.5% | |
| | 50,544 | | | Unilever NV | | | 1,934,006 | | |
| | | Switzerland 10.1% | |
| | 75,779 | | | Nestle SA | | | 4,944,085 | | |
| | 123,093 | | | Novartis AG | | | 7,776,189 | | |
| | | | 12,720,274 | | |
| | | United Kingdom 6.2% | |
| | 1,406,766 | | | Tesco PLC | | | 7,749,319 | | |
| | | United States 74.3% | |
| | 81,671 | | | American Express Co. | | | 4,694,449 | | |
| | 18,407 | | | Colgate-Palmolive Co. | | | 1,924,268 | | |
| | 110,166 | | | eBay, Inc. (a) | | | 5,620,669 | | |
| | 131,357 | | | General Mills, Inc. | | | 5,308,135 | | |
| | 11,726 | | | Google, Inc. - Class A (a) | | | 8,318,073 | | |
| | 67,249 | | | Johnson & Johnson | | | 4,714,155 | | |
| | 196,194 | | | Lowe's Companies, Inc. | | | 6,968,811 | | |
| | 8,737 | | | MasterCard, Inc. - Class A | | | 4,292,313 | | |
| | 63,770 | | | McDonald's Corp. | | | 5,625,152 | | |
| | 192,502 | | | Mondelez International,
Inc. - Class A | | | 4,903,026 | | |
| | 77,164 | | | State Street Corp. | | | 3,627,480 | | |
| | 77,072 | | | Target Corp. | | | 4,560,350 | | |
| | 167,187 | | | The Bank of New York
Mellon Corp. | | | 4,296,706 | | |
| | 44,514 | | | The Coca-Cola Co. | | | 1,613,633 | | |
| | 139,203 | | | U.S. Bancorp | | | 4,446,144 | | |
| | 36,264 | | | Visa, Inc. - Class A | | | 5,496,896 | | |
| | 80,003 | | | Wal-Mart Stores, Inc. | | | 5,458,605 | | |
| | 151,531 | | | Wells Fargo & Co. | | | 5,179,330 | | |
| | 99,128 | | | Yum! Brands, Inc. | | | 6,582,099 | | |
| | | | 93,630,294 | | |
| | | Total Common Stocks | |
| | | | | (Cost $114,175,111) | | | 122,002,842 | | |
Number of Shares | | | | Value | |
SHORT-TERM INVESTMENTS 2.2% | |
| | | Investment Company 2.2% | |
| | 2,807,729 | | | STIT-STIC Liquid Assets
Portfolio - Institutional
Class, 0.17% | | $ | 2,807,729 | | |
| | | Total Short-Term Investments | |
| | | (Cost $2,807,729) | | | 2,807,729 | | |
| | | Total Investments 99.0% | |
| | | (Cost $116,982,840) | | | 124,810,571 | | |
| | | Other Assets in Excess
of Liabilities 1.0% | | | 1,266,021 | | |
| | | TOTAL NET ASSETS 100.0% | | $ | 126,076,592 | | |
(a) Non-Income Producing.
PORTFOLIO DIVERSIFICATION
Sectors | | Percentage | |
Consumer Staples | | | 35.2 | % | |
Information Technology | | | 18.8 | | |
Financials | | | 17.7 | | |
Consumer Discretionary | | | 15.2 | | |
Health Care | | | 9.9 | | |
Total Common Stocks | | | 96.8 | | |
Total Short-Term Investments | | | 2.2 | | |
Total Investments | | | 99.0 | | |
Other Assets in Excess of Liabilities | | | 1.0 | | |
Total Net Assets | | | 100.0 | % | |
The accompanying notes are an integral part of these financial statements.
page 40

Frontegra MFG Core Infrastructure Fund
SCHEDULE OF INVESTMENTS
December 31, 2012 (Unaudited)
Number of Shares | | | | Value | |
COMMON STOCKS 98.3% | | | |
| | | Australia 8.0% | |
| | 5,190 | | | APA Group | | $ | 29,962 | | |
| | 8,135 | | | DUET Group | | | 17,648 | | |
| | 13,024 | | | Envestra Ltd. | | | 12,789 | | |
| | 26,305 | | | SP AusNet | | | 30,570 | | |
| | 11,844 | | | Spark Infrastructure Group | | | 20,707 | | |
| | 15,656 | | | Sydney Airport | | | 55,150 | | |
| | 12,158 | | | Transurban Group | | | 77,284 | | |
| | | | 244,110 | | |
| | | Austria 0.3% | |
| | 185 | | | Flughafen Wien AG | | | 10,562 | | |
| | | Belgium 0.7% | |
| | 494 | | | Elia System Operator SA/NV | | | 22,300 | | |
| | | Canada 9.4% | |
| | 1,095 | | | Emera, Inc. | | | 38,243 | | |
| | 2,290 | | | Enbridge, Inc. | | | 99,041 | | |
| | 1,591 | | | Fortis, Inc. | | | 54,734 | | |
| | 1,889 | | | TransCanada Corp. | | | 89,294 | | |
| | 331 | | | Valener, Inc. | | | 5,341 | | |
| | | | 286,653 | | |
| | | France 7.2% | |
| | 834 | | | Aeroports de Paris | | | 64,571 | | |
| | 1,852 | | | Eutelsat Communications SA | | | 61,598 | | |
| | 3,204 | | | SES SA - ADR | | | 92,278 | | |
| | | | 218,447 | | |
| | | Germany 2.1% | |
| | 820 | | | Fraport AG Frankfurt Airport
Services Worldwide | | | 47,836 | | |
| | 638 | | | Hamburger Hafen und Logistik AG | | | 15,076 | | |
| | | | 62,912 | | |
| | | Hong Kong 2.8% | |
| | 10,008 | | | Power Assets Holdings Ltd. | | | 85,865 | | |
Number of Shares | | | | Value | |
| | | Italy 10.1% | |
| | 1,772 | | | ACEA SpA | | $ | 10,667 | | |
| | 5,464 | | | Atlantia SpA | | | 99,218 | | |
| | 13,073 | | | Gemina SpA (a) | | | 18,620 | | |
| | 19,848 | | | Snam SpA | | | 92,642 | | |
| | 2,009 | | | Societa Iniziative Autostradali e
Servizi SpA | | | 18,826 | | |
| | 16,933 | | | Terna Rete Elettrica
Nazionale SpA | | | 67,762 | | |
| | | | 307,735 | | |
| | | Mexico 2.2% | |
| | 3,531 | | | Grupo Aeroportuario del Centro
Norte SAB de CV | | | 9,588 | | |
| | 4,966 | | | Grupo Aeroportuario del Pacifico
SAB de CV - Class B | | | 28,364 | | |
| | 2,630 | | | Grupo Aeroportuario del Sureste
SAB de CV - Class B | | | 29,907 | | |
| | | | 67,859 | | |
| | | Netherlands 2.5% | |
| | 1,073 | | | Koninklijke Vopak NV | | | 75,848 | | |
| | | New Zealand 1.4% | |
| | 10,822 | | | Auckland International Airport Ltd. | | | 23,954 | | |
| | 8,376 | | | Vector Ltd. | | | 18,934 | | |
| | | | 42,888 | | |
| | | Spain 6.6% | |
| | 6,137 | | | Abertis Infraestructuras SA | | | 101,361 | | |
| | 2,129 | | | Enagas SA | | | 45,612 | | |
| | 1,138 | | | Red Electrica Corp. SA | | | 56,213 | | |
| | | | 203,186 | | |
| | | Switzerland 0.8% | |
| | 53 | | | Flughafen Zuerich AG | | | 24,541 | | |
| | | United Kingdom 7.8% | |
| | 7,796 | | | National Grid PLC | | | 89,416 | | |
| | 3,214 | | | Pennon Group PLC | | | 32,806 | | |
The accompanying notes are an integral part of these financial statements.
page 41

Frontegra MFG Core Infrastructure Fund
SCHEDULE OF INVESTMENTS (continued)
December 31, 2012 (Unaudited)
Number of Shares | | | | Value | |
| COMMON STOCKS 98.3% (continued) | | | |
| | | United Kingdom 7.8% (continued) | |
| | 2,002 | | | Severn Trent PLC | | $ | 51,516 | | |
| | 5,744 | | | United Utilities Group PLC | | | 63,234 | | |
| | | | 236,972 | | |
| | | United States 36.4% | |
| | 174 | | | ALLETE, Inc. | | | 7,131 | | |
| | 620 | | | Alliant Energy Corp. | | | 27,224 | | |
| | 1,671 | | | American Electric Power Co., Inc. | | | 71,319 | | |
| | 96 | | | American States Water Co. | | | 4,606 | | |
| | 981 | | | American Water Works Co., Inc. | | | 36,424 | | |
| | 718 | | | Aqua America, Inc. | | | 18,251 | | |
| | 472 | | | Atmos Energy Corp. | | | 16,577 | | |
| | 278 | | | Avista Corp. | | | 6,703 | | |
| | 216 | | | California Water Service Group | | | 3,964 | | |
| | 2,072 | | | CenterPoint Energy, Inc. | | | 39,886 | | |
| | 81 | | | CH Energy Group, Inc. | | | 5,283 | | |
| | 287 | | | Cleco Corp. | | | 11,483 | | |
| | 1,620 | | | Consolidated Edison, Inc. | | | 89,975 | | |
| | 904 | | | DTE Energy Co. | | | 54,285 | | |
| | 1,143 | | | Duke Energy Corp. | | | 72,924 | | |
| | 195 | | | El Paso Electric Co. | | | 6,222 | | |
| | 666 | | | Great Plains Energy, Inc. | | | 13,526 | | |
| | 241 | | | IDACORP, Inc. | | | 10,447 | | |
| | 377 | | | Integrys Energy Group, Inc. | | | 19,687 | | |
| | 264 | | | ITC Holdings Corp. | | | 20,304 | | |
| | 112 | | | MGE Energy, Inc. | | | 5,706 | | |
| | 1,351 | | | NiSource, Inc. | | | 33,626 | | |
| | 876 | | | Northeast Utilities | | | 34,234 | | |
| | 137 | | | Northwest Natural Gas Co. | | | 6,055 | | |
| | 193 | | | NorthWestern Corp. | | | 6,703 | | |
| | 1,153 | | | NV Energy, Inc. | | | 20,915 | | |
| | 1,105 | | | Pepco Holdings, Inc. | | | 21,669 | | |
| | 2,124 | | | PG&E Corp. | | | 85,343 | | |
| | 375 | | | Piedmont Natural Gas Co., Inc. | | | 11,741 | | |
| | 533 | | | Pinnacle West Capital Corp. | | | 27,172 | | |
| | 422 | | | PNM Resources, Inc. | | | 8,655 | | |
Number of Shares | | | | Value | |
| | | United States 36.4% (continued) | |
| | 369 | | | Portland General Electric Co. | | $ | 10,096 | | |
| | 989 | | | Questar Corp. | | | 19,543 | | |
| | 621 | | | SCANA Corp. | | | 28,342 | | |
| | 46 | | | SJW Corp. | | | 1,224 | | |
| | 235 | | | Southwest Gas Corp. | | | 9,966 | | |
| | 1,050 | | | TECO Energy, Inc. | | | 17,598 | | |
| | 215 | | | The Empire District Electric Co. | | | 4,382 | | |
| | 1,700 | | | The Southern Co. | | | 72,778 | | |
| | 263 | | | UIL Holdings Corp. | | | 9,418 | | |
| | 177 | | | UNS Energy Corp. | | | 7,508 | | |
| | 400 | | | Vectren Corp. | | | 11,760 | | |
| | 549 | | | Westar Energy, Inc. | | | 15,712 | | |
| | 1,094 | | | Wisconsin Energy Corp. | | | 40,314 | | |
| | 2,427 | | | Xcel Energy, Inc. | | | 64,825 | | |
| | | | 1,111,506 | | |
| | | Total Common Stocks | |
| | | | | (Cost $2,743,717) | | | 3,001,384 | | |
CLOSED-END FUNDS 0.8% | | | |
| | | United Kingdom 0.8% | |
| | 6,735 | | | HICL Infrastructure Co. Ltd. | | | 13,608 | | |
| | 5,509 | | | International Public
Partnerships Ltd. | | | 11,240 | | |
| | | Total Closed-End Funds | |
| | | | | (Cost $22,700) | | | 24,848 | | |
POOLED INVESTMENT VEHICLE 0.6% | | | |
| | | Australia 0.6% | |
| | 5,505 | | | Australian Infrastructure Fund | | | 17,854 | | |
| | | Total Pooled Investment Vehicle | |
| | | | | (Cost $11,272) | | | 17,854 | | |
The accompanying notes are an integral part of these financial statements.
page 42

Frontegra MFG Core Infrastructure Fund
SCHEDULE OF INVESTMENTS (continued)
December 31, 2012 (Unaudited)
Number of Shares | | | | Value | |
SHORT-TERM INVESTMENTS 0.3% | |
| | | Investment Company 0.3% | |
| | 10,195 | | | STIT-STIC Liquid Assets
Portfolio - Institutional
Class, 0.15% | | $ | 10,195 | | |
| | | Total Short-Term Investments | |
| | | (Cost $10,195) | | | 10,195 | | |
| | | Total Investments 100.0% | |
| | | (Cost $2,787,884) | | | 3,054,281 | | |
| | | Other Assets in Excess
of Liabilities 0.0% | | | 254 | | |
| | | TOTAL NET ASSETS 100.0% | | $ | 3,054,535 | | |
(a) Non-Income Producing.
ADR - American Depositary Receipt.
PORTFOLIO DIVERSIFICATION
Sectors | | Percentage | |
Integrated Power | | | 28.1 | % | |
Transmission & Distribution | | | 20.9 | | |
Gas | | | 14.4 | | |
Airport | | | 10.3 | | |
Toll Road | | | 9.7 | | |
Water Utility | | | 6.9 | | |
Communications | | | 5.0 | | |
Port | | | 3.0 | | |
Total Common Stocks | | | 98.3 | | |
Social | | | 0.8 | | |
Total Closed-End Funds | | | 0.8 | | |
Airport | | | 0.6 | | |
Total Pooled Investment Vehicle | | | 0.6 | | |
Total Short-Term Investments | | | 0.3 | | |
Total Investments | | | 100.0 | | |
Other Assets in Excess of Liabilities | | | 0.0 | | |
Total Net Assets | | | 100.0 | % | |
The accompanying notes are an integral part of these financial statements.
page 43

Frontegra HEXAM Emerging Markets Fund
SCHEDULE OF INVESTMENTS
December 31, 2012 (Unaudited)
Number of Shares | | | | Value | |
COMMON STOCKS 90.2% | | | |
| | | Brazil 16.0% | |
| | 60,900 | | | All America Latina Logistica SA | | $ | 247,169 | | |
| | 68,700 | | | JBS SA (a) | | | 201,319 | | |
| | 72,700 | | | OGX Petroleo e Gas
Participacoes SA (a) | | | 155,519 | | |
| | 239,400 | | | PDG Realty SA
Empreendimentos e Participacoes | | | 387,015 | | |
| | 40,004 | | | Petroleo Brasileiro SA - ADR | | | 778,878 | | |
| | 27,200 | | | SLC Agricola SA | | | 263,697 | | |
| | 41,577 | | | Tim Participacoes SA - ADR | | | 824,055 | | |
| | 50,943 | | | Vale SA - ADR | | | 1,067,765 | | |
| | | | 3,925,417 | | |
| | | China 17.6% | |
| | 5,858 | | | Baidu, Inc. - ADR (a) | | | 587,499 | | |
| | 324,288 | | | BBMG Corp. | | | 302,055 | | |
| | 1,279,000 | | | China Construction Bank Corp. | | | 1,045,214 | | |
| | 243,000 | | | CNOOC Ltd. | | | 535,332 | | |
| | 67,500 | | | Ping An Insurance (Group)
Company of China Ltd. | | | 575,755 | | |
| | 1,336,000 | | | Prince Frog International
Holdings Ltd. | | | 569,154 | | |
| | 9,778 | | | Youku Tudou, Inc. (a) | | | 178,351 | | |
| | 304,600 | | | ZTE Corp. | | | 522,998 | | |
| | | | 4,316,358 | | |
| | | Hong Kong 9.9% | |
| | 302,000 | | | China Unicom United Network
Communications Group Co. Ltd. | | | 491,030 | | |
| | 1,379,000 | | | Industrial & Commercial
Bank of China | | | 995,330 | | |
| | 69,000 | | | Kingboard Chemical Holdings Ltd. | | | 249,166 | | |
| | 749,213 | | | Nine Dragons Paper Holdings Ltd. | | | 696,095 | | |
| | | | 2,431,621 | | |
| | | Kazakhstan 6.0% | |
| | 73,834 | | | Kazakhmys PLC | | | 954,285 | | |
| | 216,891 | | | Uranium One, Inc. (a) | | | 512,410 | | |
| | | | 1,466,695 | | |
Number of Shares | | | | Value | |
| | | Russian Federation 11.0% | |
| | 45,817 | | | Etalon Group Ltd. (a) | | $ | 249,703 | | |
| | 78,595 | | | Evraz PLC | | | 337,309 | | |
| | 59,904 | | | Gazprom OAO - ADR | | | 578,999 | | |
| | 50,861 | | | Magnitogorsk Iron & Steel
Works - GDR (a) | | | 229,059 | | |
| | 9,370 | | | Mobile Telesystems OJSC | | | 174,751 | | |
| | 208,912 | | | Sberbank of Russia | | | 651,263 | | |
| | 25,390 | | | Sberbank of Russia - ADR | | | 318,317 | | |
| | 9,201 | | | X5 Retail Group NV - GDR (a) | | | 166,554 | | |
| | | | 2,705,955 | | |
| | | South Africa 1.2% | |
| | 9,385 | | | Anglo American PLC | | | 295,846 | | |
| | | South Korea 23.6% | |
| | 4,540 | | | GS Engineering &
Construction Corp. | | | 245,788 | | |
| | 9,588 | | | Hankook Tire Worldwide
Co. Ltd. (a) | | | 420,908 | | |
| | 5,681 | | | Hyundai Engineering &
Construction Co. Ltd. | | | 374,507 | | |
| | 2,057 | | | Hyundai Mobis | | | 558,083 | | |
| | 29,525 | | | KB Financial Group, Inc. | | | 1,054,601 | | |
| | 2,470 | | | LG Chem Ltd. | | | 772,003 | | |
| | 1,459 | | | NCSoft Corp. | | | 206,461 | | |
| | 1,147 | | | POSCO | | | 375,746 | | |
| | 568 | | | Samsung Electronics Co. Ltd. | | | 816,103 | | |
| | 1,779 | | | Samsung Fire & Marine Insurance
Co. Ltd. | | | 361,400 | | |
| | 25,670 | | | SK Hynix, Inc. (a) | | | 624,289 | | |
| | | | 5,809,889 | | |
| | | Taiwan 1.6% | |
| | 29,000 | | | Catcher Technology Co. Ltd. | | | 145,643 | | |
| | 100,000 | | | Quanta Computer, Inc. | | | 236,678 | | |
| | | | 382,321 | | |
The accompanying notes are an integral part of these financial statements.
page 44

Frontegra HEXAM Emerging Markets Fund
SCHEDULE OF INVESTMENTS (continued)
December 31, 2012 (Unaudited)
Number of Shares | | | | Value | |
| COMMON STOCKS 90.2% (continued) | | | |
| | | Zambia 3.3% | |
| | 37,322 | | | First Quantum Minerals Ltd. | | $ | 822,082 | | |
| | | Total Common Stocks | |
| | | | | (Cost $23,745,635) | | | 22,156,184 | | |
PREFERRED STOCKS 6.4% | | | |
| | | Brazil 6.4% | |
| | 44,627 | | | Banco Bradesco SA - ADR | | | 775,171 | | |
| | 48,436 | | | Itau Unibanco Holding SA - ADR | | | 797,257 | | |
| | | | 1,572,428 | | |
| | | Total Preferred Stocks | |
| | | | | (Cost $1,802,337) | | | 1,572,428 | | |
SHORT-TERM INVESTMENTS 3.5% | | | |
| | | Investment Company 3.5% | |
| | 852,051 | | | Fidelity Institutional Money
Market Portfolio, 0.18% | | | 852,051 | | |
| | | Total Short-Term Investments | |
| | | | | (Cost $852,051) | | | 852,051 | | |
| | | Total Investments 100.1% | |
| | | | | (Cost $26,400,023) | | | 24,580,663 | | |
| | | | | Liabilities in Excess
of Other Assets (0.1)% | | | (18,396 | ) | |
| | | | | TOTAL NET ASSETS 100.0% | | $ | 24,562,267 | | |
(a) Non-Income Producing.
ADR - American Depositary Receipt.
GDR - Global Depositary Receipt.
PORTFOLIO DIVERSIFICATION
Sectors | | Percentage | |
Financials | | | 29.4 | % | |
Basic Materials | | | 22.9 | | |
Technology | | | 12.2 | | |
Oil & Gas | | | 8.3 | | |
Consumer Goods | | | 8.2 | | |
Industrials | | | 8.1 | | |
Telecommunications | | | 6.1 | | |
Consumer Services | | | 1.4 | | |
Total Common and Preferred Stocks | | | 96.6 | | |
Total Short-Term Investments | | | 3.5 | | |
Total Investments | | | 100.1 | | |
Liabilities in Excess of Other Assets | | | (0.1 | ) | |
Total Net Assets | | | 100.0 | % | |
The accompanying notes are an integral part of these financial statements.
page 45

Frontegra Timpani Small Cap Growth Fund
SCHEDULE OF INVESTMENTS
December 31, 2012 (Unaudited)
Number of Shares | | | | Value | |
COMMON STOCKS 99.9% | | | |
| | | Consumer Discretionary 18.2% | |
| | 1,365 | | | American Woodmark Corp. (a) | | $ | 37,974 | | |
| | 1,000 | | | Asbury Automotive Group, Inc. (a) | | | 32,030 | | |
| | 906 | | | Brunswick Corp. | | | 26,356 | | |
| | 1,935 | | | Conn's, Inc. (a) | | | 59,366 | | |
| | 592 | | | Dorman Products, Inc. | | | 20,921 | | |
| | 2,805 | | | Grand Canyon Education, Inc. (a) | | | 65,833 | | |
| | 695 | | | Jack In the Box, Inc. (a) | | | 19,877 | | |
| | 2,759 | | | LeapFrog Enterprises, Inc. (a) | | | 23,810 | | |
| | 1,812 | | | Lithia Motors, Inc. - Class A | | | 67,806 | | |
| | 3,437 | | | Multimedia Games Holdings
Co., Inc. (a) | | | 50,558 | | |
| | 247 | | | Polaris Industries, Inc. | | | 20,785 | | |
| | 1,453 | | | The Ryland Group, Inc. | | | 53,035 | | |
| | 116 | | | Tile Shop Holdings, Inc. (a) | | | 1,952 | | |
| | 589 | | | Ulta Salon, Cosmetics &
Fragrance, Inc. | | | 57,875 | | |
| | 631 | | | Vitamin Shoppe, Inc. (a) | | | 36,194 | | |
| | | | 574,372 | | |
| | | Consumer Staples 0.7% | |
| | 3,603 | | | Inventure Foods, Inc. (a) | | | 23,383 | | |
| | | Energy 3.4% | |
| | 1,402 | | | Diamondback Energy, Inc. (a) | | | 26,806 | | |
| | 248 | | | Geospace Technologies Corp. (a) | | | 22,040 | | |
| | 689 | | | Oasis Petroleum, Inc. (a) | | | 21,910 | | |
| | 781 | | | Rosetta Resources, Inc. (a) | | | 35,426 | | |
| | | | 106,182 | | |
| | | Financial Services 11.5% | |
| | 32 | | | Altisource Asset Management
Corp. (a) | | | 2,608 | | |
| | 318 | | | Altisource Portfolio
Solutions SA (a)(b) | | | 27,556 | | |
| | 106 | | | Altisource Residential Corp. -
Class B (a) | | | 1,679 | | |
| | 1,530 | | | CoreLogic, Inc. (a) | | | 41,188 | | |
Number of Shares | | | | Value | |
| | | Financial Services 11.5% (continued) | |
| | 2,710 | | | Homeowners Choice, Inc. | | $ | 56,341 | | |
| | 4,497 | | | Market Leader, Inc. (a) | | | 29,455 | | |
| | 509 | | | Nationstar Mortgage
Holdings, Inc. (a) | | | 15,768 | | |
| | 397 | | | Texas Capital Bancshares, Inc. (a) | | | 17,794 | | |
| | 2,648 | | | Tree.com, Inc. | | | 47,744 | | |
| | 3,701 | | | United Insurance Holdings Corp. | | | 22,577 | | |
| | 1,368 | | | ViewPoint Financial Group, Inc. | | | 28,645 | | |
| | 1,286 | | | Walter Investment Management
Corp. (a) | | | 55,324 | | |
| | 210 | | | WEX, Inc. (a) | | | 15,828 | | |
| | | | 362,507 | | |
| | | Health Care 19.2% | |
| | 1,043 | | | Acadia Healthcare
Company, Inc. (a) | | | 24,333 | | |
| | 1,395 | | | Air Methods Corp. | | | 51,462 | | |
| | 2,073 | | | Akorn, Inc. (a) | | | 27,695 | | |
| | 4,676 | | | Capital Senior Living Corp. (a) | | | 87,394 | | |
| | 1,112 | | | Catamaran Corp. (a)(b) | | | 52,386 | | |
| | 1,748 | | | Conceptus, Inc. (a) | | | 36,725 | | |
| | 1,029 | | | Cyberonics, Inc. (a) | | | 54,054 | | |
| | 2,277 | | | Cynosure, Inc. - Class A (a) | | | 54,899 | | |
| | 457 | | | Greenway Medical
Technologies, Inc. (a) | | | 7,020 | | |
| | 829 | | | Jazz Pharmaceuticals, Inc. (a)(b) | | | 44,103 | | |
| | 1,881 | | | Novadaq Technologies, Inc. (a)(b) | | | 16,703 | | |
| | 1,858 | | | Team Health Holdings, Inc. (a) | | | 53,455 | | |
| | 8,480 | | | TearLab Corp. (a) | | | 34,768 | | |
| | 2,451 | | | Vocera Communications, Inc. (a) | | | 61,520 | | |
| | | | 606,517 | | |
| | | Materials & Processing 12.3% | |
| | 2,455 | | | American Vanguard Corp. | | | 76,277 | | |
| | 2,037 | | | Apogee Enterprises, Inc. | | | 48,827 | | |
| | 1,141 | | | Beacon Roofing Supply, Inc. (a) | | | 37,972 | | |
| | 1,167 | | | Eagle Materials, Inc. | | | 68,270 | | |
| | 739 | | | Patrick Industries, Inc. (a) | | | 11,499 | | |
The accompanying notes are an integral part of these financial statements.
page 46

Frontegra Timpani Small Cap Growth Fund
SCHEDULE OF INVESTMENTS (continued)
December 31, 2012 (Unaudited)
Number of Shares | | | | Value | |
| COMMON STOCKS 99.9% (continued) | | | |
| | | Materials &
Processing 12.3% (continued) | |
| | 1,417 | | | Quanex Building Products Corp. | | $ | 28,921 | | |
| | 949 | | | Trex Co., Inc. (a) | | | 35,331 | | |
| | 588 | | | Valmont Industries, Inc. | | | 80,291 | | |
| | | | 387,388 | | |
| | | Producer Durables 16.4% | |
| | 298 | | | Allegiant Travel Co. (a) | | | 21,876 | | |
| | 1,195 | | | Barrett Business Services, Inc. | | | 45,518 | | |
| | 647 | | | CoStar Group, Inc. (a) | | | 57,822 | | |
| | 1,617 | | | InnerWorkings, Inc. (a) | | | 22,282 | | |
| | 459 | | | Lindsay Corp. | | | 36,775 | | |
| | 1,755 | | | MasTec, Inc. (a) | | | 43,752 | | |
| | 397 | | | MAXIMUS, Inc. | | | 25,098 | | |
| | 2,826 | | | On Assignment, Inc. (a) | | | 57,311 | | |
| | 1,755 | | | OSI Systems, Inc. (a) | | | 112,391 | | |
| | 1,239 | | | Team, Inc. (a) | | | 47,132 | | |
| | 223 | | | TransDigm Group, Inc. | | | 30,408 | | |
| | 974 | | | WageWorks, Inc. (a) | | | 17,337 | | |
| | | | 517,702 | | |
| | | Technology 17.3% | |
| | 1,492 | | | Bottomline Technologies, Inc. (a) | | | 39,374 | | |
| | 1,359 | | | Callidus Software, Inc. (a) | | | 6,170 | | |
| | 783 | | | CommVault Systems, Inc. (a) | | | 54,583 | | |
| | 919 | | | Demandware, Inc. (a) | | | 25,107 | | |
| | 2,662 | | | Ellie Mae, Inc. (a) | | | 73,871 | | |
| | 4,753 | | | Guidance Software, Inc. (a) | | | 56,418 | | |
| | 1,502 | | | NeuStar, Inc. - Class A (a) | | | 62,979 | | |
| | 1,813 | | | PROS Holdings, Inc. (a) | | | 33,159 | | |
| | 294 | | | Radware Ltd. (a)(b) | | | 9,702 | | |
| | 1,473 | | | Semtech Corp. (a) | | | 42,643 | | |
| | 330 | | | Sourcefire, Inc. (a) | | | 15,583 | | |
| | 525 | | | Stratasys Ltd. (a)(b) | | | 42,079 | | |
| | 2,835 | | | Tangoe, Inc. (a) | | | 33,651 | | |
| | 551 | | | Tyler Technologies, Inc. (a) | | | 26,690 | | |
| | 665 | | | Ultratech, Inc. (a) | | | 24,805 | | |
| | | | 546,814 | | |
Number of Shares | | | | Value | |
| | | Utilities 0.9% | |
| | 2,820 | | | Pike Electric Corp. | | $ | 26,931 | | |
| | | Total Common Stocks | |
| | | (Cost $2,572,273) | | | 3,151,796 | | |
SHORT-TERM INVESTMENTS 0.6% | |
| | | Investment Company 0.6% | |
| | 19,012 | | | STIT-STIC Prime Portfolio -
Institutional Class, 0.09% | | | 19,012 | | |
| | | Total Short-Term Investments | |
| | | (Cost $19,012) | | | 19,012 | | |
| | | Total Investments 100.5% | |
| | | (Cost $2,591,285) | | | 3,170,808 | | |
| | | Liabilities in Excess
of Other Assets (0.5)% | | | (14,759 | ) | |
| | | TOTAL NET ASSETS 100.0% | | $ | 3,156,049 | | |
(a) Non-Income Producing.
(b) U.S. traded security of a foreign issuer.
PORTFOLIO DIVERSIFICATION
Sectors | | Percentage | |
Health Care | | | 19.2 | % | |
Consumer Discretionary | | | 18.2 | | |
Technology | | | 17.3 | | |
Producer Durables | | | 16.4 | | |
Materials and Processing | | | 12.3 | | |
Financial Services | | | 11.5 | | |
Energy | | | 3.4 | | |
Utilities | | | 0.9 | | |
Consumer Staples | | | 0.7 | | |
Total Common Stocks | | | 99.9 | | |
Total Short-Term Investments | | | 0.6 | | |
Total Investments | | | 100.5 | | |
Liabilities in Excess of Other Assets | | | (0.5 | ) | |
Total Net Assets | | | 100.0 | % | |
The accompanying notes are an integral part of these financial statements.
page 47

Frontegra Netols Small Cap Value Fund
SCHEDULE OF INVESTMENTS
December 31, 2012 (Unaudited)
Number of Shares | | | | Value | |
COMMON STOCKS 96.7% | | | |
| | | Consumer Discretionary 19.1% | |
| | 64,296 | | | Aaron's, Inc. | | $ | 1,818,291 | | |
| | 316,426 | | | Accuride Corp. (a) | | | 1,015,727 | | |
| | 79,376 | | | ANN, Inc. (a) | | | 2,686,084 | | |
| | 65,859 | | | Cabela's, Inc. (a) | | | 2,749,613 | | |
| | 53,137 | | | Capella Education Co. (a) | | | 1,500,058 | | |
| | 39,616 | | | Carter's, Inc. (a) | | | 2,204,630 | | |
| | 36,022 | | | Coinstar, Inc. (a) | | | 1,873,504 | | |
| | 69,700 | | | Domino's Pizza, Inc. | | | 3,035,435 | | |
| | 87,499 | | | Ethan Allen Interiors, Inc. | | | 2,249,599 | | |
| | 50,972 | | | Tenneco, Inc. (a) | | | 1,789,627 | | |
| | 56,519 | | | The Cheesecake Factory, Inc. | | | 1,849,302 | | |
| | 23,188 | | | Tractor Supply Co. | | | 2,048,892 | | |
| | 188,701 | | | Zale Corp. (a) | | | 775,561 | | |
| | | | 25,596,323 | | |
| | | Consumer Staples 5.1% | |
| | 134,451 | | | Boulder Brands, Inc. (a) | | | 1,734,418 | | |
| | 28,291 | | | Casey's General Stores, Inc. | | | 1,502,252 | | |
| | 127,576 | | | SunOpta, Inc. (a)(b) | | | 718,253 | | |
| | 38,779 | | | TreeHouse Foods, Inc. (a) | | | 2,021,549 | | |
| | 17,120 | | | United Natural Foods, Inc. (a) | | | 917,461 | | |
| | | | 6,893,933 | | |
| | | Energy 4.6% | |
| | 88,055 | | | Bill Barrett Corp. (a) | | | 1,566,498 | | |
| | 73,128 | | | Superior Energy Services, Inc. (a) | | | 1,515,212 | | |
| | 37,301 | | | Whiting Petroleum Corp. (a) | | | 1,617,744 | | |
| | 288,418 | | | Willbros Group, Inc. (a) | | | 1,545,921 | | |
| | | | 6,245,375 | | |
| | | Financials 19.4% | |
| | 32,871 | | | Bank of Hawaii Corp. | | | 1,447,967 | | |
| | 67,816 | | | Cedar Fair LP | | | 2,268,445 | | |
| | 56,437 | | | Community Bank System, Inc. | | | 1,544,116 | | |
| | 54,327 | | | Endurance Specialty
Holdings Ltd. (b) | | | 2,156,238 | | |
| | 105,559 | | | Glacier Bancorp, Inc. | | | 1,552,773 | | |
| | 475,412 | | | MGIC Investment Corp. (a) | | | 1,264,596 | | |
Number of Shares | | | | Value | |
| | | Financials 19.4% (continued) | |
| | 144,662 | | | Old National Bancorp | | $ | 1,717,138 | | |
| | 104,985 | | | PHH Corp. (a) | | | 2,388,409 | | |
| | 40,901 | | | Prosperity Bancshares, Inc. | | | 1,717,842 | | |
| | 111,018 | | | Selective Insurance Group, Inc. | | | 2,139,317 | | |
| | 55,432 | | | The Hanover Insurance
Group, Inc. | | | 2,147,436 | | |
| | 68,745 | | | Walter Investment
Management Corp. (a) | | | 2,957,410 | | |
| | 73,367 | | | Webster Financial Corp. | | | 1,507,692 | | |
| | 27,691 | | | Westamerica Bancorporation | | | 1,179,360 | | |
| | | | 25,988,739 | | |
| | | Health Care 9.0% | |
| | 81,293 | | | Acadia Healthcare
Company, Inc. (a) | | | 1,896,566 | | |
| | 48,160 | | | Haemonetics Corp. (a) | | | 1,966,854 | | |
| | 36,000 | | | LifePoint Hospitals, Inc. (a) | | | 1,359,000 | | |
| | 28,895 | | | Magellan Health Services, Inc. (a) | | | 1,415,855 | | |
| | 135,314 | | | Merit Medical Systems, Inc. (a) | | | 1,880,865 | | |
| | 69,032 | | | U.S. Physical Therapy, Inc. | | | 1,901,141 | | |
| | 76,500 | | | VCA Antech, Inc. (a) | | | 1,610,325 | | |
| | | | 12,030,606 | | |
| | | Industrials 14.4% | |
| | 66,922 | | | Actuant Corp. - Class A | | | 1,867,793 | | |
| | 150,174 | | | Commercial Vehicle
Group, Inc. (a) | | | 1,232,928 | | |
| | 36,228 | | | General Cable Corp. (a) | | | 1,101,693 | | |
| | 20,881 | | | Genesee & Wyoming, Inc. (a) | | | 1,588,627 | | |
| | 81,814 | | | Herman Miller, Inc. | | | 1,752,456 | | |
| | 94,761 | | | Titan International, Inc. | | | 2,058,209 | | |
| | 88,031 | | | TriMas Corp. (a) | | | 2,461,347 | | |
| | 67,439 | | | United Rentals, Inc. (a) | | | 3,069,823 | | |
| | 46,882 | | | United Stationers, Inc. | | | 1,452,873 | | |
| | 31,872 | | | Westinghouse Air Brake
Technologies Corp. | | | 2,790,075 | | |
| | | | 19,375,824 | | |
The accompanying notes are an integral part of these financial statements.
page 48

Frontegra Netols Small Cap Value Fund
SCHEDULE OF INVESTMENTS (continued)
December 31, 2012 (Unaudited)
Number of Shares | | | | Value | |
| COMMON STOCKS 96.7% (continued) | | | |
| | | Information Technology 10.0% | |
| | 323,269 | | | Ciber, Inc. (a) | | $ | 1,079,718 | | |
| | 185,299 | | | Entegris, Inc. (a) | | | 1,701,045 | | |
| | 69,066 | | | Fair Isaac Corp. | | | 2,902,844 | | |
| | 129,392 | | | Fairchild Semiconductor
International, Inc. (a) | | | 1,863,245 | | |
| | 34,274 | | | Liquidity Services, Inc. (a) | | | 1,400,436 | | |
| | 148,903 | | | Integrated Device
Technology, Inc. (a) | | | 1,086,992 | | |
| | 88,527 | | | Progress Software Corp. (a) | | | 1,858,182 | | |
| | 88,784 | | | WMS Industries, Inc. (a) | | | 1,553,720 | | |
| | | | 13,446,182 | | |
| | | Materials 5.5% | |
| | 28,207 | | | Acuity Brands, Inc. | | | 1,910,460 | | |
| | 37,577 | | | Carpenter Technology Corp. | | | 1,940,101 | | |
| | 27,657 | | | Compass Minerals
International, Inc. | | | 2,066,254 | | |
| | 71,679 | | | Intrepid Potash, Inc. | | | 1,526,046 | | |
| | | | 7,442,861 | | |
| | | Real Estate Investment Trusts 8.4% | |
| | 383,627 | | | FelCor Lodging Trust, Inc. (a) | | | 1,791,538 | | |
| | 172,827 | | | First Industrial Realty
Trust, Inc. (a) | | | 2,433,404 | | |
| | 28,522 | | | Mid-America Apartment
Communities, Inc. | | | 1,846,800 | | |
| | 38,014 | | | National Health Investors, Inc. | | | 2,148,932 | | |
| | 75,582 | | | Sun Communities, Inc. | | | 3,014,966 | | |
| | | | 11,235,640 | | |
| | | Utilities 1.2% | |
| | 76,502 | | | The Empire District Electric Co. | | | 1,559,111 | | |
| | | Total Common Stocks | |
| | | | | (Cost $97,262,876) | | | 129,814,594 | | |
Number of Shares | | | | Value | |
SHORT-TERM INVESTMENTS 3.5% | |
| | | Investment Company 3.5% | |
| | 4,707,803 | | | Fidelity Institutional Money
Market Portfolio, 0.09% | | $ | 4,707,803 | | |
| | | Total Short-Term Investments | |
| | | (Cost $4,707,803) | | | 4,707,803 | | |
| | | Total Investments 100.2% | |
| | | (Cost $101,970,679) | | | 134,522,397 | | |
| | | Liabilities in Excess
of Other Assets (0.2)% | | | (269,513 | ) | |
| | | TOTAL NET ASSETS 100.0% | | $ | 134,252,884 | | |
(a) Non-Income Producing.
(b) U.S. traded security of a foreign issuer.
PORTFOLIO DIVERSIFICATION
Sectors | | Percentage | |
Financials | | | 19.4 | % | |
Consumer Discretionary | | | 19.1 | | |
Industrials | | | 14.4 | | |
Information Technology | | | 10.0 | | |
Health Care | | | 9.0 | | |
Real Estate Investment Trusts | | | 8.4 | | |
Materials | | | 5.5 | | |
Consumer Staples | | | 5.1 | | |
Energy | | | 4.6 | | |
Utilities | | | 1.2 | | |
Total Common Stocks | | | 96.7 | | |
Total Short-Term Investments | | | 3.5 | | |
Total Investments | | | 100.2 | | |
Liabilities in Excess of Other Assets | | | (0.2 | ) | |
Total Net Assets | | | 100.0 | % | |
The accompanying notes are an integral part of these financial statements.
page 49

Frontegra Phocas Small Cap Value Fund
SCHEDULE OF INVESTMENTS
December 31, 2012 (Unaudited)
Number of Shares | | | | Value | |
COMMON STOCKS 96.7% | | | |
| | | Consumer Discretionary 11.0% | |
| | 8,921 | | | Belo Corp. - Class A | | $ | 68,424 | | |
| | 981 | | | Bob Evans Farms, Inc. | | | 39,436 | | |
| | 680 | | | Cracker Barrel Old Country
Store, Inc. | | | 43,697 | | |
| | 2,772 | | | Dana Holding Corp. | | | 43,271 | | |
| | 1,752 | | | Destination Maternity Corp. | | | 37,773 | | |
| | 662 | | | Group 1 Automotive, Inc. | | | 41,037 | | |
| | 2,309 | | | Harman International Industries, Inc. | | | 103,074 | | |
| | 1,311 | | | Meredith Corp. | | | 45,164 | | |
| | 2,011 | | | Perry Ellis International, Inc. | | | 40,019 | | |
| | 4,399 | | | Pier 1 Imports, Inc. | | | 87,980 | | |
| | 1,107 | | | Rent-A-Center, Inc. | | | 38,037 | | |
| | 10,538 | | | Scientific Games Corp., Class A (a) | | | 91,365 | | |
| | 1,591 | | | Steiner Leisure Ltd. (a)(b) | | | 76,670 | | |
| | 1,769 | | | The Finish Line, Inc. - Class A | | | 33,487 | | |
| | 1,184 | | | Wolverine World Wide, Inc. | | | 48,520 | | |
| | | | 837,954 | | |
| | | Consumer Staples 2.2% | |
| | 4,498 | | | Darling International, Inc. (a) | | | 72,148 | | |
| | 1,588 | | | Post Holdings, Inc. (a) | | | 54,389 | | |
| | 1,259 | | | USANA Health Sciences, Inc. (a) | | | 41,459 | | |
| | | | 167,996 | | |
| | | Energy 5.4% | |
| | 7,391 | | | Goodrich Petroleum Corp. (a) | | | 68,884 | | |
| | 3,118 | | | Gulfport Energy Corp. (a) | | | 119,170 | | |
| | 1,041 | | | Hornbeck Offshore Services, Inc. (a) | | | 35,748 | | |
| | 4,271 | | | Kodiak Oil & Gas Corp. (a)(b) | | | 37,798 | | |
| | 1,130 | | | PDC Energy, Inc. (a) | | | 37,527 | | |
| | 5,798 | | | Rex Energy Corp. (a) | | | 75,490 | | |
| | 2,413 | | | Swift Energy Co. (a) | | | 37,136 | | |
| | | | 411,753 | | |
| | | Financials 23.1% | |
| | 3,516 | | | American Equity Investment Life
Holding Co. | | | 42,930 | | |
| | 5,200 | | | Banco Latinoamericano de
Comerico Exterior S.A. (b) | | | 112,112 | | |
Number of Shares | | | | Value | |
| | | Financials 23.1% (continued) | |
| | 4,769 | | | Banner Corp. | | $ | 146,551 | | |
| | 14,007 | | | CNO Financial Group, Inc. | | | 130,685 | | |
| | 4,537 | | | Columbia Banking System, Inc. | | | 81,394 | | |
| | 8,488 | | | First Pactrust Bancorp, Inc. | | | 104,148 | | |
| | 9,950 | | | Heritage Commerce Corp. (a) | | | 69,451 | | |
| | 11,176 | | | ICG Group, Inc. (a) | | | 127,742 | | |
| | 4,695 | | | Janus Capital Group, Inc. | | | 40,001 | | |
| | 4,368 | | | National Financial Partners Corp. (a) | | | 74,868 | | |
| | 8,418 | | | National Penn Bancshares, Inc. | | | 78,456 | | |
| | 1,297 | | | Nelnet, Inc. | | | 38,638 | | |
| | 7,382 | | | Park Sterling Corp. (a) | | | 38,608 | | |
| | 1,651 | | | Primerica, Inc. | | | 49,547 | | |
| | 2,809 | | | Protective Life Corp. | | | 80,281 | | |
| | 5,465 | | | State Bank Financial Corp. | | | 86,784 | | |
| | 1,587 | | | SVB Financial Group (a) | | | 88,824 | | |
| | 10,730 | | | United Community Banks, Inc. (a) | | | 101,076 | | |
| | 6,303 | | | Washington Banking Co. | | | 85,847 | | |
| | 13,219 | | | Wilshire Bancorp, Inc. (a) | | | 77,596 | | |
| | 2,800 | | | Wintrust Financial Corp. | | | 102,760 | | |
| | | | 1,758,299 | | |
| | | Health Care 5.5% | |
| | 3,814 | | | Alkermes PLC (a)(b) | | | 70,635 | | |
| | 2,359 | | | Orthofix International N.V. (a)(b) | | | 92,779 | | |
| | 2,756 | | | PhotoMedex, Inc. (a) | | | 39,989 | | |
| | 1,381 | | | United Therapeutics Corp. (a) | | | 73,773 | | |
| | 3,067 | | | ViroPharma, Inc. (a) | | | 69,805 | | |
| | 1,565 | | | WellCare Health Plans, Inc. (a) | | | 76,200 | | |
| | | | 423,181 | | |
| | | Industrials 13.8% | |
| | 12,980 | | | Aceto Corp. | | | 130,319 | | |
| | 629 | | | AMERCO, Inc. | | | 79,763 | | |
| | 2,229 | | | Beacon Roofing Supply, Inc. (a) | | | 74,181 | | |
| | 2,193 | | | Coinstar, Inc. (a) | | | 114,058 | | |
| | 1,162 | | | Esterline Technologies Corp. (a) | | | 73,915 | | |
| | 2,695 | | | MYR Group, Inc. (a) | | | 59,964 | | |
| | 1,880 | | | Park-Ohio Holdings Corp. (a) | | | 40,063 | | |
The accompanying notes are an integral part of these financial statements.
page 50

Frontegra Phocas Small Cap Value Fund
SCHEDULE OF INVESTMENTS (continued)
December 31, 2012 (Unaudited)
Number of Shares | | | | Value | |
| COMMON STOCKS 96.7% (continued) | | | |
| | | Industrials 13.8% (continued) | |
| | 2,581 | | | Performant Financial Corp. | | $ | 26,068 | | |
| | 1,735 | | | Spirit Airlines, Inc. (a) | | | 30,744 | | |
| | 3,027 | | | Tetra Tech, Inc. (a) | | | 80,064 | | |
| | 2,260 | | | Trinity Industries, Inc. | | | 80,953 | | |
| | 1,261 | | | Triumph Group, Inc. | | | 82,343 | | |
| | 1,280 | | | UniFirst Corp. | | | 93,850 | | |
| | 2,172 | | | URS Corp. | | | 85,273 | | |
| | | | 1,051,558 | | |
| | | Information Technology 12.0% | |
| | 8,119 | | | Compuware Corp. (a) | | | 88,254 | | |
| | 3,451 | | | Ebix, Inc. (a) | | | 55,458 | | |
| | 5,373 | | | Emulex Corp. (a) | | | 39,223 | | |
| | 2,924 | | | Euronet Worldwide, Inc. (a) | | | 69,006 | | |
| | 6,447 | | | Fairchild Semiconductor
International, Inc. - Class A (a) | | | 92,837 | | |
| | 844 | | | Itron, Inc. (a) | | | 37,600 | | |
| | 1,137 | | | Measurement Specialties, Inc. (a) | | | 39,067 | | |
| | 5,658 | | | Microsemi Corp. (a) | | | 119,044 | | |
| | 1,920 | | | NeuStar, Inc. (a) | | | 80,506 | | |
| | 3,596 | | | Progress Software Corp. (a) | | | 75,480 | | |
| | 2,873 | | | SYNNEX Corp. (a) | | | 98,774 | | |
| | 6,830 | | | United Online, Inc. | | | 38,180 | | |
| | 2,037 | | | ValueClick, Inc. (a) | | | 39,538 | | |
| | 1,442 | | | Verint Systems, Inc. (a) | | | 42,337 | | |
| | | | 915,304 | | |
| | | Materials 5.4% | |
| | 1,228 | | | Ashland, Inc. | | | 98,744 | | |
| | 9,063 | | | Boise, Inc. | | | 72,051 | | |
| | 2,062 | | | Cabot Corp. | | | 82,047 | | |
| | 929 | | | Kaiser Aluminum Corp. | | | 57,310 | | |
| | 2,781 | | | Sensient Technologies Corp. | | | 98,892 | | |
| | | | 409,044 | | |
| | | Real Estate Investment Trusts 12.2% | |
| | 3,789 | | | Acadia Realty Trust | | | 95,028 | | |
| | 3,148 | | | Colonial Properties Trust | | | 67,273 | | |
| | 2,618 | | | CoreSite Realty Corp. | | | 72,414 | | |
Number of Shares | | | | Value | |
| | | Real Estate Investment
Trusts 12.2% (continued) | |
| | 8,387 | | | CubeSmart | | $ | 122,199 | | |
| | 3,590 | | | First Potomac Realty Trust | | | 44,373 | | |
| | 1,520 | | | Kilroy Realty Corp. | | | 72,002 | | |
| | 6,353 | | | Medical Properties Trust, Inc. | | | 75,982 | | |
| | 17,865 | | | NorthStar Realty Finance Corp. | | | 125,770 | | |
| | 5,127 | | | Sabra Health Care REIT, Inc. | | | 111,358 | | |
| | 11,731 | | | Strategic Hotels & Resorts, Inc. (a) | | | 75,078 | | |
| | 1,672 | | | Sun Communities, Inc. | | | 66,696 | | |
| | | | 928,173 | | |
| | | Utilities 6.1% | |
| | 2,966 | | | Aqua America, Inc. | | | 75,396 | | |
| | 1,921 | | | Atmos Energy Corp. | | | 67,466 | | |
| | 2,241 | | | Black Hills Corp. | | | 81,438 | | |
| | 1,700 | | | IDACORP, Inc. | | | 73,695 | | |
| | 1,172 | | | Laclede Group, Inc. | | | 45,251 | | |
| | 1,785 | | | PNM Resources, Inc. | | | 36,610 | | |
| | 1,711 | | | Portland General Electric Co. | | | 46,813 | | |
| | 2,003 | | | The Empire District Electric Co. | | | 40,821 | | |
| | | | 467,490 | | |
| | | Total Common Stocks | |
| | | | | (Cost $5,819,025) | | | 7,370,752 | | |
CLOSED-END FUNDS 0.7% | | | |
| | | Financials 0.7% | |
| | 5,028 | | | Prospect Capital Corp. | | | 54,654 | | |
| | | Total Closed-End Funds | |
| | | | | (Cost $55,128) | | | 54,654 | | |
| | | Total Investments 97.4% | |
| | | | | (Cost $5,874,153) | | | 7,425,406 | | |
| | | | | Other Assets in Excess
of Liabilities 2.6% | | | 198,432 | | |
| | | | | TOTAL NET ASSETS 100.0% | | $ | 7,623,838 | | |
(a) Non-Income Producing.
(b) U.S. traded security of a foreign issuer.
The accompanying notes are an integral part of these financial statements.
page 51

Frontegra Phocas Small Cap Value Fund
SCHEDULE OF INVESTMENTS (continued)
December 31, 2012 (Unaudited)
PORTFOLIO DIVERSIFICATION
Sectors | | Percentage | |
Financials | | | 23.1 | % | |
Industrials | | | 13.8 | | |
Real Estate Investment Trusts | | | 12.2 | | |
Information Technology | | | 12.0 | | |
Consumer Discretionary | | | 11.0 | | |
Utilities | | | 6.1 | | |
Health Care | | | 5.5 | | |
Energy | | | 5.4 | | |
Materials | | | 5.4 | | |
Consumer Staples | | | 2.2 | | |
Total Common Stocks | | | 96.7 | | |
Financials | | | 0.7 | | |
Total Closed-End Funds | | | 0.7 | | |
Total Investments | | | 97.4 | | |
Other Assets in Excess of Liabilities | | | 2.6 | | |
Total Net Assets | | | 100.0 | % | |
The accompanying notes are an integral part of these financial statements.
page 52

Lockwell Small Cap Value Fund
SCHEDULE OF INVESTMENTS
December 31, 2012 (Unaudited)
Number of Shares | | | | Value | |
COMMON STOCKS 95.4% | | | |
| | | Consumer Discretionary 11.0% | |
| | 1,635 | | | AFC Enterprises, Inc. (a) | | $ | 42,722 | | |
| | 530 | | | Ascent Capital Group, Inc. -
Class A (a) | | | 32,828 | | |
| | 7,620 | | | Denny's Corp. (a) | | | 37,186 | | |
| | 1,630 | | | Fiesta Restaurant Group, Inc. (a) | | | 24,972 | | |
| | 815 | | | Hanesbrands, Inc. (a) | | | 29,193 | | |
| | 1,975 | | | Hillenbrand, Inc. | | | 44,655 | | |
| | 1,400 | | | Pier 1 Imports, Inc. | | | 28,000 | | |
| | 2,185 | | | SHFL entertainment, Inc. (a) | | | 31,682 | | |
| | 800 | | | Tenneco, Inc. (a) | | | 28,088 | | |
| | | | 299,326 | | |
| | | Consumer Staples 3.8% | |
| | 1,033 | | | Ingredion, Inc. | | | 66,556 | | |
| | 1,573 | | | Snyder's-Lance, Inc. | | | 37,925 | | |
| | | | 104,481 | | |
| | | Energy 1.5% | |
| | 2,295 | | | Goodrich Petroleum Corp. (a) | | | 21,389 | | |
| | 1,015 | | | Superior Energy Services, Inc. (a) | | | 21,031 | | |
| | | | 42,420 | | |
| | | Financials 21.5% | |
| | 1,060 | | | Alterra Capital Holdings Ltd. (b) | | | 29,881 | | |
| | 1,568 | | | AmTrust Financial Services, Inc. | | | 44,986 | | |
| | 845 | | | Argo Group International
Holdings Ltd. (b) | | | 28,384 | | |
| | 1,590 | | | Capitol Federal Financial, Inc. | | | 18,587 | | |
| | 7,155 | | | CNO Financial Group, Inc. | | | 66,755 | | |
| | 1,440 | | | Eagle Bancorp, Inc. (a) | | | 28,757 | | |
| | 1,405 | | | Employers Holdings, Inc. | | | 28,915 | | |
| | 1,395 | | | MB Financial, Inc. | | | 27,551 | | |
| | 1,320 | | | Northwest Bancshares, Inc. | | | 16,025 | | |
| | 1,075 | | | Ocwen Financial Corp. (a) | | | 37,184 | | |
| | 2,295 | | | Oriental Financial Group, Inc. | | | 30,638 | | |
| | 1,205 | | | Oritani Financial Corp. | | | 18,461 | | |
| | 685 | | | Platinum Underwriters
Holdings Ltd. (b) | | | 31,510 | | |
Number of Shares | | | | Value | |
| | | Financials 21.5% (continued) | |
| | 1,150 | | | ProAssurance Corp. | | $ | 48,519 | | |
| | 3,405 | | | Provident New York Bancorp | | | 31,700 | | |
| | 1,710 | | | State Bank Financial Corp. | | | 27,155 | | |
| | 1,400 | | | ViewPoint Financial Group | | | 29,316 | | |
| | 2,425 | | | Walker & Dunlop, Inc. (a) | | | 40,401 | | |
| | | | 584,725 | | |
| | | Health Care 4.4% | |
| | 3,960 | | | HealthSouth Corp. (a) | | | 83,595 | | |
| | 1,314 | | | U.S. Physical Therapy, Inc. | | | 36,188 | | |
| | | | 119,783 | | |
| | | Industrials 24.7% | |
| | 4,010 | | | ACCO Brands Corp. (a) | | | 29,433 | | |
| | 1,105 | | | Actuant Corp. - Class A | | | 30,841 | | |
| | 1,010 | | | Aegion Corp. (a) | | | 22,412 | | |
| | 5,100 | | | AerCap Holdings NV (a)(b) | | | 69,972 | | |
| | 1,465 | | | Belden, Inc. | | | 65,910 | | |
| | 1,755 | | | Celadon Group, Inc. | | | 31,713 | | |
| | 835 | | | Curtiss-Wright Corp. | | | 27,413 | | |
| | 1,110 | | | Forward Air Corp. | | | 38,861 | | |
| | 995 | | | G&K Services, Inc. - Class A | | | 33,979 | | |
| | 1,255 | | | Harsco Corp. | | | 29,493 | | |
| | 871 | | | HEICO Corp. - Class A | | | 27,855 | | |
| | 630 | | | Hub Group, Inc. - Class A (a) | | | 21,168 | | |
| | 1,030 | | | ICF International, Inc. (a) | | | 24,143 | | |
| | 1,275 | | | Insperity, Inc. | | | 41,514 | | |
| | 1,595 | | | ITT Corp. | | | 37,419 | | |
| | 578 | | | Moog, Inc. - Class A (a) | | | 23,715 | | |
| | 1,050 | | | Quanex Building Products Corp. | | | 21,431 | | |
| | 165 | | | Snap-on, Inc. | | | 13,033 | | |
| | 705 | | | Tennant Co. | | | 30,985 | | |
| | 325 | | | Triumph Group, Inc. | | | 21,223 | | |
| | 980 | | | United Stationers, Inc. | | | 30,370 | | |
| | | | 672,883 | | |
| | | Information Technology 14.3% | |
| | 920 | | | ACI Worldwide, Inc. (a) | | | 40,195 | | |
| | 1,195 | | | ADTRAN, Inc. | | | 23,350 | | |
The accompanying notes are an integral part of these financial statements.
page 53

Lockwell Small Cap Value Fund
SCHEDULE OF INVESTMENTS (continued)
December 31, 2012 (Unaudited)
Number of Shares | | | | Value | |
| COMMON STOCKS 95.4% (continued) | | | |
| | | Information
Technology 14.3% (continued) | |
| | 1,940 | | | GSI Group, Inc. (a)(b) | | $ | 16,800 | | |
| | 1,070 | | | MAXIMUS, Inc. | | | 67,646 | | |
| | 1,430 | | | Microsemi Corp. (a) | | | 30,087 | | |
| | 615 | | | NeuStar, Inc. - Class A (a) | | | 25,787 | | |
| | 695 | | | Plantronics, Inc. | | | 25,625 | | |
| | 820 | | | Rogers Corp. (a) | | | 40,721 | | |
| | 1,980 | | | Sapient Corp. (a) | | | 20,909 | | |
| | 735 | | | ScanSource, Inc. (a) | | | 23,351 | | |
| | 1,375 | | | Verint Systems, Inc. (a) | | | 40,370 | | |
| | 905 | | | Zebra Technologies Corp. (a) | | | 35,548 | | |
| | | | 390,389 | | |
| | | Materials 8.0% | |
| | 770 | | | A. Schulman, Inc. | | | 22,276 | | |
| | 535 | | | Cytec Industries, Inc. | | | 36,824 | | |
| | 1,725 | | | HB Fuller Co. | | | 60,065 | | |
| | 810 | | | Innophos Holdings, Inc. | | | 37,664 | | |
| | 1,250 | | | Materion Corp. | | | 32,225 | | |
| | 405 | | | Rock-Tenn Co. - Class A | | | 28,314 | | |
| | | | 217,368 | | |
| | | Real Estate Investment Trusts 2.1% | |
| | 1,185 | | | Agree Realty Corp. | | | 31,746 | | |
| | 1,125 | | | Pebblebrook Hotel Trust | | | 25,988 | | |
| | | | 57,734 | | |
| | | Utilities 4.1% | |
| | 470 | | | ALLETE, Inc. | | | 19,261 | | |
| | 485 | | | Cleco Corp. | | | 19,405 | | |
| | 675 | | | El Paso Electric Co. | | | 21,539 | | |
| | 780 | | | NorthWestern Corp. | | | 27,089 | | |
| | 715 | | | UGI Corp. | | | 23,388 | | |
| | | | 110,682 | | |
| | | Total Common Stocks | |
| | | | | (Cost $2,217,734) | | | 2,599,791 | | |
Number of Shares | | | | Value | |
SHORT-TERM INVESTMENTS 5.4% | |
| | | Investment Company 5.4% | |
| | 146,384 | | | STIT-STIC Liquid Assets
Portfolio - Institutional
Class, 0.15% | | $ | 146,384 | | |
| | | Total Short-Term Investments | |
| | | (Cost $146,384) | | | 146,384 | | |
| | | Total Investments 100.8% | |
| | | (Cost $2,364,118) | | | 2,746,175 | | |
| | | Liabilities in Excess
of Other Assets (0.8)% | | | (20,912 | ) | |
| | | TOTAL NET ASSETS 100.0% | | $ | 2,725,263 | | |
(a) Non-Income Producing.
(b) U.S. traded security of a foreign issuer.
PORTFOLIO DIVERSIFICATION
Sectors | | Percentage | |
Industrials | | | 24.7 | % | |
Financials | | | 21.5 | | |
Information Technology | | | 14.3 | | |
Consumer Discretionary | | | 11.0 | | |
Materials | | | 8.0 | | |
Health Care | | | 4.4 | | |
Utilities | | | 4.1 | | |
Consumer Staples | | | 3.8 | | |
Real Estate Investment Trusts | | | 2.1 | | |
Energy | | | 1.5 | | |
Total Common Stocks | | | 95.4 | | |
Total Short-Term Investments | | | 5.4 | | |
Total Investments | | | 100.8 | | |
Liabilities in Excess of Other Assets | | | (0.8 | ) | |
Total Net Assets | | | 100.0 | % | |
The accompanying notes are an integral part of these financial statements.
page 54
This page intentionally left blank.

Frontegra Funds
STATEMENTS OF ASSETS AND LIABILITIES
December 31, 2012 (Unaudited)
| | | RobecoSAM Global
Equity Fund(1) | | MFG Global
Equity Fund | | MFG Core
Infrastructure Fund | | HEXAM Emerging
Markets Fund | |
ASSETS: | |
Investments at cost | | $ | 14,706,531 | | | $ | 116,982,840 | | | $ | 2,787,884 | | | $ | 26,400,023 | | |
Foreign currency at cost | | $ | — | | | $ | 794,072 | | | $ | 9,139 | | | $ | — | | |
Investments at value | | $ | 17,321,910 | | | $ | 124,810,571 | | | $ | 3,054,281 | | | $ | 24,580,663 | | |
Foreign currency at value | | | — | | | | 798,520 | | | | 9,310 | | | | — | | |
Cash | | | — | | | | — | | | | — | | | | — | | |
Receivable for investments sold | | | — | | | | — | | | | — | | | | — | | |
Receivable for Fund shares sold | | | — | | | | 410,000 | | | | — | | | | — | | |
Interest and dividends receivable | | | 48,579 | | | | 130,445 | | | | 14,377 | | | | 23,242 | | |
Receivable from Adviser | | | — | | | | 31,514 | | | | 4,171 | | | | — | | |
Prepaid expenses and other assets | | | 9,009 | | | | 28,152 | | | | 2,320 | | | | 4,932 | | |
Total assets | | | 17,379,498 | | | | 126,209,202 | | | | 3,084,459 | | | | 24,608,837 | | |
LIABILITIES: | |
Payable for investments purchased | | | — | | | | — | | | | — | | | | — | | |
Payable for Fund shares redeemed | | | — | | | | — | | | | 4,354 | | | | — | | |
Payable to the custodian | | | — | | | | — | | | | — | | | | — | | |
Payable for foreign currency | | | 16 | | | | — | | | | — | | | | — | | |
Payable to Adviser | | | 8,683 | | | | 84,639 | | | | — | | | | 18,339 | | |
Accrued distribution and shareholder servicing fees | | | — | | | | — | | | | — | | | | — | | |
Accrued expenses | | | 29,100 | | | | 47,971 | | | | 25,570 | | | | 28,231 | | |
Total liabilities | | | 37,799 | | | | 132,610 | | | | 29,924 | | | | 46,570 | | |
Net Assets | | $ | 17,341,699 | | | $ | 126,076,592 | | | $ | 3,054,535 | | | $ | 24,562,267 | | |
NET ASSETS CONSIST OF: | |
Paid in capital | | $ | 15,820,630 | | | $ | 117,177,827 | | | $ | 2,794,971 | | | $ | 30,048,291 | | |
Undistributed net investment income (loss) | | | 10,849 | | | | 56,431 | | | | (3,956 | ) | | | (44,312 | ) | |
Accumulated net realized gain (loss) | | | (1,105,574 | ) | | | 1,010,070 | | | | (3,061 | ) | | | (3,622,367 | ) | |
Net unrealized appreciation/depreciation on: | |
Investments | | | 2,615,379 | | | | 7,827,731 | | | | 266,397 | | | | (1,819,360 | ) | |
Foreign currency | | | 415 | | | | 4,533 | | | | 184 | | | | 15 | | |
Net Assets | | $ | 17,341,699 | | | $ | 126,076,592 | | | $ | 3,054,535 | | | $ | 24,562,267 | | |
CAPITAL STOCK, $0.01 PAR VALUE | | | | | | | | | |
Net Assets | | $ | 17,341,699 | | | $ | 126,076,592 | | | $ | 3,054,535 | | | $ | 24,562,267 | | |
Authorized | | | 50,000,000 | | | | 50,000,000 | | | | 50,000,000 | | | | 50,000,000 | | |
Issued and Outstanding | | | 1,522,324 | | | | 10,794,194 | | | | 274,923 | | | | 3,255,637 | | |
Net Asset Value, Redemption Price and Offering Price Per Share | | $ | 11.39 | | | $ | 11.68 | | | $ | 11.11 | | | $ | 7.54 | | |
CAPITAL STOCK, $0.01 PAR VALUE | | | | | | | | | |
Net Assets | | | | | | | | | |
Authorized | | | | | | | | | |
Issued and Outstanding | | | | | | | | | |
Net Asset Value, Redemption Price and Offering Price Per Share | | | | | | | | | |
(1) Effective February 20, 2013, the Fund changed its name from Frontegra SAM Global Equity Fund to Frontegra RobecoSAM
Global Equity Fund.
The accompanying notes are an integral part of these financial statements.
page 56

| | | Timpani Small Cap
Growth Fund | | Netols Small Cap
Value Fund | | Phocas Small Cap
Value Fund | | Lockwell Small Cap
Value Fund | |
ASSETS: | |
Investments at cost | | $ | 2,591,285 | | | $ | 101,970,679 | | | $ | 5,874,153 | | | $ | 2,364,118 | | |
Foreign currency at cost | | $ | — | | | $ | — | | | $ | — | | | $ | — | | |
Investments at value | | $ | 3,170,808 | | | $ | 134,522,397 | | | $ | 7,425,406 | | | $ | 2,746,175 | | |
Foreign currency at value | | | — | | | | — | | | | — | | | | — | | |
Cash | | | — | | | | 17,088 | | | | — | | | | 57 | | |
Receivable for investments sold | | | 12,845 | | | | — | | | | 172,380 | | | | — | | |
Receivable for Fund shares sold | | | 23 | | | | 32,852 | | | | 74,900 | | | | — | | |
Interest and dividends receivable | | | 251 | | | | 95,988 | | | | 7,504 | | | | 1,393 | | |
Receivable from Adviser | | | 5,812 | | | | — | | | | 28,257 | | | | 2,374 | | |
Prepaid expenses and other assets | | | 2,180 | | | | 18,964 | | | | 26,901 | | | | 9,585 | | |
Total assets | | | 3,191,919 | | | | 134,687,289 | | | | 7,735,348 | | | | 2,759,584 | | |
LIABILITIES: | |
Payable for investments purchased | | | 9,216 | | | | 261,435 | | | | — | | | | — | | |
Payable for Fund shares redeemed | | | — | | | | 1,733 | | | | 1,420 | | | | 10,694 | | |
Payable to the custodian | | | — | | | | — | | | | 82,989 | | | | — | | |
Payable for foreign currency | | | — | | | | — | | | | — | | | | — | | |
Payable to Adviser | | | — | | | | 87,670 | | | | — | | | | — | | |
Accrued distribution and shareholder servicing fees | | | — | | | | 21,075 | | | | — | | | | — | | |
Accrued expenses | | | 26,654 | | | | 62,492 | | | | 27,101 | | | | 23,627 | | |
Total liabilities | | | 35,870 | | | | 434,405 | | | | 111,510 | | | | 34,321 | | |
Net Assets | | $ | 3,156,049 | | | $ | 134,252,884 | | | $ | 7,623,838 | | | $ | 2,725,263 | | |
NET ASSETS CONSIST OF: | |
Paid in capital | | $ | 2,977,758 | | | $ | 98,816,075 | | | $ | 6,367,876 | | | $ | 2,328,276 | | |
Undistributed net investment income (loss) | | | (7,557 | ) | | | 50,362 | | | | 16,461 | | | | (17 | ) | |
Accumulated net realized gain (loss) | | | (393,675 | ) | | | 2,834,729 | | | | (311,752 | ) | | | 14,947 | | |
Net unrealized appreciation/depreciation on: | |
Investments | | | 579,523 | | | | 32,551,718 | | | | 1,551,253 | | | | 382,057 | | |
Foreign currency | | | — | | | | — | | | | — | | | | — | | |
Net Assets | | $ | 3,156,049 | | | $ | 134,252,884 | | | $ | 7,623,838 | | | $ | 2,725,263 | | |
CAPITAL STOCK, $0.01 PAR VALUE | | | | Institutional Class | | | | | |
Net Assets | | $ | 3,156,049 | | | $ | 116,573,219 | | | $ | 7,623,838 | | | $ | 2,725,263 | | |
Authorized | | | 50,000,000 | | | | 50,000,000 | | | | 50,000,000 | | | | 50,000,000 | | |
Issued and Outstanding | | | 294,109 | | | | 8,815,495 | | | | 311,202 | | | | 257,500 | | |
Net Asset Value, Redemption Price and Offering Price Per Share | | $ | 10.73 | | | $ | 13.22 | | | $ | 24.50 | | | $ | 10.58 | | |
CAPITAL STOCK, $0.01 PAR VALUE | | | | Class Y | | | | | |
Net Assets | | | | $ | 17,679,665 | | | | | | |
Authorized | | | | | 50,000,000 | | | | | | |
Issued and Outstanding | | | | | 1,362,434 | | | | | | |
Net Asset Value, Redemption Price and Offering Price Per Share | | | | $ | 12.98 | | | | | | | | | | |
The accompanying notes are an integral part of these financial statements.
page 57

Frontegra Funds
STATEMENTS OF OPERATIONS
For the Six Months Ended December 31, 2012 (Unaudited)
| | | RobecoSAM Global
Equity Fund(1) | | MFG Global
Equity Fund | | MFG Core
Infrastructure Fund | | HEXAM Emerging
Markets Fund | |
INVESTMENT INCOME: | |
Dividend income | | $ | 264,285 | (2) | | $ | 934,513 | (3) | | $ | 54,927 | (4) | | $ | 94,451 | (5) | |
Interest income | | | 258 | | | | 2,219 | | | | 7,434 | | | | 509 | | |
Total investment income | | | 264,543 | | | | 936,732 | | | | 62,361 | | | | 94,960 | | |
EXPENSES: | |
Investment advisory fees | | | 79,166 | | | | 473,725 | | | | 10,258 | | | | 96,419 | | |
Fund administration and accounting fees | | | 20,071 | | | | 52,436 | | | | 15,988 | | | | 19,834 | | |
Federal and state registration fees | | | 12,007 | | | | 10,005 | | | | — | | | | 1,810 | | |
Custody fees | | | 10,998 | | | | 13,497 | | | | 7,000 | | | | 11,935 | | |
Audit fees | | | 9,384 | | | | 8,124 | | | | 8,229 | | | | 9,384 | | |
Legal fees | | | 7,211 | | | | 7,672 | | | | 7,636 | | | | 5,974 | | |
Shareholder servicing fees | | | 4,670 | | | | 8,942 | | | | 3,191 | | | | 3,698 | | |
Directors' fees and related expenses | | | 4,643 | | | | 4,886 | | | | 5,120 | | | | 4,549 | | |
Reports to shareholders | | | 3,022 | | | | 2,515 | | | | 2,342 | | | | 2,411 | | |
Distribution and shareholder servicing fees - Class Y | | | — | | | | — | | | | — | | | | — | | |
Subadministration fees - Class I | | | — | | | | — | | | | — | | | | — | | |
Other | | | 7,151 | | | | 19,266 | | | | 1,788 | | | | 8,666 | | |
Total expenses before waiver and reimbursement | | | 158,323 | | | | 601,068 | | | | 61,552 | | | | 164,680 | | |
Waiver and reimbursement of expenses by Adviser | | | (39,573 | ) | | | (127,342 | ) | | | (51,293 | ) | | | (25,408 | ) | |
Net expenses | | | 118,750 | | | | 473,726 | | | | 10,259 | | | | 139,272 | | |
Net Investment Income (Loss) | | | 145,793 | | | | 463,006 | | | | 52,102 | | | | (44,312 | ) | |
REALIZED AND UNREALIZED GAIN (LOSS) ON INVESTMENTS: | |
Net realized gain (loss) on: | |
Investments | | | (795,742 | ) | | | 2,395,520 | | | | (3,503 | ) | | | (650,455 | ) | |
Foreign currency transactions | | | (21,323 | ) | | | 24,172 | | | | 668 | | | | (11,788 | ) | |
Change in net unrealized appreciation/depreciation on: | |
Investments | | | 2,278,879 | | | | 8,350,141 | | | | 186,898 | | | | 3,856,622 | | |
Foreign currency transactions | | | (1,234 | ) | | | 6,791 | | | | 14 | | | | 3,362 | | |
Net Realized and Unrealized Gain on Investments | | | 1,460,580 | | | | 10,776,624 | | | | 184,077 | | | | 3,197,741 | | |
Net Increase in Net Assets Resulting from Operations | | $ | 1,606,373 | | | $ | 11,239,630 | | | $ | 236,179 | | | $ | 3,153,429 | | |
(1) Effective February 20, 2013, the Fund changed its name from Frontegra SAM Global Equity Fund to Frontegra RobecoSAM
Global Equity Fund.
(2) Net of $15,650 in foreign withholding taxes.
(3) Net of $19,007 in foreign withholding taxes.
(4) Net of $5,370 in foreign withholding taxes.
(5) Net of $11,335 in foreign withholding taxes.
(6) Net of $5 in foreign withholding taxes.
(7) Net of $14 in foreign withholding taxes.
The accompanying notes are an integral part of these financial statements.
page 58

| | | Timpani Small Cap
Growth Fund | | Netols Small Cap
Value Fund | | Phocas Small Cap
Value Fund | | Lockwell Small Cap
Value Fund | |
INVESTMENT INCOME: | |
Dividend income | | $ | 21,046 | (6) | | $ | 946,902 | | | $ | 103,925 | | | $ | 23,814 | (7) | |
Interest income | | | 21 | | | | 2,140 | | | | 158 | | | | 98 | | |
Total investment income | | | 21,067 | | | | 949,042 | | | | 104,083 | | | | 23,912 | | |
EXPENSES: | |
Investment advisory fees | | | 14,867 | | | | 769,365 | | | | 64,145 | | | | 13,323 | | |
Fund administration and accounting fees | | | 13,838 | | | | 67,032 | | | | 16,403 | | | | 13,517 | | |
Federal and state registration fees | | | 3,108 | | | | 4,847 | | | | 3,892 | | | | 12,589 | | |
Custody fees | | | 4,180 | | | | 7,213 | | | | 9,596 | | | | 1,518 | | |
Audit fees | | | 8,329 | | | | 8,377 | | | | 8,329 | | | | 7,038 | | |
Legal fees | | | 10,475 | | | | 10,374 | | | | 21,759 | | | | 7,671 | | |
Shareholder servicing fees | | | 3,218 | | | | 15,147 | | | | 7,661 | | | | 3,195 | | |
Directors' fees and related expenses | | | 4,551 | | | | 4,551 | | | | 4,655 | | | | 4,755 | | |
Reports to shareholders | | | 2,318 | | | | 10,802 | | | | 4,523 | | | | 2,055 | | |
Distribution and shareholder servicing fees - Class Y | | | — | | | | 35,623 | | | | — | | | | — | | |
Subadministration fees - Class I | | | — | | | | — | | | | 1,314 | | | | — | | |
Other | | | 1,969 | | | | 26,507 | | | | 5,343 | | | | 1,611 | | |
Total expenses before waiver and reimbursement | | | 66,853 | | | | 959,838 | | | | 147,620 | | | | 67,272 | | |
Waiver and reimbursement of expenses by Adviser | | | (50,500 | ) | | | (77,914 | ) | | | (81,427 | ) | | | (52,617 | ) | |
Net expenses | | | 16,353 | | | | 881,924 | | | | 66,193 | | | | 14,655 | | |
Net Investment Income (Loss) | | | 4,714 | | | | 67,118 | | | | 37,890 | | | | 9,257 | | |
REALIZED AND UNREALIZED GAIN (LOSS) ON INVESTMENTS: | |
Net realized gain (loss) on: | |
Investments | | | 61,535 | | | | 12,770,644 | | | | 2,605,213 | | | | 19,094 | | |
Foreign currency transactions | | | — | | | | — | | | | — | | | | — | | |
Change in net unrealized appreciation/depreciation on: | |
Investments | | | 50,011 | | | | (2,123,177 | ) | | | (1,797,011 | ) | | | 270,205 | | |
Foreign currency transactions | | | — | | | | — | | | | — | | | | — | | |
Net Realized and Unrealized Gain on Investments | | | 111,546 | | | | 10,647,467 | | | | 808,202 | | | | 289,299 | | |
Net Increase in Net Assets Resulting from Operations | | $ | 116,260 | | | $ | 10,714,585 | | | $ | 846,092 | | | $ | 298,556 | | |
The accompanying notes are an integral part of these financial statements.
page 59

Frontegra Funds
STATEMENTS OF CHANGES IN NET ASSETS
| | | RobecoSAM Global Equity Fund(1) | | MFG Global Equity Fund | |
| | | For the
Six Months Ended
December 31, 2012
(Unaudited) | | For the
Year Ended
June 30, 2012 | | For the
Six Months Ended
December 31, 2012
(Unaudited) | | For the Period
December 28, 2011(2)
through
June 30, 2012 | |
OPERATIONS: | |
Net investment income | | $ | 145,793 | | | $ | 298,252 | | | $ | 463,006 | | | $ | 575,272 | | |
Net realized gain (loss) on: | |
Investments | | | (795,742 | ) | | | (73,629 | ) | | | 2,395,520 | | | | 57,026 | | |
Foreign currency transactions | | | (21,323 | ) | | | (51,607 | ) | | | 24,172 | | | | (14,867 | ) | |
Change in net unrealized appreciation/depreciation on: | |
Investments | | | 2,278,879 | | | | (2,322,847 | ) | | | 8,350,141 | | | | (522,410 | ) | |
Foreign currency transactions | | | (1,234 | ) | | | (209 | ) | | | 6,791 | | | | (2,258 | ) | |
Net increase (decrease) in net assets resulting from operations | | | 1,606,373 | | | | (2,150,040 | ) | | | 11,239,630 | | | | 92,763 | | |
DISTRIBUTIONS PAID TO SHAREHOLDERS FROM: | |
Net investment income | | | (295,231 | ) | | | (342,421 | ) | | | (966,980 | ) | | | — | | |
Net realized gain on investments | | | — | | | | (1,251,705 | ) | | | (1,466,648 | ) | | | — | | |
Net decrease in net assets resulting from distributions paid | | | (295,231 | ) | | | (1,594,126 | ) | | | (2,433,628 | ) | | | — | | |
CAPITAL SHARE TRANSACTIONS: | |
Shares sold | | | 454,615 | | | | 5,331,367 | | | | 6,323,482 | | | | 111,032,500 | | |
Shares issued to holders in reinvestment of distributions | | | 277,765 | | | | 1,585,837 | | | | 2,415,348 | | | | — | | |
Shares redeemed | | | (4,653,751 | ) | | | (2,512,847 | ) | | | (18,806 | ) | | | (2,574,697 | ) | |
Net increase (decrease) in net assets resulting from capital share transactions | | | (3,921,371 | ) | | | 4,404,357 | | | | 8,720,024 | | | | 108,457,803 | | |
Total Increase (Decrease) in Net Assets | | | (2,610,229 | ) | | | 660,191 | | | | 17,526,026 | | | | 108,550,566 | | |
NET ASSETS: | |
Beginning of Period | | | 19,951,928 | | | | 19,291,737 | | | | 108,550,566 | | | | — | | |
End of Period | | $ | 17,341,699 | | | $ | 19,951,928 | | | $ | 126,076,592 | | | $ | 108,550,566 | | |
Undistributed net investment income | | $ | 10,849 | | | $ | 160,287 | | | $ | 56,431 | | | $ | 560,405 | | |
TRANSACTIONS IN SHARES: | |
Shares sold | | | 42,704 | | | | 477,250 | | | | 547,108 | | | | 10,276,542 | | |
Shares issued to holders in reinvestment of distributions | | | 24,132 | | | | 156,703 | | | | 205,562 | | | | — | | |
Shares redeemed | | | (412,492 | ) | | | (233,156 | ) | | | (1,591 | ) | | | (233,427 | ) | |
Net increase (decrease) in shares outstanding | | | (345,656 | ) | | | 400,797 | | | | 751,079 | | | | 10,043,115 | | |
(1) Effective February 20, 2013, the Fund changed its name from Frontegra SAM Global Equity Fund to Frontegra RobecoSAM Global Equity Fund.
(2) Commencement of operations.
The accompanying notes are an integral part of these financial statements.
page 60

Frontegra Funds
STATEMENTS OF CHANGES IN NET ASSETS (continued)
| | | MFG Core Infrastructure Fund | | HEXAM Emerging Markets Fund | |
| | | For the
Six Months Ended
December 31, 2012
(Unaudited) | | For the Period
January 18, 2012(1)
through
June 30, 2012 | | For the
Six Months Ended
December 31, 2012
(Unaudited) | | For the
Year Ended
June 30, 2012 | |
OPERATIONS: | |
Net investment income (loss) | | $ | 52,102 | | | $ | 54,210 | | | $ | (44,312 | ) | | $ | 233,164 | | |
Net realized gain (loss) on: | |
Investments | | | (3,503 | ) | | | 1,609 | | | | (650,455 | ) | | | (2,958,829 | ) | |
Foreign currency transactions | | | 668 | | | | 7,763 | | | | (11,788 | ) | | | (68,229 | ) | |
Change in net unrealized appreciation/depreciation on: | |
Investments | | | 186,898 | | | | 79,499 | | | | 3,856,622 | | | | (5,106,944 | ) | |
Foreign currency transactions | | | 14 | | | | 170 | | | | 3,362 | | | | (5,115 | ) | |
Net increase (decrease) in net assets resulting from operations | | | 236,179 | | | | 143,251 | | | | 3,153,429 | | | | (7,905,953 | ) | |
DISTRIBUTIONS PAID TO SHAREHOLDERS FROM: | |
Net investment income | | | (118,030 | ) | | | — | | | | (120,490 | ) | | | (128,066 | ) | |
Net realized gain on investments | | | (1,836 | ) | | | — | | | | — | | | | (183,995 | ) | |
Net decrease in net assets resulting from distributions paid | | | (119,866 | ) | | | — | | | | (120,490 | ) | | | (312,061 | ) | |
CAPITAL SHARE TRANSACTIONS: | |
Shares sold | | | 100,000 | | | | 2,600,104 | | | | 1,799,000 | | | | 2,689,500 | | |
Shares issued to holders in reinvestment of distributions | | | 99,221 | | | | — | | | | 3,189 | | | | 9,738 | | |
Shares redeemed | | | (4,354 | ) | | | — | | | | (15 | ) | | | (29,015 | ) | |
Net increase in net assets resulting from capital share transactions | | | 194,867 | | | | 2,600,104 | | | | 1,802,174 | | | | 2,670,223 | | |
Total Increase (Decrease) in Net Assets | | | 311,180 | | | | 2,743,355 | | | | 4,835,113 | | | | (5,547,791 | ) | |
NET ASSETS: | |
Beginning of Period | | | 2,743,355 | | | | — | | | | 19,727,154 | | | | 25,274,945 | | |
End of Period | | $ | 3,054,535 | | | $ | 2,743,355 | | | $ | 24,562,267 | | | $ | 19,727,154 | | |
Undistributed net investment income (loss) | | $ | (3,956 | ) | | $ | 61,972 | | | $ | (44,312 | ) | | $ | 120,490 | | |
TRANSACTIONS IN SHARES: | |
Shares sold | | | 8,873 | | | | 257,551 | | | | 263,892 | | | | 332,363 | | |
Shares issued to holders in reinvestment of distributions | | | 8,891 | | | | — | | | | 430 | | | | 1,415 | | |
Shares redeemed | | | (392 | ) | | | — | | | | (2 | ) | | | (3,975 | ) | |
Net increase in shares outstanding | | | 17,372 | | | | 257,551 | | | | 264,320 | | | | 329,803 | | |
(1) Commencement of operations.
The accompanying notes are an integral part of these financial statements.
page 61

Frontegra Funds
STATEMENTS OF CHANGES IN NET ASSETS (continued)
| | | Timpani Small Cap Growth Fund | | Netols Small Cap Value Fund | |
| | | For the
Six Months Ended
December 31, 2012
(Unaudited) | | For the
Year Ended
June 30, 2012 | | For the
Six Months Ended
December 31, 2012
(Unaudited) | | For the
Year Ended
June 30, 2012 | |
OPERATIONS: | |
Net investment income (loss) | | $ | 4,714 | | | $ | (21,614 | ) | | $ | 67,118 | | | $ | (270,951 | ) | |
Net realized gain (loss) on investments | | | 61,535 | | | | (407,979 | ) | | | 12,770,644 | | | | 2,363,339 | | |
Change in net unrealized appreciation/depreciation on investments | | | 50,011 | | | | 354,051 | | | | (2,123,177 | ) | | | (15,804,224 | ) | |
Net increase (decrease) in net assets resulting from operations | | | 116,260 | | | | (75,542 | ) | | | 10,714,585 | | | | (13,711,836 | ) | |
DISTRIBUTIONS PAID TO SHAREHOLDERS FROM: | | | | | | Institutional Class | | Institutional Class | |
Net realized gain on investments | | | — | | | | — | | | | (5,798,112 | ) | | | — | | |
Net decrease in net assets resulting from distributions paid | | | — | | | | — | | | | (5,798,112 | ) | | | — | | |
DISTRIBUTIONS PAID TO SHAREHOLDERS FROM: | | | | | | Class Y | | Class Y | |
Net realized gain on investments | | | | | | | (899,137 | ) | | | — | | |
Net decrease in net assets resulting from distributions paid | | | | | | | (899,137 | ) | | | — | | |
CAPITAL SHARE TRANSACTIONS: | | | | | | Institutional Class | | Institutional Class | |
Shares sold | | | 215,374 | | | | 879,324 | | | | 5,997,971 | | | | 6,241,189 | | |
Shares issued to holders in reinvestment of distributions | | | — | | | | — | | | | 5,233,889 | | | | — | | |
Shares redeemed | | | (17 | ) | | | (15,240 | ) | | | (32,765,145 | ) | | | (26,076,834 | ) | |
Net increase (decrease) in net assets resulting from capital share transactions | | | 215,357 | | | | 864,084 | | | | (21,533,285 | ) | | | (19,835,645 | ) | |
CAPITAL SHARE TRANSACTIONS: | | | | | | Class Y | | Class Y | |
Shares sold | | | | | | | 965,696 | | | | 3,738,101 | | |
Shares issued to holders in reinvestment of distributions | | | | | | | 898,733 | | | | — | | |
Shares redeemed | | | | | | | (2,404,222 | ) | | | (7,124,107 | ) | |
Net decrease in net assets resulting from capital share transactions | | | | | | | (539,793 | ) | | | (3,386,006 | ) | |
Total Increase (Decrease) in Net Assets | | | 331,617 | | | | 788,542 | | | | (18,055,742 | ) | | | (36,933,487 | ) | |
NET ASSETS: | |
Beginning of Period | | | 2,824,432 | | | | 2,035,890 | | | | 152,308,626 | | | | 189,242,113 | | |
End of Period | | $ | 3,156,049 | | | $ | 2,824,432 | | | $ | 134,252,884 | | | $ | 152,308,626 | | |
Undistributed net investment income (loss) | | $ | (7,557 | ) | | $ | (12,271 | ) | | $ | 50,362 | | | $ | (16,756 | ) | |
TRANSACTIONS IN SHARES: | | | | | | Institutional Class | | Institutional Class | |
Shares sold | | | 20,073 | | | | 86,238 | | | | 452,624 | | | | 528,581 | | |
Shares issued to holders in reinvestment of distributions | | | — | | | | — | | | | 396,207 | | | | — | | |
Shares redeemed | | | (2 | ) | | | (1,505 | ) | | | (2,498,615 | ) | | | (2,167,443 | ) | |
Net increase (decrease) in shares outstanding | | | 20,071 | | | | 84,733 | | | | (1,649,784 | ) | | | (1,638,862 | ) | |
TRANSACTIONS IN SHARES: | | | | | | Class Y | | Class Y | |
Shares sold | | | | | | | 72,661 | | | | 313,502 | | |
Shares issued to holders in reinvestment of distributions | | | | | | | 69,346 | | | | — | | |
Shares redeemed | | | | | | | (183,559 | ) | | | (586,729 | ) | |
Net decrease in shares outstanding | | | | | | | (41,552 | ) | | | (273,227 | ) | |
(1) Commencement of operations.
The accompanying notes are an integral part of these financial statements.
page 62

Frontegra Funds
STATEMENTS OF CHANGES IN NET ASSETS (continued)
| | | Phocas Small Cap Value Fund | | Lockwell Small Cap Value Fund | |
| | | For the
Six Months Ended
December 31, 2012
(Unaudited) | | For the
Year Ended
June 30, 2012 | | For the
Six Months Ended
December 31, 2012
(Unaudited) | | For the
Year Ended
June 30, 2012 | |
OPERATIONS: | |
Net investment income | | $ | 37,890 | | | $ | 53,407 | | | $ | 9,257 | | | $ | 5,175 | | |
Net realized gain (loss) on investments | | | 2,605,213 | | | | 129,868 | | | | 19,094 | | | | (3,413 | ) | |
Change in net unrealized appreciation/depreciation on investments | | | (1,797,011 | ) | | | (1,034,255 | ) | | | 270,205 | | | | 111,852 | | |
Net increase (decrease) in net assets resulting from operations | | | 846,092 | | | | (850,980 | ) | | | 298,556 | | | | 113,614 | | |
DISTRIBUTIONS PAID TO SHAREHOLDERS FROM: | | Institutional Class | | Institutional Class | | | | | |
Net investment income | | | (61,412 | ) | | | (13,249 | ) | | | (13,921 | ) | | | (528 | ) | |
Net realized gain on investments | | | — | | | | — | | | | (734 | ) | | | — | | |
Net decrease in net assets resulting from distributions paid | | | (61,412 | ) | | | (13,249 | ) | | | (14,655 | ) | | | (528 | ) | |
DISTRIBUTIONS PAID TO SHAREHOLDERS FROM: | | Class I | | Class I | | | | | |
Net investment income | | | — | | | | (792 | ) | | | | | |
Net decrease in net assets resulting from distributions paid | | | — | | | | (792 | ) | | | | | |
CAPITAL SHARE TRANSACTIONS(1): | | Institutional Class | | Institutional Class | | | | | |
Shares sold | | | 117,822 | | | | 746,588 | | | | 104,980 | | | | 2,898,045 | | |
Shares issued in connection with Class I conversion | | | 3,516,268 | | | | — | | | | — | | | | — | | |
Shares issued to holders in reinvestment of distributions | | | 61,412 | | | | 13,249 | | | | 14,554 | | | | 338 | | |
Shares redeemed | | | (19,165,841 | ) | | | (1,425,314 | ) | | | (123,086 | ) | | | (566,555 | ) | |
Net increase (decrease) in net assets resulting from capital share transactions | | | (15,470,339 | ) | | | (665,477 | ) | | | (3,552 | ) | | | 2,331,828 | | |
CAPITAL SHARE TRANSACTIONS(1): | | Class I | | Class I | | | | | |
Shares sold | | | — | | | | 3,273,796 | | | | | | |
Shares issued to holders in reinvestment of distributions | | | — | | | | 755 | | | | | | |
Shares redeemed | | | — | | | | (182,529 | ) | | | | | |
Net increase in net assets resulting from capital share transactions | | | — | | | | 3,092,022 | | | | | | |
Total Increase (Decrease) in Net Assets | | | (14,685,659 | ) | | | 1,561,524 | | | | 280,349 | | | | 2,444,914 | | |
NET ASSETS: | |
Beginning of Period | | | 22,309,497 | | | | 20,747,973 | | | | 2,444,914 | | | | — | | |
End of Period | | $ | 7,623,838 | | | $ | 22,309,497 | | | $ | 2,725,263 | | | $ | 2,444,914 | | |
Undistributed net investment income (loss) | | $ | 16,461 | | | $ | 39,983 | | | $ | (17 | ) | | $ | 4,647 | | |
TRANSACTIONS IN SHARES(1): | | Institutional Class | | Institutional Class | | | | | |
Shares sold | | | 4,608 | | | | 32,296 | | | | 11,080 | | | | 314,206 | | |
Conversion of Class I shares | | | 144,702 | | | | — | | | | — | | | | — | | |
Shares issued to holders in reinvestment of distributions | | | 2,510 | | | | 601 | | | | 1,381 | | | | 38 | | |
Shares redeemed | | | (648,531 | ) | | | (61,659 | ) | | | (11,624 | ) | | | (57,581 | ) | |
Net increase (decrease) in shares outstanding | | | (496,711 | ) | | | (28,762 | ) | | | 837 | | | | 256,663 | | |
TRANSACTIONS IN SHARES(1): | | | | Class I | | | | | |
Shares sold | | | | | 147,976 | | | | | | |
Shares issued to holders in reinvestment of distributions | | | | | 34 | | | | | | |
Shares redeemed | | | | | (8,061 | ) | | | | | |
Net increase in shares outstanding | | | | | 139,949 | | | | | | |
(1) Effective November 1, 2012, Class I shares of the Frontegra Phocas Small Cap Value Fund were converted into Class L shares of the Fund. Class L shares were redesignated Institutional Class shares.
The accompanying notes are an integral part of these financial statements.
page 63

Frontegra RobecoSAM Global Equity Fund
FINANCIAL HIGHLIGHTS
| | | Six Months
Ended
December 31,
2012
(Unaudited) | | Year
Ended
June 30,
2012 | | Period
Ended
June 30,
2011(1)(2) | | Year
Ended
August 31,
2010 | | Period
Ended
August 31,
2009(3) | |
Net Asset Value, Beginning of Period | | $ | 10.68 | | | $ | 13.15 | | | $ | 11.00 | | | $ | 11.30 | | | $ | 10.00 | | |
INCOME (LOSS) FROM
INVESTMENT OPERATIONS: | |
Net investment income | | | 0.11 | | | | 0.18 | (4) | | | 0.25 | | | | 0.18 | (4) | | | 0.01 | (4) | |
Net realized and unrealized gain (loss) on investments | | | 0.79 | | | | (1.67 | ) | | | 2.53 | | | | 0.47 | | | | 1.29 | | |
Total Income (Loss) from Investment Operations | | | 0.90 | | | | (1.49 | ) | | | 2.78 | | | | 0.65 | | | | 1.30 | | |
LESS DISTRIBUTIONS: | |
From net investment income | | | (0.19 | ) | | | (0.21 | ) | | | (0.21 | ) | | | (0.05 | ) | | | — | | |
From net realized gain on investments | | | — | | | | (0.77 | ) | | | (0.42 | ) | | | (0.90 | ) | | | — | | |
Total Distributions | | | (0.19 | ) | | | (0.98 | ) | | | (0.63 | ) | | | (0.95 | ) | | | — | | |
Redemption fees retained | | | — | | | | — | | | | — | | | | — | (5) | | | — | | |
Net Asset Value, End of Period | | $ | 11.39 | | | $ | 10.68 | | | $ | 13.15 | | | $ | 11.00 | | | $ | 11.30 | | |
Total Return | | | 8.45 | %(6) | | | (10.91 | )% | | | 25.64 | %(6) | | | 5.42 | % | | | 13.00 | %(6) | |
SUPPLEMENTAL DATA AND RATIOS: | |
Net assets, end of period (in thousands) | | $ | 17,342 | | | $ | 19,952 | | | $ | 19,292 | | | $ | 16,756 | | | $ | 11,614 | | |
Ratio of expenses to average net assets | |
Before waivers and reimbursements | | | 1.60 | %(7) | | | 1.62 | % | | | 2.41 | %(7) | | | 2.81 | % | | | 4.06 | %(7) | |
Net of waivers and reimbursements | | | 1.20 | %(7) | | | 1.20 | % | | | 1.20 | %(7) | | | 1.20 | % | | | 1.20 | %(7) | |
Ratio of net investment income (loss) to average net assets | |
Before waivers and reimbursements | | | 1.07 | %(7) | | | 1.16 | % | | | 1.02 | %(7) | | | (0.03 | )% | | | (2.59 | )%(7) | |
Net of waivers and reimbursements | | | 1.47 | %(7) | | | 1.58 | % | | | 2.23 | %(7) | | | 1.58 | % | | | 0.27 | %(7) | |
Portfolio turnover rate | | | 17 | %(6) | | | 52 | % | | | 33 | %(6) | | | 88 | % | | | 72 | %(6) | |
(1) Effective June 30, 2011, the Fund changed its fiscal year end to June 30 from August 31.
(2) Effective June 10, 2011, Frontegra Asset Management, Inc. became adviser and RobecoSAM USA, Inc. became subadviser to the Fund.
(3) Commenced operations on June 18, 2009.
(4) Per share net investment income has been calculated using the daily average share method.
(5) Less than one cent per share.
(6) Not annualized.
(7) Annualized.
The accompanying notes are an integral part of these financial statements.
page 64

Frontegra MFG Global Equity Fund
FINANCIAL HIGHLIGHTS
| | | Six Months
Ended
December 31,
2012
(Unaudited) | | Period
Ended
June 30,
2012(1) | |
Net Asset Value, Beginning of Period | | $ | 10.81 | | | $ | 10.00 | | |
INCOME FROM
INVESTMENT OPERATIONS: | |
Net investment income | | | 0.04 | | | | 0.11 | (2) | |
Net realized and unrealized gain on investments | | | 1.06 | | | | 0.70 | | |
Total Income from Investment Operations | | | 1.10 | | | | 0.81 | | |
LESS DISTRIBUTIONS: | |
From net investment income | | | (0.09 | ) | | | — | | |
From net realized gain on investments | | | (0.14 | ) | | | — | | |
Total Distributions | | | (0.23 | ) | | | — | | |
Net Asset Value, End of Period | | $ | 11.68 | | | $ | 10.81 | | |
Total Return | | | 10.18 | %(3) | | | 8.10 | %(3) | |
SUPPLEMENTAL DATA AND RATIOS: | |
Net assets, end of period (in thousands) | | $ | 126,077 | | | $ | 108,551 | | |
Ratio of expenses to average net assets | |
Before waivers and reimbursements | | | 1.02 | %(4) | | | 1.14 | %(4) | |
Net of waivers and reimbursements | | | 0.80 | %(4) | | | 0.80 | %(4) | |
Ratio of net investment income to average net assets | |
Before waivers and reimbursements | | | 0.56 | %(4) | | | 1.70 | %(4) | |
Net of waivers and reimbursements | | | 0.78 | %(4) | | | 2.04 | %(4) | |
Portfolio turnover rate | | | 22 | %(3) | | | 19 | %(3) | |
(1) Commenced operations on December 28, 2011.
(2) Per share net investment income has been calculated using the daily average share method.
(3) Not annualized.
(4) Annualized.
The accompanying notes are an integral part of these financial statements.
page 65

Frontegra MFG Core Infrastructure Fund
FINANCIAL HIGHLIGHTS
| | | Six Months
Ended
December 31,
2012
(Unaudited) | | Period
Ended
June 30,
2012(1) | |
Net Asset Value, Beginning of Period | | $ | 10.65 | | | $ | 10.00 | | |
INCOME FROM
INVESTMENT OPERATIONS: | |
Net investment income | | | 0.19 | | | | 0.24 | | |
Net realized and unrealized gain on investments | | | 0.71 | | | | 0.41 | | |
Total Income from Investment Operations | | | 0.90 | | | | 0.65 | | |
LESS DISTRIBUTIONS: | |
From net investment income | | | (0.44 | ) | | | — | | |
From net realized gain on investments | | | — | (2) | | | — | | |
Total Distributions | | | (0.44 | ) | | | — | | |
Net Asset Value, End of Period | | $ | 11.11 | | | $ | 10.65 | | |
Total Return | | | 8.52 | %(3) | | | 6.50 | %(3) | |
SUPPLEMENTAL DATA AND RATIOS: | |
Net assets, end of period (in thousands) | | $ | 3,055 | | | $ | 2,743 | | |
Ratio of expenses to average net assets | |
Before waivers and reimbursements | | | 4.20 | %(4) | | | 6.55 | %(4) | |
Net of waivers and reimbursements | | | 0.70 | %(4) | | | 0.70 | %(4) | |
Ratio of net investment income (loss) to average net assets | |
Before waivers and reimbursements | | | 0.06 | %(4) | | | (1.09 | )%(4) | |
Net of waivers and reimbursements | | | 3.56 | %(4) | | | 4.76 | %(4) | |
Portfolio turnover rate | | | 5 | %(3) | | | 7 | %(3) | |
(1) Commenced operations on January 18, 2012.
(2) Less than one cent per share.
(3) Not annualized.
(4) Annualized.
The accompanying notes are an integral part of these financial statements.
page 66

Frontegra HEXAM Emerging Markets Fund
FINANCIAL HIGHLIGHTS
| | | Six Months
Ended
December 31,
2012
(Unaudited) | | Year
Ended
June 30,
2012 | | Period
Ended
June 30,
2011(1) | |
Net Asset Value, Beginning of Period | | $ | 6.59 | | | $ | 9.50 | | | $ | 10.00 | | |
INCOME (LOSS) FROM
INVESTMENT OPERATIONS: | |
Net investment income (loss) | | | (0.01 | ) | | | 0.08 | (2) | | | 0.08 | (2) | |
Net realized and unrealized gain (loss) on investments | | | 1.00 | | | | (2.87 | ) | | | (0.58 | ) | |
Total Income (Loss) from Investment Operations | | | 0.99 | | | | (2.79 | ) | | | (0.50 | ) | |
LESS DISTRIBUTIONS: | |
From net investment income | | | (0.04 | ) | | | (0.05 | ) | | | — | | |
From net realized gain on investments | | | — | | | | (0.07 | ) | | | — | | |
Total Distributions | | | (0.04 | ) | | | (0.12 | ) | | | — | | |
Net Asset Value, End of Period | | $ | 7.54 | | | $ | 6.59 | | | $ | 9.50 | | |
Total Return | | | 14.99 | %(3) | | | (29.51 | )% | | | (5.00 | )%(3) | |
SUPPLEMENTAL DATA AND RATIOS: | |
Net assets, end of period (in thousands) | | $ | 24,562 | | | $ | 19,727 | | | $ | 25,275 | | |
Ratio of expenses to average net assets | |
Before waivers and reimbursements | | | 1.54 | %(4) | | | 1.65 | % | | | 2.33 | %(4) | |
Net of waivers and reimbursements | | | 1.30 | %(4) | | | 1.30 | % | | | 1.30 | %(4) | |
Ratio of net investment income (loss) to average net assets | |
Before waivers and reimbursements | | | (0.65 | )%(4) | | | 0.71 | % | | | 0.61 | %(4) | |
Net of waivers and reimbursements | | | (0.41 | )%(4) | | | 1.06 | % | | | 1.64 | %(4) | |
Portfolio turnover rate | | | 33 | %(3) | | | 89 | % | | | 33 | %(3) | |
(1) Commenced operations on December 20, 2010.
(2) Per share net investment income has been calculated using the daily average share method.
(3) Not annualized.
(4) Annualized.
The accompanying notes are an integral part of these financial statements.
page 67

Frontegra Timpani Small Cap Growth Fund
FINANCIAL HIGHLIGHTS
| | | Six Months
Ended
December 31,
2012
(Unaudited) | | Year
Ended
June 30,
2012 | | Period
Ended
June 30,
2011(1) | |
Net Asset Value, Beginning of Period | | $ | 10.31 | | | $ | 10.75 | | | $ | 10.00 | | |
INCOME (LOSS) FROM
INVESTMENT OPERATIONS: | |
Net investment income (loss) | | | 0.02 | | | | (0.08 | )(2) | | | (0.02 | )(3) | |
Net realized and unrealized gain (loss) on investments | | | 0.40 | | | | (0.36 | ) | | | 0.77 | | |
Total Income (Loss) from Investment Operations | | | 0.42 | | | | (0.44 | ) | | | 0.75 | | |
Net Asset Value, End of Period | | $ | 10.73 | | | $ | 10.31 | | | $ | 10.75 | | |
Total Return | | | 4.17 | %(4) | | | (4.28 | )% | | | 7.60 | %(4) | |
SUPPLEMENTAL DATA AND RATIOS: | |
Net assets, end of period (in thousands) | | $ | 3,156 | | | $ | 2,824 | | | $ | 2,036 | | |
Ratio of expenses to average net assets | |
Before waivers and reimbursements | | | 4.50 | %(5) | | | 5.25 | % | | | 10.93 | %(5) | |
Net of waivers and reimbursements | | | 1.10 | %(5) | | | 1.10 | % | | | 1.10 | %(5) | |
Ratio of net investment income (loss) to average net assets | |
Before waivers and reimbursements | | | (3.08 | )%(5) | | | (5.02 | )% | | | (10.75 | )%(5) | |
Net of waivers and reimbursements | | | 0.32 | %(5) | | | (0.87 | )% | | | (0.92 | )%(5) | |
Portfolio turnover rate | | | 67 | %(4) | | | 138 | % | | | 28 | %(4) | |
(1) Commenced operations on March 23, 2011.
(2) Per share net investment income has been calculated using the daily average share method.
(3) Net investment loss per share is calculated using ending balances prior to consideration of adjustments for permanent book to tax differences.
(4) Not annualized.
(5) Annualized.
The accompanying notes are an integral part of these financial statements.
page 68

Frontegra Netols Small Cap Value Fund
FINANCIAL HIGHLIGHTS
| | | Institutional Class | |
| | | Six Months
Ended
December 31,
2012
(Unaudited) | | Year
Ended
June 30,
2012 | | Year
Ended
June 30,
2011 | | Year
Ended
June 30,
2010 | | Year
Ended
June 30,
2009 | | Year
Ended
June 30,
2008 | |
Net Asset Value, Beginning of Period | | $ | 12.86 | | | $ | 13.75 | | | $ | 10.08 | | | $ | 9.03 | | | $ | 11.81 | | | $ | 12.88 | | |
INCOME (LOSS) FROM
INVESTMENT OPERATIONS: | |
Net investment income (loss) | | | 0.01 | | | | 0.01 | | | | (0.05 | )(1) | | | 0.02 | (2) | | | 0.01 | | | | — | (3) | |
Net realized and unrealized gain (loss) on investments | | | 1.04 | | | | (0.90 | ) | | | 3.72 | | | | 1.05 | | | | (2.79 | ) | | | (0.90 | ) | |
Total Income (Loss) from Investment Operations | | | 1.05 | | | | (0.89 | ) | | | 3.67 | | | | 1.07 | | | | (2.78 | ) | | | (0.90 | ) | |
LESS DISTRIBUTIONS: | |
From net investment income | | | — | | | | — | | | | — | (3) | | | (0.02 | ) | | | — | (3) | | | (0.02 | ) | |
From net realized gain on investments | | | (0.69 | ) | | | — | | | | — | | | | — | | | | — | | | | (0.15 | ) | |
From return of capital | | | — | | | | — | | | | — | | | | — | (3) | | | — | | | | — | | |
Total Distributions | | | (0.69 | ) | | | — | | | | — | | | | (0.02 | ) | | | — | | | | (0.17 | ) | |
Net Asset Value, End of Period | | $ | 13.22 | | | $ | 12.86 | | | $ | 13.75 | | | $ | 10.08 | | | $ | 9.03 | | | $ | 11.81 | | |
Total Return | | | 8.18 | %(4) | | | (6.47 | )% | | | 36.43 | % | | | 11.76 | % | | | (23.42 | )% | | | (7.01 | )% | |
SUPPLEMENTAL DATA AND RATIOS: | |
Net assets, end of period (in thousands) | | $ | 116,573 | | | $ | 134,544 | | | $ | 166,450 | | | $ | 119,657 | | | $ | 43,504 | | | $ | 31,346 | | |
Ratio of expenses to average net assets | |
Before waivers and reimbursements | | | 1.20 | %(5) | | | 1.22 | % | | | 1.13 | % | | | 1.18 | % | | | 1.45 | % | | | 1.59 | % | |
Net of waivers and reimbursements | | | 1.10 | %(5) | | | 1.10 | % | | | 1.10 | % | | | 1.10 | % | | | 1.10 | % | | | 1.10 | % | |
Ratio of net investment income (loss) to average net assets | |
Before waivers and reimbursements | | | 0.01 | %(5) | | | (0.08 | )% | | | (0.39 | )% | | | 0.17 | % | | | (0.13 | )% | | | (0.40 | )% | |
Net of waivers and reimbursements | | | 0.11 | %(5) | | | 0.04 | % | | | (0.36 | )% | | | 0.25 | % | | | 0.22 | % | | | 0.09 | % | |
Portfolio turnover rate | | | 14 | %(4) | | | 28 | % | | | 33 | % | | | 41 | % | | | 36 | % | | | 32 | % | |
(1) Net investment loss per share is calculated using ending balances prior to consideration of adjustments for permanent book to tax differences.
(2) Per share net investment income has been calculated using the daily average share method.
(3) Less than one cent per share.
(4) Not annualized.
(5) Annualized.
The accompanying notes are an integral part of these financial statements.
page 69

Frontegra Netols Small Cap Value Fund
FINANCIAL HIGHLIGHTS
| | | Class Y | |
| | | Six Months
Ended
December 31,
2012
(Unaudited) | | Year
Ended
June 30,
2012 | | Year
Ended
June 30,
2011 | | Year
Ended
June 30,
2010 | | Year
Ended
June 30,
2009 | | Period
Ended
June 30,
2008(1) | |
Net Asset Value, Beginning of Period | | $ | 12.65 | | | $ | 13.59 | | | $ | 10.00 | | | $ | 8.98 | | | $ | 11.78 | | | $ | 12.54 | | |
INCOME (LOSS) FROM
INVESTMENT OPERATIONS: | |
Net investment loss | | | (0.02 | ) | | | (0.05 | ) | | | (0.09 | )(2) | | | — | | | | (0.02 | ) | | | (0.02 | ) | |
Net realized and unrealized gain (loss) on investments | | | 1.04 | | | | (0.89 | ) | | | 3.68 | | | | 1.02 | | | | (2.78 | ) | | | (0.57 | ) | |
Total Income (Loss) from Investment Operations | | | 1.02 | | | | (0.94 | ) | | | 3.59 | | | | 1.02 | | | | (2.80 | ) | | | (0.59 | ) | |
LESS DISTRIBUTIONS: | |
From net investment income | | | — | | | | — | | | | — | | | | — | | | | — | | | | (0.02 | ) | |
From net realized gain on investments | | | (0.69 | ) | | | — | | | | — | | | | — | | | | — | | | | (0.15 | ) | |
Total Distributions | | | (0.69 | ) | | | — | | | | — | | | | — | | | | — | | | | (0.17 | ) | |
Net Asset Value, End of Period | | $ | 12.98 | | | $ | 12.65 | | | $ | 13.59 | | | $ | 10.00 | | | $ | 8.98 | | | $ | 11.78 | | |
Total Return | | | 8.08 | %(3) | | | (6.92 | )% | | | 35.90 | % | | | 11.36 | % | | | (23.77 | )% | | | (4.76 | )%(3) | |
SUPPLEMENTAL DATA AND RATIOS: | |
Net assets, end of period (in thousands) | | $ | 17,680 | | | $ | 17,765 | | | $ | 22,792 | | | $ | 15,560 | | | $ | 895 | | | $ | 1,034 | | |
Ratio of expenses to average net assets | |
Before waivers and reimbursements | | | 1.60 | %(4) | | | 1.62 | % | | | 1.53 | % | | | 1.58 | % | | | 1.85 | % | | | 2.01 | %(4) | |
Net of waivers and reimbursements | | | 1.50 | %(4) | | | 1.50 | % | | | 1.50 | % | | | 1.50 | % | | | 1.50 | % | | | 1.55 | %(4) | |
Ratio of net investment loss to average net assets | |
Before waivers and reimbursements | | | (0.39 | )%(4) | | | (0.48 | )% | | | (0.79 | )% | | | (0.23 | )% | | | (0.53 | )% | | | (0.80 | )%(4) | |
Net of waivers and reimbursements | | | (0.29 | )%(4) | | | (0.36 | )% | | | (0.76 | )% | | | (0.15 | )% | | | (0.18 | )% | | | (0.34 | )%(4) | |
Portfolio turnover rate | | | 14 | %(3) | | | 28 | % | | | 33 | % | | | 41 | % | | | 36 | % | | | 32 | %(3) | |
(1) Commenced operations on November 1, 2007.
(2) Net investment loss per share is calculated using ending balances prior to consideration of adjustments for permanent book to tax differences.
(3) Not annualized.
(4) Annualized.
The accompanying notes are an integral part of these financial statements.
page 70

Frontegra Phocas Small Cap Value Fund
FINANCIAL HIGHLIGHTS
| | | Six Months
Ended
December 31,
2012
(Unaudited) | | Year
Ended
June 30,
2012 | | Year
Ended
June 30,
2011(1) | | Six Months
Ended
June 30,
2010(2) | | Year
Ended
December 31,
2009 | | Year
Ended
December 31,
2008 | | Year
Ended
December 31,
2007 | |
Net Asset Value, Beginning
of Period | | $ | 23.30 | | | $ | 24.51 | | | $ | 18.40 | | | $ | 18.48 | | | $ | 14.93 | | | $ | 20.01 | | | $ | 21.86 | | |
INCOME (LOSS) FROM
INVESTMENT OPERATIONS: | |
Net investment income | | | 0.20 | | | | 0.06 | | | | 0.04 | (3) | | | 0.02 | (3) | | | 0.06 | (3) | | | 0.13 | (3) | | | 0.05 | (3) | |
Net realized and unrealized
gain (loss) on investments | | | 1.19 | | | | (1.25 | ) | | | 6.13 | | | | (0.10 | ) | | | 3.56 | | | | (5.08 | ) | | | (1.68 | ) | |
Total Income (Loss) from
Investment Operations | | | 1.39 | | | | (1.19 | ) | | | 6.17 | | | | (0.08 | ) | | | 3.62 | | | | (4.95 | ) | | | (1.63 | ) | |
LESS DISTRIBUTIONS: | |
From net investment income | | | (0.19 | ) | | | (0.02 | ) | | | (0.06 | ) | | | — | | | | (0.07 | ) | | | (0.13 | ) | | | (0.09 | ) | |
From net realized gain
on investments | | | — | | | | — | | | | — | | | | — | | | | — | | | | — | | | | (0.13 | ) | |
Total Distributions | | | (0.19 | ) | | | (0.02 | ) | | | (0.06 | ) | | | — | | | | (0.07 | ) | | | (0.13 | ) | | | (0.22 | ) | |
Redemption fees retained | | | — | | | | — | | | | — | (4) | | | — | (4) | | | — | (4) | | | — | (4) | | | — | (4) | |
Net Asset Value, End of Period | | $ | 24.50 | | | $ | 23.30 | | | $ | 24.51 | | | $ | 18.40 | | | $ | 18.48 | | | $ | 14.93 | | | $ | 20.01 | | |
Total Return | | | 6.03 | %(5) | | | (4.91 | )% | | | 33.55 | % | | | (0.43 | )%(5) | | | 24.29 | % | | | (24.68 | )% | | | (7.46 | )% | |
SUPPLEMENTAL DATA
AND RATIOS: | |
Net assets, end of period
(in thousands) | | $ | 7,624 | | | $ | 18,821 | | | $ | 20,507 | | | $ | 15,176 | | | $ | 19,331 | | | $ | 17,201 | | | $ | 21,936 | | |
Ratio of expenses to average
net assets | | | |
Before waivers and
reimbursements | | | 2.30 | %(6) | | | 1.70 | % | | | 1.69 | % | | | 1.68 | %(6) | | | 1.71 | % | | | 1.52 | % | | | 2.43 | % | |
Net of waivers and
reimbursements | | | 1.03 | %(6) | | | 0.99 | % | | | 0.99 | % | | | 0.99 | %(6) | | | 0.99 | % | | | 0.99 | % | | | 1.18 | % | |
Ratio of net investment income
(loss) to average net assets | |
Before waivers and
reimbursements | | | (0.68 | )%(6) | | | (0.51 | )% | | | (0.52 | )% | | | (0.53 | )%(6) | | | (0.31 | )% | | | 0.21 | % | | | (0.54 | )% | |
Net of waivers and
reimbursements | | | 0.59 | %(6) | | | 0.20 | % | | | 0.18 | % | | | 0.16 | %(6) | | | 0.41 | % | | | 0.74 | % | | | 0.71 | % | |
Portfolio turnover rate | | | 143 | %(5) | | | 50 | % | | | 37 | % | | | 43 | %(5) | | | 67 | % | | | 34 | % | | | 148 | % | |
(1) Effective October 8, 2010, Frontegra Asset Management, Inc. became adviser and Phocas Financial Corp. became subadviser to the Fund.
(2) Effective June 30, 2010, the Fund changed its fiscal year end to June 30 from December 31.
(3) Per share net investment income has been calculated using the daily average shares method.
(4) Less than one cent per share.
(5) Not annualized.
(6) Annualized.
The accompanying notes are an integral part of these financial statements.
page 71

Lockwell Small Cap Value Fund
FINANCIAL HIGHLIGHTS
| | | Six Months
Ended
December 31,
2012
(Unaudited) | | Year
Ended
June 30,
2012 | |
Net Asset Value, Beginning of Period | | $ | 9.53 | | | $ | 10.00 | | |
INCOME (LOSS) FROM
INVESTMENT OPERATIONS: | |
Net investment income | | | 0.03 | | | | 0.04 | (1) | |
Net realized and unrealized gain (loss) on investments | | | 1.07 | | | | (0.51 | ) | |
Total Income (Loss) from Investment Operations | | | 1.10 | | | | (0.47 | ) | |
LESS DISTRIBUTIONS: | |
From net investment income | | | (0.05 | ) | | | — | (2) | |
From net realized gain on investments | | | — | (2) | | | — | | |
Total Distributions | | | (0.05 | ) | | | — | | |
Net Asset Value, End of Period | | $ | 10.58 | | | $ | 9.53 | | |
Total Return | | | 11.71 | %(3) | | | (4.76 | )% | |
SUPPLEMENTAL DATA AND RATIOS: | |
Net assets, end of period (in thousands) | | $ | 2,725 | | | $ | 2,445 | | |
Ratio of expenses to average net assets | |
Before waivers and reimbursements | | | 5.05 | %(4) | | | 9.63 | % | |
Net of waivers and reimbursements | | | 1.10 | %(4) | | | 1.10 | % | |
Ratio of net investment income (loss) to average net assets | |
Before waivers and reimbursements | | | (3.26 | )%(4) | | | (8.13 | )% | |
Net of waivers and reimbursements | | | 0.69 | %(4) | | | 0.40 | % | |
Portfolio turnover rate | | | 24 | %(3) | | | 92 | % | |
(1) Per share net investment income has been calculated using the daily average share method.
(2) Less than one cent per share.
(3) Not annualized.
(4) Annualized.
The accompanying notes are an integral part of these financial statements.
page 72

NOTES TO FINANCIAL STATEMENTS
December 31, 2012 (Unaudited)
(1) ORGANIZATION
Frontegra Funds, Inc. (the "Company") was incorporated on May 24, 1996 as a Maryland corporation and is registered under the Investment Company Act of 1940, as amended (the "1940 Act"), as an open-end investment company issuing shares in series (each, a "Fund," or collectively, the "Funds"), each series representing a distinct portfolio with its own investment objectives and policies. The investment objective of each of the Frontegra RobecoSAM Global Equity Fund (formerly known as Frontegra SAM Global Equity Fund) and Frontegra HEXAM Emerging Markets Fund is long-term capital growth. The investment objective of each of the Frontegra MFG Global Equity Fund, Frontegra Timpani Small Cap Growth Fund and Frontegra Netols Small Cap Value Fund is capital appreciation. The investment objective of the Frontegra Phocas Small Cap Value Fund is long-term total investment through capital appreciation. The investment objective of each of the Frontegra MFG Core Infrastructure Fund and Lockwell Small Cap Value Fund is long-term capital appreciation.
As of December 31, 2012, the Company had eight series in operations. A summary of each Fund's investment adviser, subadviser and capital structure is as follows:
Fund | | Investment Adviser | | Subadviser | | Capital Structure | | Commencement
of Operations | |
Frontegra RobecoSAM Global Equity Fund | | Frontegra Asset Management, Inc. ("Frontegra") | | RobecoSAM USA, Inc. | | Single Class | | June 18, 2009 | |
Frontegra MFG Global Equity Fund | | Frontegra | | MFG Asset Management | | Single Class | | Dec. 28, 2011 | |
Frontegra MFG Core Infrastructure Fund | | Frontegra | | MFG Asset Management | | Single Class | | Jan. 18, 2012 | |
Frontegra HEXAM Emerging Markets Fund | | Frontegra | | HEXAM Capital Partners, LLP | | Single Class | | Dec. 20, 2010 | |
Frontegra Timpani Small Cap Growth Fund | | Timpani Capital Management LLC ("Timpani") (a) | | None | | Multi-Class
• Institutional
• Class Y (b) | | Mar. 23, 2011 | |
Frontegra Netols Small Cap Value Fund | | Frontegra | | Netols Asset Management, Inc. | | Multi-Class
• Institutional
• Class Y | | Dec. 16, 2005 | |
Frontegra Phocas Small Cap Value Fund | | Frontegra | | Phocas Financial Corp. | | Single Class (c) | | Sep. 29, 2006 | |
Lockwell Small Cap Value Fund | | Lockwell Investments, LLC ("Lockwell") | | None | | Single Class | | July 1, 2011 | |
(a) Timpani is an affiliate of Frontegra.
(b) As of December 31, 2012, the Class Y shares of the Frontegra Timpani Small Cap Growth Fund had not commenced operations.
(c) Effective November 1, 2012, the Class I shares of the Frontegra Phocas Small Cap Value Fund were converted into Class L shares of the Fund. Class L shares were redesignated Institutional Class shares.
page 73

NOTES TO FINANCIAL STATEMENTS (continued)
December 31, 2012 (Unaudited)
(2) SIGNIFICANT ACCOUNTING POLICIES
The following is a summary of significant accounting policies consistently followed by the Funds in the preparation of their financial statements.
(a) Investment Valuation
Equity securities for which market quotations are readily available are valued at the last reported sale price on the national securities exchange on which such securities are primarily traded. Equity securities for which there were no transactions on a given day or securities not listed on a national securities exchange are valued at the most recent bid price. Equity securities that are traded on NASDAQ are valued using the NASDAQ Official Closing Price ("NOCP"). Debt securities (other than short-term instruments) are valued by an independent pricing service, which uses valuation methods such as matrix pricing and other analytical pricing models as well as market transactions and evaluated dealer bid quotations. Shares of underlying mutual funds are valued at their respective NAVs. Exchange traded funds are valued at the last reported sale price on the exchange on which the security is principally traded. Securities that are primarily traded on foreign exchanges, including participatory notes, generally are valued at the last sale price of such securities on their respective exchange. In certain circumstances, such as when a significant event occurs in a foreign market so that the last sale price no longer reflects actual value, the fair value of these securities may be determined using fair valuation procedures approved by the Board of Directors. The Directors have retained an independent fair value pricing service to assist in valuing foreign securities held by the Frontegra RobecoSAM Global Equity, Frontegra MFG Global Equity, Frontegra MFG Core Infrastructure and Frontegra HEXAM Emerging Markets Funds. In valuing assets, prices denominated in foreign currencies are converted to U.S. dollar equivalents at the current exchange rate, which approximates fair value. Securities maturing within 60 days or less when purchased are valued by the amortized cost method. Any securities or other assets for which market quotations are not readily available are valued at their fair value as determined in good faith by the advisers or subadvisers pursuant to guidelines established by the Board of Directors.
The Funds follow a fair value hierarchy that distinguishes between market data obtained from independent sources (observable inputs) and the Funds' own market assumptions (unobservable inputs). These inputs are used in determining the value of each Fund's investments and are summarized in the following fair value hierarchy:
Level 1 — Quoted prices in active markets for identical securities
Level 2 — Evaluated prices based on other significant observable inputs (including quoted prices for similar securities, foreign security indices, foreign exchange rates, fair value estimates for foreign securities and changes in benchmark securities indices)
Level 3 — Significant unobservable inputs (including the Fund's own assumptions in determining fair value of investments)
RobecoSAM Global Equity
Description | | Level 1 | | Level 2 | | Level 3 | | Total | |
Equity (a) | | | | | | | | | | | | | | | | | |
| Common Stocks | | $ | 8,729,824 | | | $ | 8,115,447 | | | $ | — | | | $ | 16,845,271 | | |
| Total Equity | | | 8,729,824 | | | | 8,115,447 | | | | — | | | | 16,845,271 | | |
Short-Term Investments | | | 476,639 | | | | — | | | | — | | | | 476,639 | | |
Total Investments in Securities | | $ | 9,206,463 | | | $ | 8,115,447 | | | $ | — | | | $ | 17,321,910 | | |
page 74

NOTES TO FINANCIAL STATEMENTS (continued)
December 31, 2012 (Unaudited)
MFG Global Equity
Description | | Level 1 | | Level 2 | | Level 3 | | Total | |
Equity (a) | | | | | | | | | | | | | | | | | |
| Common Stocks | | $ | 93,630,294 | | | $ | 28,372,548 | | | $ | — | | | $ | 122,002,842 | | |
| Total Equity | | | 93,630,294 | | | | 28,372,548 | | | | — | | | | 122,002,842 | | |
Short-Term Investments | | | 2,807,729 | | | | — | | | | — | | | | 2,807,729 | | |
Total Investments in Securities | | $ | 96,438,023 | | | $ | 28,372,548 | | | $ | — | | | $ | 124,810,571 | | |
MFG Core Infrastructure
Description | | Level 1 | | Level 2 | | Level 3 | | Total | |
Equity (a) | | | | | | | | | | | | | | | | | |
| Common Stocks | | $ | 1,488,318 | | | $ | 1,513,066 | | | $ | — | | | $ | 3,001,384 | | |
| Closed-End Funds | | | 11,240 | | | | 13,608 | | | | — | | | | 24,848 | | |
| Pooled Investment Vehicle | | | — | | | | 17,854 | | | | — | | | | 17,854 | | |
| Total Equity | | | 1,499,558 | | | | 1,544,528 | | | | — | | | | 3,044,086 | | |
Short-Term Investments | | | 10,195 | | | | — | | | | — | | | | 10,195 | | |
Total Investments in Securities | | $ | 1,509,753 | | | $ | 1,544,528 | | | $ | — | | | $ | 3,054,281 | | |
HEXAM Emerging Markets
Description | | Level 1 | | Level 2 | | Level 3 | | Total | |
Equity (a) | | | | | | | | | | | | | | | | | |
| Common Stocks | | $ | 4,933,824 | | | $ | 17,222,360 | | | $ | — | | | $ | 22,156,184 | | |
| Preferred Stocks | | | 1,572,428 | | | | — | | | | — | | | | 1,572,428 | | |
| Total Equity | | | 6,506,252 | | | | 17,222,360 | | | | — | | | | 23,728,612 | | |
Short-Term Investments | | | 852,051 | | | | — | | | | — | | | | 852,051 | | |
Total Investments in Securities | | $ | 7,358,303 | | | $ | 17,222,360 | | | $ | — | | | $ | 24,580,663 | | |
Timpani Small Cap Growth
Description | | Level 1 | | Level 2 | | Level 3 | | Total | |
Equity (a) | | | | | | | | | | | | | | | | | |
| Common Stocks | | $ | 3,151,796 | | | $ | — | | | $ | — | | | $ | 3,151,796 | | |
| Total Equity | | | 3,151,796 | | | | — | | | | — | | | | 3,151,796 | | |
Short-Term Investments | | | 19,012 | | | | — | | | | — | | | | 19,012 | | |
Total Investments in Securities | | $ | 3,170,808 | | | $ | — | | | $ | — | | | $ | 3,170,808 | | |
Netols Small Cap Value
Description | | Level 1 | | Level 2 | | Level 3 | | Total | |
Equity (a) | | | | | | | | | | | | | | | | | |
| Common Stocks | | $ | 118,578,954 | | | $ | — | | | $ | — | | | $ | 118,578,954 | | |
| Real Estate Investment Trusts | | | 11,235,640 | | | | — | | | | — | | | | 11,235,640 | | |
| Total Equity | | | 129,814,594 | | | | — | | | | — | | | | 129,814,594 | | |
Short-Term Investments | | | 4,707,803 | | | | — | | | | — | | | | 4,707,803 | | |
Total Investments in Securities | | $ | 134,522,397 | | | $ | — | | | $ | — | | | $ | 134,522,397 | | |
page 75

NOTES TO FINANCIAL STATEMENTS (continued)
December 31, 2012 (Unaudited)
Phocas Small Cap Value
Description | | Level 1 | | Level 2 | | Level 3 | | Total | |
Equity (a) | | | | | | | | | | | | | | | | | |
| Common Stocks | | $ | 6,442,579 | | | $ | — | | | $ | — | | | $ | 6,442,579 | | |
| Closed End Funds | | | 54,654 | | | | — | | | | — | | | | 54,654 | | |
| Real Estate Investment Trusts | | | 928,173 | | | | — | | | | — | | | | 928,173 | | |
| Total Equity | | | 7,425,406 | | | | — | | | | — | | | | 7,425,406 | | |
Total Investments in Securities | | $ | 7,425,406 | | | $ | — | | | $ | — | | | $ | 7,425,406 | | |
Lockwell Small Cap Value
Description | | Level 1 | | Level 2 | | Level 3 | | Total | |
Equity (a) | | | | | | | | | | | | | | | | | |
| Common Stocks | | $ | 2,542,057 | | | $ | — | | | $ | — | | | $ | 2,542,057 | | |
| Real Estate Investment Trusts | | | 57,734 | | | | — | | | | — | | | | 57,734 | | |
| Total Equity | | | 2,599,791 | | | | — | | | | — | | | | 2,599,791 | | |
Short-Term Investments | | | 146,384 | | | | — | | | | — | | | | 146,384 | | |
Total Investments in Securities | | $ | 2,746,175 | | | $ | — | | | $ | — | | | $ | 2,746,175 | | |
(a) See Fund's Schedule of Investments for sector or currency classifications
| | MFG Core
Infrastructure | | HEXAM
Emerging Markets | |
| |
| |
Transfers into Level 1 | | $ | 33,540 | | | $ | 963,442 | | | | | | | | | | |
Transfers out of Level 2 | | $ | (33,540 | ) | | $ | (963,442 | ) | | | | | | | | | |
Net transfers | | $ | — | | | $ | — | | | | | | | | | | |
Transfers between Level 1 and Level 2 relate to the use of systematic fair valuation. On days when systematic fair valuation is used, non-U.S. dollar denominated securities move from Level 1 to Level 2 classification. At June 30, 2012, securities in the MFG Core Infrastructure Fund and HEXAM Emerging Markets Fund were adjusted using systematic fair valuation. At December 31, 2012, certain securities in the MFG Core Infrastructure Fund and HEXAM Emerging Markets Fund were not adjusted using systematic fair valuation. The Funds did not hold any Level 3 securities during the period ended December 31, 2012.
(b) Federal Income Taxes
Each Fund intends to comply with the requirements of Subchapter M of the Internal Revenue Code necessary to qualify as a regulated investment company and to make the requisite distributions of income and capital gains to its shareholders sufficient to relieve it from all or substantially all federal income taxes. Therefore, no federal income tax provision has been provided.
The Funds have adopted financial reporting rules regarding recognition and measurement of tax positions taken or expected to be taken on a tax return. The Funds recognized interest and penalties, if any, related to unrecognized tax benefits as income tax expense on the Statement of Operations. During the period ended December 31, 2012, the Funds did not incur any interest or penalties. The Funds have reviewed all open tax years and concluded that there is no effect to any of the Fund's financial positions or results of operations and no tax liability resulting from unrecognized tax benefits relating to uncertain income tax position taken or expected to be taken on a tax return. Open tax years are those years that are open for examination by the relevant income taxing authority. As of December 31, 2012, open federal and state income tax years include the tax years ended June 30, 2010, June 30, 2011 and June 30, 2012. The Funds have no examinations in progress. The Funds are also not aware of any tax positions for which it is reasonably possible that the total amounts of unrecognized tax expense will significantly change in twelve months.
page 76

NOTES TO FINANCIAL STATEMENTS (continued)
December 31, 2012 (Unaudited)
(c) Distributions to Shareholders
Dividends from net investment income and net realized gains, if any, are declared and paid at least annually.
All short-term capital gains are included in ordinary income for tax purposes. Distributions to shareholders are recorded on the ex-dividend date.
The tax character of distributions paid during the six months ended December 31, 2012 and the fiscal year ended June 30, 2012 were as follows:
| | Six Months Ended December 31, 2012 | | Year Ended June 30, 2012 | |
| | Ordinary
Income | | Short-Term
Capital Gains | | Long-Term
Capital Gains | | Total
Distributions | | Ordinary
Income | | Long-Term
Capital Gains | | Total
Distributions | |
RobecoSAM Global Equity | | $ | 295,231 | | | $ | — | | | $ | — | | | $ | 295,231 | | | $ | 1,035,293 | | | $ | 558,833 | | | $ | 1,594,126 | | |
MFG Global Equity | | | 966,980 | | | | 1,466,648 | | | | — | | | | 2,433,628 | | | | — | | | | — | | | | — | | |
MFG Core Infrastructure | | | 118,030 | | | | 1,836 | | | | — | | | | 119,866 | | | | — | | | | — | | | | — | | |
HEXAM Emerging Markets | | | 120,490 | | | | — | | | | — | | | | 120,490 | | | | 312,061 | | | | — | | | | 312,061 | | |
Timpani Small Cap Growth | | | — | | | | — | | | | — | | | | — | | | | — | | | | — | | | | — | | |
Netols Small Cap Value | | | — | | | | — | | | | 6,697,249 | | | | 6,697,249 | | | | — | | | | — | | | | — | | |
Phocas Small Cap Value | | | 61,412 | | | | — | | | | — | | | | 61,412 | | | | 14,041 | | | | — | | | | 14,041 | | |
Lockwell Small Cap Value | | | 13,921 | | | | 734 | | | | — | | | | 14,655 | | | | 528 | | | | — | | | | 528 | | |
At June 30, 2012, the Funds' most recent fiscal year end, the components of accumulated earnings/losses on a tax basis were as follows:
| | | SAM
Global
Equity | | MFG
Global
Equity | | MFG
Core
Infrastructure | | HEXAM
Emerging
Markets | | Timpani
Small Cap
Growth | | Netols
Small Cap
Value | | Phocas
Small Cap
Value | | Lockwell
Small Cap
Value | |
Cost of investments | | $ | 19,510,012 | | | $ | 108,704,216 | | | $ | 2,661,638 | | | $ | 25,452,806 | | | $ | 2,350,283 | | | $ | 120,080,149 | | | $ | 19,456,379 | | | $ | 2,343,606 | | |
Gross unrealized
appreciation | | $ | 2,056,576 | | | $ | 3,077,161 | | | $ | 129,557 | | | $ | 384,346 | | | $ | 577,602 | | | $ | 41,684,144 | | | $ | 4,150,804 | | | $ | 214,419 | | |
Gross unrealized
depreciation | | | (1,812,956 | ) | | | (3,636,986 | ) | | | (52,504 | ) | | | (6,094,392 | ) | | | (49,829 | ) | | | (9,320,039 | ) | | | (949,770 | ) | | | (106,088 | ) | |
Net unrealized
appreciation/
depreciation | | | 243,620 | | | | (559,825 | ) | | | 77,053 | | | | (5,710,046 | ) | | | 527,773 | | | | 32,364,105 | | | | 3,201,034 | | | | 108,331 | | |
Undistributed
ordinary income | | | 160,287 | | | | 654,846 | | | | 66,028 | | | | 120,490 | | | | — | | | | — | | | | 39,983 | | | | 4,755 | | |
Undistributed
long-term
capital gain | | | — | | | | — | | | | — | | | | — | | | | — | | | | — | | | | — | | | | — | | |
Total distributable
earnings | | | 160,287 | | | | 654,846 | | | | 66,028 | | | | 120,490 | | | | — | | | | — | | | | 39,983 | | | | 4,755 | | |
Other accumulated
gains(losses) | | | (193,980 | ) | | | (2,258 | ) | | | 170 | | | | (2,929,407 | ) | | | (465,742 | ) | | | (944,632 | ) | | | (2,769,735 | ) | | | — | | |
Total accumulated
earnings/(losses) | | $ | 209,927 | | | $ | 92,763 | | | $ | 143,251 | | | $ | (8,518,963 | ) | | $ | 62,031 | | | $ | 31,419,473 | | | $ | 471,282 | | | $ | 113,086 | | |
page 77

NOTES TO FINANCIAL STATEMENTS (continued)
December 31, 2012 (Unaudited)
The difference between book-basis and tax-basis unrealized appreciation is attributable primarily to the tax deferral of losses on wash sales.
As of the end of their tax year ended June 30, 2012, the following Funds have capital loss carryforwards ("CLCFs") as summarized in the table below. Under the provision of the Regulated Investment Company Modernization Act of 2010, CLCFs that originated in a tax year that began before December 23, 2010 (pre-effective CLCFs) may be carried forward, subject to certain limitations, and applied to offset future capital gains, and thus reduce the amount of distributable capital gains, for up to eight succeeding tax years, after which any unutilized CLCFs expire. Pre-effective CLCFs are applied as short-term capital loss regardless of whether the originating capital loss was short term or long term. CLCFs that originate in tax years beginning after December 22, 2010 (post effective CLCFs), are applied consistent with the character in which they originated as a new loss on the first day of the immediately succeeding tax year, and thus take precedent over the application of pre-effective CLCFs. Post-effective CLCFs can be carried forward indefinitely.
Pre-effective CLCFs subject to expiration:
| | | Expires | | | |
Fund | | 6/30/17 | | 6/30/18 | | Total | |
Netols Small Cap Value | | $ | — | | | $ | 927,876 | | | $ | 927,876 | | |
Phocas Small Cap Value | | | 2,652,152 | | | | — | | | | 2,652,152 | | |
Post-effective CLCFs not subject to expiration:
Fund | | Short-term
Amount | | Long-term
Amount | | Total | |
HEXAM Emerging Markets | | $ | 951,691 | | | $ | — | | | $ | 951,691 | | |
Timpani Small Cap Growth | | | 338,941 | | | | — | | | | 338,941 | | |
During the year ended June 30, 2012, the Funds utilized capital loss carry forwards as follows:
Fund | | Amount | |
Netols Small Cap Value | | $ | 2,783,078 | | |
Phocas Small Cap Value | | | 213,133 | | |
In order to meet certain excise tax requirements, the Funds are required to measure and distribute annually, net capital gains realized during the twelve month period ending October 31st. In connection with this requirement, the Funds are permitted, for tax purposes, to defer into their next fiscal year any net capital losses incurred from November 1st through the end of the fiscal year. As of June 30, 2012, the following Funds deferred, on a tax basis, post October losses and post December late-year losses of:
| | | Post-October
Capital Loss Deferred | | Late-Year Net Investment Income Loss
Deferred Per Regulated Investment
Company Modernization Act of 2010 | |
RobecoSAM Global Equity | | $ | 195,629 | | | $ | — | | |
HEXAM Emerging Markets | | | 1,974,369 | | | | — | | |
Timpani Small Cap Growth | | | 114,530 | | | | 12,271 | | |
Netols Small Cap Value | | | — | | | | 16,756 | | |
Phocas Small Cap Value | | | 117,583 | | | | — | | |
page 78

NOTES TO FINANCIAL STATEMENTS (continued)
December 31, 2012 (Unaudited)
(d) Foreign Currency Translation
Values of investments denominated in foreign currencies are converted into U.S. dollars using a spot market rate of exchange each day. Purchases and sales of investments and dividend and interest income are translated to U.S. dollars using a spot market rate of exchange prevailing on the dates of such transactions. The portion of security gains or losses resulting from changes in foreign exchange rates are included with net realized and unrealized gain or loss from investments, as appropriate, for both financial reporting and tax purposes.
Each Fund, respectively, bears the risk of changes in the foreign currency exchange rates and their impact on the value of assets and liabilities denominated in foreign currency. Each Fund also bears the risk of a counterparty failing to fulfill its obligation under a foreign currency contract.
Investments in securities of foreign companies involve additional risks including: currency exchange rate fluctuation; less available public information about the issuers of securities; less stringent regulatory standards; lack of uniform accounting, auditing and financial reporting standards; and country risks including less liquidity, high inflation rates and political and economic instability. The risks of foreign investments are typically greater in emerging and less developed markets.
(e) Indemnifications
Under the Funds' organizational documents, their officers and directors are indemnified against certain liabilities arising out of the performance of their duties to the Funds. In addition, in the normal course of business, the Funds enter into contracts that provide general indemnifications to other parties. The Funds' maximum exposure under these arrangements is unknown as this would involve future claims that may be made against the Funds that have not yet occurred. However, the Funds have not had prior claims or losses pursuant to these contracts and expect the risk of loss to be remote.
(f) Other
Investment transactions are accounted for on the trade date. The Funds determine the gain or loss realized from investment transactions by comparing the original cost of the specifically identified security lot sold with the net sale proceeds. Dividend income, less foreign taxes withheld, is recognized on the ex-dividend date, except that certain dividends from foreign securities are recorded as soon as the information becomes available to the Funds. Interest income is recognized on an accrual basis. All discounts/premiums are accreted/amortized using the effective interest method and are included in interest income. Withholding taxes on foreign dividends have been provided for in accordance with the Funds' understanding of the applicable country's tax codes and regulations.
Income, expenses (other than expenses attributable to a specific class) and realized and unrealized gains or losses on investments attributable to the Funds are generally allocated to each respective class in proportion to the relative net assets of each class.
The preparation of financial statements in conformity with U.S. generally accepted accounting principles ("GAAP") requires management to make estimates and assumptions that affect the reported amounts of assets and liabilities and disclosure of contingent assets and liabilities at the date of the financial statements, and the reported amounts of increases and decreases in net assets from operations during the reporting period. Actual results could differ from those estimates.
Net investment income and realized gains and losses for federal income tax purposes may differ from that reported on the financial statements because of permanent book-to-tax differences. GAAP requires that permanent differences in net investment income and realized gains and losses due to differences between financial reporting and tax reporting be reclassified between various
page 79

NOTES TO FINANCIAL STATEMENTS (continued)
December 31, 2012 (Unaudited)
components of net assets. These reclassifications have no effect on net assets or net asset value per share. For the year ended June 30, 2012, the following table shows the reclassifications made:
| | RobecoSAM
Global
Equity | | MFG
Global
Equity | | MFG
Core
Infrastructure | | HEXAM
Emerging
Markets | | Timpani
Small Cap
Growth | | Netols
Small Cap
Value | | Phocas
Small Cap
Value | | Lockwell
Small Cap
Value | |
Paid in capital | | $ | — | | | $ | — | | | $ | — | | | $ | — | | | $ | (9,345 | ) | | $ | (254,195 | ) | | $ | (617 | ) | | $ | — | | |
Accumulated net
investment income (loss) | | | (51,609 | ) | | | (14,867 | ) | | | 7,762 | | | | (68,244 | ) | | | 9,343 | | | | 254,195 | | | | 617 | | | | — | | |
Accumulated net
realized gain (loss) | | | 51,609 | | | | 14,867 | | | | (7,762 | ) | | | 68,244 | | | | 2 | | | | — | | | | — | | | | — | | |
The permanent differences primarily relate to foreign currency, net operating losses, and capital loss carryforward limitations.
(3) INVESTMENT ADVISER AND RELATED PARTIES
The RobecoSAM Global Equity, MFG Global Equity, MFG Core Infrastructure, HEXAM Emerging Markets, Netols Small Cap Value and Phocas Small Cap Value Funds have entered into an agreement with Frontegra, with whom certain officers and a director of the Funds are affiliated, to furnish investment advisory services to the Funds. Timpani, an affiliate of Frontegra, is the investment adviser to the Frontegra Timpani Small Cap Growth Fund. Lockwell is the investment adviser to the Lockwell Small Cap Value Fund. Fees are calculated daily and payable monthly, at annual rates set forth in the following table (expressed as a percentage of each Fund's average daily net assets). Pursuant to expense cap agreements, Frontegra, Timpani and Lockwell have agreed to waive their respective management fees and/or reimburse each Fund's operating expenses (exclusive of brokerage, interest, taxes and extraordinary expenses) to ensure that each Fund's operating expenses do not exceed the expense limitation listed below. Expenses waived are netted with advisory fees payable on the Statements of Assets and Liabilities. On a monthly basis, these accounts are settled by each Fund making payment to the respective adviser or the respective adviser reimbursing the Fund if the reimbursement amount exceeds the advisory fee. If the amount of fees waived exceeds the advisory fee earned, this is shown on the Statement of Assets and Liabilities as a receivable from the respective adviser. The expense cap agreements will continue in effect until October 31, 2013, with successive renewal terms of one year unless terminated by an adviser or a Fund prior to any such renewal.
Frontegra Fund | | Annual Advisory Fees | | Expense Limitation | |
RobecoSAM Global Equity | | | 0.80 | % | | | 1.20 | % | |
MFG Global Equity | | | 0.80 | % | | | 0.80 | % | |
MFG Core Infrastructure | | | 0.70 | % | | | 0.70 | % | |
HEXAM Emerging Markets | | | 0.90 | % | | | 1.30 | % | |
Timpani Small Cap Growth | | | 1.00 | % | | | 1.10 | % | |
Netols Small Cap Value - Institutional Class | | | 1.00 | % | | | 1.10 | % | |
Netols Small Cap Value - Class Y | | | 1.00 | % | | | 1.50 | % | |
Phocas Small Cap Value | | | 1.00 | % | | | 1.10 | % | |
Lockwell Small Cap Value | | | 1.00 | % | | | 1.10 | % | |
Any waivers or reimbursements are subject to later adjustment to allow the advisers to recoup amounts waived or reimbursed to the extent actual fees and expenses for a fiscal period are less than each Fund's expense limitation cap, provided, however, that an adviser shall only be entitled to recoup such amounts for a period of three years from the date such amount was waived or reimbursed. Expenses attributable to a specific class may only be recouped with respect to that class.
page 80

NOTES TO FINANCIAL STATEMENTS (continued)
December 31, 2012 (Unaudited)
The following table shows the waived or reimbursed expenses subject to potential recovery expiring in:
| | RobecoSAM
Global
Equity | | MFG
Global
Equity | | MFG
Core
Infrastructure | | HEXAM
Emerging
Markets | | Timpani
Small Cap
Growth | | Netols
Small Cap
Value | | Phocas
Small Cap
Value | | Lockwell
Small Cap
Value | |
2013 | | $ | — | | | $ | — | | | $ | — | | | $ | — | | | $ | — | | | $ | 75,253 | | | $ | — | | | $ | — | | |
2014 | | | 26,548 | * | | | — | | | | — | | | | 75,925 | | | | 46,572 | | | | 53,689 | | | | 104,993 | ** | | | — | | |
2015 | | | 78,884 | | | | 95,480 | *** | | | 66,588 | **** | | | 77,799 | | | | 103,400 | | | | 194,049 | | | | 146,574 | | | | 109,516 | | |
2016 | | | 39,573 | | | | 127,342 | | | | 51,293 | | | | 25,408 | | | | 50,500 | | | | 77,914 | | | | 81,427 | | | | 52,617 | | |
Total | | $ | 145,005 | | | $ | 222,822 | | | $ | 117,881 | | | $ | 179,132 | | | $ | 200,472 | | | $ | 400,905 | | | $ | 332,994 | | | $ | 162,133 | | |
* Expenses waived/reimbursed were for the period June 10, 2011 through June 30, 2011.
** Expenses waived/reimbursed were for the period October 8, 2010 through June 30, 2011.
*** Expenses waived/reimbursed were for the period December 28, 2011 through June 30, 2012.
**** Expenses waived/reimbursed were for the period January 18, 2012 through June 30, 2012.
The Frontegra Phocas Small Cap Value Fund entered into a subadministration agreement with Frontegra under which Frontegra provided certain shareholder and subadministrative services to Class I shareholders of the Fund. For its services, Frontegra, with whom certain officers and a director of the Fund are affiliated, received an annual fee of 0.11% of Class I average net assets. This fee was calculated daily and payable monthly. The subadministration agreement was terminated effective October 31, 2012.
The beneficial ownership, either directly or indirectly, of more than 25% of the voting securities creates a presumption of control of the Funds. As of December 31, 2012, affiliates of Frontegra owned a controlling interest in the Frontegra MFG Core Infrastructure Fund and affiliates of Timpani owned a controlling interest in the Frontegra Timpani Small Cap Growth Fund. As of December 31, 2012, one shareholder owned a controlling interest in the Frontegra MFG Global Equity Fund, but is not considered an affiliate of Frontegra. Shareholders with a controlling interest could affect the outcome of proxy voting or the direction of management of a Fund.
(4) INVESTMENT TRANSACTIONS
The aggregate purchases and sales of securities, excluding short-term investments for the Funds for the six months ended December 31, 2012 are summarized below:
| | RobecoSAM
Global
Equity | | MFG
Global
Equity | | MFG
Core
Infrastructure | | HEXAM
Emerging
Markets | | Timpani
Small Cap
Growth | | Netols
Small Cap
Value | | Phocas
Small Cap
Value | | Lockwell
Small Cap
Value | |
Purchases | | $ | 3,149,394 | | | $ | 31,211,442 | | | $ | 292,999 | | | $ | 8,039,759 | | | $ | 2,225,966 | | | $ | 20,458,263 | | | $ | 16,726,621 | | | $ | 613,747 | | |
Sales | | $ | 6,608,367 | | | $ | 24,629,840 | | | $ | 143,541 | | | $ | 6,903,078 | | | $ | 1,972,725 | | | $ | 51,212,482 | | | $ | 31,629,259 | | | $ | 662,624 | | |
There were no purchases or sales of U.S. Government securities for the Funds.
(5) DISTRIBUTION PLAN AND SHAREHOLDER SERVICING FEE
Frontegra, on behalf of the Frontegra Netols Small Cap Value Fund and the Frontegra Timpani Small Cap Growth Fund, has adopted a distribution plan pursuant to Rule 12b-1 under the Investment Company Act of 1940 for each Fund's Class Y shares (the "12b-1 Plan"). Pursuant to the 12b-1 Plan, the Fund pays an annual fee of up to 0.25% to Frontegra Strategies, LLC (the "Distributor"), an affiliate of Frontegra, for payments to brokers, dealers and other financial intermediaries who perform activities or
page 81

NOTES TO FINANCIAL STATEMENTS (continued)
December 31, 2012 (Unaudited)
incur expenses intended to result in the sale of Class Y shares of the Fund. As of December 31, 2012, the Class Y shares of the Frontegra Timpani Small Cap Growth Fund had not commenced operations. For the six months ended December 31, 2012, the Netols Small Cap Value Fund Class Y shares incurred $22,264 under the 12b-1 Plan.
Class Y shares of the Funds also pay an annual shareholder servicing fee of up to 0.15% per year to the Distributor for payments to brokers, dealers, and other financial intermediaries who provide on-going account services to shareholders. Those services include establishing and maintaining shareholder accounts, mailing prospectuses, account statements and other Fund documents to shareholders, processing shareholder transactions, and providing other recordkeeping and administrative services. For the six months ended December 31, 2012, the Netols Small Cap Value Fund Class Y shares incurred $13,359 in shareholder servicing expenses.
page 82
This page intentionally left blank.
This page intentionally left blank.

A NOTE ON FORWARD-LOOKING STATEMENTS
This report includes forward-looking statements such as adviser, subadviser and/or portfolio manager predictions, opinions, assessments, analyses or outlooks for individual securities, industries, market sectors and/or markets. These statements involve risks and uncertainties. In addition to the general risks described for the Funds in the current Prospectuses, other factors bearing on these statements include the accuracy of the advisers', subadvisers' or portfolio managers' forecasts and predictions, and the appropriateness of the investment programs designed by an adviser, subadviser or portfolio manager to implement their strategies efficiently and effectively. Any one or more of these factors, as well as other risks affecting the securities markets and investment instruments generally, could cause the actual results of the Funds to differ materially as compared to benchmarks associated with the Funds.
In addition, portfolio composition will change due to ongoing management of the Funds. Specific securities named in this report may not currently be owned by the applicable Fund, or the Fund's position in the securities may have changed.
ADDITIONAL INFORMATION
Frontegra Funds has adopted proxy voting policies and procedures that delegate to Frontegra Asset Management, Inc. ("Frontegra"), Timpani Capital Management LLC and Lockwell Investments, LLC, the authority to vote proxies. The proxy voting policies permit Frontegra to delegate its authority to vote proxies to a Fund's subadviser. A description of the Frontegra Funds' proxy voting policies and procedures is available without charge, upon request, by calling the Funds toll free at 1-888-825-2100. A description of these policies and procedures is also included in the Funds' Statement of Additional Information, which is available on the SEC's website at http://www.sec.gov and the Funds' website at www.frontegra.com or by calling the Funds toll free at 1-888-825-2100.
The actual voting records relating to each Fund's portfolio securities during the most recent twelve months ended June 30 are available without charge by calling the Funds toll free at 1-888-825-2100 or by accessing the SEC's website at http://www.sec.gov.
Each Fund files a complete schedule of portfolio holdings for its first and third fiscal quarters with the SEC on Form N-Q. The Form N-Q is available on the SEC's website at http://www.sec.gov. The Form N-Q may also be reviewed and copied at the SEC's Public Reference Room in Washington, D.C. Information on the operation of the Public Reference Room may be obtained by calling toll-free 1-800-SEC-0330.
Item 2. Code of Ethics.
Not applicable for semi-annual reports.
Item 3. Audit Committee Financial Expert.
Not applicable for semi-annual reports.
Item 4. Principal Accountant Fees and Services.
Not applicable for semi-annual reports.
Item 5. Audit Committee of Listed Registrants.
Not applicable to registrants who are not listed issuers (as defined in Rule 10A-3 under the Securities Exchange Act of 1934).
Item 6. Investments.
(a) Schedule of Investments is included as part of the report to shareholders filed under Item 1 of this Form.
(b) Not Applicable.
Item 7. Disclosure of Proxy Voting Policies and Procedures for Closed-End Management Investment Companies.
Not applicable to open-end investment companies.
Item 8. Portfolio Managers of Closed-End Management Investment Companies.
Not applicable to open-end investment companies.
Item 9. Purchases of Equity Securities by Closed-End Management Investment Company and Affiliated Purchasers.
Not applicable to open-end investment companies.
Item 10. Submission of Matters to a Vote of Security Holders.
Not Applicable.
Item 11. Controls and Procedures.
(a) The Registrant’s President and Treasurer have reviewed the Registrant’s disclosure controls and procedures (as defined in Rule 30a-3(c) under the Investment Company Act of 1940 (the “Act”)) as of a date within 90 days of the filing of this report, as required by Rule 30a-3(b) under the Act and Rules 13a-15(b) or 15d-15(b) under the Securities Exchange Act of 1934. Based on their review, such officers have concluded that the disclosure controls and procedures are effective in ensuring that information required to be disclosed in this report is appropriately recorded, processed, summarized and reported and made known to them by others within the Registrant and by the Registrant’s service provider.
(b) There were no changes in the Registrant’s internal control over financial reporting (as defined in Rule 30a-3(d) under the Act) that occurred during the second fiscal quarter of the period covered by this report that has materially affected, or is reasonably likely to materially affect, the Registrant’s internal control over financial reporting.
Item 12. Exhibits.
(a) (1) Any code of ethics or amendment thereto, that is the subject of the disclosure required by Item 2, to the extent that the registrant intends to satisfy Item 2 requirements through filing an exhibit. Not applicable.
(2) A separate certification for each principal executive and principal financial officer pursuant to Section 302 of the Sarbanes-Oxley Act of 2002. Filed herewith.
(3) Any written solicitation to purchase securities under Rule 23c-1 under the Act sent or given during the period covered by the report by or on behalf of the registrant to 10 or more persons. Not applicable to open-end investment companies.
(b) Certifications pursuant to Section 906 of the Sarbanes-Oxley Act of 2002. Furnished herewith.
SIGNATURES
Pursuant to the requirements of the Securities Exchange Act of 1934 and the Investment Company Act of 1940, the registrant has duly caused this report to be signed on its behalf by the undersigned, thereunto duly authorized.
Frontegra Funds, Inc. |
| |
By: | /s/ William D. Forsyth III | |
| William D. Forsyth III, President | |
| (Principal Executive Officer) | |
| | |
Date: | February 26, 2013 | |
Pursuant to the requirements of the Securities Exchange Act of 1934 and the Investment Company Act of 1940, this report has been signed below by the following persons on behalf of the registrant and in the capacities and on the dates indicated.
By: | /s/ William D. Forsyth III | |
| William D. Forsyth III, President and Secretary | |
| (Principal Executive Officer) | |
| | |
Date: | February 26, 2013 | |
By: | /s/ Elyce D. Dilworth | |
| Elyce D. Dilworth, Treasurer and Assistant Secretary | |
| (Principal Financial Officer) | |
| | |
Date: | February 26, 2013 | |