UNITED STATES
SECURITIES AND EXCHANGE COMMISSION
Washington, D.C. 20549
FORM N-CSR
CERTIFIED SHAREHOLDER REPORT OF REGISTERED
MANAGEMENT INVESTMENT COMPANIES
Investment Company Act file number | 811-07685 |
|
Frontegra Funds, Inc. |
(Exact name of registrant as specified in charter) |
|
400 Skokie Blvd. Suite 500 Northbrook, Illinois | | 60062 |
(Address of principal executive offices) | | (Zip code) |
|
William D. Forsyth III 400 Skokie Blvd., Suite 500 Northbrook, Illinois 60062 |
(Name and address of agent for service) |
|
Registrant’s telephone number, including area code: | (847) 509-9860 | |
|
Date of fiscal year end: | June 30 | |
|
Date of reporting period: | December 31, 2013 | |
| | | | | | | | |
Item 1. Reports to Stockholders.

SEMI-ANNUAL REPORT
Frontegra RobecoSAM Global Equity Fund
Frontegra MFG Global Equity Fund
Frontegra MFG Core Infrastructure Fund
Frontegra Timpani Small Cap Growth Fund
Frontegra Netols Small Cap Value Fund
Frontegra Phocas Small Cap Value Fund
Frontegra Asset Management, Inc.
December 31, 2013

TABLE OF CONTENTS
Shareholder Letter | | | 1 | | |
Frontegra RobecoSAM Global Equity Fund | |
Report from RobecoSAM USA, Inc. | | | 4 | | |
Investment Highlights | | | 6 | | |
Frontegra MFG Global Equity Fund | |
Report from MFG Asset Management | | | 8 | | |
Investment Highlights | | | 10 | | |
Frontegra MFG Core Infrastructure Fund | |
Report from MFG Asset Management | | | 12 | | |
Investment Highlights | | | 14 | | |
Frontegra Timpani Small Cap Growth Fund | |
Report from Timpani Capital Management LLC | | | 16 | | |
Investment Highlights | | | 18 | | |
Frontegra Netols Small Cap Value Fund | |
Report from Netols Asset Management, Inc. | | | 20 | | |
Investment Highlights | | | 21 | | |
Frontegra Phocas Small Cap Value Fund | |
Report from Phocas Financial Corporation | | | 24 | | |
Investment Highlights | | | 26 | | |
Expense Example | | | 27 | | |
Schedules of Investments | |
Frontegra RobecoSAM Global Equity Fund | | | 29 | | |
Frontegra MFG Global Equity Fund | | | 31 | | |
Frontegra MFG Core Infrastructure Fund | | | 32 | | |
Frontegra Timpani Small Cap Growth Fund | | | 35 | | |
Frontegra Netols Small Cap Value Fund | | | 37 | | |
Frontegra Phocas Small Cap Value Fund | | | 39 | | |
Statements of Assets and Liabilities | | | 42 | | |
Statements of Operations | | | 44 | | |
Statements of Changes in Net Assets | | | 46 | | |
Financial Highlights | | | 49 | | |
Notes to Financial Statements | | | 56 | | |
Voting Results of Special Meeting of Shareholders | | | 65 | | |
This report is submitted for the general information of the shareholders of the Funds. It is not authorized for distribution to prospective investors unless accompanied or preceded by an effective Prospectus for the applicable Fund. The Prospectus may be obtained by calling 1-888-825-2100. Each Prospectus includes more complete information about management fees and expenses, investment objectives, risks and operating policies of the applicable Fund. Please read the Prospectus carefully.
Frontegra Funds, Inc. are distributed by Frontegra Strategies, LLC, 400 Skokie Blvd., Suite 500, Northbrook, IL 60062. Frontegra Strategies, LLC, member of FINRA and SIPC, is an affiliate of Frontegra Asset Management, Inc., the Funds' investment adviser.

DEAR FELLOW SHAREHOLDERS:
We are pleased to report on the progress of the Frontegra Funds over the past six months ending December 31, 2013. The S&P 500 Index was up 16.31%, and small capitalization stocks were also up, with the Russell 2000® Index returning 19.82%. International stocks, as measured by the MSCI EAFE Index, returned 17.94% over the six month period.
Fund Results
For the six month period ending December 31, 2013, the Frontegra RobecoSAM Global Equity Fund, managed by RobecoSAM USA, returned 15.59% (net) versus the MSCI World Index (Net) return of 16.83%.
For the six month period ending December 31, 2013, the Frontegra MFG Global Equity Fund, managed by MFG Asset Management ("MFG"), returned 12.74% (net) versus the MSCI World Index (Net) return of 16.83%.
For the six month period ending December 31, 2013, the Frontegra MFG Core Infrastructure Fund, also managed by MFG, returned 8.22% (net) versus the UBS Developed Infrastructure & Utilities Index (Net) return of 8.07% and the MSCI World Index (Net) return of 16.83%.
The Frontegra Timpani Small Cap Growth Fund, managed by Timpani Capital Management, returned 27.49% (net) versus the Russell 2000® Growth Index return of 22.02% for the six month period ending December 31, 2013.
For the six month period ending December 31, 2013, the Frontegra Netols Small Cap Value Fund — Institutional Class, managed by Netols Asset Management, returned 19.02% (net) versus the Russell 2000® Value Index return of 17.60%. The Class Y shares returned 18.42% (net) over the same time period.
The Frontegra Phocas Small Cap Value Fund, managed by Phocas Financial, returned 24.23% (net) versus the Russell 2000 Value Index return of 17.60% for the six month period ending December 31, 2013.
Outlook
The markets were exceptionally strong in the second half of 2013, as the U.S. enjoyed a continuing recovery and Europe experienced a stable environment. However, as investors have become increasingly focused on the Fed and tapering, U.S. 10-year Treasury yields have risen from 2.2% mid-year to 3.0% at the end of 2013. Moreover, currencies have experienced increased volatility as well. As we enter 2014, we will work diligently to manage your assets with the skill and nimbleness necessary in these challenging times.
We will continue to oversee the investment management of the Frontegra Funds with the care and diligence that have served our shareholders well in the past. As always, we appreciate your investment and continued confidence in the Frontegra Funds.
Best regards,
William D. Forsyth, CFA
President
Frontegra Funds, Inc.
page 1
This page intentionally left blank.

FRONTEGRA
ROBECOSAM GLOBAL EQUITY FUND

REPORT FROM ROBECOSAM USA, INC.
Dear Shareholders:
The Frontegra RobecoSAM Global Equity Fund strives to achieve capital appreciation by investing in a diversified portfolio of equity and equity-related securities issued by U.S. and non-U.S. companies that combine their market and financial strategy with a high level of environmental awareness and a clearly defined social policy. The objective is measured against the MSCI World Index (Net).
Performance Review
The Frontegra RobecoSAM Global Equity Fund returned 15.59%, net of fees, for the six month period ending December 31, 2013. The Fund's return underperformed the 16.83% return of its benchmark, the MSCI World Index (Net). For the year, the Fund returned 27.67%, net of fees, compared to the benchmark's return of 26.68%. The portfolio's underperformance relative to the benchmark for the six months ending December 31 was primarily attributable to a weak stock selection within Consumer Discretionary, Health Care and Information Technology stocks. The Fund performed well within Energy, Utilities and Industrial stocks.
Over the period, the portfolio was positioned as overweight (relative to the MSCI World Index) in Energy, Consumer Staples and Telecommunications and was underweight in Financials, Industrials, Consumer Discretionary and Materials. In terms of performance contribution, portfolio sector allocation had a negative impact on the relative performance. In particular, negative contribution came from underweighting more cyclical sectors such as Industrial and Consumer Discretionary, while overweighting Utilities and Consumer Staples.
The largest positive contributions at the stock level included overweight positions in ONEOK (Utilities), Total (Energy), Legal & General (Financials) and BT Group (Telecommunications). Not holding positions in Verizon and AT&T has also had a positive contribution as these stocks underperformed the sector. The largest negative contributions at the stock level came from overweight position in IBM and Cisco (Information Technology), Manila Water (Utilities) and McDonald's (Consumer Discretionary).
Portfolio Outlook and Strategy
Global equity market performance was strong over the period. The positive development was surprisingly strong especially considering that global markets faced a host of problems, namely uncertainties about the taper of U.S. quantitative easing and China's economic slowdown. Despite that, global equities enjoyed double digit returns in the second half of 2013. On a regional level, the strong performance of European equities stand out, performing well on the back of an improving economic backdrop. The U.S. equity market also performed well and was supported by the positive outcome of the U.S. fiscal deficit debate. The deal offers a temporary fix and allows the government to be funded through the middle of January 2014, while the debt ceiling doesn't need to be raised until the beginning of February. The overall performance of emerging markets has improved in the second half but still underperformed the general global equity market.
The more recent macro data continues to support the scenario of a gradual global recovery. At the same time, the central bank monetary policies remain very expansionary, causing investors to continue to seek exposure to the equity markets.
Valuation-wise, we continue to see attractive investment opportunities in global equity markets and have added those positions to the portfolio. Overall, the current valuation level of companies in the portfolio is attractive, and the Fund should benefit from its positioning in companies that offer growth at a reasonable price. Our focus remains on investing in sustainable companies with attractive valuations and stable earnings outlooks. We also maintain an underweight (relative to MSCI World Index) in sectors where earnings visibility and valuation upside is limited, such as Financials, Industrials and Materials.
page 4

Our outlook for the Financial sector remains cautious and our approach in this space remains very selective with a focus on companies with solid cash generation, strong balance sheets and acceptable leverage. In addition, we remain underweight in Materials. Such positioning comes mainly from not investing in large benchmark holdings in the mining and chemical space, where we see limited investment opportunities.
Sincerely,
Diego d'Argenio
Senior Portfolio Manager
RobecoSAM USA, Inc.
page 5

INVESTMENT HIGHLIGHTS
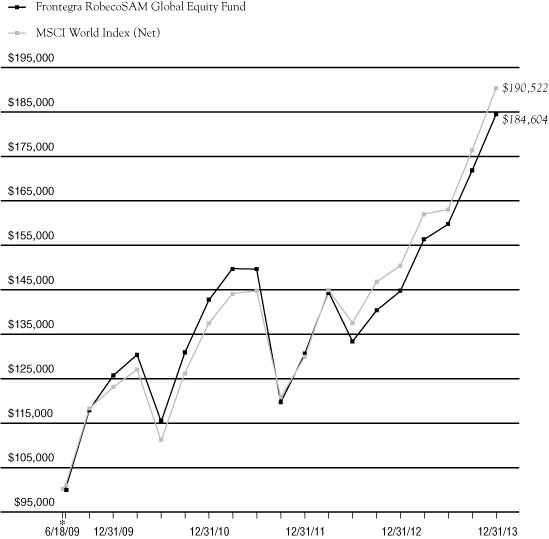
Growth of a $100,000 Investment (Unaudited)
* 6/18/09 commencement of operations.
This chart assumes an initial gross investment of $100,000 made on 6/18/09 (commencement of operations). Returns shown include the reinvestment of all distributions. Past performance is not predictive of future results. Investment return and principal value will fluctuate so that shares, when redeemed, may be worth more or less than the original cost. In the absence of existing fee waivers, total return would be reduced. Effective June 10, 2011, RobecoSAM USA, Inc. ("RobecoSAM") became subadviser to the Fund and Frontegra Asset Management, Inc. became adviser to the Fund. Prior to June 10, 2011, RobecoSAM served as adviser to the Fund. Effective February 20, 2013, the Fund changed its name from Frontegra SAM Global Equity Fund to Frontegra RobecoSAM Global Equity Fund. To receive current to the most recent month-end performance, please call 1-888-825-2100.
The MSCI World Index measures the overall performance of stock markets in 24 developed market countries in North America, Europe, and the Asia/Pacific Region. The Index does not reflect investment management fees, brokerage commissions and other expenses associated with investing in equity securities. A direct investment in the index is not possible.
Frontegra Asset Management, Inc. has contractually agreed through October 31, 2014 to waive its management fee and/or reimburse the Fund's operating expenses to the extent necessary to ensure that the Fund's total operating expenses (excluding taxes, interest, brokerage commissions, acquired fund fees and expenses and extraordinary expenses) do not exceed 1.20% of the Fund's average daily net assets. The expense ratios presented are based on the annualized expense ratios as reported in the Fund's current prospectus, which may differ from the expense ratios presented in the Fund's financial highlights.
** The returns shown do not reflect the deduction of taxes that a shareholder would pay on Fund distributions or the redemption of Fund shares.
Portfolio Total Return**
FOR PERIODS
ENDED 12/31/13 | | FUND | | INDEX | |
SIX MONTHS | | | 15.59 | % | | | 16.83 | % | |
ONE YEAR | | | 27.67 | % | | | 26.68 | % | |
AVERAGE ANNUAL
SINCE INCEPTION | | | 14.47 | % | | | 15.27 | % | |
Fund Expenses | |
GROSS EXPENSE RATIO | | | 1.63 | % | |
NET EXPENSE RATIO | | | 1.20 | % | |
page 6

FRONTEGRA
MFG GLOBAL EQUITY FUND

REPORT FROM MFG ASSET MANAGEMENT
Dear Fellow Shareholders:
The investment objective of the Frontegra MFG Global Equity Fund is capital appreciation. The objective is measured against the MSCI World Index (Net).
Performance Review
The Frontegra MFG Global Equity Fund returned 12.74%, net of fees, for the six month period ending December 31, 2013. The Fund's return underperformed the 16.83% return of its benchmark, the MSCI World Index (Net). For the year, the Fund returned 29.64%, net of fees, compared to the benchmark's return of 26.68%.
We do not manage the Fund against short-term performance metrics and it is inevitable the Fund will underperform markets at some point in the future. We aim (not guarantee) to produce absolute returns through the business cycle whilst minimizing the risk of a permanent capital loss. We will continue to focus on these objectives and will not chase short-term performance.
Fund Outlook and Strategy
We continue to view the current major source of investment risk as what will happen when the Fed ends its quantitative easing (QE) programme. The endgame for QE presents a risk for equity, and other asset markets (particularly currency and bond/credit markets) due to the likely redistribution of global money flows and rising bond yields that it will affect. Overall, we assess the risk of a disorderly unwinding of QE to be a "fat tail", or low-probability, scenario. Unfortunately, as we have repeated on many occasions, low probability does not mean zero probability.
We feel comfortable with the Fund's overall risk profile and construction, and believe it is likely to exhibit substantially less downside risk than the market in the event that a disorderly unwinding of QE occurs, or another tail event strikes.
At 31 December 2013, the Fund consisted of 27 investments (compared to 25 investments at 30 June 2013). The top-ten investments represented 56.6% of the Fund (while they represented 51.6% at 30 June 2013). Over the six months to 31 December 2013, the three stocks with the strongest local-currency returns were MasterCard (+45.6%), Google (+27.4%) and Bank of New York Mellon (+25.5%) and the stocks with the weakest returns were Unilever (-1.7%), Target (-7.1%) and Danone (-9.3%). In terms of absolute performance, the three largest stock contributors in local currency terms were Oracle, Google and MasterCard which added +1.4%, +1.3% and +1.2%, respectively. The largest detractor was Danone (-0.4%) over the period.
Over the past six months, we have made the following major changes to the portfolio:
• A new investment in DIRECTV, the world's largest pay television company by subscribers.
• A new investment in Diageo, the world's leading spirits company.
• Reductions of the investments in Google (from 6.3% to 4.5%), American Express (from 4.6% to 3.0%), Danone (from 4.5% to 3.1%) and Novartis (from 4.4% to 2.4%).
• Increases of the positions in eBay (from 5.4% to 7.3%), Oracle (from 4.6% to 6.6%), Target (from 4.4% to 5.6%) and Visa (from 3.4% to 5.4%).
page 8

The Fund remains fully invested, despite the strong rise in equity markets over the past twelve months. We believe that its holdings remain attractively valued and that they should deliver attractive returns to investors over the next 3-5 years. The Fund continues to be exposed to the following major investment themes:
• Emerging market consumption growth via investments in multinational consumer franchises. The five largest investments in multinational consumer franchises at 31 December 2013 were Yum! Brands, Nestle, Danone, McDonald's and Unilever. These companies generate, on average, around 40% of their revenues in emerging markets.
• U.S. interest rates. In our view, it is likely that U.S. short and long-term interest rates will "normalize" over the next three years as the U.S. economy recovers. This will be as a result of the U.S. Fed ceasing QE and then taking steps to shrink (or sterilize) its balance sheet, as well as the normal monetary policy action of lifting the Federal Funds Rate. We own four U.S. financial institutions which are likely to benefit from the increase in U.S. interest rates, Wells Fargo, U.S. Bancorp, Bank of New York Mellon and State Street.
• A move to a cashless society. There continues to be a strong secular shift from spending via cash and check to cashless forms of payments such as credit cards, debit cards, electronic funds transfer and mobile payments. In our opinion, the explosion of smart mobile devices will accelerate this shift on a global basis. We believe that there are only a limited number of companies that are well positioned to benefit from this structural shift. These companies are typically highly attractive, with strong network effects, low capital intensity, high barriers to entry and high returns on capital. At 31 December 2013, the Fund was invested in the payments space through exposure to companies such as PayPal (via eBay), American Express, Visa and MasterCard.
• U.S. housing. A recovery in new housing construction should drive a strong cyclical recovery in companies exposed to the U.S. housing market, while providing a boost to the overall economy. Our major exposure to this theme is via our holding in Lowe's, the home improvement retailer, and the domestic U.S. banks, Wells Fargo and U.S. Bancorp.
• Technology/software. We believe that entrenched global software companies boast enormous competitive advantages and exhibit attractive investment characteristics. The Fund's technology/software investments include Microsoft and Oracle.
• Internet/e-commerce. There are a number of internet-enabled businesses that are experiencing increasing competitive advantages and showing very attractive investment characteristics. The Fund's investments in these areas include eBay and Google.
Yours sincerely,
Hamish Douglass
Portfolio Manager
MFG Asset Management
page 9

INVESTMENT HIGHLIGHTS
Growth of a $1,000,000 Investment (Unaudited)

* 12/28/11 commencement of operations.
This chart assumes an initial gross investment of $1,000,000 made on 12/28/11 (commencement of operations). Returns shown include the reinvestment of all distributions. Past performance is not predictive of future results. Investment return and principal value will fluctuate so that shares, when redeemed, may be worth more or less than the original cost. In the absence of existing fee waivers, total return would be reduced. To receive current to the most recent month-end performance, please call 1-888-825-2100.
The MSCI World Index measures the overall performance of stock markets in 24 developed market countries in North America, Europe, and the Asia/Pacific Region. The Index does not reflect investment management fees, brokerage commissions and other expenses associated with investing in equity securities. A direct investment in the index is not possible.
Frontegra Asset Management, Inc. has contractually agreed through October 31, 2014 to waive its management fee and/or reimburse the Fund's operating expenses to the extent necessary to ensure that the Fund's total operating expenses (excluding taxes, interest, brokerage commissions, acquired fund fees and expenses and extraordinary expenses) do not exceed 0.80% of the Fund's average daily net assets. The expense ratios presented are based on the annualized expense ratios as reported in the Fund's current prospectus, which may differ from the expense ratios presented in the Fund's financial highlights.
** The returns shown do not reflect the deduction of taxes that a shareholder would pay on Fund distributions or the redemption of Fund shares.
Portfolio Total Return**
FOR PERIODS ENDED 12/31/13 | | FUND | | INDEX | |
SIX MONTHS | | | 12.74 | % | | | 16.83 | % | |
ONE YEAR | | | 29.64 | % | | | 26.68 | % | |
AVERAGE ANNUAL
SINCE INCEPTION | | | 24.15 | % | | | 21.79 | % | |
Fund Expenses | |
GROSS EXPENSE RATIO | | | 0.97 | % | |
NET EXPENSE RATIO | | | 0.80 | % | |
page 10

FRONTEGRA
MFG CORE INFRASTRUCTURE FUND

REPORT FROM MFG ASSET MANAGEMENT
Dear Fellow Shareholders:
The investment objective of the Frontegra MFG Core Infrastructure Fund is long-term capital appreciation. The objective is measured against the UBS Developed Infrastructure & Utilities Index (Net).
The types of infrastructure assets in which the Fund invests are natural monopolies that provide an essential service to the community. Infrastructure assets offer investors protection from the impacts of inflation because their earnings generally have some direct linkage to inflation. Over time, the stable, reliable earnings of infrastructure assets are expected to lead to a combination of income and capital growth for investors.
The return from the infrastructure universe (as defined by MFG Asset Management ("MFGAM")) was more than 10% p.a. for the decade to the end of 2013. Just under half of that return was in the form of dividend income.
The universe of infrastructure assets that are held by the Fund is made up of two main sectors:
• Utilities: Utilities comprise approximately 74% of the Fund and includes both regulated energy utilities and regulated water utilities. Utilities are typically subject to economic regulation. The terms of regulation typically require a utility to efficiently provide an essential service to the community and, in return, permit the utility to earn a fair rate of return on the capital it has invested in its operations. As a utility provides a basic necessity, e.g. energy or water, there is minimal fluctuation in demanded volumes in response to the economic cycle, while the price charged for the utility service can be adjusted with limited impact upon demanded volumes. As a result, the earnings of regulated utilities have been, and are expected to continue to be, stable irrespective of economic conditions.
• Infrastructure: This includes airports, ports, toll roads and broadcast communications infrastructure. Regulation of infrastructure companies is generally less intensive than regulation of utilities and this allows companies to accrue the benefits of volume growth (i.e. the returns of infrastructure companies are linked to growth in passengers, vehicles or containers). As economies develop, grow and become more inter-dependent, we expect the underlying level of aviation, shipping and vehicle traffic to increase. As a result, the revenues and earnings derived by infrastructure assets are expected to grow.
Performance Review
The Frontegra MFG Core Infrastructure Fund returned 8.22%, net of fees, for the six month period ending December 31, 2013. The Fund's return outperformed the 8.07% return of its benchmark, the UBS Developed Infrastructure & Utilities Index (Net). For the year, the Fund returned 12.41%, net of fees, compared to the benchmark's return of 14.37%.
Most sectors held by the Fund performed well during the period, with Toll Roads providing a weighted average total return of 18.9% while Airports generated a total return of 15.9%. The utilities sectors generated returns ranging from 2% for Water Utilities to 9% for Gas Utilities. The Ports sector was the only exposure to generate a negative return of 4.7%.
Geographically, the Fund's European exposures generated a return of over 15.7% and Australian/New Zealand stocks provided a return of 7.8%. The U.S. and Canadian markets generated only modest returns of 2.4% and 3.1% respectively, a reflection of the fact that these markets are now back to equilibrium having been oversold in previous years.
The performance of the benchmark was positively impacted by strong share price surges from companies that, in previous years, had been very poor places to invest and which are excluded from the MFG Core Infrastructure strategy's investment universe. This particularly applied to the large European, vertically integrated energy utilities (that have a significant proportion of their earnings exposed to the competitive power generation sector) and regulated Japanese utilities (apparently acquired as a convenient way to play a yen currency strategy).
page 12

Portfolio Outlook and Strategy
The Core Infrastructure strategy is designed to provide reliable returns over the medium-to-longer term. The Fund exceeded that expectation during 2013, partly reflecting the recovery of stocks held by the Fund that had been over-sold in previous years. We now see the utilities market as broadly in equilibrium while infrastructure stocks remain cheap.
MFGAM believes that infrastructure and utility assets, with requisite earnings reliability and a linkage of earnings to inflation, offer an attractive, long-term investment proposition. Furthermore, given the predictable nature of earnings and the structural linkage of those earnings to inflation, the investment returns generated by infrastructure assets are different from standard asset classes and offer investors valuable diversification when included in an investment portfolio. In the current uncertain economic and investment climate, the reliable financial performance of infrastructure investments makes them particularly attractive and an investment in listed infrastructure can be expected to reward patient investors with a three to five year timeframe.
Sincerely,
Dennis Eagar
Lead Portfolio Manager
MFG Asset Management
page 13

INVESTMENT HIGHLIGHTS
Growth of a $100,000 Investment (Unaudited)

* 1/18/12 commencement of operations.
This chart assumes an initial gross investment of $100,000 made on 1/18/12 (commencement of operations). Returns shown include the reinvestment of all distributions. Past performance is not predictive of future results. Investment return and principal value will fluctuate so that shares, when redeemed, may be worth more or less than the original cost. In the absence of existing fee waivers, total return would be reduced. To receive current to the most recent month-end performance, please call 1-888-825-2100.
The MSCI World Index measures the overall performance of stock markets in 24 developed market countries in North America, Europe, and the Asia/Pacific Region. The UBS Developed Infrastructure & Utilities Index is a global developed markets infrastructure and utilities benchmark. Neither index reflects investment management fees, brokerage commissions or other expenses associated with investing in equity securities. A direct investment in an index is not possible.
Frontegra Asset Management, Inc. has contractually agreed through October 31, 2014 to waive its management fee and/or reimburse the Fund's operating expenses to the extent necessary to ensure that the Fund's total operating expenses (excluding taxes, interest, brokerage commissions, acquired fund fees and expenses and extraordinary expenses) do not exceed 0.70% of the Fund's average daily net assets. The expense ratios presented are based on the annualized expense ratios as reported in the Fund's current prospectus, which may differ from the expense ratios presented in the Fund's financial highlights.
** The returns shown do not reflect the deduction of taxes that a shareholder would pay on Fund distributions or the redemption of Fund shares.
Portfolio Total Return**
FOR PERIODS
ENDED 12/31/13 | | FUND | | UBS
INDEX | | MSCI
INDEX | |
SIX MONTHS | | | 8.22 | % | | | 8.07 | % | | | 16.83 | % | |
ONE YEAR | | | 12.41 | % | | | 14.37 | % | | | 26.68 | % | |
AVERAGE ANNUAL
SINCE INCEPTION | | | 14.34 | % | | | 10.86 | % | | | 19.62 | % | |
Fund Expenses | |
GROSS EXPENSE RATIO | | | 3.66 | % | |
NET EXPENSE RATIO | | | 0.70 | % | |
page 14

FRONTEGRA
TIMPANI SMALL CAP GROWTH FUND

REPORT FROM TIMPANI CAPITAL MANAGEMENT LLC
Dear Fellow Shareholders:
The Frontegra Timpani Small Cap Growth Fund strives to achieve capital appreciation by investing in a diversified portfolio of growth companies with small market capitalizations. Timpani seeks to:
• Invest in companies where growth is robust, sustainable and underestimated by the market.
• Conduct fundamental research that provides unique insights into the perception gap that exists between market expectations and a company's true growth rate.
• Manage risk by continuously evaluating the size of the perception gap relative to market expectations and monitoring market sentiment.
• Act on new relevant incremental data points, both positive and negative, in an effort to exploit investor biases.
Performance Review
The Fund outperformed its benchmark, the Russell 2000® Growth Index, for the period July 1, 2013 through December 31, 2013, returning 27.49% (net of fees) vs. 22.02% for the Index. For the year, the Fund returned 57.07%, net of fees, compared to the benchmark's return of 43.30%.
Strong stock selection drove almost all of the outperformance, while sector allocation had a minor negative impact. In particular, Consumer Discretionary, Health Care, and Financial Services delivered the most significant gains, while Utilities were a slight drag on performance. There were no large sector weights that significantly added to performance; however, an overweight in Energy was a slight positive contributor, while an underweight in Materials and Processing was a minor detractor from performance.
The individual stocks that outperformed during the period tended to be those with the largest perception gaps. There were many companies rewarded with large positive absolute performance as investors focused more on company-specific fundamentals. The period saw strong absolute gains for the index in both Q3 and Q4. A number of stocks across a diverse group of sectors contributed significantly to the Fund's performance. For instance, each of our five largest positive contributors came from a different sector. Lannett Company was our largest positive contributor within Health Care. Responsys, which was acquired by Oracle in Q4 at a significant premium, was a strong contributor in Technology. Tree.com was a standout performer in Financial Services, and WageWorks was a strong performer in Producer Durables. Conn's, which has been our largest holding in Consumer Discretionary, continued to post industry-leading sales gains, which led to strong relative outperformance.
Portfolio Outlook
The benchmark was up sharply in both quarters, continuing a trend of valuation expansion in anticipation of an accelerating economy and gradual reduction in Federal Reserve accommodation. The first step toward monetary policy normalization occurred as the Federal Reserve announced it will soon begin to taper its quantitative easing program. We expect a smooth transition at the Federal Reserve with the leadership change taking place. Data points in the U.S. have been on balance stronger in the latter half of 2013. GDP growth is estimated to have accelerated in the second half of 2013, and the unemployment rate continues to drop, falling below 7% for the first time since the recovery started over four years ago. Weaker consumer spending around the holidays is a risk that investors are digesting. We have sought to own companies we believe have secular growth drivers, meaning they will likely be able to post attractive growth through any type of economy. We are optimistic that many of the macro concerns that have dominated the headlines over the past few years have cleared, which positions us well as company-specific positive fundamentals should be rewarded.
page 16

On a micro level, companies within our portfolio continue to have attractive growth profiles, have maintained a constructive outlook on the economy and mostly exceeded analyst expectations. The scarcity of upside surprise and strong growth means investors are disproportionately rewarding companies that have those qualities, such as the ones in our portfolio. Corporate balance sheets are generally sound, and companies are generating cash which enables them to increase cash deployment in the form of dividends, share buybacks or accretive acquisitions. We believe that positive corporate fundamentals will lead to the potential for increased merger and acquisition activity, which could benefit the companies we own as both buyers and potential sellers. As an example, we saw a benefit in Q4 as Responsys was bought out at a large premium, while Costa was acquired at a more modest premium. Other holdings, including Jazz Pharmaceuticals, Team Health and Dealertrack, were rewarded for making accretive acquisitions. Our analysis continues to confirm our optimism regarding the fundamental strength of the companies in our portfolio. In particular, meetings with company management teams and other fundamental data points indicate that many companies continue to achieve robust growth, and the perception gaps that exist remain quite large.
During the period, we continued to focus on finding robust and sustainable growers with company-specific perception gaps. Our bottom-up stock picking process led to some small changes around the edges in our sector weightings. We continue to be overweight in Consumer Discretionary and Energy with Energy now our largest sector bet on a relative basis. Technology went from being market weight to being slightly overweight, while Producer Durables went from being overweight to only slightly overweight. Consumer Staples, Financials, and Materials and Processing continue to be our biggest underweights. Health Care continues to be near benchmark weight, ending the period slightly overweight. During the period, we continued our core strategy of investing in companies where we believe there is open-ended secular growth and where the market has underestimated that growth. Looking ahead, we are confident that our bottom-up process will continue to add value for shareholders.
Thank you for your continued support.
Sincerely,
Brandon Nelson, CFA
Chief Investment Officer
Timpani Capital Management LLC
page 17

INVESTMENT HIGHLIGHTS
Growth of a $100,000 Investment (Unaudited)
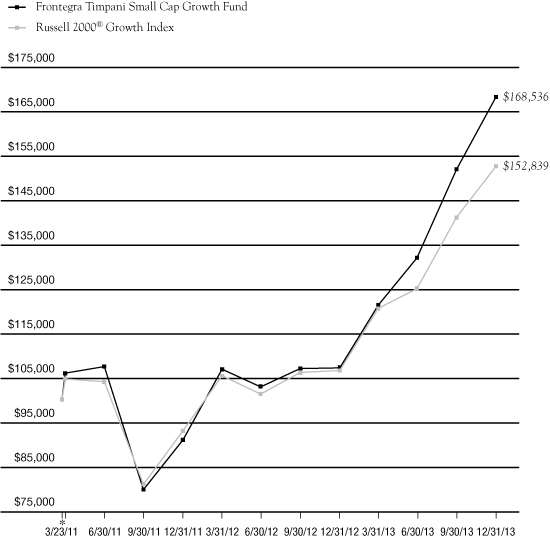
* 3/23/11 commencement of operations.
This chart assumes an initial gross investment of $100,000 made on 3/23/11. Returns shown include the reinvestment of all distributions. Past performance is not predictive of future results. Investment return and principal value will fluctuate so that shares, when redeemed, may be worth more or less than the original cost. In the absence of fee waivers, total return would be reduced. To receive current to the most recent month-end performance, please call 1-888-825-2100.
The Russell 2000® Growth Index measures the performance of the small-cap growth segment of the U.S. equity universe. The Index does not reflect investment management fees, brokerage commissions and other expenses associated with investing in equity securities. A direct investment in the index is not possible.
Timpani Capital Management LLC has contractually agreed through October 31, 2014 to waive its management fee and/or reimburse the Fund's operating expenses to the extent necessary to ensure that the Fund's total operating expenses (excluding taxes, interest, brokerage commissions, acquired fund fees and expenses and extraordinary expenses) do not exceed 1.10% of the Fund's average daily net assets. The expense ratios presented are based on the annualized expense ratios as reported in the Fund's current prospectus, which may differ from the expense ratios presented in the Fund's financial highlights.
** The returns shown do not reflect the deduction of taxes that a shareholder would pay on Fund distributions or the redemption of Fund shares.
Portfolio Total Return**
FOR PERIODS ENDED 12/31/13 | | FUND | | INDEX | |
SIX MONTHS | | | 27.49 | % | | | 22.02 | % | |
ONE YEAR | | | 57.07 | % | | | 43.30 | % | |
AVERAGE ANNUAL
SINCE INCEPTION | | | 20.69 | % | | | 16.52 | % | |
Fund Expenses | |
GROSS EXPENSE RATIO | | | 4.02 | % | |
NET EXPENSE RATIO | | | 1.10 | % | |
page 18

FRONTEGRA
NETOLS SMALL CAP VALUE FUND

REPORT FROM NETOLS ASSET MANAGEMENT, INC.
Dear Fellow Shareholders:
The Frontegra Netols Small Cap Value Fund strives to achieve capital appreciation by investing at least 80% of its assets in equity securities of small capitalization companies. The objective is relative to, and measured against, the Russell 2000® Value Index.
Performance Review
During the six month period ended December 31, 2013, the Frontegra Netols Small Cap Value Fund (Institutional Class) returned 19.02%, net of fees, compared to 17.60% for the Russell 2000 Value Index. For the year, the Fund returned 38.20%, net of fees, compared to 34.52% for the Index.
Portfolio Review
During the second half of 2013, investors focused on the strengthening domestic economy and the resulting impact on Federal Reserve Policy. Initially, concern over potential tapering drove bond yields higher and had a negative impact on emerging markets. However, incrementally positive economic news, improving employment trends, and the resolution of the government shut down resulted in a positive response in the equity markets when the Fed announced the plan to reduce current stimulus efforts. These factors led investors to more cyclical sectors, while making yield plays less attractive. As a result, sectors with potential for improved revenue growth including Materials, Health Care and Industrials outperformed, while more stable Consumer Staples and Utilities underperformed during the period.
Positive Contributions to Relative Performance in the Second Half of 2013:
• Stock selection in Energy and Financial sectors
• Overweight in Health Care and Industrial sectors
• Best performing stocks for the period: Zale, Capella Education, United Rentals, Willbros Group and Acuity Brands
Negative Contributions to Relative Performance in the Second Half of 2013:
• Stock selection in Consumer Discretionary and Industrial sectors
• Worst performing stocks for the period: Liquidity Services, Accuride, Intrepid Potash, Sun Communities and Kraton Performance Polymers
Portfolio Outlook
We believe the domestic economy is on a steadily improving growth path. As the employment outlook continues to improve, consumer confidence should strengthen and continue to boost economic activity. Improved business sentiment could result in higher levels of business investment and commercial construction, which have remained subdued to this point in the recovery. Additionally, Europe and Asia have exhibited signs of potential stabilization. These factors could be potentially additive to economic activity and provide another leg of economic growth.
Thank you for your continued support.
Jeff Netols
President
Netols Asset Management, Inc.
page 20

INVESTMENT HIGHLIGHTS
Growth of a $100,000 Investment (Unaudited)

* 12/16/05 commencement of operations.
This chart assumes an initial gross investment of $100,000 made on 12/16/05 (commencement of operations). Returns shown include the reinvestment of all distributions. Past performance is not predictive of future results. Investment return and principal value will fluctuate so that shares, when redeemed, may be worth more or less than the original cost. In the absence of existing fee waivers, total return would be reduced. To receive current to the most recent month-end performance, please call 1-888-825-2100.
The Russell 2000 Value Index measures the performance of those Russell 2000 companies with lower price-to-book ratios and lower forecasted growth values. The Index does not reflect investment management fees, brokerage commissions and other expenses associated with investing in equity securities. A direct investment in the index is not possible.
Frontegra Asset Management, Inc. has contractually agreed through October 31, 2014 to waive its management fee and/or reimburse the Fund's operating expenses to the extent necessary to ensure that the Fund's total operating expenses (excluding taxes, interest, brokerage commissions, acquired fund fees and expenses and extraordinary expenses) do not exceed 1.10% of the Fund's average daily net assets for the Institutional Class. The expense ratios presented are based on the annualized expense ratios as reported in the Fund's current prospectus, which may differ from the expense ratios presented in the Fund's financial highlights.
** The returns shown do not reflect the deduction of taxes that a shareholder would pay on Fund distributions or the redemption of Fund shares.
The above graph relates to Institutional Class shares of the Fund. Performance for Class Y shares will vary from the performance of the Institutional Class shares shown above due to differences in expenses.
Portfolio Total Return**
FOR PERIODS
ENDED 12/31/13 | | FUND | | INDEX | |
SIX MONTHS | | | 19.02 | % | | | 17.60 | % | |
ONE YEAR | | | 38.20 | % | | | 34.52 | % | |
FIVE YEAR
AVERAGE ANNUAL | | | 16.45 | % | | | 17.64 | % | |
AVERAGE ANNUAL
SINCE INCEPTION | | | 8.77 | % | | | 7.27 | % | |
Fund Expenses | |
GROSS EXPENSE RATIO | | | 1.19 | % | |
NET EXPENSE RATIO | | | 1.11 | % | |
page 21
This page intentionally left blank.

FRONTEGRA
PHOCAS SMALL CAP VALUE FUND

REPORT FROM PHOCAS FINANCIAL CORPORATION
Dear Fellow Shareholders:
The Frontegra Phocas Small Cap Value Fund strives to achieve capital appreciation by investing in a diversified portfolio of equity securities of companies with small market capitalizations. The objective is relative to, and measured against, the Russell 2000® Value Index.
Performance Review
During the six month period ended December 31, 2013, the Frontegra Phocas Small Cap Value Fund returned 24.23%, net of fees, compared to the 17.60% return of the benchmark, the Russell 2000 Value Index (the "Benchmark" or the "Index"). For the year, the Fund returned 45.63%, net of fees, compared to 34.52% for the Index.
Portfolio Review and Strategy
2013 was marked by continued economic improvement around the world, low interest rates, a lack of major traumatic events, and investors moving back into equities. Interestingly, while the rise in the U.S. stock market has received a lot of attention, nearly every asset class other than stock markets in advanced economies actually declined for the year. Interest rate sensitive investments such as bonds, REITs, preferred securities, and master limited partnerships all finished down from their levels at the beginning of 2013. Hedges against a recession, notably gold and silver but also commodities overall, were down sharply, and stock markets in emerging economies finished in the red as well.
For the third quarter, Energy was the Fund's top performing sector versus its Index peer. Many names were up attractively for the quarter. Gulfport, our largest weight within Energy, helped to drive a significant part of the Fund's outperformance for the quarter. Financials also delivered attractive relative performance thanks to all four subsectors: banks, real estate, insurance, and diversified. Within the banking group, Sterling Financial was acquired by Umpqua Bank at a nice premium. The banking group had some strong performances, especially from some of our larger names: Wilshire Bancorp, First Republic, and NewBridge Bancorp. Our best performer was American Equity Investment Life, a life insurance and annuity provider. Materials also added nicely, thanks to the acquisition of one of our positions, Boise. Health Care was also additive this quarter. This was driven by the performance of one of our largest weights within the sector, Viropharma, rumored to be in the midst of being acquired by a larger pharma company.
During the fourth quarter, Health Care was the top sector performer versus the Benchmark. Once again, we had many names that were up more than 30% for the quarter, led by a significant move by our best performer for the quarter, one of our Health Care picks, Viropharma, on its acquisition by Shire PLC. Also, our largest weight in the Fund and within the Industrial sector, Aceto, was up more than 60% for the quarter. The best performing sector for the portfolio, relative to the Benchmark, was Financials, thanks to performance in all four subsectors: banks, real estate, insurance, and diversified. Within the banking group, the best performer was Washington Banking Company, acquired by Heritage Financial. The group had some strong performers including Wilshire Bancorp, IBERIABANK, and SVB Financial Group. Within the insurance subsector, the best performer was also our largest position within the group, CNO Financial Group. Relative to the Benchmark, Industrials were a solid contributor for the quarter led by our largest position, Aceto Corp. However, Park-Ohio Holdings, Avis Budget Group, and Spirit Airlines also added to the group's overall return contribution. Information Technology was the third largest contributing sector. This was driven by the performance of three holdings within the sector: AOL, Euronet Worldwide, and Methode Electronics.
Viewing the coming year, the strong gains in the U.S. stock market in recent years have made finding attractive significantly undervalued stocks more difficult, but there are still values to be found. Safer areas like Consumer Staples, Health Care, and Utilities have become quite fully valued as cautious investors leave bonds and tiptoe back into equities. In our opinion, though, some of the more cyclical areas in the equity markets are still undervalued. They include homebuilding, autos, real estate, and retail. There are usually unrecognized
page 24

values in every sector, however, and our mission is to find them. In the Energy sector, we remain underweighted, having sold our largest position, Gulfport Energy, due to over-valuation. The recent large decline in E&P stocks in the fourth quarter gave us an opportunity to add an old name, Goodrich Petroleum. In Financials, we replaced over-priced positions like First Republic and Primerica with International Bancshares and Argo Group International Holdings. Across other sectors, we sold positions that had become overvalued and put the proceeds into companies in the same or other sectors. In Consumer Discretionary we sold Stage Stores, a struggling retailer, and replaced it with E.W. Scripps and American Axle. In Health Care, we sold Viropharma for Progenics Pharmaceutical. Within Utilities, we sold Aqua America and Atmos Energy for Chesapeake Utilities and IDACORP. We were underweighted in our real estate subsector in 2013, but we have been adding to our existing REIT positions. We also added a couple of new names, Hudson Pacific Properties and First Potomac Realty, to take advantage of their lagging performance in 2013. We remain underweight in Utilities, Energy, and Materials.
Thank you for your continued support.
William Schaff, CFA | | Steve Block, CFA | |
Chief Executive Officer and Portfolio Manager | | Portfolio Manager | |
Phocas Financial Corporation | | Phocas Financial Corporation | |
page 25

INVESTMENT HIGHLIGHTS
Growth of a $100,000 Investment (Unaudited)

* 9/29/06 commencement of operations.
This chart assumes an initial gross investment of $100,000 made on 9/29/06. Returns shown include the reinvestment of all distributions. Past performance is not predictive of future results. Investment return and principal value will fluctuate so that shares, when redeemed, may be worth more or less than the original cost. In the absence of fee waivers, total return would be reduced. Effective October 8, 2010, Phocas Financial Corp. ("Phocas") became subadviser to the Fund and Frontegra Asset Management, Inc. became adviser to the Fund. Prior to October 8, 2010, Phocas served as adviser to the Fund. To receive current to the most recent month-end performance, please call 1-888-825-2100.
The Russell 2000® Value Index measures the performance of those Russell 2000® companies with lower price-to-book ratios and lower forecasted growth values. The Index does not reflect investment management fees, brokerage commissions and other expenses associated with investing in equity securities. A direct investment in the index is not possible.
Frontegra Asset Management, Inc. has contractually agreed through October 31, 2014 to waive its management fee and/or reimburse the Fund's operating expenses to the extent necessary to ensure that the Fund's total operating expenses (excluding taxes, interest, brokerage commissions, acquired fund fees and expenses and extraordinary expenses) do not exceed 1.10% of the Fund's average daily net assets. The expense ratios presented are based on the annualized expense ratios as reported in the Fund's current prospectus, which may differ from the expense ratios presented in the Fund's financial highlights.
** The returns shown do not reflect the deduction of taxes that a shareholder would pay on Fund distributions or the redemption of Fund shares.
Portfolio Total Return**
FOR PERIODS ENDED 12/31/13 | | FUND | | INDEX | |
SIX MONTHS | | | 24.23 | % | | | 17.60 | % | |
ONE YEAR | | | 45.63 | % | | | 34.52 | % | |
FIVE YEAR
AVERAGE ANNUAL | | | 19.40 | % | | | 17.64 | % | |
AVERAGE ANNUAL
SINCE INCEPTION | | | 8.92 | % | | | 6.46 | % | |
Fund Expenses | |
GROSS EXPENSE RATIO | | | 2.62 | % | |
NET EXPENSE RATIO | | | 1.22 | % | |
page 26

Frontegra Funds
EXPENSE EXAMPLE
December 31, 2013 (Unaudited)
As a shareholder of a mutual fund, you incur two types of costs: (1) transaction costs, including redemption fees, and (2) ongoing costs, including management fees, distribution and/or service (12b-1) fees and other fund expenses. Although the Funds charge no sales loads, you will be assessed fees for outgoing wire transfers, returned checks and stop payment orders at prevailing rates charged by U.S. Bancorp Fund Services, LLC, the Funds' transfer agent. If you request that a redemption be made by wire transfer, currently the Funds' transfer agent charges a $15.00 fee. A redemption fee of 2.00% of the then current value of the shares redeemed may be imposed on certain redemptions of shares made within 30 days of purchase for the Frontegra RobecoSAM Global Equity, Frontegra MFG Global Equity and Frontegra MFG Core Infrastructure Funds.
This Example is intended to help you understand your ongoing costs (in dollars) of investing in the Funds and to compare these costs with the ongoing costs of investing in other mutual funds. The Example is based on an investment of $1,000 invested at the beginning of the period and held for the entire period (7/1/13 – 12/31/13).
Actual Expenses
The first line of the table on the following page for each Fund provides information about actual account values and actual expenses. The Example includes management fees, registration fees, fee waivers/reimbursements and other expenses. However, the Example does not include portfolio trading commissions and related expenses and other extraordinary expenses as determined under generally accepted accounting principles. You may use the information in this line, together with the amount you invested, to estimate the expenses that you paid over the period. Simply divide your account value by $1,000 (for example, an $8,600 account value divided by $1,000 = 8.6), then multiply the result by the number in the first line under the heading entitled "Expenses Paid During the Period" to estimate the expenses you paid on your account during this period.
Hypothetical Example for Comparison Purposes
The second line of the table for each Fund provides information about hypothetical account values and hypothetical expenses based on each of the Fund's actual expense ratios and an assumed rate of return of 5% per year before expenses, which is not the actual return. The hypothetical account values and expenses may not be used to estimate the actual ending account balance or expenses you paid for the period. You may use this information to compare the ongoing costs of investing in each of the Funds and other funds. To do so, compare this 5% hypothetical example with the 5% hypothetical examples that appear in the shareholder reports of the other funds.
Please note that the expenses shown in the table are meant to highlight your ongoing costs only and do not reflect any transactional costs, such as redemption fees. Therefore, the second line of the table is useful in comparing ongoing costs only, and will not help you determine the relative total costs of owning different funds. In addition, if these transactional costs were included, your costs could have been higher.
page 27

Frontegra Funds
EXPENSE EXAMPLE (continued)
December 31, 2013 (Unaudited)
| | Beginning Account
Value 7/1/2013 | | Ending Account
Value 12/31/2013 | | Annualized
Expense Ratio* | | Expenses Paid
During the Period* | |
RobecoSAM Global Equity Fund | |
Actual Fund Return | | $ | 1,000.00 | | | $ | 1,155.90 | | | | 1.20 | % | | $ | 6.52 | | |
Hypothetical 5% Return | | $ | 1,000.00 | | | $ | 1,019.16 | | | | 1.20 | % | | $ | 6.11 | | |
MFG Global Equity Fund | |
Actual Fund Return | | $ | 1,000.00 | | | $ | 1,127.40 | | | | 0.80 | % | | $ | 4.29 | | |
Hypothetical 5% Return | | $ | 1,000.00 | | | $ | 1,021.17 | | | | 0.80 | % | | $ | 4.08 | | |
MFG Core Infrastructure Fund | |
Actual Fund Return | | $ | 1,000.00 | | | $ | 1,082.20 | | | | 0.70 | % | | $ | 3.67 | | |
Hypothetical 5% Return | | $ | 1,000.00 | | | $ | 1,021.68 | | | | 0.70 | % | | $ | 3.57 | | |
Timpani Small Cap Growth Fund | |
Actual Fund Return | | $ | 1,000.00 | | | $ | 1,274.90 | | | | 1.10 | % | | $ | 6.31 | | |
Hypothetical 5% Return | | $ | 1,000.00 | | | $ | 1,019.66 | | | | 1.10 | % | | $ | 5.60 | | |
Netols Small Cap Value
Fund – Institutional Class | |
Actual Fund Return | | $ | 1,000.00 | | | $ | 1,190.20 | | | | 1.10 | % | | $ | 6.07 | | |
Hypothetical 5% Return | | $ | 1,000.00 | | | $ | 1,019.66 | | | | 1.10 | % | | $ | 5.60 | | |
Netols Small Cap Value
Fund – Class Y | |
Actual Fund Return | | $ | 1,000.00 | | | $ | 1,184.20 | | | | 1.50 | % | | $ | 8.26 | | |
Hypothetical 5% Return | | $ | 1,000.00 | | | $ | 1,017.64 | | | | 1.50 | % | | $ | 7.63 | | |
Phocas Small Cap Value Fund | |
Actual Fund Return | | $ | 1,000.00 | | | $ | 1,242.30 | | | | 1.10 | % | | $ | 6.22 | | |
Hypothetical 5% Return | | $ | 1,000.00 | | | $ | 1,019.66 | | | | 1.10 | % | | $ | 5.60 | | |
* Expenses are equal to each Fund's annualized expense ratio indicated above, multiplied by the average account value over the period, multiplied by 184/365 to reflect the one-half year period.
page 28

Frontegra RobecoSAM Global Equity Fund
SCHEDULE OF INVESTMENTS
December 31, 2013 (Unaudited)
Number of Shares | | | | Value | |
COMMON STOCKS 95.9% | | | |
| | | Australia 5.7% | |
| | 23,943 | | | AGL Energy Ltd. | | $ | 321,321 | | |
| | 8,638 | | | National Australia Bank Ltd. | | | 268,638 | | |
| | 7,084 | | | Westpac Banking Corp. | | | 204,813 | | |
| | 7,141 | | | Woodside Petroleum Ltd. | | | 248,033 | | |
| | | | 1,042,805 | | |
| | | France 4.2% | |
| | 12,376 | | | Total SA | | | 758,156 | | |
| | | Israel 1.2% | |
| | 16,178 | | | Mizrahi Tefahot Bank Ltd. | | | 211,730 | | |
| | | Italy 2.7% | |
| | 7,547 | | | Eni SpA | | | 181,589 | | |
| | 55,302 | | | Snam SpA | | | 309,338 | | |
| | | | 490,927 | | |
| | | Japan 7.5% | |
| | 22,000 | | | Chiyoda Corp. | | | 318,792 | | |
| | 24,300 | | | Inpex Corp. | | | 311,048 | | |
| | 13,800 | | | Keihin Corp. | | | 213,598 | | |
| | 36,000 | | | Marubeni Corp. | | | 258,437 | | |
| | 11,200 | | | Stanley Electric Co. Ltd. | | | 256,097 | | |
| | | | 1,357,972 | | |
| | | Netherlands 1.8% | |
| | 4,121 | | | Koninklijke DSM NV | | | 324,056 | | |
| | | Norway 2.6% | |
| | 21,148 | | | DNB ASA | | | 378,309 | | |
| | 4,253 | | | Statoil ASA | | | 103,077 | | |
| | | | 481,386 | | |
| | | Philippines 0.4% | |
| | 133,500 | | | Manila Water Co., Inc. | | | 66,175 | | |
| | | Sweden 1.0% | |
| | 3,672 | | | Svenska Handelsbanken AB -
Class A | | | 180,407 | | |
Number of Shares | | | | Value | |
| | | Switzerland 9.2% | |
| | 2,840 | | | Novartis AG | | $ | 226,678 | | |
| | 2,222 | | | Roche Holding AG | | | 620,730 | | |
| | 717 | | | Sulzer AG | | | 115,662 | | |
| | 934 | | | Swisscom AG | | | 493,045 | | |
| | 768 | | | Zurich Insurance Group AG | | | 222,552 | | |
| | | | 1,678,667 | | |
| | | United Kingdom 7.2% | |
| | 3,009 | | | AstraZeneca PLC | | | 178,109 | | |
| | 73,939 | | | Barclays PLC | | | 332,975 | | |
| | 65,796 | | | BT Group PLC | | | 413,377 | | |
| | 101,737 | | | Legal & General Group PLC | | | 375,188 | | |
| | | | 1,299,649 | | |
| | | United States 52.4% | |
| | 6,451 | | | Abbott Laboratories | | | 247,267 | | |
| | 11,451 | | | Cisco Systems, Inc. | | | 257,075 | | |
| | 4,145 | | | Colgate-Palmolive Co. | | | 270,295 | | |
| | 4,698 | | | E.I. du Pont de Nemours & Co. | | | 305,229 | | |
| | 3,628 | | | Emerson Electric Co. | | | 254,613 | | |
| | 1,252 | | | Fluor Corp. | | | 100,523 | | |
| | 14,618 | | | Hartford Financial Services
Group, Inc. | | | 529,610 | | |
| | 3,401 | | | Illinois Tool Works, Inc. | | | 285,956 | | |
| | 3,164 | | | International Business
Machines Corp. | | | 593,471 | | |
| | 4,110 | | | Kimberly-Clark Corp. | | | 429,331 | | |
| | 3,311 | | | Life Technologies Corp. (a) | | | 250,974 | | |
| | 4,157 | | | Limited Brands, Inc. | | | 257,110 | | |
| | 399 | | | MasterCard, Inc. - Class A | | | 333,349 | | |
| | 4,302 | | | McDonald's Corp. | | | 417,423 | | |
| | 12,189 | | | Microsoft Corp. | | | 456,234 | | |
| | 2,225 | | | National Oilwell Varco, Inc. | | | 176,954 | | |
| | 7,118 | | | Occidental Petroleum Corp. | | | 676,922 | | |
| | 6,332 | | | ONEOK, Inc. | | | 393,724 | | |
| | 10,529 | | | Oracle Corp. | | | 402,840 | | |
| | 1,417 | | | Parker-Hannifin Corp. | | | 182,283 | | |
| | 17,519 | | | Pfizer, Inc. | | | 536,607 | | |
The accompanying notes are an integral part of these financial statements.
page 29

Frontegra RobecoSAM Global Equity Fund
SCHEDULE OF INVESTMENTS (continued)
December 31, 2013 (Unaudited)
Number of Shares | | | | Value | |
| COMMON STOCKS 95.9% (continued) | | | |
| | | United States 52.4% (continued) | |
| | 10,049 | | | Reynolds American, Inc. | | $ | 502,349 | | |
| | 3,356 | | | SanDisk Corp. | | | 236,732 | | |
| | 8,420 | | | The Procter & Gamble Co. | | | 685,472 | | |
| | 3,126 | | | UnitedHealth Group, Inc. | | | 235,388 | | |
| | 7,982 | | | Wells Fargo & Co. | | | 362,383 | | |
| | 3,316 | | | Xylem, Inc. | | | 114,734 | | |
| | | | 9,494,848 | | |
| | | Total Common Stocks | |
| | | | | (Cost $12,780,877) | | | 17,386,778 | | |
PREFERRED STOCKS 2.9% | | | |
| | | Germany 2.9% | |
| | 2,591 | | | Henkel AG & Co. KGaA | | | 300,519 | | |
| | 804 | | | Volkswagen AG | | | 225,804 | | |
| | | | 526,323 | | |
| | | Total Preferred Stocks | |
| | | | | (Cost $315,499) | | | 526,323 | | |
SHORT-TERM INVESTMENTS 1.5% | | | |
| | | Investment Company 1.5% | |
| | 273,484 | | | STIT-STIC Prime Portfolio -
Institutional Class, 0.06% | | | 273,484 | | |
| | | Total Short-Term Investments | |
| | | | | (Cost $273,484) | | | 273,484 | | |
| | | Total Investments 100.3% | |
| | | | | (Cost $13,369,860) | | | 18,186,585 | | |
| | | | | Liabilities in Excess of
Other Assets (0.3)% | | | (57,307 | ) | |
| | | | | TOTAL NET ASSETS 100.0% | | $ | 18,129,278 | | |
(a) Non-Income Producing.
PORTFOLIO DIVERSIFICATION
Sectors | | Percentage | |
Financials | | | 16.9 | % | |
Energy | | | 13.4 | | |
Health Care | | | 12.7 | | |
Information Technology | | | 12.6 | | |
Consumer Staples | | | 12.1 | | |
Industrials | | | 9.0 | | |
Consumer Discretionary | | | 7.6 | | |
Utilities | | | 6.0 | | |
Telecommunication Services | | | 5.0 | | |
Materials | | | 3.5 | | |
Total Common and Preferred Stocks | | | 98.8 | | |
Total Short-Term Investments | | | 1.5 | | |
Total Investments | | | 100.3 | | |
Liabilities in Excess of Other Assets | | | (0.3 | ) | |
Total Net Assets | | | 100.0 | % | |
The accompanying notes are an integral part of these financial statements.
page 30

Frontegra MFG Global Equity Fund
SCHEDULE OF INVESTMENTS
December 31, 2013 (Unaudited)
Number of Shares | | | | Value | |
COMMON STOCKS 97.5% | | | |
| | | France 6.7% | |
| | 253,351 | | | Danone | | $ | 18,235,416 | | |
| | 225,494 | | | Sanofi | | | 23,923,645 | | |
| | | | 42,159,061 | | |
| | | Germany 2.0% | |
| | 96,251 | | | Adidas AG | | | 12,266,739 | | |
| | | Netherlands 1.2% | |
| | 192,964 | | | Unilever NV | | | 7,771,387 | | |
| | | Switzerland 6.7% | |
| | 385,508 | | | Nestle SA | | | 28,220,024 | | |
| | 180,257 | | | Novartis AG | | | 14,387,420 | | |
| | | | 42,607,444 | | |
| | | United Kingdom 5.7% | |
| | 202,242 | | | Diageo PLC | | | 6,698,086 | | |
| | 5,326,728 | | | Tesco PLC | | | 29,492,474 | | |
| | | | 36,190,560 | | |
| | | United States 75.2% | |
| | 193,193 | | | American Express Co. | | | 17,528,401 | | |
| | 414,693 | | | DIRECTV (a) | | | 28,651,139 | | |
| | 786,167 | | | eBay, Inc. (a) | | | 43,152,707 | | |
| | 23,510 | | | Google, Inc. - Class A (a) | | | 26,347,892 | | |
| | 113,358 | | | Johnson & Johnson | | | 10,382,459 | | |
| | 665,847 | | | Lowe's Companies, Inc. | | | 32,992,719 | | |
| | 25,446 | | | MasterCard, Inc. - Class A | | | 21,259,115 | | |
| | 123,386 | | | McDonald's Corp. | | | 11,972,144 | | |
| | 1,029,196 | | | Microsoft Corp. | | | 38,522,806 | | |
| | 1,007,561 | | | Oracle Corp. | | | 38,549,284 | | |
| | 166,522 | | | State Street Corp. | | | 12,221,050 | | |
| | 521,186 | | | Target Corp. | | | 32,975,438 | | |
| | 710,981 | | | The Bank of New York
Mellon Corp. | | | 24,841,676 | | |
| | 171,599 | | | The Coca-Cola Co. | | | 7,088,755 | | |
| | 472,425 | | | U.S. Bancorp | | | 19,085,970 | | |
| | 142,702 | | | Visa, Inc. - Class A | | | 31,776,881 | | |
| | 303,568 | | | Wal-Mart Stores, Inc. | | | 23,887,766 | | |
Number of Shares | | | | Value | |
| | | United States 75.2% (continued) | |
| | 587,670 | | | Wells Fargo & Co. | | $ | 26,680,218 | | |
| | 373,598 | | | Yum! Brands, Inc. | | | 28,247,745 | | |
| | | | 476,164,165 | | |
| | | Total Common Stocks | |
| | | | | (Cost $531,112,078) | | | 617,159,356 | | |
SHORT-TERM INVESTMENTS 2.2% | | | |
| | | Investment Company 2.2% | |
| | 14,018,266 | | | STIT Liquid Assets Portfolio -
Institutional Class, 0.07% | | | 14,018,266 | | |
| | | Total Short-Term Investments | |
| | | | | (Cost $14,018,266) | | | 14,018,266 | | |
| | | Total Investments 99.7% | |
| | | | | (Cost $545,130,344) | | | 631,177,622 | | |
| | | | | Other Assets in Excess of
Liabilities 0.3% | | | 1,973,101 | | |
| | | | | TOTAL NET ASSETS 100.0% | | $ | 633,150,723 | | |
(a) Non-Income Producing.
PORTFOLIO DIVERSIFICATION
Sectors | | Percentage | |
Information Technology | | | 31.5 | % | |
Consumer Discretionary | | | 23.2 | | |
Consumer Staples | | | 19.2 | | |
Financials | | | 15.9 | | |
Health Care | | | 7.7 | | |
Total Common Stocks | | | 97.5 | | |
Total Short-Term Investments | | | 2.2 | | |
Total Investments | | | 99.7 | | |
Other Assets in Excess of Liabilities | | | 0.3 | | |
Total Net Assets | | | 100.0 | % | |
The accompanying notes are an integral part of these financial statements.
page 31

Frontegra MFG Core Infrastructure Fund
SCHEDULE OF INVESTMENTS
December 31, 2013 (Unaudited)
Number of Shares | | | | Value | |
COMMON STOCKS 95.4% | | | |
| | | Australia 7.1% | |
| | 35,022 | | | APA Group | | $ | 187,626 | | |
| | 51,852 | | | DUET Group | | | 92,597 | | |
| | 75,280 | | | Envestra Ltd. | | | 76,628 | | |
| | 141,488 | | | SP AusNet | | | 157,286 | | |
| | 55,594 | | | Spark Infrastructure Group | | | 80,665 | | |
| | 91,971 | | | Sydney Airport | | | 312,058 | | |
| | 62,272 | | | Transurban Group | | | 380,321 | | |
| | | | 1,287,181 | | |
| | | Austria 0.4% | |
| | 878 | | | Flughafen Wien AG | | | 73,680 | | |
| | | Belgium 0.7% | |
| | 2,532 | | | Elia System Operator SA/NV | | | 117,387 | | |
| | | Canada 8.6% | |
| | 5,547 | | | Emera, Inc. | | | 159,635 | | |
| | 12,859 | | | Enbridge, Inc. | | | 561,813 | | |
| | 8,901 | | | Fortis, Inc. | | | 255,152 | | |
| | 11,977 | | | TransCanada Corp. | | | 547,294 | | |
| | 1,582 | | | Valener, Inc. | | | 22,682 | | |
| | | | 1,546,576 | | |
| | | France 6.7% | |
| | 4,133 | | | Aeroports de Paris | | | 469,078 | | |
| | 9,194 | | | Eutelsat Communications SA | | | 286,672 | | |
| | 14,101 | | | SES SA - ADR | | | 456,454 | | |
| | | | 1,212,204 | | |
| | | Germany 2.0% | |
| | 3,859 | | | Fraport AG Frankfurt Airport
Services Worldwide | | | 288,748 | | |
| | 3,042 | | | Hamburger Hafen und
Logistik AG | | | 74,408 | | |
| | | | 363,156 | | |
| | | Hong Kong 2.8% | |
| | 63,362 | | | Power Assets Holdings Ltd. | | | 503,755 | | |
Number of Shares | | | | Value | |
| | | Italy 8.8% | |
| | 24,594 | | | Atlantia SpA | | $ | 551,834 | | |
| | 100,077 | | | Snam SpA | | | 559,792 | | |
| | 5,474 | | | Societa Iniziative Autostradali
e Servizi SpA | | | 54,333 | | |
| | 84,049 | | | Terna Rete Elettrica
Nazionale SpA | | | 419,956 | | |
| | | | 1,585,915 | | |
| | | Mexico 2.7% | |
| | 14,220 | | | Grupo Aeroportuario del Centro
Norte SAB de CV | | | 47,649 | | |
| | 19,951 | | | Grupo Aeroportuario del Pacifico
SAB de CV - Class B | | | 106,658 | | |
| | 11,591 | | | Grupo Aeroportuario del Sureste
SAB de CV - Class B | | | 144,917 | | |
| | 72,476 | | | OHL Mexico SAB de CV (a) | | | 185,568 | | |
| | | | 484,792 | | |
| | | Netherlands 1.7% | |
| | 5,345 | | | Koninklijke Vopak NV | | | 312,656 | | |
| | | New Zealand 1.4% | |
| | 55,022 | | | Auckland International
Airport Ltd. | | | 159,733 | | |
| | 40,106 | | | Vector Ltd. | | | 84,767 | | |
| | | | 244,500 | | |
| | | Spain 6.6% | |
| | 25,035 | | | Abertis Infraestructuras SA | | | 556,218 | | |
| | 9,982 | | | Enagas SA | | | 260,845 | | |
| | 5,656 | | | Red Electrica Corp. SA | | | 377,378 | | |
| | | | 1,194,441 | | |
| | | Switzerland 0.8% | |
| | 256 | | | Flughafen Zuerich AG | | | 149,660 | | |
| | | United Kingdom 7.3% | |
| | 41,966 | | | National Grid PLC | | | 547,612 | | |
| | 15,436 | | | Pennon Group PLC | | | 168,322 | | |
The accompanying notes are an integral part of these financial statements.
page 32

Frontegra MFG Core Infrastructure Fund
SCHEDULE OF INVESTMENTS (continued)
December 31, 2013 (Unaudited)
Number of Shares | | | | Value | |
| COMMON STOCKS 95.4% (continued) | | | |
| | | United Kingdom 7.3% (continued) | |
| | 9,955 | | | Severn Trent PLC | | $ | 281,070 | | |
| | 28,410 | | | United Utilities Group PLC | | | 315,912 | | |
| | | | 1,312,916 | | |
| | | United States 37.8% | |
| | 965 | | | ALLETE, Inc. | | | 48,134 | | |
| | 2,743 | | | Alliant Energy Corp. | | | 141,539 | | |
| | 5,748 | | | Ameren Corp. | | | 207,848 | | |
| | 8,760 | | | American Electric Power Co., Inc. | | | 409,442 | | |
| | 957 | | | American States Water Co. | | | 27,495 | | |
| | 4,408 | | | American Water Works Co., Inc. | | | 186,282 | | |
| | 4,369 | | | Aqua America, Inc. | | | 103,065 | | |
| | 2,248 | | | Atmos Energy Corp. | | | 102,104 | | |
| | 1,422 | | | Avista Corp. | | | 40,086 | | |
| | 1,180 | | | California Water Service Group | | | 27,223 | | |
| | 10,154 | | | CenterPoint Energy, Inc. | | | 235,370 | | |
| | 1,432 | | | Cleco Corp. | | | 66,760 | | |
| | 6,327 | | | CMS Energy Corp. | | | 169,374 | | |
| | 7,243 | | | Consolidated Edison, Inc. | | | 400,393 | | |
| | 4,189 | | | DTE Energy Co. | | | 278,108 | | |
| | 5,888 | | | Duke Energy Corp. | | | 406,331 | | |
| | 953 | | | El Paso Electric Co. | | | 33,460 | | |
| | 3,644 | | | Great Plains Energy, Inc. | | | 88,331 | | |
| | 1,190 | | | IDACORP, Inc. | | | 61,690 | | |
| | 1,890 | | | Integrys Energy Group, Inc. | | | 102,835 | | |
| | 1,297 | | | ITC Holdings Corp. | | | 124,279 | | |
| | 547 | | | MGE Energy, Inc. | | | 31,671 | | |
| | 7,422 | | | NiSource, Inc. | | | 244,035 | | |
| | 7,465 | | | Northeast Utilities | | | 316,441 | | |
| | 667 | | | Northwest Natural Gas Co. | | | 28,561 | | |
| | 911 | | | NorthWestern Corp. | | | 39,464 | | |
| | 5,916 | | | Pepco Holdings, Inc. | | | 113,173 | | |
| | 10,690 | | | PG&E Corp. | | | 430,593 | | |
| | 1,877 | | | Piedmont Natural Gas Co., Inc. | | | 62,241 | | |
| | 2,607 | | | Pinnacle West Capital Corp. | | | 137,962 | | |
| | 1,887 | | | PNM Resources, Inc. | | | 45,514 | | |
Number of Shares | | | | Value | |
| | | United States 37.8% (continued) | |
| | 1,849 | | | Portland General Electric Co. | | $ | 55,840 | | |
| | 4,329 | | | Questar Corp. | | | 99,524 | | |
| | 3,330 | | | SCANA Corp. | | | 156,277 | | |
| | 4,862 | | | Sempra Energy | | | 436,413 | | |
| | 263 | | | SJW Corp. | | | 7,835 | | |
| | 1,146 | | | Southwest Gas Corp. | | | 64,073 | | |
| | 5,147 | | | TECO Energy, Inc. | | | 88,734 | | |
| | 1,062 | | | The Empire District Electric Co. | | | 24,097 | | |
| | 808 | | | The Laclede Group, Inc. | | | 36,796 | | |
| | 10,135 | | | The Southern Co. | | | 416,650 | | |
| | 1,396 | | | UIL Holdings Corp. | | | 54,095 | | |
| | 984 | | | UNS Energy Corp. | | | 58,892 | | |
| | 1,950 | | | Vectren Corp. | | | 69,225 | | |
| | 3,011 | | | Westar Energy, Inc. | | | 96,864 | | |
| | 2,294 | | | Wisconsin Energy Corp. | | | 94,834 | | |
| | 11,785 | | | Xcel Energy, Inc. | | | 329,273 | | |
| | | | 6,799,226 | | |
| | | Total Common Stocks | |
| | | | | (Cost $16,365,985) | | | 17,188,045 | | |
CLOSED-END FUNDS 1.0% | | | |
| | | United Kingdom 1.0% | |
| | 49,451 | | | HICL Infrastructure Co. Ltd. | | | 110,141 | | |
| | 31,691 | | | International Public
Partnerships Ltd. | | | 66,963 | | |
| | | | 177,104 | | |
| | | Total Closed-End Funds | |
| | | | | (Cost $164,009) | | | 177,104 | | |
CONTINGENT VALUE RIGHTS 0.0% | | | |
| | | Italy 0.0% | |
| | 6,838 | | | Atlantia SpA (a) | | | 689 | | |
| | | Total Contingent Value Rights | |
| | | | | (Cost $0) | | | 689 | | |
The accompanying notes are an integral part of these financial statements.
page 33

Frontegra MFG Core Infrastructure Fund
SCHEDULE OF INVESTMENTS (continued)
December 31, 2013 (Unaudited)
Number of Shares | | | | Value | |
SHORT-TERM INVESTMENTS 3.0% | |
| | | Investment Company 3.0% | |
| | 537,725 | | | STIT Liquid Assets Portfolio -
Institutional Class, 0.07% | | $ | 537,725 | | |
| | | Total Short-Term Investments | |
| | | (Cost $537,725) | | | 537,725 | | |
| | | Total Investments 99.4% | |
| | | (Cost $17,067,719) | | | 17,903,563 | | |
| | | Other Assets in Excess of
Liabilities 0.6% | | | 108,980 | | |
| | | TOTAL NET ASSETS 100.0% | | $ | 18,012,543 | | |
(a) Non-Income Producing.
ADR - American Depositary Receipt
PORTFOLIO DIVERSIFICATION
Sectors | | Percentage | |
Integrated Power | | | 28.1 | % | |
Transmission & Distribution | | | 18.8 | | |
Gas Utilities | | | 16.7 | | |
Airports | | | 9.7 | | |
Toll Roads | | | 9.6 | | |
Water Utilities | | | 6.2 | | |
Communications | | | 4.1 | | |
Ports | | | 2.2 | | |
Total Common Stocks and Contingent Value Rights | | | 95.4 | | |
Social | | | 1.0 | | |
Total Closed-End Funds | | | 1.0 | | |
Total Short-Term Investments | | | 3.0 | | |
Total Investments | | | 99.4 | | |
Other Assets in Excess of Liabilities | | | 0.6 | | |
Total Net Assets | | | 100.0 | % | |
The accompanying notes are an integral part of these financial statements.
page 34

Frontegra Timpani Small Cap Growth Fund
SCHEDULE OF INVESTMENTS
December 31, 2013 (Unaudited)
Number of Shares | | | | Value | |
COMMON STOCKS 97.5% | | | |
| | | Consumer Discretionary 22.8% | |
| | 352 | | | Buffalo Wild Wings, Inc. (a) | | $ | 51,814 | | |
| | 1,595 | | | Capella Education Co. | | | 105,972 | | |
| | 2,567 | | | Conn's, Inc. (a) | | | 202,254 | | |
| | 426 | | | DSW, Inc. - Class A | | | 18,203 | | |
| | 1,233 | | | Fiesta Restaurant Group, Inc. (a) | | | 64,412 | | |
| | 2,945 | | | Fifth & Pacific Companies, Inc. (a) | | | 94,446 | | |
| | 1,588 | | | Five Below, Inc. (a) | | | 68,602 | | |
| | 3,759 | | | Grand Canyon Education, Inc. (a) | | | 163,892 | | |
| | 538 | | | Jack In the Box, Inc. (a) | | | 26,911 | | |
| | 1,623 | | | Kona Grill, Inc. (a) | | | 30,058 | | |
| | 1,649 | | | Lithia Motors, Inc. - Class A | | | 114,473 | | |
| | 2,013 | | | Monro Muffler Brake, Inc. | | | 113,453 | | |
| | 5,656 | | | Motorcar Parts of America, Inc. (a) | | | 109,161 | | |
| | 3,941 | | | Multimedia Games Holdings
Co., Inc. (a) | | | 123,590 | | |
| | 1,725 | | | Nautilus, Inc. (a) | | | 14,542 | | |
| | 2,412 | | | Pandora Media, Inc. (a) | | | 64,159 | | |
| | 2,331 | | | Penske Automotive Group, Inc. | | | 109,930 | | |
| | 826 | | | Red Robin Gourmet Burgers,
Inc. (a) | | | 60,744 | | |
| | 697 | | | Shutterstock, Inc. (a) | | | 58,290 | | |
| | 1,849 | | | Tuesday Morning Corp. (a) | | | 29,510 | | |
| | | | 1,624,416 | | |
| | | Consumer Staples 0.5% | |
| | 2,443 | | | Inventure Foods, Inc. (a) | | | 32,394 | | |
| | | Energy 10.7% | |
| | 16,229 | | | American Eagle Energy Corp. (a) | | | 33,270 | | |
| | 2,732 | | | Diamondback Energy, Inc. (a) | | | 144,414 | | |
| | 600 | | | Dril-Quip, Inc. (a) | | | 65,958 | | |
| | 1,519 | | | EPL Oil & Gas, Inc. (a) | | | 43,291 | | |
| | 2,682 | | | Oasis Petroleum, Inc. (a) | | | 125,974 | | |
| | 9,950 | | | PowerSecure International, Inc. (a) | | | 170,841 | | |
| | 3,577 | | | Sanchez Energy Corp. (a) | | | 87,672 | | |
| | 9,608 | | | Synergy Resources Corp. (a) | | | 88,970 | | |
| | | | 760,390 | | |
Number of Shares | | | | Value | |
| | | Financial Services 3.9% | |
| | 2,267 | | | HCI Group, Inc. | | $ | 121,285 | | |
| | 4,792 | | | Tree.com, Inc. (a) | | | 157,369 | | |
| | | | 278,654 | | |
| | | Health Care 23.2% | |
| | 2,085 | | | Acadia Healthcare Company,
Inc. (a) | | | 98,683 | | |
| | 585 | | | Addus HomeCare Corp. (a) | | | 13,133 | | |
| | 1,013 | | | Air Methods Corp. (a) | | | 59,088 | | |
| | 9,776 | | | BioDelivery Sciences
International, Inc. (a) | | | 57,581 | | |
| | 6,604 | | | Cancer Genetics, Inc. (a) | | | 91,003 | | |
| | 3,826 | | | Cardiovascular Systems, Inc. (a) | | | 131,193 | | |
| | 6,361 | | | Horizon Pharma, Inc. (a) | | | 48,471 | | |
| | 1,093 | | | Jazz Pharmaceuticals PLC (a) | | | 138,330 | | |
| | 6,370 | | | Lannett Co., Inc. (a) | | | 210,847 | | |
| | 3,558 | | | Ligand Pharmaceuticals, Inc. -
Class B (a) | | | 187,151 | | |
| | 1,194 | | | Medidata Solutions, Inc. (a) | | | 72,321 | | |
| | 9,272 | | | Novadaq Technologies, Inc. (a) | | | 152,895 | | |
| | 6,878 | | | Repligen Corp. (a) | | | 93,816 | | |
| | 5,057 | | | Sagent Pharmaceuticals, Inc. (a) | | | 128,347 | | |
| | 1,803 | | | Team Health Holdings, Inc. (a) | | | 82,127 | | |
| | 9,521 | | | TearLab Corp. (a) | | | 88,926 | | |
| | | | 1,653,912 | | |
| | | Materials & Processing 0.4% | |
| | 1,750 | | | Stock Building Supply Holdings,
Inc. (a) | | | 31,885 | | |
| | | Producer Durables 13.9% | |
| | 560 | | | Allegiant Travel Co. | | | 59,047 | | |
| | 904 | | | Barrett Business Services, Inc. | | | 83,837 | | |
| | 587 | | | Benefitfocus, Inc. (a) | | | 33,893 | | |
| | 534 | | | Bristow Group, Inc. | | | 40,082 | | |
| | 814 | | | CoStar Group, Inc. (a) | | | 150,248 | | |
| | 875 | | | MAXIMUS, Inc. | | | 38,491 | | |
| | 528 | | | Old Dominion Freight Line, Inc. (a) | | | 27,995 | | |
The accompanying notes are an integral part of these financial statements.
page 35

Frontegra Timpani Small Cap Growth Fund
SCHEDULE OF INVESTMENTS (continued)
December 31, 2013 (Unaudited)
Number of Shares | | | | Value | |
| COMMON STOCKS 97.5% (continued) | | | |
| | | Producer Durables 13.9% (continued) | |
| | 932 | | | On Assignment, Inc. (a) | | $ | 32,546 | | |
| | 349 | | | Power Solutions International,
Inc. (a) | | | 26,210 | | |
| | 1,389 | | | Proto Labs, Inc. (a) | | | 98,869 | | |
| | 2,280 | | | Scorpio Tankers, Inc. | | | 26,881 | | |
| | 284 | | | The Middleby Corp. (a) | | | 68,151 | | |
| | 363 | | | TransDigm Group, Inc. | | | 58,450 | | |
| | 4,143 | | | WageWorks, Inc. (a) | | | 246,260 | | |
| | | | 990,960 | | |
| | | Technology 22.1% | |
| | 925 | | | Acxiom Corp. (a) | | | 34,206 | | |
| | 6,927 | | | AudioCodes Ltd. (a) | | | 49,389 | | |
| | 8,315 | | | Callidus Software, Inc. (a) | | | 114,165 | | |
| | 3,172 | | | Carbonite, Inc. (a) | | | 37,525 | | |
| | 1,694 | | | ChannelAdvisor Corp. (a) | | | 70,657 | | |
| | 2,312 | | | Ciena Corp. (a) | | | 55,326 | | |
| | 875 | | | CommVault Systems, Inc. (a) | | | 65,520 | | |
| | 1,638 | | | Dealertrack Technologies, Inc. (a) | | | 78,755 | | |
| | 687 | | | Fleetmatics Group PLC (a) | | | 29,713 | | |
| | 1,319 | | | Gogo, Inc. (a) | | | 32,724 | | |
| | 788 | | | Guidewire Software, Inc. (a) | | | 38,667 | | |
| | 1,743 | | | inContact, Inc. (a) | | | 13,613 | | |
| | 7,463 | | | LifeLock, Inc. (a) | | | 122,468 | | |
| | 11,900 | | | MaxLinear, Inc. - Class A (a) | | | 124,117 | | |
| | 926 | | | Methode Electronics, Inc. | | | 31,660 | | |
| | 2,427 | | | NeoPhotonics Corp. (a) | | | 17,135 | | |
| | 4,032 | | | Perficient, Inc. (a) | | | 94,429 | | |
| | 2,406 | | | PROS Holdings, Inc. (a) | | | 95,999 | | |
| | 4,183 | | | Responsys, Inc. (a) | | | 114,656 | | |
| | 4,743 | | | Super Micro Computer, Inc. (a) | | | 81,390 | | |
| | 1,490 | | | Tyler Technologies, Inc. (a) | | | 152,174 | | |
| | 2,707 | | | Ubiquiti Networks, Inc. (a) | | | 124,414 | | |
| | | | 1,578,702 | | |
| | | Total Common Stocks | |
| | | | | (Cost $4,868,216) | | | 6,951,313 | | |
Number of Shares | | | | Value | |
WARRANTS 0.0% | |
| | | Technology 0.0% | |
| | 532 | | | xG Technology, Inc. (a) | | $ | 255 | | |
| | | Total Warrants | |
| | | (Cost $5) | | | 255 | | |
SHORT-TERM INVESTMENTS 5.4% | |
| | | Investment Company 5.4% | |
| | 385,913 | | | STIT-STIC Prime Portfolio -
Institutional Class, 0.06% | | | 385,913 | | |
| | | Total Short-Term Investments | |
| | | (Cost $385,913) | | | 385,913 | | |
| | | Total Investments 102.9% | |
| | | (Cost $5,254,134) | | | 7,337,481 | | |
| | | Liabilities in Excess of
Other Assets (2.9)% | | | (208,600 | ) | |
| | | TOTAL NET ASSETS 100.0% | | $ | 7,128,881 | | |
(a) Non-Income Producing.
PORTFOLIO DIVERSIFICATION
Sectors | | Percentage | |
Health Care | | | 23.2 | % | |
Consumer Discretionary | | | 22.8 | | |
Technology | | | 22.1 | | |
Producer Durables | | | 13.9 | | |
Energy | | | 10.7 | | |
Financial Services | | | 3.9 | | |
Consumer Staples | | | 0.5 | | |
Materials and Processing | | | 0.4 | | |
Total Common Stocks and Warrants | | | 97.5 | | |
Total Short-Term Investments | | | 5.4 | | |
Total Investments | | | 102.9 | | |
Liabilities in Excess of Other Assets | | | (2.9 | ) | |
Total Net Assets | | | 100.0 | % | |
The accompanying notes are an integral part of these financial statements.
page 36

Frontegra Netols Small Cap Value Fund
SCHEDULE OF INVESTMENTS
December 31, 2013 (Unaudited)
Number of Shares | | | | Value | |
COMMON STOCKS 98.5% | | | |
| | | Consumer Discretionary 17.5% | |
| | 236,121 | | | Accuride Corp. (a) | | $ | 880,732 | | |
| | 46,272 | | | ANN, Inc. (a) | | | 1,691,704 | | |
| | 31,435 | | | Cabela's, Inc. (a) | | | 2,095,457 | | |
| | 33,728 | | | Capella Education Co. | | | 2,240,889 | | |
| | 20,294 | | | Carter's, Inc. | | | 1,456,906 | | |
| | 39,358 | | | DeVry, Inc. | | | 1,397,209 | | |
| | 29,151 | | | Domino's Pizza, Inc. | | | 2,030,367 | | |
| | 55,322 | | | Ethan Allen Interiors, Inc. | | | 1,682,895 | | |
| | 29,744 | | | Tenneco, Inc. (a) | | | 1,682,618 | | |
| | 30,397 | | | The Cheesecake Factory, Inc. | | | 1,467,263 | | |
| | 165,299 | | | Zale Corp. (a) | | | 2,606,765 | | |
| | | | 19,232,805 | | |
| | | Consumer Staples 5.7% | |
| | 109,765 | | | Boulder Brands, Inc. (a) | | | 1,740,873 | | |
| | 22,029 | | | Casey's General Stores, Inc. | | | 1,547,537 | | |
| | 190,170 | | | SUPERVALU, Inc. (a) | | | 1,386,340 | | |
| | 22,647 | | | TreeHouse Foods, Inc. (a) | | | 1,560,831 | | |
| | | | 6,235,581 | | |
| | | Energy 3.6% | |
| | 51,422 | | | Bill Barrett Corp. (a) | | | 1,377,081 | | |
| | 42,704 | | | Superior Energy Services, Inc. (a) | | | 1,136,353 | | |
| | 155,968 | | | Willbros Group, Inc. (a) | | | 1,469,219 | | |
| | | | 3,982,653 | | |
| | | Financials 19.5% | |
| | 65,998 | | | BancorpSouth, Inc. | | | 1,677,669 | | |
| | 39,536 | | | Cedar Fair LP | | | 1,960,195 | | |
| | 36,199 | | | Community Bank System, Inc. | | | 1,436,376 | | |
| | 31,672 | | | Endurance Specialty
Holdings Ltd. | | | 1,858,196 | | |
| | 61,535 | | | Glacier Bancorp, Inc. | | | 1,833,128 | | |
| | 277,960 | | | MGIC Investment Corp. (a) | | | 2,345,982 | | |
| | 88,072 | | | Old National Bancorp | | | 1,353,667 | | |
| | 52,614 | | | PHH Corp. (a) | | | 1,281,151 | | |
| | 20,843 | | | Prosperity Bancshares, Inc. | | | 1,321,238 | | |
| | 66,641 | | | Selective Insurance Group, Inc. | | | 1,803,306 | | |
Number of Shares | | | | Value | |
| | | Financials 19.5% (continued) | |
| | 32,369 | | | The Hanover Insurance
Group, Inc. | | $ | 1,932,753 | | |
| | 30,209 | | | Walter Investment
Management Corp. (a) | | | 1,068,190 | | |
| | 48,852 | | | Webster Financial Corp. | | | 1,523,205 | | |
| | | | 21,395,056 | | |
| | | Health Care 9.8% | |
| | 38,419 | | | Acadia Healthcare
Company, Inc. (a) | | | 1,818,371 | | |
| | 24,060 | | | Haemonetics Corp. (a) | | | 1,013,648 | | |
| | 29,810 | | | Integra LifeSciences
Holdings Corp. (a) | | | 1,422,235 | | |
| | 84,735 | | | Invacare Corp. | | | 1,966,699 | | |
| | 20,986 | | | LifePoint Hospitals, Inc. (a) | | | 1,108,900 | | |
| | 11,457 | | | Magellan Health
Services, Inc. (a) | | | 686,389 | | |
| | 40,242 | | | U.S. Physical Therapy, Inc. | | | 1,418,933 | | |
| | 44,750 | | | VCA Antech, Inc. (a) | | | 1,403,360 | | |
| | | | 10,838,535 | | |
| | | Industrials 16.3% | |
| | 39,017 | | | Actuant Corp. - Class A | | | 1,429,583 | | |
| | 142,114 | | | Commercial Vehicle
Group, Inc. (a) | | | 1,033,169 | | |
| | 12,198 | | | Genesee & Wyoming, Inc. (a) | | | 1,171,618 | | |
| | 47,785 | | | Herman Miller, Inc. | | | 1,410,613 | | |
| | 152,226 | | | PGT, Inc. (a) | | | 1,540,527 | | |
| | 50,112 | | | Thermon Group
Holdings, Inc. (a) | | | 1,369,561 | | |
| | 77,005 | | | Titan International, Inc. | | | 1,384,550 | | |
| | 51,408 | | | TriMas Corp. (a) | | | 2,050,665 | | |
| | 32,863 | | | United Rentals, Inc. (a) | | | 2,561,671 | | |
| | 27,357 | | | United Stationers, Inc. (a) | | | 1,255,413 | | |
| | 37,168 | | | Westinghouse Air Brake
Technologies Corp. | | | 2,760,467 | | |
| | | | 17,967,837 | | |
The accompanying notes are an integral part of these financial statements.
page 37

Frontegra Netols Small Cap Value Fund
SCHEDULE OF INVESTMENTS (continued)
December 31, 2013 (Unaudited)
Number of Shares | | | | Value | |
| COMMON STOCKS 98.5% (continued) | | | |
| | | Information Technology 12.6% | |
| | 114,618 | | | Checkpoint Systems, Inc. (a) | | $ | 1,807,526 | | |
| | 108,020 | | | Entegris, Inc. (a) | | | 1,253,032 | | |
| | 38,424 | | | Fair Isaac Corp. | | | 2,414,564 | | |
| | 82,758 | | | Fairchild Semiconductor
International, Inc. (a) | | | 1,104,819 | | |
| | 49,534 | | | Monotype Imaging Holdings, Inc. | | | 1,578,153 | | |
| | 32,008 | | | Plexus Corp. (a) | | | 1,385,626 | | |
| | 106,473 | | | Polycom, Inc. (a) | | | 1,195,692 | | |
| | 51,709 | | | Progress Software Corp. (a) | | | 1,335,644 | | |
| | 66,700 | | | VeriFone Systems, Inc. (a) | | | 1,788,894 | | |
| | | | 13,863,950 | | |
| | | Materials 7.3% | |
| | 16,449 | | | Acuity Brands, Inc. | | | 1,798,205 | | |
| | 21,905 | | | Carpenter Technology Corp. | | | 1,362,491 | | |
| | 12,683 | | | Compass Minerals
International, Inc. | | | 1,015,274 | | |
| | 67,713 | | | Intrepid Potash, Inc. (a) | | | 1,072,574 | | |
| | 29,344 | | | Sensient Technologies Corp. | | | 1,423,771 | | |
| | 49,513 | | | Unifi, Inc. (a) | | | 1,348,734 | | |
| | | | 8,021,049 | | |
| | | Real Estate Investment Trusts 5.3% | |
| | 223,651 | | | FelCor Lodging Trust, Inc. (a) | | | 1,824,992 | | |
| | 89,619 | | | First Industrial Realty Trust, Inc. | | | 1,563,852 | | |
| | 17,294 | | | National Health Investors, Inc. | | | 970,193 | | |
| | 33,654 | | | Sun Communities, Inc. | | | 1,435,007 | | |
| | | | 5,794,044 | | |
| | | Utilities 0.9% | |
| | 42,620 | | | The Empire District Electric Co. | | | 967,048 | | |
| | | Total Common Stocks | |
| | | | | (Cost $60,147,529) | | | 108,298,558 | | |
Number of Shares | | | | Value | |
SHORT-TERM INVESTMENTS 1.5% | |
| | | Investment Company 1.5% | |
| | 1,621,984 | | | Fidelity Institutional Money
Market Portfolio, 0.01% | | $ | 1,621,984 | | |
| | | Total Short-Term Investments | |
| | | (Cost $1,621,984) | | | 1,621,984 | | |
| | | Total Investments 100.0% | |
| | | (Cost $61,769,513) | | | 109,920,542 | | |
| | | Liabilities in Excess of
Other Assets 0.0% | | | (30,593 | ) | |
| | | TOTAL NET ASSETS 100.0% | | $ | 109,889,949 | | |
(a) Non-Income Producing.
PORTFOLIO DIVERSIFICATION
Sectors | | Percentage | |
Financials | | | 19.5 | % | |
Consumer Discretionary | | | 17.5 | | |
Industrials | | | 16.3 | | |
Information Technology | | | 12.6 | | |
Health Care | | | 9.8 | | |
Materials | | | 7.3 | | |
Consumer Staples | | | 5.7 | | |
Real Estate Investment Trusts | | | 5.3 | | |
Energy | | | 3.6 | | |
Utilities | | | 0.9 | | |
Total Common Stocks | | | 98.5 | | |
Total Short-Term Investments | | | 1.5 | | |
Total Investments | | | 100.0 | | |
Liabilities in Excess of Other Assets | | | 0.0 | | |
Total Net Assets | | | 100.0 | % | |
The accompanying notes are an integral part of these financial statements.
page 38

Frontegra Phocas Small Cap Value Fund
SCHEDULE OF INVESTMENTS
December 31, 2013 (Unaudited)
Number of Shares | | | | Value | |
COMMON STOCKS 99.0% | | | |
| | | Consumer Discretionary 12.6% | |
| | 6,249 | | | American Axle & Manufacturing
Holdings, Inc. (a) | | $ | 127,792 | | |
| | 1,557 | | | Bob Evans Farms, Inc. | | | 78,769 | | |
| | 762 | | | Cracker Barrel Old Country
Store, Inc. | | | 83,873 | | |
| | 4,926 | | | Dana Holding Corp. | | | 96,648 | | |
| | 1,790 | | | Deckers Outdoor Corp. (a) | | | 151,183 | | |
| | 1,974 | | | Destination Maternity Corp. | | | 58,983 | | |
| | 3,240 | | | DeVry, Inc. | | | 115,020 | | |
| | 992 | | | Group 1 Automotive, Inc. | | | 70,452 | | |
| | 1,976 | | | Lamar Advertising Co. -
Class A (a) | | | 103,246 | | |
| | 1,468 | | | Meredith Corp. | | | 76,042 | | |
| | 1,454 | | | Outerwall, Inc. (a) | | | 97,811 | | |
| | 4,926 | | | Pier 1 Imports, Inc. | | | 113,692 | | |
| | 13,173 | | | Scientific Games Corp. -
Class A (a) | | | 223,019 | | |
| | 2,435 | | | Steiner Leisure Ltd. (a) | | | 119,778 | | |
| | 3,146 | | | The E.W. Scripps Co. (a) | | | 68,331 | | |
| | | | 1,584,639 | | |
| | | Consumer Staples 3.3% | |
| | 1,642 | | | CST Brands, Inc. | | | 60,294 | | |
| | 5,037 | | | Darling International, Inc. (a) | | | 105,172 | | |
| | 1,778 | | | Post Holdings, Inc. (a) | | | 87,602 | | |
| | 830 | | | TreeHouse Foods, Inc. (a) | | | 57,204 | | |
| | 1,410 | | | USANA Health Sciences, Inc. (a) | | | 106,568 | | |
| | | | 416,840 | | |
| | | Energy 6.2% | |
| | 3,101 | | | Carrizo Oil & Gas, Inc. (a) | | | 138,832 | | |
| | 7,389 | | | Comstock Resources, Inc. | | | 135,145 | | |
| | 3,802 | | | Goodrich Petroleum Corp. (a) | | | 64,710 | | |
| | 11,219 | | | Kodiak Oil & Gas Corp. (a) | | | 125,765 | | |
| | 1,276 | | | PDC Energy, Inc. (a) | | | 67,909 | | |
Number of Shares | | | | Value | |
| | | Energy 6.2% (continued) | |
| | 6,492 | | | Rex Energy Corp. (a) | | $ | 127,957 | | |
| | 2,440 | | | Rosetta Resources, Inc. (a) | | | 117,218 | | |
| | | | 777,536 | | |
| | | Financials 24.7% | |
| | 5,951 | | | American Equity Investment Life
Holding Co. | | | 156,987 | | |
| | 4,920 | | | Ameris Bancorp (a) | | | 103,861 | | |
| | 1,375 | | | Argo Group International
Holdings Ltd. | | | 63,924 | | |
| | 5,821 | | | Banco Latinoamericano de
Comercio Exterior S.A. | | | 163,104 | | |
| | 3,210 | | | Banner Corp. | | | 143,872 | | |
| | 15,677 | | | CNO Financial Group, Inc. | | | 277,326 | | |
| | 11,279 | | | Heritage Commerce Corp. | | | 92,939 | | |
| | 1,411 | | | IBERIABANK Corp. | | | 88,681 | | |
| | 13,525 | | | ICG Group, Inc. (a) | | | 251,971 | | |
| | 4,752 | | | International Bancshares Corp. | | | 125,405 | | |
| | 9,423 | | | National Penn Bancshares, Inc. | | | 106,763 | | |
| | 2,066 | | | Nelnet, Inc. - Class A | | | 87,061 | | |
| | 16,991 | | | NewBridge Bancorp (a) | | | 127,433 | | |
| | 3,145 | | | Protective Life Corp. | | | 159,326 | | |
| | 6,119 | | | State Bank Financial Corp. | | | 111,305 | | |
| | 2,032 | | | Sterling Financial Corp. | | | 69,250 | | |
| | 1,777 | | | SVB Financial Group (a) | | | 186,336 | | |
| | 57,588 | | | Synovus Financial Corp. | | | 207,317 | | |
| | 9,549 | | | United Community Banks, Inc. (a) | | | 169,495 | | |
| | 7,057 | | | Washington Banking Co. | | | 125,121 | | |
| | 13,168 | | | Wilshire Bancorp, Inc. | | | 143,926 | | |
| | 3,134 | | | Wintrust Financial Corp. | | | 144,540 | | |
| | | | 3,105,943 | | |
| | | Health Care 4.3% | |
| | 18,592 | | | Accuray, Inc. (a) | | | 161,936 | | |
| | 14,047 | | | Progenics Pharmaceuticals, Inc. (a) | | | 74,871 | | |
| | 1,548 | | | United Therapeutics Corp. (a) | | | 175,048 | | |
| | 1,752 | | | WellCare Health Plans, Inc. (a) | | | 123,376 | | |
| | | | 535,231 | | |
The accompanying notes are an integral part of these financial statements.
page 39

Frontegra Phocas Small Cap Value Fund
SCHEDULE OF INVESTMENTS (continued)
December 31, 2013 (Unaudited)
Number of Shares | | | | Value | |
| COMMON STOCKS 99.0% (continued) | | | |
| | | Industrials 15.5% | |
| | 14,533 | | | Aceto Corp. | | $ | 363,470 | | |
| | 704 | | | AMERCO (a) | | | 167,439 | | |
| | 3,449 | | | Avis Budget Group, Inc. (a) | | | 139,409 | | |
| | 1,301 | | | Esterline Technologies Corp. (a) | | | 132,650 | | |
| | 1,687 | | | Kadant, Inc. | | | 68,357 | | |
| | 3,018 | | | MYR Group, Inc. (a) | | | 75,691 | | |
| | 2,739 | | | Park-Ohio Holdings Corp. (a) | | | 143,524 | | |
| | 4,480 | | | Spirit Airlines, Inc. (a) | | | 203,437 | | |
| | 1,815 | | | The Timken Company | | | 99,952 | | |
| | 2,530 | | | Trinity Industries, Inc. | | | 137,936 | | |
| | 844 | | | Triumph Group, Inc. | | | 64,203 | | |
| | 1,434 | | | UniFirst Corp. | | | 153,438 | | |
| | 2,432 | | | URS Corp. | | | 128,872 | | |
| | 705 | | | WESCO International, Inc. (a) | | | 64,204 | | |
| | | | 1,942,582 | | |
| | | Information Technology 12.7% | |
| | 2,086 | | | AOL, Inc. (a) | | | 97,249 | | |
| | 15,096 | | | Atmel Corp. (a) | | | 118,202 | | |
| | 4,072 | | | Compuware Corp. | | | 45,647 | | |
| | 3,644 | | | Euronet Worldwide, Inc. (a) | | | 174,365 | | |
| | 6,327 | | | Internap Network
Services Corp. (a) | | | 47,579 | | |
| | 1,272 | | | Measurement Specialties, Inc. (a) | | | 77,198 | | |
| | 4,328 | | | Methode Electronics, Inc. | | | 147,974 | | |
| | 2,536 | | | Microsemi Corp. (a) | | | 63,273 | | |
| | 2,151 | | | NeuStar, Inc. - Class A (a) | | | 107,249 | | |
| | 4,023 | | | Progress Software Corp. (a) | | | 103,914 | | |
| | 8,093 | | | Saba Software, Inc. (a) | | | 99,139 | | |
| | 8,869 | | | Seachange International, Inc. (a) | | | 107,847 | | |
| | 4,619 | | | Skyworks Solutions, Inc. (a) | | | 131,919 | | |
| | 1,986 | | | SYNNEX Corp. (a) | | | 133,856 | | |
| | 3,143 | | | Verint Systems, Inc. (a) | | | 134,961 | | |
| | | | 1,590,372 | | |
Number of Shares | | | | Value | |
| | | Materials 4.4% | |
| | 662 | | | Ashland, Inc. | | $ | 64,240 | | |
| | 1,489 | | | Axiall Corp. | | | 70,638 | | |
| | 1,395 | | | Cabot Corp. | | | 71,703 | | |
| | 1,369 | | | Domtar Corp. | | | 129,152 | | |
| | 1,042 | | | Kaiser Aluminum Corp. | | | 73,190 | | |
| | 3,113 | | | Sensient Technologies Corp. | | | 151,043 | | |
| | | | 559,966 | | |
| | | Real Estate Investment Trusts 11.3% | |
| | 5,164 | | | Acadia Realty Trust | | | 128,222 | | |
| | 2,931 | | | CoreSite Realty Corp. | | | 94,349 | | |
| | 6,467 | | | First Industrial Realty Trust, Inc. | | | 112,849 | | |
| | 10,400 | | | First Potomac Realty Trust | | | 120,952 | | |
| | 7,187 | | | Hudson Pacific Properties, Inc. | | | 157,180 | | |
| | 2,634 | | | Kilroy Realty Corp. | | | 132,174 | | |
| | 10,393 | | | NorthStar Realty Finance Corp. | | | 139,786 | | |
| | 5,034 | | | Pebblebrook Hotel Trust | | | 154,846 | | |
| | 1,299 | | | PS Business Parks, Inc. | | | 99,270 | | |
| | 5,743 | | | Sabra Health Care REIT, Inc. | | | 150,122 | | |
| | 13,134 | | | Strategic Hotels & Resorts, Inc. (a) | | | 124,116 | | |
| | | | 1,413,866 | | |
| | | Utilities 4.0% | |
| | 2,507 | | | Black Hills Corp. | | | 131,643 | | |
| | 1,591 | | | Chesapeake Utilities Corp. | | | 95,492 | | |
| | 1,180 | | | IDACORP, Inc. | | | 61,171 | | |
| | 1,313 | | | Laclede Group, Inc. | | | 59,794 | | |
| | 2,000 | | | PNM Resources, Inc. | | | 48,240 | | |
| | 1,915 | | | Portland General Electric Co. | | | 57,833 | | |
| | 2,241 | | | The Empire District Electric Co. | | | 50,848 | | |
| | | | 505,021 | | |
| | | Total Common Stocks | |
| | | | | (Cost $8,382,678) | | | 12,431,996 | | |
The accompanying notes are an integral part of these financial statements.
page 40

Frontegra Phocas Small Cap Value Fund
SCHEDULE OF INVESTMENTS (continued)
December 31, 2013 (Unaudited)
Number of Shares | | | | Value | |
SHORT-TERM INVESTMENTS 1.0% | |
| | | Investment Company 1.0% | |
| | 1,621,984 | | | STIT-STIC Prime Portfolio -
Institutional Class, 0.06% | | $ | 128,421 | | |
| | | Total Short-Term Investments | |
| | | (Cost $128,421) | | | 128,421 | | |
| | | Total Investments 100.0% | |
| | | (Cost $8,511,099) | | | 12,560,417 | | |
| | | Liabilities in Excess of
Other Assets 0.0% | | | (216 | ) | |
| | | TOTAL NET ASSETS 100.0% | | $ | 12,560,201 | | |
(a) Non-Income Producing.
PORTFOLIO DIVERSIFICATION
Sectors | | Percentage | |
Financials | | | 24.7 | % | |
Industrials | | | 15.5 | | |
Information Technology | | | 12.7 | | |
Consumer Discretionary | | | 12.6 | | |
Real Estate Investment Trusts | | | 11.3 | | |
Energy | | | 6.2 | | |
Materials | | | 4.4 | | |
Health Care | | | 4.3 | | |
Utilities | | | 4.0 | | |
Consumer Staples | | | 3.3 | | |
Total Common Stocks | | | 99.0 | | |
Total Short-Term Investments | | | 1.0 | | |
Total Investments | | | 100.0 | | |
Liabilities in Excess of Other Assets | | | 0.0 | | |
Total Net Assets | | | 100.0 | % | |
The accompanying notes are an integral part of these financial statements.
page 41

Frontegra Funds
STATEMENTS OF ASSETS AND LIABILITIES
December 31, 2013 (Unaudited)
| | | RobecoSAM Global
Equity Fund(1) | | MFG Global
Equity Fund | | MFG Core
Infrastructure Fund | |
ASSETS: | |
Investments at cost | | $ | 13,369,860 | | | $ | 545,130,344 | | | $ | 17,067,719 | | |
Foreign currency at cost | | $ | 221 | | | $ | 439,770 | | | $ | 32,412 | | |
Investments at value | | $ | 18,186,585 | | | $ | 631,177,622 | | | $ | 17,903,563 | | |
Foreign currency at value | | | 223 | | | | 444,165 | | | | 34,307 | | |
Cash | | | — | | | | 570,423 | | | | 6,986 | | |
Receivable for investments sold | | | — | | | | — | | | | — | | |
Receivable for Fund shares sold | | | — | | | | 9,039,316 | | | | — | | |
Interest and dividends receivable | | | 53,162 | | | | 449,624 | | | | 83,482 | | |
Receivable from Adviser | | | — | | | | — | | | | 21,727 | | |
Prepaid expenses and other assets | | | 10,168 | | | | 39,021 | | | | 2,944 | | |
Total assets | | | 18,250,138 | | | | 641,720,171 | | | | 18,053,009 | | |
LIABILITIES: | |
Payable for investments purchased | | | — | | | | 8,182,348 | | | | — | | |
Payable for Fund shares redeemed | | | 92,790 | | | | 5,237 | | | | — | | |
Payable to Directors | | | 1,725 | | | | 1,725 | | | | 1,644 | | |
Payable to Adviser | | | 1,646 | | | | 294,699 | | | | — | | |
Accrued distribution and shareholder servicing fees | | | — | | | | — | | | | — | | |
Accrued expenses | | | 24,699 | | | | 85,439 | | | | 38,822 | | |
Total liabilities | | | 120,860 | | | | 8,569,448 | | | | 40,466 | | |
Net Assets | | $ | 18,129,278 | | | $ | 633,150,723 | | | $ | 18,012,543 | | |
NET ASSETS CONSIST OF: | |
Paid in capital | | $ | 12,948,837 | | | $ | 546,471,667 | | | $ | 17,207,741 | | |
Undistributed net investment income (loss) | | | 6,563 | | | | 37,725 | | | | (3,750 | ) | |
Accumulated net realized gain (loss) | | | 355,839 | | | | 583,908 | | | | (27,829 | ) | |
Net unrealized appreciation on: | |
Investments | | | 4,816,725 | | | | 86,047,278 | | | | 835,844 | | |
Foreign currency | | | 1,314 | | | | 10,145 | | | | 537 | | |
Net Assets | | $ | 18,129,278 | | | $ | 633,150,723 | | | $ | 18,012,543 | | |
CAPITAL STOCK, $0.01 PAR VALUE | | | | | | | |
Net Assets | | $ | 18,129,278 | | | $ | 633,150,723 | | | $ | 18,012,543 | | |
Authorized | | | 50,000,000 | | | | 100,000,000 | | | | 50,000,000 | | |
Issued and Outstanding | | | 1,284,619 | | | | 42,402,630 | | | | 1,462,686 | | |
Net Asset Value, Redemption Price and Offering Price Per Share | | $ | 14.11 | | | $ | 14.93 | | | $ | 12.31 | | |
CAPITAL STOCK, $0.01 PAR VALUE | | | | | | | |
Net Assets | | | | | | | |
Authorized | | | | | | | |
Issued and Outstanding | | | | | | | |
Net Asset Value, Redemption Price and Offering Price Per Share | | | | | | | |
(1) Effective February 20, 2013, the Fund changed its name from Frontegra SAM Global Equity Fund to Frontegra RobecoSAM Global
Equity Fund.
The accompanying notes are an integral part of these financial statements.
page 42

| | | Timpani Small Cap
Growth Fund | | Netols Small Cap
Value Fund | | Phocas Small Cap
Value Fund | |
ASSETS: | |
Investments at cost | | $ | 5,254,134 | | | $ | 61,769,513 | | | $ | 8,511,099 | | |
Foreign currency at cost | | $ | — | | | $ | — | | | $ | — | | |
Investments at value | | $ | 7,337,481 | | | $ | 109,920,542 | | | $ | 12,560,417 | | |
Foreign currency at value | | | — | | | | — | | | | — | | |
Cash | | | — | | | | 10,989 | | | | — | | |
Receivable for investments sold | | | 68,928 | | | | — | | | | — | | |
Receivable for Fund shares sold | | | 5,237 | | | | 35,199 | | | | 678 | | |
Interest and dividends receivable | | | 1,829 | | | | 88,965 | | | | 9,438 | | |
Receivable from Adviser | | | 6,199 | | | | — | | | | 371 | | |
Prepaid expenses and other assets | | | 7,803 | | | | 14,319 | | | | 12,247 | | |
Total assets | | | 7,427,477 | | | | 110,070,014 | | | | 12,583,151 | | |
LIABILITIES: | |
Payable for investments purchased | | | 276,742 | | | | — | | | | — | | |
Payable for Fund shares redeemed | | | — | | | | 53,694 | | | | 233 | | |
Payable to Directors | | | 1,643 | | | | 1,644 | | | | 1,725 | | |
Payable to Adviser | | | — | | | | 81,834 | | | | — | | |
Accrued distribution and shareholder servicing fees | | | — | | | | 5,939 | | | | — | | |
Accrued expenses | | | 20,211 | | | | 36,954 | | | | 20,992 | | |
Total liabilities | | | 298,596 | | | | 180,065 | | | | 22,950 | | |
Net Assets | | $ | 7,128,881 | | | $ | 109,889,949 | | | $ | 12,560,201 | | |
NET ASSETS CONSIST OF: | |
Paid in capital | | $ | 5,034,193 | | | $ | 58,436,667 | | | $ | 8,208,951 | | |
Undistributed net investment income (loss) | | | (36,401 | ) | | | (175,262 | ) | | | 7,850 | | |
Accumulated net realized gain (loss) | | | 47,742 | | | | 3,477,515 | | | | 294,082 | | |
Net unrealized appreciation on: | |
Investments | | | 2,083,347 | | | | 48,151,029 | | | | 4,049,318 | | |
Foreign currency | | | — | | | | — | | | | — | | |
Net Assets | | $ | 7,128,881 | | | $ | 109,889,949 | | | $ | 12,560,201 | | |
CAPITAL STOCK, $0.01 PAR VALUE | | | | Institutional Class | | | |
Net Assets | | $ | 7,128,881 | | | $ | 108,859,836 | | | $ | 12,560,201 | | |
Authorized | | | 50,000,000 | | | | 50,000,000 | | | | 100,000,000 | | |
Issued and Outstanding | | | 432,037 | | | | 7,776,100 | | | | 373,129 | | |
Net Asset Value, Redemption Price and Offering Price Per Share | | $ | 16.50 | | | $ | 14.00 | | | $ | 33.66 | | |
CAPITAL STOCK, $0.01 PAR VALUE | | | | Class Y | | | |
Net Assets | | | | $ | 1,030,113 | | | | |
Authorized | | | | | 50,000,000 | | | | |
Issued and Outstanding | | | | | 76,128 | | | | |
Net Asset Value, Redemption Price and Offering Price Per Share | | | | $ | 13.53 | | | | | | |
The accompanying notes are an integral part of these financial statements.
page 43

Frontegra Funds
STATEMENTS OF OPERATIONS
For the Six Months Ended December 31, 2013 (Unaudited)
| | | RobecoSAM Global
Equity Fund(1) | | MFG Global
Equity Fund | | MFG Core
Infrastructure Fund | |
INVESTMENT INCOME: | |
Dividend income | | $ | 205,003 | (2) | | $ | 3,411,335 | (3) | | $ | 193,559 | (4) | |
Interest income | | | 80 | | | | 5,146 | | | | 134 | | |
Total investment income | | | 205,083 | | | | 3,416,481 | | | | 193,693 | | |
EXPENSES: | |
Investment advisory fees | | | 70,747 | | | | 1,967,135 | | | | 32,898 | | |
Custody fees | | | 18,344 | | | | 78,347 | | | | 31,736 | | |
Fund administration and accounting fees | | | 16,317 | | | | 84,650 | | | | 16,520 | | |
Legal fees | | | 12,074 | | | | 15,746 | | | | 11,900 | | |
Federal and state registration fees | | | 11,414 | | | | 15,098 | | | | 1,871 | | |
Directors' fees and related expenses | | | 8,425 | | | | 8,425 | | | | 8,344 | | |
Audit fees | | | 8,161 | | | | 8,671 | | | | 8,656 | | |
Shareholder servicing fees | | | 3,695 | | | | 8,812 | | | | 3,344 | | |
Reports to shareholders | | | 1,463 | | | | 6,061 | | | | 822 | | |
Distribution and shareholder servicing fees - Class Y | | | — | | | | — | | | | — | | |
Other | | | 3,364 | | | | 44,942 | | | | 3,783 | | |
Total expenses before waiver and reimbursement | | | 154,004 | | | | 2,237,887 | | | | 119,874 | | |
Waiver and reimbursement of expenses by Adviser | | | (47,874 | ) | | | (279,726 | ) | | | (86,975 | ) | |
Net expenses | | | 106,130 | | | | 1,958,161 | | | | 32,899 | | |
Net Investment Income (Loss) | | | 98,953 | | | | 1,458,320 | | | | 160,794 | | |
REALIZED AND UNREALIZED GAIN (LOSS) ON INVESTMENTS: | |
Net realized gain (loss) on: | | | | | | | |
Investments | | | 1,065,590 | | | | 2,055,377 | | | | (5,926 | ) | |
Foreign currency transactions | | | (16,218 | ) | | | 23,338 | | | | (14,487 | ) | |
Change in net unrealized appreciation/depreciation on: | | | | | | | |
Investments | | | 1,382,769 | | | | 58,605,863 | | | | 650,085 | | |
Foreign currency transactions | | | 2,873 | | | | 20,752 | | | | 1,610 | | |
Net Realized and Unrealized Gain on Investments | | | 2,435,014 | | | | 60,705,330 | | | | 631,282 | | |
Net Increase in Net Assets Resulting from Operations | | $ | 2,533,967 | | | $ | 62,163,650 | | | $ | 792,076 | | |
(1) Effective February 20, 2013, the Fund changed its name from Frontegra SAM Global Equity Fund to Frontegra RobecoSAM
Global Equity Fund.
(2) Net of $10,234 in foreign withholding taxes.
(3) Net of $63,534 in foreign withholding taxes.
(4) Net of $15,872 in foreign withholding taxes.
The accompanying notes are an integral part of these financial statements.
page 44

| | | Timpani Small Cap
Growth Fund | | Netols Small Cap
Value Fund | | Phocas Small Cap
Value Fund | |
INVESTMENT INCOME: | |
Dividend income | | $ | 10,380 | | | $ | 493,659 | | | $ | 71,181 | | |
Interest income | | | 30 | | | | 76 | | | | 62 | | |
Total investment income | | | 10,410 | | | | 493,735 | | | | 71,243 | | |
EXPENSES: | |
Investment advisory fees | | | 27,708 | | | | 613,468 | | | | 57,629 | | |
Custody fees | | | 4,776 | | | | 12,421 | | | | 3,100 | | |
Fund administration and accounting fees | | | 13,625 | | | | 30,955 | | | | 15,140 | | |
Legal fees | | | 8,964 | | | | 11,552 | | | | 11,875 | | |
Federal and state registration fees | | | 2,332 | | | | 5,914 | | | | 13,063 | | |
Directors' fees and related expenses | | | 8,345 | | | | 8,344 | | | | 9,231 | | |
Audit fees | | | 7,161 | | | | 7,662 | | | | 7,660 | | |
Shareholder servicing fees | | | 3,129 | | | | 8,616 | | | | 4,342 | | |
Reports to shareholders | | | 743 | | | | 12,005 | | | | 4,531 | | |
Distribution and shareholder servicing fees - Class Y | | | — | | | | 9,096 | | | | — | | |
Other | | | 848 | | | | 16,812 | | | | 2,166 | | |
Total expenses before waiver and reimbursement | | | 77,631 | | | | 736,845 | | | | 128,737 | | |
Waiver and reimbursement of expenses by Adviser | | | (47,152 | ) | | | (58,554 | ) | | | (65,344 | ) | |
Net expenses | | | 30,479 | | | | 678,291 | | | | 63,393 | | |
Net Investment Income (Loss) | | | (20,069 | ) | | | (184,556 | ) | | | 7,850 | | |
REALIZED AND UNREALIZED GAIN (LOSS) ON INVESTMENTS: | |
Net realized gain (loss) on: | | | | | | | |
Investments | | | 270,591 | | | | 16,056,816 | | | | 695,371 | | |
Foreign currency transactions | | | — | | | | — | | | | — | | |
Change in net unrealized appreciation/depreciation on: | | | | | | | |
Investments | | | 1,052,435 | | | | 5,857,550 | | | | 1,704,148 | | |
Foreign currency transactions | | | — | | | | — | | | | — | | |
Net Realized and Unrealized Gain on Investments | | | 1,323,026 | | | | 21,914,366 | | | | 2,399,519 | | |
Net Increase in Net Assets Resulting from Operations | | $ | 1,302,957 | | | $ | 21,729,810 | | | $ | 2,407,369 | | |
The accompanying notes are an integral part of these financial statements.
page 45

Frontegra Funds
STATEMENTS OF CHANGES IN NET ASSETS
| | | RobecoSAM Global Equity Fund(1) | | MFG Global Equity Fund | |
| | | For the
Six Months Ended
December 31, 2013
(Unaudited) | | For the
Year Ended
June 30, 2013 | | For the
Six Months Ended
December 31, 2013
(Unaudited) | | For the
Year Ended
June 30, 2013 | |
OPERATIONS: | |
Net investment income | | $ | 98,953 | | | $ | 310,148 | | | $ | 1,458,320 | | | $ | 2,299,496 | | |
Net realized gain (loss) on: | |
Investments | | | 1,065,590 | | | | (97,457 | ) | | | 2,055,377 | | | | 5,005,073 | | |
Foreign currency transactions | | | (16,218 | ) | | | (35,600 | ) | | | 23,338 | | | | (3,763 | ) | |
Change in net unrealized appreciation/depreciation on: | |
Investments | | | 1,382,769 | | | | 3,097,456 | | | | 58,605,863 | | | | 27,963,825 | | |
Foreign currency transactions | | | 2,873 | | | | (3,208 | ) | | | 20,752 | | | | (8,349 | ) | |
Net increase in net assets resulting from operations | | | 2,533,967 | | | | 3,271,339 | | | | 62,163,650 | | | | 35,256,282 | | |
DISTRIBUTIONS PAID TO SHAREHOLDERS FROM: | |
Net investment income | | | (231,994 | ) | | | (295,231 | ) | | | (3,309,753 | ) | | | (966,980 | ) | |
Net realized gain on investments | | | (307,567 | ) | | | — | | | | (5,090,258 | ) | | | (1,466,648 | ) | |
Net decrease in net assets resulting from distributions paid | | | (539,561 | ) | | | (295,231 | ) | | | (8,400,011 | ) | | | (2,433,628 | ) | |
CAPITAL SHARE TRANSACTIONS: | |
Shares sold | | | 129,900 | | | | 454,816 | | | | 233,542,861 | | | | 203,278,933 | | |
Shares issued to holders in reinvestment of distributions | | | 501,905 | | | | 277,765 | | | | 7,777,052 | | | | 2,415,348 | | |
Shares redeemed | | | (804,795 | ) | | | (7,352,755 | ) | | | (8,628,356 | ) | | | (373,668 | ) | |
Redemption fees | | | — | | | | — | | | | 668 | | | | 1,026 | | |
Net increase (decrease) in net assets resulting from capital share transactions | | | (172,990 | ) | | | (6,620,174 | ) | | | 232,692,225 | | | | 205,321,639 | | |
Total Increase (Decrease) in Net Assets | | | 1,821,416 | | | | (3,644,066 | ) | | | 286,455,864 | | | | 238,144,293 | | |
NET ASSETS: | |
Beginning of Period | | | 16,307,862 | | | | 19,951,928 | | | | 346,694,859 | | | | 108,550,566 | | |
End of Period | | $ | 18,129,278 | | | $ | 16,307,862 | | | $ | 633,150,723 | | | $ | 346,694,859 | | |
Undistributed net investment income | | $ | 6,563 | | | $ | 139,604 | | | $ | 37,725 | | | $ | 1,889,158 | | |
TRANSACTIONS IN SHARES: | |
Shares sold | | | 9,859 | | | | 42,720 | | | | 16,642,148 | | | | 15,602,744 | | |
Shares issued to holders in reinvestment of distributions | | | 36,555 | | | | 24,132 | | | | 536,348 | | | | 205,562 | | |
Shares redeemed | | | (58,795 | ) | | | (637,832 | ) | | | (599,123 | ) | | | (28,164 | ) | |
Net increase (decrease) in shares outstanding | | | (12,381 | ) | | | (570,980 | ) | | | 16,579,373 | | | | 15,780,142 | | |
(1) Effective February 20, 2013, the Fund changed its name from Frontegra SAM Global Equity Fund to Frontegra RobecoSAM Global Equity Fund.
The accompanying notes are an integral part of these financial statements.
page 46

Frontegra Funds
STATEMENTS OF CHANGES IN NET ASSETS (continued)
| | | MFG Core Infrastructure Fund | | Timpani Small Cap Growth Fund | |
| | | For the
Six Months Ended
December 31, 2013
(Unaudited) | | For the
Year Ended
June 30, 2013 | | For the
Six Months Ended
December 31, 2013
(Unaudited) | | For the
Year Ended
June 30, 2013 | |
OPERATIONS: | |
Net investment income (loss) | | $ | 160,794 | | | $ | 145,393 | | | $ | (20,069 | ) | | $ | (11,618 | ) | |
Net realized gain (loss) on: | |
Investments | | | (5,926 | ) | | | (7,191 | ) | | | 270,591 | | | | 367,810 | | |
Foreign currency transactions | | | (14,487 | ) | | | (822 | ) | | | — | | | | — | | |
Change in net unrealized appreciation/depreciation on: | |
Investments | | | 650,085 | | | | 106,260 | | | | 1,052,435 | | | | 501,400 | | |
Foreign currency transactions | | | 1,610 | | | | (1,243 | ) | | | — | | | | — | | |
Net increase in net assets resulting from operations | | | 792,076 | | | | 242,397 | | | | 1,302,957 | | | | 857,592 | | |
DISTRIBUTIONS PAID TO SHAREHOLDERS FROM: | |
Net investment income | | | (253,056 | ) | | | (118,030 | ) | | | — | | | | — | | |
Net realized gain on investments | | | — | | | | (1,836 | ) | | | (135,449 | ) | | | — | | |
Net decrease in net assets resulting from distributions paid | | | (253,056 | ) | | | (119,866 | ) | | | (135,449 | ) | | | — | | |
CAPITAL SHARE TRANSACTIONS: | |
Shares sold | | | 10,045,000 | | | | 4,342,000 | | | | 1,922,781 | | | | 302,712 | | |
Shares issued to holders in reinvestment of distributions | | | 244,776 | | | | 99,221 | | | | 127,954 | | | | — | | |
Shares redeemed | | | (119,002 | ) | | | (4,358 | ) | | | (72,641 | ) | | | (1,457 | ) | |
Net increase in net assets resulting from capital share transactions | | | 10,170,774 | | | | 4,436,863 | | | | 1,978,094 | | | | 301,255 | | |
Total Increase in Net Assets | | | 10,709,794 | | | | 4,559,394 | | | | 3,145,602 | | | | 1,158,847 | | |
NET ASSETS: | |
Beginning of Period | | | 7,302,749 | | | | 2,743,355 | | | | 3,983,279 | | | | 2,824,432 | | |
End of Period | | $ | 18,012,543 | | | $ | 7,302,749 | | | $ | 7,128,881 | | | $ | 3,983,279 | | |
Undistributed net investment income (loss) | | $ | (3,750 | ) | | $ | 88,512 | | | $ | (36,401 | ) | | $ | (16,332 | ) | |
TRANSACTIONS IN SHARES: | |
Shares sold | | | 819,385 | | | | 366,605 | | | | 127,127 | | | | 27,417 | | |
Shares issued to holders in reinvestment of distributions | | | 20,280 | | | | 8,891 | | | | 8,114 | | | | — | | |
Shares redeemed | | | (9,634 | ) | | | (392 | ) | | | (4,529 | ) | | | (130 | ) | |
Net increase in shares outstanding | | | 830,031 | | | | 375,104 | | | | 130,712 | | | | 27,287 | | |
The accompanying notes are an integral part of these financial statements.
page 47

Frontegra Funds
STATEMENTS OF CHANGES IN NET ASSETS (continued)
| | | Netols Small Cap Value Fund | | Phocas Small Cap Value Fund | |
| | | For the
Six Months Ended
December 31, 2013
(Unaudited) | | For the
Year Ended
June 30, 2013 | | For the
Six Months Ended
December 31, 2013
(Unaudited) | | For the
Year Ended
June 30, 2013 | |
OPERATIONS: | |
Net investment income (loss) | | $ | (184,556 | ) | | $ | (154,288 | ) | | $ | 7,850 | | | $ | 38,278 | | |
Net realized gain on investments | | | 16,056,816 | | | | 24,070,378 | | | | 695,371 | | | | 3,196,331 | | |
Change in net unrealized appreciation/depreciation on investments | | | 5,857,550 | | | | 7,618,584 | | | | 1,704,148 | | | | (1,003,094 | ) | |
Net increase in net assets resulting from operations | | | 21,729,810 | | | | 31,534,674 | | | | 2,407,369 | | | | 2,231,515 | | |
DISTRIBUTIONS PAID TO SHAREHOLDERS FROM: | | Institutional Class | | Institutional Class | | Institutional Class | | Institutional Class | |
Net investment income | | | — | | | | — | | | | (16,849 | ) | | | (61,412 | ) | |
Net realized gain on investments | | | (26,286,823 | ) | | | (5,798,112 | ) | | | (680,655 | ) | | | — | | |
Net decrease in net assets resulting from distributions paid | | | (26,286,823 | ) | | | (5,798,112 | ) | | | (697,504 | ) | | | (61,412 | ) | |
DISTRIBUTIONS PAID TO SHAREHOLDERS FROM: | | Class Y | | Class Y | | | | | |
Net realized gain on investments | | | (239,893 | ) | | | (899,137 | ) | | | | | |
Net decrease in net assets resulting from distributions paid | | | (239,893 | ) | | | (899,137 | ) | | | | | |
CAPITAL SHARE TRANSACTIONS(1): | | Institutional Class | | Institutional Class | | Institutional Class | | Institutional Class | |
Shares sold | | | 22,611,087 | | | | 8,289,832 | | | | 2,083,614 | | | | 1,139,262 | | |
Shares issued in connection with Class I conversion | | | — | | | | — | | | | — | | | | 3,516,268 | | |
Shares issued to holders in reinvestment of distributions | | | 22,953,330 | | | | 5,233,889 | | | | 697,504 | | | | 61,412 | | |
Shares redeemed | | | (43,962,886 | ) | | | (56,528,040 | ) | | | (934,907 | ) | | | (20,192,417 | ) | |
Net increase (decrease) in net assets resulting from capital share transactions | | | 1,601,531 | | | | (43,004,319 | ) | | | 1,846,211 | | | | (15,475,475 | ) | |
CAPITAL SHARE TRANSACTIONS: | | Class Y | | Class Y | | | | | |
Shares sold | | | 80,120 | | | | 2,276,127 | | | | | | |
Shares issued to holders in reinvestment of distributions | | | 239,893 | | | | 898,733 | | | | | | |
Shares redeemed | | | (20,613,636 | ) | | | (3,937,645 | ) | | | | | |
Net decrease in net assets resulting from capital share transactions | | | (20,293,623 | ) | | | (762,785 | ) | | | | | |
Total Increase (Decrease) in Net Assets | | | (23,488,998 | ) | | | (18,929,679 | ) | | | 3,556,076 | | | | (13,305,372 | ) | |
NET ASSETS: | |
Beginning of Period | | | 133,378,947 | | | | 152,308,626 | | | | 9,004,125 | | | | 22,309,497 | | |
End of Period | | $ | 109,889,949 | | | $ | 133,378,947 | | | $ | 12,560,201 | | | $ | 9,004,125 | | |
Undistributed net investment income (loss) | | $ | (175,262 | ) | | $ | 9,294 | | | $ | 7,850 | | | $ | 16,849 | | |
TRANSACTIONS IN SHARES(1): | | Institutional Class | | Institutional Class | | Institutional Class | | Institutional Class | |
Shares sold | | | 1,387,658 | | | | 612,746 | | | | 67,104 | | | | 43,996 | | |
Conversion of Class I shares | | | — | | | | — | | | | — | | | | 144,702 | | |
Shares issued to holders in reinvestment of distributions | | | 1,688,987 | | | | 396,207 | | | | 21,402 | | | | 2,510 | | |
Shares redeemed | | | (2,673,771 | ) | | | (4,101,006 | ) | | | (28,883 | ) | | | (835,389 | ) | |
Net increase (decrease) in shares outstanding | | | 402,874 | | | | (3,092,053 | ) | | | 59,623 | | | | (644,181 | ) | |
TRANSACTIONS IN SHARES: | | Class Y | | Class Y | | | | | |
Shares sold | | | 5,010 | | | | 164,466 | | | | | | |
Shares issued to holders in reinvestment of distributions | | | 18,256 | | | | 69,346 | | | | | | |
Shares redeemed | | | (1,293,015 | ) | | | (291,921 | ) | | | | | |
Net decrease in shares outstanding | | | (1,269,749 | ) | | | (58,109 | ) | | | | | |
(1) Effective November 1, 2012, Class I shares of the Frontegra Phocas Small Cap Value Fund were converted into Class L shares of the Fund. Class L shares were redesignated Institutional Class shares.
The accompanying notes are an integral part of these financial statements.
page 48

Frontegra RobecoSAM Global Equity Fund
FINANCIAL HIGHLIGHTS
| | | Six Months
Ended
December 31,
2013
(Unaudited) | | Year
Ended
June 30,
2013 | | Year
Ended
June 30,
2012 | | Period
Ended
June 30,
2011(1)(2) | | Year
Ended
August 31,
2010 | | Period
Ended
August 31,
2009(3) | |
Net Asset Value, Beginning of Period | | $ | 12.57 | | | $ | 10.68 | | | $ | 13.15 | | | $ | 11.00 | | | $ | 11.30 | | | $ | 10.00 | | |
INCOME (LOSS) FROM
INVESTMENT OPERATIONS: | |
Net investment income | | | 0.08 | | | | 0.22 | | | | 0.18 | (4) | | | 0.25 | | | | 0.18 | (4) | | | 0.01 | (4) | |
Net realized and unrealized gain (loss) on investments | | | 1.88 | | | | 1.86 | | | | (1.67 | ) | | | 2.53 | | | | 0.47 | | | | 1.29 | | |
Total Income (Loss) from Investment Operations | | | 1.96 | | | | 2.08 | | | | (1.49 | ) | | | 2.78 | | | | 0.65 | | | | 1.30 | | |
LESS DISTRIBUTIONS: | |
From net investment income | | | (0.18 | ) | | | (0.19 | ) | | | (0.21 | ) | | | (0.21 | ) | | | (0.05 | ) | | | — | | |
From net realized gain on investments | | | (0.24 | ) | | | — | | | | (0.77 | ) | | | (0.42 | ) | | | (0.90 | ) | | | — | | |
Total Distributions | | | (0.42 | ) | | | (0.19 | ) | | | (0.98 | ) | | | (0.63 | ) | | | (0.95 | ) | | | — | | |
Redemption fees retained | | | — | | | | — | | | | — | | | | — | | | | — | (5) | | | — | | |
Net Asset Value, End of Period | | $ | 14.11 | | | $ | 12.57 | | | $ | 10.68 | | | $ | 13.15 | | | $ | 11.00 | | | $ | 11.30 | | |
Total Return | | | 15.59 | %(6) | | | 19.78 | % | | | (10.91 | )% | | | 25.64 | %(6) | | | 5.42 | % | | | 13.00 | %(6) | |
SUPPLEMENTAL DATA AND RATIOS: | |
Net assets, end of period (in thousands) | | $ | 18,129 | | | $ | 16,308 | | | $ | 19,952 | | | $ | 19,292 | | | $ | 16,756 | | | $ | 11,614 | | |
Ratio of expenses to average net assets | |
Before waivers and reimbursements | | | 1.74 | %(7) | | | 1.63 | % | | | 1.62 | % | | | 2.41 | %(7) | | | 2.81 | % | | | 4.06 | %(7) | |
Net of waivers and reimbursements | | | 1.20 | %(7) | | | 1.20 | % | | | 1.20 | % | | | 1.20 | %(7) | | | 1.20 | % | | | 1.20 | %(7) | |
Ratio of net investment income (loss) to average net assets | |
Before waivers and reimbursements | | | 0.58 | %(7) | | | 1.28 | % | | | 1.16 | % | | | 1.02 | %(7) | | | (0.03 | )% | | | (2.59 | )%(7) | |
Net of waivers and reimbursements | | | 1.12 | %(7) | | | 1.71 | % | | | 1.58 | % | | | 2.23 | %(7) | | | 1.58 | % | | | 0.27 | %(7) | |
Portfolio turnover rate | | | 31 | %(6) | | | 36 | % | | | 52 | % | | | 33 | %(6) | | | 88 | % | | | 72 | %(6) | |
(1) Effective June 30, 2011, the Fund changed its fiscal year end to June 30 from August 31.
(2) Effective June 10, 2011, Frontegra Asset Management, Inc. became adviser and RobecoSAM USA, Inc. (f/k/a Sustainable Asset Management USA, Inc.) became subadviser to the Fund.
(3) Commenced operations on June 18, 2009.
(4) Per share net investment income has been calculated using the daily average share method.
(5) Less than one cent per share.
(6) Not annualized.
(7) Annualized.
The accompanying notes are an integral part of these financial statements.
page 49

Frontegra MFG Global Equity Fund
FINANCIAL HIGHLIGHTS
| | | Six Months
Ended
December 31,
2013
(Unaudited) | | Year
Ended
June 30,
2013 | | Period
Ended
June 30,
2012(1) | |
Net Asset Value, Beginning of Period | | $ | 13.43 | | | $ | 10.81 | | | $ | 10.00 | | |
INCOME FROM
INVESTMENT OPERATIONS: | |
Net investment income | | | 0.04 | (2) | | | 0.17 | (2) | | | 0.11 | (2) | |
Net realized and unrealized gain on investments | | | 1.66 | | | | 2.68 | | | | 0.70 | | |
Total Income from Investment Operations | | | 1.70 | | | | 2.85 | | | | 0.81 | | |
LESS DISTRIBUTIONS: | |
From net investment income | | | (0.08 | ) | | | (0.09 | ) | | | — | | |
From net realized gain on investments | | | (0.12 | ) | | | (0.14 | ) | | | — | | |
Total Distributions | | | (0.20 | ) | | | (0.23 | ) | | | — | | |
Redemption fees retained | | | — | (3) | | | — | (3) | | | — | | |
Net Asset Value, End of Period | | $ | 14.93 | | | $ | 13.43 | | | $ | 10.81 | | |
Total Return | | | 12.74 | %(4) | | | 26.68 | % | | | 8.10 | %(4) | |
SUPPLEMENTAL DATA AND RATIOS: | |
Net assets, end of period (in thousands) | | $ | 633,151 | | | $ | 346,695 | | | $ | 108,551 | | |
Ratio of expenses to average net assets | |
Before waivers and reimbursements | | | 0.91 | %(5) | | | 0.97 | % | | | 1.14 | %(5) | |
Net of waivers and reimbursements | | | 0.80 | %(5) | | | 0.80 | % | | | 0.80 | %(5) | |
Ratio of net investment income to average net assets | |
Before waivers and reimbursements | | | 0.48 | %(5) | | | 1.17 | % | | | 1.70 | %(5) | |
Net of waivers and reimbursements | | | 0.59 | %(5) | | | 1.34 | % | | | 2.04 | %(5) | |
Portfolio turnover rate | | | 15 | %(4) | | | 31 | % | | | 19 | %(4) | |
(1) Commenced operations on December 28, 2011.
(2) Per share net investment income has been calculated using the daily average share method.
(3) Less than one cent per share.
(4) Not annualized.
(5) Annualized.
The accompanying notes are an integral part of these financial statements.
page 50

Frontegra MFG Core Infrastructure Fund
FINANCIAL HIGHLIGHTS
| | | Six Months
Ended
December 31,
2013
(Unaudited) | | Year
Ended
June 30,
2013 | | Period
Ended
June 30,
2012(1) | |
Net Asset Value, Beginning of Period | | $ | 11.54 | | | $ | 10.65 | | | $ | 10.00 | | |
INCOME FROM
INVESTMENT OPERATIONS: | |
Net investment income | | | 0.21 | (2) | | | 0.49 | (2) | | | 0.24 | | |
Net realized and unrealized gain on investments | | | 0.74 | | | | 0.84 | | | | 0.41 | | |
Total Income from Investment Operations | | | 0.95 | | | | 1.33 | | | | 0.65 | | |
LESS DISTRIBUTIONS: | |
From net investment income | | | (0.18 | ) | | | (0.44 | ) | | | — | | |
From net realized gain on investments | | | — | | | | — | (3) | | | — | | |
Total Distributions | | | (0.18 | ) | | | (0.44 | ) | | | — | | |
Net Asset Value, End of Period | | $ | 12.31 | | | $ | 11.54 | | | $ | 10.65 | | |
Total Return | | | 8.22 | %(4) | | | 12.73 | % | | | 6.50 | %(4) | |
SUPPLEMENTAL DATA AND RATIOS: | |
Net assets, end of period (in thousands) | | $ | 18,013 | | | $ | 7,303 | | | $ | 2,743 | | |
Ratio of expenses to average net assets | |
Before waivers and reimbursements | | | 2.55 | %(5) | | | 3.66 | % | | | 6.55 | %(5) | |
Net of waivers and reimbursements | | | 0.70 | %(5) | | | 0.70 | % | | | 0.70 | %(5) | |
Ratio of net investment income (loss) to average net assets | |
Before waivers and reimbursements | | | 1.57 | %(5) | | | 1.34 | % | | | (1.09 | )%(5) | |
Net of waivers and reimbursements | | | 3.42 | %(5) | | | 4.30 | % | | | 4.76 | %(5) | |
Portfolio turnover rate | | | 8 | %(4) | | | 7 | % | | | 7 | %(4) | |
(1) Commenced operations on January 18, 2012.
(2) Per share net investment income has been calculated using the daily average share method.
(3) Less than one cent per share.
(4) Not annualized.
(5) Annualized.
The accompanying notes are an integral part of these financial statements.
page 51

Frontegra Timpani Small Cap Growth Fund
FINANCIAL HIGHLIGHTS
| | | Six Months
Ended
December 31,
2013
(Unaudited) | | Year
Ended
June 30,
2013 | | Year
Ended
June 30,
2012 | | Period
Ended
June 30,
2011(1) | |
Net Asset Value, Beginning of Period | | $ | 13.22 | | | $ | 10.31 | | | $ | 10.75 | | | $ | 10.00 | | |
INCOME (LOSS) FROM
INVESTMENT OPERATIONS: | |
Net investment loss | | | (0.06 | )(2) | | | (0.04 | )(2) | | | (0.08 | )(2) | | | (0.02 | )(3) | |
Net realized and unrealized gain (loss) on investments | | | 3.68 | | | | 2.95 | | | | (0.36 | ) | | | 0.77 | | |
Total Income (Loss) from Investment Operations | | | 3.62 | | | | 2.91 | | | | (0.44 | ) | | | 0.75 | | |
LESS DISTRIBUTIONS: | |
From net realized gain on investments | | | (0.34 | ) | | | — | | | | — | | | | — | | |
Total Distributions | | | (0.34 | ) | | | — | | | | — | | | | — | | |
Net Asset Value, End of Period | | $ | 16.50 | | | $ | 13.22 | | | $ | 10.31 | | | $ | 10.75 | | |
Total Return | | | 27.49 | %(4) | | | 28.35 | % | | | (4.28 | )% | | | 7.60 | %(4) | |
SUPPLEMENTAL DATA AND RATIOS: | |
Net assets, end of period (in thousands) | | $ | 7,129 | | | $ | 3,983 | | | $ | 2,824 | | | $ | 2,036 | | |
Ratio of expenses to average net assets | |
Before waivers and reimbursements | | | 2.80 | %(5) | | | 4.02 | % | | | 5.25 | % | | | 10.93 | %(5) | |
Net of waivers and reimbursements | | | 1.10 | %(5) | | | 1.10 | % | | | 1.10 | % | | | 1.10 | %(5) | |
Ratio of net investment loss to average net assets | |
Before waivers and reimbursements | | | (2.43 | )%(5) | | | (3.28 | )% | | | (5.02 | )% | | | (10.75 | )%(5) | |
Net of waivers and reimbursements | | | (0.73 | )%(5) | | | (0.36 | )% | | | (0.87 | )% | | | (0.92 | )%(5) | |
Portfolio turnover rate | | | 59 | %(4) | | | 140 | % | | | 138 | % | | | 28 | %(4) | |
(1) Commenced operations on March 23, 2011.
(2) Per share net investment income has been calculated using the daily average share method.
(3) Net investment loss per share is calculated using ending balances prior to consideration of adjustments for permanent book to tax differences.
(4) Not annualized.
(5) Annualized.
The accompanying notes are an integral part of these financial statements.
page 52

Frontegra Netols Small Cap Value Fund
FINANCIAL HIGHLIGHTS
| | | Institutional Class | |
| | | Six Months
Ended
December 31,
2013
(Unaudited) | | Year
Ended
June 30,
2013 | | Year
Ended
June 30,
2012 | | Year
Ended
June 30,
2011 | | Year
Ended
June 30,
2010 | | Year
Ended
June 30,
2009 | |
Net Asset Value, Beginning of Period | | $ | 15.35 | | | $ | 12.86 | | | $ | 13.75 | | | $ | 10.08 | | | $ | 9.03 | | | $ | 11.81 | | |
INCOME (LOSS) FROM
INVESTMENT OPERATIONS: | |
Net investment income (loss) | | | (0.02 | )(1) | | | 0.01 | | | | 0.01 | | | | (0.05 | )(2) | | | 0.02 | (1) | | | 0.01 | | |
Net realized and unrealized gain (loss) on investments | | | 2.82 | | | | 3.17 | | | | (0.90 | ) | | | 3.72 | | | | 1.05 | | | | (2.79 | ) | |
Total Income (Loss) from Investment Operations | | | 2.80 | | | | 3.18 | | | | (0.89 | ) | | | 3.67 | | | | 1.07 | | | | (2.78 | ) | |
LESS DISTRIBUTIONS: | |
From net investment income | | | — | | | | — | | | | — | | | | — | (3) | | | (0.02 | ) | | | — | (3) | |
From net realized gain on investments | | | (4.15 | ) | | | (0.69 | ) | | | — | | | | — | | | | — | | | | — | | |
From return of capital | | | — | | | | — | | | | — | | | | — | | | | — | (3) | | | — | | |
Total Distributions | | | (4.15 | ) | | | (0.69 | ) | | | — | | | | — | | | | (0.02 | ) | | | — | | |
Net Asset Value, End of Period | | $ | 14.00 | | | $ | 15.35 | | | $ | 12.86 | | | $ | 13.75 | | | $ | 10.08 | | | $ | 9.03 | | |
Total Return | | | 19.02 | %(4) | | | 25.61 | % | | | (6.47 | )% | | | 36.43 | % | | | 11.76 | % | | | (23.42 | )% | |
SUPPLEMENTAL DATA AND RATIOS: | |
Net assets, end of period (in thousands) | | $ | 108,860 | | | $ | 113,151 | | | $ | 134,544 | | | $ | 166,450 | | | $ | 119,657 | | | $ | 43,504 | | |
Ratio of expenses to average net assets | |
Before waivers and reimbursements | | | 1.18 | %(5) | | | 1.18 | % | | | 1.22 | % | | | 1.13 | % | | | 1.18 | % | | | 1.45 | % | |
Net of waivers and reimbursements | | | 1.10 | %(5) | | | 1.10 | % | | | 1.10 | % | | | 1.10 | % | | | 1.10 | % | | | 1.10 | % | |
Ratio of net investment income (loss) to average
net assets | |
Before waivers and reimbursements | | | (0.35 | )%(5) | | | (0.14 | )% | | | (0.08 | )% | | | (0.39 | )% | | | 0.17 | % | | | (0.13 | )% | |
Net of waivers and reimbursements | | | (0.27 | )%(5) | | | (0.06 | )% | | | 0.04 | % | | | (0.36 | )% | | | 0.25 | % | | | 0.22 | % | |
Portfolio turnover rate | | | 12 | %(4) | | | 28 | % | | | 28 | % | | | 33 | % | | | 41 | % | | | 36 | % | |
(1) Per share net investment income has been calculated using the daily average share method.
(2) Net investment loss per share is calculated using ending balances prior to consideration of adjustments for permanent book to tax differences.
(3) Less than one cent per share.
(4) Not annualized.
(5) Annualized.
The accompanying notes are an integral part of these financial statements.
page 53

Frontegra Netols Small Cap Value Fund
FINANCIAL HIGHLIGHTS
| | | Class Y | |
| | | Six Months
Ended
December 31,
2013
(Unaudited) | | Year
Ended
June 30,
2013 | | Year
Ended
June 30,
2012 | | Year
Ended
June 30,
2011 | | Year
Ended
June 30,
2010 | | Year
Ended
June 30,
2009 | |
Net Asset Value, Beginning of Period | | $ | 15.03 | | | $ | 12.65 | | | $ | 13.59 | | | $ | 10.00 | | | $ | 8.98 | | | $ | 11.78 | | |
INCOME (LOSS) FROM
INVESTMENT OPERATIONS: | |
Net investment loss | | | (0.09 | )(1) | | | (0.05 | ) | | | (0.05 | ) | | | (0.09 | )(2) | | | — | | | | (0.02 | ) | |
Net realized and unrealized gain (loss) on investments | | | 2.74 | | | | 3.12 | | | | (0.89 | ) | | | 3.68 | | | | 1.02 | | | | (2.78 | ) | |
Total Income (Loss) from Investment Operations | | | 2.65 | | | | 3.07 | | | | (0.94 | ) | | | 3.59 | | | | 1.02 | | | | (2.80 | ) | |
LESS DISTRIBUTIONS: | |
From net investment income | | | — | | | | — | | | | — | | | | — | | | | — | | | | — | | |
From net realized gain on investments | | | (4.15 | ) | | | (0.69 | ) | | | — | | | | — | | | | — | | | | — | | |
Total Distributions | | | (4.15 | ) | | | (0.69 | ) | | | — | | | | — | | | | — | | | | — | | |
Net Asset Value, End of Period | | $ | 13.53 | | | $ | 15.03 | | | $ | 12.65 | | | $ | 13.59 | | | $ | 10.00 | | | $ | 8.98 | | |
Total Return | | | 18.42 | %(3) | | | 25.15 | % | | | (6.92 | )% | | | 35.90 | % | | | 11.36 | % | | | (23.77 | )% | |
SUPPLEMENTAL DATA AND RATIOS: | |
Net assets, end of period (in thousands) | | $ | 1,030 | | | $ | 20,228 | | | $ | 17,765 | | | $ | 22,792 | | | $ | 15,560 | | | $ | 895 | | |
Ratio of expenses to average net assets | |
Before waivers and reimbursements | | | 1.58 | %(4) | | | 1.58 | % | | | 1.62 | % | | | 1.53 | % | | | 1.58 | % | | | 1.85 | % | |
Net of waivers and reimbursements | | | 1.50 | %(4) | | | 1.50 | % | | | 1.50 | % | | | 1.50 | % | | | 1.50 | % | | | 1.50 | % | |
Ratio of net investment loss to average net assets | |
Before waivers and reimbursements | | | (1.22 | )%(4) | | | (0.54 | )% | | | (0.48 | )% | | | (0.79 | )% | | | (0.23 | )% | | | (0.53 | )% | |
Net of waivers and reimbursements | | | (1.14 | )%(4) | | | (0.46 | )% | | | (0.36 | )% | | | (0.76 | )% | | | (0.15 | )% | | | (0.18 | )% | |
Portfolio turnover rate | | | 12 | %(3) | | | 28 | % | | | 28 | % | | | 33 | % | | | 41 | % | | | 36 | % | |
(1) Per share net investment income has been calculated using the daily average share method.
(2) Net investment loss per share is calculated using ending balances prior to consideration of adjustments for permanent book to tax differences.
(3) Not annualized.
(4) Annualized.
The accompanying notes are an integral part of these financial statements.
page 54

Frontegra Phocas Small Cap Value Fund
FINANCIAL HIGHLIGHTS
| | | Six Months
Ended
December 31,
2013
(Unaudited) | | Year
Ended
June 30,
2013 | | Year
Ended
June 30,
2012 | | Year
Ended
June 30,
2011(1) | | Six Months
Ended
June 30,
2010(2) | | Year
Ended
December 31,
2009 | | Year
Ended
December 31,
2008 | |
Net Asset Value, Beginning of Period | | $ | 28.72 | | | $ | 23.30 | | | $ | 24.51 | | | $ | 18.40 | | | $ | 18.48 | | | $ | 14.93 | | | $ | 20.01 | | |
INCOME (LOSS) FROM
INVESTMENT OPERATIONS: | |
Net investment income | | | 0.02 | | | | 0.20 | | | | 0.06 | | | | 0.04 | (3) | | | 0.02 | (3) | | | 0.06 | (3) | | | 0.13 | (3) | |
Net realized and unrealized gain (loss)
on investments | | | 6.88 | | | | 5.41 | | | | (1.25 | ) | | | 6.13 | | | | (0.10 | ) | | | 3.56 | | | | (5.08 | ) | |
Total Income (Loss) from Investment Operations | | | 6.90 | | | | 5.61 | | | | (1.19 | ) | | | 6.17 | | | | (0.08 | ) | | | 3.62 | | | | (4.95 | ) | |
LESS DISTRIBUTIONS: | |
From net investment income | | | (0.05 | ) | | | (0.19 | ) | | | (0.02 | ) | | | (0.06 | ) | | | — | | | | (0.07 | ) | | | (0.13 | ) | |
From net realized gain on investments | | | (1.91 | ) | | | — | | | | — | | | | — | | | | — | | | | — | | | | — | | |
Total Distributions | | | (1.96 | ) | | | (0.19 | ) | | | (0.02 | ) | | | (0.06 | ) | | | — | | | | (0.07 | ) | | | (0.13 | ) | |
Redemption fees retained | | | — | | | | — | | | | — | | | | — | (4) | | | — | (4) | | | — | (4) | | | — | (4) | |
Net Asset Value, End of Period | | $ | 33.66 | | | $ | 28.72 | | | $ | 23.30 | | | $ | 24.51 | | | $ | 18.40 | | | $ | 18.48 | | | $ | 14.93 | | |
Total Return | | | 24.23 | %(5) | | | 24.29 | % | | | (4.91 | )% | | | 33.55 | % | | | (0.43 | )%(5) | | | 24.29 | % | | | (24.68 | )% | |
SUPPLEMENTAL DATA AND RATIOS: | |
Net assets, end of period (in thousands) | | $ | 12,560 | | | $ | 9,004 | | | $ | 18,821 | | | $ | 20,507 | | | $ | 15,176 | | | $ | 19,331 | | | $ | 17,201 | | |
Ratio of expenses to average net assets | |
Before waivers and reimbursements | | | 2.23 | %(6) | | | 2.50 | % | | | 1.70 | % | | | 1.69 | % | | | 1.68 | %(6) | | | 1.71 | % | | | 1.52 | % | |
Net of waivers and reimbursements | | | 1.10 | %(6) | | | 1.05 | % | | | 0.99 | % | | | 0.99 | % | | | 0.99 | %(6) | | | 0.99 | % | | | 0.99 | % | |
Ratio of net investment income (loss) to
average net assets | |
Before waivers and reimbursements | | | (1.00 | )%(6) | | | (1.08 | )% | | | (0.51 | )% | | | (0.52 | )% | | | (0.53 | )%(6) | | | (0.31 | )% | | | 0.21 | % | |
Net of waivers and reimbursements | | | 0.13 | %(6) | | | 0.37 | % | | | 0.20 | % | | | 0.18 | % | | | 0.16 | %(6) | | | 0.41 | % | | | 0.74 | % | |
Portfolio turnover rate | | | 28 | %(5) | | | 196 | % | | | 50 | % | | | 37 | % | | | 43 | %(5) | | | 67 | % | | | 34 | % | |
(1) Effective October 8, 2010, Frontegra Asset Management, Inc. became adviser and Phocas Financial Corp. became subadviser to the Fund.
(2) Effective June 30, 2010, the Fund changed its fiscal year end to June 30 from December 31.
(3) Per share net investment income has been calculated using the daily average shares method.
(4) Less than one cent per share.
(5) Not annualized.
(6) Annualized.
The accompanying notes are an integral part of these financial statements.
page 55

NOTES TO FINANCIAL STATEMENTS
December 31, 2013 (Unaudited)
(1) ORGANIZATION
Frontegra Funds, Inc. (the "Company") was incorporated on May 24, 1996 as a Maryland corporation and is registered under the Investment Company Act of 1940, as amended (the "1940 Act"), as an open-end investment company issuing shares in series (each, a "Fund," or collectively, the "Funds"), each series representing a distinct portfolio with its own investment objectives and policies. The investment objective of the Frontegra RobecoSAM Global Equity Fund (formerly known as Frontegra SAM Global Equity Fund) is long-term capital growth. The investment objective of each of the Frontegra MFG Global Equity Fund, Frontegra Timpani Small Cap Growth Fund and Frontegra Netols Small Cap Value Fund is capital appreciation. The investment objective of the Frontegra MFG Core Infrastructure Fund is long-term capital appreciation. The investment objective of the Frontegra Phocas Small Cap Value Fund is long-term total investment through capital appreciation.
As of December 31, 2013, the Company had six series in operations. A summary of each Fund's investment adviser, subadviser and capital structure is as follows:
Fund | | Investment Adviser | | Subadviser | | Capital Structure | | Commencement
of Operations | |
Frontegra RobecoSAM Global Equity Fund (a) | | Frontegra Asset Management, Inc. ("Frontegra") | | RobecoSAM USA, Inc. | | Single Class | | June 18, 2009 | |
Frontegra MFG Global Equity Fund (a) | | Frontegra | | MFG Asset Management | | Single Class | | Dec. 28, 2011 | |
Frontegra MFG Core Infrastructure Fund (a) | | Frontegra | | MFG Asset Management | | Single Class | | Jan. 18, 2012 | |
Frontegra Timpani Small Cap Growth Fund | | Timpani Capital Management LLC ("Timpani") (b) | | None | | Multi-Class
• Institutional
• Class Y (c) | | Mar. 23, 2011 | |
Frontegra Netols Small Cap Value Fund | | Frontegra | | Netols Asset Management, Inc. | | Multi-Class
• Institutional
• Class Y | | Dec. 16, 2005 | |
Frontegra Phocas Small Cap Value Fund | | Frontegra | | Phocas Financial Corp. | | Single Class (d) | | Sep. 29, 2006 | |
(a) A redemption fee of 2.00% will be charged on shares of the Fund redeemed 30 days or less from their date of purchase.
(b) Timpani is an affiliate of Frontegra.
(c) As of December 31, 2013, the Class Y shares of the Frontegra Timpani Small Cap Growth Fund had not commenced operations.
(d) Effective November 1, 2012, the Class I shares of the Frontegra Phocas Small Cap Value Fund were converted into Class L shares of the Fund. Class L shares were redesignated Institutional Class shares.
page 56

NOTES TO FINANCIAL STATEMENTS (continued)
December 31, 2013 (Unaudited)
(2) SIGNIFICANT ACCOUNTING POLICIES
The following is a summary of significant accounting policies consistently followed by the Funds in the preparation of their financial statements.
(a) Investment Valuation
Equity securities for which market quotations are readily available are valued at the last reported sale price on the national securities exchange on which such securities are primarily traded. Equity securities for which there were no transactions on a given day or securities not listed on a national securities exchange are valued at the most recent bid price. Equity securities that are traded on NASDAQ are valued using the NASDAQ Official Closing Price ("NOCP"). Debt securities (other than short-term instruments) are valued by an independent pricing service, which uses valuation methods such as matrix pricing and other analytical pricing models as well as market transactions and evaluated dealer bid quotations. Shares of underlying mutual funds are valued at their respective NAVs. Exchange traded funds are valued at the last reported sale price on the exchange on which the security is principally traded. Securities that are primarily traded on foreign exchanges, generally are valued at the last sale price of such securities on their respective exchange. In certain circumstances, such as when a significant event occurs in a foreign market so that the last sale price no longer reflects actual value, the fair value of these securities may be determined using fair valuation procedures approved by the Board of Directors. The Directors have retained an independent fair value pricing service to assist in valuing foreign securities held by the Frontegra RobecoSAM Global Equity, Frontegra MFG Global Equity and Frontegra MFG Core Infrastructure Funds. In valuing assets, prices denominated in foreign currencies are converted to U.S. dollar equivalents at the current exchange rate, which approximates fair value. Securities maturing within 60 days or less when purchased are valued by the amortized cost method. Any securities or other assets for which market quotations are not readily available are valued at their fair value as determined in good faith by the advisers or subadvisers pursuant to guidelines established by the Board of Directors.
The Funds follow a fair value hierarchy that distinguishes between market data obtained from independent sources (observable inputs) and the Funds' own market assumptions (unobservable inputs). These inputs are used in determining the value of each Fund's investments and are summarized in the following fair value hierarchy:
Level 1 — Quoted prices in active markets for identical securities
Level 2 — Evaluated prices based on other significant observable inputs (including quoted prices for similar securities, foreign security indices, foreign exchange rates, fair value estimates for foreign securities and changes in benchmark securities indices)
Level 3 — Significant unobservable inputs (including the Fund's own assumptions in determining fair value of investments)
RobecoSAM Global Equity
Description | | Level 1 | | Level 2 | | Level 3 | | Total | |
Equity (a) | |
| Common Stocks | | $ | 17,386,778 | | | $ | — | | | $ | — | | | $ | 17,386,778 | | |
| Preferred Stocks | | | 526,323 | | | | — | | | | — | | | | 526,323 | | |
| Total Equity | | | 17,913,101 | | | | — | | | | — | | | | 17,913,101 | | |
Short-Term Investments | | | 273,484 | | | | — | | | | — | | | | 273,484 | | |
Total Investments in Securities | | $ | 18,186,585 | | | $ | — | | | $ | — | | | $ | 18,186,585 | | |
page 57

NOTES TO FINANCIAL STATEMENTS (continued)
December 31, 2013 (Unaudited)
MFG Global Equity
Description | | Level 1 | | Level 2 | | Level 3 | | Total | |
Equity (a) | |
| Common Stocks | | $ | 617,159,356 | | | $ | — | | | $ | — | | | $ | 617,159,356 | | |
| Total Equity | | | 617,159,356 | | | | — | | | | — | | | | 617,159,356 | | |
Short-Term Investments | | | 14,018,266 | | | | — | | | | — | | | | 14,018,266 | | |
Total Investments in Securities | | $ | 631,177,622 | | | $ | — | | | $ | — | | | $ | 631,177,622 | | |
MFG Core Infrastructure
Description | | Level 1 | | Level 2 | | Level 3 | | Total | |
Equity (a) | |
| Common Stocks | | $ | 17,188,045 | | | $ | — | | | $ | — | | | $ | 17,188,045 | | |
| Closed-End Funds | | | 177,104 | | | | — | | | | — | | | | 177,104 | | |
| Total Equity | | | 17,365,149 | | | | — | | | | — | | | | 17,365,149 | | |
Contingent Value Rights | | | — | | | | 689 | | | | — | | | | 689 | | |
Short-Term Investments | | | 537,725 | | | | — | | | | — | | | | 537,725 | | |
Total Investments in Securities | | $ | 17,902,874 | | | $ | 689 | | | $ | — | | | $ | 17,903,563 | | |
Timpani Small Cap Growth
Description | | Level 1 | | Level 2 | | Level 3 | | Total | |
Equity (a) | |
| Common Stocks | | $ | 6,951,313 | | | $ | — | | | $ | — | | | $ | 6,951,313 | | |
| Total Equity | | | 6,951,313 | | | | — | | | | — | | | | 6,951,313 | | |
Warrants | | | — | | | | 255 | | | | — | | | | 255 | | |
Short-Term Investments | | | 385,913 | | | | — | | | | — | | | | 385,913 | | |
Total Investments in Securities | | $ | 7,337,226 | | | $ | 255 | | | $ | — | | | $ | 7,337,481 | | |
Netols Small Cap Value
Description | | Level 1 | | Level 2 | | Level 3 | | Total | |
Equity (a) | |
| Common Stocks | | $ | 108,298,558 | | | $ | — | | | $ | — | | | $ | 108,298,558 | | |
| Total Equity | | | 108,298,558 | | | | — | | | | — | | | | 108,298,558 | | |
Short-Term Investments | | | 1,621,984 | | | | — | | | | — | | | | 1,621,984 | | |
Total Investments in Securities | | $ | 109,920,542 | | | $ | — | | | $ | — | | | $ | 109,920,542 | | |
Phocas Small Cap Value
Description | | Level 1 | | Level 2 | | Level 3 | | Total | |
Equity (a) | |
| Common Stocks | | $ | 12,431,996 | | | $ | — | | | $ | — | | | $ | 12,431,996 | | |
| Total Equity | | | 12,431,996 | | | | — | | | | — | | | | 12,431,996 | | |
Short-Term Investments | | | 128,421 | | | | — | | | | — | | | | 128,421 | | |
Total Investments in Securities | | $ | 12,560,417 | | | $ | — | | | $ | — | | | $ | 12,560,417 | | |
(a) See Fund's Schedule of Investments for sector or country classifications.
page 58

NOTES TO FINANCIAL STATEMENTS (continued)
December 31, 2013 (Unaudited)
As of December 31, 2013, there were no transfers between Levels 1, 2 and 3. The Funds did not hold any Level 3 securities during the six month period ended December 31, 2013. It is the Funds' policy to record transfers at the end of the reporting period.
(b) Federal Income Taxes
Each Fund intends to comply with the requirements of Subchapter M of the Internal Revenue Code necessary to qualify as a regulated investment company and to make the requisite distributions of income and capital gains to its shareholders sufficient to relieve it from all or substantially all federal income taxes. Therefore, no federal income tax provision has been provided.
The Funds have adopted financial reporting rules regarding recognition and measurement of tax positions taken or expected to be taken on a tax return. The Funds recognize interest and penalties, if any, related to unrecognized tax benefits as income tax expense on the Statement of Operations. During the period ended December 31, 2013, the Funds did not incur any interest or penalties. The Funds have reviewed all open tax years and concluded that there is no effect to any of the Fund's financial positions or results of operations and no tax liability resulting from unrecognized tax benefits relating to uncertain income tax positions taken or expected to be taken on a tax return. Open tax years are those years that are open for examination by the relevant income taxing authority. As of December 31, 2013, open federal and state income tax years include the tax years ended June 30, 2011, June 30, 2012 and June 30, 2013. The Funds have no examinations in progress.
(c) Distributions to Shareholders
Dividends from net investment income and net realized gains, if any, are declared and paid at least annually. All short-term capital gains are included in ordinary income for tax purposes. Distributions to shareholders are recorded on the ex-dividend date.
The tax character of distributions paid during the six months ended December 31, 2013 and the fiscal year ended June 30, 2013 were as follows:
| | Six Months Ended December 31, 2013 | | Year Ended June 30, 2013 | |
| | Ordinary
Income | | Long-Term
Capital Gains | | Total
Distributions | | Ordinary
Income | | Long-Term
Capital Gains | | Total
Distributions | |
RobecoSAM Global Equity | | $ | 306,528 | | | $ | 233,033 | | | $ | 539,561 | | | $ | 295,231 | | | $ | — | | | $ | 295,231 | | |
MFG Global Equity | | | 7,828,247 | | | | 571,764 | | | | 8,400,011 | | | | 2,433,628 | | | | — | | | | 2,433,628 | | |
MFG Core Infrastructure | | | 253,056 | | | | — | | | | 253,056 | | | | 119,866 | | | | — | | | | 119,866 | | |
Timpani Small Cap Growth | | | 46,045 | | | | 89,404 | | | | 135,449 | | | | — | | | | — | | | | — | | |
Netols Small Cap Value | | | 954,829 | | | | 25,571,887 | | | | 26,526,716 | | | | — | | | | 6,697,249 | | | | 6,697,249 | | |
Phocas Small Cap Value | | | 126,612 | | | | 570,892 | | | | 697,504 | | | | 61,412 | | | | — | | | | 61,412 | | |
At June 30, 2013, the Funds' most recent fiscal year end, the components of accumulated earnings/losses on a tax basis were as follows:
| | | RobecoSAM
Global
Equity | | MFG
Global
Equity | | MFG
Core
Infrastructure | | Timpani
Small Cap
Growth | | Netols
Small Cap
Value | | Phocas
Small Cap
Value | |
Cost of investments | | $ | 12,833,312 | | | $ | 319,490,469 | | | $ | 7,065,825 | | | $ | 2,961,310 | | | $ | 93,054,652 | | | $ | 6,645,669 | | |
Gross unrealized appreciation | | $ | 3,631,602 | | | $ | 32,822,603 | | | $ | 373,347 | | | $ | 1,054,030 | | | $ | 45,256,269 | | | $ | 2,408,166 | | |
Gross unrealized depreciation | | | (275,661 | ) | | | (5,504,224 | ) | | | (192,491 | ) | | | (24,120 | ) | | | (4,980,417 | ) | | | (114,836 | ) | |
Net unrealized appreciation/depreciation | | | 3,355,941 | | | | 27,318,379 | | | | 180,856 | | | | 1,029,910 | | | | 40,275,852 | | | | 2,293,330 | | |
page 59

NOTES TO FINANCIAL STATEMENTS (continued)
December 31, 2013 (Unaudited)
(table continued from prior page)
| | | RobecoSAM
Global
Equity | | MFG
Global
Equity | | MFG
Core
Infrastructure | | Timpani
Small Cap
Growth | | Netols
Small Cap
Value | | Phocas
Small Cap
Value | |
Undistributed ordinary income | | $ | 139,604 | | | $ | 5,379,860 | | | $ | 90,723 | | | $ | — | | | $ | 24,395 | | | $ | 16,849 | | |
Undistributed long-term capital gain | | | — | | | | 227,785 | | | | — | | | | — | | | | 15,949,941 | | | | 331,206 | | |
Total distributable earnings | | | 139,604 | | | | 5,607,645 | | | | 90,723 | | | | — | | | | 15,974,336 | | | | 348,055 | | |
Other accumulated losses | | | (309,510 | ) | | | (10,607 | ) | | | (5,797 | ) | | | (102,730 | ) | | | — | | | | — | | |
Total accumulated earnings/(losses) | | $ | 3,186,035 | | | $ | 32,915,417 | | | $ | 265,782 | | | $ | 927,180 | | | $ | 56,250,188 | | | $ | 2,641,385 | | |
The difference between book-basis and tax-basis unrealized appreciation is attributable primarily to the tax deferral of losses on wash sales.
As of the end of their tax year ended June 30, 2013, the following Funds have capital loss carryforwards ("CLCFs") as summarized in the table below. Under the provision of the Regulated Investment Company Modernization Act of 2010, CLCFs that originated in a tax year that began before December 23, 2010 (pre-effective CLCFs) may be carried forward, subject to certain limitations, and applied to offset future capital gains, and thus reduce the amount of distributable capital gains, for up to eight succeeding tax years, after which any unutilized CLCFs expire. Pre-effective CLCFs are applied as short-term capital loss regardless of whether the originating capital loss was short term or long term. CLCFs that originate in tax years beginning after December 22, 2010 (post effective CLCFs), are applied consistent with the character in which they originated as a new loss on the first day of the immediately succeeding tax year, and thus take precedent over the application of pre-effective CLCFs. Post-effective CLCFs can be carried forward indefinitely.
Post-effective CLCFs not subject to expiration:
Fund | | Short-term
Amount | | Long-term
Amount | | Total | |
RobecoSAM Global Equity | | $ | — | | | $ | 307,951 | | | $ | 307,951 | | |
Timpani Small Cap Growth | | | 86,398 | | | | — | | | | 86,398 | | |
During the year ended June 30, 2013, the Funds utilized CLCFs as follows:
Fund | | Amount | |
Timpani Small Cap Growth | | $ | 252,543 | | |
Netols Small Cap Value | | | 934,891 | | |
Phocas Small Cap Value | | | 2,649,941 | | |
In order to meet certain excise tax requirements, the Funds are required to measure and distribute annually, net capital gains realized during the twelve month period ending October 31st. In connection with this requirement, the Funds are permitted, for tax purposes, to defer into their next fiscal year any net capital losses incurred from November 1st through the end of the fiscal
page 60

NOTES TO FINANCIAL STATEMENTS (continued)
December 31, 2013 (Unaudited)
year. As of June 30, 2013, the following Funds deferred, on a tax basis, post-October losses and post-December late-year losses of:
| | | Post-October
Capital Loss Deferred | | Ordinary Late-Year
Loss Deferred | |
MFG Core Infrastructure | | $ | 4,724 | | | $ | — | | |
Timpani Small Cap Growth | | | — | | | | 16,332 | | |
(d) Foreign Currency Translation
Values of investments denominated in foreign currencies are converted into U.S. dollars using a spot market rate of exchange each day. Purchases and sales of investments and dividend and interest income are translated to U.S. dollars using a spot market rate of exchange prevailing on the dates of such transactions. The portion of security gains or losses resulting from changes in foreign exchange rates are included with net realized and unrealized gain or loss from investments, as appropriate, for both financial reporting and tax purposes.
Each Fund, respectively, bears the risk of changes in the foreign currency exchange rates and their impact on the value of assets and liabilities denominated in foreign currency. Each Fund also bears the risk of a counterparty failing to fulfill its obligation under a foreign currency contract.
Investments in securities of foreign companies involve additional risks including: currency exchange rate fluctuation; less available public information about the issuers of securities; less stringent regulatory standards; lack of uniform accounting, auditing and financial reporting standards; and country risks including less liquidity, high inflation rates and political and economic instability. The risks of foreign investments are typically greater in emerging and less developed markets.
(e) Indemnifications
Under the Funds' organizational documents, their officers and directors are indemnified against certain liabilities arising out of the performance of their duties to the Funds. In addition, in the normal course of business, the Funds enter into contracts that provide general indemnifications to other parties. The Funds' maximum exposure under these arrangements is unknown as this would involve future claims that may be made against the Funds that have not yet occurred. However, the Funds have not had prior claims or losses pursuant to these contracts and expect the risk of loss to be remote.
(f) Subsequent Events
The Class Y shares of the Frontegra Timpani Small Cap Growth Fund commenced operations on January 6, 2014.
(g) Other
Investment transactions are accounted for on the trade date. The Funds determine the gain or loss realized from investment transactions by comparing the original cost of the specifically identified security lot sold with the net sale proceeds. Dividend income, less foreign taxes withheld, is recognized on the ex-dividend date, except that certain dividends from foreign securities are recorded as soon as the information becomes available to the Funds. Interest income is recognized on an accrual basis. All discounts/premiums are accreted/amortized using the effective interest method and are included in interest income. Withholding taxes on foreign dividends have been provided for in accordance with the Funds' understanding of the applicable country's tax codes and regulations.
page 61

NOTES TO FINANCIAL STATEMENTS (continued)
December 31, 2013 (Unaudited)
Income, expenses (other than expenses attributable to a specific class) and realized and unrealized gains or losses on investments attributable to the Funds are generally allocated to each respective class in proportion to the relative net assets of each class.
The preparation of financial statements in conformity with U.S. generally accepted accounting principles ("GAAP") requires management to make estimates and assumptions that affect the reported amounts of assets and liabilities and disclosure of contingent assets and liabilities at the date of the financial statements, and the reported amounts of increases and decreases in net assets from operations during the reporting period. Actual results could differ from those estimates.
Net investment income and realized gains and losses for federal income tax purposes may differ from that reported on the financial statements because of permanent book-to-tax differences. GAAP requires that permanent differences in net investment income and realized gains and losses due to differences between financial reporting and tax reporting be reclassified between various components of net assets. These reclassifications have no effect on net assets or net asset value per share. For the fiscal year ended June 30, 2013, the following table shows the reclassifications made:
| | | RobecoSAM
Global
Equity | | MFG
Global
Equity | | MFG
Core
Infrastructure | | Timpani
Small Cap
Growth | | Netols
Small Cap
Value | | Phocas
Small Cap
Value | |
Paid in capital | | $ | — | | | $ | — | | | $ | — | | | $ | (7,557 | ) | | $ | 6,710 | | | $ | — | | |
Accumulated net investment income (loss) | | | (35,600 | ) | | | (3,763 | ) | | | (823 | ) | | | 7,557 | | | | 180,338 | | | | — | | |
Accumulated net realized gain (loss) | | | 35,600 | | | | 3,763 | | | | 823 | | | | — | | | | (187,048 | ) | | | — | | |
The permanent differences primarily relate to foreign currency, net operating losses and CLCF limitations.
(3) INVESTMENT ADVISER AND RELATED PARTIES
The RobecoSAM Global Equity, MFG Global Equity, MFG Core Infrastructure, Netols Small Cap Value and Phocas Small Cap Value Funds have entered into an agreement with Frontegra, with whom certain officers and a director of the Funds are affiliated, to furnish investment advisory services to the Funds. Timpani, an affiliate of Frontegra, is the investment adviser to the Frontegra Timpani Small Cap Growth Fund. Fees are calculated daily and payable monthly, at annual rates set forth in the following table (expressed as a percentage of each Fund's average daily net assets). Pursuant to expense cap agreements, Frontegra and Timpani have agreed to waive their respective management fees and/or reimburse each Fund's operating expenses (exclusive of brokerage, acquired fund fees and expenses, interest, taxes and extraordinary expenses) to ensure that each Fund's operating expenses do not exceed the expense limitation listed below. Expenses waived are netted with advisory fees payable on the Statement of Assets and Liabilities. On a monthly basis, these accounts are settled by each Fund making payment to the respective adviser or the respective adviser reimbursing the Fund if the reimbursement amount exceeds the advisory fee. If the amount of fees waived exceeds the advisory fee earned, this is shown on the Statement of Assets and Liabilities as a receivable from the respective adviser. The expense cap agreements will continue in effect until October 31, 2014, with successive renewal terms of one year unless terminated by an adviser or a Fund prior to any such renewal.
Frontegra Fund | | Annual Advisory Fees | | Expense Limitation | |
RobecoSAM Global Equity | | | 0.80 | % | | | 1.20 | % | |
MFG Global Equity | | | 0.80 | % | | | 0.80 | % | |
MFG Core Infrastructure | | | 0.70 | % | | | 0.70 | % | |
Timpani Small Cap Growth | | | 1.00 | % | | | 1.10 | % | |
Netols Small Cap Value - Institutional Class | | | 1.00 | % | | | 1.10 | % | |
Netols Small Cap Value - Class Y | | | 1.00 | % | | | 1.50 | % | |
Phocas Small Cap Value | | | 1.00 | % | | | 1.10 | % | |
page 62

NOTES TO FINANCIAL STATEMENTS (continued)
December 31, 2013 (Unaudited)
Any waivers or reimbursements are subject to later adjustment to allow the advisers to recoup amounts waived or reimbursed to the extent actual fees and expenses for a fiscal period are less than each Fund's expense limitation cap, provided, however, that an adviser shall only be entitled to recoup such amounts for a period of three years from the date such amount was waived or reimbursed. Expenses attributable to a specific class may only be recouped with respect to that class.
The following table shows the waived or reimbursed expenses subject to potential recovery expiring in:
| | RobecoSAM
Global
Equity | | MFG
Global
Equity | | MFG
Core
Infrastructure | | Timpani
Small Cap
Growth | | Netols
Small Cap
Value | | Phocas
Small Cap
Value | |
2014 | | $ | 26,548 | * | | $ | — | | | $ | — | | | $ | 46,572 | | | $ | 53,689 | | | $ | 104,993 | ** | |
2015 | | | 78,884 | | | | 95,480 | *** | | | 66,588 | **** | | | 103,400 | | | | 194,049 | | | | 146,574 | | |
2016 | | | 78,470 | | | | 294,528 | | | | 100,062 | | | | 95,252 | | | | 121,910 | | | | 147,770 | | |
2017 | | | 47,874 | | | | 279,276 | | | | 86,975 | | | | 47,152 | | | | 58,554 | | | | 65,344 | | |
Total | | $ | 231,776 | | | $ | 669,284 | | | $ | 253,625 | | | $ | 292,376 | | | $ | 428,202 | | | $ | 464,681 | | |
* Expenses waived/reimbursed were for the period June 10, 2011 through June 30, 2011.
** Expenses waived/reimbursed were for the period October 8, 2010 through June 30, 2011.
*** Expenses waived/reimbursed were for the period December 28, 2011 through June 30, 2012.
**** Expenses waived/reimbursed were for the period January 18, 2012 through June 30, 2012.
The beneficial ownership, either directly or indirectly, of more than 25% of the voting securities creates a presumption of control of the Funds. As of December 31, 2013, affiliates of Timpani owned a controlling interest in the Frontegra Timpani Small Cap Growth Fund. As of December 31, 2013, one shareholder owned a controlling interest in the Frontegra MFG Core Infrastructure Fund, but is not considered an affiliate of Frontegra. Shareholders with a controlling interest could affect the outcome of proxy voting or the direction of management of a Fund.
(4) INVESTMENT TRANSACTIONS
The aggregate purchases and sales of securities, excluding short-term investments for the Funds for the six months ended December 31, 2013 are summarized below:
| | RobecoSAM
Global
Equity | | MFG
Global
Equity | | MFG
Core
Infrastructure | | Timpani
Small Cap
Growth | | Netols
Small Cap
Value | | Phocas
Small Cap
Value | |
Purchases | | $ | 5,258,426 | | | $ | 289,798,387 | | | $ | 10,436,837 | | | $ | 4,937,959 | | | $ | 13,886,041 | | | $ | 4,316,400 | | |
Sales | | $ | 5,463,014 | | | $ | 69,985,635 | | | $ | 729,600 | | | $ | 3,210,769 | | | $ | 56,959,685 | | | $ | 3,072,083 | | |
There were no purchases or sales of U.S. Government securities for the Funds.
(5) DISTRIBUTION PLAN AND SHAREHOLDER SERVICING FEE
The Company, on behalf of the Frontegra Netols Small Cap Value Fund and the Frontegra Timpani Small Cap Growth Fund, has adopted a distribution plan pursuant to Rule 12b-1 under the Investment Company Act of 1940 for each Fund's Class Y shares (the "12b-1 Plan"). Pursuant to the 12b-1 Plan, the Fund pays an annual fee of up to 0.25% to Frontegra Strategies, LLC (the "Distributor"), an affiliate of Frontegra, for payments to brokers, dealers and other financial intermediaries who perform activities or
page 63

NOTES TO FINANCIAL STATEMENTS (continued)
December 31, 2013 (Unaudited)
incur expenses intended to result in the sale of Class Y shares of the Fund. As of December 31, 2013, the Class Y shares of the Frontegra Timpani Small Cap Growth Fund had not commenced operations. For the six months ended December 31, 2013, the Netols Small Cap Value Fund Class Y shares incurred $5,685 under the 12b-1 Plan.
Class Y shares of the Funds also pay an annual shareholder servicing fee of up to 0.15% per year to the Distributor for payments to brokers, dealers, and other financial intermediaries who provide on-going account services to shareholders. Those services include establishing and maintaining shareholder accounts, mailing prospectuses, account statements and other Fund documents to shareholders, processing shareholder transactions, and providing other recordkeeping and administrative services. For the six months ended December 31, 2013, the Netols Small Cap Value Fund Class Y shares incurred $3,411 in shareholder servicing expenses.
page 64

VOTING RESULTS OF SPECIAL MEETING OF SHAREHOLDERS
A special meeting of shareholders (the "Special Meeting") of the Frontegra RobecoSAM Global Equity Fund (the "Fund") was held on August 16, 2013. At the Special Meeting, shareholders voted on a proposal to approve a new subadvisory agreement between Frontegra Asset Management, Inc. ("Frontegra"), the investment adviser to the Fund, and RobecoSAM USA, Inc. ("RobecoSAM"), the subadviser to the Fund. Further details regarding the proposal and the Special Meeting are contained in a definitive proxy statement filed with the SEC on June 24, 2013.
At the Special Meeting held on August 16, 2013, a new subadvisory agreement between Frontegra and RobecoSAM was approved by shareholders of the Fund as follows:
| Votes For | | Votes Against | | Abstained | | Broker Non-Votes | |
| | 991,159 | | | | 0 | | | | 47,339 | | | | N/A | | |
page 65

A NOTE ON FORWARD-LOOKING STATEMENTS
This report includes forward-looking statements such as adviser, subadviser and/or portfolio manager predictions, opinions, assessments, analyses or outlooks for individual securities, industries, market sectors and/or markets. These statements involve risks and uncertainties. In addition to the general risks described for the Funds in the current Prospectuses, other factors bearing on these statements include the accuracy of the advisers', subadvisers' or portfolio managers' forecasts and predictions, and the appropriateness of the investment programs designed by an adviser, subadviser or portfolio manager to implement their strategies efficiently and effectively. Any one or more of these factors, as well as other risks affecting the securities markets and investment instruments generally, could cause the actual results of the Funds to differ materially as compared to benchmarks associated with the Funds.
In addition, portfolio composition will change due to ongoing management of the Funds. Specific securities named in this report may not currently be owned by the applicable Fund, or the Fund's position in the securities may have changed.
ADDITIONAL INFORMATION
Frontegra Funds has adopted proxy voting policies and procedures that delegate to Frontegra Asset Management, Inc. ("Frontegra") and Timpani Capital Management LLC the authority to vote proxies. The proxy voting policies permit Frontegra to delegate its authority to vote proxies to a Fund's subadviser. A description of the Frontegra Funds' proxy voting policies and procedures is available without charge, upon request, by calling the Funds toll free at 1-888-825-2100. A description of these policies and procedures is also included in the Funds' Statement of Additional Information, which is available on the SEC's website at http://www.sec.gov and the Funds' website at www.frontegra.com or by calling the Funds toll free at 1-888-825-2100.
The actual voting records relating to each Fund's portfolio securities during the most recent twelve months ended June 30 are available without charge by calling the Funds toll free at 1-888-825-2100 or by accessing the SEC's website at http://www.sec.gov.
Each Fund files a complete schedule of portfolio holdings for its first and third fiscal quarters with the SEC on Form N-Q. The Form N-Q is available on the SEC's website at http://www.sec.gov. The Form N-Q may also be reviewed and copied at the SEC's Public Reference Room in Washington, D.C. Information on the operation of the Public Reference Room may be obtained by calling toll-free 1-800-SEC-0330.
Item 2. Code of Ethics.
Not applicable for semi-annual reports.
Item 3. Audit Committee Financial Expert.
Not applicable for semi-annual reports.
Item 4. Principal Accountant Fees and Services.
Not applicable for semi-annual reports.
Item 5. Audit Committee of Listed Registrants.
Not applicable to registrants who are not listed issuers (as defined in Rule 10A-3 under the Securities Exchange Act of 1934).
Item 6. Investments.
(a) Schedule of Investments is included as part of the report to shareholders filed under Item 1 of this Form.
(b) Not Applicable.
Item 7. Disclosure of Proxy Voting Policies and Procedures for Closed-End Management Investment Companies.
Not applicable to open-end investment companies.
Item 8. Portfolio Managers of Closed-End Management Investment Companies.
Not applicable to open-end investment companies.
Item 9. Purchases of Equity Securities by Closed-End Management Investment Company and Affiliated Purchasers.
Not applicable to open-end investment companies.
Item 10. Submission of Matters to a Vote of Security Holders.
Not Applicable.
1
Item 11. Controls and Procedures.
(a) The Registrant’s President and Treasurer have reviewed the Registrant’s disclosure controls and procedures (as defined in Rule 30a-3(c) under the Investment Company Act of 1940 (the “Act”)) as of a date within 90 days of the filing of this report, as required by Rule 30a-3(b) under the Act and Rules 13a-15(b) or 15d-15(b) under the Securities Exchange Act of 1934. Based on their review, such officers have concluded that the disclosure controls and procedures are effective in ensuring that information required to be disclosed in this report is appropriately recorded, processed, summarized and reported and made known to them by others within the Registrant and by the Registrant’s service provider.
(b) There were no changes in the Registrant’s internal control over financial reporting (as defined in Rule 30a-3(d) under the Act) that occurred during the second fiscal quarter of the period covered by this report that has materially affected, or is reasonably likely to materially affect, the Registrant’s internal control over financial reporting.
Item 12. Exhibits.
(a) (1) Any code of ethics or amendment thereto, that is the subject of the disclosure required by Item 2, to the extent that the registrant intends to satisfy Item 2 requirements through filing an exhibit. Not applicable.
(2) A separate certification for each principal executive and principal financial officer pursuant to Section 302 of the Sarbanes-Oxley Act of 2002. Filed herewith.
(3) Any written solicitation to purchase securities under Rule 23c-1 under the Act sent or given during the period covered by the report by or on behalf of the registrant to 10 or more persons. Not applicable to open-end investment companies.
(b) Certifications pursuant to Section 906 of the Sarbanes-Oxley Act of 2002. Furnished herewith.
2
SIGNATURES
Pursuant to the requirements of the Securities Exchange Act of 1934 and the Investment Company Act of 1940, the registrant has duly caused this report to be signed on its behalf by the undersigned, thereunto duly authorized.
Frontegra Funds, Inc. | |
| | |
By: | /s/ William D. Forsyth III | |
| William D. Forsyth III, President | |
| (Principal Executive Officer) | |
| | |
Date: | February 18, 2014 | |
Pursuant to the requirements of the Securities Exchange Act of 1934 and the Investment Company Act of 1940, this report has been signed below by the following persons on behalf of the registrant and in the capacities and on the dates indicated.
By: | /s/ William D. Forsyth III | |
| William D. Forsyth III, President | |
| (Principal Executive Officer) | |
| | |
Date: | February 18, 2014 | |
| | |
By: | /s/ Elyce D. Dilworth | |
| Elyce D. Dilworth, Treasurer and Assistant Secretary | |
| (Principal Financial Officer) | |
| | |
Date: | February 18, 2014 | |
3