UNITED STATES
SECURITIES AND EXCHANGE COMMISSION
Washington, D.C. 20549
FORM N-CSR
CERTIFIED SHAREHOLDER REPORT OF REGISTERED
MANAGEMENT INVESTMENT COMPANIES
Investment Company Act file number | 811-07685 |
|
Frontier Funds, Inc. |
(Exact name of registrant as specified in charter) |
|
400 Skokie Blvd. Suite 500 Northbrook, IL | | 60062 |
(Address of principal executive offices) | | (Zip code) |
|
William D. Forsyth III 400 Skokie Blvd., Suite 500 Northbrook, Illinois 60062 |
(Name and address of agent for service) |
|
Registrant’s telephone number, including area code: | (847) 509-9860 | |
|
Date of fiscal year end: | June 30 | |
|
Date of reporting period: | December 31, 2016 | |
| | | | | | | | |
Item 1. Reports to Stockholders.

SEMI-ANNUAL REPORT
Frontier MFG Global Equity Fund
Frontier MFG Global Plus Fund
Frontier MFG Core Infrastructure Fund
Frontier Timpani Small Cap Growth Fund
Frontier Netols Small Cap Value Fund
Frontier Phocas Small Cap Value Fund
Frontegra Asset Management, Inc.
December 31, 2016

TABLE OF CONTENTS
Shareholder Letter | | | 1 | | |
Frontier MFG Global Equity Fund and Frontier MFG Global Plus Fund | |
Report from MFG Asset Management | | | 4 | | |
Investment Highlights | | | 6 | | |
Frontier MFG Core Infrastructure Fund | |
Report from MFG Asset Management | | | 10 | | |
Investment Highlights | | | 12 | | |
Frontier Timpani Small Cap Growth Fund | |
Report from Timpani Capital Management LLC | | | 14 | | |
Investment Highlights | | | 16 | | |
Frontier Netols Small Cap Value Fund | |
Report from Netols Asset Management, Inc. | | | 18 | | |
Investment Highlights | | | 20 | | |
Frontier Phocas Small Cap Value Fund | |
Report from Phocas Financial Corporation | | | 22 | | |
Investment Highlights | | | 23 | | |
Expense Example | | | 24 | | |
Schedules of Investments | |
Frontier MFG Global Equity Fund | | | 27 | | |
Frontier MFG Global Plus Fund | | | 28 | | |
Frontier MFG Core Infrastructure Fund | | | 29 | | |
Frontier Timpani Small Cap Growth Fund | | | 32 | | |
Frontier Netols Small Cap Value Fund | | | 35 | | |
Frontier Phocas Small Cap Value Fund | | | 37 | | |
Statements of Assets and Liabilities | | | 40 | | |
Statements of Operations | | | 42 | | |
Statements of Changes in Net Assets | | | 44 | | |
Financial Highlights | | | 47 | | |
Notes to Financial Statements | | | 59 | | |
This report is submitted for the general information of the shareholders of the above-listed Funds. It is not authorized for distribution to prospective investors unless accompanied or preceded by an effective Prospectus for the applicable Fund. The Prospectuses may be obtained by calling 1-888-825-2100. Each Prospectus includes more complete information about management fees and expenses, investment objectives, risks and operating policies of the applicable Fund. Please read the applicable Prospectus carefully.
Frontier Funds, Inc. are distributed by Frontegra Strategies, LLC, 400 Skokie Blvd., Suite 500, Northbrook, IL 60062. Frontegra Strategies, LLC, member of FINRA and SIPC, is an affiliate of Frontegra Asset Management, Inc. and Timpani Capital Management LLC, the Funds' investment advisers.

DEAR FELLOW SHAREHOLDERS:
We are pleased to report on the progress of the Frontier Funds over the past six months ending December 31, 2016. The S&P 500 Index was up 7.82% and small capitalization stocks were up, with the Russell 2000® Index returning 18.68%. International stocks, as measured by the MSCI EAFE Index, returned 5.67% over the six month period.
Fund Results
The Frontier MFG Global Equity Fund, managed by MFG Asset Management ("MFG"), returned 6.61% (net) versus the MSCI World Index (Net) return of 6.81% for the six month period ending December 31, 2016.
The Frontier MFG Global Plus Fund, Institutional Class, also managed by MFG, returned 6.27% (net) versus the MSCI World Index (Net) return of 6.81% for the six month period ending December 31, 2016. The Service Class shares returned 6.14% (net) over the same time period.
For the six month period ending December 31, 2016, the Frontier MFG Core Infrastructure Fund, Institutional Class, also managed by MFG, returned -7.29% (net) versus the S&P Global Infrastructure Index return of -1.45%. For the period from July 15, 2016, (inception), through December 31, 2016, the Service Class shares returned -7.06% (net) versus the MSCI World Index (Net) return of 3.79%.
The Frontier Timpani Small Cap Growth Fund, Institutional Class, managed by Timpani Capital Management, returned 6.97% (net) versus the Russell 2000® Growth Index return of 13.12% for the six month period ending December 31, 2016. The Class Y shares returned 6.84% (net) over the same time period. For the period from July 15, 2016, (inception), through December 31, 2016, the Service Class shares returned 2.46% (net) versus the MSCI World Index (Net) return of 8.20%.
For the six month period ending December 31, 2016, the Frontier Netols Small Cap Value Fund, Institutional Class, managed by Netols Asset Management, returned 15.80% (net) versus the Russell 2000® Value Index return of 24.19%. The Class Y shares returned 15.81% (net) over the same time period.
The Frontier Phocas Small Cap Value Fund, Institutional Class, managed by Phocas Financial, returned 18.88% (net) versus the Russell 2000 Value Index return of 24.19% for the six month period ending December 31, 2016. For the period from July 15, 2016, (inception), through December 31, 2016, the Service Class shares returned 14.77% (net) versus the Russell 2000® Value Index return of 18.50%.
Outlook
Calendar year 2016 can be bifurcated into two periods: pre-U.S. election and post-U.S. election. The first ten months of the year were characterized by solid if unspectacular returns in U.S. and non-U.S. equity markets and a strong U.S. dollar, as well as strong returns in the small cap U.S. stocks, especially value-oriented names. Following the November 8th election, equity markets went into overdrive, effectively doubling U.S. and non-U.S. equity returns through year end and turbocharging small cap stocks. As we enter 2017, there is considerable uncertainty, and we will work diligently to navigate markets with the care and diligence necessary in these volatile times.
We will continue to oversee the investment management of the Frontier Funds with the care and diligence that have served our shareholders well in the past. As always, we appreciate your investment and continued confidence in the Frontier Funds.
Best regards,
William D. Forsyth, CFA
President
Frontier Funds, Inc.
page 1
This page intentionally left blank.

FRONTIER
MFG GLOBAL EQUITY FUND
AND
FRONTIER
MFG GLOBAL PLUS FUND

REPORT FROM MFG ASSET MANAGEMENT
Dear Fellow Shareholders:
The investment objective of the Frontier MFG Global Equity Fund and the Frontier MFG Global Plus Fund is capital appreciation. The objective is measured against the MSCI World Index (Net).
Performance Review
The Frontier MFG Global Equity Fund returned 6.61%, net of fees, for the six month period ending December 31, 2016, while the Frontier MFG Global Plus Fund (Institutional Class) returned 6.27%, net of fees, for the same time period. Both Funds underperformed the 6.81% return of their benchmark, the MSCI World Index (Net).
Over the six months to December 31, 2016, the three largest contributors to the Funds' absolute returns were Apple, Microsoft and eBay, with returns in local currency of 22.2%, 22.8% and 26.7%, respectively. Apple performed well following its result release and a positive reaction to the recent release of the iPhone 7 and 7 Plus phones. Microsoft continued to perform well following strong earnings results relative to its guidance targets and the market's consensus estimates. The results featured continued revenue growth within its Productivity and Intelligent Cloud businesses with only a modest contraction in revenues from its Personal Computing segment. eBay's stock price rose strongly in July following its earnings release which was favourably received by the market. The company exceeded market consensus expectations for revenue and earnings per share growth, with the result showing a sequential improvement in U.S. Gross Merchandise Value growth.
Over the six months to December 31, 2016, the three largest detractors from the Funds' absolute returns were CVS Health, Lowe's and Novartis, with returns in local currency of -16.9%, -9.5% and -7.6%, respectively. CVS Health registered a weak performance following its recent earnings update, where management cut its full-year earnings expectations due to volume losses at its retail pharmacy. Lowe's was weak following its second quarter earnings release, with its comparable sales growth slowing to 2%. However, the company maintained full-year guidance of 4% and reiterated confidence in growth improving in the second half of 2016. Novartis' share price reflected weakness in the health care sector associated with the U.S. election and the implications for pharmaceuticals.
We feel strongly that people cannot retire on "relative investment returns"; only by generating investment returns that exceed the rate of inflation (ideally by a satisfactory margin) will investors increase their wealth over time. As such, we are happy to be judged on the absolute returns of our strategy over time.
Fund Outlook and Strategy
We remain cautious about the outlook for equity markets over the next few years, given the environment of abnormally low interest rates, historically elevated price-earnings multiples, risks associated with the recapitalisation of the Italian banking system and the continued withdrawal of U.S. monetary policy stimulus.
We are fairly relaxed about the appointment of the Trump administration and its implications for our investment portfolio. Trump's economic policies such as tax cuts and spending on infrastructure and defense are broadly stimulatory, so there is likely to be some upward pressure on growth, inflation and interest rates in the medium term, which has been priced by bond markets.
Nonetheless, we expect the near term to bring bouts of elevated market volatility, as markets do not like surprises and there remains great uncertainty on the actual policy platform that Trump, and the majority Republicans in Congress, will seek to enact.
Notwithstanding the current macroeconomic uncertainty, we expect to see a continuation of the U.S. economic recovery with modestly rising inflation, a continued slowdown in China (but not a financial crisis or hard landing) and an improvement in the economic outlook for Europe.
page 4

The Funds
Consistent with the stance held over the past two years, we retain a large weight in cash to preserve capital and continue to apply a consistent approach to selecting high quality companies that are well positioned to deliver satisfactory returns over the long term. Many of these companies are structurally advantaged through their exposure to the following major investment themes that are prevalent within the Funds:
• Consumer technology platforms: The leading digital platforms have tremendous opportunities to monetise new services and products (even when they are not the originator). With high switching costs and barriers to entry, their entrenched positions are unlikely to be challenged in the foreseeable future.
• Enterprise software: Established enterprise software vendors benefit from their incumbency. They typically operate in concentrated markets with high barriers to entry, network effects, and high switching costs. The shift to cloud computing presents a significant opportunity for leading vendors to expand their addressable markets and win a greater share of total enterprise IT expenditure.
• Health care and ageing population dynamics: The health care sector has attractive growth tailwinds due to rising patient volumes, increasing expenditure and large unmet health care needs.
• The move to a cashless society: There continues to be a strong secular shift from spending via cash and cheque to cashless forms of payments, such a credit cards, debit cards, electronic funds transfer and mobile payments. The explosion of smart and internet connected devices will accelerate this shift on a global basis.
We retain confidence in the quality and long-term outlook for our investments and are comfortable with the Funds' overall risk profile and construction.
Yours sincerely,
Hamish Douglass
Portfolio Manager
MFG Asset Management
page 5

INVESTMENT HIGHLIGHTS
Growth of a $1,000,000 Investment (Unaudited)
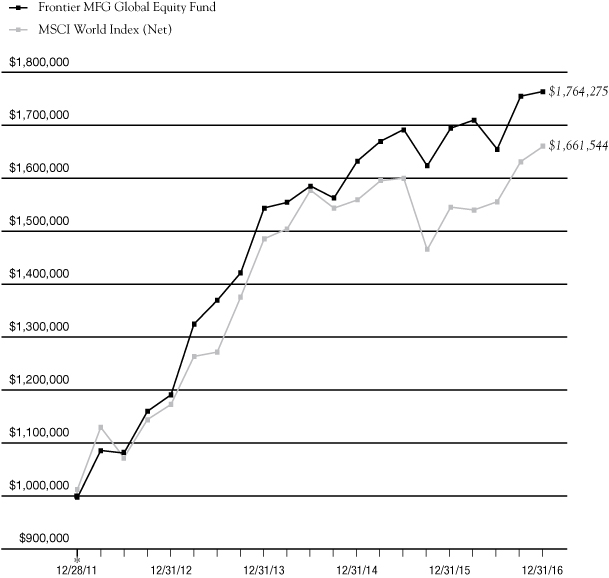
* 12/28/11 commencement of operations.
Portfolio Total Return**
FOR PERIODS ENDED 12/31/16 | | FUND | | INDEX | |
SIX MONTHS | | | 6.61 | % | | | 6.81 | % | |
ONE YEAR | | | 4.12 | % | | | 7.51 | % | |
FIVE YEAR
AVERAGE ANNUAL | | | 12.09 | % | | | 10.41 | % | |
AVERAGE ANNUAL
SINCE INCEPTION | | | 12.00 | % | | | 10.67 | % | |
Fund Expenses | |
GROSS EXPENSE RATIO | | | 0.87 | % | |
NET EXPENSE RATIO | | | 0.82 | % | |
This chart assumes an initial gross investment of $1,000,000 made on 12/28/11 (commencement of operations). Returns shown include the reinvestment of all distributions. Past performance is not predictive of future results. Investment return and principal value will fluctuate so that shares, when redeemed, may be worth more or less than the original cost. In the absence of existing fee waivers, total return would be reduced. To receive current to the most recent month-end performance, please call 1-888-825-2100.
The MSCI World Index (Net) represents large and mid cap equities across 23 Developed Markets countries. The index covers approximately 85% of the free float-adjusted market capitalization in each country. The index does not reflect investment management fees, brokerage commissions and other expenses associated with investing in equity securities. A direct investment in the index is not possible.
Frontegra Asset Management, Inc. has contractually agreed through October 31, 2018, to waive its management fee and/or reimburse the Fund's operating expenses to the extent necessary to ensure that the Fund's total operating expenses (excluding taxes, interest, brokerage commissions, acquired fund fees and expenses and extraordinary expenses) do not exceed 0.80% of the Fund's average daily net assets. The expense ratios presented are based on the annualized expense ratios as reported in the Fund's current prospectus, which may differ from the expense ratios presented in the Fund's financial highlights.
** The returns shown do not reflect the deduction of taxes that a shareholder would pay on Fund distributions or the redemption of Fund shares.
page 6

INVESTMENT HIGHLIGHTS
Growth of a $1,000,000 Investment (Unaudited)

* 3/23/15 commencement of operations.
Portfolio Total Return**
FOR PERIODS ENDED 12/31/16 | | FUND | | INDEX | |
SIX MONTHS | | | 6.27 | % | | | 6.81 | % | |
ONE YEAR | | | 3.46 | % | | | 7.51 | % | |
AVERAGE ANNUAL
SINCE INCEPTION | | | 1.34 | % | | | 1.17 | % | |
Institutional Class Expenses | |
GROSS EXPENSE RATIO | | | 2.05 | % | |
NET EXPENSE RATIO | | | 0.82 | % | |
This chart assumes an initial gross investment of $1,000,000 made on 3/23/15 (commencement of operations). Returns shown include the reinvestment of all distributions. Past performance is not predictive of future results. Investment return and principal value will fluctuate so that shares, when redeemed, may be worth more or less than the original cost. In the absence of existing fee waivers, total return would be reduced. To receive current to the most recent month-end performance, please call 1-888-825-2100.
The MSCI World Index (Net) represents large and mid cap equities across 23 Developed Markets countries. The index covers approximately 85% of the free float-adjusted market capitalization in each country. The index does not reflect investment management fees, brokerage commissions and other expenses associated with investing in equity securities. A direct investment in the index is not possible.
Frontegra Asset Management, Inc. has contractually agreed through October 31, 2018, to waive its management fee and/or reimburse the Fund's operating expenses to the extent necessary to ensure that the Fund's total operating expenses (excluding taxes, interest, brokerage commissions, acquired fund fees and expenses and extraordinary expenses) do not exceed 0.80% of the Fund's average daily net assets for the Institutional Class. The expense ratios presented are based on the annualized expense ratios as reported in the Fund's current prospectus, which may differ from the expense ratios presented in the Fund's financial highlights.
** The returns shown do not reflect the deduction of taxes that a shareholder would pay on Fund distributions or the redemption of Fund shares.
The above graph relates to Institutional Class shares of the Fund. Performance for Service Class shares will vary from the performance of the Institutional Class shares shown above due to differences in expenses.
page 7
This page intentionally left blank.

FRONTIER
MFG CORE INFRASTRUCTURE FUND

REPORT FROM MFG ASSET MANAGEMENT
Dear Fellow Shareholders:
The investment objective of the Frontier MFG Core Infrastructure Fund is long-term capital appreciation. The objective is measured against the S&P Global Infrastructure Index.
The types of infrastructure assets in which the Fund invests are generally natural monopolies that provide an essential service to the community. Infrastructure assets offer investors protection from the impacts of inflation because their earnings generally have some direct linkage to inflation. Over time, the stable, reliable earnings of infrastructure assets are expected to lead to a combination of income and capital growth for investors.
The universe of infrastructure assets that are held by the Fund is made up of two main sectors:
• Utilities: Utilities comprise approximately 65% of the Fund and includes both regulated energy utilities and regulated water utilities. Utilities are typically subject to economic regulation. The terms of regulation typically require a utility to efficiently provide an essential service to the community and, in return, permit the utility to earn a fair rate of return on the capital it has invested in its operations. As a utility provides a basic necessity, e.g. energy or water, there is minimal fluctuation in demanded volumes in response to the economic cycle, while the price charged for the utility service can be adjusted with limited impact upon demanded volumes. As a result, the earnings of regulated utilities have been, and are expected to continue to be, stable irrespective of economic conditions.
• Infrastructure: This includes airports, ports, toll roads and broadcast communications infrastructure. Regulation of infrastructure companies is generally less intensive than regulation of utilities and this allows companies to accrue the benefits of volume growth (i.e. the returns of infrastructure companies are linked to growth in passengers, vehicles or containers). As economies develop, grow and become more inter-dependent, we expect the underlying level of aviation, shipping and vehicle traffic to increase. As a result, the revenues and earnings derived by infrastructure assets are expected to grow.
A key feature of the portfolio construction process for the MFG Core Infrastructure strategy is the application of what we call "the 75% rule". This relates to those companies whose assets are a mixture of assets that MFG Asset Management classifies as infrastructure and those assets that do not meet our strict requirements. In those circumstances, we require at least, and on a consistent basis, 75% of the earnings of the company to be derived from the assets that meet our definitional requirement before it can be included in the Fund.
Performance Review
The Frontier MFG Core Infrastructure Fund, Institutional Class, returned -7.29%, net of fees, for the six month period ending December 31, 2016. The Fund's return underperformed the -1.45% return of its benchmark, the S&P Global Infrastructure Index. For the year, the Fund returned 6.18%, net of fees, compared to the benchmark's return of 12.43%.
The second half of 2016 has seen an increase in underlying interest rates in the U.S., UK and Australia as markets regained some confidence that rates would begin normalising. Donald Trump's election spurred those markets even further on the logic that a Trump administration would be good for economic growth and inflation. The companies held within the Fund are seen to be interest rate sensitive by investment markets and have been sold off as rates have risen. We acknowledge that the value of the Fund's assets is sensitive to real interest rates. However, to the extent that inflation pushes bond rates higher, almost all of the stocks in the Fund have either the express (e.g. CPI toll increases) or implied (e.g. regulated utility returns) ability to pass inflation impacts through to customers, thereby preserving the real value of the asset cash flows.
page 10

The period had a number of stocks that delivered negative shareholder returns, with 60 of the 83 stocks in the portfolio delivering negative returns during the period. There were a number of strong returns from companies in the portfolio, with U.S. utility SJW Corp. (Total Shareholder Return (TSR) of +43.5%), Frankfurt airport operator, Fraport (+17.0%) and European satellite operator, Eutelsat (+15.2%). The most negative performers in the portfolio were Mexican airport company, Grupo Aeroportuario del Centro Norte (-17.5%), U.S. utilities NiSource (-15.4%) and Aqua America (-14.7%).
The majority of the sectors in the portfolio were negative in the period, particularly those considered to have more sensitivity to rising interest rates. The Water Utility sector delivered a weighted average TSR of -9.5%, the Gas Utility sector -9.3%, the Integrated Power sector at -5.3%. With the recovery in the oil price over the period, stocks in the Energy Infrastructure sector had positive performance (+3.0%), albeit we expect this is more reflective of investor sentiment in the market and will have limited impact on the earnings of these companies in the short to medium term as our 75% rule screens out companies with significant commodity price exposure.
Geographically, the Fund's U.S. exposures generated a TSR of -6.3% and the UK returned -8.9%. The best performing region was Canada, which rose by 1.5% over the period.
Portfolio Outlook and Strategy
The Fund is designed to provide reliable returns over the medium-to-longer term. We believe that infrastructure and utility assets, with requisite earnings reliability and a linkage of earnings to inflation, offer an attractive, long-term investment proposition. Furthermore, given the predictable nature of earnings and the structural linkage of those earnings to inflation, the investment returns generated by infrastructure assets are different from standard asset classes and offer investors valuable diversification when included in an investment portfolio. In the current uncertain economic and investment climate, the reliable financial performance of infrastructure investments makes them particularly attractive and an investment in listed infrastructure can be expected to reward patient investors with a three to five year timeframe.
Sincerely,
Dennis Eagar
Portfolio Manager
MFG Asset Management
page 11

INVESTMENT HIGHLIGHTS
Growth of a $100,000 Investment (Unaudited)

* 1/18/12 commencement of operations.
Portfolio Total Return**
FOR PERIODS
ENDED
12/31/16 | | FUND | | MSCI
INDEX | | S&P
GLOBAL
INDEX | |
SIX MONTHS | | | (7.29 | )% | | | 6.81 | % | | | (1.45 | )% | |
ONE YEAR | | | 6.18 | % | | | 7.51 | % | | | 12.43 | % | |
AVERAGE
ANNUAL
SINCE
INCEPTION | | | 9.84 | % | | | 9.77 | % | | | 7.59 | % | |
Fund Expenses | |
GROSS EXPENSE RATIO | | | 0.84 | % | |
NET EXPENSE RATIO | | | 0.71 | % | |
This chart assumes an initial gross investment of $100,000 made on 1/18/12 (commencement of operations). Returns shown include the reinvestment of all distributions. Past performance is not predictive of future results. Investment return and principal value will fluctuate so that shares, when redeemed, may be worth more or less than the original cost. In the absence of existing fee waivers, total return would be reduced. To receive current to the most recent month-end performance, please call 1-888-825-2100.
The MSCI World Index (Net) represents large and mid cap equities across 23 Developed Markets countries and covers approximately 85% of the free float-adjusted market capitalization in each country. The S&P Global Infrastructure Index is a global developed markets infrastructure and utilities benchmark. Neither index reflects investment management fees, brokerage commissions or other expenses associated with investing in equity securities. A direct investment in an index is not possible.
Frontegra Asset Management, Inc. has contractually agreed through October 31, 2018, to waive its management fee and/or reimburse the Fund's operating expenses to the extent necessary to ensure that the Fund's total operating expenses (excluding taxes, interest, brokerage commissions, acquired fund fees and expenses and extraordinary expenses) do not exceed 0.70% of the Fund's average daily net assets. The expense ratios presented are based on the annualized expense ratios as reported in the Fund's current prospectus, which may differ from the expense ratios presented in the Fund's financial highlights.
** The returns shown do not reflect the deduction of taxes that a shareholder would pay on Fund distributions or the redemption of Fund shares.
The above graph relates to Institutional Class shares of the Fund. Performance for Service Class shares will vary from the performance of the Institutional Class shares shown above due to differences in expenses.
page 12

FRONTIER
TIMPANI SMALL CAP GROWTH FUND

REPORT FROM TIMPANI CAPITAL MANAGEMENT LLC
Dear Fellow Shareholders:
The Frontier Timpani Small Cap Growth Fund strives to achieve capital appreciation by investing in a diversified portfolio of growth companies with small market capitalizations. Timpani seeks to:
• Invest in companies where growth is robust, sustainable and underestimated by the market.
• Conduct fundamental research that provides unique insights into the growth gap that exists between market expectations and a company's true growth rate.
• Manage risk by continuously evaluating the size of the growth gap relative to market expectations and monitoring market sentiment.
• Act on new relevant incremental data points, both positive and negative, in an effort to exploit investor biases.
For the six months ended December 31, 2016, the Frontier Timpani Small Cap Growth Fund, Institutional Class, underperformed its benchmark, the Russell 2000® Growth Index, returning 6.97%, net of fees, compared to 13.12% for the benchmark. For the year, the Fund returned -1.06%, net of fees, compared to 11.32% for the Index.
Performance Review
For most of the period, cyclical value stocks, or stocks that are heavily tied to the general economy, significantly outperformed less economically sensitive secular growth stocks. This worked against Timpani's investment approach which heavily weights secular growers. Despite our recent struggles, our outlook is positive as we believe Timpani's specific investment approach is due for a mean-reverting recovery.
Secular, bad. Cyclical, good. This was the theme during the period and we were on the wrong end of both sides of this rotation. Detailed attribution analysis of the portfolio suggests stock selection drove the poor performance while sector allocation was slightly positive. Our overweight in Technology was the main driver of our value-added sector allocation. Health Care stock selection was the biggest contributor to the downside, led by Ligand Pharmaceuticals, a long-term winner for Timpani. Ligand's weakness was caused by a damaging analyst downgrade and poor clinical data from one of its drugs. Another notable underperformer during the period was a Producer Durable stock, Dycom Industries. It provides outsourced engineering and construction services but under-performed due to slowed spending from one of its customers. Our largest individual winner was a Health Care stock, Heska Corporation. It targets the growing animal health industry and is gaining market share due to an improved product offering and a new distribution model. Infrastructure services stocks, MasTec and Quanta Services, were positive contributors within the Producer Durables sector. Finally, laser manufacturer, Coherent, was our best performing Technology stock. We are excited about Coherent's demand outlook from its flat panel display customers as well as its synergy prospects tied to its recent acquisition.
Portfolio Outlook
Small-cap stock indices shined during the period, outperforming mid- and large-cap stocks. Value stocks materially outperformed growth stocks, especially following the November elections which led investors to conclude domestic economic growth is likely to accelerate.
We continue to have a positive outlook for the overall stock market. The combination of steady to improving economic growth and accommodative monetary policy is creating a benign backdrop for equities. Even though interest rates are likely to further rise, absolute levels remain low enough to enable economic growth and strong corporate earnings. In addition, valuation multiples look reasonable compared to prior non-recessionary periods of valuation expansion.
page 14

We are positive on the outlook for Timpani. Over the past 15 months, we have lived through a perfect storm of stylistic headwinds, whereby, our key investment criteria have been under-appreciated by the market. As a result, relative valuation of small cap growth stocks to small cap value stocks has reached an extreme low. In my 20-year career, I have never seen headwinds last for this long or get this extreme. In some ways, one could argue growth is the new value. We think things are stretched and a reversion to the mean recovery is coming for Timpani.
We continue to focus on finding robust and sustainable growers where the growth is being underestimated. That research has resulted in some sector weights that vary from the benchmark weights including an overweight in Technology, where we see notable fundamental strength, and underweights in Financial Services and Materials & Processing.
We will continue to make it our mission to find companies that have characteristics consistent with our investment process. We believe this approach is most value-added for shareholders over the long term.
Thank you for your continued support.
Sincerely,
Brandon Nelson, CFA
Chief Investment Officer
Timpani Capital Management LLC
page 15

INVESTMENT HIGHLIGHTS
Growth of a $100,000 Investment (Unaudited)

* 3/23/11 commencement of operations.
Portfolio Total Return**
FOR PERIODS ENDED 12/31/16 | | FUND | | INDEX | |
SIX MONTHS | | | 6.97 | % | | | 13.12 | % | |
ONE YEAR | | | (1.06 | )% | | | 11.32 | % | |
FIVE YEAR
AVERAGE ANNUAL | | | 12.14 | % | | | 13.74 | % | |
AVERAGE ANNUAL
SINCE INCEPTION | | | 8.64 | % | | | 10.41 | % | |
Institutional Class Expenses | |
GROSS EXPENSE RATIO | | | 1.32 | % | |
NET EXPENSE RATIO | | | 1.10 | % | |
This chart assumes an initial gross investment of $100,000 made on 3/23/11. Returns shown include the reinvestment of all distributions. Past performance is not predictive of future results. Investment return and principal value will fluctuate so that shares, when redeemed, may be worth more or less than the original cost. In the absence of fee waivers, total return would be reduced. To receive current to the most recent month-end performance, please call 1-888-825-2100.
The Russell 2000® Growth Index measures the performance of the small-cap growth segment of the U.S. equity universe. The index does not reflect investment management fees, brokerage commissions and other expenses associated with investing in equity securities. A direct investment in the index is not possible.
Timpani Capital Management LLC has contractually agreed through October 31, 2018, to waive its management fee and/or reimburse the Fund's operating expenses to the extent necessary to ensure that the Fund's total operating expenses (excluding taxes, interest, brokerage commissions, acquired fund fees and expenses and extraordinary expenses) do not exceed 1.10% of the Fund's average daily net assets of the Institutional Class. The expense ratios presented are based on the annualized expense ratios as reported in the Fund's current prospectus, which may differ from the expense ratios presented in the Fund's financial highlights.
** The returns shown do not reflect the deduction of taxes that a shareholder would pay on Fund distributions or the redemption of Fund shares.
The above graph relates to Institutional Class shares of the Fund. Performance for Class Y and Service Class shares will vary from the performance of the Institutional Class shares shown above due to differences in expenses.
page 16

FRONTIER
NETOLS SMALL CAP VALUE FUND

REPORT FROM NETOLS ASSET MANAGEMENT, INC.
Dear Fellow Shareholders:
The Frontier Netols Small Cap Value Fund strives to achieve capital appreciation by investing at least 80% of its net assets in equity securities of small capitalization companies. The Fund's performance is measured against the Russell 2000® Value Index.
Performance Review
During the six month period ended December 31, 2016, the Frontier Netols Small Cap Value Fund (Institutional Class) returned 15.80%, net of fees, compared to 24.19% for the Russell 2000 Value Index. For the year, the Fund returned 19.62%, net of fees, compared to 31.74% for the Index.
Portfolio Review
During the second half of 2016, the market was driven by a low interest rate environment and the U.S. Presidential Election. Donald Trump's win drove equity markets to record highs on a belief that significant economic change will take hold with the change in administration. Campaign promises of lower taxes, less regulation, bringing jobs back to the United States, and fiscal stimulus drove the reflation trade. This sent equity markets higher, along with the dollar and a reversal in treasury yields. The results of the election overshadowed the Federal Reserve raising rates and promising further hikes in 2017. Inflation appeared to pick up in the fourth quarter and may see an additional boost if OPEC supply cuts hold and December wage inflation is the start of a trend. These factors resulted in outperformance in Financials, Energy, and Information Technology, while Utilities, Real Estate and Health Care underperformed during the period.
Positive Contributions to Relative Performance in the Second Half of 2016:
• Stock selection in Financials sector
• Underweight in Utilities and Real Estate sectors
• Best performing stocks for the period: MGIC Investment Corp., Webster Financial, CenterState Banks, United Rentals, Community Bank System
Negative Contributions to Relative Performance in the Second Half of 2016:
• Stock selection in Information Technology, Consumer Discretionary, and Materials sectors
• Underweight in Financials sector
• Worst performing stocks for the period: Noodles & Co., Performance Sports Group, Avid Technology, Kindred Healthcare, Carter's
Portfolio Outlook
The U.S. economy appears to be steadily improving, anchored by solid employment growth. After years of monetary stimulus, inflation appears to have an upward bias. Going forward, as the Federal Reserve signals additional rate increases, stimulus tools should migrate from monetary to fiscal in nature. Additionally, the upcoming change in administration has driven the level of optimism in the U.S. higher based upon a pro-business stance. However, this will come with some offsets as the U.S. manages trade relations with countries like China, which is currently working to manage capital flows and economic growth. These factors may result in periods of higher volatility as the Fed attempts to normalize rates over a number of years.
The portfolio should perform better if the domestic economy continues to steadily improve and market distortions normalize. With a strong economy and artificially low rates, investors started the year with a reach for yield that morphed into a run to higher beta, lower
page 18

quality names. This happened as the Federal Reserve remained on the sidelines until the potentially disruptive Brexit vote and U.S. election were over, despite the economy approaching full employment. As a result, the Fed waited until December to raise rates and signal multiple increases in the upcoming year. These events created a pause in business activity for our companies that should normalize as we move through 2017. Additionally, capital spending levels could benefit from a more business-friendly environment driven by tax reform and a reduced regulatory burden. This growth leg has been missing in the recent recovery as corporations have chosen to repurchase shares rather than reinvest in their businesses. These factors could provide needed revenue growth for many of our companies to exhibit strong operating leverage created from ongoing efforts to streamline operations.
Thank you for your continued support.
Jeff Netols
President
Netols Asset Management, Inc.
page 19

INVESTMENT HIGHLIGHTS
Growth of a $100,000 Investment (Unaudited)

Portfolio Total Return*
FOR PERIODS
ENDED 12/31/16 | | FUND | | INDEX | |
SIX MONTHS | | | 15.80 | % | | | 24.19 | % | |
ONE YEAR | | | 19.62 | % | | | 31.74 | % | |
FIVE YEAR
AVERAGE ANNUAL | | | 13.14 | % | | | 15.07 | % | |
TEN YEAR
AVERAGE ANNUAL | | | 7.25 | % | | | 6.26 | % | |
Institutional Class Expenses | |
GROSS EXPENSE RATIO | | | 1.21 | % | |
NET EXPENSE RATIO | | | 1.10 | % | |
This chart assumes an initial gross investment of $100,000 made on 12/31/06. Returns shown include the reinvestment of all distributions. Past performance is not predictive of future results. Investment return and principal value will fluctuate so that shares, when redeemed, may be worth more or less than the original cost. In the absence of existing fee waivers, total return would be reduced. To receive current to the most recent month-end performance, please call 1-888-825-2100.
The Russell 2000 Value Index measures the performance of those Russell 2000 companies with lower price-to-book ratios and lower forecasted growth values. The index does not reflect investment management fees, brokerage commissions and other expenses associated with investing in equity securities. A direct investment in the index is not possible.
Frontegra Asset Management, Inc. has contractually agreed through October 31, 2018, to waive its management fee and/or reimburse the Fund's operating expenses to the extent necessary to ensure that the Fund's total operating expenses (excluding taxes, interest, brokerage commissions, acquired fund fees and expenses and extraordinary expenses) do not exceed 1.10% of the Fund's average daily net assets for the Institutional Class. The expense ratios presented are based on the annualized expense ratios as reported in the Fund's current prospectus, which may differ from the expense ratios presented in the Fund's financial highlights.
* The returns shown do not reflect the deduction of taxes that a shareholder would pay on Fund distributions or the redemption of Fund shares.
The above graph relates to Institutional Class shares of the Fund. Performance for Class Y shares will vary from the performance of the Institutional Class shares shown above due to differences in expenses.
page 20

FRONTIER
PHOCAS SMALL CAP VALUE FUND

REPORT FROM PHOCAS FINANCIAL CORPORATION
Dear Fellow Shareholders:
The Frontier Phocas Small Cap Value Fund strives to achieve capital appreciation by investing in a diversified portfolio of equity securities of companies with small market capitalizations. The Fund's performance is measured against the Russell 2000® Value Index.
Performance Review
During the six-month period ended December 31, 2016, the Frontier Phocas Small Cap Value Fund, Institutional Class, returned 18.88%, net of fees, compared to the 24.19% return of the benchmark, the Russell 2000® Value Index (the "Benchmark" or the "Index"). For the calendar year, the Frontier Phocas Small Cap Value Fund, Institutional Class, returned 23.31%, net of fees, compared to 31.74% for the Index.
Portfolio Review and Strategy
For the third quarter, the biggest individual contributors were Intersil Corp. and Nortek Inc. Intersil was acquired by Renesas Electronics for $22.50/share or almost 40x projected 2017 EPS, a very hefty valuation premium. Meanwhile, Nortek, a manufacturer of ventilation equipment, was offered a price of $86/share by Melrose Industries PLC shortly after the quarter started. Within Health Care, Progenics Pharmaceuticals, a biopharma company, was up significantly based on approval of oral Relistor, which has potential to be a very large drug. Within Materials, KapStone Paper rose due to improving corrugated containerboard pricing. During the quarter, Callon Petroleum and Ring Energy helped the Energy sector, both showing double digit gains, respectively. Within Financials and Real Estate, the best performers were Radian Group, a mortgage insurance company, NorthStar Asset Management, and Sabra Health Care REIT. Northstar is involved in a "merger of equals" with Colony Capital, which should be highly accretive to ongoing free cash flow if consummated. Health Care in the Fund had a negative return relative to the Benchmark due to two of our weaker positions this quarter, Lannett Co., Inc. and Aceto Corp. Both are involved in generic pharmaceuticals production which has come under a lot of pricing pressure. Within Financials, one of our largest positions, CNO Financial Group, was a significant laggard due to news that part of their reinsured long-term care reinsurance pool with Beechwood Re, would have to be recaptured. The recapture resulted in a large portion of their excess capital being reallocated as a required backstop; this was originally targeted for share buybacks. This issue is temporary, but the overhead news resulted in a weak quarter.
For the fourth quarter, though we had winners in other sectors, the biggest individual contributors were primarily banks: Heritage Oaks Bancorp (acquired by Pacific Premier Bancorp in a stock deal), Heritage Financial, CenterState Banks (a Florida-based community bank), and United Community Banks. Our best performing Industrial stock was also our largest position within that sector, SkyWest, up. Despite our struggles within Health Care, one of the better performers was our biotechnology investment, Progenics. Within Consumer Discretionary, Ruth's Hospitality Group was up attractively, and we sold it near the end of the quarter. Within Technology, Mentor Graphics also rose significantly due to a takeout offer by Siemens. On the other hand, the Health Care sector had the largest negative relative return due to two of our weaker positions this quarter, Lannett Co., Inc. and Community Health Systems. GameStop, within Consumer Discretionary, was the weakest performer. Within Technology, VASCO Data Security International, a company that designs authentication security solutions, primarily for banking and retail, also declined. VASCO's biggest customers are overseas financial institutions, many of whom were struggling to maintain operations let alone implement security.
We continue to sell highly appreciated positions as well as under-performing names that remain fundamentally challenged. We also continue to reinvest in lower valued names. Despite fair valuations within the broader domestic small cap equity market, select stocks still appear to present attractive investment opportunities.
Thank you for your continued support.
William Schaff, CFA | | Steve Block, CFA | |
Chief Executive Officer and Portfolio Manager | | Portfolio Manager | |
Phocas Financial Corporation | | Phocas Financial Corporation | |
page 22

INVESTMENT HIGHLIGHTS
Growth of a $100,000 Investment (Unaudited)

Portfolio Total Return*
FOR PERIODS ENDED 12/31/16 | | FUND | | INDEX | |
SIX MONTHS | | | 18.88 | % | | | 24.19 | % | |
ONE YEAR | | | 23.31 | % | | | 31.74 | % | |
FIVE YEAR
AVERAGE ANNUAL | | | 15.11 | % | | | 15.07 | % | |
TEN YEAR
AVERAGE ANNUAL | | | 7.90 | % | | | 6.26 | % | |
Fund Expenses | |
GROSS EXPENSE RATIO | | | 1.49 | % | |
NET EXPENSE RATIO | | | 1.10 | % | |
This chart assumes an initial gross investment of $100,000 made on 12/31/06. Returns shown include the reinvestment of all distributions. Past performance is not predictive of future results. Investment return and principal value will fluctuate so that shares, when redeemed, may be worth more or less than the original cost. In the absence of fee waivers, total return would be reduced. Effective October 8, 2010, Phocas Financial Corp. ("Phocas") became subadviser to the Fund and Frontegra Asset Management, Inc. became adviser to the Fund. Prior to October 8, 2010, Phocas served as adviser to the Fund. To receive current to the most recent month-end performance, please call 1-888-825-2100.
The Russell 2000® Value Index measures the performance of those Russell 2000® companies with lower price-to-book ratios and lower forecasted growth values. The index does not reflect investment management fees, brokerage commissions and other expenses associated with investing in equity securities. A direct investment in the index is not possible.
Frontegra Asset Management, Inc. has contractually agreed through October 31, 2018, to waive its management fee and/or reimburse the Fund's operating expenses to the extent necessary to ensure that the Fund's total operating expenses (excluding taxes, interest, brokerage commissions, acquired fund fees and expenses and extraordinary expenses) do not exceed 1.10% of the Fund's average daily net assets. The expense ratios presented are based on the annualized expense ratios as reported in the Fund's current prospectus, which may differ from the expense ratios presented in the Fund's financial highlights.
* The returns shown do not reflect the deduction of taxes that a shareholder would pay on Fund distributions or the redemption of Fund shares.
The above graph relates to Institutional Class shares of the Fund. Performance for Service Class shares will vary from the performance of the Institutional Class shares shown above due to differences in expenses.
page 23

Frontier Funds
EXPENSE EXAMPLE
December 31, 2016 (Unaudited)
As a shareholder of a mutual fund, you incur two types of costs: (1) transaction costs, including redemption fees, and (2) ongoing costs, including management fees, distribution and/or service (12b-1) fees and other fund expenses. Although the Funds charge no sales loads, you will be assessed fees for outgoing wire transfers, returned checks and stop payment orders at prevailing rates charged by U.S. Bancorp Fund Services, LLC, the Funds' transfer agent. If you request that a redemption be made by wire transfer, currently the Funds' transfer agent charges a $15.00 fee. A redemption fee of 2.00% of the then current value of the shares redeemed may be imposed on certain redemptions of shares made within 30 days of purchase for the Frontier MFG Global Equity, Frontier MFG Global Plus and Frontier MFG Core Infrastructure Funds.
This Example is intended to help you understand your ongoing costs (in dollars) of investing in the Funds and to compare these costs with the ongoing costs of investing in other mutual funds. The Example is based on an investment of $1,000 invested at the beginning of the period and held for the entire period (7/1/16 – 12/31/16).
Actual Expenses
The first line of the table on the following page for each Fund provides information about actual account values and actual expenses. The Example includes management fees, registration fees, fee waivers/reimbursements and other expenses. However, the Example does not include portfolio trading commissions and related expenses and other extraordinary expenses as determined under generally accepted accounting principles. You may use the information in this line, together with the amount you invested, to estimate the expenses that you paid over the period. Simply divide your account value by $1,000 (for example, an $8,600 account value divided by $1,000 = 8.6), then multiply the result by the number in the first line under the heading entitled "Expenses Paid During the Period" to estimate the expenses you paid on your account during this period.
Hypothetical Example for Comparison Purposes
The second line of the table for each Fund provides information about hypothetical account values and hypothetical expenses based on each of the Fund's actual expense ratios and an assumed rate of return of 5% per year before expenses, which is not the actual return. The hypothetical account values and expenses may not be used to estimate the actual ending account balance or expenses you paid for the period. You may use this information to compare the ongoing costs of investing in each of the Funds and other funds. To do so, compare this 5% hypothetical example with the 5% hypothetical examples that appear in the shareholder reports of the other funds.
Please note that the expenses shown in the table are meant to highlight your ongoing costs only and do not reflect any transactional costs, such as redemption fees. Therefore, the second line of the table is useful in comparing ongoing costs only, and will not help you determine the relative total costs of owning different funds. In addition, if these transactional costs were included, your costs could have been higher.
page 24

Frontier Funds
EXPENSE EXAMPLE (continued)
December 31, 2016 (Unaudited)
| | Beginning Account
Value 7/1/2016 | | Ending Account
Value 12/31/2016 | | Annualized
Expense Ratio* | | Expenses Paid
During the Period* | |
MFG Global Equity Fund | |
Actual Fund Return | | $ | 1,000.00 | | | $ | 1,066.10 | | | | 0.80 | % | | $ | 4.17 | | |
Hypothetical 5% Return | | $ | 1,000.00 | | | $ | 1,021.17 | | | | 0.80 | % | | $ | 4.08 | | |
MFG Global Plus Fund –
Institutional Class | |
Actual Fund Return | | $ | 1,000.00 | | | $ | 1,062.70 | | | | 0.80 | % | | $ | 4.16 | | |
Hypothetical 5% Return | | $ | 1,000.00 | | | $ | 1,021.17 | | | | 0.80 | % | | $ | 4.08 | | |
MFG Global Plus Fund –
Service Class | |
Actual Fund Return | | $ | 1,000.00 | | | $ | 1,061.40 | | | | 0.87 | % | | $ | 4.52 | | |
Hypothetical 5% Return | | $ | 1,000.00 | | | $ | 1,020.82 | | | | 0.87 | % | | $ | 4.43 | | |
MFG Core Infrastructure
Fund – Institutional Class | |
Actual Fund Return | | $ | 1,000.00 | | | $ | 927.10 | | | | 0.70 | % | | $ | 3.40 | | |
Hypothetical 5% Return | | $ | 1,000.00 | | | $ | 1,021.68 | | | | 0.70 | % | | $ | 3.57 | | |
Timpani Small Cap Growth
Fund – Institutional Class | |
Actual Fund Return | | $ | 1,000.00 | | | $ | 1,069.70 | | | | 1.10 | % | | $ | 5.74 | | |
Hypothetical 5% Return | | $ | 1,000.00 | | | $ | 1,019.66 | | | | 1.10 | % | | $ | 5.60 | | |
Timpani Small Cap Growth
Fund – Class Y | |
Actual Fund Return | | $ | 1,000.00 | | | $ | 1,068.40 | | | | 1.50 | % | | $ | 7.82 | | |
Hypothetical 5% Return | | $ | 1,000.00 | | | $ | 1,017.64 | | | | 1.50 | % | | $ | 7.63 | | |
Netols Small Cap Value
Fund – Institutional Class | |
Actual Fund Return | | $ | 1,000.00 | | | $ | 1,158.00 | | | | 1.10 | % | | $ | 5.98 | | |
Hypothetical 5% Return | | $ | 1,000.00 | | | $ | 1,019.66 | | | | 1.10 | % | | $ | 5.60 | | |
Netols Small Cap Value
Fund – Class Y | |
Actual Fund Return | | $ | 1,000.00 | | | $ | 1,158.10 | | | | 1.10 | % | | $ | 5.98 | | |
Hypothetical 5% Return | | $ | 1,000.00 | | | $ | 1,019.66 | | | | 1.10 | % | | $ | 5.60 | | |
Phocas Small Cap Value
Fund – Institutional Class | |
Actual Fund Return | | $ | 1,000.00 | | | $ | 1,188.80 | | | | 1.10 | % | | $ | 6.07 | | |
Hypothetical 5% Return | | $ | 1,000.00 | | | $ | 1,019.66 | | | | 1.10 | % | | $ | 5.60 | | |
* Expenses are equal to each Fund's annualized expense ratio indicated above, multiplied by the average account value over the period, multiplied by 184/365 to reflect the one-half year period.
page 25

Frontier Funds
EXPENSE EXAMPLE (continued)
December 31, 2016 (Unaudited)
| | Beginning Account
Value | | Ending Account
Value 12/31/2016 | | Annualized
Expense Ratio | | Expenses Paid
During the Period | |
MFG Core Infrastructure
Fund – Service Class | |
Actual Fund Return* | | $ | 1,000.00 | | | $ | 929.40 | | | | 0.75 | % | | $ | 3.37 | | |
Hypothetical 5% Return** | | $ | 1,000.00 | | | $ | 1,021.42 | | | | 0.75 | % | | $ | 3.82 | | |
Timpani Small Cap Growth
Fund – Service Class | |
Actual Fund Return* | | $ | 1,000.00 | | | $ | 1,024.60 | | | | 1.10 | % | | $ | 5.19 | | |
Hypothetical 5% Return** | | $ | 1,000.00 | | | $ | 1,019.66 | | | | 1.10 | % | | $ | 5.60 | | |
Phocas Small Cap Value
Fund – Service Class | |
Actual Fund Return* | | $ | 1,000.00 | | | $ | 1,147.70 | | | | 1.10 | % | | $ | 5.50 | | |
Hypothetical 5% Return** | | $ | 1,000.00 | | | $ | 1,019.66 | | | | 1.10 | % | | $ | 5.60 | | |
* Actual expenses are equal to each Fund's annualized expense ratio indicated above, multiplied by the average account value over the period, multiplied by 170/365 to reflect the most recent fiscal period end since the MFG Core Infrastructure Fund — Service Class, Timpani Small Cap Growth Fund — Service Class and Phocas Small Cap Value Fund — Service Class commenced operations on July 15, 2016.
** Hypothetical expenses are equal to each Fund's annualized expense ratio indicated above, multiplied by the average account value over the period commencing July 1, 2016, multiplied by 184/365 to reflect information had the MFG Core Infrastructure Fund — Service Class, Timpani Small Cap Growth Fund — Service Class and Phocas Small Cap Value Fund — Service Class been in operation for the entire fiscal half year.
page 26

Frontier MFG Global Equity Fund
SCHEDULE OF INVESTMENTS
December 31, 2016 (Unaudited)
Number of Shares | | | | Value | |
COMMON STOCKS 86.0% | | | |
| | | Australia 0.6% | |
| | 382,597 | | | Woolworths Ltd. | | $ | 6,654,053 | | |
| | | France 2.9% | |
| | 371,869 | | | Sanofi | | | 30,102,451 | | |
| | | Switzerland 6.4% | |
| | 490,163 | | | Nestle SA | | | 35,162,926 | | |
| | 441,756 | | | Novartis AG | | | 32,145,850 | | |
| | | | 67,308,776 | | |
| | | United Kingdom 5.6% | |
| | 35,252,216 | | | Lloyds Banking Group PLC | | | 27,157,526 | | |
| | 12,240,008 | | | Tesco PLC (a) | | | 31,202,653 | | |
| | | | 58,360,179 | | |
| | | United States 70.5% | |
| | 9,845 | | | Alphabet, Inc. - Class A (a) | | | 7,801,670 | | |
| | 56,303 | | | Alphabet, Inc. - Class C (a) | | | 43,455,790 | | |
| | 602,180 | | | Apple, Inc. | | | 69,744,488 | | |
| | 140,080 | | | Costco Wholesale Corp. | | | 22,428,209 | | |
| | 495,703 | | | CVS Health Corp. | | | 39,115,924 | | |
| | 1,336,919 | | | eBay, Inc. (a) | | | 39,693,125 | | |
| | 301,406 | | | Facebook, Inc. - Class A (a) | | | 34,676,760 | | |
| | 365,023 | | | HCA Holdings, Inc. (a) | | | 27,019,003 | | |
| | 638,445 | | | Intel Corp. | | | 23,156,400 | | |
| | 692,729 | | | Lowe's Companies, Inc. | | | 49,266,887 | | |
| | 296,641 | | | MasterCard, Inc. - Class A | | | 30,628,183 | | |
| | 304,327 | | | McDonald's Corp. | | | 37,042,682 | | |
| | 775,025 | | | Microsoft Corp. | | | 48,160,054 | | |
| | 957,863 | | | Oracle Corp. | | | 36,829,832 | | |
| | 856,214 | | | PayPal Holdings, Inc. (a) | | | 33,794,767 | | |
| | 367,545 | | | QUALCOMM, Inc. | | | 23,963,934 | | |
| | 348,118 | | | Target Corp. | | | 25,144,563 | | |
| | 640,803 | | | Visa, Inc. - Class A | | | 49,995,450 | | |
| | 871,983 | | | Wells Fargo & Co. | | | 48,054,983 | | |
| | 561,619 | | | Yum China Holdings, Inc. (a) | | | 14,669,488 | | |
Number of Shares | | | | Value | |
| | | United States 70.5% (continued) | |
| | 561,619 | | | Yum! Brands, Inc. | | $ | 35,567,331 | | |
| | | | 740,209,523 | | |
| | | Total Common Stocks | |
| | | (Cost $789,869,307) | | | 902,634,982 | | |
SHORT-TERM INVESTMENTS 12.5% | |
| | | Investment Company 12.5% | |
| | 131,370,278 | | | Morgan Stanley Institutional
Liquidity Funds - Government
Portfolio - Institutional Class,
0.44% | | | 131,370,278 | | |
| | | Total Short-Term Investments | |
| | | (Cost $131,370,278) | | | 131,370,278 | | |
| | | Total Investments 98.5% | |
| | | (Cost $921,239,585) | | | 1,034,005,260 | | |
| | | Other Assets in Excess of
Liabilities 1.5% | | | 16,175,608 | | |
| | | TOTAL NET ASSETS 100.0% | | $ | 1,050,180,868 | | |
(a) Non-Income Producing.
PORTFOLIO DIVERSIFICATION
Sectors | | Percentage | |
Information Technology | | | 42.1 | % | |
Consumer Discretionary | | | 15.4 | | |
Consumer Staples | | | 12.8 | | |
Health Care | | | 8.5 | | |
Financials | | | 7.2 | | |
Total Common Stocks | | | 86.0 | | |
Total Short-Term Investments | | | 12.5 | | |
Total Investments | | | 98.5 | | |
Other Assets in Excess of Liabilities | | | 1.5 | | |
Total Net Assets | | | 100.0 | % | |
The accompanying notes are an integral part of these financial statements.
page 27

Frontier MFG Global Plus Fund
SCHEDULE OF INVESTMENTS
December 31, 2016 (Unaudited)
Number of Shares | | | | Value | |
COMMON STOCKS 87.9% | | | |
| | | Australia 0.3% | |
| | 18,751 | | | Woolworths Ltd. | | $ | 326,114 | | |
| | | France 3.1% | |
| | 49,458 | | | Sanofi | | | 4,003,579 | | |
| | | Switzerland 7.0% | |
| | 64,892 | | | Nestle SA | | | 4,655,171 | | |
| | 58,517 | | | Novartis AG | | | 4,258,185 | | |
| | | | 8,913,356 | | |
| | | United Kingdom 2.8% | |
| | 4,688,923 | | | Lloyds Banking Group PLC | | | 3,612,242 | | |
| | | United States 74.7% | |
| | 1,211 | | | Alphabet, Inc. - Class A (a) | | | 959,657 | | |
| | 7,457 | | | Alphabet, Inc. - Class C (a) | | | 5,755,462 | | |
| | 79,214 | | | Apple, Inc. | | | 9,174,565 | | |
| | 17,718 | | | Costco Wholesale Corp. | | | 2,836,829 | | |
| | 65,710 | | | CVS Health Corp. | | | 5,185,176 | | |
| | 177,234 | | | eBay, Inc. (a) | | | 5,262,077 | | |
| | 39,652 | | | Facebook, Inc. - Class A (a) | | | 4,561,963 | | |
| | 48,291 | | | HCA Holdings, Inc. (a) | | | 3,574,500 | | |
| | 81,029 | | | Intel Corp. | | | 2,938,922 | | |
| | 91,133 | | | Lowe's Companies, Inc. | | | 6,481,380 | | |
| | 39,279 | | | MasterCard, Inc. - Class A | | | 4,055,557 | | |
| | 40,251 | | | McDonald's Corp. | | | 4,899,351 | | |
| | 101,958 | | | Microsoft Corp. | | | 6,335,670 | | |
| | 126,696 | | | Oracle Corp. | | | 4,871,461 | | |
| | 109,613 | | | PayPal Holdings, Inc. (a) | | | 4,326,425 | | |
| | 49,151 | | | QUALCOMM, Inc. | | | 3,204,645 | | |
| | 46,311 | | | Target Corp. | | | 3,345,044 | | |
| | 84,302 | | | Visa, Inc. - Class A | | | 6,577,242 | | |
| | 114,713 | | | Wells Fargo & Co. | | | 6,321,833 | | |
| | 73,884 | | | Yum! Brands, Inc. | | | 4,679,074 | | |
| | | | 95,346,833 | | |
| | | Total Common Stocks | |
| | | | | (Cost $109,568,253) | | | 112,202,124 | | |
Number of Shares | | | | Value | |
SHORT-TERM INVESTMENTS 12.1% | |
| | | Investment Company 12.1% | |
| | 15,399,714 | | | Morgan Stanley Institutional
Liquidity Funds - Government
Portfolio - Institutional Class,
0.44% | | $ | 15,399,714 | | |
| | | Total Short-Term Investments | |
| | | (Cost $15,399,714) | | | 15,399,714 | | |
| | | Total Investments 100.0% | |
| | | (Cost $124,967,967) | | | 127,601,838 | | |
| | | Liabilities in Excess of
Other Assets 0.0% | | | (21,128 | ) | |
| | | TOTAL NET ASSETS 100.0% | | $ | 127,580,710 | | |
(a) Non-Income Producing.
PORTFOLIO DIVERSIFICATION
Sectors | | Percentage | |
Information Technology | | | 45.5 | % | |
Consumer Discretionary | | | 15.2 | | |
Consumer Staples | | | 10.2 | | |
Health Care | | | 9.2 | | |
Financials | | | 7.8 | | |
Total Common Stocks | | | 87.9 | | |
Total Short-Term Investments | | | 12.1 | | |
Total Investments | | | 100.0 | | |
Liabilities in Excess of Other Assets | | | 0.0 | | |
Total Net Assets | | | 100.0 | % | |
The accompanying notes are an integral part of these financial statements.
page 28

Frontier MFG Core Infrastructure Fund
SCHEDULE OF INVESTMENTS
December 31, 2016 (Unaudited)
Number of Shares | | | | Value | |
COMMON STOCKS 96.9% | | | |
| | | Australia 8.4% | |
| | 357,536 | | | APA Group | | $ | 2,211,201 | | |
| | 1,087,025 | | | AusNet Services | | | 1,239,437 | | |
| | 810,775 | | | DUET Group | | | 1,603,166 | | |
| | 165,367 | | | Macquarie Atlas Roads Group | | | 602,654 | | |
| | 512,496 | | | Spark Infrastructure Group | | | 880,228 | | |
| | 731,929 | | | Sydney Airport | | | 3,163,905 | | |
| | 664,549 | | | Transurban Group | | | 4,949,192 | | |
| | | | 14,649,783 | | |
| | | Canada 9.5% | |
| | 65,220 | | | Emera, Inc. | | | 2,204,846 | | |
| | 122,326 | | | Enbridge, Inc. | | | 5,147,595 | | |
| | 130,032 | | | Fortis, Inc. | | | 4,015,288 | | |
| | 113,806 | | | TransCanada Corp. | | | 5,131,505 | | |
| | 12,902 | | | Valener, Inc. | | | 201,412 | | |
| | | | 16,700,646 | | |
| | | France 5.4% | |
| | 31,760 | | | Aeroports de Paris | | | 3,403,407 | | |
| | 77,519 | | | Eutelsat Communications SA | | | 1,501,044 | | |
| | 183,162 | | | Groupe Eurotunnel SE | | | 1,741,811 | | |
| | 124,736 | | | SES SA - ADR | | | 2,747,532 | | |
| | | | 9,393,794 | | |
| | | Germany 1.0% | |
| | 29,666 | | | Fraport AG Frankfurt Airport
Services Worldwide | | | 1,754,078 | | |
| | | Hong Kong 2.8% | |
| | 556,428 | | | Power Assets Holdings Ltd. | | | 4,904,488 | | |
| | | Italy 8.7% | |
| | 222,677 | | | Atlantia SpA | | | 5,217,783 | | |
| | 177,656 | | | Enav SpA (a) | | | 614,142 | | |
| | 269,489 | | | Italgas SpA (a) | | | 1,060,390 | | |
| | 1,123,417 | | | Snam SpA | | | 4,628,575 | | |
| | 76,350 | | | Societa Iniziative Autostradali e
Servizi SpA | | | 650,998 | | |
Number of Shares | | | | Value | |
| | | Italy 8.7% (continued) | |
| | 653,923 | | | Terna Rete Elettrica
Nazionale SpA | | $ | 2,995,719 | | |
| | | | 15,167,607 | | |
| | | Mexico 2.1% | |
| | 101,062 | | | Grupo Aeroportuario del Centro
Norte SAB de CV | | | 435,018 | | |
| | 158,813 | | | Grupo Aeroportuario del Pacifico
SAB de CV - Class B | | | 1,305,460 | | |
| | 92,270 | | | Grupo Aeroportuario del Sureste
SAB de CV - Class B | | | 1,328,257 | | |
| | 581,381 | | | OHL Mexico SAB de CV | | | 571,855 | | |
| | | | 3,640,590 | | |
| | | Netherlands 1.1% | |
| | 42,579 | | | Koninklijke Vopak NV | | | 2,011,340 | | |
| | | New Zealand 1.4% | |
| | 382,264 | | | Auckland International
Airport Ltd. | | | 1,659,742 | | |
| | 334,324 | | | Vector Ltd. | | | 752,506 | | |
| | | | 2,412,248 | | |
| | | Spain 9.0% | |
| | 317,831 | | | Abertis Infraestructuras SA | | | 4,448,055 | | |
| | 37,563 | | | Aena SA | | | 5,126,469 | | |
| | 71,047 | | | Cellnex Telecom SAU | | | 1,021,976 | | |
| | 76,618 | | | Enagas SA | | | 1,945,735 | | |
| | 176,032 | | | Red Electrica Corp SA | | | 3,321,516 | | |
| | | | 15,863,751 | | |
| | | Switzerland 1.0% | |
| | 9,854 | | | Flughafen Zuerich AG | | | 1,827,969 | | |
| | | United Kingdom 6.4% | |
| | 449,331 | | | National Grid PLC | | | 5,269,569 | | |
| | 137,780 | | | Pennon Group PLC | | | 1,404,255 | | |
| | 75,652 | | | Severn Trent PLC | | | 2,071,661 | | |
| | 221,777 | | | United Utilities Group PLC | | | 2,462,610 | | |
| | | | 11,208,095 | | |
The accompanying notes are an integral part of these financial statements.
page 29

Frontier MFG Core Infrastructure Fund
SCHEDULE OF INVESTMENTS (continued)
December 31, 2016 (Unaudited)
Number of Shares | | | | Value | |
| COMMON STOCKS 96.9% (continued) | | | |
| | | United States 40.1% | |
| | 6,810 | | | ALLETE, Inc. | | $ | 437,134 | | |
| | 36,206 | | | Alliant Energy Corp. | | | 1,371,845 | | |
| | 36,936 | | | Ameren Corp. | | | 1,937,663 | | |
| | 60,587 | | | American Electric Power Co., Inc. | | | 3,814,557 | | |
| | 6,560 | | | American States Water Co. | | | 298,874 | | |
| | 34,747 | | | American Tower Corp. | | | 3,672,063 | | |
| | 27,563 | | | American Water Works Co., Inc. | | | 1,994,459 | | |
| | 25,415 | | | Aqua America, Inc. | | | 763,467 | | |
| | 14,957 | | | Atmos Energy Corp. | | | 1,109,062 | | |
| | 8,779 | | | Avista Corp. | | | 351,072 | | |
| | 7,850 | | | California Water Service Group | | | 266,115 | | |
| | 42,610 | | | CMS Energy Corp. | | | 1,773,428 | | |
| | 47,165 | | | Consolidated Edison, Inc. | | | 3,475,117 | | |
| | 42,637 | | | Crown Castle International Corp. | | | 3,699,612 | | |
| | 50,683 | | | Dominion Resources, Inc. | | | 3,881,811 | | |
| | 50,221 | | | Duke Energy Corp. | | | 3,898,154 | | |
| | 49,597 | | | Edison International | | | 3,570,488 | | |
| | 5,972 | | | El Paso Electric Co. | | | 277,698 | | |
| | 48,238 | | | Eversource Energy | | | 2,664,185 | | |
| | 34,284 | | | Great Plains Energy, Inc. | | | 937,667 | | |
| | 7,077 | | | IDACORP, Inc. | | | 570,052 | | |
| | 46,175 | | | NiSource, Inc. | | | 1,022,314 | | |
| | 4,041 | | | Northwest Natural Gas Co. | | | 241,652 | | |
| | 6,623 | | | NorthWestern Corp. | | | 376,650 | | |
| | 7,200 | | | ONE Gas, Inc. | | | 460,512 | | |
| | 63,240 | | | PG&E Corp. | | | 3,843,095 | | |
| | 16,877 | | | Pinnacle West Capital Corp. | | | 1,316,912 | | |
| | 11,214 | | | PNM Resources, Inc. | | | 384,640 | | |
| | 12,744 | | | Portland General Electric Co. | | | 552,197 | | |
| | 105,347 | | | PPL Corp. | | | 3,587,065 | | |
| | 21,907 | | | SCANA Corp. | | | 1,605,345 | | |
| | 37,893 | | | Sempra Energy | | | 3,813,552 | | |
| | 1,405 | | | SJW Corp. | | | 78,652 | | |
| | 6,567 | | | Southwest Gas Corp. | | | 503,164 | | |
| | 6,096 | | | Spire, Inc. | | | 393,497 | | |
Number of Shares | | | | Value | |
| | | United States 40.1% (continued) | |
| | 6,418 | | | The Empire District Electric Co. | | $ | 218,790 | | |
| | 78,627 | | | The Southern Co. | | | 3,867,662 | | |
| | 48,045 | | | WEC Energy Group, Inc. | | | 2,817,839 | | |
| | 20,726 | | | Westar Energy, Inc. | | | 1,167,910 | | |
| | 77,324 | | | Xcel Energy, Inc. | | | 3,147,087 | | |
| | | | 70,163,058 | | |
| | | Total Common Stocks | |
| | | | | (Cost $160,877,824) | | | 169,697,447 | | |
CLOSED-END FUNDS 0.9% | | | |
| | | United Kingdom 0.9% | |
| | 485,186 | | | HICL Infrastructure Co. Ltd. | | | 984,220 | | |
| | 338,970 | | | International Public
Partnerships Ltd. | | | 643,334 | | |
| | | | 1,627,554 | | |
| | | Total Closed-End Funds | |
| | | | | (Cost $1,793,705) | | | 1,627,554 | | |
SHORT-TERM INVESTMENTS 1.9% | | | |
| | | Investment Company 1.9% | |
| | 3,274,684 | | | Morgan Stanley Institutional
Liquidity Funds - Government
Portfolio - Institutional Class,
0.44% | | | 3,274,684 | | |
| | | Total Short-Term Investments | |
| | | | | (Cost $3,274,684) | | | 3,274,684 | | |
| | | Total Investments 99.7% | |
| | | | | (Cost $165,946,213) | | | 174,599,685 | | |
| | | | | Other Assets in Excess of
Liabilities 0.3% | | | 448,903 | | |
| | | | | TOTAL NET ASSETS 100.0% | | $ | 175,048,588 | | |
(a) Non-Income Producing.
ADR - American Depositary Receipt | |
The accompanying notes are an integral part of these financial statements.
page 30

Frontier MFG Core Infrastructure Fund
SCHEDULE OF INVESTMENTS (continued)
December 31, 2016 (Unaudited)
PORTFOLIO DIVERSIFICATION
Sectors | | Percentage | |
Integrated Power | | | 28.3 | % | |
Transmission & Distribution | | | 17.4 | | |
Airports | | | 11.8 | | |
Toll Roads | | | 10.4 | | |
Energy Infrastructure | | | 8.3 | | |
Gas Utilities | | | 8.2 | | |
Communications | | | 7.2 | | |
Water Utilities | | | 5.3 | | |
Total Common Stocks | | | 96.9 | | |
Social | | | 0.9 | | |
Total Closed-End Funds | | | 0.9 | | |
Total Short-Term Investments | | | 1.9 | | |
Total Investments | | | 99.7 | | |
Other Assets in Excess of Liabilities | | | 0.3 | | |
Total Net Assets | | | 100.0 | % | |
The accompanying notes are an integral part of these financial statements.
page 31

Frontier Timpani Small Cap Growth Fund
SCHEDULE OF INVESTMENTS
December 31, 2016 (Unaudited)
Number of Shares | | | | Value | |
COMMON STOCKS 98.3% | | | |
| | | Consumer Discretionary 20.5% | |
| | 15,888 | | | Bojangles', Inc. (a) | | $ | 296,311 | | |
| | 18,022 | | | Boot Barn Holdings, Inc. (a) | | | 225,635 | | |
| | 12,229 | | | Build-A-Bear Workshop, Inc. (a) | | | 168,149 | | |
| | 8,796 | | | Central Garden & Pet Co. (a) | | | 291,060 | | |
| | 21,101 | | | Century Communities, Inc. (a) | | | 443,121 | | |
| | 58,535 | | | Chegg, Inc. (a) | | | 431,988 | | |
| | 21,562 | | | Conn's, Inc. (a) | | | 272,759 | | |
| | 9,136 | | | Dave & Buster's
Entertainment, Inc. (a) | | | 514,357 | | |
| | 14,509 | | | Fox Factory Holding Corp. (a) | | | 402,625 | | |
| | 5,637 | | | Hibbett Sports, Inc. (a) | | | 210,260 | | |
| | 2,175 | | | Jack in the Box, Inc. | | | 242,817 | | |
| | 11,245 | | | LGI Homes, Inc. (a) | | | 323,069 | | |
| | 3,414 | | | Lithia Motors, Inc. - Class A | | | 330,578 | | |
| | 27,750 | | | Nautilus, Inc. (a) | | | 513,375 | | |
| | 16,489 | | | Nutrisystem, Inc. | | | 571,344 | | |
| | 22,557 | | | Ollie's Bargain Outlet
Holdings, Inc. (a) | | | 641,747 | | |
| | 1,111 | | | Panera Bread Co. - Class A (a) | | | 227,855 | | |
| | 4,247 | | | Papa John's International, Inc. | | | 363,458 | | |
| | 27,788 | | | Planet Fitness, Inc. - Class A | | | 558,539 | | |
| | 4,105 | | | RH (a) | | | 126,023 | | |
| | 8,351 | | | Stamps.com, Inc. (a) | | | 957,442 | | |
| | 3,745 | | | Texas Roadhouse, Inc. | | | 180,659 | | |
| | 5,315 | | | The Children's Place, Inc. | | | 536,549 | | |
| | 14,450 | | | The Habit Restaurants, Inc. -
Class A (a) | | | 249,263 | | |
| | 10,092 | | | Zoe's Kitchen, Inc. (a) | | | 242,107 | | |
| | | | 9,321,090 | | |
| | | Consumer Staples 2.6% | |
| | 6,640 | | | MGP Ingredients, Inc. | | | 331,867 | | |
| | 29,613 | | | Primo Water Corp. (a) | | | 363,648 | | |
| | 12,068 | | | Snyder's-Lance, Inc. | | | 462,687 | | |
| | | | 1,158,202 | | |
Number of Shares | | | | Value | |
| | | Financial Services 3.8% | |
| | 8,511 | | | BofI Holding, Inc. (a) | | $ | 242,989 | | |
| | 6,318 | | | Kinsale Capital Group, Inc. | | | 214,875 | | |
| | 7,472 | | | LendingTree, Inc. (a) | | | 757,287 | | |
| | 10,007 | | | Western Alliance Bancorp (a) | | | 487,441 | | |
| | | | 1,702,592 | | |
| | | Health Care 19.8% | |
| | 3,102 | | | ABIOMED, Inc. (a) | | | 349,533 | | |
| | 30,455 | | | AxoGen, Inc. (a) | | | 274,095 | | |
| | 17,686 | | | BioTelemetry, Inc. (a) | | | 395,282 | | |
| | 12,541 | | | Cardiovascular Systems, Inc. (a) | | | 303,618 | | |
| | 44,180 | | | Castlight Health, Inc. - Class B (a) | | | 218,691 | | |
| | 19,512 | | | Glaukos Corp. (a) | | | 669,262 | | |
| | 16,287 | | | Heska Corp. (a) | | | 1,166,149 | | |
| | 6,327 | | | ICU Medical, Inc. (a) | | | 932,283 | | |
| | 7,774 | | | INC Research Holdings, Inc. -
Class A (a) | | | 408,912 | | |
| | 12,674 | | | Inogen, Inc. (a) | | | 851,313 | | |
| | 4,615 | | | Ligand Pharmaceuticals, Inc. (a) | | | 468,930 | | |
| | 37,131 | | | NeoGenomics, Inc. (a) | | | 318,213 | | |
| | 4,899 | | | Nevro Corp. (a) | | | 355,961 | | |
| | 11,974 | | | NuVasive, Inc. (a) | | | 806,569 | | |
| | 11,170 | | | Penumbra, Inc. (a) | | | 712,646 | | |
| | 7,037 | | | PRA Health Sciences, Inc. (a) | | | 387,879 | | |
| | 10,262 | | | Supernus Pharmaceuticals, Inc. (a) | | | 259,116 | | |
| | 19,569 | | | Synergy Pharmaceuticals, Inc. (a) | | | 119,175 | | |
| | | | 8,997,627 | | |
| | | Materials & Processing 3.6% | |
| | 5,848 | | | Beacon Roofing Supply, Inc. (a) | | | 269,417 | | |
| | 2,688 | | | Patrick Industries, Inc. (a) | | | 205,094 | | |
| | 20,604 | | | Summit Matierals, Inc. -
Class A (a) | | | 490,175 | | |
| | 9,789 | | | U.S. Concrete, Inc. (a) | | | 641,180 | | |
| | | | 1,605,866 | | |
| | | Producer Durables 16.9% | |
| | 12,834 | | | Advanced Energy
Industries, Inc. (a) | | | 702,661 | | |
The accompanying notes are an integral part of these financial statements.
page 32

Frontier Timpani Small Cap Growth Fund
SCHEDULE OF INVESTMENTS (continued)
December 31, 2016 (Unaudited)
Number of Shares | | | | Value | |
| COMMON STOCKS 98.3% (continued) | | | |
| | | Producer Durables 16.9% (continued) | |
| | 28,509 | | | Air Transport Services
Group, Inc. (a) | | $ | 455,004 | | |
| | 9,855 | | | Atkore International
Group, Inc. (a) | | | 235,633 | | |
| | 6,271 | | | Dycom Industries, Inc. (a) | | | 503,499 | | |
| | 8,181 | | | Granite Construction, Inc. | | | 449,955 | | |
| | 11,463 | | | Hudson Technologies, Inc. (a) | | | 91,819 | | |
| | 9,855 | | | John Bean Technologies Corp. | | | 847,037 | | |
| | 13,903 | | | Knight Transportation, Inc. | | | 459,494 | | |
| | 28,336 | | | MasTec, Inc. (a) | | | 1,083,852 | | |
| | 17,166 | | | NV5 Global, Inc. (a) | | | 573,344 | | |
| | 4,559 | | | Old Dominion Freight
Line, Inc. (a) | | | 391,117 | | |
| | 4,311 | | | OSI Systems, Inc. (a) | | | 328,153 | | |
| | 18,169 | | | Polar Power, Inc. (a) | | | 162,613 | | |
| | 22,642 | | | Quanta Services, Inc. (a) | | | 789,074 | | |
| | 10,716 | | | Swift Transportation Co. (a) | | | 261,042 | | |
| | 1,400 | | | TransDigm Group, Inc. | | | 348,544 | | |
| | | | 7,682,841 | | |
| | | Technology 30.1% | |
| | 24,591 | | | A10 Networks, Inc. (a) | | | 204,351 | | |
| | 14,329 | | | Airgain, Inc. (a) | | | 206,338 | | |
| | 11,582 | | | Asure Software, Inc. (a) | | | 98,563 | | |
| | 39,513 | | | AXT, Inc. (a) | | | 189,662 | | |
| | 24,818 | | | Bazaarvoice, Inc. (a) | | | 120,367 | | |
| | 52,738 | | | Carbonite, Inc. (a) | | | 864,903 | | |
| | 19,247 | | | CEVA, Inc. (a) | | | 645,737 | | |
| | 7,661 | | | Coherent, Inc. (a) | | | 1,052,507 | | |
| | 17,270 | | | CommVault Systems, Inc. (a) | | | 887,678 | | |
| | 8,351 | | | Evolent Health, Inc. - Class A (a) | | | 123,595 | | |
| | 15,142 | | | Fabrinet (a) | | | 610,223 | | |
| | 65,553 | | | Five9, Inc. (a) | | | 930,197 | | |
| | 19,900 | | | Gigamon, Inc. (a) | | | 906,445 | | |
| | 28,705 | | | GTT Communications, Inc. (a) | | | 825,269 | | |
| | 15,360 | | | II-VI, Inc. (a) | | | 455,424 | | |
Number of Shares | | | | Value | |
| | | Technology 30.1% (continued) | |
| | 2,469 | | | iRobot Corp. (a) | | $ | 144,313 | | |
| | 4,263 | | | LogMeIn, Inc. | | | 411,593 | | |
| | 22,888 | | | Lumentum Holdings, Inc. (a) | | | 884,621 | | |
| | 12,778 | | | Match Group, Inc. (a) | | | 218,504 | | |
| | 26,151 | | | Orbotech Ltd. (a) | | | 873,705 | | |
| | 10,252 | | | Q2 Holdings, Inc. (a) | | | 295,770 | | |
| | 21,678 | | | RADCOM Ltd. (a) | | | 385,868 | | |
| | 23,182 | | | RealPage, Inc. (a) | | | 695,460 | | |
| | 9,770 | | | Rudolph Technologies, Inc. (a) | | | 228,130 | | |
| | 21,053 | | | The KEYW Holding Corp. (a) | | | 248,215 | | |
| | 19,686 | | | TTM Technologies, Inc. (a) | | | 268,320 | | |
| | 23,758 | | | Varonis Systems, Inc. (a) | | | 636,714 | | |
| | 6,044 | | | Wix.com Ltd. (a) | | | 269,260 | | |
| | | | 13,681,732 | | |
| | | Utilities 1.0% | |
| | 37,179 | | | Boingo Wireless, Inc. (a) | | | 453,212 | | |
| | | Total Common Stocks | |
| | | | | (Cost $35,424,249) | | | 44,603,162 | | |
SHORT-TERM INVESTMENTS 1.0% | | | |
| | | Investment Company 1.0% | |
| | 468,176 | | | Morgan Stanley Institutional
Liquidity Funds - Government
Portfolio - Institutional Class,
0.44% | | | 468,176 | | |
| | | Total Short-Term Investments | |
| | | | | (Cost $468,176) | | | 468,176 | | |
| | | Total Investments 99.3% | |
| | | | | (Cost $35,892,425) | | | 45,071,338 | | |
| | | | | Other Assets in Excess of
Liabilities 0.7% | | | 315,613 | | |
| | | | | TOTAL NET ASSETS 100.0% | | $ | 45,386,951 | | |
(a) Non-Income Producing.
The accompanying notes are an integral part of these financial statements.
page 33

Frontier Timpani Small Cap Growth Fund
SCHEDULE OF INVESTMENTS (continued)
December 31, 2016 (Unaudited)
PORTFOLIO DIVERSIFICATION
Sectors | | Percentage | |
Technology | | | 30.1 | % | |
Consumer Discretionary | | | 20.5 | | |
Health Care | | | 19.8 | | |
Producer Durables | | | 16.9 | | |
Financial Services | | | 3.8 | | |
Materials & Processing | | | 3.6 | | |
Consumer Staples | | | 2.6 | | |
Utilities | | | 1.0 | | |
Total Common Stocks | | | 98.3 | | |
Total Short-Term Investments | | | 1.0 | | |
Total Investments | | | 99.3 | | |
Other Assets in Excess of Liabilities | | | 0.7 | | |
Total Net Assets | | | 100.0 | % | |
The accompanying notes are an integral part of these financial statements.
page 34

Frontier Netols Small Cap Value Fund
SCHEDULE OF INVESTMENTS
December 31, 2016 (Unaudited)
Number of Shares | | | | Value | |
COMMON STOCKS 98.1% | | | |
| | | Consumer Discretionary 13.8% | |
| | 61,463 | | | Arctic Cat, Inc. (a) | | $ | 923,174 | | |
| | 26,667 | | | Bob Evans Farms, Inc. | | | 1,418,951 | | |
| | 11,116 | | | Carter's, Inc. | | | 960,311 | | |
| | 34,342 | | | Ethan Allen Interiors, Inc. | | | 1,265,503 | | |
| | 76,741 | | | Lumber Liquidators
Holdings, Inc. (a) | | | 1,207,904 | | |
| | 16,421 | | | Matthews International Corp. -
Class A | | | 1,261,954 | | |
| | 45,197 | | | Motorcar Parts of America, Inc. (a) | | | 1,216,703 | | |
| | 135,912 | | | Noodles & Co. (a) | | | 557,239 | | |
| | 17,258 | | | Tenneco, Inc. (a) | | | 1,078,107 | | |
| | 13,544 | | | The Cheesecake Factory, Inc. | | | 811,015 | | |
| | | | 10,700,861 | | |
| | | Consumer Staples 3.2% | |
| | 22,175 | | | Cal-Maine Foods, Inc. | | | 979,581 | | |
| | 12,783 | | | Casey's General Stores, Inc. | | | 1,519,643 | | |
| | | | 2,499,224 | | |
| | | Energy 6.5% | |
| | 103,269 | | | Bill Barrett Corp. (a) | | | 721,850 | | |
| | 228,443 | | | McDermott International, Inc. (a) | | | 1,688,194 | | |
| | 27,494 | | | Oil States International, Inc. (a) | | | 1,072,266 | | |
| | 132,381 | | | Synergy Resources Corp. (a) | | | 1,179,515 | | |
| | 115,601 | | | Willbros Group, Inc. (a) | | | 374,547 | | |
| | | | 5,036,372 | | |
| | | Financials 25.2% | |
| | 40,026 | | | BancorpSouth, Inc. | | | 1,242,807 | | |
| | 26,677 | | | Blackhawk Network
Holdings, Inc. (a) | | | 1,005,056 | | |
| | 52,688 | | | CenterState Banks, Inc. | | | 1,326,157 | | |
| | 20,999 | | | Community Bank System, Inc. | | | 1,297,528 | | |
| | 35,696 | | | Glacier Bancorp, Inc. | | | 1,293,266 | | |
| | 166,054 | | | MGIC Investment Corp. (a) | | | 1,692,090 | | |
| | 65,787 | | | Old National Bancorp | | | 1,194,034 | | |
| | 38,665 | | | Selective Insurance Group, Inc. | | | 1,664,528 | | |
| | 48,436 | | | State Bank Financial Corp. | | | 1,300,991 | | |
Number of Shares | | | | Value | |
| | | Financials 25.2% (continued) | |
| | 74,896 | | | Sterling Bancorp | | $ | 1,752,567 | | |
| | 18,777 | | | The Hanover Insurance
Group, Inc. | | | 1,708,895 | | |
| | 35,442 | | | Union Bankshares Corp. | | | 1,266,697 | | |
| | 28,338 | | | Webster Financial Corp. | | | 1,538,187 | | |
| | 29,801 | | | WesBanco, Inc. | | | 1,283,231 | | |
| | | | 19,566,034 | | |
| | | Health Care 9.2% | |
| | 63,378 | | | Albany Molecular
Research, Inc. (a) | | | 1,188,971 | | |
| | 25,569 | | | CONMED Corp. | | | 1,129,383 | | |
| | 14,147 | | | Integra LifeSciences
Holdings Corp. (a) | | | 1,213,671 | | |
| | 80,201 | | | Invacare Corp. | | | 1,046,623 | | |
| | 64,851 | | | Kindred Healthcare, Inc. | | | 509,080 | | |
| | 11,702 | | | U.S. Physical Therapy, Inc. | | | 821,481 | | |
| | 18,237 | | | VCA Antech, Inc. (a) | | | 1,251,970 | | |
| | | | 7,161,179 | | |
| | | Industrials 15.5% | |
| | 41,028 | | | Brady Corp. - Class A | | | 1,540,601 | | |
| | 56,991 | | | Briggs & Stratton Corp. | | | 1,268,620 | | |
| | 16,909 | | | CIRCOR International, Inc. | | | 1,097,056 | | |
| | 81,272 | | | Commercial Vehicle
Group, Inc. (a) | | | 449,434 | | |
| | 63,078 | | | General Cable Corp. | | | 1,201,636 | | |
| | 14,124 | | | Genesee & Wyoming, Inc. -
Class A (a) | | | 980,347 | | |
| | 29,876 | | | Herman Miller, Inc. | | | 1,021,759 | | |
| | 51,191 | | | PGT, Inc. (a) | | | 586,137 | | |
| | 38,731 | | | Thermon Group Holdings, Inc. (a) | | | 739,375 | | |
| | 44,208 | | | TriMas Corp. (a) | | | 1,038,888 | | |
| | 10,012 | | | United Rentals, Inc. (a) | | | 1,057,067 | | |
| | 12,417 | | | Wabtec Corp. | | | 1,030,859 | | |
| | | | 12,011,779 | | |
The accompanying notes are an integral part of these financial statements.
page 35

Frontier Netols Small Cap Value Fund
SCHEDULE OF INVESTMENTS (continued)
December 31, 2016 (Unaudited)
Number of Shares | | | | Value | |
| COMMON STOCKS 98.1% (continued) | | | |
| | | Information Technology 15.2% | |
| | 157,790 | | | Avid Technology, Inc. (a) | | $ | 694,276 | | |
| | 39,868 | | | Bottomline Technologies
(de), Inc. (a) | | | 997,497 | | |
| | 13,333 | | | CACI International, Inc. -
Class A (a) | | | 1,657,292 | | |
| | 62,663 | | | Entegris, Inc. (a) | | | 1,121,668 | | |
| | 11,244 | | | Fair Isaac Corp. | | | 1,340,510 | | |
| | 100,808 | | | FormFactor, Inc. (a) | | | 1,129,050 | | |
| | 35,505 | | | ManTech International Corp. -
Class A | | | 1,500,086 | | |
| | 23,411 | | | Plexus Corp. (a) | | | 1,265,130 | | |
| | 33,142 | | | Progress Software Corp. | | | 1,058,224 | | |
| | 58,471 | | | VeriFone Systems, Inc. (a) | | | 1,036,691 | | |
| | | | 11,800,424 | | |
| | | Materials 4.6% | |
| | 3,701 | | | Acuity Brands, Inc. | | | 854,413 | | |
| | 18,567 | | | Carpenter Technology Corp. | | | 671,568 | | |
| | 12,743 | | | Sensient Technologies Corp. | | | 1,001,345 | | |
| | 32,150 | | | Unifi, Inc. (a) | | | 1,049,054 | | |
| | | | 3,576,380 | | |
| | | Real Estate Investment Trusts 4.9% | |
| | 27,939 | | | Education Realty Trust, Inc. | | | 1,181,820 | | |
| | 41,338 | | | First Industrial Realty Trust, Inc. | | | 1,159,531 | | |
| | 19,163 | | | Sun Communities, Inc. | | | 1,468,077 | | |
| | | | 3,809,428 | | |
| | | Total Common Stocks | |
| | | | | (Cost $48,169,484) | | | 76,161,681 | | |
Number of Shares | | | | Value | |
SHORT-TERM INVESTMENTS 2.2% | |
| | | Investment Company 2.2% | |
| | 1,705,810 | | | Morgan Stanley Institutional
Liquidity Funds - Government
Portfolio - Institutional Class,
0.44% | | $ | 1,705,810 | | |
| | | Total Short-Term Investments | |
| | | (Cost $1,705,810) | | | 1,705,810 | | |
| | | Total Investments 100.3% | |
| | | (Cost $49,875,294) | | | 77,867,491 | | |
| | | Liabilities in Excess of
Other Assets (0.3)% | | | (240,044 | ) | |
| | | TOTAL NET ASSETS 100.0% | | $ | 77,627,447 | | |
(a) Non-Income Producing.
PORTFOLIO DIVERSIFICATION
Sectors | | Percentage | |
Financials | | | 25.2 | % | |
Industrials | | | 15.5 | | |
Information Technology | | | 15.2 | | |
Consumer Discretionary | | | 13.8 | | |
Health Care | | | 9.2 | | |
Energy | | | 6.5 | | |
Real Estate Investment Trusts | | | 4.9 | | |
Materials | | | 4.6 | | |
Consumer Staples | | | 3.2 | | |
Total Common Stocks | | | 98.1 | | |
Total Short-Term Investments | | | 2.2 | | |
Total Investments | | | 100.3 | | |
Liabilities in Excess of Other Assets | | | (0.3 | ) | |
Total Net Assets | | | 100.0 | % | |
The accompanying notes are an integral part of these financial statements.
page 36

Frontier Phocas Small Cap Value Fund
SCHEDULE OF INVESTMENTS
December 31, 2016 (Unaudited)
Number of Shares | | | | Value | |
COMMON STOCKS 96.0% | | | |
| | | Consumer Discretionary 9.3% | |
| | 3,205 | | | Columbia Sportswear Co. | | $ | 186,851 | | |
| | 3,608 | | | Dick's Sporting Goods, Inc. | | | 191,585 | | |
| | 20,084 | | | Entercom Communications
Corp. - Class A | | | 307,285 | | |
| | 34,570 | | | J.C. Penney Co., Inc. (a) | | | 287,277 | | |
| | 5,712 | | | Meredith Corp. | | | 337,865 | | |
| | 15,352 | | | National CineMedia, Inc. | | | 226,135 | | |
| | 91,222 | | | Office Depot, Inc. | | | 412,323 | | |
| | 3,421 | | | Red Robin Gourmet
Burgers, Inc. (a) | | | 192,944 | | |
| | 13,720 | | | Sinclair Broadcast Group, Inc. -
Class A | | | 457,562 | | |
| | 9,552 | | | TopBuild Corp. (a) | | | 340,051 | | |
| | 13,899 | | | Tower International, Inc. | | | 394,037 | | |
| | 5,287 | | | Urban Outfitters, Inc. (a) | | | 150,574 | | |
| | | | 3,484,489 | | |
| | | Consumer Staples 1.1% | |
| | 1,876 | | | TreeHouse Foods, Inc. (a) | | | 135,428 | | |
| | 4,548 | | | USANA Health Sciences, Inc. (a) | | | 278,338 | | |
| | | | 413,766 | | |
| | | Energy 5.4% | |
| | 25,996 | | | Callon Petroleum Co. (a) | | | 399,559 | | |
| | 12,330 | | | Carrizo Oil & Gas, Inc. (a) | | | 460,526 | | |
| | 6,195 | | | PDC Energy, Inc. (a) | | | 449,633 | | |
| | 42,860 | | | Ring Energy, Inc. (a) | | | 556,751 | | |
| | 8,945 | | | Superior Energy Services, Inc. | | | 150,992 | | |
| | | | 2,017,461 | | |
| | | Financials 30.2% | |
| | 10,972 | | | Banner Corp. | | | 612,347 | | |
| | 13,877 | | | BNC Bancorp | | | 442,676 | | |
| | 4,533 | | | Brown & Brown, Inc. | | | 203,350 | | |
| | 10,487 | | | Bryn Mawr Bank Corp. | | | 442,027 | | |
| | 6,137 | | | Capital Bank Financial Corp. | | | 240,877 | | |
| | 24,492 | | | CenterState Banks, Inc. | | | 616,464 | | |
| | 35,405 | | | CNO Financial Group, Inc. | | | 678,006 | | |
Number of Shares | | | | Value | |
| | | Financials 30.2% (continued) | |
| | 4,177 | | | First American Financial Corp. | | $ | 153,003 | | |
| | 8,639 | | | Guaranty Bancorp | | | 209,064 | | |
| | 12,900 | | | Heartland Financial USA, Inc. | | | 619,200 | | |
| | 17,832 | | | Heritage Commerce Corp. | | | 257,316 | | |
| | 14,184 | | | Heritage Financial Corp. | | | 365,238 | | |
| | 38,556 | | | Heritage Oaks Bancorp | | | 475,396 | | |
| | 7,653 | | | IBERIABANK Corp. | | | 640,939 | | |
| | 12,068 | | | NorthStar Asset Management
Group, Inc. | | | 180,055 | | |
| | 14,400 | | | Pacific Premier Bancorp, Inc. (a) | | | 509,040 | | |
| | 31,185 | | | Park Sterling Corp. | | | 336,486 | | |
| | 3,343 | | | Primerica, Inc. | | | 231,168 | | |
| | 24,069 | | | Radian Group, Inc. | | | 432,761 | | |
| | 8,041 | | | Selective Insurance Group, Inc. | | | 346,165 | | |
| | 16,491 | | | State Bank Financial Corp. | | | 442,948 | | |
| | 12,438 | | | Synovus Financial Corp. | | | 510,953 | | |
| | 12,541 | | | TriCo Bancshares | | | 428,651 | | |
| | 24,799 | | | United Community Banks, Inc. | | | 734,546 | | |
| | 7,079 | | | Wintrust Financial Corp. | | | 513,723 | | |
| | 19,225 | | | Yadkin Financial Corp. | | | 658,649 | | |
| | | | 11,281,048 | | |
| | | Health Care 4.0% | |
| | 17,851 | | | Aceto Corp. | | | 392,187 | | |
| | 3,681 | | | Envision Healthcare Corp. (a) | | | 232,970 | | |
| | 2,496 | | | PAREXEL International Corp. (a) | | | 164,037 | | |
| | 9,870 | | | PharMerica Corp. (a) | | | 248,231 | | |
| | 52,921 | | | Progenics Pharmaceuticals, Inc. (a) | | | 457,237 | | |
| | | | 1,494,662 | | |
| | | Industrials 14.7% | |
| | 5,035 | | | ABM Industries, Inc. | | | 205,629 | | |
| | 5,112 | | | Astec Industries, Inc. | | | 344,856 | | |
| | 32,953 | | | CBIZ, Inc. (a) | | | 451,456 | | |
| | 4,585 | | | Curtiss-Wright Corp. | | | 450,981 | | |
| | 7,159 | | | Deluxe Corp. | | | 512,656 | | |
| | 3,204 | | | EMCOR Group, Inc. | | | 226,715 | | |
| | 2,939 | | | Esterline Technologies Corp. (a) | | | 262,159 | | |
The accompanying notes are an integral part of these financial statements.
page 37

Frontier Phocas Small Cap Value Fund
SCHEDULE OF INVESTMENTS (continued)
December 31, 2016 (Unaudited)
Number of Shares | | | | Value | |
| COMMON STOCKS 96.0% (continued) | | | |
| | | Industrials 14.7% (continued) | |
| | 11,261 | | | Gibraltar Industries, Inc. (a) | | $ | 469,021 | | |
| | 6,039 | | | Kadant, Inc. | | | 369,587 | | |
| | 10,941 | | | MYR Group, Inc. (a) | | | 412,257 | | |
| | 4,059 | | | On Assignment, Inc. (a) | | | 179,245 | | |
| | 16,855 | | | SkyWest, Inc. | | | 614,365 | | |
| | 14,388 | | | Tetra Tech, Inc. | | | 620,842 | | |
| | 9,739 | | | The Timken Company | | | 386,638 | | |
| | | | 5,506,407 | | |
| | | Information Technology 10.5% | |
| | 2,523 | | | Cass Information Systems, Inc. | | | 185,617 | | |
| | 33,181 | | | Cypress Semiconductor Corp. | | | 379,591 | | |
| | 6,720 | | | MKS Instruments, Inc. | | | 399,168 | | |
| | 17,460 | | | NCR Corp. (a) | | | 708,177 | | |
| | 16,191 | | | Photronics, Inc. (a) | | | 182,958 | | |
| | 7,463 | | | Plexus Corp. (a) | | | 403,300 | | |
| | 11,885 | | | Progress Software Corp. | | | 379,488 | | |
| | 6,406 | | | Science Applications
International Corp. | | | 543,229 | | |
| | 5,462 | | | Silicon Motion Technology
Corp. - ADR | | | 232,026 | | |
| | 8,864 | | | VASCO Data Security
International, Inc. (a) | | | 120,994 | | |
| | 7,097 | | | Verint Systems, Inc. (a) | | | 250,169 | | |
| | 6,905 | | | Web.com Group, Inc. (a) | | | 146,041 | | |
| | | | 3,930,758 | | |
| | | Materials 4.8% | |
| | 22,295 | | | Ferro Corp. (a) | | | 319,487 | | |
| | 3,087 | | | Kaiser Aluminum Corp. | | | 239,829 | | |
| | 12,043 | | | KapStone Paper and
Packaging Corp. | | | 265,548 | | |
| | 9,720 | | | Materion Corp. | | | 384,912 | | |
| | 4,496 | | | Sensient Technologies Corp. | | | 353,296 | | |
| | 13,319 | | | TimkenSteel Corp. (a) | | | 206,178 | | |
| | | | 1,769,250 | | |
Number of Shares | | | | Value | |
| | | Real Estate Investment Trusts 10.7% | |
| | 11,662 | | | Acadia Realty Trust | | $ | 381,114 | | |
| | 12,254 | | | Armada Hoffler Properties, Inc. | | | 178,541 | | |
| | 18,178 | | | Colony Capital, Inc. - Class A | | | 368,104 | | |
| | 6,261 | | | CoreSite Realty Corp. | | | 496,936 | | |
| | 7,202 | | | Education Realty Trust, Inc. | | | 304,645 | | |
| | 11,194 | | | Hudson Pacific Properties, Inc. | | | 389,327 | | |
| | 15,411 | | | National Storage Affiliates Trust | | | 340,121 | | |
| | 6,065 | | | Pebblebrook Hotel Trust | | | 180,434 | | |
| | 16,553 | | | Rexford Industrial Realty, Inc. | | | 383,864 | | |
| | 13,960 | | | Sabra Health Care REIT, Inc. | | | 340,903 | | |
| | 3,412 | | | Seritage Growth Properties -
Class A | | | 145,726 | | |
| | 6,493 | | | Sun Communities, Inc. | | | 497,429 | | |
| | | | 4,007,144 | | |
| | | Utilities 5.3% | |
| | 3,882 | | | Black Hills Corp. | | | 238,122 | | |
| | 15,205 | | | Calpine Corp. (a) | | | 173,793 | | |
| | 5,390 | | | Chesapeake Utilities Corp. | | | 360,861 | | |
| | 2,664 | | | IDACORP, Inc. | | | 214,585 | | |
| | 8,256 | | | PNM Resources, Inc. | | | 283,181 | | |
| | 5,736 | | | Portland General Electric Co. | | | 248,541 | | |
| | 5,692 | | | South Jersey Industries, Inc. | | | 191,763 | | |
| | 4,187 | | | Spire, Inc. | | | 270,271 | | |
| | | | 1,981,117 | | |
| | | Total Common Stocks | |
| | | | | (Cost $25,735,208) | | | 35,886,102 | | |
The accompanying notes are an integral part of these financial statements.
page 38

Frontier Phocas Small Cap Value Fund
SCHEDULE OF INVESTMENTS (continued)
December 31, 2016 (Unaudited)
Number of Shares | | | | Value | |
SHORT-TERM INVESTMENTS 2.8% | |
| | | Investment Company 2.8% | |
| | 1,061,858 | | | Morgan Stanley Institutional
Liquidity Funds - Government
Portfolio - Institutional Class,
0.44% | | $ | 1,061,858 | | |
| | | Total Short-Term Investments | |
| | | (Cost $1,061,858) | | | 1,061,858 | | |
| | | Total Investments 98.8% | |
| | | (Cost $26,797,066) | | | 36,947,960 | | |
| | | Other Assets in Excess of
Liabilities 1.2% | | | 439,787 | | |
| | | TOTAL NET ASSETS 100.0% | | $ | 37,387,747 | | |
(a) Non-Income Producing.
ADR - American Depositary Receipt | |
PORTFOLIO DIVERSIFICATION
Sectors | | Percentage | |
Financials | | | 30.2 | % | |
Industrials | | | 14.7 | | |
Real Estate Investment Trusts | | | 10.7 | | |
Information Technology | | | 10.5 | | |
Consumer Discretionary | | | 9.3 | | |
Energy | | | 5.4 | | |
Utilities | | | 5.3 | | |
Materials | | | 4.8 | | |
Health Care | | | 4.0 | | |
Consumer Staples | | | 1.1 | | |
Total Common Stocks | | | 96.0 | | |
Total Short-Term Investments | | | 2.8 | | |
Total Investments | | | 98.8 | | |
Other Assets in Excess of Liabilities | | | 1.2 | | |
Total Net Assets | | | 100.0 | % | |
The accompanying notes are an integral part of these financial statements.
page 39

Frontier Funds
STATEMENTS OF ASSETS AND LIABILITIES
December 31, 2016 (Unaudited)
| | | MFG Global
Equity Fund | | MFG Global
Plus Fund | | MFG Core
Infrastructure Fund | |
ASSETS: | |
Investments at cost | | $ | 921,239,585 | | | $ | 124,967,967 | | | $ | 165,946,213 | | |
Foreign currency at cost | | $ | 2,082,071 | | | $ | 18,704 | | | $ | 246,046 | | |
Investments at value | | $ | 1,034,005,260 | | | $ | 127,601,838 | | | $ | 174,599,685 | | |
Foreign currency at value | | | 2,101,854 | | | | 18,555 | | | | 244,476 | | |
Receivable for investments sold | | | 11,991,438 | | | | — | | | | — | | |
Receivable for Fund shares sold | | | 2,251,074 | | | | 60,000 | | | | 45,000 | | |
Interest and dividends receivable | | | 626,475 | | | | 8,859 | | | | 701,521 | | |
Prepaid expenses and other assets | | | 39,107 | | | | 11,678 | | | | 13,999 | | |
Total assets | | | 1,051,015,208 | | | | 127,700,930 | | | | 175,604,681 | | |
LIABILITIES: | |
Payable for Fund shares redeemed | | | 62,830 | | | | 28,230 | | | | 445,461 | | |
Payable to Directors | | | 86 | | | | 86 | | | | 60 | | |
Payable for foreign currency | | | 16,439 | | | | — | | | | — | | |
Payable to Adviser | | | 687,703 | | | | 58,603 | | | | 78,264 | | |
Accrued shareholder servicing fees | | | — | | | | 2,481 | | | | — | | |
Accrued expenses | | | 67,282 | | | | 30,820 | | | | 32,308 | | |
Total liabilities | | | 834,340 | | | | 120,220 | | | | 556,093 | | |
Net Assets | | $ | 1,050,180,868 | | | $ | 127,580,710 | | | $ | 175,048,588 | | |
NET ASSETS CONSIST OF: | |
Paid in capital | | $ | 945,747,088 | | | $ | 124,926,875 | | | $ | 167,406,359 | | |
Undistributed net investment income | | | 18,969 | | | | 55,675 | | | | 91,696 | | |
Accumulated undistributed net realized loss | | | (8,281,843 | ) | | | (35,408 | ) | | | (1,098,669 | ) | |
Net unrealized appreciation/depreciation on: | |
Investments | | | 112,765,675 | | | | 2,633,871 | | | | 8,653,472 | | |
Foreign currency | | | (69,021 | ) | | | (303 | ) | | | (4,270 | ) | |
Net Assets | | $ | 1,050,180,868 | | | $ | 127,580,710 | | | $ | 175,048,588 | | |
CAPITAL STOCK, $0.01 PAR VALUE | | | | Institutional Class | | Institutional Class | |
Net Assets | | $ | 1,050,180,868 | | | $ | 84,641,340 | | | $ | 174,934,922 | | |
Authorized | | | 100,000,000 | | | | 100,000,000 | | | | 50,000,000 | | |
Issued and Outstanding | | | 68,526,475 | | | | 8,325,311 | | | | 12,542,841 | | |
Net Asset Value, Redemption Price and Offering Price Per Share | | $ | 15.33 | | | $ | 10.17 | | | $ | 13.95 | | |
CAPITAL STOCK, $0.01 PAR VALUE | | | | Service Class | | Service Class | |
Net Assets | | | | $ | 42,939,370 | | | $ | 113,666 | | |
Authorized | | | | | 50,000,000 | | | | 50,000,000 | | |
Issued and Outstanding | | | | | 4,222,111 | | | | 8,148 | | |
Net Asset Value, Redemption Price and Offering Price Per Share | | | | $ | 10.17 | | | $ | 13.95 | | |
The accompanying notes are an integral part of these financial statements.
page 40

Frontier Funds
STATEMENTS OF ASSETS AND LIABILITIES (continued)
December 31, 2016 (Unaudited)
| | | Timpani Small Cap
Growth Fund | | Netols Small Cap
Value Fund | | Phocas Small Cap
Value Fund | |
ASSETS: | |
Investments at cost | | $ | 35,892,425 | | | $ | 49,875,294 | | | $ | 26,797,066 | | |
Investments at value | | $ | 45,071,338 | | | $ | 77,867,491 | | | $ | 36,947,960 | | |
Receivable for investments sold | | | 447,707 | | | | — | | | | 415,338 | | |
Receivable for Fund shares sold | | | 53,763 | | | | 47,964 | | | | 2,260 | | |
Interest and dividends receivable | | | 2,815 | | | | 58,491 | | | | 48,464 | | |
Prepaid expenses and other assets | | | 21,336 | | | | 9,240 | | | | 14,877 | | |
Total assets | | | 45,596,959 | | | | 77,983,186 | | | | 37,428,899 | | |
LIABILITIES: | |
Payable for Fund shares redeemed | | | 150,140 | | | | 277,101 | | | | 2,369 | | |
Payable to Directors | | | 88 | | | | 86 | | | | 85 | | |
Payable to Adviser | | | 32,739 | | | | 55,049 | | | | 19,010 | | |
Accrued distribution and shareholder servicing fees | | | 1,382 | | | | 3,148 | | | | — | | |
Accrued expenses | | | 25,659 | | | | 20,355 | | | | 19,688 | | |
Total liabilities | | | 210,008 | | | | 355,739 | | | | 41,152 | | |
Net Assets | | $ | 45,386,951 | | | $ | 77,627,447 | | | $ | 37,387,747 | | |
NET ASSETS CONSIST OF: | |
Paid in capital | | $ | 44,445,700 | | | $ | 51,131,828 | | | $ | 27,352,082 | | |
Undistributed net investment income (loss) | | | (300,167 | ) | | | 25,830 | | | | 26,411 | | |
Accumulated undistributed net realized loss | | | (7,937,495 | ) | | | (1,522,408 | ) | | | (141,640 | ) | |
Net unrealized appreciation on investments | | | 9,178,913 | | | | 27,992,197 | | | | 10,150,894 | | |
Net Assets | | $ | 45,386,951 | | | $ | 77,627,447 | | | $ | 37,387,747 | | |
CAPITAL STOCK, $0.01 PAR VALUE | | Institutional Class | | Institutional Class | | Institutional Class | |
Net Assets | | $ | 41,915,466 | | | $ | 77,526,026 | | | $ | 37,387,632 | | |
Authorized | | | 50,000,000 | | | | 50,000,000 | | | | 100,000,000 | | |
Issued and Outstanding | | | 2,653,285 | | | | 8,147,958 | | | | 943,793 | | |
Net Asset Value, Redemption Price and Offering Price Per Share | | $ | 15.80 | | | $ | 9.51 | | | $ | 39.61 | | |
CAPITAL STOCK, $0.01 PAR VALUE | | Class Y | | Class Y | | | |
Net Assets | | $ | 3,471,383 | | | $ | 101,421 | | | | |
Authorized | | | 50,000,000 | | | | 50,000,000 | | | | |
Issued and Outstanding | | | 222,284 | | | | 11,366 | | | | |
Net Asset Value, Redemption Price and Offering Price Per Share | | $ | 15.62 | | | $ | 8.92 | | | | |
CAPITAL STOCK, $0.01 PAR VALUE | | Service Class | | | | Service Class | |
Net Assets | | $ | 102 | | | | | $ | 115 | | |
Authorized | | | 50,000,000 | | | | | | 50,000,000 | | |
Issued and Outstanding | | | 6 | | | | | | 3 | | |
Net Asset Value, Redemption Price and Offering Price Per Share | | $ | 15.80 | (1) | | | | $ | 39.62 | (1) | |
(1) Net Asset Value is calculated using unrounded net assets and shares outstanding.
The accompanying notes are an integral part of these financial statements.
page 41

Frontier Funds
STATEMENTS OF OPERATIONS
For the Six Months Ended December 31, 2016 (Unaudited)
| | | MFG Global
Equity Fund | | MFG Global
Plus Fund | | MFG Core
Infrastructure Fund | |
INVESTMENT INCOME: | |
Dividend income | | $ | 7,398,821 | | | $ | 419,245 | | | $ | 2,570,615 | (1) | |
Interest income | | | 259,990 | | | | 19,147 | | | | 5,285 | | |
Total investment income | | | 7,658,811 | | | | 438,392 | | | | 2,575,900 | | |
EXPENSES: | |
Investment advisory fees | | | 4,398,662 | | | | 262,370 | | | | 659,774 | | |
Fund administration and accounting fees | | | 115,832 | | | | 17,899 | | | | 34,165 | | |
Custody fees | | | 49,750 | | | | 16,448 | | | | 31,969 | | |
Transfer agent fees | | | 18,285 | | | | 8,463 | | | | 10,818 | | |
Federal and state registration fees | | | 12,392 | | | | 15,443 | | | | 12,109 | | |
Directors' fees and related expenses | | | 10,799 | | | | 10,799 | | | | 10,774 | | |
Audit fees | | | 8,636 | | | | 8,636 | | | | 8,633 | | |
Legal fees | | | 6,151 | | | | 6,304 | | | | 6,220 | | |
Reports to shareholders | | | 6,062 | | | | 3,347 | | | | 3,912 | | |
Shareholder servicing fees - Service Class | | | — | | | | 6,924 | | | | 12 | | |
Other | | | 28,182 | | | | 9,244 | | | | 8,131 | | |
Total expenses before waiver and reimbursement | | | 4,654,751 | | | | 365,877 | | | | 786,517 | | |
Waiver and reimbursement of expenses by Adviser | | | (256,090 | ) | | | (96,487 | ) | | | (126,733 | ) | |
Net expenses | | | 4,398,661 | | | | 269,390 | | | | 659,784 | | |
Net Investment Income | | | 3,260,150 | | | | 169,002 | | | | 1,916,116 | | |
REALIZED AND UNREALIZED GAIN (LOSS)
ON INVESTMENTS: | |
Net realized gain (loss) on: | |
Investments | | | 14,949,022 | | | | 41,059 | | | | 539,056 | | |
Foreign currency transactions | | | (37,356 | ) | | | (7,453 | ) | | | (37,923 | ) | |
Change in net unrealized appreciation/depreciation on: | |
Investments | | | 50,937,699 | | | | 3,342,718 | | | | (16,592,585 | ) | |
Foreign currency transactions | | | (21,363 | ) | | | 402 | | | | 18,383 | | |
Net Realized and Unrealized Gain (Loss) on Investments | | | 65,828,002 | | | | 3,376,726 | | | | (16,073,069 | ) | |
Net Increase (Decrease) in Net Assets Resulting from Operations | | $ | 69,088,152 | | | $ | 3,545,728 | | | $ | (14,156,953 | ) | |
(1) Net of $177,307 in foreign withholding taxes.
The accompanying notes are an integral part of these financial statements.
page 42

Frontier Funds
STATEMENTS OF OPERATIONS (continued)
For the Six Months Ended December 31, 2016 (Unaudited)
| | | Timpani Small Cap
Growth Fund | | Netols Small Cap
Value Fund | | Phocas Small Cap
Value Fund | |
INVESTMENT INCOME: | |
Dividend income | | $ | 205,755 | | | $ | 437,458 | | | $ | 271,797 | | |
Interest income | | | 1,808 | | | | 2,931 | | | | 1,302 | | |
Total investment income | | | 207,563 | | | | 440,389 | | | | 273,099 | | |
EXPENSES: | |
Investment advisory fees | | | 289,876 | | | | 368,634 | | | | 170,366 | | |
Fund administration and accounting fees | | | 19,291 | | | | 19,675 | | | | 17,299 | | |
Transfer agent fees | | | 14,522 | | | | 7,802 | | | | 8,215 | | |
Federal and state registration fees | | | 13,171 | | | | 6,794 | | | | 10,029 | | |
Directors' fees and related expenses | | | 10,803 | | | | 10,800 | | | | 10,799 | | |
Custody fees | | | 10,096 | | | | 4,214 | | | | 6,880 | | |
Audit fees | | | 7,629 | | | | 7,628 | | | | 7,628 | | |
Distribution and shareholder servicing fees - Class Y | | | 7,240 | | | | — | | | | — | | |
Legal fees | | | 5,733 | | | | 6,755 | | | | 6,254 | | |
Reports to shareholders | | | 4,670 | | | | 3,841 | | | | 3,295 | | |
Other | | | 3,283 | | | | 3,659 | | | | 3,059 | | |
Total expenses before waiver and reimbursement | | | 386,314 | | | | 439,802 | | | | 243,824 | | |
Waiver and reimbursement of expenses by Adviser | | | (60,209 | ) | | | (34,303 | ) | | | (56,421 | ) | |
Net expenses | | | 326,105 | | | | 405,499 | | | | 187,403 | | |
Net Investment Income (Loss) | | | (118,542 | ) | | | 34,890 | | | | 85,696 | | |
REALIZED AND UNREALIZED GAIN ON INVESTMENTS: | |
Net realized gain on investments | | | 2,932,154 | | | | 2,175,565 | | | | 257,381 | | |
Change in net unrealized appreciation on investments | | | 1,224,776 | | | | 8,703,526 | | | | 5,596,093 | | |
Net Realized and Unrealized Gain on Investments | | | 4,156,930 | | | | 10,879,091 | | | | 5,853,474 | | |
Net Increase in Net Assets Resulting from Operations | | $ | 4,038,388 | | | $ | 10,913,981 | | | $ | 5,939,170 | | |
The accompanying notes are an integral part of these financial statements.
page 43

Frontier Funds
STATEMENTS OF CHANGES IN NET ASSETS
| | MFG Global Equity Fund | | MFG Global Plus Fund | |
| | For the
Six Months Ended
December 31, 2016
(Unaudited) | | For the
Year Ended
June 30, 2016 | | For the
Six Months Ended
December 31, 2016
(Unaudited) | | For the
Year Ended
June 30, 2016 | |
| OPERATIONS: | |
Net investment income | | $ | 3,260,150 | | | $ | 9,904,805 | | | $ | 169,002 | | | $ | 115,904 | | |
Net realized gain (loss) on: | |
Investments | | | 14,949,022 | | | | 32,621,342 | | | | 41,059 | | | | (9,241 | ) | |
Foreign currency transactions | | | (37,356 | ) | | | 29,624 | | | | (7,453 | ) | | | (730 | ) | |
Change in net unrealized appreciation/depreciation on: | |
Investments | | | 50,937,699 | | | | (67,202,067 | ) | | | 3,342,718 | | | | (633,956 | ) | |
Foreign currency transactions | | | (21,363 | ) | | | 27,804 | | | | 402 | | | | (569 | ) | |
Net increase (decrease) in net assets resulting from operations | | | 69,088,152 | | | | (24,618,492 | ) | | | 3,545,728 | | | | (528,592 | ) | |
DISTRIBUTIONS PAID TO SHAREHOLDERS | |
From net investment income: | |
Institutional Class | | | (9,428,431 | ) | | | (8,131,435 | ) | | | (139,634 | ) | | | (43,537 | ) | |
Service Class(1) | | | | | | | | | | | (62,179 | ) | | | — | | |
From net realized gain on investments: | |
Institutional Class | | | (39,274,536 | ) | | | (33,623,773 | ) | | | (37,020 | ) | | | — | | |
Service Class(1) | | | | | | | | | | | (18,277 | ) | | | — | | |
Net decrease in net assets resulting from distributions paid | | | (48,702,967 | ) | | | (41,755,208 | ) | | | (257,110 | ) | | | (43,537 | ) | |
CAPITAL SHARE TRANSACTIONS | |
Shares sold: | |
Institutional Class | | | 21,442,549 | | | | 139,961,409 | | | | 61,401,500 | | | | 16,371,092 | | |
Service Class(1) | | | | | | | | | | | 34,956,963 | | | | 10,966,860 | | |
Shares issued to holders in reinvestment of distributions: | |
Institutional Class | | | 43,253,679 | | | | 37,406,977 | | | | 169,072 | | | | 28,167 | | |
Service Class(1) | | | | | | | | | | | 57,773 | | | | — | | |
Shares redeemed: | |
Institutional Class | | | (108,209,022 | ) | | | (144,216,930 | ) | | | (826,852 | ) | | | (237,986 | ) | |
Service Class(1) | | | | | | | | | | | (3,740,148 | ) | | | (142,470 | ) | |
Redemption fees: | |
Institutional Class | | | 553 | | | | 5,345 | | | | — | | | | — | | |
Service Class(1) | | | | | | | | | | | — | | | | 904 | | |
Net increase (decrease) in net assets resulting from capital
share transactions | | | (43,512,241 | ) | | | 33,156,801 | | | | 92,018,308 | | | | 26,986,567 | | |
Total Increase (Decrease) in Net Assets | | | (23,127,056 | ) | | | (33,216,899 | ) | | | 95,306,926 | | | | 26,414,438 | | |
NET ASSETS: | |
Beginning of Period | | | 1,073,307,924 | | | | 1,106,524,823 | | | | 32,273,784 | | | | 5,859,346 | | |
End of Period | | $ | 1,050,180,868 | | | $ | 1,073,307,924 | | | $ | 127,580,710 | | | $ | 32,273,784 | | |
Undistributed net investment income | | $ | 18,969 | | | $ | 6,187,250 | | | $ | 55,675 | | | $ | 88,486 | | |
TRANSACTIONS IN SHARES | |
Shares sold: | |
Institutional Class | | | 1,358,293 | | | | 9,015,780 | | | | 6,144,164 | | | | 1,676,557 | | |
Service Class(1) | | | | | | | | | | | 3,464,661 | | | | 1,132,625 | | |
Shares issued to holders in reinvestment of distributions: | |
Institutional Class | | | 2,788,761 | | | | 2,467,479 | | | | 16,431 | | | | 2,907 | | |
Service Class(1) | | | | | | | | | | | 5,609 | | | | — | | |
Shares redeemed: | |
Institutional Class | | | (6,927,815 | ) | | | (9,364,338 | ) | | | (81,892 | ) | | | (24,082 | ) | |
Service Class(1) | | | | | | | | | | | (366,111 | ) | | | (14,673 | ) | |
Net increase (decrease) in shares outstanding | | | (2,780,761 | ) | | | 2,118,921 | | | | 9,182,862 | | | | 2,773,334 | | |
(1) MFG Global Plus Fund Service Class commenced operations on May 9, 2016.
The accompanying notes are an integral part of these financial statements.
page 44

Frontier Funds
STATEMENTS OF CHANGES IN NET ASSETS (continued)
| | MFG Core Infrastructure Fund | | Timpani Small Cap Growth Fund | |
| | For the
Six Months Ended
December 31, 2016
(Unaudited) | | For the
Year Ended
June 30, 2016 | | For the
Six Months Ended
December 31, 2016
(Unaudited) | | For the
Year Ended
June 30, 2016 | |
| OPERATIONS: | |
Net investment income (loss) | | $ | 1,916,116 | | | $ | 4,941,603 | | | $ | (118,542 | ) | | $ | (431,098 | ) | |
Net realized gain (loss) on: | |
Investments | | | 539,056 | | | | (644,468 | ) | | | 2,932,154 | | | | (8,964,275 | ) | |
Foreign currency transactions | | | (37,923 | ) | | | (80,313 | ) | | | — | | | | — | | |
Change in net unrealized appreciation/depreciation on: | |
Investments | | | (16,592,585 | ) | | | 29,818,171 | | | | 1,224,776 | | | | (2,635,556 | ) | |
Foreign currency transactions | | | 18,383 | | | | (19,400 | ) | | | — | | | | — | | |
Net increase (decrease) in net assets resulting from operations | | | (14,156,953 | ) | | | 34,015,593 | | | | 4,038,388 | | | | (12,030,929 | ) | |
DISTRIBUTIONS PAID TO SHAREHOLDERS | |
From net investment income: | |
Institutional Class | | | (2,224,185 | ) | | | (4,698,427 | ) | | | — | | | | — | | |
Service Class(2) | | | (856 | ) | | | | | | | — | | | | | | |
Net realized gain on investments | |
Institutional Class | | | (358,342 | ) | | | (505,668 | ) | | | — | | | | — | | |
Service Class(2) | | | (188 | ) | | | | | | | — | | | | | | |
Net decrease in net assets resulting from distributions paid | | | (2,583,571 | ) | | | (5,204,095 | ) | | | — | | | | — | | |
CAPITAL SHARE TRANSACTIONS | |
Shares sold: | |
Institutional Class | | | 24,439,995 | | | | 38,831,913 | | | | 2,961,696 | | | | 24,065,204 | | |
Class Y | | | | | | | | | | | 411,513 | | | | 3,188,863 | | |
Service Class(2) | | | 117,076 | | | | | | | | 100 | | | | | | |
Shares issued to holders in reinvestment of distributions: | |
Institutional Class | | | 2,082,520 | | | | 4,493,451 | | | | — | | | | — | | |
Service Class(2) | | | 313 | | | | | | | | — | | | | | | |
Shares redeemed: | |
Institutional Class | | | (42,837,884 | ) | | | (25,880,421 | ) | | | (17,460,017 | ) | | | (7,635,954 | ) | |
Class Y | | | | | | | | | | | (528,980 | ) | | | (1,339,596 | ) | |
Service Class(2) | | | — | | | | | | | | — | | | | | | |
Redemption fees | |
Institutional Class | | | 1,922 | | | | 6,882 | | | | — | | | | — | | |
Net increase (decrease) in net assets resulting from capital
share transactions | | | (16,196,058 | ) | | | 17,451,825 | | | | (14,615,688 | ) | | | 18,278,517 | | |
Total Increase (Decrease) in Net Assets | | | (32,936,582 | ) | | | 46,263,323 | | | | (10,577,300 | ) | | | 6,247,588 | | |
NET ASSETS: | |
Beginning of Period | | | 207,985,170 | | | | 161,721,847 | | | | 55,964,251 | | | | 49,716,663 | | |
End of Period | | $ | 175,048,588 | | | $ | 207,985,170 | | | $ | 45,386,951 | | | $ | 55,964,251 | | |
Undistributed net investment income (loss) | | $ | 91,696 | | | $ | 400,621 | | | $ | (300,167 | ) | | $ | (181,625 | ) | |
TRANSACTIONS IN SHARES | |
Shares sold: | |
Institutional Class | | | 1,680,712 | | | | 2,841,186 | | | | 191,676 | | | | 1,500,949 | | |
Class Y | | | | | | | | | | | 26,350 | | | | 192,366 | | |
Service Class(2) | | | 8,125 | | | | | | | | 6 | | | | | | |
Shares issued to holders in reinvestment of distributions: | |
Institutional Class | | | 146,029 | | | | 322,454 | | | | — | | | | — | | |
Class Y | | | | | | | | | | | — | | | | — | | |
Service Class(2) | | | 23 | | | | | | | | — | | | | | | |
Shares redeemed: | |
Institutional Class | | | (2,907,233 | ) | | | (1,895,504 | ) | | | (1,100,542 | ) | | | (492,751 | ) | |
Class Y | | | | | | | | | | | (34,438 | ) | | | (84,429 | ) | |
Service Class(2) | | | — | | | | | | | | — | | | | | | |
Net increase (decrease) in shares outstanding | | | (1,072,344 | ) | | | 1,268,136 | | | | (916,948 | ) | | | 1,116,135 | | |
(2) MFG Core Infrastructure Fund Service Class and Timpani Small Cap Growth Fund Service Class commenced operations on July 15, 2016.
The accompanying notes are an integral part of these financial statements.
page 45

Frontier Funds
STATEMENTS OF CHANGES IN NET ASSETS (continued)
| | Netols Small Cap Value Fund | | Phocas Small Cap Value Fund | |
| | For the
Six Months Ended
December 31, 2016
(Unaudited) | | For the
Year Ended
June 30, 2016 | | For the
Six Months Ended
December 31, 2016
(Unaudited) | | For the
Year Ended
June 30, 2016 | |
| OPERATIONS: | |
Net investment income | | $ | 34,890 | | | $ | 48,217 | | | $ | 85,696 | | | $ | 133,647 | | |
Net realized gain (loss) on investments | | | 2,175,565 | | | | 5,998,585 | | | | 257,381 | | | | (367,619 | ) | |
Change in net unrealized appreciation/depreciation on investments | | | 8,703,526 | | | | (10,460,813 | ) | | | 5,596,093 | | | | 49,824 | | |
Net increase (decrease) in net assets resulting from operations | | | 10,913,981 | | | | (4,414,011 | ) | | | 5,939,170 | | | | (184,148 | ) | |
DISTRIBUTIONS PAID TO SHAREHOLDERS | |
From net investment income: | |
Institutional Class | | | (29,494 | ) | | | (28,132 | ) | | | (148,581 | ) | | | (186,980 | ) | |
Class Y | | | (44 | ) | | | (191 | ) | | | | | | | | | |
Service Class(3) | | | | | | | | | | | — | (4) | | | | | |
Net realized gain on investments | |
Institutional Class | | | (5,135,645 | ) | | | (12,487,471 | ) | | | — | | | | (163,607 | ) | |
Class Y | | | (7,538 | ) | | | (84,874 | ) | | | | | | | | | |
Service Class(3) | | | | | | | | | | | — | | | | | | |
Net decrease in net assets resulting from distributions paid | | | (5,172,721 | ) | | | (12,600,668 | ) | | | (148,581 | ) | | | (350,587 | ) | |
CAPITAL SHARE TRANSACTIONS | |
Shares sold: | |
Institutional Class | | | 3,711,968 | | | | 9,509,321 | | | | 2,010,012 | | | | 8,318,040 | | |
Class Y | | | — | | | | 20,044 | | | | | | | | | | |
Service Class(3) | | | | | | | | | | | 100 | | | | | | |
Shares issued to holders in reinvestment of distributions: | |
Institutional Class | | | 4,527,161 | | | | 10,488,792 | | | | 148,581 | | | | 350,587 | | |
Class Y | | | 6,849 | | | | 83,093 | | | | | | | | | | |
Service Class(3) | | | | | | | | | | | — | (4) | | | | | |
Shares redeemed: | |
Institutional Class | | | (7,110,166 | ) | | | (10,263,331 | ) | | | (2,508,018 | ) | | | (4,873,241 | ) | |
Class Y | | | (67,742 | ) | | | (328,308 | ) | | | | | | | | | |
Service Class(3) | | | | | | | | | | | — | | | | | | |
Net increase (decrease) in net assets resulting from capital
share transactions | | | 1,068,070 | | | | 9,509,611 | | | | (349,325 | ) | | | 3,795,386 | | |
Total Increase (Decrease) in Net Assets | | | 6,809,330 | | | | (7,505,068 | ) | | | 5,441,264 | | | | 3,260,651 | | |
NET ASSETS: | |
Beginning of Period | | | 70,818,117 | | | | 78,323,185 | | | | 31,946,483 | | | | 28,685,832 | | |
End of Period | | $ | 77,627,447 | | | $ | 70,818,117 | | | $ | 37,387,747 | | | $ | 31,946,483 | | |
Undistributed net investment income | | $ | 25,830 | | | $ | 20,478 | | | $ | 26,411 | | | $ | 89,296 | | |
TRANSACTIONS IN SHARES | |
Shares sold: | |
Institutional Class | | | 387,219 | | | | 1,107,409 | | | | 55,457 | | | | 256,993 | | |
Class Y | | | — | | | | 2,364 | | | | | | | | | | |
Service Class(3) | | | | | | | | | | | 3 | | | | | | |
Shares issued to holders in reinvestment of distributions: | |
Institutional Class | | | 467,682 | | | | 1,251,646 | | | | 3,694 | | | | 11,049 | | |
Class Y | | | 754 | | | | 10,518 | | | | | | | | | | |
Service Class(3) | | | | | | | | | | | — | (5) | | | | | |
Shares redeemed: | |
Institutional Class | | | (755,201 | ) | | | (1,015,987 | ) | | | (70,297 | ) | | | (148,620 | ) | |
Class Y | | | (7,531 | ) | | | (41,787 | ) | | | | | | | | | |
Service Class(3) | | | | | | | | | | | — | | | | | | |
Net increase (decrease) in shares outstanding | | | 92,923 | | | | 1,314,163 | | | | (11,143 | ) | | | 119,422 | | |
(3) Phocas Small Cap Value Fund Service Class commenced operations on July 15, 2016.
(4) Less than one dollar.
(5) Less than one share.
The accompanying notes are an integral part of these financial statements.
page 46

Frontier MFG Global Equity Fund
FINANCIAL HIGHLIGHTS
| | | Six Months
Ended
December 31,
2016
(Unaudited) | | Year
Ended
June 30,
2016 | | Year
Ended
June 30,
2015 | | Year
Ended
June 30,
2014 | | Year
Ended
June 30,
2013 | | Period
Ended
June 30,
2012(1) | |
Net Asset Value, Beginning of Period | | $ | 15.05 | | | $ | 15.99 | | | $ | 15.33 | | | $ | 13.43 | | | $ | 10.81 | | | $ | 10.00 | | |
INCOME (LOSS) FROM
INVESTMENT OPERATIONS: | |
Net investment income | | | 0.05 | | | | 0.14 | | | | 0.10 | (2) | | | 0.19 | (2) | | | 0.17 | (2) | | | 0.11 | (2) | |
Net realized and unrealized gain (loss) on investments | | | 0.95 | | | | (0.48 | ) | | | 0.91 | | | | 1.91 | | | | 2.68 | | | | 0.70 | | |
Total Income (Loss) from Investment Operations | | | 1.00 | | | | (0.34 | ) | | | 1.01 | | | | 2.10 | | | | 2.85 | | | | 0.81 | | |
LESS DISTRIBUTIONS: | |
From net investment income | | | (0.14 | ) | | | (0.12 | ) | | | (0.12 | ) | | | (0.08 | ) | | | (0.09 | ) | | | — | | |
From net realized gain on investments | | | (0.58 | ) | | | (0.48 | ) | | | (0.23 | ) | | | (0.12 | ) | | | (0.14 | ) | | | — | | |
Total Distributions | | | (0.72 | ) | | | (0.60 | ) | | | (0.35 | ) | | | (0.20 | ) | | | (0.23 | ) | | | — | | |
Redemption fees retained | | | — | (3) | | | — | (3) | | | — | (3) | | | — | (3) | | | — | (3) | | | — | | |
Net Asset Value, End of Period | | $ | 15.33 | | | $ | 15.05 | | | $ | 15.99 | | | $ | 15.33 | | | $ | 13.43 | | | $ | 10.81 | | |
Total Return | | | 6.61 | %(4) | | | (2.19 | )% | | | 6.72 | % | | | 15.76 | % | | | 26.68 | % | | | 8.10 | %(4) | |
SUPPLEMENTAL DATA AND RATIOS: | |
Net assets, end of period (in thousands) | | $ | 1,050,181 | | | $ | 1,073,308 | | | $ | 1,106,525 | | | $ | 791,043 | | | $ | 346,695 | | | $ | 108,551 | | |
Ratio of expenses to average net assets | |
Before waivers and reimbursements | | | 0.85 | %(5) | | | 0.85 | % | | | 0.86 | % | | | 0.89 | % | | | 0.97 | % | | | 1.14 | %(5) | |
Net of waivers and reimbursements | | | 0.80 | %(5) | | | 0.80 | % | | | 0.80 | % | | | 0.80 | % | | | 0.80 | % | | | 0.80 | %(5) | |
Ratio of net investment income to average net assets | |
Before waivers and reimbursements | | | 0.55 | %(5) | | | 0.85 | % | | | 0.56 | % | | | 1.18 | % | | | 1.17 | % | | | 1.70 | %(5) | |
Net of waivers and reimbursements | | | 0.60 | %(5) | | | 0.90 | % | | | 0.62 | % | | | 1.27 | % | | | 1.34 | % | | | 2.04 | %(5) | |
Portfolio turnover rate | | | 18 | %(4) | | | 38 | % | | | 69 | % | | | 20 | % | | | 31 | % | | | 19 | %(4) | |
(1) Commenced operations on December 28, 2011.
(2) Per share net investment income has been calculated using the daily average share method.
(3) Less than one cent per share.
(4) Not annualized.
(5) Annualized.
The accompanying notes are an integral part of these financial statements.
page 47

Frontier MFG Global Plus Fund
FINANCIAL HIGHLIGHTS
| | | Institutional Class | |
| | | Six Months
Ended
December 31,
2016
(Unaudited) | | Year
Ended
June 30,
2016 | | Period
Ended
June 30,
2015(1) | |
Net Asset Value, Beginning of Period | | $ | 9.59 | | | $ | 9.91 | | | $ | 10.00 | | |
INCOME (LOSS) FROM INVESTMENT OPERATIONS: | |
Net investment income | | | 0.03 | (2) | | | 0.09 | (2) | | | 0.03 | | |
Net realized and unrealized gain (loss) on investments | | | 0.57 | | | | (0.36 | ) | | | (0.12 | ) | |
Total Income (Loss) from Investment Operations | | | 0.60 | | | | (0.27 | ) | | | (0.09 | ) | |
LESS DISTRIBUTIONS: | |
From net investment income | | | (0.02 | ) | | | (0.05 | ) | | | — | | |
From net realized gain on investments | | | — | (3) | | | — | | | | — | | |
Total Distributions | | | (0.02 | ) | | | (0.05 | ) | | | — | | |
Net Asset Value, End of Period | | $ | 10.17 | | | $ | 9.59 | | | $ | 9.91 | | |
Total Return | | | 6.27 | %(4) | | | (2.77 | )% | | | (0.90 | )%(4) | |
SUPPLEMENTAL DATA AND RATIOS: | |
Net assets, end of period (in thousands) | | $ | 84,641 | | | $ | 21,547 | | | $ | 5,859 | | |
Ratio of expenses to average net assets | |
Before waivers and reimbursements | | | 1.09 | %(5) | | | 2.03 | % | | | 4.96 | %(5) | |
Net of waivers and reimbursements | | | 0.80 | %(5) | | | 0.80 | % | | | 0.80 | %(5) | |
Ratio of net investment income (loss) to average net assets | |
Before waivers and reimbursements | | | 0.35 | %(5) | | | (0.29 | )% | | | (3.16 | )%(5) | |
Net of waivers and reimbursements | | | 0.64 | %(5) | | | 0.94 | % | | | 1.00 | %(5) | |
Portfolio turnover rate(6) | | | 21 | %(4) | | | 30 | % | | | 7 | %(4) | |
(1) Commenced operations on March 23, 2015.
(2) Per share net investment income has been calculated using the daily average share method.
(3) Less than one cent per share.
(4) Not annualized.
(5) Annualized.
(6) Portfolio turnover is calculated on the basis of the Fund as a whole without distinguishing between the classes of shares issued.
The accompanying notes are an integral part of these financial statements.
page 48

Frontier MFG Global Plus Fund
FINANCIAL HIGHLIGHTS
| | | Service Class | |
| | | Six Months
Ended
December 31,
2016
(Unaudited) | | Period
Ended
June 30,
2016(1) | |
Net Asset Value, Beginning of Period | | $ | 9.60 | | | $ | 9.73 | | |
INCOME (LOSS) FROM INVESTMENT OPERATIONS: | |
Net investment income (loss) | | | 0.01 | | | | — | (2) | |
Net realized and unrealized gain (loss) on investments | | | 0.58 | | | | (0.13 | ) | |
Total Income (Loss) from Investment Operations | | | 0.59 | | | | (0.13 | ) | |
LESS DISTRIBUTIONS: | |
From net investment income | | | (0.02 | ) | | | — | | |
From net realized gain on investments | | | — | (2) | | | — | | |
Total Distributions | | | (0.02 | ) | | | — | | |
Redemption fees retained | | | — | | | | — | (2) | |
Net Asset Value, End of Period | | $ | 10.17 | | | $ | 9.60 | | |
Total Return | | | 6.14 | %(3) | | | (1.34 | )%(3) | |
SUPPLEMENTAL DATA AND RATIOS: | |
Net assets, end of period (in thousands) | | $ | 42,940 | | | $ | 10,727 | | |
Ratio of expenses to average net assets | |
Before waivers and reimbursements | | | 1.17 | %(4) | | | 1.38 | %(4) | |
Net of waivers and reimbursements | | | 0.87 | %(4) | | | 0.80 | %(4) | |
Ratio of net investment income (loss) to average net assets | |
Before waivers and reimbursements | | | (0.05 | )%(4) | | | (0.70 | )%(4) | |
Net of waivers and reimbursements | | | 0.25 | %(4) | | | (0.12 | )%(4) | |
Portfolio turnover rate(5) | | | 21 | %(3) | | | 30 | %(3) | |
(1) Commenced operations on May 9, 2016.
(2) Less than one cent per share.
(3) Not annualized.
(4) Annualized.
(5) Portfolio turnover is calculated on the basis of the Fund as a whole without distinguishing between the classes of shares issued.
The accompanying notes are an integral part of these financial statements.
page 49

Frontier MFG Core Infrastructure Fund
FINANCIAL HIGHLIGHTS
| | | Institutional Class | |
| | | Six Months
Ended
December 31,
2016
(Unaudited) | | Year
Ended
June 30,
2016 | | Year
Ended
June 30,
2015 | | Year
Ended
June 30,
2014 | | Year
Ended
June 30,
2013 | | Period
Ended
June 30,
2012(1) | |
Net Asset Value, Beginning of Period | | $ | 15.27 | | | $ | 13.09 | | | $ | 14.13 | | | $ | 11.54 | | | $ | 10.65 | | | $ | 10.00 | | |
INCOME (LOSS) FROM
INVESTMENT OPERATIONS: | |
Net investment income | | | 0.16 | | | | 0.37 | | | | 0.42 | (2) | | | 0.55 | (2) | | | 0.49 | (2) | | | 0.24 | | |
Net realized and unrealized gain (loss) on investments | | | (1.27 | ) | | | 2.21 | | | | (0.96 | ) | | | 2.22 | | | | 0.84 | | | | 0.41 | | |
Total Income (Loss) from Investment Operations | | | (1.11 | ) | | | 2.58 | | | | (0.54 | ) | | | 2.77 | | | | 1.33 | | | | 0.65 | | |
LESS DISTRIBUTIONS: | |
From net investment income | | | (0.18 | ) | | | (0.36 | ) | | | (0.47 | ) | | | (0.18 | ) | | | (0.44 | ) | | | — | | |
From net realized gain on investments | | | (0.03 | ) | | | (0.04 | ) | | | (0.03 | ) | | | — | | | | — | (3) | | | — | | |
Total Distributions | | | (0.21 | ) | | | (0.40 | ) | | | (0.50 | ) | | | (0.18 | ) | | | (0.44 | ) | | | — | | |
Redemption fees retained | | | — | (3) | | | — | (3) | | | — | (3) | | | — | (3) | | | — | | | | — | | |
Net Asset Value, End of Period | | $ | 13.95 | | | $ | 15.27 | | | $ | 13.09 | | | $ | 14.13 | | | $ | 11.54 | | | $ | 10.65 | | |
Total Return | | | (7.29 | )%(4) | | | 20.00 | % | | | (4.03 | )% | | | 24.22 | % | | | 12.73 | % | | | 6.50 | %(4) | |
SUPPLEMENTAL DATA AND RATIOS: | |
Net assets, end of period (in thousands) | | $ | 174,935 | | | $ | 207,985 | | | $ | 161,722 | | | $ | 65,666 | | | $ | 7,303 | | | $ | 2,743 | | |
Ratio of expenses to average net assets | |
Before waivers and reimbursements | | | 0.83 | %(5) | | | 0.83 | % | | | 0.93 | % | | | 1.45 | % | | | 3.66 | % | | | 6.55 | %(5) | |
Net of waivers and reimbursements | | | 0.70 | %(5) | | | 0.70 | % | | | 0.70 | % | | | 0.70 | % | | | 0.70 | % | | | 0.70 | %(5) | |
Ratio of net investment income (loss) to average net assets | |
Before waivers and reimbursements | | | 1.90 | %(5) | | | 2.62 | % | | | 2.77 | % | | | 3.47 | % | | | 1.34 | % | | | (1.09 | )%(5) | |
Net of waivers and reimbursements | | | 2.03 | %(5) | | | 2.75 | % | | | 3.00 | % | | | 4.22 | % | | | 4.30 | % | | | 4.76 | %(5) | |
Portfolio turnover rate(6) | | | 13 | %(4) | | | 15 | % | | | 17 | % | | | 16 | % | | | 7 | % | | | 7 | %(4) | |
(1) Commenced operations on January 18, 2012.
(2) Per share net investment income has been calculated using the daily average share method.
(3) Less than one cent per share.
(4) Not annualized.
(5) Annualized.
(6) Portfolio turnover is calculated on the basis of the Fund as a whole without distinguishing between the classes of shares issued.
The accompanying notes are an integral part of these financial statements.
page 50

Frontier MFG Core Infrastructure Fund
FINANCIAL HIGHLIGHTS
| | | Service Class | |
| | | Period
Ended
December 31,
2016(1)
(Unaudited) | |
Net Asset Value, Beginning of Period | | $ | 15.23 | | |
LOSS FROM INVESTMENT OPERATIONS: | |
Net investment income | | | 0.20 | (2) | |
Net realized and unrealized loss on investments | | | (1.27 | ) | |
Total Loss from Investment Operations | | | (1.07 | ) | |
LESS DISTRIBUTIONS: | |
From net investment income | | | (0.18 | ) | |
From net realized gain on investments | | | (0.03 | ) | |
Total Distributions | | | (0.21 | ) | |
Net Asset Value, End of Period | | $ | 13.95 | | |
Total Return | | | (7.06 | )%(3) | |
SUPPLEMENTAL DATA AND RATIOS: | |
Net assets, end of period (in thousands) | | $ | 114 | | |
Ratio of expenses to average net assets | |
Before waivers and reimbursements | | | 2.15 | %(4) | |
Net of waivers and reimbursements | | | 0.75 | %(4) | |
Ratio of net investment income to average net assets | |
Before waivers and reimbursements | | | 1.74 | %(4) | |
Net of waivers and reimbursements | | | 3.14 | %(4) | |
Portfolio turnover rate(5) | | | 13 | %(3) | |
(1) Commenced operations on July 15, 2016.
(2) Per share net investment loss has been calculated using the daily average share method.
(3) Not annualized.
(4) Annualized.
(5) Portfolio turnover is calculated on the basis of the Fund as a whole without distinguishing between the classes of shares issued.
The accompanying notes are an integral part of these financial statements.
page 51

Frontier Timpani Small Cap Growth Fund
FINANCIAL HIGHLIGHTS
| | | Institutional Class | |
| | | Six Months
Ended
December 31,
2016
(Unaudited) | | Year
Ended
June 30,
2016 | | Year
Ended
June 30,
2015 | | Year
Ended
June 30,
2014 | | Year
Ended
June 30,
2013 | | Year
Ended
June 30,
2012 | |
Net Asset Value, Beginning of Period | | $ | 14.77 | | | $ | 18.58 | | | $ | 16.06 | | | $ | 13.22 | | | $ | 10.31 | | | $ | 10.75 | | |
INCOME (LOSS) FROM
INVESTMENT OPERATIONS: | |
Net investment loss | | | (0.03 | )(1) | | | (0.12 | )(1) | | | (0.16 | )(1) | | | (0.14 | )(1) | | | (0.04 | )(1) | | | (0.08 | )(1) | |
Net realized and unrealized gain (loss) on investments | | | 1.06 | | | | (3.69 | ) | | | 2.68 | | | | 3.32 | | | | 2.95 | | | | (0.36 | ) | |
Total Income (Loss) from Investment Operations | | | 1.03 | | | | (3.81 | ) | | | 2.52 | | | | 3.18 | | | | 2.91 | | | | (0.44 | ) | |
LESS DISTRIBUTIONS: | |
From net realized gain on investments | | | — | | | | — | | | | — | | | | (0.34 | ) | | | — | | | | — | | |
Total Distributions | | | — | | | | — | | | | — | | | | (0.34 | ) | | | — | | | | — | | |
Net Asset Value, End of Period | | $ | 15.80 | | | $ | 14.77 | | | $ | 18.58 | | | $ | 16.06 | | | $ | 13.22 | | | $ | 10.31 | | |
Total Return | | | 6.97 | %(2) | | | (20.51 | )% | | | 15.62 | % | | | 24.16 | % | | | 28.35 | % | | | (4.28 | )% | |
SUPPLEMENTAL DATA AND RATIOS: | |
Net assets, end of period (in thousands) | | $ | 41,916 | | | $ | 52,595 | | | $ | 47,455 | | | $ | 13,478 | | | $ | 3,983 | | | $ | 2,824 | | |
Ratio of expenses to average net assets | |
Before waivers and reimbursements | | | 1.31 | %(3) | | | 1.32 | % | | | 1.52 | % | | | 2.46 | % | | | 4.02 | % | | | 5.25 | % | |
Net of waivers and reimbursements | | | 1.10 | %(3) | | | 1.10 | % | | | 1.10 | % | | | 1.10 | % | | | 1.10 | % | | | 1.10 | % | |
Ratio of net investment loss to average net assets | |
Before waivers and reimbursements | | | (0.59 | )%(3) | | | (0.99 | )% | | | (1.37 | )% | | | (2.26 | )% | | | (3.28 | )% | | | (5.02 | )% | |
Net of waivers and reimbursements | | | (0.38 | )%(3) | | | (0.77 | )% | | | (0.95 | )% | | | (0.90 | )% | | | (0.36 | )% | | | (0.87 | )% | |
Portfolio turnover rate(4) | | | 90 | %(2) | | | 156 | % | | | 124 | % | | | 173 | % | | | 140 | % | | | 138 | % | |
(1) Per share net investment loss has been calculated using the daily average share method.
(2) Not annualized.
(3) Annualized.
(4) Portfolio turnover is calculated on the basis of the Fund as a whole without distinguishing between the classes of shares issued.
The accompanying notes are an integral part of these financial statements.
page 52

Frontier Timpani Small Cap Growth Fund
FINANCIAL HIGHLIGHTS
| | | Class Y | |
| | | Six Months
Ended
December 31,
2016
(Unaudited) | | Year
Ended
June 30,
2016 | | Year
Ended
June 30,
2015 | | Period
Ended
June 30,
2014(1) | |
Net Asset Value, Beginning of Period | | $ | 14.62 | | | $ | 18.48 | | | $ | 16.04 | | | $ | 16.35 | | |
INCOME (LOSS) FROM INVESTMENT OPERATIONS: | |
Net investment loss | | | (0.07 | ) | | | (0.18 | )(2) | | | (0.23 | )(2) | | | (0.08 | )(2) | |
Net realized and unrealized gain (loss) on investments | | | 1.07 | | | | (3.68 | ) | | | 2.67 | | | | (0.23 | )(3) | |
Total Income (Loss) from Investment Operations | | | 1.00 | | | | (3.86 | ) | | | 2.44 | | | | (0.31 | ) | |
Net Asset Value, End of Period | | $ | 15.62 | | | $ | 14.62 | | | $ | 18.48 | | | $ | 16.04 | | |
Total Return | | | 6.84 | %(4) | | | (20.84 | )% | | | 15.15 | % | | | (1.90 | )%(4) | |
SUPPLEMENTAL DATA AND RATIOS: | |
Net assets, end of period (in thousands) | | $ | 3,471 | | | $ | 3,369 | | | $ | 2,262 | | | $ | 1,215 | | |
Ratio of expenses to average net assets | |
Before waivers and reimbursements | | | 1.70 | %(5) | | | 1.70 | % | | | 1.95 | % | | | 2.73 | %(5) | |
Net of waivers and reimbursements | | | 1.50 | %(5) | | | 1.50 | % | | | 1.50 | % | | | 1.50 | %(5) | |
Ratio of net investment loss to average net assets | |
Before waivers and reimbursements | | | (0.99 | )%(5) | | | (1.36 | )% | | | (1.82 | )% | | | (2.36 | )%(5) | |
Net of waivers and reimbursements | | | (0.79 | )%(5) | | | (1.16 | )% | | | (1.37 | )% | | | (1.13 | )%(5) | |
Portfolio turnover rate(6) | | | 90 | %(4) | | | 156 | % | | | 124 | % | | | 173 | %(4) | |
(1) Commenced operations on January 6, 2014.
(2) Per share net investment loss has been calculated using the daily average share method.
(3) Net realized and unrealized loss on investments does not reconcile with net realized and unrealized gain on investments in the Statement of Operations due to the timing of the Class Y inception.
(4) Not annualized.
(5) Annualized.
(6) Portfolio turnover is calculated on the basis of the Fund as a whole without distinguishing between the classes of shares issued.
The accompanying notes are an integral part of these financial statements.
page 53

Frontier Timpani Small Cap Growth Fund
FINANCIAL HIGHLIGHTS
| | | Service Class | |
| | | Period
Ended
December 31,
2016(1)
(Unaudited) | |
Net Asset Value, Beginning of Period | | $ | 15.42 | | |
INCOME FROM INVESTMENT OPERATIONS: | |
Net investment loss | | | (0.03 | ) | |
Net realized and unrealized gain on investments | | | 0.41 | | |
Total Income from Investment Operations | | | 0.38 | | |
Net Asset Value, End of Period | | $ | 15.80 | | |
Total Return | | | 2.46 | %(2) | |
SUPPLEMENTAL DATA AND RATIOS: | |
Net assets, end of period (in hundreds) | | $ | 1 | | |
Ratio of expenses to average net assets | |
Before waivers and reimbursements | | | 634.46 | %(3) | |
Net of waivers and reimbursements | | | 1.10 | %(3) | |
Ratio of net investment loss to average net assets | |
Before waivers and reimbursements | | | (633.78 | )%(3) | |
Net of waivers and reimbursements | | | (0.42 | )%(3) | |
Portfolio turnover rate(4) | | | 90 | %(2) | |
(1) Commenced operations on July 15, 2016.
(2) Not annualized.
(3) Annualized.
(4) Portfolio turnover is calculated on the basis of the Fund as a whole without distinguishing between the classes of shares issued.
The accompanying notes are an integral part of these financial statements.
page 54

Frontier Netols Small Cap Value Fund
FINANCIAL HIGHLIGHTS
| | | Institutional Class | |
| | | Six Months
Ended
December 31,
2016
(Unaudited) | | Year
Ended
June 30,
2016 | | Year
Ended
June 30,
2015 | | Year
Ended
June 30,
2014 | | Year
Ended
June 30,
2013 | | Year
Ended
June 30,
2012 | |
Net Asset Value, Beginning of Period | | $ | 8.78 | | | $ | 11.60 | | | $ | 14.66 | | | $ | 15.35 | | | $ | 12.86 | | | $ | 13.75 | | |
INCOME (LOSS) FROM
INVESTMENT OPERATIONS: | |
Net investment income (loss) | | | — | (1) | | | — | (1) | | | 0.01 | | | | (0.04 | )(2) | | | 0.01 | | | | 0.01 | | |
Net realized and unrealized gain (loss) on investments | | | 1.40 | | | | (0.80 | ) | | | 0.37 | | | | 3.50 | | | | 3.17 | | | | (0.90 | ) | |
Total Income (Loss) from Investment Operations | | | 1.40 | | | | (0.80 | ) | | | 0.38 | | | | 3.46 | | | | 3.18 | | | | (0.89 | ) | |
LESS DISTRIBUTIONS: | |
From net investment income | | | — | (1) | | | — | (1) | | | — | | | | — | | | | — | | | | — | | |
From net realized gain on investments | | | (0.67 | ) | | | (2.02 | ) | | | (3.44 | ) | | | (4.15 | ) | | | (0.69 | ) | | | — | | |
Total Distributions | | | (0.67 | ) | | | (2.02 | ) | | | (3.44 | ) | | | (4.15 | ) | | | (0.69 | ) | | | — | | |
Net Asset Value, End of Period | | $ | 9.51 | | | $ | 8.78 | | | $ | 11.60 | | | $ | 14.66 | | | $ | 15.35 | | | $ | 12.86 | | |
Total Return | | | 15.80 | %(3) | | | (5.99 | )% | | | 3.61 | % | | | 24.63 | % | | | 25.61 | % | | | (6.47 | )% | |
SUPPLEMENTAL DATA AND RATIOS: | |
Net assets, end of period (in thousands) | | $ | 77,526 | | | $ | 70,668 | | | $ | 77,802 | | | $ | 98,504 | | | $ | 113,151 | | | $ | 134,544 | | |
Ratio of expenses to average net assets | |
Before waivers and reimbursements | | | 1.19 | %(4) | | | 1.21 | % | | | 1.18 | % | | | 1.17 | % | | | 1.18 | % | | | 1.22 | % | |
Net of waivers and reimbursements | | | 1.10 | %(4) | | | 1.10 | % | | | 1.10 | % | | | 1.10 | % | | | 1.10 | % | | | 1.10 | % | |
Ratio of net investment income (loss) to average net assets | |
Before waivers and reimbursements | | | 0.00 | %(4) | | | (0.04 | )% | | | (0.18 | )% | | | (0.35 | )% | | | (0.14 | )% | | | (0.08 | )% | |
Net of waivers and reimbursements | | | 0.09 | %(4) | | | 0.07 | % | | | (0.10 | )% | | | (0.28 | )% | | | (0.06 | )% | | | 0.04 | % | |
Portfolio turnover rate(5) | | | 13 | %(3) | | | 25 | % | | | 22 | % | | | 24 | % | | | 28 | % | | | 28 | % | |
(1) Less than one cent per share.
(2) Per share net investment loss has been calculated using the daily average share method.
(3) Not annualized.
(4) Annualized.
(5) Portfolio turnover is calculated on the basis of the Fund as a whole without distinguishing between the classes of shares issued.
The accompanying notes are an integral part of these financial statements.
page 55

Frontier Netols Small Cap Value Fund
FINANCIAL HIGHLIGHTS
| | | Class Y | |
| | | Six Months
Ended
December 31,
2016
(Unaudited) | | Year
Ended
June 30,
2016 | | Year
Ended
June 30,
2015 | | Year
Ended
June 30,
2014 | | Year
Ended
June 30,
2013 | | Year
Ended
June 30,
2012 | |
Net Asset Value, Beginning of Period | | $ | 8.27 | | | $ | 11.07 | | | $ | 14.15 | | | $ | 15.03 | | | $ | 12.65 | | | $ | 13.59 | | |
INCOME (LOSS) FROM
INVESTMENT OPERATIONS: | |
Net investment income (loss) | | | — | (1)(2) | | | — | (1)(2) | | | (0.01 | )(1) | | | (0.17 | )(1) | | | (0.05 | ) | | | (0.05 | ) | |
Net realized and unrealized gain (loss) on investments | | | 1.32 | | | | (0.78 | ) | | | 0.37 | | | | 3.44 | | | | 3.12 | | | | (0.89 | ) | |
Total Income (Loss) from Investment Operations | | | 1.32 | | | | (0.78 | ) | | | 0.36 | | | | 3.27 | | | | 3.07 | | | | (0.94 | ) | |
LESS DISTRIBUTIONS: | |
From net investment income | | | — | (2) | | | — | (2) | | | — | | | | — | | | | — | | | | — | | |
From net realized gain on investments | | | (0.67 | ) | | | (2.02 | ) | | | (3.44 | ) | | | (4.15 | ) | | | (0.69 | ) | | | — | | |
Total Distributions | | | (0.67 | ) | | | (2.02 | ) | | | (3.44 | ) | | | (4.15 | ) | | | (0.69 | ) | | | — | | |
Net Asset Value, End of Period | | $ | 8.92 | | | $ | 8.27 | | | $ | 11.07 | | | $ | 14.15 | | | $ | 15.03 | | | $ | 12.65 | | |
Total Return | | | 15.81 | %(3) | | | (6.12 | )% | | | 3.61 | % | | | 23.84 | % | | | 25.15 | % | | | (6.92 | )% | |
SUPPLEMENTAL DATA AND RATIOS: | |
Net assets, end of period (in thousands) | | $ | 101 | | | $ | 150 | | | $ | 521 | | | $ | 633 | | | $ | 20,228 | | | $ | 17,765 | | |
Ratio of expenses to average net assets | |
Before waivers and reimbursements | | | 1.19 | %(4) | | | 1.21 | % | | | 1.18 | % | | | 1.57 | % | | | 1.58 | % | | | 1.62 | % | |
Net of waivers and reimbursements | | | 1.10 | %(4) | | | 1.10 | % | | | 1.10 | % | | | 1.50 | % | | | 1.50 | % | | | 1.50 | % | |
Ratio of net investment income (loss) to average net assets | |
Before waivers and reimbursements | | | (0.01 | )%(4) | | | (0.10 | )% | | | (0.18 | )% | | | (1.19 | )% | | | (0.54 | )% | | | (0.48 | )% | |
Net of waivers and reimbursements | | | 0.08 | %(4) | | | 0.01 | % | | | (0.10 | )% | | | (1.12 | )% | | | (0.46 | )% | | | (0.36 | )% | |
Portfolio turnover rate(5) | | | 13 | %(3) | | | 25 | % | | | 22 | % | | | 24 | % | | | 28 | % | | | 28 | % | |
(1) Per share net investment income (loss) has been calculated using the daily average share method.
(2) Less than one cent per share.
(3) Not annualized.
(4) Annualized.
(5) Portfolio turnover is calculated on the basis of the Fund as a whole without distinguishing between the classes of shares issued.
The accompanying notes are an integral part of these financial statements.
page 56

Frontier Phocas Small Cap Value Fund
FINANCIAL HIGHLIGHTS
| | | Institutional Class | |
| | | Six Months
Ended
December 31,
2016
(Unaudited) | | Year
Ended
June 30,
2016 | | Year
Ended
June 30,
2015 | | Year
Ended
June 30,
2014 | | Year
Ended
June 30,
2013 | | Year
Ended
June 30,
2012 | |
Net Asset Value, Beginning of Period | | $ | 33.45 | | | $ | 34.33 | | | $ | 35.96 | | | $ | 28.72 | | | $ | 23.30 | | | $ | 24.51 | | |
INCOME (LOSS) FROM
INVESTMENT OPERATIONS: | |
Net investment income (loss) | | | 0.09 | | | | 0.15 | | | | 0.19 | | | | (0.05 | )(1) | | | 0.20 | | | | 0.06 | | |
Net realized and unrealized gain (loss) on investments | | | 6.23 | | | | (0.62 | ) | | | 0.08 | | | | 9.25 | | | | 5.41 | | | | (1.25 | ) | |
Total Income (Loss) from Investment Operations | | | 6.32 | | | | (0.47 | ) | | | 0.27 | | | | 9.20 | | | | 5.61 | | | | (1.19 | ) | |
LESS DISTRIBUTIONS: | |
From net investment income | | | (0.16 | ) | | | (0.22 | ) | | | (0.03 | ) | | | (0.05 | ) | | | (0.19 | ) | | | (0.02 | ) | |
From net realized gain on investments | | | — | | | | (0.19 | ) | | | (1.87 | ) | | | (1.91 | ) | | | — | | | | — | | |
Total Distributions | | | (0.16 | ) | | | (0.41 | ) | | | (1.90 | ) | | | (1.96 | ) | | | (0.19 | ) | | | (0.02 | ) | |
Net Asset Value, End of Period | | $ | 39.61 | | | $ | 33.45 | | | $ | 34.33 | | | $ | 35.96 | | | $ | 28.72 | | | $ | 23.30 | | |
Total Return | | | 18.88 | %(2) | | | (1.29 | )% | | | 0.84 | % | | | 32.72 | % | | | 24.29 | % | | | (4.91 | )% | |
SUPPLEMENTAL DATA AND RATIOS: | |
Net assets, end of period (in thousands) | | $ | 37,388 | | | $ | 31,946 | | | $ | 28,686 | | | $ | 24,152 | | | $ | 9,004 | | | $ | 18,821 | | |
Ratio of expenses to average net assets | |
Before waivers and reimbursements | | | 1.43 | %(3) | | | 1.49 | % | | | 1.54 | % | | | 1.97 | % | | | 2.50 | % | | | 1.70 | % | |
Net of waivers and reimbursements | | | 1.10 | %(3) | | | 1.10 | % | | | 1.10 | % | | | 1.10 | % | | | 1.05 | % | | | 0.99 | % | |
Ratio of net investment income (loss) to average net assets | |
Before waivers and reimbursements | | | 0.17 | %(3) | | | 0.06 | % | | | 0.16 | % | | | (1.00 | )% | | | (1.08 | )% | | | (0.51 | )% | |
Net of waivers and reimbursements | | | 0.50 | %(3) | | | 0.45 | % | | | 0.60 | % | | | (0.13 | )% | | | 0.37 | % | | | 0.20 | % | |
Portfolio turnover rate(4) | | | 23 | %(2) | | | 49 | % | | | 52 | % | | | 53 | % | | | 196 | % | | | 50 | % | |
(1) Per share net investment loss has been calculated using the daily average shares method.
(2) Not annualized.
(3) Annualized.
(4) Portfolio turnover is calculated on the basis of the Fund as a whole without distinguishing between the classes of shares issued.
The accompanying notes are an integral part of these financial statements.
page 57

Frontier Phocas Small Cap Value Fund
FINANCIAL HIGHLIGHTS
| | | Service Class | |
| | | Period
Ended
December 31,
2016(1)
(Unaudited) | |
Net Asset Value, Beginning of Period | | $ | 34.66 | | |
INCOME FROM INVESTMENT OPERATIONS: | |
Net investment income | | | 0.12 | | |
Net realized and unrealized gain on investments | | | 5.00 | | |
Total Income from Investment Operations | | | 5.12 | | |
LESS DISTRIBUTIONS: | |
From net investment income | | | (0.16 | ) | |
From net realized gain on investments | | | — | | |
Total Distributions | | | (0.16 | ) | |
Net Asset Value, End of Period | | $ | 39.62 | | |
Total Return | | | 14.77 | %(2) | |
SUPPLEMENTAL DATA AND RATIOS: | |
Net assets, end of period (in hundreds) | | $ | 1 | | |
Ratio of expenses to average net assets | |
Before waivers and reimbursements | | | 619.70 | %(3) | |
Net of waivers and reimbursements | | | 1.10 | %(3) | |
Ratio of net investment income (loss) to average net assets | |
Before waivers and reimbursements | | | (617.95 | )%(3) | |
Net of waivers and reimbursements | | | 0.65 | %(3) | |
Portfolio turnover rate(4) | | | 23 | %(2) | |
(1) Commenced operations on July 15, 2016.
(2) Not annualized.
(3) Annualized.
(4) Portfolio turnover is calculated on the basis of the Fund as a whole without distinguishing between the classes of shares issued.
The accompanying notes are an integral part of these financial statements.
page 58

NOTES TO FINANCIAL STATEMENTS
December 31, 2016 (Unaudited)
(1) ORGANIZATION
Frontier Funds, Inc. (the "Company") was incorporated on May 24, 1996, as a Maryland corporation and is registered under the Investment Company Act of 1940, as amended (the "1940 Act"), as an open-end investment company issuing shares in series (each, a "Fund," or collectively, the "Funds"), each series representing a distinct portfolio with its own investment objectives and policies. The Company consists of seven separate series, six of which are included herein. The investment objective of each of the Frontier MFG Global Equity Fund, Frontier MFG Global Plus Fund, Frontier Timpani Small Cap Growth Fund and Frontier Netols Small Cap Value Fund is capital appreciation. The investment objective of the Frontier MFG Core Infrastructure Fund is long-term capital appreciation. The investment objective of the Frontier Phocas Small Cap Value Fund is long-term total investment through capital appreciation. Each Fund is a diversified fund, except the Frontier MFG Global Equity Fund and Frontier MFG Global Plus Fund, which are non-diversified.
A summary of each Fund's investment adviser, subadviser and capital structure is as follows:
Fund | | Investment Adviser | | Subadviser | | Capital Structure | | Commencement
of Operations | |
Frontier MFG Global Equity Fund (a) | | Frontegra Asset Management, Inc. ("Frontegra") | | MFG Asset Management | | Multi-Class
• Institutional
• Service Class (b) | | Dec. 28, 2011 | |
Frontier MFG Global Plus Fund (a) | | Frontegra | | MFG Asset Management | | Multi-Class
• Institutional
• Class Y (c)
• Service Class | | Mar. 23, 2015 | |
Frontier MFG Core Infrastructure Fund (a) | | Frontegra | | MFG Asset Management | | Multi-Class
• Institutional
• Service Class | | Jan. 18, 2012 | |
Frontier Timpani Small Cap Growth Fund | | Timpani Capital Management LLC ("Timpani") (d) | | None | | Multi-Class
• Institutional
• Class Y
• Service Class | | Mar. 23, 2011 | |
Frontier Netols Small Cap Value Fund | | Frontegra | | Netols Asset Management, Inc. | | Multi-Class
• Institutional
• Class Y
• Service Class (b) | | Dec. 16, 2005 | |
Frontier Phocas Small Cap Value Fund | | Frontegra | | Phocas Financial Corp. | | Multi-Class
• Institutional
• Service Class | | Sep. 29, 2006 | |
(a) A redemption fee of 2.00% will be charged on shares of the Fund redeemed 30 days or less from their date of purchase.
(b) As of December 31, 2016, the Service Class shares of the Frontier MFG Global Equity Fund and Frontier Netols Small Cap Value Fund had not commenced operations.
(c) As of December 31, 2016, the Class Y shares of the Frontier MFG Global Plus Fund had not commenced operations.
(d) Timpani is an affiliate of Frontegra.
page 59

NOTES TO FINANCIAL STATEMENTS (continued)
December 31, 2016 (Unaudited)
(2) SIGNIFICANT ACCOUNTING POLICIES
Each Fund is an investment company and accordingly follows the investment company accounting and reporting guidance of the Financial Accounting Standards Board ("FASB") Accounting Standards Codification Topic 946 Financial Services — Investment Companies.
The following is a summary of significant accounting policies consistently followed by the Funds in the preparation of their financial statements.
(a) Investment Valuation
Equity securities for which market quotations are readily available are valued at the last reported sale price on the national securities exchange on which such securities are primarily traded. Equity securities for which there were no transactions on a given day or securities not listed on a national securities exchange are valued at the most recent bid price. Equity securities that are traded on NASDAQ are valued using the NASDAQ Official Closing Price ("NOCP"). Debt securities are valued at the bid price provided by an independent pricing service, which uses valuation methods such as matrix pricing and other analytical pricing models as well as market transactions and dealer bid quotations. Shares of underlying mutual funds are valued at their respective Net Asset Value ("NAV"). Exchange-traded funds and closed-end funds are valued at the last reported sale price on the exchange on which the security is principally traded. Securities that are primarily traded on foreign exchanges generally are valued at the last sale price of such securities on their respective exchange. In the case of foreign securities, the occurrence of events after the close of the foreign markets, but prior to the time the Fund's NAV is calculated, will result in a systematic fair value adjustment to the trading prices of foreign securities. The Fund will value foreign securities at fair value using fair valuation procedures approved by the Board of Directors (the "Board"), taking into account such events in calculating the NAV. In such cases, use of fair valuation can reduce an investor's ability to seek to profit by estimating the Fund's NAV in advance of the time the NAV is calculated. The Board has retained an independent fair value pricing service to assist in valuing foreign securities held by the MFG Global Equity, MFG Global Plus and MFG Core Infrastructure Funds. In valuing assets, prices denominated in foreign currencies are converted to U.S. dollar equivalents at the current exchange rate, which approximates fair value. Any securities or other assets for which market quotations are not readily available are valued at their fair value as determined in good faith by the advisers or subadvisers pursuant to guidelines established by the Board.
The Funds follow a fair value hierarchy that distinguishes between market data obtained from independent sources (observable inputs) and the Funds' own market assumptions (unobservable inputs). These inputs are used in determining the value of each Fund's investments and are summarized in the following fair value hierarchy:
Level 1 — Quoted prices in active markets for identical securities
Level 2 — Evaluated prices based on other significant observable inputs (including quoted prices for similar securities, foreign security indices, foreign exchange rates, fair value estimates for foreign securities and changes in benchmark securities indices)
Level 3 — Significant unobservable inputs (including the Fund's own assumptions in determining fair value of investments)
The following is a summary of inputs used to value the Funds' securities as of December 31, 2016:
MFG Global Equity
Description | | Level 1 | | Level 2 | | Level 3 | | Total | |
Equity (a) | |
| Common Stocks | | $ | 902,634,982 | | | $ | — | | | $ | — | | | $ | 902,634,982 | | |
| Total Equity | | | 902,634,982 | | | | — | | | | — | | | | 902,634,982 | | |
Short-Term Investments | | | 131,370,278 | | | | — | | | | — | | | | 131,370,278 | | |
Total Investments in Securities | | $ | 1,034,005,260 | | | $ | — | | | $ | — | | | $ | 1,034,005,260 | | |
page 60

NOTES TO FINANCIAL STATEMENTS (continued)
December 31, 2016 (Unaudited)
MFG Global Plus
Description | | Level 1 | | Level 2 | | Level 3 | | Total | |
Equity (a) | |
| Common Stocks | | $ | 112,202,124 | | | $ | — | | | $ | — | | | $ | 112,202,124 | | |
| Total Equity | | | 112,202,124 | | | | — | | | | — | | | | 112,202,124 | | |
Short-Term Investments | | | 15,399,714 | | | | — | | | | — | | | | 15,399,714 | | |
Total Investments in Securities | | $ | 127,601,838 | | | $ | — | | | $ | — | | | $ | 127,601,838 | | |
MFG Core Infrastructure
Description | | Level 1 | | Level 2 | | Level 3 | | Total | |
Equity (a) | |
| Common Stocks | | $ | 169,697,447 | | | $ | — | | | $ | — | | | $ | 169,697,447 | | |
| Closed-End Funds | | | 1,627,554 | | | | — | | | | — | | | | 1,627,554 | | |
| Total Equity | | | 171,325,001 | | | | — | | | | — | | | | 171,325,001 | | |
Short-Term Investments | | | 3,274,684 | | | | — | | | | — | | | | 3,274,684 | | |
Total Investments in Securities | | $ | 174,599,685 | | | $ | — | | | $ | — | | | $ | 174,599,685 | | |
Timpani Small Cap Growth
Description | | Level 1 | | Level 2 | | Level 3 | | Total | |
Equity (a) | |
| Common Stocks | | $ | 44,603,162 | | | $ | — | | | $ | — | | | $ | 44,603,162 | | |
| Total Equity | | | 44,603,162 | | | | — | | | | — | | | | 44,603,162 | | |
Short-Term Investments | | | 468,176 | | | | — | | | | — | | | | 468,176 | | |
Total Investments in Securities | | $ | 45,071,338 | | | $ | — | | | $ | — | | | $ | 45,071,338 | | |
Netols Small Cap Value
Description | | Level 1 | | Level 2 | | Level 3 | | Total | |
Equity (a) | |
| Common Stocks | | $ | 76,161,681 | | | $ | — | | | $ | — | | | $ | 76,161,681 | | |
| Total Equity | | | 76,161,681 | | | | — | | | | — | | | | 76,161,681 | | |
Short-Term Investments | | | 1,705,810 | | | | — | | | | — | | | | 1,705,810 | | |
Total Investments in Securities | | $ | 77,867,491 | | | $ | — | | | $ | — | | | $ | 77,867,491 | | |
Phocas Small Cap Value
Description | | Level 1 | | Level 2 | | Level 3 | | Total | |
Equity (a) | |
| Common Stocks | | $ | 35,886,102 | | | $ | — | | | $ | — | | | $ | 35,886,102 | | |
| Total Equity | | | 35,886,102 | | | | — | | | | — | | | | 35,886,102 | | |
Short-Term Investments | | | 1,061,858 | | | | — | | | | — | | | | 1,061,858 | | |
Total Investments in Securities | | $ | 36,947,960 | | | $ | — | | | $ | — | | | $ | 36,947,960 | | |
(a) See Fund's Schedule of Investments for sector or country classifications.
page 61

NOTES TO FINANCIAL STATEMENTS (continued)
December 31, 2016 (Unaudited)
| | MFG Global
Equity | | MFG Global
Plus | | MFG Core
Infrastructure | |
Transfers into Level 1 | | $ | 139,565,504 | | | $ | 3,536,701 | | | $ | 75,986,445 | | |
Transfers out of Level 2 | | | (139,565,504 | ) | | | (3,536,701 | ) | | | (75,986,445 | ) | |
Net transfers | | $ | — | | | $ | — | | | $ | — | | |
Transfers between Level 1 and Level 2 relate to the use of systematic fair valuation. On days when systematic fair valuation is used, certain non-U.S. dollar denominated securities move from Level 1 to Level 2 classification. At June 30, 2016, securities in the MFG Global Equity, MFG Global Plus and MFG Core Infrastructure Funds were adjusted using systematic fair valuation resulting in a Level 2 classification. At December 31, 2016, securities in the MFG Global Equity, MFG Global Plus and MFG Core Infrastructure Funds were not adjusted using systematic fair valuation resulting in a Level 1 classification. The Funds did not hold any Level 3 securities as of December 31, 2016. It is the Funds' policy to record transfers at the end of the reporting period.
(b) Federal Income Taxes
Each Fund intends to comply with the requirements of Subchapter M of the Internal Revenue Code of 1986, as amended, necessary to qualify as a regulated investment company and to make the requisite distributions of income and capital gains to its shareholders sufficient to relieve it from all or substantially all federal income taxes. Therefore, no federal income tax provision has been provided.
The Funds have adopted financial reporting rules regarding recognition and measurement of tax positions taken or expected to be taken on a tax return. The Funds recognize interest and penalties, if any, related to unrecognized tax benefits as income tax expense on the Statements of Operations. During the period, the Funds did not incur any interest or penalties. The Funds have reviewed all open tax years and concluded that there is no effect to any of the Fund's financial positions or results of operations and no tax liability resulting from unrecognized tax benefits relating to uncertain income tax positions taken or expected to be taken on a tax return. The Funds have no examinations in progress.
(c) Distributions to Shareholders
With the exception of the MFG Core Infrastructure Fund, dividends from net investment income are usually declared and paid annually. The MFG Core Infrastructure Fund usually declares and pays dividends quarterly. Distributions from net realized gains, if any, are declared and paid at least annually for all Funds. All short-term capital gains are included in ordinary income for tax purposes. Distributions to shareholders are recorded on the ex-dividend date.
The tax character of distributions paid during the six months ended December 31, 2016, and the fiscal year ended June 30, 2016, were as follows:
| | Six Months Ended December 31, 2016 | | Year Ended June 30, 2016 | |
| | Ordinary
Income | | Long-Term
Capital Gains | | Total
Distributions | | Ordinary
Income | | Long-Term
Capital Gains | | Total
Distributions | |
MFG Global Equity | | $ | 16,181,930 | | | $ | 32,521,037 | | | $ | 48,702,967 | | | $ | 14,706,897 | | | $ | 27,048,311 | | | $ | 41,755,208 | | |
MFG Global Plus | | | 257,110 | | | | — | | | | 257,110 | | | | 43,537 | | | | — | | | | 43,537 | | |
MFG Core Infrastructure | | | 2,225,041 | | | | 358,530 | | | | 2,583,571 | | | | 4,918,379 | | | | 285,716 | | | | 5,204,095 | | |
Netols Small Cap Value | | | 83,953 | | | | 5,088,769 | | | | 5,172,721 | | | | 984,151 | | | | 11,616,517 | | | | 12,600,668 | | |
Phocas Small Cap Value | | | 148,581 | | | | — | | | | 148,581 | | | | 180,816 | | | | 169,771 | | | | 350,587 | | |
page 62

NOTES TO FINANCIAL STATEMENTS (continued)
December 31, 2016 (Unaudited)
At June 30, 2016, the Funds' most recent fiscal year end, the components of accumulated earnings/losses on a tax basis were as follows:
| | | MFG
Global
Equity | | MFG
Global
Plus | | MFG
Core
Infrastructure | | Timpani
Small Cap
Growth | | Netols
Small Cap
Value | | Phocas
Small Cap
Value | |
Cost of investments | | $ | 1,026,620,292 | | | $ | 32,988,335 | | | $ | 181,309,633 | | | $ | 48,752,223 | | | $ | 52,920,840 | | | $ | 27,411,346 | | |
Gross unrealized appreciation | | $ | 138,267,960 | | | $ | 733,935 | | | $ | 31,239,341 | | | $ | 9,187,335 | | | $ | 23,615,776 | | | $ | 5,662,503 | | |
Gross unrealized depreciation | | | (91,606,471 | ) | | | (1,511,732 | ) | | | (6,686,393 | ) | | | (1,608,593 | ) | | | (5,723,186 | ) | | | (1,147,199 | ) | |
Net unrealized appreciation/depreciation | | | 46,661,489 | | | | (777,797 | ) | | | 24,552,948 | | | | 7,578,742 | | | | 17,892,590 | | | | 4,515,304 | | |
Undistributed ordinary income | | | 11,807,887 | | | | 143,719 | | | | 413,100 | | | | — | | | | 20,478 | | | | 89,296 | | |
Undistributed long-term capital gain | | | 25,626,877 | | | | — | | | | — | | | | — | | | | 2,841,291 | | | | — | | |
Total distributable earnings | | | 37,434,764 | | | | 143,719 | | | | 413,100 | | | | — | | | | 2,861,769 | | | | 89,296 | | |
Other accumulated losses | | | (47,658 | ) | | | (705 | ) | | | (583,295 | ) | | | (10,675,879 | ) | | | — | | | | (359,524 | ) | |
Total accumulated earnings (losses) | | $ | 84,048,595 | | | $ | (634,783 | ) | | $ | 24,382,753 | | | $ | (3,097,137 | ) | | $ | 20,754,359 | | | $ | 4,245,076 | | |
The difference between book-basis and tax-basis unrealized appreciation is attributable primarily to the tax deferral of losses on wash sales and mark-to-market on passive foreign investment companies.
At June 30, 2016, the Timpani Small Cap Growth Fund had a short-term capital loss carryforward that will not expire of $3,970,619.
In order to meet certain excise tax requirements, the Funds are required to measure and distribute annually, net capital gains realized during the twelve month period ending October 31. In connection with this requirement, the Funds are permitted, for tax purposes, to defer into their next fiscal year any net capital losses incurred from November 1 through the end of the fiscal year. As of the fiscal year ended June 30, 2016, the following Funds deferred, on a tax basis, post-October losses and ordinary late-year losses of:
| | | Post-October
Capital Loss Deferred | | Ordinary Late-Year
Loss Deferred | |
MFG Core Infrastructure | | $ | 560,642 | | | $ | — | | |
Timpani Small Cap Growth | | | 6,485,784 | | | | 181,625 | | |
Phocas Small Cap Value | | | 358,606 | | | | — | | |
d) Foreign Currency Translation
Values of investments denominated in foreign currencies are converted into U.S. dollars using a spot market rate of exchange each day. Purchases and sales of investments and dividend and interest income are translated to U.S. dollars using a spot market rate of exchange prevailing on the dates of such transactions. The Funds do not isolate that portion of the results of operations resulting from changes in foreign exchange rates on investments from the fluctuations arising from changes in fair value of securities held. Such fluctuations are included with the net realized and unrealized gain or loss on investments. Each Fund separately reports net realized foreign exchange gains and losses that arise from sales of foreign currencies, currency gains or losses realized between the trade and settlement dates on securities transactions, and the difference between the amounts of dividends, interest, and foreign withholding taxes recorded on the Fund's books and the U.S. dollar equivalent of the amounts actually received or paid. Net unrealized foreign exchange gains and losses arise from changes in the fair values of assets and liabilities, other than investments in securities at fiscal period end, resulting from changes in exchange rates.
page 63

NOTES TO FINANCIAL STATEMENTS (continued)
December 31, 2016 (Unaudited)
Each Fund, respectively, bears the risk of changes in the foreign currency exchange rates and their impact on the value of assets and liabilities denominated in foreign currency. Each Fund also bears the risk of a counterparty failing to fulfill its obligation under a foreign currency contract.
Investing in foreign companies involves risks not generally associated with investment in the securities of U.S. companies, including risks relating to political, social and economic developments abroad and differences between U.S. and foreign regulatory requirements and market practices, including fluctuations in foreign currencies. The risks of foreign investments are typically greater in emerging and less developed markets.
(e) Indemnifications
Under the Funds' organizational documents, their officers and directors are indemnified against certain liabilities arising out of the performance of their duties to the Funds. In addition, in the normal course of business, the Funds enter into contracts that provide general indemnifications to other parties. The Funds' maximum exposure under these arrangements is unknown as this would involve future claims that may be made against the Funds that have not yet occurred. However, the Funds have not had prior claims or losses pursuant to these contracts and expect the risk of loss to be remote.
(f) Other
Investment transactions are accounted for on the trade date. The Funds determine the gain or loss realized from investment transactions by comparing the original cost of the specifically identified security lot sold with the net sale proceeds. Dividend income, less foreign taxes withheld, is recognized on the ex-dividend date, except that certain dividends from foreign securities are recorded as soon as the information becomes available to the Funds. Interest income is recognized on an accrual basis. All discounts/premiums are accreted/amortized using the effective interest method and are included in interest income. Withholding taxes on foreign dividends have been provided for in accordance with the Funds' understanding of the applicable country's tax codes and regulations.
Income, expenses (other than expenses attributable to a specific class) and realized and unrealized gains or losses on investments attributable to the Funds are generally allocated to each respective class in proportion to the relative net assets of each class.
The preparation of financial statements in conformity with U.S. generally accepted accounting principles ("GAAP") requires management to make estimates and assumptions that affect the reported amounts of assets and liabilities and disclosure of contingent assets and liabilities at the date of the financial statements, and the reported amounts of increases and decreases in net assets from operations during the reporting period. Actual results could differ from those estimates.
Net investment income and realized gains and losses for federal income tax purposes may differ from that reported on the financial statements because of permanent book-to-tax differences. GAAP requires that permanent differences in net investment income and realized gains and losses due to differences between financial reporting and tax reporting be reclassified between various
page 64

NOTES TO FINANCIAL STATEMENTS (continued)
December 31, 2016 (Unaudited)
components of net assets. These reclassifications have no effect on net assets or net asset value per share. For the fiscal year ended June 30, 2016, the following table shows the reclassifications made:
| | | MFG
Global
Equity | | MFG
Global
Plus | | MFG
Core
Infrastructure | | Timpani
Small Cap
Growth | | Netols
Small Cap
Value | | Phocas
Small Cap
Value | |
Paid in capital | | $ | — | | | $ | — | | | $ | 76 | | | $ | (437,671 | ) | | $ | — | | | $ | — | | |
Undistributed net investment income (loss) | | | 29,624 | | | | (730 | ) | | | (80,389 | ) | | | 437,671 | | | | 584 | | | | 6,164 | | |
Accumulated undistributed net realized gain (loss) | | | (29,624 | ) | | | 730 | | | | 80,313 | | | | — | | | | (584 | ) | | | (6,164 | ) | |
The permanent differences primarily relate to foreign currency and net operating losses.
(3) INVESTMENT ADVISER AND RELATED PARTIES
The MFG Global Equity, MFG Global Plus, MFG Core Infrastructure, Netols Small Cap Value and Phocas Small Cap Value Funds have entered into an agreement with Frontegra, with whom certain officers and a director of the Funds are affiliated, to furnish investment advisory services to such Funds. Timpani, an affiliate of Frontegra, is the investment adviser to the Timpani Small Cap Growth Fund. Fees are calculated daily and payable monthly, at annual rates set forth in the following table (expressed as a percentage of each Fund's average daily net assets). Pursuant to expense cap agreements, Frontegra and Timpani have agreed to waive their respective management fees and/or reimburse each Fund's operating expenses (exclusive of brokerage, acquired fund fees and expenses, interest, taxes and extraordinary expenses) to ensure that each Fund's operating expenses do not exceed the expense limitation listed below. The expense limitation for Service Class shares includes up to 0.15% exclusively for shareholder servicing fees. The expense limitation for Class Y shares includes up to 0.25% exclusively for 12b-1 fees and 0.15% exclusively for shareholder servicing fees. Expenses waived are netted with advisory fees payable on the Statements of Assets and Liabilities. On a monthly basis, these accounts are settled by each Fund making payment to the respective adviser or the respective adviser reimbursing the Fund if the reimbursement amount exceeds the advisory fee. If the amount of fees waived exceeds the advisory fee earned, this is shown on the Statements of Assets and Liabilities as a receivable from the respective adviser. The expense cap agreements will continue in effect until October 31, 2018, with successive renewal terms of one year unless terminated by an adviser or a Fund prior to any such renewal.
Frontier Fund | | Annual Advisory Fees | | Expense Limitation | |
MFG Global Equity | | | 0.80 | % | | | 0.80 | % | |
MFG Global Plus - Institutional Class | | | 0.80 | % | | | 0.80 | % | |
MFG Global Plus - Service Class | | | 0.80 | % | | | 0.95 | % | |
MFG Core Infrastructure - Institutional Class | | | 0.70 | % | | | 0.70 | % | |
MFG Core Infrastructure - Service Class | | | 0.70 | % | | | 0.85 | % | |
Timpani Small Cap Growth - Institutional Class | | | 1.00 | % | | | 1.10 | % | |
Timpani Small Cap Growth - Class Y | | | 1.00 | % | | | 1.50 | % | |
Timpani Small Cap Growth - Service Class | | | 1.00 | % | | | 1.25 | % | |
Netols Small Cap Value - Institutional Class | | | 1.00 | % | | | 1.10 | % | |
Netols Small Cap Value - Class Y | | | 1.00 | % | | | 1.50 | % | |
Phocas Small Cap Value - Institutional Class | | | 1.00 | % | | | 1.10 | % | |
Phocas Small Cap Value - Service Class | | | 1.00 | % | | | 1.25 | % | |
An adviser is entitled to recoup the fees waived and/or expenses reimbursed within a three-year period from the time the expenses were incurred to the extent of the expense limitations described above and in place at the time of the recoupment. Expenses attributable to a specific class may only be recouped with respect to that class.
page 65

NOTES TO FINANCIAL STATEMENTS (continued)
December 31, 2016 (Unaudited)
The following table shows the waived or reimbursed expenses subject to potential recovery expiring in:
| | MFG
Global
Equity | | MFG
Global
Plus | | MFG
Core
Infrastructure | | Timpani
Small Cap
Growth | | Netols
Small Cap
Value | | Phocas
Small Cap
Value | |
2017 | | $ | 524,574 | | | $ | — | | | $ | 147,255 | | | $ | 107,201 | | | $ | 78,732 | | | $ | 117,689 | | |
2018 | | | 621,649 | | | | 60,682 | * | | | 232,227 | | | | 131,253 | | | | 69,287 | | | | 114,802 | | |
2019 | | | 543,066 | | | | 161,019 | | | | 235,636 | | | | 117,182 | | | | 76,239 | | | | 115,125 | | |
2020 | | | 256,090 | | | | 96,487 | | | | 126,733 | | | | 60,209 | | | | 34,303 | | | | 56,421 | | |
Total | | $ | 1,945,379 | | | $ | 318,188 | | | $ | 741,851 | | | $ | 415,845 | | | $ | 258,561 | | | $ | 404,037 | | |
* Expenses waived/reimbursed were for the period March 23, 2015 through June 30, 2015.
The beneficial ownership, either directly or indirectly, of more than 25% of a Fund's voting securities creates a presumption of control. As of December 31, 2016, the MFG Global Equity, MFG Global Plus, Netols Small Cap Value and Phocas Small Cap Value Funds had individual shareholder accounts and/or omnibus shareholder accounts (comprised of a group of individual shareholders), which amounted to more than 25% of the total shares outstanding of the respective Fund. Shareholders with a controlling interest could affect the outcome of proxy voting or direction of management of a Fund.
(4) INVESTMENT TRANSACTIONS
The aggregate purchases and sales of securities, excluding short-term investments, for the Funds for the six months ended December 31, 2016, are summarized below:
| | MFG
Global
Equity | | MFG
Global
Plus | | MFG
Core
Infrastructure | | Timpani
Small Cap
Growth | | Netols
Small Cap
Value | | Phocas
Small Cap
Value | |
Purchases | | $ | 164,626,791 | | | $ | 93,449,802 | | | $ | 24,419,325 | | | $ | 48,816,286 | | | $ | 9,163,235 | | | $ | 7,477,290 | | |
Sales | | $ | 230,532,879 | | | $ | 11,643,488 | | | $ | 37,675,129 | | | $ | 63,099,242 | | | $ | 12,680,407 | | | $ | 8,694,258 | | |
There were no purchases or sales of U.S. Government securities for the Funds.
(5) DISTRIBUTION PLAN AND SHAREHOLDER SERVICING FEE
The Company, on behalf of the Netols Small Cap Value, Timpani Small Cap Growth and MFG Global Plus Funds, has adopted a distribution plan pursuant to Rule 12b-1 under the 1940 Act for each Fund's Class Y shares (the "12b-1 Plan"). Pursuant to the 12b-1 Plan, the Class Y shares of each Fund pays an annual fee of up to 0.25% to Frontegra Strategies, LLC (the "Distributor"), an affiliate of Frontegra, for payments to brokers, dealers and other financial intermediaries who perform activities or incur expenses intended to result in the sale of Class Y shares of the Funds. As of December 31, 2016, the Class Y shares of the MFG Global Plus Fund had not commenced operations. For the six months ended December 31, 2016, the Netols Small Cap Value Fund and the Timpani Small Cap Growth Fund incurred $0 and $4,525, respectively, under the 12b-1 Plan.
The Company has adopted a shareholder servicing plan (the "Service Plan") on behalf of the Class Y and Service Class shares offered by certain Funds. Pursuant to the Service Plan, the Service Class and Class Y shares of the applicable Funds pay an annual shareholder servicing fee of up to 0.15% per year to the Distributor for payments to brokers, dealers, and other financial intermediaries who provide on-going account services to shareholders. Those services include establishing and maintaining shareholder accounts, mailing prospectuses, account statements and other Fund documents to shareholders, processing shareholder transactions, and providing
page 66

NOTES TO FINANCIAL STATEMENTS (continued)
December 31, 2016 (Unaudited)
other recordkeeping and administrative services. As of December 3l, 20l6, the Class Y shares of the MFG Global Plus Fund and the Service Class shares of the MFG Global Equity and Netols Small Cap Value Funds had not commenced operations. For the six months ended December 31, 2016, the Class Y shares of the Timpani Small Cap Growth Fund, the Service Class shares of the MFG Global Plus Fund and the Service Class shares of MFG Core Infrastructure Fund incurred $2,715, $6,924 and $12, respectively, under the Service Plan. The Class Y shares of the Netols Small Cap Value Fund, the Service Class shares of the Timpani Small Cap Growth Fund and the Service Class shares of the Phocas Small Cap Value Fund did not incur any expenses under the Service Plan.
(6) REPORTING MODERNIZATION FOR REGISTERED INVESTMENT COMPANIES
In October 2016, the U.S. Securities and Exchange Commission adopted new rules and amended existing rules (together, "final rules") intended to modernize the reporting and disclosure of information by registered investment companies. In part, the final rules amend Regulation S-X and require standardized, enhanced disclosure about derivatives in investment company financial statements, as well as other amendments. The compliance date for the amendments to Regulation S-X is August 1, 2017. Management is currently evaluating the impact that the adoption of the amendments to Regulation S-X will have on the financial statements and related disclosures.
page 67
This page intentionally left blank.
This page intentionally left blank.

A NOTE ON FORWARD-LOOKING STATEMENTS
This report includes forward-looking statements such as adviser, subadviser and/or portfolio manager predictions, opinions, assessments, analyses or outlooks for individual securities, industries, market sectors and/or markets. These statements involve risks and uncertainties. In addition to the general risks described for the Funds in the current Prospectuses, other factors bearing on these statements include the accuracy of the advisers', subadvisers' or portfolio managers' forecasts and predictions, and the appropriateness of the investment programs designed by an adviser, subadviser or portfolio manager to implement their strategies efficiently and effectively. Any one or more of these factors, as well as other risks affecting the securities markets and investment instruments generally, could cause the actual results of the Funds to differ materially as compared to benchmarks associated with the Funds.
In addition, portfolio composition will change due to ongoing management of the Funds. Specific securities named in this report may not currently be owned by the applicable Fund, or the Fund's position in the securities may have changed.
ADDITIONAL INFORMATION
Frontier Funds has adopted proxy voting policies and procedures that delegate to Frontegra Asset Management, Inc. ("Frontegra") and Timpani Capital Management LLC the authority to vote proxies. The proxy voting policies permit Frontegra to delegate its authority to vote proxies to a Fund's subadviser. A description of the Frontier Funds' proxy voting policies and procedures is available without charge, upon request, by calling the Funds toll free at 1-888-825-2100. A description of these policies and procedures is also included in the Funds' Statement of Additional Information, which is available on the SEC's website at http://www.sec.gov and the Funds' website at www.frontiermutualfunds.com or by calling the Funds toll free at 1-888-825-2100.
The actual voting records relating to each Fund's portfolio securities during the most recent twelve months ended June 30 are available without charge by calling the Funds toll free at 1-888-825-2100 or by accessing the SEC's website at http://www.sec.gov.
Each Fund files a complete schedule of portfolio holdings for its first and third fiscal quarters with the SEC on Form N-Q. The Form N-Q is available on the SEC's website at http://www.sec.gov. The Form N-Q may also be reviewed and copied at the SEC's Public Reference Room in Washington, D.C. Information on the operation of the Public Reference Room may be obtained by calling toll-free 1-800-SEC-0330.

SEMI-ANNUAL REPORT
Frontier Silk Invest New Horizons Fund
Frontegra Asset Management, Inc.
December 31, 2016

TABLE OF CONTENTS | | |
| | |
Shareholder Letter | | 1 |
Investment Highlights | | 3 |
Expense Example | | 4 |
Schedule of Investments | | 6 |
Statement of Assets and Liabilities | | 9 |
Statement of Operations | | 10 |
Statements of Changes in Net Assets | | 11 |
Financial Highlights | | 12 |
Notes to Financial Statements | | 14 |
This report is submitted for the general information of the shareholders of the Fund. It is not authorized for distribution to prospective investors unless accompanied or preceded by an effective Prospectus. The Prospectus may be obtained by calling 1-888-825-2100. The Prospectus includes more complete information about management fees and expenses, investment objectives, risks and operating policies of the Fund. Please read the Prospectus carefully.
Frontier Funds, Inc. are distributed by Frontegra Strategies, LLC, 400 Skokie Blvd., Suite 500, Northbrook, IL 60062. Frontegra Strategies, LLC, member of FINRA and SIPC, is an affiliate of Frontegra Asset Management, Inc., the Fund’s investment adviser.

REPORT FROM SILK INVEST LTD.
Dear Shareholders:
The investment objective of the Frontier Silk Invest New Horizons Fund (the “Fund”) is capital appreciation. The objective is measured against the MSCI Frontier Markets Index (Net).
Performance Review
The Fund’s Institutional Class returned 3.83%, net of fees, for the two month period ending December 31, 2016, compared to the 0.89% returned by its benchmark, the MSCI Frontier Markets Index (Net). Since inception on May 25, 2016, the Fund returned -2.40%, net of fees, compared to the benchmark’s return of -0.80%.
2016 was a tale of two halves for frontier markets. The year commenced with a bearish theme, similar to emerging and developed markets with all asset prices falling, including equities. China’s economic slowdown, slumping commodity prices (chiefly crude oil), drought in Southern Africa, currency challenges in markets like Egypt and Nigeria, and the Fed’s stance to increase the interest rates kept all the markets down. Performance rebounded in the 4th quarter, buoyed by stability in the price of oil and strong political and economic catalyst with implementation of reforms and prudent macroeconomic policies in markets such as Saudi Arabia, Egypt and Nigeria.
Fund Outlook and Strategy
2017 is anticipated to be positive for frontier markets, as valuations remain attractive at current levels, with a forward PE for the MSCI Frontier Markets Index (Net) at 12.3 times and dividend yield at 3.9%. The expected upgrade of Pakistan and Argentina to the Emerging Markets Index later this year will likely serve as a positive catalyst for these markets for at least the first half of 2017. With the Fed expected to become more aggressive on interest rate hikes in the coming months, we expect to see frontier markets hold their ground at their current valuations.
Frontier markets continue to showcase stronger GDP growth than the rest of the world and lower government debt levels, and represent an opportunity to invest in companies that have a higher profitability and margin growth than emerging and developed market counterparts.
The stability of the price of oil following the successful completion of the OPEC output agreement should result in improvement in growth and fiscal balances in 2017 for a number of oil exporting countries. The devaluations and ongoing fiscal reforms in some of these countries are expected to drive a rebalancing in many of those economies towards investment-led growth in 2017.
Frontier markets have shown their resilience during periods of high volatility in 2016 and continue to represent a compelling opportunity for investors seeking diversification and strong risk adjusted returns.
1
The Fund
For the two months to December 31, 2016, the three investments with the strongest returns in local currency were Cherat Cement Company (+31.38%), Al Khaleej Training and Education (+31.0%) and Savola Group (+28.5%). The investments with the weakest returns were EFG-Hermes (-21.5%), Lafarge Africa (-14.5%) and East African Breweries (-13.1%). On an absolute basis, the three largest contributors to the Fund’s return, in local currency, were Al Khaleej Training and Education, Cherat Cement and Lucky Cement which added +0.8%, +0.7% and +0.6%, respectively. Conversely, the three largest detractors were EFG-Hermes, Grupo Clarin and East African Breweries, returning -0.7%, -0.33% and -0.32%, respectively.
Within the current macroeconomic environment, we expect to see strong performances from our high conviction companies exposed to certain investment themes.
· Financials: We believe that the ongoing infrastructure developments in the main frontier countries will lead to an increase in loan demand and expect net interest margins to remain attractive. Our focus is on better quality banks and diversified financial institutions.
· Telecoms: While voice penetration in developing countries is already relatively high, there is scope for significant growth in data given the proliferation of smart phones and the growing popularity of mobile banking.
· Changing lifestyles: The increase in disposable income and the continued trend of urbanization have created new demand for consumer products and services.
· Materials: Public sector infrastructure development and affordable housing continues to increase the demand for materials (e.g. cement).
Zin Bekkali
Chief Investment Officer and Portfolio Manager
Silk Invest Ltd.
2
INVESTMENT HIGHLIGHTS
Growth of a $100,000 Investment (Unaudited)
*5/25/16 commencement of operations.
Portfolio Total Return**
FOR PERIODS ENDED 12/31/16 | | FUND | | INDEX | |
TWO MONTHS | | 3.83 | % | 0.89 | % |
SINCE INCEPTION | | (2.40 | )% | (0.80 | )% |
| | | | | |
Institutional Class Expenses | | | | | |
GROSS EXPENSE RATIO | | | | 2.04 | % |
NET EXPENSE RATIO | | | | 1.85 | % |
This chart assumes an initial gross investment of $100,000 made on 5/25/16 (commencement of operations). Returns shown include the reinvestment of all distributions. Past performance is not predictive of future results. Investment return and principal value will fluctuate so that shares, when redeemed, may be worth more or less than the original cost. In the absence of existing fee waivers, total return would be reduced. To receive current to the most recent month-end performance, please call 1-888-825-2100.
The MSCI Frontier Markets Index (Net) captures large and mid cap representation across 30 Frontier Markets countries. The index includes 123 constituents, covering about 85% of the free float-adjusted market capitalization in each country. The index does not reflect investment management fees, brokerage commissions and other expenses associated with investing in equity securities. A direct investment in the index is not possible.
Frontegra Asset Management, Inc. has contractually agreed through October 31, 2018, to waive its management fee and/or reimburse the Fund’s operating expenses to the extent necessary to ensure that the Fund’s total operating expenses (excluding taxes, interest, brokerage commissions, acquired fund fees and expenses and extraordinary expenses) do not exceed 1.85% of the Fund’s average daily net assets for the Institutional Class. The expense ratios presented are based on the annualized expense ratios as reported in the Fund’s current prospectus, which may differ from the expense ratios presented in the Fund’s financial highlights.
** The returns shown do not reflect the deduction of taxes that a shareholder would pay on Fund distributions or the redemption of Fund shares.
The above graph relates to Institutional Class shares of the Fund. Performance for Service Class shares will vary from the performance of the Institutional Class shares shown above due to differences in expenses.
3
EXPENSE EXAMPLE
December 31, 2016 (Unaudited)
As a shareholder of a mutual fund, you incur two types of costs: (1) transaction costs, including redemption fees, and (2) ongoing costs, including management fees, service fees and other fund expenses. Although the Frontier Silk Invest New Horizons Fund (the “Fund”) does not charge a sales load, you will be assessed fees for outgoing wire transfers, returned checks and stop payment orders at prevailing rates charged by U.S. Bancorp Fund Services, LLC, the Fund’s transfer agent. If you request that a redemption be made by wire transfer, currently the Fund’s transfer agent charges a $15.00 fee. A redemption fee of 2.00% of the then current value of the shares redeemed may be imposed on certain redemptions of shares made within 180 days of purchase for the Fund.
This Example is intended to help you understand your ongoing costs (in dollars) of investing in the Fund and to compare these costs with the ongoing costs of investing in other mutual funds. Effective December 12, 2016, the Fund changed its fiscal year end to June 30 from October 31. This example is based on an investment of $1,000 invested at the beginning of the period and held for the entire period (11/1/16 – 12/31/16).
Actual Expenses
The first line of the table on the following page for each Class provides information about actual account values and actual expenses. The Example includes management fees, registration fees, fee waivers/reimbursements and other expenses. However, the Example does not include portfolio trading commissions and related expenses and other extraordinary expenses as determined under generally accepted accounting principles. You may use the information in this line, together with the amount you invested, to estimate the expenses that you paid over the period. Simply divide your account value by $1,000 (for example, an $8,600 account value divided by $1,000 = 8.6), then multiply the result by the number in the first line under the heading entitled “Expenses Paid During the Period” to estimate the expenses you paid on your account during this period.
Hypothetical Example for Comparison Purposes
The second line of the table for each Class provides information about hypothetical account values and hypothetical expenses based on each of the Class’ actual expense ratios and an assumed rate of return of 5% per year before expenses, which is not the actual return. The hypothetical account values and expenses may not be used to estimate the actual ending account balance or expenses you paid for the period. You may use this information to compare the ongoing costs of investing in the Fund and other funds. To do so, compare this 5% hypothetical example with the 5% hypothetical examples that appear in the shareholder reports of the other funds.
Please note that the expenses shown in the table are meant to highlight your ongoing costs only and do not reflect any transactional costs, such as redemption fees. Therefore, the second line of the table is useful in comparing ongoing costs only, and will not help you determine the relative total costs of owning different funds. In addition, if these transactional costs were included, your costs could have been higher.
4
EXPENSE EXAMPLE (continued)
December 31, 2016 (Unaudited)
| | | | Ending | | | | Expenses Paid | |
| | Beginning | | Account Value | | Annualized | | During the | |
| | Account Value | | 12/31/2016 | | Expense Ratio | | Period | |
Silk Invest New Horizons | | | | | | | | | |
Fund — Institutional Class | | | | | | | | | |
Actual Fund Return* | | $ | 1,000.00 | | $ | 1,038.30 | | 1.85 | % | $ | 4.75 | |
Hypothetical 5% Return** | | $ | 1,000.00 | | $ | 1,015.88 | | 1.85 | % | $ | 9.40 | |
Silk Invest New Horizons | | | | | | | | | |
Fund — Service Class | | | | | | | | | |
Actual Fund Return* | | $ | 1,000.00 | | $ | 1,038.90 | | 1.95 | % | $ | 5.01 | |
Hypothetical 5% Return** | | $ | 1,000.00 | | $ | 1,015.38 | | 1.95 | % | $ | 9.91 | |
* Expenses are equal to each Class’ annualized expense ratio indicated above, multiplied by the average account value over the period, multiplied by 61/242 to reflect the two month period due to the change in the Fund’s fiscal year end to June 30 from October 31.
**Hypothetical expenses are equal to each Class’ annualized expense ratio indicated above, multiplied by the average account value over the period commencing July 1, 2016, multiplied by 184/365 to reflect the one-half year period.
5
Frontier Silk Invest New Horizons Fund
SCHEDULE OF INVESTMENTS
December 31, 2016 (Unaudited)
Number of Shares | | | | Value | |
COMMON STOCKS 78.8% | | | |
| | Argentina 10.0% | | | |
56,000 | | Adecoagro SA (a) | | $ | 581,280 | |
59,000 | | Grupo Clarin SA - GDR | | 1,333,400 | |
32,685 | | Grupo Financiero Galicia SA - ADR | | 879,880 | |
101,371 | | Telecom Argentina SA - ADR | | 1,841,911 | |
| | | | 4,636,471 | |
| | Bangladesh 9.0% | | | |
817,000 | | BRAC Bank Ltd. | | 666,281 | |
540,300 | | GrameenPhone Ltd. | | 1,952,916 | |
495,000 | | Square Pharmaceuticals Ltd. | | 1,568,760 | |
| | | | 4,187,957 | |
| | Egypt 4.5% | | | |
766,500 | | Egyptian Financial Group-Hermes Holding Co. (a) | | 1,078,878 | |
106,000 | | Egyptian Financial Group-Hermes Holding Co. - GDR (a) | | 239,030 | |
4,585,000 | | Palm Hills Developments SAE | | 782,922 | |
| | | | 2,100,830 | |
| | Ghana 1.6% | | | |
292,700 | | Ecobank Ghana Ltd. (b) | | 435,616 | |
387,200 | | Ghana Commercial Bank Ltd. (b) | | 320,286 | |
| | | | 755,902 | |
| | Kenya 10.0% | | | |
2,490,670 | | Centum Investment Co. Ltd. (b) | | 899,334 | |
143,300 | | East African Breweries Ltd. | | 341,224 | |
3,396,907 | | Equity Group Holdings Ltd. | | 994,508 | |
3,645,224 | | KCB Group Ltd. | | 1,024,360 | |
7,336,906 | | Safaricom Ltd. | | 1,371,150 | |
| | | | 4,630,576 | |
| | Morocco 7.2% | | | |
79,567 | | Auto Hall (b) | | 863,707 | |
294,650 | | Douja Promotion Groupe Addoha SA | | 1,249,722 | |
88,100 | | Maroc Telecom | | 1,234,555 | |
| | | | 3,347,984 | |
| | Nigeria 8.7% | | | |
18,815,504 | | Guaranty Trust Bank PLC | | 1,476,812 | |
4,052,989 | | Lafarge Africa PLC | | 529,831 | |
332,388 | | Nestle Nigeria PLC | | 855,341 | |
25,169,452 | | Zenith Bank PLC | | 1,177,955 | |
| | | | 4,039,939 | |
| | Oman 2.2% | | | |
620,950 | | Ooredoo (c) | | 1,010,999 | |
| | | | | |
| | Pakistan 11.3% | | | |
1,300,000 | | Adamjee Insurance Co. Ltd. | | 923,420 | |
942,000 | | Bank Al Habib Ltd. | | 532,054 | |
710,000 | | Cherat Cement Co. Ltd. | | 1,183,889 | |
170,500 | | Lucky Cement Ltd. | | 1,415,892 | |
526,000 | | United Bank Ltd. | | 1,203,292 | |
| | | | 5,258,547 | |
| | Qatar 2.3% | | | |
37,520 | | Ooredoo QSC | | 1,047,927 | |
| | | | | | |
The accompanying notes are an integral part of these financial statements.
6
Number of Shares | | | | Value | |
COMMON STOCKS 78.8% (continued) | | | |
| | South Africa 2.2% | | | |
110,000 | | MTN Group Ltd. - ADR | | 995,500 | |
| | | | | |
| | Sri Lanka 1.2% | | | |
314,000 | | Sampath Bank PLC | | 545,832 | |
| | | | | |
| | United Arab Emirates 8.6% | | | |
709,080 | | Agthia Group PJSC | | 1,371,759 | |
2,709,000 | | Air Arabia PJSC | | 980,651 | |
838,100 | | Emaar Properties PJSC | | 1,624,927 | |
| | | | 3,977,337 | |
| | Total Common Stocks | | | |
| | (Cost $37,201,328) | | 36,535,801 | |
| | | | | |
PARTICIPATION (EQUITY LINKED) NOTES (d) 16.1% | | | |
| | Saudi Arabia 12.4% | | | |
30,440 | | Abdullah Al Othaim Markets Co., Issued by EFG Hermes Mena Securities Ltd., Expires 12/11/2018 | | 801,817 | |
11,380 | | Abdullah Al Othaim Markets Co., Issued by Morgan Stanley BV, Expires 08/28/2017 | | 299,759 | |
104,160 | | Al Khaleej Training and Education Co., Issued by Credit Suisse AG, Expires 08/27/2018 | | 552,010 | |
178,460 | | Al Khaleej Training and Education Co., Issued by Morgan Stanley BV, Expires 01/29/2018 | | 945,774 | |
12,800 | | BUPA Arabia for Cooperative Insurance Co., Issued by Morgan Stanley BV, Expires 02/12/2018 | | 448,300 | |
39,060 | | Herfy Food Services Co. Ltd., Issued by EFG Hermes Mena Securities Ltd., Expires 01/30/2019 | | 816,457 | |
24,180 | | Herfy Food Services Co. Ltd., Issued by Morgan Stanley BV, Expires 02/14/2018 | | 505,426 | |
129,066 | | Samba Financial Group, Issued by Credit Suisse AG, Expires 02/04/2019 | | 837,801 | |
49,700 | | The Savola Group, Issued by Morgan Stanley BV, Expires 08/28/2017 | | 531,554 | |
| | | | 5,738,898 | |
| | United Arab Emirates 3.7% | | | |
190,140 | | Agthia Group PJSC, Issued by Deutsche Bank AG, Expires 05/15/2017 | | 367,585 | |
1,435,000 | | Air Arabia PJSC, Issued by Deutsche Bank AG, Expires 07/31/2017 | | 519,672 | |
424,809 | | Emaar Properties PJSC, Issued by Morgan Stanley BV, Expires 12/07/2017 | | 824,726 | |
| | | | 1,711,983 | |
| | Total Participation (Equity Linked) Notes | | | |
| | (Cost $7,248,756) | | 7,450,881 | |
| | | | | |
SHORT-TERM INVESTMENTS 5.2% | | | |
| | Investment Company 5.2% | | | |
2,419,142 | | Morgan Stanley Institutional Liquidity Funds - Government Portfolio - Institutional Class, 0.44% | | 2,419,142 | |
| | Total Short-Term Investments | | | |
| | (Cost $2,419,142) | | 2,419,142 | |
| | | | | |
| | Total Investments 100.1% | | | |
| | (Cost $46,869,226) | | 46,405,824 | |
| | | | | |
| | Liabilities in Excess of Other Assets (0.1)% | | (33,837 | ) |
| | | | | |
| | TOTAL NET ASSETS 100.0% | | $ | 46,371,987 | |
| | | | | | |
(a) Non-Income Producing.
(b) Illiquid security, pursuant to guidelines established by the Board of Directors. See Note 2(f) in Notes to Financial Statements.
(c) Security was fair valued under procedures adopted by the Board of Directors. See Note 2(a) in Notes to Financial Statements.
(d) Restricted securities, pursuant to Rule 144A or Regulation S under the Securities Act of 1933, as amended. See Note 2(f) in Notes to Financial Statements.
ADR - American Depositary Receipt
GDR - Global Depositary Receipt
The accompanying notes are an integral part of these financial statements.
7
Portfolio Diversification (Unaudited)
Sectors | | Percentage | |
Financials | | 26.7 | % |
Telecommunication Services | | 20.4 | |
Real Estate | | 7.9 | |
Consumer Staples | | 6.8 | |
Materials | | 6.8 | |
Consumer Discretionary | | 4.7 | |
Health Care | | 3.4 | |
Industrials | | 2.1 | |
Total Common Stocks | | 78.8 | |
Consumer Discretionary | | 6.1 | |
Consumer Staples | | 4.3 | |
Financials | | 2.8 | |
Real Estate | | 1.8 | |
Industrials | | 1.1 | |
Total Participation Notes | | 16.1 | |
Total Short-Term Investments | | 5.2 | |
Total Investments | | 100.1 | |
Liabilities in Excess of Other Assets | | (0.1 | ) |
Total Net Assets | | 100.0 | % |
The accompanying notes are an integral part of these financial statements.
8
Frontier Silk Invest New Horizons Fund
STATEMENT OF ASSETS AND LIABILITIES
December��31, 2016 (Unaudited)
ASSETS: | | | |
Investments at cost | | $ | 46,869,226 | |
Investments at value | | $ | 46,405,824 | |
Interest and dividends receivable | | 19,869 | |
Prepaid expenses and other assets | | 25,871 | |
Total assets | | 46,451,564 | |
| | | |
LIABILITIES: | | | |
Payable to Adviser | | 34,855 | |
Accrued shareholder servicing fees | | 1,138 | |
Accrued expenses | | 43,584 | |
Total liabilities | | 79,577 | |
| | | |
Net Assets | | $ | 46,371,987 | |
| | | |
NET ASSETS CONSIST OF: | | | |
Paid in capital | | $ | 47,174,145 | |
Undistributed net investment loss | | (106,687 | ) |
Accumulated undistributed net realized loss | | (232,144 | ) |
Net unrealized appreciation/depreciation on: | | | |
Investments | | (463,402 | ) |
Foreign currency | | 75 | |
Net Assets | | $ | 46,371,987 | |
| | | |
CAPITAL STOCK, $0.01 PAR VALUE | | | |
INSTITUTIONAL CLASS: | | | |
Net Assets | | $ | 31,937,010 | |
Authorized | | 50,000,000 | |
Issued and Outstanding | | 3,281,494 | |
Net Asset Value, Redemption Price and Offering Price Per Share | | $ | 9.73 | |
| | | |
CAPITAL STOCK, $0.01 PAR VALUE | | | |
SERVICE CLASS: | | | |
Net Assets | | $ | 14,434,977 | |
Authorized | | 50,000,000 | |
Issued and Outstanding | | 1,482,304 | |
Net Asset Value, Redemption Price and Offering Price Per Share | | $ | 9.74 | |
The accompanying notes are an integral part of these financial statements.
9
Frontier Silk Invest New Horizons Fund
STATEMENT OF OPERATIONS
| | For the Period | |
| | November 1, 2016 | |
| | through | |
| | December 31, 2016(1) | |
| | (Unaudited) | |
INVESTMENT INCOME: | | | |
Dividend income(2) | | $ | 29,542 | |
Interest income | | 542 | |
Total investment income | | 30,084 | |
| | | |
EXPENSES: | | | |
Investment advisory fees | | 105,386 | |
Custody fees | | 24,813 | |
Federal and state registration fees | | 7,636 | |
Fund administration and accounting fees | | 6,148 | |
Audit fees | | 4,273 | |
Directors’ fees and related expenses | | 4,051 | |
Legal fees | | 2,758 | |
Shareholder servicing fees - Service Class | | 2,311 | |
Transfer agent fees | | 2,258 | |
Reports to shareholders | | 1,208 | |
Other | | 4,388 | |
Total expenses before waiver and reimbursement | | 165,230 | |
Waiver and reimbursement of expenses by Adviser | | (28,462 | ) |
Net expenses | | 136,768 | |
| | | |
Net Investment Loss | | (106,684 | ) |
| | | |
REALIZED AND UNREALIZED GAIN (LOSS) ON INVESTMENTS: | | | |
Net realized loss on: | | | |
Investments | | (133,621 | ) |
Foreign currency transactions | | (34,827 | ) |
| | | |
Change in net unrealized appreciation/depreciation on: | | | |
Investments | | 1,947,587 | |
Foreign currency transactions | | (1,340 | ) |
| | | |
Net Realized and Unrealized Gain on Investments | | 1,777,799 | |
| | | |
Net Increase in Net Assets Resulting from Operations | | $ | 1,671,115 | |
(1) Effective December 12, 2016, the Fund changed its fiscal year end to June 30 from October 31.
(2) Net of $8,327 in foreign withholding taxes.
The accompanying notes are an integral part of these financial statements.
10
Frontier Silk Invest New Horizons Fund
STATEMENTS OF CHANGES IN NET ASSETS
| | For the Period | | | |
| | November 1, 2016 | | For the Period | |
| | through | | May 25, 2016(2) | |
| | December 31, 2016(1) | | through | |
| | (Unaudited) | | October 31, 2016 | |
OPERATIONS: | | | | | |
Net investment income (loss) | | $ | (106,684 | ) | $ | 184,635 | |
Net realized loss on: | | | | | |
Investments | | (133,621 | ) | (64,084 | ) |
Foreign currency transactions | | (34,827 | ) | (56,977 | ) |
Change in net unrealized appreciation/depreciation on: | | | | | |
Investments | | 1,947,587 | | (2,410,989 | ) |
Foreign currency transactions | | (1,340 | ) | 1,415 | |
Net increase (decrease) in net assets resulting from operations | | 1,671,115 | | (2,346,000 | ) |
| | | | | |
DISTRIBUTIONS PAID TO INSTITUTIONAL | | | | | |
CLASS SHAREHOLDERS FROM: | | | | | |
Net investment income | | (91,381 | ) | — | |
Net decrease in net assets resulting from distributions paid | | (91,381 | ) | — | |
| | | | | |
DISTRIBUTIONS PAID TO SERVICE CLASS | | | | | |
CLASS SHAREHOLDERS FROM: | | | | | |
Net investment income | | (36,280 | ) | — | |
Net decrease in net assets resulting from distributions paid | | (36,280 | ) | — | |
| | | | | |
CAPITAL SHARE TRANSACTIONS: | | | | | |
Shares sold - Institutional Class | | 1,420,000 | | 4,628,026 | |
Shares issued from transfer in-kind - Institutional Class(3) | | — | | 26,604,000 | |
Shares sold - Service Class(4) | | 282,630 | | 15,902,780 | |
Shares issued to holders in reinvestment of distributions - Institutional Class | | 90,244 | | — | |
Shares issued to holders in reinvestment of distributions - Service Class(4) | | 36,280 | | — | |
Shares redeemed - Institutional Class | | (15 | ) | — | |
Shares redeemed - Service Class(4) | | (57,456 | ) | (1,731,956 | ) |
Net increase in net assets resulting from capital share transactions | | 1,771,683 | | 45,402,850 | |
| | | | | |
Total Increase in Net Assets | | 3,315,137 | | 43,056,850 | |
| | | | | |
NET ASSETS: | | | | | |
Beginning of Period | | 43,056,850 | | — | |
| | | | | |
End of Period (includes undistributed net investment income (loss) of $(106,687) and $127,658, respectively) | | $ | 46,371,987 | | $ | 43,056,850 | |
| | | | | |
TRANSACTIONS IN SHARES - INSTITUTIONAL CLASS: | | | | | |
Shares sold | | 146,694 | | 464,982 | |
Shares issued from transfer in-kind (3) | | — | | 2,660,400 | |
Shares issued to holders in reinvestment of distributions | | 9,420 | | — | |
Shares redeemed | | (2 | ) | — | |
Net increase in shares outstanding | | 156,112 | | 3,125,382 | |
| | | | | |
TRANSACTIONS IN SHARES - SERVICE CLASS(4): | | | | | |
Shares sold | | 29,395 | | 1,626,587 | |
Shares issued to holders in reinvestment of distributions | | 3,783 | | — | |
Shares redeemed | | (5,980 | ) | (171,481 | ) |
Net increase in shares outstanding | | 27,198 | | 1,455,106 | |
(1) Effective December 12, 2016, the Fund changed its fiscal year end to June 30 from October 31.
(2) Commenced operations on May 25, 2016.
(3) See Note 1 in Notes to Financial Statements.
(4) Service Class commenced operations on May 27, 2016.
The accompanying notes are an integral part of these financial statements.
11
Frontier Silk Invest New Horizons Fund
FINANCIAL HIGHLIGHTS
| | Institutional Class | |
| | For the Period | | | |
| | November 1, 2016 | | For the Period | |
| | through | | May 25, 2016(2) | |
| | December 31, 2016(1) | | through | |
| | (Unaudited) | | October 31, 2016 | |
Net Asset Value, Beginning of Period | | $ | 9.40 | | $ | 10.00 | |
| | | | | |
INCOME (LOSS) FROM INVESTMENT OPERATIONS: | | | | | |
Net investment income (loss) | | (0.02 | ) | 0.04 | |
Net realized and unrealized gain (loss) on investments | | 0.38 | | (0.64 | ) |
Total Income (Loss) from Investment Operations | | 0.36 | | (0.60 | ) |
| | | | | |
LESS DISTRIBUTIONS: | | | | | |
From net investment income | | (0.03 | ) | — | |
Total Distributions | | (0.03 | ) | — | |
| | | | | |
Net Asset Value, End of Period | | $ | 9.73 | | $ | 9.40 | |
| | | | | |
Total Return | | 3.83 | %(3) | (6.00 | )%(3) |
| | | | | |
SUPPLEMENTAL DATA AND RATIOS: | | | | | |
Net assets, end of period (in thousands) | | $ | 31,937 | | $ | 29,376 | |
Ratio of expenses to average net assets | | | | | |
Before waivers and reimbursements | | 2.24 | %(4) | 2.27 | %(4) |
Net of waivers and reimbursements | | 1.85 | %(4) | 1.85 | %(4) |
Ratio of net investment income (loss) to average net assets | | | | | |
Before waivers and reimbursements | | (1.83 | )%(4) | 0.66 | %(4) |
Net of waivers and reimbursements | | (1.44 | )%(4) | 1.08 | %(4) |
Portfolio turnover rate(5) | | 5 | %(3) | 15 | %(3) |
(1) Effective December 12, 2016, the Fund changed its fiscal year end to June 30 from October 31.
(2) Commenced operations on May 25, 2016.
(3) Not annualized.
(4) Annualized.
(5) Portfolio turnover is calculated on the basis of the Fund as a whole without distinguishing between the classes of shares issued.
The accompanying notes are an integral part of these financial statements.
12
Frontier Silk Invest New Horizons Fund
FINANCIAL HIGHLIGHTS
| | Service Class | |
| | For the Period | | | |
| | November 1, 2016 | | For the Period | |
| | through | | May 27, 2016(2) | |
| | December 31, 2016(1) | | through | |
| | (Unaudited) | | October 31, 2016 | |
Net Asset Value, Beginning of Period | | $ | 9.40 | | $ | 10.02 | |
| | | | | |
INCOME (LOSS) FROM INVESTMENT OPERATIONS: | | | | | |
Net investment income (loss) | | (0.02 | ) | 0.03 | |
Net realized and unrealized gain (loss) on investments | | 0.38 | | (0.65 | ) |
Total Income (Loss) from Investment Operations | | 0.36 | | (0.62 | ) |
| | | | | |
LESS DISTRIBUTIONS: | | | | | |
From net investment income | | (0.02 | ) | — | |
Total Distributions | | (0.02 | ) | — | |
| | | | | |
Net Asset Value, End of Period | | $ | 9.74 | | $ | 9.40 | |
| | | | | |
Total Return | | 3.89 | %(3) | (6.19 | )%(3) |
| | | | | |
SUPPLEMENTAL DATA AND RATIOS: | | | | | |
Net assets, end of period (in thousands) | | $ | 14,435 | | $ | 13,681 | |
Ratio of expenses to average net assets | | | | | |
Before waivers and reimbursements | | 2.34 | %(4) | 2.35 | %(4) |
Net of waivers and reimbursements | | 1.95 | %(4) | 1.95 | %(4) |
Ratio of net investment income (loss) to average net assets | | | | | |
Before waivers and reimbursements | | (1.93 | )%(4) | 0.73 | %(4) |
Net of waivers and reimbursements | | (1.54 | )%(4) | 1.13 | %(4) |
Portfolio turnover rate(5) | | 5 | %(3) | 15 | %(3) |
(1) Effective December 12, 2016, the Fund changed its fiscal year end to June 30 from October 31.
(2) Commenced operations on May 27, 2016.
(3) Not annualized.
(4) Annualized.
(5) Portfolio turnover is calculated on the basis of the Fund as a whole without distinguishing between the classes of shares issued.
The accompanying notes are an integral part of these financial statements.
13
NOTES TO FINANCIAL STATEMENTS
December 31, 2016 (Unaudited)
(1) ORGANIZATION
Frontier Funds, Inc. (the “Company”) was incorporated on May 24, 1996, as a Maryland corporation and is registered under the Investment Company Act of 1940, as amended (the “1940 Act”), as an open-end investment company issuing shares in series, each series representing a distinct portfolio with its own investment objectives and policies. The Company consists of seven separate series, one of which is included herein. The accompanying financial statements include the Frontier Silk Invest New Horizons Fund (the “Fund”). The Fund offers two share classes, the Institutional Class and the Service Class. The Institutional Class commenced operations on May 25, 2016, and the Service Class commenced operations on May 27, 2016. The investment objective of the Fund is capital appreciation and the Fund is a diversified fund. Frontegra Asset Management, Inc. (“Frontegra”) and Silk Invest Limited (“Silk”) serve as investment adviser and subadviser, respectively, to the Fund.
Simultaneous with the commencement of the Fund’s investment operations on May 25, 2016, the Silk Road Global Frontier Fund, LLC (the “Private Fund”), a limited liability company managed by Silk Capital Management, LLC, an affiliate of Silk, transferred all of the assets of the Private Fund to the Fund in exchange for Institutional Class shares of the Fund. The investment objective of the Private Fund was substantially similar to that of the Fund. The total amount of the transfer was $26,604,000, consisting of securities, cash and other receivables, which were recorded at value as of the date of the conversion. The transaction was considered non-taxable by the Fund for tax purposes. For tax purposes, the cost basis of investments received by the Fund from the Private Fund was carried forward to align the ongoing reporting of the Fund’s realized and unrealized gains and losses with the amounts distributable to shareholders. As a result of the in-kind transfer, the Fund issued 2,660,400 Institutional Class shares at a net asset value (“NAV”) of $10.00 per share.
As part of the conversion, Frontegra and Silk agreed to reimburse the Fund for brokerage commissions and transactional costs incurred in connection with the sale and repurchase of certain securities held by the Private Fund that could not be transferred from the Private Fund to the Fund due to foreign market restrictions. As of December 31, 2016, Frontegra and Silk had reimbursed the Fund $70,717 and $0, respectively.
Effective December 12, 2016, the Board approved the change in the Fund’s fiscal year end to June 30 from October 31.
(2) SIGNIFICANT ACCOUNTING POLICIES
The Fund is an investment company and accordingly follows the investment company accounting and reporting guidance of the Financial Accounting Standards Board (“FASB”) Accounting Standards Codification Topic 946 Financial Services — Investment Companies. The following is a summary of significant accounting policies consistently followed by the Fund in the preparation of its financial statements.
(a) Investment Valuation
Equity securities for which market quotations are readily available are valued at the last reported sale price on the national securities exchange on which such securities are primarily traded. Equity securities for which there were no transactions on a given day or securities not listed on a national securities exchange are valued at the most recent bid price. Equity securities that are traded on NASDAQ are valued using the NASDAQ Official Closing Price (“NOCP”). Participation (Equity Linked) Notes (“P-Notes”) are valued based on an evaluated price provided by an
14
NOTES TO FINANCIAL STATEMENTS (continued)
December 31, 2016 (Unaudited)
independent pricing service, using a methodology for P-Notes provided by a third-party analytics firm. Debt securities are valued at the bid price provided by an independent pricing service, which uses valuation methods, such as matrix pricing and other analytical pricing models as well as market transactions and dealer bid quotations. Shares of underlying mutual funds are valued at their respective NAVs. Securities that are primarily traded on foreign exchanges generally are valued at the last sale price of such securities on their respective exchange. In the case of foreign securities, the occurrence of events after the close of the foreign markets, but prior to the time the Fund’s NAV is calculated, will result in a systematic fair value adjustment to the trading prices of foreign securities. The Fund will value securities at fair value, using fair valuation procedures approved by the Board of Directors (the “Board”), taking into account such events in calculating the NAV. In such cases, use of fair valuation can reduce an investor’s ability to seek profit by estimating the Fund’s NAV in advance of the time the NAV is calculated. The Board has retained an independent fair value pricing service to assist in valuing foreign securities held by the Fund. In valuing assets, prices denominated in foreign currencies are converted to U.S. dollar equivalents at the current exchange rate. Any securities or other assets for which market quotations are not readily available are valued at their fair value as determined in good faith by the adviser or subadviser pursuant to guidelines established by the Board. In determining fair value, an adviser or subadviser may consider factors including, but not limited to: the reason for the absence market quotations, the issuer’s financial condition, values of similar securities of issuers in the same industry, the prior day’s valuation or last traded price and historical data. The degree of judgment exercised in determining fair value is greatest for securities categorized as Level 3.
The Fund follows a fair value hierarchy that distinguishes between market data obtained from independent sources (observable inputs) and the Fund’s own market assumptions (unobservable inputs). These inputs are used in determining the value of the Fund’s investments and are summarized in the following fair value hierarchy:
Level 1 - Quoted prices in active markets for identical securities
Level 2 - Evaluated prices based on other significant observable inputs (including quoted prices for similar securities, foreign security indices, foreign exchange rates, fair value estimates for foreign securities and changes in benchmark securities indices)
Level 3 - Significant unobservable inputs (including the Fund’s own assumptions in determining fair value of investments)
Assets categorized as Level 3 in the hierarchy have been fair valued at a discount (5%) to the last trade prior to a trading halt.
15
NOTES TO FINANCIAL STATEMENTS (continued)
December 31, 2016 (Unaudited)
The following is a summary of inputs used to value the Fund’s securities as of December 31, 2016:
Description | | Level 1 | | Level 2 | | Level 3 | | Total | |
Equity (a) | | | | | | | | | |
Common Stocks | | $ | 18,752,030 | | $ | 16,772,772 | | $ | 1,010,999 | | $ | 36,535,801 | |
P-Notes | | — | | 7,450,881 | | — | | 7,450,881 | |
Total Equity | | 18,752,030 | | 24,223,653 | | 1,010,999 | | 43,986,682 | |
Short-Term Investments | | 2,419,142 | | — | | — | | 2,419,142 | |
Total Investments in Securities | | $ | 21,171,172 | | $ | 24,223,653 | | $ | 1,010,999 | | $ | 46,405,824 | |
(a) See Fund’s Schedule of Investments for country classifications.
Transfers into Level 1 | | $ | 2,429,322 | |
Transfers out of Level 2 | | (2,429,322 | ) |
Net transfers | | $ | — | |
| | | |
Transfers into Level 3 | | $ | 1,010,999 | |
Transfers out of Level 2 | | (1,010,999 | ) |
Net transfers | | $ | — | |
Transfers between Level 1 and Level 2 relate to the use of systematic fair valuation. On days when systematic fair valuation is used, certain non-U.S. dollar denominated securities move from Level 1 to Level 2 classification. At October 31, 2016, certain securities held by the Fund were adjusted using systematic fair valuation resulting in a Level 2 classification. At December 31, 2016, certain securities held by the Fund were not adjusted using systematic fair valuation resulting in a Level 1 classification. Transfers between Level 2 and Level 3 relate to the use of significant unobservable inputs. On days when significant unobservable inputs are used, certain non-U.S. dollar denominated securities move from Level 1 or 2 to Level 3 classification. At December 31, 2016, certain Level 2 securities held by the Fund were adjusted using significant unobservable inputs resulting in a Level 3 classification. It is the Fund’s policy to record transfers at the end of the reporting period.
The following is a reconciliation of the beginning and ending balances for assets and liabilities measured at fair value using significant unobservable inputs (Level 3) during the period ended December 31, 2016:
| | Common Stocks | |
Balance, October 31, 2016 | | $ | — | |
Purchases | | — | |
Sales | | — | |
Realized gain/(loss) | | — | |
Change in unrealized depreciation | | — | |
Transfers into Level 3 | | 1,010,999 | |
Transfers out of Level 3 | | — | |
Balance, December 31, 2016 | | $ | 1,010,999 | |
As of December 31, 2016, unrealized depreciation attributable to Level 3 investments was $33,432.
16
NOTES TO FINANCIAL STATEMENTS (continued)
December 31, 2016 (Unaudited)
(b) Federal Income Taxes
The Fund intends to comply with the requirements of Subchapter M of the Internal Revenue Code of 1986, as amended, necessary to qualify as a regulated investment company and to make the requisite distributions of income and capital gains to its shareholders sufficient to relieve it from all or substantially all federal income taxes. Therefore, no federal income tax provision has been provided.
The Fund has adopted financial reporting rules regarding recognition and measurement of tax positions taken or expected to be taken on a tax return. The Fund recognizes interest and penalties, if any, related to unrecognized tax benefits as income tax expense on the Statement of Operations. During the period, the Fund did not incur any interest or penalties. The Fund has reviewed all open tax years and concluded that there is no effect to the Fund’s financial position or results of operations and no tax liability resulting from unrecognized tax benefits relating to uncertain income tax positions taken or expected to be taken on a tax return. The Fund has no examinations in progress.
(c) Distributions to Shareholders
Distributions from net investment income and net realized gains, if any, are declared and paid at least annually. All short-term capital gains are included in ordinary income for tax purposes. Distributions to shareholders are recorded on the ex-dividend date. The Fund did not pay a distribution during the fiscal period ended October 31, 2016. During the period ended December 31, 2016, the Fund paid distributions of ordinary income in the amount of $127,661. There were no distributions of short-term or long-term capital gains.
At October 31, 2016, the components of accumulated losses on a tax basis were as follows:
| | Silk Invest New Horizons Fund | |
Cost of investments | | $ | 44,939,036 | |
Gross unrealized appreciation | | $ | 2,001,143 | |
Gross unrealized depreciation | | (4,412,132 | ) |
Net unrealized depreciation | | (2,410,989 | ) |
Undistributed ordinary income | | 127,658 | |
Undistributed long-term capital gain | | — | |
Total distributable earnings | | 127,658 | |
Other accumulated losses | | (62,281 | ) |
Total accumulated losses | | $ | (2,345,612 | ) |
At October 31, 2016, the Fund had a short-term capital loss carryforward that will not expire of $63,696.
17
NOTES TO FINANCIAL STATEMENTS (continued)
December 31, 2016 (Unaudited)
(d) Foreign Currency Translation and Risks
Values of investments denominated in foreign currencies are converted into U.S. dollars using a spot market rate of exchange each day. Purchases and sales of investments and dividend and interest income are translated to U.S. dollars using a spot market rate of exchange prevailing on the dates of such transactions. The Fund does not isolate that portion of the results of operations resulting from changes in foreign exchange rates on investments from the fluctuations arising from changes in the fair value of securities held. Such fluctuations are included with the net realized and unrealized gain or loss on investments. The Fund reports net realized foreign exchange gains and losses that arise from sales of foreign currencies, currency gains or losses realized between the trade and settlement dates on securities transactions, and the difference between the amounts of dividends, interest, and foreign withholding taxes recorded on the Fund’s books and the U.S. dollar equivalent of the amounts actually received or paid. Net unrealized foreign exchange gains and losses arise from changes in the fair values of assets and liabilities, other than investments in securities at fiscal period end, resulting from changes in exchange rates.
The Fund bears the risk of changes in the foreign currency exchange rates and their impact on the value of assets and liabilities denominated in foreign currency. The Fund also bears the risk of a counterparty failing to fulfill its obligation under a foreign currency contract.
Investments in securities of foreign companies involve additional risks including:
Foreign Securities Risks - Investments in securities of foreign companies involve additional risks, including less liquidity, currency-rate fluctuations, political and economic instability, differences in financial reporting standards and securities market regulation, and imposition of foreign withholding taxes. Geopolitical events, including those in the Ukraine and Middle East, may also cause market disruptions.
Frontier Markets Risks - Frontier market countries generally have smaller economies or less developed capital markets than traditional emerging markets, and as a result, the risks of investing in emerging markets countries are magnified in frontier market countries. Frontier market economies can be subject to greater social, economic, regulatory, and political uncertainties. Adverse government policies, taxation, restrictions on foreign investment and on currency convertibility and repatriation, currency fluctuations and other developments in laws and regulations of frontier countries in which Fund investments may be made, including expropriation, nationalism, and other confiscation, could result in loss.
Currency Risks - The value of the Fund’s foreign holdings as measured in U.S. dollars may be affected unfavorably by changes in foreign currency exchange rates. The Fund may also incur costs in connection with conversions between various currencies. Currency rates in foreign countries may fluctuate significantly over short periods of time for a number of reasons, including but not limited to, changes in interest rates, intervention by central banks or supranational entities such as the International Monetary Fund, managed adjustments in relative currency values and other protectionist measures imposed or negotiated by countries with which frontier markets companies trade. For example, Nigeria has experienced economic challenges and liquidity issues with respect to its currency.
18
NOTES TO FINANCIAL STATEMENTS (continued)
December 31, 2016 (Unaudited)
P-Note Risks - P-Notes are issued by banks and broker-dealers and are designed to offer a return linked to the performance of an underlying security or market. P-Notes are subject to counterparty risk, which is the risk that the broker-dealer or bank that issues the notes will not fulfill its contractual obligations under the notes.
(e) Indemnifications
Under the Fund’s organizational documents, its officers and directors are indemnified against certain liabilities arising out of the performance of their duties to the Fund. In addition, in the normal course of business, the Fund enters into contracts that provide general indemnifications to other parties. The Fund’s maximum exposure under these arrangements is unknown as this would involve future claims that may be made against the Fund that have not yet occurred. However, the Fund has not had prior claims or losses pursuant to these contracts and expects the risk of loss to be remote.
(f) Restricted and Illiquid Securities
A restricted security is a security that has been purchased through a private offering and cannot be resold to the general public without prior registration under the Securities Act of 1933, as amended (the “Act”), pursuant to the resale limitations provided by Rule 144A or Regulation S under the Act, or an exemption from the registration requirements of the Act. Whether a restricted security is illiquid is determined pursuant to guidelines established by the Board. None of the Fund’s restricted securities are considered to be illiquid. As of December 31, 2016, Rule 144A and Regulation S securities held in the Fund represented 16.1% of net assets.
The Fund may invest up to 15% of its net assets in illiquid securities. A security may be considered illiquid if it lacks a readily available market. Securities are generally considered liquid if they can be sold or disposed of in the ordinary course of business within seven calendar days at approximately the price at which the security is valued by the Fund. Illiquid securities may be valued under methods approved by the Board as reflecting fair value. As of December 31, 2016, the Fund had investments in illiquid securities with a total value of $2,518,943 or 5.4% of total net assets.
(g) Other
Investment transactions are accounted for on the trade date. The Fund determines the gain or loss realized from investment transactions by comparing the original cost of the specifically identified security lot sold with the net sale proceeds. Dividend income, less foreign taxes withheld, is recognized on the ex-dividend date, except that certain dividends from foreign securities are recorded as soon as the information becomes available to the Fund. Interest income is recognized on an accrual basis. All discounts/premiums are accreted/amortized using the effective interest method and are included in interest income. While the Fund is entitled to receive from the bank or broker any dividends or other distributions paid on the underlying securities linked to its investments in P-Notes, the holder is not entitled to the same rights as an owner of the underlying securities, such as voting rights. Income received from P-Notes is recorded as dividend income in the Statement of Operations. Withholding taxes on foreign dividends have been provided for in accordance with the Fund’s understanding of the applicable country’s tax codes and regulations.
Income, expenses (other than expenses attributable to a specific class) and realized and unrealized gains or losses on investments attributable to the Fund are generally allocated to each respective class in proportion to the relative net assets of each class. Expenses incurred which do not
19
NOTES TO FINANCIAL STATEMENTS (continued)
December 31, 2016 (Unaudited)
specifically relate to an individual Fund are allocated among all Funds in the Company in proportion to each Fund’s relative net assets or by other equitable means.
The preparation of financial statements in conformity with U.S. generally accepted accounting principles (“GAAP”) requires management to make estimates and assumptions that affect the reported amounts of assets and liabilities and disclosure of contingent assets and liabilities at the date of the financial statements, and the reported amounts of increases and decreases in net assets from operations during the reporting period. Actual results could differ from those estimates.
Net investment income and realized gains and losses for federal income tax purposes may differ from that reported on the financial statements because of permanent book-to-tax differences. GAAP requires that permanent differences in net investment income and realized gains and losses due to differences between financial reporting and tax reporting be reclassified between various components of net assets. These reclassifications have no effect on net assets or net asset value per share. For the period ended October 31, 2016, the Fund decreased undistributed net investment income and paid in capital by $56,977 and $388, respectively, and decreased accumulated undistributed net realized loss by $57,365. The permanent differences primarily relate to foreign currency and book/tax adjustments for transfers in-kind.
(3) INVESTMENT ADVISER AND RELATED PARTIES
The Fund has entered into an agreement with Frontegra, with whom certain officers and a director of the Fund are affiliated, to furnish investment advisory services to the Fund. Fees are calculated daily and payable monthly, at annual rates set forth in the following table (expressed as a percent of average daily net assets). Pursuant to an expense cap agreement, Frontegra has agreed to waive its management fee and/or reimburse the Fund’s operating expenses (exclusive of brokerage, acquired fund fees and expenses, interest, taxes and extraordinary expenses) to ensure that the Fund’s operating expenses do not exceed the expense limitation listed below. The expense limitation for Service Class shares includes up to 0.15% exclusively for shareholder servicing fees. Expenses waived are netted with advisory fees payable on the Statement of Assets and Liabilities. On a monthly basis, these accounts are settled by the Fund making payment to Frontegra or Frontegra reimbursing the Fund if the reimbursement amount exceeds the advisory fee. If the amount of fees waived exceeds the advisory fee earned, this is shown on the Statement of Assets and Liabilities as a receivable from the adviser. The expense cap agreement will continue in effect until October 31, 2018, with successive renewal terms of one year unless terminated by Frontegra or the Fund prior to any such renewal.
| | Annual | | Expense | |
Fund | | Advisory Fees | | Limitation | |
Silk Invest New Horizons Fund — Institutional Class | | 1.45 | % | 1.85 | % |
Silk Invest New Horizons Fund — Service Class | | 1.45 | % | 2.00 | % |
Any waivers or reimbursements are subject to later adjustment to allow Frontegra to recoup amounts waived or reimbursed to the extent actual fees and expenses for a fiscal period are less than the Fund’s expense limitation cap, provided, however, that Frontegra shall only be entitled to recoup such amounts for a period of three years from the date such amount was waived or reimbursed. Expenses attributable to a specific class may only be recouped with respect to that class.
20
NOTES TO FINANCIAL STATEMENTS (continued)
December 31, 2016 (Unaudited)
The table below shows the waived or reimbursed expenses subject to potential recovery expiring in:
Fund | | October 31, 2019 | | December 31, 2019 | |
Silk Invest New Horizons Fund | | $ | 70,610 | * | $ | 28,462 | ** |
| | | | | | | |
* Expenses waived/reimbursed were for the fiscal period May 25, 2016, through October 31, 2016.
** Expenses waived/reimbursed were for the fiscal period November 1, 2016, through December 31, 2016.
The beneficial ownership, either directly or indirectly, of more than 25% of a Fund’s voting securities creates a presumption of control. As of December 31, 2016, the Fund had an individual shareholder account and an omnibus shareholder account (composed of a group of individual shareholders), each of which amounted to more than 25% of the total shares outstanding of the Fund. Shareholders with a controlling interest could affect the outcome of proxy voting or direction of management of the Fund.
(4) INVESTMENT TRANSACTIONS
The aggregate purchases and sales of securities, excluding short-term investments, for the Fund for the period ended December 31, 2016, were $2,889,109 and $2,006,877, respectively. The Fund did not purchase or sell any U.S. Government securities during the period.
(5) SHAREHOLDER SERVICING FEE
The Company, on behalf of the Service Class shares of the Fund, has adopted a shareholder servicing plan (the “Service Plan”). Pursuant to the Service Plan, the Service Class shares of the Fund pay an annual shareholder servicing fee of up to 0.15% per year to Frontegra Strategies, LLC (the “Distributor”) for payments to authorized agents, such as a fund supermarket or broker-dealer who is authorized by the Distributor or an affiliate of the Fund, who provide on-going account services to shareholders. Those services include establishing and maintaining shareholder accounts, mailing prospectuses, account statements and other Fund documents to shareholders, processing shareholder transactions, and providing other recordkeeping, sub-accounting and administrative services. For the period ended December 31, 2016, the Service Class shares of the Fund incurred $2,311 in fees under the Service Plan.
(6) REPORTING MODERNIZATION FOR REGISTERED INVESTMENT COMPANIES
In October 2016, the U.S. Securities and Exchange Commission adopted new rules and amended existing rules (together, “final rules”) intended to modernize the reporting and disclosure of information by registered investment companies. In part, the final rules amend Regulation S-X and require standardized, enhanced disclosure about derivatives in investment company financial statements, as well as other amendments. The compliance date for the amendments to Regulation S-X is August 1, 2017. Management is currently evaluating the impact that the adoption of the amendments to Regulation S-X will have on the financial statements and related disclosures.
21
A NOTE ON FORWARD-LOOKING STATEMENTS
This report includes forward-looking statements such as adviser, subadviser and/or portfolio manager predictions, opinions, assessments, analyses or outlooks for individual securities, industries, market sectors and/or markets. These statements involve risks and uncertainties. In addition to the general risks described for the Fund in the current Prospectus, other factors bearing on these statements include the accuracy of the adviser’s, subadviser’s or portfolio manager’s forecasts and predictions, and the appropriateness of the investment programs designed by an adviser, subadviser or portfolio manager to implement their strategies efficiently and effectively. Any one or more of these factors, as well as other risks affecting the securities markets and investment instruments generally, could cause the actual results of the Fund to differ materially as compared to benchmarks associated with the Fund.
In addition, portfolio composition will change due to ongoing management of the Fund. Specific securities named in this report may not currently be owned by the Fund, or the Fund’s position in the securities may have changed.
ADDITIONAL INFORMATION
Frontier Funds has adopted proxy voting policies and procedures that delegate to Frontegra Asset Management, Inc. (“Frontegra”) the authority to vote proxies. The proxy voting policies permit Frontegra to delegate its authority to vote proxies to a Fund’s subadviser. A description of the Frontier Funds’ proxy voting policies and procedures is available without charge, upon request, by calling the Funds toll free at 1-888-825-2100. A description of these policies and procedures is also included in the Funds’ Statement of Additional Information, which is available on the SEC’s website at http://www.sec.gov and the Funds’ website at www.frontiermutualfunds.com or by calling the Funds toll free at 1-888-825-2100.
The actual voting records relating to the Fund’s portfolio securities during the most recent period ended June 30 are available without charge by calling the Fund toll free at 1-888-825-2100 or by accessing the SEC’s website at http://www.sec.gov.
The Fund files a complete schedule of portfolio holdings for its first and third fiscal quarters with the SEC on Form N-Q. The Form N-Q is available on the SEC’s website at http://www.sec.gov. The Form N-Q may also be reviewed and copied at the SEC’s Public Reference Room in Washington, D.C. Information on the operation of the Public Reference Room may be obtained by calling toll-free 1-800-SEC-0330.
Item 2. Code of Ethics.
Not applicable for semi-annual reports.
Item 3. Audit Committee Financial Expert.
Not applicable for semi-annual reports.
Item 4. Principal Accountant Fees and Services.
Not applicable for semi-annual reports.
Item 5. Audit Committee of Listed Registrants.
Not applicable to registrants who are not listed issuers (as defined in Rule 10A-3 under the Securities Exchange Act of 1934).
Item 6. Investments.
(a) Schedule of Investments is included as part of the report to shareholders filed under Item 1 of this Form.
(b) Not Applicable.
Item 7. Disclosure of Proxy Voting Policies and Procedures for Closed-End Management Investment Companies.
Not applicable to open-end investment companies.
Item 8. Portfolio Managers of Closed-End Management Investment Companies.
Not applicable to open-end investment companies.
Item 9. Purchases of Equity Securities by Closed-End Management Investment Company and Affiliated Purchasers.
Not applicable to open-end investment companies.
Item 10. Submission of Matters to a Vote of Security Holders.
Not Applicable.
Item 11. Controls and Procedures.
(a) Based on an evaluation of the registrant’s disclosure controls and procedures (as defined in Rule 30a-3(c) under the Investment Company Act of 1940 (the “Act”)) as of a date within 90 days prior to the filing date of this Form N-CSR, the registrant’s principal executive officer and principal financial officer have concluded that the disclosure controls and procedures are effective.
(b) There were no changes in the Registrant’s internal control over financial reporting (as defined in Rule 30a-3(d) under the Act) that occurred during the second fiscal quarter of the period covered by this report that has materially affected, or is reasonably likely to materially affect, the Registrant’s internal control over financial reporting.
Item 12. Exhibits.
(a) (1) Any code of ethics or amendment thereto, that is the subject of the disclosure required by Item 2, to the extent that the registrant intends to satisfy Item 2 requirements through filing an exhibit. Incorporated by reference to the Registrant’s Form N-CSR filed September 8, 2008.
(2) A separate certification for each principal executive officer and principal financial officer pursuant to Section 302 of the Sarbanes-Oxley Act of 2002. Filed herewith.
(3) Any written solicitation to purchase securities under Rule 23c-1 under the Act sent or given during the period covered by the report by or on behalf of the registrant to 10 or more persons. Not applicable to open-end investment companies.
(b) Certifications pursuant to Section 906 of the Sarbanes-Oxley Act of 2002. Furnished herewith.
2
SIGNATURES
Pursuant to the requirements of the Securities Exchange Act of 1934 and the Investment Company Act of 1940, the registrant has duly caused this report to be signed on its behalf by the undersigned, thereunto duly authorized.
Frontier Funds, Inc. | |
| | |
By: | /s/ William D. Forsyth III | |
| William D. Forsyth III, President and Secretary | |
| (Principal Executive Officer) | |
| | |
Date: | 2/28/2017 | |
Pursuant to the requirements of the Securities Exchange Act of 1934 and the Investment Company Act of 1940, this report has been signed below by the following persons on behalf of the registrant and in the capacities and on the dates indicated.
By: | /s/ William D. Forsyth III | |
| William D. Forsyth III, President and Secretary | |
| (Principal Executive Officer) | |
Date: | 2/28/2017 | |
| | |
By: | /s/ Elyce D. Dilworth | |
| Elyce D. Dilworth, Treasurer and Assistant Secretary | |
| (Principal Financial Officer) | |
Date: | 2/28/2017 | |
3