UNITED STATES
SECURITIES AND EXCHANGE COMMISSION
Washington, D.C. 20549
FORM N-CSR
CERTIFIED SHAREHOLDER REPORT OF REGISTERED
MANAGEMENT INVESTMENT COMPANIES
Investment Company Act file number | 811-07685 |
|
Frontier Funds, Inc. |
(Exact name of registrant as specified in charter) |
|
400 Skokie Blvd. Suite 500 Northbrook, Illinois | | 60062 |
(Address of principal executive offices) | | (Zip code) |
|
William D. Forsyth III 400 Skokie Blvd., Suite 500 Northbrook, Illinois 60062 |
(Name and address of agent for service) |
|
Registrant’s telephone number, including area code: | (847) 509-9860 | |
|
Date of fiscal year end: | June 30 | |
|
Date of reporting period: | December 31, 2015 | |
| | | | | | | | |
Item 1. Reports to Stockholders.

SEMI-ANNUAL REPORT
Frontier MFG Global Equity Fund
Frontier MFG Global Plus Fund
Frontier MFG Core Infrastructure Fund
Frontier Timpani Small Cap Growth Fund
Frontier Netols Small Cap Value Fund
Frontier Phocas Small Cap Value Fund
Frontegra Asset Management, Inc.
December 31, 2015

TABLE OF CONTENTS
Shareholder Letter | | | 1 | | |
Frontier MFG Global Equity Fund | |
Report from MFG Asset Management | | | 4 | | |
Investment Highlights | | | 6 | | |
Frontier MFG Global Plus Fund | |
Report from MFG Asset Management | | | 8 | | |
Investment Highlights | | | 10 | | |
Frontier MFG Core Infrastructure Fund | |
Report from MFG Asset Management | | | 12 | | |
Investment Highlights | | | 14 | | |
Frontier Timpani Small Cap Growth Fund | |
Report from Timpani Capital Management LLC | | | 16 | | |
Investment Highlights | | | 18 | | |
Frontier Netols Small Cap Value Fund | |
Report from Netols Asset Management, Inc. | | | 20 | | |
Investment Highlights | | | 21 | | |
Frontier Phocas Small Cap Value Fund | |
Report from Phocas Financial Corporation | | | 24 | | |
Investment Highlights | | | 26 | | |
Expense Example | | | 27 | | |
Schedules of Investments | |
Frontier MFG Global Equity Fund | | | 29 | | |
Frontier MFG Global Plus Fund | | | 30 | | |
Frontier MFG Core Infrastructure Fund | | | 31 | | |
Frontier Timpani Small Cap Growth Fund | | | 34 | | |
Frontier Netols Small Cap Value Fund | | | 37 | | |
Frontier Phocas Small Cap Value Fund | | | 39 | | |
Statements of Assets and Liabilities | | | 42 | | |
Statements of Operations | | | 44 | | |
Statements of Changes in Net Assets | | | 46 | | |
Financial Highlights | | | 49 | | |
Notes to Financial Statements | �� | | 57 | | |
Voting Results of Special Meeting of Shareholders | | | 65 | | |
This report is submitted for the general information of the shareholders of the Funds. It is not authorized for distribution to prospective investors unless accompanied or preceded by an effective Prospectus for the applicable Fund. The Prospectus may be obtained by calling 1-888-825-2100. Each Prospectus includes more complete information about management fees and expenses, investment objectives, risks and operating policies of the applicable Fund. Please read the Prospectus carefully.
Frontier Funds, Inc. are distributed by Frontegra Strategies, LLC, 400 Skokie Blvd., Suite 500, Northbrook, IL 60062. Frontegra Strategies, LLC, member of FINRA and SIPC, is an affiliate of Frontegra Asset Management, Inc., the Funds' investment adviser.

DEAR FELLOW SHAREHOLDERS:
We are pleased to report on the progress of the Frontier Funds over the past six months ending December 31, 2015. The S&P 500 Index was up 0.15% and small capitalization stocks were down, with the Russell 2000® Index returning -8.75%. International stocks, as measured by the MSCI EAFE Index, returned -6.01% over the six month period.
Fund Results
The Frontier MFG Global Equity Fund, managed by MFG Asset Management ("MFG"), returned 0.15% (net) versus the MSCI World Index (Net) return of -3.41% for the six month period ending December 31, 2015.
The Frontier MFG Global Plus Fund, also managed by MFG, returned -0.13% (net) versus the MSCI World Index (Net) return of -3.41% for the six month period ending December 31, 2015.
For the six month period ending December 31, 2015, the Frontier MFG Core Infrastructure Fund, also managed by MFG, returned 4.78% (net) versus the S&P Global Infrastructure Index return of -9.10%.
The Frontier Timpani Small Cap Growth Fund, Institutional Class, managed by Timpani Capital Management, returned -14.05% (net) versus the Russell 2000® Growth Index return of -9.31% for the six month period ending December 31, 2015. The Class Y shares returned -14.19% (net) over the same time period.
For the six month period ending December 31, 2015, the Frontier Netols Small Cap Value Fund, Institutional Class, managed by Netols Asset Management, returned -8.99% (net) versus the Russell 2000® Value Index return of -8.17%. The Class Y shares returned -8.96% (net) over the same time period.
The Frontier Phocas Small Cap Value Fund, managed by Phocas Financial, returned -4.83% (net) versus the Russell 2000 Value Index return of -8.17% for the six month period ending December 31, 2015.
Outlook
Calendar year 2015 was like A Tale of Two Cities. The first six months of the year were generally strong, with small but solid gains in both U.S. and non-U.S. equity markets and very strong performance in small cap U.S. stocks, especially growth-oriented names. The second half of the year was almost the polar opposite; U.S. and non-U.S. equities gave back the gains they had enjoyed in the first half of the year, and small cap U.S. stocks were largely routed. Market volatility spiked during the year, and three overriding themes seemed to have a pervasive effect on markets: 1) a plunge in oil prices, which fell nearly 40%; 2) an unexpectedly sharp rise in the U.S. dollar; and 3) concerns about emerging markets, especially China. As we enter 2016, we will work diligently to navigate markets with the care and diligence necessary in these tumultuous times.
We will continue to oversee the investment management of the Frontier Funds with the care and diligence that have served our shareholders well in the past. As always, we appreciate your investment and continued confidence in the Frontier Funds.
Best regards,
William D. Forsyth, CFA
President
Frontier Funds, Inc.
page 1
This page intentionally left blank.

FRONTIER
MFG GLOBAL EQUITY FUND

REPORT FROM MFG ASSET MANAGEMENT
Dear Shareholders:
The investment objective of the Frontier MFG Global Equity Fund is capital appreciation. The objective is measured against the MSCI World Index (Net).
Performance Review
The Frontier MFG Global Equity Fund returned 0.15%, net of fees, for the six month period ending December 31, 2015, compared to -3.41% for the MSCI World Index (Net). For the year, the Fund returned 3.78%, net of fees, compared to the benchmark's return of -0.87%.
We do not manage the Fund against short-term performance metrics, and it is inevitable the Fund will underperform markets at some point in the future. We feel strongly that people cannot retire on "relative investment returns;" only by generating investment returns that exceed the rate of inflation (ideally by a satisfactory margin) will investors increase their wealth over time. As such, we are happy to be judged on the absolute returns of our strategy over time.
Fund Outlook and Strategy
The current risk pricing environment for high quality assets is quite extraordinary in a historical context. Pricing for sovereign credit, high quality corporate and financial credit and other high quality defensive assets is at, or near, record highs at present. The pricing of high quality assets reflects the prevailing environment of ultra-low policy rates and massive Quantitative Easing (QE) programmes over the past eight years by the G4 central banks (the U.S. Federal Reserve (Fed), the Bank of England (BOE), the Bank of Japan (BOJ) and the European Central Bank (ECB)) and the accumulation of foreign exchange reserves by China, Saudi Arabia and Switzerland, which have had policies to peg their currencies to either the U.S. dollar or the euro. We refer to these collectively as the G7 Central Banks.
Equity markets have become more challenging and value has become harder to find as share prices have continued to rise. While nothing is certain in investing, we predict that the next three years will be challenging for equities as they battle the headwind of rising long-term interest rates.
In April 2015, we increased the cash weighting of the Fund to approximately 15% (cash weighting at December 31, 2015, is approximately 13%). The cash weighting increases the defensiveness of our portfolio and should act as a partial hedge to increasing interest rates. In addition, we have reduced our exposure to emerging markets and euro earnings. We have also materially reduced our exposure to high quality defensive equities, as they are particularly exposed to higher than expected bond yields as relative pricing is very stretched.
We feel comfortable with the Fund's overall risk profile and construction. We believe it is likely to deliver satisfactory returns over the next investment cycle, while also exhibiting below-benchmark downside risk in the event that there is a major downturn in markets.
The Fund
On December 31, 2015, the Fund held 26 investments. Over the six months to December 31, 2015, the three investments, continuously held to the end of the period, with the strongest returns in local currency, were Alphabet (formerly Google) (+48.2%), Microsoft (+27.1%), and Home Depot (+20.0%) while the investments with the weakest returns were Tesco (-29.7%), QUALCOMM (-19.1%) and Yum! Brands (-18.1%). On an absolute basis, the three largest contributors to the Fund's return, in local currency, were Microsoft, Alphabet and eBay which added +1.8%, +1.2% and +0.9% respectively. Conversely, the three bottom contributors were Tesco, Yum! Brands and IBM, which detracted -1.2%, -0.9% and -0.7%, respectively.
page 4

Within the current macroeconomic environment we continue to see value in high-quality companies exposed to certain investment themes. The Fund continues to be exposed to the following major investment themes:
• Technology/software. We believe that the entrenched global enterprise software companies continue to have enormous competitive advantages and exhibit attractive investment characteristics.
• U.S. housing recovery. A recovery in new housing construction should drive a strong cyclical recovery in companies exposed to U.S. housing and also provide a strong boost to the overall economy.
• The move to a cashless society. There continues to be a strong secular shift from spending via cash and cheque to cashless forms of payments such as credit cards, debit cards, electronic funds transfer and mobile payments. In our opinion, the explosion of smart and internet-connected, mobile devices will accelerate this shift on a global basis. We believe that there are only a limited number of companies that are well positioned to directly benefit from this structural shift.
• U.S. interest rates. In our view, it is likely that U.S. short- and long-term interest rates will "normalize" over the next two years as the U.S. economy recovers. Now that the Fed has ended its QE programme, this may occur alongside the shrinking (or sterilisation) of its balance sheet, as well as the normal monetary policy action of lifting the Federal Funds Rate (FFR).
• Emerging market consumption growth. The Fund gains its exposure via selective investments in multinational consumer franchises.
Yours sincerely,
Hamish Douglass
Portfolio Manager
MFG Asset Management
page 5

INVESTMENT HIGHLIGHTS
Growth of a $1,000,000 Investment (Unaudited)

* 12/28/11 commencement of operations.
This chart assumes an initial gross investment of $1,000,000 made on 12/28/11 (commencement of operations). Returns shown include the reinvestment of all distributions. Past performance is not predictive of future results. Investment return and principal value will fluctuate so that shares, when redeemed, may be worth more or less than the original cost. In the absence of existing fee waivers, total return would be reduced. To receive current to the most recent month-end performance, please call 1-888-825-2100.
The MSCI World Index represents large and mid cap equities across 23 Developed Markets countries. The index covers approximately 85% of the free float-adjusted market capitalization in each country. The index does not reflect investment management fees, brokerage commissions and other expenses associated with investing in equity securities. A direct investment in the index is not possible.
Frontegra Asset Management, Inc. has contractually agreed through October 31, 2016, to waive its management fee and/or reimburse the Fund's operating expenses to the extent necessary to ensure that the Fund's total operating expenses (excluding taxes, interest, brokerage commissions, acquired fund fees and expenses and extraordinary expenses) do not exceed 0.80% of the Fund's average daily net assets. The expense ratios presented are based on the annualized expense ratios as reported in the Fund's current prospectus, which may differ from the expense ratios presented in the Fund's financial highlights.
** The returns shown do not reflect the deduction of taxes that a shareholder would pay on Fund distributions or the redemption of Fund shares.
Portfolio Total Return**
FOR PERIODS ENDED 12/31/15 | | FUND | | INDEX | |
SIX MONTHS | | | 0.15 | % | | | (3.41 | )% | |
ONE YEAR | | | 3.78 | % | | | (0.87 | )% | |
AVERAGE ANNUAL
SINCE INCEPTION | | | 14.06 | % | | | 11.47 | % | |
Fund Expenses | |
GROSS EXPENSE RATIO | | | 0.88 | % | |
NET EXPENSE RATIO | | | 0.82 | % | |
page 6

FRONTIER
MFG GLOBAL PLUS FUND

REPORT FROM MFG ASSET MANAGEMENT
Dear Fellow Shareholders:
The investment objective of the Frontier MFG Global Plus Fund is capital appreciation. The objective is measured against the MSCI World Index (Net).
Performance Review
The Frontier MFG Global Plus Fund returned -0.13%, net of fees, for the six month period ending December 31, 2015, compared to -3.41% the MSCI World Index (Net). Since inception on March 23, 2015, the Fund returned -1.03%, net of fees, compared to the benchmark's return of -5.05%.
We feel strongly that people cannot retire on "relative investment returns;" only by generating investment returns that exceed the rate of inflation (ideally by a satisfactory margin) will investors increase their wealth over time. As such, we are happy to be judged by the Fund's absolute returns over time.
Fund Outlook and Strategy
The current risk pricing environment for high quality assets is quite extraordinary in a historical context. Pricing for sovereign credit, high quality corporate and financial credit and other high quality defensive assets is at, or near, record highs at present. The pricing of high quality assets reflects the prevailing environment of ultra-low policy rates and massive Quantitative Easing (QE) programmes over the past eight years by the G4 central banks (the U.S. Federal Reserve (Fed), the Bank of England (BOE), the Bank of Japan (BOJ) and the European Central Bank (ECB)) and the accumulation of foreign exchange reserves by China, Saudi Arabia and Switzerland, which have had policies to peg their currencies to either the U.S. dollar or the euro. We refer to these collectively as the G7 Central Banks.
Equity markets have become more challenging and value has become harder to find as share prices have continued to rise. While nothing is certain in investing, we predict that the next three years will be challenging for equities as they battle the headwind of rising long-term interest rates.
In April 2015, we increased the cash weighting of the Fund to approximately 15% (cash weighting at December 31, 2015, is approximately 12%). The cash weighting increases the defensiveness of our portfolio and should act as a partial hedge to increasing interest rates. In addition, we have reduced our exposure to emerging markets and euro earnings. We have also materially reduced our exposure to high quality defensive equities, as they are particularly exposed to higher than expected bond yields as relative pricing is very stretched.
We feel comfortable with the Fund's overall risk profile and construction. We believe it is likely to deliver satisfactory returns over the next investment cycle, while also exhibiting below-benchmark downside risk in the event that there is a major downturn in markets.
The Fund
On December 31, 2015, the Fund held 26 investments. Over the six months to December 31, 2015, the three investments, continuously held to the end of the period, with the strongest returns in local currency, were Alphabet (formerly Google) (+48.2%), Microsoft (+27.1%), and Home Depot (+20.0%) while the investments with the weakest returns were Tesco (-29.7%), QUALCOMM (-19.1%) and Yum! Brands (-18.1%). On an absolute basis, the three largest contributors to the Fund's return, in local currency, were Microsoft, Alphabet and eBay which added +1.8%, +1.2% and +0.9%, respectively. Conversely, the three bottom contributors were Tesco, Yum! Brands and IBM, which detracted -1.2%, -0.9% and -0.7%, respectively.
page 8

Within the current macroeconomic environment, we continue to see value in high-quality companies exposed to certain investment themes. The Fund continues to be exposed to the following major investment themes:
• Technology/software. We believe that the entrenched global enterprise software companies continue to have enormous competitive advantages and exhibit attractive investment characteristics.
• U.S. housing recovery. A recovery in new housing construction should drive a strong cyclical recovery in companies exposed to U.S. housing and also provide a strong boost to the overall economy.
• The move to a cashless society. There continues to be a strong secular shift from spending via cash and cheque to cashless forms of payments, such a credit cards, debit cards, electronic funds transfer and mobile payments.
• U.S. interest rates normalizing over the next two years as the U.S. economy continues to recover.
• Emerging market consumption growth via selective investments in multinational consumer franchises.
Yours sincerely,
Hamish Douglass
Portfolio Manager
MFG Asset Management
page 9

INVESTMENT HIGHLIGHTS
Growth of a $1,000,000 Investment (Unaudited)

* 3/23/15 commencement of operations.
This chart assumes an initial gross investment of $1,000,000 made on 3/23/15 (commencement of operations). Returns shown include the reinvestment of all distributions. Past performance is not predictive of future results. Investment return and principal value will fluctuate so that shares, when redeemed, may be worth more or less than the original cost. In the absence of existing fee waivers, total return would be reduced. To receive current to the most recent month-end performance, please call 1-888-825-2100.
The MSCI World Index represents large and mid cap equities across 23 Developed Markets countries. The index covers approximately 85% of the free float-adjusted market capitalization in each country. The index does not reflect investment management fees, brokerage commissions and other expenses associated with investing in equity securities. A direct investment in the index is not possible.
Frontegra Asset Management, Inc. has contractually agreed through October 31, 2016, to waive its management fee and/or reimburse the Fund's operating expenses to the extent necessary to ensure that the Fund's total operating expenses (excluding taxes, interest, brokerage commissions, acquired fund fees and expenses and extraordinary expenses) do not exceed 0.80% of the Fund's average daily net assets. The expense ratios presented are based on the annualized expense ratios as reported in the Fund's current prospectus, which may differ from the expense ratios presented in the Fund's financial highlights.
** The returns shown do not reflect the deduction of taxes that a shareholder would pay on Fund distributions or the redemption of Fund shares.
Portfolio Total Return**
FOR PERIODS ENDED 12/31/15 | | FUND | | INDEX | |
SIX MONTHS | | | (0.13 | )% | | | (3.41 | )% | |
SINCE INCEPTION | | | (1.03 | )% | | | (5.05 | )% | |
Fund Expenses | |
GROSS EXPENSE RATIO | | | 4.97 | % | |
NET EXPENSE RATIO | | | 0.81 | % | |
page 10

FRONTIER
MFG CORE INFRASTRUCTURE FUND

REPORT FROM MFG ASSET MANAGEMENT
Dear Fellow Shareholders:
The investment objective of the Frontier MFG Core Infrastructure Fund is long-term capital appreciation. The objective is currently measured against the S&P Global Infrastructure Index.
The types of infrastructure assets in which the Fund invests are generally natural monopolies that provide an essential service to the community. Infrastructure assets offer investors protection from the impacts of inflation because their earnings generally have some direct linkage to inflation. Over time, the stable, reliable earnings of infrastructure assets are expected to lead to a combination of income and capital growth for investors.
The universe of infrastructure assets that are held by the Fund is made up of two main sectors:
• Utilities: Utilities comprise approximately 65% of the Fund and includes both regulated energy utilities and regulated water utilities. Utilities are typically subject to economic regulation. The terms of regulation typically require a utility to efficiently provide an essential service to the community and, in return, permit the utility to earn a fair rate of return on the capital it has invested in its operations. As a utility provides a basic necessity, e.g. energy or water, there is minimal fluctuation in demanded volumes in response to the economic cycle, while the price charged for the utility service can be adjusted with limited impact upon demanded volumes. As a result, the earnings of regulated utilities have been, and are expected to continue to be, stable irrespective of economic conditions.
• Infrastructure: This includes airports, ports, toll roads and broadcast communications infrastructure. Regulation of infrastructure companies is generally less intensive than regulation of utilities and this allows companies to accrue the benefits of volume growth (i.e. the returns of infrastructure companies are linked to growth in passengers, vehicles or containers). As economies develop, grow and become more inter-dependent, we expect the underlying level of aviation, shipping and vehicle traffic to increase. As a result, the revenues and earnings derived by infrastructure assets are expected to grow.
Performance Review
The Frontier MFG Core Infrastructure Fund returned 4.78%, net of fees, for the six month period ending December 31, 2015. The Fund's return outperformed the -9.10% return of its benchmark, the S&P Global Infrastructure Index, by 13.88%. For the year, the Fund returned -1.03%, net of fees, compared to the benchmark's return of -11.46%. The negative return for the year was impacted by the appreciation of the U.S. dollar over the period. The U.S. dollar hedged version of the benchmark index was down only 7.4% for the year.
The last year has provided a clear demonstration of the importance of how a global listed infrastructure investor defines their investment universe. As we have noted in previous investor letters, MFG applies a conservative definition of the infrastructure investment universe that is designed to provide investors with predictable, through the cycle, inflation linked returns. This means that MFG excludes those stocks from the investable universe whose earnings are materially impacted by competition, sovereign risk and, importantly in the last year, changes in commodity prices. Outperformance over listed infrastructure and global equities benchmarks reflects the limited exposure of the Fund to stocks impacted by falling energy prices and, to a lesser extent, emerging markets.
Seventy-five of the 89 stocks in the Fund generated a positive shareholder return in the period. Particularly strong returns were provided by U.S. utilities Piedmont Natural Gas (Total Shareholder Return (TSR) of +63.8%), TECO Energy (+53.7%) and Empire District Electric Co. (+31.8%). Other strong performers included Mexican airport company GAPB (+44.6%), Sydney Airport (+30.1%), and other U.S. utilities Westar Energy (+26.3%), PNM Resources (+26.1%) and Atmos Energy (+24.6%).
page 12

All sectors held by the Fund, except Energy Infrastructure, delivered positive returns for the period. The Airports sector provided a weighted average TSR of +18.5%, the Power Transmission & Distribution sector +13.1%, Integrated Power +12.8% and Gas Utilities +11.9%. The Energy Infrastructure sector was clearly impacted by the fall in oil prices; however, we remain confident that this will have only marginal impacts on the earnings of those stocks held in the Fund.
Geographically, the Fund's Latin American exposures generated a TSR of +17.9%, U.S. stocks were up +13.5% and Australian/New Zealand stocks provided a TSR of +12.9%.
As previously mentioned, the performance of the benchmark was negatively impacted by stocks with a material exposure to oil prices. Examples of significantly weighted stocks in the index, but not held by the Fund, caught up in the commodity price falls included Kinder Morgan (TSR of -59.9% for the period), The Williams Companies (-53.6%) and Cheniere Energy (-46.2%).
Portfolio Outlook and Strategy
The Fund is designed to provide reliable returns over the medium-to-longer term. We believe that infrastructure and utility assets, with requisite earnings reliability and a linkage of earnings to inflation, offer an attractive, long-term investment proposition. Furthermore, given the predictable nature of earnings and the structural linkage of those earnings to inflation, the investment returns generated by infrastructure assets are different from standard asset classes and offer investors valuable diversification when included in an investment portfolio. In the current uncertain economic and investment climate, the reliable financial performance of infrastructure investments makes them particularly attractive and an investment in listed infrastructure can be expected to reward patient investors with a three to five year timeframe.
Sincerely,
Dennis Eagar
Portfolio Manager
MFG Asset Management
page 13

INVESTMENT HIGHLIGHTS
Growth of a $100,000 Investment (Unaudited)
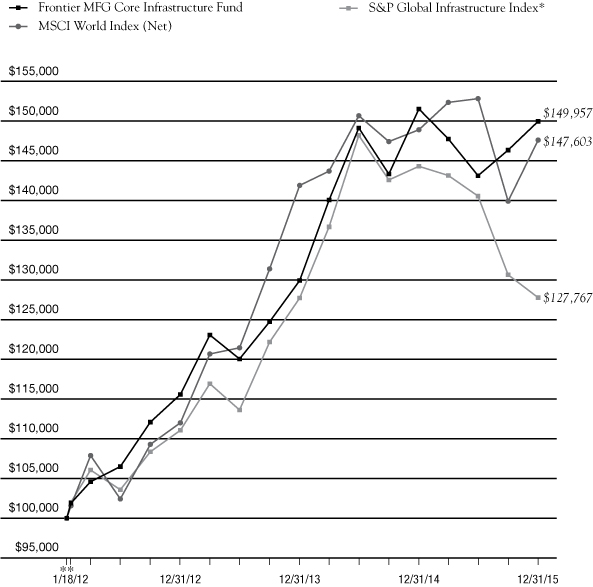
* The UBS Developed Infrastructure & Utilities Index (Net), a former benchmark index for the Frontier MFG Core Infrastructure Fund, was discontinued on April 1, 2015.
** 1/18/12 commencement of operations.
This chart assumes an initial gross investment of $100,000 made on 1/18/12 (commencement of operations). Returns shown include the reinvestment of all distributions. Past performance is not predictive of future results. Investment return and principal value will fluctuate so that shares, when redeemed, may be worth more or less than the original cost. In the absence of existing fee waivers, total return would be reduced. To receive current to the most recent month-end performance, please call 1-888-825-2100.
The MSCI World Index represents large and mid cap equities across 23 Developed Markets countries and covers approximately 85% of the free float-adjusted market capitalization in each country. The S&P Global Infrastructure Index is a global developed markets infrastructure and utilities benchmark. Neither index reflects investment management fees, brokerage commissions or other expenses associated with investing in equity securities. A direct investment in an index is not possible.
Frontegra Asset Management, Inc. has contractually agreed through October 31, 2016, to waive its management fee and/or reimburse the Fund's operating expenses to the extent necessary to ensure that the Fund's total operating expenses (excluding taxes, interest, brokerage commissions, acquired fund fees and expenses and extraordinary expenses) do not exceed 0.70% of the Fund's average daily net assets. The expense ratios presented are based on the annualized expense ratios as reported in the Fund's current prospectus, which may differ from the expense ratios presented in the Fund's financial highlights.
*** The returns shown do not reflect the deduction of taxes that a shareholder would pay on Fund distributions or the redemption of Fund shares.
Portfolio Total Return***
FOR PERIODS
ENDED
12/31/15 | | FUND | | MSCI
INDEX | | S&P
GLOBAL
INDEX | |
SIX MONTHS | | | 4.78 | % | | | (3.41 | )% | | | (9.10 | )% | |
ONE YEAR | | | (1.03 | )% | | | (0.87 | )% | | | (11.46 | )% | |
AVERAGE
ANNUAL
SINCE
INCEPTION | | | 10.79 | % | | | 10.35 | % | | | 6.39 | % | |
Fund Expenses | |
GROSS EXPENSE RATIO | | | 0.93 | % | |
NET EXPENSE RATIO | | | 0.70 | % | |
page 14

FRONTIER
TIMPANI SMALL CAP GROWTH FUND

REPORT FROM TIMPANI CAPITAL MANAGEMENT LLC
Dear Fellow Shareholders:
The Frontier Timpani Small Cap Growth Fund strives to achieve capital appreciation by investing in a diversified portfolio of growth companies with small market capitalizations. Timpani seeks to:
• Invest in companies where growth is robust, sustainable and underestimated by the market.
• Conduct fundamental research that provides unique insights into the growth gap that exists between market expectations and a company's true growth rate.
• Manage risk by continuously evaluating the size of the growth gap relative to market expectations and monitoring market sentiment.
• Act on new relevant incremental data points, both positive and negative, in an effort to exploit investor biases.
Performance Review
For the six months ended December 31, 2015, the Fund underperformed its benchmark, the Russell 2000® Growth Index, returning -14.05%, net of fees, compared to -9.31% for the benchmark. For the year, the Fund returned -2.68%, net of fees, compared to -1.38% for the Index.
Stock selection drove the majority of the negative impact, while sector allocation was also a negative impact on the portfolio. While we outperformed in the third quarter, the main theme during the fourth quarter was rotation — rotation away from high-performance stocks and into lower-performance stocks. This profit-taking represented a broad-based headwind, especially within Health Care, which had been one of our strongest areas of performance in the first half of calendar 2015. While we also took some profits along the way, the stylistic headwinds were too powerful to overcome. Stock selection within Energy was the only notable positive, while Health Care was a noteworthy headwind to performance. An overweight in Health Care and a slight overweight in Energy were the main detractors to performance from a sector allocation standpoint. We had several individual winners, but the magnitude of contribution was dulled by the aforementioned rotation. Our largest individual winner was LendingTree, a Timpani holding for over three years. It continued to post strong results, especially in its non-mortgage segment. Consumers are increasingly using the internet to shop for money and LendingTree is efficiently connecting those consumers to various financial lenders. Another winner was Health Care stock, INC Research Holdings, a contract research organization. It reported impressive results and a positive outlook relative to expectations. Health Care stocks, Adeptus Health and Horizon Pharma, notable winners from earlier in 2015, were notable losers in the second half of 2015. Adeptus Health operates free-standing emergency medical centers and faced questions about the sustainability of its pricing model. Horizon Pharma was sold from the portfolio as concerns about pricing and the sustainability of organic growth came into question.
Portfolio Outlook
Most stock indices were lower in the second half of the year, and the weakness domestically was led by small cap stocks. The third quarter was characterized by a very weak market and mini-crash, while the fourth quarter saw the market gain its footing and rise.
In December 2015, after months of speculation, the Federal Reserve finally raised interest rates for the first time in about a decade. Commentary from the Fed suggests further increases will be gradual and drawn out over time which should be well-received by markets. Importantly, rising interest rates by the Fed are most likely to be accompanied by further improvement in the domestic economy. The biggest macro risk is economic recession and that seems very unlikely in the intermediate term. Meanwhile, international central banks remain very accommodative, supporting global growth prospects.
page 16

China is a source of anxiety for investors. The dislocation in China's stock market and currency is disturbing, but the likelihood of it derailing U.S. growth seems minimal. Falling commodity prices and its impact on earnings and high-yield debt securities is another source of concern for investors. Timpani has minimal direct exposure to these issues, but is closely monitoring potentially broader implications.
On a micro level, we think the fundamental backdrop remains constructive for the U.S. economy. Data points from company management teams continue to confirm the economy is on solid footing and that secular growth can be found in numerous pockets of the economy. That growth is being sought by investors and can potentially drive upside to analyst estimates and lead to strong stock price performance. Based on where we are in the current stock market cycle, we expect secular growth and upside surprise to be embraced by the marketplace.
During the period, we continued to focus on finding robust and sustainable growers where the growth is being underestimated. That research has resulted in some sector weight changes that vary from the benchmark weights. The only notable overweight is Technology, while notable underweights include Producer Durables and Health Care.
We will continue to make it our mission to find companies that have characteristics consistent with our investment process. We believe this approach is most value-added for shareholders over the long term.
Thank you for your continued support.
Sincerely,
Brandon Nelson, CFA
Chief Investment Officer
Timpani Capital Management LLC
page 17

INVESTMENT HIGHLIGHTS
Growth of a $100,000 Investment (Unaudited)
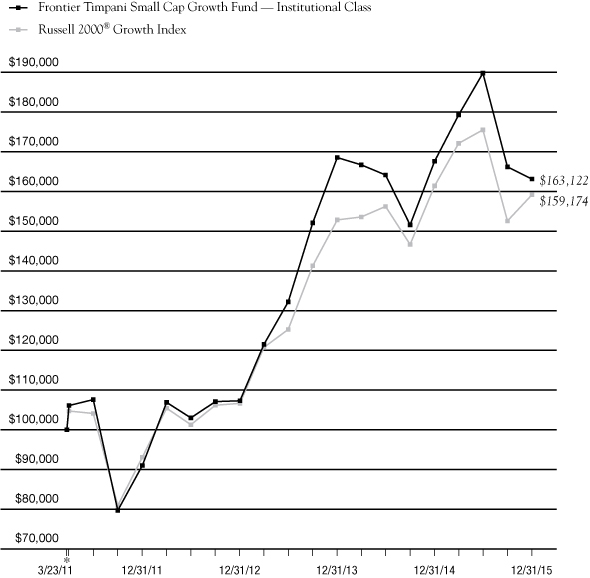
* 3/23/11 commencement of operations.
This chart assumes an initial gross investment of $100,000 made on 3/23/11. Returns shown include the reinvestment of all distributions. Past performance is not predictive of future results. Investment return and principal value will fluctuate so that shares, when redeemed, may be worth more or less than the original cost. In the absence of fee waivers, total return would be reduced. To receive current to the most recent month-end performance, please call 1-888-825-2100.
The Russell 2000® Growth Index measures the performance of the small-cap growth segment of the U.S. equity universe. The index does not reflect investment management fees, brokerage commissions and other expenses associated with investing in equity securities. A direct investment in the index is not possible.
Timpani Capital Management LLC has contractually agreed through October 31, 2016, to waive its management fee and/or reimburse the Fund's operating expenses to the extent necessary to ensure that the Fund's total operating expenses (excluding taxes, interest, brokerage commissions, acquired fund fees and expenses and extraordinary expenses) do not exceed 1.10% of the Fund's average daily net assets of the Institutional Class. The expense ratios presented are based on the annualized expense ratios as reported in the Fund's current prospectus, which may differ from the expense ratios presented in the Fund's financial highlights.
** The returns shown do not reflect the deduction of taxes that a shareholder would pay on Fund distributions or the redemption of Fund shares.
The above graph relates to Institutional Class shares of the Fund. Performance for Class Y shares will vary from the performance of the Institutional Class shares shown above due to differences in expenses.
Portfolio Total Return**
FOR PERIODS ENDED 12/31/15 | | FUND | | INDEX | |
SIX MONTHS | | | (14.05 | )% | | | (9.31 | )% | |
ONE YEAR | | | (2.68 | )% | | | (1.38 | )% | |
AVERAGE ANNUAL
SINCE INCEPTION | | | 10.79 | % | | | 10.22 | % | |
Institutional Class Expenses | |
GROSS EXPENSE RATIO | | | 1.52 | % | |
NET EXPENSE RATIO | | | 1.10 | % | |
page 18

FRONTIER
NETOLS SMALL CAP VALUE FUND

REPORT FROM NETOLS ASSET MANAGEMENT, INC.
Dear Fellow Shareholders:
The Frontier Netols Small Cap Value Fund strives to achieve capital appreciation by investing at least 80% of its assets in equity securities of small capitalization companies. The Fund's performance is measured against the Russell 2000® Value Index.
Performance Review
During the six month period ended December 31, 2015, the Frontier Netols Small Cap Value Fund (Institutional Class) returned -8.99%, net of fees, compared to -8.17% for the Russell 2000 Value Index. For the year, the Fund returned -6.58%, net of fees, compared to -7.47% for the Index.
Portfolio Review
During the second half of 2015, the main factor impacting the financial markets was the action by the Federal Reserve. After postponing a rate hike in the September quarter, the Fed raised rates in December with the indication of four additional increases in 2016. While this provided some clarity domestically, questions remained about the strength of the world economy. As a result, the ECB cut the savings rate and extended quantitative easing by six months. Additionally, economic weakness in China prompted a 50 basis point rate cut and emerging markets continued to experience capital outflows. The result was a softening of the high yield and equity markets. Overall, more domestically focused Utilities, Financials, and Consumer Staples outperformed on a relative basis while commodity focused Energy and Materials underperformed during the period.
Positive Contributions to Relative Performance in the Second Half of 2015:
• Stock selection in Materials, Energy, Consumer Staples, and Financials sectors
• Overweight in Consumer Staples sector
• Underweight in Energy
• Best performing stocks for the period: Willbros Group, Acuity Brands, Casey's General Stores, Education Realty Trust, Selective Insurance Group
Negative Contributions to Relative Performance in the Second Half of 2015:
• Stock selection in Health Care and Information Technology sectors
• Overweight in Consumer Discretionary sector
• Underweight in Financials and Utilities sectors
• Worst performing stocks for the period: Commercial Vehicle Group, Accuride, Cloud Peak Energy, Bill Barret, Kindred Healthcare
Portfolio Outlook
We believe the U.S. economy remains stable, driven by a modestly improving employment outlook. However, softness in some international economies and in particular China has raised concerns. Added to the mix is increased geopolitical tension in various parts of the world. These factors raise doubts about the ability of the Federal Reserve to continue on the path of higher rates.
Thank you for your continued support.
Jeff Netols
President
Netols Asset Management, Inc.
page 20

INVESTMENT HIGHLIGHTS
Growth of a $100,000 Investment (Unaudited)
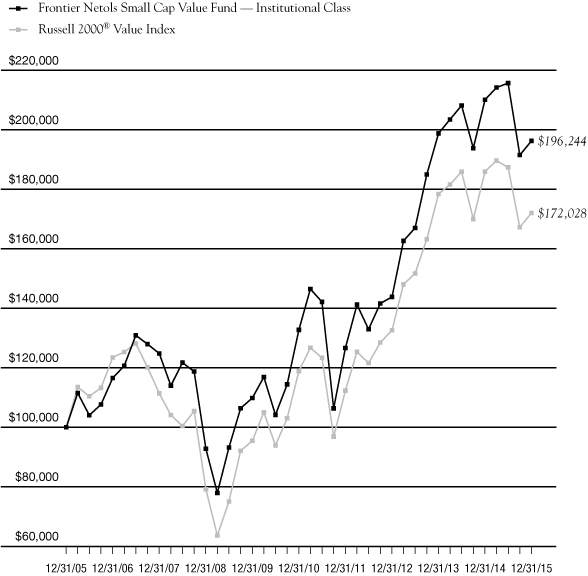
This chart assumes an initial gross investment of $100,000 made on 12/31/05. Returns shown include the reinvestment of all distributions. Past performance is not predictive of future results. Investment return and principal value will fluctuate so that shares, when redeemed, may be worth more or less than the original cost. In the absence of existing fee waivers, total return would be reduced. To receive current to the most recent month-end performance, please call 1-888-825-2100.
The Russell 2000 Value Index measures the performance of those Russell 2000 companies with lower price-to-book ratios and lower forecasted growth values. The index does not reflect investment management fees, brokerage commissions and other expenses associated with investing in equity securities. A direct investment in the index is not possible.
Frontegra Asset Management, Inc. has contractually agreed through October 31, 2016, to waive its management fee and/or reimburse the Fund's operating expenses to the extent necessary to ensure that the Fund's total operating expenses (excluding taxes, interest, brokerage commissions, acquired fund fees and expenses and extraordinary expenses) do not exceed 1.10% of the Fund's average daily net assets for the Institutional Class. The expense ratios presented are based on the annualized expense ratios as reported in the Fund's current prospectus, which may differ from the expense ratios presented in the Fund's financial highlights.
* The returns shown do not reflect the deduction of taxes that a shareholder would pay on Fund distributions or the redemption of Fund shares.
The above graph relates to Institutional Class shares of the Fund. Performance for Class Y shares will vary from the performance of the Institutional Class shares shown above due to differences in expenses.
Portfolio Total Return*
FOR PERIODS
ENDED 12/31/15 | | FUND | | INDEX | |
SIX MONTHS | | | (8.99 | )% | | | (8.17 | )% | |
ONE YEAR | | | (6.58 | )% | | | (7.47 | )% | |
FIVE YEAR
AVERAGE ANNUAL | | | 8.13 | % | | | 7.67 | % | |
TEN YEAR
AVERAGE ANNUAL | | | 6.97 | % | | | 5.57 | % | |
Institutional Class Expenses | |
GROSS EXPENSE RATIO | | | 1.18 | % | |
NET EXPENSE RATIO | | | 1.10 | % | |
page 21
This page intentionally left blank.

FRONTIER
PHOCAS SMALL CAP VALUE FUND

REPORT FROM PHOCAS FINANCIAL CORPORATION
Dear Fellow Shareholders:
The Frontier Phocas Small Cap Value Fund strives to achieve capital appreciation by investing in a diversified portfolio of equity securities of companies with small market capitalizations. The Fund's performance is measured against the Russell 2000® Value Index.
Performance Review
During the six-month period ended December 31, 2015, the Frontier Phocas Small Cap Value Fund returned -4.83%, net of fees, compared to the -8.17% return of the benchmark, the Russell 2000 Value Index (the "Benchmark" or the "Index"). For the calendar year, the Fund returned -4.35%, net of fees, compared to -7.47% for the Index.
Portfolio Review and Strategy
For the third quarter, M&A finally made a statement within the Fund. As we have said in the past, we do not intentionally buy stocks for that reason, but reasonably run small companies valued cheaply tend to make good acquisition targets. Atmel, a semiconductor company, finally announced a deal after reviewing strategic alternatives. Dialog Semiconductor, a London, U.K.-based company, offered to buy Atmel for both cash and stock. Solera Holdings, another technology holding that is also an insurance company underneath, was acquired by Vista Equity Partners, a private equity firm. On the other end of the spectrum, Blackstone, another private equity firm, in September offered to buy Strategic Hotels & Resorts for cash plus assumed debt. Our biggest outperformer in the third quarter was AMERCO (U-Haul). Banks and Real Estate also lifted returns. The biggest individual detractor for the third quarter was Park-Ohio Holdings, a supplier of industrial supply chain logistics closely tied to the transportation industry. A missed EPS quarter, and an out-of-favor Industrial sector did not help, but we remain confident in the company's future. The second largest laggard was Verint Systems. As a provider of large data business analytics, this company has a bright future. Unfortunately, they guided earnings downward and, needless to say, their share price was taken down accordingly. We do not feel anything has changed fundamentally with either company, and continue to hold the positions.
The biggest individual contributor for the fourth quarter was within Financials. NewBridge Bancorp, a North Carolina based community bank, rose more than 40% as it was being acquired by local peer Yadkin Financial Corp. The deal is expected to close in early 2016. Accuray, a medical imaging device company, was up more than 30%, as backlog and sales began to build after their new product launch. Surprisingly, a very modest small electric company, Empire District Electric, was up nearly 30%. Slow and steady won the race during the quarter. Another Health Care company, PharMerica, an institutional pharmacy services company, was our fourth best performer, climbing more than 20%. Given the weakness within Energy, one could easily assume that most of the top detractors would come from that segment. That, however, was not the case. In fact, none of the worst performers came from that sector. The worst performer was within Consumer Discretionary: retailer JC Penney, down nearly 30%. Many of their peers were equally hit hard during the quarter including Wall Street favorite, Macy's. We believe the valuation discount is excessive, and are waiting patiently for price recovery. Within Technology, Mentor Graphics declined, down more than 20%. They badly missed earnings due to the loss of a large client. Their remaining business, though, remains solid, their balance sheet quality is high, and we believe that management will recover much or all of that business revenue elsewhere at better margins. Within Industrials, we had two major names down over 20%: Allegiant Travel, a leisure travel air carrier serving small to medium sized cities, and MYR Group, an industrial company providing electrical construction services focusing on transmission lines, electric substations, and electricity distribution systems. We continue to believe in both of these businesses, as well as their future prospects.
With the strong gains in the U.S. stock market over the last several years, finding attractive significantly undervalued stocks has been more difficult, but there are still values to be found. Safer areas like Consumer Staples, Health Care, and Utilities have become quite fully valued as cautious investors migrate from fixed income and migrate towards equities. Even global investors want more U.S. equities given the strengthening dollar trends. In our opinion, though, some of the more cyclical areas in the equity markets remain undervalued. There are usually unrecognized values in every sector, however, and our perennial mission is to find them.
page 24

We continue to sell off highly appreciated positions as well as under-performing names that remain fundamentally challenged, and also continue to reinvest in low-valued names. Despite fair valuations within the broader domestic equity market, select stocks still continue to represent investment opportunities. We have focused a lot of attention within Consumer Discretionary, as it had a few of the harder hit subsectors this year, especially specialty retail and apparel. We continue to evaluate the quality of assets within the Energy sector complemented by the quality of balance sheets that will allow companies to survive what we think are currently unsustainably low commodity crude and natural gas prices.
We made a number of changes within the portfolio this quarter, positioning to take advantage of various market mispricings, and believe that the Fund is well positioned to benefit from new management teams improving their businesses.
Thank you for your continued support.
William Schaff, CFA | | Steve Block, CFA | |
Chief Executive Officer and Portfolio Manager | | Portfolio Manager | |
Phocas Financial Corporation | | Phocas Financial Corporation | |
page 25

INVESTMENT HIGHLIGHTS
Growth of a $100,000 Investment (Unaudited)
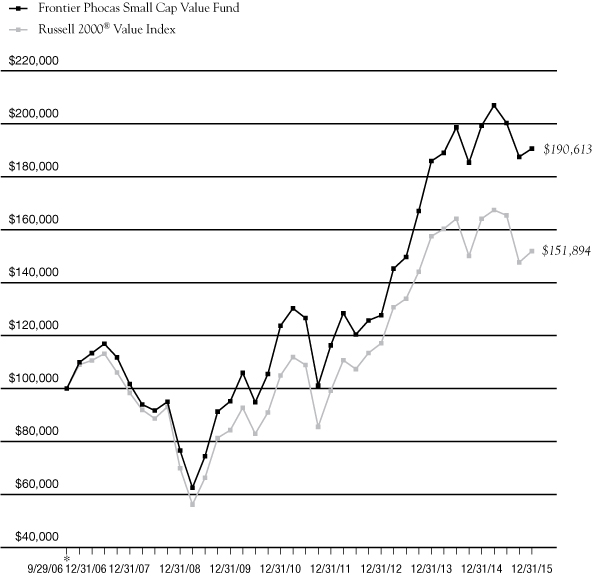
* 9/29/06 commencement of operations.
This chart assumes an initial gross investment of $100,000 made on 9/29/06. Returns shown include the reinvestment of all distributions. Past performance is not predictive of future results. Investment return and principal value will fluctuate so that shares, when redeemed, may be worth more or less than the original cost. In the absence of fee waivers, total return would be reduced. Effective October 8, 2010, Phocas Financial Corp. ("Phocas") became subadviser to the Fund and Frontegra Asset Management, Inc. became adviser to the Fund. Prior to October 8, 2010, Phocas served as adviser to the Fund. To receive current to the most recent month-end performance, please call 1-888-825-2100.
The Russell 2000® Value Index measures the performance of those Russell 2000® companies with lower price-to-book ratios and lower forecasted growth values. The index does not reflect investment management fees, brokerage commissions and other expenses associated with investing in equity securities. A direct investment in the index is not possible.
Frontegra Asset Management, Inc. has contractually agreed through October 31, 2016, to waive its management fee and/or reimburse the Fund's operating expenses to the extent necessary to ensure that the Fund's total operating expenses (excluding taxes, interest, brokerage commissions, acquired fund fees and expenses and extraordinary expenses) do not exceed 1.10% of the Fund's average daily net assets. The expense ratios presented are based on the annualized expense ratios as reported in the Fund's current prospectus, which may differ from the expense ratios presented in the Fund's financial highlights.
** The returns shown do not reflect the deduction of taxes that a shareholder would pay on Fund distributions or the redemption of Fund shares.
Portfolio Total Return**
FOR PERIODS ENDED 12/31/15 | | FUND | | INDEX | |
SIX MONTHS | | | (4.83 | )% | | | (8.17 | )% | |
ONE YEAR | | | (4.35 | )% | | | (7.47 | )% | |
FIVE YEAR
AVERAGE ANNUAL | | | 9.03 | % | | | 7.67 | % | |
AVERAGE ANNUAL
SINCE INCEPTION | | | 7.22 | % | | | 4.62 | % | |
Fund Expenses | |
GROSS EXPENSE RATIO | | | 1.54 | % | |
NET EXPENSE RATIO | | | 1.10 | % | |
page 26

Frontier Funds
EXPENSE EXAMPLE
December 31, 2015 (Unaudited)
As a shareholder of a mutual fund, you incur two types of costs: (1) transaction costs, including redemption fees, and (2) ongoing costs, including management fees, distribution and/or service (12b-1) fees and other fund expenses. Although the Funds charge no sales loads, you will be assessed fees for outgoing wire transfers, returned checks and stop payment orders at prevailing rates charged by U.S. Bancorp Fund Services, LLC, the Funds' transfer agent. If you request that a redemption be made by wire transfer, currently the Funds' transfer agent charges a $15.00 fee. A redemption fee of 2.00% of the then current value of the shares redeemed may be imposed on certain redemptions of shares made within 30 days of purchase for the Frontier MFG Global Equity, Frontier MFG Global Plus and Frontier MFG Core Infrastructure Funds.
This Example is intended to help you understand your ongoing costs (in dollars) of investing in the Funds and to compare these costs with the ongoing costs of investing in other mutual funds. The Example is based on an investment of $1,000 invested at the beginning of the period and held for the entire period (7/1/15 – 12/31/15).
Actual Expenses
The first line of the table on the following page for each Fund provides information about actual account values and actual expenses. The Example includes management fees, registration fees, fee waivers/reimbursements and other expenses. However, the Example does not include portfolio trading commissions and related expenses and other extraordinary expenses as determined under generally accepted accounting principles. You may use the information in this line, together with the amount you invested, to estimate the expenses that you paid over the period. Simply divide your account value by $1,000 (for example, an $8,600 account value divided by $1,000 = 8.6), then multiply the result by the number in the first line under the heading entitled "Expenses Paid During the Period" to estimate the expenses you paid on your account during this period.
Hypothetical Example for Comparison Purposes
The second line of the table for each Fund provides information about hypothetical account values and hypothetical expenses based on each of the Fund's actual expense ratios and an assumed rate of return of 5% per year before expenses, which is not the actual return. The hypothetical account values and expenses may not be used to estimate the actual ending account balance or expenses you paid for the period. You may use this information to compare the ongoing costs of investing in each of the Funds and other funds. To do so, compare this 5% hypothetical example with the 5% hypothetical examples that appear in the shareholder reports of the other funds.
Please note that the expenses shown in the table are meant to highlight your ongoing costs only and do not reflect any transactional costs, such as redemption fees. Therefore, the second line of the table is useful in comparing ongoing costs only, and will not help you determine the relative total costs of owning different funds. In addition, if these transactional costs were included, your costs could have been higher.
page 27

Frontier Funds
EXPENSE EXAMPLE (continued)
December 31, 2015 (Unaudited)
| | Beginning Account
Value 7/1/2015 | | Ending Account
Value 12/31/2015 | | Annualized
Expense Ratio* | | Expenses Paid
During the Period* | |
MFG Global Equity Fund | |
Actual Fund Return | | $ | 1,000.00 | | | $ | 1,001.50 | | | | 0.80 | % | | $ | 4.02 | | |
Hypothetical 5% Return | | $ | 1,000.00 | | | $ | 1,021.11 | | | | 0.80 | % | | $ | 4.06 | | |
MFG Global Plus Fund | |
Actual Fund Return | | $ | 1,000.00 | | | $ | 998.70 | | | | 0.80 | % | | $ | 4.02 | | |
Hypothetical 5% Return | | $ | 1,000.00 | | | $ | 1,021.11 | | | | 0.80 | % | | $ | 4.06 | | |
MFG Core Infrastructure Fund | |
Actual Fund Return | | $ | 1,000.00 | | | $ | 1,047.80 | | | | 0.70 | % | | $ | 3.60 | | |
Hypothetical 5% Return | | $ | 1,000.00 | | | $ | 1,021.62 | | | | 0.70 | % | | $ | 3.56 | | |
Timpani Small Cap Growth
Fund – Institutional Class | |
Actual Fund Return | | $ | 1,000.00 | | | $ | 859.50 | | | | 1.10 | % | | $ | 5.14 | | |
Hypothetical 5% Return | | $ | 1,000.00 | | | $ | 1,019.61 | | | | 1.10 | % | | $ | 5.58 | | |
Timpani Small Cap Growth
Fund – Class Y | |
Actual Fund Return | | $ | 1,000.00 | | | $ | 858.10 | | | | 1.50 | % | | $ | 7.01 | | |
Hypothetical 5% Return | | $ | 1,000.00 | | | $ | 1,017.60 | | | | 1.50 | % | | $ | 7.61 | | |
Netols Small Cap Value
Fund – Institutional Class | |
Actual Fund Return | | $ | 1,000.00 | | | $ | 910.10 | | | | 1.10 | % | | $ | 5.28 | | |
Hypothetical 5% Return | | $ | 1,000.00 | | | $ | 1,019.61 | | | | 1.10 | % | | $ | 5.58 | | |
Netols Small Cap Value
Fund – Class Y | |
Actual Fund Return | | $ | 1,000.00 | | | $ | 910.40 | | | | 1.10 | % | | $ | 5.28 | | |
Hypothetical 5% Return | | $ | 1,000.00 | | | $ | 1,019.61 | | | | 1.10 | % | | $ | 5.58 | | |
Phocas Small Cap Value Fund | |
Actual Fund Return | | $ | 1,000.00 | | | $ | 951.70 | | | | 1.10 | % | | $ | 5.40 | | |
Hypothetical 5% Return | | $ | 1,000.00 | | | $ | 1,019.61 | | | | 1.10 | % | | $ | 5.58 | | |
* Expenses are equal to each Fund's annualized expense ratio indicated above, multiplied by the average account value over the period, multiplied by 184/366 to reflect the one-half year period.
page 28

Frontier MFG Global Equity Fund
SCHEDULE OF INVESTMENTS
December 31, 2015 (Unaudited)
Number of Shares | | | | Value | |
COMMON STOCKS 85.0% | | | |
| | | Australia 2.4% | |
| | 1,463,589 | | | Woolworths Ltd. | | $ | 26,129,614 | | |
| | | France 2.4% | |
| | 307,839 | | | Sanofi | | | 26,295,299 | | |
| | | Netherlands 1.7% | |
| | 415,839 | | | Unilever NV | | | 18,124,068 | | |
| | | Switzerland 1.4% | |
| | 208,658 | | | Nestle SA | | | 15,530,605 | | |
| | | United Kingdom 6.5% | |
| | 38,341,677 | | | Lloyds Banking Group PLC | | | 41,301,820 | | |
| | 13,353,171 | | | Tesco PLC (a) | | | 29,429,615 | | |
| | | | 70,731,435 | | |
| | | United States 70.6% | |
| | 10,698 | | | Alphabet, Inc. - Class A (a) | | | 8,323,151 | | |
| | 22,144 | | | Alphabet, Inc. - Class C (a) | | | 16,804,647 | | |
| | 315,896 | | | Apple, Inc. | | | 33,251,213 | | |
| | 442,033 | | | CVS Health Corp. | | | 43,217,566 | | |
| | 1,586,811 | | | eBay, Inc. (a) | | | 43,605,566 | | |
| | 1,504,984 | | | Intel Corp. | | | 51,846,699 | | |
| | 319,256 | | | International Business
Machines Corp. | | | 43,936,011 | | |
| | 669,014 | | | Lowe's Companies, Inc. | | | 50,871,825 | | |
| | 323,619 | | | MasterCard, Inc. - Class A | | | 31,507,546 | | |
| | 1,339,577 | | | Microsoft Corp. | | | 74,319,732 | | |
| | 1,186,678 | | | Oracle Corp. | | | 43,349,347 | | |
| | 1,278,343 | | | PayPal Holdings, Inc. (a) | | | 46,276,017 | | |
| | 402,689 | | | QUALCOMM, Inc. | | | 20,128,410 | | |
| | 308,329 | | | State Street Corp. | | | 20,460,712 | | |
| | 527,162 | | | Target Corp. | | | 38,277,233 | | |
| | 540,887 | | | The Bank of New York
Mellon Corp. | | | 22,295,362 | | |
| | 292,926 | | | The Home Depot, Inc. | | | 38,739,463 | | |
| | 696,621 | | | Visa, Inc. - Class A | | | 54,022,958 | | |
Number of Shares | | | | Value | |
| | | United States 70.6% (continued) | |
| | 849,875 | | | Wells Fargo & Co. | | $ | 46,199,205 | | |
| | 612,394 | | | Yum! Brands, Inc. | | | 44,735,382 | | |
| | | | 772,168,045 | | |
| | | Total Common Stocks | |
| | | | | (Cost $821,000,149) | | | 928,979,066 | | |
SHORT-TERM INVESTMENTS 12.8% | | | |
| | | Investment Company 12.8% | |
| | 139,804,334 | | | STIT Liquid Assets
Portfolio - Institutional
Class, 0.29% | | | 139,804,334 | | |
| | | Total Short-Term Investments | |
| | | | | (Cost $139,804,334) | | | 139,804,334 | | |
| | | Total Investments 97.8% | |
| | | | | (Cost $960,804,483) | | | 1,068,783,400 | | |
| | | | | Other Assets in Excess of
Liabilities 2.2% | | | 24,050,563 | | |
| | | | | TOTAL NET ASSETS 100.0% | | $ | 1,092,833,963 | | |
(a) Non-Income Producing.
PORTFOLIO DIVERSIFICATION
Sectors | | Percentage | |
Information Technology | | | 42.8 | % | |
Consumer Discretionary | | | 15.8 | | |
Consumer Staples | | | 12.1 | | |
Financials | | | 11.9 | | |
Health Care | | | 2.4 | | |
Total Common Stocks | | | 85.0 | | |
Total Short-Term Investments | | | 12.8 | | |
Total Investments | | | 97.8 | | |
Other Assets in Excess of Liabilities | | | 2.2 | | |
Total Net Assets | | | 100.0 | % | |
The accompanying notes are an integral part of these financial statements.
page 29

Frontier MFG Global Plus Fund
SCHEDULE OF INVESTMENTS
December 31, 2015 (Unaudited)
Number of Shares | | | | Value | |
COMMON STOCKS 62.7% | | | |
| | | Australia 1.8% | |
| | 12,523 | | | Woolworths Ltd. | | $ | 223,574 | | |
| | | France 1.8% | |
| | 2,679 | | | Sanofi | | | 228,838 | | |
| | | Netherlands 1.3% | |
| | 3,640 | | | Unilever NV | | | 158,648 | | |
| | | Switzerland 1.0% | |
| | 1,785 | | | Nestle SA | | | 132,859 | | |
| | | United Kingdom 4.7% | |
| | 328,058 | | | Lloyds Banking Group PLC | | | 353,385 | | |
| | 114,252 | | | Tesco PLC (a) | | | 251,805 | | |
| | | | 605,190 | | |
| | | United States 52.1% | |
| | 92 | | | Alphabet, Inc. - Class A (a) | | | 71,577 | | |
| | 194 | | | Alphabet, Inc. - Class C (a) | | | 147,223 | | |
| | 2,707 | | | Apple, Inc. | | | 284,939 | | |
| | 3,787 | | | CVS Health Corp. | | | 370,255 | | |
| | 13,577 | | | eBay, Inc. (a) | | | 373,096 | | |
| | 13,046 | | | Intel Corp. | | | 449,435 | | |
| | 2,765 | | | International Business
Machines Corp. | | | 380,519 | | |
| | 5,732 | | | Lowe's Companies, Inc. | | | 435,860 | | |
| | 2,811 | | | MasterCard, Inc. - Class A | | | 273,679 | | |
| | 11,670 | | | Microsoft Corp. | | | 647,451 | | |
| | 10,153 | | | Oracle Corp. | | | 370,889 | | |
| | 11,186 | | | PayPal Holdings, Inc. (a) | | | 404,933 | | |
| | 3,445 | | | QUALCOMM, Inc. | | | 172,198 | | |
| | 2,638 | | | State Street Corp. | | | 175,058 | | |
| | 4,571 | | | Target Corp. | | | 331,900 | | |
| | 4,628 | | | The Bank of New York
Mellon Corp. | | | 190,766 | | |
| | 2,510 | | | The Home Depot, Inc. | | | 331,948 | | |
| | 6,037 | | | Visa, Inc. - Class A | | | 468,170 | | |
Number of Shares | | | | Value | |
| | | United States 52.1% (continued) | |
| | 7,437 | | | Wells Fargo & Co. | | $ | 404,275 | | |
| | 5,240 | | | Yum! Brands, Inc. | | | 382,782 | | |
| | | | 6,666,953 | | |
| | | Total Common Stocks | |
| | | | | (Cost $8,196,724) | | | 8,016,062 | | |
SHORT-TERM INVESTMENTS 11.5% | | | |
| | | Investment Company 11.5% | |
| | 1,473,239 | | | STIT Liquid Assets
Portfolio - Institutional
Class, 0.29% | | | 1,473,239 | | |
| | | Total Short-Term Investments | |
| | | | | (Cost $1,473,239) | | | 1,473,239 | | |
| | | Total Investments 74.2% | |
| | | | | (Cost $9,669,963) | | | 9,489,301 | | |
| | | | | Other Assets in Excess of
Liabilities 25.8% | | | 3,303,216 | | |
| | | | | TOTAL NET ASSETS 100.0% | | $ | 12,792,517 | | |
(a) Non-Income Producing.
PORTFOLIO DIVERSIFICATION
Sectors | | Percentage | |
Information Technology | | | 31.6 | % | |
Consumer Discretionary | | | 11.6 | | |
Consumer Staples | | | 8.9 | | |
Financials | | | 8.8 | | |
Health Care | | | 1.8 | | |
Total Common Stocks | | | 62.7 | | |
Total Short-Term Investments | | | 11.5 | | |
Total Investments | | | 74.2 | | |
Other Assets in Excess of Liabilities | | | 25.8 | | |
Total Net Assets | | | 100.0 | % | |
The accompanying notes are an integral part of these financial statements.
page 30

Frontier MFG Core Infrastructure Fund
SCHEDULE OF INVESTMENTS
December 31, 2015 (Unaudited)
Number of Shares | | | | Value | |
COMMON STOCKS 96.2% | | | |
| | | Australia 7.6% | |
| | 330,577 | | | APA Group | | $ | 2,090,933 | | |
| | 1,223,041 | | | AusNet Services | | | 1,323,474 | | |
| | 688,628 | | | DUET Group | | | 1,144,108 | | |
| | 593,333 | | | Spark Infrastructure Group | | | 830,133 | | |
| | 661,388 | | | Sydney Airport | | | 3,060,397 | | |
| | 601,862 | | | Transurban Group | | | 4,591,888 | | |
| | | | 13,040,933 | | |
| | | Austria 0.4% | |
| | 6,818 | | | Flughafen Wien AG | | | 649,072 | | |
| | | Canada 8.0% | |
| | 42,156 | | | Emera, Inc. | | | 1,317,051 | | |
| | 148,103 | | | Enbridge, Inc. | | | 4,923,566 | | |
| | 83,123 | | | Fortis, Inc. | | | 2,247,331 | | |
| | 154,791 | | | TransCanada Corp. | | | 5,055,290 | | |
| | 12,902 | | | Valener, Inc. | | | 167,930 | | |
| | | | 13,711,168 | | |
| | | France 6.0% | |
| | 29,358 | | | Aeroports de Paris | | | 3,420,213 | | |
| | 69,056 | | | Eutelsat Communications SA | | | 2,071,298 | | |
| | 162,743 | | | Groupe Eurotunnel SE | | | 2,026,837 | | |
| | 101,933 | | | SES SA - ADR | | | 2,833,103 | | |
| | | | 10,351,451 | | |
| | | Germany 1.1% | |
| | 27,408 | | | Fraport AG Frankfurt Airport
Services Worldwide | | | 1,755,575 | | |
| | 6,286 | | | Hamburger Hafen und
Logistik AG | | | 96,049 | | |
| | | | 1,851,624 | | |
| | | Hong Kong 3.2% | |
| | 588,652 | | | Power Assets Holdings Ltd. | | | 5,415,564 | | |
| | | Italy 8.3% | |
| | 185,719 | | | Atlantia SpA | | | 4,944,864 | | |
| | 1,010,252 | | | Snam SpA | | | 5,302,843 | | |
| | 80,260 | | | Societa Iniziative Autostradali
e Servizi SpA | | | 854,786 | | |
Number of Shares | | | | Value | |
| | | Italy 8.3% (continued) | |
| | 596,278 | | | Terna Rete Elettrica
Nazionale SpA | | $ | 3,081,928 | | |
| | | | 14,184,421 | | |
| | | Mexico 2.2% | |
| | 106,238 | | | Grupo Aeroportuario del
Centro Norte SAB de CV | | | 517,428 | | |
| | 159,984 | | | Grupo Aeroportuario del Pacifico
SAB de CV - Class B | | | 1,413,210 | | |
| | 87,896 | | | Grupo Aeroportuario del Sureste
SAB de CV - Class B | | | 1,245,217 | | |
| | 611,157 | | | OHL Mexico SAB de CV (a) | | | 643,267 | | |
| | | | 3,819,122 | | |
| | | Netherlands 1.0% | |
| | 37,925 | | | Koninklijke Vopak NV | | | 1,635,007 | | |
| | | New Zealand 1.3% | |
| | 353,253 | | | Auckland International
Airport Ltd. | | | 1,389,237 | | |
| | 351,447 | | | Vector Ltd. | | | 761,977 | | |
| | | | 2,151,214 | | |
| | | Spain 9.5% | |
| | 279,816 | | | Abertis Infraestructuras SA | | | 4,381,961 | | |
| | 44,497 | | | Aena SA (a) | | | 5,096,867 | | |
| | 79,062 | | | Cellnex Telecom SAU | | | 1,481,279 | | |
| | 70,825 | | | Enagas SA | | | 2,001,206 | | |
| | 40,130 | | | Red Electrica Corp. SA | | | 3,362,883 | | |
| | | | 16,324,196 | | |
| | | Switzerland 0.8% | |
| | 1,822 | | | Flughafen Zuerich AG | | | 1,370,684 | | |
| | | United Kingdom 6.9% | |
| | 373,252 | | | National Grid PLC | | | 5,158,606 | | |
| | 122,312 | | | Pennon Group PLC | | | 1,552,499 | | |
| | 69,953 | | | Severn Trent PLC | | | 2,245,038 | | |
| | 202,294 | | | United Utilities Group PLC | | | 2,789,882 | | |
| | | | 11,746,025 | | |
The accompanying notes are an integral part of these financial statements.
page 31

Frontier MFG Core Infrastructure Fund
SCHEDULE OF INVESTMENTS (continued)
December 31, 2015 (Unaudited)
Number of Shares | | | | Value | |
| COMMON STOCKS 96.2% (continued) | | | |
| | | United States 39.9% | |
| | 7,159 | | | ALLETE, Inc. | | $ | 363,892 | | |
| | 18,445 | | | Alliant Energy Corp. | | | 1,151,890 | | |
| | 42,746 | | | Ameren Corp. | | | 1,847,910 | | |
| | 67,166 | | | American Electric Power Co., Inc. | | | 3,913,763 | | |
| | 6,560 | | | American States Water Co. | | | 275,192 | | |
| | 38,958 | | | American Tower Corp. | | | 3,776,978 | | |
| | 31,756 | | | American Water Works Co., Inc. | | | 1,897,421 | | |
| | 31,147 | | | Aqua America, Inc. | | | 928,181 | | |
| | 17,858 | | | Atmos Energy Corp. | | | 1,125,768 | | |
| | 9,229 | | | Avista Corp. | | | 326,430 | | |
| | 7,850 | | | California Water Service Group | | | 182,670 | | |
| | 8,950 | | | Cleco Corp. | | | 467,280 | | |
| | 48,742 | | | CMS Energy Corp. | | | 1,758,611 | | |
| | 48,693 | | | Consolidated Edison, Inc. | | | 3,129,499 | | |
| | 45,169 | | | Crown Castle International Corp. | | | 3,904,860 | | |
| | 52,835 | | | Duke Energy Corp. | | | 3,771,891 | | |
| | 54,842 | | | Edison International | | | 3,247,195 | | |
| | 5,972 | | | El Paso Electric Co. | | | 229,922 | | |
| | 52,734 | | | Eversource Energy | | | 2,693,125 | | |
| | 26,095 | | | Great Plains Energy, Inc. | | | 712,654 | | |
| | 7,439 | | | IDACORP, Inc. | | | 505,852 | | |
| | 27,508 | | | ITC Holdings Corp. | | | 1,079,689 | | |
| | 52,086 | | | NiSource, Inc. | | | 1,016,198 | | |
| | 4,041 | | | Northwest Natural Gas Co. | | | 204,515 | | |
| | 6,962 | | | NorthWestern Corp. | | | 377,689 | | |
| | 7,569 | | | ONE Gas, Inc. | | | 379,737 | | |
| | 71,035 | | | PG&E Corp. | | | 3,778,352 | | |
| | 11,659 | | | Piedmont Natural Gas Co., Inc. | | | 664,796 | | |
| | 17,741 | | | Pinnacle West Capital Corp. | | | 1,143,940 | | |
| | 11,788 | | | PNM Resources, Inc. | | | 360,359 | | |
| | 15,637 | | | Portland General Electric Co. | | | 568,718 | | |
| | 112,772 | | | PPL Corp. | | | 3,848,908 | | |
| | 25,972 | | | Questar Corp. | | | 505,935 | | |
| | 25,178 | | | SCANA Corp. | | | 1,523,017 | | |
| | 40,718 | | | Sempra Energy | | | 3,827,899 | | |
| | 1,405 | | | SJW Corp. | | | 41,658 | | |
| | 6,903 | | | Southwest Gas Corp. | | | 380,769 | | |
Number of Shares | | | | Value | |
| | | United States 39.9% (continued) | |
| | 41,444 | | | TECO Energy, Inc. | | $ | 1,104,483 | | |
| | 6,418 | | | The Empire District Electric Co. | | | 180,153 | | |
| | 6,408 | | | The Laclede Group, Inc. | | | 380,699 | | |
| | 86,675 | | | The Southern Co. | | | 4,055,523 | | |
| | 52,486 | | | WEC Energy Group, Inc. | | | 2,693,057 | | |
| | 24,884 | | | Westar Energy, Inc. | | | 1,055,330 | | |
| | 84,330 | | | Xcel Energy, Inc. | | | 3,028,290 | | |
| | | | 68,410,698 | | |
| | | Total Common Stocks | |
| | | | | (Cost $161,541,716) | | | 164,661,179 | | |
CLOSED-END FUNDS 0.9% | | | |
| | | United Kingdom 0.9% | |
| | 446,232 | | | HICL Infrastructure Co. Ltd. | | | 991,363 | | |
| | 289,267 | | | International Public
Partnerships Ltd. | | | 594,031 | | |
| | | | 1,585,394 | | |
| | | Total Closed-End Funds | |
| | | | | (Cost $1,627,593) | | | 1,585,394 | | |
SHORT-TERM INVESTMENTS 1.7% | | | |
| | | Investment Company 1.7% | |
| | 2,934,092 | | | STIT Liquid Assets
Portfolio - Institutional
Class, 0.29% | | | 2,934,092 | | |
| | | Total Short-Term Investments | |
| | | | | (Cost $2,934,092) | | | 2,934,092 | | |
| | | Total Investments 98.8% | |
| | | | | (Cost $166,103,401) | | | 169,180,665 | | |
| | | | | Other Assets in Excess
of Liabilities 1.2% | | | 2,124,716 | | |
| | | | | TOTAL NET ASSETS 100.0% | | $ | 171,305,381 | | |
(a) Non-Income Producing.
ADR - American Depositary Receipt
The accompanying notes are an integral part of these financial statements.
page 32

Frontier MFG Core Infrastructure Fund
SCHEDULE OF INVESTMENTS (continued)
December 31, 2015 (Unaudited)
PORTFOLIO DIVERSIFICATION
Sectors | | Percentage | |
Integrated Power | | | 27.5 | % | |
Transmission & Distribution | | | 16.2 | | |
Gas | | | 15.6 | | |
Airport | | | 11.6 | | |
Toll Road | | | 10.2 | | |
Communications | | | 8.2 | | |
Water Utility | | | 5.8 | | |
Port | | | 1.1 | | |
Total Common Stocks | | | 96.2 | | |
Social | | | 0.9 | | |
Total Closed-End Funds | | | 0.9 | | |
Total Short-Term Investments | | | 1.7 | | |
Total Investments | | | 98.8 | | |
Other Assets in Excess of Liabilities | | | 1.2 | | |
Total Net Assets | | | 100.0 | % | |
The accompanying notes are an integral part of these financial statements.
page 33

Frontier Timpani Small Cap Growth Fund
SCHEDULE OF INVESTMENTS
December 31, 2015 (Unaudited)
Number of Shares | | | | Value | |
COMMON STOCKS 96.9% | | | |
| | | Consumer Discretionary 18.1% | |
| | 5,825 | | | American Woodmark Corp. (a) | | $ | 465,884 | | |
| | 4,190 | | | BJ's Restaurants, Inc. (a) | | | 182,139 | | |
| | 8,840 | | | CalAtlantic Group, Inc. | | | 335,213 | | |
| | 18,805 | | | Century Communities, Inc. (a) | | | 333,037 | | |
| | 22,255 | | | Chuy's Holdings, Inc. (a) | | | 697,472 | | |
| | 2,918 | | | Expedia, Inc. | | | 362,708 | | |
| | 3,136 | | | G-III Apparel Group Ltd. (a) | | | 138,799 | | |
| | 2,318 | | | Jack in the Box, Inc. | | | 177,814 | | |
| | 11,998 | | | LGI Homes, Inc. (a) | | | 291,911 | | |
| | 8,207 | | | Lithia Motors, Inc. - Class A | | | 875,441 | | |
| | 15,272 | | | MCBC Holdings, Inc. (a) | | | 209,226 | | |
| | 4,423 | | | Monro Muffler Brake, Inc. | | | 292,891 | | |
| | 23,499 | | | Motorcar Parts of America, Inc. (a) | | | 794,501 | | |
| | 53,181 | | | Nautilus, Inc. (a) | | | 889,186 | | |
| | 33,708 | | | PFSweb, Inc. (a) | | | 433,822 | | |
| | 70,675 | | | Red Lion Hotels Corp. (a) | | | 495,432 | | |
| | 25,016 | | | Skechers U.S.A., Inc. - Class A (a) | | | 755,733 | | |
| | 12,537 | | | Sonic Corp. | | | 405,071 | | |
| | 27,373 | | | Sportsman's Warehouse
Holdings, Inc. (a) | | | 353,112 | | |
| | 8,385 | | | Stamps.com, Inc. (a) | | | 919,080 | | |
| | 38,848 | | | Tile Shop Holdings, Inc. (a) | | | 637,107 | | |
| | | | 10,045,579 | | |
| | | Consumer Staples 1.2% | |
| | 8,562 | | | TreeHouse Foods, Inc. (a) | | | 671,774 | | |
| | | Energy 0.4% | |
| | 8,269 | | | Canadian Solar, Inc. (a) | | | 239,470 | | |
| | | Financial Services 9.6% | |
| | 10,853 | | | Bank of The Ozarks, Inc. | | | 536,789 | | |
| | 6,357 | | | Blackhawk Network Holdings,
Inc. (a) | | | 281,043 | | |
| | 15,407 | | | Euronet Worldwide, Inc. (a) | | | 1,115,929 | | |
| | 3,893 | | | Heartland Payment Systems, Inc. | | | 369,134 | | |
| | 13,109 | | | Home BancShares, Inc. | | | 531,177 | | |
Number of Shares | | | | Value | |
| | | Financial Services 9.6% (continued) | |
| | 21,979 | | | LendingTree, Inc. (a) | | $ | 1,962,285 | | �� |
| | 15,468 | | | Western Alliance Bancorp. (a) | | | 554,682 | | |
| | | | 5,351,039 | | |
| | | Health Care 23.8% | |
| | 7,961 | | | Adeptus Health,
Inc. - Class A (a) | | | 434,034 | | |
| | 22,450 | | | AMN Healthcare Services, Inc. (a) | | | 697,072 | | |
| | 13,891 | | | Avinger, Inc. (a) | | | 315,465 | | |
| | 28,028 | | | BioDelivery Sciences
International, Inc. (a) | | | 134,254 | | |
| | 45,214 | | | BioTelemetry, Inc. (a) | | | 528,100 | | |
| | 15,974 | | | Cambrex Corp. (a) | | | 752,216 | | |
| | 12,888 | | | Cantel Medical Corp. | | | 800,860 | | |
| | 42,434 | | | Cross Country Healthcare, Inc. (a) | | | 695,493 | | |
| | 9,666 | | | Cynosure, Inc. - Class A (a) | | | 431,780 | | |
| | 20,659 | | | Dipexium Pharmaceuticals, Inc. (a) | | | 231,381 | | |
| | 5,787 | | | Eagle Pharmaceuticals, Inc. (a) | | | 513,133 | | |
| | 25,835 | | | Heska Corp. (a) | | | 999,298 | | |
| | 5,120 | | | ICU Medical, Inc. (a) | | | 577,434 | | |
| | 33,306 | | | INC Research Holdings,
Inc. - Class A (a) | | | 1,615,674 | | |
| | 6,162 | | | Inogen, Inc. (a) | | | 247,035 | | |
| | 22,302 | | | iRadimed Corp. (a) | | | 625,125 | | |
| | 20,140 | | | LeMaitre Vascular, Inc. | | | 347,415 | | |
| | 14,885 | | | Ligand Pharmaceuticals, Inc. (a) | | | 1,613,832 | | |
| | 19,624 | | | STERIS plc | | | 1,478,472 | | |
| | 5,267 | | | Vascular Solutions, Inc. (a) | | | 181,132 | | |
| | | | 13,219,205 | | |
| | | Materials & Processing 5.0% | |
| | 29,667 | | | Aceto Corp. | | | 800,416 | | |
| | 48,243 | | | Energy Focus, Inc. (a) | | | 663,341 | | |
| | 21,141 | | | Summit Materials,
Inc. - Class A (a) | | | 423,669 | | |
| | 16,354 | | | U.S. Concrete, Inc. (a) | | | 861,201 | | |
| | | | 2,748,627 | | |
The accompanying notes are an integral part of these financial statements.
page 34

Frontier Timpani Small Cap Growth Fund
SCHEDULE OF INVESTMENTS (continued)
December 31, 2015 (Unaudited)
Number of Shares | | | | Value | |
| COMMON STOCKS 96.9% (continued) | | | |
| | | Producer Durables 7.9% | |
| | 1,103 | | | Allegiant Travel Co. | | $ | 185,116 | | |
| | 13,664 | | | Benefitfocus, Inc. (a) | | | 497,233 | | |
| | 4,906 | | | CoStar Group, Inc. (a) | | | 1,014,021 | | |
| | 24,179 | | | CUI Global, Inc. (a) | | | 170,220 | | |
| | 7,639 | | | Dycom Industries, Inc. (a) | | | 534,424 | | |
| | 18,252 | | | Kforce, Inc. | | | 461,411 | | |
| | 1,815 | | | OSI Systems, Inc. (a) | | | 160,918 | | |
| | 17,687 | | | Radiant Logistics, Inc. (a) | | | 60,666 | | |
| | 4,745 | | | The Middleby Corp. (a) | | | 511,843 | | |
| | 3,377 | | | TransDigm Group, Inc. (a) | | | 771,476 | | |
| | | | 4,367,328 | | |
| | | Technology 28.5% | |
| | 39,752 | | | Attunity Ltd. (a) | | | 439,260 | | |
| | 36,503 | | | Autobytel, Inc. (a) | | | 823,508 | | |
| | 12,159 | | | CEVA, Inc. (a) | | | 284,034 | | |
| | 14,644 | | | Cvent, Inc. (a) | | | 511,222 | | |
| | 26,509 | | | Digi International, Inc. (a) | | | 301,673 | | |
| | 10,517 | | | EPAM Systems, Inc. (a) | | | 826,847 | | |
| | 28,168 | | | Fabrinet (a) | | | 670,962 | | |
| | 19,983 | | | Five9, Inc. (a) | | | 173,852 | | |
| | 7,425 | | | Fleetmatics Group plc (a) | | | 377,116 | | |
| | 19,751 | | | Globant SA (a) | | | 740,860 | | |
| | 43,573 | | | GTT Communications, Inc. (a) | | | 743,355 | | |
| | 17,010 | | | HubSpot, Inc. (a) | | | 957,833 | | |
| | 14,004 | | | Imperva, Inc. (a) | | | 886,593 | | |
| | 46,651 | | | inContact, Inc. (a) | | | 445,051 | | |
| | 7,471 | | | Luxoft Holding, Inc. - Class A (a) | | | 576,238 | | |
| | 6,116 | | | Manhattan Associates, Inc. (a) | | | 404,696 | | |
| | 23,418 | | | Paycom Software, Inc. (a) | | | 881,219 | | |
| | 13,104 | | | Proofpoint, Inc. (a) | | | 851,891 | | |
| | 25,815 | | | Q2 Holdings, Inc. (a) | | | 680,742 | | |
| | 38,705 | | | The Rubicon Project, Inc. (a) | | | 636,697 | | |
| | 5,726 | | | The Ultimate Software
Group, Inc. (a) | | | 1,119,490 | | |
| | 47,530 | | | TubeMogul, Inc. (a) | | | 646,408 | | |
Number of Shares | | | | Value | |
| | | Technology 28.5% (continued) | |
| | 7,538 | | | Tyler Technologies, Inc. (a) | | $ | 1,314,024 | | |
| | 17,386 | | | Workiva, Inc. - Class A (a) | | | 305,472 | | |
| | 45,759 | | | Zix Corp. (a) | | | 232,456 | | |
| | | | 15,831,499 | | |
| | | Utilities 2.4% | |
| | 58,032 | | | Boingo Wireless, Inc. (a) | | | 384,172 | | |
| | 11,724 | | | j2 Global, Inc. | | | 965,119 | | |
| | | | 1,349,291 | | |
| | | Total Common Stocks | |
| | | | | (Cost $48,014,058) | | | 53,823,812 | | |
SHORT-TERM INVESTMENTS 3.3% | | | |
| | | Investment Company 3.3% | |
| | 1,839,522 | | | STIT-STIC Prime
Portfolio - Institutional
Class, 0.27% | | | 1,839,522 | | |
| | | Total Short-Term Investments | |
| | | | | (Cost $1,839,522) | | | 1,839,522 | | |
| | | Total Investments 100.2% | |
| | | | | (Cost $49,853,580) | | | 55,663,334 | | |
| | | | | Liabilities in Excess of
Other Assets (0.2)% | | | (89,565 | ) | |
| | | | | TOTAL NET ASSETS 100.0% | | $ | 55,573,769 | | |
(a) Non-Income Producing.
The accompanying notes are an integral part of these financial statements.
page 35

Frontier Timpani Small Cap Growth Fund
SCHEDULE OF INVESTMENTS (continued)
December 31, 2015 (Unaudited)
PORTFOLIO DIVERSIFICATION
Sectors | | Percentage | |
Technology | | | 28.5 | % | |
Health Care | | | 23.8 | | |
Consumer Discretionary | | | 18.1 | | |
Financial Services | | | 9.6 | | |
Producer Durables | | | 7.9 | | |
Materials and Processing | | | 5.0 | | |
Utilities | | | 2.4 | | |
Consumer Staples | | | 1.2 | | |
Energy | | | 0.4 | | |
Total Common Stocks | | | 96.9 | | |
Total Short-Term Investments | | | 3.3 | | |
Total Investments | | | 100.2 | | |
Liabilities in Excess of Other Assets | | | (0.2 | ) | |
Total Net Assets | | | 100.0 | % | |
The accompanying notes are an integral part of these financial statements.
page 36

Frontier Netols Small Cap Value Fund
SCHEDULE OF INVESTMENTS
December 31, 2015 (Unaudited)
Number of Shares | | | | Value | |
COMMON STOCKS 96.3% | | | |
| | | Consumer Discretionary 14.9% | |
| | 114,458 | | | Accuride Corp. (a) | | $ | 190,000 | | |
| | 25,683 | | | Bob Evans Farms, Inc. | | | 997,785 | | |
| | 24,223 | | | Cabela's, Inc. (a) | | | 1,131,941 | | |
| | 12,059 | | | Carter's, Inc. | | | 1,073,613 | | |
| | 10,196 | | | Domino's Pizza, Inc. | | | 1,134,305 | | |
| | 36,497 | | | Ethan Allen Interiors, Inc. | | | 1,015,346 | | |
| | 71,438 | | | Lumber Liquidators
Holdings, Inc. (a) | | | 1,240,164 | | |
| | 77,789 | | | Performance Sports Group Ltd. (a) | | | 749,108 | | |
| | 17,677 | | | Tenneco, Inc. (a) | | | 811,551 | | |
| | 13,875 | | | The Cheesecake Factory, Inc. | | | 639,776 | | |
| | 55,142 | | | The Finish Line, Inc. - Class A | | | 996,967 | | |
| | | | 9,980,556 | | |
| | | Consumer Staples 5.1% | |
| | 22,714 | | | Cal-Maine Foods, Inc. | | | 1,052,566 | | |
| | 13,093 | | | Casey's General Stores, Inc. | | | 1,577,052 | | |
| | 114,478 | | | SUPERVALU, Inc. (a) | | | 776,161 | | |
| | | | 3,405,779 | | |
| | | Energy 3.2% | |
| | 103,020 | | | Bill Barrett Corp. (a) | | | 404,869 | | |
| | 53,756 | | | Cloud Peak Energy, Inc. (a) | | | 111,812 | | |
| | 259,752 | | | McDermott International, Inc. (a) | | | 870,169 | | |
| | 48,073 | | | Synergy Resources Corp. (a) | | | 409,582 | | |
| | 120,139 | | | Willbros Group, Inc. (a) | | | 323,174 | | |
| | | | 2,119,606 | | |
| | | Financials 19.6% | |
| | 40,999 | | | BancorpSouth, Inc. | | | 983,566 | | |
| | 53,969 | | | CenterState Banks, Inc. | | | 844,615 | | |
| | 21,508 | | | Community Bank System, Inc. | | | 859,030 | | |
| | 18,820 | | | Endurance Specialty Holdings Ltd. | | | 1,204,292 | | |
| | 36,566 | | | Glacier Bancorp, Inc. | | | 970,096 | | |
| | 138,810 | | | MGIC Investment Corp. (a) | | | 1,225,692 | | |
| | 57,533 | | | Old National Bancorp | | | 780,147 | | |
| | 39,608 | | | Selective Insurance Group, Inc. | | | 1,330,037 | | |
| | 49,616 | | | State Bank Financial Corp. | | | 1,043,424 | | |
Number of Shares | | | | Value | |
| | | Financials 19.6% (continued) | |
| | 76,719 | | | Sterling Bancorp | | $ | 1,244,382 | | |
| | 19,233 | | | The Hanover Insurance
Group, Inc. | | | 1,564,412 | | |
| | 29,026 | | | Webster Financial Corp. | | | 1,079,477 | | |
| | | | 13,129,170 | | |
| | | Health Care 12.2% | |
| | 53,781 | | | Albany Molecular
Research, Inc. (a) | | | 1,067,553 | | |
| | 20,868 | | | CONMED Corp. | | | 919,235 | | |
| | 19,385 | | | Integra LifeSciences
Holdings Corp. (a) | | | 1,313,915 | | |
| | 58,960 | | | Invacare Corp. | | | 1,025,314 | | |
| | 60,301 | | | Kindred Healthcare, Inc. | | | 718,185 | | |
| | 8,819 | | | LifePoint Hospitals, Inc. (a) | | | 647,315 | | |
| | 21,806 | | | U.S. Physical Therapy, Inc. | | | 1,170,546 | | |
| | 23,305 | | | VCA Antech, Inc. (a) | | | 1,281,775 | | |
| | | | 8,143,838 | | |
| | | Industrials 11.2% | |
| | 42,029 | | | Brady Corp. - Class A | | | 965,827 | | |
| | 54,273 | | | Briggs & Stratton Corp. | | | 938,923 | | |
| | 84,465 | | | Commercial Vehicle
Group, Inc. (a) | | | 233,123 | | |
| | 7,250 | | | Genesee & Wyoming,
Inc. - Class A (a) | | | 389,253 | | |
| | 30,604 | | | Herman Miller, Inc. | | | 878,335 | | |
| | 87,923 | | | PGT, Inc. (a) | | | 1,001,443 | | |
| | 39,674 | | | Thermon Group Holdings, Inc. (a) | | | 671,284 | | |
| | 38,069 | | | TriMas Corp. (a) | | | 709,987 | | |
| | 11,134 | | | United Rentals, Inc. (a) | | | 807,660 | | |
| | 12,719 | | | Westinghouse Air Brake
Technologies Corp. | | | 904,575 | | |
| | | | 7,500,410 | | |
| | | Information Technology 15.8% | |
| | 36,669 | | | Bottomline Technologies (de),
Inc. (a) | | | 1,090,169 | | |
| | 13,657 | | | CACI International,
Inc. - Class A (a) | | | 1,267,096 | | |
The accompanying notes are an integral part of these financial statements.
page 37

Frontier Netols Small Cap Value Fund
SCHEDULE OF INVESTMENTS (continued)
December 31, 2015 (Unaudited)
Number of Shares | | | | Value | |
| COMMON STOCKS 96.3% (continued) | | | |
| | | Information
Technology 15.8% (continued) | |
| | 125,410 | | | Checkpoint Systems, Inc. | | $ | 786,321 | | |
| | 64,188 | | | Entegris, Inc. (a) | | | 851,775 | | |
| | 15,428 | | | Fair Isaac Corp. | | | 1,453,009 | | |
| | 100,758 | | | FormFactor, Inc. (a) | | | 906,822 | | |
| | 36,371 | | | ManTech International
Corp. - Class A | | | 1,099,859 | | |
| | 23,979 | | | Plexus Corp. (a) | | | 837,347 | | |
| | 43,330 | | | Progress Software Corp. (a) | | | 1,039,920 | | |
| | 44,582 | | | VeriFone Systems, Inc. (a) | | | 1,249,188 | | |
| | | | 10,581,506 | | |
| | | Materials 7.2% | |
| | 6,312 | | | Acuity Brands, Inc. | | | 1,475,746 | | |
| | 19,018 | | | Carpenter Technology Corp. | | | 575,675 | | |
| | 11,306 | | | Compass Minerals
International, Inc. | | | 851,003 | | |
| | 13,053 | | | Sensient Technologies Corp. | | | 819,989 | | |
| | 38,128 | | | Unifi, Inc. (a) | | | 1,073,303 | | |
| | | | 4,795,716 | | |
| | | Real Estate Investment Trusts 7.1% | |
| | 28,619 | | | Education Realty Trust, Inc. | | | 1,084,088 | | |
| | 86,545 | | | FelCor Lodging Trust, Inc. | | | 631,778 | | |
| | 42,343 | | | First Industrial Realty Trust, Inc. | | | 937,051 | | |
| | 11,177 | | | National Health Investors, Inc. | | | 680,344 | | |
| | 20,577 | | | Sun Communities, Inc. | | | 1,410,142 | | |
| | | | 4,743,403 | | |
| | | Total Common Stocks | |
| | | | | (Cost $45,727,470) | | | 64,399,984 | | |
Number of Shares | | | | Value | |
SHORT-TERM INVESTMENTS 5.7% | |
| | | Investment Company 5.7% | |
| | 3,846,072 | | | Fidelity Institutional Money
Market Portfolio, Select
Class, 0.22% | | $ | 3,846,072 | | |
| | | Total Short-Term Investments | |
| | | (Cost $3,846,072) | | | 3,846,072 | | |
| | | Total Investments 102.0% | |
| | | (Cost $49,573,542) | | | 68,246,056 | | |
| | | Liabilities in Excess of
Other Assets (2.0)% | | | (1,343,797 | ) | |
| | | TOTAL NET ASSETS 100.0% | | $ | 66,902,259 | | |
(a) Non-Income Producing.
PORTFOLIO DIVERSIFICATION
Sectors | | Percentage | |
Financials | | | 19.6 | % | |
Information Technology | | | 15.8 | | |
Consumer Discretionary | | | 14.9 | | |
Health Care | | | 12.2 | | |
Industrials | | | 11.2 | | |
Materials | | | 7.2 | | |
Real Estate Investment Trusts | | | 7.1 | | |
Consumer Staples | | | 5.1 | | |
Energy | | | 3.2 | | |
Total Common Stocks | | | 96.3 | | |
Total Short-Term Investments | | | 5.7 | | |
Total Investments | | | 102.0 | | |
Liabilities in Excess of Other Assets | | | (2.0 | ) | |
Total Net Assets | | | 100.0 | % | |
The accompanying notes are an integral part of these financial statements.
page 38

Frontier Phocas Small Cap Value Fund
SCHEDULE OF INVESTMENTS
December 31, 2015 (Unaudited)
Number of Shares | | | | Value | |
COMMON STOCKS 99.1% | | | |
| | | Consumer Discretionary 9.7% | |
| | 3,480 | | | Columbia Sportswear Co. | | $ | 169,685 | | |
| | 24,398 | | | Dana Holding Corp. | | | 336,692 | | |
| | 2,470 | | | DineEquity, Inc. | | | 209,135 | | |
| | 7,214 | | | DSW, Inc. - Class A | | | 172,126 | | |
| | 14,352 | | | Entercom Communications
Corp. - Class A (a) | | | 161,173 | | |
| | 10,328 | | | Express, Inc. (a) | | | 178,468 | | |
| | 13,084 | | | Interval Leisure Group, Inc. | | | 204,241 | | |
| | 25,112 | | | JC Penney Co., Inc. (a) | | | 167,246 | | |
| | 6,200 | | | Meredith Corp. | | | 268,150 | | |
| | 16,666 | | | National CineMedia, Inc. | | | 261,823 | | |
| | 19,042 | | | Ruth's Hospitality Group, Inc. | | | 303,149 | | |
| | 14,895 | | | Sinclair Broadcast Group,
Inc. - Class A | | | 484,683 | | |
| | 14,220 | | | The E.W. Scripps Co. - Class A | | | 270,180 | | |
| | | | 3,186,751 | | |
| | | Consumer Staples 0.8% | |
| | 6,019 | | | Dean Foods Co. | | | 103,226 | | |
| | 2,036 | | | TreeHouse Foods, Inc. (a) | | | 159,745 | | |
| | | | 262,971 | | |
| | | Energy 4.2% | |
| | 38,704 | | | Bonanza Creek Energy, Inc. (a) | | | 203,970 | | |
| | 9,460 | | | Carrizo Oil & Gas, Inc. (a) | | | 279,827 | | |
| | 10,555 | | | Delek US Holdings, Inc. | | | 259,653 | | |
| | 6,726 | | | PDC Energy, Inc. (a) | | | 359,034 | | |
| | 31,205 | | | Synergy Resources Corp. (a) | | | 265,866 | | |
| | | | 1,368,350 | | |
| | | Financials 28.7% | |
| | 6,617 | | | American Equity Investment
Life Holding Co. | | | 159,006 | | |
| | 14,974 | | | Ameris Bancorp | | | 508,966 | | |
| | 7,202 | | | Argo Group International
Holdings Ltd. | | | 430,968 | | |
| | 4,277 | | | Artisan Partners Asset
Management, Inc. - Class A | | | 154,229 | | |
Number of Shares | | | | Value | |
| | | Financials 28.7% (continued) | |
| | 10,124 | | | Banner Corp. | | $ | 464,287 | | |
| | 15,065 | | | BNC Bancorp | | | 382,350 | | |
| | 6,662 | | | Capital Bank Financial Corp. | | | 213,051 | | |
| | 26,619 | | | CenterState Banks, Inc. | | | 416,587 | | |
| | 38,439 | | | CNO Financial Group, Inc. | | | 733,800 | | |
| | 5,137 | | | Endurance Specialty Holdings Ltd. | | | 328,717 | | |
| | 15,690 | | | Fidelity Southern Corp. | | | 350,044 | | |
| | 19,359 | | | Heritage Commerce Corp. | | | 231,534 | | |
| | 15,399 | | | Heritage Financial Corp. | | | 290,117 | | |
| | 41,859 | | | Heritage Oaks Bancorp | | | 335,291 | | |
| | 14,775 | | | HomeStreet, Inc. (a) | | | 320,765 | | |
| | 3,459 | | | IBERIABANK Corp. | | | 190,487 | | |
| | 16,251 | | | National Penn Bancshares, Inc. | | | 200,375 | | |
| | 41,744 | | | NewBridge Bancorp | | | 508,442 | | |
| | 11,041 | | | NorthStar Asset Management
Group, Inc. | | | 134,038 | | |
| | 15,632 | | | Pacific Premier Bancorp, Inc. (a) | | | 332,180 | | |
| | 4,485 | | | Piper Jaffray Companies (a) | | | 181,194 | | |
| | 18,588 | | | Radian Group, Inc. | | | 248,893 | | |
| | 17,904 | | | State Bank Financial Corp. | | | 376,521 | | |
| | 20,831 | | | Synovus Financial Corp. | | | 674,508 | | |
| | 13,615 | | | Trico Bancshares | | | 373,596 | | |
| | 23,413 | | | United Community Banks, Inc. | | | 456,319 | | |
| | 7,685 | | | Wintrust Financial Corp. | | | 372,876 | | |
| | | | 9,369,141 | | |
| | | Health Care 7.2% | |
| | 26,727 | | | Accuray, Inc. (a) | | | 180,407 | | |
| | 19,380 | | | Aceto Corp. | | | 522,872 | | |
| | 7,878 | | | Alere, Inc. (a) | | | 307,951 | | |
| | 5,887 | | | Impax Laboratories, Inc. (a) | | | 251,728 | | |
| | 5,016 | | | PAREXEL International Corp. (a) | | | 341,690 | | |
| | 10,716 | | | PharMerica Corp. (a) | | | 375,060 | | |
| | 4,287 | | | Prestige Brands Holdings, Inc. (a) | | | 220,695 | | |
| | 24,908 | | | Progenics Pharmaceuticals, Inc. (a) | | | 152,686 | | |
| | | | 2,353,089 | | |
The accompanying notes are an integral part of these financial statements.
page 39

Frontier Phocas Small Cap Value Fund
SCHEDULE OF INVESTMENTS (continued)
December 31, 2015 (Unaudited)
Number of Shares | | | | Value | |
| COMMON STOCKS 99.1% (continued) | | | |
| | | Industrials 13.2% | |
| | 1,426 | | | Allegiant Travel Co. | | $ | 239,326 | | |
| | 2,440 | | | Astec Industries, Inc. | | | 99,308 | | |
| | 4,180 | | | Avis Budget Group, Inc. (a) | | | 151,692 | | |
| | 35,775 | | | CBIZ, Inc. (a) | | | 352,742 | | |
| | 4,978 | | | Curtiss-Wright Corp. | | | 340,993 | | |
| | 7,773 | | | Deluxe Corp. | | | 423,940 | | |
| | 3,478 | | | EMCOR Group, Inc. | | | 167,083 | | |
| | 3,190 | | | Esterline Technologies Corp. (a) | | | 258,390 | | |
| | 12,231 | | | Gibraltar Industries, Inc. (a) | | | 311,156 | | |
| | 4,136 | | | Kadant, Inc. | | | 167,963 | | |
| | 11,879 | | | MYR Group, Inc. (a) | | | 244,826 | | |
| | 13,888 | | | SkyWest, Inc. | | | 264,150 | | |
| | 15,621 | | | Tetra Tech, Inc. | | | 406,458 | | |
| | 7,732 | | | The Timken Company | | | 221,058 | | |
| | 1,581 | | | UniFirst Corp. | | | 164,740 | | |
| | 24,963 | | | Wabash National Corp. (a) | | | 295,312 | | |
| | 10,053 | | | West Corp. | | | 216,843 | | |
| | | | 4,325,980 | | |
| | | Information Technology 11.4% | |
| | 6,041 | | | ARRIS Group, Inc. (a) | | | 184,673 | | |
| | 46,972 | | | Atmel Corp. | | | 404,429 | | |
| | 36,023 | | | Cypress Semiconductor Corp. | | | 353,386 | | |
| | 9,567 | | | Mentor Graphics Corp. | | | 176,224 | | |
| | 4,101 | | | Methode Electronics, Inc. | | | 130,535 | | |
| | 17,578 | | | Photronics, Inc. (a) | | | 218,846 | | |
| | 8,103 | | | Plexus Corp. (a) | | | 282,957 | | |
| | 12,903 | | | Progress Software Corp. (a) | | | 309,672 | | |
| | 6,956 | | | Science Applications
International Corp. | | | 318,446 | | |
| | 5,930 | | | Silicon Motion Technology
Corp. - ADR | | | 185,965 | | |
| | 5,163 | | | SYNNEX Corp. | | | 464,308 | | |
| | 8,641 | | | VeriFone Systems, Inc. (a) | | | 242,121 | | |
| | 7,706 | | | Verint Systems, Inc. (a) | | | 312,555 | | |
| | 7,496 | | | Web.com Group, Inc. (a) | | | 149,995 | | |
| | | | 3,734,112 | | |
Number of Shares | | | | Value | |
| | | Materials 3.4% | |
| | 1,624 | | | Ashland, Inc. | | $ | 166,785 | | |
| | 3,351 | | | Kaiser Aluminum Corp. | | | 280,344 | | |
| | 6,382 | | | Materion Corp. | | | 178,696 | | |
| | 7,633 | | | Sensient Technologies Corp. | | | 479,505 | | |
| | | | 1,105,330 | | |
| | | Real Estate Investment Trusts 15.4% | |
| | 12,661 | | | Acadia Realty Trust | | | 419,712 | | |
| | 9,434 | | | CoreSite Realty Corp. | | | 535,097 | | |
| | 22,986 | | | First Industrial Realty Trust, Inc. | | | 508,680 | | |
| | 36,280 | | | First Potomac Realty Trust | | | 413,592 | | |
| | 20,872 | | | Hudson Pacific Properties, Inc. | | | 587,338 | | |
| | 4,746 | | | Kilroy Realty Corp. | | | 300,327 | | |
| | 11,937 | | | Kite Realty Group Trust | | | 309,526 | | |
| | 10,729 | | | National Storage Affiliates Trust | | | 183,788 | | |
| | 12,524 | | | Pebblebrook Hotel Trust | | | 350,923 | | |
| | 3,851 | | | QTS Realty Trust, Inc. | | | 173,719 | | |
| | 8,601 | | | Rexford Industrial Realty, Inc. | | | 140,712 | | |
| | 11,871 | | | Sabra Health Care REIT, Inc. | | | 240,150 | | |
| | 13,133 | | | STAG Industrial, Inc. | | | 242,304 | | |
| | 9,073 | | | Sun Communities, Inc. | | | 621,773 | | |
| | | | 5,027,641 | | |
| | | Utilities 5.1% | |
| | 7,153 | | | Black Hills Corp. | | | 332,114 | | |
| | 5,851 | | | Chesapeake Utilities Corp. | | | 332,044 | | |
| | 2,893 | | | IDACORP, Inc. | | | 196,724 | | |
| | 4,546 | | | Laclede Group, Inc. | | | 270,078 | | |
| | 6,226 | | | Portland General Electric Co. | | | 226,439 | | |
| | 6,179 | | | South Jersey Industries, Inc. | | | 145,330 | | |
| | 5,495 | | | The Empire District Electric Co. | | | 154,245 | | |
| | | | 1,656,974 | | |
| | | Total Common Stocks | |
| | | | | (Cost $29,479,627) | | | 32,390,339 | | |
The accompanying notes are an integral part of these financial statements.
page 40

Frontier Phocas Small Cap Value Fund
SCHEDULE OF INVESTMENTS (continued)
December 31, 2015 (Unaudited)
Number of Shares | | | | Value | |
SHORT-TERM INVESTMENTS 0.7% | |
| | | Investment Company 0.7% | |
| | 229,663 | | | STIT-STIC Prime
Portfolio - Institutional
Class, 0.27% | | $ | 229,663 | | |
| | | Total Short-Term Investments | |
| | | (Cost $229,663) | | | 229,663 | | |
| | | Total Investments 99.8% | |
| | | (Cost $29,709,290) | | | 32,620,002 | | |
| | | Other Assets in Excess
of Liabilities 0.2% | | | 58,680 | | |
| | | TOTAL NET ASSETS 100.0% | | $ | 32,678,682 | | |
(a) Non-Income Producing.
PORTFOLIO DIVERSIFICATION
Sectors | | Percentage | |
Financials | | | 28.7 | % | |
Real Estate Investment Trusts | | | 15.4 | | |
Industrials | | | 13.2 | | |
Information Technology | | | 11.4 | | |
Consumer Discretionary | | | 9.7 | | |
Health Care | | | 7.2 | | |
Utilities | | | 5.1 | | |
Energy | | | 4.2 | | |
Materials | | | 3.4 | | |
Consumer Staples | | | 0.8 | | |
Total Common Stocks | | | 99.1 | | |
Total Short-Term Investments | | | 0.7 | | |
Total Investments | | | 99.8 | | |
Other Assets in Excess of Liabilities | | | 0.2 | | |
Total Net Assets | | | 100.0 | % | |
The accompanying notes are an integral part of these financial statements.
page 41

Frontier Funds
STATEMENTS OF ASSETS AND LIABILITIES
December 31, 2015 (Unaudited)
| | | MFG Global
Equity Fund | | MFG Global
Plus Fund | | MFG Core
Infrastructure Fund | |
ASSETS: | |
Investments at cost | | $ | 960,804,483 | | | $ | 9,669,963 | | | $ | 166,103,401 | | |
Foreign currency at cost | | $ | 1,199,070 | | | $ | 31,691 | | | $ | 205,172 | | |
Investments at value | | $ | 1,068,783,400 | | | $ | 9,489,301 | | | $ | 169,180,665 | | |
Foreign currency at value | | | 1,192,034 | | | | 31,698 | | | | 204,728 | | |
Receivable for investments sold | | | 21,176,224 | | | | — | | | | 2,616,502 | | |
Receivable for Fund shares sold | | | 1,455,055 | | | | 3,369,750 | | | | 469 | | |
Interest and dividends receivable | | | 977,304 | | | | 2,815 | | | | 739,531 | | |
Receivable for foreign currency | | | 1,871,392 | | | | 13,701 | | | | 3,765,832 | | |
Receivable from Adviser | | | — | | | | 9,329 | | | | — | | |
Prepaid expenses and other assets | | | 45,841 | | | | 12,197 | | | | 15,773 | | |
Total assets | | | 1,095,501,250 | | | | 12,928,791 | | | | 176,523,500 | | |
LIABILITIES: | |
Payable for investments purchased | | | — | | | | 86,828 | | | | 532,184 | | |
Payable to Directors | | | 1,263 | | | | 1,250 | | | | 1,263 | | |
Payable to Custodian | | | — | | | | 13,762 | | | | 799,528 | | |
Payable for foreign currency | | | 1,866,099 | | | | 13,775 | | | | 3,771,806 | | |
Payable to Adviser | | | 717,359 | | | | — | | | | 79,675 | | |
Accrued expenses | | | 82,566 | | | | 20,659 | | | | 33,663 | | |
Total liabilities | | | 2,667,287 | | | | 136,274 | | | | 5,218,119 | | |
Net Assets | | $ | 1,092,833,963 | | | $ | 12,792,517 | | | $ | 171,305,381 | | |
NET ASSETS CONSIST OF: | |
Paid in capital | | $ | 981,840,242 | | | $ | 12,942,183 | | | $ | 170,024,136 | | |
Undistributed net investment income (loss) | | | (26,429 | ) | | | 448 | | | | 13,432 | | |
Accumulated undistributed net realized gain (loss) | | | 3,160,663 | | | | 30,592 | | | | (1,797,319 | ) | |
Net unrealized appreciation/depreciation on: | |
Investments | | | 107,978,917 | | | | (180,662 | ) | | | 3,077,264 | | |
Foreign currency | | | (119,430 | ) | | | (44 | ) | | | (12,132 | ) | |
Net Assets | | $ | 1,092,833,963 | | | $ | 12,792,517 | | | $ | 171,305,381 | | |
CAPITAL STOCK, $0.01 PAR VALUE | |
Net Assets | | $ | 1,092,833,963 | | | $ | 12,792,517 | | | $ | 171,305,381 | | |
Authorized | | | 100,000,000 | | | | 100,000,000 | | | | 50,000,000 | | |
Issued and Outstanding | | | 70,895,417 | | | | 1,299,019 | | | | 12,693,774 | | |
Net Asset Value, Redemption Price and Offering Price Per Share | | $ | 15.41 | | | $ | 9.85 | | | $ | 13.50 | | |
The accompanying notes are an integral part of these financial statements.
page 42

Frontier Funds
STATEMENTS OF ASSETS AND LIABILITIES (continued)
December 31, 2015 (Unaudited)
| | | Timpani Small Cap
Growth Fund | | Netols Small Cap
Value Fund | | Phocas Small Cap
Value Fund | |
ASSETS: | |
Investments at cost | | $ | 49,853,580 | | | $ | 49,573,542 | | | $ | 29,709,290 | | |
Investments at value | | $ | 55,663,334 | | | $ | 68,246,056 | | | $ | 32,620,002 | | |
Receivable for investments sold | | | 48,236 | | | | — | | | | — | | |
Receivable for Fund shares sold | | | 342,804 | | | | 596,455 | | | | 29,571 | | |
Interest and dividends receivable | | | 2,077 | | | | 48,620 | | | | 47,429 | | |
Prepaid expenses and other assets | | | 22,131 | | | | 10,892 | | | | 18,849 | | |
Total assets | | | 56,078,582 | | | | 68,902,023 | | | | 32,715,851 | | |
LIABILITIES: | |
Payable for investments purchased | | | 440,942 | | | | 1,760,992 | | | | — | | |
Payable for Fund shares redeemed | | | 10,295 | | | | 157,898 | | | | 1,336 | | |
Payable to Directors | | | 1,264 | | | | 1,263 | | | | 1,263 | | |
Payable to Adviser | | | 27,774 | | | | 53,651 | | | | 15,366 | | |
Accrued distribution and shareholder servicing fees | | | 1,036 | | | | 3,716 | | | | — | | |
Accrued expenses | | | 23,502 | | | | 22,244 | | | | 19,204 | | |
Total liabilities | | | 504,813 | | | | 1,999,764 | | | | 37,169 | | |
Net Assets | | $ | 55,573,769 | | | $ | 66,902,259 | | | $ | 32,678,682 | | |
NET ASSETS CONSIST OF: | |
Paid in capital | | $ | 55,507,771 | | | $ | 48,514,398 | | | $ | 29,583,821 | | |
Undistributed net investment income (loss) | | | (437,663 | ) | | | 20,527 | | | | 33,871 | | |
Accumulated undistributed net realized gain (loss) | | | (5,306,093 | ) | | | (305,180 | ) | | | 150,278 | | |
Net unrealized appreciation on investments | | | 5,809,754 | | | | 18,672,514 | | | | 2,910,712 | | |
Net Assets | | $ | 55,573,769 | | | $ | 66,902,259 | | | $ | 32,678,682 | | |
CAPITAL STOCK, $0.01 PAR VALUE | | Institutional Class | | Institutional Class | | | |
Net Assets | | $ | 52,484,249 | | | $ | 66,492,547 | | | $ | 32,678,682 | | |
Authorized | | | 50,000,000 | | | | 50,000,000 | | | | 100,000,000 | | |
Issued and Outstanding | | | 3,285,767 | | | | 7,819,802 | | | | 1,013,293 | | |
Net Asset Value, Redemption Price and Offering Price Per Share | | $ | 15.97 | | | $ | 8.50 | | | $ | 32.25 | | |
CAPITAL STOCK, $0.01 PAR VALUE | | Class Y | | Class Y | | | |
Net Assets | | $ | 3,089,520 | | | $ | 409,712 | | | | |
Authorized | | | 50,000,000 | | | | 50,000,000 | | | | |
Issued and Outstanding | | | 194,897 | | | | 51,114 | | | | |
Net Asset Value, Redemption Price and Offering Price Per Share | | $ | 15.85 | | | $ | 8.02 | | | | |
The accompanying notes are an integral part of these financial statements.
page 43

Frontier Funds
STATEMENTS OF OPERATIONS
For the Six Months Ended December 31, 2015 (Unaudited)
| | | MFG Global
Equity Fund | | MFG Global
Plus Fund | | MFG Core
Infrastructure Fund | |
INVESTMENT INCOME: | |
Dividend income | | $ | 8,107,084 | (1) | | $ | 59,158 | (2) | | $ | 2,606,011 | (3) | |
Interest income | | | 127,442 | | | | 1,000 | | | | 2,024 | | |
Total investment income | | | 8,234,526 | | | | 60,158 | | | | 2,608,035 | | |
EXPENSES: | |
Investment advisory fees | | | 4,513,776 | | | | 33,021 | | | | 603,582 | | |
Fund administration and accounting fees | | | 126,591 | | | | 12,467 | | | | 33,325 | | |
Custody fees | | | 45,844 | | | | 12,173 | | | | 24,098 | | |
Federal and state registration fees | | | 24,977 | | | | 13,547 | | | | 14,655 | | |
Transfer agent fees | | | 13,628 | | | | 3,325 | | | | 6,913 | | |
Directors' fees and related expenses | | | 11,263 | | | | 8,005 | | | | 11,263 | | |
Audit fees | | | 8,605 | | | | 8,562 | | | | 8,604 | | |
Legal fees | | | 7,355 | | | | 9,118 | | | | 6,715 | | |
Reports to shareholders | | | 6,077 | | | | 2,865 | | | | 4,174 | | |
Other | | | 27,756 | | | | 2,928 | | | | 8,818 | | |
Total expenses before waiver and reimbursement | | | 4,785,872 | | | | 106,011 | | | | 722,147 | | |
Waiver and reimbursement of expenses by Adviser | | | (272,096 | ) | | | (72,989 | ) | | | (118,565 | ) | |
Net expenses | | | 4,513,776 | | | | 33,022 | | | | 603,582 | | |
Net Investment Income | | | 3,720,750 | | | | 27,136 | | | | 2,004,453 | | |
REALIZED AND UNREALIZED GAIN (LOSS)
ON INVESTMENTS: | |
Net realized gain (loss) on: | |
Investments | | | 19,681,445 | | | | 35,875 | | | | (1,147,754 | ) | |
Foreign currency transactions | | | 19,533 | | | | (807 | ) | | | (52,761 | ) | |
Change in net unrealized appreciation/depreciation on: | |
Investments | | | (21,051,126 | ) | | | (105,771 | ) | | | 7,649,378 | | |
Foreign currency transactions | | | (43,968 | ) | | | 92 | | | | (8,879 | ) | |
Net Realized and Unrealized Gain (Loss) on Investments | | | (1,394,116 | ) | | | (70,611 | ) | | | 6,439,984 | | |
Net Increase (Decrease) in Net Assets Resulting from Operations | | $ | 2,326,634 | | | $ | (43,475 | ) | | $ | 8,444,437 | | |
(1) Net of $77,982 in foreign withholding taxes.
(2) Net of $638 in foreign withholding taxes.
(3) Net of $206,058 in foreign withholding taxes.
The accompanying notes are an integral part of these financial statements.
page 44

Frontier Funds
STATEMENTS OF OPERATIONS (continued)
For the Six Months Ended December 31, 2015 (Unaudited)
| | | Timpani Small Cap
Growth Fund | | Netols Small Cap
Value Fund | | Phocas Small Cap
Value Fund | |
INVESTMENT INCOME: | |
Dividend income | | $ | 60,452 | (4) | | $ | 437,534 | | | $ | 239,864 | | |
Interest income | | | 797 | | | | 640 | | | | 561 | | |
Total investment income | | | 61,249 | | | | 438,174 | | | | 240,425 | | |
EXPENSES: | |
Investment advisory fees | | | 276,892 | | | | 353,931 | | | | 141,854 | | |
Fund administration and accounting fees | | | 19,537 | | | | 19,855 | | | | 16,997 | | |
Federal and state registration fees | | | 14,789 | | | | 6,005 | | | | 13,016 | | |
Directors' fees and related expenses | | | 11,263 | | | | 11,263 | | | | 11,264 | | |
Transfer agent fees | | | 10,278 | | | | 7,343 | | | | 5,192 | | |
Custody fees | | | 9,631 | | | | 8,623 | | | | 8,255 | | |
Legal fees | | | 7,604 | | | | 8,843 | | | | 7,823 | | |
Audit fees | | | 7,587 | | | | 7,597 | | | | 7,597 | | |
Distribution and shareholder servicing fees - Class Y | | | 6,133 | | | | — | | | | — | | |
Reports to shareholders | | | 5,323 | | | | 2,954 | | | | 2,419 | | |
Other | | | 3,080 | | | | 3,250 | | | | 2,482 | | |
Total expenses before waiver and reimbursement | | | 372,117 | | | | 429,664 | | | | 216,899 | | |
Waiver and reimbursement of expenses by Adviser | | | (61,403 | ) | | | (40,340 | ) | | | (60,860 | ) | |
Net expenses | | | 310,714 | | | | 389,324 | | | | 156,039 | | |
Net Investment Income (Loss) | | | (249,465 | ) | | | 48,850 | | | | 84,386 | | |
REALIZED AND UNREALIZED GAIN (LOSS)
ON INVESTMENTS: | |
Net realized gain (loss) on investments | | | (3,400,719 | ) | | | 4,247,611 | | | | 175,516 | | |
Change in net unrealized appreciation/depreciation on investments | | | (4,779,939 | ) | | | (11,076,970 | ) | | | (1,594,265 | ) | |
Net Realized and Unrealized Loss on Investments | | | (8,180,658 | ) | | | (6,829,359 | ) | | | (1,418,749 | ) | |
Net Decrease in Net Assets Resulting from Operations | | $ | (8,430,123 | ) | | $ | (6,780,509 | ) | | $ | (1,334,363 | ) | |
(4) Net of $116 in foreign withholding taxes.
The accompanying notes are an integral part of these financial statements.
page 45

Frontier Funds
STATEMENTS OF CHANGES IN NET ASSETS
| | | MFG Global Equity Fund | | MFG Global Plus Fund | |
| | | For the
Six Months Ended
December 31, 2015
(Unaudited) | | For the
Year Ended
June 30, 2015 | | For the
Six Months Ended
December 31, 2015
(Unaudited) | | For the Period
March 23, 2015(1)
through
June 30, 2015 | |
OPERATIONS: | |
Net investment income | | $ | 3,720,750 | | | $ | 6,175,435 | | | $ | 27,136 | | | $ | 14,591 | | |
Net realized gain (loss) on: | |
Investments | | | 19,681,445 | | | | 27,905,829 | | | | 35,875 | | | | (4,476 | ) | |
Foreign currency transactions | | | 19,533 | | | | (102,432 | ) | | | (807 | ) | | | 2,258 | | |
Change in net unrealized appreciation/depreciation on: | |
Investments | | | (21,051,126 | ) | | | 31,856,303 | | | | (105,771 | ) | | | (74,891 | ) | |
Foreign currency transactions | | | (43,968 | ) | | | (102,745 | ) | | | 92 | | | | (136 | ) | |
Net increase (decrease) in net assets resulting from operations | | | 2,326,634 | | | | 65,732,390 | | | | (43,475 | ) | | | (62,654 | ) | |
DISTRIBUTIONS PAID TO SHAREHOLDERS FROM: | |
Net investment income | | | (8,131,435 | ) | | | (7,806,584 | ) | | | (43,537 | ) | | | — | | |
Net realized gain on investments | | | (33,623,773 | ) | | | (14,749,904 | ) | | | — | | | | — | | |
Net decrease in net assets resulting from distributions paid | | | (41,755,208 | ) | | | (22,556,488 | ) | | | (43,537 | ) | | | — | | |
CAPITAL SHARE TRANSACTIONS: | |
Shares sold | | | 66,126,817 | | | | 498,489,918 | | | | 7,019,275 | | | | 5,922,000 | | |
Shares issued to holders in reinvestment of distributions | | | 37,406,977 | | | | 20,274,009 | | | | 28,167 | | | | — | | |
Shares redeemed | | | (77,796,215 | ) | | | (246,459,830 | ) | | | (27,259 | ) | | | — | | |
Redemption fees | | | 135 | | | | 1,688 | | | | — | | | | — | | |
Net increase in net assets resulting from capital share transactions | | | 25,737,714 | | | | 272,305,785 | | | | 7,020,183 | | | | 5,922,000 | | |
Total Increase (Decrease) in Net Assets | | | (13,690,860 | ) | | | 315,481,687 | | | | 6,933,171 | | | | 5,859,346 | | |
NET ASSETS: | |
Beginning of Period | | | 1,106,524,823 | | | | 791,043,136 | | | | 5,859,346 | | | | — | | |
End of Period | | $ | 1,092,833,963 | | | $ | 1,106,524,823 | | | $ | 12,792,517 | | | $ | 5,859,346 | | |
Undistributed net investment income (loss) | | $ | (26,429 | ) | | $ | 4,384,256 | | | $ | 448 | | | $ | 16,849 | | |
TRANSACTIONS IN SHARES: | |
Shares sold | | | 4,175,727 | | | | 32,287,531 | | | | 707,625 | | | | 591,226 | | |
Shares issued to holders in reinvestment of distributions | | | 2,467,479 | | | | 1,313,083 | | | | 2,907 | | | | — | | |
Shares redeemed | | | (4,936,104 | ) | | | (16,019,051 | ) | | | (2,739 | ) | | | — | | |
Net increase in shares outstanding | | | 1,707,102 | | | | 17,581,563 | | | | 707,793 | | | | 591,226 | | |
(1) Commencement of operations.
The accompanying notes are an integral part of these financial statements.
page 46

Frontier Funds
STATEMENTS OF CHANGES IN NET ASSETS (continued)
| | | MFG Core Infrastructure Fund | | Timpani Small Cap Growth Fund | |
| | | For the
Six Months Ended
December 31, 2015
(Unaudited) | | For the
Year Ended
June 30, 2015 | | For the
Six Months Ended
December 31, 2015
(Unaudited) | | For the
Year Ended
June 30, 2015 | |
| OPERATIONS: | |
Net investment income (loss) | | $ | 2,004,453 | | | $ | 3,030,256 | | | $ | (249,465 | ) | | $ | (306,299 | ) | |
Net realized gain (loss) on: | |
Investments | | | (1,147,754 | ) | | | 18,860 | | | | (3,400,719 | ) | | | (1,321,289 | ) | |
Foreign currency transactions | | | (52,761 | ) | | | (51,376 | ) | | | — | | | | — | | |
Change in net unrealized appreciation/depreciation on: | |
Investments | | | 7,649,378 | | | | (8,935,477 | ) | | | (4,779,939 | ) | | | 8,399,839 | | |
Foreign currency transactions | | | (8,879 | ) | | | (5,981 | ) | | | — | | | | — | | |
Net increase (decrease) in net assets resulting from operations | | | 8,444,437 | | | | (5,943,718 | ) | | | (8,430,123 | ) | | | 6,772,251 | | |
DISTRIBUTIONS PAID TO SHAREHOLDERS FROM: | |
Net investment income | | | (2,228,855 | ) | | | (3,388,775 | ) | | | — | | | | — | | |
Net realized gain on investments | | | (505,668 | ) | | | (128,895 | ) | | | — | | | | — | | |
Net decrease in net assets resulting from distributions paid | | | (2,734,523 | ) | | | (3,517,670 | ) | | | — | | | | — | | |
CAPITAL SHARE TRANSACTIONS: | | | | | | Institutional Class | | Institutional Class | |
Shares sold | | | 18,935,214 | | | | 114,530,022 | | | | 16,362,907 | | | | 30,079,520 | | |
Shares issued to holders in reinvestment of distributions | | | 2,335,572 | | | | 3,166,238 | | | | — | | | | — | | |
Shares redeemed | | | (17,398,012 | ) | | | (12,181,750 | ) | | | (3,428,667 | ) | | | (2,574,944 | ) | |
Redemption fees | | | 846 | | | | 2,805 | | | | — | | | | — | | |
Net increase in net assets resulting from capital share transactions | | | 3,873,620 | | | | 105,517,315 | | | | 12,934,240 | | | | 27,504,576 | | |
CAPITAL SHARE TRANSACTIONS: | | | | | | Class Y | | Class Y | |
Shares sold | | | | | | | 2,286,206 | | | | 1,105,481 | | |
Shares redeemed | | | | | | | (933,217 | ) | | | (358,350 | ) | |
Net increase in net assets resulting from capital share transactions | | | | | | | 1,352,989 | | | | 747,131 | | |
Total Increase in Net Assets | | | 9,583,534 | | | | 96,055,927 | | | | 5,857,106 | | | | 35,023,958 | | |
NET ASSETS: | |
Beginning of Period | | | 161,721,847 | | | | 65,665,920 | | | | 49,716,663 | | | | 14,692,705 | | |
End of Period | | $ | 171,305,381 | | | $ | 161,721,847 | | | $ | 55,573,769 | | | $ | 49,716,663 | | |
Undistributed net investment income (loss) | | $ | 13,432 | | | $ | 237,834 | | | $ | (437,663 | ) | | $ | (188,198 | ) | |
TRANSACTIONS IN SHARES: | | | | | | Institutional Class | | Institutional Class | |
Shares sold | | | 1,456,488 | | | | 8,340,792 | | | | 933,380 | | | | 1,871,234 | | |
Shares issued to holders in reinvestment of distributions | | | 176,235 | | | | 231,339 | | | | — | | | | — | | |
Shares redeemed | | | (1,294,146 | ) | | | (865,296 | ) | | | (201,566 | ) | | | (156,298 | ) | |
Net increase in shares outstanding | | | 338,577 | | | | 7,706,835 | | | | 731,814 | | | | 1,714,936 | | |
TRANSACTIONS IN SHARES: | | | | | | Class Y | | Class Y | |
Shares sold | | | | | | | 127,796 | | | | 68,452 | | |
Shares redeemed | | | | | | | (55,334 | ) | | | (21,760 | ) | |
Net increase in shares outstanding | | | | | | | 72,462 | | | | 46,692 | | |
The accompanying notes are an integral part of these financial statements.
page 47

Frontier Funds
STATEMENTS OF CHANGES IN NET ASSETS (continued)
| | | Netols Small Cap Value Fund | | Phocas Small Cap Value Fund | |
| | | For the
Six Months Ended
December 31, 2015
(Unaudited) | | For the
Year Ended
June 30, 2015 | | For the
Six Months Ended
December 31, 2015
(Unaudited) | | For the
Year Ended
June 30, 2015 | |
OPERATIONS: | |
Net investment income (loss) | | $ | 48,850 | | | $ | (88,931 | ) | | $ | 84,386 | | | $ | 156,452 | | |
Net realized gain on investments | | | 4,247,611 | | | | 13,553,228 | | | | 175,516 | | | | 370,123 | | |
Change in net unrealized appreciation/depreciation on investments | | | (11,076,970 | ) | | | (10,639,302 | ) | | | (1,594,265 | ) | | | (331,926 | ) | |
Net increase (decrease) in net assets resulting from operations | | | (6,780,509 | ) | | | 2,824,995 | | | | (1,334,363 | ) | | | 194,649 | | |
DISTRIBUTIONS PAID TO SHAREHOLDERS FROM: | | Institutional Class | | Institutional Class | | | | | |
Net investment income | | | (28,132 | ) | | | — | | | | (186,980 | ) | | | (19,945 | ) | |
Net realized gain on investments | | | (12,487,471 | ) | | | (20,922,751 | ) | | | (163,607 | ) | | | (1,223,630 | ) | |
Net decrease in net assets resulting from distributions paid | | | (12,515,603 | ) | | | (20,922,751 | ) | | | (350,587 | ) | | | (1,243,575 | ) | |
DISTRIBUTIONS PAID TO SHAREHOLDERS FROM: | | Class Y | | Class Y | | | | | |
Net investment income | | | (191 | ) | | | — | | | | | | |
Net realized gain on investments | | | (84,874 | ) | | | (140,390 | ) | | | | | |
Net decrease in net assets resulting from distributions paid | | | (85,065 | ) | | | (140,390 | ) | | | | | |
CAPITAL SHARE TRANSACTIONS: | | Institutional Class | | Institutional Class | | | | | |
Shares sold | | | 5,270,211 | | | | 4,476,451 | | | | 7,506,980 | | | | 8,336,269 | | |
Shares issued to holders in reinvestment of distributions | | | 10,488,792 | | | | 18,286,489 | | | | 350,587 | | | | 1,243,575 | | |
Shares redeemed | | | (7,817,557 | ) | | | (25,348,922 | ) | | | (2,179,767 | ) | | | (3,996,912 | ) | |
Net increase (decrease) in net assets resulting from capital share transactions | | | 7,941,446 | | | | (2,585,982 | ) | | | 5,677,800 | | | | 5,582,932 | | |
CAPITAL SHARE TRANSACTIONS: | | Class Y | | Class Y | | | | | |
Shares sold | | | 6,869 | | | | 30,613 | | | | | | |
Shares issued to holders in reinvestment of distributions | | | 83,093 | | | | 140,390 | | | | | | |
Shares redeemed | | | (71,157 | ) | | | (161,366 | ) | | | | | |
Net increase in net assets resulting from capital share transactions | | | 18,805 | | | | 9,637 | | | | | | |
Total Increase (Decrease) in Net Assets | | | (11,420,926 | ) | | | (20,814,491 | ) | | | 3,992,850 | | | | 4,534,006 | | |
NET ASSETS: | |
Beginning of Period | | | 78,323,185 | | | | 99,137,676 | | | | 28,685,832 | | | | 24,151,826 | | |
End of Period | | $ | 66,902,259 | | | $ | 78,323,185 | | | $ | 32,678,682 | | | $ | 28,685,832 | | |
Undistributed net investment income | | $ | 20,527 | | | $ | — | | | $ | 33,871 | | | $ | 136,465 | | |
TRANSACTIONS IN SHARES: | | Institutional Class | | Institutional Class | | | | | |
Shares sold | | | 581,103 | | | | 359,802 | | | | 231,400 | | | | 242,804 | | |
Shares issued to holders in reinvestment of distributions | | | 1,251,646 | | | | 1,644,468 | | | | 11,049 | | | | 36,869 | | |
Shares redeemed | | | (718,137 | ) | | | (2,016,766 | ) | | | (64,673 | ) | | | (115,864 | ) | |
Net increase (decrease) in shares outstanding | | | 1,114,612 | | | | (12,496 | ) | | | 177,776 | | | | 163,809 | | |
TRANSACTIONS IN SHARES: | | Class Y | | Class Y | | | | | |
Shares sold | | | 657 | | | | 2,349 | | | | | | |
Shares issued to holders in reinvestment of distributions | | | 10,518 | | | | 13,232 | | | | | | |
Shares redeemed | | | (7,109 | ) | | | (13,308 | ) | | | | | |
Net increase in shares outstanding | | | 4,066 | | | | 2,273 | | | | | | |
The accompanying notes are an integral part of these financial statements.
page 48

Frontier MFG Global Equity Fund
FINANCIAL HIGHLIGHTS
| | | Six Months
Ended
December 31,
2015
(Unaudited) | | Year
Ended
June 30,
2015 | | Year
Ended
June 30,
2014 | | Year
Ended
June 30,
2013 | | Period
Ended
June 30,
2012(1) | |
Net Asset Value, Beginning of Period | | $ | 15.99 | | | $ | 15.33 | | | $ | 13.43 | | | $ | 10.81 | | | $ | 10.00 | | |
INCOME FROM INVESTMENT OPERATIONS: | |
Net investment income | | | 0.05 | | | | 0.10 | (2) | | | 0.19 | (2) | | | 0.17 | (2) | | | 0.11 | (2) | |
Net realized and unrealized gain (loss) on investments | | | (0.03 | ) | | | 0.91 | | | | 1.91 | | | | 2.68 | | | | 0.70 | | |
Total Income from Investment Operations | | | 0.02 | | | | 1.01 | | | | 2.10 | | | | 2.85 | | | | 0.81 | | |
LESS DISTRIBUTIONS: | |
From net investment income | | | (0.12 | ) | | | (0.12 | ) | | | (0.08 | ) | | | (0.09 | ) | | | — | | |
From net realized gain on investments | | | (0.48 | ) | | | (0.23 | ) | | | (0.12 | ) | | | (0.14 | ) | | | — | | |
Total Distributions | | | (0.60 | ) | | | (0.35 | ) | | | (0.20 | ) | | | (0.23 | ) | | | — | | |
Redemption fees retained | | | — | (3) | | | — | (3) | | | — | (3) | | | — | (3) | | | — | | |
Net Asset Value, End of Period | | $ | 15.41 | | | $ | 15.99 | | | $ | 15.33 | | | $ | 13.43 | | | $ | 10.81 | | |
Total Return | | | 0.15 | %(4) | | | 6.72 | % | | | 15.76 | % | | | 26.68 | % | | | 8.10 | %(4) | |
SUPPLEMENTAL DATA AND RATIOS: | |
Net assets, end of period (in thousands) | | $ | 1,092,834 | | | $ | 1,106,525 | | | $ | 791,043 | | | $ | 346,695 | | | $ | 108,551 | | |
Ratio of expenses to average net assets | |
Before waivers and reimbursements | | | 0.85 | %(5) | | | 0.86 | % | | | 0.89 | % | | | 0.97 | % | | | 1.14 | %(5) | |
Net of waivers and reimbursements | | | 0.80 | %(5) | | | 0.80 | % | | | 0.80 | % | | | 0.80 | % | | | 0.80 | %(5) | |
Ratio of net investment income to average net assets | |
Before waivers and reimbursements | | | 0.61 | %(5) | | | 0.56 | % | | | 1.18 | % | | | 1.17 | % | | | 1.70 | %(5) | |
Net of waivers and reimbursements | | | 0.66 | %(5) | | | 0.62 | % | | | 1.27 | % | | | 1.34 | % | | | 2.04 | %(5) | |
Portfolio turnover rate | | | 19 | %(4) | | | 69 | % | | | 20 | % | | | 31 | % | | | 19 | %(4) | |
(1) Commenced operations on December 28, 2011.
(2) Per share net investment income has been calculated using the daily average share method.
(3) Less than one cent per share.
(4) Not annualized.
(5) Annualized.
The accompanying notes are an integral part of these financial statements.
page 49

Frontier MFG Global Plus Fund
FINANCIAL HIGHLIGHTS
| | | Six Months
Ended
December 31,
2015
(Unaudited) | | Period
Ended
June 30,
2015(1) | |
Net Asset Value, Beginning of Period | | $ | 9.91 | | | $ | 10.00 | | |
LOSS FROM INVESTMENT OPERATIONS: | |
Net investment income | | | 0.02 | | | | 0.03 | | |
Net realized and unrealized loss on investments | | | (0.03 | ) | | | (0.12 | ) | |
Total Loss from Investment Operations | | | (0.01 | ) | | | (0.09 | ) | |
LESS DISTRIBUTIONS: | |
From net investment income | | | (0.05 | ) | | | — | | |
Total Distributions | | | (0.05 | ) | | | — | | |
Net Asset Value, End of Period | | $ | 9.85 | | | $ | 9.91 | | |
Total Return | | | (0.13 | )%(2) | | | (0.90 | )%(2) | |
SUPPLEMENTAL DATA AND RATIOS: | |
Net assets, end of period (in thousands) | | $ | 12,793 | | | $ | 5,859 | | |
Ratio of expenses to average net assets | |
Before waivers and reimbursements | | | 2.57 | %(3) | | | 4.96 | %(3) | |
Net of waivers and reimbursements | | | 0.80 | %(3) | | | 0.80 | %(3) | |
Ratio of net investment income (loss) to average net assets | |
Before waivers and reimbursements | | | (1.11 | )%(3) | | | (3.16 | )%(3) | |
Net of waivers and reimbursements | | | 0.66 | %(3) | | | 1.00 | %(3) | |
Portfolio turnover rate | | | 15 | %(2) | | | 7 | %(2) | |
(1) Commenced operations on March 23, 2015.
(2) Not annualized.
(3) Annualized.
The accompanying notes are an integral part of these financial statements.
page 50

Frontier MFG Core Infrastructure Fund
FINANCIAL HIGHLIGHTS
| | | Six Months
Ended
December 31,
2015
(Unaudited) | | Year
Ended
June 30,
2015 | | Year
Ended
June 30,
2014 | | Year
Ended
June 30,
2013 | | Period
Ended
June 30,
2012(1) | |
Net Asset Value, Beginning of Period | | $ | 13.09 | | | $ | 14.13 | | | $ | 11.54 | | | $ | 10.65 | | | $ | 10.00 | | |
INCOME (LOSS) FROM INVESTMENT OPERATIONS: | |
Net investment income | | | 0.15 | | | | 0.42 | (2) | | | 0.55 | (2) | | | 0.49 | (2) | | | 0.24 | | |
Net realized and unrealized gain (loss) on investments | | | 0.47 | | | | (0.96 | ) | | | 2.22 | | | | 0.84 | | | | 0.41 | | |
Total Income (Loss) from Investment Operations | | | 0.62 | | | | (0.54 | ) | | | 2.77 | | | | 1.33 | | | | 0.65 | | |
LESS DISTRIBUTIONS: | |
From net investment income | | | (0.17 | ) | | | (0.47 | ) | | | (0.18 | ) | | | (0.44 | ) | | | — | | |
From net realized gain on investments | | | (0.04 | ) | | | (0.03 | ) | | | — | | | | — | (3) | | | — | | |
Total Distributions | | | (0.21 | ) | | | (0.50 | ) | | | (0.18 | ) | | | (0.44 | ) | | | — | | |
Redemption fees retained | | | — | (3) | | | — | (3) | | | — | (3) | | | — | | | | — | | |
Net Asset Value, End of Period | | $ | 13.50 | | | $ | 13.09 | | | $ | 14.13 | | | $ | 11.54 | | | $ | 10.65 | | |
Total Return | | | 4.78 | %(4) | | | (4.03 | )% | | | 24.22 | % | | | 12.73 | % | | | 6.50 | %(4) | |
SUPPLEMENTAL DATA AND RATIOS: | |
Net assets, end of period (in thousands) | | $ | 171,305 | | | $ | 161,722 | | | $ | 65,666 | | | $ | 7,303 | | | $ | 2,743 | | |
Ratio of expenses to average net assets | |
Before waivers and reimbursements | | | 0.84 | %(5) | | | 0.93 | % | | | 1.45 | % | | | 3.66 | % | | | 6.55 | %(5) | |
Net of waivers and reimbursements | | | 0.70 | %(5) | | | 0.70 | % | | | 0.70 | % | | | 0.70 | % | | | 0.70 | %(5) | |
Ratio of net investment income (loss) to average net assets | |
Before waivers and reimbursements | | | 2.18 | %(5) | | | 2.77 | % | | | 3.47 | % | | | 1.34 | % | | | (1.09 | )%(5) | |
Net of waivers and reimbursements | | | 2.32 | %(5) | | | 3.00 | % | | | 4.22 | % | | | 4.30 | % | | | 4.76 | %(5) | |
Portfolio turnover rate | | | 11 | %(4) | | | 17 | % | | | 16 | % | | | 7 | % | | | 7 | %(4) | |
(1) Commenced operations on January 18, 2012.
(2) Per share net investment income has been calculated using the daily average share method.
(3) Less than one cent per share.
(4) Not annualized.
(5) Annualized.
The accompanying notes are an integral part of these financial statements.
page 51

Frontier Timpani Small Cap Growth Fund
FINANCIAL HIGHLIGHTS
| | | Institutional Class | |
| | | Six Months
Ended
December 31,
2015
(Unaudited) | | Year
Ended
June 30,
2015 | | Year
Ended
June 30,
2014 | | Year
Ended
June 30,
2013 | | Year
Ended
June 30,
2012 | | Period
Ended
June 30,
2011(1) | |
Net Asset Value, Beginning of Period | | $ | 18.58 | | | $ | 16.06 | | | $ | 13.22 | | | $ | 10.31 | | | $ | 10.75 | | | $ | 10.00 | | |
INCOME (LOSS) FROM
INVESTMENT OPERATIONS: | |
Net investment loss | | | (0.08 | )(2) | | | (0.16 | )(2) | | | (0.14 | )(2) | | | (0.04 | )(2) | | | (0.08 | )(2) | | | (0.02 | )(3) | |
Net realized and unrealized gain (loss) on investments | | | (2.53 | ) | | | 2.68 | | | | 3.32 | | | | 2.95 | | | | (0.36 | ) | | | 0.77 | | |
Total Income (Loss) from Investment Operations | | | (2.61 | ) | | | 2.52 | | | | 3.18 | | | | 2.91 | | | | (0.44 | ) | | | 0.75 | | |
LESS DISTRIBUTIONS: | |
From net realized gain on investments | | | — | | | | — | | | | (0.34 | ) | | | — | | | | — | | | | — | | |
Total Distributions | | | — | | | | — | | | | (0.34 | ) | | | — | | | | — | | | | — | | |
Net Asset Value, End of Period | | $ | 15.97 | | | $ | 18.58 | | | $ | 16.06 | | | $ | 13.22 | | | $ | 10.31 | | | $ | 10.75 | | |
Total Return | | | (14.05 | )%(4) | | | 15.62 | % | | | 24.16 | % | | | 28.35 | % | | | (4.28 | )% | | | 7.60 | %(4) | |
SUPPLEMENTAL DATA AND RATIOS: | |
Net assets, end of period (in thousands) | | $ | 52,484 | | | $ | 47,455 | | | $ | 13,478 | | | $ | 3,983 | | | $ | 2,824 | | | $ | 2,036 | | |
Ratio of expenses to average net assets | |
Before waivers and reimbursements | | | 1.32 | %(5) | | | 1.52 | % | | | 2.46 | % | | | 4.02 | % | | | 5.25 | % | | | 10.93 | %(5) | |
Net of waivers and reimbursements | | | 1.10 | %(5) | | | 1.10 | % | | | 1.10 | % | | | 1.10 | % | | | 1.10 | % | | | 1.10 | %(5) | |
Ratio of net investment loss to average net assets | |
Before waivers and reimbursements | | | (1.10 | )%(5) | | | (1.37 | )% | | | (2.26 | )% | | | (3.28 | )% | | | (5.02 | )% | | | (10.75 | )%(5) | |
Net of waivers and reimbursements | | | (0.88 | )%(5) | | | (0.95 | )% | | | (0.90 | )% | | | (0.36 | )% | | | (0.87 | )% | | | (0.92 | )%(5) | |
Portfolio turnover rate(6) | | | 85 | %(4) | | | 124 | % | | | 173 | % | | | 140 | % | | | 138 | % | | | 28 | %(4) | |
(1) Commenced operations on March 23, 2011.
(2) Per share net investment loss has been calculated using the daily average share method.
(3) Net investment loss per share is calculated using ending balances prior to consideration of adjustments for permanent book to tax differences.
(4) Not annualized.
(5) Annualized.
(6) Portfolio turnover is calculated on the basis of the Fund as a whole without distinguishing between the classes of shares issued.
The accompanying notes are an integral part of these financial statements.
page 52

Frontier Timpani Small Cap Growth Fund
FINANCIAL HIGHLIGHTS
| | | Class Y | |
| | | Six Months
Ended
December 31,
2015
(Unaudited) | | Year
Ended
June 30,
2015 | | Period
Ended
June 30,
2014(1) | |
Net Asset Value, Beginning of Period | | $ | 18.48 | | | $ | 16.04 | | | $ | 16.35 | | |
INCOME (LOSS) FROM INVESTMENT OPERATIONS: | |
Net investment loss | | | (0.11 | )(2) | | | (0.23 | )(2) | | | (0.08 | )(2) | |
Net realized and unrealized gain (loss) on investments | | | (2.52 | ) | | | 2.67 | | | | (0.23 | )(3) | |
Total Income (Loss) from Investment Operations | | | (2.63 | ) | | | 2.44 | | | | (0.31 | ) | |
Net Asset Value, End of Period | | $ | 15.85 | | | $ | 18.48 | | | $ | 16.04 | | |
Total Return | | | (14.19 | )%(4) | | | 15.15 | % | | | (1.90 | )%(4) | |
SUPPLEMENTAL DATA AND RATIOS: | |
Net assets, end of period (in thousands) | | $ | 3,090 | | | $ | 2,262 | | | $ | 1,215 | | |
Ratio of expenses to average net assets | |
Before waivers and reimbursements | | | 1.72 | %(5) | | | 1.95 | % | | | 2.73 | %(5) | |
Net of waivers and reimbursements | | | 1.50 | %(5) | | | 1.50 | % | | | 1.50 | %(5) | |
Ratio of net investment loss to average net assets | |
Before waivers and reimbursements | | | (1.50 | )%(5) | | | (1.82 | )% | | | (2.36 | )%(5) | |
Net of waivers and reimbursements | | | (1.28 | )%(5) | | | (1.37 | )% | | | (1.13 | )%(5) | |
Portfolio turnover rate(6) | | | 85 | %(4) | | | 124 | % | | | 173 | %(4) | |
(1) Commenced operations on January 6, 2014.
(2) Per share net investment loss has been calculated using the daily average share method.
(3) Net realized and unrealized loss on investments does not reconcile with net realized and unrealized gain on investments in the Statement of Operations due to the timing of the Class Y inception.
(4) Not annualized.
(5) Annualized.
(6) Portfolio turnover is calculated on the basis of the Fund as a whole without distinguishing between the classes of shares issued.
The accompanying notes are an integral part of these financial statements.
page 53

Frontier Netols Small Cap Value Fund
FINANCIAL HIGHLIGHTS
| | | Institutional Class | |
| | | Six Months
Ended
December 31,
2015
(Unaudited) | | Year
Ended
June 30,
2015 | | Year
Ended
June 30,
2014 | | Year
Ended
June 30,
2013 | | Year
Ended
June 30,
2012 | | Year
Ended
June 30,
2011 | |
Net Asset Value, Beginning of Period | | $ | 11.60 | | | $ | 14.66 | | | $ | 15.35 | | | $ | 12.86 | | | $ | 13.75 | | | $ | 10.08 | | |
INCOME (LOSS) FROM
INVESTMENT OPERATIONS: | |
Net investment income (loss) | | | — | (1) | | | 0.01 | | | | (0.04 | )(2) | | | 0.01 | | | | 0.01 | | | | (0.05 | )(3) | |
Net realized and unrealized gain (loss) on investments | | | (1.07 | ) | | | 0.37 | | | | 3.50 | | | | 3.17 | | | | (0.90 | ) | | | 3.72 | | |
Total Income (Loss) from Investment Operations | | | (1.07 | ) | | | 0.38 | | | | 3.46 | | | | 3.18 | | | | (0.89 | ) | | | 3.67 | | |
LESS DISTRIBUTIONS: | |
From net investment income | | | (0.01 | ) | | | — | | | | — | | | | — | | | | — | | | | — | (1) | |
From net realized gain on investments | | | (2.02 | ) | | | (3.44 | ) | | | (4.15 | ) | | | (0.69 | ) | | | — | | | | — | | |
Total Distributions | | | (2.03 | ) | | | (3.44 | ) | | | (4.15 | ) | | | (0.69 | ) | | | — | | | | — | | |
Net Asset Value, End of Period | | $ | 8.50 | | | $ | 11.60 | | | $ | 14.66 | | | $ | 15.35 | | | $ | 12.86 | | | $ | 13.75 | | |
Total Return | | | (8.99 | )%(4) | | | 3.61 | % | | | 24.63 | % | | | 25.61 | % | | | (6.47 | )% | | | 36.43 | % | |
SUPPLEMENTAL DATA AND RATIOS: | |
Net assets, end of period (in thousands) | | $ | 66,492 | | | $ | 77,802 | | | $ | 98,504 | | | $ | 113,151 | | | $ | 134,544 | | | $ | 166,450 | | |
Ratio of expenses to average net assets | |
Before waivers and reimbursements | | | 1.21 | %(5) | | | 1.18 | % | | | 1.17 | % | | | 1.18 | % | | | 1.22 | % | | | 1.13 | % | |
Net of waivers and reimbursements | | | 1.10 | %(5) | | | 1.10 | % | | | 1.10 | % | | | 1.10 | % | | | 1.10 | % | | | 1.10 | % | |
Ratio of net investment income (loss) to average
net assets | |
Before waivers and reimbursements | | | 0.02 | %(5) | | | (0.18 | )% | | | (0.35 | )% | | | (0.14 | )% | | | (0.08 | )% | | | (0.39 | )% | |
Net of waivers and reimbursements | | | 0.13 | %(5) | | | (0.10 | )% | | | (0.28 | )% | | | (0.06 | )% | | | 0.04 | % | | | (0.36 | )% | |
Portfolio turnover rate(6) | | | 12 | %(4) | | | 22 | % | | | 24 | % | | | 28 | % | | | 28 | % | | | 33 | % | |
(1) Less than one cent per share.
(2) Per share net investment loss has been calculated using the daily average share method.
(3) Net investment loss per share is calculated using ending balances prior to consideration of adjustments for permanent book to tax differences.
(4) Not annualized.
(5) Annualized.
(6) Portfolio turnover is calculated on the basis of the Fund as a whole without distinguishing between the classes of shares issued.
The accompanying notes are an integral part of these financial statements.
page 54

Frontier Netols Small Cap Value Fund
FINANCIAL HIGHLIGHTS
| | | Class Y | |
| | | Six Months
Ended
December 31,
2015
(Unaudited) | | Year
Ended
June 30,
2015 | | Year
Ended
June 30,
2014 | | Year
Ended
June 30,
2013 | | Year
Ended
June 30,
2012 | | Year
Ended
June 30,
2011 | |
Net Asset Value, Beginning of Period | | $ | 11.07 | | | $ | 14.15 | | | $ | 15.03 | | | $ | 12.65 | | | $ | 13.59 | | | $ | 10.00 | | |
INCOME (LOSS) FROM
INVESTMENT OPERATIONS: | |
Net investment income (loss) | | | — | (1)(2) | | | (0.01 | )(1) | | | (0.17 | )(1) | | | (0.05 | ) | | | (0.05 | ) | | | (0.09 | )(3) | |
Net realized and unrealized gain (loss) on investments | | | (1.02 | ) | | | 0.37 | | | | 3.44 | | | | 3.12 | | | | (0.89 | ) | | | 3.68 | | |
Total Income (Loss) from Investment Operations | | | (1.02 | ) | | | 0.36 | | | | 3.27 | | | | 3.07 | | | | (0.94 | ) | | | 3.59 | | |
LESS DISTRIBUTIONS: | |
From net investment income | | | (0.01 | ) | | | — | | | | — | | | | — | | | | — | | | | — | | |
From net realized gain on investments | | | (2.02 | ) | | | (3.44 | ) | | | (4.15 | ) | | | (0.69 | ) | | | — | | | | — | | |
Total Distributions | | | (2.03 | ) | | | (3.44 | ) | | | (4.15 | ) | | | (0.69 | ) | | | — | | | | — | | |
Net Asset Value, End of Period | | $ | 8.02 | | | $ | 11.07 | | | $ | 14.15 | | | $ | 15.03 | | | $ | 12.65 | | | $ | 13.59 | | |
Total Return | | | (8.96 | )%(4) | | | 3.61 | % | | | 23.84 | % | | | 25.15 | % | | | (6.92 | )% | | | 35.90 | % | |
SUPPLEMENTAL DATA AND RATIOS: | |
Net assets, end of period (in thousands) | | $ | 410 | | | $ | 521 | | | $ | 633 | | | $ | 20,228 | | | $ | 17,765 | | | $ | 22,792 | | |
Ratio of expenses to average net assets | |
Before waivers and reimbursements | | | 1.21 | %(5) | | | 1.18 | % | | | 1.57 | % | | | 1.58 | % | | | 1.62 | % | | | 1.53 | % | |
Net of waivers and reimbursements | | | 1.10 | %(5) | | | 1.10 | % | | | 1.50 | % | | | 1.50 | % | | | 1.50 | % | | | 1.50 | % | |
Ratio of net investment income (loss) to average net assets | |
Before waivers and reimbursements | | | 0.02 | %(5) | | | (0.18 | )% | | | (1.19 | )% | | | (0.54 | )% | | | (0.48 | )% | | | (0.79 | )% | |
Net of waivers and reimbursements | | | 0.13 | %(5) | | | (0.10 | )% | | | (1.12 | )% | | | (0.46 | )% | | | (0.36 | )% | | | (0.76 | )% | |
Portfolio turnover rate(6) | | | 12 | %(4) | | | 22 | % | | | 24 | % | | | 28 | % | | | 28 | % | | | 33 | % | |
(1) Per share net investment income (loss) has been calculated using the daily average share method.
(2) Less than one cent per share.
(3) Net investment loss per share is calculated using ending balances prior to consideration of adjustments for permanent book to tax differences.
(4) Not annualized.
(5) Annualized.
(6) Portfolio turnover is calculated on the basis of the Fund as a whole without distinguishing between the classes of shares issued.
The accompanying notes are an integral part of these financial statements.
page 55

Frontier Phocas Small Cap Value Fund
FINANCIAL HIGHLIGHTS
| | | Six Months
Ended
December 31,
2015
(Unaudited) | | Year
Ended
June 30,
2015 | | Year
Ended
June 30,
2014 | | Year
Ended
June 30,
2013 | | Year
Ended
June 30,
2012 | | Year
Ended
June 30,
2011(1) | |
Net Asset Value, Beginning of Period | | $ | 34.33 | | | $ | 35.96 | | | $ | 28.72 | | | $ | 23.30 | | | $ | 24.51 | | | $ | 18.40 | | |
INCOME (LOSS) FROM
INVESTMENT OPERATIONS: | |
Net investment income (loss) | | | 0.09 | | | | 0.19 | | | | (0.05 | )(2) | | | 0.20 | | | | 0.06 | | | | 0.04 | (2) | |
Net realized and unrealized gain (loss) on investments | | | (1.76 | ) | | | 0.08 | | | | 9.25 | | | | 5.41 | | | | (1.25 | ) | | | 6.13 | | |
Total Income (Loss) from Investment Operations | | | (1.67 | ) | | | 0.27 | | | | 9.20 | | | | 5.61 | | | | (1.19 | ) | | | 6.17 | | |
LESS DISTRIBUTIONS: | |
From net investment income | | | (0.22 | ) | | | (0.03 | ) | | | (0.05 | ) | | | (0.19 | ) | | | (0.02 | ) | | | (0.06 | ) | |
From net realized gain on investments | | | (0.19 | ) | | | (1.87 | ) | | | (1.91 | ) | | | — | | | | — | | | | — | | |
Total Distributions | | | (0.41 | ) | | | (1.90 | ) | | | (1.96 | ) | | | (0.19 | ) | | | (0.02 | ) | | | (0.06 | ) | |
Redemption fees retained | | | — | | | | — | | | | — | | | | — | | | | — | | | | — | (3) | |
Net Asset Value, End of Period | | $ | 32.25 | | | $ | 34.33 | | | $ | 35.96 | | | $ | 28.72 | | | $ | 23.30 | | | $ | 24.51 | | |
Total Return | | | (4.83 | )%(4) | | | 0.84 | % | | | 32.72 | % | | | 24.29 | % | | | (4.91 | )% | | | 33.55 | % | |
SUPPLEMENTAL DATA AND RATIOS: | |
Net assets, end of period (in thousands) | | $ | 32,679 | | | $ | 28,686 | | | $ | 24,152 | | | $ | 9,004 | | | $ | 18,821 | | | $ | 20,507 | | |
Ratio of expenses to average net assets | |
Before waivers and reimbursements | | | 1.53 | %(5) | | | 1.54 | % | | | 1.97 | % | | | 2.50 | % | | | 1.70 | % | | | 1.69 | % | |
Net of waivers and reimbursements | | | 1.10 | %(5) | | | 1.10 | % | | | 1.10 | % | | | 1.05 | % | | | 0.99 | % | | | 0.99 | % | |
Ratio of net investment income (loss) to average net assets | |
Before waivers and reimbursements | | | 0.16 | %(5) | | | 0.16 | % | | | (1.00 | )% | | | (1.08 | )% | | | (0.51 | )% | | | (0.52 | )% | |
Net of waivers and reimbursements | | | 0.59 | %(5) | | | 0.60 | % | | | (0.13 | )% | | | 0.37 | % | | | 0.20 | % | | | 0.18 | % | |
Portfolio turnover rate | | | 19 | %(4) | | | 52 | % | | | 53 | % | | | 196 | % | | | 50 | % | | | 37 | % | |
(1) Effective October 8, 2010, Frontegra Asset Management, Inc. became adviser and Phocas Financial Corp. became subadviser to the Fund.
(2) Per share net investment income (loss) has been calculated using the daily average shares method.
(3) Less than one cent per share.
(4) Not annualized.
(5) Annualized.
The accompanying notes are an integral part of these financial statements.
page 56

NOTES TO FINANCIAL STATEMENTS
December 31, 2015 (Unaudited)
(1) ORGANIZATION
Frontier Funds, Inc. (the "Company") was incorporated on May 24, 1996, as a Maryland corporation and is registered under the Investment Company Act of 1940, as amended (the "1940 Act"), as an open-end investment company issuing shares in series (each, a "Fund," or collectively, the "Funds"), each series representing a distinct portfolio with its own investment objectives and policies. The investment objective of each of the Frontier MFG Global Equity Fund, Frontier MFG Global Plus Fund, Frontier Timpani Small Cap Growth Fund and Frontier Netols Small Cap Value Fund is capital appreciation. The investment objective of the Frontier MFG Core Infrastructure Fund is long-term capital appreciation. The investment objective of the Frontier Phocas Small Cap Value Fund is long-term total investment through capital appreciation.
As of December 31, 2015, the Company had six series in operations. A summary of each Fund's investment adviser, subadviser and capital structure is as follows:
Fund | | Investment Adviser | | Subadviser | | Capital Structure | | Commencement
of Operations | |
Frontier MFG Global Equity Fund (a) | | Frontegra Asset Management, Inc. ("Frontegra") | | MFG Asset Management | | Single Class | | Dec. 28, 2011 | |
Frontier MFG Global Plus Fund (a) | | Frontegra | | MFG Asset Management | | Multi-Class
• Institutional
• Class Y (b) | | Mar. 23, 2015 | |
Frontier MFG Core Infrastructure Fund (a) | | Frontegra | | MFG Asset Management | | Single Class | | Jan. 18, 2012 | |
Frontier Timpani Small Cap Growth Fund | | Timpani Capital Management LLC ("Timpani") (c) | | | None | | | Multi-Class
• Institutional
• Class Y | | Mar. 23, 2011 | |
Frontier Netols Small Cap Value Fund | | Frontegra | | Netols Asset Management, Inc. | | Multi-Class
• Institutional
• Class Y | | Dec. 16, 2005 | |
Frontier Phocas Small Cap Value Fund | | Frontegra | | Phocas Financial Corp. | | Single Class | | Sep. 29, 2006 | |
(a) A redemption fee of 2.00% will be charged on shares of the Fund redeemed 30 days or less from their date of purchase.
(b) As of December 31, 2015, the Class Y shares of the Frontier MFG Global Plus Fund had not commenced operations.
(c) Timpani is an affiliate of Frontegra.
page 57

NOTES TO FINANCIAL STATEMENTS (continued)
December 31, 2015 (Unaudited)
(2) SIGNIFICANT ACCOUNTING POLICIES
The following is a summary of significant accounting policies consistently followed by the Funds in the preparation of their financial statements.
(a) Investment Valuation
Equity securities for which market quotations are readily available are valued at the last reported sale price on the national securities exchange on which such securities are primarily traded. Equity securities for which there were no transactions on a given day or securities not listed on a national securities exchange are valued at the most recent bid price. Equity securities that are traded on NASDAQ are valued using the NASDAQ Official Closing Price ("NOCP"). Debt securities are valued at the bid price provided by an independent pricing service, which uses valuation methods such as matrix pricing and other analytical pricing models as well as market transactions and dealer bid quotations. Shares of underlying mutual funds are valued at their respective NAVs. Exchanged-traded funds and closed-end funds are valued at the last reported sale price on the exchange on which the security is principally traded. Securities that are primarily traded on foreign exchanges generally are valued at the last sale price of such securities on their respective exchange. In certain circumstances, such as when a significant event occurs in a foreign market so that the last sale price no longer reflects actual value, the fair value of these securities may be determined using fair valuation procedures approved by the Board of Directors (the "Board"). The Board has retained an independent fair value pricing service to assist in valuing foreign securities held by the Frontier MFG Global Equity, Frontier MFG Global Plus and Frontier MFG Core Infrastructure Funds. In valuing assets, prices denominated in foreign currencies are converted to U.S. dollar equivalents at the current exchange rate, which approximates fair value. Any securities or other assets for which market quotations are not readily available are valued at their fair value as determined in good faith by the advisers or subadvisers pursuant to guidelines established by the Board.
The Funds follow a fair value hierarchy that distinguishes between market data obtained from independent sources (observable inputs) and the Funds' own market assumptions (unobservable inputs). These inputs are used in determining the value of each Fund's investments and are summarized in the following fair value hierarchy:
Level 1 — Quoted prices in active markets for identical securities
Level 2 — Evaluated prices based on other significant observable inputs (including quoted prices for similar securities, foreign security indices, foreign exchange rates, fair value estimates for foreign securities and changes in benchmark securities indices)
Level 3 — Significant unobservable inputs (including the Fund's own assumptions in determining fair value of investments)
The following is a summary of inputs used to value the Funds' securities as of December 31, 2015:
MFG Global Equity
Description | | Level 1 | | Level 2 | | Level 3 | | Total | |
Equity (a) | |
| Common Stocks | | $ | 928,979,066 | | | $ | — | | | $ | — | | | $ | 928,979,066 | | |
| Total Equity | | | 928,979,066 | | | | — | | | | — | | | | 928,979,066 | | |
Short-Term Investments | | | 139,804,334 | | | | — | | | | — | | | | 139,804,334 | | |
Total Investments in Securities | | $ | 1,068,783,400 | | | $ | — | | | $ | — | | | $ | 1,068,783,400 | | |
page 58

NOTES TO FINANCIAL STATEMENTS (continued)
December 31, 2015 (Unaudited)
MFG Global Plus
Description | | Level 1 | | Level 2 | | Level 3 | | Total | |
Equity (a) | |
| Common Stocks | | $ | 8,016,062 | | | $ | — | | | $ | — | | | $ | 8,016,062 | | |
| Total Equity | | | 8,016,062 | | | | — | | | | — | | | | 8,016,062 | | |
Short-Term Investments | | | 1,473,239 | | | | — | | | | — | | | | 1,473,239 | | |
Total Investments in Securities | | $ | 9,489,301 | | | $ | — | | | $ | — | | | $ | 9,489,301 | | |
MFG Core Infrastructure
Description | | Level 1 | | Level 2 | | Level 3 | | Total | |
Equity (a) | |
| Common Stocks | | $ | 164,661,179 | | | $ | — | | | $ | — | | | $ | 164,661,179 | | |
| Closed-End Funds | | | 1,585,394 | | | | — | | | | — | | | | 1,585,394 | | |
Total Equity | | | 166,246,573 | | | | — | | | | — | | | | 166,246,573 | | |
Short-Term Investments | | | 2,934,092 | | | | — | | | | — | | | | 2,934,092 | | |
Total Investments in Securities | | $ | 169,180,665 | | | $ | — | | | $ | — | | | $ | 169,180,665 | | |
Timpani Small Cap Growth
Description | | Level 1 | | Level 2 | | Level 3 | | Total | |
Equity (a) | |
| Common Stocks | | $ | 53,823,812 | | | $ | — | | | $ | — | | | $ | 53,823,812 | | |
Total Equity | | | 53,823,812 | | | | — | | | | — | | | | 53,823,812 | | |
Short-Term Investments | | | 1,839,522 | | | | — | | | | — | | | | 1,839,522 | | |
Total Investments in Securities | | $ | 55,663,334 | | | $ | — | | | $ | — | | | $ | 55,663,334 | | |
Netols Small Cap Value
Description | | Level 1 | | Level 2 | | Level 3 | | Total | |
Equity (a) | |
| Common Stocks | | $ | 64,399,984 | | | $ | — | | | $ | — | | | $ | 64,399,984 | | |
Total Equity | | | 64,399,984 | | | | — | | | | — | | | | 64,399,984 | | |
Short-Term Investments | | | 3,846,072 | | | | — | | | | — | | | | 3,846,072 | | |
Total Investments in Securities | | $ | 68,246,056 | | | $ | — | | | $ | — | | | $ | 68,246,056 | | |
Phocas Small Cap Value
Description | | Level 1 | | Level 2 | | Level 3 | | Total | |
Equity (a) | |
| Common Stocks | | $ | 32,390,339 | | | $ | — | | | $ | — | | | $ | 32,390,339 | | |
Total Equity | | | 32,390,339 | | | | — | | | | — | | | | 32,390,339 | | |
Short-Term Investments | | | 229,663 | | | | — | | | | — | | | | 229,663 | | |
Total Investments in Securities | | $ | 32,620,002 | | | $ | — | | | $ | — | | | $ | 32,620,002 | | |
(a) See Fund's Schedule of Investments for sector or country classifications.
page 59

NOTES TO FINANCIAL STATEMENTS (continued)
December 31, 2015 (Unaudited)
For the six months ended December 31, 2015, there were no transfers between Levels 1, 2 and 3. The Funds did not hold any Level 3 securities during the six month period ended December 31, 2015. It is the Funds' policy to record transfers at the end of the reporting period.
(b) Federal Income Taxes
Each Fund intends to comply with the requirements of Subchapter M of the Internal Revenue Code of 1986, as amended, necessary to qualify as a regulated investment company and to make the requisite distributions of income and capital gains to its shareholders sufficient to relieve it from all or substantially all federal income taxes. Therefore, no federal income tax provision has been provided.
The Funds have adopted financial reporting rules regarding recognition and measurement of tax positions taken or expected to be taken on a tax return. The Funds recognize interest and penalties, if any, related to unrecognized tax benefits as income tax expense on the Statement of Operations. During the period, the Funds did not incur any interest or penalties. The Funds have reviewed all open tax years and concluded that there is no effect to any of the Fund's financial positions or results of operations and no tax liability resulting from unrecognized tax benefits relating to uncertain income tax positions taken or expected to be taken on a tax return. Open tax years are those years that are open for examination by the relevant income taxing authority. The Funds have no examinations in progress.
(c) Distributions to Shareholders
With the exception of the Frontier MFG Core Infrastructure Fund, dividends from net investment income are usually declared and paid annually. The Frontier MFG Core lnfrastructure Fund usually declares and pays dividends quarterly. Distributions from net realized gains, if any, are declared and paid at least annually for all Funds. All short-term capital gains are included in ordinary income for tax purposes. Distributions to shareholders are recorded on the ex-dividend date.
The tax character of distributions paid during the six months ended December 31, 2015, and the fiscal year ended June 30, 2015, were as follows:
| | Six Months Ended December 31, 2015 | | Year Ended June 30, 2015 | |
| | Ordinary
Income | | Long-Term
Capital Gains | | Total
Distributions | | Ordinary
Income | | Long-Term
Capital Gains | | Total
Distributions | |
MFG Global Equity | | $ | 14,706,898 | | | $ | 27,048,310 | | | $ | 41,755,208 | | | $ | 16,691,674 | | | $ | 5,864,814 | | | $ | 22,556,488 | | |
MFG Global Plus | | | 43,537 | | | | — | | | | 43,537 | | | | — | | | | — | | | | — | | |
MFG Core Infrastructure | | | 2,448,851 | | | | 285,672 | | | | 2,734,523 | | | | 3,489,745 | | | | 27,925 | | | | 3,517,670 | | |
Netols Small Cap Value | | | 984,151 | | | | 11,616,517 | | | | 12,600,668 | | | | — | | | | 21,063,141 | | | | 21,063,141 | | |
Phocas Small Cap Value | | | 186,980 | | | | 163,607 | | | | 350,587 | | | | 316,055 | | | | 927,520 | | | | 1,243,575 | | |
page 60

NOTES TO FINANCIAL STATEMENTS (continued)
December 31, 2015 (Unaudited)
At June 30, 2015, the Funds' most recent fiscal year end, the components of accumulated earnings/losses on a tax basis were as follows:
| | | MFG
Global
Equity | | MFG
Global
Plus | | MFG
Core
Infrastructure | | Timpani
Small Cap
Growth | | Netols
Small Cap
Value | | Phocas
Small Cap
Value | |
Cost of investments | | $ | 988,685,878 | | | $ | 5,928,338 | | | $ | 165,129,525 | | | $ | 39,575,216 | | | $ | 50,058,716 | | | $ | 23,967,663 | | |
Gross unrealized appreciation | | $ | 154,970,966 | | | $ | 88,059 | | | $ | 4,330,474 | | | $ | 11,198,149 | | | $ | 32,372,622 | | | $ | 5,233,966 | | |
Gross unrealized depreciation | | | (37,440,768 | ) | | | (163,762 | ) | | | (9,320,533 | ) | | | (750,457 | ) | | | (4,093,408 | ) | | | (754,221 | ) | |
Net unrealized appreciation/depreciation | | | 117,530,198 | | | | (75,703 | ) | | | (4,990,059 | ) | | | 10,447,692 | | | | 28,279,214 | | | | 4,479,745 | | |
Undistributed ordinary income | | | 9,255,166 | | | | 16,849 | | | | 382,816 | | | | — | | | | 955,823 | | | | 136,465 | | |
Undistributed long-term capital gain | | | 23,712,393 | | | | — | | | | 181,827 | | | | — | | | | 8,534,001 | | | | 163,601 | | |
Total distributable earnings | | | 32,967,559 | | | | 16,849 | | | | 564,643 | | | | — | | | | 9,489,824 | | | | 300,066 | | |
Other accumulated losses | | | (75,462 | ) | | | (3,800 | ) | | | (3,253 | ) | | | (1,951,571 | ) | | | — | | | | — | | |
Total accumulated earnings (losses) | | $ | 150,422,295 | | | $ | (62,654 | ) | | $ | (4,428,669 | ) | | $ | 8,496,121 | | | $ | 37,769,038 | | | $ | 4,779,811 | | |
The difference between book-basis and tax-basis unrealized appreciation is attributable primarily to the tax deferral of losses on wash sales and mark-to-market on passive foreign investment companies.
At June 30, 2015, the Timpani Small Cap Growth Fund had a short-term capital loss carryforward that will not expire of $1,597,380.
In order to meet certain excise tax requirements, the Funds are required to measure and distribute annually, net capital gains realized during the twelve month period ending October 31. In connection with this requirement, the Funds are permitted, for tax purposes, to defer into their next fiscal year any net capital losses incurred from November 1 through the end of the fiscal year. As of the fiscal year ended June 30, 2015, the following Funds deferred, on a tax basis, post-October losses and ordinary late-year losses of:
| | | Post-October
Capital Loss Deferred | | Ordinary Late-Year
Loss Deferred | |
MFG Global Plus | | $ | 3,664 | | | $ | — | | |
Timpani Small Cap Growth | | | 165,993 | | | | 188,198 | | |
d) Foreign Currency Translation
Values of investments denominated in foreign currencies are converted into U.S. dollars using a spot market rate of exchange each day. Purchases and sales of investments and dividend and interest income are translated to U.S. dollars using a spot market rate of exchange prevailing on the dates of such transactions. The portion of security gains or losses resulting from changes in foreign exchange rates are included with net realized and unrealized gain or loss from investments, as appropriate, for both financial reporting and tax purposes.
Each Fund, respectively, bears the risk of changes in the foreign currency exchange rates and their impact on the value of assets and liabilities denominated in foreign currency. Each Fund also bears the risk of a counterparty failing to fulfill its obligation under a foreign currency contract.
Investments in securities of foreign companies involve additional risks including: currency exchange rate fluctuation; less available public information about the issuers of securities; less stringent regulatory standards; lack of uniform accounting, auditing and financial reporting standards; and country risks including less liquidity, high inflation rates and political and economic instability. The risks of foreign investments are typically greater in emerging and less developed markets.
page 61

NOTES TO FINANCIAL STATEMENTS (continued)
December 31, 2015 (Unaudited)
(e) Indemnifications
Under the Funds' organizational documents, their officers and directors are indemnified against certain liabilities arising out of the performance of their duties to the Funds. In addition, in the normal course of business, the Funds enter into contracts that provide general indemnifications to other parties. The Funds' maximum exposure under these arrangements is unknown as this would involve future claims that may be made against the Funds that have not yet occurred. However, the Funds have not had prior claims or losses pursuant to these contracts and expect the risk of loss to be remote.
(f) Other
Investment transactions are accounted for on the trade date. The Funds determine the gain or loss realized from investment transactions by comparing the original cost of the specifically identified security lot sold with the net sale proceeds. Dividend income, less foreign taxes withheld, is recognized on the ex-dividend date, except that certain dividends from foreign securities are recorded as soon as the information becomes available to the Funds. Interest income is recognized on an accrual basis. All discounts/premiums are accreted/amortized using the effective interest method and are included in interest income. Withholding taxes on foreign dividends have been provided for in accordance with the Funds' understanding of the applicable country's tax codes and regulations.
Income, expenses (other than expenses attributable to a specific class) and realized and unrealized gains or losses on investments attributable to the Funds are generally allocated to each respective class in proportion to the relative net assets of each class.
The preparation of financial statements in conformity with U.S. generally accepted accounting principles ("GAAP") requires management to make estimates and assumptions that affect the reported amounts of assets and liabilities and disclosure of contingent assets and liabilities at the date of the financial statements, and the reported amounts of increases and decreases in net assets from operations during the reporting period. Actual results could differ from those estimates.
Net investment income and realized gains and losses for federal income tax purposes may differ from that reported on the financial statements because of permanent book-to-tax differences. GAAP requires that permanent differences in net investment income and realized gains and losses due to differences between financial reporting and tax reporting be reclassified between various components of net assets. These reclassifications have no effect on net assets or net asset value per share. For the fiscal year ended June 30, 2015, the following table shows the reclassifications made:
| | | MFG
Global
Equity | | MFG
Global
Plus | | MFG
Core
Infrastructure | | Timpani
Small Cap
Growth | | Netols
Small Cap
Value | | Phocas
Small Cap
Value | |
Paid in capital | | $ | — | | | $ | — | | | $ | — | | | $ | (206,307 | ) | | $ | (1,555 | ) | | $ | — | | |
Undistributed net investment income (loss) | | | (102,432 | ) | | | 2,258 | | | | (51,376 | ) | | | 165,378 | | | | 140,742 | | | | (42 | ) | |
Accumulated undistributed net realized gain (loss) | | | 102,432 | | | | (2,258 | ) | | | 51,376 | | | | 40,929 | | | | (139,187 | ) | | | 42 | | |
The permanent differences primarily relate to foreign currency and net operating losses.
(3) INVESTMENT ADVISER AND RELATED PARTIES
The MFG Global Equity, MFG Global Plus, MFG Core Infrastructure, Netols Small Cap Value and Phocas Small Cap Value Funds have entered into an agreement with Frontegra, with whom certain officers and a director of the Funds are affiliated, to furnish investment advisory services to the Funds. Timpani, an affiliate of Frontegra, is the investment adviser to the Timpani Small Cap Growth Fund. Fees are calculated daily and payable monthly, at annual rates set forth in the following table (expressed as a percentage
page 62

NOTES TO FINANCIAL STATEMENTS (continued)
December 31, 2015 (Unaudited)
of each Fund's average daily net assets). Pursuant to expense cap agreements, Frontegra and Timpani have agreed to waive their respective management fees and/or reimburse each Fund's operating expenses (exclusive of brokerage, acquired fund fees and expenses, interest, taxes and extraordinary expenses) to ensure that each Fund's operating expenses do not exceed the expense limitation listed below. Expenses waived are netted with advisory fees payable on the Statement of Assets and Liabilities. On a monthly basis, these accounts are settled by each Fund making payment to the respective adviser or the respective adviser reimbursing the Fund if the reimbursement amount exceeds the advisory fee. If the amount of fees waived exceeds the advisory fee earned, this is shown on the Statement of Assets and Liabilities as a receivable from the respective adviser. The expense cap agreements will continue in effect until October 31, 2016, with successive renewal terms of one year unless terminated by an adviser or a Fund prior to any such renewal.
Frontier Fund | | Annual Advisory Fees | | Expense Limitation | |
MFG Global Equity | | | 0.80 | % | | | 0.80 | % | |
MFG Global Plus | | | 0.80 | % | | | 0.80 | % | |
MFG Core Infrastructure | | | 0.70 | % | | | 0.70 | % | |
Timpani Small Cap Growth - Institutional Class | | | 1.00 | % | | | 1.10 | % | |
Timpani Small Cap Growth - Class Y | | | 1.00 | % | | | 1.50 | % | |
Netols Small Cap Value - Institutional Class | | | 1.00 | % | | | 1.10 | % | |
Netols Small Cap Value - Class Y | | | 1.00 | % | | | 1.50 | % | |
Phocas Small Cap Value | | | 1.00 | % | | | 1.10 | % | |
Any waivers or reimbursements are subject to later adjustment to allow the advisers to recoup amounts waived or reimbursed to the extent actual fees and expenses for a fiscal period are less than each Fund's expense limitation cap, provided, however, that an adviser shall only be entitled to recoup such amounts for a period of three years from the date such amount was waived or reimbursed. Expenses attributable to a specific class may only be recouped with respect to that class.
The following table shows the waived or reimbursed expenses subject to potential recovery expiring in:
| | MFG
Global
Equity | | MFG
Global
Plus | | MFG
Core
Infrastructure | | Timpani
Small Cap
Growth | | Netols
Small Cap
Value | | Phocas
Small Cap
Value | |
2016 | | $ | 294,528 | | | $ | — | | | $ | 100,062 | | | $ | 95,252 | | | $ | 121,910 | | | $ | 147,770 | | |
2017 | | | 524,574 | | | | — | | | | 147,255 | | | | 107,201 | | | | 78,732 | | | | 117,689 | | |
2018 | | | 621,649 | | | | 60,682 | * | | | 232,227 | | | | 131,253 | | | | 69,287 | | | | 114,802 | | |
2019 | | | 272,096 | | | | 72,989 | | | | 118,565 | | | | 61,403 | | | | 40,340 | | | | 60,860 | | |
Total | | $ | 1,712,847 | | | $ | 133,671 | | | $ | 598,109 | | | $ | 395,109 | | | $ | 310,269 | | | $ | 441,121 | | |
* Expenses waived/reimbursed were for the period March 23, 2015 through June 30, 2015.
The beneficial ownership, either directly or indirectly, of more than 25% of a Fund's voting securities creates a presumption of control. As of December 31, 2015, an affiliate of Frontegra owned a controlling interest in the Frontier MFG Global Plus Fund. Shareholders with a controlling interest could affect the outcome of proxy voting or direction of management of a Fund.
page 63

NOTES TO FINANCIAL STATEMENTS (continued)
December 31, 2015 (Unaudited)
(4) INVESTMENT TRANSACTIONS
The aggregate purchases and sales of securities, excluding short-term investments, for the Funds for the six months ended December 31, 2015, are summarized below:
| | MFG
Global
Equity | | MFG
Global
Plus | | MFG
Core
Infrastructure | | Timpani
Small Cap
Growth | | Netols
Small Cap
Value | | Phocas
Small Cap
Value | |
Purchases | | $ | 181,279,273 | | | $ | 4,149,188 | | | $ | 21,526,616 | | | $ | 58,500,693 | | | $ | 8,110,413 | | | $ | 11,190,341 | | |
Sales | | $ | 187,222,194 | | | $ | 1,027,167 | | | $ | 18,299,562 | | | $ | 45,338,487 | | | $ | 14,023,553 | | | $ | 5,338,627 | | |
There were no purchases or sales of U.S. Government securities for the Funds.
(5) DISTRIBUTION PLAN AND SHAREHOLDER SERVICING FEE
The Company, on behalf of the Frontier Netols Small Cap Value Fund, the Frontier Timpani Small Cap Growth Fund and the Frontier MFG Global Plus Fund, has adopted a distribution plan pursuant to Rule 12b-1 under the 1940 Act for each Fund's Class Y shares (the "12b-1 Plan"). Pursuant to the 12b-1 Plan, each Fund pays an annual fee of up to 0.25% to Frontegra Strategies, LLC (the "Distributor"), an affiliate of Frontegra, for payments to brokers, dealers and other financial intermediaries who perform activities or incur expenses intended to result in the sale of Class Y shares of the Funds. As of December 31, 2015, the Class Y shares of the Frontier MFG Global Plus Fund had not commenced operations. For the six months ended December 31, 2015, the Netols Small Cap Value Fund and the Timpani Small Cap Growth Fund incurred $0 and $3,833, respectively, under the 12b-1 Plan.
Class Y shares of the Funds also pay an annual shareholder servicing fee of up to 0.15% per year to the Distributor for payments to brokers, dealers, and other financial intermediaries who provide on-going account services to shareholders. Those services include establishing and maintaining shareholder accounts, mailing prospectuses, account statements and other Fund documents to shareholders, processing shareholder transactions, and providing other recordkeeping and administrative services. For the six months ended December 31, 2015, the Netols Small Cap Value Fund and the Timpani Small Cap Growth Fund incurred $0 and $2,300, respectively, in shareholder servicing expenses.
page 64

VOTING RESULTS OF SPECIAL MEETING OF SHAREHOLDERS (Unaudited)
A special meeting of shareholders (the "Special Meeting") of the Frontier Timpani Small Cap Growth Fund (the "Fund"), a series of Frontier Funds, Inc. (the "Company"), was held on August 18, 2015. At the Special Meeting, shareholders voted on a proposal to approve a new advisory agreement between Timpani Capital Management LLC ("Timpani"), the investment adviser to the Fund, and the Company. Further details regarding the proposal and the Special Meeting are contained in a definitive proxy statement filed with the SEC on June 24, 2015.
At the Special Meeting held on August 18, 2015, a new advisory agreement between Timpani and the Company was approved by shareholders of the Fund as follows:
| Votes For | | Votes Against | | Abstained | | Broker Non-Votes | |
| | 1,361,262 | | | | 0 | | | | 152,645 | | | | N/A | | |
page 65

A NOTE ON FORWARD-LOOKING STATEMENTS
This report includes forward-looking statements such as adviser, subadviser and/or portfolio manager predictions, opinions, assessments, analyses or outlooks for individual securities, industries, market sectors and/or markets. These statements involve risks and uncertainties. In addition to the general risks described for the Funds in the current Prospectuses, other factors bearing on these statements include the accuracy of the advisers', subadvisers' or portfolio managers' forecasts and predictions, and the appropriateness of the investment programs designed by an adviser, subadviser or portfolio manager to implement their strategies efficiently and effectively. Any one or more of these factors, as well as other risks affecting the securities markets and investment instruments generally, could cause the actual results of the Funds to differ materially as compared to benchmarks associated with the Funds.
In addition, portfolio composition will change due to ongoing management of the Funds. Specific securities named in this report may not currently be owned by the applicable Fund, or the Fund's position in the securities may have changed.
ADDITIONAL INFORMATION
Frontier Funds has adopted proxy voting policies and procedures that delegate to Frontegra Asset Management, Inc. ("Frontegra") and Timpani Capital Management LLC the authority to vote proxies. The proxy voting policies permit Frontegra to delegate its authority to vote proxies to a Fund's subadviser. A description of the Frontier Funds' proxy voting policies and procedures is available without charge, upon request, by calling the Funds toll free at 1-888-825-2100. A description of these policies and procedures is also included in the Funds' Statement of Additional Information, which is available on the SEC's website at http://www.sec.gov and the Funds' website at www.frontiermutualfunds.com or by calling the Funds toll free at 1-888-825-2100.
The actual voting records relating to each Fund's portfolio securities during the most recent twelve months ended June 30 are available without charge by calling the Funds toll free at 1-888-825-2100 or by accessing the SEC's website at http://www.sec.gov.
Each Fund files a complete schedule of portfolio holdings for its first and third fiscal quarters with the SEC on Form N-Q. The Form N-Q is available on the SEC's website at http://www.sec.gov. The Form N-Q may also be reviewed and copied at the SEC's Public Reference Room in Washington, D.C. Information on the operation of the Public Reference Room may be obtained by calling toll-free 1-800-SEC-0330.
Item 2. Code of Ethics.
Not applicable for semi-annual reports.
Item 3. Audit Committee Financial Expert.
Not applicable for semi-annual reports.
Item 4. Principal Accountant Fees and Services.
Not applicable for semi-annual reports.
Item 5. Audit Committee of Listed Registrants.
Not applicable to registrants who are not listed issuers (as defined in Rule 10A-3 under the Securities Exchange Act of 1934).
Item 6. Investments.
(a) Schedule of Investments is included as part of the report to shareholders filed under Item 1 of this Form.
(b) Not Applicable.
Item 7. Disclosure of Proxy Voting Policies and Procedures for Closed-End Management Investment Companies.
Not applicable to open-end investment companies.
Item 8. Portfolio Managers of Closed-End Management Investment Companies.
Not applicable to open-end investment companies.
Item 9. Purchases of Equity Securities by Closed-End Management Investment Company and Affiliated Purchasers.
Not applicable to open-end investment companies.
Item 10. Submission of Matters to a Vote of Security Holders.
Not Applicable.
Item 11. Controls and Procedures.
(a) Based on an evaluation of the registrant’s disclosure controls and procedures (as defined in Rule 30a-3(c) under the Investment Company Act of 1940 (the “Act”)) as of a date within 90 days prior to the filing date of this Form N-CSR, the registrant’s principal executive officer and principal financial officer have concluded that the disclosure controls and procedures are effective.
(b) There were no changes in the registrant’s internal control over financial reporting (as defined in Rule 30a-3(d) under the Act) that occurred during the second fiscal quarter of the period covered by this report that has materially affected, or is reasonably likely to materially affect, the registrant’s internal control over financial reporting.
Item 12. Exhibits.
(a) (1) Any code of ethics or amendment thereto, that is the subject of the disclosure required by Item 2, to the extent that the registrant intends to satisfy Item 2 requirements through filing an exhibit. Incorporated by reference to the registrant’s Form N-CSR filed September 8, 2008.
(2) A separate certification for each principal executive and principal financial officer pursuant to Section 302 of the Sarbanes-Oxley Act of 2002. Filed herewith.
(3) Any written solicitation to purchase securities under Rule 23c-1 under the Act sent or given during the period covered by the report by or on behalf of the registrant to 10 or more persons. Not applicable to open-end investment companies.
(b) Certifications pursuant to Section 906 of the Sarbanes-Oxley Act of 2002. Furnished herewith.
SIGNATURES
Pursuant to the requirements of the Securities Exchange Act of 1934 and the Investment Company Act of 1940, the registrant has duly caused this report to be signed on its behalf by the undersigned, thereunto duly authorized.
Frontier Funds, Inc.
By: | /s/ William D. Forsyth III | |
| William D. Forsyth III, President | |
| (Principal Executive Officer) | |
| | |
Date: | 2/22/2016 | |
Pursuant to the requirements of the Securities Exchange Act of 1934 and the Investment Company Act of 1940, this report has been signed below by the following persons on behalf of the registrant and in the capacities and on the dates indicated.
By: | /s/ William D. Forsyth III | |
| William D. Forsyth III, President and Secretary | |
| (Principal Executive Officer) | |
| | |
Date: | 2/22/2016 | |
| | |
| | |
By: | /s/ Elyce D. Dilworth | |
| Elyce D. Dilworth, Treasurer and Assistant Secretary |
| (Principal Financial Officer) |
| | |
Date: | 2/22/2016 | |