UNITED STATES
SECURITIES AND EXCHANGE COMMISSION
Washington, D.C. 20549
FORM N-CSR
CERTIFIED SHAREHOLDER REPORT OF REGISTERED
MANAGEMENT INVESTMENT COMPANIES
Investment Company Act file number | 811-07685 |
|
Frontier Funds, Inc. |
(Exact name of registrant as specified in charter) |
|
400 Skokie Blvd. Suite 500 Northbrook, Illinois | | 60062 |
(Address of principal executive offices) | | (Zip code) |
|
William D. Forsyth III 400 Skokie Blvd., Suite 500 Northbrook, Illinois 60062 |
(Name and address of agent for service) |
|
Registrant’s telephone number, including area code: | (847) 509-9860 | |
|
Date of fiscal year end: | June 30 | |
|
Date of reporting period: | December 31, 2014 | |
| | | | | | | | |
Item 1. Reports to Stockholders.

SEMI-ANNUAL REPORT
Frontier RobecoSAM Global Equity Fund
Frontier MFG Global Equity Fund
Frontier MFG Core Infrastructure Fund
Frontier Timpani Small Cap Growth Fund
Frontier Netols Small Cap Value Fund
Frontier Phocas Small Cap Value Fund
Frontegra Asset Management, Inc.
December 31, 2014

TABLE OF CONTENTS
Shareholder Letter | | | 1 | | |
Frontier RobecoSAM Global Equity Fund | |
Report from RobecoSAM USA, Inc. | | | 4 | | |
Investment Highlights | | | 6 | | |
Frontier MFG Global Equity Fund | |
Report from MFG Asset Management | | | 8 | | |
Investment Highlights | | | 10 | | |
Frontier MFG Core Infrastructure Fund | |
Report from MFG Asset Management | | | 12 | | |
Investment Highlights | | | 14 | | |
Frontier Timpani Small Cap Growth Fund | |
Report from Timpani Capital Management LLC | | | 16 | | |
Investment Highlights | | | 18 | | |
Frontier Netols Small Cap Value Fund | |
Report from Netols Asset Management, Inc. | | | 20 | | |
Investment Highlights | | | 21 | | |
Frontier Phocas Small Cap Value Fund | |
Report from Phocas Financial Corporation | | | 24 | | |
Investment Highlights | | | 25 | | |
Expense Example | | | 26 | | |
Schedules of Investments | |
Frontier RobecoSAM Global Equity Fund | | | 28 | | |
Frontier MFG Global Equity Fund | | | 30 | | |
Frontier MFG Core Infrastructure Fund | | | 31 | | |
Frontier Timpani Small Cap Growth Fund | | | 34 | | |
Frontier Netols Small Cap Value Fund | | | 36 | | |
Frontier Phocas Small Cap Value Fund | | | 38 | | |
Statements of Assets and Liabilities | | | 41 | | |
Statements of Operations | | | 43 | | |
Statements of Changes in Net Assets | | | 45 | | |
Financial Highlights | | | 48 | | |
Notes to Financial Statements | | | 56 | | |
This report is submitted for the general information of the shareholders of the Funds. It is not authorized for distribution to prospective investors unless accompanied or preceded by an effective Prospectus for the applicable Fund. The Prospectus may be obtained by calling 1-888-825-2100. Each Prospectus includes more complete information about management fees and expenses, investment objectives, risks and operating policies of the applicable Fund. Please read the Prospectus carefully.
Frontier Funds, Inc. are distributed by Frontegra Strategies, LLC, 400 Skokie Blvd., Suite 500, Northbrook, IL 60062. Frontegra Strategies, LLC, member of FINRA and SIPC, is an affiliate of Frontegra Asset Management, Inc., the Funds' investment adviser.

DEAR FELLOW SHAREHOLDERS:
We are pleased to report on the progress of the Frontier Funds over the past six months ending December 31, 2014. The S&P 500 Index was up 6.12%, and small capitalization stocks were also up, with the Russell 2000® Index returning 1.65%. International stocks, as measured by the MSCI EAFE Index, returned -9.24% over the six month period.
Fund Results
For the six month period ending December 31, 2014, the Frontier RobecoSAM Global Equity Fund, managed by RobecoSAM USA, returned -3.08% (net) versus the MSCI World Index (Net) return of -1.17%.
The Frontier MFG Global Equity Fund, managed by MFG Asset Management ("MFG"), returned 2.99% (net) versus the MSCI World Index (Net) return of -1.17% for the six month period ending December 31, 2014.
For the six month period ending December 31, 2014, the Frontier MFG Core Infrastructure Fund, also managed by MFG, returned 1.60% (net) versus the UBS Developed Infrastructure & Utilities Index (Net) return of -1.10% and the S&P Global Infrastructure Index return of -2.62%.
The Frontier Timpani Small Cap Growth Fund, Institutional Class, managed by Timpani Capital Management, returned 2.12% (net) versus the Russell 2000® Growth Index return of 3.31% for the six month period ending December 31, 2014. The Class Y shares returned 1.93% (net) over the same time period.
For the six month period ending December 31, 2014, the Frontier Netols Small Cap Value Fund — Institutional Class, managed by Netols Asset Management, returned 0.93% (net) versus the Russell 2000® Value Index return of 0.01%. The Class Y shares returned 0.89% (net) over the same time period.
The Frontier Phocas Small Cap Value Fund, managed by Phocas Financial, returned 0.34% (net) versus the Russell 2000 Value Index return of 0.01% for the six month period ending December 31, 2014.
Outlook
Markets were mixed in the second half of 2014, as the U.S. enjoyed a continuing recovery while European markets struggled, primarily due to the strength of the U.S. dollar. The dollar performed extremely well versus most other currencies, significantly impacting returns in various international markets. Investors are now focused on when the Fed will raise interest rates and by how much. This has led to a significant increase in market volatility. As we enter 2015, we will strive to navigate the markets with the skill and agility necessary in these turbulent markets.
We will continue to oversee the investment management of the Frontier Funds with the care and diligence that have served our shareholders well in the past. As always, we appreciate your investment and continued confidence in the Frontier Funds.
Best regards,
William D. Forsyth, CFA
President
Frontier Funds, Inc.
page 1
This page intentionally left blank.

FRONTIER
ROBECOSAM GLOBAL EQUITY FUND

REPORT FROM ROBECOSAM USA, INC.
Dear Shareholders:
The Frontier RobecoSAM Global Equity Fund strives to achieve capital appreciation by investing in a diversified portfolio of equity and equity-related securities issued by U.S. and non-U.S. companies that combine their market and financial strategy with a high level of environmental awareness and a clearly defined social policy. The Fund's performance is measured against the MSCI World Index (Net).
Performance Review
The Frontier RobecoSAM Global Equity Fund returned -3.08%, net of fees, for the six month period ending December 31, 2014, compared to the -1.17% return of its benchmark, the MSCI World Index (Net). For the year, the Fund returned 2.90%, net of fees, compared to the benchmark's return of 4.94%.
RobecoSAM employs a fundamental research approach and selects stocks bottom-up. The investment process aims to achieve a risk contribution that highlights stock selection as the dominant risk and performance factor. Other factors, such as currencies or sector allocation, demonstrate a limited contribution as respective sector allocations are kept relatively close to the benchmark (+/- 5%). While allocation did show some minor negative contribution, the negative relative performance is mostly explained by stock selection.
Stock selection did work favorably in Consumer Discretionary. Holdings such as Fossil Group, Dollar Tree and particularly L Brands provided positive returns. While the overall retail sector profited from positive consumer sentiment and decreasing energy prices, the portfolio holdings posted positive earnings resulting from successfully implemented growth strategies. Conversely, contribution from Technology and Health Care was negative. While core investments Microsoft, Cisco and Oracle performed in line with the overall sector, they lagged the Internet and social media stars Apple and Facebook. Neither company is part of the eligible investment universe given their inferior sustainability profile. In Health Care, valuation supported large pharma companies such as Roche, Pfizer and UnitedHealth Group. The group underperformed relative to Biotech and Life Science. The least attractive portfolio holding was UK utility Drax, whose share price plummeted after the UK government proposed a change in the subsidy system. Drax owns coal-fired plants that are currently switching to biomass.
The only sector deviation having some relevant impact on performance was Energy. In the light of falling energy and oil prices, the overweight did not add value. After OPEC's announcement not to cut supply, oil prices are expected to trade at a lower level for an extended period of time. The exposure was reduced to neutral.
Portfolio Outlook and Strategy
Over the period, sentiment on the global equity market was a roller coaster. While the U.S. showed strong economic growth, the eurozone was hardly growing at all. In addition, growth in China is close to the 7.5% threshold, resulting in a surprising interest rate reduction. Also, the Bank of Japan and the European Central Bank pleased investors as they announced and initiated further asset purchases. The focus mainly was on the ECB as the market started to expect an additional bond purchase program in order to achieve the announced balance sheet target. The plan of owning EUR 3 trillion in assets likely will not be achieved with just acquiring asset-backed securities. In addition, the debate about the future of Greece in the eurozone was re-activated as the parliament refused to form a new government and decided to initiate new elections. The euro declined from nearly 1.4 in May to just above 1.2 at year end relative to the U.S. dollar. Besides the currency moves, falling oil prices have been the dominant theme. While neither OPEC, nor any other of the large oil producers such as Russia or the U.S., is willing to cut supply, demand is expected to decline in line with muted economic growth expectations. As a consequence, Brent oil prices dropped to around USD 60 per barrel.
page 4

In the coming quarters, we expect global monetary conditions to remain highly accommodative. Our focus remains on investing in sustainable companies with attractive valuation and stable earnings outlook. We also maintain an underweight (relative to MSCI World Index) in sectors where earnings visibility and valuation upside is limited, such as industrials and IT.
Sincerely,
Rainer Baumann
Senior Portfolio Manager
RobecoSAM USA, Inc.
page 5

INVESTMENT HIGHLIGHTS
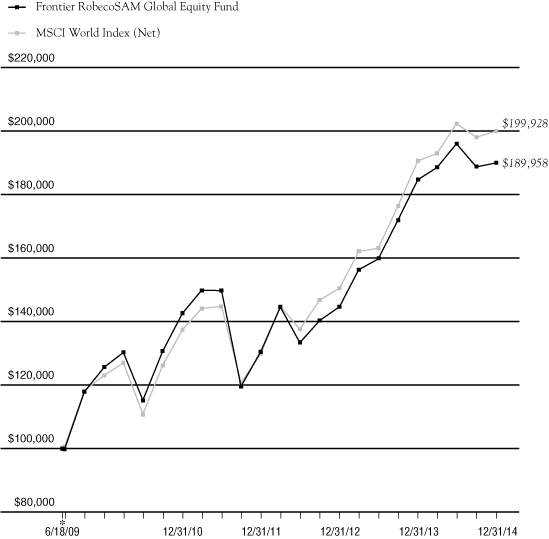
Growth of a $100,000 Investment (Unaudited)
* 6/18/09 commencement of operations.
This chart assumes an initial gross investment of $100,000 made on 6/18/09 (commencement of operations). Returns shown include the reinvestment of all distributions. Past performance is not predictive of future results. Investment return and principal value will fluctuate so that shares, when redeemed, may be worth more or less than the original cost. In the absence of existing fee waivers, total return would be reduced. Effective June 10, 2011, RobecoSAM USA, Inc. ("RobecoSAM") became subadviser to the Fund and Frontegra Asset Management, Inc. became adviser to the Fund. Prior to June 10, 2011, RobecoSAM served as adviser to the Fund. To receive current to the most recent month-end performance, please call 1-888-825-2100.
The MSCI World Index represents large and mid cap equities across 23 Developed Markets countries. The index covers approximately 85% of the free float-adjusted market capitalization in each country. The Index does not reflect investment management fees, brokerage commissions and other expenses associated with investing in equity securities. A direct investment in the index is not possible.
Frontegra Asset Management, Inc. has contractually agreed through October 31, 2015 to waive its management fee and/or reimburse the Fund's operating expenses to the extent necessary to ensure that the Fund's total operating expenses (excluding taxes, interest, brokerage commissions, acquired fund fees and expenses and extraordinary expenses) do not exceed 1.20% of the Fund's average daily net assets. The expense ratios presented are based on the annualized expense ratios as reported in the Fund's current prospectus, which may differ from the expense ratios presented in the Fund's financial highlights.
** The returns shown do not reflect the deduction of taxes that a shareholder would pay on Fund distributions or the redemption of Fund shares.
Portfolio Total Return**
FOR PERIODS
ENDED 12/31/14 | | FUND | | INDEX | |
SIX MONTHS | | | (3.08 | )% | | | (1.17 | )% | |
ONE YEAR | | | 2.90 | % | | | 4.94 | % | |
FIVE YEAR
AVERAGE ANNUAL | | | 8.62 | % | | | 10.20 | % | |
AVERAGE ANNUAL
SINCE INCEPTION | | | 12.29 | % | | | 13.33 | % | |
Fund Expenses | |
GROSS EXPENSE RATIO | | | 1.67 | % | |
NET EXPENSE RATIO | | | 1.20 | % | |
page 6

FRONTIER
MFG GLOBAL EQUITY FUND

REPORT FROM MFG ASSET MANAGEMENT
Dear Fellow Shareholders:
The investment objective of the Frontier MFG Global Equity Fund is capital appreciation. The objective is measured against the MSCI World Index (Net).
Performance Review
The Frontier MFG Global Equity Fund returned 2.99%, net of fees, for the six month period ending December 31, 2014, compared to -1.17% for the MSCI World Index (Net). For the year, the Fund returned 5.75%, net of fees, compared to the benchmark's return of 4.94%.
We do not manage the Fund against short-term performance metrics and it is inevitable the Fund will underperform markets at some point in the future. We feel strongly that people cannot retire on "relative investment returns"; only by generating investment returns that exceed the rate of inflation (ideally by a satisfactory margin) will investors increase their wealth over time. As such, we are happy to be judged on the absolute returns of our strategy over time.
Fund Outlook and Strategy
Since the beginning of 2013, we have observed a massive compression in risk premia across multiple asset classes. We believe that there is an elevated probability that this compression will unwind over the next 12 months or so as investors focus on a normalization of U.S. interest rates. Broadly speaking, market risks are elevated at present due to uncertainty about the trajectory of interest rates in the U.S., emerging market instability, ongoing sovereign debt challenges in Europe, the slowdown in China, and commodity price declines, each of which could trigger material corrections in global credit and equity markets.
While we are not predicting that there will be a market crash, in our view it is better to be prudent and cautious given the current set of facts, than to be complacent. Investing is a long-term endeavor and if we give up some short-term return to protect our clients' capital, then so be it. As Warren Buffett has often reminded investors, "To finish first you must first finish." It may turn out that we are right to be cautious, but that we are too early in reducing the equity risk in the portfolio. Nonetheless, we believe it is better to be six months too early than six minutes too late.
Equity markets have become more challenging and value has become harder to find as share prices have continued to rise. While nothing is certain in investing, we predict that the next three years will be challenging for equities as they battle the headwind of rising long-term interest rates.
We feel comfortable with the Fund's overall risk profile and construction. We believe it is likely to deliver satisfactory returns over the next investment cycle, while also exhibiting below-benchmark downside risk in the event that there is a major downturn in markets.
On 31 December 2014, the Fund held 27 investments. Over the six months ending 31 December 2014, the three stocks with the strongest returns in local currency were Lowe's (+44.6%), Target (+33.2), and Visa (+25.0%) and the stocks with the weakest returns were Tesco (-33.1%), Adidas (-19.4%), and Yum! Brands (-9.3%). In terms of absolute performance, the three largest stock contributors in local currency terms were Lowe's, Target, and Visa, which added +2.0%, +1.4% and +1.0%, respectively. The largest detractors were Tesco (-2.3%), Sanofi (-0.6%), and Yum! Brands (-0.4%).
Over the past six months, we have made the following major changes to the Fund:
• In August we increased the cash weighting to approximately 10%.
• We added new positions in Lloyds Banking Group and Home Depot. We also increased our positions in SAP and Unilever.
page 8

• We exited the positions in Adidas, Diageo, Johnson and Johnson, and Coca Cola, and reduced the holdings in Danone, DIRECTV, Walmart, Target, McDonalds, American Express, US Bancorp, Bank of New York Mellon, and Wells Fargo.
The Fund continues to be exposed to the following major investment themes:
• Emerging market consumption growth: The Fund gains its exposure via investments in multinational consumer franchises. On 31 December 2014, the Fund's three largest investments in multinational consumer franchises were Yum! Brands, Nestle, and Unilever. These companies generate around 40% of their revenue in emerging markets.
• U.S. interest rates: In our view, it is likely that U.S. short- and long-term interest rates will normalize over the next two years as the U.S. economy recovers. Now that the Fed has ended its QE program, this may occur alongside the shrinking (or sterilization) of its balance sheet, as well as the normal monetary policy action of lifting the Federal Funds Rate. We own four U.S. financial institutions that are likely to benefit from the increase in U.S. interest rates: Wells Fargo, US Bancorp, Bank of New York Mellon, and State Street.
• The move to a cashless society: There continues to be a strong secular shift from spending via cash and check to cashless forms of payments such as credit cards, debit cards, electronic funds transfer and mobile payments. In our opinion, the explosion of smart, or internet-connected, mobile devices will accelerate this shift on a global basis. We believe that there are only a limited number of companies that are well positioned to directly benefit from this structural shift. These companies are typically highly attractive, with strong network effects, low capital intensity, high barriers to market entry and high returns on capital. On 31 December 2014, the Fund was invested in the payments space through exposure to companies such as PayPal (via eBay), American Express, Visa, and MasterCard.
• U.S. housing: A recovery in new housing construction, together with investment in existing housing stock, should drive a strong cyclical recovery in companies exposed to the U.S. housing market, while providing a boost to the overall economy. Our major exposure to this theme is via holdings in Lowe's and Home Depot, the home improvement retailers, as well as our investments in domestic U.S. banks, Wells Fargo and US Bancorp.
• Technology/software: We believe that entrenched global software companies boast enormous competitive advantages and exhibit attractive investment characteristics. The Fund's technology/software investments include Microsoft, Oracle, and SAP.
• Internet/e-commerce: There are a number of internet-enabled businesses that are experiencing increasing competitive advantages and showing very attractive investment characteristics. The Fund's investments in these areas include eBay and Google.
Yours sincerely,
Hamish Douglass
Portfolio Manager
MFG Asset Management
page 9

INVESTMENT HIGHLIGHTS
Growth of a $1,000,000 Investment (Unaudited)

* 12/28/11 commencement of operations.
This chart assumes an initial gross investment of $1,000,000 made on 12/28/11 (commencement of operations). Returns shown include the reinvestment of all distributions. Past performance is not predictive of future results. Investment return and principal value will fluctuate so that shares, when redeemed, may be worth more or less than the original cost. In the absence of existing fee waivers, total return would be reduced. To receive current to the most recent month-end performance, please call 1-888-825-2100.
The MSCI World Index represents large and mid cap equities across 23 Developed Markets countries. The index covers approximately 85% of the free float-adjusted market capitalization in each country. The Index does not reflect investment management fees, brokerage commissions and other expenses associated with investing in equity securities. A direct investment in the index is not possible.
Frontegra Asset Management, Inc. has contractually agreed through October 31, 2015 to waive its management fee and/or reimburse the Fund's operating expenses to the extent necessary to ensure that the Fund's total operating expenses (excluding taxes, interest, brokerage commissions, acquired fund fees and expenses and extraordinary expenses) do not exceed 0.80% of the Fund's average daily net assets. The expense ratios presented are based on the annualized expense ratios as reported in the Fund's current prospectus, which may differ from the expense ratios presented in the Fund's financial highlights.
** The returns shown do not reflect the deduction of taxes that a shareholder would pay on Fund distributions or the redemption of Fund shares.
Portfolio Total Return**
FOR PERIODS ENDED 12/31/14 | | FUND | | INDEX | |
SIX MONTHS | | | 2.99 | % | | | (1.17 | )% | |
ONE YEAR | | | 5.75 | % | | | 4.94 | % | |
AVERAGE ANNUAL
SINCE INCEPTION | | | 17.70 | % | | | 15.91 | % | |
Fund Expenses | |
GROSS EXPENSE RATIO | | | 0.89 | % | |
NET EXPENSE RATIO | | | 0.80 | % | |
page 10

FRONTIER
MFG CORE INFRASTRUCTURE FUND

REPORT FROM MFG ASSET MANAGEMENT
Dear Fellow Shareholders:
The investment objective of the Frontier MFG Core Infrastructure Fund is long-term capital appreciation. The objective is currently measured against the UBS Developed Infrastructure & Utilities Index (Net). Unfortunately, UBS has decided to discontinue production of this index, so the Fund will use the S&P Global Infrastructure Index as its benchmark beginning 1 January 2015. Historically, the S&P index has performed similarly to the UBS index.
The types of infrastructure assets in which the Fund invests are generally natural monopolies that provide an essential service to the community. Infrastructure assets offer investors protection from the impacts of inflation because their earnings generally have some direct linkage to inflation. Over time, the stable, reliable earnings of infrastructure assets are expected to lead to a combination of income and capital growth for investors.
The universe of infrastructure assets that are held by the Fund is made up of two main sectors:
• Utilities: Utilities comprise approximately 70% of the Fund and includes both regulated energy utilities and regulated water utilities. Utilities are typically subject to economic regulation. The terms of regulation typically require a utility to efficiently provide an essential service to the community and, in return, permit the utility to earn a fair rate of return on the capital it has invested in its operations. As a utility provides a basic necessity, e.g. energy or water, there is minimal fluctuation in demanded volumes in response to the economic cycle, while the price charged for the utility service can be adjusted with limited impact upon demanded volumes. As a result, the earnings of regulated utilities have been, and are expected to continue to be, stable irrespective of economic conditions.
• Infrastructure: This includes airports, ports, toll roads and broadcast communications infrastructure. Regulation of infrastructure companies is generally less intensive than regulation of utilities and this allows companies to accrue the benefits of volume growth (i.e. the returns of infrastructure companies are linked to growth in passengers, vehicles or containers). As economies develop, grow and become more inter-dependent, we expect the underlying level of aviation, shipping and vehicle traffic to increase. As a result, the revenues and earnings derived by infrastructure assets are expected to grow.
Performance Review
The Frontier MFG Core Infrastructure Fund returned 1.60%, net of fees, for the six month period ending 31 December 2014. The Fund's return outperformed the (1.10)% return of its benchmark, the UBS Developed Infrastructure & Utilities Index (Net), by 2.7%. For the year, the Fund returned 16.63%, net of fees, compared to the benchmark's return of 14.11%. The returns of both the Fund and Index were negatively impacted by the strong U.S. dollar and the different currency exposures of the Fund and the benchmark index.
Eighty of the ninety stocks in the Fund generated a positive shareholder return in the period. Particularly strong returns were provided by Mexican airport company OMAB (Total Shareholder Return (TSR) of 34.8%), Zurich Airport (TSR of 22.3%), Canadian electricity and gas distribution company Fortis (22.3%), oil and chemical tank storage company Vopak (20.7%) and UK water utility Pennon Group (20.6%).
All sectors held by the Fund delivered positive returns for the period. The Integrated Power sector provided a weighted average TSR of 14.7%, Water Utilities delivered a TSR of 12.7%, the Electricity Transmission & Distribution sector delivered a TSR of 9.8%, and Airports generated a TSR of 9.0%.
Geographically, the Fund's U.S. exposure generated a TSR of 14.3%, Australian/New Zealand stocks provided a TSR of 10.7%, UK stocks 9.8%, Canadian stocks 8.0% and European stocks 3.2%.
page 12

Portfolio Outlook and Strategy
The Core Infrastructure strategy is designed to provide reliable returns over the medium-to-longer term. The Fund exceeded that expectation during 2014, partly reflecting the recovery of stocks held by the Fund that had been over-sold in previous years. We now see the utilities market as broadly in equilibrium while infrastructure stocks remain cheap.
We believe that infrastructure and utility assets, with requisite earnings reliability and a linkage of earnings to inflation, offer an attractive, long-term investment proposition. Furthermore, given the predictable nature of earnings and the structural linkage of those earnings to inflation, the investment returns generated by infrastructure assets are different from standard asset classes and offer investors valuable diversification when included in an investment portfolio. In the current uncertain economic and investment climate, the reliable financial performance of infrastructure investments makes them particularly attractive and an investment in listed infrastructure can be expected to reward patient investors with a three to five year timeframe.
Sincerely,
Dennis Eagar
Portfolio Manager
MFG Asset Management
page 13

INVESTMENT HIGHLIGHTS
Growth of a $100,000 Investment (Unaudited)

* 1/18/12 commencement of operations.
This chart assumes an initial gross investment of $100,000 made on 1/18/12 (commencement of operations). Returns shown include the reinvestment of all distributions. Past performance is not predictive of future results. Investment return and principal value will fluctuate so that shares, when redeemed, may be worth more or less than the original cost. In the absence of existing fee waivers, total return would be reduced. To receive current to the most recent month-end performance, please call 1-888-825-2100.
The MSCI World Index represents large and mid cap equities across 23 Developed Markets countries. The index covers approximately 85% of the free float-adjusted market capitalization in each country. The UBS Developed Infrastructure & Utilities Index and the S&P Global Infrastructure Index are global developed markets infrastructure and utilities benchmarks. None of the indices reflect investment management fees, brokerage commissions or other expenses associated with investing in equity securities. A direct investment in an index is not possible.
Frontegra Asset Management, Inc. has contractually agreed through October 31, 2015 to waive its management fee and/or reimburse the Fund's operating expenses to the extent necessary to ensure that the Fund's total operating expenses (excluding taxes, interest, brokerage commissions, acquired fund fees and expenses and extraordinary expenses) do not exceed 0.70% of the Fund's average daily net assets. The expense ratios presented are based on the annualized expense ratios as reported in the Fund's current prospectus, which may differ from the expense ratios presented in the Fund's financial highlights.
** The returns shown do not reflect the deduction of taxes that a shareholder would pay on Fund distributions or the redemption of Fund shares.
Portfolio Total Return**
FOR PERIODS
ENDED
12/31/14 | | FUND | | UBS
INDEX | | MSCI
INDEX | | S&P
GLOBAL
INDEX | |
SIX MONTHS | | | 1.60 | % | | | (1.10 | )% | | | (1.17 | )% | | | (2.62 | )% | |
ONE YEAR | | | 16.63 | % | | | 14.11 | % | | | 4.94 | % | | | 12.98 | % | |
AVERAGE
ANNUAL
SINCE
INCEPTION | | | 15.11 | % | | | 11.95 | % | | | 14.43 | % | | | 13.22 | % | |
Fund Expenses | |
GROSS EXPENSE RATIO | | | 1.46 | % | |
NET EXPENSE RATIO | | | 0.71 | % | |
page 14

FRONTIER
TIMPANI SMALL CAP GROWTH FUND

REPORT FROM TIMPANI CAPITAL MANAGEMENT LLC
Dear Fellow Shareholders:
The Frontier Timpani Small Cap Growth Fund strives to achieve capital appreciation by investing in a diversified portfolio of growth companies with small market capitalizations. Timpani seeks to:
• Invest in companies where growth is robust, sustainable and underestimated by the market.
• Conduct fundamental research that provides unique insights into the perception gap that exists between market expectations and a company's true growth rate.
• Manage risk by continuously evaluating the size of the perception gap relative to market expectations and monitoring market sentiment.
• Act on new relevant incremental data points, both positive and negative, in an effort to exploit investor biases.
Performance Review
During the six month period ended December 31, 2014, the Frontier Timpani Small Cap Growth Fund (Institutional Class) returned 2.12%, net of fees, compared to 3.31% for the Russell 2000 Growth Index. For the year, the Fund returned -0.55%, net of fees, compared to 5.60% for the Index.
Strong stock selection in some sectors offset weak stock selection in others which produced the slightly negative relative returns, while sector allocation had virtually no impact. In particular, Producer Durables, Financial Services, and Technology delivered the most significant gains, while Energy and Health Care were a drag on performance. There were other sector weights that added to or subtracted from performance; however, they largely offset one another. From a sector allocation standpoint, an overweight in Energy was a negative contributor, while an underweight in Materials & Processing was a positive contributor to performance.
It was a difficult year from an investment style perspective which was a headwind to our performance, particularly in the third quarter during the month of July. Health Care was the sector that lagged the most and within Health Care, Lannett was the worst performer. Marchex, which was our biggest negative contributor, surprised us negatively when it decided to drop its largest customer, Allstate, due to a disagreement about fee structure. Several Energy names, hurt by the crash in oil prices, were a drag on performance before we cut exposure to the sector, including Sanchez Energy, Diamondback Energy, and Basic Energy Services. A number of stocks across a diverse group of sectors contributed significantly to the Fund's performance. For instance, six of our largest positive contributors came from five different sectors. LendingTree was our largest positive contributor within Financial Services. TubeMogul and Super Micro Computer were standout performers within Technology. Hawaiian Holdings was a standout performer in Producer Durables, and ANI Pharmaceuticals was a strong performer in Health Care. Jack in the Box, a large holding in Consumer Discretionary, continued to post positive comparable store sales, which led to relative outperformance.
Portfolio Outlook
During the latter half of 2014, the benchmark trended modestly higher. However, the path to get there was volatile — weak in the third quarter and strong in the fourth quarter. The third quarter was characterized by falling interest rates and a strong dollar, evidence of risk aversion in the market place, mostly caused by global economic concerns along with an Ebola scare. In the fourth quarter, the U.S. economy was robust and Ebola fears subsided. However, global economic fears persisted and the U.S. dollar further appreciated. The most notable event in the fourth quarter was a crash in the price of oil. It plummeted from over $90 per barrel to under $60 per barrel. This had and will likely continue to have a major impact on the fundamentals of companies in the portfolio for the foreseeable future. As the negative fundamental energy-related data points accumulated early in the fourth quarter, our strict sell discipline kicked-in and helped us avoid much of the carnage. In addition, weak energy prices helped other parts of the portfolio, including several consumer and
page 16

transportation names. The general consensus is that the domestic economy is on very solid footing, while most investor concerns are directed towards our foreign trading partners. There are many concerns about the broader world economy especially within Europe and Asia as data points have become significantly more challenging as of late. On a more positive note, central banks remain accommodative which should serve to buttress growth prospects around the globe. While we know interest rate increases by the U.S. Federal Reserve are inevitable and likely to start in mid to late 2015, those have been well telegraphed by the marketplace, and will be rising from an unusually low level. Thus, we expect the news to be digested without much fanfare. Perhaps just as importantly, rising interest rates are most likely to be accompanied by a continued stronger economy, which should be favorable for stocks.
On a micro level, things appear to be favorable. Fundamental data points from company management teams continue to confirm the economy is on solid footing and that secular growth can be found in numerous pockets of the economy. That growth is being sought by investors and can potentially drive upside to analyst estimates and lead to strong stock price performance. Going forward, we expect secular growth and upside surprise to be more fully embraced by the marketplace now that small cap growth valuations have compressed and the earnings momentum style correction has likely ended. In addition to these improving characteristics, corporate balance sheets remain sound, and companies are generating cash which enables them to increase cash deployment in the form of dividends, share buybacks or accretive acquisitions. We believe positive corporate fundamentals will lead to the potential for increased M&A activity, which could benefit the companies we own as both buyers and potential sellers.
During the period, we continued to focus on finding robust and sustainable growers where the growth is being underestimated. That research has resulted in sector weights that vary from the benchmark weights. The most notable change was Energy which went from overweight to underweight during the latter part of the year. Other key overweights include Consumer Discretionary, Technology, and Health Care, while notable underweights include Financial Services and Materials & Processing.
We will continue to make it our mission to find companies that have characteristics consistent with our investment process. We believe this approach is most value-added for shareholders over the long term.
Thank you for your continued support.
Sincerely,
Brandon Nelson, CFA
Chief Investment Officer
Timpani Capital Management LLC
page 17

INVESTMENT HIGHLIGHTS
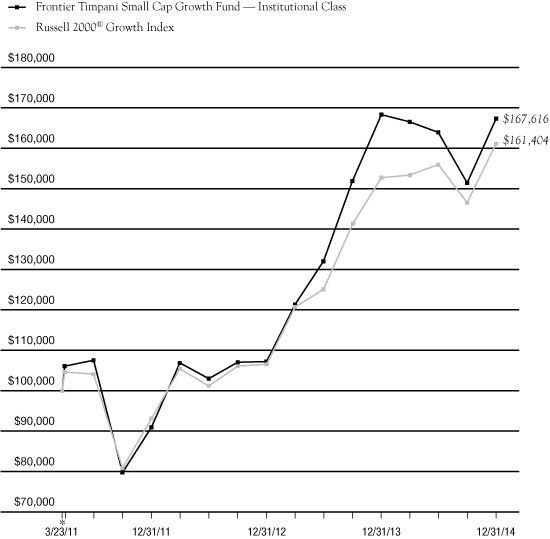
Growth of a $100,000 Investment (Unaudited)
* 3/23/11 commencement of operations.
This chart assumes an initial gross investment of $100,000 made on 3/23/11. Returns shown include the reinvestment of all distributions. Past performance is not predictive of future results. Investment return and principal value will fluctuate so that shares, when redeemed, may be worth more or less than the original cost. In the absence of fee waivers, total return would be reduced. To receive current to the most recent month-end performance, please call 1-888-825-2100.
The Russell 2000® Growth Index measures the performance of the small-cap growth segment of the U.S. equity universe. The Index does not reflect investment management fees, brokerage commissions and other expenses associated with investing in equity securities. A direct investment in the index is not possible.
Timpani Capital Management LLC has contractually agreed through October 31, 2015 to waive its management fee and/or reimburse the Fund's operating expenses to the extent necessary to ensure that the Fund's total operating expenses (excluding taxes, interest, brokerage commissions, acquired fund fees and expenses and extraordinary expenses) do not exceed 1.10% of the Fund's average daily net assets of the Institutional Class. The expense ratios presented are based on the annualized expense ratios as reported in the Fund's current prospectus, which may differ from the expense ratios presented in the Fund's financial highlights.
** The returns shown do not reflect the deduction of taxes that a shareholder would pay on Fund distributions or the redemption of Fund shares.
The above graph relates to Institutional Class shares of the Fund. Performance for Class Y shares will vary from the performance of the Institutional Class shares shown above due to differences in expenses.
Portfolio Total Return**
FOR PERIODS ENDED 12/31/14 | | FUND | | INDEX | |
SIX MONTHS | | | 2.12 | % | | | 3.31 | % | |
ONE YEAR | | | (0.55 | )% | | | 5.60 | % | |
AVERAGE ANNUAL
SINCE INCEPTION | | | 14.66 | % | | | 13.52 | % | |
Institutional Class Expenses | |
GROSS EXPENSE RATIO | | | 2.46 | % | |
NET EXPENSE RATIO | | | 1.10 | % | |
page 18

FRONTIER
NETOLS SMALL CAP VALUE FUND

REPORT FROM NETOLS ASSET MANAGEMENT, INC.
Dear Fellow Shareholders:
The Frontier Netols Small Cap Value Fund strives to achieve capital appreciation by investing at least 80% of its assets in equity securities of small capitalization companies. The Fund's performance is measured against the Russell 2000® Value Index.
Performance Review
During the six month period ended December 31, 2014, the Frontier Netols Small Cap Value Fund (Institutional Class) returned 0.93%, net of fees, compared to 0.01% for the Russell 2000 Value Index. For the year, the Fund returned 5.69%, net of fees, compared to 4.22% for the Index.
Portfolio Review
During the second half of 2014, the main factors shaping market sentiment were a stronger domestic economy, offset by overseas headwinds resulting from softening economic growth and political unrest. Incrementally positive U.S. economic news, including an improving employment outlook, allowed the Federal Reserve to conclude its bond purchasing activity. However, as the domestic economy strengthened, other world economies weakened. The decline in oil prices that aided the U.S. consumer hurt many emerging economies. Additionally, China's economy continued to slow and deflation fears hit Europe. As a result, China lowered interest rates while Europe and Japan contemplated further stimulus measures. This strengthened the dollar as the Federal Reserve began charting the path of policy normalization. These factors resulted in more domestically focused sectors like Health Care and Financials outperforming. Additionally, more cyclical and internationally impacted sectors like Energy and Materials underperformed during the period.
Positive Contributions to Relative Performance in the Second Half of 2014:
• Stock selection in Industrials and Consumer Discretionary sectors
• Overweight in Health Care and Consumer Staples sectors
• Underweight in Energy
• Best performing stocks for the period: TASER International, Capella Education, VCA Inc, Acadia Healthcare and Casey's General Stores
Negative Contributions to Relative Performance in the Second Half of 2014:
• Stock selection in Energy
• Underweight in Financials and Utilities
• Worst performing stocks for the period: McDermott International, Bill Barrett, Willbros Group, Superior Energy Services and Commercial Vehicle Group
Portfolio Outlook
We believe the U.S. economy continues to move forward. The current employment environment should continue to drive consumer confidence and further economic activity. Companies have started to selectively increase capacity after years of rationalization and cost reduction. While the domestic outlook appears stable, international economies have softened as a result of capital flows and currency fluctuations stemming from Fed policy normalization, geopolitical unrest, and the actions of foreign central banks. If these factors prove to be transitory in nature, other economies should rebound and be additive to the growth in the U.S.
Thank you for your continued support.
Jeff Netols
President
Netols Asset Management, Inc.
page 20

INVESTMENT HIGHLIGHTS
Growth of a $100,000 Investment (Unaudited)

* 12/16/05 commencement of operations.
This chart assumes an initial gross investment of $100,000 made on 12/16/05 (commencement of operations). Returns shown include the reinvestment of all distributions. Past performance is not predictive of future results. Investment return and principal value will fluctuate so that shares, when redeemed, may be worth more or less than the original cost. In the absence of existing fee waivers, total return would be reduced. To receive current to the most recent month-end performance, please call 1-888-825-2100.
The Russell 2000 Value Index measures the performance of those Russell 2000 companies with lower price-to-book ratios and lower forecasted growth values. The Index does not reflect investment management fees, brokerage commissions and other expenses associated with investing in equity securities. A direct investment in the index is not possible.
Frontegra Asset Management, Inc. has contractually agreed through October 31, 2015 to waive its management fee and/or reimburse the Fund's operating expenses to the extent necessary to ensure that the Fund's total operating expenses (excluding taxes, interest, brokerage commissions, acquired fund fees and expenses and extraordinary expenses) do not exceed 1.10% of the Fund's average daily net assets for the Institutional Class. The expense ratios presented are based on the annualized expense ratios as reported in the Fund's current prospectus, which may differ from the expense ratios presented in the Fund's financial highlights.
** The returns shown do not reflect the deduction of taxes that a shareholder would pay on Fund distributions or the redemption of Fund shares.
The above graph relates to Institutional Class shares of the Fund. Performance for Class Y shares will vary from the performance of the Institutional Class shares shown above due to differences in expenses.
Portfolio Total Return**
FOR PERIODS
ENDED 12/31/14 | | FUND | | INDEX | |
SIX MONTHS | | | 0.93 | % | | | 0.01 | % | |
ONE YEAR | | | 5.69 | % | | | 4.22 | % | |
FIVE YEAR
AVERAGE ANNUAL | | | 13.84 | % | | | 14.26 | % | |
AVERAGE ANNUAL
SINCE INCEPTION | | | 8.42 | % | | | 6.93 | % | |
Institutional Class Expenses | |
GROSS EXPENSE RATIO | | | 1.17 | % | |
NET EXPENSE RATIO | | | 1.10 | % | |
page 21
This page intentionally left blank.

FRONTIER
PHOCAS SMALL CAP VALUE FUND

REPORT FROM PHOCAS FINANCIAL CORPORATION
Dear Fellow Shareholders:
The Frontier Phocas Small Cap Value Fund strives to achieve capital appreciation by investing in a diversified portfolio of equity securities of companies with small market capitalizations. The Fund's performance is measured against the Russell 2000® Value Index.
Performance Review
During the six month period ended December 31, 2014, the Frontier Phocas Small Cap Value Fund returned 0.34%, net of fees, compared to the 0.01% return of the benchmark, the Russell 2000 Value Index (the "Benchmark" or the "Index"). For the year, the Fund returned 7.19%, net of fees, compared to 4.22% for the Index.
Portfolio Review and Strategy
For the third quarter, Health Care was the top performer for the Fund, followed by Information Technology. Unfortunately, these were our only two sectors that resulted in positive quarterly returns, other than cash equivalents. Despite the weak backdrop, the Fund owned some stocks that were up 25% or better for the quarter, led by a significant move by United Therapeutics, a biopharma company that won a patent extension for one of their major drugs. Other solid performers included: Skyworks Solutions, a wireless chipmaker that has a strong position within Apple's smartphones; Progenics Pharmaceuticals, a biotech pharma company that received FDA approval for their first drug; Saba Software, an HR cloud software company that was recovering from accounting issues; Verint Systems, a customer intelligence software solution provider; and AOL, better known as a search engine company than for their strong advertising platforms.
Unlike the third quarter, the fourth quarter saw attractive performance in every major sector within the Index except Energy. For the Fund, Financials — including the Benchmark weight of REITs within the sector — was the top relative performing sector, followed by Materials. Our lack of exposure to weak specialty retail stocks, and our overweight within Media and Auto & Component subsectors helped our performance in the Consumer Discretionary sector. The Fund also realized attractive outperformance from the Telecom sector, but there was only one name within it (West Corp.). Several names within the Fund generated quarterly total returns north of 20%, but a few stood out: Spansion, a semiconductor company that focuses on flash memory and is merging with Cypress Semiconductor, more than doubled; Progenics Pharmaceuticals, a biotech pharma company with a strong drug pipeline that has participated in a robust rally within Health Care stocks; and Cracker Barrel restaurants, a family restaurant chain. Both Progenics and Cracker Barrel were up more than 30% for the quarter.
With the strong gains in the U.S. stock market in recent years, finding attractive significantly undervalued stocks has been more difficult, but there are still values to be found. Safer areas like Consumer Staples, Health Care, and Utilities have become quite fully valued as cautious investors migrate from fixed income towards equities. Even global investors want more U.S. equities given the strengthening dollar trends. In our opinion, though, some of the more cyclical areas in the equity markets remain undervalued. There are usually unrecognized values in every sector, however, and our perennial mission is to find them.
We continue to sell off highly appreciated positions as well as under-performing names that remain fundamentally challenged, and also continue to reinvest in low-valued names. Despite fair valuations within the broader domestic equity market, select stocks still continue to represent investment opportunities. We have focused a lot of attention within Consumer Discretionary, as it had a few of the harder hit subsectors this year, especially specialty retail and apparel. In the Energy sector, we have reduced our exposure to only the best names with balance sheets that will allow them to survive potentially crippling short-term energy prices.
Thank you for your continued support.
William Schaff, CFA | | Steve Block, CFA | |
Chief Executive Officer and Portfolio Manager | | Portfolio Manager | |
Phocas Financial Corporation | | Phocas Financial Corporation | |
page 24

INVESTMENT HIGHLIGHTS
Growth of a $100,000 Investment (Unaudited)

* 9/29/06 commencement of operations.
This chart assumes an initial gross investment of $100,000 made on 9/29/06. Returns shown include the reinvestment of all distributions. Past performance is not predictive of future results. Investment return and principal value will fluctuate so that shares, when redeemed, may be worth more or less than the original cost. In the absence of fee waivers, total return would be reduced. Effective October 8, 2010, Phocas Financial Corp. ("Phocas") became subadviser to the Fund and Frontegra Asset Management, Inc. became adviser to the Fund. Prior to October 8, 2010, Phocas served as adviser to the Fund. To receive current to the most recent month-end performance, please call 1-888-825-2100.
The Russell 2000® Value Index measures the performance of those Russell 2000® companies with lower price-to-book ratios and lower forecasted growth values. The Index does not reflect investment management fees, brokerage commissions and other expenses associated with investing in equity securities. A direct investment in the index is not possible.
Frontegra Asset Management, Inc. has contractually agreed through October 31, 2015 to waive its management fee and/or reimburse the Fund's operating expenses to the extent necessary to ensure that the Fund's total operating expenses (excluding taxes, interest, brokerage commissions, acquired fund fees and expenses and extraordinary expenses) do not exceed 1.10% of the Fund's average daily net assets. The expense ratios presented are based on the annualized expense ratios as reported in the Fund's current prospectus, which may differ from the expense ratios presented in the Fund's financial highlights.
** The returns shown do not reflect the deduction of taxes that a shareholder would pay on Fund distributions or the redemption of Fund shares.
Portfolio Total Return**
FOR PERIODS ENDED 12/31/14 | | FUND | | INDEX | |
SIX MONTHS | | | 0.34 | % | | | 0.01 | % | |
ONE YEAR | | | 7.19 | % | | | 4.22 | % | |
FIVE YEAR
AVERAGE ANNUAL | | | 15.92 | % | | | 14.26 | % | |
AVERAGE ANNUAL
SINCE INCEPTION | | | 8.71 | % | | | 6.19 | % | |
Fund Expenses | |
GROSS EXPENSE RATIO | | | 2.00 | % | |
NET EXPENSE RATIO | | | 1.13 | % | |
page 25

Frontier Funds
EXPENSE EXAMPLE
December 31, 2014 (Unaudited)
As a shareholder of a mutual fund, you incur two types of costs: (1) transaction costs, including redemption fees, and (2) ongoing costs, including management fees, distribution and/or service (12b-1) fees and other fund expenses. Although the Funds charge no sales loads, you will be assessed fees for outgoing wire transfers, returned checks and stop payment orders at prevailing rates charged by U.S. Bancorp Fund Services, LLC, the Funds' transfer agent. If you request that a redemption be made by wire transfer, currently the Funds' transfer agent charges a $15.00 fee. A redemption fee of 2.00% of the then current value of the shares redeemed may be imposed on certain redemptions of shares made within 30 days of purchase for the Frontier RobecoSAM Global Equity, Frontier MFG Global Equity and Frontier MFG Core Infrastructure Funds.
This Example is intended to help you understand your ongoing costs (in dollars) of investing in the Funds and to compare these costs with the ongoing costs of investing in other mutual funds. The Example is based on an investment of $1,000 invested at the beginning of the period and held for the entire period (7/1/14 – 12/31/14).
Actual Expenses
The first line of the table on the following page for each Fund provides information about actual account values and actual expenses. The Example includes management fees, registration fees, fee waivers/reimbursements and other expenses. However, the Example does not include portfolio trading commissions and related expenses and other extraordinary expenses as determined under generally accepted accounting principles. You may use the information in this line, together with the amount you invested, to estimate the expenses that you paid over the period. Simply divide your account value by $1,000 (for example, an $8,600 account value divided by $1,000 = 8.6), then multiply the result by the number in the first line under the heading entitled "Expenses Paid During the Period" to estimate the expenses you paid on your account during this period.
Hypothetical Example for Comparison Purposes
The second line of the table for each Fund provides information about hypothetical account values and hypothetical expenses based on each of the Fund's actual expense ratios and an assumed rate of return of 5% per year before expenses, which is not the actual return. The hypothetical account values and expenses may not be used to estimate the actual ending account balance or expenses you paid for the period. You may use this information to compare the ongoing costs of investing in each of the Funds and other funds. To do so, compare this 5% hypothetical example with the 5% hypothetical examples that appear in the shareholder reports of the other funds.
Please note that the expenses shown in the table are meant to highlight your ongoing costs only and do not reflect any transactional costs, such as redemption fees. Therefore, the second line of the table is useful in comparing ongoing costs only, and will not help you determine the relative total costs of owning different funds. In addition, if these transactional costs were included, your costs could have been higher.
page 26

Frontier Funds
EXPENSE EXAMPLE (continued)
December 31, 2014 (Unaudited)
| | | Beginning Account
Value 7/1/2014 | | Ending Account
Value 12/31/2014 | | Annualized
Expense Ratio* | | Expenses Paid
During the Period* | |
RobecoSAM Global Equity Fund | |
Actual Fund Return | | $ | 1,000.00 | | | $ | 969.20 | | | | 1.20 | % | | $ | 5.96 | | |
Hypothetical 5% Return | | $ | 1,000.00 | | | $ | 1,019.16 | | | | 1.20 | % | | $ | 6.11 | | |
MFG Global Equity Fund | |
Actual Fund Return | | $ | 1,000.00 | | | $ | 1,029.90 | | | | 0.80 | % | | $ | 4.09 | | |
Hypothetical 5% Return | | $ | 1,000.00 | | | $ | 1,021.17 | | | | 0.80 | % | | $ | 4.08 | | |
MFG Core Infrastructure Fund | |
Actual Fund Return | | $ | 1,000.00 | | | $ | 1,016.00 | | | | 0.70 | % | | $ | 3.56 | | |
Hypothetical 5% Return | | $ | 1,000.00 | | | $ | 1,021.68 | | | | 0.70 | % | | $ | 3.57 | | |
Timpani Small Cap Growth
Fund – Institutional Class | |
Actual Fund Return | | $ | 1,000.00 | | | $ | 1,021.20 | | | | 1.10 | % | | $ | 5.60 | | |
Hypothetical 5% Return | | $ | 1,000.00 | | | $ | 1,019.66 | | | | 1.10 | % | | $ | 5.60 | | |
Timpani Small Cap Growth
Fund – Class Y | |
Actual Fund Return* | | $ | 1,000.00 | | | $ | 1,019.30 | | | | 1.50 | % | | $ | 7.63 | | |
Hypothetical 5% Return** | | $ | 1,000.00 | | | $ | 1,017.64 | | | | 1.50 | % | | $ | 7.63 | | |
Netols Small Cap Value
Fund – Institutional Class | |
Actual Fund Return | | $ | 1,000.00 | | | $ | 1,009.30 | | | | 1.10 | % | | $ | 5.57 | | |
Hypothetical 5% Return | | $ | 1,000.00 | | | $ | 1,019.66 | | | | 1.10 | % | | $ | 5.60 | | |
Netols Small Cap Value
Fund – Class Y | |
Actual Fund Return | | $ | 1,000.00 | | | $ | 1,008.90 | | | | 1.50 | % | | $ | 7.60 | | |
Hypothetical 5% Return | | $ | 1,000.00 | | | $ | 1,017.64 | | | | 1.50 | % | | $ | 7.63 | | |
Phocas Small Cap Value Fund | |
Actual Fund Return | | $ | 1,000.00 | | | $ | 1,003.40 | | | | 1.10 | % | | $ | 5.55 | | |
Hypothetical 5% Return | | $ | 1,000.00 | | | $ | 1,019.66 | | | | 1.10 | % | | $ | 5.60 | | |
* Expenses are equal to each Fund's annualized expense ratio indicated above, multiplied by the average account value over the period, multiplied by 184/365 to reflect the one-half year period.
page 27

Frontier RobecoSAM Global Equity Fund
SCHEDULE OF INVESTMENTS
December 31, 2014 (Unaudited)
Number of Shares | | | | Value | |
COMMON STOCKS 93.2% | | | |
| | | Australia 1.5% | |
| | 19,100 | | | AGL Energy Ltd. | | $ | 208,326 | | |
| | | Austria 0.7% | |
| | 6,500 | | | Raiffeisen Bank
International AG | | | 99,320 | | |
| | | France 4.6% | |
| | 7,200 | | | CNP Assurances | | | 127,643 | | |
| | 1,500 | | | Sanofi | | | 136,756 | | |
| | 7,700 | | | Suez Environnement Co. | | | 134,159 | | |
| | 4,400 | | | Total SA | | | 225,422 | | |
| | | | 623,980 | | |
| | | Germany 3.7% | |
| | 940 | | | Allianz SE | | | 155,689 | | |
| | 2,100 | | | BASF SE | | | 176,150 | | |
| | 3,300 | | | Fresenius SE & Co. KGaA | | | 171,581 | | |
| | | | 503,420 | | |
| | | Israel 1.3% | |
| | 16,300 | | | Mizrahi Tefahot Bank Ltd. (a) | | | 170,586 | | |
| | | Italy 0.7% | |
| | 5,400 | | | Eni SpA | | | 94,589 | | |
| | | Japan 6.1% | |
| | 6,100 | | | Honda Motor Co. Ltd. | | | 178,963 | | |
| | 30,200 | | | Inpex Corp. | | | 336,216 | | |
| | 11,800 | | | Keihin Corp. | | | 175,143 | | |
| | 6,000 | | | Stanley Electric Co. Ltd. | | | 129,561 | | |
| | | | 819,883 | | |
| | | Netherlands 2.5% | |
| | 3,900 | | | Koninklijke DSM NV | | | 237,873 | | |
| | 3,400 | | | Koninklijke Philips NV | | | 98,553 | | |
| | | | 336,426 | | |
| | | Norway 2.0% | |
| | 18,400 | | | DNB ASA | | | 271,411 | | |
Number of Shares | | | | Value | |
| | | Sweden 0.7% | |
| | 3,575 | | | Atlas Copco AB - Class A | | $ | 99,477 | | |
| | | Switzerland 5.1% | |
| | 3,100 | | | Nestle SA | | | 225,993 | | |
| | 1,300 | | | Roche Holding AG | | | 352,225 | | |
| | 740 | | | Schindler Holding AG | | | 106,830 | | |
| | | | 685,048 | | |
| | | United Kingdom 6.2% | |
| | 39,300 | | | Barclays PLC | | | 147,742 | | |
| | 48,800 | | | BT Group PLC | | | 303,540 | | |
| | 3,000 | | | Croda International PLC | | | 123,823 | | |
| | 17,000 | | | Drax Group PLC | | | 121,736 | | |
| | 5,600 | | | SSE PLC | | | 141,496 | | |
| | | | 838,337 | | |
| | | United States 58.1% | |
| | 6,400 | | | Abbott Laboratories | | | 288,128 | | �� |
| | 3,200 | | | Celanese Corp - Class A | | | 191,872 | | |
| | 14,100 | | | Cisco Systems, Inc. | | | 392,191 | | |
| | 3,300 | | | Colgate-Palmolive Co. | | | 228,327 | | |
| | 3,400 | | | Discover Financial Services | | | 222,666 | | |
| | 3,800 | | | Dollar Tree, Inc. (a) | | | 267,444 | | |
| | 4,100 | | | Emerson Electric Co. | | | 253,093 | | |
| | 1,700 | | | Fluor Corp. | | | 103,071 | | |
| | 2,900 | | | Fossil Group, Inc. (a) | | | 321,146 | | |
| | 2,300 | | | Franklin Resources, Inc. | | | 127,351 | | |
| | 2,400 | | | GNC Holdings, Inc. | | | 112,704 | | |
| | 3,000 | | | Illinois Tool Works, Inc. | | | 284,100 | | |
| | 1,600 | | | International Business
Machines Corp. | | | 256,704 | | |
| | 2,600 | | | Johnson & Johnson | | | 271,882 | | |
| | 5,300 | | | L Brands, Inc. | | | 458,715 | | |
| | 3,500 | | | MasterCard, Inc - Class A | | | 301,560 | | |
| | 1,200 | | | Mead Johnson Nutrition Co. | | | 120,648 | | |
| | 8,400 | | | Microsoft Corp. | | | 390,180 | | |
| | 2,100 | | | National Oilwell Varco, Inc. | | | 137,613 | | |
| | 3,200 | | | Occidental Petroleum Corp. | | | 257,952 | | |
The accompanying notes are an integral part of these financial statements.
page 28

Frontier RobecoSAM Global Equity Fund
SCHEDULE OF INVESTMENTS (continued)
December 31, 2014 (Unaudited)
Number of Shares | | | | Value | |
| COMMON STOCKS 93.2% (continued) | | | |
| | | United States 58.1% (continued) | |
| | 6,800 | | | Oracle Corp. | | $ | 305,796 | | |
| | 1,300 | | | Parker-Hannifin Corp. | | | 167,635 | | |
| | 2,200 | | | PepsiCo, Inc. | | | 208,032 | | |
| | 8,500 | | | Pfizer, Inc. | | | 264,775 | | |
| | 3,700 | | | The Chubb Corp. | | | 382,839 | | |
| | 4,000 | | | The Coca-Cola Co. | | | 168,880 | | |
| | 5,500 | | | The Hartford Financial
Services Group, Inc. | | | 229,295 | | |
| | 2,700 | | | The PNC Financial Services
Group, Inc. | | | 246,321 | | |
| | 3,300 | | | UnitedHealth Group, Inc. | | | 333,597 | | |
| | 7,300 | | | Wells Fargo & Co. | | | 400,186 | | |
| | 4,700 | | | Xylem, Inc. | | | 178,929 | | |
| | | | 7,873,632 | | |
| | | Total Common Stocks | |
| | | | | (Cost $10,376,873) | | | 12,624,435 | | |
PREFERRED STOCKS 3.8% | | | |
| | | Germany 3.8% | |
| | 2,100 | | | Henkel AG & Co. KGaA | | | 226,208 | | |
| | 1,300 | | | Volkswagen AG | | | 288,933 | | |
| | | | 515,141 | | |
| | | Total Preferred Stocks | |
| | | | | (Cost $380,621) | | | 515,141 | | |
Number of Shares | | | | Value | |
SHORT-TERM INVESTMENTS 1.5% | |
| | | Investment Company 1.5% | |
| | 208,440 | | | STIT-STIC Prime Portfolio -
Institutional Class, 0.04% | | $ | 208,440 | | |
| | | Total Short-Term Investments | |
| | | (Cost $208,440) | | | 208,440 | | |
| | | Total Investments 98.5% | |
| | | (Cost $10,965,934) | | | 13,348,016 | | |
| | | Other Assets in Excess of
Liabilities 1.5% | | | 199,646 | | |
| | | TOTAL NET ASSETS 100.0% | | $ | 13,547,662 | | |
(a) Non-Income Producing.
PORTFOLIO DIVERSIFICATION
Sectors | | Percentage | |
Financials | | | 19.0 | % | |
Consumer Discretionary | | | 14.3 | | |
Health Care | | | 13.4 | | |
Information Technology | | | 12.2 | | |
Industrials | | | 9.5 | | |
Consumer Staples | | | 8.7 | | |
Energy | | | 7.8 | | |
Materials | | | 5.4 | | |
Utilities | | | 4.5 | | |
Telecommunication Services | | | 2.2 | | |
Total Common and Preferred Stocks | | | 97.0 | | |
Total Short-Term Investments | | | 1.5 | | |
Total Investments | | | 98.5 | | |
Other Assets in Excess of Liabilities | | | 1.5 | | |
Total Net Assets | | | 100.0 | % | |
The accompanying notes are an integral part of these financial statements.
page 29

Frontier MFG Global Equity Fund
SCHEDULE OF INVESTMENTS
December 31, 2014 (Unaudited)
Number of Shares | | | | Value | |
COMMON STOCKS 88.7% | | | |
| | | France 4.5% | |
| | 184,087 | | | Danone | | $ | 12,035,280 | | |
| | 371,949 | | | Sanofi | | | 33,910,853 | | |
| | | | 45,946,133 | | |
| | | Germany 4.6% | |
| | 663,006 | | | SAP SE | | | 46,296,753 | | |
| | | Netherlands 3.4% | |
| | 895,498 | | | Unilever NV | | | 35,029,944 | | |
| | | Switzerland 7.1% | |
| | 620,209 | | | Nestle SA | | | 45,213,865 | | |
| | 289,948 | | | Novartis AG | | | 26,890,786 | | |
| | | | 72,104,651 | | |
| | | United Kingdom 6.4% | |
| | 23,580,581 | | | Lloyds Banking Group PLC (a) | | | 27,736,953 | | |
| | 12,863,900 | | | Tesco PLC | | | 37,507,351 | | |
| | | | 65,244,304 | | |
| | | United States 62.7% | |
| | 78,300 | | | American Express Co. | | | 7,285,032 | | |
| | 326,497 | | | DIRECTV (a) | | | 28,307,290 | | |
| | 1,089,698 | | | eBay, Inc. (a) | | | 61,153,852 | | |
| | 39,665 | | | Google, Inc. - Class A (a) | | | 21,048,629 | | |
| | 21,137 | | | Google, Inc. - Class C (a) | | | 11,126,517 | | |
| | 832,761 | | | Lowe's Companies, Inc. | | | 57,293,957 | | |
| | 311,960 | | | MasterCard, Inc. - Class A | | | 26,878,474 | | |
| | 150,371 | | | McDonald's Corp. | | | 14,089,763 | | |
| | 1,281,727 | | | Microsoft Corp. | | | 59,536,219 | | |
| | 1,146,768 | | | Oracle Corp. | | | 51,570,157 | | |
| | 377,992 | | | State Street Corp. | | | 29,672,372 | | |
| | 572,964 | | | Target Corp. | | | 43,493,697 | | |
| | 716,299 | | | The Bank of New York
Mellon Corp. | | | 29,060,250 | | |
| | 391,352 | | | The Home Depot, Inc. | | | 41,080,219 | | |
| | 240,363 | | | U.S. Bancorp | | | 10,804,317 | | |
| | 186,746 | | | Visa, Inc. - Class A | | | 48,964,801 | | |
| | 263,873 | | | Wal-Mart Stores, Inc. | | | 22,661,413 | | |
Number of Shares | | | | Value | |
| | | United States 62.7% (continued) | |
| | 457,595 | | | Wells Fargo & Co. | | $ | 25,085,358 | | |
| | 641,952 | | | Yum! Brands, Inc. | | | 46,766,203 | | |
| | | | 635,878,520 | | |
| | | Total Common Stocks | |
| | | | | (Cost $783,094,490) | | | 900,500,305 | | |
SHORT-TERM INVESTMENTS 11.4% | | | |
| | | Investment Company 11.4% | |
| | 115,153,016 | | | STIT Liquid Assets Portfolio -
Institutional Class, 0.07% | | | 115,153,016 | | |
| | | Total Short-Term Investments | |
| | | | | (Cost $115,153,016) | | | 115,153,016 | | |
| | | Total Investments 100.1% | |
| | | | | (Cost $898,247,506) | | | 1,015,653,321 | | |
| | | | | Liabilities in Excess of
Other Assets (0.1)% | | | (811,140 | ) | |
| | | | | TOTAL NET ASSETS 100.0% | | $ | 1,014,842,181 | | |
(a) Non-Income Producing.
PORTFOLIO DIVERSIFICATION
Sectors | | Percentage | |
Information Technology | | | 32.2 | % | |
Consumer Discretionary | | | 22.7 | | |
Consumer Staples | | | 15.0 | | |
Financials | | | 12.8 | | |
Health Care | | | 6.0 | | |
Total Common Stocks | | | 88.7 | | |
Total Short-Term Investments | | | 11.4 | | |
Total Investments | | | 100.1 | | |
Liabilities in Excess of Other Assets | | | (0.1 | ) | |
Total Net Assets | | | 100.0 | % | |
The accompanying notes are an integral part of these financial statements.
page 30

Frontier MFG Core Infrastructure Fund
SCHEDULE OF INVESTMENTS
December 31, 2014 (Unaudited)
Number of Shares | | | | Value | |
COMMON STOCKS 95.4% | | | |
| | | Australia 7.6% | |
| | 163,104 | | | APA Group | | $ | 986,011 | | |
| | 501,349 | | | AusNet Services | | | 541,643 | | |
| | 216,053 | | | DUET Group | | | 424,667 | | |
| | 229,601 | | | Spark Infrastructure Group | | | 397,704 | | |
| | 324,385 | | | Sydney Airport | | | 1,241,907 | | |
| | 279,033 | | | Transurban Group | | | 1,944,503 | | |
| | | | 5,536,435 | | |
| | | Austria 0.4% | |
| | 3,356 | | | Flughafen Wien AG | | | 311,961 | | |
| | | Belgium 0.0% | |
| | 588 | | | Elia System Operator SA/NV | | | 27,381 | | |
| | | Canada 9.1% | |
| | 20,799 | | | Emera, Inc. | | | 691,748 | | |
| | 45,653 | | | Enbridge, Inc. | | | 2,347,487 | | |
| | 40,187 | | | Fortis, Inc. | | | 1,347,638 | | |
| | 43,669 | | | TransCanada Corp. | | | 2,146,238 | | |
| | 3,649 | | | Valener, Inc. | | | 50,316 | | |
| | | | 6,583,427 | | |
| | | France 6.4% | |
| | 14,485 | | | Aeroports de Paris | | | 1,751,600 | | |
| | 33,583 | | | Eutelsat Communications SA | | | 1,086,065 | | |
| | 49,414 | | | SES SA - ADR | | | 1,772,978 | | |
| | | | 4,610,643 | | |
| | | Germany 1.4% | |
| | 13,516 | | | Fraport AG Frankfurt Airport
Services Worldwide | | | 779,900 | | |
| | 11,337 | | | Hamburger Hafen und
Logistik AG | | | 235,597 | | |
| | | | 1,015,497 | | |
| | | Hong Kong 3.0% | |
| | 223,148 | | | Power Assets Holdings Ltd. | | | 2,157,398 | | |
Number of Shares | | | | Value | |
| | | Italy 7.8% | |
| | 85,536 | | | Atlantia SpA | | $ | 1,988,030 | | |
| | 404,507 | | | Snam SpA | | | 2,002,000 | | |
| | 34,030 | | | Societa Iniziative Autostradali
e Servizi SpA | | | 327,488 | | |
| | 294,197 | | | Terna Rete Elettrica
Nazionale SpA | | | 1,336,296 | | |
| | | | 5,653,814 | | |
| | | Mexico 2.3% | |
| | 54,256 | | | Grupo Aeroportuario del Centro
Norte SAB de CV | | | 249,441 | | |
| | 69,803 | | | Grupo Aeroportuario del Pacifico
SAB de CV - Class B | | | 438,677 | | |
| | 40,559 | | | Grupo Aeroportuario del Sureste
SAB de CV - Class B (a) | | | 536,177 | | |
| | 253,568 | | | OHL Mexico SAB de CV (a) | | | 470,056 | | |
| | | | 1,694,351 | | |
| | | Netherlands 1.3% | |
| | 18,711 | | | Koninklijke Vopak NV | | | 970,766 | | |
| | | New Zealand 1.3% | |
| | 182,574 | | | Auckland International
Airport Ltd. | | | 600,736 | | |
| | 145,748 | | | Vector Ltd. | | | 316,884 | | |
| | | | 917,620 | | |
| | | Spain 6.7% | |
| | 99,194 | | | Abertis Infraestructuras SA | | | 1,967,001 | | |
| | 34,943 | | | Enagas SA | | | 1,102,142 | | |
| | 19,800 | | | Red Electrica Corp. SA | | | 1,745,403 | | |
| | | | 4,814,546 | | |
| | | Switzerland 0.8% | |
| | 899 | | | Flughafen Zuerich AG | | | 601,217 | | |
| | | United Kingdom 7.4% | |
| | 144,233 | | | National Grid PLC | | | 2,046,567 | | |
| | 58,418 | | | Pennon Group PLC | | | 834,601 | | |
The accompanying notes are an integral part of these financial statements.
page 31

Frontier MFG Core Infrastructure Fund
SCHEDULE OF INVESTMENTS (continued)
December 31, 2014 (Unaudited)
Number of Shares | | | | Value | |
| COMMON STOCKS 95.4% (continued) | | | |
| | | United Kingdom 7.4% (continued) | |
| | 35,074 | | | Severn Trent PLC | | $ | 1,093,934 | | |
| | 99,806 | | | United Utilities Group PLC | | | 1,417,640 | | |
| | | | 5,392,742 | | |
| | | United States 39.8% | |
| | 2,910 | | | ALLETE, Inc. | | | 160,457 | | |
| | 6,816 | | | Alliant Energy Corp. | | | 452,719 | | |
| | 14,907 | | | Ameren Corp. | | | 687,660 | | |
| | 25,252 | | | American Electric Power Co., Inc. | | | 1,533,301 | | |
| | 2,582 | | | American States Water Co. | | | 97,238 | | |
| | 14,098 | | | American Tower Corp. | | | 1,393,587 | | |
| | 11,017 | | | American Water Works Co., Inc. | | | 587,206 | | |
| | 11,649 | | | Aqua America, Inc. | | | 311,028 | | |
| | 6,168 | | | Atmos Energy Corp. | | | 343,804 | | |
| | 4,389 | | | Avista Corp. | | | 155,151 | | |
| | 2,767 | | | California Water Service Group | | | 68,096 | | |
| | 26,407 | | | CenterPoint Energy, Inc. | | | 618,716 | | |
| | 4,147 | | | Cleco Corp. | | | 226,177 | | |
| | 16,966 | | | CMS Energy Corp. | | | 589,569 | | |
| | 18,264 | | | Consolidated Edison, Inc. | | | 1,205,607 | | |
| | 18,254 | | | Crown Castle International Corp. | | | 1,436,590 | | |
| | 10,877 | | | DTE Energy Co. | | | 939,447 | | |
| | 17,917 | | | Duke Energy Corp. | | | 1,496,786 | | |
| | 20,017 | | | Edison International | | | 1,310,713 | | |
| | 2,804 | | | El Paso Electric Co. | | | 112,328 | | |
| | 10,131 | | | Great Plains Energy, Inc. | | | 287,822 | | |
| | 3,456 | | | IDACORP, Inc. | | | 228,753 | | |
| | 4,913 | | | Integrys Energy Group, Inc. | | | 382,477 | | |
| | 9,568 | | | ITC Holdings Corp. | | | 386,834 | | |
| | 19,396 | | | NiSource, Inc. | | | 822,778 | | |
| | 19,464 | | | Northeast Utilities | | | 1,041,713 | | |
| | 1,345 | | | Northwest Natural Gas Co. | | | 67,116 | | |
| | 2,720 | | | NorthWestern Corp. | | | 153,898 | | |
| | 3,379 | | | ONE Gas, Inc. | | | 139,282 | | |
| | 15,477 | | | Pepco Holdings, Inc. | | | 416,796 | | |
| | 28,592 | | | PG&E Corp. | | | 1,522,238 | | |
Number of Shares | | | | Value | |
| | | United States 39.8% (continued) | |
| | 5,369 | | | Piedmont Natural Gas Co., Inc. | | $ | 211,592 | | |
| | 6,786 | | | Pinnacle West Capital Corp. | | | 463,552 | | |
| | 5,472 | | | PNM Resources, Inc. | | | 162,135 | | |
| | 5,371 | | | Portland General Electric Co. | | | 203,185 | | |
| | 41,104 | | | PPL Corp. | | | 1,493,308 | | |
| | 10,768 | | | Questar Corp. | | | 272,215 | | |
| | 8,758 | | | SCANA Corp. | | | 528,983 | | |
| | 13,205 | | | Sempra Energy | | | 1,470,509 | | |
| | 1,405 | | | SJW Corp. | | | 45,129 | | |
| | 3,195 | | | Southwest Gas Corp. | | | 197,483 | | |
| | 14,963 | | | TECO Energy, Inc. | | | 306,592 | | |
| | 2,344 | | | The Empire District Electric Co. | | | 69,711 | | |
| | 2,963 | | | The Laclede Group, Inc. | | | 157,632 | | |
| | 30,466 | | | The Southern Co. | | | 1,496,185 | | |
| | 3,884 | | | UIL Holdings Corp. | | | 169,109 | | |
| | 5,665 | | | Vectren Corp. | | | 261,893 | | |
| | 8,033 | | | Westar Energy, Inc. | | | 331,281 | | |
| | 13,856 | | | Wisconsin Energy Corp. | | | 730,765 | | |
| | 31,068 | | | Xcel Energy, Inc. | | | 1,115,963 | | |
| | | | 28,863,109 | | |
| | | Total Common Stocks | |
| | | | | (Cost $64,123,217) | | | 69,150,907 | | |
CLOSED-END FUNDS 0.9% | | | |
| | | United Kingdom 0.9% | |
| | 181,214 | | | HICL Infrastructure Co. Ltd. | | | 430,931 | | |
| | 119,625 | | | International Public
Partnerships Ltd. | | | 252,077 | | |
| | | | 683,008 | | |
| | | Total Closed-End Funds | |
| | | | | (Cost $663,939) | | | 683,008 | | |
The accompanying notes are an integral part of these financial statements.
page 32

Frontier MFG Core Infrastructure Fund
SCHEDULE OF INVESTMENTS (continued)
December 31, 2014 (Unaudited)
Number of Shares | | | | Value | |
SHORT-TERM INVESTMENTS 2.9% | |
| | | Investment Company 2.9% | |
| | 2,076,157 | | | STIT Liquid Assets Portfolio -
Institutional Class, 0.07% | | $ | 2,076,157 | | |
| | | Total Short-Term Investments | |
| | | (Cost $2,076,157) | | | 2,076,157 | | |
| | | Total Investments 99.2% | |
| | | (Cost $66,863,313) | | | 71,910,072 | | |
| | | Other Assets in Excess of
Liabilities 0.8% | | | 581,040 | | |
| | | TOTAL NET ASSETS 100.0% | | $ | 72,491,112 | | |
(a) Non-Income Producing.
ADR - American Depositary Receipt
PORTFOLIO DIVERSIFICATION
Sectors | | Percentage | |
Integrated Power | | | 28.8 | % | |
Transmission & Distribution | | | 17.1 | | |
Gas | | | 15.6 | | |
Toll Road | | | 9.2 | | |
Airport | | | 9.0 | | |
Communications | | | 7.9 | | |
Water Utility | | | 6.1 | | |
Port | | | 1.7 | | |
Total Common Stocks | | | 95.4 | | |
Social | | | 0.9 | | |
Total Closed-End Funds | | | 0.9 | | |
Total Short-Term Investments | | | 2.9 | | |
Total Investments | | | 99.2 | | |
Other Assets in Excess of Liabilities | | | 0.8 | | |
Total Net Assets | | | 100.0 | % | |
The accompanying notes are an integral part of these financial statements.
page 33

Frontier Timpani Small Cap Growth Fund
SCHEDULE OF INVESTMENTS
December 31, 2014 (Unaudited)
Number of Shares | | | | Value | |
COMMON STOCKS 96.6% | | | |
| | | Consumer Discretionary 21.6% | |
| | 14,902 | | | Big 5 Sporting Goods Corp. | | $ | 218,016 | | |
| | 5,957 | | | BJ's Restaurants, Inc. (a) | | | 299,101 | | |
| | 3,291 | | | Capella Education Co. | | | 253,275 | | |
| | 8,247 | | | Fiesta Restaurant Group, Inc. (a) | | | 501,418 | | |
| | 7,055 | | | Five Below, Inc. (a) | | | 288,056 | | |
| | 3,840 | | | Gentherm, Inc. (a) | | | 140,621 | | |
| | 3,279 | | | G-III Apparel Group Ltd. (a) | | | 331,212 | | |
| | 12,508 | | | Grand Canyon Education, Inc. (a) | | | 583,623 | | |
| | 11,546 | | | Jack in the Box, Inc. | | | 923,218 | | |
| | 3,109 | | | Kate Spade & Co. (a) | | | 99,519 | | |
| | 15,684 | | | Kona Grill, Inc. (a) | | | 362,143 | | |
| | 3,439 | | | Lithia Motors, Inc.. - Class A | | | 298,127 | | |
| | 20,499 | | | Motorcar Parts of America, Inc. (a) | | | 637,314 | | |
| | 30,915 | | | Nautilus, Inc. (a) | | | 469,290 | | |
| | 7,512 | | | Skechers U.S.A., Inc.. - Class A (a) | | | 415,038 | | |
| | 10,949 | | | Sonic Corp. | | | 298,141 | | |
| | 18,470 | | | Tuesday Morning Corp. (a) | | | 400,799 | | |
| | 11,866 | | | Zoe's Kitchen, Inc. (a) | | | 354,912 | | |
| | | | 6,873,823 | | |
| | | Consumer Staples 1.0% | |
| | 4,890 | | | Core-Mark Holding Co., Inc. | | | 302,838 | | |
| | | Energy 1.4% | |
| | 31,847 | | | Enphase Energy, Inc. (a) | | | 455,094 | | |
| | | Financial Services 2.9% | |
| | 19,344 | | | LendingTree, Inc. (a) | | | 935,089 | | |
| | | Health Care 26.5% | |
| | 3,166 | | | Abaxis, Inc. | | | 179,924 | | |
| | 12,967 | | | Adeptus Health, Inc.. - Class A (a) | | | 484,966 | | |
| | 8,634 | | | Akorn, Inc. (a) | | | 312,551 | | |
| | 12,742 | | | ANI Pharmaceuticals, Inc. (a) | | | 718,521 | | |
| | 45,587 | | | BioDelivery Sciences
International, Inc. (a) | | | 547,956 | | |
| | 9,631 | | | Cantel Medical Corp. | | | 416,637 | | |
Number of Shares | | | | Value | |
| | | Health Care 26.5% (continued) | |
| | 14,596 | | | Cardiovascular Systems, Inc. (a) | | $ | 439,048 | | |
| | 19,116 | | | Dipexium Pharmaceuticals,
Inc. (a) | | | 217,636 | | |
| | 5,495 | | | ExamWorks Group, Inc. (a) | | | 228,537 | | |
| | 31,103 | | | Horizon Pharma Plc (a) | | | 400,918 | | |
| | 11,169 | | | Inogen, Inc. (a) | | | 350,372 | | |
| | 2,880 | | | Jazz Pharmaceuticals PLC (a) | | | 471,542 | | |
| | 7,525 | | | Lannett Co., Inc. (a) | | | 322,672 | | |
| | 10,728 | | | LDR Holding Corp. (a) | | | 351,664 | | |
| | 10,505 | | | Ligand Pharmaceuticals, Inc. (a) | | | 558,971 | | |
| | 35,142 | | | Pernix Therapeutics Holdings,
Inc. (a) | | | 329,983 | | |
| | 4,548 | | | PTC Therapeutics, Inc. (a) | | | 235,450 | | |
| | 10,285 | | | Quidel Corp. (a) | | | 297,442 | | |
| | 20,033 | | | RadNet, Inc. (a) | | | 171,082 | | |
| | 3,986 | | | STERIS Corp. | | | 258,492 | | |
| | 9,620 | | | Team Health Holdings, Inc. (a) | | | 553,438 | | |
| | 20,372 | | | ZELTIQ Aesthetics, Inc. (a) | | | 568,582 | | |
| | | | 8,416,384 | | |
| | | Materials & Processing 0.7% | |
| | 5,282 | | | Apogee Enterprises, Inc. | | | 223,798 | | |
| | | Producer Durables 14.0% | |
| | 1,004 | | | Allegiant Travel Co. | | | 150,931 | | |
| | 2,052 | | | CoStar Group, Inc. (a) | | | 376,809 | | |
| | 2,345 | | | Covenant Transportation Group,
Inc.. - Class A (a) | | | 63,573 | | |
| | 15,952 | | | CUI Global, Inc. (a) | | | 118,842 | | |
| | 3,113 | | | Forward Air Corp. | | | 156,802 | | |
| | 26,732 | | | Hawaiian Holdings, Inc. (a) | | | 696,369 | | |
| | 3,496 | | | Knight Transportation, Inc. | | | 117,675 | | |
| | 5,887 | | | Old Dominion Freight Line,
Inc. (a) | | | 457,067 | | |
| | 10,230 | | | TASER International, Inc. (a) | | | 270,890 | | |
| | 5,534 | | | The Middleby Corp. (a) | | | 548,419 | | |
| | 1,772 | | | TransDigm Group, Inc. | | | 347,932 | | |
The accompanying notes are an integral part of these financial statements.
page 34

Frontier Timpani Small Cap Growth Fund
SCHEDULE OF INVESTMENTS (continued)
December 31, 2014 (Unaudited)
Number of Shares | | | | Value | |
| COMMON STOCKS 96.6% (continued) | | | |
| | | Producer Durables 14.0% (continued) | |
| | 18,707 | | | TriNet Group, Inc. (a) | | $ | 585,155 | | |
| | 8,357 | | | WageWorks, Inc. (a) | | | 539,612 | | |
| | | | 4,430,076 | | |
| | | Technology 27.9% | |
| | 3,944 | | | Barracuda Networks, Inc. (a) | | | 141,353 | | |
| | 18,914 | | | Callidus Software, Inc. (a) | | | 308,866 | | |
| | 8,240 | | | Cavium, Inc. (a) | | | 509,397 | | |
| | 4,613 | | | Dealertrack Technologies, Inc. (a) | | | 204,402 | | |
| | 4,681 | | | Demandware, Inc. (a) | | | 269,345 | | |
| | 8,480 | | | DTS, Inc. (a) | | | 260,760 | | |
| | 4,952 | | | EPAM Systems, Inc. (a) | | | 236,458 | | |
| | 5,386 | | | GrubHub, Inc. (a) | | | 195,619 | | |
| | 28,572 | | | inContact, Inc. (a) | | | 251,148 | | |
| | 3,267 | | | Inphi Corp. (a) | | | 60,374 | | |
| | 11,697 | | | Mellanox Technologies Ltd. (a) | | | 499,813 | | |
| | 13,792 | | | Proofpoint, Inc. (a) | | | 665,188 | | |
| | 22,897 | | | Q2 Holdings, Inc. (a) | | | 431,379 | | |
| | 9,520 | | | Qualys, Inc. (a) | | | 359,380 | | |
| | 5,313 | | | RF Micro Devices, Inc. (a) | | | 352,587 | | |
| | 22,374 | | | Super Micro Computer, Inc. (a) | | | 780,405 | | |
| | 7,316 | | | Synchronoss Technologies, Inc. (a) | | | 306,248 | | |
| | 38,782 | | | TechTarget, Inc. (a) | | | 440,951 | | |
| | 1,012 | | | The Ultimate Software Group,
Inc. (a) | | | 148,577 | | |
| | 16,326 | | | TrueCar, Inc. (a) | | | 373,865 | | |
| | 29,070 | | | TubeMogul, Inc. (a) | | | 655,528 | | |
| | 4,140 | | | Tyler Technologies, Inc. (a) | | | 453,082 | | |
| | 6,360 | | | Upland Software, Inc. (a) | | | 60,802 | | |
| | 13,290 | | | VASCO Data Security
International, Inc. (a) | | | 374,911 | | |
| | 9,010 | | | Verint Systems, Inc. (a) | | | 525,103 | | |
| | | | 8,865,541 | | |
| | | Utilities 0.6% | |
| | 26,197 | | | Boingo Wireless, Inc. (a) | | | 200,931 | | |
| | | Total Common Stocks | |
| | | | | (Cost $25,766,651) | | | 30,703,574 | | |
Number of Shares | | | | Value | |
SHORT-TERM INVESTMENTS 1.7% | |
| | | Investment Company 1.7% | |
| | 538,619 | | | STIT-STIC Prime Portfolio -
Institutional Class, 0.04% | | $ | 538,619 | | |
| | | Total Short-Term Investments | |
| | | (Cost $538,619) | | | 538,619 | | |
| | | Total Investments 98.3% | |
| | | (Cost $26,305,270) | | | 31,242,193 | | |
| | | Other Assets in Excess of
Liabilities 1.7% | | | 524,958 | | |
| | | TOTAL NET ASSETS 100.0% | | $ | 31,767,151 | | |
(a) Non-Income Producing.
PORTFOLIO DIVERSIFICATION
Sectors | | Percentage | |
Technology | | | 27.9 | % | |
Health Care | | | 26.5 | | |
Consumer Discretionary | | | 21.6 | | |
Producer Durables | | | 14.0 | | |
Financial Services | | | 2.9 | | |
Energy | | | 1.4 | | |
Consumer Staples | | | 1.0 | | |
Materials and Processing | | | 0.7 | | |
Utilities | | | 0.6 | | |
Total Common Stocks | | | 96.6 | | |
Total Short-Term Investments | | | 1.7 | | |
Total Investments | | | 98.3 | | |
Other Assets in Excess of Liabilities | | | 1.7 | | |
Total Net Assets | | | 100.0 | % | |
The accompanying notes are an integral part of these financial statements.
page 35

Frontier Netols Small Cap Value Fund
SCHEDULE OF INVESTMENTS
December 31, 2014 (Unaudited)
Number of Shares | | | | Value | |
COMMON STOCKS 99.6% | | | |
| | | Consumer Discretionary 14.7% | |
| | 176,617 | | | Accuride Corp. (a) | | $ | 766,518 | | |
| | 34,611 | | | ANN, Inc. (a) | | | 1,262,609 | | |
| | 23,513 | | | Cabela's, Inc. (a) | | | 1,239,370 | | |
| | 22,738 | | | Capella Education Co. | | | 1,749,916 | | |
| | 15,179 | | | Carter's, Inc. | | | 1,325,279 | | |
| | 27,598 | | | DeVry, Inc. | | | 1,310,077 | | |
| | 13,617 | | | Domino's Pizza, Inc. | | | 1,282,313 | | |
| | 44,890 | | | Ethan Allen Interiors, Inc. | | | 1,390,243 | | |
| | 22,249 | | | Tenneco, Inc. (a) | | | 1,259,516 | | |
| | 22,735 | | | The Cheesecake Factory, Inc. | | | 1,143,798 | | |
| | | | 12,729,639 | | |
| | | Consumer Staples 6.0% | |
| | 96,499 | | | Boulder Brands, Inc. (a) | | | 1,067,279 | | |
| | 16,478 | | | Casey's General Stores, Inc. | | | 1,488,293 | | |
| | 159,807 | | | SUPERVALU, Inc. (a) | | | 1,550,128 | | |
| | 12,655 | | | TreeHouse Foods, Inc. (a) | | | 1,082,382 | | |
| | | | 5,188,082 | | |
| | | Energy 3.9% | |
| | 86,626 | | | Bill Barrett Corp. (a) | | | 986,670 | | |
| | 288,292 | | | McDermott International, Inc. (a) | | | 838,930 | | |
| | 37,753 | | | Superior Energy Services, Inc. | | | 760,723 | | |
| | 127,740 | | | Willbros Group, Inc. (a) | | | 800,930 | | |
| | | | 3,387,253 | | |
| | | Financials 16.4% | |
| | 51,613 | | | BancorpSouth, Inc. | | | 1,161,809 | | |
| | 27,078 | | | Community Bank System, Inc. | | | 1,032,484 | | |
| | 23,689 | | | Endurance Specialty
Holdings Ltd. | | | 1,417,550 | | |
| | 46,029 | | | Glacier Bancorp, Inc. | | | 1,278,225 | | |
| | 174,735 | | | MGIC Investment Corp. (a) | | | 1,628,530 | | |
| | 65,875 | | | Old National Bancorp | | | 980,220 | | |
| | 49,848 | | | Selective Insurance Group, Inc. | | | 1,354,370 | | |
| | 58,891 | | | State Bank Financial Corp. | | | 1,176,642 | | |
| | 87,577 | | | Sterling Bancorp | | | 1,259,357 | | |
Number of Shares | | | | Value | |
| | | Financials 16.4% (continued) | |
| | 24,214 | | | The Hanover Insurance
Group, Inc. | | $ | 1,726,943 | | |
| | 36,540 | | | Webster Financial Corp. | | | 1,188,646 | | |
| | | | 14,204,776 | | |
| | | Health Care 10.8% | |
| | 17,241 | | | Acadia Healthcare
Company, Inc. (a) | | | 1,055,322 | | |
| | 67,699 | | | Albany Molecular
Research, Inc. (a) | | | 1,102,140 | | |
| | 17,996 | | | Haemonetics Corp. (a) | | | 673,410 | | |
| | 24,401 | | | Integra LifeSciences
Holdings Corp. (a) | | | 1,323,266 | | |
| | 80,686 | | | Invacare Corp. | | | 1,352,297 | | |
| | 15,699 | | | LifePoint Hospitals, Inc. (a) | | | 1,128,915 | | |
| | 30,103 | | | U.S. Physical Therapy, Inc. | | | 1,263,122 | | |
| | 29,336 | | | VCA Antech, Inc. (a) | | | 1,430,717 | | |
| | | | 9,329,189 | | |
| | | Industrials 16.0% | |
| | 43,526 | | | Brady Corp. - Class A | | | 1,190,001 | | |
| | 50,036 | | | Briggs & Stratton Corp. | | | 1,021,735 | | |
| | 106,301 | | | Commercial Vehicle
Group, Inc. (a) | | | 707,965 | | |
| | 9,125 | | | Genesee & Wyoming, Inc. (a) | | | 820,520 | | |
| | 38,527 | | | Herman Miller, Inc. | | | 1,133,850 | | |
| | 122,140 | | | PGT, Inc. (a) | | | 1,176,208 | | |
| | 71,999 | | | TASER International, Inc. (a) | | | 1,906,534 | | |
| | 49,934 | | | Thermon Group Holdings,
Inc. (a) | | | 1,207,903 | | |
| | 31,073 | | | Titan International, Inc. | | | 330,306 | | |
| | 47,919 | | | TriMas Corp. (a) | | | 1,499,385 | | |
| | 9,990 | | | United Rentals, Inc. (a) | | | 1,019,080 | | |
| | 21,666 | | | Westinghouse Air Brake
Technologies Corp. | | | 1,882,559 | | |
| | | | 13,896,046 | | |
The accompanying notes are an integral part of these financial statements.
page 36

Frontier Netols Small Cap Value Fund
SCHEDULE OF INVESTMENTS (continued)
December 31, 2014 (Unaudited)
Number of Shares | | | | Value | |
| COMMON STOCKS 99.6% (continued) | | | |
| | | Information Technology 14.3% | |
| | 17,190 | | | CACI International, Inc. -
Class A (a) | | $ | 1,481,434 | | |
| | 101,468 | | | Checkpoint Systems, Inc. (a) | | | 1,393,155 | | |
| | 80,800 | | | Entegris, Inc. (a) | | | 1,067,368 | | |
| | 23,603 | | | Fair Isaac Corp. | | | 1,706,497 | | |
| | 38,590 | | | Monotype Imaging Holdings, Inc. | | | 1,112,550 | | |
| | 38,790 | | | Park Electrochemical Corp. | | | 967,035 | | |
| | 30,189 | | | Plexus Corp. (a) | | | 1,244,089 | | |
| | 54,543 | | | Progress Software Corp. (a) | | | 1,473,752 | | |
| | 52,806 | | | VeriFone Systems, Inc. (a) | | | 1,964,383 | | |
| | | | 12,410,263 | | |
| | | Materials 8.3% | |
| | 10,448 | | | Acuity Brands, Inc. | | | 1,463,451 | | |
| | 18,078 | | | Carpenter Technology Corp. | | | 890,342 | | |
| | 14,232 | | | Compass Minerals
International, Inc. | | | 1,235,765 | | |
| | 60,663 | | | Intrepid Potash, Inc. (a) | | | 842,002 | | |
| | 21,948 | | | Sensient Technologies Corp. | | | 1,324,342 | | |
| | 47,997 | | | Unifi, Inc. (a) | | | 1,426,951 | | |
| | | | 7,182,853 | | |
| | | Real Estate Investment Trusts 9.2% | |
| | 136,137 | | | Campus Crest Communities, Inc. | | | 995,162 | | |
| | 36,000 | | | Education Realty Trust, Inc. | | | 1,317,240 | | |
| | 112,984 | | | FelCor Lodging Trust, Inc. | | | 1,222,487 | | |
| | 67,034 | | | First Industrial Realty Trust, Inc. | | | 1,378,219 | | |
| | 16,861 | | | National Health Investors, Inc. | | | 1,179,595 | | |
| | 31,715 | | | Sun Communities, Inc. | | | 1,917,489 | | |
| | | | 8,010,192 | | |
| | | Total Common Stocks | |
| | | | | (Cost $52,123,774) | | | 86,338,293 | | |
Number of Shares | | | | Value | |
SHORT-TERM INVESTMENTS 0.9% | |
| | | Investment Company 0.9% | |
| | 762,917 | | | Fidelity Institutional Money
Market Portfolio, Select
Class, 0.02% | | $ | 762,917 | | |
| | | Total Short-Term Investments | |
| | | (Cost $762,917) | | | 762,917 | | |
| | | Total Investments 100.5% | |
| | | (Cost $52,886,691) | | | 87,101,210 | | |
| | | Liabilities in Excess of
Other Assets (0.5)% | | | (429,191 | ) | |
| | | TOTAL NET ASSETS 100.0% | | $ | 86,672,019 | | |
(a) Non-Income Producing.
PORTFOLIO DIVERSIFICATION
Sectors | | Percentage | |
Financials | | | 16.4 | % | |
Industrials | | | 16.0 | | |
Consumer Discretionary | | | 14.7 | | |
Information Technology | | | 14.3 | | |
Health Care | | | 10.8 | | |
Real Estate Investment Trusts | | | 9.2 | | |
Materials | | | 8.3 | | |
Consumer Staples | | | 6.0 | | |
Energy | | | 3.9 | | |
Total Common Stocks | | | 99.6 | | |
Total Short-Term Investments | | | 0.9 | | |
Total Investments | | | 100.5 | | |
Liabilities in Excess of Other Assets | | | (0.5 | ) | |
Total Net Assets | | | 100.0 | % | |
The accompanying notes are an integral part of these financial statements.
page 37

Frontier Phocas Small Cap Value Fund
SCHEDULE OF INVESTMENTS
December 31, 2014 (Unaudited)
Number of Shares | | | | Value | |
COMMON STOCKS 78.5% | | | |
| | | Consumer Discretionary 9.8% | |
| | 10,810 | | | American Axle & Manufacturing
Holdings, Inc. (a) | | $ | 244,198 | | |
| | 5,889 | | | Columbia Sportswear Co. | | | 262,296 | | |
| | 1,318 | | | Cracker Barrel Old Country
Store, Inc. | | | 185,522 | | |
| | 11,912 | | | Dana Holding Corp. | | | 258,967 | | |
| | 3,097 | | | Deckers Outdoor Corp. (a) | | | 281,951 | | |
| | 1,725 | | | DineEquity, Inc. | | | 178,779 | | |
| | 4,063 | | | Guess?, Inc. | | | 85,648 | | |
| | 17,795 | | | Harte-Hanks, Inc. | | | 137,733 | | |
| | 3,390 | | | HSN, Inc. | | | 257,640 | | |
| | 5,446 | | | Interval Leisure Group, Inc. | | | 113,767 | | |
| | 2,541 | | | Meredith Corp. | | | 138,027 | | |
| | 13,404 | | | Ruth's Hospitality Group, Inc. | | | 201,060 | | |
| | 7,879 | | | Sinclair Broadcast Group, Inc. -
Class A | | | 215,569 | | |
| | 6,231 | | | Superior Industries International,
Inc. | | | 123,312 | | |
| | 8,668 | | | The E.W. Scripps Co. -
Class A (a) | | | 193,730 | | |
| | | | 2,878,199 | | |
| | | Consumer Staples 0.4% | |
| | 1,436 | | | TreeHouse Foods, Inc. (a) | | | 122,821 | | |
| | | Energy 3.0% | |
| | 5,365 | | | Carrizo Oil & Gas, Inc. (a) | | | 223,184 | | |
| | 7,444 | | | Delek US Holdings, Inc. | | | 203,072 | | |
| | 3,726 | | | PDC Energy, Inc. (a) | | | 153,772 | | |
| | 5,548 | | | Rosetta Resources, Inc. (a) | | | 123,776 | | |
| | 15,112 | | | Synergy Resources Corp. (a) | | | 189,504 | | |
| | | | 893,308 | | |
| | | Financials 19.9% | |
| | 14,827 | | | Actua Corp. (a) | | | 273,855 | | |
| | 10,295 | | | American Equity Investment Life
Holding Co. | | | 300,511 | | |
Number of Shares | | | | Value | |
| | | Financials 19.9% (continued) | |
| | 10,565 | | | Ameris Bancorp | | $ | 270,887 | | |
| | 4,620 | | | Argo Group International
Holdings Ltd. | | | 256,271 | | |
| | 10,070 | | | Banco Latinoamericano de
Comercio Exterior S.A. | | | 303,107 | | |
| | 7,143 | | | Banner Corp. | | | 307,292 | | |
| | 8,836 | | | Boston Private Financial
Holdings, Inc. | | | 119,021 | | |
| | 4,701 | | | Capital Bank Financial Corp. (a) | | | 125,987 | | |
| | 27,122 | | | CNO Financial Group, Inc. | | | 467,041 | | |
| | 9,349 | | | Fidelity Southern Corp. | | | 150,612 | | |
| | 13,660 | | | Heritage Commerce Corp. | | | 120,618 | | |
| | 10,866 | | | Heritage Financial Corp. | | | 190,698 | | |
| | 15,610 | | | Heritage Oaks Bancorp | | | 130,968 | | |
| | 2,441 | | | IBERIABANK Corp. | | | 158,299 | | |
| | 11,467 | | | National Penn Bancshares, Inc. | | | 120,690 | | |
| | 3,574 | | | Nelnet, Inc. - Class A | | | 165,583 | | |
| | 29,454 | | | NewBridge Bancorp (a) | | | 256,544 | | |
| | 19,257 | | | NorthStar Asset Management
Group, Inc. | | | 434,631 | | |
| | 12,633 | | | State Bank Financial Corp. | | | 252,407 | | |
| | 14,031 | | | Synovus Financial Corp. | | | 380,100 | | |
| | 6,617 | | | Trico Bancshares | | | 163,440 | | |
| | 16,520 | | | United Community Banks, Inc. | | | 312,889 | | |
| | 8,293 | | | United Financial Bancorp, Inc. | | | 119,087 | | |
| | 22,781 | | | Wilshire Bancorp, Inc. | | | 230,772 | | |
| | 5,422 | | | Wintrust Financial Corp. | | | 253,533 | | |
| | | | 5,864,843 | | |
| | | Health Care 3.6% | |
| | 26,457 | | | Accuray, Inc. (a) | | | 199,751 | | |
| | 4,153 | | | Impax Laboratories, Inc. (a) | | | 131,567 | | |
| | 5,780 | | | Nektar Therapeutics (a) | | | 89,590 | | |
| | 38,717 | | | Progenics Pharmaceuticals,
Inc. (a) | | | 292,700 | | |
| | 2,677 | | | United Therapeutics Corp. (a) | | | 346,645 | | |
| | | | 1,060,253 | | |
The accompanying notes are an integral part of these financial statements.
page 38

Frontier Phocas Small Cap Value Fund
SCHEDULE OF INVESTMENTS (continued)
December 31, 2014 (Unaudited)
Number of Shares | | | | Value | |
| COMMON STOCKS 78.5% (continued) | | | |
| | | Industrials 11.0% | |
| | 13,674 | | | Aceto Corp. | | $ | 296,726 | | |
| | 1,218 | | | AMERCO | | | 346,229 | | |
| | 3,866 | | | Avis Budget Group, Inc. (a) | | | 256,432 | | |
| | 25,243 | | | CBIZ, Inc. (a) | | | 216,080 | | |
| | 4,131 | | | Deluxe Corp. | | | 257,155 | | |
| | 3,075 | | | Engility Holdings, Inc. (a) | | | 131,610 | | |
| | 2,251 | | | Esterline Technologies Corp. (a) | | | 246,890 | | |
| | 2,919 | | | Kadant, Inc. | | | 124,612 | | |
| | 5,220 | | | MYR Group, Inc. (a) | | | 143,028 | | |
| | 4,950 | | | Park-Ohio Holdings Corp. | | | 311,999 | | |
| | 9,812 | | | SkyWest, Inc. | | | 130,303 | | |
| | 4,249 | | | Tetra Tech, Inc. | | | 113,448 | | |
| | 5,455 | | | The Timken Company | | | 232,819 | | |
| | 1,461 | | | Triumph Group, Inc. | | | 98,208 | | |
| | 1,115 | | | UniFirst Corp. | | | 135,417 | | |
| | 2,563 | | | WESCO International, Inc. (a) | | | 195,326 | | |
| | | | 3,236,282 | | |
| | | Information Technology 10.1% | |
| | 8,578 | | | AOL, Inc. (a) | | | 396,046 | | |
| | 33,143 | | | Atmel Corp. (a) | | | 278,235 | | |
| | 6,304 | | | Euronet Worldwide, Inc. (a) | | | 346,090 | | |
| | 3,471 | | | Methode Electronics, Inc. | | | 126,726 | | |
| | 2,887 | | | NCR Corp. (a) | | | 84,127 | | |
| | 5,680 | | | Plexus Corp. (a) | | | 234,073 | | |
| | 9,104 | | | Progress Software Corp. (a) | | | 245,990 | | |
| | 4,832 | | | Rovi Corp. (a) | | | 109,155 | | |
| | 6,992 | | | Spansion, Inc. (a) | | | 239,266 | | |
| | 5,049 | | | SYNNEX Corp. | | | 394,630 | | |
| | 16,778 | | | TiVo, Inc. (a) | | | 198,652 | | |
| | 5,437 | | | Verint Systems, Inc. (a) | | | 316,868 | | |
| | | | 2,969,858 | | |
| | | Materials 3.6% | |
| | 1,146 | | | Ashland, Inc. | | | 137,245 | | |
| | 2,414 | | | Cabot Corp. | | | 105,878 | | |
| | 2,204 | | | Domtar Corp. | | | 88,645 | | |
Number of Shares | | | | Value | |
| | | Materials 3.6% (continued) | |
| | 8,562 | �� | | Ferro Corp. (a) | | $ | 110,963 | | |
| | 2,364 | | | Kaiser Aluminum Corp. | | | 168,861 | | |
| | 3,255 | | | Materion Corp. | | | 114,674 | | |
| | 5,386 | | | Sensient Technologies Corp. | | | 324,991 | | |
| | | | 1,051,257 | | |
| | | Real Estate Investment Trusts 12.5% | |
| | 8,934 | | | Acadia Realty Trust | | | 286,156 | | |
| | 6,657 | | | CoreSite Realty Corp. | | | 259,956 | | |
| | 19,850 | | | Cousins Properties, Inc. | | | 226,687 | | |
| | 16,219 | | | First Industrial Realty Trust, Inc. | | | 333,463 | | |
| | 25,598 | | | First Potomac Realty Trust | | | 316,391 | | |
| | 14,727 | | | Hudson Pacific Properties, Inc. | | | 442,694 | | |
| | 3,339 | | | Kilroy Realty Corp. | | | 230,625 | | |
| | 8,399 | | | Kite Realty Group Trust | | | 241,387 | | |
| | 8,837 | | | Pebblebrook Hotel Trust | | | 403,232 | | |
| | 8,353 | | | Sabra Health Care REIT, Inc. | | | 253,680 | | |
| | 22,723 | | | Strategic Hotels & Resorts,
Inc. (a) | | | 300,625 | | |
| | 6,402 | | | Sun Communities, Inc. | | | 387,065 | | |
| | | | 3,681,961 | | |
| | | Telecommunication Service 0.6% | |
| | 5,405 | | | West Corp. | | | 178,365 | | |
| | | Utilities 4.0% | |
| | 4,336 | | | Black Hills Corp. | | | 229,981 | | |
| | 4,129 | | | Chesapeake Utilities Corp. | | | 205,046 | | |
| | 2,041 | | | IDACORP, Inc. | | | 135,094 | | |
| | 2,271 | | | Laclede Group, Inc. | | | 120,818 | | |
| | 3,460 | | | PNM Resources, Inc. | | | 102,520 | | |
| | 3,314 | | | Portland General Electric Co. | | | 125,368 | | |
| | 3,877 | | | The Empire District Electric Co. | | | 115,302 | | |
| | 3,242 | | | UIL Holdings Corp. | | | 141,157 | | |
| | | | 1,175,286 | | |
| | | Total Common Stocks | |
| | | | | (Cost $18,142,390) | | | 23,112,433 | | |
The accompanying notes are an integral part of these financial statements.
page 39

Frontier Phocas Small Cap Value Fund
SCHEDULE OF INVESTMENTS (continued)
December 31, 2014 (Unaudited)
Number of Shares | | | | Value | |
SHORT-TERM INVESTMENTS 2.2% | |
| | | Investment Company 2.2% | |
| | 631,150 | | | STIT-STIC Prime Portfolio -
Institutional Class, 0.04% | | $ | 631,150 | | |
| | | Total Short-Term Investments | |
| | | (Cost $631,150) | | | 631,150 | | |
| | | Total Investments 80.7% | |
| | | (Cost $18,773,540) | | | 23,743,583 | | |
| | | Other Assets in Excess of
Liabilities 19.3% | | | 5,690,106 | | |
| | | TOTAL NET ASSETS 100.0% | | $ | 29,433,689 | | |
(a) Non-Income Producing.
PORTFOLIO DIVERSIFICATION
Sectors | | Percentage | |
Financials | | | 19.9 | % | |
Real Estate Investment Trusts | | | 12.5 | | |
Industrials | | | 11.0 | | |
Information Technology | | | 10.1 | | |
Consumer Discretionary | | | 9.8 | | |
Utilities | | | 4.0 | | |
Materials | | | 3.6 | | |
Health Care | | | 3.6 | | |
Energy | | | 3.0 | | |
Telecommunication Service | | | 0.6 | | |
Consumer Staples | | | 0.4 | | |
Total Common Stocks | | | 78.5 | | |
Total Short-Term Investments | | | 2.2 | | |
Total Investments | | | 80.7 | | |
Other Assets in Excess of Liabilities | | | 19.3 | | |
Total Net Assets | | | 100.0 | % | |
The accompanying notes are an integral part of these financial statements.
page 40

Frontier Funds
STATEMENTS OF ASSETS AND LIABILITIES
December 31, 2014 (Unaudited)
| | | RobecoSAM Global
Equity Fund | | MFG Global
Equity Fund | | MFG Core
Infrastructure Fund | |
ASSETS: | |
Investments at cost | | $ | 10,965,934 | | | $ | 898,247,506 | | | $ | 66,863,313 | | |
Foreign currency at cost | | $ | 167,563 | | | $ | 478,180 | | | $ | 55,192 | | |
Investments at value | | $ | 13,348,016 | | | $ | 1,015,653,321 | | | $ | 71,910,072 | | |
Foreign currency at value | | | 166,825 | | | | 467,893 | | | | 54,843 | | |
Cash | | | — | | | | — | | | | 14,968 | | |
Receivable for investments sold | | | — | | | | 574,753 | | | | — | | |
Receivable for Fund shares sold | | | — | | | | 1,747,170 | | | | 268,126 | | |
Interest and dividends receivable | | | 40,771 | | | | 1,090,897 | | | | 278,732 | | |
Receivable for foreign currency | | | 58,256 | | | | 391,399 | | | | — | | |
Prepaid expenses and other assets | | | 10,448 | | | | 52,378 | | | | 15,928 | | |
Total assets | | | 13,624,316 | | | | 1,019,977,811 | | | | 72,542,669 | | |
LIABILITIES: | |
Payable for investments purchased | | | — | | | | 3,749,493 | | | | — | | |
Payable for Fund shares redeemed | | | — | | | | 300,707 | | | | — | | |
Payable to Directors | | | 64 | | | | 63 | | | | 63 | | |
Payable for foreign currency | | | 58,256 | | | | 391,398 | | | | — | | |
Payable to Adviser | | | 447 | | | | 614,856 | | | | 28,041 | | |
Accrued expenses | | | 17,887 | | | | 79,113 | | | | 23,453 | | |
Total liabilities | | | 76,654 | | | | 5,135,630 | | | | 51,557 | | |
Net Assets | | $ | 13,547,662 | | | $ | 1,014,842,181 | | | $ | 72,491,112 | | |
NET ASSETS CONSIST OF: | |
Paid in capital | | $ | 10,683,378 | | | $ | 900,581,459 | | | $ | 67,699,421 | | |
Undistributed net investment loss | | | (62,511 | ) | | | (57,231 | ) | | | (43,824 | ) | |
Accumulated undistributed net realized gain (loss) | | | 548,679 | | | | (2,994,065 | ) | | | (209,910 | ) | |
Net unrealized appreciation/depreciation on: | |
Investments | | | 2,382,082 | | | | 117,405,815 | | | | 5,046,759 | | |
Foreign currency | | | (3,966 | ) | | | (93,797 | ) | | | (1,334 | ) | |
Net Assets | | $ | 13,547,662 | | | $ | 1,014,842,181 | | | $ | 72,491,112 | | |
CAPITAL STOCK, $0.01 PAR VALUE | |
Net Assets | | $ | 13,547,662 | | | $ | 1,014,842,181 | | | $ | 72,491,112 | | |
Authorized | | | 50,000,000 | | | | 100,000,000 | | | | 50,000,000 | | |
Issued and Outstanding | | | 1,135,972 | | | | 65,771,267 | | | | 5,168,689 | | |
Net Asset Value, Redemption Price and Offering Price Per Share | | $ | 11.93 | | | $ | 15.43 | | | $ | 14.03 | | |
The accompanying notes are an integral part of these financial statements.
page 41

Frontier Funds
STATEMENTS OF ASSETS AND LIABILITIES (continued)
December 31, 2014 (Unaudited)
| | | Timpani Small Cap
Growth Fund | | Netols Small Cap
Value Fund | | Phocas Small Cap
Value Fund | |
ASSETS: | |
Investments at cost | | $ | 26,305,270 | | | $ | 52,886,691 | | | $ | 18,773,540 | | |
Investments at value | | $ | 31,242,193 | | | $ | 87,101,210 | | | $ | 23,743,583 | | |
Receivable for Fund shares sold | | | 625,420 | | | | 6,129 | | | | 5,668,219 | | |
Interest and dividends receivable | | | 1,752 | | | | 87,116 | | | | 33,947 | | |
Prepaid expenses and other assets | | | 20,067 | | | | 12,726 | | | | 15,070 | | |
Total assets | | | 31,889,432 | | | | 87,207,181 | | | | 29,460,819 | | |
LIABILITIES: | |
Payable for investments purchased | | | — | | | | 44,649 | | | | — | | |
Payable for Fund shares redeemed | | | 93,784 | | | | 388,892 | | | | 176 | | |
Payable to Directors | | | 63 | | | | 65 | | | | 68 | | |
Payable to Adviser | | | 9,853 | | | | 74,633 | | | | 11,160 | | |
Accrued distribution and shareholder servicing fees | | | 559 | | | | 4,773 | | | | — | | |
Accrued expenses | | | 18,022 | | | | 22,150 | | | | 15,726 | | |
Total liabilities | | | 122,281 | | | | 535,162 | | | | 27,130 | | |
Net Assets | | $ | 31,767,151 | | | $ | 86,672,019 | | | $ | 29,433,689 | | |
NET ASSETS CONSIST OF: | |
Paid in capital | | $ | 28,990,206 | | | $ | 51,071,791 | | | $ | 24,814,701 | | |
Undistributed net investment income (loss) | | | (149,353 | ) | | | (119,535 | ) | | | 16,409 | | |
Accumulated undistributed net realized gain (loss) | | | (2,010,625 | ) | | | 1,505,244 | | | | (367,464 | ) | |
Net unrealized appreciation on investments | | | 4,936,923 | | | | 34,214,519 | | | | 4,970,043 | | |
Net Assets | | $ | 31,767,151 | | | $ | 86,672,019 | | | $ | 29,433,689 | | |
CAPITAL STOCK, $0.01 PAR VALUE | | Institutional Class | | Institutional Class | | | |
Net Assets | | $ | 30,028,106 | | | $ | 86,088,815 | | | $ | 29,433,689 | | |
Authorized | | | 50,000,000 | | | | 50,000,000 | | | | 100,000,000 | | |
Issued and Outstanding | | | 1,830,182 | | | | 7,617,320 | | | | 861,705 | | |
Net Asset Value, Redemption Price and Offering Price Per Share | | $ | 16.41 | | | $ | 11.30 | | | $ | 34.16 | | |
CAPITAL STOCK, $0.01 PAR VALUE | | Class Y | | Class Y | | | |
Net Assets | | $ | 1,739,045 | | | $ | 583,204 | | | | |
Authorized | | | 50,000,000 | | | | 50,000,000 | | | | |
Issued and Outstanding | | | 106,383 | | | | 54,097 | | | | |
Net Asset Value, Redemption Price and Offering Price Per Share | | $ | 16.35 | | | $ | 10.78 | | | | |
The accompanying notes are an integral part of these financial statements.
page 42

Frontier Funds
STATEMENTS OF OPERATIONS
For the Six Months Ended December 31, 2014 (Unaudited)
| | | RobecoSAM Global
Equity Fund | | MFG Global
Equity Fund | | MFG Core
Infrastructure Fund | |
INVESTMENT INCOME: | |
Dividend income | | $ | 160,397 | (1) | | $ | 5,233,783 | (2) | | $ | 1,053,439 | (3) | |
Interest income | | | 7,964 | | | | 24,649 | | | | 953 | | |
Total investment income | | | 168,361 | | | | 5,258,432 | | | | 1,054,392 | | |
EXPENSES: | |
Investment advisory fees | | | 67,919 | | | | 3,626,831 | | | | 246,830 | | |
Fund administration and accounting fees | | | 16,345 | | | | 103,250 | | | | 23,601 | | |
Custody fees | | | 11,867 | | | | 72,396 | | | | 20,614 | | |
Legal fees | | | 9,993 | | | | 10,011 | | | | 11,707 | | |
Federal and state registration fees | | | 9,746 | | | | 18,805 | | | | 14,807 | | |
Directors' fees and related expenses | | | 9,264 | | | | 9,263 | | | | 9,260 | | |
Audit fees | | | 8,589 | | | | 8,589 | | | | 8,589 | | |
Transfer agent fees | | | 3,731 | | | | 17,914 | | | | 5,629 | | |
Reports to shareholders | | | 949 | | | | 7,372 | | | | 2,175 | | |
Other | | | 5,196 | | | | 42,103 | | | | 9,699 | | |
Total expenses before waiver and reimbursement | | | 143,599 | | | | 3,916,534 | | | | 352,911 | | |
Waiver and reimbursement of expenses by Adviser | | | (41,720 | ) | | | (289,618 | ) | | | (105,996 | ) | |
Net expenses | | | 101,879 | | | | 3,626,916 | | | | 246,915 | | |
Net Investment Income | | | 66,482 | | | | 1,631,516 | | | | 807,477 | | |
REALIZED AND UNREALIZED GAIN (LOSS)
ON INVESTMENTS: | |
Net realized gain (loss) on: | |
Investments | | | 1,106,691 | | | | 7,810,001 | | | | (62,209 | ) | |
Foreign currency transactions | | | (23,589 | ) | | | 18,305 | | | | (37,705 | ) | |
Change in net unrealized appreciation/depreciation on: | |
Investments | | | (1,678,033 | ) | | | 20,232,075 | | | | 683,396 | | |
Foreign currency transactions | | | (4,720 | ) | | | (121,080 | ) | | | (4,062 | ) | |
Net Realized and Unrealized Gain (Loss) on Investments | | | (599,651 | ) | | | 27,939,301 | | | | 579,420 | | |
Net Increase (Decrease) in Net Assets Resulting from Operations | | $ | (533,169 | ) | | $ | 29,570,817 | | | $ | 1,386,897 | | |
(1) Net of $8,053 in foreign withholding taxes.
(2) Net of $72,084 in foreign withholding taxes.
(3) Net of $90,928 in foreign withholding taxes.
The accompanying notes are an integral part of these financial statements.
page 43

Frontier Funds
STATEMENTS OF OPERATIONS (continued)
For the Six Months Ended December 31, 2014 (Unaudited)
| | | Timpani Small Cap
Growth Fund | | Netols Small Cap
Value Fund | | Phocas Small Cap
Value Fund | |
INVESTMENT INCOME: | |
Dividend income | | $ | 16,110 | (4) | | $ | 445,454 | | | $ | 164,723 | (5) | |
Interest income | | | 83 | | | | 90 | | | | 62 | | |
Total investment income | | | 16,193 | | | | 445,544 | | | | 164,785 | | |
EXPENSES: | |
Investment advisory fees | | | 104,951 | | | | 466,606 | | | | 116,755 | | |
Fund administration and accounting fees | | | 14,759 | | | | 21,723 | | | | 16,152 | | |
Custody fees | | | 5,724 | | | | 8,110 | | | | 9,280 | | |
Legal fees | | | 9,885 | | | | 9,835 | | | | 8,022 | | |
Federal and state registration fees | | | 16,962 | | | | 3,814 | | | | 10,124 | | |
Directors' fees and related expenses | | | 9,264 | | | | 9,266 | | | | 9,267 | | |
Audit fees | | | 7,578 | | | | 7,581 | | | | 7,583 | | |
Transfer agent fees | | | 7,878 | | | | 8,209 | | | | 6,175 | | |
Reports to shareholders | | | 4,050 | | | | 5,551 | | | | 2,541 | | |
Distribution and shareholder servicing fees - Class Y | | | 2,822 | | | | — | | | | — | | |
Other | | | 3,368 | | | | 6,264 | | | | 1,883 | | |
Total expenses before waiver and reimbursement | | | 187,241 | | | | 546,959 | | | | 187,782 | | |
Waiver and reimbursement of expenses by Adviser | | | (68,972 | ) | | | (33,691 | ) | | | (59,351 | ) | |
Net expenses | | | 118,269 | | | | 513,268 | | | | 128,431 | | |
Net Investment Income (Loss) | | | (102,076 | ) | | | (67,724 | ) | | | 36,354 | | |
REALIZED AND UNREALIZED GAIN (LOSS)
ON INVESTMENTS: | |
Net realized gain (loss) on investments | | | (1,385,611 | ) | | | 6,899,731 | | | | (135,668 | ) | |
Change in net unrealized appreciation/depreciation on investments | | | 2,747,069 | | | | (6,174,267 | ) | | | 133,140 | | |
Net Realized and Unrealized Gain (Loss) on Investments | | | 1,361,458 | | | | 725,464 | | | | (2,528 | ) | |
Net Increase in Net Assets Resulting from Operations | | $ | 1,259,382 | | | $ | 657,740 | | | $ | 33,826 | | |
(4) Net of $168 in foreign withholding taxes.
(5) Net of $388 in foreign withholding taxes.
The accompanying notes are an integral part of these financial statements.
page 44

Frontier Funds
STATEMENTS OF CHANGES IN NET ASSETS
| | | RobecoSAM Global Equity Fund | | MFG Global Equity Fund | |
| | | For the
Six Months Ended
December 31, 2014
(Unaudited) | | For the
Year Ended
June 30, 2014 | | For the
Six Months Ended
December 31, 2014
(Unaudited) | | For the
Year Ended
June 30, 2014 | |
OPERATIONS: | |
Net investment income | | $ | 66,482 | | | $ | 269,131 | | | $ | 1,631,516 | | | $ | 7,537,146 | | |
Net realized gain (loss) on: | |
Investments | | | 1,106,691 | | | | 2,720,932 | | | | 7,810,001 | | | | 5,422,340 | | |
Foreign currency transactions | | | (23,589 | ) | | | (23,551 | ) | | | 18,305 | | | | 1,286 | | |
Change in net unrealized appreciation/depreciation on: | |
Investments | | | (1,678,033 | ) | | | 626,159 | | | | 20,232,075 | | | | 69,732,325 | | |
Foreign currency transactions | | | (4,720 | ) | | | 2,313 | | | | (121,080 | ) | | | 37,890 | | |
Net increase (decrease) in net assets resulting from operations | | | (533,169 | ) | | | 3,594,984 | | | | 29,570,817 | | | | 82,730,987 | | |
DISTRIBUTIONS PAID TO SHAREHOLDERS FROM: | |
Net investment income | | | (291,920 | ) | | | (231,994 | ) | | | (7,806,584 | ) | | | (3,309,753 | ) | |
Net realized gain on investments | | | (2,552,085 | ) | | | (307,567 | ) | | | (14,749,904 | ) | | | (5,090,258 | ) | |
Net decrease in net assets resulting from distributions paid | | | (2,844,005 | ) | | | (539,561 | ) | | | (22,556,488 | ) | | | (8,400,011 | ) | |
CAPITAL SHARE TRANSACTIONS: | |
Shares sold | | | 2,440 | | | | 178,469 | | | | 309,026,320 | | | | 401,764,717 | | |
Shares issued to holders in reinvestment of distributions | | | 2,609,906 | | | | 501,905 | | | | 20,274,009 | | | | 7,777,052 | | |
Shares redeemed | | | (3,517,900 | ) | | | (2,213,269 | ) | | | (112,517,216 | ) | | | (39,525,775 | ) | |
Redemption fees | | | — | | | | — | | | | 1,603 | | | | 1,307 | | |
Net increase (decrease) in net assets resulting from capital share transactions | | | (905,554 | ) | | | (1,532,895 | ) | | | 216,784,716 | | | | 370,017,301 | | |
Total Increase (Decrease) in Net Assets | | | (4,282,728 | ) | | | 1,522,528 | | | | 223,799,045 | | | | 444,348,277 | | |
NET ASSETS: | |
Beginning of Period | | | 17,830,390 | | | | 16,307,862 | | | | 791,043,136 | | | | 346,694,859 | | |
End of Period | | $ | 13,547,662 | | | $ | 17,830,390 | | | $ | 1,014,842,181 | | | $ | 791,043,136 | | |
Undistributed net investment income (loss) | | $ | (62,511 | ) | | $ | 162,927 | | | $ | (57,231 | ) | | $ | 6,117,837 | | |
TRANSACTIONS IN SHARES: | |
Shares sold | | | 163 | | | | 13,101 | | | | 20,227,145 | | | | 27,908,105 | | |
Shares issued to holders in reinvestment of distributions | | | 218,037 | | | | 36,556 | | | | 1,313,083 | | | | 536,348 | | |
Shares redeemed | | | (272,443 | ) | | | (156,442 | ) | | | (7,375,713 | ) | | | (2,660,958 | ) | |
Net increase (decrease) in shares outstanding | | | (54,243 | ) | | | (106,785 | ) | | | 14,164,515 | | | | 25,783,495 | | |
The accompanying notes are an integral part of these financial statements.
page 45

Frontier Funds
STATEMENTS OF CHANGES IN NET ASSETS (continued)
| | | MFG Core Infrastructure Fund | | Timpani Small Cap Growth Fund | |
| | | For the
Six Months Ended
December 31, 2014
(Unaudited) | | For the
Year Ended
June 30, 2014 | | For the
Six Months Ended
December 31, 2014
(Unaudited) | | For the
Year Ended
June 30, 2014 | |
OPERATIONS: | |
Net investment income (loss) | | $ | 807,477 | | | $ | 826,498 | | | $ | (102,076 | ) | | $ | (71,872 | ) | |
Net realized gain (loss) on: | |
Investments | | | (62,209 | ) | | | 26,315 | | | | (1,385,611 | ) | | | (361,238 | ) | |
Foreign currency transactions | | | (37,705 | ) | | | (14,225 | ) | | | — | | | | — | | |
Change in net unrealized appreciation/depreciation on: | |
Investments | | | 683,396 | | | | 4,177,604 | | | | 2,747,069 | | | | 1,158,942 | | |
Foreign currency transactions | | | (4,062 | ) | | | 3,801 | | | | — | | | | — | | |
Net increase in net assets resulting from operations | | | 1,386,897 | | | | 5,019,993 | | | | 1,259,382 | | | | 725,832 | | |
DISTRIBUTIONS PAID TO SHAREHOLDERS FROM: | | | | | | Institutional Class | | Institutional Class | |
Net investment income | | | (1,499,030 | ) | | | (253,056 | ) | | | — | | | | — | | |
Net realized gain on investments | | | (128,895 | ) | | | — | | | | — | | | | (135,449 | ) | |
Net decrease in net assets resulting from distributions paid | | | (1,627,925 | ) | | | (253,056 | ) | | | — | | | | (135,449 | ) | |
CAPITAL SHARE TRANSACTIONS: | | | | | | Institutional Class | | Institutional Class | |
Shares sold | | | 12,590,388 | | | | 53,704,784 | | | | 16,555,408 | | | | 11,857,476 | | |
Shares issued to holders in reinvestment of distributions | | | 1,606,280 | | | | 244,776 | | | | — | | | | 127,954 | | |
Shares redeemed | | | (7,131,537 | ) | | | (354,534 | ) | | | (1,208,814 | ) | | | (3,043,387 | ) | |
Redemption fees | | | 1,089 | | | | 1,208 | | | | — | | | | — | | |
Net increase in net assets resulting from capital share transactions | | | 7,066,220 | | | | 53,596,234 | | | | 15,346,594 | | | | 8,942,043 | | |
CAPITAL SHARE TRANSACTIONS(1): | | | | | | Class Y | | Class Y | |
Shares sold | | | | | | | 568,720 | | | | 1,177,000 | | |
Shares redeemed | | | | | | | (100,250 | ) | | | — | | |
Net increase in net assets resulting from capital share transactions | | | | | | | 468,470 | | | | 1,177,000 | | |
Total Increase in Net Assets | | | 6,825,192 | | | | 58,363,171 | | | | 17,074,446 | | | | 10,709,426 | | |
NET ASSETS: | |
Beginning of Period | | | 65,665,920 | | | | 7,302,749 | | | | 14,692,705 | | | | 3,983,279 | | |
End of Period | | $ | 72,491,112 | | | $ | 65,665,920 | | | $ | 31,767,151 | | | $ | 14,692,705 | | |
Undistributed net investment income (loss) | | $ | (43,824 | ) | | $ | 647,729 | | | $ | (149,353 | ) | | $ | (47,277 | ) | |
TRANSACTIONS IN SHARES: | | | | | | Institutional Class | | Institutional Class | |
Shares sold | | | 904,692 | | | | 4,023,089 | | | | 1,069,600 | | | | 734,505 | | |
Shares issued to holders in reinvestment of distributions | | | 115,145 | | | | 20,280 | | | | — | | | | 8,114 | | |
Shares redeemed | | | (499,510 | ) | | | (27,662 | ) | | | (78,435 | ) | | | (204,927 | ) | |
Net increase in shares outstanding | | | 520,327 | | | | 4,015,707 | | | | 991,165 | | | | 537,692 | | |
TRANSACTIONS IN SHARES(1): | | | | | | Class Y | | Class Y | |
Shares sold | | | | | | | 37,188 | | | | 75,743 | | |
Shares redeemed | | | | | | | (6,548 | ) | | | — | | |
Net increase in shares outstanding | | | | | | | 30,640 | | | | 75,743 | | |
(1) Class Y Commenced operations on January 6, 2014.
The accompanying notes are an integral part of these financial statements.
page 46

Frontier Funds
STATEMENTS OF CHANGES IN NET ASSETS (continued)
| | | Netols Small Cap Value Fund | | Phocas Small Cap Value Fund | |
| | | For the
Six Months Ended
December 31, 2014
(Unaudited) | | For the
Year Ended
June 30, 2014 | | For the
Six Months Ended
December 31, 2014
(Unaudited) | | For the
Year Ended
June 30, 2014 | |
OPERATIONS: | |
Net investment income (loss) | | $ | (67,724 | ) | | $ | (337,695 | ) | | $ | 36,354 | | | $ | (18,695 | ) | |
Net realized gain (loss) on investments | | | 6,899,731 | | | | 28,516,118 | | | | (135,668 | ) | | | 1,411,818 | | |
Change in net unrealized appreciation/depreciation on investments | | | (6,174,267 | ) | | | (1,904,693 | ) | | | 133,140 | | | | 2,491,733 | | |
Net increase in net assets resulting from operations | | | 657,740 | | | | 26,273,730 | | | | 33,826 | | | | 3,884,856 | | |
DISTRIBUTIONS PAID TO SHAREHOLDERS FROM: | | Institutional Class | | Institutional Class | | | | | |
Net investment income | | | — | | | | — | | | | (19,945 | ) | | | (16,849 | ) | |
Net realized gain on investments | | | (20,922,751 | ) | | | (26,286,823 | ) | | | (1,223,630 | ) | | | (680,655 | ) | |
Net decrease in net assets resulting from distributions paid | | | (20,922,751 | ) | | | (26,286,823 | ) | | | (1,243,575 | ) | | | (697,504 | ) | |
DISTRIBUTIONS PAID TO SHAREHOLDERS FROM: | | Class Y | | Class Y | | | | | |
Net realized gain on investments | | | (140,390 | ) | | | (239,893 | ) | | | | | |
Net decrease in net assets resulting from distributions paid | | | (140,390 | ) | | | (239,893 | ) | | | | | |
CAPITAL SHARE TRANSACTIONS: | | Institutional Class | | Institutional Class | | | | | |
Shares sold | | | 2,116,454 | | | | 25,306,701 | | | | 6,918,263 | | | | 13,555,485 | | |
Shares issued to holders in reinvestment of distributions | | | 18,286,489 | | | | 22,953,330 | | | | 1,243,575 | | | | 697,504 | | |
Shares redeemed | | | (12,549,471 | ) | | | (61,531,235 | ) | | | (1,670,226 | ) | | | (2,292,640 | ) | |
Net increase (decrease) in net assets resulting from capital share transactions | | | 7,853,472 | | | | (13,271,204 | ) | | | 6,491,612 | | | | 11,960,349 | | |
CAPITAL SHARE TRANSACTIONS: | | Class Y | | Class Y | | | | | |
Shares sold | | | 24,814 | | | | 87,891 | | | | | | |
Shares issued to holders in reinvestment of distributions | | | 140,390 | | | | 239,893 | | | | | | |
Shares redeemed | | | (78,932 | ) | | | (21,044,865 | ) | | | | | |
Net increase (decrease) in net assets resulting from capital share transactions | | | 86,272 | | | | (20,717,081 | ) | | | | | |
Total Increase (Decrease) in Net Assets | | | (12,465,657 | ) | | | (34,241,271 | ) | | | 5,281,863 | | | | 15,147,701 | | |
NET ASSETS: | |
Beginning of Period | | | 99,137,676 | | | | 133,378,947 | | | | 24,151,826 | | | | 9,004,125 | | |
End of Period | | $ | 86,672,019 | | | $ | 99,137,676 | | | $ | 29,433,689 | | | $ | 24,151,826 | | |
Undistributed net investment income (loss) | | $ | (119,535 | ) | | $ | (51,811 | ) | | $ | 16,409 | | | $ | — | | |
TRANSACTIONS IN SHARES: | | Institutional Class | | Institutional Class | | | | | |
Shares sold | | | 151,518 | | | | 1,583,761 | | | | 201,830 | | | | 405,895 | | |
Shares issued to holders in reinvestment of distributions | | | 1,644,468 | | | | 1,688,987 | | | | 36,868 | | | | 21,402 | | |
Shares redeemed | | | (896,352 | ) | | | (3,928,288 | ) | | | (48,701 | ) | | | (69,095 | ) | |
Net increase (decrease) in shares outstanding | | | 899,634 | | | | (655,540 | ) | | | 189,997 | | | | 358,202 | | |
TRANSACTIONS IN SHARES: | | Class Y | | Class Y | | | | | |
Shares sold | | | 1,826 | | | | 5,581 | | | | | | |
Shares issued to holders in reinvestment of distributions | | | 13,231 | | | | 18,257 | | | | | | |
Shares redeemed | | | (5,735 | ) | | | (1,324,940 | ) | | | | | |
Net increase (decrease) in shares outstanding | | | 9,322 | | | | (1,301,102 | ) | | | | | |
The accompanying notes are an integral part of these financial statements.
page 47

Frontier RobecoSAM Global Equity Fund
FINANCIAL HIGHLIGHTS
| | | Six Months
Ended
December 31,
2014
(Unaudited) | | Year
Ended
June 30,
2014 | | Year
Ended
June 30,
2013 | | Year
Ended
June 30,
2012 | | Period
Ended
June 30,
2011(1)(2) | | Year
Ended
August 31,
2010 | | Period
Ended
August 31,
2009(3) | |
Net Asset Value, Beginning of Period | | $ | 14.98 | | | $ | 12.57 | | | $ | 10.68 | | | $ | 13.15 | | | $ | 11.00 | | | $ | 11.30 | | | $ | 10.00 | | |
INCOME (LOSS) FROM
INVESTMENT OPERATIONS: | |
Net investment income | | | 0.07 | | | | 0.21 | | | | 0.22 | | | | 0.18 | (4) | | | 0.25 | | | | 0.18 | (4) | | | 0.01 | (4) | |
Net realized and unrealized gain (loss)
on investments | | | (0.52 | ) | | | 2.62 | | | | 1.86 | | | | (1.67 | ) | | | 2.53 | | | | 0.47 | | | | 1.29 | | |
Total Income (Loss) from Investment Operations | | | (0.45 | ) | | | 2.83 | | | | 2.08 | | | | (1.49 | ) | | | 2.78 | | | | 0.65 | | | | 1.30 | | |
LESS DISTRIBUTIONS: | |
From net investment income | | | (0.27 | ) | | | (0.18 | ) | | | (0.19 | ) | | | (0.21 | ) | | | (0.21 | ) | | | (0.05 | ) | | | — | | |
From net realized gain on investments | | | (2.33 | ) | | | (0.24 | ) | | | — | | | | (0.77 | ) | | | (0.42 | ) | | | (0.90 | ) | | | — | | |
Total Distributions | | | (2.60 | ) | | | (0.42 | ) | | | (0.19 | ) | | | (0.98 | ) | | | (0.63 | ) | | | (0.95 | ) | | | — | | |
Redemption fees retained | | | — | | | | — | | | | — | | | | — | | | | — | | | | — | (5) | | | — | | |
Net Asset Value, End of Period | | $ | 11.93 | | | $ | 14.98 | | | $ | 12.57 | | | $ | 10.68 | | | $ | 13.15 | | | $ | 11.00 | | | $ | 11.30 | | |
Total Return | | | (3.08 | )%(6) | | | 22.72 | % | | | 19.78 | % | | | (10.91 | )% | | | 25.64 | %(6) | | | 5.42 | % | | | 13.00 | %(6) | |
SUPPLEMENTAL DATA AND RATIOS: | |
Net assets, end of period (in thousands) | | $ | 13,548 | | | $ | 17,830 | | | $ | 16,308 | | | $ | 19,952 | | | $ | 19,292 | | | $ | 16,756 | | | $ | 11,614 | | |
Ratio of expenses to average net assets | |
Before waivers and reimbursements | | | 1.69 | %(7) | | | 1.67 | % | | | 1.63 | % | | | 1.62 | % | | | 2.41 | %(7) | | | 2.81 | % | | | 4.06 | %(7) | |
Net of waivers and reimbursements | | | 1.20 | %(7) | | | 1.20 | % | | | 1.20 | % | | | 1.20 | % | | | 1.20 | %(7) | | | 1.20 | % | | | 1.20 | %(7) | |
Ratio of net investment income (loss) to
average net assets | |
Before waivers and reimbursements | | | 0.29 | %(7) | | | 1.05 | % | | | 1.28 | % | | | 1.16 | % | | | 1.02 | %(7) | | | (0.03 | )% | | | (2.59 | )%(7) | |
Net of waivers and reimbursements | | | 0.78 | %(7) | | | 1.52 | % | | | 1.71 | % | | | 1.58 | % | | | 2.23 | %(7) | | | 1.58 | % | | | 0.27 | %(7) | |
Portfolio turnover rate | | | 26 | %(6) | | | 56 | % | | | 36 | % | | | 52 | % | | | 33 | %(6) | | | 88 | % | | | 72 | %(6) | |
(1) Effective June 30, 2011, the Fund changed its fiscal year end to June 30 from August 31.
(2) Effective June 10, 2011, Frontegra Asset Management, Inc. became adviser and RobecoSAM USA, Inc. (f/k/a Sustainable Asset Management USA, Inc.) became subadviser to the Fund.
(3) Commenced operations on June 18, 2009.
(4) Per share net investment income has been calculated using the daily average share method.
(5) Less than one cent per share.
(6) Not annualized.
(7) Annualized.
The accompanying notes are an integral part of these financial statements.
page 48

Frontier MFG Global Equity Fund
FINANCIAL HIGHLIGHTS
| | | Six Months
Ended
December 31,
2014
(Unaudited) | | Year
Ended
June 30,
2014 | | Year
Ended
June 30,
2013 | | Period
Ended
June 30,
2012(1) | |
Net Asset Value, Beginning of Period | | $ | 15.33 | | | $ | 13.43 | | | $ | 10.81 | | | $ | 10.00 | | |
INCOME FROM INVESTMENT OPERATIONS: | |
Net investment income | | | 0.03 | (2) | | | 0.19 | (2) | | | 0.17 | (2) | | | 0.11 | (2) | |
Net realized and unrealized gain on investments | | | 0.42 | | | | 1.91 | | | | 2.68 | | | | 0.70 | | |
Total Income from Investment Operations | | | 0.45 | | | | 2.10 | | | | 2.85 | | | | 0.81 | | |
LESS DISTRIBUTIONS: | |
From net investment income | | | (0.12 | ) | | | (0.08 | ) | | | (0.09 | ) | | | — | | |
From net realized gain on investments | | | (0.23 | ) | | | (0.12 | ) | | | (0.14 | ) | | | — | | |
Total Distributions | | | (0.35 | ) | | | (0.20 | ) | | | (0.23 | ) | | | — | | |
Redemption fees retained | | | — | (3) | | | — | (3) | | | — | (3) | | | — | | |
Net Asset Value, End of Period | | $ | 15.43 | | | $ | 15.33 | | | $ | 13.43 | | | $ | 10.81 | | |
Total Return | | | 2.99 | %(4) | | | 15.76 | % | | | 26.68 | % | | | 8.10 | %(4) | |
SUPPLEMENTAL DATA AND RATIOS: | |
Net assets, end of period (in thousands) | | $ | 1,014,842 | | | $ | 791,043 | | | $ | 346,695 | | | $ | 108,551 | | |
Ratio of expenses to average net assets | |
Before waivers and reimbursements | | | 0.86 | %(5) | | | 0.89 | % | | | 0.97 | % | | | 1.14 | %(5) | |
Net of waivers and reimbursements | | | 0.80 | %(5) | | | 0.80 | % | | | 0.80 | % | | | 0.80 | %(5) | |
Ratio of net investment income to average net assets | |
Before waivers and reimbursements | | | 0.30 | %(5) | | | 1.18 | % | | | 1.17 | % | | | 1.70 | %(5) | |
Net of waivers and reimbursements | | | 0.36 | %(5) | | | 1.27 | % | | | 1.34 | % | | | 2.04 | %(5) | |
Portfolio turnover rate | | | 36 | %(4) | | | 20 | % | | | 31 | % | | | 19 | %(4) | |
(1) Commenced operations on December 28, 2011.
(2) Per share net investment income has been calculated using the daily average share method.
(3) Less than one cent per share.
(4) Not annualized.
(5) Annualized.
The accompanying notes are an integral part of these financial statements.
page 49

Frontier MFG Core Infrastructure Fund
FINANCIAL HIGHLIGHTS
| | | Six Months
Ended
December 31,
2014
(Unaudited) | | Year
Ended
June 30,
2014 | | Year
Ended
June 30,
2013 | | Period
Ended
June 30,
2012(1) | |
Net Asset Value, Beginning of Period | | $ | 14.13 | | | $ | 11.54 | | | $ | 10.65 | | | $ | 10.00 | | |
INCOME FROM INVESTMENT OPERATIONS: | |
Net investment income | | | 0.15 | | | | 0.55 | (2) | | | 0.49 | (2) | | | 0.24 | | |
Net realized and unrealized gain on investments | | | 0.07 | | | | 2.22 | | | | 0.84 | | | | 0.41 | | |
Total Income from Investment Operations | | | 0.22 | | | | 2.77 | | | | 1.33 | | | | 0.65 | | |
LESS DISTRIBUTIONS: | |
From net investment income | | | (0.30 | ) | | | (0.18 | ) | | | (0.44 | ) | | | — | | |
From net realized gain on investments | | | (0.02 | ) | | | — | | | | — | (3) | | | — | | |
Total Distributions | | | (0.32 | ) | | | (0.18 | ) | | | (0.44 | ) | | | — | | |
Redemption fees retained | | | — | (3) | | | — | (3) | | | — | | | | — | | |
Net Asset Value, End of Period | | $ | 14.03 | | | $ | 14.13 | | | $ | 11.54 | | | $ | 10.65 | | |
Total Return | | | 1.60 | %(4) | | | 24.22 | % | | | 12.73 | % | | | 6.50 | %(4) | |
SUPPLEMENTAL DATA AND RATIOS: | |
Net assets, end of period (in thousands) | | $ | 72,491 | | | $ | 65,666 | | | $ | 7,303 | | | $ | 2,743 | | |
Ratio of expenses to average net assets | |
Before waivers and reimbursements | | | 1.00 | %(5) | | | 1.45 | % | | | 3.66 | % | | | 6.55 | %(5) | |
Net of waivers and reimbursements | | | 0.70 | %(5) | | | 0.70 | % | | | 0.70 | % | | | 0.70 | %(5) | |
Ratio of net investment income (loss) to average net assets | |
Before waivers and reimbursements | | | 1.99 | %(5) | | | 3.47 | % | | | 1.34 | % | | | (1.09 | )%(5) | |
Net of waivers and reimbursements | | | 2.29 | %(5) | | | 4.22 | % | | | 4.30 | % | | | 4.76 | %(5) | |
Portfolio turnover rate | | | 14 | %(4) | | | 16 | % | | | 7 | % | | | 7 | %(4) | |
(1) Commenced operations on January 18, 2012.
(2) Per share net investment income has been calculated using the daily average share method.
(3) Less than one cent per share.
(4) Not annualized.
(5) Annualized.
The accompanying notes are an integral part of these financial statements.
page 50

Frontier Timpani Small Cap Growth Fund
FINANCIAL HIGHLIGHTS
| | | Institutional Class | |
| | | Six Months
Ended
December 31,
2014
(Unaudited) | | Year
Ended
June 30,
2014 | | Year
Ended
June 30,
2013 | | Year
Ended
June 30,
2012 | | Period
Ended
June 30,
2011(1) | |
Net Asset Value, Beginning of Period | | $ | 16.06 | | | $ | 13.22 | | | $ | 10.31 | | | $ | 10.75 | | | $ | 10.00 | | |
INCOME (LOSS) FROM INVESTMENT OPERATIONS: | |
Net investment loss | | | (0.07 | )(2) | | | (0.14 | )(2) | | | (0.04 | )(2) | | | (0.08 | )(2) | | | (0.02 | )(3) | |
Net realized and unrealized gain (loss) on investments | | | 0.42 | | | | 3.32 | | | | 2.95 | | | | (0.36 | ) | | | 0.77 | | |
Total Income (Loss) from Investment Operations | | | 0.35 | | | | 3.18 | | | | 2.91 | | | | (0.44 | ) | | | 0.75 | | |
LESS DISTRIBUTIONS: | |
From net realized gain on investments | | | — | | | | (0.34 | ) | | | — | | | | — | | | | — | | |
Total Distributions | | | — | | | | (0.34 | ) | | | — | | | | — | | | | — | | |
Net Asset Value, End of Period | | $ | 16.41 | | | $ | 16.06 | | | $ | 13.22 | | | $ | 10.31 | | | $ | 10.75 | | |
Total Return | | | 2.12 | %(4) | | | 24.16 | % | | | 28.35 | % | | | (4.28 | )% | | | 7.60 | %(4) | |
SUPPLEMENTAL DATA AND RATIOS: | |
Net assets, end of period (in thousands) | | $ | 30,028 | | | $ | 13,478 | | | $ | 3,983 | | | $ | 2,824 | | | $ | 2,036 | | |
Ratio of expenses to average net assets | |
Before waivers and reimbursements | | | 1.76 | %(5) | | | 2.46 | % | | | 4.02 | % | | | 5.25 | % | | | 10.93 | %(5) | |
Net of waivers and reimbursements | | | 1.10 | %(5) | | | 1.10 | % | | | 1.10 | % | | | 1.10 | % | | | 1.10 | %(5) | |
Ratio of net investment loss to average net assets | |
Before waivers and reimbursements | | | (1.60 | )%(5) | | | (2.26 | )% | | | (3.28 | )% | | | (5.02 | )% | | | (10.75 | )%(5) | |
Net of waivers and reimbursements | | | (0.94 | )%(5) | | | (0.90 | )% | | | (0.36 | )% | | | (0.87 | )% | | | (0.92 | )%(5) | |
Portfolio turnover rate | | | 63 | %(4) | | | 173 | % | | | 140 | % | | | 138 | % | | | 28 | %(4) | |
(1) Commenced operations on March 23, 2011.
(2) Per share net investment loss has been calculated using the daily average share method.
(3) Net investment loss per share is calculated using ending balances prior to consideration of adjustments for permanent book to tax differences.
(4) Not annualized.
(5) Annualized.
The accompanying notes are an integral part of these financial statements.
page 51

Frontier Timpani Small Cap Growth Fund
FINANCIAL HIGHLIGHTS
| | | Class Y | |
| | | Six Months
Ended
December 31,
2014
(Unaudited) | | Period
Ended
June 30,
2014(1) | |
Net Asset Value, Beginning of Period | | $ | 16.04 | | | $ | 16.35 | | |
INCOME (LOSS) FROM INVESTMENT OPERATIONS: | |
Net investment loss | | | (0.09 | ) | | | (0.08 | )(2) | |
Net realized and unrealized gain (loss) on investments | | | 0.40 | | | | (0.23 | )(3) | |
Total Income (Loss) from Investment Operations | | | 0.31 | | | | (0.31 | ) | |
Net Asset Value, End of Period | | $ | 16.35 | | | $ | 16.04 | | |
Total Return | | | 1.93 | %(4) | | | (1.90 | )%(4) | |
SUPPLEMENTAL DATA AND RATIOS: | |
Net assets, end of period (in thousands) | | $ | 1,739 | | | $ | 1,215 | | |
Ratio of expenses to average net assets | |
Before waivers and reimbursements | | | 2.16 | %(5) | | | 2.73 | %(5) | |
Net of waivers and reimbursements | | | 1.50 | %(5) | | | 1.50 | %(5) | |
Ratio of net investment loss to average net assets | |
Before waivers and reimbursements | | | (2.01 | )%(5) | | | (2.36 | )%(5) | |
Net of waivers and reimbursements | | | (1.35 | )%(5) | | | (1.13 | )%(5) | |
Portfolio turnover rate | | | 63 | %(4) | | | 173 | %(4) | |
(1) Commenced operations on January 6, 2014.
(2) Per share net investment loss has been calculated using the daily average share method.
(3) Net realized and unrealized loss on investments does not reconcile with net realized and unrealized gain on investments in the Statement of Operations due to the timing of the Class Y inception.
(4) Not annualized.
(5) Annualized.
The accompanying notes are an integral part of these financial statements.
page 52

Frontier Netols Small Cap Value Fund
FINANCIAL HIGHLIGHTS
| | | Institutional Class | |
| | | Six Months
Ended
December 31,
2014
(Unaudited) | | Year
Ended
June 30,
2014 | | Year
Ended
June 30,
2013 | | Year
Ended
June 30,
2012 | | Year
Ended
June 30,
2011 | | Year
Ended
June 30,
2010 | |
Net Asset Value, Beginning of Period | | $ | 14.66 | | | $ | 15.35 | | | $ | 12.86 | | | $ | 13.75 | | | $ | 10.08 | | | $ | 9.03 | | |
INCOME (LOSS) FROM
INVESTMENT OPERATIONS: | |
Net investment income (loss) | | | (0.01 | ) | | | (0.04 | )(1) | | | 0.01 | | | | 0.01 | | | | (0.05 | )(2) | | | 0.02 | (1) | |
Net realized and unrealized gain (loss) on investments | | | 0.09 | | | | 3.50 | | | | 3.17 | | | | (0.90 | ) | | | 3.72 | | | | 1.05 | | |
Total Income (Loss) from Investment Operations | | | 0.08 | | | | 3.46 | | | | 3.18 | | | | (0.89 | ) | | | 3.67 | | | | 1.07 | | |
LESS DISTRIBUTIONS: | |
From net investment income | | | — | | | | — | | | | — | | | | — | | | | — | (3) | | | (0.02 | ) | |
From net realized gain on investments | | | (3.44 | ) | | | (4.15 | ) | | | (0.69 | ) | | | — | | | | — | | | | — | | |
From return of capital | | | — | | | | — | | | | — | | | | — | | | | — | | | | — | (3) | |
Total Distributions | | | (3.44 | ) | | | (4.15 | ) | | | (0.69 | ) | | | — | | | | — | | | | (0.02 | ) | |
Net Asset Value, End of Period | | $ | 11.30 | | | $ | 14.66 | | | $ | 15.35 | | | $ | 12.86 | | | $ | 13.75 | | | $ | 10.08 | | |
Total Return | | | 0.93 | %(4) | | | 24.63 | % | | | 25.61 | % | | | (6.47 | )% | | | 36.43 | % | | | 11.76 | % | |
SUPPLEMENTAL DATA AND RATIOS: | |
Net assets, end of period (in thousands) | | $ | 86,089 | | | $ | 98,504 | | | $ | 113,151 | | | $ | 134,544 | | | $ | 166,450 | | | $ | 119,657 | | |
Ratio of expenses to average net assets | |
Before waivers and reimbursements | | | 1.17 | %(5) | | | 1.17 | % | | | 1.18 | % | | | 1.22 | % | | | 1.13 | % | | | 1.18 | % | |
Net of waivers and reimbursements | | | 1.10 | %(5) | | | 1.10 | % | | | 1.10 | % | | | 1.10 | % | | | 1.10 | % | | | 1.10 | % | |
Ratio of net investment income (loss) to average
net assets | |
Before waivers and reimbursements | | | (0.22 | )%(5) | | | (0.35 | )% | | | (0.14 | )% | | | (0.08 | )% | | | (0.39 | )% | | | 0.17 | % | |
Net of waivers and reimbursements | | | (0.15 | )%(5) | | | (0.28 | )% | | | (0.06 | )% | | | 0.04 | % | | | (0.36 | )% | | | 0.25 | % | |
Portfolio turnover rate | | | 9 | %(4) | | | 24 | % | | | 28 | % | | | 28 | % | | | 33 | % | | | 41 | % | |
(1) Per share net investment income (loss) has been calculated using the daily average share method.
(2) Net investment loss per share is calculated using ending balances prior to consideration of adjustments for permanent book to tax differences.
(3) Less than one cent per share.
(4) Not annualized.
(5) Annualized.
The accompanying notes are an integral part of these financial statements.
page 53

Frontier Netols Small Cap Value Fund
FINANCIAL HIGHLIGHTS
| | | Class Y | |
| | | Six Months
Ended
December 31,
2014
(Unaudited) | | Year
Ended
June 30,
2014 | | Year
Ended
June 30,
2013 | | Year
Ended
June 30,
2012 | | Year
Ended
June 30,
2011 | | Year
Ended
June 30,
2010 | |
Net Asset Value, Beginning of Period | | $ | 14.15 | | | $ | 15.03 | | | $ | 12.65 | | | $ | 13.59 | | | $ | 10.00 | | | $ | 8.98 | | |
INCOME (LOSS) FROM
INVESTMENT OPERATIONS: | |
Net investment loss | | | (0.01 | )(1) | | | (0.17 | )(1) | | | (0.05 | ) | | | (0.05 | ) | | | (0.09 | )(2) | | | — | | |
Net realized and unrealized gain (loss) on investments | | | 0.08 | | | | 3.44 | | | | 3.12 | | | | (0.89 | ) | | | 3.68 | | | | 1.02 | | |
Total Income (Loss) from Investment Operations | | | 0.07 | | | | 3.27 | | | | 3.07 | | | | (0.94 | ) | | | 3.59 | | | | 1.02 | | |
LESS DISTRIBUTIONS: | |
From net realized gain on investments | | | (3.44 | ) | | | (4.15 | ) | | | (0.69 | ) | | | — | | | | — | | | | — | | |
Total Distributions | | | (3.44 | ) | | | (4.15 | ) | | | (0.69 | ) | | | — | | | | — | | | | — | | |
Net Asset Value, End of Period | | $ | 10.78 | | | $ | 14.15 | | | $ | 15.03 | | | $ | 12.65 | | | $ | 13.59 | | | $ | 10.00 | | |
Total Return | | | 0.89 | %(3) | | | 23.84 | % | | | 25.15 | % | | | (6.92 | )% | | | 35.90 | % | | | 11.36 | % | |
SUPPLEMENTAL DATA AND RATIOS: | |
Net assets, end of period (in thousands) | | $ | 583 | | | $ | 633 | | | $ | 20,228 | | | $ | 17,765 | | | $ | 22,792 | | | $ | 15,560 | | |
Ratio of expenses to average net assets | |
Before waivers and reimbursements | | | 1.17 | %(4) | | | 1.57 | % | | | 1.58 | % | | | 1.62 | % | | | 1.53 | % | | | 1.58 | % | |
Net of waivers and reimbursements | | | 1.10 | %(4) | | | 1.50 | % | | | 1.50 | % | | | 1.50 | % | | | 1.50 | % | | | 1.50 | % | |
Ratio of net investment loss to average net assets | |
Before waivers and reimbursements | | | (0.21 | )%(4) | | | (1.19 | )% | | | (0.54 | )% | | | (0.48 | )% | | | (0.79 | )% | | | (0.23 | )% | |
Net of waivers and reimbursements | | | (0.14 | )%(4) | | | (1.12 | )% | | | (0.46 | )% | | | (0.36 | )% | | | (0.76 | )% | | | (0.15 | )% | |
Portfolio turnover rate | | | 9 | %(3) | | | 24 | % | | | 28 | % | | | 28 | % | | | 33 | % | | | 41 | % | |
(1) Per share net investment loss has been calculated using the daily average share method.
(2) Net investment loss per share is calculated using ending balances prior to consideration of adjustments for permanent book to tax differences.
(3) Not annualized.
(4) Annualized.
The accompanying notes are an integral part of these financial statements.
page 54

Frontier Phocas Small Cap Value Fund
FINANCIAL HIGHLIGHTS
| | | Six Months
Ended
December 31,
2014
(Unaudited) | | Year
Ended
June 30,
2014 | | Year
Ended
June 30,
2013 | | Year
Ended
June 30,
2012 | | Year
Ended
June 30,
2011(1) | | Six Months
Ended
June 30,
2010(2) | | Year
Ended
December 31,
2009 | |
Net Asset Value, Beginning of Period | | $ | 35.96 | | | $ | 28.72 | | | $ | 23.30 | | | $ | 24.51 | | | $ | 18.40 | | | $ | 18.48 | | | $ | 14.93 | | |
INCOME (LOSS) FROM
INVESTMENT OPERATIONS: | |
Net investment income (loss) | | | 0.05 | | | | (0.05 | )(3) | | | 0.20 | | | | 0.06 | | | | 0.04 | (3) | | | 0.02 | (3) | | | 0.06 | (3) | |
Net realized and unrealized gain (loss)
on investments | | | 0.05 | (4) | | | 9.25 | | | | 5.41 | | | | (1.25 | ) | | | 6.13 | | | | (0.10 | ) | | | 3.56 | | |
Total Income (Loss) from Investment Operations | | | 0.10 | | | | 9.20 | | | | 5.61 | | | | (1.19 | ) | | | 6.17 | | | | (0.08 | ) | | | 3.62 | | |
LESS DISTRIBUTIONS: | |
From net investment income | | | (0.03 | ) | | | (0.05 | ) | | | (0.19 | ) | | | (0.02 | ) | | | (0.06 | ) | | | — | | | | (0.07 | ) | |
From net realized gain on investments | | | (1.87 | ) | | | (1.91 | ) | | | — | | | | — | | | | — | | | | — | | | | — | | |
Total Distributions | | | (1.90 | ) | | | (1.96 | ) | | | (0.19 | ) | | | (0.02 | ) | | | (0.06 | ) | | | — | | | | (0.07 | ) | |
Redemption fees retained | | | — | | | | — | | | | — | | | | — | | | | — | (5) | | | — | (5) | | | — | (5) | |
Net Asset Value, End of Period | | $ | 34.16 | | | $ | 35.96 | | | $ | 28.72 | | | $ | 23.30 | | | $ | 24.51 | | | $ | 18.40 | | | $ | 18.48 | | |
Total Return | | | 0.34 | %(6) | | | 32.72 | % | | | 24.29 | % | | | (4.91 | )% | | | 33.55 | % | | | (0.43 | )%(6) | | | 24.29 | % | |
SUPPLEMENTAL DATA AND RATIOS: | |
Net assets, end of period (in thousands) | | $ | 29,434 | | | $ | 24,152 | | | $ | 9,004 | | | $ | 18,821 | | | $ | 20,507 | | | $ | 15,176 | | | $ | 19,331 | | |
Ratio of expenses to average net assets | |
Before waivers and reimbursements | | | 1.61 | %(7) | | | 1.97 | % | | | 2.50 | % | | | 1.70 | % | | | 1.69 | % | | | 1.68 | %(7) | | | 1.71 | % | |
Net of waivers and reimbursements | | | 1.10 | %(7) | | | 1.10 | % | | | 1.05 | % | | | 0.99 | % | | | 0.99 | % | | | 0.99 | %(7) | | | 0.99 | % | |
Ratio of net investment income (loss) to
average net assets | |
Before waivers and reimbursements | | | (0.20 | )%(7) | | | (1.00 | )% | | | (1.08 | )% | | | (0.51 | )% | | | (0.52 | )% | | | (0.53 | )%(7) | | | (0.31 | )% | |
Net of waivers and reimbursements | | | 0.31 | %(7) | | | (0.13 | )% | | | 0.37 | % | | | 0.20 | % | | | 0.18 | % | | | 0.16 | %(7) | | | 0.41 | % | |
Portfolio turnover rate | | | 28 | %(6) | | | 53 | % | | | 196 | % | | | 50 | % | | | 37 | % | | | 43 | %(6) | | | 67 | % | |
(1) Effective October 8, 2010, Frontegra Asset Management, Inc. became adviser and Phocas Financial Corp. became subadviser to the Fund.
(2) Effective June 30, 2010, the Fund changed its fiscal year end to June 30 from December 31.
(3) Per share net investment income (loss) has been calculated using the daily average shares method.
(4) Net realized and unrealized gain on investments per share is a balancing amount necessary to reconcile the change in net asset value per share for the period, and may not reconcile with the net realized and unrealized loss on investments in the Statement of Operations.
(5) Less than one cent per share.
(6) Not annualized.
(7) Annualized.
The accompanying notes are an integral part of these financial statements.
page 55

NOTES TO FINANCIAL STATEMENTS
December 31, 2014 (Unaudited)
(1) ORGANIZATION
Frontier Funds, Inc. (the "Company") was incorporated on May 24, 1996 as a Maryland corporation and is registered under the Investment Company Act of 1940, as amended (the "1940 Act"), as an open-end investment company issuing shares in series (each, a "Fund," or collectively, the "Funds"), each series representing a distinct portfolio with its own investment objectives and policies. The investment objective of the Frontier RobecoSAM Global Equity Fund is long-term capital growth. The investment objective of each of the Frontier MFG Global Equity Fund, Frontier Timpani Small Cap Growth Fund and Frontier Netols Small Cap Value Fund is capital appreciation. The investment objective of the Frontier MFG Core Infrastructure Fund is long-term capital appreciation. The investment objective of the Frontier Phocas Small Cap Value Fund is long-term total investment through capital appreciation.
Effective October 31, 2014, the Company changed its name from "Frontegra Funds, Inc." to "Frontier Funds, Inc." and each Fund was renamed as listed in the table below.
As of December 31, 2014, the Company had six series in operations. A summary of each Fund's investment adviser, subadviser and capital structure is as follows:
Fund | | Investment Adviser | | Subadviser | | Capital Structure | | Commencement
of Operations | |
Frontier RobecoSAM Global Equity Fund (a) | | Frontegra Asset Management, Inc. ("Frontegra") | | RobecoSAM USA, Inc. | | Single Class | | June 18, 2009 | |
Frontier MFG Global Equity Fund (a) | | Frontegra | | MFG Asset Management | | Single Class | | Dec. 28, 2011 | |
Frontier MFG Core Infrastructure Fund (a) | | Frontegra | | MFG Asset Management | | Single Class | | Jan. 18, 2012 | |
Frontier Timpani Small Cap Growth Fund | | Timpani Capital Management LLC ("Timpani") (b) | | None | | Multi-Class
• Institutional
• Class Y | | Mar. 23, 2011 | |
Frontier Netols Small Cap Value Fund | | Frontegra | | Netols Asset Management, Inc. | | Multi-Class
• Institutional
• Class Y | | Dec. 16, 2005 | |
Frontier Phocas Small Cap Value Fund | | Frontegra | | Phocas Financial Corp. | | Single Class | | Sep. 29, 2006 | |
(a) A redemption fee of 2.00% will be charged on shares of the Fund redeemed 30 days or less from their date of purchase.
(b) Timpani is an affiliate of Frontegra.
page 56

NOTES TO FINANCIAL STATEMENTS (continued)
December 31, 2014 (Unaudited)
(2) SIGNIFICANT ACCOUNTING POLICIES
The following is a summary of significant accounting policies consistently followed by the Funds in the preparation of their financial statements.
(a) Investment Valuation
Equity securities for which market quotations are readily available are valued at the last reported sale price on the national securities exchange on which such securities are primarily traded. Equity securities for which there were no transactions on a given day or securities not listed on a national securities exchange are valued at the most recent bid price. Equity securities that are traded on NASDAQ are valued using the NASDAQ Official Closing Price ("NOCP"). Debt securities are valued at the bid price provided by an independent pricing service, which uses valuation methods such as matrix pricing and other analytical pricing models as well as market transactions and dealer bid quotations. Shares of underlying mutual funds are valued at their respective NAVs. Exchange traded funds are valued at the last reported sale price on the exchange on which the security is principally traded. Securities that are primarily traded on foreign exchanges generally are valued at the last sale price of such securities on their respective exchange. In certain circumstances, such as when a significant event occurs in a foreign market so that the last sale price no longer reflects actual value, the fair value of these securities may be determined using fair valuation procedures approved by the Board of Directors (the "Board"). The Board has retained an independent fair value pricing service to assist in valuing foreign securities held by the Frontier RobecoSAM Global Equity, Frontier MFG Global Equity and Frontier MFG Core Infrastructure Funds. In valuing assets, prices denominated in foreign currencies are converted to U.S. dollar equivalents at the current exchange rate, which approximates fair value. Debt securities maturing within 60 days or less, which are not priced by a pricing service, may be valued by the amortized cost method. Any securities or other assets for which market quotations are not readily available are valued at their fair value as determined in good faith by the advisers or subadvisers pursuant to guidelines established by the Board.
The Funds follow a fair value hierarchy that distinguishes between market data obtained from independent sources (observable inputs) and the Funds' own market assumptions (unobservable inputs). These inputs are used in determining the value of each Fund's investments and are summarized in the following fair value hierarchy:
Level 1 — Quoted prices in active markets for identical securities
Level 2 — Evaluated prices based on other significant observable inputs (including quoted prices for similar securities, foreign security indices, foreign exchange rates, fair value estimates for foreign securities and changes in benchmark securities indices)
Level 3 — Significant unobservable inputs (including the Fund's own assumptions in determining fair value of investments)
RobecoSAM Global Equity
Description | | Level 1 | | Level 2 | | Level 3 | | Total | |
Equity (a) | |
| Common Stocks | | $ | 8,081,958 | | | $ | 4,542,477 | | | $ | — | | | $ | 12,624,435 | | |
| Preferred Stocks | | | — | | | | 515,141 | | | | — | | | | 515,141 | | |
| Total Equity | | | 8,081,958 | | | | 5,057,618 | | | | — | | | | 13,139,576 | | |
Short-Term Investments | | | 208,440 | | | | — | | | | — | | | | 208,440 | | |
Total Investments in Securities | | $ | 8,290,398 | | | $ | 5,057,618 | | | $ | — | | | $ | 13,348,016 | | |
page 57

NOTES TO FINANCIAL STATEMENTS (continued)
December 31, 2014 (Unaudited)
MFG Global Equity
Description | | Level 1 | | Level 2 | | Level 3 | | Total | |
Equity (a) | |
| Common Stocks | | $ | 635,878,520 | | | $ | 264,621,785 | | | $ | — | | | $ | 900,500,305 | | |
| Total Equity | | | 635,878,520 | | | | 264,621,785 | | | | — | | | | 900,500,305 | | |
Short-Term Investments | | | 115,153,016 | | | | — | | | | — | | | | 115,153,016 | | |
Total Investments in Securities | | $ | 751,031,536 | | | $ | 264,621,785 | | | $ | — | | | $ | 1,015,653,321 | | |
MFG Core Infrastructure
Description | | Level 1 | | Level 2 | | Level 3 | | Total | |
Equity (a) | |
| Common Stocks | | $ | 37,452,848 | | | $ | 31,698,059 | | | $ | — | | | $ | 69,150,907 | | |
| Closed-End Funds | | | 252,077 | | | | 430,931 | | | | — | | | | 683,008 | | |
| Total Equity | | | 37,704,925 | | | | 32,128,990 | | | | — | | | | 69,833,915 | | |
Short-Term Investments | | | 2,076,157 | | | | — | | | | — | | | | 2,076,157 | | |
Total Investments in Securities | | $ | 39,781,082 | | | $ | 32,128,990 | | | $ | — | | | $ | 71,910,072 | | |
Timpani Small Cap Growth
Description | | Level 1 | | Level 2 | | Level 3 | | Total | |
Equity (a) | |
| Common Stocks | | $ | 30,703,574 | | | $ | — | | | $ | — | | | $ | 30,703,574 | | |
| Total Equity | | | 30,703,574 | | | | — | | | | — | | | | 30,703,574 | | |
Short-Term Investments | | | 538,619 | | | | — | | | | — | | | | 538,619 | | |
Total Investments in Securities | | $ | 31,242,193 | | | $ | — | | | $ | — | | | $ | 31,242,193 | | |
Netols Small Cap Value
Description | | Level 1 | | Level 2 | | Level 3 | | Total | |
Equity (a) | |
| Common Stocks | | $ | 86,338,293 | | | $ | — | | | $ | — | | | $ | 86,338,293 | | |
| Total Equity | | | 86,338,293 | | | | — | | | | — | | | | 86,338,293 | | |
Short-Term Investments | | | 762,917 | | | | — | | | | — | | | | 762,917 | | |
Total Investments in Securities | | $ | 87,101,210 | | | $ | — | | | $ | — | | | $ | 87,101,210 | | |
Phocas Small Cap Value
Description | | Level 1 | | Level 2 | | Level 3 | | Total | |
| | | | Equity (a) | | |
| Common Stocks | | $ | 23,112,433 | | | $ | — | | | $ | — | | | $ | 23,112,433 | | |
| Total Equity | | | 23,112,433 | | | | — | | | | — | | | | 23,112,433 | | |
Short-Term Investments | | | 631,150 | | | | — | | | | — | | | | 631,150 | | |
Total Investments in Securities | | $ | 23,743,583 | | | $ | — | | | $ | — | | | $ | 23,743,583 | | |
(a) See Fund's Schedule of Investments for sector or country classifications.
page 58

NOTES TO FINANCIAL STATEMENTS (continued)
December 31, 2014 (Unaudited)
| | RobecoSAM
Global Equity | | MFG Global
Equity | | MFG Core
Infrastructure | |
Transfers out of Level 1 | | $ | (5,057,618 | ) | | $ | (264,621,785 | ) | | $ | (32,128,990 | ) | |
Transfers into Level 2 | | $ | 5,057,618 | | | $ | 264,621,785 | | | $ | 32,128,990 | | |
Net transfers | | $ | — | | | $ | — | | | $ | — | | |
Transfers between Level 1 and Level 2 relate to the use of systematic fair valuation. On days when systematic fair valuation is used, certain non-U.S. dollar denominated securities move from Level 1 to Level 2 classification. At December 31, 2014, securities in the RobecoSAM Global Equity, MFG Global Equity and MFG Core Infrastructure Funds were adjusted using systematic fair valuation resulting in a Level 2 classification. At June 30, 2014, securities in the RobecoSAM Global Equity, MFG Global Equity and MFG Core Infrastructure Funds were not adjusted using systematic fair valuation resulting in a Level 1 Classification. The Funds did not hold any Level 3 securities during the six months ended December 31, 2014. It is the Funds' policy to record transfers at the end of the reporting period.
(b) Federal Income Taxes
Each Fund intends to comply with the requirements of Subchapter M of the Internal Revenue Code necessary to qualify as a regulated investment company and to make the requisite distributions of income and capital gains to its shareholders sufficient to relieve it from all or substantially all federal income taxes. Therefore, no federal income tax provision has been provided.
The Funds have adopted financial reporting rules regarding recognition and measurement of tax positions taken or expected to be taken on a tax return. The Funds recognize interest and penalties, if any, related to unrecognized tax benefits as income tax expense on the Statement of Operations. During the period, the Funds did not incur any interest or penalties. The Funds have reviewed all open tax years and concluded that there is no effect to any of the Fund's financial positions or results of operations and no tax liability resulting from unrecognized tax benefits relating to uncertain income tax positions taken or expected to be taken on a tax return. Open tax years are those years that are open for examination by the relevant income taxing authority. As of December 31, 2014, open federal and state income tax years include the tax years ended June 30, 2012, June 30, 2013 and June 30, 2014. The Funds have no examinations in progress.
(c) Distributions to Shareholders
Dividends from net investment income and net realized gains, if any, are declared and paid at least annually. All short-term capital gains are included in ordinary income for tax purposes. Distributions to shareholders are recorded on the ex-dividend date.
The tax character of distributions paid during the six months ended December 31, 2014 and the fiscal year ended June 30, 2014 were as follows:
| | Six Months Ended December 31, 2014 | | Year Ended June 30, 2014 | |
| | Ordinary
Income | | Long-Term
Capital Gains | | Total
Distributions | | Ordinary
Income | | Long-Term
Capital Gains | | Total
Distributions | |
RobecoSAM Global Equity | | $ | 448,162 | | | $ | 2,395,843 | | | $ | 2,844,005 | | | $ | 306,528 | | | $ | 233,033 | | | $ | 539,561 | | |
MFG Global Equity | | | 16,691,674 | | | | 5,864,814 | | | | 22,556,488 | | | | 7,828,247 | | | | 571,764 | | | | 8,400,011 | | |
MFG Core Infrastructure | | | 1,600,000 | | | | 27,925 | | | | 1,627,925 | | | | 253,056 | | | | — | | | | 253,056 | | |
Timpani Small Cap Growth | | | — | | | | — | | | | — | | | | 5,119 | | | | 130,330 | | | | 135,449 | | |
Netols Small Cap Value | | | — | | | | 21,063,141 | | | | 21,063,141 | | | | 954,829 | | | | 25,571,887 | | | | 26,526,716 | | |
Phocas Small Cap Value | | | 316,055 | | | | 927,520 | | | | 1,243,575 | | | | 126,612 | | | | 570,892 | | | | 697,504 | | |
page 59

NOTES TO FINANCIAL STATEMENTS (continued)
December 31, 2014 (Unaudited)
At June 30, 2014, the Funds' most recent fiscal year end, the components of accumulated earnings/losses on a tax basis were as follows:
| | RobecoSAM
Global
Equity | | MFG
Global
Equity | | MFG
Core
Infrastructure | | Timpani
Small Cap
Growth | | Netols
Small Cap
Value | | Phocas
Small Cap
Value | |
Cost of investments | | $ | 14,032,448 | | | $ | 692,539,573 | | | $ | 61,953,497 | | | $ | 12,648,604 | | | $ | 60,088,308 | | | $ | 19,386,221 | | |
Gross unrealized appreciation | | $ | 4,161,173 | | | $ | 109,067,541 | | | $ | 4,639,712 | | | $ | 2,361,981 | | | $ | 40,961,461 | | | $ | 4,990,957 | | |
Gross unrealized depreciation | | | (279,268 | ) | | | (12,777,884 | ) | | | (347,609 | ) | | | (417,897 | ) | | | (2,202,516 | ) | | | (209,412 | ) | |
Net unrealized appreciation/depreciation | | | 3,881,905 | | | | 96,289,657 | | | | 4,292,103 | | | | 1,944,084 | | | | 38,758,945 | | | | 4,781,545 | | |
Undistributed ordinary income | | $ | 448,153 | | | $ | 10,064,210 | | | $ | 731,959 | | | $ | — | | | $ | — | | | $ | 296,108 | | |
Undistributed long-term capital gain | | | 1,910,646 | | | | 865,243 | | | | 5,929 | | | | 419,609 | | | | 17,356,588 | | | | 751,084 | | |
Total distributable earnings | | | 2,358,799 | | | | 10,929,453 | | | | 737,888 | | | | 419,609 | | | | 17,356,588 | | | | 1,047,192 | | |
Other accumulated gains (losses) | | | 754 | | | | 27,283 | | | | 2,728 | | | | (846,130 | ) | | | (109,904 | ) | | | — | | |
Total accumulated earnings | | $ | 6,241,458 | | | $ | 107,246,393 | | | $ | 5,032,719 | | | $ | 1,517,563 | | | $ | 56,005,629 | | | $ | 5,828,737 | | |
The difference between book-basis and tax-basis unrealized appreciation is attributable primarily to the tax deferral of losses on wash sales and mark-to-market on passive foreign investment companies.
During the fiscal year ended June 30, 2014, the Funds utilized capital loss carryforwards as follows:
Fund | | Amount | |
RobecoSAM Global Equity | | $ | 307,951 | | |
Timpani Small Cap Growth | | | 86,398 | | |
As of the fiscal year ended June 30, 2014, the Funds do not have any capital loss carryforwards available for future use.
In order to meet certain excise tax requirements, the Funds are required to measure and distribute annually, net capital gains realized during the twelve month period ending October 31. In connection with this requirement, the Funds are permitted, for tax purposes, to defer into their next fiscal year any net capital losses incurred from November 1 through the end of the fiscal year. As of the fiscal year ended June 30, 2014, the following Funds deferred, on a tax basis, post-October losses and ordinary late-year losses of:
| | Post-October
Capital Loss Deferred | | Ordinary Late-Year
Loss Deferred | |
Timpani Small Cap Growth | | $ | 798,853 | | | $ | 47,277 | | |
Netols Small Cap Value | | | — | | | | 109,904 | | |
page 60

NOTES TO FINANCIAL STATEMENTS (continued)
December 31, 2014 (Unaudited)
(d) Foreign Currency Translation
Values of investments denominated in foreign currencies are converted into U.S. dollars using a spot market rate of exchange each day. Purchases and sales of investments and dividend and interest income are translated to U.S. dollars using a spot market rate of exchange prevailing on the dates of such transactions. The portion of security gains or losses resulting from changes in foreign exchange rates are included with net realized and unrealized gain or loss from investments, as appropriate, for both financial reporting and tax purposes.
Each Fund, respectively, bears the risk of changes in the foreign currency exchange rates and their impact on the value of assets and liabilities denominated in foreign currency. Each Fund also bears the risk of a counterparty failing to fulfill its obligation under a foreign currency contract.
Investments in securities of foreign companies involve additional risks including: currency exchange rate fluctuation; less available public information about the issuers of securities; less stringent regulatory standards; lack of uniform accounting, auditing and financial reporting standards; and country risks including less liquidity, high inflation rates and political and economic instability. The risks of foreign investments are typically greater in emerging and less developed markets.
(e) Indemnifications
Under the Funds' organizational documents, their officers and directors are indemnified against certain liabilities arising out of the performance of their duties to the Funds. In addition, in the normal course of business, the Funds enter into contracts that provide general indemnifications to other parties. The Funds' maximum exposure under these arrangements is unknown as this would involve future claims that may be made against the Funds that have not yet occurred. However, the Funds have not had prior claims or losses pursuant to these contracts and expect the risk of loss to be remote.
(f) Subsequent Event
On February 19, 2015, the Board of Directors approved a plan of liquidation for the Frontier RobecoSAM Global Equity Fund, which will occur on or about March 23, 2015. After February 19, 2015, the Fund no longer accepts incoming purchases or exchanges.
(g) Other
Investment transactions are accounted for on the trade date. The Funds determine the gain or loss realized from investment transactions by comparing the original cost of the specifically identified security lot sold with the net sale proceeds. Dividend income, less foreign taxes withheld, is recognized on the ex-dividend date, except that certain dividends from foreign securities are recorded as soon as the information becomes available to the Funds. Interest income is recognized on an accrual basis. All discounts/premiums are accreted/amortized using the effective interest method and are included in interest income. Withholding taxes on foreign dividends have been provided for in accordance with the Funds' understanding of the applicable country's tax codes and regulations.
Income, expenses (other than expenses attributable to a specific class) and realized and unrealized gains or losses on investments attributable to the Funds are generally allocated to each respective class in proportion to the relative net assets of each class.
The preparation of financial statements in conformity with U.S. generally accepted accounting principles ("GAAP") requires management to make estimates and assumptions that affect the reported amounts of assets and liabilities and disclosure of
page 61

NOTES TO FINANCIAL STATEMENTS (continued)
December 31, 2014 (Unaudited)
contingent assets and liabilities at the date of the financial statements, and the reported amounts of increases and decreases in net assets from operations during the reporting period. Actual results could differ from those estimates.
Net investment income and realized gains and losses for federal income tax purposes may differ from that reported on the financial statements because of permanent book-to-tax differences. GAAP requires that permanent differences in net investment income and realized gains and losses due to differences between financial reporting and tax reporting be reclassified between various components of net assets. These reclassifications have no effect on net assets or net asset value per share. For the fiscal year ended June 30, 2014, the following table shows the reclassifications made:
| | RobecoSAM
Global
Equity | | MFG
Global
Equity | | MFG
Core
Infrastructure | | Timpani
Small Cap
Growth | | Netols
Small Cap
Value | | Phocas
Small Cap
Value | |
Paid in capital | | $ | — | | | $ | — | | | $ | — | | | $ | — | | | $ | (8,427 | ) | | $ | — | | |
Undistributed net investment income (loss) | | | (13,814 | ) | | | 1,286 | | | | (14,225 | ) | | | 40,927 | | | | 276,590 | | | | 18,695 | | |
Accumulated undistributed net realized gain (loss) | | | 13,814 | | | | (1,286 | ) | | | 14,225 | | | | (40,927 | ) | | | (268,163 | ) | | | (18,695 | ) | |
The permanent differences primarily relate to foreign currency and net operating losses.
(3) INVESTMENT ADVISER AND RELATED PARTIES
The RobecoSAM Global Equity, MFG Global Equity, MFG Core Infrastructure, Netols Small Cap Value and Phocas Small Cap Value Funds have entered into an agreement with Frontegra, with whom certain officers and a director of the Funds are affiliated, to furnish investment advisory services to the Funds. Timpani, an affiliate of Frontegra, is the investment adviser to the Timpani Small Cap Growth Fund. Fees are calculated daily and payable monthly, at annual rates set forth in the following table (expressed as a percentage of each Fund's average daily net assets). Pursuant to expense cap agreements, Frontegra and Timpani have agreed to waive their respective management fees and/or reimburse each Fund's operating expenses (exclusive of brokerage, acquired fund fees and expenses, interest, taxes and extraordinary expenses) to ensure that each Fund's operating expenses do not exceed the expense limitation listed below. Expenses waived are netted with advisory fees payable on the Statement of Assets and Liabilities. On a monthly basis, these accounts are settled by each Fund making payment to the respective adviser or the respective adviser reimbursing the Fund if the reimbursement amount exceeds the advisory fee. If the amount of fees waived exceeds the advisory fee earned, this is shown on the Statement of Assets and Liabilities as a receivable from the respective adviser. The expense cap agreements will continue in effect until October 31, 2015, with successive renewal terms of one year unless terminated by an adviser or a Fund prior to any such renewal.
Frontier Fund | | Annual Advisory Fees | | Expense Limitation | |
RobecoSAM Global Equity | | | 0.80 | % | | | 1.20 | % | |
MFG Global Equity | | | 0.80 | % | | | 0.80 | % | |
MFG Core Infrastructure | | | 0.70 | % | | | 0.70 | % | |
Timpani Small Cap Growth - Institutional Class | | | 1.00 | % | | | 1.10 | % | |
Timpani Small Cap Growth - Class Y | | | 1.00 | % | | | 1.50 | % | |
Netols Small Cap Value - Institutional Class | | | 1.00 | % | | | 1.10 | % | |
Netols Small Cap Value - Class Y | | | 1.00 | % | | | 1.50 | % | |
Phocas Small Cap Value | | | 1.00 | % | | | 1.10 | % | |
page 62

NOTES TO FINANCIAL STATEMENTS (continued)
December 31, 2014 (Unaudited)
Any waivers or reimbursements are subject to later adjustment to allow the advisers to recoup amounts waived or reimbursed to the extent actual fees and expenses for a fiscal period are less than each Fund's expense limitation cap, provided, however, that an adviser shall only be entitled to recoup such amounts for a period of three years from the date such amount was waived or reimbursed. Expenses attributable to a specific class may only be recouped with respect to that class.
The following table shows the waived or reimbursed expenses subject to potential recovery expiring in:
| | RobecoSAM
Global
Equity | | MFG
Global
Equity | | MFG
Core
Infrastructure | | Timpani
Small Cap
Growth | | Netols
Small Cap
Value | | Phocas
Small Cap
Value | |
2015 | | $ | 78,884 | | | $ | 95,480 | * | | $ | 66,588 | ** | | $ | 103,400 | | | $ | 194,049 | | | $ | 146,574 | | |
2016 | | | 78,470 | | | | 294,528 | | | | 100,062 | | | | 95,252 | | | | 121,910 | | | | 147,770 | | |
2017 | | | 82,363 | | | | 524,574 | | | | 147,255 | | | | 107,201 | | | | 78,732 | | | | 117,689 | | |
2018 | | | 41,720 | | | | 289,618 | | | | 105,996 | | | | 68,972 | | | | 33,691 | | | | 59,351 | | |
Total | | $ | 281,437 | | | $ | 1,204,200 | | | $ | 419,901 | | | $ | 374,825 | | | $ | 428,382 | | | $ | 471,384 | | |
* Expenses waived/reimbursed were for the period December 28, 2011 through June 30, 2012.
** Expenses waived/reimbursed were for the period January 18, 2012 through June 30, 2012.
(4) INVESTMENT TRANSACTIONS
The aggregate purchases and sales of securities, excluding short-term investments, for the Funds for the six months ended December 31, 2014, are summarized below:
| | RobecoSAM
Global
Equity | | MFG
Global
Equity | | MFG
Core
Infrastructure | | Timpani
Small Cap
Growth | | Netols
Small Cap
Value | | Phocas
Small Cap
Value | |
Purchases | | $ | 4,170,176 | | | $ | 395,432,002 | | | $ | 14,604,827 | | | $ | 28,175,295 | | | $ | 8,554,516 | | | $ | 6,426,061 | | |
Sales | | $ | 7,557,633 | | | $ | 296,967,906 | | | $ | 9,872,810 | | | $ | 12,999,988 | | | $ | 20,181,116 | | | $ | 6,667,330 | | |
There were no purchases or sales of U.S. Government securities for the Funds.
(5) DISTRIBUTION PLAN AND SHAREHOLDER SERVICING FEE
The Company, on behalf of the Frontier Netols Small Cap Value Fund and the Frontier Timpani Small Cap Growth Fund, has adopted a distribution plan pursuant to Rule 12b-1 under the Investment Company Act of 1940 for each Fund's Class Y shares (the "12b-1 Plan"). Pursuant to the 12b-1 Plan, each Fund pays an annual fee of up to 0.25% to Frontegra Strategies, LLC (the "Distributor"), an affiliate of Frontegra, for payments to brokers, dealers and other financial intermediaries who perform activities or incur expenses intended to result in the sale of Class Y shares of the Funds. For the six months ended December 31, 2014, the Netols Small Cap Value Fund and the Timpani Small Cap Growth Fund incurred $0 and $1,764, respectively, under the 12b-1 Plan.
Class Y shares of the Funds also pay an annual shareholder servicing fee of up to 0.15% per year to the Distributor for payments to brokers, dealers, and other financial intermediaries who provide on-going account services to shareholders. Those services include establishing and maintaining shareholder accounts, mailing prospectuses, account statements and other Fund documents to shareholders, processing shareholder transactions, and providing other recordkeeping and administrative services. For the six months ended December 31, 2014, the Netols Small Cap Value Fund and the Timpani Small Cap Growth Fund incurred $0 and $1,058, respectively, in shareholder servicing expenses.
page 63
This page intentionally left blank.

A NOTE ON FORWARD-LOOKING STATEMENTS
This report includes forward-looking statements such as adviser, subadviser and/or portfolio manager predictions, opinions, assessments, analyses or outlooks for individual securities, industries, market sectors and/or markets. These statements involve risks and uncertainties. In addition to the general risks described for the Funds in the current Prospectuses, other factors bearing on these statements include the accuracy of the advisers', subadvisers' or portfolio managers' forecasts and predictions, and the appropriateness of the investment programs designed by an adviser, subadviser or portfolio manager to implement their strategies efficiently and effectively. Any one or more of these factors, as well as other risks affecting the securities markets and investment instruments generally, could cause the actual results of the Funds to differ materially as compared to benchmarks associated with the Funds.
In addition, portfolio composition will change due to ongoing management of the Funds. Specific securities named in this report may not currently be owned by the applicable Fund, or the Fund's position in the securities may have changed.
ADDITIONAL INFORMATION
Frontier Funds has adopted proxy voting policies and procedures that delegate to Frontegra Asset Management, Inc. ("Frontegra") and Timpani Capital Management LLC the authority to vote proxies. The proxy voting policies permit Frontegra to delegate its authority to vote proxies to a Fund's subadviser. A description of the Frontier Funds' proxy voting policies and procedures is available without charge, upon request, by calling the Funds toll free at 1-888-825-2100. A description of these policies and procedures is also included in the Funds' Statement of Additional Information, which is available on the SEC's website at http://www.sec.gov and the Funds' website at www.frontiermutualfunds.com or by calling the Funds' toll free at 1-888-825-2100.
The actual voting records relating to each Fund's portfolio securities during the most recent twelve months ended June 30 are available without charge by calling the Funds toll free at 1-888-825-2100 or by accessing the SEC's website at http://www.sec.gov.
Each Fund files a complete schedule of portfolio holdings for its first and third fiscal quarters with the SEC on Form N-Q. The Form N-Q is available on the SEC's website at http://www.sec.gov. The Form N-Q may also be reviewed and copied at the SEC's Public Reference Room in Washington, D.C. Information on the operation of the Public Reference Room may be obtained by calling toll-free 1-800-SEC-0330.
Item 2. Code of Ethics.
Not applicable for semi-annual reports.
Item 3. Audit Committee Financial Expert.
Not applicable for semi-annual reports.
Item 4. Principal Accountant Fees and Services.
Not applicable for semi-annual reports.
Item 5. Audit Committee of Listed Registrants.
Not applicable to registrants who are not listed issuers (as defined in Rule 10A-3 under the Securities Exchange Act of 1934).
Item 6. Investments.
(a) Schedule of Investments is included as part of the report to shareholders filed under Item 1 of this Form.
(b) Not Applicable.
Item 7. Disclosure of Proxy Voting Policies and Procedures for Closed-End Management Investment Companies.
Not applicable to open-end investment companies.
Item 8. Portfolio Managers of Closed-End Management Investment Companies.
Not applicable to open-end investment companies.
Item 9. Purchases of Equity Securities by Closed-End Management Investment Company and Affiliated Purchasers.
Not applicable to open-end investment companies.
Item 10. Submission of Matters to a Vote of Security Holders.
Not Applicable.
1
Item 11. Controls and Procedures.
(a) The Registrant’s President and Treasurer have reviewed the Registrant’s disclosure controls and procedures (as defined in Rule 30a-3(c) under the Investment Company Act of 1940 (the “Act”)) as of a date within 90 days of the filing of this report, as required by Rule 30a-3(b) under the Act and Rules 13a-15(b) or 15d-15(b) under the Securities Exchange Act of 1934. Based on their review, such officers have concluded that the disclosure controls and procedures are effective in ensuring that information required to be disclosed in this report is appropriately recorded, processed, summarized and reported and made known to them by others within the Registrant and by the Registrant’s service provider.
(b) There were no changes in the Registrant’s internal control over financial reporting (as defined in Rule 30a-3(d) under the Act) that occurred during the second fiscal quarter of the period covered by this report that has materially affected, or is reasonably likely to materially affect, the Registrant’s internal control over financial reporting.
Item 12. Exhibits.
(a) (1) Any code of ethics or amendment thereto, that is the subject of the disclosure required by Item 2, to the extent that the registrant intends to satisfy Item 2 requirements through filing an exhibit. Not applicable.
(2) A separate certification for each principal executive and principal financial officer pursuant to Section 302 of the Sarbanes-Oxley Act of 2002. Filed herewith.
(3) Any written solicitation to purchase securities under Rule 23c-1 under the Act sent or given during the period covered by the report by or on behalf of the registrant to 10 or more persons. Not applicable to open-end investment companies.
(b) Certifications pursuant to Section 906 of the Sarbanes-Oxley Act of 2002. Furnished herewith.
2
SIGNATURES
Pursuant to the requirements of the Securities Exchange Act of 1934 and the Investment Company Act of 1940, the registrant has duly caused this report to be signed on its behalf by the undersigned, thereunto duly authorized.
Frontier Funds, Inc. | |
| |
By: | /s/ William D. Forsyth III | |
| William D. Forsyth III, President | |
| (Principal Executive Officer) | |
| | |
Date: | February 24, 2015 | |
Pursuant to the requirements of the Securities Exchange Act of 1934 and the Investment Company Act of 1940, this report has been signed below by the following persons on behalf of the registrant and in the capacities and on the dates indicated.
By: | /s/ William D. Forsyth III | |
| William D. Forsyth III, President | |
| (Principal Executive Officer) | |
| | |
Date: | February 24, 2015 | |
| | |
By: | /s/ Elyce D. Dilworth | |
| Elyce D. Dilworth, Treasurer and Assistant Secretary | |
| (Principal Financial Officer) | |
| | |
Date: | February 23, 2015 | |
3