UNITED STATES
SECURITIES AND EXCHANGE COMMISSION
Washington, D.C. 20549
FORM N-CSR
CERTIFIED SHAREHOLDER REPORT OF REGISTERED
MANAGEMENT INVESTMENT COMPANIES
Investment Company Act file number 811-07655
| Driehaus Mutual Funds |
(Exact name of registrant as specified in charter)
25 East Erie Street Chicago, IL 60611 |
(Address of principal executive offices) (Zip code)
Janet L. McWilliams Driehaus Capital Management LLC 25 East Erie Street Chicago, IL 60611 |
(Name and address of agent for service)
Registrant’s telephone number, including area code: 312-587-3800
Date of fiscal year end: December 31
Date of reporting period: December 31, 2011
Form N-CSR is to be used by management investment companies to file reports with the Commission not later than 10 days after the transmission to stockholders of any report that is required to be transmitted to stockholders under Rule 30e-1 under the Investment Company Act of 1940 (17 CFR 270.30e-1). The Commission may use the information provided on Form N-CSR in its regulatory, disclosure review, inspection, and policymaking roles.
A registrant is required to disclose the information specified by Form N-CSR, and the Commission will make this information public. A registrant is not required to respond to the collection of information contained in Form N-CSR unless the Form displays a currently valid Office of Management and Budget (“OMB”) control number. Please direct comments concerning the accuracy of the information collection burden estimate and any suggestions for reducing the burden to Secretary, Securities and Exchange Commission, 100 F Street, NE, Washington, DC 20549. The OMB has reviewed this collection of information under the clearance requirements of 44 U.S.C. § 3507.
| Item 1. | Reports to Stockholders. |
Driehaus Mutual Funds
Trustees, Advisory Board Members & Officers
Richard H. Driehaus
Trustee
A.R. Umans
Chairman of the Board
Francis J. Harmon
Trustee
Daniel F. Zemanek
Trustee
Dawn M. Vroegop
Advisory Board Member
Theodore J. Beck
Advisory Board Member
Robert H. Gordon
President
Michelle L. Cahoon
Vice President & Treasurer
Janet L. McWilliams
Assistant Vice President &
Chief Compliance Officer
Diane J. Drake
Secretary
Michael P. Kailus
Assistant Secretary
William H. Wallace, III
Assistant Secretary
Investment Adviser
Driehaus Capital Management LLC
25 East Erie Street
Chicago, IL 60611
Distributor
Driehaus Securities LLC
25 East Erie Street
Chicago, IL 60611
Administrator
BNY Mellon Investment Servicing (US) Inc.
4400 Computer Drive
Westborough, MA 01581
Transfer Agent
BNY Mellon Investment Servicing (US) Inc.
4400 Computer Drive
Westborough, MA 01581
Custodian
The Northern Trust Company
50 South LaSalle Street
Chicago, IL 60603
Annual Report to Shareholders December 31, 2011

Driehaus International Discovery Fund
Driehaus Emerging Markets Growth Fund
Driehaus Emerging Markets Small Cap Growth Fund
Driehaus International Small Cap Growth Fund
Driehaus Global Growth Fund
Driehaus Mid Cap Growth Fund
Driehaus Large Cap Growth Fund
Distributed by:
Driehaus Securities LLC
This report has been prepared for the shareholders of the Funds and is not an offering to sell or buy any Fund securities. Such offering is only made by the Funds' prospectus.
Investment Philosophy:
The Adviser seeks to achieve superior investment returns primarily by investing in global companies that are currently demonstrating rapid growth in their sales and earnings and which, in its judgement, have the ability to continue or accelerate their growth rates in the future. The Adviser manages the portfolios actively (above average turnover) to ensure that the Funds are fully invested, under appropriate market conditions, in companies that meet these criteria. Investors should note that investments in overseas markets can pose more risks than U.S. investments, and the international Funds’ share prices are expected to be more volatile than those of the U.S.-only Funds. In addition, the Funds’ returns will fluctuate with changes in stock market conditions, currency values, interest rates, government regulations, and economic and political conditions in countries in which the Funds invest. These risks are generally greater when investing in emerging markets.
Annual Report to Shareholders December 31, 2011
Driehaus International Discovery Fund
Driehaus Emerging Markets Growth Fund
Driehaus Emerging Markets Small Cap Growth Fund
Driehaus International Small Cap Growth Fund
Driehaus Global Growth Fund
Driehaus Mid Cap Growth Fund
Driehaus Large Cap Growth Fund
Portfolio Managers’ Letter, Performance Overview and Schedule of Investments: | ||||
| 1 | ||||
| 8 | ||||
| 15 | ||||
| 22 | ||||
| 29 | ||||
| 35 | ||||
| 40 | ||||
| 46 | ||||
| 48 | ||||
| 50 | ||||
| 54 | ||||
| 61 | ||||
| 72 | ||||
| 73 | ||||
| 74 | ||||
| 75 | ||||
| 76 | ||||
| 78 | ||||
| 79 | ||||
Board Considerations in Connection with the Annual Review of the Investment Advisory Agreement | 81 | |||
Driehaus International Discovery Fund — Portfolio Managers’ Letter
Dear Fellow Shareholders,
The Driehaus International Discovery Fund (“Fund”) returned –19.85% for the year ended December 31, 2011. This return was below the performance of the Morgan Stanley Capital International (“MSCI”) All Country World ex USA Growth Index (“Benchmark”) (which returned –13.93% for the year) and below the performance of the MSCI All Country World ex USA Index (which returned –13.33%, which are the Fund’s two primary benchmark indices.
The ongoing European saga caused the developed ex.-U.S. asset class to underperform U.S. equities during the year. The Eurozone clearly suffers from significant policy overhang as well as the presence of a possible dissolution of the Euro and continues to have an impact on equity prices. An improvement in the perception of these risks or an unexpected improvement in the economic data could be a significant catalyst for the European markets. Nevertheless, the European situation continues to be rife with both opportunities and risks. Emerging market equities also struggled throughout the year, underperforming developed markets in a period that was marked by increasing evidence of slowing growth in the major markets of China, Brazil and India. While some slowdown had been expected, the pace at which activity indicators lost steam was alarming to many market participants. The ongoing deleveraging in developed markets combined with wariness over the global outlook continued to exert negative pressure on emerging market currencies throughout the year.
Certain areas detracted from Fund performance during the year. Two sectors where stock selection negatively affected the performance of the Fund relative to the Benchmark were the industrials and information technology sectors. Additionally, holdings in Canada and Germany detracted from Fund performance versus the Benchmark.
Within Canada, IMAX Corp. (NYSE: IMAX) was one of the Fund’s largest detractors from performance. The company is the leading manufacturer of 3D movie technologies and also produces original content. Leveraging off of a strong presence in North America, the company is aggressively expanding internationally to meet consumer demand. IMAX is developing joint ventures with foreign partners in an effort to quickly penetrate underserved markets while controlling capital investment. Importantly, international sales have a larger impact on the company’s revenue growth due to significantly higher revenue per screen. Despite the favorable market dynamics, the company reported a very weak third quarter, with revenue and earnings missing consensus expectations. The weaker performance per screen was largely due to a general weak box office in the quarter coupled with disappointing titles on the IMAX platform.
Similarly, stock selection in the industrials sector also detracted from the performance of the Fund in 2011, including holdings such as Deutz AG (DEZ GY). The German company designs and manufactures diesel and gas engines for use in trucks, buses, locomotives and power generation plants. The main driver of the company is its engine supply agreement with Volvo, generating nearly half of its business. As we enter 2012, company specific fundamental trends have not noticeably deteriorated, however continued macro concerns and deteriorating industrial sector data prompted analysts to downgrade their forward earnings outlook, resulting in the stock’s decline. We continue to like the company’s positioning and prospects, but did exit the position pending further clarification on the data.
Over the course of 2011, key contributors to performance versus the Benchmark were the Fund’s holdings in the health care and materials sectors. In addition, stock selection in both France and South Korea positively contributed to the performance of the Fund.
Within South Korea, Seegene, Inc. (096530 KS) was a holding that contributed to the Fund’s performance in 2011. The company manufactures and produces molecular diagnostic testing kits and possesses patented technology that allows these tests to be performed at a superior speed and cost relative to competing products. During the year, the company reported extremely strong growth in revenues and earnings, and the company’s share price was boosted by new product approvals and improved prospects for international sales partnerships.
Within the consumer discretionary sector, Sanrio Co., Ltd. (9136 JP), favorably contributed to performance. The Japanese company owns the licensing and royalty rights to the Hello Kitty brand upon which children’s character goods, apparel, greeting cards, books, movies and household goods are based. Due
1
to its superior licensing business model and exclusive rights to the brand, the company has repeatedly surpassed expectations and experienced strong sales and earnings growth. After a successful European campaign, the licensing team is now in the United States where Wal-Mart, Best Buy and Walgreens took leadership in retailing disposable goods with this character.
Looking ahead into 2012, we recognize that a significant portion of the Eurozone sovereign debt needs to be refinanced in the first quarter. Although there are some modest signs of economic stabilization/improvement in Europe, risk appetite remains low, which should make the bond auctions challenging. Sovereign spreads in the peripheral countries are still elevated, particularly for longer maturities, which will increase funding costs and make the fiscal situation worse. However, European Central Bank (ECB) President Draghi has been more responsive than his predecessor in confronting the economic headwinds and is significantly increasing liquidity. Furthermore, Eurozone leaders are making gradual progress toward a framework for fiscal reform and monitoring. If these incremental positives are sufficient to alleviate short term fears, the debt auctions may be able to exceed expectations which would likely reduce the risk premium in the market. Our view remains that there is a higher probability of funding challenges which will create volatility in both the debt and equity markets. However, we believe these pullbacks will present opportunities to increase exposure to Eurozone equities as we move into the second half of the year. Given the concerns in the region, expectations for economic growth are extremely bearish and investors are discounting meaningful weakness in corporate profits (as reflected in the disparity between European and U.S. price-to-earnings multiples). We are already seeing some early signs of economic stabilization which could lead to a positive adjustment in growth expectations. As importantly, ongoing improvements in the U.S. and solid nominal Gross Domestic Product (GDP) growth in the emerging markets should create favorable conditions for high quality exporters. Therefore, we anticipate increasing our European industrial exposure in the Fund during the first half of the year. We have identified several companies that meet our fundamental investment criteria, but will be selective about our entry points. Within the emerging markets, we think that regional and country positioning will continue to be extremely important given the divergence in fiscal and monetary policies.
As always, we at Driehaus Capital Management LLC thank you for your interest in the Driehaus International Discovery Fund and would like to express our gratitude to you as shareholders for your continued confidence in our management capabilities. As we move into the next calendar year, we remain focused on uncovering opportunities consistent with the Driehaus growth investment philosophy and managing the unique risks and opportunities presented by the non-U.S. equity markets on behalf of our shareholders.
Sincerely,
 |  | |
| Daniel M. Rea | Sebastien Pigeon | |
| Portfolio Manager | Assistant Portfolio Manager |
Performance is historical and does not represent future results.
2
Driehaus International Discovery Fund
Performance Overview (unaudited)
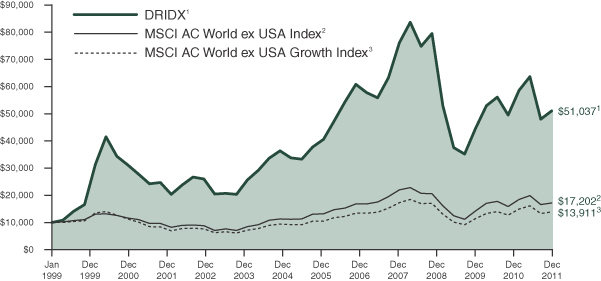
The performance summarized below is historical and does not represent future results. Investment returns and principal value vary, and you may have a gain or loss when you sell shares. Performance data presented measures the change in the value of an investment in the Fund, assuming reinvestment of all dividends and capital gains. Average annual total return reflects annualized change.
The table does not reflect the deduction of taxes that a shareholder would pay on Fund distributions or the redemption of Fund shares. The graph compares the results of a $10,000 investment in the Fund since December 31, 1998 (the date of the Fund’s inception), with all dividends and capital gains reinvested, with the indicated indices (and dividends reinvested) for the same period.
| Average Annual Total Returns as of 12/31/11 | 1 Year | 3 Years | 5 Years | 10 Years | Since Inception (12/31/98 - 12/31/11) | |||||||||||||||
Driehaus International Discovery Fund (DRIDX)1 | –19.85% | 10.73% | –4.19% | 7.92% | 13.36% | |||||||||||||||
MSCI AC World ex USA Index2 | –13.33% | 11.20% | –2.49% | 6.75% | 4.26% | |||||||||||||||
MSCI AC World ex USA Growth Index3 | –13.93% | 11.21% | –1.84% | 5.94% | 2.57% | |||||||||||||||
| 1 | The returns for the periods prior to July 1, 2003, reflect fee waivers and/or reimbursements without which performance would have been lower. |
| 2 | The Morgan Stanley Capital International All Country World ex USA Index (MSCI AC World ex USA Index) is a market capitalization-weighted index designed to measure equity market performance in 44 global developed and emerging markets, excluding the U.S. Data is in U.S. dollars. Source: Morgan Stanley Capital International Inc. |
| 3 | The Morgan Stanley Capital International All Country World ex USA Growth Index (MSCI AC World ex USA Growth Index) is a subset of the MSCI AC World ex USA Index and is composed only of the MSCI AC World ex USA Index stocks which are categorized as growth stocks. Data is in U.S. dollars. Source: Morgan Stanley Capital International Inc. |
3
Driehaus International Discovery Fund
Schedule of Investments
December 31, 2011
Number of Shares | Market Value (Note A) | |||||||
| EQUITY SECURITIES — 96.6% | ||||||||
| EUROPE — 48.5% | ||||||||
Germany — 9.3% |
| |||||||
Aareal Bank AG** | 167,010 | $ | 3,022,889 | |||||
Adidas AG | 41,054 | 2,670,516 | ||||||
Bayerische Motoren Werke AG | 25,609 | 1,715,553 | ||||||
Dialog Semiconductor PLC** | 143,542 | 2,337,097 | ||||||
ElringKlinger AG | 58,033 | 1,440,591 | ||||||
GEA Group AG | 133,438 | 3,773,533 | ||||||
Hugo Boss AG — Pref. | 27,078 | 1,994,096 | ||||||
Infineon Technologies AG | 377,369 | 2,840,585 | ||||||
|
| |||||||
| 19,794,860 | ||||||||
|
| |||||||
United Kingdom — 6.1% |
| |||||||
Aggreko PLC | 116,068 | 3,635,687 | ||||||
ARM Holdings PLC | 215,122 | 1,977,765 | ||||||
Burberry Group PLC | 113,703 | 2,092,466 | ||||||
Petrofac, Ltd. | 132,760 | 2,970,977 | ||||||
Rolls-Royce Holdings PLC** | 192,820 | 2,235,373 | ||||||
|
| |||||||
| 12,912,268 | ||||||||
|
| |||||||
Switzerland — 5.5% |
| |||||||
ABB, Ltd.** | 133,737 | 2,517,268 | ||||||
Dufry AG** | 28,716 | 2,642,924 | ||||||
Syngenta AG** | 7,731 | 2,263,414 | ||||||
Temenos Group AG** | 111,679 | 1,830,998 | ||||||
Xstrata PLC | 162,645 | 2,470,288 | ||||||
|
| |||||||
| 11,724,892 | ||||||||
|
| |||||||
France — 4.7% |
| |||||||
Alcatel-Lucent** | 773,970 | 1,209,062 | ||||||
Remy Cointreau SA | 33,949 | 2,728,135 | ||||||
Technip SA | 25,183 | 2,366,905 | ||||||
Zodiac Aerospace | 42,587 | 3,609,133 | ||||||
|
| |||||||
| 9,913,235 | ||||||||
|
| |||||||
Russia — 4.0% |
| |||||||
NovaTek — SP GDR | 30,730 | 3,847,396 | ||||||
Sberbank RF — SP ADR | 326,381 | 3,237,700 | ||||||
Uralkali — SP GDR | 40,454 | 1,456,344 | ||||||
|
| |||||||
| 8,541,440 | ||||||||
|
| |||||||
Italy — 4.0% |
| |||||||
Davide Campari-Milano SpA | 465,502 | 3,099,732 | ||||||
Saipem SpA | 56,983 | 2,422,690 | ||||||
Salvatore Ferragamo Italia SpA** | 222,410 | 2,930,348 | ||||||
|
| |||||||
| 8,452,770 | ||||||||
|
| |||||||
Denmark — 3.1% |
| |||||||
Novo Nordisk AS — B | 27,202 | 3,125,959 | ||||||
Novozymes AS — B | 110,120 | 3,399,487 | ||||||
|
| |||||||
| 6,525,446 | ||||||||
|
| |||||||
Number of Shares | Market Value (Note A) | |||||||
Ireland — 3.1% |
| |||||||
Elan Corp. PLC — SP ADR** | 107,698 | $ | 1,479,770 | |||||
Kenmare Resources PLC** | 2,217,358 | 1,584,024 | ||||||
Shire PLC | 98,784 | 3,440,995 | ||||||
|
| |||||||
| 6,504,789 | ||||||||
|
| |||||||
Sweden — 2.3% |
| |||||||
Lundin Petroleum AB** | 105,020 | 2,581,990 | ||||||
Tele2 AB — B | 112,710 | 2,192,932 | ||||||
|
| |||||||
| 4,774,922 | ||||||||
|
| |||||||
Netherlands — 1.9% |
| |||||||
ASML Holding NV | 46,020 | 1,934,252 | ||||||
Koninklijke Vopak NV | 41,440 | 2,189,592 | ||||||
|
| |||||||
| 4,123,844 | ||||||||
|
| |||||||
Norway — 1.8% |
| |||||||
DnB NOR ASA | 158,791 | 1,554,497 | ||||||
Telenor ASA | 131,500 | 2,156,909 | ||||||
|
| |||||||
| 3,711,406 | ||||||||
|
| |||||||
Finland — 1.7% |
| |||||||
Nokian Renkaat OYJ | 109,340 | 3,520,843 | ||||||
Portugal — 1.0% |
| |||||||
Jeronimo Martins SGPS SA** | 134,570 | 2,227,594 | ||||||
|
| |||||||
Total EUROPE | 102,728,309 | |||||||
|
| |||||||
| FAR EAST — 32.3% | ||||||||
China — 12.7% |
| |||||||
Anhui Conch Cement Co., Ltd. — H | 550,401 | 1,633,500 | ||||||
Baidu, Inc. — SP ADR** | 13,129 | 1,529,135 | ||||||
Belle International Holdings, Ltd. | 1,267,492 | 2,209,698 | ||||||
Brilliance China Automotive Holdings, Ltd.** | 1,828,847 | 1,973,288 | ||||||
China Shenhua Energy Co., Ltd. — H | 530,608 | 2,302,357 | ||||||
Emperor Watch & Jewellery, Ltd. | 17,042,301 | 2,128,477 | ||||||
Hengan International Group Co., Ltd. | 419,169 | 3,920,973 | ||||||
Sa Sa International Holdings, Ltd. | 4,115,681 | 2,278,658 | ||||||
Sands China, Ltd.** | 1,289,558 | 3,644,555 | ||||||
Sany Heavy Equipment International Holdings Co., Ltd. | 2,618,667 | 2,134,288 | ||||||
Want Want China Holdings, Ltd. | 3,089,315 | 3,082,712 | ||||||
|
| |||||||
| 26,837,641 | ||||||||
|
| |||||||
Notes to Financial Statements are an integral part of this Schedule.
4
Driehaus International Discovery Fund
Schedule of Investments
December 31, 2011
Number of Shares | Market Value (Note A) | |||||||
Japan — 10.8% |
| |||||||
Capcom Co., Ltd. | 119,310 | $ | 2,818,053 | |||||
Chiyoda Corp. | 203,260 | 2,067,722 | ||||||
Dena Co., Ltd. | 45,382 | 1,361,401 | ||||||
Exedy Corp. | 45,312 | 1,307,496 | ||||||
FANUC Corp. | 17,543 | 2,684,897 | ||||||
Komatsu, Ltd. | 69,337 | 1,620,596 | ||||||
M3, Inc. | 288 | 1,298,376 | ||||||
Makita Corp. | 56,681 | 1,834,382 | ||||||
Nabtesco Corp. | 96,837 | 1,765,133 | ||||||
Sanrio Co., Ltd. | 90,845 | 4,667,948 | ||||||
Sumitomo Realty & Development Co., Ltd. | 77,663 | 1,360,137 | ||||||
|
| |||||||
| 22,786,141 | ||||||||
|
| |||||||
Australia — 3.1% |
| |||||||
Coca-Cola Amatil, Ltd. | 246,829 | 2,905,771 | ||||||
Iluka Resources, Ltd. | 233,894 | 3,708,008 | ||||||
|
| |||||||
| 6,613,779 | ||||||||
|
| |||||||
South Korea — 2.4% |
| |||||||
Kia Motors Corp. | 37,410 | 2,178,685 | ||||||
Seegene, Inc.** | 46,010 | 3,005,038 | ||||||
|
| |||||||
| 5,183,723 | ||||||||
|
| |||||||
Indonesia — 1.9% |
| |||||||
PT Bank Mandiri Tbk | 3,042,632 | 2,264,987 | ||||||
PT Gudang Garam Tbk | 260,309 | 1,781,326 | ||||||
|
| |||||||
| 4,046,313 | ||||||||
|
| |||||||
Philippines — 0.5% |
| |||||||
Metropolitan Bank & Trust | 712,120 | 1,107,369 | ||||||
India — 0.5% |
| |||||||
ICICI Bank, Ltd. — SP ADR | 37,300 | 985,839 | ||||||
Taiwan — 0.4% |
| |||||||
TPK Holding Co., Ltd.** | 66,750 | 869,675 | ||||||
|
| |||||||
Total FAR EAST | 68,430,480 | |||||||
|
| |||||||
| NORTH AMERICA — 7.3% | ||||||||
Canada — 4.0% |
| |||||||
B2Gold Corp.** | 286,310 | 871,226 | ||||||
Canadian Natural Resources, Ltd. | 62,349 | 2,334,836 | ||||||
Finning International, Inc. | 44,802 | 976,739 | ||||||
New Gold, Inc.** | 201,789 | 2,036,212 | ||||||
SEMAFO, Inc. | 190,705 | 1,235,488 | ||||||
Suncor Energy, Inc. | 37,400 | 1,078,588 | ||||||
|
| |||||||
| 8,533,089 | ||||||||
|
| |||||||
United States — 2.1% |
| |||||||
Perrigo Co. | 18,448 | 1,821,385 | ||||||
SXC Health Solutions Corp.** | 44,466 | 2,511,440 | ||||||
|
| |||||||
| 4,332,825 | ||||||||
|
| |||||||
Number of Shares | Market Value (Note A) | |||||||
Bermuda — 1.2% |
| |||||||
Golar LNG, Ltd. | 59,176 | $ | 2,630,373 | |||||
|
| |||||||
Total NORTH AMERICA | 15,496,287 | |||||||
|
| |||||||
| SOUTH AMERICA — 6.3% | ||||||||
Brazil — 5.3% |
| |||||||
Cia. Hering SA | 124,400 | 2,164,870 | ||||||
Itau Unibanco Holding SA — PREF ADR | 123,074 | 2,284,253 | ||||||
OGX Petroleo e Gas Participacoes SA** | 367,300 | 2,682,014 | ||||||
PDG Realty SA Empreendimentos e Participacoes | 363,060 | 1,148,400 | ||||||
Vale SA — SP ADR | 130,228 | 2,793,391 | ||||||
|
| |||||||
| 11,072,928 | ||||||||
|
| |||||||
Chile — 1.0% |
| |||||||
Sociedad Quimica y Minera de Chile SA — SP ADR | 40,320 | 2,171,232 | ||||||
|
| |||||||
Total SOUTH AMERICA | 13,244,160 | |||||||
|
| |||||||
| MIDDLE EAST — 1.1% | ||||||||
Israel — 1.1% |
| |||||||
Check Point Software Technologies, Ltd.** | 46,254 | 2,430,185 | ||||||
|
| |||||||
Total MIDDLE EAST | 2,430,185 | |||||||
|
| |||||||
| AFRICA — 1.1% | ||||||||
South Africa — 1.1% |
| |||||||
Mr. Price Group, Ltd. | 241,230 | 2,384,644 | ||||||
|
| |||||||
Total AFRICA | 2,384,644 | |||||||
|
| |||||||
Total EQUITY SECURITIES |
| 204,714,065 | ||||||
|
| |||||||
| ||||||||
TOTAL INVESTMENTS | 96.6 | % | $ | 204,714,065 | ||||
Other Assets In Excess Of Liabilities | 3.4 | % | 7,212,643 | |||||
|
|
|
| |||||
| Net Assets | 100.0 | % | $ | 211,926,708 | ||||
| ||||||||
The federal income tax basis and unrealized appreciation (depreciation) for all investments is as follows:
| Basis: | $ | 199,401,474 | ||
|
| |||
| Gross Appreciation | $ | 25,629,862 | ||
| Gross Depreciation | (20,317,271 | ) | ||
|
| |||
Net Appreciation | $ | 5,312,591 | ||
|
|
| ** | Non-income producing security |
PREF ADR — Preferred American Depository Receipt
SP ADR — Sponsored American Depository Receipt
SP GDR — Sponsored Global Depository Receipt
Notes to Financial Statements are an integral part of this Schedule.
5
Driehaus International Discovery Fund
Schedule of Investments
December 31, 2011
Regional Weightings*
Western Europe | 44.5% | |||
Asia/Far East Ex-Japan | 21.5% | |||
Japan | 10.8% | |||
North America | 7.3% | |||
South America | 6.3% | |||
Eastern Europe | 4.0% | |||
Middle East | 1.1% | |||
Africa | 1.1% |
Top Ten Holdings*
Sanrio Co., Ltd. | 2.2% | |||
Hengan International Group Co., Ltd. | 1.9% | |||
NovaTek — SP GDR | 1.8% | |||
GEA Group AG | 1.8% | |||
Iluka Resources, Ltd. | 1.7% | |||
Sands China, Ltd. | 1.7% | |||
Aggreko PLC | 1.7% | |||
Zodiac Aerospace | 1.7% | |||
Nokian Renkaat OYJ | 1.7% | |||
Shire PLC | 1.6% |
| * | All percentages are stated as a percent of net assets at December 31, 2011. |
Notes to Financial Statements are an integral part of this Schedule.
6
Driehaus International Discovery Fund
Schedule of Investments
December 31, 2011
Industry | Percent of Net Assets | |||
Aerospace & Defense | 2.8% | |||
Auto Components | 3.0% | |||
Automobiles | 2.8% | |||
Beverages | 4.1% | |||
Biotechnology | 1.4% | |||
Chemicals | 4.4% | |||
Commercial Banks | 5.4% | |||
Commercial Services & Supplies | 1.7% | |||
Communications Equipment | 0.6% | |||
Construction & Engineering | 1.0% | |||
Construction Materials | 0.8% | |||
Diversified Telecommunications | 2.1% | |||
Electrical Equipment | 1.2% | |||
Electronic Equipment, Instruments & Components | 0.4% | |||
Energy Equipment & Services | 3.7% | |||
Food & Staples Retailing | 1.1% | |||
Food Products | 1.5% | |||
Health Care Technology | 1.8% | |||
Hotels, Restaurants & Leisure | 1.7% | |||
Industry | Percent of Net Assets | |||
Household Durables | 0.5% | |||
Internet Software & Services | 1.3% | |||
Machinery | 6.5% | |||
Metals & Mining | 6.9% | |||
Oil, Gas & Consumable Fuels | 8.2% | |||
Personal Products | 1.9% | |||
Pharmaceuticals | 4.6% | |||
Real Estate Management & Development | 0.6% | |||
Semiconductors & Semiconductor Equipment | 4.3% | |||
Software | 3.3% | |||
Specialty Retail | 8.7% | |||
Textiles, Apparel & Luxury Goods | 4.6% | |||
Thrifts & Mortgage Finance | 1.4% | |||
Tobacco | 0.8% | |||
Trading Companies & Distributors | 0.5% | |||
Transportation Infrastructure | 1.0% | |||
Other Assets in Excess of Liabilities | 3.4% | |||
|
| |||
TOTAL | 100.0% | |||
|
| |||
Notes to Financial Statements are an integral part of this Schedule.
7
Driehaus Emerging Markets Growth Fund — Portfolio Managers’ Letter
Dear Fellow Shareholders,
The Driehaus Emerging Markets Growth Fund (“Fund”) returned –15.02% for the year ended December 31, 2011. This return was above the performance of the Morgan Stanley Capital International (“MSCI”) Emerging Markets Index (which returned –18.17% for the year) and the MSCI Emerging Markets Growth Index (“Benchmark”) (which returned –18.77% for the year), which are the Fund’s two primary benchmark indices.
The emerging market asset class witnessed only its second aggregate outflow in the past decade during 2011. Consequently, the asset class appears cheap based on conventional measures including price-to-earnings and price-to-book value relative to history. However, the fluctuating liquidity conditions and ongoing global macro concerns are expected to keep volatility elevated into 2012. Consequently, stocks with strong cash-flow profiles, stable funding bases and/or resilient business-end markets look compelling on a relative basis. Global events likely to significantly impact risk appetite for emerging markets include the unfolding plight of the Eurozone in addition to the degree of slowdown in the Chinese economy. We anticipate that a continuation of the heightened macro volatility witnessed in 2011 will require an active, nimble approach in 2012. However, we feel that as macro developments, particularly in Europe, reach a “crescendo” over the coming year, dispersion of equity returns will gradually revert towards more normalized levels, favoring active investment managers and stock pickers.
Over the course of 2011, key contributors to performance versus the Benchmark were the Fund’s holdings in the telecommunication services, energy and health care sectors. In addition, stock selection in both China and Brazil positively contributed to the performance of the Fund.
Within the information technology sector, Samsung Electronics Co., Ltd. (“Samsung”) (005930 KS) was a holding that contributed to the Fund’s performance in 2011 and was the Fund’s largest contributor to return for the year. Samsung is a leading global semiconductor and consumer electronics company. During the year, the company effectively executed its mobile strategy to become the world’s number one smartphone maker. Furthermore, the company’s 2011 results and outlook for its semiconductor and mobile divisions exceeded analysts’ expectations and resulted in positive earnings per share revisions.
Within the healthcare sector, Seegene, Inc. (096530 KS) was a holding that contributed to the Fund’s performance in 2011. The company manufactures and produces molecular diagnostic testing kits and possesses patented technology that allows these tests to be performed at a superior speed and cost relative to competing products. During the year, the company reported extremely strong growth in revenues and earnings, and the company’s share price was boosted by new product approvals and improved prospects for international sales partnerships.
Despite the relative outperformance versus the Benchmark, not all holdings contributed positively to performance. One sector where stock selection detracted from Fund performance was the consumer discretionary sector. Additionally, holdings in Mexico, Argentina and India detracted from Fund performance versus the Benchmark.
Within the consumer discretionary sector, Mahindra & Mahindra Ltd. (MM IN) was one of the Fund’s largest detractors from performance for the year. The company is a leading producer of commercial vehicles and tractors in India. During the year, the company reported weaker than expected margins, as raw material input cost pressure failed to ease as widely expected. The U.S. dollar (“USD”) performance of the stock also suffered from weakness in the Indian currency, which was down significantly versus the USD and also underperformed the average emerging market currency by a substantial margin.
Vale SA — SP ADR (Sponsored ADR) (NYSE: VALE), a leading producer of iron ore in Brazil, was the Fund’s largest detractor from performance in 2011. As concerns mounted about weakening gross domestic product growth and fixed asset investment in China, demand for steel waned, putting pressure on raw materials such as iron ore. Investors also became more concerned about the growing influence of the Brazilian government on Vale’s operations, foreseeing a more stringent environment for project approvals, as well as higher royalties.
8
As we move into 2012, we are concerned with the dual effect of overly optimistic earnings expectations and high operating leverage for certain companies. Cyclical sectors such as industrials and basic materials, as well as countries including South Korea, Russia and India, are exposed to this dynamic, and we enter the year with underweight positions in these areas. While we structurally favor companies oriented towards domestic demand (e.g., consumer staples), we also recognize that the valuation gap between defensive and cyclical companies currently is near a decade high, with cyclical companies looking ostensibly inexpensive. Thus, we have selectively added higher quality cyclical companies with attractive valuations, steady growth prospects and tactical opportunity to exploit overly bearish consensus expectations. Additionally, with the understanding that policymakers will likely ultimately sacrifice inflationary expectations in order to support growth, we remain attentive to companies which stand to benefit as a result of loosening monetary and/or fiscal policy. Business models which benefit from declining inflationary pressures and/or reductions in cost of funding and rates have a strong potential to deliver growth surpassing more cautious expectations. At the regional level, we remain positive on Southeast Asia, with overweight positions in Thailand and the Philippines, and a constructive outlook on Indonesia. The latter two markets are experiencing strengthened government and private commitment to improve lacking infrastructure while simultaneously benefiting from compelling demographics, pervasively lower inflation and underpenetrated yet healthy banking and credit systems.
We at Driehaus Capital Management LLC thank you for your interest in the Driehaus Emerging Markets Growth Fund and would like to express our gratitude to you as shareholders for your confidence in our management capabilities.
Sincerely,
 |  | |
| Howard Schwab | Chad Cleaver | |
| Portfolio Manager | Assistant Portfolio Manager |
Performance is historical and does not represent future results.
9
Driehaus Emerging Markets Growth Fund
Performance Overview (unaudited)
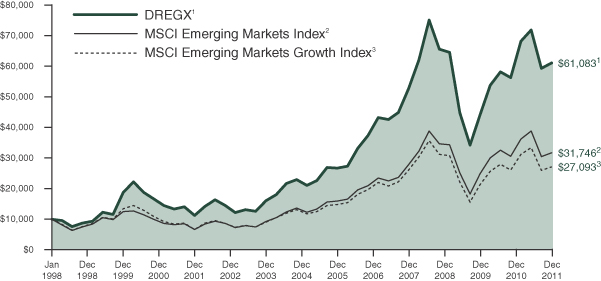
The performance summarized below is historical and does not represent future results. Investment returns and principal value vary, and you may have a gain or loss when you sell shares. Performance data presented measures the change in the value of an investment in the Fund, assuming reinvestment of all dividends and capital gains. Average annual total return reflects annualized change.
The table does not reflect the deduction of taxes that a shareholder would pay on Fund distributions or the redemption of Fund shares. The graph compares the results of a $10,000 investment in the Fund since December 31, 1997 (the date of the Fund’s inception), with all dividends and capital gains reinvested, with the indicated indices (and dividends reinvested) for the same period.
| Average Annual Total Returns as of 12/31/11 | 1 Year | 3 Years | 5 Years | 10 Years | Since Inception (12/31/97 - 12/31/11) | |||||||||||||||
Driehaus Emerging Markets Growth Fund (DREGX)1 | –15.02% | 21.33% | 2.98% | 15.74% | 13.80% | |||||||||||||||
MSCI Emerging Markets Index2 | –18.17% | 20.41% | 2.70% | 14.20% | 8.60% | |||||||||||||||
MSCI Emerging Markets Growth Index3 | –18.77% | 20.12% | 0.78% | 12.06% | 7.37% | |||||||||||||||
| 1 | The returns for the periods prior to July 1, 2003, reflect fee waivers and/or reimbursements without which performance would have been lower. |
| 2 | The Morgan Stanley Capital International Emerging Markets Index (MSCI Emerging Markets Index) is a market capitalization-weighted index designed to measure equity market performance in 21 global emerging markets. Data is in U.S. dollars. Source: Morgan Stanley Capital International Inc. |
| 3 | The Morgan Stanley Capital International Emerging Markets Growth Index (MSCI Emerging Markets Growth Index) is a subset of the MSCI Emerging Markets Index and includes only the MSCI Emerging Markets Index stocks which are categorized as growth stocks. Data is in U.S. dollars. Source: Morgan Stanley Capital International Inc. |
10
Driehaus Emerging Markets Growth Fund
Schedule of Investments
December 31, 2011
Number of Shares | Market Value (Note A) | |||||||
| EQUITY SECURITIES — 90.6% | ||||||||
| FAR EAST — 50.6% | ||||||||
China — 18.7% |
| |||||||
AAC Technologies Holdings, Inc. | 2,838,975 | $ | 6,374,955 | |||||
Beijing Enterprises Holdings, Ltd. | 1,389,500 | 8,337,072 | ||||||
China Mengniu Dairy Co., Ltd. | 1,574,283 | 3,681,016 | ||||||
China Mobile, Ltd. | 1,912,500 | 18,690,128 | ||||||
China Petroleum & Chemical Corp. — H | 10,869,765 | 11,434,344 | ||||||
China Shenhua Energy Co., Ltd. — H | 2,236,500 | 9,704,382 | ||||||
China Shipping Container Lines Co., Ltd. — H** | 34,196,322 | 7,793,306 | ||||||
China Unicom (Hong Kong), Ltd. | 2,702,000 | 5,684,686 | ||||||
CNOOC, Ltd. | 2,886,982 | 5,047,925 | ||||||
CSR Corp., Ltd. — H | 15,920,945 | 9,101,666 | ||||||
Great Wall Motor Co., | 5,255,500 | 7,673,547 | ||||||
Industrial & Commercial Bank of China, | 44,965,219 | 26,689,885 | ||||||
NetEase.com, Inc. — ADR** | 85,830 | 3,849,475 | ||||||
Want Want China Holdings, Ltd. | 14,936,243 | 14,904,319 | ||||||
|
| |||||||
| 138,966,706 | ||||||||
|
| |||||||
South Korea — 8.3% |
| |||||||
Hyundai Mobis | 22,413 | 5,716,029 | ||||||
LG Chem, Ltd. | 27,439 | 7,613,315 | ||||||
NCsoft Corp. | 3,212 | 860,264 | ||||||
NHN Corp.** | 39,305 | 7,219,060 | ||||||
Samsung Electronics Co., Ltd. | 33,249 | 30,682,974 | ||||||
Seegene, Inc.** | 138,705 | 9,059,200 | ||||||
|
| |||||||
| 61,150,842 | ||||||||
|
| |||||||
Taiwan — 8.0% |
| |||||||
Advanced Semiconductor Engineering, Inc. | 8,194,000 | 7,008,970 | ||||||
Hon Hai Precision Industry Co., Ltd. | 4,122,000 | 11,285,505 | ||||||
Taiwan Mobile Co., Ltd. | 5,774,300 | 18,002,375 | ||||||
Taiwan Semiconductor Manufacturing Co. | 1,799,049 | 23,225,723 | ||||||
|
| |||||||
| 59,522,573 | ||||||||
|
| |||||||
India — 4.7% |
| |||||||
ACC, Ltd. | 341,837 | 7,318,228 | ||||||
Hero Honda Motors, Ltd.** | 187,899 | 6,740,905 | ||||||
Housing Development Finance Corp. | 474,991 | 5,832,179 | ||||||
Number of Shares | Market Value (Note A) | |||||||
Infosys, Ltd. — SP ADR | 51,312 | $ | 2,636,411 | |||||
Jubilant Foodworks, Ltd.** | 250,244 | 3,554,921 | ||||||
Lupin, Ltd.** | 610,635 | 5,149,664 | ||||||
Mahindra & Mahindra, Ltd. | 300,493 | 3,857,944 | ||||||
|
| |||||||
| 35,090,252 | ||||||||
|
| |||||||
Philippines — 4.5% |
| |||||||
Bank of Philippine Islands | 7,112,229 | 8,966,844 | ||||||
Philippine Long Distance Telephone Co. | 195,945 | 11,307,048 | ||||||
Security Bank Corp. | 3,553,433 | 7,919,509 | ||||||
SM Investments Corp. | 390,532 | 5,203,701 | ||||||
|
| |||||||
| 33,397,102 | ||||||||
|
| |||||||
Indonesia — 2.6% |
| |||||||
PT Bank Mandiri Tbk | 5,137,280 | 3,824,278 | ||||||
PT Gudang Garam Tbk | 1,318,839 | 9,024,975 | ||||||
PT Semen Gresik Persero Tbk | 4,934,000 | 6,230,416 | ||||||
|
| |||||||
| 19,079,669 | ||||||||
|
| |||||||
Thailand — 2.6% |
| |||||||
CP All Public Co., Ltd. — NVDR | 5,548,056 | 9,100,219 | ||||||
Siam Commercial Bank Public Co., Ltd. — NVDR | 2,650,193 | 9,785,974 | ||||||
|
| |||||||
| 18,886,193 | ||||||||
|
| |||||||
Malaysia — 1.2% |
| |||||||
Public Bank BHD | 2,080,600 | 8,781,838 | ||||||
|
| |||||||
Total FAR EAST | 374,875,175 | |||||||
|
| |||||||
| SOUTH AMERICA — 20.9% | ||||||||
Brazil — 15.5% |
| |||||||
Banco Bradesco SA — ADR | 793,511 | 13,235,763 | ||||||
Banco Bradesco SA — Pref. | 921,642 | 15,193,937 | ||||||
BR Malls Participacoes SA | 396,340 | 3,850,251 | ||||||
CETIP SA | 1,028,479 | 14,859,943 | ||||||
Cia. de Bebidas das | 204,514 | 7,379,060 | ||||||
Cielo SA | 414,815 | 10,719,251 | ||||||
Gerdau SA — Pref. | 1,180,133 | 9,174,067 | ||||||
OdontoPrev SA | 397,957 | 5,675,194 | ||||||
OGX Petroleo e Gas Participacoes SA** | 2,452,623 | 17,908,980 | ||||||
Souza Cruz SA | 303,443 | 3,727,049 | ||||||
Tractebel Energia SA | 327,395 | 5,258,681 | ||||||
Vale SA — SP ADR | 353,575 | 7,584,184 | ||||||
|
| |||||||
| 114,566,360 | ||||||||
|
| |||||||
Notes to Financial Statements are an integral part of this Schedule.
11
Driehaus Emerging Markets Growth Fund
Schedule of Investments
December 31, 2011
Number of Shares | Market Value (Note A) | |||||||
Chile — 2.8% |
| |||||||
Aguas Andinas SA — A | 16,244,350 | $ | 9,318,222 | |||||
Empresa Nacional de Telecomunicaciones SA | 605,840 | 11,334,631 | ||||||
|
| |||||||
| 20,652,853 | ||||||||
|
| |||||||
Peru — 1.5% |
| |||||||
Credicorp, Ltd. | 105,147 | 11,510,442 | ||||||
Colombia — 1.1% |
| |||||||
Ecopetrol SA — SP ADR | 189,863 | 8,452,701 | ||||||
|
| |||||||
Total SOUTH AMERICA | 155,182,356 | |||||||
|
| |||||||
| NORTH AMERICA — 6.5% | ||||||||
Mexico — 5.5% |
| |||||||
America Movil SAB de | 9,877,150 | 11,169,099 | ||||||
Fomento Economico Mexicano SAB de CV — SP ADR | 146,513 | 10,213,421 | ||||||
Genomma Lab Internacional SAB de CV — B** | 3,545,987 | 6,838,019 | ||||||
Wal-Mart de Mexico SAB de CV — V | 4,501,400 | 12,354,520 | ||||||
|
| |||||||
| 40,575,059 | ||||||||
|
| |||||||
United States — 1.0% |
| |||||||
Southern Copper Corp. | 259,370 | 7,827,787 | ||||||
|
| |||||||
Total NORTH AMERICA | 48,402,846 | |||||||
|
| |||||||
| AFRICA — 6.2% | ||||||||
South Africa — 6.2% |
| |||||||
Life Healthcare Group Holdings, Ltd. | 4,300,525 | 10,995,638 | ||||||
Mr. Price Group, Ltd. | 1,024,000 | 10,122,601 | ||||||
Sasol, Ltd. | 223,082 | 10,653,153 | ||||||
Shoprite Holdings, Ltd. | 488,691 | 8,245,191 | ||||||
Vodacom Group, Ltd. | 541,049 | 5,965,074 | ||||||
|
| |||||||
| 45,981,657 | ||||||||
|
| |||||||
Total AFRICA | 45,981,657 | |||||||
|
| |||||||
| EUROPE — 6.2% | ||||||||
Russia — 3.1% |
| |||||||
NovaTek — SP GDR | 59,936 | 7,503,987 | ||||||
Rosneft Oil Co. — GDR | 1,247,030 | 8,230,398 | ||||||
Sberbank RF | 3,070,903 | 7,493,003 | ||||||
|
| |||||||
| 23,227,388 | ||||||||
|
| |||||||
Luxembourg — 2.1% |
| |||||||
Millicom International Cellular SA — SDR | 61,134 | 6,124,904 | ||||||
Tenaris SA — ADR | 249,129 | 9,262,616 | ||||||
|
| |||||||
| 15,387,520 | ||||||||
|
| |||||||
Poland — 1.0% |
| |||||||
Bank Pekao SA | 170,821 | 6,989,662 | ||||||
|
| |||||||
Total EUROPE | 45,604,570 | |||||||
|
| |||||||
Number of Shares | Market Value (Note A) | |||||||
| MIDDLE EAST — 0.2% | ||||||||
Qatar — 0.2% |
| |||||||
Qatar National Bank | 32,348 | $ | 1,350,276 | |||||
|
| |||||||
Total MIDDLE EAST | 1,350,276 | |||||||
|
| |||||||
Total EQUITY SECURITIES |
| 671,396,880 | ||||||
|
| |||||||
| ||||||||
| EXCHANGE-TRADED FUNDS — 1.4% | ||||||||
| NORTH AMERICA — 1.4% | ||||||||
United States — 1.4% |
| |||||||
SPDR Gold Shares** | 68,550 | 10,418,914 | ||||||
|
| |||||||
Total NORTH AMERICA | 10,418,914 | |||||||
|
| |||||||
Total EXCHANGE-TRADED FUNDS |
| 10,418,914 | ||||||
|
| |||||||
| ||||||||
TOTAL INVESTMENTS | 92.0 | % | $ | 681,815,794 | ||||
Other Assets In Excess Of Liabilities | 8.0 | % | 59,475,295 | |||||
|
|
|
| |||||
| Net Assets | 100.0 | % | $ | 741,291,089 | ||||
| ||||||||
The federal income tax basis and unrealized appreciation (depreciation) for all investments is as follows:
| Basis: | $ | 673,627,143 | ||
|
| |||
| Gross Appreciation | $ | 39,497,363 | ||
| Gross Depreciation | (31,308,712 | ) | ||
|
| |||
Net Appreciation | $ | 8,188,651 | ||
|
|
| ** | Non-income producing security |
ADR — American Depository Receipt
GDR — Global Depository Receipt
NVDR — Non-Voting Depository Receipt
SDR — Swedish Depository Receipt
SP ADR — Sponsored American Depository Receipt
SP GDR — Sponsored Global Depository Receipt
Notes to Financial Statements are an integral part of this Schedule.
12
Driehaus Emerging Markets Growth Fund
Schedule of Investments
December 31, 2011
Regional Weightings*
Asia/Far East Ex-Japan | 50.6% | |||
South America | 20.9% | |||
North America | 7.9 % | |||
Africa | 6.2 % | |||
Eastern Europe | 4.1 % | |||
Western Europe | 2.1 % | |||
Middle East | 0.2 % |
Top Ten Holdings*
Samsung Electronics Co., Ltd. | 4.1% | |||
Industrial & Commercial Bank of China, | 3.6% | |||
Taiwan Semiconductor Manufacturing Co. | 3.1% | |||
China Mobile, Ltd. | 2.5% | |||
Taiwan Mobile Co., Ltd. | 2.4% | |||
OGX Petroleo e Gas Participacoes SA | 2.4% | |||
Banco Bradesco SA — Pref. | 2.0% | |||
Want Want China Holdings, Ltd. | 2.0% | |||
CETIP SA | 2.0% | |||
Banco Bradesco SA — ADR | 1.8% |
| * | All percentages are stated as a percent of net assets at December 31, 2011. |
Notes to Financial Statements are an integral part of this Schedule.
13
Driehaus Emerging Markets Growth Fund
Schedule of Investments
December 31, 2011
Industry | Percent of Net Assets | |||
Auto Components | 0.8% | |||
Automobiles | 2.5% | |||
Beverages | 2.4% | |||
Biotechnology | 1.2% | |||
Capital Markets | 2.0% | |||
Chemicals | 1.0% | |||
Commercial Banks | 16.4% | |||
Communications Equipment | 0.9% | |||
Construction Materials | 1.8% | |||
Diversified Telecommunication Services | 0.8% | |||
Electronic Equipment, Instruments & Components | 1.5% | |||
Energy Equipment & Services | 1.3% | |||
Food & Staples Retailing | 4.0% | |||
Food Products | 2.5% | |||
Health Care Providers & Services | 2.3% | |||
Hotels, Restaurants & Leisure | 0.5% | |||
Independent Power Producers & Energy Traders | 0.7% | |||
Industry | Percent of Net Assets | |||
Industrial Conglomerates | 1.8% | |||
Internet Software & Service | 1.5% | |||
IT Services | 1.8% | |||
Machinery | 1.2% | |||
Marine | 1.1% | |||
Metals & Mining | 3.3% | |||
Oil, Gas & Consumable Fuels | 10.6% | |||
Other | 1.4% | |||
Pharmaceuticals | 1.6% | |||
Real Estate Management & Development | 0.5% | |||
Semiconductors & Semiconductor Equipment | 8.2% | |||
Software | 0.1% | |||
Specialty Retail | 1.4% | |||
Thrifts & Mortgage Finance | 0.8% | |||
Tobacco | 1.7% | |||
Water Utilities | 1.3% | |||
Wireless Telecommunication Services | 11.1% | |||
Other Assets in Excess of Liabilities | 8.0% | |||
|
| |||
TOTAL | 100.0% | |||
|
| |||
Notes to Financial Statements are an integral part of this Schedule.
14
Driehaus Emerging Markets Small Cap Growth Fund — Portfolio Managers’ Letter
Dear Fellow Shareholders,
The Driehaus Emerging Markets Small Cap Growth Fund (“Fund”) returned –11.90% from its inception on August 22, 2011 through December 31, 2011.1 This return was below the performance of the Morgan Stanley Capital International (“MSCI”) Emerging Markets Index (which returned –4.89% for the same period) and above the performance of the MSCI Emerging Markets Small Cap Index (“Benchmark”) (which returned –13.76% for the same period), which are the Fund’s two primary benchmark indices.
The emerging market asset class witnessed only its second aggregate outflow in the past decade during 2011. Consequently, the asset class appears cheap based on conventional measures including price-to-earnings and price-to-book value relative to history. However, the fluctuating liquidity conditions and ongoing global macro concerns promise to keep volatility elevated into 2012. Consequently, stocks with strong cash-flow profiles, stable funding bases and/or resilient business-end markets look compelling on a relative basis. Global events likely to significantly impact risk appetite for emerging markets include the unfolding plight of the Eurozone in addition to the degree of slowdown in the Chinese economy. We anticipate that a continuation of the heightened macro volatility witnessed in 2011 will require an active, nimble approach in 2012. However, we feel that as macro developments, particularly in Europe, reach a “crescendo” over the coming year, dispersion of equity returns will gradually revert towards more normalized levels, favoring active investment managers and stock pickers.
Since the inception of the Fund, key contributors to performance versus the Benchmark were the Fund’s holdings in the consumer staples and consumer discretionary sectors. In addition, stock selection in Indonesia, India and China positively contributed to the performance of the Fund.
Within China, Vinda International Holdings, Ltd. (3331 HK) was a consumer staples holding that contributed to the Fund’s performance. The company manufactures tissue paper products. During the time it was held by the Fund, the company benefited from resilient product demand and easing cost pressure as the price of its key raw material input, pulp, declined due to an improving global supply-demand balance. The company also provided the market with improved visibility regarding the timing and magnitude of its robust capacity expansion plans.
Within the consumer discretionary sector, Restoque Comercio e Confeccoes de Roupas SA (LLIS3 BZ) was a holding that contributed to the Fund’s performance. Restoque is a Brazilian-based vertically integrated apparel retailer. It is positioned as an aspirational premium brand, which fills in the gap between high-end designer and mass casual brands. During the time it was held by the Fund, the company delivered robust revenue and earnings growth, driven by solid execution of expansion plans and higher mark-ups from superior merchandising. In addition, further acceleration of store roll-out plans due to the introduction of two new brands in 2011 also exceeded market expectations and resulted in positive earnings per share revisions.
Despite the relative outperformance versus the Benchmark, not all holdings contributed positively to performance. One sector where stock selection detracted from Fund performance was the information technology sector. Additionally, holdings in Hong Kong, Canada (companies with significant exposure to emerging markets) and South Korea detracted from Fund performance versus the Benchmark.
Within Canada, Avion Gold Corp. (AVR CN) was one of the Fund’s largest detractors from performance. Avion Gold Corp., formerly Avion Resources Corp., is a gold mining company focused in West Africa that holds 80% of the Tabakoto and Segala gold projects in Mali. The shares underperformed due to a production delay, as well as a pullback in precious metals prices.
Holdings in the information technology sector such as Kingdee International Software Group Co., Ltd. (268 HK), also detracted from the performance of the Fund. The company is a leading software vendor in China, specializing in enterprise resource planning applications for small-to-medium-sized enterprises. In 2011, China’s tightening measures reduced liquidity to corporations, which negatively impacted information technology spending. As a result, the company posted slower-than-expected sales growth, resulting in negative earnings per share revisions.
We utilized option strategies in the Fund that benefited performance during the period since inception. These strategies primarily consisted of put spreads on exchange traded funds (ETFs) designed to manage downside risk. Given the decline in the markets during the period, these option strategies were successful, adding to the Fund’s return.
15
As we move into 2012, we are concerned with the dual effect of overly optimistic earnings expectations and high operating leverage for certain companies. Cyclical sectors such as industrials and basic materials, as well as countries including South Korea, Russia and India, are exposed to this dynamic, and we enter the year with underweight positions in these areas. While we structurally favor companies oriented towards domestic demand (e.g., consumer staples), we also recognize that the valuation gap between defensive and cyclical companies currently is near a decade high, with cyclical companies looking ostensibly inexpensive. Thus, we have selectively added higher quality cyclical companies with attractive valuations, steady growth prospects and tactical opportunity to exploit overly bearish consensus expectations. Additionally, with the understanding that policymakers will likely ultimately sacrifice inflationary expectations in order to support growth, we remain attentive to companies which stand to benefit as a result of loosening monetary and/or fiscal policy. Business models which benefit from declining inflationary pressures and/or reductions in cost of funding and rates have a strong potential to deliver growth surpassing more cautious expectations. At the regional level, we remain positive on Southeast Asia, with overweight positions in Thailand and the Philippines, and a constructive outlook on Indonesia. The latter two markets are experiencing strengthened government and private commitment to improve lacking infrastructure while simultaneously benefiting from compelling demographics, pervasively lower inflation and underpenetrated yet healthy banking and credit systems.
We at Driehaus Capital Management LLC thank you for your interest in the Driehaus Emerging Markets Small Cap Growth Fund and would like to express our gratitude to you as shareholders for your confidence in our management capabilities.
Sincerely,
|
| |
| Chad Cleaver | Howard Schwab | |
| Co-Portfolio Manager | Co-Portfolio Manager |
| 1 | During this period, the Fund’s returns reflect fee waivers and/or reimbursements without which performance would have been lower. |
Performance is historical and does not represent future results.
16
Driehaus Emerging Markets Small Cap Growth Fund
Performance Overview (unaudited)
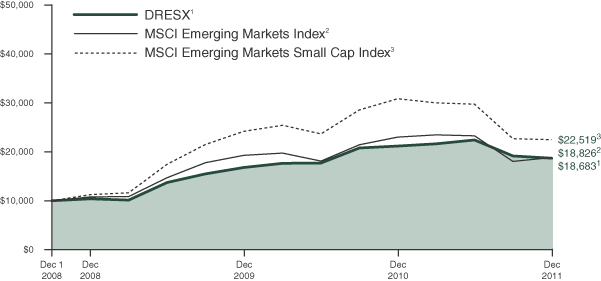
The performance summarized below is historical and does not represent future results. Investment returns and principal value vary, and you may have a gain or loss when you sell shares. Performance data presented measures the change in the value of an investment in the Fund, assuming reinvestment of all dividends and capital gains. Average annual total return reflects annualized change.
The table does not reflect the deduction of taxes that a shareholder would pay on Fund distributions or the redemption of Fund shares. The graph compares the results of a $10,000 investment in the Fund since December 1, 2008 (the date of the Predecessor Limited Partnership’s inception), with all dividends and capital gains reinvested, with the indicated indices (and dividends reinvested) for the same period.
| Fund Only | Including Predecessor Limited Partnership | |||||||||||||||
Average Annual Total Returns as of 12/31/11 | Since Inception (08/22/11 - 12/31/11) | 1 Year | 3 Years | Since Inception (12/01/08 - 12/31/11) | ||||||||||||
Driehaus Emerging Markets Small Cap Growth | –11.90% | –14.29% | 20.26% | 21.30% | ||||||||||||
MSCI Emerging Markets Index2 | –4.89% | –18.17% | 20.41% | 22.76% | ||||||||||||
MSCI Emerging Markets Small Cap Index3 | –13.76% | –26.96% | 25.90% | 30.10% | ||||||||||||
| 1 | The Driehaus Emerging Markets Small Cap Growth Fund (the “Fund”) performance shown above includes the performance of the Driehaus Emerging Markets Small Cap Growth Fund, L.P. (the “Predecessor Limited Partnership”), the Fund’s predecessor, for the periods before the Fund’s registration statement became effective. The Predecessor Limited Partnership, which was established on December 1, 2008, was managed with substantially the same investment objective, policies and philosophies as are followed by the Fund. The Fund succeeded to the Predecessor Limited Partnership’s assets on August 22, 2011. The Predecessor Limited Partnership was not registered under the Investment Company Act of 1940, as amended (“1940 Act”), and thus was not subject to certain investment and operational restrictions that are imposed by the 1940 Act. If the Predecessor Limited Partnership had been registered under the 1940 Act, its performance may have been adversely affected. The Predecessor Limited Partnership’s performance has been restated to reflect estimated expenses of the Fund. The returns for the periods reflect fee waivers and/or reimbursements without which performance would have been lower. |
| 2 | The Morgan Stanley Capital International Emerging Markets Index (MSCI Emerging Markets Index) is a market capitalization weighted index designed to measure equity market performance in 21 global emerging markets. Data is in U.S. dollars. Source: Morgan Stanley Capital International Inc. |
| 3 | The Morgan Stanley Capital International Emerging Markets Small Cap Index (MSCI Emerging Markets Small Cap Index) is a market capitalization-weighted index designed to measure equity market performance of small cap stocks in 21 global emerging markets. Data is in U.S. dollars. Source: Morgan Stanley Capital International Inc. |
17
Driehaus Emerging Markets Small Cap Growth Fund
Schedule of Investments
December 31, 2011
Number of Shares | Market Value (Note A) | |||||||
| EQUITY SECURITIES — 77.0% | ||||||||
| FAR EAST — 51.3% | ||||||||
China — 13.6% |
| |||||||
Asia Cement China Holdings Corp. | 760,500 | $ | 356,426 | |||||
Chaowei Power Holdings, Ltd. | 1,191,000 | 492,250 | ||||||
China Kanghui Holdings, | 15,041 | 221,704 | ||||||
Daphne International Holdings, Ltd. | 328,000 | 365,308 | ||||||
Emperor Watch & Jewellery, Ltd. | 3,561,664 | 444,830 | ||||||
Sa Sa International Holdings, Ltd. | 537,974 | 297,851 | ||||||
Sany Heavy Equipment International Holdings Co., Ltd. | 277,723 | 226,352 | ||||||
Shenguan Holdings Group, Ltd. | 708,000 | 410,218 | ||||||
Stella International Holdings, Ltd. | 243,500 | 529,225 | ||||||
Vinda International Holdings, Ltd. | 550,973 | 707,285 | ||||||
Zhuzhou CSR Times Electric Co., Ltd. — H | 187,000 | 409,798 | ||||||
|
| |||||||
| 4,461,247 | ||||||||
|
| |||||||
South Korea — 9.7% |
| |||||||
Cosmax, Inc. | 39,640 | 543,566 | ||||||
Dongkuk Steel Mill Co., Ltd. | 14,260 | 255,920 | ||||||
Foosung Co., Ltd.** | 46,390 | 322,915 | ||||||
Himart Co., Ltd.** | 3,687 | 260,103 | ||||||
LG Fashion Corp. | 10,990 | 386,833 | ||||||
Mando Corp. | 2,613 | 470,024 | ||||||
OCI Materials Co., Ltd. | 4,957 | 344,342 | ||||||
Seegene, Inc.** | 9,014 | 588,729 | ||||||
|
| |||||||
| 3,172,432 | ||||||||
|
| |||||||
Indonesia — 8.4% |
| |||||||
PT Bank Tabungan Pensiunan Nasional Tbk** | 769,000 | 288,349 | ||||||
PT Harum Energy Tbk | 364,500 | 275,360 | ||||||
PT Indomobil Sukses Internasional Tbk** | 426,000 | 601,356 | ||||||
PT Jasa Marga Tbk | 1,155,500 | 535,219 | ||||||
PT Media Nusantara Citra Tbk | 3,704,000 | 535,124 | ||||||
PT Mitra Adiperkasa Tbk | 924,500 | 525,081 | ||||||
|
| |||||||
| 2,760,489 | ||||||||
|
| |||||||
Thailand — 7.1% |
| |||||||
Dynasty Ceramic | 188,000 | 360,507 | ||||||
Home Products Center | 1,737,800 | 605,889 | ||||||
Siam Makro PCL — NVDR | 77,463 | 586,804 | ||||||
Supalai PCL — NVDR | 1,039,500 | 471,152 | ||||||
Tisco Financial Group | 236,600 | 284,970 | ||||||
|
| |||||||
| 2,309,322 | ||||||||
|
| |||||||
Number of Shares | Market Value (Note A) | |||||||
Philippines — 5.8% |
| |||||||
Ayala Land, Inc. | 1,004,500 | $ | 348,434 | |||||
Puregold Price Club, Inc.** | 1,034,600 | 421,814 | ||||||
Security Bank Corp. | 249,840 | 556,816 | ||||||
Universal Robina Corp. | 504,600 | 553,228 | ||||||
|
| |||||||
| 1,880,292 | ||||||||
|
| |||||||
Taiwan — 4.2% |
| |||||||
CTCI Corp. | 379,000 | 516,949 | ||||||
Eva Airways Corp. | 681,000 | 431,824 | ||||||
Genius Electronic Optical Co., Ltd. | 26,000 | 177,747 | ||||||
Kinsus Interconnect Technology Corp. | 99,000 | 262,875 | ||||||
|
| |||||||
| 1,389,395 | ||||||||
|
| |||||||
Singapore — 1.3% |
| |||||||
Parkson Retail Asia, Ltd.** | 453,000 | 436,568 | ||||||
Cambodia — 1.2% |
| |||||||
NagaCorp, Ltd. | 1,554,000 | 392,172 | ||||||
|
| |||||||
Total FAR EAST | 16,801,917 | |||||||
|
| |||||||
| SOUTH AMERICA — 15.1% | ||||||||
Brazil — 13.5% |
| |||||||
Arezzo Industria e Comercio SA | 29,800 | 370,653 | ||||||
Autometal SA | 63,100 | 469,550 | ||||||
BR Properties SA | 40,873 | 405,388 | ||||||
Cia. Hering SA | 17,011 | 296,034 | ||||||
Marcopolo SA — pref. | 60,100 | 228,446 | ||||||
Mills Estruturas e Servicos de Engenharia SA | 43,000 | 408,042 | ||||||
OdontoPrev SA | 40,276 | 574,369 | ||||||
Qualicorp SA** | 70,400 | 632,194 | ||||||
Raia Drogasil SA | 69,200 | 481,182 | ||||||
Restoque Comercio e Confeccoes de Roupas SA | 38,200 | 559,099 | ||||||
|
| |||||||
| 4,424,957 | ||||||||
|
| |||||||
Colombia — 1.6% |
| |||||||
Almacenes Exito SA | 40,646 | 533,839 | ||||||
|
| |||||||
Total SOUTH AMERICA | 4,958,796 | |||||||
|
| |||||||
| AFRICA — 6.0% | ||||||||
South Africa — 4.8% |
| |||||||
Clicks Group, Ltd. | 69,329 | 397,034 | ||||||
Life Healthcare Group Holdings, Ltd. | 192,756 | 492,841 | ||||||
Mr. Price Group, Ltd. | 16,467 | 162,782 | ||||||
The Spar Group, Ltd. | 37,894 | 509,741 | ||||||
|
| |||||||
| 1,562,398 | ||||||||
|
| |||||||
Nigeria — 1.2% |
| |||||||
Guaranty Trust Bank PLC | 4,537,662 | 398,408 | ||||||
|
| |||||||
Total AFRICA | 1,960,806 | |||||||
|
| |||||||
Notes to Financial Statements are an integral part of this Schedule.
18
Driehaus Emerging Markets Small Cap Growth Fund
Schedule of Investments
December 31, 2011
Number of Shares/ | Market Value (Note A) | |||||||
| NORTH AMERICA — 2.2% | ||||||||
Mexico — 1.5% |
| |||||||
Genomma Lab Internacional SAB de CV — B** | 244,300 | $ | 471,104 | |||||
Canada — 0.7% |
| |||||||
Avion Gold Corp.** | 151,548 | 240,989 | ||||||
|
| |||||||
Total NORTH AMERICA | 712,093 | |||||||
|
| |||||||
| MIDDLE EAST — 1.3% | ||||||||
United Arab Emirates — 1.3% |
| |||||||
Lamprell PLC | 101,170 | 422,170 | ||||||
|
| |||||||
Total MIDDLE EAST | 422,170 | |||||||
|
| |||||||
| EUROPE — 1.1% | ||||||||
Turkey — 1.1% |
| |||||||
Bizim Toptan Satis | 35,223 | 349,673 | ||||||
|
| |||||||
Total EUROPE | 349,673 | |||||||
|
| |||||||
Total EQUITY SECURITIES (Cost $25,148,982) | 25,205,455 | |||||||
|
| |||||||
| ||||||||
| EQUITY CERTIFICATES — 4.7% | ||||||||
| FAR EAST — 4.7% | ||||||||
India — 4.7% |
| |||||||
Ashok Leyland, Ltd.† | 566,519 | 243,228 | ||||||
IRB Infrastructure Developers, Ltd.† | 120,307 | 294,962 | ||||||
Jubilant Foodworks, Ltd.†** | 34,517 | 490,342 | ||||||
V.I.P. Industries, Ltd.† | 168,740 | 245,301 | ||||||
Yes Bank, Ltd.† | 55,865 | 251,211 | ||||||
|
| |||||||
Total FAR EAST | 1,525,044 | |||||||
|
| |||||||
Total EQUITY CERTIFICATES (Cost $2,121,748) | 1,525,044 | |||||||
|
| |||||||
| ||||||||
| PURCHASED CALL OPTION* — 0.5% | ||||||||
iPath S&P 500 VIX Short-Term Futures Index, Exercise Price: $40.00, Expiration Date January, 2012** | 1,333 | 158,627 | ||||||
|
| |||||||
Total PURCHASED CALL OPTIONS | 158,627 | |||||||
|
| |||||||
| ||||||||
| PURCHASED PUT OPTIONS* — 0.9% | ||||||||
iShares MSCI Emerging Markets Index Fund, Exercise Price: $36.00, Expiration Date January, 2012** | 3,000 | 129,000 | ||||||
iShares MSCI Emerging Markets Index Fund, Exercise Price: $38.00, Expiration Date January, 2012** | 1,250 | 127,500 | ||||||
Number of Shares/ | Market Value (Note A) | |||||||
iShares Russell 2000 Index Fund, Exercise Price: $67.00, Expiration Date January, 2012** | 750 | $ | 30,000 | |||||
SPDR S&P 500 ETF Trust, Exercise Price: $110.00, Expiration Date January, 2012.** | 500 | 8,000 | ||||||
|
| |||||||
Total PURCHASED PUT | 294,500 | |||||||
|
| |||||||
| ||||||||
TOTAL INVESTMENTS | 83.1 | % | $ | 27,183,626 | ||||
Other Assets In Excess Of Liabilities | 16.9 | % | 5,536,144 | |||||
|
|
|
| |||||
| Net Assets | 100.0 | % | $ | 32,719,770 | ||||
| ||||||||
| ||||||||
| SECURITIES SOLD SHORT | ||||||||
| WRITTEN CALL OPTION* — (0.2%) | ||||||||
iPath S&P 500 VIX Short-Term Futures Index, Exercise Price: $45.00, Expiration Date January, 2012** | (1,333 | ) | $ | (73,315 | ) | |||
|
| |||||||
Total WRITTEN CALL OPTIONS | (73,315 | ) | ||||||
|
| |||||||
| ||||||||
| WRITTEN PUT OPTIONS* — (0.1%) | ||||||||
SPDR S&P 500 ETF Trust, Exercise Price: $105.00, Expiration Date January, 2012** | (1,000 | ) | (6,000 | ) | ||||
iShares Russell 2000 Index Fund, Exercise Price: $62.00, Expiration Date January, 2012** | (500 | ) | (6,000 | ) | ||||
iShares MSCI Emerging Markets Index Fund, Exercise Price: $34.00, Expiration Date January, 2012** | (1,750 | ) | (22,750 | ) | ||||
|
| |||||||
Total WRITTEN PUT OPTIONS | (34,750 | ) | ||||||
|
| |||||||
| ||||||||
TOTAL SECURITIES SOLD SHORT | (0.3 | )% | $ | (108,065 | ) | |||
| ||||||||
Notes to Financial Statements are an integral part of this Schedule.
19
Driehaus Emerging Markets Small Cap Growth Fund
Schedule of Investments
December 31, 2011
The federal income tax basis and unrealized appreciation (depreciation) for all investments is as follows:
| Basis: | $ | 28,230,507 | ||
|
| |||
| Gross Appreciation | $ | 1,563,149 | ||
| Gross Depreciation | (2,610,030 | ) | ||
|
| |||
Net Depreciation | $ | (1,046,881 | ) | |
|
|
| * | The primary risk exposure is equity contracts. |
| ** | Non-income producing security |
| † | Restricted security — Investments in securities not registered under the Securities Act of 1933, excluding 144A securities. At December 31, 2011, the value of these restricted securities amounted to $1,525,044 or 4.66% of net assets. |
Additional information on each restricted security is as follows:
Security | Acquisition Date(s) | Acquisition Cost | ||||||
Ashok Leyland, Ltd. | 09/08/11 to 11/03/11 | $ | 330,535 | |||||
IRB Infrastructure | 10/05/11 to 11/03/11 | $ | 408,480 | |||||
Jubilant Foodworks, Ltd. | 09/15/11 to 10/11/11 | $ | 614,015 | |||||
V.I.P. Industries, Ltd. | 10/11/11 to 12/16/11 | $ | 451,305 | |||||
Yes Bank, Ltd. | 08/22/11 to 10/13/11 | $ | 317,413 | |||||
NVDR — Non-Voting Depository Receipt
SP ADR — Sponsored American Depository Receipt
Regional Weightings(a)(b)
Asia/Far East Ex-Japan | 56.0 % | |||
South America | 15.1 % | |||
Africa | 6.0 % | |||
North America | 2.2 % | |||
Middle East | 1.3 % | |||
Eastern Europe | 1.1 % |
Top Ten Holdings(a)
Vinda International Holdings, Ltd. | 2.2 % | |||
Qualicorp SA | 1.9 % | |||
Home Products Center PCL — NVDR | 1.9 % | |||
PT Indomobil Sukses Internasional Tbk | 1.8 % | |||
Seegene, Inc. | 1.8 % | |||
Siam Makro PCL — NVDR | 1.8 % | |||
OdontoPrev SA | 1.8 % | |||
Restoque Comercio e Confeccoes de Roupas SA | 1.7 % | |||
Security Bank Corp. | 1.7 % | |||
Universal Robina Corp. | 1.7 % |
| (a) | All percentages are stated as a percent of net assets at December 31, 2011. |
| (b) | Excludes purchased options and written options. |
Notes to Financial Statements are an integral part of this Schedule.
20
Driehaus Emerging Markets Small Cap Growth Fund
Schedule of Investments
December 31, 2011
Industry | Percent of Net Assets | |||
Airlines | 1.3% | |||
Auto Components | 4.4% | |||
Biotechnology | 1.8% | |||
Building Products | 1.1% | |||
Chemicals | 2.0% | |||
Commercial Banks | 5.4% | |||
Construction & Engineering | 2.5% | |||
Construction Materials | 1.1% | |||
Electrical Equipment | 1.3% | |||
Energy Equipment & Services | 1.3% | |||
Food & Staples Retailing | 10.0% | |||
Food Products | 3.0% | |||
Health Care Equipment & Supplies | 0.7% | |||
Health Care Providers & Services | 3.3% | |||
Hotels, Restaurants & Leisure | 2.7% | |||
Household Products | 2.2% | |||
Leisure Equipment & Products | 0.5% | |||
Machinery | 2.1% | |||
Industry | Percent of Net Assets | |||
Media | 1.6% | |||
Metals & Mining | 1.5% | |||
Multiline Retail | 2.9% | |||
Oil, Gas & Consumable Fuels | 0.8% | |||
Other | 1.4% | |||
Personal Products | 1.7% | |||
Pharmaceuticals | 1.4% | |||
Professional Services | 1.9% | |||
Real Estate Management & Development | 3.8% | |||
Semiconductors & Semiconductor Equipment | 0.8% | |||
Specialty Retail | 8.2% | |||
Textiles, Apparel & Luxury Goods | 7.5% | |||
Trading Companies & Distributors | 1.3% | |||
Transportation Infrastructure | 1.6% | |||
Other Assets in Excess of Liabilities | 16.9% | |||
|
| |||
TOTAL | 100.0% | |||
|
| |||
Notes to Financial Statements are an integral part of this Schedule.
21
Driehaus International Small Cap Growth Fund — Portfolio Managers’ Letter
Dear Fellow Shareholders,
The Driehaus International Small Cap Growth Fund (“Fund”) returned –11.39% for the year ended December 31, 2011. This return was above the performance of the Morgan Stanley Capital International (“MSCI”) All Country World ex USA Small Cap Growth Index (“Benchmark”) (which returned –17.65% for the year) and above the performance of the MSCI World ex USA Small Cap Index (which returned –15.50%, which are the Fund’s two primary benchmark indices.
The ongoing European saga caused the developed ex.-U.S. asset class to underperform U.S. equities during the year. The Eurozone clearly suffers from significant policy overhang as well as the presence of a possible dissolution of the Euro and continues to have an impact on equity prices. An improvement in the perception of these risks or an unexpected improvement in the economic data could be a significant catalyst for the European markets. Nevertheless, the European situation continues to be rife with both opportunities and risks. Emerging market equities also struggled throughout the year underperforming developed markets in a period that was marked by increasing evidence of slowing growth in the major markets of China, Brazil and India. While some slowdown had been expected, the pace at which activity indicators lost steam was alarming to many market participants. The ongoing deleveraging in developed markets combined with wariness over the global outlook continued to exert negative pressure on emerging market currencies throughout the year.
Over the course of 2011, key contributors to performance versus the Benchmark were the Fund’s holdings in the consumer discretionary and energy sectors. In addition, stock selection in Canada and Norway positively contributed to the performance of the Fund compared to the Benchmark.
Within the consumer discretionary sector, Sanrio Co., Ltd. (8136 JP), favorably contributed to performance. The company owns the licensing and royalty rights to the Hello Kitty brand upon which children’s character goods, apparel, greeting cards, books, movies and household goods are based. It has been one of the Fund’s best performing consumer discretionary holdings over the past few years due to its superior licensing business model and exclusive rights to the brand, which has enabled it to repeatedly surpass expectations and experience sustained strong sales and earnings growth.
Additionally, through bottom-up stock selection, we found attractive opportunities that benefited the portfolio in Canada. One of the holdings in Canada that contributed to the Fund’s performance in 2011 was Poseidon Concepts Corp. (formerly Open Range Energy Corp.) (PSN CN). The company is an equipment and services provider to the oil and gas exploration and production industries. Poseidon developed what is called a “frac tank” for storage and proper disposal of hazardous water and oil frac fluid used in the extraction and production process. Their revolutionary design, having only been in the market for two years, has enabled them to secure first mover advantage and capture sizeable market share in the frac fluid storage market. This has driven and is expected to continue to drive robust sales and earnings growth over the next two years as they continue to build out capacity and capture even more market share.
Certain areas detracted from the Fund’s performance versus the Benchmark. Two sectors where holdings negatively affected the performance of the Fund were the materials and financials sectors. The Fund was significantly underweight the materials sector throughout the year, which proved beneficial, however stock selection within the sector detracted from performance. Heading into the year, the Fund was substantially underweight the financials sector, which became a modest overweight by year end as we found several real estate related securities that looked attractive. Unfortunately, the modest overweight and stock selection within the sector detracted from the Fund’s performance. Additionally, holdings in Italy and Switzerland detracted from Fund performance versus the Benchmark.
Within France, Altran Technologies SA (ALT FP) was one of the Fund’s weaker holdings and largest detractor from performance for the year. The company is a technology engineering and consulting services provider to the telecom, automotive, financial, energy and aerospace industries, with operations throughout Western Europe. Our thesis worked well for the early part of the year based on the company’s internal restructuring efforts to boost profitability and an improving demand environment for technology consulting services. Unfortunately, this proved short lived as spending on their services deteriorated sharply due to the unfolding Eurozone crisis and threat of recession in the middle to later part of the year. As a result, they experienced project delays and cancelations, ultimately downgrading their earnings growth forecast and outlook for the balance of the year and into 2012, citing very limited visibility on a resumption of growth in their end markets.
22
Similarly, stock selection in Germany also detracted from the performance of the Fund in 2011, including holdings such as Deutz AG (DEZ GY). The company designs and manufactures diesel and gas engines for use in trucks, buses, locomotives and power generation plants. The main driver of the company is its engine supply agreement with Volvo, generating nearly half of its business. To date company specific fundamental trends have not noticeably deteriorated, however continued macro concerns and deteriorating industrial sector data prompted analysts to downgrade their forward earnings outlook and the stock succumbed to a multiple de-rating. We continue to like the company’s positioning and prospects, but did exit the position pending further clarification.
As we enter 2012, the Fund is slightly more defensively positioned given the ongoing uncertainty in both the Eurozone and intensifying hard landing fears in China. As a result, from a sector perspective, the Fund is overweight the health care, consumer staples, information technology and energy sectors and underweight in the consumer discretionary and industrials sectors. The Fund is also significantly underweight in the materials sector (commodities). We believe materials/commodities are essentially a call on Chinese industrial and construction growth, on which we have a slightly negative short/intermediate term view and quantitative easing policies of the world’s central bankers, which we are confident will continue. We are also beginning to see more aggressive policy action, specifically in China, as it relates to easing credit availability and the potential for targeted stimulus packages to support specific sectors of the economy. In short, policy has shifted away from concerns over inflation to one of supporting and boosting growth, and we are seeing this globally. From a macro perspective, we are still very concerned with the ongoing uncertainty and lack of visibility in Europe, the potential for recession in the Eurozone and hard landing fears in China and a general slowdown across emerging markets. On the flip side, from a company specific basis, we continue to find many quality growth stocks with strong growth stories across a variety of sectors and countries in both developed and emerging markets.
As always, we at Driehaus Capital Management LLC thank you for your interest in the Driehaus International Small Cap Growth Fund and would like to express our gratitude to you as shareholders for your continued confidence in our management capabilities. As we move into the next calendar year, we remain focused on uncovering opportunities consistent with the Driehaus growth investment philosophy and managing the unique risks and opportunities presented by the non-U.S. equity markets on behalf of our shareholders.
Sincerely,
 | |  | ||
| David Mouser | Howard Schwab | Ryan Carpenter | ||
| Co-Portfolio Manager | Co-Portfolio Manager | Assistant Portfolio Manager |
Performance is historical and does not represent future results.
23
Driehaus International Small Cap Growth Fund
Performance Overview (unaudited)
The performance summarized below is historical and does not represent future results. Investment returns and principal value vary, and you may have a gain or loss when you sell shares. Performance data presented measures the change in the value of an investment in the Fund, assuming reinvestment of all dividends and capital gains. Average annual total return reflects annualized change.
The table does not reflect the deduction of taxes that a shareholder would pay on Fund distributions or the redemption of Fund shares. The graph compares the results of a $10,000 investment in the Fund since August 1, 2002 (the date of the Predecessor Limited Partnership’s inception), with all dividends and capital gains reinvested, with the indicated indices (and dividends reinvested) for the same period.
| Fund Only | Including Predecessor Limited Partnership | |||||||||||||||||||
Average Annual Total Returns as of 12/31/11 | 1 Year | 3 Years | Since Inception (09/17/07 - 12/31/11) | 5 Years | Since Inception (08/1/02 -12/31/11) | |||||||||||||||
Driehaus International Small Cap Growth | –11.39% | 20.46% | –0.61% | 4.01% | 18.26% | |||||||||||||||
MSCI World ex USA Small Cap Index2 | –15.50% | 16.91% | –0.82% | –2.86% | 10.28% | |||||||||||||||
MSCI AC World ex USA Small Cap Growth Index3 | –17.65% | 19.29% | –0.04% | –1.79% | 10.40% | |||||||||||||||
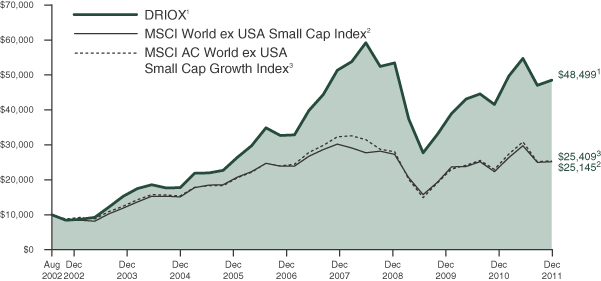
| 1 | The Driehaus International Small Cap Growth Fund (the “Fund”) performance shown above includes the performance of the Driehaus International Opportunities Fund, L.P. (the “Predecessor Limited Partnership”), the Fund’s predecessor, for the periods before the Fund’s registration statement became effective. The Predecessor Limited Partnership, which was established on August 1, 2002, was managed with substantially the same investment objective, policies and philosophies as are followed by the Fund. The Fund succeeded to the Predecessor Limited Partnership’s assets on September 17, 2007. The Predecessor Limited Partnership was not registered under the Investment Company Act of 1940, as amended (“1940 Act”), and thus was not subject to certain investment and operational restrictions that are imposed by the 1940 Act. If the Predecessor Limited Partnership had been registered under the 1940 Act, its performance may have been adversely affected. The Predecessor Limited Partnership’s performance has been restated to reflect estimated expenses of the Fund. The returns for the periods prior to January 1, 2010, reflect fee waivers and/or reimbursements without which performance would have been lower. |
| 2 | The Morgan Stanley Capital International World ex USA Small Cap Index (MSCI World ex USA Small Cap Index) is a market capitalization-weighted index designed to measure the equity performance in 23 global developed markets, excluding the U.S., and is composed of stocks which are categorized as small capitalization stocks. Data is in U.S. dollars. Source: Morgan Stanley Capital International, Inc. |
| 3 | The Morgan Stanley Capital International All Country World ex USA Small Cap Growth Index (MSCI AC World ex USA Small Cap Growth Index) is a market capitalization-weighted index designed to measure equity performance in 44 global developed markets and emerging markets, excluding the U.S., and is composed of stocks which are categorized as small capitalization growth stocks. Data is in U.S. dollars. Source: Morgan Stanley Capital International, Inc. |
24
Driehaus International Small Cap Growth Fund
Schedule of Investments
December 31, 2011
Number of Shares | Market (Note A) | |||||||
| EQUITY SECURITIES — 93.9% | ||||||||
| FAR EAST — 37.8% | ||||||||
Japan — 16.3% |
| |||||||
Anritsu Corp. | 540,000 | $ | 5,949,331 | |||||
Calbee, Inc. | 86,318 | 4,222,259 | ||||||
CyberAgent, Inc. | 790 | 2,566,961 | ||||||
Kakaku.com, Inc. | 62,400 | 2,287,811 | ||||||
M3, Inc. | 536 | 2,416,422 | ||||||
NET One Systems Co., Ltd. | 2,275 | 6,204,008 | ||||||
Nifco, Inc. | 85,653 | 2,393,655 | ||||||
Pigeon Corp. | 62,159 | 2,531,746 | ||||||
Sanrio Co., Ltd. | 45,889 | 2,357,945 | ||||||
Sawai Pharmaceutical Co., Ltd. | 25,296 | 2,625,894 | ||||||
Sugi Holdings Co., Ltd. | 78,400 | 2,285,690 | ||||||
United Arrows, Ltd. | 116,716 | 2,253,345 | ||||||
|
| |||||||
| 38,095,067 | ||||||||
|
| |||||||
China — 7.0% |
| |||||||
AAC Technologies Holdings, Inc. | 996,433 | 2,237,503 | ||||||
Emperor Watch & Jewellery, Ltd. | 8,659,207 | 1,081,481 | ||||||
Hutchison Telecommunications Hong Kong Holdings, Ltd. | 9,497,338 | 3,656,303 | ||||||
Sany Heavy Equipment International Holdings Co., Ltd. | 1,416,819 | 1,154,748 | ||||||
Vinda International Holdings, Ltd. | 2,761,265 | 3,544,641 | ||||||
Xinyi Glass Holdings, Ltd. | 3,928,371 | 2,255,882 | ||||||
Zhuzhou CSR Times Electric Co., Ltd. — H | 1,068,000 | 2,340,453 | ||||||
|
| |||||||
| 16,271,011 | ||||||||
|
| |||||||
South Korea — 6.1% |
| |||||||
Cheil Worldwide, Inc. | 148,982 | 2,457,531 | ||||||
LG Fashion Corp. | 32,480 | 1,143,251 | ||||||
Mando Corp. | 19,722 | 3,547,571 | ||||||
Nexen Tire Corp. | 150,090 | 2,425,848 | ||||||
Seegene, Inc.** | 35,212 | 2,299,791 | ||||||
Silicon Works Co., Ltd.** | 83,922 | 2,292,547 | ||||||
|
| |||||||
| 14,166,539 | ||||||||
|
| |||||||
Australia — 2.7% |
| |||||||
Aurora Oil & Gas, Ltd.** | 436,227 | 1,512,523 | ||||||
Campbell Brothers, Ltd. | 45,877 | 2,298,753 | ||||||
Monadelphous Group, Ltd. | 117,203 | 2,411,885 | ||||||
|
| |||||||
| 6,223,161 | ||||||||
|
| |||||||
Number of Shares | Market (Note A) | |||||||
Singapore — 2.3% |
| |||||||
Biosensors International Group, Ltd.** | 4,792,386 | $ | 5,283,614 | |||||
Philippines — 1.2% |
| |||||||
SM Prime Holdings, | 9,013,400 | 2,737,643 | ||||||
Indonesia — 1.0% |
| |||||||
PT Mitra Adiperkasa Tbk | 4,100,000 | 2,328,646 | ||||||
Thailand — 0.8% |
| |||||||
Home Product Center | 1,531,891 | 534,098 | ||||||
LPN Development | 3,438,864 | 1,395,165 | ||||||
|
| |||||||
| 1,929,263 | ||||||||
|
| |||||||
Malaysia — 0.4% |
| |||||||
Alliance Financial Group BHD | 833,327 | 1,038,373 | ||||||
|
| |||||||
Total FAR EAST | 88,073,317 | |||||||
|
| |||||||
| EUROPE — 36.2% | ||||||||
United Kingdom — 17.4% |
| |||||||
Ashtead Group PLC | 592,587 | 2,079,834 | ||||||
Babcock International Group PLC | 505,379 | 5,772,554 | ||||||
Domino’s Pizza UK & IRL PLC | 204,849 | 1,280,465 | ||||||
Fenner PLC | 682,696 | 4,247,236 | ||||||
IG Group Holdings PLC | 703,008 | 5,206,618 | ||||||
Melrose PLC | 854,988 | 4,514,473 | ||||||
Morgan Crucible Co., PLC | 555,550 | 2,269,065 | ||||||
Rotork PLC | 159,984 | 4,795,147 | ||||||
Telecity Group PLC** | 646,118 | 6,492,085 | ||||||
WH Smith PLC | 451,270 | 3,724,842 | ||||||
|
| |||||||
| 40,382,319 | ||||||||
|
| |||||||
Germany — 6.9% |
| |||||||
Deutsche Euroshop AG | 36,074 | 1,157,879 | ||||||
Deutsche Wohnen AG | 179,103 | 2,379,463 | ||||||
Dialog Semiconductor PLC** | 142,064 | 2,313,033 | ||||||
Gerresheimer AG | 81,462 | 3,394,382 | ||||||
Gerry Weber International AG | 95,849 | 2,923,912 | ||||||
Wirecard AG | 243,836 | 3,919,554 | ||||||
|
| |||||||
| 16,088,223 | ||||||||
|
| |||||||
Sweden — 4.7% |
| |||||||
Elekta AB — B | 160,273 | 6,951,634 | ||||||
Intrum Justitia AB | 256,139 | 4,010,284 | ||||||
|
| |||||||
| 10,961,918 | ||||||||
|
| |||||||
Spain — 1.9% |
| |||||||
Viscofan SA | 121,050 | 4,490,122 | ||||||
Notes to Financial Statements are an integral part of this Schedule.
25
Driehaus International Small Cap Growth Fund
Schedule of Investments
December 31, 2011
Number of Shares | Market (Note A) | |||||||
France — 1.1% |
| |||||||
Ingenico SA | 72,701 | $ | 2,625,196 | |||||
Netherlands — 1.1% |
| |||||||
Gemalto NV | 53,649 | 2,609,370 | ||||||
Denmark — 1.1% |
| |||||||
Christian Hansen Holding AS | 116,520 | 2,533,970 | ||||||
Ireland — 1.1% |
| |||||||
Kenmare Resources PLC** | 3,476,920 | 2,483,823 | ||||||
Switzerland — 0.9% |
| |||||||
Dufry AG** | 23,897 | 2,199,399 | ||||||
|
| |||||||
Total EUROPE | 84,374,340 | |||||||
|
| |||||||
| NORTH AMERICA — 13.9% | ||||||||
Canada — 11.0% |
| |||||||
Celtic Exploration, Ltd.** | 102,142 | 2,292,994 | ||||||
Crew Energy, Inc.** | 203,600 | 2,248,344 | ||||||
Home Capital Group, Inc. | 47,851 | 2,306,242 | ||||||
Kirkland Lake Gold, Inc.** | 69,210 | 1,047,576 | ||||||
Peyto Exploration & Development Corp. | 93,915 | 2,248,429 | ||||||
Poseidon Concepts Corp. | 217,725 | 2,660,787 | ||||||
Precision Drilling Corp.** | 206,876 | 2,132,219 | ||||||
Trican Well Service, Ltd. | 133,259 | 2,295,652 | ||||||
Trinidad Drilling, Ltd. | 311,889 | 2,378,775 | ||||||
Veresen, Inc. | 209,594 | 3,147,768 | ||||||
Westport Innovations, Inc.** | 81,861 | 2,721,060 | ||||||
|
| |||||||
| 25,479,846 | ||||||||
|
| |||||||
Bermuda — 1.5% |
| |||||||
Lancashire Holdings, Ltd. | 313,140 | 3,523,263 | ||||||
Mexico — 1.4% |
| |||||||
Genomma Lab Internacional SAB de | 1,683,179 | 3,245,813 | ||||||
|
| |||||||
Total NORTH AMERICA | 32,248,922 | |||||||
|
| |||||||
| SOUTH AMERICA — 2.9% | ||||||||
Brazil — 2.9% |
| |||||||
BR Properties SA | 461,201 | 4,574,303 | ||||||
Cia. Hering SA | 126,512 | 2,201,624 | ||||||
|
| |||||||
| 6,775,927 | ||||||||
|
| |||||||
Total SOUTH AMERICA | 6,775,927 | |||||||
|
| |||||||
Number of Shares | Market (Note A) | |||||||
| AFRICA — 2.3% | ||||||||
South Africa — 2.3% |
| |||||||
Life Healthcare Group Holdings, Ltd. | 1,397,947 | $ | 3,574,289 | |||||
The Spar Group, Ltd. | 128,681 | 1,730,986 | ||||||
|
| |||||||
| 5,305,275 | ||||||||
|
| |||||||
Total AFRICA | 5,305,275 | |||||||
|
| |||||||
| CENTRAL AMERICA — 0.8% | ||||||||
Panama — 0.8% |
| |||||||
Copa Holdings SA — A | 31,415 | 1,843,118 | ||||||
|
| |||||||
Total CENTRAL AMERICA | 1,843,118 | |||||||
|
| |||||||
Total EQUITY SECURITIES (Cost $211,152,429) | 218,620,899 | |||||||
|
| |||||||
| ||||||||
TOTAL INVESTMENTS | 93.9 | % | $ | 218,620,899 | ||||
Other Assets In Excess Of Liabilities | 6.1 | % | 14,108,196 | |||||
|
|
|
| |||||
| Net Assets | 100.0 | % | $ | 232,729,095 | ||||
| ||||||||
The federal income tax basis and unrealized appreciation (depreciation) for all investments is as follows:
| Basis: | $ | 215,391,160 | ||
|
| |||
| Gross Appreciation | $ | 13,110,192 | ||
| Gross Depreciation | (9,880,453 | ) | ||
|
| |||
Net Appreciation | $ | 3,229,739 | ||
|
|
** Non-income producing security
NVDR — Non-Voting Depository Receipt
Notes to Financial Statements are an integral part of this Schedule.
26
Driehaus International Small Cap Growth Fund
Schedule of Investments
December 31, 2011
Regional Weightings*
Western Europe | 36.2% | |||
Asia/Far East Ex-Japan | 21.5% | |||
Japan | 16.3% | |||
North America | 13.9% | |||
South America | 2.9% | |||
Africa | 2.3% | |||
Central America | 0.8% |
Top Ten Holdings*
Elekta AB — B | 3.0% | |||
Telecity Group PLC | 2.8% | |||
NET One Systems Co., Ltd. | 2.7% | |||
Anritsu Corp. | 2.6% | |||
Babcock International Group PLC | 2.5% | |||
Biosensors International Group, Ltd. | 2.3% | |||
IG Group Holdings PLC | 2.2% | |||
Rotork PLC | 2.1% | |||
BR Properties SA | 2.0% | |||
Melrose PLC | 1.9% |
| * | All percentages are stated as a percent of net assets at December 31, 2011. |
Notes to Financial Statements are an integral part of this Schedule.
27
Driehaus International Small Cap Growth Fund
Schedule of Investments
December 31, 2011
Industry | Percent of Net Assets | |||
Airlines | 0.8% | |||
Auto Components | 4.6% | |||
Biotechnology | 1.0% | |||
Chemicals | 1.1% | |||
Commercial Banks | 0.4% | |||
Commercial Services & Supplies | 4.2% | |||
Communications Equipment | 1.0% | |||
Computers & Peripherals | 1.1% | |||
Construction & Engineering | 1.0% | |||
Diversified Financial Services | 2.2% | |||
Diversified Telecommunications | 1.6% | |||
Electrical Equipment | 1.0% | |||
Electronic Equipment, Instruments & Components | 3.7% | |||
Energy Equipment & Services | 4.1% | |||
Food & Staples Retailing | 1.7% | |||
Food Products | 3.7% | |||
Health Care Equipment & Supplies | 5.3% | |||
Health Care Providers & Services | 1.5% | |||
Health Care Technology | 1.0% | |||
Hotels, Restaurants & Leisure | 0.5% | |||
Industry | Percent of Net Assets | |||
Household Products | 2.6% | |||
Internet Software & Services | 3.8% | |||
IT Services | 4.3% | |||
Insurance | 1.5% | |||
Life Sciences Tools & Services | 1.5% | |||
Machinery | 8.5% | |||
Media | 2.2% | |||
Metals & Mining | 1.5% | |||
Multiline Retail | 1.0% | |||
Oil, Gas & Consumable Fuels | 4.9% | |||
Pharmaceuticals | 2.5% | |||
Professional Services | 1.0% | |||
Real Estate Management & Development | 5.3% | |||
Semiconductors & Semiconductor Equipment | 2.0% | |||
Specialty Retail | 6.2% | |||
Textiles, Apparel & Luxury Goods | 1.7% | |||
Thrifts & Mortgage Finance | 1.0% | |||
Trading Companies & Distributors | 0.9% | |||
Other Assets in Excess of Liabilities | 6.1% | |||
|
| |||
TOTAL | 100.0% | |||
|
| |||
Notes to Financial Statements are an integral part of this Schedule.
28
Driehaus Global Growth Fund — Portfolio Managers’ Letter
Dear Fellow Shareholders,
The Driehaus Global Growth Fund (“Fund”) returned –18.15% for the year ended December 31, 2011. This return was below the performance of the Fund’s primary benchmark index, the Morgan Stanley Capital International All Country World Growth Index (“Benchmark”), which returned –7.04% for the year.
The ongoing European saga caused the developed ex-U.S. asset class to underperform U.S. equities during the year. Within the U.S., retail sales and personal consumption were resilient in 2011 and drove U.S. economic growth. We will need to see continued improvement in the job market in order for gradual U.S. economic growth to be sustained. The Eurozone clearly suffers from significant policy overhang as well as the presence of a possible dissolution of the Euro, which we believe is a low-probability event, but continues to have an impact on equity prices. An improvement in the perception of these risks or an unexpected improvement in the economic data could be a significant catalyst for the European markets. Nevertheless, the European situation continues to be rife with both opportunities and risks. Emerging market equities also struggled throughout the year, underperforming developed markets in a period that was marked by increasing evidence of slowing growth in the major markets of China, Brazil and India. While some slowdown had been expected, the pace at which activity indicators lost steam was alarming to many market participants. The ongoing deleveraging in developed markets combined with wariness over the global outlook continued to exert negative pressure on emerging market currencies throughout the year.
Certain areas detracted from Fund performance during the year. Two sectors in which stock selection negatively affected the performance of the Fund versus the Benchmark were the information technology and materials sectors. Additionally, holdings in the United States and Canada detracted from Fund performance versus the Benchmark.
Within the materials sector, Molycorp, Inc. (NYSE: MCP) detracted from performance due to the emergence of pricing concerns for its key products. Molycorp Inc. is a U.S. based producer of rare earth oxides (REO), which are used in a wide variety of high technology applications. Broadly, REO prices have been increasing due to solid demand and a substantial reduction in Chinese exports. Aside from price increases, Molycorp, Inc. is poised to significantly ramp up production volume at its low-cost Mountain Pass mine in California. Despite the favorable longer-term fundamentals, REO prices deteriorated in the second half of the year due to concerns about the impact of incremental supply.
Within Canada, IMAX Corp. (NYSE: IMAX) also detracted from performance in 2011. The company is the leading manufacturer of 3D movie technologies and also produces original content. Leveraging off of a strong presence in North America, the company is aggressively expanding internationally to meet consumer demand. IMAX is developing joint ventures with foreign partners in an effort to quickly penetrate underserved markets while controlling capital investment. Importantly, international sales have a larger impact on the company’s revenue growth due to significantly higher revenue per screen. Despite the favorable market dynamics, the company reported a very weak third quarter, with revenue and earnings missing consensus expectations. The weaker performance per screen was largely due to a general weak box office in the quarter coupled with disappointing titles on the IMAX platform.
Over the course of 2011, key contributors to performance versus the Benchmark were the Fund’s holdings in the health care and telecommunication services sectors. In addition, stock selection in both France and Bermuda positively contributed to the performance of the Fund versus the Benchmark.
Incorporated in Bermuda, Golar LNG, Ltd. (NASDAQ: GLNG) was a significant contributor to performance for the year. The company owns and operates a fleet of liquid natural gas (LNG) tankers that it contracts on a longer term basis. The company is benefiting from a tight supply environment as there have been very few newly built LNG tankers in the past several years. More importantly, global demand for LNG is increasing following the nuclear disaster in Japan. As supply/demand conditions tighten, pricing as measured in day rates is increasing. Given the high fixed cost nature of the business, strong pricing dynamics are translating into significant profit growth.
Within the health care sector, Alexion Pharmaceuticals, Inc. (NASDAQ: ALXN) contributed to the Fund’s performance in 2011 and was the Fund’s largest contributor to return for the year. The biopharmaceutical company engages in the discovery, development and commercialization of biologic therapeutic products for
29
treating patients with severe and life-threatening diseases. The company continues to see a strong, sustainable ramp up of its drug, Solaris, in the treatment of paroxysmal nocturnal hemoglobinuria (a rare blood disease). In addition, the company will now be launching Solaris for another blood disease indication, Atypical Hemolytic Uremic Syndrome.
Looking ahead into 2012, we recognize that a significant portion of the Eurozone sovereign debt needs to be refinanced in the first quarter. Although there are some modest signs of economic stabilization/improvement in Europe, risk appetite remains low which should make the bond auctions challenging. Sovereign spreads in the peripheral countries are still elevated, particularly for longer maturities, which will increase funding costs and make the fiscal situation worse. However, European Central Bank (ECB) President Draghi has been more responsive than his predecessor in confronting the economic headwinds and is significantly increasing liquidity. Furthermore, Eurozone leaders are making gradual progress toward a framework for fiscal reform and monitoring. If these incremental positives are sufficient to alleviate short term fears, the debt auctions may be able to exceed expectations, which would likely reduce the risk premium in the market. Our view remains that there is a higher probability of funding challenges which will create volatility in both the debt and equity markets. However, we believe these pullbacks will present opportunities to increase exposure to Eurozone equities (essentially reduce our underweight) as we move into the second half of the year. We are already seeing some early signs of economic stabilization which could lead to a positive adjustment in growth expectations. As importantly, ongoing improvements in the U.S. and solid nominal Gross Domestic Product (GDP) growth in the emerging markets should create favorable conditions for high quality exporters. Therefore, we anticipate increasing our European industrial exposure in the Fund during the first half of the year. Within the emerging markets, we think that regional and country positioning will continue to be extremely important given the divergence in fiscal and monetary policies. We have a constructive view on the U.S. as the region continues to experience positive GDP growth. Potential headwinds we are monitoring in 2012 are U.S. fiscal policy, federal regulations, the recession risk in the European Union and further potential Chinese and emerging market weakness. U.S. GDP is led by consumption and consumption is led by retail sales. Retail sales remained resilient in 2011 and we believe will remain resilient in 2012 if the U.S. employment data continues to improve.
As always, we at Driehaus Capital Management LLC thank you for your interest in the Driehaus Global Growth Fund and would like to express our gratitude to you as shareholders for your continued confidence in our management capabilities. As we move into the next calendar year, we remain focused on uncovering opportunities consistent with the Driehaus growth investment philosophy and managing the unique risks and opportunities presented by the global equity markets on behalf of our shareholders.
Sincerely,
|  | |
| Daniel M. Rea | Andrew Srichandra | |
| Portfolio Manager | Assistant Portfolio Manager |
Performance is historical and does not represent future results.
30
Driehaus Global Growth Fund
Performance Overview (unaudited)
The performance summarized below is historical and does not represent future results. Investment returns and principal value vary, and you may have a gain or loss when you sell shares. Performance data presented measures the change in the value of an investment in the Fund, assuming reinvestment of all dividends and capital gains. Average annual total return reflects annualized change.
The table does not reflect the deduction of taxes that a shareholder would pay on Fund distributions or the redemption of Fund shares. The graph compares the results of a $10,000 investment in the Fund since May 1, 2008 (the date of the Fund’s inception), with all dividends and capital gains reinvested, with the indicated index (and dividends reinvested) for the same period.
| Average Annual Total Returns as of 12/31/11 | 1 Year | 3 Years | Since Inception (05/01/08 - 12/31/11) | |||||||||
Driehaus Global Growth Fund (DRGGX)1 | –18.15% | 14.08% | –7.90% | |||||||||
MSCI AC World Growth Index2 | –7.04% | 14.03% | –3.31% | |||||||||
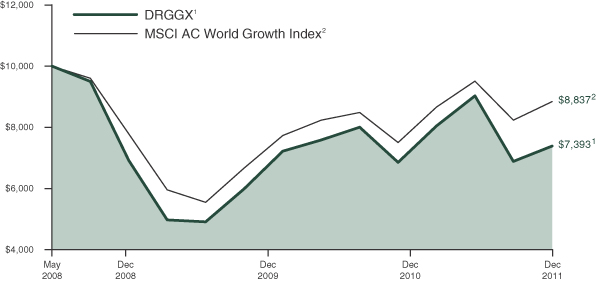
| 1 | The returns for the periods prior to September 1, 2009, reflect fee waivers and/or reimbursements without which performance would have been lower. |
| 2 | The Morgan Stanley Capital International All Country World Growth Index (MSCI AC World Growth Index) is a subset of the MSCI All Country World Index (MSCI ACWI) and includes only the MSCI ACWI stocks which are categorized as growth stocks. The MSCI ACWI is a free float-adjusted market-capitalization weighted index that is designed to measure the equity market performance of 24 developed and 21 emerging markets. Data is in U.S. dollars. Source: Morgan Stanley Capital International Inc. |
31
Driehaus Global Growth Fund
Schedule of Investments
December 31, 2011
| Number of Shares | Market Value (Note A) | |||||||
| EQUITY SECURITIES — 96.6% | ||||||||
| NORTH AMERICA — 60.3% | ||||||||
United States — 56.8% |
| |||||||
Acme Packet, Inc.** | 8,184 | $ | 252,967 | |||||
Alexion Pharmaceuticals, Inc.** | 7,959 | 569,068 | ||||||
Altera Corp. | 8,167 | 302,996 | ||||||
Amazon.com, Inc.** | 1,608 | 278,345 | ||||||
Apple Inc.** | 3,155 | 1,277,775 | ||||||
Ariad Pharmaceuticals, Inc.** | 20,394 | 249,826 | ||||||
Baker Hughes, Inc. | 8,556 | 416,164 | ||||||
Bristol-Myers Squibb Co. | 15,120 | 532,829 | ||||||
Cameron International Corp.** | 11,712 | 576,113 | ||||||
Carpenter Technology Corp. | 11,126 | 572,766 | ||||||
Cavium, Inc.** | 8,790 | 249,900 | ||||||
Celgene Corp.** | 5,786 | 391,134 | ||||||
Cerner Corp.** | 5,104 | 312,620 | ||||||
Chart Industries, Inc.** | 8,919 | 482,250 | ||||||
Ciena Corp.** | 24,830 | 300,443 | ||||||
Deckers Outdoor Corp.** | 2,744 | 207,364 | ||||||
Diamond Foods, Inc. | 7,282 | 234,990 | ||||||
DSW, Inc. — A | 7,798 | 344,750 | ||||||
Edwards Lifesciences Corp.** | 5,964 | 421,655 | ||||||
Equinix, Inc.** | 3,538 | 358,753 | ||||||
First Cash Financial Services, Inc.** | 6,591 | 231,278 | ||||||
Fortinet, Inc.** | 8,278 | 180,543 | ||||||
Fossil, Inc.** | 2,700 | 214,272 | ||||||
Freeport-McMoRan Copper & Gold, Inc. | 12,824 | 471,795 | ||||||
Gilead Sciences, Inc.** | 8,893 | 363,990 | ||||||
GNC Holdings, Inc. — A** | 21,967 | 635,945 | ||||||
Google, Inc. — A** | 596 | 384,956 | ||||||
Hansen Natural Corp.** | 3,378 | 311,249 | ||||||
InterDigital, Inc. | 7,612 | 331,655 | ||||||
Intuitive Surgical, Inc.** | 1,117 | 517,182 | ||||||
Joy Global, Inc. | 5,682 | 425,980 | ||||||
McDonald’s Corp. | 6,164 | 618,434 | ||||||
Molycorp, Inc.** | 7,773 | 186,397 | ||||||
Nu Skin Enterprises, Inc. — A | 8,979 | 436,110 | ||||||
Oracle Corp. | 11,986 | 307,441 | ||||||
Pioneer Natural Resources Co. | 3,306 | 295,821 | ||||||
Precision Castparts Corp. | 3,179 | 523,867 | ||||||
priceline.com, Inc.** | 762 | 356,395 | ||||||
Qualcomm, Inc. | 10,394 | 568,552 | ||||||
Ryder System, Inc. | 5,548 | 294,821 | ||||||
Salesforce.com, Inc.** | 2,895 | 293,727 | ||||||
Starbucks Corp. | 12,624 | 580,830 | ||||||
SXC Health Solutions Corp.** | 4,693 | 265,061 | ||||||
The Coca-Cola Co. | 6,984 | 488,670 | ||||||
Tidewater, Inc. | 8,062 | 397,457 | ||||||
Ulta Salon Cosmetics & Fragrance, Inc.** | 5,538 | 359,527 | ||||||
Under Armour, Inc. — A** | 4,884 | 350,622 | ||||||
United Rentals, Inc.** | 16,287 | 481,281 | ||||||
Universal Display Corp.** | 10,382 | 380,916 | ||||||
Whole Foods Market, Inc. | 9,039 | 628,934 | ||||||
|
| |||||||
| 20,216,416 | ||||||||
|
| |||||||
| Number of Shares | Market Value (Note A) | |||||||
Mexico — 1.3% |
| |||||||
Fresnillo PLC | 19,597 | $ | 464,726 | |||||
Bermuda — 1.3% |
| |||||||
Golar LNG, Ltd. | 9,973 | 443,300 | ||||||
Canada — 0.9% |
| |||||||
New Gold, Inc.** | 33,287 | 335,892 | ||||||
|
| |||||||
Total NORTH AMERICA | 21,460,334 | |||||||
|
| |||||||
| EUROPE — 20.5% | ||||||||
United Kingdom — 4.2% |
| |||||||
Aggreko PLC | 9,894 | 309,917 | ||||||
ARM Holdings PLC | 33,700 | 309,827 | ||||||
Diageo PLC | 22,013 | 480,825 | ||||||
Petrofac, Ltd. | 17,108 | 382,852 | ||||||
|
| |||||||
| 1,483,421 | ||||||||
|
| |||||||
France — 3.5% |
| |||||||
Remy Cointreau SA | 5,857 | 470,667 | ||||||
Sodexo | 5,248 | 376,764 | ||||||
Technip SA | 4,359 | 409,695 | ||||||
|
| |||||||
| 1,257,126 | ||||||||
|
| |||||||
Germany — 2.9% |
| |||||||
Bayerische Motoren Werke AG | 4,430 | 296,767 | ||||||
GEA Group AG | 14,490 | 409,767 | ||||||
Hugo Boss AG — Pref. | 4,307 | 317,179 | ||||||
|
| |||||||
| 1,023,713 | ||||||||
|
| |||||||
Russia — 2.3% |
| |||||||
Sberbank RF — SP ADR | 49,281 | 488,868 | ||||||
Uralkali — SP GDR | 9,506 | 342,216 | ||||||
|
| |||||||
| 831,084 | ||||||||
|
| |||||||
Ireland — 1.7% |
| |||||||
Shire PLC | 17,207 | 599,380 | ||||||
Switzerland — 1.4% |
| |||||||
Temenos Group AG** | 11,860 | 194,447 | ||||||
Xstrata PLC | 20,860 | 316,826 | ||||||
|
| |||||||
| 511,273 | ||||||||
|
| |||||||
Norway — 1.4% |
| |||||||
Telenor ASA | 30,077 | 493,334 | ||||||
Portugal — 1.3% |
| |||||||
Jeronimo Martins SGPS SA** | 28,637 | 474,040 | ||||||
Denmark — 1.2% |
| |||||||
Novo Nordisk AS — B | 3,642 | 418,526 | ||||||
Netherlands — 0.6% |
| |||||||
ASML Holding NV | 4,850 | 203,849 | ||||||
|
| |||||||
Total EUROPE | 7,295,746 | |||||||
|
| |||||||
Notes to Financial Statements are an integral part of this Schedule.
32
Driehaus Global Growth Fund
Schedule of Investments
December 31, 2011
Number of Shares | Market Value (Note A) | |||||||
| FAR EAST — 10.3% | ||||||||
China — 4.6% |
| |||||||
Baidu, Inc. — SP ADR** | 2,213 | $ | 257,748 | |||||
Belle International Holdings, Ltd. | 245,657 | 428,269 | ||||||
Sands China, Ltd.** | 173,415 | 490,106 | ||||||
Want Want China Holdings, Ltd. | 455,153 | 454,180 | ||||||
|
| |||||||
| 1,630,303 | ||||||||
|
| |||||||
Japan — 2.7% |
| |||||||
FANUC Corp. | 2,373 | 363,180 | ||||||
Komatsu, Ltd. | 14,350 | 335,399 | ||||||
Makita Corp. | 8,011 | 259,262 | ||||||
|
| |||||||
| 957,841 | ||||||||
|
| |||||||
Australia — 1.9% |
| |||||||
Boart Longyear, Ltd. | 33,381 | 94,915 | ||||||
Iluka Resources, Ltd. | 36,860 | 584,355 | ||||||
|
| |||||||
| 679,270 | ||||||||
|
| |||||||
Indonesia — 0.7% |
| |||||||
PT Bank Mandiri Tbk | 332,187 | 247,286 | ||||||
|
| |||||||
India — 0.4% |
| |||||||
ICICI Bank, Ltd. — SP ADR | 6,151 | 162,571 | ||||||
|
| |||||||
Total FAR EAST | 3,677,271 | |||||||
|
| |||||||
| SOUTH AMERICA — 4.4% | ||||||||
Brazil — 3.7% |
| |||||||
Itau Unibanco Holding | 14,848 | 275,579 | ||||||
OGX Petroleo e Gas Participacoes SA** | 73,359 | 535,665 | ||||||
Vale SA — SP ADR | 23,632 | 506,906 | ||||||
|
| |||||||
| 1,318,150 | ||||||||
|
| |||||||
Number of Shares | Market Value (Note A) | |||||||
Argentina — 0.7% |
| |||||||
Banco Macro SA — ADR | 12,984 | $ | 253,188 | |||||
|
| |||||||
Total SOUTH AMERICA | 1,571,338 | |||||||
|
| |||||||
| MIDDLE EAST — 1.1% | ||||||||
Israel — 1.1% |
| |||||||
Check Point Software Technologies, Ltd.** | 7,020 | 368,831 | ||||||
|
| |||||||
Total MIDDLE EAST | 368,831 | |||||||
|
| |||||||
Total EQUITY SECURITIES (Cost $32,588,216) | 34,373,520 | |||||||
|
| |||||||
| ||||||||
TOTAL INVESTMENTS | 96.6 | % | $ | 34,373,520 | ||||
Other Assets In Excess Of Liabilities | 3.4 | % | 1,206,149 | |||||
|
|
|
| |||||
| Net Assets | 100.0 | % | $ | 35,579,669 | ||||
| ||||||||
The federal income tax basis and unrealized appreciation (depreciation) for all investments is as follows:
| Basis: | $ | 33,183,554 | ||
|
| |||
| Gross Appreciation | $ | 4,130,657 | ||
| Gross Depreciation | (2,940,691 | ) | ||
|
| |||
Net Appreciation | $ | 1,189,966 | ||
|
|
| ** | Non-income producing security |
ADR — American Depository Receipt
PREF ADR — Preferred American Depository Receipt
SP ADR — Sponsored American Depository Receipt
SP GDR — Sponsored Global Depository Receipt
Regional Weightings*
North America | 60.3% | |||
Western Europe | 18.2% | |||
Asia/Far East Ex-Japan | 7.6% | |||
South America | 4.4% | |||
Japan | 2.7% | |||
Eastern Europe | 2.3% | |||
Middle East | 1.1% |
Top Ten Holdings*
Apple Inc. | 3.6% | |||
GNC Holdings, Inc. — A | 1.8% | |||
Whole Foods Market, Inc. | 1.8% | |||
McDonald’s Corp. | 1.7% | |||
Shire PLC | 1.7% | |||
Iluka Resources, Ltd. | 1.6% | |||
Starbucks Corp. | 1.6% | |||
Cameron International Corp. | 1.6% | |||
Carpenter Technology Corp. | 1.6% | |||
Alexion Pharmaceuticals, Inc. | 1.6% |
| * | All percentages are stated as a percent of net assets at December 31, 2011. |
Notes to Financial Statements are an integral part of this Schedule.
33
Driehaus Global Growth Fund
Schedule of Investments
December 31, 2011
Industry | Percent of Net Assets | |||
Aerospace & Defense | 1.5% | |||
Automobiles | 0.9% | |||
Beverages | 4.9% | |||
Biotechnology | 4.4% | |||
Chemicals | 1.0% | |||
Commercial Banks | 4.0% | |||
Commercial Services & Supplies | 0.9% | |||
Communications Equipment | 4.1% | |||
Computers & Peripherals | 3.6% | |||
Construction & Engineering | 0.3% | |||
Consumer Finance | 0.7% | |||
Diversified Telecommunication Services | 1.4% | |||
Electronic Equipment, Instruments & Components | 1.1% | |||
Energy Equipment & Services | 6.1% | |||
Food & Staples Retailing | 3.1% | |||
Food Products | 1.9% | |||
Industry | Percent of Net Assets | |||
Health Care Equipment & Supplies | 2.6% | |||
Health Care Technology | 1.6% | |||
Hotels, Restaurants & Leisure | 5.8% | |||
Internet & Catalog Retail | 1.8% | |||
Internet Software & Services | 2.8% | |||
Machinery | 6.4% | |||
Metals & Mining | 9.6% | |||
Oil, Gas & Consumable Fuels | 3.6% | |||
Personal Products | 1.2% | |||
Pharmaceuticals | 4.3% | |||
Road & Rail | 0.8% | |||
Semiconductors & Semiconductor Equipment | 3.0% | |||
Software | 3.8% | |||
Specialty Retail | 4.9% | |||
Textiles, Apparel & Luxury Goods | 3.1% | |||
Trading Companies & Distributors | 1.4% | |||
Other Assets in Excess of Liabilities | 3.4% | |||
|
| |||
TOTAL | 100.0% | |||
|
| |||
Notes to Financial Statements are an integral part of this Schedule.
34
Driehaus Mid Cap Growth Fund — Portfolio Managers’ Letter
Dear Fellow Shareholders,
The Driehaus Mid Cap Growth Fund (“Fund”) returned –2.15% for the year ended December 31, 2011.1 This return was slightly below the performance of the Fund’s benchmark index, the Russell Midcap® Growth Index (the “Benchmark”), which returned –1.65% for the same period.
After posting a strong fourth quarter, U.S. equities outperformed both developed and emerging markets during 2011. In the fourth quarter, U.S. equities were supported by both improving U.S. economic data, and the Long-Term Repo Operation (LTRO) put in place by the European Central Bank (ECB). The LTRO added liquidity into the European banking system, which has resulted in lower systemic risk, and a lowering of equity risk premiums. Retail sales and personal consumption were resilient in 2011 and this drove U.S economic growth. We will need to see continued improvement in the job market in order for gradual U.S. economic growth to be sustained. Thus far in 2012, the jobs picture has shown gradual improvement and has been supported by strengthening manufacturing output, a mild improvement in credit conditions, and some stabilizing signals from the housing market. Along with monitoring U.S. economic data, we continue to monitor developments in the Eurozone, China and the rest of the world.
During 2011, two sectors where allocation and stock selection detracted from Fund performance versus the Benchmark were the information technology and energy sectors.
Within the information technology sector, Rovi Corp. (NASDAQ: ROVI) was one of the Fund’s weaker holdings and largest detractor from performance for the year. Rovi Corp. provides digital entertainment technology solutions for the discovery and management of entertainment content. Its offerings include interactive program guides; embedded licensing technologies; media recognition technologies; licensing of the company’s database of descriptive information; and analog content protection technologies and services. The company was adversely impacted by international macro uncertainty and purchase delays by service providers of its next generation product causing the stock to decline during the year.
Within the energy sector, SandRidge Energy, Inc. (NYSE: SD) also detracted from Fund performance in 2011. The company, together with its subsidiaries, engages in the exploration, development and production of oil and gas properties. During the year, the company announced the implementation of a “Three-Year Strategic Plan” where it increases activity to achieve double-digit growth and a self-funding development program by 2014. This plan will cause capital expenditure to increase by an incremental $1 billion over the next two years. This resulted in a funding gap issue and caused the company’s stock to come under pressure.
Over the course of 2011, key contributors to performance were the Fund’s selection of holdings in the consumer staples and consumer discretionary sectors versus the Benchmark.
Within the consumer discretionary sector, GNC Holdings, Inc. (NYSE: GNC), was an example of a holding that contributed to performance in 2011. The company operates as a specialty retailer of health and wellness products. The company’s products include vitamins, minerals and herbal supplement products, as well as sports nutrition products, diet products and other wellness products. Throughout the year the company continued to report improving and strong same-store-sales driven by third-party partners and secular growth in sports nutrition.
Additionally, within the health care sector, Alexion Pharmaceuticals, Inc. (NASDAQ: ALXN) was a holding that contributed to the Fund’s performance in 2011 and was the Fund’s largest contributor to return for the year. The biopharmaceutical company engages in the discovery, development and commercialization of biologic therapeutic products for treating patients with severe and life-threatening diseases. The company continues to see a strong, sustainable ramp up of its drug, Solaris, in the treatment of paroxysmal nocturnal hemoglobinuria (a rare blood disease). In addition, the company will now be launching Solaris for another blood disease indication, Atypical Hemolytic Uremic Syndrome.
As we enter 2012, we have a constructive view as the U.S. continues to experience positive Gross Domestic Product (GDP) growth and the systemic risk in Europe appears to be stabilizing. Potential headwinds we are monitoring in 2012 are U.S. fiscal policy, federal regulations, the recession risk in the European Union and further potential Chinese and emerging market weakness. However, this backdrop could enable the U.S. equity market to again outperform on a relative basis like it did in 2011. U.S. GDP is led by consumption and consumption is led by retail sales. Retail sales remained resilient in 2011 and we believe will
35
remain resilient in 2012 if the U.S. employment data continues to improve. The improvement in jobless claims, payroll numbers and small business willingness to hire make us constructive on the U.S. In addition to the job market, many other economic indicators are showing strength such as bank loans, railcar loadings, truck volumes, manufacturing PMIs (Purchasing Managers’ Index), housing and autos. Finally, while exports are growing, the U.S. is less reliant on exports for growth than most other industrial nations, making it slightly more immune from a broader global slowdown. Such a positive, albeit slow, economic picture, along with a very accommodative monetary policy and continued productivity gains could lead to continued growth in corporate earnings, which should be supportive of U.S. equity prices.
As always, we at Driehaus Capital Management LLC thank you for your interest in the Driehaus Mid Cap Growth Fund and would like to express our gratitude to you as shareholders for your continued confidence in our management capabilities.
Sincerely,
|
| |
| Dan Wasiolek | Michael Schmidt | |
| Portfolio Manager | Assistant Portfolio Manager |
| 1 | During this period, the Fund’s returns reflect fee waivers and/or reimbursements without which performance would have been lower. |
Performance is historical and does not represent future results.
36
Driehaus Mid Cap Growth Fund
Performance Overview (unaudited)
The performance summarized below is historical and does not represent future results. Investment returns and principal value vary, and you may have a gain or loss when you sell shares. Performance data presented measures the change in the value of an investment in the Fund, assuming reinvestment of all dividends and capital gains. Average annual total return reflects annualized change.
The table does not reflect the deduction of taxes that a shareholder would pay on Fund distributions or the redemption of Fund shares. The graph compares the results of a $10,000 investment in the Fund since January 1, 1999, with all dividends and capital gains reinvested, with the indicated index (and dividends reinvested) for the same period.
| Fund Only | Including Predecessor Limited Partnership | |||||||||||||||||||||||
| Average Annual Total Returns as of 12/31/11 | 1 Year | Since Inception (04/27/09 - 12/31/11) | 3 Years | 5 Years | 10 Years | Since Inception (01/01/99 - 12/31/11) | ||||||||||||||||||
Driehaus Mid Cap Growth Fund (DRMGX)1 | –2.15% | 18.63% | 15.20% | 5.09% | 6.08% | 7.92% | ||||||||||||||||||
Russell Midcap Growth Index2 | –1.65% | 21.11% | 22.06% | 2.44% | 5.29% | 4.55% | ||||||||||||||||||
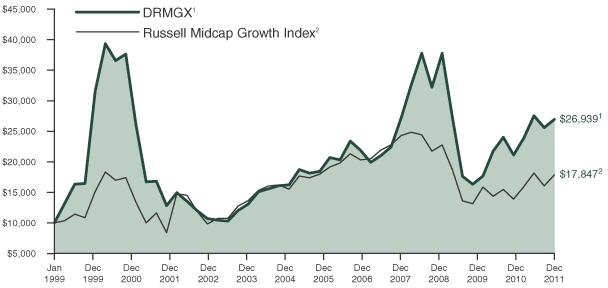
| 1 | The Driehaus Mid Cap Growth Fund (the “Fund”) performance shown above includes the performance of the Driehaus Institutional Mid Cap, L.P. (the “Predecessor Limited Partnership”), one of the Fund’s predecessors, for the periods before the Fund’s registration statement became effective. The Predecessor Limited Partnership, which was established on July 1, 1986, was managed with substantially the same investment objective, policies and philosophies as are followed by the Fund. The Fund succeeded to the Predecessor Limited Partnership’s assets together with the assets of the Driehaus Mid Cap Investors, L.P. on April 27, 2009. The Predecessor Limited Partnership was not registered under the Investment Company Act of 1940, as amended (“1940 Act”), and thus was not subject to certain investment and operational restrictions that are imposed by the 1940 Act. If the Predecessor Limited Partnership had been registered under the 1940 Act, its performance may have been adversely affected. The Predecessor Limited Partnership’s performance has been restated to reflect estimated expenses of the Fund. The returns reflect fee waivers and/or reimbursements without which performance would have been lower. |
| 2 | The Russell Midcap Growth Index measures the performance of those Russell Midcap Index companies with higher price-to-book ratios and higher forecasted growth values. The Russell Midcap Index measures the performance of the 800 smallest companies in the Russell 1000 Index. Source: Russell Indices |
37
Driehaus Mid Cap Growth Fund
Schedule of Investments
December 31, 2011
| Number of Shares | Market (Note A) | |||||||
| EQUITY SECURITIES — 93.5% | ||||||||
| CONSUMER DISCRETIONARY — 18.2% | ||||||||
Specialty Retail — 8.2% |
| |||||||
Bed Bath & Beyond, Inc.** | 2,073 | $ | 120,172 | |||||
DSW, Inc. — A | 9,547 | 422,073 | ||||||
GNC Holdings, Inc. — A** | 19,483 | 564,033 | ||||||
Ross Stores, Inc. | 11,518 | 547,451 | ||||||
Ulta Salon Cosmetics & Fragrance, Inc.** | 2,067 | 134,190 | ||||||
|
| |||||||
| 1,787,919 | ||||||||
|
| |||||||
Textiles, Apparel & Luxury Goods — 4.5% |
| |||||||
Deckers Outdoor Corp.** | 4,274 | 322,986 | ||||||
Fossil, Inc.** | 2,729 | 216,573 | ||||||
Michael Kors Holdings, Ltd** | 5,799 | 158,023 | ||||||
Under Armour, Inc. — A** | 4,139 | 297,139 | ||||||
|
| |||||||
| 994,721 | ||||||||
|
| |||||||
Leisure Equipment & Products — 2.2% |
| |||||||
Mattel, Inc. | 10,489 | 291,175 | ||||||
Polaris Industries, Inc. | 3,384 | 189,436 | ||||||
|
| |||||||
| 480,611 | ||||||||
|
| |||||||
Hotels, Restaurants & Leisure — 1.9% |
| |||||||
Darden Restaurants, Inc. | 5,408 | 246,497 | ||||||
Life Time Fitness, Inc.** | 3,881 | 181,437 | ||||||
|
| |||||||
| 427,934 | ||||||||
|
| |||||||
Distributors — 1.0% |
| |||||||
LKQ Corp.** | 7,068 | 212,605 | ||||||
Internet & Catalog Retail — 0.4% |
| |||||||
HomeAway, Inc.** | 3,557 | 82,700 | ||||||
|
| |||||||
Total CONSUMER DISCRETIONARY | 3,986,490 | |||||||
|
| |||||||
| CONSUMER STAPLES — 16.5% | ||||||||
Food Products — 6.2% |
| |||||||
The Hershey Co. | 9,235 | 570,538 | ||||||
The JM Smucker Co. | 4,374 | 341,916 | ||||||
TreeHouse Foods, Inc.** | 6,848 | 447,722 | ||||||
|
| |||||||
| 1,360,176 | ||||||||
|
| |||||||
Beverages — 4.5% |
| |||||||
Brown-Forman Corp. — B | 3,025 | 243,543 | ||||||
Fortune Brands, Inc.** | 5,954 | 305,023 | ||||||
Monster Beverage Corp.** | 4,680 | 431,215 | ||||||
|
| |||||||
| 979,781 | ||||||||
|
| |||||||
Household Products — 2.2% |
| |||||||
Church & Dwight Co., Inc. | 10,389 | 475,401 | ||||||
Personal Products — 2.1% |
| |||||||
Nu Skin Enterprises, Inc. — A | 9,489 | 460,881 | ||||||
| Number of Shares | Market (Note A) | |||||||
Food & Staples Retailing — 1.5% |
| |||||||
Whole Foods Market, Inc. | 4,766 | $ | 331,618 | |||||
|
| |||||||
Total CONSUMER STAPLES | 3,607,857 | |||||||
|
| |||||||
| INDUSTRIALS — 14.5% | ||||||||
Machinery — 3.7% |
| |||||||
Robbins & Myers, Inc. | 4,911 | 238,429 | ||||||
SPX Corp. | 6,010 | 362,223 | ||||||
Woodward, Inc. | 5,066 | 207,351 | ||||||
|
| |||||||
| 808,003 | ||||||||
|
| |||||||
Road & Rail — 3.5% |
| |||||||
Genesee & Wyoming, | 7,500 | 454,350 | ||||||
Ryder System, Inc. | 5,658 | 300,666 | ||||||
|
| |||||||
| 755,016 | ||||||||
|
| |||||||
Marine — 1.9% |
| |||||||
Kirby Corp.** | 6,451 | 424,734 | ||||||
Aerospace & Defense — 1.8% |
| |||||||
Triumph Group, Inc. | 6,908 | 403,773 | ||||||
Commercial Services & Supplies — 1.3% |
| |||||||
Waste Connections, Inc. | 8,508 | 281,955 | ||||||
Trading Companies & Distributors — 1.3% |
| |||||||
United Rentals, Inc.** | 9,346 | 276,174 | ||||||
Construction & Engineering — 1.0% |
| |||||||
MasTec, Inc.** | 13,075 | 227,113 | ||||||
|
| |||||||
Total INDUSTRIALS | 3,176,768 | |||||||
|
| |||||||
| INFORMATION TECHNOLOGY — 13.6% | ||||||||
Software — 6.2% |
| |||||||
Check Point Software Technologies, Ltd.** | 9,473 | 497,711 | ||||||
Electronic Arts, Inc.** | 17,045 | 351,127 | ||||||
QLIK Technologies, Inc.** | 2,790 | 67,518 | ||||||
Red Hat, Inc.** | 8,072 | 333,293 | ||||||
SolarWinds, Inc.** | 3,520 | 98,384 | ||||||
|
| |||||||
| 1,348,033 | ||||||||
|
| |||||||
Internet Software & Services — 5.0% |
| |||||||
Bankrate, Inc.** | 17,943 | 385,775 | ||||||
Equinix, Inc.** | 4,079 | 413,611 | ||||||
Rackspace Hosting, Inc.** | 7,048 | 303,134 | ||||||
|
| |||||||
| 1,102,520 | ||||||||
|
| |||||||
Semiconductors & Semiconductor |
| |||||||
Altera Corp. | 7,204 | 267,268 | ||||||
ARM Holdings PLC — SP | 9,086 | 251,410 | ||||||
|
| |||||||
| 518,678 | ||||||||
|
| |||||||
Total INFORMATION TECHNOLOGY | 2,969,231 | |||||||
|
| |||||||
Notes to Financial Statements are an integral part of this Schedule.
38
Driehaus Mid Cap Growth Fund
Schedule of Investments
December 31, 2011
| Number of Shares | Market (Note A) | |||||||
| HEALTH CARE — 12.0% | ||||||||
Biotechnology — 6.0% |
| |||||||
Alexion Pharmaceuticals, Inc.** | 10,224 | $ | 731,016 | |||||
ARIAD Pharmaceuticals, Inc.** | 11,151 | 136,600 | ||||||
BioMarin Pharmaceutical, Inc.** | 7,553 | 259,672 | ||||||
Cubist Pharmaceuticals, Inc.** | 4,766 | 188,829 | ||||||
|
| |||||||
| 1,316,117 | ||||||||
|
| |||||||
Health Care Providers & Services — 1.6% |
| |||||||
HMS Holdings Corp.** | 10,951 | 350,213 | ||||||
Pharmaceuticals — 1.6% |
| |||||||
Elan Corp. PLC — SP ADR** | 19,807 | 272,148 | ||||||
Questcor Pharmaceuticals, Inc.** | 1,681 | 69,896 | ||||||
|
| |||||||
| 342,044 | ||||||||
|
| |||||||
Health Care Technology — 1.5% |
| |||||||
SXC Health Solutions Corp.** | 5,905 | 333,514 | ||||||
Health Care Equipment & Supplies — 1.3% |
| |||||||
Intuitive Surgical, Inc.** | 635 | 294,011 | ||||||
|
| |||||||
Total HEALTH CARE | 2,635,899 | |||||||
|
| |||||||
| ENERGY — 10.0% | ||||||||
Oil, Gas & Consumable Fuels — 6.2% |
| |||||||
Concho Resources, Inc.** | 3,883 | 364,031 | ||||||
Golar LNG, Ltd. | 7,582 | 337,020 | ||||||
Laredo Petroleum Holdings, Inc.** | 7,040 | 156,992 | ||||||
Pioneer Natural Resources Co. | 5,543 | 495,988 | ||||||
|
| |||||||
| 1,354,031 | ||||||||
|
| |||||||
Energy Equipment & Services — 3.8% |
| |||||||
FMC Technologies, Inc.** | 5,204 | 271,805 | ||||||
Gulfmark Offshore, Inc. — A** | 13,178 | 553,608 | ||||||
|
| |||||||
| 825,413 | ||||||||
|
| |||||||
Total ENERGY | 2,179,444 | |||||||
|
| |||||||
| Number of Shares | Market (Note A) | |||||||
| MATERIALS — 4.0% | ||||||||
Metals & Mining — 4.0% |
| |||||||
Allied Nevada Gold Corp.** | 10,244 | $ | 310,188 | |||||
Carpenter Technology Corp. | 11,026 | 567,618 | ||||||
|
| |||||||
| 877,806 | ||||||||
|
| |||||||
Total MATERIALS | 877,806 | |||||||
|
| |||||||
| FINANCIALS — 2.8% | ||||||||
Real Estate Investment Trusts — 2.8% |
| |||||||
American Capital Agency Corp. | 16,579 | 465,538 | ||||||
Boston Properties, Inc. | 1,494 | 148,802 | ||||||
|
| |||||||
| 614,340 | ||||||||
|
| |||||||
Total FINANCIALS | 614,340 | |||||||
|
| |||||||
| UTILITIES — 1.9% | ||||||||
Electric Utilities — 1.9% |
| |||||||
UIL Holdings Corp. | 11,708 | 414,112 | ||||||
|
| |||||||
Total UTILITIES | 414,112 | |||||||
|
| |||||||
Total EQUITY SECURITIES (Cost $17,474,729) | 20,461,947 | |||||||
|
| |||||||
| ||||||||
TOTAL INVESTMENTS | 93.5 | % | $ | 20,461,947 | ||||
Other Assets In Excess Of Liabilities | 6.5 | % | 1,432,659 | |||||
|
|
|
| |||||
| Net Assets | 100.0 | % | $ | 21,894,606 | ||||
| ||||||||
The federal income tax basis and unrealized appreciation (depreciation) for all investments is as follows:
| Basis: | $ | 17,590,999 | ||
|
| |||
| Gross Appreciation | $ | 3,233,350 | ||
| Gross Depreciation | (362,402 | ) | ||
|
| |||
Net Appreciation | $ | 2,870,948 | ||
|
|
** Non-income producing security
SP ADR — Sponsored American Depository Receipt
Top Ten Holdings*
Alexion Pharmaceuticals, Inc. | 3.3% | |||
The Hershey Co. | 2.6% | |||
Carpenter Technology Corp. | 2.6% | |||
GNC Holdings, Inc. — A | 2.6% | |||
Gulfmark Offshore, Inc. — A | 2.5% | |||
Ross Stores, Inc. | 2.5% | |||
Check Point Software Technologies, Ltd. | 2.3% | |||
Pioneer Natural Resources Co. | 2.3% | |||
Church & Dwight Co., Inc. | 2.2% | |||
American Capital Agency Corp. | 2.1% |
| * | All percentages are stated as a percent of net assets at December 31, 2011. |
Notes to Financial Statements are an integral part of this Schedule.
39
Driehaus Large Cap Growth Fund — Portfolio Managers’ Letter
Dear Fellow Shareholders,
The Driehaus Large Cap Growth Fund (“Fund”) returned –0.97% for the year ended December 31, 2011.1 This return was below the performance of the Fund’s benchmark index, the Russell 1000® Growth Index (the “Benchmark”), which returned 2.64% for the same period.
After posting a strong fourth quarter, U.S. equities outperformed both developed and emerging markets during 2011. In the fourth quarter, U.S. equities were supported by both improving U.S. economic data, and the Long-Term Repo Operation (LTRO) put in place by the European Central Bank (ECB). The LTRO added liquidity into the European banking system, which has resulted in lower systemic risk, and a lowering of equity risk premiums. Retail sales and personal consumption were resilient in 2011 and this drove U.S economic growth. We will need to see continued improvement in the job market in order for gradual U.S. economic growth to be sustained. Thus far in 2012, the jobs picture has shown gradual improvement and has been supported by strengthening manufacturing output, a mild improvement in credit conditions, and some stabilizing signals from the housing market. Along with monitoring U.S. economic data, we continue to monitor developments in the Eurozone, China and the rest of the world.
During 2011, two sectors where allocation and stock selection detracted from Fund performance versus the Benchmark were the information technology and energy sectors.
Within the energy sector, Baker Hughes, Inc. (NYSE: BHI) was one of the Fund’s weaker holdings and largest detractor from performance for the year. The company supplies wellbore related products, and technology services and systems for drilling, formation evaluation, completion and production, and reservoir technology and consulting to the oil and natural gas industry worldwide. The company underperformed on concerns that North American activity could start to slow and specific segments such as pressure pumping could experience increasing competitive pressures. We currently find energy stocks exposed to deepwater, international regions, and exploration and production more attractive.
Within the information technology sector, Rovi Corp. (NASDAQ: ROVI) was also a large detractor from performance for the year. Rovi Corp. provides digital entertainment technology solutions for the discovery and management of entertainment content. Its offerings include interactive program guides; embedded licensing technologies; media recognition technologies; licensing of the company’s database of descriptive information; and analog content protection technologies and services. The company was adversely impacted by international macro uncertainty and purchase delays by service providers of its next generation product, causing the stock to decline during the year.
Over the course of 2011, key contributors to performance versus the Benchmark were the Fund’s holdings in the health care and materials sectors.
Within the health care sector, Alexion Pharmaceuticals, Inc. (NASDAQ: ALXN) was a holding that contributed to the Fund’s performance in 2011 and was one of the Fund’s largest contributors to return for the year. The biopharmaceutical company engages in the discovery, development and commercialization of biologic therapeutic products for treating patients with severe and life-threatening diseases. The company continues to see a strong, sustainable ramp up of its drug, Solaris, in the treatment of paroxysmal nocturnal hemoglobinuria (a rare blood disease). In addition, the company will now be launching Solaris for another blood disease indication, Atypical Hemolytic Uremic Syndrome.
Additionally, within the consumer discretionary sector, Starbucks Corp. (NASDAQ: SBUX) was a holding that contributed to the Fund’s performance in 2011 and was one of the Fund’s largest contributors to return for the year. The company purchases and roasts whole bean coffees and provides regular and decaffeinated coffee beverages, Italian-style espresso beverages, cold blended beverages, iced shaken refreshment beverages, premium teas, packaged roasted whole bean coffees, and soluble coffees. The company continues to have both multi-year top-line growth and margin drivers that we believe can drive future earnings acceleration.
As we enter 2012, we have a constructive view as the U.S. continues to experience positive Gross Domestic Product (GDP) growth and the systemic risk in Europe appears to be stabilizing. Potential headwinds we are monitoring in 2012 are U.S. fiscal policy, federal regulations, the recession risk in the European Union and further potential Chinese and emerging market weakness. However, this backdrop could
40
enable the U.S. equity market to again outperform on a relative basis like it did in 2011. U.S. GDP is led by consumption and consumption is led by retail sales. Retail sales remained resilient in 2011 and we believe will remain resilient in 2012 if the U.S. employment data continues to improve. The improvement in jobless claims, payroll numbers and small business willingness to hire make us constructive on the U.S. In addition to the job market, many other economic indicators are showing strength such as bank loans, railcar loadings, truck volumes, manufacturing PMIs (Purchasing Managers’ Index), housing and autos. Finally, while exports are growing, the U.S. is less reliant on exports for growth than most other industrial nations making it slightly more immune from a broader global slowdown. Such a positive, albeit slow, economic picture, along with a very accommodative monetary policy and continued productivity gains could lead to continued growth in corporate earnings, which should be supportive of U.S. equity prices.
As always, we at Driehaus Capital Management LLC thank you for your interest in the Driehaus Large Cap Growth Fund and would like to express our gratitude to you as shareholders for your continued confidence in our management capabilities.
Sincerely,
 | 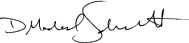 | |
| Dan Wasiolek | Michael Schmidt | |
| Portfolio Manager | Assistant Portfolio Manager |
| 1 | During this period, the Fund’s returns reflect fee waivers and/or reimbursements without which performance would have been lower. |
Performance is historical and does not represent future results.
41
Driehaus Large Cap Growth Fund
Performance Overview (unaudited)
The performance summarized below is historical and does not represent future results. Investment returns and principal value vary, and you may have a gain or loss when you sell shares. Performance data presented measures the change in the value of an investment in the Fund, assuming reinvestment of all dividends and capital gains. Average annual total return reflects annualized change.
The table does not reflect the deduction of taxes that a shareholder would pay on Fund distributions or the redemption of Fund shares. The graph compares the results of a $10,000 investment in the Fund since January 1, 2008 (the date of the Predecessor Limited Partnership’s inception), with all dividends and capital gains reinvested, with the indicated index (and dividends reinvested) for the same period.
| Fund Only | Including Predecessor Limited Partnership | |||||||||||||||
| Average Annual Total Returns as of 12/31/11 | 1 Year | Since Inception (04/27/09 - 12/31/11) | 3 Years | Since Inception (01/01/08 - 12/31/11) | ||||||||||||
Driehaus Large Cap Growth Fund (DRLGX)1 | –0.97% | 15.73% | 14.01% | –4.34% | ||||||||||||
Russell 1000 Growth Index2 | 2.64% | 18.69% | 18.02% | 0.30% | ||||||||||||
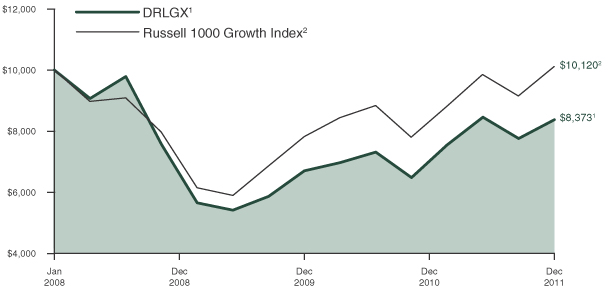
| 1 | The Driehaus Large Cap Growth Fund (the “Fund”) performance shown above includes the performance of the Driehaus Large Cap Growth Fund, L.P. (the “Predecessor Limited Partnership”), the Fund’s predecessor, for the periods before the Fund’s registration statement became effective. The Predecessor Limited Partnership, which was established on January 1, 2008, was managed with substantially the same investment objective, policies and philosophies as are followed by the Fund. The Fund succeeded to the Predecessor Limited Partnership’s assets on April 27, 2009. The Predecessor Limited Partnership was not registered under the Investment Company Act of 1940, as amended (“1940 Act”), and thus was not subject to certain investment and operational restrictions that are imposed by the 1940 Act. If the Predecessor Limited Partnership had been registered under the 1940 Act, its performance may have been adversely affected. The Predecessor Limited Partnership’s performance has been restated to reflect estimated expenses of the Fund. The returns reflect fee waivers and/or reimbursements without which performance would have been lower. |
| 2 | The Russell 1000 Growth Index measures the performance of those Russell 1000 Index companies with higher price-to-book ratios and higher forecasted growth values. The Russell 1000 Index measures the performance of the 1000 largest companies in the Russell 3000 Index, which represents approximately 98% of the investable U.S. equity market. Source: Russell Indices |
42
Driehaus Large Cap Growth Fund
Schedule of Investments
December 31, 2011
Number of Shares | Market (Note A) | |||||||
| EQUITY SECURITIES — 97.4% | ||||||||
| INFORMATION TECHNOLOGY — 21.7% | ||||||||
Computers & Peripherals — 7.3% |
| |||||||
Apple Inc.** | 3,470 | $ | 1,405,350 | |||||
Software — 4.7% |
| |||||||
Check Point Software Technologies, Ltd.** | 7,606 | 399,619 | ||||||
Electronic Arts, Inc.** | 14,525 | 299,215 | ||||||
Oracle Corp. | 7,928 | 203,353 | ||||||
|
| |||||||
| 902,187 | ||||||||
|
| |||||||
Communications Equipment — 3.6% |
| |||||||
Cisco Systems, Inc. | 10,191 | 184,253 | ||||||
Qualcomm, Inc. | �� | 9,421 | 515,329 | |||||
|
| |||||||
| 699,582 | ||||||||
|
| |||||||
Semiconductors & Semiconductor Equipment — 2.7% |
| |||||||
ARM Holdings PLC — SP ADR | 6,497 | 179,772 | ||||||
ASML Holding NV | 3,513 | 146,808 | ||||||
Intel Corp. | 8,199 | 198,826 | ||||||
|
| |||||||
| 525,406 | ||||||||
|
| |||||||
Internet Software & Services — 2.0% |
| |||||||
Google, Inc. — A** | 599 | 386,894 | ||||||
IT Services – 1.4% |
| |||||||
Accenture PLC — A | 3,382 | 180,024 | ||||||
Automatic Data Processing, Inc. | 1,743 | 94,139 | ||||||
|
| |||||||
| 274,163 | ||||||||
|
| |||||||
Total INFORMATION TECHNOLOGY | 4,193,582 | |||||||
|
| |||||||
| CONSUMER DISCRETIONARY — 17.8% | ||||||||
Hotels, Restaurants & Leisure — 8.1% |
| |||||||
Las Vegas Sands Corp.** | 4,113 | 175,748 | ||||||
McDonald’s Corp. | 6,387 | 640,808 | ||||||
Starbucks Corp. | 16,137 | 742,463 | ||||||
|
| |||||||
| 1,559,019 | ||||||||
|
| |||||||
Specialty Retail — 4.2% |
| |||||||
Bed Bath & Beyond, Inc.** | 1,244 | 72,115 | ||||||
DSW, Inc. — A | 2,940 | 129,977 | ||||||
Ross Stores, Inc. | 8,688 | 412,941 | ||||||
Tiffany & Co. | 3,005 | 199,111 | ||||||
|
| |||||||
| 814,144 | ||||||||
|
| |||||||
Textiles, Apparel & Luxury Goods — 3.4% |
| |||||||
Coach, Inc. | 4,064 | 248,067 | ||||||
Deckers Outdoor Corp.** | 1,916 | 144,792 | ||||||
NIKE, Inc. — B | 2,690 | 259,235 | ||||||
|
| |||||||
| 652,094 | ||||||||
|
| |||||||
Number of Shares | Market (Note A) | |||||||
Internet & Catalog Retail — 1.1% |
| |||||||
Amazon.com, Inc.** | 1,286 | $ | 222,607 | |||||
Multiline Retail — 1.0% |
| |||||||
Macy’s, Inc. | 5,723 | 184,166 | ||||||
|
| |||||||
Total CONSUMER DISCRETIONARY | 3,432,030 | |||||||
|
| |||||||
| CONSUMER STAPLES — 17.1% | ||||||||
Food Products — 6.0% |
| |||||||
Kraft Foods, Inc. — A | 8,922 | 333,326 | ||||||
The Hershey Co. | 9,125 | 563,743 | ||||||
The JM Smucker Co. | 3,352 | 262,026 | ||||||
|
| |||||||
| 1,159,095 | ||||||||
|
| |||||||
Food & Staples Retailing — 4.3% |
| |||||||
Costco Wholesale Corp. | 7,105 | 591,989 | ||||||
Whole Foods Market, Inc. | 3,647 | 253,758 | ||||||
|
| |||||||
| 845,747 | ||||||||
|
| |||||||
Beverages — 4.1% |
| |||||||
Brown-Forman | 3,402 | 273,895 | ||||||
Diageo PLC — SP ADR | 3,168 | 276,947 | ||||||
Monster Beverage Corp.** | 2,586 | 238,274 | ||||||
|
| |||||||
| 789,116 | ||||||||
|
| |||||||
Household Products — 2.7% |
| |||||||
Church & Dwight Co., Inc. | 11,320 | 518,003 | ||||||
|
| |||||||
Total CONSUMER STAPLES | 3,311,961 | |||||||
|
| |||||||
| HEALTH CARE — 13.1% | ||||||||
Pharmaceuticals — 6.7% |
| |||||||
Allergan, Inc. | 3,762 | 330,078 | ||||||
Bristol-Myers Squibb Co. | 6,601 | 232,619 | ||||||
Pfizer, Inc. | 15,528 | 336,026 | ||||||
Shire PLC — ADR | 3,782 | 392,950 | ||||||
|
| |||||||
| 1,291,673 | ||||||||
|
| |||||||
Biotechnology — 5.1% |
| |||||||
Alexion Pharmaceuticals, Inc.** | 6,821 | 487,701 | ||||||
Biogen Idec, Inc.** | 1,890 | 207,995 | ||||||
BioMarin Pharmaceutical, Inc.** | 5,622 | 193,284 | ||||||
Celgene Corp.** | 1,499 | 101,332 | ||||||
|
| |||||||
| 990,312 | ||||||||
|
| |||||||
Health Care Equipment & Supplies — 1.3% |
| |||||||
Intuitive Surgical, Inc.** | 562 | 260,212 | ||||||
|
| |||||||
Total HEALTH CARE | 2,542,197 | |||||||
|
| |||||||
Notes to Financial Statements are an integral part of this Schedule.
43
Driehaus Large Cap Growth Fund
Schedule of Investments
December 31, 2011
Number of Shares | Market (Note A) | |||||||
| INDUSTRIALS — 9.3% | ||||||||
Machinery — 2.9% |
| |||||||
Cummins, Inc. | 3,408 | $ | 299,972 | |||||
SPX Corp. | 4,448 | 268,081 | ||||||
|
| |||||||
| 568,053 | ||||||||
|
| |||||||
Aerospace & Defense — 2.5% |
| |||||||
Precision Castparts Corp. | 2,177 | 358,748 | ||||||
Spirit Aerosystems Holdings, Inc. — A** | 6,211 | 129,065 | ||||||
|
| |||||||
| 487,813 | ||||||||
|
| |||||||
Marine — 2.3% |
| |||||||
Kirby Corp.** | 6,758 | 444,947 | ||||||
Commercial Services & Supplies — 1.1% |
| |||||||
Waste Connections, Inc. | 6,146 | 203,678 | ||||||
Industrial Conglomerates — 0.5% |
| |||||||
Danaher Corp. | 1,915 | 90,082 | ||||||
|
| |||||||
Total INDUSTRIALS | 1,794,573 | |||||||
|
| |||||||
| ENERGY — 7.9% | ||||||||
Oil, Gas & Consumable Fuels — 4.2% |
| |||||||
Exxon Mobil Corp. | 1,121 | 95,016 | ||||||
Occidental Petroleum Corp. | 2,883 | 270,137 | ||||||
Pioneer Natural Resources Co. | 4,901 | 438,541 | ||||||
|
| |||||||
| 803,694 | ||||||||
|
| |||||||
Energy Equipment & Services — 3.7% |
| |||||||
Baker Hughes, Inc. | 1,899 | 92,367 | ||||||
Cameron International Corp.** | 8,605 | 423,280 | ||||||
Seadrill, Ltd. | 6,108 | 202,663 | ||||||
|
| |||||||
| 718,310 | ||||||||
|
| |||||||
Total ENERGY | 1,522,004 | |||||||
|
| |||||||
Number of Shares | Market (Note A) | |||||||
| FINANCIALS — 5.6% | ||||||||
Real Estate Investment Trusts — 4.2% |
| |||||||
American Capital Agency Corp. | 11,621 | $ | 326,318 | |||||
American Tower | 8,163 | 489,862 | ||||||
|
| |||||||
| 816,180 | ||||||||
|
| |||||||
Diversified Financial Services — 1.4% |
| |||||||
IntercontinentalExchange, Inc.** | 2,217 | 267,259 | ||||||
|
| |||||||
Total FINANCIALS | 1,083,439 | |||||||
|
| |||||||
| MATERIALS — 4.9% | ||||||||
Metals & Mining — 3.5% |
| |||||||
Carpenter Technology Corp. | 9,312 | 479,382 | ||||||
Newmont Mining Corp. | 3,451 | 207,095 | ||||||
|
| |||||||
| 686,477 | ||||||||
|
| |||||||
Chemicals — 1.4% |
| |||||||
Praxair, Inc. | 2,492 | 266,395 | ||||||
|
| |||||||
Total MATERIALS | 952,872 | |||||||
|
| |||||||
Total EQUITY SECURITIES (Cost $15,669,659) | 18,832,658 | |||||||
|
| |||||||
| ||||||||
TOTAL INVESTMENTS | 97.4 | % | $ | 18,832,658 | ||||
Other Assets In Excess Of Liabilities | 2.6 | % | 502,462 | |||||
|
|
|
| |||||
| Net Assets | 100.0 | % | $ | 19,335,120 | ||||
| ||||||||
The federal income tax basis and unrealized appreciation (depreciation) for all investments is as follows:
| Basis | $ | 15,808,151 | ||
|
| |||
| Gross Appreciation | $ | 3,384,275 | ||
| Gross Depreciation | (359,768 | ) | ||
|
| |||
Net Appreciation | $ | 3,024,507 | ||
|
|
| ** | Non-income producing security |
| ADR | — American Depository Receipt |
| SP | ADR — Sponsored American Depository Receipt |
Top Ten Holdings*
Apple Inc. | 7.3% | |||
Starbucks Corp. | 3.8% | |||
McDonald’s Corp. | 3.3% | |||
Costco Wholesale Corp. | 3.1% | |||
The Hershey Co. | 2.9% | |||
Church & Dwight Co., Inc. | 2.7% | |||
Qualcomm, Inc. | 2.7% | |||
American Tower Corp. — A | 2.5% | |||
Alexion Pharmaceuticals, Inc. | 2.5% | |||
Carpenter Technology Corp. | 2.5% |
| * | All percentages are stated as a percent of net assets at December 31, 2011. |
Notes to Financial Statements are an integral part of this Schedule.
44
(This page intentionally left blank)
45
Statements of Assets and Liabilities
December 31, 2011
Driehaus Fund | Driehaus Emerging Markets Growth Fund | |||||||
ASSETS: | ||||||||
Investments, at cost | $ | 197,498,314 | $ | 661,604,684 | ||||
|
|
|
| |||||
Investments, at market value | $ | 204,714,065 | $ | 681,815,794 | ||||
Foreign currency** | 3,614,648 | 10,178,540 | ||||||
Cash | 5,327,240 | 54,424,972 | ||||||
Segregated cash | — | — | ||||||
Receivables: | ||||||||
Dividends | 256,822 | 758,226 | ||||||
Interest | 61 | 510 | ||||||
Investment securities sold | 369,512 | 18,753,328 | ||||||
Fund shares sold | 1,985 | 2,636,484 | ||||||
Net unrealized appreciation on unsettled foreign currency transactions | 1,637 | — | ||||||
Prepaid expenses | 7,954 | 20,083 | ||||||
|
|
|
| |||||
| ||||||||
TOTAL ASSETS | 214,293,924 | 768,587,937 | ||||||
|
|
|
| |||||
| ||||||||
LIABILITIES: | ||||||||
Payables: | ||||||||
Investment securities purchased | 1,698,431 | 19,078,745 | ||||||
Fund shares redeemed | 302,960 | 7,037,598 | ||||||
Net unrealized depreciation on unsettled foreign currency transactions | — | 20,445 | ||||||
Due to affiliates | 274,997 | 973,825 | ||||||
Audit and tax fees | 30,300 | 39,300 | ||||||
Accrued expenses | 60,528 | 146,935 | ||||||
Outstanding options written, at value (proceeds received $204,989) | — | — | ||||||
|
|
|
| |||||
| ||||||||
TOTAL LIABILITIES | 2,367,216 | 27,296,848 | ||||||
|
|
|
| |||||
| ||||||||
NET ASSETS | $ | 211,926,708 | $ | 741,291,089 | ||||
|
|
|
| |||||
SHARES OUTSTANDING (Unlimited shares authorized, no par value) | 8,731,450 | 28,826,520 | ||||||
|
|
|
| |||||
NET ASSET VALUE | $ | 24.27 | $ | 25.72 | ||||
|
|
|
| |||||
| ||||||||
NET ASSETS CONSISTED OF THE FOLLOWING AT DECEMBER 31, 2011: | ||||||||
Paid-in capital | $ | 476,029,911 | $ | 793,336,706 | ||||
Accumulated net investment income (loss) | (1,778,973 | ) | (22,884 | ) | ||||
Accumulated net realized gain (loss) | (269,588,890 | ) | (72,421,995 | ) | ||||
Unrealized net foreign exchange gain (loss) | 48,909 | 188,152 | ||||||
Unrealized net appreciation (depreciation) on written options | — | — | ||||||
Unrealized net appreciation (depreciation) on investments | 7,215,751 | 20,211,110 | ||||||
|
|
|
| |||||
NET ASSETS | $ | 211,926,708 | $ | 741,291,089 | ||||
|
|
|
| |||||
| ||||||||
| * | Fund commenced operations on August 22, 2011. |
| ** | The cost of foreign currency was $3,573,346, $9,341,612, $1,026,339, $4,664, $65,363, $0 and $0, respectively. |
Notes to Financial Statements are an integral part of this Statement.
46
Statements of Assets and Liabilities
December 31, 2011
Driehaus Emerging Markets | Driehaus International Small Cap Growth Fund | Driehaus Global Growth Fund | Driehaus Mid Cap Fund | Driehaus Large Cap Growth Fund | ||||||||||||||
| $ | 27,923,644 | $ | 211,152,429 | $ | 32,588,216 | $ | 17,474,729 | $ | 15,669,659 | |||||||||
|
|
|
|
|
|
|
|
|
| |||||||||
| $ | 27,183,626 | $ | 218,620,899 | $ | 34,373,520 | $ | 20,461,947 | $ | 18,832,658 | |||||||||
| 1,027,016 | 4,664 | 71,485 | — | — | ||||||||||||||
| 4,950,273 | 13,346,555 | 1,617,819 | 1,391,336 | 498,871 | ||||||||||||||
| 1,000,000 | — | — | — | — | ||||||||||||||
| 17,128 | 216,441 | 18,051 | 25,003 | 23,327 | ||||||||||||||
| — | 120 | — | 127 | — | ||||||||||||||
| 1,053,070 | 3,204,919 | 117,988 | 141,583 | 132,862 | ||||||||||||||
| 3,407 | 125,861 | — | 47,656 | — | ||||||||||||||
| 3,966 |
| 19,171 | 20 | — | — | ||||||||||||
| 17,378 | 6,021 | 4,250 | 4,172 | 4,151 | ||||||||||||||
|
|
|
|
|
|
|
|
|
| |||||||||
|
| |||||||||||||||||
| 35,255,864 | 235,544,651 | 36,203,133 | 22,071,824 | 19,491,869 | ||||||||||||||
|
|
|
|
|
|
|
|
|
| |||||||||
|
| |||||||||||||||||
| 2,357,797 | 2,327,578 | 287,052 | 120,066 | 112,538 | ||||||||||||||
| — | 106,553 | 251,041 | 9,955 | — | ||||||||||||||
| — |
| — | — | — | — | ||||||||||||
| 21,240 | 295,978 | 38,227 | 7,441 | 5,746 | ||||||||||||||
| 26,200 | 31,300 | 27,300 | 22,800 | 22,800 | ||||||||||||||
| 22,792 | 54,147 | 19,844 | 16,956 | 15,665 | ||||||||||||||
| 108,065 | — | — | — | — | ||||||||||||||
|
|
|
|
|
|
|
|
|
| |||||||||
|
| |||||||||||||||||
| 2,536,094 | 2,815,556 | 623,464 | 177,218 | 156,749 | ||||||||||||||
|
|
|
|
|
|
|
|
|
| |||||||||
|
| |||||||||||||||||
| $ | 32,719,770 | $ | 232,729,095 | $ | 35,579,669 | $ | 21,894,606 | $ | 19,335,120 | |||||||||
|
|
|
|
|
|
|
|
|
| |||||||||
| 3,715,216 | 27,361,589 | 5,411,237 | 1,747,686 | 1,543,907 | ||||||||||||||
|
|
|
|
|
|
|
|
|
| |||||||||
| $ | 8.81 | $ | 8.51 | $ | 6.58 | $ | 12.53 | $ | 12.52 | |||||||||
|
|
|
|
|
|
|
|
|
| |||||||||
|
| |||||||||||||||||
| $ | 36,917,697 | $ | 242,341,550 | $ | 34,598,383 | $ | 18,581,287 | $ | 16,008,734 | |||||||||
| (60,764 | ) | 636,313 | (181,564 | ) | — | — | ||||||||||||
| (3,495,821 | ) | (17,715,993 | ) | (628,249 | ) | 326,101 | 163,387 | |||||||||||
| 1,752 | (1,245 | ) | 5,795 | — | — | |||||||||||||
| 96,924 | — | — | — | — | ||||||||||||||
| (740,018 | ) | 7,468,470 | 1,785,304 | 2,987,218 | 3,162,999 | |||||||||||||
|
|
|
|
|
|
|
|
|
| |||||||||
| $ | 32,719,770 | $ | 232,729,095 | $ | 35,579,669 | $ | 21,894,606 | $ | 19,335,120 | |||||||||
|
|
|
|
|
|
|
|
|
| |||||||||
|
| |||||||||||||||||
Notes to Financial Statements are an integral part of this Statement.
47
For the year ended December 31, 2011
| Driehaus International Discovery Fund | Driehaus Emerging Markets Growth Fund | |||||||
INVESTMENT INCOME (LOSS): | ||||||||
Income: | ||||||||
Dividends** | $ | 6,037,799 | $ | 17,570,002 | ||||
Interest | — | — | ||||||
|
|
|
| |||||
| ||||||||
Total income | 6,037,799 | 17,570,002 | ||||||
|
|
|
| |||||
| ||||||||
Expenses: | ||||||||
Investment advisory fee | 4,202,798 | 12,396,322 | ||||||
Administration fee | 256,719 | 516,384 | ||||||
Professional fees | 58,865 | 160,969 | ||||||
Audit and tax fees | 60,746 | 86,745 | ||||||
Federal and state registration fees | 27,614 | 69,033 | ||||||
Custodian fees | 56,040 | 280,522 | ||||||
Transfer agent fees | 77,167 | 170,687 | ||||||
Trustees’ and Advisory Board Members’ fees | 24,367 | 39,982 | ||||||
Chief compliance officer fees | 9,106 | 9,106 | ||||||
Reports to shareholders | 26,438 | 79,369 | ||||||
Interest expense | 1,836 | — | ||||||
Miscellaneous | 28,733 | 41,597 | ||||||
|
|
|
| |||||
Total expenses | 4,830,429 | 13,850,716 | ||||||
|
|
|
| |||||
| ||||||||
Investment advisory fees recaptured (waived) | — | — | ||||||
Administration fees waived | — | — | ||||||
Transfer agent fees waived | — | — | ||||||
Fees paid indirectly | (33,000 | ) | (334,082 | ) | ||||
|
|
|
| |||||
Net expenses | 4,797,429 | 13,516,634 | ||||||
|
|
|
| |||||
| ||||||||
Net investment income (loss) | 1,240,370 | 4,053,368 | ||||||
|
|
|
| |||||
| ||||||||
| NET REALIZED AND UNREALIZED GAIN (LOSS) ON INVESTMENTS, WRITTEN OPTIONS AND FOREIGN CURRENCY TRANSACTIONS: | ||||||||
Net realized gain (loss) from security transactions | 20,087,489 | (64,502,832 | ) | |||||
Net realized foreign exchange gain (loss)*** | (634,891 | ) | (4,161,211 | ) | ||||
Net realized gain (loss) on written options**** | — | — | ||||||
Net change in unrealized foreign exchange gain (loss) | (54,205 | ) | (663,579 | ) | ||||
Net change in unrealized appreciation (depreciation) on written options | — | — | ||||||
Net change in unrealized appreciation (depreciation) on investments | (75,709,126 | ) | (69,088,402 | ) | ||||
|
|
|
| |||||
| ||||||||
Net realized and unrealized gain (loss) on investments, written options and foreign currency transactions | (56,310,733 | ) | (138,416,024 | ) | ||||
|
|
|
| |||||
| ||||||||
NET INCREASE (DECREASE) IN NET ASSETS RESULTING FROM OPERATIONS | $ | (55,070,363 | ) | $ | (134,362,656 | ) | ||
|
|
|
| |||||
| ||||||||
| * | Fund commenced operations on August 22, 2011. |
| ** | Dividends are net of $373,114, $1,725,184, $7,650, $401,205, $28,046, $0 and $1,740 nonreclaimable foreign taxes withheld, respectively. |
| *** | Net realized foreign exchange gain (loss) is net of $0, $563,243, $23,444, $0, $0, $0 and $0 of Brazilian foreign transaction tax, respectively. |
| **** | The primary risk exposure is the price movement of underlying equity indices. |
Notes to Financial Statements are an integral part of these Statements.
48
Statements of Operations
For the year ended December 31, 2011
| Driehaus Emerging Markets Small Cap Growth Fund* | Driehaus International Small Cap Growth Fund | Driehaus Global Growth Fund | Driehaus Mid Cap Growth Fund | Driehaus Large Cap Growth Fund | ||||||||||||||
| $ | 109,118 | $ | 6,561,309 | $ | 406,832 | $ | 151,495 | $ | 212,165 | |||||||||
| 2,223 | — | — | 2,827 | 1,176 | ||||||||||||||
|
|
|
|
|
|
|
|
|
| |||||||||
|
| |||||||||||||||||
| 111,341 | 6,561,309 | 406,832 | 154,322 | 213,341 | ||||||||||||||
|
|
|
|
|
|
|
|
|
| |||||||||
|
| |||||||||||||||||
| 157,549 | 4,179,767 | 572,368 | 250,058 | 194,790 | ||||||||||||||
| 29,002 | 257,163 | 87,712 | 57,460 | 54,619 | ||||||||||||||
| 7,448 | 60,221 | 19,289 | 17,154 | 16,587 | ||||||||||||||
| 43,900 | 62,493 | 55,246 | 40,300 | 40,300 | ||||||||||||||
| 11,225 | 25,453 | 17,121 | 21,117 | 20,675 | ||||||||||||||
| 9,245 | 83,940 | 11,894 | 9,700 | 6,360 | ||||||||||||||
| 15,712 | 65,702 | 38,475 | 38,542 | 37,955 | ||||||||||||||
| 5,687 | 24,037 | 17,380 | 16,763 | 16,673 | ||||||||||||||
| 1,736 | 9,106 | 9,106 | 9,106 | 9,106 | ||||||||||||||
| 3,774 | 25,593 | 12,081 | 11,680 | 11,463 | ||||||||||||||
| — | — | 1,102 | — | — | ||||||||||||||
| 2,772 | 25,324 | 17,422 | 16,449 | 16,419 | ||||||||||||||
|
|
|
|
|
|
|
|
|
| |||||||||
| 288,050 | 4,818,799 | 859,196 | 488,329 | 424,947 | ||||||||||||||
|
|
|
|
|
|
|
|
|
| |||||||||
|
| |||||||||||||||||
| (57,581 | ) | — | 43,191 | (48,478 | ) | (43,939 | ) | |||||||||||
| (5,403 | ) | — | — | — | — | |||||||||||||
| (15,000 | ) | — | — | (2,250 | ) | (2,250 | ) | |||||||||||
| (2,803 | ) | (97,604 | ) | (1,795 | ) | — | — | |||||||||||
|
|
|
|
|
|
|
|
|
| |||||||||
| 207,263 | 4,721,195 | 900,592 | 437,601 | 378,758 | ||||||||||||||
|
|
|
|
|
|
|
|
|
| |||||||||
|
| |||||||||||||||||
| (95,922 | ) | 1,840,114 | (493,760 | ) | (283,279 | ) | (165,417 | ) | ||||||||||
|
|
|
|
|
|
|
|
|
| |||||||||
|
| |||||||||||||||||
| (3,607,140 | ) | 1,687,064 | 1,679,668 | 1,118,775 | 1,324,203 | |||||||||||||
| (83,911 | ) | (606,058 | ) | 45,574 | — | — | ||||||||||||
| 251,168 | — | — | — | — | ||||||||||||||
| 1,752 | (351,013 | ) | (79,634 | ) | — | — | ||||||||||||
| 96,924 |
| — | — | — | — | ||||||||||||
| (740,018 | ) | (31,799,392 | ) | (9,838,827 | ) | (1,492,884 | ) | (1,452,726 | ) | ||||||||
|
|
|
|
|
|
|
|
|
| |||||||||
|
| |||||||||||||||||
| (4,081,225 | ) | (31,069,399 | ) | (8,193,219 | ) | (374,109 | ) | (128,523 | ) | ||||||||
|
|
|
|
|
|
|
|
|
| |||||||||
|
| |||||||||||||||||
$ | (4,177,147 | ) | $ | (29,229,285 | ) | $ | (8,686,979 | ) | $ | (657,388 | ) | $ | (293,940 | ) | ||||
|
|
|
|
|
|
|
|
|
| |||||||||
|
| |||||||||||||||||
Notes to Financial Statements are an integral part of these Statements.
49
Statements of Changes in Net Assets
| Driehaus International Discovery Fund | Driehaus Emerging Markets Growth Fund | |||||||||||||||
| For the year ended December 31, 2011 | For the year | For the year ended December 31, 2011 | For the year ended December 31, 2010 | |||||||||||||
INCREASE (DECREASE) IN NET ASSETS: | ||||||||||||||||
Operations: | ||||||||||||||||
Net investment income (loss) | $ | 1,240,370 | $ | (2,613,372 | ) | $ | 4,053,368 | $ | (939,213 | ) | ||||||
Net realized gain (loss) on investments, written options and foreign currency transactions | 19,452,598 | 50,484,752 | (68,664,043 | ) | 159,677,843 | |||||||||||
Net change in unrealized gain (loss) on investments, written options and foreign currency transactions | (75,763,331 | ) | (6,202,601 | ) | (69,751,981 | ) | (14,675,239 | ) | ||||||||
|
|
|
|
|
|
|
| |||||||||
| ||||||||||||||||
Net increase (decrease) in net assets resulting from operations | (55,070,363 | ) | 41,668,779 | (134,362,656 | ) | 144,063,391 | ||||||||||
|
|
|
|
|
|
|
| |||||||||
| ||||||||||||||||
Distributions to shareholders: | ||||||||||||||||
Net investment income | — | (6,325,312 | ) | — | (15,972,778 | ) | ||||||||||
Capital gains | — | — | (45,863,976 | ) | (72,514,637 | ) | ||||||||||
|
|
|
|
|
|
|
| |||||||||
Total distributions to shareholders | — | (6,325,312 | ) | (45,863,976 | ) | (88,487,415 | ) | |||||||||
|
|
|
|
|
|
|
| |||||||||
| ||||||||||||||||
Capital share transactions: | ||||||||||||||||
Proceeds from shares sold | 12,941,401 | 14,634,310 | 301,459,540 | 278,323,660 | ||||||||||||
Reinvestment of distributions | — | 6,266,379 | 43,894,950 | 87,406,427 | ||||||||||||
Cost of shares redeemed | (84,785,765 | ) | (81,819,068 | ) | (258,212,279 | ) | (162,907,606 | ) | ||||||||
Redemption fees | 1,670 | 4,014 | 64,812 | 70,228 | ||||||||||||
|
|
|
|
|
|
|
| |||||||||
Net increase (decrease) in net assets derived from capital share transactions | (71,842,694 | ) | (60,914,365 | ) | 87,207,023 | 202,892,709 | ||||||||||
|
|
|
|
|
|
|
| |||||||||
Total increase (decrease) in net assets | (126,913,057 | ) | (25,570,898 | ) | (93,019,609 | ) | 258,468,685 | |||||||||
|
|
|
|
|
|
|
| |||||||||
| ||||||||||||||||
NET ASSETS: | ||||||||||||||||
| ||||||||||||||||
Beginning of period | $ | 338,839,765 | $ | 364,410,663 | $ | 834,310,698 | $ | 575,842,013 | ||||||||
|
|
|
|
|
|
|
| |||||||||
End of period | $ | 211,926,708 | $ | 338,839,765 | $ | 741,291,089 | $ | 834,310,698 | ||||||||
|
|
|
|
|
|
|
| |||||||||
Accumulated net investment income (loss) | $ | (1,778,973 | ) | $ | (5,520,759 | ) | $ | (22,884 | ) | $ | (4,238,683 | ) | ||||
|
|
|
|
|
|
|
| |||||||||
| ||||||||||||||||
Capital share transactions are as follows: | ||||||||||||||||
Shares issued | 470,032 | 535,857 | 9,680,600 | 8,734,081 | ||||||||||||
Shares reinvested | — | 210,493 | 1,705,983 | 2,763,403 | ||||||||||||
Shares redeemed | (2,931,206 | ) | (2,955,630 | ) | (8,467,597 | ) | (5,283,366 | ) | ||||||||
|
|
|
|
|
|
|
| |||||||||
Net increase (decrease) from capital share transactions | (2,461,174 | ) | (2,209,280 | ) | 2,918,986 | 6,214,118 | ||||||||||
|
|
|
|
|
|
|
| |||||||||
| ||||||||||||||||
| * | Fund commenced operations on August 22, 2011. |
Notes to Financial Statements are an integral part of this Statement.
50
Statements of Changes in Net Assets
| Driehaus Emerging Markets Small Cap Growth Fund | Driehaus International Small Cap Growth Fund | |||||||||
For the period August 22, December 31, 2011* | For the year ended December 31, 2011 | For the year ended December 31, 2010 | ||||||||
| $ | (95,922 | ) | $ | 1,840,114 | $ | (1,608,988 | ) | |||
| (3,439,883 | ) | 1,081,006 | 52,018,616 | ||||||
| (641,342 | ) | (32,150,405 | ) | 4,004,389 | |||||
|
|
|
|
|
| |||||
|
| |||||||||
| (4,177,147 | ) | (29,229,285 | ) | 54,414,017 | |||||
|
|
|
|
|
| |||||
|
| |||||||||
| — | (1,347,630 | ) | (1,697,404 | ) | ||||||
| — | — | — | ||||||||
|
|
|
|
|
| |||||
| — |
| (1,347,630 | ) | (1,697,404 | ) | ||||
|
|
|
|
|
| |||||
|
| |||||||||
| 36,999,932 | 84,575,481 | 54,394,213 | ||||||||
| — | 1,244,851 | 1,571,651 | ||||||||
| (103,015 | ) | (80,964,036 | ) | (51,259,574 | ) | |||||
| — | 3,636 | 2,879 | ||||||||
|
|
|
|
|
| |||||
| 36,896,917 |
| 4,859,932 | 4,709,169 | ||||||
|
|
|
|
|
| |||||
| 32,719,770 |
| (25,716,983 | ) | 57,425,782 | |||||
|
|
|
|
|
| |||||
|
| |||||||||
|
| |||||||||
| $ | — | $ | 258,446,078 | $ | 201,020,296 | |||||
|
|
|
|
|
| |||||
| $ | 32,719,770 | $ | 232,729,095 | $ | 258,446,078 | |||||
|
|
|
|
|
| |||||
$ | (60,764 | ) | $ | 636,313 | $ | (890,575 | ) | |||
|
|
|
|
|
| |||||
|
| |||||||||
| 3,726,377 | 8,803,227 | 6,400,797 | ||||||||
| — | 148,373 | 167,019 | ||||||||
| (11,161 | ) | (8,344,929 | ) | (6,109,192 | ) | |||||
|
|
|
|
|
| |||||
| 3,715,216 |
| 606,671 | 458,624 | ||||||
|
|
|
|
|
| |||||
|
| |||||||||
Notes to Financial Statements are an integral part of this Statement.
51
Statements of Changes in Net Assets
| Driehaus Global Growth Fund | ||||||||
| For the year ended December 31, 2011 | For the year ended December 31, 2010 | |||||||
INCREASE (DECREASE) IN NET ASSETS: | ||||||||
Operations: | ||||||||
Net investment income (loss) | $ | (493,760 | ) | $ | (685,936 | ) | ||
Net realized gain (loss) on investments, written options and foreign currency transactions | 1,725,242 | 6,461,194 | ||||||
Net change in unrealized gain (loss) on investments, written options and foreign currency transactions | (9,918,461 | ) | 2,532,721 | |||||
|
|
|
| |||||
| ||||||||
Net increase (decrease) in net assets resulting from operations | (8,686,979 | ) | 8,307,979 | |||||
|
|
|
| |||||
| ||||||||
Distributions to shareholders: | ||||||||
Net investment income | — | (130,775 | ) | |||||
Capital gains | (3,868,133 | ) | — | |||||
|
|
|
| |||||
Total distributions to shareholders | (3,868,133 | ) | (130,775 | ) | ||||
|
|
|
| |||||
| ||||||||
Capital share transactions: | ||||||||
Proceeds from shares sold | 7,143,933 | 15,723,555 | ||||||
Reinvestment of distributions | 3,868,133 | 130,775 | ||||||
Cost of shares redeemed | (15,596,557 | ) | (11,613,598 | ) | ||||
Redemption fees | 568 | — | ||||||
|
|
|
| |||||
Net increase (decrease) in net assets derived from capital share transactions | (4,583,923 | ) | 4,240,732 | |||||
|
|
|
| |||||
Total increase (decrease) in net assets | (17,139,035 | ) | 12,417,936 | |||||
|
|
|
| |||||
| ||||||||
NET ASSETS: | ||||||||
| ||||||||
Beginning of period | $ | 52,718,704 | $ | 40,300,768 | ||||
|
|
|
| |||||
End of period | $ | 35,579,669 | $ | 52,718,704 | ||||
|
|
|
| |||||
Accumulated net investment income (loss) | $ | (181,564 | ) | $ | (518,937 | ) | ||
|
|
|
| |||||
| ||||||||
Capital share transactions are as follows: | ||||||||
Shares issued | 804,222 | 1,941,686 | ||||||
Shares reinvested | 587,862 | 14,546 | ||||||
Shares redeemed | (1,832,167 | ) | (1,415,181 | ) | ||||
|
|
|
| |||||
Net increase (decrease) from capital share transactions | (440,083 | ) | 541,051 | |||||
|
|
|
| |||||
| ||||||||
Notes to Financial Statements are an integral part of this Statement.
52
Statements of Changes in Net Assets
| Driehaus Mid Cap Growth Fund | Driehaus Large Cap Growth Fund | |||||||||||||
| For the year ended December 31, 2011 | For the year ended December 31, 2010 | For the year ended December 31, 2011 | For the year ended December 31, 2010 | |||||||||||
| $ | (283,279 | ) | $ | (210,356 | ) | $ | (165,417 | ) | $ | (179,882 | ) | |||
| 1,118,775 | 2,231,602 | 1,324,203 | 1,834,936 | |||||||||||
| (1,492,884 | ) | 1,530,998 | (1,452,726 | ) | 1,720,320 | |||||||||
|
|
|
|
|
|
|
| |||||||
|
| |||||||||||||
| (657,388 | ) | 3,552,244 | (293,940 | ) | 3,375,374 | |||||||||
|
|
|
|
|
|
|
| |||||||
|
| |||||||||||||
| — | — | — | — | |||||||||||
| (1,411,100 | ) | (1,227,343 | ) | (1,600,488 | ) | (969,241 | ) | |||||||
|
|
|
|
|
|
|
| |||||||
| (1,411,100 | ) | (1,227,343 | ) | (1,600,488 | ) | (969,241 | ) | |||||||
|
|
|
|
|
|
|
| |||||||
|
| |||||||||||||
| 5,187,425 | 5,368,327 | 3,177,254 | 7,203,826 | |||||||||||
| 1,365,613 | 1,173,613 | 1,575,209 | 956,036 | |||||||||||
| (4,163,241 | ) | (2,115,249 | ) | (4,692,707 | ) | (3,272,399 | ) | |||||||
| 692 | 106 | 894 | 176 | |||||||||||
|
|
|
|
|
|
|
| |||||||
| 2,390,489 | 4,426,797 | 60,650 | 4,887,639 | |||||||||||
|
|
|
|
|
|
|
| |||||||
| 322,001 | 6,751,698 | (1,833,778 | ) | 7,293,772 | ||||||||||
|
|
|
|
|
|
|
| |||||||
|
| |||||||||||||
|
| |||||||||||||
| $ | 21,572,605 | $ | 14,820,907 | $ | 21,168,898 | $ | 13,875,126 | |||||||
|
|
|
|
|
|
|
| |||||||
| $ | 21,894,606 | $ | 21,572,605 | $ | 19,335,120 | $ | 21,168,898 | |||||||
|
|
|
|
|
|
|
| |||||||
| $ | — | $ | — | $ | — | $ | — | |||||||
|
|
|
|
|
|
|
| |||||||
|
| |||||||||||||
| 352,650 | 398,098 | 226,550 | 584,787 | |||||||||||
| 109,249 | 84,615 | 126,421 | 68,928 | |||||||||||
| (289,931 | ) | (180,990 | ) | (344,046 | ) | (280,713 | ) | |||||||
|
|
|
|
|
|
|
| |||||||
| 171,968 | 301,723 | 8,925 | 373,002 | |||||||||||
|
|
|
|
|
|
|
| |||||||
|
| |||||||||||||
Notes to Financial Statements are an integral part of this Statement.
53
Driehaus International Discovery Fund
Financial Highlights
| For the year ended December 31, 2011 | For the year ended December 31, 2010 | For the year ended December 31, 2009 | For the year ended December 31, 2008 | For the year ended December 31, 2007 | ||||||||||||||||
Net asset value, beginning of period | $ | 30.27 | $ | 27.19 | $ | 18.28 | $ | 41.55 | $ | 39.35 | ||||||||||
|
|
|
|
|
|
|
|
|
| |||||||||||
INCOME (LOSS) FROM INVESTMENT OPERATIONS: | ||||||||||||||||||||
Net investment income (loss) | 0.13 | ^ | (0.22 | ) | 0.00 | ~ | (0.06 | ) | (0.03 | ) | ||||||||||
Net realized and unrealized gain (loss) on investments and foreign currency transactions | (6.13 | ) | 3.86 | 9.02 | (22.85 | ) | 12.19 | |||||||||||||
|
|
|
|
|
|
|
|
|
| |||||||||||
Total income (loss) from investment operations | (6.00 | ) | 3.64 | 9.02 | (22.91 | ) | 12.16 | |||||||||||||
|
|
|
|
|
|
|
|
|
| |||||||||||
LESS DISTRIBUTIONS: | ||||||||||||||||||||
Dividends from net investment income | — | (0.56 | ) | (0.11 | ) | — | (0.13 | ) | ||||||||||||
Distributions from capital gains | — | — | — | (0.38 | ) | (9.83 | ) | |||||||||||||
|
|
|
|
|
|
|
|
|
| |||||||||||
Total distributions | — | �� | (0.56 | ) | (0.11 | ) | (0.38 | ) | (9.96 | ) | ||||||||||
|
|
|
|
|
|
|
|
|
| |||||||||||
Redemption fees added to paid-in capital | 0.00 | ~ | 0.00 | ~ | 0.00 | ~ | 0.02 | 0.00 | ~ | |||||||||||
|
|
|
|
|
|
|
|
|
| |||||||||||
Net asset value, end of period | $ | 24.27 | $ | 30.27 | $ | 27.19 | $ | 18.28 | $ | 41.55 | ||||||||||
|
|
|
|
|
|
|
|
|
| |||||||||||
Total Return | (19.85 | )% | 13.47 | % | 49.28 | % | (55.07 | )% | 32.32 | % | ||||||||||
RATIOS/SUPPLEMENTAL DATA | ||||||||||||||||||||
Net assets, end of period (in 000’s) | $ | 211,927 | $ | 338,840 | $ | 364,411 | $ | 302,112 | $ | 857,041 | ||||||||||
Ratio of expenses before reimbursements, waivers and fees paid indirectly to average net assets | 1.72 | %∞ | 1.71 | % | 1.75 | % | 1.65 | % | 1.63 | % | ||||||||||
Ratio of net expenses to average net assets | 1.71 | %#∞ | 1.70 | %# | 1.74 | %# | 1.64 | %# | 1.59 | %# | ||||||||||
Ratio of net investment income (loss) to average net assets | 0.44 | %# | (0.77 | ) %# | 0.07 | %# | (0.07 | )%# | (0.28 | )%# | ||||||||||
Portfolio turnover | 119 | % | 93 | % | 145 | % | 188 | % | 218 | % | ||||||||||
| ||||||||||||||||||||
| ^ | Net investment income (loss) per share has been calculated using the average shares method. |
| ~ | Amount represents less than $0.01 per share |
| # | Such ratios are net of fees paid indirectly (see Note B in the Notes to Financial Statements). |
| ∞ | Ratio of expenses to average net assets includes interest expense of less than 0.005% for the year ended December 31, 2011. The interest expense is from utilizing the line of credit (see Note F in the Notes to Financial Statements). |
Notes to Financial Statements are an integral part of this Schedule.
54
Driehaus Emerging Markets Growth Fund
Financial Highlights
| For the year ended December 31, 2011 | For the year ended December 31, 2010 | For the year ended December 31, 2009 | For the year ended December 31, 2008 | For the year ended December 31, 2007 | ||||||||||||||||
Net asset value, beginning of period | $ | 32.20 | $ | 29.24 | $ | 17.19 | $ | 43.45 | $ | 39.09 | ||||||||||
|
|
|
|
|
|
|
|
|
| |||||||||||
INCOME (LOSS) FROM INVESTMENT OPERATIONS: | ||||||||||||||||||||
Net investment income (loss) | 0.16 | (0.04 | )^ | (0.05 | ) | (0.08 | ) | (0.09 | ) | |||||||||||
Net realized and unrealized gain (loss) on investments and foreign currency transactions | (4.97 | ) | 6.84 | 12.09 | (23.53 | ) | 16.00 | |||||||||||||
|
|
|
|
|
|
|
|
|
| |||||||||||
Total income (loss) from investment operations | (4.81 | ) | 6.80 | 12.04 | (23.61 | ) | 15.91 | |||||||||||||
|
|
|
|
|
|
|
|
|
| |||||||||||
LESS DISTRIBUTIONS: | ||||||||||||||||||||
Dividends from net investment income | — | (0.69 | ) | — | — | — | ||||||||||||||
Distributions from capital gains | (1.67 | ) | (3.15 | ) | — | (2.65 | ) | (11.56 | ) | |||||||||||
|
|
|
|
|
|
|
|
|
| |||||||||||
Total distributions | (1.67 | ) | (3.84 | ) | — | (2.65 | ) | (11.56 | ) | |||||||||||
|
|
|
|
|
|
|
|
|
| |||||||||||
Redemption fees added to paid-in capital | 0.00 | ~ | 0.00 | ~ | 0.01 | 0.00 | ~ | 0.01 | ||||||||||||
|
|
|
|
|
|
|
|
|
| |||||||||||
Net asset value, end of period | $ | 25.72 | $ | 32.20 | $ | 29.24 | $ | 17.19 | $ | 43.45 | ||||||||||
|
|
|
|
|
|
|
|
|
| |||||||||||
Total Return | (15.02 | )% | 23.56 | % | 70.10 | % | (54.45 | )% | 42.36 | % | ||||||||||
RATIOS/SUPPLEMENTAL DATA | ||||||||||||||||||||
Net assets, end of period (in 000’s) | $ | 741,291 | $ | 834,311 | $ | 575,842 | $ | 263,406 | $ | 958,230 | ||||||||||
Ratio of expenses before reimbursements, waivers and fees paid indirectly to average net assets | 1.68 | % | 1.69 | % | 1.78 | % | 1.77 | % | 1.74 | % | ||||||||||
Ratio of net expenses to average net assets | 1.64 | %# | 1.63 | %# | 1.75 | %# | 1.75 | %# | 1.69 | %# | ||||||||||
Ratio of net investment income (loss) to average net assets | 0.49 | %# | (0.15 | )%# | (0.30 | )%# | (0.19 | )%# | (0.22 | )%# | ||||||||||
Portfolio turnover | 342 | % | 293 | % | 275 | % | 313 | % | 165 | % | ||||||||||
| ||||||||||||||||||||
| ^ | Net investment income (loss) per share has been calculated using the average shares method. |
| ~ | Amount represents less than $0.01 per share |
| # | Such ratios are net of fees paid indirectly (see Note B in the Notes to Financial Statements). |
Notes to Financial Statements are an integral part of this Schedule.
55
Driehaus Emerging Markets Small Cap Growth Fund
Financial Highlights
| For the period August 22, 2011 through December 31, 2011 | ||||
Net asset value, beginning of period | $ | 10.00 | ||
|
| |||
INCOME (LOSS) FROM INVESTMENT OPERATIONS: | ||||
Net investment income (loss) | (0.03 | ) | ||
Net realized and unrealized gain (loss) on investments | (1.16 | ) | ||
|
| |||
Total income (loss) from investment operations | (1.19 | ) | ||
|
| |||
LESS DISTRIBUTIONS: | ||||
Dividends from net investment income | — | |||
Distributions from capital gains | — | |||
|
| |||
Total distributions | — | |||
|
| |||
Redemption fees added to paid-in capital | — | |||
|
| |||
Net asset value, end of period | $ | 8.81 | ||
|
| |||
Total Return | (11.90 | ) %** | ||
RATIOS/SUPPLEMENTAL DATA | ||||
Net assets, end of period (in 000’s) | $ | 32,720 | ||
Ratio of expenses before reimbursements and waivers to average net assets | 2.74 | %* | ||
Ratio of net expenses to average net assets | 1.97 | %*+# | ||
Ratio of net investment loss to average net assets | (0.91 | )%*+# | ||
Portfolio turnover | 74 | %** | ||
| ||||
| * | Annualized |
| ** | Not Annualized |
| + | Such ratios are after administrative and transfer agent waivers and adviser expense reimbursements, when applicable. BNY Mellon Investment Servicing (US) Inc., the administrative agent and transfer agent, waived a portion of its fees beginning with the Fund’s commencement of operations, August 22, 2011. The Adviser agreed to waive its investment advisory fee or absorb other operating expenses to the extent necessary to ensure that total Fund operating expenses (other than interest, taxes, brokerage commissions, dividends and interest on short sales and other portfolio transaction expenses, capital expenditures, and extraordinary expenses) would not exceed the Fund’s operating expense cap of 2.00% of average daily net assets until August 21, 2014. |
| # | Such ratios are net of fees paid indirectly (see Note B in the Notes to Financial Statements). |
Notes to Financial Statements are an integral part of this Schedule.
56
Driehaus International Small Cap Growth Fund
Financial Highlights
| For the year ended December 31, 2011 | For the year ended December 31, 2010 | For the year ended December 31, 2009 | For the year ended December 31, 2008 | For the period September 17, 2007 through December 31, 2007 | ||||||||||||||||
Net asset value, beginning of period | $ | 9.66 | $ | 7.64 | $ | 4.93 | $ | 11.14 | $ | 10.00 | ||||||||||
|
|
|
|
|
|
|
|
|
| |||||||||||
INCOME (LOSS) FROM INVESTMENT OPERATIONS: | ||||||||||||||||||||
Net investment income (loss) | 0.07 | (0.06 | ) | (0.02 | ) | (0.01 | ) | (0.02 | ) | |||||||||||
Net realized and unrealized gain | ||||||||||||||||||||
(loss) on investments and foreign currency transactions | (1.17 | ) | 2.14 | 2.73 | (5.90 | ) | 1.84 | |||||||||||||
|
|
|
|
|
|
|
|
|
| |||||||||||
Total income (loss) from investment operations | (1.10 | ) | 2.08 | 2.71 | (5.91 | ) | 1.82 | |||||||||||||
|
|
|
|
|
|
|
|
|
| |||||||||||
LESS DISTRIBUTIONS: | ||||||||||||||||||||
Dividends from net investment income | (0.05 | ) | (0.06 | ) | — | (0.01 | ) | (0.10 | ) | |||||||||||
Distributions from capital gains | — | — | — | (0.29 | ) | (0.61 | ) | |||||||||||||
|
|
|
|
|
|
|
|
|
| |||||||||||
Total distributions | (0.05 | ) | (0.06 | ) | — | (0.30 | ) | (0.71 | ) | |||||||||||
|
|
|
|
|
|
|
|
|
| |||||||||||
Redemption fees added to paid-in capital | 0.00 | ~ | 0.00 | ~ | 0.00 | ~ | 0.00 | ~ | 0.03 | |||||||||||
|
|
|
|
|
|
|
|
|
| |||||||||||
Net asset value, end of period | $ | 8.51 | $ | 9.66 | $ | 7.64 | $ | 4.93 | $ | 11.14 | ||||||||||
|
|
|
|
|
|
|
|
|
| |||||||||||
Total Return | (11.39 | )% | 27.13 | % | 55.17 | % | (53.12 | )% | 18.88 | %** | ||||||||||
RATIOS/SUPPLEMENTAL DATA | ||||||||||||||||||||
Net assets, end of period (in 000’s) | $ | 232,729 | $ | 258,446 | $ | 201,020 | $ | 111,446 | $ | 143,364 | ||||||||||
Ratio of expenses before reimbursements, waivers and fees paid indirectly to average net assets | 1.73 | % | 1.75 | % | 1.87 | % | 1.88 | % | 1.94 | %* | ||||||||||
Ratio of net expenses to average net assets | 1.69 | %# | 1.72 | %+# | 1.85 | %+# | 1.83 | %+# | 1.90 | %*+# | ||||||||||
Ratio of net investment income (loss) to average net assets | 0.66 | %# | (0.76 | )%+# | (0.54 | ) %+# | (0.71 | )%+# | (0.83 | )%*+# | ||||||||||
Portfolio turnover | 311 | % | 298 | % | 265 | % | 271 | % | 100 | %** | ||||||||||
| ||||||||||||||||||||
| * | Annualized |
| ** | Not Annualized |
| ~ | Amount represents less than $0.01 per share |
| + | Such ratios are after administrative and transfer agent waivers and adviser expense reimbursements, when applicable. BNY Mellon Investment Servicing (US) Inc., the administrative agent and transfer agent, waived a portion of its fees beginning with the Fund’s commencement of operations, September 17, 2007. The Adviser agreed to waive its investment advisory fee or absorb other operating expenses to the extent necessary to ensure that total Fund operating expenses (other than interest, taxes, brokerage commissions and other portfolio transaction expenses, capital expenditures, and extraordinary expenses) would not exceed the Fund’s operating expense cap of 2.00% of average daily net assets until September 16, 2010. |
| # | Such ratios are net of fees paid indirectly (see Note B in the Notes to Financial Statements). |
Notes to Financial Statements are an integral part of this Schedule.
57
Driehaus Global Growth Fund
Financial Highlights
| For the year ended December 31, 2011 | For the year ended December 31, 2010 | For the year ended December 31, 2009 | For the period 2008 through | |||||||||||||
Net asset value, beginning of period | $ | 9.01 | $ | 7.59 | $ | 4.98 | $ | 10.00 | ||||||||
|
|
|
|
|
|
|
| |||||||||
INCOME (LOSS) FROM INVESTMENT OPERATIONS: | ||||||||||||||||
Net investment income (loss) | (0.10 | ) | (0.11 | ) | (0.05 | ) | (0.02 | ) | ||||||||
Net realized and unrealized gain (loss) on investments and foreign currency transactions | (1.53 | ) | 1.55 | 2.66 | (5.00 | ) | ||||||||||
|
|
|
|
|
|
|
| |||||||||
Total income (loss) from investment operations | (1.63 | ) | 1.44 | 2.61 | (5.02 | ) | ||||||||||
|
|
|
|
|
|
|
| |||||||||
LESS DISTRIBUTIONS: | ||||||||||||||||
Dividends from net investment income | — | (0.02 | ) | — | — | |||||||||||
Distributions from capital gains | (0.80 | ) | — | — | — | |||||||||||
|
|
|
|
|
|
|
| |||||||||
Total distributions | (0.80 | ) | (0.02 | ) | — | — | ||||||||||
|
|
|
|
|
|
|
| |||||||||
Redemption fees added to paid-in capital | 0.00 | ~ | — | 0.00 | ~ | 0.00 | ~ | |||||||||
|
|
|
|
|
|
|
| |||||||||
Net asset value, end of period | $ | 6.58 | $ | 9.01 | $ | 7.59 | $ | 4.98 | ||||||||
|
|
|
|
|
|
|
| |||||||||
Total Return | (18.15 | )% | 19.00 | % | 52.41 | % | (50.20 | )%** | ||||||||
RATIOS/SUPPLEMENTAL DATA | ||||||||||||||||
Net assets, end of period (in 000’s) | $ | 35,580 | $ | 52,719 | $ | 40,301 | $ | 14,557 | ||||||||
Ratio of expenses before reimbursements and/or recapture, waivers and fees paid indirectly to average net assets | 1.88 | %∞ | 1.81 | % | 2.34 | % | 3.94 | %* | ||||||||
Ratio of net expenses to average net assets | 1.97 | %+#∞ | 2.00 | %+# | 2.00 | %+# | 2.00 | %*+# | ||||||||
Ratio of net investment income (loss) to average net assets | (1.08 | )%+# | (1.37 | )%+# | (1.09 | )%+# | (0.86 | )%*+# | ||||||||
Portfolio turnover | 142 | % | 145 | % | 119 | % | 74 | %** | ||||||||
| ||||||||||||||||
| * | Annualized |
| ** | Not Annualized |
| ~ | Amount represents less than $0.01 per share |
| + | Such ratios are after administrative and transfer agent waivers and adviser expense reimbursements and/or recapture, when applicable. BNY Mellon Investment Servicing (US) Inc., the administrative agent and transfer agent, waived a portion of its fees beginning with the Fund’s commencement of operations, May 1, 2008. The Adviser agreed to waive its investment advisory fee or absorb other operating expenses to the extent necessary to ensure that total Fund operating expenses (other than interest, taxes, brokerage commissions and other portfolio transaction expenses, capital expenditures, and extraordinary expenses) would not exceed the Fund’s operating expense cap of 2.00% of average daily net assets until April 30, 2011. |
| ∞ | Ratio of expenses to average net assets include interest expense of less than 0.005% for the year ended December 31, 2011. The interest expense is from utilizing the line of credit (see Note F in the Notes to Financial Statements). |
| # | Such ratios are net of fees paid indirectly (see Note B in the Notes to Financial Statements). |
Notes to Financial Statements are an integral part of this Schedule.
58
Driehaus Mid Cap Growth Fund
Financial Highlights
| For the year ended December 31, 2011 | For the year ended December 31, 2010 | For the period April 27, 2009 through December 31, 2009 | ||||||||||
Net asset value, beginning of period | $ | 13.69 | $ | 11.63 | $ | 10.00 | ||||||
|
|
|
|
|
| |||||||
INCOME (LOSS) FROM INVESTMENT OPERATIONS: | ||||||||||||
Net investment income (loss) | (0.16 | ) | (0.14 | ) | (0.08 | ) | ||||||
Net realized and unrealized gain (loss) on investments | (0.14 | ) | 3.25 | 2.85 | ||||||||
|
|
|
|
|
| |||||||
Total income (loss) from investment operations | (0.30 | ) | 3.11 | 2.77 | ||||||||
|
|
|
|
|
| |||||||
LESS DISTRIBUTIONS: | ||||||||||||
Dividends from net investment income | — | — | — | |||||||||
Distributions from capital gains | (0.86 | ) | (1.05 | ) | (1.14 | ) | ||||||
|
|
|
|
|
| |||||||
Total distributions | (0.86 | ) | (1.05 | ) | (1.14 | ) | ||||||
|
|
|
|
|
| |||||||
Redemption fees added to paid-in capital | 0.00 | ~ | 0.00 | ~ | 0.00 | ~ | ||||||
|
|
|
|
|
| |||||||
Net asset value, end of period | $ | 12.53 | $ | 13.69 | $ | 11.63 | ||||||
|
|
|
|
|
| |||||||
Total Return | (2.15 | )% | 26.59 | % | 27.66 | %** | ||||||
RATIOS/SUPPLEMENTAL DATA | ||||||||||||
Net assets, end of period (in 000’s) | $ | 21,895 | $ | 21,573 | $ | 14,821 | ||||||
Ratio of expenses before reimbursements and waivers to average net assets | 1.95 | % | 2.47 | % | 2.82 | %* | ||||||
Ratio of net expenses to average net assets | 1.75 | %+ | 1.75 | %+ | 1.75 | %*+ | ||||||
Ratio of net investment income (loss) to average net assets | (1.13 | )%+ | (1.39 | )%+ | (1.15 | )%*+ | ||||||
Portfolio turnover | 193 | % | 182 | % | 208 | %** | ||||||
| ||||||||||||
| * | Annualized |
| ** | Not Annualized |
| ~ | Amount represents less than $0.01 per share |
| + | Such ratios are after administrative and transfer agent waivers and adviser expense reimbursements, when applicable. BNY Mellon Investment Servicing (US) Inc., the administrative agent and transfer agent, waived a portion of its fees beginning with the Fund’s commencement of operations, April 27, 2009. The Adviser agreed to waive its investment advisory fee or absorb other operating expenses to the extent necessary to ensure that total Fund operating expenses (other than interest, taxes, brokerage commissions and other portfolio transaction expenses, capital expenditures, and extraordinary expenses) would not exceed the Fund’s operating expense cap of 1.75% of average daily net assets until April 30, 2015. |
Notes to Financial Statements are an integral part of this Schedule.
59
Driehaus Large Cap Growth Fund
Financial Highlights
| For the year ended December 31, 2011 | For the year ended December 31, 2010 | For the period April 27, 2009 through December 31, 2009 | ||||||||||
Net asset value, beginning of period | $ | 13.79 | $ | 11.94 | $ | 10.00 | ||||||
|
|
|
|
|
| |||||||
INCOME (LOSS) FROM INVESTMENT OPERATIONS: | ||||||||||||
Net investment income (loss) | (0.11 | ) | (0.12 | ) | (0.05 | ) | ||||||
Net realized and unrealized gain (loss) on investments | (0.03 | ) | 2.67 | 2.36 | ||||||||
|
|
|
|
|
| |||||||
Total income (loss) from investment operations | (0.14 | ) | 2.55 | 2.31 | ||||||||
|
|
|
|
|
| |||||||
LESS DISTRIBUTIONS: | ||||||||||||
Dividends from net investment income | — | — | — | |||||||||
Distributions from capital gains | (1.13 | ) | (0.70 | ) | (0.37 | ) | ||||||
|
|
|
|
|
| |||||||
Total distributions | (1.13 | ) | (0.70 | ) | (0.37 | ) | ||||||
|
|
|
|
|
| |||||||
Redemption fees added to paid-in capital | 0.00 | ~ | 0.00 | ~ | 0.00 | ~ | ||||||
|
|
|
|
|
| |||||||
Net asset value, end of period | $ | 12.52 | $ | 13.79 | $ | 11.94 | ||||||
|
|
|
|
|
| |||||||
Total Return | (0.97 | )% | 21.36 | % | 23.14 | %** | ||||||
RATIOS/SUPPLEMENTAL DATA | ||||||||||||
Net assets, end of period (in 000’s) | $ | 19,335 | $ | 21,169 | $ | 13,875 | ||||||
Ratio of expenses before reimbursements and waivers to average net assets | 1.96 | % | 2.28 | % | 2.72 | %* | ||||||
Ratio of net expenses to average net assets | 1.75 | %+ | 1.75 | %+ | 1.75 | %*+ | ||||||
Ratio of net investment loss to average net assets | (0.76 | )%+ | (1.12 | )%+ | (0.67 | )%*+ | ||||||
Portfolio turnover | 156 | % | 140 | % | 142 | %** | ||||||
| ||||||||||||
| * | Annualized |
| ** | Not Annualized |
| ~ | Amount represents less than $0.01 per share |
| + | Such ratios are after administrative and transfer agent waivers and adviser expense reimbursements, when applicable. BNY Mellon Investment Servicing (US) Inc., the administrative agent and transfer agent, waived a portion of its fees beginning with the Fund’s commencement of operations, April 27, 2009. The Adviser agreed to waive its investment advisory fee or absorb other operating expenses to the extent necessary to ensure that total Fund operating expenses (other than interest, taxes, brokerage commissions and other portfolio transaction expenses, capital expenditures, and extraordinary expenses) would not exceed the Fund’s operating expense cap of 1.75% of average daily net assets until April 30, 2015. |
Notes to Financial Statements are an integral part of this Schedule.
60
Notes to Financial Statements
A. SUMMARY OF SIGNIFICANT ACCOUNTING POLICIES
Organization
The Driehaus Mutual Funds (the “Trust”) is a registered management investment company, organized as a Delaware statutory trust, with nine separate series currently in operation. The Trust was organized under an Agreement and Declaration of Trust dated May 31, 1996 and may issue an unlimited number of full and fractional units of beneficial interest (shares) without par value. The seven series (“Funds” or each a “Fund”) included in this report are as follows:
| Fund | Commencement of Operations | |||
Driehaus International Discovery Fund | 12/31/98 | |||
Driehaus Emerging Markets Growth Fund | 12/31/97 | |||
Driehaus Emerging Markets Small Cap Growth Fund | 08/22/11 | |||
Driehaus International Small Cap Growth Fund* | 09/17/07 | |||
Driehaus Global Growth Fund | 05/01/08 | |||
Driehaus Mid Cap Growth Fund | 04/27/09 | |||
Driehaus Large Cap Growth | 04/27/09 | |||
|
|
| ||
| * | On December 29, 2010, the Driehaus International Small Cap Growth Fund was closed to new investors. |
The investment objective of each Fund is to maximize capital appreciation.
Driehaus International Discovery Fund seeks to achieve its objective by generally investing in equity securities of non-U.S. companies exhibiting strong growth characteristics.
Driehaus Emerging Markets Growth Fund seeks to achieve its objective by investing primarily in equity securities of emerging markets companies.
Driehaus Emerging Markets Small Cap Growth Fund seeks to achieve its objective by investing primarily in equity securities of small capitalization emerging markets companies.
Driehaus International Small Cap Growth Fund seeks to achieve its objective by investing primarily in equity securities of smaller capitalization non-U.S. companies exhibiting strong growth characteristics.
Driehaus Global Growth Fund seeks to achieve its objective by investing primarily in equity securities of both U.S. and non-U.S. companies exhibiting strong growth characteristics.
Driehaus Mid Cap Growth Fund seeks to achieve its objective by investing primarily in equity securities of mid capitalization U.S. companies exhibiting strong growth characteristics.
Driehaus Large Cap Growth Fund seeks to achieve its objective by investing primarily in equity securities of large capitalization U.S. companies exhibiting strong growth characteristics.
Fiscal Year End
The fiscal year end for the Funds is December 31.
Securities Valuation and Transactions
Equity securities are valued at the last sale price as of the close of the primary exchange or other designated time. In addition, if quotations are not readily available, if the values have been materially affected by events occurring after the closing of a foreign market, or if there has been a movement in the United States market that exceeds a certain threshold, assets may be valued at fair value as determined in good faith by or under the direction of the Trust’s Board of Trustees. Events that may materially affect asset values that could cause a fair value determination include, but are not limited to: corporate announcements relating to a specific security; natural and other disasters which may impact an entire market or region; and political and other events which may be global or impact a particular country or region. The frequency with which these
61
Driehaus Mutual Funds
Notes to Financial Statements — (Continued)
procedures are used cannot be predicted and they may be utilized to a significant extent. To the extent utilized, securities would be considered level 2 in the hierarchy described below. Substantially all transfers between level 1 and level 2 relate to the use of these procedures.
Each Fund is subject to fair value accounting standards that define fair value, establish the framework for measuring fair value and provide a three-level hierarchy for fair valuation based upon the inputs to the valuation as of the measurement date. The three levels of the fair value hierarchy are as follows:
Level 1 — quoted prices in active markets for identical securities
Level 2 — significant observable inputs (including quoted prices for similar securities, interest rates, prepayment speeds, credit risk, etc.)
Level 3 — significant unobservable inputs (including the Fund’s own assumptions in determining the fair value of investments)
The inputs or methodology used for valuing securities are not necessarily an indication of the risk associated with investing in those securities.
The summary of inputs used to value each Fund’s net assets as of December 31, 2011 is as follows:
Fund | Total Value at December 31, 2011 | Level 1 Quoted Price | Level 2 Significant Observable Inputs | Level 3 Significant Unobservable Inputs | ||||||||||||
Driehaus International Discovery Fund | ||||||||||||||||
Equity Securities: | ||||||||||||||||
Africa | $ | 2,384,644 | $ | 2,384,644 | $ | — | $ | — | ||||||||
Europe | 102,728,309 | 102,728,309 | — | — | ||||||||||||
Far East | 68,430,480 | 62,139,388 | 6,291,092 | — | ||||||||||||
Middle East | 2,430,185 | 2,430,185 | — | — | ||||||||||||
North America | 15,496,287 | 13,674,902 | 1,821,385 | — | ||||||||||||
South America | 13,244,160 | 13,244,160 | — | — | ||||||||||||
|
|
|
|
|
|
|
| |||||||||
Total Investments | $ | 204,714,065 | $ | 196,601,588 | $ | 8,112,477 | $ | — | ||||||||
|
|
|
|
|
|
|
| |||||||||
Driehaus Emerging Markets Growth Fund | ||||||||||||||||
Equity Securities: | ||||||||||||||||
Africa | $ | 45,981,657 | $ | 45,981,657 | $ | — | $ | — | ||||||||
Europe | 45,604,570 | 38,111,567 | 7,493,003 | — | ||||||||||||
Far East | 374,875,175 | 280,327,231 | 94,547,944 | — | ||||||||||||
Middle East | 1,350,276 | 1,350,276 | — | — | ||||||||||||
North America | 48,402,846 | 48,402,846 | — | — | ||||||||||||
South America | 155,182,356 | 155,182,356 | — | — | ||||||||||||
Exchange-Traded Funds | 10,418,914 | 10,418,914 | — | — | ||||||||||||
|
|
|
|
|
|
|
| |||||||||
Total Investments | $ | 681,815,794 | $ | 579,774,847 | $ | 102,040,947 | $ | — | ||||||||
|
|
|
|
|
|
|
| |||||||||
Driehaus Emerging Markets Small Cap Growth Fund | ||||||||||||||||
Assets: | ||||||||||||||||
Equity Securities: | ||||||||||||||||
Africa | $ | 1,960,806 | $ | 1,960,806 | $ | — | $ | — | ||||||||
Europe | 349,673 | 349,673 | — | — | ||||||||||||
62
Driehaus Mutual Funds
Notes to Financial Statements — (Continued)
Fund | Total Value at December 31, 2011 | Level 1 Quoted Price | Level 2 Significant Observable Inputs | Level 3 Significant Unobservable Inputs | ||||||||||||
Far East | 16,801,917 | 11,749,193 | 5,052,724 | — | ||||||||||||
Middle East | 422,170 | 422,170 | — | — | ||||||||||||
North America | 712,093 | 712,093 | — | — | ||||||||||||
South America | 4,958,796 | 4,958,796 | — | — | ||||||||||||
Equity Certificates | 1,525,044 | 1,525,044 | — | — | ||||||||||||
Purchased Call Options by Risk Category | ||||||||||||||||
Equity Contracts | 158,627 | 158,627 | — | — | ||||||||||||
Purchased Put Options by Risk Category | ||||||||||||||||
Equity Contracts | 294,500 | 294,500 | — | — | ||||||||||||
|
|
|
|
|
|
|
| |||||||||
Total Investments | $ | 27,183,626 | $ | 22,130,902 | $ | 5,052,724 | $ | — | ||||||||
|
|
|
|
|
|
|
| |||||||||
Liabilities: | ||||||||||||||||
Written Call Options by Risk Category | ||||||||||||||||
Equity Contracts | $ | (73,315 | ) | $ | (73,315 | ) | $ | — | $ | — | ||||||
Written Put Options by Risk Category | ||||||||||||||||
Equity Contracts | (34,750 | ) | (34,750 | ) | — | — | ||||||||||
|
|
|
|
|
|
|
| |||||||||
Total Liabilities | $ | (108,065 | ) | $ | (108,065 | ) | $ | — | $ | — | ||||||
|
|
|
|
|
|
|
| |||||||||
Driehaus International Small Cap Growth Fund | ||||||||||||||||
Equity Securities: | ||||||||||||||||
Africa | $ | 5,305,275 | $ | 5,305,275 | $ | — | $ | — | ||||||||
Central America | 1,843,118 | 1,843,118 | — | — | ||||||||||||
Europe | 84,374,340 | 84,374,340 | — | — | ||||||||||||
Far East | 88,073,317 | 71,169,135 | 16,904,182 | — | ||||||||||||
North America | 32,248,922 | 32,248,922 | — | — | ||||||||||||
South America | 6,775,927 | 6,775,927 | — | — | ||||||||||||
|
|
|
|
|
|
|
| |||||||||
Total Investments | $ | 218,620,899 | $ | 201,716,717 | $ | 16,904,182 | $ | — | ||||||||
|
|
|
|
|
|
|
| |||||||||
Driehaus Global Growth Fund | ||||||||||||||||
Investments in Securities* | $ | 34,373,520 | $ | 34,373,520 | $ | — | $ | — | ||||||||
|
|
|
|
|
|
|
| |||||||||
Driehaus Mid Cap Growth Fund | ||||||||||||||||
Investments in Securities* | $ | 20,461,947 | $ | 20,461,947 | $ | — | $ | — | ||||||||
|
|
|
|
|
|
|
| |||||||||
Driehaus Large Cap Growth Fund | ||||||||||||||||
Investments in Securities* | $ | 18,832,658 | $ | 18,832,658 | $ | — | $ | — | ||||||||
|
|
|
|
|
|
|
| |||||||||
| * | See Schedule of Investments for industry and/or country breakout. |
Transfers between levels, if any, are recognized as of the last day in the fiscal quarter of the period in which the event or change in circumstances that caused the reclassification occurred. The Funds used observable inputs in their valuation methodologies whenever they were available and deemed reliable.
63
Driehaus Mutual Funds
Notes to Financial Statements — (Continued)
When fair value pricing is employed, the prices of securities used by a Fund to calculate its net asset value may differ from closing prices for the same securities, which means that a Fund may value those securities higher or lower than another fund that does not employ fair value. In addition, the fair value price may differ materially from the value a Fund may ultimately realize.
Securities transactions are accounted for on trade date. The cost of investments sold is determined by the use of specific identification method for both financial reporting and income tax purposes. Interest income is recorded on an accrual basis. Dividend income, net of non-reclaimable foreign taxes withheld, is recorded on the ex-dividend date or as soon as the information is available. Income and expenses are accrued daily.
Options Contracts
The Funds are subject to equity and other risk exposures in the normal course of pursuing their investment objective. The Funds may use options contracts to hedge their portfolio or a portion thereof or speculatively for the purpose of profiting from a decline in the market value of a security.
The Funds may write covered call and put options on futures, securities or currencies the Funds own or in which they may invest. Writing put options tends to increase a Fund’s exposure to the underlying instrument. Writing call options tends to decrease a Fund’s exposure to the underlying instrument. When a Fund writes a call or put option, an amount equal to the premium received is recorded as a liability and subsequently marked to market to reflect the current value of the option written. These liabilities are reflected as written options outstanding in the Schedule of Investments. Payments received or made, if any, from writing options with premiums to be determined on a future date are reflected as such in the Schedule of Investments. Premiums received from writing options which expire are treated as realized gains. Premiums received from writing options which are exercised or closed are added to the proceeds or offset against amounts paid on the underlying future, security or currency transaction to determine the realized gain or loss. A Fund, as a writer of an option, has no control over whether the underlying future, security or currency may be sold (call) or purchased (put) and, as a result, bears the market risk of an unfavorable change in the price of the future, security or currency underlying the written option. The risk exists that a Fund may not be able to enter into a closing transaction because of an illiquid market.
For the period August 22, 2011 through December 31, 2011, the average volume of purchased and written options for Driehaus Emerging Markets Small Cap Growth Fund is $609,638 and $216,065, respectively.
The premium amount and the number of option contracts written during the period ended December 31, 2011, were as follows:
Driehaus Emerging Markets Small Cap Growth Fund | Number of Contracts | Premium Amount | ||||||
Options outstanding at August 22, 2011* | — | $ | — | |||||
Options written | 31,708 | 1,691,008 | ||||||
Options closed | (15,125 | ) | (1,004,074 | ) | ||||
Options expired | (12,000 | ) | (481,945 | ) | ||||
|
|
|
| |||||
Options outstanding as of December 31, 2011 | 4,583 | $ | 204,989 | |||||
|
|
|
| |||||
| * | Commencement of operations. |
The Funds may also purchase put and call options. Purchasing call options tends to increase a Fund’s exposure to the underlying instrument. Purchasing put options tends to decrease a Fund’s exposure to the underlying instrument. A Fund pays a premium which is included in its Schedule of Investments as an investment and subsequently marked-to-market to reflect the current value of the option. Premiums paid for purchasing options which expire are treated as realized losses. The risk associated with purchasing put and call options is limited to the premium paid. Premiums paid for purchasing options which are exercised or closed are added to the amounts paid or offset against the proceeds on the underlying future, security or currency transaction to determine the realized gain or loss. When entering into purchased option contracts, a Fund bears the risk of securities prices moving unexpectedly, in which case, a Fund may not achieve the anticipated benefits of the purchased option contracts; however, the risk of loss is limited to the premium paid. As of December 31, 2011, the Funds had outstanding options as listed on the Schedule of Investments.
64
Driehaus Mutual Funds
Notes to Financial Statements — (Continued)
Federal Income Taxes
No provision is made for Federal income taxes since each Fund has elected or will elect to be taxed as a “regulated investment company” under Subchapter M of the Internal Revenue Code (the “Code”) and has made and declared all the required distributions to its shareholders in amounts sufficient to relieve each Fund from all or substantially all Federal income and excise taxes under provisions of current Federal tax law.
Each Fund is subject to accounting standards that establish a minimum threshold for recognizing, and a system for measuring, the benefits of a tax position taken or expected to be taken in a tax return. Taxable years ending 2011, 2010, 2009 and 2008 remain open to Federal and state audit. As of December 31, 2011, management has evaluated the application of these standards to each Fund, and has determined that no provision for income tax is required in each Fund’s financial statements for uncertain tax provisions. The Funds recognize interest and penalties, if any, related to unrecognized tax benefits as income tax expense in the Statements of Operations. During the year, the Funds did not incur any interest or penalties. The Funds may be subject to foreign taxes on income, gains on investments or currency repatriation, a portion of which may be recoverable. Foreign taxes are provided for based on the Funds’ understanding of the tax rules and regulations that exist in the foreign markets in which they invest.
The amount of dividends and distributions from net investment income and net realized capital gains are determined in accordance with Federal income tax regulations, which may differ from U.S. generally accepted accounting principles.
For the year ended December 31, 2011, reclassifications were recorded to undistributed net investment income, undistributed net realized gain and paid-in capital for any permanent tax differences. These reclassifications relate primarily to foreign currency gains and losses, sales of passive foreign investment companies and net operating losses. Results of operations and net assets were not affected by these reclassifications.
| Driehaus International Discovery Fund | Driehaus Emerging Markets Growth Fund | Driehaus Emerging Markets Small Cap Growth Fund | Driehaus International Small Cap Growth Fund | Driehaus Global Growth Fund | Driehaus Mid Cap Growth Fund | Driehaus Large Cap Growth Fund | ||||||||||||||||||||||
Undistributed net investment income | $ | 2,501,416 | $ | 162,431 | $ | 35,158 | $ | 1,034,404 | $ | 831,133 | $ | 283,279 | $ | 165,417 | ||||||||||||||
Undistributed net realized gain | (2,083,581 | ) | (162,431 | ) | (55,938 | ) | (1,034,404 | ) | (206,355 | ) | — | — | ||||||||||||||||
Paid-in capital | (417,835 | ) | — | 20,780 | — | (624,778 | ) | (283,279 | ) | (165,417 | ) | |||||||||||||||||
For Federal income tax purposes, capital loss carryforwards represent net capital losses of a fund that may be carried forward for a maximum period of eight years and applied against future net realized gains. On December 22, 2010, the Regulated Investment Company Modernization Act of 2010 was enacted to modernize several of the Federal income and excise tax provisions related to regulated investment companies. Under pre-enactment law, capital losses could be carried forward for eight years, and carried forward as short-term capital losses, irrespective of the character of the original loss. New net capital losses (those earned in taxable years beginning after December 22, 2010) may be carried forward indefinitely and must retain the character of the original loss. Such new net capital losses generally must be used by a regulated investment company before it uses any net capital losses incurred in taxable years beginning on or before December 22, 2010. This increases the likelihood that net capital losses incurred in taxable years beginning on or before December 22, 2010 will expire unused.
During the year ended December 31, 2011, Driehaus International Discovery Fund utilized $18,755,180 of capital loss carryforwards and as of December 31, 2011, had capital loss carryforwards of $4,895,971 expiring in 2015, $150,784,019 expiring in 2016 and $109,113,076 expiring in 2017. During the year ended December 31, 2011, Driehaus Emerging Markets Growth Fund did not utilize any capital loss carryforwards and as of December 31, 2011, had capital loss carryforwards of $30,833,247 with no expiration date. During the period ended December 31, 2011, Driehaus Emerging Markets Small Cap Growth Fund did not utilize any capital loss carryforwards and as of December 31, 2011, had capital loss carryforwards of
65
Driehaus Mutual Funds
Notes to Financial Statements — (Continued)
$1,341,385 with no expiration date. During the year ended December 31, 2011, Driehaus International Small Cap Growth Fund utilized $12,998,689 of capital loss carryforwards and as of December 31, 2011, had capital loss carryforwards of $3,818,027 expiring in 2017. During the year ended December 31, 2011, Driehaus Global Growth Fund, Driehaus Mid Cap Growth Fund and Driehaus Large Cap Growth Fund did not utilize any capital loss carryforwards and as of December 31, 2011, had no capital loss carryforwards. To the extent that the Funds realize future net capital gains, those capital gains will be offset by any unused capital loss carryforwards subject to the limitations described above and below. For the year or period ended December 31, 2011, Driehaus International Discovery Fund, Driehaus Emerging Markets Growth Fund, Driehaus Emerging Markets Small Cap Growth Fund, Driehaus International Small Cap Growth Fund and Driehaus Global Growth Fund had late-year ordinary loss deferrals of $532,171, $2,925,109, $9,595, $177,777 and $45,026, respectively, which were deferred for tax purposes and were recognized on January 1, 2012. For the year or period ended December 31, 2011, Driehaus International Discovery Fund, Driehaus Emerging Markets Growth Fund, Driehaus Emerging Markets Small Cap Growth Fund, Driehaus International Small Cap Growth Fund, Driehaus Global Growth Fund, Driehaus Mid Cap Growth Fund and Driehaus Large Cap Growth Fund had late-year capital loss deferrals of $4,139,514, $30,325,458, $1,897,337, $9,894,543, $575,600, $260,058 and $105,420, respectively, which were deferred for tax purposes and were recognized on January 1, 2012.
Included in the capital loss carryforward amounts stated above are capital losses that Driehaus International Discovery Fund inherited from its merger with Driehaus International Equity Yield Fund on September 19, 2008 of approximately $4,895,971, which may be applied against any realized net taxable capital gains in future years. Section 382 of the Code imposes certain limitations that will likely reduce the Fund’s ability to use these capital loss carryforwards.
Distributions to Shareholders
The tax character of distributions paid during the fiscal year ended December 31, 2011 was as follows:
Distributions paid | Driehaus International Discovery Fund | Driehaus Emerging Markets Growth Fund | Driehaus Emerging Markets Small Cap Growth Fund | Driehaus International Small Cap Growth Fund | Driehaus Global Growth Fund | Driehaus Mid Cap Growth Fund | Driehaus Large Cap Growth Fund | |||||||||||||||||||||
Ordinary income | $ | — | $ | 44,003,425 | $ | — | $ | 1,347,630 | $ | — | $ | 254,377 | $ | 414,273 | ||||||||||||||
Net long-term capital gain | — | 1,860,551 | — | — | 3,868,133 | 1,156,723 | 1,186,215 | |||||||||||||||||||||
|
|
|
|
|
|
|
|
|
|
|
|
|
| |||||||||||||||
Total distributions paid | $ | — | $ | 45,863,976 | $ | — | $ | 1,347,630 | $ | 3,868,133 | $ | 1,411,100 | $ | 1,600,488 | ||||||||||||||
|
|
|
|
|
|
|
|
|
|
|
|
|
| |||||||||||||||
The tax character of distributions paid during the fiscal year ended December 31, 2010 was as follows:
Distributions paid from: | Driehaus International Discovery Fund | Driehaus Emerging Markets Growth Fund | Driehaus International Small Cap Growth Fund | Driehaus Global Growth Fund | Driehaus Mid Cap Growth Fund | Driehaus Large Cap Growth Fund | ||||||||||||||||||
Ordinary income | $ | 6,325,312 | $ | 62,595,686 | $ | 1,697,404 | $ | 130,742 | $ | 440,656 | $ | 1,652 | ||||||||||||
Net long-term capital gain | — | 25,891,729 | — | 33 | 786,687 | 967,589 | ||||||||||||||||||
|
|
|
|
|
|
|
|
|
|
|
| |||||||||||||
Total distributions paid | $ | 6,325,312 | $ | 88,487,415 | $ | 1,697,404 | $ | 130,775 | $ | 1,227,343 | $ | 969,241 | ||||||||||||
|
|
|
|
|
|
|
|
|
|
|
| |||||||||||||
66
Driehaus Mutual Funds
Notes to Financial Statements — (Continued)
As of December 31, 2011, the components of net assets on a tax basis were as follows:
| Driehaus International Discovery Fund | Driehaus Emerging Markets Growth Fund | Driehaus Emerging Markets Small Cap Growth Fund | Driehaus International Small Cap Growth Fund | Driehaus Global Growth Fund | Driehaus Mid Cap Growth Fund | Driehaus Large Cap Growth Fund | ||||||||||||||||||||||
Undistributed ordinary income | $ | — | $ | 3,661,395 | $ | — | $ | 1,069,438 | $ | — | $ | — | $ | — | ||||||||||||||
Undistributed long-term capital gain | — | — | — | — | 406,151 | 702,428 | 407,300 | |||||||||||||||||||||
|
|
|
|
|
|
|
|
|
|
|
|
|
| |||||||||||||||
Accumulated earnings | $ | — | $ | 3,661,395 | $ | — | $ | 1,069,438 | $ | 406,151 | $ | 702,428 | $ | 407,300 | ||||||||||||||
Paid-in capital | 476,029,911 | 793,336,706 | 36,917,697 | 242,341,550 | 34,598,383 | 18,581,287 | 16,008,734 | |||||||||||||||||||||
Accumulated capital and other losses | (269,464,752 | ) | (64,083,815 | ) | (3,248,317 | ) | (13,890,345 | ) | (620,626 | ) | (260,057 | ) | (105,421 | ) | ||||||||||||||
Unrealized appreciation (depreciation) on foreign currency | 48,958 | 188,152 | 97,271 | (21,287 | ) | 5,795 | — | — | ||||||||||||||||||||
Unrealized appreciation on investments | 5,312,591 | 8,188,651 | (1,046,881 | ) | 3,229,739 | 1,189,966 | 2,870,948 | 3,024,507 | ||||||||||||||||||||
|
|
|
|
|
|
|
|
|
|
|
|
|
| |||||||||||||||
Net assets | $ | 211,926,708 | $ | 741,291,089 | $ | 32,719,770 | $ | 232,729,095 | $ | 35,579,669 | $ | 21,894,606 | $ | 19,335,120 | ||||||||||||||
|
|
|
|
|
|
|
|
|
|
|
|
|
| |||||||||||||||
The differences between book-basis and tax-basis unrealized appreciation (depreciation) are attributable primarily to the tax deferral of losses on wash sales and passive foreign investment company (PFIC) mark-to-market.
Foreign Currency Translation
Foreign currency and equity securities not denominated in U.S. dollars are translated into U.S. dollar values based upon the current rates of exchange on the date of the Funds’ valuations.
Net realized foreign exchange gains or losses which are reported by the Funds result from currency gains and losses on transaction hedges arising from changes in exchange rates between the trade and settlement dates on spot contracts underlying securities transactions, the difference between the amounts accrued for dividends, interest, and foreign taxes and the amounts actually received or paid in U.S. dollars for these items, and taxes imposed each time a Fund purchases Brazilian currency. Net unrealized foreign exchange gains and losses result from changes in the U.S. dollar value of assets and liabilities (other than investments in securities), which are denominated in foreign currencies, as a result of changes in exchange rates.
Net realized foreign exchange gains or losses on portfolio hedges result from the use of spot contracts to hedge portfolio positions denominated or quoted in a particular currency in order to reduce or limit exposure in that currency. The Funds had no portfolio hedges during the year ended December 31, 2011.
67
Driehaus Mutual Funds
Notes to Financial Statements — (Continued)
The Funds do not isolate that portion of the results of operations which results from fluctuations in foreign exchange rates on investments. These fluctuations are included with the net realized gain (loss) from security transactions and the net change in unrealized appreciation (depreciation) of investments.
Use of Estimates
The preparation of financial statements, in conformity with U.S. generally accepted accounting principles, requires management to make estimates and assumptions that affect the reported amount of assets and liabilities and disclosure of contingent assets and liabilities at the date of the financial statements and the reported amounts of net increases or decreases in net assets from operations during the reporting period. Actual results could differ from those estimates.
Indemnifications
Under the Trust’s organizational documents, the officers and Trustees are indemnified against certain liabilities arising out of the performance of their duties to the Trust. In addition, in the normal course of business, the Trust enters into contracts that provide general indemnifications to other parties. The Funds’ maximum exposure under these agreements is unknown as this would involve future claims that may be made against the Funds that have not yet occurred. However, the Funds have not had prior claims or losses pursuant to these contracts and expect the risk of loss to be remote.
New Accounting Pronouncements
In May 2011, the Financial Accounting Standards Board (“FASB”) issued Accounting Standards Update (“ASU”) No. 2011-04 “Amendments to Achieve Common Fair Value Measurement and Disclosure Requirements in U.S. Generally Accepted Accounting Principles (“U.S. GAAP”) and International Financial Reporting Standards (“IFRS”).” ASU No. 2011-04 includes common requirements for measurement of and disclosure about fair value between U.S. GAAP and IFRS. ASU No. 2011-04 will require reporting entities to disclose the following information for fair value measurements categorized within Level 3 of the fair value hierarchy: quantitative information about the unobservable inputs used in the fair value measurement, the valuation processes used by the reporting entity and a narrative description of the sensitivity of the fair value measurement to changes in unobservable inputs and the interrelationships between those unobservable inputs. In addition, ASU No. 2011-04 will require reporting entities to make disclosures about amounts and reasons for all transfers in and out of Level 1 and Level 2 fair value measurements. The new and revised disclosures are effective for interim and annual reporting periods beginning after December 15, 2011. Management is currently evaluating the implications of ASU No. 2011-04 and its impact on the financial statements.
In December 2011, FASB issued ASU No. 2011-11, “Disclosures about Offsetting Assets and Liabilities.” ASU No. 2011-11 requires disclosures to make financial statements that are prepared under U.S. GAAP more comparable to those prepared under IFRS. The new disclosure requirements mandate that entities disclose both gross and net information about instruments and transactions eligible for offset in the statement of assets and liabilities as well as instruments and transactions subject to an agreement similar to a master netting arrangement. In addition, ASU No. 2011-11 requires disclosure of collateral received and posted in connection with master netting agreements or similar arrangements. New disclosures are required for annual reporting periods beginning on or after January 1, 2013, and interim periods within those annual periods. Management is evaluating the impact of ASU No. 2011-11 on the financial statements and disclosures.
B. INVESTMENT ADVISORY FEES, TRANSACTIONS WITH AFFILIATES, AND ADMINISTRATIVE FEES
Richard H. Driehaus, an Interested Trustee of the Trust, is also the Chairman of the Board of Driehaus Capital Management LLC (“DCM” or the “Adviser”), a registered investment adviser, and of Driehaus Securities LLC (“DS LLC” or the “Distributor”), a registered broker-dealer.
DCM serves as the Funds’ investment adviser. In return for its services to the Funds, DCM receives monthly fees. Driehaus International Discovery Fund pays the Adviser an annual management fee on a monthly basis computed and accrued daily as follows: 1.50% on the first $500 million of average daily net
68
Driehaus Mutual Funds
Notes to Financial Statements — (Continued)
assets, 1.35% on the next $500 million and 1.25% of average daily net assets in excess of $1 billion. Driehaus Emerging Markets Growth Fund, Driehaus Emerging Markets Small Cap Growth Fund and Driehaus International Small Cap Growth Fund each pay the Adviser a monthly fee computed and accrued daily at an annual rate of 1.50% of each Fund’s average daily net assets. Driehaus Global Growth Fund pays the Adviser a monthly fee computed and accrued daily at an annual rate of 1.25% of the Fund’s average daily net assets. Driehaus Mid Cap Growth Fund pays the Adviser a monthly fee computed and accrued daily at an annual rate of 1.00% of the Fund’s average daily net assets. Driehaus Large Cap Growth Fund pays the Adviser a monthly fee computed and accrued daily at an annual rate of 0.90% of the Fund’s average daily net assets.
DCM entered into an agreement to cap Driehaus Emerging Markets Growth Fund’s annual operating expenses (other than interest, taxes, brokerage commissions and other portfolio transaction expenses, capital expenditures and extraordinary expenses) at 2.00% of average daily net assets until November 30, 2011. For a period of three years subsequent to December 1, 2008, DCM is entitled to reimbursement for previously waived fees and reimbursed expenses to the extent that the Fund’s expense ratio remains below the operating expense cap. For the year ended December 31, 2011, DCM did not waive any of its fees payable by the Fund. There are no previously waived fees or reimbursed expenses currently subject to recapture.
DCM entered into an agreement to cap Driehaus Emerging Markets Small Cap Growth Fund’s annual operating expenses (other than interest, taxes, brokerage commissions and other portfolio transaction expenses, capital expenditures and extraordinary expenses) at 2.00% of average daily net assets until August 21, 2014. For a period of three years subsequent to the Fund’s commencement of operations, DCM is entitled to reimbursement for previously waived fees and reimbursed expenses to the extent that the Fund’s expense ratio remains below the operating expense cap. For the period ended December 31, 2011, DCM waived fees for Driehaus Emerging Markets Small Cap Growth Fund totaling $57,581 under this agreement, all of which is subject to recapture at December 31, 2011.
DCM entered into an agreement to cap Driehaus Global Growth Fund’s annual operating expenses (other than interest, taxes, brokerage commissions and other portfolio transaction expenses, capital expenditures and extraordinary expenses) at 2.00% of average daily net assets until April 30, 2011. For a period of three years subsequent to the Fund’s commencement of operations, DCM is entitled to reimbursement for previously waived fees and reimbursed expenses to the extent that the Fund’s expense ratio remains below the operating expense cap. For the year ended December 31, 2011, DCM did not waive any of its fees payable by the Fund. For the year ended December 31, 2011, DCM recaptured $43,191 of the Fund’s fees waived in prior years.
DCM has entered into agreements to cap Driehaus Mid Cap Growth Fund’s and Driehaus Large Cap Growth Fund’s annual operating expenses (other than interest, taxes, brokerage commissions and other portfolio transaction expenses, capital expenditures and extraordinary expenses) at 1.75% of average daily net assets until April 30, 2015. For a period of three years subsequent to the Funds’ commencement of operations, DCM is entitled to reimbursement for previously waived fees and reimbursed expenses to the extent that each Fund’s expense ratio remains below the operating expense cap. For the year ended December 31, 2011, DCM waived fees for Driehaus Mid Cap Growth Fund and Driehaus Large Cap Growth Fund totaling $48,478 and $43,939, respectively, under these agreements, and the total amount of expenses still subject to recapture under the agreements are $203,754 and $166,027, respectively.
The amounts accrued and payable to DCM during the year ended December 31, 2011, are as follows:
| Fund | Advisory Fees | Advisory Fees Payable (included in Due to affiliates) | ||||||
Driehaus International Discovery Fund | $ | 4,202,798 | $ | 274,997 | ||||
Driehaus Emerging Markets Growth Fund | 12,396,322 | 973,825 | ||||||
Driehaus Emerging Markets Small Cap Growth Fund | 157,549 | 21,240 | ||||||
Driehaus International Small Cap Growth Fund | 4,179,767 | 295,978 | ||||||
Driehaus Global Growth Fund | 572,368 | 38,227 | ||||||
Driehaus Mid Cap Growth Fund | 250,058 | 7,441 | ||||||
Driehaus Large Cap Growth Fund | 194,790 | 5,746 | ||||||
|
|
|
|
| ||||
69
Driehaus Mutual Funds
Notes to Financial Statements — (Continued)
Certain of the Funds direct certain portfolio trades, subject to obtaining the best price and execution, to brokers who have agreed to pay a portion of the Funds’ operating expenses using part of the commissions generated, which are reflected as fees paid indirectly in the Statements of Operations. For the year ended December 31, 2011, these arrangements reduced the expenses of Driehaus International Discovery Fund, Driehaus Emerging Markets Growth Fund, Driehaus Emerging Markets Small Cap Growth Fund, Driehaus International Small Cap Growth Fund and Driehaus Global Growth Fund by $33,000 (0.7%), $334,082 (2.4%), $2,803 (1.0%), $97,604 (2.0%) and $1,795 (0.2%), respectively.
Certain officers of the Trust are also officers of DCM and DS LLC. The Funds pay a portion of the Chief Compliance Officer’s salary and bonus. No other officers received compensation from the Funds.
BNY Mellon Investment Servicing (US) Inc. (“BNY Mellon”) serves as the Funds’ administrative and accounting agent. In compensation for these services, BNY Mellon receives the larger of a monthly minimum fee or a monthly fee based upon average net assets. BNY Mellon has agreed to waive a portion of its monthly fee for administrative and accounting agent service for the first six months of operations for Driehaus Emerging Markets Small Cap Growth Fund. For the period ended December 31, 2011, BNY Mellon waived $5,403 for Driehaus Emerging Markets Small Cap Growth Fund. BNY Mellon also acts as the transfer agent and dividend disbursing agent for the Funds. For these services, BNY Mellon receives a monthly fee based on shareholder processing activity during the month. BNY Mellon has agreed to waive a portion of its monthly fee for transfer agent service for the first two years of operations for Driehaus Emerging Markets Small Cap Growth Fund, Driehaus Mid Cap Growth Fund and Driehaus Large Cap Growth Fund. For the year ended December 31, 2011, BNY Mellon waived $15,000, $2,250 and $2,250, respectively, for Driehaus Emerging Markets Small Cap Growth Fund, Driehaus Mid Cap Growth Fund and Driehaus Large Cap Growth Fund.
C. DERIVATIVES AND OTHER FINANCIAL INSTRUMENTS
The Driehaus Emerging Markets Small Cap Growth Fund invests in equity certificates which allow the Fund to participate in the appreciation (depreciation) of the underlying security without actually owning the underlying security. These instruments are purchased pursuant to an agreement with a financial institution and are valued at a calculated market price based on the value of the underlying security in accordance with the agreement. At December 31, 2011, Driehaus Emerging Markets Small Cap Growth Fund had unrealized depreciation of $596,704 as a result of its investment in these financial instruments. The aggregate market values of these certificates for the Driehaus Emerging Markets Small Cap Growth Fund represented 4.7% of the Fund’s net assets at December 31, 2011.
The Funds enter into foreign currency spot contracts to facilitate transactions in foreign denominated securities. These spot contracts are typically open for 2 to 5 days, depending on the settlement terms of the underlying security transaction. At December 31, 2011, the Funds had foreign currency spot contracts outstanding under which they are obligated to exchange currencies at specified future dates. The unrealized appreciation or depreciation on spot contracts is reflected as a separate line item in the Statement of Assets and Liabilities. At December 31, 2011, the Funds’ currency transactions were limited to transaction hedges.
D. INVESTMENT TRANSACTIONS
The aggregate purchases and sales of investment securities, other than short-term obligations, for the year ended December 31, 2011 were as follows:
| Fund | Purchases | Sales | ||||||
Driehaus International Discovery Fund | $ | 324,160,455 | $ | 397,295,807 | ||||
Driehaus Emerging Markets Growth Fund | 2,657,986,779 | 2,633,163,755 | ||||||
Driehaus Emerging Markets Small Cap Growth Fund | 26,128,354 | 18,243,863 | ||||||
Driehaus International Small Cap Growth Fund | 828,137,660 | 823,552,129 | ||||||
Driehaus Global Growth Fund | 62,840,755 | 70,930,963 | ||||||
Driehaus Mid Cap Growth Fund | 49,132,876 | 45,245,954 | ||||||
Driehaus Large Cap Growth Fund | 32,581,850 | 33,255,883 | ||||||
|
|
|
|
| ||||
70
Driehaus Mutual Funds
Notes to Financial Statements — (Continued)
E. RESTRICTED SECURITIES
Restricted securities are securities that are not registered for sale under the Securities Act of 1933 or applicable foreign law and that may be re-sold only in transactions exempt from applicable registration. Restricted securities include Rule 144A securities which may be sold normally to qualified institutional buyers. At December 31, 2011, the Funds held no restricted securities, other than equity certificates. Since an investment in equity certificates represents an agreement entered into with a financial institution, with terms set by such financial institution, these instruments are also deemed to be restricted (see Note C).
F. LINE OF CREDIT
Effective April 1, 2010, the Driehaus International Discovery Fund, Driehaus Emerging Markets Growth Fund and Driehaus International Small Cap Growth Fund obtained an uncommitted line of credit in the amount of $25,000,000 and the Driehaus Global Growth Fund, Driehaus Mid Cap Growth Fund and Driehaus Large Cap Growth Fund obtained an uncommitted line of credit in the amount of $5,000,000. These lines of credit are available primarily to meet large, unexpected shareholder redemptions subject to certain restrictions. Interest is charged at a rate per annum equal to the Federal Funds Rate in effect at the time of the borrowings plus 1.5%. The Driehaus International Discovery Fund and Driehaus Global Growth Fund utilized the line of credit during the period February 28, 2011 to March 8, 2011. The average daily loan balance outstanding on days where borrowings existed was $5,000,000 and $3,000,000, respectively, the weighted average interest rate was 1.47% and 1.47%, respectively, and the interest expense which is included on the Statements of Operations, was $1,836 and $1,102, respectively, for the Driehaus International Discovery Fund and Driehaus Global Growth Fund.
G. RISKS CONCENTRATIONS
To the extent a Fund invests in foreign securities, it may entail risks due to the potential for political and economic instability in the countries where the issuers of these securities are located. In addition, foreign exchange fluctuations could affect the value of positions held. These risks are generally intensified in emerging markets.
H. REDEMPTION FEES
The Funds may charge a redemption fee of 2.00% of the redemption amount for shares redeemed within 60 days of purchase. The redemption fees are recorded in paid-in capital.
71
Report of Independent Registered Public Accounting Firm
To the Board of Trustees and Shareholders of the Driehaus Mutual Funds:
We have audited the accompanying statements of assets and liabilities, including the schedules of investments, of Driehaus Emerging Markets Growth Fund, Driehaus Emerging Markets Small Cap Growth Fund, Driehaus Global Growth Fund, Driehaus International Discovery Fund, Driehaus International Small Cap Growth Fund, Driehaus Large Cap Growth Fund, and Driehaus Mid Cap Growth Fund (collectively, the “Funds”), of the Driehaus Mutual Funds, as of December 31, 2011, and the related statements of operations for the period then ended, the statements of changes in net assets and the financial highlights for each of the periods indicated therein. These financial statements and financial highlights are the responsibility of the Funds’ management. Our responsibility is to express an opinion on these financial statements and financial highlights based on our audits.
We conducted our audits in accordance with the standards of the Public Company Accounting Oversight Board (United States). Those standards require that we plan and perform the audits to obtain reasonable assurance about whether the financial statements and financial highlights are free of material misstatement. We were not engaged to perform an audit of the Funds’ internal control over financial reporting. Our audits included consideration of internal control over financial reporting as a basis for designing audit procedures that are appropriate in the circumstances, but not for the purpose of expressing an opinion on the effectiveness of the Funds’ internal control over financial reporting. Accordingly, we express no such opinion. An audit also includes examining, on a test basis, evidence supporting the amounts and disclosures in the financial statements and financial highlights, assessing the accounting principles used and significant estimates made by management, and evaluating the overall financial statement presentation. Our procedures included confirmation of securities owned as of December 31, 2011, by correspondence with the custodian and brokers. We believe that our audits provide a reasonable basis for our opinion.
In our opinion, the financial statements and financial highlights referred to above present fairly, in all material respects, the financial position of each of the respective Funds noted above at December 31, 2011, the results of their operations for the period then ended, the changes in their net assets and their financial highlights for the periods indicated therein in conformity with US generally accepted accounting principles.

Chicago, Illinois
February 24, 2012
72
Interested and Independent Trustees of the Trust
The following table sets forth certain information with respect to the Trustees of the Trust:
Name, Address and Year of Birth | Position(s) | Term of Office and Time Served** | Number of Portfolios in Trust Overseen by Trustee | Principal Occupation(s) | Other Directorships Held by Trustee During the Past 5 Years | |||||
Interested Trustee:* | ||||||||||
Richard H. Driehaus 25 East Erie Street Chicago, IL 60611 YOB: 1942 | Trustee | Since 1996 | 9 | Chairman of the Board of the Adviser, the Distributor and Driehaus Capital Management (USVI) LLC (“USVI”); Chief Investment Officer and Portfolio Manager of the Adviser. President of the Trust from 1996-2011. | Driehaus Capital Holdings LLC; Driehaus Enterprise Management, Inc.; The Richard H. Driehaus Foundation; and The Richard H. Driehaus Museum | |||||
Independent | ||||||||||
A.R. Umans c/o Driehaus Capital Management LLC 25 East Erie Street Chicago, IL 60611 YOB: 1927 | Trustee and Chairman | Since 1996 Since 2005 | 9 | Chairman of the Board, Commerce National Group (investment company) since 2005; Chairman of the Board and Chief Executive Officer, RHC/Spacemaster Corporation (manufacturing corporation) prior thereto. | Sinai Health System; Schwab Rehabilitation Hospital | |||||
Francis J. Harmon c/o Driehaus Capital Management LLC 25 East Erie Street Chicago, IL 60611 YOB: 1942 | Trustee | Since 1998 | 9 | Relationship Manager, Great Lakes Advisors, Inc. since February 2008; Principal Account Executive — Labor Affairs, Blue Cross and Blue Shield of Illinois prior thereto. | None | |||||
Daniel F. Zemanek c/o Driehaus Capital Management LLC 25 East Erie Street Chicago, IL 60611 YOB: 1942 | Trustee | Since 1996 | 9 | President of Ludan, Inc. (real estate services specializing in senior housing) since April 2008; Senior Vice President of Sunrise Development, Inc. (senior living) from 2003-2007; Consultant, real estate development prior thereto. | None |
| * | Mr. Driehaus is an “interested person” of the Trust, the Adviser and the Distributor, as defined in the 1940 Act, because he is an officer of the Adviser and the Distributor. In addition, Mr. Driehaus has a controlling interest in the Adviser and the Distributor. |
| ** | Each Trustee will serve as a Trustee of the Trust until (i) termination of the Trust, or (ii) the Trustee’s retirement, resignation, or death, or (iii) as otherwise specified in the Trust’s governing documents. |
73
Advisory Board Members of the Trust
The following table sets forth certain information with respect to the Advisory Board Members of the Trust.
Name, Address and | Position(s) | Term of Office | Principal Occupation(s) | Other Directorships | ||||
Advisory Board | ||||||||
Theodore J. Beck c/o Driehaus Capital Management LLC 25 East Erie Street Chicago, IL 60611 YOB: 1952 | Advisory Board Member | Since 2011 | President and Chief Executive Officer, National Endowment for Financial Education, 2005 to present; Associate Dean for Executive Education and Corporate Relations and President for the Center for Advanced Studies in Business at the University of Wisconsin — Madison, 1999-2005. | President’s Advisory Council on Financial Capability since 2010; Federal Deposit Insurance Corporation Advisory Committee on Economic Inclusion since 2007; Jump$tart Coalition for Personal Financial Literacy since 2008; Wisconsin Alumni Association Board since 2006; President’s Advisory Council on Financial Literacy from 2008-2010; Wilshire Variable Insurance Trust, 2008-2010; Wilshire Mutual Funds Inc, 2008-2010. | ||||
Dawn M. Vroegop c/o Driehaus Capital Management LLC 25 East Erie Street Chicago, IL 60611 YOB: 1966 | Advisory Board Member | Since 2011 | Managing Director, Dresdner RCM Global Investors from September 1999 to September 2003. | Independent Trustee, Met Investors Series Trust since December 2000; Director, Metropolitan Series Fund, Inc. since May 2009; Director and Investment Committee Chair, City College of San Francisco Foundation since 2003. |
| *** | The Advisory Board Members serve for a one year term from November 1, 2011 through October 31, 2012 and may be appointed to serve additional terms to be determined by the Board at its discretion. |
74
The following table sets forth certain information with respect to the officers of the Trust.
Name, Address and Year of Birth | Position(s) | Length of | Principal Occupation(s) During Past 5 Years | |||
Robert H. Gordon 25 East Erie Street Chicago, IL 60611 YOB: 1961 | President | Since 2011 | President and Chief Executive Officer of Adviser, Distributor and USVI since October 2006; Advisor to Adviser and Distributor from April to September 2006; Chief Operating Officer, Aris Capital Management from 2003-2006. Senior Vice President of the Trust from 2006-2011. | |||
Michelle L. Cahoon 25 East Erie Street Chicago, IL 60611 YOB: 1966 | Vice President and Treasurer | Since 2006
Since 2002 | Vice President, Treasurer and Chief Financial Officer of the Adviser, Distributor and USVI since 2004. | |||
Janet L. McWilliams 25 East Erie Street Chicago, IL 60611 YOB: 1970 | Chief Compliance Officer and Assistant Vice President | Since 2006
Since 2007 | Chief Compliance Officer of the Adviser and Distributor since 2006; Senior Attorney with the Adviser since 2003; Attorney with the Adviser since 2000. | |||
Diane J. Drake 301 Bellevue Parkway Wilmington, DE 19809 YOB: 1967 | Secretary | Since 2006 | Managing Director and Senior Counsel, BNY Mellon Investment Servicing (US) Inc. (formerly, PNC Global Investment Servicing (U.S.) Inc. (“PNC”), a financial services company) since 2010; Vice President and Counsel, PNC from 2008-2010; Vice President and Associate Counsel, PNC from 2003-2007. | |||
Michael P. Kailus 25 East Erie Street Chicago, IL 60611 YOB: 1971 | Assistant Secretary | Since 2010 | Assistant Secretary of the Adviser, Distributor and USVI since 2010; Associate General Counsel of Superfund Group (financial services company) from 2005-2010. | |||
William H. Wallace, III 301 Bellevue Parkway Wilmington, DE 19809 YOB: 1969 | Assistant Secretary | Since 2008 | Vice President and Manager, BNY Mellon Investment Servicing (US) Inc. (formerly, PNC, a financial services company) since 2010; Assistant Vice President and Manager, PNC from 2008-2010; Sr. Regulatory Administrator, PNC from 2007-2008; Regulatory Administrator, PNC from 2004-2007. |
The Statement of Additional Information for Driehaus Mutual Funds contains more detail about the Trust’s Trustees and officers and is available upon request, without charge. For further information, please call 1-800-560-6111.
75
As a mutual fund shareholder, you may incur two types of costs: (1) transaction costs, including sales charges; redemption fees; and exchange fees and (2) ongoing costs, including management fees; distribution (12b-1) fees; and other fund expenses. This example is intended to help you understand your ongoing costs (in dollars) of investing in each Fund and to compare these costs with the ongoing costs of investing in other mutual funds.
The example is based on an investment of $1,000 invested at the beginning of the period and held for the entire six months ending December 31, 2011.
Actual Expenses
The first line of the tables below (“Actual”) provides information about actual account values and actual expenses. You may use the information in this line, together with the amount you invested, to estimate the expense that you paid over the period. Simply divide your account value by $1,000 (for example, an $8,600 account value divided by $1,000 = 8.6), then multiply the result by the number in the first line under the heading entitled “Expenses Paid During Period” to estimate the expenses you paid on your account during this period.
Hypothetical Example for Comparison Purposes
The second line of the tables below (“Hypothetical”) provides information about hypothetical account values and hypothetical expenses based on the Fund’s actual expense ratio and an assumed rate of return of 5% per year before expenses, which is not the Fund’s actual return. You may use this information to compare the ongoing costs of investing in the Funds versus other funds. To do so, compare this 5% hypothetical example with the 5% hypothetical examples that appear in the shareholder reports of the other funds.
Please note that the expenses shown in the table are meant to highlight your ongoing costs only and do not reflect any transactional costs, such as sales charges, redemption fees or exchange fees. Therefore, the second line of the table is useful in comparing ongoing costs only, and will not help you determine the relative total costs of owning different funds. In addition, if these transactional costs were included, your costs would have been higher.
Driehaus International Discovery Fund
Beginning Account Value July 1, 2011 | Ending Account Value December 31, 2011 | Expenses Paid During December 31, 2011* | ||||||||||
Actual | $ | 1,000 | $ | 791.10 | $ | 7.90 | ||||||
Hypothetical (5% return before expenses) | $ | 1,000 | $ | 1,016.38 | $ | 8.89 | ||||||
Driehaus Emerging Markets Growth Fund
Beginning Account Value July 1, 2011 | Ending Account Value December 31, 2011 | Expenses Paid During December 31, 2011* | ||||||||||
Actual | $ | 1,000 | $ | 838.40 | $ | 7.65 | ||||||
Hypothetical (5% return before expenses) | $ | 1,000 | $ | 1,016.89 | $ | 8.39 | ||||||
Driehaus Emerging Markets Small Cap Growth Fund**
Beginning Account Value July 1, 2011** | Ending Account Value December 31, 2011 | Expenses Paid During | ||||||||||
Actual | $ | 1,000 | $ | 881.00 | $ | 6.70 | ||||||
Hypothetical (5% return before expenses) | $ | 1,000 | $ | 1,015.27 | $ | 10.01 | ||||||
|
|
|
|
|
| |||||||
76
Fund Expense Examples — (Continued)
Driehaus International Small Cap Growth Fund
Beginning Account Value July 1, 2011 | Ending Account Value December 31, 2011 | Expenses Paid During December 31, 2011* | ||||||||||
Actual | $ | 1,000 | $ | 819.90 | $ | 7.89 | ||||||
Hypothetical (5% return before expenses) | $ | 1,000 | $ | 1,016.53 | $ | 8.74 | ||||||
Driehaus Global Growth Fund
Beginning Account Value July 1, 2011 | Ending Account Value December 31, 2011 | Expenses Paid During December 31, 2011* | ||||||||||
Actual | $ | 1,000 | $ | 833.30 | $ | 9.15 | ||||||
Hypothetical (5% return before expenses) | $ | 1,000 | $ | 1,015.22 | $ | 10.06 | ||||||
Driehaus Mid Cap Growth Fund
Beginning Account Value July 1, 2011 | Ending Account Value December 31, 2011 | Expenses Paid During December 31, 2011* | ||||||||||
Actual | $ | 1,000 | $ | 881.30 | $ | 8.30 | ||||||
Hypothetical (5% return before expenses) | $ | 1,000 | $ | 1,016.38 | $ | 8.89 | ||||||
Driehaus Large Cap Growth Fund
Beginning Account Value July 1, 2011 | Ending Account Value December 31, 2011 | Expenses Paid During December 31, 2011* | ||||||||||
Actual | $ | 1,000 | $ | 987.40 | $ | 8.77 | ||||||
Hypothetical (5% return before expenses) | $ | 1,000 | $ | 1,016.38 | $ | 8.89 | ||||||
|
|
|
|
|
| |||||||
| * | Expenses are equal to the Fund’s annualized expense ratio for the six-month period in the table below multiplied by the average account value over the period, multiplied by the number of days in the most recent fiscal half-year (184), or applicable period, then divided by 365 to reflect the half-year period. |
| ** | The Driehaus Emerging Markets Small Cap Growth Fund commenced operations on August 22, 2011. The actual return and expenses paid during the period by this Fund were for the period from August 22, 2011 to December 31, 2011 (132 days) instead of the entire six-month period. The hypothetical return is based on the entire six-month period for comparison purposes. |
Driehaus International Discovery Fund | 1.75% | |
Driehaus Emerging Markets Growth Fund | 1.65% | |
Driehaus Emerging Markets Small Cap Growth Fund | 1.97% | |
Driehaus International Small Cap Growth Fund | 1.72% | |
Driehaus Global Growth Fund | 1.98% | |
Driehaus Mid Cap Growth Fund | 1.75% | |
Driehaus Large Cap Growth Fund | 1.75% |
77
TAX INFORMATION (UNAUDITED) FOR THE YEAR ENDED DECEMBER 31, 2011
We are providing this information as required by the Internal Revenue Code. The amounts shown may differ from those elsewhere in this report because of differences between tax and financial reporting requirements.
The Funds’ distributions included capital gain amounts as follows:
| Driehaus International Discovery Fund | Driehaus Emerging Markets Growth Fund | Driehaus Emerging Markets Small Cap Growth Fund | Driehaus International Small Cap Growth Fund | Driehaus Global Growth Fund | Driehaus Mid Cap Growth Fund | Driehaus Large Cap Growth Fund | ||||||||||||||||||||||
Total long-term gains 15% rate gains | $ | — | $ | 1,860,551 | $ | — | $ | — | $ | 3,868,133 | $ | 1,473,512 | $ | 1,470,274 | ||||||||||||||
For taxable non-corporate shareholders, the following percentages of income and short-term capital gains represent qualified dividend income subject to the 15% rate category:
Driehaus International Discovery | Driehaus Emerging Markets Growth Fund | Driehaus Emerging Markets Small Cap Growth Fund | Driehaus International Small Cap Growth Fund | Driehaus Global Growth Fund | Driehaus Mid Cap Growth Fund | Driehaus Large Cap Growth Fund | ||||||||||||||||||||
| 0.00% | 22.03% | 0.00% | 100.00% | 0.00% | 42.43% | 45.48% | ||||||||||||||||||||
For corporate shareholders, the following percentages of income and short-term capital gains qualified for the dividends-received deduction:
Driehaus International Discovery | Driehaus Emerging Markets Growth Fund | Driehaus Emerging Markets Small Cap Growth Fund | Driehaus International Small Cap Growth Fund | Driehaus Global Growth Fund | Driehaus Mid Cap Growth Fund | Driehaus Large Cap Growth Fund | ||||||||||||||||||||
| 0.00% | 0.00% | 0.00% | 0.00% | 0.00% | 39.04% | 35.18% | ||||||||||||||||||||
PROXY VOTING POLICIES AND PROCEDURES AND PROXY VOTING RECORD
A description of the Funds’ policies and procedures with respect to the voting of proxies relating to the Funds’ portfolio securities is available without charge, upon request, by calling 1-800-560-6111. This information is also available on the Funds’ website at http://www.driehaus.com.
Information regarding how the Funds voted proxies related to portfolio securities during the 12-month period ended June 30, 2011 is available without charge, upon request, by calling 1-800-560-6111. This information is also available on the Securities and Exchange Commission’s (“SEC”) website at http://www.sec.gov.
HOW TO OBTAIN QUARTERLY PORTFOLIO HOLDINGS
Each Fund files a complete schedule of portfolio holdings with the SEC for the first and third quarters of each fiscal year on Form N-Q. The Funds’ Form N-Q is available electronically on the SEC’s website at http://www.sec.gov; hard copies may be reviewed and copied at the SEC’s Public Reference Room in Washington, DC 20549. For more information on the Public Reference Room, call 1-800-SEC-0330. Each Fund’s complete schedule of portfolio holdings is also available on the Fund’s website at http://www.driehaus.com.
78
Board Considerations in Connection with the Initial Approval of the Investment Advisory
Agreement for Driehaus Emerging Markets Small Cap Growth Fund
The Board of Trustees of Driehaus Mutual Funds (the “Trust”) approved the investment advisory agreement (the “Agreement”) with Driehaus Capital Management LLC (the “Adviser”) for Driehaus Emerging Markets Small Cap Growth Fund (“DRESX” or the “New Fund”) in May 2011. As part of its review process, the Board requested and evaluated all information it deemed reasonably necessary to evaluate the Agreement. The Board reviewed comprehensive materials received from the Adviser and from independent legal counsel. The Independent Trustees, represented by independent legal counsel, met independent of Fund management to consider approval of the Agreement. After their review of the information received, the Independent Trustees presented their findings and their recommendation to renew the Agreement to the full Board. In connection with the contract review process, the Board considered the factors discussed below, among others.
Nature, Quality and Extent of Services. The Board considered the nature, extent and quality of services to be provided under the Agreement, including portfolio management services and administrative services. The Board considered the experience and skills of senior management and investment personnel, the resources made available to such personnel, the ability of the Adviser to attract and retain high-quality personnel, and the organizational depth of the Adviser. The Board also considered the Trust’s compliance with legal and regulatory requirements as well as the Adviser’s risk management processes developed for analyzing, reviewing and assessing risk exposure for the New Fund. In addition, the Board considered the investment performance of Driehaus Emerging Markets Small Cap Growth Fund L.P. (the “Predecessor Partnership”), and concluded that the Adviser’s performance in managing a product similar to the New Fund was satisfactory.
On the basis of this evaluation and the Board’s experience with the Adviser in managing other series of the Trust, the Board concluded that the nature, quality and extent of services to be provided by the Adviser are expected to be satisfactory.
Fees. The Board considered the New Fund’s proposed advisory fee, operating expenses and estimated total expense ratio, and compared the advisory fee and expense ratio to fees and expense ratios of a peer group of emerging market funds based on data compiled as of March 31, 2011 from Lipper Inc. (“Lipper”) as of the fiscal year end of each fund in the peer group. The Board noted that the New Fund’s proposed advisory fee of 1.50% would be in the 4th percentile (1st percentile being the highest fee); however, the Board also considered that the Adviser will reimburse the New Fund for annual expenses in excess of 2.00% of net assets (excluding dividends and interest on short sales) for the first three years of operations. The Board also considered the fact that the Adviser has agreed to absorb the organizational costs of the New Fund, including legal costs related to organization. In addition, the Board considered the New Fund’s proposed advisory fee rate as compared to fees charged by the Adviser to other series of the Trust and to the Predecessor Partnership. The Board considered that two other series of the Trust with similar investment objectives to the New Fund also charge an advisory fee of 1.50% and the Predecessor Partnership charges an advisory fee of 1.50% plus a 10% performance fee. In addition, the Board considered the estimated expense ratio of the New Fund after reaching the first year projected asset level, which would rank the New Fund in the 31st percentile of its Lipper peer group (1st percentile would be the highest expense ratio).
On the basis of the information provided, the Board concluded that the proposed advisory fee was reasonable and appropriate in light of the nature and quality of services expected to be provided by the Adviser.
Profitability and Economies of Scale. In considering the reasonableness of the proposed advisory fee, the Board considered the undertaking by the Adviser to assume New Fund organizational expenses as well as to reimburse New Fund expenses exceeding a 2.00% cap (other than dividends and interest on short sales) for a three-year period.
The Board also considered potential economies of scale with respect to the management of the New Fund and whether the New Fund will benefit from any economies of scale. The Board noted the Adviser’s expectation that it will not earn its full fee until assets reach approximately $65 million.
Other Benefits to the Adviser and its Affiliates. The Board also considered the character and amount of other incidental benefits to be received by the Adviser and its affiliates. The Board noted that the Adviser does expect to earn fall-out benefits in the form of soft dollar credits from its relationship with the New Fund
79
similar to those earned on other series of the Trust. The Board concluded that the proposed advisory fee was reasonable in light of any anticipated fall-out benefits.
Based on all of the information considered and the conclusions reached, the Board determined that the terms of the Agreement for the New Fund were fair and reasonable and that the approval of the Agreement is in the best interests of the New Fund. No single factor was determinative in the Board’s analysis.
80
Board Considerations in Connection with the Annual Review of the
Investment Advisory Agreement
The Board of Trustees of Driehaus Mutual Funds (the “Trust”) approved the renewal of the investment advisory agreement (the “Agreement”) with Driehaus Capital Management LLC (the “Adviser”) for Driehaus Emerging Markets Growth Fund (“DREGX”), Driehaus International Discovery Fund (“DRIDX”), Driehaus International Small Cap Growth Fund (“DRIOX”), Driehaus Global Growth Fund (“DRGGX”), Driehaus Mid Cap Growth Fund (“DRMGX”) and Driehaus Large Cap Growth Fund (“DRLGX”) (DREGX, DRIDX, DRIOX, DRGGX, DRMGX and DRLGX are each a “Fund” and collectively the “Funds”) in September 2011. As part of its review process, the Board requested and evaluated all information it deemed reasonably necessary to evaluate the Agreement. The Board reviewed comprehensive materials received from the Adviser and from independent legal counsel. The Board also received extensive information throughout the year regarding performance and operating results of each Fund. The Independent Trustees, represented by independent legal counsel, met independent of Fund management to consider renewal of the Agreement. After their review of the information received, the Independent Trustees presented their findings and their recommendation to approve the Agreement to the full Board.
In connection with the contract review process, the Board considered the factors discussed below, among others. The Board also considered that the Adviser has managed each Fund since its inception, and the Board believes that a long-term relationship with a capable, conscientious adviser is in the best interests of each Fund. The Board considered, generally, that shareholders invested in each Fund, knowing that the Adviser managed the Fund and knowing the investment advisory fee schedule.
Nature, Quality and Extent of Services. The Board considered the nature, extent and quality of services provided under the Agreement, including portfolio management services and administrative services. The Board considered the experience and skills of senior management and investment personnel, the resources made available to such personnel, the ability of the Adviser to attract and retain high-quality personnel, and the organizational depth of the Adviser. The Board also considered compliance with legal and regulatory requirements, as well as the Adviser’s handling of portfolio brokerage, including the use of its affiliated broker-dealer until January 1, 2011 to execute portfolio transactions in the U.S. for the Funds, and noted the Adviser’s process for evaluating best execution.
The Board reviewed DREGX’s and DRIDX’s performance on a net return basis over the 1-, 3- and 5-year periods and for the year-to-date period ended June 30, 2011. Given the more recent inception of DRIOX (resulting from the conversion of a predecessor limited partnership’s assets in September 2007), the Board reviewed its performance on a net return basis over the 1- and 3- year periods and for the year-to-date period ended June 30, 2011. In addition, given the even more recent inception of DRGGX (on May 1, 2008), DRMGX (resulting from the conversion of two predecessor limited partnerships’ assets in April 2009) and DRLGX (resulting from the conversion of a predecessor limited partnership’s assets in April 2009), the Board considered the performance of these Funds on a net return basis for the 1-year and year-to-date periods ended June 30, 2011. The Board also reviewed (i) performance for DRIOX on a net basis for the 5-year period ended June 30, 2011, that includes the performance of its predecessor limited partnership; (ii) performance for DRMGX, including that of one of its predecessor limited partnerships, on a net return basis for the 3- and 5-year periods ended June 30, 2011; and (iii) performance for DRLGX, including that of its predecessor limited partnership, on a net return basis for the 3- and 5-year periods ended June 30, 2011. Because the predecessor limited partnerships to DRIOX, DRMGX and DRLGX did not operate as mutual funds and were not subject to certain investment and operational restrictions, the Board factored those differences into its evaluation of these Funds’ performance information. The Board noted that the Adviser represented that because the Funds’ performance can be volatile over shorter time periods, it was meaningful to also analyze the performance of DREGX, DRIDX, DRIOX, DRMGX and DRLGX over rolling time periods to show the consistent out-performance to their benchmark indices. The Board compared short-term and longer-term returns to various agreed-upon performance measures, including market indices and peer groups. Peer group data was compiled from Morningstar, Inc. and Lipper Inc., independent providers of mutual fund data. The Board also considered whether investment results were consistent with each Fund’s investment objective and policies.
On the basis of this evaluation and its ongoing review of investment results, the Board concluded that the nature, quality and extent of services provided by the Adviser for DREGX, DRIOX, DRMGX and DRLGX continue to be satisfactory. As to the specific Funds, the Board noted that DREGX’s performance was above the median of its peer group for the 1-, 3- and 5-year periods. The Board also noted that DREGX
81
outperformed its benchmark index for the 1-, 3-, 5-and 10-year and since-inception (December 31, 1997) periods. The Board noted that DRIOX’s performance for the 1- and 3-year periods, and for the 5-year period (which includes the performance of its predecessor limited partnership), was above the median of its peer group. In addition, the Board noted that DRIOX outperformed its benchmark index for the 1- and 5-year periods (the latter of which includes the performance of its predecessor partnership) and underperformed its benchmark index for the 3-year period. The Board noted that DRMGX’s performance for the 1- and 5-year periods was above the median of its peer group, while the Fund’s performance for the 3-year period was below the median. The Board also considered that DRMGX’s performance for the 3- and 5-year periods includes the performance of a predecessor partnership. In addition, the Board noted that DRMGX outperformed its benchmark index for the 1-year period and that the Fund (including the performance of a predecessor partnership) underperformed the index for the 3-year period, while outperforming the index for the 5- and 10-year periods. The Board noted that DRLGX had underperformed its peer group median and its benchmark index for the 1- and 3-year periods. The Board considered the reasons for the Fund’s underperformance, noting the impact of market capitalization on DRLGX’s performance as compared to DRMGX.
On the basis of its evaluation of the information presented and its ongoing review of investment results, the Board concluded that based on the nature, quality and extent of services provided by the Adviser for DRIDX and DRGGX, it continues to be in the best interests of the Funds to continue the Agreement. The Board noted the Adviser’s on-going adherence to its investment style and the need to judge performance over an entire market cycle. For DRIDX, the Board noted that the Fund underperformed the median of its peer group for the 1-, 3- and 5-year periods. The Board also noted that the Fund underperformed its benchmark index for the 1-, 3- and 5-year periods (for the 1-year period, the Fund’s performance was almost the same as that of its benchmark), but outperformed its benchmark index for the 10-year and since-inception (December 31, 1998) periods. The Board reviewed the reasons for the recent underperformance, which were primarily related to performance in the first half of 2011. The Board also took into consideration various other measures of performance since the current portfolio manager assumed responsibility for the Fund and noted that some of the underperformance for DRIDX preceded the tenure of the current portfolio manager. For DRGGX, the Board noted that the Fund’s performance was below the median of its peer group and that the Fund underperformed its benchmark index for the 1- and 3-year periods. The Board considered the reasons for the underperformance, noting that the longer term underperformance was primarily due to performance in the last six months of 2008.
The Board also considered DREGX’s, DRIDX’s, DRIOX’s, DRMGX’s and DRLGX’s rolling one-year, three-year and five-year returns over the life of the Funds relative to their benchmarks and noted that, with the exception of DRLGX, in a majority of the time periods measured, each Fund outperformed its benchmark index. As to the Funds in general, the Board concluded that the Adviser had consistently implemented its investment philosophy, and that over the long term, the investment philosophy produces value for shareholders.
Fees. The Board considered each Fund’s advisory fee rates, operating expenses and total expense ratio as of June 30, 2011, and compared the advisory fee and total expense ratio to the fees and expense ratios of peer group funds based on data compiled from Lipper Inc. as of June 30, 2011. The information provided to the Board showed that each Fund’s advisory fee rate ranked high as compared to its peer group. However, because of the Funds’ fee structures, total expense ratios are relatively competitive, as they all fall between the 26th and 54th percentile (1st percentile being the highest expense ratio). The Board considered the Funds’ asset size and for DREGX, DRMGX and DRLGX, the expense reimbursement arrangements with the Adviser. The Board also considered the Funds’ advisory fee rates as compared to fees charged by the Adviser for similarly managed institutional accounts. With respect to institutional accounts, the Board noted that: (i) both the mix of services provided and the level of responsibility required under the Agreement were significantly greater as compared to the Adviser’s obligations for managing the other accounts; and (ii) the advisory fees for the other accounts are less relevant to the Board’s consideration because they reflect significantly different competitive forces than those in the mutual fund marketplace. In considering the reasonableness of the advisory fees, the Board took into account the Adviser’s aggressive growth style and the substantial human and technological resources devoted to investing for the Funds, the relatively small amount of assets under management and the limited capacity of the investment style. The Board also noted that the Funds do not have a Rule 12b-1 fee or shareholder service fee, and that the Adviser’s affiliate, Driehaus Securities LLC (“DS LLC”), serves as distributor of the Funds without compensation and that DS LLC provides compensation to intermediaries for distribution of Fund shares and for shareholder and administrative services to shareholders,
82
the expense of which as of January 1, 2011 is reimbursed by the Adviser under an expense sharing arrangement with DS LLC. The Board also noted that the Adviser’s directed brokerage program had resulted in reducing expenses of DREGX, DRIDX and DRIOX and that the Adviser is pursuing the ability to generate directed brokerage commissions for the Funds’ U.S. trades.
On the basis of the information reviewed, the Board concluded that the advisory fee schedule for each Fund was reasonable and appropriate in light of the nature and quality of services provided by the Adviser.
Profitability. The Board reviewed information regarding revenues received by the Adviser under the Agreement from each Fund and discussed the Adviser’s methodology in allocating its costs to the management of the Funds. The Board considered the estimated costs to the Adviser of managing the Funds. The Board noted that DRIOX is currently closed to new investors in order to maintain assets at a level that the Adviser feels is prudent, which limits the Fund’s profitability to the Adviser. The Board concluded that, based on the projected profitability calculated for the Trust as well as for the Funds individually (noting that DRGGX, DRMGX and DRLGX were currently being operated at a loss), the advisory fees appeared to be reasonable.
Economies of Scale. The Board considered whether there are economies of scale with respect to the management of the Funds and whether the Funds benefit from any such economies of scale. Given the size of the Funds and the capacity constraints of the investment style, the Board concluded that the advisory fee rates under the Agreement are reasonable and reflect an appropriate sharing of any such economies of scale, noting the breakpoints in DRIDX’s advisory fee schedule.
Other Benefits to the Adviser and its Affiliates. The Board also considered the character and amount of other incidental benefits received by the Adviser and its affiliates, including fees received by DS LLC for brokerage services through December 31, 2010. The Board also considered benefits to the Adviser related to soft dollar allocations. The Board concluded that advisory fees were reasonable in light of these fall-out benefits.
Based on all of the information considered and the conclusions reached, the Board determined that the terms of the Agreement continue to be fair and reasonable and that the continuation of the Agreement is in the best interests of each Fund. No single factor was determinative in the Board’s analysis.
83
DRH-AR2011
Item 1. Reports to StockholdersThe Reports to Shareholders are attached herewith.
Driehaus Mutual Funds
Trustees, Advisory Board Members & Officers
Richard H. Driehaus
Trustee
A.R. Umans
Chairman of the Board
Francis J. Harmon
Trustee
Daniel F. Zemanek
Trustee
Dawn M. Vroegop
Advisory Board Member
Theodore J. Beck
Advisory Board Member
Robert H. Gordon
President
Michelle L. Cahoon
Vice President & Treasurer
Janet L. McWilliams
Assistant Vice President &
Chief Compliance Officer
Diane J. Drake
Secretary
Michael P. Kailus
Assistant Secretary
William H. Wallace, III
Assistant Secretary
Investment Adviser
Driehaus Capital Management LLC
25 East Erie Street
Chicago, IL 60611
Distributor
Driehaus Securities LLC
25 East Erie Street
Chicago, IL 60611
Administrator
UMB Fund Services, Inc.
803 W. Michigan St.
Milwaukee, WI 53233
Transfer Agent
UMB Fund Services, Inc.
803 W. Michigan St.
Milwaukee, WI 53233
Custodian
UMB Bank, n.a.
928 Grand Blvd.
Kansas City, MO 64106
Annual Report to Shareholders
December 31, 2011

Driehaus Active Income Fund
Driehaus Select Credit Fund
Distributed by:
Driehaus Securities LLC
This report has been prepared for the shareholders of the Funds and is not an offering to sell or buy any Fund securities. Such offering is only made by the Funds' prospectus.
Table of Contents
Portfolio Managers’ Letter, Performance Overview and Schedule of Investments: | ||||
| 1 | ||||
| 13 | ||||
| 21 | ||||
| 22 | ||||
| 23 | ||||
| 24 | ||||
| 27 | ||||
| 40 | ||||
| 41 | ||||
| 42 | ||||
| 43 | ||||
| 44 | ||||
| 45 | ||||
Board Considerations in Connection with the Annual Review of the Investment Advisory Agreement | 46 | |||
Driehaus Active Income Fund — Portfolio Managers’ Letter
Dear Shareholders,
The Driehaus Active Income Fund1 (“Fund”) returned -5.61% for the year ending December 31, 2011. This return was below the performance of the Fund’s benchmark index, the Citigroup 3-Month T-Bill Index (the “Benchmark”), which returned 0.08% for the same period. The Fund also underperformed the Barclays Capital U.S. Aggregate Bond Index (the “Index”), which returned 7.85% for the same period.
We experienced a number of periods of weaker performance throughout the second half of the year. They were kicked off by a downgrade in the U.S. credit markets and further fueled by concerns of sovereign defaults. The year began with concerns about Greece and ended with the spotlight on Italy. Over a five month period, the credit markets struggled with concerns of financial contagion and slowing global growth, as well as one way flows driven by large-scale deleveraging by the bank and hedge fund community. Frustratingly, the volatility segment (generally, put spreads on the S&P 500 Index) of our portfolio detracted from performance for the year as we struggled with the anomaly of a rising equity market (declining volatility) against a collapsing high yield market.
As we reflect on the year, we certainly got some calls incorrect. In hindsight, we should have placed less exposure on lower quality credits, more emphasis on the short-term chaos that could result in our markets from the Eurozone crisis and realized that the hedge fund community would be deleveraging through the remainder of 2011. We believe taking any of these actions would have limited losses to the Fund to more tolerable levels.
At the same time, last year was somewhat of an anomaly as a number of factors outside of our control worked against our strategy. We manage concentrated portfolios where company fundamentals are the most significant determinant of our positioning. Company fundamentals were, and continue to be, quite strong in spite of the Eurozone crisis and a dysfunctional U.S. political environment. In other words, our portfolio companies’ results and outlooks did not foreshadow the sharp drop in prices we experienced in many of these positions. Additionally, the sharp drop in interest rates served as a substantial drag on our results. Even during this cycle of falling rates, last year was quite exceptional. The yield on the U.S. 10 Year Treasury dropped 143 basis points throughout the year to finish at 1.88%. That is the third largest drop in the 10 Year Treasury yield over the past 20 years, trailing only 1995 (230 basis point drop) and 2008 (221 basis point drop).
The main detractors from performance during the year came from the Fund’s interest rate hedge, holdings within the event-driven segment and volatility hedges. The interest rate hedge, which is constructed by shorting U.S. Treasury futures and U.S. Treasury securities, detracted as both the 10 and 30 Year U.S. Treasury bond yields collapsed by over 140 basis points, resulting in a decline for the hedge. The volatility hedge, which was constructed by implementing various option strategies consisting of straddles or strangles on the S&P 500 Index, had little impact on the Fund during the first three quarters of the year and declined during the fourth quarter as equities prices moved higher and volatility dropped. Within the event-driven segment, where the Fund tries to profit from an event such as a merger or reorganization, accelerating investor caution around the U.S. auto market and pressure on U.S. financial institutions weighed on the strategy, especially during the last five months of the year. Despite high yield spreads ending the year nearly 200 basis points wider, the directional long segment of the Fund was the largest contributor to returns, driven by both a healthy coupon in our directional long positions and outperformance in months when investment sentiment was positive.
We are particularly excited entering the new year as we believe individual credits will be the story in 2012, as opposed to the macro-driven trading environment of 2011. The high correlation, flight-to-quality market of 2011 left many credits impaired on a mark-to-market basis. That has left a lot of opportunity for us to sift through as we look for interesting stories and trades that can weather a number of macro-trading environments. If we are correct in our analysis of the credit quality of these firms, and we structure the trade correctly, then we anticipate they should perform under a variety of trading environments. Remember that unlike stocks, bonds cannot trade “cheap” to a fundamental value forever. There is a maturity date associated with these bonds, and on that maturity date that bond will either be retired or in default.
1
As always, we at Driehaus Capital Management LLC thank you for your interest in the Driehaus Active Income Fund and would like to express our gratitude to you as shareholders for your continued confidence in our management capabilities.
Sincerely,
 |  |  | ||
| K.C. Nelson | Mirsada Durakovic | Elizabeth Cassidy | ||
| Portfolio Manager | Assistant Portfolio Manager | Assistant Portfolio Manager |
| 1 | The Driehaus Active Income Fund closed to new investors on March 1, 2011. |
Performance is historical and does not represent future results.
2
Driehaus Active Income Fund
Performance Overview (unaudited)
The performance summarized below is historical and does not represent future results. Investment returns and principal value vary, and you may have a gain or loss when you sell shares. Performance data presented measures the change in the value of an investment in the Fund, assuming reinvestment of all dividends and capital gains. Average annual total return reflects annualized change.
The table does not reflect the deduction of taxes that a shareholder would pay on Fund distributions or the redemption of Fund shares. The graph compares the results of a $25,000 investment (minimum investment) in the Fund since November 8, 2005 (the date of the Predecessor Fund’s inception), with all dividends and capital gains reinvested, with the indicated indices (and dividends reinvested) for the same period.
| Average Annual Total Returns as of 12/31/11 | 1 Year | 3 Years | 5 Years | Since Inception (11/08/05 - 12/31/11) | ||||||||||||
Driehaus Active Income Fund (LCMAX)1 | –5.61% | 6.63% | 4.29% | 4.30% | ||||||||||||
Citigroup 3-Month T-Bill Index2 | 0.08% | 0.12% | 1.36% | 1.98% | ||||||||||||
Barclays Capital U.S. Aggregate Bond Index3 | 7.85% | 6.77% | 6.50% | 6.57% | ||||||||||||
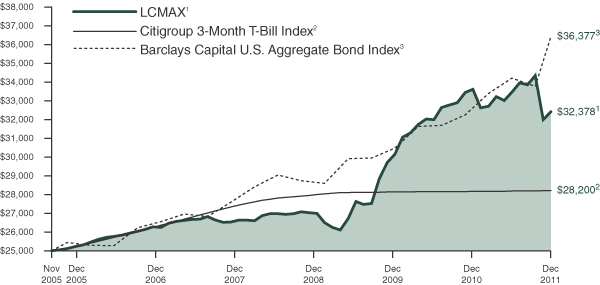
| 1 | The Driehaus Active Income Fund (the “Fund”) performance shown above includes the performance of the Lotsoff Capital Management Active Income Fund (the “Predecessor Fund”) for the periods before the Fund’s registration statement became effective. The Fund received the assets and liabilities of the Predecessor Fund on June 1, 2009 through a reorganization of the Predecessor Fund into the Fund. The Predecessor Fund was a nondiversified fund that was a series of another management investment company registered under the Investment Company Act of 1940, as amended. The Fund had no prior operating history prior to succeeding to the assets of the Predecessor Fund. The Fund has substantially similar investment objectives, strategies, and policies as the Predecessor Fund. Financial and performance information of the Fund includes the Predecessor Fund information. The returns for the periods prior to October 1, 2006, reflect fee waivers and/or reimbursements without which performance would have been lower. |
| 2 | The Citigroup 3-Month T-Bill Index is designed to mirror the performance of the 3 month U.S. Treasury Bill. The Citigroup 3-Month T-Bill Index is unmanaged and its returns reflect reinvestment of all distributions and changes in market prices. |
| 3 | The Barclays Capital U.S. Aggregate Bond Index, an unmanaged index, represents securities that are SEC-registered, taxable and dollar denominated. This index covers the U.S. investment grade fixed rate bond market, with index components for government and corporate securities, mortgage pass-through securities and asset-backed securities. These major sectors are subdivided into more specific indices that are calculated and reported on a regular basis. |
3
Driehaus Active Income Fund
Schedule of Investments
December 31, 2011
| Shares, Principal Amount, or Number of Contracts | Value | |||||||
| ASSET-BACKED SECURITIES — 2.74% | ||||||||
Bear Stearns Asset Backed Securities Trust | $ | 3,408,418 | $ | 3,230,900 | ||||
Capital Auto Receivables Asset Trust | 1,898,328 | 1,904,737 | ||||||
Citigroup Mortgage Loan Trust, Inc. | 418,525 | 158,845 | ||||||
CNL Funding | 3,373,826 | 3,222,436 | ||||||
Countrywide Asset-Backed Certificates | 122,988 | 95,621 | ||||||
Fannie Mae REMICS | 17,958,526 | 18,144,900 | ||||||
Fannie Mae REMICS | 16,014,937 | 15,985,325 | ||||||
Freddie Mac REMICS | 8,709,753 | 8,668,182 | ||||||
JP Morgan Alternative Loan Trust | 186,875 | 166,836 | ||||||
MBNA Credit Card Master Note Trust | 15,000,000 | 15,007,065 | ||||||
Merrill Lynch Mortgage Investors, Inc. | 124,929 | 114,977 | ||||||
|
| |||||||
Total ASSET-BACKED SECURITIES | 66,699,824 | |||||||
|
| |||||||
| BANK LOANS — 7.63% | ||||||||
Auto Manufacturers — 1.58% |
| |||||||
General Motors Holdings LLC | 44,000,000 | 38,258,000 | ||||||
Commercial Services —1.10% |
| |||||||
Altegrity, Inc. | 26,907,419 | 26,638,345 | ||||||
Electronics — 0.30% |
| |||||||
NuSil Technology LLC 5.25%, 3/28/172 | 7,460,794 | 7,292,926 | ||||||
Internet — 0.09% |
| |||||||
Mood Media Corp. (Canada) | 2,487,500 | 2,298,873 | ||||||
Retail — 1.42% |
| |||||||
Gymboree Corp. | 8,467,318 | 7,514,744 | ||||||
Neiman Marcus Group, Inc. | 28,000,000 | 26,950,000 | ||||||
|
| |||||||
| 34,464,744 | ||||||||
|
| |||||||
| Shares, Principal Amount, or Number of Contracts | Value | |||||||
Software — 0.67% |
| |||||||
First Data Corp. | $ | 18,000,000 | $ | 16,301,340 | ||||
Telecommunications — 2.47% |
| |||||||
Arinc, Inc. | 36,000,000 | 35,235,000 | ||||||
LightSquared LP | 56,004,463 | 23,381,863 | ||||||
Sorenson Communications, Inc. | 1,530,737 | 1,473,335 | ||||||
|
| |||||||
| 60,090,198 | ||||||||
|
| |||||||
Total BANK LOANS (Cost $221,067,058) | 185,344,426 | |||||||
|
| |||||||
| CORPORATE BONDS — 58.41% | ||||||||
Agriculture — 1.60% |
| |||||||
Lorillard Tobacco Co. | 12,000,000 | 14,294,376 | ||||||
Lorillard Tobacco Co. | 22,000,000 | 24,583,636 | ||||||
|
| |||||||
| 38,878,012 | ||||||||
|
| |||||||
Banks — 5.05% |
| |||||||
Chase Capital II | 21,879,000 | 14,991,163 | ||||||
First Chicago NBD Institutional Capital I 0.98%, 2/1/272 | 725,000 | 500,893 | ||||||
JP Morgan Chase Capital XXIII | 28,000,000 | 19,150,992 | ||||||
JPMorgan Chase & Co. | 48,813,000 | 51,970,713 | ||||||
JPMorgan Chase Capital XXI | 15,000,000 | 10,625,145 | ||||||
Morgan Stanley | 16,000,000 | 16,295,184 | ||||||
Wells Fargo & Co. | 8,500,000 | 9,105,625 | ||||||
|
| |||||||
| 122,639,715 | ||||||||
|
| |||||||
Biotechnology — 0.47% |
| |||||||
STHI Holding Corp. | 11,000,000 | 11,302,500 | ||||||
Chemicals — 2.88% |
| |||||||
CF Industries, Inc. | 25,395,000 | 30,029,587 | ||||||
Hexion U.S. Finance Corp./ Hexion Nova Scotia Finance ULC 8.88%, 2/1/18 | 2,000,000 | 1,875,000 | ||||||
Momentive Performance Materials, Inc. | 2,000,000 | 2,120,000 | ||||||
Notes to Financial Statements are an integral part of this Schedule.
4
Driehaus Active Income Fund
Schedule of Investments
December 31, 2011
| Shares, Principal Amount, or Number of Contracts | Value | |||||||
Momentive Performance Materials, Inc. | $ | 34,740,000 | $ | 25,881,300 | ||||
Nalco Co. | 8,665,000 | 10,029,738 | ||||||
|
| |||||||
| 69,935,625 | ||||||||
|
| |||||||
Commercial Services — 1.95% |
| |||||||
DynCorp International, Inc. | 28,927,000 | 25,166,490 | ||||||
Wyle Services Corp. | 22,285,000 | 22,285,000 | ||||||
|
| |||||||
| 47,451,490 | ||||||||
|
| |||||||
Computers — 2.22% |
| |||||||
Seagate HDD Cayman (Cayman Islands) | 36,330,000 | 38,646,037 | ||||||
Seagate HDD Cayman (Cayman Islands) | 15,000,000 | 15,412,500 | ||||||
|
| |||||||
| 54,058,537 | ||||||||
|
| |||||||
Diversified Financial Services — 2.59% |
| |||||||
American Express Co. | 56,843,000 | 56,558,785 | ||||||
Textron Financial Corp. | 8,824,000 | 6,353,280 | ||||||
|
| |||||||
| 62,912,065 | ||||||||
|
| |||||||
Electric — 1.00% |
| |||||||
Edison Mission Energy | 37,450,000 | 24,342,500 | ||||||
Entertainment — 2.81% |
| |||||||
Midwest Gaming Borrower LLC/Midwest Finance Corp. | 15,137,000 | 16,423,645 | ||||||
Production Resource Group, Inc. | 30,475,000 | 27,884,625 | ||||||
WM Finance Corp. | 3,500,000 | 3,797,500 | ||||||
WMG Acquisition Corp. 9.50%, 6/15/16 | 18,500,000 | 20,072,500 | ||||||
|
| |||||||
| 68,178,270 | ||||||||
|
| |||||||
Healthcare - Services — 2.97% |
| |||||||
Aurora Diagnostics Holdings / Aurora Diagnostics Financing, Inc. | 14,500,000 | 14,427,500 | ||||||
Healthsouth Corp. | 1,500,000 | 1,488,750 | ||||||
Healthsouth Corp. | 34,250,000 | 33,693,437 | ||||||
| Shares, Principal Amount, or Number of Contracts | Value | |||||||
Kindred Healthcare, Inc. 8.25%, 6/1/19 | $ | 9,400,000 | $ | 7,896,000 | ||||
National Mentor, Inc. 12.50%, 2/15/181 | 15,850,000 | 14,601,813 | ||||||
|
| |||||||
| 72,107,500 | ||||||||
|
| |||||||
Household Products/Wares — 1.13% |
| |||||||
Armored Autogroup, Inc. | 35,575,000 | 27,481,688 | ||||||
Insurance — 1.36% |
| |||||||
Chubb Corp. | 29,500,000 | 29,131,250 | ||||||
MBIA Insurance Corp. 14.00%, 1/15/331,2 | 7,150,000 | 4,004,000 | ||||||
|
| |||||||
| 33,135,250 | ||||||||
|
| |||||||
Iron/Steel — 1.66% |
| |||||||
Allegheny Technologies, Inc. | 13,000,000 | 16,602,027 | ||||||
ArcelorMittal (Luxembourg) | 25,625,000 | 23,813,671 | ||||||
|
| |||||||
| 40,415,698 | ||||||||
|
| |||||||
Leisure Time — 1.75% |
| |||||||
Equinox Holdings, Inc. 9.50%, 2/1/161 | 41,337,000 | 42,473,768 | ||||||
Lodging — 0.32% |
| |||||||
Hyatt Hotels Corp. | 7,000,000 | 7,811,377 | ||||||
Media — 1.05% |
| |||||||
Clear Channel Worldwide Holdings, Inc. | 600,000 | 645,000 | ||||||
Clear Channel Worldwide Holdings, Inc. | 2,400,000 | 2,592,000 | ||||||
ProQuest LLC/ProQuest Notes Co. | 27,605,000 | 22,360,050 | ||||||
|
| |||||||
| 25,597,050 | ||||||||
|
| |||||||
Metal Fabricate/Hardware — 0.22% |
| |||||||
Dynacast International LLC / Dynacast Finance, Inc. | 5,527,000 | 5,223,015 | ||||||
Miscellaneous Manufacturing — 2.45% |
| |||||||
Amsted Industries, Inc. 8.13%, 3/15/181 | 21,700,000 | 23,002,000 | ||||||
GE Capital Trust I | 37,140,000 | 36,490,050 | ||||||
|
| |||||||
| 59,492,050 | ||||||||
|
| |||||||
Notes to Financial Statements are an integral part of this Schedule.
5
Driehaus Active Income Fund
Schedule of Investments
December 31, 2011
| Shares, Principal Amount, or Number of Contracts | Value | |||||||
Oil & Gas — 1.51% |
| |||||||
Venoco, Inc. | $ | 40,780,000 | $ | 36,702,000 | ||||
Packaging & Containers — 0.65% |
| |||||||
Berry Plastics Corp. | 5,000,000 | 4,700,000 | ||||||
Berry Plastics Corp. | 6,000,000 | 5,985,000 | ||||||
Graham Packaging Co. LP/GPC Capital Corp. I | 5,000,000 | 5,081,250 | ||||||
|
| |||||||
| 15,766,250 | ||||||||
|
| |||||||
Pharmaceuticals — 1.85% |
| |||||||
ConvaTec Healthcare E S.A. (Luxembourg) | 39,666,000 | 35,401,905 | ||||||
Patheon, Inc. (Canada) | 12,000,000 | 9,540,000 | ||||||
|
| |||||||
| 44,941,905 | ||||||||
|
| |||||||
Pipelines — 1.56% |
| |||||||
Enbridge Energy Partners LP | 31,500,000 | 33,282,963 | ||||||
Oneok, Inc. | 4,250,000 | 4,548,958 | ||||||
|
| |||||||
| 37,831,921 | ||||||||
|
| |||||||
Retail — 7.96% |
| |||||||
Gymboree Corp. | 17,500,000 | 15,312,500 | ||||||
Michaels Stores, Inc. | 18,730,000 | 19,851,927 | ||||||
Michaels Stores, Inc. | 23,000,000 | 23,230,000 | ||||||
Neiman Marcus Group, Inc. | 19,985,000 | 20,759,619 | ||||||
Rite Aid Corp. | 21,400,000 | 20,918,500 | ||||||
Rite Aid Corp. | 18,000,000 | 17,370,000 | ||||||
Rite Aid Corp. | 17,000,000 | 16,405,000 | ||||||
Rite Aid Corp. | 6,000,000 | 6,570,000 | ||||||
Rite Aid Corp. | 25,850,000 | 27,465,625 | ||||||
Rite Aid Corp. | 2,859,000 | 2,855,426 | ||||||
Rite Aid Corp. | 18,850,000 | 17,200,625 | ||||||
Rite Aid Corp. | 5,000,000 | 5,512,500 | ||||||
|
| |||||||
| 193,451,722 | ||||||||
|
| |||||||
| Shares, Principal Amount, or Number of Contracts | Value | |||||||
Software — 1.52% |
| |||||||
First Data Corp. | $ | 29,165,000 | $ | 24,206,950 | ||||
SSI Investments II/SSI Co.-Issuer LLC | 12,000,000 | 12,690,000 | ||||||
|
| |||||||
| 36,896,950 | ||||||||
|
| |||||||
Telecommunications — 9.88% |
| |||||||
Clearwire Communications LLC/Clearwire Finance, Inc. | 36,600,000 | 35,044,500 | ||||||
Clearwire Communications LLC/Clearwire Finance, Inc. | 77,000,000 | 74,112,500 | ||||||
Clearwire Communications LLC/Clearwire Finance, Inc. | 14,110,000 | 11,781,850 | ||||||
CommScope, Inc. | 50,300,000 | 50,300,000 | ||||||
NII Capital Corp. | 28,427,000 | 28,213,797 | ||||||
Telcordia Technologies, Inc. | 32,000,000 | 40,640,000 | ||||||
|
| |||||||
| 240,092,647 | ||||||||
|
| |||||||
Total CORPORATE BONDS (Cost $1,451,280,537) | 1,419,119,505 | |||||||
|
| |||||||
| CONVERTIBLE CORPORATE BONDS — 11.13% | ||||||||
Auto Manufacturers — 2.25% |
| |||||||
Ford Motor Co. | 38,150,000 | 54,697,563 | ||||||
Computers — 1.51% |
| |||||||
SanDisk Corp. | 31,100,000 | 36,620,250 | ||||||
Electrical Components & Equipment — 2.60% |
| |||||||
SunPower Corp. | 46,334,000 | 38,051,797 | ||||||
Suntech Power Holdings Co., Ltd. (China) | 60,322,000 | 25,184,435 | ||||||
|
| |||||||
| 63,236,232 | ||||||||
|
| |||||||
Internet — 0.97% |
| |||||||
WebMD Health Corp. 2.25%, 3/31/161 | 24,450,000 | 23,472,000 | ||||||
Lodging — 0.63% |
| |||||||
Gaylord Entertainment Co. | 13,730,000 | 15,274,625 | ||||||
Real Estate Investment Trusts — 1.17% |
| |||||||
Host Hotels & Resorts LP 2.50%, 10/15/291 | 23,000,000 | 28,491,250 | ||||||
Notes to Financial Statements are an integral part of this Schedule.
6
Driehaus Active Income Fund
Schedule of Investments
December 31, 2011
| Shares, Principal Amount, or Number of Contracts | Value | |||||||
Software — 1.61% |
| |||||||
Electronic Arts, Inc. | $ | 40,220,000 | $ | 39,063,675 | ||||
Telecommunications — 0.39% |
| |||||||
Clearwire Communications LLC/Clearwire Finance, Inc. | 15,044,000 | 9,552,940 | ||||||
|
| |||||||
Total CONVERTIBLE | 270,408,535 | |||||||
|
| |||||||
| U.S. GOVERNMENT AND AGENCY SECURITIES — 0.05% | ||||||||
Freddie Mac Non Gold Pool | 1,109,625 | 1,169,542 | ||||||
|
| |||||||
Total U.S. GOVERNMENT | 1,169,542 | |||||||
|
| |||||||
| COMMON STOCK — 3.29% | ||||||||
Airlines — 0.09% |
| |||||||
United Continental Holdings, Inc.* | 118,124 | 2,229,000 | ||||||
Auto Manufacturers — 1.16% |
| |||||||
General Motors Co.* | 1,394,763 | 28,271,846 | ||||||
Auto Parts & Equipment — 1.08% |
| |||||||
Lear Corp. | 551,360 | 21,944,128 | ||||||
TRW Automotive Holdings Corp.* | 128,329 | 4,183,525 | ||||||
|
| |||||||
| 26,127,653 | ||||||||
|
| |||||||
Investment Companies — 0.34% |
| |||||||
Ares Capital Corp. | 535,996 | 8,281,138 | ||||||
Real Estate Investment Trusts — 0.32% |
| |||||||
Annaly Capital Management, Inc. |
| 491,620 |
| 7,846,255 | ||||
Software — 0.30% |
| |||||||
Microsoft Corp. | 280,637 | 7,285,337 | ||||||
|
| |||||||
Total COMMON STOCK | 80,041,229 | |||||||
|
| |||||||
| CONVERTIBLE PREFERRED STOCK — 5.56% | ||||||||
Auto Manufacturers — 0.10% |
| |||||||
General Motors Corp. Senior Convertible Preferred Escrow - B 5.25%, 3/6/324 | 475,000 | 90,250 | ||||||
General Motors Corp. Senior Convertible Preferred Escrow - C 6.25%, 7/15/334 | 11,790,650 | 2,240,223 | ||||||
|
| |||||||
| 2,330,473 | ||||||||
|
| |||||||
| Shares, Principal Amount, or Number of Contracts | Value | |||||||
Banks — 2.90% |
| |||||||
Bank of America Corp. 7.25%, 12/31/49 | $ | 84,896 | $ | 66,899,746 | ||||
Citigroup, Inc. | 45,000 | 3,656,250 | ||||||
|
| |||||||
| 70,555,996 | ||||||||
|
| |||||||
Telecommunications — 2.56% |
| |||||||
Lucent Technologies Capital Trust I | 101,162 | 62,113,468 | ||||||
|
| |||||||
Total CONVERTIBLE | 134,999,937 | |||||||
|
| |||||||
| PREFERRED STOCKS — 5.07% | ||||||||
Banks — 0.41% |
| |||||||
Goldman Sachs Group, Inc. | 400,000 | 9,908,000 | ||||||
Food — 1.22% |
| |||||||
H.J. Heinz Finance Co. 8.00%, 7/15/131 | 285 | 29,764,688 | ||||||
Office/Business Equipment — 2.17% |
| |||||||
Pitney Bowes International Holdings, Inc. | 57,950 | 52,734,500 | ||||||
Telecommunications — 1.27% |
| |||||||
Centaur Funding Corp. (Cayman Islands) | 27,242 | 30,868,591 | ||||||
|
| |||||||
Total PREFERRED STOCKS | 123,275,779 | |||||||
|
| |||||||
| PURCHASED PUT OPTIONS — 0.27% | ||||||||
Annaly Capital Management, Inc., Exercise Price: $17.50, Expiration Date: January, 2012* | 4,096 | 626,688 | ||||||
Ares Capital Corp., Exercise Price: $15.00, Expiration Date: January, 2012* | 5,456 | 95,480 | ||||||
MBIA, Inc., Exercise Price: $5.00, Expiration Date: January, 2012*4 | 3,300 | — | ||||||
MBIA, Inc., Exercise Price: $4.00, Expiration Date: January, 2012*4 | 2,700 | — | ||||||
Standard and Poor’s 500 Index, Exercise Price: $1,175.00, Expiration Date: February, 2012* | 465 | 799,800 | ||||||
Notes to Financial Statements are an integral part of this Schedule.
7
Driehaus Active Income Fund
Schedule of Investments
December 31, 2011
| Shares, Principal Amount, or Number of Contracts | Value | |||||||
Standard and Poor’s 500 Index, Exercise Price: $1,200.00, Expiration Date: February, 2012* | 465 | $ | 1,023,000 | |||||
Standard and Poor’s 500 Index, Exercise Price: $1,250.00, Expiration Date: February, 2012* | 930 | 3,645,600 | ||||||
The Goodyear Tire & Rubber Company, Exercise Price: $11.00, Expiration Date: April, 2012* | 6,068 | 273,060 | ||||||
The Goodyear Tire & Rubber Company, Exercise Price: $10.00, Expiration Date: January, 2012*4 | 11,193 | — | ||||||
|
| |||||||
Total PURCHASED PUT OPTIONS | 6,463,628 | |||||||
|
| |||||||
| DEMAND DEPOSIT — 10.50% | ||||||||
UMB Money Market Fiduciary 0.01% | 255,111,473 | 255,111,473 | ||||||
|
| |||||||
Total DEMAND DEPOSIT | 255,111,473 | |||||||
|
| |||||||
| WARRANTS — 0.91% | ||||||||
General Motors Co. - CW 16, Strike Price $10.00, Expiration Date 7/10/16 | 1,136,155 | 13,327,098 | ||||||
General Motors Co. - CW 19, Strike Price $18.33, Expiration Date 7/10/19 | 1,136,155 | 8,884,732 | ||||||
|
| |||||||
Total WARRANTS | 22,211,830 | |||||||
|
| |||||||
| ||||||||
TOTAL INVESTMENTS (Cost $2,771,108,714) | 105.56 | % | 2,564,845,708 | |||||
Liabilities less Other Assets | (5.56 | )% | (135,111,385 | ) | ||||
|
|
|
| |||||
| Net Assets | 100.00 | % | $ | 2,429,734,323 | ||||
| ||||||||
| SECURITIES SOLD SHORT — (6.55)% | ||||||||
| ||||||||
| CORPORATE BONDS — (0.41)% | ||||||||
Chemicals — (0.26)% | ||||||||
Huntsman International LLC | $ | (6,000,000 | ) | (6,420,000 | ) | |||
| Shares, Principal Amount, or Number of Contracts | Value | |||||||
Food — (0.15)% |
| |||||||
BI-LO LLC / BI-LO Finance Corp. | $ | (3,400,000 | ) | $ | (3,536,000 | ) | ||
|
| |||||||
Total CORPORATE BONDS (Proceeds $8,974,706) | (9,956,000 | ) | ||||||
|
| |||||||
| CONVERTIBLE CORPORATE BONDS — (1.58)% | ||||||||
Software — (1.58)% |
| |||||||
Microsoft Corp. | (37,500,000 | ) | (38,343,750 | ) | ||||
|
| |||||||
Total CONVERTIBLE CORPORATE BONDS (Proceeds $38,228,889) | (38,343,750 | ) | ||||||
|
| |||||||
| COMMON STOCK — (4.50)% | ||||||||
Airlines — (0.00)% |
| |||||||
United Continental Holdings, Inc.* | (1,848 | ) | (34,872 | ) | ||||
Auto Manufacturers — (1.68)% |
| |||||||
Ford Motor Co.* | (3,788,112 | ) | (40,760,085 | ) | ||||
Banks — (0.18)% |
| |||||||
Bank of America Corp. | (806,890 | ) | (4,486,308 | ) | ||||
Computers — (0.87)% |
| |||||||
SanDisk Corp.* | (427,402 | ) | (21,032,452 | ) | ||||
Electrical Components & Equipment — (0.00)% |
| |||||||
SunPower Corp.* | (13,869 | ) | (86,404 | ) | ||||
Healthcare - Services — (0.03)% |
| |||||||
Kindred Healthcare, Inc.* | (67,132 | ) | (790,144 | ) | ||||
Internet — (0.12)% |
| |||||||
WebMD Health Corp.* | (80,970 | ) | (3,040,423 | ) | ||||
Lodging — (0.39)% |
| |||||||
Gaylord Entertainment Co.* | (387,621 | ) | (9,357,171 | ) | ||||
Real Estate Investment Trusts — (0.73)% |
| |||||||
Host Hotels & Resorts, Inc. | (1,193,449 | ) | (17,627,242 | ) | ||||
Software — (0.50)% |
| |||||||
Electronic Arts, Inc.* | (591,300 | ) | (12,180,780 | ) | ||||
|
| |||||||
Total COMMON STOCK (Proceeds $128,702,354) | (109,395,881 | ) | ||||||
|
| |||||||
| WRITTEN PUT OPTIONS — (0.06)% | ||||||||
Standard and Poor’s 500 Index, Exercise Price: $1,075.00, Expiration Date: February, 2012* | (465 | ) | (271,095 | ) | ||||
Standard and Poor’s 500 Index, Exercise Price: $1,100.00, Expiration Date: February, 2012* | (1,395 | ) | (1,102,050 | ) | ||||
Notes to Financial Statements are an integral part of this Schedule.
8
Driehaus Active Income Fund
Schedule of Investments
December 31, 2011
| Shares, Principal Amount, or Number of Contracts | Value | |||||||
The Goodyear Tire & Rubber Company, Exercise Price: $10.00, Expiration Date: January, 2012*4 | (14 | ) | $ | — | ||||
|
| |||||||
Total WRITTEN PUT OPTIONS | (1,373,145 | ) | ||||||
|
| |||||||
| ||||||||
TOTAL INVESTMENT SECURITIES SOLD SHORT (Proceeds $181,945,298) | (6.55 | )% | $ | (159,068,776 | ) | |||
| ||||||||
| * | Non-income producing security. |
| 1 | 144A restricted security. |
| 2 | Variable rate security. |
| 3 | Foreign security denominated in U.S. dollars and traded on a U.S. exchange. |
| 4 | Security valued at fair value as determined in good faith by Driehaus Capital Management LLC, investment adviser to the Fund, in accordance with procedures established by, and under the general supervision of, the Trust’s Board of Trustees. |
Percentages are stated as a percent of net assets.
Notes to Financial Statements are an integral part of this Schedule.
9
Driehaus Active Income Fund
Schedule of Investments
December 31, 2011
| Counterparty | Reference Instrument | Notional AmountB | Pay/ ReceiveA Fixed Rate | Fixed Rate | Expiration Date | Premium Paid (Received) | Unrealized Appreciation/ (Depreciation) | Credit Event | RatingC | |||||||||||||||||||
SWAP CONTRACTS | ||||||||||||||||||||||||||||
Credit Default Swaps | ||||||||||||||||||||||||||||
| Goldman Sachs | Alcatel-Lucent USA, Inc. 6.50%, 1/15/28 | $ | 15,000,000 | Pay | 5.00% | 9/20/2012 | $ | (480,584 | ) | $ | 973,052 | Bankruptcy/FTP | B | |||||||||||||||
| Goldman Sachs | Alcatel-Lucent USA, Inc. 6.50%, 1/15/28 | 5,000,000 | Pay | 5.00 | 12/20/2012 | (278,812 | ) | 525,573 | Bankruptcy/FTP | B | ||||||||||||||||||
| Morgan Stanley | American Express Co. 5.50%, 9/12/16 | 25,000,000 | Pay | 1.00 | 12/20/2016 | 324,580 | (188,426 | ) | Bankruptcy/FTP | BBB+ | ||||||||||||||||||
| Goldman Sachs | Bank of America Corp. 6.25%, 4/15/12 | 10,000,000 | Pay | 1.00 | 12/20/2016 | 1,499,776 | (228,234 | ) | Bankruptcy/FTP | A- | ||||||||||||||||||
| Goldman Sachs | Boston Properties L.P. 6.25%, 1/15/13 | 11,000,000 | Pay | 1.00 | 9/20/2014 | 848,323 | (840,770 | ) | Bankruptcy/FTP | A- | ||||||||||||||||||
| Goldman Sachs | Brunswick Corp. 7.13%, 8/1/27 | 10,000,000 | Pay | 5.00 | 12/20/2014 | 40,542 | (887,071 | ) | Bankruptcy/FTP | B | ||||||||||||||||||
| Goldman Sachs | Brunswick Corp. 7.13%, 8/1/27 | 10,000,000 | Pay | 5.00 | 12/20/2014 | (143,212 | ) | (703,317 | ) | Restructuring/ Bankruptcy/FTP | B | |||||||||||||||||
| Goldman Sachs | Centex Corp. 5.25%, 6/15/15 | 5,000,000 | Pay | 4.21 | 3/20/2013 | — | (110,510 | ) | Bankruptcy/FTP | BB- | ||||||||||||||||||
| Merrill Lynch | Citigroup, Inc. 6.13%, 5/15/18 | 5,000,000 | Pay | 1.00 | 12/20/2016 | 432,520 | (33,419 | ) | Bankruptcy/FTP | A- | ||||||||||||||||||
| Goldman Sachs | Citigroup, Inc. 6.13%, 5/15/18 | 5,000,000 | Pay | 1.00 | 12/20/2016 | 379,663 | 19,437 | Bankruptcy/FTP | A- | |||||||||||||||||||
| Goldman Sachs | Continental Airlines, Inc. 5.00%, 6/15/23 | 1,000,000 | Receive | 5.00 | 6/20/2013 | (400,000 | ) | 370,592 | Bankruptcy/FTP | B | ||||||||||||||||||
| Goldman Sachs | Continental Airlines, Inc. 5.00%, 6/15/23 | 500,000 | Receive | 4.93 | 6/20/2012 | — | (749 | ) | Bankruptcy/FTP | B | ||||||||||||||||||
| Goldman Sachs | Continental Airlines, Inc. 5.00%, 6/15/23 | 1,000,000 | Receive | 5.00 | 6/20/2013 | (290,000 | ) | 260,592 | Bankruptcy/FTP | B | ||||||||||||||||||
| Goldman Sachs | CVS Caremark Corp. 4.88%, 9/15/14 | 10,000,000 | Pay | 1.00 | 9/20/2014 | (286,840 | ) | 112,349 | Bankruptcy/FTP | BBB+ | ||||||||||||||||||
| Goldman Sachs | CVS Caremark Corp. 6.13%, 8/15/16 | 5,000,000 | Pay | 1.00 | 12/20/2016 | (76,759 | ) | (16,722 | ) | Bankruptcy/FTP | BBB+ | |||||||||||||||||
| Goldman Sachs | Dow Jones CDX NA High Yield Series II Index | 7,650,000 | Pay | 5.00 | 12/20/2013 | 2,108,531 | (2,054,841 | ) | Bankruptcy/FTP | CCC | ||||||||||||||||||
| Goldman Sachs | Dow Jones CDX NA Investment Grade Series 8 Index | 2,420,000 | Receive | 0.35 | 6/20/2012 | (34,974 | ) | 20,077 | Bankruptcy/FTP | BBB | ||||||||||||||||||
| Goldman Sachs | Eastman Kodak Co. 7.25%, 11/15/13 | 14,000,000 | Pay | 5.00 | 9/20/2014 | 3,030,000 | 5,464,117 | Bankruptcy/FTP | D | |||||||||||||||||||
| Goldman Sachs | Eastman Kodak Co. 7.25%, 11/15/13 | 14,000,000 | Receive | 5.00 | 9/20/2016 | (4,200,000 | ) | (4,913,263 | ) | Bankruptcy/FTP | D | |||||||||||||||||
| Goldman Sachs | Enbridge Energy, L.P. 4.75%, 6/1/13 | 10,000,000 | Pay | 1.00 | 6/20/2015 | 56,732 | 56,676 | Bankruptcy/FTP | BBB | |||||||||||||||||||
| Goldman Sachs | First Data Corp. 9.88%, 9/24/15 | 5,000,000 | Pay | 5.00 | 6/20/2016 | 350,000 | 671,547 | Bankruptcy/FTP | B- | |||||||||||||||||||
| Goldman Sachs | H.J. Heinz Co. 6.38%, 7/15/28 | 10,000,000 | Pay | 1.00 | 9/20/2014 | (320,193 | ) | 115,303 | Bankruptcy/FTP | BBB+ | ||||||||||||||||||
| Goldman Sachs | Host Hotels & Resorts, Inc. 6.75%, 6/1/16 | 10,000,000 | Pay | 1.00 | 12/20/2016 | 1,067,644 | (112,532 | ) | Bankruptcy/FTP | BB+ | ||||||||||||||||||
Notes to Financial Statements are an integral part of this Schedule.
10
Driehaus Active Income Fund
Schedule of Investments
December 31, 2011
| Counterparty | Reference Instrument | Notional AmountB | Pay/ ReceiveA Fixed Rate | Fixed Rate | Expiration Date | Premium Paid (Received) | Unrealized Appreciation/ (Depreciation) | Credit Event | RatingC | |||||||||||||||||||
| Goldman Sachs | Huntsman Corp. 11.50%, 7/15/12 | $ | 5,000,000 | Pay | 5.00 | % | 12/20/2016 | $ | 124,119 | $ | 161,677 | Bankruptcy/FTP | B+ | |||||||||||||||
| Goldman Sachs | iStar Financial, Inc. 6.00%, 12/15/10 | 4,000,000 | Pay | 5.50 | 3/20/2013 | — | 360,900 | Bankruptcy/FTP | B+ | |||||||||||||||||||
| Goldman Sachs | iStar Financial, Inc. 6.00%, 12/15/10 | 4,000,000 | Pay | 5.05 | 6/20/2013 | — | 408,134 | Bankruptcy/FTP | B+ | |||||||||||||||||||
| Goldman Sachs | iStar Financial, Inc. 5.95%, 10/15/13 | 5,000,000 | Pay | 5.00 | 6/20/2013 | 700,000 | (186,744 | ) | Bankruptcy/FTP | B+ | ||||||||||||||||||
| Goldman Sachs | iStar Financial, Inc. 5.95%, 10/15/13 | 5,000,000 | Pay | 5.00 | 6/20/2013 | 725,000 | (211,744 | ) | Restructuring/ Bankruptcy/FTP | B+ | ||||||||||||||||||
| Goldman Sachs | Limited Brands, Inc. 6.13%, 12/1/12 | 4,150,000 | Pay | 3.38 | 6/20/2013 | — | (163,182 | ) | Restructuring/ Bankruptcy/FTP | BB+ | ||||||||||||||||||
| Goldman Sachs | Limited Brands, Inc. 6.13%, 12/1/12 | 4,700,000 | Pay | 2.55 | 6/20/2013 | — | (126,505 | ) | Restructuring/ Bankruptcy/FTP | BB+ | ||||||||||||||||||
| Goldman Sachs | Limited Brands, Inc. 6.90%, 7/15/17 | 15,000,000 | Pay | 1.00 | 12/20/2015 | 679,159 | (318,496 | ) | Restructuring/ Bankruptcy/FTP | BB+ | ||||||||||||||||||
| Goldman Sachs | Liz Claiborne, Inc. 5.00%, 7/8/13 | 15,000,000 | Pay | 5.00 | 9/20/2014 | 1,875,000 | (2,353,025 | ) | Restructuring/ Bankruptcy/FTP | CCC | ||||||||||||||||||
| Goldman Sachs | Liz Claiborne, Inc. 5.00%, 7/8/13 | 15,000,000 | Pay | 5.00 | 12/20/2014 | 1,087,500 | (1,547,798 | ) | Restructuring/ Bankruptcy/FTP | CCC | ||||||||||||||||||
| Goldman Sachs | Markit CDX NA High Yield Series 16 Index | 14,600,000 | Pay | 5.00 | 12/20/2016 | 1,541,000 | (541,009 | ) | Bankruptcy/FTP | CCC | ||||||||||||||||||
| Merrill Lynch | Markit CDX NA High Yield Series 16 Index | 5,000,000 | Pay | 5.00 | 12/20/2016 | 550,000 | (207,537 | ) | Bankruptcy/FTP | CCC | ||||||||||||||||||
| Goldman Sachs | Masco Corp. 6.13%, 10/3/16 | 15,000,000 | Pay | 1.00 | 12/20/2015 | 1,047,333 | 177,789 | Bankruptcy/FTP | BBB- | |||||||||||||||||||
| Morgan Stanley | Masco Corp. 6.13%, 10/3/16 | 4,500,000 | Pay | 1.00 | 3/20/2016 | 273,169 | 130,783 | Bankruptcy/FTP | BBB- | |||||||||||||||||||
| Goldman Sachs | Newell Rubbermaid, Inc. 5.50%, 4/15/13 | 30,000,000 | Pay | 1.00 | 6/20/2014 | 620,488 | (887,141 | ) | Bankruptcy/FTP | BBB- | ||||||||||||||||||
| Merrill Lynch | Pitney Bowes, Inc. 4.63%, 10/1/12 | 25,000,000 | Pay | 1.00 | 3/20/2016 | 562,996 | 620,202 | Bankruptcy/FTP | BBB+ | |||||||||||||||||||
| Goldman Sachs | Pitney Bowes, Inc. 6.25%, 3/15/19 | 5,000,000 | Pay | 1.00 | 9/20/2016 | 164,656 | 141,604 | Bankruptcy/FTP | BBB+ | |||||||||||||||||||
| Morgan Stanley | Pitney Bowes, Inc. 6.25%, 3/15/19 | 5,000,000 | Pay | 1.00 | 12/20/2016 | 244,614 | 94,853 | Bankruptcy/FTP | BBB+ | |||||||||||||||||||
| Goldman Sachs | RadioShack Corp. 7.38%, 5/15/11 | 9,000,000 | Pay | 2.27 | 9/20/2013 | — | 357,977 | Bankruptcy/FTP | BB | |||||||||||||||||||
| Goldman Sachs | Realogy Corp. 10.50%, 4/15/14 | 5,000,000 | Pay | 5.00 | 3/20/2016 | 475,000 | 858,647 | Bankruptcy/FTP | CC | |||||||||||||||||||
| Merrill Lynch | Rite Aid Corp. 7.70%, 2/15/27 | 10,000,000 | Pay | 5.00 | 12/20/2013 | 700,000 | (352,801 | ) | Bankruptcy/FTP | CCC | ||||||||||||||||||
| Goldman Sachs | Saks, Inc. 2.00%, 3/15/24 | 10,000,000 | Pay | 5.00 | 12/20/2016 | 406,250 | (758,963 | ) | Bankruptcy/FTP | BB | ||||||||||||||||||
| Morgan Stanley | Sprint Nextel Corp. 6.00%, 12/1/16 | 5,000,000 | Pay | 5.00 | 3/20/2016 | (354,760 | ) | 971,569 | Bankruptcy/FTP | B+ | ||||||||||||||||||
| Goldman Sachs | Standard Pacific Corp. 7.00%, 8/15/15 | 4,000,000 | Receive | 6.70 | 9/20/2013 | — | 107,434 | Bankruptcy/FTP | B | |||||||||||||||||||
Notes to Financial Statements are an integral part of this Schedule.
11
Driehaus Active Income Fund
Schedule of Investments
December 31, 2011
| Counterparty | Reference Instrument | Notional AmountB | Pay/ ReceiveA Fixed Rate | Fixed Rate | Expiration Date | Premium Paid (Received) | Unrealized Appreciation/ (Depreciation) | Credit Event | RatingC | |||||||||||||||||||
| Goldman Sachs | The Chubb Corp. 6.60%, 8/15/18 | $ | 10,000,000 | Pay | 1.00 | 12/20/2014 | $ | (242,813 | ) | $ | 72,180 | Bankruptcy/FTP | A+ | |||||||||||||||
| Goldman Sachs | The Chubb Corp. 6.60%, 8/15/18 | 10,000,000 | Pay | 1.00 | 3/20/2015 | (257,326 | ) | 80,345 | Bankruptcy/FTP | A+ | ||||||||||||||||||
| Goldman Sachs | TRW Automotive, Inc. 7.25%, 3/15/17 | 5,000,000 | Pay | 5.00 | % | 3/20/2015 | 92,579 | (388,942 | ) | Bankruptcy/FTP | BB+ | |||||||||||||||||
| Goldman Sachs | TRW Automotive, Inc. 7.25%, 3/15/17 | 3,000,000 | Pay | 5.00 | 6/20/2015 | (133,100 | ) | (41,745 | ) | Bankruptcy/FTP | BB+ | |||||||||||||||||
| Goldman Sachs | Tyson Foods, Inc. 6.85%, 4/1/16 | 6,000,000 | Pay | 3.05 | 9/20/2013 | — | (251,778 | ) | Bankruptcy/FTP | BBB- | ||||||||||||||||||
| Goldman Sachs | Vornado Realty L.P. 4.75%, 12/1/10 | 5,500,000 | Pay | 1.50 | 6/20/2013 | — | (43,646 | ) | Restructuring/ Bankruptcy/FTP | BBB | ||||||||||||||||||
| Morgan Stanley | Vulcan Materials Co. 6.40%, 11/30/17 | 5,000,000 | Pay | 5.00 | 12/20/2016 | 255,000 | (619,237 | ) | Bankruptcy/FTP | BB | ||||||||||||||||||
|
|
|
| |||||||||||||||||||||||||
Total Credit Default Swaps |
| 14,762,801 | (5,956,738 | ) | ||||||||||||||||||||||||
|
|
|
| |||||||||||||||||||||||||
Total Swap Contracts |
| $ | 14,762,801 | $ | (5,956,738 | ) | ||||||||||||||||||||||
|
|
|
| |||||||||||||||||||||||||
| A | If the Fund is paying a fixed rate, the counterparty acts as guarantor of the variable instrument and thus the Fund is a buyer of protection. If the Fund is receiving a fixed rate, the Fund acts as guarantor of the variable insturment and thus is a seller of protection. |
| B | For contracts to sell protection, the notional amout is equal to the maximum potential amount of the future payments and no recourse has been entered into in association with the contracts. |
| C | Based on Standard & Poor’s corporation credit rating. |
FTP=Failure to Pay
FUTURES CONTRACTS
| Futures Contracts | Number of Contracts Long/(Short) | Expiration Date | Unrealized Appreciation/ (Depreciation) | |||||||||
U.S. 5 Year Treasury Note | (1,889 | ) | March 2012 | $ | (1,080,852 | ) | ||||||
U.S. 10 Year Treasury Note | (3,299 | ) | March 2012 | (4,848,949 | ) | |||||||
U.S. 30 Year Treasury Note | (232 | ) | March 2012 | (413,684 | ) | |||||||
|
| |||||||||||
Total Futures Contracts | $ | (6,343,485 | ) | |||||||||
|
| |||||||||||
Notes to Financial Statements are an integral part of this Schedule.
12
Driehaus Select Credit Fund — Portfolio Managers’ Letter
Dear Shareholders,
The Driehaus Select Credit Fund (“Fund”) returned -2.64% for the year ending December 31, 2011. This return was below the performance of the Fund’s benchmark index, the Citigroup 3-Month T-Bill Index (the “Benchmark”), which returned 0.08% for the same period. The Fund also underperformed the Merrill Lynch U.S. High Yield Master II Index (the “Index”), which returned 4.38% for the same period.
We experienced a number of periods of weaker performance throughout the second half of the year. They were kicked off by a downgrade in the U.S. credit markets and further fueled by concerns of sovereign defaults. The year began with concerns about Greece and ended with the spotlight on Italy. Over a five month period, the credit markets struggled with concerns of financial contagion and slowing global growth, as well as one way flows driven by large-scale deleveraging by the bank and hedge fund community. Frustratingly, the volatility segment (generally, put spreads on the S&P 500 Index) of our portfolio detracted from performance for the year as we struggled with the anomaly of a rising equity market (declining volatility) against a collapsing high yield market.
As we reflect on the year, we certainly got some calls incorrect. In hindsight, we should have placed less exposure on lower quality credits, more emphasis on the short-term chaos that could result in our markets from the Eurozone crisis and realized that the hedge fund community would be deleveraging through the remainder of 2011. We believe taking any of these actions would have limited losses to the Fund to more tolerable levels.
At the same time, last year was somewhat of an anomaly as a number of factors outside of our control worked against our strategy. We manage concentrated portfolios where company fundamentals are the most significant determinant of our positioning. Company fundamentals were, and continue to be, quite strong in spite of the Eurozone crisis and a dysfunctional U.S. political environment. In other words, our portfolio companies’ results and outlooks did not foreshadow the sharp drop in prices we experienced in many of these positions. Additionally, the sharp drop in interest rates served as a substantial drag on our results. Even during this cycle of falling rates, last year was quite exceptional. The yield on the U.S. 10 Year Treasury dropped 143 basis points throughout the year to finish at 1.88%. That is the third largest drop in the 10 Year Treasury yield over the past 20 years, trailing only 1995 (230 basis point drop) and 2008 (221 basis point drop).
The main detractors from performance during the year came from holdings within the capital structure arbitrage and event-driven segments in addition to the Fund’s interest rate hedge. Capital structure arbitrage is where the Fund attempts to exploit a pricing inefficiency between two securities of the same company. Losses within that segment occurred primarily in the third quarter and were attributed to pressure on certain large financial institutions and spread widening in positions within a large data processor and telecom infrastructure company. Within the event-driven segment, where the Fund tries to profit from an event such as a merger or reorganization, accelerating investor caution around the U.S. auto market and pressure on U.S. financial institutions weighed on the strategy, especially during the last five months of the year. The interest rate hedge, which is constructed by shorting U.S. Treasury futures and U.S. Treasury securities, detracted as both the 10 and 30 Year U.S. Treasury bond yields collapsed by over 140 basis points, resulting in a decline for the hedge. The Fund also implemented option strategies related to its volatility hedge, which consisted of various straddles or strangles on the S&P 500 Index. These option strategies had little impact on the Fund during the first three quarters of the year and declined during the fourth quarter as equities prices moved higher and volatility dropped. Despite high yield spreads ending the year nearly 200 basis points wider, the directional long segment of the Fund was the largest contributor to returns, driven by both a healthy coupon in our directional long positions and outperformance in months when investment sentiment was positive.
We are particularly excited entering the new year as we believe individual credits will be the story in 2012, as opposed to the macro-driven trading environment of 2011. The high correlation, flight-to-quality market of 2011 left many credits impaired on a mark-to-market basis. That has left a lot of opportunity for us to sift through as we look for interesting stories and trades that can weather a number of macro-trading environments. If we are correct in our analysis of the credit quality of these firms, and we structure the trade correctly, then we anticipate they should perform under a variety of trading environments. Remember that unlike stocks, bonds cannot trade “cheap” to a fundamental value forever. There is a maturity date associated with these bonds, and on that maturity date that bond will either be retired or in default.
13
As always, we at Driehaus Capital Management LLC thank you for your interest in the Driehaus Select Credit Fund and would like to express our gratitude to you as shareholders for your continued confidence in our management capabilities.
Sincerely,
| | | ||
| K.C. Nelson | Mirsada Durakovic | Elizabeth Cassidy | ||
| Portfolio Manager | Assistant Portfolio Manager | Assistant Portfolio Manager |
Performance is historical and does not represent future results.
14
Driehaus Select Credit Fund
Performance Overview (unaudited)
The performance summarized below is historical and does not represent future results. Investment returns and principal value vary, and you may have a gain or loss when you sell shares. Performance data presented measures the change in the value of an investment in the Fund, assuming reinvestment of all dividends and capital gains.
The table does not reflect the deduction of taxes that a shareholder would pay on Fund distributions or the redemption of Fund shares. The graph compares the results of a $25,000 investment (minimum investment) in the Fund since September 30, 2010 (the date of the Fund’s inception), with all dividends and capital gains reinvested, with the indicated indices (and dividends reinvested) for the same period.
| Average Annual Total Returns as of 12/31/11 | 1 Year | Since Inception (09/30/10 - 12/31/11) | ||||||
Driehaus Select Credit Fund (DRSLX)1 | –2.64% | 0.55% | ||||||
Citigroup 3-Month T-Bill Index2 | 0.08% | 0.09% | ||||||
Merrill Lynch U.S. High Yield Master II Index3 | 4.38% | 6.01% | ||||||
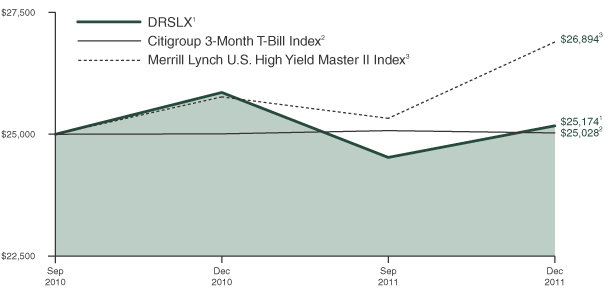
| 1 | The returns for the periods prior to February 1, 2011, reflect fee waivers and/or reimbursements without which performance would have been lower. |
| 2 | The Citigroup 3-Month T-Bill Index is designed to mirror the performance of the 3 month U.S. Treasury Bill. The Citigroup 3-Month T-Bill Index is unmanaged and its returns reflect reinvestment of all distributions and changes in market prices. |
| 3 | The Merrill Lynch U.S. High Yield Master II Index is an unmanaged index that tracks the performance of below-investment grade, U.S.-dollar denominated corporate bonds publicly issued in the U.S. domestic market. |
15
Driehaus Select Credit Fund
Schedule of Investments
December 31, 2011
| Shares, Principal Amount, or Number of Contracts | Value | |||||||
| BANK LOANS — 7.80% | ||||||||
Internet — 1.99% |
| |||||||
Mood Media Corp. (Canada) | $ | 4,000,000 | $ | 3,670,000 | ||||
Media — 1.32% |
| |||||||
Cumulus Media, Inc. | 2,500,000 | 2,428,125 | ||||||
Oil & Gas — 2.16% |
| |||||||
Buffalo Gulf Coast Terminals | 3,990,000 | 3,990,000 | ||||||
Retail — 1.53% |
| |||||||
Targus Group International | 2,985,000 | 2,813,363 | ||||||
Telecommunications — 0.80% |
| |||||||
Arinc, Inc. | 1,500,000 | 1,468,125 | ||||||
|
| |||||||
Total BANK LOANS | 14,369,613 | |||||||
|
| |||||||
| CORPORATE BONDS — 63.79% | ||||||||
Agriculture — 2.01% |
| |||||||
American Rock Salt Co. LLC/American Rock Capital Corp. | 3,830,000 | 3,695,950 | ||||||
Banks — 2.03% |
| |||||||
ABN Amro North American Holding Preferred Capital Repackage Trust I 6.52%, 12/29/491,2 | 5,500,000 | 3,746,875 | ||||||
Building Materials — 1.89% |
| |||||||
Cemex SAB de CV (Mexico) | 4,680,000 | 3,480,750 | ||||||
Chemicals — 4.67% |
| |||||||
Hexion U.S. Finance Corp./ Hexion Nova Scotia Finance ULC | 3,000,000 | 2,610,000 | ||||||
Hexion U.S. Finance Corp./ Hexion Nova Scotia Finance ULC | 3,000,000 | 2,812,500 | ||||||
Momentive Performance Materials, Inc. | 3,000,000 | 3,180,000 | ||||||
|
| |||||||
| 8,602,500 | ||||||||
|
| |||||||
Commercial Services — 4.53% |
| |||||||
DynCorp International, Inc. | 3,647,000 | 3,172,890 | ||||||
iPayment Holdings, Inc. | 5,500,000 | 5,170,000 | ||||||
|
| |||||||
| 8,342,890 | ||||||||
|
| |||||||
| Shares, Principal Amount, or Number of Contracts | Value | |||||||
Electric — 2.44% |
| |||||||
Atlantic Power Corp. | $ | 2,500,000 | $ | 2,506,250 | ||||
Edison Mission Energy | 3,050,000 | 1,982,500 | ||||||
|
| |||||||
| 4,488,750 | ||||||||
|
| |||||||
Entertainment — 7.57% |
| |||||||
Midwest Gaming Borrower LLC/Midwest Finance Corp. | 5,000,000 | 5,425,000 | ||||||
Production Resource Group, Inc. | 5,500,000 | 5,032,500 | ||||||
WMG Acquisition Corp. | 3,500,000 | 3,473,750 | ||||||
|
| |||||||
| 13,931,250 | ||||||||
|
| |||||||
Food — 1.45% |
| |||||||
Dean Foods Co. | 2,500,000 | 2,662,500 | ||||||
Healthcare — Products — 3.70% |
| |||||||
ConvaTec Healthcare E S.A. (Luxembourg) | 5,430,000 | 4,846,275 | ||||||
Kinetic Concepts, Inc./ | 2,000,000 | 1,960,000 | ||||||
|
| |||||||
| 6,806,275 | ||||||||
|
| |||||||
Healthcare — Services — 5.43% |
| |||||||
Aurora Diagnostics Holdings/Aurora Diagnostics Financing, Inc. | 500,000 | 497,500 | ||||||
Kindred Healthcare, Inc. | 5,955,000 | 5,002,200 | ||||||
National Mentor, Inc. | 4,875,000 | 4,491,094 | ||||||
|
| |||||||
| 9,990,794 | ||||||||
|
| |||||||
Household Products/Wares — 1.22% |
| |||||||
Armored Autogroup, Inc. | 2,900,000 | 2,240,250 | ||||||
Insurance — 0.68% |
| |||||||
MBIA Insurance Corp. | 2,250,000 | 1,260,000 | ||||||
Iron/Steel — 2.93% |
| |||||||
Edgen Murray Corp. | 5,973,000 | 5,405,565 | ||||||
Mining — 3.26% |
| |||||||
Cuco Resources Ltd. | 6,000,000 | 6,000,000 | ||||||
Notes to Financial Statements are an integral part of this Schedule.
16
Driehaus Select Credit Fund
Schedule of Investments
December 31, 2011
| Shares, Principal Amount, or Number of Contracts | Value | |||||||
Oil & Gas — 7.61% |
| |||||||
Bill Barrett Corp. | $ | 3,000,000 | $ | 3,135,000 | ||||
Newfield Exploration Co. | 1,000,000 | 1,080,000 | ||||||
United Refining Co. | 5,600,000 | 5,236,000 | ||||||
Venoco, Inc. | 5,075,000 | 4,567,500 | ||||||
|
| |||||||
| 14,018,500 | ||||||||
|
| |||||||
Retail — 4.65% |
| |||||||
Michaels Stores, Inc. | 3,000,000 | 3,179,700 | ||||||
Rite Aid Corp. | 5,500,000 | 5,376,250 | ||||||
|
| |||||||
| 8,555,950 | ||||||||
|
| |||||||
Software — 2.40% |
| |||||||
First Data Corp. | 5,335,000 | 4,428,050 | ||||||
Telecommunications — 5.32% |
| |||||||
Clearwire Communications LLC/Clearwire Finance, Inc. | 6,500,000 | 5,427,500 | ||||||
Nortel Networks Ltd. (Canada) | 4,000,000 | 4,370,000 | ||||||
|
| |||||||
| 9,797,500 | ||||||||
|
| |||||||
Total CORPORATE BONDS | 117,454,349 | |||||||
|
| |||||||
| CONVERTIBLE CORPORATE BONDS — 8.14% | ||||||||
Electrical Components & Equipment — 2.73% |
| |||||||
SunPower Corp. | 4,336,000 | 3,560,940 | ||||||
Suntech Power Holdings Co., Ltd. (China) | 3,500,000 | 1,461,250 | ||||||
|
| |||||||
| 5,022,190 | ||||||||
|
| |||||||
Pharmaceuticals — 0.38% |
| |||||||
MannKind Corp. | 1,355,000 | 706,294 | ||||||
Retail — 2.99% |
| |||||||
Regis Corp. 5.00%, 7/15/14 | 4,400,000 | 5,494,500 | ||||||
Software — 2.04% |
| |||||||
Nuance Communications, Inc. | 3,500,000 | 3,758,125 | ||||||
|
| |||||||
Total CONVERTIBLE CORPORATE BONDS | 14,981,109 | |||||||
|
| |||||||
| Shares, Principal Amount, or Number of Contracts | Value | |||||||
| COMMON STOCK — 1.53% | ||||||||
Auto Manufacturers — 0.11% |
| |||||||
General Motors Co.* | 9,541 | $ | 193,396 | |||||
Beverages — 0.44% |
| |||||||
Molson Coors Brewing Co. - B | 18,700 | 814,198 | ||||||
Investment Companies — 0.50% |
| |||||||
Ares Capital Corp. | 59,555 | 920,125 | ||||||
Real Estate Investment Trusts — 0.48% |
| |||||||
Annaly Capital Management, Inc. | 55,490 | 885,620 | ||||||
|
| |||||||
Total COMMON STOCK | 2,813,339 | |||||||
|
| |||||||
| CONVERTIBLE PREFERRED STOCK — 6.41% | ||||||||
Auto Manufacturers — 1.50% |
| |||||||
General Motors Co. | 80,000 | 2,740,000 | ||||||
General Motors Corp. Senior Convertible Preferred Escrow - C | 94,958 | 18,042 | ||||||
|
| |||||||
| 2,758,042 | ||||||||
|
| |||||||
Banks — 2.58% |
| |||||||
Wells Fargo & Co. | 4,500 | 4,743,000 | ||||||
Telecommunications — 2.33% |
| |||||||
Lucent Technologies Capital Trust I | 7,000 | 4,298,000 | ||||||
|
| |||||||
Total CONVERTIBLE PREFERRED STOCK | 11,799,042 | |||||||
|
| |||||||
| PURCHASED PUT OPTIONS — 0.24% | ||||||||
Annaly Capital Management, Inc., Exercise Price: $17.50, Expiration Date: January, 2012* | 469 | 71,757 | ||||||
Ares Capital Corp., Exercise Price: $15.00, Expiration Date: January, 2012* | 606 | 10,605 | ||||||
MBIA, Inc., Exercise Price: $5.00, Expiration Date: January, 2012*4 | 1,100 | — | ||||||
Standard and Poor’s 500 Index, Exercise Price: $1,175.00, Expiration Date: February, 2012* | 30 | 51,600 | ||||||
Standard and Poor’s 500 Index, Exercise Price: $1,200.00, Expiration Date: February, 2012* | 30 | 66,000 | ||||||
Notes to Financial Statements are an integral part of this Schedule.
17
Driehaus Select Credit Fund
Schedule of Investments
December 31, 2011
| Shares, Principal Amount, or Number of Contracts | Value | |||||||
Standard and Poor’s 500 Index, Exercise Price: $1,250.00, Expiration Date: February, 2012* | 60 | $ | 235,200 | |||||
|
| |||||||
Total PURCHASED PUT OPTIONS | 435,162 | |||||||
|
| |||||||
| DEMAND DEPOSIT — 10.32% | ||||||||
UMB Money Market Fiduciary | 19,004,049 | 19,004,049 | ||||||
|
| |||||||
Total DEMAND DEPOSIT | 19,004,049 | |||||||
|
| |||||||
| WARRANTS — 0.09% | ||||||||
Cuco Resources Ltd. - Strike Price $4.00, Expiration Date 12/1/164 | 600,000 | — | ||||||
General Motors Co. - CW 16, Strike Price $10.00, Expiration Date 7/10/16 | 8,675 | 101,758 | ||||||
General Motors Co. - CW 19, Strike Price $18.33, Expiration Date 7/10/19 | 8,675 | 67,838 | ||||||
|
| |||||||
Total WARRANTS | 169,596 | |||||||
|
| |||||||
TOTAL INVESTMENTS | 98.32 | % | 181,026,259 | |||||
Other Assets less Liabilities | 1.68 | % | 3,084,494 | |||||
|
|
|
| |||||
| Net Assets | 100.00 | % | $ | 184,110,753 | ||||
| ||||||||
| SECURITIES SOLD SHORT — (8.93)% | ||||||||
| CORPORATE BONDS — (3.27)% | ||||||||
Food — (0.34)% |
| |||||||
BI-LO LLC/BI-LO Finance Corp. | $ | (600,000 | ) | (624,000 | ) | |||
|
| |||||||
Oil & Gas — (2.93)% |
| |||||||
Newfield Exploration Co. | (5,000,000 | ) | (5,400,000 | ) | ||||
|
| |||||||
Total CORPORATE BONDS (Proceeds $5,898,383) | (6,024,000 | ) | ||||||
|
| |||||||
| Shares, Principal Amount, or Number of Contracts | Value | |||||||
| CONVERTIBLE CORPORATE BONDS — (1.45)% | ||||||||
Beverages — (1.45)% |
| |||||||
Molson Coors Brewing Co. | $ | (2,500,000 | ) | $ | (2,671,875 | ) | ||
|
| |||||||
Total CONVERTIBLE CORPORATE BONDS (Proceeds $2,705,946) | (2,671,875 | ) | ||||||
|
| |||||||
| COMMON STOCK — (3.12)% | ||||||||
Banks — (0.14)% |
| |||||||
Bank of America Corp. | (46,110 | ) | (256,372 | ) | ||||
Healthcare — Services — (0.21)% |
| |||||||
Kindred Healthcare, | (32,168 | ) | (378,617 | ) | ||||
Retail — (1.88)% |
| |||||||
Regis Corp. | (209,442 | ) | (3,466,265 | ) | ||||
Software — (0.89)% |
| |||||||
Nuance Communications, Inc.* | (65,000 | ) | (1,635,400 | ) | ||||
|
| |||||||
Total COMMON STOCK (Proceeds $5,669,811) | (5,736,654 | ) | ||||||
|
| |||||||
| WRITTEN CALL OPTIONS — 0.00% | ||||||||
Clearwire Corp., Exercise Price: $7.50 Expiration Date: January, 2013* | (425 | ) | (4,250 | ) | ||||
|
| |||||||
Total WRITTEN CALL OPTIONS | (4,250 | ) | ||||||
|
| |||||||
| WRITTEN PUT OPTIONS — (0.05)% | ||||||||
Standard and Poor’s 500 Index, Exercise Price: $1,075.00, Expiration Date: February, 2012* | (30 | ) | (17,490 | ) | ||||
Standard and Poor’s 500 Index, Exercise Price: $1,100.00, Expiration Date: February, 2012* | (90 | ) | (71,100 | ) | ||||
|
| |||||||
Total WRITTEN PUT OPTIONS | (88,590 | ) | ||||||
|
| |||||||
| INTERNATIONAL BONDS — (1.04)% | ||||||||
Building Materials — (1.04)% |
| |||||||
Cemex Finance Europe BV (Spain) | (2,000,000 | ) | (1,915,486 | ) | ||||
|
| |||||||
Total INTERNATIONAL BONDS | (1,915,486 | ) | ||||||
|
| |||||||
| ||||||||
TOTAL INVESTMENT SECURITIES SOLD SHORT (Proceeds $16,665,272) | (8.93 | )% | $ | (16,440,855 | ) | |||
| ||||||||
Notes to Financial Statements are an integral part of this Schedule.
18
Driehaus Select Credit Fund
Schedule of Investments
December 31, 2011
| * | Non-income producing security. |
| 1 | 144A restricted security. |
| 2 | Variable rate security. |
| 3 | Foreign security denominated in U.S. dollars and traded on a U.S. exchange. |
| 4 | Security valued at fair value as determined in good faith by Driehaus Capital Management LLC, investment adviser to the Fund, in accordance with procedures established by, and under the general supervision of, the Trust’s Board of Trustees. |
| 5 | Security is in default. |
| Percentages | are stated as a percent of net assets. |
Notes to Financial Statements are an integral part of this Schedule.
19
Driehaus Select Credit Fund
Schedule of Investments
December 31, 2011
| Counterparty | Reference Instrument | Notional AmountB | Pay/ ReceiveA Fixed Rate | Fixed Rate | Expiration Date | Premium Paid (Received) | Unrealized Appreciation/ (Depreciation) | Credit Event | RatingC | |||||||||||||||||||||
| SWAP CONTRACTS | ||||||||||||||||||||||||||||||
| Credit Default Swaps | ||||||||||||||||||||||||||||||
| Morgan Stanley | Eastman Kodak Co. | |||||||||||||||||||||||||||||
| 7.25%, 11/15/13 | $ | 3,000,000 | Pay | 5.00 | % | 6/20/2014 | $ | 420,000 | $ | 1,383,725 | Bankruptcy/FTP | D | ||||||||||||||||||
| Goldman Sachs | Eastman Kodak Co. | |||||||||||||||||||||||||||||
| 7.25%, 11/15/13 | 1,000,000 | Pay | 5.00 | 9/20/2014 | 257,500 | 349,223 | Bankruptcy/FTP | D | ||||||||||||||||||||||
| Goldman Sachs | Eastman Kodak Co. | |||||||||||||||||||||||||||||
| 7.25%, 11/15/13 | 1,000,000 | Receive | 5.00 | 9/20/2016 | (350,000 | ) | (300,947 | ) | Bankruptcy/FTP | D | ||||||||||||||||||||
| Morgan Stanley | Eastman Kodak Co. | |||||||||||||||||||||||||||||
| 7.25%, 11/15/13 | 3,000,000 | Receive | 5.00 | 6/20/2016 | (660,000 | ) | (1,277,803 | ) | Bankruptcy/FTP | D | ||||||||||||||||||||
| Goldman Sachs | Masco Corp. | |||||||||||||||||||||||||||||
| 6.13%, 10/3/16 | 500,000 | Pay | 1.00 | 12/20/2015 | 39,569 | 1,268 | Bankruptcy/FTP | BBB | ||||||||||||||||||||||
| Morgan Stanley | Masco Corp. | |||||||||||||||||||||||||||||
| 6.13%, 10/3/16 | 500,000 | Pay | 1.00 | 3/20/2016 | 30,352 | 14,531 | Bankruptcy/FTP | BBB | ||||||||||||||||||||||
| Morgan Stanley | Masco Corp. | |||||||||||||||||||||||||||||
| 6.13%, 10/3/16 | 1,000,000 | Pay | 1.00 | 3/20/2016 | 66,735 | 32,993 | Bankruptcy/FTP | BBB | ||||||||||||||||||||||
| Morgan Stanley | Vulcan Materials Co. | |||||||||||||||||||||||||||||
| 6.40%, 11/30/17 | 3,000,000 | Pay | 5.00 | 12/20/2016 | 202,500 | (421,042 | ) | Bankruptcy/FTP | BB | |||||||||||||||||||||
|
|
|
| |||||||||||||||||||||||||||
| Total Credit Default Swaps | 6,656 | (218,052 | ) | |||||||||||||||||||||||||||
|
|
|
| |||||||||||||||||||||||||||
| Total Swap Contracts | $ | 6,656 | $ | (218,052 | ) | |||||||||||||||||||||||||
|
|
|
| |||||||||||||||||||||||||||
| A | If the Fund is paying a fixed rate, the counterparty acts as guarantor of the variable instrument and thus the Fund is a buyer of protection. If the Fund is receiving a fixed rate, the Fund acts as guarantor of the variable insturment and thus is a seller of protection. |
| B | For contracts to sell protection, the notional amout is equal to the maximum potential amount of the future payments and no recourse has been entered into in association with the contracts. |
| C | Based on Standard & Poor’s corporation credit rating. |
FTP=Failure to Pay
FUTURES CONTRACTS
| Futures Contracts | Number of Contracts Long/(Short) | Expiration Date | Unrealized Appreciation/ (Depreciation) | |||||||||
| U.S. 5 Year Treasury Note | (59 | ) | March 2012 | $ | (33,759 | ) | ||||||
| U.S. 10 Year Treasury Note | (32 | ) | March 2012 | (47,036 | ) | |||||||
| U.S. 30 Year Treasury Note | (1 | ) | March 2012 | (1,783 | ) | |||||||
|
| |||||||||||
| Total Futures Contracts | $ | (82,578 | ) | |||||||||
|
| |||||||||||
Notes to Financial Statements are an integral part of this Schedule.
20
Statements of Assets and Liabilities
December 31, 2011
Driehaus Active Income Fund | Driehaus Select Credit Fund | |||||||
ASSETS: | ||||||||
Investment securities, at fair value (cost $2,755,068,421 and $189,920,442, respectively) | $ | 2,558,382,080 | $ | 180,591,097 | ||||
Purchased options, at fair value (cost $16,040,293 and $1,087,465, respectively) | 6,463,628 | 435,162 | ||||||
Foreign currency (cost $0 and $2,018,598, respectively) | — | 1,877,544 | ||||||
Unrealized appreciation on open swap contracts | 13,133,409 | 1,781,740 | ||||||
Premiums paid on open swap contracts | 22,262,174 | 1,016,656 | ||||||
Cash | 52,536 | 1,361 | ||||||
Collateral held at custodian for the benefit of brokers | 34,653,729 | 13,063,773 | ||||||
Receivable for investment securities sold | 1,310,059 | — | ||||||
Receivable for capital stock sold | 4,931,379 | 3,816,347 | ||||||
Receivable for interest and dividends | 31,774,441 | 3,004,242 | ||||||
Prepaid expenses | 123,927 | 20,368 | ||||||
|
|
|
| |||||
| ||||||||
TOTAL ASSETS | 2,673,087,362 | 205,608,290 | ||||||
|
|
|
| |||||
| ||||||||
LIABILITIES: | ||||||||
Payable for investment securities sold short, at fair value (proceeds $175,905,949 and $16,245,052, respectively) | 157,695,631 | 16,348,015 | ||||||
Written options outstanding, at fair value (premiums received $6,039,349 and $420,220, respectively) | 1,373,145 | 92,840 | ||||||
Unrealized depreciation on open swap contracts | 19,090,147 | 1,999,792 | ||||||
Premiums received on open swap contracts | 7,499,373 | 1,010,000 | ||||||
Payable for capital stock redeemed | 10,791,836 | 1,450,682 | ||||||
Payable for investment securities purchased | 42,428,722 | 150 | ||||||
Payable for interest and dividends on securities sold short | 330,858 | 291,865 | ||||||
Payable for variation margin | 1,325,006 | 19,453 | ||||||
Accrued investment advisory fees | 1,183,351 | 124,814 | ||||||
Accrued shareholder services plan fees | 1,117,025 | 57,600 | ||||||
Accrued administration and accounting fees | 79,214 | 10,921 | ||||||
Accrued expenses | 438,731 | 91,405 | ||||||
|
|
|
| |||||
| ||||||||
TOTAL LIABILITIES | 243,353,039 | 21,497,537 | ||||||
|
|
|
| |||||
| ||||||||
NET ASSETS | $ | 2,429,734,323 | $ | 184,110,753 | ||||
|
|
|
| |||||
SHARES OUTSTANDING (Unlimited shares authorized, no par value) | 242,770,962 | 19,233,157 | ||||||
|
|
|
| |||||
NET ASSET VALUE, OFFERING AND REDEMPTION PRICE PER SHARE | $ | 10.01 | $ | 9.57 | ||||
|
|
|
| |||||
| ||||||||
NET ASSETS CONSISTED OF THE FOLLOWING AT DECEMBER 31, 2011: | ||||||||
Paid-in-capital | $ | 2,745,867,425 | $ | 195,276,189 | ||||
Undistributed net investment income (loss) | 11,075,496 | (50,592 | ) | |||||
Undistributed net realized gain (loss) on investments, futures and swap contracts | (131,521,891 | ) | (921,917 | ) | ||||
Net unrealized appreciation (depreciation) on: | ||||||||
Investments | (196,686,341 | ) | (9,329,345 | ) | ||||
Purchased options | (9,576,665 | ) | (652,303 | ) | ||||
Securities sold short | 18,210,318 | (102,963 | ) | |||||
Written options | 4,666,204 | 327,380 | ||||||
Futures contracts | (6,343,485 | ) | (82,578 | ) | ||||
Swap contracts | (5,956,738 | ) | (218,052 | ) | ||||
Foreign currency | — | (141,054 | ) | |||||
Foreign interest translations | — | 5,988 | ||||||
|
|
|
| |||||
NET ASSETS | $ | 2,429,734,323 | $ | 184,110,753 | ||||
|
|
|
| |||||
| ||||||||
Notes to Financial Statements are an integral part of these Statements.
21
For the year ended December 31, 2011
Driehaus Active Income Fund | Driehaus Select Credit Fund | |||||||
INVESTMENT INCOME: | ||||||||
Interest income* | $ | 138,137,531 | $ | 6,747,963 | ||||
Dividend income | 25,100,111 | 1,062,512 | ||||||
|
|
|
| |||||
| ||||||||
Total investment income | 163,237,642 | 7,810,475 | ||||||
|
|
|
| |||||
| ||||||||
Expenses: | ||||||||
Investment advisory fees | 16,462,083 | 819,518 | ||||||
Shareholder services plan fees | 5,778,079 | 130,639 | ||||||
Custody fees | 1,728,692 | 112,206 | ||||||
Administration and fund accounting fees | 1,066,770 | 77,259 | ||||||
Transfer agent fees and expenses | 391,977 | 64,040 | ||||||
Federal and state registration fees | 243,541 | 52,372 | ||||||
Reports to shareholders | 145,100 | 27,388 | ||||||
Legal fees | 85,411 | 17,172 | ||||||
Trustees’ and Advisory Board Members’ fees | 83,630 | 14,528 | ||||||
Audit and tax fees | 54,911 | 51,244 | ||||||
Chief compliance officer fees | 9,123 | 9,110 | ||||||
Miscellaneous | 150,898 | 26,124 | ||||||
Interest on short positions | 2,807,493 | 441,470 | ||||||
Interest expense | 728,853 | 11,348 | ||||||
Dividends on short positions | 519,747 | — | ||||||
|
|
|
| |||||
Total expenses | 30,256,308 | 1,854,418 | ||||||
|
|
|
| |||||
| ||||||||
Investment advisory fees recaptured | — | 62,523 | ||||||
|
|
|
| |||||
Net expenses | 30,256,308 | 1,916,941 | ||||||
|
|
|
| |||||
| ||||||||
Net investment income | 132,981,334 | 5,893,534 | ||||||
|
|
|
| |||||
| ||||||||
| NET REALIZED AND UNREALIZED GAIN (LOSS) ON INVESTMENTS: | ||||||||
Net realized gain (loss) on transactions from: | ||||||||
Investments | 26,172,853 | (1,230,785 | ) | |||||
Purchased options | (44,692,501 | ) | (1,154,521 | ) | ||||
Securities sold short | (17,353,006 | ) | 2,048,628 | |||||
Written options | 12,637,800 | 418,038 | ||||||
Futures contracts | (77,527,667 | ) | (541,639 | ) | ||||
Swap contracts | (4,640,694 | ) | (83,051 | ) | ||||
Foreign currency | — | 19,058 | ||||||
|
|
|
| |||||
| ||||||||
Total realized loss on investments | (105,403,215 | ) | (524,272 | ) | ||||
|
|
|
| |||||
| ||||||||
Change in net unrealized appreciation (depreciation) on: | ||||||||
Investments | (330,154,455 | ) | (9,682,036 | ) | ||||
Purchased options | (1,428,189 | ) | (1,213,753 | ) | ||||
Short positions | 69,366,633 | (78,203 | ) | |||||
Written options | 4,666,204 | 327,380 | ||||||
Futures contracts | (6,058,830 | ) | (80,528 | ) | ||||
Swap contracts | 5,848,638 | (207,306 | ) | |||||
Foreign currency | — | (141,054 | ) | |||||
Foreign interest translations | — | 5,988 | ||||||
|
|
|
| |||||
Total change in net unrealized appreciation (depreciation) on investments | (257,759,999 | ) | (11,069,512 | ) | ||||
|
|
|
| |||||
| ||||||||
Net realized and unrealized loss on investments | (363,163,214 | ) | (11,593,784 | ) | ||||
|
|
|
| |||||
| ||||||||
NET DECREASE IN NET ASSETS RESULTING FROM OPERATIONS | $ | (230,181,880 | ) | $ | (5,700,250 | ) | ||
|
|
|
| |||||
| ||||||||
| * | Interest income is net of $0 and $3,183, respectively, of non-reclaimable foreign taxes withheld. |
Notes to Financial Statements are an integral part of these Statements.
22
Statements of Changes in Net Assets
| Driehaus Active Income Fund | Driehaus Select Credit Fund | |||||||||||||||
| Year Ended December 31, 2011 | Year Ended December 31, 2010 | Year Ended December 31, 2011 | September 30, to | |||||||||||||
Operations: | ||||||||||||||||
Net investment income | $ | 132,981,334 | $ | 57,491,093 | $ | 5,893,534 | $ | 88,731 | ||||||||
Net realized gain (loss) on investments | (105,403,215 | ) | 55,564,015 | (524,272 | ) | (370,626 | ) | |||||||||
Net change in unrealized appreciation (depreciation) on investments | (257,759,999 | ) | (20,133,268 | ) | (11,069,512 | ) | 876,585 | |||||||||
|
|
|
|
|
|
|
| |||||||||
| ||||||||||||||||
Net increase (decrease) in net assets resulting from operations | (230,181,880 | ) | 92,921,840 | (5,700,250 | ) | 594,690 | ||||||||||
|
|
|
|
|
|
|
| |||||||||
| ||||||||||||||||
Distributions: | ||||||||||||||||
Net investment income | (124,363,014 | ) | (50,500,194 | ) | (5,908,053 | ) | (122,175 | ) | ||||||||
Net capital gains | (911,125 | ) | (11,667,411 | ) | — | (48,949 | ) | |||||||||
|
|
|
|
|
|
|
| |||||||||
Total distributions | (125,274,139 | ) | (62,167,605 | ) | (5,908,053 | ) | (171,124 | ) | ||||||||
|
|
|
|
|
|
|
| |||||||||
| ||||||||||||||||
Capital share transactions: | ||||||||||||||||
Proceeds from shares sold | 2,567,335,879 | 1,656,262,651 | 235,170,355 | 23,097,012 | ||||||||||||
Reinvested distributions | 106,285,193 | 57,722,879 | 4,992,614 | 170,921 | ||||||||||||
Cost of shares redeemed | (2,071,493,070 | ) | (821,391,429 | ) | (68,082,955 | ) | (52,457 | ) | ||||||||
|
|
|
|
|
|
|
| |||||||||
Net increase from capital | 602,128,002 | 892,594,101 | 172,080,014 | 23,215,476 | ||||||||||||
|
|
|
|
|
|
|
| |||||||||
Total increase in net assets | 246,671,983 | 923,348,336 | 160,471,711 | 23,639,042 | ||||||||||||
|
|
|
|
|
|
|
| |||||||||
| ||||||||||||||||
NET ASSETS: | ||||||||||||||||
| ||||||||||||||||
Beginning of period | $ | 2,183,062,340 | $ | 1,259,714,004 | $ | 23,639,042 | $ | — | ||||||||
|
|
|
|
|
|
|
| |||||||||
End of period | $ | 2,429,734,323 | $ | 2,183,062,340 | $ | 184,110,753 | $ | 23,639,042 | ||||||||
|
|
|
|
|
|
|
| |||||||||
Undistributed net investment income (loss) | $ | 11,075,496 | $ | 7,994,791 | $ | (50,592 | ) | $ | 10,579 | |||||||
|
|
|
|
|
|
|
| |||||||||
| ||||||||||||||||
Capital share transactions in shares: | ||||||||||||||||
Shares sold | 233,708,393 | 150,264,703 | 23,452,516 | 2,292,712 | ||||||||||||
Reinvested distributions | 10,151,083 | 5,238,011 | 514,078 | 16,692 | ||||||||||||
Shares redeemed | (198,619,052 | ) | (74,511,512 | ) | (7,037,721 | ) | (5,120 | ) | ||||||||
|
|
|
|
|
|
|
| |||||||||
Net increase | 45,240,424 | 80,991,202 | 16,928,873 | 2,304,284 | ||||||||||||
|
|
|
|
|
|
|
| |||||||||
| ||||||||||||||||
| * | Fund commenced operations on September 30, 2010. |
Notes to Financial Statements are an integral part of these Statements.
23
Financial Highlights
December 31, | For the year December 31, | |||||||
Net asset value, beginning of period | $ | 11.05 | $ | 10.81 | ||||
|
|
|
| |||||
INCOME FROM INVESTMENT OPERATIONS: | ||||||||
Net investment income | 0.48 | 0.36 | ||||||
Net realized and unrealized gain/(loss) on investments | (1.09 | ) | 0.20 | |||||
|
|
|
| |||||
Total from investment operations | (0.61 | ) | 0.56 | |||||
|
|
|
| |||||
LESS DISTRIBUTIONS TO SHAREHOLDERS FROM: | ||||||||
Net investment income | (0.43 | ) | (0.26 | ) | ||||
Tax return of capital | — | — | ||||||
Net realized gains | — | † | (0.06 | ) | ||||
|
|
|
| |||||
Total distributions | (0.43 | ) | (0.32 | ) | ||||
|
|
|
| |||||
Net asset value, end of period | $ | 10.01 | $ | 11.05 | ||||
|
|
|
| |||||
Total Return | (5.61 | )% | 5.18 | % | ||||
SUPPLEMENTAL DATA AND RATIOS: | ||||||||
Net assets, end of period (in 000’s) | 2,429,734 | 2,183,062 | ||||||
Ratio of total expenses to average net assets less waivers | 1.01 | %3 | 1.79 | %5 | ||||
Ratio of total expenses to average net assets before waivers | 1.01 | %3 | 1.79 | %5 | ||||
Ratio of net investment income to average net assets, net of waivers | 4.44 | %4 | 3.24 | %6 | ||||
Ratio of net investment income to average net assets, before waivers | 4.44 | %4 | 3.24 | %6 | ||||
Portfolio turnover rate | 55 | % | 51 | % | ||||
| ||||||||
| * | Inception |
| ** | Fiscal year end change to December 31. |
| † | Represents less than $0.01 per share. |
| 1 | Not annualized. |
| 2 | Annualized. |
| 3 | The ratio of expenses to average net assets includes dividends and interest on short positions and interest expense. Excluding dividends and interest on short positions and interest expense, the ratio of expenses to average net assets was 0.88%. |
| 4 | The ratio of net investment income to average net assets includes dividends and interest on short positions and interest expense. Excluding dividends and interest on short positions and interest expense, the net investment income to average net assets was 4.58%. |
| 5 | The ratio of expenses to average net assets includes dividends and interest on short positions and interest expense. Excluding dividends and interest on short positions and interest expense, the ratio of expenses to average net assets was 0.92%. |
| 6 | The ratio of net investment income to average net assets includes dividends and interest on short positions and interest expense. Excluding dividends and interest on short positions and interest expense, the net investment income to average net assets was 4.12%. |
Notes to Financial Statements are an integral part of this Schedule.
24
Financial Highlights
For the period December 31, | For the year September 30, | For the year September 30, | For the year September 30, | For the period September 30, | ||||||||||||||
| $ | 12.12 | $ | 10.17 | $ | 10.25 | $ | 10.37 | $ | 10.00 | |||||||||
|
|
|
|
|
|
|
|
|
| |||||||||
| 0.09 | 0.38 | 0.23 | 0.40 | 0.23 | ||||||||||||||
| 0.26 | 1.61 | (0.24 | ) | (0.21 | ) | 0.18 | ||||||||||||
|
|
|
|
|
|
|
|
|
| |||||||||
| 0.35 | 1.99 | (0.01 | ) | (0.19 | ) | 0.41 | ||||||||||||
|
|
|
|
|
|
|
|
|
| |||||||||
| (1.66 | ) | (0.04 | ) | (0.04 | ) | (0.31 | ) | (0.04 | ) | |||||||||
| — | — | (0.03 | ) | — | — | |||||||||||||
| — | — | — | — | — | ||||||||||||||
|
|
|
|
|
|
|
|
|
| |||||||||
| (1.66 | ) | (0.04 | ) | (0.07 | ) | (0.31 | ) | (0.04 | ) | |||||||||
|
|
|
|
|
|
|
|
|
| |||||||||
| $ | 10.81 | $ | 12.12 | $ | 10.17 | $ | 10.25 | $ | 10.37 | |||||||||
|
|
|
|
|
|
|
|
|
| |||||||||
| 2.87 | %1 | 19.66 | % | (0.13 | )% | 1.88 | % | 4.16 | %1 | |||||||||
| 1,259,714 | 1,036,182 | 487,110 | 191,949 | 93,604 | ||||||||||||||
| 1.99 | %2,7 | 1.96 | %9 | 1.45 | %11 | 1.17 | %13 | 0.95 | %2 | |||||||||
| 1.99 | %2,7 | 1.96 | %9 | 1.45 | %11 | 1.17 | %13 | 0.98 | %2 | |||||||||
| 2.85 | %2,8 | 3.52 | %10 | 2.54 | %12 | 3.86 | %14 | 3.48 | %2 | |||||||||
| 2.85 | %2,8 | 3.52 | %10 | 2.54 | %12 | 3.86 | %14 | 3.45 | %2 | |||||||||
| 7 | %1 | 150 | % | 387 | % | 495 | % | 363 | %1 | |||||||||
|
| |||||||||||||||||
| 7 | The ratio of expenses to average net assets includes dividends and interest on short positions and interest expense. Excluding dividends and interest on short positions and interest expense, the ratio of expenses to average net assets was 0.96%. |
| 8 | The ratio of net investment income to average net assets includes dividends and interest on short positions and interest expense. Excluding dividends and interest on short positions and interest expense, the net investment income to average net assets was 3.88%. |
| 9 | The ratio of expenses to average net assets includes dividends and interest on short positions and interest expense. Excluding dividends and interest on short positions and interest expense, the ratio of expenses to average net assets was 0.91%. |
| 10 | The ratio of net investment income to average net assets includes dividends and interest on short positions and interest expense. Excluding dividends and interest on short positions and interest expense, the net investment income to average net assets was 4.56%. |
| 11 | The ratio of expenses to average net assets includes dividends and interest on short positions and interest expense. Excluding dividends and interest on short positions and interest expense, the ratio of expenses to average net assets was 0.94%. |
| 12 | The ratio of net investment income to average net assets includes dividends and interest on short positions and interest expense. Excluding dividends and interest on short positions and interest expense, the net investment income to average net assets was 3.05%. |
| 13 | The ratio of expenses to average net assets includes dividends and interest on short positions and interest expense. Excluding dividends and interest on short positions and interest expense, the ratio of expenses to average net assets was 0.87%. |
| 14 | The ratio of net investment income to average net assets includes dividends and interest on short positions and interest expense. Excluding dividends and interest on short positions and interest expense, the net investment income to average net assets was 4.16%. |
Notes to Financial Statements are an integral part of this Schedule.
25
Driehaus Select Credit Fund
Financial Highlights
For the year December 31, | For the period December 31, | |||||||
Net asset value, beginning of period | $ | 10.26 | $ | 10.00 | ||||
|
|
|
| |||||
INCOME FROM INVESTMENT OPERATIONS: | ||||||||
Net investment income | 0.57 | 0.05 | ||||||
Net realized and unrealized gain on investments | (0.84 | ) | 0.29 | |||||
|
|
|
| |||||
Total from investment operations | (0.27 | ) | 0.34 | |||||
|
|
|
| |||||
LESS DISTRIBUTIONS TO SHAREHOLDERS FROM: | ||||||||
Net investment income | (0.42 | ) | (0.06 | ) | ||||
Net realized gains | — | (0.02 | ) | |||||
|
|
|
| |||||
Total distributions | (0.42 | ) | (0.08 | ) | ||||
|
|
|
| |||||
Net asset value, end of period | $ | 9.57 | $ | 10.26 | ||||
|
|
|
| |||||
Total Return | (2.64 | )% | 3.43 | %1 | ||||
SUPPLEMENTAL DATA AND RATIOS: | ||||||||
Net assets, end of period (in 000’s) | $ | 184,111 | $ | 23,639 | ||||
Ratio of total expenses to average net assets including waivers and recapture | 1.87 | %3 | 2.15 | %2,5 | ||||
Ratio of total expenses to average net assets before waivers and recapture | 1.81 | %3 | 3.54 | % 2,5 | ||||
Ratio of net investment income to average net assets, including waivers and recapture | 5.75 | %4 | 1.98 | %2,6 | ||||
Ratio of net investment income to average net assets, before waivers and recapture | 5.81 | %4 | 0.59 | %2,6 | ||||
Portfolio turnover rate | 64 | % | 52 | %1 | ||||
| ||||||||
| * | Fund commenced operations on September 30, 2010. |
| 1 | Not annualized. |
| 2 | Annualized. |
| 3 | The ratio of expenses to average net assets includes dividends and interest on short positions and interest expense. Excluding dividends and interest on short positions and interest expense, the ratio of expenses to average net assets, including recapture, was 1.43%. Excluding dividends and interest on short positions and interest expense, the ratio of expenses to average net assets before recapture was 1.37%. |
| 4 | The ratio of net investment income to average net assets includes dividends and interest on short positions and interest expense. Excluding dividends and interest on short positions and interest expense, the ratio of net investment income to average net assets, including recapture, was 6.20%. Excluding dividends and interest on short positions and interest expense, the ratio of net investment income to average net assets before recapture was 6.26%. |
| 5 | The ratio of expenses to average net assets includes dividends and interest on short positions and interest expense. Excluding dividends and interest on short positions and interest expense, the ratio of expenses to average net assets, less waivers, was 1.75%. Excluding dividends and interest on short positions and interest expense, the ratio of expenses to average net assets before waivers was 3.14%. |
| 6 | The ratio of net investment income to average net assets includes dividends and interest on short positions and interest expense. Excluding dividends and interest on short positions and interest expense, the ratio of net investment income to average net assets, less waivers, was 2.38%. Excluding dividends and interest on short positions and interest expense, the ratio of net investment income to average net assets before waivers was 0.99%. |
Notes to Financial Statements are an integral part of this Schedule.
26
Driehaus Mutual Funds
A. ORGANIZATION AND SUMMARY OF SIGNIFICANT ACCOUNTING POLICIES
Organization
The Driehaus Mutual Funds (the “Trust”) is an open-end registered management investment company, organized as a Delaware statutory trust, with nine separate series currently in operation. The Trust was organized under an Agreement and Declaration of Trust dated May 31, 1996, as subsequently amended, and may issue an unlimited number of full and fractional units of beneficial interest (shares) without par value. The Driehaus Active Income Fund (the “Active Income Fund”) commenced operations on June 1, 2009 following the receipt of the assets and liabilities of the Lotsoff Capital Management Active Income Fund (the “Acquired Fund”) pursuant to a plan of reorganization approved by the shareholders of the Acquired Fund. The reorganization was accomplished by a tax-free exchange of Acquired Fund shares for an equal number of shares of the Active Income Fund as of June 1, 2009. The Active Income Fund seeks to provide current income and capital appreciation. The Active Income Fund was closed to new investors as of March 1, 2011. The Driehaus Select Credit Fund (the “Select Credit Fund” and, together with the Active Income Fund, the “Funds”) commenced operations on September 30, 2010. The Select Credit Fund seeks to provide positive returns under a variety of market conditions.
Significant Accounting Policies
The presentation of financial statements in conformity with U.S. generally accepted accounting principles (“GAAP”) requires management to make estimates and assumptions that affect the reported amounts of assets and liabilities at the date of the financial statements and the reported amounts of income and expenses. Actual results may differ from those estimates.
Securities Valuation
Investments in securities traded on a national securities exchange are valued at the last reported sales price on the day of valuation and are generally classified as level 1. Securities traded on the Nasdaq markets are valued at the Nasdaq Official Closing Price (“NOCP”) and are generally classified as level 1. Exchange-traded securities for which no sale was reported and Nasdaq-traded securities for which there is no NOCP are valued at the mean of the closing bid and ask prices from the exchange the security is primarily traded on and are generally classified as level 1. Long-term fixed income securities are valued at the representative quoted bid price when held long or the representative quoted ask price if sold short or, if such prices are not available, at prices for securities of comparable maturity, quality and type or as determined by an independent pricing service and are generally classified as level 2. Short-term investments with remaining maturities of 60 days or less are stated at amortized cost, which approximates fair value. If amortized cost does not approximate fair value, short-term securities are reported at fair value. These securities are generally classified as level 2. Securities for which market quotations are not readily available are valued at their fair value as determined in good faith by or under the direction of the Trust’s Board of Trustees and are generally classified as level 3.
Each Fund is subject to fair value accounting standards that define fair value, establish the framework for measuring fair value and provide a three-level hierarchy for fair valuation based upon the inputs to the valuation as of the measurement date. The three levels of the fair value hierarchy are as follows:
Level 1 — quoted prices for active markets for identical securities
Level 2 — significant observable inputs (including quoted prices for similar securities, interest rates, prepayment speeds, credit risk, etc.)
Level 3 — significant unobservable inputs (including the Fund’s own assumptions in determining the fair value of investments).
The inputs or methodology used for valuing securities are not necessarily an indication of the risk associated with investing in those securities. During the year ended December 31, 2011, there were no
27
Driehaus Mutual Funds
Notes to Financial Statements — (Continued)
significant transfers between levels for the Active Income Fund or Select Credit Fund. The following is a summary of the inputs used to value the Active Income Fund’s investments as of December 31, 2011:
Assets | Level 1 | Level 2 | Level 3 | Total | ||||||||||||
Asset-Backed Securities | $ | — | $ | 66,699,824 | $ | — | $ | 66,699,824 | ||||||||
Bank Loans | — | 185,344,426 | — | 185,344,426 | ||||||||||||
Common Stocks | ||||||||||||||||
Airlines | 2,229,000 | — | — | 2,229,000 | ||||||||||||
Auto Manufacturers | 28,271,846 | — | — | 28,271,846 | ||||||||||||
Auto Parts & Equipment | 26,127,653 | — | — | 26,127,653 | ||||||||||||
Investment Companies | 8,281,138 | — | — | 8,281,138 | ||||||||||||
Real Estate Investment Trusts | 7,846,255 | — | — | 7,846,255 | ||||||||||||
Software | 7,285,337 | — | — | 7,285,337 | ||||||||||||
Convertible Corporate Bonds | — | 270,408,535 | — | 270,408,535 | ||||||||||||
Convertible Preferred Stocks | ||||||||||||||||
Auto Manufacturers | — | — | 2,330,473 | 2,330,473 | ||||||||||||
Banks | 70,555,996 | — | — | 70,555,996 | ||||||||||||
Telecommunications | 62,113,468 | — | — | 62,113,468 | ||||||||||||
Corporate Bonds | — | 1,419,119,505 | — | 1,419,119,505 | ||||||||||||
Demand Deposit | 255,111,473 | — | — | 255,111,473 | ||||||||||||
Preferred Stocks | ||||||||||||||||
Banks | 9,908,000 | — | — | 9,908,000 | ||||||||||||
Food | — | 29,764,688 | — | 29,764,688 | ||||||||||||
Office/Business Equipment | — | 52,734,500 | — | 52,734,500 | ||||||||||||
Telecommunications | — | 30,868,591 | — | 30,868,591 | ||||||||||||
Purchased Put Options | 6,095,088 | 368,540 | — | 6,463,628 | ||||||||||||
U.S. Government And Agency Securities | — | 1,169,542 | — | 1,169,542 | ||||||||||||
Warrants | 22,211,830 | — | — | 22,211,830 | ||||||||||||
|
|
|
|
|
|
|
| |||||||||
Total | $ | 506,037,084 | $ | 2,056,478,151 | $ | 2,330,473 | $ | 2,564,845,708 | ||||||||
|
|
|
|
|
|
|
| |||||||||
Liabilities | ||||||||||||||||
Common Stocks | ||||||||||||||||
Airlines | $ | (34,872 | ) | $ | — | $ | — | $ | (34,872 | ) | ||||||
Auto Manufacturers | (40,760,085 | ) | — | — | (40,760,085 | ) | ||||||||||
Banks | (4,486,308 | ) | — | — | (4,486,308 | ) | ||||||||||
Computers | (21,032,452 | ) | — | — | (21,032,452 | ) | ||||||||||
Electrical Components & Equipment | (86,404 | ) | — | — | (86,404 | ) | ||||||||||
Healthcare — Services | (790,144 | ) | — | — | (790,144 | ) | ||||||||||
Internet | (3,040,423 | ) | — | — | (3,040,423 | ) | ||||||||||
Lodging | (9,357,171 | ) | — | — | (9,357,171 | ) | ||||||||||
Real Estate Investment Trusts | (17,627,242 | ) | — | — | (17,627,242 | ) | ||||||||||
Software | (12,180,780 | ) | — | — | (12,180,780 | ) | ||||||||||
Convertible Corporate Bonds | — | (38,343,750 | ) | — | (38,343,750 | ) | ||||||||||
Corporate Bonds | — | (9,956,000 | ) | — | (9,956,000 | ) | ||||||||||
Written Put Options | (1,373,145 | ) | — | — | (1,373,145 | ) | ||||||||||
|
|
|
|
|
|
|
| |||||||||
Total | $ | (110,769,026 | ) | $ | (48,299,750 | ) | $ | — | $ | (159,068,776 | ) | |||||
|
|
|
|
|
|
|
| |||||||||
28
Driehaus Mutual Funds
Notes to Financial Statements — (Continued)
Other Financial Instruments* | Level 1 | Level 2 | Level 3 | Total | ||||||||||||
Credit Default Swaps | $ | — | $ | 8,806,063 | $ | — | $ | 8,806,063 | ||||||||
Futures Contracts | (6,343,485 | ) | — | — | (6,343,485 | ) | ||||||||||
|
|
|
|
|
|
|
| |||||||||
Total Swap and Futures Contracts | $ | (6,343,485 | ) | $ | 8,806,063 | $ | — | $ | 2,462,578 | |||||||
|
|
|
|
|
|
|
| |||||||||
| * | Other financial instruments are swap and futures contracts, which are detailed in the Schedule of Investments. |
Following is a reconciliation of level 3 assets for which significant unobservable inputs were used to determine fair value in the Active Income Fund:
| Investments, at Value | ||||
Balance as of 1/1/11 | $ | — | ||
Realized gain (loss) | — | |||
Change in unrealized appreciation (depreciation) | — | |||
Purchase | — | |||
Sales | — | |||
Transfers in and/or out of level 3 | 2,330,473 | |||
|
| |||
Balance as of 12/31/11 | $ | 2,330,473 | ||
|
| |||
The following is a summary of the inputs used to value the Select Credit Fund’s investments as of December 31, 2011:
Assets | Level 1 | Level 2 | Level 3 | Total | ||||||||||||
Bank Loans | $ | — | $ | 14,369,613 | $ | — | $ | 14,369,613 | ||||||||
Common Stocks | ||||||||||||||||
Auto Manufacturers | 193,396 | — | — | 193,396 | ||||||||||||
Beverages | 814,198 | — | — | 814,198 | ||||||||||||
Investment Companies | 920,125 | — | — | 920,125 | ||||||||||||
Real Estate Investment Trusts | 885,620 | — | — | 885,620 | ||||||||||||
Convertible Corporate Bonds | — | 14,981,109 | — | 14,981,109 | ||||||||||||
Convertible Preferred Stocks | ||||||||||||||||
Auto Manufacturers | 2,740,000 | — | 18,042 | 2,758,042 | ||||||||||||
Banks | 4,743,000 | — | — | 4,743,000 | ||||||||||||
Telecommunications | 4,298,000 | — | — | 4,298,000 | ||||||||||||
Corporate Bonds | — | 111,454,349 | 6,000,000 | 117,454,349 | ||||||||||||
Purchased Put Options | 435,162 | — | — | 435,162 | ||||||||||||
Demand Deposit | 19,004,049 | — | — | 19,004,049 | ||||||||||||
Warrants | 169,596 | — | — | 169,596 | ||||||||||||
|
|
|
|
|
|
|
| |||||||||
Total | $ | 34,203,146 | $ | 140,805,071 | $ | 6,018,042 | $ | 181,026,259 | ||||||||
|
|
|
|
|
|
|
| |||||||||
Liabilities | ||||||||||||||||
Common Stocks | ||||||||||||||||
Banks | $ | (256,372 | ) | $ | — | $ | — | $ | (256,372 | ) | ||||||
Healthcare — Services | (378,617 | ) | — | — | (378,617 | ) | ||||||||||
Retail | (3,466,265 | ) | — | — | (3,466,265 | ) | ||||||||||
Software | (1,635,400 | ) | — | — | (1,635,400 | ) | ||||||||||
Convertible Corporate Bonds | — | (2,671,875 | ) | — | (2,671,875 | ) | ||||||||||
Corporate Bonds | — | (6,024,000 | ) | — | (6,024,000 | ) | ||||||||||
International Bonds | — | (1,915,486 | ) | — | (1,915,486 | ) | ||||||||||
Written Call Options | (4,250 | ) | — | — | (4,250 | ) | ||||||||||
Written Put Options | (88,590 | ) | — | — | (88,590 | ) | ||||||||||
|
|
|
|
|
|
|
| |||||||||
Total | $ | (5,829,494 | ) | $ | (10,611,361 | ) | $ | — | $ | (16,440,855 | ) | |||||
|
|
|
|
|
|
|
| |||||||||
29
Driehaus Mutual Funds
Notes to Financial Statements — (Continued)
Other Financial Instruments* | Level 1 | Level 2 | Level 3 | Total | ||||||||||||
Credit Default Swaps | $ | — | $ | (211,396 | ) | $ | — | $ | (211,396 | ) | ||||||
Futures Contracts | (82,578 | ) | — | — | (82,578 | ) | ||||||||||
|
|
|
|
|
|
|
| |||||||||
Total Swap and Futures Contracts | $ | (82,578 | ) | $ | (211,396 | ) | $ | — | $ | (293,974 | ) | |||||
|
|
|
|
|
|
|
| |||||||||
| * | Other financial instruments are swap and futures contracts, which are detailed in the Schedule of Investments. |
Following is a reconciliation of level 3 assets for which significant unobservable inputs were used to determine fair value in the Select Credit Fund:
| Investments, at Value | ||||
Balance as of 1/1/11 | $ | — | ||
Realized gain (loss) | — | |||
Change in unrealized appreciation (depreciation) | — | |||
Purchase | 6,000,000 | |||
Sales | — | |||
Transfers in and/or out of level 3 | 18,042 | |||
|
| |||
Balance as of 12/31/11 | $ | 6,018,042 | ||
|
| |||
Securities Sold Short
The Funds are engaged in selling securities short, which obligates them to replace a borrowed security with the same security at current market value. Each Fund incurs a loss if the price of the security increases between the date of the short sale and the date on which the Fund replaces the borrowed security. Each Fund realizes a gain if the price of the security declines between those dates. Gains are limited to the price at which the Fund sold the security short, while losses are potentially unlimited in size.
The Funds are required to establish a margin account with the broker lending the security sold short. While the short sale is outstanding, the broker retains the proceeds of the short sale and the Fund must maintain a deposit with the broker consisting of cash and securities having a value equal to a specified percentage of the value of the securities sold short. Such deposit is included in “Collateral held at custodian for the benefit of brokers” on the Statements of Assets and Liabilities. Each Fund is obligated to pay the counterparty any dividends or interest due on securities sold short. Such dividends and interest are recorded as an expense to the Funds on the Statements of Operations.
Federal Income Taxes
The Funds’ policy is to continue to comply with the requirements of Subchapter M of the Internal Revenue Code that are applicable to regulated investment companies and to distribute substantially all their taxable income to their shareholders. Therefore, no Federal income tax provision is required.
The Financial Accounting Standards Board’s (“FASB”) “Accounting for Uncertainty in Income Taxes” (“Tax Statement”) requires the evaluation of tax positions taken or expected to be taken in the course of preparing the Funds’ tax returns to determine whether the tax positions are “more-likely-than-not” of being sustained by the applicable tax authority. Tax positions not deemed to meet the more-likely-than-not threshold would be recorded as a tax benefit or expense in the current year. Management has evaluated the implications of the Tax Statement and all of the uncertain tax positions and has determined that no liability is required to be recorded in the financial statements as of December 31, 2011. The Funds file tax returns with the U.S. Internal
30
Driehaus Mutual Funds
Notes to Financial Statements — (Continued)
Revenue Service and various states. Generally, the tax years ended September 30, 2008, September 30, 2009, December 31, 2009, December 31, 2010 and December 31, 2011 remain subject to examination by taxing authorities.
For federal income tax purpose, capital loss carryforwards represent net capital losses of a fund that may be carried forward for a maximum period of eight years and applied against future net realized gains. On December 22, 2010, the Regulated Investment Company Modernization Act of 2010 was enacted to modernize several of the federal income and excise tax provisions related to regulated investment companies. Under pre-enactment law, capital losses could be carried forward for eight years, and were required to be carried forward as short-term capital losses, irrespective of the character of the original loss. New net capital losses (those earned in taxable years beginning after December 22, 2010) may be carried forward indefinitely and must retain the character of the original loss. Such new net capital losses generally must be used by a regulated investment company before it uses any net capital losses incurred in taxable years beginning on or before December 22, 2010. This increases the likelihood that net capital losses incurred in taxable years beginning on or before December 22, 2010 will expire unused.
At December 31, 2011, gross unrealized appreciation and depreciation on investments, based on cost for federal income tax purposes, were as follows:
| Active Income Fund | Select Credit Fund | |||||||
Cost of investments | $ | 2,790,012,327 | $ | 191,057,630 | ||||
|
|
|
| |||||
Gross unrealized appreciation | $ | 59,731,731 | $ | 3,503,913 | ||||
Gross unrealized depreciation | (284,898,350 | ) | (13,535,284 | ) | ||||
|
|
|
| |||||
Net unrealized appreciation/(depreciation) on investments | $ | (225,166,619 | ) | $ | (10,031,371 | ) | ||
|
|
|
| |||||
The difference between cost amounts for financial statement and federal income tax purposes is due primarily to the tax deferral of losses on wash sales.
The amount of dividends and distributions from net investment income and net realized capital gains are determined in accordance with Federal income tax regulations, which may differ from U.S. generally accepted accounting principles.
For the year ended December 31, 2011, reclassifications were recorded to undistributed net investment income, undistributed net realized gain and paid-in capital for any permanent tax differences. These reclassifications relate primarily to the differing tax treatment of income from paydowns and swaps, return of capital and capital gain distributions on real estate investment trusts and regulated investment companies, and foreign currency gains and losses. Results of operations and net assets were not affected by these reclassifications.
| Active Income Fund | Select Credit Fund | |||||||
Paid-in capital | $ | (3,811,038 | ) | $ | (166 | ) | ||
Undistributed net investment income (loss) | (5,537,615 | ) | (46,652 | ) | ||||
Undistributed net realized gain (loss) on investments, futures and swap contracts | 9,348,653 | 46,818 | ||||||
The tax character of distributions paid were as follows:
Active Income Fund
Distributions paid from: | January 1, 2011 to December 31, 2011 | January 1, 2010 to December 31, 2010 | ||||||
Ordinary income | $ | 125,274,139 | $ | 62,167,605 | ||||
|
|
|
| |||||
Total distributions paid | $ | 125,274,139 | $ | 62,167,605 | ||||
|
|
|
| |||||
31
Driehaus Mutual Funds
Notes to Financial Statements — (Continued)
Select Credit Fund
Distributions paid from: | January 1, 2011 to December 31, 2011 | October 1, 2010 to December 31, 2010 | ||||||
Ordinary income | $ | 5,908,053 | $ | 171,124 | ||||
|
|
|
| |||||
Total distributions paid | $ | 5,908,053 | $ | 171,124 | ||||
|
|
|
| |||||
As of December 31, 2011, the components of accumulated earnings (deficit) were as follows:
| Active Income Fund | Select Credit Fund | |||||||
Undistributed ordinary income | $ | 11,185,776 | $ | 35,956 | ||||
Undistributed long-term capital gains | — | — | ||||||
|
|
|
| |||||
Accumulated earnings | 11,185,776 | 35,956 | ||||||
Accumulated capital and other losses | (131,386,169 | ) | (1,420,084 | ) | ||||
Unrealized appreciation/(depreciation) | (225,166,619 | ) | (10,031,371 | ) | ||||
|
|
|
| |||||
Total accumulated earnings/(deficit) | $ | (345,367,012 | ) | $ | (11,415,499 | ) | ||
|
|
|
| |||||
As of December 31, 2011, the Funds had net capital loss carryforwards to offset future net capital gains, if any, to the extent provided by Treasury regulations:
| Not Subject to Expiration | ||||||||
| Short-Term | Long-Term | |||||||
Active Income Fund | $ | 64,865,443 | $ | 32,856,442 | ||||
Select Credit Fund | 287,378 | 828,105 | ||||||
Post-October capital losses and late-year ordinary losses incurred after October 31 and within the taxable year are deemed to arise on the first business day of the Funds’ taxable year. As of December 31, 2011, the Funds had the following post-October capital losses and late-year ordinary losses:
| Post-October Capital Losses | Late-Year Ordinary Losses | |||||||
Active Income Fund | $ | 27,597,266 | $ | 6,067,018 | ||||
Select Credit Fund | — | 304,601 | ||||||
Foreign Currency Translation
Foreign currency and equity securities not denominated in U.S. dollars are translated into U.S. dollar values based upon the current rates of exchange on the date of the Funds’ valuations.
Net realized foreign exchange gains or losses which are reported by the Funds result from currency gains and losses on transaction hedges arising from changes in exchange rates between the trade and settlement dates on forward contract transactions, and the difference between the amounts accrued for dividends, interest, and foreign taxes and the amounts actually received or paid in U.S. dollars for these items. Net unrealized foreign exchange gains and losses result from changes in the U.S. dollar value of assets and liabilities (other than investments in securities), which are denominated in foreign currencies, as a result of changes in exchange rates.
Net realized foreign exchange gains or losses on portfolio hedges result from the use of forward contracts to hedge portfolio positions denominated or quoted in a particular currency in order to reduce or limit exposure in that currency. The Active Income Fund and Select Credit Fund had no portfolio hedges during the period January 1, 2011 through December 31, 2011.
The Funds do not isolate that portion of the results of operations which results from fluctuations in foreign exchange rates on investments. These fluctuations are included with the net realized gain (loss) from security transactions and the net change in unrealized appreciation (depreciation) of investments.
32
Driehaus Mutual Funds
Notes to Financial Statements — (Continued)
Indemnifications
Under the Trust’s organizational documents, the officers and Trustees are indemnified against certain liabilities arising out of the performance of their duties to the Trust. In addition, in the normal course of business, the Trust enters into contracts that provide general indemnifications to other parties. A Fund’s maximum exposure under these agreements is unknown as this would involve future claims that may be made against a Fund that have not yet occurred. However, the Funds have not had prior claims or losses pursuant to these contracts and expect the risk of loss to be remote.
New Accounting Pronouncements
In May 2011, the Financial Accounting Standards Board (“FASB”) issued Accounting Standards Update (“ASU”) No. 2011-04 “Amendments to Achieve Common Fair Value Measurement and Disclosure Requirements in U.S. Generally Accepted Accounting Principles (“U.S. GAAP”) and International Financial Reporting Standards (“IFRS”).” ASU No. 2011-04 includes common requirements for measurement of and disclosure about fair value between U.S. GAAP and IFRS. ASU No. 2011-04 will require reporting entities to disclose the following information for fair value measurements categorized within Level 3 of the fair value hierarchy: quantitative information about the unobservable inputs used in the fair value measurement, the valuation processes used by the reporting entity and a narrative description of the sensitivity of the fair value measurement to changes in unobservable inputs and the interrelationships between those unobservable inputs. In addition, ASU No. 2011-04 will require reporting entities to make disclosures about amounts and reasons for all transfers in and out of Level 1 and Level 2 fair value measurements. The new and revised disclosures are effective for interim and annual reporting periods beginning after December 15, 2011. Management is currently evaluating the implications of ASU No. 2011-04 and its impact on the financial statements.
In December 2011, FASB issued ASU No. 2011-11, “Disclosures about Offsetting Assets and Liabilities.” ASU No. 2011-11 requires disclosures to make financial statements that are prepared under U.S. GAAP more comparable to those prepared under IFRS. The new disclosure requirements mandate that entities disclose both gross and net information about instruments and transactions eligible for offset in the statement of assets and liabilities as well as instruments and transactions subject to an agreement similar to a master netting arrangement. In addition, ASU No. 2011-11 requires disclosure of collateral received and posted in connection with master netting agreements or similar arrangements. New disclosures are required for annual reporting periods beginning on or after January 1, 2013, and interim periods within those annual periods. Management is evaluating the impact of ASU No. 2011-11 on the financial statements and disclosures.
Other
The Trust records security transactions based on trade date. Realized gains and losses on sales of securities are calculated using the first-in, first-out method. Dividend income is recognized on the ex-dividend date, and interest income is recognized on an accrual basis. Discounts and premiums on securities purchased are amortized over the lives of the respective securities using the effective yield method. Withholding taxes on foreign dividends have been provided for in accordance with the Trust’s understanding of the applicable country’s tax rules and rates.
Pursuant to the terms of certain of the senior unsecured bridge loan agreements, the Funds may have unfunded loan commitments, which are callable on demand. Each Fund will have available with the custodian, cash and/or liquid securities having an aggregate value at least equal to the amount of the unfunded senior bridge loan commitments. At December 31, 2011, the Active Income Fund and Select Credit Fund had no unfunded senior bridge loan commitments.
With respect to the senior loans held in each Fund’s portfolio, the Funds may: 1) invest in assignments; 2) act as a participant in primary lending syndicates; or 3) invest in participations. If a Fund purchases a participation of a senior loan interest, the Fund would typically enter into a contractual agreement with the lender or other third party selling the participation, rather than directly with the borrower. As such, the Fund not only assumes the credit risk of the borrower, but also that of the selling participant or other persons interpositioned between the Fund and the borrower. At December 31, 2011, there were no such outstanding senior loan participation commitments in the Funds.
33
Driehaus Mutual Funds
Notes to Financial Statements — (Continued)
B. INVESTMENTS IN DERIVATIVES
Swap Contracts
The Funds are subject to credit risk and interest rate risk exposure in the normal course of pursuing their investment objectives. The Funds may engage in various swap transactions, including forward rate agreements and interest rate, currency, index and total return swaps, primarily to manage duration and yield curve risk, or as alternatives to direct investments. In addition to the swap contracts described above, the Funds may also engage in credit default swaps which involve the exchange of a periodic premium for protection against a defined credit event (such as payment default, refinancing or bankruptcy).
Interest rate swaps are agreements between two parties to exchange cash flows based on a notional principal amount. The Funds may elect to pay a fixed rate and receive a floating rate or receive a floating rate and pay a fixed rate on a notional principal amount. The net interest received or paid on interest rate swap agreements is accrued daily as interest income/expense. Interest rate swaps are marked-to-market daily using fair value estimates provided by an independent pricing service based on the present value of fixed and projected floating rate cash flows over the term of the swap contract. Changes in value, including accrued interest, are recorded as unrealized appreciation/(depreciation). Unrealized gains are reported as an asset and unrealized losses are reported as a liability. The change in value of swaps, including accruals of periodic amounts of interest to be paid or received on swaps, is reported as unrealized gains or losses. Gains or losses are realized upon termination of the contracts. The risk of loss under a swap contract may exceed the amount recorded as an asset or a liability.
Under the terms of a credit default swap contract, one party acts as a guarantor receiving a periodic payment that is a fixed percentage applied to a notional amount. In return, the party agrees to purchase the notional amount of the underlying instrument, at par, if a credit event occurs during the term of the contract. Each Fund may enter into credit default swaps in which the Fund acts as guarantor, and may enter into credit default swaps in which the counterparty acts as guarantor. Premiums paid to or by the Funds are amortized daily and included in realized gain (loss) on swaps. The contracts are marked-to-market daily using fair value estimates provided by an independent pricing service using inputs such as credit spread quotations and expected default recovery rates in their proprietary models. Changes in value are recorded as unrealized appreciation/(depreciation). Unrealized gains are reported as an asset and unrealized losses are reported as a liability. The change in value of swaps, including accruals of periodic amounts of interest to be paid or received on swaps is reported as unrealized gains or losses. Gains or losses are realized upon termination of the contracts. The risk of loss under a swap contract may exceed the amount recorded as an asset or a liability. The notional amount of a swap contract is the reference amount pursuant to which the counterparties make payments. For swaps in which the reference obligation is an index, in the event of default of any debt security included in the corresponding index, the Fund pays or receives the percentage of the corresponding index that the defaulted security comprises (1) multiplied by the notional value and (2) multiplied by the ratio of one minus the ratio of the market value of the defaulted debt security to its par value.
Risks associated with swap contracts include changes in the returns of underlying instruments, failure of the counterparties to perform under the contracts’ terms and the possible lack of liquidity with respect to the contracts. Credit default swaps can involve greater risks than if an investor had invested in the reference obligation directly since, in addition to general market risks, credit default swaps are subject to counterparty credit risk, leverage risk, hedging risk, correlation risk and liquidity risk. The Funds disclose swap contracts on a gross basis, with no netting of contracts held with the same counterparty. As of December 31, 2011, the Funds had outstanding swap contracts as listed on the Schedules of Investments and the required collateral is included in the Statements of Assets and Liabilities.
Futures Contracts
The Funds may enter into futures contracts to produce incremental earnings, hedge existing positions or protect against market changes in the value of equities or interest rates. Upon entering into a futures contract with a broker, a Fund is required to deposit in a segregated account a specified amount of cash or U.S. government securities. Futures contracts are valued daily at the exchange settlement price and unrealized gains or losses are recorded in a “variation margin” account. Daily, the Fund receives from or pays to the broker a
34
Driehaus Mutual Funds
Notes to Financial Statements — (Continued)
specified amount of cash based upon changes in the variation margin account. When a contract is closed, the Fund recognizes a realized gain or loss. Futures contracts have market risks, including the risk that the change in the value of the contract may not correlate with changes in the value of the underlying securities. With futures, there is minimal counterparty credit risk to the Funds since futures are exchange traded and the exchange’s clearinghouse, as counterparty to all exchange traded futures, guarantees the futures contract against default. As of December 31, 2011, the Funds had outstanding futures contracts as listed on the Schedules of Investments and the required collateral is included in the Statements of Assets and Liabilities.
Options Contracts
The Funds may use options contracts to hedge downside risk on their fixed income holdings, produce incremental earnings or protect against market changes in the value of equities or interest rates. The Funds may write covered call and put options on futures, swaps, securities or currencies the Funds own or in which they may invest. Writing put options tends to increase a Fund’s exposure to the underlying instrument. Writing call options tends to decrease a Fund’s exposure to the underlying instrument. When a Fund writes a call or put option, an amount equal to the premium received is recorded as a liability and subsequently marked to market to reflect the current value of the option written. These liabilities are reflected as written options outstanding in the Schedule of Investments. Payments received or made, if any, from writing options with premiums to be determined on a future date are reflected as such in the Schedule of Investments. Premiums received from writing options which expire are treated as realized gains. Premiums received from writing options which are exercised or closed are added to the proceeds or offset against amounts paid on the underlying future, swap, security or currency transaction to determine the realized gain or loss. A Fund, as a writer of an option, has no control over whether the underlying future, swap, security or currency may be sold (call) or purchased (put) and, as a result, bears the market risk of an unfavorable change in the price of the future, swap, security or currency underlying the written option. The risk exists that a Fund may not be able to enter into a closing transaction because of an illiquid market.
The premium amount and the number of option contracts written by the Active Income Fund during the period January 1, 2011 through December 31, 2011, were as follows:
Active Income Fund | Number of Contracts | Premium Amount | ||||||
Options outstanding at December 31, 2010 | — | $ | — | |||||
Options written | 9,549 | 19,170,499 | ||||||
Options closed | (1,950 | ) | (2,139,150 | ) | ||||
Options expired | (5,725 | ) | (10,992,000 | ) | ||||
|
|
|
| |||||
Options outstanding at December 31, 2011 | 1,874 | $ | 6,039,349 | |||||
|
|
|
| |||||
The premium amount and the number of option contracts written by the Select Credit Fund during the period January 1, 2011 through December 31, 2011, were as follows:
Select Credit Fund | Number of Contracts | Premium Amount | ||||||
Options outstanding at December 31, 2010 | — | $ | — | |||||
Options written | 1,980 | 847,113 | ||||||
Options closed | (35 | ) | (38,395 | ) | ||||
Options expired | (1,400 | ) | (388,498 | ) | ||||
|
|
|
| |||||
Options outstanding at December 31, 2011 | 545 | $ | 420,220 | |||||
|
|
|
| |||||
The Funds may also purchase put and call options. Purchasing call options tends to increase a Fund’s exposure to the underlying instrument. Purchasing put options tends to decrease a Fund’s exposure to the underlying instrument. A Fund pays a premium which is included in its Schedule of Investments as an investment and subsequently marked-to-market to reflect the current value of the option. Premiums paid for purchasing options which expire are treated as realized losses. The risk associated with purchasing put and call options is limited to the premium paid. Premiums paid for purchasing options which are exercised or closed are added to the amounts paid or offset against the proceeds on the underlying future, swap, security
35
Driehaus Mutual Funds
Notes to Financial Statements — (Continued)
or currency transaction to determine the realized gain or loss. When entering into purchased option contracts, a Fund bears the risk of securities prices moving unexpectedly, in which case, a Fund may not achieve the anticipated benefits of the purchased option contracts; however, the risk of loss is limited to the premium paid. As of December 31, 2011, the Funds had outstanding options as listed on the Schedules of Investments and the required collateral is included in the Statements of Assets and Liabilities.
Derivative Investment Holdings Categorized by Risk Exposure
Each Fund is subject to FASB’s “Disclosures about Derivative Instruments and Hedging Activities” (the “Derivatives Statement”). The Derivatives Statement amends and expands disclosures about derivative instruments and hedging activities. The Derivatives Statement is intended to improve financial reporting about derivative instruments by requiring enhanced disclosures to enable investors to better understand how and why the Fund uses derivative instruments, how these derivative instruments are accounted for and their effects on the Funds’ financial position and results of operations.
The following table sets forth the fair value and the location in the Statement of Assets and Liabilities of the Active Income Fund’s derivative contracts by primary risk exposure as of December 31, 2011:
Asset derivatives | Liability derivatives | |||||||||||
Risk exposure category | Statement of Assets and Liabilities location | Fair value | Statement of Assets and Liabilities location | Fair value | ||||||||
Credit contracts | Unrealized appreciation on open swap contracts | $ | 13,133,409 | Unrealized depreciation on open swap contracts | $ | 19,090,147 | ||||||
Equity contracts | Purchased options, at fair value | 6,463,628 | Written options, at fair value | 1,373,145 | ||||||||
Interest rate contracts* | N/A | N/A | N/A | 6,343,485 | ||||||||
Total | $ | 19,597,037 | $ | 26,806,777 | ||||||||
| * | Includes cumulative appreciation/depreciation of futures contracts as shown in the Schedule of Investments. |
Only current day’s varation margin is reported in the Statement of Assets and Liabilities.
The following table sets forth the fair value and the location in the Statement of Assets and Liabilities of the Select Credit Fund’s derivative contracts by primary risk exposure as of December 31, 2011:
Asset derivatives | Liability derivatives | |||||||||||
Risk exposure category | Statement of Assets and Liabilities location | Fair value | Statement of Assets and Liabilities location | Fair value | ||||||||
Credit contracts | Unrealized appreciation on open swap contracts | $ | 1,781,740 | Unrealized depreciation on open swap contracts | $ | 1,999,792 | ||||||
Equity contracts | Purchased options, at fair value | 435,162 | Written options, at fair value | 92,840 | ||||||||
Interest rate contracts* | N/A | N/A | N/A | 82,578 | ||||||||
Total | $ | 2,216,902 | $ | 2,175,210 | ||||||||
| * | Includes cumulative appreciation/depreciation of futures contracts as shown in the Schedule of Investments. |
Only current day’s varation margin is reported in the Statement of Assets and Liabilities.
36
Driehaus Mutual Funds
Notes to Financial Statements — (Continued)
The following table sets forth the Active Income Fund’s realized gain/loss by primary risk exposure and by type of derivative contract for the period January 1, 2011 through December 31, 2011:
| Amount of realized gain/(loss) on derivatives | ||||||||||||||||||||
Risk exposure category | Purchased Options | Written Options | Futures Contracts | Swap Contracts | Total | |||||||||||||||
Credit contracts | $ | — | $ | — | $ | — | $ | (4,640,694 | ) | $ | (4,640,694 | ) | ||||||||
Equity contracts | (44,692,501 | ) | 12,637,800 | — | — | (32,054,701 | ) | |||||||||||||
Interest rate contracts | — | — | (77,527,667 | ) | — | (77,527,667 | ) | |||||||||||||
|
|
|
|
|
|
|
|
|
| |||||||||||
Total | $ | (44,692,501 | ) | $ | 12,637,800 | $ | (77,527,667 | ) | $ | (4,640,694 | ) | $ | (114,223,062 | ) | ||||||
|
|
|
|
|
|
|
|
|
| |||||||||||
The following table sets forth the Select Credit Fund’s realized gain/losses by primary risk exposure and by type of derivative contract for the period January 1, 2011 through December 31, 2011:
| Amount of realized gain/(loss) on derivatives | ||||||||||||||||||||
Risk exposure category | Purchased Options | Written Options | Futures Contracts | Swap Contracts | Total | |||||||||||||||
Credit contracts | $ | — | $ | — | $ | — | $ | (83,051 | ) | $ | (83,051 | ) | ||||||||
Equity contracts | (1,154,521 | ) | 418,038 | — | — | (736,483 | ) | |||||||||||||
Interest rate contracts | — | — | (541,639 | ) | — | (541,639 | ) | |||||||||||||
|
|
|
|
|
|
|
|
|
| |||||||||||
Total | $ | (1,154,521 | ) | $ | 418,038 | $ | (541,639 | ) | $ | (83,051 | ) | $ | (1,361,173 | ) | ||||||
|
|
|
|
|
|
|
|
|
| |||||||||||
The following table sets forth the Active Income Fund’s change in unrealized appreciation/depreciation by primary risk exposure and by type of derivative contract for the period January 1, 2011 through December 31, 2011:
Change in unrealized appreciation/(depreciation) on derivatives | ||||||||||||||||||||
Risk exposure category | Purchased Options | Written Options | Futures Contracts | Swap Contracts | Total | |||||||||||||||
Credit contracts | $ | — | $ | — | $ | — | $ | 5,848,638 | $ | 5,848,638 | ||||||||||
Equity contracts | (1,428,189 | ) | 4,666,204 | — | — | 3,238,015 | ||||||||||||||
Interest rate contracts | — | — | (6,058,830 | ) | — | (6,058,830 | ) | |||||||||||||
|
|
|
|
|
|
|
|
|
| |||||||||||
Total | $ | (1,428,189 | ) | $ | 4,666,204 | $ | (6,058,830 | ) | $ | 5,848,638 | $ | 3,027,823 | ||||||||
|
|
|
|
|
|
|
|
|
| |||||||||||
The gross notional amount of swap contracts and the number of option contracts for the Active Income Fund as of December 31, 2011 is included on the Schedule of Investments. The quarterly average gross notional amount of the swap contracts for the Active Income Fund was $362,984,000 for the period January 1, 2011 through December 31, 2011. The quarterly average number of futures contracts purchased and sold short for the Active Income Fund was 0 and (4,081), respectively, for the period January 1, 2011 through December 31, 2011. The quarterly average number of purchased option contracts for the Active Income Fund was 58,145 for the period January 1, 2011 through December 31, 2011. The fair value of such contracts at December 31, 2011 is set forth in the table above.
The following table sets forth the Select Credit Fund’s change in unrealized appreciation/depreciation by primary risk exposure and by type of derivative contract for the period January 1, 2011 through December 31, 2011:
Change in unrealized appreciation/(depreciation) on derivatives | ||||||||||||||||||||
Risk exposure category | Purchased Options | Written Options | Futures Contracts | Swap Contracts | Total | |||||||||||||||
Credit contracts | $ | — | $ | — | $ | — | $ | (207,306 | ) | $ | (207,306 | ) | ||||||||
Equity contracts | (1,213,753 | ) | 327,380 | — | — | (886,373 | ) | |||||||||||||
Interest rate contracts | — | — | (80,528 | ) | — | (80,528 | ) | |||||||||||||
|
|
|
|
|
|
|
|
|
| |||||||||||
Total | $ | (1,213,753 | ) | $ | 327,380 | $ | (80,528 | ) | $ | (207,306 | ) | $ | (1,174,207 | ) | ||||||
|
|
|
|
|
|
|
|
|
| |||||||||||
37
Driehaus Mutual Funds
Notes to Financial Statements — (Continued)
The gross notional amount of swap contracts and the number of option contracts for the Select Credit Fund as of December 31, 2011 is included on the Schedule of Investments. The quarterly average gross notional amount of the swap contracts for the Select Credit Fund was $6,850,000 for the period January 1, 2011 through December 31, 2011. The quarterly average number of futures contracts purchased and sold short for the Select Credit Fund was 0 and (53), respectively, for the period January 1, 2011 through December 31, 2011. The quarterly average number of purchased option contracts for the Select Credit Fund was 4,302 for the period January 1, 2011 through December 31, 2011. The fair value of such contracts at December 31, 2011 is set forth in the table above.
C. INVESTMENT ADVISORY FEES, TRANSACTIONS WITH AFFILIATES, AND ADMINISTRATIVE FEES
Richard H. Driehaus, the President of the Trust, is also the Chairman of the Board of Driehaus Capital Management LLC (“DCM” or the “Adviser”), a registered investment adviser, and of Driehaus Securities LLC (“DS LLC” or the “Distributor”), a registered broker-dealer.
DCM serves as the Funds’ investment adviser. In return for its services to the Funds, the Funds pay the Adviser an annual management fee on a monthly basis of 0.55% and 0.80% of average net assets respectively, for the Active Income Fund and Select Credit Fund.
DCM has entered into a written agreement to cap the Select Credit Fund’s annual ordinary operating expenses (other than interest, taxes, brokerage commissions, dividends and interest on short sales, other investment-related expenses and extraordinary expenses) at 1.75% of average daily net assets until at least September 30, 2013. For this same time period, DCM is entitled to reimbursement for previously waived fees and reimbursed expenses to the extent that the Select Credit Fund’s expense ratio remains below the operating expense cap. For the year ended December 31, 2011, DCM did not waive any of its fees payable by the Select Credit Fund. During the period January 1, 2011 through December 31, 2011, DCM recaptured $62,523 of the Select Credit Fund’s fees waived in the prior year and there are no additional amounts subject to recapture.
The Active Income Fund accrued $16,462,083 for investment advisory fees during the period January 1, 2011 through December 31, 2011, of which $1,183,351 was payable to DCM at December 31, 2011. The Select Credit Fund accrued $819,518 for investment advisory fees during the period January 1, 2011 through December 31, 2011, and $124,814 was payable to DCM at December 31, 2011.
DS LLC is the Funds’ distributor. DS LLC does not earn any compensation from the Funds for these services. DS LLC has entered into a Fee Reimbursement Agreement with the Trust for the Funds. Under this agreement, the Funds reimburse DS LLC for certain fees paid by DS LLC to intermediaries who provide shareholder administrative and/or sub-transfer agency services to the Funds. The amount to be reimbursed will not exceed 0.25% of the average daily net assets held by such intermediaries. Prior to June 1, 2010, the amount to be reimbursed did not exceed 0.15%. As of December 31, 2011, the Active Income Fund owes $909,183 in reimbursements to DS LLC under this agreement, which is included in accrued shareholder services plan fees on the Statement of Assets and Liabilities. As of December 31, 2011, the Select Credit Fund owes $58,838 in reimbursements to DS LLC under this agreement, which is included in accrued shareholder services plan fees on the Statement of Assets and Liabilities.
Certain officers of the Trust are also officers of DCM and DS LLC. The Funds pay a portion of the Chief Compliance Officer’s salary. No other officers received compensation from the Funds during the period January 1, 2011 through December 31, 2011.
UMB Fund Services, Inc. (“UMBFS”), an affiliate of UMB Financial Corporation, serves as the Funds’ administrative and accounting agent. In compensation for these services, UMBFS receives the larger of a monthly minimum fee or a monthly fee based upon each Fund’s average net assets. UMBFS also acts as the transfer agent and dividend disbursing agent for the Funds. For these services, UMBFS receives a monthly fee based in part on shareholder processing activity during the month.
38
Driehaus Mutual Funds
Notes to Financial Statements — (Continued)
D. INVESTMENT TRANSACTIONS
Purchases and sales of investment securities (excluding options, futures, short-term securities and U.S. government obligations) for the Funds for the period January 1, 2011 through December 31, 2011, were as follows:
Active Income Fund
Purchases | $ | 1,944,773,140 | ||
Sales | $ | 1,313,970,286 |
Select Credit Fund
Purchases | $ | 215,712,380 | ||
Sales | $ | 59,403,725 |
The aggregate purchases and sales of U.S. government obligations for the Funds for the period January 1, 2011 through December 31, 2011, were as follows:
Active Income Fund
Purchases | $ | 499,377,672 | ||
Sales | $ | 499,895,240 |
Select Credit Fund
Purchases | $ | — | ||
Sales | $ | — |
E. RESTRICTED SECURITIES
Restricted securities are securities that are not registered for sale under the Securities Act of 1933 or applicable foreign law and that may be re-sold only in transactions exempt from applicable registration. Restricted securities include Rule 144A securities which may be sold normally to qualified institutional buyers. At December 31, 2011, the Funds held restricted securities as denoted on the Schedules of Investments.
F. PRINCIPAL SHAREHOLDER
As of December 31, 2011, the Active Income Fund had a shareholder that holds 21% of the outstanding shares of the Fund. A significant redemption by this shareholder could affect the Fund’s liquidity. The shareholder is a registered investment adviser providing advisory services to a variety of individual and institutional clients. The Active Income Fund is offered as one of several investment choices for these clients. Clients are permitted to transfer some or all of their account balances into or out of the Active Income Fund at any time.
In addition, the Active Income Fund has a Shareholder Servicing Agreement (the “Agreement”) in place with this shareholder. Under the terms of this Agreement, the Active Income Fund makes payments for services provided on behalf of the Active Income Fund. Such services may include, but shall not be limited to: transfer agent and sub-transfer agent services; aggregating and processing purchase and redemption orders; providing periodic statements; receiving and transmitting funds; processing dividend payments; providing sub-accounting services; forwarding shareholder communications; receiving, tabulating and transmitting proxies; responding to inquiries and performing such other related services as the Active Income Fund may request. The Shareholder Services Plan allows for annual payments not to exceed 0.25% of average daily net assets; however, the Board of Trustees of the Trust limited payment to 0.15% of average daily net assets for this Agreement for the period June 1, 2009 through May 31, 2010. For the period January 1, 2011 through December 31, 2011, the Active Income Fund had expenses of $2,363,747 under the terms of this Agreement with this shareholder.
39
Report of Independent Registered Public Accounting Firm
To the Board of Trustees and Shareholders of the Driehaus Mutual Funds:
We have audited the accompanying statements of assets and liabilities, including the schedules of investments, of Driehaus Active Income Fund and Driehaus Select Credit Fund (collectively, the “Funds”), of the Driehaus Mutual Funds, as of December 31, 2011, and the related statements of operations for the period then ended, the statements of changes in net assets and the financial highlights for each of the periods indicated therein. These financial statements and financial highlights are the responsibility of the Funds’ management. Our responsibility is to express an opinion on these financial statements and financial highlights based on our audits.
We conducted our audits in accordance with the standards of the Public Company Accounting Oversight Board (United States). Those standards require that we plan and perform the audits to obtain reasonable assurance about whether the financial statements and financial highlights are free of material misstatement. We were not engaged to perform an audit of the Funds’ internal control over financial reporting. Our audits included consideration of internal control over financial reporting as a basis for designing audit procedures that are appropriate in the circumstances, but not for the purpose of expressing an opinion on the effectiveness of the Funds’ internal control over financial reporting. Accordingly, we express no such opinion. An audit also includes examining, on a test basis, evidence supporting the amounts and disclosures in the financial statements and financial highlights, assessing the accounting principles used and significant estimates made by management, and evaluating the overall financial statement presentation. Our procedures included confirmation of securities owned as of December 31, 2011, by correspondence with the custodian and brokers. We believe that our audits provide a reasonable basis for our opinion.
In our opinion, the financial statements and financial highlights referred to above present fairly, in all material respects, the financial position of Driehaus Active Income Fund and Driehaus Select Credit Fund, at December 31, 2011, the results of their operations for the period then ended, the changes in their net assets and their financial highlights for the periods indicated therein in conformity with US generally accepted accounting principles.

Chicago, Illinois
February 24, 2011
40
Interested and Independent Trustees of the Trust
The following table sets forth certain information with respect to the Trustees of the Trust:
Name, Address and Year of Birth | Position(s) | Term of Office and Time Served** | Number of Portfolios in Trust Overseen by Trustee | Principal Occupation(s) | Other Directorships Held by Trustee During the Past 5 Years | |||||
Interested Trustee:* | ||||||||||
Richard H. Driehaus 25 East Erie Street Chicago, IL 60611 YOB: 1942 | Trustee | Since 1996 | 9 | Chairman of the Board of the Adviser, the Distributor and Driehaus Capital Management (USVI) LLC (“USVI”); Chief Investment Officer and Portfolio Manager of the Adviser. President of the Trust from 1996-2011. | Driehaus Capital Holdings LLC; Driehaus Enterprise Management, Inc.; The Richard H. Driehaus Foundation; and The Richard H. Driehaus Museum | |||||
Independent | ||||||||||
A.R. Umans c/o Driehaus Capital Management LLC 25 East Erie Street Chicago, IL 60611 YOB: 1927 | Trustee and Chairman | Since 1996 Since 2005 | 9 | Chairman of the Board, Commerce National Group (investment company) since 2005; Chairman of the Board and Chief Executive Officer, RHC/Spacemaster Corporation (manufacturing corporation) prior thereto. | Sinai Health System; Schwab Rehabilitation Hospital | |||||
Francis J. Harmon c/o Driehaus Capital Management LLC 25 East Erie Street Chicago, IL 60611 YOB: 1942 | Trustee | Since 1998 | 9 | Relationship Manager, Great Lakes Advisors, Inc. since February 2008; Principal Account Executive — Labor Affairs, Blue Cross and Blue Shield of Illinois prior thereto. | None | |||||
Daniel F. Zemanek c/o Driehaus Capital Management LLC 25 East Erie Street Chicago, IL 60611 YOB: 1942 | Trustee | Since 1996 | 9 | President of Ludan, Inc. (real estate services specializing in senior housing) since April 2008; Senior Vice President of Sunrise Development, Inc. (senior living) from 2003-2007; Consultant, real estate development prior thereto. | None |
| * | Mr. Driehaus is an “interested person” of the Trust, the Adviser and the Distributor, as defined in the 1940 Act, because he is an officer of the Adviser and the Distributor. In addition, Mr. Driehaus has a controlling interest in the Adviser and the Distributor. |
| ** | Each Trustee will serve as a Trustee of the Trust until (i) termination of the Trust, or (ii) the Trustee’s retirement, resignation, or death, or (iii) as otherwise specified in the Trust’s governing documents. |
41
Advisory Board Members of the Trust
The following table sets forth certain information with respect to the Advisory Board Members of the Trust.
Name, Address and | Position(s) | Term of Office | Principal Occupation(s) | Other Directorships | ||||
Advisory Board | ||||||||
Theodore J. Beck c/o Driehaus Capital Management LLC 25 East Erie Street Chicago, IL 60611 YOB: 1952 | Advisory Board Member | Since 2011 | President and Chief Executive Officer, National Endowment for Financial Education, 2005 to present; Associate Dean for Executive Education and Corporate Relations and President for the Center for Advanced Studies in Business at the University of Wisconsin — Madison, 1999-2005. | President’s Advisory Council on Financial Capability since 2010; Federal Deposit Insurance Corporation Advisory Committee on Economic Inclusion since 2007; Jump$tart Coalition for Personal Financial Literacy since 2008; Wisconsin Alumni Association Board since 2006; President’s Advisory Council on Financial Literacy from 2008-2010; Wilshire Variable Insurance Trust, 2008-2010; Wilshire Mutual Funds Inc, 2008-2010. | ||||
Dawn M. Vroegop c/o Driehaus Capital Management LLC 25 East Erie Street Chicago, IL 60611 YOB: 1966 | Advisory Board Member | Since 2011 | Managing Director, Dresdner RCM Global Investors from September 1999 to September 2003. | Independent Trustee, Met Investors Series Trust since December 2000; Director, Metropolitan Series Fund, Inc. since May 2009; Director and Investment Committee Chair, City College of San Francisco Foundation since 2003. |
| *** | The Advisory Board Members serve for a one year term from November 1, 2011 through October 31, 2012 and may be appointed to serve additional terms to be determined by the Board at its discretion. |
42
The following table sets forth certain information with respect to the officers of the Trust.
Name, Address and Year of Birth | Position(s) | Length of | Principal Occupation(s) During Past 5 Years | |||
Robert H. Gordon 25 East Erie Street Chicago, IL 60611 YOB: 1961 | President | Since 2011 | President and Chief Executive Officer of Adviser, Distributor and USVI since October 2006; Advisor to Adviser and Distributor from April to September 2006; Chief Operating Officer, Aris Capital Management from 2003-2006. Senior Vice President of the Trust from 2006-2011. | |||
Michelle L. Cahoon 25 East Erie Street Chicago, IL 60611 YOB: 1966 | Vice President and Treasurer | Since 2006
Since 2002 | Vice President, Treasurer and Chief Financial Officer of the Adviser, Distributor and USVI since 2004. | |||
Janet L. McWilliams 25 East Erie Street Chicago, IL 60611 YOB: 1970 | Chief Compliance Officer and Assistant Vice President | Since 2006
Since 2007 | Chief Compliance Officer of the Adviser and Distributor since 2006; Senior Attorney with the Adviser since 2003; Attorney with the Adviser since 2000. | |||
Diane J. Drake 301 Bellevue Parkway Wilmington, DE 19809 YOB: 1967 | Secretary | Since 2006 | Managing Director and Senior Counsel, BNY Mellon Investment Servicing (US) Inc. (formerly, PNC Global Investment Servicing (U.S.) Inc. (“PNC”), a financial services company) since 2010; Vice President and Counsel, PNC from 2008-2010; Vice President and Associate Counsel, PNC from 2003-2007. | |||
Michael P. Kailus 25 East Erie Street Chicago, IL 60611 YOB: 1971 | Assistant Secretary | Since 2010 | Assistant Secretary of the Adviser, Distributor and USVI since 2010; Associate General Counsel of Superfund Group (financial services company) from 2005-2010. | |||
William H. Wallace, III 301 Bellevue Parkway Wilmington, DE 19809 YOB: 1969 | Assistant Secretary | Since 2008 | Vice President and Manager, BNY Mellon Investment Servicing (US) Inc. (formerly, PNC, a financial services company) since 2010; Assistant Vice President and Manager, PNC from 2008-2010; Sr. Regulatory Administrator, PNC from 2007-2008; Regulatory Administrator, PNC from 2004-2007. |
The Statement of Additional Information for Driehaus Mutual Funds contains more detail about the Trust’s Trustees and officers and is available upon request, without charge. For further information, please call 1-877-779-0079.
43
As a mutual fund shareholder, you may incur two types of costs: (1) transaction costs, including sales charges; redemption fees; and exchange fees and (2) ongoing costs, including management fees; distribution (12b-1) and/or service fees; and other fund expenses. This example is intended to help you understand your ongoing costs (in dollars) of investing in each Fund and to compare these costs with the ongoing costs of investing in other mutual funds.
The example is based on an investment of $1,000 invested at the beginning of the period and held for the entire six month period ending December 31, 2011.
Actual Expenses
The first line of the table below (“Actual”) provides information about actual account values and actual expenses. You may use the information in this line, together with the amount you invested, to estimate the expense that you paid over the period. Simply divide your account value by $1,000 (for example, an $8,600 account value divided by $1,000 = 8.6), then multiply the result by the number in the first line under the heading entitled “Expenses Paid During Period” to estimate the expenses you paid on your account during this period.
Hypothetical Example for Comparison Purposes
The second line of the tables below (“Hypothetical”) provides information about hypothetical account values and hypothetical expenses based on the Fund’s actual expense ratio and an assumed rate of return of 5% per year before expenses, which is not the Fund’s actual return. You may use this information to compare the ongoing costs of investing in the Fund versus other funds. To do so, compare this 5% hypothetical example with the 5% hypothetical examples that appear in the shareholder reports of the other funds.
Please note that the expenses shown in the table are meant to highlight your ongoing costs only and do not reflect any transactional costs, such as sales charges, redemption fees or exchange fees. Therefore, the second line of the table is useful in comparing ongoing costs only, and will not help you determine the relative total costs of owning different funds. In addition, if these transactional costs were included, your costs would have been higher.
Driehaus Active Income Fund
| Beginning Account Value July 1, 2011 | Ending Account Value December 31, 2011 | Expenses Paid During Six Months Ended December 31, 2011* | ||||||||||
Actual | $ | 1,000.00 | $ | 926.40 | $ | 4.79 | ||||||
Hypothetical Example, assuming a 5% return before expenses | $ | 1,000.00 | $ | 1,020.02 | $ | 5.03 | ||||||
Driehaus Select Credit Fund
| Beginning Account Value July 1, 2011 | Ending Account Value December 31, 2011 | Expenses Paid During Six Months Ended December 31, 2011* | ||||||||||
Actual | $ | 1,000.00 | $ | 946.60 | $ | 8.77 | ||||||
Hypothetical Example, assuming a 5% return before expenses | $ | 1,000.00 | $ | 1,015.99 | $ | 9.08 | ||||||
| * | Expenses are equal to the Fund’s annualized expense ratio for the six-month period in the table below multiplied by the average account value over the period, multiplied by the number of days in the most recent fiscal half-year (184), then divided by 365 to reflect the half-year period. |
Driehaus Active Income Fund | 0.99% | |
Driehaus Select Credit Fund | 1.79% |
44
TAX INFORMATION (UNAUDITED) FOR THE YEAR ENDED DECEMBER 31, 2011
We are providing this information as required by the Internal Revenue Code. The amounts shown may differ from those elsewhere in this report because of differences between tax and financial reporting requirements.
For taxable non-corporate shareholders, the following percentages of income and short-term capital gains represent qualified dividend income subject to the 15% rate category:
Active Income Fund | Select Credit Fund | |||||
| 17.13% | 15.00% | |||||
For corporate shareholders, the following percentages of income and short-term capital gains qualified for the dividends-received deduction:
Active Income Fund | Select Credit Fund | |||||
| 17.13% | 15.00% | |||||
PROXY VOTING POLICIES AND PROCEDURES AND PROXY VOTING RECORD
A description of the Funds’ policies and procedures with respect to the voting of proxies relating to the Funds’ portfolio securities is available, without charge, upon request, by calling 1-877-779-0079. This information is also available on the Funds’ website at http://www.driehaus.com.
Information regarding how the Driehaus Active Income Fund and Driehaus Select Credit Fund voted proxies related to portfolio securities during the 12-month period ended June 30, 2011 is available without charge, upon request, by calling 1-877-779-0079. This information is also available on the Securities and Exchange Commission’s (“SEC”) website at http://www.sec.gov.
HOW TO OBTAIN QUARTERLY PORTFOLIO HOLDINGS
Each Fund files a complete schedule of portfolio holdings with the SEC for the first and third quarters of each fiscal year on Form N-Q. The Funds’ Form N-Q is available electronically on the SEC’s website at http://www.sec.gov; hard copies may be reviewed and copied at the SEC’s Public Reference Room in Washington, DC. For more information on the Public Reference Room, call 1-800-SEC-0330. Each Fund’s complete schedule of portfolio holdings is also available on the Funds’ website at http://www.driehaus.com.
45
Board Considerations in Connection with the Annual Review of the Investment Advisory Agreement
The Board of Trustees of Driehaus Mutual Funds (the “Trust”) approved the renewal of the investment advisory agreement (the “Agreement”) with Driehaus Capital Management LLC (the “Adviser”) for Driehaus Active Income Fund (“LCMAX”) and Driehaus Select Credit Fund (“DRSLX”) (LCMAX and DRSLX are each a “Fund” and collectively the “Funds”) in September 2011. As part of its review process, the Board requested and evaluated all information it deemed reasonably necessary to evaluate the Agreement. The Board reviewed comprehensive materials received from the Adviser and from independent legal counsel. The Board also received extensive information throughout the year regarding performance and operating results of each Fund. The Independent Trustees, represented by independent legal counsel, met independent of Fund management to consider renewal of the Agreement. After their review of the information received, the Independent Trustees presented their findings and their recommendation to renew the Agreement to the full Board. In connection with the contract review process, the Board considered the factors discussed below, among others.
Nature, Quality and Extent of Services. The Board considered the nature, extent and quality of services provided under the Agreement, including portfolio management services and administrative services. The Board considered the experience and skills of senior management and investment personnel, the resources made available to such personnel, the ability of the Adviser to attract and retain high-quality personnel, and the organizational depth of the Adviser. The Board also considered the Trust’s compliance with legal and regulatory requirements, as well as the Adviser’s handling of portfolio brokerage, and noted the Adviser’s process for evaluating best execution. The Board considered the Adviser’s risk management strategies and the process developed by the Adviser for analyzing, reviewing and assessing risk exposure for the Funds. In addition, the Board reviewed LCMAX’s performance, including that of LCMAX’s predecessor fund (which was reorganized into LCMAX on June 1, 2009), given that a core portion of the portfolio management team managed the predecessor fund of LCMAX from 2007 to 2009. Given the investment strategies of LCMAX, the Board noted the limitations in comparing the performance of LCMAX to a peer group of funds compiled from Morningstar, Inc. and Lipper Inc., respectively, independent providers of mutual fund data, and the Board also considered LCMAX’s performance compared to an additional Lipper peer group. The Board compared LCMAX’s performance to peer groups of funds and to two benchmark indices for the 1-, 3- and 5-year periods ended June 30, 2011, and considered the Adviser’s explanation for the Fund’s 1-year underperformance compared to its peers. The Board also reviewed DRSLX’s performance, comparing it to a peer group of funds compiled from Morningstar, Inc. and to benchmark indices for the year-to-date period ended June 30, 2011 (the Fund’s inception date was September 30, 2010). The Board noted that DRSLX’s performance was below the median of its peer group and that it had outperformed the benchmark indices for this year-to-date period. For LCMAX and DRSLX, the Board considered whether investment results were consistent with each Fund’s investment objective and policies. The Board concluded that performance was satisfactory.
On the basis of this evaluation and its ongoing review of investment results, the Board concluded that the nature, quality and extent of services provided by the Adviser continue to be satisfactory.
Fees. The Board considered the Funds’ advisory fees, operating expenses and total expense ratios, and compared the advisory fees and expense ratios to peer groups based on data compiled from Lipper Inc. as of the fiscal year end of each fund in the peer groups. The Board noted the limitations in comparing the fees and expense ratios of LCMAX to the peer group of funds designated by Lipper (the mixed target allocation conservative strategy), which consists primarily of fund of funds that pursue a different investment strategy and typically have lower advisory fees, so the Board also compared the Fund’s advisory fees and expense ratios to the Lipper-designated peer group for DRSLX, which is a long/short funds category that the Adviser believes also is applicable to LCMAX. The Board noted that LCMAX’s annual advisory fee rate of ..55% is in the 10th percentile and the 45th percentile, respectively, of the two Lipper peer groups (1st percentile being the highest fee) and that the second peer group was more applicable to LCMAX. The Board noted that DRSLX’s annual advisory fee rate of .80% is in the 65th percentile of its peer group. The Board also considered that the Adviser had agreed to reimburse DRSLX for expenses in excess of 1.75% of net assets (excluding dividends and interest on short sales) until September 30, 2013, and that when the Adviser’s reimbursement is taken into consideration for DRSLX, its advisory fee was in the 91st percentile. Furthermore, the Board noted that the Adviser does not provide services to any other accounts with similar objectives and policies as the Funds. In considering the reasonableness of the advisory fees, the Board took into account the substantial human and technological resources devoted to investing for the Funds and the limited capacity of the investment styles, noting that LCMAX is currently closed to new investors.
46
The Board also noted that the Funds do not have a Rule 12b-1 fee and that the Adviser’s affiliate, DS LLC, serves as distributor of the Funds without compensation, that DS LLC provides compensation to intermediaries for distribution of the Funds’ shares and for shareholder services, and that DS LLC is reimbursed by the Funds under a Shareholder Services Plan for certain amounts paid for shareholder services covered under the Plan. The Board also considered that for the fiscal year ended December 31, 2010, LCMAX’s expense ratio was in the 44th percentile and 99th percentile, respectively, of the two Lipper peer groups and that the second peer group was more applicable to LCMAX. The Board noted that DRSLX’s expense ratio annualized for the period from September 30, 2010 to December 31, 2010 was in the 58th percentile and for the six months ended June 30, 2011 was in the 64th percentile of its Lipper peer group. On the basis of the information provided, the Board concluded that the advisory fees were reasonable and appropriate in light of the nature and quality of services provided by the Adviser.
Profitability. The Board reviewed information regarding the revenues received by the Adviser under the Agreement and discussed the methodology in allocating its costs to the management of the Funds. The Board considered the estimated costs to the Adviser of each Fund. The Board concluded that, based on the projected profitability calculated for the Trust as well as the Funds individually (noting that DRSLX was currently being operated at a loss), the advisory fees appeared to be reasonable.
Economies of Scale. In considering the reasonableness of the advisory fee, the Board considered whether there are economies of scale with respect to the management of the Funds and whether the Funds benefit from any economies of scale. Given the size of DRSLX and the capacity constraints of the Funds, the Board concluded that the advisory fee rates under the Agreement are reasonable and reflect an appropriate sharing of any such economies of scale.
Other Benefits to the Adviser and its Affiliates. The Board also considered the character and amount of other incidental benefits received by the Adviser and its affiliates. The Board noted that the Adviser’s affiliated broker-dealer does not execute any portfolio transactions for the Funds, and that payments to DS LLC under a Shareholder Services Plan are in reimbursement of payments made to intermediaries for shareholder services. The Board noted that there are no benefits to the Adviser related to soft dollar allocations. The Board concluded that the advisory fees were reasonable in light of any fall-out benefits.
Based on all of the information considered and the conclusions reached, the Board determined that the terms of the Agreement for the Funds were fair and reasonable and that the continuation of the Agreement is in the best interests of each Fund. No single factor was determinative in the Board’s analysis.
47
| Item 2. | Code of Ethics. |
| (a) | The registrant, as of the end of the period covered by this report, has adopted a code of ethics that applies to the registrant’s principal executive officer, principal financial officer, principal accounting officer or controller, or persons performing similar functions, regardless of whether these individuals are employed by the registrant or a third party. |
| (b) | No response required. |
| (c) | None. |
| (d) | None. |
| (e) | Not applicable. |
| (f) | The registrant’s Code of Ethics for Principal Executive and Financial Officers is filed hereto as Exhibit 12(a)(1) to this Certified Shareholder Report on Form N-CSR. |
| Item 3. | Audit Committee Financial Expert. |
The registrant’s Board of Trustees has designated A.R. Umans as an audit committee financial expert. Mr. Umans is “independent,” as defined by this Item 3.
| Item 4. | Principal Accountant Fees and Services. |
(a) Audit Fees
For the fiscal years ended December 31, 2011 and 2010, Ernst & Young LLP, the registrant’s principal accountant (“E&Y”), billed the registrant $340,300 and $300,100, respectively, for professional services rendered for the audit of the registrant’s annual financial statements or services that are normally provided in connection with statutory and regulatory filings.
(b) Audit-Related Fees
For the fiscal years ended December 31, 2011 and 2010, E&Y billed the registrant $0 and $0, respectively, for assurance and related services that are reasonably related to the performance of the audit of the registrant’s financial statements and that are not reported above.
For engagements that Driehaus Capital Management LLC, the registrant’s investment adviser (“DCM”), or Driehaus Securities LLC, the registrant’s distributor (“DS”), entered into with E&Y for fiscal years 2011 and 2010, E&Y provided no audit-related services to DCM or DS that were for engagements directly related to the registrant’s operations and financial reporting.
(c) Tax Fees
For the fiscal years ended December 31, 2011 and 2010, E&Y billed the registrant $82,900 and $107,400, respectively, for professional services rendered for tax compliance, tax advice and tax planning. Such services consisted of review of the registrant’s income tax returns and tax distribution requirements, analysis related to passive foreign investment company status, analysis related to loss carryforward limitations as well as assistance with the preparation, submission and responses related to a change in method of accounting election. The Audit Committee pre-approved all tax services that E&Y provided to the registrant.
For fiscal years 2011 and 2010, E&Y provided no tax services to DCM or DS that were for engagements directly related to the registrant’s operations and financial reporting.
(d) All Other Fees
For the fiscal years ended December 31, 2011 and 2010, E&Y billed the registrant $0 and $0, respectively, for products and services provided, other than the services reported above.
For fiscal years 2011 and 2010, E&Y provided no other services to DCM or DS that were for engagements directly related to the registrant’s operations and financial reporting.
(e)(1) Audit Committee Pre-Approval Policies and Procedures
Pursuant to registrant’s Audit Committee Charter (the “Charter”), the Audit Committee is responsible for pre-approving any engagement of the principal accountant to provide non-prohibited services to the registrant, including the fees and other compensation to be paid to the principal accountant, to the extent required by Rule 2-01(c)(7) of Regulation S-X. The Chairman of the Audit Committee may grant pre-approval for engagements of $5,000 or less. All such delegated pre-approvals will be presented to the Audit Committee no later than the next Audit Committee meeting.
Pursuant to the Charter, the Audit Committee is also responsible for pre-approving any engagement of the principal accountant, including the fees and other compensation to be paid to the principal accountant, to provide non-audit services to the registrant’s investment adviser (or any entity controlling, controlled by, or under common control with the adviser that provides ongoing services to the registrant), if the engagement relates directly to the operations and financial reporting of the registrant, to the extent required by Rule 2-01(c)(7) of Regulation S-X. The Chairman of the Audit Committee may grant pre-approval for engagements of $5,000 or less. All such delegated pre-approvals will be presented to the Audit Committee no later than the next Audit Committee meeting.
(e)(2) The percentage of services described in each of paragraphs (b) through (d) of this Item that were approved by the audit committee pursuant to paragraph (c)(7)(i)(C) of Rule 2-01 of Regulation S-X is 0%.
(f) Not applicable.
(g) Non-Audit Fees
For the fiscal years ended December 31, 2011 and 2010, E&Y billed the registrant $82,900 and $107,400, respectively, in aggregate non-audit fees. For the fiscal years ended December 31, 2011 and 2010, E&Y billed DCM or DS $0 and $0, respectively, in aggregate non-audit fees.
(h) Not applicable.
| Item 5. | Audit Committee of Listed Registrants. |
Not applicable.
| Item 6. | Investments. |
| (a) | Schedule of Investments in securities of unaffiliated issuers as of the close of the reporting period is included as part of the report to shareholders filed under Item 1 of this form. |
| (b) | Not applicable. |
| Item 7. | Disclosure of Proxy Voting Policies and Procedures for Closed-End Management Investment Companies. |
Not applicable.
| Item 8. | Portfolio Managers of Closed-End Management Investment Companies. |
Not applicable.
| Item 9. | Purchases of Equity Securities by Closed-End Management Investment Company and Affiliated Purchasers. |
Not applicable.
| Item 10. | Submission of Matters to a Vote of Security Holders. |
There have been no material changes to the procedures by which the shareholders may recommend nominees to the registrant’s board of directors, where those changes were implemented after the registrant last provided disclosure in response to the requirements of Item 407(c)(2)(iv) of Regulation S-K (17 CFR 229.407) (as required by Item 22(b)(15) of Schedule 14A (17 CFR 240.14a-101)), or this Item.
| Item 11. | Controls and Procedures. |
| (a) | The registrant’s principal executive and principal financial officers, or persons performing similar functions, have concluded that the registrant’s disclosure controls and procedures (as defined in Rule 30a-3(c) under the Investment Company Act of 1940, as amended (the “1940 Act”) (17 CFR 270.30a-3(c))) are effective, as of a date within 90 days of the filing date of the report that includes the disclosure required by this paragraph, based on their evaluation of these controls and procedures required by Rule 30a-3(b) under the 1940 Act (17 CFR 270.30a-3(b)) and Rules 13a-15(b) or 15d-15(b) under the Securities Exchange Act of 1934, as amended (17 CFR 240.13a-15(b) or 240.15d-15(b)). |
| (b) | There were no changes in the registrant’s internal control over financial reporting (as defined in Rule 30a-3(d) under the 1940 Act (17 CFR 270.30a-3(d)) that occurred during the registrant’s second fiscal quarter of the period covered by this report that has materially affected, or is reasonably likely to materially affect, the registrant’s internal control over financial reporting. |
| Item 12. | Exhibits. |
| (a)(1) | Code of ethics, or any amendment thereto, that is the subject of disclosure required by Item 2 is attached hereto. | |
| (a)(2) | Certifications pursuant to Rule 30a-2(a) under the 1940 Act and Section 302 of the Sarbanes-Oxley Act of 2002 are attached hereto. | |
| (a)(3) | Not applicable. | |
| (b) | Certifications pursuant to Rule 30a-2(b) under the 1940 Act and Section 906 of the Sarbanes- Oxley Act of 2002 are attached hereto. | |
SIGNATURES
Pursuant to the requirements of the Securities Exchange Act of 1934 and the Investment Company Act of 1940, the registrant has duly caused this report to be signed on its behalf by the undersigned, thereunto duly authorized.
| (registrant) | Driehaus Mutual Funds | |||||
By (Signature and Title)* | /s/ Robert H. Gordon | |||||
| Robert H. Gordon, President | ||||||
| (principal executive officer) | ||||||
| Date | March 2, 2012 | |||||
Pursuant to the requirements of the Securities Exchange Act of 1934 and the Investment Company Act of 1940, this report has been signed below by the following persons on behalf of the registrant and in the capacities and on the dates indicated.
| By (Signature and Title)* | /s/ Robert H. Gordon | |||||
| Robert H. Gordon, President | ||||||
| (principal executive officer) | ||||||
| Date | March 2, 2012 | |||||
| By (Signature and Title)* | /s/ Michelle L. Cahoon | |||||
| Michelle L. Cahoon, Vice President and Treasurer | ||||||
| (principal financial officer) | ||||||
| Date | March 2, 2012 | |||||
| * | Print the name and title of each signing officer under his or her signature. |