Table of Contents
UNITED STATES
SECURITIES AND EXCHANGE COMMISSION
Washington, D.C. 20549
FORM N-CSR
CERTIFIED SHAREHOLDER REPORT OF REGISTERED MANAGEMENT
INVESTMENT COMPANIES
Investment Company Act file number 811-07655
Driehaus Mutual Funds
(Exact name of registrant as specified in charter)
25 East Erie Street
Chicago, IL 60611
(Address of principal executive offices) (Zip code)
Janet L. McWilliams
Driehaus Capital Management LLC
25 East Erie Street
Chicago, IL 60611
(Name and address of agent for service)
Registrant’s telephone number, including area code: 312-587-3800
Date of fiscal year end: December 31
Date of reporting period: December 31, 2014
Form N-CSR is to be used by management investment companies to file reports with the Commission not later than 10 days after the transmission to stockholders of any report that is required to be transmitted to stockholders under Rule 30e-1 under the Investment Company Act of 1940 (17 CFR 270.30e-1). The Commission may use the information provided on Form N-CSR in its regulatory, disclosure review, inspection, and policymaking roles.
A registrant is required to disclose the information specified by Form N-CSR, and the Commission will make this information public. A registrant is not required to respond to the collection of information contained in Form N-CSR unless the Form displays a currently valid Office of Management and Budget (“OMB”) control number. Please direct comments concerning the accuracy of the information collection burden estimate and any suggestions for reducing the burden to Secretary, Securities and Exchange Commission, 100 F Street, NE, Washington, DC 20549. The OMB has reviewed this collection of information under the clearance requirements of 44 U.S.C. § 3507.
Table of Contents
| Item 1. | Reports to Stockholders. |
The Reports to Shareholders are attached herewith.
Table of Contents
Driehaus Mutual Funds
Trustees & Officers
Richard H. Driehaus
Trustee
Theodore J. Beck
Trustee
Francis J. Harmon
Trustee
A.R. Umans
Trustee
Dawn M. Vroegop
Trustee
Daniel F. Zemanek
Chairman of the Board
Robert H. Gordon
President
Michelle L. Cahoon
Vice President & Treasurer
Janet L. McWilliams
Chief Legal Officer &
Assistant Vice President
Michael R. Shoemaker
Chief Compliance Officer &
Assistant Vice President
Diane J. Drake
Secretary
Michael P. Kailus
Assistant Secretary &
Anti-Money Laundering Compliance Officer
William H. Wallace, III
Assistant Secretary
Investment Adviser
Driehaus Capital Management LLC
25 East Erie Street
Chicago, IL 60611
Distributor
Driehaus Securities LLC
25 East Erie Street
Chicago, IL 60611
Administrator & Transfer Agent
BNY Mellon Investment Servicing (US) Inc.
4400 Computer Drive
Westborough, MA 01581
Custodian
The Northern Trust Company
50 South LaSalle Street
Chicago, IL 60603
Annual Report to Shareholders
December 31, 2014

Driehaus International Discovery Fund
Driehaus Emerging Markets Growth Fund
Driehaus Emerging Markets Small Cap Growth Fund
Driehaus International Small Cap Growth Fund
Driehaus Micro Cap Growth Fund
Distributed by:
Driehaus Securities LLC
This report has been prepared for the shareholders of the Funds and is not an offer to sell or buy any Fund securities. Such offer is only made by the Funds' prospectus.
Table of Contents
Investment Philosophy:
The Adviser seeks to achieve superior investment returns primarily by investing in global companies that are currently demonstrating rapid growth in their sales and earnings and which, in its judgement, have the ability to continue or accelerate their growth rates in the future. The Adviser manages the portfolios actively (above average turnover) to ensure that the Funds are fully invested, under appropriate market conditions, in companies that meet these criteria. Investors should note that investments in overseas markets can pose more risks than U.S. investments, and the international Funds’ share prices are expected to be more volatile than those of the U.S.-only Funds. In addition, the Funds’ returns will fluctuate with changes in stock market conditions, currency values, interest rates, government regulations, and economic and political conditions in countries in which the Funds invest. These risks are generally greater when investing in emerging markets.
Annual Report to Shareholders December 31, 2014
Driehaus International Discovery Fund
Driehaus Emerging Markets Growth Fund
Driehaus Emerging Markets Small Cap Growth Fund
Driehaus International Small Cap Growth Fund
Driehaus Micro Cap Growth Fund
Table of Contents
Portfolio Managers’ Letter, Performance Overview and Schedule of Investments: | ||||
| 1 | ||||
| 7 | ||||
| 14 | ||||
| 22 | ||||
| 28 | ||||
| 34 | ||||
| 36 | ||||
| 38 | ||||
| 40 | ||||
| 45 | ||||
| 55 | ||||
| 56 | ||||
| 58 | ||||
| 59 | ||||
| 61 | ||||
Board Considerations in Connection with the Annual Review of the Investment Advisory Agreement | 62 | |||
Table of Contents
Driehaus International Discovery Fund — Portfolio Manager’s Letter
Dear Fellow Shareholders,
The Driehaus International Discovery Fund (“Fund”) returned -7.85% for the year ended December 31, 2014. The Fund’s benchmark, the Morgan Stanley Capital International (“MSCI”) All Country World ex USA Growth Index (“Benchmark”), returned -2.29% for the year, while the MSCI All Country World ex USA Index, returned -3.44%.
International markets were largely unkind to US investors during 2014. The US dollar appreciated against most currencies and generally sapped returns from international equity markets, though country returns in local currency terms were not nearly as poor. While Japan’s dramatic monetary policy significantly depreciated the yen relative to the US dollar, in local currency terms the country’s equity market posted better returns than most regions. Asia ex-Japan performed in line with Europe ex-UK. Emerging markets posted a second consecutive year of lackluster gains as a strong US dollar and declining commodity prices weighed heavily on economic growth. The improving US economy and the associated expectations about the US dollar and Fed rate direction remained significant market drivers into the year-end.
Over the course of 2014, key contributors to performance versus the Benchmark were the Fund’s holdings in the industrials and materials sectors. In addition, stock selection in Germany and the Netherlands contributed to the performance of the Fund.
A notable contribution to the Fund’s return for the year came from holding Ashtead Group PLC (Ticker: AHT LN). The company is engaged in equipment rental to industrial and commercial users, mainly in the non-residential construction sectors in the US and the UK. Ashtead Group PLC started the year strong with excellent revenue growth, market share gains, and a supportive US macro environment. This positive momentum continued throughout 2014.
LyondellBasell Industries NV (Ticker: LYB), incorporated in the Netherlands, was a significant contributor to return during 2014. LyondellBasell manufactures plastic, chemical and fuel products. The release of second quarter results in July prompted a major uptick in its share price as earnings beat consensus. Additionally, cumulative buybacks, growth projects, and increased productivity convinced investors to raise estimates and forecasts.
Certain areas detracted from Fund performance during the year. Two sectors that hurt the performance of the Fund relative to the Benchmark were the consumer discretionary and information technology sectors. Additionally, holdings in Japan and Hong Kong detracted from Fund performance versus the Benchmark.
Holding Melco Crown Entertainment, Ltd. (Ticker: MPEL) was one of the most significant detractors to the Fund’s performance during 2014. The company is a developer, owner and operator of casino gaming and entertainment resort facilities in Asia. Although Melco Crown entered 2014 with strong results and growth momentum, policy changes in mainland China affected the gaming industry as a whole, putting downward pressure on share prices. In particular, the anti-graft campaign, which caused a change to transit visa procedures to Macau and additional state security monitoring of gambling activities, resulted in decreased VIP and premium gaming.
Galaxy Entertainment Group, Ltd. (Ticker: 27 HK) was a significant detractor from the Fund’s return during the year. Galaxy Entertainment is engaged in operating casinos, hospitality, and the manufacture, sale and distribution of construction materials in Hong Kong. Similar to Melco Crown, the company entered 2014 on an upward trajectory but was severely affected by the anti-graft campaign in mainland China.
The near-term outlook for developed markets is rife with event risk. This is mostly focused on Europe’s stagnating economic growth. While we are sympathetic to the prevailing narrative of deflation in Europe, we are not as negative as the consensus. Further, we are cautiously optimistic about the European Central Bank’s (“ECB”) aggressive policy response to the region’s growth problems. The ECB’s balance sheet had contracted by roughly a third since 2013, so the lack of monetary growth or inflation is not a surprise. To our knowledge, this was the biggest contraction of a major central bank balance sheet in history and reversing it will offer a chance to reverse many of its adverse effects.
Within emerging markets (“EM”), the coming year is likely to see continued volatility and high levels of performance dispersion at the country and sector levels. We anticipate a primary component of EM equities’
1
Table of Contents
overall return will again be foreign exchange. With most currencies having already corrected significantly, we are less bearish on their outlook than a year ago, in part due to high yields and many reforms that we believe are likely to bear fruit. The top-line growth outlook is not exciting but we see significant room for profitability improvements at the company level given how poor profit discipline has been in recent years for many large companies.
By the time you read this letter, the Fund will be nearing completion of its merger into the Driehaus International Small Cap Growth Fund. We at Driehaus Capital Management LLC appreciate your support over the years.
Sincerely,
 | ||
| Joshua Rubin | ||
| Portfolio Manager |
Performance is historical and does not represent future results.
Please see the following performance overview page for index descriptions.
2
Table of Contents
Driehaus International Discovery Fund
Performance Overview (unaudited)
The performance summarized below is historical and does not represent future results. Investment returns and principal value vary, and you may have a gain or loss when you sell shares. Performance data presented measures the change in the value of an investment in the Fund, assuming reinvestment of all dividends and capital gains. Average annual total return reflects annualized change.
The table does not reflect the deduction of taxes that a shareholder would pay on Fund distributions or the redemption of Fund shares. The graph compares the results of a $10,000 investment in the Fund since December 31, 1998 (the date of the Fund’s inception), with all dividends and capital gains reinvested, with the indicated indices (and dividends reinvested) for the same period.
| Average Annual Total Returns as of 12/31/14 | 1 Year | 3 Years | 5 Years | 10 Years | Since Inception (12/31/98 - 12/31/14) | |||||||||||||||
Driehaus International Discovery Fund (DRIDX)1 | –7.85% | 7.38% | 2.40% | 5.29% | 12.21% | |||||||||||||||
MSCI AC World ex USA Growth Index2 | –2.29% | 9.84% | 5.54% | 5.77% | 3.89% | |||||||||||||||
MSCI AC World ex USA Index3 | –3.44% | 9.49% | 4.89% | 5.59% | 5.22% | |||||||||||||||
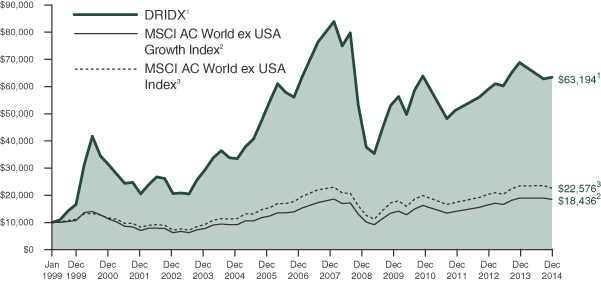
| 1 | The returns for the periods prior to July 1, 2003, reflect fee waivers and/or reimbursements without which performance would have been lower. |
| 2 | The Morgan Stanley Capital International All Country World ex USA Growth Index (MSCI AC World ex USA Growth Index) is a subset of the MSCI AC World ex USA Index and is composed only of the MSCI AC World ex USA Index stocks which are categorized as growth stocks. Data is in U.S. dollars. Source: Morgan Stanley Capital International Inc. |
| 3 | The Morgan Stanley Capital International All Country World ex USA Index (MSCI AC World ex USA Index) is a market capitalization-weighted index designed to measure equity market performance in 45 global developed and emerging markets, excluding the U.S. Data is in U.S. dollars. Source: Morgan Stanley Capital International Inc. |
3
Table of Contents
Driehaus International Discovery Fund
Schedule of Investments
December 31, 2014
| Number of Shares | Value (Note A) | |||||||
| EQUITY SECURITIES — 97.7% | ||||||||
| EUROPE — 54.6% | ||||||||
Germany — 10.8% |
| |||||||
Aurelius AG | 40,269 | $ | 1,524,029 | |||||
Bayer AG | 6,765 | 922,129 | ||||||
Deutsche Annington Immobilien SE | 59,825 | 2,031,164 | ||||||
Deutsche Wohnen AG | 45,143 | 1,064,914 | ||||||
Dialog Semiconductor PLC** | 39,418 | 1,376,311 | ||||||
LEG Immobilien AG** | 12,900 | 960,972 | ||||||
MorphoSys AG** | 9,282 | 864,685 | ||||||
Symrise AG | 15,074 | 908,137 | ||||||
|
| |||||||
| 9,652,341 | ||||||||
|
| |||||||
United Kingdom — 9.7% |
| |||||||
Ashtead Group PLC | 101,815 | 1,808,229 | ||||||
AstraZeneca PLC — SP ADR | 12,770 | 898,753 | ||||||
BTG PLC** | 76,685 | 946,513 | ||||||
Domino’s Pizza Group PLC | 93,597 | 1,021,930 | ||||||
Halma PLC | 148,369 | 1,580,419 | ||||||
ITV PLC | 436,608 | 1,456,403 | ||||||
St. James’s Place PLC | 77,332 | 975,073 | ||||||
|
| |||||||
| 8,687,320 | ||||||||
|
| |||||||
Ireland — 7.6% |
| |||||||
Endo International PLC** | 27,656 | 1,994,551 | ||||||
FleetMatics Group PLC** | 19,803 | 702,808 | ||||||
Perrigo Co., PLC | 15,231 | 2,546,014 | ||||||
Shire PLC — ADR | 7,380 | 1,568,545 | ||||||
|
| |||||||
| 6,811,918 | ||||||||
|
| |||||||
Switzerland — 6.8% |
| |||||||
Nestle SA | 38,800 | 2,828,559 | ||||||
Roche Holding AG | 12,051 | 3,265,125 | ||||||
|
| |||||||
| 6,093,684 | ||||||||
|
| |||||||
France — 4.5% |
| |||||||
BNP Paribas SA | 20,947 | 1,236,590 | ||||||
Ingenico | 9,164 | 965,324 | ||||||
Teleperformance | 26,696 | 1,817,203 | ||||||
|
| |||||||
| 4,019,117 | ||||||||
|
| |||||||
Sweden — 2.9% |
| |||||||
Assa Abloy AB — B | 35,985 | 1,900,602 | ||||||
Electrolux AB — B | 24,108 | 704,417 | ||||||
|
| |||||||
| 2,605,019 | ||||||||
|
| |||||||
Italy — 2.7% |
| |||||||
Intesa Sanpaolo SpA | 834,355 | 2,420,389 | ||||||
Belgium — 2.6% |
| |||||||
Anheuser-Busch InBev NV | 20,958 | 2,358,648 | ||||||
Denmark — 2.6% |
| |||||||
Coloplast AS — B | 11,284 | 944,296 | ||||||
Pandora AS | 17,228 | 1,396,453 | ||||||
|
| |||||||
| 2,340,749 | ||||||||
|
| |||||||
| Number of Shares | Value (Note A) | |||||||
Norway — 2.0% |
| |||||||
Marine Harvest ASA | 66,151 | $ | 908,281 | |||||
Opera Software ASA | 40,175 | 507,935 | ||||||
Schibsted ASA | 6,505 | 412,543 | ||||||
|
| |||||||
| 1,828,759 | ||||||||
|
| |||||||
Netherlands — 1.2% |
| |||||||
Sensata Technologies Holding NV** | 21,354 | 1,119,163 | ||||||
Luxembourg — 1.2% |
| |||||||
GAGFAH SA** | 47,585 | 1,062,689 | ||||||
|
| |||||||
Total EUROPE | 48,999,796 | |||||||
|
| |||||||
| FAR EAST — 23.5% | ||||||||
Japan — 13.9% |
| |||||||
Astellas Pharma, Inc. | 74,403 | 1,035,846 | ||||||
Calbee, Inc. | 37,891 | 1,305,224 | ||||||
Daiwa Securities Group, Inc. | 85,324 | 668,099 | ||||||
Hoshizaki Electric Co., Ltd. | 9,263 | 446,365 | ||||||
Keyence Corp. | 1,131 | 503,968 | ||||||
LIXIL Group Corp. | 34,128 | 718,249 | ||||||
M3, Inc. | 59,267 | 991,656 | ||||||
Minebea Co., Ltd. | 51,098 | 754,610 | ||||||
MISUMI Group, Inc. | 29,800 | 982,661 | ||||||
Nihon M&A Center, Inc. | 31,100 | 936,918 | ||||||
Ono Pharmaceutical Co., Ltd. | 13,102 | 1,159,992 | ||||||
Suruga Bank, Ltd. | 34,456 | 633,198 | ||||||
Toyota Motor Corp. — SP ADR | 11,943 | 1,498,608 | ||||||
Zenkoku Hosho Co., Ltd. | 31,017 | 880,184 | ||||||
|
| |||||||
| 12,515,578 | ||||||||
|
| |||||||
China — 7.3% |
| |||||||
AIA Group, Ltd. | 355,338 | 1,959,855 | ||||||
Baidu, Inc. — SP ADR** | 7,842 | 1,787,741 | ||||||
Michael Kors Holdings, Ltd.** | 12,840 | 964,284 | ||||||
Tencent Holdings, Ltd. | 125,158 | 1,810,902 | ||||||
|
| |||||||
| 6,522,782 | ||||||||
|
| |||||||
Australia — 0.9% |
| |||||||
Domino’s Pizza Enterprises, Ltd. | 39,193 | 798,010 | ||||||
Malaysia — 0.8% |
| |||||||
Astro Malaysia Holdings BHD | 785,813 | 679,252 | ||||||
Philippines — 0.6% |
| |||||||
Robinsons Retail Holdings, Inc. | 338,229 | 572,379 | ||||||
|
| |||||||
Total FAR EAST | 21,088,001 | |||||||
|
| |||||||
| NORTH AMERICA — 17.2% | ||||||||
Canada — 11.4% |
| |||||||
AltaGas, Ltd. | 18,209 | 679,272 | ||||||
CCL Industries, Inc. — B | 21,643 | 2,344,814 | ||||||
Dollarama, Inc. | 14,961 | 764,919 | ||||||
Intact Financial Corp. | 15,339 | 1,107,054 | ||||||
Interfor Corp.** | 76,524 | 1,445,775 | ||||||
Notes to Financial Statements are an integral part of this Schedule.
4
Table of Contents
Driehaus International Discovery Fund
Schedule of Investments
December 31, 2014
| Number of Shares | Value (Note A) | |||||||
Progressive Waste Solutions, Ltd. | 59,953 | $ | 1,802,512 | |||||
Valeant Pharmaceuticals International, Inc.** | 14,350 | 2,054,429 | ||||||
|
| |||||||
| 10,198,775 | ||||||||
|
| |||||||
Mexico — 3.8% |
| |||||||
Cemex SAB de CV — SP ADR** | 143,488 | 1,462,143 | ||||||
Fibra Uno Administracion SA de CV — REIT | 676,381 | 1,993,327 | ||||||
|
| |||||||
| 3,455,470 | ||||||||
|
| |||||||
United States — 2.0% |
| |||||||
Actavis PLC** | 6,923 | 1,782,049 | ||||||
|
| |||||||
Total NORTH AMERICA | 15,436,294 | |||||||
|
| |||||||
| MIDDLE EAST — 2.4% | ||||||||
Israel — 2.4% |
| |||||||
CaesarStone Sdot-Yam, Ltd. | 14,795 | 885,037 | ||||||
Teva Pharmaceutical Industries, Ltd. — SP ADR | 21,093 | 1,213,058 | ||||||
|
| |||||||
| 2,098,095 | ||||||||
|
| |||||||
Total MIDDLE EAST | 2,098,095 | |||||||
|
| |||||||
Total EQUITY SECURITIES (Cost $81,196,252) | 87,622,186 | |||||||
|
| |||||||
| ||||||||
TOTAL INVESTMENTS (COST $81,196,252) | 97.7 | % | $ | 87,622,186 | ||||
Other Assets In Excess Of Liabilities | 2.3 | % | 2,057,003 | |||||
|
|
|
| |||||
Net Assets | 100.0 | % | $ | 89,679,189 | ||||
| ||||||||
The federal income tax basis and unrealized appreciation (depreciation) for all investments is as follows:
Basis: | $ | 81,470,029 | ||
|
| |||
Gross Appreciation | $ | 8,213,747 | ||
Gross Depreciation | (2,061,590 | ) | ||
|
| |||
Net Appreciation | $ | 6,152,157 | ||
|
|
** Non-income producing security
ADR — American Depository Receipt
REIT — Real Estate Investment Trust
SP ADR — Sponsored American Depository Receipt
Regional Weightings*
Western Europe | 54.6% | |||
North America | 17.2% | |||
Japan | 13.9% | |||
Asia/Far East Ex-Japan | 9.6% | |||
Middle East | 2.4% |
Top Ten Holdings*
Roche Holding AG | 3.6% | |||
Nestle SA | 3.2% | |||
Perrigo Co., PLC | 2.8% | |||
Intesa Sanpaolo SpA | 2.7% | |||
Anheuser-Busch InBev NV | 2.6% | |||
CCL Industries, Inc. — B | 2.6% | |||
Valeant Pharmaceuticals International, Inc. | 2.3% | |||
Deutsche Annington Immobilien SE | 2.3% | |||
Endo International PLC | 2.2% | |||
Fibra Uno Administracion SA de CV — REIT | 2.2% |
| * | All percentages are stated as a percent of net assets at December 31, 2014. |
Notes to Financial Statements are an integral part of this Schedule.
5
Table of Contents
Driehaus International Discovery Fund
Schedule of Investments (unaudited)
December 31, 2014
Industry | Percent of Net Assets | |||
Automobiles | 1.7% | |||
Beverages | 2.6% | |||
Building Products | 2.1% | |||
Capital Markets | 2.5% | |||
Chemicals | 1.0% | |||
Commercial Banks | 4.8% | |||
Commercial Sevices & Supplies | 2.0% | |||
Construction Materials | 2.6% | |||
Container & Packaging | 2.6% | |||
Diversified Financial Services | 1.0% | |||
Electrical Equipment | 1.2% | |||
Electronic Equipment, Instruments & Components | 3.4% | |||
Food & Staples Retailing | 0.6% | |||
Food Products | 5.6% | |||
Health Care Equipment & Supplies | 1.1% | |||
Health Care Technology | 1.1% | |||
Hotels, Restaurants & Leisure | 2.0% | |||
Household Durables | 0.8% | |||
Industry | Percent of Net Assets | |||
Insurance | 4.5% | |||
Internet Software & Services | 4.6% | |||
Life Sciences Tools & Services | 1.0% | |||
Machinery | 2.1% | |||
Media | 2.8% | |||
Multiline Retail | 1.0% | |||
Oil, Gas & Consumable Fuels | 0.8% | |||
Paper & Forest Products | 1.6% | |||
Pharmaceuticals | 21.6% | |||
Professional Services | 3.1% | |||
Real Estate Investment Trusts | 2.2% | |||
Real Estate Management & Development | 5.7% | |||
Semiconductors & Semiconductor Equipment | 1.5% | |||
Software | 0.8% | |||
Textiles, Apparel & Luxury Goods | 2.6% | |||
Trading Companies & Distributors | 3.1% | |||
Other Assets in Excess of Liabilities | 2.3% | |||
|
| |||
TOTAL | 100.0% | |||
|
| |||
Notes to Financial Statements are an integral part of this Schedule.
6
Table of Contents
Driehaus Emerging Markets Growth Fund — Portfolio Managers’ Letter
Dear Fellow Shareholders,
The Driehaus Emerging Markets Growth Fund (“Fund”) returned -5.96% for the year ended December 31, 2014. The Fund’s benchmark, the Morgan Stanley Capital International (“MSCI”) Emerging Markets Index (“Benchmark”), returned -1.82% for the year, while the MSCI Emerging Markets Growth Index returned -0.09%.
Emerging markets (“EM”) had another difficult year and underperformed the broad global and US indices. EM currencies suffered as the US dollar rallied and, as a group, depreciated 11.8% during 2014. The year’s challenges were exacerbated by commodity weakness, especially falling oil prices during the second half of 2014, and the extreme movements of the Russian ruble. Equity performance for the developing markets saw wide dispersion as commodity-producing nations fell sharply, although oil importers generally reacted well.
Over the course of 2014, an overweight to the health care sector contributed to the Fund’s return versus the Benchmark, along with holdings within the telecommunication services sector. From a country perspective, an underweight to Russia and holdings within India contributed to return versus the Benchmark.
The largest contributor to the Fund’s absolute return in 2014 was information technology holding Vipshop Holdings, Ltd. (Ticker: VIPS). The company is an online discount retailer that offers products to consumers in the People’s Republic of China through flash sales on its website. Although Vipshop’s share price has grown steadily since the end of 2012, the launch of a new global flash sale channel in September prompted an additional uptick in October 2014. The global flash sale channel provides customers with fast access to foreign goods and convenient electronic payment systems.
Maruti Suzuki India, Ltd. (Ticker: MSIL IN) was a significant contributor to the Fund’s return. The company manufactures, purchases and sells motor vehicles, automobile components and spare parts. Maruti Suzuki’s board agreed to address investor concerns regarding a proposed plant in Gujarat in March, which helped advance its share price through the rest of the year. The new measures included agreements on the role of minority shareholders and transfer costs.
For the year 2014, the information technology and consumer staples sectors detracted from the Fund’s return versus the Benchmark. At the country level, China and Taiwan detracted from Fund performance versus the Benchmark.
A significant detractor from the Fund’s return for the year was Yandex NV (Ticker: YNDX). The company is an Internet search provider in Russia, Turkey, Ukraine, Belarus and Kazakhstan. Yandex NV’s share price stumbled after the company posted mixed results for its fourth quarter 2013, which were below consensus estimates with higher-than-expected expenses. As the year progressed, a weak macroeconomic environment in Russia and ruble volatility further depressed the company’s share price despite Yandex NV posting solid results.
Fund holding Magnit PJSC (Ticker: MGNT LI) was also a large detractor. The company is a Russia-based holding company engaged in the food retail industry. Although the retailer appears on track to meet expectations with strong new store openings, a general decline in the sector and market, depreciation of the ruble, and risks in the broader Russian economy have continued to put pressure on its share price.
This coming year is likely to see continued volatility within emerging markets and higher levels of dispersion at the country and sector levels. We anticipate a primary component of EM equities’ overall return will again be foreign exchange. Given the significant decline in many EM currencies relative to the US dollar, we see relative value buffers starting to emerge in selective currency levels along with higher relative yields in many EM markets. Fundamentally, countries and companies capable of implementing meaningful reforms are likely to outperform the broader universe in 2015. The top-line growth outlook for the global economy is muted but we nonetheless see significant room for profitability improvements at the company level driven by factors such as better margin execution, declining input costs, improving competitiveness and/or structural demand.
7
Table of Contents
We at Driehaus Capital Management LLC thank you for your interest in the Driehaus Emerging Markets Growth Fund and would like to express our gratitude to you as shareholders for your confidence in our management capabilities.
Sincerely,
 |  |  | ||
| Howard Schwab | Chad Cleaver | Rich Thies | ||
| Lead Portfolio Manager | Co-Portfolio Manager | Assistant Portfolio Manager |
Performance is historical and does not represent future results.
Please see the following performance overview page for index descriptions.
8
Table of Contents
Driehaus Emerging Markets Growth Fund
Performance Overview (unaudited)
The performance summarized below is historical and does not represent future results. Investment returns and principal value vary, and you may have a gain or loss when you sell shares. Performance data presented measures the change in the value of an investment in the Fund, assuming reinvestment of all dividends and capital gains. Average annual total return reflects annualized change.
The table does not reflect the deduction of taxes that a shareholder would pay on Fund distributions or the redemption of Fund shares. The graph compares the results of a $10,000 investment in the Fund since December 31, 1997 (the date of the Fund’s inception), with all dividends and capital gains reinvested, with the indicated indices (and dividends reinvested) for the same period.
| Average Annual Total Returns as of 12/31/14 | 1 Year | 3 Years | 5 Years | 10 Years | Since Inception (12/31/97 - 12/31/14) | |||||||||||||||
Driehaus Emerging Markets Growth Fund (DREGX)1 | –5.96% | 6.97% | 5.15% | 10.77% | 12.56% | |||||||||||||||
MSCI Emerging Markets Index2 | –1.82% | 4.41% | 2.11% | 8.78% | 7.84% | |||||||||||||||
MSCI Emerging Markets Growth Index3 | –0.09% | 6.51% | 3.26% | 8.48% | 7.22% | |||||||||||||||
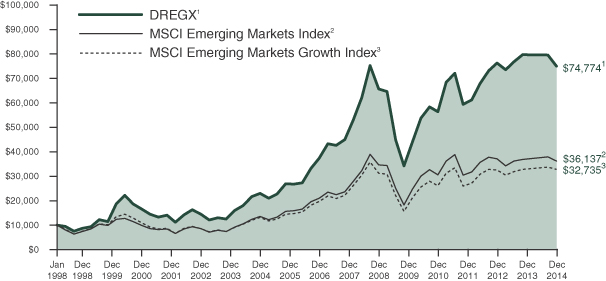
| 1 | The returns for the periods prior to July 1, 2003, reflect fee waivers and/or reimbursements without which performance would have been lower. |
| 2 | The Morgan Stanley Capital International Emerging Markets Index (MSCI Emerging Markets Index) is a market capitalization-weighted index designed to measure equity market performance in 23 global emerging markets. Data is in U.S. dollars. Source: Morgan Stanley Capital International Inc. |
| 3 | The Morgan Stanley Capital International Emerging Markets Growth Index (MSCI Emerging Markets Growth Index) is a subset of the MSCI Emerging Markets Index and includes only the MSCI Emerging Markets Index stocks which are categorized as growth stocks. Data is in U.S. dollars. Source: Morgan Stanley Capital International Inc. |
9
Table of Contents
Driehaus Emerging Markets Growth Fund
Schedule of Investments
December 31, 2014
| Number of Shares | Value (Note A) | |||||||
| EQUITY SECURITIES — 94.6% | ||||||||
| FAR EAST — 60.7% | ||||||||
China — 23.9% |
| |||||||
AIA Group, Ltd. | 4,111,508 | $ | 22,676,891 | |||||
Alibaba Group Holding Ltd. — SP ADR** | 203,677 | 21,170,187 | ||||||
Baidu, Inc. — SP ADR** | 244,953 | 55,841,935 | ||||||
CAR, Inc.** | 2,760,882 | 3,686,857 | ||||||
China Everbright International, Ltd. | 10,282,679 | 15,181,351 | ||||||
China Mobile, Ltd. | 2,454,013 | 28,743,233 | ||||||
China Overseas Land & Investment, Ltd. | 4,402,000 | 13,022,133 | ||||||
China Shipping Development Co., Ltd. — H ** | 8,482,446 | 5,782,829 | ||||||
China Taiping Insurance Holdings Co., Ltd.** | 1,162,608 | 3,303,917 | ||||||
Galaxy Entertainment Group, Ltd. | 1,444,800 | 8,028,342 | ||||||
Great Wall Motor Co., Ltd. — H | 4,364,775 | 24,689,229 | ||||||
Hengan International Group Co., Ltd. | 661,820 | 6,900,275 | ||||||
Hong Kong Exchanges & Clearing, Ltd. | 864,021 | 19,074,760 | ||||||
HSBC Holdings PLC | 1,083,600 | 10,303,912 | ||||||
Kweichow Moutai Co. Ltd. — A | 622,161 | 19,015,823 | ||||||
Luye Pharma Group, Ltd.** | 10,770,721 | 13,767,260 | ||||||
PetroChina Co., Ltd. —ADR | 272,830 | 30,273,217 | ||||||
PICC Property & Casualty Co. Ltd. — H | 16,088,000 | 31,045,401 | ||||||
Sihuan Pharmaceutical Holdings Group, Ltd. | 19,657,720 | 13,075,504 | ||||||
Sinopharm Group Co., Ltd. — H | 5,719,222 | 20,125,086 | ||||||
Sunac China Holdings, Ltd. | 12,109,961 | 12,233,085 | ||||||
Tencent Holdings, Ltd. | 1,277,982 | 18,491,033 | ||||||
WuXi PharmaTech Cayman, Inc. — ADR** | 328,316 | 11,054,400 | ||||||
|
| |||||||
| 407,486,660 | ||||||||
|
| |||||||
India — 14.2% |
| |||||||
Adani Ports & Special Economic Zone, Ltd | 2,332,276 | 11,739,510 | ||||||
Bharti Infratel, Ltd. | 2,150,427 | 11,451,258 | ||||||
Colgate-Palmolive India, Ltd. | 434,987 | 12,285,189 | ||||||
Container Corp Of India, Ltd. | 439,040 | 9,373,095 | ||||||
Glenmark Pharmaceuticals, Ltd. | 789,536 | 9,612,264 | ||||||
| Number of Shares | Value (Note A) | |||||||
HDFC Bank, Ltd. — ADR | 488,165 | $ | 24,774,374 | |||||
ICICI Bank, Ltd. | 5,073,580 | 28,234,191 | ||||||
ITC, Ltd. | 3,790,926 | 22,083,538 | ||||||
Lupin, Ltd. | 819,692 | 18,519,680 | ||||||
Maruti Suzuki India, Ltd. | 554,547 | 29,196,480 | ||||||
SKS Microfinance, Ltd.** | 2,450,887 | 15,974,634 | ||||||
Tata Consultancy Services, Ltd. | 462,340 | 18,720,474 | ||||||
Tata Motors, Ltd. — SP ADR | 691,475 | 29,235,563 | ||||||
|
| |||||||
| 241,200,250 | ||||||||
|
| |||||||
Taiwan — 9.1% |
| |||||||
Cathay Financial Holding Co., Ltd. | 7,984,450 | 11,798,140 | ||||||
Fubon Financial Holding Co., Ltd. | 12,605,000 | 20,063,743 | ||||||
Inotera Memories, Inc.** | 11,426,000 | 17,927,371 | ||||||
Largan Precision Co., Ltd. | 354,000 | 26,499,120 | ||||||
MediaTek, Inc. | 1,376,000 | 20,003,504 | ||||||
Pegatron Corp. | 7,596,000 | 17,362,470 | ||||||
Taiwan Semiconductor Manufacturing Co., Ltd. — SP ADR | 1,807,650 | 40,455,207 | ||||||
|
| |||||||
| 154,109,555 | ||||||||
|
| |||||||
South Korea — 7.8% |
| |||||||
Coway Co., Ltd. | 109,712 | 8,365,719 | ||||||
LG Household & Health Care, Ltd. | 31,566 | 17,891,660 | ||||||
LG Uplus Corp. | 1,598,681 | 16,668,615 | ||||||
Samsung Electronics Co., Ltd. — Pref. | 37,527 | 35,296,789 | ||||||
Samsung Fire & Marine Insurance Co., Ltd. | 78,892 | 20,244,754 | ||||||
Shinhan Financial Group Co., Ltd. | 201,243 | 8,088,985 | ||||||
SK Hynix, Inc.** | 601,105 | 25,688,476 | ||||||
|
| |||||||
| 132,244,998 | ||||||||
|
| |||||||
Thailand — 1.8% |
| |||||||
Advanced Info Service PCL — NVDR | 1,970,100 | 14,939,600 | ||||||
BTS Group Holdings PCL — NVDR | 29,276,584 | 8,524,515 | ||||||
Minor International PCL — NVDR | 7,416,550 | 7,275,416 | ||||||
|
| |||||||
| 30,739,531 | ||||||||
|
| |||||||
Philippines — 1.7% |
| |||||||
SM Prime Holdings, Inc. | 35,689,883 | 13,510,162 | ||||||
Universal Robina Corp. | 3,519,357 | 15,343,997 | ||||||
|
| |||||||
| 28,854,159 | ||||||||
|
| |||||||
Indonesia — 1.7% |
| |||||||
PT Bank Rakyat Indonesia Persero Tbk | 30,590,946 | 28,754,896 | ||||||
Notes to Financial Statements are an integral part of this Schedule.
10
Table of Contents
Driehaus Emerging Markets Growth Fund
Schedule of Investments
December 31, 2014
| Number of Shares | Value (Note A) | |||||||
Malaysia — 0.5% |
| |||||||
Malayan Banking BHD | 3,302,308 | $ | 8,648,156 | |||||
|
| |||||||
Total FAR EAST | 1,032,038,205 | |||||||
|
| |||||||
| EUROPE — 9.7% | ||||||||
Turkey — 2.5% |
| |||||||
TAV Havalimanlari Holding AS | 1,902,131 | 15,528,337 | ||||||
Turkiye Garanti Bankasi AS | 6,500,333 | 26,112,722 | ||||||
|
| |||||||
| 41,641,059 | ||||||||
|
| |||||||
Belgium — 1.6% |
| |||||||
Anheuser-Busch InBev NV | 248,172 | 27,929,689 | ||||||
United Kingdom — 1.4% |
| |||||||
Hikma Pharmaceuticals PLC | 361,492 | 11,091,137 | ||||||
Randgold Resources, Ltd. — ADR | 191,907 | 12,936,451 | ||||||
|
| |||||||
| 24,027,588 | ||||||||
|
| |||||||
Switzerland — 1.1% |
| |||||||
Glencore PLC** | 1,439,035 | 6,642,353 | ||||||
Roche Holding AG | 46,601 | 12,626,178 | ||||||
|
| |||||||
| 19,268,531 | ||||||||
|
| |||||||
France — 1.0% |
| |||||||
Ingenico | 157,596 | 16,600,955 | ||||||
Russia — 0.9% |
| |||||||
Magnit — SP GDR | 354,979 | 16,042,556 | ||||||
Romania — 0.7% |
| |||||||
Fondul Proprietatea SA** | 49,555,214 | 11,944,899 | ||||||
Portugal — 0.5% |
| |||||||
Jeronimo Martins SGPS SA | 766,539 | 7,681,039 | ||||||
|
| |||||||
Total EUROPE | 165,136,316 | |||||||
|
| |||||||
| SOUTH AMERICA — 8.8% | ||||||||
Brazil — 7.1% |
| |||||||
CETIP SA | 2,215,456 | 26,836,838 | ||||||
Itau Unibanco Holding SA — PREF ADR | 2,746,411 | 35,730,807 | ||||||
Kroton Educacional SA | 2,369,428 | 13,816,167 | ||||||
Linx SA | 591,849 | 11,243,840 | ||||||
Raia Drogasil SA | 292,162 | 2,786,211 | ||||||
Smiles SA | 1,085,251 | 18,800,620 | ||||||
Valid Solucoes e Servicos de Seguranca em Meios de Pagamento e Identificacao SA | 784,284 | 12,509,834 | ||||||
|
| |||||||
| 121,724,317 | ||||||||
|
| |||||||
Peru — 1.7% |
| |||||||
Credicorp, Ltd. | 177,619 | 28,451,011 | ||||||
|
| |||||||
Total SOUTH AMERICA | 150,175,328 | |||||||
|
| |||||||
| Number of Shares | Value (Note A) | |||||||
| AFRICA — 7.9% | ||||||||
South Africa — 6.1% |
| |||||||
Aspen Pharmacare Holdings, Ltd.** | 465,499 | $ | 16,239,440 | |||||
Discovery, Ltd. | 938,519 | 8,985,873 | ||||||
Mr. Price Group, Ltd. | 449,157 | 9,085,945 | ||||||
MTN Group, Ltd. | 468,923 | 8,920,103 | ||||||
Naspers, Ltd. — N | 196,894 | 25,469,270 | ||||||
Sanlam, Ltd. | 2,699,191 | 16,241,803 | ||||||
Tiger Brands, Ltd. | 581,710 | 18,436,545 | ||||||
|
| |||||||
| 103,378,979 | ||||||||
|
| |||||||
Egypt — 1.4% |
| |||||||
Commercial International Bank Egypt SAE | 3,398,724 | 23,189,927 | ||||||
Nigeria — 0.4% |
| |||||||
Guaranty Trust Bank PLC | 55,126,957 | 7,514,150 | ||||||
|
| |||||||
Total AFRICA | 134,083,056 | |||||||
|
| |||||||
| NORTH AMERICA — 6.9% | ||||||||
Mexico — 4.9% |
| |||||||
Cemex SAB de CV** | 26,812,051 | 27,332,254 | ||||||
Fomento Economico Mexicano SAB de CV — SP ADR** | 247,849 | 21,818,147 | ||||||
Grupo Aeroportuario Del Sureste SAB de CV — B** | 445,011 | 5,882,907 | ||||||
Grupo Financiero Inbursa SAB de CV | 7,393,510 | 19,082,936 | ||||||
Infraestructura Energetica Nova SAB de CV | 1,699,880 | 8,503,001 | ||||||
|
| |||||||
| 82,619,245 | ||||||||
|
| |||||||
United States — 2.0% |
| |||||||
Cognizant Technology Solutions Corp. — A** | 442,115 | 23,281,776 | ||||||
EPAM Systems Inc.** | 243,406 | 11,622,637 | ||||||
|
| |||||||
| 34,904,413 | ||||||||
|
| |||||||
Total NORTH AMERICA | 117,523,658 | |||||||
|
| |||||||
| MIDDLE EAST — 0.6% | ||||||||
United Arab Emirates — 0.6% |
| |||||||
Emaar Malls Group PJSC** | 13,289,025 | 9,696,189 | ||||||
|
| |||||||
Total MIDDLE EAST | 9,696,189 | |||||||
|
| |||||||
Total EQUITY SECURITIES (Cost $1,548,069,147) | 1,608,652,752 | |||||||
|
| |||||||
| ||||||||
Notes to Financial Statements are an integral part of this Schedule.
11
Table of Contents
Driehaus Emerging Markets Growth Fund
Schedule of Investments
December 31, 2014
| Number of Shares | Value (Note A) | |||||||
| EQUITY CERTIFICATES — 1.3% | ||||||||
| MIDDLE EAST — 1.3% | ||||||||
Saudi Arabia — 1.3% |
| |||||||
Bupa Arabia for Cooperative Insurance Co.† | 235,859 | $ | 10,616,782 | |||||
Samba Financial Group† | 1,150,121 | 11,830,849 | ||||||
|
| |||||||
| 22,447,631 | ||||||||
|
| |||||||
Total MIDDLE EAST | 22,447,631 | |||||||
|
| |||||||
Total EQUITY CERTIFICATES (Cost $23,741,592) | 22,447,631 | |||||||
|
| |||||||
| ||||||||
TOTAL INVESTMENTS (COST $1,571,810,739) | 95.9 | % | $ | 1,631,100,383 | ||||
Other Assets In Excess Of Liabilities | 4.1 | % | 70,118,465 | |||||
|
|
|
| |||||
Net Assets | 100.0 | % | $ | 1,701,218,848 | ||||
| ||||||||
The federal income tax basis and unrealized appreciation (depreciation) for all investments is as follows:
Basis: | $ | 1,580,686,066 | ||
|
| |||
Gross Appreciation | $ | 107,846,158 | ||
Gross Depreciation | (57,431,841 | ) | ||
|
| |||
Net Appreciation | $ | 50,414,317 | ||
|
|
| ** | Non-income producing security |
| † | Restricted security — Investments in securities not registered under the Securities Act of 1933, excluding 144A securities. At December 31, 2014, the value of these restricted securities amounted to $22,447,631 or 1.3% of net assets. |
Additional information on each restricted security is as follows:
Security | Counter- party | Acquisition Date(s) | Acquisition Cost | |||||||||
Bupa Arabia for Cooperative Insurance Co. | HSBC | | 09/11/14 to 11/10/14 | | $ | 9,639,178 | ||||||
Samba Financial Group | HSBC | | 09/18/14 to 12/30/14 | | $ | 14,102,414 | ||||||
ADR — American Depository Receipt
HSBC — Hong Kong Shanghai Banking Corporation
NVDR — Non-Voting Depository Receipt
PREF ADR — Preferred American Depository Receipt
SP ADR — Sponsored American Depository Receipt
SP GDR — Sponsored Global Depository Receipt
Regional Weightings*
Asia/Far East Ex-Japan | 60.7% | |||
South America | 8.8% | |||
Africa | 7.9% | |||
North America | 6.9% | |||
Western Europe | 5.6% | |||
Eastern Europe | 4.1% | |||
Middle East | 1.9% |
Top Ten Holdings*
Baidu, Inc. — SP ADR | 3.3% | |||
Taiwan Semiconductor Manufacturing Co., Ltd. — SP ADR | 2.4% | |||
Itau Unibanco Holding SA — PREF ADR | 2.1% | |||
Samsung Electronics Co., Ltd.— Pref. | 2.1% | |||
PICC Property & Casualty Co. Ltd. — H | 1.8% | |||
PetroChina Co., Ltd. — ADR | 1.8% | |||
Tata Motors, Ltd. — SP ADR | 1.7% | |||
Maruti Suzuki India, Ltd. | 1.7% | |||
PT Bank Rakyat Indonesia Persero Tbk | 1.7% | |||
China Mobile, Ltd. | 1.7% |
| * | All percentages are stated as a percent of net assets at December 31, 2014. |
Notes to Financial Statements are an integral part of this Schedule.
12
Table of Contents
Driehaus Emerging Markets Growth Fund
Schedule of Investments (unaudited)
December 31, 2014
Industry | Percent of Net Assets | |||
Automobiles | 4.9% | |||
Beverages | 4.0% | |||
Capital Markets | 1.6% | |||
Commercial Banks | 15.3% | |||
Commercial Sevices & Supplies | 1.6% | |||
Computer & Peripherals | 1.0% | |||
Construction Materials | 1.6% | |||
Consumer Finance | 0.9% | |||
Diversified Consumer Services | 0.8% | |||
Diversified Financial Services | 2.3% | |||
Diversified Telecommunication Services | 1.0% | |||
Electronic Equipment, Instruments & Components | 2.5% | |||
Food & Staples Retailing | 1.6% | |||
Food Products | 2.0% | |||
Gas Utilities | 0.5% | |||
Health Care Providers & Services | 1.2% | |||
Hotels, Restaurants & Leisure | 0.9% | |||
Household Durables | 0.5% | |||
Household Products | 1.1% | |||
Insurance | 7.3% | |||
Industry | Percent of Net Assets | |||
Internet Software & Services | 5.6% | |||
Information Technology Services | 3.2% | |||
Life Sciences Tools & Services | 0.6% | |||
Marine | 0.3% | |||
Media | 2.6% | |||
Metal & Mining | 1.2% | |||
Oil, Gas & Consumable Fuels | 1.8% | |||
Other | 0.7% | |||
Personal Products | 1.1% | |||
Pharmaceuticals | 5.6% | |||
Real Estate Management & Development | 2.8% | |||
Road & Rail | 0.8% | |||
Semiconductors & Semiconductor Equipment | 8.2% | |||
Software | 0.7% | |||
Speciality Retail | 0.5% | |||
Tobacco | 1.3% | |||
Transportation Infrastructure | 2.5% | |||
Wireless Telecommunication Services | 3.8% | |||
Other Assets in Excess of Liabilities | 4.1% | |||
|
| |||
TOTAL | 100.0% | |||
|
| |||
Notes to Financial Statements are an integral part of this Schedule.
13
Table of Contents
Driehaus Emerging Markets Small Cap Growth Fund — Portfolio Managers’ Letter
Dear Fellow Shareholders,
The Driehaus Emerging Markets Small Cap Growth Fund (“Fund”) returned 5.77% for the year ended December 31, 2014. This return outperformed the Morgan Stanley Capital International (“MSCI”) Emerging Markets Small Cap Index (“Benchmark”), which returned 1.34% for the same period. The Fund’s return also outperformed the secondary benchmark, the MSCI Emerging Markets Index, which returned -1.82% for the same period.
Emerging markets (“EM”) had another difficult year and underperformed the broad global and US indices. EM currencies suffered as the US dollar rallied and, as a group, depreciated 11.8% during 2014. The year’s challenges were exacerbated by commodity weakness, especially falling oil prices during the second half of 2014, and the extreme movements of the Russian ruble. Equity performance for the developing markets saw wide dispersion as commodity-producing nations fell sharply, although oil importers generally reacted well.
For 2014, at the sector level, key contributions to performance versus the Benchmark came from security selection within the consumer discretionary and financials sectors. In addition, stock selection in India and China contributed to the Fund’s outperformance. An overweight allocation to Saudi Arabia also made a significant contribution to performance during the year.
SKS Microfinance, Ltd. (Ticker: SKSM IN) was the most significant contributor to return for 2014. The company provides microfinance services to women in rural areas of India. The company’s share price exhibited a steady upward trajectory throughout 2014 that began mid-2013. SKS has seen recoveries in a portion of its loan portfolio as well as operating efficiencies which have improved margins. Additionally, India’s Microfinance Bill and improving regulatory environment were viewed positively by investors.
Vipshop Holdings, Ltd. (VIPS) made a notable contribution to the Fund’s relative and absolute returns for the year. The company is an online discount retailer that offers products to consumers in the People’s Republic of China through flash sales on its website. Although Vipshop’s share price has grown steadily since the end of 2012, the launch of a new global flash sale channel in September prompted an additional uptick in October 2014. The global flash sale channel provides customers with fast access to foreign goods and convenient electronic payment systems.
Certain areas detracted from Fund performance during the year. Two sectors that detracted from the performance of the Fund versus the Benchmark were energy and information technology. Certain holdings listed on exchanges in developed markets, but with operations in emerging markets, detracted from the Fund’s return.
Africa Oil Corp. (Ticker: AOI SS) was the most significant detractor from relative performance for the year. Africa Oil Corp is an independent international upstream oil and gas exploration company with interests in Kenya, Ethiopia and Somalia. The company’s share price declined after an operational update outlining unsuccessful results in Ethiopia and Kenya. An additional update in October disclosed further unsuccessful explorations, prompting yet another dip in the company’s share price. More broadly, the steep decline in oil prices during the second half of 2014 also hurt oil and gas exploration companies.
DNO ASA (Ticker: DNO NO) was a significant detractor for the year. The company is an oil and gas exploration and production company with activities primarily located in the Middle East and North Africa. In the middle of 2014, its share price dropped due to security concerns from the Islamic State fighting in the Kurdish region, where the company operates. An overall decline in the price of oil during the second half of 2014 also weighed on oil and gas exploration companies.
We utilized option strategies in the Fund primarily to hedge a portion of the Fund’s portfolio, dampen volatility, and manage downside risk. These strategies primarily consisted of puts and put spreads on exchange-traded funds (ETFs). During 2014, options detracted from performance while helping the portfolio realize less volatility than the Benchmark.
Within emerging markets, the coming year is likely to see continued volatility and high levels of performance dispersion at the country and sector levels. We anticipate a primary component of EM equities’ overall return will again be foreign exchange. With most currencies having already corrected significantly, we
14
Table of Contents
are less bearish on their outlook than a year ago, in part due to high yields and many reforms that we believe are likely to bear fruit.
We at Driehaus Capital Management LLC thank you for your interest in the Driehaus Emerging Markets Small Cap Growth Fund and would like to express our gratitude to you as shareholders for your confidence in our management capabilities.
Sincerely,
| |  | ||
| Chad Cleaver, CFA | Howard Schwab | Trent DeBruin, CFA | ||
| Lead Portfolio Manager | Co-Portfolio Manager | Assistant Portfolio Manager |
Performance is historical and does not represent future results.
Please see the following performance overview page for index descriptions.
15
Table of Contents
Driehaus Emerging Markets Small Cap Growth Fund
Performance Overview (unaudited)
The performance summarized below is historical and does not represent future results. Investment returns and principal value vary, and you may have a gain or loss when you sell shares. Performance data presented measures the change in the value of an investment in the Fund, assuming reinvestment of all dividends and capital gains. Average annual total return reflects annualized change.
The table does not reflect the deduction of taxes that a shareholder would pay on Fund distributions or the redemption of Fund shares. The graph compares the results of a $10,000 investment in the Fund since December 1, 2008 (the date of the Predecessor Limited Partnership’s inception), with all dividends and capital gains reinvested, with the indicated indices (and dividends reinvested) for the same period.
| Fund Only | Including Predecessor Limited Partnership | |||||||||||||||||||
| Average Annual Total Returns as of 12/31/14 | 1 Year | 3 Years | Since Inception (08/22/11 - 12/31/14) | 5 Years | Since Inception (12/01/08 - 12/31/14) | |||||||||||||||
Driehaus Emerging Markets Small Cap Growth Fund (DRESX)1 | 5.77% | 15.17% | 9.24% | 10.55% | 18.24% | |||||||||||||||
MSCI Emerging Markets Small Cap Index2 | 1.34% | 7.98% | 2.48% | 3.23% | 18.67% | |||||||||||||||
MSCI Emerging Markets Index3 | –1.82% | 4.41% | 2.39% | 2.11% | 13.34% | |||||||||||||||
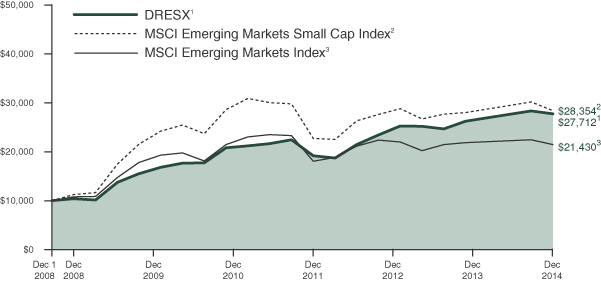
| 1 | The Driehaus Emerging Markets Small Cap Growth Fund (the “Fund”) performance shown above includes the performance of the Driehaus Emerging Markets Small Cap Growth Fund, L.P. (the “Predecessor Limited Partnership”), the Fund’s predecessor, for the periods before the Fund’s registration statement became effective. The Predecessor Limited Partnership, which was established on December 1, 2008, was managed with substantially the same investment objective, policies and philosophies as are followed by the Fund. The Fund succeeded to the Predecessor Limited Partnership’s assets on August 22, 2011. The Predecessor Limited Partnership was not registered under the Investment Company Act of 1940, as amended (“1940 Act”), and thus was not subject to certain investment and operational restrictions that are imposed by the 1940 Act. If the Predecessor Limited Partnership had been registered under the 1940 Act, its performance may have been adversely affected. The Predecessor Limited Partnership’s performance has been restated to reflect estimated expenses of the Fund. The returns for the periods prior to August 21, 2014, reflect fee waivers and/or reimbursements without which performance would have been lower. |
| 2 | The Morgan Stanley Capital International Emerging Markets Small Cap Index (MSCI Emerging Markets Small Cap Index) is a market capitalization-weighted index designed to measure equity market performance of small cap stocks in 23 global emerging markets. Data is in U.S. dollars. Source: Morgan Stanley Capital International Inc. |
| 3 | The Morgan Stanley Capital International Emerging Markets Index (MSCI Emerging Markets Index) is a market capitalization weighted index designed to measure equity market performance in 23 global emerging markets. Data is in U.S. dollars. Source: Morgan Stanley Capital International Inc. |
16
Table of Contents
Driehaus Emerging Markets Small Cap Growth Fund
Schedule of Investments
December 31, 2014
Number of Shares | Value (Note A) | |||||||
| EQUITY SECURITIES — 79.6% | ||||||||
| FAR EAST — 57.8% | ||||||||
China — 19.8% |
| |||||||
Angang Steel Co., | 8,883,297 | $ | 7,512,517 | |||||
Beijing Jingneng Clean Energy Co., Ltd. — H | 11,566,000 | 4,988,722 | ||||||
Bitauto Holdings, Ltd. —ADR** | 49,547 | 3,488,604 | ||||||
CAR, Inc.** | 1,689,901 | 2,256,679 | ||||||
China Animal Healthcare, Ltd. | 2,743,757 | 1,898,990 | ||||||
China Medical System Holdings, Ltd. | 1,333,591 | 2,197,082 | ||||||
China Shipping Development Co., | 7,040,912 | 4,800,077 | ||||||
China Singyes Solar Technologies Holdings, Ltd.** | 1,694,017 | 2,341,366 | ||||||
CIMC Enric Holdings, Ltd. | 3,694,000 | 2,914,693 | ||||||
CT Environmental Group, Ltd. | 8,883,826 | 9,059,151 | ||||||
Haitian International Holdings, Ltd. | 1,257,000 | 2,634,538 | ||||||
Hilong Holding, Ltd. | 7,949,000 | 1,841,719 | ||||||
Hollysys Automation Technologies, Ltd.** | 189,688 | 4,634,078 | ||||||
Luye Pharma Group, Ltd.** | 1,625,931 | 2,078,284 | ||||||
Man Wah Holdings, Ltd. | 1,550,800 | 2,550,630 | ||||||
Ozner Water International Holding, Ltd.** | 7,356,000 | 2,815,523 | ||||||
PAX Global Technology, Ltd.** | 4,823,037 | 4,940,263 | ||||||
Sunac China Holdings, Ltd. | 10,639,000 | 10,747,169 | ||||||
Sunny Optical Technology Group Co., Ltd. | 3,580,811 | 6,148,674 | ||||||
TAL Education Group — ADR** | 87,358 | 2,453,886 | ||||||
Vipshop Holdings, Ltd. — ADR** | 181,230 | 3,541,234 | ||||||
Wasion Group Holdings, Ltd. | 2,512,000 | 2,331,890 | ||||||
WuXi PharmaTech Cayman, Inc. — ADR** | 96,230 | 3,240,064 | ||||||
Zhuzhou CSR Times Electric Co., Ltd. — H | 1,637,500 | 9,555,154 | ||||||
|
| |||||||
| 100,970,987 | ||||||||
|
| |||||||
India — 13.9% |
| |||||||
Berger Paints India, Ltd. | 592,895 | 3,769,502 | ||||||
Bharat Electronics, Ltd. | 113,942 | 5,302,209 | ||||||
Castrol India, Ltd. | 364,494 | 2,891,883 | ||||||
CCL Products India, Ltd. | 688,871 | 1,801,605 | ||||||
Colgate-Palmolive India, Ltd. | 185,668 | 5,243,758 | ||||||
Number of Shares | Value (Note A) | |||||||
Credit Analysis & Research, Ltd. | 156,834 | $ | 3,669,691 | |||||
Eicher Motors, Ltd. | 7,387 | 1,750,395 | ||||||
Gujarat Pipavav Port, Ltd.** | 478,094 | 1,563,299 | ||||||
Indiabulls Housing Finance, Ltd. | 569,553 | 4,122,846 | ||||||
Kaveri Seed Co., Ltd. | 259,300 | 3,152,430 | ||||||
Kitex Garments Ltd. | 285,705 | 2,315,830 | ||||||
Marico Kaya Enterprises, Ltd.** | 113,055 | 1,709,191 | ||||||
Marico, Ltd. | 835,500 | 4,291,721 | ||||||
Max India, Ltd. | 645,066 | 4,023,802 | ||||||
Shree Cement, Ltd. | 15,102 | 2,243,847 | ||||||
SKS Microfinance, Ltd.** | 840,727 | 5,479,774 | ||||||
Snowman Logistics, Ltd.** | 2,023,780 | 3,183,672 | ||||||
Strides Arcolab, Ltd. | 157,191 | 2,379,814 | ||||||
WABCO India, Ltd. | 23,920 | 1,695,303 | ||||||
Wonderla Holidays, Ltd. | 347,143 | 1,705,992 | ||||||
Yes Bank, Ltd. | 428,744 | 5,209,895 | ||||||
Zee Learn, Ltd.** | 6,869,000 | 3,215,745 | ||||||
|
| |||||||
| 70,722,204 | ||||||||
|
| |||||||
Taiwan — 6.7% |
| |||||||
Chailease Holding Co., Ltd. | 1,931,000 | 4,782,369 | ||||||
Chroma ATE, Inc. | 777,000 | 2,009,423 | ||||||
Cub Elecparts, Inc. | 287,000 | 2,694,476 | ||||||
E.Sun Financial Holding Co., Ltd. | 6,882,000 | 4,264,253 | ||||||
eMemory Technology, Inc. | 516,000 | 5,928,191 | ||||||
Hermes Microvision, Inc. | 141,000 | 7,051,503 | ||||||
Makalot Industrial Co., Ltd. | 665,000 | 3,537,715 | ||||||
PChome Online, Inc. | 351,623 | 3,775,018 | ||||||
|
| |||||||
| 34,042,948 | ||||||||
|
| |||||||
Philippines — 4.5% |
| |||||||
D&L Industries, Inc. | 9,321,900 | 3,454,185 | ||||||
GT Capital Holdings, Inc. | 266,090 | 6,094,843 | ||||||
Megaworld Corp. | 60,215,615 | 6,222,261 | ||||||
Vista Land & Lifescapes, Inc. | 44,952,668 | 7,225,110 | ||||||
|
| |||||||
| 22,996,399 | ||||||||
|
| |||||||
Indonesia — 4.5% |
| |||||||
PT Jasa Marga Persero Tbk | 6,193,900 | 3,514,879 | ||||||
PT Matahari Department Store Tbk | 1,755,672 | 2,115,516 | ||||||
PT Pakuwon Jati Tbk | 126,993,400 | 5,261,782 | ||||||
PT Surya Citra Media Tbk | 20,459,600 | 5,773,755 | ||||||
PT Tambang Batubara Bukit Asam Tbk | 6,144,700 | 6,154,690 | ||||||
|
| |||||||
| 22,820,622 | ||||||||
|
| |||||||
Notes to Financial Statements are an integral part of this Schedule.
17
Table of Contents
Driehaus Emerging Markets Small Cap Growth Fund
Schedule of Investments
December 31, 2014
Number of Shares | Value (Note A) | |||||||
South Korea — 3.1% |
| |||||||
Cosmax, Inc.** | 40,716 | $ | 3,675,550 | |||||
i-SENS, Inc.** | 58,022 | 3,313,641 | ||||||
Korea Aerospace Industries, Ltd. | 109,679 | 3,957,946 | ||||||
Wonik IPS Co., Ltd.** | 406,590 | 5,108,121 | ||||||
|
| |||||||
| 16,055,258 | ||||||||
|
| |||||||
Thailand — 1.9% |
| |||||||
Bumrungrad Hospital PCL — NVDR | 557,600 | 2,379,180 | ||||||
Chularat Hospital PCL — NVDR | 3,710,700 | 2,020,639 | ||||||
Forth Smart Service PCL — NVDR** | 12,612,200 | 2,875,122 | ||||||
TMB Bank PCL — NVDR | 26,257,500 | 2,318,779 | ||||||
|
| |||||||
| 9,593,720 | ||||||||
|
| |||||||
Malaysia — 1.0% |
| |||||||
Berjaya Auto BHD | 5,488,500 | 5,159,669 | ||||||
Sri Lanka — 0.9% |
| |||||||
Hatton National Bank PLC | 1,695,335 | 2,512,861 | ||||||
John Keells Holdings PLC | 1,125,758 | 2,145,118 | ||||||
|
| |||||||
| 4,657,979 | ||||||||
|
| |||||||
Singapore — 0.8% |
| |||||||
First Real Estate Investment Trust — REIT | 1,844,000 | 1,742,620 | ||||||
Yoma Strategic Holdings, Ltd.** | 4,859,000 | 2,412,938 | ||||||
|
| |||||||
| 4,155,558 | ||||||||
|
| |||||||
Vietnam — 0.7% |
| |||||||
Hatien 1 Cement JSC** | 2,365,880 | 1,924,784 | ||||||
Kinh Bac City Development Share Holding Corp.** | 2,473,490 | 1,838,854 | ||||||
|
| |||||||
| 3,763,638 | ||||||||
|
| |||||||
Total FAR EAST | 294,938,982 | |||||||
|
| |||||||
| SOUTH AMERICA — 7.8% | ||||||||
Brazil — 7.8% |
| |||||||
Banco do Estado do Rio Grande do Sul SA — Pref. | 1,703,200 | 9,290,648 | ||||||
CETIP SA | 528,800 | 6,405,598 | ||||||
Fleury SA | 632,000 | 3,870,649 | ||||||
Linx SA | 220,141 | 4,182,199 | ||||||
Localiza Rent a Car SA | 371,200 | 4,986,665 | ||||||
Mills Estruturas e Servicosde Engenharia SA | 727,000 | 2,611,861 | ||||||
Smiles SA | 273,330 | 4,735,101 | ||||||
Valid Solucoes e Servicos de Seguranca em Meios de Pagamento e Identificacao SA | 242,100 | 3,861,651 | ||||||
|
| |||||||
| 39,944,372 | ||||||||
|
| |||||||
Total SOUTH AMERICA | 39,944,372 | |||||||
|
| |||||||
Number of Shares | Value (Note A) | |||||||
| AFRICA — 5.8% | ||||||||
South Africa — 3.7% |
| |||||||
AVI, Ltd. | 767,465 | $ | 5,141,822 | |||||
Clicks Group, Ltd. | 744,279 | 5,203,794 | ||||||
Mr. Price Group, Ltd. | 243,100 | 4,917,642 | ||||||
Petra Diamonds, Ltd.** | 1,174,054 | 3,524,799 | ||||||
|
| |||||||
| 18,788,057 | ||||||||
|
| |||||||
Nigeria — 0.9% |
| |||||||
Guaranty Trust Bank PLC | 13,677,252 | 1,864,295 | ||||||
Zenith Bank PLC | 26,077,602 | 2,592,776 | ||||||
|
| |||||||
| 4,457,071 | ||||||||
|
| |||||||
Egypt — 0.7% |
| |||||||
Six of October Development & Investment Co.** | 1,699,878 | 3,364,402 | ||||||
Kenya — 0.5% |
| |||||||
Safaricom, Ltd. | 17,818,200 | 2,764,723 | ||||||
|
| |||||||
Total AFRICA | 29,374,253 | |||||||
|
| |||||||
| EUROPE — 5.3% | ||||||||
Turkey — 2.8% |
| |||||||
Tofas Turk Otomobil Fabrikasi AS | 980,765 | 6,683,494 | ||||||
Turkiye Sinai Kalkinma Bankasi AS | 5,902,730 | 5,079,043 | ||||||
Ulker Biskuvi Sanayi AS | 269,543 | 2,133,624 | ||||||
|
| |||||||
| 13,896,161 | ||||||||
|
| |||||||
Norway — 1.2% |
| |||||||
DNO ASA** | 2,904,112 | 6,144,761 | ||||||
Poland — 0.8% |
| |||||||
Eurocash SA | 186,046 | 1,990,735 | ||||||
TVN SA** | 479,441 | 2,193,711 | ||||||
|
| |||||||
| 4,184,446 | ||||||||
|
| |||||||
United Kingdom — 0.5% |
| |||||||
Eros International PLC** | 124,329 | 2,630,802 | ||||||
|
| |||||||
Total EUROPE | 26,856,170 | |||||||
|
| |||||||
| MIDDLE EAST — 1.5% | ||||||||
Pakistan — 1.5% |
| |||||||
Fauji Fertilizer Co., Ltd. | 2,192,300 | 2,545,648 | ||||||
United Bank, Ltd. | 2,922,700 | 5,137,730 | ||||||
|
| |||||||
| 7,683,378 | ||||||||
|
| |||||||
Total MIDDLE EAST | 7,683,378 | |||||||
|
| |||||||
| NORTH AMERICA — 1.4% | ||||||||
Mexico — 1.4% |
| |||||||
Compartamos SAB de CV** | 1,222,800 | 2,457,410 | ||||||
Grupo Aeroportuario del Centro Norte SAB de CV — ADR | 63,145 | 2,294,689 | ||||||
Notes to Financial Statements are an integral part of this Schedule.
18
Table of Contents
Driehaus Emerging Markets Small Cap Growth Fund
Schedule of Investments
December 31, 2014
Number of Shares | Value (Note A) | |||||||
PLA Administradora Industrial S de RL de CV — REIT | 1,156,000 | $ | 2,418,756 | |||||
|
| |||||||
| 7,170,855 | ||||||||
|
| |||||||
Total NORTH AMERICA | 7,170,855 | |||||||
|
| |||||||
Total EQUITY SECURITIES | 405,968,010 | |||||||
|
| |||||||
| ||||||||
| EQUITY CERTIFICATES — 12.0% | ||||||||
| FAR EAST — 7.5% | ||||||||
India — 7.5% |
| |||||||
Eicher Motors, Ltd.† | 17,825 | 4,256,990 | ||||||
Kaveri Seed Co., Ltd.† | 102,738 | 1,255,610 | ||||||
Marico Kaya Enterprises, Ltd.**† | 82,139 | 1,241,796 | ||||||
Shree Cement, Ltd.† | 15,260 | 2,273,836 | ||||||
SKS Microfinance, Ltd.**† | 3,150,167 | 20,616,008 | ||||||
Symphony, Ltd.† | 76,400 | 2,353,576 | ||||||
Va Tech Wabag, Ltd.† | 83,184 | 1,942,201 | ||||||
WABCO India, Ltd.† | 34,222 | 2,427,622 | ||||||
Wonderla Holidays, Ltd.† | 425,589 | 2,095,835 | ||||||
|
| |||||||
| 38,463,474 | ||||||||
|
| |||||||
Total FAR EAST | 38,463,474 | |||||||
|
| |||||||
| MIDDLE EAST — 4.5% | ||||||||
Saudi Arabia — 4.5% |
| |||||||
Al Khleej Training and Education Co.† | 103,748 | 1,815,925 | ||||||
Al Tayyar Travel Group† | 76,814 | 2,435,768 | ||||||
Bupa Arabia for Cooperative Insurance Co.† | 166,484 | 7,493,987 | ||||||
Dallah Healthcare Holding Co.† | 104,855 | 3,630,365 | ||||||
Saudi Airlines Catering Co.† | 48,754 | 2,415,580 | ||||||
Saudi International Petrochemical Co.† | 726,389 | 5,137,541 | ||||||
|
| |||||||
| 22,929,166 | ||||||||
|
| |||||||
Total MIDDLE EAST | 22,929,166 | |||||||
|
| |||||||
Total EQUITY CERTIFICATES | 61,392,640 | |||||||
|
| |||||||
| ||||||||
| PURCHASED PUT OPTIONS — 0.8% | ||||||||
iShares MSCI Emerging Markets Index Fund, Exercise Price $38.00, Expiration Date January, 2015** | 30,000 | 750,000 | ||||||
iShares MSCI Emerging Markets Index Fund, Exercise Price $39.00, Expiration Date January, 2015** | 25,000 | 1,275,000 | ||||||
Number of Shares | Value (Note A) | |||||||
iShares Russell 2000 Index Fund, Exercise Price $118.00, Expiration Date January, 2015** | 5,000 | $ | 720,000 | |||||
iShares Russell 2000 Index Fund, Exercise Price $120.00, Expiration Date January, 2015** | 5,000 | 1,055,000 | ||||||
|
| |||||||
Total PURCHASED PUT OPTIONS | 3,800,000 | |||||||
|
| |||||||
| ||||||||
TOTAL INVESTMENTS | 92.4 | % | $ | 471,160,650 | ||||
Other Assets In Excess Of Liabilities | 7.6 | % | 39,013,910 | |||||
|
|
|
| |||||
Net Assets | 100.0 | % | $ | 510,174,560 | ||||
| ||||||||
The federal income tax basis and unrealized appreciation (depreciation) for all investments is as follows:
Basis: | $ | 438,042,568 | ||
|
| |||
Gross Appreciation | $ | 47,762,747 | ||
Gross Depreciation | (14,644,665 | ) | ||
|
| |||
Net Appreciation | $ | 33,118,082 | ||
|
|
| ** | Non-income producing security |
| † | Restricted security — Investments in securities not registered under the Securities Act of 1933, excluding 144A securities. At December 31, 2014, the value of these restricted securities amounted to $61,392,640 or 12.0% of net assets. |
Additional information on each restricted security is as follows:
Security | Counter- party | Acquisition Date(s) | Acquisition Cost | |||||||||
Al Khleej Trainingand Education Co. | CSFB | 02/24/14 | $ | 1,400,298 | ||||||||
Al Tayyar Travel Group | MLCO | | 07/11/13 to 10/02/13 | | $ | 1,370,195 | ||||||
Bupa Arabia for Cooperative Insurance Co. | HSBC | | 07/23/14 to 11/10/14 | | $ | 5,301,236 | ||||||
Dallah Healthcare Holding Co. | HSBC | | 12/04/14 to 12/08/14 | | $ | 3,918,377 | ||||||
Eicher Motors, Ltd. | MLCO | | 04/29/13 to 08/13/14 | | $ | 1,480,864 | ||||||
Kaveri Seed Co., Ltd. | MLCO | | 10/05/12 to 11/01/12 | | $ | 417,987 | ||||||
Marico Kaya Enterprises, Ltd. | MLCO | | 09/04/14 to 09/08/14 | | $ | 912,277 | ||||||
Notes to Financial Statements are an integral part of this Schedule.
19
Table of Contents
Driehaus Emerging Markets Small Cap Growth Fund
Schedule of Investments
December 31, 2014
Security | Counter- party | Acquisition Date(s) | Acquisition Cost | |||||||||
Saudi Airlines Catering Co. | MSCO | | 03/20/14 to 07/15/14 | | $ | 2,118,280 | ||||||
Saudi International Petrochemical Co. | HSBC | | 09/17/14 to 12/18/14 | | $ | 6,524,657 | ||||||
Shree Cement, Ltd. | MSCO | 09/04/14 | $ | 2,152,870 | ||||||||
SKS Microfinance, Ltd. | | MLCO & MSCO | | | 11/05/13 to 09/03/14 | | $ | 13,141,374 | ||||
Symphony, Ltd. | MSCO | | 07/02/14 to 07/11/14 | | $ | 1,376,195 | ||||||
Va Tech Wabag, Ltd. | MSCO | | 07/02/14 to 08/12/14 | | $ | 1,960,008 | ||||||
WABCO India, Ltd. | MSCO | | 07/02/14 to 09/04/14 | | $ | 2,102,698 | ||||||
Wonderla Holidays, Ltd. | MSCO | | 08/12/14 to 09/03/14 | | $ | 1,782,936 | ||||||
ADR — American Depository Receipt
CSFB — CS First Boston
HSBC — Hong Kong Shanghai Banking Corporation
MLCO — Merrill Lynch & Co., Inc.
MSCO — Morgan Stanley
NVDR — Non-Voting Depository Receipt
REIT — Real Estate Investment Trust
Regional Weightings(a)(b)
Asia/Far East Ex-Japan | 65.3% | |||
South America | 7.8% | |||
Middle East | 6.0% | |||
Africa | 5.8% | |||
Eastern Europe | 3.6% | |||
Western Europe | 1.7% | |||
North America | 1.4% |
Top Ten Holdings(a)
SKS Microfinance, Ltd. | 5.1 | % | ||
Sunac China Holdings, Ltd. | 2.1 | % | ||
Zhuzhou CSR Times Electric Co., Ltd. — H | 1.9 | % | ||
Banco do Estado do Rio Grande do Sul SA — Pref. | 1.8 | % | ||
CT Environmental Group, Ltd. | 1.8 | % | ||
Angang Steel Co., Ltd. — H | 1.5 | % | ||
Bupa Arabia for Cooperative Insurance Co. | 1.5 | % | ||
Vista Land & Lifescapes, Inc. | 1.4 | % | ||
Hermes Microvision, Inc. | 1.4 | % | ||
Tofas Turk Otomobil Fabrikasi AS | 1.3 | % |
| (a) | All percentages are stated as a percent of net assets at December 31, 2014. |
| (b) | Excludes purchased options. |
Notes to Financial Statements are an integral part of this Schedule.
20
Table of Contents
Driehaus Emerging Markets Small Cap Growth Fund
Schedule of Investments (unaudited)
December 31, 2014
Industry | Percent of Net Assets | |||
Aerospace & Defense | 1.8% | |||
Air Freight & Logistics | 0.6% | |||
Auto Components | 1.3% | |||
Automobiles | 1.3% | |||
Capital Markets | 1.3% | |||
Chemicals | 3.5% | |||
Commercial Banks | 7.5% | |||
Commercial Services & Supplies | 1.2% | |||
Construction & Engineering | 0.9% | |||
Construction Materials | 1.3% | |||
Consumer Finance | 5.6% | |||
Diversified Consumer Services | 2.1% | |||
Diversified Financial Services | 2.9% | |||
Electrical Equipment | 1.9% | |||
Electronic Equipment, Instruments & Components | 3.9% | |||
Energy Equipment & Services | 0.4% | |||
Food & Staples Retailing | 1.4% | |||
Food Products | 2.6% | |||
Health Care Equipment & Supplies | 0.7% | |||
Health Care Providers & Services | 2.3% | |||
Hotels, Restaurants & Leisure | 1.2% | |||
Household Durables | 1.5% | |||
Independent Power Producers & Energy Traders | 1.0% | |||
Industrial Conglomerates | 0.4% | |||
Insurance | 2.3% | |||
Internet & Catalog Retail | 0.7% | |||
Industry | Percent of Net Assets | |||
Internet Software & Services | 1.4% | |||
Information Technology Services | 0.6% | |||
Life Sciences Tools & Services | 0.6% | |||
Machinery | 2.3% | |||
Marine | 0.9% | |||
Media | 3.0% | |||
Metals & Mining | 2.2% | |||
Multiline Retail | 0.4% | |||
Oil, Gas & Consumable Fuels | 2.4% | |||
Other | 0.7% | |||
Personal Products | 2.6% | |||
Pharmaceuticals | 1.7% | |||
Real Estate Investment Trusts | 0.8% | |||
Real Estate Management & Development | 6.8% | |||
Road & Rail | 1.4% | |||
Semiconductors & Semiconductor Equipment | 3.6% | |||
Software | 0.8% | |||
Specialty Retail | 2.0% | |||
Textiles, Apparel & Luxury Goods | 1.2% | |||
Thrifts & Mortgage Finance | 0.8% | |||
Trading Companies & Distributors | 0.5% | |||
Transportation Infrastructure | 1.4% | |||
Water Utilities | 2.2% | |||
Wireless Telecommunication Services | 0.5% | |||
Other Assets in Excess of Liabilities | 7.6% | |||
|
| |||
TOTAL | 100.0% | |||
|
| |||
Notes to Financial Statements are an integral part of this Schedule.
21
Table of Contents
Driehaus International Small Cap Growth Fund — Portfolio Managers’ Letter
Dear Fellow Shareholders,
The Driehaus International Small Cap Growth Fund (“Fund”) returned -4.32% for the year ended December 31, 2014. The Fund’s benchmark, the Morgan Stanley Capital International (“MSCI”) All Country World ex USA Small Cap Growth Index (“Benchmark”), returned -3.35%.
International markets were largely unkind to US investors during 2014. The US dollar appreciated against most currencies and generally sapped returns from international equity markets, though country returns in local currency terms were not nearly as poor. While Japan’s dramatic monetary policy significantly depreciated the yen relative to the US dollar, in local currency terms the country’s equity market posted better returns than most regions. Asia ex-Japan performed in line with Europe ex-UK. Emerging markets posted a second consecutive year of lackluster gains as a strong US dollar and declining commodity prices weighed heavily on economic growth. The improving US economy and the associated expectations about the US dollar and Fed rate direction remained significant market drivers into the year-end.
Over the course of 2014, key contributors to performance versus the Benchmark were the Fund’s holdings in the industrials and consumer discretionary sectors. In addition, stock selection in Germany and Japan contributed positively to the performance of the Fund relative to the Benchmark.
Minebea Co., Ltd. (Ticker: 6479 JP) was the most significant contributor to the Fund’s performance during 2014. The company manufactures machine processed components, rotary appliances and electronic devices. Minebea has beat consensus estimates for six straight quarters with strong earnings growth, particularly in its LED backlights. In May 2013, the company began its steady share price climb when orders for its LED backlights from one of the largest US smartphone makers grew sharply.
GAGFAH S.A. (Ticker: GFJ GY) made significant contributions to the Fund’s return during 2014. GAGFAH owns a portfolio of more than 145,000 rental units in Germany, with concentrations in Dresden and Berlin. The company has exhibited steady share price growth since the end of 2011. At the end of 2014, GAGFAH experienced another upward tick when the company agreed to combine its business with Deutsche Annington Immobilien SE, a proposed merger that at the time of the announcement was to result in a combined entity with a market cap of over 9 billion euros.
For 2014, the financials and energy sectors detracted from the Fund’s performance versus the Benchmark. At the country level, security selection within China and the United Kingdom detracted value.
One holding that significantly detracted from returns for the year was DeeThree Exploration, Ltd. (Ticker: DTX CN). The company is engaged in natural gas and light crude oil exploration, development and production in Western Canada. Companies in industries that are dependent on the price of oil and gas, such as DeeThree Exploration, suffered during the second half of 2014 as crude prices declined by almost 50%. DeeThree Exploration’s drop in share price coincides with the downward market move in oil prices.
Sun Frontier Fudousan Co., Ltd. (Ticker: 8934 JP) was a significant detractor from the Fund within the financials sector. Sun Frontier is a real estate company that engages in brokerage, property management, re-planning (revitalization), and real estate securitization. The company’s share price fell in the first half of 2014 after rising sharply the previous year. The second half of the year saw management assuming a cautious gross margin outlook, particularly in the re-planning business, and predicting a slowdown in profit growth.
The near-term outlook for developed markets is rife with event risk. This is mostly focused on Europe‘s stagnating economic growth. While we are sympathetic to the prevailing narrative of deflation in Europe, we are not as negative as the consensus. Further, we are cautiously optimistic about the European Central Bank’s (“ECB”) aggressive policy response to the region’s growth problems. The ECB’s balance sheet had contracted by roughly a third since 2013, so the lack of monetary growth or inflation is not a surprise. To our knowledge, this was the biggest contraction of a major central bank balance sheet in history and reversing it will reverse many of its adverse effects.
Within emerging markets (“EM”), the coming year is likely to see continued volatility and high levels of performance dispersion at the country and sector levels. We anticipate a primary component of EM equities’ overall return will again be foreign exchange. With most currencies having already corrected significantly, we are less bearish on their outlook than a year ago, in part due to high yields and many reforms that are likely to bear fruit.
22
Table of Contents
As always, we at Driehaus Capital Management LLC thank you for your interest in the Driehaus International Small Cap Growth Fund and would like to express our gratitude to you as shareholders for your continued confidence in our management capabilities.
Sincerely,
 |  |  | ||
| David Mouser | Daniel Burr | Ryan Carpenter | ||
| Lead Portfolio Manager | Co-Portfolio Manager | Assistant Portfolio Manager |
Performance is historical and does not represent future results.
Please see the following performance overview page for index description.
23
Table of Contents
Driehaus International Small Cap Growth Fund
Performance Overview (unaudited)
The performance summarized below is historical and does not represent future results. Investment returns and principal value vary, and you may have a gain or loss when you sell shares. Performance data presented measures the change in the value of an investment in the Fund, assuming reinvestment of all dividends and capital gains. Average annual total return reflects annualized change.
The table does not reflect the deduction of taxes that a shareholder would pay on Fund distributions or the redemption of Fund shares. The graph compares the results of a $10,000 investment in the Fund since August 1, 2002 (the date of the Predecessor Limited Partnership’s inception), with all dividends and capital gains reinvested, with the indicated index (and dividends reinvested) for the same period.
| Fund Only | Including Predecessor Limited Partnership | |||||||||||||||||||||||
| Average Annual Total Returns as of 12/31/14 | 1 Year | 3 Years | 5 Years | Since Inception (09/17/07 - 12/31/14) | 10 Years | Since Inception (08/1/02 - 12/31/14) | ||||||||||||||||||
Driehaus International Small Cap Growth Fund (DRIOX)1 | –4.32% | 11.36% | 9.24% | 4.15% | 11.85% | 16.55% | ||||||||||||||||||
MSCI AC World ex USA Small Cap Growth Index2 | –3.35% | 10.40% | 7.16% | 1.40% | 6.71% | 10.40% | ||||||||||||||||||
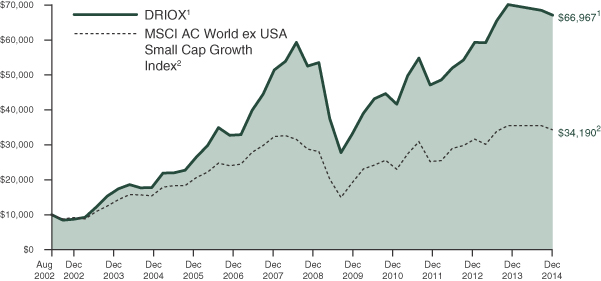
| 1 | The Driehaus International Small Cap Growth Fund (the “Fund”) performance shown above includes the performance of the Driehaus International Opportunities Fund, L.P. (the “Predecessor Limited Partnership”), the Fund’s predecessor, for the periods before the Fund’s registration statement became effective. The Predecessor Limited Partnership, which was established on August 1, 2002, was managed with substantially the same investment objective, policies and philosophies as are followed by the Fund. The Fund succeeded to the Predecessor Limited Partnership’s assets on September 17, 2007. The Predecessor Limited Partnership was not registered under the Investment Company Act of 1940, as amended (“1940 Act”), and thus was not subject to certain investment and operational restrictions that are imposed by the 1940 Act. If the Predecessor Limited Partnership had been registered under the 1940 Act, its performance may have been adversely affected. The Predecessor Limited Partnership’s performance has been restated to reflect estimated expenses of the Fund. The returns for the periods prior to January 1, 2010, reflect fee waivers and/or reimbursements without which performance would have been lower. |
| 2 | The Morgan Stanley Capital International All Country World ex USA Small Cap Growth Index (MSCI AC World ex USA Small Cap Growth Index) is a market capitalization-weighted index designed to measure equity performance in 45 global developed markets and emerging markets, excluding the U.S., and is composed of stocks which are categorized as small capitalization growth stocks. Data is in U.S. dollars. Source: Morgan Stanley Capital International, Inc. |
24
Table of Contents
Driehaus International Small Cap Growth Fund
Schedule of Investments
December 31, 2014
| Number of Shares | Value (Note A) | |||||||
| EQUITY SECURITIES — 98.7% | ||||||||
| EUROPE — 54.2% | ||||||||
Germany — 16.0% |
| |||||||
Aurelius AG | 72,704 | $ | 2,751,574 | |||||
Deutsche Annington Immobilien SE | 144,217 | 4,896,420 | ||||||
Deutsche Wohnen AG | 104,090 | 2,455,462 | ||||||
Dialog Semiconductor PLC** | 166,876 | 5,826,610 | ||||||
Drillisch AG | 62,928 | 2,236,677 | ||||||
Krones AG | 23,497 | 2,284,812 | ||||||
KUKA AG | 15,982 | 1,130,445 | ||||||
LEG Immobilien AG** | 46,525 | 3,465,831 | ||||||
MorphoSys AG** | 23,569 | 2,195,621 | ||||||
Stroeer Media SE | 51,244 | 1,520,054 | ||||||
Wirecard AG | 89,935 | 3,921,546 | ||||||
Zalando SE** | 75,322 | 2,324,162 | ||||||
|
| |||||||
| 35,009,214 | ||||||||
|
| |||||||
United Kingdom — 12.3% |
| |||||||
Ashtead Group PLC | 301,076 | 5,347,093 | ||||||
Barratt Developments PLC | 364,519 | 2,653,019 | ||||||
Bellway PLC | 77,954 | 2,337,974 | ||||||
BTG PLC** | 185,025 | 2,283,739 | ||||||
Domino’s Pizza Group PLC | 229,184 | 2,502,323 | ||||||
Halma PLC | 255,044 | 2,716,716 | ||||||
Howden Joinery Group PLC | 639,597 | 3,990,285 | ||||||
Inchcape PLC | 205,471 | 2,308,485 | ||||||
Provident Financial PLC | 75,346 | 2,876,094 | ||||||
|
| |||||||
| 27,015,728 | ||||||||
|
| |||||||
Switzerland — 5.8% |
| |||||||
Forbo Holding AG** | 4,016 | 4,017,212 | ||||||
Helvetia Holding AG | 5,005 | 2,378,123 | ||||||
Leonteq AG** | 12,244 | 2,938,310 | ||||||
U-Blox AG** | 24,270 | 3,321,681 | ||||||
|
| |||||||
| 12,655,326 | ||||||||
|
| |||||||
Norway — 5.0% |
| |||||||
Marine Harvest ASA | 182,174 | 2,501,326 | ||||||
Opera Software ASA | 399,667 | 5,053,017 | ||||||
Schibsted ASA | 52,779 | 3,347,211 | ||||||
|
| |||||||
| 10,901,554 | ||||||||
|
| |||||||
France — 4.6% |
| |||||||
Ingenico | 44,088 | 4,644,172 | ||||||
Montupet | 26,292 | 2,102,961 | ||||||
Teleperformance | 49,839 | 3,392,553 | ||||||
|
| |||||||
| 10,139,686 | ||||||||
|
| |||||||
Sweden — 2.6% |
| |||||||
Betsson AB** | 56,478 | 1,983,544 | ||||||
Electrolux AB — B | 130,014 | 3,798,909 | ||||||
|
| |||||||
| 5,782,453 | ||||||||
|
| |||||||
| Number of Shares | Value (Note A) | |||||||
Luxembourg — 2.2% |
| |||||||
GAGFAH SA** | 210,502 | $ | 4,701,021 | |||||
Denmark — 2.0% |
| |||||||
Genmab AS** | 38,728 | 2,246,241 | ||||||
Pandora AS | 26,515 | 2,149,230 | ||||||
|
| |||||||
| 4,395,471 | ||||||||
|
| |||||||
Ireland — 1.1% |
| |||||||
Greencore Group PLC | 550,228 | 2,444,043 | ||||||
Italy — 1.1% |
| |||||||
Brembo SpA | 70,125 | 2,350,364 | ||||||
Spain — 1.1% |
| |||||||
Almirall SA** | 140,808 | 2,323,642 | ||||||
Netherlands — 0.4% |
| |||||||
TomTom NV** | 141,195 | 939,019 | ||||||
|
| |||||||
Total EUROPE | 118,657,521 | |||||||
|
| |||||||
| FAR EAST — 29.5% | ||||||||
Japan — 20.8% |
| |||||||
Alps Electric Co., Ltd. | 107,876 | 2,039,114 | ||||||
Calbee, Inc. | 66,807 | 2,301,288 | ||||||
Disco Corp. | 28,400 | 2,271,504 | ||||||
Don Quijote Holdings Co., Ltd. | 35,100 | 2,413,020 | ||||||
Haseko Corp. | 352,800 | 2,837,522 | ||||||
Hitachi High-Technologies Corp. | 77,253 | 2,219,222 | ||||||
Hoshizaki Electric Co., Ltd. | 45,670 | 2,200,744 | ||||||
M3, Inc. | 68,320 | 1,143,131 | ||||||
Mabuchi Motor Co., Ltd. | 53,846 | 2,137,278 | ||||||
Minebea Co., Ltd. | 146,479 | 2,163,187 | ||||||
MISUMI Group, Inc. | 97,746 | 3,223,193 | ||||||
Nifco, Inc. | 33,926 | 1,097,388 | ||||||
Nihon M&A Center, Inc. | 83,879 | 2,526,936 | ||||||
Nippon Shinyaku Co., Ltd. | 76,000 | 2,441,772 | ||||||
NOK Corp. | 103,526 | 2,635,100 | ||||||
Sanken Electric Co., Ltd. | 279,818 | 2,225,071 | ||||||
Shimizu Corp. | 160,000 | 1,086,732 | ||||||
Tokyo Tatemono Co., Ltd. | 206,000 | 1,499,191 | ||||||
Topcon Corp. | 100,997 | 2,141,994 | ||||||
Tsuruha Holdings, Inc. | 40,180 | 2,324,941 | ||||||
Zenkoku Hosho Co., Ltd. | 89,728 | 2,546,255 | ||||||
|
| |||||||
| 45,474,583 | ||||||||
|
| |||||||
China — 3.5% |
| |||||||
CAR, Inc.** | 445,210 | 594,529 | ||||||
CT Environmental Group, Ltd. | 2,378,338 | 2,425,275 | ||||||
Man Wah Holdings, Ltd. | 693,200 | 1,140,119 | ||||||
PAX Global Technology, Ltd.** | 1,175,034 | 1,203,594 | ||||||
Sunny Optical Technology Group Co., Ltd. | 1,303,279 | 2,237,883 | ||||||
|
| |||||||
| 7,601,400 | ||||||||
|
| |||||||
Notes to Financial Statements are an integral part of this Schedule.
25
Table of Contents
Driehaus International Small Cap Growth Fund
Schedule of Investments
December 31, 2014
| Number of Shares | Value (Note A) | |||||||
Philippines — 2.4% |
| |||||||
GT Capital Holdings, Inc. | 64,230 | $ | 1,471,201 | |||||
Jollibee Foods Corp. | 343,997 | 1,644,464 | ||||||
Megaworld Corp. | 21,704,827 | 2,242,825 | ||||||
|
| |||||||
| 5,358,490 | ||||||||
|
| |||||||
South Korea — 1.7% |
| |||||||
Cosmax, Inc.** | 12,271 | 1,107,738 | ||||||
i-SENS, Inc.** | 33,922 | 1,937,288 | ||||||
Naturalendo Tech Co., Ltd.** | 15,893 | 657,464 | ||||||
|
| |||||||
| 3,702,490 | ||||||||
|
| |||||||
Australia — 1.1% |
| |||||||
Domino’s Pizza Enterprises, Ltd. | 117,163 | 2,385,560 | ||||||
|
| |||||||
Total FAR EAST | 64,522,523 | |||||||
|
| |||||||
| NORTH AMERICA — 14.2% | ||||||||
Canada — 13.2% |
| |||||||
CCL Industries, Inc. — B | 81,122 | 8,788,799 | ||||||
FirstService Corp. | 43,613 | 2,225,322 | ||||||
Interfor Corp.** | 110,025 | 2,078,713 | ||||||
Intertape Polymer Group, Inc. | 84,860 | 1,359,308 | ||||||
Linamar Corp. | 73,130 | 4,465,978 | ||||||
Open Text Corp. | 44,092 | 2,565,898 | ||||||
Progressive Waste Solutions, Ltd. | 155,804 | 4,684,312 | ||||||
Sierra Wireless, Inc.** | 55,012 | 2,607,019 | ||||||
|
| |||||||
| 28,775,349 | ||||||||
|
| |||||||
| Number of Shares | Value (Note A) | |||||||
Mexico — 1.0% |
| |||||||
Compartamos SAB de CV | 1,122,271 | $ | 2,255,382 | |||||
|
| |||||||
Total NORTH AMERICA | 31,030,731 | |||||||
|
| |||||||
| AFRICA — 0.8% | ||||||||
South Africa — 0.8% |
| |||||||
Clicks Group, Ltd. | 262,245 | 1,833,545 | ||||||
|
| |||||||
Total AFRICA | 1,833,545 | |||||||
|
| |||||||
Total EQUITY SECURITIES (Cost $198,314,192) | 216,044,320 | |||||||
|
| |||||||
| ||||||||
TOTAL INVESTMENTS (COST $198,314,192) | 98.7 | % | $ | 216,044,320 | ||||
Other Assets In Excess Of Liabilities | 1.3 | % | 2,934,257 | |||||
|
|
|
| |||||
Net Assets | 100.0 | % | $ | 218,978,577 | ||||
| ||||||||
The federal income tax basis and unrealized appreciation (depreciation) for all investments is as follows:
Basis: | $ | 200,113,719 | ||
|
| |||
Gross Appreciation | $ | 20,960,936 | ||
Gross Depreciation | (5,030,335 | ) | ||
|
| |||
Net Appreciation | $ | 15,930,601 | ||
|
|
| ** | Non-income producing security |
Regional Weightings*
Western Europe | 54.2% | |||
Japan | 20.8% | |||
North America | 14.2% | |||
Asia/Far East Ex-Japan | 8.7% | |||
Africa | 0.8% |
Top Ten Holdings*
CCL Industries, Inc. — B | 4.0% | |||
Dialog Semiconductor PLC | 2.7% | |||
Ashtead Group PLC | 2.4% | |||
Opera Software ASA | 2.3% | |||
Deutsche Annington Immobilien SE | 2.2% | |||
GAGFAH SA | 2.1% | |||
Progressive Waste Solutions, Ltd. | 2.1% | |||
Ingenico | 2.1% | |||
Linamar Corp. | 2.0% | |||
Forbo Holding AG | 1.8% |
| * | All percentages are stated as a percent of net assets at December 31, 2014. |
Notes to Financial Statements are an integral part of this Schedule.
26
Table of Contents
Driehaus International Small Cap Growth Fund
Schedule of Investments (unaudited)
December 31, 2014
Industry | Percent of Net Assets | |||
Auto Components | 5.8% | |||
Biotechnology | 1.3% | |||
Capital Markets | 2.6% | |||
Commercial Services & Supplies | 2.1% | |||
Communications Equipment | 1.2% | |||
Construction & Engineering | 0.5% | |||
Consumer Finance | 2.3% | |||
Containers & Packaging | 4.6% | |||
Distributors | 1.1% | |||
Diversified Financial Services | 1.8% | |||
Electrical Equipment | 1.0% | |||
Electronic Equipment, Instruments & Components | 7.9% | |||
Food & Staples Retailing | 1.9% | |||
Food Products | 3.3% | |||
Health Care Equipment & Supplies | 0.9% | |||
Health Care Technology | 0.5% | |||
Hotels, Restaurants & Leisure | 3.9% | |||
Household Durables | 8.1% | |||
Insurance | 1.1% | |||
Internet & Catalog Retail | 1.1% | |||
Internet Software & Services | 2.3% | |||
Industry | Percent of Net Assets | |||
Information Technology Services | 1.8% | |||
Life Sciences Tools & Services | 1.0% | |||
Machinery | 3.6% | |||
Media | 2.2% | |||
Multiline Retail | 1.1% | |||
Paper & Forest Products | 1.0% | |||
Personal Products | 0.5% | |||
Pharmaceuticals | 3.2% | |||
Professional Services | 2.7% | |||
Real Estate Management & Development | 9.8% | |||
Road & Rail | 0.3% | |||
Semiconductors & Semiconductor Equipment | 6.2% | |||
Software | 1.2% | |||
Specialty Retail | 1.8% | |||
Textiles, Apparel & Luxury Goods | 1.0% | |||
Trading Companies & Distributors | 3.9% | |||
Water Utilities | 1.1% | |||
Wireless Telecommunication Services | 1.0% | |||
Other Assets in Excess of Liabilities | 1.3% | |||
|
| |||
TOTAL | 100.0% | |||
|
| |||
Notes to Financial Statements are an integral part of this Schedule.
27
Table of Contents
Driehaus Micro Cap Growth Fund — Portfolio Managers’ Letter
Dear Fellow Shareholders,
The Driehaus Micro Cap Growth Fund (“Fund”) returned 8.21% for the year ended December 31, 2014.1 This return was above the performance of the Fund’s benchmark index, the Russell Microcap® Growth Index (the “Benchmark”), which returned 4.30% for the same period.
US equities posted another strong year of returns and outperformed almost all other developed markets. Throughout 2014, investors continued to reward the US for its sounder near- and medium-term growth outlook relative to most non-US markets. Within the US equity market, large caps outperformed small caps by the widest margin in 16 years, with the S&P 500 Index up 13.69% and the Russell 2000 Index advancing only 4.89%. As the year came to a close, inflation abated, US employment and the US dollar strengthened, and bond yields continued to fall, a mix of conditions that we view favorably.
For 2014, key contributors to performance versus the Benchmark were the Fund’s security selection within the consumer discretionary, information technology and energy sectors.
Rentrak Corp. (Ticker: RENT) was a significant contributor to Fund performance for the period. The company serves the entertainment, television, video and advertising industries by providing global media information and measurement. Rentrak signed agreements with CBS, FOX and GroupM, all of which increased investor confidence in its ability to establish its set-top box measurement system as a viable alternative to Nielsen. Given that the company valuation has been closely linked to its ability to generate new customer contracts, this was a catalyst for share price growth. Additionally, the company remains a leader in capturing video-on-demand viewing data, creating further revenue growth.
Green Plains, Inc. (Ticker: GPRE) was also a holding that contributed significantly to the Fund’s performance for the period. The company is a vertically integrated producer, marketer and distributor of ethanol. The release of positive fourth quarter 2013 results in January, 2014 provided the company with strong momentum entering the year. Green Plains continued to exhibit strong share price growth through September, as earnings per share growth accelerated due to falling input costs and strong demand.
During the period, the two sectors that detracted the most value from Fund performance versus the Benchmark were industrials and consumer staples.
A holding that detracted significantly from the Fund’s return during the period was Natural Grocers by Vitamin Cottage, Inc. (Ticker: NGVC). Natural Grocers operates natural and organic grocery and dietary supplement stores. The company was attractive from an investment growth perspective as it had a differentiated offering and was rapidly growing its store base, same store sales and earnings per share. However, the stock fell as the earnings outlook was lowered due to new competitive store openings in its home state of Colorado as well as in Texas and Arizona.
PowerSecure International, Inc. (Ticker: POWR) was also a significant detractor for the period. The company is a provider of products and services to electric utilities and to their commercial, institutional and industrial customers. A significant selloff occurred in May after first quarter results came in well below estimates and management’s forward guidance for the year disappointed consensus predictions. Issues plaguing the utility infrastructure and distributed generation segments of the business hurt revenue.
We are optimistic about micro caps as we start the new year for several reasons. First, their earnings remain strong, outpacing large caps in terms of absolute year-over-year growth rates as well as superior relative outperformance versus consensus expectations. Second, the healthy US economy and dramatically lower crude oil prices are powerful tailwinds for micro and small caps, which are generally US-centric in terms of their end-market exposure. Third, the degree to which large caps outperformed micro caps last year reached a level at which it historically has reverted.
More broadly, the equity market drivers remain firmly intact. These include: strong, sustainable earnings; low and stable core inflation; a dovish Fed; a steep yield curve despite falling longer-term rates; and positive economic activity with strong GDP growth. Nevertheless, we are closely monitoring the potential meaning and impact of lower yields in the US and overseas as well as lower crude oil prices. Overall, we continue to discover many exciting businesses that have strong, sustainable earnings growth and we have high conviction in the companies we hold.
28
Table of Contents
Thank you for your interest in the Driehaus Micro Cap Growth Fund. We appreciate your confidence in our management capabilities.
Sincerely,
 |  | |
| Jeff James | Michael Buck | |
| Portfolio Manager | Assistant Portfolio Manager |
| 1 | During this period, the Fund’s returns reflect fee waivers and/or expense reimbursements without which performance would have been lower. |
Performance is historical and does not represent future results.
Please see the following performance overview page for index description.
29
Table of Contents
Driehaus Micro Cap Growth Fund
Performance Overview (unaudited)
The performance summarized below is historical and does not represent future results. Investment returns and principal value vary, and you may have a gain or loss when you sell shares. Performance data presented measures the change in the value of an investment in the Fund, assuming reinvestment of all dividends and capital gains. Average annual total return reflects annualized change.
The table does not reflect the deduction of taxes that a shareholder would pay on Fund distributions or the redemption of Fund shares. The graph compares the results of a $10,000 investment in the Fund since January 1, 2003 (which includes performance of the Predecessor Limited Partnership), with all dividends and capital gains reinvested, with the indicated index (and dividends reinvested) for the same period.
| Fund Only | Including Predecessor Limited Partnership | |||||||||||||||||||||||
| Average Annual Total Returns as of 12/31/14 | 1 Year | Since Inception (11/18/13 - 12/31/14) | 3 Years | 5 Years | 10 Years | Since Inception (01/01/03 - 12/31/14) | ||||||||||||||||||
Driehaus Micro Cap Growth Fund (DMCRX)1 | 8.21% | 14.35% | 27.93% | 17.51% | 12.20% | 18.46% | ||||||||||||||||||
Russell Microcap® Growth Index2 | 4.30% | 5.22% | 22.45% | 16.84% | 6.38% | 10.73% | ||||||||||||||||||
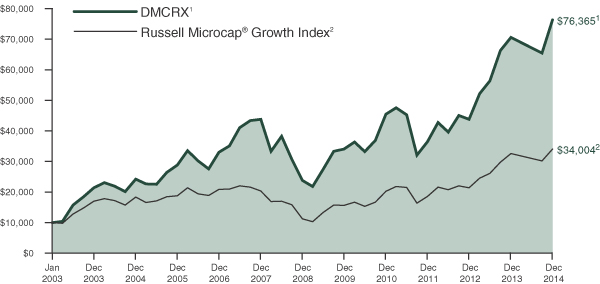
| 1 | The Driehaus Micro Cap Growth Fund (the “Fund”) performance shown above includes the performance of the Driehaus Micro Cap Fund, L.P. (the “Predecessor Limited Partnership”), one of the Fund’s predecessors, for the periods before the Fund’s registration statement became effective. The Predecessor Limited Partnership, which was established on July 1, 1996, was managed with substantially the same investment objective, policies and philosophies as are followed by the Fund. The Fund succeeded to the Predecessor Limited Partnership’s assets together with the assets of the Driehaus Institutional Micro Cap Fund, L.P. on November 18, 2013. The Predecessor Limited Partnership was not registered under the Investment Company Act of 1940, as amended (“1940 Act”), and thus was not subject to certain investment and operational restrictions that are imposed by the 1940 Act. If the Predecessor Limited Partnership had been registered under the 1940 Act, its performance may have been adversely affected. The Predecessor Limited Partnership’s performance has been restated to reflect estimated expenses of the Fund. The returns reflect fee waivers and/or reimbursements without which performance would have been lower. |
| 2 | The Russell Microcap® Growth Index is constructed to provide a comprehensive and unbiased barometer of the micro cap growth market. Based on ongoing empirical research of investment manager behavior, the methodology used to determine growth probability approximates the aggregate microcap growth manager's opportunity set. |
30
Table of Contents
Driehaus Micro Cap Growth Fund
Schedule of Investments
December 31, 2014
| Number of Shares | Value (Note A) | |||||||
| EQUITY SECURITIES — 100.2% | ||||||||
| HEALTH CARE — 38.1% | ||||||||
Biotechnology — 16.3% |
| |||||||
Acceleron Pharma, Inc.** | 35,872 | $ | 1,397,573 | |||||
Alder Biopharmaceuticals, Inc.** | 27,522 | 800,615 | ||||||
AMAG Pharmaceuticals, Inc.** | 30,668 | 1,307,070 | ||||||
Aquinox Pharmaceuticals, Inc.** | 39,332 | 294,990 | ||||||
Auspex Pharmaceuticals, Inc.** | 19,273 | 1,011,447 | ||||||
Avalanche Biotechnologies, Inc.** | 13,145 | 709,830 | ||||||
Bluebird Bio, Inc.** | 16,424 | 1,506,409 | ||||||
Dyax Corp.** | 46,210 | 649,713 | ||||||
Five Prime Therapeutics, Inc.** | 22,441 | 605,907 | ||||||
Heron Therapeutics, Inc.** | 74,288 | 747,337 | ||||||
Infinity Pharmaceuticals, Inc.** | 63,353 | 1,070,032 | ||||||
Karyopharm Therapeutics, Inc.** | 22,715 | 850,222 | ||||||
Loxo Oncology, Inc.** | 40,059 | 470,693 | ||||||
MacroGenics, Inc.** | 37,079 | 1,300,361 | ||||||
MiMedx Group, Inc.** | 84,510 | 974,400 | ||||||
Mirati Therapeutics, Inc.** | 25,920 | 480,038 | ||||||
Oncothyreon, Inc.** | 319,272 | 606,617 | ||||||
OvaScience, Inc.** | 13,246 | 585,738 | ||||||
Receptos, Inc.** | 9,723 | 1,191,165 | ||||||
Repligen Corp.** | 58,086 | 1,150,103 | ||||||
Sunesis Pharmaceuticals, Inc.** | 183,887 | 468,912 | ||||||
|
| |||||||
| 18,179,172 | ||||||||
|
| |||||||
Health Care Equipment & Supplies — 10.3% |
| |||||||
AtriCure, Inc.** | 59,422 | 1,186,063 | ||||||
K2M Group Holdings, Inc.** | 41,127 | 858,321 | ||||||
LDR Holding Corp.** | 35,547 | 1,165,231 | ||||||
Natus Medical, Inc.** | 28,160 | 1,014,886 | ||||||
OraSure Technologies, Inc.** | 109,368 | 1,108,992 | ||||||
Oxford Immunotec Global PLC** | 31,198 | 424,917 | ||||||
The Spectranetics Corp.** | 68,709 | 2,375,957 | ||||||
TriVascular Technologies, Inc.** | 36,513 | 458,968 | ||||||
Vascular Solutions, Inc.** | 21,988 | 597,194 | ||||||
Zeltiq Aesthetics, Inc.** | 83,917 | 2,342,123 | ||||||
|
| |||||||
| 11,532,652 | ||||||||
|
| |||||||
Pharmaceuticals — 4.9% |
| |||||||
Aerie Pharmaceuticals, Inc.** | 29,614 | 864,433 | ||||||
ANI Pharmaceuticals, Inc.** | 10,717 | 604,332 | ||||||
Aratana Therapeutics, Inc.** | 30,341 | 540,677 | ||||||
Cempra, Inc.** | 38,343 | 901,444 | ||||||
Flamel Technologies SA — SP ADR** | 59,896 | 1,026,018 | ||||||
| Number of Shares | Value (Note A) | |||||||
Foamix Pharmaceuticals, Ltd.** | 59,596 | $ | 417,768 | |||||
Pernix Therapeutics Holdings, Inc.** | 56,854 | 533,859 | ||||||
XenoPort, Inc.** | 67,428 | 591,344 | ||||||
|
| |||||||
| 5,479,875 | ||||||||
|
| |||||||
Health Care Providers & Services — 4.4% |
| |||||||
AAC Holdings, Inc.** | 56,602 | 1,750,134 | ||||||
AMN Healthcare Services, Inc.** | 80,857 | 1,584,797 | ||||||
Cross Country Healthcare, Inc.** | 77,997 | 973,403 | ||||||
US Physical Therapy, Inc. | 15,267 | 640,603 | ||||||
|
| |||||||
| 4,948,937 | ||||||||
|
| |||||||
Life Sciences Tools & Services — 1.1% |
| |||||||
NeoGenomics, Inc.** | 297,670 | 1,241,284 | ||||||
Health Care Technology — 1.1% |
| |||||||
HealthStream, Inc.** | 39,510 | 1,164,755 | ||||||
|
| |||||||
Total HEALTH CARE | 42,546,675 | |||||||
|
| |||||||
| INFORMATION TECHNOLOGY — 19.0% | ||||||||
Software — 9.8% |
| |||||||
Callidus Software, Inc.** | 144,599 | 2,361,302 | ||||||
Ellie Mae, Inc.** | 31,528 | 1,271,209 | ||||||
ePlus, Inc.** | 8,086 | 612,029 | ||||||
Globant SA** | 77,804 | 1,215,299 | ||||||
Mavenir Systems, Inc.** | 25,125 | 340,695 | ||||||
Paycom Software, Inc.** | 58,219 | 1,532,906 | ||||||
Proofpoint, Inc.** | 46,335 | 2,234,737 | ||||||
TubeMogul, Inc.** | 44,408 | 1,001,400 | ||||||
Yodlee, Inc.** | 35,386 | 431,709 | ||||||
|
| |||||||
| 11,001,286 | ||||||||
|
| |||||||
Semiconductors & Semiconductor Equipment — 4.7% |
| |||||||
Ambarella, Inc.** | 26,605 | 1,349,406 | ||||||
Inphi Corp.** | 25,132 | 464,439 | ||||||
Mattson Technology, Inc.** | 121,934 | 414,576 | ||||||
Nova Measuring Instruments, Ltd.** | 39,718 | 412,670 | ||||||
Silicon Motion Technology Corp. — ADR | 52,921 | 1,251,582 | ||||||
Tower Semiconductor, Ltd.** | 106,335 | 1,417,446 | ||||||
|
| |||||||
| 5,310,119 | ||||||||
|
| |||||||
Internet Software & Services — 2.7% |
| |||||||
Hortonworks, Inc.** | 4,671 | 126,117 | ||||||
Q2 Holdings, Inc.** | 54,317 | 1,023,332 | ||||||
QuinStreet, Inc.** | 24,060 | 146,044 | ||||||
Stamps.com, Inc.** | 11,380 | 546,126 | ||||||
Tucows, Inc. — A** | 29,347 | 569,625 | ||||||
Wix.com, Ltd.** | 27,077 | 568,617 | ||||||
|
| |||||||
| 2,979,861 | ||||||||
|
| |||||||
Notes to Financial Statements are an integral part of this Schedule.
31
Table of Contents
Driehaus Micro Cap Growth Fund
Schedule of Investments
December 31, 2014
| Number of Shares | Value (Note A) | |||||||
Computers & Peripherals — 1.0% |
| |||||||
Super Micro Computer, Inc.** | 30,400 | $ | 1,060,352 | |||||
Information Technology Services — 0.8% |
| |||||||
Virtusa Corp.** | 21,424 | 892,738 | ||||||
|
| |||||||
Total INFORMATION TECHNOLOGY | 21,244,356 | |||||||
|
| |||||||
| CONSUMER DISCRETIONARY — 18.0% | ||||||||
Hotels, Restaurants & Leisure — 5.0% |
| |||||||
Dave & Buster’s Entertainment, Inc.** | 25,415 | 693,830 | ||||||
Denny’s Corp.** | 63,041 | 649,953 | ||||||
Fiesta Restaurant Group, Inc.** | 32,644 | 1,984,755 | ||||||
Good Times Restaurants, Inc.** | 62,768 | 436,865 | ||||||
Kona Grill, Inc.** | 24,214 | 559,101 | ||||||
Popeyes Louisiana Kitchen, Inc.** | 14,750 | 829,983 | ||||||
Zoe’s Kitchen, Inc.** | 16,602 | 496,566 | ||||||
|
| |||||||
| 5,651,053 | ||||||||
|
| |||||||
Specialty Retail — 2.4% |
| |||||||
Build-A-Bear Workshop, Inc.** | 27,314 | 549,011 | ||||||
Kirkland’s, Inc.** | 32,861 | 776,834 | ||||||
MarineMax, Inc.** | 70,222 | 1,407,951 | ||||||
|
| |||||||
| 2,733,796 | ||||||||
|
| |||||||
Household Durables — 2.1% |
| |||||||
Installed Building Products, Inc.** | 25,119 | 447,621 | ||||||
Skullcandy, Inc.** | 101,854 | 936,038 | ||||||
Universal Electronics, Inc.** | 14,125 | 918,549 | ||||||
|
| |||||||
| 2,302,208 | ||||||||
|
| |||||||
Diversified Consumer Services — 1.5% |
| |||||||
Capella Education Co. | 15,638 | 1,203,501 | ||||||
Liberty Tax, Inc.** | 12,715 | 454,434 | ||||||
|
| |||||||
| 1,657,935 | ||||||||
|
| |||||||
Multiline Retail — 1.5% |
| |||||||
Tuesday Morning Corp.** | 76,024 | 1,649,721 | ||||||
Auto Components — 1.4% |
| |||||||
Motorcar Parts of America, Inc.** | 50,697 | 1,576,170 | ||||||
Media — 1.0% |
| |||||||
Rentrak Corp.** | 14,946 | 1,088,368 | ||||||
Distributors — 0.9% |
| |||||||
Core-Mark Holding Co., Inc. | 16,543 | 1,024,508 | ||||||
Leisure Equipment & Products — 0.9% |
| |||||||
Nautilus, Inc.** | 62,810 | 953,456 | ||||||
Textiles, Apparel & Luxury Goods — 0.7% |
| |||||||
Sequential Brands Group, Inc.** | 63,902 | 835,199 | ||||||
| Number of Shares | Value (Note A) | |||||||
Internet & Catalog Retail — 0.6% |
| |||||||
EVINE Live, Inc.** | 106,142 | $ | 699,476 | |||||
|
| |||||||
Total CONSUMER DISCRETIONARY | 20,171,890 | |||||||
|
| |||||||
| INDUSTRIALS — 8.8% | ||||||||
Airlines — 1.8% |
| |||||||
Hawaiian Holdings, Inc.** | 38,264 | 996,777 | ||||||
Republic Airways Holdings, Inc.** | 69,718 | 1,017,186 | ||||||
|
| |||||||
| 2,013,963 | ||||||||
|
| |||||||
Aerospace & Defense — 1.6% |
| |||||||
TASER International, Inc.** | 68,794 | 1,821,665 | ||||||
Commercial Services & Supplies — 1.3% |
| |||||||
ARC Document Solutions, Inc.** | 75,934 | 776,046 | ||||||
Multi-Color Corp. | 12,656 | 701,396 | ||||||
|
| |||||||
| 1,477,442 | ||||||||
|
| |||||||
Professional Services — 1.3% |
| |||||||
Paylocity Holding Corp.** | 52,656 | 1,374,848 | ||||||
Building Products — 1.0% |
| |||||||
Insteel Industries, Inc. | 26,899 | 634,278 | ||||||
Norcraft Companies, Inc.** | 25,771 | 497,380 | ||||||
|
| |||||||
| 1,131,658 | ||||||||
|
| |||||||
Road & Rail — 0.7% |
| |||||||
Covenant Transportation Group, Inc. — A** | 29,503 | 799,826 | ||||||
Transportation Infrastructure — 0.6% |
| |||||||
Aegean Marine Petroleum Network, Inc. | 49,097 | 688,340 | ||||||
Construction & Engineering — 0.4% |
| |||||||
Comfort Systems USA, Inc. | 25,807 | 441,816 | ||||||
Electrical Equipment — 0.1% |
| |||||||
Allied Motion Technologies, Inc. | 3,118 | 73,865 | ||||||
|
| |||||||
Total INDUSTRIALS | 9,823,423 | |||||||
|
| |||||||
| FINANCIALS — 5.8% | ||||||||
Thrifts & Mortgage Finance — 2.0% |
| |||||||
LendingTree, Inc.** | 46,872 | 2,265,792 | ||||||
Capital Markets — 2.0% |
| |||||||
FXCM, Inc. — A | 52,220 | 865,285 | ||||||
Ladenburg Thalmann Financial Services, Inc.** | 6,092 | 24,063 | ||||||
Marcus & Millichap, Inc.** | 38,249 | 1,271,779 | ||||||
|
| |||||||
| 2,161,127 | ||||||||
|
| |||||||
Real Estate Investment Trusts — 1.2% |
| |||||||
Summit Hotel Properties, Inc. | 106,928 | 1,330,184 | ||||||
Insurance — 0.5% |
| |||||||
Atlas Financial Holdings, Inc.** | 33,111 | 540,372 | ||||||
Notes to Financial Statements are an integral part of this Schedule.
32
Table of Contents
Driehaus Micro Cap Growth Fund
Schedule of Investments
December 31, 2014
| Number of Shares | Value (Note A) | |||||||
Commercial Banks — 0.1% |
| |||||||
Square 1 Financial, Inc. — A** | 5,816 | $ | 143,655 | |||||
|
| |||||||
Total FINANCIALS | 6,441,130 | |||||||
|
| |||||||
| CONSUMER STAPLES — 5.5% | ||||||||
Food Products — 4.1% |
| |||||||
Calavo Growers, Inc. | 20,668 | 977,596 | ||||||
Farmer Brothers Co.** | 23,205 | 683,387 | ||||||
Inventure Foods, Inc.** | 79,065 | 1,007,288 | ||||||
John B Sanfilippo & Son, Inc. | 13,418 | 610,519 | ||||||
SunOpta, Inc.** | 107,548 | 1,274,444 | ||||||
|
| |||||||
| 4,553,234 | ||||||||
|
| |||||||
Personal Products — 0.7% |
| |||||||
IGI Laboratories, Inc.** | 97,819 | 860,807 | ||||||
Beverages — 0.7% |
| |||||||
Craft Brew Alliance, Inc.** | 58,294 | 777,642 | ||||||
|
| |||||||
Total CONSUMER STAPLES | 6,191,683 | |||||||
|
| |||||||
| TELECOMMUNICATION SERVICES — 4.1% | ||||||||
Diversified Telecommunication Services — 4.1% |
| |||||||
8X8, Inc.** | 178,145 | 1,631,808 | ||||||
GTT Communications, Inc.** | 116,472 | 1,540,925 | ||||||
inContact, Inc.** | 163,615 | 1,438,176 | ||||||
|
| |||||||
| 4,610,909 | ||||||||
|
| |||||||
Total TELECOMMUNICATION SERVICES | 4,610,909 | |||||||
|
| |||||||
| Number of Shares | Value (Note A) | |||||||
| ENERGY — 0.9% | ||||||||
Oil, Gas & Consumable Fuels — 0.9% |
| |||||||
Synergy Resources Corp.** | 43,323 | $ | 543,270 | |||||
Teekay Tankers Ltd. — A | 98,248 | 497,135 | ||||||
|
| |||||||
| 1,040,405 | ||||||||
|
| |||||||
Total ENERGY | 1,040,405 | |||||||
|
| |||||||
Total EQUITY SECURITIES (Cost $86,602,454) | 112,070,471 | |||||||
|
| |||||||
| ||||||||
TOTAL INVESTMENTS (COST $86,602,454) | 100.2 | % | $ | 112,070,471 | ||||
Other Assets In Excess Of Liabilities | (0.2 | %) | (224,804 | ) | ||||
|
|
|
| |||||
Net Assets | 100.0 | % | $ | 111,845,667 | ||||
| ||||||||
The federal income tax basis and unrealized appreciation (depreciation) for all investments is as follows:
Basis: | $ | 87,524,041 | ||
|
| |||
Gross Appreciation | $ | 26,764,524 | ||
Gross Depreciation | (2,218,094 | ) | ||
|
| |||
Net Appreciation | $ | 24,546,430 | ||
|
|
| ** | Non-income producing security |
ADR — American Depository Receipt
SP ADR — Sponsored American Depository Receipt
Top Ten Holdings*
The Spectranetics Corp. | 2.1% | |||
Callidus Software, Inc. | 2.1% | |||
Zeltiq Aesthetics, Inc. | 2.1% | |||
LendingTree, Inc. | 2.0% | |||
Proofpoint, Inc. | 2.0% | |||
Fiesta Restaurant Group, Inc. | 1.8% | |||
TASER International, Inc. | 1.6% | |||
AAC Holdings, Inc. | 1.6% | |||
Tuesday Morning Corp. | 1.5% | |||
8X8, Inc. | 1.5% |
| * | All percentages are stated as a percent of net assets at December 31, 2014. |
Notes to Financial Statements are an integral part of this Schedule.
33
Table of Contents
Statements of Assets and Liabilities
December 31, 2014
| Driehaus International Discovery Fund | Driehaus Emerging Markets Growth Fund | |||||||
ASSETS: | ||||||||
Investments, at cost | $ | 81,196,252 | $ | 1,571,810,739 | ||||
|
|
|
| |||||
Investments, at market value | $ | 87,622,186 | $ | 1,631,100,383 | ||||
Foreign currency* | 5,387 | 15,596,311 | ||||||
Cash | 2,743,862 | 60,594,984 | ||||||
Collateral held at custodian for the benefit of brokers | — | — | ||||||
Receivables: | ||||||||
Dividends | 282,965 | 518,553 | ||||||
Investment securities sold | — | 66,482,871 | ||||||
Fund shares sold | 608 | 4,175,259 | ||||||
Prepaid expenses | 5,720 | 18,283 | ||||||
|
|
|
| |||||
| ||||||||
TOTAL ASSETS | 90,660,728 | 1,778,486,644 | ||||||
|
|
|
| |||||
| ||||||||
LIABILITIES: | ||||||||
Payables: | ||||||||
Investment securities purchased | — | 62,503,780 | ||||||
Fund shares redeemed | 820,064 | 11,884,667 | ||||||
Net unrealized depreciation on unsettled foreign currency transactions | — | 276,374 | ||||||
Due to affiliate | 98,860 | 2,258,376 | ||||||
Audit and tax fees | 28,953 | 30,775 | ||||||
Accrued expenses | 33,662 | 313,824 | ||||||
|
|
|
| |||||
| ||||||||
TOTAL LIABILITIES | 981,539 | 77,267,796 | ||||||
|
|
|
| |||||
| ||||||||
NET ASSETS | $ | 89,679,189 | $ | 1,701,218,848 | ||||
|
|
|
| |||||
SHARES OUTSTANDING (Unlimited shares authorized, no par value) | 3,013,788 | 57,411,983 | ||||||
|
|
|
| |||||
NET ASSET VALUE | $ | 29.76 | $ | 29.63 | ||||
|
|
|
| |||||
| ||||||||
NET ASSETS CONSISTED OF THE FOLLOWING AT DECEMBER 31, 2014: | ||||||||
Paid-in capital | $ | 308,979,057 | $ | 1,703,361,432 | ||||
Accumulated net investment income (loss) | (294,654 | ) | (4,591,578 | ) | ||||
Accumulated net realized gain (loss) | (225,425,401 | ) | (56,453,937 | ) | ||||
Unrealized net foreign exchange gain (loss) | (5,747 | ) | (386,713 | ) | ||||
Unrealized net appreciation (depreciation) on investments | 6,425,934 | 59,289,644 | ||||||
|
|
|
| |||||
NET ASSETS | $ | 89,679,189 | $ | 1,701,218,848 | ||||
|
|
|
| |||||
| ||||||||
| * | The cost of foreign currency was $5,392, $15,683,576, $13,884,506, $17,743 and $0, respectively. |
Notes to Financial Statements are an integral part of this Statement.
34
Table of Contents
Statements of Assets and Liabilities
December 31, 2014
| Driehaus Emerging Markets Small Cap Growth Fund | Driehaus International Small Cap Growth Fund | Driehaus Micro Cap Growth Fund | ||||||||
| $ | 436,502,097 | $ | 198,314,192 | $ | 86,602,454 | |||||
|
|
|
|
|
| |||||
| $ | 471,160,650 | $ | 216,044,320 | $ | 112,070,471 | |||||
| 13,917,647 | 17,729 | — | ||||||||
| 17,120,414 | 2,037,109 | 408,820 | ||||||||
| 4,730,642 | — | — | ||||||||
| 118,140 | 254,058 | 5,800 | ||||||||
| 18,783,100 | 3,561,507 | 229,729 | ||||||||
| 5,632,760 | 90,197 | 14,198 | ||||||||
| 17,327 | 2,117 | 23,614 | ||||||||
|
|
|
|
|
| |||||
|
| |||||||||
| 531,480,680 | 222,007,037 | 112,752,632 | ||||||||
|
|
|
|
|
| |||||
|
| |||||||||
| 19,455,619 | 2,454,239 | 684,940 | ||||||||
| 1,056,557 | 208,162 | 67,871 | ||||||||
| 23,404 |
| 8,710 | — | ||||||
| 633,246 | 286,884 | 113,901 | ||||||||
| 30,353 | 28,953 | 16,453 | ||||||||
| 106,941 | 41,512 | 23,800 | ||||||||
|
|
|
|
|
| |||||
|
| |||||||||
| 21,306,120 | 3,028,460 | 906,965 | ||||||||
|
|
|
|
|
| |||||
|
| |||||||||
| $ | 510,174,560 | $ | 218,978,577 | $ | 111,845,667 | |||||
|
|
|
|
|
| |||||
| 38,626,060 | 23,796,356 | 9,944,157 | ||||||||
|
|
|
|
|
| |||||
| $ | 13.21 | $ | 9.20 | $ | 11.25 | |||||
|
|
|
|
|
| |||||
|
| |||||||||
| $ | 484,959,243 | $ | 205,995,113 | $ | 85,289,831 | |||||
| (1,279,354 | ) | (1,226,081 | ) | — | ||||||
| (8,179,383 | ) | (3,500,686 | ) | 1,087,819 | ||||||
| 15,501 | (19,897 | ) | — | |||||||
| 34,658,553 | 17,730,128 | 25,468,017 | ||||||||
|
|
|
|
|
| |||||
| $ | 510,174,560 | $ | 218,978,577 | $ | 111,845,667 | |||||
|
|
|
|
|
| |||||
|
| |||||||||
Notes to Financial Statements are an integral part of this Statement.
35
Table of Contents
For the Year Ended December 31, 2014
Driehaus | Driehaus Emerging Markets Growth Fund | |||||||
INVESTMENT INCOME (LOSS): | ||||||||
Income: | ||||||||
Dividends* | $ | 1,269,600 | $ | 32,063,201 | ||||
|
|
|
| |||||
| ||||||||
Total income | 1,269,600 | 32,063,201 | ||||||
|
|
|
| |||||
| ||||||||
Expenses: | ||||||||
Investment advisory fee | 1,407,946 | 27,558,897 | ||||||
Administration fee | 147,439 | 927,414 | ||||||
Professional fees | 32,900 | 277,925 | ||||||
Audit and tax fees | 52,098 | 74,708 | ||||||
Federal and state registration fees | 21,000 | 151,492 | ||||||
Custodian fees | 29,904 | 660,821 | ||||||
Transfer agent fees | 59,100 | 373,118 | ||||||
Trustees’ fees | 31,713 | 80,996 | ||||||
Chief compliance officer fees | 6,688 | 6,688 | ||||||
Reports to shareholders | 20,562 | 143,754 | ||||||
Miscellaneous | 30,129 | 59,866 | ||||||
|
|
|
| |||||
Total expenses | 1,839,479 | 30,315,679 | ||||||
|
|
|
| |||||
| ||||||||
Investment advisory fees recaptured (waived) | — | — | ||||||
Administration fees waived | — | — | ||||||
Transfer agent fees waived | — | — | ||||||
Fees paid indirectly | (13,500 | ) | (314,698 | ) | ||||
|
|
|
| |||||
Net expenses | 1,825,979 | 30,000,981 | ||||||
|
|
|
| |||||
| ||||||||
Net investment income (loss) | (556,379 | ) | 2,062,220 | |||||
|
|
|
| |||||
| ||||||||
| NET REALIZED AND UNREALIZED GAIN (LOSS) ON INVESTMENTS, WRITTEN OPTIONS AND FOREIGN CURRENCY TRANSACTIONS: | ||||||||
Net realized gain (loss) from security transactions | 4,593,564 | 7,427,720 | ||||||
Net realized foreign exchange gain (loss) | (76,618 | ) | (7,450,931 | ) | ||||
Net realized gain (loss) on written options | — | — | ||||||
Net change in unrealized foreign exchange gain (loss) | (26,796 | ) | (389,844 | ) | ||||
Net change in unrealized appreciation (depreciation) on investments | (13,467,408 | ) | (116,489,278 | ) | ||||
|
|
|
| |||||
| ||||||||
Net realized and unrealized gain (loss) on investments, written options and foreign currency transactions | (8,977,258 | ) | (116,902,333 | ) | ||||
|
|
|
| |||||
| ||||||||
NET INCREASE (DECREASE) IN NET ASSETS RESULTING FROM OPERATIONS | $ | (9,533,637 | ) | $ | (114,840,113 | ) | ||
|
|
|
| |||||
| ||||||||
| * | Dividends are net of $187,406, $2,885,420, $178,022, $302,369 and $0 nonreclaimable foreign taxes withheld, respectively. |
Notes to Financial Statements are an integral part of this Statement.
36
Table of Contents
Statements of Operations
For the Year Ended December 31, 2014
| Driehaus Emerging Markets Small Cap Growth Fund | Driehaus International Small Cap Growth Fund | Driehaus Micro Cap Growth Fund | ||||||||
| $ | 5,501,754 | $ | 3,213,334 | $ | 177,669 | |||||
|
|
|
|
|
| |||||
|
| |||||||||
| 5,501,754 | 3,213,334 | 177,669 | ||||||||
|
|
|
|
|
| |||||
|
| |||||||||
| 5,257,311 | 3,659,355 | 1,237,651 | ||||||||
| 301,482 | 239,722 | 112,888 | ||||||||
| 66,390 | 50,841 | 28,750 | ||||||||
| 55,423 | 54,598 | 41,418 | ||||||||
| 71,574 | 23,117 | 26,448 | ||||||||
| 157,135 | 66,083 | 20,411 | ||||||||
| 53,390 | 49,188 | 39,975 | ||||||||
| 37,239 | 35,602 | 31,071 | ||||||||
| 6,688 | 6,688 | 6,687 | ||||||||
| 32,159 | 20,115 | 14,727 | ||||||||
| 28,314 | 35,736 | 14,226 | ||||||||
|
|
|
|
|
| |||||
| 6,067,105 | 4,241,045 | 1,574,252 | ||||||||
|
|
|
|
|
| |||||
|
| |||||||||
| — | — | 39,026 | ||||||||
| — | — | (2,500 | ) | |||||||
| — | — | (28,500 | ) | |||||||
| (59,257 | ) | (52,176 | ) | — | ||||||
|
|
|
|
|
| |||||
| 6,007,848 | 4,188,869 | 1,582,278 | ||||||||
|
|
|
|
|
| |||||
|
| |||||||||
| (506,094 | ) | (975,535 | ) | (1,404,609 | ) | |||||
|
|
|
|
|
| |||||
|
| |||||||||
| (1,504,725 | ) | 12,821,822 | 1,492,816 | |||||||
| (1,613,774 | ) | (208,765 | ) | — | ||||||
| 643,905 | — | — | ||||||||
| 1,704 | (28,473 | ) | — | |||||||
| 7,397,152 | (22,108,419 | ) | 7,233,238 | |||||||
|
|
|
|
|
| |||||
|
|
|
| |||||||
| 4,924,262 | (9,523,835 | ) | 8,726,054 | |||||||
|
|
|
|
|
| |||||
|
|
|
| |||||||
| $ | 4,418,168 | $ | (10,499,370 | ) | $ | 7,321,445 | ||||
|
|
|
|
|
| |||||
|
| |||||||||
Notes to Financial Statements are an integral part of this Statement.
37
Table of Contents
Statements of Changes in Net Assets
| Driehaus International Discovery Fund | Driehaus Emerging Markets Growth Fund | |||||||||||||||
| For the year ended December 31, 2014 | For the year ended December 31, 2013 | For the year ended December 31, 2014 | For the year ended December 31, 2013 | |||||||||||||
INCREASE (DECREASE) IN NET ASSETS: | ||||||||||||||||
Operations: | ||||||||||||||||
Net investment income (loss) | $ | (556,379 | ) | $ | 182,887 | $ | 2,062,220 | $ | 4,198,494 | |||||||
Net realized gain (loss) on investments, written options and foreign currency transactions | 4,516,946 | 32,911,417 | (23,211 | ) | 73,336,137 | |||||||||||
Net change in unrealized gain (loss) on investments, written options and foreign currency transactions | (13,494,204 | ) | (7,871,491 | ) | (116,879,122 | ) | 29,644,247 | |||||||||
|
|
|
|
|
|
|
| |||||||||
| ||||||||||||||||
Net increase (decrease) in net assets resulting from operations | (9,533,637 | ) | 25,222,813 | (114,840,113 | ) | 107,178,878 | ||||||||||
|
|
|
|
|
|
|
| |||||||||
| ||||||||||||||||
Distributions to shareholders: | ||||||||||||||||
Net investment income | (895,291 | ) | — | — | — | |||||||||||
Capital gains | — | — | (54,103,175 | ) | (38,958,248 | ) | ||||||||||
|
|
|
|
|
|
|
| |||||||||
Total distributions to shareholders | (895,291 | ) | — | (54,103,175 | ) | (38,958,248 | ) | |||||||||
|
|
|
|
|
|
|
| |||||||||
| ||||||||||||||||
Capital share transactions: | ||||||||||||||||
Proceeds from shares sold | 2,647,063 | 11,537,101 | 693,446,944 | 798,853,985 | ||||||||||||
Reinvestment of distributions | 885,900 | — | 51,221,013 | 36,327,537 | ||||||||||||
Cost of shares redeemed | (37,312,642 | ) | (109,272,884 | ) | (509,558,324 | ) | (257,928,242 | ) | ||||||||
Redemption fees | 444 | 7,011 | 186,630 | 133,953 | ||||||||||||
|
|
|
|
|
|
|
| |||||||||
Net increase (decrease) in net assets derived from capital share transactions | (33,779,235 | ) | (97,728,772 | ) | 235,296,263 | 577,387,233 | ||||||||||
|
|
|
|
|
|
|
| |||||||||
Total increase (decrease) in net assets | (44,208,163 | ) | (72,505,959 | ) | 66,352,975 | 645,607,863 | ||||||||||
|
|
|
|
|
|
|
| |||||||||
| ||||||||||||||||
NET ASSETS: | ||||||||||||||||
| ||||||||||||||||
Beginning of period | $ | 133,887,352 | $ | 206,393,311 | $ | 1,634,865,873 | $ | 989,258,010 | ||||||||
|
|
|
|
|
|
|
| |||||||||
End of period | $ | 89,679,189 | $ | 133,887,352 | $ | 1,701,218,848 | $ | 1,634,865,873 | ||||||||
|
|
|
|
|
|
|
| |||||||||
Accumulated net investment income (loss) | $ | (294,654 | ) | $ | 368,561 | $ | (4,591,578 | ) | $ | (188,729 | ) | |||||
|
|
|
|
|
|
|
| |||||||||
| ||||||||||||||||
Capital share transactions are as follows: | ||||||||||||||||
Shares issued | 84,850 | 393,225 | 21,385,832 | 24,927,434 | ||||||||||||
Shares reinvested | 29,491 | — | 1,731,026 | 1,125,389 | ||||||||||||
Shares redeemed | (1,206,664 | ) | (3,697,504 | ) | (15,968,610 | ) | (8,112,206 | ) | ||||||||
|
|
|
|
|
|
|
| |||||||||
Net increase (decrease) from capital share transactions | (1,092,323 | ) | (3,304,279 | ) | 7,148,248 | 17,940,617 | ||||||||||
|
|
|
|
|
|
|
| |||||||||
| ||||||||||||||||
| * | Fund commenced operations on November 18, 2013 |
Notes to Financial Statements are an integral part of this Statement.
38
Table of Contents
Statements of Changes in Net Assets
| Driehaus Emerging Markets Small Cap Growth Fund | Driehaus International Small Cap Growth Fund | Driehaus Micro Cap Growth Fund | ||||||||||||||||||||
| For the year ended December 31, 2014 | For the year ended December 31, 2013 | For the year ended December 31, 2014 | For the year ended December 31, 2013 | For the year ended December 31, 2014 | For the period November 18, 2013 through December 31, 2013* | |||||||||||||||||
| $ | (506,094 | ) | $ | (30,018 | ) | $ | (975,535 | ) | $ | (270,870 | ) | $ | (1,404,609 | ) | $ | (127,358 | ) | |||||
| (2,474,594 | ) | (1,979,980 | ) | 12,613,057 | 56,702,877 | 1,492,816 | 3,463,074 | |||||||||||||||
| 7,398,856 | 13,628,441 | (22,136,892 | ) | 8,737,749 | 7,233,238 | 18,234,779 | ||||||||||||||||
|
|
|
|
|
|
|
|
|
|
|
| |||||||||||
|
| |||||||||||||||||||||
| 4,418,168 | 11,618,443 | (10,499,370 | ) | 65,169,756 | 7,321,445 | 21,570,495 | ||||||||||||||||
|
|
|
|
|
|
|
|
|
|
|
| |||||||||||
|
| |||||||||||||||||||||
| — | (309,776 | ) | (1,354,663 | ) | (2,881,066 | ) | — | — | ||||||||||||||
| — | — | (24,445,714 | ) | (27,524,912 | ) | (3,527,388 | ) | — | ||||||||||||||
|
|
|
|
|
|
|
|
|
|
|
| |||||||||||
| — | (309,776 | ) | (25,800,377 | ) | (30,405,978 | ) | (3,527,388 | ) | — | |||||||||||||
|
|
|
|
|
|
|
|
|
|
|
| |||||||||||
|
| |||||||||||||||||||||
| 426,167,539 | 131,452,307 | 15,508,526 | 16,017,728 | 62,163,421 | 53,149,020 | |||||||||||||||||
| — | 255,145 | 22,612,764 | 25,648,585 | 3,082,937 | — | |||||||||||||||||
| (111,716,374 | ) | (32,737,622 | ) | (53,517,412 | ) | (40,720,045 | ) | (31,884,076 | ) | (42,730 | ) | |||||||||||
| 20,494 | 8,846 | 3,732 | 2,085 | 12,543 | — | |||||||||||||||||
|
|
|
|
|
|
|
|
|
|
|
| |||||||||||
| 314,471,659 | 98,978,676 | (15,392,390 | ) | 948,353 | 33,374,825 | 53,106,290 | ||||||||||||||||
|
|
|
|
|
|
|
|
|
|
|
| |||||||||||
| 318,889,827 | 110,287,343 | (51,692,137 | ) | 35,712,131 | 37,168,882 | 74,676,785 | ||||||||||||||||
|
|
|
|
|
|
|
|
|
|
|
| |||||||||||
|
| |||||||||||||||||||||
|
| |||||||||||||||||||||
| $ | 191,284,733 | $ | 80,997,390 | $ | 270,670,714 | $ | 234,958,583 | $ | 74,676,785 | $ | — | |||||||||||
|
|
|
|
|
|
|
|
|
|
|
| |||||||||||
| $ | 510,174,560 | $ | 191,284,733 | $ | 218,978,577 | $ | 270,670,714 | $ | 111,845,667 | $ | 74,676,785 | |||||||||||
|
|
|
|
|
|
|
|
|
|
|
| |||||||||||
| $ | (1,279,354 | ) | $ | (530,093 | ) | $ | (1,226,081 | ) | $ | (828,338 | ) | $ | — | $ | — | |||||||
|
|
|
|
|
|
|
|
|
|
|
| |||||||||||
|
| |||||||||||||||||||||
| 31,805,044 | 10,815,539 | 1,427,397 | 1,486,659 | 5,750,668 | 6,954,301 | |||||||||||||||||
| — | 20,760 | 2,436,720 | 2,447,384 | 278,999 | — | |||||||||||||||||
| (8,496,865 | ) | (2,780,050 | ) | (5,035,552 | ) | (3,826,073 | ) | (3,035,803 | ) | (4,008 | ) | |||||||||||
|
|
|
|
|
|
|
|
|
|
|
| |||||||||||
| 23,308,179 | 8,056,249 | (1,171,435 | ) | 107,970 | 2,993,864 | 6,950,293 | ||||||||||||||||
|
|
|
|
|
|
|
|
|
|
|
| |||||||||||
|
| |||||||||||||||||||||
Notes to Financial Statements are an integral part of this Statement.
39
Table of Contents
Driehaus International Discovery Fund
| For the year ended December 31, 2014 | For the year ended December 31, 2013 | For the year ended December 31, 2012 | For the year ended December 31, 2011 | For the year ended December 31, 2010 | ||||||||||||||||
Net asset value, beginning of period | $ | 32.61 | $ | 27.85 | $ | 24.27 | $ | 30.27 | $ | 27.19 | ||||||||||
|
|
|
|
|
|
|
|
|
| |||||||||||
INCOME (LOSS) FROM INVESTMENT OPERATIONS: | ||||||||||||||||||||
Net investment income (loss) | (0.16 | ) | 0.03 | 0.03 | ^ | 0.13 | ^ | (0.22 | ) | |||||||||||
Net realized and unrealized gain (loss) on investments and foreign currency transactions | (2.40 | ) | 4.73 | 3.55 | (6.13 | ) | 3.86 | |||||||||||||
|
|
|
|
|
|
|
|
|
| |||||||||||
Total income (loss) from investment operations | (2.56 | ) | 4.76 | 3.58 | (6.00 | ) | 3.64 | |||||||||||||
|
|
|
|
|
|
|
|
|
| |||||||||||
LESS DISTRIBUTIONS: | ||||||||||||||||||||
Dividends from net investment income | (0.29 | ) | — | — | — | (0.56 | ) | |||||||||||||
Distributions from capital gains | — | — | — | — | — | |||||||||||||||
|
|
|
|
|
|
|
|
|
| |||||||||||
Total distributions | (0.29 | ) | — | — | — | (0.56 | ) | |||||||||||||
|
|
|
|
|
|
|
|
|
| |||||||||||
Redemption fees added to paid-in capital | 0.00 | ~ | 0.00 | ~ | 0.00 | ~ | 0.00 | ~ | 0.00 | ~ | ||||||||||
|
|
|
|
|
|
|
|
|
| |||||||||||
Net asset value, end of period | $ | 29.76 | $ | 32.61 | $ | 27.85 | $ | 24.27 | $ | 30.27 | ||||||||||
|
|
|
|
|
|
|
|
|
| |||||||||||
Total Return | (7.85 | )% | 17.09 | % | 14.75 | % | (19.85 | )% | 13.47 | % | ||||||||||
RATIOS/SUPPLEMENTAL DATA | ||||||||||||||||||||
Net assets, end of period (in 000’s) | $ | 89,679 | $ | 133,887 | $ | 206,393 | $ | 211,927 | $ | 338,840 | ||||||||||
Ratio of expenses before reimbursements, waivers and fees paid indirectly to average net assets | 1.63 | % | 1.65 | %¥ | 1.76 | %¥ | 1.72 | %¥ | 1.71 | % | ||||||||||
Ratio of net expenses to average net assets | 1.62 | %# | 1.62 | %#¥ | 1.75 | %#¥ | 1.71 | %#¥ | 1.70 | %# | ||||||||||
Ratio of net investment income (loss) to average net assets | (0.49 | )%# | 0.11 | %# | 0.11 | %# | 0.44 | %# | (0.77 | )%# | ||||||||||
Portfolio turnover | 147 | % | 156 | % | 112 | % | 119 | % | 93 | % | ||||||||||
|
|
|
|
|
|
|
|
|
|
| ||||||||||
| ^ | Net investment income (loss) per share has been calculated using the average shares method. |
| ~ | Amount represents less than $0.01 per share |
| # | Such ratios are net of fees paid indirectly (see Note B in the Notes to Financial Statements). |
| ¥ | Ratio of expenses to average net assets includes interest expense of less than 0.005% for the years ended December 31, 2013, 2012 and 2011. The interest expense is from utilizing the line of credit (see Note F in the Notes to Financial Statements). |
Notes to Financial Statements are an integral part of this Schedule.
40
Table of Contents
Driehaus Emerging Markets Growth Fund
Financial Highlights
| For the year ended December 31, 2014 | For the year ended December 31, 2013 | For the year ended December 31, 2012 | For the year ended December 31, 2011 | For the year ended December 31, 2010 | ||||||||||||||||
Net asset value, beginning of period | $ | 32.53 | $ | 30.61 | $ | 25.72 | $ | 32.20 | $ | 29.24 | ||||||||||
|
|
|
|
|
|
|
|
|
| |||||||||||
INCOME (LOSS) FROM INVESTMENT OPERATIONS: | ||||||||||||||||||||
Net investment income (loss) | 0.04 | 0.10 | 0.13 | 0.16 | (0.04 | )^ | ||||||||||||||
Net realized and unrealized gain (loss) on investments and foreign currency transactions | (1.99 | ) | 2.62 | 4.88 | (4.97 | ) | 6.84 | |||||||||||||
|
|
|
|
|
|
|
|
|
| |||||||||||
Total income (loss) from investment operations | (1.95 | ) | 2.72 | 5.01 | (4.81 | ) | 6.80 | |||||||||||||
|
|
|
|
|
|
|
|
|
| |||||||||||
LESS DISTRIBUTIONS: | ||||||||||||||||||||
Dividends from net investment income | — | — | (0.12 | ) | — | (0.69 | ) | |||||||||||||
Distributions from capital gains | (0.95 | ) | (0.80 | ) | — | (1.67 | ) | (3.15 | ) | |||||||||||
|
|
|
|
|
|
|
|
|
| |||||||||||
Total distributions | (0.95 | ) | (0.80 | ) | (0.12 | ) | (1.67 | ) | (3.84 | ) | ||||||||||
|
|
|
|
|
|
|
|
|
| |||||||||||
Redemption fees added to paid-in capital | 0.00 | ~ | 0.00 | ~ | 0.00 | ~ | 0.00 | ~ | 0.00 | ~ | ||||||||||
|
|
|
|
|
|
|
|
|
| |||||||||||
Net asset value, end of period | $ | 29.63 | $ | 32.53 | $ | 30.61 | $ | 25.72 | $ | 32.20 | ||||||||||
|
|
|
|
|
|
|
|
|
| |||||||||||
Total Return | (5.96 | )% | 8.92 | % | 19.51 | % | (15.02 | )% | 23.56 | % | ||||||||||
RATIOS/SUPPLEMENTAL DATA | ||||||||||||||||||||
Net assets, end of period (in 000’s) | $ | 1,701,219 | $ | 1,634,866 | $ | 989,258 | $ | 741,291 | $ | 834,311 | ||||||||||
Ratio of expenses before reimbursements, waivers and fees paid indirectly to average net assets | 1.65 | % | 1.66 | % | 1.68 | % | 1.68 | % | 1.69 | % | ||||||||||
Ratio of net expenses to average net assets | 1.63 | %# | 1.64 | %# | 1.66 | %# | 1.64 | %# | 1.63 | %# | ||||||||||
Ratio of net investment income (loss) to average net assets | 0.11 | %# | 0.33 | %# | 0.48 | %# | 0.49 | %# | (0.15 | )%# | ||||||||||
Portfolio turnover | 289 | % | 264 | % | 278 | % | 342 | % | 293 | % | ||||||||||
|
|
|
|
|
|
|
|
|
|
| ||||||||||
| ^ | Net investment income (loss) per share has been calculated using the average shares method. |
| ~ | Amount represents less than $0.01 per share |
| # | Such ratios are net of fees paid indirectly (see Note B in the Notes to Financial Statements). |
Notes to Financial Statements are an integral part of this Schedule.
41
Table of Contents
Driehaus Emerging Markets Small Cap Growth Fund
Financial Highlights
| For the year ended December 31, 2014 | For the year ended December 31, 2013 | For the year ended December 31, 2012 | For the period August 22, 2011 through December 31, 2011 | |||||||||||||
Net asset value, beginning of period | $ | 12.49 | $ | 11.15 | $ | 8.81 | $ | 10.00 | ||||||||
|
|
|
|
|
|
|
| |||||||||
INCOME (LOSS) FROM INVESTMENT OPERATIONS: | ||||||||||||||||
Net investment income (loss) | (0.02 | )^ | (0.00 | )^~ | 0.00 | ^~ | (0.03 | ) | ||||||||
Net realized and unrealized gain (loss) on investments | 0.74 | 1.36 | 2.52 | (1.16 | ) | |||||||||||
|
|
|
|
|
|
|
| |||||||||
Total income (loss) from investment operations | 0.72 | 1.36 | 2.52 | (1.19 | ) | |||||||||||
|
|
|
|
|
|
|
| |||||||||
LESS DISTRIBUTIONS: | ||||||||||||||||
Dividends from net investment income | — | (0.02 | ) | (0.18 | ) | — | ||||||||||
Distributions from capital gains | — | — | — | — | ||||||||||||
|
|
|
|
|
|
|
| |||||||||
Total distributions | — | (0.02 | ) | (0.18 | ) | — | ||||||||||
|
|
|
|
|
|
|
| |||||||||
Redemption fees added to paid-in capital | 0.00 | ~ | 0.00 | ~ | 0.00 | ~ | — | |||||||||
|
|
|
|
|
|
|
| |||||||||
Net asset value, end of period | $ | 13.21 | $ | 12.49 | $ | 11.15 | $ | 8.81 | ||||||||
|
|
|
|
|
|
|
| |||||||||
Total Return | 5.77 | % | 12.11 | % | 28.83 | % | (11.90 | )%** | ||||||||
RATIOS/SUPPLEMENTAL DATA | ||||||||||||||||
Net assets, end of period (in 000’s) | $ | 510,175 | $ | 191,285 | $ | 80,997 | $ | 32,720 | ||||||||
Ratio of expenses before reimbursements and/or recapture, waivers and fees paid indirectly to average net assets | 1.73 | % | 1.85 | % | 2.15 | % | 2.74 | %* | ||||||||
Ratio of net expenses to average net assets | 1.71 | %+# | 1.90 | %+# | 1.99 | %+# | 1.97 | %*+# | ||||||||
Ratio of net investment loss to average net assets | (0.14 | )%+# | (0.02 | )%+# | (0.02 | )%+# | (0.91 | )%*+# | ||||||||
Portfolio turnover | 265 | % | 223 | % | 183 | % | 74 | %** | ||||||||
| ||||||||||||||||
| * | Annualized |
| ** | Not Annualized |
| ^ | Net investment income (loss) per share has been calculated using the average shares method. |
| ~ | Amount represents less than $0.01 per share |
| + | Such ratios are after administrative and transfer agent waivers and adviser expense reimbursements, when applicable. BNY Mellon Investment Servicing (US) Inc., the administrative agent and transfer agent, waived a portion of its fees beginning with the Fund’s commencement of operations, August 22, 2011. The Adviser contractually agreed to waive its investment advisory fee or absorb other operating expenses to the extent necessary to ensure that total annual Fund operating expenses (other than interest, taxes, brokerage commissions and other portfolio transaction expenses, capital expenditures, and extraordinary expenses) would not exceed the Fund’s operating expense cap of 2.00% of average daily net assets until August 21, 2014. |
| # | Such ratios are net of fees paid indirectly (see Note B in the Notes to Financial Statements). |
Notes to Financial Statements are an integral part of this Schedule.
42
Table of Contents
Driehaus International Small Cap Growth Fund
Financial Highlights
| For the year ended December 31, 2014 | For the year ended December 31, 2013 | For the year ended December 31, 2012 | For the year ended December 31, 2011 | For the year ended December 31, 2010 | ||||||||||||||||
Net asset value, beginning of period | $ | 10.84 | $ | 9.45 | $ | 8.51 | $ | 9.66 | $ | 7.64 | ||||||||||
|
|
|
|
|
|
|
|
|
| |||||||||||
INCOME (LOSS) FROM INVESTMENT OPERATIONS: | ||||||||||||||||||||
Net investment income (loss) | (0.04 | ) | (0.01 | )^ | 0.03 | 0.07 | (0.06 | ) | ||||||||||||
Net realized and unrealized gain (loss) on investments and foreign currency transactions | (0.42 | ) | 2.74 | 0.95 | (1.17 | ) | 2.14 | |||||||||||||
|
|
|
|
|
|
|
|
|
| |||||||||||
Total income (loss) from investment operations | (0.46 | ) | 2.73 | 0.98 | (1.10 | ) | 2.08 | |||||||||||||
|
|
|
|
|
|
|
|
|
| |||||||||||
LESS DISTRIBUTIONS: | ||||||||||||||||||||
Dividends from net investment income | (0.06 | ) | (0.13 | ) | (0.04 | ) | (0.05 | ) | (0.06 | ) | ||||||||||
Distributions from capital gains | (1.12 | ) | (1.21 | ) | — | — | — | |||||||||||||
|
|
|
|
|
|
|
|
|
| |||||||||||
Total distributions | (1.18 | ) | (1.34 | ) | (0.04 | ) | (0.05 | ) | (0.06 | ) | ||||||||||
|
|
|
|
|
|
|
|
|
| |||||||||||
Redemption fees added to paid-in capital | 0.00 | ~ | 0.00 | ~ | 0.00 | ~ | 0.00 | ~ | 0.00 | ~ | ||||||||||
|
|
|
|
|
|
|
|
|
| |||||||||||
Net asset value, end of period | $ | 9.20 | $ | 10.84 | $ | 9.45 | $ | 8.51 | $ | 9.66 | ||||||||||
|
|
|
|
|
|
|
|
|
| |||||||||||
Total Return | (4.32 | )% | 29.24 | % | 11.67 | % | (11.39 | )% | 27.13 | % | ||||||||||
RATIOS/SUPPLEMENTAL DATA | ||||||||||||||||||||
Net assets, end of period (in 000’s) | $ | 218,979 | $ | 270,671 | $ | 234,959 | $ | 232,729 | $ | 258,446 | ||||||||||
Ratio of expenses before reimbursements, waivers and fees paid indirectly to average net assets | 1.74 | % | 1.73 | % | 1.76 | % | 1.73 | % | 1.75 | % | ||||||||||
Ratio of net expenses to average net assets | 1.72 | %# | 1.70 | %# | 1.74 | %# | 1.69 | %# | 1.72 | %+# | ||||||||||
Ratio of net investment income (loss) to average net assets | (0.40 | )%# | (0.11 | )%# | 0.31 | %# | 0.66 | %# | (0.76 | )%+# | ||||||||||
Portfolio turnover | 277 | % | 320 | % | 280 | % | 311 | % | 298 | % | ||||||||||
|
|
|
|
|
|
|
|
|
|
| ||||||||||
| ^ | Net investment income (loss) per share has been calculated using the average shares method. |
| ~ | Amount represents less than $0.01 per share |
| + | Such ratios are after adviser expense reimbursements, when applicable. The Adviser contractually agreed to waive its investment advisory fee or absorb other operating expenses to the extent necessary to ensure that total annual Fund operating expenses (other than interest, taxes, brokerage commissions and other portfolio transaction expenses, capital expenditures, and extraordinary expenses) would not exceed the Fund’s operating expense cap of 2.00% of average daily net assets until September 16, 2010. |
| # | Such ratios are net of fees paid indirectly (see Note B in the Notes to Financial Statements). |
Notes to Financial Statements are an integral part of this Schedule.
43
Table of Contents
Driehaus Micro Cap Growth Fund
Financial Highlights
| For the year ended December 31, 2014 | For the period November 18, 2013 through December 31, 2013 | |||||||
Net asset value, beginning of period | $ | 10.74 | $ | 10.00 | ||||
|
|
|
| |||||
INCOME (LOSS) FROM INVESTMENT OPERATIONS: | ||||||||
Net investment income (loss) | (0.14 | ) | (0.02 | ) | ||||
Net realized and unrealized gain (loss) on investments | 1.01 | 0.76 | ||||||
|
|
|
| |||||
Total income (loss) from investment operations | 0.87 | 0.74 | ||||||
|
|
|
| |||||
LESS DISTRIBUTIONS: | ||||||||
Dividends from net investment income | — | — | ||||||
Distributions from capital gains | (0.36 | ) | — | |||||
|
|
|
| |||||
Total distributions | (0.36 | ) | — | |||||
|
|
|
| |||||
Redemption fees added to paid-in capital | 0.00 | ~ | — | |||||
|
|
|
| |||||
Net asset value, end of period | $ | 11.25 | $ | 10.74 | ||||
|
|
|
| |||||
Total Return | 8.21 | % | 7.40 | %** | ||||
RATIOS/SUPPLEMENTAL DATA | ||||||||
Net assets, end of period (in 000’s) | $ | 111,846 | $ | 74,677 | ||||
Ratio of expenses before reimbursements and waivers and fees recaptured, if any, to average net assets | 1.59 | % | 2.28 | %* | ||||
Ratio of net expenses to average net assets | 1.60 | %+# | 1.70 | %*+# | ||||
Ratio of net investment income (loss) to average net assets | (1.39 | )%+# | (1.55 | )%*+# | ||||
Portfolio turnover | 191 | % | 21 | %** | ||||
| ||||||||
| * | Annualized |
| ** | Not Annualized |
| ~ | Amount represents less than $0.01 per share |
| + | Such ratios are after administrative and transfer agent waivers and adviser expense reimbursements, when applicable. BNY Mellon Investment Servicing (US) Inc., the administrative agent and transfer agent, waived a portion of its fees beginning with the Fund’s commencement of operations, November 18, 2013. The Adviser contractually agreed to waive its investment advisory fee or absorb other operating expenses to the extent necessary to ensure that total annual Fund operating expenses (other than interest, taxes, brokerage commissions and other portfolio transaction expenses, capital expenditures, and extraordinary expenses) would not exceed the Fund’s operating expense cap of 1.70% of average daily net assets until November 18, 2016. |
| # | Such ratios are net of fees paid indirectly (see Note B in the Notes to Financial Statements). |
Notes to Financial Statements are an integral part of this Schedule.
44
Table of Contents
Driehaus Mutual Funds
A. SUMMARY OF SIGNIFICANT ACCOUNTING POLICIES
Organization
The Driehaus Mutual Funds (the “Trust”) is a registered management investment company under the Investment Company Act of 1940, as amended, organized as a Delaware statutory trust, with eight separate series currently in operation. The Trust was organized under an Agreement and Declaration of Trust dated May 31, 1996, as subsequently amended and restated as of June 6, 2013, and may issue an unlimited number of full and fractional units of beneficial interest (shares) without par value. The five series (“Funds” or each a “Fund”) included in this report are as follows:
| Fund | Commencement of Operations | |||
Driehaus International Discovery Fund** | 12/31/98 | |||
Driehaus Emerging Markets Growth Fund | 12/31/97 | |||
Driehaus Emerging Markets Small Cap Growth Fund | 08/22/11 | |||
Driehaus International Small Cap Growth Fund* | 09/17/07 | |||
Driehaus Micro Cap Growth Fund | 11/18/13 | |||
|
|
| ||
| * | On December 29, 2010, the Driehaus International Small Cap Growth Fund was closed to new investors. |
| ** | On February 11, 2015, the shareholders approved a Plan of Reorganization for the merger of Driehaus International Discovery Fund into Driehaus International Small Cap Growth Fund. |
The investment objective of each Fund is to maximize capital appreciation.
Driehaus International Discovery Fund seeks to achieve its objective by generally investing in equity securities of non-U.S. companies exhibiting strong growth characteristics.
Driehaus Emerging Markets Growth Fund seeks to achieve its objective by investing primarily in equity securities of emerging markets companies.
Driehaus Emerging Markets Small Cap Growth Fund seeks to achieve its objective by investing primarily in equity securities of small capitalization emerging markets companies.
Driehaus International Small Cap Growth Fund seeks to achieve its objective by investing primarily in equity securities of smaller capitalization non-U.S. companies exhibiting strong growth characteristics.
Driehaus Micro Cap Growth Fund seeks to achieve its objective by investing primarily in equity securities of micro capitalization U.S. companies exhibiting strong growth characteristics.
Fiscal Year-End
The fiscal year-end for the Funds is December 31.
Securities Valuation and Transactions
Equity securities and exchange-traded options are valued at the last sale price as of the close of the primary exchange or other designated time. Equity certificates are valued at the last sale price of the underlying security as of the close of the primary exchange. In addition, if quotations are not readily available, if the values have been materially affected by events occurring after the closing of a foreign market, or if there has been a movement in the United States market that exceeds a certain threshold, assets may be valued at fair value as determined in good faith by or under the direction of the Trust’s Board of Trustees. Events that may materially affect asset values that could cause a fair value determination include, but are not limited to: corporate announcements relating to a specific security; natural and other disasters which may impact an entire market or region; and political and other events which may be global or impact a particular country or region. The frequency with which these procedures are used cannot be predicted and may be utilized to a significant extent. To the extent utilized, securities would be considered level 2 in the hierarchy described below. Substantially all transfers between level 1 and level 2 relate to the use of these procedures.
45
Table of Contents
Driehaus Mutual Funds
Notes to Financial Statements — (Continued)
Each Fund is subject to fair value accounting standards that define fair value, establish the framework for measuring fair value and provide a three-level hierarchy for fair valuation based upon the inputs to the valuation as of the measurement date. The three levels of the fair value hierarchy are as follows:
Level 1 — quoted prices in active markets for identical securities
Level 2 — significant observable inputs (including quoted prices for similar securities, interest rates, prepayment speeds, credit risk, etc.)
Level 3 — significant unobservable inputs (including the Funds’ own assumptions in determining the fair value of investments)
The inputs or methodology used for valuing securities are not necessarily an indication of the risk associated with investing in those securities.
The summary of the Funds’ investments that are measured at fair value by level within the fair value hierarchy as of December 31, 2014 is as follows:
Fund | Total Value at December 31, 2014 | Level 1 Quoted Price | Level 2 Significant Observable Inputs | Level 3 Significant Unobservable Inputs | ||||||||||||
Driehaus International Discovery Fund | ||||||||||||||||
Equity Securities: | ||||||||||||||||
Europe | $ | 48,999,796 | $ | 8,829,834 | $ | 40,169,962 | $ | — | ||||||||
Far East | 21,088,001 | 4,823,012 | 16,264,989 | — | ||||||||||||
Middle East | 2,098,095 | 2,098,095 | — | — | ||||||||||||
North America | 15,436,294 | 15,436,294 | — | — | ||||||||||||
|
|
|
|
|
|
|
| |||||||||
Total Investments | $ | 87,622,186 | $ | 31,187,235 | $ | 56,434,951 | $ | — | ||||||||
|
|
|
|
|
|
|
| |||||||||
Driehaus Emerging Markets Growth Fund | ||||||||||||||||
Equity Securities: | ||||||||||||||||
Africa | $ | 134,083,056 | $ | — | $ | 134,083,056 | $ | — | ||||||||
Europe | 165,136,316 | 12,936,451 | 152,199,865 | — | ||||||||||||
Far East | 1,032,038,205 | 249,712,366 | 782,325,839 | — | ||||||||||||
Middle East | 9,696,189 | 9,696,189 | — | — | ||||||||||||
North America | 117,523,658 | 117,523,658 | — | — | ||||||||||||
South America | 150,175,328 | 150,175,328 | — | — | ||||||||||||
Equity Certificates* | 22,447,631 | — | 22,447,631 | — | ||||||||||||
|
|
|
|
|
|
|
| |||||||||
Total Investments | $ | 1,631,100,383 | $ | 540,043,992 | $ | 1,091,056,391 | $ | — | ||||||||
|
|
|
|
|
|
|
| |||||||||
Driehaus Emerging Markets Small Cap Growth Fund | ||||||||||||||||
Equity Securities | ||||||||||||||||
Africa | $ | 29,374,253 | $ | 2,764,723 | $ | 26,609,530 | $ | — | ||||||||
Europe | 26,856,170 | 4,824,513 | 22,031,657 | |||||||||||||
Far East | 294,938,982 | 42,905,591 | 252,033,391 | — | ||||||||||||
Middle East | 7,683,378 | 5,137,730 | 2,545,648 | — | ||||||||||||
North America | 7,170,855 | 7,170,855 | — | — | ||||||||||||
South America | 39,944,372 | 39,944,372 | — | — | ||||||||||||
46
Table of Contents
Driehaus Mutual Funds
Notes to Financial Statements — (Continued)
Fund | Total Value at December 31, 2014 | Level 1 Quoted Price | Level 2 Significant Observable Inputs | Level 3 Significant Unobservable Inputs | ||||||||||||
Equity Certificates* | $ | 61,392,640 | $ | — | $ | 61,392,640 | $ | — | ||||||||
Purchased Put Options by Risk Category Equity Contracts | 3,800,000 | 3,800,000 | — | — | ||||||||||||
|
|
|
|
|
|
|
| |||||||||
Total Investments | $ | 471,160,650 | $ | 106,547,784 | $ | 364,612,866 | $ | — | ||||||||
|
|
|
|
|
|
|
| |||||||||
Driehaus International Small Cap Growth Fund | ||||||||||||||||
Equity Securities: | ||||||||||||||||
Africa | $ | 1,833,545 | $ | — | $ | 1,833,545 | $ | — | ||||||||
Europe | 118,657,521 | 6,341,374 | 112,316,147 | — | ||||||||||||
Far East | 64,522,523 | — | 64,522,523 | — | ||||||||||||
North America | 31,030,731 | 31,030,731 | — | — | ||||||||||||
|
|
|
|
|
|
|
| |||||||||
Total Investments | $ | 216,044,320 | $ | 37,372,105 | $ | 178,672,215 | $ | — | ||||||||
|
|
|
|
|
|
|
| |||||||||
Driehaus Micro Cap Growth Fund | ||||||||||||||||
Investments in Securities* | $ | 112,070,471 | $ | 112,070,471 | $ | — | $ | — | ||||||||
|
|
|
|
|
|
|
| |||||||||
| * | See Schedule of Investments for industry and/or country breakout. |
Transfers between levels, if any, are recognized as of the last day in the fiscal quarter of the period in which the event or change in circumstances that caused the reclassification occurred. The Funds used observable inputs in their valuation methodologies whenever they were available and deemed reliable.
When fair value pricing is employed, the prices of securities used by a Fund to calculate its net asset value may differ from closing prices for the same securities, which means that a Fund may value those securities higher or lower than another fund that does not employ fair value. In addition, the fair value price may differ materially from the value a Fund may ultimately realize.
For the period ended December 31, 2014, securities with end of period values of $17,745,272, $226,025,178, $56,747,536 and $39,712,206 held by Driehaus International Discovery Fund, Driehaus Emerging Markets Growth Fund, Driehaus Emerging Markets Small Cap Growth Fund and Driehaus International Small Cap Growth Fund, respectively, were transferred from level 1 to level 2.
Securities transactions are accounted for on trade date. The cost of investments sold is determined by the use of the specific identification method for both financial reporting and income tax purposes. Interest income is recorded on an accrual basis. Dividend income, net of non-reclaimable foreign taxes withheld, is recorded on the ex-dividend date or as soon as the information is available. Income and expenses are accrued daily.
Options Contracts
The Funds are subject to equity and other risk exposures in the normal course of pursuing their investment objective. The Funds may use options contracts to hedge their portfolio or a portion thereof or speculatively for the purpose of profiting from a decline in the market value of a security.
The Funds may write covered call and put options on futures, securities or currencies the Funds own or in which they may invest. Writing put options tends to increase a Fund’s exposure to the underlying instrument. Writing call options tends to decrease a Fund’s exposure to the underlying instrument. When a Fund writes a call or put option, an amount equal to the premium received is recorded as a liability and subsequently marked-to-market to reflect the current value of the option written. These liabilities are reflected as written options outstanding in the Schedule of Investments. Payments received or made, if any, from writing options with premiums to be determined on a future date are reflected as such in the Schedule of
47
Table of Contents
Driehaus Mutual Funds
Notes to Financial Statements — (Continued)
Investments. Premiums received from writing options which expire are treated as realized gains. Premiums received from writing options which are exercised or closed are added to the proceeds or offset against amounts paid on the underlying future, security or currency transaction to determine the realized gain or loss. A Fund, as a writer of an option, has no control over whether the underlying future, security or currency may be sold (call) or purchased (put) and, as a result, bears the market risk of an unfavorable change in the price of the future, security or currency underlying the written option. The risk exists that a Fund may not be able to enter into a closing transaction because of an illiquid market.
For the year ended December 31, 2014, the average volume of purchased and written options for Driehaus Emerging Markets Small Cap Growth Fund was $3,596,919 and $176,602, respectively.
The premiums received and the number of option contracts written during the period ended December 31, 2014, were as follows:
Driehaus Emerging Markets Small Cap Growth Fund | Number of Contracts | Premiums Received | ||||||
Options outstanding at December 31, 2013 | — | $ | — | |||||
Options written | 293,215 | 9,267,558 | ||||||
Options closed | (271,215 | ) | (8,784,208 | ) | ||||
Options expired | (22,000 | ) | (483,350 | ) | ||||
|
|
|
| |||||
Options outstanding at December 31, 2014 | — | $ | — | |||||
|
|
|
| |||||
The Funds may also purchase put and call options. Purchasing call options tends to increase a Fund’s exposure to the underlying instrument. Purchasing put options tends to decrease a Fund’s exposure to the underlying instrument. A Fund pays a premium which is included in its Schedule of Investments as an investment and subsequently marked-to-market to reflect the current value of the option. Premiums paid for purchasing options which expire are treated as realized losses. Premiums paid for purchasing options which are exercised or closed are added to the amounts paid or offset against the proceeds on the underlying future, security or currency transaction to determine the realized gain or loss. When entering into purchased option contracts, a Fund bears the risk of securities prices moving unexpectedly, in which case, a Fund may not achieve the anticipated benefits of the purchased option contracts; however, the risk of loss is limited to the premium paid. As of December 31, 2014, the Funds had outstanding options as listed on the Schedule of Investments.
Equity Certificates
The Funds may invest in equity certificates which allow the Funds to participate in the appreciation (depreciation) of the underlying security without actually owning the underlying security. These derivative instruments are purchased pursuant to an agreement with a financial institution and are valued at a calculated market price based on the value of the underlying security in accordance with the agreement. These equity certificates are subject to the credit risk of the issuing financial institution. There is no off-balance sheet risk associated with equity certificates and the Funds’ potential loss is limited to the purchase price of the securities. The Funds are exposed to credit risk associated with the counterparty to the transaction, which is monitored by the Funds’ management on a periodic basis.
On December 31, 2014, Driehaus Emerging Markets Growth Fund and Driehaus Emerging Markets Small Cap Growth Fund had unrealized appreciation (depreciation) of $(1,293,961) and $15,432,388, respectively, as a result of their investments in these financial instruments. The aggregate market values of these certificates for Driehaus Emerging Markets Growth Fund and Driehaus Emerging Markets Small Cap Growth Fund represented 1.4% and 13.0%, respectively, of their total market values at December 31, 2014.
Derivative Investment Holdings Categorized by Risk Exposure
Each Fund is subject to the Financial Accounting Standards Board’s (“FASB”) “Disclosures about Derivative Instruments and Hedging Activities” (the “Derivatives Statement”). The Derivatives Statement amends and expands disclosures about derivative instruments and hedging activities. The Derivatives
48
Table of Contents
Driehaus Mutual Funds
Notes to Financial Statements — (Continued)
Statement is intended to improve financial reporting about derivative instruments requiring enhanced disclosures to enable investors to better understand how and why the Funds use derivative instruments, how these derivative instruments are accounted for and their effects on the Funds’ financial position and results of operations.
The following table sets forth the fair value and the location in the Statement of Assets and Liabilities of the Driehaus Emerging Markets Growth Fund’s derivative contracts by primary risk exposure as of December 31, 2014:
Asset derivatives | ||||||
Risk exposure category | Statement of Assets and Liabilities location | Fair value | ||||
Equity contracts | Investments, at market value | $ | 22,447,631 | |||
|
|
|
| |||
The following table sets forth the fair value and the location in the Statement of Assets and Liabilities of the Driehaus Emerging Markets Small Cap Growth Fund’s derivative contracts by primary risk exposure as of December 31, 2014:
Asset derivatives | ||||||
Risk exposure category | Statement of Assets and Liabilities location | Fair value | ||||
Equity contracts | Investments, at market value | $ | 65,192,640 | |||
|
|
|
| |||
The following table sets forth the Driehaus Emerging Markets Growth Fund’s realized gain (loss) by primary risk exposure and by type of derivative contract for the year ended December 31, 2014:
| Amount of realized gain (loss) on derivatives | ||||
Risk exposure category | Equity Certificates | |||
Equity contracts | $ | 11,432,304 | ||
|
|
| ||
The following table sets forth the Driehaus Emerging Markets Small Cap Growth Fund’s realized gain (loss) by primary risk exposure and by type of derivative contract for the year ended December 31, 2014:
| Amount of realized gain (loss) on derivatives | ||||||||||||
Risk exposure category | Equity Certificates | Purchased Options | Written Options | |||||||||
Equity contracts | $ | 13,102,027 | $ | (5,229,087 | ) | $ | 643,905 | |||||
Commodity contracts | — | (8,848 | ) | — | ||||||||
|
|
|
|
|
|
| ||||||
The following table sets forth the Driehaus Emerging Markets Growth Fund’s change in unrealized appreciation (depreciation) by primary risk exposure and by type of derivative contract for the year ended December 31, 2014:
| Change in unrealized appreciation (depreciation) on derivatives | ||||
Risk exposure category | Equity Certificates | |||
Equity contracts | $ | (1,404,072 | ) | |
|
|
| ||
The following table sets forth the Driehaus Emerging Markets Small Cap Growth Fund’s change in unrealized appreciation (depreciation) by primary risk exposure and by type of derivative contract for the year ended December 31, 2014:
| Change in unrealized appreciation (depreciation) on derivatives | ||||||||
Risk exposure category | Equity Certificates | Purchased Options | ||||||
Equity contracts | $ | 9,676,635 | $ | 433,040 | ||||
|
|
|
|
| ||||
Federal Income Taxes
No provision is made for Federal income taxes since each Fund has elected to be taxed as a “regulated investment company” under Subchapter M of the Internal Revenue Code (the “Code”) and has made and declared all the required distributions to its shareholders in amounts sufficient to relieve each Fund from all or substantially all Federal income and excise taxes under provisions of current Federal tax law.
49
Table of Contents
Driehaus Mutual Funds
Notes to Financial Statements — (Continued)
Each Fund is subject to accounting standards that establish a minimum threshold for recognizing, and a system for measuring, the benefits of a tax position taken or expected to be taken in a tax return. Taxable years ending 2014, 2013, 2012 and 2011 remain open to Federal and state audit. As of December 31, 2014, management has evaluated the application of these standards to each Fund, and has determined that no provision for income tax is required in each Fund’s financial statements for uncertain tax provisions. The Funds recognize interest and penalties, if any, related to unrecognized tax benefits as income tax expense in the Statements of Operations. During the year, the Funds did not incur any interest or penalties. The Funds may be subject to foreign taxes on income, gains on investments or currency repatriation, a portion of which may be recoverable. Foreign taxes are provided for based on the Funds’ understanding of the tax rules and regulations that exist in the foreign markets in which they invest.
The amount of dividends and distributions from net investment income and net realized capital gains are determined in accordance with Federal income tax regulations, which may differ from U.S. generally accepted accounting principles (“U.S. GAAP”).
For the year ended December 31, 2014, reclassifications were recorded to undistributed net investment income, undistributed net realized gain and paid-in capital for any permanent tax differences. These reclassifications relate primarily to foreign currency losses, sales of passive foreign investment companies, net operating losses and foreign capital gain taxes paid. Results of operations and net assets were not affected by these reclassifications.
| Driehaus International Discovery Fund | Driehaus Emerging Markets Growth Fund | Driehaus Emerging Markets Small Cap Growth Fund | Driehaus International Small Cap Growth Fund | Driehaus Micro Cap Growth Fund | ||||||||||||||||
Undistributed net investment income | $ | 788,455 | $ | (6,465,069 | ) | $ | (243,167 | ) | $ | 1,932,455 | $ | 1,404,609 | ||||||||
Undistributed net realized gain | (442,835 | ) | 13,444,972 | 1,703,410 | (1,932,455 | ) | — | |||||||||||||
Paid-in capital | (345,620 | ) | (6,979,903 | ) | (1,460,243 | ) | — | (1,404,609 | ) | |||||||||||
For Federal income tax purposes, capital loss carryforwards represent net capital losses of a Fund that may be carried forward for a maximum period of eight years and applied against future net realized gains. On December 22, 2010, the Regulated Investment Company Modernization Act of 2010 was enacted to modernize several of the Federal income and excise tax provisions related to regulated investment companies. Under pre-enactment law, capital losses could be carried forward for up to eight years, and carried forward as short-term capital losses, irrespective of the character of the original loss. New net capital losses (those earned in taxable years beginning after December 22, 2010) may be carried forward indefinitely and must retain the character of the original loss. Such new net capital losses generally must be used by a regulated investment company before it uses any net capital losses incurred in taxable years beginning on or before December 22, 2010. This increases the likelihood that net capital losses incurred in taxable years beginning on or before December 22, 2010 will expire unused. The following table shows the expiration dates for capital loss carryover from pre-enactment taxable years and the amounts of capital loss carryover, if any, by each of the applicable Funds as of December 31, 2014:
| Pre-Enactment Net Capital Loss Carryover Expiring In | Post-Enactment Unlimited Period of Net Capital Loss Carryover | |||||||||||||||||||
Fund | 2016 | 2017 | Short- Term | Long-Term | Accumulated Capital Loss Carryover | |||||||||||||||
Driehaus International Discovery Fund | $ | 114,345,693 | $ | 109,113,076 | $ | — | $ | — | $ | — | ||||||||||
Driehaus Emerging Markets Small Cap Growth Fund | — | — | 6,697,111 | — | 6,697,111 | |||||||||||||||
During the year ended December 31, 2014, Driehaus International Discovery Fund and Driehaus Emerging Markets Small Cap Growth Fund utilized $5,527,690 and $32,924 of capital loss carryforwards, respectively.
50
Table of Contents
Driehaus Mutual Funds
Notes to Financial Statements — (Continued)
Pursuant to Federal income tax rules applicable to regulated investment companies, the Funds may elect to treat certain capital losses between November 1 and December 31 as occurring on the first day of the following tax year. For the year ended December 31, 2014, the following qualified late-year losses were deferred and recognized on January 1, 2015:
Fund | Late-Year Ordinary Loss Deferral | Short-Term Capital Loss Deferral | Long-Term Capital Loss Deferral | Total | ||||||||||||
Driehaus International Discovery Fund | $ | 129,280 | $ | 1,858,229 | $ | — | $ | 1,987,509 | ||||||||
Driehaus Emerging Markets Growth Fund | 4,708,682 | 47,578,610 | — | 52,287,292 | ||||||||||||
Driehaus Emerging Markets Small Cap Growth Fund | 1,221,155 | — | — | 1,221,155 | ||||||||||||
Driehaus International Small Cap Growth Fund | 561,360 | 4,421,290 | — | 4,982,650 | ||||||||||||
Distributions to Shareholders
The tax character of distributions paid during the fiscal year ended December 31, 2014 was as follows:
Distributions paid from: | Driehaus International Discovery Fund | Driehaus Emerging Markets Growth Fund | Driehaus Emerging Markets Small Cap Growth Fund | Driehaus International Small Cap Growth Fund | Driehaus Micro Cap Growth Fund | |||||||||||||||
Ordinary income | $ | 895,291 | $ | 1,569,189 | $ | — | $ | 10,021,652 | $ | 1,275,778 | ||||||||||
Net long-term capital gain | — | 52,533,986 | — | 15,778,725 | 2,251,610 | |||||||||||||||
|
|
|
|
|
|
|
|
|
| |||||||||||
Total distributions paid | $ | 895,291 | $ | 54,103,175 | $ | — | $ | 25,800,377 | $ | 3,527,388 | ||||||||||
|
|
|
|
|
|
|
|
|
| |||||||||||
The tax character of distributions paid during the fiscal year ended December 31, 2013 was as follows:
Distributions paid from: | Driehaus International Discovery Fund | Driehaus Emerging Markets Growth Fund | Driehaus Emerging Markets Small Cap Growth Fund | Driehaus International Small Cap Growth Fund | Driehaus Micro Cap Growth Fund | |||||||||||||||
Ordinary income | $ | — | $ | — | $ | 309,776 | $ | 16,561,929 | $ | — | ||||||||||
Net long-term capital gain | — | 38,958,248 | — | 13,844,049 | — | |||||||||||||||
|
|
|
|
|
|
|
|
|
| |||||||||||
Total distributions paid | $ | — | $ | 38,958,248 | $ | 309,776 | $ | 30,405,978 | $ | — | ||||||||||
|
|
|
|
|
|
|
|
|
| |||||||||||
As of December 31, 2014, the components of net assets on a tax basis were as follows:
Distributions paid from: | Driehaus International Discovery Fund | Driehaus Emerging Markets Growth Fund | Driehaus Emerging Markets Small Cap Growth Fund | Driehaus International Small Cap Growth Fund | Driehaus Micro Cap Growth Fund | |||||||||||||||
Undistributed ordinary income | $ | — | $ | — | $ | — | $ | — | $ | — | ||||||||||
Undistributed long-term capital gain | — | — | — | 2,047,729 | 2,009,406 | |||||||||||||||
|
|
|
|
|
|
|
|
|
| |||||||||||
Accumulated earnings | $ | — | $ | — | $ | — | $ | 2,047,729 | $ | 2,009,406 | ||||||||||
Paid-in capital | 308,979,057 | 1,703,361,432 | 484,959,243 | 205,995,113 | 85,289,831 | |||||||||||||||
Accumulated capital and other losses | (225,446,278 | ) | (52,287,292 | ) | (7,918,266 | ) | (4,982,650 | ) | — | |||||||||||
Unrealized appreciation (depreciation) on foreign currency | (5,747 | ) | (269,609 | ) | 15,501 | (12,216 | ) | — | ||||||||||||
Unrealized appreciation on investments | 6,152,157 | 50,414,317 | 33,118,082 | 15,930,601 | 24,546,430 | |||||||||||||||
|
|
|
|
|
|
|
|
|
| |||||||||||
Net assets | $ | 89,679,189 | $ | 1,701,218,848 | $ | 510,174,560 | $ | 218,978,577 | $ | 111,845,667 | ||||||||||
|
|
|
|
|
|
|
|
|
| |||||||||||
51
Table of Contents
Driehaus Mutual Funds
Notes to Financial Statements — (Continued)
The differences between book-basis and tax-basis unrealized appreciation are attributable primarily to the tax deferral of losses on wash sales and passive foreign investment company (PFIC) mark-to-market.
Foreign Currency Translation
Foreign currency and equity securities not denominated in U.S. dollars are translated into U.S. dollar values based upon the current rates of exchange on the date of the Funds’ valuations.
Net realized foreign exchange gains or losses which are reported by the Funds result from currency gains and losses on transaction hedges arising from changes in exchange rates between the trade and settlement dates on spot contracts underlying securities transactions and the difference between the amounts accrued for dividends, interest, and foreign taxes and the amounts actually received or paid in U.S. dollars for these items. Net unrealized foreign exchange gains and losses result from changes in the U.S. dollar value of assets and liabilities (other than investments in securities), which are denominated in foreign currencies, as a result of changes in exchange rates.
Net realized foreign exchange gains or losses on portfolio hedges result from the use of spot contracts to hedge portfolio positions denominated or quoted in a particular currency in order to reduce or limit exposure in that currency. The Funds had no portfolio hedges during the year ended December 31, 2014.
The Funds do not isolate that portion of the results of operations which results from fluctuations in foreign exchange rates on investments. These fluctuations are included with the net realized gain (loss) from security transactions and the net change in unrealized appreciation (depreciation) of investments.
Use of Estimates
The preparation of financial statements, in conformity with U.S. GAAP, requires management to make estimates and assumptions that affect the reported amount of assets and liabilities and disclosure of contingent assets and liabilities at the date of the financial statements and the reported amounts of net increases or decreases in net assets from operations during the reporting period. Actual results could differ from those estimates.
Indemnifications
Under the Trust’s organizational documents, the officers and Trustees are indemnified against certain liabilities arising out of the performance of their duties to the Trust. In addition, in the normal course of business, the Trust enters into contracts that provide general indemnifications to other parties. The Funds’ maximum exposure under these agreements is unknown as this would involve future claims that may be made against the Funds that have not yet occurred. However, the Funds have not had prior claims or losses pursuant to these contracts and expect the risk of loss to be remote.
B. INVESTMENT ADVISORY FEES, TRANSACTIONS WITH AFFILIATES, AND ADMINISTRATIVE FEES
Richard H. Driehaus, an Interested Trustee of the Trust, is also the Chairman of the Board of Driehaus Capital Management LLC (“DCM” or the “Adviser”), a registered investment adviser, and of Driehaus Securities LLC (“DS LLC” or the “Distributor”), a registered broker-dealer.
DCM serves as the Funds’ investment adviser. In return for its services to the Funds, DCM receives monthly fees. Driehaus International Discovery Fund and Driehaus Micro Cap Growth Fund each pay the Adviser a monthly fee computed and accrued daily at an annual rate of 1.25% of each Fund’s average daily net assets. Driehaus Emerging Markets Growth Fund, Driehaus Emerging Markets Small Cap Growth Fund and Driehaus International Small Cap Growth Fund each pay the Adviser a monthly fee computed and accrued daily at an annual rate of 1.50% of each Fund’s average daily net assets.
DCM entered into an agreement to cap Driehaus Emerging Markets Small Cap Growth Fund’s annual operating expenses (other than interest, taxes, brokerage commissions and other portfolio transaction expenses, capital expenditures and extraordinary expenses) at 2.00% of average daily net assets until August 21, 2014. For a period of three years subsequent to the Fund’s commencement of operations, DCM
52
Table of Contents
Driehaus Mutual Funds
Notes to Financial Statements — (Continued)
was entitled to reimbursement for previously waived fees and reimbursed expenses to the extent that the Fund’s expense ratio remained below the operating expense cap. For the year ended December 31, 2014, DCM did not waive or recapture fees for Driehaus Emerging Markets Small Cap Growth Fund under this agreement.
DCM has entered into an agreement to cap Driehaus Micro Cap Growth Fund’s annual operating expenses (other than interest, taxes, brokerage commissions and other portfolio transaction expenses, capital expenditures and extraordinary expenses) at 1.70% of average daily net assets until November 18, 2016. For a period of three years subsequent to the Fund’s commencement of operations, DCM is entitled to reimbursement for previously waived fees and reimbursed expenses to the extent that the Fund’s expense ratio remains below the operating expense cap. For the year ended December 31, 2014, DCM recaptured fees for Driehaus Micro Cap Growth Fund totaling $39,026 under this agreement and there are no additional amounts subject to recapture.
The amounts accrued and payable to DCM during the year ended December 31, 2014, are as follows:
| Fund | Advisory Fees | Advisory Fees Payable (included in Due to affiliates) | ||||||
Driehaus International Discovery Fund | $ | 1,407,946 | $ | 98,860 | ||||
Driehaus Emerging Markets Growth Fund | 27,558,897 | 2,258,376 | ||||||
Driehaus Emerging Markets Small Cap Growth Fund | 5,257,311 | 633,246 | ||||||
Driehaus International Small Cap Growth Fund | 3,659,355 | 286,884 | ||||||
Driehaus Micro Cap Growth Fund | 1,237,651 | 113,901 | ||||||
|
|
|
|
| ||||
The Funds direct certain portfolio trades, subject to obtaining the best price and execution, to brokers who have agreed to pay a portion of the Funds’ operating expenses using part of the commissions generated. For the year ended December 31, 2014, these arrangements reduced the expenses of Driehaus International Discovery Fund, Driehaus Emerging Markets Growth Fund, Driehaus Emerging Markets Small Cap Growth Fund, Driehaus International Small Cap Growth Fund and Driehaus Micro Cap Growth Fund by $13,500 (0.7%), $314,698 (1.0%), $59,257 (1.0%), $52,176 (1.2%) and $0 (0.0%), respectively.
Certain officers of the Trust are also officers of DCM and DS LLC. The Funds pay a portion of the Chief Compliance Officer’s salary and bonus. No other officers received compensation from the Funds.
BNY Mellon Investment Servicing (US) Inc. (“BNY Mellon”) serves as the Funds’ administrative and accounting agent. In compensation for these services, BNY Mellon earns the larger of a monthly minimum fee or a monthly fee based upon average net assets. For the year ended December 31, 2014, BNY Mellon waived $2,500 for administrative and accounting fees for Driehaus Micro Cap Growth Fund. BNY Mellon also acts as the transfer agent and dividend disbursing agent for the Funds. For these services, BNY Mellon earns a monthly fee based on shareholder processing activity during the month. BNY Mellon has agreed to waive a portion of its monthly fee for transfer agent service for the first two years of operations for Driehaus Micro Cap Growth Fund. For the year ended December 31, 2014, BNY Mellon waived $28,500 for Driehaus Micro Cap Growth Fund.
C. OTHER FINANCIAL INSTRUMENTS
The Funds enter into foreign currency spot contracts to facilitate transactions in foreign currency denominated securities. These spot contracts are typically open for 2 to 5 days, depending on the settlement terms of the underlying security transaction. On December 31, 2014, the Funds had foreign currency spot contracts outstanding under which they are obligated to exchange currencies at specified future dates. The unrealized appreciation or depreciation on spot contracts is reflected as a separate line item in the Statements of Assets and Liabilities. On December 31, 2014, the Funds’ currency transactions were limited to transaction hedges.
53
Table of Contents
Driehaus Mutual Funds
Notes to Financial Statements — (Continued)
D. INVESTMENT TRANSACTIONS
The aggregate purchases and sales of investment securities, other than short-term obligations and options, for the year ended December 31, 2014 were as follows:
| Fund | Purchases | Sales | ||||||
Driehaus International Discovery Fund | $ | 161,945,333 | $ | 196,958,833 | ||||
Driehaus Emerging Markets Growth Fund | 5,189,370,313 | 5,020,837,615 | ||||||
Driehaus Emerging Markets Small Cap Growth Fund | 1,115,079,540 | 842,347,381 | ||||||
Driehaus International Small Cap Growth Fund | 652,642,494 | 694,580,047 | ||||||
Driehaus Micro Cap Growth Fund | 212,512,661 | 182,676,360 | ||||||
|
|
|
|
| ||||
E. RESTRICTED SECURITIES
Restricted securities are securities that are not registered for sale under the Securities Act of 1933 or applicable foreign law and that may be re-sold only in transactions exempt from applicable registration. Restricted securities include Rule 144A securities which may be sold normally to qualified institutional buyers. On December 31, 2014, the Funds held no restricted securities, other than equity certificates. Since an investment in equity certificates represents an agreement entered into with a financial institution, with terms set by such financial institution, these instruments are also deemed to be restricted (see Note A).
F. LINE OF CREDIT
Driehaus International Discovery Fund, Driehaus Emerging Markets Growth Fund and Driehaus International Small Cap Growth Fund have together obtained an uncommitted line of credit in the amount of $25,000,000 and Driehaus Emerging Markets Small Cap Growth Fund and Driehaus Micro Cap Growth Fund have together obtained an uncommitted line of credit in the amount of $5,000,000. These lines of credit are available primarily to meet large, unexpected shareholder withdrawals subject to certain restrictions. Interest is charged at a rate per annum equal to the Federal Funds Rate in effect at the time of the borrowings plus 1.5%. At December 31, 2014, the Funds had no outstanding borrowings under the lines of credit.
G. FOREIGN INVESTMENT RISKS
To the extent a Fund invests in foreign securities, it may entail risks due to the potential for political and economic instability in the countries where the issuers of these securities are located. In addition, foreign exchange fluctuations could affect the value of positions held. These risks are generally intensified in emerging markets.
H. REDEMPTION FEES
The Funds may charge a redemption fee of 2.00% of the redemption amount for shares redeemed within 60 days of purchase. The redemption fees are recorded in paid-in capital and reflected on the Statements of Changes in Net Assets.
I. SUBSEQUENT EVENT
At a meeting held on October 23, 2014, the Board of Trustees of the Trust approved the Agreement and Plan of Reorganization of the Driehaus International Discovery Fund with and into the Driehaus International Small Cap Growth Fund (the “Merger”), each a series of the Trust. On February 11, 2015, the Merger was approved by the shareholders of the Driehaus International Discovery Fund, and it is anticipated that the Merger will likely occur on or about March 9, 2015.
54
Table of Contents
Report of Independent Registered Public Accounting Firm
The Board of Trustees and Shareholders of Driehaus Mutual Funds
We have audited the accompanying statements of assets and liabilities, including the schedules of investments, of Driehaus International Discovery Fund, Driehaus Emerging Markets Growth Fund, Driehaus Emerging Markets Small Cap Growth Fund, Driehaus International Small Cap Growth Fund, and Driehaus Micro Cap Growth Fund, (collectively, the “Funds”) as of December 31, 2014, and the related statements of operations, statements of changes in net assets and financial highlights for the each of the periods indicated therein. These financial statements and financial highlights are the responsibility of the Funds’ management. Our responsibility is to express an opinion on these financial statements and financial highlights based on our audits.
We conducted our audits in accordance with the standards of the Public Company Accounting Oversight Board (United States). Those standards require that we plan and perform the audit to obtain reasonable assurance about whether the financial statements and financial highlights are free of material misstatement. We were not engaged to perform an audit of the Funds’ internal control over financial reporting. Our audits included consideration of internal control over financial reporting as a basis for designing audit procedures that are appropriate in the circumstances, but not for the purpose of expressing an opinion on the effectiveness of the Funds’ internal control over financial reporting. Accordingly, we express no such opinion. An audit also includes examining, on a test basis, evidence supporting the amounts and disclosures in the financial statements and financial highlights, assessing the accounting principles used and significant estimates made by management, and evaluating the overall financial statement presentation. Our procedures included confirmation of securities owned as of December 31, 2014, by correspondence with the custodian and brokers or by other appropriate auditing procedures where replies from brokers were not received. We believe that our audits provide a reasonable basis for our opinion.
In our opinion, the financial statements and financial highlights referred to above present fairly, in all material respects, the financial position of each of the respective Funds noted above at December 31, 2014, and the results of their operations, the changes in their net assets, and the financial highlights for the periods indicated therein, in conformity with U.S. generally accepted accounting principles.

Chicago, Illinois
February 25, 2015
55
Table of Contents
Interested and Independent Trustees of the Trust
The following table sets forth certain information with respect to the Trustees of the Trust:
Name, Address and Year of Birth | Position(s) Held with the Trust | Term of Office and Length of Time Served** | Principal Occupation(s) | Number of Portfolios in Trust Overseen by Trustee | Other Directorships | |||||
Interested Trustee:* | ||||||||||
Richard H. Driehaus 25 East Erie Street Chicago, IL 60611 YOB: 1942 | Trustee | Since 1996 | Chairman of the Board of the Adviser, the Distributor and Driehaus Capital Management (USVI) LLC (“USVI”); Chief Investment Officer and Portfolio Manager of the Adviser. President of the Trust from 1996-2011. | 8 | None | |||||
Independent Trustees: | ||||||||||
Daniel F. Zemanek c/o Driehaus Capital Management LLC 25 East Erie Street Chicago, IL 60611 YOB: 1942 | Trustee and Chairman | Since 1996 Since 2014 | Retired; President of Ludan, Inc. (real estate services specializing in senior housing) from April 2008 to December 2014; Senior Vice President of Sunrise Development, Inc. (senior living) from 2003-2007; Consultant, real estate development prior thereto. | 8 | None | |||||
Theodore J. Beck c/o Driehaus Capital Management LLC 25 East Erie Street Chicago, IL 60611 YOB: 1952 | Trustee | Since 2012 | President and Chief Executive Officer, National Endowment for Financial Education, 2005 to present; Associate Dean for Executive Education and Corporate Relations and President for the Center for Advanced Studies in Business at the University of Wisconsin-Madison, 1999-2005. | 8 | Wilshire Variable Insurance Trust, 2008-2010; Wilshire Mutual Funds Inc., 2008-2010; Advisory Board of the Trust, 2011-2012. | |||||
Francis J. Harmon c/o Driehaus Capital Management LLC 25 East Erie Street Chicago, IL 60611 YOB: 1942 | Trustee | Since 1998 | Relationship Manager, Great Lakes Advisors, Inc. since February 2008; Principal Account Executive — Labor Affairs, Blue Cross and Blue Shield of Illinois prior thereto. | 8 | None | |||||
56
Table of Contents
Interested and Independent Trustees of the Trust
Name, Address and Year of Birth | Position(s) Held with the Trust | Term of Office and Length of Time Served** | Principal Occupation(s) | Number of Portfolios in Trust Overseen by Trustee | Other Directorships | |||||
Independent Trustees: | ||||||||||
A.R. Umans c/o Driehaus Capital Management LLC 25 East Erie Street Chicago, IL 60611 YOB: 1927 | Trustee | Since 1996 | Chairman of the Board, Commerce National Group (private investment company) since 2005; Chairman of the Board and Chief Executive Officer, RHC/Spacemaster Corporation (manufacturing corporation) prior thereto. | 8 | None | |||||
Dawn M. Vroegop c/o Driehaus Capital Management LLC 25 East Erie Street Chicago, IL 60611 YOB: 1966 | Trustee | Since 2012 | Private Investor since 2003; Managing Director, Dresdner RCM Global Investors from September 1999 to September 2003. | 8 | Independent Trustee, Met Investors Series Trust since December 2000; Director, Metropolitan Series Fund, Inc. since May 2009; Advisory Board of the Trust, 2011-2012. | |||||
| * | Mr. Driehaus is an “interested person” of the Trust, the Adviser and the Distributor, as defined in the 1940 Act, because he is an officer of the Adviser and the Distributor. In addition, Mr. Driehaus has a controlling interest in the Adviser and the Distributor. |
| ** | Each Trustee will serve as a Trustee of the Trust until (i) termination of the Trust, or (ii) the Trustee’s retirement, resignation, or death, or (iii) as otherwise specified in the Trust’s governing documents. |
57
Table of Contents
The following table sets forth certain information with respect to the officers of the Trust:
Name, Address and Year of Birth | Position(s) Held with the Trust | Length of Time Served | Principal Occupation(s) During Past 5 Years | |||
Robert H. Gordon 25 East Erie Street Chicago, IL 60611 YOB: 1961 | President | Since 2011 | President and Chief Executive Officer of Adviser, Distributor and USVI since October 2006; Senior Vice President of the Trust from 2006-2011. | |||
Michelle L. Cahoon 25 East Erie Street Chicago, IL 60611 YOB: 1966 | Vice President and Treasurer | Since 2006 Since 2002 | Managing Director, Treasurer and Chief Financial Officer of the Adviser and Distributor since 2012; Vice President, Treasurer and Chief Financial Officer of USVI since 2004; Vice President, Treasurer and Chief Financial Officer of the Adviser and Distributor from 2004-2012. | |||
Janet L. McWilliams 25 East Erie Street Chicago, IL 60611 YOB: 1970 | Assistant Vice President and Chief Legal Officer | Since 2007 Since 2012 | Managing Director, Secretary and General Counsel of the Adviser since 2012; Chief Compliance Officer of the Trust, Adviser and Distributor from 2006-2012. | |||
Michael R. Shoemaker 25 East Erie Street Chicago, IL 60611 YOB: 1981 | Chief Compliance Officer and Assistant Vice President | Since 2012 | Assistant Vice President and Chief Compliance Officer of the Adviser and Distributor since 2012; Associate Chief Compliance Officer of the Adviser and Distributor from 2011-2012; Compliance Officer, Pacific Investment Management Company LLC and PIMCO Investments LLC from 2010-2011; Senior Compliance Analyst of the Adviser and Distributor from 2007-2010. | |||
Diane J. Drake 301 Bellevue Parkway Wilmington, DE 19809 YOB: 1967 | Secretary | Since 2006 | Managing Director and Senior Counsel, BNY Mellon Investment Servicing (US) Inc. (formerly, PNC Global Investment Servicing (U.S.) Inc. (“PNC”), (financial services company)) since 2010; Vice President and Counsel, PNC from 2008-2010. | |||
Michael P. Kailus 25 East Erie Street Chicago, IL 60611 YOB: 1971 | Assistant Secretary and Anti-Money Laundering Compliance Officer | Since 2010 Since 2011 | Assistant Secretary of the Adviser, Distributor and USVI since 2010; Senior Attorney with the Adviser since 2010; Associate General Counsel of Superfund Group (formerly, Quadriga Group, a financial services company) from 2005-2010. | |||
William H. Wallace, III 301 Bellevue Parkway Wilmington, DE 19809 YOB: 1969 | Assistant Secretary | Since 2008 | Vice President and Manager, BNY Mellon Investment Servicing (US) Inc. (formerly PNC, a financial services company) since 2010; Assistant Vice President and Manager, PNC from 2008-2010. |
The Statement of Additional Information for Driehaus Mutual Funds contains more detail about the Trust’s Trustees and officers and is available upon request, without charge. For further information, please call 1-800-560-6111.
58
Table of Contents
As a mutual fund shareholder, you may incur two types of costs: (1) transaction costs, including sales charges; redemption fees; and exchange fees and (2) ongoing costs, including management fees; distribution (12b-1) fees; and other fund expenses. This example is intended to help you understand your ongoing costs (in dollars) of investing in each Fund and to compare these costs with the ongoing costs of investing in other mutual funds.
The example is based on an investment of $1,000 invested at the beginning of the period and held for the entire six months ended December 31, 2014.
Actual Expenses
The first line of the tables below (“Actual”) provides information about actual account values and actual expenses. You may use the information in this line, together with the amount you invested, to estimate the expense that you paid over the period. Simply divide your account value by $1,000 (for example, an $8,600 account value divided by $1,000 = 8.6), then multiply the result by the number in the first line under the heading entitled “Expenses Paid During Period” to estimate the expenses you paid on your account during this period.
Hypothetical Example for Comparison Purposes
The second line of the tables below (“Hypothetical”) provides information about hypothetical account values and hypothetical expenses based on the Fund’s actual expense ratio and an assumed rate of return of 5% per year before expenses, which is not the Fund’s actual return. You may use this information to compare the ongoing costs of investing in the Funds versus other funds. To do so, compare this 5% hypothetical example with the 5% hypothetical examples that appear in the shareholder reports of the other funds.
Please note that the expenses shown in the table are meant to highlight your ongoing costs only and do not reflect any transactional costs, such as sales charges, redemption fees or exchange fees. Therefore, the second line of the table is useful in comparing ongoing costs only, and will not help you determine the relative total costs of owning different funds. In addition, if these transactional costs were included, your costs would have been higher.
Driehaus International Discovery Fund
| Beginning Account Value July 1, 2014 | Ending Account Value December 31, 2014 | Expenses Paid During Six Months Ended December 31, 2014* | ||||||||||
Actual | $ | 1,000 | $ | 937.90 | $ | 8.06 | ||||||
Hypothetical (5% return before expenses) | $ | 1,000 | $ | 1,016.89 | $ | 8.39 | ||||||
Driehaus Emerging Markets Growth Fund
| Beginning Account Value July 1, 2014 | Ending Account Value December 31, 2014 | Expenses Paid During Six Months Ended December 31, 2014* | ||||||||||
Actual | $ | 1,000 | $ | 906.40 | $ | 7.93 | ||||||
Hypothetical (5% return before expenses) | $ | 1,000 | $ | 1,016.89 | $ | 8.39 | ||||||
59
Table of Contents
Fund Expense Examples — (Continued)
Driehaus Emerging Markets Small Cap Growth Fund
| Beginning Account Value July 1, 2014 | Ending Account Value December 31, 2014 | Expenses Paid During Six Months Ended December 31, 2014* | ||||||||||
Actual | $ | 1,000 | $ | 976.30 | $ | 8.52 | ||||||
Hypothetical (5% return before expenses) | $ | 1,000 | $ | 1,016.59 | $ | 8.69 | ||||||
Driehaus International Small Cap Growth Fund
| Beginning Account Value July 1, 2014 | Ending Account Value December 31, 2014 | Expenses Paid During Six Months Ended December 31, 2014* | ||||||||||
Actual | $ | 1,000 | $ | 907.40 | $ | 8.27 | ||||||
Hypothetical (5% return before expenses) | $ | 1,000 | $ | 1,016.53 | $ | 8.74 | ||||||
Driehaus Micro Cap Growth Fund
| Beginning Account Value July 1, 2014 | Ending Account Value December 31, 2014 | Expenses Paid During Six Months Ended December 31, 2014* | ||||||||||
Actual | $ | 1,000 | $ | 1,096.40 | $ | 8.35 | ||||||
Hypothetical (5% return before expenses) | $ | 1,000 | $ | 1,017.24 | $ | 8.03 | ||||||
| * | Expenses are equal to the Fund’s annualized expense ratios for the six-month period in the table below multiplied by the average account value over the period, multiplied by the number of days in the most recent fiscal half-year (184), then divided by 365 to reflect the half-year period. |
Driehaus International Discovery Fund | 1.65% | |
Driehaus Emerging Markets Growth Fund | 1.65% | |
Driehaus Emerging Markets Small Cap Growth Fund | 1.71% | |
Driehaus International Small Cap Growth Fund | 1.72% | |
Driehaus Micro Cap Growth Fund | 1.58% |
60
Table of Contents
TAX INFORMATION (UNAUDITED) FOR THE YEAR ENDED DECEMBER 31, 2014
We are providing this information as required by the Internal Revenue Code. The amounts shown may differ from those elsewhere in this report because of differences between tax and financial reporting requirements.
The Funds designate the following amounts as a long-term capital gain distribution:
Driehaus | Driehaus Emerging Markets Growth Fund | Driehaus Emerging Markets Small Cap Growth Fund | Driehaus International Small Cap Growth Fund | Driehaus Micro Cap Growth Fund | ||||||||||||||
| $ | — | $ | 52,533,986 | $ | — | $ | 15,778,725 | $ | 2,251,610 | |||||||||
For taxable non-corporate shareholders, the following percentages of income and short-term capital gains represent qualified dividend income subject to the 15% rate category:
Driehaus | Driehaus Emerging Markets Growth Fund | Driehaus Emerging Markets Small Cap Growth Fund | Driehaus International Small Cap Growth Fund | Driehaus Micro Cap Growth Fund | ||||||||||||||
| 100.00% | 100.00% | 0.00% | 27.65% | 13.06% | ||||||||||||||
For corporate shareholders, the following percentages of income and short-term capital gains qualified for the dividends-received deduction:
Driehaus | Driehaus Emerging Markets Growth Fund | Driehaus Emerging Markets Small Cap Growth Fund | Driehaus International Small Cap Growth Fund | Driehaus Micro Cap Growth Fund | ||||||||||||||
| 0.00% | 93.79% | 0.00% | 0.00% | 8.77% | ||||||||||||||
PROXY VOTING POLICIES AND PROCEDURES AND PROXY VOTING RECORD
A description of the Funds’ policies and procedures with respect to the voting of proxies relating to the Funds’ portfolio securities is available without charge, upon request, by calling 1-800-560-6111. This information is also available on the Funds’ website at http://www.driehaus.com.
Information regarding how the Funds voted proxies related to portfolio securities during the 12-month period ended June 30, 2014 is available without charge, upon request, by calling 1-800-560-6111. This information is also available on the Securities and Exchange Commission’s (“SEC”) website at http://www.sec.gov.
HOW TO OBTAIN QUARTERLY PORTFOLIO HOLDINGS
Each Fund files a complete schedule of portfolio holdings with the SEC for the first and third quarters of each fiscal year on Form N-Q. The Funds’ Form N-Q is available electronically on the SEC’s website at http://www.sec.gov; hard copies may be reviewed and copied at the SEC’s Public Reference Room in Washington, DC 20549. For more information on the Public Reference Room, call 1-800-SEC-0330. Each Fund’s complete schedule of portfolio holdings is also available on the Fund’s website at http://www.driehaus.com.
61
Table of Contents
Board Considerations in Connection with the Annual Review of the
Investment Advisory Agreement
The Board of Trustees of Driehaus Mutual Funds (the “Trust”), including a majority of the Trustees who are not “interested persons” (as defined in the Investment Company Act of 1940, as amended) (the “Independent Trustees”), approved the renewal of the investment advisory agreement (the “Agreement”) with Driehaus Capital Management LLC (the “Adviser”) for Driehaus Emerging Markets Growth Fund (“DREGX”), Driehaus International Discovery Fund (“DRIDX”), Driehaus International Small Cap Growth Fund (“DRIOX”), Driehaus Global Growth Fund (“DRGGX”), Driehaus Micro Cap Growth Fund (“DMCRX”) and Driehaus Emerging Markets Small Cap Growth Fund (“DRESX”) (DREGX, DRIDX, DRIOX, DRGGX, DMCRX and DRESX are each a “Fund” and collectively the “Funds”) on September 11, 2014 for an additional one-year term ending September 30, 2015 for each Fund except DRGGX and DRIDX, and approved the renewal of the Agreement for DRGGX and DRIDX for periods ending December 31, 2014 and March 31, 2015, respectively. As part of its review process, the Board requested and evaluated all information it deemed reasonably necessary to evaluate the Agreement. The Board reviewed comprehensive materials received from the Adviser and from independent legal counsel. The Board also received extensive information throughout the year regarding performance and operating results of each Fund. The Independent Trustees held a conference call with their independent legal counsel on September 5, 2014 to review the materials provided in response to their request, and identified areas for further response by Fund management. Following receipt of further responses from Fund management, the Independent Trustees, represented by independent legal counsel, met independent of Fund management to consider renewal of the Agreement for each Fund. After their consideration of all the information received, the Independent Trustees presented their findings and their recommendation to renew the Agreement to the full Board.
In connection with the contract review process, the Board considered the factors discussed below, among others. The Board also considered that the Adviser has managed each Fund since its inception, and the Board believes that a long-term relationship with a capable, conscientious adviser is in the best interests of each Fund. The Board considered, generally, that shareholders invested in each Fund, knowing that the Adviser managed the Fund and knowing the investment advisory fee schedule, and noted that the Adviser has proposed alternatives to address performance issues for DRIDX and DRGGX.
Nature, Quality and Extent of Services. The Board considered the nature, extent and quality of services provided under the Agreement, including portfolio management services and administrative services. The Board considered the experience and skills of senior management and investment personnel, the resources made available to such personnel, the ability of the Adviser to attract and retain high-quality personnel, and the organizational depth of the Adviser. The Board also considered compliance with legal and regulatory requirements, as well as the Adviser’s handling of portfolio brokerage, and noted the Adviser’s process for evaluating best execution. The Board considered the Adviser’s risk management strategies and the process developed by the Adviser for analyzing, reviewing and assessing risk exposure for the Funds. The Board also considered the Funds’ process for fair valuation of portfolio securities and noted the Board’s review of Fund valuation matters throughout the year.
The Board reviewed DREGX’s, DRIDX’s, DRGGX’s and DRIOX’s performance on a net return basis over the 1-, 3- and 5-year and year-to-date periods ended June 30, 2014. For DRESX, the Board considered the performance on a net return basis for the 1-year and year-to-date periods ended June 30, 2014. For DMCRX, the Board considered the performance on a net return basis for the since-inception (November 18, 2013) period ended June 30, 2014. The Board also reviewed performance for DMCRX that included one of its predecessor limited partnerships for the 1-, 3- and 5-year periods ended June 30, 2014; and performance for DRESX, including that of its predecessor limited partnership, for the 3- and 5-year periods ended June 30, 2014. Because the predecessor limited partnerships to DMCRX and DRESX (as well as to DRIOX, for periods over 5 years) did not operate as mutual funds and were not subject to certain investment and operational restrictions, the Board factored those differences into its evaluation of these Funds’ longer-term performance information. The Board noted that the Adviser represented that because the Funds’ performance can be volatile over shorter time periods, for Funds with longer performance records, it was meaningful to also analyze the performance over rolling time periods, and the Board reviewed rolling relative performance to benchmark information for certain Funds. The Board compared short-term and longer-term returns to various agreed-upon performance measures, including market indices and peer groups. Peer group data was compiled from Lipper Inc., an independent provider of mutual fund data (“Lipper”). The Board also considered whether investment results were consistent with each Fund’s investment objective and policies.
62
Table of Contents
On the basis of this evaluation and its ongoing review of investment results, the Board concluded that the nature, quality and extent of services provided by the Adviser for DREGX, DRIOX, DMCRX and DRESX continue to be satisfactory.
As to the specific Funds, the Board noted that DREGX’s performance was in the top decile of its peer group for the 3- and 5-year periods and in the third quartile for the 1-year period. The Board also noted that DREGX outperformed its benchmark index for the 3-, 5- and 10-year and since-inception (December 31, 1997) periods, while underperforming its benchmark index for the 1-year period. With respect to DRIOX, the Board noted that, although its performance for the 1-and 3-year periods was below the median of its peer group, its performance was above the median for the 5-year and year-to-date periods. The Board also noted that DRIOX outperformed its benchmark index for the 3-, 5- and 10-year periods (the latter of which includes the performance of its predecessor partnership), while underperforming the benchmark for the 1-year period. The Board considered that although DMCRX’s performance for the year-to-date period was below the median of its peer group, performance for the 1-, 3- and 5-year periods (which include the performance of a predecessor partnership) was above the median. In addition, the Board noted that although DMCRX underperformed its benchmark index for the since-inception and 1-year periods (the latter of which includes the performance of a predecessor partnership), the Fund outperformed its benchmark index for the 3-, 5- and 10-year periods (all of which include the performance of a predecessor partnership). For DRESX, the Board noted that although the Fund’s performance was below the median of its peer group for the 1-year period, performance was above the median for the year-to-date and 3- and 5-year periods (the 3-and 5-year periods include the performance of its predecessor limited partnership). In addition, the Fund outperformed its benchmark for the 3- and 5-year periods (which include the performance of its predecessor limited partnership).
On the basis of its evaluation of the information presented and its ongoing review of investment results, the Board concluded that based on the nature, quality and extent of services provided by the Adviser for DRIDX and DRGGX, it is in the best interests of these Funds to continue the Agreement until March 31, 2015 and December 31, 2014, respectively, to allow time to further address alternatives proposed by the Adviser. The Board noted the Adviser’s ongoing adherence to its investment style, including maintaining its high ratio of active share in comparison to each Fund’s benchmark. Recognizing that the Funds performed below the median of their peer groups and underperformed their benchmarks for each of the periods reviewed, the Board considered and approved at the September 2014 meeting the Adviser’s recommendation for the liquidation of DRGGX, which is anticipated to occur before year-end. With respect to DRIDX, the Board is evaluating a proposal by the Adviser to reorganize DRIDX into DRIOX. If approved by the Board and shareholders, the Adviser anticipates the reorganization would take place by March 31, 2015.
The Board also considered each Fund’s rolling 1-year, 3-year and 5-year returns over the life of the Fund relative to its benchmark and noted that, in a majority of the time periods measured, each Fund (with the exception of DRGGX) outperformed its benchmark index. As to the Funds in general, the Board concluded that the Adviser had consistently implemented its investment philosophy, and that over the long term, the investment philosophy produces value for shareholders.
Fees. The Board considered each Fund’s advisory fee rates, operating expenses and total expense ratio as of June 30, 2014, and compared the advisory fee and total expense ratio to the fees and expense ratios of peer group funds based on data compiled from Lipper as of June 30, 2014. The information provided to the Board showed that each Fund’s advisory fee rate ranked high as compared to its peer group; however, because of the Funds’ fee structures, total expense ratios are relatively competitive, as they all fall between the 30th and 49th percentiles (1st percentile being the highest expense ratio). The Board considered, among other factors, the Funds’ asset size and, for DRESX, the expense reimbursement arrangements with the Adviser as well as the asset growth that has resulted in a decrease in the Fund’s expense ratio. The Board also considered the Funds’ advisory fee rates as compared to fees charged by the Adviser for similarly managed institutional accounts, as applicable. With respect to institutional accounts, the Board noted that: (i) both the mix of services provided and the level of responsibility and resources required under the Agreement were significantly greater as compared to the Adviser’s obligations for managing the other accounts; and (ii) the advisory fees for the other accounts are less relevant to the Board’s consideration because they reflect significantly different competitive forces than those in the mutual fund marketplace. In considering the reasonableness of the advisory fees, the Board took into account the Adviser’s substantial human and technological resources devoted to investing for the Funds, the relatively small amount of assets under management and the limited capacity of the investment style. In addition, the Board noted that the Adviser’s directed brokerage program had resulted in a total of approximately $390,000 in directed brokerage credits, which are used to reduce expenses of the Funds.
63
Table of Contents
On the basis of the information reviewed, the Board concluded that the advisory fee schedule for each Fund was reasonable and appropriate in light of the nature and quality of services provided by the Adviser.
Profitability. The Board reviewed information regarding revenues received by the Adviser under the Agreement from each Fund and discussed the Adviser’s methodology in allocating its costs to the management of the Funds. The Board considered the estimated costs to the Adviser of managing the Funds. The Board noted that DRIOX is currently closed to new investors in order to maintain assets at a level that the Adviser feels is prudent, which limits the Fund’s profitability to the Adviser. The Board also noted that the Funds do not have a Rule 12b-1 fee or shareholder service fee, and that the Adviser’s affiliate, Driehaus Securities LLC (“DS LLC”), serves as distributor of the Funds without compensation and that DS LLC provides compensation to intermediaries for distribution of Fund shares and for shareholder and administrative services to shareholders, the expense of which is reimbursed by the Adviser under an expense sharing arrangement with DS LLC. The Board concluded that, based on the projected profitability calculated for the Trust as well as for the Funds individually (noting that DRESX, DRGGX, DRIDX and DMCRX were expected to be operated at a loss), the advisory fees appeared to be reasonable.
Economies of Scale. The Board considered whether there are economies of scale with respect to the management of the Funds and whether the Funds benefit from any such economies of scale. Given the size of the Funds and the capacity constraints of the investment style, the Board concluded that the advisory fee rates under the Agreement are reasonable and reflect an appropriate sharing of any such economies of scale.
Other Benefits to the Adviser and its Affiliates. The Board also considered the character and amount of other incidental benefits received by the Adviser and its affiliates. The Board also considered benefits to the Adviser related to soft dollar allocations. The Board concluded that advisory fees were reasonable in light of these fall-out benefits.
Based on all of the information considered and the conclusions reached, the Board determined that the terms of the Agreement continue to be fair and reasonable and that the continuation of the Agreement is in the best interests of each Fund. No single factor was determinative in the Board’s analysis.
64
Table of Contents
DRH-AR2014
Table of Contents
Driehaus Mutual Funds
Trustees & Officers
Richard H. Driehaus
Trustee
Theodore J. Beck
Trustee
Francis J. Harmon
Trustee
A.R. Umans
Trustee
Dawn M. Vroegop
Trustee
Daniel F. Zemanek
Chairman of the Board
Robert H. Gordon
President
Michelle L. Cahoon
Vice President & Treasurer
Janet L. McWilliams
Chief Legal Officer &
Assistant Vice President
Michael R. Shoemaker
Chief Compliance Officer &
Assistant Vice President
Diane J. Drake
Secretary
Michael P. Kailus
Assistant Secretary & Anti-Money Laundering Compliance Officer
William H. Wallace, III
Assistant Secretary
Investment Adviser
Driehaus Capital Management LLC
25 East Erie Street
Chicago, IL 60611
Distributor
Driehaus Securities LLC
25 East Erie Street
Chicago, IL 60611
Administrator & Transfer Agent
UMB Fund Services, Inc.
235 W. Galena Street
Milwaukee, WI 53212
Custodian
The Northern Trust Company
50 South LaSalle Street
Chicago, IL 60603
Annual Report to Shareholders
December 31, 2014

Driehaus Active Income Fund
Driehaus Select Credit Fund
Driehaus Event Driven Fund
Distributed by:
Driehaus Securities LLC
This report has been prepared for the shareholders of the Funds and is not an offer to sell or buy any Fund securities. Such offer is only made by the Funds’ prospectus.
Table of Contents
Table of Contents
Driehaus Active Income Fund — Portfolio Managers’ Letter
Dear Shareholders,
The Driehaus Active Income Fund (“Fund”) returned -0.87% for the year ended December 31, 2014. This return was below the performance of the Fund’s benchmark index, the Citigroup 3-Month T-Bill Index, which returned 0.03% for the same period. The Fund also underperformed the Barclays Capital U.S. Aggregate Bond Index, which returned 5.97% for the same period.
As we entered 2014, the 10-year Treasury was nearing a 3% yield, with many market participants expecting an end to quantitative easing and a rise in interest rates during the year. Instead, yields trended lower as high yield spreads tightened 50 basis points in the first part of the year and dropped even further in the second half of 2014 as geopolitical concerns drove a general market flight to safety. The 10-year Treasury closed the year at 2.17%. High yield followed a similar path, with spreads grinding tighter from 400 to 350 basis points through June, and then subsequently moving wider in the back half of the year as the price of oil dropped and geopolitical risk grew.
The most significant positive contribution to return for the year came from the directional long trading strategy. The top three trades in the directional long strategy were positions in preferred securities of companies in the financials and telecom sectors. These positions were slightly offset by three positions in the energy and auto industries.
The capital arbitrage strategy also contributed to performance. Capital structure arbitrage trades are created with a long and short side to the trade, which will move inversely to each other, allowing us to hedge the risk and dampen volatility. While one side of the trade will often detract from the trade, the overall trade is designed for the contributor to be larger than the detractor. The capital arbitrage trades that had the greatest effect on portfolio performance were long positions in the preferred securities of companies in the financials sector versus short unsecured positions via credit default swaps.
The interest rate hedge was the most significant detractor from performance during 2014. The interest rate hedge, which is constructed with U.S. Treasury futures and U.S. Treasury swaptions, worked against the Fund as rates continued to decline throughout 2014. Despite the dramatic fall in rates, our hedge only cost the Fund slightly more than half the drag imposed on the Fund by the hedge in 2011, despite the move down in rates being quite similar. Utilizing swaptions enabled us to protect the Fund against the big moves in rates, while lowering sensitivity to minor market moves.
The volatility trades were the second most significant detractor for the year. Volatility trades are generally constructed by implementing various option strategies, such as straddles or strangles on various market indices or through the use of credit default swaps on indices. The Fund generally held long volatility trades that would benefit performance only when volatility increases. While there were periods of increased volatility during the year, they were generally less than we expected.
Looking ahead, we will keep our eyes on market volatility across asset classes, interest rates and credit spreads. The most important change that we foresee in the year ahead is a change in market volatility, and therefore stability. We expect higher volatility going forward, largely due to divergent central bank policies, declining economic growth overseas and rising corporate defaults. We anticipate greater opportunity for our investment strategies as a result of these higher levels of market volatility. Already, credit spreads have widened and many of the risk premia in the arbitrage trades that we monitor have increased as a result of the market turbulence over the past few months. Historically, these developments have led to compelling investment opportunities, and we see no reason why this time will be any different.
As always, we at Driehaus Capital Management LLC thank you for your interest in the Driehaus Active Income Fund and would like to express our gratitude to you as shareholders for your continued confidence in our management capabilities.
Sincerely,
 | 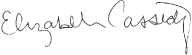 |  | ||
| K.C. Nelson | Elizabeth Cassidy | Adam Abbas | ||
| Portfolio Manager | Assistant Portfolio Manager | Assistant Portfolio Manager |
Performance is historical and does not represent future results.
Please see the following performance page for index definitions.
1
Table of Contents
Performance Overview (unaudited)
The performance summarized below is historical and does not represent future results. Investment returns and principal value vary, and you may have a gain or loss when you sell shares. Performance data presented measures the change in the value of an investment in the Fund, assuming reinvestment of all dividends and capital gains. Average annual total return reflects annualized change.
The table does not reflect the deduction of taxes that a shareholder would pay on Fund distributions or the redemption of Fund shares. The graph compares the results of a $25,000 investment (minimum investment) in the Fund since November 8, 2005 (the date of the Predecessor Fund’s inception), with all dividends and capital gains reinvested, with the indicated indices (and dividends reinvested) for the same period.
| Average Annual Total Returns as of 12/31/14 | 1 Year | 3 Years | 5 Years | Since Inception (11/08/05 - 12/31/14) | ||||||||||||
Driehaus Active Income Fund (LCMAX)1 | -0.87% | 3.74% | 2.08% | 4.11% | ||||||||||||
Citigroup 3-Month T-Bill Index2 | 0.03% | 0.05% | 0.07% | 1.34% | ||||||||||||
Barclays Capital U.S. Aggregate Bond Index3 | 5.97% | 2.66% | 4.45% | 5.23% | ||||||||||||

| 1 | The Driehaus Active Income Fund (the “Fund”) performance shown above includes the performance of the Lotsoff Capital Management Active Income Fund (the “Predecessor Fund”) for the periods before the Fund’s registration statement became effective. The Fund received the assets and liabilities of the Predecessor Fund on June 1, 2009 through a reorganization of the Predecessor Fund into the Fund. The Predecessor Fund was a nondiversified fund that was a series of another management investment company registered under the Investment Company Act of 1940, as amended. The Fund had no prior operating history prior to succeeding to the assets of the Predecessor Fund. The Fund has substantially similar investment objectives, strategies, and policies as the Predecessor Fund. Financial and performance information of the Fund includes the Predecessor Fund information. The returns for the periods prior to October 1, 2006, reflect fee waivers and/or reimbursements without which performance would have been lower. |
| 2 | The Citigroup 3-Month T-Bill Index is designed to mirror the performance of the 3-month U.S. Treasury Bill. The Citigroup 3-Month T-Bill Index is unmanaged and its returns reflect reinvestment of all distributions and changes in market prices. |
| 3 | The Barclays Capital U.S. Aggregate Bond Index, an unmanaged index, represents securities that are SEC-registered, taxable and dollar denominated. This index covers the U.S. investment grade fixed rate bond market, with index components for government and corporate securities, mortgage pass-through securities and asset-backed securities. These major sectors are subdivided into more specific indices that are calculated and reported on a regular basis. |
2
Table of Contents
Driehaus Active Income Fund
Schedule of Investments
December 31, 2014
| Shares, Principal Amount, or Number of Contracts | Value | |||||||
| ASSET-BACKED SECURITIES — 6.00% | ||||||||
ARLP Securitization Trust Series 2014-1 3.47%, 9/25/441 | $ | 30,000,000 | $ | 30,031,830 | ||||
Citigroup Mortgage Loan Trust, Inc. 0.24%, 1/25/372 | 329,999 | 210,130 | ||||||
Cobalt CMBS Commercial Mortgage Trust 2006-C1 5.20%, 8/15/48 | 16,953,765 | 17,980,299 | ||||||
Countrywide Asset-Backed Certificates 0.65%, 4/25/342 | 122,988 | 113,842 | ||||||
Fannie Mae REMICS 0.82%, 9/25/232 | 4,843,372 | 4,877,609 | ||||||
Fannie Mae REMICS 0.49%, 6/25/362 | 8,218,993 | 8,237,099 | ||||||
Freddie Mac REMICS 2.00%, 2/15/27 | 53,948,540 | 53,583,254 | ||||||
Freddie Mac REMICS 2.00%, 4/15/28 | 63,799,754 | 63,238,763 | ||||||
Freddie Mac REMICS 0.36%, 1/15/352 | 4,986,100 | 4,982,037 | ||||||
JP Morgan Resecuritization Trust Series 2009-10 2.35%, 8/26/361,2 | 12,331,487 | 12,468,551 | ||||||
Merrill Lynch Mortgage Investors, Inc. 1.11%, 8/25/352 | 124,929 | 120,471 | ||||||
Oak Hill Advisors Residential Loan Trust 2014-NPL1 2.88%, 5/25/541 | 24,900,552 | 24,927,768 | ||||||
Wells Fargo Mortgage Loan Trust | 18,960,362 | 18,149,503 | ||||||
|
| |||||||
Total ASSET-BACKED SECURITIES (Cost $240,144,441) | 238,921,156 | |||||||
|
| |||||||
| BANK LOANS — 30.59% | ||||||||
Apparel — 1.31% |
| |||||||
Calceus Acquisition, Inc. 5.00%, 2/1/202 | 27,463,824 | 26,330,941 | ||||||
Stuart Weitzman Acquisition Co. LLC 4.50%, 3/4/202 | 26,616,250 | 25,851,033 | ||||||
|
| |||||||
| 52,181,974 | ||||||||
|
| |||||||
Biotechnology — 0.16% |
| |||||||
STHI Holding Corp. 4.50%, 8/6/212 | 6,483,750 | 6,424,313 | ||||||
Building Materials — 0.82% |
| |||||||
Cemex Espana S.A. (Spain) | 26,079,319 | 25,883,724 | ||||||
| Shares, Principal Amount, or Number of Contracts | Value | |||||||
Cemex S.A.B. de C.V. (Mexico) 4.65%, 2/14/172 | $ | 6,786,712 | $ | 6,735,811 | ||||
|
| |||||||
| 32,619,535 | ||||||||
|
| |||||||
Commercial Services — 0.44% |
| |||||||
Westway Group, Inc. 4.50%, 2/27/202 | 17,982,222 | 17,600,100 | ||||||
Diversified Financial Services — 0.28% |
| |||||||
Sears Roebuck Acceptance Corp. | 11,487,190 | 11,008,553 | ||||||
Electronics — 1.05% |
| |||||||
NuSil Technology LLC 5.25%, 4/28/172 | 42,495,114 | 41,910,806 | ||||||
Entertainment — 0.50% |
| |||||||
Peninsula Gaming LLC / Peninsula Gaming Corp. | 7,562,424 | 7,472,620 | ||||||
WMG Acquisition Corp. 3.75%, 7/1/202 | 12,968,838 | 12,385,240 | ||||||
|
| |||||||
| 19,857,860 | ||||||||
|
| |||||||
Environmental Control — 0.24% |
| |||||||
WTG Holdings III Corp. 4.75%, 1/15/212 | 9,900,000 | 9,689,625 | ||||||
Food — 0.29% |
| |||||||
Fairway Group Acquisition Co. 5.00%, 8/17/182 | 980,000 | 823,200 | ||||||
SUPERVALU, Inc. 4.50%, 3/21/192 | 10,804,661 | 10,615,580 | ||||||
|
| |||||||
| 11,438,780 | ||||||||
|
| |||||||
Healthcare — Services — 2.44% |
| |||||||
Gentiva Health Services, Inc. | 30,063,578 | 29,950,839 | ||||||
HCA, Inc. | 7,979,798 | 7,898,340 | ||||||
Kindred Healthcare, Inc. 4.00%, 4/9/212 | 22,892,481 | 22,148,476 | ||||||
National Mentor Holdings, Inc. 4.75%, 1/31/212 | 38,252,381 | 37,041,043 | ||||||
|
| |||||||
| 97,038,698 | ||||||||
|
| |||||||
Holding Companies — Diversified — 0.31% |
| |||||||
Osmose Holdings, Inc. 4.75%, 8/15/212 | 12,437,500 | 12,313,125 | ||||||
Internet — 0.67% |
| |||||||
ProQuest LLC 5.25%, 9/24/212 | 27,000,000 | 26,932,500 | ||||||
Notes to Financial Statements are an integral part of this Schedule.
3
Table of Contents
Driehaus Active Income Fund
Schedule of Investments
December 31, 2014
| Shares, Principal Amount, or Number of Contracts | Value | |||||||
Investment Companies — 0.58% |
| |||||||
Larchmont Resources LLC 8.25%, 8/7/192 | $ | 24,625,000 | $ | 23,147,500 | ||||
Leisure Time — 1.87% |
| |||||||
Equinox Holdings, Inc. 4.50%, 2/1/202 | 65,050,841 | 64,346,145 | ||||||
Equinox Holdings, Inc. 9.75%, 7/31/202 | 10,000,000 | 10,150,000 | ||||||
|
| |||||||
| 74,496,145 | ||||||||
|
| |||||||
Lodging — 3.52% |
| |||||||
Las Vegas Sands LLC 3.25%, 12/19/202 | 57,791,248 | 57,079,203 | ||||||
MGM Resorts International 3.50%, 12/20/192 | 85,530,175 | 83,142,429 | ||||||
|
| |||||||
| 140,221,632 | ||||||||
|
| |||||||
Media — 2.81% |
| |||||||
Gray Television, Inc. 3.75%, 6/13/212 | 2,677,594 | 2,632,966 | ||||||
Springer Science+Business Media GmbH (Germany) | 71,126,877 | 69,911,817 | ||||||
Tribune Media Co. 4.00%, 7/1/202 | 40,000,000 | 39,233,320 | ||||||
|
| |||||||
| 111,778,103 | ||||||||
|
| |||||||
Real Estate Investment Trusts — 1.01% |
| |||||||
Starwood Property Trust, Inc. | 41,376,056 | 40,341,654 | ||||||
Retail — 5.32% |
| |||||||
Hudson’s Bay Co. (Canada) 4.75%, 11/4/202 | 4,875,000 | 4,848,592 | ||||||
J.C. Penney Corp., Inc. 6.00%, 5/22/182 | 42,980,524 | 42,013,463 | ||||||
Michaels Stores, Inc. 3.75%, 1/28/202 | 985,000 | 964,772 | ||||||
Michaels Stores, Inc. 4.00%, 1/28/202 | 3,990,000 | 3,926,587 | ||||||
Neiman Marcus Group Ltd. LLC 4.25%, 10/25/202 | 95,774,902 | 93,679,826 | ||||||
Rite Aid Corp. 5.75%, 8/21/202 | 17,830,000 | 17,755,702 | ||||||
Rite Aid Corp. 4.88%, 6/21/212 | 48,950,000 | 48,684,838 | ||||||
|
| |||||||
| 211,873,780 | ||||||||
|
| |||||||
Semiconductors — 1.06% |
| |||||||
NXP BV (Netherlands) 3.25%, 1/11/202 | 21,803,518 | 21,440,119 | ||||||
| Shares, Principal Amount, or Number of Contracts | Value | |||||||
VAT Holding A.G. (Switzerland) 4.75%, 2/11/212 | $ | 21,041,000 | $ | 20,777,987 | ||||
|
| |||||||
| 42,218,106 | ||||||||
|
| |||||||
Software — 4.93% |
| |||||||
Applied Systems, Inc. 4.25%, 1/23/212 | 48,753,583 | 47,790,700 | ||||||
BMC Software, Inc. 5.00%, 9/10/202 | 67,824,722 | 65,450,857 | ||||||
BMC Software, Inc. (Ireland) 5.00%, 9/10/202 | 7,920,000 | 7,603,200 | ||||||
Evergreen Skills Lux Sarl (Luxembourg) 5.75%, 4/28/212 | 39,900,000 | 38,790,301 | ||||||
First Data Corp. 3.66%, 3/24/182 | 37,413,433 | 36,571,631 | ||||||
|
| |||||||
| 196,206,689 | ||||||||
|
| |||||||
Telecommunications — 0.98% |
| |||||||
Cincinnati Bell, Inc. 4.00%, 9/10/202 | 39,625,000 | 39,030,625 | ||||||
|
| |||||||
Total BANK LOANS (Cost $1,239,296,703) | 1,218,330,103 | |||||||
|
| |||||||
| CORPORATE BONDS — 32.68% | ||||||||
Banks — 2.73% |
| |||||||
Chase Capital II 0.73%, 2/1/272 | 11,879,000 | 9,978,360 | ||||||
First Chicago NBD Institutional Capital I | 725,000 | 609,000 | ||||||
JP Morgan Chase Capital XXIII | 4,000,000 | 3,240,000 | ||||||
JPMorgan Chase & Co. 7.90%, 4/29/492 | 25,313,000 | 27,244,382 | ||||||
JPMorgan Chase Capital XXI | 15,000,000 | 12,300,000 | ||||||
Royal Bank of Scotland Group PLC (United Kingdom) 7.65%, 8/29/492,3 | 46,708,000 | 54,414,820 | ||||||
Wachovia Capital Trust III 5.57%, 3/29/492 | 1,000,000 | 965,500 | ||||||
|
| |||||||
| 108,752,062 | ||||||||
|
| |||||||
Biotechnology — 0.94% |
| |||||||
STHI Holding Corp. 8.00%, 3/15/181 | 35,673,000 | 37,278,285 | ||||||
Building Materials — 0.81% |
| |||||||
Cemex S.A.B. de C.V. (Mexico) 4.98%, 10/15/181,2,3 | 20,180,000 | 20,753,112 | ||||||
Notes to Financial Statements are an integral part of this Schedule.
4
Table of Contents
Driehaus Active Income Fund
Schedule of Investments
December 31, 2014
| Shares, Principal Amount, or Number of Contracts | Value | |||||||
Cemex S.A.B. de C.V. (Mexico) 6.50%, 12/10/191,3 | $ | 11,345,000 | $ | 11,622,953 | ||||
|
| |||||||
| 32,376,065 | ||||||||
|
| |||||||
Chemicals — 0.05% |
| |||||||
Hexion U.S. Finance Corp. / Hexion Nova Scotia Finance ULC 8.88%, 2/1/18 | 2,000,000 | 1,780,000 | ||||||
Momentive Performance Materials, Inc. 11.50%, 12/1/164,5 | 4,540,000 | — | ||||||
|
| |||||||
| 1,780,000 | ||||||||
|
| |||||||
Commercial Services — 0.06% |
| |||||||
AA Bond Co., Ltd. (Jersey) | 1,500,000 | 6 | 2,570,527 | |||||
Computers — 0.98% |
| |||||||
DynCorp International, Inc. | 27,373,000 | 23,267,050 | ||||||
Seagate HDD Cayman (Cayman Islands) 6.88%, 5/1/203 | 15,000,000 | 15,750,000 | ||||||
|
| |||||||
| 39,017,050 | ||||||||
|
| |||||||
Diversified Financial Services — 6.20% |
| |||||||
American Express Co. 6.80%, 9/1/662 | 67,984,000 | 71,213,240 | ||||||
E*TRADE Financial Corp. 6.38%, 11/15/19 | 48,487,000 | 51,396,220 | ||||||
GE Capital Trust I 6.38%, 11/15/672 | 34,140,000 | 36,770,589 | ||||||
General Electric Capital Corp. | 7,000,000 | 8,146,250 | ||||||
Rio Oil Finance Trust Series 2014-1 6.25%, 7/6/241 | 73,000,000 | 69,812,090 | ||||||
Textron Financial Corp. 6.00%, 2/15/671,2 | 10,824,000 | 9,741,600 | ||||||
|
| |||||||
| 247,079,989 | ||||||||
|
| |||||||
Entertainment — 0.82% |
| |||||||
Gala Group Finance PLC (United Kingdom) 8.88%, 9/1/18 | 8,100,000 | 6 | 13,193,304 | |||||
Graton Economic Development Authority 9.63%, 9/1/191 | 17,955,000 | 19,615,838 | ||||||
|
| |||||||
| 32,809,142 | ||||||||
|
| |||||||
Healthcare — Products — 0.80% |
| |||||||
ConvaTec Healthcare E S.A. (Luxembourg) 10.50%, 12/15/181,3 | 30,166,000 | 31,825,130 | ||||||
| Shares, Principal Amount, or Number of Contracts | Value | |||||||
Healthcare — Services — 1.13% |
| |||||||
Healthsouth Corp. 7.75%, 9/15/22 | $ | 14,073,000 | $ | 14,917,380 | ||||
Kindred Escrow Corp. II 8.00%, 1/15/201 | 5,000,000 | 5,312,500 | ||||||
Kindred Healthcare, Inc. 6.38%, 4/15/221 | 20,277,000 | 19,313,843 | ||||||
National Mentor, Inc. 12.50%, 2/15/181 | 5,249,000 | 5,448,462 | ||||||
| �� |
|
| ||||||
| 44,992,185 | ||||||||
|
| |||||||
Insurance — 0.79% |
| |||||||
Chubb Corp. 6.38%, 3/29/672 | 29,500,000 | 31,625,475 | ||||||
Internet — 0.05% |
| |||||||
Mood Media Corp. (Canada) 9.25%, 10/15/201,3 | 2,500,000 | 2,062,500 | ||||||
Iron/Steel — 0.11% |
| |||||||
Ferrexpo Finance PLC (United Kingdom) 7.88%, 4/7/163 | 6,000,000 | 4,560,000 | ||||||
Lodging — 0.18% |
| |||||||
Station Casinos LLC 7.50%, 3/1/21 | 7,000,000 | 7,175,000 | ||||||
Media — 0.08% |
| |||||||
Clear Channel Worldwide Holdings, Inc. 6.50%, 11/15/22 | 810,000 | 824,175 | ||||||
Clear Channel Worldwide Holdings, Inc. 6.50%, 11/15/22 | 2,190,000 | 2,255,700 | ||||||
|
| |||||||
| 3,079,875 | ||||||||
|
| |||||||
Metal Fabricate/Hardware — 1.26% |
| |||||||
Dynacast International LLC / Dynacast Finance, Inc. 9.25%, 7/15/19 | 4,630,000 | 4,965,675 | ||||||
Edgen Murray Corp. 8.75%, 11/1/201 | 41,540,000 | 45,278,600 | ||||||
|
| |||||||
| 50,244,275 | ||||||||
|
| |||||||
Miscellaneous Manufacturing — 1.09% |
| |||||||
Amsted Industries, Inc. 5.00%, 3/15/221 | 44,000,000 | 43,230,000 | ||||||
Oil & Gas — 3.85% |
| |||||||
California Resources Corp. | 45,850,000 | 39,774,875 | ||||||
Calumet Specialty Products Partners LP / Calumet Finance Corp. 6.50%, 4/15/211 | 55,936,500 | 49,783,485 | ||||||
Shelf Drilling Holdings Ltd. (United Arab Emirates) 8.63%, 11/1/181,3 | 23,100,000 | 18,942,000 | ||||||
Notes to Financial Statements are an integral part of this Schedule.
5
Table of Contents
Driehaus Active Income Fund
Schedule of Investments
December 31, 2014
| Shares, Principal Amount, or Number of Contracts | Value | |||||||
United Refining Co. 10.50%, 2/28/18 | $ | 23,834,000 | $ | 24,549,020 | ||||
Venoco, Inc. 8.88%, 2/15/19 | 36,566,000 | 20,111,300 | ||||||
|
| |||||||
| 153,160,680 | ||||||||
|
| |||||||
Packaging & Containers — 1.52% |
| |||||||
Ardagh Packaging Finance PLC/Ardagh Holdings USA, Inc. (Ireland) 4.25%, 1/15/22 | 11,000,000 | 6 | 13,082,865 | |||||
Berry Plastics Corp. 9.75%, 1/15/21 | 42,781,000 | 47,593,863 | ||||||
|
| |||||||
| 60,676,728 | ||||||||
|
| |||||||
Pipelines — 0.98% |
| |||||||
Enbridge Energy Partners LP | 31,500,000 | 34,177,500 | ||||||
Sabine Pass Liquefaction LLC | 3,000,000 | 2,947,500 | ||||||
Sabine Pass Liquefaction LLC | 2,000,000 | 1,955,000 | ||||||
|
| |||||||
| 39,080,000 | ||||||||
|
| |||||||
Retail — 3.71% |
| |||||||
Claire’s Stores, Inc. 9.00%, 3/15/191 | 17,400,000 | 17,139,000 | ||||||
Claire’s Stores, Inc. 6.13%, 3/15/201 | 18,972,000 | 16,790,220 | ||||||
Michaels Stores, Inc. 5.88%, 12/15/201 | 25,000,000 | 25,250,000 | ||||||
Neiman Marcus Group, Inc. | 5,750,000 | 6,080,625 | ||||||
Rite Aid Corp. 9.25%, 3/15/20 | 27,800,000 | 30,336,750 | ||||||
Rite Aid Corp. 8.00%, 8/15/20 | 13,425,000 | 14,347,969 | ||||||
Rite Aid Corp. 6.75%, 6/15/21 | 36,570,000 | 37,758,525 | ||||||
|
| |||||||
| 147,703,089 | ||||||||
|
| |||||||
Software — 2.71% |
| |||||||
First Data Corp. 6.75%, 11/1/201 | 14,444,000 | 15,418,970 | ||||||
First Data Corp. 11.75%, 8/15/21 | 17,842,000 | 20,473,695 | ||||||
Nuance Communications, Inc. | 71,687,000 | 71,866,218 | ||||||
|
| |||||||
| 107,758,883 | ||||||||
|
| |||||||
Telecommunications — 1.83% |
| |||||||
Alcatel-Lucent USA, Inc. 4.63%, 7/1/171 | 5,000,000 | 5,050,000 | ||||||
| Shares, Principal Amount, or Number of Contracts | Value | |||||||
Alcatel-Lucent USA, Inc. 6.50%, 1/15/28 | $ | 5,000,000 | $ | 4,812,500 | ||||
CommScope, Inc. 5.00%, 6/15/211 | 2,000,000 | 1,970,000 | ||||||
CommScope, Inc. 5.50%, 6/15/241 | 1,000,000 | 985,000 | ||||||
Intelsat Luxembourg SA (Luxembourg) 7.75%, 6/1/213 | 19,426,000 | 19,474,565 | ||||||
Nortel Networks Ltd. (Canada) 10.13%, 7/15/153,5 | 9,500,000 | 10,562,812 | ||||||
Nortel Networks Ltd. (Canada) 10.75%, 7/15/163,5 | 8,000,000 | 9,020,000 | ||||||
Wind Acquisition Finance S.A. (Luxembourg) 4.75%, 7/15/203 | 22,422,000 | 20,964,570 | ||||||
|
| |||||||
| 72,839,447 | ||||||||
|
| |||||||
Total CORPORATE BONDS (Cost $1,319,454,216) | 1,301,676,387 | |||||||
|
| |||||||
| CONVERTIBLE CORPORATE BONDS — 2.68% | ||||||||
Electrical Components & Equipment — 0.01% |
| |||||||
Suntech Power Holdings Co., Ltd. (China) 3.00%, 3/15/153,5 | 27,872,000 | 278,720 | ||||||
Lodging — 0.92% |
| |||||||
MGM Resorts International 4.25%, 4/15/15 | 31,000,000 | 36,580,000 | ||||||
Real Estate Investment Trusts — 1.06% |
| |||||||
Host Hotels & Resorts LP 2.50%, 10/15/291 | 23,000,000 | 42,478,125 | ||||||
Telecommunications — 0.69% |
| |||||||
Nortel Networks Corp. (Canada) 1.75%, 4/15/153,5 | 19,125,000 | 18,742,500 | ||||||
Nortel Networks Corp. (Canada) 2.13%, 4/15/153,5 | 9,000,000 | 8,791,875 | ||||||
|
| |||||||
| 27,534,375 | ||||||||
|
| |||||||
Total CONVERTIBLE CORPORATE BONDS (Cost $111,359,257) | 106,871,220 | |||||||
|
| |||||||
| U.S. GOVERNMENT AND AGENCY SECURITIES — 4.13% | ||||||||
Fannie Mae Pool 2.50%, 1/1/23 | 35,817,074 | 36,848,247 | ||||||
Fannie Mae REMICS 1.50%, 4/25/28 | 90,915,186 | 87,732,973 | ||||||
Freddie Mac Non Gold Pool | 611,155 | 654,746 | ||||||
Notes to Financial Statements are an integral part of this Schedule.
6
Table of Contents
Driehaus Active Income Fund
Schedule of Investments
December 31, 2014
| Shares, Principal Amount, or Number of Contracts | Value | |||||||
Freddie Mac REMICS 1.50%, 3/15/28 | $ | 40,504,360 | $ | 39,397,173 | ||||
|
| |||||||
Total U.S. GOVERNMENT AND AGENCY SECURITIES (Cost $168,990,478) | 164,633,139 | |||||||
|
| |||||||
| COMMON STOCK — 3.52% | ||||||||
Agriculture — 0.20% |
| |||||||
Lorillard, Inc. | 125,000 | 7,867,500 | ||||||
Auto Manufacturers — 1.22% |
| |||||||
Ford Motor Co. | 959,628 | 14,874,234 | ||||||
General Motors Co. | 876,769 | 30,608,006 | ||||||
Motors Liquidation Co. GUC Trust | 167,113 | 3,216,925 | ||||||
|
| |||||||
| 48,699,165 | ||||||||
|
| |||||||
Auto Parts & Equipment — 0.85% |
| |||||||
TRW Automotive Holdings Corp.* | 330,000 | 33,940,500 | ||||||
Chemicals — 0.35% |
| |||||||
Sigma-Aldrich Corp. | 101,000 | 13,864,270 | ||||||
Media — 0.57% |
| |||||||
Time Warner Cable, Inc. | 149,271 | 22,698,148 | ||||||
Retail — 0.19% |
| |||||||
Family Dollar Stores, Inc. | 95,000 | 7,524,950 | ||||||
Telecommunications — 0.14% |
| |||||||
T-Mobile US, Inc.* | 200,000 | 5,388,000 | ||||||
|
| |||||||
Total COMMON STOCK (Cost $118,936,957) | 139,982,533 | |||||||
|
| |||||||
| CONVERTIBLE PREFERRED STOCK — 0.48% | ||||||||
Auto Manufacturers — 0.00% |
| |||||||
General Motors Corp. Senior Convertible Preferred Escrow — B | 475,000 | — | ||||||
General Motors Corp. Senior Convertible Preferred Escrow — C | 11,790,650 | — | ||||||
|
| |||||||
| — | ||||||||
|
| |||||||
Banks — 0.48% |
| |||||||
Bank of America Corp. 7.25%, 12/31/49 | 16,322 | 18,981,996 | ||||||
|
| |||||||
Total CONVERTIBLE PREFERRED STOCK (Cost $15,382,327) | 18,981,996 | |||||||
|
| |||||||
| PREFERRED STOCKS — 4.53% | ||||||||
Banks — 1.13% | ||||||||
GMAC Capital Trust I 8.13%, 2/15/402 | 1,710,062 | 45,111,436 | ||||||
| Shares, Principal Amount, or Number of Contracts | Value | |||||||
Diversified Financial Services — 0.72% |
| |||||||
RBS Capital Funding Trust V | 300,000 | $ | 7,290,000 | |||||
RBS Capital Funding Trust VII | 865,912 | 21,119,594 | ||||||
|
| |||||||
| 28,409,594 | ||||||||
|
| |||||||
Holding Companies — Diversified — 1.54% |
| |||||||
Pitney Bowes International Holdings, Inc. | 57,905 | 61,379,300 | ||||||
Telecommunications — 1.14% |
| |||||||
Centaur Funding Corp. (Cayman Islands) 9.08%, 4/21/201,3 | 36,242 | 45,529,013 | ||||||
|
| |||||||
Total PREFERRED STOCKS (Cost $164,567,823) | 180,429,343 | |||||||
|
| |||||||
| SHORT-TERM INVESTMENTS — 0.01% | ||||||||
UMB Money Market Fiduciary 0.01% | 412,915 | 412,915 | ||||||
|
| |||||||
Total SHORT-TERM INVESTMENTS (Cost $412,915) | 412,915 | |||||||
|
| |||||||
Warrants — 0.54% | ||||||||
General Motors Co. — CW 16, Strike Price: $10.00, Expiration Date: 7/10/16* | 49,839 | 1,258,933 | ||||||
General Motors Co. — CW 19, Strike Price: $18.33, Expiration Date: 7/10/19* | 1,185,994 | 20,316,077 | ||||||
|
| |||||||
Total WARRANTS (Cost $21,642,994) | 21,575,010 | |||||||
|
| |||||||
| ||||||||
TOTAL INVESTMENTS (Cost $3,400,188,111) | 85.16 | % | 3,391,813,802 | |||||
Other Assets less Liabilities | 14.84 | % | 590,972,715 | |||||
|
|
|
| |||||
Net Assets | 100.00 | % | $ | 3,982,786,517 | ||||
| ||||||||
| ||||||||
| SECURITIES SOLD SHORT — (3.98)% | ||||||||
| CORPORATE BONDS — (0.95)% | ||||||||
Chemicals — (0.16)% |
| |||||||
Huntsman International LLC | $ | (6,000,000 | ) | $ | (6,495,000 | ) | ||
Lodging — (0.20)% |
| |||||||
MGM Resorts International 7.63%, 1/15/17 | (7,315,000 | ) | (7,918,488 | ) | ||||
Notes to Financial Statements are an integral part of this Schedule.
7
Table of Contents
Driehaus Active Income Fund
Schedule of Investments
December 31, 2014
| Shares, Principal Amount, or Number of Contracts | Value | |||||||
Oil & Gas — (0.59)% |
| |||||||
Petrobras International Finance Co. S.A. (Luxembourg) 5.38%, 1/27/213 | $ | (25,000,000 | ) | $ | (23,414,250 | ) | ||
|
| |||||||
Total CORPORATE BONDS (Proceeds $39,299,478) | (37,827,738 | ) | ||||||
|
| |||||||
| COMMON STOCK — (2.49)% | ||||||||
Agriculture — (0.06)% |
| |||||||
Reynolds American, Inc. | (36,363 | ) | (2,337,050 | ) | ||||
Banks — (0.28)% |
| |||||||
Bank of America Corp. | (628,321 | ) | (11,240,663 | ) | ||||
Healthcare — Services — (0.10)% |
| |||||||
Kindred Healthcare, Inc. | (221,974 | ) | (4,035,487 | ) | ||||
Lodging — (0.67)% |
| |||||||
MGM Resorts International* | (1,248,974 | ) | (26,703,064 | ) | ||||
Media — (0.63)% |
| |||||||
Comcast Corp. — Cl. A | (430,748 | ) | (24,987,691 | ) | ||||
Real Estate Investment Trusts — (0.75)% |
| |||||||
Host Hotels & Resorts, Inc. | (1,193,449 | ) | (28,368,283 | ) | ||||
Ryman Hospitality Properties | (30,000 | ) | (1,582,200 | ) | ||||
|
| |||||||
| (29,950,483 | ) | |||||||
|
| |||||||
Total COMMON STOCK (Proceeds $78,548,442) | (99,254,438 | ) | ||||||
|
| |||||||
| Shares, Principal Amount, or Number of Contracts | Value | |||||||
| EXCHANGE-TRADED FUND — (0.54)% | ||||||||
SPDR Barclays High Yield Bond ETF | (557,235 | ) | $ | (21,514,843 | ) | |||
|
| |||||||
Total EXCHANGE-TRADED FUND (Proceeds $21,731,229) | (21,514,843 | ) | ||||||
|
| |||||||
| ||||||||
TOTAL INVESTMENT SECURITIES SOLD SHORT (Proceeds $139,579,149) | (3.98 | )% | $ | (158,597,019 | ) | |||
| ||||||||
| * | Non-income producing security. |
| 1 | 144A restricted security. |
| 2 | Variable rate security. Rates disclosed are as of December 31, 2014. |
| 3 | Foreign security denominated in U.S. dollars and traded on a U.S. exchange. |
| 4 | Security valued at fair value as determined in good faith by Driehaus Capital Management LLC, investment adviser to the Fund, in accordance with procedures established by or under the direction of the Trust’s Board of Trustees. |
| 5 | Security is in default. |
| 6 | Foreign security, par value shown in local currency. |
Percentages are stated as a percent of net assets.
Notes to Financial Statements are an integral part of this Schedule.
8
Table of Contents
Driehaus Active Income Fund
Schedule of Investments
December 31, 2014
SWAP CONTRACTS
Credit Default Swaps
| Counterparty | Reference Instrument | Currency | Notional AmountB | Pay/ ReceiveA Fixed Rate | Fixed Rate | Expiration Date | Premium Paid (Received) | Unrealized Appreciation/ (Depreciation) | Credit Event | RatingC | ||||||||||||||||||||||
Merrill Lynch | Ally Financial, Inc. 7.50%, 9/15/20 | USD | 10,000,000 | Pay | 5.00 | % | 3/20/2019 | $ | (1,581,464 | ) | $ | 151,085 | Bankruptcy/FTP | BB+ | ||||||||||||||||||
Merrill Lynch | Ally Financial, Inc. 7.50%, 9/15/20 | USD | 10,000,000 | Pay | 5.00 | 12/20/2018 | (1,492,458 | ) | 120,290 | Bankruptcy/FTP | BB+ | |||||||||||||||||||||
Morgan Stanley | American Express Co. 5.50%, 9/12/16 | USD | 20,000,000 | Pay | 1.00 | 12/20/2016 | 263,406 | (609,003 | ) | Bankruptcy/FTP | BBB+ | |||||||||||||||||||||
Goldman Sachs | American Express Co. 5.50%, 9/12/16 | USD | 5,000,000 | Pay | 1.00 | 12/20/2016 | 61,174 | (147,572 | ) | Bankruptcy/FTP | BBB+ | |||||||||||||||||||||
Barclays | Ardargh Packaging Finance PLC 9.25%, 10/15/2020 | EUR | 3,000,000 | Pay | 5.00 | 12/20/2019 | (100,524 | ) | (18,719 | ) | Bankruptcy/FTP | CCC+ | ||||||||||||||||||||
Barclays | Ardagh Packaging Finance PLC 9.25%, 10/15/2020 | EUR | 5,000,000 | Pay | 5.00 | 12/20/2019 | (168,445 | ) | (29,452 | ) | Bankruptcy/FTP | CCC+ | ||||||||||||||||||||
Goldman Sachs | Bank of America Corp. 6.25%, 4/15/12 | USD | 10,000,000 | Pay | 1.00 | 12/20/2016 | 1,499,776 | (1,635,401 | ) | Bankruptcy/FTP | NR | |||||||||||||||||||||
Merrill Lynch | Citigroup, Inc. 6.13%, 5/15/18 | USD | 5,000,000 | Pay | 1.00 | 12/20/2016 | 432,520 | (499,853 | ) | Bankruptcy/FTP | A- | |||||||||||||||||||||
Goldman Sachs | Citigroup, Inc. 6.13%, 5/15/18 | USD | 5,000,000 | Pay | 1.00 | 12/20/2016 | 379,663 | (446,997 | ) | Bankruptcy/FTP | A- | |||||||||||||||||||||
Morgan Stanley | Enbridge Energy, L.P. 4.75%, 6/1/13 | USD | 10,000,000 | Pay | 1.00 | 6/20/2015 | 56,732 | (97,235 | ) | Bankruptcy/FTP | NR | |||||||||||||||||||||
JP Morgan | Federative Republic of Brazil 12.25%, 3/6/30 | USD | 15,000,000 | Pay | 1.00 | 12/20/2019 | 491,493 | 134,230 | Bankruptcy/FTP | BBB- | ||||||||||||||||||||||
Goldman Sachs | First Data Corp. 9.88%, 9/24/15 | USD | 3,000,000 | Pay | 5.00 | 3/20/2017 | 540,000 | (802,065 | ) | Bankruptcy/FTP | B- | |||||||||||||||||||||
Morgan Stanley | First Data Corp. 9.88%, 9/24/15 | USD | 10,000,000 | Pay | 5.00 | 3/20/2017 | 1,150,000 | (2,023,549 | ) | Bankruptcy/FTP | B- | |||||||||||||||||||||
Goldman Sachs | First Data Corp. 9.88%, 9/24/15 | USD | 5,000,000 | Pay | 5.00 | 6/20/2016 | 350,000 | (667,758 | ) | Bankruptcy/FTP | B- | |||||||||||||||||||||
JP Morgan | Hess Corp. 7.00%, 2/15/14 | USD | 8,000,000 | Pay | 1.00 | 6/20/2018 | 154,644 | (182,807 | ) | Bankruptcy/FTP | NR | |||||||||||||||||||||
Morgan Stanley | Hess Corp. 7.00%, 2/15/14 | USD | 4,000,000 | Pay | 1.00 | 6/20/2018 | 77,280 | (91,362 | ) | Bankruptcy/FTP | NR | |||||||||||||||||||||
Morgan Stanley | Hess Corp. 7.00%, 2/15/14 | USD | 4,000,000 | Pay | 1.00 | 6/20/2018 | 80,701 | (94,783 | ) | Bankruptcy/FTP | NR | |||||||||||||||||||||
Morgan Stanley | Hess Corp. 7.00%, 2/15/14 | USD | 4,000,000 | Pay | 1.00 | 6/20/2018 | 91,702 | (105,784 | ) | Bankruptcy/FTP | NR | |||||||||||||||||||||
Credit Suisse | Hess Corp. 7.00%, 2/15/14 | USD | 20,000,000 | Pay | 1.00 | 9/20/2018 | 309,975 | (318,608 | ) | Bankruptcy/FTP | NR | |||||||||||||||||||||
Goldman Sachs | Host Hotels & Resorts, Inc. 6.75%, 6/1/16 | USD | 10,000,000 | Pay | 1.00 | 12/20/2016 | 1,067,644 | (1,222,510 | ) | Bankruptcy/FTP | BBB | |||||||||||||||||||||
Notes to Financial Statements are an integral part of this Schedule.
9
Table of Contents
Driehaus Active Income Fund
Schedule of Investments
December 31, 2014
Credit Default Swaps (continued)
| Counterparty | Reference Instrument | Currency | Notional AmountB | Pay/ ReceiveA Fixed Rate | Fixed Rate | Expiration Date | Premium Paid (Received) | Unrealized Appreciation/ (Depreciation) | Credit Event | RatingC | ||||||||||||||||||||||
Goldman Sachs | Huntsman Corp. | |||||||||||||||||||||||||||||||
| 11.50%, 7/15/12 | USD | 5,000,000 | Pay | 5.00 | % | 12/20/2016 | $ | 124,119 | $ | (566,713 | ) | Bankruptcy/FTP | NR | |||||||||||||||||||
Credit Suisse | J.C. Penney Corp., Inc. 6.38%, 10/15/36 | USD | 6,667,000 | Pay | 5.00 | 12/20/2016 | 700,035 | (434,751 | ) | Bankruptcy/FTP | CCC- | |||||||||||||||||||||
Goldman Sachs | J.C. Penney Corp., Inc. 6.38%, 10/15/36 | USD | (13,334,000 | ) | Receive | 5.00 | 3/20/2015 | (933,380 | ) | 1,009,614 | Bankruptcy/FTP | CCC- | ||||||||||||||||||||
Goldman Sachs | Limited Brands, Inc. 6.90%, 7/15/17 | USD | 15,000,000 | Pay | 1.00 | 12/20/2015 | 679,159 | (808,381 | ) | Bankruptcy/FTP | BB- | |||||||||||||||||||||
Goldman Sachs | Masco Corp. 6.13%, 10/3/16 | USD | 15,000,000 | Pay | 1.00 | 12/20/2015 | 1,047,333 | (1,189,230 | ) | Bankruptcy/FTP | BBB | |||||||||||||||||||||
Morgan Stanley | Masco Corp. 6.13%, 10/3/16 | USD | 4,500,000 | Pay | 1.00 | 3/20/2016 | 273,169 | (324,837 | ) | Bankruptcy/FTP | BBB | |||||||||||||||||||||
Goldman Sachs | Pitney Bowes, Inc. 6.25%, 3/15/19 | USD | 5,000,000 | Pay | 1.00 | 9/20/2016 | 164,656 | (238,340 | ) | Bankruptcy/FTP | BBB | |||||||||||||||||||||
Morgan Stanley | Pitney Bowes, Inc. 6.25%, 3/15/19 | USD | 5,000,000 | Pay | 1.00 | 12/20/2016 | 244,614 | (325,993 | ) | Bankruptcy/FTP | BBB | |||||||||||||||||||||
Merrill Lynch | Pitney Bowes, Inc. 4.63%, 10/01/12 | USD | 20,000,000 | Pay | 1.00 | 3/20/2016 | 436,253 | (668,191 | ) | Bankruptcy/FTP | BBB | |||||||||||||||||||||
Goldman Sachs | Realogy Corp. 10.50%, 4/15/14 | USD | 3,000,000 | Pay | 5.00 | 3/20/2016 | 285,000 | (452,729 | ) | Bankruptcy/FTP | B | |||||||||||||||||||||
Merrill Lynch | Realogy Corp. 10.50%, 4/15/14 | USD | 2,000,000 | Pay | 5.00 | 3/20/2016 | 190,000 | (301,820 | ) | Bankruptcy/FTP | B | |||||||||||||||||||||
Goldman Sachs | Saks, Inc. | |||||||||||||||||||||||||||||||
| 2.00%, 3/15/24 | USD | 10,000,000 | Pay | 5.00 | 12/20/2016 | 406,250 | (1,374,158 | ) | Bankruptcy/FTP | NR | ||||||||||||||||||||||
Goldman Sachs | Sears Roebuck Acceptance Corp. 7.00%, 6/1/32 | USD | 1,600,000 | Pay | 5.00 | 3/20/2019 | 380,000 | (88,942 | ) | Bankruptcy/FTP | CCC+ | |||||||||||||||||||||
Merrill Lynch | Sears Roebuck Acceptance Corp. 7.00%, 6/1/32 | USD | 1,600,000 | Pay | 5.00 | 3/20/2019 | 372,000 | (80,942 | ) | Bankruptcy/FTP | CCC+ | |||||||||||||||||||||
Barclays | Sears Roebuck Acceptance Corp. 7.00%, 6/1/32 | USD | 8,000,000 | Pay | 5.00 | 3/20/2019 | 1,500,000 | (44,707 | ) | Bankruptcy/FTP | CCC+ | |||||||||||||||||||||
Barclays | Sears Roebuck Acceptance Corp. 7.00%, 6/1/32 | USD | 1,600,000 | Pay | 5.00 | 3/20/2019 | 296,000 | (4,941 | ) | Bankruptcy/FTP | CCC+ | |||||||||||||||||||||
Barclays | Sears Roebuck Acceptance Corp. 7.00%, 6/1/32 | USD | 2,400,000 | Pay | 5.00 | 3/20/2019 | 456,000 | (19,412 | ) | Bankruptcy/FTP | CCC+ | |||||||||||||||||||||
Notes to Financial Statements are an integral part of this Schedule.
10
Table of Contents
Driehaus Active Income Fund
Schedule of Investments
December 31, 2014
Credit Default Swaps (continued)
| Counterparty | Reference Instrument | Currency | Notional AmountB | Pay/ ReceiveA Fixed Rate | Fixed Rate | Expiration Date | Premium Paid (Received) | Unrealized Appreciation/ (Depreciation) | Credit Event | RatingC | ||||||||||||||||||||||
Goldman Sachs | Sears Roebuck Acceptance Corp. 7.00%, 6/1/32 | USD | 1,600,000 | Pay | 5.00 | % | 3/20/2019 | $ | 292,000 | $ | (941 | ) | Bankruptcy/FTP | CCC+ | ||||||||||||||||||
Barclays | Sears Roebuck Acceptance Corp. 7.00%, 6/1/32 | USD | 1,600,000 | Pay | 5.00 | 3/20/2019 | 284,000 | 7,059 | Bankruptcy/FTP | CCC+ | ||||||||||||||||||||||
Barclays | Sears Roebuck Acceptance Corp. 7.00%, 6/1/32 | USD | 4,000,000 | Pay | 5.00 | 6/20/2019 | 740,000 | 25,611 | Bankruptcy/FTP | CCC+ | ||||||||||||||||||||||
Morgan Stanley | Sprint Nextel Corp. 6.00%, 12/1/16 | USD | 5,000,000 | Pay | 5.00 | 3/20/2016 | (354,760 | ) | 108,659 | Bankruptcy/FTP | B+ | |||||||||||||||||||||
Goldman Sachs | The Chubb Corp. 6.60%, 8/15/18 | USD | 10,000,000 | Pay | 1.00 | 3/20/2015 | (257,326 | ) | 232,775 | Bankruptcy/FTP | A+ | |||||||||||||||||||||
Goldman Sachs | The Markit CDX NA | |||||||||||||||||||||||||||||||
| High Yield Series 17 Index | USD | 14,200,000 | Pay | 5.00 | 12/20/2016 | 1,475,875 | (2,228,419 | ) | Bankruptcy/FTP | NA | ||||||||||||||||||||||
Merrill Lynch | The Markit CDX NA | |||||||||||||||||||||||||||||||
| High Yield Series 17 Index | USD | 4,800,000 | Pay | 5.00 | 12/20/2016 | 550,000 | (804,381 | ) | Bankruptcy/FTP | NA | ||||||||||||||||||||||
Goldman Sachs | The Markit iTraxx Europe | |||||||||||||||||||||||||||||||
| Crossover IndexSeries 19 | EUR | 24,500,000 | Pay | 5.00 | 6/20/2018 | (1,602,328 | ) | (1,896,798 | ) | Bankruptcy/FTP | NA | |||||||||||||||||||||
Goldman Sachs | The Markit iTraxx Europe | |||||||||||||||||||||||||||||||
| Crossover IndexSeries 20 | EUR | 10,000,000 | Pay | 5.00 | 12/20/2018 | (2,134,040 | ) | 115,045 | Bankruptcy/FTP | NA | ||||||||||||||||||||||
Morgan Stanley | The Markit iTraxx Europe | |||||||||||||||||||||||||||||||
| Crossover IndexSeries 20 | EUR | 10,000,000 | Pay | 5.00 | 12/20/2018 | (2,137,029 | ) | 118,034 | Bankruptcy/FTP | NA | ||||||||||||||||||||||
Morgan Stanley | The Markit iTraxx Europe | |||||||||||||||||||||||||||||||
| Crossover IndexSeries 20 | EUR | 10,000,000 | Pay | 5.00 | 12/20/2018 | (2,252,200 | ) | 233,206 | Bankruptcy/FTP | NA | ||||||||||||||||||||||
Goldman Sachs | The Markit iTraxx Europe | |||||||||||||||||||||||||||||||
| Crossover IndexSeries 22 | EUR | 16,500,000 | Pay | 5.00 | 12/20/2019 | (1,322,301 | ) | (49,259 | ) | Bankruptcy/FTP | NA | |||||||||||||||||||||
Goldman Sachs | TRW Automotive, Inc. 7.25%, 3/15/17 | USD | 5,000,000 | Pay | 5.00 | 3/20/2015 | 92,579 | (152,418 | ) | Bankruptcy/FTP | BBB- | |||||||||||||||||||||
Goldman Sachs | TRW Automotive, Inc. 7.25%, 3/15/17 | USD | 3,000,000 | Pay | 5.00 | 6/20/2015 | (133,100 | ) | 60,275 | Bankruptcy/FTP | BBB- | |||||||||||||||||||||
|
|
|
| |||||||||||||||||||||||||||||
Total Credit Default Swaps |
| 3,526,397 | (18,733,878 | ) | ||||||||||||||||||||||||||||
|
|
|
| |||||||||||||||||||||||||||||
Total Swap Contracts |
| $ | 3,526,397 | $ | (18,733,878 | ) | ||||||||||||||||||||||||||
|
|
|
| |||||||||||||||||||||||||||||
Notes to Financial Statements are an integral part of this Schedule.
11
Table of Contents
Driehaus Active Income Fund
Schedule of Investments
December 31, 2014
| A | If the Fund is paying a fixed rate, the counterparty acts as guarantor of the variable instrument and thus the Fund is a buyer of protection. If the Fund is receiving a fixed rate, the Fund acts as guarantor of the variable instrument and thus is a seller of protection. |
| B | For contracts to sell protection, the notional amout is equal to the maximum potential amount of the future payments and no recourse has been entered into in association with the contracts. |
| C | Based on Moody’s or Standard & Poor’s credit rating for the underlying reference instrument entity (unaudited). |
FTP=Failure to Pay
NR=Not Rated
NA=Not Applicable
EUR — Euro
USD — United States Dollar
FUTURES CONTRACTS
| Futures Contracts | Number of Contracts (Short) | Expiration Date | Unrealized Appreciation/ (Depreciation) | |||||||||
U.S. 5 Year Treasury Note | (1,827 | ) | March 2015 | $ | 383,221 | |||||||
U.S. 10 Year Treasury Note | (1,749 | ) | March 2015 | (527,126 | ) | |||||||
U.S. Treasury Long Bond | (155 | ) | March 2015 | (468,856 | ) | |||||||
|
| |||||||||||
Total Futures Contracts | $ | (612,761 | ) | |||||||||
|
| |||||||||||
SWAPTIONS
Interest Rate Swaptions
| Counterparty | Floating Rate Index | Currency | Notional Amount | Pay/ Receive Fixed rate | Exercise Rate | Expiration Date | Premium Paid (Received) | Market Value | ||||||||||||||||||||
Morgan Stanley | 3-Month USD-LIBOR-BBA | USD | 55,000,000 | Pay | 2.53 | % | 2/23/2015 | $ | 702,625 | $ | 202,346 | |||||||||||||||||
Morgan Stanley | 3-Month USD-LIBOR-BBA | USD | 147,000,000 | Pay | 1.89 | 2/23/2015 | 1,062,075 | 658,832 | ||||||||||||||||||||
Morgan Stanley | 3-Month USD-LIBOR-BBA | USD | 309,000,000 | Pay | 2.23 | 2/23/2015 | 2,974,125 | 1,277,162 | ||||||||||||||||||||
|
|
|
| |||||||||||||||||||||||||
Total Interest Rate Swaptions |
| 4,738,825 | 2,138,340 | |||||||||||||||||||||||||
|
|
|
| |||||||||||||||||||||||||
TOTAL SWAPTIONS |
| $ | 4,738,825 | $ | 2,138,340 | |||||||||||||||||||||||
|
|
|
| |||||||||||||||||||||||||
USD — United States Dollar
FORWARD FOREIGN CURRENCY CONTRACTS
| Sale Contracts | Settlement Date | Currency Amount Sold | Value At Settlement Date | Value At December 31, 2014 | Unrealized Appreciation (Depreciation) | |||||||||||||||
Euro | March 18, 2015 | (11,000,000 | ) | $ | (13,496,673 | ) | $ | (13,319,985 | ) | $ | 176,688 | |||||||||
|
|
|
|
|
| |||||||||||||||
Total Sale Contracts | (13,496,673 | ) | (13,319,985 | ) | 176,688 | |||||||||||||||
|
|
|
|
|
| |||||||||||||||
TOTAL FORWARD FOREIGN CURRENCY CONTRACTS |
| $ | (13,496,673 | ) | $ | (13,319,985 | ) | $ | 176,688 | |||||||||||
|
|
|
|
|
| |||||||||||||||
Notes to Financial Statements are an integral part of this Schedule.
12
Table of Contents
Driehaus Select Credit Fund — Portfolio Managers’ Letter
Dear Shareholders,
The Driehaus Select Credit Fund1 (“Fund”) returned -6.56% for the year ended December 31, 2014. This return was below the performance of the Fund’s benchmark index, the Citigroup 3-Month T-Bill Index, which returned 0.03% for the same period. The Fund underperformed the BofA Merrill Lynch U.S. High Yield Index, which returned 2.50% for the same period.
As we entered 2014, the 10-year Treasury was nearing a 3% yield, with many market participants expecting an end to quantitative easing and a rise in interest rates during the year. Instead, yields trended lower as high yield spreads tightened 50 basis points in the first part of the year and dropped even further in the second half of 2014 as geopolitical concerns drove a general market flight to safety. The 10-year Treasury closed the year at 2.17%. High yield followed a similar path, with spreads grinding tighter from 400 to 350 basis points through June, and then subsequently moving wider in the back half of the year as the price of oil dropped and geopolitical risk grew.
For the year, the most significant positive contributions to return came from several positions in our directional long strategy. The positive contributions were from long positions in the bonds of companies involved in healthcare, casual dining, retail, and technology. However, these gains were more than offset by positions in energy, chemicals, and grocery, causing the directional long strategy overall to detract from returns. Energy trades suffered as oil prices declined and credit quality concerns subsequently rose.
The trading strategy that detracted most from the Fund’s performance this year was the event driven strategy. Losses in energy-related positions accounted for the majority of underperformance and were not offset by gains in technology and telecom positions. Event trades focus on catalyst-driven corporate events, such as mergers or company announcements. Depending on the anticipated timing and nature of the event, these trades can be structured using a single security type or a combination of bonds, options, bank loans, swaps and equities.
The interest rate hedge also detracted from performance. The interest rate hedge, which is constructed with U.S. Treasury futures and U.S. Treasury swaptions, worked against the Fund as rates continued to decline throughout 2014. Despite the dramatic fall in rates, our hedge only cost the Fund slightly more than half the drag imposed on the Fund by the hedge in 2011, despite the move down in rates being quite similar. Utilizing swaptions enabled us to protect the Fund against the big moves in rates, while lowering sensitivity to minor market moves.
Looking ahead, we will keep our eyes on market volatility across asset classes, interest rates and credit spreads. The most important change that we foresee in the year ahead is a change in market volatility, and therefore stability. We expect higher volatility going forward largely due to divergent central bank policies, declining economic growth overseas and rising corporate defaults. We anticipate greater opportunity for our investment strategies as a result of these higher levels of market volatility. Already, credit spreads have widened and many of the risk premia in the arbitrage trades that we monitor have increased as a result of the market turbulence over the past few months. Historically, these developments have led to compelling investment opportunities, and we see no reason why this time will be any different.
As always, we at Driehaus Capital Management LLC thank you for your interest in the Driehaus Select Credit Fund and would like to express our gratitude to you as shareholders for your continued confidence in our management capabilities.
Sincerely,
| | | ||
| K.C. Nelson | Elizabeth Cassidy | Adam Abbas | ||
| Portfolio Manager | Assistant Portfolio Manager | Assistant Portfolio Manager |
| 1 | The Driehaus Select Credit Fund closed to new investors on January 31, 2014. |
Performance is historical and does not represent future results.
Please see the following performance page for index definitions.
13
Table of Contents
Driehaus Select Credit Fund
Performance Overview (unaudited)
The performance summarized below is historical and does not represent future results. Investment returns and principal value vary, and you may have a gain or loss when you sell shares. Performance data presented measures the change in the value of an investment in the Fund, assuming reinvestment of all dividends and capital gains.
The table does not reflect the deduction of taxes that a shareholder would pay on Fund distributions or the redemption of Fund shares. The graph compares the results of a $25,000 investment (minimum investment) in the Fund since September 30, 2010 (the date of the Fund’s inception), with all dividends and capital gains reinvested, with the indicated indices (and dividends reinvested) for the same period.
| Average Annual Total Returns as of 12/31/14 | 1 Year | 3 Years | Since Inception (09/30/10 - 12/31/14) | |||||||||
Driehaus Select Credit Fund (DRSLX)1 | –6.56% | 2.59% | 1.98% | |||||||||
Citigroup 3-Month T-Bill Index2 | 0.03% | 0.05% | 0.06% | |||||||||
BofA Merrill Lynch U.S. High Yield Index3 | 2.50% | 8.37% | 7.67% | |||||||||
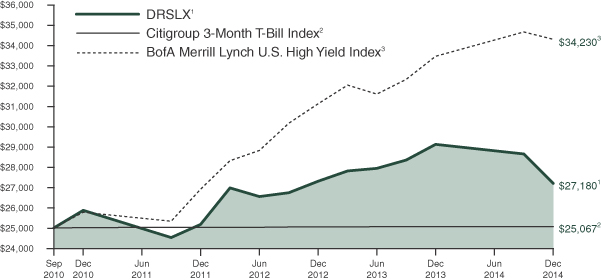
| 1 | The returns for the periods prior to February 1, 2011, reflect fee waivers and/or reimbursements without which performance would have been lower. |
| 2 | The Citigroup 3-Month T-Bill Index is designed to mirror the performance of the 3-month U.S. Treasury Bill. The Citigroup 3-Month T-Bill Index is unmanaged and its returns reflect reinvestment of all distributions and changes in market prices. |
| 3 | The BofA Merrill Lynch U.S. High Yield Index is an unmanaged index that tracks the performance of below-investment grade, U.S.-dollar denominated corporate bonds publicly issued in the U.S. domestic market. |
14
Table of Contents
Driehaus Select Credit Fund
Schedule of Investments
December 31, 2014
| Shares, Principal Amount, or Number of Contracts | Value | |||||||
| BANK LOANS — 19.31% | ||||||||
Diversified Financial Services — 0.34% |
| |||||||
Sears Roebuck Acceptance Corp. | $ | 2,875,072 | $ | 2,755,277 | ||||
Engineering & Construction — 1.28% |
| |||||||
Deutsche Raststatten Gruppe III GmbH (Germany) 12.50%, 12/10/212 | 7,915,228 | 6 | 10,200,529 | |||||
Food — 2.14% |
| |||||||
Hostess Brands, Inc. | 16,872,500 | 17,125,588 | ||||||
Internet — 1.51% |
| |||||||
Mood Media Corp. (Canada) 7.00%, 5/1/192 | 12,319,544 | 12,042,354 | ||||||
Leisure Time — 2.00% |
| |||||||
Equinox Holdings, Inc. | 15,748,824 | 15,985,056 | ||||||
Oil & Gas — 2.15% |
| |||||||
Bennu Oil & Gas LLC | 23,050,296 | 17,172,470 | ||||||
Retail — 1.48% |
| |||||||
J.C. Penney Corp., Inc. | 12,146,832 | 11,873,529 | ||||||
Software — 8.41% |
| |||||||
Applied Systems, Inc. | 39,000,000 | 38,415,000 | ||||||
Evergreen Skills Lux Sarl (Luxembourg) 9.25%, 4/28/222 | 31,000,000 | 28,881,677 | ||||||
|
| |||||||
| 67,296,677 | ||||||||
|
| |||||||
Total BANK LOANS | 154,451,480 | |||||||
|
| |||||||
| CORPORATE BONDS — 53.73% | ||||||||
Banks — 1.28% |
| |||||||
Royal Bank of Scotland Group PLC (United Kingdom) 5.50%, 11/29/49 | 8,957,000 | 6 | 10,220,778 | |||||
Building Materials — 1.53% |
| |||||||
Cemex Finance LLC | 11,000,000 | 12,265,000 | ||||||
Chemicals — 3.38% |
| |||||||
Kissner Milling Co., Ltd. (Canada) | 27,065,000 | 27,065,000 | ||||||
Momentive Performance Materials, Inc. 11.50%, 12/1/164,5 | 5,530,000 | — | ||||||
|
| |||||||
| 27,065,000 | ||||||||
|
| |||||||
| Shares, Principal Amount, or Number of Contracts | Value | |||||||
Computers — 1.43% |
| |||||||
DynCorp International, Inc. 10.38%, 7/1/17 | $ | 13,490,000 | $ | 11,466,500 | ||||
Diversified Financial Services — 5.24% |
| |||||||
Cementos Progreso Trust (Cayman Islands) 7.13%, 11/6/231,3 | 10,500,000 | 11,361,000 | ||||||
Denver Parent Corp. | 23,424,812 | 2,342,481 | ||||||
Rio Oil Finance Trust Series 2014-1 | 29,500,000 | 28,211,735 | ||||||
|
| |||||||
| 41,915,216 | ||||||||
|
| |||||||
Entertainment — 2.53% |
| |||||||
Peninsula Gaming LLC/Peninsula Gaming Corp. 8.38%, 2/15/181 | 19,500,000 | 20,280,000 | ||||||
Food — 1.79% |
| |||||||
WM Morrison Supermarkets PLC (United Kingdom) 3.50%, 7/27/26 | 10,000,000 | 6 | 14,282,544 | |||||
Healthcare — Services — 4.33% |
| |||||||
Aurora Diagnostics Holdings/Aurora Diagnostics Financing, Inc. | 23,685,000 | 20,369,100 | ||||||
Kindred Healthcare, Inc. | 14,973,000 | 14,261,783 | ||||||
|
| |||||||
| 34,630,883 | ||||||||
|
| |||||||
Internet — 0.88% |
| |||||||
Mood Media Corp. (Canada) 9.25%, 10/15/201,3 | 8,500,000 | 7,012,500 | ||||||
Oil & Gas — 10.70% |
| |||||||
California Resources Corp. 6.00%, 11/15/241 | 26,000,000 | 21,970,000 | ||||||
Calumet Specialty Products Partners LP/Calumet Finance Corp. | 41,719,500 | 37,130,355 | ||||||
Sanchez Energy Corp. | 17,100,000 | 15,903,000 | ||||||
Sanchez Energy Corp. 6.13%, 1/15/231 | 3,000,000 | 2,520,000 | ||||||
Venoco, Inc. 8.88%, 2/15/19 | 14,577,000 | 8,017,350 | ||||||
|
| |||||||
| 85,540,705 | ||||||||
|
| |||||||
Packaging & Containers — 2.23% |
| |||||||
Ardagh Packaging Finance PLC/Ardagh Holdings USA, Inc. (Ireland) 4.25%, 1/15/22 | 15,000,000 | 6 | 17,840,416 | |||||
Restaurants — 3.45% |
| |||||||
Ruby Tuesday, Inc. 7.63%, 5/15/20 | 28,150,000 | 27,587,000 | ||||||
Notes to Financial Statements are an integral part of this Schedule.
15
Table of Contents
Driehaus Select Credit Fund
Schedule of Investments
December 31, 2014
| Shares, Principal Amount, or Number of Contracts | Value | |||||||
Retail — 9.99% |
| |||||||
Claire’s Stores, Inc. 9.00%, 3/15/191 | $ | 16,600,000 | $ | 16,351,000 | ||||
Claire’s Stores, Inc. 7.75%, 6/1/201 | 2,000,000 | 1,130,000 | ||||||
Conn’s, Inc. 7.25%, 7/15/221 | 9,000,000 | 6,750,000 | ||||||
Neiman Marcus Group, Inc. 8.00%, 10/15/211 | 26,000,000 | 27,495,000 | ||||||
Rite Aid Corp. 6.75%, 6/15/21 | 27,250,000 | 28,135,625 | ||||||
|
| |||||||
| 79,861,625 | ||||||||
|
| |||||||
Software — 1.84% |
| |||||||
Nuance Communications, Inc. | 14,688,000 | 14,724,720 | ||||||
Telecommunications — 3.13% |
| |||||||
Cincinnati Bell, Inc. 8.75%, 3/15/18 | 9,305,000 | 9,560,888 | ||||||
Intelsat Luxembourg SA (Luxembourg) 7.75%, 6/1/213 | 15,401,000 | 15,439,502 | ||||||
|
| |||||||
| 25,000,390 | ||||||||
|
| |||||||
Total CORPORATE BONDS | 429,693,277 | |||||||
|
| |||||||
| CONVERTIBLE CORPORATE BONDS — 4.40% | ||||||||
Electrical Components & Equipment — 2.03% |
| |||||||
SunPower Corp. 4.50%, 3/15/15 | 13,836,000 | 16,144,882 | ||||||
Suntech Power Holdings Co., Ltd. (China) 3.00%, 3/15/153,5 | 4,000,000 | 40,000 | ||||||
|
| |||||||
| 16,184,882 | ||||||||
|
| |||||||
Holding Companies — Diversified — 2.33% |
| |||||||
Gala Electric Casinos PLC (United Kingdom) 11.50%, 6/1/19 | 11,500,000 | 6 | 18,658,822 | |||||
Mining — 0.04% |
| |||||||
Great Western Minerals Group Ltd. (Canada) 8.00%, 4/6/173 | 2,000,000 | 320,000 | ||||||
|
| |||||||
Total CONVERTIBLE CORPORATE BONDS (Cost $40,230,879) | 35,163,704 | |||||||
|
| |||||||
| COMMON STOCK — 8.43% | ||||||||
Agriculture — 1.68% |
| |||||||
Lorillard, Inc. | 213,355 | 13,428,563 | ||||||
Auto Manufacturers — 1.07% |
| |||||||
General Motors Co. | 246,099 | 8,591,312 | ||||||
Auto Parts & Equipment — 0.77% |
| |||||||
TRW Automotive Holdings Corp.* | 60,000 | 6,171,000 | ||||||
| Shares, Principal Amount, or Number of Contracts | Value | |||||||
Media — 1.07% |
| |||||||
Time Warner Cable, Inc. | 56,079 | $ | 8,527,373 | |||||
Oil & Gas — 1.57% |
| |||||||
Chesapeake Energy Corp. | 111,527 | 2,182,583 | ||||||
Chevron Corp. | 18,764 | 2,104,945 | ||||||
ConocoPhillips | 29,692 | 2,050,530 | ||||||
Continental Resources, Inc.* | 54,926 | 2,106,961 | ||||||
Devon Energy Corp. | 34,532 | 2,113,704 | ||||||
EOG Resources, Inc. | 22,165 | 2,040,732 | ||||||
|
| |||||||
| 12,599,455 | ||||||||
|
| |||||||
Restaurants — 0.51% |
| |||||||
Ruby Tuesday, Inc.* | 595,426 | 4,072,714 | ||||||
Telecommunications — 1.76% |
| |||||||
Cincinnati Bell, Inc.* | 2,735,444 | 8,726,066 | ||||||
T-Mobile US, Inc.* | 198,255 | 5,340,990 | ||||||
|
| |||||||
| 14,067,056 | ||||||||
|
| |||||||
Total COMMON STOCK | 67,457,473 | |||||||
|
| |||||||
| CONVERTIBLE PREFERRED STOCK — 0.00% | ||||||||
Auto Manufacturers — 0.00% |
| |||||||
General Motors Corp. Senior Convertible Preferred Escrow — C 7.25%, 4/15/144,5 | 94,958 | — | ||||||
|
| |||||||
Total CONVERTIBLE PREFERRED STOCK | — | |||||||
|
| |||||||
| PURCHASED PUT OPTIONS — 0.55% | ||||||||
Crude Oil Futures, Exercise Price: $47.50, Expiration Date: April 2015* | 750 | 1,530,000 | ||||||
Crude Oil Futures, Exercise Price: $57.50, Expiration Date: April 2015* | 450 | 2,848,500 | ||||||
|
| |||||||
Total PURCHASED PUT OPTIONS | 4,378,500 | |||||||
|
| |||||||
| SHORT-TERM INVESTMENTS — 0.01% | ||||||||
UMB Money Market Fiduciary 0.01% | 100,113 | 100,113 | ||||||
|
| |||||||
Total SHORT-TERM INVESTMENTS | 100,113 | |||||||
|
| |||||||
Notes to Financial Statements are an integral part of this Schedule.
16
Table of Contents
Driehaus Select Credit Fund
Schedule of Investments
December 31, 2014
| Shares, Principal Amount, or Number of Contracts | Value | |||||||
WARRANTS — 0.05% |
| |||||||
General Motors Co. — CW 16, Strike Price: $10.00, Expiration Date: 7/10/16* | 8,920 | $ | 225,328 | |||||
General Motors Co. — CW 19, Strike Price: $18.33, Expiration Date: 7/10/19* | 8,920 | 152,806 | ||||||
|
| |||||||
Total WARRANTS | 378,134 | |||||||
|
| |||||||
| ||||||||
TOTAL INVESTMENTS | 86.48 | % | 691,622,681 | |||||
Other Assets less Liabilities | 13.52 | % | 108,085,015 | |||||
|
|
|
| |||||
Net Assets | 100.00 | % | $ | 799,707,696 | ||||
| ||||||||
| SECURITIES SOLD SHORT — (2.98)% | ||||||||
| COMMON STOCK — (2.98)% | ||||||||
Agriculture — (0.50)% |
| |||||||
Reynolds American, Inc. | (62,065 | ) | $ | (3,988,917 | ) | |||
Electrical Components & Equipment — (1.28)% |
| |||||||
SunPower Corp.* | (395,553 | ) | (10,217,134 | ) | ||||
Healthcare — Services — (0.07)% |
| |||||||
Kindred Healthcare, Inc. | (31,223 | ) | (567,634 | ) | ||||
Media — (1.13)% |
| |||||||
Comcast Corp. — Cl. A | (155,473 | ) | (9,018,989 | ) | ||||
|
| |||||||
Total COMMON STOCK | (23,792,674 | ) | ||||||
|
| |||||||
| WRITTEN CALL OPTIONS — 0.00% | ||||||||
Cemex SAB de CV (Mexico), Exercise Price: $14.42, Expiration Date: January, 2015*3 | (10,320 | ) | (16,099 | ) | ||||
|
| |||||||
Total WRITTEN CALL OPTIONS (Premiums received $829,949) | (16,099 | ) | ||||||
|
| |||||||
| ||||||||
TOTAL INVESTMENT SECURITIES SOLD SHORT (Proceeds $25,317,807) | (2.98 | )% | $ | (23,808,773 | ) | |||
| ||||||||
| * | Non-income producing security. |
| 1 | 144A restricted security. |
| 2 | Variable rate security. Rates disclosed are as of December 31, 2014. |
| 3 | Foreign security denominated in U.S. dollars and traded on a U.S. exchange. |
| 4 | Security valued at fair value as determined in good faith by Driehaus Capital Management LLC, investment adviser to the Fund, in accordance with procedures established by or under the direction of the Trust’s Board of Trustees. |
| 5 | Security is in default. |
| 6 | Foreign security, par value shown in local currency. |
Percentages are stated as a percent of net assets.
Notes to Financial Statements are an integral part of this Schedule.
17
Table of Contents
Driehaus Select Credit Fund
Schedule of Investments
December 31, 2014
SWAP CONTRACTS
Credit Default Swaps
| Counterparty | Reference Instrument | Currency | Notional AmountB | Pay/ ReceiveA Fixed Rate | Fixed Rate | Expiration Date | Premium Paid (Received) | Unrealized Appreciation/ (Depreciation) | Credit Event | RatingC | ||||||||||||||||||||||
Barclays | Ardagh Packaging Finance PLC 9.25%, 10/15/20 | EUR | 2,000,000 | Pay | 5.00 | % | 9/20/2019 | $ | (118,810 | ) | $ | 26,395 | Bankruptcy/FTP | CCC+ | ||||||||||||||||||
Bank of America | Ardagh Packaging Finance PLC 9.25%, 10/15/20 | EUR | 2,000,000 | Pay | 5.00 | 9/20/2019 | (116,527 | ) | 24,113 | Bankruptcy/FTP | CCC+ | |||||||||||||||||||||
Bank of America | Ardagh Packaging Finance PLC 9.25%, 10/15/20 | EUR | 3,000,000 | Pay | 5.00 | 9/20/2019 | (178,329 | ) | 39,706 | Bankruptcy/FTP | CCC+ | |||||||||||||||||||||
Morgan Stanley | Ardagh Packaging Finance PLC 9.25%, 10/15/20 | EUR | 3,000,000 | Pay | 5.00 | 9/20/2019 | (165,974 | ) | 27,352 | Bankruptcy/FTP | CCC+ | |||||||||||||||||||||
Barclays | Ardagh Packaging Finance PLC 9.25%, 10/15/20 | EUR | 2,000,000 | Pay | 5.00 | 9/20/2019 | (88,220 | ) | (4,195 | ) | Bankruptcy/FTP | CCC+ | ||||||||||||||||||||
Barclays | Ardagh Packaging Finance PLC 9.25%, 10/15/20 | EUR | 3,000,000 | Pay | 5.00 | 9/20/2019 | (132,330 | ) | (6,292 | ) | Bankruptcy/FTP | CCC+ | ||||||||||||||||||||
Bank of America | Ardagh Packaging Finance PLC 9.25%, 10/15/20 | EUR | 3,000,000 | Pay | 5.00 | 12/20/2019 | (54,846 | ) | (63,892 | ) | Bankruptcy/FTP | CCC+ | ||||||||||||||||||||
Goldman Sachs | Federative Republic of Brazil 12.25%, 3/6/30 | USD | 15,000,000 | Pay | 1.00 | 12/20/2019 | 505,606 | 120,118 | Bankruptcy/FTP | BBB- | ||||||||||||||||||||||
Goldman Sachs | First Data Corp. 12.63%, 1/15/21 | USD | 2,000,000 | Pay | 5.00 | 3/20/2019 | — | (211,383 | ) | Bankruptcy/FTP | B- | |||||||||||||||||||||
Goldman Sachs | First Data Corp. 12.63%, 1/15/21 | USD | 2,000,000 | Pay | 5.00 | 3/20/2019 | — | (211,383 | ) | Bankruptcy/FTP | B- | |||||||||||||||||||||
Goldman Sachs | First Data Corp. 12.63%, 1/15/21 | USD | 5,000,000 | Pay | 5.00 | 3/20/2019 | 16,475 | (544,932 | ) | Bankruptcy/FTP | B- | |||||||||||||||||||||
Bank of America | Freeport-McMoRan Copper & Gold, Inc. 3.55%, 3/1/22 | USD | 2,000,000 | Pay | 1.00 | 3/20/2017 | 40,381 | (51,952 | ) | Bankruptcy/FTP | NR | |||||||||||||||||||||
Morgan Stanley | French Republic 4.25%, 4/25/19 | USD | 30,000,000 | Pay | 0.25 | 12/20/2019 | 260,237 | (65,324 | ) | Bankruptcy/FTP | Aa1 | |||||||||||||||||||||
Morgan Stanley | French Republic 4.25%, 4/25/19 | USD | 10,000,000 | Pay | 0.25 | 12/20/2019 | 89,136 | (24,166 | ) | Bankruptcy/FTP | Aa1 | |||||||||||||||||||||
JP Morgan | Hess Corp. 7.00%, 2/15/14 | USD | 2,000,000 | Pay | 1.00 | 6/20/2018 | 38,660 | (45,701 | ) | Bankruptcy/FTP | NR | |||||||||||||||||||||
Morgan Stanley | Hess Corp. 7.00%, 2/15/14 | USD | 1,000,000 | Pay | 1.00 | 6/20/2018 | 19,320 | (22,841 | ) | Bankruptcy/FTP | NR | |||||||||||||||||||||
Morgan Stanley | Hess Corp. | |||||||||||||||||||||||||||||||
| 7.00%, 2/15/14 | USD | 1,000,000 | Pay | 1.00 | 6/20/2018 | 20,175 | (23,696 | ) | Bankruptcy/FTP | NR | ||||||||||||||||||||||
Morgan Stanley | Hess Corp. 7.00%, 2/15/14 | USD | 1,000,000 | Pay | 1.00 | 6/20/2018 | 22,925 | (26,446 | ) | Bankruptcy/FTP | NR | |||||||||||||||||||||
Credit Suisse | Hess Corp. 7.00%, 2/15/14 | USD | 5,000,000 | Pay | 1.00 | 9/20/2018 | 77,494 | (79,652 | ) | Bankruptcy/FTP | NR | |||||||||||||||||||||
Notes to Financial Statements are an integral part of this Schedule.
18
Table of Contents
Driehaus Select Credit Fund
Schedule of Investments
December 31, 2014
| Counterparty | Reference Instrument | Currency | Notional AmountB | Pay/ ReceiveA Fixed Rate | Fixed Rate | Expiration Date | Premium Paid (Received) | Unrealized Appreciation/ (Depreciation) | Credit Event | RatingC | ||||||||||||||||||||||
Credit Suisse | J.C. Penney Corp., Inc. 6.38%, 10/15/36 | USD | (5,000,000 | ) | Receive | 5.00 | % | 3/20/2015 | $ | (206,250 | ) | $ | 234,836 | Bankruptcy/FTP | CCC- | |||||||||||||||||
Barclays | J.C. Penney Corp., Inc. 6.38%, 10/15/36 | USD | (5,000,000 | ) | Receive | 5.00 | 3/20/2015 | (206,250 | ) | 234,836 | Bankruptcy/FTP | CCC- | ||||||||||||||||||||
Barclays | J.C. Penney Corp., Inc. 6.38%, 10/15/36 | USD | (3,000,000 | ) | Receive | 5.00 | 3/20/2015 | (120,000 | ) | 137,152 | Bankruptcy/FTP | CCC- | ||||||||||||||||||||
Goldman Sachs | J.C. Penney Corp., Inc. 6.38%, 10/15/36 | USD | (6,666,000 | ) | Receive | 5.00 | 3/20/2015 | (466,620 | ) | 504,731 | Bankruptcy/FTP | CCC- | ||||||||||||||||||||
Credit Suisse | J.C. Penney Corp., Inc. 6.38%, 10/15/36 | USD | 3,333,000 | Pay | 5.00 | 12/20/2016 | 349,965 | (217,343 | ) | Bankruptcy/FTP | CCC- | |||||||||||||||||||||
Goldman Sachs | Masco Corp. 6.13%, 10/3/16 | USD | 500,000 | Pay | 1.00 | 12/20/2015 | 39,569 | (44,299 | ) | Bankruptcy/FTP | BBB | |||||||||||||||||||||
Morgan Stanley | Masco Corp. 6.13%, 10/3/16 | USD | 500,000 | Pay | 1.00 | 3/20/2016 | 30,352 | (36,093 | ) | Bankruptcy/FTP | BBB | |||||||||||||||||||||
Morgan Stanley | Masco Corp. 6.13%, 10/3/16 | USD | 1,000,000 | Pay | 1.00 | 6/20/2016 | 66,736 | (79,383 | ) | Bankruptcy/FTP | BBB | |||||||||||||||||||||
Goldman Sachs | Petroleo Brasileiro S/A Petrobras 8.38%, 12/10/18 | USD | 15,000,000 | Pay | 1.00 | 12/20/2019 | 1,698,746 | (465,792 | ) | Bankruptcy/FTP | BBB- | |||||||||||||||||||||
Morgan Stanley | Portugese Republic 4.95%, 10/25/23 | USD | 20,000,000 | Pay | 1.00 | 12/20/2019 | 773,071 | (65,676 | ) | Bankruptcy/FTP | Ba1 | |||||||||||||||||||||
Morgan Stanley | Republic of Austria 4.65%, 1/15/18 | USD | 30,000,000 | Pay | 1.00 | 12/20/2019 | (1,145,053 | ) | (31,498 | ) | Bankruptcy/FTP | AA+ | ||||||||||||||||||||
Barclays | Safeway Ltd. 6.13%, 12/17/18 | EUR | 10,000,000 | Pay | 1.00 | 9/20/2019 | 284,033 | 3,168 | Bankruptcy/FTP | Baa2 | ||||||||||||||||||||||
Goldman Sachs | Sears Roebuck Acceptance Corp. 7.00%, 6/1/32 | USD | 400,000 | Pay | 5.00 | 3/20/2019 | 95,000 | (22,235 | ) | Bankruptcy/FTP | CCC+ | |||||||||||||||||||||
Bank of America | Sears Roebuck Acceptance Corp. 7.00%, 6/1/32 | USD | 400,000 | Pay | 5.00 | 3/20/2019 | 93,000 | (20,235 | ) | Bankruptcy/FTP | CCC+ | |||||||||||||||||||||
Barclays | Sears Roebuck Acceptance Corp. 7.00%, 6/1/32 | USD | 2,000,000 | Pay | 5.00 | 3/20/2019 | 375,000 | (11,177 | ) | Bankruptcy/FTP | CCC+ | |||||||||||||||||||||
Barclays | Sears Roebuck Acceptance Corp. 7.00%, 6/1/32 | USD | 400,000 | Pay | 5.00 | 3/20/2019 | 74,000 | (1,235 | ) | Bankruptcy/FTP | CCC+ | |||||||||||||||||||||
Barclays | Sears Roebuck Acceptance Corp. 7.00%, 6/1/32 | USD | 600,000 | Pay | 5.00 | 3/20/2019 | 114,000 | (4,853 | ) | Bankruptcy/FTP | CCC+ | |||||||||||||||||||||
Goldman Sachs | Sears Roebuck Acceptance Corp. 7.00%, 6/1/32 | USD | 400,000 | Pay | 5.00 | 3/20/2019 | 73,000 | (235 | ) | Bankruptcy/FTP | CCC+ | |||||||||||||||||||||
Barclays | Sears Roebuck Acceptance Corp. 7.00%, 6/1/32 | USD | 400,000 | Pay | 5.00 | 3/20/2019 | 71,000 | 1,765 | Bankruptcy/FTP | CCC+ | ||||||||||||||||||||||
Notes to Financial Statements are an integral part of this Schedule.
19
Table of Contents
Driehaus Select Credit Fund
Schedule of Investments
December 31, 2014
| Counterparty | Reference Instrument | Currency | Notional AmountB | Pay/ ReceiveA Fixed Rate | Fixed Rate | Expiration Date | Premium Paid (Received) | Unrealized Appreciation/ (Depreciation) | Credit Event | RatingC | ||||||||||||||||||||||
Barclays | Sears Roebuck Acceptance Corp. 7.00%, 6/1/32 | USD | 1,000,000 | Pay | 5.00 | % | 6/20/2019 | $ | 185,000 | $ | 6,403 | Bankruptcy/FTP | CCC+ | |||||||||||||||||||
Goldman Sachs | The Markit CDX Credit Default Swap Index High Yield Series 22 | USD | (4,950,000 | ) | Receive | 5.00 | 6/20/2019 | 336,335 | 13,920 | Bankruptcy/FTP | NA | |||||||||||||||||||||
Goldman Sachs | The Markit CDX Credit Default Swap Index High Yield Series 22 | USD | (4,950,000 | ) | Receive | 5.00 | 6/20/2019 | 336,325 | 13,930 | Bankruptcy/FTP | NA | |||||||||||||||||||||
Goldman Sachs | The Markit CDX Credit Default Swap Index High Yield Series 22 | USD | (14,850,000 | ) | Receive | 5.00 | 6/20/2019 | 1,009,005 | 41,761 | Bankruptcy/FTP | NA | |||||||||||||||||||||
Goldman Sachs | The Markit iTraxx Europe Crossover Index Series 19 | EUR | 5,096,000 | Pay | 5.00 | 6/20/2018 | (333,284 | ) | (394,533 | ) | Bankruptcy/FTP | NA | ||||||||||||||||||||
Morgan Stanley | The Markit iTraxx Europe Sub Financials Series 20 | EUR | 10,000,000 | Pay | 5.00 | 12/20/2018 | (2,003,612 | ) | (15,382 | ) | Bankruptcy/FTP | NA | ||||||||||||||||||||
|
|
|
| |||||||||||||||||||||||||||||
Total Credit Default Swaps |
| 1,758,441 | (1,361,638 | ) | ||||||||||||||||||||||||||||
|
|
|
| |||||||||||||||||||||||||||||
Total Swap Contracts |
| $ | 1,758,441 | $ | (1,361,638 | ) | ||||||||||||||||||||||||||
|
|
|
| |||||||||||||||||||||||||||||
| A | If the Fund is paying a fixed rate, the counterparty acts as guarantor of the variable instrument and thus the Fund is a buyer of protection. If the Fund is receiving a fixed rate, the Fund acts as guarantor of the variable instrument and thus is a seller of protection. |
| B | For contracts to sell protection, the notional amout is equal to the maximum potential amount of the future payments and no recourse has been entered into in association with the contracts. |
| C | Based on Moody’s or Standard & Poor’s credit rating for the underlying reference instrument entity (unaudited). |
FTP=Failure to Pay
NR=Not Rated
NA=Not Applicable
EUR — Euro
USD — United States Dollar
FUTURES CONTRACTS
| Futures Contracts | Number of Contracts Long/(Short) | Expiration Date | Unrealized Appreciation/ (Depreciation) | |||||||||
U.S. 5 Year Treasury Note | (1,150 | ) | March 2015 | $ | 297,245 | |||||||
U.S. 10 Year Treasury Note | (583 | ) | March 2015 | (145,581 | ) | |||||||
U.S. Treasury Long Bond | (100 | ) | March 2015 | (289,087 | ) | |||||||
|
| |||||||||||
Total Futures Contracts | $ | (137,423 | ) | |||||||||
|
| |||||||||||
Notes to Financial Statements are an integral part of this Schedule.
20
Table of Contents
Driehaus Select Credit Fund
Schedule of Investments
December 31, 2014
SWAPTIONS
Interest Rate Swaptions
| Counterparty | Floating Rate Index | Currency | Notional Amount | Pay/ Receive Fixed Rate | Exercise Rate | Expiration Date | Premium Paid (Received) | Market Value | ||||||||||||||||||||
Morgan Stanley | 3-Month USD-LIBOR-BBA | USD | 40,000,000 | Pay | 2.53 | % | 2/23/2015 | $ | 511,000 | $ | 147,161 | |||||||||||||||||
Morgan Stanley | 3-Month USD-LIBOR-BBA | USD | 83,000,000 | Pay | 1.89 | 2/23/2015 | 599,675 | 371,994 | ||||||||||||||||||||
Morgan Stanley | 3-Month USD-LIBOR-BBA | USD | 116,000,000 | Pay | 2.23 | 2/23/2015 | 1,116,500 | 479,452 | ||||||||||||||||||||
|
|
|
| |||||||||||||||||||||||||
Total Interest Rate Swaptions |
| 2,227,175 | 998,607 | |||||||||||||||||||||||||
|
|
|
| |||||||||||||||||||||||||
TOTAL SWAPTIONS |
| $ | 2,227,175 | $ | 998,607 | |||||||||||||||||||||||
|
|
|
| |||||||||||||||||||||||||
USD — United States Dollar
FORWARD FOREIGN CURRENCY CONTRACTS
| Purchase Contracts | Settlement Date | Currency Amount Purchased | Value At Settlement Date | Value At December 31, 2014 | Unrealized Appreciation (Depreciation) | |||||||||||||||
Euro | March 18, 2015 | 2,988,750 | $ | 3,741,221 | $ | 3,619,100 | $ | (122,121 | ) | |||||||||||
| Sale Contracts | Settlement Date | Currency Amount Sold | Value At Settlement Date | Value At December 31, 2014 | Unrealized (Depreciation) | |||||||||||||||
British Pound | March 18, 2015 | (19,000,000 | ) | $ | (30,765,693 | ) | $ | (29,594,524 | ) | $ | 1,171,169 | |||||||||
Euro | March 18, 2015 | (47,570,000 | ) | (61,641,015 | ) | (57,602,879 | ) | 4,038,136 | ||||||||||||
|
|
|
|
|
| |||||||||||||||
| (92,406,708 | ) | (87,197,403 | ) | 5,209,305 | ||||||||||||||||
|
|
|
|
|
| |||||||||||||||
TOTAL FORWARD FOREIGN CURRENCY CONTRACTS |
| $ | (88,665,487 | ) | $ | (83,578,303 | ) | $ | 5,087,184 | |||||||||||
|
|
|
|
|
| |||||||||||||||
Notes to Financial Statements are an integral part of this Schedule.
21
Table of Contents
Driehaus Event Driven Fund — Portfolio Managers’ Letter
Dear Shareholders,
The Driehaus Event Driven Fund (“Fund”) returned -6.35% for the year. This return is in comparison to the performance of the Fund’s benchmark index, the S&P 500 Index (the “Benchmark”), which returned 13.69% for the same period, and the Citigroup 3-Month T-Bill Index, an additional index against which the Fund’s performance may be compared, which returned 0.03%.
2014 was a tumultuous year for event funds and we didn’t escape that tumult. On the positive side, we largely avoided certain situations in the merger arbitrage space that caused material pain for the average event-driven fund. On the negative side, we stumbled on a few discrete situations where external events overwhelmed our trade thesis.
Looking at trades that added to performance for the year, we identified several situations where our fundamental view informed us that the options market was mispricing volatility. Two of the Fund’s top five contributors were product cycle trades that identified deeply discounted equities with cheap options. The remaining three of our five highest returning positions were biotech names where we traded around data releases. Looking further down the list of top performers, there are many trades with positive asymmetry resulting from a very firm view of each trade’s valuation ceiling and floor. Going forward, this is a component that we will continue to stress in our trades.
At the event type level, the market dislocation category contributed the most to performance for the year. Market dislocation trades are based on a mispricing between securities, often caused by non-fundamental factors. While a rising equity market generally helped these trades, security selection was the primary determinant of the Fund’s success with these trades during 2014.
On the negative side, three things stand out: Africa, energy and sum-of-the-parts. Our worst performing position for the year, by far, was an energy trade that fell apart quickly due not only to the drop in oil prices, but also to management missteps. On Africa, the Ebola outbreak exposed us to an external event whose effect we initially underestimated. Trades related to energy and Africa account for three of our top five worst performers. The remaining two positions were sum-of-the-parts trades, one where we underestimated risks to the core business and the other where we believe management misled investors with their public disclosures. A sum-of-the-parts trade is when there are multiple businesses within a company and the valuations of the disparate businesses imply a significant discount to the value of the whole.
At the event type level, the most significant detractors from performance for the year were the portfolio hedges and earnings trades. Within the portfolio hedges category, trades structured to protect against increased market volatility detracted, as volatility remained more muted than we expected. Volatility trades are generally constructed by implementing option strategies, such as straddles or strangles on the S&P 500 Index or other indices. Earnings trades, which are based on a thesis involving an upside or downside surprise to earnings versus market expectations, also detracted because, in a few instances, the market reactions to earnings announcements worked against our positions.
Within the Fund, we seek to have lower volatility than the Benchmark. For the year, Fund volatility was 7.39% versus the Benchmark volatility of 11.52%. We also seek to provide some diversification. For 2014, the Fund’s correlation to the Benchmark was 0.60.
Looking ahead, we expect a positive environment for event-driven investment situations. We have identified several investment themes that we believe will help us find attractive opportunities. One theme we are following is the consolidation of market share leaders. As market share leaders consider the best ways to deploy capital, we expect many companies will attempt to gain scale through megadeals. We also expect merger arbitrage deals to provide new opportunities. In this opportunity set, we will look to establish and increase position sizes at times when failed deals fuel fear in the mergers and acquisition space, allowing us to enter positions at attractive spreads. We remain optimistic about the portfolio and look forward to capitalizing on the many new opportunities we are discovering.
22
Table of Contents
Thank you for your interest in the Driehaus Event Driven Fund. We appreciate your confidence in our management capabilities.
Sincerely,
| |  | ||
| K.C. Nelson | Adam Abbas | Michael Caldwell | ||
| Portfolio Manager | Assistant Portfolio Manager | Assistant Portfolio Manager |
Performance is historical and does not represent future results.
Please see the following performance page for index definitions.
23
Table of Contents
Driehaus Event Driven Fund
Performance Overview (unaudited)
The performance summarized below is historical and does not represent future results. Investment returns and principal value vary, and you may have a gain or loss when you sell shares. Performance data presented measures the change in the value of an investment in the Fund, assuming reinvestment of all dividends and capital gains.
The table does not reflect the deduction of taxes that a shareholder would pay on Fund distributions or the redemption of Fund shares. The graph compares the results of a $10,000 investment in the Fund since August 26, 2013 (the date of the Fund’s inception), with all dividends and capital gains reinvested, with the indicated indices (and dividends reinvested) for the same period.
| Cumulative Total Returns as of 12/31/14 | 1 Year | Since Inception (08/26/13 - 12/31/14) | ||||||
Driehaus Event Driven Fund (DEVDX)1 | –6.35% | 2.46% | ||||||
S&P 500 Index2 | 13.69% | 19.54% | ||||||
Citigroup 3-Month T-Bill Index3 | 0.03% | 0.03% | ||||||
| 1 | The returns for the periods reflect fee waivers and/or reimbursements without which performance would have been lower. |
| 2 | The S&P 500 Index consists of 500 stocks chosen for market size, liquidity and industry group. It is a market-weighted index, with each stock’s weight in the index proportionate to its market value. |
| 3 | The Citigroup 3-Month T-Bill Index is designed to mirror the performance of the 3-month U.S. Treasury Bill. The Citigroup 3-Month T-Bill Index is unmanaged and its returns reflect reinvestment of all distributions and changes in market prices. |
24
Table of Contents
Driehaus Event Driven Fund
Schedule of Investments
December 31, 2014
| Shares, Principal Amount, or Number of Contracts | Value | |||||||
| CORPORATE BONDS — 10.96% | ||||||||
Diversified Financial Services — 0.68% |
| |||||||
Denver Parent Corp. | $ | 11,341,250 | $ | 1,134,125 | ||||
Entertainment — 5.06% |
| |||||||
Peninsula Gaming LLC/Peninsula Gaming Corp. | 8,085,000 | 8,408,400 | ||||||
Media — 3.05% |
| |||||||
Comcast Corp. | 3,750,000 | 5,073,337 | ||||||
Real Estate Management — 0.16% |
| |||||||
Newland International Properties Corp. (Panama) | 645,031 | 272,203 | ||||||
Telecommunications — 2.01% |
| |||||||
Nortel Networks Ltd. (Canada) | 3,000,000 | 3,335,625 | ||||||
|
| |||||||
Total CORPORATE BONDS (Cost $28,529,315) | 18,223,690 | |||||||
|
| |||||||
| COMMON STOCK — 69.60% | ||||||||
Aerospace & Defense — 4.54% |
| |||||||
Alliant Techsystems, Inc. | 65,000 | 7,556,250 | ||||||
Agriculture — 5.44% |
| |||||||
Lorillard, Inc. | 143,645 | 9,041,016 | ||||||
Auto Manufacturers — 0.04% |
| |||||||
General Motors Co. | 297 | 10,368 | ||||||
Motors Liquidation Co. GUC Trust | 2,555 | 49,184 | ||||||
|
| |||||||
| 59,552 | ||||||||
|
| |||||||
Beverages — 4.41% |
| |||||||
SABMiller PLC (United Kingdom) | 140,000 | 7,333,853 | ||||||
Biotechnology — 1.71% |
| |||||||
Loxo Oncology, Inc.* | 241,317 | 2,835,475 | ||||||
Food — 6.50% |
| |||||||
SunOpta, Inc. | 311,871 | 3,695,671 | ||||||
Sysco Corp. | 179,300 | 7,116,417 | ||||||
|
| |||||||
| 10,812,088 | ||||||||
|
| |||||||
Healthcare — Products — 7.27% |
| |||||||
STERIS Corp. | 113,000 | 7,328,050 | ||||||
Synergy Health PLC (United Kingdom) | 147,000 | 4,765,586 | ||||||
|
| |||||||
| 12,093,636 | ||||||||
|
| |||||||
Household Products/Wares — 2.17% |
| |||||||
CSS Industries, Inc. | 130,198 | 3,598,673 | ||||||
Media — 4.72% |
| |||||||
Time Warner Cable, Inc. | 51,650 | 7,853,899 | ||||||
| Shares, Principal Amount, or Number of Contracts | Value | |||||||
Pharmaceuticals — 15.83% |
| |||||||
Aquinox Pharmaceuticals, Inc. (Canada)* | 109,493 | $ | 821,198 | |||||
Auxilium Pharmaceuticals, Inc.* | 161,000 | 5,535,985 | ||||||
Endo International PLC (Ireland)* | 103,000 | 7,428,360 | ||||||
GlaxoSmithKline PLC ADR | 181,000 | 7,735,940 | ||||||
Heron Therapeutics, Inc.* | 477,951 | 4,808,187 | ||||||
|
| |||||||
| 26,329,670 | ||||||||
|
| |||||||
Restaurants — 3.02% |
| |||||||
Ruby Tuesday, Inc.* | 735,130 | 5,028,289 | ||||||
Retail — 4.91% |
| |||||||
Family Dollar Stores, Inc. | 103,000 | 8,158,630 | ||||||
Telecommunications — 9.04% |
| |||||||
Nokia OYJ ADR (Finland) | 885,000 | 6,956,100 | ||||||
T-Mobile US, Inc.* | 300,000 | 8,082,000 | ||||||
|
| |||||||
| 15,038,100 | ||||||||
|
| |||||||
Total COMMON STOCK (Cost $116,119,768) | 115,739,131 | |||||||
|
| |||||||
| CONVERTIBLE PREFERRED STOCK — 0.00% | ||||||||
Auto Manufacturers — 0.00% |
| |||||||
General Motors Corp. | 25,000 | — | ||||||
General Motors Corp. Senior Convertible Preferred Escrow — C 7.25%, 4/15/412,3 | 162,750 | — | ||||||
|
| |||||||
| — | ||||||||
|
| |||||||
Total CONVERTIBLE PREFERRED STOCK | — | |||||||
|
| |||||||
| PURCHASED CALL OPTIONS — 0.63% | ||||||||
Baxter International, Inc., Exercise Price: $75.00, Expiration Date: January, 2015* | 3,000 | 90,000 | ||||||
Baxter International, Inc., Exercise Price: $77.50, Expiration Date: January, 2015* | 2,000 | 11,000 | ||||||
Baxter International, Inc., Exercise Price: $80.00, Expiration Date: May, 2015* | 2,000 | 142,000 | ||||||
Baxter International, Inc., Exercise Price: $80.00, Expiration Date: January, 2016* | 1,000 | 180,000 | ||||||
Notes to Financial Statements are an integral part of this Schedule.
25
Table of Contents
Driehaus Event Driven Fund
Schedule of Investments
December 31, 2014
| Shares, Principal Amount, or Number of Contracts | Value | |||||||
Halliburton Co., Exercise Price: $50.00, Expiration Date: January, 2016* | 500 | $ | 106,000 | |||||
Halliburton Co., Exercise Price: $60.00, Expiration Date: January, 2017* | 2,500 | 525,000 | ||||||
Synaptics, Inc., Exercise Price: $80.00, Expiration Date: January, 2015* | 400 | 4,000 | ||||||
|
| |||||||
Total PURCHASED CALL OPTIONS | 1,058,000 | |||||||
|
| |||||||
| WARRANTS — 0.02% | ||||||||
General Motors Co. — CW 16, Strike Price: $10.00, Expiration Date: 7/10/16* | 761 | 19,223 | ||||||
General Motors Co. — CW 19, Strike Price: $18.33, Expiration Date: 7/10/19* | 761 | 13,036 | ||||||
|
| |||||||
Total WARRANTS (Cost $23,932) | 32,259 | |||||||
|
| |||||||
| ||||||||
TOTAL INVESTMENTS | 81.21 | % | 135,053,080 | |||||
Other Assets less Liabilities | 18.79 | % | 31,246,755 | |||||
|
|
|
| |||||
Net Assets | 100.00 | % | $ | 166,299,835 | ||||
| ||||||||
| ||||||||
| SECURITIES SOLD SHORT — (15.73)% | ||||||||
| CORPORATE BONDS — (3.11)% | ||||||||
Media — (3.11)% |
| |||||||
Time Warner Cable, Inc. 4.50%, 9/15/42 | $ | (5,000,000 | ) | $ | (5,180,860 | ) | ||
|
| |||||||
Total Corporate Bonds (Proceeds $4,995,750) | (5,180,860 | ) | ||||||
|
| |||||||
| COMMON STOCK — (8.12)% | ||||||||
Aerospace & Defense — (1.41)% |
| |||||||
Orbital Sciences Corp.* | (87,000 | ) | (2,339,430 | ) | ||||
Agriculture — (1.61)% |
| |||||||
Reynolds American, Inc. | (41,788 | ) | (2,685,715 | ) | ||||
Media — (5.10)% |
| |||||||
Comcast Corp. — Cl. A | (146,097 | ) | (8,475,087 | ) | ||||
|
| |||||||
Total COMMON STOCK (Proceeds $12,729,733) | (13,500,232 | ) | ||||||
|
| |||||||
| Shares, Principal Amount, or Number of Contracts | Value | |||||||
| EXCHANGE-TRADED FUND — (4.50)% | ||||||||
iShares Russell 2000 ETF | (62,500 | ) | $ | (7,479,375 | ) | |||
|
| |||||||
Total EXCHANGE-TRADED FUND (Proceeds $7,260,711) | (7,479,375 | ) | ||||||
|
| |||||||
| ||||||||
TOTAL INVESTMENT SECURITIES SOLD SHORT (Proceeds $24,986,194) | (15.73)% | $ | (26,160,467 | ) | ||||
| ||||||||
| * | Non-income producing security. |
| 1 | 144A restricted security. |
| 2 | Security is in default. |
| 3 | Security valued at fair value as determined in good faith by Driehaus Capital Management LLC, investment adviser to the Fund, in accordance with procedures established by or under the direction of the Trust’s Board of Trustees. |
Percentages are stated as a percent of net assets.
Notes to Financial Statements are an integral part of this Schedule.
26
Table of Contents
Driehaus Event Driven Fund
Schedule of Investments
December 31, 2014
SWAP CONTRACTS
Credit Default Swaps
Counterparty | Reference Instrument | Currency | Notional AmountB | Pay/ ReceiveA Fixed Rate | Fixed Rate | Expiration Date | Premium Paid (Received) | Unrealized Appreciation/ (Depreciation) | Credit Event | RatingC | ||||||||||||||||||||||
Barclays | French Republic 4.25%, 4/25/19 | USD | 40,000,000 | Pay | 0.25 | % | 12/20/2019 | $ | 337,413 | $ | (77,529 | ) | Bankruptcy/FTP | Aa1 | ||||||||||||||||||
Bank of America | Portuguese Republic 4.95%, 10/25/23 | USD | 20,000,000 | Pay | 1.00 | 12/20/2019 | 964,552 | (82,295 | ) | Bankruptcy/FTP | Ba1 | |||||||||||||||||||||
Barclays | Portuguese Republic 4.95%, 10/25/23 | USD | 5,000,000 | Pay | 1.00 | 3/20/2020 | 211,443 | (14,525 | ) | Bankruptcy/FTP | B- | |||||||||||||||||||||
Bank of America | Republic of Austria 4.65%, 1/15/18 | USD | 10,000,000 | Pay | 1.00 | 12/20/2019 | (379,175 | ) | (13,009 | ) | Bankruptcy/FTP | AA+ | ||||||||||||||||||||
Barclays | Republic of Austria 4.65%, 1/15/18 | USD | 10,000,000 | Pay | 1.00 | 12/20/2019 | (384,195 | ) | (7,989 | ) | Bankruptcy/FTP | AA+ | ||||||||||||||||||||
|
|
|
| |||||||||||||||||||||||||||||
Total Credit Default Swaps |
| 750,038 | (195,347 | ) | ||||||||||||||||||||||||||||
|
|
|
| |||||||||||||||||||||||||||||
Total Swap Contracts |
| $ | 750,038 | $ | (195,347 | ) | ||||||||||||||||||||||||||
|
|
|
| |||||||||||||||||||||||||||||
| A | If the Fund is paying a fixed rate, the counterparty acts as guarantor of the variable instrument and thus the Fund is a buyer of protection. If the Fund is receiving a fixed rate, the Fund acts as guarantor of the variable instrument and thus is a seller of protection. |
| B | For contracts to sell protection, the notional amout is equal to the maximum potential amount of the future payments and no recourse has been entered into in association with the contracts. |
| C | Based on Moody’s or Standard & Poor’s credit rating for the underlying reference instrument entity (unaudited). |
FTP=Failure to Pay
NR=Not Rated
NA=Not Applicable
USD — United States Dollar
FUTURES CONTRACTS
| Futures Contracts | Number of Contracts Long/(Short) | Expiration Date | Unrealized Appreciation/ (Depreciation) | |||||||||
E-mini S&P 500 Index | (40 | ) | March 2015 | $ | (138,492 | ) | ||||||
|
| |||||||||||
Total Futures Contracts | $ | (138,492 | ) | |||||||||
|
| |||||||||||
Notes to Financial Statements are an integral part of this Schedule.
27
Table of Contents
Driehaus Event Driven Fund
Schedule of Investments
December 31, 2014
SWAPTIONS
Interest Rate Swaptions
| Counterparty | Fixed Rate Index | Currency | Notional Amount | Pay/ Receive Fixed Rate | Exercise Rate | Expiration Date | Premium Paid (Received) | Market Value | ||||||||||||||||||||
Goldman Sachs | 6-Month 10-Year Payor Swaption | USD | 58,000,000 | Pay | 2.80 | % | 1/20/2015 | $ | 980,200 | $ | 122 | |||||||||||||||||
|
|
|
| |||||||||||||||||||||||||
Total Interest Rate Swaptions |
| 980,200 | 122 | |||||||||||||||||||||||||
|
|
|
| |||||||||||||||||||||||||
TOTAL SWAPTIONS |
| $ | 980,200 | $ | 122 | |||||||||||||||||||||||
|
|
|
| |||||||||||||||||||||||||
USD — United States Dollar
FORWARD FOREIGN CURRENCY CONTRACTS
| Purchase Contracts | Settlement Date | Currency Amount Purchased | Value At Settlement Date | Value At December 31, 2014 | Unrealized Appreciation (Depreciation) | |||||||||||||||
Mexican Peso | March 18, 2015 | 50,911,919 | $ | 3,450,000 | $ | 3,434,118 | $ | (15,882 | ) | |||||||||||
|
|
|
|
|
| |||||||||||||||
Total Purchase Contracts |
| 3,450,000 | 3,434,118 | (15,882 | ) | |||||||||||||||
|
|
|
|
|
| |||||||||||||||
| Sale Contracts | Settlement Date | Currency Amount Sold | Value At Settlement Date | Value At December 31, 2014 | Unrealized Appreciation (Depreciation) | |||||||||||||||
Mexican Peso | March 18, 2015 | (101,899,662 | ) | $ | (6,900,000 | ) | $ | (6,873,351 | ) | $ | 26,649 | |||||||||
|
|
|
|
|
| |||||||||||||||
Total Sale Contracts |
| (6,900,000 | ) | (6,873,351 | ) | 26,649 | ||||||||||||||
|
|
|
|
|
| |||||||||||||||
TOTAL FORWARD FOREIGN CURRENCY CONTRACTS |
| $ | (3,450,000 | ) | $ | (3,439,233 | ) | $ | 10,767 | |||||||||||
|
|
|
|
|
| |||||||||||||||
Notes to Financial Statements are an integral part of this Schedule.
28
Table of Contents
Statements of Assets and Liabilities
December 31, 2014
Driehaus Active Income Fund | Driehaus Select Credit Fund | Driehaus Event Driven Fund | ||||||||||
ASSETS: | ||||||||||||
Investment securities, at fair value (cost $3,400,188,111, $756,428,816 and $144,674,893, respectively) | $ | 3,391,813,802 | $ | 687,244,181 | $ | 133,995,080 | ||||||
Purchased options contracts, at fair value (premiums paid $0, $2,861,360 and $1,514,972, respectively) | — | 4,378,500 | 1,058,000 | |||||||||
Purchased swaptions contracts, at fair value (premiums paid $4,738,825, $2,227,175 and $980,200, respectively) | 2,138,340 | 998,607 | 122 | |||||||||
Foreign currency, at fair value (cost $1,144,680, $598,876 and $877,637, respectively) | 1,135,372 | 596,122 | 875,176 | |||||||||
Unrealized appreciation on forward foreign currency contracts | 176,688 | 5,209,305 | 26,649 | |||||||||
Unrealized appreciation on open swap contracts | 2,315,883 | 1,430,186 | — | |||||||||
Premiums paid on open swap contracts | 17,995,752 | 7,094,546 | 1,513,408 | |||||||||
Cash | 521,019,338 | 30,697,131 | 11,738,642 | |||||||||
Collateral held at custodian for the benefit of brokers | 262,732,627 | 24,124,068 | 29,995,614 | |||||||||
Receivable for investment securities sold | 26,406,237 | 69,596,550 | 21,470,268 | |||||||||
Receivable for fund shares sold | 6,884,402 | 2,448,140 | 116,772 | |||||||||
Receivable from custodian | — | 1,044,496 | 53,400 | |||||||||
Receivable for interest and dividends | 27,891,011 | 11,086,682 | 980,495 | |||||||||
Receivable for variation margin | — | — | 48,600 | |||||||||
Prepaid expenses | 70,986 | 38,736 | 22,884 | |||||||||
|
|
|
|
|
| |||||||
| ||||||||||||
TOTAL ASSETS | 4,260,580,438 | 845,987,250 | 201,895,110 | |||||||||
|
|
|
|
|
| |||||||
| ||||||||||||
LIABILITIES: | ||||||||||||
Payable for investment securities sold short, at fair value (proceeds $139,579,149, $24,487,858 and $24,986,194, respectively) | 158,597,019 | 23,792,674 | 26,160,467 | |||||||||
Written options outstanding, at fair value (premiums received $0, $829,949 and $0, respectively) | — | 16,099 | — | |||||||||
Unrealized depreciation on forward foreign currency contracts | — | 122,121 | 15,882 | |||||||||
Unrealized depreciation on open swap contracts | 21,049,761 | 2,791,824 | 195,347 | |||||||||
Premiums received on open swap contracts | 14,469,355 | 5,336,105 | 763,370 | |||||||||
Payable for fund shares redeemed | 45,776,624 | 12,700,841 | 1,389,057 | |||||||||
Payable for investment securities purchased | 32,646,786 | — | 6,694,694 | |||||||||
Payable for interest and dividends on securities sold short | 1,519,090 | 113,801 | 107,891 | |||||||||
Payable for variation margin | 711,656 | 335,344 | — | |||||||||
Payable to affiliate | 1,937,185 | 630,805 | 150,585 | |||||||||
Accrued shareholder services plan fees | 628,548 | 195,089 | 23,743 | |||||||||
Accrued administration and accounting fees | 113,479 | 44,358 | 6,338 | |||||||||
Accrued expenses | 344,418 | 200,493 | 87,901 | |||||||||
|
|
|
|
|
| |||||||
| ||||||||||||
TOTAL LIABILITIES | 277,793,921 | 46,279,554 | 35,595,275 | |||||||||
|
|
|
|
|
| |||||||
| ||||||||||||
NET ASSETS | $ | 3,982,786,517 | $ | 799,707,696 | $ | 166,299,835 | ||||||
|
|
|
|
|
| |||||||
SHARES OUTSTANDING (Unlimited shares authorized, no par value) | 382,312,447 | 87,416,332 | 16,609,111 | |||||||||
|
|
|
|
|
| |||||||
NET ASSET VALUE, OFFERING AND REDEMPTION PRICE PER SHARE | $ | 10.42 | $ | 9.15 | $ | 10.01 | ||||||
|
|
|
|
|
| |||||||
| ||||||||||||
NET ASSETS CONSISTED OF THE FOLLOWING AT DECEMBER 31, 2014: | ||||||||||||
Paid-in-capital | $ | 4,252,822,922 | $ | 908,889,798 | $ | 185,902,159 | ||||||
Undistributed net investment income (loss) | 38,524,474 | (1,580,237 | ) | 19,689 | ||||||||
Undistributed net realized gain (loss) on investments, options, swaptions, futures, swap contracts and foreign currency | (259,382,563 | ) | (43,770,619 | ) | (6,004,415 | ) | ||||||
Net unrealized appreciation (depreciation) on: | ||||||||||||
Investments | (8,374,309 | ) | (69,184,635 | ) | (10,679,813 | ) | ||||||
Purchased options contracts | — | 1,517,140 | (456,972 | ) | ||||||||
Purchased swaptions contracts | (2,600,485 | ) | (1,228,568 | ) | (980,078 | ) | ||||||
Securities sold short | (19,017,870 | ) | 695,184 | (1,174,273 | ) | |||||||
Written options contracts | — | 813,850 | — | |||||||||
Futures contracts | (612,761 | ) | (137,423 | ) | (138,492 | ) | ||||||
Swap contracts | (18,733,878 | ) | (1,361,638 | ) | (195,347 | ) | ||||||
Foreign currency | (9,308 | ) | (2,754 | ) | (2,461 | ) | ||||||
Foreign currency translations | 170,295 | 5,057,598 | 9,838 | |||||||||
|
|
|
|
|
| |||||||
NET ASSETS | $ | 3,982,786,517 | $ | 799,707,696 | $ | 166,299,835 | ||||||
|
|
|
|
|
| |||||||
| ||||||||||||
Notes to Financial Statements are an integral part of these Statements.
29
Table of Contents
For the year ended December 31, 2014
Driehaus Active Income Fund | Driehaus Select Credit Fund | Driehaus Event Driven Fund | ||||||||||
INVESTMENT INCOME (LOSS): | ||||||||||||
Interest income (net of $91,837, $0 and $25,857 of non-reclaimable foreign taxes withheld, respectively) | $ | 148,227,346 | $ | 53,809,356 | $ | 2,426,460 | ||||||
Dividend income (net of $0, $0 and $35,791 of non-reclaimable foreign taxes withheld, respectively) | 16,065,842 | 1,503,114 | 996,728 | |||||||||
|
|
|
|
|
| |||||||
| ||||||||||||
Total investment income | 164,293,188 | 55,312,470 | 3,423,188 | |||||||||
|
|
|
|
|
| |||||||
| ||||||||||||
Expenses: | ||||||||||||
Investment advisory fees | 25,412,080 | 9,717,327 | 2,097,824 | |||||||||
Shareholder services plan fees | 6,919,194 | 2,522,790 | 236,019 | |||||||||
Administration and fund accounting fees | 1,455,095 | 602,890 | 146,848 | |||||||||
Transfer agent fees and expenses | 753,809 | 266,304 | 80,668 | |||||||||
Reports to shareholders | 223,504 | 109,147 | 52,132 | |||||||||
Federal and state registration fees | 171,902 | 92,239 | 61,896 | |||||||||
Trustees’ fees | 156,345 | 59,797 | 30,438 | |||||||||
Custody fees | 128,335 | 53,761 | 17,104 | |||||||||
Legal fees | 113,849 | 48,414 | 26,089 | |||||||||
Audit and tax fees | 50,935 | 50,930 | 50,930 | |||||||||
Chief compliance officer fees | 6,254 | 6,254 | 6,253 | |||||||||
Dividends on short positions | 5,914,197 | 420,316 | 525,001 | |||||||||
Interest on short positions | 5,033,154 | 1,458,944 | 138,414 | |||||||||
Interest expense | 1,844,635 | 492,725 | 276,753 | |||||||||
Miscellaneous | 199,864 | 97,391 | 27,339 | |||||||||
|
|
|
|
|
| |||||||
Total expenses | 48,383,152 | 15,999,229 | 3,773,708 | |||||||||
Fees recaptured by advisor | — | — | 4,008 | |||||||||
|
|
|
|
|
| |||||||
Net expenses | 48,383,152 | 15,999,229 | 3,777,716 | |||||||||
|
|
|
|
|
| |||||||
| ||||||||||||
Net investment income (loss) | 115,910,036 | 39,313,241 | (354,528 | ) | ||||||||
|
|
|
|
|
| |||||||
| ||||||||||||
| NET REALIZED AND UNREALIZED GAIN (LOSS) ON INVESTMENTS: | ||||||||||||
Net realized gain (loss) on transactions from: | ||||||||||||
Investments | 43,260,358 | (19,608,971 | ) | (156,219 | ) | |||||||
Purchased options contracts | 14,279,033 | 8,684,317 | (995,541 | ) | ||||||||
Purchased swaptions contracts | (19,147,525 | ) | (5,728,450 | ) | (973,500 | ) | ||||||
Securities sold short | (3,361,259 | ) | (3,812,077 | ) | (4,108,454 | ) | ||||||
Written options contracts | (25,228,790 | ) | (10,275,702 | ) | (176,106 | ) | ||||||
Written swaptions contracts | 853,875 | 341,550 | — | |||||||||
Futures contracts | (19,378,840 | ) | (4,842,703 | ) | 118,474 | |||||||
Swap contracts | (33,831,334 | ) | (8,632,468 | ) | (49,331 | ) | ||||||
Foreign currency | 41,008 | 73,413 | (67,218 | ) | ||||||||
|
|
|
|
|
| |||||||
| ||||||||||||
Total net realized gain (loss) on investments | (42,513,474 | ) | (43,801,091 | ) | (6,407,895 | ) | ||||||
|
|
|
|
|
| |||||||
| ||||||||||||
Change in net unrealized appreciation (depreciation) on: | ||||||||||||
Investments | (134,290,081 | ) | (82,772,652 | ) | (12,442,902 | ) | ||||||
Purchased options contracts | — | 555,181 | (274,425 | ) | ||||||||
Purchased swaptions contracts | (34,204 | ) | (266,212 | ) | (980,078 | ) | ||||||
Short positions | 15,348,044 | 6,131,987 | (1,202,805 | ) | ||||||||
Written options contracts | — | 813,850 | 8,018 | |||||||||
Futures contracts | (10,058,078 | ) | (2,354,777 | ) | (138,492 | ) | ||||||
Swap contracts | 16,292,190 | (41,102 | ) | (195,347 | ) | |||||||
Foreign currency | (9,308 | ) | (2,754 | ) | (2,346 | ) | ||||||
Foreign currency translations | 169,052 | 5,056,217 | 9,837 | |||||||||
|
|
|
|
|
| |||||||
Total change in net unrealized appreciation (depreciation) on investments | (112,582,385 | ) | (72,880,262 | ) | (15,218,540 | ) | ||||||
|
|
|
|
|
| |||||||
| ||||||||||||
Net realized and unrealized gain (loss) on investments | (155,095,859 | ) | (116,681,353 | ) | (21,626,435 | ) | ||||||
|
|
|
|
|
| |||||||
| ||||||||||||
NET INCREASE (DECREASE) IN NET ASSETS RESULTING FROM OPERATIONS | $ | (39,185,823 | ) | $ | (77,368,112 | ) | $ | (21,980,963 | ) | |||
|
|
|
|
|
| |||||||
| ||||||||||||
Notes to Financial Statements are an integral part of these Statements.
30
Table of Contents
(This page intentionally left blank)
31
Table of Contents
Statements of Changes in Net Assets
| Driehaus Active Income Fund | Driehaus Select Credit Fund | |||||||||||||||
| Year Ended December 31, 2014 | Year Ended December 31, 2013 | Year Ended December 31, 2014 | Year Ended December 31, 2013 | |||||||||||||
Operations: | ||||||||||||||||
Net investment income (loss) | $ | 115,910,036 | $ | 100,954,196 | $ | 39,313,241 | $ | 19,388,282 | ||||||||
Net realized gain (loss) on investments | (42,513,474 | ) | (22,579,599 | ) | (43,801,091 | ) | 4,740,978 | |||||||||
Net change in unrealized appreciation (depreciation) on investments | (112,582,385 | ) | 28,110,272 | (72,880,262 | ) | 14,506,483 | ||||||||||
|
|
|
|
|
|
|
| |||||||||
| ||||||||||||||||
Net increase (decrease) in net assets resulting from operations | (39,185,823 | ) | 106,484,869 | (77,368,112 | ) | 38,635,743 | ||||||||||
|
|
|
|
|
|
|
| |||||||||
| ||||||||||||||||
Distributions: | ||||||||||||||||
Net investment income | (110,661,412 | ) | (74,335,357 | ) | (36,843,162 | ) | (20,366,889 | ) | ||||||||
Net capital gains | — | — | (3,723,776 | ) | (3,845,894 | ) | ||||||||||
|
|
|
|
|
|
|
| |||||||||
Total distributions | (110,661,412 | ) | (74,335,357 | ) | (40,566,938 | ) | (24,212,783 | ) | ||||||||
|
|
|
|
|
|
|
| |||||||||
| ||||||||||||||||
Capital share transactions: | ||||||||||||||||
Proceeds from shares sold | 1,645,298,003 | 2,722,918,458 | 684,999,625 | 820,203,191 | ||||||||||||
Reinvested distributions | 54,829,331 | 43,039,239 | 25,753,542 | 17,481,030 | ||||||||||||
Cost of shares redeemed | (2,175,296,465 | ) | (1,057,325,798 | ) | (816,545,648 | ) | (153,795,032 | ) | ||||||||
|
|
|
|
|
|
|
| |||||||||
Net increase (decrease) from capital transactions | (475,169,131 | ) | 1,708,631,899 | (105,792,481 | ) | 683,889,189 | ||||||||||
|
|
|
|
|
|
|
| |||||||||
Total increase (decrease) in net assets | (625,016,366 | ) | 1,740,781,411 | (223,727,531 | ) | 698,312,149 | ||||||||||
|
|
|
|
|
|
|
| |||||||||
| ||||||||||||||||
NET ASSETS: | ||||||||||||||||
Beginning of period | $ | 4,607,802,883 | $ | 2,867,021,472 | $ | 1,023,435,227 | $ | 325,123,078 | ||||||||
|
|
|
|
|
|
|
| |||||||||
End of period | $ | 3,982,786,517 | $ | 4,607,802,883 | $ | 799,707,696 | $ | 1,023,435,227 | ||||||||
|
|
|
|
|
|
|
| |||||||||
Undistributed net investment income (loss) | $ | 38,254,474 | $ | 39,781,769 | $ | (1,580,237 | ) | $ | (558,062 | ) | ||||||
|
|
|
|
|
|
|
| |||||||||
| ||||||||||||||||
Capital share transactions in shares: | ||||||||||||||||
Shares sold | 153,456,745 | 253,362,227 | 67,850,452 | 81,193,431 | ||||||||||||
Reinvested distributions | 5,163,250 | 4,010,113 | 2,690,795 | 1,733,262 | ||||||||||||
Shares redeemed | (204,063,976 | ) | (98,271,129 | ) | (83,743,182 | ) | (15,242,049 | ) | ||||||||
|
|
|
|
|
|
|
| |||||||||
Net increase (decrease) | (45,443,981 | ) | 159,101,211 | (13,201,935 | ) | 67,684,644 | ||||||||||
|
|
|
|
|
|
|
| |||||||||
| ||||||||||||||||
| * | Fund commenced operations on August 26, 2013. |
Notes to Financial Statements are an integral part of these Statements.
32
Table of Contents
Statements of Changes in Net Assets
| Driehaus Event Driven Fund | ||||||
| Year Ended December 31, 2014 | For the period August 26, 2013* through December 31, 2013 | |||||
| $ | (354,528 | ) | $ | (201,340 | ) | |
| (6,407,895 | ) | 1,838,840 | |||
| (15,218,540 | ) | 1,600,942 | |||
|
|
|
| |||
| (21,980,963 | ) | 3,238,442 | |||
|
|
|
| |||
| — | — | |||||
| (661,102 | ) | (1,024,950 | ) | |||
|
|
|
| |||
| (661,102 | ) | (1,024,950 | ) | |||
|
|
|
| |||
| 313,193,192 | 40,436,692 | |||||
| 612,519 | 1,024,404 | |||||
| (166,896,936 | ) | (1,641,463 | ) | |||
|
|
|
| |||
| 146,908,775 |
| 39,819,633 | |||
|
|
|
| |||
| 124,266,710 |
| 42,033,125 | |||
|
|
|
| |||
| $ | 42,033,125 | $ | — | |||
|
|
|
| |||
| $ | 166,299,835 | $ | 42,033,125 | |||
|
|
|
| |||
$ | 19,689 |
| $ | (27,560 | ) | |
|
|
|
| |||
|
| |||||
| 28,570,565 | 3,972,158 | |||||
| 60,466 | 97,100 | |||||
| (15,936,011 | ) | (155,167 | ) | |||
|
|
|
| |||
| 12,695,020 | 3,914,091 | |||||
|
|
|
| |||
|
| |||||
Notes to Financial Statements are an integral part of these Statements.
33
Table of Contents
Financial Highlights
For the year December 31, | For the year December 31, | For the year December 31, | For the year December 31, | For the year December 31, | ||||||||||||||||
Net asset value, beginning of period | $ | 10.77 | $ | 10.67 | $ | 10.01 | $ | 11.05 | $ | 10.81 | ||||||||||
|
|
|
|
|
|
|
|
|
| |||||||||||
INCOME FROM INVESTMENT OPERATIONS: | ||||||||||||||||||||
Net investment income | 0.27 | 0.30 | 0.44 | 0.48 | 0.36 | |||||||||||||||
Net realized and unrealized gain (loss) on investments | (0.36 | ) | 0.02 | 0.49 | (1.09 | ) | 0.20 | |||||||||||||
|
|
|
|
|
|
|
|
|
| |||||||||||
Total from investment operations | (0.09 | ) | 0.32 | 0.93 | (0.61 | ) | 0.56 | |||||||||||||
|
|
|
|
|
|
|
|
|
| |||||||||||
LESS DISTRIBUTIONS TO SHAREHOLDERS FROM: | ||||||||||||||||||||
Net investment income | (0.26 | ) | (0.22 | ) | (0.27 | ) | (0.43 | ) | (0.26 | ) | ||||||||||
Net realized gains | — | — | — | — | † | (0.06 | ) | |||||||||||||
|
|
|
|
|
|
|
|
|
| |||||||||||
Total distributions | (0.26 | ) | (0.22 | ) | (0.27 | ) | (0.43 | ) | (0.32 | ) | ||||||||||
|
|
|
|
|
|
|
|
|
| |||||||||||
Net asset value, end of period | $ | 10.42 | $ | 10.77 | $ | 10.67 | $ | 10.01 | $ | 11.05 | ||||||||||
|
|
|
|
|
|
|
|
|
| |||||||||||
Total Return | (0.87 | )% | 2.99 | % | 9.34 | % | (5.61 | )% | 5.18 | % | ||||||||||
SUPPLEMENTAL DATA AND RATIOS: | ||||||||||||||||||||
Net assets, end of period (in 000’s) | $ | 3,982,787 | $ | 4,607,803 | $ | 2,867,021 | $ | 2,429,734 | $ | 2,183,062 | ||||||||||
Ratio of total expenses to average net assets | 1.05 | %1 | 1.14 | %3 | 1.31 | %5 | 1.01 | %7 | 1.79 | %9 | ||||||||||
Ratio of net investment income to average net assets | 2.51 | %2 | 2.80 | %4 | 4.22 | %6 | 4.44 | %8 | 3.24 | %10 | ||||||||||
Portfolio turnover rate | 43 | % | 48 | % | 42 | % | 55 | % | 51 | % | ||||||||||
| ||||||||||||||||||||
| † | Represents less than $0.01 per share. |
| 1 | The ratio of expenses to average net assets includes dividends and interest on short positions and interest expense. Excluding dividends and interest on short positions and interest expense, the ratio of expenses to average net assets was 0.77%. |
| 2 | The ratio of net investment income to average net assets includes dividends and interest on short positions and interest expense. Excluding dividends and interest on short positions and interest expense, the net investment income to average net assets was 2.79%. |
| 3 | The ratio of expenses to average net assets includes dividends and interest on short positions and interest expense. Excluding dividends and interest on short positions and interest expense, the ratio of expenses to average net assets was 0.79%. |
| 4 | The ratio of net investment income to average net assets includes dividends and interest on short positions and interest expense. Excluding dividends and interest on short positions and interest expense, the net investment income to average net assets was 3.15%. |
| 5 | The ratio of expenses to average net assets includes dividends and interest on short positions and interest expense. Excluding dividends and interest on short positions and interest expense, the ratio of expenses to average net assets was 0.91%. |
| 6 | The ratio of net investment income to average net assets includes dividends and interest on short positions and interest expense. Excluding dividends and interest on short positions and interest expense, the net investment income to average net assets was 4.63%. |
| 7 | The ratio of expenses to average net assets includes dividends and interest on short positions and interest expense. Excluding dividends and interest on short positions and interest expense, the ratio of expenses to average net assets was 0.88%. |
| 8 | The ratio of net investment income to average net assets includes dividends and interest on short positions and interest expense. Excluding dividends and interest on short positions and interest expense, the net investment income to average net assets was 4.58%. |
| 9 | The ratio of expenses to average net assets includes dividends and interest on short positions and interest expense. Excluding dividends and interest on short positions and interest expense, the ratio of expenses to average net assets was 0.92%. |
| 10 | The ratio of net investment income to average net assets includes dividends and interest on short positions and interest expense. Excluding dividends and interest on short positions and interest expense, the net investment income to average net assets was 4.12%. |
Notes to Financial Statements are an integral part of this Schedule.
34
Table of Contents
Driehaus Select Credit Fund
Financial Highlights
For the year December 31, | For the year December 31, | For the year December 31, | For the year December 31, | For the period September 30, 2010* to December 31, 2010 | ||||||||||||||||
Net asset value, beginning of period | $ | 10.17 | $ | 9.87 | $ | 9.57 | $ | 10.26 | $ | 10.00 | ||||||||||
|
|
|
|
|
|
|
|
|
| |||||||||||
INCOME FROM INVESTMENT OPERATIONS: | ||||||||||||||||||||
Net investment income | 0.32 | 0.32 | 0.58 | 0.57 | 0.05 | |||||||||||||||
Net realized and unrealized gain/(loss) on investments | (0.98 | ) | 0.33 | 0.21 | (0.84 | ) | 0.29 | |||||||||||||
|
|
|
|
|
|
|
|
|
| |||||||||||
Total from investment operations | (0.66 | ) | 0.65 | 0.79 | (0.27 | ) | 0.34 | |||||||||||||
|
|
|
|
|
|
|
|
|
| |||||||||||
LESS DISTRIBUTIONS TO SHAREHOLDERS FROM: | ||||||||||||||||||||
Net investment income | (0.32 | ) | (0.31 | ) | (0.49 | ) | (0.42 | ) | (0.06 | ) | ||||||||||
Net realized gain | (0.04 | ) | (0.04 | ) | — | — | — | |||||||||||||
Tax return of capital | — | — | — | — | (0.02 | ) | ||||||||||||||
|
|
|
|
|
|
|
|
|
| |||||||||||
Total distributions | (0.36 | ) | (0.35 | ) | (0.49 | ) | (0.42 | ) | (0.08 | ) | ||||||||||
|
|
|
|
|
|
|
|
|
| |||||||||||
Net asset value, end of period | $ | 9.15 | $ | 10.17 | $ | 9.87 | $ | 9.57 | $ | 10.26 | ||||||||||
|
|
|
|
|
|
|
|
|
| |||||||||||
Total Return | (6.56 | )% | 6.62 | % | 8.37 | % | (2.64 | )% | 3.43 | %1 | ||||||||||
SUPPLEMENTAL DATA AND RATIOS: | ||||||||||||||||||||
Net assets, end of period (in 000’s) | $ | 799,708 | $ | 1,023,435 | $ | 325,123 | $ | 184,111 | $ | 23,639 | ||||||||||
Ratio of total expenses to average net assets including waivers and recapture | 1.32 | %3 | 1.81 | %5 | 1.69 | %7 | 1.87 | %9 | 2.15 | %2,11 | ||||||||||
Ratio of total expenses to average net assets before waivers and recapture | 1.32 | %3 | 1.81 | %5 | 1.69 | %7 | 1.81 | %9 | 3.54 | %2,11 | ||||||||||
Ratio of net investment income to average net assets, including waivers and recapture | 3.24 | %4 | 3.17 | %6 | 5.82 | %8 | 5.75 | %10 | 1.98 | %2,12 | ||||||||||
Ratio of net investment income to average net assets, before waivers and recapture | 3.24 | %4 | 3.17 | %6 | 5.82 | %8 | 5.81 | %10 | 0.59 | %2,12 | ||||||||||
Portfolio turnover rate | 79 | % | 54 | % | 78 | % | 64 | % | 52 | %1 | ||||||||||
| ||||||||||||||||||||
| * | Fund commenced operations on September 30, 2010. |
| 1 | Not annualized. |
| 2 | Annualized. |
| 3 | The ratio of expenses to average net assets includes dividends and interest on short positions and interest expense. Excluding dividends and interest on short positions and interest expense, the ratio of expenses to average net assets was 1.12%. |
| 4 | The ratio of net investment income to average net assets includes dividends and interest on short positions and interest expense. Excluding dividends and interest on short positions and interest expense, the ratio of net investment income to average net assets was 3.43%. |
| 5 | The ratio of expenses to average net assets includes dividends and interest on short positions and interest expense. Excluding dividends and interest on short positions and interest expense, the ratio of expenses to average net assets was 1.13%. |
| 6 | The ratio of net investment income to average net assets includes dividends and interest on short positions and interest expense. Excluding dividends and interest on short positions and interest expense, the ratio of net investment income to average net assets was 3.85%. |
| 7 | The ratio of expenses to average net assets includes dividends and interest on short positions and interest expense. Excluding dividends and interest on short positions and interest expense, the ratio of expenses to average net assets was 1.23%. |
| 8 | The ratio of net investment income to average net assets includes dividends and interest on short positions and interest expense. Excluding dividends and interest on short positions and interest expense, the ratio of net investment income to average net assets was 6.28%. |
Notes to Financial Statements are an integral part of this Schedule.
35
Table of Contents
Driehaus Select Credit Fund
Financial Highlights — (Continued)
| 9 | The ratio of expenses to average net assets includes dividends and interest on short positions and interest expense. Excluding dividends and interest on short positions and interest expense, the ratio of expenses to average net assets, including recapture, was 1.43%. Excluding dividends and interest on short positions and interest expense, the ratio of expenses to average net assets before recapture was 1.37%. |
| 10 | The ratio of net investment income to average net assets includes dividends and interest on short positions and interest expense. Excluding dividends and interest on short positions and interest expense, the ratio of net investment income to average net assets, including recapture, was 6.20%. Excluding dividends and interest on short positions and interest expense, the ratio of net investment income to average net assets before recapture was 6.26%. |
| 11 | The ratio of expenses to average net assets includes dividends and interest on short positions and interest expense. Excluding dividends and interest on short positions and interest expense, the ratio of expenses to average net assets, less waivers, was 1.75%. Excluding dividends and interest on short positions and interest expense, the ratio of expenses to average net assets before waivers was 3.14%. |
| 12 | The ratio of net investment income to average net assets includes dividends and interest on short positions and interest expense. Excluding dividends and interest on short positions and interest expense, the ratio of net investment income to average net assets, less waivers, was 2.38%. Excluding dividends and interest on short positions and interest expense, the ratio of net investment income to average net assets before waivers was 0.99%. |
Notes to Financial Statements are an integral part of this Schedule.
36
Table of Contents
Driehaus Event Driven Fund
Financial Highlights
For the year ended December 31, | For the period August 26, December 31, | |||||||
Net asset value, beginning of period | $ | 10.74 | $ | 10.00 | ||||
|
|
|
| |||||
INCOME FROM INVESTMENT OPERATIONS: | ||||||||
Net investment loss | (0.02 | ) | (0.06 | ) | ||||
Net realized and unrealized gain (loss) on investments | (0.67 | ) | 1.09 | |||||
|
|
|
| |||||
Total from investment operations | (0.69 | ) | 1.03 | |||||
|
|
|
| |||||
LESS DISTRIBUTIONS TO SHAREHOLDERS FROM: | ||||||||
Net realized gains | (0.04 | ) | (0.29 | ) | ||||
|
|
|
| |||||
Net asset value, end of period | $ | 10.01 | $ | 10.74 | ||||
|
|
|
| |||||
Total Return | (6.35 | )% | 10.35 | %1 | ||||
SUPPLEMENTAL DATA AND RATIOS: | ||||||||
Net assets, end of period (in 000’s) | $ | 166,300 | $ | 42,033 | ||||
Ratio of total expenses to average net assets including waivers and recapture | 1.80 | %3 | 3.00 | %2,5 | ||||
Ratio of total expenses to average net assets before waivers and recapture | 1.80 | %3 | 3.03 | %2,5 | ||||
Ratio of net investment income (loss) to average net assets, including waivers and recapture | (0.17 | )%4 | (1.75 | )%2,6 | ||||
Ratio of net investment income (loss) to average net assets, before waivers and recapture | (0.17 | )%4 | (1.78 | )%2,6 | ||||
Portfolio turnover rate | 315 | % | 104 | %1 | ||||
| ||||||||
| * | Fund commenced operations on August 26, 2013. |
| 1 | Not annualized. |
| 2 | Annualized. |
| 3 | The ratio of expenses to average net assets includes dividends and interest on short positions and interest expense. Excluding dividends and interest on short positions and interest expense, the ratio of expenses to average net assets, including recapture, was 1.35%. Excluding dividends and interest on short positions and interest expense, the ratio of expenses to average net assets before recapture was 1.35%. |
| 4 | The ratio of net investment income to average net assets includes dividends and interest on short positions and interest expense. Excluding dividends and interest on short positions and interest expense, the ratio of net investment income (loss) to average net assets, including recapture, was 0.28%. Excluding dividends and interest on short positions and interest expense, the ratio of net investment income (loss) to average net assets before recapture was 0.28%. |
| 5 | The ratio of expenses to average net assets includes dividends and interest on short positions. Excluding dividends and interest on short positions the ratio of expenses to average net assets, less waivers, was 2.00%. Excluding dividends and interest on short positions, the ratio of expenses to average net assets before waivers was 2.03%. |
��
| 6 | The ratio of net investment income to average net assets includes dividends and interest on short positions. Excluding dividends and interest on short positions, the ratio of net investment income (loss) to average net assets, less waivers, was (0.75)%. Excluding dividends and interest on short positions, the ratio of net investment income (loss) to average net assets before waivers was (0.78)%. |
Notes to Financial Statements are an integral part of this Schedule.
37
Table of Contents
Driehaus Mutual Funds
A. ORGANIZATION AND SUMMARY OF SIGNIFICANT ACCOUNTING POLICIES
Organization
The Driehaus Mutual Funds (the “Trust”) is an open-end registered management investment company under the Investment Company Act of 1940, as amended, organized as a Delaware statutory trust, with eight separate series currently in operation. The Trust was organized under an Agreement and Declaration of Trust dated May 31, 1996, as subsequently amended and restated as of June 6, 2013, and may issue an unlimited number of full and fractional units of beneficial interest (shares) without par value. The Driehaus Active Income Fund (the “Active Income Fund”) commenced operations on June 1, 2009 following the receipt of the assets and liabilities of the Lotsoff Capital Management Active Income Fund (the “Acquired Fund”) pursuant to a plan of reorganization approved by the shareholders of the Acquired Fund. The reorganization was accomplished by a tax-free exchange of Acquired Fund shares for an equal number of shares of the Active Income Fund as of June 1, 2009. The Active Income Fund seeks to provide current income and capital appreciation. The Active Income Fund was closed to new investors as of March 1, 2011. The Driehaus Select Credit Fund (the “Select Credit Fund”) commenced operations on September 30, 2010. The Select Credit Fund seeks to provide positive returns under a variety of market conditions. The Select Credit Fund was closed to new investors as of January 31, 2014. The Driehaus Event Driven Fund (the “Event Driven Fund” and together with the Active Income Fund and Select Credit Fund, the “Funds”) commenced operations on August 26, 2013, following the receipt of the assets and liabilities of the Driehaus Credit Opportunities Fund, L.P. The Event Driven Fund seeks to provide positive returns over full market cycles.
Significant Accounting Policies
The presentation of financial statements in conformity with U.S. generally accepted accounting principles (“GAAP”) requires management to make estimates and assumptions that affect the reported amounts of assets and liabilities at the date of the financial statements and the reported amounts of income and expenses. Actual results may differ from those estimates.
Securities Valuation
Investments in securities traded on a national securities exchange, including exchange-traded futures and options, are valued at the last reported sales or settlement price on the day of valuation and are generally classified as level 1. Securities traded on the Nasdaq markets are valued at the Nasdaq Official Closing Price (“NOCP”) and are generally classified as level 1. Exchange-traded securities for which no sale was reported and Nasdaq-traded securities for which there is no NOCP are valued at the mean of the closing bid and ask prices from the exchange the security is primarily traded on and are generally classified as level 1. Long-term fixed income securities are valued at the representative quoted bid price when held long or the representative quoted ask price if sold short or, if such prices are not available, at prices for securities of comparable maturity, quality and type or as determined by an independent pricing service. The pricing service provider may employ methodologies that utilize actual market transactions, broker-dealer supplied valuations or other techniques. Such techniques generally consider factors such as composite security prices, yields, maturities, call features, credit ratings and developments relating to specific securities, in arriving at valuations. Fixed income securities are generally classified as level 2. Short-term investments with remaining maturities of 60 days or less at the time of purchase are stated at amortized cost, which approximates fair value. If amortized cost does not approximate fair value, short-term securities are reported at fair value. These securities are generally classified as level 2. Swaps, forward foreign currency contracts and other financial derivatives are valued daily, primarily by an independent pricing service using pricing models and are generally classified as level 2. The pricing models use inputs that are observed from actively quoted markets such as issuer details, indices, spreads, interest rates, yield curves, dividends and exchange rates. If valuations are not available from the independent pricing service or values received are deemed not representative of market value, values will be obtained from a third party broker-dealer or counterparty. Investments initially valued in currencies other than the U.S. dollar are converted to the U.S. dollar using exchange rates obtained from an independent pricing service. Securities for which market quotations are not readily available are valued at their fair value as determined in good faith in accordance with procedures established by or under the direction of the Trust’s Board of Trustees and are generally classified as level 3. Under these procedures, the Funds primarily employ a market-based approach which may use related or comparable assets or liabilities, recent transactions, market multiples, book values and
38
Table of Contents
Driehaus Mutual Funds
Notes to Financial Statements — (Continued)
other relevant information for the investment to determine the fair value of the investment. It is possible that the estimated values may differ significantly from the values that would have been used had a ready market existed for the investments, and such differences could be material.
Each Fund is subject to fair value accounting standards that define fair value, establish the framework for measuring fair value and provide a three-level hierarchy for fair valuation based upon the inputs to the valuation as of the measurement date. The three levels of the fair value hierarchy are as follows:
Level 1 — quoted prices for active markets for identical securities
Level 2 — significant observable inputs (including quoted prices for similar securities, interest rates, prepayment speeds, credit risk, etc.)
Level 3 — significant unobservable inputs (including the Fund’s own assumptions in determining the fair value of investments).
The Funds adopted the Financial Accounting Standards Board (“FASB”) amendments to authoritative guidance which require the Funds to disclose details of transfers in and out of Level 1 and Level 2 measurements and Level 2 and Level 3 measurements and the reasons for the transfers. During the period ended December 31, 2014, there were no significant transfers between levels for the Event Driven Fund. It is the Funds’ policy to recognize transfers into and out of all levels at the end of the reporting period.
The inputs or methodology used for valuing securities are not necessarily an indication of the risk associated with investing in those securities. The following is a summary of the inputs used to value the Active Income Fund’s investments as of December 31, 2014:
Assets | Level 1 | Level 2 | Level 3 | Total | ||||||||||||
Asset-Backed Securities | $ | — | $ | 238,921,156 | $ | — | $ | 238,921,156 | ||||||||
Bank Loans | — | 1,218,330,103 | — | 1,218,330,103 | ||||||||||||
Common Stocks | ||||||||||||||||
Agriculture | 7,867,500 | — | — | 7,867,500 | ||||||||||||
Auto Manufacturers | 48,699,165 | — | — | 48,699,165 | ||||||||||||
Auto Parts & Equipment | 33,940,500 | — | — | 33,940,500 | ||||||||||||
Chemicals | 13,864,270 | — | — | 13,864,270 | ||||||||||||
Media | 22,698,148 | — | — | 22,698,148 | ||||||||||||
Retail | 7,524,950 | — | — | 7,524,950 | ||||||||||||
Telecommunications | 5,388,000 | — | — | 5,388,000 | ||||||||||||
Convertible Corporate Bonds | — | 106,871,220 | — | 106,871,220 | ||||||||||||
Convertible Preferred Stocks | ||||||||||||||||
Auto Manufacturers | — | — | — | — | ||||||||||||
Banks | 18,981,996 | — | — | 18,981,996 | ||||||||||||
Corporate Bonds | — | 1,301,676,387 | — | 1,301,676,387 | ||||||||||||
Preferred Stocks | ||||||||||||||||
Banks | 45,111,436 | — | — | 45,111,436 | ||||||||||||
Diversified Financial Services | 28,409,594 | — | — | 28,409,594 | ||||||||||||
Holding Companies – Diversified | — | 61,379,300 | — | 61,379,300 | ||||||||||||
Telecommunications | — | 45,529,013 | — | 45,529,013 | ||||||||||||
Short-Term Investments | 412,915 | — | — | 412,915 | ||||||||||||
U.S. Government and Agency Securities | — | 164,633,139 | — | 164,633,139 | ||||||||||||
Warrants | 21,575,010 | — | — | 21,575,010 | ||||||||||||
|
|
|
|
|
|
|
| |||||||||
Total | $ | 254,473,484 | $ | 3,137,340,318 | $ | — | $ | 3,391,813,802 | ||||||||
|
|
|
|
|
|
|
| |||||||||
39
Table of Contents
Driehaus Mutual Funds
Notes to Financial Statements — (Continued)
Liabilities | Level 1 | Level 2 | Level 3 | Total | ||||||||||||
Common Stocks | ||||||||||||||||
Agriculture | $ | (2,337,050 | ) | $ | — | $ | — | $ | (2,337,050 | ) | ||||||
Banks | (11,240,663 | ) | — | — | (11,240,663 | ) | ||||||||||
Healthcare-Services | (4,035,487 | ) | — | — | (4,035,487 | ) | ||||||||||
Lodging | (26,703,064 | ) | — | — | (26,703,064 | ) | ||||||||||
Media | (24,987,691 | ) | — | — | (24,987,691 | ) | ||||||||||
Real Estate Investment Trusts | (29,950,483 | ) | — | — | (29,950,483 | ) | ||||||||||
Corporate Bonds | — | (37,827,738 | ) | — | (37,827,738 | ) | ||||||||||
Exchange-Traded Fund | (21,514,843 | ) | — | — | (21,514,843 | ) | ||||||||||
|
|
|
|
|
|
|
| |||||||||
Total | $ | (120,769,281 | ) | $ | (37,827,738 | ) | $ | — | $ | (158,597,019 | ) | |||||
|
|
|
|
|
|
|
| |||||||||
Other Financial Instruments* | ||||||||||||||||
Credit Default Swaps — Assets | $ | — | $ | 20,311,635 | $ | — | $ | 20,311,635 | ||||||||
Credit Default Swaps — Liabilities | — | (35,519,116 | ) | — | (35,519,116 | ) | ||||||||||
Forward Foreign Currency Contracts — Assets | — | 176,688 | — | 176,688 | ||||||||||||
Futures Contracts | (612,761 | ) | — | — | (612,761 | ) | ||||||||||
Interest Rate Swaptions | — | 2,138,340 | — | 2,138,340 | ||||||||||||
|
|
|
|
|
|
|
| |||||||||
Total Other Financial Instruments | $ | (612,761 | ) | $ | (12,892,453 | ) | $ | — | $ | (13,505,214 | ) | |||||
|
|
|
|
|
|
|
| |||||||||
| * | Other financial instruments are swap, forward foreign currency and futures contracts and interest rate swaptions, which are detailed in the Schedule of Investments. |
Following is a reconciliation of Level 3 assets for which significant unobservable inputs were used to determine fair value in the Active Income Fund:
| Investments, at Value | ||||
Balance as of December 31, 2013 | $ | — | ||
Realized gain (loss) | — | |||
Change in net unrealized appreciation (depreciation) | — | |||
Purchase | — | |||
Sales | — | |||
Transfers in and/or out of Level 3 | — | |||
|
| |||
Balance as of December 31, 2014 | $ | — | ||
|
| |||
As of December 31, 2014, the Active Income Fund held Level 3 investments in General Motors Corp. senior convertible preferred stock, valued at fair value as determined in good faith in accordance with procedures established by or under the direction of the Trust’s Board of Trustees. As a part of the ongoing restructuring of General Motors, any value previously ascribed to these holdings has been transferred to the General Motors Co. Motors Liquidation Co. GUC Trust common stock, which is freely and actively traded, and therefore the senior convertible preferred stock was fair valued at $0.
As of December 31, 2014, the Active Income Fund held Level 3 investments in Momentive Performance Materials, Inc. corporate bonds, valued at fair value as determined in good faith in accordance with procedures established by or under the direction of the Trust’s Board of Trustees. Momentive filed for Chapter 11 bankruptcy and emerged in 2014. As a part of the ongoing restructuring of the company, the bankruptcy court assigned a zero recovery to these holdings, therefore the corporate bond was fair valued at $0. At the beginning of the period, this security was classified as a Level 1, and represents the only transfer between levels for the Active Income Fund and Select Credit Fund.
40
Table of Contents
Driehaus Mutual Funds
Notes to Financial Statements — (Continued)
The following is a summary of the inputs used to value the Select Credit Fund’s investments as of December 31, 2014:
Assets | Level 1 | Level 2 | Level 3 | Total | ||||||||||||
Bank Loans | $ | — | $ | 154,451,480 | $ | — | $ | 154,451,480 | ||||||||
Common Stocks | ||||||||||||||||
Agriculture | 13,428,563 | — | — | 13,428,563 | ||||||||||||
Auto Manufacturers | 8,591,312 | — | — | 8,591,312 | ||||||||||||
Auto Parts & Equipment | 6,171,000 | — | — | 6,171,000 | ||||||||||||
Media | 8,527,373 | — | — | 8,527,373 | ||||||||||||
Oil & Gas | 12,599,455 | — | — | 12,599,455 | ||||||||||||
Restaurants | 4,072,714 | — | — | 4,072,714 | ||||||||||||
Telecommunications | 14,067,056 | — | — | 14,067,056 | ||||||||||||
Convertible Corporate Bonds | — | 35,163,704 | — | 35,163,704 | ||||||||||||
Convertible Preferred Stocks | ||||||||||||||||
Auto Manufacturers | — | — | — | — | ||||||||||||
Corporate Bonds | — | 429,693,277 | — | 429,693,277 | ||||||||||||
Purchased Put Options | 4,378,500 | — | — | 4,378,500 | ||||||||||||
Short-Term Investments | 100,113 | — | — | 100,113 | ||||||||||||
Warrants | 378,134 | — | — | 378,134 | ||||||||||||
|
|
|
|
|
|
|
| |||||||||
Total | $ | 72,314,220 | $ | 619,308,461 | $ | — | $ | 691,622,681 | ||||||||
|
|
|
|
|
|
|
| |||||||||
Liabilities | ||||||||||||||||
Common Stocks | ||||||||||||||||
Agriculture | $ | (3,988,917 | ) | $ | — | $ | — | $ | (3,988,917 | ) | ||||||
Electrical Components & Equipment | (10,217,134 | ) | — | — | (10,217,134 | ) | ||||||||||
Health Care — Services | (567,634 | ) | — | — | (567,634 | ) | ||||||||||
Media | (9,018,989 | ) | — | — | (9,018,989 | ) | ||||||||||
Written Call Options | — | (16,099 | ) | — | (16,099 | ) | ||||||||||
|
|
|
|
|
|
|
| |||||||||
Total | $ | (23,792,674 | ) | $ | (16,099 | ) | $ | — | $ | (23,808,773 | ) | |||||
|
|
|
|
|
|
|
| |||||||||
Other Financial Instruments* | ||||||||||||||||
Credit Default Swaps — Assets | $ | — | $ | 8,524,732 | $ | — | $ | 8,524,732 | ||||||||
Credit Default Swaps — Liabilities | — | (8,127,929 | ) | — | (8,127,929 | ) | ||||||||||
Forward Foreign Currency Contracts — Asset | — | 5,209,305 | — | 5,209,305 | ||||||||||||
Forward Foreign Currency Contracts — Liability | — | (122,121 | ) | — | (122,121 | ) | ||||||||||
Futures Contracts | (137,423 | ) | — | — | (137,423 | ) | ||||||||||
Interest Rate Swaptions | — | 998,607 | — | 998,607 | ||||||||||||
|
|
|
|
|
|
|
| |||||||||
Total Other Financial Instruments | $ | (137,423 | ) | $ | 6,482,594 | $ | — | $ | 6,345,171 | |||||||
|
|
|
|
|
|
|
| |||||||||
| * | Other financial instruments are swap, forward foreign currency and futures contracts and interest rate swaptions, which are detailed in the Schedule of Investments. |
41
Table of Contents
Driehaus Mutual Funds
Notes to Financial Statements — (Continued)
Following is a reconciliation of Level 3 assets for which significant unobservable inputs were used to determine fair value in the Select Credit Fund:
| Investments, at Value | ||||
Balance as of December 31, 2013 | $ | 2,625,000 | ||
Realized gain (loss) | (1,050,010 | ) | ||
Change in net unrealized appreciation (depreciation) | 875,000 | |||
Purchase | — | |||
Sales | (2,449,990 | ) | ||
Transfers in and/or out of Level 3 | — | |||
|
| |||
Balance as of December 31, 2014 | $ | — | ||
|
| |||
As of December 31, 2014, the Select Credit Fund held Level 3 investments in General Motors Corp. senior convertible preferred stock and Momentive Performance Materials, Inc. corporate bonds, which were valued in the same manner as described above for the Active Income Fund.
The following is a summary of the inputs used to value the Event Driven Fund’s investments as of December 31, 2014:
Assets | Level 1 | Level 2 | Level 3 | Total | ||||||||||||
Common Stocks | ||||||||||||||||
Aerospace & Defense | $ | 7,556,250 | $ | — | $ | — | $ | 7,556,250 | ||||||||
Agriculture | 9,041,016 | — | — | 9,041,016 | ||||||||||||
Auto Manufacturers | 59,552 | — | — | 59,552 | ||||||||||||
Beverages | 7,333,853 | — | — | 7,333,853 | ||||||||||||
Biotechnology | 2,835,475 | — | — | 2,835,475 | ||||||||||||
Food | 10,812,088 | — | — | 10,812,088 | ||||||||||||
Healthcare – Products | 12,093,636 | — | — | 12,093,636 | ||||||||||||
Household Products/Wares | 3,598,673 | — | — | 3,598,673 | ||||||||||||
Media | 7,853,899 | — | — | 7,853,899 | ||||||||||||
Pharmaceuticals | 26,329,670 | — | — | 26,329,670 | ||||||||||||
Restaurants | 5,028,289 | — | — | 5,028,289 | ||||||||||||
Retail | 8,158,630 | — | — | 8,158,630 | ||||||||||||
Telecommunications | 15,038,100 | — | — | 15,038,100 | ||||||||||||
Convertible Preferred Stocks | ||||||||||||||||
Auto Manufacturers | — | — | — | — | ||||||||||||
Corporate Bonds | — | 18,223,690 | — | 18,223,690 | ||||||||||||
Purchased Call Options | 1,058,000 | — | — | 1,058,000 | ||||||||||||
Warrants | 32,259 | — | — | 32,259 | ||||||||||||
|
|
|
|
|
|
|
| |||||||||
Total | $ | 116,829,390 | $ | 18,223,690 | $ | — | $ | 135,053,080 | ||||||||
|
|
|
|
|
|
|
| |||||||||
42
Table of Contents
Driehaus Mutual Funds
Notes to Financial Statements — (Continued)
Liabilities | Level 1 | Level 2 | Level 3 | Total | ||||||||||||
Common Stocks | ||||||||||||||||
Aerospace & Defense | $ | (2,339,430 | ) | $ | — | $ | — | $ | (2,339,430 | ) | ||||||
Agriculture | (2,685,715 | ) | — | — | (2,685,715 | ) | ||||||||||
Media | (8,475,087 | ) | — | — | (8,475,087 | ) | ||||||||||
Corporate Bonds | — | (5,180,860 | ) | — | (5,180,860 | ) | ||||||||||
Exchange-Traded Fund | (7,479,375 | ) | — | — | (7,479,375 | ) | ||||||||||
|
|
|
|
|
|
|
| |||||||||
Total | $ | (20,979,607 | ) | $ | (5,180,860 | ) | $ | — | $ | (26,160,467 | ) | |||||
|
|
|
|
|
|
|
| |||||||||
Other Financial Instruments* | ||||||||||||||||
Credit Default Swaps — Assets | $ | — | $ | 1,513,408 | $ | — | $ | 1,513,408 | ||||||||
Credit Default Swaps — Liabilities | — | (958,717 | ) | (958,717 | ) | |||||||||||
Futures Contracts | (138,492 | ) | — | — | (138,492 | ) | ||||||||||
Forward Foreign Currency Contracts — Asset | — | 26,649 | — | 26,649 | ||||||||||||
Forward Foreign Currency Contracts — Liabilities | — | (15,882 | ) | — | (15,882 | ) | ||||||||||
Interest Rate Swaptions | — | 122 | — | 122 | ||||||||||||
|
|
|
|
|
|
|
| |||||||||
Total Other Financial Instruments | $ | (138,492 | ) | $ | 565,580 | $ | — | $ | 427,088 | |||||||
|
|
|
|
|
|
|
| |||||||||
| * | Other financial instruments are swap, forward foreign currency and futures contracts and interest rate swaptions, which are detailed in the Schedule of Investments. |
Following is a reconciliation of Level 3 assets for which significant unobservable inputs were used to determine fair value in the Event Driven Fund:
| Investments, at Value | ||||
Balance as of December 31, 2013 | $ | — | ||
Realized gain (loss) | — | |||
Change in net unrealized appreciation (depreciation) | — | |||
Purchase | — | |||
Sales | — | |||
Transfers in and/or out of Level 3 | — | |||
|
| |||
Balance as of December 31, 2014 | $ | — | ||
|
| |||
As of December 31, 2014, the Event Driven Fund held Level 3 investments in General Motors Corp. senior convertible preferred stock, which were valued in the same manner as described above for the Active Income Fund.
Securities Sold Short
The Funds are engaged in selling securities short, which obligates them to replace a borrowed security with the same security at current market value. Each Fund incurs a loss if the price of the security increases between the date of the short sale and the date on which the Fund replaces the borrowed security. Each Fund realizes a gain if the price of the security declines between those dates. Gains are limited to the price at which the Fund sold the security short, while losses are potentially unlimited in size.
The Funds are required to establish a margin account with the broker lending the security sold short. While the short sale is outstanding, the broker retains the proceeds of the short sale and the Fund must maintain a deposit with the broker consisting of cash and securities having a value equal to a specified percentage of the value of the securities sold short. Such deposit is included in “Collateral held at custodian for the benefit of brokers” on the Statements of Assets and Liabilities. Each Fund is obligated to pay any dividends or interest due on securities sold short. Such dividends and interest are recorded as an expense to the Funds on the Statements of Operations.
43
Table of Contents
Driehaus Mutual Funds
Notes to Financial Statements — (Continued)
Federal Income Taxes
The Funds’ policy is to comply with the requirements of Subchapter M of the Internal Revenue Code that are applicable to regulated investment companies and to distribute substantially all their taxable income to their shareholders. Therefore, no Federal income tax provision is required.
The FASB’s “Accounting for Uncertainty in Income Taxes” (“Tax Statement”) requires the evaluation of tax positions taken or expected to be taken in the course of preparing the Funds’ tax returns to determine whether the tax positions are “more-likely-than-not” of being sustained by the applicable tax authority. Tax positions not deemed to meet the more-likely-than-not threshold would be recorded as a tax benefit or expense in the current year. Management has evaluated the implications of the Tax Statement and all of the uncertain tax positions and has determined that no liability is required to be recorded in the financial statements as of December 31, 2014. The Funds file tax returns with the U.S. Internal Revenue Service and various states. Generally, the tax years ended December 31, 2011, 2012, 2013 and 2014 remain subject to examination by taxing authorities.
For Federal income tax purposes, capital loss carryforwards represent net capital losses of a fund that may be carried forward and applied against future net realized gains. On December 22, 2010, the Regulated Investment Company Modernization Act of 2010 was enacted to modernize several of the Federal income and excise tax provisions related to regulated investment companies. Under pre-enactment law, capital losses could be carried forward for up to eight years, and were required to be carried forward as short-term capital losses, irrespective of the character of the original loss. New net capital losses (those earned in taxable years beginning after December 22, 2010) may be carried forward indefinitely and must retain the character of the original loss. Such new net capital losses generally must be used by a regulated investment company before it uses any net capital losses incurred in taxable years beginning on or before December 22, 2010. This increases the likelihood that net capital losses incurred in taxable years beginning on or before December 22, 2010 will expire unused.
At December 31, 2014, gross unrealized appreciation and depreciation on investments, based on cost for Federal income tax purposes, were as follows:
| Active Income Fund | Select Credit Fund | Event Driven Fund | ||||||||||
Cost of investments | $ | 3,420,489,206 | $ | 759,641,299 | $ | 146,223,602 | ||||||
|
|
|
|
|
| |||||||
Gross unrealized appreciation | $ | 94,057,683 | $ | 10,377,059 | $ | 3,675,924 | ||||||
Gross unrealized depreciation | (122,733,087) | (78,395,677) | (14,846,446) | |||||||||
|
|
|
|
|
| |||||||
Net unrealized appreciation (depreciation) on investments | $ | (28,675,404) | $ | (68,018,618) | $ | (11,170,522) | ||||||
|
|
|
|
|
| |||||||
The difference between cost amounts for financial statement and Federal income tax purposes is due primarily to the tax deferral of losses on wash sales.
The amount of dividends and distributions from net investment income and net realized capital gains are determined in accordance with Federal income tax regulations, which may differ from U.S. GAAP.
For the year ended December 31, 2014, reclassifications were recorded to undistributed net investment income, undistributed net realized gain and paid-in capital for any permanent tax differences. These reclassifications relate primarily to the differing tax treatment of income from paydowns and swaps, deemed dividend distributions on convertible securities, return of capital and capital gain distributions on real estate investment trusts and regulated investment companies, net operating losses, and foreign currency gains and losses. Results of operations and net assets were not affected by these reclassifications.
| Active Income Fund | Select Credit Fund | Event Driven Fund | ||||||||||
Paid-in capital | $ | (636,351 | ) | $ | 1,026,452 | $ | (805,260 | ) | ||||
Undistributed net investment income (loss) | (6,505,919 | ) | (3,492,254 | ) | 401,777 | |||||||
Undistributed net realized gain (loss) on investments, futures, swap contracts and foreign currency | 7,142,270 | 2,465,802 | 403,483 | |||||||||
44
Table of Contents
Driehaus Mutual Funds
Notes to Financial Statements — (Continued)
The tax character of distributions paid were as follows:
| Active Income Fund | ||||||||
Distributions paid from: | January 1, 2014 to December 31, 2014 | January 1, 2013 to December 31, 2013 | ||||||
Ordinary income | $ | 110,661,412 | $ | 74,335,357 | ||||
|
|
|
| |||||
Total distributions paid | $ | 110,661,412 | $ | 74,335,357 | ||||
|
|
|
| |||||
| Select Credit Fund | ||||||||
Distributions paid from: | January 1, 2014 to December 31, 2014 | January 1, 2013 to December 31, 2013 | ||||||
Ordinary income | $ | 40,566,938 | $ | 24,212,783 | ||||
|
|
|
| |||||
Total distributions paid | $ | 40,566,938 | $ | 24,212,783 | ||||
|
|
|
| |||||
| Event Driven Fund | ||||||||
Distributions paid from: | January 1, 2014 to December 31, 2014 | August 26, 2013 to December 31, 2013* | ||||||
Ordinary income | $ | 638,265 | $ | 871,553 | ||||
Long-term capital gains | 22,837 | 153,397 | ||||||
|
|
|
| |||||
Total distributions paid | $ | 661,102 | $ | 1,024,950 | ||||
|
|
|
| |||||
| * | The Fund commenced operations on August 26, 2013. |
As of December 31, 2014, the components of accumulated earnings (deficit) were as follows:
| Active Income Fund | Select Credit Fund | Event Driven Fund | ||||||||||
Undistributed ordinary income | $ | 19,967,284 | $ | 2,145,309 | $ | — | ||||||
Undistributed long-term capital gains | — | — | — | |||||||||
|
|
|
|
|
| |||||||
Accumulated earnings | 19,967,284 | 2,145,309 | — | |||||||||
Accumulated capital and other losses | (236,840,012 | ) | (41,970,431 | ) | (6,153,189 | ) | ||||||
Unrealized appreciation (depreciation) | (28,675,404 | ) | (68,018,618 | ) | (11,170,522 | ) | ||||||
|
|
|
|
|
| |||||||
Total accumulated earnings (deficit) | $ | (245,548,132 | ) | $ | (107,843,740 | ) | $ | (17,323,711 | ) | |||
|
|
|
|
|
| |||||||
As of December 31, 2014, the Funds had net capital loss carryforwards to offset future net capital gains, if any, to the extent provided by Treasury regulations:
| Not Subject to Expiration | ||||||||
| Short-Term | Long-Term | |||||||
Active Income Fund | $ | 169,596,431 | $ | 67,243,581 | ||||
Select Credit Fund | 33,409,624 | 8,560,807 | ||||||
Event Driven Fund | 4,507,235 | 1,481,063 | ||||||
45
Table of Contents
Driehaus Mutual Funds
Notes to Financial Statements — (Continued)
Qualified late-year ordinary losses incurred after October 31 and within the taxable year are deemed to arise on the first business day of the Funds’ following taxable year. As of December 31, 2014, the Funds had the following qualified late-year ordinary losses:
| Qualified Late-Year Ordinary Losses | ||||
Active Income Fund | $ | — | ||
Select Credit Fund | — | |||
Event Driven Fund | 164,891 | |||
Foreign Currency Translation
The value of securities, currencies and other assets and liabilities not denominated in U.S. dollars are translated into U.S. dollar values based upon the current rates of exchange on the date of the Funds’ valuations.
Net realized foreign exchange gains or losses which are reported by the Funds result from currency gains and losses on transaction hedges arising from changes in exchange rates between the trade and settlement dates on forward contract transactions, and the difference between the amounts accrued for dividends, interest, and foreign taxes and the amounts actually received or paid in U.S. dollars for these items. Net unrealized foreign exchange gains and losses result from changes in the U.S. dollar value of assets and liabilities (other than investments in securities), which are denominated in foreign currencies, as a result of changes in exchange rates.
Net realized foreign exchange gains or losses on portfolio hedges result from the use of forward contracts to hedge portfolio positions denominated or quoted in a particular currency in order to reduce or limit exposure in that currency. The Active Income Fund, Select Credit Fund and Event Driven Fund held portfolio hedges as of December 31, 2014 as disclosed in the Schedule of Investments.
The Funds do not isolate that portion of the results of operations which results from fluctuations in foreign exchange rates on investments. These fluctuations are included with the net realized gain (loss) on investments and the net change in unrealized appreciation (depreciation) on investments.
Indemnifications
Under the Trust’s organizational documents, the officers and Trustees are indemnified against certain liabilities arising out of the performance of their duties to the Trust. In addition, in the normal course of business, the Trust enters into contracts that provide general indemnifications to other parties. A Fund’s maximum exposure under these agreements is unknown as this would involve future claims that may be made against a Fund that have not yet occurred. However, the Funds have not had prior claims or losses pursuant to these contracts and expect the risk of loss to be remote.
Other
The Trust records security transactions based on trade date. Dividend income is recognized on the ex-dividend date, and interest income is recognized on an accrual basis. Discounts and premiums on securities purchased are amortized over the lives of the respective securities using the effective yield method. Withholding taxes on foreign dividends and interest have been provided for in accordance with the Trust’s understanding of the applicable country’s tax rules and rates.
Pursuant to the terms of certain of the senior unsecured loan agreements, the Funds may have unfunded loan commitments, which are callable on demand. Each Fund would have available with its custodian, cash and/or liquid securities having an aggregate value at least equal to the amount of the unfunded senior loan commitments. At December 31, 2014, the Active Income Fund, Select Credit Fund and Event Driven Fund had no unfunded senior loan commitments.
With respect to the senior loans held in each Fund’s portfolio, the Funds may: 1) invest in assignments; 2) act as a participant in primary lending syndicates; or 3) invest in participations. If a Fund purchases a
46
Table of Contents
Driehaus Mutual Funds
Notes to Financial Statements — (Continued)
participation of a senior loan interest, the Fund would typically enter into a contractual agreement with the lender or other third party selling the participation, rather than directly with the borrower. As such, the Fund not only assumes the credit risk of the borrower, but also that of the selling participant or other persons interpositioned between the Fund and the borrower. At December 31, 2014, the Funds had no such outstanding senior loan participation commitments.
B. INVESTMENTS IN DERIVATIVES
Swap Contracts
The Funds are subject to credit risk, volatility risk and interest rate risk exposure in the normal course of pursuing their investment objectives. The Funds may engage in various swap transactions, including forward rate agreements and interest rate, currency, volatility, index and total return swaps, primarily to manage duration and yield curve risk, or as alternatives to direct investments. In addition to the swap contracts described above, the Funds may also engage in credit default swaps which involve the exchange of a periodic premium for protection against a defined credit event (such as payment default, refinancing or bankruptcy).
Interest rate swaps are agreements between two parties to exchange cash flows based on a notional principal amount. The Funds may elect to pay a fixed rate and receive a floating rate or receive a fixed rate and pay a floating rate on a notional principal amount. The net interest received or paid on interest rate swap agreements is accrued daily as interest income/expense. Interest rate swaps are marked-to-market daily using fair value estimates provided by an independent pricing service. Changes in value, including accrued interest, are recorded as unrealized appreciation (depreciation). Unrealized gains are reported as an asset and unrealized losses are reported as a liability. The change in value of swaps, including accruals of periodic amounts of interest to be paid or received on swaps, is reported as unrealized gains or losses. Gains or losses are realized upon termination of the contracts. The risk of loss under a swap contract may exceed the amount recorded as an asset or a liability.
Volatility swaps are forward contracts on the future realized volatility of an underlying instrument. Volatility swaps are generally used to speculate on future volatility levels, trade the spread between realized and implied volatility or hedge volatility exposure of other positions. Changes in value are recorded as unrealized appreciation (depreciation). Unrealized gains are reported as an asset and unrealized losses are reported as a liability. The change in value of swaps is reported as unrealized gains or losses. Gains or losses are realized upon termination of the contracts. The risk of loss under a volatility swap contract is dependent upon the volatility of the underlying instrument.
Under the terms of a credit default swap contract, one party acts as a guarantor receiving a periodic payment that is a fixed percentage applied to a notional amount. In return, the party agrees to purchase the notional amount of the underlying instrument, at par, if a credit event occurs during the term of the contract. Each Fund may enter into credit default swaps in which the Fund acts as guarantor (a seller of protection), and may enter into credit default swaps in which the counterparty acts as guarantor (a buyer of protection). Premiums paid to or by the Funds are accrued daily and included in realized gain (loss) on swaps. The contracts are marked-to-market daily using fair value estimates provided by an independent pricing service. Changes in value are recorded as unrealized appreciation (depreciation). Unrealized gains are reported as an asset and unrealized losses are reported as a liability. The change in value of swaps, including accruals of periodic amounts of interest to be paid or received on swaps is reported as unrealized gains or losses. Gains or losses are realized upon termination of the contracts. The risk of loss under a swap contract may exceed the amount recorded as an asset or a liability. The notional amount of a swap contract is the reference amount pursuant to which the counterparties make payments. For swaps in which the referenced obligation is an index, in the event of default of any debt security included in the corresponding index, the Fund pays or receives the percentage of the corresponding index that the defaulted security comprises (1) multiplied by the notional value and (2) multiplied by the ratio of one minus the ratio of the market value of the defaulted debt security to its par value. The maximum exposure to loss of the notional value as a seller of credit default swaps outstanding at December 31, 2014 for the Active Income Fund, Select Credit Fund and Event Driven Fund was $13,334,000, $44,416,000 and $0, respectively.
47
Table of Contents
Driehaus Mutual Funds
Notes to Financial Statements — (Continued)
Risks associated with swap contracts include changes in the returns of underlying instruments, failure of the counterparties to perform under the contracts’ terms and the possible lack of liquidity with respect to the contracts. Credit default swaps can involve greater risks than if an investor had invested in the reference obligation directly since, in addition to general market risks, credit default swaps are subject to counterparty credit risk, leverage risk, hedging risk, correlation risk and liquidity risk. The Funds disclose swap contracts on a gross basis, with no netting of contracts held with the same counterparty. As of December 31, 2014, the Funds had outstanding swap contracts as listed on the Schedule of Investments and the required collateral is included in the Statements of Assets and Liabilities.
Futures Contracts
The Funds may enter into futures contracts to produce incremental earnings, hedge existing positions or protect against market changes in the value of equities or interest rates. Upon entering into a futures contract with a broker, a Fund is required to deposit in a segregated account a specified amount of cash or U.S. government securities. Futures contracts are valued daily and unrealized gains or losses are recorded in a “variation margin” account. Daily, the Fund receives from or pays to the broker a specified amount of cash based upon changes in the variation margin account. When a contract is closed, the Fund recognizes a realized gain or loss. Futures contracts have market risks, including the risk that the change in the value of the contract may not correlate with changes in the value of the underlying securities. With futures, there is minimal counterparty credit risk to the Funds since futures are exchange traded and the exchange’s clearinghouse, as counterparty to all exchange traded futures, guarantees the futures contract against default. As of December 31, 2014, the Funds had outstanding futures contracts as listed in the Schedule of Investments and the required collateral is included in the Statements of Assets and Liabilities.
Options Contracts
The Funds may use options contracts to hedge downside risk on their fixed income holdings, produce incremental earnings or protect against market changes in the value of equities or interest rates. The Funds may write covered call and put options on futures, swaps, securities or currencies the Funds own or in which they may invest. Writing put options tends to increase a Fund’s exposure to the underlying instrument. Writing call options tends to decrease a Fund’s exposure to the underlying instrument. When a Fund writes a call or put option, an amount equal to the premium received is recorded as a liability and subsequently marked to market to reflect the current value of the option written. These liabilities are reflected as written options outstanding in the Schedule of Investments. Payments received or made, if any, from writing options with premiums to be determined on a future date are reflected as such in the Schedule of Investments. Premiums received from writing options that expire are treated as realized gains. Premiums received from writing options that are exercised or closed are added to the proceeds or offset against amounts paid on the underlying future, swap, security or currency transaction to determine the realized gain or loss. A Fund, as a writer of an option, has no control over whether the underlying future, swap, security or currency may be sold (call) or purchased (put) and, as a result, bears the market risk of an unfavorable change in the price of the future, swap, security or currency underlying the written option. The risk exists that a Fund may not be able to enter into a closing transaction because of an illiquid market. In addition, to the extent a Fund purchases an over-the-counter (“OTC”) option, it is subject to credit risk that the counterparty to the trade does not perform under the contract’s terms. The Funds are not subject to credit risk on OTC options written as the counterparty has already performed its obligation by paying the premium at the inception of the contract.
The premium amount and the number of option contracts written by the Active Income Fund during the period January 1, 2014 through December 31, 2014, were as follows:
Active Income Fund | Number of Contracts | Premium Amount | ||||||
Options outstanding at December 31, 2013 | — | $ | — | |||||
Options written | 8,950 | 16,530,308 | ||||||
Options closed | (6,714 | ) | (12,400,501 | ) | ||||
Options expired | (2,236 | ) | (4,129,807 | ) | ||||
|
|
|
| |||||
Options outstanding at December 31, 2014 | — | $ | — | |||||
|
|
|
| |||||
48
Table of Contents
Driehaus Mutual Funds
Notes to Financial Statements — (Continued)
The premium amount and the number of option contracts written by the Select Credit Fund during the period January 1, 2014 through December 31, 2014, were as follows:
Select Credit Fund | Number of Contracts | Premium Amount | ||||||
Options outstanding at December 31, 2013 | — | $ | — | |||||
Options written | 13,970 | 7,571,359 | ||||||
Options closed | (2,736 | ) | (5,053,287 | ) | ||||
Options expired | (914 | ) | (1,688,123 | ) | ||||
|
|
|
| |||||
Options outstanding at December 31, 2014 | 10,320 | $ | 829,949 | |||||
|
|
|
| |||||
The premium amount and the number of option contracts written by the Event Driven Fund during the period January 1, 2014 through December 31, 2014, were as follows:
Event Driven Fund | Number of Contracts | Premium Amount | ||||||
Options outstanding at December 31, 2013 | 500 | $ | 34,482 | |||||
Options written | 18,347 | 3,038,231 | ||||||
Options closed | (8,195 | ) | (2,161,637 | ) | ||||
Options expired | (9,262 | ) | (653,188 | ) | ||||
Options exercised | (1,390 | ) | (257,888 | ) | ||||
|
|
|
| |||||
Options outstanding at December 31, 2014 | — | $ | — | |||||
|
|
|
| |||||
The Funds may also purchase put and call options. Purchasing call options tends to increase a Fund’s exposure to the underlying instrument. Purchasing put options tends to decrease a Fund’s exposure to the underlying instrument. A Fund pays a premium which is included in its Schedule of Investments as an investment and subsequently marked-to-market to reflect the current value of the option. Premiums paid for purchasing options which expire are treated as realized losses. The risk associated with purchasing put and call options is limited to the premium paid. Premiums paid for purchasing options which are exercised or closed are added to the amounts paid or offset against the proceeds on the underlying future, swap, security or currency transaction to determine the realized gain or loss. When entering into purchased option contracts, a Fund bears the risk of securities prices moving unexpectedly, in which case, a Fund may not achieve the anticipated benefits of the purchased option contracts; however, the risk of loss is limited to the premium paid. As of December 31, 2014, the Funds had outstanding options as listed on the Schedule of Investments and the required collateral is included in the Statements of Assets and Liabilities.
Swaptions
An option on a swap contract, also called a “swaption,” is an option that gives the buyer the right, but not the obligation, to enter into a swap on a future date in exchange for paying a market-based “premium.” A call or receiver swaption gives the owner the right to receive the total return of a specified asset, reference rate, or index swap. A put or payer swaption gives the owner the right to pay the total return of a specified asset, reference rate, or index swap. Swaptions also include options that allow an existing swap to be terminated or extended by one of the counterparties. As of December 31, 2014, the Funds had outstanding swaptions as listed on the Schedule of Investments.
The premium amount and the number of swaptions contracts written by the Active Income Fund during the period January 1, 2014 through December 31, 2014, were as follows:
Active Income Fund | Number of Contracts | Premium Amount | ||||||
Swaptions outstanding at December 31, 2013 | — | $ | — | |||||
Swaptions written | 250,000,000 | 853,875 | ||||||
Swaptions closed | — | — | ||||||
Swaptions expired | (250,000,000 | ) | (853,875 | ) | ||||
|
|
|
| |||||
Swaptions outstanding at December 31, 2014 | — | $ | — | |||||
|
|
|
| |||||
49
Table of Contents
Driehaus Mutual Funds
Notes to Financial Statements — (Continued)
The premium amount and the number of swaptions contracts written by the Select Credit Fund during the period January 1, 2014 through December 31, 2014, were as follows:
Select Credit Fund | Number of Contracts | Premium Amount | ||||||
Swaptions outstanding at December 31, 2013 | — | $ | — | |||||
Swaptions written | 100,000,000 | 341,550 | ||||||
Swaptions closed | — | — | ||||||
Swaptions expired | (100,000,000 | ) | (341,550 | ) | ||||
|
|
|
| |||||
Swaptions outstanding at December 31, 2014 | — | $ | — | |||||
|
|
|
| |||||
Forward Foreign Currency Contracts
The Funds may use forward foreign currency contracts to manage foreign currency, to produce incremental earnings or hedge existing positions. A forward foreign currency contract involves an obligation to purchase or sell a specific currency at a future date, which may be any fixed number of days from the date of the contract agreed upon by the parties, at a price set at the time of the contract. These contracts are principally traded in the inter-bank market conducted directly between currency traders (usually large commercial banks) and their customers.
The market value of a forward foreign currency contract fluctuates with changes in currency exchange rates. Outstanding forward foreign currency contracts are valued daily at current market rates and the resulting change in market value is recorded as unrealized appreciation or depreciation. When a forward foreign currency contract is settled, the Fund records a realized gain or loss equal to the difference between the value at the time the forward foreign currency contract was opened and the value at the time it was settled. A forward foreign currency contract may involve market risk in excess of the unrealized gain or loss reflected on the Statements of Assets and Liabilities. In addition, the Funds could be exposed to a credit risk if the counterparties are unable or unwilling to meet the terms of the contracts or if the value of the foreign currency changes unfavorably. As of December 31, 2014, the Active Income Fund, Select Credit Fund and Event Driven Fund had outstanding forward foreign currency contracts as listed in the Schedule of Investments.
Derivative Investment Holdings Categorized by Risk Exposure
Each Fund is subject to the FASB’s “Disclosures about Derivative Instruments and Hedging Activities” (the “Derivatives Statement”). The Derivatives Statement amends and expands disclosures about derivative instruments and hedging activities. The Derivatives Statement is intended to improve financial reporting about derivative instruments by requiring enhanced disclosures to enable investors to better understand how and why the Fund uses derivative instruments, how these derivative instruments are accounted for and their effects on the Funds’ financial position and results of operations.
The following table sets forth the fair value and the location in the Statement of Assets and Liabilities of the Active Income Fund’s derivative contracts by primary risk exposure as of December 31, 2014:
Asset derivatives | ||||||
Risk exposure category | Statement of Assets and Liabilities location | Fair Value | ||||
Credit contracts | Unrealized appreciation on open swap contracts | $ | 2,315,883 | |||
Interest rate contracts | Purchased swaptions, at fair value | 2,138,340 | ||||
Currency contracts | Unrealized appreciation on forward foreign currency contracts | 176,688 | ||||
|
|
|
| |||
Total | $ | 4,630,910 | ||||
|
|
|
| |||
50
Table of Contents
Driehaus Mutual Funds
Notes to Financial Statements — (Continued)
Liability derivatives | ||||||
Risk exposure category | Statement of Assets and Liabilities location | Fair Value | ||||
Credit contracts | Unrealized depreciation on open swap contracts | $ | 21,049,761 | |||
Interest rate contracts | N/A* | 612,761 | ||||
|
|
|
| |||
Total | $ | 21,662,521 | ||||
|
|
|
| |||
| * | Includes cumulative appreciation/depreciation of futures contracts as shown in the Schedule of Investments. Only current day’s variation margin is reported in the Statement of Assets and Liabilities |
The following table sets forth the fair value and the location in the Statement of Assets and Liabilities of the Select Credit Fund’s derivative contracts by primary risk exposure as of December 31, 2014:
Asset derivatives | ||||||
Risk exposure category | Statement of Assets and Liabilities location | Fair Value | ||||
Credit contracts | Unrealized appreciation on open swap contracts | $ | 1,430,186 | |||
Commodity contracts | Purchased options, at fair value | 4,378,500 | ||||
Currency contracts | Unrealized appreciation on forward foreign currency contracts | 5,209,305 | ||||
Interest rate contracts | Purchased swaptions, at fair value | 998,607 | ||||
|
|
|
| |||
Total | $ | 12,016,598 | ||||
|
|
|
| |||
Liability derivatives | ||||||
Risk exposure category | Statement of Assets and Liabilities location | Fair Value | ||||
Currency contracts | Unrealized depreciation on forward foreign currency contracts | $ | 122,121 | |||
Credit contracts | Unrealized depreciation on open swap contracts | 2,791,824 | ||||
Interest rate contracts | N/A* | 137,423 | ||||
Equity contracts | Written options, at fair value | 16,099 | ||||
|
|
|
| |||
Total | $ | 3,067,467 | ||||
|
|
|
| |||
| * | Includes cumulative appreciation/depreciation of futures contracts as shown in the Schedule of Investments. Only current day’s variation margin is reported in the Statement of Assets and Liabilities |
The following table sets forth the fair value and the location in the Statement of Assets and Liabilities of the Event Driven Fund’s derivative contracts by primary risk exposure as of December 31, 2014:
Asset derivatives | ||||||
Risk exposure category | Statement of Assets and Liabilities location | Fair Value | ||||
Currency contracts | Unrealized appreciation on forward foreign currency contracts | $ | 26,649 | |||
Equity contracts | Purchased options, at fair value | 1,058,000 | ||||
Interest rate contracts | Purchased swaptions, at fair value | 122 | ||||
|
|
|
| |||
Total | $ | 1,084,771 | ||||
|
|
|
| |||
51
Table of Contents
Driehaus Mutual Funds
Notes to Financial Statements — (Continued)
Liability derivatives | ||||||
Risk exposure category | Statement of Assets and Liabilities location | Fair Value | ||||
Credit contracts | Unrealized depreciation on open swap contracts | $ | 195,347 | |||
Equity contracts | N/A* | 138,492 | ||||
Currency contracts | Unrealized depreciation on forward foreign currency contracts | 15,882 | ||||
|
|
|
| |||
Total | $ | 349,721 | ||||
|
|
|
| |||
| * | Includes cumulative appreciation/depreciation of futures contracts as shown in the Schedule of Investments. Only current day’s variation margin is reported in the Statement of Assets and Liabilities |
The following table sets forth the Active Income Fund’s net realized gain/loss by primary risk exposure and by type of derivative contract for the period January 1, 2014 through December 31, 2014:
Amount of net realized gain (loss) on derivatives | ||||||||||||||||||||
| Risk exposure category | ||||||||||||||||||||
Derivative | Credit contracts | Commodity contracts | Equity contracts | Interest rate contracts | Total | |||||||||||||||
Purchased options contracts | $ | — | $ | (2,547,709 | ) | $ | 16,826,742 | $ | — | $ | 14,279,033 | |||||||||
Purchased swaptions contracts | (878,625 | ) | — | — | (18,268,900 | ) | (19,147,525 | ) | ||||||||||||
Written options contracts | — | — | (25,228,790 | ) | — | (25,228,790 | ) | |||||||||||||
Written swaptions contracts | 853,875 | — | — | — | 853,875 | |||||||||||||||
Futures contracts | — | — | — | (19,378,840 | ) | (19,378,840 | ) | |||||||||||||
Swap contracts | (30,591,334 | ) | — | — | (3,240,000 | ) | (33,831,334 | ) | ||||||||||||
|
|
|
|
|
|
|
|
|
| |||||||||||
Total | $ | (30,616,084 | ) | $ | (2,547,709 | ) | $ | (8,402,048 | ) | $ | (40,887,740 | ) | $ | (82,453,581 | ) | |||||
|
|
|
|
|
|
|
|
|
| |||||||||||
The following table sets forth the Select Credit Fund’s net realized gain/loss by primary risk exposure and by type of derivative contract for the period January 1, 2014 through December 31, 2014:
Amount of net realized gain (loss) on derivatives | ||||||||||||||||||||
| Risk exposure category | ||||||||||||||||||||
Derivative | Credit contracts | Commodity contracts | Equity contracts | Interest rate contracts | Total | |||||||||||||||
Purchased options contracts | $ | — | $ | 141,689 | $ | 8,542,628 | $ | — | $ | 8,684,317 | ||||||||||
Purchased swaption contracts | (351,450 | ) | — | — | (5,377,000 | ) | (5,728,450 | ) | ||||||||||||
Written options contracts | — | — | (10,275,702 | ) | — | (10,275,702 | ) | |||||||||||||
Written swaptions contracts | 341,550 | — | — | — | 341,550 | |||||||||||||||
Futures contracts | — | — | — | (4,842,703 | ) | (4,842,703 | ) | |||||||||||||
Swap contracts | (7,417,468 | ) | — | — | (1,215,000 | ) | (8,632,468 | ) | ||||||||||||
|
|
|
|
|
|
|
|
|
| |||||||||||
Total | $ | (7,427,368 | ) | $ | 141,689 | $ | (1,733,074 | ) | $ | (11,434,703 | ) | $ | (20,453,456 | ) | ||||||
|
|
|
|
|
|
|
|
|
| |||||||||||
The following table sets forth the Event Driven Fund’s net realized gain/loss by primary risk exposure and by type of derivative contract for the period January 1, 2014 through December 31, 2014:
Amount of net realized gain (loss) on derivatives | ||||||||||||||||||||
| Risk exposure category | ||||||||||||||||||||
Derivative | Credit contracts | Commodity contracts | Equity contracts | Interest rate contracts | Total | |||||||||||||||
Purchased options contracts | $ | — | $ | (1,248,862 | ) | $ | 253,321 | $ | — | $ | (995,541 | ) | ||||||||
Purchased swaption contracts | — | — | — | (973,500 | ) | (973,500 | ) | |||||||||||||
Written options contracts | — | — | (176,106 | ) | — | (176,106 | ) | |||||||||||||
Futures contracts | — | — | 118,474 | — | 118,474 | |||||||||||||||
Swap contracts | (128,194 | ) | — | 78,863 | — | (49,331 | ) | |||||||||||||
|
|
|
|
|
|
|
|
|
| |||||||||||
Total | $ | (128,194 | ) | $ | (1,248,862 | ) | $ | 274,552 | $ | (973,500 | ) | $ | (2,076,004 | ) | ||||||
|
|
|
|
|
|
|
|
|
| |||||||||||
52
Table of Contents
Driehaus Mutual Funds
Notes to Financial Statements — (Continued)
The following table sets forth the Active Income Fund’s change in net unrealized appreciation/depreciation by primary risk exposure and by type of derivative contract for the period January 1, 2014 through December 31, 2014:
Change in net unrealized appreciation (depreciation) on derivatives | ||||||||||||||||||||
| Risk exposure category | ||||||||||||||||||||
Derivative | Credit contracts | Equity contracts | Currency contracts | Interest rate contracts | Total | |||||||||||||||
Purchased swaption contracts | $ | — | $ | — | $ | — | $ | (34,204 | ) | $ | (34,204 | ) | ||||||||
Futures contracts | — | — | — | (10,058,078 | ) | (10,058,078 | ) | |||||||||||||
Swap contracts | 16,292,190 | — | — | — | 16,292,190 | |||||||||||||||
Forward foreign currency contracts | — | — | 176,688 | — | 176,688 | |||||||||||||||
|
|
|
|
|
|
|
|
|
| |||||||||||
Total | $ | 16,292,190 | $ | — | $ | 176,688 | $ | (10,092,282 | ) | $ | 6,376,596 | |||||||||
|
|
|
|
|
|
|
|
|
| |||||||||||
The gross notional amount and the number of contracts for the Active Income Fund as of December 31, 2014 is included on the Schedule of Investments. The fair value of such contracts at December 31, 2014 is set forth in the table below.
Quarterly Derivative Averages | ||||||
Derivative | Quarterly Average | $ Amount / Number | ||||
Options Contracts — Purchased | number of contracts | 21,472 | ||||
Futures Contracts — Short | number of contracts | (3,683 | ) | |||
Swap Contracts | gross notional amount | $ | 892,041,965 | |||
Swaptions Contracts — Purchased | gross notional amount | $ | 531,024,000 | |||
Forward Contracts — Long | fair value | $ | 35,338 | |||
The following table sets forth the Select Credit Fund’s change in net unrealized appreciation/depreciation by primary risk exposure and by type of derivative contract for the period January 1, 2014 through December 31, 2014:
Change in net unrealized appreciation (depreciation) on derivatives | ||||||||||||||||||||||||
| Risk exposure category | ||||||||||||||||||||||||
Derivative | Credit contracts | Commodity contracts | Equity contracts | Interest rate contracts | Currency contracts | Total | ||||||||||||||||||
Purchased options contracts | $ | — | $ | 1,517,140 | $ | (961,959 | ) | $ | — | $ | — | $ | 555,181 | |||||||||||
Purchased swaptions contracts | — | — | — | (266,212 | ) | — | (266,212 | ) | ||||||||||||||||
Written options contracts | — | — | 813,850 | — | — | 813,850 | ||||||||||||||||||
Forward foreign currency contracts | — | — | — | — | 5,087,184 | 5,087,184 | ||||||||||||||||||
Futures contracts | — | — | — | (2,354,777 | ) | — | (2,354,777 | ) | ||||||||||||||||
Swap contracts | (41,102 | ) | — | — | — | — | (41,102 | ) | ||||||||||||||||
|
|
|
|
|
|
|
|
|
|
|
| |||||||||||||
Total | $ | (41,102 | ) | $ | 1,517,140 | $ | (148,109 | ) | $ | (2,620,989 | ) | $ | 5,087,184 | $ | 3,794,124 | |||||||||
|
|
|
|
|
|
|
|
|
|
|
| |||||||||||||
The gross notional amount and the number of contracts for the Select Credit Fund as of December 31, 2014 is included on the Schedule of Investments. The fair value of such contracts at December 31, 2014 is set forth in the table below.
Quarterly Derivative Averages | ||||||
Derivative | Quarterly Average | $ Amount / Number | ||||
Options Contracts — Purchased | number of contracts | 165,372 | ||||
Futures Contracts — Long | number of contracts | — | ||||
Futures Contracts — Short | number of contracts | (1,065 | ) | |||
Swap Contracts | gross notional amount | $ | 235,942,400 | |||
Swaptions Contracts — Purchased | gross notional amount | $ | 172,609,000 | |||
Forward Contracts — Long | fair value | $ | 723,820 | |||
Forward Contracts — Short | fair value | $ | (35,604,043 | ) | ||
53
Table of Contents
Driehaus Mutual Funds
Notes to Financial Statements — (Continued)
The following table sets forth the Event Driven Fund’s change in net unrealized appreciation/depreciation by primary risk exposure and by type of derivative contract for the period January 1, 2014 through December 31, 2014:
Change in net unrealized appreciation (depreciation) on derivatives | ||||||||||||||||||||
| Risk exposure category | ||||||||||||||||||||
Derivative | Credit contracts | Equity contracts | Currency contracts | Interest rate contracts | Total | |||||||||||||||
Purchased options contracts | $ | — | $ | (274,425 | ) | $ | — | $ | — | $ | (274,425 | ) | ||||||||
Purchased swaptions contracts | — | — | — | (980,078 | ) | (980,078 | ) | |||||||||||||
Written options contracts | — | 8,018 | — | — | 8,018 | |||||||||||||||
Futures contracts | — | (138,492 | ) | — | — | (138,492 | ) | |||||||||||||
Swap contracts | (195,347 | ) | — | — | — | (195,347 | ) | |||||||||||||
Forward foreign currency contracts | — | — | 10,767 | — | 10,767 | |||||||||||||||
|
|
|
|
|
|
|
|
|
| |||||||||||
Total | $ | (195,347 | ) | $ | (404,899 | ) | $ | 10,767 | $ | (980,078 | ) | $ | (1,569,557 | ) | ||||||
|
|
|
|
|
|
|
|
|
| |||||||||||
The gross notional amount and the number of contracts for the Event Driven Fund as of December 31, 2014 is included on the Schedule of Investments. The fair value of such contracts at December 31, 2014 is set forth in the table below.
Quarterly Derivative Averages | ||||||
Derivative | Quarterly Average | $ Amount /Number | ||||
Options Contracts — Purchased | number of contracts | 4,009,962 | ||||
Futures Contracts — Long | number of contracts | — | ||||
Futures Contracts — Short | number of contracts | (39 | ) | |||
Swap Contracts | gross notional amount | $ | 2,701,883 | |||
Swaptions Contracts — Purchased | gross notional amount | $ | 45,200,000 | |||
Forward Contracts — Long | fair value | $ | 686,824 | |||
Forward Contracts — Short | fair value | $ | (1,374,670 | ) | ||
Disclosures about Offsetting Assets and Liabilities
Each Fund is subject to the FASB’s “Disclosures about Offsetting Assets and Liabilities”, which requires an entity to disclose information about offsetting and related arrangements to enable users of its financial statements to understand the effect of those arrangements on its financial position.
For financial reporting purposes, the Funds do not offset derivative assets and liabilities that are subject to Master Netting Agreements (“MNA”) or similar arrangements in the Statements of Assets and Liabilities.
The following table presents the Active Income Fund’s derivative assets by type, net of amounts available for offset under a MNA and net of the related collateral received by the Active Income Fund as of December 31, 2014:
Description | Gross Amounts Recognized in Statement of Assets and Liabilities | Derivatives Available for Offset | Collateral Received | Net Amount1 | ||||||||||||
Unrealized appreciation on open swap contracts | $ | 2,315,883 | $ | (2,315,883 | ) | $ | — | $ | — | |||||||
54
Table of Contents
Driehaus Mutual Funds
Notes to Financial Statements — (Continued)
The following table presents the Active Income Fund’s derivative liabilities by type, net of amounts available for offset under a MNA and net of the related collateral pledged by the Active Income Fund as of December 31, 2014:
Description | Gross Amounts Recognized in Statement of Assets and Liabilities | Derivatives Available for Offset | Collateral Pledged | Net Amount2 | ||||||||||||
Unrealized depreciation on open swap contracts | $ | 21,049,761 | $ | (2,315,883 | ) | $ | (18,733,877 | ) | $ | — | ||||||
| 1 | Net amount represents the net amount receivable from the counterparty in the event of default. |
| 2 | Net amount represents the net amount payable to the counterparty in the event of default. |
The following table presents the Select Credit Fund’s derivative assets by type, net of amounts available for offset under a MNA and net of the related collateral received by the Select Credit Fund as of December 31, 2014:
Description | Gross Amounts Recognized in Statement of Assets and Liabilities | Derivatives Available for Offset | Collateral Received | Net Amount1 | ||||||||||||
Unrealized appreciation on open swap contracts | $ | 1,430,186 | $ | (1,048,219 | ) | $ | — | $ | 381,967 | |||||||
The following table presents the Select Credit Fund’s derivative liabilities by type, net of amounts available for offset under a MNA and net of the related collateral pledged by the Select Credit Fund as of December 31, 2014:
Description | Gross Amounts Recognized in Statement of Assets and Liabilities | Derivatives Available for Offset | Collateral Pledged | Net Amount2 | ||||||||||||
Unrealized depreciation on open swap contracts | $ | 2,791,824 | $ | (1,048,219 | ) | $ | (1,743,605 | ) | $ | — | ||||||
Unrealized depreciation on forward foreign currency contracts | 122,121 | — | (122,121 | ) | — | |||||||||||
Written options, at fair value | 16,099 | — | (16,099 | ) | — | |||||||||||
| 1 | Net amount represents the net amount receivable from the counterparty in the event of default. |
| 2 | Net amount represents the net amount payable to the counterparty in the event of default. |
The following table presents the Event Driven Fund’s derivative liabilities by type, net of amounts available for offset under a MNA and net of the related collateral pledged by the Event Driven Fund as of December 31, 2014:
Description | Gross Amounts Recognized in Statement of Assets and Liabilities | Derivatives Available for Offset | Collateral Pledged | Net Amount2 | ||||||||||||
Unrealized depreciation on open swap contracts | $ | (195,347 | ) | $ | — | $ | (195,347 | ) | $ | — | ||||||
Unrealized depreciation on forward foreign currency contracts | 15,882 | — | (15,882 | ) | — | |||||||||||
| 1 | Net amount represents the net amount receivable from the counterparty in the event of default. |
| 2 | Net amount represents the net amount payable to the counterparty in the event of default. |
55
Table of Contents
Driehaus Mutual Funds
Notes to Financial Statements — (Continued)
C. INVESTMENT ADVISORY FEES, TRANSACTIONS WITH AFFILIATES, AND ADMINISTRATIVE FEES
Richard H. Driehaus, an Interested Trustee of the Trust, is also the Chairman of the Board of Driehaus Capital Management LLC (“DCM” or the “Adviser”), a registered investment adviser, and of Driehaus Securities LLC (“DS LLC” or the “Distributor”), a registered broker-dealer.
DCM serves as the Funds’ investment adviser. In return for its services to the Funds, the Funds pay the Adviser an annual management fee on a monthly basis of 0.55%, 0.80% and 1.00% of average net assets, respectively, for the Active Income Fund, Select Credit Fund and Event Driven Fund.
DCM has entered into a written agreement to cap the Event Driven Fund’s annual ordinary operating expenses (other than interest, taxes, brokerage commissions, dividends and interest on short sales, other investment-related expenses and extraordinary expenses) at 2.00% of average daily net assets until at least August 25, 2016. For this same time period, DCM is entitled to reimbursement for previously waived fees and reimbursed expenses to the extent that the Event Driven Fund’s expense ratio remains below the operating expense cap. During the period January 1, 2014 through December 31, 2014, DCM recaptured $4,008 of the advisory fees from the Event Driven Fund waived in the prior year, and there are no additional amounts subject to recapture.
The Active Income Fund accrued $25,412,080 for investment advisory fees during the period January 1, 2014 through December 31, 2014, of which $1,937,185 was payable to DCM at December 31, 2014. The Select Credit Fund accrued $9,717,327 for investment advisory fees during the period January 1, 2014 through December 31, 2014, and $630,805 was payable to DCM at December 31, 2014. The Event Driven Fund accrued $2,097,824 for investment advisory fees during the period from January 1, 2014 through December 31, 2014, and $150,585 was payable to DCM at December 31, 2014.
DS LLC is the Funds’ distributor. DS LLC does not earn any compensation from the Funds for these services. DS LLC has entered into a Fee Reimbursement Agreement with each of the Funds. Under these agreements, the Funds reimburse DS LLC for certain fees paid by DS LLC to intermediaries who provide shareholder administrative and/or sub-transfer agency services to the Fund. Currently, the amount to be reimbursed will not exceed 0.25% of the average daily net assets held by such intermediaries. As of December 31, 2014, the Active Income Fund, Select Credit Fund and Event Driven Fund owe $604,749, $193,153 and $23,743, respectively, in reimbursements to DS LLC under these agreements, which are included in accrued shareholder services plan fees on the Statement of Assets and Liabilities.
Certain officers of the Trust are also officers of DCM and DS LLC. The Funds pay a portion of the Chief Compliance Officer’s salary. No other officers received compensation from the Funds during the period January 1, 2014 through December 31, 2014.
UMB Fund Services, Inc. (“UMBFS”), an affiliate of UMB Financial Corporation, serves as the Funds’ administrative and accounting agent. In compensation for these services, UMBFS earns the larger of a monthly minimum fee or a monthly fee based upon each Fund’s average daily net assets. UMBFS also acts as the transfer agent and dividend disbursing agent for the Funds. For these services, UMBFS earns a monthly fee based in part on shareholder processing activity during the month.
D. INVESTMENT TRANSACTIONS
Purchases and sales of investment securities (excluding swaps, options, futures, short-term securities and U.S. government obligations) for the Active Income Fund, Select Credit Fund and Event Driven Fund for the period January 1, 2014 through December 31, 2014, were as follows:
Active Income Fund | Select Credit Fund | Event Driven Fund | ||||||||||||||
| Purchases | $ | 1,581,242,564 | Purchases | $ | 844,582,849 | Purchases | $ | 589,185,183 | ||||||||
| Sales | $ | 1,470,519,015 | Sales | $ | 670,813,957 | Sales | $ | 466,290,546 | ||||||||
56
Table of Contents
Driehaus Mutual Funds
Notes to Financial Statements — (Continued)
E. RESTRICTED SECURITIES
Restricted securities are securities that are not registered for sale under the Securities Act of 1933 or applicable foreign law and that may be re-sold only in transactions exempt from applicable registration. Restricted securities include Rule 144A securities which may be sold normally to qualified institutional buyers. At December 31, 2014, the Funds held restricted securities as denoted on the Schedule of Investments.
F. SHAREHOLDER SERVICING AGREEMENTS
The Active Income Fund and Select Credit Fund have a Shareholder Servicing Agreement (the “Agreement”) in place with a shareholder. Under the terms of this Agreement, the Active Income Fund and Select Credit Fund make payments for services provided on behalf of the Active Income Fund and Select Credit Fund. Such services may include, but shall not be limited to: transfer agent and sub-transfer agent services; aggregating and processing purchase and redemption orders; providing periodic statements; receiving and transmitting funds; processing dividend payments; providing sub-accounting services; forwarding shareholder communications; receiving, tabulating and transmitting proxies; responding to inquiries and performing such other related services as the Active Income Fund and Select Credit Fund may request. The Shareholder Services Plan allows for annual payments not to exceed 0.25% of average daily net assets of the Funds. For the period January 1, 2014 through December 31, 2014, the Active Income Fund and Select Credit Fund had expenses of $376,963 and $20,118, respectively, under the terms of this Agreement with this shareholder.
57
Table of Contents
Report of Independent Registered Public Accounting Firm
The Board of Trustees and Shareholders of Driehaus Mutual Funds
We have audited the accompanying statements of assets and liabilities, including the schedules of investments, of Driehaus Active Income Fund, Driehaus Select Credit Fund, and Driehaus Event Driven Fund (collectively, the “Funds”) as of December 31, 2014, and the related statements of operations, statements of changes in net assets and financial highlights for the each of the periods indicated therein. These financial statements and financial highlights are the responsibility of the Funds’ management. Our responsibility is to express an opinion on these financial statements and financial highlights based on our audits.
We conducted our audits in accordance with the standards of the Public Company Accounting Oversight Board (United States). Those standards require that we plan and perform the audit to obtain reasonable assurance about whether the financial statements and financial highlights are free of material misstatement. We were not engaged to perform an audit of the Funds’ internal control over financial reporting. Our audits included consideration of internal control over financial reporting as a basis for designing audit procedures that are appropriate in the circumstances, but not for the purpose of expressing an opinion on the effectiveness of the Funds’ internal control over financial reporting. Accordingly, we express no such opinion. An audit also includes examining, on a test basis, evidence supporting the amounts and disclosures in the financial statements and financial highlights, assessing the accounting principles used and significant estimates made by management, and evaluating the overall financial statement presentation. Our procedures included confirmation of securities owned as of December 31, 2014, by correspondence with the custodian, brokers, and agent banks or by other appropriate auditing procedures where replies from brokers and agent banks were not received. We believe that our audits provide a reasonable basis for our opinion.
In our opinion, the financial statements and financial highlights referred to above present fairly, in all material respects, the financial position of each of the respective Funds noted above at December 31, 2014, and the results of their operations, the changes in their net assets, and the financial highlights for the periods indicated therein, in conformity with U.S. generally accepted accounting principles.

Chicago, Illinois
February 25, 2015
58
Table of Contents
Interested and Independent Trustees of the Trust
The following table sets forth certain information with respect to the Trustees of the Trust:
Name, Address and Year of Birth | Position(s) Held with the Trust | Term of Office and Length of Time Served** | Principal Occupation(s) | Number of Portfolios in Trust Overseen by Trustee | Other Directorships | |||||
Interested Trustee:* | ||||||||||
Richard H. Driehaus 25 East Erie Street Chicago, IL 60611 YOB: 1942 | Trustee | Since 1996 | Chairman of the Board of the Adviser, the Distributor and Driehaus Capital Management (USVI) LLC (“USVI”); Chief Investment Officer and Portfolio Manager of the Adviser. President of the Trust from 1996-2011. | 8 | None | |||||
Independent Trustees: | ||||||||||
Daniel F. Zemanek c/o Driehaus Capital Management LLC 25 East Erie Street Chicago, IL 60611 YOB: 1942 | Trustee and Chairman | Since 1996 Since 2014 | Retired; President of Ludan, Inc. (real estate services specializing in senior housing) from April 2008 to December 2014; Senior Vice President of Sunrise Development, Inc. (senior living) from 2003-2007; Consultant, real estate development prior thereto. | 8 | None | |||||
Theodore J. Beck c/o Driehaus Capital Management LLC 25 East Erie Street Chicago, IL 60611 YOB: 1952 | Trustee | Since 2012 | President and Chief Executive Officer, National Endowment for Financial Education, 2005 to present; Associate Dean for Executive Education and Corporate Relations and President for the Center for Advanced Studies in Business at the University of Wisconsin-Madison, 1999-2005. | 8 | Wilshire Variable Insurance Trust, 2008-2010; Wilshire Mutual Funds Inc., 2008-2010; Advisory Board of the Trust, 2011-2012. | |||||
Francis J. Harmon c/o Driehaus Capital Management LLC 25 East Erie Street Chicago, IL 60611 YOB: 1942 | Trustee | Since 1998 | Relationship Manager, Great Lakes Advisors, Inc. since February 2008; Principal Account Executive — Labor Affairs, Blue Cross and Blue Shield of Illinois prior thereto. | 8 | None | |||||
59
Table of Contents
Interested and Independent Trustees of the Trust
Name, Address and Year of Birth | Position(s) Held with the Trust | Term of Office and Length of Time Served** | Principal Occupation(s) | Number of Portfolios in Trust Overseen by Trustee | Other Directorships | |||||
Independent Trustees: | ||||||||||
A.R. Umans c/o Driehaus Capital Management LLC 25 East Erie Street Chicago, IL 60611 YOB: 1927 | Trustee | Since 1996 | Chairman of the Board, Commerce National Group (private investment company) since 2005; Chairman of the Board and Chief Executive Officer, RHC/Spacemaster Corporation (manufacturing corporation) prior thereto. | 8 | None | |||||
Dawn M. Vroegop c/o Driehaus Capital Management LLC 25 East Erie Street Chicago, IL 60611 YOB: 1966 | Trustee | Since 2012 | Private Investor since 2003; Managing Director, Dresdner RCM Global Investors from September 1999 to September 2003. | 8 | Independent Trustee, Met Investors Series Trust since December 2000; Director, Metropolitan Series Fund, Inc. since May 2009; Advisory Board of the Trust, 2011-2012. | |||||
| * | Mr. Driehaus is an “interested person” of the Trust, the Adviser and the Distributor, as defined in the 1940 Act, because he is an officer of the Adviser and the Distributor. In addition, Mr. Driehaus has a controlling interest in the Adviser and the Distributor. |
| ** | Each Trustee will serve as a Trustee of the Trust until (i) termination of the Trust, or (ii) the Trustee’s retirement, resignation, or death, or (iii) as otherwise specified in the Trust’s governing documents. |
60
Table of Contents
The following table sets forth certain information with respect to the officers of the Trust:
Name, Address and Year of Birth | Position(s) Held with the Trust | Length of Time Served | Principal Occupation(s) During Past 5 Years | |||
Robert H. Gordon 25 East Erie Street Chicago, IL 60611 YOB: 1961 | President | Since 2011 | President and Chief Executive Officer of Adviser, Distributor and USVI since October 2006; Senior Vice President of the Trust from 2006-2011. | |||
Michelle L. Cahoon 25 East Erie Street Chicago, IL 60611 YOB: 1966 | Vice President and Treasurer | Since 2006 Since 2002 | Managing Director, Treasurer and Chief Financial Officer of the Adviser and Distributor since 2012; Vice President, Treasurer and Chief Financial Officer of USVI since 2004; Vice President, Treasurer and Chief Financial Officer of the Adviser and Distributor from 2004-2012. | |||
Janet L. McWilliams 25 East Erie Street Chicago, IL 60611 YOB: 1970 | Assistant Vice President and Chief Legal Officer | Since 2007 Since 2012 | Managing Director, Secretary and General Counsel of the Adviser since 2012; Chief Compliance Officer of the Trust, Adviser and Distributor from 2006-2012. | |||
Michael R. Shoemaker 25 East Erie Street Chicago, IL 60611 YOB: 1981 | Chief Compliance Officer and Assistant Vice President | Since 2012 | Assistant Vice President and Chief Compliance Officer of the Adviser and Distributor since 2012; Associate Chief Compliance Officer of the Adviser and Distributor from 2011-2012; Compliance Officer, Pacific Investment Management Company LLC and PIMCO Investments LLC from 2010-2011; Senior Compliance Analyst of the Adviser and Distributor from 2007-2010. | |||
Diane J. Drake 301 Bellevue Parkway Wilmington, DE 19809 YOB: 1967 | Secretary | Since 2006 | Managing Director and Senior Counsel, BNY Mellon Investment Servicing (US) Inc. (formerly, PNC Global Investment Servicing (U.S.) Inc. (“PNC”), (financial services company)) since 2010; Vice President and Counsel, PNC from 2008-2010. | |||
Michael P. Kailus 25 East Erie Street Chicago, IL 60611 YOB: 1971 | Assistant Secretary and Anti-Money Laundering Compliance Officer | Since 2010 Since 2011 | Assistant Secretary of the Adviser, Distributor and USVI since 2010; Senior Attorney with the Adviser since 2010; Associate General Counsel of Superfund Group (formerly, Quadriga Group, a financial services company) from 2005-2010. | |||
William H. Wallace, III 301 Bellevue Parkway Wilmington, DE 19809 YOB: 1969 | Assistant Secretary | Since 2008 | Vice President and Manager, BNY Mellon Investment Servicing (US) Inc. (formerly PNC, a financial services company) since 2010; Assistant Vice President and Manager, PNC from 2008-2010. |
The Statement of Additional Information for Driehaus Mutual Funds contains more detail about the Trust’s Trustees and officers and is available upon request, without charge. For further information, please call 1-877-779-0079.
61
Table of Contents
As a mutual fund shareholder, you may incur two types of costs: (1) transaction costs, including sales charges; redemption fees; and exchange fees and (2) ongoing costs, including management fees; distribution (12b-1) and/or service fees; and other fund expenses. This example is intended to help you understand your ongoing costs (in dollars) of investing in the Fund and to compare these costs with the ongoing costs of investing in other mutual funds.
The example is based on an investment of $1,000 invested at the beginning of the period and held for the entire six month period ended December 31, 2014.
Actual Expenses
The first line of the table below (“Actual”) provides information about actual account values and actual expenses. You may use the information in this line, together with the amount you invested, to estimate the expense that you paid over the period. Simply divide your account value by $1,000 (for example, an $8,600 account value divided by $1,000 = 8.6), then multiply the result by the number in the first line under the heading entitled “Expenses Paid During Period” to estimate the expenses you paid on your account during this period.
Hypothetical Example for Comparison Purposes
The second line of the tables below (“Hypothetical”) provides information about hypothetical account values and hypothetical expenses based on the Fund’s actual expense ratio and an assumed rate of return of 5% per year before expenses, which is not the Fund’s actual return. You may use this information to compare the ongoing costs of investing in the Fund versus other funds. To do so, compare this 5% hypothetical example with the 5% hypothetical examples that appear in the shareholder reports of the other funds.
Please note that the expenses shown in the table are meant to highlight your ongoing costs only and do not reflect any transactional costs, such as sales charges, redemption fees or exchange fees. Therefore, the second line of the table is useful in comparing ongoing costs only, and will not help you determine the relative total costs of owning different funds. In addition, if these transactional costs were included, your costs would have been higher.
Driehaus Active Income Fund
Beginning Account Value July 1, 2014 | Ending Account Value December 31, 2014 | Expenses Paid During Six Months Ended December 31, 2014* | ||||||||||
Actual | $ | 1,000.00 | $ | 983.50 | $ | 5.25 | ||||||
Hypothetical Example, assuming a 5% return before expenses | $ | 1,000.00 | $ | 1,019.91 | $ | 5.35 | ||||||
Driehaus Select Credit Fund
Beginning Account Value July 1, 2014 | Ending Account Value December 31, 2014 | Expenses Paid During Six Months Ended December 31, 2014* | ||||||||||
Actual | $ | 1,000.00 | $ | 924.70 | $ | 6.21 | ||||||
Hypothetical Example, assuming a 5% return before expenses | $ | 1,000.00 | $ | 1,018.75 | $ | 6.51 | ||||||
62
Table of Contents
Fund Expense Examples — (Continued)
Driehaus Event Driven Fund
Beginning Account Value July 1, 2014 | Ending Account Value December 31, 2014 | Expenses Paid During Six Months Ended December 31, 2014* | ||||||||||
Actual | $ | 1,000.00 | $ | 909.40 | $ | 9.29 | ||||||
Hypothetical Example, assuming a 5% return before expenses | $ | 1,000.00 | $ | 1,015.48 | $ | 9.80 | ||||||
| * | Expenses are equal to the Funds’ annualized expense ratios for the six-month period in the table below multiplied by the average account value over the period, multiplied by the number of days in the most recent fiscal half-year (184), then divided by 365 to reflect the half-year period. |
Driehaus Active Income Fund | 1.05% | |
Driehaus Select Credit Fund | 1.28% | |
Driehaus Event Driven Fund | 1.93% |
63
Table of Contents
TAX INFORMATION (UNAUDITED) FOR THE YEAR ENDED DECEMBER 31, 2014
We are providing this information as required by the Internal Revenue Code. The amounts shown may differ from those elsewhere in this report because of differences between tax and financial reporting requirements.
For taxable non-corporate shareholders, the following percentages of income and short-term capital gains represent qualified dividend income subject to the 15% rate category:
Active Income Fund | Select Credit Fund | Event Driven Fund | ||||||
| 14.33% | 2.48% | 3.59% | ||||||
For corporate shareholders, the following percentages of income and short-term capital gains qualified for the dividends-received deduction:
Active Income Fund | Select Credit Fund | Event Driven Fund | ||||||
| 14.33% | 2.48% | 4.04% | ||||||
Long-term Capital Gain
The Event Driven Fund designates $22,837 as a long-term capital gain distribution.
PROXY VOTING POLICIES AND PROCEDURES AND PROXY VOTING RECORD
A description of the Funds’ policies and procedures with respect to the voting of proxies relating to the Funds’ portfolio securities is available, without charge, upon request, by calling 1-877-779-0079. This information is also available on the Funds’ website at http://www.driehaus.com.
Information regarding how the Funds voted proxies related to portfolio securities during the 12-month period ended June 30, 2014 is available without charge, upon request, by calling 1-877-779-0079. This information is also available on the Securities and Exchange Commission’s (“SEC”) website at http://www.sec.gov.
HOW TO OBTAIN QUARTERLY PORTFOLIO HOLDINGS
Each Fund files a complete schedule of portfolio holdings with the SEC for the first and third quarters of each fiscal year on Form N-Q. The Funds’ Form N-Q is available electronically on the SEC’s website at http://www.sec.gov; hard copies may be reviewed and copied at the SEC’s Public Reference Room in Washington, DC. For more information on the Public Reference Room, call 1-800-SEC-0330. Each Fund’s complete schedule of portfolio holdings is also available on the Funds’ website at http://www.driehaus.com.
64
Table of Contents
Board Considerations in Connection with the Annual Review of the
Investment Advisory Agreement
The Board of Trustees of the Driehaus Mutual Funds (the “Trust”), including a majority of the Trustees who are not “interested persons” (as defined in the Investment Company Act of 1940, as amended) (the “Independent Trustees”), approved the renewal of the investment advisory agreement (the “Agreement”) with Driehaus Capital Management LLC (the “Adviser”) for Driehaus Active Income Fund (“LCMAX”), Driehaus Select Credit Fund (“DRSLX”) and Driehaus Event Driven Fund (“DEVDX” and together with LCMAX and DRSLX, the “Funds”) on September 11, 2014. As part of its review process, the Board requested and evaluated all information it deemed reasonably necessary to evaluate the Agreement. The Board reviewed comprehensive materials received from the Adviser and from independent legal counsel. The Board also received extensive information throughout the year regarding performance and operating results of each Fund. The Independent Trustees held a conference call with their independent legal counsel on September 5, 2014 to review the materials provided in response to their request and identified areas for further response by Fund management. Following receipt of further responses from Fund management, the Independent Trustees, represented by independent legal counsel, met independent of Fund management to consider renewal of the Agreement for each Fund. After their consideration of all the information received, the Independent Trustees presented their findings and their recommendation to renew the Agreement to the full Board.
In connection with the contract review process, the Board considered the factors discussed below, among others. The Board also considered that the Adviser has managed each Fund for an extended period or since inception, and the Board believes that a long-term relationship with a capable, conscientious adviser is in the best interests of each Fund.
Nature, Quality and Extent of Services. The Board considered the nature, extent and quality of services provided under the Agreement, including portfolio management services and administrative services. The Board considered the experience and skills of senior management and investment personnel, the resources made available to such personnel, the ability of the Adviser to attract and retain high-quality personnel, and the organizational depth of the Adviser. The Board also considered the Trust’s compliance with legal and regulatory requirements, as well as the Adviser’s handling of portfolio brokerage, and noted the Adviser’s process for evaluating best execution. The Board considered the Adviser’s risk management strategies and the process developed by the Adviser for analyzing, reviewing and assessing risk exposure for the Funds. The Board also considered the Funds’ process for fair valuation of portfolio securities and noted the Board’s review of Fund valuation matters throughout the year.
The Board reviewed LCMAX’s performance, including that of LCMAX’s predecessor fund (which was reorganized into LCMAX on June 1, 2009), given that the portfolio manager managed the predecessor fund of LCMAX from 2007 to 2009. The Board noted that Lipper Inc., an independent provider of mutual fund data (“Lipper”) reassigned LCMAX to a peer group of alternative credit focus funds from a peer group of general bond funds. The Board noted the Adviser’s statement that this is a more appropriate peer group, but that there are limitations in comparing the performance of LCMAX to a peer group which consists of a broad collection of funds that may differ significantly by objective and portfolio characteristics. The Board compared LCMAX’s performance to the peer group and to two benchmark indices for the year-to-date and 1-, 3- and 5-year periods ended June 30, 2014. The Board considered that, although LCMAX underperformed its peer group for each such period, it outperformed one of its benchmark indices, the Citigroup 3-Month T-Bill Index, for all periods reviewed. The Board also noted that, while LCMAX underperformed its other benchmark index, the Barclays Capital U.S. Aggregate Bond Index ( “Barclays Index”), for all periods reviewed, LCMAX had met its volatility objective of being less volatile than the Barclays Index. The Board also noted that continuing flows and retention of assets by existing shareholders reflected their continuing satisfaction with the Fund, which has been closed to new investors because of capacity constraints.
The Board reviewed DRSLX’s performance, comparing it to the alternative credit focus funds peer group compiled from Lipper, and to two benchmark indices for the year-to-date and 1- and 3-year periods ended June 30, 2014 (the Fund’s inception date was September 30, 2010). The Board noted that Lipper reassigned DRSLX to the alternative credit focus funds peer group from the long/short funds peer group, and considered the Adviser’s statement regarding the limitations of the peer group, while also noting that the Adviser believes that this appears to be a more appropriate peer group. The Board noted that, although DRSLX’s performance was below the median of its peer group for the year-to-date and 3-year periods, performance was above the median for the 1-year period. The Board also noted that the Fund had outperformed one of its benchmark
65
Table of Contents
indices, the Citigroup 3-Month T-Bill Index, and underperformed the other benchmark index, the BofA Merrill Lynch US High Yield Index (“BofA Index”), for all periods reviewed. The Board noted that DRSLX had met its volatility objective of being less volatile than the BofA Index. The Board also noted that continuing flows and retention of assets by existing shareholders reflected their continuing satisfaction with the Fund, which has been closed to new investors because of capacity constraints.
The Board also reviewed DEVDX’s performance, comparing it to a peer group of alternative event driven funds compiled from Lipper and to two benchmark indices for the year-to-date and since-inception periods ended June 30, 2014 (the Fund’s inception date was August 26, 2013). The Board noted that the Fund’s performance was above the median of the peer group for the year-to-date period. The Board also noted that, although DEVDX underperformed one of its benchmark indices, the S&P 500 Index, for the since inception period, it outperformed the other benchmark index, the Citigroup 3-Month T-Bill Index, for this short time period, and considered that DEVDX had met its volatility objective.
The Board considered whether investment results for LCMAX, DRSLX and DEVDX, were consistent with each Fund’s investment objective and policies. The Board concluded that performance was satisfactory.
On the basis of this evaluation and its ongoing review of investment results, the Board concluded that the nature, quality and extent of services provided by the Adviser continue to be satisfactory.
Fees. The Board considered the Funds’ advisory fees, operating expenses and total expense ratios, and compared the advisory fees and expense ratios to peer groups based on data compiled from Lipper as of the fiscal year end of each fund in the peer groups. The Board noted certain limitations in comparing the fees and expense ratios of LCMAX and DRSLX to the peer group of funds designated by Lipper (the alternative credit focus funds peer group), as noted above. The Board noted that LCMAX’s annual advisory fee rate of .55% is in the 38th percentile of its peer group (1st percentile being the highest fee), DRSLX’s advisory fee rate of .80% was in the 17th percentile of its peer group, and DEVDX’s advisory fee rate of 1.00% is in the 30th percentile of its peer group. In considering the reasonableness of the advisory fees, the Board took into account the substantial human and technological resources devoted to investing for the Funds and the limited capacity of the investment styles, noting that LCMAX and DRSLX are currently closed to new investors.
The Board also considered that for the fiscal year ended December 31, 2013, LCMAX and DRSLX’s expense ratios were in the 83rd and 57th percentile of their peer group, respectively. The Board noted that DEVDX’s expense ratio of 1.21% for the six months ended June 30, 2014, was in the 85th percentile. The Board considered that the Adviser has agreed to reimburse DEVDX for any expenses in excess of 2.00% of average daily net assets (excluding interest, taxes, brokerage commissions, dividends and interest on short sales, other investment-related costs and extraordinary expenses) through August 25, 2016. On the basis of the information provided, the Board concluded that the advisory fees were reasonable and appropriate in light of the nature and quality of services provided by the Adviser.
Profitability. The Board reviewed information regarding the revenues received by the Adviser under the Agreement and discussed the methodology in allocating its costs to the management of the Funds. The Board considered the estimated costs to the Adviser of each Fund. The Board also noted that the Funds do not have a Rule 12b-1 fee and that the Adviser’s affiliate, Driehaus Securities LLC (“DS LLC”), serves as distributor of the Funds without compensation, that DS LLC provides compensation to intermediaries for distribution of the Funds’ shares and for shareholder services, and that DS LLC is reimbursed by the Funds under a Shareholder Services Plan for certain amounts paid for shareholder services covered under the Plan. The Board concluded that, based on the projected profitability calculated for the Trust as well as the Funds individually (noting that DEVDX was expected to be operated at a loss), the advisory fees appeared to be reasonable.
Economies of Scale. In considering the reasonableness of the advisory fee, the Board considered whether there are economies of scale with respect to the management of the Funds and whether the Funds benefit from any economies of scale. Given the capacity constraints of LCMAX and DRSLX and the current size of DEVDX, the Board concluded that the advisory fee rates under the Agreement are reasonable and reflect an appropriate sharing of any such economies of scale.
Other Benefits to the Adviser and its Affiliates. The Board also considered the character and amount of other incidental benefits received by the Adviser and its affiliates. The Board noted that payments to DS LLC under a Shareholder Services Plan are in reimbursement of payments made to intermediaries for shareholder services. The Board noted that there are no benefits to the Adviser related to soft dollar allocations for LCMAX or DRSLX and that the soft dollar amounts for DEVDX were limited during this period. The Board concluded that the advisory fees were reasonable in light of any fall-out benefits.
66
Table of Contents
Based on all of the information considered and the conclusions reached, the Board determined that the terms of the Agreement continue to be fair and reasonable and that the continuation of the Agreement is in the best interests of each Fund. No single factor was determinative in the Board’s analysis.
67
Table of Contents
| Item 2. | Code of Ethics. |
| (a) | The registrant, as of the end of the period covered by this report, has adopted a code of ethics that applies to the registrant’s principal executive officer, principal financial officer, principal accounting officer or controller, or persons performing similar functions, regardless of whether these individuals are employed by the registrant or a third party. |
| (b) | No response required. |
| (c) | None |
| (d) | None. |
| (e) | Not applicable. |
| (f) | The registrant’s Code of Ethics for Principal Executive and Financial Officers was filed as Exhibit 12(a)(1) to the registrant’s Certified Shareholder Report on Form N-CSR, Accession Number 0001193125-12-093739, on March 2, 2012, and is incorporated herein by reference. |
| Item 3. | Audit Committee Financial Expert. |
The registrant’s Board of Trustees has designated Dawn M. Vroegop as an audit committee financial expert. Ms. Vroegop is “independent,” as defined by this Item 3.
| Item 4. | Principal Accountant Fees and Services. |
| (a) | Audit Fees |
For the fiscal years ended December 31, 2014 and 2013, Ernst & Young LLP, the registrant’s principal accountant (“E&Y”), billed the registrant $343,000 and $402,700, respectively, for professional services rendered for the audit of the registrant’s annual financial statements or services that are normally provided in connection with statutory and regulatory filings.
| (b) | Audit-Related Fees |
For the fiscal years ended December 31, 2014 and 2013, E&Y billed the registrant $0 and $0, respectively, for assurance and related services that are reasonably related to the performance of the audit of the registrant’s financial statements and that are not reported above.
For engagements that Driehaus Capital Management LLC, the registrant’s investment adviser (“DCM”), or Driehaus Securities LLC, the registrant’s distributor (“DS”), entered into with E&Y for fiscal years 2014 and 2013, E&Y provided no audit-related services to DCM or DS that were for engagements directly related to the registrant’s operations and financial reporting, except for
Table of Contents
the issuance of a consent in connection with the filing of a Form N-14 in 2014 for the registrant, for which E&Y billed DCM $10,500. This engagement was pre-approved by the registrant’s Audit Committee.
| (c) | Tax Fees |
For the fiscal years ended December 31, 2014 and 2013, E&Y billed the registrant $75,961 and $82,450, respectively, for professional services rendered for tax compliance, tax advice, and tax planning. Such services consisted of review of the registrant’s income tax returns and tax distribution requirements and analysis related to passive foreign investment company status. The registrant’s Audit Committee pre-approved all tax services that E&Y provided to the registrant.
For fiscal years 2014 and 2013, E&Y provided no tax services to DCM or DS that were for engagements directly related to the registrant’s operations and financial reporting.
| (d) | All Other Fees |
For the fiscal years ended December 31, 2014 and 2013, E&Y billed the registrant $0 and $0, respectively, for products and services provided, other than the services reported above.
For fiscal years 2014 and 2013, E&Y provided no other services to DCM or DS that were for engagements directly related to the registrant’s operations and financial reporting.
| (e)(1) | Audit Committee Pre-Approval Policies and Procedures |
Pursuant to registrant’s Audit Committee Charter (the “Charter”), the Audit Committee is responsible for pre-approving any engagement of the principal accountant to provide non-prohibited services to the registrant, including the fees and other compensation to be paid to the principal accountant, to the extent required by Rule 2-01(c)(7) of Regulation S-X. The Chairman of the Audit Committee may grant pre-approval for such engagements of $5,000 or less. All such delegated pre-approvals will be presented to the Audit Committee no later than the next Audit Committee meeting.
Pursuant to the Charter, the Audit Committee is also responsible for pre-approving any engagement of the principal accountant, including the fees and other compensation to be paid to the principal accountant, to provide non-audit services to the registrant’s investment adviser (or any entity controlling, controlled by, or under common control with the adviser that provides ongoing services to the registrant), if the engagement relates directly to the operations and financial reporting of the registrant, to the extent required by Rule 2-01(c)(7) of Regulation S-X. The Chairman of the Audit Committee may grant pre-approval for such engagements of $5,000 or less. All such delegated pre-approvals will be presented to the Audit Committee no later than the next Audit Committee meeting.
| (e)(2) | The percentage of services described in each of paragraphs (b) through (d) of this Item that were approved by the audit committee pursuant to paragraph (c)(7)(i)(C) of Rule 2-01 of Regulation S-X is 0%. |
Table of Contents
| (f) | Not applicable. |
| (g) | Non-Audit Fees |
For the fiscal years ended December 31, 2014 and 2013, E&Y billed the registrant $75,961 and $82,450, respectively, in aggregate non-audit fees. For the fiscal years ended December 31, 2014 and 2013, E&Y billed DCM or DS $0 and $0, respectively, in aggregate non-audit fees.
| (h) | Not applicable. |
| Item 5. | Audit Committee of Listed Registrants. |
Not applicable.
| Item 6. | Investments. |
| (a) | Schedule of Investments in securities of unaffiliated issuers as of the close of the reporting period is included as part of the report to shareholders filed under Item 1 of this form. |
| (b) | Not applicable. |
| Item 7. | Disclosure of Proxy Voting Policies and Procedures for Closed-End Management Investment Companies. |
Not applicable.
| Item 8. | Portfolio Managers of Closed-End Management Investment Companies. |
Not applicable.
| Item 9. | Purchases of Equity Securities by Closed-End Management Investment Company and Affiliated Purchasers. |
Not applicable.
Table of Contents
| Item 10. | Submission of Matters to a Vote of Security Holders. |
There have been no material changes to the procedures by which the shareholders may recommend nominees to the registrant’s board of directors, where those changes were implemented after the registrant last provided disclosure in response to the requirements of Item 407(c)(2)(iv) of Regulation S-K (17 CFR 229.407) (as required by Item 22(b)(15) of Schedule 14A (17 CFR 240.14a-101)), or this Item.
| Item 11. | Controls and Procedures. |
| (a) | The registrant’s principal executive and principal financial officers, or persons performing similar functions, have concluded that the registrant’s disclosure controls and procedures (as defined in Rule 30a-3(c) under the Investment Company Act of 1940, as amended (the “1940 Act”) (17 CFR 270.30a-3(c))) are effective, as of a date within 90 days of the filing date of the report that includes the disclosure required by this paragraph, based on their evaluation of these controls and procedures required by Rule 30a-3(b) under the 1940 Act (17 CFR 270.30a-3(b)) and Rules 13a-15(b) or 15d-15(b) under the Securities Exchange Act of 1934, as amended (17 CFR 240.13a-15(b) or 240.15d-15(b)). |
| (b) | There were no changes in the registrant’s internal control over financial reporting (as defined in Rule 30a-3(d) under the 1940 Act (17 CFR 270.30a-3(d)) that occurred during the registrant’s second fiscal quarter of the period covered by this report that has materially affected, or is reasonably likely to materially affect, the registrant’s internal control over financial reporting. |
| Item 12. | Exhibits. |
| (a)(1) | Code of ethics, or any amendment thereto, that is the subject of disclosure required by Item 2, filed as Exhibit 12(a)(1) to the registrant’s Form N-CSR, filed on March 2, 2012 (Accession No. 0001193125-12-093739) incorporated herein by reference. |
| (a)(2) | Certifications pursuant to Rule 30a-2(a) under the 1940 Act and Section 302 of the Sarbanes-Oxley Act of 2002 are attached hereto. |
| (a)(3) | Not applicable. |
| (b) | Certifications pursuant to Rule 30a-2(b) under the 1940 Act and Section 906 of the Sarbanes-Oxley Act of 2002 are attached hereto. |
Table of Contents
SIGNATURES
Pursuant to the requirements of the Securities Exchange Act of 1934 and the Investment Company Act of 1940, the registrant has duly caused this report to be signed on its behalf by the undersigned, thereunto duly authorized.
| (Registrant) | Driehaus Mutual Funds | |||
| By (Signature and Title)* | /s/ Robert H. Gordon | |||
| Robert H. Gordon, President | ||||
| (principal executive officer) | ||||
| Date | March 4, 2015 | |||
Pursuant to the requirements of the Securities Exchange Act of 1934 and the Investment Company Act of 1940, this report has been signed below by the following persons on behalf of the registrant and in the capacities and on the dates indicated.
| By (Signature and Title)* | /s/ Robert H. Gordon | |||
| Robert H. Gordon, President | ||||
| (principal executive officer) | ||||
| Date | March 4, 2015 | |||
| By (Signature and Title)* | /s/ Michelle L. Cahoon | |||
| Michelle L. Cahoon, Vice President and Treasurer | ||||
| (principal financial officer) | ||||
| Date | March 4, 2015 | |||
| * | Print the name and title of each signing officer under his or her signature. |