Table of Contents
UNITED STATES
SECURITIES AND EXCHANGE COMMISSION
Washington, D.C. 20549
FORM N-CSR
CERTIFIED SHAREHOLDER REPORT OF REGISTERED MANAGEMENT
INVESTMENT COMPANIES
Investment Company Act file number 811-07655
Driehaus Mutual Funds
(Exact name of registrant as specified in charter)
25 East Erie Street
Chicago, IL 60611
(Address of principal executive offices) (Zip code)
Janet L. McWilliams
Driehaus Capital Management LLC
25 East Erie Street
Chicago, IL 60611
(Name and address of agent for service)
Registrant’s telephone number, including area code: 312-587-3800
Date of fiscal year end: December 31
Date of reporting period: December 31, 2017
Form N-CSR is to be used by management investment companies to file reports with the Commission not later than 10 days after the transmission to stockholders of any report that is required to be transmitted to stockholders under Rule 30e-1 under the Investment Company Act of 1940 (17 CFR 270.30e-1). The Commission may use the information provided on Form N-CSR in its regulatory, disclosure review, inspection, and policymaking roles.
A registrant is required to disclose the information specified by Form N-CSR, and the Commission will make this information public. A registrant is not required to respond to the collection of information contained in Form N-CSR unless the Form displays a currently valid Office of Management and Budget (“OMB”) control number. Please direct comments concerning the accuracy of the information collection burden estimate and any suggestions for reducing the burden to Secretary, Securities and Exchange Commission, 450 Fifth Street, NW, Washington, DC 20549-0609. The OMB has reviewed this collection of information under the clearance requirements of 44 U.S.C. § 3507.
Table of Contents
Item 1. Reports to Stockholders.
Table of Contents
Driehaus Mutual Funds
Trustees & Officers
Theodore J. Beck
Trustee
Francis J. Harmon
Trustee
Christopher J. Towle
Trustee
Dawn M. Vroegop
Trustee
Daniel F. Zemanek
Chairman of the Board
Stephen J. Kneeley
President
Michelle L. Cahoon
Vice President & Treasurer
Janet L. McWilliams
Chief Legal Officer &
Assistant Vice President
Michael R. Shoemaker
Chief Compliance Officer &
Assistant Vice President
William H. Wallace, III
Secretary
Michael P. Kailus
Assistant Secretary & Anti-Money
Laundering Compliance Officer
Christine Mason
Assistant Secretary
Investment Adviser
Driehaus Capital Management LLC
25 East Erie Street
Chicago, IL 60611
Distributor
Driehaus Securities LLC
25 East Erie Street
Chicago, IL 60611
Administrator
The Bank of New York Mellon
4400 Computer Drive
Westborough, MA 01581
Transfer Agent
BNY Mellon Investment Servicing (US) Inc.
4400 Computer Drive
Westborough, MA 01581
Custodian
The Northern Trust Company
50 South LaSalle Street
Chicago, IL 60603
Annual Report to Shareholders
December 31, 2017

Driehaus Emerging Markets Growth Fund
Driehaus Emerging Markets Small Cap Growth Fund
Driehaus Frontier Emerging Markets Fund
Driehaus International Small Cap Growth Fund
Driehaus Micro Cap Growth Fund
Driehaus Small Cap Growth Fund
Distributed by:
Driehaus Securities LLC
This report has been prepared for the shareholders of the Funds and is not an offer to sell or buy any Fund securities. Such offer is only made by the Funds’ prospectus.
Table of Contents
Annual Report to Shareholders
December 31, 2017
Investment Philosophy:
The Adviser seeks to achieve superior investment returns primarily by investing in global companies that are currently demonstrating rapid growth in their sales and earnings and which, in its judgment, have the ability to continue or accelerate their growth rates in the future. The Adviser manages the portfolios actively (above average turnover) to ensure that the Funds are fully invested, under appropriate market conditions, in companies that meet these criteria. Investors should note that investments in overseas markets can pose more risks than U.S. investments, and the international Funds’ share prices are expected to be more volatile than those of the U.S.-only Funds. In addition, the Funds’ returns will fluctuate with changes in stock market conditions, currency values, interest rates, government regulations, and economic and political conditions in countries in which the Funds invest. These risks are generally greater when investing in emerging markets.
Driehaus Emerging Markets Growth Fund
Driehaus Emerging Markets Small Cap Growth Fund
Driehaus Frontier Emerging Markets Fund
Driehaus International Small Cap Growth Fund
Driehaus Micro Cap Growth Fund
Driehaus Small Cap Growth Fund
Table of Contents
Portfolio Manager Letter, Performance Overview and Schedule of Investments: | ||||
| 1 | ||||
| 8 | ||||
| 17 | ||||
| 24 | ||||
| 31 | ||||
| 38 | ||||
| 46 | ||||
| 48 | ||||
| 50 | ||||
| 52 | ||||
| 60 | ||||
| 74 | ||||
| 76 | ||||
| 77 | ||||
| 78 | ||||
| 81 | ||||
Board Considerations in Connection with the Annual Review of the Investment Advisory Agreement | 82 | |||
| 85 | ||||
Table of Contents
Driehaus Emerging Markets Growth Fund — Portfolio Managers’ Letter
Dear Fellow Shareholders,
The Driehaus Emerging Markets Growth Fund (“Fund”) Investor class (DREGX) returned 42.52% and the Institutional class (DIEMX) returned 42.58% for the year ended December 31, 2017. The Fund’s primary benchmark, the Morgan Stanley Capital International (“MSCI”) Emerging Markets Index (“Benchmark”), returned 37.28% for the year, while the MSCI Emerging Markets Growth Index returned 46.80%.
Multiple factors set the stage for a robust year of global equity market performance. Strong economic figures, notably European GDP and North Asian trade data, confirmed a pickup in coordinated global growth. At the same time, subdued US inflation sustained market expectations of a modest interest rate tightening cycle, while progress on tax reform lifted investor sentiment. Moderate depreciation of the US dollar versus most major currencies further helped encourage risk-on sentiment during the fourth quarter. Emerging markets completed a clean sweep for the year, leading global equity market gains in each quarter. For 2017 as a whole, emerging markets rose 37%, while global equities returned 22% and the S&P 500 appreciated by 22%.
Over the course of 2017, security selection within the financials and information technology sectors contributed to the Fund’s returns versus the Benchmark. From a country perspective, holdings in China and India made key contributions to performance versus the Benchmark in the past year.
Alibaba Group Holding, Ltd. (Ticker: BABA) made a notable contribution to the Fund’s relative and absolute returns for the year. The China-based company provides online and mobile marketplaces to the retail and wholesale sectors. Strong growth in user engagement and the core commerce business were the primary drivers of strong performance. The Company has been investing to expand the customer base and to improve the customer experience as well as in the infrastructure necessary for sustainable growth.
Ping An Insurance Group Co. of China, Ltd. (Ticker: 2318 HK) was a significant contributor to the Fund’s return. The China-based company provides personal financial products and services such as insurance, banking and investments. Earnings growth from life and health insurance as well as the asset management business drove core business growth. Additionally, the proprietary financial technology powering the company’s ecosystem has become increasingly valuable and a key differentiating factor.
During 2017, stock selection within the real estate and energy sectors detracted from the Fund’s returns versus the Benchmark. At the country level, holdings in South Korea and Brazil detracted from Fund performance versus the Benchmark.
Fund holding Rosneft Oil Co. PJSC (Ticker: ROSN LI) was a notable detractor from returns. The Russia-based company is engaged in the exploration, production, refining and distribution of oil and gas products. Rosneft underperformed in the first half of 2017 against a background of concern about certain international investments that were perceived as having political motivations combined with a muted production outlook following the OPEC agreement in November 2016.
Another significant detractor from the Fund’s return for the year was Hanssem Co., Ltd (Ticker: 009240 KS). The South Korea-based company manufactures and distributes wood furniture for homes and businesses. The company saw decreased sales and slowed down the launch of its stores. The company was also negatively impacted by broader macro conditions such as slower than expected growth in the number of marriages and a weak housing market.
Accelerating earnings growth and positive earnings revisions created a favorable backdrop for our investment approach in 2017. As we look ahead, we are monitoring key variables such as the yield curve and the Chinese economy. We are mindful of the potential for US growth and inflation expectations to rise, driven by fiscal stimulus or a tightening labor market, which could pull up the long end of the yield curve and drive a value rotation that may act as a headwind to our style. We continue to see cyclical opportunities in countries that are recovering after having undergone significant economic slowdowns and adjustments during the 2011-2015 period. The Fund maintains exposure to companies exhibiting a cyclical improvement in earnings, emphasizing pricing power and operational efficiencies in an environment in which input costs are rising. Following a substantial easing of financial conditions over the past two years, we expect earnings growth to be the primary driver of share prices, as further compression of the cost of equity may be more limited at this point in the market cycle.
1
Table of Contents
We thank you for your interest in the Driehaus Emerging Markets Growth Fund and would like to express our gratitude to you as shareholders for your confidence in our management capabilities.
Sincerely,
 |  |  | ||
| Howard Schwab | Chad Cleaver | Rich Thies | ||
| Lead Portfolio Manager | Portfolio Manager | Portfolio Manager |
Performance is historical and does not represent future results.
Please see the following performance overview page for index descriptions.
2
Table of Contents
Driehaus Emerging Markets Growth Fund
Performance Overview (unaudited)
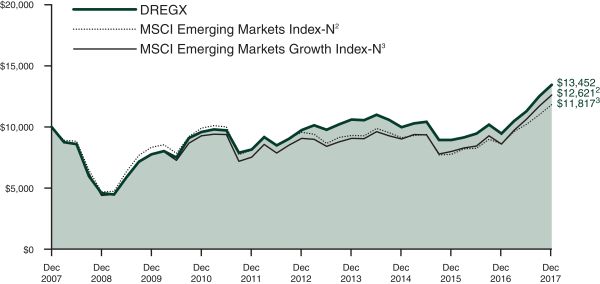
The performance summarized below is historical and does not represent future results. Investment returns and principal value vary, and you may have a gain or loss when you sell shares. Performance data presented measures the change in the value of an investment in the Fund, assuming reinvestment of all dividends and capital gains. Average annual total return reflects annualized change.
The table does not reflect the deduction of taxes that a shareholder would pay on Fund distributions or the redemption of Fund shares. The graph compares the results of a $10,000 investment in the Fund over the last 10 fiscal year periods, with all dividends and capital gains reinvested, with the indicated indices (and dividends reinvested) for the same period.
Average Annual Total Returns as of 12/31/17 | 1 Year | 3 Years | 5 Years | 10 Years | ||||||||||||
Driehaus Emerging Markets Growth Fund - Investor Class (DREGX) | 42.52% | 10.54% | 6.71% | 3.01% | ||||||||||||
Driehaus Emerging Markets Growth Fund - Institutional Class (DIEMX)1 | 42.58% | 10.55% | 6.72% | 3.01% | ||||||||||||
MSCI Emerging Markets Index-N2 | 37.28% | 9.10% | 4.35% | 1.68% | ||||||||||||
MSCI Emerging Markets Growth Index-N3 | 46.80% | 11.88% | 6.85% | 2.35% | ||||||||||||
| 1 | The returns for the periods prior to July 17, 2017 (institutional share class inception date) include the performance of the investor share class. |
| 2 | The Morgan Stanley Capital International Emerging Markets Index-Net (MSCI Emerging Markets Index-N) is a market capitalization-weighted index designed to measure equity market performance in emerging markets. Data is in U.S. dollars and is calculated with net dividend reinvestment. Source: Morgan Stanley Capital International Inc. |
| 3 | The Morgan Stanley Capital International Emerging Markets Growth Index-Net (MSCI Emerging Markets Growth Index-N) is a subset of the MSCI Emerging Markets Index and includes only the MSCI Emerging Markets Index stocks which are categorized as growth stocks. Data is in U.S. dollars and is calculated with net dividend reinvestment. Source: Morgan Stanley Capital International Inc. |
3
Table of Contents
Driehaus Emerging Markets Growth Fund
Schedule of Investments
December 31, 2017
| Number of Shares | Value (Note A) | |||||||
| EQUITY SECURITIES — 92.6% | ||||||||
| FAR EAST — 61.7% | ||||||||
China — 26.7% |
| |||||||
AIA Group, Ltd. | 2,787,641 | $ | 23,780,857 | |||||
Alibaba Group Holding, Ltd. — SP ADR** | 342,013 | 58,973,302 | ||||||
Aluminum Corp. of China, Ltd. — H** | 10,240,278 | 7,326,795 | ||||||
Baidu, Inc. — SP ADR** | 45,037 | 10,548,116 | ||||||
China Construction Bank Corp. — H | 38,948,257 | 35,893,106 | ||||||
China Shenhua Energy Co., Ltd. — H | 8,366,974 | 21,686,225 | ||||||
Galaxy Entertainment Group, Ltd. | 2,161,113 | 17,343,451 | ||||||
Inner Mongolia Yili Industrial Group Co., Ltd. — A | 3,059,888 | 15,125,583 | ||||||
JD.com, Inc. — ADR** | 417,311 | 17,285,022 | ||||||
Kweichow Moutai Co., Ltd. — A | 180,479 | 19,330,820 | ||||||
NetEase, Inc. — ADR | 11,130 | 3,840,629 | ||||||
New Oriental Education & Technology Group, Inc. — SP ADR | 192,323 | 18,078,362 | ||||||
Ping An Insurance Group Co. of China, Ltd. — H | 3,648,997 | 37,994,574 | ||||||
Sands China, Ltd. | 2,709,003 | 13,990,832 | ||||||
Shanghai International Airport Co., Ltd. — A | 2,759,040 | 19,070,084 | ||||||
Shenzhou International Group Holdings, Ltd. | 1,422,756 | 13,548,583 | ||||||
Shimao Property Holdings, Ltd. | 1,702,361 | 3,704,172 | ||||||
Silergy Corp. | 277,381 | 6,338,326 | ||||||
Techtronic Industries Co., Ltd. | 2,054,320 | 13,396,853 | ||||||
Tencent Holdings, Ltd. | 1,614,564 | 83,901,903 | ||||||
Tonghua Dongbao Pharmaceutical Co., Ltd. — A | 6,163,007 | 21,663,272 | ||||||
Yum China Holdings, Inc. | 314,603 | 12,590,412 | ||||||
|
| |||||||
| 475,411,279 | ||||||||
|
| |||||||
India — 11.4% |
| |||||||
Crompton Greaves Consumer Electricals, Ltd. | 700,692 | 3,024,412 | ||||||
Edelweiss Financial Services, Ltd. | 2,217,557 | 10,318,662 | ||||||
HDFC Bank, Ltd. — ADR | 442,901 | 45,029,745 | ||||||
Indraprastha Gas, Ltd. | 2,705,327 | 14,232,875 | ||||||
Larsen & Toubro, Ltd. | 451,841 | 8,907,273 | ||||||
Maruti Suzuki India, Ltd. | 107,911 | 16,449,422 | ||||||
Motherson Sumi Systems, Ltd. | 1,608,367 | 9,556,589 | ||||||
| Number of Shares | Value (Note A) | |||||||
Petronet LNG, Ltd. | 2,929,159 | $ | 11,690,937 | |||||
Reliance Industries, Ltd. | 855,763 | 12,348,917 | ||||||
State Bank of India | 3,625,642 | 17,603,485 | ||||||
Tata Consultancy Services, Ltd. | 525,338 | 22,232,470 | ||||||
Titan Co., Ltd. | 1,168,884 | 15,715,449 | ||||||
Zee Entertainment Enterprises, Ltd. | 1,726,474 | 15,737,144 | ||||||
|
| |||||||
| 202,847,380 | ||||||||
|
| |||||||
South Korea — 10.1% |
| |||||||
Hana Financial Group, Inc. | 282,248 | 13,129,653 | ||||||
Hyundai Marine & Fire Insurance Co., Ltd. | 161,789 | 7,102,969 | ||||||
ING Life Insurance Korea, Ltd.1 | 207,549 | 10,352,731 | ||||||
Macquarie Korea Infrastructure Fund2 | 750,408 | 5,782,884 | ||||||
NAVER Corp. | 22,339 | 18,154,154 | ||||||
Netmarble Games Corp.1** | 30,713 | 5,407,875 | ||||||
POSCO Chemtech Co., Ltd. | 242,199 | 9,004,269 | ||||||
Samsung Biologics Co., Ltd.1** | 49,074 | 17,006,636 | ||||||
Samsung Electronics Co., Ltd. | 21,614 | 51,443,157 | ||||||
Samsung Electronics Co., Ltd. — Pref. | 10,524 | 20,545,663 | ||||||
Shinhan Financial Group Co., Ltd. | 155,551 | 7,177,824 | ||||||
SK Holdings Co., Ltd. | 57,852 | 15,293,182 | ||||||
|
| |||||||
| 180,400,997 | ||||||||
|
| |||||||
Taiwan — 7.0% |
| |||||||
Cathay Financial Holding Co., Ltd. | 18,102,147 | 32,544,142 | ||||||
MediaTek, Inc. | 901,350 | 8,904,915 | ||||||
Parade Technologies, Ltd. | 532,861 | 10,546,739 | ||||||
Silicon Motion Technology Corp. — ADR | 269,742 | 14,285,536 | ||||||
Taiwan Semiconductor Manufacturing Co., Ltd. — SP ADR | 1,454,493 | 57,670,647 | ||||||
|
| |||||||
| 123,951,979 | ||||||||
|
| |||||||
Indonesia — 1.7% |
| |||||||
PT Bank Central Asia Tbk | 18,524,943 | 29,902,064 | ||||||
Philippines — 1.6% |
| |||||||
BDO Unibank, Inc. | 5,379,534 | 17,673,149 | ||||||
SM Prime Holdings, Inc. | 14,573,585 | 10,947,705 | ||||||
|
| |||||||
| 28,620,854 | ||||||||
|
| |||||||
Thailand — 1.4% |
| |||||||
Kasikornbank PCL — NVDR | 1,629,815 | 11,602,242 | ||||||
Notes to Financial Statements are an integral part of this Schedule.
4
Table of Contents
Driehaus Emerging Markets Growth Fund
Schedule of Investments
December 31, 2017
| Number of Shares | Value (Note A) | |||||||
Minor International PCL — NVDR | 9,556,301 | $ | 12,828,726 | |||||
|
| |||||||
| 24,430,968 | ||||||||
|
| |||||||
Japan — 0.9% |
| |||||||
Keyence Corp. | 29,327 | 16,428,846 | ||||||
Malaysia — 0.9% |
| |||||||
Public Bank BHD | 3,074,925 | 15,788,718 | ||||||
|
| |||||||
Total FAR EAST | 1,097,783,085 | |||||||
|
| |||||||
| EUROPE — 13.1% | ||||||||
Russia — 7.5% |
| |||||||
Lukoil PJSC — SP ADR | 378,485 | 21,656,912 | ||||||
MMC Norilsk Nickel PJSC — ADR | 828,996 | 15,535,385 | ||||||
Novatek PJSC — SP GDR | 94,424 | 11,349,765 | ||||||
Sberbank of Russia PJSC —SP ADR | 3,975,247 | 67,300,932 | ||||||
X5 Retail Group NV — GDR** | 106,195 | 4,010,985 | ||||||
Yandex NV — A** | 425,257 | 13,927,167 | ||||||
|
| |||||||
| 133,781,146 | ||||||||
|
| |||||||
Turkey — 1.2% |
| |||||||
Turkcell Iletisim Hizmetleri AS | 5,192,663 | 21,206,285 | ||||||
France — 1.1% |
| |||||||
LVMH Moet Hennessy Louis Vuitton SE | 69,240 | 20,387,186 | ||||||
Greece — 0.9% |
| |||||||
Hellenic Telecommunications Organization SA | 1,128,207 | 15,567,264 | ||||||
Switzerland — 0.7% |
| |||||||
Nestle SA | 147,073 | 12,647,870 | ||||||
Austria — 0.7% |
| |||||||
Erste Group Bank AG | 277,721 | 12,031,000 | ||||||
United Kingdom — 0.5% |
| |||||||
HSBC Holdings PLC | 874,863 | 9,058,575 | ||||||
Jersey — 0.5% | ||||||||
Aptiv PLC | 100,626 | 8,536,104 | ||||||
|
| |||||||
Total EUROPE | 233,215,430 | |||||||
|
| |||||||
| SOUTH AMERICA — 10.0% | ||||||||
Brazil — 7.1% |
| |||||||
B3 SA — Brasil Bolsa Balcao | 1,662,632 | 11,418,033 | ||||||
Banco Santander Brasil SA | 1,218,317 | 11,709,007 | ||||||
Braskem SA — Pref. A | 674,921 | 8,722,638 | ||||||
Kroton Educacional SA | 3,809,614 | 21,131,982 | ||||||
Lojas Renner SA | 836,279 | 8,947,436 | ||||||
OdontoPrev SA | 2,051,937 | 9,841,825 | ||||||
Raia Drogasil SA | 419,640 | 11,613,443 | ||||||
Telefonica Brasil SA — Pref. | 504,170 | 7,389,812 | ||||||
Vale SA — SP ADR | 1,209,824 | 14,796,148 | ||||||
| Number of Shares | Value (Note A) | |||||||
Via Varejo SA | 1,651,773 | $ | 12,185,007 | |||||
WEG SA | 1,196,015 | 8,693,112 | ||||||
|
| |||||||
| 126,448,443 | ||||||||
|
| |||||||
Peru — 1.5% |
| |||||||
Cia de Minas Buenaventura SAA — ADR | 1,070,475 | 15,072,288 | ||||||
Credicorp, Ltd. | 53,157 | 11,026,357 | ||||||
|
| |||||||
| 26,098,645 | ||||||||
|
| |||||||
Argentina — 1.4% |
| |||||||
Grupo Financiero Galicia SA — ADR | 135,657 | 8,933,013 | ||||||
MercadoLibre, Inc. | 49,725 | 15,646,469 | ||||||
|
| |||||||
| 24,579,482 | ||||||||
|
| |||||||
Total SOUTH AMERICA | 177,126,570 | |||||||
|
| |||||||
| AFRICA — 4.9% | ||||||||
South Africa — 4.6% |
| |||||||
Capitec Bank Holdings, Ltd. | 138,202 | 12,264,317 | ||||||
Mr. Price Group, Ltd. | 779,730 | 15,432,005 | ||||||
Naspers, Ltd. — N | 116,588 | 32,519,312 | ||||||
Sasol, Ltd. | 275,475 | 9,533,472 | ||||||
Standard Bank Group, Ltd. | 789,945 | 12,492,272 | ||||||
|
| |||||||
| 82,241,378 | ||||||||
|
| |||||||
Egypt — 0.3% |
| |||||||
Commercial International Bank Egypt SAE | 1,314,115 | 5,725,787 | ||||||
|
| |||||||
Total AFRICA | 87,967,165 | |||||||
|
| |||||||
| NORTH AMERICA — 2.3% | ||||||||
Mexico — 2.3% |
| |||||||
America Movil SAB de CV — L — SP ADR | 495,923 | 8,505,079 | ||||||
Grupo Financiero Banorte SAB de CV — O | 2,578,866 | 14,155,728 | ||||||
Wal-Mart de Mexico SAB de CV | 7,446,872 | 18,262,590 | ||||||
|
| |||||||
Total NORTH AMERICA | 40,923,397 | |||||||
|
| |||||||
| MIDDLE EAST — 0.6 | ||||||||
United Arab Emirates — 0.6% |
| |||||||
DP World, Ltd. | 405,797 | 10,144,925 | ||||||
|
| |||||||
Total MIDDLE EAST | 10,144,925 | |||||||
|
| |||||||
Total EQUITY SECURITIES | 1,647,160,572 | |||||||
|
| |||||||
| ||||||||
TOTAL INVESTMENTS | 92.6 | % | $ | 1,647,160,572 | ||||
Other Assets In Excess Of Liabilities | 7.4 | % | 132,340,034 | |||||
|
|
|
| |||||
Net Assets | 100.0 | % | $ | 1,779,500,606 | ||||
| ||||||||
Notes to Financial Statements are an integral part of this Schedule.
5
Table of Contents
Driehaus Emerging Markets Growth Fund
Schedule of Investments
December 31, 2017
| 1 | 144A — This security was purchased pursuant to Rule 144A of the Securities Act of 1933 and may not be resold subject to that rule except to qualified institutional buyers. At December 31, 2017, these securities amounted to $32,767,242 or 1.8% of net assets. These 144A securities have not been deemed illiquid. |
| 2 | Pursuant to procedures adopted by Driehaus Mutual Funds’ (the “Trust”) Board of Trustees, this security has been determined to be illiquid by Driehaus Capital Management LLC, the Fund’s investment adviser. |
| ** | Non-income producing security |
ADR — American Depository Receipt
GDR — Global Depository Receipt
NVDR — Non-Voting Depository Receipt
SP ADR — Sponsored American Depository Receipt
SP GDR — Sponsored Global Depository Receipt
Regional Weightings*
Asia/Far East Ex-Japan | 60.8% | |||
South America | 10.0% | |||
Eastern Europe | 8.7% | |||
Africa | 4.9% | |||
Western Europe | 4.4% | |||
North America | 2.3% | |||
Japan | 0.9% | |||
Middle East | 0.6% |
Top Ten Holdings*
Tencent Holdings, Ltd. | 4.7% | |||
Sberbank of Russia PJSC — SP ADR | 3.8% | |||
Alibaba Group Holding, Ltd. — SP ADR | 3.3% | |||
Taiwan Semiconductor Manufacturing Co., Ltd. — SP ADR | 3.2% | |||
Samsung Electronics Co., Ltd. | 2.9% | |||
HDFC Bank, Ltd. — ADR | 2.5% | |||
Ping An Insurance Group Co. of China, Ltd. — H | 2.1% | |||
China Construction Bank Corp. — H | 2.0% | |||
Cathay Financial Holding Co., Ltd. | 1.8% | |||
Naspers, Ltd. — N | 1.8% |
| * | All percentages are stated as a percent of net assets at December 31, 2017. |
Notes to Financial Statements are an integral part of this Schedule.
6
Table of Contents
Driehaus Emerging Markets Growth Fund
Schedule of Investments
December 31, 2017
Industry | Percent of Net Assets | |||
Auto Components | 1.0% | |||
Automobiles | 0.9% | |||
Beverages | 1.1% | |||
Capital Markets | 1.5% | |||
Chemicals | 1.0% | |||
Commercial Banks | 20.1% | |||
Computers & Peripherals | 4.0% | |||
Construction & Engineering | 0.5% | |||
Construction Materials | 0.5% | |||
Diversified Consumer Services | 2.2% | |||
Diversified Telecommunication Services | 1.3% | |||
Electronic Equipment, Instruments & Components | 0.9% | |||
Food & Staples Retailing | 1.9% | |||
Food Products | 1.6% | |||
Gas Utilities | 0.8% | |||
Health Care Providers & Services | 0.6% | |||
Hotels, Restaurants & Leisure | 3.2% | |||
Household Durables | 0.9% | |||
Industrial Conglomerates | 0.9% | |||
Industry | Percent of Net Assets | |||
Information Technology Services | 1.3% | |||
Insurance | 6.3% | |||
Internet & Catalog Retail | 1.0% | |||
Internet Software & Services | 11.5% | |||
Life Sciences Tools & Services | 1.0% | |||
Machinery | 0.5% | |||
Media | 2.7% | |||
Metals & Mining | 3.0% | |||
Multiline Retail | 0.5% | |||
Oil, Gas & Consumable Fuels | 4.4% | |||
Pharmaceuticals | 1.2% | |||
Real Estate Management & Development | 0.8% | |||
Semiconductors & Semiconductor Equipment | 5.5% | |||
Software | 0.3% | |||
Specialty Retail | 1.6% | |||
Textiles, Apparel & Luxury Goods | 2.8% | |||
Transportation Infrastructure | 1.6% | |||
Wireless Telecommunication Services | 1.7% | |||
Other Assets in Excess of Liabilities | 7.4% | |||
|
| |||
TOTAL | 100.0% | |||
|
| |||
Notes to Financial Statements are an integral part of this Schedule.
7
Table of Contents
Driehaus Emerging Markets Small Cap Growth Fund — Portfolio Managers’ Letter
Dear Fellow Shareholders,
The Driehaus Emerging Markets Small Cap Growth Fund (“Fund”) returned 33.30% for the year ended December 31, 2017. This return underperformed the Morgan Stanley Capital International (“MSCI”) Emerging Markets Small Cap Index (“Benchmark”), which rose 33.84% for the same period, and the Fund’s secondary benchmark, the MSCI Emerging Markets Index, which advanced 37.28%.
Multiple factors set the stage for another robust year of global equity market performance. Strong economic figures confirmed a pickup in coordinated global growth. At the same time, subdued inflation sustained market expectations of a modest interest rate tightening cycle, while depreciation of the US dollar versus most major currencies further helped encourage risk-on sentiment.
For 2017, at the sector level, key contributions to performance versus the Benchmark came from security selection within the consumer discretionary and consumer staples sectors. In addition, security selection in China, South Africa and Thailand contributed to the Fund’s outperformance.
Beauty Community PCL (Ticker: BEAUTY-R TB) was a significant contributor to returns for 2017. The Thailand-based company retails and distributes cosmetics and skincare products. Growth in sales through retail stores and overseas distributors where promotional expenses declined as well as increased Chinese tourism were primary drivers of performance.
TAL Education Group (Ticker: TAL) made a notable contribution to the Fund’s relative and absolute returns for the year. The China-based company provides after-school tutoring programs for primary and secondary school students. Student enrollment growth, network expansion and strong brand recognition continued to drive performance.
Certain areas detracted from Fund performance during the year. One sector that detracted from the performance of the Fund versus the Benchmark was the industrials sector. In addition, an underweight to and security selection in Taiwan and security selection within South Korea detracted from Fund performance versus the Benchmark.
Hyundai Development Co. — Engineering & Construction (Ticker: 012630 KS) was a significant detractor from Fund performance for the year. The South Korea-based company is mainly engaged in the engineering and construction business. The cyclical downturn in domestic housing negatively impacted the company along with continued government regulation. Additionally, pre-sale volumes were disappointing due to these same factors.
Vieworks Co., Ltd. (Ticker: 100120 KS) was also a detractor from Fund performance for the year. The South Korea-based company develops digital medical imaging solutions. Competition has threatened its digital imaging business as key clients move away from the technology offered by the company.
The Fund uses derivatives primarily to hedge a portion of the portfolio, dampen volatility, and manage downside risk. Derivatives held in the Fund generally consisted of put options on exchange-traded funds (ETFs), currency forwards and swaps. During 2017, the derivative positions, in aggregate, detracted from performance while helping the portfolio realize less volatility than the Benchmark.
We remain positive on the prospects for emerging market equities as an asset class. The case for emerging markets, built on attractive relative valuations, improving profit margins and growth, more disciplined corporate management, and structural reforms, remains intact. Heading into 2018, we remain cognizant of the risk of incrementally higher inflation and are positioning the portfolio in companies that exhibit strong pricing power amid this backdrop.
8
Table of Contents
We thank you for your interest in the Driehaus Emerging Markets Small Cap Growth Fund and would like to express our gratitude to you as shareholders for your confidence in our management capabilities.
Sincerely,
| | |
| Chad Cleaver, CFA | Howard Schwab | |
| Lead Portfolio Manager | Portfolio Manager |
|  | |
| Rich Thies | Trent DeBruin, CFA | |
| Portfolio Manager | Assistant Portfolio Manager |
Performance is historical and does not represent future results.
Please see the following performance overview page for index descriptions.
9
Table of Contents
Driehaus Emerging Markets Small Cap Growth Fund
Performance Overview (unaudited)
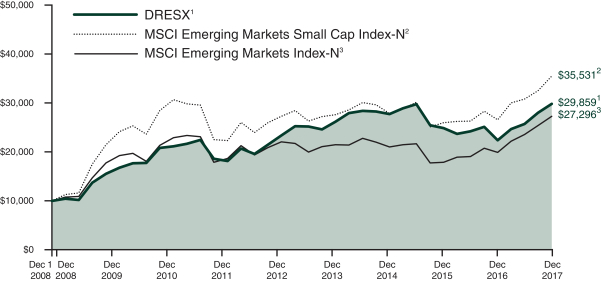
The performance summarized below is historical and does not represent future results. Investment returns and principal value vary, and you may have a gain or loss when you sell shares. Performance data presented measures the change in the value of an investment in the Fund, assuming reinvestment of all dividends and capital gains. Average annual total return reflects annualized change.
The table does not reflect the deduction of taxes that a shareholder would pay on Fund distributions or the redemption of Fund shares. The graph compares the results of a $10,000 investment in the Fund since December 1, 2008 (the date of the Predecessor Limited Partnership’s inception), with all dividends and capital gains reinvested, with the indicated indices (and dividends reinvested) for the same period.
| Fund Only | Including Predecessor Limited Partnership | |||||||||||||||||||
| Average Annual Total Returns as of 12/31/17 | 1 Year | 3 Years | 5 Years | Since Inception (8/22/11 - 12/31/17) | Since Inception (12/1/08 - 12/31/17) | |||||||||||||||
Driehaus Emerging Markets Small Cap Growth Fund (DRESX)1 | 33.30% | 2.52% | 5.02% | 6.01% | 12.80% | |||||||||||||||
MSCI Emerging Markets Small Cap Index-N2 | 33.84% | 8.44% | 5.41% | 5.08% | 14.97% | |||||||||||||||
MSCI Emerging Markets Index-N3 | 37.28% | 9.10% | 4.35% | 5.32% | 11.68% | |||||||||||||||
| 1 | The Driehaus Emerging Markets Small Cap Growth Fund (the “Fund”) performance shown above includes the performance of the Driehaus Emerging Markets Small Cap Growth Fund, L.P. (the “Predecessor Limited Partnership”), the Fund’s predecessor, for the periods before the Fund’s registration statement became effective. The Predecessor Limited Partnership, which was established on December 1, 2008, was managed with substantially the same investment objective, policies and philosophies as are followed by the Fund. The Fund succeeded to the Predecessor Limited Partnership’s assets on August 22, 2011. The Predecessor Limited Partnership was not registered under the Investment Company Act of 1940, as amended (“1940 Act”), and thus was not subject to certain investment and operational restrictions that are imposed by the 1940 Act. If the Predecessor Limited Partnership had been registered under the 1940 Act, its performance may have been adversely affected. The Predecessor Limited Partnership’s performance has been restated to reflect estimated expenses of the Fund. The returns for the periods prior to August 21, 2014, reflect fee waivers and/or reimbursements without which performance would have been lower. |
| 2 | The Morgan Stanley Capital International Emerging Markets Small Cap Index-Net (MSCI Emerging Markets Small Cap Index-N) is a market capitalization-weighted index designed to measure equity market performance of small cap stocks in emerging markets. Data is in U.S. dollars and is calculated with net dividend reinvestment. Source: Morgan Stanley Capital International Inc. |
10
Table of Contents
Driehaus Emerging Markets Small Cap Growth Fund
Performance Overview (unaudited)
| 3 | The Morgan Stanley Capital International Emerging Markets Index-Net (MSCI Emerging Markets Index-N) is a market capitalization weighted index designed to measure equity market performance in emerging markets. Data is in U.S. dollars and is calculated with net dividend reinvestment. Source: Morgan Stanley Capital International Inc. |
11
Table of Contents
Driehaus Emerging Markets Small Cap Growth Fund
Schedule of Investments
December 31, 2017
| Number of Shares | Value (Note A) | |||||||
| EQUITY SECURITIES — 94.9% | ||||||||
| FAR EAST — 65.8% | ||||||||
India — 22.8% |
| |||||||
AU Small Finance Bank, Ltd.1** | 159,188 | $ | 1,663,022 | |||||
Avenue Supermarts, Ltd.1** | 72,531 | 1,342,439 | ||||||
Bharat Electronics, Ltd. | 851,406 | 2,429,730 | ||||||
Bharat Financial Inclusion, Ltd.** | 161,589 | 2,532,158 | ||||||
Britannia Industries, Ltd. | 16,867 | 1,244,462 | ||||||
Cochin Shipyard, Ltd.1** | 142,163 | 1,229,692 | ||||||
Crompton Greaves Consumer Electricals, Ltd. | 681,560 | 2,941,832 | ||||||
Dalmia Bharat, Ltd. | 49,974 | 2,511,756 | ||||||
Dilip Buildcon, Ltd.1 | 92,467 | 1,433,925 | ||||||
Dixon Technologies India, Ltd.** | 10,579 | 694,623 | ||||||
DLF, Ltd. | 531,085 | 2,157,955 | ||||||
Edelweiss Financial Services, Ltd. | 330,584 | 1,538,262 | ||||||
Eris Lifesciences, Ltd.1** | 104,276 | 1,297,742 | ||||||
Escorts, Ltd. | 167,559 | 2,067,202 | ||||||
Future Retail, Ltd.** | 163,778 | 1,346,737 | ||||||
Future Supply Chain Solutions, Ltd.1** | 225,742 | 2,398,802 | ||||||
India Grid Trust1,2 | 2,995,461 | 4,409,127 | ||||||
Mahanagar Gas, Ltd. | 174,059 | 2,984,726 | ||||||
Motilal Oswal Financial Services, Ltd. | 57,164 | 1,337,581 | ||||||
MRF, Ltd. | 1,197 | 1,356,960 | ||||||
Page Industries, Ltd. | 5,645 | 2,258,933 | ||||||
PC Jeweller, Ltd. | 199,752 | 1,429,427 | ||||||
Petronet LNG, Ltd. | 841,910 | 3,360,253 | ||||||
Phillips Carbon Black, Ltd. | 77,754 | 1,188,100 | ||||||
Phoenix Mills, Ltd. | 222,239 | 2,182,958 | ||||||
Praxis Home Retail, Ltd.2,3** | 6,715 | — | ||||||
Quess Corp., Ltd.1** | 140,000 | 2,531,526 | ||||||
RBL Bank, Ltd.1 | 292,979 | 2,341,445 | ||||||
SpiceJet, Ltd.** | 652,275 | 1,491,513 | ||||||
Sterlite Technologies, Ltd. | 591,463 | 2,710,940 | ||||||
United Breweries, Ltd. | 80,727 | 1,364,685 | ||||||
Vakrangee, Ltd. | 333,848 | 2,198,106 | ||||||
|
| |||||||
| 61,976,619 | ||||||||
|
| |||||||
China — 16.0% | ||||||||
Angang Steel Co., Ltd. — H | 2,556,000 | 2,339,146 | ||||||
Bitauto Holdings, Ltd. — ADR4** | 58,763 | 1,868,663 | ||||||
China Lodging Group, Ltd. — SP ADR4 | 10,656 | 1,539,046 | ||||||
China Resources Cement Holdings, Ltd. | 3,714,914 | 2,444,007 | ||||||
China Taiping Insurance Holdings Co., Ltd. | 880,200 | 3,300,954 | ||||||
| Number of Shares | Value (Note A) | |||||||
CIMC Enric Holdings, Ltd.** | 1,135,573 | $ | 954,929 | |||||
Greentown Service Group Co., Ltd. | 1,771,864 | 1,387,945 | ||||||
Haitian International Holdings, Ltd. | 468,000 | 1,407,681 | ||||||
Hangzhou Tigermed Consulting Co., Ltd. — A | 652,507 | 3,525,061 | ||||||
Hua Hong Semiconductor, Ltd.1 | 639,599 | 1,357,322 | ||||||
Lee & Man Paper Manufacturing, Ltd. | 2,727,571 | 3,225,808 | ||||||
Li Ning Co., Ltd.** | 1,689,900 | 1,369,163 | ||||||
Logan Property Holdings Co., Ltd. | 1,988,000 | 2,055,977 | ||||||
Maanshan Iron & Steel Co., Ltd. — H** | 5,671,546 | 2,678,665 | ||||||
Minth Group, Ltd. | 676,000 | 4,079,612 | ||||||
Silergy Corp. | 55,836 | 1,275,887 | ||||||
TAL Education Group — ADR4 | 90,767 | 2,696,688 | ||||||
Tonghua Dongbao Pharmaceutical Co., Ltd. — A | 922,741 | 3,243,480 | ||||||
Wuxi Biologics Cayman, Inc.1** | 490,328 | 2,742,576 | ||||||
|
| |||||||
| 43,492,610 | ||||||||
|
| |||||||
Taiwan — 8.5% | ||||||||
Accton Technology Corp. | 932,031 | 3,319,901 | ||||||
Airtac International Group | 115,526 | 2,076,933 | ||||||
Ennoconn Corp. | 79,000 | 1,194,617 | ||||||
Gourmet Master Co., Ltd. | 234,257 | 3,424,292 | ||||||
Kingpak Technology, Inc. | 211,000 | 1,967,589 | ||||||
Parade Technologies, Ltd. | 165,397 | 3,273,647 | ||||||
Silicon Motion Technology Corp. — ADR4 | 61,198 | 3,241,046 | ||||||
Sunny Friend Environmental Technology Co., Ltd. | 206,743 | 1,771,577 | ||||||
TCI Co., Ltd. | 141,140 | 1,361,197 | ||||||
Tong Hsing Electronic Industries, Ltd. | 289,219 | 1,312,047 | ||||||
|
| |||||||
| 22,942,846 | ||||||||
|
| |||||||
Thailand — 6.9% | ||||||||
Beauty Community PCL — NVDR | 5,809,648 | 3,707,907 | ||||||
Esso Thailand PCL — NVDR** | 3,916,700 | 2,115,186 | ||||||
IRPC PCL — NVDR | 13,050,845 | 2,823,211 | ||||||
Land & Houses PCL — NVDR | 6,158,179 | 1,984,071 | ||||||
Minor International PCL — NVDR | 2,877,094 | 3,862,316 | ||||||
Srisawad Corp. PCL — NVDR | 975,279 | 1,952,653 | ||||||
Star Petroleum Refining PCL — NVDR | 2,281,695 | 1,197,207 | ||||||
Notes to Financial Statements are an integral part of this Schedule.
12
Table of Contents
Driehaus Emerging Markets Small Cap Growth Fund
Schedule of Investments
December 31, 2017
| Number of Shares | Value (Note A) | |||||||
Workpoint Entertainment PCL — NVDR | 409,258 | $ | 1,057,993 | |||||
|
| |||||||
| 18,700,544 | ||||||||
|
| |||||||
South Korea — 6.8% | ||||||||
CJ E&M Corp. | 21,059 | 1,921,876 | ||||||
Douzone Bizon Co., Ltd. | 37,594 | 1,169,380 | ||||||
Eugene Technology Co., Ltd. | 113,986 | 2,246,607 | ||||||
ING Life Insurance Korea, Ltd.1 | 39,446 | 1,967,602 | ||||||
Koh Young Technology, Inc. | 14,689 | 1,131,981 | ||||||
LG Chem, Ltd. — Pref. | 10,972 | 2,551,985 | ||||||
Loen Entertainment, Inc. | 12,729 | 1,337,642 | ||||||
Nasmedia Co., Ltd. | 10,460 | 727,916 | ||||||
POSCO Chemtech Co., Ltd. | 59,895 | 2,226,725 | ||||||
SFA Engineering Corp. | 44,513 | 1,611,208 | ||||||
Tokai Carbon Korea Co., Ltd. | 20,243 | 1,455,991 | ||||||
|
| |||||||
| 18,348,913 | ||||||||
|
| |||||||
Malaysia — 1.7% | ||||||||
AirAsia BHD | 1,555,592 | 1,287,678 | ||||||
Malaysia Airports Holdings BHD | 929,500 | 2,018,855 | ||||||
My EG Services BHD | 2,542,286 | 1,400,864 | ||||||
|
| |||||||
| 4,707,397 | ||||||||
|
| |||||||
Philippines — 1.6% | ||||||||
Metro Pacific Investments Corp. | 19,027,401 | 2,610,931 | ||||||
Security Bank Corp. | 329,190 | 1,657,820 | ||||||
|
| |||||||
| 4,268,751 | ||||||||
|
| |||||||
Indonesia — 1.0% | ||||||||
PT Bank Tabungan Negara Persero Tbk | 10,302,799 | 2,710,963 | ||||||
Vietnam — 0.5% | ||||||||
Vietjet Aviation JSC | 206,980 | 1,338,001 | ||||||
|
| |||||||
Total FAR EAST | 178,486,644 | |||||||
|
| |||||||
| SOUTH AMERICA — 13.9% | ||||||||
Brazil — 10.1% | ||||||||
Arezzo Industria e Comercio SA | 83,800 | 1,381,888 | ||||||
BK Brasil Operacao e Assessoria a Restaurantes SA** | 200,000 | 1,055,139 | ||||||
Bradespar SA — Pref. | 393,543 | 3,407,360 | ||||||
Estacio Participacoes SA | 266,500 | 2,636,800 | ||||||
Iochpe Maxion SA | 400,726 | 2,778,541 | ||||||
Lojas Renner SA | 170,807 | 1,827,482 | ||||||
Magazine Luiza SA | 120,200 | 2,906,890 | ||||||
MRV Engenharia e Participacoes SA | 457,500 | 2,074,342 | ||||||
Nexa Resources SA4** | 132,484 | 2,598,011 | ||||||
OdontoPrev SA | 242,332 | 1,162,311 | ||||||
| Number of Shares | Value (Note A) | |||||||
Raia Drogasil SA | 97,273 | $ | 2,692,008 | |||||
Via Varejo SA | 393,300 | 2,901,345 | ||||||
|
| |||||||
| 27,422,117 | ||||||||
|
| |||||||
Argentina — 2.6% | ||||||||
Grupo Supervielle SA — SP ADR4 | 90,334 | 2,648,593 | ||||||
Loma Negra Cia Industrial Argentina SA — SP ADR4** | 78,345 | 1,805,069 | ||||||
Pampa Energia SA — SP ADR4** | 19,359 | 1,302,474 | ||||||
Telecom Argentina SA — SP ADR4 | 36,634 | 1,341,903 | ||||||
|
| |||||||
| 7,098,039 | ||||||||
|
| |||||||
Uruguay — 1.2% | ||||||||
Arcos Dorados Holdings, Inc. — A4** | 294,093 | 3,043,863 | ||||||
|
| |||||||
Total SOUTH AMERICA | 37,564,019 | |||||||
|
| |||||||
| EUROPE — 6.7% | ||||||||
Poland — 2.9% | ||||||||
Alior Bank SA** | 91,794 | 2,096,446 | ||||||
CCC SA | 16,975 | 1,389,815 | ||||||
Dino Polska SA1** | 120,778 | 2,734,112 | ||||||
Grupa Lotos SA | 98,585 | 1,634,139 | ||||||
|
| |||||||
| 7,854,512 | ||||||||
|
| |||||||
Russia — 1.4% | ||||||||
Evraz PLC | 458,436 | 2,104,451 | ||||||
Globaltrans Investment PLC — SP GDR | 192,943 | 1,811,735 | ||||||
|
| |||||||
| 3,916,186 | ||||||||
|
| |||||||
Netherlands — 1.0% | ||||||||
DP Eurasia NV1,2** | 890,000 | 2,583,507 | ||||||
Turkey — 0.9% | ||||||||
Migros Ticaret AS** | 173,635 | 1,262,467 | ||||||
Tofas Turk Otomobil Fabrikasi AS | 139,520 | 1,215,394 | ||||||
|
| |||||||
| 2,477,861 | ||||||||
|
| |||||||
United Kingdom — 0.5% | ||||||||
BGEO Group PLC | 29,458 | 1,414,713 | ||||||
|
| |||||||
Total EUROPE | 18,246,779 | |||||||
|
| |||||||
| AFRICA — 4.4% | ||||||||
South Africa — 3.7% | ||||||||
AVI, Ltd. | 350,221 | 3,129,556 | ||||||
Barloworld, Ltd. | 201,690 | 2,601,063 | ||||||
Capitec Bank Holdings, Ltd. | 17,646 | 1,565,941 | ||||||
Imperial Holdings, Ltd. | 130,516 | 2,765,283 | ||||||
|
| |||||||
| 10,061,843 | ||||||||
|
| |||||||
Kenya — 0.7% | ||||||||
Safaricom, Ltd. | 7,510,810 | 1,947,786 | ||||||
|
| |||||||
Total AFRICA | 12,009,629 | |||||||
|
| |||||||
Notes to Financial Statements are an integral part of this Schedule.
13
Table of Contents
Driehaus Emerging Markets Small Cap Growth Fund
Schedule of Investments
December 31, 2017
| Number of Shares | Value (Note A) | |||||||
| MIDDLE EAST — 2.4% | ||||||||
Israel — 1.0% | ||||||||
Frutarom Industries, Ltd. | 29,367 | $ | 2,755,543 | |||||
United Arab Emirates — 1.0% |
| |||||||
NMC Health PLC | 66,839 | 2,603,496 | ||||||
Pakistan — 0.4% | ||||||||
United Bank, Ltd. | 702,883 | 1,197,290 | ||||||
|
| |||||||
Total MIDDLE EAST | 6,556,329 | |||||||
|
| |||||||
| NORTH AMERICA — 1.7% | ||||||||
United States — 1.2% | ||||||||
Nexteer Automotive Group, Ltd. | 1,356,297 | 3,232,399 | ||||||
Mexico — 0.5% | ||||||||
Infraestructura Energetica Nova SAB de CV | 258,813 | 1,266,259 | ||||||
|
| |||||||
Total NORTH AMERICA | 4,498,658 | |||||||
|
| |||||||
Total EQUITY SECURITIES | 257,362,058 | |||||||
|
| |||||||
| ||||||||
| PURCHASED PUT OPTIONS — 0.1% | ||||||||
iShares MSCI Emerging Markets Index ETF, Exercise Price $47.00, Notional Amount $23,500,000, Expiration Date January 19, 2018** | 5,000 | 275,000 | ||||||
|
| |||||||
Total PURCHASED PUT OPTIONS | 275,000 | |||||||
|
| |||||||
| ||||||||
TOTAL INVESTMENTS | 95.0 | % | $ | 257,637,058 | ||||
Other Assets In Excess Of Liabilities | 5.0 | % | 13,508,936 | |||||
|
|
|
| |||||
Net Assets | 100.0 | % | $ | 271,145,994 | ||||
| ||||||||
| 1 | 144A — This security was purchased pursuant to Rule 144A of the Securities Act of 1933 and may not be resold subject to that rule except to qualified institutional buyers. At December 31, 2017, these securities amounted to $30,032,839 or 11.1% of net assets. These 144A securities have not been deemed illiquid, unless otherwise noted. |
| 2 | Pursuant to procedures adopted by Driehaus Mutual Funds’ (the “Trust”) Board of Trustees, this security has been determined to be illiquid by Driehaus Capital Management LLC, the Fund’s investment adviser. |
| 3 | Investments categorized as Level 3 pricing (See Note A in the Notes to Financial Statements). |
| 4 | All or a portion of the security is pledged as collateral for derivatives transactions. |
| ** | Non-income producing security |
ADR — American Depository Receipt
ETF — Exchange-Traded Fund
NVDR — Non-Voting Depository Receipt
SP ADR — Sponsored American Depository Receipt
SP GDR — Sponsored Global Depository Receipt
Regional Weightings(a)(b)
Asia/Far East Ex-Japan | 65.8% | |||
South America | 13.9% | |||
Eastern Europe | 5.2% | |||
Africa | 4.4% | |||
Middle East | 2.4% | |||
North America | 1.7% | |||
Western Europe | 1.5% |
Top Ten Holdings(a)
India Grid Trust | 1.6% | |||
Minth Group, Ltd. | 1.5% | |||
Minor International PCL — NVDR | 1.4% | |||
Beauty Community PCL — NVDR | 1.4% | |||
Hangzhou Tigermed Consulting Co., Ltd. — A | 1.3% | |||
Gourmet Master Co., Ltd. | 1.3% | |||
Bradespar SA — Pref. | 1.3% | |||
Petronet LNG, Ltd. | 1.2% | |||
Accton Technology Corp. | 1.2% | |||
China Taiping Insurance Holdings Co., Ltd. | 1.2% |
| (a) | All percentages are stated as a percent of net assets at December 31, 2017. |
| (b) | Excludes purchased options. |
Notes to Financial Statements are an integral part of this Schedule.
14
Table of Contents
Driehaus Emerging Markets Small Cap Growth Fund
Schedule of Investments
December 31, 2017
SWAP CONTRACTS
Credit Default Swaps
| Counterparty | Reference Instrument | Notional Amount(4) | Buy/Sell Protection(1)(2) | Pay (Receive) Fixed Rate | Payment Frequency | Expiration Date | Implied Credit Spread(3) | Upfront Premium Paid (Received) | Unrealized Appreciation/ (Depreciation) | Value | ||||||||||||||||||||||||||||
Bank of America | Republic of Turkey, 11.875%, 1/15/30 | $ | 11,250,000 | Buy | 1.00 | % | Quarterly | 6/20/2022 | 1.49 | % | $ | 691,796 | $ | (466,611 | ) | $ | 225,185 | |||||||||||||||||||||
Morgan Stanley | Republic of Turkey, 11.875%, 1/15/30 | $ | 11,250,000 | Buy | 1.00 | % | Quarterly | 6/20/2022 | 1.49 | % | 695,981 | (470,797 | ) | 225,184 | ||||||||||||||||||||||||
|
|
|
|
|
| |||||||||||||||||||||||||||||||||
Total Credit Default Swaps |
| $ | 1,387,777 | $ | (937,408 | ) | $ | 450,369 | ||||||||||||||||||||||||||||||
|
|
|
|
|
| |||||||||||||||||||||||||||||||||
| (1) | If the Fund is a buyer of protection and a credit event occurs, as defined under the terms of that particular swap agreement, the Fund will either (i) receive from the seller of protection an amount equal to the notional amount of the swap and deliver the referenced obligation or underlying investments comprising the referenced index or (ii) receive a net settlement amount in the form of cash or investments equal to the notional amount of the swap less the recovery value of the referenced obligation or underlying investments comprising the referenced index. |
| (2) | If the Fund is a seller of protection and a credit event occurs, as defined under the terms of that particular swap agreement, the Fund will either (i) pay to the buyer of protection an amount equal to the notional amount of the swap and take delivery of the referenced obligation or underlying investments comprising the referenced index or (ii) pay a net settlement amount in the form of cash or investments equal to the notional amount of the swap less the recovery value of the referenced obligation or underlying investments comprising the referenced index. |
| (3) | An implied credit spread is the spread in yield between a U.S. Treasury security and the referenced obligation or underlying investment that are identical in all respects except for the quality rating. Implied credit spreads, represented in absolute terms, utilized in determining the value of credit default swap agreements on corporate and sovereign issues as of period end serve as an indicator of the current status of the payment/performance risk and represent the likelihood of risk of default for the credit derivative. The implied credit spread of a particular referenced entity reflects the cost of buying/selling protection and may include upfront payments required to be made to enter into the agreement. Wider credit spreads, in comparison to narrower credit spreads, represent a deterioration of the referenced entity’s credit soundness and a greater likelihood of risk of default or other credit event occurring as defined under the terms of the agreement. A credit spread identified as “Defaulted” indicates a credit event has occurred for the referenced entity or obligation. |
| (4) | The maximum potential amount the Fund could be required to pay as a seller of credit protection or receive as a buyer of credit protection if a credit event occurs as defined under the terms of that particular swap agreement. |
Interest Rate Swaps
| Counterparty | Notional Amount | Fixed Rate(1) | Floating Rate Index(1) | Payment Frequency | Expiration Date | Upfront Premium Paid (Received) | Unrealized Appreciation/ (Depreciation) | Value | ||||||||||||||||||||||
Goldman Sachs | KRW 11,500,000,000 | 2.21 | % | 3-Month KRW KWCDC | Quarterly | 12/22/2027 | $ | — | $ | (12,446 | ) | $ | (12,446 | ) | ||||||||||||||||
|
|
|
|
|
| |||||||||||||||||||||||||
Total Interest Rate Swaps |
| $ | — | $ | (12,446 | ) | $ | (12,446 | ) | |||||||||||||||||||||
|
|
|
|
|
| |||||||||||||||||||||||||
| (1) | Fund pays the floating rate and receives the fixed rate. |
KRW — South Korean Won
KWCDC — Korean Won 3-month Certificate of Deposit Rate
Notes to Financial Statements are an integral part of this Schedule.
15
Table of Contents
Driehaus Emerging Markets Small Cap Growth Fund
Schedule of Investments
December 31, 2017
Industry | Percent of Net Assets | |||
Aerospace & Defense | 0.9% | |||
Air Freight & Logistics | 0.9% | |||
Airlines | 1.5% | |||
Auto Components | 3.2% | |||
Automobiles | 0.4% | |||
Beverages | 0.5% | |||
Capital Markets | 1.1% | |||
Chemicals | 2.4% | |||
Commercial Banks | 5.8% | |||
Commercial Services & Supplies | 1.2% | |||
Communications Equipment | 2.2% | |||
Computers & Peripherals | 0.4% | |||
Construction & Engineering | 0.5% | |||
Construction Materials | 3.3% | |||
Consumer Finance | 2.3% | |||
Distributors | 1.0% | |||
Diversified Consumer Services | 2.0% | |||
Diversified Financial Services | 0.9% | |||
Diversified Telecommunication Services | 0.5% | |||
Electric Utilities | 2.1% | |||
Electronic Equipment, Instruments & Components | 1.8% | |||
Food & Staples Retailing | 3.0% | |||
Food Products | 1.6% | |||
Gas Utilities | 1.6% | |||
Health Care Providers & Services | 1.4% | |||
Hotels, Restaurants & Leisure | 5.7% | |||
Household Durables | 2.1% | |||
Industry | Percent of Net Assets | |||
Information Technology Services | 1.3% | |||
Insurance | 1.9% | |||
Internet Software & Services | 0.7% | |||
Life Sciences Tools & Services | 2.3% | |||
Machinery | 3.9% | |||
Media | 1.9% | |||
Metals & Mining | 4.8% | |||
Multiline Retail | 2.2% | |||
Oil, Gas & Consumable Fuels | 4.1% | |||
Other | 0.1% | |||
Paper & Forest Products | 1.2% | |||
Personal Products | 0.5% | |||
Pharmaceuticals | 1.7% | |||
Professional Services | 0.9% | |||
Real Estate Management & Development | 3.1% | |||
Road & Rail | 0.7% | |||
Semiconductors & Semiconductor Equipment | 5.2% | |||
Software | 0.4% | |||
Specialty Retail | 3.0% | |||
Textiles, Apparel & Luxury Goods | 2.4% | |||
Trading Companies & Distributors | 1.0% | |||
Transportation Infrastructure | 0.7% | |||
Wireless Telecommunication Services | 0.7% | |||
Other Assets in Excess of Liabilities | 5.0% | |||
|
| |||
TOTAL | 100.0% | |||
|
| |||
Notes to Financial Statements are an integral part of this Schedule.
16
Table of Contents
Driehaus Frontier Emerging Markets Fund — Portfolio Managers’ Letter
Dear Fellow Shareholders,
The Driehaus Frontier Emerging Markets Fund (“Fund”) returned 20.04% for the year ended December 31, 2017.1 This return underperformed the Morgan Stanley Capital International (“MSCI”) Frontier Markets Index (“Benchmark”), which returned 31.86% for the same period.
Multiple factors set the stage for another robust year of global equity market performance. Strong economic figures confirmed a pickup in coordinated global growth. At the same time, subdued inflation sustained market expectations of a modest interest rate tightening cycle, while depreciation of the US dollar versus most major currencies further helped encourage risk-on sentiment. Rising foreign direct investment, structural reforms, and increasing domestic demand supported a number of frontier economies over the course of the year, including Vietnam, Bangladesh, and Argentina.
Over the course of 2017, key contributions to performance versus the Benchmark came from the Fund’s security selection in the industrials sector and an underweight to as well as security selection in the telecommunications sector. In addition, an underweight to Oman and Morocco and security selection in Nigeria contributed to performance.
A notable contribution to the Fund’s return for the year came from holding Airports Corp. of Vietnam JSC (Ticker: ACV VN). The Vietnam-based company invests in, develops, operates and maintains airports. The company has benefitted from increases in various airport charges and its plan to auction off a 20% stake in the company. Positive implications for this sale, particularly to financial investors, would be improved liquidity of the stock and transparency of governance.
GrameenPhone, Ltd. (Ticker: GRAM BD) was a significant contributor to returns during 2017. The Bangladesh-based company develops and distributes telecommunication services. Top line growth and operational efficiency drove strong performance during the year. Specifically, a rebound in voice business and substantial growth in the data business have been primary drivers of performance throughout the year.
Certain areas detracted from Fund performance during the year. Security selection in the materials sector and an underweight to and security selection in the energy sector hurt performance of the Fund relative to the Benchmark. Additionally, an overweight to Pakistan, an underweight to Argentina, and security selection in Vietnam detracted from Fund performance versus the Benchmark.
Lucky Cement, Ltd. (Ticker: LUCK PA) was a significant detractor from the Fund’s performance during 2017. The Pakistan-based company manufactures and delivers cement. With declining net sales and profits in the cement business due to lower sales volumes, the company reported weak results. In the industry more broadly, higher international coal prices combined with downward price pressures drove underperformance across the board.
United Bank, Ltd. (Ticker: UBL PA) was a significant detractor from the Fund’s performance during 2017. The Pakistan-based company provides commercial banking and related services. Political uncertainty in the country regarding corruption investigations targeted at the sitting Prime Minister, a widening current account deficit and foreign exchange concerns drove down the company’s share price. However, fundamentals remain strong with superior margins and solid potential for growth.
We remain positive on the prospects for frontier market equities as an asset class. The maturation of local capital markets, growing domestic demand, and low correlation of the asset class relative to global equity markets support the investment case for frontier markets. Heading into 2018, we see diverging fundamentals across a number of frontier markets and anticipate a strong opportunity for country selection. We continue to see a supportive backdrop for domestic demand and are positioning the portfolio in companies that are positioned to capitalize on this trend and deliver accelerating earnings growth.
17
Table of Contents
We thank you for your interest in the Driehaus Frontier Emerging Markets Fund and would like to express our gratitude to you as shareholders for your confidence in our management capabilities.
Sincerely,
| | |
| Chad Cleaver, CFA | Rich Thies | |
| Lead Portfolio Manager | Portfolio Manager |
| 1 | During this period, the Fund’s returns reflect fee waivers and/or expense reimbursements without which performance would have been lower. |
Performance is historical and does not represent future results.
Please see the following performance overview page for index descriptions.
18
Table of Contents
Driehaus Frontier Emerging Markets Fund
Performance Overview (unaudited)
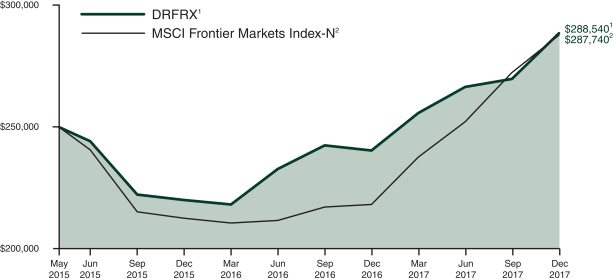
The performance summarized below is historical and does not represent future results. Investment returns and principal value vary, and you may have a gain or loss when you sell shares. Performance data presented measures the change in the value of an investment in the Fund, assuming reinvestment of all dividends and capital gains. Average annual total return reflects annualized change.
The table does not reflect the deduction of taxes that a shareholder would pay on Fund distributions or the redemption of Fund shares. The graph compares the results of a $250,000 investment (minimum investment) in the Fund since May 4, 2015 (the date of the Fund’s inception), with all dividends and capital gains reinvested, with the indicated index (and dividends reinvested) for the same period.
Average Annual Total Returns as of 12/31/17 | 1 Year | Since Inception | ||||||
Driehaus Frontier Emerging Markets Fund (DRFRX)1 | 20.04% | 5.53% | ||||||
MSCI Frontier Markets Index-N2 | 31.86% | 5.42% | ||||||
| 1 | The returns for the period reflect fee waivers and/or reimbursements without which performance would have been lower. |
| 2 | The Morgan Stanley Capital International Frontier Markets Index-Net (MSCI Frontier Markets Index-N) provides broad representation of the equity opportunity set in frontier markets while taking investability requirements into consideration within each market. Data is in U.S. dollars and is calculated with net dividend reinvestment. Source: Morgan Stanley Capital International Inc. |
19
Table of Contents
Driehaus Frontier Emerging Markets Fund
Schedule of Investments
December 31, 2017
| Number of Shares | Value (Note A) | |||||||
| EQUITY SECURITIES — 89.2% | ||||||||
| FAR EAST — 34.1% | ||||||||
Vietnam — 18.1% |
| |||||||
Airports Corp. of Vietnam JSC | 247,600 | $ | 1,182,994 | |||||
Bank for Foreign Trade of Vietnam JSC | 313,906 | 750,588 | ||||||
Dat Xanh Real Estate Service & Construction JSC | 755,320 | 716,771 | ||||||
Mobile World Investment Corp. | 100,000 | 709,542 | ||||||
Nam Long Investment Corp. | 177,123 | 234,770 | ||||||
Saigon Beer Alcohol Beverage Corp. | 46,720 | 512,893 | ||||||
Saigon Securities, Inc. | 715,930 | 907,956 | ||||||
Viet Capital Securities JSC** | 278,030 | 954,967 | ||||||
Vietjet Aviation JSC | 113,856 | 736,010 | ||||||
Vietnam Dairy Products JSC | 82,854 | 761,079 | ||||||
Vietnam Joint Stock Commercial Bank for Industry and Trade | 249,840 | 266,244 | ||||||
Vietnam National Petroleum Group | 147,540 | 487,274 | ||||||
VNDirect Securities Corp.** | 119,710 | 139,167 | ||||||
|
| |||||||
| 8,360,255 | ||||||||
|
| |||||||
Bangladesh — 13.7% |
| |||||||
Beximco Pharmaceuticals, Ltd. | 186,632 | 232,911 | ||||||
BRAC Bank, Ltd. | 1,703,776 | 2,220,491 | ||||||
British American Tobacco Bangladesh Co., Ltd. | 10,360 | 423,692 | ||||||
Delta Brac Housing Finance Corp., Ltd. | 496,566 | 811,938 | ||||||
GrameenPhone, Ltd. | 169,450 | 959,147 | ||||||
IDLC Finance, Ltd. | 734,901 | 753,677 | ||||||
Singer Bangladesh, Ltd. | 99,767 | 234,499 | ||||||
Square Pharmaceuticals, Ltd. | 187,469 | 680,230 | ||||||
|
| |||||||
| 6,316,585 | ||||||||
|
| |||||||
Thailand — 1.5% |
| |||||||
Beauty Community PCL — NVDR | 1,062,212 | 677,938 | ||||||
Sri Lanka — 0.8% |
| |||||||
Ceylon Cold Stores PLC | 56,423 | 349,161 | ||||||
|
| |||||||
Total FAR EAST | 15,703,939 | |||||||
|
| |||||||
| SOUTH AMERICA — 17.5% | ||||||||
Argentina — 15.4% |
| |||||||
Banco Macro SA — ADR | 2,794 | 323,769 | ||||||
Grupo Financiero Galicia SA — ADR | 31,106 | 2,048,330 | ||||||
Grupo Supervielle SA — SP ADR | 15,408 | 451,763 | ||||||
Holcim Argentina SA | 125,171 | 500,684 | ||||||
| Number of Shares | Value (Note A) | |||||||
IRSA Inversiones y Representaciones SA — SP ADR | 22,028 | $ | 652,029 | |||||
Loma Negra Cia Industrial Argentina SA — SP ADR** | 29,567 | 681,224 | ||||||
MercadoLibre, Inc. | 3,244 | 1,020,757 | ||||||
Pampa Energia SA — SP ADR** | 8,840 | 594,755 | ||||||
Telecom Argentina SA — SP ADR | 12,505 | 458,058 | ||||||
YPF SA — SP ADR | 16,140 | 369,767 | ||||||
|
| |||||||
| 7,101,136 | ||||||||
|
| |||||||
Uruguay — 1.2% |
| |||||||
Arcos Dorados Holdings, Inc. — A** | 55,273 | 572,076 | ||||||
Brazil — 0.9% |
| |||||||
Nexa Resources SA** | 19,934 | 390,906 | ||||||
|
| |||||||
Total SOUTH AMERICA | 8,064,118 | |||||||
|
| |||||||
| AFRICA — 14.8% | ||||||||
Egypt — 5.1% |
| |||||||
Egyptian Financial Group- Hermes Holding Co. | 238,799 | 316,429 | ||||||
Ezz Steel** | 580,908 | 670,756 | ||||||
ElSewdy Electric Co. | 82,946 | 697,110 | ||||||
Ghabbour Auto** | 1,717,227 | 427,858 | ||||||
Sidi Kerir Petrochemicals Co. | 165,411 | 229,324 | ||||||
|
| |||||||
| 2,341,477 | ||||||||
|
| |||||||
Nigeria — 3.4% |
| |||||||
Dangote Cement PLC | 651,669 | 416,344 | ||||||
Guaranty Trust Bank PLC | 5,135,522 | 581,313 | ||||||
Zenith Bank PLC | 8,072,381 | 574,933 | ||||||
|
| |||||||
| 1,572,590 | ||||||||
|
| |||||||
Kenya — 2.1% |
| |||||||
Safaricom, Ltd. | 3,662,061 | 949,686 | ||||||
Morocco — 1.3% |
| |||||||
Societe d’Exploitation des Ports | 36,183 | 618,790 | ||||||
Senegal — 1.1% |
| |||||||
Sonatel | 11,367 | 488,613 | ||||||
Botswana — 0.8% |
| |||||||
Letshego Holdings, Ltd. | 2,066,739 | 395,347 | ||||||
Tanzania — 0.8% |
| |||||||
Tanzania Breweries, Ltd. | 56,583 | 352,856 | ||||||
Ghana — 0.2% |
| |||||||
FAN Milk, Ltd.** | 30,500 | 119,409 | ||||||
|
| |||||||
Total AFRICA | 6,838,768 | |||||||
|
| |||||||
| MIDDLE EAST — 14.3% | ||||||||
Kuwait — 6.7% |
| |||||||
Human Soft Holding Co. KSC | 54,290 | 672,599 | ||||||
Kuwait Finance House KSCP | 356,088 | 679,611 | ||||||
Notes to Financial Statements are an integral part of this Schedule.
20
Table of Contents
Driehaus Frontier Emerging Markets Fund
Schedule of Investments
December 31, 2017
| Number of Shares | Value (Note A) | |||||||
National Bank of Kuwait SAKP | 709,957 | $ | 1,712,554 | |||||
|
| |||||||
| 3,064,764 | ||||||||
|
| |||||||
Saudi Arabia — 2.3% |
| |||||||
Mouwasat Medical Services Co. | 9,637 | 390,074 | ||||||
Samba Financial Group | 72,269 | 449,188 | ||||||
Saudi Co. For Hardware LLC | 7,973 | 235,557 | ||||||
|
| |||||||
| 1,074,819 | ||||||||
|
| |||||||
Jordan — 1.6% |
| |||||||
Al-Eqbal Investment Co. PLC | 16,473 | 743,492 | ||||||
United Arab Emirates — 1.6% |
| |||||||
Aramex PJSC | 166,285 | 194,684 | ||||||
NMC Health PLC | 13,623 | 530,640 | ||||||
|
| |||||||
| 725,324 | ||||||||
|
| |||||||
Kazakhstan — 1.4% |
| |||||||
KazMunaiGas Exploration Production JSC — GDR | 49,452 | 642,876 | ||||||
Pakistan — 0.7% |
| |||||||
United Bank, Ltd. | 192,393 | 327,722 | ||||||
|
| |||||||
Total MIDDLE EAST | 6,578,997 | |||||||
|
| |||||||
| EUROPE — 8.5% | ||||||||
Romania — 3.5% |
| |||||||
Banca Transilvania | 632,058 | 346,249 | ||||||
BRD-Groupe Societe Generale SA | 161,054 | 534,334 | ||||||
Fondul Proprietatea SA | 1,045,673 | 232,360 | ||||||
Transgaz SA Medias | 5,064 | 500,122 | ||||||
|
| |||||||
| 1,613,065 | ||||||||
|
| |||||||
United Kingdom — 1.7% |
| |||||||
BGEO Group PLC | 6,756 | 324,455 | ||||||
KAZ Minerals PLC** | 40,643 | 490,848 | ||||||
|
| |||||||
| 815,303 | ||||||||
|
| |||||||
Georgia — 1.6% |
| |||||||
Georgia Healthcare Group PLC1** | 54,152 | 259,552 | ||||||
TBC Bank Group PLC | 19,964 | 471,701 | ||||||
|
| |||||||
| 731,253 | ||||||||
|
| |||||||
Estonia — 0.7% |
| |||||||
Tallink Grupp AS | 209,550 | 314,285 | ||||||
Switzerland — 0.5% |
| |||||||
Ferrexpo PLC | 59,408 | 235,094 | ||||||
Croatia — 0.5% |
| |||||||
Valamar Riviera DD | 31,887 | 225,263 | ||||||
|
| |||||||
Total EUROPE | 3,934,263 | |||||||
|
| |||||||
Total EQUITY SECURITIES | 41,120,085 | |||||||
|
| |||||||
| Number of Shares | Value (Note A) | |||||||
| EQUITY CERTIFICATES — 0.2% | ||||||||
| FAR EAST — 0.2% | ||||||||
Vietnam — 0.2% |
| |||||||
Nam Long Investment Corp.2 | 58,487 | $ | 77,523 | |||||
|
| |||||||
Total FAR EAST | 77,523 | |||||||
|
| |||||||
Total EQUITY CERTIFICATES | 77,523 | |||||||
|
| |||||||
| ||||||||
TOTAL INVESTMENTS | 89.4 | % | $ | 41,197,608 | ||||
Other Assets In Excess Of Liabilities | 10.6 | % | 4,894,399 | |||||
|
|
|
| |||||
Net Assets | 100.0 | % | $ | 46,092,007 | ||||
| ||||||||
| 1 | 144A — This security was purchased pursuant to Rule 144A of the Securities Act of 1933 and may not be resold subject to that rule except to qualified institutional buyers. At December 31, 2017, this security amounted to $259,552 or 0.6% of net assets. This 144A security has not been deemed illiquid. |
| 2 | Restricted security — Investments in securities not registered under the Securities Act of 1933, excluding 144A securities. At December 31, 2017, the value of this restricted security amounted to $77,523 or 0.2% of net assets. This restricted security has not been deemed illiquid. |
| ** | Non-income producing security |
Additional information on each restricted security is as follows:
Security | Counter- Party | Acquisition Date(s) | Acquisition Cost | |||||||||
Nam Long Investment Corp. | MACQ | | 05/04/15 to 05/07/15 | | $ | 47,802 | ||||||
ADR — American Depository Receipt
GDR — Global Depository Receipt
MACQ — Macquarie Capital Group, Ltd.
NVDR — Non-Voting Depository Receipt
SP ADR — Sponsored American Depository Receipt
Notes to Financial Statements are an integral part of this Schedule.
21
Table of Contents
Driehaus Frontier Emerging Markets Fund
Schedule of Investments
December 31, 2017
Regional Weightings*
Asia/Far East Ex-Japan | 34.3% | |||
South America | 17.5% | |||
Africa | 14.8% | |||
Middle East | 14.3% | |||
Eastern Europe | 6.3% | |||
Western Europe | 2.2% |
Top Ten Holdings*
BRAC Bank, Ltd. | 4.8% | |||
Grupo Financiero Galicia SA — ADR | 4.4% | |||
National Bank of Kuwait SAKP | 3.7% | |||
Airports Corp. of Vietnam JSC | 2.6% | |||
MercadoLibre, Inc. | 2.2% | |||
GrameenPhone, Ltd. | 2.1% | |||
Viet Capital Securities JSC | 2.1% | |||
Safaricom, Ltd. | 2.1% | |||
Saigon Securities, Inc. | 2.0% | |||
Delta Brac Housing Finance Corp., Ltd. | 1.8% |
| * | All percentages are stated as a percent of net assets at December 31, 2017. |
Notes to Financial Statements are an integral part of this Schedule.
22
Table of Contents
Driehaus Frontier Emerging Markets Fund
Schedule of Investments
December 31, 2017
Industry | Percent of Net Assets | |||
Air Freight & Logistics | 0.4% | |||
Airlines | 1.6% | |||
Automobiles | 0.9% | |||
Beverages | 2.6% | |||
Capital Markets | 5.0% | |||
Chemicals | 0.5% | |||
Commercial Banks | 26.2% | |||
Construction Materials | 3.5% | |||
Consumer Finance | 4.3% | |||
Diversified Consumer Services | 1.5% | |||
Diversified Financial Services | 0.5% | |||
Diversified Telecommunication Services | 2.1% | |||
Electric Utilities | 1.3% | |||
Electrical Equipment | 1.5% | |||
Food Products | 1.9% | |||
Industry | Percent of Net Assets | |||
Health Care Providers & Services | 2.6% | |||
Hotels, Restaurants & Leisure | 1.7% | |||
Household Durables | 0.5% | |||
Internet Software & Services | 2.2% | |||
Marine | 0.7% | |||
Metals & Mining | 3.9% | |||
Oil, Gas & Consumable Fuels | 4.3% | |||
Pharmaceuticals | 2.0% | |||
Real Estate Management & Development | 3.7% | |||
Specialty Retail | 3.5% | |||
Tobacco | 2.5% | |||
Transportation Infrastructure | 3.9% | |||
Wireless Telecommunication Services | 4.1% | |||
Other Assets in Excess of Liabilities | 10.6% | |||
|
| |||
TOTAL | 100.0% | |||
|
| |||
Notes to Financial Statements are an integral part of this Schedule.
23
Table of Contents
Driehaus International Small Cap Growth Fund — Portfolio Managers’ Letter
Dear Fellow Shareholders,
The Driehaus International Small Cap Growth Fund (“Fund”) returned 41.44% for the year ended December 31, 2017. The Fund’s benchmark, the Morgan Stanley Capital International (“MSCI”) All Country World ex USA Small Cap Growth Index (“Benchmark”), returned 33.64%.
Entering 2017, we were optimistic that the returns would be much less driven by factor volatility and more by stock selection, as compared to 2016. A strong macro backdrop and relatively uneventful political environment provided exactly that. Over 3% global growth, combined with low inflation, low interest rates, strong wage growth, and improving corporate earnings, was enough to spur very strong equity market returns globally. Remarkably, 2017 will likely be the first year since 2007 that every Organization for Economic Cooperation and Development (OECD) country has had positive real GDP (gross domestic product) growth.
The setup for 2018 appears similar. While the best of the acceleration in growth has likely passed, tax cuts in the United States (and potentially in other global markets) should be supportive.
Over the course of 2017, key contributors to performance versus the Benchmark were the Fund’s holdings in the information technology sector and the industrials sector as compared to the Benchmark. In addition, holdings in Japan, France and Switzerland contributed positively to the performance of the Fund compared to the Benchmark.
Daifuku Co., Ltd. (Ticker: 6383 JP) made significant contributions to the Fund’s return during 2017. The Japan-based company designs, manufactures, installs and provides additional services for logistic systems and material handling equipment. Key drivers of the company’s strong performance were improved capacity utilization, productivity improvement, strong demand and a favorable selling environment.
Air France — KLM (Ticker: AF FP) also made significant contributions to the Fund’s return during 2017. The France-based company provides passenger and air cargo transportation. The airline saw strong traffic increases over the previous year with growth in passenger numbers as well as in total revenues. The cargo segment of the business also had increased revenue.
For 2017, security selection in the financials, energy, and materials sectors detracted from the Fund’s performance versus the Benchmark. At the country level, underweights to India and Taiwan and selection in Belgium and Germany detracted value.
A significant detractor from returns for the year was Aurelius Equity Opportunities SE & Co. KGaA (Ticker: AR4 GY). The Germany-based company acquires companies primarily in the information technology and business services, industrials and chemicals, and lifestyle and consumer goods sectors. Early in the year, its share price tumbled due to an extensive negative note that was published by a short seller in the company. Despite responses from the company and positive comments from other analysts, shares sold off on the news. The company refocused on delivering more transparency to the investment community through asset disposals and other strategies, which raised its stock price, but not back to the prices from earlier in the year.
Bekaert SA (Ticker: BEKB BB) was a notable detractor from the Fund. The Belgium-based company provides steel wire products and coating solutions. The company has been hurt by technology shifts in Asia that have driven down demand for abrasive wire products as well as an inability to pass on raw material price increases in almost all of its businesses.
While the best of the acceleration in growth has likely passed, tax cuts in the United States (and potentially in other global markets) should be supportive in 2018. America, Japan, and the European Union should grow at low single digit rates. In emerging markets, Brazil and Russia have emerged from their latest recessions, and India and China continue to chug along at mid-single digit rates.
Other than adverse political events, the primary risks at this point in the cycle are some combination of central bank error, too much leverage in the system, or misallocation of capital. None of those appear to be on the immediate horizon, but we are watchful. We continue to believe that by investing in quality companies with strong earnings growth, we will deliver superior results over the long term and over full market cycles.
24
Table of Contents
As always, we thank you for your interest in the Driehaus International Small Cap Growth Fund and would like to express our gratitude to you as shareholders for your continued confidence in our management capabilities.
Sincerely,
 |  |  | ||
| David Mouser | Daniel Burr | Ryan Carpenter | ||
| Portfolio Manager | Portfolio Manager | Assistant Portfolio Manager |
Performance is historical and does not represent future results.
Please see the following performance overview page for index description.
25
Table of Contents
Driehaus International Small Cap Growth Fund
Performance Overview (unaudited)
The performance summarized below is historical and does not represent future results. Investment returns and principal value vary, and you may have a gain or loss when you sell shares. Performance data presented measures the change in the value of an investment in the Fund, assuming reinvestment of all dividends and capital gains. Average annual total return reflects annualized change.
The table does not reflect the deduction of taxes that a shareholder would pay on Fund distributions or the redemption of Fund shares. The graph compares the results of a $10,000 investment in the Fund over the last 10 fiscal year periods, with all dividends and capital gains reinvested, with the indicated index (and dividends reinvested) for the same period.
Average Annual Total Returns as of 12/31/17 | 1 Year | 3 Years | 5 Years | 10 Years | ||||||||||||
Driehaus International Small Cap Growth Fund (DRIOX)1 | 41.44% | 14.30% | 13.05% | 5.39% | ||||||||||||
MSCI AC World ex USA Small Cap Growth Index-N2 | 33.64% | 12.38% | 10.15% | 4.24% | ||||||||||||
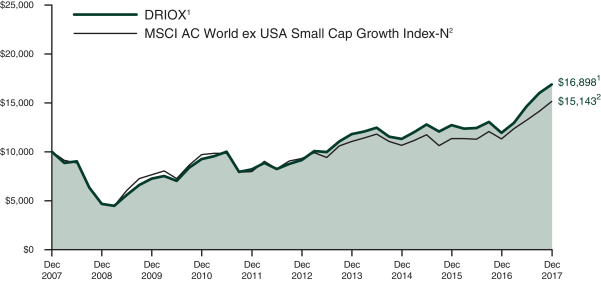
| 1 | The returns for the periods prior to January 1, 2010, reflect fee waivers and/or reimbursements without which performance would have been lower. |
| 2 | The Morgan Stanley Capital International All Country World ex USA Small Cap Growth Index-Net (MSCI AC World ex USA Small Cap Growth Index-N) is a market capitalization-weighted index designed to measure equity market performance in global developed markets and emerging markets, excluding the U.S., and is composed of stocks which are categorized as small capitalization growth stocks. Data is in U.S. dollars and is calculated with net dividend reinvestment. Source: Morgan Stanley Capital International Inc. |
26
Table of Contents
Driehaus International Small Cap Growth Fund
Schedule of Investments
December 31, 2017
| Number of Shares | Value (Note A) | |||||||
| EQUITY SECURITIES — 97.3% | ||||||||
| EUROPE — 49.4% | ||||||||
United Kingdom — 16.1% |
| |||||||
Abcam PLC | 217,334 | $ | 3,095,717 | |||||
Balfour Beatty PLC | 1,044,097 | 4,186,763 | ||||||
Burford Capital, Ltd. | 205,446 | 3,195,445 | ||||||
Clinigen Group PLC | 209,511 | 2,913,568 | ||||||
Croda International PLC | 100,196 | 5,984,758 | ||||||
Dechra Pharmaceuticals PLC | 114,818 | 3,249,244 | ||||||
Dunelm Group PLC | 179,698 | 1,680,135 | ||||||
Fenner PLC | 385,246 | 2,079,255 | ||||||
Rentokil Initial PLC | 742,196 | 3,186,595 | ||||||
Scapa Group PLC | 631,875 | 3,740,950 | ||||||
Sophos Group PLC1 | 466,901 | 3,593,195 | ||||||
Spirax-Sarco Engineering PLC | 25,542 | 1,938,083 | ||||||
SSP Group PLC | 254,247 | 2,344,540 | ||||||
Stock Spirits Group PLC | 494,298 | 1,793,570 | ||||||
SuperGroup PLC | 61,785 | 1,649,191 | ||||||
Vesuvius PLC | 662,609 | 5,224,579 | ||||||
Worldpay Group PLC1 | 447,296 | 2,572,680 | ||||||
|
| |||||||
| 52,428,268 | ||||||||
|
| |||||||
Germany — 8.6% |
| |||||||
ADO Properties SA1 | 65,918 | 3,343,988 | ||||||
Carl Zeiss Meditec AG | 54,612 | 3,391,626 | ||||||
CTS Eventim AG & Co., KGaA | 29,485 | 1,373,530 | ||||||
Fraport AG Frankfurt Airport Services Worldwide | 40,094 | 4,419,076 | ||||||
MTU Aero Engines AG | 17,763 | 3,184,143 | ||||||
Puma SE | 7,545 | 3,286,181 | ||||||
Scout24 AG1 | 63,514 | 2,594,850 | ||||||
SGL Carbon SE** | 197,773 | 2,702,815 | ||||||
STRATEC Biomedical AG | 20,846 | 1,621,778 | ||||||
Vapiano SE1** | 67,022 | 1,950,091 | ||||||
|
| |||||||
| 27,868,078 | ||||||||
|
| |||||||
Italy — 4.9% |
| |||||||
Azimut Holding SpA | 161,062 | 3,086,197 | ||||||
DiaSorin SpA | 17,162 | 1,523,791 | ||||||
Gima TT SpA1** | 169,421 | 3,376,467 | ||||||
Maire Tecnimont SpA | 455,782 | 2,361,378 | ||||||
Moncler SpA | 111,285 | 3,482,330 | ||||||
OVS SpA1 | 305,439 | 2,035,796 | ||||||
|
| |||||||
| 15,865,959 | ||||||||
|
| |||||||
France — 4.0% |
| |||||||
Maisons du Monde SA1 | 92,622 | 4,195,240 | ||||||
Mersen SA | 53,843 | 2,412,288 | ||||||
Ste Industrielle d’Aviation Latecoere SA** | 241,025 | 1,651,292 | ||||||
Teleperformance | 33,322 | 4,775,764 | ||||||
|
| |||||||
| 13,034,584 | ||||||||
|
| |||||||
Netherlands — 3.3% |
| |||||||
Aalberts Industries NV | 98,321 | 5,001,342 | ||||||
Rhi Magnesita NV** | 56,064 | 2,955,876 | ||||||
| Number of Shares | Value (Note A) | |||||||
TomTom NV** | 281,403 | $ | 2,787,221 | |||||
|
| |||||||
| 10,744,439 | ||||||||
|
| |||||||
Sweden — 2.5% |
| |||||||
Com Hem Holding AB | 241,138 | 3,686,253 | ||||||
Saab AB — B | 55,781 | 2,713,196 | ||||||
SAS AB** | 625,016 | 1,622,904 | ||||||
|
| |||||||
| 8,022,353 | ||||||||
|
| |||||||
Switzerland — 2.1% |
| |||||||
Bobst Group SA | 12,669 | 1,684,953 | ||||||
Bucher Industries AG | 12,844 | 5,219,584 | ||||||
|
| |||||||
| 6,904,537 | ||||||||
|
| |||||||
Luxembourg — 2.0% |
| |||||||
APERAM SA | 46,913 | 2,416,179 | ||||||
B&M European Value Retail SA | 706,695 | 4,041,747 | ||||||
|
| |||||||
| 6,457,926 | ||||||||
|
| |||||||
Austria — 1.5% |
| |||||||
BUWOG AG** | 79,957 | 2,758,163 | ||||||
FACC AG** | 94,827 | 1,968,925 | ||||||
|
| |||||||
| 4,727,088 | ||||||||
|
| |||||||
Denmark — 1.4% |
| |||||||
Christian Hansen Holding AS | 27,703 | 2,598,538 | ||||||
FLSmidth & Co., AS | 35,243 | 2,052,202 | ||||||
|
| |||||||
| 4,650,740 | ||||||||
|
| |||||||
Portugal — 1.4% |
| |||||||
Mota-Engil SGPS SA | 1,047,722 | 4,604,777 | ||||||
Norway — 1.2% |
| |||||||
Sbanken ASA1 | 238,039 | 2,348,325 | ||||||
Wallenius Wilhelmsen Logistics** | 234,801 | 1,694,390 | ||||||
|
| |||||||
| 4,042,715 | ||||||||
|
| |||||||
Spain — 0.4% |
| |||||||
Tubacex SA** | 364,660 | 1,465,746 | ||||||
|
| |||||||
Total EUROPE | 160,817,210 | |||||||
|
| |||||||
| FAR EAST — 32.4% | ||||||||
Japan — 24.1% |
| |||||||
Asahi Intecc Co., Ltd. | 84,330 | 2,903,931 | ||||||
Daifuku Co., Ltd. | 20,041 | 1,092,094 | ||||||
Fuji Electric Co., Ltd. | 467,147 | 3,519,927 | ||||||
Furukawa Electric Co., Ltd. | 25,186 | 1,242,815 | ||||||
Ichikoh Industries, Ltd. | 527,641 | 4,696,906 | ||||||
Itochu Techno-Solutions Corp. | 102,924 | 4,466,815 | ||||||
Koito Manufacturing Co., Ltd. | 49,223 | 3,459,917 | ||||||
Kose Corp. | 30,902 | 4,824,195 | ||||||
Kusuri no Aoki Holdings Co., Ltd. | 52,050 | 2,757,830 | ||||||
M&A Capital Partners Co., Ltd.** | 58,863 | 3,850,191 | ||||||
Notes to Financial Statements are an integral part of this Schedule.
27
Table of Contents
Driehaus International Small Cap Growth Fund
Schedule of Investments
December 31, 2017
| Number of Shares | Value (Note A) | |||||||
Minebea Mitsumi, Inc. | 134,891 | $ | 2,828,910 | |||||
Miura Co., Ltd. | 133,909 | 3,601,014 | ||||||
NET One Systems Co., Ltd. | 228,584 | 3,513,712 | ||||||
Nichias Corp. | 140,508 | 1,871,777 | ||||||
Nifco, Inc. | 35,698 | 2,436,367 | ||||||
Nihon M&A Center, Inc. | 31,692 | 1,510,415 | ||||||
NOK Corp. | 111,600 | 2,605,898 | ||||||
PALTAC Corp. | 53,643 | 2,447,083 | ||||||
Rohm Co., Ltd. | 45,011 | 4,985,465 | ||||||
Ryohin Keikaku Co., Ltd. | 9,985 | 3,110,482 | ||||||
Seria Co., Ltd. | 29,717 | 1,793,438 | ||||||
Start Today Co., Ltd. | 62,528 | 1,900,674 | ||||||
Tadano, Ltd. | 198,545 | 3,296,895 | ||||||
TechnoPro Holdings, Inc. | 75,649 | 4,108,914 | ||||||
Tokai Carbon Co., Ltd. | 209,920 | 2,598,965 | ||||||
Tokyo Tatemono Co., Ltd. | 210,212 | 2,839,518 | ||||||
|
| |||||||
| 78,264,148 | ||||||||
|
| |||||||
Australia — 3.0% |
| |||||||
ALS, Ltd. | 366,561 | 1,999,205 | ||||||
Bapcor, Ltd. | 642,904 | 2,834,187 | ||||||
NEXTDC, Ltd.** | 1,074,889 | 5,032,095 | ||||||
|
| |||||||
| 9,865,487 | ||||||||
|
| |||||||
China — 2.8% |
| |||||||
China Railway Signal & Communication Corp., Ltd. — H1 | 2,798,226 | 2,191,920 | ||||||
CIMC Enric Holdings, Ltd.** | 1,970,916 | 1,657,387 | ||||||
GDS Holdings, Ltd. — ADR** | 137,052 | 3,087,782 | ||||||
Haier Electronics Group Co., Ltd. | 790,680 | 2,165,734 | ||||||
|
| |||||||
| 9,102,823 | ||||||||
|
| |||||||
South Korea — 1.1% |
| |||||||
Hotel Shilla Co., Ltd. | 16,753 | 1,328,597 | ||||||
Koh Young Technology, Inc. | 30,404 | 2,343,029 | ||||||
|
| |||||||
| 3,671,626 | ||||||||
|
| |||||||
Taiwan — 0.5% |
| |||||||
Kingpak Technology, Inc. | 190,984 | 1,780,939 | ||||||
Philippines — 0.5% |
| |||||||
Metro Pacific Investments Corp. | 11,183,384 | 1,534,579 | ||||||
Indonesia — 0.4% |
| |||||||
PT Bumi Serpong Damai Tbk | 9,833,519 | 1,232,134 | ||||||
|
| |||||||
Total FAR EAST | 105,451,736 | |||||||
|
| |||||||
| NORTH AMERICA — 11.7% | ||||||||
Canada — 9.8% |
| |||||||
Air Canada** | 216,059 | 4,448,375 | ||||||
CAE, Inc. | 229,368 | 4,260,734 | ||||||
| Number of Shares | Value (Note A) | |||||||
Canada Goose Holdings, Inc.** | 117,458 | $ | 3,706,975 | |||||
CES Energy Solutions Corp. | 704,488 | 3,659,751 | ||||||
Kelt Exploration, Ltd.** | 314,685 | 1,799,988 | ||||||
Kirkland Lake Gold, Ltd. | 123,434 | 1,892,262 | ||||||
Martinrea International, Inc. | 214,691 | 2,739,573 | ||||||
Parex Resources, Inc.** | 213,344 | 3,082,201 | ||||||
Parkland Fuel Corp. | 160,086 | 3,419,498 | ||||||
Trican Well Service, Ltd.** | 890,707 | 2,891,078 | ||||||
|
| |||||||
| 31,900,435 | ||||||||
|
| |||||||
United States — 1.4% |
| |||||||
Nexteer Automotive Group, Ltd. | 855,039 | 2,037,774 | ||||||
Samsonite International SA | 551,314 | 2,533,285 | ||||||
|
| |||||||
| 4,571,059 | ||||||||
|
| |||||||
Mexico — 0.5% |
| |||||||
Promotora y Operadora de Infraestructura SAB de CV | 171,814 | 1,697,562 | ||||||
|
| |||||||
Total NORTH AMERICA | 38,169,056 | |||||||
|
| |||||||
| SOUTH AMERICA — 3.1% | ||||||||
Brazil — 2.4% |
| |||||||
Cyrela Brazil Realty SA Empreendimentos e Participacoes | 265,691 | 1,058,887 | ||||||
Fibria Celulose SA | 90,165 | 1,300,653 | ||||||
Gol Linhas Aereas Inteligentes SA — Pref.** | 521,565 | 2,295,634 | ||||||
Marcopolo SA — Pref. | 1,347,768 | 1,621,173 | ||||||
Randon SA Implementos e Participacoes — Pref. | 693,334 | 1,498,660 | ||||||
|
| |||||||
| 7,775,007 | ||||||||
|
| |||||||
Uruguay — 0.7% |
| |||||||
Arcos Dorados Holdings, Inc. — A** | 222,013 | 2,297,835 | ||||||
|
| |||||||
Total SOUTH AMERICA | 10,072,842 | |||||||
|
| |||||||
| AFRICA — 0.7% | ||||||||
South Africa — 0.7% |
| |||||||
Clicks Group, Ltd. | 147,762 | 2,163,195 | ||||||
|
| |||||||
Total AFRICA | 2,163,195 | |||||||
|
| |||||||
Total EQUITY SECURITIES (Cost $256,752,586) | 316,674,039 | |||||||
|
| |||||||
| ||||||||
TOTAL INVESTMENTS | 97.3 | % | $ | 316,674,039 | ||||
Other Assets In Excess Of Liabilities | 2.7 | % | 8,687,406 | |||||
|
|
|
| |||||
Net Assets | 100.0 | % | $ | 325,361,445 | ||||
| ||||||||
Notes to Financial Statements are an integral part of this Schedule.
28
Table of Contents
Driehaus International Small Cap Growth Fund
Schedule of Investments
December 31, 2017
| 1 | 144A — This security was purchased pursuant to Rule 144A of the Securities Act of 1933 and may not be resold subject to that rule except to qualified institutional buyers. At December 31, 2017, these securities amounted to $28,202,552 or 8.7% of net assets. These 144A securities have not been deemed illiquid. |
| ** | Non-income producing security |
ADR — American Depository Receipt
Regional Weightings*
Western Europe | 49.4% | |||
Japan | 24.1% | |||
North America | 11.7% | |||
Asia/Far East Ex-Japan | 8.3% | |||
South America | 3.1% | |||
Africa | 0.7% |
Top Ten Holdings*
Croda International PLC | 1.8% | |||
Vesuvius PLC | 1.6% | |||
Bucher Industries AG | 1.6% | |||
NEXTDC, Ltd. | 1.5% | |||
Aalberts Industries NV | 1.5% | |||
Rohm Co., Ltd. | 1.5% | |||
Kose Corp. | 1.5% | |||
Teleperformance | 1.5% | |||
Ichikoh Industries, Ltd. | 1.4% | |||
Mota-Engil SGPS SA | 1.4% |
| * | All percentages are stated as a percent of net assets at December 31, 2017. |
Notes to Financial Statements are an integral part of this Schedule.
29
Table of Contents
Driehaus International Small Cap Growth Fund
Schedule of Investments
December 31, 2017
Industry | Percent of Net Assets | |||
Aerospace & Defense | 4.2% | |||
Airlines | 2.6% | |||
Auto Components | 5.5% | |||
Beverages | 0.6% | |||
Biotechnology | 1.0% | |||
Building Products | 0.6% | |||
Capital Markets | 3.1% | |||
Chemicals | 4.6% | |||
Commercial Banks | 0.7% | |||
Commercial Services & Supplies | 1.0% | |||
Construction & Engineering | 4.1% | |||
Construction Materials | 0.9% | |||
Distributors | 1.6% | |||
Diversified Financial Services | 0.5% | |||
Diversified Telecommunication Services | 1.1% | |||
Electrical Equipment | 3.0% | |||
Electronic Equipment, Instruments & Components | 1.2% | |||
Energy Equipment & Services | 2.0% | |||
Food & Staples Retailing | 1.5% | |||
Health Care Equipment & Supplies | 2.9% | |||
Hotels, Restaurants & Leisure | 2.0% | |||
Household Durables | 1.9% | |||
Industry | Percent of Net Assets | |||
Information Technology Services | 4.2% | |||
Internet & Catalog Retail | 0.6% | |||
Internet Software & Services | 2.3% | |||
Life Sciences Tools & Services | 0.9% | |||
Machinery | 12.3% | |||
Marine | 0.5% | |||
Media | 0.4% | |||
Metals & Mining | 1.8% | |||
Multiline Retail | 2.7% | |||
Oil, Gas & Consumable Fuels | 2.6% | |||
Paper & Forest Products | 0.4% | |||
Personal Products | 1.5% | |||
Pharmaceuticals | 1.0% | |||
Professional Services | 3.8% | |||
Real Estate Management & Development | 3.1% | |||
Semiconductors & Semiconductor Equipment | 2.3% | |||
Software | 1.1% | |||
Specialty Retail | 2.7% | |||
Textiles, Apparel & Luxury Goods | 4.6% | |||
Transportation Infrastructure | 1.9% | |||
Other Assets in Excess of Liabilities | 2.7% | |||
|
| |||
TOTAL | 100.0% | |||
|
| |||
Notes to Financial Statements are an integral part of this Schedule.
30
Table of Contents
Driehaus Micro Cap Growth Fund — Portfolio Managers’ Letter
Dear Fellow Shareholders,
The Driehaus Micro Cap Growth Fund (“Fund”) returned 24.30% for the year ended December 31, 2017. This return was above the performance of the Fund’s benchmark, the Russell Microcap® Growth Index (the “Benchmark”), which returned 16.65% for the same period.
The current macroeconomic environment has improved markedly over the past year with the US and most parts of the globe benefitting from synchronized global economic growth. This positive backdrop is conducive to rising earnings and provides fundamental support for the recent market gains. Many economic indicators have seen a sharp acceleration. The majority of recent US macro data (initial jobless claims, personal income, Purchasing Manager’s Index (PMI), business and consumer confidence, durable goods, housing starts, etc.) support the prospect for sustained growth into 2018.
One of the most significant and positive changes over the past year has been the reining in and rolling back of countless federal regulations. This is a major reason for the acceleration in economic growth in the past year. The pace of deregulation can be measured by the massive reduction in the pages of the Federal Register and it is frequently cited as a primary driver (along with taxes) for the multi-year highs in small business and CEO optimism.
For the year 2017, key contributors to performance versus the Benchmark were the Fund’s selection of holdings in the information technology and health care sectors.
Loxo Oncology, Inc. (Ticker: LOXO) was the top contributor to Fund performance for the period. The biopharmaceutical company develops medicines for patients with genetically defined cancers. Strong preliminary results of clinical trials released earlier in the year drove major gains for the stock. Their product, lartrectinib, is expected to reach markets in the US in 2018 and results showed that seventeen different types of cancer responded to treatment. Later in the year, the company announced a partnership with Bayer to develop and commercialize lartrectinib, which will allow Loxo to reach more patients as well as continue to develop new therapies.
SMART Global Holdings, Inc. (Ticker: SGH) also contributed to the Fund’s performance for the period. The company designs, manufactures, and supplies specialty memory solutions for desktops, notebooks, servers and smartphones. Due to economic recovery in Brazil, the company, which is the largest memory solution provider in Brazil, was able to increase share and grow revenues throughout the year. Mobile memory and specialty memory growth also added to the company’s strong performance.
During the period, the two sectors that detracted the most value from Fund performance versus the Benchmark were selections within the energy and financials sectors.
A holding that detracted from the Fund’s return during the period was Fairmount Santrol Holdings, Inc. (Ticker: FMSA). The company supplies sand-based proppants for use in hydraulic fracturing operations and sand products for use in various industries. Revenues did not meet investor expectations and growth fell behind its peers. Shifts in techniques by end users caused a mismatch with the company’s product mix and contributed to its lackluster performance.
Seacoast Banking Corporation of Florida (Ticker: SBCF) was also a detractor to the Fund’s returns for the period. The company provides a full range of banking and investment services. Its stock lagged during the middle of the year as interest rates and the yield curve were unfavorable for the banking sector. We eliminated the position from the portfolio in favor of other ideas in other sectors and did not hold it later in the year when the stock rallied.
As we enter 2018, most key economic statistics and indicators are trending positively, with many at new cycle highs. The economic expansion is boosting most industries and most parts of the economy. The synchronized global growth backdrop is healthy and provides a bullish environment for equities. Tax cuts are incrementally boosting earnings (and helping valuations) and deregulation is helping business optimism. The Federal Reserve Chair will transition to Jerome (Jay) Powell but the Fed’s accommodative monetary policy is expected to remain status quo.
Naturally, there are risks that could disrupt these positive conditions. The pace of growth could tip inflation higher causing the Fed to get more aggressive with rates, ruining the current positive interplay
31
Table of Contents
between growth, inflation and rates. With the Fed raising rates, if the long end of the treasury yield curve does not rise greater than the short end, the shape of the yield curve could flatten further. Trump’s trade and immigration rhetoric could move from potential risks to actual policies with uncertain outcomes. Terrorism and the war of words with North Korea could also result in dangerous scenarios. Finally, a deceleration in economic growth or earnings, even if short-term, could cause a correction in equities and an increase in volatility. We have a sanguine outlook regarding all these risks, but market scares and resulting corrections are natural market events and volatility is likely to pick up after record low levels in 2017.
Thank you for your interest in the Driehaus Micro Cap Growth Fund. We appreciate your confidence in our management capabilities.
Sincerely,
 |  | |
| Jeff James | Michael Buck | |
| Portfolio Manager | Assistant Portfolio Manager |
Performance is historical and does not represent future results.
Please see the following performance overview page for index description.
32
Table of Contents
Driehaus Micro Cap Growth Fund
Performance Overview (unaudited)
The performance summarized below is historical and does not represent future results. Investment returns and principal value vary, and you may have a gain or loss when you sell shares. Performance data presented measures the change in the value of an investment in the Fund, assuming reinvestment of all dividends and capital gains. Average annual total return reflects annualized change.
The table does not reflect the deduction of taxes that a shareholder would pay on Fund distributions or the redemption of Fund shares. The graph compares the results of a $10,000 investment in the Fund over the last 10 fiscal year periods (which includes performance of the Predecessor Limited Partnership), with all dividends and capital gains reinvested, with the indicated index (and dividends reinvested) for the same period.
| Fund Only | Including Predecessor Limited Partnership | |||||||||||||||||||
Average Annual Total Returns as of 12/31/17 | 1 Year | 3 Years | Since Inception | 5 Years | 10 Years | |||||||||||||||
Driehaus Micro Cap Growth Fund (DMCRX)1 | 24.30% | 13.34% | 13.62% | 20.47% | 9.78% | |||||||||||||||
Russell Microcap® Growth Index2 | 16.65% | 6.22% | 7.33% | 13.82% | 7.23% | |||||||||||||||
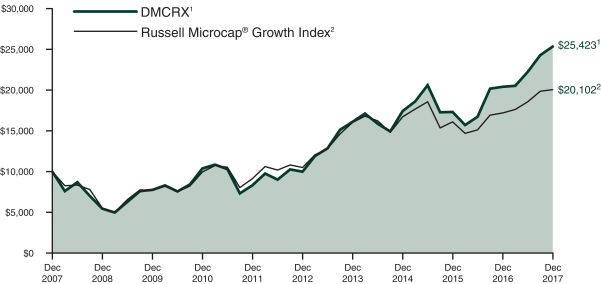
| 1 | The Driehaus Micro Cap Growth Fund (the “Fund”) performance shown above includes the performance of the Driehaus Micro Cap Fund, L.P. (the “Predecessor Limited Partnership”), one of the Fund’s predecessors, for the periods before the Fund’s registration statement became effective. The Predecessor Limited Partnership, which was established on July 1, 1996, was managed with substantially the same investment objective, policies and philosophies as are followed by the Fund. The Fund succeeded to the Predecessor Limited Partnership’s assets together with the assets of the Driehaus Institutional Micro Cap Fund, L.P. on November 18, 2013. The Predecessor Limited Partnership was not registered under the Investment Company Act of 1940, as amended (“1940 Act”), and thus was not subject to certain investment and operational restrictions that are imposed by the 1940 Act. If the Predecessor Limited Partnership had been registered under the 1940 Act, its performance may have been adversely affected. The Predecessor Limited Partnership’s performance has been restated to reflect estimated expenses of the Fund. The returns for periods prior to November 18, 2016, reflect fee waivers and/or reimbursements without which performance would have been lower. |
| 2 | The Russell Microcap® Growth Index is constructed to provide a comprehensive and unbiased barometer of the micro cap growth market. Based on ongoing empirical research of investment manager behavior, the methodology used to determine growth probability approximates the aggregate microcap growth manager's opportunity set. |
33
Table of Contents
Driehaus Micro Cap Growth Fund
Schedule of Investments
December 31, 2017
| Number of Shares | Value (Note A) | |||||||
| EQUITY SECURITIES — 99.8% | ||||||||
| HEALTH CARE — 24.8% | ||||||||
Biotechnology — 10.7% |
| |||||||
Adamas Pharmaceuticals, Inc.** | 79,823 | $ | 2,705,201 | |||||
Argenx SE — ADR** | 40,528 | 2,558,938 | ||||||
Array BioPharma, Inc.** | 496,565 | 6,356,032 | ||||||
Audentes Therapeutics, Inc.** | 70,252 | 2,195,375 | ||||||
Blueprint Medicines Corp.** | 53,657 | 4,046,274 | ||||||
Catalyst Pharmaceuticals, Inc.** | 390,359 | 1,526,304 | ||||||
Clementia Pharmaceuticals, Inc.** | 149,721 | 2,841,705 | ||||||
Global Blood Therapeutics, Inc.** | 77,283 | 3,041,086 | ||||||
Loxo Oncology, Inc.** | 75,654 | 6,368,554 | ||||||
Natera, Inc.** | 196,872 | 1,769,879 | ||||||
Ovid Therapeutics, Inc.** | 100,943 | 996,307 | ||||||
|
| |||||||
| 34,405,655 | ||||||||
|
| |||||||
Health Care Equipment & Supplies — 8.8% |
| |||||||
AxoGen, Inc.** | 221,405 | 6,265,761 | ||||||
CryoLife, Inc.** | 82,916 | 1,587,841 | ||||||
Inogen, Inc.** | 38,185 | 4,547,070 | ||||||
iRhythm Technologies, Inc.** | 75,829 | 4,250,215 | ||||||
LeMaitre Vascular, Inc. | 41,593 | 1,324,321 | ||||||
OrthoPediatrics Corp.** | 148,636 | 2,852,325 | ||||||
Sientra, Inc.** | 115,466 | 1,623,452 | ||||||
Tactile Systems Technology, Inc.** | 209,032 | 6,057,747 | ||||||
|
| |||||||
| 28,508,732 | ||||||||
|
| |||||||
Pharmaceuticals — 3.9% |
| |||||||
Aclaris Therapeutics, Inc.** | 59,640 | 1,470,722 | ||||||
Aerie Pharmaceuticals, Inc.** | 22,036 | 1,316,651 | ||||||
Foamix Pharmaceuticals, Ltd.1** | 203,395 | 1,222,404 | ||||||
Intersect ENT, Inc.** | 66,708 | 2,161,339 | ||||||
MyoKardia, Inc.** | 69,187 | 2,912,773 | ||||||
Optinose, Inc.** | 85,239 | 1,611,017 | ||||||
Zogenix, Inc.** | 47,441 | 1,900,012 | ||||||
|
| |||||||
| 12,594,918 | ||||||||
|
| |||||||
Health Care Technology — 0.8% |
| |||||||
Vocera Communications, Inc.** | 83,652 | 2,527,963 | ||||||
Health Care Providers & Services — 0.6% |
| |||||||
Teladoc, Inc.** | 53,599 | 1,867,925 | ||||||
|
| |||||||
Total HEALTH CARE | 79,905,193 | |||||||
|
| |||||||
| INFORMATION TECHNOLOGY — 22.2% | ||||||||
Software — 6.9% |
| |||||||
Altair Engineering, Inc. — A** | 160,849 | 3,847,508 | ||||||
Asure Software, Inc.** | 172,609 | 2,437,239 | ||||||
Everbridge, Inc.** | 159,073 | 4,727,650 | ||||||
| Number of Shares | Value (Note A) | |||||||
ForeScout Technologies, Inc.** | 85,975 | $ | 2,741,743 | |||||
Materialise NV — ADR** | 105,591 | 1,342,062 | ||||||
Talend SA — ADR** | 38,515 | 1,443,542 | ||||||
Upland Software, Inc.** | 88,434 | 1,915,480 | ||||||
Varonis Systems, Inc.** | 76,739 | 3,725,678 | ||||||
|
| |||||||
| 22,180,902 | ||||||||
|
| |||||||
Semiconductors & Semiconductor Equipment — 5.7% |
| |||||||
Adesto Technologies Corp.** | 323,304 | 2,085,311 | ||||||
AXT, Inc.** | 146,340 | 1,273,158 | ||||||
Ichor Holdings, Ltd.** | 42,465 | 1,044,639 | ||||||
Nova Measuring Instruments, Ltd.** | 60,996 | 1,580,406 | ||||||
Silicon Motion Technology Corp. — ADR | 35,203 | 1,864,351 | ||||||
SMART Global Holdings, Inc.** | 199,418 | 6,720,387 | ||||||
SolarEdge Technologies, Inc.** | 102,047 | 3,831,865 | ||||||
|
| |||||||
| 18,400,117 | ||||||||
|
| |||||||
Internet Software & Services — 5.6% |
| |||||||
Five9, Inc.** | 149,237 | 3,713,017 | ||||||
GTT Communications, Inc.** | 134,852 | 6,331,301 | ||||||
Internap Corp.** | 119,320 | 1,874,517 | ||||||
Mimecast, Ltd.** | 101,292 | 2,904,042 | ||||||
Q2 Holdings, Inc.** | 45,369 | 1,671,848 | ||||||
QuinStreet, Inc.** | 176,159 | 1,476,212 | ||||||
|
| |||||||
| 17,970,937 | ||||||||
|
| |||||||
Information Technology Services — 1.9% |
| |||||||
Everi Holdings, Inc.** | 393,818 | 2,969,388 | ||||||
Virtusa Corp.** | 70,523 | 3,108,654 | ||||||
|
| |||||||
| 6,078,042 | ||||||||
|
| |||||||
Communications Equipment — 1.5% |
| |||||||
CalAmp Corp.** | 35,888 | 769,080 | ||||||
RADCOM, Ltd.** | 95,483 | 1,895,338 | ||||||
Silicom, Ltd. | 32,609 | 2,286,217 | ||||||
|
| |||||||
| 4,950,635 | ||||||||
|
| |||||||
Electronic Equipment, Instruments & Components — 0.4% |
| |||||||
Control4 Corp.** | 44,943 | 1,337,504 | ||||||
Computers & Peripherals — 0.2% |
| |||||||
USA Technologies, Inc.** | 82,490 | 804,278 | ||||||
|
| |||||||
Total INFORMATION TECHNOLOGY | 71,722,415 | |||||||
|
| |||||||
| CONSUMER DISCRETIONARY — 17.5% | ||||||||
Hotels, Restaurants & Leisure — 3.9% |
| |||||||
Bluegreen Vacations Corp. | 112,213 | 2,049,009 | ||||||
Century Casinos, Inc.** | 266,000 | 2,428,580 | ||||||
Eldorado Resorts, Inc.** | 147,707 | 4,896,487 | ||||||
Golden Entertainment, Inc.** | 64,772 | 2,114,806 | ||||||
Notes to Financial Statements are an integral part of this Schedule.
34
Table of Contents
Driehaus Micro Cap Growth Fund
Schedule of Investments
December 31, 2017
| Number of Shares | Value (Note A) | |||||||
Monarch Casino & Resort, Inc.** | 23,488 | $ | 1,052,732 | |||||
|
| |||||||
| 12,541,614 | ||||||||
|
| |||||||
Leisure Equipment & Products — 3.0% |
| |||||||
Callaway Golf Co. | 256,977 | 3,579,690 | ||||||
Malibu Boats, Inc. — A** | 132,987 | 3,953,703 | ||||||
MCBC Holdings, Inc.** | 99,472 | 2,210,268 | ||||||
|
| |||||||
| 9,743,661 | ||||||||
|
| |||||||
Textiles, Apparel & Luxury Goods — 2.3% |
| |||||||
Crocs, Inc.** | 239,549 | 3,027,899 | ||||||
G-III Apparel Group, Ltd.** | 70,833 | 2,613,029 | ||||||
Movado Group, Inc. | 52,669 | 1,695,942 | ||||||
|
| |||||||
| 7,336,870 | ||||||||
|
| |||||||
Specialty Retail — 2.0% |
| |||||||
Boot Barn Holdings, Inc.** | 77,300 | 1,283,953 | ||||||
Citi Trends, Inc. | 42,542 | 1,125,661 | ||||||
Conn’s, Inc.** | 81,463 | 2,896,010 | ||||||
Lumber Liquidators Holdings, Inc.** | 40,935 | 1,284,950 | ||||||
|
| |||||||
| 6,590,574 | ||||||||
|
| |||||||
Auto Components — 1.7% |
| |||||||
Modine Manufacturing Co.** | 166,509 | 3,363,482 | ||||||
Stoneridge, Inc.** | 93,585 | 2,139,353 | ||||||
|
| |||||||
| 5,502,835 | ||||||||
|
| |||||||
Household Durables — 1.6% |
| |||||||
SodaStream International, Ltd.** | 27,187 | 1,912,334 | ||||||
William Lyon Homes — A** | 58,401 | 1,698,301 | ||||||
ZAGG, Inc.** | 83,555 | 1,541,590 | ||||||
|
| |||||||
| 5,152,225 | ||||||||
|
| |||||||
Automobiles — 1.6% |
| |||||||
Winnebago Industries, Inc. | 92,172 | 5,124,763 | ||||||
Diversified Consumer Services — 1.4% |
| |||||||
Career Education Corp.** | 91,262 | 1,102,445 | ||||||
Chegg, Inc.** | 207,212 | 3,381,700 | ||||||
|
| |||||||
| 4,484,145 | ||||||||
|
| |||||||
Total CONSUMER DISCRETIONARY | 56,476,687 | |||||||
|
| |||||||
| INDUSTRIALS — 16.4% | ||||||||
Machinery — 3.9% |
| |||||||
Altra Industrial Motion Corp. | 32,860 | 1,656,144 | ||||||
Columbus McKinnon Corp. | 51,198 | 2,046,896 | ||||||
Energy Recovery, Inc.** | 189,087 | 1,654,511 | ||||||
Federal Signal Corp. | 84,600 | 1,699,614 | ||||||
Kadant, Inc. | 20,293 | 2,037,417 | ||||||
NN, Inc. | 56,504 | 1,559,510 | ||||||
Spartan Motors, Inc. | 113,782 | 1,792,066 | ||||||
|
| |||||||
| 12,446,158 | ||||||||
|
| |||||||
Trading Companies & Distributors — 3.1% |
| |||||||
Foundation Building Materials, Inc.** | 198,072 | 2,929,485 | ||||||
| Number of Shares | Value (Note A) | |||||||
GMS, Inc.** | 79,740 | $ | 3,001,414 | |||||
H&E Equipment Services, Inc. | 51,566 | 2,096,158 | ||||||
SiteOne Landscape Supply, Inc.** | 25,076 | 1,923,329 | ||||||
|
| |||||||
| 9,950,386 | ||||||||
|
| |||||||
Building Products — 3.0% |
| |||||||
NCI Building Systems, Inc.** | 123,754 | 2,388,452 | ||||||
Patrick Industries, Inc.** | 72,792 | 5,055,404 | ||||||
PGT Innovations, Inc.** | 140,387 | 2,365,521 | ||||||
|
| |||||||
| 9,809,377 | ||||||||
|
| |||||||
Aerospace & Defense — 1.4% |
| |||||||
Kratos Defense & Security Solutions, Inc.** | 149,798 | 1,586,361 | ||||||
Mercury Systems, Inc.** | 60,396 | 3,101,335 | ||||||
|
| |||||||
| 4,687,696 | ||||||||
|
| |||||||
Air Freight & Logistics — 1.3% |
| |||||||
Air Transport Services Group, Inc.** | 108,398 | 2,508,330 | ||||||
Atlas Air Worldwide Holdings, Inc.** | 26,490 | 1,553,638 | ||||||
|
| |||||||
| 4,061,968 | ||||||||
|
| |||||||
Road & Rail — 1.2% |
| |||||||
Saia, Inc.** | 55,845 | 3,951,034 | ||||||
Construction & Engineering — 1.2% |
| |||||||
NV5 Global, Inc.** | 27,225 | 1,474,234 | ||||||
Sterling Construction Co., Inc.** | 147,515 | 2,401,544 | ||||||
|
| |||||||
| 3,875,778 | ||||||||
|
| |||||||
Commercial Services & Supplies — 0.8% |
| |||||||
Casella Waste Systems, Inc. — A** | 113,317 | 2,608,557 | ||||||
Marine — 0.5% |
| |||||||
Star Bulk Carriers Corp.** | 137,456 | 1,547,755 | ||||||
|
| |||||||
Total INDUSTRIALS | 52,938,709 | |||||||
|
| |||||||
| FINANCIALS — 7.9% | ||||||||
Commercial Banks — 4.1% |
| |||||||
Live Oak Bancshares, Inc. | 176,210 | 4,202,609 | ||||||
Preferred Bank/Los Angeles CA | 68,432 | 4,022,433 | ||||||
Seacoast Banking Corp. of Florida** | 65,856 | 1,660,230 | ||||||
TriState Capital Holdings, Inc.** | 64,385 | 1,480,855 | ||||||
Triumph Bancorp, Inc.** | 61,809 | 1,946,984 | ||||||
|
| |||||||
| 13,313,111 | ||||||||
|
| |||||||
Thrifts & Mortgage Finance — 2.4% |
| |||||||
Meta Financial Group, Inc. | 28,194 | 2,612,174 | ||||||
NMI Holdings, Inc. — A** | 180,858 | 3,074,586 | ||||||
Sterling Bancorp, Inc.** | 170,091 | 2,160,156 | ||||||
|
| |||||||
| 7,846,916 | ||||||||
|
| |||||||
Notes to Financial Statements are an integral part of this Schedule.
35
Table of Contents
Driehaus Micro Cap Growth Fund
Schedule of Investments
December 31, 2017
| Number of Shares | Value (Note A) | |||||||
Real Estate Investment Trust — 0.8% |
| |||||||
Monmouth Real Estate Investment Corp. | 143,253 | $ | 2,549,903 | |||||
Insurance — 0.6% |
| |||||||
Kinsale Capital Group, Inc. | 41,961 | 1,888,245 | ||||||
|
| |||||||
Total FINANCIALS | 25,598,175 | |||||||
|
| |||||||
| CONSUMER STAPLES — 3.9% | ||||||||
Food Products — 2.1% |
| |||||||
Calavo Growers, Inc. | 34,255 | 2,891,122 | ||||||
Freshpet, Inc.** | 209,458 | 3,969,229 | ||||||
|
| |||||||
| 6,860,351 | ||||||||
|
| |||||||
Beverages — 1.1% |
| |||||||
MGP Ingredients, Inc. | 43,394 | 3,336,131 | ||||||
Personal Products — 0.4% |
| |||||||
Medifast, Inc. | 17,524 | 1,223,350 | ||||||
Food & Staples Retailing — 0.3% |
| |||||||
The Chefs’ Warehouse, Inc.** | 52,391 | 1,074,015 | ||||||
|
| |||||||
Total CONSUMER STAPLES | 12,493,847 | |||||||
|
| |||||||
| ENERGY — 3.5% | ||||||||
Energy Equipment & Services — 2.6% |
| |||||||
Keane Group, Inc.** | 96,180 | 1,828,382 | ||||||
ProPetro Holding Corp.** | 93,716 | 1,889,315 | ||||||
Solaris Oilfield Infrastructure, Inc. — A** | 213,021 | 4,560,780 | ||||||
|
| |||||||
| 8,278,477 | ||||||||
|
| |||||||
Oil, Gas & Consumable Fuels — 0.9% |
| |||||||
GasLog, Ltd. | 45,853 | 1,020,229 | ||||||
Ring Energy, Inc.** | 148,636 | 2,066,040 | ||||||
|
| |||||||
| 3,086,269 | ||||||||
|
| |||||||
Total ENERGY | 11,364,746 | |||||||
|
| |||||||
| Number of Shares | Value (Note A) | |||||||
| MATERIALS — 2.4% | ||||||||
Chemicals — 2.1% |
| |||||||
AdvanSix, Inc.** | 38,282 | $ | 1,610,524 | |||||
Ferro Corp.** | 94,089 | 2,219,560 | ||||||
KMG Chemicals, Inc. | 44,149 | 2,917,366 | ||||||
|
| |||||||
| 6,747,450 | ||||||||
|
| |||||||
Metals & Mining — 0.3% |
| |||||||
Schnitzer Steel Industries, Inc. — A | 29,781 | 997,664 | ||||||
|
| |||||||
Total MATERIALS | 7,745,114 | |||||||
|
| |||||||
| TELECOMMUNICATION SERVICES — 1.2% | ||||||||
Wireless Telecommunication Services — 1.2% |
| |||||||
Boingo Wireless, Inc.** | 165,289 | 3,719,002 | ||||||
|
| |||||||
Total TELECOMMUNICATION SERVICES | 3,719,002 | |||||||
|
| |||||||
Total EQUITY SECURITIES (Cost $236,814,985) | 321,963,888 | |||||||
|
| |||||||
| ||||||||
TOTAL INVESTMENTS | 99.8 | % | $ | 321,963,888 | ||||
Other Assets In Excess Of Liabilities | 0.2 | % | 568,964 | |||||
|
|
|
| |||||
Net Assets | 100.0 | % | $ | 322,532,852 | ||||
| ||||||||
| 1 | Pursuant to procedures adopted by Driehaus Mutual Funds’ (the “Trust”) Board of Trustees, this security has been determined to be illiquid by Driehaus Capital Management LLC, the Fund’s investment adviser. |
| ** | Non-income producing security |
ADR — American Depository Receipt
Top Ten Holdings*
SMART Global Holdings, Inc. | 2.1% | |||
Loxo Oncology, Inc. | 2.0% | |||
Array BioPharma, Inc. | 2.0% | |||
GTT Communications, Inc. | 2.0% | |||
AxoGen, Inc. | 1.9% | |||
Tactile Systems Technology, Inc. | 1.9% | |||
Winnebago Industries, Inc. | 1.6% | |||
Patrick Industries, Inc. | 1.6% | |||
Eldorado Resorts, Inc. | 1.5% | |||
Everbridge, Inc. | 1.5% |
| * | All percentages are stated as a percent of net assets at December 31, 2017. |
Notes to Financial Statements are an integral part of this Schedule.
36
Table of Contents
Driehaus Micro Cap Growth Fund
Schedule of Investments
December 31, 2017
Industry | Percent of Net Assets | |||
Aerospace & Defense | 1.4% | |||
Air Freight & Logistics | 1.3% | |||
Auto Components | 1.7% | |||
Automobiles | 1.6% | |||
Beverages | 1.1% | |||
Biotechnology | 10.7% | |||
Building Products | 3.0% | |||
Chemicals | 2.1% | |||
Commercial Banks | 4.1% | |||
Commercial Services & Supplies | 0.8% | |||
Communications Equipment | 1.5% | |||
Computers & Peripherals | 0.2% | |||
Construction & Engineering | 1.2% | |||
Diversified Consumer Services | 1.4% | |||
Electronic Equipment, Instruments & Components | 0.4% | |||
Energy Equipment & Services | 2.6% | |||
Food & Staples Retailing | 0.3% | |||
Food Products | 2.1% | |||
Health Care Equipment & Supplies | 8.8% | |||
Health Care Providers & Services | 0.6% | |||
Health Care Technology | 0.8% | |||
Hotels, Restaurants & Leisure | 3.9% | |||
Industry | Percent of Net Assets | |||
Household Durables | 1.6% | |||
Information Technology Services | 1.9% | |||
Insurance | 0.6% | |||
Internet Software & Services | 5.6% | |||
Leisure Equipment & Products | 3.0% | |||
Machinery | 3.9% | |||
Marine | 0.5% | |||
Metals & Mining | 0.3% | |||
Oil, Gas & Consumable Fuels | 0.9% | |||
Personal Products | 0.4% | |||
Pharmaceuticals | 3.9% | |||
Real Estate Investment Trust | 0.8% | |||
Road & Rail | 1.2% | |||
Semiconductors & Semiconductor Equipment | 5.7% | |||
Software | 6.9% | |||
Specialty Retail | 2.0% | |||
Textiles, Apparel & Luxury Goods | 2.3% | |||
Thrifts & Mortgage Finance | 2.4% | |||
Trading Companies & Distributors | 3.1% | |||
Wireless Telecommunication Services | 1.2% | |||
Other Assets in Excess of Liabilities | 0.2% | |||
|
| |||
TOTAL | 100.0% | |||
|
| |||
Notes to Financial Statements are an integral part of this Schedule.
37
Table of Contents
Driehaus Small Cap Growth Fund — Portfolio Managers’ Letter
Dear Fellow Shareholders,
The Driehaus Small Cap Growth Fund (“Fund”) Investor class (DVSMX) returned 18.18% and Institutional class (DNSMX) returned 18.28% for the period from inception on August 21, 2017 through December 31, 2017.1 This return was above the performance of the Fund’s benchmark, the Russell 2000® Growth Index (the “Benchmark”), which returned 14.80% for the same period.
The current macroeconomic environment has improved markedly over the past year with the US and most parts of the globe benefitting from synchronized global economic growth. This positive backdrop is conducive to rising earnings and provides fundamental support for the recent market gains. Many economic indicators have seen a sharp acceleration. The majority of recent US macro data (initial jobless claims, personal income, Purchasing Manager’s Index (PMI), business and consumer confidence, durable goods, housing starts, etc.) support the prospect for sustained growth into 2018.
One of the most significant and positive changes over the past year has been the reining in and rolling back of countless federal regulations. This is a major reason for the acceleration in economic growth in the past year. The pace of deregulation can be measured by the massive reduction in the pages of the Federal Register and it is frequently cited as a primary driver (along with taxes) for the multi-year highs in small business and CEO optimism.
For the year 2017, key contributors to performance versus the Benchmark were the Fund’s selection of holdings in the information technology and telecommunication services sectors.
Roku, Inc. (Ticker: ROKU) was one of the top contributors to the Fund’s absolute performance for the period. Roku provides a streaming platform for television. The company has continued to add accounts and grow the number of hours streamed throughout the year. As the company’s licensed products, such as Roku TV, gain traction, engagement and revenues continue to increase and drive the company’s performance.
GTT Communications, Inc. (Ticker: GTT) also contributed to the Fund’s performance for the period. The company provides cloud networking services for multinational clients. Company performance in 2017 was driven by a year of strong organic growth and acquisitions. Early in the year, the company acquired Hibernia, which added scale and depth to GTT’s portfolio with a strategic transatlantic fiber network. Throughout the rest of the year, the company continued to exceed investor expectations.
During the period, the two sectors that detracted the most value from Fund performance versus the Benchmark were selections within the health care and financials sectors.
A holding in the health care sector that detracted from the Fund’s return during the period was Tactile Systems Technology, Inc. (Ticker: TCMD). The company develops and provides medical devices for the treatment of chronic diseases at home. There were some concerns regarding the company’s realignment of its salesforce, which caused a smaller than usual positive revenue surprise for the September quarter, and impacted its share price.
Euronet Worldwide, Inc. (Ticker: EEFT) was also a notable detractor to the Fund’s returns for the period. The company provides electronic payment and transaction processing solutions for financial institutions. Uncertainty surrounding European Commission regulations for the company’s ATM dynamic currency conversion business led to a selloff of the stock. The overhang from this ongoing European Commission pursuit of new or improved rules for the category remains a risk for the company.
As we enter 2018, looking at a wide number of economic indicators, the current strong macro environment appears sustainable. Credit conditions are benign. Most key economic statistics and indicators are trending positively, with many at new cycle highs. The economic expansion is boosting most industries and most parts of the economy. The synchronized global growth backdrop is healthy and provides a bullish environment for equities. Tax cuts are incrementally boosting earnings (and helping valuations) and deregulation is helping business optimism. The Federal Reserve Chair will transition to Jerome (Jay) Powell but the Fed’s accommodative monetary policy is expected to remain status quo.
Naturally, there are risks that could disrupt these positive conditions. The pace of growth could tip inflation higher causing the Fed to get more aggressive with rates, ruining the current positive interplay between growth, inflation and rates. With the Fed raising rates, if the long end of the treasury yield curve does
38
Table of Contents
not rise greater than the short end, the shape of the yield curve could flatten further. Trump’s trade and immigration rhetoric could move from potential risks to actual policies with uncertain outcomes. Terrorism and the war of words with North Korea could also result in dangerous scenarios. Finally, a deceleration in economic growth or earnings, even if short-term, could cause a correction in equities and an increase in volatility. We have a sanguine outlook regarding all these risks, but market scares and resulting corrections are natural market events and volatility is likely to pick up after record low levels in 2017.
Thank you for your interest in the Driehaus Small Cap Growth Fund. We appreciate your confidence in our management capabilities.
Sincerely,
| | |
| Jeff James | Michael Buck | |
| Portfolio Manager | Assistant Portfolio Manager |
| 1 | During this period, the Fund’s returns reflect fee waivers and/or expense reimbursements without which performance would have been lower. |
Performance is historical and does not represent future results.
Please see the following performance overview page for index description.
39
Table of Contents
Driehaus Small Cap Growth Fund
Performance Overview (unaudited)
The performance summarized below is historical and does not represent future results. Investment returns and principal value vary, and you may have a gain or loss when you sell shares. Performance data presented measures the change in the value of an investment in the Fund, assuming reinvestment of all dividends and capital gains. Average annual total return reflects annualized change.
The table does not reflect the deduction of taxes that a shareholder would pay on Fund distributions or the redemption of Fund shares. The graph compares the results of a $10,000 investment in the Fund over the last 10 fiscal year periods (which includes performance of the Predecessor Partnership), with all dividends and capital gains reinvested, with the indicated index (and dividends reinvested) for the same period.
| Fund Only | Including Predecessor Partnership | |||||||||||||||||||
Average Annual Total Returns as of 12/31/17 | Since Inception | 1 Year | 3 Years | 5 Years | 10 Years | |||||||||||||||
Driehaus Small Cap Growth Fund - Investor Class (DVSMX)1 | 18.18% | 30.65% | 13.48% | 18.85% | 8.17% | |||||||||||||||
Driehaus Small Cap Growth Fund - Institutional Class (DNSMX)1 | 18.28% | 30.76% | 13.51% | 18.87% | 8.18% | |||||||||||||||
Russell 2000® Growth Index2 | 14.80% | 22.17% | 10.28% | 15.21% | 9.19% | |||||||||||||||
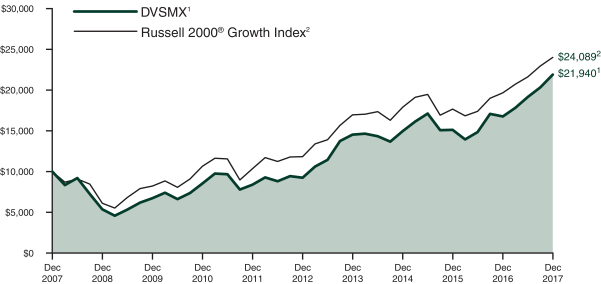
| 1 | The Driehaus Small Cap Growth Fund (“the Fund”) performance shown above includes the performance of the Driehaus Institutional Small Cap, L.P. (the “Predecessor Partnership”), one of the Fund’s predecessors, for the periods before the Fund’s registration statement became effective. The Predecessor Partnership was managed by the same investment team with substantially the same investment objective, policies and philosophies as are followed by the Fund. The Fund succeeded to the Predecessor Partnership’s assets together with the assets of the Driehaus Institutional Small Cap Recovery Fund, L.P., Driehaus Small Cap Recovery Fund, L.P. and Driehaus Small Cap Investors, L.P. (together, the “Limited Partnerships”) on August 21, 2017. The investment portfolios of the Limited Partnerships were identical and therefore had similar performance. The performance of the Predecessor Partnership is shown here because it has been in operation the longest. The Predecessor Partnership was not registered under the Investment Company Act of 1940, as amended (“1940 Act”), and thus was not subject to certain investment and operational restrictions that are imposed by the 1940 Act. If the Predecessor Partnership had been registered under the 1940 Act, its performance may have been adversely affected. The Predecessor Partnership’s performance has not been restated to reflect estimated expenses applicable to each class of shares of the Fund. The returns reflect fee waivers and/or reimbursements without which performance would have been lower. |
| 2 | The Russell 2000® Growth Index measures the performance of those Russell 2000® companies with higher price-to-book ratios and higher forecasted growth values. The performance data includes reinvested dividends. The Russell 2000® Index measures the performance of the 2,000 smallest companies in the Russell 3000® Index. |
40
Table of Contents
Driehaus Small Cap Growth Fund
Schedule of Investments
December 31, 2017
| Number of Shares | Value (Note A) | |||||||
| EQUITY SECURITIES — 99.9% | ||||||||
| INFORMATION TECHNOLOGY — 24.8% | ||||||||
Internet Software & Services — 9.0% |
| |||||||
Alarm.com Holdings, Inc.** | 5,496 | $ | 207,474 | |||||
ANGI Homeservices, Inc. — A** | 16,139 | 168,814 | ||||||
Cargurus, Inc.** | 6,790 | 203,564 | ||||||
Envestnet, Inc.** | 7,292 | 363,506 | ||||||
Five9, Inc.** | 14,171 | 352,574 | ||||||
GrubHub, Inc.** | 4,658 | 334,444 | ||||||
GTT Communications, Inc.** | 15,538 | 729,509 | ||||||
Mimecast, Ltd.** | 9,589 | 274,917 | ||||||
Nutanix, Inc. — A** | 19,874 | 701,155 | ||||||
Q2 Holdings, Inc.** | 7,103 | 261,746 | ||||||
|
| |||||||
| 3,597,703 | ||||||||
|
| |||||||
Software — 7.9% |
| |||||||
Altair Engineering, Inc. — A** | 18,906 | 452,232 | ||||||
Everbridge, Inc.** | 11,321 | 336,460 | ||||||
ForeScout Technologies, Inc.** | 9,685 | 308,855 | ||||||
Materialise NV — ADR** | 9,467 | 120,326 | ||||||
Proofpoint, Inc.** | 3,788 | 336,412 | ||||||
RingCentral, Inc. — A** | 16,745 | 810,458 | ||||||
Varonis Systems, Inc.** | 6,437 | 312,516 | ||||||
Zendesk, Inc.** | 5,930 | 200,671 | ||||||
Zynga, Inc. — A** | 73,177 | 292,708 | ||||||
|
| |||||||
| 3,170,638 | ||||||||
|
| |||||||
Semiconductors & Semiconductor Equipment — 5.0% |
| |||||||
Monolithic Power Systems, Inc. | 1,723 | 193,596 | ||||||
Silicon Motion Technology Corp. — ADR | 4,345 | 230,111 | ||||||
SMART Global Holdings, Inc.** | 17,922 | 603,971 | ||||||
SolarEdge Technologies, Inc.** | 12,084 | 453,754 | ||||||
Tower Semiconductor, Ltd.** | 15,426 | 525,718 | ||||||
|
| |||||||
| 2,007,150 | ||||||||
|
| |||||||
Information Technology Services — 1.9% |
| |||||||
EPAM Systems, Inc.** | 7,135 | 766,513 | ||||||
Computers & Peripherals — 1.0% |
| |||||||
Pure Storage, Inc. — A** | 24,021 | 380,973 | ||||||
|
| |||||||
Total INFORMATION TECHNOLOGY | 9,922,977 | |||||||
|
| |||||||
| CONSUMER DISCRETIONARY — 21.3% | ||||||||
Hotels, Restaurants & Leisure — 4.6% |
| |||||||
Eldorado Resorts, Inc.** | 18,469 | 612,247 | ||||||
Hilton Grand Vacations, Inc.** | 5,236 | 219,650 | ||||||
Penn National Gaming, Inc.** | 12,088 | 378,717 | ||||||
Planet Fitness, Inc. — A** | 12,578 | 435,576 | ||||||
| Number of Shares | Value (Note A) | |||||||
Red Rock Resorts, Inc. — A | 6,527 | $ | 220,221 | |||||
|
| |||||||
| 1,866,411 | ||||||||
|
| |||||||
Specialty Retail — 4.0% |
| |||||||
At Home Group, Inc.** | 7,399 | 224,856 | ||||||
Camping World Holdings, Inc. — A | 12,204 | 545,885 | ||||||
Five Below, Inc.** | 6,201 | 411,250 | ||||||
The Children’s Place, Inc. | 2,808 | 408,143 | ||||||
|
| |||||||
| 1,590,134 | ||||||||
|
| |||||||
Diversified Consumer Services — 3.1% |
| |||||||
Adtalem Global Education, Inc.** | 5,436 | 228,584 | ||||||
Bright Horizons Family Solutions, Inc.** | 2,228 | 209,432 | ||||||
Chegg, Inc.** | 19,215 | 313,589 | ||||||
Grand Canyon Education, Inc.** | 5,354 | 479,344 | ||||||
|
| |||||||
| 1,230,949 | ||||||||
|
| |||||||
Household Durables — 2.6% |
| |||||||
Roku, Inc.** | 11,593 | 600,286 | ||||||
SodaStream International, Ltd.** | 3,364 | 236,624 | ||||||
William Lyon Homes — A** | 6,895 | 200,507 | ||||||
|
| |||||||
| 1,037,417 | ||||||||
|
| |||||||
Textiles, Apparel & Luxury Goods — 2.5% |
| |||||||
Canada Goose Holdings, Inc.** | 7,137 | 225,244 | ||||||
G-III Apparel Group, Ltd.** | 6,607 | 243,732 | ||||||
Wolverine World Wide, Inc. | 17,130 | 546,104 | ||||||
|
| |||||||
| 1,015,080 | ||||||||
|
| |||||||
Auto Components — 1.7% |
| |||||||
LCI Industries | 2,673 | 347,490 | ||||||
Visteon Corp.** | 2,609 | 326,490 | ||||||
|
| |||||||
| 673,980 | ||||||||
|
| |||||||
Leisure Equipment & Products — 1.6% |
| |||||||
Callaway Golf Co. | 25,319 | 352,694 | ||||||
Malibu Boats, Inc. — A** | 9,312 | 276,846 | ||||||
|
| |||||||
| 629,540 | ||||||||
|
| |||||||
Automobiles — 0.6% |
| |||||||
Winnebago Industries, Inc. | 4,724 | 262,654 | ||||||
Distributors — 0.6% |
| |||||||
Pool Corp. | 1,806 | 234,148 | ||||||
|
| |||||||
Total CONSUMER DISCRETIONARY | 8,540,313 | |||||||
|
| |||||||
| HEALTH CARE — 19.7% | ||||||||
Biotechnology — 9.2% |
| |||||||
Argenx SE — ADR** | 2,965 | 187,210 | ||||||
Array BioPharma, Inc.** | 45,695 | 584,896 | ||||||
Blueprint Medicines Corp.** | 7,105 | 535,788 | ||||||
Exact Sciences Corp.** | 7,029 | 369,304 | ||||||
Global Blood Therapeutics, Inc.** | 7,136 | 280,802 | ||||||
Notes to Financial Statements are an integral part of this Schedule.
41
Table of Contents
Driehaus Small Cap Growth Fund
Schedule of Investments
December 31, 2017
| Number of Shares | Value (Note A) | |||||||
Insmed, Inc.** | 6,128 | $ | 191,071 | |||||
Loxo Oncology, Inc.** | 9,461 | 796,427 | ||||||
Sage Therapeutics, Inc.** | 1,129 | 185,958 | ||||||
Sarepta Therapeutics, Inc.** | 9,770 | 543,603 | ||||||
|
| |||||||
| 3,675,059 | ||||||||
|
| |||||||
Health Care Equipment & Supplies — 6.5% |
| |||||||
AxoGen, Inc.** | 11,351 | 321,233 | ||||||
Inogen, Inc.** | 5,369 | 639,341 | ||||||
Insulet Corp.** | 10,621 | 732,849 | ||||||
iRhythm Technologies, Inc.** | 6,181 | 346,445 | ||||||
Tactile Systems Technology, Inc.** | 19,583 | 567,515 | ||||||
|
| |||||||
| 2,607,383 | ||||||||
|
| |||||||
Pharmaceuticals — 2.9% |
| |||||||
Aclaris Therapeutics, Inc.** | 7,876 | 194,222 | ||||||
Aerie Pharmaceuticals, Inc.** | 3,060 | 182,835 | ||||||
Catalent, Inc.** | 5,110 | 209,919 | ||||||
MyoKardia, Inc.** | 8,018 | 337,558 | ||||||
Optinose, Inc.** | 11,472 | 216,821 | ||||||
|
| |||||||
| 1,141,355 | ||||||||
|
| |||||||
Health Care Technology — 1.1% |
| |||||||
Medidata Solutions, Inc.** | 2,833 | 179,527 | ||||||
Vocera Communications, Inc.** | 8,974 | 271,194 | ||||||
|
| |||||||
| 450,721 | ||||||||
|
| |||||||
Total HEALTH CARE | 7,874,518 | |||||||
|
| |||||||
| INDUSTRIALS — 17.2% | ||||||||
Building Products — 4.3% |
| |||||||
AAON, Inc. | 5,160 | 189,372 | ||||||
American Woodmark Corp.** | 3,153 | 410,678 | ||||||
Builders FirstSource, Inc.** | 13,552 | 295,298 | ||||||
NCI Building Systems, Inc.** | 15,752 | 304,014 | ||||||
Patrick Industries, Inc.** | 7,629 | 529,834 | ||||||
|
| |||||||
| 1,729,196 | ||||||||
|
| |||||||
Trading Companies & Distributors — 3.9% |
| |||||||
Air Lease Corp. | 5,966 | 286,905 | ||||||
GMS, Inc.** | 13,296 | 500,461 | ||||||
H&E Equipment Services, Inc. | 5,965 | 242,477 | ||||||
Rush Enterprises, Inc. — A** | 6,551 | 332,856 | ||||||
SiteOne Landscape Supply, Inc.** | 2,730 | 209,391 | ||||||
|
| |||||||
| 1,572,090 | ||||||||
|
| |||||||
Air Freight & Logistics — 3.1% |
| |||||||
Air Transport Services Group, Inc.** | 12,242 | 283,280 | ||||||
XPO Logistics, Inc.** | 10,303 | 943,652 | ||||||
|
| |||||||
| 1,226,932 | ||||||||
|
| |||||||
Machinery — 1.9% |
| |||||||
Altra Industrial Motion Corp. | 3,993 | 201,247 | ||||||
John Bean Technologies Corp. | 3,307 | 366,416 | ||||||
| Number of Shares | Value (Note A) | |||||||
Meritor, Inc.** | 7,185 | $ | 168,560 | |||||
|
| |||||||
| 736,223 | ||||||||
|
| |||||||
Road & Rail — 1.8% |
| |||||||
Knight-Swift Transportation Holdings, Inc. | 4,632 | 202,511 | ||||||
Saia, Inc.** | 7,360 | 520,720 | ||||||
|
| |||||||
| 723,231 | ||||||||
|
| |||||||
Aerospace & Defense — 0.9% |
| |||||||
Mercury Systems, Inc.** | 7,008 | 359,861 | ||||||
Construction & Engineering — 0.7% |
| |||||||
MasTec, Inc.** | 5,892 | 288,413 | ||||||
Airlines — 0.6% |
| |||||||
SkyWest, Inc. | 4,358 | 231,410 | ||||||
|
| |||||||
Total INDUSTRIALS | 6,867,356 | |||||||
|
| |||||||
| FINANCIALS — 6.8% | ||||||||
Commercial Banks — 2.8% |
| |||||||
Live Oak Bancshares, Inc. | 18,208 | 434,261 | ||||||
Pacific Premier Bancorp, Inc.** | 7,071 | 282,840 | ||||||
Seacoast Banking Corp. of Florida** | 14,910 | 375,881 | ||||||
|
| |||||||
| 1,092,982 | ||||||||
|
| |||||||
Thrifts & Mortgage Finance — 2.1% |
| |||||||
Essent Group, Ltd.** | 8,652 | 375,670 | ||||||
LendingTree, Inc.** | 1,387 | 472,204 | ||||||
|
| |||||||
| 847,874 | ||||||||
|
| |||||||
Real Estate Investment Trust — 1.0% |
| |||||||
QTS Realty Trust, Inc. — A | 3,647 | 197,522 | ||||||
Rexford Industrial Realty, Inc. | 6,740 | 196,538 | ||||||
|
| |||||||
| 394,060 | ||||||||
|
| |||||||
Consumer Finance — 0.9% |
| |||||||
Green Dot Corp. — A** | 6,168 | 371,684 | ||||||
|
| |||||||
Total FINANCIALS | 2,706,600 | |||||||
|
| |||||||
| MATERIALS — 4.3% | ||||||||
Chemicals — 2.4% |
| |||||||
Ferro Corp.** | 14,709 | 346,985 | ||||||
Ingevity Corp.** | 4,117 | 290,125 | ||||||
Venator Materials PLC** | 15,101 | 334,034 | ||||||
|
| |||||||
| 971,144 | ||||||||
|
| |||||||
Construction Materials — 1.0% |
| |||||||
Eagle Materials, Inc. | 3,415 | 386,920 | ||||||
Metals & Mining — 0.9% |
| |||||||
Ferroglobe PLC | 23,482 | 380,408 | ||||||
|
| |||||||
Total MATERIALS | 1,738,472 | |||||||
|
| |||||||
| ENERGY — 3.0% | ||||||||
Energy Equipment & Services — 1.9% |
| |||||||
Keane Group, Inc.** | 14,399 | 273,725 | ||||||
ProPetro Holding Corp.** | 10,781 | 217,345 | ||||||
Notes to Financial Statements are an integral part of this Schedule.
42
Table of Contents
Driehaus Small Cap Growth Fund
Schedule of Investments
December 31, 2017
| Number of Shares | Value (Note A) | |||||||
Solaris Oilfield Infrastructure, Inc. — A** | 12,139 | $ | 259,896 | |||||
|
| |||||||
| 750,966 | ||||||||
|
| |||||||
Oil, Gas & Consumable Fuels — 1.1% |
| |||||||
Callon Petroleum Co.** | 19,419 | 235,941 | ||||||
Extraction Oil & Gas, Inc.** | 13,932 | 199,367 | ||||||
|
| |||||||
| 435,308 | ||||||||
|
| |||||||
Total ENERGY | 1,186,274 | |||||||
|
| |||||||
| CONSUMER STAPLES — 1.4% | ||||||||
Household Products — 1.0% |
| |||||||
Central Garden & Pet Co.** | 10,037 | 390,640 | ||||||
Beverages — 0.4% |
| |||||||
The Boston Beer Co., Inc. — A** | 842 | 160,906 | ||||||
|
| |||||||
Total CONSUMER STAPLES | 551,546 | |||||||
|
| |||||||
| TELECOMMUNICATION SERVICES — 0.7% | ||||||||
Wireless Telecommunication Services — 0.7% |
| |||||||
Boingo Wireless, Inc.** | 12,305 | 276,862 | ||||||
|
| |||||||
Total TELECOMMUNICATION SERVICES | 276,862 | |||||||
|
| |||||||
| Number of Shares | Value (Note A) | |||||||
| UTILITIES — 0.7% | ||||||||
Water Utilities — 0.7% |
| |||||||
Evoqua Water Technologies Corp.** | 11,421 | $ | 270,792 | |||||
|
| |||||||
Total UTILITIES | 270,792 | |||||||
|
| |||||||
Total EQUITY SECURITIES (Cost $30,900,527) | 39,935,710 | |||||||
|
| |||||||
| ||||||||
TOTAL INVESTMENTS | 99.9 | % | $ | 39,935,710 | ||||
Other Assets In Excess Of Liabilities | 0.1 | % | 39,452 | |||||
|
|
|
| |||||
Net Assets | 100.0 | % | $ | 39,975,162 | ||||
| ||||||||
| ** | Non-income producing security |
ADR — American Depository Receipt
Top Ten Holdings*
XPO Logistics, Inc. | 2.4% | |||
RingCentral, Inc. — A | 2.0% | |||
Loxo Oncology, Inc. | 2.0% | |||
EPAM Systems, Inc. | 1.9% | |||
Insulet Corp. | 1.8% | |||
GTT Communications, Inc. | 1.8% | |||
Nutanix, Inc. — A | 1.8% | |||
Inogen, Inc. | 1.6% | |||
Eldorado Resorts, Inc. | 1.5% | |||
SMART Global Holdings, Inc. | 1.5% |
| * | All percentages are stated as a percent of net assets at December 31, 2017. |
Notes to Financial Statements are an integral part of this Schedule.
43
Table of Contents
Driehaus Small Cap Growth Fund
Schedule of Investments
December 31, 2017
Industry | Percent of Net Assets | |||
Aerospace & Defense | 0.9% | |||
Air Freight & Logistics | 3.1% | |||
Airlines | 0.6% | |||
Auto Components | 1.7% | |||
Automobiles | 0.6% | |||
Beverages | 0.4% | |||
Biotechnology | 9.2% | |||
Building Products | 4.3% | |||
Chemicals | 2.4% | |||
Commercial Banks | 2.8% | |||
Computers & Peripherals | 1.0% | |||
Construction & Engineering | 0.7% | |||
Construction Materials | 1.0% | |||
Consumer Finance | 0.9% | |||
Distributors | 0.6% | |||
Diversified Consumer Services | 3.1% | |||
Energy Equipment & Services | 1.9% | |||
Health Care Equipment & Supplies | 6.5% | |||
Health Care Technology | 1.1% | |||
Hotels, Restaurants & Leisure | 4.6% | |||
Household Durables | 2.6% | |||
Industry | Percent of Net Assets | |||
Household Products | 1.0% | |||
Information Technology Services | 1.9% | |||
Internet Software & Services | 9.0% | |||
Leisure Equipment & Products | 1.6% | |||
Machinery | 1.9% | |||
Metals & Mining | 0.9% | |||
Oil, Gas & Consumable Fuels | 1.1% | |||
Pharmaceuticals | 2.9% | |||
Real Estate Investment Trust | 1.0% | |||
Road & Rail | 1.8% | |||
Semiconductors & Semiconductor Equipment | 5.0% | |||
Software | 7.9% | |||
Specialty Retail | 4.0% | |||
Textiles, Apparel & Luxury Goods | 2.5% | |||
Thrifts & Mortgage Finance | 2.1% | |||
Trading Companies & Distributors | 3.9% | |||
Water Utilities | 0.7% | |||
Wireless Telecommunication Services | 0.7% | |||
Other Assets in Excess of Liabilities | 0.1% | |||
|
| |||
TOTAL | 100.0% | |||
|
| |||
Notes to Financial Statements are an integral part of this Schedule.
44
Table of Contents
(This page intentionally left blank)
Table of Contents
Statements of Assets and Liabilities
December 31, 2017
| Driehaus Emerging Markets Growth Fund | Driehaus Emerging Markets Small Cap Growth Fund | |||||||
ASSETS: | ||||||||
Investments, at cost | $ | 1,220,566,545 | $ | 211,788,952 | ||||
|
|
|
| |||||
Investments, at fair value | $ | 1,647,160,572 | $ | 257,637,058 | ||||
Foreign currency, at fair value* | 1,570,110 | 6,858,091 | ||||||
Cash | 114,974,291 | 9,131,524 | ||||||
Premiums paid for swap agreements | — | 1,387,777 | ||||||
Collateral held at custodian for the benefit of brokers | — | 1,078 | ||||||
Receivables: | ||||||||
Dividends | 2,623,930 | 344,451 | ||||||
Investment securities sold | 30,253,024 | 8,157,418 | ||||||
Fund shares sold | 3,407,510 | 533,855 | ||||||
Net unrealized appreciation on unsettled foreign currency transactions | 104,458 | 13,731 | ||||||
Prepaid expenses | 8,667 | 12,473 | ||||||
|
|
|
| |||||
| ||||||||
TOTAL ASSETS | 1,800,102,562 | 284,077,456 | ||||||
|
|
|
| |||||
| ||||||||
LIABILITIES: | ||||||||
Payables: | ||||||||
Investment securities purchased | 12,334,459 | 10,396,139 | ||||||
Fund shares redeemed | 4,942,694 | 413,550 | ||||||
Net unrealized depreciation on unsettled foreign currency transactions | — | — | ||||||
Due to affiliates | 1,847,347 | 333,353 | ||||||
Accrued foreign capital gains taxes | 1,236,118 | 736,893 | ||||||
Audit and tax fees | 60,589 | 67,134 | ||||||
Accrued expenses | 180,749 | 34,539 | ||||||
Unrealized depreciation on swap agreements | — | 949,854 | ||||||
|
|
|
| |||||
| ||||||||
TOTAL LIABILITIES | 20,601,956 | 12,931,462 | ||||||
|
|
|
| |||||
| ||||||||
NET ASSETS | $ | 1,779,500,606 | $ | 271,145,994 | ||||
|
|
|
| |||||
| ||||||||
NET ASSETS CONSISTED OF THE FOLLOWING AT DECEMBER 31, 2017: | ||||||||
Paid-in capital | $ | 1,333,560,760 | $ | 274,790,345 | ||||
Accumulated net investment income (loss) | (668,759 | ) | 181,870 | |||||
Accumulated net realized gain (loss) | 19,873,232 | (48,784,638 | ) | |||||
Unrealized net foreign exchange gain (loss) | 141,346 | 60,165 | ||||||
Unrealized net appreciation (depreciation) on swap contracts | — | (949,854 | ) | |||||
Unrealized net appreciation (depreciation) on purchased options | — | (5,208 | ) | |||||
Unrealized net appreciation (depreciation) on investments | 426,594,027 | 45,853,314 | ||||||
|
|
|
| |||||
NET ASSETS | $ | 1,779,500,606 | $ | 271,145,994 | ||||
|
|
|
| |||||
| ||||||||
NET ASSETS | — | $ | 271,145,994 | |||||
SHARES OUTSTANDING (Unlimited shares authorized, no par value) | — | 19,085,309 | ||||||
NET ASSET VALUE | — | $ | 14.21 | |||||
INVESTOR CLASS SHARES: | ||||||||
NET ASSETS | $ | 1,266,365,139 | — | |||||
SHARES OUTSTANDING (Unlimited shares authorized, no par value) | 31,950,047 | — | ||||||
NET ASSET VALUE | $ | 39.64 | — | |||||
INSTITUTIONAL CLASS SHARES: | ||||||||
NET ASSETS | $ | 513,135,467 | — | |||||
SHARES OUTSTANDING (Unlimited shares authorized, no par value) | 12,954,408 | — | ||||||
NET ASSET VALUE | $ | 39.61 | — | |||||
| * | The cost of foreign currency was $1,569,937, $6,839,334, $1,005,011, $0, $0 and $0, respectively. |
Notes to Financial Statements are an integral part of this Statement.
46
Table of Contents
Statements of Assets and Liabilities
December 31, 2017
| Driehaus Frontier Emerging Markets Fund | Driehaus International Small Cap Growth Fund | Driehaus Micro Cap Growth Fund | Driehaus Small Cap Growth Fund | |||||||||||
| $ | 31,286,388 | $ | 256,752,586 | $ | 236,814,985 | $ | 30,900,527 | |||||||
|
|
|
|
|
|
|
| |||||||
| $ | 41,197,608 | $ | 316,674,039 | $ | 321,963,888 | $ | 39,935,710 | |||||||
| 1,003,215 | — | — | — | |||||||||||
| 3,946,509 | 9,235,533 | 1,037,966 | 51,676 | |||||||||||
| — | — | — | — | |||||||||||
| — | — | — | — | |||||||||||
| 60,411 | 522,197 | 21,235 | 10,920 | |||||||||||
| 555,832 | 857,922 | — | — | |||||||||||
| 103,542 | 48,494 | 133,921 | 2,000 | |||||||||||
| — | — | — | — | |||||||||||
| 8,198 | 10,287 | 26,568 | 39,189 | |||||||||||
|
|
|
|
|
|
|
| |||||||
|
| |||||||||||||
| 46,875,315 | 327,348,472 | 323,183,578 | 40,039,495 | |||||||||||
|
|
|
|
|
|
|
| |||||||
|
| |||||||||||||
| 349,112 | 1,106,492 | — | — | |||||||||||
| — | 374,774 | 252,870 | — | |||||||||||
| 19 | 315 | — | — | |||||||||||
| 40,876 | 410,591 | 343,508 | 20,130 | |||||||||||
| 289,000 | — | — | — | |||||||||||
| 45,118 | 45,417 | 35,920 | 31,320 | |||||||||||
| 59,183 | 49,438 | 18,428 | 12,883 | |||||||||||
| — | — | — | — | |||||||||||
|
|
|
|
|
|
|
| |||||||
|
| |||||||||||||
| 783,308 | 1,987,027 | 650,726 | 64,333 | |||||||||||
|
|
|
|
|
|
|
| |||||||
|
| |||||||||||||
| $ | 46,092,007 | $ | 325,361,445 | $ | 322,532,852 | $ | 39,975,162 | |||||||
|
|
|
|
|
|
|
| |||||||
|
| |||||||||||||
| $ | 36,458,924 | $ | 256,790,545 | $ | 232,865,467 | $ | 29,011,040 | |||||||
| (192,922 | ) | (1,215,046 | ) | (343,289 | ) | — | ||||||||
| (88,338 | ) | 9,863,697 | 4,861,771 | 1,928,939 | ||||||||||
| 3,123 | 796 | — | — | |||||||||||
| — | — | — | — | |||||||||||
| — | — | — | — | |||||||||||
| 9,911,220 | 59,921,453 | 85,148,903 | 9,035,183 | |||||||||||
|
|
|
|
|
|
|
| |||||||
| $ | 46,092,007 | $ | 325,361,445 | $ | 322,532,852 | $ | 39,975,162 | |||||||
|
|
|
|
|
|
|
| |||||||
|
| |||||||||||||
| $ | 46,092,007 | $ | 325,361,445 | $ | 322,532,852 | — | ||||||||
| 4,245,198 | 28,570,447 | 22,334,469 | — | |||||||||||
| $ | 10.86 | $ | 11.39 | $ | 14.44 | — | ||||||||
| — | — | — | $ | 1,344,113 | ||||||||||
| — | — | — | 115,693 | |||||||||||
| — | — | — | $ | 11.62 | ||||||||||
| — | — | — | $ | 38,631,049 | ||||||||||
| — | — | — | 3,322,124 | |||||||||||
| — | — | — | $ | 11.63 | ||||||||||
Notes to Financial Statements are an integral part of this Statement.
47
Table of Contents
For the Year Ended December 31, 2017
| Driehaus Emerging Markets Growth Fund | Driehaus Emerging Markets Small Cap Growth Fund | |||||||
INVESTMENT INCOME (LOSS); | ||||||||
Income: | ||||||||
Dividends* | $ | 29,021,679 | $ | 4,921,179 | ||||
|
|
|
| |||||
| ||||||||
Total income | 29,021,679 | 4,921,179 | ||||||
|
|
|
| |||||
| ||||||||
Expenses: | ||||||||
Investment advisory fee | 19,590,626 | 3,780,375 | ||||||
Administration fee | 814,307 | 247,465 | ||||||
Professional fees | 262,688 | 54,774 | ||||||
Audit and tax fees | 94,916 | 114,303 | ||||||
Federal and state registration fees | 79,858 | 45,000 | ||||||
Custodian fees | 425,730 | 120,644 | ||||||
Transfer agent fees | 345,529 | 69,689 | ||||||
Trustees’ fees | 139,405 | 55,860 | ||||||
Chief compliance officer fees | 18,744 | 18,744 | ||||||
Reports to shareholders | 133,551 | 24,432 | ||||||
Interest expense | — | — | ||||||
Shareholder services fees (Investor Class) | 1,402,600 | — | ||||||
Miscellaneous | 91,345 | 47,944 | ||||||
|
|
|
| |||||
Total expenses | 23,399,299 | 4,579,230 | ||||||
|
|
|
| |||||
| ||||||||
Investment advisory fees waived | — | — | ||||||
Administration fees waived | — | — | ||||||
Transfer agent fees waived | — | — | ||||||
Fees paid indirectly | (156,136 | ) | (47,272 | ) | ||||
|
|
|
| |||||
Net expenses | 23,243,163 | 4,531,958 | ||||||
|
|
|
| |||||
| ||||||||
Net investment income (loss) | 5,778,516 | 389,221 | ||||||
|
|
|
| |||||
| ||||||||
| NET REALIZED AND UNREALIZED GAIN (LOSS) ON INVESTMENTS, WRITTEN OUTSTANDING OPTIONS AND FOREIGN CURRENCY TRANSACTIONS: | ||||||||
Net realized gain (loss) from security transactions | 218,006,860 | 48,065,589 | ||||||
Net realized foreign exchange gain (loss) | (1,400,208 | ) | (187,185 | ) | ||||
Net realized gain (loss) on forward foreign currency contracts | — | (2,150,339 | ) | |||||
Net realized gain (loss) on written options | — | 1,434,054 | ||||||
Net realized gain (loss) on purchased options | — | (11,570,010 | ) | |||||
Net realized gain (loss) on swap contracts | — | 324,100 | ||||||
Net change in unrealized foreign exchange gain (loss) | 158,147 | 46,771 | ||||||
Net change in unrealized appreciation (depreciation) on swap contracts | — | (853,659 | ) | |||||
Net change in unrealized appreciation (depreciation) on forward foreign currency contracts | — | 2,188,223 | ||||||
Net change in unrealized appreciation (depreciation) on written options | — | (149,278 | ) | |||||
Net change in unrealized appreciation (depreciation) on purchased options | — | 868,720 | ||||||
Net change in unrealized appreciation (depreciation) on investments | 322,036,644 | 35,184,814 | ||||||
|
|
|
| |||||
| ||||||||
Net realized and unrealized gain (loss) on investments, written options and foreign currency transactions | 538,801,443 | 73,201,800 | ||||||
|
|
|
| |||||
| ||||||||
NET INCREASE (DECREASE) IN NET ASSETS RESULTING FROM OPERATIONS | $ | 544,579,959 | $ | 73,591,021 | ||||
|
|
|
| |||||
| ||||||||
| * | Dividends are net of $3,035,034, $626,667, $178,190, $415,033, $0 and $0 non-reclaimable foreign taxes withheld, respectively. |
| ** | Fund commenced operations on August 21, 2017. |
Notes to Financial Statements are an integral part of this Statement.
48
Table of Contents
Statements of Operations
For the Year Ended December 31, 2017
| Driehaus Frontier Emerging Markets Fund | Driehaus International Small Cap Growth Fund | Driehaus Micro Cap Growth Fund | Driehaus Small Cap Growth Fund** | |||||||||||
| $ | 2,152,991 | $ | 3,646,825 | $ | 345,232 | $ | 38,259 | |||||||
|
|
|
|
|
|
|
| |||||||
|
| |||||||||||||
| 2,152,991 | 3,646,825 | 345,232 | 38,259 | |||||||||||
|
|
|
|
|
|
|
| |||||||
|
| |||||||||||||
| 939,599 | 4,301,192 | 4,083,208 | 88,830 | |||||||||||
| 109,739 | 265,542 | 264,630 | 25,415 | |||||||||||
| 25,072 | 59,497 | 66,481 | 7,116 | |||||||||||
| 60,605 | 58,892 | 46,880 | 43,020 | |||||||||||
| 20,896 | 24,000 | 34,000 | 16,761 | |||||||||||
| 161,304 | 52,716 | 34,867 | 4,420 | |||||||||||
| 38,247 | 51,406 | 56,932 | 29,388 | |||||||||||
| 43,326 | 57,972 | 62,794 | 15,775 | |||||||||||
| 18,744 | 18,744 | 18,744 | 3,333 | |||||||||||
| 12,387 | 17,177 | 32,634 | 5,204 | |||||||||||
| — | — | 3,103 | — | |||||||||||
| — | — | — | 102 | |||||||||||
| 32,187 | 45,687 | 41,162 | 1,446 | |||||||||||
|
|
|
|
|
|
|
| |||||||
| 1,462,106 | 4,952,825 | 4,745,435 | 240,810 | |||||||||||
|
|
|
|
|
|
|
| |||||||
|
| |||||||||||||
| (206,307 | ) | — | — | (67,173 | ) | |||||||||
| — | — | — | (5,443 | ) | ||||||||||
| (3,000 | ) | — | — | (26,710 | ) | |||||||||
| (4,473 | ) | (37,090 | ) | (69,824 | ) | — | ||||||||
|
|
|
|
|
|
|
| |||||||
| 1,248,326 | 4,915,735 | 4,675,611 | 141,484 | |||||||||||
|
|
|
|
|
|
|
| |||||||
|
| |||||||||||||
| 904,665 | (1,268,910 | ) | (4,330,379 | ) | (103,225 | ) | ||||||||
|
|
|
|
|
|
|
| |||||||
|
| |||||||||||||
| 4,584,074 | 58,040,419 | 54,316,286 | 2,869,260 | |||||||||||
| (892,483 | ) | (135,531 | ) | — | — | |||||||||
| — | — | — | — | |||||||||||
| — | — | — | — | |||||||||||
| — | — | — | — | |||||||||||
| — | — | — | — | |||||||||||
| 2,241 | 26,045 | — | — | |||||||||||
| — | — | — | — | |||||||||||
| — | | — | — | — | ||||||||||
| | — | — | — | — | ||||||||||
| | — | — | — | — | ||||||||||
| | 6,821,126 | 40,987,364 | 15,229,939 | 4,026,863 | ||||||||||
|
|
|
|
|
|
|
| |||||||
|
| |||||||||||||
| | 10,514,958 | 98,918,297 | 69,546,225 | 6,896,123 | ||||||||||
|
|
|
|
|
|
|
| |||||||
|
| |||||||||||||
| $ | 11,419,623 | $ | 97,649,387 | $ | 65,215,846 | $ | 6,792,898 | |||||||
|
|
|
|
|
|
|
| |||||||
|
| |||||||||||||
Notes to Financial Statements are an integral part of this Statement.
49
Table of Contents
Statements of Changes in Net Assets
| Driehaus Emerging Markets Growth Fund | Driehaus Emerging Markets Small Cap Growth Fund | |||||||||||||||
For the year | For the year ended December 31, 2016 | For the year ended December 31, 2017 | For the year ended December 31, 2016 | |||||||||||||
INCREASE (DECREASE) IN NET ASSETS: | ||||||||||||||||
Operations: | ||||||||||||||||
Net investment income (loss) | $ | 5,778,516 | $ | 1,490,264 | $ | 389,221 | $ | (1,029,545 | ) | |||||||
Net realized gain (loss) on investments, written options and foreign currency transactions | 216,606,652 | (2,175,940 | ) | 35,916,209 | (18,192,328 | ) | ||||||||||
Net change in unrealized gain (loss) on investments, written options and foreign currency transactions | 322,194,791 | 80,241,657 | 37,285,591 | (18,713,592 | ) | |||||||||||
|
|
|
|
|
|
|
| |||||||||
| ||||||||||||||||
Net increase (decrease) in net assets resulting from operations | 544,579,959 | 79,555,981 | 73,591,021 | (37,935,465 | ) | |||||||||||
|
|
|
|
|
|
|
| |||||||||
| ||||||||||||||||
Distributions to shareholders: | ||||||||||||||||
Net investment income | ||||||||||||||||
Fund | — | — | — | (450,242 | ) | |||||||||||
Investor Class Shares | (7,508,221 | ) | (5,290,378 | ) | — | — | ||||||||||
Institutional Class Shares | (3,509,534 | ) | — | — | — | |||||||||||
Capital gains | ||||||||||||||||
Fund | — | — | — | — | ||||||||||||
Investor Class Shares | — | — | — | — | ||||||||||||
Institutional Class Shares | — | — | — | — | ||||||||||||
|
|
|
|
|
|
|
| |||||||||
Total distributions to shareholders | (11,017,755 | ) | (5,290,378 | ) | — | (450,242 | ) | |||||||||
|
|
|
|
|
|
|
| |||||||||
| ||||||||||||||||
Capital share transactions: | ||||||||||||||||
Proceeds from shares sold: | ||||||||||||||||
Fund | — | — | 92,470,261 | 129,130,689 | ||||||||||||
Investor Class Shares | 271,797,882 | 309,521,714 | — | — | ||||||||||||
Institutional Class Shares | 491,937,774 | — | — | — | ||||||||||||
Reinvestment of distributions: | ||||||||||||||||
Fund | — | — | — | 313,519 | ||||||||||||
Investor Class Shares | 6,838,405 | 4,691,045 | — | — | ||||||||||||
Institutional Class Shares | 2,999,863 | — | — | — | ||||||||||||
Cost of shares redeemed: | ||||||||||||||||
Fund | — | — | (156,312,117 | ) | (262,403,964 | ) | ||||||||||
Investor Class Shares | (844,792,483 | ) | (415,113,177 | ) | — | — | ||||||||||
Institutional Class Shares | (18,766,180 | ) | — | — | — | |||||||||||
Redemption fees: | ||||||||||||||||
Fund | — | — | 9,900 | 14,640 | ||||||||||||
Investor Class Shares | 44,733 | 86,534 | — | — | ||||||||||||
Institutional Class Shares | 5,674 | — | — | — | ||||||||||||
|
|
|
|
|
|
|
| |||||||||
Net increase (decrease) in net assets derived from capital share transactions | (89,934,332 | ) | (100,813,884 | ) | (63,831,956 | ) | (132,945,116 | ) | ||||||||
|
|
|
|
|
|
|
| |||||||||
Total increase (decrease) in net assets | 443,627,872 | (26,548,281 | ) | 9,759,065 | (171,330,823 | ) | ||||||||||
|
|
|
|
|
|
|
| |||||||||
| ||||||||||||||||
NET ASSETS: | ||||||||||||||||
| ||||||||||||||||
Beginning of period | $ | 1,335,872,734 | $ | 1,362,421,015 | $ | 261,386,929 | $ | 432,717,752 | ||||||||
|
|
|
|
|
|
|
| |||||||||
End of period | $ | 1,779,500,606 | $ | 1,335,872,734 | $ | 271,145,994 | $ | 261,386,929 | ||||||||
|
|
|
|
|
|
|
| |||||||||
Accumulated net investment income (loss) | $ | (668,759 | ) | $ | (1,925,249 | ) | $ | 181,870 | $ | (935,864 | ) | |||||
|
|
|
|
|
|
|
| |||||||||
| ||||||||||||||||
| * | Fund commenced operations on August 21, 2017. |
Notes to Financial Statements are an integral part of this Statement.
50
Table of Contents
Statements of Changes in Net Assets
| Driehaus Frontier Emerging Markets Fund | Driehaus International Small Cap Growth Fund | Driehaus Micro Cap Growth Fund | Driehaus Small Cap Growth Fund | |||||||||||||||||||||||
| For the year ended December 31, 2017 | For the year ended December 31, 2016 | For the year ended December 31, 2017 | For the year ended December 31, 2016 | For the year ended December 31, 2017 | For the year ended December 31, 2016 | For the period August 21, 2017 through December 31, 2017* | ||||||||||||||||||||
| $ | 904,665 | $ | 655,562 | $ | (1,268,910 | ) | $ | (469,325 | ) | $ | (4,330,379 | ) | $ | (2,857,287 | ) | $ | (103,225 | ) | ||||||||
| 3,691,591 |
| (1,265,767 | ) | 57,904,888 | (1,844,526 | ) | 54,316,286 | (221,102 | ) | 2,869,260 | |||||||||||||||
| 6,823,367 |
| 3,667,819 | 41,013,409 | (18,121,774 | ) | 15,229,939 | 52,521,417 | 4,026,863 | |||||||||||||||||
|
|
|
|
|
|
|
|
|
|
|
|
|
| |||||||||||||
|
| |||||||||||||||||||||||||
| 11,419,623 |
| 3,057,614 | 97,649,387 | (20,435,625 | ) | 65,215,846 | 49,443,028 | 6,792,898 | |||||||||||||||||
|
|
|
|
|
|
|
|
|
|
|
|
|
| |||||||||||||
|
| |||||||||||||||||||||||||
| (112,019 | ) | (420,026 | ) | — | — | — | — | — | ||||||||||||||||||
| — | — | — | — | — | — | — | ||||||||||||||||||||
| — | — | — | — | — | — | — | ||||||||||||||||||||
| (2,313,790 | ) | — | (45,275,762 | ) | (3,539,778 | ) | (26,974,093 | ) | — | — | ||||||||||||||||
| — | — | — | — | — | — | (22,468 | ) | |||||||||||||||||||
| — | — | — | — | — | — | (642,608 | ) | |||||||||||||||||||
|
|
|
|
|
|
|
|
|
|
|
|
|
| |||||||||||||
| (2,425,809 | ) | (420,026 | ) | (45,275,762 | ) | (3,539,778 | ) | (26,974,093 | ) | — | (665,076 | ) | |||||||||||||
|
|
|
|
|
|
|
|
|
|
|
|
|
| |||||||||||||
|
| |||||||||||||||||||||||||
| 3,010,067 | 63,249,508 | 31,966,198 | 21,691,545 | 62,642,640 | 165,744,856 | — | ||||||||||||||||||||
| — | — | — | — | — | — | 1,270,517 | ||||||||||||||||||||
| — | — | — | — | — | — | 36,880,432 | ||||||||||||||||||||
| 2,425,416 | 419,165 | 40,876,829 | 3,236,249 | 25,135,678 | — | — | ||||||||||||||||||||
| — | — | — | — | — | — | 22,468 | ||||||||||||||||||||
| — | — | — | — | — | — | 642,608 | ||||||||||||||||||||
| (41,654,531 | ) | (12,560,154 | ) | (70,258,314 | ) | (71,803,138 | ) | (200,086,696 | ) | (100,792,906 | ) | — | ||||||||||||||
| — | — | — | — | — | — | (68,562 | ) | |||||||||||||||||||
| — | — | — | — | — | — | (4,900,123 | ) | |||||||||||||||||||
| 70 | 1,432 | 1,731 | 3,469 | 9,825 | 16,537 | — | ||||||||||||||||||||
| — | — | — | — | — | — | — | ||||||||||||||||||||
| — | — | — | — | — | — | — | ||||||||||||||||||||
|
|
|
|
|
|
|
|
|
|
|
|
|
| |||||||||||||
| (36,218,978 | ) | 51,109,951 | 2,586,444 | (46,871,875 | ) | (112,298,553 | ) | 64,968,487 | 33,847,340 | ||||||||||||||||
|
|
|
|
|
|
|
|
|
|
|
|
|
| |||||||||||||
| (27,225,164 | ) | 53,747,539 | 54,960,069 | (70,847,278 | ) | (74,056,800 | ) | 114,411,515 | 39,975,162 | ||||||||||||||||
|
|
|
|
|
|
|
|
|
|
|
|
|
| |||||||||||||
|
| |||||||||||||||||||||||||
|
| |||||||||||||||||||||||||
| $ | 73,317,171 | $ | 19,569,632 | $ | 270,401,376 | $ | 341,248,654 | $ | 396,589,652 | $ | 282,178,137 | $ | — | |||||||||||||
|
|
|
|
|
|
|
|
|
|
|
|
|
| |||||||||||||
| $ | 46,092,007 | $ | 73,317,171 | $ | 325,361,445 | $ | 270,401,376 | $ | 322,532,852 | $ | 396,589,652 | $ | 39,975,162 | |||||||||||||
|
|
|
|
|
|
|
|
|
|
|
|
|
| |||||||||||||
$ | (192,922 | ) | $ | (9,860 | ) | $ | (1,215,046 | ) | $ | — | $ | (343,289 | ) | $ | 316,181 | $ | — | |||||||||
|
|
|
|
|
|
|
|
|
|
|
|
|
| |||||||||||||
|
| |||||||||||||||||||||||||
Notes to Financial Statements are an integral part of this Statement.
51
Table of Contents
Driehaus Emerging Markets Growth Fund — Investor Class
| For the year ended December 31, 2017 | For the year ended December 31, 2016 | For the year ended December 31, 2015 | For the year ended December 31, 2014 | For the year ended December 31, 2013 | ||||||||||||||||
Net asset value, beginning of period | $ | 27.98 | $ | 26.52 | $ | 29.63 | $ | 32.53 | $ | 30.61 | ||||||||||
|
|
|
|
|
|
|
|
|
| |||||||||||
INCOME (LOSS) FROM INVESTMENT OPERATIONS: | ||||||||||||||||||||
Net investment income (loss) | 0.11 | ^ | 0.03 | 0.06 | 0.04 | 0.10 | ||||||||||||||
Net realized and unrealized gain (loss) on investments and foreign currency transactions | 11.78 | 1.54 | (3.17 | ) | (1.99 | ) | 2.62 | |||||||||||||
|
|
|
|
|
|
|
|
|
| |||||||||||
Total income (loss) from investment operations | 11.89 | 1.57 | (3.11 | ) | (1.95 | ) | 2.72 | |||||||||||||
|
|
|
|
|
|
|
|
|
| |||||||||||
LESS DISTRIBUTIONS: | ||||||||||||||||||||
Dividends from net investment income | (0.23 | ) | (0.11 | ) | — | — | — | |||||||||||||
Distributions from capital gains | — | — | — | (0.95 | ) | (0.80 | ) | |||||||||||||
|
|
|
|
|
|
|
|
|
| |||||||||||
Total distributions | (0.23 | ) | (0.11 | ) | — | (0.95 | ) | (0.80 | ) | |||||||||||
|
|
|
|
|
|
|
|
|
| |||||||||||
Redemption fees added to paid-in capital | 0.00 | ~ | 0.00 | ~ | 0.00 | ~ | 0.00 | ~ | 0.00 | ~ | ||||||||||
|
|
|
|
|
|
|
|
|
| |||||||||||
Net asset value, end of period | $ | 39.64 | $ | 27.98 | $ | 26.52 | $ | 29.63 | $ | 32.53 | ||||||||||
|
|
|
|
|
|
|
|
|
| |||||||||||
Total Return | 42.52 | % | 5.88 | % | (10.49 | )% | (5.96 | )% | 8.92 | % | ||||||||||
RATIOS/SUPPLEMENTAL DATA | ||||||||||||||||||||
Net assets, end of period (in 000’s) | $ | 1,266,365 | $ | 1,335,873 | $ | 1,362,421 | $ | 1,701,219 | $ | 1,634,866 | ||||||||||
Ratio of expenses before reimbursements, waivers and fees paid indirectly to average net assets | 1.54 | % | 1.65 | % | 1.65 | % | 1.65 | % | 1.66 | % | ||||||||||
Ratio of net expenses to average net assets | 1.53 | %# | 1.63 | %# | 1.64 | %# | 1.63 | %# | 1.64 | %# | ||||||||||
Ratio of net investment income (loss) to average net assets | 0.33 | %# | 0.11 | %# | 0.22 | %# | 0.11 | %# | 0.33 | %# | ||||||||||
Portfolio turnover | 176 | % | 232 | % | 257 | % | 289 | % | 264 | % | ||||||||||
| ^ | Net investment income (loss) per share has been calculated using the average shares method. |
| ~ | Amount represents less than $0.01 per share |
| # | Such ratios are net of fees paid indirectly (see Note B in the Notes to Financial Statements). |
Notes to Financial Statements are an integral part of this Schedule.
52
Table of Contents
Driehaus Emerging Markets Growth Fund — Institutional Class
Financial Highlights
| For the period July 17, 2017 through December 31, 2017 | ||||
Net asset value, beginning of period | $ | 34.85 | ||
|
| |||
INCOME (LOSS) FROM INVESTMENT OPERATIONS: | ||||
Net investment income (loss) | 0.12 | ^ | ||
Net realized and unrealized gain (loss) on investments and foreign currency transactions | 4.92 | |||
|
| |||
Total income (loss) from investment operations | 5.04 | |||
|
| |||
LESS DISTRIBUTIONS: | ||||
Dividends from net investment income | (0.28 | ) | ||
Distributions from capital gains | — | |||
|
| |||
Total distributions | (0.28 | ) | ||
|
| |||
Redemption fees added to paid-in capital | 0.00 | ~ | ||
|
| |||
Net asset value, end of period | $ | 39.61 | ||
|
| |||
Total Return | 14.47 | %** | ||
RATIOS/SUPPLEMENTAL DATA | ||||
Net assets, end of period (in 000’s) | $ | 513,135 | ||
Ratio of expenses before reimbursements, waivers and fees paid indirectly to average net assets | 1.17 | %* | ||
Ratio of net expenses to average net assets | 1.16 | %*# | ||
Ratio of net investment income (loss) to average net assets | 0.71 | %*# | ||
Portfolio turnover | 176 | %** | ||
| * | Annualized |
| ** | Not Annualized |
| ^ | Net investment income (loss) per share has been calculated using the average shares method. |
| ~ | Amount represents less than $0.01 per share |
| # | Such ratios are net of fees paid indirectly (see Note B in the Notes to Financial Statements). |
Notes to Financial Statements are an integral part of this Schedule.
53
Table of Contents
Driehaus Emerging Markets Small Cap Growth Fund
Financial Highlights
| For the year ended December 31, 2017 | For the year ended December 31, 2016 | For the year ended December 31, 2015 | For the year ended December 31, 2014 | For the year ended December 31, 2013 | ||||||||||||||||
Net asset value, beginning of period | $ | 10.66 | $ | 11.85 | $ | 13.21 | $ | 12.49 | $ | 11.15 | ||||||||||
|
|
|
|
|
|
|
|
|
| |||||||||||
INCOME (LOSS) FROM INVESTMENT OPERATIONS: | ||||||||||||||||||||
Net investment income (loss) | 0.02 | ^ | (0.03 | )^ | (0.05 | )^ | (0.02 | )^ | (0.00 | )^~ | ||||||||||
Net realized and unrealized gain (loss) on investments | 3.53 | (1.14 | ) | (1.31 | ) | 0.74 | 1.36 | |||||||||||||
|
|
|
|
|
|
|
|
|
| |||||||||||
Total income (loss) from investment operations | 3.55 | (1.17 | ) | (1.36 | ) | 0.72 | 1.36 | |||||||||||||
|
|
|
|
|
|
|
|
|
| |||||||||||
LESS DISTRIBUTIONS: | ||||||||||||||||||||
Dividends from net investment income | — | (0.02 | ) | — | — | (0.02 | ) | |||||||||||||
Distributions from capital gains | — | — | — | — | — | |||||||||||||||
|
|
|
|
|
|
|
|
|
| |||||||||||
Total distributions | — | (0.02 | ) | — | — | (0.02 | ) | |||||||||||||
|
|
|
|
|
|
|
|
|
| |||||||||||
Redemption fees added to paid-in capital | 0.00 | ~ | 0.00 | ~ | 0.00 | ~ | 0.00 | ~ | 0.00 | ~ | ||||||||||
|
|
|
|
|
|
|
|
|
| |||||||||||
Net asset value, end of period | $ | 14.21 | $ | 10.66 | $ | 11.85 | $ | 13.21 | $ | 12.49 | ||||||||||
|
|
|
|
|
|
|
|
|
| |||||||||||
Total Return | 33.30 | % | (9.97 | )% | (10.22 | )% | 5.77 | % | 12.11 | % | ||||||||||
RATIOS/SUPPLEMENTAL DATA | ||||||||||||||||||||
Net assets, end of period (in 000’s) | $ | 271,146 | $ | 261,387 | $ | 432,718 | $ | 510,175 | $ | 191,285 | ||||||||||
Ratio of expenses before reimbursements and/or recapture, waivers and fees paid indirectly to average net assets | 1.82 | % | 1.75 | % | 1.69 | %¥ | 1.73 | % | 1.85 | % | ||||||||||
Ratio of net expenses to average net assets | 1.80 | %# | 1.73 | %# | 1.68 | %#¥ | 1.71 | %+# | 1.90 | %+# | ||||||||||
Ratio of net investment income (loss) to average net assets | 0.15 | %# | (0.26 | )%# | (0.39 | )%# | (0.14 | )%+# | (0.02 | )%+# | ||||||||||
Portfolio turnover | 243 | % | 240 | % | 306 | % | 265 | % | 223 | % | ||||||||||
| ^ | Net investment income (loss) per share has been calculated using the average shares method. |
| ~ | Amount represents less than $0.01 per share |
| + | Such ratios are after administrative and transfer agent waivers and adviser expense reimbursements, when applicable. BNY Mellon Investment Servicing (US) Inc., the administrative agent and transfer agent, waived a portion of its fees beginning with the Fund’s commencement of operations, August 22, 2011. The Adviser contractually agreed to waive its investment advisory fee or absorb other operating expenses to the extent necessary to ensure that total annual Fund operating expenses (other than interest, taxes, brokerage commissions and other portfolio transaction expenses, capital expenditures, and extraordinary expenses) would not exceed the Fund’s operating expense cap of 2.00% of average daily net assets until August 21, 2014. |
| # | Such ratios are net of fees paid indirectly (see Note B in the Notes to Financial Statements). |
| ¥ | Ratio of expenses to average net assets includes interest expense of less than 0.005% for the year ended December 31, 2015. The interest expense is from utilizing the line of credit (see Note E in the Notes to Financial Statements). |
Notes to Financial Statements are an integral part of this Schedule.
54
Table of Contents
Driehaus Frontier Emerging Markets Fund
Financial Highlights
| For the year ended December 31, 2017 | For the year ended December 31, 2016 | For the period May 4, 2015 through December 31, 2015 | ||||||||||
Net asset value, beginning of period | $ | 9.56 | $ | 8.80 | $ | 10.00 | ||||||
|
|
|
|
|
| |||||||
INCOME (LOSS) FROM INVESTMENT OPERATIONS: | ||||||||||||
Net investment income (loss) | 0.15 | ^ | 0.12 | ^ | (0.01 | ) | ||||||
Net realized and unrealized gain (loss) on investments | 1.76 | 0.69 | (1.19 | ) | ||||||||
|
|
|
|
|
| |||||||
Total income (loss) from investment operations | 1.91 | 0.81 | (1.20 | ) | ||||||||
|
|
|
|
|
| |||||||
LESS DISTRIBUTIONS: | ||||||||||||
Dividends from net investment income | (0.03 | ) | (0.05 | ) | — | |||||||
Distributions from capital gains | (0.58 | ) | — | — | ||||||||
|
|
|
|
|
| |||||||
Total distributions | (0.61 | ) | (0.05 | ) | — | |||||||
|
|
|
|
|
| |||||||
Redemption fees added to paid-in capital | 0.00 | ~ | 0.00 | ~ | — | |||||||
|
|
|
|
|
| |||||||
Net asset value, end of period | $ | 10.86 | $ | 9.56 | $ | 8.80 | ||||||
|
|
|
|
|
| |||||||
Total Return | 20.04 | % | 9.26 | % | (12.00 | )%** | ||||||
RATIOS/SUPPLEMENTAL DATA | ||||||||||||
Net assets, end of period (in 000’s) | $ | 46,092 | $ | 73,317 | $ | 19,570 | ||||||
Ratio of expenses before reimbursements and waivers and fees recaptured, if any, to average net assets | 2.33 | % | 2.50 | % | 3.89 | %* | ||||||
Ratio of net expenses to average net assets | 1.99 | %+# | 1.99 | %+# | 2.00 | %*+# | ||||||
Ratio of net investment income (loss) to average net assets | 1.44 | %+# | 1.31 | %+# | (0.22 | )%*+# | ||||||
Portfolio turnover | 105 | % | 90 | % | 66 | %** | ||||||
| * | Annualized |
| ** | Not Annualized |
| ^ | Net investment income (loss) per share has been calculated using the average share method. |
| ~ | Amount represents less than $0.01 per share |
| + | Such ratios are after administrative and transfer agent waivers and adviser expense reimbursements, when applicable. BNY Mellon Investment Servicing (US) Inc., the administrative agent and transfer agent, waived a portion of its fees beginning with the Fund’s commencement of operations, May 4, 2015. The Adviser contractually agreed to waive its investment advisory fee or absorb other operating expenses to the extent necessary to ensure that total annual Fund operating expenses (other than interest, taxes, brokerage commissions and other portfolio transaction expenses, capital expenditures, and extraordinary expenses) would not exceed the Fund’s operating expense cap of 2.00% of average daily net assets until May 3, 2018. |
| # | Such ratios are net of fees paid indirectly (see Note B in the Notes to Financial Statements). |
Notes to Financial Statements are an integral part of this Schedule.
55
Table of Contents
Driehaus International Small Cap Growth Fund
Financial Highlights
| For the year ended December 31, 2017 | For the year ended December 31, 2016 | For the year ended December 31, 2015 | For the year ended December 31, 2014 | For the year ended December 31, 2013 | ||||||||||||||||
Net asset value, beginning of period | $ | 9.33 | $ | 10.08 | $ | 9.20 | $ | 10.84 | $ | 9.45 | ||||||||||
|
|
|
|
|
|
|
|
|
| |||||||||||
INCOME (LOSS) FROM INVESTMENT OPERATIONS: | ||||||||||||||||||||
Net investment income (loss) | (0.04 | ) | (0.02 | ) | (0.02 | )^ | (0.04 | ) | (0.01 | )^ | ||||||||||
Net realized and unrealized gain (loss) on investments and foreign currency transactions | 3.88 | (0.61 | ) | 1.17 | (0.42 | ) | 2.74 | |||||||||||||
|
|
|
|
|
|
|
|
|
| |||||||||||
Total income (loss) from investment operations | 3.84 | (0.63 | ) | 1.15 | (0.46 | ) | 2.73 | |||||||||||||
|
|
|
|
|
|
|
|
|
| |||||||||||
LESS DISTRIBUTIONS: | ||||||||||||||||||||
Dividends from net investment income | — | — | (0.03 | ) | (0.06 | ) | (0.13 | ) | ||||||||||||
Distributions from capital gains | (1.78 | ) | (0.12 | ) | (0.24 | ) | (1.12 | ) | (1.21 | ) | ||||||||||
|
|
|
|
|
|
|
|
|
| |||||||||||
Total distributions | (1.78 | ) | (0.12 | ) | (0.27 | ) | (1.18 | ) | (1.34 | ) | ||||||||||
|
|
|
|
|
|
|
|
|
| |||||||||||
Redemption fees added to paid-in capital | 0.00 | ~ | 0.00 | ~ | 0.00 | ~ | 0.00 | ~ | 0.00 | ~ | ||||||||||
|
|
|
|
|
|
|
|
|
| |||||||||||
Net asset value, end of period | $ | 11.39 | $ | 9.33 | $ | 10.08 | $ | 9.20 | $ | 10.84 | ||||||||||
|
|
|
|
|
|
|
|
|
| |||||||||||
Total Return | 41.44 | % | (6.22 | )% | 12.58 | % | (4.32 | )% | 29.24 | % | ||||||||||
RATIOS/SUPPLEMENTAL DATA | ||||||||||||||||||||
Net assets, end of period (in 000’s) | $ | 325,361 | $ | 270,401 | $ | 341,249 | $ | 218,979 | $ | 270,671 | ||||||||||
Ratio of expenses before reimbursements, waivers and fees paid indirectly to average net assets | 1.73 | % | 1.72 | % | 1.71 | % | 1.74 | % | 1.73 | % | ||||||||||
Ratio of net expenses to average net assets | 1.71 | %# | 1.70 | %# | 1.70 | %# | 1.72 | %# | 1.70 | %# | ||||||||||
Ratio of net investment income (loss) to average net assets | (0.44 | )%# | (0.15 | )%# | (0.19 | )%# | (0.40 | )%# | (0.11 | )%# | ||||||||||
Portfolio turnover | 143 | % | 151 | % | 251 | % | 277 | % | 320 | % | ||||||||||
| ^ | Net investment income (loss) per share has been calculated using the average shares method. |
| ~ | Amount represents less than $0.01 per share |
| # | Such ratios are net of fees paid indirectly (see Note B in the Notes to Financial Statements). |
Notes to Financial Statements are an integral part of this Schedule.
56
Table of Contents
Driehaus Micro Cap Growth Fund
Financial Highlights
| For the year ended December 31, 2017 | For the year ended December 31, 2016 | For the year ended December 31, 2015 | For the year ended December 31, 2014 | For the period November 18, 2013 through December 31, 2013 | ||||||||||||||||
Net asset value, beginning of period | $ | 12.65 | $ | 10.74 | $ | 11.25 | $ | 10.74 | $ | 10.00 | ||||||||||
|
|
|
|
|
|
|
|
|
| |||||||||||
INCOME (LOSS) FROM INVESTMENT OPERATIONS: | ||||||||||||||||||||
Net investment income (loss) | (0.18 | )^ | (0.11 | )^ | (0.14 | )^ | (0.14 | ) | (0.02 | ) | ||||||||||
Net realized and unrealized gain (loss) on investments | 3.26 | 2.02 | 0.08 | 1.01 | 0.76 | |||||||||||||||
|
|
|
|
|
|
|
|
|
| |||||||||||
Total income (loss) from investment operations | 3.08 | 1.91 | (0.06 | ) | 0.87 | 0.74 | ||||||||||||||
|
|
|
|
|
|
|
|
|
| |||||||||||
LESS DISTRIBUTIONS: | ||||||||||||||||||||
Dividends from net investment income | — | — | — | — | — | |||||||||||||||
Distributions from capital gains | (1.29 | ) | — | (0.45 | ) | (0.36 | ) | — | ||||||||||||
|
|
|
|
|
|
|
|
|
| |||||||||||
Total distributions | (1.29 | ) | — | (0.45 | ) | (0.36 | ) | — | ||||||||||||
|
|
|
|
|
|
|
|
|
| |||||||||||
Redemption fees added to paid-in capital | 0.00 | ~ | 0.00 | ~ | 0.00 | ~ | 0.00 | ~ | — | |||||||||||
|
|
|
|
|
|
|
|
|
| |||||||||||
Net asset value, end of period | $ | 14.44 | $ | 12.65 | $ | 10.74 | $ | 11.25 | $ | 10.74 | ||||||||||
|
|
|
|
|
|
|
|
|
| |||||||||||
Total Return | 24.30 | % | 17.78 | % | (0.55 | )% | 8.21 | % | 7.40 | %** | ||||||||||
RATIOS/SUPPLEMENTAL DATA | ||||||||||||||||||||
Net assets, end of period (in 000’s) | $ | 322,533 | $ | 396,590 | $ | 282,178 | $ | 111,846 | $ | 74,677 | ||||||||||
Ratio of expenses before reimbursements and waivers and fees recaptured, if any, to average net assets | 1.45 | %¥ | 1.48 | % | 1.53 | % | 1.59 | % | 2.28 | %* | ||||||||||
Ratio of net expenses to average net assets | 1.43 | %#¥ | 1.44 | %+# | 1.52 | %+# | 1.60 | %+# | 1.70 | %*+# | ||||||||||
Ratio of net investment income (loss) to average net assets | (1.33 | )%# | (1.00 | )%+# | (1.21 | )%+# | (1.39 | )%+# | (1.55 | )%*+# | ||||||||||
Portfolio turnover | 177 | % | 180 | % | 183 | % | 191 | % | 21 | %** | ||||||||||
| * | Annualized |
| ** | Not Annualized |
| ^ | Net investment income (loss) per share has been calculated using the average shares method. |
| ~ | Amount represents less than $0.01 per share |
| + | Such ratios are after administrative and transfer agent waivers and adviser expense reimbursements, when applicable. BNY Mellon Investment Servicing (US) Inc., the administrative agent and transfer agent, waived a portion of its fees beginning with the Fund’s commencement of operations, November 18, 2013. The Adviser contractually agreed to waive its investment advisory fee or absorb other operating expenses to the extent necessary to ensure that total annual Fund operating expenses (other than interest, taxes, brokerage commissions and other portfolio transaction expenses, capital expenditures, and extraordinary expenses) would not exceed the Fund’s operating expense cap of 1.70% of average daily net assets until November 17, 2016. |
| # | Such ratios are net of fees paid indirectly (see Note B in the Notes to Financial Statements). |
| ¥ | Ratio of expenses to average net assets includes interest expense of less than 0.005% for the year ended December 31, 2017. The interest expense is from utilizing the line of credit (see Note E in the Notes to Financial Statements). |
Notes to Financial Statements are an integral part of this Schedule.
57
Table of Contents
Driehaus Small Cap Growth Fund — Investor Class
Financial Highlights
| For the period August 21, 2017 through December 31, 2017 | ||||
Net asset value, beginning of period | $ | 10.00 | ||
|
| |||
INCOME (LOSS) FROM INVESTMENT OPERATIONS: | ||||
Net investment income (loss) | (0.04 | )^ | ||
Net realized and unrealized gain (loss) on investments and foreign currency transactions | 1.86 | |||
|
| |||
Total income (loss) from investment operations | 1.82 | |||
|
| |||
LESS DISTRIBUTIONS: | ||||
Dividends from net investment income | — | |||
Distributions from capital gains | (0.20 | ) | ||
|
| |||
Total distributions | (0.20 | ) | ||
|
| |||
Redemption fees added to paid-in capital | — | |||
|
| |||
Net asset value, end of period | $ | 11.62 | ||
|
| |||
Total Return | 18.18 | %** | ||
RATIOS/SUPPLEMENTAL DATA | ||||
Net assets, end of period (in 000’s) | $ | 1,344 | ||
Ratio of expenses before reimbursements, waivers and fees paid indirectly to average net assets | 7.86 | %* | ||
Ratio of net expenses to average net assets | 1.20 | %*+ | ||
Ratio of net investment income (loss) to average net assets | (0.94 | )%*+ | ||
Portfolio turnover | 66 | %** | ||
| * | Annualized |
| ** | Not Annualized |
| ^ | Net investment loss per share has been calculated using the average share method. |
| ~ | Amount represents less than $0.01 per share |
| + | Such ratios are after administrative and transfer agent waivers and adviser expense reimbursements, when applicable. BNY Mellon Investment Servicing (US) Inc., the administrative agent and transfer agent, waived a portion of its fees beginning with the Fund’s commencement of operations, August 21, 2017. The Adviser contractually agreed to waive its investment advisory fee or absorb other operating expenses to the extent necessary to ensure that total annual Fund operating expenses (other than interest, taxes, brokerage commissions and other portfolio transaction expenses, capital expenditures, and extraordinary expenses) would not exceed the Fund’s operating expense cap of 1.20% of average daily net assets until August 20, 2020. |
Notes to Financial Statements are an integral part of this Schedule.
58
Table of Contents
Driehaus Small Cap Growth Fund — Institutional Class
Financial Highlights
| For the period August 21, 2017 through December 31, 2017 | ||||
Net asset value, beginning of period | $ | 10.00 | ||
|
| |||
INCOME (LOSS) FROM INVESTMENT OPERATIONS: | ||||
Net investment income (loss) | (0.03 | )^ | ||
Net realized and unrealized gain (loss) on investments and foreign currency transactions | 1.86 | |||
|
| |||
Total income (loss) from investment operations | 1.83 | |||
|
| |||
LESS DISTRIBUTIONS: | ||||
Dividends from net investment income | — | |||
Distributions from capital gains | (0.20 | ) | ||
|
| |||
Total distributions | (0.20 | ) | ||
|
| |||
Redemption fees added to paid-in capital | — | |||
|
| |||
Net asset value, end of period | $ | 11.63 | ||
|
| |||
Total Return | 18.28 | %** | ||
RATIOS/SUPPLEMENTAL DATA | ||||
Net assets, end of period (in 000’s) | $ | 38,631 | ||
Ratio of expenses before reimbursements, waivers and fees paid indirectly to average net assets | 1.48 | %* | ||
Ratio of net expenses to average net assets | 0.95 | %*+ | ||
Ratio of net investment income (loss) to average net assets | (0.69 | )%*+ | ||
Portfolio turnover | 66 | %** | ||
| * | Annualized |
| ** | Not Annualized |
| ^ | Net investment loss per share has been calculated using the average share method. |
| ~ | Amount represents less than $0.01 per share |
| + | Such ratios are after administrative and transfer agent waivers and adviser expense reimbursements, when applicable. BNY Mellon Investment Servicing (US) Inc., the administrative agent and transfer agent, waived a portion of its fees beginning with the Fund’s commencement of operations, August 21, 2017. The Adviser contractually agreed to waive its investment advisory fee or absorb other operating expenses to the extent necessary to ensure that total annual Fund operating expenses (other than interest, taxes, brokerage commissions and other portfolio transaction expenses, capital expenditures, and extraordinary expenses) would not exceed the Fund’s operating expense cap of 0.95% of average daily net assets until August 20, 2020. |
Notes to Financial Statements are an integral part of this Schedule.
59
Table of Contents
Driehaus Mutual Funds
A. SUMMARY OF SIGNIFICANT ACCOUNTING POLICIES
Organization
The Driehaus Mutual Funds (the “Trust”) is an open-end registered management investment company under the Investment Company Act of 1940, as amended, organized as a Delaware statutory trust, with nine separate series currently in operation. The Trust was organized under an Agreement and Declaration of Trust dated May 31, 1996, as subsequently amended and restated as of June 6, 2013, and amended as of June 4, 2015, and may issue an unlimited number of full and fractional units of beneficial interest (shares) without par value. The six series (“Funds” or each a “Fund”) included in this report are as follows:
| Fund | Commencement of Operations | |||
Driehaus Emerging Markets Growth Fund | 12/31/97 | |||
Driehaus Emerging Markets Small Cap Growth Fund | 08/22/11 | |||
Driehaus Frontier Emerging Markets Fund | 05/04/15 | |||
Driehaus International Small Cap Growth Fund* | 09/17/07 | |||
Driehaus Micro Cap Growth Fund** | 11/18/13 | |||
Driehaus Small Cap Growth Fund | 08/21/17 | |||
| * | Effective January 2, 2018, the Driehaus International Small Cap Growth Fund has been reopened to new investors. The Fund had been closed to most new investors since December 29, 2010. |
| ** | On September 29, 2017, the Driehaus Micro Cap Growth Fund was closed to new investors. |
The Driehaus Emerging Markets Growth Fund and Driehaus Small Cap Growth Fund each offer two classes of shares, designated as Institutional Class and Investor Class. Each class of shares represents an interest in the same portfolio of investments of the respective Fund and voting privileges with respect to the Fund in general. Each class of shares has exclusive voting rights with respect to any matters involving only that class. The classes of each Fund pay pro rata the costs of management of that Fund’s portfolio, including the management fee. Each class of a Fund bears the cost of its own transfer agency and shareholder servicing arrangements, and any other class-specific expenses, which will result in differing expenses by class.
The investment objective of each Fund is to maximize capital appreciation.
Driehaus Emerging Markets Growth Fund seeks to achieve its objective by investing primarily in equity securities of emerging markets companies.
Driehaus Emerging Markets Small Cap Growth Fund seeks to achieve its objective by investing primarily in equity securities of small capitalization emerging markets companies.
Driehaus Frontier Emerging Markets Fund seeks to achieve its objective by investing primarily in equity securities of frontier emerging markets companies.
Driehaus International Small Cap Growth Fund seeks to achieve its objective by investing primarily in equity securities of smaller capitalization non-U.S. companies exhibiting strong growth characteristics.
Driehaus Micro Cap Growth Fund seeks to achieve its objective by investing primarily in equity securities of micro capitalization U.S. companies exhibiting strong growth characteristics.
Driehaus Small Cap Growth Fund seeks to achieve its objective by investing primarily in equity securities of U.S. small capitalization companies.
The Funds, which are investment companies within the scope of Financial Accounting Standards Board (“FASB”) Accounting Standards Update 2013-08, follow accounting and reporting guidance under FASB Accounting Standards Codification Topic 946, Financial Services-Investment Companies.
Securities Valuation and Transactions
Equity securities and exchange-traded options are valued at the last sale price as of the close of the primary exchange or other designated time. Equity certificates are valued at the last sale price of the underlying security as of the close of the primary exchange. Swaps, forward foreign currency contracts and
60
Table of Contents
Driehaus Mutual Funds
Notes to Financial Statements — (Continued)
other financial derivatives are valued daily, primarily by an independent pricing service using pricing models, and are generally classified as level 2. The pricing models use inputs that are observed from actively quoted markets such as issuer details, indices, spreads, interest rates, yield curves, dividends and exchange rates. If valuations are not available from the independent pricing service or values received are deemed not representative of market value, values will be obtained from a third party broker-dealer or counterparty. Investments initially valued in currencies other than the U.S. dollar are converted to the U.S. dollar using exchange rates obtained from an independent pricing service. In addition, if quotations are not readily available, if the values have been materially affected by events occurring after the closing of a foreign market, or if there has been a movement in the U.S. market that exceeds a certain threshold, assets may be valued at fair value as determined in good faith by or under the direction of the Trust’s Board of Trustees. Events that may materially affect asset values that could cause a fair value determination include, but are not limited to: corporate announcements relating to a specific security; natural and other disasters which may impact an entire market or region; and political and other events which may be global or impact a particular country or region. The frequency with which these procedures are used cannot be predicted and may be utilized to a significant extent. To the extent utilized, securities would be considered level 2 in the hierarchy described below. Substantially all transfers between level 1 and level 2 relate to the use of these procedures.
Each Fund is subject to fair value accounting standards that define fair value, establish the framework for measuring fair value and provide a three-level hierarchy for fair valuation based upon the inputs to the valuation as of the measurement date. The three levels of the fair value hierarchy are as follows:
Level 1 — quoted prices in active markets for identical securities
Level 2 — significant observable inputs (including quoted prices for similar securities, interest rates, prepayment speeds, credit risk, etc.)
Level 3 — significant unobservable inputs (including the Funds’ own assumptions in determining the fair value of investments)
The inputs or methodology used for valuing securities are not necessarily an indication of the risk associated with investing in those securities.
The summary of the Funds’ investments that are measured at fair value by level within the fair value hierarchy as of December 31, 2017 is as follows:
Fund | Total Value at December 31, 2017 | Level 1 Quoted Price | Level 2 Significant Observable Inputs | Level 3 Significant Unobservable Inputs | ||||||||||||
Driehaus Emerging Markets Growth Fund | ||||||||||||||||
Investments in Securities* | $ | 1,647,160,572 | $ | 1,647,160,572 | $ | — | $ | — | ||||||||
|
|
|
|
|
|
|
| |||||||||
Driehaus Emerging Markets Small Cap Growth Fund | ||||||||||||||||
Assets: | ||||||||||||||||
Equity Securities: | ||||||||||||||||
Africa | $ | 12,009,629 | $ | 12,009,629 | $ | — | $ | — | ||||||||
Europe | 18,246,779 | 18,246,779 | — | — | ||||||||||||
Far East | 178,486,644 | 178,486,644 | — | 0 | ||||||||||||
Middle East | 6,556,329 | 6,556,329 | — | — | ||||||||||||
North America | 4,498,658 | 4,498,658 | — | — | ||||||||||||
South America | 37,564,019 | 37,564,019 | — | — | ||||||||||||
Purchased Put Options | 275,000 | 275,000 | — | — | ||||||||||||
Swap Contracts | 450,369 | — | 450,369 | — | ||||||||||||
|
|
|
|
|
|
|
| |||||||||
Total Assets | $ | 258,087,427 | $ | 257,637,058 | $ | 450,369 | $ | 0 | ||||||||
|
|
|
|
|
|
|
| |||||||||
61
Table of Contents
Driehaus Mutual Funds
Notes to Financial Statements — (Continued)
Fund | Total Value at December 31, 2017 | Level 1 Quoted Price | Level 2 Significant Observable Inputs | Level 3 Significant Unobservable Inputs | ||||||||||||
Liabilities: | ||||||||||||||||
Swap Contracts . | $ | (12,446 | ) | $ | — | $ | (12,446 | ) | $ | — | ||||||
|
|
|
|
|
|
|
| |||||||||
Total Liabilities | $ | (12,446 | ) | $ | — | $ | (12,446 | ) | $ | — | ||||||
|
|
|
|
|
|
|
| |||||||||
Driehaus Frontier Emerging Markets Fund | ||||||||||||||||
Equity Securities: | ||||||||||||||||
Africa | $ | 6,838,768 | $ | 6,443,421 | $ | 395,347 | $ | — | ||||||||
Europe | 3,934,263 | 3,934,263 | — | — | ||||||||||||
Far East | 15,703,939 | 14,645,236 | 1,058,703 | — | ||||||||||||
Middle East | 6,578,997 | 6,578,997 | — | — | ||||||||||||
South America | 8,064,118 | 8,064,118 | — | — | ||||||||||||
Equity Certificates* | 77,523 | — | 77,523 | — | ||||||||||||
|
|
|
|
|
|
|
| |||||||||
Total Investments | $ | 41,197,608 | $ | 39,666,035 | $ | 1,531,573 | $ | — | ||||||||
|
|
|
|
|
|
|
| |||||||||
Driehaus International Small Cap Growth Fund | ||||||||||||||||
Investments in Securities* | $ | 316,674,039 | $ | 316,674,039 | $ | — | $ | — | ||||||||
|
|
|
|
|
|
|
| |||||||||
Driehaus Micro Cap Growth Fund | ||||||||||||||||
Investments in Securities* | $ | 321,963,888 | $ | 321,963,888 | $ | — | $ | — | ||||||||
|
|
|
|
|
|
|
| |||||||||
Driehaus Small Cap Growth Fund | ||||||||||||||||
Investments in Securities* | $ | 39,935,710 | $ | 39,935,710 | $ | — | $ | — | ||||||||
|
|
|
|
|
|
|
| |||||||||
| * | See Schedule of Investments for industry and/or country breakout. |
At December 31, 2017, the Driehaus Emerging Markets Small Cap Growth Fund held a Level 3 investment in Praxis Home Retail, Ltd. The shares were received as part of a spin-off in late November, 2017, but were not trading as of year-end and were valued at $0.
Transfers between levels, if any, are recognized as of the last day in the fiscal quarter of the period in which the event or change in circumstances that caused the reclassification occurred. The Funds used observable inputs in their valuation methodologies whenever they were available and deemed reliable.
When fair value pricing is employed, the prices of securities used by a Fund to calculate its net asset value may differ from closing prices for the same securities, which means that a Fund may value those securities higher or lower than another fund that does not employ fair value. In addition, the fair value price may differ materially from the value a Fund may ultimately realize.
For the year ended December 31, 2017, securities with end of period values of $744,508 held by Driehaus Frontier Emerging Markets Fund were transferred from level 1 to level 2, due to the lack of trading volume at the end of the quarter.
Securities transactions are accounted for on trade date. The cost of investments sold is determined by the use of the specific identification method for both financial reporting and income tax purposes. Interest income is recorded on an accrual basis. Dividend income, net of non-reclaimable foreign taxes withheld, is recorded on the ex-dividend date or as soon as the information is available. Income and expenses are accrued daily. The Funds’ investment income, expenses (other than class-specific expenses) and unrealized and realized gains and losses are allocated daily to each class of shares based upon the relative proportion of net assets of each class at the beginning of the day.
62
Table of Contents
Driehaus Mutual Funds
Notes to Financial Statements — (Continued)
Options Contracts
The Funds are subject to equity and other risk exposures in the normal course of pursuing their investment objective. The Funds may use options contracts to hedge their portfolio or a portion thereof or speculatively for the purpose of profiting from a decline in the market value of a security. The Driehaus Emerging Markets Small Cap Growth Fund used both purchased and written options during the year ended December 31, 2017 to hedge exposure to certain countries, sectors or currencies.
The Funds may write covered call and put options on futures, securities or currencies the Funds own or in which they may invest. Writing put options tends to increase a Fund’s exposure to the underlying instrument. Writing call options tends to decrease a Fund’s exposure to the underlying instrument. When a Fund writes a call or put option, an amount equal to the premium received is recorded as a liability and subsequently marked-to-market to reflect the current value of the option written. These liabilities are reflected as written options outstanding in the Schedule of Investments. Payments received or made, if any, from writing options with premiums to be determined on a future date are reflected as such in the Schedule of Investments. Premiums received from writing options that expire are treated as realized gains. Premiums received from writing options that are exercised or closed are added to the proceeds or offset against amounts paid on the underlying future, security or currency transaction to determine the realized gain or loss. A Fund, as a writer of an option, has no control over whether the underlying future, security or currency may be sold (call) or purchased (put) and, as a result, bears the market risk of an unfavorable change in the price of the future, security or currency underlying the written option. The risk exists that a Fund may not be able to enter into a closing transaction because of an illiquid market.
For the year ended December 31, 2017, the average monthly volume of purchased and written options based on premium value for Driehaus Emerging Markets Small Cap Growth Fund were $1,081,880 and $197,713, respectively.
The Funds may also purchase put and call options. Purchasing call options tends to increase a Fund’s exposure to the underlying instrument. Purchasing put options tends to decrease a Fund’s exposure to the underlying instrument. A Fund pays a premium which is included in its Schedule of Investments as an investment and subsequently marked-to-market to reflect the current value of the option. Premiums paid for purchasing options that expire are treated as realized losses. Premiums paid for purchasing options that are exercised or closed are added to the amounts paid or offset against the proceeds on the underlying future, security or currency transaction to determine the realized gain or loss. When entering into purchased option contracts, a Fund bears the risk of securities prices moving unexpectedly, in which case, a Fund may not achieve the anticipated benefits of the purchased option contracts; however, the risk of loss is limited to the premium paid. As of December 31, 2017, Funds with outstanding options are as listed on the Schedules of Investments.
Swap Contracts
The Driehaus Emerging Markets Small Cap Growth Fund may engage in various swap transactions, including forward rate agreements and interest rate, primarily to manage risk, or as alternatives to direct investments. The Fund may also engage in credit default swaps, which involve the exchange of a periodic premium for protection against a defined credit event (such as payment default, refinancing or bankruptcy). The Fund engaged in credit default swaps during the year ended December 31, 2017 to protect against credit events and interest rate swaps to hedge currency risks.
Under the terms of a credit default swap contract, one party acts as a guarantor receiving a periodic payment that is a fixed percentage applied to a notional amount. In return, the party agrees to purchase the notional amount of the underlying instrument, at par, if a credit event occurs during the term of the contract. The Fund may enter into credit default swaps in which the Fund acts as guarantor (a seller of protection), and may enter into credit default swaps in which the counterparty acts as guarantor (a buyer of protection). Premiums paid to or by the Fund are accrued daily and included in realized gain (loss) on swaps. The contracts are marked-to-market daily using fair value estimates provided by an independent pricing service. Changes in value are recorded as net change in unrealized appreciation (depreciation) on the statements of operations. Unrealized gains are reported as an asset and unrealized losses are reported as a liability on the statement of assets and liabilities. Gains or losses are realized upon termination of the contracts. The risk of
63
Table of Contents
Driehaus Mutual Funds
Notes to Financial Statements — (Continued)
loss under a swap contract may exceed the amount recorded as an asset or a liability. The notional amount of a swap contract is the reference amount pursuant to which the counterparties make payments. For swaps in which the referenced obligation is an index, in the event of default of any debt security included in the corresponding index, the Fund pays or receives the percentage of the corresponding index that the defaulted security comprises (1) multiplied by the notional value and (2) multiplied by the ratio of one minus the ratio of the market value of the defaulted debt security to its par value. The maximum exposure to loss of the notional value as a seller of credit default swaps outstanding at December 31, 2017, for the Driehaus Emerging Markets Small Cap Growth Fund was $0.
Interest rate swaps are agreements between two parties to exchange cash flows based on a notional principal amount. The Fund may elect to pay a fixed rate and receive a floating rate or receive a fixed rate and pay a floating rate on a notional principal amount. The net interest received or paid on interest rate swap agreements is accrued daily as interest income/expense. Interest rate swaps are marked-to-market daily using fair value estimates provided by an independent pricing service. Changes in value, including accrued interest, are recorded as net change in unrealized appreciation (depreciation) on the statement of operations. Unrealized gains are reported as an asset and unrealized losses are reported as a liability on the statement of assets and liabilities. Gains or losses are realized upon termination of the contracts. The risk of loss under a swap contract may exceed the amount recorded as an asset or a liability.
Risks associated with swap contracts include changes in the returns of underlying instruments, failure of the counterparties to perform under the contracts’ terms and the possible lack of liquidity with respect to the contracts. Credit default swaps can involve greater risks than if an investor had invested in the reference obligation directly since, in addition to general market risks, credit default swaps are subject to counterparty credit risk, leverage risk, hedging risk, correlation risk and liquidity risk. The Fund discloses swap contracts on a gross basis, with no netting of contracts held with the same counterparty. As of December 31, 2017, the Driehaus Emerging Markets Small Cap Growth Fund had outstanding swap contracts as listed on the Schedule of Investments.
Forward Foreign Currency Contracts
The Driehaus Emerging Markets Small Cap Growth Fund used forward foreign currency contracts during the year ended December 31, 2017 to hedge foreign currency exposure in the portfolio. A forward foreign currency contract involves an obligation to purchase or sell a specific currency at a future date, which may be any fixed number of days from the date of the contract agreed upon by the parties, at a price set at the time of the contract. These contracts are principally traded in the inter-bank market conducted directly between currency traders (usually large commercial banks) and their customers.
The market value of a forward foreign currency contract fluctuates with changes in currency exchange rates. Outstanding forward foreign currency contracts are valued daily at current market rates and the resulting change in market value is recorded as net change in unrealized appreciation or depreciation on the statement of operations. When a forward foreign currency contract is settled, the Fund records a realized gain or loss equal to the difference between the value at the time the forward foreign currency contract was opened and the value at the time it was settled. A forward foreign currency contract may involve market risk in excess of the unrealized gain or loss reflected on the Statements of Assets and Liabilities. In addition, the Fund could be exposed to credit risk if the counterparties are unable or unwilling to meet the terms of the contracts or market risk if the value of the foreign currency changes unfavorably. As of December 31, 2017, the Driehaus Emerging Markets Small Cap Growth Fund had no outstanding forward foreign currency contracts.
Foreign Currency Spot Contracts
The Funds enter into foreign currency spot contracts to facilitate transactions in foreign currency denominated securities. These spot contracts are typically open for 2 to 5 days, depending on the settlement terms of the underlying security transaction. On December 31, 2017, the Funds had foreign currency spot contracts outstanding under which they are obligated to exchange currencies at specified future dates. The net unrealized appreciation or depreciation on spot contracts is reflected as Net unrealized appreciation or depreciation on unsettled foreign currency transactions in the Statements of Assets and Liabilities.
64
Table of Contents
Driehaus Mutual Funds
Notes to Financial Statements — (Continued)
Equity Certificates
The Funds may invest in equity certificates, which allow the Funds to participate in the appreciation (depreciation) of the underlying security without actually owning the underlying security. These derivative instruments are purchased pursuant to an agreement with a financial institution and are valued at a calculated market price based on the value of the underlying security in accordance with the agreement. These equity certificates are subject to the credit risk of the issuing financial institution. There is no off-balance sheet risk associated with equity certificates and the Funds’ potential loss is limited to the purchase price of the securities. The Funds are exposed to credit risk associated with the counterparty to the transaction, which is monitored by the Funds’ management on a periodic basis. A Fund’s equity certificates are not subject to any master netting agreement.
On December 31, 2017, Driehaus Frontier Emerging Markets Fund had unrealized appreciation (depreciation) of $29,721 as a result of its investments in these financial instruments. The aggregate market values of these certificates for Driehaus Frontier Emerging Markets Funds represented 0.2% of its total market value of investments at December 31, 2017.
Derivative Investment Holdings Categorized by Risk Exposure
Each Fund is subject to the FASB’s “Disclosures about Derivative Instruments and Hedging Activities” (the “Derivatives Statement”). The Derivatives Statement amends and expands disclosures about derivative instruments and hedging activities. The Derivatives Statement is intended to improve financial reporting about derivative instruments requiring enhanced disclosures to enable investors to better understand how and why the Funds use derivative instruments, how these derivative instruments are accounted for and their effects on the Funds’ financial position and results of operations.
The following table sets forth the fair value and the location in the Statement of Assets and Liabilities of the Driehaus Emerging Markets Small Cap Growth Fund’s derivative contracts by primary risk exposure as of December 31, 2017:
Risk exposure category | Asset derivatives | Fair value | Liability derivatives | Fair value | ||||||||
Credit contracts | Premiums paid for swap agreements | $ | 1,387,777 | Unrealized depreciation on swap agreements | $ | 937,408 | ||||||
Equity contracts | Investments, at fair value | $ | 275,000 | |||||||||
Interest rate contracts | Unrealized depreciation on swap agreements | $ | 12,446 | |||||||||
The following table sets forth the fair value and the location in the Statement of Assets and Liabilities of the Driehaus Frontier Emerging Markets Fund’s derivative contracts by primary risk exposure as of December 31, 2017:
Risk exposure category | Asset derivatives | Fair value | ||||
Equity contracts | Investments, at market value | $ | 77,523 | |||
The following table sets forth the Driehaus Emerging Markets Small Cap Growth Fund’s net realized gain (loss) by primary risk exposure and by type of derivative contract for the year ended December 31, 2017.
| Amount of realized gain (loss) on derivatives | ||||||||||||||||||||
Risk exposure category | Credit Default Swap Contracts | Interest Rate Swap Contracts | Purchased Options | Written Options | Forward Foreign Currency Contracts | |||||||||||||||
Credit contracts | $ | (492,081 | ) | $ | — | $ | — | $ | — | $ | — | |||||||||
Equity contracts | — | — | (10,931,460 | ) | 1,434,054 | — | ||||||||||||||
Foreign currency contracts | — | — | (638,550 | ) | — | (2,150,339 | ) | |||||||||||||
Interest contracts | — | 816,181 | — | — | — | |||||||||||||||
65
Table of Contents
Driehaus Mutual Funds
Notes to Financial Statements — (Continued)
The following table sets forth the Driehaus Frontier Emerging Markets Fund’s net realized gain (loss) by primary risk exposure and by type of derivative contract for the year ended December 31, 2017.
| Amount of realized gain (loss) on derivatives | ||||
Risk exposure category | Equity Certificates | |||
Equity contracts | $ | 36,956 | ||
The following table sets forth the Driehaus Emerging Markets Small Cap Growth Fund’s change in net unrealized appreciation (depreciation) by primary risk exposure and by type of derivative contract for the year ended December 31, 2017.
| Change in unrealized appreciation (depreciation) on derivatives | ||||||||||||||||||||
Risk exposure category | Credit Default Swap Contracts | Interest Rate Swap Contracts | Purchased Options | Written Options | Forward Foreign Currency Contracts | |||||||||||||||
Credit contracts | $ | (934,609 | ) | $ | — | $ | — | $ | — | $ | — | |||||||||
Equity contracts | — | — | 868,720 | (149,278 | ) | — | ||||||||||||||
Foreign currency contracts | — | — | — | — | 2,188,223 | |||||||||||||||
Interest rate contracts | — | 80,950 | — | — | — | |||||||||||||||
The following table sets forth the Driehaus Frontier Emerging Markets Fund’s change in net unrealized appreciation (depreciation) by primary risk exposure and by type of derivative contract for the year ended December 31, 2017.
| Change in unrealized appreciation (depreciation) on derivatives | ||||
Risk exposure category | Equity Certificates | |||
Equity contracts | $ | 23,531 | ||
Disclosures about Offsetting Assets and Liabilities
The Driehaus Emerging Markets Small Cap Growth Fund is party to various agreements, including International Swaps and Derivatives Association Inc. master agreements and related Credit Support Annexes (“Master Netting Agreements” or “MNA”), which govern the terms of certain transactions with select counterparties. MNAs are designed to reduce counterparty risk associated with the relevant transactions by establishing credit protection mechanisms and providing standardization as a means of improving legal certainty. As MNAs are specific to the unique operations of different asset types, they allow the Fund to close out and net its total exposure to a counterparty in the event of default with respect to all of the transactions governed under a single agreement with that counterparty. MNAs can also help reduce counterparty risk by specifying collateral posting requirements at pre-arranged exposure levels. Securities and cash pledged as collateral are reflected as assets on the Statement of Assets and Liabilities as either a component of Investments at market value or Collateral held at custodian for the benefit of brokers.
The Funds’ derivative contracts held at December 31, 2017, are not accounted for as hedging instruments under U.S. generally accepted accounting principles (“U.S. GAAP”). For financial reporting purposes, the Funds do not offset financial assets and financial liabilities that are subject to MNAs or similar arrangements on the Statements of Assets and Liabilities. The settlement of exchange-traded options is guaranteed by the exchange the option is traded on and is not subject to arrangements with particular counterparties. For that reason, these options are excluded from the below disclosure.
66
Table of Contents
Driehaus Mutual Funds
Notes to Financial Statements — (Continued)
The following table presents the Driehaus Emerging Markets Small Cap Growth Fund’s financial and derivative liabilities subject to Master Netting Agreements by type, net of amounts available for offset under a MNA and net of the related collateral pledged by the Fund as of December 31, 2017:
Description | Gross Amounts Recognized in Statement of Assets and Liabilities | Derivatives Available for Offset | Collateral Pledged | Net Amount2 | ||||||||||||
Unrealized depreciation on swap agreements | $ | 949,854 | $ | — | $ | (12,446 | ) | $ | 937,408 | |||||||
| 2 | Net amount represents the net amount payable to the counterparty in the event of default. |
Federal Income Taxes
No provision is made for Federal income taxes since each Fund has elected or will elect to be taxed as a “regulated investment company” under Subchapter M of the Internal Revenue Code (the “Code”) and has made and declared all the required distributions to its shareholders in amounts sufficient to relieve each Fund from all or substantially all Federal income and excise taxes under provisions of current Federal tax law.
Each Fund is subject to accounting standards that establish a minimum threshold for recognizing, and a system for measuring, the benefits of a tax position taken or expected to be taken in a tax return. Taxable years ending 2017, 2016, 2015 and 2014 remain open to Federal and state audit. As of December 31, 2017, management has evaluated the application of these standards to each Fund, and has determined that no provision for income tax is required in each Fund’s financial statements for uncertain tax provisions. The Funds recognize interest and penalties, if any, related to unrecognized tax benefits as income tax expense in the Statements of Operations. During the year, the Funds did not incur any interest or penalties. The Funds may be subject to foreign taxes on income, gains on investments or currency repatriation, a portion of which may be recoverable. Foreign taxes are provided for based on the Funds’ understanding of the tax rules and regulations that exist in the foreign markets in which they invest.
The amount of dividends and distributions from net investment income and net realized capital gains are determined in accordance with Federal income tax regulations, which may differ from U.S. GAAP.
For the year ended December 31, 2017, reclassifications were recorded to undistributed net investment income, undistributed net realized gain and paid-in capital for any permanent tax differences. These reclassifications relate primarily to foreign currency losses, sales of passive foreign investment companies, net operating losses and foreign capital gain taxes paid. Results of operations and net assets were not affected by these reclassifications.
| Driehaus Emerging Markets Growth Fund | Driehaus Emerging Markets Small Cap Growth Fund | Driehaus Frontier Emerging Markets Fund | Driehaus International Small Cap Growth Fund | Driehaus Micro Cap Growth Fund | Driehaus Small Cap Growth Fund | |||||||||||||||||||
Undistributed net investment income | $ | 6,495,729 | $ | 728,513 | $ | (975,708 | ) | $ | 53,864 | $ | 3,670,909 | $ | 103,225 | |||||||||||
Undistributed net realized gain | (6,495,729 | ) | 2,470,623 | 1,309,810 | (53,864 | ) | (3,643,378 | ) | (275,245 | ) | ||||||||||||||
Paid-in capital | — | (3,199,136 | ) | (334,102 | ) | — | (27,531 | ) | 172,020 | |||||||||||||||
Accumulated capital losses represent net capital loss carryovers that may be available for an unlimited period to offset future realized capital gains and thereby reduce future capital gains distributions. Capital loss carryover retains the character of the original loss. The following table shows the amounts of capital loss carryover, if any, by each of the applicable Funds as of December 31, 2017:
| Unlimited Period of Net Capital Loss Carryover | ||||||||||||
Fund | Short-Term | Long-Term | Accumulated Capital Loss Carryover | |||||||||
Driehaus Emerging Markets Small Cap Growth Fund | $ | 48,263,562 | $ | — | $ | 48,263,562 | ||||||
67
Table of Contents
Driehaus Mutual Funds
Notes to Financial Statements — (Continued)
During the year ended December 31, 2017, Driehaus Emerging Markets Growth Fund, Driehaus Emerging Markets Small Cap Growth Fund, Driehaus Frontier Emerging Markets Fund, Driehaus International Small Cap Growth Fund and Driehaus Micro Cap Growth Fund utilized $186,212,543, $37,701,882, $2,738,349, $2,120,671 and 13,972,775, respectively of capital loss carryforwards.
Pursuant to Federal income tax rules applicable to regulated investment companies, the Funds may elect to treat certain capital losses between November 1 and December 31 as occurring on the first day of the following tax year. For the year ended December 31, 2017, the following qualified late-year losses were deferred and recognized on January 1, 2018:
Fund | Late-Year Ordinary Loss Deferral | Total Capital Loss Deferral | Total | |||||||||
Driehaus Emerging Markets Growth Fund | $ | 668,759 | $ | — | $ | 668,759 | ||||||
Driehaus Emerging Markets Small Cap Growth Fund | 143,085 | — | 143,085 | |||||||||
Distributions to Shareholders
The tax character of distributions paid during the fiscal year ended December 31, 2017 was as follows:
Distributions paid from: | Driehaus Emerging Markets Growth Fund | Driehaus Emerging Markets Small Cap Growth Fund | Driehaus Frontier Emerging Markets Fund | Driehaus International Small Cap Growth Fund | Driehaus Micro Cap Growth Fund | Driehaus Small Cap Growth Fund | ||||||||||||||||||
Ordinary income | $ | 11,017,755 | $ | — | $ | 112,002 | $ | 21,815,148 | $ | — | $ | 222,898 | ||||||||||||
Net long-term capital gain | — | — | 2,313,807 | 23,460,614 | 26,974,093 | 442,178 | ||||||||||||||||||
|
|
|
|
|
|
|
|
|
|
|
| |||||||||||||
Total distributions paid | $ | 11,017,755 | $ | — | $ | 2,425,809 | $ | 45,275,762 | $ | 26,974,093 | $ | 665,076 | ||||||||||||
|
|
|
|
|
|
|
|
|
|
|
| |||||||||||||
The tax character of distributions paid during the fiscal year ended December 31, 2016 was as follows:
Distributions paid from: | Driehaus Emerging Markets Growth Fund | Driehaus Emerging Markets Small Cap Growth Fund | Driehaus Frontier Emerging Markets Fund | Driehaus International Small Cap Growth Fund | Driehaus Micro Cap Growth Fund | |||||||||||||||
Ordinary income | $ | 5,290,378 | $ | 450,242 | $ | 420,026 | $ | — | $ | — | ||||||||||
Net long-term capital gain | — | — | — | 3,539,778 | — | |||||||||||||||
|
|
|
|
|
|
|
|
|
| |||||||||||
Total distributions paid | $ | 5,290,378 | $ | 450,242 | $ | 420,026 | $ | 3,539,778 | $ | — | ||||||||||
|
|
|
|
|
|
|
|
|
| |||||||||||
As of December 31, 2017, the components of net assets on a tax basis were as follows:
| Driehaus Emerging Markets Growth Fund | Driehaus Emerging Markets Small Cap Growth Fund | Driehaus Frontier Emerging Markets Fund | Driehaus International Small Cap Growth Fund | Driehaus Micro Cap Growth Fund | Driehaus Small Cap Growth Fund | |||||||||||||||||||
Undistributed ordinary income | $ | — | $ | — | $ | — | $ | 5,657,722 | $ | 1,997,501 | $ | 1,454,358 | ||||||||||||
Undistributed long-term capital gain | 24,671,838 | — | 52,410 | 4,334,508 | 5,040,181 | 715,323 | ||||||||||||||||||
|
|
|
|
|
|
|
|
|
|
|
| |||||||||||||
Accumulated earnings | $ | 24,671,838 | $ | — | $ | 52,410 | $ | 9,992,230 | $ | 7,037,682 | $ | 2,169,681 | ||||||||||||
Paid-in capital | 1,333,560,760 | 274,790,345 | 36,458,924 | 256,790,545 | 232,865,467 | 29,011,040 | ||||||||||||||||||
Accumulated capital and other losses | (668,759 | ) | (48,406,647 | ) | — | — | — | — | ||||||||||||||||
Unrealized appreciation (depreciation) on foreign currency | 141,346 | 40,219 | 3,123 | 796 | — | — | ||||||||||||||||||
Unrealized appreciation on investments | 421,795,421 | 44,712,965 | 9,577,550 | 58,577,874 | 82,629,703 | 8,794,441 | ||||||||||||||||||
Other temporary differences | — | 9,112 | — | — | — | — | ||||||||||||||||||
|
|
|
|
|
|
|
|
|
|
|
| |||||||||||||
Net assets | $ | 1,779,500,606 | $ | 271,145,994 | $ | 46,092,007 | $ | 325,361,445 | $ | 322,532,852 | $ | 39,975,162 | ||||||||||||
|
|
|
|
|
|
|
|
|
|
|
| |||||||||||||
68
Table of Contents
Driehaus Mutual Funds
Notes to Financial Statements — (Continued)
The differences between book-basis and tax-basis unrealized appreciation are attributable primarily to the tax deferral of losses on wash sales and passive foreign investment company (PFIC) mark-to-market.
The aggregate cost of investments and the composition of unrealized appreciation and depreciation on investments and derivatives for Federal income tax purposes as of December 31, 2017, were as follows:
Fund | Basis | Gross Appreciation | Gross Depreciation | Net Appreciation | ||||||||||||
Driehaus Emerging Markets Growth Fund | $ | 1,225,365,151 | $ | 441,000,622 | $ | (19,100,743 | ) | $ | 421,899,879 | |||||||
Driehaus Emerging Markets Small Cap Growth Fund | $ | 212,924,093 | $ | 48,279,977 | $ | (3,573,227 | ) | $ | 44,706,750 | |||||||
Driehaus Frontier Emerging Markets Fund | $ | 31,620,058 | $ | 10,875,169 | $ | (1,297,638 | ) | $ | 9,577,531 | |||||||
Driehaus International Small Cap Growth Fund | $ | 258,096,165 | $ | 66,051,831 | $ | (7,474,272 | ) | $ | 58,577,559 | |||||||
Driehaus Micro Cap Growth Fund | $ | 239,334,185 | $ | 88,489,988 | $ | (5,860,285 | ) | $ | 82,629,703 | |||||||
Driehaus Small Cap Growth Fund | $ | 31,141,312 | $ | 9,281,183 | $ | (486,785 | ) | $ | 8,794,398 | |||||||
Foreign Currency Translation
Foreign currency and equity securities not denominated in U.S. dollars are translated into U.S. dollar values based upon the current rates of exchange on the date of the Funds’ valuations.
Net realized foreign exchange gains or losses which are reported by the Funds result from currency gains and losses on transaction hedges arising from changes in exchange rates between the trade and settlement dates on spot contracts underlying securities transactions and the difference between the amounts accrued for dividends, interest, and foreign taxes and the amounts actually received or paid in U.S. dollars for these items. Net unrealized foreign exchange gains and losses result from changes in the U.S. dollar value of assets and liabilities (other than investments in securities), which are denominated in foreign currencies, as a result of changes in exchange rates.
The Funds do not isolate that portion of the results of operations which results from fluctuations in foreign exchange rates on investments. These fluctuations are included with the net realized gain (loss) from security transactions and the net change in unrealized appreciation (depreciation) of investments.
Use of Estimates
The preparation of financial statements, in conformity with U.S. GAAP, requires management to make estimates and assumptions that affect the reported amount of assets and liabilities and disclosure of contingent assets and liabilities at the date of the financial statements and the reported amounts of net increases or decreases in net assets from operations during the reporting period. Actual results could differ from those estimates.
Indemnifications
Under the Trust’s organizational documents, the officers and Trustees are indemnified against certain liabilities arising out of the performance of their duties to the Trust. In addition, in the normal course of business, the Trust enters into contracts that provide general indemnifications to other parties. The Funds’ maximum exposure under these agreements is unknown as this would involve future claims that may be made against the Funds that have not yet occurred. However, the Funds have not had prior claims or losses pursuant to these contracts and expect the risk of loss to be remote.
B. INVESTMENT ADVISORY FEES, TRANSACTIONS WITH AFFILIATES, AND ADMINISTRATIVE FEES
Richard H. Driehaus is Chairman of Driehaus Capital Management LLC (“DCM” or the “Adviser”), a registered investment adviser, and of Driehaus Securities LLC (“DS LLC” or the “Distributor”), a registered broker-dealer. As of December 31, 2017, Richard H. Driehaus controls the Driehaus Frontier Emerging Markets Fund due to his power to vote a majority of the shares of the Fund.
69
Table of Contents
Driehaus Mutual Funds
Notes to Financial Statements — (Continued)
DCM serves as the Funds’ investment adviser. In return for its services to the Funds, DCM receives monthly fees. Driehaus Micro Cap Growth Fund pays the Adviser a monthly fee computed and accrued daily at an annual rate of 1.25% of the Fund’s average daily net assets. Driehaus Small Cap Growth Fund pays the Adviser a monthly fee computed and accrued daily at an annual rate of 0.60% of the Fund’s average daily net assets. Driehaus Emerging Markets Small Cap Growth Fund, Driehaus Frontier Emerging Markets Fund and Driehaus International Small Cap Growth Fund each pay the Adviser a monthly fee computed and accrued daily at an annual rate of 1.50% of each Fund’s average daily net assets. Prior to July 17, 2017, the Driehaus Emerging Markets Growth Fund paid the Adviser a monthly fee computed and accrued daily at an annual rate of 1.50% on the first $1.5 billion, 1.00% on the next $500 million and 0.75% in excess of $2 billion of the Fund’s average daily net assets. Beginning July 17, 2017, the Driehaus Emerging Markets Growth Fund pays the Adviser a monthly fee computed and accrued daily at an annual rate of 1.05% on the first $1.5 billion and 0.75% in excess of $1.5 billion of the Fund’s average daily net assets.
DCM entered into an agreement to cap Driehaus Micro Cap Growth Fund’s annual operating expenses (other than interest, taxes, brokerage commissions and other portfolio transaction expenses, capital expenditures and extraordinary expenses such as litigation and other expenses not incurred in the ordinary course of the Fund’s business) at 1.70% of average daily net assets until November 17, 2016. For a period of three years subsequent to the Fund’s commencement of operations, DCM was entitled to reimbursement for previously waived fees and reimbursed expenses to the extent that the Fund’s expense ratio remained below the operating expense cap in place at the time of the waiver and the current operating expense cap. There are no amounts still subject to recapture under this agreement.
DCM has entered into a contractual agreement to cap Driehaus Frontier Emerging Markets Fund’s annual operating expenses (other than interest, taxes, brokerage commissions, dividends and interest on short sales and other portfolio transaction expenses and extraordinary expenses such as litigation and other expenses not incurred in the ordinary course of the Fund’s business) at 2.00% of average daily net assets until May 3, 2018. For a period of three years subsequent to the Fund’s commencement of operations on May 4, 2015, DCM is entitled to reimbursement for previously waived fees and reimbursed expenses to the extent that the Fund’s expense ratio remains below the operating expense cap in place at the time of the waiver and the current operating expense cap. For the year ended December 31, 2017, DCM waived fees for Driehaus Frontier Emerging Markets Fund totaling $206,307 under this agreement. The amount of potential recovery expiring May 3, 2018 was $622,215.
DCM has entered into a contractual agreement to cap Driehaus Small Cap Growth Fund’s annual operating expenses (other than interest, taxes, brokerage commissions, dividends and interest on short sales and other portfolio transaction expenses and extraordinary expenses such as litigation and other expenses not incurred in the ordinary course of the Fund’s business) at 1.20% of average daily net assets for the Investor Class and 0.95% of average daily net assets for the Institutional Class until August 20, 2020. For a period of three years subsequent to the Fund’s commencement of operations on August 21, 2017, DCM is entitled to reimbursement for previously waived fees and reimbursed expenses to the extent that the Fund’s expense ratio remains below the operating expense cap in place at the time of the waiver and the current operating expense cap. For the period ended December 31, 2017, DCM waived fees for Driehaus Small Cap Growth Fund totaling $67,173 under this agreement. The amount of potential recovery expiring August 20, 2020 was $67,173.
The amounts incurred and payable to DCM during the year ended December 31, 2017 are as follows:
| Fund | Advisory Fees | Advisory Fees Payable (included in Due to affiliate) | ||||||
Driehaus Emerging Markets Growth Fund | $ | 19,590,626 | $ | 1,490,369 | ||||
Driehaus Emerging Markets Small Cap Growth Fund | 3,780,375 | 333,353 | ||||||
Driehaus Frontier Emerging Markets Fund | 939,599 | 40,876 | ||||||
Driehaus International Small Cap Growth Fund | 4,301,192 | 410,591 | ||||||
Driehaus Micro Cap Growth Fund | 4,083,208 | 343,508 | ||||||
Driehaus Small Cap Growth Fund | 88,830 | 20,099 | ||||||
70
Table of Contents
Driehaus Mutual Funds
Notes to Financial Statements — (Continued)
The Funds direct certain portfolio trades, subject to obtaining the best price and execution, to brokers who have agreed to pay a portion of the Funds’ operating expenses using part of the commissions generated. For the year ended December 31, 2017, these arrangements reduced the expenses of Driehaus Emerging Markets Growth Fund, Driehaus Emerging Markets Small Cap Growth Fund, Driehaus Frontier Emerging Markets Fund, Driehaus International Small Cap Growth Fund and Driehaus Micro Cap Growth Fund by $156,136 (0.7%), $47,272 (1.0%), $4,473 (0.3%), $37,090 (0.7%) and $69,824 (1.5%), respectively.
Certain officers of the Trust are also officers of DCM and DS LLC. The Funds pay a portion of the Chief Compliance Officer’s salary and bonus. No other officers received compensation from the Funds. The Independent Trustees are compensated for their services to the Trust and such compensation is reflected as Trustees’ fees in the Statements of Operations.
BNY Mellon Investment Servicing (US) Inc. (“BNY Mellon”) serves as the Funds’ administrative and accounting agent. In compensation for these services, BNY Mellon earns the greater of a monthly minimum fee or a monthly fee based upon average daily net assets. BNY Mellon has agreed to waive a portion of its monthly fee for administrative services for the first two years of operations for Driehaus Small Cap Growth Fund. For the period ended December 31, 2017, BNY Mellon waived $5,443 for Driehaus Small Cap Growth Fund. BNY Mellon also acts as the transfer agent and dividend disbursing agent for the Funds. For these services, BNY Mellon earns a monthly fee based on shareholder processing activity during the month. BNY Mellon has agreed to waive a portion of its monthly fee for transfer agent services for the first two years of operations for Driehaus Frontier Emerging Markets Fund and Driehaus Small Cap Growth Fund. For the year and period ended December 31, 2017, BNY Mellon waived $3,000 and $26,710 for Driehaus Frontier Emerging Markets Fund and Driehaus Small Cap Growth Fund, respectively.
DS LLC is the Funds’ distributor. DS LLC does not earn any compensation from the Funds for these services. DS LLC has entered into a Fee Reimbursement Agreement (“Agreement”) with the Driehaus Emerging Markets Growth Fund and Driehaus Small Cap Growth Fund. Under these Agreements, the Funds reimburse DS LLC for certain fees paid by DS LLC to intermediaries who provide shareholder administrative and/or sub-transfer agency services to the Investor Class shares of the Driehaus Emerging Markets Growth Fund and Driehaus Small Cap Growth Fund. Currently, the amount to be reimbursed will not exceed 0.25% of the Investor Class’ average daily net assets held by such intermediaries.
The amounts incurred and payable to DS LLC during the year ended December 31, 2017 are as follows:
| Fund | Shareholder Services Fees | Accrued Shareholder Services Fees (included in Due to affiliate) | ||||||
Driehaus Emerging Markets Growth Fund | $ | 1,402,600 | $ | 356,978 | ||||
Driehaus Small Cap Growth Fund | 102 | 31 | ||||||
C. INVESTMENT TRANSACTIONS
The aggregate purchases and sales of investment securities, other than short-term obligations and options, for the year ended December 31, 2017 were as follows:
| Fund | Purchases | Sales | ||||||
Driehaus Emerging Markets Growth Fund | $ | 2,577,956,290 | $ | 2,765,280,607 | ||||
Driehaus Emerging Markets Small Cap Growth Fund | 576,281,190 | 654,907,628 | ||||||
Driehaus Frontier Emerging Markets Fund | 60,932,843 | 101,983,621 | ||||||
Driehaus International Small Cap Growth Fund | 395,875,350 | 437,942,732 | ||||||
Driehaus Micro Cap Growth Fund | 580,715,721 | 719,930,675 | ||||||
Driehaus Small Cap Growth Fund | 26,532,471 | 30,140,092 | ||||||
71
Table of Contents
Driehaus Mutual Funds
Notes to Financial Statements — (Continued)
D. CAPITAL SHARE TRANSACTIONS
For the years ended December 31, 2017 and 2016, transactions in capital shares (authorized shares unlimited) were as follows:
| Driehaus Emerging Markets Growth Fund | Driehaus Emerging Markets Small Cap Growth Fund | Driehaus Frontier Emerging Markets Fund | ||||||||||||||||||||||
| 2017 | 2016 | 2017 | 2016 | 2017 | 2016 | |||||||||||||||||||
| Fund | ||||||||||||||||||||||||
Shares issued | — | — | 7,441,081 | 11,418,322 | 293,210 | 6,722,422 | ||||||||||||||||||
Shares reinvested | — | — | — | 29,916 | 227,525 | 44,497 | ||||||||||||||||||
Shares redeemed | — | — | (12,881,043 | ) | (23,426,218 | ) | (3,942,460 | ) | (1,323,560 | ) | ||||||||||||||
|
|
|
|
|
|
|
|
|
|
|
| |||||||||||||
Net increase (decrease) | — | — | (5,439,962 | ) | (11,977,980 | ) | (3,421,725 | ) | 5,443,359 | |||||||||||||||
|
|
|
|
|
|
|
|
|
|
|
| |||||||||||||
Investor Class | ||||||||||||||||||||||||
Shares issued | 53,291,270 | 11,334,611 | — | — | — | — | ||||||||||||||||||
Shares reinvested | 175,258 | 170,089 | — | — | — | — | ||||||||||||||||||
Shares redeemed | (69,265,507 | ) | (15,124,739 | ) | — | — | — | — | ||||||||||||||||
|
|
|
|
|
|
|
|
|
|
|
| |||||||||||||
Net decrease | (15,798,979 | ) | (3,620,039 | ) | — | — | — | — | ||||||||||||||||
|
|
|
|
|
|
|
|
|
|
|
| |||||||||||||
Institutional Class | ||||||||||||||||||||||||
Shares issued | 13,364,735 | — | — | — | — | — | ||||||||||||||||||
Shares reinvested | 76,939 | — | — | — | — | — | ||||||||||||||||||
Shares redeemed | (487,266 | ) | — | — | — | — | — | |||||||||||||||||
|
|
|
|
|
|
|
|
|
|
|
| |||||||||||||
Net increase | 12,954,408 | — | — | — | — | — | ||||||||||||||||||
|
|
|
|
|
|
|
|
|
|
|
| |||||||||||||
Total net decrease | (2,844,571 | ) | — | — | — | — | — | |||||||||||||||||
|
|
|
|
|
|
|
|
|
|
|
| |||||||||||||
| Driehaus International Small Cap Growth Fund | Driehaus Micro Cap Growth Fund | Driehaus Small Cap Growth Fund* | ||||||||||||||||||||||
| 2017 | 2016 | 2017 | 2016 | 2017 | 2016 | |||||||||||||||||||
| Fund | ||||||||||||||||||||||||
Shares issued | 2,719,395 | 2,243,567 | 4,641,406 | 14,632,527 | — | — | ||||||||||||||||||
Shares reinvested | 3,643,211 | 351,766 | 1,738,290 | — | — | — | ||||||||||||||||||
Shares redeemed | (6,783,946 | ) | (7,448,066 | ) | (15,385,865 | ) | (9,568,318 | ) | — | — | ||||||||||||||
|
|
|
|
|
|
|
|
|
|
|
| |||||||||||||
Net increase (decrease) | (421,340 | ) | (4,852,733 | ) | 9,006,169 | ) | 5,064,209 | — | — | |||||||||||||||
|
|
|
|
|
|
|
|
|
|
|
| |||||||||||||
Investor Class | ||||||||||||||||||||||||
Shares issued | — | — | — | — | 120,209 | — | ||||||||||||||||||
Shares reinvested | — | — | — | — | 1,942 | — | ||||||||||||||||||
Shares redeemed | — | — | — | — | (6,458 | ) | — | |||||||||||||||||
|
|
|
|
|
|
|
|
|
|
|
| |||||||||||||
Net increase | — | — | — | — | 115,693 | — | ||||||||||||||||||
|
|
|
|
|
|
|
|
|
|
|
| |||||||||||||
Institutional Class | ||||||||||||||||||||||||
Shares issued | — | — | — | — | 3,684,462 | — | ||||||||||||||||||
Shares reinvested | — | — | — | — | 55,493 | — | ||||||||||||||||||
Shares redeemed | — | — | — | — | (417,831 | ) | — | |||||||||||||||||
|
|
|
|
|
|
|
|
|
|
|
| |||||||||||||
Net increase | — | — | — | — | 3,322,124 | — | ||||||||||||||||||
|
|
|
|
|
|
|
|
|
|
|
| |||||||||||||
Total net increase | — | — | — | — | 3,437,817 | — | ||||||||||||||||||
|
|
|
|
|
|
|
|
|
|
|
| |||||||||||||
| * | Fund commenced operations on August 21, 2017. |
72
Table of Contents
Driehaus Mutual Funds
Notes to Financial Statements — (Continued)
The Driehaus Small Cap Growth Fund commenced operations on August 21, 2017 after succeeding to the assets of the Driehaus Institutional Small Cap, L.P., Driehaus Small Cap Investors, L.P., Driehaus Institutional Small Cap Recovery Fund, L.P. and Driehaus Small Cap Recovery Fund, L.P. The transactions were structured to be tax-free exchanges and the cost basis and holding period of the underlying securities were carried over to the Driehaus Small Cap Growth Fund. Unrealized appreciation at the date of the transaction of $5,008,320 is not reflected in the Net change in unrealized appreciation (depreciation) on investments in the Statement of Operations or Statement of Changes in Net Assets.
E. LINE OF CREDIT
The Funds, except for the Driehaus Small Cap Growth Fund, have, with certain other funds in the Trust, together obtained a committed line of credit in the amount of $50,000,000. This line of credit is available primarily to meet large, unexpected shareholder withdrawals subject to certain restrictions. Interest is charged at a rate per annum equal to the Federal Funds Rate in effect at the time of the borrowings plus 1.5%, or 1.75%, whichever is greater. There is a commitment fee of 0.10% of the excess of the $50,000,000 committed amount over the sum of the average daily balance of any loans, which is allocated amongst all funds that have access to the line. Driehaus Micro Cap Growth Fund utilized the line of credit during the period July 11, 2017 to July 17, 2017. For the period July 11, 2017 to July 17, 2017, the average daily loan balance outstanding on days where borrowings existed was $7,000,000 and the weighted average interest rate was 2.66%. The interest expense, which is included on the Statements of Operations, was $3,103 for Driehaus Micro Cap Growth Fund.
F. FOREIGN INVESTMENT RISKS
To the extent a Fund invests in foreign securities, it may entail risks due to the potential for political and economic instability in the countries where the issuers of these securities are located. In addition, foreign exchange fluctuations could affect the value of positions held. These risks are generally intensified in emerging markets.
G. REDEMPTION FEES
The Funds may charge a redemption fee of 2.00% of the redemption amount for shares redeemed within 60 days of purchase. The redemption fees are recorded in paid-in capital and reflected in the Statements of Changes in Net Assets.
H. SUBSEQUENT EVENTS
Events or transactions that occurred after the date of this report through the date the report was issued have been evaluated for potential impact to the financial statements. There are no subsequent events that require recognition or disclosure in the financial statements.
73
Table of Contents
Report of Independent Registered Public Accounting Firm
To the Shareholders of Driehaus Emerging Markets Growth Fund, Driehaus Emerging Markets Small Cap Growth Fund, Driehaus Frontier Emerging Markets Fund, Driehaus International Small Cap Growth Fund, Driehaus Micro Cap Growth Fund, and Driehaus Small Cap Growth Fund and the Board of Trustees of the Driehaus Mutual Funds
Opinion on the Financial Statements
We have audited the accompanying statements of assets and liabilities of Driehaus Emerging Markets Growth Fund, Driehaus Emerging Markets Small Cap Growth Fund, Driehaus Frontier Emerging Markets Fund, Driehaus International Small Cap Growth Fund, Driehaus Micro Cap Growth Fund, and Driehaus Small Cap Growth Fund, (collectively referred to as the “Funds”), (six of the funds constituting the Driehaus Mutual Funds (the “Trust”)), including the schedules of investments, as of December 31, 2017, and the related statements of operations and changes in net assets, and the financial highlights for each of the periods indicated in the table below and the related notes (collectively referred to as the “financial statements”). In our opinion, the financial statements present fairly, in all material respects, the financial position of each of the Funds (six of the funds constituting the Driehaus Mutual Funds) at December 31, 2017, and the results of their operations, changes in net assets and financial highlights for each of the periods indicated in the table below, in conformity with U.S. generally accepted accounting principles.
Individual fund constituting the Driehaus Mutual Funds | Statement of operations | Statement of changes | Financial highlights | |||
| Driehaus Emerging Markets Growth Fund | For the year ended December 31, 2017 | For each of the two years in the period ended December 31, 2017 | For each of the five years in the period ended December 31, 2017 | |||
| Driehaus Emerging Markets Small Cap Growth Fund | For the year ended December 31, 2017 | For each of the two years in the period ended December 31, 2017 | For each of the five years in the period ended December 31, 2017 | |||
| Driehaus Frontier Emerging Markets Fund | For the year ended December 31, 2017 | For each of the two years in the period ended December 31, 2017 | For each of the two years in the period ended December 31, 2017 and the period from May 4, 2015 (commencement of operations) through December 31, 2015 | |||
| Driehaus International Small Cap Growth Fund | For the year ended December 31, 2017 | For each of the two years in the period ended December 31, 2017 | For each of the five years in the period ended December 31, 2017 | |||
| Driehaus Micro Cap Growth Fund | For the year ended December 31, 2017 | For each of the two years in the period ended December 31, 2017 | For each of the four years in the period ended December 31, 2017 and the period from November 18, 2013 (commencement of operations) through December 31, 2013 | |||
| Driehaus Small Cap Growth Fund | For the period from August 21, 2017 (commencement of operations) through December 31, 2017 | |||||
Basis for Opinion
These financial statements are the responsibility of the Trust’s management. Our responsibility is to express an opinion on each of the Fund’s financial statements based on our audits. We are a public accounting firm registered with the Public Company Accounting Oversight Board (United States) (“PCAOB”)
74
Table of Contents
Report of Independent Registered Public Accounting Firm — (Continued)
and are required to be independent with respect to the Trust in accordance with the U.S. federal securities laws and the applicable rules and regulations of the Securities and Exchange Commission and the PCAOB.
We conducted our audits in accordance with the standards of the PCAOB. Those standards require that we plan and perform the audit to obtain reasonable assurance about whether the financial statements are free of material misstatement, whether due to error or fraud. The Trust is not required to have, nor were we engaged to perform, an audit of the Trust’s internal control over financial reporting. As part of our audits, we are required to obtain an understanding of internal control over financial reporting, but not for the purpose of expressing an opinion on the effectiveness of the Trust’s internal control over financial reporting. Accordingly, we express no such opinion.
Our audits included performing procedures to assess the risks of material misstatement of the financial statements, whether due to error or fraud, and performing procedures that respond to those risks. Such procedures included examining, on a test basis, evidence regarding the amounts and disclosures in the financial statements. Our procedures included confirmation of securities owned as of December 31, 2017, by correspondence with the custodians and brokers or by other appropriate auditing procedures where replies from brokers were not received. Our audits also included evaluating the accounting principles used and significant estimates made by management, as well as evaluating the overall presentation of the financial statements. We believe that our audits provide a reasonable basis for our opinion.

We have served as the auditor of one or more Driehaus investment companies since 2002.
Chicago, Illinois
February 22, 2018
75
Table of Contents
Independent Trustees of the Trust
The following table sets forth certain information with respect to the Trustees of the Trust as of December 31, 2017:
Name, Address and | Position(s) | Term of | Number of Portfolios in Trust Overseen by Trustee | Principal Occupation(s) | Other Directorships | |||||||
Independent Trustees: | ||||||||||||
Daniel F. Zemanek c/o Driehaus Capital Management LLC 25 East Erie Street Chicago, IL 60611 YOB: 1942 | Trustee and Chairman | Since 1996 Since 2014 | 9 | Retired; President of Ludan, Inc. (real estate development services specializing in senior housing) from April 2008 to December 2014. | None | |||||||
Theodore J. Beck c/o Driehaus Capital Management LLC 25 East Erie Street Chicago, IL 60611 YOB: 1952 | Trustee | Since 2012 | 9 | President and Chief Executive Officer, National Endowment for Financial Education, 2005 to present. | None. | |||||||
Francis J. Harmon c/o Driehaus Capital Management LLC 25 East Erie Street Chicago, IL 60611 YOB: 1942 | Trustee | Since 1998 | 9 | Relationship Manager, Great Lakes Advisors, Inc. since February 2008. | None | |||||||
Dawn M. Vroegop c/o Driehaus Capital Management LLC 25 East Erie Street Chicago, IL 60611 YOB: 1966 | Trustee | Since 2012 | 9 | Private Investor since 2003. | Independent Trustee, Brighthouse Funds Trust I (formerly, Met Investors Series Trust) since December 2000 and Brighthouse Funds Trust II (formerly, Metropolitan Series Fund, Inc.) since May 2009. | |||||||
Christopher J. Towle, CFA c/o Driehaus Capital Management LLC 25 East Erie Street Chicago, IL 60611 YOB: 1957 | Trustee | Since 2016 | 9 | Retired; Partner, Portfolio Manager, Director of High Yield and Convertible Securities, Lord Abbett & Co. from 1987-2014. | None | |||||||
76
Table of Contents
The following table sets forth certain information with respect to the officers of the Trust:
Name, Address | Position(s) | Length of | Principal Occupation(s) During Past 5 Years | |||
Stephen J. Kneeley 25 East Erie Street Chicago, IL 60611 YOB: 1963 | President | Since 2017 | President and Chief Executive Officer of the Adviser and Driehaus Capital Management (USVI) LLC (“USVI”) since January 2018; President of the Trust since March 2017; Interim President and Interim Chief Executive Officer of Adviser and USVI March 2017- December 2017; Chief Executive Officer, Context Asset Management, L.P. from 2014-2016; Chief Executive Officer, Spider Management Company, LLC from 2012-2013; Chief Executive Officer, Ardmore Investment Partners from 2009-2012; Chairman of Board of Trustees, Context Capital Funds from 2014-2017; Director, Spider Management Company, LLC since 2012; and Trustee, Copeland Trust from 2010-2017. | |||
Michelle L. Cahoon 25 East Erie Street Chicago, IL 60611 YOB: 1966 | Vice President and Treasurer | Since 2006 Since 2002 | Chief Financial Officer and Treasurer of the Adviser and Distributor since 2012; Vice President, Treasurer and Chief Financial Officer of USVI since 2004. | |||
Janet L. McWilliams 25 East Erie Street Chicago, IL 60611 YOB: 1970 | Assistant Vice President and Chief Legal Officer | Since 2007 Since 2012 | General Counsel and Secretary of the Adviser and Distributor since 2012. | |||
Michael R. Shoemaker 25 East Erie Street Chicago, IL 60611 YOB: 1981 | Chief Compliance Officer and Assistant Vice President | Since 2012 | Assistant Vice President and Chief Compliance Officer of the Adviser and Distributor since 2012. | |||
William H. Wallace, III 301 Bellevue Parkway Wilmington, DE 19809 YOB: 1969 | Secretary | Since 2015 | Vice President and Manager, The Bank of New York Mellon since 2010. | |||
Michael P. Kailus 25 East Erie Street Chicago, IL 60611 YOB: 1971 | Assistant Secretary and Anti-Money Laundering Compliance Officer | Since 2010 Since 2011 | Assistant Secretary of the Adviser, Distributor and USVI since 2010; Senior Attorney with the Adviser since 2010. | |||
Christine V. Mason 301 Bellevue Parkway Wilmington, DE 19809 YOB: 1956 | Assistant Secretary | Since 2015 | Senior Specialist, The Bank of New York Mellon since 2013; Senior Paralegal, Foreside Funds Distributors LLC (formerly BNY Mellon Distributors Inc.) from 2004-2013. | |||
The Statement of Additional Information for Driehaus Mutual Funds contains more detail about the Trust’s Trustees and officers and is available upon request, without charge. For further information, please call 1-800-560-6111.
77
Table of Contents
As a mutual fund shareholder, you may incur two types of costs: (1) transaction costs, including sales charges; redemption fees; and exchange fees and (2) ongoing costs, including management fees; distribution (12b-1) fees; and other fund expenses. This example is intended to help you understand your ongoing costs (in dollars) of investing in each Fund and to compare these costs with the ongoing costs of investing in other mutual funds.
The example is based on an investment of $1,000 invested at the beginning of the period and held for the entire six months ended December 31, 2017.
Actual Expenses
The first line of the tables below (“Actual”) provides information about actual account values and actual expenses. You may use the information in this line, together with the amount you invested, to estimate the expenses that you paid over the period. Simply divide your account value by $1,000 (for example, an $8,600 account value divided by $1,000 = 8.6), then multiply the result by the number in the first line under the heading entitled “Expenses Paid During Period” to estimate the expenses you paid on your account during this period.
Hypothetical Example for Comparison Purposes
The second line of the tables below (“Hypothetical”) provides information about hypothetical account values and hypothetical expenses based on the Fund’s actual expense ratio and an assumed rate of return of 5% per year before expenses, which is not the Fund’s actual return. You may use this information to compare the ongoing costs of investing in the Funds versus other funds. To do so, compare this 5% hypothetical example with the 5% hypothetical examples that appear in the shareholder reports of the other funds.
Please note that the expenses shown in the table are meant to highlight your ongoing costs only and do not reflect any transactional costs, such as sales charges, redemption fees or exchange fees. Therefore, the second line of the table is useful in comparing ongoing costs only, and will not help you determine the relative total costs of owning different funds. In addition, if these transactional costs were included, your costs would have been higher.
Driehaus Emerging Markets Growth Fund — Investor Class
| Beginning Account Value July 1, 2017 | Ending Account Value December 31, 2017 | Expenses Paid During Six Months Ended December 31, 2017* | ||||||||||
Actual | $ | 1,000 | $ | 1,192.90 | $ | 7.74 | ||||||
Hypothetical (5% return before expenses) | $ | 1,000 | $ | 1,018.15 | $ | 7.12 | ||||||
Driehaus Emerging Markets Growth Fund — Institutional Class
| Beginning Account Value July 17, 2017 | Ending Account Value December 31, 2017 | Expenses Paid During Period Ended December 31, 2017** | ||||||||||
Actual | $ | 1,000 | $ | 1,144.70 | $ | 5.73 | ||||||
Hypothetical (5% return before expenses) | $ | 1,000 | $ | 1,019.36 | $ | 5.90 | ||||||
78
Table of Contents
Fund Expense Examples — (Continued)
Driehaus Emerging Markets Small Cap Growth Fund
| Beginning Account Value July 1, 2017 | Ending Account Value December 31, 2017 | Expenses Paid During Six Months Ended December 31, 2017* | ||||||||||
Actual | $ | 1,000 | $ | 1,160.00 | $ | 9.64 | ||||||
Hypothetical (5% return before expenses) | $ | 1,000 | $ | 1,016.28 | $ | 9.00 | ||||||
Driehaus Frontier Emerging Markets Fund
| Beginning Account Value July 1, 2017 | Ending Account Value December 31, 2017 | Expenses Paid During Six Months Ended December 31, 2017* | ||||||||||
Actual | $ | 1,000 | $ | 1,082.70 | $ | 10.45 | ||||||
Hypothetical (5% return before expenses) | $ | 1,000 | $ | 1,015.17 | $ | 10.11 | ||||||
Driehaus International Small Cap Growth Fund
| Beginning Account Value July 1, 2017 | Ending Account Value December 31, 2017 | Expenses Paid During Six Months Ended December 31, 2017* | ||||||||||
Actual | $ | 1,000 | $ | 1,156.60 | $ | 9.24 | ||||||
Hypothetical (5% return before expenses) | $ | 1,000 | $ | 1,016.64 | $ | 8.64 | ||||||
Driehaus Micro Cap Growth Fund
| Beginning Account Value July 1, 2017 | Ending Account Value December 31, 2017 | Expenses Paid During Six Months Ended December 31, 2017* | ||||||||||
Actual | $ | 1,000 | $ | 1,139.50 | $ | 7.71 | ||||||
Hypothetical (5% return before expenses) | $ | 1,000 | $ | 1,018.00 | $ | 7.27 | ||||||
Driehaus Small Cap Growth Fund — Investor Class
| Beginning Account Value August 21, 2017 | Ending Account Value December 31, 2017 | Expenses Paid During Period Ended December 31, 2017*** | ||||||||||
Actual | $ | 1,000 | $ | 1,181.80 | $ | 4.77 | ||||||
Hypothetical (5% return before expenses) | $ | 1,000 | $ | 1,019.16 | $ | 6.11 | ||||||
79
Table of Contents
Fund Expense Examples — (Continued)
Driehaus Small Cap Growth Fund — Institutional Class
| Beginning Account Value August 21, 2017 | Ending Account Value December 31, 2017 | Expenses Paid During Period Ended December 31, 2017*** | ||||||||||
Actual | $ | 1,000 | $ | 1,182.80 | $ | 3.78 | ||||||
Hypothetical (5% return before expenses) | $ | 1,000 | $ | 1,020.42 | $ | 4.84 | ||||||
| * | Expenses are equal to the Fund’s annualized expense ratios for the six-month period in the table below multiplied by the average account value over the period, multiplied by the number of days in the most recent fiscal half-year (184), then divided by 365 to reflect the half-year period. |
| ** | The Driehaus Emerging Markets Growth Fund — Institutional Class commenced operations on July 17, 2017. The actual return and expenses paid during the period by this Fund were for the period from July 17, 2017 through December 31, 2017 (168 days) instead of the entire six-month period. The hypothetical return is based on the entire six-month period for comparison purposes. |
| *** | The Driehaus Small Cap Growth Fund commenced operations on August 21, 2017. The actual return and expenses paid during the period by this Fund were for the period from August 21, 2017 through December 31, 2017 (133 days) instead of the entire six-month period. The hypothetical return is based on the entire six-month period for comparison purposes. |
Driehaus Emerging Markets Growth Fund — Investor Class | 1.40% | |||
Driehaus Emerging Markets Growth Fund — Institutional Class | 1.16% | |||
Driehaus Emerging Markets Small Cap Growth Fund | 1.77% | |||
Driehaus Frontier Emerging Markets Fund | 1.99% | |||
Driehaus International Small Cap Growth Fund | 1.70% | |||
Driehaus Micro Cap Growth Fund | 1.43% | |||
Driehaus Small Cap Growth Fund — Investor Class. | 1.20% | |||
Driehaus Small Cap Growth Fund — Institutional Class | 0.95% |
80
Table of Contents
TAX INFORMATION (UNAUDITED) FOR THE YEAR ENDED DECEMBER 31, 2017
We are providing this information as required by the Internal Revenue Code. The amounts shown may differ from those elsewhere in this report because of differences between tax and financial reporting requirements.
The Funds designate the following amounts as a long-term capital gain distribution:
| Driehaus Emerging Markets Growth Fund | Driehaus Emerging Markets Small Cap Growth Fund | Driehaus Frontier Emerging Markets Fund | Driehaus International Small Cap Growth Fund | Driehaus Micro Cap Growth Fund | Driehaus Small Cap Growth Fund | |||||||||||||||||
| $ | 24,671,838 | $ | — | $ | 2,366,217 | $ | 27,795,122 | $ | 32,014,274 | $ | 1,157,501 | |||||||||||
For taxable non-corporate shareholders, the following percentages of income and short-term capital gains represent qualified dividend income subject to the 15% rate category:
| Driehaus Emerging Markets Growth Fund | Driehaus Emerging Markets Small Cap Growth Fund | Driehaus Frontier Emerging Markets Fund | Driehaus International Small Cap Growth Fund | Driehaus Micro Cap Growth Fund | Driehaus Small Cap Growth Fund | |||||||||||||||||
| 100.00% | 0.00% | 100.00% | 17.02% | 0.00% | 12.90% | |||||||||||||||||
For corporate shareholders, the following percentages of income and short-term capital gains qualified for the dividends-received deduction:
| Driehaus Emerging Markets Growth Fund | Driehaus Emerging Markets Small Cap Growth Fund | Driehaus Frontier Emerging Markets Fund | Driehaus International Small Cap Growth Fund | Driehaus Micro Cap Growth Fund | Driehaus Small Cap Growth Fund | |||||||||||||||||
| 1.39% | 0.00% | 0.00% | 0.00% | 0.00% | 13.01% | |||||||||||||||||
PROXY VOTING POLICIES AND PROCEDURES AND PROXY VOTING RECORD
A description of the Funds’ policies and procedures with respect to the voting of proxies relating to the Funds’ portfolio securities is available without charge, upon request, by calling 1-800-560-6111. This information is also available on the Funds’ website at http://www.driehaus.com.
Information regarding how the Funds voted proxies related to portfolio securities during the 12-month period ended June 30, 2017 is available without charge, upon request, by calling 1-800-560-6111. This information is also available on the Securities and Exchange Commission’s (“SEC”) website at http://www.sec.gov.
HOW TO OBTAIN QUARTERLY PORTFOLIO HOLDINGS
Each Fund files a complete schedule of portfolio holdings with the SEC for the first and third quarters of each fiscal year on Form N-Q. The Funds’ Form N-Q is available electronically on the SEC’s website at http://www.sec.gov; hard copies may be reviewed and copied at the SEC’s Public Reference Room in Washington, DC 20549. For more information on the Public Reference Room, call 1-800-SEC-0330. Each Fund’s complete schedule of portfolio holdings is also available on the Fund’s website at http://www.driehaus.com.
81
Table of Contents
Board Considerations in Connection with the Annual Review of the
Investment Advisory Agreement
The Board of Trustees of Driehaus Mutual Funds (the “Trust”), including a majority of the Trustees who are not “interested persons” (as defined in the Investment Company Act of 1940, as amended) (the “Independent Trustees”), approved the renewal of the investment advisory agreement (the “Agreement”) with Driehaus Capital Management LLC (the “Adviser”) for Driehaus Emerging Markets Growth Fund (“DREGX”), Driehaus International Small Cap Growth Fund (“DRIOX”), Driehaus Micro Cap Growth Fund (“DMCRX”), Driehaus Emerging Markets Small Cap Growth Fund (“DRESX”) and Driehaus Frontier Emerging Markets Fund (“DRFRX”) (DREGX, DRIOX, DMCRX, DRESX and DRFRX are each a “Fund” and collectively, the “Funds”) on September 14, 2017 for an additional one-year term ending September 30, 2018. As part of its review process, the Board requested and evaluated all information it deemed reasonably necessary to evaluate the Agreement. The Board reviewed comprehensive materials received from the Adviser and from independent legal counsel. The Board also received extensive information throughout the year regarding performance and operating results of each Fund. The Independent Trustees held a conference call with their independent legal counsel on September 6, 2017 to review the materials provided in response to their request, and identified areas for further response by Fund management. Following receipt of further information from Fund management, the Independent Trustees, represented by independent legal counsel, met independent of Fund management to consider renewal of the Agreement for each Fund. After their consideration of all the information received, the Independent Trustees presented their findings and their recommendation to renew the Agreement at the Board meeting.
In connection with the contract review process, the Board considered the factors discussed below, among others. The Board also considered that the Adviser has managed each Fund since its inception, and the Board believes that a long-term relationship with a capable, conscientious adviser is in the best interests of each Fund. The Board considered, generally, that shareholders invested in each Fund, knowing that the Adviser managed the Fund and knowing the investment advisory fee schedule.
Nature, Quality and Extent of Services. The Board considered the nature, extent and quality of services provided under the Agreement, including portfolio management services and administrative services. The Board considered the experience and skills of senior management and investment personnel, the resources made available to such personnel, the ability of the Adviser to attract and retain high-quality personnel, and the organizational depth of the Adviser. The Board also considered the Trust’s compliance with legal and regulatory requirements, as well as the Adviser’s handling of portfolio brokerage, and noted the Adviser’s process for evaluating best execution. The Board considered the Adviser’s risk management strategies and the process developed by the Adviser for analyzing, reviewing and assessing risk exposure for the Funds. The Board also considered the Funds’ process for fair valuation of portfolio securities and noted the Board’s review of Fund valuation matters throughout the year.
The Board evaluated DREGX’s, DRIOX’s, DRESX’s and DMCRX’s performance for year-to-date and 1-, 3- and 5-year periods ended June 30, 2017 and DRFRX’s performance for year-to-date and 1-year periods ended June 30, 2017 (the Fund’s inception date was May 4, 2015), as available, comparing it to performance of a peer group of funds compiled by the Adviser from data from Lipper Analytical Services, Inc., an independent provider of mutual fund data that is a service of Broadridge Financial Solutions (“Lipper”) and to each Fund’s primary benchmark index, as identified in reports to shareholders. The Board noted that for DMCRX and DRFRX all information was based on a custom peer group created by the Adviser from the full peer group. The Board also noted that the performance information for DMCRX included the performance of the Fund’s predecessor limited partnership for certain periods. Because the predecessor limited partnership did not operate as a mutual fund and was not subject to certain investment and operational restrictions, the Board factored those differences into its evaluation of DMCRX’s longer-term performance information. The Board noted that the Adviser represented that because the Funds’ performance can be volatile over shorter time periods, for Funds with longer performance records, it was meaningful to also analyze the performance over rolling time periods, and the Board reviewed rolling relative performance to benchmark information for all the Funds other than DRFRX. The Board also considered whether investment results were consistent with each Fund’s investment objective and policies.
As to the specific Funds, the Board considered that, as of June 30, 2017, DREGX’s performance was in the top quartile of its custom and full peer groups for the 5-year period and in the second quartile of its custom and full peer group for the year-to-date period. The Board further noted that DREGX was in the second
82
Table of Contents
quartile of its full peer group and in the third quartile of its custom peer group for the 3-year period but in the third quartile of its custom and full peer groups for the 1-year period. The Board noted that DREGX outperformed its benchmark index for the year-to-date and 5- year periods, but underperformed the index for the 1- and 3-year periods reviewed.
The Board considered that, as of June 30, 2017, DRIOX’s performance was in the top decile of its peer group for the year-to-date period. The Board further noted that DRIOX’s performance was in the second quartile for the 3- and 5-year periods and in the third quartile of its peer group for the 1-year period. The Board also noted that DRIOX outperformed its benchmark index for the year-to-date, 1-, 3- and 5-year periods.
The Board considered that, as of June 30, 2017, DMCRX’s performance for the 5-year period was in the top decile of its custom peer group and for the 1- and 3-year periods was in the top quartile of its custom peer group (noting that the 5-year period includes the performance of a predecessor partnership). In addition, the Board noted that DMCRX outperformed its benchmark index for the year-to-date, 1-, 3- and 5-year periods (the 5-year period includes the performance of its predecessor limited partnership).
The Board considered that, as of June 30, 2017, DRESX’s performance was in the top quartile of its custom and full peer groups for the 5-year period, but that DRESX’s performance was in the fourth quartile of its custom and full peer groups for the year-to-date, 1- and 3-year periods reviewed. In addition, the Board noted that DRESX outperformed its benchmark index, the MSCI Emerging Markets Small Cap Index (“MSCI EM Small Cap”) for the 5-year period (the 5-year period includes the performance of its predecessor limited partnership), but underperformed its index for the year-to-date and 1- and 3-year periods. The Board also considered portfolio attribution information provided by the Adviser as compared to the MSCI EM Small Cap for the 1- and 3-year periods ended June 30, 2017, which showed that underperformance was due in part to the cash held by the Fund, the use of options and the Fund’s expenses, which are not represented in the benchmark index. With respect to its peer group, the Board noted that the Fund’s peer group is largely comprised of emerging markets funds of all capitalizations and that the MSCI EM Small Cap underperformed the MSCI Emerging Markets Index for the 1-year period.
The Board considered that, as of June 30, 2017, DRFRX’s performance was in the fourth quartile of its custom peer group (primary share class only) based upon data provided by eVestment for the year-to-date and 1-year periods reviewed. The Board also noted that DRFRX’s performance was in the fourth quartile of its custom peer group (all share classes) for the year-to-date period and in the third quartile for the 1-year period. In addition, the Board noted that DRFRX underperformed its benchmark index for the year-to-date and 1-year periods. The Board also considered portfolio attribution information provided by the Adviser as compared to its benchmark index for the 1-year period ended June 30, 2017, which showed that underperformance was due in part to cash held by the Fund and the Fund’s expenses, which are not represented in the benchmark index. The Board further noted that, due to DRFRX’s investment restrictions, the Fund is limited in its ability to track the sector weightings of the benchmark index.
For each Fund other than DRFRX, the Board also considered each Fund’s rolling 1-year, 3-year and 5-year returns over the life of the Fund relative to its benchmark and noted that, in a majority of the time periods measured, each Fund outperformed its benchmark index. As to the Funds in general, the Board concluded that the Adviser had consistently implemented its investment philosophy, and that over the long term, the investment philosophy produces value for shareholders.
On the basis of this evaluation and its ongoing review of investment results, the Board concluded that the nature, quality and extent of services provided by the Adviser supported renewal of the Agreement for each Fund.
Fees. The Board considered each Fund’s advisory fee rates, operating expenses and total expense ratio as of December 31, 2016 as compared to peer group information based on data compiled from Lipper as of the most recent fiscal year end of each fund in the peer group. The information provided to the Board showed that each Fund’s advisory fee rate ranked at the high end of its peer group; however, because of the Funds’ fee structures, total expense ratios are relatively competitive, falling between the 25th and 62nd percentiles (the 71st percentile for Institutional Share Class of DREGX, launched as of July 17, 2017) (1st percentile being the highest expense ratio). In addition, the Board considered the expense reimbursement arrangement with the Adviser for DRFRX. The Board also considered the Funds’ advisory fee rates as compared to fees charged by the Adviser for similarly managed institutional accounts and sub-advised unaffiliated mutual funds, as applicable. With respect to institutional accounts and other mutual funds, the Board noted that the mix of
83
Table of Contents
services provided, the level of responsibility, the legal, reputational and regulatory risks and the resources required under the Agreement were significantly greater as compared to the Adviser’s obligations for managing the other accounts. In considering the reasonableness of the advisory fees, the Board took into account the Adviser’s substantial human and technological resources devoted to investing for the Funds, the relatively small amount of assets under management and the limited capacity of the investment style. In addition, the Board noted that the Adviser’s directed brokerage program had resulted in a total of approximately $602,000 in directed brokerage credits during calendar year 2016, which were used to reduce expenses of the Funds.
On the basis of the information reviewed, the Board concluded that the advisory fee schedule for each Fund was reasonable in light of the nature and quality of services provided by the Adviser.
Profitability. The Board reviewed information regarding revenues received by the Adviser under the Agreement from each Fund and discussed the Adviser’s methodology in allocating its costs to the management of the Funds. The Board considered the estimated costs to the Adviser of managing the Funds. The Board noted that DRIOX is currently closed to new investors in order to maintain assets at a level that the Adviser feels is prudent, which limits the Fund’s profitability to the Adviser. The Board also noted that the Funds do not have a Rule 12b-1 fee or shareholder service fee (except for the Investor Share Class of DREGX, which has a shareholder service fee as of July 17, 2017), and that the Adviser’s affiliate, Driehaus Securities LLC (“DS LLC”), serves as distributor of the Funds without compensation and that DS LLC provides compensation to intermediaries for distribution of Fund shares and for shareholder and administrative services to shareholders, the expense of which is reimbursed by the Adviser under an expense sharing arrangement with DS LLC. The Board concluded that, based on the profitability calculated for the Trust as well as for the Funds individually (noting DRFRX operated at a loss and that profitability for DREGX was expected to decline due to the decrease in its advisory fee rate), the profitability was not excessive in light of the nature, extent and quality of the services provided to the Funds.
Economies of Scale. In considering the reasonableness of the advisory fee, the Board considered whether there are economies of scale with respect to the management of the Funds and whether the Funds benefit from any such economies of scale. Given the size of the Funds and the capacity constraints of the investment style, the Board concluded that the advisory fee rates under the Agreement are reasonable and reflect an appropriate sharing of any such economies of scale.
Other Benefits to the Adviser and its Affiliates. The Board also considered the character and amount of other incidental benefits received by the Adviser and its affiliates. The Board also considered benefits to the Adviser related to soft dollar allocations. The Board concluded that advisory fees were reasonable in light of these fall-out benefits.
Based on all of the information considered and the conclusions reached, the Board determined that the terms of the Agreement continue to be fair and reasonable and that the continuation of the Agreement is in the best interests of each Fund. No single factor was determinative in the Board’s analysis.
84
Table of Contents
Board Considerations in Connection with the Initial Approval of the
Investment Advisory Agreement for Driehaus Small Cap Growth Fund
The Board of Trustees of the Driehaus Mutual Funds (the “Trust”), including a majority of the Trustees who are not “interested persons” (as defined in the Investment Company Act of 1940, as amended) (the “Independent Trustees”), approved the investment advisory agreement (the “Agreement”) with Driehaus Capital Management LLC (the “Adviser”) for the Driehaus Small Cap Growth Fund (the “Fund”) on June 8, 2017. As part of its review process, the Board requested and evaluated all information it deemed reasonably necessary to evaluate the Agreement. The Board reviewed comprehensive materials received from the Adviser and from independent legal counsel. After their review of the information received, the Independent Trustees presented their findings and their recommendation to approve the Agreement to the full Board. In connection with the review, the Board considered the factors discussed below, among others.
Nature, Quality and Extent of Services. The Board considered the nature, extent and quality of services to be provided under the Agreement, including portfolio management services and administrative services. The Board considered the experience and skills of senior management and investment personnel, the resources made available to such personnel, the ability of the Adviser to attract and retain high-quality personnel, and the organizational depth of the Adviser. The Board also considered the Trust’s compliance with legal and regulatory requirements as well as the Adviser’s risk management processes developed for analyzing, reviewing and assessing risk exposure for the Fund. In particular, the Board considered the management team’s experience relevant to managing other products with a small-cap growth investment strategy, including the performance of the longest in existence predecessor partnership (the “Predecessor Partnership”) as compared to the Russell 2000 Growth Index for the 1-, 3-, 5- and 10-year periods ended December 31, 2016. The Board noted that the Predecessor Partnership outperformed the Russell 2000 Growth Index for the 5- and 10-year periods and underperformed the Russell 2000 Growth Index for the 1- and 3-year periods ended December 31, 2016. The Board also considered the performance of the Predecessor Partnership as compared to peer group information based on data compiled from Lipper Analytical Services, Inc., an independent provider of mutual fund data that is a service of Broadridge Financial Solutions (“Lipper”) and noted that the Predecessor Partnership outperformed the median of the Lipper small cap growth peer group for all periods reviewed. Because the Predecessor Partnership did not operate as a mutual fund and was not subject to certain investment and operational restrictions, the Board factored those differences into its evaluation of the performance information.
On the basis of this evaluation and the Board’s experience with the Adviser in managing other series of the Trust, the Board concluded that the nature, quality and extent of services to be provided by the Adviser are expected to be satisfactory.
Fees. The Board considered the Fund’s proposed advisory fee, estimated operating expenses and total expense ratio, and compared the advisory fee and expense ratio to fees and expense ratios of a peer group of funds based on data compiled from Lipper, as of the fiscal year end of each fund in the peer group. The Board noted that the Fund’s proposed advisory fee of 0.60% would rank in the 70th percentile of the Lipper peer group actual management fees as of April 30, 2017 (1st percentile would be the highest advisory fee). The Board considered that the Adviser will reimburse the Fund for annual expenses in excess of 0.95% of average daily net assets for the Institutional Share Class and 1.20% of average daily net assets for the Investor Share Class (excluding interest, taxes, brokerage commissions, other investment-related expenses, acquired fund fees and expenses, and extraordinary expenses, such as litigation and other expenses not incurred in the ordinary course of the Fund’s business) for a three-year period, which would rank the Fund’s expense ratio in the 81st percentile for the Institutional Share Class and in the 54th percentile for the Investor Share Class (1st percentile would be the highest expense ratio). In addition, the Board considered that the proposed advisory fee was lower than the advisory fee charged by the Adviser to other “equity” mutual funds that the Adviser manages and was lower than the stated advisory fee for the limited partnerships which will be reorganized into the Fund. The Board also considered the Fund’s advisory fee rate as compared to fees charged by the Adviser for similarly managed institutional accounts. With respect to institutional accounts, the Board noted that: (i) both the mix of services provided and the level of responsibility and resources required under the Agreement were significantly greater as compared to the Adviser’s obligations for managing the other accounts; and (ii) the advisory fees for the other accounts are less relevant to the Board’s consideration because they reflect significantly different competitive forces than those in the mutual fund marketplace.
85
Table of Contents
On the basis of the information provided, the Board concluded that the proposed advisory fee was reasonable and appropriate in light of the nature and quality of services expected to be provided by the Adviser.
Profitability and Economies of Scale. In considering the reasonableness of the proposed advisory fee, the Board considered the undertaking by the Adviser to assume the Fund’s organizational expenses as well as to reimburse Fund expenses exceeding a 0.95% cap for the Institutional Share Class and a 1.20% cap for the Investor Share Class (excluding interest, taxes, brokerage commissions, other investment-related expenses, acquired fund fees and expenses, and extraordinary expenses, such as litigation and other expenses not incurred in the ordinary course of the Fund’s business) for a three-year period.
The Board also considered potential economies of scale with respect to the management of the Fund and whether the Fund will benefit from any economies of scale. The Board noted the Adviser’s estimation that it will not earn its full fee until net assets reach approximately $90 million.
Other Benefits to the Adviser and its Affiliates. The Board also considered the character and amount of other incidental benefits to be received by the Adviser and its affiliates. The Board noted that the Adviser expects to earn fall-out benefits in the form of soft dollar credits from its relationship with the Fund. The Board concluded that the proposed advisory fee was reasonable in light of any anticipated fall-out benefits.
Based on all of the information considered and the conclusions reached, the Board determined that the terms of the Agreement for the Fund were fair and reasonable and that the approval of the Agreement is in the best interests of the Fund. No single factor was determinative in the Board’s analysis.
86
Table of Contents
DRH-AR2017
Table of Contents
Driehaus Mutual Funds
Trustees & Officers
Theodore J. Beck
Trustee
Francis J. Harmon
Trustee
Christopher J. Towle
Trustee
Dawn M. Vroegop
Trustee
Daniel F. Zemanek
Chairman of the Board
Stephen J. Kneeley
President
Michelle L. Cahoon
Vice President & Treasurer
Janet L. McWilliams
Chief Legal Officer &
Assistant Vice President
Michael R. Shoemaker
Chief Compliance Officer &
Assistant Vice President
William H. Wallace, III
Secretary
Michael P. Kailus
Assistant Secretary & Anti-Money
Laundering Compliance Officer
Christine Mason
Assistant Secretary
Investment Adviser
Driehaus Capital Management LLC
25 East Erie Street
Chicago, IL 60611
Distributor
Driehaus Securities LLC
25 East Erie Street
Chicago, IL 60611
Administrator & Transfer Agent
UMB Fund Services, Inc.
235 W. Galena Street
Milwaukee, WI 53212
Custodian
The Northern Trust Company
50 South LaSalle Street
Chicago, IL 60603
Annual Report to Shareholders
December 31, 2017

Driehaus Active Income Fund
Driehaus Event Driven Fund
Driehaus Multi-Asset Growth Economies Fund
Distributed by:
Driehaus Securities LLC
This report has been prepared for the shareholders of the Funds and is not an offer to sell or buy any Fund securities. Such offer is only made by the Funds’ prospectus.
Table of Contents
Table of Contents
Driehaus Active Income Fund — Portfolio Managers’ Letter
Dear Shareholders,
The Driehaus Active Income Fund (“Fund”) returned 0.59% for the year ended December 31, 2017. This return underperformed the Fund’s benchmark, the Citigroup 3-Month T-Bill Index, which returned 0.84% for the same period and the Bloomberg Barclays US Aggregate Bond Index, which returned 3.54% for the year.
2017 was a year of unprecedented low volatility coupled with near-record high equity performance. The opportunity for capital appreciation was focused in the first half of the year when high yield credit spreads compressed 45 basis points from 422 basis points to 377 basis points. The second part of the year was fairly stagnant in terms of credit spread movement (high yield spreads tightened 14 basis points), but it did bring some interest rate pressures, particularly on the short end of the curve.
The directional long trading strategy was the most significant contributor for the year, driven primarily by a combination of spread tightening and company specific news events. The positions with the largest impact were a healthcare company that announced its sale, an aerospace and defense company that benefitted from spread tightening and improved earnings, and a Caribbean telecommunications company that also benefitted from spread tightening and solid earnings. The capital structure arbitrage strategy was the second most significant contributor, driven primarily by spread-tightening in long leaning positions in the financial and energy industries. Capital structure arbitrage trades are created with a long and short side to the trade, which will typically move inversely to each other, allowing us to hedge risk and dampen volatility.
On the negative side, the event strategy detracted from performance. Gains in two regional gaming companies and a semiconductor company were offset by losses in a cinema, title insurance, and an entertainment technology company. Directional short positions also detracted from performance. Shorts in a variety of industries and a European sovereign underperformed as credit spreads moved steadily lower throughout the year.
Both portfolio hedging strategies detracted from performance in 2017. The volatility hedges that were focused on various equity indices detracted from the fund as equity markets marched steadily higher throughout the year with historically low volatility. Volatility trades are generally constructed by implementing various option strategies, through forwards, or through the use of credit default swaps on indices. The interest rate hedge, which is constructed with US Treasury futures and US Treasury swaptions, also had a negative effect on returns. The hedge had the largest drag on performance in the first part of the year when significant macro concerns dominated investor sentiment. The hedge contributed to returns in the second half of the year driven by Fed rate hikes, tax reform and pro-reflation macro conditions.
In 2018, we expect the macro environment to continue to be supportive of US credit. Consumers and executives are showing rising confidence (which supports both corporate earnings and security valuations), defaults are low and are expected to remain that way, global growth is solid and interest rates keep inching higher on the back of stronger inflation and growth data. Given this backdrop, we’ve identified a few key themes that we intend to emphasize in the portfolio in 2018. Since there are limited opportunities for capital appreciation in the current credit spread environment, we are focused on increasing the yield on the portfolio with higher quality, coupon-clipping positions while spending less capital on interest rate and top-down volatility hedging.
We anticipate increasing our exposure to leveraged loans during the year and also to have an increased allocation to investment-grade financial institutions. In addition, we will be opportunistically looking for long-volatility trades if spreads continue to tighten and also look to capitalize on non-traditional merger and acquisition activity.
In a lower rate of return environment, it is critical to have effective hedges. In 2018, we plan to focus on minimizing hedging costs through general portfolio positioning. We have decreased the un-hedged duration of the Fund, which means less capital will be needed to hedge the remaining duration exposure. Also, we are focusing on higher quality companies that should hold up better in risk-off environments, which will also decrease our hedging costs.
1
Table of Contents
As always, we at Driehaus Capital Management thank you for your interest in the Driehaus Active Income Fund and would like to express our gratitude to you as shareholders for your continued confidence in our management capabilities.
Sincerely,
 |  | |
| K.C. Nelson | Elizabeth Cassidy | |
| Portfolio Manager | Portfolio Manager |
Performance is historical and does not represent future results.
Please see the following performance page for index definitions.
2
Table of Contents
Performance Overview (unaudited)
The performance summarized below is historical and does not represent future results. Investment returns and principal value vary, and you may have a gain or loss when you sell shares. Performance data presented measures the change in the value of an investment in the Fund, assuming reinvestment of all dividends and capital gains. Average annual total return reflects annualized change.
The table does not reflect the deduction of taxes that a shareholder would pay on Fund distributions or the redemption of Fund shares. The graph compares the results of a $25,000 investment (minimum investment) in the Fund over the last 10 fiscal year periods (which includes performance of the Predecessor Fund), with all dividends and capital gains reinvested, with the indicated indices (and dividends reinvested) for the same period.
Average Annual Total Returns as of 12/31/17 | 1 Year | 3 Years | 5 Years | 10 Years | ||||||||||||
Driehaus Active Income Fund (LCMAX)1 | 0.59% | 1.68% | 1.42% | 3.63% | ||||||||||||
FTSE 3-Month T-Bill Index2 | 0.84% | 0.38% | 0.24% | 0.34% | ||||||||||||
Bloomberg Barclays U.S. Aggregate Bond Index3 | 3.54% | 2.24% | 2.10% | 4.01% | ||||||||||||
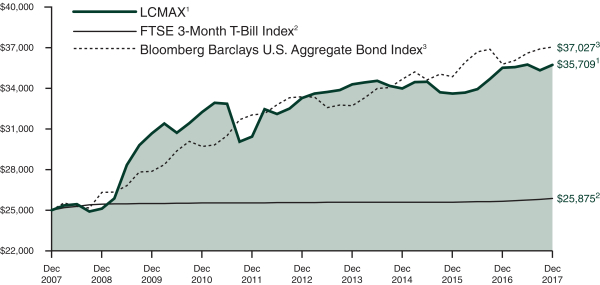
| 1 | The Driehaus Active Income Fund (the “Fund”) performance shown above includes the performance of the Lotsoff Capital Management Active Income Fund (the “Predecessor Fund”) for the periods before the Fund’s registration statement became effective. The Fund received the assets and liabilities of the Predecessor Fund on June 1, 2009 through a reorganization of the Predecessor Fund into the Fund. The Predecessor Fund was a nondiversified fund that was a series of another management investment company registered under the Investment Company Act of 1940, as amended. The Fund had no prior operating history prior to succeeding to the assets of the Predecessor Fund. The Fund has substantially similar investment objectives, strategies, and policies as the Predecessor Fund. Financial and performance information of the Fund includes the Predecessor Fund information. |
| 2 | The FTSE 3-Month T-Bill Index is designed to mirror the performance of the 3-month U.S. Treasury Bill. The FTSE 3-Month T-Bill Index is unmanaged and its returns reflect reinvestment of all distributions and changes in market prices. |
| 3 | The Bloomberg Barclays U.S. Aggregate Bond Index, an unmanaged index, represents securities that are SEC-registered, taxable and dollar denominated. This index covers the U.S. investment grade fixed rate bond market, with index components for government and corporate securities, mortgage pass-through securities and asset-backed securities. These major sectors are subdivided into more specific indices that are calculated and reported on a regular basis. |
3
Table of Contents
Driehaus Active Income Fund
Schedule of Investments
December 31, 2017
| Shares, Principal Amount, or Number of Contracts | Value | |||||||
| BANK LOANS — 30.67% | ||||||||
Advertising — 1.36% |
| |||||||
Getty Images, Inc. | $ | 22,859,686 | $ | 20,896,267 | ||||
Auto Manufacturers — 1.18% |
| |||||||
Navistar, Inc. | 18,005,502 | 18,098,320 | ||||||
Computers — 1.92% |
| |||||||
DynCorp International, Inc. | 10,921,841 | 10,980,983 | ||||||
McAfee LLC | 10,054,800 | 10,036,852 | ||||||
McAfee LLC | 8,400,000 | 8,442,042 | ||||||
|
| |||||||
| 29,459,877 | ||||||||
|
| |||||||
Entertainment — 2.34% |
| |||||||
Scientific Games International, Inc. | 35,610,750 | 35,942,108 | ||||||
Food — 3.29% |
| |||||||
Chobani LLC | 33,611,542 | 33,933,540 | ||||||
SUPERVALU, Inc. | 10,523,165 | 10,312,702 | ||||||
SUPERVALU, Inc. | 6,313,899 | 6,187,621 | ||||||
|
| |||||||
| 50,433,863 | ||||||||
|
| |||||||
Insurance — 2.09% |
| |||||||
Acrisure LLC | 14,202,854 | 14,364,411 | ||||||
Asurion LLC | 17,200,000 | 17,710,582 | ||||||
|
| |||||||
| 32,074,993 | ||||||||
|
| |||||||
| Shares, Principal Amount, or Number of Contracts | Value | |||||||
Internet — 7.31% |
| |||||||
EIG Investors Corp. | $ | 12,667,224 | $ | 12,766,219 | ||||
Hoya Midco LLC | 43,801,633 | 43,892,960 | ||||||
ProQuest LLC | 26,183,998 | 26,560,523 | ||||||
Uber Technologies, Inc. | 28,647,400 | 28,865,836 | ||||||
|
| |||||||
| 112,085,538 | ||||||||
|
| |||||||
Investment Companies — 0.43% |
| |||||||
Larchmont Resources LLC | 6,703,250 | 6,636,217 | ||||||
Leisure Time — 1.75% |
| |||||||
Equinox Holdings, Inc. | 19,900,000 | 20,107,358 | ||||||
Equinox Holdings, Inc. | 6,500,000 | 6,727,500 | ||||||
|
| |||||||
| 26,834,858 | ||||||||
|
| |||||||
Real Estate Investment Trusts — 1.77% |
| |||||||
Uniti Group, Inc. | 28,018,990 | 27,134,711 | ||||||
Retail — 1.87% |
| |||||||
Neiman Marcus Group Ltd. LLC | 5,590,958 | 4,581,119 | ||||||
Rite Aid Corp. | 7,830,000 | 7,872,439 | ||||||
Rite Aid Corp. | 16,200,000 | 16,260,750 | ||||||
|
| |||||||
| 28,714,308 | ||||||||
|
| |||||||
Notes to Financial Statements are an integral part of this Schedule.
4
Table of Contents
Driehaus Active Income Fund
Schedule of Investments
December 31, 2017
| Shares, Principal Amount, or Number of Contracts | Value | |||||||
Software — 3.85% |
| |||||||
Digicert Holdings, Inc. | $ | 12,750,000 | $ | 12,929,265 | ||||
Digicert Holdings, Inc. | 8,500,000 | 8,565,110 | ||||||
Evergreen Skills Lux Sarl (Luxembourg) | 38,977,493 | 37,634,134 | ||||||
|
| |||||||
| 59,128,509 | ||||||||
|
| |||||||
Telecommunications — 1.51% |
| |||||||
Avaya, Inc. | 23,520,000 | 23,189,309 | ||||||
|
| |||||||
Total BANK LOANS |
| 470,628,878 | ||||||
|
| |||||||
| CORPORATE BONDS — 49.10% | ||||||||
Agriculture — 1.66% |
| |||||||
Adecoagro S.A. (Argentina) | 6,300,000 | 6,246,450 | ||||||
Vector Group Ltd. | 18,509,000 | 19,156,815 | ||||||
|
| |||||||
| 25,403,265 | ||||||||
|
| |||||||
Banks — 6.12% |
| |||||||
JPMorgan Chase & Co. | 19,813,000 | 20,060,663 | ||||||
Royal Bank of Scotland Group PLC (United Kingdom) | 27,450,000 | 27,244,125 | ||||||
State Street Corp. | 17,670,000 | 15,924,911 | ||||||
USB Realty Corp. | 34,110,000 | 30,741,637 | ||||||
|
| |||||||
| 93,971,336 | ||||||||
|
| |||||||
Building Materials — 1.29% |
| |||||||
Builders FirstSource, Inc. | 19,034,000 | 19,808,684 | ||||||
| Shares, Principal Amount, or Number of Contracts | Value | |||||||
Commercial Services — 2.97% |
| |||||||
Ceridian HCM Holding, Inc. | $ | 16,075,000 | $ | 16,798,375 | ||||
Syniverse Foreign Holdings Corp. | 28,324,550 | 28,749,418 | ||||||
|
| |||||||
| 45,547,793 | ||||||||
|
| |||||||
Computers — 2.12% |
| |||||||
DynCorp International, Inc. | 30,758,946 | 32,527,585 | ||||||
Diversified Financial Services — 0.00% |
| |||||||
Rio Oil Finance Trust Series 2014-1 (Brazil) | 3,407 | 3,679 | ||||||
Electric — 0.18% |
| |||||||
NRG Energy, Inc. | 2,600,000 | 2,723,500 | ||||||
Entertainment — 2.40% |
| |||||||
Codere Finance 2 Luxembourg S.A. (Luxembourg) | 8,000,000 | 8 | 10,119,894 | |||||
Codere Finance 2 Luxembourg S.A. (Luxembourg) | 26,375,000 | 26,775,900 | ||||||
|
| |||||||
| 36,895,794 | ||||||||
|
| |||||||
Healthcare — Products — 1.90% |
| |||||||
Sterigenics-Nordion Holdings LLC | 28,037,000 | 29,228,573 | ||||||
Healthcare — Services — 2.34% |
| |||||||
Kindred Healthcare, Inc. | 15,294,000 | 16,570,284 | ||||||
Kindred Healthcare, Inc. | 19,077,000 | 19,363,155 | ||||||
|
| |||||||
| 35,933,439 | ||||||||
|
| |||||||
Holding Companies — Diversified — 3.48% |
| |||||||
HRG Group, Inc. | 51,408,000 | 53,335,800 | ||||||
Insurance — 1.40% |
| |||||||
Acrisure LLC / Acrisure Finance, Inc. | 5,040,000 | 4,857,350 | ||||||
Chubb Corp. | 16,753,000 | 16,627,353 | ||||||
|
| |||||||
| 21,484,703 | ||||||||
|
| |||||||
Internet — 1.31% |
| |||||||
EIG Investors Corp. | 18,060,000 | 20,046,600 | ||||||
Notes to Financial Statements are an integral part of this Schedule.
5
Table of Contents
Driehaus Active Income Fund
Schedule of Investments
December 31, 2017
| Shares, Principal Amount, or Number of Contracts | Value | |||||||
Media — 3.11% |
| |||||||
Altice Luxembourg S.A. (Luxembourg) | $ | 16,005,000 | $ | 15,764,925 | ||||
SFR Group S.A. (France) | 15,320,000 | 15,722,150 | ||||||
Sinclair Television Group, Inc. | 15,810,000 | 16,304,062 | ||||||
|
| |||||||
| 47,791,137 | ||||||||
|
| |||||||
Miscellaneous Manufacturing — 1.55% |
| |||||||
Amsted Industries, Inc. | 23,250,000 | 23,802,188 | ||||||
Oil & Gas — 5.79% |
| |||||||
Antero Resources Corp. | 21,350,000 | 21,777,000 | ||||||
Chesapeake Energy Corp. | 4,250,000 | 4,292,500 | ||||||
Continental Resources, Inc. | 15,129,000 | 14,448,195 | ||||||
Diamondback Energy, Inc. | 6,015,000 | 6,037,556 | ||||||
Diamondback Energy, Inc. | 21,290,000 | 21,902,087 | ||||||
Newfield Exploration Co. | 9,972,000 | 10,719,900 | ||||||
Newfield Exploration Co. | 4,250,000 | 4,494,375 | ||||||
Transocean, Inc. (Cayman Islands) | 3,910,000 | 4,227,688 | ||||||
Transocean, Inc. (Cayman Islands) | 850,000 | 870,443 | ||||||
|
| |||||||
| 88,769,744 | ||||||||
|
| |||||||
Packaging & Containers — 1.44% |
| |||||||
Ardagh Packaging Finance PLC / Ardagh Holdings USA, Inc. (Ireland) | 8,000,000 | 8,162,400 | ||||||
Ardagh Packaging Finance PLC / Ardagh Holdings USA, Inc. (Ireland) | 13,260,000 | 13,956,150 | ||||||
|
| |||||||
| 22,118,550 | ||||||||
|
| |||||||
Pipelines — 2.04% |
| |||||||
Enbridge Energy Partners LP | 31,500,000 | 31,224,375 | ||||||
| Shares, Principal Amount, or Number of Contracts | Value | |||||||
Real Estate Investment Trusts — 2.96% |
| |||||||
Communications Sales & Leasing, Inc. / CSL Capital LLC | $ | 6,000,000 | $ | 5,767,500 | ||||
Communications Sales & Leasing, Inc. / CSL Capital LLC | 2,000,000 | 1,820,000 | ||||||
ESH Hospitality, Inc. | 37,528,000 | 37,903,280 | ||||||
|
| |||||||
| 45,490,780 | ||||||||
|
| |||||||
Retail — 0.82% |
| |||||||
Neiman Marcus Group Ltd. LLC | 18,335,000 | 10,546,292 | ||||||
Rite Aid Corp. | 1,995,000 | 1,985,025 | ||||||
|
| |||||||
| 12,531,317 | ||||||||
|
| |||||||
Telecommunications — 2.91% |
| |||||||
Digicel Ltd. (Jamaica) | 13,180,000 | 12,958,049 | ||||||
Digicel Ltd. (Jamaica) | 32,300,000 | 31,756,068 | ||||||
|
| |||||||
| 44,714,117 | ||||||||
|
| |||||||
Transportation — 1.31% |
| |||||||
XPO CNW, Inc. | 19,277,000 | 20,048,080 | ||||||
|
| |||||||
Total CORPORATE BONDS | 753,401,039 | |||||||
|
| |||||||
| CONVERTIBLE CORPORATE BONDS — 2.98% | ||||||||
Semiconductors — 1.47% |
| |||||||
Microchip Technology, Inc. | 13,200,000 | 22,473,000 | ||||||
Telecommunications — 1.51% |
| |||||||
Ciena Corp. | 19,931,000 | 23,169,787 | ||||||
|
| |||||||
Total CONVERTIBLE CORPORATE BONDS | 45,642,787 | |||||||
|
| |||||||
| U.S. GOVERNMENT AND AGENCY SECURITIES — 0.45% | ||||||||
United States Treasury Note | 7,047,000 | 6,870,001 | ||||||
|
| |||||||
Total U.S. GOVERNMENT AND AGENCY SECURITIES | 6,870,001 | |||||||
|
| |||||||
Notes to Financial Statements are an integral part of this Schedule.
6
Table of Contents
Driehaus Active Income Fund
Schedule of Investments
December 31, 2017
| Shares, Principal Amount, or Number of Contracts | Value | |||||||
| COMMON STOCKS — 6.79% | ||||||||
Auto Manufacturers — 0.57% |
| |||||||
General Motors Co.3 | 212,341 | $ | 8,703,858 | |||||
Banks — 1.34% |
| |||||||
BB&T Corp. | 80,600 | 4,007,432 | ||||||
Huntington Bancshares, Inc. | 334,950 | 4,876,872 | ||||||
Kearny Financial Corp. | 268,600 | 3,881,270 | ||||||
KeyCorp | 202,382 | 4,082,045 | ||||||
M&T Bank Corp. | 21,493 | 3,675,088 | ||||||
|
| |||||||
| 20,522,707 | ||||||||
|
| |||||||
Investment Companies — 0.17% |
| |||||||
Larchmont Resources LLC4 | 7,824 | 2,699,280 | ||||||
Media — 1.02% |
| |||||||
Charter Communications, Inc., Class A* | — | 121 | ||||||
TiVo Corp. | 1,003,087 | 15,648,157 | ||||||
|
| |||||||
| 15,648,278 | ||||||||
|
| |||||||
Savings & Loans — 0.22% |
| |||||||
Investors Bancorp, Inc. | 244,282 | 3,390,634 | ||||||
Semiconductors — 2.85% |
| |||||||
NXP Semiconductors N.V. (Netherlands)*3,9 | 373,710 | 43,757,704 | ||||||
Software — 0.62% |
| |||||||
Avaya Holdings Corp.* | 540,375 | 9,483,581 | ||||||
|
| |||||||
Total COMMON STOCKS | 104,206,042 | |||||||
|
| |||||||
| CONVERTIBLE PREFERRED STOCKS — 2.94% | ||||||||
Auto Manufacturers — 0.00% |
| |||||||
General Motors Corp. Senior Convertible Preferred Escrow — B | 475,000 | — | ||||||
General Motors Corp. Senior Convertible Preferred Escrow — C | 11,790,650 | — | ||||||
|
| |||||||
| — | ||||||||
|
| |||||||
Banks — 1.54% |
| |||||||
Huntington Bancshares, Inc. | 16,800 | 23,604,000 | ||||||
Investment Companies — 1.40% |
| |||||||
Mandatory Exchangeable Trust | 110,000 | 21,437,350 | ||||||
|
| |||||||
Total CONVERTIBLE PREFERRED STOCKS | 45,041,350 | |||||||
|
| |||||||
| Shares, Principal Amount, or Number of Contracts | Value | |||||||
| PREFERRED STOCKS — 2.42% | ||||||||
Banks — 2.42% |
| |||||||
GMAC Capital Trust I | 1,428,511 | $ | 37,069,860 | |||||
|
| |||||||
Total PREFERRED STOCKS | 37,069,860 | |||||||
|
| |||||||
| PURCHASED PUT OPTIONS — 0.00% | ||||||||
Alibaba Group Holding Ltd. ADR, Exercise Price: $30.00, | 1,500 | — | ||||||
|
| |||||||
Total PURCHASED PUT OPTIONS | — | |||||||
|
| |||||||
| ||||||||
TOTAL INVESTMENTS | 95.35 | % | $ | 1,462,859,957 | ||||
Other Assets less Liabilities | 4.65 | % | 71,410,302 | |||||
|
|
|
| |||||
Net Assets | 100.00 | % | $ | 1,534,270,259 | ||||
| ||||||||
| SECURITIES SOLD SHORT — (7.33)% | ||||||||
| CORPORATE BONDS — (1.65)% | ||||||||
Diversified Financial Services — (0.12)% |
| |||||||
Abe Investment Holdings, Inc./Getty Images, Inc. | $ | (2,565,000 | ) | $ | (1,769,850 | ) | ||
Entertainment — (1.06)% |
| |||||||
Scientific Games International, Inc. | (11,000,000 | ) | (11,646,250 | ) | ||||
Scientific Games International, Inc. | (4,400,000 | ) | (4,658,500 | ) | ||||
|
| |||||||
| (16,304,750 | ) | |||||||
|
| |||||||
Pipelines — (0.47)% |
| |||||||
Enbridge Energy Partners LP | (6,400,000 | ) | (7,271,206 | ) | ||||
|
| |||||||
Total CORPORATE BONDS |
| (25,345,806 | ) | |||||
|
| |||||||
Notes to Financial Statements are an integral part of this Schedule.
7
Table of Contents
Driehaus Active Income Fund
Schedule of Investments
December 31, 2017
| Shares, Principal Amount, or Number of Contracts | Value | |||||||
| U.S. GOVERNMENT AND AGENCY SECURITIES — (1.87)% | ||||||||
United States Treasury Bond | ||||||||
3.00%, 11/15/44 | $ | (16,000,000 | ) | $ | (16,813,120 | ) | ||
3.00%, 5/15/45 | (11,293,000 | ) | (11,865,149 | ) | ||||
|
| |||||||
| (28,678,269 | ) | |||||||
|
| |||||||
Total U.S. GOVERNMENT AND AGENCY SECURITIES | (28,678,269 | ) | ||||||
|
| |||||||
| COMMON STOCKS — (3.81)% | ||||||||
Internet — (1.31)% |
| |||||||
Alibaba Group Holding Ltd. ADR* | (116,750 | ) | (20,131,202 | ) | ||||
Media — 0.00% |
| |||||||
Charter Communications, Inc., Class A* | — | (123 | ) | |||||
Real Estate Investment Trusts — (0.45)% |
| |||||||
Quality Care Properties, Inc.* | (495,954 | ) | (6,849,125 | ) | ||||
Semiconductors — (1.37)% |
| |||||||
Microchip Technology, Inc. | (239,591 | ) | (21,055,257 | ) | ||||
Telecommunications — (0.68)% |
| |||||||
Ciena Corp.* | (495,800 | ) | (10,377,094 | ) | ||||
|
| |||||||
Total COMMON STOCKS | (58,412,801 | ) | ||||||
|
| |||||||
| ||||||||
TOTAL INVESTMENT SECURITIES SOLD | (7.33 | )% | $ | (112,436,876 | ) | |||
|
| |||||||
| ||||||||
| WRITTEN CALL OPTIONS — (0.26)% | ||||||||
NXP Semiconductors N.V. (Netherlands), Exercise Price: $110.00, | (3,100 | ) | $ | (4,030,000 | ) | |||
|
| |||||||
| ||||||||
TOTAL WRITTEN CALL OPTIONS | (0.26 | )% | $ | (4,030,000 | ) | |||
| ||||||||
| ||||||||
| * | Non-income producing security. |
| US | LIBOR — U.S. Dollar London Interbank Offered Rate. |
| LIBOR | 3 Month — 3 Month U.S. Dollar London Interbank Offered Rate. |
| 1 | Security is exempt from registration under Rule 144A of the Securities Act of 1933, as amended. Unless otherwise indicated, this security has been determined to be liquid under procedures established by Driehaus Mutual Funds’ (the “Trust”) Board of Trustees and may be resold in transactions exempt from registration, normally to qualified institutional buyers. |
| 2 | Variable or Floating rate security. Rates disclosed as of December 31, 2017. |
| 3 | All or a portion of this security is pledged as collateral for short sales or derivatives transactions. |
| 4 | Pursuant to procedures adopted by the Trust’s Board of Trustees, this security has been determined to be illiquid by Driehaus Capital Management LLC (the “Adviser”), investment adviser to the Fund. |
| 5 | Security is in default. |
| 6 | Security valued at fair value as determined in good faith by the Adviser, in accordance with procedures established by, and under the general supervision of, the Trust’s Board of Trustees. |
| 7 | Bank loans in which the Fund invests pay interest at rates which are periodically predetermined by reference to a base lending rate plus a premium. These base lending rates are generally (i) the lending rate offered by one or more major European banks, such as the London Inter-Bank Offered Rate (“LIBOR”), (ii) the prime rate offered by one or more United States banks or (iii) the certificate of deposit rate. Certain bank loans are subject to a LIBOR floor that establishes a minimum LIBOR rate. The interest rate shown reflects the rate in effect at December 31, 2017. Bank loans generally are subject to mandatory and/or optional repayment. As a result, the actual remaining maturity may be substantially less than the stated maturities shown. |
| 8 | Foreign security, par value shown in local currency (Euro). |
| 9 | Foreign security denominated in U.S. dollars and traded in the U.S. |
Percentages are stated as a percent of net assets.
Security Type | Percent of Total Net Assets | |||
Bank Loans | 30.67 | % | ||
Corporate Bonds | 49.10 | % | ||
Convertible Corporate Bonds | 2.98 | % | ||
U.S. Government and Agency Securities | 0.45 | % | ||
Common Stocks | 6.79 | % | ||
Convertible Preferred Stocks | 2.94 | % | ||
Preferred Stocks | 2.42 | % | ||
Purchased Put Options | 0.00 | % | ||
|
| |||
Total Investments | 95.35 | % | ||
Other Assets less Liabilities | 4.65 | % | ||
|
| |||
Total Net Assets | 100.00 | % | ||
|
| |||
Percentages are stated as a percent of net assets.
Notes to Financial Statements are an integral part of this Schedule.
8
Table of Contents
Driehaus Active Income Fund
Schedule of Investments
December 31, 2017
SWAP CONTRACTS
| Credit Default Swaps | ||||||||||||||||||||||||||||||||||||||||||
| Counterparty | Reference Instrument | Currency | Notional Amount(4) | Buy/Sell Protection(1)(2) | Pay (Receive) Fixed Rate | Payment Frequency | Expiration Date | Implied Credit Spread(3) | Upfront Premium Paid (Received) | Unrealized Appreciation/ (Depreciation) | Value | |||||||||||||||||||||||||||||||
Bank of America | Ally Financial, Inc. 7.50%, 9/15/20 | USD | 10,000,000 | Buy | 5.00 | % | Quarterly | 12/20/2018 | 0.17 | % | $ | (1,492,458 | ) | $ | 1,004,681 | $ | (487,777 | ) | ||||||||||||||||||||||||
JP Morgan | Hess Corp. 7.00%, 2/15/14 | USD | 8,000,000 | Buy | 1.00 | Quarterly | 6/20/2018 | 0.11 | 154,644 | (191,200 | ) | (36,556 | ) | |||||||||||||||||||||||||||||
Morgan Stanley | Hess Corp. 7.00%, 2/15/14 | USD | 4,000,000 | Buy | 1.00 | Quarterly | 6/20/2018 | 0.11 | 77,280 | (95,559 | ) | (18,279 | ) | |||||||||||||||||||||||||||||
Morgan Stanley | Hess Corp. 7.00%, 2/15/14 | USD | 4,000,000 | Buy | 1.00 | Quarterly | 6/20/2018 | 0.11 | 80,701 | (98,980 | ) | (18,279 | ) | |||||||||||||||||||||||||||||
Morgan Stanley | Hess Corp. 7.00%, 2/15/14 | USD | 4,000,000 | Buy | 1.00 | Quarterly | 6/20/2018 | 0.11 | 91,703 | (109,981 | ) | (18,278 | ) | |||||||||||||||||||||||||||||
Credit Suisse | Hess Corp. 7.00%, 2/15/14 | USD | 20,000,000 | Buy | 1.00 | Quarterly | 9/20/2018 | 0.12 | 309,975 | (444,949 | ) | (134,974 | ) | |||||||||||||||||||||||||||||
Goldman Sachs | SUPERVALU, Inc. 6.75%, 6/1/21 | USD | 17,660,000 | Buy | 5.00 | Quarterly | 12/20/2022 | 6.49 | 1,125,825 | (108,308 | ) | 1,017,517 | ||||||||||||||||||||||||||||||
Goldman Sachs | The Markit iTraxx Europe Crossover IndexSeries 20 | EUR | 10,000,000 | Buy | 5.00 | Quarterly | 12/20/2018 | 0.07 | (2,134,040 | ) | 1,528,369 | (605,671 | ) | |||||||||||||||||||||||||||||
Morgan Stanley | The Markit iTraxx Europe | |||||||||||||||||||||||||||||||||||||||||
| Crossover IndexSeries 20 | EUR | 10,000,000 | Buy | 5.00 | Quarterly | 12/20/2018 | 0.07 | (2,137,029 | ) | 1,531,358 | (605,671 | ) | ||||||||||||||||||||||||||||||
Morgan Stanley | The Markit iTraxx Europe | |||||||||||||||||||||||||||||||||||||||||
| Crossover IndexSeries 20 | EUR | 10,000,000 | Buy | 5.00 | Quarterly | 12/20/2018 | 0.07 | (2,252,200 | ) | 1,646,529 | (605,671 | ) | ||||||||||||||||||||||||||||||
|
|
|
|
|
| |||||||||||||||||||||||||||||||||||||
TOTAL CREDIT DEFAULT SWAPS |
| $ | (6,175,599 | ) | $ | 4,661,960 | $ | (1,513,639 | ) | |||||||||||||||||||||||||||||||||
|
|
|
|
|
| |||||||||||||||||||||||||||||||||||||
| 1 | If the Fund is a buyer of protection and a credit event occurs, as defined under the terms of that particular swap agreement, the Fund will either (i) receive from the seller of protection an amount equal to the notional amount of the swap and deliver the referenced obligation or underlying investments comprising the referenced index or (ii) receive a net settlement amount in the form of cash or investments equal to the notional amount of the swap less the recovery value of the referenced obligation or underlying investments comprising the referenced index. |
| 2 | If the Fund is a seller of protection and a credit event occurs, as defined under the terms of that particular swap agreement, the Fund will either (i) pay to the buyer of protection an amount equal to the notional amount of the swap and take delivery of the referenced obligation or underlying investments comprising the referenced index or (ii) pay a net settlement amount in the form of cash or investments equal to the notional amount of the swap less the recovery value of the referenced obligation or underlying investments comprising the referenced index. |
| 3 | An implied credit spread is the spread in yield between a U.S. Treasury security and the referenced obligation or underlying investment that are identical in all respects except for the quality rating. Implied credit spreads, represented in absolute terms, utilized in determining the value of credit default swap agreements on corporate and sovereign issues as of period end serve as an indicator of the current status of the payment/performance risk and represent the likelihood of risk of default for the credit derivative. The implied credit spread of a particular referenced entity reflects the cost of buying/selling protection and may include upfront payments required to be made to enter into the agreement. Wider credit spreads, in comparison to narrower credit spreads, represent a deterioration of the referenced entity’s credit soundness and a greater likelihood of risk of default or other credit event occurring as defined under the terms of the agreement. A credit spread identified as “Defaulted” indicates a credit event has occurred for the referenced entity or obligation. |
| 4 | The maximum potential amount the Fund could be required to pay as a seller of credit protection or receive as a buyer of credit protection if a credit event occurs as defined under the terms of that particular swap agreement. |
EUR — Euro
USD — United States Dollar
Notes to Financial Statements are an integral part of this Schedule.
9
Table of Contents
Driehaus Active Income Fund
Schedule of Investments
December 31, 2017
Total Return Swaps
|
| |||||||||||||||||||||||||||||||||
| Counterparty | Reference Instrument | Currency | Notional Amount | Pay/ Receive Total Return on Reference Instrument | Financing Rate3 | Payment Frequency | Termination Date | Upfront Premium Paid (Received) | Unrealized Appreciation/ (Depreciation) | Value | ||||||||||||||||||||||||
Goldman Sachs | Goldman Sachs Catch-Up Energy Index4 | USD | 1,934,167 | See Note 1 | 1-Month USD-LIBOR plus 0.40% | Monthly | 9/18/2018 | $ | — | $ | 185,031 | $ | 2,119,198 | |||||||||||||||||||||
Goldman Sachs | Goldman Sachs Stable Energy Index5 | USD | 6,515,378 | See Note 1 | 1-Month USD-LIBOR plus 0.40% | Monthly | 9/18/2018 | — | 895,065 | 7,410,443 | ||||||||||||||||||||||||
Goldman Sachs | Egypt Treasury Bill 0.00%, 6/5/2018 | EGP | 370,050,000 | See Note 2 | 3-Month USD-LIBOR plus 0.75% | At Termination | 6/5/2018 | 19,229,219 | 62,000 | 19,291,218 | ||||||||||||||||||||||||
|
|
|
|
|
| |||||||||||||||||||||||||||||
TOTAL TOTAL RETURN SWAPS |
| $ | 19,229,219 | $ | 1,142,096 | $ | 28,820,859 | |||||||||||||||||||||||||||
|
|
|
|
|
| |||||||||||||||||||||||||||||
| 1 | The Fund pays the financing rate. The Fund receives payment from the counterparty if the value of the total return of the reference index has increased and makes payment if the value has decreased. |
| 2 | The Fund pays the financing rate. The Fund receives payment from the counterparty if the value of the total return of the reference treasury bill has increased and makes payment if the value has decreased. |
| 3 | Financing rate is based upon predetermined notional amounts. |
| 4 | The Goldman Sachs Catch-Up Energy Index is a customized index comprised of 4 U.S. energy equity securities. |
| 5 | The Goldman Sachs Stable Energy Index is a customized index comprised of 5 U.S. energy equity securities. |
EGP — Egyptian Pound
USD — United States Dollar
1-Month USD-LIBOR — 1 Month U.S. Dollar London Interbank Offered Rate.
3-Month USD-LIBOR — 3 Month U.S. Dollar London Interbank Offered Rate.
SWAPTIONS
| Interest Rate Swaptions | ||||||||||||||||||||||||||||||
| Counterparty | Floating Rate Index | Currency | Notional Amount | Pay/ Receive Fixed Rate | Exercise Rate | Expiration Date | Premium Paid/ (Received) | Market Value | ||||||||||||||||||||||
Morgan Stanley | 3-Month USD-LIBOR | USD | 61,000,000 | Pay | 2.14 | % | 2/1/2018 | $ | 334,890 | $ | 375,756 | |||||||||||||||||||
Morgan Stanley | 3-Month USD-LIBOR | USD | 47,000,000 | Pay | 2.25 | 2/1/2018 | 366,835 | 285,560 | ||||||||||||||||||||||
Morgan Stanley | 3-Month USD-LIBOR | USD | 34,000,000 | Pay | 2.38 | 2/1/2018 | 373,558 | 211,841 | ||||||||||||||||||||||
|
|
|
| |||||||||||||||||||||||||||
TOTAL INTEREST RATE SWAPTIONS |
| $ | 1,075,283 | $ | 873,157 | |||||||||||||||||||||||||
|
|
|
| |||||||||||||||||||||||||||
USD — United States Dollar
3-Month USD-LIBOR — 3 Month U.S. Dollar London Interbank Offered Rate.
Notes to Financial Statements are an integral part of this Schedule.
10
Table of Contents
Driehaus Active Income Fund
Schedule of Investments
December 31, 2017
FUTURES CONTRACTS
| Counterparty | Futures Contracts | Number of Contracts (Short) | Expiration Date | Notional Amount | Value at December 31, 2017 | Unrealized Appreciation/ (Depreciation) | ||||||||||||||||
Goldman Sachs | U.S. 5 Year Treasury Note | (2,158 | ) | March 29, 2018 | $ | (251,595,160 | ) | $ | (250,682,128 | ) | $ | 913,032 | ||||||||||
Goldman Sachs | U.S. 10 Year Treasury Note | (640 | ) | March 20, 2018 | (79,646,856 | ) | (79,390,016 | ) | 256,840 | |||||||||||||
Goldman Sachs | U.S. Treasury Long Bond | (277 | ) | March 20, 2018 | (42,149,358 | ) | (42,381,000 | ) | (231,642 | ) | ||||||||||||
|
|
|
|
|
| |||||||||||||||||
TOTAL FUTURES CONTRACTS |
| $ | (373,391,374 | ) | $ | (372,453,144 | ) | $ | 938,230 | |||||||||||||
|
|
|
|
|
| |||||||||||||||||
FORWARD FOREIGN CURRENCY CONTRACTS
| Counterparty | Currency Purchased | Currency Sold | Settlement Date | Unrealized Appreciation/ (Depreciation) | ||||||||||||||||||||
Goldman Sachs | USD | 9,373,600 | EUR | 8,000,000 | February 2, 2018 | $ | (245,022 | ) | ||||||||||||||||
|
| |||||||||||||||||||||||
TOTAL FORWARD FOREIGN CURRENCY CONTRACTS |
| $ | (245,022 | ) | ||||||||||||||||||||
|
| |||||||||||||||||||||||
EUR = Euro
USD = United States Dollar
Notes to Financial Statements are an integral part of this Schedule.
11
Table of Contents
Driehaus Event Driven Fund — Portfolio Managers’ Letter
Dear Shareholders,
The Driehaus Event Driven Fund (“Fund”) returned 4.35% for the year ended December 31, 2017. This return is in comparison to the performance of the Fund’s benchmark, the S&P 500 Index (the “Benchmark”), which returned 21.83% for the same period, and the Citigroup 3-Month T-Bill Index, an additional index against which the Fund’s performance may be compared, which returned 0.84%.
As financial markets closed the ninth year of the bull market, activity in the event-driven investing category continued to be robust. According to Dealogic and Citi, mergers and acquisitions (M&A) volume (as measured in dollars) was the third highest annual level since the 2008 crisis. Importantly, this elevated M&A volume brought with it a material increase in purchase multiples — as measured by enterprise value-to-earnings before interest, taxes, depreciation and amortization (EBITDA), multiples rose to 14.0 times, well above the long term average of 11.6 times. Additionally, market activity for IPOs and spinoffs remained similarly robust.
Within the Fund, catalyst-driven long equity positions were the most significant contributors to performance during the year. The largest single contributor from this strategy was a long equity position in a company that develops and distributes biomedical treatments; the stock’s positive performance was primarily due to the release of efficacy data related to one of its drugs. The second largest contributor from this strategy was also a healthcare company. The company focuses on small molecule cancer drugs for genetically defined patient subsets and had positive performance due to the company’s announcement that a large number of patients responded favorably to treatment from one of its drugs. However, not all catalyst-driven long equity positions performed well. The single largest detractor from the Fund’s return was an equity catalyst-driven trade in a motion picture production and distribution company. The company’s stock underperformed expectations due to a weak summer box office and the on-going threat of premium on-demand movie viewing in the home. Notably, the Fund’s bond catalyst-driven trades also contributed positively to Fund returns. Bond catalyst-driven trades are typically event driven trades that are expressed predominately through bond positions.
Portfolio hedges detracted the most from Fund returns during the year. In particular, a biotech ETF used as a hedge to the Fund’s long single-stock equity exposure detracted from performance for the year as sentiment improved surrounding the prospects for the biotech industry. Portfolio hedges typically include options, forwards on currencies, indices or commodities, credit default swaps, and interest rate futures. These securities are generally used to hedge unwanted exposures, such as to the equity market, foreign currencies or credit risks, or to help dampen market volatility.
Risk arbitrage trades also detracted from performance for the year. Risk arbitrage trades attempt to capture a valuation discrepancy between similar securities. The biggest detractor was a trade in which the merger spread widened after the Department of Justice filed a lawsuit to block closure of the proposed transaction. This legal action significantly altered the probability of deal closure. The merger spread became far less attractive and the Fund exited the position.
Within the Fund, we seek to have lower volatility than the Benchmark. For the year, Fund volatility was 7.12% versus the Benchmark volatility of 6.77%. 2017 was a year of unprecedented low volatility making it difficult to achieve our goal. We also seek to provide some diversification from the Benchmark. For 2017, the Fund’s correlation to the Benchmark was 0.54.
As the Fund enters 2018, our focus remains committed to capitalizing on our repeatable process for investment ideas and trade structures. Creating asymmetric risk reward set ups, aligned with incentivized key players that are successful stewards of capital, will continue to be a focal point. Likewise, an emphasis on producing outcomes with limited correlation to the broader markets and keying in on optimal structuring across asset classes will remain an area of interest. Seminal changes such as financial deregulation, E-commerce penetration and the further blurring of retailer lines, and an FDA supportive of new drug approvals are taking place. Tax reform will have implications across industries, company structures and investment cycles. Given the significance of the tax legislation, we think the tentacles of the reform will ripple through the financial system and capital structures throughout the year intermittently, much like the US election outcome of 2016 had a finger on the pulse of markets throughout this past year.
12
Table of Contents
As we look ahead into 2018, we believe the historically low volatility regime that has gripped the global markets for the better part of two years will come to an end in 2018, likely driven by higher interest rate volatility as a response to an uptick in global growth and inflation expectations. We expect that this regime change will be supportive of our strategy and look forward to opportunities that may arise as a result.
As always, we thank you for your investment in the Driehaus Event Driven Fund. We appreciate your confidence in our management capabilities.
Sincerely,
|  | |
| K.C. Nelson | Michael Caldwell | |
| Portfolio Manager | Assistant Portfolio Manager |
 |  | |
| Tom McCauley | Yoav Sharon | |
| Assistant Portfolio Manager | Assistant Portfolio Manager |
Performance is historical and does not represent future results.
Please see the following performance page for index definitions.
13
Table of Contents
Performance Overview (unaudited)
The performance summarized below is historical and does not represent future results. Investment returns and principal value vary, and you may have a gain or loss when you sell shares. Performance data presented measures the change in the value of an investment in the Fund, assuming reinvestment of all dividends and capital gains.
The table does not reflect the deduction of taxes that a shareholder would pay on Fund distributions or the redemption of Fund shares. The graph compares the results of a $10,000 investment in the Fund since August 26, 2013 (the date of the Fund’s inception), with all dividends and capital gains reinvested, with the indicated indices (and dividends reinvested) for the same period.
Average Annual Total Returns as of 12/31/17 | 1 Year | 3 Years | Since Inception | |||||||||
Driehaus Event Driven Fund (DEVDX)1 | 4.35% | 3.12% | 2.92% | |||||||||
S&P 500 Index2 | 21.83% | 11.41% | 13.87% | |||||||||
FTSE 3-Month T-Bill Index3 | 0.84% | 0.38% | 0.27% | |||||||||
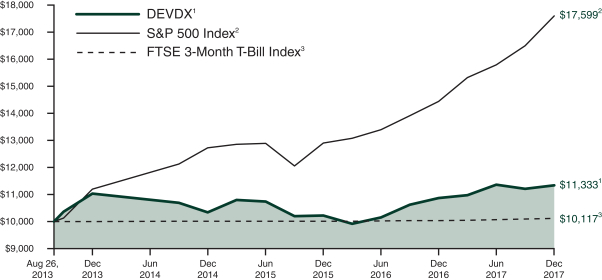
| 1 | The returns for the periods prior to March 1, 2014, reflect fee waivers and/or reimbursements without which performance would have been lower. |
| 2 | The S&P 500 Index consists of 500 stocks chosen for market size, liquidity and industry group. It is a market-weighted index, with each stock’s weight in the index proportionate to its market value. |
| 3 | The FTSE 3-Month T-Bill Index is designed to mirror the performance of the 3-month U.S. Treasury Bill. The FTSE 3-Month T-Bill Index is unmanaged and its returns reflect reinvestment of all distributions and changes in market prices. |
14
Table of Contents
Driehaus Event Driven Fund
Schedule of Investments
December 31, 2017
| Shares, Principal Amount, or Number of Contracts | Value | |||||||
| BANK LOANS — 4.91% | ||||||||
Advertising — 2.20% |
| |||||||
Getty Images, Inc. | $ | 3,989,529 | $ | 3,646,868 | ||||
Cosmetics/Personal Care — 1.83% |
| |||||||
Revlon Consumer Products Corp. | 4,050,011 | 3,029,915 | ||||||
Telecommunications — 0.88% |
| |||||||
Avaya, Inc. | 1,470,000 | 1,449,332 | ||||||
|
| |||||||
Total BANK LOANS | 8,126,115 | |||||||
|
| |||||||
| CORPORATE BONDS — 15.55% | ||||||||
Banks — 1.63% |
| |||||||
USB Realty Corp. | 3,000,000 | 2,703,750 | ||||||
Commercial Services — 4.65% |
| |||||||
Rent-A-Center, Inc. | 6,801,000 | 6,426,945 | ||||||
Syniverse Foreign Holdings Corp. | 1,250,000 | 1,268,750 | ||||||
|
| |||||||
| �� | 7,695,695 | |||||||
|
| |||||||
Distribution/Wholesale — 3.83% |
| |||||||
Matalan Finance PLC (United Kingdom) | 4,750,000 | 8 | 6,347,070 | |||||
Diversified Financial Services — 0.41% |
| |||||||
Abe Investment Holdings, Inc./Getty Images, Inc. | 1,000,000 | 680,000 | ||||||
Telecommunications — 5.03% |
| |||||||
HC2 Holdings, Inc. | 8,205,000 | 8,338,331 | ||||||
|
| |||||||
Total CORPORATE BONDS | 25,764,846 | |||||||
|
| |||||||
| COMMON STOCK — 68.47% | ||||||||
Biotechnology — 8.73% |
| |||||||
Blueprint Medicines Corp.* | 39,082 | 2,947,174 | ||||||
Loxo Oncology, Inc.*3 | 136,690 | 11,506,564 | ||||||
|
| |||||||
| 14,453,738 | ||||||||
|
| |||||||
| Shares, Principal Amount, or Number of Contracts | Value | |||||||
Building Materials — 8.12% |
| |||||||
Builders FirstSource, Inc.* | 229,758 | $ | 5,006,427 | |||||
Eagle Materials, Inc. | 45,804 | 5,189,593 | ||||||
Martin Marietta Materials, Inc.3 | 14,742 | 3,258,572 | ||||||
|
| |||||||
| 13,454,592 | ||||||||
|
| |||||||
Chemicals — 6.03% |
| |||||||
Huntsman Corp. | 160,882 | 5,355,762 | ||||||
Venator Materials PLC (United Kingdom)* | 209,142 | 4,626,221 | ||||||
|
| |||||||
| 9,981,983 | ||||||||
|
| |||||||
Commercial Services — 2.47% |
| |||||||
Quanta Services, Inc.* | 85,353 | 3,338,156 | ||||||
Rent-A-Center, Inc. | 68,390 | 759,129 | ||||||
|
| |||||||
| 4,097,285 | ||||||||
|
| |||||||
Healthcare — Services — 1.31% |
| |||||||
Natera, Inc.*3 | 242,300 | 2,178,277 | ||||||
Insurance — 6.24% |
| |||||||
FGL Holdings (Bermuda)*3 | 1,027,075 | 10,342,645 | ||||||
Media — 1.68% |
| |||||||
TiVo Corp.3 | 178,272 | 2,781,043 | ||||||
Pharmaceuticals — 10.66% |
| |||||||
Aclaris Therapeutics, Inc.* | 155,525 | 3,835,246 | ||||||
Akorn, Inc.* | 107,474 | 3,463,887 | ||||||
Array Biopharma, Inc.* | 361,167 | 4,622,938 | ||||||
Catalyst Pharmaceuticals, Inc.* | 87,058 | 340,397 | ||||||
Clementia Pharmaceuticals, Inc. (Canada)* | 220,487 | 4,184,843 | ||||||
Concert Pharmaceuticals, Inc.* | 46,548 | 1,204,197 | ||||||
|
| |||||||
| 17,651,508 | ||||||||
|
| |||||||
Retail — 1.02% |
| |||||||
Group 1 Automotive, Inc. | 23,703 | 1,682,202 | ||||||
Savings & Loans — 5.73% |
| |||||||
OceanFirst Financial Corp.3 | 180,438 | 4,736,498 | ||||||
Oritani Financial Corp.3 | 183,563 | 3,010,433 | ||||||
Waterstone Financial, Inc. | 102,165 | 1,741,913 | ||||||
|
| |||||||
| 9,488,844 | ||||||||
|
| |||||||
Semiconductors — 7.91% |
| |||||||
NXP Semiconductors N.V. (Netherlands)* | 111,968 | 13,110,333 | ||||||
Software — 0.92% |
| |||||||
Avaya Holdings Corp.* | 87,008 | 1,526,990 | ||||||
Transportation — 7.65% |
| |||||||
XPO Logistics, Inc.*3 | 138,331 | 12,669,736 | ||||||
|
| |||||||
Total COMMON STOCK | 113,419,176 | |||||||
|
| |||||||
Notes to Financial Statements are an integral part of this Schedule.
15
Table of Contents
Driehaus Event Driven Fund
Schedule of Investments
December 31, 2017
| Shares, Principal Amount, or Number of Contracts | Value | |||||||
| CONVERTIBLE PREFERRED STOCK — 0.00% | ||||||||
Auto Manufacturers — 0.00% |
| |||||||
General Motors Corp. Senior Convertible Preferred Escrow — B | 25,000 | $ | — | |||||
General Motors Corp. Senior Convertible Preferred Escrow — C | 162,750 | — | ||||||
|
| |||||||
Total CONVERTIBLE PREFERRED STOCK | — | |||||||
|
| |||||||
| ||||||||
TOTAL INVESTMENTS | 88.93 | % | $ | 147,310,137 | ||||
Other Assets less Liabilities | 11.07 | % | 18,337,612 | |||||
|
|
|
| |||||
Net Assets | 100.00 | % | $ | 165,647,749 | ||||
| ||||||||
| SECURITIES SOLD SHORT — (13.56)% | ||||||||
| CORPORATE BONDS — (1.68)% | ||||||||
Cosmetics/Personal Care — (1.68)% |
| |||||||
Revlon Consumer Products Corp. | $ | (3,640,000 | ) | $ | (2,784,600 | ) | ||
|
| |||||||
Total CORPORATE BONDS | (2,784,600 | ) | ||||||
|
| |||||||
| COMMON STOCK — (0.91)% | ||||||||
Real Estate Investment Trusts — (0.91)% |
| |||||||
Quality Care Properties, Inc. * | (109,055 | ) | (1,506,049 | ) | ||||
|
| |||||||
Total COMMON STOCK | (1,506,049 | ) | ||||||
|
| |||||||
| EXCHANGE-TRADED FUNDS — (10.97)% | ||||||||
iShares Nasdaq Biotechnology ETF | (50,400 | ) | (5,381,208 | ) | ||||
iShares PHLX Semiconductor ETF | (12,938 | ) | (2,197,002 | ) | ||||
SPDR S&P Biotech ETF | (124,825 | ) | (10,593,898 | ) | ||||
|
| |||||||
Total EXCHANGE-TRADED FUNDS | (18,172,108 | ) | ||||||
|
| |||||||
| ||||||||
TOTAL INVESTMENT SECURITIES SOLD SHORT | (13.56 | )% | $ | (22,462,757 | ) | |||
|
| |||||||
| ||||||||
| WRITTEN CALL OPTIONS — (0.69)% | ||||||||
NXP Semiconductors N.V. (Netherlands), Exercise Price: $110.00, Notional Amount $(9,625,000), Expiration Date: January 18, 2019* | (875 | ) | (1,137,500 | ) | ||||
|
| |||||||
| ||||||||
TOTAL WRITTEN CALL OPTIONS | (0.69 | )% | $ | (1,137,500 | ) | |||
| ||||||||
| * | Non-income producing security. |
| US | LIBOR — U.S. Dollar London Interbank Offered Rate. |
| LIBOR | 3 Month — 3 Month U.S. Dollar London Interbank Offered Rate. |
| 1 | Security is exempt from registration under Rule 144A of the Securities Act of 1933, as amended. Unless otherwise indicated, this security has been determined to be liquid under procedures established by Driehaus Mutual Funds’ ( the “Trust”) Board of Trustees and may be resold in transactions exempt from registration, normally to qualified institutional buyers. |
| 2 | Variable or floating rate security. Rates disclosed as of December 31, 2017. |
| 3 | All or a portion of this security is pledged as collateral for short sales or derivatives transactions. |
| 4 | Pursuant to procedures adopted by the Trust’s Board of Trustees, this security has been determined to be illiquid by Driehaus Capital Management LLC (the “Adviser”), investment adviser to the Fund. |
| 5 | Security is in default. |
| 6 | Security valued at fair value as determined in good faith by the Adviser, in accordance with procedures established by, and under the general supervision of, the Trust’s Board of Trustees. |
| 7 | Bank loans in which the Fund invests pay interest at rates which are periodically predetermined by reference to a base lending rate plus a premium. These base lending rates are generally (i) the lending rate offered by one or more major European banks, such as the London Inter-Bank Offered Rate (“LIBOR”), (ii) the prime rate offered by one or more United States banks or (iii) the certificate of deposit rate. Certain bank loans are subject to a LIBOR floor that establishes a minimum LIBOR rate. The interest rate shown reflects the rate in effect at December 31, 2017. Bank loans generally are subject to mandatory and/or optional repayment. As a result, the actual remaining maturity may be substantially less than the stated maturities shown. |
| 8 | Foreign security, par value shown in local currency (British Pound). |
Percentages are stated as a percent of net assets.
Security Type | Percent of Total Net Assets | |||
Corporate Bonds | 15.55 | % | ||
Common Stock | 68.47 | % | ||
Convertible Preferred Stock | 0.0 | % | ||
Bank Loans | 4.91 | % | ||
|
| |||
Total Investments | 88.93 | % | ||
Other Assets less Liabilities | 11.07 | % | ||
|
| |||
Total Net Assets | 100.00 | % | ||
|
| |||
Percentages are stated as a percent of net assets.
Notes to Financial Statements are an integral part of this Schedule.
16
Table of Contents
Driehaus Event Driven Fund
Schedule of Investments
December 31, 2017
FORWARD FOREIGN CURRENCY CONTRACTS
| Counterparty | Currency Purchased | Currency Sold | Settlement Date | Unrealized Appreciation/ (Depreciation) | ||||||||||||||||||||
Goldman Sachs | USD | 6,216,372 | GBP | 4,750,000 | February 2, 2018 | $ | (203,913 | ) | ||||||||||||||||
|
| |||||||||||||||||||||||
TOTAL FORWARD FOREIGN CURRENCY CONTRACTS |
| $ | (203,913 | ) | ||||||||||||||||||||
|
| |||||||||||||||||||||||
GBP = British Pound
USD = United States Dollar
Notes to Financial Statements are an integral part of this Schedule.
17
Table of Contents
Driehaus Multi-Asset Growth Economies Fund — Portfolio Managers’ Letter
Dear Fellow Shareholders,
The Driehaus Multi-Asset Growth Economies Fund (“Fund”) returned 21.14% for the period from inception on April 10, 2017 through December 31, 2017.1 The Fund’s primary benchmark, which is an equally weighted benchmark comprised 50% by the Morgan Stanley Capital International (“MSCI”) Emerging Markets Index and 50% by the JP Morgan Global Bond Index Emerging Markets Global Diversified (“Benchmark”), returned 15.47% for the same time period, while the MSCI Emerging Markets Index returned 22.72%.
Multiple factors set the stage for a robust year of global equity market performance. Strong economic figures, notably European GDP (gross domestic product) and North Asian trade data, confirmed a pickup in coordinated global growth. At the same time, subdued US inflation sustained market expectations of a modest interest rate tightening cycle, while progress on tax reform lifted investor sentiment. Moderate depreciation of the US dollar versus most major currencies further helped encourage risk-on sentiment.
In 2017, equity security selection in the financials, information technology and telecommunications sectors contributed to the Fund’s return versus the Benchmark. From a country perspective, holdings in China and India made key contributions to performance versus the Benchmark in the period since the Fund’s inception.
Ping An Insurance Group Co. of China, Ltd. (Ticker: 2318 HK) was one of the most significant contributors to the Fund’s return on an absolute basis. The China-based company provides personal financial products and services such as insurance, banking and investments. Earnings growth from life and health insurance as well as the asset management business drove core business growth. Additionally, the proprietary financial technology powering the company’s ecosystem has become increasingly valuable and a key differentiating factor.
For 2017, stock selection within the energy and utilities sectors detracted from the Fund’s returns versus the Benchmark. At the country level, holdings in Pakistan and Brazil detracted from Fund performance versus the Benchmark.
One of the most significant detractors from Fund performance was an equity holding in Pakistan, United Bank, Ltd. (Ticker: UBL PA). The company provides commercial banking and related services. Political uncertainty in the country regarding corruption investigations targeted at the sitting Prime Minister, a widening current account deficit and foreign exchange concerns drove down the company’s share price. However, fundamentals remain strong with superior margins and solid potential for growth.
The non-equity allocations in the Fund generally consist of sovereign bonds and derivatives, including purchased and written options on currencies and index ETFs, interest rate swaps and foreign currency forward contracts. These positions are primarily utilized to hedge or gain exposure to certain market segments, hedge against interest rate fluctuations and manage currency risk in the Fund’s equity holdings. Since the Fund’s inception in April, these positions, in aggregate, contributed to the Fund’s return. From a country perspective, the top contributors were in South Africa and Egypt. The Fund holds a small position in South African bonds that is currency hedged. We have remained underweight in South Africa given the risk in local politics, foreign flows exposure and high volatility of the currency. Egyptian treasury bill holdings also contributed to returns. The low beta nature, high yields and stable currency of these treasury bills support the Fund’s objective of achieving high volatility-adjusted returns. Interest rate swap positions were a detractor in 2017 due to the rising inflation caused by currency volatility and rising energy prices. This increase in inflation and inflation expectations led the Bank of Mexico to raise the policy rate which worked counter to the Fund’s positioning.
We remain positive on the prospects for emerging markets, particularly relative to developed markets. The case for emerging markets is built upon attractive relative valuations and improving fundamentals, most notably a better outlook for profit margins and growth, more disciplined corporate management, and structural reforms supporting macroeconomic conditions. From a multi-asset perspective, we continue to be overweight equities relative to other assets as they are best-positioned to benefit from a growth recovery and a recovery in profitability. Despite that view, we see cyclical optimism across markets globally as being very high, equities being broadly expensive and thus we continue to look for lower volatility fixed income positions to fill out the portfolio. We see the outlook for emerging market foreign currency in 2018 as supportive given anticipated continuation of US dollar weakness and the fact that most emerging market currencies remain cheap on a trade-weighted basis. As such, we expect inflows to continue to be strong into the asset class.
18
Table of Contents
We thank you for your interest in the Driehaus Multi-Asset Growth Economies Fund and would like to express our gratitude to you as shareholders for your confidence in our management capabilities.
Sincerely,
 |
| |
| Rich Thies | Chad Cleaver | |
| Lead Portfolio Manager | Portfolio Manager |

 |
| |
| Howard Schwab | Ayman Ahmed | |
| Portfolio Manager | Assistant Portfolio Manager |

| 1 | During this period, the Fund’s returns reflect fee waivers and/or expense reimbursements without which performance would have been lower. |
Performance is historical and does not represent future results.
Please see the following performance overview page for index descriptions.
19
Table of Contents
Driehaus Multi-Asset Growth Economies Fund
Performance Overview (unaudited)
The performance summarized below is historical and does not represent future results. Investment returns and principal value vary, and you may have a gain or loss when you sell shares. Performance data presented measures the change in the value of an investment in the Fund, assuming reinvestment of all dividends and capital gains.
The table does not reflect the deduction of taxes that a shareholder would pay on Fund distributions or the redemption of Fund shares. The graph compares the results of a $10,000 investment in the Fund since April 10, 2017 (the date of the Fund’s inception), with all dividends and capital gains reinvested, with the indicated indices (and dividends reinvested) for the same period.
| Cumulative Total Returns as of 12/31/17 | Since Inception (4/10/17 - 12/31/17) | |||
Driehaus Multi-Asset Growth Economies Fund (DMAGX)1 | 21.14% | |||
MSCI EM/JP Morgan GBI Blended Index2 | 15.47% | |||
MSCI Emerging Markets Index-N3 | 22.72% | |||
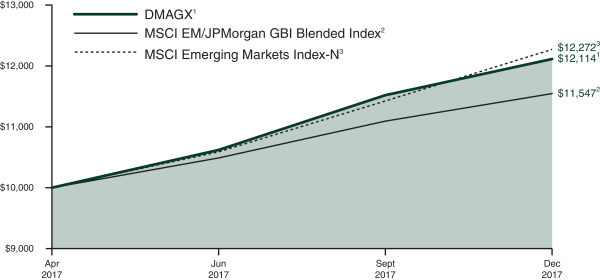
| 1 | The returns for the period reflect fee waivers and/or reimbursements without which performance would have been lower. |
| 2 | The MSCI EM/JPMorgan GBI Blended Index is an equally weighted benchmark comprised of 50 percent by the Morgan Stanley Capital International Emerging Markets Index-Net (MSCI EM) and 50 percent by the JPMorgan Global Bond Index Emerging Markets Global Diversified (JPMorgan GBI). The MSCI EM is a market capitalization-weighted index designed to measure equity market performance in emerging markets and the JPMorgan GBI tracks debt instruments in the emerging markets. Source: Morgan Stanley Capital International Inc. and JPMorgan. |
| 3 | The Morgan Stanley Capital International Emerging Markets Index-Net (MSCI Emerging Markets Index-N) is a market capitalization-weighted index designed to measure equity market performance in emerging markets. Data is in U.S. dollars and is calculated with net dividend reinvestment. Source: Morgan Stanley Capital International Inc. |
20
Table of Contents
Driehaus Multi-Asset Growth Economies Fund
Schedule of Investments
December 31, 2017
| Shares, Principal Amount, or Number of Contracts | Value | |||||||
| SOVEREIGN BONDS — 21.88% | ||||||||
Argentina — 4.62% |
| |||||||
Letras del Banco Central de la Republica Argentina | 15,000,000 | 7 | $ | 748,091 | ||||
Letras del Banco Central de la Republica Argentina | 21,000,000 | 7 | 971,773 | |||||
Provincia de Buenos Aires 25.36% (BADLARPP+383 basis points), 5/31/222,6,7 | 5,000,000 | 7 | 277,316 | |||||
|
| |||||||
| 1,997,180 | ||||||||
|
| |||||||
Egypt — 4.66% |
| |||||||
Egypt Treasury Bills | 10,000,000 | 7 | 508,406 | |||||
Egypt Treasury Bills | 18,000,000 | 7 | 907,395 | |||||
Egypt Treasury Bills | 12,400,000 | 7 | 598,496 | |||||
|
| |||||||
| 2,014,297 | ||||||||
|
| |||||||
Indonesia — 3.82% |
| |||||||
Indonesia Treasury Bond | 19,827,000,000 | 7 | 1,651,129 | |||||
Malaysia — 2.12% |
| |||||||
Malaysia Government Bond | 3,750,000 | 7 | 914,695 | |||||
Mexico — 2.19% |
| |||||||
Mexican Bonos 7.50%, 6/3/277 | 188,000 | 7 | 945,092 | |||||
Poland — 2.37% |
| |||||||
Republic of Poland Government Bond 2.50%, 7/25/277 | 3,800,000 | 7 | 1,021,299 | |||||
South Africa — 2.10% |
| |||||||
Republic of South Africa Government Bond | 12,466,000 | 7 | 906,240 | |||||
|
| |||||||
Total SOVEREIGN BONDS | 9,449,932 | |||||||
|
| |||||||
| EQUITY SECURITIES — 69.45% | ||||||||
Argentina — 2.16% |
| |||||||
MercadoLibre, Inc.3 | 1,612 | 507,232 | ||||||
Telecom Argentina SA ADR3 | 11,601 | 424,945 | ||||||
|
| |||||||
| 932,177 | ||||||||
|
| |||||||
Brazil — 5.08% |
| |||||||
Ambev SA ADR3 | 36,518 | 235,906 | ||||||
Banco do Brasil SA | 22,876 | 219,443 | ||||||
Banco Santander Brasil SA | 35,316 | 339,415 | ||||||
| Shares, Principal Amount, or Number of Contracts | Value | |||||||
Hypermarcas SA | 16,414 | $ | 178,139 | |||||
Odontoprev SA | 61,471 | 294,837 | ||||||
Petroleo Brasileiro SA — SP ADR*3 | 31,715 | 326,347 | ||||||
Vale SA — ADR3 | 48,878 | 597,778 | ||||||
|
| |||||||
| 2,191,865 | ||||||||
|
| |||||||
Canada — 0.53% |
| |||||||
IAMGOLD Corp.*3 | 39,131 | 228,134 | ||||||
China — 23.02% |
| |||||||
58.com, Inc. ADR*3 | 2,423 | 173,414 | ||||||
AIA Group, Ltd. | 62,353 | 531,919 | ||||||
Alibaba Group Holding, Ltd. — SP ADR*3 | 8,169 | 1,408,581 | ||||||
Aluminum Corp. of China, Ltd. — H* | 320,069 | 229,004 | ||||||
China Construction Bank Corp. — H | 294,018 | 270,953 | ||||||
China Life Insurance Co., Ltd. — H | 97,349 | 305,894 | ||||||
China Shenhua Energy Co., Ltd. | 127,000 | 329,167 | ||||||
CSPC Pharmaceutical Group, Ltd. | 254,238 | 513,494 | ||||||
GDS Holdings, Ltd. ADR*3 | 11,619 | 261,776 | ||||||
Hangzhou Hikvision Digital Technology Co., Ltd. — A | 52,584 | 314,923 | ||||||
Industrial & Commercial Bank of China, Ltd. | 540,117 | 434,837 | ||||||
JD.com, Inc. ADR*3 | 7,829 | 324,277 | ||||||
Kweichow Moutai Co., Ltd. — A | 5,572 | 596,808 | ||||||
Lee & Man Paper Manufacturing, Ltd. | 210,594 | 249,061 | ||||||
Li Ning Co., Ltd.* | 410,489 | 332,577 | ||||||
Ping An Insurance Group Co. of China, Ltd. — H | 91,247 | 950,088 | ||||||
Sands China, Ltd. | 103,410 | 534,065 | ||||||
Silergy Corp. | 10,000 | 228,506 | ||||||
Tencent Holdings, Ltd. | 34,119 | 1,773,005 | ||||||
Tonghua Dongbao Pharmaceutical Co., Ltd. | 50,300 | 176,807 | ||||||
|
| |||||||
| 9,939,156 | ||||||||
|
| |||||||
Cyprus — 0.58% |
| |||||||
TCS Group Holding PLC GDR | 13,342 | 251,497 | ||||||
Czech Republic — 0.56% |
| |||||||
Moneta Money Bank AS1 | 62,310 | 241,118 | ||||||
Egypt — 0.33% |
| |||||||
Commercial International Bank Egypt SAE — GDR | 32,956 | 143,194 | ||||||
Notes to Financial Statements are an integral part of this Schedule.
21
Table of Contents
Driehaus Multi-Asset Growth Economies Fund
Schedule of Investments
December 31, 2017
| Shares, Principal Amount, or Number of Contracts | Value | |||||||
France — 0.79% |
| |||||||
LVMH Moet Hennessy Louis Vuitton SE | 1,162 | $ | 342,158 | |||||
Greece — 1.37% |
| |||||||
Hellenic Telecommunications Organization SA | 26,772 | 369,424 | ||||||
OPAP SA | 17,768 | 223,859 | ||||||
|
| |||||||
| 593,283 | ||||||||
|
| |||||||
India — 5.25% |
| |||||||
Crompton Greaves Consumer Electricals, Ltd. | 16,842 | 72,695 | ||||||
HDFC Bank, Ltd. — ADR3 | 6,643 | 675,394 | ||||||
Housing Development Finance Corp., Ltd. | 9,839 | 263,658 | ||||||
ICICI Bank, Ltd. — SP ADR3 | 31,852 | 309,920 | ||||||
Petronet LNG, Ltd. | 64,362 | 256,883 | ||||||
Tata Consultancy Services, Ltd. | 10,315 | 436,534 | ||||||
Vakrangee, Ltd. | 38,058 | 250,580 | ||||||
|
| |||||||
| 2,265,664 | ||||||||
|
| |||||||
Indonesia — 2.18% |
| |||||||
PT Bank Central Asia Tbk | 223,597 | 360,920 | ||||||
PT Bank Tabungan Negara Persero Tbk | 1,333,063 | 350,767 | ||||||
Telekomunikasi Indonesia Persero Tbk | 703,023 | 230,066 | ||||||
|
| |||||||
| 941,753 | ||||||||
|
| |||||||
Malaysia — 1.03% |
| |||||||
Public Bank BHD | 86,387 | 443,568 | ||||||
Mexico — 2.60% |
| |||||||
America Movil S.A.B. de C.V. — L — SP | 14,634 | 250,973 | ||||||
Grupo Financiero Banorte S.A.B. de | 76,625 | 420,215 | ||||||
Prologis Property Mexico S.A. de C.V. | 133,409 | 230,756 | ||||||
Wal-Mart de Mexico S.A.B. de C.V. | 89,902 | 220,337 | ||||||
|
| |||||||
| 1,122,281 | ||||||||
|
| |||||||
Pakistan — 0.99% |
| |||||||
United Bank, Ltd. | 252,244 | 429,672 | ||||||
Philippines — 0.66% |
| |||||||
BDO Unibank, Inc. | 86,277 | 283,442 | ||||||
Qatar — 0.46% |
| |||||||
Qatar National Bank QPSC | 5,661 | 197,443 | ||||||
| Shares, Principal Amount, or Number of Contracts | Value | |||||||
Russia — 3.03% |
| |||||||
Gazprom PJSC — ADR | 63,899 | $ | 281,794 | |||||
MMC Norilsk Nickel PJSC ADR | 20,463 | 383,477 | ||||||
Sberbank of Russia PJSC — SP ADR | 37,974 | 642,900 | ||||||
|
| |||||||
| 1,308,171 | ||||||||
|
| |||||||
South Africa — 2.52% |
| |||||||
Capitec Bank Holdings, Ltd. | 2,395 | 212,537 | ||||||
MTN Group, Ltd. | 44,895 | 495,669 | ||||||
Sasol, Ltd. | 10,921 | 377,947 | ||||||
|
| |||||||
| 1,086,153 | ||||||||
|
| |||||||
South Korea — 8.42% |
| |||||||
Hana Financial Group, Inc. | 12,309 | 572,592 | ||||||
ING Life Insurance Korea, Ltd.1 | 5,003 | 249,554 | ||||||
LG Chem, Ltd.* | 808 | 305,675 | ||||||
Macquarie Korea Infrastructure Fund | 33,158 | 255,526 | ||||||
Netmarble Games Corp.*1 | 1,718 | 302,501 | ||||||
POSCO ADR*3 | 2,745 | 214,467 | ||||||
Samsung Biologics Co., Ltd.*1 | 1,253 | 434,228 | ||||||
Samsung Electronics Co., Ltd. | 491 | 1,168,622 | ||||||
SK Holdings Co., Ltd. | 508 | 134,290 | ||||||
|
| |||||||
| 3,637,455 | ||||||||
|
| |||||||
Taiwan — 4.40% |
| |||||||
Cathay Financial Holding Co., Ltd. | 347,578 | 624,878 | ||||||
MediaTek, Inc. | 28,331 | 279,897 | ||||||
Silicon Motion Technology Corp. — ADR3 | 8,150 | 431,624 | ||||||
Taiwan Semiconductor Manufacturing Co., Ltd. — SP ADR | 73,175 | 564,331 | ||||||
|
| |||||||
| 1,900,730 | ||||||||
|
| |||||||
Thailand — 0.73% |
| |||||||
Kasikornbank PCL — NVDR | 25,247 | 179,727 | ||||||
Star Petroleum Refining PCL — NVDR | 262,324 | 137,642 | ||||||
|
| |||||||
| 317,369 | ||||||||
|
| |||||||
Turkey — 1.03% |
| |||||||
Turkcell Iletisim Hizmetleri AS | 109,210 | 446,002 | ||||||
United Arab Emirates — 0.96% |
| |||||||
Abu Dhabi Commercial Bank PJSC | 106,704 | 197,557 | ||||||
DP World, Ltd. | 8,738 | 218,450 | ||||||
|
| |||||||
| 416,007 | ||||||||
|
| |||||||
Notes to Financial Statements are an integral part of this Schedule.
22
Table of Contents
Driehaus Multi-Asset Growth Economies Fund
Schedule of Investments
December 31, 2017
| Shares, Principal Amount, or Number of Contracts | Value | |||||||
United States — 0.77% |
| |||||||
Applied Materials, Inc.3 | 6,488 | $ | 331,667 | |||||
|
| |||||||
Total EQUITY SECURITIES | 29,989,959 | |||||||
|
| |||||||
| PURCHASED CALL OPTION — 0.08% | ||||||||
OTC TRY vs USD Exercise Price: $3.92, Notional Amount: $3,920,000 | 1,000,000 | 31,909 | ||||||
|
| |||||||
Total PURCHASED CALL OPTION | 31,909 | |||||||
|
| |||||||
| EQUITY CERTIFICATES — 1.44% | ||||||||
India — 1.44% |
| |||||||
Hindustan Petroleum Corp., Ltd.5 | 19,440 | 127,493 | ||||||
ITC, Ltd.5 | 48,407 | 199,650 | ||||||
Mahanagar Gas, Ltd.5 | 8,711 | 149,374 | ||||||
Motherson Sumi Systems, Ltd.*5 | 24,507 | 145,616 | ||||||
|
| |||||||
Total EQUITY CERTIFICATES | 622,133 | |||||||
|
| |||||||
| ||||||||
TOTAL INVESTMENTS | 92.85 | % | $ | 40,093,933 | ||||
Other Assets less Liabilities | 7.15 | % | 3,089,460 | |||||
|
|
|
| |||||
Net Assets | 100.00 | % | $ | 43,183,393 | ||||
| ||||||||
| * | Non-income producing security. |
ADR — American Depository Receipt
BADLARPP Index — Argentina Deposit Rates Badlar Private Banks ARS 30 to 35 Days
CALY — Calyon Securities
GDR — Global Depository Receipt
NVDR — Non-Voting Depository Receipt
SP ADR — Sponsored American Depository Receipt
TRY — Turkish Lira
USD — United States Dollar
| 1 | Security is exempt from registration under Rule 144A of the Securities Act of 1933, as amended. Unless otherwise indicated, this security has been determined to be liquid under procedures established by Driehaus Mutual Funds’ (the “Trust”) Board of Trustees and may be resold in transactions exempt from registration, normally to qualified institutional buyers. |
| 2 | Variable or floating rate security. Rates disclosed as of December 31, 2017. |
| 3 | All or a portion of this security is pledged as collateral for short sales or derivatives transactions. |
| 4 | Foreign security denominated in U.S. dollars and traded in the U.S. |
| 5 | Restricted security — Investments in securities not registered under the Securities Act of 1933, excluding 144A securities. At December 31, 2017, the value of these restricted securities amounted to $622,133 or 1.44% of net assets. These restricted securities have not been deemed illiquid. |
| 6 | Daily valuation of security includes daily interest income. |
| 7 | Foreign security, par value shown in local currency. |
Percentages are stated as a percent of net assets.
Additional information on each restricted security is as follows:
Security | Counter- Party | Acquisition Date(s) | Acquisition Costs | |||||||||
Hindustan Petroleum Corp., Ltd. | CALY | 5/17/17 | $ | 110,524 | ||||||||
ITC, Ltd. | CALY | 4/11/17 | $ | 205,716 | ||||||||
Mahanagar Gas, Ltd. | CALY | 4/11/17 | $ | 124,025 | ||||||||
Motherson Sumi Systems, Ltd. | CALY | 4/11/17 | $ | 97,179 | ||||||||
Notes to Financial Statements are an integral part of this Schedule.
23
Table of Contents
Driehaus Multi-Asset Growth Economies Fund
Schedule of Investments
December 31, 2017
Security Type/Sector | Percent of Total Net Assets | |||
Sovereign Bonds | 21.88 | % | ||
Equity Securities | 69.45 | % | ||
Purchased Call Options | 0.08 | % | ||
Equity Certificates | 1.44 | % | ||
|
| |||
Total Investments | 92.85 | % | ||
Other Assets less Liabilities | 7.15 | % | ||
|
| |||
Total Net Assets | 100.00 | % | ||
|
| |||
Regional Weightings(a)
Asia/Far East Ex-Japan | 53.07% | |||
South America | 11.86% | |||
Africa | 9.61% | |||
Eastern Europe | 7.78% | |||
North America | 6.17% | |||
Middle East | 2.99% | |||
Western Europe | 1.37% |
| (a) | All percentages are stated as a percent of net assets at December 31, 2017. |
SWAP CONTRACTS
| Credit Default Swaps | ||||||||||||||||||||||||||||||||||||||||||
| Counterparty | Reference Instrument | Currency | Notional Amount(4) | Buy/Sell Protection(1)(2) | Pay (Receive) Fixed Rate | Payment Frequency | Expiration Date | Implied Credit Spread(3) | Upfront Premium | Unrealized Appreciation/ (Depreciation) | Value | |||||||||||||||||||||||||||||||
Goldman Sachs | United Mexican States 4.15%, 3/28/27 5 Year Senior Debt | USD | 3,500,000 | Buy | 1.00 | % | Quarterly | 12/20/2022 | 1.06 | % | $ | 18,257 | $ | (9,721 | ) | $ | 8,536 | |||||||||||||||||||||||||
|
|
|
|
|
| |||||||||||||||||||||||||||||||||||||
TOTAL CREDIT DEFAULT SWAPS |
| $ | 18,257 | $ | (9,721 | ) | $ | 8,536 | ||||||||||||||||||||||||||||||||||
|
|
|
|
|
| |||||||||||||||||||||||||||||||||||||
| 1 | If the Fund is a buyer of protection and a credit event occurs, as defined under the terms of that particular swap agreement, the Fund will either (i) receive from the seller of protection an amount equal to the notional amount of the swap and deliver the referenced obligation or underlying investments comprising the referenced index or (ii) receive a net settlement amount in the form of cash or investments equal to the notional amount of the swap less the recovery value of the referenced obligation or underlying investments comprising the referenced index. |
| 2 | If the Fund is a seller of protection and a credit event occurs, as defined under the terms of that particular swap agreement, the Fund will either (i) pay to the buyer of protection an amount equal to the notional amount of the swap and take delivery of the referenced obligation or underlying investments comprising the referenced index or (ii) pay a net settlement amount in the form of cash or investments equal to the notional amount of the swap less the recovery value of the referenced obligation or underlying investments comprising the referenced index. |
| 3 | An implied credit spread is the spread in yield between a U.S. Treasury security and the referenced obligation or underlying investment that are identical in all respects except for the quality rating. Implied credit spreads, represented in absolute terms, utilized in determining the value of credit default swap agreements on corporate and sovereign issues as of period end serve as an indicator of the current status of the payment/performance risk and represent the likelihood of risk of default for the credit derivative. The implied credit spread of a particular referenced entity reflects the cost of buying/selling protection and may include upfront payments required to be made to enter into the agreement. Wider credit spreads, in comparison to narrower credit spreads, represent a deterioration of the referenced entity’s credit soundness and a greater likelihood of risk of default or other credit event occurring as defined under the terms of the agreement. A credit spread identified as “Defaulted” indicates a credit event has occurred for the referenced entity or obligation. |
| 4 | The maximum potential amount the Fund could be required to pay as a seller of credit protection or receive as a buyer of credit protection if a credit event occurs as defined under the terms of that particular swap agreement. |
USD — United States Dollar
Notes to Financial Statements are an integral part of this Schedule.
24
Table of Contents
Driehaus Multi-Asset Growth Economies Fund
Schedule of Investments
December 31, 2017
SWAP CONTRACTS
| Interest Rate Swaps | ||||||||||||||||||||||||
| Counterparty | Notional Amount | Fixed Rate | Floating Rate Index | Payment Frequency | Expiration Date | Value/ Unrealized Appreciation/ (Depreciation) | ||||||||||||||||||
Chicago Mercantile Exchange | BRL | 14,545,467 | 9.10 | %2 | 1- Day BRL BZDIOVRA2 | Daily | 1/4/2021 | $ | 24,800 | |||||||||||||||
LCH Clearnet Limited | CZK | 235,000,000 | 0.99 | %1 | 6-Months CZK PRIBOR1 | Semi-Annually | 9/15/2019 | (33,258 | ) | |||||||||||||||
LCH Clearnet Limited | CZK | 220,000,000 | 1.20 | %1 | 6-Months CZK PRIBOR1 | Semi-Annually | 11/14/2019 | (12,324 | ) | |||||||||||||||
LCH Clearnet Limited | CZK | 95,000,000 | 1.26 | %2 | 6-Months CZK PRIBOR2 | Semi-Annually | 9/15/2022 | 63,301 | ||||||||||||||||
LCH Clearnet Limited | CZK | 90,000,000 | 1.55 | %2 | 6-Months CZK PRIBOR2 | Semi-Annually | 11/14/2022 | 10,035 | ||||||||||||||||
Goldman Sachs | EUR | 1,200,000 | 1.46 | %1 | 6-Months EUR EURIBOR1 | Semi-Annually | 12/15/2047 | (12,637 | ) | |||||||||||||||
Goldman Sachs | EUR | 15,200,000 | (0.19 | %)2 | 6-Months EUR EURIBOR2 | Semi-Annually | 12/15/2019 | 10,673 | ||||||||||||||||
LCH Clearnet Limited | HUF | 1,200,000,000 | 0.19 | %2 | 6-Months HUF BUBOR2 | Semi-Annually | 11/14/2019 | 743 | ||||||||||||||||
Bank of America | HUF | 1,350,000,000 | 0.20 | %2 | 6-Months HUF BUBOR2 | Semi-Annually | 11/17/2019 | 75 | ||||||||||||||||
LCH Clearnet Limited | HUF | 1,330,000,000 | 0.22 | %2 | 6-Months HUF BUBOR2 | Semi-Annually | 12/8/2019 | (1,391 | ) | |||||||||||||||
LCH Clearnet Limited | HUF | 255,000,000 | 1.89 | %1 | 6-Months HUF BUBOR1 | Semi-Annually | 11/14/2027 | 19,645 | ||||||||||||||||
Bank of America | HUF | 290,000,000 | 1.89 | %1 | 6-Months HUF BUBOR1 | Semi-Annually | 11/17/2027 | 21,335 | ||||||||||||||||
LCH Clearnet Limited | HUF | 284,000,000 | 1.77 | %1 | 6-Months HUF BUBOR1 | Semi-Annually | 12/8/2027 | 6,721 | ||||||||||||||||
Bank of America | INR | 2,020,000,000 | 6.33 | %1 | 1-Day INR MIBOR1 | Daily | 12/14/2018 | (41,991 | ) | |||||||||||||||
Bank of America | INR | 450,000,000 | 6.61 | %2 | 1-Day INR MIBOR1 | Daily | 12/14/2022 | 19,208 | ||||||||||||||||
LCH Clearnet Limited | ZAR | 34,000,000 | 8.00 | %1 | 3-Months ZAR JIBAR Safex1 | Quarterly | 11/30/2022 | 80,230 | ||||||||||||||||
LCH Clearnet Limited | ZAR | 35,000,000 | 7.97 | %1 | 3-Months ZAR JIBAR Safex1 | Quarterly | 12/6/2022 | 78,574 | ||||||||||||||||
|
| |||||||||||||||||||||||
TOTAL INTEREST RATE SWAPS |
| $ | 233,739 | |||||||||||||||||||||
|
| |||||||||||||||||||||||
| 1 | Fund Pays the floating rate and receives the fixed rate. |
| 2 | Fund Pays the fixed rate and receives the floating rate. |
BRL — Brazilian Real
CZK — Czech Koruna
EUR — Euro
HUF — Hungarian Forint
INR — Indian Rupee
ZAR — South African Rand
BZDIOVRA — Brazil Interbank Deposit Rate
PRIBO6M — Czech Interbank Offered Rate
EUR006M — Euro Interbank Offered Rate
BUBOR06M — National Bank of Budapest Interbank Offerred Rate
IN000/N — FBIL Overnight Mumbai Interbank Outright Rate
JIBA3M — SAFE South Africa Johannesburg Interbank Agreed Rate
Notes to Financial Statements are an integral part of this Schedule.
25
Table of Contents
Driehaus Multi-Asset Growth Economies Fund
Schedule of Investments
December 31, 2017
FORWARD FOREIGN CURRENCY CONTRACTS
| Counterparty | Currency Purchased | Currency Sold | Settlement Date | Unrealized Appreciation/ (Depreciation) | ||||||||||||||||||||
Morgan Stanley & Co. | RUB | 30,175,000 | USD | 500,000 | February 1, 2018 | $ | 21,169 | |||||||||||||||||
Morgan Stanley & Co. | RUB | 29,585,000 | USD | 500,000 | February 1, 2018 | 10,979 | ||||||||||||||||||
Morgan Stanley & Co. | TRY | 2,500,000 | USD | 660,607 | February 1, 2018 | (7,617 | ) | |||||||||||||||||
Morgan Stanley & Co. | USD | 650,257 | TRY | 2,500,000 | February 1, 2018 | (2,733 | ) | |||||||||||||||||
Morgan Stanley & Co. | USD | 660,607 | ZAR | 9,188,657 | February 1, 2018 | (78,232 | ) | |||||||||||||||||
Morgan Stanley & Co. | ZAR | 9,088,970 | USD | 650,257 | February 1, 2018 | 80,566 | ||||||||||||||||||
Morgan Stanley & Co. | RUB | 29,510,000 | USD | 500,000 | February 2, 2018 | 9,612 | ||||||||||||||||||
Morgan Stanley & Co. | USD | 500,000 | COP | 1,524,250,000 | February 5, 2018 | (8,990 | ) | |||||||||||||||||
Morgan Stanley & Co. | USD | 500,000 | COP | 1,513,500,000 | February 5, 2018 | (5,401 | ) | |||||||||||||||||
|
| |||||||||||||||||||||||
TOTAL FORWARD FOREIGN CURRENCY CONTRACTS |
| $ | 19,353 | |||||||||||||||||||||
|
| |||||||||||||||||||||||
COP = Colombian Peso
RUB = Russian Ruble
TRY = Turkish Lira
USD = United States Dollar
ZAR = South African Rand
Notes to Financial Statements are an integral part of this Schedule.
26
Table of Contents
Statements of Assets and Liabilities
December 31, 2017
Driehaus Active Income Fund | Driehaus Event Driven Fund | Driehaus Multi-Asset Growth Economies Fund | ||||||||||
ASSETS: | ||||||||||||
Investment securities, at fair value (cost $1,432,068,967, $137,001,359 and $34,818,694, respectively) | $ | 1,462,859,957 | $ | 147,310,137 | $ | 40,062,024 | ||||||
Purchased options contracts, at fair value (premiums paid $151,991, $0 and $14,588, respectively) | — | — | 31,909 | |||||||||
Purchased swaptions contracts, at fair value (premiums paid $1,075,283, $0 and $0, respectively) | 873,157 | — | — | |||||||||
Foreign currency, at fair value (cost $0, $0 and $84,196, respectively) | — | — | 82,041 | |||||||||
Unrealized appreciation on forward foreign currency contracts | — | — | 122,326 | |||||||||
Unrealized appreciation on open swap contracts | 6,853,033 | — | 335,340 | |||||||||
Premiums paid on open swap contracts | 21,069,347 | — | 18,257 | |||||||||
Cash | 2,178,520 | 13,750,201 | 2,014,441 | |||||||||
Collateral held at custodian for the benefit of brokers | 130,527,182 | 28,486,752 | 696,291 | |||||||||
Receivable for investment securities sold | 37,279,252 | 327,615 | 2,246,582 | |||||||||
Receivable for fund shares sold | 561,397 | 67,059 | — | |||||||||
Receivable for interest and dividends | 17,178,349 | 301,809 | 137,534 | |||||||||
Receivable from custodian | 4,383 | — | — | |||||||||
Prepaid expenses | 50,269 | 18,180 | 25,385 | |||||||||
|
|
|
|
|
| |||||||
| ||||||||||||
TOTAL ASSETS | 1,679,434,846 | 190,261,753 | 45,772,130 | |||||||||
|
|
|
|
|
| |||||||
| ||||||||||||
LIABILITIES: | ||||||||||||
Payable for investment securities sold short, at fair value (proceeds $93,088,800, $20,951,152 and $0, respectively) | 112,436,876 | 22,462,757 | — | |||||||||
Written options outstanding, at fair value (premiums received $1,610,037, $454,126 and $0, respectively) | 4,030,000 | 1,137,500 | — | |||||||||
Foreign currency due to custodian, at fair value (proceeds $181, $0 and $2,693, respectively) | 183 | — | 2,728 | |||||||||
Unrealized depreciation on open swap contracts | 1,048,977 | — | 111,322 | |||||||||
Unrealized depreciation on forward foreign currency contracts | 245,022 | 203,913 | 102,973 | |||||||||
Premiums received on open swap contracts | 8,015,727 | — | — | |||||||||
Payable for investment securities purchased | 3,313,819 | 312,188 | 2,245,794 | |||||||||
Payable for fund shares redeemed | 13,661,021 | 163,053 | — | |||||||||
Payable to affiliate | 752,149 | 137,769 | 64,746 | |||||||||
Payable for interest and dividends on securities sold short | 766,114 | 91,875 | — | |||||||||
Payable for variation margin on futures contracts | 410,219 | — | — | |||||||||
Accrued shareholder services plan fees | 259,001 | 26,795 | — | |||||||||
Accrued administration and accounting fees | 59,613 | 9,661 | 2,530 | |||||||||
Accrued foreign capital gains taxes | — | — | 3,994 | |||||||||
Accrued expenses | 165,866 | 68,493 | 54,650 | |||||||||
|
|
|
|
|
| |||||||
| ||||||||||||
TOTAL LIABILITIES | 145,164,587 | 24,614,004 | 2,588,737 | |||||||||
|
|
|
|
|
| |||||||
| ||||||||||||
NET ASSETS | $ | 1,534,270,259 | $ | 165,647,749 | $ | 43,183,393 | ||||||
|
|
|
|
|
| |||||||
SHARES OUTSTANDING (Unlimited shares authorized, no par value) | 155,650,842 | 15,350,817 | 3,743,556 | |||||||||
|
|
|
|
|
| |||||||
NET ASSET VALUE, OFFERING AND REDEMPTION PRICE PER SHARE | $ | 9.86 | $ | 10.79 | $ | 11.54 | ||||||
|
|
|
|
|
| |||||||
| ||||||||||||
NET ASSETS CONSISTED OF THE FOLLOWING AT DECEMBER 31, 2017: | ||||||||||||
Paid-in-capital | $ | 1,982,983,935 | $ | 172,252,792 | $ | 37,481,615 | ||||||
Undistributed net investment income (loss) | 1,884,025 | (467,790 | ) | (9,632 | ) | |||||||
Undistributed net realized gain (loss) on investments, options, swaptions, securities sold short, futures contracts, swap contracts, forward foreign currency contracts and foreign currency | (465,765,685 | ) | (14,047,367 | ) | 206,428 | |||||||
Net unrealized appreciation (depreciation) on: | ||||||||||||
Investments | 30,790,990 | 10,308,778 | 5,243,330 | |||||||||
Purchased options contracts | (151,991 | ) | — | 17,321 | ||||||||
Purchased swaptions contracts | (202,126 | ) | — | — | ||||||||
Securities sold short | (19,348,076 | ) | (1,511,605 | ) | — | |||||||
Written options contracts | (2,419,963 | ) | (683,374 | ) | — | |||||||
Futures contracts | 938,230 | — | — | |||||||||
Swap contracts | 5,804,056 | — | 224,018 | |||||||||
Forward foreign currency contracts | (245,022 | ) | (203,913 | ) | 19,353 | |||||||
Foreign currency | (2 | ) | — | (2,190 | ) | |||||||
Foreign currency translations | 1,888 | 228 | 3,150 | |||||||||
|
|
|
|
|
| |||||||
NET ASSETS | $ | 1,534,270,259 | $ | 165,647,749 | $ | 43,183,393 | ||||||
|
|
|
|
|
| |||||||
| ||||||||||||
Notes to Financial Statements are an integral part of these Statements.
27
Table of Contents
For the year ended December 31, 2017
Driehaus Active Income Fund | Driehaus Event Driven Fund | Driehaus Multi-Asset Growth Economies Fund* | ||||||||||
INVESTMENT INCOME (LOSS): | ||||||||||||
Interest income (net of $0, $0, and $7,615 of non-reclaimable foreign taxes withheld, respectively) | $ | 80,431,807 | $ | 1,695,059 | $ | 342,175 | ||||||
Dividend income (net of $0, $0, and $64,137 of non-reclaimable foreign taxes withheld, respectively) | 12,846,645 | 1,923,448 | 424,926 | |||||||||
|
|
|
|
|
| |||||||
| ||||||||||||
Total investment income | 93,278,452 | 3,618,507 | 767,101 | |||||||||
|
|
|
|
|
| |||||||
| ||||||||||||
Expenses: | ||||||||||||
Investment advisory fees | 10,913,512 | 1,876,435 | 198,175 | |||||||||
Shareholder services plan fees | 3,100,973 | 370,650 | — | |||||||||
Administration and fund accounting fees | 796,069 | 131,350 | 15,539 | |||||||||
Transfer agent fees and expenses | 391,505 | 63,752 | 30,241 | |||||||||
Trustees’ fees | 207,498 | 61,103 | 21,042 | |||||||||
Federal and state registration fees | 125,540 | 31,473 | 6,383 | |||||||||
Reports to shareholders | 98,182 | 41,048 | 9,296 | |||||||||
Custody fees | 70,248 | 5,746 | 14,976 | |||||||||
Legal fees | 68,484 | 25,782 | 13,068 | |||||||||
Audit and tax fees | 57,760 | 57,760 | 46,000 | |||||||||
Chief compliance officer fees | 18,744 | 18,744 | 14,028 | |||||||||
Interest on short positions | 4,120,951 | 328,214 | — | |||||||||
Dividends on short positions | 2,673,014 | 204,133 | — | |||||||||
Interest expense | 488,604 | 53,954 | — | |||||||||
Miscellaneous | 223,751 | 56,105 | 36,399 | |||||||||
|
|
|
|
|
| |||||||
Total expenses | 23,354,835 | 3,326,249 | 405,147 | |||||||||
Fees paid indirectly | (50,779 | ) | (23,832 | ) | — | |||||||
Fees waived by Adviser | — | — | (58,341 | ) | ||||||||
|
|
|
|
|
| |||||||
Net expenses | 23,304,056 | 3,302,417 | 346,806 | |||||||||
|
|
|
|
|
| |||||||
| ||||||||||||
Net investment income (loss) | 69,974,396 | 316,090 | 420,295 | |||||||||
|
|
|
|
|
| |||||||
| ||||||||||||
NET REALIZED AND UNREALIZED GAIN (LOSS) ON INVESTMENTS: | ||||||||||||
Net realized gain (loss) on transactions from: | ||||||||||||
Investments | (452,462 | ) | 27,651,559 | 2,109,325 | ||||||||
Purchased options contracts | (538,103 | ) | (1,444,876 | ) | (165,752 | ) | ||||||
Purchased swaptions contracts | (118,981 | ) | — | — | ||||||||
Securities sold short | (51,014,281 | ) | (5,482,282 | ) | — | |||||||
Written options contracts | — | — | 26,492 | |||||||||
Futures contracts | (7,361,194 | ) | — | — | ||||||||
Swap contracts | (20,747,346 | ) | (2,112,355 | ) | (154,113 | ) | ||||||
Forward foreign currency contracts | (524,457 | ) | (1,107,014 | ) | 1,274 | |||||||
Foreign currency | 120,924 | 85,647 | (37,588 | ) | ||||||||
|
|
|
|
|
| |||||||
| ||||||||||||
Net realized gain (loss) on investments | (80,635,900 | ) | 17,590,679 | 1,779,638 | ||||||||
|
|
|
|
|
| |||||||
| ||||||||||||
Change in net unrealized appreciation (depreciation) on: | ||||||||||||
Investments | 20,299,532 | (9,944,143 | ) | 2,789,312 | ||||||||
Purchased options contracts | 473,603 | 1,379,197 | 17,321 | |||||||||
Purchased swaptions contracts | (3,391,698 | ) | — | — | ||||||||
Securities sold short | (7,275,857 | ) | (253,940 | ) | — | |||||||
Written options contracts | (2,419,963 | ) | (683,374 | ) | — | |||||||
Futures contracts | (1,136,988 | ) | — | — | ||||||||
Swap contracts | 10,997,541 | (152,804 | ) | 224,018 | ||||||||
Forward foreign currency contracts | (334,000 | ) | (324,931 | ) | 19,353 | |||||||
Foreign currency | (10,132 | ) | — | (2,241 | ) | |||||||
Foreign currency translations | 8,411 | 228 | 2,437 | |||||||||
|
|
|
|
|
| |||||||
Net change in net unrealized appreciation (depreciation) on investments | 17,210,449 | (9,979,767 | ) | 3,050,200 | ||||||||
|
|
|
|
|
| |||||||
| ||||||||||||
Net realized and unrealized gain (loss) on investments | (63,425,451 | ) | 7,610,912 | 4,829,838 | ||||||||
|
|
|
|
|
| |||||||
| ||||||||||||
NET INCREASE (DECREASE) IN NET ASSETS RESULTING FROM OPERATIONS | $ | 6,548,945 | $ | 7,927,002 | $ | 5,250,133 | ||||||
|
|
|
|
|
| |||||||
| ||||||||||||
| * | Fund commenced operations on April 10, 2017 |
Notes to Financial Statements are an integral part of these Statements.
28
Table of Contents
(This page intentionally left blank)
Table of Contents
Statements of Changes in Net Assets
| Driehaus Active Income Fund | Driehaus Event Driven Fund | |||||||||||||||
Year Ended December 31, | Year Ended December 31, 2016 | Year Ended December 31, | Year Ended December 31, | |||||||||||||
Operations: | ||||||||||||||||
Net investment income (loss) | $ | 69,974,396 | $ | 80,370,007 | $ | 316,090 | $ | 409,668 | ||||||||
Net realized gain (loss) on investments | (80,635,900 | ) | (104,062,682 | ) | 17,590,679 | (7,233,352 | ) | |||||||||
Net change in unrealized appreciation (depreciation) on investments | 17,210,449 | 151,767,866 | (9,979,767 | ) | 19,880,665 | |||||||||||
|
|
|
|
|
|
|
| |||||||||
| ||||||||||||||||
Net increase (decrease) in net assets resulting from operations | 6,548,945 | 128,075,191 | 7,927,002 | 13,056,981 | ||||||||||||
|
|
|
|
|
|
|
| |||||||||
| ||||||||||||||||
Distributions: | ||||||||||||||||
Net investment income | (74,683,208 | ) | (79,985,655 | ) | — | (2,312,787 | ) | |||||||||
Tax return of capital | — | — | — | (736,638 | ) | |||||||||||
Net capital gains | — | — | — | — | ||||||||||||
|
|
|
|
|
|
|
| |||||||||
Total distributions | (74,683,208 | ) | (79,985,655 | ) | — | (3,049,425 | ) | |||||||||
|
|
|
|
|
|
|
| |||||||||
| ||||||||||||||||
Capital share transactions: | ||||||||||||||||
Proceeds from shares sold | 533,408,414 | 651,023,207 | 66,521,757 | 95,816,829 | ||||||||||||
Reinvested distributions | 40,540,265 | 44,649,390 | — | 2,654,029 | ||||||||||||
Cost of shares redeemed | (1,246,371,265 | ) | (1,344,927,935 | ) | (165,282,973 | ) | (84,452,324 | ) | ||||||||
|
|
|
|
|
|
|
| |||||||||
Net increase (decrease) from capital transactions | (672,422,586 | ) | (649,255,338 | ) | (98,761,216 | ) | 14,018,534 | |||||||||
|
|
|
|
|
|
|
| |||||||||
Total increase (decrease) in net assets | (740,556,849 | ) | (601,165,802 | ) | (90,834,214 | ) | 24,026,090 | |||||||||
|
|
|
|
|
|
|
| |||||||||
| ||||||||||||||||
NET ASSETS: | ||||||||||||||||
| ||||||||||||||||
Beginning of period | $ | 2,274,827,108 | $ | 2,875,992,910 | $ | 256,481,963 | $ | 232,455,873 | ||||||||
|
|
|
|
|
|
|
| |||||||||
End of period | $ | 1,534,270,259 | $ | 2,274,827,108 | $ | 165,647,749 | $ | 256,481,963 | ||||||||
|
|
|
|
|
|
|
| |||||||||
Undistributed net investment income (loss) | $ | 1,884,025 | $ | 15,419,092 | $ | (467,790 | ) | $ | (582,052 | ) | ||||||
|
|
|
|
|
|
|
| |||||||||
| ||||||||||||||||
Capital share transactions in shares: | ||||||||||||||||
Shares sold | 53,202,812 | 65,691,151 | 6,332,559 | 9,701,497 | ||||||||||||
Reinvested distributions | 4,096,719 | 4,516,230 | — | 258,174 | ||||||||||||
Shares redeemed | (125,133,149 | ) | (135,715,627 | ) | (15,782,409 | ) | (8,751,928 | ) | ||||||||
|
|
|
|
|
|
|
| |||||||||
Net increase (decrease) | (67,833,618 | ) | (65,508,246 | ) | (9,449,850 | ) | 1,207,743 | |||||||||
|
|
|
|
|
|
|
| |||||||||
| ||||||||||||||||
| * | Fund commenced operations on April 10, 2017 |
Notes to Financial Statements are an integral part of these Statements.
30
Table of Contents
Statements of Changes in Net Assets
| Driehaus Multi-Asset Growth Economies Fund | ||
| For the Period April 10, 2017* through December 31, 2017 | ||
| $ | 420,295 | |
| 1,779,638 |
|
| 3,050,200 |
|
|
| |
|
| |
| 5,250,133 |
|
|
| |
|
| |
| (555,003 | ) | |
| — | ||
| (1,463,728 | ) | |
|
| |
| (2,018,731 | ) | |
|
| |
|
| |
|
| |
| 38,153,988 | ||
| 2,018,731 | ||
| (220,728 | ) | |
|
| |
| 39,951,991 |
|
|
| |
| 43,183,393 |
|
|
| |
|
| |
|
| |
| $ | — | |
|
| |
| $ | 43,183,393 | |
|
| |
$ | (9,632 | ) |
|
| |
|
| |
| 3,586,704 | ||
| 177,393 | ||
| (20,541 | ) | |
|
| |
| 3,743,556 | ||
|
| |
|
| |
Notes to Financial Statements are an integral part of these Statements.
31
Table of Contents
Driehaus Active Income Fund
| For the year ended December 31, 2017 | For the year ended December 31, 2016 | For the year ended December 31, 2015 | For the year ended December 31, 2014 | For the year ended December 31, 2013 | ||||||||||||||||
Net asset value, beginning of period | $ | 10.18 | $ | 9.95 | $ | 10.42 | $ | 10.77 | $ | 10.67 | ||||||||||
|
|
|
|
|
|
|
|
|
| |||||||||||
INCOME FROM INVESTMENT OPERATIONS: | ||||||||||||||||||||
Net investment income1 | 0.35 | 0.32 | 0.38 | 0.27 | 0.30 | |||||||||||||||
Net realized and unrealized gain (loss) on investments | (0.29 | ) | 0.23 | (0.49 | ) | (0.36 | ) | 0.02 | ||||||||||||
|
|
|
|
|
|
|
|
|
| |||||||||||
Total from investment operations | 0.06 | 0.55 | (0.11 | ) | (0.09 | ) | 0.32 | |||||||||||||
|
|
|
|
|
|
|
|
|
| |||||||||||
LESS DISTRIBUTIONS TO SHAREHOLDERS FROM: | ||||||||||||||||||||
Net investment income | (0.38 | ) | (0.32 | ) | (0.36 | ) | (0.26 | ) | (0.22 | ) | ||||||||||
Net realized gain | — | — | — | — | — | |||||||||||||||
|
|
|
|
|
|
|
|
|
| |||||||||||
Total distributions | (0.38 | ) | (0.32 | ) | (0.36 | ) | (0.26 | ) | (0.22 | ) | ||||||||||
|
|
|
|
|
|
|
|
|
| |||||||||||
Net asset value, end of period | $ | 9.86 | $ | 10.18 | $ | 9.95 | $ | 10.42 | $ | 10.77 | ||||||||||
|
|
|
|
|
|
|
|
|
| |||||||||||
Total Return | 0.59 | % | 5.63 | % | (1.07 | )% | (0.87 | )% | 2.99 | % | ||||||||||
SUPPLEMENTAL DATA AND RATIOS: | ||||||||||||||||||||
Net assets, end of period (in 000’s) | $ | 1,534,270 | $ | 2,274,827 | $ | 2,875,993 | $ | 3,982,787 | $ | 4,607,803 | ||||||||||
Ratio of total expenses before reimbursements, waivers, recaptures and/or fees paid indirectly to average net assets | 1.18 | % | 1.38 | % | 1.05 | % | 1.05 | % | 1.14 | % | ||||||||||
Ratio of total expenses net of reimbursements, waivers, recaptures and/or fees paid indirectly to average net assets | 1.17 | %2 | 1.38 | %2 | 1.05 | % | 1.05 | % | 1.14 | % | ||||||||||
Ratio of expenses (excluding dividends and interest on short positions and interest expense) before reimbursements, waivers, recaptures and/or fees paid indirectly to average net assets | 0.81 | % | 0.80 | % | 0.78 | % | 0.77 | % | 0.79 | % | ||||||||||
Ratio of expenses (excluding dividends and interest on short positions and interest expense) net of reimbursements, waivers, recaptures and/or fees paid indirectly to average net assets | 0.81 | %2 | 0.80 | %2 | 0.78 | % | 0.77 | % | 0.79 | % | ||||||||||
Ratio of net investment income (including dividends and interest on short positions and interest expense) net of reimbursements, waivers, recaptures and/or fees paid indirectly to average net assets | 3.53 | % | 3.20 | % | 3.69 | % | 2.51 | % | 2.80 | % | ||||||||||
Ratio of net investment income (excluding dividends and interest on short positions and interest expense) net of reimbursements, waivers, recaptures and/or fees paid indirectly to average net assets | 3.89 | % | 3.78 | % | 3.96 | % | 2.79 | % | 3.15 | % | ||||||||||
Portfolio turnover rate | 89 | % | 115 | % | 76 | % | 43 | % | 48 | % | ||||||||||
| 1 | Calculated based on average shares outstanding. |
| 2 | Such ratios are net of fees paid indirectly (see Note C in the Notes to Financial Statements). |
Notes to Financial Statements are an integral part of this Schedule.
32
Table of Contents
Driehaus Event Driven Fund
Financial Highlights
| For the year ended December 31, 2017 | For the year ended December 31, 2016 | For the year ended December 31, 2015 | For the year ended December 31, 2014 | For the period August 26, 2013* through December 31, 2013 | ||||||||||||||||
Net asset value, beginning of period | $ | 10.34 | $ | 9.85 | $ | 10.01 | $ | 10.74 | $ | 10.00 | ||||||||||
|
|
|
|
|
|
|
|
|
| |||||||||||
INCOME FROM INVESTMENT OPERATIONS: | ||||||||||||||||||||
Net investment income (loss)1 | 0.02 | 0.02 | 0.05 | (0.02 | ) | (0.06 | ) | |||||||||||||
Net realized and unrealized gain (loss) on investments | 0.43 | 0.59 | (0.15 | ) | (0.67 | ) | 1.09 | |||||||||||||
|
|
|
|
|
|
|
|
|
| |||||||||||
Total from investment operations | 0.45 | 0.61 | (0.10 | ) | (0.69 | ) | 1.03 | |||||||||||||
|
|
|
|
|
|
|
|
|
| |||||||||||
LESS DISTRIBUTIONS TO SHAREHOLDERS FROM: | ||||||||||||||||||||
Net investment income | — | (0.09 | ) | (0.06 | ) | — | — | |||||||||||||
Net realized gain | — | — | — | (0.04 | ) | (0.29 | ) | |||||||||||||
Tax return of capital | — | (0.03 | ) | — | — | — | ||||||||||||||
|
|
|
|
|
|
|
|
|
| |||||||||||
Total Distributions | — | (0.12 | ) | (0.06 | ) | (0.04 | ) | (0.29 | ) | |||||||||||
|
|
|
|
|
|
|
|
|
| |||||||||||
Net asset value, end of period | $ | 10.79 | $ | 10.34 | $ | 9.85 | $ | 10.01 | $ | 10.74 | ||||||||||
|
|
|
|
|
|
|
|
|
| |||||||||||
Total Return | 4.35 | % | 6.25 | % | (1.08 | )% | (6.35 | )% | 10.35 | %3 | ||||||||||
SUPPLEMENTAL DATA AND RATIOS: | ||||||||||||||||||||
Net assets, end of period (in 000’s) | $ | 165,648 | $ | 256,482 | $ | 232,456 | $ | 166,300 | $ | 42,033 | ||||||||||
Ratio of total expenses before reimbursements, waivers, recaptures and/or fees paid indirectly to average net assets | 1.77 | % | 2.03 | % | 1.86 | % | 1.80 | % | 3.03 | %4 | ||||||||||
Ratio of total expenses net of reimbursements, waivers, recaptures and/or fees paid indirectly to average net assets | 1.76 | %2 | 2.01 | %2 | 1.86 | % | 1.80 | % | 3.00 | %4 | ||||||||||
Ratio of expenses (excluding dividends and interest on short positions and interest expense) before reimbursements, waivers, recaptures and/or fees paid indirectly to average net assets | 1.46 | % | 1.44 | % | 1.43 | % | 1.35 | % | 2.03 | %4 | ||||||||||
Ratio of expenses (excluding dividends and interest on short positions and interest expense) net of reimbursements, waivers, recaptures and/or fees paid indirectly to average net assets | 1.45 | %2 | 1.42 | %2 | 1.43 | % | 1.35 | % | 2.00 | %4 | ||||||||||
Ratio of net investment income (including dividends and interest on short positions and interest expense) net of reimbursements, waivers, recaptures and/or fees paid indirectly to average net assets | 0.17 | % | 0.19 | % | 0.45 | % | (0.17 | )% | (1.75 | )%4 | ||||||||||
Ratio of net investment income (excluding dividends and interest on short positions and interest expense) net of reimbursements, waivers, recaptures and/or fees paid indirectly to average net assets | 0.48 | % | 0.78 | % | 0.89 | % | 0.28 | % | (0.75 | )%4 | ||||||||||
Portfolio turnover rate | 198 | % | 246 | % | 400 | % | 315 | % | 104 | %3 | ||||||||||
| * | Fund commenced operations on August 26, 2013. |
| 1 | Calculated based on average shares outstanding. |
| 2 | Such ratios are net of fees paid indirectly (see Note C in the Notes to Financial Statements). |
| 3 | Not annualized. |
| 4 | Annualized. |
Notes to Financial Statements are an integral part of this Schedule.
33
Table of Contents
Driehaus Multi-Asset Growth Economies Fund
Financial Highlights
| For the period April 10, 2017* through December 31, 2017 | ||||
Net asset value, beginning of period | $ | 10.00 | ||
|
| |||
INCOME FROM INVESTMENT OPERATIONS: | ||||
Net investment income (loss)1 | 0.17 | |||
Net realized and unrealized gain (loss) on investments | 1.94 | |||
|
| |||
Total from investment operations | 2.11 | |||
|
| |||
LESS DISTRIBUTIONS TO SHAREHOLDERS FROM: | ||||
Net investment income | (0.16 | ) | ||
Net realized gain | (0.41 | ) | ||
|
| |||
Total distributions | (0.57 | ) | ||
|
| |||
Redemption fees added to paid-in capital | 0.00 | 4 | ||
|
| |||
Net asset value, end of period | $ | 11.54 | ||
|
| |||
Total Return | 21.14 | %2 | ||
SUPPLEMENTAL DATA AND RATIOS: | ||||
Net assets, end of period (in 000’s) | $ | 43,183 | ||
Ratio of total expenses before reimbursements, waivers, recaptures and/or fees paid indirectly to average net assets | 2.04 | %3 | ||
Ratio of total expenses net of reimbursements, waivers, recaptures and/or fees paid indirectly to average net assets | 1.75 | %3,5 | ||
Ratio of expenses (excluding dividends and interest on short positions and interest expense) before reimbursements, waivers, recaptures and/or fees paid indirectly to average net assets | 2.04 | %3 | ||
Ratio of expenses (excluding dividends and interest on short positions and interest expense) net of reimbursements, waivers, recaptures and/or fees paid indirectly to average net assets | 1.75 | %3,5 | ||
Ratio of net investment income (including dividends and interest on short positions and interest expense) net of reimbursements, waivers, recaptures and/or fees paid indirectly to average net assets | 2.12 | %3 | ||
Ratio of net investment income (excluding dividends and interest on short positions and interest expense) net of reimbursements, waivers, recaptures and/or fees paid indirectly to average net assets | 2.12 | %3,5 | ||
Portfolio turnover rate | 99 | %2 | ||
| * | Fund commenced operations on April 10, 2017. |
| 1 | Calculated based on average shares outstanding. |
| 2 | Not annualized. |
| 3 | Annualized. |
| 4 | Amount represents less than $0.01 per share. |
| 5 | The Adviser contractually agreed to waive its investment advisory fee or absorb other operating expenses to the extent necessary to ensure that total annual Fund operating expenses (other than interest, taxes, brokerage commissions, dividends and interest on short sales, other investment-related expenses, acquired fund fees and expenses, and extraordinary expenses such as litigation and other expenses not incurred in the ordinary course of the Fund’s business) would not exceed the Fund’s operating expense cap of 1.75% of average daily net assets until April 9, 2020. |
Notes to Financial Statements are an integral part of this Schedule.
34
Table of Contents
Driehaus Mutual Funds
A. ORGANIZATION AND SUMMARY OF SIGNIFICANT ACCOUNTING POLICIES
Organization
The Driehaus Mutual Funds (the “Trust”) is an open-end registered management investment company under the Investment Company Act of 1940, as amended, organized as a Delaware statutory trust, with nine separate series currently in operation. The Trust was organized under an Agreement and Declaration of Trust dated May 31, 1996, as subsequently amended and restated as of June 6, 2013 and amended as of June 4, 2015, and may issue an unlimited number of full and fractional units of beneficial interest (shares) without par value. The three series (“Funds” or each a “Fund”) included in this report are as follows: the Driehaus Active Income Fund (the “Active Income Fund”) commenced operations on June 1, 2009 following the receipt of the assets and liabilities of the Lotsoff Capital Management Active Income Fund (the “Acquired Fund”) pursuant to a plan of reorganization approved by the shareholders of the Acquired Fund. The reorganization was accomplished by a tax-free exchange of Acquired Fund shares for an equal number of shares of the Active Income Fund as of June 1, 2009. The Active Income Fund seeks to provide current income and capital appreciation. The Driehaus Event Driven Fund (the “Event Driven Fund”) commenced operations on August 26, 2013, following the receipt of the assets and liabilities of the Driehaus Credit Opportunities Fund, L.P. The Event Driven Fund seeks to provide positive returns over full market cycles. The Driehaus Multi-Asset Growth Economies Fund (the “Multi-Asset Growth Economies Fund”) commenced operations on April 10, 2017, after succeeding to the assets of the Driehaus Emerging Markets Dividend Growth Fund, L.P. The transaction was structured to be a tax-free exchange and the cost basis and holding period of the underlying securities were carried over to the Multi-Asset Growth Economies Fund. Unrealized appreciation at the date of the transaction of $2,454,782 is not reflected in the Net change in unrealized appreciation (depreciation) on investments in the Statement of Operations or Statement of Changes in Net Assets. The Multi-Asset Growth Economies Fund seeks to maximize total return.
Significant Accounting Policies
The presentation of financial statements in conformity with U.S. generally accepted accounting principles (“U.S. GAAP”) requires management to make estimates and assumptions that affect the reported amounts of assets and liabilities at the date of the financial statements and the reported amounts of income and expenses. Actual results may differ from those estimates.
The Funds, which are investment companies within the scope of Financial Accounting Standards Board (“FASB”) Accounting Standards Update 2013-08, follow accounting and reporting guidance under FASB Accounting Standards Codification Topic 946, Financial Services-Investment Companies.
Securities Valuation
Investments in securities traded on a national securities exchange, including exchange-traded futures and options, are valued at the last reported sales or settlement price on the day of valuation and are generally classified as level 1. Exchange-traded securities for which no sale was reported are valued at the mean of the closing bid and ask prices from the exchange the security is primarily traded on and are generally classified as level 1. Equity certificates are valued at the last sale price of the underlying security as of the close of the primary exchange. Long-term fixed income securities are valued at the representative quoted bid price when held long or the representative quoted ask price if sold short or, if such prices are not available, at prices for securities of comparable maturity, quality and type or as determined by an independent pricing service. The pricing service provider may employ methodologies that utilize actual market transactions, broker-dealer supplied valuations or other techniques. Such techniques generally consider factors such as composite security prices, yields, maturities, call features, credit ratings and developments relating to specific securities, in arriving at valuations. Fixed income securities are generally classified as level 2. Short-term investments with remaining maturities of 60 days or less at the time of purchase are stated at amortized cost, which approximates fair value. If amortized cost does not approximate fair value, short-term securities are reported at fair value. These securities are generally classified as level 2. Swaps, forward foreign currency contracts and other financial derivatives are valued daily, primarily by an independent pricing service using pricing models and are generally classified as level 2. The pricing models use inputs that are observed from actively quoted markets such as issuer details, indices, spreads, interest rates, yield curves, dividends and exchange rates. If valuations are not available from the independent pricing service or values received are deemed not representative of
35
Table of Contents
Driehaus Mutual Funds
Notes to Financial Statements — (Continued)
market value, values will be obtained from a third party broker-dealer or counterparty. Investments initially valued in currencies other than the U.S. dollar are converted to the U.S. dollar using exchange rates obtained from an independent pricing service. In addition, for Multi-Asset Growth Economies Fund, if quotations are not readily available, if the values have been materially affected by events occurring after the closing of a foreign market, or if there has been a movement in the U.S. market that exceeds a certain threshold, assets may be valued at fair value as determined in good faith by or under the direction of the Trust’s Board of Trustees. Events that may materially affect asset values that could cause a fair value determination include, but are not limited to: corporate announcements relating to a specific security; natural and other disasters which may impact an entire market or region; and political and other events which may be global or impact a particular country or region. The frequency with which these procedures are used cannot be predicted and may be utilized to a significant extent. To the extent utilized, securities would be considered level 2 in the hierarchy described below. Securities for which market quotations are not readily available are valued at fair value as determined in good faith in accordance with procedures established by or under the direction of the Trust’s Board of Trustees and are generally classified as level 3. Under these procedures, the Funds primarily employ a market-based approach, which may use related or comparable assets or liabilities, recent transactions, market multiples, book values and other relevant information for the investment to determine the fair value of the investment. It is possible that the estimated values may differ significantly from the values that would have been used had a ready market existed for the investments, and such differences could be material.
Each Fund is subject to fair value accounting standards that define fair value, establish the framework for measuring fair value and provide a three-level hierarchy for fair valuation based upon the inputs to the valuation as of the measurement date. The three levels of the fair value hierarchy are as follows:
Level 1 — quoted prices for active markets for identical securities
Level 2 — significant observable inputs (including quoted prices for similar securities, interest rates, prepayment speeds, credit risk, etc.)
Level 3 — significant unobservable inputs (including the Fund’s own assumptions in determining the fair value of investments).
The Funds adopted the FASB amendments to authoritative guidance which require the Funds to disclose details of transfers in and out of Level 1 and Level 2 measurements and Level 2 and Level 3 measurements and the reasons for the transfers. During the year ended December 31, 2017, there were no transfers between levels for the Active Income Fund, Event Driven Fund and Multi-Asset Growth Economies Fund. It is the Funds’ policy to recognize transfers into and out of all levels at the end of the reporting period.
The inputs or methodology used for valuing securities are not necessarily an indication of the risk associated with investing in those securities. The following is a summary of the inputs used to value the Active Income Fund’s investments as of December 31, 2017:
Assets | Level 1 | Level 2 | Level 3 | Total | ||||||||||||
Bank Loans | $ | — | $ | 470,628,878 | $ | — | $ | 470,628,878 | ||||||||
Common Stocks | ||||||||||||||||
Auto Manufacturers | 8,703,858 | — | — | 8,703,858 | ||||||||||||
Banks | 20,522,707 | — | — | 20,522,707 | ||||||||||||
Investment Companies | — | 2,699,280 | — | 2,699,280 | ||||||||||||
Media | 15,648,278 | — | — | 15,648,278 | ||||||||||||
Savings & Loans | 3,390,634 | — | — | 3,390,634 | ||||||||||||
Semiconductors | 43,757,704 | — | — | 43,757,704 | ||||||||||||
Software | 9,483,581 | — | — | 9,483,581 | ||||||||||||
Convertible Corporate Bonds | — | 45,642,787 | — | 45,642,787 | ||||||||||||
Convertible Preferred Stocks | ||||||||||||||||
Auto Manufacturers | — | — | 0 | 0 | ||||||||||||
Banks | 23,604,000 | — | — | 23,604,000 | ||||||||||||
Investment Companies | — | 21,437,350 | — | 21,437,350 | ||||||||||||
36
Table of Contents
Driehaus Mutual Funds
Notes to Financial Statements — (Continued)
Assets (continued) | Level 1 | Level 2 | Level 3 | Total | ||||||||||||
Corporate Bonds | $ | — | $ | 753,401,039 | $ | — | $ | 753,401,039 | ||||||||
Preferred Stocks | ||||||||||||||||
Banks | 37,069,860 | — | — | 37,069,860 | ||||||||||||
Purchased Put Options | — | 0 | — | 0 | ||||||||||||
U.S. Government and Agency Securities | — | 6,870,001 | — | 6,870,001 | ||||||||||||
|
|
|
|
|
|
|
| |||||||||
Total | $ | 162,180,622 | $ | 1,300,679,335 | $ | 0 | $ | 1,462,859,957 | ||||||||
|
|
|
|
|
|
|
| |||||||||
Liabilities | ||||||||||||||||
Common Stocks Sold Short | ||||||||||||||||
Internet | $ | (20,131,202 | ) | $ | — | $ | — | $ | (20,131,202 | ) | ||||||
Media | (123 | ) | — | — | (123 | ) | ||||||||||
Real Estate Investment Trusts | (6,849,125 | ) | — | — | (6,849,125 | ) | ||||||||||
Semiconductors | (21,055,257 | ) | — | — | (21,055,257 | ) | ||||||||||
Telecommunications | (10,377,094 | ) | — | — | (10,377,094 | ) | ||||||||||
Corporate Bonds Sold Short | — | (25,345,806 | ) | — | (25,345,806 | ) | ||||||||||
U.S. Government and Agency Securities Sold Short | — | (28,678,269 | ) | — | (28,678,269 | ) | ||||||||||
Written Call Options | (4,030,000 | ) | — | — | (4,030,000 | ) | ||||||||||
|
|
|
|
|
|
|
| |||||||||
Total | $ | (62,442,801 | ) | $ | (54,024,075 | ) | $ | — | $ | (116,466,876 | ) | |||||
|
|
|
|
|
|
|
| |||||||||
Other Financial Instruments* | ||||||||||||||||
Credit Default Swaps — Assets | $ | — | $ | 7,551,064 | $ | — | $ | 7,551,064 | ||||||||
Credit Default Swaps — Liabilities | — | (9,064,703 | ) | — | (9,064,703 | ) | ||||||||||
Forward Foreign Currency Contracts — Liabilities | — | (245,022 | ) | — | (245,022 | ) | ||||||||||
Futures Contracts | 938,230 | — | — | 938,230 | ||||||||||||
Interest Rate Swaptions — Assets | — | 873,157 | — | 873,157 | ||||||||||||
Total Return Swaps — Assets | — | 1,142,096 | — | 1,142,096 | ||||||||||||
|
|
|
|
|
|
|
| |||||||||
Total Other Financial Instruments | $ | 938,230 | $ | 256,592 | $ | — | $ | 1,194,822 | ||||||||
|
|
|
|
|
|
|
| |||||||||
| * | Other financial instruments are swap, forward foreign currency and futures contracts and interest rate swaptions, which are detailed in the Schedule of Investments. |
The following is a reconciliation of Level 3 assets for which significant unobservable inputs were used to determine fair value in the Active Income Fund:
| Investments, at Value | ||||
Balance as of December 31, 2016 | $ | 0 | ||
Realized gain (loss) | — | |||
Change in net unrealized appreciation (depreciation) | — | |||
Purchases | — | |||
Sales | — | |||
Transfers in and/or out of Level 3 | 0 | |||
|
| |||
Balance as of December 31, 2017 | $ | 0 | ||
|
| |||
As of December 31, 2017 and December 31, 2016, the Active Income Fund held Level 3 investments in General Motors Corp. senior convertible preferred stock, valued at fair value as determined in good faith in accordance with procedures established by or under the direction of the Trust’s Board of Trustees. As a part of
37
Table of Contents
Driehaus Mutual Funds
Notes to Financial Statements — (Continued)
the ongoing restructuring of General Motors, any value previously ascribed to these holdings has been transferred to the General Motors Co. Motors Liquidation Co. GUC Trust common stock, which is freely and actively traded, and therefore the senior convertible preferred stock was fair valued at $0.
The following is a summary of the inputs used to value the Event Driven Fund’s investments as of December 31, 2017:
Assets | Level 1 | Level 2 | Level 3 | Total | ||||||||||||
Bank Loans | $ | — | $ | 8,126,115 | $ | — | $ | 8,126,115 | ||||||||
Common Stocks | ||||||||||||||||
Biotechnology | 14,453,738 | — | — | 14,453,738 | ||||||||||||
Building Materials | 13,454,592 | — | — | 13,454,592 | ||||||||||||
Chemicals | 9,981,983 | — | — | 9,981,983 | ||||||||||||
Commercial Services | 4,097,285 | — | — | 4,097,285 | ||||||||||||
Healthcare – Services | 2,178,277 | — | — | 2,178,277 | ||||||||||||
Insurance | 10,342,645 | — | — | 10,342,645 | ||||||||||||
Media | 2,781,043 | — | — | 2,781,043 | ||||||||||||
Pharmaceuticals | 17,651,508 | — | — | 17,651,508 | ||||||||||||
Retail | 1,682,202 | — | — | 1,682,202 | ||||||||||||
Savings & Loans | 9,488,844 | — | — | 9,488,844 | ||||||||||||
Semiconductors | 13,110,333 | — | — | 13,110,333 | ||||||||||||
Software | 1,526,990 | — | — | 1,526,990 | ||||||||||||
Transportation | 12,669,736 | — | — | 12,669,736 | ||||||||||||
Convertible Preferred Stocks | ||||||||||||||||
Auto Manufacturers | — | — | 0 | 0 | ||||||||||||
Corporate Bonds | — | 25,764,846 | — | 25,764,846 | ||||||||||||
|
|
|
|
|
|
|
| |||||||||
Total | $ | 113,419,176 | $ | 33,890,961 | $ | 0 | $ | 147,310,137 | ||||||||
|
|
|
|
|
|
|
| |||||||||
Liabilities | ||||||||||||||||
Common Stocks Sold Short | ||||||||||||||||
Real Estate Investment Trusts | $ | (1,506,049 | ) | $ | — | $ | — | $ | (1,506,049 | ) | ||||||
Corporate Bonds Sold Short | — | (2,784,600 | ) | — | (2,784,600 | ) | ||||||||||
Exchange-Traded Funds Sold Short | (18,172,108 | ) | — | — | (18,172,108 | ) | ||||||||||
Written Call Options | (1,137,500 | ) | — | — | (1,137,500 | ) | ||||||||||
|
|
|
|
|
|
|
| |||||||||
Total | $ | (20,815,657 | ) | $ | (2,784,600 | ) | $ | — | $ | (23,600,257 | ) | |||||
|
|
|
|
|
|
|
| |||||||||
Other Financial Instruments* | ||||||||||||||||
Forward Foreign Currency Contracts — Liabilities | $ | — | $ | (203,913 | ) | $ | — | $ | (203,913 | ) | ||||||
|
|
|
|
|
|
|
| |||||||||
Total Other Financial Instruments | $ | — | $ | (203,913 | ) | $ | — | $ | (203,913 | ) | ||||||
|
|
|
|
|
|
|
| |||||||||
| * | Other financial instruments are forward foreign currency contracts, which are detailed in the Schedule of Investments. |
38
Table of Contents
Driehaus Mutual Funds
Notes to Financial Statements — (Continued)
The following is a reconciliation of Level 3 assets for which significant unobservable inputs were used to determine fair value in the Event Driven Fund:
| Investments, at Value | ||||
Balance as of December 31, 2016 | $ | 4,657,500 | ||
Realized gain (loss) | 496,196 | |||
Change in net unrealized appreciation (depreciation) | — | |||
Purchases | — | |||
Sales | (5,153,696 | ) | ||
Transfers in and/or out of Level 3 | — | |||
|
| |||
Balance as of December 31, 2017 | $ | 0 | ||
|
| |||
As of December 31, 2017, the Event Driven Fund held Level 3 investments in General Motors Corp. senior convertible preferred stock, which were valued in the same manner as described above for the Active Income Fund.
The following is a summary of the inputs used to value the Multi-Asset Growth Economies Fund’s investments as of December 31, 2017:
Assets | Level 1 | Level 2 | Level 3 | Total | ||||||||||||
Sovereign Bonds | ||||||||||||||||
Argentina | $ | — | $ | 1,997,180 | $ | — | $ | 1,997,180 | ||||||||
Egypt | — | 2,014,297 | — | 2,014,297 | ||||||||||||
Indonesia | — | 1,651,129 | — | 1,651,129 | ||||||||||||
Malaysia | — | 914,695 | — | 914,695 | ||||||||||||
Mexico | — | 945,092 | — | 945,092 | ||||||||||||
Poland | — | 1,021,299 | — | 1,021,299 | ||||||||||||
South Africa | — | 906,240 | — | 906,240 | ||||||||||||
Equity Securities | ||||||||||||||||
Argentina | 932,177 | — | — | 932,177 | ||||||||||||
Brazil | 2,191,865 | — | — | 2,191,865 | ||||||||||||
Canada | 228,134 | — | — | 228,134 | ||||||||||||
China | 9,939,156 | — | — | 9,939,156 | ||||||||||||
Cyprus | 251,497 | — | — | 251,497 | ||||||||||||
Czech Republic | 241,118 | — | — | 241,118 | ||||||||||||
Egypt | 143,194 | — | — | 143,194 | ||||||||||||
France | 342,158 | — | — | 342,158 | ||||||||||||
Greece | 593,283 | — | — | 593,283 | ||||||||||||
India | 2,265,664 | — | — | 2,265,664 | ||||||||||||
Indonesia | 941,753 | — | — | 941,753 | ||||||||||||
Malaysia | 443,568 | — | — | 443,568 | ||||||||||||
Mexico | 1,122,281 | — | — | 1,122,281 | ||||||||||||
Pakistan | 429,672 | — | — | 429,672 | ||||||||||||
Philippines | 283,442 | — | — | 283,442 | ||||||||||||
Qatar | 197,443 | — | — | 197,443 | ||||||||||||
Russia | 1,308,171 | — | — | 1,308,171 | ||||||||||||
South Africa | 1,086,153 | — | — | 1,086,153 | ||||||||||||
39
Table of Contents
Driehaus Mutual Funds
Notes to Financial Statements — (Continued)
Assets (continued) | Level 1 | Level 2 | Level 3 | Total | ||||||||||||
South Korea | $ | 3,637,455 | $ | — | $ | — | $ | 3,637,455 | ||||||||
Taiwan | 1,900,730 | — | — | 1,900,730 | ||||||||||||
Thailand | 317,369 | — | — | 317,369 | ||||||||||||
Turkey | 446,002 | — | — | 446,002 | ||||||||||||
United Arab Emirates | 416,007 | — | — | 416,007 | ||||||||||||
United States | 331,667 | — | — | 331,667 | ||||||||||||
Purchased Call Options | — | 31,909 | — | 31,909 | ||||||||||||
Equity Certificates** | — | 622,133 | — | 622,133 | ||||||||||||
|
|
|
|
|
|
|
| |||||||||
Total | $ | 29,989,959 | $ | 10,103,974 | $ | — | $ | 40,093,933 | ||||||||
|
|
|
|
|
|
|
| |||||||||
Other Financial Instruments* | ||||||||||||||||
Credit Default Swap — Liabilities | $ | — | $ | (9,721 | ) | $ | — | $ | (9,721 | ) | ||||||
Interest Rate Swaps — Asset | — | 335,340 | — | 335,340 | ||||||||||||
Interest Rate Swaps — Liabilities | — | (101,601 | ) | — | (101,601 | ) | ||||||||||
Forward Foreign Currency Contracts — Assets | — | 122,326 | — | 122,326 | ||||||||||||
Forward Foreign Currency Contracts — Liabilities | — | (102,973 | ) | — | (102,973 | ) | ||||||||||
|
|
|
|
|
|
|
| |||||||||
Total Other Financial Instruments | $ | — | $ | 243,371 | $ | — | $ | 243,371 | ||||||||
|
|
|
|
|
|
|
| |||||||||
| * | Other financial instruments are swap and forward foreign currency contracts, which are detailed in the Schedule of Investments. |
| ** | See Schedule of Investments for industry and/or country breakout. |
Securities Sold Short
The Funds are engaged in selling securities short, which obligates them to replace a borrowed security by purchasing it at market price at the time of replacement. Each Fund incurs a loss if the price of the security increases between the date of the short sale and the date on which the Fund replaces the borrowed security. Each Fund realizes a gain if the price of the security declines between those dates. Gains are limited to the price at which the Fund sold the security short, while losses are potentially unlimited in size.
The Funds are required to establish a margin account with the broker lending the security sold short. While the short sale is outstanding, the broker retains the proceeds of the short sale and the Fund must maintain a deposit with the broker consisting of cash and securities having a value equal to a specified percentage of the value of the securities sold short. Such deposit is included in “Collateral held at custodian for the benefit of brokers” on the Statements of Assets and Liabilities. Each Fund is obligated to pay any dividends or interest due on securities sold short. Such dividends and interest are recorded as an expense to the Funds on the Statements of Operations.
Federal Income Taxes
The Funds’ policy is to comply with the requirements of Subchapter M of the Internal Revenue Code that are applicable to regulated investment companies and to distribute substantially all their taxable income to their shareholders. Therefore, no Federal income tax provision is required.
The FASB’s “Accounting for Uncertainty in Income Taxes” (“Tax Statement”) requires the evaluation of tax positions taken or expected to be taken in the course of preparing the Funds’ tax returns to determine whether the tax positions are “more-likely-than-not” of being sustained by the applicable tax authority. Tax positions not deemed to meet the more-likely-than-not threshold would be recorded as a tax benefit or expense in the current year. Management has evaluated the implications of the Tax Statement and all of the uncertain tax positions and has determined that no liability is required to be recorded in the financial
40
Table of Contents
Driehaus Mutual Funds
Notes to Financial Statements — (Continued)
statements as of December 31, 2017. The Funds file tax returns with the U.S. Internal Revenue Service and various states. Taxable years ending 2017, 2016, 2015, and 2014 remain subject to examination by taxing authorities.
For Federal income tax purposes, capital loss carryforwards represent net capital losses of a fund that may be carried forward and applied against future net realized gains. On December 22, 2010, the Regulated Investment Company Modernization Act of 2010 was enacted to modernize several of the Federal income and excise tax provisions related to regulated investment companies. Under pre-enactment law, capital losses could be carried forward for up to eight years, and were required to be carried forward as short-term capital losses, irrespective of the character of the original loss. New net capital losses (those earned in taxable years beginning after December 22, 2010) may be carried forward indefinitely and must retain the character of the original loss.
At December 31, 2017, gross unrealized appreciation and depreciation on investments, based on cost for Federal income tax purposes, were as follows:
| Active Income Fund | Event Driven Fund | Multi-Asset Growth Economies Fund | ||||||||||
Cost of investments | $ | 1,365,640,748 | $ | 117,298,627 | $ | 34,908,493 | ||||||
|
|
|
|
|
| |||||||
Gross unrealized appreciation | $ | 57,950,851 | $ | 14,178,196 | $ | 5,647,707 | ||||||
Gross unrealized depreciation | (54,519,134 | ) | (7,312,817 | ) | (444,010 | ) | ||||||
|
|
|
|
|
| |||||||
Net unrealized appreciation on investments | $ | 3,431,717 | $ | 6,865,379 | $ | 5,203,697 | ||||||
|
|
|
|
|
| |||||||
The difference between cost amounts for financial statement and federal income tax purposes is due primarily to the tax deferral of losses on wash sales and timing differences in recognizing certain gains and losses on security transactions.
The amount of dividends and distributions from net investment income and net realized capital gains are determined in accordance with Federal income tax regulations, which may differ from U.S. GAAP.
For the year ended December 31, 2017, reclassifications were recorded to undistributed net investment income, undistributed net realized gain and paid-in capital for any permanent tax differences. These reclassifications relate primarily to the differing tax treatment of income from paydowns and swaps, return of capital and capital gain distributions on real estate investment trusts and regulated investment companies, net operating losses, sales of passive foreign investment companies and foreign currency gains and losses. Results of operations and net assets were not affected by these reclassifications.
| Active Income Fund | Event Driven Fund | Multi-Asset Growth Economies Fund | ||||||||||
Paid-in capital | $ | — | $ | (841,813 | ) | $ | (15,594 | ) | ||||
Undistributed net investment income (loss) | (8,826,255 | ) | (201,828 | ) | 125,076 | |||||||
Undistributed net realized gain (loss) on investments, futures, swap contracts and foreign currency | 8,826,255 | 1,043,641 | (109,482 | ) | ||||||||
The tax character of distributions paid were as follows:
Active Income Fund | ||||||||
Distributions paid from: | January 1, 2017 to December 31, 2017 | January 1, 2016 to December 31, 2016 | ||||||
Ordinary income | $ | 74,683,208 | $ | 79,985,655 | ||||
|
|
|
| |||||
Total distributions paid | $ | 74,683,208 | $ | 79,985,655 | ||||
|
|
|
| |||||
41
Table of Contents
Driehaus Mutual Funds
Notes to Financial Statements — (Continued)
Event Driven Fund | ||||||||
Distributions paid from: | January 1, 2017 to December 31, 2017 | January 1, 2016 to December 31, 2016 | ||||||
Ordinary income | $ | — | $ | 2,312,787 | ||||
Taxable return of capital distribution | — | 736,638 | ||||||
|
|
|
| |||||
Total distributions paid | $ | — | $ | 3,049,425 | ||||
|
|
|
| |||||
Multi-Asset Growth Economies Fund | ||||
Distributions paid from: | April 10, 2017* to December 31, 2017 | |||
Ordinary income | $ | 1,804,830 | ||
Long term capital gains | 213,901 | |||
|
| |||
Total distributions paid | $ | 2,018,731 | ||
|
| |||
| * | The Fund commenced operations on April 10, 2017. |
As of December 31, 2017, the components of accumulated earnings (deficit) were as follows:
| Active Income Fund | Event Driven Fund | Multi-Asset Growth Economies Fund | ||||||||||
Undistributed ordinary income | $ | 7,443,059 | $ | — | $ | 233,413 | ||||||
Undistributed long-term capital gains | — | — | 29,969 | |||||||||
|
|
|
|
|
| |||||||
Accumulated earnings | 7,443,059 | — | 263,382 | |||||||||
Accumulated capital and other losses | (459,388,212 | ) | (13,470,650 | ) | — | |||||||
Unrealized appreciation (depreciation) on currency and foreign currency translations | 1,886 | 228 | 960 | |||||||||
Unrealized appreciation (depreciation) on swap and swaptions contracts | (202,126 | ) | — | 233,739 | ||||||||
Unrealized appreciation (depreciation) on investments, securities sold short, swap, forwards and futures | 3,431,717 | 6,865,379 | 5,203,697 | |||||||||
|
|
|
|
|
| |||||||
Total accumulated earnings (deficit) | $ | (448,713,676 | ) | $ | (6,605,043 | ) | $ | 5,701,778 | ||||
|
|
|
|
|
| |||||||
As of December 31, 2017, the Funds had net capital loss carryforwards to offset future net capital gains, if any, to the extent provided by Treasury regulations:
| Not Subject to Expiration | ||||||||
| Short-Term | Long-Term | |||||||
Active Income Fund | $ | 269,247,897 | $ | 178,404,662 | ||||
Event Driven Fund | 13,470,650 | — | ||||||
Multi-Asset Growth Economies Fund | — | — | ||||||
Post-October capital losses and late-year ordinary losses incurred after October 31 and within the taxable year are deemed to arise on the first business day of the Funds’ taxable year. As of December 31, 2017, the Funds had no post-October capital losses or late-year ordinary losses.
Foreign Currency Translation
The value of securities, currencies and other assets and liabilities not denominated in U.S. dollars are translated into U.S. dollar values based upon the current rates of exchange on the date of the Funds’ valuations.
Net realized foreign exchange gains or losses which are reported by the Funds result from currency gains and losses on transaction hedges arising from changes in exchange rates between the trade and settlement dates on forward contract transactions, and the difference between the amounts accrued for dividends,
42
Table of Contents
Driehaus Mutual Funds
Notes to Financial Statements — (Continued)
interest, and foreign taxes and the amounts actually received or paid in U.S. dollars for these items. Net unrealized foreign exchange gains and losses result from changes in the U.S. dollar value of assets and liabilities (other than investments in securities), which are denominated in foreign currencies, as a result of changes in exchange rates.
Net realized foreign exchange gains or losses on portfolio hedges result from the use of forward contracts to hedge portfolio positions denominated or quoted in a particular currency in order to reduce or limit exposure in that currency. The Active Income Fund, Event Driven Fund and Multi-Asset Growth Economies Fund held portfolio hedges as of December 31, 2017 as disclosed in the Schedule of Investments.
The Funds do not isolate that portion of the results of operations which results from fluctuations in foreign exchange rates on investments. These fluctuations are included with the net realized gain (loss) on investments and the net change in unrealized appreciation (depreciation) on investments.
Indemnifications
Under the Trust’s organizational documents, the officers and Trustees are indemnified against certain liabilities arising out of the performance of their duties to the Trust. In addition, in the normal course of business, the Trust enters into contracts that provide general indemnifications to other parties. A Fund’s maximum exposure under these agreements is unknown as this would involve future claims that may be made against a Fund that have not yet occurred. However, the Funds have not had prior claims or losses pursuant to these contracts and expect the risk of loss to be remote.
Securities Transactions and Income
The Trust records security transactions based on trade date. Dividend income is recognized on the ex-dividend date, and interest income is recognized on an accrual basis. Discounts and premiums on securities purchased are accreted and amortized over the lives of the respective securities using the effective yield method. Withholding taxes on foreign dividends and interest have been provided for in accordance with the Trust’s understanding of the applicable country’s tax rules and rates.
Pursuant to the terms of certain of the senior unsecured loan agreements, the Funds may have unfunded loan commitments, which are callable on demand. Each Fund will have available with its custodian, cash and/or liquid securities having an aggregate value at least equal to the amount of the unfunded senior loan commitments. At December 31, 2017, the Funds had no unfunded senior loan commitments.
With respect to the senior loans held in each Fund’s portfolio, the Funds may: 1) invest in assignments; 2) act as a participant in primary lending syndicates; or 3) invest in participations. If a Fund purchases a participation of a senior loan interest, the Fund would typically enter into a contractual agreement with the lender or other third party selling the participation, rather than directly with the borrower. As such, the Fund not only assumes the credit risk of the borrower, but also that of the selling participant or other persons interpositioned between the Fund and the borrower. At December 31, 2017, the Funds had no such outstanding senior loan participation commitments.
B. INVESTMENTS IN DERIVATIVES
Each Fund uses derivative instruments such as swaps, futures, options, swaptions and forward foreign currency contracts in connection with their respective investment strategies. For the year ended December 31, 2017, the Active Income Fund primarily utilized: 1) credit default swaps as alternatives to direct investments to manage exposure to specific sectors/markets/industries and/or credit events and manage volatility; 2) total return swaps to gain exposure to certain sectors and manage volatility; 3) futures to hedge their interest rate and/or commodity risk and manage volatility; 4) options to hedge downside risk and manage volatility; and 5) forward foreign currency contracts to manage currency risk in portfolio holdings. For the year ended December 31, 2017, the Event Driven Fund primarily utilized: 1) options to both hedge exposure and provide exposure to certain market segments or specific securities; and 2) forward foreign currency contracts to manage currency risk in portfolio holdings. During the period April 10, 2017 through December 31, 2017, the Multi-Asset Growth Economies Fund primarily utilized: 1) interest rate swaps to hedge against interest rate
43
Table of Contents
Driehaus Mutual Funds
Notes to Financial Statements — (Continued)
fluctuation and enable the parties involved to exchange fixed and floating cash flows; 2) credit default swaps as alternatives to direct investments to manage exposure to specific sectors/markets/industries and/or credit events and manage volatility; 3) options to both hedge exposure and provide exposure to certain market segments or specific securities; and 4) forward foreign currency contracts to manage currency risk in portfolio holdings. Detail regarding each derivative type is included below.
Swap Contracts
The Funds are subject to credit risk, volatility risk and interest rate risk exposure in the normal course of pursuing their investment objectives. The Funds engage in various swap transactions, including forward rate agreements and interest rate, currency, volatility, index and total return swaps, primarily to manage duration and yield curve risk, or as alternatives to direct investments.
Interest rate swaps are agreements between two parties to exchange cash flows based on a notional principal amount. The Funds may elect to pay a fixed rate and receive a floating rate or receive a fixed rate and pay a floating rate on a notional principal amount. The net interest received or paid on interest rate swap agreements is accrued daily as interest income/expense. Interest rate swaps are marked-to-market daily using fair value estimates provided by an independent pricing service. Changes in value, including accrued interest, are recorded as changes in net unrealized appreciation (depreciation). Unrealized appreciation is reported as an asset and unrealized depreciation is reported as a liability on the statements of assets and liabilities. Gains or losses are realized upon termination of the contracts. The risk of loss under a swap contract may exceed the amount recorded as an asset or a liability.
Total return swap contracts are arrangements to exchange a market linked return for a periodic payment, both based on a notional principal amount, to hedge sector exposure and to manage exposure to specific sectors or industries and/or to gain exposure to specific markets/countries and to specific sectors/industries. To the extent that the total return of the security, index or other financial measure underlying the transaction exceeds or falls short of the offsetting interest rate obligation, the Fund will receive a payment from or make a payment to the counterparty. Total return swap contracts are marked to market daily based upon quotations from market makers and the change, if any, is recorded as a change in net unrealized appreciation (depreciation) on the statement of operations. Payments received or made are recorded as realized gains or losses. Gains or losses are realized upon termination of the contracts. Each Fund’s maximum risk of loss from counterparty risk is the fair value of the contract.
Volatility swaps are forward contracts on the future realized volatility of an underlying instrument. Volatility swaps are generally used to speculate on future volatility levels, trade the spread between realized and implied volatility or hedge volatility exposure of other positions. Changes in value are recorded as changes in net unrealized appreciation (depreciation). Unrealized gains are reported as an asset and unrealized losses are reported as a liability on the statement of operations. Gains or losses are realized upon termination of the contracts. The risk of loss under a volatility swap contract is dependent upon the volatility of the underlying instrument.
Under the terms of a credit default swap contract, one party acts as a guarantor receiving a periodic payment that is a fixed percentage applied to a notional amount. In return, the party agrees to purchase the notional amount of the underlying instrument, at par, if a credit event occurs during the term of the contract. Each Fund may enter into credit default swaps in which the Fund acts as guarantor (a seller of protection), and may enter into credit default swaps in which the counterparty acts as guarantor (a buyer of protection). Premiums paid to or by the Funds are accrued daily and included in realized gain (loss) on swaps. The contracts are marked-to-market daily using fair value estimates provided by an independent pricing service. Changes in value are recorded as unrealized appreciation (depreciation) on the statement of operations. Unrealized gains are reported as an asset and unrealized losses are reported as a liability. Gains or losses are realized upon termination of the contracts. The risk of loss under a swap contract may exceed the amount recorded as an asset or a liability. The notional amount of a swap contract is the reference amount pursuant to which the counterparties make payments. For swaps in which the referenced obligation is an index, in the event of default of any debt security included in the corresponding index, the Fund pays or receives the percentage of the corresponding index that the defaulted security comprises (1) multiplied by the notional value and (2) multiplied by the ratio of one minus the ratio of the market value of the defaulted debt security
44
Table of Contents
Driehaus Mutual Funds
Notes to Financial Statements — (Continued)
to its par value. The maximum exposure to loss of the notional value as a seller of credit default swaps outstanding at December 31, 2017 for the Active Income Fund, Event Driven Fund and Multi-Asset Growth Economies Fund was $0, $0 and $0, respectively.
Risks associated with swap contracts include changes in the returns of underlying instruments and/or interest rates, failure of the counterparties to perform under the contracts’ terms and the possible lack of liquidity with respect to the contracts. Credit default swaps can involve greater risks than if an investor had invested in the reference obligation directly since, in addition to general market risks, credit default swaps are subject to counterparty credit risk, leverage risk, hedging risk, correlation risk and liquidity risk. The Funds disclose swap contracts on a gross basis, with no netting of contracts held with the same counterparty. As of December 31, 2017, the Active Income Fund and Multi-Asset Growth Economies Fund had outstanding swap contracts as listed on the Schedule of Investments and the required collateral is included in the Statements of Assets and Liabilities. The Event Driven Fund had no outstanding swap contracts at December 31, 2017.
Futures Contracts
The Funds may enter into futures contracts to produce incremental earnings, hedge existing positions or protect against market changes in the value of equities or interest rates. Upon entering into a futures contract with a broker, a Fund is required to deposit in a segregated account a specified amount of cash or U.S. government securities. Futures contracts are valued daily and unrealized gains or losses are recorded in a “variation margin” account. Daily, the Fund receives from or pays to the broker a specified amount of cash based upon changes in the variation margin account. When a contract is closed, the Fund recognizes a realized gain or loss. Futures contracts have market risks, including the risk that the change in the value of the contract may not correlate with changes in the value of the underlying securities. With futures contracts, there is minimal counterparty credit risk to the Funds since futures contracts are exchange-traded and the exchange’s clearinghouse, as counterparty to all exchange-traded futures contracts, guarantees the futures contract against default. As of December 31, 2017, the Active Income Fund had outstanding futures contracts as listed in the Schedule of Investments and the required collateral is included in the Statements of Assets and Liabilities. The Event Driven Fund and Multi-Asset Growth Economies Fund had no outstanding futures contracts at December 31, 2017.
Options Contracts
The Funds may use options contracts to hedge downside risk, produce incremental earnings or protect against market changes in the value of equities or interest rates. The Funds may write covered call and put options on futures, swaps, securities or currencies the Funds own or in which they may invest. Writing put options tends to increase a Fund’s exposure to the underlying instrument. Writing call options tends to decrease a Fund’s exposure to the underlying instrument. When a Fund writes a call or put option, an amount equal to the premium received is recorded as a liability and subsequently marked to market to reflect the current value of the option written. These liabilities are reflected as written options outstanding in the Schedule of Investments. Premiums received from writing options that expire are treated as realized gains. Premiums received from writing options that are exercised or closed are added to the proceeds or offset against amounts paid on the underlying future, swap, security or currency transaction to determine the realized gain or loss. A Fund, as a writer of an option, has no control over whether the underlying future, swap, security or currency may be sold (call) or purchased (put) and, as a result, bears the market risk of an unfavorable change in the price of the future, swap, security or currency underlying the written option. The risk exists that a Fund may not be able to enter into a closing transaction because of an illiquid market. In addition, to the extent a Fund purchases an over-the-counter (“OTC”) option, it is subject to credit risk that the counterparty to the trade does not perform under the contract’s terms. The Funds are not subject to credit risk on OTC options written as the counterparty has already performed its obligation by paying the premium at the inception of the contract.
The Funds may also purchase put and call options. Purchasing call options tends to increase a Fund’s exposure to the underlying instrument. Purchasing put options tends to decrease a Fund’s exposure to the underlying instrument. A Fund pays a premium, which is included in its Schedule of Investments as an investment and subsequently marked-to-market to reflect the current value of the option. Premiums paid for
45
Table of Contents
Driehaus Mutual Funds
Notes to Financial Statements — (Continued)
purchasing options that expire are treated as realized losses. The risk associated with purchasing put and call options is limited to the premium paid. Premiums paid for purchasing options that are exercised or closed are added to the amounts paid or offset against the proceeds on the underlying future, swap, security or currency transaction to determine the realized gain or loss. When entering into purchased option contracts, a Fund bears the risk of securities prices moving unexpectedly, in which case, a Fund may not achieve the anticipated benefits of the purchased option contracts; however, the risk of loss is limited to the premium paid. As of December 31, 2017, the Funds had outstanding options as listed on the Schedule of Investments and the required collateral is included in the Statements of Assets and Liabilities.
Swaptions
An option on a swap contract, also called a “swaption,” is an option that gives the buyer the right, but not the obligation, to enter into a swap on a future date in exchange for paying a market-based “premium.” A call or receiver swaption gives the owner the right to receive the total return of a specified asset, reference rate, or index swap. A put or payer swaption gives the owner the right to pay the total return of a specified asset, reference rate, or index swap. Swaptions also include options that allow an existing swap to be terminated or extended by one of the counterparties. As of December 31, 2017, the Active Income Fund had outstanding swaptions as listed on the Schedule of Investments and the required collateral is included in the Statements of Assets and Liabilities. The Event Driven Fund and Multi-Asset Growth Economies Fund had no outstanding swaptions at December 31, 2017.
Forward Foreign Currency Contracts
The Funds use forward foreign currency contracts to manage foreign currency, to produce incremental earnings or to hedge existing positions. A forward foreign currency contract involves an obligation to purchase or sell a specific currency at a future date, which may be any fixed number of days from the date of the contract agreed upon by the parties, at a price set at the time of the contract. These contracts are principally traded in the inter-bank market conducted directly between currency traders (usually large commercial banks) and their customers.
The market value of a forward foreign currency contract fluctuates with changes in currency exchange rates. Outstanding forward foreign currency contracts are valued daily at current market rates and the resulting change in market value is recorded as change in net unrealized appreciation or depreciation on the statement of operations. When a forward foreign currency contract is settled, the Fund records a realized gain or loss equal to the difference between the value at the time the forward foreign currency contract was opened and the value at the time it was settled. A forward foreign currency contract may involve market risk in excess of the unrealized appreciation (depreciation) reflected on the Statements of Assets and Liabilities. In addition, the Funds could be exposed to credit risk if the counterparties are unable or unwilling to meet the terms of the contracts or market risk if the value of the foreign currency changes unfavorably. As of December 31, 2017, the Funds had forward foreign currency contracts as listed in the Schedule of Investments.
Equity Certificates
The Funds may invest in equity certificates, which allow the Funds to participate in the appreciation (depreciation) of the underlying security without actually owning the underlying security. These derivative instruments are purchased pursuant to an agreement with a financial institution and are valued at a calculated market price based on the value of the underlying security in accordance with the agreement. These equity certificates are subject to the credit risk of the issuing financial institution. There is no off-balance sheet risk associated with equity certificates and the Funds’ potential loss is limited to the purchase price of the securities. The Funds are exposed to credit risk associated with the counterparty to the transaction, which is monitored by the Funds’ management on a periodic basis. A Fund’s equity certificates are not subject to any master netting agreement.
On December 31, 2017, Multi-Asset Growth Economies Fund had unrealized appreciation (depreciation) of $84,689 as a result of its investments in these financial instruments. The aggregate market values of these certificates for Multi-Asset Growth Economies Fund represented 1.6% of its total market value of investments at December 31, 2017.
46
Table of Contents
Driehaus Mutual Funds
Notes to Financial Statements — (Continued)
Derivative Investment Holdings Categorized by Risk Exposure
Each Fund is subject to the FASB’s “Disclosures about Derivative Instruments and Hedging Activities” (the “Derivatives Statement”). The Derivatives Statement amends and expands disclosures about derivative instruments and hedging activities. The Derivatives Statement is intended to improve financial reporting about derivative instruments by requiring enhanced disclosures to enable investors to better understand how and why the Fund uses derivative instruments, how these derivative instruments are accounted for and their effects on the Funds’ financial position and results of operations.
The following table sets forth the fair value and the location in the Statement of Assets and Liabilities of the Active Income Fund’s derivative contracts by primary risk exposure as of December 31, 2017:
Asset derivatives | ||||||
Risk exposure category | Statement of Assets and Liabilities location | Fair Value | ||||
Credit contracts | Unrealized appreciation on open swap contracts | $ | 5,710,937 | |||
Equity contracts | Purchased options, at fair value | 0 | ||||
Equity contracts | Unrealized appreciation on open swap contracts | 1,080,096 | ||||
Interest rate contracts | Unrealized appreciation on open swap contracts | 62,000 | ||||
Interest rate contracts | Purchased swaptions, at fair value | 873,157 | ||||
Interest rate contracts | N/A* | 938,230 | ||||
Total | $ | 8,664,420 | ||||
Liability derivatives | ||||||
Risk exposure category | Statement of Assets and Liabilities location | Fair Value | ||||
Credit contracts | Unrealized depreciation on open swap contracts | $ | 1,048,977 | |||
Currency contracts | Unrealized depreciation on forward foreign currency contracts | 245,022 | ||||
Equity contracts | Written options, at fair value | 4,030,000 | ||||
Total | $ | 5,323,999 | ||||
| * | Includes cumulative appreciation/depreciation of futures contracts as shown in the Schedule of Investments. Only current day’s variation margin is reported in the Statement of Assets and Liabilities. |
The following table sets forth the fair value and the location in the Statement of Assets and Liabilities of the Event Driven Fund’s derivative contracts by primary risk exposure as of December 31, 2017:
Liability derivatives | ||||||
Risk exposure category | Statement of Assets and Liabilities location | Fair Value | ||||
Currency contracts | Unrealized depreciation on forward foreign currency contracts | $ | 203,913 | |||
Equity contracts | Written options outstanding, at fair value | 1,137,500 | ||||
Total | $ | 1,341,413 | ||||
47
Table of Contents
Driehaus Mutual Funds
Notes to Financial Statements — (Continued)
The following table sets forth the fair value and the location in the Statement of Assets and Liabilities of the Multi-Asset Growth Economies Fund’s derivative contracts by primary risk exposure as of December 31, 2017:
Asset derivatives | ||||||
Risk exposure category | Statement of Assets and Liabilities location | Fair Value | ||||
Interest contracts | Unrealized appreciation on open swap contracts | $ | 335,340 | |||
Currency contracts | Unrealized appreciation on forward foreign currency contracts | 122,326 | ||||
Currency contracts | Purchased options, at fair value | 31,909 | ||||
Total | $ | 489,575 | ||||
Liability derivatives | ||||||
Risk exposure category | Statement of Assets and Liabilities location | Fair Value | ||||
Credit contracts | Unrealized depreciation on open swap contracts | $ | 9,721 | |||
Interest contracts | Unrealized depreciation on open swap contracts | 101,601 | ||||
Currency contracts | Unrealized depreciation on forward foreign currency contracts | 102,973 | ||||
Total | $ | 214,295 | ||||
The following table sets forth the Active Income Fund’s net realized gain/loss by primary risk exposure and by type of derivative contract for the year ended December 31, 2017:
Amount of net realized gain (loss) on derivatives | ||||||||||||||||||||
| Risk exposure category | ||||||||||||||||||||
Derivative | Credit contracts | Currency contracts | Equity contracts | Interest rate contracts | Total | |||||||||||||||
Purchased options contracts | $ | — | $ | — | $ | (538,103 | ) | $ | — | $ | (538,103 | ) | ||||||||
Purchased swaptions contracts | — | — | — | (118,981 | ) | (118,981 | ) | |||||||||||||
Forward foreign currency contracts | — | (524,457 | ) | — | — | (524,457 | ) | |||||||||||||
Futures contracts | — | — | (5,299,860 | ) | (2,061,334 | ) | (7,361,194 | ) | ||||||||||||
Swap contracts | (14,531,538 | ) | — | (6,215,808 | ) | — | (20,747,346 | ) | ||||||||||||
|
|
|
|
|
|
|
|
|
| |||||||||||
Total | $ | (14,531,538 | ) | $ | (524,457 | ) | $ | (12,053,771 | ) | $ | (2,180,315 | ) | $ | (29,290,081 | ) | |||||
|
|
|
|
|
|
|
|
|
| |||||||||||
The following table sets forth the Event Driven Fund’s net realized gain/loss by primary risk exposure and by type of derivative contract for the year ended December 31, 2017:
Amount of net realized gain (loss) on derivatives | ||||||||||||
| Risk exposure category | ||||||||||||
Derivative | Currency contracts | Equity contracts | Total | |||||||||
Purchased options contracts | $ | — | $ | (1,444,876 | ) | $ | (1,444,876 | ) | ||||
Forward foreign currency contracts | (1,107,014 | ) | — | (1,107,014 | ) | |||||||
Swap contracts | — | (2,112,355 | ) | (2,112,355 | ) | |||||||
|
|
|
|
|
| |||||||
Total | $ | (1,107,014 | ) | $ | (3,557,231 | ) | $ | (4,664,245 | ) | |||
|
|
|
|
|
| |||||||
48
Table of Contents
Driehaus Mutual Funds
Notes to Financial Statements — (Continued)
The following table sets forth the Multi-Asset Growth Economies Fund’s net realized gain/loss by primary risk exposure and by type of derivative contract from inception through December 31, 2017:
Amount of net realized gain (loss) on derivatives | ||||||||||||||||||||
| Risk exposure category | ||||||||||||||||||||
Derivative | Credit contracts | Currency contracts | Equity contracts | Interest rate contracts | Total | |||||||||||||||
Purchased options contracts | $ | — | $ | (35,650 | ) | $ | (130,102 | ) | $ | — | $ | (165,752 | ) | |||||||
Written options contracts | — | — | 26,492 | — | 26,492 | |||||||||||||||
Forward foreign currency contracts | — | 1,274 | — | — | 1,274 | |||||||||||||||
Swap contracts | — | — | — | (154,113 | ) | (154,113 | ) | |||||||||||||
|
|
|
|
|
|
|
|
|
| |||||||||||
Total | $ | — | $ | (34,376 | ) | $ | (103,610 | ) | $ | (154,113 | ) | $ | (292,099 | ) | ||||||
|
|
|
|
|
|
|
|
|
| |||||||||||
The following table sets forth the Active Income Fund’s change in net unrealized appreciation/depreciation by primary risk exposure and by type of derivative contract for the year ended December 31, 2017:
Change in net unrealized appreciation (depreciation) on derivatives | ||||||||||||||||||||
| Risk exposure category | ||||||||||||||||||||
Derivative | Credit contracts | Equity contracts | Currency contracts | Interest rate contracts | Total | |||||||||||||||
Purchased options contracts | $ | — | $ | 473,603 | $ | — | $ | — | $ | 473,603 | ||||||||||
Purchased swaptions contracts | — | — | — | (3,391,698 | ) | (3,391,698 | ) | |||||||||||||
Written options contracts | — | (2,419,963 | ) | — | — | (2,419,963 | ) | |||||||||||||
Futures contracts | — | (403,568 | ) | — | (733,420 | ) | (1,136,988 | ) | ||||||||||||
Swap contracts | 9,220,513 | 1,715,028 | — | 62,000 | 10,997,541 | |||||||||||||||
Forward foreign currency contracts | — | — | (334,000 | ) | — | (334,000 | ) | |||||||||||||
|
|
|
|
|
|
|
|
|
| |||||||||||
Total | $ | 9,220,513 | $ | (634,900 | ) | $ | (334,000 | ) | $ | (4,063,118 | ) | $ | 4,188,495 | |||||||
|
|
|
|
|
|
|
|
|
| |||||||||||
The gross notional amount and/or the number of contracts for the Active Income Fund as of December 31, 2017 are included on the Schedule of Investments. The quarterly average values of derivative investments for the year ended December 31, 2017 is set forth in the table below:
Quarterly Derivative Averages | ||||||
Derivative | Quarterly Average | $ Amount / Number | ||||
Purchased options contracts | number of contracts | 2,400 | ||||
Written options contracts | number of contracts | (1,240 | ) | |||
Futures contracts — Short | number of contracts | (3,435 | ) | |||
Swap contracts | gross notional amount | 124,599,554 | ||||
Purchased swaptions contracts | gross notional amount | $ | 141,535,000 | |||
Forward foreign currency contracts — Long | fair value | $ | 2,499,458 | |||
Forward foreign currency contracts — Short | fair value | $ | (11,234,382 | ) | ||
The following table sets forth the Event Driven Fund’s change in net unrealized appreciation/depreciation by primary risk exposure and by type of derivative contract for the year ended December 31, 2017:
Change in net unrealized appreciation (depreciation) on derivatives | ||||||||||||
| Risk exposure category | ||||||||||||
Derivative | Equity contracts | Currency contracts | Total | |||||||||
Purchased options contracts | $ | 1,379,197 | $ | — | $ | 1,379,197 | ||||||
Written options contracts | (683,374 | ) | — | (683,374 | ) | |||||||
Swap contracts | (152,804 | ) | — | (152,804 | ) | |||||||
Forward foreign currency contracts | — | (324,931 | ) | (324,931 | ) | |||||||
|
|
|
|
|
| |||||||
Total | $ | 543,019 | $ | (324,931 | ) | $ | 218,088 | |||||
|
|
|
|
|
| |||||||
49
Table of Contents
Driehaus Mutual Funds
Notes to Financial Statements — (Continued)
The gross notional amount and/or the number of contracts for the Event Driven Fund as of December 31, 2017 are included on the Schedule of Investments. The quarterly average values of derivative investments for the year ended December 31, 2017 is set forth in the table below:
Quarterly Derivative Averages | ||||||
Derivative | Quarterly Average | $ Amount / Number | ||||
Purchased options contracts | number of contracts | 1,733 | ||||
Written options contracts | number of contracts | (350 | ) | |||
Swap contracts | gross notional amount | $ | (78,308 | ) | ||
Forward foreign currency contracts — Long | fair value | $ | 2,683,491 | |||
Forward foreign currency contracts — Short | fair value | $ | (11,084,397 | ) | ||
The following table sets forth Multi-Asset Growth Economies Fund’s change in net unrealized appreciation/depreciation by primary risk exposure and by type of derivative contract from inception through December 31, 2017:
Change in net unrealized appreciation (depreciation) on derivatives | ||||||||||||||||||||
| Risk exposure category | ||||||||||||||||||||
Derivative | Credit contracts | Equity contracts | Currency contracts | Interest rate contracts | Total | |||||||||||||||
Purchased options contracts | $ | — | $ | — | $ | 17,321 | $ | — | $ | 17,321 | ||||||||||
Equity certificates | — | 84,689 | — | — | 84,689 | |||||||||||||||
Forward foreign currency contracts | — | — | 19,353 | — | 19,353 | |||||||||||||||
Swap contracts | (9,721 | ) | — | — | 233,739 | 224,018 | ||||||||||||||
|
|
|
|
|
|
|
|
|
| |||||||||||
Total | $ | (9,721 | ) | $ | 84,689 | $ | 36,674 | $ | 233,739 | $ | 345,381 | |||||||||
|
|
|
|
|
|
|
|
|
| |||||||||||
The gross notional amount and/or the number of contracts for the Multi-Asset Growth Economies Fund as of December 31, 2017 are included on the Schedule of Investments. The quarterly average values of derivative investments from inception through December 31, 2017 is set forth in the table below:
Quarterly Derivative Averages | ||||||
Derivative | Quarterly Average | $ Amount / Number | ||||
Purchased options contracts | number of contracts | 2,000,333 | ||||
Written options contracts | number of contracts | (333 | ) | |||
Swap contracts | gross notional amount | 2,975,030,369 | ||||
Forward foreign currency contracts — Long | fair value | $ | 1,319,887 | |||
Forward foreign currency contracts — Short | fair value | $ | (1,312,979 | ) | ||
Disclosures about Offsetting Assets and Liabilities
The Funds are party to various agreements, including International Swaps and Derivatives Association Agreements and related Credit Support Annexes (“Master Netting Agreements” or “MNA”), which govern the terms of certain transactions with select counterparties. MNAs are designed to reduce counterparty risk associated with the relevant transactions by establishing credit protection mechanisms and providing standardization as a means of improving legal certainty. As MNAs are specific to the unique operations of different asset types, they allow each Fund to close out and net its total exposure to a counterparty in the event of default with respect to all of the transactions governed under a single agreement with that counterparty. MNAs can also help reduce counterparty risk by specifying collateral posting requirements at pre-arranged exposure levels. Securities and cash pledged as collateral are reflected as assets in the Statement of Assets and Liabilities as either a component of Investment securities at fair value or Collateral held at custodian for the benefit of brokers.
The Funds’ derivative contracts held at December 31, 2017, are not accounted for as hedging instruments under U.S. GAAP. For financial reporting purposes, the Funds do not offset financial assets and financial liabilities that are subject to MNAs or similar arrangements on the Statements of Assets and Liabilities. The settlement of futures contracts, exchange-traded purchased options and certain swap agreements is guaranteed by the clearinghouse or exchange the instrument is traded on and is not subject to arrangements with particular counterparties. For that reason, these instruments are excluded from the below disclosure.
50
Table of Contents
Driehaus Mutual Funds
Notes to Financial Statements — (Continued)
The following table presents the Active Income Fund’s financial and derivative assets subject to Master Netting Agreements by type, net of amounts available for offset under a MNA and net of the related collateral received by the Active Income Fund as of December 31, 2017:
Description | Gross Amounts Recognized in Statement of Assets and Liabilities | Derivatives Available for Offset | Collateral Received | Net Amount1 | ||||||||||||
Unrealized appreciation on open swap contracts | $ | 6,853,033 | $ | (412,828 | ) | $ | — | $ | 6,440,205 | |||||||
The following table presents the Active Income Fund’s financial and derivative liabilities subject to Master Netting Agreements by type, net of amounts available for offset under a MNA and net of the related collateral pledged by the Active Income Fund as of December 31, 2017:
Description | Gross Amounts Recognized in Statement of Assets and Liabilities | Derivatives Available for Offset | Collateral Pledged | Net Amount2 | ||||||||||||
Unrealized depreciation on open swap contracts | $ | 1,048,977 | $ | (412,828 | ) | $ | (636,149 | ) | $ | — | ||||||
Unrealized depreciation on forward foreign currency contracts | 245,022 | — | (245,022 | ) | — | |||||||||||
| 1 | Net amount represents the net amount receivable from the counterparty in the event of default. |
| 2 | Net amount represents the net amount payable to the counterparty in the event of default. |
The following table presents the Event Driven Fund’s financial and derivative liabilities subject to Master Netting Agreements by type, net of amounts available for offset under a MNA and net of the related collateral pledged by the Event Driven Fund as of December 31, 2017:
Description | Gross Amounts Recognized in Statement of Assets and Liabilities | Derivatives Available for Offset | Collateral Pledged | Net Amount1 | ||||||||||||
Unrealized depreciation on forward foreign currency contracts | $ | 203,913 | $ | — | $ | (203,913 | ) | $ | — | |||||||
| 1 | Net amount represents the net amount payable to the counterparty in the event of default. |
The following table presents the Multi-Asset Growth Economies Fund’s financial and derivative assets subject to Master Netting Agreements by type, net of amounts available for offset under a MNA and net of the related collateral received by the Multi-Asset Growth Economies Fund as of December 31, 2017:
Description | Gross Amounts Recognized in Statement of Assets and Liabilities | Derivatives Available for Offset | Collateral Received | Net Amount1 | ||||||||||||
Unrealized appreciation on open swap contracts | $ | 51,291 | $ | (51,291 | ) | $ | — | $ | — | |||||||
Unrealized appreciation on forward foreign currency contracts | 122,326 | (102,973 | ) | — | 19,353 | |||||||||||
51
Table of Contents
Driehaus Mutual Funds
Notes to Financial Statements — (Continued)
The following table presents the Multi-Asset Growth Economies Fund’s financial and derivative liabilities subject to Master Netting Agreements by type, net of amounts available for offset under a MNA and net of the related collateral pledged by the Multi-Asset Growth Economies Fund as of December 31, 2017:
Description | Gross Amounts Recognized in Statement of Assets and Liabilities | Derivatives Available for Offset | Collateral Pledged | Net Amount2 | ||||||||||||
Unrealized depreciation on open swap contracts | $ | 64,349 | $ | (51,291 | ) | $ | (13,058 | ) | $ | — | ||||||
Unrealized depreciation on forward foreign currency contracts | 102,973 | (102,973 | ) | — | — | |||||||||||
| 1 | Net amount represents the net amount receivable from the counterparty in the event of default. |
| 2 | Net amount represents the net amount payable to the counterparty in the event of default. |
C. INVESTMENT ADVISORY FEES, TRANSACTIONS WITH AFFILIATES, AND ADMINISTRATIVE FEES
Richard H. Driehaus is the Chairman of the Board of Driehaus Capital Management LLC (“DCM” or the “Adviser”), a registered investment adviser, and of Driehaus Securities LLC (“DS LLC” or the “Distributor”), a registered broker-dealer. As of December 31, 2017, Richard H. Driehaus controls the Driehaus Multi-Asset Growth Economies Fund due to his power to vote a majority of the shares of the Fund.
DCM serves as the Funds’ investment adviser. In return for its services to the Funds, the Funds pay the Adviser an annual management fee on a monthly basis of 0.55%, 1.00% and 1.00% of average daily net assets, respectively, for the Active Income Fund and Event Driven Fund and Multi-Asset Growth Economies Fund.
DCM entered into a written agreement to cap the Multi-Asset Growth Economies Fund’s annual ordinary operating expenses (other than interest, taxes, brokerage commissions, dividends and interest on short sales, other investment-related expenses and extraordinary expenses such as litigation and other expenses not incurred in the ordinary course of the Fund’s business) at 1.75% of average daily net assets until at least April 9, 2020. For this same time period, DCM is entitled to reimbursement for previously waived fees and reimbursed expenses to the extent that the Multi-Asset Growth Economies Fund’s expense ratio remains below the operating expense cap in place at the time of the waiver and the current operating expense cap. During the period from inception through December 31, 2017, the Multi-Asset Growth Economies Fund had fees waived by DCM in the amount of $58,341 and as of December 31, 2017, this entire amount is subject to recapture.
The Active Income Fund incurred $10,913,512 for investment advisory fees during the year ended December 31, 2017, of which $752,149 was payable to DCM at December 31, 2017. The Event Driven Fund incurred $1,876,435 for investment advisory fees during the year ended December 31, 2017, and $137,769 was payable to DCM at December 31, 2017. The Multi-Asset Growth Economies Fund incurred $198,175 for investment advisory fees during the period from inception through December 31, 2017, and $64,746 was payable to DCM at December 31, 2017.
The Funds direct certain portfolio trades, subject to obtaining the best price and execution, to brokers who have agreed to pay a portion of the Funds’ operating expenses using part of the commissions generated. For the year ended December 31, 2017, these arrangements reduced the expenses of Driehaus Active Income Fund, Driehaus Event Driven Fund and Multi-Asset Growth Economies Fund by $50,779 (0.2%), $23,832 (0.7%) and $0 (0.0%), respectively.
The Funds are permitted to purchase or sell securities from or to certain affiliated funds under specified conditions outlined in procedures adopted by the Board. The procedures have been designed to ensure that any purchase or sale of securities by a Fund from or to another fund or portfolio that is or could be considered an affiliate by virtue of having a common investment adviser (or affiliated investment advisers), common trustees and/or common officers complies with Rule 17a-7 of the 1940 Act. Further, as defined under
52
Table of Contents
Driehaus Mutual Funds
Notes to Financial Statements — (Continued)
these procedures, each transaction is affected at the current market price to minimize trading costs, where permissible. For the year ended December 31, 2017, the Funds engaged in purchases and sales of securities, pursuant to Rule 17a-7 of the 1940 Act, as follows:
Fund | Purchases | Sales | Net Realized Gain (Loss) | |||||||||
Active Income Fund | $ | 11,188,750 | $ | 9,506,875 | $ | 340,157 | ||||||
Event Driven Fund | — | 6,352,500 | (91,000 | ) | ||||||||
Multi-Asset Growth Economies Fund | — | — | — | |||||||||
An affiliated issuer is an entity in which the Fund has ownership of at least 5% of the voting securities or any investment in a Driehaus Mutual Fund. Issuers that are affiliates of the Fund at period-end are noted in the Fund’s Schedule of Investments. Additional security purchases and the reduction of certain securities shares outstanding of existing portfolio holdings that were not considered affiliated in prior years may result in the Fund owning in excess of 5% of the outstanding shares at period-end. The table below reflects transactions during the period with entities that are affiliates as of December 31, 2017:
Fund/Security Description | Value Beginning of Period | Purchases | Sales Proceeds | Unrealized Appreciation (Depreciation) | Value End of Period | Dividends Credited to Income | Net Realized Gain (Loss) | |||||||||||||||||||||
Active Income Fund: | ||||||||||||||||||||||||||||
Apollo Education Group, Inc.(1) | $ | 74,096,322 | $ | — | $ | (74,844,770 | ) | $ | (8,748,882 | ) | $ | — | $ | — | $ | 9,497,330 | ||||||||||||
Pinnacle Entertainment, Inc.(2) | 62,302,078 | — | (83,883,222 | ) | (15,441,117 | ) | — | — | 37,022,261 | |||||||||||||||||||
Stewart Information Services Corp.(2) | 76,766,101 | — | (61,532,571 | ) | (389,037 | ) | — | 923,099 | (14,844,493 | ) | ||||||||||||||||||
Fund/Security Description | Shares Beginning of Period | Purchases | Sales | Shares End of Period | ||||||||||||
Active Income Fund: | ||||||||||||||||
Apollo Education Group, Inc.(1) | 7,484,477 | — | (7,484,477 | ) | — | |||||||||||
Pinnacle Entertainment, Inc.(2) | 4,296,695 | — | (4,296,695 | ) | — | |||||||||||
Stewart Information Services Corp.(2) | 1,665,931 | — | (1,665,931 | ) | — | |||||||||||
| (1) | No longer affiliated as of December 31, 2017 |
| (2) | Not affiliated as of December 31, 2016, but was affiliated during the fiscal year. No longer affiliated as of December 31, 2017. |
DS LLC is the Funds’ distributor. DS LLC does not earn any compensation from the Funds for these services. DS LLC has entered into a Fee Reimbursement Agreement (“Agreement”) with the Active Income Fund and Event Driven Fund. Under these Agreements, the Funds reimburse DS LLC for certain fees paid by DS LLC to intermediaries who provide shareholder administrative and/or sub-transfer agency services to the Funds. Currently, the amount to be reimbursed will not exceed 0.25% of the average daily net assets held by such intermediaries. The amounts incurred and payable to DS LLC during the year ended December 31, 2017 are as follows:
Fund | Shareholder services plan fees | Accrued shareholder services plan fees | ||||||
Active Income Fund | $ | 3,100,973 | $ | 259,001 | ||||
Event Driven Fund | 370,650 | 26,795 | ||||||
Certain officers of the Trust are also officers of DCM and DS LLC. The Funds pay a portion of the Chief Compliance Officer’s salary. No other officers received compensation from the Funds during the year ended December 31, 2017. The Independent Trustees are compensated for their services to the Trust and such compensation is reflected as Trustees’ fees in the Statements of Operations.
53
Table of Contents
Driehaus Mutual Funds
Notes to Financial Statements — (Continued)
UMB Fund Services, Inc. (“UMBFS”), an affiliate of UMB Financial Corporation, serves as the Funds’ administrative and accounting agent. In compensation for these services, UMBFS earns the larger of a monthly minimum fee or a monthly fee based upon each Fund’s average daily net assets. UMBFS also acts as the transfer agent and dividend disbursing agent for the Funds. For these services, UMBFS earns a monthly fee based in part on shareholder processing activity during the month.
D. INVESTMENT TRANSACTIONS
Purchases and sales of investment securities (excluding swaps, options, futures, forwards, short-term securities and U.S. government obligations) for the Active Income Fund, Event Driven Fund and Multi-Asset Growth Economies Fund for the year ended December 31, 2017, were as follows:
Active Income Fund | Event Driven Fund | Multi-Asset Growth | ||||||||||||||
| Purchases | $ | 1,566,177,174 | Purchases | $ | 327,091,938 | Purchases | $ | 34,680,007 | ||||||||
| Sales | $ | 2,090,432,666 | Sales | $ | 424,677,147 | Sales | $ | 23,557,775 | ||||||||
The aggregate purchases and sales of U.S. government obligations for the Active Income Fund, Event Driven Fund and Multi-Asset Growth Economies Fund for the year ended December 31, 2017, were as follows:
Active Income Fund | Event Driven Fund | Multi-Asset Growth | ||||||||||||||
| Purchases | $ | — | Purchases | $ | — | Purchases | $ | — | ||||||||
| Sales | $ | — | Sales | $ | 12,180,820 | Sales | $ | — | ||||||||
E. RESTRICTED SECURITIES
Restricted securities are securities that are not registered for sale under the Securities Act of 1933 or applicable foreign law and that may be resold only in transactions exempt from applicable registration. Restricted securities include Rule 144A securities which may be sold normally to qualified institutional buyers. At December 31, 2017, the Funds held restricted securities as denoted on the Schedule of Investments.
F. LINE OF CREDIT
Active Income Fund and Event Driven Fund have, together with certain other funds in the Trust, obtained a committed line of credit in the amount of $50,000,000. The line of credit is available primarily to meet large, unexpected shareholder withdrawals subject to certain restrictions. Interest is charged at a rate per annum equal to the Federal Funds Rate in effect at the time of the borrowings plus 1.5%, or 1.75%, whichever is greater. There is a commitment fee of 0.10% of the excess of the $50,000,000 committed amount over the sum of the average daily balance of any loans, which is allocated amongst all funds that have access to the line. At December 31, 2017, the Funds had no outstanding borrowings under the line of credit.
G. REDEMPTION FEES
The Multi-Asset Growth Economies Fund may charge a redemption fee of 2.00% of the redemption amount for shares redeemed within 60 days of purchase. The redemption fees are recorded in paid-in capital and reflected in the Statements of Changes in Net Assets.
H. SUBSEQUENT EVENTS
Events or transactions that occurred after the date of this report through the date the report was issued have been evaluated for potential impact to the financial statements. There are no subsequent events that require recognition or disclosure in the financial statements.
54
Table of Contents
Report of Independent Registered Public Accounting Firm
To the Shareholders of Driehaus Active Income Fund, Driehaus Event Driven Fund, and Driehaus Multi-Asset Growth Economies Fund and the Board of Trustees of the Driehaus Mutual Funds
Opinion on the Financial Statements
We have audited the accompanying statements of assets and liabilities of Driehaus Active Income Fund, Driehaus Event Driven Fund, and Driehaus Multi-Asset Growth Economies Fund, (collectively referred to as the “Funds”), (three of the funds constituting the Driehaus Mutual Funds (the “Trust”)), including the schedules of investments, as of December 31, 2017, and the related statements of operations and changes in net assets, and the financial highlights for each of the periods indicated in the table below and the related notes (collectively referred to as the “financial statements”). In our opinion, the financial statements present fairly, in all material respects, the financial position of each of the Funds (three of the funds constituting the Driehaus Mutual Funds) at December 31, 2017, and the results of their operations, changes in net assets and financial highlights for each of the periods indicated in the table below, in conformity with U.S. generally accepted accounting principles.
Individual fund constituting the Driehaus Mutual Funds | Statement of operations | Statement of changes | Financial highlights | |||
| Driehaus Active Income Fund | For the year ended December 31, 2017 | For each of the two years in the period ended December 31, 2017 | For each of the five years in the period ended December 31, 2017 | |||
| Driehaus Event Driven Fund | For the year ended December 31, 2017 | For each of the two years in the period ended December 31, 2017 | For each of the four years in the period ended December 31, 2017 and the period from August 26, 2013 (commencement of operations) through December 31, 2013 | |||
| Driehaus Multi-Asset Growth Economies Fund | For the period from April 10, 2017 (commencement of operations) through December 31, 2017 | |||||
Basis for Opinion
These financial statements are the responsibility of the Trust’s management. Our responsibility is to express an opinion on each of the Fund’s financial statements based on our audits. We are a public accounting firm registered with the Public Company Accounting Oversight Board (United States) (“PCAOB”) and are required to be independent with respect to the Trust in accordance with the U.S. federal securities laws and the applicable rules and regulations of the Securities and Exchange Commission and the PCAOB.
We conducted our audits in accordance with the standards of the PCAOB. Those standards require that we plan and perform the audit to obtain reasonable assurance about whether the financial statements are free of material misstatement, whether due to error or fraud. The Trust is not required to have, nor were we engaged to perform, an audit of the Trust’s internal control over financial reporting. As part of our audits, we are required to obtain an understanding of internal control over financial reporting, but not for the purpose of expressing an opinion on the effectiveness of the Trust’s internal control over financial reporting. Accordingly, we express no such opinion.
55
Table of Contents
Report of Independent Registered Public Accounting Firm — (Continued)
Our audits included performing procedures to assess the risks of material misstatement of the financial statements, whether due to error or fraud, and performing procedures that respond to those risks. Such procedures included examining, on a test basis, evidence regarding the amounts and disclosures in the financial statements. Our procedures included confirmation of securities owned as of December 31, 2017, by correspondence with the custodians and brokers or by other appropriate auditing procedures where replies from brokers were not received. Our audits also included evaluating the accounting principles used and significant estimates made by management, as well as evaluating the overall presentation of the financial statements. We believe that our audits provide a reasonable basis for our opinion.

We have served as the auditor of one or more Driehaus investment companies since 2002.
Chicago, Illinois
February 22, 2018
56
Table of Contents
Independent Trustees of the Trust
The following table sets forth certain information with respect to the Trustees of the Trust as of December 31, 2017:
Name, Address and Year of Birth | Position(s) | Term of | Number of Portfolios in Trust Overseen by Trustee | Principal Occupation(s) | Other Directorships | |||||||
Independent Trustees: | ||||||||||||
Daniel F. Zemanek c/o Driehaus Capital Management LLC 25 East Erie Street Chicago, IL 60611 YOB: 1942 | Trustee and Chairman | Since 1996 Since 2014 | 9 | Retired; President of Ludan, Inc. (real estate development services specializing in senior housing) from April 2008 to December 2014. | None | |||||||
Theodore J. Beck c/o Driehaus Capital Management LLC 25 East Erie Street Chicago, IL 60611 YOB: 1952 | Trustee | Since 2012 | 9 | President and Chief Executive Officer, National Endowment for Financial Education, 2005 to present. | None. | |||||||
Francis J. Harmon c/o Driehaus Capital Management LLC 25 East Erie Street Chicago, IL 60611 YOB: 1942 | Trustee | Since 1998 | 9 | Relationship Manager, Great Lakes Advisors, Inc. since February 2008. | None | |||||||
Dawn M. Vroegop c/o Driehaus Capital Management LLC 25 East Erie Street Chicago, IL 60611 YOB: 1966 | Trustee | Since 2012 | 9 | Private Investor since 2003. | Independent Trustee, Brighthouse Funds Trust I (formerly, Met Investors Series Trust) since December 2000 and Brighthouse Funds Trust II (formerly, Metropolitan Series Fund, Inc.) since May 2009. | |||||||
Christopher J. Towle, CFA c/o Driehaus Capital Management LLC 25 East Erie Street Chicago, IL 60611 YOB: 1957 | Trustee | Since 2016 | 9 | Retired; Partner, Portfolio Manager, Director of High Yield and Convertible Securities, Lord Abbett & Co. from 1987-2014. | None | |||||||
57
Table of Contents
The following table sets forth certain information with respect to the officers of the Trust:
Name, Address and Year of Birth | Position(s) | Length of | Principal Occupation(s) During Past 5 Years | |||
Stephen J. Kneeley 25 East Erie Street Chicago, IL 60611 YOB: 1963 | President | Since 2017 | President and Chief Executive Officer of the Adviser and Driehaus Capital Management (USVI) LLC (“USVI”) since January 2018; President of the Trust since March 2017; Interim President and Interim Chief Executive Officer of Adviser and USVI March 2017- December 2017; Chief Executive Officer, Context Asset Management, L.P. from 2014-2016; Chief Executive Officer, Spider Management Company, LLC from 2012-2013; Chief Executive Officer, Ardmore Investment Partners from 2009-2012; Chairman of Board of Trustees, Context Capital Funds from 2014-2017; Director, Spider Management Company, LLC since 2012; and Trustee, Copeland Trust from 2010-2017. | |||
Michelle L. Cahoon 25 East Erie Street Chicago, IL 60611 YOB: 1966 | Vice President and Treasurer | Since 2006 Since 2002 | Chief Financial Officer and Treasurer of the Adviser and Distributor since 2012; Vice President, Treasurer and Chief Financial Officer of USVI since 2004. | |||
Janet L. McWilliams 25 East Erie Street Chicago, IL 60611 YOB: 1970 | Assistant Vice President and Chief Legal Officer | Since 2007 Since 2012 | General Counsel and Secretary of the Adviser and Distributor since 2012. | |||
Michael R. Shoemaker 25 East Erie Street Chicago, IL 60611 YOB: 1981 | Chief Compliance Officer and Assistant Vice President | Since 2012 | Assistant Vice President and Chief Compliance Officer of the Adviser and Distributor since 2012. | |||
William H. Wallace, III 301 Bellevue Parkway Wilmington, DE 19809 YOB: 1969 | Secretary | Since 2015 | Vice President and Manager, The Bank of New York Mellon since 2010. | |||
Michael P. Kailus 25 East Erie Street Chicago, IL 60611 YOB: 1971 | Assistant Secretary and Anti-Money Laundering Compliance Officer | Since 2010 Since 2011 | Assistant Secretary of the Adviser, Distributor and USVI since 2010; Senior Attorney with the Adviser since 2010. | |||
Christine V. Mason 301 Bellevue Parkway Wilmington, DE 19809 YOB: 1956 | Assistant Secretary | Since 2015 | Senior Specialist, The Bank of New York Mellon since 2013; Senior Paralegal, Foreside Funds Distributors LLC (formerly BNY Mellon Distributors Inc.) from 2004-2013. | |||
The Statement of Additional Information for Driehaus Mutual Funds contains more detail about the Trust’s Trustees and officers and is available upon request, without charge. For further information, please call 1-877-779-0079.
58
Table of Contents
As a mutual fund shareholder, you may incur two types of costs: (1) transaction costs, including sales charges; redemption fees; and exchange fees and (2) ongoing costs, including management fees; distribution (12b-1) and/or service fees; and other fund expenses. This example is intended to help you understand your ongoing costs (in dollars) of investing in the Fund and to compare these costs with the ongoing costs of investing in other mutual funds.
The example is based on an investment of $1,000 invested at the beginning of the period and held for the entire six month period ended December 31, 2017.
Actual Expenses
The first line of the table below (“Actual”) provides information about actual account values and actual expenses. You may use the information in this line, together with the amount you invested, to estimate the expense that you paid over the period. Simply divide your account value by $1,000 (for example, an $8,600 account value divided by $1,000 = 8.6), then multiply the result by the number in the first line under the heading entitled “Expenses Paid During Period” to estimate the expenses you paid on your account during this period.
Hypothetical Example for Comparison Purposes
The second line of the tables below (“Hypothetical”) provides information about hypothetical account values and hypothetical expenses based on the Fund’s actual expense ratio and an assumed rate of return of 5% per year before expenses, which is not the Fund’s actual return. You may use this information to compare the ongoing costs of investing in the Fund versus other funds. To do so, compare this 5% hypothetical example with the 5% hypothetical examples that appear in the shareholder reports of the other funds.
Please note that the expenses shown in the table are meant to highlight your ongoing costs only and do not reflect any transactional costs, such as sales charges, redemption fees or exchange fees. Therefore, the second line of the table is useful in comparing ongoing costs only, and will not help you determine the relative total costs of owning different funds. In addition, if these transactional costs were included, your costs would have been higher.
Driehaus Active Income Fund
Beginning Account Value July 1, 2017 | Ending Account Value December 31, 2017 | Expenses Paid During Six Months Ended December 31, 2017* | ||||||||||
Actual | $ | 1,000.00 | $ | 998.90 | $ | 5.74 | ||||||
Hypothetical Example, assuming a 5% return before expenses | $ | 1,000.00 | $ | 1,019.46 | $ | 5.80 | ||||||
Driehaus Event Driven Fund
Beginning Account Value July 1, 2017 | Ending Account Value December 31, 2017 | Expenses Paid During Six Months Ended December 31, 2017* | ||||||||||
Actual | $ | 1,000.00 | $ | 997.20 | $ | 9.41 | ||||||
Hypothetical Example, assuming a 5% return before expenses | $ | 1,000.00 | $ | 1,015.78 | $ | 9.50 | ||||||
59
Table of Contents
Fund Expense Examples — (Continued)
Driehaus Multi-Asset Growth Economies Fund
Beginning Account Value July 1, 2017 | Ending Account Value December 31, 2017 | Expenses Paid During Six Months Ended December 31, 2017* | ||||||||||
Actual | $ | 1,000.00 | $ | 1,140.70 | $ | 9.44 | ||||||
Hypothetical Example, assuming a 5% return before expenses | $ | 1,000.00 | $ | 1,016.38 | $ | 8.89 | ||||||
| * | Expenses are equal to the Funds’ annualized expense ratios for the six-month period in the table below multiplied by the average account value over the period, multiplied by the number of days in the most recent fiscal half-year (184), then divided by 365 to reflect the half-year period. |
Driehaus Active Income Fund | 1.14% | |||
Driehaus Event Driven Fund | 1.87% | |||
Driehaus Multi-Asset Growth Economies Fund | 1.75% |
60
Table of Contents
TAX INFORMATION (UNAUDITED) FOR THE YEAR ENDED DECEMBER 31, 2017
We are providing this information as required by the Internal Revenue Code. The amounts shown may differ from those elsewhere in this report because of differences between tax and financial reporting requirements.
The Funds designate the following amounts as a long-term capital gain distribution:
Active Income Fund | Event Driven Fund | Multi-Asset Growth Economies Fund | ||||||||
| $ | — | $ | — | $ | 213,901 | |||||
For taxable non-corporate shareholders, the following percentages of income and short-term capital gains represent qualified dividend income subject to the 15% rate category:
Active Income Fund | Event Driven Fund | Multi-Asset Growth Economies Fund | ||||||||
| 13.55% | 0% | 21.73% | ||||||||
For corporate shareholders, the following percentages of income and short-term capital gains qualified for the dividends-received deduction:
Active Income Fund | Event Driven Fund | Multi-Asset Growth Economies Fund | ||||||||
| 13.46% | 0% | 0.14% | ||||||||
PROXY VOTING POLICIES AND PROCEDURES AND PROXY VOTING RECORD
A description of the Funds’ policies and procedures with respect to the voting of proxies relating to the Funds’ portfolio securities is available, without charge, upon request, by calling 1-877-779-0079. This information is also available on the Funds’ website at http://www.driehaus.com.
Information regarding how the Funds voted proxies related to portfolio securities during the 12-month period ended June 30, 2017 is available without charge, upon request, by calling 1-877-779-0079. This information is also available on the Securities and Exchange Commission’s (“SEC”) website at http://www.sec.gov.
HOW TO OBTAIN QUARTERLY PORTFOLIO HOLDINGS
Each Fund files a complete schedule of portfolio holdings with the SEC for the first and third quarters of each fiscal year on Form N-Q. The Funds’ Form N-Q is available electronically on the SEC’s website at http://www.sec.gov; hard copies may be reviewed and copied at the SEC’s Public Reference Room in Washington, DC. For more information on the Public Reference Room, call 1-800-SEC-0330. Each Fund’s complete schedule of portfolio holdings is also available on the Funds’ website at http://www.driehaus.com.
61
Table of Contents
Board Considerations in Connection with the Annual Review of the
Investment Advisory Agreement
The Board of Trustees of the Driehaus Mutual Funds (the “Trust”), including a majority of the Trustees who are not “interested persons” (as defined in the Investment Company Act of 1940, as amended) (the “Independent Trustees”), approved the renewal of the investment advisory agreement (the “Agreement”) with Driehaus Capital Management LLC (the “Adviser”) for Driehaus Active Income Fund (“LCMAX”) and Driehaus Event Driven Fund (“DEVDX” and together with LCMAX, the “Funds”) on September 14, 2017 for an additional one-year term ending September 30, 2018. As part of its review process, the Board requested and evaluated all information it deemed reasonably necessary to evaluate the Agreement. The Board reviewed comprehensive materials received from the Adviser and from independent legal counsel. The Board also received extensive information throughout the year regarding performance and operating results of each Fund. The Independent Trustees held a conference call with their independent legal counsel on September 6, 2017 to review the materials provided in response to their request and identified areas for further response by Fund management. Following receipt of further information from Fund management, the Independent Trustees, represented by independent legal counsel, met independent of Fund management to consider renewal of the Agreement for each Fund. After their consideration of all the information received, the Independent Trustees presented their findings and their recommendation to renew the Agreement at the Board meeting.
In connection with the contract review process, the Board considered the factors discussed below, among others. The Board also considered that the Adviser has managed each Fund for an extended period or since inception, and the Board believes that a long-term relationship with a capable, conscientious adviser is in the best interests of each Fund.
Nature, Quality and Extent of Services. The Board considered the nature, extent and quality of services provided under the Agreement, including portfolio management services and administrative services. The Board considered the experience and skills of senior management and investment personnel, the resources made available to such personnel, the ability of the Adviser to attract and retain high-quality personnel, and the organizational depth of the Adviser. The Board also considered the Trust’s compliance with legal and regulatory requirements, as well as the Adviser’s handling of portfolio brokerage, and noted the Adviser’s process for evaluating best execution. The Board considered the Adviser’s risk management strategies and the process developed by the Adviser for analyzing, reviewing and assessing risk exposure for the Funds. The Board also considered the Funds’ process for fair valuation of portfolio securities and noted the Board’s review of Fund valuation matters throughout the year.
The Board evaluated LCMAX’s performance for year-to-date and 1-, 3- and 5-year periods ended June 30, 2017 and DEVDX’s performance for year-to-date, 1- and 3-year periods ended June 30, 2017 (the Fund’s inception date was August 26, 2013), comparing each Fund to performance of a peer group of funds compiled by the Adviser from data from Lipper Analytical Services, Inc., an independent provider of mutual fund data that is a service of Broadridge Financial Solutions (“Lipper”) and to each Fund’s primary benchmark index, as identified in reports to shareholders. The Board noted the Adviser’s statement that there are limitations in comparing the performance of the Funds to a peer group of funds that may differ significantly by objective and portfolio characteristics. The Adviser also noted that the benchmarks are more representative for long-only funds. For LCMAX, the Board noted that it considered performance information with regard to the Fund’s full peer group (all share classes) as well as the peer funds’ primary share class only and for DEVDX it considered performance information with regard to the peer funds’ primary share class only.
The Board considered that, as of June 30, 2017, although LCMAX was in the third quartile of each peer group for the 1-, 3- and 5-year periods, the Fund outperformed its primary benchmark index, the Citigroup 3-Month T-Bill Index (“Citigroup Index”), for the year-to-date, 1-, 3- and 5-year periods. The Board also noted that LCMAX outperformed its other benchmark index, the Barclays Capital U.S. Aggregate Bond Index (“Barclays Index”) for the 1-year period and had met its volatility objective of being less volatile than the Barclays Index for the 1-year period.
The Board considered that, as of June 30, 2017, DEVDX’s performance was below the median of its peer group for the 3-year period, but that, given the remedial steps taken by the Adviser, the Fund outperformed its peer group for the year-to-date and 1-year periods. The Board noted that DEVDX underperformed the S&P 500 Index for all periods reviewed. The Board noted that for the 3-year period, DEVDX had met its volatility objective of being less volatile than the S&P 500 Index, but slightly missed its target of having a standard deviation of two-thirds or less than that of the S&P 500 Index.
62
Table of Contents
For LCMAX, the Board also considered the Fund’s rolling 1-year, 3-year and 5-year returns over the life of the Fund relative to the Citigroup Index and noted that, in a majority of the time periods measured, the Fund outperformed its benchmark index. Based upon this review, the Board concluded that the Adviser had consistently implemented its investment philosophy for the Fund, and that over the long term, the investment philosophy produces value for shareholders. The Adviser concluded that DEVDX did not have sufficient performance periods to produce meaningful results and did not provide rolling returns for DEVDX.
On the basis of this evaluation and its ongoing review of investment results, the Board concluded that the nature, quality and extent of services provided by the Adviser supported renewal of the Agreement for each Fund.
Fees. The Board considered each Fund’s advisory fee rates, operating expenses and total expense ratio as of December 31, 2016 as compared to peer group information based on data compiled from Lipper as of the most recent fiscal year end of each fund in the peer group. The Board noted the limitations of the peer group of funds designated by Lipper for LCMAX (the alternative credit focus funds peer group), as discussed above, and that the expense information for LCMAX and DEVDX was compared to each Fund’s full peer group (all share classes). The Board noted that LCMAX’s annual advisory fee rate of .55% is in the 34th percentile of the actual fees of its peer group (1st percentile being the highest fee) and DEVDX’s advisory fee rate of 1.00% is in the 40th percentile of the actual fees of its peer group.
The Board also considered that for the fiscal year ended December 31, 2016, LCMAX’s and DEVDX’s expense ratios (excluding dividends and interest on short sales) were in the 82nd and 69th percentile of their peer group, respectively. The Board also considered each Fund’s advisory fee rate as compared to the fee charged by the Adviser for a similar sub-advised unaffiliated mutual fund. The Board noted that the mix of services provided, the level of responsibility, the legal, reputational and regulatory risks and the resources required under the Agreement were significantly greater as compared to the Adviser’s obligations for sub-advising the other mutual funds. In considering the reasonableness of the advisory fees, the Board took into account the Adviser’s substantial human and technological resources devoted to investing for the Funds, the relatively small amount of assets under management and the limited capacity of the investment styles.
On the basis of the information reviewed, the Board concluded that the advisory fee schedule for each Fund was reasonable in light of the nature and quality of services provided by the Adviser.
Profitability. The Board reviewed information regarding revenues received by the Adviser under the Agreement from each Fund and discussed the Adviser’s methodology in allocating its costs to the management of the Funds. The Board considered the estimated costs to the Adviser of managing the Funds. The Board also noted that the Funds do not have a Rule 12b-1 fee and that the Adviser’s affiliate, Driehaus Securities LLC (“DS LLC”), serves as distributor of the Funds without compensation, that DS LLC provides compensation to intermediaries for distribution of the Funds’ shares and for shareholder services, and that DS LLC is reimbursed by the Funds under a Shareholder Services Plan (the “Plan”) for certain amounts paid for shareholder services covered under the Plan. The Board concluded that, based on the profitability calculated for the Trust as well as for the Funds individually (noting that DEVDX operated at a loss and that profitability for LCMAX was expected to decline due to declining assets), profitability was not excessive in light of the nature, extent and quality of the services provided to the Funds.
Economies of Scale. In considering the reasonableness of the advisory fee, the Board considered whether there are economies of scale with respect to the management of the Funds and whether the Funds benefit from any such economies of scale. Given the capacity constraints of LCMAX and the current size of DEVDX, the Board concluded that the advisory fee rates under the Agreement are reasonable and reflect an appropriate sharing of any such economies of scale.
Other Benefits to the Adviser and its Affiliates. The Board also considered the character and amount of other incidental benefits received by the Adviser and its affiliates. The Board noted that payments to DS LLC under the Plan are in reimbursement of payments made to intermediaries for shareholder services. The Board also noted that the soft dollar amounts for each Fund were limited during this period. The Board concluded that the advisory fees were reasonable in light of any fall-out benefits.
Based on all of the information considered and the conclusions reached, the Board determined that the terms of the Agreement continue to be fair and reasonable and that the continuation of the Agreement is in the best interests of each Fund. No single factor was determinative in the Board’s analysis.
63
Table of Contents
Item 2. Code of Ethics.
| (a) | The registrant, as of the end of the period covered by this report, has adopted a code of ethics that applies to the registrant’s principal executive officer, principal financial officer, principal accounting officer or controller, or persons performing similar functions, regardless of whether these individuals are employed by the registrant or a third party. |
| (b) | No response required. |
| (c) | There have been no amendments, during the period covered by this report, to a provision of the code of ethics that applies to the registrant’s principal executive officer, principal financial officer, principal accounting officer or controller, or persons performing similar functions, regardless of whether these individuals are employed by the registrant or a third party, and that relates to any element of the code of ethics description. |
| (d) | The registrant has not granted any waivers, including an implicit waiver, from a provision of the code of ethics that applies to the registrant’s principal executive officer, principal financial officer, principal accounting officer or controller, or persons performing similar functions, regardless of whether these individuals are employed by the registrant or a third party, that relates to one or more of the items set forth in paragraph (b) of this item’s instructions. |
| (e) | Not applicable. |
| (f) | The registrant’s Code of Ethics for Principal Executive and Financial Officers was filed as Exhibit 13(a)(1) to the registrant’s Certified Shareholder Report on Form N-CSR, Accession Number 0001193125-12-093739, on March 2, 2012, and is incorporated herein by reference. |
Item 3. Audit Committee Financial Expert.
The registrant’s Board of Trustees has designated Dawn M. Vroegop as an “audit committee financial expert” as defined by this Item 3, serving on the Audit Committee. Ms. Vroegop is “independent,” as defined by this Item 3.
Item 4. Principal Accountant Fees and Services.
| (a) | Audit Fees |
For the fiscal years ended December 31, 2017 and 2016, Ernst & Young LLP, the registrant’s principal accountant (“E&Y”), billed the registrant $383,500 and $353,000, respectively, for professional services rendered for the audit of the registrant’s annual financial statements or services that are normally provided in connection with statutory and regulatory filings.
Table of Contents
| (b) | Audit-Related Fees |
For the fiscal years ended December 31, 2017 and 2016, E&Y billed the registrant $0 and $0, respectively, for assurance and related services that are reasonably related to the performance of the audit of the registrant’s financial statements and that are not reported above.
For engagements that Driehaus Capital Management LLC, the registrant’s investment adviser (“DCM”), or Driehaus Securities LLC, the registrant’s distributor (“DS”), entered into with E&Y for fiscal years 2017 and 2016, E&Y provided no audit-related services to DCM or DS that were for engagements directly related to the registrant’s operations and financial reporting, except for the following services for which E&Y billed DCM a total of $17,500 in 2017: (i) the issuance of three consents to be included in the registration statements for two new series of the registrant, and (ii) the audits of the full schedule of investments for two predecessor partnerships to the new series of the registrant.
| (c) | Tax Fees |
For the fiscal years ended December 31, 2017 and 2016, E&Y billed the registrant $97,045 and $84,390, respectively, for professional services rendered for tax compliance, tax advice, and tax planning. Such services consisted of review of the registrant’s income tax returns and tax distribution requirements and analysis related to passive foreign investment company status. The Audit Committee pre-approved all tax services that E&Y provided to the registrant.
For fiscal years 2017 and 2016, E&Y provided no tax services to DCM or DS that were for engagements directly related to the registrant’s operations and financial reporting.
| (d) | All Other Fees |
For the fiscal years ended December 31, 2017 and 2016, E&Y billed the registrant $0 and $0, respectively, for products and services provided, other than the services reported above.
For fiscal years 2017 and 2016, E&Y provided no other services to DCM or DS that were for engagements directly related to the registrant’s operations and financial reporting.
| (e)(1) | Audit Committee Pre-Approval Policies and Procedures |
Pursuant to registrant’s Audit Committee Charter (the “Charter”), the Audit Committee is responsible for pre-approving any engagement of the principal accountant to provide non-prohibited services to the registrant, including the fees and other compensation to be paid to the principal accountant, to the extent required by Rule 2-01(c)(7) of Regulation S-X. The Chairman of the Audit Committee may grant pre-approval for such engagements of $5,000 or less. All such delegated pre-approvals will be presented to the Audit Committee no later than the next Audit Committee meeting.
Pursuant to the Charter, the Audit Committee is also responsible for pre-approving any engagement of the principal accountant, including the fees and other compensation to be paid to the principal accountant, to provide non-audit services to the registrant’s investment adviser (or any entity controlling, controlled by, or under common control with the adviser that provides
Table of Contents
ongoing services to the registrant), if the engagement relates directly to the operations and financial reporting of the registrant, to the extent required by Rule 2-01(c)(7) of Regulation S-X. The Chairman of the Audit Committee may grant pre-approval for engagements of $5,000 or less. All such delegated pre-approvals will be presented to the Audit Committee no later than the next Audit Committee meeting.
| (e)(2) | The percentage of services described in each of paragraphs (b) through (d) of this Item that were approved by the audit committee pursuant to paragraph (c)(7)(i)(C) of Rule 2-01 of Regulation S-X is 0%. |
| (f) | Not applicable. |
| (g) | Non-Audit Fees |
For the fiscal years ended December 31, 2017 and 2016, E&Y billed the registrant $97,045 and $84,390, respectively, in aggregate non-audit fees. For the fiscal years ended December 31, 2017 and 2016, E&Y billed DCM or DS $0 and $0, respectively, in aggregate non-audit fees.
| (h) | Not applicable. |
Item 5. Audit Committee of Listed Registrants.
Not applicable.
Item 6. Investments.
| (a) | Schedule of Investments in securities of unaffiliated issuers as of the close of the reporting period is included as part of the report to shareholders filed under Item 1 of this form. |
| (b) | Not applicable. |
Item 7. Disclosure of Proxy Voting Policies and Procedures for Closed-End Management Investment Companies.
Not applicable.
Item 8. Portfolio Managers of Closed-End Management Investment Companies.
Not applicable.
Item 9. Purchases of Equity Securities by Closed-End Management Investment Company and Affiliated Purchasers.
Not applicable.
Table of Contents
Item 10. Submission of Matters to a Vote of Security Holders.
There have been no material changes to the procedures by which the shareholders may recommend nominees to the registrant’s board of directors, where those changes were implemented after the registrant last provided disclosure in response to the requirements of Item 407(c)(2)(iv) of Regulation S-K (17 CFR 229.407) (as required by Item 22(b)(15) of Schedule 14A (17 CFR 240.14a-101)), or this Item.
Item 11. Controls and Procedures.
| (a) | The registrant’s principal executive and principal financial officers, or persons performing similar functions, have concluded that the registrant’s disclosure controls and procedures (as defined in Rule 30a-3(c) under the Investment Company Act of 1940, as amended (the “1940 Act”) (17 CFR 270.30a-3(c))) are effective, as of a date within 90 days of the filing date of the report that includes the disclosure required by this paragraph, based on their evaluation of these controls and procedures required by Rule 30a-3(b) under the 1940 Act (17 CFR 270.30a-3(b)) and Rules 13a-15(b) or 15d-15(b) under the Securities Exchange Act of 1934, as amended (17 CFR 240.13a-15(b) or 240.15d-15(b)). |
| (b) | There were no changes in the registrant’s internal control over financial reporting (as defined in Rule 30a-3(d) under the 1940 Act (17 CFR 270.30a-3(d))) that occurred during the registrant’s last fiscal quarter that has materially affected, or is reasonably likely to materially affect, the registrant’s internal control over financial reporting. |
Item 12. Disclosure of Securities Lending Activities for Closed-End Management Investment Companies.
Not applicable.
Item 13. Exhibits.
| (a)(1) | Code of ethics, or any amendment thereto, that is the subject of disclosure required by Item 2, filed as Exhibit 12(a)(1) to the Registrant’s Form N-CSR, filed on March 2, 2012 (Accession No. 0001193125-12-093738) incorporated herein by reference. |
| (a)(2) | Certifications pursuant to Rule 30a-2(a) under the 1940 Act and Section 302 of the Sarbanes-Oxley Act of 2002 are attached hereto. |
| (a)(3) | Not applicable. |
| (a)(4) | Not applicable. |
| (b) | Certifications pursuant to Rule 30a-2(b) under the 1940 Act and Section 1350 of Chapter 63 of Title 18 of the United States Code (18 U.S.C. 1350) are attached hereto. |
Table of Contents
SIGNATURES
Pursuant to the requirements of the Securities Exchange Act of 1934 and the Investment Company Act of 1940, the registrant has duly caused this report to be signed on its behalf by the undersigned, thereunto duly authorized.
(Registrant) Driehaus Mutual Funds |
By (Signature and Title)* /s/ Stephen J. Kneeley |
Stephen J. Kneeley, President (principal executive officer) |
Date March 2, 2018 |
Pursuant to the requirements of the Securities Exchange Act of 1934 and the Investment Company Act of 1940, this report has been signed below by the following persons on behalf of the registrant and in the capacities and on the dates indicated.
By (Signature and Title)* /s/ Stephen J. Kneeley |
Stephen J. Kneeley, President (principal executive officer) |
Date March 2, 2018 |
By (Signature and Title)* /s/ Michelle L. Cahoon |
Michelle L. Cahoon, Vice President and Treasurer (principal financial officer) |
Date March 2, 2018 |
| * | Print the name and title of each signing officer under his or her signature. |