UNITED STATES
SECURITIES AND EXCHANGE COMMISSION
Washington, D.C. 20549
FORM N-CSR
CERTIFIED SHAREHOLDER REPORT OF REGISTERED MANAGEMENT
INVESTMENT COMPANIES
Investment Company Act file number811-07655
Driehaus Mutual Funds
(Exact name of registrant as specified in charter)
25 East Erie Street
Chicago, IL 60611
(Address of principal executive offices) (Zip code)
Janet L. McWilliams
Driehaus Capital Management LLC
25 East Erie Street
Chicago, IL 60611
(Name and address of agent for service)
Registrant's telephone number, including area code:312-587-3800
Date of fiscal year end:December 31
Date of reporting period:December 31, 2019
Form N-CSR is to be used by management investment companies to file reports with the Commission not later than 10 days after the transmission to stockholders of any report that is required to be transmitted to stockholders under Rule 30e-1 under the Investment Company Act of 1940 (17 CFR 270.30e-1). The Commission may use the information provided on Form N-CSR in its regulatory, disclosure review, inspection, and policymaking roles.
A registrant is required to disclose the information specified by Form N-CSR, and the Commission will make this information public. A registrant is not required to respond to the collection of information contained in Form N-CSR unless the Form displays a currently valid Office of Management and Budget ("OMB") control number. Please direct comments concerning the accuracy of the information collection burden estimate and any suggestions for reducing the burden to Secretary, Securities and Exchange Commission, 450 Fifth Street, NW, Washington, DC 20549-0609. The OMB has reviewed this collection of information under the clearance requirements of 44 U.S.C. § 3507.
Item 1. Reports to Stockholders.
The Reports to Shareholders are attached herewith.

Beginning on May 1, 2021, as permitted by regulations adopted by the Securities and Exchange Commission, paper copies of shareholder reports will no longer be sent by mail, unless you specifically request paper copies of the reports. Instead, the reports will be made available on the Fund’s website (https://www.driehaus.com/fund-resources), and you will be notified by mail each time a report is posted and provided with a website link to access the report.
If you already elected to receive shareholder reports electronically, you will not be affected by this change and you need not take any action. You may elect to receive shareholder reports and other communications from a Fund electronically at any time by contacting your financial intermediary (such as a broker-dealer or bank) or, if you invest directly with a Fund, by calling 1-800-560-6111.
You may elect to receive all future reports in paper free of charge. If you invest through a financial intermediary, you can contact your financial intermediary to request that you continue to receive paper copies of your shareholder reports. If you invest directly with a Fund, you can call 1-800-560-6111 to inform the Fund that you wish to continue receiving paper copies of your shareholder reports. Your election to receive reports in paper will apply to all funds held in your account if you invest through a financial intermediary or all funds in the Driehaus Mutual Funds if you invest directly with a Fund.
Annual Report to Shareholders
December 31, 2019
Investment Philosophy:
The Adviser seeks to achieve superior investment returns primarily by investing in global companies that are currently demonstrating rapid growth in their sales and earnings and which, in its judgment, have the ability to continue or accelerate their growth rates in the future. The Adviser manages the portfolios actively (above average turnover) to ensure that the Funds are fully invested, under appropriate market conditions, in companies that meet these criteria. Investors should note that investments in overseas markets can pose more risks than U.S. investments, and the international Funds’ share prices are expected to be more volatile than those of the U.S.- only Funds. In addition, the Funds’ returns will fluctuate with changes in stock market conditions, currency values, interest rates, government regulations, and economic and political conditions in countries in which the Funds invest. These risks are generally greater when investing in emerging markets.
Driehaus Emerging Markets Growth Fund
Driehaus Emerging Markets Small Cap Growth Fund
Driehaus International Small Cap Growth Fund
Driehaus Micro Cap Growth Fund
Driehaus Small Cap Growth Fund
Table of Contents |
Portfolio Manager Letter, Performance Overview and Schedule of Investments: | |
Driehaus Emerging Markets Growth Fund | 1 |
Driehaus Emerging Markets Small Cap Growth Fund | 8 |
Driehaus International Small Cap Growth Fund | 15 |
Driehaus Micro Cap Growth Fund | 22 |
Driehaus Small Cap Growth Fund | 29 |
Statements of Assets and Liabilities | 36 |
Statements of Operations | 38 |
Statements of Changes in Net Assets | 40 |
Financial Highlights | 42 |
Notes to Financial Statements | 49 |
Report of Independent Registered Public Accounting Firm | 59 |
Interested and Independent Trustees of the Trust | 61 |
Officers of the Trust | 62 |
Fund Expense Examples | 63 |
Shareholder Information | 65 |
Board Considerations in Connection with the Annual Review of the Investment Advisory Agreement for Equity Funds | 66 |
Driehaus Emerging Markets Growth Fund — Portfolio Managers’ Letter |
Dear Fellow Shareholders,
The Driehaus Emerging Markets Growth Fund (“Fund”) Investor class (DREGX) returned 25.34% and the Institutional class (DIEMX) returned 25.60% for the year ended December 31, 2019. The Fund’s primary benchmark, the Morgan Stanley Capital International (“MSCI”) Emerging Markets Index (“Benchmark”), returned 18.42% for the year, while the MSCI Emerging Markets Growth Index returned 25.10%.
Emerging market equities were volatile over the course of 2019 buffeted by trade war concerns and global cyclical risks. By the fourth quarter however, sentiment began to take on a steadily more positive tone. While global macroeconomic data and indicators remained choppy through much of the fourth quarter, the period was marked by an apparent easing of trade war risks and liquidity conditions, first hesitantly, then more decisively. This began with an announcement early in the quarter that plans for an October 15th tariff increase by the U.S. had been suspended until December 15th in anticipation of agreement on a Phase 1 deal. Early December news that a deal was close to being finalized and the prospective announcement of a signing scheduled for January 15th seemed to further sideline the trade war overhang.
Over the course of 2019, security selection within the financials, consumer discretionary and consumer staples sectors contributed to the Fund’s returns versus the Benchmark. From a geographic perspective, holdings in China and Brazil made key contributions to performance versus the Benchmark in the past year.
Alibaba Group Holding Ltd. Sponsored ADR (Ticker: LREN3-BR) was a notable contributor to the Fund’s returns for the year. The company is the largest e-commerce marketplace and cloud computing provider in China. The company posted strong results during its annual shopping holiday – Single’s Day. Additionally, the company’s secondary listing on the Hong Kong exchange was well-received by investors and helped to drive new capital flows into the stock. Finally, the stock also benefitted from progress in the U.S./China trade war, as the market started to discount the signing of the phase one trade agreement. The Fund ultimately added to its position during the fourth quarter of 2019.
Taiwan Semiconductor Manufacturing Co., Ltd. Sponsored ADR (Ticker: TSM-US) was also a significant contributor to the Fund’s return. The company is the world’s leading semiconductor manufacturer and a critical enabler of the biggest growth trends in technology. The position’s outperformance was due to signs of accelerating demand for the company’s leading manufacturing processes, primarily driven by the launch of 5G networks and high-performance computing.
During 2019, stock selection within the real estate and information technology sectors underperformed versus the Benchmark, but still contributed positive absolute returns to the Fund despite the relative underperformance. At the country level, although holdings in Taiwan underperformed the Benchmark, they contributed positively to absolute returns, while positions in Turkey detracted from Fund’s performance relative to the Benchmark and absolute returns.
Fund holding Samsung Fire & Marine Insurance Co., Ltd (Ticker: 000810-KR) was a notable detractor from returns. Samsung Fire & Marine Insurance Co., Ltd is a blender insurer based in Korea. The company was hurt by adverse regulatory changes in the health insurance industry in Korea.
Another significant detractor from the Fund’s return for the year was Akbank TAS (Ticker: AKBNK-TR). Akbank is a Turkey based company that offers retail and corporate banking services. The company had a weak start to the fourth quarter as a result of ongoing geopolitical issues and the withdrawal of U.S. troops from Syria. Following that withdrawal, the U.S. threatened sanctions on Turkey if they mounted an attack on Kurdish forces. As a result of that threat, the Turkish lira and banking stocks came under pressure.
Improved visibility on resolution of trade headwinds and more accommodative monetary postures in both the U.S. and China appeared to set up a relatively benign outlook for emerging markets generally. Our expectation of weaker U.S. economic growth paired with a “lower for longer” interest rate outlook should keep real rates well contained even if inflation reemerges to drive nominal rates higher. We continue to pay significant attention to the pace and nature of stimulus within the Chinese economy, as this could be a key lever to drive broader growth expectations, particularly within cyclical areas of the market.
All else being equal, we expect the current global backdrop to support emerging market assets by keeping U.S. Dollar strength at bay and accentuating growth differentials in favor of emerging markets. We further believe that the appeal of emerging market equities is further enhanced by a wider than average valuation discount relative to the U.S. equities.
1
Our key focus for the months ahead will be to remain focused on seeking earnings inflections that reflect the wider range of opportunities that may surface in the current environment. We believe our flexibility to seek out improving earnings growth dynamics across a range of market segments combined with our sensitivity to shifting macro dynamics should position the Fund to perform well in 2020.
We thank you for investing alongside us in the Driehaus Emerging Markets Growth Fund and would like to express our gratitude for your continued confidence in our management capabilities.
Sincerely,
|
|
|
Howard Schwab | Chad Cleaver | Rich Thies |
Lead Portfolio Manager | Portfolio Manager | Portfolio Manager |


Performance is historical and does not represent future results.
Please see the following performance overview page for index descriptions.
2
Driehaus Emerging Markets Growth Fund Performance Overview (unaudited) |
The performance summarized below is historical and does not represent future results. Investment returns and principal value vary, and you may have a gain or loss when you sell shares. Performance data presented measures the change in the value of an investment in the Fund, assuming reinvestment of all dividends and capital gains. Average annual total return reflects annualized change.
The table does not reflect the deduction of taxes that a shareholder would pay on Fund distributions or the redemption of Fund shares. The graph compares the results of a $10,000 investment in the Fund over the last 10 fiscal year periods, with all dividends and capital gains reinvested, with the indicated indices (and dividends reinvested) for the same period.
Average Annual Total Returns as of 12/31/19 | 1 Year | 3 Years | 5 Years | 10 Years |
Driehaus Emerging Markets Growth Fund Investor Class (DREGX) | 25.34% | 14.36% | 7.23% | 6.18% |
Driehaus Emerging Markets Growth Fund Institutional Class (DIEMX)1 | 25.60% | 14.54% | 7.33% | 6.23% |
MSCI Emerging Markets Index-N2 | 18.42% | 11.57% | 5.61% | 3.68% |
MSCI Emerging Markets Growth Index-N3 | 25.10% | 14.50% | 7.45% | 5.20% |

1 | The returns for the periods prior to July 17, 2017 (institutional share class inception date) include the performance of the investor share class. |
2 | The Morgan Stanley Capital International Emerging Markets Index-Net (MSCI Emerging Markets Index-N) is a market capitalization-weighted index designed to measure equity market performance in emerging markets. Data is in U.S. dollars and is calculated with net dividend reinvestment. Source: Morgan Stanley Capital International Inc. |
3 | The Morgan Stanley Capital International Emerging Markets Growth Index-Net (MSCI Emerging Markets Growth Index-N) is a subset of the MSCI Emerging Markets Index and includes only the MSCI Emerging Markets Index stocks which are categorized as growth stocks. Data is in U.S. dollars and is calculated with net dividend reinvestment. Source: Morgan Stanley Capital International Inc. |
3
Driehaus Emerging Markets Growth Fund |
Number of | Value | |||||||
EQUITY SECURITIES — 95.6% | ||||||||
FAR EAST — 64.8% | ||||||||
China — 32.0% | ||||||||
AIA Group, Ltd. | 2,716,663 | $ | 28,518,285 | |||||
Alibaba Group Holding, Ltd. — SP ADR** | 471,306 | 99,964,003 | ||||||
Baidu, Inc. — SP ADR** | 110,514 | 13,968,970 | ||||||
Centre Testing International Group Co., Ltd. — A | 734,953 | 1,573,158 | ||||||
China International Capital Corp., Ltd. — H1 | 5,897,814 | 11,368,295 | ||||||
China Mengniu Dairy Co., Ltd. | 2,061,853 | 8,334,942 | ||||||
China Merchants Bank Co., Ltd. — H | 1,902,446 | 9,777,981 | ||||||
China Mobile, Ltd. | 1,504,000 | 12,642,224 | ||||||
China Resources Cement Holdings, Ltd. | 11,447,829 | 14,573,677 | ||||||
China Resources Land, Ltd. | 1,320,756 | 6,576,407 | ||||||
Country Garden Services Holdings Co., Ltd. | 3,594,131 | 12,107,586 | ||||||
Foshan Haitian Flavouring & Food Co., Ltd. — A | 575,003 | 8,874,711 | ||||||
Galaxy Entertainment Group, Ltd. | 986,944 | 7,270,073 | ||||||
Hangzhou Robam Appliances Co., Ltd. — A | 3,642,422 | 17,679,528 | ||||||
Industrial & Commercial Bank of China, Ltd. — H | 24,150,323 | 18,595,529 | ||||||
Li Ning Co., Ltd. | 3,526,754 | 10,568,087 | ||||||
Meituan Dianping — B** | 950,727 | 12,432,668 | ||||||
MTR Corp., Ltd. | 1,997,990 | 11,807,482 | ||||||
NetEase, Inc. — ADR | 29,019 | 8,898,386 | ||||||
New Oriental Education & Technology Group, Inc. — SP ADR** | 139,032 | 16,857,630 | ||||||
Ping An Healthcare and Technology Co., Ltd.1** | 1,930,820 | 14,086,613 | ||||||
Ping An Insurance Group Co. of China, Ltd. — H | 2,180,480 | 25,771,878 | ||||||
Shenzhou International Group Holdings, Ltd. | 1,485,668 | 21,716,000 | ||||||
Sunac China Holdings, Ltd. | 1,393,700 | 8,325,749 | ||||||
Techtronic Industries Co., Ltd. | 2,766,880 | 22,565,253 | ||||||
Tencent Holdings, Ltd. | 1,425,176 | 68,695,521 | ||||||
Wuliangye Yibin Co., Ltd. — A | 1,254,665 | 23,957,821 | ||||||
Wuxi Biologics Cayman, Inc.1** | 1,700,889 | 21,533,142 | ||||||
Yantai Jereh Oilfield Services Group Co., Ltd. — A | 4,837,892 | 25,669,852 | ||||||
ZTO Express Cayman, Inc. — ADR | 386,784 | 9,031,406 | ||||||
| 573,742,857 | ||||||||
India — 10.7% | ||||||||
Asian Paints, Ltd. | 385,246 | 9,633,828 | ||||||
HDFC Bank, Ltd. — ADR | 505,416 | 32,028,212 | ||||||
Housing Development Finance Corp., Ltd. | 514,348 | 17,384,736 | ||||||
ICICI Bank, Ltd. — SP ADR | 2,516,747 | �� | 37,977,712 | |||||
Number of | Value | |||||||
ICICI Lombard General Insurance Co., Ltd.1 | 730,667 | $ | 14,196,067 | |||||
Kotak Mahindra Bank, Ltd. | 1,212,897 | 28,621,407 | ||||||
Larsen & Toubro, Ltd. | 496,366 | 9,027,725 | ||||||
Nestle India, Ltd. | 49,122 | 10,175,186 | ||||||
Reliance Industries, Ltd. | 958,772 | 20,337,158 | ||||||
Tech Mahindra, Ltd. | 1,206,879 | 12,889,153 | ||||||
| 192,271,184 | ||||||||
Taiwan — 8.5% | ||||||||
Accton Technology Corp. | 1,297,555 | 7,271,883 | ||||||
Airtac International Group | 378,440 | 5,889,257 | ||||||
Chailease Holding Co., Ltd. | 3,828,840 | 17,626,177 | ||||||
Giant Manufacturing Co., Ltd. | 1,771,918 | 12,590,270 | ||||||
Largan Precision Co., Ltd. | 99,214 | 16,548,354 | ||||||
Parade Technologies, Ltd. | 353,995 | 7,262,465 | ||||||
President Chain Store Corp. | 1,413,808 | 14,337,580 | ||||||
Taiwan Semiconductor Manufacturing Co., Ltd. — SP ADR | 1,142,551 | 66,382,213 | ||||||
Win Semiconductors Corp. | 527,520 | 5,173,663 | ||||||
| 153,081,862 | ||||||||
South Korea — 6.1% | ||||||||
Hyundai Mobis Co., Ltd. | 23,731 | 5,253,263 | ||||||
Macquarie Korea Infrastructure Fund | 1,268,647 | 12,725,414 | ||||||
Samsung Electro-Mechanics Co., Ltd. | 104,863 | 11,334,580 | ||||||
Samsung Electronics Co., Ltd. | 1,640,612 | 79,161,356 | ||||||
| 108,474,613 | ||||||||
Thailand — 2.3% | ||||||||
CP ALL PCL — NVDR | 7,225,108 | 17,427,336 | ||||||
Thai Beverage PCL | 19,394,317 | 12,833,891 | ||||||
WHA Corp PCL — NVDR | 85,810,737 | 11,115,325 | ||||||
| 41,376,552 | ||||||||
Indonesia — 1.8% | ||||||||
PT Bank Central Asia Tbk | 12,377,891 | 29,802,342 | ||||||
PT Bank Tabungan Pensiunan Nasional Syariah Tbk** | 6,746,002 | 2,065,227 | ||||||
| 31,867,569 | ||||||||
Japan — 1.1% | ||||||||
Keyence Corp. | 58,306 | 20,654,346 | ||||||
Philippines — 1.0% | ||||||||
BDO Unibank, Inc. | 5,750,742 | 17,940,907 | ||||||
Malaysia — 1.0% | ||||||||
Dialog Group BHD | 20,453,861 | 17,251,148 | ||||||
Singapore — 0.3% | ||||||||
Sea, Ltd. — ADR** | 116,237 | 4,675,052 | ||||||
Total FAR EAST | 1,161,336,090 | |||||||
EUROPE — 11.2% | ||||||||
Russia — 4.9% | ||||||||
Lukoil PJSC — SP ADR | 392,113 | 38,889,767 | ||||||
Novatek PJSC — SP GDR | 96,659 | 19,621,777 | ||||||
Sberbank of Russia PJSC — SP ADR | 1,180,766 | 19,411,793 | ||||||
Notes to Financial Statements are an integral part of this Schedule.
4
Driehaus Emerging Markets Growth Fund |
Number of | Value | |||||||
Tatneft PJSC — SP ADR | 144,600 | $ | 10,680,156 | |||||
| 88,603,493 | ||||||||
Hungary — 1.5% | ||||||||
OTP Bank PLC | 516,396 | 27,004,951 | ||||||
Greece — 1.3% | ||||||||
Hellenic Telecommunications Organization SA | 988,890 | 15,817,803 | ||||||
OPAP SA | 652,896 | 8,488,014 | ||||||
| 24,305,817 | ||||||||
Switzerland — 0.8% | ||||||||
Roche Holding AG | 42,242 | 13,705,299 | ||||||
Netherlands — 0.7% | ||||||||
ASML Holding NV | 44,809 | 13,254,216 | ||||||
Poland — 0.7% | ||||||||
CD Projekt SA | 163,281 | 12,029,057 | ||||||
United Kingdom — 0.6% | ||||||||
Diageo PLC | 238,386 | 10,106,159 | ||||||
Turkey — 0.4% | ||||||||
Pegasus Hava Tasimaciligi AS** | 524,284 | 7,614,412 | ||||||
France — 0.3% | ||||||||
SOITEC** | 49,917 | 5,246,464 | ||||||
Total EUROPE | 201,869,868 | |||||||
SOUTH AMERICA — 9.3% | ||||||||
Brazil — 7.3% | ||||||||
Afya, Ltd. — A** | 259,961 | 7,050,142 | ||||||
Azul SA — ADR** | 271,873 | 11,636,164 | ||||||
B2W Cia Digital** | 305,464 | 4,773,278 | ||||||
Banco do Brasil SA | 700,519 | 9,198,154 | ||||||
Itau Unibanco Holding SA — SP PREF ADR | 2,374,511 | 21,726,776 | ||||||
Lojas Renner SA | 1,229,162 | 17,169,218 | ||||||
Notre Dame Intermedica Participacoes SA | 605,681 | 10,276,115 | ||||||
Petroleo Brasileiro SA — SP ADR | 1,019,314 | 16,247,865 | ||||||
Raia Drogasil SA | 541,636 | 15,031,756 | ||||||
Sul America SA | 866,099 | 12,900,950 | ||||||
XP, Inc. — A** | 139,668 | 5,380,011 | ||||||
| 131,390,429 | ||||||||
Argentina — 1.3% | ||||||||
Globant SA** | 87,942 | 9,326,249 | ||||||
MercadoLibre, Inc.** | 22,377 | 12,798,301 | ||||||
| 22,124,550 | ||||||||
Colombia — 0.7% | ||||||||
Bancolombia SA — SP ADR | 231,890 | 12,705,253 | ||||||
Total SOUTH AMERICA | 166,220,232 | |||||||
NORTH AMERICA — 6.3% | ||||||||
United States — 3.1% | ||||||||
Freeport-McMoRan, Inc. | 805,019 | 10,561,849 | ||||||
Liberty Media Corp-Liberty Formula One — C** | 381,390 | 17,530,591 | ||||||
The Estee Lauder Cos., Inc. — A | 127,636 | 26,361,939 | ||||||
| 54,454,379 | ||||||||
Number of | Value | |||||||
Mexico — 1.8% | ||||||||
America Movil SAB de CV — L — SP ADR | 960,945 | $ | 15,375,120 | |||||
Wal-Mart de Mexico SAB de CV | 5,887,305 | 16,901,384 | ||||||
| 32,276,504 | ||||||||
Canada — 1.4% | ||||||||
B2Gold Corp. | 1,575,665 | 6,321,832 | ||||||
Barrick Gold Corp. | 733,616 | 13,637,921 | ||||||
Wheaton Precious Metals Corp. | 190,230 | 5,659,343 | ||||||
| 25,619,096 | ||||||||
Total NORTH AMERICA | 112,349,979 | |||||||
AFRICA — 2.7% | ||||||||
South Africa — 1.9% | ||||||||
Capitec Bank Holdings, Ltd. | 157,659 | 16,278,973 | ||||||
Clicks Group, Ltd. | 932,880 | 17,090,367 | ||||||
| 33,369,340 | ||||||||
Egypt — 0.8% | ||||||||
Commercial International Bank Egypt SAE | 2,799,840 | 14,482,412 | ||||||
Total AFRICA | 47,851,752 | |||||||
MIDDLE EAST — 0.9% | ||||||||
United Arab Emirates — 0.9% | ||||||||
Abu Dhabi Commercial Bank PJSC | 3,010,247 | 6,490,657 | ||||||
Network International Holdings PLC1** | 1,184,503 | 10,057,308 | ||||||
Total MIDDLE EAST | 16,547,965 | |||||||
CENTRAL AMERICA — 0.4% | ||||||||
Panama — 0.4% | ||||||||
Copa Holdings SA — A | 65,190 | 7,045,735 | ||||||
Total CENTRAL AMERICA | 7,045,735 | |||||||
Total EQUITY SECURITIES (Cost $1,265,348,861) | 1,713,221,621 | |||||||
| ||||||||
TOTAL INVESTMENTS (COST $1,265,348,861) | 95.6 | % | $ | 1,713,221,621 | ||||
Other Assets In Excess Of Liabilities | 4.4 | % | 78,543,371 | |||||
Net Assets | 100.0 | % | $ | 1,791,764,992 | ||||
1 | 144A — This security was purchased pursuant to Rule 144A of the Securities Act of 1933 and may not be resold subject to that rule except to qualified institutional buyers. At December 31, 2019, these securities amounted to $71,241,425 or 4.0% of net assets. These 144A securities have not been deemed illiquid. |
** | Non-income producing security |
ADR — American Depository Receipt
NVDR — Non-Voting Depository Receipt
SP ADR — Sponsored American Depository Receipt
SP GDR — Sponsored Global Depository Receipt
SP PREF ADR — Sponsored Preferred American Depository Receipt
Notes to Financial Statements are an integral part of this Schedule.
5
Driehaus Emerging Markets Growth Fund |
Regional Weightings* | |
Asia/Far East Ex-Japan | 63.7% |
South America | 9.3% |
Eastern Europe | 7.5% |
North America | 6.3% |
Western Europe | 3.7% |
Africa | 2.7% |
Japan | 1.1% |
Middle East | 0.9% |
Central America | 0.4% |
Top Ten Holdings* | |
Alibaba Group Holding, Ltd. — SP ADR | 5.6% |
Samsung Electronics Co., Ltd. | 4.4% |
Tencent Holdings, Ltd. | 3.8% |
Taiwan Semiconductor Manufacturing Co., Ltd. — SP ADR | 3.7% |
Lukoil PJSC — SP ADR | 2.2% |
ICICI Bank, Ltd. — SP ADR | 2.1% |
HDFC Bank, Ltd. — ADR | 1.8% |
PT Bank Central Asia Tbk | 1.7% |
Kotak Mahindra Bank, Ltd. | 1.6% |
AIA Group, Ltd. | 1.6% |
* | All percentages are stated as a percent of net assets at December 31, 2019 |
Notes to Financial Statements are an integral part of this Schedule.
6
Driehaus Emerging Markets Growth Fund |
Industry | Percent of |
Air Freight & Logistics | 0.5% |
Airlines | 1.5% |
Auto Components | 0.3% |
Beverages | 2.6% |
Capital Markets | 1.6% |
Chemicals | 0.5% |
Commercial Banks | 17.0% |
Commercial Services & Supplies | 0.7% |
Communications Equipment | 0.4% |
Computers & Peripherals | 4.4% |
Construction & Engineering | 0.5% |
Construction Materials | 0.8% |
Diversified Consumer Services | 1.3% |
Diversified Financial Services | 1.0% |
Diversified Telecommunication Services | 0.9% |
Electronic Equipment, Instruments & Components | 2.7% |
Energy Equipment & Services | 2.4% |
Entertainment | 2.4% |
Food & Staples Retailing | 4.5% |
Food Products | 1.5% |
Health Care Providers & Services | 0.6% |
Health Care Technology | 0.8% |
Hotels, Restaurants & Leisure | 0.9% |
Industry | Percent of |
Household Durables | 1.0% |
Information Technology Services | 1.3% |
Insurance | 4.5% |
Interactive Media & Services | 4.6% |
Internet & Catalog Retail | 7.2% |
Leisure Equipment & Products | 0.7% |
Life Sciences Tools & Services | 1.2% |
Machinery | 1.6% |
Metals & Mining | 2.0% |
Multiline Retail | 1.0% |
Oil, Gas & Consumable Fuels | 5.9% |
Personal Products | 1.5% |
Pharmaceuticals | 0.8% |
Professional Services | 0.1% |
Real Estate Management & Development | 1.4% |
Road & Rail | 0.7% |
Semiconductors & Semiconductor Equipment | 5.4% |
Software | 0.5% |
Textiles, Apparel & Luxury Goods | 1.8% |
Thrifts & Mortgage Finance | 1.0% |
Wireless Telecommunication Services | 1.6% |
Other Assets in Excess of Liabilities | 4.4% |
TOTAL | 100.0% |
Notes to Financial Statements are an integral part of this Schedule.
7
Driehaus Emerging Markets Small Cap Growth Fund — Portfolio Managers’ Letter |
Dear Fellow Shareholders,
The Driehaus Emerging Markets Small Cap Growth Fund (“Fund”) returned 33.71% for the year ended December 31, 2019. The Fund’s primary benchmark, the Morgan Stanley Capital International (“MSCI”) Emerging Markets Small Cap Index (“Benchmark”), returned 11.50% for the same period, and the Fund’s secondary benchmark, the MSCI Emerging Markets Small Cap Growth Index, returned 12.02%.
2019 was a strong year for the fund, as global equity markets recovered sharply throughout the year. A dovish turn in Federal Reserve monetary policy at the end of 2018 set the tone for easier financial conditions throughout emerging markets over the course of the year. Despite the lingering effects of US-China trade tensions, emerging market companies continue to benefit from improving capital discipline and operating efficiencies, reflected in rising free cash flow generation. Further, targeted policy stimulus in China supported the consumer discretionary sector, as well as infrastructure and property development in the second half of the year. With a marked reduction in global real interest rates and a significant degree of interest rate cuts by emerging market central banks, we exit the year with many of the same conditions in place which made for a favorable backdrop in 2019.
For 2019, at the sector level, key contributions to performance versus the Benchmark came from security selection within the consumer discretionary and industrial sectors. On a country level, security selection in China and Hong Kong contributed to the Fund’s performance.
Li Ning Company Limited. (Ticker: 2331-HK) was the most significant contributor to the Fund’s returns for the year. The Hong Kong based company is a successful turnaround story in a very attractive China Sportswear market, with the potential to become a premium fashion brand. We believe that the company’s margin profile will continue to improve based on changes in the company’s distribution channel mix, its recent successful product introductions (which are driving better selling terms with the wholesale channel), and an increase in the company’s percentage of in-house production. Moreover, China Li Ning, the company’s more premium fashion brand and new store project is increasingly attracting social media vibe and interest amongst the younger population.
NagaCorp Ltd. (Ticker: 3918-HK) also made a notable contribution to the Fund’s returns for the year. The company operates casinos in Cambodia under an exclusive long-term license. In 2018, they launched their second casino, and operational performance exceeded expectations as it ramped up, driven by strong tourist arrivals into the country and growth initiatives undertaken by NagaCorp to bolster the VIP segment.
Although stock selection contributed positively in all sectors in 2019, a reduced allocation to information technology relative to the Benchmark detracted from performance. From a geographic perspective, although Taiwan contributed positively to the Fund’s absolute performance, it underperformed the Benchmark due to underweight allocation. In addition, security selection in South Korea detracted from the Fund’s performance versus the Benchmark.
Moving on to detractors. CIMC Enric Holdings Limited (Ticker: 3899-HK) was the Fund’s most notable detractor during the year. CIMC Enric is a China-based producer of natural gas storage equipment. Amid the ongoing US-China trade tensions, China’s demand for natural gas decelerated, and the company’s volume growth was disappointing relative to expectations.
TCI Co. Ltd. (Ticker: 8436-TW) was also a significant detractor from Fund performance for the year. The Taiwan based company produces functional drinks and has realized strong sales in China through WeChat Commerce. The introduction of a new e-commerce law, along with the macroeconomic uncertainty in China in the second half of 2018, led to a delay in orders by key customers.
While 2019 has been a strong year for relative performance by the Fund, we note that the small cap segment of emerging markets continued to lag behind the broad MSCI Emerging Markets Index, trailing by 702 basis points in 2019 and marking the fourth consecutive year of relative underperformance versus large caps.
We, however, have seen a strong period for alpha generation in small caps in 2019 and expect to see an improving performance opportunity for small caps in 2020, as investors seek diversification amid a growth backdrop that is broadening out. We exit 2019 with a full pipeline of ideas and remain compelled by the opportunity set in emerging markets small cap.
8
We thank you for investing alongside us in the Driehaus Emerging Markets Small Cap Growth Fund and would like to express our gratitude for your continued confidence in our management capabilities.
Sincerely,
|
|
|
Chad Cleaver, CFA | Howard Schwab | Rich Thies |
Lead Portfolio Manager | Portfolio Manager | Portfolio Manager |


Performance is historical and does not represent future results.
Please see the following performance overview page for index descriptions.
9
Driehaus Emerging Markets Small Cap Growth Fund Performance Overview (unaudited) |
The performance summarized below is historical and does not represent future results. Investment returns and principal value vary, and you may have a gain or loss when you sell shares. Performance data presented measures the change in the value of an investment in the Fund, assuming reinvestment of all dividends and capital gains. Average annual total return reflects annualized change.
The table does not reflect the deduction of taxes that a shareholder would pay on Fund distributions or the redemption of Fund shares. The graph compares the results of a $10,000 investment in the Fund over the last 10 fiscal year periods (which includes performance of the Predecessor Limited Partnership’s inception), with all dividends and capital gains reinvested, with the indicated indices (and dividends reinvested) for the same period.
Fund Only | Including Predecessor Limited Partnership | ||||
Average Annual Total Returns as of 12/31/19 | 1 Year | 3 Years | 5 Years | Since Inception | 10 Years |
Driehaus Emerging Markets Small Cap Growth Fund (DRESX)1 | 33.71% | 10.65% | 1.83% | 4.74% | 6.10% |
MSCI Emerging Markets Small Cap Index-N2 | 11.50% | 6.70% | 2.97% | 2.65% | 2.95% |
MSCI Emerging Markets Small Cap Growth Index-N3 | 12.02% | 5.59% | 1.38% | 1.89% | 1.94% |

1 | The Driehaus Emerging Markets Small Cap Growth Fund (the “Fund”) performance shown above includes the performance of the Driehaus Emerging Markets Small Cap Growth Fund, L.P. (the “Predecessor Limited Partnership”), the Fund’s predecessor, for the periods before the Fund’s registration statement became effective. The Predecessor Limited Partnership, which was established on December 1, 2008, was managed with substantially the same investment objective, policies and philosophies as are followed by the Fund. The Fund succeeded to the Predecessor Limited Partnership’s assets on August 22, 2011. The Predecessor Limited Partnership was not registered under the Investment Company Act of 1940, as amended (“1940 Act”), and thus was not subject to certain investment and operational restrictions that are imposed by the 1940 Act. If the Predecessor Limited Partnership had been registered under the 1940 Act, its performance may have been adversely affected. The Predecessor Limited Partnership’s performance has been restated to reflect estimated expenses of the Fund. The returns for the periods prior to August 21, 2014, reflect fee waivers and/or reimbursements without which performance would have been lower. |
2 | The Morgan Stanley Capital International Emerging Markets Small Cap Index-Net (MSCI Emerging Markets Small Cap Index-N) is a market capitalization-weighted index designed to measure equity market performance of small cap stocks in emerging markets. Data is in U.S. dollars and is calculated with net dividend reinvestment. Source: Morgan Stanley Capital International Inc. |
10
Driehaus Emerging Markets Small Cap Growth Fund |
Number of | Value | |||||||
EQUITY SECURITIES — 95.8% | ||||||||
FAR EAST — 60.5% | ||||||||
China — 20.6% | ||||||||
A-Living Services Co., Ltd. — H1 | 91,250 | $ | 315,006 | |||||
Changzhou Xingyu Automotive Lighting Systems Co., Ltd. — A | 24,900 | 339,521 | ||||||
China Resources Cement Holdings, Ltd. | 672,914 | 856,654 | ||||||
CIFI Holdings Group Co., Ltd. | 1,056,000 | 893,066 | ||||||
GDS Holdings, Ltd. — ADR** | 14,173 | 731,043 | ||||||
Hangzhou Tigermed Consulting Co., Ltd. — A | 33,748 | 305,954 | ||||||
Jiangsu Hengli Hydraulic Co., Ltd. — A | 115,520 | 825,060 | ||||||
Jinxin Fertility Group, Ltd.1** | 408,000 | 545,585 | ||||||
Li Ning Co., Ltd. | 116,592 | 349,374 | ||||||
Ping An Healthcare and Technology Co., Ltd.1** | 109,100 | 795,957 | ||||||
Shanghai M&G Stationery, Inc. — A | 40,900 | 286,183 | ||||||
Silergy Corp. | 15,000 | 475,364 | ||||||
SITC International Holdings Co., Ltd. | 247,000 | 301,131 | ||||||
Times China Holdings, Ltd. | 435,000 | 867,510 | ||||||
Times Neighborhood Holdings, Ltd.** | 485,432 | 302,137 | ||||||
Xinyi Glass Holdings, Ltd. | 978,000 | 1,295,248 | ||||||
Yantai Jereh Oilfield Services Group Co., Ltd. — A | 248,800 | 1,320,133 | ||||||
Yihai International Holding, Ltd. | 47,157 | 276,565 | ||||||
Zhejiang Dingli Machinery Co., Ltd. — A | 96,098 | 986,406 | ||||||
Zoomlion Heavy Industry Science and Technology Co., Ltd. — H | 903,400 | 757,055 | ||||||
| 12,824,952 | ||||||||
India — 13.5% | ||||||||
Aarti Surfactants, Ltd.2,3** | 2,704 | 0 | ||||||
Aavas Financiers, Ltd.** | 26,052 | 723,073 | ||||||
AU Small Finance Bank, Ltd.1 | 51,721 | 581,931 | ||||||
Bharat Forge, Ltd. | 44,606 | 301,933 | ||||||
Cholamandalam Investment and Finance Co., Ltd. | 269,029 | 1,151,450 | ||||||
Colgate-Palmolive India, Ltd. | 26,290 | 538,815 | ||||||
Embassy Office Parks REIT | 74,600 | 442,302 | ||||||
Godrej Properties, Ltd.** | 29,060 | 402,364 | ||||||
Gujarat Gas, Ltd. | 194,589 | 647,602 | ||||||
ICICI Lombard General Insurance Co., Ltd.1 | 21,963 | 426,717 | ||||||
IndiaMart InterMesh, Ltd.1** | 20,831 | 602,927 | ||||||
Indraprastha Gas, Ltd. | 141,154 | 846,689 | ||||||
PI Industries, Ltd. | 22,406 | 453,876 | ||||||
Trent, Ltd. | 76,446 | 564,578 | ||||||
Voltas, Ltd. | 79,989 | 738,836 | ||||||
| 8,423,093 | ||||||||
Number of | Value | |||||||
Taiwan — 10.9% | ||||||||
Accton Technology Corp. | 83,000 | $ | 465,157 | |||||
Airtac International Group | 29,000 | 451,296 | ||||||
Andes Technology Corp. | 138,000 | 607,666 | ||||||
Eclat Textile Co., Ltd. | 44,000 | 591,520 | ||||||
Genius Electronic Optical Co., Ltd. | 42,000 | 822,431 | ||||||
Parade Technologies, Ltd. | 89,584 | 1,837,881 | ||||||
Realtek Semiconductor Corp. | 75,000 | 587,951 | ||||||
Vanguard International Semiconductor Corp. | 176,000 | 465,584 | ||||||
Voltronic Power Technology Corp. | 13,000 | 310,071 | ||||||
Win Semiconductors Corp. | 31,000 | 304,033 | ||||||
Wiwynn Corp. | 16,509 | 349,709 | ||||||
| 6,793,299 | ||||||||
Vietnam — 4.2% | ||||||||
FPT Corp. | 416,308 | 1,204,504 | ||||||
Military Commercial Joint Stock Bank | 805,374 | 903,645 | ||||||
Nam Long Investment Corp. | 453,537 | 538,236 | ||||||
| 2,646,385 | ||||||||
Malaysia — 3.5% | ||||||||
Carlsberg Brewery Malaysia BHD | 95,000 | 682,802 | ||||||
Dialog Group BHD | 1,061,799 | 895,540 | ||||||
Heineken Malaysia BHD | 95,300 | 631,839 | ||||||
| 2,210,181 | ||||||||
Thailand — 2.6% | ||||||||
Amata Corp PCL — NVDR | 1,065,600 | 715,054 | ||||||
WHA Corp PCL — NVDR | 7,063,400 | 914,944 | ||||||
| 1,629,998 | ||||||||
South Korea — 1.7% | ||||||||
Koh Young Technology, Inc. | 6,719 | 612,957 | ||||||
RFHIC Corp. | 14,880 | 474,148 | ||||||
| 1,087,105 | ||||||||
Indonesia — 1.5% | ||||||||
PT Bank Tabungan Pensiunan Nasional Syariah Tbk** | 2,967,700 | 908,534 | ||||||
Singapore — 1.0% | ||||||||
Sea, Ltd. — ADR** | 15,622 | 628,317 | ||||||
Sri Lanka — 0.5% | ||||||||
John Keells Holdings PLC | 311,933 | 288,242 | ||||||
Cambodia — 0.5% | ||||||||
NagaCorp, Ltd. | 164,403 | 286,935 | ||||||
Total FAR EAST | 37,727,041 | |||||||
SOUTH AMERICA — 13.1% | ||||||||
Brazil — 12.4% | ||||||||
Afya, Ltd. — A** | 23,175 | 628,506 | ||||||
Arco Platform, Ltd. — A** | 6,754 | 298,527 | ||||||
Azul SA — ADR** | 16,798 | 718,954 | ||||||
Banco BMG SA — Pref.1 | 195,200 | 475,056 | ||||||
Bradespar SA — Pref. | 31,500 | 299,754 | ||||||
Construtora Tenda SA | 67,100 | 503,579 | ||||||
Notes to Financial Statements are an integral part of this Schedule.
11
Driehaus Emerging Markets Small Cap Growth Fund |
Number of | Value | |||||||
Grupo SBF SA** | 75,800 | $ | 662,899 | |||||
LOG Commercial Properties e Participacoes SA | 85,400 | 689,110 | ||||||
Lojas Renner SA | 23,970 | 334,818 | ||||||
Movida Participacoes SA | 161,500 | 767,614 | ||||||
Notre Dame Intermedica Participacoes SA | 30,015 | 509,241 | ||||||
Petro Rio SA** | 42,400 | 348,459 | ||||||
Raia Drogasil SA | 11,000 | 305,278 | ||||||
Randon SA Implementos e Participacoes — Pref. | 94,600 | 315,122 | ||||||
Rumo SA** | 49,400 | 320,516 | ||||||
Sul America SA | 37,100 | 552,622 | ||||||
| 7,730,055 | ||||||||
Argentina — 0.7% | ||||||||
Globant SA** | 4,195 | 444,880 | ||||||
Total SOUTH AMERICA | 8,174,935 | |||||||
EUROPE — 10.3% | ||||||||
Russia — 4.4% | ||||||||
Aeroflot PJSC | 337,411 | 562,657 | ||||||
Detsky Mir PJSC1 | 582,472 | 938,468 | ||||||
Globaltrans Investment PLC — SP GDR | 66,509 | 588,605 | ||||||
TCS Group Holding PLC — GDR | 29,723 | 639,045 | ||||||
| 2,728,775 | ||||||||
Greece — 2.1% | ||||||||
Hellenic Petroleum SA | 47,324 | 465,543 | ||||||
JUMBO SA | 40,329 | 839,151 | ||||||
| 1,304,694 | ||||||||
Poland — 1.3% | ||||||||
CD Projekt SA | 7,115 | 524,168 | ||||||
Dino Polska SA1** | 8,404 | 318,979 | ||||||
| 843,147 | ||||||||
United Kingdom — 1.0% | ||||||||
KAZ Minerals PLC | 91,847 | 646,508 | ||||||
Turkey — 1.0% | ||||||||
Pegasus Hava Tasimaciligi AS** | 41,911 | 608,692 | ||||||
Czech Republic — 0.5% | ||||||||
Moneta Money Bank AS1 | 81,204 | 304,470 | ||||||
Total EUROPE | 6,436,286 | |||||||
NORTH AMERICA — 4.0% | ||||||||
Canada — 2.0% | ||||||||
B2Gold Corp. | 316,347 | 1,269,237 | ||||||
Mexico — 2.0% | ||||||||
Bolsa Mexicana de Valores SAB de CV | 197,500 | 434,328 | ||||||
Grupo Aeroportuario del Centro Norte SAB de CV — ADR | 7,410 | 444,155 | ||||||
Qualitas Controladora SAB de CV | 78,600 | 331,070 | ||||||
| 1,209,553 | ||||||||
Total NORTH AMERICA | 2,478,790 | |||||||
Number of | Value | |||||||
MIDDLE EAST — 3.6% | ||||||||
United Arab Emirates — 1.6% | ||||||||
Network International Holdings PLC1** | 117,935 | $ | 1,001,356 | |||||
Saudi Arabia — 1.5% | ||||||||
Leejam Sports Co. JSC | 21,899 | 473,438 | ||||||
United International Transportation Co. | 49,207 | 478,782 | ||||||
| 952,220 | ||||||||
Pakistan — 0.5% | ||||||||
United Bank, Ltd. | 298,900 | 317,496 | ||||||
Total MIDDLE EAST | 2,271,072 | |||||||
AFRICA — 3.3% | ||||||||
South Africa — 2.3% | ||||||||
Clicks Group, Ltd. | 25,216 | 461,957 | ||||||
Imperial Logistics, Ltd. | 112,796 | 471,124 | ||||||
Kumba Iron Ore, Ltd. | 16,767 | 499,263 | ||||||
| 1,432,344 | ||||||||
Egypt — 1.0% | ||||||||
Commercial International Bank Egypt SAE — GDR | 122,003 | 622,215 | ||||||
Total AFRICA | 2,054,559 | |||||||
CENTRAL AMERICA — 1.0% | ||||||||
Panama — 1.0% | ||||||||
Copa Holdings SA — A | 5,893 | 636,915 | ||||||
Total CENTRAL AMERICA | 636,915 | |||||||
Total EQUITY SECURITIES (Cost $49,720,109) | 59,779,598 | |||||||
| ||||||||
TOTAL INVESTMENTS (COST $49,720,109) | 95.8 | % | $ | 59,779,598 | ||||
Other Assets In Excess Of Liabilities | 4.2 | % | 2,627,848 | |||||
Net Assets | 100.0 | % | $ | 62,407,446 | ||||
1 | 144A — This security was purchased pursuant to Rule 144A of the Securities Act of 1933 and may not be resold subject to that rule except to qualified institutional buyers. At December 31, 2019, these securities amounted to $6,306,452 or 10.1% of net assets. These 144A securities have not been deemed illiquid, unless otherwise noted. |
2 | Pursuant to procedures adopted by Driehaus Mutual Funds’ (the “Trust”) Board of Trustees, this security has been determined to be illiquid by Driehaus Capital Management LLC, the Fund’s investment adviser. |
3 | Investments categorized as Level 3 pricing (See Note A in the Notes to Financial Statements). |
** | Non-income producing security |
ADR — American Depository Receipt
GDR — Global Depository Receipt
NVDR — Non-Voting Depository Receipt
REIT — Real Estate Investment Trust
SP GDR — Sponsored Global Depository Receipt
Notes to Financial Statements are an integral part of this Schedule.
12
Driehaus Emerging Markets Small Cap Growth Fund |
Regional Weightings* | |
Asia/Far East Ex-Japan | 60.5% |
South America | 13.1% |
Eastern Europe | 7.2% |
North America | 4.0% |
Middle East | 3.6% |
Africa | 3.3% |
Western Europe | 3.1% |
Central America | 1.0% |
Top Ten Holdings* | |
Parade Technologies, Ltd. | 2.9% |
Yantai Jereh Oilfield Services Group Co., Ltd. — A | 2.1% |
Xinyi Glass Holdings, Ltd. | 2.1% |
B2Gold Corp. | 2.0% |
FPT Corp. | 1.9% |
Cholamandalam Investment and Finance Co., Ltd. | 1.8% |
Network International Holdings PLC | 1.6% |
Zhejiang Dingli Machinery Co., Ltd. — A | 1.6% |
Detsky Mir PJSC | 1.5% |
WHA Corp PCL — NVDR | 1.5% |
* | All percentages are stated as a percent of net assets at December 31, 2019 |
Notes to Financial Statements are an integral part of this Schedule.
13
Driehaus Emerging Markets Small Cap Growth Fund |
Industry | Percent of |
Air Freight & Logistics | 0.8% |
Airlines | 4.0% |
Auto Components | 3.1% |
Beverages | 2.1% |
Capital Markets | 0.7% |
Chemicals | 0.7% |
Commercial Banks | 6.9% |
Commercial Services & Supplies | 1.0% |
Communications Equipment | 0.7% |
Computers & Peripherals | 0.6% |
Construction & Engineering | 1.2% |
Construction Materials | 1.4% |
Consumer Finance | 1.8% |
Diversified Consumer Services | 1.5% |
Diversified Financial Services | 0.8% |
Electrical Equipment | 0.5% |
Electronic Equipment, Instruments & Components | 3.2% |
Energy Equipment & Services | 3.5% |
Entertainment | 1.8% |
Food & Staples Retailing | 1.7% |
Food Products | 0.4% |
Gas Utilities | 2.4% |
Health Care Providers & Services | 1.7% |
Health Care Technology | 1.3% |
Industry | Percent of |
Hotels, Restaurants & Leisure | 1.2% |
Household Durables | 0.8% |
Industrial Conglomerates | 0.5% |
Information Technology Services | 2.8% |
Insurance | 2.1% |
Life Sciences Tools & Services | 0.5% |
Machinery | 5.3% |
Marine | 0.5% |
Metals & Mining | 4.4% |
Multiline Retail | 1.4% |
Oil, Gas & Consumable Fuels | 1.3% |
Personal Products | 0.9% |
Real Estate Investment Trust | 0.7% |
Real Estate Management & Development | 8.5% |
Road & Rail | 3.5% |
Semiconductors & Semiconductor Equipment | 8.6% |
Software | 0.7% |
Specialty Retail | 3.9% |
Textiles, Apparel & Luxury Goods | 1.5% |
Thrifts & Mortgage Finance | 1.2% |
Trading Companies & Distributors | 1.0% |
Transportation Infrastructure | 0.7% |
Other Assets in Excess of Liabilities | 4.2% |
TOTAL | 100.0% |
Notes to Financial Statements are an integral part of this Schedule.
14
Driehaus International Small Cap Growth Fund — Portfolio Managers’ Letter |
Dear Fellow Shareholders,
The Driehaus International Small Cap Growth Fund (“Fund”) returned 30.41% for the year ended December 31, 2019. The Fund’s benchmark, the Morgan Stanley Capital International (“MSCI”) All Country World ex USA Small Cap Growth Index (“Benchmark”), returned 24.61%.
Virtually all global indices closed the year near all-time highs. This is a sharp contrast to December of 2018 when markets plunged amidst concerns that the end of the economic cycle was finally here.
As the year unfolded, recessionary fears continued to percolate driven by the US-China trade war escalation, the ongoing Brexit saga and various other perceived geopolitical tensions. The narrower manufacturing economy began to slow amidst these trade concerns, a sharp manufacturing inventory correction and slower Chinese growth. Yet, economic data remained generally sound (particularly in services related sectors) and global stock markets powered ahead.
From a sector perspective, 2019 key contributors to performance versus the Benchmark were the Fund’s holdings in the information technology and financials sectors. From a geographical perspective, holdings in Japan and Hong Kong contributed positively to the performance of the Fund compared to the Benchmark.
Li Ning Company Limited (Ticker: 2331-HK) was the most significant contributor to the Fund’s returns for the year. The Hong Kong based company is a successful turnaround story in a very attractive China Sportswear market, with the potential to become a premium fashion brand. We believe that the company’s margin profile will continue to improve based on changes in the company’s distribution channel mix, its recent successful product introductions (which are driving better selling terms with the wholesale channel), and an increase in the company’s percentage of in-house production. Moreover, China Li Ning, the company’s more premium fashion brand and new store project is increasingly attracting social media vibe and interest amongst the younger population.
PUMA SE (Ticker: PUMA) also made significant contributions to the Fund’s return during 2019. PUMA is a global footwear and apparel sportswear brand that continues its push toward a successful brand turnaround. This effort seems to be coming to fruition with the company experiencing consistent market share gains and margin improvement in the growing sportswear market. It appears that relevant social media and marketing strategies, an improved product offering, and a successful re-introduction to the Basketball category in 2018 has led to improved consumer demand and global market share gains throughout 2018 and 2019, with notable strength in North America and China.
For 2019, security selection in the communication services and materials sectors detracted from the Fund’s performance versus the Benchmark. At the country level, while the United Kingdom and Sweden both contributed positively to Fund’s absolute performance, these positions detracted from the Fund’s performance versus the Benchmark.
The most significant detractor from returns for the year was Ubisoft Entertainment SA (Ticker: UBI-FR). Ubisoft is a leading global video game publishing studio. Ubisoft shares declined sharply in October following poor consumer reception to new game launches, which led to management delaying future product launches and a significant reduction of management’s full year revenue and earnings guidance.
CIMC Enric Holdings Limited (Ticker: 3899-HK) was also a notable detractor from the Fund in 2019. CIMC Enric is a China-based producer of natural gas storage equipment. Amid the ongoing US-China trade tensions, China’s demand for natural gas decelerated, and the company’s volume growth was disappointing relative to initial expectations.
We believe growth likely will start 2020 at a sluggish pace, before picking up as we approach mid-year as companies begin to normalize global inventory re-stocking and capital expenditures. We nonetheless are acutely aware that key risks exist, including geopolitical and trade tensions, increased populism and political polarization, a potential re-escalation of the trade war, continued soft capital expenditures and manufacturing, and Brexit uncertainties.
On a relative basis, international stocks appear historically attractive, and we believe that they could disproportionately benefit from any rebound in cyclical activities. In addition, free cash flow yields as compared to bond yields seem to be at reasonable levels historically. If the global economy does not have an acceleration as we expect, we remain optimistic that our flexible approach to growth will continue to enable us to identify companies experiencing fundamental inflections.
15
As always, we thank you for investing alongside us in the Driehaus International Small Cap Growth Fund and would like to express our gratitude for your continued confidence in our management capabilities.
Sincerely,
|
|
|
Daniel Burr | David Mouser | Ryan Carpenter |
Portfolio Manager | Portfolio Manager | Assistant Portfolio Manager |


Performance is historical and does not represent future results.
Please see the following performance overview page for index description.
16
Driehaus International Small Cap Growth Fund Performance Overview (unaudited) |
The performance summarized below is historical and does not represent future results. Investment returns and principal value vary, and you may have a gain or loss when you sell shares. Performance data presented measures the change in the value of an investment in the Fund, assuming reinvestment of all dividends and capital gains. Average annual total return reflects annualized change.
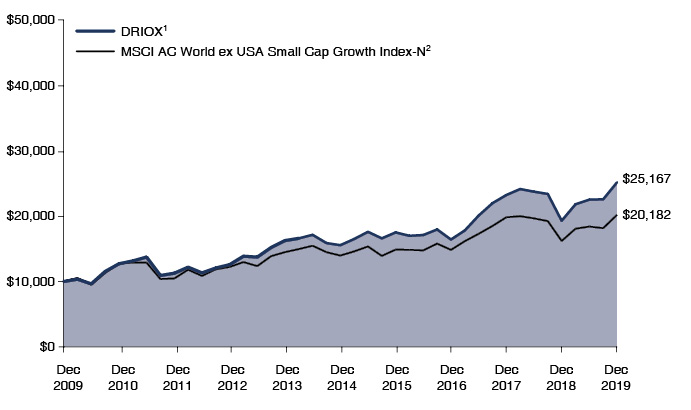
The table does not reflect the deduction of taxes that a shareholder would pay on Fund distributions or the redemption of Fund shares. The graph compares the results of a $10,000 investment in the Fund over the last 10 fiscal year periods, with all dividends and capital gains reinvested, with the indicated index (and dividends reinvested) for the same period.
Average Annual Total Returns as of 12/31/19 | 1 Year | 3 Years | 5 Years | 10 Years |
Driehaus International Small Cap Growth Fund (DRIOX)1 | 30.41% | 15.29% | 10.10% | 9.67% |
MSCI AC World ex USA Small Cap Growth Index-N2 | 24.61% | 10.82% | 7.64% | 7.27% |
1 | The returns for the periods prior to January 1, 2010, reflect fee waivers and/or reimbursements without which performance would have been lower. |
2 | The Morgan Stanley Capital International All Country World ex USA Small Cap Growth Index-Net (MSCI AC World ex USA Small Cap Growth Index-N) is a market capitalization-weighted index designed to measure equity market performance in global developed markets and emerging markets, excluding the U.S., and is composed of stocks which are categorized as small capitalization growth stocks. Data is in U.S. dollars and is calculated with net dividend reinvestment. Source: Morgan Stanley Capital International Inc. |
17
Driehaus International Small Cap Growth Fund |
Number of | Value | |||||||
EQUITY SECURITIES — 93.7% | ||||||||
EUROPE — 52.7% | ||||||||
United Kingdom — 17.1% | ||||||||
Ashmore Group PLC | 533,271 | $ | 3,659,024 | |||||
Aveva Group PLC | 31,335 | 1,932,548 | ||||||
Balfour Beatty PLC | 788,088 | 2,728,776 | ||||||
Clinigen Group PLC | 202,784 | 2,483,294 | ||||||
ConvaTec Group PLC1 | 1,266,502 | 3,329,236 | ||||||
Cranswick PLC | 37,171 | 1,669,135 | ||||||
Croda International PLC | 38,731 | 2,626,735 | ||||||
Electrocomponents PLC | 94,442 | 847,669 | ||||||
Endava PLC — SP ADR** | 44,528 | 2,075,005 | ||||||
Greggs PLC | 122,652 | 3,733,466 | ||||||
Intermediate Capital Group PLC | 122,399 | 2,610,305 | ||||||
Serco Group PLC** | 1,904,279 | 4,083,805 | ||||||
Spirax-Sarco Engineering PLC | 22,790 | 2,683,698 | ||||||
Stock Spirits Group PLC | 439,251 | 1,201,491 | ||||||
Subsea 7 SA | 163,067 | 1,949,345 | ||||||
The Weir Group PLC | 154,161 | 3,082,444 | ||||||
Vesuvius PLC | 377,140 | 2,497,814 | ||||||
WH Smith PLC | 78,565 | 2,705,765 | ||||||
| 45,899,555 | ||||||||
Germany — 6.4% | ||||||||
Duerr AG | 68,269 | 2,326,430 | ||||||
Hornbach Holding AG & Co. KGaA | 17,816 | 1,288,987 | ||||||
Puma SE | 32,653 | 2,503,458 | ||||||
Rheinmetall AG | 10,742 | 1,233,854 | ||||||
Scout24 AG1 | 44,039 | 2,912,057 | ||||||
TAG Immobilien AG | 102,047 | 2,536,581 | ||||||
TeamViewer AG** | 123,056 | 4,400,477 | ||||||
| 17,201,844 | ||||||||
France — 6.2% | ||||||||
Coface SA | 294,983 | 3,629,796 | ||||||
Constellium SE** | 288,439 | 3,865,083 | ||||||
Edenred | 24,400 | 1,261,739 | ||||||
JCDecaux SA | 43,156 | 1,330,260 | ||||||
Teleperformance | 9,341 | 2,277,884 | ||||||
Ubisoft Entertainment SA** | 19,143 | 1,322,295 | ||||||
Virbac SA** | 10,723 | 2,844,632 | ||||||
| 16,531,689 | ||||||||
Italy — 4.6% | ||||||||
Amplifon SpA | 67,018 | 1,927,472 | ||||||
Autogrill SpA | 239,898 | 2,510,654 | ||||||
DiaSorin SpA | 13,756 | 1,780,642 | ||||||
Leonardo SpA | 368,185 | 4,315,797 | ||||||
Piaggio & C SpA | 554,655 | 1,709,694 | ||||||
| 12,244,259 | ||||||||
Denmark — 3.4% | ||||||||
Ascendis Pharma AS — ADR** | 9,628 | 1,339,447 | ||||||
GN Store Nord AS | 27,570 | 1,296,589 | ||||||
Netcompany Group AS1** | 64,719 | 3,079,613 | ||||||
Number of | Value | |||||||
Royal Unibrew AS | 35,916 | $ | 3,288,690 | |||||
| 9,004,339 | ||||||||
Netherlands — 3.1% | ||||||||
Argenx SE** | 11,565 | 1,862,854 | ||||||
ASM International NV | 22,947 | 2,577,837 | ||||||
BE Semiconductor Industries NV | 44,095 | 1,704,446 | ||||||
OCI NV** | 99,469 | 2,092,029 | ||||||
| 8,237,166 | ||||||||
Switzerland — 2.2% | ||||||||
Galenica AG1 | 47,271 | 2,923,300 | ||||||
Softwareone Holding AG** | 14,685 | 375,546 | ||||||
Tecan Group AG | 9,687 | 2,722,529 | ||||||
| 6,021,375 | ||||||||
Luxembourg — 2.0% | ||||||||
B&M European Value Retail SA | 606,756 | 3,292,013 | ||||||
Befesa SA1 | 51,686 | 2,203,105 | ||||||
| 5,495,118 | ||||||||
Sweden — 1.8% | ||||||||
Elekta AB — B | 82,880 | 1,091,487 | ||||||
Getinge AB — B | 106,120 | 1,971,406 | ||||||
Tele2 AB — B | 123,603 | 1,792,744 | ||||||
| 4,855,637 | ||||||||
Finland — 1.8% | ||||||||
Huhtamaki OYJ | 62,410 | 2,896,832 | ||||||
Tokmanni Group Corp. | 128,141 | 1,813,953 | ||||||
| 4,710,785 | ||||||||
Russia — 1.2% | ||||||||
Globaltrans Investment PLC — SP GDR | 120,195 | 1,063,726 | ||||||
X5 Retail Group NV — GDR | 64,487 | 2,224,802 | ||||||
| 3,288,528 | ||||||||
Belgium — 1.1% | ||||||||
Barco NV | 12,104 | 2,973,389 | ||||||
Spain — 1.0% | ||||||||
Masmovil Ibercom SA** | 118,563 | 2,705,072 | ||||||
Turkey — 0.8% | ||||||||
Migros Ticaret AS** | 538,898 | 2,194,001 | ||||||
Total EUROPE | 141,362,757 | |||||||
FAR EAST — 25.0% | ||||||||
Japan — 17.6% | ||||||||
CKD Corp. | 137,152 | 2,320,053 | ||||||
Fujitec Co., Ltd. | 82,350 | 1,348,310 | ||||||
Harmonic Drive Systems, Inc. | 61,728 | 2,993,940 | ||||||
Hitachi High-Technologies Corp. | 29,033 | 2,068,155 | ||||||
Kobe Bussan Co., Ltd. | 56,186 | 1,939,142 | ||||||
Lasertec Corp. | 40,906 | 2,093,207 | ||||||
M&A Capital Partners Co., Ltd.** | 49,678 | 2,025,434 | ||||||
Minebea Mitsumi, Inc. | 109,454 | 2,293,744 | ||||||
Nichias Corp. | 62,330 | 1,597,617 | ||||||
Nihon Unisys, Ltd. | 61,118 | 1,926,549 | ||||||
Notes to Financial Statements are an integral part of this Schedule.
18
Driehaus International Small Cap Growth Fund |
Number of | Value | |||||||
PALTAC Corp. | 19,346 | $ | 932,981 | |||||
SCSK Corp. | 56,705 | 2,959,066 | ||||||
SG Holdings Co., Ltd. | 53,823 | 1,218,578 | ||||||
Shimadzu Corp. | 104,800 | 3,317,951 | ||||||
Square Enix Holdings Co., Ltd. | 77,368 | 3,866,442 | ||||||
Sugi Holdings Co., Ltd. | 44,731 | 2,371,272 | ||||||
TechnoPro Holdings, Inc. | 31,250 | 2,200,198 | ||||||
THK Co., Ltd. | 42,223 | 1,153,356 | ||||||
Tokyo Tatemono Co., Ltd. | 243,141 | 3,824,288 | ||||||
United Arrows, Ltd. | 84,755 | 2,410,317 | ||||||
Yokogawa Electric Corp. | 124,360 | 2,207,818 | ||||||
| 47,068,418 | ||||||||
Taiwan — 2.5% | ||||||||
Eclat Textile Co., Ltd. | 114,028 | 1,532,951 | ||||||
Giant Manufacturing Co., Ltd. | 361,824 | 2,570,921 | ||||||
Hiwin Technologies Corp. | 141,132 | 1,322,951 | ||||||
Win Semiconductors Corp. | 143,000 | 1,402,475 | ||||||
| 6,829,298 | ||||||||
Australia — 1.9% | ||||||||
Megaport, Ltd.** | 379,153 | 2,857,596 | ||||||
NEXTDC, Ltd.** | 494,087 | 2,281,452 | ||||||
| 5,139,048 | ||||||||
China — 1.7% | ||||||||
Beijing Chunlizhengda Medical Instruments Co., Ltd. — H | 170,691 | 1,004,348 | ||||||
CIMC Enric Holdings, Ltd. | 2,103,632 | 1,255,328 | ||||||
Li Ning Co., Ltd. | 736,820 | 2,207,916 | ||||||
| 4,467,592 | ||||||||
South Korea — 1.3% | ||||||||
Douzone Bizon Co., Ltd. | 28,168 | 1,972,941 | ||||||
Koh Young Technology, Inc. | 16,173 | 1,475,422 | ||||||
| 3,448,363 | ||||||||
Total FAR EAST | 66,952,719 | |||||||
NORTH AMERICA — 9.1% | ||||||||
Canada — 8.2% | ||||||||
Boardwalk REIT | 102,647 | 3,630,647 | ||||||
CAE, Inc. | 160,276 | 4,243,417 | ||||||
CCL Industries, Inc. — B | 28,750 | 1,224,789 | ||||||
Empire Co., Ltd. — A | 47,493 | 1,114,040 | ||||||
Kelt Exploration, Ltd.** | 552,924 | 2,073,651 | ||||||
Kinaxis, Inc.** | 27,604 | 2,126,181 | ||||||
Morneau Shepell, Inc. | 100,427 | 2,613,244 | ||||||
Parkland Fuel Corp. | 134,363 | 4,936,628 | ||||||
| 21,962,597 | ||||||||
Mexico — 0.9% | ||||||||
Alsea SAB de CV** | 510,208 | 1,344,634 | ||||||
Grupo Cementos de Chihuahua SAB de CV | 196,386 | 1,048,535 | ||||||
| 2,393,169 | ||||||||
Total NORTH AMERICA | 24,355,766 | |||||||
Number of | Value | |||||||
SOUTH AMERICA — 3.3% | ||||||||
Brazil — 2.3% | ||||||||
Rumo SA** | 337,872 | $ | 2,192,174 | |||||
Sul America SA | 260,635 | 3,882,280 | ||||||
| 6,074,454 | ||||||||
Uruguay — 1.0% | ||||||||
Arcos Dorados Holdings, Inc. — A | 345,649 | 2,799,757 | ||||||
Total SOUTH AMERICA | 8,874,211 | |||||||
MIDDLE EAST — 2.0% | ||||||||
United Arab Emirates — 1.1% | ||||||||
Network International Holdings PLC1** | 345,556 | 2,934,027 | ||||||
Israel — 0.9% | ||||||||
Nice, Ltd. — SP ADR** | 15,352 | 2,381,863 | ||||||
Total MIDDLE EAST | 5,315,890 | |||||||
CENTRAL AMERICA — 0.9% | ||||||||
Panama — 0.9% | ||||||||
Copa Holdings SA — A | 22,990 | 2,484,759 | ||||||
Total CENTRAL AMERICA | 2,484,759 | |||||||
AFRICA — 0.7% | ||||||||
South Africa — 0.7% | ||||||||
Clicks Group, Ltd. | 105,830 | 1,938,806 | ||||||
Total AFRICA | 1,938,806 | |||||||
Total EQUITY SECURITIES (Cost $207,367,162) | 251,284,908 | |||||||
| ||||||||
TOTAL INVESTMENTS (COST $207,367,162) | 93.7 | % | $ | 251,284,908 | ||||
Other Assets In Excess Of Liabilities | 6.3 | % | 16,943,783 | |||||
Net Assets | 100.0 | % | $ | 268,228,691 | ||||
1 | 144A — This security was purchased pursuant to Rule 144A of the Securities Act of 1933 and may not be resold subject to that rule except to qualified institutional buyers. At December 31, 2019, these securities amounted to $17,381,338 or 6.5% of net assets. These 144A securities have not been deemed illiquid. |
** | Non-income producing security |
ADR — American Depository Receipt
GDR — Global Depository Receipt
REIT — Real Estate Investment Trust
SP ADR — Sponsored American Depository Receipt
SP GDR — Sponsored Global Depository Receipt
Notes to Financial Statements are an integral part of this Schedule.
19
Driehaus International Small Cap Growth Fund |
Regional Weightings* | |
Western Europe | 50.7% |
Japan | 17.6% |
North America | 9.1% |
Asia/Far East Ex-Japan | 7.4% |
South America | 3.3% |
Eastern Europe | 2.0% |
Middle East | 2.0% |
Central America | 0.9% |
Africa | 0.7% |
Top Ten Holdings* | |
Parkland Fuel Corp. | 1.8% |
TeamViewer AG | 1.6% |
Leonardo SpA | 1.6% |
CAE, Inc. | 1.6% |
Serco Group PLC | 1.5% |
Sul America SA | 1.4% |
Square Enix Holdings Co., Ltd. | 1.4% |
Constellium SE | 1.4% |
Tokyo Tatemono Co., Ltd. | 1.4% |
Greggs PLC | 1.4% |
* | All percentages are stated as a percent of net assets at December 31, 2019 |
Notes to Financial Statements are an integral part of this Schedule.
20
Driehaus International Small Cap Growth Fund |
Industry | Percent of |
Aerospace & Defense | 3.2% |
Air Freight & Logistics | 0.5% |
Airlines | 0.9% |
Automobiles | 0.6% |
Beverages | 1.7% |
Biotechnology | 1.2% |
Building Products | 0.6% |
Capital Markets | 3.1% |
Chemicals | 1.8% |
Commercial Services & Supplies | 2.8% |
Construction & Engineering | 1.0% |
Construction Materials | 0.4% |
Containers & Packaging | 1.5% |
Distributors | 0.3% |
Diversified Telecommunication Services | 1.0% |
Electronic Equipment, Instruments & Components | 4.4% |
Energy Equipment & Services | 0.7% |
Entertainment | 1.9% |
Food & Staples Retailing | 4.4% |
Food Products | 0.6% |
Health Care Equipment & Supplies | 3.9% |
Health Care Providers & Services | 1.8% |
Hotels, Restaurants & Leisure | 3.9% |
Industry | Percent of |
Industrial Conglomerates | 0.5% |
Information Technology Services | 5.6% |
Insurance | 2.8% |
Interactive Media & Services | 1.1% |
Leisure Equipment & Products | 1.0% |
Life Sciences Tools & Services | 1.9% |
Machinery | 8.7% |
Media | 0.5% |
Metals & Mining | 1.4% |
Multiline Retail | 1.9% |
Oil, Gas & Consumable Fuels | 2.6% |
Pharmaceuticals | 1.1% |
Professional Services | 2.6% |
Real Estate Investment Trust | 1.4% |
Real Estate Management & Development | 2.4% |
Road & Rail | 1.2% |
Semiconductors & Semiconductor Equipment | 3.5% |
Software | 5.9% |
Specialty Retail | 2.4% |
Textiles, Apparel & Luxury Goods | 2.3% |
Wireless Telecommunication Services | 0.7% |
Other Assets in Excess of Liabilities | 6.3% |
TOTAL | 100.0% |
Notes to Financial Statements are an integral part of this Schedule.
21
Driehaus Micro Cap Growth Fund — Portfolio Managers’ Letter |
Dear Fellow Shareholders,
The Driehaus Micro Cap Growth Fund (“Fund”) returned 33.89% for the year ended December 31, 2019. This return outperformed the Fund’s benchmark, the Russell Microcap® Growth Index (the “Benchmark”), which returned 23.33% for the same period.
A year ago, in the December quarter of 2018, equities were in a near free fall. The average US stock was in a cyclical bear market, as it seemed that the market was convinced the Federal Reserve was hiking interest rates too aggressively, which many investors perceived to be a major policy mistake. One year later the policy backdrop has brightened considerably. The Federal Reserve’s dovish actions over the course of 2019 appears to have successfully re-steepened the yield curve and helped stabilize economic conditions, kicking recessionary concerns far down the road. The US-China trade conflict even saw some thawing, as both sides have signed a Phase 1 agreement. As a result, from October to December, equities enjoyed a steady advance to new highs for most of the major averages. In October, the S&P 500 and the Nasdaq Indices made new all-time highs, and the small cap Russell 2000 Index similarly reached a new high in November. Micro caps, after lagging since the summer of 2018, surged, outperforming all other market cap ranges during the last three months of the year.
The Federal Reserve’s dovish policy pivot, better economic data and reduced odds of a recession fueled strength and certainly boosted micro caps as they materially outperformed large caps in the fourth quarter. This current advance, which is broad in terms of market cap, style and sector leadership is potentially a powerful signal as we enter the new year of 2020. The US market has impressively emerged out of a two-year consolidation and appears to be in a healthy position to sustain its advance. We believe that the equity outlook for the year ahead is supported by the potential for stable to even improved economic and earnings growth compared to 2019. Other potential positive factors include an accommodative monetary policy, sustained low inflation and interest rates, continued strong consumer spending, services growth and potentially improved manufacturing data which should in turn drive capital expenditure growth. Importantly, it is our belief that all these variables provide a constructive environment for smaller cap equities to continue their recent outperformance versus large caps.
We see a healthy US consumer enjoying robust labor markets, increasing wages and rising overall wealth, which should support consumer spending growth. Services (non-manufacturing) remains strong in the US and together with consumer spending makes up most of the US economy and offsets the relatively smaller manufacturing and export related sides of the economy, both of which have been weak but should see improvement in 2020.
For the year 2019, key contributors to performance versus the Benchmark were the Fund’s selection of holdings in the health care and information technology sectors.
Reata Pharmaceuticals, Inc. (Ticker: RETA) was the top contributor to Fund performance for the year. Reata is a development stage drug company focused on diseases associated with metabolic dysfunction. In October of 2019 the company released high level details from a phase 3 study in patients with Friedrick’s Ataxia, indicating the study had succeeded. Shares of the stock rallied over 100%.
Cardlytics, Inc. (Ticker: CDLX) also contributed to the Fund’s performance for the period. The company uses purchase intelligence from banking rewards programs to provide relevant and measurable advertising outcomes. Cardlytics, Inc. was a top contributor as the stock reacted positively to a strong third quarter report, in which billings growth accelerated and 2019 guidance was significantly increased.
During the period, the two sectors that detracted the most value from Fund performance versus the Benchmark were selections within the industrials and materials sectors.
The holding that detracted the most from the Fund’s return during the period was QuinStreet (Ticker: QNST). The company is a leading internet performance marketing company. The stock declined 20% as fiscal year 2019 (June) guidance was reduced on the December quarter 2018 report. Guidance was cut due to weakness in refinancing activity and restructuring at an education client.
Fluidigm Corporation (Ticker: FLDM) was also a detractor to the Fund’s returns for the period. Fluidigm is a commercial stage life sciences tools company, commercializing products that quantify and characterize biological constituents for researchers. In August, Fluidigm reported second quarter operating results below guidance and consensus expectations and gave September quarter guidance below expectations, driven by lumpiness in orders from their growth product line.
22
The market environment appears brighter as economic and earnings conditions have incrementally improved and as the concerns about monetary policy and trade policy have ebbed. There are certainly a handful of market risks, which we are monitoring carefully but on balance, the outlook into the new year is attractive.
We continue to see broad fundamental strength within health care (biotech, medical devices, life science tools and diagnostics) as many companies with innovative products continue to gain market share. Within technology, software, information technology services and ecommerce remain robust as the mega-trends of cloud adoption and digitalization are multi-year in nature. Within consumer, financials, industrials and other cyclicals, we see positive and incremental opportunities as these groups experience improving fundamentals.
Thank you for investing alongside us in the Driehaus Micro Cap Growth Fund. We appreciate your continued confidence in our management capabilities.
Sincerely,
|
|
Jeff James | Michael Buck |
Lead Portfolio Manager | Portfolio Manager |


Performance is historical and does not represent future results.
Please see the following performance overview page for index description.
23
Driehaus Micro Cap Growth Fund Performance Overview (unaudited) |
The performance summarized below is historical and does not represent future results. Investment returns and principal value vary, and you may have a gain or loss when you sell shares. Performance data presented measures the change in the value of an investment in the Fund, assuming reinvestment of all dividends and capital gains. Average annual total return reflects annualized change.
The table does not reflect the deduction of taxes that a shareholder would pay on Fund distributions or the redemption of Fund shares. The graph compares the results of a $10,000 investment in the Fund over the last 10 fiscal year periods (which includes performance of the Predecessor Limited Partnership), with all dividends and capital gains reinvested, with the indicated index (and dividends reinvested) for the same period.
Fund Only | Including Predecessor Limited Partnership | ||||
Average Annual Total Returns as of 12/31/19 | 1 Year | 3 Years | 5 Years | Since Inception (11/18/13 - 12/31/19) | 10 Years |
Driehaus Micro Cap Growth Fund (DMCRX)1 | 33.89% | 20.02% | 15.16% | 15.01% | 16.33% |
Russell Microcap® Growth Index2 | 23.33% | 7.28% | 4.87% | 5.85% | 10.69% |

1 | The Driehaus Micro Cap Growth Fund (the “Fund”) performance shown above includes the performance of the Driehaus Micro Cap Fund, L.P. (the “Predecessor Limited Partnership”), one of the Fund’s predecessors, for the periods before the Fund’s registration statement became effective. The Predecessor Limited Partnership, which was established on July 1, 1996, was managed with substantially the same investment objective, policies and philosophies as are followed by the Fund. The Fund succeeded to the Predecessor Limited Partnership’s assets together with the assets of the Driehaus Institutional Micro Cap Fund, L.P. on November 18, 2013. The Predecessor Limited Partnership was not registered under the Investment Company Act of 1940, as amended (“1940 Act”), and thus was not subject to certain investment and operational restrictions that are imposed by the 1940 Act. If the Predecessor Limited Partnership had been registered under the 1940 Act, its performance may have been adversely affected. The Predecessor Limited Partnership’s performance has been restated to reflect estimated expenses of the Fund. The returns for periods prior to November 18, 2016, reflect fee waivers and/or reimbursements without which performance would have been lower. |
2 | The Russell Microcap® Growth Index is constructed to provide a comprehensive and unbiased barometer of the micro cap growth market. Based on ongoing empirical research of investment manager behavior, the methodology used to determine growth probability approximates the aggregate microcap growth manager’s opportunity set. |
24
Driehaus Micro Cap Growth Fund |
Number of | Value | |||||||
EQUITY SECURITIES — 99.4% | ||||||||
HEALTH CARE — 35.2% | ||||||||
Biotechnology — 18.8% | ||||||||
Allakos, Inc.** | 11,136 | $ | 1,061,929 | |||||
Apellis Pharmaceuticals, Inc.** | 59,865 | 1,833,066 | ||||||
Argenx SE — ADR** | 30,148 | 4,839,357 | ||||||
Castle Biosciences, Inc.** | 65,556 | 2,253,160 | ||||||
Cytokinetics, Inc.** | 318,101 | 3,375,052 | ||||||
Dicerna Pharmaceuticals, Inc.** | 160,729 | 3,540,860 | ||||||
Eidos Therapeutics, Inc.** | 28,951 | 1,661,498 | ||||||
Forty Seven, Inc.** | 33,926 | 1,335,667 | ||||||
Global Blood Therapeutics, Inc.** | 51,087 | 4,060,906 | ||||||
Immunovant, Inc.** | 97,569 | 1,546,469 | ||||||
Merus NV** | 117,680 | 1,656,934 | ||||||
Mirati Therapeutics, Inc.** | 15,766 | 2,031,607 | ||||||
Momenta Pharmaceuticals, Inc.** | 70,470 | 1,390,373 | ||||||
Natera, Inc.** | 62,272 | 2,097,944 | ||||||
Orchard Therapeutics PLC — ADR** | 134,680 | 1,851,850 | ||||||
Principia Biopharma, Inc.** | 49,309 | 2,701,147 | ||||||
SpringWorks Therapeutics, Inc.** | 73,630 | 2,834,019 | ||||||
Sutro Biopharma, Inc.** | 36,479 | 401,269 | ||||||
Turning Point Therapeutics, Inc.** | 39,568 | 2,464,691 | ||||||
Twist Bioscience Corp.** | 75,186 | 1,578,906 | ||||||
Veracyte, Inc.** | 67,000 | 1,870,640 | ||||||
Vericel Corp.** | 92,161 | 1,603,601 | ||||||
Y-mAbs Therapeutics, Inc.** | 80,951 | 2,529,719 | ||||||
| 50,520,664 | ||||||||
Pharmaceuticals — 6.7% | ||||||||
Axsome Therapeutics, Inc.** | 49,469 | 5,113,116 | ||||||
Collegium Pharmaceutical, Inc.** | 46,210 | 951,002 | ||||||
MyoKardia, Inc.** | 75,013 | 5,467,323 | ||||||
Odonate Therapeutics, Inc.** | 79,321 | 2,573,966 | ||||||
Revance Therapeutics, Inc.** | 114,285 | 1,854,846 | ||||||
Tricida, Inc.** | 54,716 | 2,064,982 | ||||||
| 18,025,235 | ||||||||
Health Care Equipment & Supplies — 5.4% | ||||||||
Alphatec Holdings, Inc.** | 225,569 | 1,600,412 | ||||||
BioLife Solutions, Inc.** | 95,815 | 1,550,287 | ||||||
OrthoPediatrics Corp.** | 99,865 | 4,692,656 | ||||||
SI-BONE, Inc.** | 104,803 | 2,253,264 | ||||||
Tactile Systems Technology, Inc.** | 28,630 | 1,932,811 | ||||||
Tandem Diabetes Care, Inc.** | 29,445 | 1,755,216 | ||||||
Vapotherm, Inc.** | 54,630 | 664,301 | ||||||
ViewRay, Inc.** | 47,573 | 200,758 | ||||||
| 14,649,705 | ||||||||
Health Care Technology — 2.8% | ||||||||
Inspire Medical Systems, Inc.** | 77,198 | 5,728,864 | ||||||
Number of | Value | |||||||
Phreesia, Inc.** | 64,247 | $ | 1,711,540 | |||||
| 7,440,404 | ||||||||
Life Sciences Tools & Services — 1.0% | ||||||||
NeoGenomics, Inc.** | 89,309 | 2,612,288 | ||||||
Health Care Providers & Services — 0.5% | ||||||||
Fulgent Genetics, Inc.** | 110,988 | 1,431,745 | ||||||
Total HEALTH CARE | 94,680,041 | |||||||
INFORMATION TECHNOLOGY — 23.3% | ||||||||
Semiconductors & Semiconductor Equipment — 10.0% | ||||||||
Adesto Technologies Corp.** | 158,951 | 1,351,083 | ||||||
FormFactor, Inc.** | 82,112 | 2,132,449 | ||||||
Ichor Holdings, Ltd.** | 151,853 | 5,052,149 | ||||||
Impinj, Inc.** | 66,235 | 1,712,837 | ||||||
Inphi Corp.** | 50,161 | 3,712,917 | ||||||
Silicon Motion Technology Corp. — ADR | 78,593 | 3,985,451 | ||||||
SiTime Corp.** | 95,667 | 2,439,509 | ||||||
SMART Global Holdings, Inc.** | 86,075 | 3,265,686 | ||||||
Ultra Clean Holdings, Inc.** | 135,865 | 3,188,752 | ||||||
| 26,840,833 | ||||||||
Information Technology Services — 7.5% | ||||||||
ChaSerg Technology | ||||||||
Acquisition Corp. — A** | 185,248 | 2,002,531 | ||||||
Endava PLC — SP ADR** | 113,964 | 5,310,722 | ||||||
I3 Verticals, Inc. — A** | 137,433 | 3,882,482 | ||||||
Limelight Networks, Inc.** | 469,670 | 1,916,254 | ||||||
Perficient, Inc.** | 100,383 | 4,624,645 | ||||||
Repay Holdings Corp.** | 171,569 | 2,513,486 | ||||||
| 20,250,120 | ||||||||
Software — 3.8% | ||||||||
Alteryx, Inc. — A** | 11,037 | 1,104,473 | ||||||
Digital Turbine, Inc.** | 237,261 | 1,691,671 | ||||||
Everbridge, Inc.** | 18,210 | 1,421,837 | ||||||
Five9, Inc.** | 16,037 | 1,051,706 | ||||||
SVMK, Inc.** | 71,099 | 1,270,539 | ||||||
Telaria, Inc.** | 413,805 | 3,645,622 | ||||||
| 10,185,848 | ||||||||
Electronic Equipment, Instruments & Components — 1.5% | ||||||||
Knowles Corp.** | 62,025 | 1,311,829 | ||||||
nLight, Inc.** | 131,544 | 2,667,712 | ||||||
| 3,979,541 | ||||||||
Communications Equipment — 0.5% | ||||||||
Infinera Corp.** | 175,939 | 1,396,956 | ||||||
Total INFORMATION TECHNOLOGY | 62,653,298 | |||||||
CONSUMER DISCRETIONARY — 13.3% | ||||||||
Specialty Retail — 4.6% | ||||||||
Boot Barn Holdings, Inc.** | 113,075 | 5,035,230 | ||||||
Hibbett Sports, Inc.** | 60,087 | 1,684,839 | ||||||
Sonic Automotive, Inc. — A | 86,550 | 2,683,050 | ||||||
Sportsman’s Warehouse Holdings, Inc.** | 257,705 | 2,069,371 | ||||||
Notes to Financial Statements are an integral part of this Schedule.
25
Driehaus Micro Cap Growth Fund |
Number of | Value | |||||||
Stage Stores, Inc. | 109,149 | $ | 886,290 | |||||
| 12,358,780 | ||||||||
Household Durables — 2.9% | ||||||||
Installed Building Products, Inc.** | 30,235 | 2,082,284 | ||||||
Skyline Champion Corp.** | 142,038 | 4,502,605 | ||||||
The Lovesac Co.** | 79,305 | 1,272,845 | ||||||
| 7,857,734 | ||||||||
Textiles, Apparel & Luxury Goods — 1.3% | ||||||||
Crocs, Inc.** | 83,951 | 3,516,707 | ||||||
Internet & Catalog Retail — 1.1% | ||||||||
The Rubicon Project, Inc.** | 353,447 | 2,884,128 | ||||||
Automobiles — 1.0% | ||||||||
Winnebago Industries, Inc. | 51,050 | 2,704,629 | ||||||
Hotels, Restaurants & Leisure — 1.0% | ||||||||
Papa John’s International, Inc. | 42,395 | 2,677,244 | ||||||
Leisure Equipment & Products — 0.9% | ||||||||
Callaway Golf Co. | 110,285 | 2,338,042 | ||||||
Diversified Consumer Services — 0.5% | ||||||||
OneSpaWorld Holdings, Ltd.** | 76,223 | 1,283,595 | ||||||
Total CONSUMER DISCRETIONARY | 35,620,859 | |||||||
INDUSTRIALS — 12.5% | ||||||||
Machinery — 5.0% | ||||||||
Chart Industries, Inc.** | 19,247 | 1,298,980 | ||||||
Columbus McKinnon Corp. | 47,531 | 1,902,666 | ||||||
Douglas Dynamics, Inc. | 25,716 | 1,414,380 | ||||||
Federal Signal Corp. | 55,013 | 1,774,169 | ||||||
Kadant, Inc. | 14,185 | 1,494,248 | ||||||
Kornit Digital, Ltd.** | 35,371 | 1,210,749 | ||||||
Meritor, Inc.** | 94,173 | 2,466,391 | ||||||
SPX FLOW, Inc.** | 41,284 | 2,017,549 | ||||||
| 13,579,132 | ||||||||
Building Products — 1.7% | ||||||||
American Woodmark Corp.** | 12,494 | 1,305,748 | ||||||
Gibraltar Industries, Inc.** | 38,852 | 1,959,695 | ||||||
Patrick Industries, Inc. | 25,494 | 1,336,650 | ||||||
| 4,602,093 | ||||||||
Trading Companies & Distributors — 1.5% | ||||||||
H&E Equipment Services, Inc. | 64,704 | 2,163,055 | ||||||
Rush Enterprises, Inc. — A | 42,630 | 1,982,295 | ||||||
| 4,145,350 | ||||||||
Commercial Services & Supplies — 1.1% | ||||||||
Casella Waste Systems, Inc. — A** | 32,976 | 1,517,885 | ||||||
Knoll, Inc. | 51,918 | 1,311,449 | ||||||
| 2,829,334 | ||||||||
Construction & Engineering — 0.9% | ||||||||
Arcosa, Inc. | 56,655 | 2,523,980 | ||||||
Road & Rail — 0.9% | ||||||||
Saia, Inc.** | 26,136 | 2,433,784 | ||||||
Professional Services — 0.7% | ||||||||
ICF International, Inc. | 20,704 | 1,896,900 | ||||||
Number of | Value | |||||||
Aerospace & Defense — 0.5% | ||||||||
Vectrus, Inc.** | 25,556 | $ | 1,310,001 | |||||
Electrical Equipment — 0.2% | ||||||||
Vicor Corp.** | 8,656 | 404,408 | ||||||
Total INDUSTRIALS | 33,724,982 | |||||||
FINANCIALS — 8.0% | ||||||||
Insurance — 4.5% | ||||||||
BRP Group, Inc. — A** | 117,124 | 1,879,840 | ||||||
eHealth, Inc.** | 32,210 | 3,094,737 | ||||||
Goosehead Insurance, Inc. — A | 44,013 | 1,866,151 | ||||||
Kinsale Capital Group, Inc. | 23,543 | 2,393,381 | ||||||
Palomar Holdings, Inc.** | 59,828 | 3,020,716 | ||||||
| 12,254,825 | ||||||||
Thrifts & Mortgage Finance — 2.2% | ||||||||
Meta Financial Group, Inc. | 84,865 | 3,098,421 | ||||||
NMI Holdings, Inc. — A** | 82,013 | 2,721,191 | ||||||
| 5,819,612 | ||||||||
Commercial Banks — 1.3% | ||||||||
TriState Capital Holdings, Inc.** | 58,334 | 1,523,684 | ||||||
Triumph Bancorp, Inc.** | 52,099 | 1,980,804 | ||||||
| 3,504,488 | ||||||||
Total FINANCIALS | 21,578,925 | |||||||
CONSUMER STAPLES — 2.6% | ||||||||
Personal Products — 1.9% | ||||||||
BellRing Brands, Inc. — A** | 120,606 | 2,567,702 | ||||||
elf Beauty, Inc.** | 161,548 | 2,605,769 | ||||||
| 5,173,471 | ||||||||
Food Products — 0.7% | ||||||||
Freshpet, Inc.** | 32,334 | 1,910,616 | ||||||
Total CONSUMER STAPLES | 7,084,087 | |||||||
COMMUNICATION SERVICES — 2.6% | ||||||||
Media — 1.8% | ||||||||
Cardlytics, Inc.** | 77,383 | 4,864,295 | ||||||
Interactive Media & Services — 0.8% | ||||||||
EverQuote, Inc. — A** | 63,482 | 2,180,607 | ||||||
Total COMMUNICATION SERVICES | 7,044,902 | |||||||
MATERIALS — 1.3% | ||||||||
Metals & Mining — 0.9% | ||||||||
Constellium SE** | 177,989 | 2,385,053 | ||||||
Paper & Forest Products — 0.4% | ||||||||
Boise Cascade Co. | 32,000 | 1,168,960 | ||||||
Total MATERIALS | 3,554,013 | |||||||
Notes to Financial Statements are an integral part of this Schedule.
26
Driehaus Micro Cap Growth Fund |
Number of | Value | |||||||
ENERGY — 0.6% | ||||||||
Oil, Gas & Consumable Fuels — 0.6% | ||||||||
Scorpio Tankers, Inc. | 37,432 | $ | 1,472,575 | |||||
Total ENERGY | 1,472,575 | |||||||
Total EQUITY SECURITIES (Cost $192,335,405) | 267,413,682 | |||||||
| ||||||||
TOTAL INVESTMENTS (COST $192,335,405) | 99.4 | % | $ | 267,413,682 | ||||
Other Assets In Excess Of Liabilities | 0.6 | % | 1,706,488 | |||||
Net Assets | 100.0 | % | $ | 269,120,170 | ||||
** | Non-income producing security |
ADR — American Depository Receipt
SP ADR — Sponsored American Depository Receipt
Top Ten Holdings* | |
Inspire Medical Systems, Inc. | 2.1 % |
MyoKardia, Inc. | 2.0 % |
Endava PLC — SP ADR | 2.0 % |
Axsome Therapeutics, Inc. | 1.9 % |
Ichor Holdings, Ltd. | 1.9 % |
Boot Barn Holdings, Inc. | 1.9 % |
Cardlytics, Inc. | 1.8 % |
Argenx SE — ADR | 1.8 % |
OrthoPediatrics Corp. | 1.7 % |
Perficient, Inc. | 1.7 % |
* | All percentages are stated as a percent of net assets at December 31, 2019. |
Notes to Financial Statements are an integral part of this Schedule.
27
Driehaus Micro Cap Growth Fund |
Industry | Percent of |
Aerospace & Defense | 0.5% |
Automobiles | 1.0% |
Biotechnology | 18.8% |
Building Products | 1.7% |
Commercial Banks | 1.3% |
Commercial Services & Supplies | 1.1% |
Communications Equipment | 0.5% |
Construction & Engineering | 0.9% |
Diversified Consumer Services | 0.5% |
Electrical Equipment | 0.2% |
Electronic Equipment, Instruments & Components | 1.5% |
Food Products | 0.7% |
Health Care Equipment & Supplies | 5.4% |
Health Care Providers & Services | 0.5% |
Health Care Technology | 2.8% |
Hotels, Restaurants & Leisure | 1.0% |
Household Durables | 2.9% |
Information Technology Services | 7.5% |
Insurance | 4.5% |
Interactive Media & Services | 0.8% |
Industry | Percent of |
Internet & Catalog Retail | 1.1% |
Leisure Equipment & Products | 0.9% |
Life Sciences Tools & Services | 1.0% |
Machinery | 5.0% |
Media | 1.8% |
Metals & Mining | 0.9% |
Oil, Gas & Consumable Fuels | 0.6% |
Paper & Forest Products | 0.4% |
Personal Products | 1.9% |
Pharmaceuticals | 6.7% |
Professional Services | 0.7% |
Road & Rail | 0.9% |
Semiconductors & Semiconductor Equipment | 10.0% |
Software | 3.8% |
Specialty Retail | 4.6% |
Textiles, Apparel & Luxury Goods | 1.3% |
Thrifts & Mortgage Finance | 2.2% |
Trading Companies & Distributors | 1.5% |
Other Assets in Excess of Liabilities | 0.6% |
TOTAL | 100.0% |
Notes to Financial Statements are an integral part of this Schedule.
28
Driehaus Small Cap Growth Fund — Portfolio Managers’ Letter |
Dear Fellow Shareholders,
The Driehaus Small Cap Growth Fund (“Fund”) Investor class (DVSMX) returned 40.25% and Institutional class (DNSMX) returned 40.62% for the year ended December 31, 2019. This return outperformed the Fund’s benchmark, the Russell 2000® Growth Index (the “Benchmark”), which returned 28.48% for the same period.
A year ago, in the December quarter of 2018, equities were in a near free fall. The average US stock was in a cyclical bear market, and the market appeared convinced that the Federal Reserve was hiking interest rates too aggressively, which many investors considered a major policy mistake. One year later the policy backdrop has brightened considerably. The Federal Reserve’s dovish actions over the course of 2019 successfully re-steepened the yield curve and helped stabilize economic conditions, kicking recessionary concerns far down the road. The US-China trade conflict even saw some thawing, as both sides have signed a Phase 1 agreement. As a result, from October to December, equities enjoyed a steady advance to new highs for most of the major averages. In October, the S&P 500 and the Nasdaq Indices made new all-time highs and the small cap Russell 2000 Index then followed-on by reaching a new high in November.
The Federal Reserve’s dovish policy pivot, better economic data and reduced odds of a recession fueled strength and boosted small caps as they materially outperformed large caps in the fourth quarter. This recent advance, which has been broad in terms of market cap, style and sector leadership is potentially a powerful signal as we enter the new year of 2020. The US market has impressively emerged out of a two-year consolidation and appears to be in a healthy position to sustain its advance. We believe that the equity outlook for the year ahead is supported by the potential for stable to even improved economic and earnings growth compared to 2019. Other positive factors include an accommodative monetary policy, sustained low inflation and interest rates, continued strong consumer spending, services growth and potentially improved manufacturing data that should result in capital expenditure growth. Importantly, all these variables should provide a constructive environment for smaller cap equities to continue their recent outperformance versus large caps.
We see a healthy US consumer enjoying robust labor markets, increasing wages and rising overall wealth, which should support consumer spending growth. Services (non-manufacturing) remains strong in the US and together with consumer spending makes up most of the US economy and offsets the relatively smaller manufacturing and export related sides of the economy, both of which have been weak but should see improvement in 2020.
For the year 2019, key contributors to performance versus the Benchmark were the Fund’s selection of holdings in the health care and information technology services sectors.
Roku, Inc. (Ticker: ROKU) is an Over The Top (OTT) streaming platform company. In 2019, Roku’s streaming platform achieved critical scale as active accounts in the US on the platform grew 35%+ to over 36 million. In addition, 2019 marked the year where advertising budgets shifted from linear cable television to OTT streaming platforms at an accelerating rate resulting in Roku seeing a robust ad spending environment. Advertising on OTT platforms is still <5% of overall TV ad budgets, which presents a long runway for growth. Although we took some profits in 2019, we still maintain a smaller weighting in the stock.
Array BioPharma Inc. (Ticker: ARRY) also contributed to the Fund’s performance for the period. Array BioPharma is a commercial stage biopharma company developing therapies to treat genetically-defined cancers. In May, they announced updated clinical data in a subset of colorectal cancer that substantially improved the likelihood that they’d reach market in a greenfield indication. In June, Pfizer announced they were acquiring Array for a large premium (nearly 60%) and a market value of $11.4 billion.
During the period, the two sectors that detracted the most value from Fund performance versus the Benchmark were selections within the industrials and materials.
The holding that detracted the most from the Fund’s return during the period was Sarepta Therapeutics (Ticker: SRPT). Sarepta is a commercial stage drug company with a deep pipeline of genetic medicines. During 2019, Sarepta was dealt a setback when the FDA rejected the new drug application for their second muscular dystrophy drug. At the time, it was unclear what the reasoning was for the rejection, but it seemed possible that the rejection resulted from a potential conflict with FDA. Though we believed this to be unlikely, we sold SRPT for a loss in lieu of other ideas with less controversy.
Harsco Corporation (Ticker: HSC) was also a notable detractor to the Fund’s returns for the period. Harsco Corporation provides outsourced and on-site mill services to metal producing companies. During 2019, Harsco underwent a portfolio shift towards environmental services which was expected to be accretive to both margins and earnings. However, the
29
stock underperformed as synergies from the environmental services did not materialize fast enough while demand in other end markets deteriorated faster than expected. Due to these issues, we sold Harsco for a loss to focus on other ideas with more favorable end market outlooks.
The market environment appears brighter as economic and earnings conditions have incrementally improved and as the concerns about monetary policy and trade policy seem to have ebbed. There are certainly a handful of market risks, which we are monitoring carefully but on balance, the outlook into the new year is attractive.
We continue to see broad fundamental strength within health care (biotech, medical devices, life science tools and diagnostics) as many companies with innovative products continue to gain market share. Within technology, software, information technology services and e-commerce remain robust as the mega-trends of cloud adoption and digitalization are multi-year in nature. Within consumer, financials, industrials and other cyclicals, we see positive and incremental opportunities as these groups experience improving fundamentals.
Thank you for investing alongside us in the Driehaus Small Cap Growth Fund. We appreciate your continued confidence in our management capabilities.
Sincerely,
|
|
Jeff James | Michael Buck |
Lead Portfolio Manager | Portfolio Manager |


Performance is historical and does not represent future results.
Please see the following performance overview page for index description.
30
Driehaus Small Cap Growth Fund Performance Overview (unaudited) |
The performance summarized below is historical and does not represent future results. Investment returns and principal value vary, and you may have a gain or loss when you sell shares. Performance data presented measures the change in the value of an investment in the Fund, assuming reinvestment of all dividends and capital gains. Average annual total return reflects annualized change.
The table does not reflect the deduction of taxes that a shareholder would pay on Fund distributions or the redemption of Fund shares. The graph compares the results of a $10,000 investment in the Fund over the last 10 fiscal year periods (which includes performance of the Predecessor Partnership), with all dividends and capital gains reinvested, with the indicated index (and dividends reinvested) for the same period.
Fund Only | Including Predecessor | ||||
Average Annual Total Returns as of 12/31/19 | 1 Year | Since Inception (8/21/17 - 12/31/19) | 3 Years | 5 Years | 10 Years |
Driehaus Small Cap Growth Fund Investor Class (DVSMX)1 | 40.25% | 25.55% | 23.71% | 16.19% | 16.78% |
Driehaus Small Cap Growth Fund Institutional Class (DNSMX)1 | 40.62% | 25.87% | 23.96% | 16.33% | 16.85% |
Russell 2000® Growth Index2 | 28.48% | 13.10% | 12.49% | 9.34% | 13.01% |

1 | The Driehaus Small Cap Growth Fund (“the Fund”) performance shown above includes the performance of the Driehaus Institutional Small Cap, L.P. (the “Predecessor Partnership”), one of the Fund’s predecessors, for the periods before the Fund’s registration statement became effective. The Predecessor Partnership was managed by the same investment team with substantially the same investment objective, policies and philosophies as are followed by the Fund. The Fund succeeded to the Predecessor Partnership’s assets together with the assets of the Driehaus Institutional Small Cap Recovery Fund, L.P., Driehaus Small Cap Recovery Fund, L.P. and Driehaus Small Cap Investors, L.P. (together, the “Limited Partnerships”) on August 21, 2017. The investment portfolios of the Limited Partnerships were identical and therefore had similar performance. The performance of the Predecessor Partnership is shown here because it has been in operation the longest. The Predecessor Partnership was not registered under the Investment Company Act of 1940, as amended (“1940 Act”), and thus was not subject to certain investment and operational restrictions that are imposed by the 1940 Act. If the Predecessor Partnership had been registered under the 1940 Act, its performance may have been adversely affected. The Predecessor Partnership’s performance has not been restated to reflect estimated expenses applicable to each class of shares of the Fund. The returns reflect fee waivers and/or reimbursements without which performance would have been lower. |
2 | The Russell 2000® Growth Index measures the performance of those Russell 2000® companies with higher price-to-book ratios and higher forecasted growth values. The performance data includes reinvested dividends. The Russell 2000® Index measures the performance of the 2,000 smallest companies in the Russell 3000® Index. |
31
Driehaus Small Cap Growth Fund |
Number of | Value | |||||||
EQUITY SECURITIES — 99.8% | ||||||||
INFORMATION TECHNOLOGY — 25.9% | ||||||||
Semiconductors & Semiconductor Equipment — 14.9% | ||||||||
Advanced Energy Industries, Inc.** | 26,983 | $ | 1,921,190 | |||||
Enphase Energy, Inc.** | 91,468 | 2,390,059 | ||||||
FormFactor, Inc.** | 41,664 | 1,082,014 | ||||||
Ichor Holdings, Ltd.** | 87,177 | 2,900,379 | ||||||
Inphi Corp.** | 39,925 | 2,955,248 | ||||||
Lattice Semiconductor Corp.** | 93,100 | 1,781,934 | ||||||
Power Integrations, Inc. | 18,465 | 1,826,373 | ||||||
Silicon Laboratories, Inc.** | 10,601 | 1,229,504 | ||||||
Silicon Motion Technology Corp. — ADR | 48,953 | 2,482,407 | ||||||
SolarEdge Technologies, Inc.** | 28,701 | 2,729,178 | ||||||
Tower Semiconductor, Ltd.** | 115,212 | 2,772,001 | ||||||
Ultra Clean Holdings, Inc.** | 73,363 | 1,721,830 | ||||||
| 25,792,117 | ||||||||
Software — 5.2% | ||||||||
Alteryx, Inc. — A** | 6,228 | 623,236 | ||||||
Bottomline Technologies (DE), Inc.** | 16,425 | 880,380 | ||||||
Coupa Software, Inc.** | 4,471 | 653,884 | ||||||
Everbridge, Inc.** | 12,581 | 982,324 | ||||||
Five9, Inc.** | 18,994 | 1,245,627 | ||||||
Globant SA** | 10,979 | 1,164,323 | ||||||
Paylocity Holding Corp.** | 6,722 | 812,152 | ||||||
RingCentral, Inc. — A** | 7,087 | 1,195,364 | ||||||
Telaria, Inc.** | 159,698 | 1,406,939 | ||||||
| 8,964,229 | ||||||||
Information Technology Services — 4.8% | ||||||||
Endava PLC — SP ADR** | 60,946 | 2,840,084 | ||||||
EPAM Systems, Inc.** | 8,028 | 1,703,220 | ||||||
KBR, Inc. | 66,955 | 2,042,127 | ||||||
Perficient, Inc.** | 37,210 | 1,714,265 | ||||||
| 8,299,696 | ||||||||
Electronic Equipment, Instruments & Components — 1.0% | ||||||||
Itron, Inc.** | 19,518 | 1,638,536 | ||||||
Total INFORMATION TECHNOLOGY | 44,694,578 | |||||||
HEALTH CARE — 23.1% | ||||||||
Biotechnology — 11.5% | ||||||||
Allakos, Inc.** | 7,388 | 704,520 | ||||||
Apellis Pharmaceuticals, Inc.** | 40,612 | 1,243,539 | ||||||
Argenx SE — ADR** | 20,699 | 3,322,603 | ||||||
Ascendis Pharma AS — ADR** | 14,638 | 2,036,439 | ||||||
Blueprint Medicines Corp.** | 9,750 | 781,072 | ||||||
Cytokinetics, Inc.** | 109,633 | 1,163,206 | ||||||
Dicerna Pharmaceuticals, Inc.** | 38,748 | 853,618 | ||||||
Eidos Therapeutics, Inc.** | 17,151 | 984,296 | ||||||
Global Blood Therapeutics, Inc.** | 35,406 | 2,814,423 | ||||||
Mirati Therapeutics, Inc.** | 10,511 | 1,354,447 | ||||||
Number of | Value | |||||||
Orchard Therapeutics PLC — ADR** | 75,687 | $ | 1,040,696 | |||||
SpringWorks Therapeutics, Inc.** | 48,343 | 1,860,722 | ||||||
Turning Point Therapeutics, Inc.** | 25,853 | 1,610,383 | ||||||
| 19,769,964 | ||||||||
Pharmaceuticals — 3.4% | ||||||||
Axsome Therapeutics, Inc.** | 8,887 | 918,560 | ||||||
MyoKardia, Inc.** | 48,747 | 3,552,925 | ||||||
Reata Pharmaceuticals, Inc. — A** | 3,943 | 806,067 | ||||||
Revance Therapeutics, Inc.** | 37,468 | 608,106 | ||||||
| 5,885,658 | ||||||||
Health Care Technology — 2.8% | ||||||||
Inspire Medical Systems, Inc.** | 45,075 | 3,345,016 | ||||||
Teladoc Health, Inc.** | 18,255 | 1,528,309 | ||||||
| 4,873,325 | ||||||||
Life Sciences Tools & Services — 2.3% | ||||||||
10X Genomics, Inc. — A** | 11,657 | 888,846 | ||||||
NeoGenomics, Inc.** | 52,054 | 1,522,580 | ||||||
Repligen Corp.** | 16,021 | 1,481,942 | ||||||
| 3,893,368 | ||||||||
Health Care Equipment & Supplies — 2.0% | ||||||||
SI-BONE, Inc.** | 74,463 | 1,600,955 | ||||||
Tactile Systems Technology, Inc.** | 14,174 | 956,887 | ||||||
Tandem Diabetes Care, Inc.** | 15,184 | 905,118 | ||||||
| 3,462,960 | ||||||||
Health Care Providers & Services — 1.1% | ||||||||
AMN Healthcare Services, Inc.** | 18,315 | 1,141,208 | ||||||
Guardant Health, Inc.** | 10,601 | 828,362 | ||||||
| 1,969,570 | ||||||||
Total HEALTH CARE | 39,854,845 | |||||||
INDUSTRIALS — 19.0% | ||||||||
Commercial Services & Supplies — 3.6% | ||||||||
Clean Harbors, Inc.** | 24,943 | 2,138,862 | ||||||
Knoll, Inc. | 30,381 | 767,424 | ||||||
McGrath RentCorp | 18,281 | 1,399,228 | ||||||
MSA Safety, Inc. | 7,006 | 885,278 | ||||||
Tetra Tech, Inc. | 12,211 | 1,052,100 | ||||||
| 6,242,892 | ||||||||
Building Products — 3.5% | ||||||||
Armstrong World Industries, Inc. | 8,827 | 829,473 | ||||||
Gibraltar Industries, Inc.** | 22,563 | 1,138,078 | ||||||
JELD-WEN Holding, Inc.** | 35,079 | 821,199 | ||||||
Trex Co., Inc.** | 27,138 | 2,439,163 | ||||||
Universal Forest Products, Inc. | 16,679 | 795,588 | ||||||
| 6,023,501 | ||||||||
Machinery — 2.6% | ||||||||
Colfax Corp.** | 42,991 | 1,564,013 | ||||||
Meritor, Inc.** | 35,028 | 917,383 | ||||||
SPX Corp.** | 22,950 | 1,167,696 | ||||||
Notes to Financial Statements are an integral part of this Schedule.
32
Driehaus Small Cap Growth Fund |
Number of | Value | |||||||
The Timken Co. | 14,797 | $ | 833,219 | |||||
| 4,482,311 | ||||||||
Trading Companies & Distributors — 2.5% | ||||||||
Herc Holdings, Inc.** | 24,891 | 1,218,166 | ||||||
SiteOne Landscape Supply, Inc.** | 25,634 | 2,323,722 | ||||||
Univar Solutions, Inc.** | 33,297 | 807,119 | ||||||
| 4,349,007 | ||||||||
Professional Services — 2.2% | ||||||||
Exponent, Inc. | 14,617 | 1,008,719 | ||||||
FTI Consulting, Inc.** | 25,785 | 2,853,368 | ||||||
| 3,862,087 | ||||||||
Construction & Engineering — 1.7% | ||||||||
Arcosa, Inc. | 40,152 | 1,788,772 | ||||||
WillScot Corp.** | 62,999 | 1,164,852 | ||||||
| 2,953,624 | ||||||||
Electrical Equipment — 1.3% | ||||||||
Generac Holdings, Inc.** | 13,195 | 1,327,285 | ||||||
Vicor Corp. ** | 18,901 | 883,055 | ||||||
| 2,210,340 | ||||||||
Aerospace & Defense — 1.1% | ||||||||
Axon Enterprise, Inc.** | 11,447 | 838,836 | ||||||
Mercury Systems, Inc.** | 14,157 | 978,390 | ||||||
| 1,817,226 | ||||||||
Road & Rail — 0.5% | ||||||||
Saia, Inc.** | 9,531 | 887,527 | ||||||
Total INDUSTRIALS | 32,828,515 | |||||||
CONSUMER DISCRETIONARY — 18.5% | ||||||||
Specialty Retail — 5.1% | ||||||||
Aaron’s, Inc. | 13,221 | 755,051 | ||||||
Bed Bath & Beyond, Inc. | 52,587 | 909,755 | ||||||
Boot Barn Holdings, Inc.** | 57,625 | 2,566,041 | ||||||
Carvana Co.** | 12,684 | 1,167,562 | ||||||
Floor & Decor Holdings, Inc. — A** | 23,487 | 1,193,374 | ||||||
Lithia Motors, Inc. — A | 10,090 | 1,483,230 | ||||||
Murphy USA, Inc.** | 5,674 | 663,858 | ||||||
| 8,738,871 | ||||||||
Household Durables — 3.1% | ||||||||
Skyline Champion Corp.** | 79,024 | 2,505,061 | ||||||
Tempur Sealy International, Inc.** | 20,699 | 1,802,055 | ||||||
TopBuild Corp.** | 10,115 | 1,042,654 | ||||||
| 5,349,770 | ||||||||
Textiles, Apparel & Luxury Goods — 2.6% | ||||||||
Crocs, Inc.** | 76,271 | 3,194,992 | ||||||
Deckers Outdoor Corp.** | 7,578 | 1,279,621 | ||||||
| 4,474,613 | ||||||||
Hotels, Restaurants & Leisure — 2.4% | ||||||||
Churchill Downs, Inc. | 10,691 | 1,466,805 | ||||||
Eldorado Resorts, Inc.** | 15,283 | 911,478 | ||||||
Papa John’s International, Inc. | 28,332 | 1,789,166 | ||||||
| 4,167,449 | ||||||||
Number of | Value | |||||||
Leisure Equipment & Products — 2.1% | ||||||||
Callaway Golf Co. | 74,450 | $ | 1,578,340 | |||||
YETI Holdings, Inc.** | 58,102 | 2,020,788 | ||||||
| 3,599,128 | ||||||||
Auto Components — 1.0% | ||||||||
Visteon Corp.** | 20,557 | 1,780,031 | ||||||
Distributors — 0.8% | ||||||||
Pool Corp. | 5,958 | 1,265,360 | ||||||
Diversified Consumer Services — 0.7% | ||||||||
WW International, Inc.** | 32,996 | 1,260,777 | ||||||
Automobiles — 0.7% | ||||||||
Winnebago Industries, Inc. | 23,621 | 1,251,441 | ||||||
Total CONSUMER DISCRETIONARY | 31,887,440 | |||||||
FINANCIALS — 4.7% | ||||||||
Insurance — 2.2% | ||||||||
eHealth, Inc.** | 14,995 | 1,440,720 | ||||||
Kinsale Capital Group, Inc. | 14,836 | 1,508,228 | ||||||
RLI Corp. | 9,660 | 869,593 | ||||||
| 3,818,541 | ||||||||
Thrifts & Mortgage Finance — 0.9% | ||||||||
NMI Holdings, Inc. — A** | 44,065 | 1,462,077 | ||||||
Commercial Banks — 0.8% | ||||||||
Triumph Bancorp, Inc.** | 37,201 | 1,414,382 | ||||||
Capital Markets — 0.8% | ||||||||
Hamilton Lane, Inc. — A | 23,388 | 1,393,925 | ||||||
Total FINANCIALS | 8,088,925 | |||||||
CONSUMER STAPLES — 3.4% | ||||||||
Personal Products — 1.8% | ||||||||
BellRing Brands, Inc. — A** | 41,475 | 883,003 | ||||||
elf Beauty, Inc.** | 84,286 | 1,359,533 | ||||||
Inter Parfums, Inc. | 11,786 | 856,960 | ||||||
| 3,099,496 | ||||||||
Food Products — 1.6% | ||||||||
Freshpet, Inc.** | 29,345 | 1,733,996 | ||||||
The Simply Good Foods Co.** | 34,564 | 986,457 | ||||||
| 2,720,453 | ||||||||
Total CONSUMER STAPLES | 5,819,949 | |||||||
REAL ESTATE — 2.2% | ||||||||
Real Estate Investment Trust — 2.2% | ||||||||
Rexford Industrial Realty, Inc. | 37,983 | 1,734,684 | ||||||
Ryman Hospitality Properties, Inc. | 24,998 | 2,166,327 | ||||||
Total REAL ESTATE | 3,901,011 | |||||||
MATERIALS — 1.3% | ||||||||
Paper & Forest Products — 0.7% | ||||||||
Louisiana-Pacific Corp. | 40,096 | 1,189,648 | ||||||
Notes to Financial Statements are an integral part of this Schedule.
33
Driehaus Small Cap Growth Fund |
Number of | Value | |||||||
Metals & Mining — 0.6% | ||||||||
Constellium SE** | 84,677 | $ | 1,134,672 | |||||
Total MATERIALS | 2,324,320 | |||||||
ENERGY — 0.9% | ||||||||
Oil, Gas & Consumable Fuels — 0.9% | ||||||||
Euronav NV | 124,992 | 1,567,400 | ||||||
Total ENERGY | 1,567,400 | |||||||
COMMUNICATION SERVICES — 0.8% | ||||||||
Entertainment — 0.8% | ||||||||
Roku, Inc.** | 10,244 | 1,371,672 | ||||||
Total COMMUNICATION SERVICES | 1,371,672 | |||||||
Total EQUITY SECURITIES (Cost $138,822,544) | 172,338,655 | |||||||
| ||||||||
TOTAL INVESTMENTS (COST $138,822,544) | 99.8 | % | $ | 172,338,655 | ||||
Other Assets In Excess Of Liabilities | 0.2 | % | 381,530 | |||||
Net Assets | 100.0 | % | $ | 172,720,185 | ||||
** | Non-income producing security |
ADR — American Depository Receipt
SP ADR — Sponsored American Depository Receipt
Top Ten Holdings* | |
MyoKardia, Inc. | 2.1 % |
Inspire Medical Systems, Inc. | 1.9 % |
Argenx SE — ADR | 1.9 % |
Crocs, Inc. | 1.9 % |
Inphi Corp. | 1.7 % |
Ichor Holdings, Ltd. | 1.7 % |
FTI Consulting, Inc. | 1.7 % |
Endava PLC — SP ADR | 1.6 % |
Global Blood Therapeutics, Inc. | 1.6 % |
Tower Semiconductor, Ltd. | 1.6 % |
* | All percentages are stated as a percent of net assets at December 31, 2019. |
Notes to Financial Statements are an integral part of this Schedule.
34
Driehaus Small Cap Growth Fund |
Industry | Percent of |
Aerospace & Defense | 1.1% |
Auto Components | 1.0% |
Automobiles | 0.7% |
Biotechnology | 11.5% |
Building Products | 3.5% |
Capital Markets | 0.8% |
Commercial Banks | 0.8% |
Commercial Services & Supplies | 3.6% |
Construction & Engineering | 1.7% |
Distributors | 0.8% |
Diversified Consumer Services | 0.7% |
Electrical Equipment | 1.3% |
Electronic Equipment, Instruments & Components | 1.0% |
Entertainment | 0.8% |
Food Products | 1.6% |
Health Care Equipment & Supplies | 2.0% |
Health Care Providers & Services | 1.1% |
Health Care Technology | 2.8% |
Hotels, Restaurants & Leisure | 2.4% |
Household Durables | 3.1% |
Industry | Percent of |
Information Technology Services | 4.8% |
Insurance | 2.2% |
Leisure Equipment & Products | 2.1% |
Life Sciences Tools & Services | 2.3% |
Machinery | 2.6% |
Metals & Mining | 0.6% |
Oil, Gas & Consumable Fuels | 0.9% |
Paper & Forest Products | 0.7% |
Personal Products | 1.8% |
Pharmaceuticals | 3.4% |
Professional Services | 2.2% |
Real Estate Investment Trust | 2.2% |
Road & Rail | 0.5% |
Semiconductors & Semiconductor Equipment | 14.9% |
Software | 5.2% |
Specialty Retail | 5.1% |
Textiles, Apparel & Luxury Goods | 2.6% |
Thrifts & Mortgage Finance | 0.9% |
Trading Companies & Distributors | 2.5% |
Other Assets in excess of Liabilities | 0.2% |
TOTAL | 100.0% |
Notes to Financial Statements are an integral part of this Schedule.
35
Statements of Assets and Liabilities December 31, 2019 |
Driehaus | Driehaus | |||||||
ASSETS: | ||||||||
Investments, at cost | $ | 1,265,348,861 | $ | 49,720,109 | ||||
Investments, at fair value | $ | 1,713,221,621 | $ | 59,779,598 | ||||
Foreign currency, at fair value* | 11,054,710 | 3,769 | ||||||
Cash and cash equivalents | 55,942,635 | 1,864,653 | ||||||
Receivables: | ||||||||
Dividends | 3,096,239 | 168,068 | ||||||
Investment securities sold | 11,108,854 | 746,131 | ||||||
Fund shares sold | 7,530,330 | 458 | ||||||
Foreign taxes | — | 822,516 | ||||||
Net unrealized appreciation on unsettled foreign currency transactions | — | 1,153 | ||||||
Prepaid expenses | 96,003 | 6,113 | ||||||
TOTAL ASSETS | 1,802,050,392 | 63,392,459 | ||||||
LIABILITIES: | ||||||||
Payables: | ||||||||
Investment securities purchased | 6,309,290 | 688,665 | ||||||
Fund shares redeemed | 1,467,543 | 100,580 | ||||||
Net unrealized depreciation on unsettled foreign currency transactions | 18 | — | ||||||
Due to affiliates | 1,680,292 | 103,921 | ||||||
Accrued foreign capital gains taxes | 465,848 | — | ||||||
Audit and tax fees | 40,550 | 46,350 | ||||||
Accrued expenses | 321,859 | 45,497 | ||||||
TOTAL LIABILITIES | 10,285,400 | 985,013 | ||||||
NET ASSETS | $ | 1,791,764,992 | $ | 62,407,446 | ||||
NET ASSETS CONSISTED OF THE FOLLOWING AT DECEMBER 31, 2019: | ||||||||
Paid-in capital | $ | 1,347,226,604 | $ | 97,787,630 | ||||
Total distributable earnings (deficit) | 444,538,388 | (35,380,184 | ) | |||||
NET ASSETS | $ | 1,791,764,992 | $ | 62,407,446 | ||||
NET ASSETS | — | $ | 62,407,446 | |||||
SHARES OUTSTANDING (Unlimited shares authorized, no par value) | — | 4,338,628 | ||||||
NET ASSET VALUE | — | $ | 14.38 | |||||
INVESTOR CLASS SHARES: | ||||||||
NET ASSETS | $ | 863,534,762 | — | |||||
SHARES OUTSTANDING (Unlimited shares authorized, no par value) | 21,843,712 | — | ||||||
NET ASSET VALUE | $ | 39.53 | — | |||||
INSTITUTIONAL CLASS SHARES: | ||||||||
NET ASSETS | $ | 928,230,230 | — | |||||
SHARES OUTSTANDING (Unlimited shares authorized, no par value) | 23,510,289 | — | ||||||
NET ASSET VALUE | $ | 39.48 | — | |||||
* | The cost of foreign currency was $11,037,080, $3,769, $1,779,117, $0 and $0, respectively. |
Notes to Financial Statements are an integral part of this Statement.
36
Statements of Assets and Liabilities |
Driehaus | Driehaus | Driehaus | |||||||||
| $ | 207,367,162 | $ | 192,335,405 | $ | 138,822,544 | ||||||
| $ | 251,284,908 | $ | 267,413,682 | $ | 172,338,655 | ||||||
| 1,779,117 | — | — | |||||||||
| 17,100,005 | 3,040,639 | 886,427 | |||||||||
| 708,660 | 17,829 | 60,682 | |||||||||
| 1,232,607 | — | — | |||||||||
| 209,912 | 38,962 | 273,917 | |||||||||
| — | — | — | |||||||||
| 8,274 | — | — | |||||||||
| 15,032 | 94,704 | 25,507 | |||||||||
| 272,338,515 | 270,605,816 | 173,585,188 | |||||||||
| 3,453,239 | 1,005,264 | 657,963 | |||||||||
| 349,287 | 122,961 | 53,622 | |||||||||
| — | — | — | |||||||||
| 217,588 | 274,335 | 82,415 | |||||||||
| — | — | — | |||||||||
| 33,075 | 34,400 | 35,100 | |||||||||
| 56,635 | 48,686 | 35,903 | |||||||||
| 4,109,824 | 1,485,646 | 865,003 | |||||||||
| $ | 268,228,691 | $ | 269,120,170 | $ | 172,720,185 | ||||||
| $ | 213,611,895 | $ | 190,634,510 | $ | 138,034,521 | ||||||
| 54,616,796 | 78,485,660 | 34,685,664 | |||||||||
| $ | 268,228,691 | $ | 269,120,170 | $ | 172,720,185 | ||||||
| $ | 268,228,691 | $ | 269,120,170 | — | |||||||
| 25,495,334 | 20,785,749 | — | |||||||||
| $ | 10.52 | $ | 12.95 | — | |||||||
| — | — | $ | 10,899,367 | ||||||||
| — | — | 709,300 | |||||||||
| — | — | $ | 15.37 | ||||||||
| — | — | $ | 161,820,818 | ||||||||
| — | — | 10,461,560 | |||||||||
| — | — | $ | 15.47 | ||||||||
Notes to Financial Statements are an integral part of this Statement.
37
Statements of Operations For the Year Ended December 31, 2019 |
Driehaus | Driehaus | |||||||
INVESTMENT INCOME (LOSS): | ||||||||
Income: | ||||||||
Dividends* | $ | 37,123,437 | $ | 1,307,099 | ||||
Total income | 37,123,437 | 1,307,099 | ||||||
Expenses: | ||||||||
Investment advisory fee | 16,837,477 | 764,508 | ||||||
Administration fee | 864,084 | 129,187 | ||||||
Professional fees | 346,971 | 13,579 | ||||||
Audit and tax fees | 73,904 | 94,798 | ||||||
Federal and state registration fees | 55,500 | 21,500 | ||||||
Custodian fees | 355,420 | 49,598 | ||||||
Transfer agent fees | 400,812 | 56,687 | ||||||
Trustees’ fees | 395,245 | 17,302 | ||||||
Chief compliance officer fees | 20,000 | 20,000 | ||||||
Reports to shareholders | 138,267 | 2,619 | ||||||
Interest expense | — | 4,169 | ||||||
Shareholder services fees (Investor Class) | 1,791,565 | — | ||||||
Miscellaneous | 189,083 | 21,948 | ||||||
Total expenses | 21,468,328 | 1,195,895 | ||||||
Investment advisory fees recoupment (reimbursement) | — | (227,780 | ) | |||||
Transfer agent fees waived | — | — | ||||||
Fees paid indirectly | (133,804 | ) | (5,598 | ) | ||||
Net expenses | 21,334,524 | 962,517 | ||||||
Net investment income (loss) | 15,788,913 | 344,582 | ||||||
NET REALIZED AND UNREALIZED GAIN (LOSS) ON INVESTMENT TRANSACTIONS: | ||||||||
Net realized gain (loss) from security transactions** | 72,926,655 | 10,044,306 | ||||||
Net realized foreign exchange gain (loss) | (1,240,561 | ) | (83,115 | ) | ||||
Net change in unrealized foreign exchange gain (loss) | 91,561 | (30,468 | ) | |||||
Net change in unrealized appreciation (depreciation) on investments | 281,757,076 | 10,304,435 | ||||||
Net realized and unrealized gain (loss) on investment transactions | 353,534,731 | 20,235,158 | ||||||
NET INCREASE (DECREASE) IN NET ASSETS RESULTING FROM OPERATIONS | $ | 369,323,644 | $ | 20,579,740 | ||||
* | Dividends are net of $3,715,611, $119,317, $414,938, $0 and $2,587 non-reclaimable foreign taxes withheld, respectively. |
** | Net realized gain (loss) from security transactions are net of $899,232, $193,061, $0, $0 and $0 foreign capital gains tax withheld, respectively. |
Notes to Financial Statements are an integral part of this Statement.
38
Statements of Operations |
Driehaus | Driehaus | Driehaus | |||||||||
| $ | 4,759,807 | $ | 264,321 | $ | 365,345 | ||||||
| 4,759,807 | 264,321 | 365,345 | |||||||||
| 2,525,272 | 3,140,853 | 961,297 | |||||||||
| 257,812 | 231,156 | 171,041 | |||||||||
| 52,356 | 52,093 | 33,264 | |||||||||
| 53,857 | 47,915 | 46,845 | |||||||||
| 25,000 | 23,000 | 38,000 | |||||||||
| 44,332 | 38,949 | 27,625 | |||||||||
| 50,224 | 52,806 | 90,067 | |||||||||
| 60,955 | 64,914 | 39,197 | |||||||||
| 20,000 | 20,000 | 20,000 | |||||||||
| 11,955 | 14,636 | 11,487 | |||||||||
| — | — | — | |||||||||
| — | — | 18,045 | |||||||||
| 40,977 | 43,424 | 30,227 | |||||||||
| 3,142,740 | 3,729,746 | 1,487,095 | |||||||||
| — | — | 71,454 | |||||||||
| — | — | (12,000 | ) | ||||||||
| (15,079 | ) | (148,122 | ) | (40,946 | ) | ||||||
| 3,127,661 | 3,581,624 | 1,505,603 | |||||||||
| 1,632,146 | (3,317,303 | ) | (1,140,258 | ) | |||||||
| 18,229,406 | 50,822,845 | 21,736,831 | |||||||||
| (72,440 | ) | — | — | ||||||||
| 3,313 | — | — | |||||||||
| 46,112,742 | 21,885,605 | 30,538,084 | |||||||||
| 64,273,021 | 72,708,450 | 52,274,915 | |||||||||
| $ | 65,905,167 | $ | 69,391,147 | $ | 51,134,657 | ||||||
Notes to Financial Statements are an integral part of this Statement.
39
Statements of Changes in Net Assets |
Driehaus | Driehaus | |||||||||||||||
For the year | For the year | For the year | For the year | |||||||||||||
INCREASE (DECREASE) IN NET ASSETS: | ||||||||||||||||
Operations: | ||||||||||||||||
Net investment income (loss) | $ | 15,788,913 | $ | 13,091,970 | $ | 344,582 | $ | (651,909 | ) | |||||||
Net realized gain (loss) on investment transactions | 71,686,094 | (44,556,639 | ) | 9,961,191 | (7,135,511 | ) | ||||||||||
Net change in unrealized gain (loss) on investment transactions | 281,848,637 | (260,680,098 | ) | 10,273,967 | (45,204,627 | ) | ||||||||||
Net increase (decrease) in net assets resulting from operations | 369,323,644 | (292,144,767 | ) | 20,579,740 | (52,992,047 | ) | ||||||||||
Distributions from distributable earnings to shareholders: | ||||||||||||||||
Fund | — | — | (255,325 | ) | — | |||||||||||
Investor Class Shares | (7,060,076 | ) | (33,373,513 | ) | — | — | ||||||||||
Institutional Class Shares | (9,417,880 | ) | (29,571,288 | ) | — | — | ||||||||||
Total distribution to shareholders | (16,477,956 | ) | �� | (62,944,801 | ) | (255,325 | ) | — | ||||||||
Capital share transactions: | ||||||||||||||||
Proceeds from shares sold: | ||||||||||||||||
Fund | — | — | 10,428,657 | 46,460,249 | ||||||||||||
Investor Class Shares | 102,153,849 | 248,502,111 | — | — | ||||||||||||
Institutional Class Shares | 247,854,903 | 435,408,153 | — | — | ||||||||||||
Reinvestment of distributions: | ||||||||||||||||
Fund | — | — | 209,523 | — | ||||||||||||
Investor Class Shares | 6,761,528 | 32,164,851 | — | — | ||||||||||||
Institutional Class Shares | 6,842,565 | 25,064,735 | — | — | ||||||||||||
Cost of shares redeemed: | ||||||||||||||||
Fund | — | — | (58,228,599 | ) | (174,964,581 | ) | ||||||||||
Investor Class Shares | (215,941,727 | ) | (560,155,804 | ) | — | — | ||||||||||
Institutional Class Shares | (154,953,413 | ) | (159,370,078 | ) | — | — | ||||||||||
Redemption fees: | ||||||||||||||||
Fund | — | — | 20,320 | 3,515 | ||||||||||||
Investor Class Shares | 53,415 | 47,011 | — | — | ||||||||||||
Institutional Class Shares | 46,979 | 29,188 | — | — | ||||||||||||
Net increase (decrease) in net assets derived from capital share transactions | (7,181,901 | ) | 21,690,167 | (47,570,099 | ) | (128,500,817 | ) | |||||||||
Total increase (decrease) in net assets | 345,663,787 | (333,399,401 | ) | (27,245,684 | ) | (181,492,864 | ) | |||||||||
NET ASSETS: | ||||||||||||||||
Beginning of period | $ | 1,446,101,205 | $ | 1,779,500,606 | $ | 89,653,130 | $ | 271,145,994 | ||||||||
End of period | $ | 1,791,764,992 | $ | 1,446,101,205 | $ | 62,407,446 | $ | 89,653,130 | ||||||||
Notes to Financial Statements are an integral part of this Statement.
40
Statements of Changes in Net Assets |
Driehaus | Driehaus Micro | Driehaus Small | |||||||||||||||||||||
For the year | For the year | For the year | For the year | For the year | For the year | ||||||||||||||||||
| $ | 1,632,146 | $ | (647,474 | ) | $ | (3,317,303 | ) | $ | (4,596,602 | ) | $ | (1,140,258 | ) | $ | (600,193 | ) | |||||||
| 18,156,966 | 14,971,674 | 50,822,845 | 57,475,280 | 21,736,831 | (9,010,176 | ) | |||||||||||||||||
| 46,116,055 | (62,120,561 | ) | 21,885,605 | (31,956,231 | ) | 30,538,084 | (6,057,156 | ) | |||||||||||||||
| 65,905,167 | (47,796,361 | ) | 69,391,147 | 20,922,447 | 51,134,657 | (15,667,525 | ) | ||||||||||||||||
| (1,976,543 | ) | (30,824,444 | ) | (33,768,834 | ) | (72,862,388 | ) | — | — | ||||||||||||||
| — | — | — | — | (640,385 | ) | (209,521 | ) | ||||||||||||||||
| — | — | — | — | (9,268,936 | ) | (3,384,429 | ) | ||||||||||||||||
| (1,976,543 | ) | (30,824,444 | ) | (33,768,834 | ) | (72,862,388 | ) | (9,909,321 | ) | (3,593,950 | ) | ||||||||||||
| 44,599,170 | 75,278,152 | 68,729,193 | 114,618,353 | — | — | ||||||||||||||||||
| — | — | — | — | 7,758,179 | 11,673,140 | ||||||||||||||||||
| — | — | — | — | 57,398,808 | 108,943,026 | ||||||||||||||||||
| 1,754,974 | 28,587,722 | 29,366,777 | 65,764,404 | — | — | ||||||||||||||||||
| — | — | — | — | 640,385 | 209,521 | ||||||||||||||||||
| — | — | — | — | 9,197,963 | 3,384,429 | ||||||||||||||||||
| (60,484,970 | ) | (132,180,063 | ) | (129,214,201 | ) | (186,474,543 | ) | — | — | ||||||||||||||
| — | — | — | — | (7,175,856 | ) | (3,748,523 | ) | ||||||||||||||||
| — | — | — | — | (67,276,279 | ) | (10,289,299 | ) | ||||||||||||||||
| 406 | 4,036 | 9,243 | 105,720 | — | — | ||||||||||||||||||
| — | — | — | — | 1,112 | 2,471 | ||||||||||||||||||
| — | — | — | — | 17,340 | 44,745 | ||||||||||||||||||
| (14,130,420 | ) | (28,310,153 | ) | (31,108,988 | ) | (5,986,066 | ) | 561,652 | 110,219,510 | ||||||||||||||
| 49,798,204 | (106,930,958 | ) | 4,513,325 | (57,926,007 | ) | 41,786,988 | 90,958,035 | ||||||||||||||||
| $ | 218,430,487 | $ | 325,361,445 | $ | 264,606,845 | $ | 322,532,852 | $ | 130,933,197 | $ | 39,975,162 | ||||||||||||
| $ | 268,228,691 | $ | 218,430,487 | $ | 269,120,170 | $ | 264,606,845 | $ | 172,720,185 | $ | 130,933,197 | ||||||||||||
Notes to Financial Statements are an integral part of this Statement.
41
Driehaus Emerging Markets Growth Fund — Investor Class Financial Highlights |
For the year | For the year | For the year | For the year | For the year | ||||||||||||||||
Net asset value, beginning of period | $ | 31.80 | $ | 39.64 | $ | 27.98 | $ | 26.52 | $ | 29.63 | ||||||||||
INCOME (LOSS) FROM INVESTMENT OPERATIONS: | ||||||||||||||||||||
Net investment income (loss) | 0.30 | ^ | 0.26 | ^ | 0.11 | ^ | 0.03 | 0.06 | ||||||||||||
Net realized and unrealized gain (loss) | 7.76 | (6.73 | ) | 11.78 | 1.54 | (3.17 | ) | |||||||||||||
Total income (loss) from investment operations | 8.06 | (6.47 | ) | 11.89 | 1.57 | (3.11 | ) | |||||||||||||
LESS DISTRIBUTIONS: | ||||||||||||||||||||
Dividends from net investment income | (0.33 | ) | (0.16 | ) | (0.23 | ) | (0.11 | ) | — | |||||||||||
Distributions from capital gains | — | (1.21 | ) | — | — | — | ||||||||||||||
Total distributions | (0.33 | ) | (1.37 | ) | (0.23 | ) | (0.11 | ) | — | |||||||||||
Redemption fees added to paid-in capital | 0.00 | ~ | 0.00 | ~ | 0.00 | ~ | 0.00 | ~ | 0.00 | ~ | ||||||||||
Net asset value, end of period | $ | 39.53 | $ | 31.80 | $ | 39.64 | $ | 27.98 | $ | 26.52 | ||||||||||
Total Return | 25.34 | % | (16.26 | )% | 42.52 | % | 5.88 | % | (10.49 | )% | ||||||||||
RATIOS/SUPPLEMENTAL DATA | ||||||||||||||||||||
Net assets, end of period (in 000’s) | $ | 863,535 | $ | 791,656 | $ | 1,266,365 | $ | 1,335,873 | $ | 1,362,421 | ||||||||||
Ratio of expenses before reimbursements, waivers and fees paid indirectly to average net assets | 1.41 | % | 1.38 | % | 1.54 | % | 1.65 | % | 1.65 | % | ||||||||||
Ratio of net expenses to average net assets | 1.40 | %# | 1.37 | %# | 1.53 | %# | 1.63 | %# | 1.64 | %# | ||||||||||
Ratio of net investment income (loss) to average net assets | 0.85 | %# | 0.69 | %# | 0.33 | %# | 0.11 | %# | 0.22 | %# | ||||||||||
Portfolio turnover | 167 | % | 218 | % | 176 | % | 232 | % | 257 | % | ||||||||||
^ | Net investment income (loss) per share has been calculated using the average shares method. |
~ | Amount represents less than $0.01 per share |
# | Such ratios are net of fees paid indirectly (see Note B in the Notes to Financial Statements). |
Notes to Financial Statements are an integral part of this Schedule.
42
Driehaus Emerging Markets Growth Fund —Institutional Class |
For the year | For the year | For the period | ||||||||||
Net asset value, beginning of period | $ | 31.76 | $ | 39.61 | $ | 34.85 | ||||||
INCOME (LOSS) FROM INVESTMENT OPERATIONS: | ||||||||||||
Net investment income (loss) | 0.38 | ^ | 0.32 | 0.12 | ^ | |||||||
Net realized and unrealized gain (loss) | 7.75 | (6.71 | ) | 4.92 | ||||||||
Total income (loss) from investment operations | 8.13 | (6.39 | ) | 5.04 | ||||||||
LESS DISTRIBUTIONS: | ||||||||||||
Dividends from net investment income | (0.41 | ) | (0.25 | ) | (0.28 | ) | ||||||
Distributions from capital gains | — | (1.21 | ) | — | ||||||||
Total distributions | (0.41 | ) | (1.46 | ) | (0.28 | ) | ||||||
Redemption fees added to paid-in capital | 0.00 | ~ | 0.00 | ~ | 0.00 | ~ | ||||||
Net asset value, end of period | $ | 39.48 | $ | 31.76 | $ | 39.61 | ||||||
Total Return | 25.60 | % | (16.08 | )% | 14.47 | %** | ||||||
RATIOS/SUPPLEMENTAL DATA | ||||||||||||
Net assets, end of period (in 000’s) | $ | 928,230 | $ | 654,445 | $ | 513,135 | ||||||
Ratio of expenses before reimbursements, waivers and fees paid indirectly to average net assets | 1.20 | % | 1.17 | % | 1.17 | %* | ||||||
Ratio of net expenses to average net assets | 1.19 | %# | 1.16 | %# | 1.16 | %*# | ||||||
Ratio of net investment income (loss) to average net assets | 1.07 | %# | 0.89 | %# | 0.71 | %*# | ||||||
Portfolio turnover | 167 | % | 218 | % | 176 | %** | ||||||
* | Annualized |
** | Not Annualized |
^ | Net investment income (loss) per share has been calculated using the average shares method. |
~ | Amount represents less than $0.01 per share |
# | Such ratios are net of fees paid indirectly (see Note B in the Notes to Financial Statements). |
Notes to Financial Statements are an integral part of this Schedule.
43
Driehaus Emerging Markets Small Cap Growth Fund |
For the year | For the year | For the year | For the year | For the year | ||||||||||||||||
Net asset value, beginning of period | $ | 10.80 | $ | 14.21 | $ | 10.66 | $ | 11.85 | $ | 13.21 | ||||||||||
INCOME (LOSS) FROM INVESTMENT OPERATIONS: | ||||||||||||||||||||
Net investment income (loss) | 0.06 | (0.04 | )^ | 0.02 | ^ | (0.03 | )^ | (0.05 | )^ | |||||||||||
Net realized and unrealized gain (loss) | 3.58 | (3.37 | ) | 3.53 | (1.14 | ) | (1.31 | ) | ||||||||||||
Total income (loss) from investment operations | 3.64 | (3.41 | ) | 3.55 | (1.17 | ) | (1.36 | ) | ||||||||||||
LESS DISTRIBUTIONS: | ||||||||||||||||||||
Dividends from net investment income | (0.06 | ) | — | — | (0.02 | ) | — | |||||||||||||
Distributions from capital gains | — | — | — | — | — | |||||||||||||||
Total distributions | (0.06 | ) | — | — | (0.02 | ) | — | |||||||||||||
Redemption fees added to paid-in capital | 0.00 | ~ | 0.00 | ~ | 0.00 | ~ | 0.00 | ~ | 0.00 | ~ | ||||||||||
Net asset value, end of period | $ | 14.38 | $ | 10.80 | $ | 14.21 | $ | 10.66 | $ | 11.85 | ||||||||||
Total Return | 33.71 | % | (24.00 | )% | 33.30 | % | (9.97 | )% | (10.22 | )% | ||||||||||
RATIOS/SUPPLEMENTAL DATA | ||||||||||||||||||||
Net assets, end of period (in 000’s) | $ | 62,407 | $ | 89,653 | $ | 271,146 | $ | 261,387 | $ | 432,718 | ||||||||||
Ratio of expenses before reimbursements, waivers and fees paid indirectly and recoupments, if any, to average net assets | 1.80 | %∞ | 2.27 | %∞ | 1.82 | % | 1.75 | % | 1.69 | %∞ | ||||||||||
Ratio of net expenses to average net assets | 1.45 | %+#∞ | 2.26 | %#∞ | 1.80 | %# | 1.73 | %# | 1.68 | %#∞ | ||||||||||
Ratio of net investment income (loss) to average net assets | 0.52 | %+# | (0.30 | )%# | 0.15 | %# | (0.26 | )%# | (0.39 | )%# | ||||||||||
Portfolio turnover | 220 | % | 207 | % | 243 | % | 240 | % | 306 | % | ||||||||||
^ | Net investment income (loss) per share has been calculated using the average shares method. |
~ | Amount represents less than $0.01 per share |
+ | Such ratios are after administrative and transfer agent waivers and adviser expense reimbursements, when applicable. BNY Mellon Investment Servicing (US) Inc., the administrative agent and transfer agent, waived a portion of its fees beginning with the Fund’s commencement of operations, August 22, 2011. The Adviser contractually agreed to waive its investment advisory fee or absorb other operating expenses to the extent necessary to ensure that total annual Fund operating expenses (other than interest, taxes, brokerage commissions and other portfolio transaction expenses, capital expenditures, and extraordinary expenses) would not exceed the Fund’s operating expense cap of 1.45% of average daily net assets from November 1, 2018 until October 31, 2021. |
# | Such ratios are net of fees paid indirectly (see Note B in the Notes to Financial Statements). |
∞ | Ratio of expenses to average net assets includes interest expense of 0.01% for the year ended December 31, 2019, and less than 0.005% for the years ended December 31, 2018 and 2015. The interest expense is from utilizing the line of credit (see Note E in the Notes to Financial Statements). |
Notes to Financial Statements are an integral part of this Schedule.
44
Driehaus International Small Cap Growth Fund |
For the year | For the year | For the year | For the year | For the year | ||||||||||||||||
Net asset value, beginning of period | $ | 8.13 | $ | 11.39 | $ | 9.33 | $ | 10.08 | $ | 9.20 | ||||||||||
INCOME (LOSS) FROM INVESTMENT OPERATIONS: | ||||||||||||||||||||
Net investment income (loss) | 0.06 | (0.02 | )^ | (0.04 | ) | (0.02 | ) | (0.02 | )^ | |||||||||||
Net realized and unrealized gain (loss) | 2.41 | (1.92 | ) | 3.88 | (0.61 | ) | 1.17 | |||||||||||||
Total income (loss) from investment operations | 2.47 | (1.94 | ) | 3.84 | (0.63 | ) | 1.15 | |||||||||||||
LESS DISTRIBUTIONS: | ||||||||||||||||||||
Dividends from net investment income | (0.01 | ) | — | — | — | (0.03 | ) | |||||||||||||
Distributions from capital gains | (0.07 | ) | (1.32 | ) | (1.78 | ) | (0.12 | ) | (0.24 | ) | ||||||||||
Total distributions | (0.08 | ) | (1.32 | ) | (1.78 | ) | (0.12 | ) | (0.27 | ) | ||||||||||
Redemption fees added to paid-in capital | 0.00 | ~ | 0.00 | ~ | 0.00 | ~ | 0.00 | ~ | 0.00 | ~ | ||||||||||
Net asset value, end of period | $ | 10.52 | $ | 8.13 | $ | 11.39 | $ | 9.33 | $ | 10.08 | ||||||||||
Total Return | 30.41 | % | (16.92 | )% | 41.44 | % | (6.22 | )% | 12.58 | % | ||||||||||
RATIOS/SUPPLEMENTAL DATA | ||||||||||||||||||||
Net assets, end of period (in 000’s) | $ | 268,229 | $ | 218,430 | $ | 325,361 | $ | 270,401 | $ | 341,249 | ||||||||||
Ratio of expenses before reimbursements, waivers and fees paid indirectly to average net assets | 1.24 | % | 1.50 | % | 1.73 | % | 1.72 | % | 1.71 | % | ||||||||||
Ratio of net expenses to average net assets | 1.24 | %# | 1.49 | %# | 1.71 | %# | 1.70 | %# | 1.70 | %# | ||||||||||
Ratio of net investment income (loss) to average net assets | 0.65 | %# | (0.21 | )%# | (0.44 | )%# | (0.15 | )%# | (0.19 | )%# | ||||||||||
Portfolio turnover | 96 | % | 118 | % | 143 | % | 151 | % | 251 | % | ||||||||||
^ | Net investment income (loss) per share has been calculated using the average shares method. |
~ | Amount represents less than $0.01 per share |
# | Such ratios are net of fees paid indirectly (see Note B in the Notes to Financial Statements). |
Notes to Financial Statements are an integral part of this Schedule.
45
Driehaus Micro Cap Growth Fund |
For the year | For the year | For the year | For the year | For the year | ||||||||||||||||
Net asset value, beginning of period | $ | 11.11 | $ | 14.44 | $ | 12.65 | $ | 10.74 | $ | 11.25 | ||||||||||
INCOME (LOSS) FROM INVESTMENT OPERATIONS: | ||||||||||||||||||||
Net investment income (loss) | (0.16 | ) | (0.19 | ) | (0.18 | )^ | (0.11 | )^ | (0.14 | )^ | ||||||||||
Net realized and unrealized gain (loss) | 3.90 | 0.55 | 3.26 | 2.02 | 0.08 | |||||||||||||||
Total income (loss) from investment operations | 3.74 | 0.36 | 3.08 | 1.91 | (0.06 | ) | ||||||||||||||
LESS DISTRIBUTIONS: | ||||||||||||||||||||
Dividends from net investment income | (0.02 | ) | — | — | — | — | ||||||||||||||
Distributions from capital gains | (1.88 | ) | (3.69 | ) | (1.29 | ) | — | (0.45 | ) | |||||||||||
Total distributions | (1.90 | ) | (3.69 | ) | (1.29 | ) | — | (0.45 | ) | |||||||||||
Redemption fees added to paid-in capital | 0.00 | ~ | 0.00 | ~ | 0.00 | ~ | 0.00 | ~ | 0.00 | ~ | ||||||||||
Net asset value, end of period | $ | 12.95 | $ | 11.11 | $ | 14.44 | $ | 12.65 | $ | 10.74 | ||||||||||
Total Return | 33.89 | % | 3.88 | % | 24.30 | % | 17.78 | % | (0.55 | )% | ||||||||||
RATIOS/SUPPLEMENTAL DATA | ||||||||||||||||||||
Net assets, end of period (in 000’s) | $ | 269,120 | $ | 264,607 | $ | 322,533 | $ | 396,590 | $ | 282,178 | ||||||||||
Ratio of expenses before reimbursements, waivers and fees paid indirectly and recoupments, if any, to average net assets | 1.48 | % | 1.44 | %∞ | 1.45 | %∞ | 1.48 | % | 1.53 | % | ||||||||||
Ratio of net expenses to average net assets | 1.43 | %# | 1.42 | %#∞ | 1.43 | %#∞ | 1.44 | %+# | 1.52 | %+# | ||||||||||
Ratio of net investment income (loss) to average net assets | (1.32 | )%# | (1.19 | )%# | (1.33 | )%# | (1.00 | )%+# | (1.21 | )%+# | ||||||||||
Portfolio turnover | 165 | % | 156 | % | 177 | % | 180 | % | 183 | % | ||||||||||
^ | Net investment income (loss) per share has been calculated using the average shares method. |
~ | Amount represents less than $0.01 per share |
+ | Such ratios are after administrative and transfer agent waivers and adviser expense reimbursements, when applicable. BNY Mellon Investment Servicing (US) Inc., the administrative agent and transfer agent, waived a portion of its fees beginning with the Fund’s commencement of operations, November 18, 2013. The Adviser contractually agreed to waive its investment advisory fee or absorb other operating expenses to the extent necessary to ensure that total annual Fund operating expenses (other than interest, taxes, brokerage commissions and other portfolio transaction expenses, capital expenditures, and extraordinary expenses) would not exceed the Fund’s operating expense cap of 1.70% of average daily net assets until November 17, 2016. |
# | Such ratios are net of fees paid indirectly (see Note B in the Notes to Financial Statements). |
∞ | Ratio of expenses to average net assets includes interest expense of less than 0.005% for the years ended December 31, 2018 and 2017. The interest expense is from utilizing the line of credit (see Note E in the Notes to Financial Statements). |
Notes to Financial Statements are an integral part of this Schedule.
46
Driehaus Small Cap Growth Fund — Investor Class |
For the year | For the year | For the period | ||||||||||
Net asset value, beginning of period | $ | 11.66 | $ | 11.62 | $ | 10.00 | ||||||
INCOME (LOSS) FROM INVESTMENT OPERATIONS: | ||||||||||||
Net investment income (loss) | (0.13 | ) | (0.12 | )^ | (0.04 | )^ | ||||||
Net realized and unrealized gain (loss) | 4.81 | 0.48 | 1.86 | |||||||||
Total income (loss) from investment operations | 4.68 | 0.36 | 1.82 | |||||||||
LESS DISTRIBUTIONS: | ||||||||||||
Dividends from net investment income | — | — | — | |||||||||
Distributions from capital gains | (0.97 | ) | (0.33 | ) | (0.20 | ) | ||||||
Total distributions | (0.97 | ) | (0.33 | ) | (0.20 | ) | ||||||
Redemption fees added to paid-in capital | 0.00 | ~ | 0.01 | — | ||||||||
Net asset value, end of period | $ | 15.37 | $ | 11.66 | $ | 11.62 | ||||||
Total Return | 40.25 | % | 3.33 | % | 18.18 | %** | ||||||
RATIOS/SUPPLEMENTAL DATA | ||||||||||||
Net assets, end of period (in 000’s) | $ | 10,899 | $ | 7,538 | $ | 1,344 | ||||||
Ratio of expenses before reimbursements, waivers and fees paid indirectly to average net assets | 1.59 | % | 2.57 | % | 7.86 | %* | ||||||
Ratio of net expenses to average net assets | 1.17 | %+# | 1.18 | %+# | 1.20 | %*+ | ||||||
Ratio of net investment income (loss) to average net assets | (0.95 | )%+# | (0.87 | )%+# | (0.94 | )%*+ | ||||||
Portfolio turnover | 206 | % | 193 | % | 66 | %** | ||||||
* | Annualized |
** | Not Annualized |
^ | Net investment loss per share has been calculated using the average share method. |
~ | Amount represents less than $0.01 per share |
+ | Such ratios are after administrative and transfer agent waivers and adviser expense reimbursements, when applicable. BNY Mellon Investment Servicing (US) Inc., the administrative agent and transfer agent, waived a portion of its fees beginning with the Fund’s commencement of operations, August 21, 2017. The Adviser contractually agreed to waive its investment advisory fee or absorb other operating expenses to the extent necessary to ensure that total annual operating expenses for the Investor Class (other than interest, taxes, brokerage commissions and other portfolio transaction expenses, capital expenditures, and extraordinary expenses) would not exceed the Investor Class’s operating expense cap of 1.20% of average daily net assets until August 20, 2020. |
# | Such ratios are net of fees paid indirectly (see Note B in the Notes to Financial Statements). |
Notes to Financial Statements are an integral part of this Schedule.
47
Driehaus Small Cap Growth Fund — Institutional Class |
For the year | For the year | For the period | ||||||||||
Net asset value, beginning of period | $ | 11.70 | $ | 11.63 | $ | 10.00 | ||||||
INCOME (LOSS) FROM INVESTMENT OPERATIONS: | ||||||||||||
Net investment income (loss) | (0.10 | ) | (0.08 | )^ | (0.03 | )^ | ||||||
Net realized and unrealized gain (loss) | 4.84 | 0.47 | 1.86 | |||||||||
Total income (loss) from investment operations | 4.74 | 0.39 | 1.83 | |||||||||
LESS DISTRIBUTIONS: | ||||||||||||
Dividends from net investment income | — | — | — | |||||||||
Distributions from capital gains | (0.97 | ) | (0.33 | ) | (0.20 | ) | ||||||
Total distributions | (0.97 | ) | (0.33 | ) | (0.20 | ) | ||||||
Redemption fees added to paid-in capital | 0.00 | ~ | 0.01 | — | ||||||||
Net asset value, end of period | $ | 15.47 | $ | 11.70 | $ | 11.63 | ||||||
Total Return | 40.62 | % | 3.59 | % | 18.28 | %** | ||||||
RATIOS/SUPPLEMENTAL DATA | ||||||||||||
Net assets, end of period (in 000’s) | $ | 161,821 | $ | 123,395 | $ | 38,631 | ||||||
Ratio of expenses before reimbursements, waivers and fees paid indirectly and recoupments, if any, to average net assets | 0.89 | % | 1.04 | % | 1.48 | %* | ||||||
Ratio of net expenses to average net assets | 0.92 | %+# | 0.93 | %+# | 0.95 | %*+ | ||||||
Ratio of net investment income (loss) to average net assets | (0.70 | )%+# | (0.62 | )%+# | (0.69 | )%*+ | ||||||
Portfolio turnover | 206 | % | 193 | % | 66 | %** | ||||||
* | Annualized |
** | Not Annualized |
^ | Net investment loss per share has been calculated using the average share method. |
~ | Amount represents less than $0.01 per share |
+ | Such ratios are after administrative and transfer agent waivers and adviser expense reimbursements, when applicable. BNY Mellon Investment Servicing (US) Inc., the administrative agent and transfer agent, waived a portion of its fees beginning with the Fund’s commencement of operations, August 21, 2017. The Adviser contractually agreed to waive its investment advisory fee or absorb other operating expenses to the extent necessary to ensure that total annual operating expenses for the Institutional Class (other than interest, taxes, brokerage commissions and other portfolio transaction expenses, capital expenditures, and extraordinary expenses) would not exceed the Institutional Class’s operating expense cap of 0.95% of average daily net assets until August 20, 2020. |
# | Such ratios are net of fees paid indirectly (see Note B in the Notes to Financial Statements). |
Notes to Financial Statements are an integral part of this Schedule.
48
Driehaus Mutual Funds Notes to Financial Statements |
A. SUMMARY OF SIGNIFICANT ACCOUNTING POLICIES
Organization
The Driehaus Mutual Funds (the “Trust”) is an open-end registered management investment company under the Investment Company Act of 1940, as amended, organized as a Delaware statutory trust, with eight separate series currently in operation. The Trust was organized under an Agreement and Declaration of Trust dated May 31, 1996, as subsequently amended and restated as of June 6, 2013, and amended as of June 4, 2015, and may issue an unlimited number of full and fractional units of beneficial interest (shares) without par value. The five series (“Funds” or each a “Fund”) included in this report are as follows:
Fund | Commencement of Operations |
Driehaus Emerging Markets Growth Fund* | 12/31/97 |
Driehaus Emerging Markets Small Cap Growth Fund | 08/22/11 |
Driehaus International Small Cap Growth Fund | 09/17/07 |
Driehaus Micro Cap Growth Fund** | 11/18/13 |
Driehaus Small Cap Growth Fund | 08/21/17 |
* | Effective as of the close of business on February 28, 2020, the Driehaus Emerging Markets Growth Fund will be closed to new investors. |
** | On September 29, 2017, the Driehaus Micro Cap Growth Fund was closed to new investors. |
The Driehaus Emerging Markets Growth Fund and Driehaus Small Cap Growth Fund each offer two classes of shares, designated as Institutional Class and Investor Class. Each class of shares represents an interest in the same portfolio of investments of the respective Fund and voting privileges with respect to the Fund in general. Each class of shares has exclusive voting rights with respect to any matters involving only that class. The classes of each Fund pay pro rata the costs of management of that Fund’s portfolio, including the management fee. Each class of a Fund bears the cost of its own transfer agency and shareholder servicing arrangements, and any other class-specific expenses, which will result in differing expenses by class.
The investment objective of each Fund is to maximize capital appreciation.
Driehaus Emerging Markets Growth Fund seeks to achieve its objective by investing primarily in equity securities of emerging markets companies.
Driehaus Emerging Markets Small Cap Growth Fund seeks to achieve its objective by investing primarily in equity securities of small capitalization emerging markets companies.
Driehaus International Small Cap Growth Fund seeks to achieve its objective by investing primarily in equity securities of smaller capitalization non-U.S. companies exhibiting strong growth characteristics.
Driehaus Micro Cap Growth Fund seeks to achieve its objective by investing primarily in equity securities of micro capitalization U.S. companies exhibiting strong growth characteristics.
Driehaus Small Cap Growth Fund seeks to achieve its objective by investing primarily in equity securities of U.S. small capitalization companies.
The Funds, which are investment companies within the scope of Financial Accounting Standards Board (“FASB”) Accounting Standards Update 2013-08, follow accounting and reporting guidance under FASB Accounting Standards Codification Topic 946, Financial Services-Investment Companies.
Cash is held at U.S. financial institutions, and at times, may exceed the amount insured by the U.S. Federal Deposit Insurance Corporation. The Funds consider highly liquid investments, with maturities of ninety days or less when purchased to be cash equivalents, and such investments may include money market mutual fund investments. All such investments are categorized in Level 1 of the fair value hierarchy.
Securities Valuation and Transactions
Equity securities and exchange-traded options are valued at the last sale price as of the close of the primary exchange or other designated time. Equity certificates are valued at the last sale price of the underlying security as of the close of the primary exchange. Investments initially valued in currencies other than the U.S. dollar are converted to the U.S. dollar using exchange rates obtained from an independent pricing service. In addition, if quotations are not
49
Driehaus Mutual Funds |
readily available, if the values have been materially affected by events occurring after the closing of a foreign market, or if there has been a movement in the U.S. market that exceeds a certain threshold, assets may be valued at fair value as determined in good faith by or under the direction of the Trust’s Board of Trustees (the “Board”). Events that may materially affect asset values that could cause a fair value determination include, but are not limited to: corporate announcements relating to a specific security; natural and other disasters which may impact an entire market or region; and political and other events which may be global or impact a particular country or region. The frequency with which these procedures are used cannot be predicted and may be utilized to a significant extent. To the extent utilized, securities would be considered level 2 or Level 3 in the hierarchy described below.
Each Fund is subject to fair value accounting standards that define fair value, establish the framework for measuring fair value and provide a three-level hierarchy for fair valuation based upon the inputs to the valuation as of the measurement date. The three levels of the fair value hierarchy are as follows:
Level 1 — quoted prices in active markets for identical securities
Level 2 — significant observable inputs (including quoted prices for similar securities, interest rates, prepayment speeds, credit risk, etc.)
Level 3 — significant unobservable inputs (including the Funds’ own assumptions in determining the fair value of investments)
The inputs or methodology used for valuing securities are not necessarily an indication of the risk associated with investing in those securities.
The summary of the Funds’ investments that are measured at fair value by level within the fair value hierarchy as of December 31, 2019 is as follows:
Fund | Total | Level 1 | Level 2 | Level 3 | ||||||||||||
Driehaus Emerging Markets Growth Fund | ||||||||||||||||
Investments in Securities* | $ | 1,713,221,621 | $ | 1,713,221,621 | $ | — | $ | — | ||||||||
Driehaus Emerging Markets Small Cap Growth Fund | ||||||||||||||||
Equity Securities: | ||||||||||||||||
Africa | $ | 2,054,559 | $ | 2,054,559 | $ | — | $ | — | ||||||||
Central America | 636,915 | 636,915 | — | — | ||||||||||||
Europe | 6,436,286 | 4,935,161 | 1,501,125 | — | ||||||||||||
Far East | 37,727,041 | 35,618,892 | 2,108,149 | 0 | ||||||||||||
Middle East | 2,271,072 | 2,271,072 | — | — | ||||||||||||
North America | 2,478,790 | 2,478,790 | — | — | ||||||||||||
South America | 8,174,935 | 8,174,935 | — | — | ||||||||||||
Total Investments | $ | 59,779,598 | $ | 56,170,324 | $ | 3,609,274 | $ | 0 | ||||||||
Driehaus International Small Cap Growth Fund | ||||||||||||||||
Investments in Securities* | $ | 251,284,908 | $ | 251,284,908 | $ | — | $ | — | ||||||||
Driehaus Micro Cap Growth Fund | ||||||||||||||||
Investments in Securities* | $ | 267,413,682 | $ | 267,413,682 | $ | — | $ | — | ||||||||
Driehaus Small Cap Growth Fund | ||||||||||||||||
Investments in Securities* | $ | 172,338,655 | $ | 172,338,655 | $ | — | $ | — | ||||||||
* | See Schedule of Investments for industry and/or country breakout. |
50
Driehaus Mutual Funds |
At December 31, 2019, the Driehaus Emerging Markets Small Cap Growth Fund held a Level 3 investment in Aarti Surfactants, Ltd. The shares were received as part of a spin-off in mid-September, 2019, but were not trading as of year-end and were valued at $0.
The Funds used observable inputs in their valuation methodologies whenever they were available and deemed reliable.
When fair value pricing is employed, the prices of securities used by a Fund to calculate its net asset value may differ from closing prices for the same securities, which means that a Fund may value those securities higher or lower than another fund that does not employ fair value. In addition, the fair value price may differ materially from the value a Fund may ultimately realize.
Securities transactions are accounted for on trade date. The cost of investments sold is determined by the use of the specific identification method for both financial reporting and income tax purposes. Interest income is recorded on an accrual basis. Dividend income, net of non-reclaimable foreign taxes withheld, is recorded on the ex-dividend date or as soon as the information is available. Income and expenses are accrued daily. The Funds’ investment income, expenses (other than class-specific expenses) and unrealized and realized gains and losses are allocated daily to each class of shares based upon the relative proportion of net assets of each class at the beginning of the day.
Forward Foreign Currency Contracts
The Funds may use forward foreign currency contracts to hedge foreign currency exposure in the portfolio. A forward foreign currency contract involves an obligation to purchase or sell a specific currency at a future date, which may be any fixed number of days from the date of the contract agreed upon by the parties, at a price set at the time of the contract. These contracts are principally traded in the inter-bank market conducted directly between currency traders (usually large commercial banks) and their customers.
The fair value of a forward foreign currency contract fluctuates with changes in currency exchange rates. Outstanding forward foreign currency contracts are valued daily at current market rates and the resulting change in fair value is recorded as net change in unrealized appreciation or depreciation on the Statements of Operations. When a forward foreign currency contract is settled, the Funds record a realized gain or loss equal to the difference between the value at the time the forward foreign currency contract was opened and the value at the time it was settled. A forward foreign currency contract may involve market risk in excess of the unrealized gain or loss reflected on the Statements of Assets and Liabilities. In addition, the Funds could be exposed to credit risk if the counterparties are unable or unwilling to meet the terms of the contracts or market risk if the value of the foreign currency changes unfavorably. As of December 31, 2019, the Funds had no outstanding forward foreign currency contracts.
Foreign Currency Spot Contracts
The Funds enter into foreign currency spot contracts to facilitate transactions in foreign currency denominated securities. These spot contracts are typically open for 2 to 5 days, depending on the settlement terms of the underlying security transaction. On December 31, 2019, the Funds had foreign currency spot contracts outstanding under which they are obligated to exchange currencies at specified future dates. The net unrealized appreciation or depreciation on spot contracts is reflected as Net unrealized appreciation or depreciation on unsettled foreign currency transactions in the Statements of Assets and Liabilities.
Equity Certificates
The Funds may invest in equity certificates, which allow the Funds to participate in the appreciation (depreciation) of the underlying security without actually owning the underlying security. These derivative instruments are purchased pursuant to an agreement with a financial institution and are valued at a calculated market price based on the value of the underlying security in accordance with the agreement. These equity certificates are subject to the credit risk of the issuing financial institution. There is no off-balance sheet risk associated with equity certificates and the Funds’ potential loss is limited to the purchase price of the securities. The Funds are exposed to credit risk associated with the counterparty to the transaction, which is monitored by the Funds’ management on a periodic basis. A Fund’s equity certificates are not subject to any master netting agreement.
51
Driehaus Mutual Funds |
Federal Income Taxes
No provision is made for Federal income taxes since each Fund has elected to be taxed as a “regulated investment company” under Subchapter M of the Internal Revenue Code (the “Code”) and has made and declared all the required distributions to its shareholders in amounts sufficient to relieve each Fund from all or substantially all Federal income and excise taxes under provisions of current Federal tax law.
Each Fund is subject to accounting standards that establish a minimum threshold for recognizing, and a system for measuring, the benefits of a tax position taken or expected to be taken in a tax return. Taxable years ending 2019, 2018, 2017 and 2016 remain open to Federal and state audit. As of December 31, 2019, management has evaluated the application of these standards to each Fund, and has determined that no provision for income tax is required in each Fund’s financial statements for uncertain tax provisions. The Funds recognize interest and penalties, if any, related to unrecognized tax benefits as income tax expense in the Statements of Operations. During the year, the Funds did not incur any interest or penalties. The Funds may be subject to foreign taxes on income, gains on investments or currency repatriation, a portion of which may be recoverable. Foreign taxes are provided for based on the Funds’ understanding of the tax rules and regulations that exist in the foreign markets in which they invest.
The amount of dividends and distributions from net investment income and net realized capital gains are determined in accordance with Federal income tax regulations, which may differ from United States Generally Accepted Accounting Principles (“U.S. GAAP”).
For the year ended December 31, 2019, reclassifications were recorded to distributable earnings (deficit) and paid-in capital for any permanent tax differences. These reclassifications relate primarily to foreign currency losses, sales of passive foreign investment companies (“PFIC”), net operating losses and foreign capital gain taxes paid. Results of operations and net assets were not affected by these reclassifications.
Driehaus | Driehaus | Driehaus | Driehaus | Driehaus | ||||||||||||||||
Distributable earnings (deficit) | $ | — | $ | — | $ | — | $ | 1,817,658 | $ | 1,106,394 | ||||||||||
Paid-in capital | — | — | — | (1,817,658 | ) | (1,106,394 | ) | |||||||||||||
Accumulated capital losses represent net capital loss carryovers that may be available for an unlimited period to offset future realized capital gains and thereby reduce future capital gains distributions. Capital loss carryover retains the character of the original loss. The following table shows the amounts of capital loss carryover, if any, by each of the applicable Funds as of December 31, 2019:
Unlimited Period of Net Capital Loss Carryover | ||||||||||||
Fund | Short-Term | Long- Term | Accumulated | |||||||||
Driehaus Emerging Markets Small Cap Growth Fund | $ | 45,337,455 | $ | — | $ | 45,337,455 | ||||||
During the year ended December 31, 2019, Driehaus Emerging Markets Small Cap Growth Fund utilized $9,103,909 of capital loss carryforwards.
52
Driehaus Mutual Funds |
Pursuant to Federal income tax rules applicable to regulated investment companies, the Funds may elect to treat certain capital losses between November 1 and December 31 as occurring on the first day of the following tax year. For the year ended December 31, 2019, the following qualified late-year losses were deferred and recognized on January 1, 2020:
Fund | Late-Year | Total Capital | Total | |||||||||
Driehaus Emerging Markets Growth Fund | $ | 187,752 | $ | — | $ | 187,752 | ||||||
Driehaus Emerging Markets Small Cap Growth Fund | — | — | — | |||||||||
Driehaus International Small Cap Growth Fund | — | — | — | |||||||||
Driehaus Micro Cap Growth Fund | — | — | — | |||||||||
Driehaus Small Cap Growth Fund | — | — | — | |||||||||
Distributions to Shareholders
The tax character of distributions paid during the fiscal year ended December 31, 2019 was as follows:
Distributions paid from: | Driehaus | Driehaus | Driehaus | Driehaus | Driehaus | |||||||||||||||
Ordinary income | $ | 15,701,188 | $ | 255,325 | $ | 343,991 | $ | — | $ | — | ||||||||||
Net long-term capital gain | 776,768 | — | 1,632,552 | 33,768,834 | 9,909,321 | |||||||||||||||
Total distributions paid | $ | 16,477,956 | $ | 255,325 | $ | 1,976,543 | $ | 33,768,834 | $ | 9,909,321 | ||||||||||
The tax character of distributions paid during the fiscal year ended December 31, 2018 was as follows:
Distributions paid from: | Driehaus | Driehaus | Driehaus | Driehaus | Driehaus | |||||||||||||||
Ordinary income | $ | 8,970,853 | $ | — | $ | 5,657,722 | $ | 22,348,104 | $ | 1,454,358 | ||||||||||
Net long-term capital gain | 53,973,948 | — | 25,166,722 | 50,514,284 | 2,139,592 | |||||||||||||||
Total distributions paid | $ | 62,944,801 | $ | — | $ | 30,824,444 | $ | 72,862,388 | $ | 3,593,950 | ||||||||||
53
Driehaus Mutual Funds |
As of December 31, 2019, the components of net assets on a tax basis were as follows:
Driehaus | Driehaus | Driehaus | Driehaus | Driehaus | ||||||||||||||||
Undistributed ordinary income | $ | — | $ | 246,959 | $ | 1,663,136 | $ | — | $ | — | ||||||||||
Undistributed long-term capital gain | 7,126,649 | — | 9,929,217 | 5,257,541 | 2,747,088 | |||||||||||||||
Accumulated earnings | $ | 7,126,649 | $ | 246,959 | $ | 11,592,353 | $ | 5,257,541 | $ | 2,747,088 | ||||||||||
Paid-in capital | 1,347,226,604 | 97,787,630 | 213,611,895 | 190,634,510 | 138,034,521 | |||||||||||||||
Accumulated capital and other losses | (187,752 | ) | (45,337,455 | ) | — | — | — | |||||||||||||
Unrealized appreciation (depreciation) on foreign currency | 31,152 | (32,620 | ) | 1,409 | — | — | ||||||||||||||
Unrealized appreciation on investments | 437,568,339 | 9,742,932 | 43,023,034 | 73,228,119 | 31,934,101 | |||||||||||||||
Other temporary differences | — | — | — | — | 4,475 | |||||||||||||||
Net assets | $ | 1,791,764,992 | $ | 62,407,446 | $ | 268,228,691 | $ | 269,120,170 | $ | 172,720,185 | ||||||||||
The differences between book-basis and tax-basis unrealized appreciation are attributable primarily to the tax deferral of losses on wash sales and PFIC mark-to-market.
The aggregate cost of investments and the composition of unrealized appreciation and depreciation on investments and net unrealized appreciation and/or depreciation on derivatives for Federal income tax purposes as of December 31, 2019, were as follows:
Fund | Basis | Gross | Gross | Net | ||||||||||||
Driehaus Emerging Markets Growth Fund | $ | 1,275,653,282 | $ | 461,880,529 | $ | (24,312,190 | ) | $ | 437,568,339 | |||||||
Driehaus Emerging Markets Small Cap Growth Fund | $ | 50,036,666 | $ | 10,711,507 | $ | (968,575 | ) | $ | 9,742,932 | |||||||
Driehaus International Small Cap Growth Fund | $ | 208,261,874 | $ | 50,602,205 | $ | (7,579,171 | ) | $ | 43,023,034 | |||||||
Driehaus Micro Cap Growth Fund | $ | 194,185,563 | $ | 76,500,551 | $ | (3,272,432 | ) | $ | 73,228,119 | |||||||
Driehaus Small Cap Growth Fund | $ | 140,404,554 | $ | 34,425,408 | $ | (2,491,307 | ) | $ | 31,934,101 | |||||||
Foreign Currency Translation
Foreign currency and equity securities not denominated in U.S. dollars are translated into U.S. dollar values based upon the current rates of exchange on the date of the Funds’ valuations.
Net realized foreign exchange gains or losses which are reported by the Funds result from currency gains and losses on transaction hedges arising from changes in exchange rates between the trade and settlement dates on spot contracts underlying securities transactions and the difference between the amounts accrued for dividends, interest, and foreign taxes and the amounts actually received or paid in U.S. dollars for these items. Net unrealized foreign exchange gains and losses result from changes in the U.S. dollar value of assets and liabilities (other than investments in securities), which are denominated in foreign currencies, as a result of changes in exchange rates.
The Funds do not isolate that portion of the results of operations which results from fluctuations in foreign exchange rates on investments. These fluctuations are included with the net realized gain (loss) from security transactions and the net change in unrealized appreciation (depreciation) of investments.
Use of Estimates
The preparation of financial statements, in conformity with U.S. GAAP, requires management to make estimates and assumptions that affect the reported amount of assets and liabilities and disclosure of contingent assets and liabilities at the date of the financial statements and the reported amounts of net increases or decreases in net assets from operations during the reporting period. Actual results could differ from those estimates.
54
Driehaus Mutual Funds |
Indemnifications
Under the Trust’s organizational documents, the officers and Trustees are indemnified against certain liabilities arising out of the performance of their duties to the Trust. In addition, in the normal course of business, the Trust enters into contracts that provide general indemnifications to other parties. The Funds’ maximum exposure under these agreements is unknown as this would involve future claims that may be made against the Funds that have not yet occurred. However, the Funds have not had prior claims or losses pursuant to these contracts and expect the risk of loss to be remote.
B. INVESTMENT ADVISORY FEES, TRANSACTIONS WITH AFFILIATES, AND ADMINISTRATIVE FEES
Richard H. Driehaus is Chairman of Driehaus Capital Management LLC (“DCM” or the “Adviser”), a registered investment adviser, and of Driehaus Securities LLC (“DS LLC”), an entity that was registered as a broker-dealer and served as the distributor of the Funds through December 31, 2019. As of December 31, 2019, Richard H. Driehaus held substantial, non-controlling interests in certain Funds.
DCM serves as the Funds’ investment adviser. In return for its services to the Funds, DCM receives monthly fees. Driehaus Micro Cap Growth Fund pays the Adviser a monthly fee computed and accrued daily at an annual rate of 1.25% of the Fund’s average daily net assets. Driehaus Small Cap Growth Fund pays the Adviser a monthly fee computed and accrued daily at an annual rate of 0.60% of the Fund’s average daily net assets. Driehaus Emerging Markets Small Cap Growth Fund pays the Adviser a monthly fee computed and accrued daily at the annual rate of 1.15% of the Fund’s average daily net assets. Driehaus International Small Cap Growth Fund pays the Adviser a monthly fee computed and accrued daily at an annual rate of 1.00% of the Fund’s average daily net assets. Driehaus Emerging Markets Growth Fund pays the Adviser a monthly fee computed and accrued daily at an annual rate of 1.05% on the first $1.5 billion and 0.75% in excess of $1.5 billion of the Fund’s average daily net assets.
DCM entered into a contractual agreement to cap Driehaus Emerging Markets Small Cap Growth Fund’s annual operating expenses (other than interest, taxes, brokerage commissions, dividends and interest on short sales and other portfolio transaction expenses and extraordinary expenses such as litigation and other expenses not incurred in the ordinary course of the Fund’s business) at 1.45% of average daily net assets until October 31, 2021. DCM is entitled to recoupment for previously waived fees and reimbursed expenses to the extent that the Fund’s expense ratio remains below the operating expense cap in place at the time of the waiver and the current operating expense cap for a period not to exceed three years from the date on which the waiver or reimbursement was made. For the year ended December 31, 2019, DCM waived fees for Driehaus Emerging Markets Small Cap Growth Fund totaling $227,780 under this agreement.
DCM has entered into a contractual agreement to cap Driehaus Small Cap Growth Fund’s annual operating expenses (other than interest, taxes, brokerage commissions, dividends and interest on short sales and other portfolio transaction expenses and extraordinary expenses such as litigation and other expenses not incurred in the ordinary course of the Fund’s business) at 1.20% of average daily net assets for the Investor Class and 0.95% of average daily net assets for the Institutional Class until August 20, 2020. For a period of three years subsequent to the Fund’s commencement of operations on August 21, 2017, DCM is entitled to recoupment of previously waived fees and reimbursed expenses to the extent that the expense ratio of each share class remains below the respective operating expense cap in place at the time of the waiver and the current operating expense cap for a period not to exceed three years from the date on which the waiver or reimbursement was made. For the year ended December 31, 2019, DCM waived fees for the Investor Class shares of the Driehaus Small Cap Growth Fund totaling $31,856 and recouped fees for the Institutional Class shares of the Driehaus Small Cap Growth Fund totaling $103,310 under this agreement.
The table below indicates the amount of fees available for potential recoupment by DCM in future periods:
Year Ended December 31 | Driehaus | Driehaus | ||||||
2020 | $ | — | $ | 9,050 | ||||
2021 | — | 34,917 | ||||||
2022 | 227,780 | 31,856 | ||||||
Total | $ | 227,780 | $ | 75,823 | ||||
55
Driehaus Mutual Funds |
The amounts incurred and payable to DCM during the year ended December 31, 2019 are as follows:
Fund | Advisory Fees | Advisory Fees | ||||||
Driehaus Emerging Markets Growth Fund | $ | 16,837,477 | $ | 1,490,823 | ||||
Driehaus Emerging Markets Small Cap Growth Fund | 764,508 | 59,068 | ||||||
Driehaus International Small Cap Growth Fund | 2,525,272 | 217,588 | ||||||
Driehaus Micro Cap Growth Fund | 3,140,853 | 274,335 | ||||||
Driehaus Small Cap Growth Fund | 961,297 | 82,415 | ||||||
The Funds direct certain portfolio trades, subject to obtaining the best price and execution, to brokers who have agreed to pay a portion of the Funds’ operating expenses using part of the commissions generated. For the year ended December 31, 2019, these arrangements reduced the expenses of Driehaus Emerging Markets Growth Fund, Driehaus Emerging Markets Small Cap Growth Fund, Driehaus International Small Cap Growth Fund, Driehaus Micro Cap Growth Fund and Driehaus Small Cap Growth Fund by $133,804 (0.6%), $5,598 (0.5%), $15,079 (0.5%), $148,122 (4.0%) and $40,946 (2.8%), respectively.
The Funds are permitted to purchase or sell securities from or to certain affiliated funds under specified conditions outlined in procedures adopted by the Board. The procedures have been designed to ensure that any purchase or sale of securities by the fund from or to another fund or portfolio that is or could be considered an affiliate by virtue of having a common investment adviser (or affiliated investment advisers), common trustees and/or common officers complies with Rule 17a-7 of the 1940 Act. Further, as defined under these procedures, each transaction is effected at the current market price to minimize trading costs, where permissible. For the year ended December 31, 2019, the Funds engaged in purchases and sales of securities, pursuant to Rule 17a-7 of the 1940 Act, as follows:
Fund | Purchases | Sales | Net Realized | |||||||||
Driehaus Micro Cap Growth Fund | $ | — | $ | 560,821 | $ | (54,736 | ) | |||||
Certain officers of the Trust are also officers of DCM and DS LLC. The Funds pay a portion of the Chief Compliance Officer’s salary and bonus. No other officers received compensation from the Funds. The Independent Trustees are compensated for their services to the Trust and such compensation is reflected as Trustees’ fees in the Statements of Operations.
BNY Mellon Investment Servicing (US) Inc. (“BNY Mellon”) serves as the Funds’ administrative and accounting agent. In compensation for these services, BNY Mellon earns the greater of a monthly minimum fee or a monthly fee based upon average daily net assets. BNY Mellon has agreed to waive a portion of its monthly fee for administrative services for the first two years of operations for Driehaus Small Cap Growth Fund. For the year ended December 31, 2019, BNY Mellon waived $0 for Driehaus Small Cap Growth Fund. BNY Mellon also acts as the transfer agent and dividend disbursing agent for the Funds. For these services, BNY Mellon earns a monthly fee based on shareholder processing activity during the month. BNY Mellon has agreed to waive a portion of its monthly fee for transfer agent services for the first two years of operations for Driehaus Small Cap Growth Fund. For the year ended December 31, 2019, BNY Mellon waived $12,000 for Driehaus Small Cap Growth Fund.
For the year ended December 31, 2019, DS LLC, an affiliate registered broker-dealer, served as the Funds’ distributor. DS LLC did not earn any compensation from the Funds for these services. DS LLC was replaced as the Funds’ distributor by Foreside Financial Services, LLC (“Foreside” or the “Distributor”), an unaffiliated registered broker-dealer effective January 1, 2020. Foreside will similarly not receive any compensation from the Funds for these services. Prior to the Funds’ appointment of Foreside, DS LLC was a party to a Fee Reimbursement Agreement (“Agreement”) with the Driehaus Emerging Markets Growth Fund and the Driehaus Small Cap Growth Fund. The Agreement with DS LLC was terminated on December 31, 2019, and the Adviser entered into the Agreement with the Driehaus Emerging Markets Growth Fund and the Driehaus Small Cap Growth Fund effective January 1, 2020. Under these Agreements, the Funds
56
Driehaus Mutual Funds |
reimbursed DS LLC and will reimburse the Adviser for certain fees paid by each entity to intermediaries who provide shareholder administrative and/or sub-transfer agency services to the Funds. Currently, the amount to be reimbursed will not exceed 0.25% of the average daily net assets held by such intermediaries.
The amounts incurred and payable to DS LLC during the year ended December 31, 2019 are as follows:
Fund | Shareholder | Accrued | ||||||
Driehaus Emerging Markets Growth Fund | $ | 1,791,565 | $ | 189,469 | ||||
Driehaus Small Cap Growth Fund | 18,045 | — | ||||||
C. INVESTMENT TRANSACTIONS
The aggregate purchases and sales of investment securities, other than short-term obligations and options, for the year ended December 31, 2019 were as follows:
Fund | Purchases | Sales | ||||||
Driehaus Emerging Markets Growth Fund | $ | 2,572,408,244 | $ | 2,550,322,459 | ||||
Driehaus Emerging Markets Small Cap Growth Fund | 139,131,838 | 185,132,441 | ||||||
Driehaus International Small Cap Growth Fund | 230,209,447 | 256,946,791 | ||||||
Driehaus Micro Cap Growth Fund | 415,732,958 | 483,794,871 | ||||||
Driehaus Small Cap Growth Fund | 324,505,307 | 332,234,459 | ||||||
D. CAPITAL SHARE TRANSACTIONS
For the years ended December 31, 2019 and 2018, transactions in capital shares (authorized shares unlimited) were as follows:
Driehaus Emerging | Driehaus Emerging Markets | Driehaus International | ||||||||||||||||||||||
2019 | 2018 | 2019 | 2018 | 2019 | 2018 | |||||||||||||||||||
Fund | ||||||||||||||||||||||||
Shares issued | — | — | 874,262 | 3,442,832 | 4,710,527 | 6,768,601 | ||||||||||||||||||
Shares reinvested | — | — | 14,891 | — | 169,235 | 3,560,115 | ||||||||||||||||||
Shares redeemed | — | — | (4,849,550 | ) | (14,229,116 | ) | (6,242,924 | ) | (12,040,667 | ) | ||||||||||||||
Net increase (decrease) | — | — | (3,960,397 | ) | (10,786,284 | ) | (1,363,162 | ) | (1,711,951 | ) | ||||||||||||||
Investor Class | ||||||||||||||||||||||||
Shares issued | 2,872,532 | 6,511,231 | — | — | — | — | ||||||||||||||||||
Shares reinvested | 172,532 | 1,023,706 | — | — | — | — | ||||||||||||||||||
Shares redeemed | (6,094,234 | ) | (14,592,102 | ) | — | — | — | — | ||||||||||||||||
Net increase (decrease) | (3,049,170 | ) | (7,057,165 | ) | — | — | — | — | ||||||||||||||||
Institutional Class | ||||||||||||||||||||||||
Shares issued | 7,006,838 | 11,261,606 | — | — | — | — | ||||||||||||||||||
Shares reinvested | 174,824 | 798,753 | — | — | — | — | ||||||||||||||||||
Shares redeemed | (4,277,922 | ) | (4,408,218 | ) | — | — | — | — | ||||||||||||||||
Net increase (decrease) | 2,903,740 | 7,652,141 | — | — | — | — | ||||||||||||||||||
Total net increase (decrease) | (145,430 | ) | 594,976 | — | — | — | — | |||||||||||||||||
57
Driehaus Mutual Funds |
Driehaus Micro Cap | Driehaus Small Cap | |||||||||||||||
2019 | 2018 | 2019 | 2018 | |||||||||||||
Fund | ||||||||||||||||
Shares issued | 5,178,977 | 6,979,421 | — | — | ||||||||||||
Shares reinvested | 2,292,488 | 6,239,529 | — | — | ||||||||||||
Shares redeemed | (10,513,427 | ) | (11,725,708 | ) | — | — | ||||||||||
Net increase (decrease) | (3,041,962 | ) | 1,493,242 | — | — | |||||||||||
Investor Class | ||||||||||||||||
Shares issued | — | — | 526,045 | 802,721 | ||||||||||||
Shares reinvested | — | — | 42,020 | 18,657 | ||||||||||||
Shares redeemed | — | — | (505,115 | ) | (290,721 | ) | ||||||||||
Net increase (decrease) | — | — | 62,950 | 530,657 | ||||||||||||
Institutional Class | ||||||||||||||||
Shares issued | — | — | 3,970,530 | 7,683,576 | ||||||||||||
Shares reinvested | — | — | 599,613 | 300,304 | ||||||||||||
Shares redeemed | — | — | (4,651,842 | ) | (762,745 | ) | ||||||||||
Net increase (decrease) | — | — | (81,699 | ) | 7,221,135 | |||||||||||
Total net increase (decrease) | — | — | (18,749 | ) | 7,751,792 | |||||||||||
E. LINE OF CREDIT
The Funds, together with other funds in the Trust, obtained a committed line of credit in the amount of $50,000,000. The line of credit is available primarily to meet large, unexpected shareholder redemptions subject to certain restrictions. Interest is charged at a rate per annum equal to the Federal Funds Rate in effect at the time of the borrowings plus 1.5%, or 1.75%, whichever is greater. There is a commitment fee of 0.10% of the excess of the $50,000,000 committed amount over the sum of the average daily balance of any loans, which is allocated amongst all funds that have access to the line. Driehaus Emerging Markets Small Cap Growth Fund utilized the line of credit during the periods January 1, 2019 to January 3, 2019 and February 25, 2019 to February 28, 2019. For the period January 1, 2019 to January 3, 2019, the average daily loan balance outstanding on days where borrowings existed was $5,000,000 and the weighted average interest rate was 4.00%. For the period February 25, 2019 to February 28, 2019, the average daily loan balance outstanding on days where borrowings existed was $6,000,000 and the weighted average interest rate was 4.00%. The interest expense, which is included on the Statements of Operations, was $4,169 for Driehaus Emerging Markets Small Cap Growth Fund.
F. FOREIGN INVESTMENT RISKS
To the extent a Fund invests in foreign securities, it may entail risks due to the potential for political and economic instability in the countries where the issuers of these securities are located. In addition, foreign exchange fluctuations could affect the value of positions held. These risks are generally intensified in emerging markets.
G. REDEMPTION FEES
The Funds may charge a redemption fee of 2.00% of the redemption amount for shares redeemed within 60 days of purchase. The redemption fees are recorded in paid-in capital and reflected in the Statements of Changes in Net Assets.
H. SUBSEQUENT EVENTS
Events or transactions that occurred after the date of this report through the date the report was issued have been evaluated for potential impact to the financial statements. Effective January 1, 2020, Foreside Financial Services, LLC replaced DS LLC as the Funds’ distributor.
58
Report of Independent Registered Public Accounting Firm |
To the Shareholders of Driehaus Emerging Markets Growth Fund, Driehaus Emerging Markets Small Cap Growth Fund, Driehaus International Small Cap Growth Fund, Driehaus Micro Cap Growth Fund, and Driehaus Small Cap Growth Fund and the Board of Trustees of the Driehaus Mutual Funds
Opinion on the Financial Statements
We have audited the accompanying statements of assets and liabilities of Driehaus Emerging Markets Growth Fund, Driehaus Emerging Markets Small Cap Growth Fund, Driehaus International Small Cap Growth Fund, Driehaus Micro Cap Growth Fund, and Driehaus Small Cap Growth Fund, (collectively referred to as the “Funds”), (five of the funds constituting the Driehaus Mutual Funds (the “Trust”)), including the schedules of investments, as of December 31, 2019, and the related statements of operations and changes in net assets, and the financial highlights for each of the periods indicated in the table below and the related notes (collectively referred to as the “financial statements”). In our opinion, the financial statements present fairly, in all material respects, the financial position of each of the Funds (five of the funds constituting the Driehaus Mutual Funds) at December 31, 2019, and the results of their operations, changes in net assets and financial highlights for each of the periods indicated in the table below, in conformity with U.S. generally accepted accounting principles.
Individual fund constituting | Statement of operations | Statement of changes | Financial highlights |
Driehaus Emerging Markets Growth Fund
Driehaus Emerging Markets Small Cap Growth Fund
Driehaus International Small Cap Growth Fund
Driehaus Micro Cap Growth Fund | For the year ended December 31, 2019 | For each of the two years in the period ended December 31, 2019 | For each of the five years in the period ended December 31, 2019 |
Driehaus Small Cap Growth Fund | For the year ended December 31, 2019 | For each of the two years in the period ended December 31, 2019 | For each of the two years in the period ended December 31, 2019 and the period from August 21, 2017 (commencement of operations) through December 31, 2017 |
Basis for Opinion
These financial statements are the responsibility of the Trust’s management. Our responsibility is to express an opinion on each of the Fund’s financial statements based on our audits. We are a public accounting firm registered with the Public Company Accounting Oversight Board (United States) (“PCAOB”) and are required to be independent with respect to the Trust in accordance with the U.S. federal securities laws and the applicable rules and regulations of the Securities and Exchange Commission and the PCAOB.
We conducted our audits in accordance with the standards of the PCAOB. Those standards require that we plan and perform the audit to obtain reasonable assurance about whether the financial statements are free of material misstatement, whether due to error or fraud. The Trust is not required to have, nor were we engaged to perform,
59
Report of Independent Registered Public Accounting Firm — (Continued) |
an audit of the Trust’s internal control over financial reporting. As part of our audits, we are required to obtain an understanding of internal control over financial reporting but not for the purpose of expressing an opinion on the effectiveness of the Trust’s internal control over financial reporting. Accordingly, we express no such opinion.
Our audits included performing procedures to assess the risks of material misstatement of the financial statements, whether due to error or fraud, and performing procedures that respond to those risks. Such procedures included examining, on a test basis, evidence regarding the amounts and disclosures in the financial statements. Our procedures included confirmation of securities owned as of December 31, 2019, by correspondence with the custodian and brokers or by other appropriate auditing procedures where replies from brokers were not received. Our audits also included evaluating the accounting principles used and significant estimates made by management, as well as evaluating the overall presentation of the financial statements. We believe that our audits provide a reasonable basis for our opinion.

We have served as the auditor of one or more Driehaus investment companies since 2002.
Chicago, Illinois
February 21, 2020
60
Interested and Independent Trustees of the Trust |
The following table sets forth certain information with respect to the Trustees of the Trust as of December 31, 2019:
Name, Address | Position(s) | Term of | Number of | Principal Occupation(s) | Other Directorships |
Interested Trustee:* | |||||
Stephen J. Kneeley 25 East Erie Street Chicago, IL 60611 YOB: 1963 | Trustee and President | Since 2018
Since 2017 | 8 | President and Chief Executive Officer of the Adviser since January 2018; Interim President and Interim Chief Executive Officer of Adviser from March 2017 to December 2017; Chief Executive Officer, Context Asset Management, L.P. from 2014 to 2016. | Chairman of Board of Trustees, Context Capital Funds from 2014 to 2017; and Trustee, Copeland Trust from 2010 to 2017. |
Independent Trustees: | |||||
Daniel F. Zemanek c/o Driehaus Capital Management LLC 25 East Erie Street Chicago, IL 60611 YOB: 1942 | Trustee and Chairperson | Since 1996
Since 2014 | 8 | Retired; President of Ludan, Inc. (real estate development services specializing in senior housing) from April 2008 to December 2014. | None. |
Theodore J. Beck c/o Driehaus Capital Management LLC 25 East Erie Street Chicago, IL 60611 YOB: 1952 | Trustee | Since 2012 | 8 | Retired; President and Chief Executive Officer, National Endowment for Financial Education, 2005 to July 2018. | None. |
Francis J. Harmon c/o Driehaus Capital Management LLC 25 East Erie Street Chicago, IL 60611 YOB: 1942 | Trustee | Since 1998 | 8 | Consultant, Great Lakes Advisors, Inc. since January 2020; Relationship Manager, Great Lakes Advisors, Inc. through December 2019. | None. |
Dawn M. Vroegop c/o Driehaus Capital Management LLC 25 East Erie Street Chicago, IL 60611 YOB: 1966 | Trustee | Since 2012 | 8 | Private Investor. | Independent Trustee, Brighthouse Funds Trust I since December 2000 and Brighthouse Funds Trust II since May 2009. |
Christopher J. Towle, CFA c/o Driehaus Capital Management LLC 25 East Erie Street Chicago, IL 60611 YOB: 1957 | Trustee | Since 2016 | 8 | Retired; Partner, Portfolio Manager, Director of High Yield and Convertible Securities, Lord Abbett & Co. 1987 to 2014. | Independent Trustee, Brighthouse Funds Trust I and Brighthouse Funds Trust II, each from April 2018 to August 2019. |
* | Mr. Kneeley became a Trustee on March 6, 2018. Mr. Kneeley is an “interested person” of the Trust and the Adviser, as defined in the 1940 Act, because he is an officer of the Adviser. |
61
Officers of the Trust |
The following table sets forth certain information with respect to the officers of the Trust.
Name, Address | Position(s) Held | Length of | Principal Occupation(s) During Past 5 Years |
Robert M. Kurinsky | Vice President and Treasurer | Since January 2019 | Chief Financial Officer and Treasurer of the Adviser and Driehaus Securities LLC since January 2019; Treasurer, Secretary and Chief Legal Officer of the Keeley Funds, Inc. through December 2018; President and Chief Operating Officer of Keeley-Teton Advisors, LLC from March 2017 to December 2018; Treasurer and Secretary of Joley Corp. and Keeley Holdings, Inc. through February 2017; Secretary, Treasurer, Chief Financial Officer and General Counsel of Keeley Asset Management Corp. through February 2017; Secretary, Treasurer, Chief Financial Officer and General Counsel of Keeley Investment Corp. through February 2017. |
Janet L. McWilliams | Assistant Vice President and Chief Legal Officer | Since 2007 Since 2012 | General Counsel and Secretary of the Adviser and Driehaus Securities LLC since 2012. |
Anne S. Kochevar* | Chief Compliance Officer and Anti-Money Laundering Compliance Officer | Since 2019 | Anti-Money Laundering Compliance Officer of Driehaus Securities LLC since 2019; Chief Compliance Officer of the Adviser and Driehaus Securities LLC since 2019; Chief Compliance Officer of Confluence Investment Management from January 2018 to June 2019; and Chief Compliance Officer of Henderson Global Investors U.S. from November 2014 to January 2018. |
William H. Wallace, III 301 Bellevue Parkway Wilmington, DE 19809 YOB: 1969 | Secretary | Since 2015 | Vice President and Manager, The Bank of New York Mellon since 2010. |
Christine V. Mason | Assistant Secretary | Since 2015 | Vice President and Manager, The Bank of New York Mellon since March 2018; and Senior Specialist, The Bank of New York Mellon from 2013 to March 2018. |
Christina E.H. Jacobs | Assistant Secretary | Since January 2019 | Senior Attorney of the Adviser since January 2019; Senior Attorney, Aegon USA Investment Management, LLC from December 2014 to January 2019; Head of Corporate Strategy and Support, Aegon USA Investment Management, LLC from April 2015 to January 2017. |
* | Ms. Kochevar became Chief Compliance Officer and Anti-Money Laundering Compliance Officer on July 1, 2019, succeeding Michael R. Shoemaker. |
The Statement of Additional Information for Driehaus Mutual Funds contains more detail about the Trust’s Trustees and officers and is available upon request, without charge. For further information, please call 1-800-560-6111.
62
Fund Expense Examples (unaudited) |
As a mutual fund shareholder, you may incur two types of costs: (1) transaction costs, including sales charges; redemption fees; and exchange fees and (2) ongoing costs, including management fees; distribution (12b-1) fees; and other fund expenses. This example is intended to help you understand your ongoing costs (in dollars) of investing in each Fund and to compare these costs with the ongoing costs of investing in other mutual funds.
The example is based on an investment of $1,000 invested at the beginning of the period and held for the entire six months ended December 31, 2019.
Actual Expenses
The first line of the tables below (“Actual”) provides information about actual account values and actual expenses. You may use the information in this line, together with the amount you invested, to estimate the expenses that you paid over the period. Simply divide your account value by $1,000 (for example, an $8,600 account value divided by $1,000 = 8.6), then multiply the result by the number in the first line under the heading entitled “Expenses Paid During Period” to estimate the expenses you paid on your account during this period.
Hypothetical Example for Comparison Purposes
The second line of the tables below (“Hypothetical”) provides information about hypothetical account values and hypothetical expenses based on the Fund’s actual expense ratio and an assumed rate of return of 5% per year before expenses, which is not the Fund’s actual return. You may use this information to compare the ongoing costs of investing in the Funds versus other funds. To do so, compare this 5% hypothetical example with the 5% hypothetical examples that appear in the shareholder reports of the other funds.
Please note that the expenses shown in the table are meant to highlight your ongoing costs only and do not reflect any transactional costs, such as sales charges, redemption fees or exchange fees. Therefore, the second line of the table is useful in comparing ongoing costs only, and will not help you determine the relative total costs of owning different funds. In addition, if these transactional costs were included, your costs would have been higher.
Driehaus Emerging Markets Growth Fund — Investor Class
| Beginning | Ending | Expenses |
Actual | $1,000 | $1,089.00 | $7.63 |
Hypothetical (5% return before expenses) | $1,000 | $1,017.90 | $7.38 |
Driehaus Emerging Markets Growth Fund — Institutional Class
| Beginning | Ending | Expenses |
Actual | $1,000 | $1,090.50 | $6.32 |
Hypothetical (5% return before expenses) | $1,000 | $1,019.16 | $6.11 |
Driehaus Emerging Markets Small Cap Growth Fund
| Beginning | Ending | Expenses |
Actual | $1,000 | $1,113.40 | $7.72 |
Hypothetical (5% return before expenses) | $1,000 | $1,017.90 | $7.38 |
63
Fund Expense Examples (unaudited) — (Continued) |
Driehaus International Small Cap Growth Fund
| Beginning | Ending | Expenses |
Actual | $1,000 | $1,117.20 | $6.56 |
Hypothetical (5% return before expenses) | $1,000 | $1,019.00 | $6.26 |
Driehaus Micro Cap Growth Fund
| Beginning | Ending | Expenses |
Actual | $1,000 | $1,044.60 | $7.58 |
Hypothetical (5% return before expenses) | $1,000 | $1,017.80 | $7.48 |
Driehaus Small Cap Growth Fund – Investor Class
| Beginning | Ending | Expenses |
Actual | $1,000 | $1,046.30 | $6.19 |
Hypothetical (5% return before expenses) | $1,000 | $1,019.16 | $6.11 |
Driehaus Small Cap Growth Fund – Institutional Class
| Beginning | Ending | Expenses |
Actual | $1,000 | $1,047.30 | $4.90 |
Hypothetical (5% return before expenses) | $1,000 | $1,020.42 | $4.84 |
* | Expenses are equal to the Fund’s annualized expense ratios for the six-month period in the table below multiplied by the average account value over the period, multiplied by the number of days in the most recent fiscal half-year (184), then divided by 365 to reflect the half-year period. These amounts exclude the reduction in expenses for fees paid indirectly and may differ from the Fund’s annualized expense ratio shown in the Financial Highlights. |
Driehaus Emerging Markets Growth Fund – Investor Class | 1.45% |
Driehaus Emerging Markets Growth Fund – Institutional Class | 1.20% |
Driehaus Emerging Markets Small Cap Growth Fund | 1.45% |
Driehaus International Small Cap Growth Fund | 1.23% |
Driehaus Micro Cap Growth Fund | 1.47% |
Driehaus Small Cap Growth Fund – Investor Class | 1.20% |
Driehaus Small Cap Growth Fund – Institutional Class | 0.95% |
64
Shareholder Information (unaudited) |
TAX INFORMATION FOR THE YEAR ENDED DECEMBER 31, 2019
We are providing this information as required by the Internal Revenue Code. The amounts shown may differ from those elsewhere in this report because of differences between tax and financial reporting requirements.
The Funds designate the following amounts as a long-term capital gain distribution:
Driehaus | Driehaus | Driehaus | Driehaus | Driehaus |
$7,903,417 | $— | $11,510,755 | $39,026,375 | $12,243,998 |
For taxable non-corporate shareholders, the following percentages of income and short-term capital gains represent qualified dividend income subject to the 15% rate category:
Driehaus | Driehaus | Driehaus | Driehaus | Driehaus |
100.00% | 100.00% | 100.00% | 0.00% | 0.00% |
For corporate shareholders, the following percentages of income and short-term capital gains qualified for the dividends-received deduction:
Driehaus | Driehaus | Driehaus | Driehaus | Driehaus |
1.39% | 0.00% | 0.00% | 0.00% | 0.00% |
PROXY VOTING POLICIES AND PROCEDURES AND PROXY VOTING RECORD
A description of the Funds’ policies and procedures with respect to the voting of proxies relating to the Funds’ portfolio securities is available without charge, upon request, by calling 1-800-560-6111. This information is also available on the Funds’ website at http://www.driehaus.com.
Information regarding how the Funds voted proxies related to portfolio securities during the 12-month period ended June 30, 2019 is available without charge, upon request, by calling 1-800-560-6111. This information is also available on the Securities and Exchange Commission’s (“SEC”) website at http://www.sec.gov.
HOW TO OBTAIN QUARTERLY PORTFOLIO HOLDINGS
Each Fund files a complete schedule of portfolio holdings with the SEC for the first and third quarters of each fiscal year on Form NPORT-EX. The Funds’ Form NPORT-EX is available electronically on the SEC’s website at http://www.sec.gov. Each Fund’s complete schedule of portfolio holdings is also available on the Fund’s website at http://www.driehaus.com.
65
Board Considerations in Connection with the Annual Review of the Investment Advisory Agreement for Equity Funds |
The Board of Trustees of Driehaus Mutual Funds (the “Trust”), including a majority of the Trustees who are not “interested persons” (as defined in the Investment Company Act of 1940, as amended) (the “Independent Trustees”), approved the renewal of the investment advisory agreement (the “Agreement”) with Driehaus Capital Management LLC (the “Adviser”) for Driehaus Emerging Markets Growth Fund (“DREGX/DIEMX”), Driehaus International Small Cap Growth Fund (“DRIOX”), Driehaus Micro Cap Growth Fund (“DMCRX”), Driehaus Emerging Markets Small Cap Growth Fund (“DRESX”) and Driehaus Small Cap Growth Fund (“DVSMX/DNSMX”) (DREGX, DRIOX, DMCRX, DRESX and DVSMX/DNSMX are each a “Fund” and collectively, the “Funds”) on September 12, 2019 for an additional one-year term ending September 30, 2020. As part of its review process, the Board requested and evaluated all information it deemed reasonably necessary to evaluate the Agreement. The Board reviewed comprehensive materials received from the Adviser and from independent legal counsel. The Board also received extensive information throughout the year regarding performance and operating results of each Fund. The Independent Trustees held a conference call with their independent legal counsel on September [4], 2019 to review the materials provided in response to their request, and identified areas for further response by Fund management. Following receipt of further information from Fund management, the Independent Trustees, represented by independent legal counsel, met independent of Fund management to consider renewal of the Agreement for each Fund. After their consideration of all the information received, the Independent Trustees presented their findings and their recommendation to renew the Agreement at the Board meeting.
In connection with the contract review process, the Board considered the factors discussed below, among others. The Board also considered that the Adviser has managed each Fund since its inception, and the Board believes that a long-term relationship with a capable, conscientious adviser is in the best interests of each Fund. The Board considered, generally, that shareholders invested in each Fund, knowing that the Adviser managed the Fund and knowing the investment advisory fee schedule.
Nature, Quality and Extent of Services. The Board considered the nature, extent and quality of services provided under the Agreement, including portfolio management services and certain administrative services. The Board considered the experience and skills of senior management and investment personnel, the resources made available to such personnel, the ability of the Adviser to attract and retain high-quality personnel, and the organizational depth of the Adviser. The Board also considered the Trust’s compliance with legal and regulatory requirements, as well as the Adviser’s handling of portfolio brokerage, and noted the Adviser’s process for evaluating best execution. The Board noted the Adviser’s role in overseeing the Funds’ other service providers, including the Adviser’s review of expenses. The Board considered the Adviser’s risk management strategies and the process developed by the Adviser for analyzing, reviewing and assessing risk exposure for the Funds. The Board also considered the Funds’ process for fair valuation of portfolio securities and noted the Board’s review of Fund valuation matters throughout the year.
The Board received and considered performance information provided for each Fund (and share class, as applicable), comparing it to the performance of a peer universe of funds (the “Performance Universe”) and a peer group of funds, as applicable, compiled by Broadridge Financial Solutions (“Broadridge”) using data from Lipper Analytical Services, Inc., an independent provider of mutual fund data (“Lipper”) and to each Fund’s primary benchmark index, as identified in reports to shareholders. The Board noted that the Adviser represented that, because the Funds’ performance can be volatile over shorter time periods, for Funds with longer performance records, it was also meaningful to analyze the performance over rolling time periods. The Board reviewed rolling performance for all the Funds for 1-year, 3-year and 5-year returns, as applicable, over the life of each Fund relative to its benchmark and noted that, in a majority of the time periods measured, each Fund outperformed its benchmark index. The Board also noted that the rolling performance information for Driehaus International Small Cap Growth Fund, Driehaus Emerging Markets Small Cap Growth Fund, Driehaus Micro Cap Growth Fund and Driehaus Small Cap Growth Fund included the performance of each Fund’s predecessor limited partnership. Because the predecessor limited partnerships did not operate as mutual funds and were not subject to certain investment and operational restrictions, the Board factored those differences into its evaluation of such Funds’ longer-term performance information. The Board also considered whether investment results were consistent with each Fund’s investment objective and policies.
As to the specific Funds, the Board considered that, as of June 30, 2019, Driehaus Emerging Markets Growth Fund’s (Investor Shares) performance was in the first quintile of its Performance Universe for the 5-year period and in the second quintile of its Performance Universe for the 1- and 3-year periods (the first quintile being the best performers and the fifth quintile being the worst performers). The Board noted that Driehaus Emerging Markets Growth Fund (Investor Shares) outperformed its benchmark index, the MSCI Emerging Markets Index, for the 1-, 3- and 5-year periods. The Board further noted that, as of June 30, 2019, Driehaus Emerging Markets Growth Fund’s (Institutional Shares) performance was in the first quintile of its Performance Universe for the since-inception period (the Fund’s
66
Institutional Shares inception date was July 17, 2017) and in the second quintile of its Performance Universe for the 1-year period and that Driehaus Emerging Markets Growth Fund (Institutional Shares) outperformed its benchmark index for the 1-year and since-inception periods.
The Board considered that, as of June 30, 2019, Driehaus International Small Cap Growth Fund’s performance was in the first quintile of its Performance Universe for the 5-year period and in the second quintile for the 1- and 3-year periods. The Board noted that Driehaus International Small Cap Growth Fund outperformed its benchmark index, the MSCI All Country World ex USA Small Cap Growth Index, for the 1-, 3- and 5-year periods.
The Board considered that, as of June 30, 2019, Driehaus Micro Cap Growth Fund’s performance was in the first quintile of its Performance Universe for the 3- and 5-year and since-inception periods (the Fund’s inception date was November 18, 2013) and in the second quintile for the 1-year period. In addition, the Board noted that Driehaus Micro Cap Growth Fund outperformed its benchmark index, the Russell Microcap Growth Index, for the 1-, 3- and 5-year and since-inception periods.
The Board considered that, as of June 30, 2019, Driehaus Emerging Markets Small Cap Growth Fund’s performance was in the second quintile of its Performance Universe for the since-inception period (the Fund’s inception date was August 22, 2011), in the fourth quintile for 1-year period and in the fifth quintile for the 3- and 5-year periods. In addition, the Board noted that Driehaus Emerging Markets Small Cap Growth Fund outperformed its benchmark index, the MSCI Emerging Markets Small Cap Index, for the 1-year and since-inception periods. The Board considered the Adviser’s statement that performance had been negatively impacted by the use of hedging techniques, which were discontinued as a principal investment strategy of the Fund effective November 1, 2018, and that year-to-date performance ranked in the first quintile. The Board also considered rolling relative performance, which for each period reviewed outperformed the benchmark.
The Board considered that, as of June 30, 2019, Driehaus Small Cap Growth Fund’s (Investor Shares and Institutional Shares) performance was in the first quintile of its Performance Universe for the 1-year and since-inception periods (the Fund’s inception date was August 21, 2017). The Board noted that Driehaus Small Cap Growth Fund (Investor Shares and Institutional Shares) outperformed its benchmark index, the Russell 2000 Growth Index, for the 1-year and since-inception periods.
As to the Funds in general, the Board concluded that the Adviser had consistently implemented its investment philosophy, and that over the long term, the investment philosophy produces value for shareholders.
On the basis of this evaluation and its ongoing review of investment results, the Board concluded that the nature, quality and extent of services provided by the Adviser supported renewal of the Agreement for each Fund.
Fees. The Board considered each Fund’s contractual management fee rate, operating expenses and total expense ratio as of December 31, 2018 as compared to peer expense group information based on data compiled by Broadridge using data from Lipper as of the most recent fiscal year end of each fund in the peer group (with the fifth quintile being the highest fee). The Board noted that Driehaus Small Cap Growth Fund’s (Investor Shares and Institutional Shares) contractual management fee rate was in the first quintile of its peer group, that Driehaus Emerging Markets Small Cap Growth Fund’s contractual management fee rate was in the third quintile of its peer group and equal to its peer group median, that Driehaus Emerging Markets Growth Fund’s (Investor Shares and Institutional Shares) contractual management fee rate was in the fourth quintile of its peer group and that Driehaus International Small Cap Growth Fund’s and Driehaus Micro Cap Growth Fund’s contractual management fee rates were in the fifth quintile of their respective peer group. The Board further noted that the Adviser had implemented a new advisory fee schedule for Driehaus International Small Cap Growth Fund, effective July 2, 2018, which lowered the Fund’s advisory fee rate to 1.00%. In addition, the Board noted that the Adviser implemented a new advisory fee schedule for Driehaus Emerging Markets Small Cap Growth Fund, effective November 1, 2018, which lowered the advisory fee rate to 1.15%, and that the Adviser implemented an expense reimbursement arrangement, effective the same date.
The Board also considered that for the fiscal year ended December 31, 2018, Driehaus Small Cap Growth Fund’s (Investor Shares) total expense ratio was in the first quintile of its peer group, Driehaus Small Cap Growth Fund’s (Institutional Shares) and Driehaus Emerging Markets Growth Fund’s (Investor Shares) total expense ratios were in the second quintile of their respective peer group, Driehaus International Small Cap Growth Fund’s and Driehaus Emerging Markets Growth Fund’s (Institutional Shares) total expense ratios were in the third quintile of their respective peer group and equal to each Fund’s peer group median, Driehaus Micro Cap Growth Fund’s total expense ratio was in the fourth quintile of its peer group and Driehaus Emerging Markets Small Cap Growth Fund’s total expense ratio was in the fifth quintile of its peer group. In addition, the Board considered the expense reimbursement arrangement with the Adviser for Driehaus Emerging Markets Small Cap Growth Fund and Driehaus Small Cap Growth Fund (Investor Shares and Institutional Shares). The Board noted the limited number of peers included in Driehaus Emerging Markets Small Cap Growth Fund’s peer group and that the Fund’s total expense ranking was in part driven by certain non-management expenses (including custodian and other non-management fee expenses).
67
The Board also considered the Funds’ advisory fee rates as compared to fees charged by the Adviser for similarly managed institutional accounts and sub-advised unaffiliated mutual funds, as applicable. With respect to institutional accounts and other mutual funds, the Board noted that the mix of services provided, the level of responsibility, the legal, reputational and regulatory risks and the resources required under the Agreement were significantly greater as compared to the Adviser’s obligations for managing the other accounts. In considering the reasonableness of the advisory fees, the Board took into account the Adviser’s substantial human and technological resources devoted to investing for the Funds, the relatively small amount of assets under management and the limited capacity of the investment style. In addition, the Board noted that the Adviser’s directed brokerage program had resulted in a total of approximately $367,000 in directed brokerage credits during calendar year 2018, which were used to reduce expenses of the Funds.
On the basis of the information reviewed, the Board concluded that the advisory fee schedule for each Fund was reasonable in light of the nature and quality of services provided by the Adviser.
Profitability. The Board reviewed information regarding revenues received by the Adviser under the Agreement from each Fund and discussed the Adviser’s methodology in allocating its costs to the management of the Funds. The Board considered the estimated costs to the Adviser of managing the Funds. The Board noted that Driehaus Micro Cap Growth Fund is currently closed to new investors in order to maintain assets at a level that the Adviser believes is prudent, which limits the Fund’s profitability to the Adviser. The Board also noted that the Funds do not have a Rule 12b-1 fee or shareholder service fee (except for Investor Shares of Driehaus Emerging Markets Growth Fund and Driehaus Small Cap Growth Fund), that the Adviser’s affiliate, Driehaus Securities LLC (“DS LLC”), serves as distributor of the Funds without compensation and that DS LLC provides compensation to intermediaries for distribution of Fund shares and for shareholder and administrative services to shareholders, the expense of which is reimbursed by the Adviser under an expense sharing arrangement with DS LLC, except for Driehaus Emerging Markets Growth Fund (Investor Shares) and Driehaus Small Cap Growth Fund (Investor Shares), which reimburse DS LLC under a Shareholder Services Plan (the “Plan”) for certain amounts paid for shareholder services covered under the Plan. The Board concluded that, based on the profitability calculated for the Trust as well as for the Funds individually (noting Driehaus Small Cap Growth Fund operated at a loss), the profitability was not excessive in light of the nature, extent and quality of the services provided to the Funds.
Economies of Scale. In considering the reasonableness of the advisory fee, the Board considered whether there are economies of scale with respect to the management of the Funds and whether the Funds benefit from any such economies of scale. Given the size of the Funds and the capacity constraints of their investment styles, as well as the fee reductions and waivers for certain of the Funds, the Board concluded that the advisory fee rates under the Agreement are reasonable and reflect an appropriate sharing of any such economies of scale.
Other Benefits to the Adviser and its Affiliates. The Board also considered the character and amount of other incidental benefits received by the Adviser and its affiliates. The Board also considered benefits to the Adviser related to soft dollar allocations. The Board concluded that advisory fees were reasonable in light of these fall-out benefits.
Based on all of the information considered and the conclusions reached, the Board determined that the terms of the Agreement continue to be fair and reasonable and that the continuation of the Agreement is in the best interests of each Fund. No single factor was determinative in the Board’s analysis.
68
[This page intentionally left blank]
DRH-AR2019
Beginning on May 1, 2021, as permitted by regulations adopted by the Securities and Exchange Commission, paper copies of shareholder reports will no longer be sent by mail, unless you specifically request paper copies of the reports. Instead, the reports will be made available on the Fund’s website (https://www.driehaus.com/fund-resources), and you will be notified by mail each time a report is posted and provided with a website link to access the report.
If you already elected to receive shareholder reports electronically, you will not be affected by this change and you need not take any action. You may elect to receive shareholder reports and other communications from a Fund electronically at any time by contacting your financial intermediary or, if you invest directly with a Fund, by calling 1-877-779-0079.
You may elect to receive all future reports in paper free of charge. If you invest through a financial intermediary, you can contact your financial intermediary to request that you continue to receive paper copies of your shareholder reports. If you invest directly with a Fund, you can call 1-877-779-0079 to inform the Fund that you wish to continue receiving paper copies of your shareholder reports. Your election to receive reports in paper will apply to all funds held in your account if you invest through a financial intermediary or all funds in the Driehaus Mutual Funds if you invest directly with a Fund.
Table of Contents |
Portfolio Managers’ Letter, Performance Overview and Schedule of Investments: | |
Driehaus Active Income Fund | 1 |
Driehaus Event Driven Fund | 9 |
Driehaus Emerging Markets Opportunities Fund | 15 |
Statements of Assets and Liabilities | 21 |
Statements of Operations | 22 |
Statements of Changes in Net Assets | 24 |
Financial Highlights | 26 |
Notes to Financial Statements | 29 |
Report of Independent Registered Public Accounting Firm | 47 |
Interested and Independent Trustees of the Trust | 48 |
Officers of the Trust | 49 |
Fund Expense Examples | 50 |
Shareholder Information | 52 |
Board Considerations in Connection with the Annual Review of the Investment Advisory Agreement | 53 |
Driehaus Active Income Fund — Portfolio Managers’ Letter |
Dear Fellow Shareholders,
The Driehaus Active Income Fund (“Fund”) returned 5.89% for the year ended December 31, 2019. This return compares to the Fund’s benchmark, the FTSE 3-Month T-Bill Index, which returned 2.25% for the same period and the Bloomberg Barclays US Aggregate Bond Index, which returned 8.72% for the year.
2019 was a year of broad ‘risk on’ in credit markets. Coming out of the final quarter of 2018, the Federal Reserve pivoted its stance on financial conditions, setting the stage for an accommodative backdrop throughout the year. This action in turn reignited the ‘reach for yield’ phenomenon, as investors’ appetite for yield (income) became seemingly insatiable. During the year, the option-adjusted spread (“OAS”) of the ICE BofA ML US High Yield Index tightened by 173 basis points from 533 to 360. The yield to maturity on the 10-year US Treasury Bond declined 77 basis points from 2.68% to 1.92% throughout the year as global central banks implemented accommodative policy and inflation expectations declined. Returns across corporate credit indexes were strongly positive for 2019 with the S&P/LSTA U.S. Leveraged Loan 100 Index returning 10.65% for the year, the BAML US Corporate (Investment Grade) Index returning 14.23% for the year and the BAML High Yield Index returning 14.41% during 2019. While 2019 was a strong year for risk assets in general, there was dispersion in the returns of certain sectors of the high yield universe including energy, retail, and telecommunications and across the credit quality spectrum, where CCC rated credit materially underperformed the high yield index.
The directional long strategy, which involves taking long positions in corporate debt or equity instruments with the anticipation of profiting from price movements and coupon collection in such assets, contributed the largest amount to performance. The returns on the directional long book were 18x greater than its losses. The Fund’s directional long book (81% of the fund on average) generated a 10% return on capital.
The capital structure arbitrage strategy, which is constructed to exploit potential price inefficiencies between two different securities of the same company, contributed to performance during the year, as gains on the long side of these positions were greater than the losses on the short side. This strategy has become an increasing area of opportunity throughout the year as the Fund has been able to exploit discrepancies in the pricing of various parts within capital structures.
Not surprisingly, in a year of risk on in financial markets, the Fund’s key detractors were composed of hedges. Portfolio hedges, composed of the interest rate hedge and the directional short category, were the most significant detractors for the year. Additionally, the volatility strategy, which was composed of broad market hedges with a limited risk budget, also detracted from performance. No other strategy meaningfully impacted 2019 performance.
Although the starting level of corporate spreads and global interest rates is lower than last year, we perceive the opportunity set for our absolute return mandate to be robust. Our process is based upon our belief that the corporate credit market provides consistent inefficiencies due primarily to the constrained mandates that dominate fund management within the asset class. We further believe that our ability to move across industry, ratings, duration, and asset classes allows us to systematically capitalize on these ongoing inefficiencies to provide risk-reduced yield and opportunities for capital appreciation.
Throughout 2019, we continued to improve our hedging process to maximize efficiency and lower the costs of such hedges on the portfolio. We did this primarily by increasing our allocation to short duration bonds (from 16% at December 31, 2018 to a peak of approximately 30% at October 31, 2019) and increasing our allocation to capital structure arbitrage. The result was muted volatility and limited drawdowns for the Fund, while maintaining steady income generation throughout the year.
Our objective in 2020, not surprisingly, is to continue to deliver performance that exceeds our absolute return mandate. The markets will bring new opportunities, threats, and uncertainties, and we will continue to adjust our portfolio construction in a manner that aims to deliver attractive risk adjusted returns. We will remain steadfast in our core philosophy and investment process, while continuing to refine and improve on the latter. We manage the Fund to deliver attractive risk-adjusted returns across a range of market paths and economic scenarios.
We continue to believe in our framework and processes and are optimistic about how we have positioned the Fund. The Fund’s returns over the last year were driven by our repeatable framework, which we believe is the foundation for 2020 and beyond.
1
As always, we thank you for investing alongside us in the Driehaus Active Income Fund and would like to express our gratitude for your continued confidence in our management capabilities.
Sincerely,
|
|
|
Thomas McCauley | Yoav Sharon | John Khym |
Portfolio Manager | Portfolio Manager | Assistant Portfolio Manager |


Performance is historical and does not represent future results.
Please see the following performance overview page for index description.
2
Driehaus Active Income Fund Performance Overview (unaudited) |
The performance summarized below is historical and does not represent future results. Investment returns and principal value vary, and you may have a gain or loss when you sell shares. Performance data presented measures the change in the value of an investment in the Fund, assuming reinvestment of all dividends and capital gains. Average annual total return reflects annualized change.
The table does not reflect the deduction of taxes that a shareholder would pay on Fund distributions or the redemption of Fund shares. The graph compares the results of a $25,000 investment (minimum investment) in the Fund over the last 10 fiscal year periods (which includes performance of the Predecessor Fund), with all dividends and capital gains reinvested, with the indicated indices (and dividends reinvested) for the same period.
Average Annual Total Returns as of 12/31/19 | 1 Year | 3 Years | 5 Years | 10 Years |
Driehaus Active Income Fund (LCMAX)1 | 5.89% | 1.69% | 1.91% | 1.99% |
FTSE 3-Month T-Bill Index2 | 2.25% | 1.65% | 1.05% | 0.56% |
Bloomberg Barclays U.S. Aggregate Bond Index3 | 8.72% | 4.03% | 3.05% | 3.75% |

1 The Driehaus Active Income Fund (the “Fund”) performance shown above includes the performance of the Lotsoff Capital Management Active Income Fund (the “Predecessor Fund”) for the periods before the Fund’s registration statement became effective. The Fund received the assets and liabilities of the Predecessor Fund on June 1, 2009 through a reorganization of the Predecessor Fund into the Fund. The Predecessor Fund was a nondiversified fund that was a series of another management investment company registered under the Investment Company Act of 1940, as amended. The Fund had no prior operating history prior to succeeding to the assets of the Predecessor Fund. The Fund has substantially similar investment objectives, strategies, and policies as the Predecessor Fund. Financial and performance information of the Fund includes the Predecessor Fund information.
2 The FTSE 3-Month T-Bill Index is designed to mirror the performance of the 3-month U.S. Treasury Bill. The FTSE 3-Month T-Bill Index is unmanaged and its returns reflect reinvestment of all distributions and changes in market prices.
3 The Bloomberg Barclays U.S. Aggregate Bond Index, an unmanaged index, represents securities that are SEC-registered, taxable and dollar denominated. This index covers the U.S. investment grade fixed rate bond market, with index components for government and corporate securities, mortgage pass-through securities and asset-backed securities. These major sectors are subdivided into more specific indices that are calculated and reported on a regular basis.
3
Driehaus Active Income Fund |
Shares, | Value | |||||||
BANK LOANS — 19.25% | ||||||||
Computers — 2.43% | ||||||||
McAfee LLC | ||||||||
5.55% (3-Month USD Libor+375 basis points), 9/29/241,2 | $ | 810,609 | $ | 815,169 | ||||
McAfee LLC | ||||||||
10.31% (3-Month USD Libor+850 basis points), 9/28/251,2 | 4,963,636 | 5,008,309 | ||||||
| 5,823,478 | ||||||||
Distribution/Wholesale — 2.34% | ||||||||
Fossil Group, Inc. | ||||||||
8.20% (1-Month USD Libor+650 basis points), 9/26/241,2 | 5,850,000 | 5,606,231 | ||||||
Food — 1.69% | ||||||||
Bellring Brands LLC | ||||||||
6.70% (1-Month USD Libor+500 basis points), 10/21/241,2 | 4,000,000 | 4,052,520 | ||||||
Healthcare - Services — 1.98% | ||||||||
Heartland Dental LLC | ||||||||
5.45% (3-Month USD Libor+375 basis points), 4/30/251,2 | 298,068 | 297,447 | ||||||
Heartland Dental LLC | ||||||||
6.27% (3-Month USD Libor+375 basis points), 4/30/251,2 | 6,721 | 6,707 | ||||||
Tivity Health, Inc. | ||||||||
7.05% (3-Month USD Libor+525 basis points), 3/8/261,2 | 4,433,735 | 4,445,928 | ||||||
| 4,750,082 | ||||||||
Insurance — 3.75% | ||||||||
Acrisure LLC | ||||||||
6.20% (3-Month USD Libor+425 basis points), 11/22/231,2 | 2,246,698 | 2,256,527 | ||||||
Asurion LLC | ||||||||
8.30% (3-Month USD Libor+650 basis points), 8/4/251,2 | 6,628,049 | 6,724,984 | ||||||
| 8,981,511 | ||||||||
Internet — 0.14% | ||||||||
Hoya Midco LLC | ||||||||
5.30% (3-Month USD Libor+350 basis points), 6/30/241,2 | 345,674 | 344,953 | ||||||
Shares, | Value | |||||||
Investment Companies — 2.28% | ||||||||
Larchmont Resources LLC | ||||||||
8.89% (3-Month USD Libor+700 basis point Cash, 3-Month USD Libor+900 basis point PIK), 8/7/201,2,13 | $ | 5,884,140 | $ | 5,457,540 | ||||
Media — 1.62% | ||||||||
iHeartCommunications, Inc. | ||||||||
5.69% (3-Month USD Libor+400 basis points), 5/1/261,2 | 3,841,091 | 3,878,695 | ||||||
Software — 3.02% | ||||||||
Blackboard, Inc. | ||||||||
7.91% (1-Month USD Libor+600 basis points), 6/30/241,2 | 2,492,500 | 2,457,455 | ||||||
Cerence, Inc. | ||||||||
7.78% (1-Month USD Libor+600 basis points), 10/1/241,2 | 5,000,000 | 4,775,000 | ||||||
| �� | 7,232,455 | |||||||
Total BANK LOANS (Cost $46,264,909) | 46,127,465 | |||||||
CORPORATE BONDS — 53.27% | ||||||||
Aerospace & Defense — 2.41% | ||||||||
Bombardier, Inc. (Canada) | ||||||||
8.75%, 12/1/213,4 | 2,500,000 | 2,742,187 | ||||||
TransDigm, Inc. | ||||||||
5.50%, 11/15/273 | 3,000,000 | 3,035,565 | ||||||
| 5,777,752 | ||||||||
Agriculture — 1.87% | ||||||||
Vector Group Ltd. | ||||||||
6.13%, 2/1/253,5 | 4,560,000 | 4,486,132 | ||||||
Banks — 3.93% | ||||||||
JPMorgan Chase & Co. | ||||||||
5.40% (3-Month USD Libor+347 basis points), 12/29/492,6,7 | 3,915,000 | 3,941,037 | ||||||
USB Realty Corp. | ||||||||
3.15% (3-Month USD Libor+115 basis points), 1/15/622,3,6,7 | 6,335,000 | 5,471,856 | ||||||
| 9,412,893 | ||||||||
Beverages — 0.87% | ||||||||
Cott Holdings, Inc. | ||||||||
5.50%, 4/1/253 | 2,000,000 | 2,090,247 | ||||||
Chemicals — 1.38% | ||||||||
CVR Partners LP / CVR Nitrogen Finance Corp. | ||||||||
9.25%, 6/15/233 | 3,160,000 | 3,305,018 | ||||||
Notes to Financial Statements are an integral part of this Schedule.
4
Driehaus Active Income Fund |
Shares, | Value | |||||||
Commercial Services — 1.39% | ||||||||
Nielsen Finance LLC / Nielsen Finance Co. | ||||||||
5.00%, 4/15/223 | $ | 3,309,000 | $ | 3,325,803 | ||||
Computers — 1.34% | ||||||||
NCR Corp. | ||||||||
6.38%, 12/15/235 | 3,125,000 | 3,205,100 | ||||||
Cosmetics/Personal Care — 3.00% | ||||||||
Avon International Operations, Inc. | ||||||||
7.87%, 8/15/223,5 | 4,136,000 | 4,311,332 | ||||||
Avon Products, Inc. (United Kingdom) | ||||||||
8.95%, 3/15/434 | 2,250,000 | 2,874,375 | ||||||
| 7,185,707 | ||||||||
Diversified Financial Services — 1.21% | ||||||||
ILFC E-Capital Trust I | ||||||||
3.90%, 12/21/653,7,8 | 1,906,000 | 1,510,505 | ||||||
ILFC E-Capital Trust I | ||||||||
3.90%, 12/21/657,9 | 1,750,000 | 1,386,875 | ||||||
| 2,897,380 | ||||||||
Energy-Alternate Sources — 0.44% | ||||||||
Enviva Partners LP / Enviva Partners Finance Corp. | ||||||||
6.50%, 1/15/263 | 1,000,000 | 1,069,454 | ||||||
Entertainment — 1.76% | ||||||||
Lions Gate Capital Holdings LLC | ||||||||
6.38%, 2/1/243,5 | 4,070,000 | 4,220,929 | ||||||
Insurance — 1.28% | ||||||||
Acrisure LLC / Acrisure Finance, Inc. | ||||||||
8.13%, 2/15/243,5 | 2,818,000 | 3,058,851 | ||||||
Internet — 4.90% | ||||||||
EIG Investors Corp. | ||||||||
10.88%, 2/1/245 | 7,560,000 | 7,560,590 | ||||||
Uber Technologies, Inc. | ||||||||
7.50%, 11/1/233 | 4,000,000 | 4,181,667 | ||||||
| 11,742,257 | ||||||||
Investment Companies — 1.31% | ||||||||
Compass Group Diversified Holdings LLC | ||||||||
8.00%, 5/1/263,5 | 2,868,000 | 3,131,498 | ||||||
Iron/Steel — 1.32% | ||||||||
AK Steel Corp. | ||||||||
7.63%, 10/1/215 | 3,150,000 | 3,178,596 | ||||||
Media — 5.54% | ||||||||
Cumulus Media New Holdings, Inc. | ||||||||
6.75%, 7/1/263 | 2,400,000 | 2,572,440 | ||||||
GCI LLC | ||||||||
6.88%, 4/15/255 | 3,500,000 | 3,665,782 | ||||||
Shares, | Value | |||||||
iHeartCommunications, Inc. | ||||||||
8.37%, 5/1/27 | $ | 1,200,000 | $ | 1,327,128 | ||||
LCPR Senior Secured Financing DAC (Ireland) | ||||||||
6.75%, 10/15/273,4 | 2,750,000 | 2,923,171 | ||||||
Lee Enterprises, Inc. | ||||||||
9.50%, 3/15/223 | 2,975,000 | 2,787,575 | ||||||
| 13,276,096 | ||||||||
Mining — 0.76% | ||||||||
Mountain Province Diamonds, Inc. (Canada) | ||||||||
8.00%, 12/15/223,4,5 | 1,894,000 | 1,828,725 | ||||||
Miscellaneous Manufacturing — 1.29% | ||||||||
LSB Industries, Inc. | ||||||||
9.63%, 5/1/233 | 3,000,000 | 3,095,990 | ||||||
Oil & Gas — 1.81% | ||||||||
Transocean Pontus Ltd. (Cayman Islands) | ||||||||
6.13%, 8/1/253,4,5 | 4,227,500 | 4,346,398 | ||||||
Oil & Gas Services — 1.52% | ||||||||
Archrock Partners LP / Archrock Partners Finance Corp. | ||||||||
6.00%, 10/1/22 | 1,260,000 | 1,270,741 | ||||||
Archrock Partners LP / Archrock Partners Finance Corp. | ||||||||
6.87%, 4/1/273 | 2,000,000 | 2,118,580 | ||||||
Archrock Partners LP / Archrock Partners Finance Corp. | ||||||||
6.25%, 4/1/283 | 250,000 | 257,673 | ||||||
| 3,646,994 | ||||||||
Packaging & Containers — 0.90% | ||||||||
Ardagh Packaging Finance PLC / Ardagh Holdings USA, Inc. (Ireland) | ||||||||
6.00%, 2/15/253,4 | 2,060,000 | 2,160,267 | ||||||
Pharmaceuticals — 1.77% | ||||||||
HLF Financing Sarl LLC / Herbalife International, Inc. | ||||||||
7.25%, 8/15/263,5 | 3,995,000 | 4,234,700 | ||||||
Retail — 2.52% | ||||||||
CEC Entertainment, Inc. | ||||||||
8.00%, 2/15/22 | 2,750,000 | 2,715,515 | ||||||
PetSmart, Inc. | ||||||||
5.87%, 6/1/253 | 3,250,000 | 3,320,011 | ||||||
| 6,035,526 | ||||||||
Software — 1.32% | ||||||||
Donnelley Financial Solutions, Inc. | ||||||||
8.25%, 10/15/24 | 3,098,000 | 3,174,288 | ||||||
Notes to Financial Statements are an integral part of this Schedule.
5
Driehaus Active Income Fund |
Shares, | Value | |||||||
Telecommunications — 5.11% | ||||||||
Consolidated Communications, Inc. | ||||||||
6.50%, 10/1/225 | $ | 8,451,000 | $ | 7,711,538 | ||||
Gogo Intermediate Holdings LLC / Gogo Finance Co., Inc. | ||||||||
9.87%, 5/1/243 | 3,500,000 | 3,707,867 | ||||||
HC2 Holdings, Inc. | ||||||||
11.50%, 12/1/213,5 | 872,000 | 824,040 | ||||||
| 12,243,445 | ||||||||
Trucking & Leasing — 2.32% | ||||||||
Fortress Transportation & Infrastructure Investors LLC | ||||||||
6.75%, 3/15/223,5 | 5,320,000 | 5,559,400 | ||||||
Total CORPORATE BONDS (Cost $126,995,314) | 127,689,446 | |||||||
COMMON STOCKS — 0.40% | ||||||||
Banks — 0.25% | ||||||||
Kearny Financial Corp | 43,451 | 600,928 | ||||||
Telecommunications — 0.15% | ||||||||
Consolidated Communications Holdings, Inc | 91,265 | 354,108 | ||||||
Total COMMON STOCKS (Cost $1,080,663) | 955,036 | |||||||
CONVERTIBLE PREFERRED STOCKS — 0.00% | ||||||||
Auto Manufacturers — 0.00% | ||||||||
General Motors Corp. Senior Convertible Preferred Escrow - B | ||||||||
5.25%, 3/6/34*10,11,12 | 475,000 | — | ||||||
General Motors Corp. Senior Convertible Preferred Escrow - C | ||||||||
6.25% 12/15/12*10,11,12 | 11,790,650 | — | ||||||
| — | ||||||||
Total CONVERTIBLE PREFERRED STOCKS (Cost $—) | — | |||||||
PREFERRED STOCKS — 3.27% | ||||||||
Banks — 3.27% | ||||||||
GMAC Capital Trust I | ||||||||
7.70% (3-Month USD Libor+579 basis points), 2/15/405,7 | 301,161 | 7,845,244 | ||||||
Total PREFERRED STOCKS (Cost $7,972,857) | 7,845,244 | |||||||
Shares, | Value | |||||||
PRIVATE STOCK — 0.49% | ||||||||
Investment Companies — 0.49% | ||||||||
Larchmont Resources LLC*10,12 | 7,824 | $ | 1,173,600 | |||||
Total PRIVATE STOCK (Cost $977,968) | 1,173,600 | |||||||
PURCHASED PUT OPTIONS — 0.03% | ||||||||
Fossil Group, Inc. Exercise Price: $7.00, Notional Amount: $633,500, Expiration Date: March 20, 2020* | 905 | 76,925 | ||||||
Total PURCHASED PUT OPTIONS (Premiums paid $105,920) | 76,925 | |||||||
| ||||||||
TOTAL INVESTMENTS (Cost $183,397,631) | 76.71 | % | $ | 183,867,716 | ||||
Other Assets less Liabilities | 23.29 | % | 55,815,994 | |||||
Net Assets | 100.00 | % | $ | 239,683,710 | ||||
INVESTMENT SECURITIES SOLD SHORT — (2.58)% | ||||||||
CORPORATE BONDS — (2.11)% | ||||||||
Healthcare - Services — (1.90)% | ||||||||
DaVita, Inc. | ||||||||
5.13%, 7/15/24 | $ | (2,000,000 | ) | (2,050,617 | ) | |||
Hadrian Merger Sub, Inc. | ||||||||
8.50%, 5/1/263 | (2,440,000 | ) | (2,506,719 | ) | ||||
| (4,557,336 | ) | |||||||
Software — (0.21)% | ||||||||
Blackboard, Inc. | ||||||||
10.38%, 11/15/243 | (500,000 | ) | (498,750 | ) | ||||
Total CORPORATE BONDS (Proceeds $4,735,612) | (5,056,086 | ) | ||||||
COMMON STOCKS — (0.47)% | ||||||||
Agriculture — (0.16)% | ||||||||
Vector Group Ltd. | (28,500 | ) | (381,615 | ) | ||||
Investment Companies — (0.15)% | ||||||||
Compass Diversified Holdings | (15,000 | ) | (372,900 | ) | ||||
Pharmaceuticals — (0.16)% | ||||||||
Herbalife Nutrition Ltd.* | (8,000 | ) | (381,360 | ) | ||||
Total COMMON STOCKS (Proceeds $1,060,751) | (1,135,875 | ) | ||||||
| ||||||||
TOTAL INVESTMENT SECURITIES SOLD SHORT (Proceeds $5,796,363) | (2.58 | )% | $ | (6,191,961 | ) | |||
USD LIBOR — U.S. Dollar London Interbank Offered Rate.
* | Non-income producing security. |
Notes to Financial Statements are an integral part of this Schedule.
6
Driehaus Active Income Fund |
1 | Bank loans in which the Fund invests pay interest at rates which are periodically predetermined by reference to a base lending rate plus a premium. These base lending rates are generally (i) the lending rate offered by one or more major European banks, such as the London Inter-Bank Offered Rate (“LIBOR”), (ii) the prime rate offered by one or more United States banks or (iii) the certificate of deposit rate. Certain bank loans are subject to a LIBOR floor that establishes a minimum LIBOR rate. The interest rate shown reflects the rate in effect at December 31, 2019. Bank loans generally are subject to mandatory and/or optional repayment. As a result, the actual remaining maturity may be substantially less than the stated maturities shown. |
2 | Floating rate security. Rates disclosed as of December 31, 2019. |
3 | Security is exempt from registration under Rule 144A of the Securities Act of 1933, as amended. Unless otherwise indicated, this security has been determined to be liquid under procedures established by Driehaus Mutual Funds’ (the “Trust”) Board of Trustees and may be resold in transactions exempt from registration, normally to qualified institutional buyers. The total value of these securities is $82,672,412, which represents 34% of Net Assets. |
4 | Foreign security denominated in U.S. dollars and traded in the U.S. |
5 | All or a portion of this security is pledged as collateral for short sales or derivatives transactions. |
6 | Perpetual security. Maturity date shown is the next call date or final legal maturity date, whichever comes first. |
7 | Variable rate security. Rates disclosed as of December 31, 2019. |
8 | The coupon rate equals 155 basis points plus the highest of the LIBOR 3 Month, the Constant Maturity Treasury 10 year rate, and the Constant Maturity Treasury 30 year rate, with a maximum of 12.95%. |
9 | The coupon rate equals 155 basis points plus the highest of the LIBOR 3 Month, the Constant Maturity Treasury 10 year rate, and the Constant Maturity Treasury 30 year rate, with a maximum of 14.5%. |
10 | Pursuant to procedures adopted by the Trust’s Board of Trustees, this security has been determined to be illiquid by Driehaus Capital Management LLC (the “Adviser”), investment adviser to the Fund. |
11 | Security is in default. |
12 | Security valued at fair value as determined in good faith by the Adviser, in accordance with procedures established by, and under the general supervision of, the Trust’s Board of Trustee. The security is valued using significant unobservable inputs. |
13 | Security has the ability to pay in kind (“PIK”) or pay income in cash. When applicable separate rates of such payments are disclosed. |
Percentages are stated as a percent of net assets.
Security Type | Percent of Total |
Bank Loans | 19.25% |
Corporate Bonds | 53.27% |
Common Stocks | 0.40% |
Convertible Preferred Stocks | 0.00% |
Preferred Stocks | 3.27% |
Private Stock | 0.49% |
Purchased Put Options | 0.03% |
Total Investments | 76.71% |
Other Assets less Liabilities | 23.29% |
Total Net Assets | 100.00% |
Percentages are stated as a percent of net assets.
Notes to Financial Statements are an integral part of this Schedule.
7
Driehaus Active Income Fund |
FUTURES CONTRACTS
Counterparty | Futures Contracts | Number of | Expiration | Notional | Value at | Unrealized | |||||||||||||||
Goldman Sachs | U.S. 5 Year Treasury Note | (77) | March 31, 2020 | $ | (9,166,429 | ) | $ | (9,132,924 | ) | $ | 33,505 | ||||||||||
Goldman Sachs | U.S. 10 Year Treasury Note | (47) | March 20, 2020 | (6,089,694 | ) | (6,035,829 | ) | 53,865 | |||||||||||||
Goldman Sachs | U.S. Treasury Long Bond | (10) | March 20, 2020 | (1,592,711 | ) | (1,559,063 | ) | 33,648 | |||||||||||||
TOTAL FUTURES CONTRACTS | $ | (16,848,834 | ) | $ | (16,727,816 | ) | $ | 121,018 | |||||||||||||
Notes to Financial Statements are an integral part of this Schedule.
8
Driehaus Event Driven Fund — Portfolio Managers’ Letter |
Dear Fellow Shareholders,
The Driehaus Event Driven Fund (“Fund”) returned 19.53% for the year ended December 31, 2019. This return is in comparison to the performance of the Fund’s benchmark, the S&P 500 Index (the “Benchmark”), which returned 31.49% for the same period, and the FTSE 3-Month T-Bill Index, an additional index against which the Fund’s performance may be compared, which returned 2.25%.
As financial markets completed the final year of the decade, activity in the event-driven investing category remained robust. Interestingly, while 2019 marked the fourth highest year of deal activity, it was predominantly driven by ‘mega deal’ volume1. Nearly a quarter of all merger and acquisition (M&A) activity was generated by 21 deals greater than $20 Billion. While traditional merger arbitrage activity was more concentrated in the past year, the broader range of event driven investing pushed forward at a healthy clip. With $1.8 trillion of cash piles on corporate balance sheets, companies continue to be opportunistic in implementing value unlocking actions. As a consequence of the Federal Reserve’s financial easing pivot to start the year, management teams became highly incentivized to capitalize on the extended window of historically low global rates. This manifested itself in a slew of corporate actions including M&A, refinancing, recapitalizations, and restructurings.
Within the Fund, the equity catalyst driven strategy, which seeks to place event driven trades that are expressed predominantly through equity issues, was the largest contributor for the Fund during 2019. Throughout the year, a whole range of events across the multi-strategy catalyst spectrum yielded fruitful investments. The Fund capitalized on idiosyncratic catalysts across a handful of industries, particularly in healthcare and financials. Additionally, a few select corporate spins and takeovers contributed to the category’s return.
The bond with catalyst positions, which are event driven investments that are expressed predominantly through bond issues, were the second most significant long exposure contributors to performance during the year. The strategy saw contributions across select credits that addressed their capital allocation programs during the year, through a combination of dividend cuts, debt paydowns, and refinancing activity. As we head into 2020, this strategy type composes nearly 40% of the Fund’s assets, and given our perceived opportunity set for continued corporate credit actions at this point in the cycle, we anticipate allocation to this strategy will remain healthy.
Risk arbitrage trades, which strive to capture valuation discrepancies between similar securities, also contributed to performance for the year. The Fund continued to utilize a selective approach to risk arbitrage, focusing on situations that had a line of sight to deal closure, and avoided deals with cross border regulatory risk. The Fund’s exposure in the category included cash tenders with high probabilities of success, M&A with reputable and repeat buyers, and exposures that were strengthened by (downside) valuation support.
Portfolio hedges detracted the most from Fund returns during the year. Sector Exchange Traded Funds (ETF’s) in the healthcare and financials space were used to hedge the Fund’s long single security exposures in the select industries and detracted from our equity catalyst driven holdings contribution. Portfolio hedges typically utilize sector or market ETFs, as well as options or futures. These securities are generally used to hedge unwanted exposures, such as to the equity market, foreign currencies or credit risks, or to help dampen market volatility. Portfolio hedges are established at the security, industry, asset class, or market level depending on our strongest risk adjusted profile.
Within the Fund, we seek volatility below that of the Benchmark. In 2019, Fund volatility was 7.78% versus Benchmark volatility of 12.47%. The Fund’s 100-day volatility (at December 31, 2019) was limited to 47% of the Benchmark’s volatility. Additionally, we also seek to provide some diversification from the Benchmark. For 2019, the Fund’s correlation to the Benchmark was 0.43.
As the Fund enters 2020, our focus remains committed to capitalizing on what we believe to be our repeatable process for investment ideas and trade structures. The Fund leverages unique areas of expertise to execute a multi-strategy approach to event driven investing. The result of this approach is a portfolio comprised of what we view to be the best risk-adjusted, idiosyncratic opportunities across the event driven universe. This process factors in the probability of success associated with individual value unlocking catalysts. Coupled with flexible structuring that capitalizes on a multi-strategy approach to investing, the Fund seeks to hedge exposures that are non-core to its investment thesis. Consequently, a collection of idiosyncratic catalysts is constructed which produces a portfolio that strives to be uncorrelated to broader markets while providing downside protection during periods of market duress.
1 | Source: Citigroup and Deal Logic |
9
During 2019, the Fund achieved a downside capture of 30.59%. Notably, during days when the S&P500 drawdowns eclipsed 50 basis points & 100 basis points the Fund’s downside capture was even lower, declining to 27.7% & 21.1% respectively. Importantly, the Fund produced its 2019 return profile on muted volatility, finishing the year at 7.8%. A strong return profile with minimal volatility, coupled with an emphasis on drawdown protection, produced a Sharpe ratio of 2.22 for the year.
As we head to 2020, we view the opportunity set across the catalyst spectrum to remain strong, and the Fund continues to implement our investment philosophy and process to ensure that we deploy capital into the areas that offer what we perceive to be the most compelling risk adjusted returns.
As always, we thank you for investing alongside us in the Driehaus Event Driven Fund and appreciate your continued confidence in our management capabilities.
Sincerely,
|
|
|
Michael Caldwell | Tom McCauley | Yoav Sharon |
Portfolio Manager | Portfolio Manager | Portfolio Manager |


Performance is historical and does not represent future results.
Please see the following performance overview page for index descriptions.
10
Driehaus Event Driven Fund Performance Overview (unaudited) |
The performance summarized below is historical and does not represent future results. Investment returns and principal value vary, and you may have a gain or loss when you sell shares. Performance data presented measures the change in the value of an investment in the Fund, assuming reinvestment of all dividends and capital gains.
The table does not reflect the deduction of taxes that a shareholder would pay on Fund distributions or the redemption of Fund shares. The graph compares the results of a $10,000 investment in the Fund since August 26, 2013 (the date of the Fund’s inception), with all dividends and capital gains reinvested, with the indicated indices (and dividends reinvested) for the same period.
Cumulative Total Returns as of 12/31/19 | 1 Year | 3 Years | 5 Years | Since Inception |
Driehaus Event Driven Fund (DEVDX)1 | 19.53% | 6.18% | 4.70% | 4.22% |
S&P 500 Index2 | 31.49% | 15.27% | 11.70% | 13.32% |
FTSE 3-Month T-Bill Index3 | 2.25% | 1.65% | 1.05% | 0.83% |

1 The returns for the periods prior to March 1, 2014, reflect fee waivers and/or reimbursements without which performance would have been lower.
2 The S&P 500 Index consists of 500 stocks chosen for market size, liquidity and industry group. It is a market-weighted index, with each stock’s weight in the index proportionate to its market value.
3 The FTSE 3-Month T-Bill Index is designed to mirror the performance of the 3-month U.S. Treasury Bill. The FTSE 3-Month T-Bill Index is unmanaged and its returns reflect reinvestment of all distributions and changes in market prices.
11
Driehaus Event Driven Fund |
Shares, | Value | |||||||
BANK LOANS — 10.46% | ||||||||
Distribution/Wholesale — 2.69% | ||||||||
Fossil Group, Inc. | ||||||||
8.20% (1-Month USD Libor+650 basis points), 9/26/241,2 | $ | 1,950,000 | $ | 1,868,744 | ||||
Insurance — 3.36% | ||||||||
Asurion LLC | ||||||||
8.30% (3-Month USD Libor+650 basis points), 8/4/251,2 | 2,300,000 | 2,333,637 | ||||||
Media — 1.66% | ||||||||
NEP Group, Inc. | ||||||||
8.80% (3-Month USD Libor+700 basis points), 10/19/261,2 | 1,269,676 | 1,152,231 | ||||||
Software — 2.75% | ||||||||
Cerence, Inc. | ||||||||
7.78% (1-Month USD Libor+600 basis points), 10/1/241,2 | 2,000,000 | 1,910,000 | ||||||
Total BANK LOANS (Cost $7,222,398) | 7,264,612 | |||||||
CORPORATE BONDS — 28.71% | ||||||||
Agriculture — 3.23% | ||||||||
Vector Group Ltd. | ||||||||
6.13%, 2/1/253,4 | 2,281,000 | 2,244,050 | ||||||
Banks — 3.36% | ||||||||
USB Realty Corp. | ||||||||
3.15% (3-Month USD Libor+115 basis points), 1/15/623,4,5,6 | 2,698,000 | 2,330,397 | ||||||
Cosmetics/Personal Care — 3.68% | ||||||||
Avon Products, Inc. (United Kingdom) | ||||||||
8.95%, 3/15/437 | 2,000,000 | 2,555,000 | ||||||
Diversified Financial Services — 2.59% | ||||||||
ILFC E-Capital Trust I | ||||||||
3.90%, 12/21/653,4,6,8 | 2,269,000 | 1,798,183 | ||||||
Internet — 2.67% | ||||||||
EIG Investors Corp. | ||||||||
10.87%, 2/1/24 | 1,850,000 | 1,850,144 | ||||||
Lodging — 2.47% | ||||||||
Arrow Bidco LLC | ||||||||
9.50%, 3/15/243,4 | 1,785,000 | 1,718,063 | ||||||
Pharmaceuticals — 1.37% | ||||||||
HLF Financing Sarl LLC / Herbalife International, Inc. | ||||||||
7.25%, 8/15/263 | 900,000 | 954,000 | ||||||
Retail — 1.42% | ||||||||
CEC Entertainment, Inc. | ||||||||
8.00%, 2/15/22 | 1,000,000 | 987,460 | ||||||
Shares, | Value | |||||||
Telecommunications — 7.92% | ||||||||
Consolidated Communications, Inc. | ||||||||
6.50%, 10/1/224 | $ | 3,377,000 | $ | 3,081,512 | ||||
HC2 Holdings, Inc. | ||||||||
11.50%, 12/1/213,4 | 2,558,500 | 2,417,783 | ||||||
| 5,499,295 | ||||||||
Total CORPORATE BONDS (Cost $19,881,492) | 19,936,592 | |||||||
CONVERTIBLE CORPORATE BONDS — 2.17% | ||||||||
Pharmaceuticals — 1.17% | ||||||||
Cytokinetics, Inc. | ||||||||
4.00%, 11/15/26 | 700,000 | 815,500 | ||||||
Telecommunications — 1.00% | ||||||||
Gogo, Inc. | ||||||||
6.00%, 5/15/22 | 560,000 | 694,400 | ||||||
Total CONVERTIBLE CORPORATE BONDS (Cost $1,319,749) | 1,509,900 | |||||||
COMMON STOCKS — 48.48% | ||||||||
Advertising — 0.96% | ||||||||
Clear Channel Outdoor Holdings, Inc.* | 232,972 | 666,300 | ||||||
Banks — 3.99% | ||||||||
HarborOne Bancorp, Inc.4 | 124,593 | 1,369,277 | ||||||
Kearny Financial Corp.4 | 101,547 | 1,404,395 | ||||||
| 2,773,672 | ||||||||
Biotechnology — 11.29% | ||||||||
Aptose Biosciences, Inc. (Canada)*,7 | 157,219 | 891,432 | ||||||
Argenx SE ADR (Netherlands)*4,7 | 13,028 | 2,091,255 | ||||||
BELLUS Health, Inc. (Canada)*7 | 25,991 | 197,532 | ||||||
Blueprint Medicines Corp.*7 . | 6,628 | 530,969 | ||||||
Ideaya Biosciences, Inc.*9 | 150,637 | 1,129,777 | ||||||
Medicines Co./The*7 | 16,000 | 1,359,040 | ||||||
Orchard Therapeutics plc ADR (United Kingdom)* | 119,163 | 1,638,491 | ||||||
| 7,838,496 | ||||||||
Healthcare - Products — 3.11% | ||||||||
Alphatec Holdings, Inc.* | 84,079 | 596,540 | ||||||
SI-BONE, Inc.*4 | 66,292 | 1,425,278 | ||||||
ViewRay, Inc.* | 32,567 | 137,433 | ||||||
| 2,159,251 | ||||||||
Healthcare - Services — 0.44% | ||||||||
Vapotherm, Inc.* | 25,141 | 305,715 | ||||||
Holding Companies-Diversified — 3.90% | ||||||||
Diamond Eagle Acquisition Corp.*4 | 117,000 | 1,262,430 | ||||||
Notes to Financial Statements are an integral part of this Schedule.
12
Driehaus Event Driven Fund |
Shares, | Value | |||||||
Healthcare Merger Corp.* | 140,000 | $ | 1,449,000 | |||||
| 2,711,430 | ||||||||
Insurance — 4.31% | ||||||||
FGL Holdings (Bermuda) | 280,825 | 2,990,786 | ||||||
Pharmaceuticals — 15.20% | ||||||||
Allergan PLC | 12,669 | 2,421,933 | ||||||
Ascendis Pharma A/S ADR (Denmark)*4 | 9,659 | 1,343,760 | ||||||
Cytokinetics, Inc.*4 | 153,763 | 1,631,425 | ||||||
Merus NV (Netherlands)* | 88,356 | 1,244,052 | ||||||
MyoKardia, Inc.*4 | 32,749 | 2,386,911 | ||||||
Odonate Therapeutics, Inc.*,4 | 38,529 | 1,250,266 | ||||||
Sutro Biopharma, Inc.* | 16,946 | 186,406 | ||||||
Trevi Therapeutics, Inc.* | 23,962 | 89,858 | ||||||
| 10,554,611 | ||||||||
Savings & Loans — 0.99% | ||||||||
OceanFirst Financial Corp.4 | 26,937 | 687,971 | ||||||
Telecommunications — 4.29% | ||||||||
Consolidated Communications Holdings, Inc. | 161,919 | 628,246 | ||||||
HC2 Holdings, Inc.* | 60,025 | 130,254 | ||||||
Zayo Group Holdings, Inc.*4 . | 64,150 | 2,222,797 | ||||||
| 2,981,297 | ||||||||
Total COMMON STOCKS (Cost $30,960,903) | 33,669,529 | |||||||
CONVERTIBLE PREFERRED STOCKS — 0.00% | ||||||||
Auto Manufacturers — 0.00% | ||||||||
General Motors Corp. Senior Convertible Preferred Escrow - B | ||||||||
5.25%, 3/6/34*9,10,11 | 25,000 | — | ||||||
General Motors Corp. Senior Convertible Preferred Escrow - C | ||||||||
7.25%, 4/15/41*9,10,11 | 162,750 | — | ||||||
| — | ||||||||
Total CONVERTIBLE PREFERRED STOCKS (Cost $1,877) | — | |||||||
PRIVATE PREFERRED STOCK — 0.59% | ||||||||
Biotechnology — 0.59% | ||||||||
14ner Oncology, Inc. Private Equity9,11 | 550,000 | 412,500 | ||||||
Total PRIVATE PREFERRED STOCK (Cost $550,000) | 412,500 | |||||||
Shares, | Value | |||||||
WARRANTS — 0.32% | ||||||||
AdaptHealth Corp.* | 69,352 | $ | 126,568 | |||||
Diamond Eagle Acquisition Corp.4 | 39,000 | 94,770 | ||||||
X4 Pharmaceuticals, Inc.*9,11 | 5,547 | — | ||||||
Total WARRANTS (Cost $121,220) | 221,338 | |||||||
| ||||||||
TOTAL INVESTMENTS (Cost $60,057,639) | 90.73 | % | $ | 63,014,471 | ||||
Other Assets less Liabilities | 9.27 | % | 6,440,558 | |||||
Net Assets | 100.00 | % | $ | 69,455,029 | ||||
INVESTMENT SECURITIES SOLD SHORT — (22.61)% | ||||||||
CORPORATE BONDS — (1.54)% | ||||||||
Healthcare - Services — (1.54)% | ||||||||
Hadrian Merger Sub, Inc. 8.50%, 5/1/263 | $ | (1,041,000 | ) | (1,069,465 | ) | |||
Total CORPORATE BONDS (Proceeds $994,837) | (1,069,465 | ) | ||||||
COMMON STOCKS — (1.59)% | ||||||||
Pharmaceuticals — (1.49)% | ||||||||
AbbVie, Inc | (10,971 | ) | (971,372 | ) | ||||
Herbalife Nutrition Ltd.* | (1,306 | ) | (62,257 | ) | ||||
| (1,033,629 | ) | |||||||
Agriculture — (0.10)% | ||||||||
Vector Group Ltd. | (5,278 | ) | (70,673 | ) | ||||
Total COMMON STOCKS (Proceeds $849,006) | (1,104,302 | ) | ||||||
EXCHANGE-TRADED FUNDS — (19.48)% | ||||||||
iShares Nasdaq Biotechnology ETF | (32,760 | ) | (3,947,908 | ) | ||||
SPDR S&P Biotech ETF | (80,260 | ) | (7,633,528 | ) | ||||
SPDR S&P Regional Banking ETF | (33,415 | ) | (1,946,424 | ) | ||||
Total EXCHANGE-TRADED FUNDS (Proceeds $11,383,240) | (13,527,860 | ) | ||||||
| ||||||||
TOTAL INVESTMENT SECURITIES SOLD SHORT (Proceeds $13,227,083) | (22.61 | )% | $ | (15,701,627 | ) | |||
ADR – American Depositary Receipt
USD Libor – U.S. Dollar London Interbank Offered Rate.
* | Non-income producing security. |
1 | Bank loans in which the Fund invests pay interest at rates which are periodically predetermined by reference to a base lending rate plus a premium. These base lending rates are generally (i) the lending rate offered by one or more major European banks, such as the London Inter-Bank Offered Rate (“LIBOR”), |
Notes to Financial Statements are an integral part of this Schedule.
13
Driehaus Event Driven Fund |
(ii) the prime rate offered by one or more United States banks or (iii) the certificate of deposit rate. Certain bank loans are subject to a LIBOR floor that establishes a minimum LIBOR rate. The interest rate shown reflects the rate in effect at December 31, 2019. Bank loans generally are subject to mandatory and/or optional repayment. As a result, the actual remaining maturity may be substantially less than the stated maturities shown.
2 | Floating rate security. Rates disclosed as of December 31, 2019. |
3 | Security is exempt from registration under Rule 144A of the Securities Act of 1933, as amended. Unless otherwise indicated, this security has been determined to be liquid under procedures established by Driehaus Mutual Funds’ (the “Trust”) Board of Trustees and may be resold in transactions exempt from registration, normally to qualified institutional buyers. The total value of these securities is $10,393,011, which represents 15% of Net Assets. |
4 | All or a portion of this security is pledged as collateral for short sales or derivatives transactions. |
5 | Perpetual security. Maturity date shown is the next call date or final legal maturity date, whichever comes first. |
6 | Variable rate security. Rates disclosed as of December 31, 2019. |
7 | Foreign security denominated in U.S. dollars and traded in the U.S. |
8 | The coupon rate equals 155 basis points plus the highest of the LIBOR 3 Month, the Constant Maturity Treasury 10 year rate, and the Constant Maturity Treasury 30 year rate, with a maximum of 12.95%. |
9 | Pursuant to procedures adopted by the Trust’s Board of Trustees, this security has been determined to be illiquid by Driehaus Capital Management LLC (the “Adviser”), investment adviser to the Fund. |
10 | Security is in default. |
11 | Security valued at fair value as determined in good faith by the Adviser, in accordance with procedures established by, and under the general supervision of, the Trust’s Board of Trustee. The security is valued using significant unobservable inputs. |
Percentages are stated as a percent of net assets.
Security Type | Percent of Total |
Bank Loans | 10.46% |
Corporate Bonds | 28.71% |
Convertible Corporate Bonds | 2.17% |
Common Stocks | 48.48% |
Convertible Preferred Stocks | 0.00% |
Private Preferred Stock | 0.59% |
Warrants | 0.32% |
Total Investments | 90.73% |
Other Assets less Liabilities | 9.27% |
Total Net Assets | 100.00% |
Percentages are stated as a percent of net assets.
Notes to Financial Statements are an integral part of this Schedule.
14
Driehaus Emerging Markets Opportunities Fund — Portfolio Managers’ Letter |
Dear Fellow Shareholders,
The Driehaus Emerging Markets Opportunities Fund (“Fund”), previously the Driehaus Multi-Asset Growth Economies Fund, returned 21.64% for the year ended December 31, 2019. The Fund outperformed both its primary Benchmark and secondary Benchmark for the year. The equally weighted 50% Morgan Stanley Capital International (“MSCI”) Emerging Markets Index and 50% JP Morgan Global Bond Index Emerging Markets Global Diversified (“Benchmark”), returned 16.06% for the year, while the MSCI Emerging Markets Index returned 18.42%.
Global macroeconomic data and indicators remained choppy through much of the fourth quarter of 2019. The period, however, was marked by an apparent easing of trade war risks and liquidity conditions, first hesitantly then more decisively. This began with an announcement early in the quarter that plans for an October 15th tariff increase by the U.S. had been suspended until December 15th in anticipation of agreement on a Phase 1 trade deal. Early December news that a deal was close to being finalized and the announcement of a signing scheduled for January 15th seemed to further sideline the trade war overhang.
We believe that the Fund benefited from its flexible mandate to invest across emerging markets assets. The Fund enjoyed a higher allocation to fixed income during the middle part of the year before again increasing its allocation to equities during the fourth quarter. Combining this flexible allocation with strong stock selection allowed the Fund to outperform the MSCI Emerging Markets Equity Index while having roughly 60% of the volatility of the MSCI Emerging Markets Index.
In 2019, equity security selection in the consumer discretionary and financial sectors contributed to the Fund’s return versus the Benchmark. From a country perspective, holdings in China and Brazil made key contributions to performance.
Alibaba Group Holding Ltd. Sponsored ADR (Ticker: BABA-US) was the most significant contributor to the Fund’s return. Alibaba is the largest ecommerce marketplace and cloud computing provider in China. The company posted strong results during its annual shopping holiday Single’s Day. Additionally, the secondary listing on the Hong Kong exchange seemed to be well-received by investors which further helped to drive new capital flows into the stock. Finally, the stock also benefitted from progress in the U.S./China trade war as the market began to discount the signing of the phase one trade agreement.
For 2019, stock selection within the utilities and industrials detracted from the Fund’s returns versus the Benchmark. At the country level, equity holdings in Argentina and Chile detracted from Fund performance. In addition to these positions, Argentine Government bonds were the most notable detractor from returns, which we attribute to the positions being held while political turmoil unfolded in Argentina.
The non-equity allocations in the Fund generally consist of sovereign bonds and derivatives, including purchased and written options on currencies, interest rate swaps and foreign currency forward contracts. These positions are primarily utilized to gain exposure to certain market segments, hedge against interest rate fluctuations and manage currency risk in the Fund’s equity holdings.
In 2019, the non-equity positions, in aggregate, contributed to the Fund’s return. From a country perspective, the top contributors were in Egypt and Mexico. Additionally, our long-standing allocation to Egyptian fixed income made the country a key contributor to the Fund’s returns. The country has enjoyed a very supportive macro backdrop the past few years with inflation falling from record highs, external balances improving and finally domestic demand now starting to recover.
An improving global activity backdrop is typically good for emerging markets and generally coincides with a benign U.S. dollar environment. We think that is still the right big picture view but are concerned with currencies in countries like Brazil who have cut interest rates significantly and have little remaining real rate support. We also are concerned by the fact that stronger global growth has, thus far, not resulted in any recovery in the euro which is usually needed for a broad emerging markets FX rally. We also see a much different starting point than we did three months ago, with emerging markets dollar bond spreads extremely tight, equities having rerated and currencies looking more fairly valued. We don’t see the scope for another beta rally in emerging markets like we have had since October 2019. These concerns pre-dated the outbreak of the coronavirus in China. While we cannot forecast the evolution of that issue, we do believe that it will make the post-Lunar New Year data hangover worse than it would have been otherwise. As a result, any sentiment toward a global demand recovery will likely remain tepid at best until coronavirus infections peak. Despite this uncertainty, we continue to look across emerging markets for the best relative value opportunities and the best prospects for earnings growth. We are encouraged by what we expect to be a broadly improving economic
15
environment as the year progresses and a lot to be excited about at the company level. We see much more going in the right direction in emerging markets right now than in the wrong direction and hope to capitalize on the opportunities provided.
We thank you for investing alongside us in the Driehaus Emerging Markets Opportunities Fund and express our gratitude for your continued confidence in our management capabilities.
Sincerely,
|
|
Richard Thies | Chad Cleaver |
Lead Portfolio Manager | Portfolio Manager |


|
|
Howard Schwab | Ayman Ahmed |
Portfolio Manager | Assistant Portfolio Manager |


Performance is historical and does not represent future results.
Please see the following performance overview page for index descriptions.
16
Driehaus Emerging Markets Opportunities Fund Performance Overview (unaudited) |
The performance summarized below is historical and does not represent future results. Investment returns and principal value vary, and you may have a gain or loss when you sell shares. Performance data presented measures the change in the value of an investment in the Fund, assuming reinvestment of all dividends and capital gains.
The table does not reflect the deduction of taxes that a shareholder would pay on Fund distributions or the redemption of Fund shares. The graph compares the results of a $10,000 investment in the Fund since April 10, 2017 (the date of the Fund’s inception), with all dividends and capital gains reinvested, with the indicated indices (and dividends reinvested) for the same period.
Cumulative Total Returns as of 12/31/19 | 1 Year | Since Inception |
Driehaus Emerging Markets Opportunities Fund (DMAGX)1 | 21.64% | 9.43% |
MSCI EM/JP Morgan GBI Blended Index2 | 16.06% | 6.97% |
MSCI Emerging Markets Index-N3 | 18.42% | 8.25% |
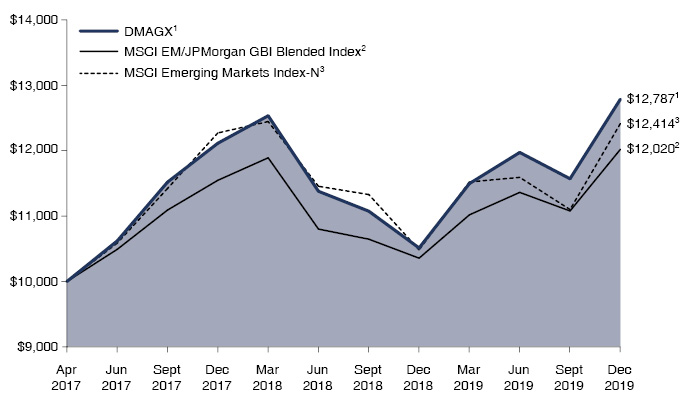
1 Prior to January 29, 2020, the Driehaus Emerging Markets Opportunities Fund was known as the Driehaus Multi-Asset Growth Economies Fund. The returns for the period reflect fee waivers and/or reimbursements without which performance would have been lower.
2 The MSCI EM/JPMorgan GBI Blended Index is an equally weighted benchmark comprised of 50 percent by the Morgan Stanley Capital International Emerging Markets Index-Net (MSCI EM) and 50 percent by the JPMorgan Global Bond Index Emerging Markets Global Diversified (JPMorgan GBI). The MSCI EM is a market capitalization-weighted index designed to measure equity market performance in emerging markets and the JPMorgan GBI tracks debt instruments in the emerging markets. Source: Morgan Stanley Capital International Inc. and JPMorgan.
3 The Morgan Stanley Capital International Emerging Markets Index-Net (MSCI Emerging Markets Index-N) is a market capitalization-weighted index designed to measure equity market performance in emerging markets. Data is in U.S. dollars and is calculated with net dividend reinvestment. Source: Morgan Stanley Capital International Inc.
17
Driehaus Emerging Markets Opportunities Fund |
Shares, | Value | |||||||
SOVEREIGN BONDS — 26.46% | ||||||||
Brazil — 3.40% | ||||||||
Brazil Notas do Tesouro Nacional Series F | ||||||||
10.00%, 1/1/291 | $ | 1,850,000 | 1 | $ | 576,527 | |||
Brazilian Government International Bond | ||||||||
4.63%, 1/13/282 | 700,000 | 752,798 | ||||||
| 1,329,325 | ||||||||
China — 1.13% | ||||||||
China Government Bond | ||||||||
3.20%, 3/16/241 | 1,200,000 | 1 | 174,662 | |||||
China Government Bond | ||||||||
3.54%, 8/16/281 | 1,800,000 | 1 | 266,657 | |||||
| 441,319 | ||||||||
Colombia — 0.99% | ||||||||
Colombian TES | ||||||||
7.25%, 10/18/341 | 1,200,000,000 | 1 | 385,909 | |||||
Egypt — 5.03% | ||||||||
Egypt Government Bond | ||||||||
17.00%, 4/3/221 | 22,500,000 | 1 | 1,483,274 | |||||
Egypt Government International Bond | ||||||||
8.70%, 3/1/492 | 430,000 | 480,829 | ||||||
| 1,964,103 | ||||||||
Hungary — 1.33% | ||||||||
Hungary Government Bond | ||||||||
3.00%, 10/27/381 | 150,000,000 | 1 | 519,594 | |||||
Indonesia — 2.66% | ||||||||
Indonesia Treasury Bond | ||||||||
8.37%, 9/15/261 | 13,400,000,000 | 1 | 1,038,339 | |||||
Malaysia — 1.84% | ||||||||
Malaysia Government Bond | ||||||||
3.89%, 8/15/291 | 2,800,000 | 1 | 716,944 | |||||
Mexico — 3.93% | ||||||||
Mexican Bonos | ||||||||
8.00%, 12/7/231 | 100,000 | 1 | 550,915 | |||||
Mexican Bonos | ||||||||
8.50%, 11/18/381 | 163,000 | 1 | 982,312 | |||||
| 1,533,227 | ||||||||
Panama — 0.96% | ||||||||
Panama Government International Bond | ||||||||
7.13%, 1/29/262 | 300,000 | 376,025 | ||||||
Peru — 1.86% | ||||||||
Peruvian Government International Bond | ||||||||
6.95%, 8/12/311 | 2,000,000 | 1 | 727,115 | |||||
South Africa — 0.95% | ||||||||
Republic of South Africa Government Bond | ||||||||
8.50%, 1/31/371 | 5,900,000 | 1 | 373,050 | |||||
Shares, | Value | |||||||
Turkey — 1.42% | ||||||||
Turkey Government International Bond | ||||||||
7.62%, 4/26/292 | $ | 500,000 | $ | 553,070 | ||||
Ukraine — 0.96% | ||||||||
Ukraine Government International Bond | ||||||||
7.37%, 9/25/322 | 350,000 | 373,830 | ||||||
Total SOVEREIGN BONDS (Cost $9,692,254) | 10,331,850 | |||||||
EQUITY SECURITIES — 68.09% | ||||||||
Argentina — 1.28% | ||||||||
Globant SA*2,3 | 1,820 | 193,011 | ||||||
MercadoLibre, Inc.*3 | 534 | 305,416 | ||||||
| 498,427 | ||||||||
Brazil — 5.66% | ||||||||
Afya, Ltd.*2,3 | 9,252 | 250,914 | ||||||
Banco BMG SA4 | 37,500 | 91,263 | ||||||
Banco do Brasil SA | 34,398 | 451,662 | ||||||
BR Properties SA* | 58,005 | 208,793 | ||||||
Itau Unibanco Holding SA - SP ADR2 | 27,038 | 247,398 | ||||||
LOG Commercial Properties e Participacoes SA | 44,862 | 362,001 | ||||||
Petroleo Brasileiro SA - ADR2,3 | 14,217 | 226,619 | ||||||
Sul America SA | 18,688 | 278,367 | ||||||
XP, Inc. - A*2,3 | 2,362 | 90,984 | ||||||
| 2,208,001 | ||||||||
Chile — 0.59% | ||||||||
Banco Santander Chile - ADR2 | 10,011 | 230,954 | ||||||
China — 19.83% | ||||||||
AIA Group, Ltd. | 37,725 | 396,020 | ||||||
Aier Eye Hospital Group Co., Ltd. - A | 1 | 4 | ||||||
Alibaba Group Holding, Ltd. - SP ADR*2,3 | 5,454 | 1,156,793 | ||||||
China International Capital Corp. Ltd. - H4 | 105,600 | 203,549 | ||||||
China Mobile, Ltd. | 16,500 | 138,695 | ||||||
China Resources Land, Ltd. | 42,000 | 209,129 | ||||||
Jinxin Fertility Group, Ltd.*4 . | 116,000 | 155,117 | ||||||
Li Ning Co., Ltd. | 51,375 | 153,948 | ||||||
Luxshare Precision Industry Co., Ltd. | 73,472 | 384,990 | ||||||
Meituan Dianping- B* | 22,381 | 292,677 | ||||||
MTR Corp., Ltd. | 65,287 | 385,825 | ||||||
Ping An Healthcare and Technology Co., Ltd.*4 | 54,100 | 394,695 | ||||||
Ping An Insurance Group Co. of China, Ltd. - H | 47,671 | 563,441 | ||||||
Shenzhou International Group Holdings, Ltd. | 25,468 | 372,266 | ||||||
Notes to Financial Statements are an integral part of this Schedule.
18
Driehaus Emerging Markets Opportunities Fund |
Shares, | Value | |||||||
Sun Art Retail Group, Ltd. | 234,500 | $ | 284,386 | |||||
Sunac China Holdings, Ltd. | 59,000 | 352,457 | ||||||
Sunny Optical Technology Group Co., Ltd. | 11,600 | 200,819 | ||||||
Tencent Holdings, Ltd. | 22,144 | 1,067,372 | ||||||
Wuxi Biologics Cayman, Inc.*4 | 20,500 | 259,529 | ||||||
Yantai Jereh Oilfield Services Group Co., Ltd. - A | 97,900 | 519,457 | ||||||
ZTO Express Cayman, Inc. - ADR2,3 | 10,680 | 249,378 | ||||||
| 7,740,547 | ||||||||
Colombia — 1.06% | ||||||||
Bancolombia SA - SP ADR2,3 . | 7,582 | 415,418 | ||||||
Czech Republic — 0.99% | ||||||||
Moneta Money Bank AS4 | 102,637 | 384,830 | ||||||
France — 1.31% | ||||||||
L’Oreal SA | 1,732 | 512,897 | ||||||
India — 8.13% | ||||||||
HDFC Bank, Ltd. - ADR2,3 . . | 9,528 | 603,789 | ||||||
Hindustan Unilever, Ltd. | 15,386 | 414,514 | ||||||
Housing Development Finance Corp., Ltd. | 9,115 | 308,083 | ||||||
ICICI Bank, Ltd. - SP ADR2,3 | 42,382 | 639,544 | ||||||
ICICI Lombard General Insurance Co., Ltd.4 | 15,288 | 297,029 | ||||||
Kotak Mahindra Bank, Ltd. | 13,342 | 314,839 | ||||||
Maruti Suzuki India, Ltd. | 1,873 | 193,356 | ||||||
Reliance Industries, Ltd. | 19,084 | 404,803 | ||||||
| 3,175,957 | ||||||||
Indonesia — 1.03% | ||||||||
PT Bank Central Asia Tbk | 167,449 | 403,168 | ||||||
Japan — 0.57% | ||||||||
LINE Corp. - SP ADR*2,3 | 4,558 | 223,388 | ||||||
Mexico — 1.89% | ||||||||
Fibra Uno Administracion SA de CV | 251,191 | 389,125 | ||||||
Wal-Mart de Mexico SAB de CV | 121,179 | 347,050 | ||||||
| 736,175 | ||||||||
Philippines — 0.91% | ||||||||
BDO Unibank, Inc | 113,349 | 353,621 | ||||||
Poland — 0.80% | ||||||||
CD Projekt SA | 4,243 | 312,586 | ||||||
Russia — 4.24% | ||||||||
Gazprom PJSC - SP ADR2 | 26,770 | 220,264 | ||||||
LUKOIL PJSC - ADR2 | 2,456 | 243,586 | ||||||
MMC Norilsk Nickel PJSC - ADR2 | 12,921 | 394,736 | ||||||
Sberbank of Russia PJSC - SP ADR2 | 29,886 | 491,326 | ||||||
Tatneft PJSC - ADR2 | 4,110 | 303,565 | ||||||
| 1,653,477 | ||||||||
Shares, | Value | |||||||
Singapore — 0.83% | ||||||||
Sea, Ltd. - ADR*2,3 | 8,069 | $ | 324,535 | |||||
Slovenia — 0.83% | ||||||||
Nova Ljubljanska Banka dd GDR | 23,882 | 323,070 | ||||||
South Africa — 1.58% | ||||||||
Capitec Bank Holdings, Ltd. | 2,358 | 243,474 | ||||||
Clicks Group, Ltd. | 20,416 | 374,021 | ||||||
| 617,495 | ||||||||
South Korea — 5.71% | ||||||||
KB Financial Group, Inc.* | 7,615 | 313,766 | ||||||
Korea Shipbuilding & Offshore Engineering Co., Ltd.* | 2,168 | 237,150 | ||||||
Macquarie Korea Infrastructure Fund | 28,231 | 283,177 | ||||||
Samsung Electro-Mechanics Co., Ltd. | 3,327 | 359,613 | ||||||
Samsung Electronics Co., Ltd. | 16,314 | 787,169 | ||||||
SK Hynix, Inc.* | 3,046 | 247,852 | ||||||
| 2,228,727 | ||||||||
Taiwan — 6.03% | ||||||||
Accton Technology Corp | 70,023 | 392,430 | ||||||
Giant Manufacturing Co., Ltd. | 47,000 | 333,956 | ||||||
Kindom Development Co., Ltd. | 365,000 | 388,414 | ||||||
Taiwan Semiconductor Manufacturing Co., Ltd. | 112,432 | 1,241,452 | ||||||
| 2,356,252 | ||||||||
Thailand — 1.66% | ||||||||
Thai Beverage PCL | 389,070 | 257,451 | ||||||
Tisco Financial Group PCL - NVDR | 118,291 | 391,950 | ||||||
| 649,401 | ||||||||
United Arab Emirates — 0.92% | ||||||||
Network International Holdings PLC*4 | 42,395 | 359,984 | ||||||
United States — 2.24% | ||||||||
Freeport-McMoRan, Inc.3 | 17,753 | 232,919 | ||||||
Liberty Media Corp.-Liberty Formula One - C*3 | 4,347 | 199,810 | ||||||
NIKE, Inc. - B3 | 1,900 | 192,489 | ||||||
NVIDIA Corp.3 | 1,059 | 249,183 | ||||||
| 874,401 | ||||||||
Total EQUITY SECURITIES (Cost $20,444,152) | 26,583,311 | |||||||
| ||||||||
TOTAL INVESTMENTS (Cost $30,136,406) | 94.55 | % | 36,915,161 | |||||
Other Assets less Liabilities | 5.45 | % | 2,127,896 | |||||
Net Assets | 100.00 | % | $ | 39,043,057 | ||||
ADR – American Depositary Receipt
GDR – Global Depositary Receipt
Notes to Financial Statements are an integral part of this Schedule.
19
Driehaus Emerging Markets Opportunities Fund |
NVDR – Non-Voting Depository Receipt
PCL – Public Company Limited
PJSC – Public Joint Stock Company
PLC – Public Limited Company
SP ADR – Sponsored American Depositary Receipt
* | Non-income producing security. |
1 | Foreign security, par value shown in local currency. |
2 | Foreign security denominated in U.S. dollars and traded in the U.S. |
3 | All or a portion of this security is pledged as collateral for short sales or derivatives transactions. |
4 | Security is exempt from registration under Rule 144A of the Securities Act of 1933, as amended. Unless otherwise indicated, this security has been determined to be liquid under procedures established by Driehaus Mutual Funds’ (the “Trust”) Board of Trustees and may be resold in transactions exempt from registration, normally to qualified institutional buyers. The total value of these securities is $2,145,996, which represents 5% of Net Assets. |
Percentages are stated as a percent of net assets.
Security Type/Sector | Percent of Total |
Sovereign Bonds | 26.46% |
Equity Securities | 68.09% |
Total Investments | 94.55% |
Other Assets less Liabilities | 5.45% |
Total Net Assets | 100.00% |
Percentages are stated as a percent of net assets.
INTEREST RATE SWAPS
CENTRALLY CLEARED SWAP CONTRACTS
Clearing Exchange | Notional | Fixed Rate | Floating | Payment | Expiration | Value/ | |||||||||||||||
Chicago Mercantile Exchange | BRL 124,117,910 | 4.59%2 | 1- Day BRL BZDIOVRA2 | Quarterly | 1/4/2021 | $ | (16,186 | ) | |||||||||||||
Chicago Mercantile Exchange | BRL 42,126,724 | 5.83%1 | 1- Day BRL BZDIOVRA1 | Quarterly | 1/2/2023 | 34,005 | |||||||||||||||
TOTAL CENTRALLY CLEARED SWAP CONTRACTS | $ | 17,819 | |||||||||||||||||||
OTC SWAP CONTRACTS
Counterparty | Notional | Fixed Rate | Floating | Payment | Expiration | Value/ | |||||||||||||||
JP Morgan | RUB 225,000,000 | 6.65%1 | 3-Months RUB MOSKP31 | Quarterly | 11/22/2024 | $ | 8,313 | ||||||||||||||
TOTAL OTC SWAP CONTRACTS | 8,313 | ||||||||||||||||||||
TOTAL INTEREST RATE SWAPS | $ | 26,132 | |||||||||||||||||||
1 | Fund Pays the floating rate and receives the fixed rate. |
2 | Fund Pays the fixed rate and receives the floating rate. |
BRL – Brazilian Real
RUB – Russian Ruble
BZDIOVRA – Brazil Interbank Deposit Rate
MOSKP3 – NFEA MosPrime 3 Month Rate
Notes to Financial Statements are an integral part of this Schedule.
20
Statements of Assets and Liabilities December 31, 2019 |
Driehaus | Driehaus | Driehaus | ||||||||||
ASSETS: | ||||||||||||
Investment securities, at fair value (cost $183,291,711, $59,936,419 and $30,136,406, respectively) | $ | 183,790,791 | $ | 62,793,133 | $ | 36,915,161 | ||||||
Purchased options contracts, at fair value (premiums paid $105,920, $0 and $0, respectively) | 76,925 | — | — | |||||||||
Warrant securities, at fair value (cost $0, $121,220, and $0, respectively) | — | 221,338 | — | |||||||||
Foreign currency, at fair value (cost $0, $0 and $10,410, respectively) | — | — | 10,865 | |||||||||
Unrealized appreciation on open OTC swap contracts | — | — | 8,313 | |||||||||
Cash and cash equivalents | 43,742,162 | 6,675,510 | 1,265,374 | |||||||||
Collateral held at custodian for the benefit of brokers | 7,250,849 | 16,252,659 | 688,869 | |||||||||
Receivable for investment securities sold | 13,811,248 | 152,370 | 231,266 | |||||||||
Receivable for fund shares sold | 87,643 | 68,937 | — | |||||||||
Receivable for interest and dividends | 2,606,609 | 452,370 | 258,500 | |||||||||
Receivable for variation margin on futures contracts | 10,383 | — | — | |||||||||
Receivable for variation margin on centrally cleared swaps | — | — | 351 | |||||||||
Due from affiliate | — | — | 1,051 | |||||||||
Prepaid expenses | 31,048 | 13,904 | 7,029 | |||||||||
TOTAL ASSETS | 251,407,658 | 86,630,221 | 39,386,779 | |||||||||
LIABILITIES: | ||||||||||||
Payable for investment securities sold short, at fair value (proceeds $5,796,363, $13,227,083 and $0, respectively) | 6,191,961 | 15,701,627 | — | |||||||||
Payable for fund shares redeemed | 3,154,052 | 38,019 | — | |||||||||
Payable for investment securities purchased | 1,879,761 | 1,289,710 | 280,963 | |||||||||
Payable to affiliate | 135,743 | 57,085 | — | |||||||||
Payable for interest and dividends on securities sold short | 89,756 | 14,747 | — | |||||||||
Accrued shareholder services plan fees | 68,371 | 5,372 | — | |||||||||
Accrued administration and accounting fees | 32,128 | 6,892 | 4,947 | |||||||||
Accrued expenses | 172,176 | 61,740 | 57,812 | |||||||||
TOTAL LIABILITIES | 11,723,948 | 17,175,192 | 343,722 | |||||||||
NET ASSETS | $ | 239,683,710 | $ | 69,455,029 | $ | 39,043,057 | ||||||
SHARES OUTSTANDING (Unlimited shares authorized, no par value) | 25,698,497 | 6,014,407 | 3,269,016 | |||||||||
NET ASSET VALUE, OFFERING AND REDEMPTION PRICE PER SHARE | $ | 9.33 | $ | 11.55 | $ | 11.94 | ||||||
NET ASSETS CONSISTED OF THE FOLLOWING AT DECEMBER 31, 2019: | ||||||||||||
Paid-in-capital | $ | 747,931,968 | $ | 70,421,491 | $ | 32,801,801 | ||||||
Total distributable earnings (deficit) | (508,248,258 | ) | (966,462 | ) | 6,241,256 | |||||||
NET ASSETS | $ | 239,683,710 | $ | 69,455,029 | $ | 39,043,057 | ||||||
Notes to Financial Statements are an integral part of this Statement.
21
Statements of Operations For the Year Ended December 31, 2019 |
Driehaus | Driehaus | Driehaus | ||||||||||
INVESTMENT INCOME (LOSS): | ||||||||||||
Interest income (net of $0, $0, and $35,433 of non-reclaimable foreign taxes withheld, respectively) | $ | 27,503,624 | $ | 2,489,995 | $ | 905,723 | ||||||
Dividend income (net of $0, $0, and $79,578 of non-reclaimable foreign taxes withheld, respectively) | 1,292,712 | 137,217 | 478,890 | |||||||||
Total investment income | 28,796,336 | 2,627,212 | 1,384,613 | |||||||||
Expenses: | ||||||||||||
Investment advisory fees | 2,660,954 | 620,645 | 330,930 | |||||||||
Shareholder services plan fees | 636,539 | 57,273 | — | |||||||||
Administration and fund accounting fees | 358,673 | 85,299 | 80,865 | |||||||||
Transfer agent fees and expenses | 187,617 | 53,602 | 33,914 | |||||||||
Trustees’ fees | 162,637 | 19,223 | 9,802 | |||||||||
Audit and tax fees | 60,556 | 60,556 | 76,437 | |||||||||
Reports to shareholders | 59,333 | 8,373 | 782 | |||||||||
Custody fees | 58,256 | 9,691 | 36,878 | |||||||||
Legal fees | 41,371 | 5,564 | 3,274 | |||||||||
Federal and state registration fees | 36,632 | 23,299 | 20,995 | |||||||||
Chief compliance officer fees | 20,000 | 20,000 | 20,000 | |||||||||
Dividends on short positions | 764,472 | 96,538 | — | |||||||||
Interest on short positions | 1,435,963 | 62,136 | — | |||||||||
Interest expense | 155,467 | 27,708 | — | |||||||||
Miscellaneous | 158,088 | 50,834 | 58,104 | |||||||||
Total expenses | 6,796,558 | 1,200,741 | 671,981 | |||||||||
Fees paid indirectly | (16,985 | ) | (21,830 | ) | (600 | ) | ||||||
Fees waived by Adviser | — | — | (234,125 | ) | ||||||||
Net expenses | 6,779,573 | 1,178,911 | 437,256 | |||||||||
Net investment income (loss) | 22,016,763 | 1,448,301 | 947,357 | |||||||||
NET REALIZED AND UNREALIZED GAIN (LOSS) ON INVESTMENTS: | ||||||||||||
Net realized gain (loss) on transactions from: | ||||||||||||
Investments | (21,662,555 | ) | 4,678,492 | 208,507 | ||||||||
Purchased options contracts | (618,552 | ) | (158,201 | ) | (91,403 | ) | ||||||
Securities sold short | (4,101,315 | ) | 156,402 | — | ||||||||
Written options contracts | 154,020 | 16,273 | — | |||||||||
Futures contracts | (4,872,340 | ) | — | — | ||||||||
Swap contracts | — | — | 296,647 | |||||||||
Forward foreign currency contracts | — | 6,806 | (60,511 | ) | ||||||||
Foreign currency | (4 | ) | (390 | ) | (19,906 | ) | ||||||
Net realized gain (loss) on investments | (31,100,746 | ) | 4,699,382 | 333,334 | ||||||||
Change in net unrealized appreciation (depreciation) on: | ||||||||||||
Investments | 39,678,198 | 7,345,169 | 5,532,529 | |||||||||
Purchased options contracts | (28,995 | ) | 158,041 | 13,259 | ||||||||
Warrants | — | 100,118 | — | |||||||||
Securities sold short | (1,670,956 | ) | (3,592,430 | ) | — | |||||||
Futures contracts | 1,973,234 | — | — | |||||||||
Swap contracts | — | — | 6,736 | |||||||||
Forward foreign currency contracts | — | (232 | ) | 58,783 | ||||||||
Foreign currency | — | — | 816 | |||||||||
Foreign currency translations | — | — | 2,115 | |||||||||
Net change in net unrealized appreciation (depreciation) on investments | 39,951,481 | 4,010,666 | 5,614,238 | |||||||||
Net realized and unrealized gain (loss) on investments | 8,850,735 | 8,710,048 | 5,947,572 | |||||||||
NET INCREASE (DECREASE) IN NET ASSETS RESULTING FROM OPERATIONS | $ | 30,867,498 | $ | 10,158,349 | $ | 6,894,929 | ||||||
Notes to Financial Statements are an integral part of this Statement.
22
[This page intentionally left blank]
Statements of Changes in Net Assets |
Driehaus Active | Driehaus Event | |||||||||||||||
For the year | For the year | For the year | For the year | |||||||||||||
Operations: | ||||||||||||||||
Net investment income (loss) | $ | 22,016,763 | $ | 65,164,801 | $ | 1,448,301 | $ | 2,271,357 | ||||||||
Net realized gain (loss) on investments | (31,100,746 | ) | (13,038,583 | ) | 4,699,382 | 8,715,118 | ||||||||||
Net change in unrealized appreciation (depreciation) on investments | 39,951,481 | (54,923,960 | ) | 4,010,666 | (11,438,492 | ) | ||||||||||
Net increase (decrease) in net assets resulting from operations | 30,867,498 | (2,797,742 | ) | 10,158,349 | (452,017 | ) | ||||||||||
Distributions from distributable earnings to shareholders | (26,303,891 | ) | (61,286,044 | ) | (2,262,269 | ) | (1,805,482 | ) | ||||||||
Capital share transactions: | ||||||||||||||||
Proceeds from shares sold | 79,909,192 | 409,022,218 | 36,050,717 | 24,110,692 | ||||||||||||
Reinvested distributions | 9,520,893 | 30,925,792 | 2,071,307 | 1,595,256 | ||||||||||||
Cost of shares redeemed | (649,333,198 | ) | (1,115,111,267 | ) | (28,238,483 | ) | (137,420,790 | ) | ||||||||
Net increase (decrease) from capital transactions | (559,903,113 | ) | (675,163,257 | ) | 9,883,541 | (111,714,842 | ) | |||||||||
Total increase (decrease) in net assets | (555,339,506 | ) | (739,247,043 | ) | 17,779,621 | (113,972,341 | ) | |||||||||
NET ASSETS: | ||||||||||||||||
Beginning of period | $ | 795,023,216 | $ | 1,534,270,259 | $ | 51,675,408 | $ | 165,647,749 | ||||||||
End of period | $ | 239,683,710 | $ | 795,023,216 | $ | 69,455,029 | $ | 51,675,408 | ||||||||
Capital share transactions in shares: | ||||||||||||||||
Shares sold | 8,508,587 | 41,609,514 | 3,126,556 | 2,212,662 | ||||||||||||
Reinvested distributions | 1,024,936 | 3,181,505 | 181,217 | 163,616 | ||||||||||||
Shares redeemed | (69,173,948 | ) | (115,102,939 | ) | (2,468,451 | ) | (12,552,010 | ) | ||||||||
Net increase (decrease) | (59,640,425 | ) | (70,311,920 | ) | 839,322 | (10,175,732 | ) | |||||||||
Notes to Financial Statements are an integral part of this Statement.
24
Statements of Changes in Net Assets |
Driehaus | |||||||
For the year | For the year | ||||||
| $ | 947,357 | $ | 890,806 | ||||
| 333,334 | (2,333,064 | ) | |||||
| 5,614,238 | (4,311,453 | ) | |||||
| 6,894,929 | (5,753,711 | ) | |||||
| (443,723 | ) | (263,384 | ) | ||||
| 10,925,869 | 1,507,595 | ||||||
| 443,412 | 263,384 | ||||||
| (10,414,503 | ) | (7,300,204 | ) | ||||
| 954,778 | (5,529,225 | ) | |||||
| 7,405,984 | (11,546,320 | ) | |||||
| $ | 31,637,073 | $ | 43,183,393 | ||||
| $ | 39,043,057 | $ | 31,637,073 | ||||
| 920,608 | 132,325 | ||||||
| 37,514 | 26,740 | ||||||
| (873,645 | ) | (718,082 | ) | ||||
| 84,477 | (559,017 | ) | |||||
Notes to Financial Statements are an integral part of this Statement.
25
Driehaus Active Income Fund Financial Highlights |
For the year | For the year | For the year | For the year | For the year | ||||||||||||||||
Net asset value, beginning of period | $ | 9.32 | $ | 9.86 | $ | 10.18 | $ | 9.95 | $ | 10.42 | ||||||||||
INCOME (LOSS) FROM INVESTMENT OPERATIONS: | ||||||||||||||||||||
Net investment income (loss) 1 | 0.43 | 0.46 | 0.35 | 0.32 | 0.38 | |||||||||||||||
Net realized and unrealized gain (loss) on investments | 0.11 | (0.57 | ) | (0.29 | ) | 0.23 | (0.49 | ) | ||||||||||||
Total from investment operations | 0.54 | (0.11 | ) | 0.06 | 0.55 | (0.11 | ) | |||||||||||||
LESS DISTRIBUTIONS TO SHAREHOLDERS FROM: | ||||||||||||||||||||
Net investment income | (0.53 | ) | (0.43 | ) | (0.38 | ) | (0.32 | ) | (0.36 | ) | ||||||||||
Net realized gain | — | — | — | — | — | |||||||||||||||
Total distributions | (0.53 | ) | (0.43 | ) | (0.38 | ) | (0.32 | ) | (0.36 | ) | ||||||||||
Net asset value, end of period | $ | 9.33 | $ | 9.32 | $ | 9.86 | $ | 10.18 | $ | 9.95 | ||||||||||
Total Return | 5.89 | % | (1.26 | )% | 0.59 | % | 5.63 | % | (1.07 | )% | ||||||||||
SUPPLEMENTAL DATA AND RATIOS: | ||||||||||||||||||||
Net assets, end of period (in 000���s) | $ | 239,684 | $ | 795,023 | $ | 1,534,270 | $ | 2,274,827 | $ | 2,875,993 | ||||||||||
Ratio of total expenses before reimbursements, waivers, recaptures and/or fees paid indirectly to average net assets | 1.40 | % | 1.10 | % | 1.18 | % | 1.38 | % | 1.05 | % | ||||||||||
Ratio of total expenses net of reimbursements, waivers, recaptures and/or fees paid indirectly to average net assets | 1.40 | %2 | 1.10 | %2 | 1.17 | %2 | 1.38 | %2 | 1.05 | % | ||||||||||
Ratio of expenses (excluding dividends and interest on short positions and interest expense) before reimbursements, waivers, recaptures and/or fees paid indirectly to average net assets | 0.91 | % | 0.82 | % | 0.81 | % | 0.80 | % | 0.78 | % | ||||||||||
Ratio of expenses (excluding dividends and interest on short positions and interest expense) net of reimbursements, waivers, recaptures and/or fees paid indirectly to average net assets | 0.91 | %2 | 0.82 | %2 | 0.81 | %2 | 0.80 | %2 | 0.78 | % | ||||||||||
Ratio of net investment income (including dividends and interest on short positions and interest expense) net of reimbursements, waivers, recaptures and/or fees paid indirectly to average net assets | 4.55 | % | 4.70 | % | 3.53 | % | 3.20 | % | 3.69 | % | ||||||||||
Ratio of net investment income (excluding dividends and interest on short positions and interest expense) net of reimbursements, waivers, recaptures and/or fees paid indirectly to average net assets | 5.04 | % | 4.99 | % | 3.89 | % | 3.78 | % | 3.96 | % | ||||||||||
Portfolio turnover rate | 84 | % | 74 | % | 89 | % | 115 | % | 76 | % | ||||||||||
1 | Calculated based on average shares outstanding. |
2 | Such ratios are net of fees paid indirectly (see Note C in the Notes to Financial Statements). |
Notes to Financial Statements are an integral part of this Schedule.
26
Driehaus Event Driven Fund |
For the year | For the year | For the year | For the year | For the year | ||||||||||||||||
Net asset value, beginning of period | $ | 9.99 | $ | 10.79 | $ | 10.34 | $ | 9.85 | $ | 10.01 | ||||||||||
INCOME (LOSS) FROM INVESTMENT OPERATIONS: | ||||||||||||||||||||
Net investment income (loss)1 | 0.26 | 0.25 | 0.02 | 0.02 | 0.05 | |||||||||||||||
Net realized and unrealized gain (loss) on investments | 1.69 | (0.69 | ) | 0.43 | 0.59 | (0.15 | ) | |||||||||||||
Total from investment operations | 1.95 | (0.44 | ) | 0.45 | 0.61 | (0.10 | ) | |||||||||||||
LESS DISTRIBUTIONS TO SHAREHOLDERS FROM: | ||||||||||||||||||||
Net investment income | (0.39 | ) | (0.36 | ) | — | (0.09 | ) | (0.06 | ) | |||||||||||
Net realized gain | — | — | — | — | — | |||||||||||||||
Tax return of capital | — | — | — | (0.03 | ) | — | ||||||||||||||
Total distributions | (0.39 | ) | (0.36 | ) | — | (0.12 | ) | (0.06 | ) | |||||||||||
Net asset value, end of period | $ | 11.55 | $ | 9.99 | $ | 10.79 | $ | 10.34 | $ | 9.85 | ||||||||||
Total Return | 19.53 | % | (4.03 | )% | 4.35 | % | 6.25 | % | (1.08 | )% | ||||||||||
SUPPLEMENTAL DATA AND RATIOS: | ||||||||||||||||||||
Net assets, end of period (in 000’s) | $ | 69,455 | $ | 51,675 | $ | 165,648 | $ | 256,482 | $ | 232,456 | ||||||||||
Ratio of total expenses before reimbursements, waivers, recaptures and/or fees paid indirectly to average net assets | 1.93 | % | 1.90 | % | 1.77 | % | 2.03 | % | 1.86 | % | ||||||||||
Ratio of total expenses net of reimbursements, waivers, recaptures and/or fees paid indirectly to average net assets | 1.90 | %2 | 1.88 | %2 | 1.76 | %2 | 2.01 | %2 | 1.86 | % | ||||||||||
Ratio of expenses (excluding dividends and interest on short positions and interest expense) before reimbursements, waivers, recaptures and/or fees paid indirectly to average net assets | 1.63 | % | 1.59 | % | 1.46 | % | 1.44 | % | 1.43 | % | ||||||||||
Ratio of expenses (excluding dividends and interest on short positions and interest expense) net of reimbursements, waivers, recaptures and/or fees paid indirectly to average net assets | 1.60 | %2 | 1.57 | %2 | 1.45 | %2 | 1.42 | %2 | 1.43 | % | ||||||||||
Ratio of net investment income (including dividends and interest on short positions and interest expense) net of reimbursements, waivers, recaptures and/or fees paid indirectly to average net assets | 2.33 | % | 2.25 | % | 0.17 | % | 0.19 | % | 0.45 | % | ||||||||||
Ratio of net investment income (excluding dividends and interest on short positions and interest expense) net of reimbursements, waivers, recaptures and/or fees paid indirectly to average net assets | 2.63 | % | 2.57 | % | 0.48 | % | 0.78 | % | 0.89 | % | ||||||||||
Portfolio turnover rate | 111 | % | 101 | % | 198 | % | 246 | % | 400 | % | ||||||||||
1 | Calculated based on average shares outstanding. |
2 | Such ratios are net of fees paid indirectly (see Note C in the Notes to Financial Statements). |
Notes to Financial Statements are an integral part of this Schedule.
27
Driehaus Emerging Markets Opportunities Fund |
For the year | For the year | For the period | ||||||||||
Net asset value, beginning of period | $ | 9.93 | $ | 11.54 | $ | 10.00 | ||||||
INCOME (LOSS) FROM INVESTMENT OPERATIONS: | ||||||||||||
Net investment income (loss)1 | 0.29 | 0.24 | 0.17 | |||||||||
Net realized and unrealized gain (loss) on investments | 1.86 | (1.77 | ) | 1.94 | ||||||||
Total from investment operations | 2.15 | (1.53 | ) | 2.11 | ||||||||
LESS DISTRIBUTIONS TO SHAREHOLDERS FROM: | ||||||||||||
Net investment income | (0.14 | ) | — | (0.16 | ) | |||||||
Net realized gain | — | (0.08 | ) | (0.41 | ) | |||||||
Total distributions | (0.14 | ) | (0.08 | ) | (0.57 | ) | ||||||
Redemption fees added to paid-in capital | — | — | 0.00 | 4 | ||||||||
Net asset value, end of period | $ | 11.94 | $ | 9.93 | $ | 11.54 | ||||||
Total Return | 21.64 | % | (13.22 | )% | 21.14 | %2 | ||||||
SUPPLEMENTAL DATA AND RATIOS: | ||||||||||||
Net assets, end of period (in 000’s) | $ | 39,043 | $ | 31,637 | $ | 43,183 | ||||||
Ratio of total expenses before reimbursements, waivers, recaptures and/or fees paid indirectly to average net assets | 1.89 | % | 2.05 | % | 2.04 | %3 | ||||||
Ratio of total expenses net of reimbursements, waivers, recaptures and/or fees paid indirectly to average net assets | 1.23 | %5,6 | 1.75 | %5,6 | 1.75 | %3,5 | ||||||
Ratio of expenses (excluding dividends and interest on short positions and interest expense) before reimbursements, waivers, recaptures and/or fees paid indirectly to average net assets | 1.89 | % | 2.05 | % | 2.04 | %3 | ||||||
Ratio of expenses (excluding dividends and interest on short positions and interest expense) net of reimbursements, waivers, recaptures and/or fees paid indirectly to average net assets | 1.23 | %5,6 | 1.75 | %5,6 | 1.75 | %3,5 | ||||||
Ratio of net investment income (including dividends and interest on short positions and interest expense) net of reimbursements, waivers, recaptures and/or fees paid indirectly to average net assets | 2.67 | %5 | 2.19 | %5 | 2.12 | %3 | ||||||
Ratio of net investment income (excluding dividends and interest on short positions and interest expense) net of reimbursements, waivers, recaptures and/or fees paid indirectly to average net assets | 2.67 | %5 | 2.19 | %5 | 2.12 | %3,5 | ||||||
Portfolio turnover rate | 155 | % | 169 | % | 99 | %2 | ||||||
* | Fund commenced operations on April 10, 2017. |
1 | Calculated based on average shares outstanding. |
2 | Not annualized. |
3 | Annualized. |
4 | Amount represents less than $0.01 per share. |
5 | Effective May 1, 2019 the Adviser contractually agreed to waive its investment advisory fee or absorb other operating expenses to the extent necessary to ensure that total annual Fund operating expenses (other than interest, taxes, brokerage commissions, dividends and interest on short sales, other investment-related expenses, acquired fund fees and expenses, and extraordinary expenses such as litigation and other expenses not incurred in the ordinary course of the Fund’s business) would not exceed the Fund’s operating expense cap of 0.99% of average daily net assets until April 30, 2022. Prior to May 1, 2019. the annual operating expense limitation was 1.75%. |
6 | Such ratios are net of fees paid indirectly (see Note C in the Notes to Financial Statements). |
Notes to Financial Statements are an integral part of this Schedule.
28
Driehaus Mutual Funds Notes to Financial Statements |
A. ORGANIZATION AND SUMMARY OF SIGNIFICANT ACCOUNTING POLICIES
Organization
The Driehaus Mutual Funds (the “Trust”) is an open-end registered management investment company under the Investment Company Act of 1940, as amended, organized as a Delaware statutory trust, with eight separate series currently in operation. The Trust was organized under an Agreement and Declaration of Trust dated May 31, 1996, as subsequently amended and restated as of June 6, 2013 and amended as of June 4, 2015, and may issue an unlimited number of full and fractional units of beneficial interest (shares) without par value. The three series (“Funds” or each a “Fund”) included in this report are as follows: the Driehaus Active Income Fund (the “Active Income Fund”) commenced operations on June 1, 2009 following the receipt of the assets and liabilities of the Lotsoff Capital Management Active Income Fund (the “Acquired Fund”) pursuant to a plan of reorganization approved by the shareholders of the Acquired Fund. The reorganization was accomplished by a tax-free exchange of Acquired Fund shares for an equal number of shares of the Active Income Fund as of June 1, 2009. The Active Income Fund seeks to provide current income and capital appreciation. The Driehaus Event Driven Fund (the “Event Driven Fund”) commenced operations on August 26, 2013, following a tax-free exchange with the Driehaus Credit Opportunities Fund, L.P. The Event Driven Fund seeks to provide positive returns over full market cycles. The Driehaus Emerging Markets Opportunities Fund (the “Emerging Markets Opportunities Fund”) commenced operations on April 10, 2017, after succeeding to the assets of the Driehaus Emerging Markets Dividend Growth Fund, L.P. The transaction was structured to be a tax-free exchange and the cost basis and holding period of the underlying securities were carried over to the Emerging Markets Opportunities Fund. Prior to January 29, 2020 the Emerging Markets Opportunities Fund was known as the Driehaus Multi-Asset Growth Economies Fund. The Emerging Markets Opportunities Fund seeks to maximize total return.
Significant Accounting Policies
The presentation of financial statements in conformity with U.S. generally accepted accounting principles (“U.S. GAAP”) requires management to make estimates and assumptions that affect the reported amounts of assets and liabilities at the date of the financial statements and the reported amounts of income and expenses. Actual results may differ from those estimates.
The Funds, which are investment companies within the scope of Financial Accounting Standards Board (“FASB”) Accounting Standards Update 2013-08, follow accounting and reporting guidance under FASB Accounting Standards Codification Topic 946, Financial Services-Investment Companies.
Cash is held at U.S. financial institutions, and at times, may exceed the amount insured by the U.S. Federal Deposit Insurance Corporation. The Funds consider highly liquid investments, with maturities of ninety days or less when purchased to be cash equivalents, and such investments may include money market mutual fund investments. All such investments are categorized in Level 1 of the fair value hierarchy.
Securities Valuation
Investments in securities traded on a national securities exchange, including exchange-traded futures and options, are valued at the last reported sales or settlement price on the day of valuation and are generally classified as level 1. Exchange-traded securities for which no sale was reported are valued at the mean of the closing bid and ask prices from the exchange the security is primarily traded on and are generally classified as level 1. Equity certificates are valued at the last sale price of the underlying security as of the close of the primary exchange. Long-term fixed income securities are valued at the representative quoted bid price when held long or the representative quoted ask price if sold short or, if such prices are not available, at prices for securities of comparable maturity, quality and type or as determined by an independent pricing service. The pricing service provider may employ methodologies that utilize actual market transactions, broker-dealer supplied valuations or other techniques. Such techniques generally consider factors such as composite security prices, yields, maturities, call features, credit ratings and developments relating to specific securities, in arriving at valuations. Fixed income securities are generally classified as level 2. Short-term investments with remaining maturities of 60 days or less at the time of purchase are stated at amortized cost, which approximates fair value. If amortized cost does not approximate fair value, short-term securities are reported at fair value. These securities are generally classified as level 2. Swaps, forward foreign currency contracts and other financial derivatives are valued daily, primarily by an independent pricing service using pricing models and are generally classified as level 2. The pricing models use inputs that are observed from actively quoted markets such as issuer details, indices, spreads, interest rates, yield curves, dividends and exchange rates. If valuations are not available from the independent pricing service or values received are deemed not representative of fair value, values will be obtained from a third party broker-dealer or
29
Driehaus Mutual Funds |
counterparty. Investments initially valued in currencies other than the U.S. dollar are converted to the U.S. dollar using exchange rates obtained from an independent pricing service. In addition, for Emerging Markets Opportunities Fund, if quotations are not readily available, if the values have been materially affected by events occurring after the closing of a foreign market, or if there has been a movement in the U.S. market that exceeds a certain threshold, assets may be valued at fair value as determined in good faith by or under the direction of the Trust’s Board of Trustees. Events that may materially affect asset values that could cause a fair value determination include, but are not limited to: corporate announcements relating to a specific security; natural and other disasters which may impact an entire market or region; and political and other events which may be global or impact a particular country or region. The frequency with which these procedures are used cannot be predicted and may be utilized to a significant extent. To the extent utilized, securities would be considered level 2 in the hierarchy described below. Securities for which market quotations are not readily available are valued at fair value as determined in good faith in accordance with procedures established by or under the direction of the Trust’s Board of Trustees and are generally classified as level 3. Under these procedures, the Funds primarily employ a market-based approach, which may use related or comparable assets or liabilities, recent transactions, market multiples, book values and other relevant information for the investment to determine the fair value of the investment. In addition, level 3 investments in certain early stage companies may be valued based upon initial transaction prices with management conducting ongoing assessments to determine whether new information is available to support a fair value adjustment. The information management may consider in its ongoing assessments may include, but are not limited to, actual or upcoming financing or third-party sale transactions, current or forecasted performance, or regulatory approval status updates. It is possible that estimated values may differ significantly from the values that would have been used had a ready market existed for the investments, and such differences could be material.
Each Fund is subject to fair value accounting standards that define fair value, establish the framework for measuring fair value and provide a three-level hierarchy for fair valuation based upon the inputs to the valuation as of the measurement date. The three levels of the fair value hierarchy are as follows:
Level 1 – quoted prices for active markets for identical securities
Level 2 – significant observable inputs (including quoted prices for similar securities, interest rates, prepayment speeds, credit risk, etc.)
Level 3 – significant unobservable inputs (including the Fund’s own assumptions in determining the fair value of investments).
The inputs or methodology used for valuing securities are not necessarily an indication of the risk associated with investing in those securities. The following is a summary of the inputs used to value the Active Income Fund’s investments as of December 31, 2019:
Assets | Level 1 | Level 2 | Level 3 | Total | ||||||||||||
Bank Loans | $ | — | $ | 46,127,465 | $ | — | $ | 46,127,465 | ||||||||
Common Stocks | 955,036 | — | — | 955,036 | ||||||||||||
Convertible Preferred Stocks | ||||||||||||||||
Auto Manufacturers | — | — | 0 | 0 | ||||||||||||
Corporate Bonds | — | 127,689,446 | — | 127,689,446 | ||||||||||||
Preferred Stock | 7,845,244 | — | — | 7,845,244 | ||||||||||||
Private Stock | ||||||||||||||||
Investment Companies | — | — | 1,173,600 | 1,173,600 | ||||||||||||
Purchased Put Options | 76,925 | — | — | 76,925 | ||||||||||||
Total | $ | 8,877,205 | $ | 173,816,911 | $ | 1,173,600 | $ | 183,867,716 | ||||||||
Liabilities | ||||||||||||||||
Common Stocks Sold Short | $ | (1,135,875 | ) | $ | — | $ | — | $ | (1,135,875 | ) | ||||||
Corporate Bonds Sold Short | — | (5,056,086 | ) | — | (5,056,086 | ) | ||||||||||
Total | $ | (1,135,875 | ) | $ | (5,056,086 | ) | $ | — | $ | (6,191,961 | ) |
30
Driehaus Mutual Funds |
Other Financial Instruments* | Level 1 | Level 2 | Level 3 | Total | ||||||||||||
Futures Contracts | $ | 121,018 | $ | — | $ | — | $ | 121,018 | ||||||||
Total Other Financial Instruments | $ | 121,018 | $ | — | $ | — | $ | 121,018 | ||||||||
* | Other financial instruments are futures contracts, which are detailed in the Schedule of Investments. |
The following is a reconciliation of Level 3 assets for which significant unobservable inputs were used to determine fair value in the Active Income Fund:
Investments, | ||||
Balance as of December 31, 2018 | $ | 1,956,000 | ||
Realized gain (loss) | — | |||
Change in net unrealized appreciation (depreciation) | (782,400 | ) | ||
Purchases | — | |||
Sales | — | |||
Transfers in and/or out of Level 3 | — | |||
Balance as of December 31, 2019 | $ | 1,173,600 | ||
As of December 31, 2019, the Active Income Fund held Level 3 investments in General Motors Corp. senior convertible preferred stock and Larchmont Resources LLC private stock, valued at fair value as determined in good faith in accordance with procedures established by or under the direction of the Trust’s Board of Trustees. As a part of the ongoing restructuring of General Motors, any value previously ascribed to these holdings has been transferred to the General Motors Co. Motors Liquidation Co. GUC Trust common stock, which is freely and actively traded, and therefore the senior convertible preferred stock was fair valued at $0. The common stock investment in Larchmont Resources LLC has been valued using an unadjusted third-party pricing vendor quote. On December 17, 2019, the valuation technique for the Larchmont Resources LLC investment was changed from a securities dealer broker quote approach to a recovery analysis approach performed by an oil and gas broker. This change was implemented because the security had not traded and management became aware of new information while conducting its on-going valuation assessment. There were no transfers into or out of Level 3 during the year ended December 31, 2019. The following table summarizes the quantitative inputs and assumptions used for items categorized as Level 3 of the fair value hierarchy as of December 31, 2019:
Financial Assets | Fair Value at | Valuation Technique(s) | Unobservable Inputs | Price/Range | ||||||
Convertible Preferred Stock | $ | — | Cash available in relation to claim | Estimated recovery | $ | — | ||||
Private Stock | $ | 1,173,600 | Recovery analysis | N/A | N/A | |||||
31
Driehaus Mutual Funds |
The following is a summary of the inputs used to value the Event Driven Fund’s investments as of December 31, 2019:
Assets | Level 1 | Level 2 | Level 3 | Total | ||||||||||||
Bank Loans | $ | — | $ | 7,264,612 | $ | — | $ | 7,264,612 | ||||||||
Common Stocks | 33,669,529 | — | — | 33,669,529 | ||||||||||||
Convertible Corporate Bonds | — | 1,509,900 | — | 1,509,900 | ||||||||||||
Convertible Preferred Stocks | ||||||||||||||||
Auto Manufacturers | — | — | 0 | 0 | ||||||||||||
Corporate Bonds | — | 19,936,592 | — | 19,936,592 | ||||||||||||
Private Preferred Stocks | — | — | 412,500 | 412,500 | ||||||||||||
Warrants | 126,568 | 94,770 | 0 | 221,338 | ||||||||||||
Total | $ | 33,796,097 | $ | 28,805,874 | $ | 412,500 | $ | 63,014,471 | ||||||||
Liabilities | ||||||||||||||||
Common Stocks Sold Short | $ | (1,104,302 | ) | $ | — | $ | — | $ | (1,104,302 | ) | ||||||
Corporate Bonds Sold Short | — | (1,069,465 | ) | — | (1,069,465 | ) | ||||||||||
Exchange-Traded Funds Sold Short | (13,527,860 | ) | — | — | (13,527,860 | ) | ||||||||||
Total | $ | (14,632,162 | ) | $ | (1,069,465 | ) | $ | — | $ | (15,701,627 | ) | |||||
The following is a reconciliation of Level 3 assets for which significant unobservable inputs were used to determine fair value in the Event Driven Fund:
Investments, | ||||
Balance as of December 31, 2018 | $ | 830,745 | ||
Realized gain (loss) | — | |||
Change in net unrealized appreciation (depreciation) | (54,225 | ) | ||
Purchases | 550,000 | |||
Sales | — | |||
Transfers in and/or out of Level 3 | (914,020 | ) | ||
Balance as of December 31, 2019 | $ | 412,500 | ||
As of December 31, 2019, the Event Driven Fund held Level 3 investments in General Motors Corp. senior convertible preferred stock, X4 Pharmaceuticals, Inc. warrant contracts and 14ner Oncology, Inc. private preferred stock. The General Motors Corp. senior convertible preferred stock was valued in the same manner described for the Active Income Fund. X4 Pharmaceuticals, Inc. warrants were valued at $0 due to low trading volumes of the warrant contracts and the value of the underlying X4 Pharmaceuticals, Inc. common equity. The 14ner Oncology, Inc. private preferred stock was valued using a market approach as adjusted based upon an assessment of the probability assigned to a successful regulatory outcome. As of December 31, 2019, the Event Driven Fund’s investment in Ideaya Biosciences, Inc. transferred from Level 3 to Level 1 because the security commenced actively trading subsequent to a market offering. The following table summarizes the quantitative inputs and assumptions used for items categorized as Level 3 of the fair value hierarchy as of December 31, 2019:
Financial Assets | Fair Value at | Valuation Technique(s) | Unobservable Inputs | Weighted | ||||||
Convertible Preferred Stock | $ | — | Cash available in relation to claim | Estimated recovery | — | |||||
Private Preferred Stock | $ | 412,500 | Market approach discounted for regulatory milestones | Probability of achieving regulatory milestones | 75 | % | ||||
Warrant | $ | — | Market approach | Intrinsic value | $ | 0 | ||||
32
Driehaus Mutual Funds |
The following is a summary of the inputs used to value the Emerging Markets Opportunities Fund’s investments as of December 31, 2019:
Assets | Level 1 | Level 2 | Level 3 | Total | ||||||||||||
Sovereign Bonds | $ | — | $ | 10,331,850 | $ | — | $ | 10,331,850 | ||||||||
Equity Securities | 26,583,311 | — | — | 26,583,311 | ||||||||||||
Total | $ | 26,583,311 | $ | 10,331,850 | $ | — | $ | 36,915,161 | ||||||||
Other Financial Instruments* | ||||||||||||||||
Interest Rate Swaps - Asset** | $ | — | $ | 34,005 | $ | — | $ | 34,005 | ||||||||
Interest Rate Swaps - Liabilities** | — | (16,186 | ) | — | (16,186 | ) | ||||||||||
OTC Interest Rate Swaps - Asset | — | 8,313 | — | 8,313 | ||||||||||||
Total Other Financial Instruments | $ | — | $ | 26,132 | $ | — | $ | 26,132 | ||||||||
* | Other financial instruments are swap contracts, which are detailed in the Schedule of Investments. |
** | Includes cumulative appreciation (depreciation) of centrally cleared swap contracts as shown in the Schedule of Investments. Only current day’s variation margin is reported in the Statements of Assets and Liabilities. |
Securities Sold Short
The Funds are engaged in selling securities short, which obligates them to replace a borrowed security by purchasing it at market price at the time of replacement. Each Fund incurs a loss if the price of the security increases between the date of the short sale and the date on which the Fund replaces the borrowed security. Each Fund realizes a gain if the price of the security declines between those dates. Gains are limited to the price at which the Fund sold the security short, while losses are potentially unlimited in size.
The Funds are required to establish a margin account with the broker lending the security sold short. While the short sale is outstanding, the broker retains the proceeds of the short sale and the Fund must maintain a deposit with the broker consisting of cash and securities having a value equal to a specified percentage of the value of the securities sold short. Such deposit is included in “Collateral held at custodian for the benefit of brokers” on the Statements of Assets and Liabilities. Each Fund is obligated to pay any dividends or interest due on securities sold short. Such dividends and interest are recorded as an expense to the Funds on the Statements of Operations.
Federal Income Taxes
The Funds’ policy is to comply with the requirements of Subchapter M of the Internal Revenue Code that are applicable to regulated investment companies and to distribute substantially all their taxable income to their shareholders. Therefore, no Federal income tax provision is required.
The FASB’s “Accounting for Uncertainty in Income Taxes” (“Tax Statement”) requires the evaluation of tax positions taken or expected to be taken in the course of preparing the Funds’ tax returns to determine whether the tax positions are “more-likely-than-not” of being sustained by the applicable tax authority. Tax positions not deemed to meet the more-likely-than-not threshold would be recorded as a tax benefit or expense in the current year. Management has evaluated the implications of the Tax Statement and all of the uncertain tax positions and has determined that no liability is required to be recorded in the financial statements as of December 31, 2019. The Funds file tax returns with the U.S. Internal Revenue Service and various states. Taxable years ending 2019, 2018, 2017, and 2016 remain subject to examination by taxing authorities.
For Federal income tax purposes, capital loss carryforwards represent net capital losses of a fund that may be carried forward and applied against future net realized gains. On December 22, 2010, the Regulated Investment Company Modernization Act of 2010 was enacted to modernize several of the Federal income and excise tax provisions related to regulated investment companies. Under pre-enactment law, capital losses could be carried forward for up to eight years, and were required to be carried forward as short-term capital losses, irrespective of the character of the original loss. New net capital losses (those earned in taxable years beginning after December 22, 2010) may be carried forward indefinitely and must retain the character of the original loss.
33
Driehaus Mutual Funds |
At December 31, 2019, gross unrealized appreciation (depreciation) on investments, based on cost for Federal income tax purposes, were as follows:
Active | Event | Emerging | ||||||||||
Cost of investments | $ | 178,472,469 | $ | 47,454,727 | $ | 30,256,254 | ||||||
Gross unrealized appreciation | $ | 2,991,776 | $ | 5,174,170 | $ | 6,769,987 | ||||||
Gross unrealized depreciation | (3,788,490 | ) | (5,316,053 | ) | (111,080 | ) | ||||||
Net unrealized appreciation (depreciation) on investments | $ | (796,714 | ) | $ | (141,883 | ) | $ | 6,658,907 | ||||
The difference between cost amounts for financial statements and federal income tax purposes is due primarily to the tax deferral of losses on wash sales and timing differences in recognizing certain gains and losses on security transactions.
For the year ended December 31, 2019, reclassifications were recorded to total distributable earnings (deficit) and paid-in capital for any permanent tax differences. Results of operations and net assets were not affected by these reclassifications.
Active | Event | Emerging | ||||||||||
Paid-in capital | $ | 7,858 | $ | — | $ | — | ||||||
Total distributable earnings (deficit) | (7,858 | ) | — | — | ||||||||
The amount of dividends and distributions from net investment income and net realized capital gains are determined in accordance with Federal income tax regulations, which may differ from U.S. GAAP.
The tax character of distributions paid were as follows:
Active Income Fund | ||||||||
Distributions paid from: | January 1, 2019 | January 1, 2018 | ||||||
Ordinary income | $ | 26,303,891 | $ | 61,286,044 | ||||
Total distributions paid | $ | 26,303,891 | $ | 61,286,044 | ||||
Event Driven Fund | ||||||||
Distributions paid from: | January 1, 2019 | January 1, 2018 | ||||||
Ordinary income | $ | 2,262,269 | $ | 1,805,482 | ||||
Total distributions paid | $ | 2,262,269 | $ | 1,805,482 | ||||
34
Driehaus Mutual Funds |
Emerging Markets Opportunities Fund | ||||||||
Distributions paid from: | January 1, 2019 | April 10, 2018 | ||||||
Ordinary income | $ | 443,723 | $ | 233,414 | ||||
Long term capital gains distribution | — | 29,970 | ||||||
Total distributions paid | $ | 443,723 | $ | 263,384 | ||||
As of December 31, 2019, the components of accumulated earnings (deficit) were as follows:
Active | Event | Emerging | ||||||||||
Undistributed ordinary income | $ | 1,277,797 | $ | 539,724 | $ | 255,525 | ||||||
Undistributed long-term capital gains | — | — | — | |||||||||
Accumulated earnings | 1,277,797 | 539,724 | 255,525 | |||||||||
Accumulated capital and other losses | (508,729,341 | ) | (1,364,303 | ) | (702,292 | ) | ||||||
Unrealized appreciation (depreciation) on currency and foreign currency translations | — | — | 2,880 | |||||||||
Unrealized appreciation (depreciation) on swap contracts | — | — | 26,132 | |||||||||
Unrealized appreciation (depreciation) on investments, securities sold short, options and futures contracts | (796,714 | ) | (141,883 | ) | 6,659,011 | |||||||
Total accumulated earnings (deficit) | $ | (508,248,258 | ) | $ | (966,462 | ) | $ | 6,241,256 | ||||
As of December 31, 2019, the Funds had net capital loss carryforwards to offset future net capital gains, if any, to the extent provided by Treasury regulations:
Not Subject to Expiration | ||||||||
Short-Term | Long-Term | |||||||
Active Income Fund | $ | 332,112,366 | $ | 176,616,975 | ||||
Event Driven Fund | 1,364,303 | — | ||||||
Emerging Markets Opportunities Fund | 702,292 | — | ||||||
Foreign Currency Translation
The value of securities, currencies and other assets and liabilities not denominated in U.S. dollars are translated into U.S. dollar values based upon the current rates of exchange on the date of the Funds’ valuations.
Net realized foreign exchange gains or losses which are reported by the Funds result from currency gains and losses on transaction hedges arising from changes in exchange rates between the trade and settlement dates on forward contract transactions, and the difference between the amounts accrued for dividends, interest, and foreign taxes and the amounts actually received or paid in U.S. dollars for these items. Net unrealized foreign exchange gains and losses result from changes in the U.S. dollar value of assets and liabilities (other than investments in securities), which are denominated in foreign currencies, as a result of changes in exchange rates.
Net realized gain (loss) on foreign currency contracts on portfolio hedges result from the use of forward contracts to hedge portfolio positions denominated or quoted in a particular currency in order to reduce or limit exposure in that currency. At December 31, 2019, the Funds had no portfolio hedges.
The Funds do not isolate that portion of the results of operations which results from fluctuations in foreign exchange rates on investments. These fluctuations are included with the net realized gain (loss) on investments and the net change in unrealized appreciation (depreciation) on investments.
35
Driehaus Mutual Funds |
Indemnifications
Under the Trust’s organizational documents, the officers and Trustees are indemnified against certain liabilities arising out of the performance of their duties to the Trust. In addition, in the normal course of business, the Trust enters into contracts that provide general indemnifications to other parties. A Fund’s maximum exposure under these agreements is unknown as this would involve future claims that may be made against a Fund that have not yet occurred. However, the Funds have not had prior claims or losses pursuant to these contracts and expect the risk of loss to be remote.
Recent Accounting Pronouncements
In March 2017, the FASB issued ASU No. 2017-08 “Premium Amortization on Purchased Callable Debt Securities” which provides guidance related to the amortization period for certain purchased callable debt securities held at a premium. This ASU is effective for annual periods beginning after December 15, 2018, and interim periods within those annual periods, however, early adoption is permitted. The amendments in this ASU should be applied on a modified retrospective basis through a cumulative-effect adjustment directly to retained earnings as of the beginning of the period of adoption. Management has evaluated the implications of ASU No. 2017-08 and has adopted all aspects related to the amortization period for purchased callable debt securities held at a premium starting in the reporting period ended December 31, 2019. This adoption had no impact on these financial statements.
Securities Transactions, Income and Commitments
The Trust records security transactions based on trade date. Dividend income is recognized on the ex-dividend date, and interest income is recognized on an accrual basis. Discounts and premiums on securities purchased are accreted and amortized over the lives of the respective securities using the effective yield method. Withholding taxes on foreign dividends and interest have been provided for in accordance with the Trust’s understanding of the applicable country’s tax rules and rates.
Pursuant to the terms of certain of the senior unsecured loan agreements, the Funds may have unfunded loan commitments, which are callable on demand. Each Fund will have available with its custodian, cash and/or liquid securities having an aggregate value at least equal to the amount of the unfunded senior loan commitments. At December 31, 2019, the Funds had no unfunded senior loan commitments.
With respect to the senior loans held in each Fund’s portfolio, the Funds may: 1) invest in assignments; 2) act as a participant in primary lending syndicates; or 3) invest in participations. If a Fund purchases a participation of a senior loan interest, the Fund would typically enter into a contractual agreement with the lender or other third party selling the participation, rather than directly with the borrower. As such, the Fund not only assumes the credit risk of the borrower, but also that of the selling participant or other persons interpositioned between the Fund and the borrower. At December 31, 2019, the Funds had no such outstanding senior loan participation commitments.
The Event Driven Fund may invest in early-stage companies that may require additional contributions or funding if certain performance milestones are met. Management continuously assesses whether these companies will achieve these performance milestones and considers the impact of these commitments as they become due. At December 31, 2019, the Event Driven Fund had outstanding commitments, which are subject to change, to make additional investments in portfolio companies of $1,000,000.
B. INVESTMENTS IN DERIVATIVES
Each Fund uses derivative instruments such as swaps, futures, options, swaptions and forward foreign currency contracts in connection with their respective investment strategies. During the period January 1, 2019 through December 31, 2019, the Active Income Fund primarily utilized: 1) futures to hedge its interest rate and/or commodity risk and manage volatility; and 2) options to hedge downside risk and manage volatility. During the period January 1, 2019 through December 31, 2019, the Event Driven Fund primarily utilized: 1) options, including warrants, to both hedge exposure and provide exposure to certain market segments or specific securities; and 2) forward foreign currency contracts to manage currency risk in portfolio holdings. During the period January 1, 2019 through December 31, 2019, the Emerging Markets Opportunities Fund primarily utilized: 1) interest rate swaps to hedge against interest rate fluctuation and enable the parties involved to exchange fixed and floating cash flows; 2) credit default swaps as alternatives to direct investments to manage exposure to specific sectors/markets/industries and/or credit events and manage volatility; 3) options to both hedge exposure and provide exposure to certain market segments or specific securities; and 4) forward foreign currency contracts to manage currency risk in portfolio holdings. Detail regarding each derivative type is included below.
36
Driehaus Mutual Funds |
Swap Contracts
The Funds are subject to credit risk, volatility risk and interest rate risk exposure in the normal course of pursuing their investment objectives. The Funds engage in various swap transactions, including forward rate agreements and interest rate, currency, volatility, index and total return swaps, primarily to manage duration and yield curve risk, or as alternatives to direct investments. Swaps that are centrally cleared are exposed to the creditworthiness of the clearing organizations (and, consequentially, that of their members — generally, banks and broker-dealers) involved in the transaction. Centrally cleared swaps are valued daily and unrealized gains or losses are recorded in a “variation margin” account. The Fund receives from or pays to the clearing organization a specified amount of cash based upon changes in the variation margin account. When a contract is closed, the Fund recognizes a realized gain or loss.
Interest rate swaps are agreements between two parties to exchange cash flows based on a notional principal amount. The Funds may elect to pay a fixed rate and receive a floating rate or receive a fixed rate and pay a floating rate on a notional principal amount. The net interest received or paid on interest rate swap agreements is accrued daily as interest income/expense. Interest rate swaps are marked-to-market daily using fair value estimates provided by an independent pricing service. Changes in value, including accrued interest, are recorded as changes in net unrealized appreciation (depreciation) on the Statements of Operations. Unrealized appreciation is reported as an asset and unrealized depreciation is reported as a liability on the Statements of Assets and Liabilities. Gains or losses are realized upon termination of the contracts. The risk of loss under a swap contract may exceed the amount recorded as an asset or a liability.
Total return swap contracts are arrangements to exchange a market linked return for a periodic payment, both based on a notional principal amount, to hedge sector exposure and to manage exposure to specific sectors or industries and/or to gain exposure to specific markets/countries and to specific sectors/industries. To the extent that the total return of the security, index or other financial measure underlying the transaction exceeds or falls short of the offsetting interest rate obligation, the Fund will receive a payment from or make a payment to the counterparty. Total return swap contracts are marked to market daily based upon quotations from market makers and the change, if any, is recorded as a change in net unrealized appreciation (depreciation) on the Statements of Operations. Unrealized appreciation is reported as an asset and unrealized depreciation is reported as a liability on the Statements of Assets and Liabilities. Payments received or made are recorded as realized gains or losses. Gains or losses are realized upon termination of the contracts. Each Fund’s maximum risk of loss from counterparty risk is the fair value of the contract. The Funds held no total return swaps at December 31, 2019.
Volatility swaps are forward contracts on the future realized volatility of an underlying instrument. Volatility swaps are generally used to speculate on future volatility levels, trade the spread between realized and implied volatility or hedge volatility exposure of other positions. Changes in value are recorded as changes in net unrealized appreciation (depreciation) on the Statements of Operations. Unrealized gains are reported as an asset and unrealized losses are reported as a liability on the Statements of Assets and Liabilities. Gains or losses are realized upon termination of the contracts. The risk of loss under a volatility swap contract is dependent upon the volatility of the underlying instrument. The Funds held no volatility swaps at December 31, 2019.
Under the terms of a credit default swap contract, one party acts as a guarantor receiving a periodic payment that is a fixed percentage applied to a notional amount. In return, the party agrees to purchase the notional amount of the underlying instrument, at par, if a credit event occurs during the term of the contract. Each Fund may enter into credit default swaps in which the Fund acts as guarantor (a seller of protection), and may enter into credit default swaps in which the counterparty acts as guarantor (a buyer of protection). Premiums paid to or by the Funds are accrued daily and included in net realized gain (loss) on swap contracts. The contracts are marked-to-market daily using fair value estimates provided by an independent pricing service. Changes in value are recorded as unrealized appreciation (depreciation) on the Statements of Operations. Unrealized gains are reported as an asset and unrealized losses are reported as a liability on the Statements of Assets and Liabilities. Gains or losses are realized upon termination of the contracts. The risk of loss under a swap contract may exceed the amount recorded as an asset or a liability. The notional amount of a swap contract is the reference amount pursuant to which the counterparties make payments. For swaps in which the referenced obligation is an index, in the event of default of any debt security included in the corresponding index, the Fund pays or receives the percentage of the corresponding index that the defaulted security comprises (1) multiplied by the notional value and (2) multiplied by the ratio of one minus the ratio of the market value of the defaulted debt security to its par value. The Funds held no credit default swaps at December 31, 2019.
Risks associated with swap contracts include changes in the returns of underlying instruments and/or interest rates, failure of the counterparties to perform under the contracts’ terms and the possible lack of liquidity with respect to the contracts. For centrally cleared swap contracts, counterparty risk is limited due to the role of the clearinghouse. Credit
37
Driehaus Mutual Funds |
default swaps can involve greater risks than if an investor had invested in the reference obligation directly since, in addition to general market risks, credit default swaps are subject to counterparty credit risk, leverage risk, hedging risk, correlation risk and liquidity risk. The Funds disclose swap contracts on a gross basis, with no netting of contracts held with the same counterparty. As of December 31, 2019, the Emerging Markets Opportunities Fund had outstanding swap contracts as listed on the Schedule of Investments and the required collateral is included in the Statements of Assets and Liabilities. The Active Income Fund and Event Driven Fund had no outstanding swap contracts at December 31, 2019.
Futures Contracts
The Funds may enter into futures contracts to produce incremental earnings, hedge existing positions or protect against market changes in the value of equities or interest rates. Upon entering into a futures contract with a broker, a Fund is required to deposit in a segregated account a specified amount of cash or U.S. government securities. Futures contracts are valued daily and unrealized gains or losses are recorded in a “variation margin” account. Daily, the Fund receives from or pays to the broker a specified amount of cash based upon changes in the variation margin account. When a contract is closed, the Fund recognizes a realized gain or loss. Futures contracts have market risks, including the risk that the change in the value of the contract may not correlate with changes in the value of the underlying securities. With futures contracts, there is minimal counterparty credit risk to the Funds since futures contracts are exchange-traded and the exchange’s clearinghouse, as counterparty to all exchange-traded futures contracts, guarantees the futures contract against default. As of December 31, 2019, the Active Income Fund had outstanding futures contracts as listed in the Schedule of Investments and the required collateral is included in the Statements of Assets and Liabilities. The Event Driven Fund and Emerging Markets Opportunities Fund had no outstanding futures contracts at December 31, 2019.
Options Contracts
The Funds may use options, which include warrants, contracts to hedge downside risk, produce incremental earnings or protect against market changes in the value of equities or interest rates. The Funds may write covered call and put options on futures, swaps, securities or currencies the Funds own or in which they may invest. Writing put options tends to increase a Fund’s exposure to the underlying instrument. Writing call options tends to decrease a Fund’s exposure to the underlying instrument. When a Fund writes a call or put option, an amount equal to the premium received is recorded as a liability and subsequently marked to market to reflect the current value of the option written. These liabilities are reflected as written options outstanding in the Schedule of Investments. Premiums received from writing options that expire are treated as realized gains. Premiums received from writing options that are exercised or closed are added to the proceeds or offset against amounts paid on the underlying future, swap, security or currency transaction to determine the realized gain or loss. A Fund, as a writer of an option, has no control over whether the underlying future, swap, security or currency may be sold (call) or purchased (put) and, as a result, bears the market risk of an unfavorable change in the price of the future, swap, security or currency underlying the written option. The risk exists that a Fund may not be able to enter into a closing transaction because of an illiquid market. In addition, to the extent a Fund purchases an over-the-counter (“OTC”) option, it is subject to credit risk that the counterparty to the trade does not perform under the contract’s terms. The Funds are not subject to credit risk on OTC options written as the counterparty has already performed its obligation by paying the premium at the inception of the contract.
The Funds may also purchase put and call options. Purchasing call options tends to increase a Fund’s exposure to the underlying instrument. Purchasing put options tends to decrease a Fund’s exposure to the underlying instrument. A Fund pays a premium, which is included in its Schedule of Investments as an investment and subsequently marked-to-market to reflect the current value of the option. Premiums paid for purchasing options that expire are treated as realized losses. The risk associated with purchasing put and call options is limited to the premium paid. Premiums paid for purchasing options that are exercised or closed are added to the amounts paid or offset against the proceeds on the underlying future, swap, security or currency transaction to determine the realized gain or loss. When entering into purchased option contracts, a Fund bears the risk of securities prices moving unexpectedly, in which case, a Fund may not achieve the anticipated benefits of the purchased option contracts; however, the risk of loss is limited to the premium paid. As of December 31, 2019, the Active Income Fund and the Event Driven Fund had outstanding warrants and outstanding options as listed on the Schedule of Investments and the required collateral is included in the Statements of Assets and Liabilities. The Emerging Markets Opportunities Fund had no outstanding options at December 31, 2019.
38
Driehaus Mutual Funds |
Swaptions
An option on a swap contract, also called a “swaption,” is an option that gives the buyer the right, but not the obligation, to enter into a swap on a future date in exchange for paying a market-based “premium.” A call or receiver swaption gives the owner the right to receive the total return of a specified asset, reference rate, or index swap. A put or payer swaption gives the owner the right to pay the total return of a specified asset, reference rate, or index swap. Swaptions also include options that allow an existing swap to be terminated or extended by one of the counterparties. The Funds had no outstanding swaptions at December 31, 2019.
Forward Foreign Currency Contracts
The Funds use forward foreign currency contracts to manage foreign currency, to produce incremental earnings or to hedge existing positions. A forward foreign currency contract involves an obligation to purchase or sell a specific currency at a future date, which may be any fixed number of days from the date of the contract agreed upon by the parties, at a price set at the time of the contract. These contracts are principally traded in the inter-bank market conducted directly between currency traders (usually large commercial banks) and their customers.
The market value of a forward foreign currency contract fluctuates with changes in currency exchange rates. Outstanding forward foreign currency contracts are valued daily at current market rates and the resulting change in market value is recorded as change in net unrealized appreciation or depreciation on the Statements of Operations. When a forward foreign currency contract is settled, the Fund records a realized gain or loss equal to the difference between the value at the time the forward foreign currency contract was opened and the value at the time it was settled. A forward foreign currency contract may involve market risk in excess of the unrealized appreciation (depreciation) reflected on the Statements of Assets and Liabilities. In addition, the Funds could be exposed to credit risk if the counterparties are unable or unwilling to meet the terms of the contracts or market risk if the value of the foreign currency changes unfavorably. The Funds had no outstanding forward foreign currency contracts at December 31, 2019.
Equity Certificates
The Funds may invest in equity certificates, which allow the Funds to participate in the appreciation (depreciation) of the underlying security without actually owning the underlying security. These derivative instruments are purchased pursuant to an agreement with a financial institution and are valued at a calculated market price based on the value of the underlying security in accordance with the agreement. These equity certificates are subject to the credit risk of the issuing financial institution. There is no off-balance sheet risk associated with equity certificates and the Funds’ potential loss is limited to the purchase price of the securities. The Funds are exposed to credit risk associated with the counterparty to the transaction, which is monitored by the Funds’ management on a periodic basis. A Fund’s equity certificates are not subject to any master netting agreement. The Funds had no outstanding equity certificates at December 31, 2019.
Derivative Investment Holdings Categorized by Risk Exposure
Each Fund is subject to the FASB’s “Disclosures about Derivative Instruments and Hedging Activities” (the “Derivatives Statement”). The Derivatives Statement amends and expands disclosures about derivative instruments and hedging activities. The Derivatives Statement is intended to improve financial reporting about derivative instruments by requiring enhanced disclosures to enable investors to better understand how and why the Fund uses derivative instruments, how these derivative instruments are accounted for and their effects on the Funds’ financial position and results of operations.
The following table sets forth the fair value and the location in the Statements of Assets and Liabilities of the Active Income Fund’s derivative contracts by primary risk exposure as of December 31, 2019:
Asset derivatives | |||||
Risk exposure category | Statements of Assets and Liabilities location | Fair Value | |||
Equity Contracts | Purchased options, at fair value | $ | 76,925 | ||
Interest rate contracts | N/A* | 121,018 | |||
Total |
| $ | 197,943 | ||
* | Includes cumulative appreciation/depreciation of futures contracts as shown in the Schedule of Investments. Only current day’s variation margin is reported in the Statements of Assets and Liabilities. |
39
Driehaus Mutual Funds |
The following table sets forth the fair value and the location in the Statements of Assets and Liabilities of the Event Driven Fund’s derivative contracts by primary risk exposure as of December 31, 2019:
Asset derivatives | |||||
Risk exposure category | Statements of Assets and Liabilities location | Fair Value | |||
Equity contracts | Warrant securities, at fair value | $ | 221,338 | ||
Total |
| $ | 221,338 | ||
The following table sets forth the fair value and the location in the Statements of Assets and Liabilities of the Emerging Markets Opportunities Fund’s derivative contracts by primary risk exposure as of December 31, 2019:
Asset derivatives | |||||
Risk exposure category | Statements of Assets and Liabilities location | Fair Value | |||
Interest contracts | N/A* | $ | 34,005 | ||
Interest contracts | Unrealized appreciation on open OTC swap contracts | 8,313 | |||
Total |
| $ | 42,318 | ||
Liability derivatives | |||||
Risk exposure category | Statements of Assets and Liabilities location | Fair Value | |||
Interest contracts | N/A* | $ | 16,186 | ||
Total |
| $ | 16,186 | ||
* | Includes cumulative appreciation (depreciation) of centrally cleared swaps as shown in the Schedule of Investments. Only current day’s variation margin is reported in the Statements of Assets and Liabilities. |
The following table sets forth the Active Income Fund’s net realized gain (loss) by primary risk exposure and by type of derivative contract for the period January 1, 2019 through December 31, 2019:
Amount of net realized gain (loss) on derivatives | ||||||||||||
Risk exposure category | ||||||||||||
Derivative | Equity | Interest rate | Total | |||||||||
Purchased options contracts | $ | (618,552 | ) | $ | — | $ | (618,552 | ) | ||||
Written options contracts | 154,020 | — | 154,020 | |||||||||
Futures contracts | — | (4,872,340 | ) | (4,872,340 | ) | |||||||
Total | $ | (464,532 | ) | $ | (4,872,340 | ) | $ | (5,336,872 | ) | |||
40
Driehaus Mutual Funds |
The following table sets forth the Event Driven Fund’s net realized gain (loss) by primary risk exposure and by type of derivative contract for the period January 1, 2019 through December 31, 2019:
Amount of net realized gain (loss) on derivatives | ||||||||||||
Risk exposure category | ||||||||||||
Derivative | Currency | Equity | Total | |||||||||
Purchased options contracts | $ | — | $ | (158,201 | ) | $ | (158,201 | ) | ||||
Written options contracts | 16,273 | — | 16,273 | |||||||||
Forward foreign currency contracts | 6,806 | — | 6,806 | |||||||||
Total | $ | 23,079 | $ | (158,201 | ) | $ | (135,122 | ) | ||||
The following table sets forth the Emerging Markets Opportunities Fund’s net realized gain (loss) by primary risk exposure and by type of derivative contract for the period January 1, 2019 through December 31, 2019:
Amount of net realized gain (loss) on derivatives | ||||||||||||||||||||
Risk exposure category | ||||||||||||||||||||
Derivative | Credit | Currency | Equity | Interest rate | Total | |||||||||||||||
Purchased options contracts | $ | — | $ | (91,403 | ) | $ | — | $ | — | $ | (91,403 | ) | ||||||||
Forward foreign currency contracts | — | (60,511 | ) | — | — | (60,511 | ) | |||||||||||||
Equity certificates* | — | — | (10,908 | ) | — | (10,908 | ) | |||||||||||||
Swap contracts | (93,918 | ) | — | — | 390,545 | 296,647 | ||||||||||||||
Total | $ | (106,001 | ) | $ | (151,914 | ) | $ | (10,908 | ) | $ | 402,648 | $ | 133,825 | |||||||
* | Included in change in net realized gain (loss) on investments in the Statements of Operations. |
The following table sets forth the Active Income Fund’s change in net unrealized appreciation (depreciation) by primary risk exposure and by type of derivative contract for the period January 1, 2019 through December 31, 2019:
Change in net unrealized appreciation (depreciation) on derivatives | ||||||||||||
Risk exposure category | ||||||||||||
Derivative | Equity | Interest rate | Total | |||||||||
Purchased options contracts | $ | (28,995 | ) | $ | — | $ | (28,995 | ) | ||||
Futures contracts | — | 1,973,234 | 1,973,234 | |||||||||
Total | $ | (28,995 | ) | 1,973,234 | $ | 1,944,239 | ||||||
41
Driehaus Mutual Funds |
The gross notional amount and/or the number of contracts for the Active Income Fund as of December 31, 2019 are included on the Schedule of Investments. The quarterly average values of derivative investments for the period January 1, 2019 through December 31, 2019 is set forth in the table below:
Quarterly Derivative Averages | |||||
Derivative | Quarterly Average | $ Amount / | |||
Purchased options contracts | number of contracts | 2,221 | |||
Written options contracts | number of contracts | (2,040 | ) | ||
Futures contracts - Short | number of contracts | (385 | ) | ||
The following table sets forth the Event Driven Fund’s change in net unrealized appreciation (depreciation) by primary risk exposure and by type of derivative contract for the period January 1, 2019 through December 31, 2019:
Change in net unrealized appreciation (depreciation) on derivatives | ||||||||||||
Risk exposure category | ||||||||||||
Derivative | Equity | Currency | Total | |||||||||
Purchased options contracts | $ | 158,041 | $ | — | $ | 158,041 | ||||||
Forward foreign currency contracts | — | (232 | ) | (232 | ) | |||||||
Warrant contracts | 100,118 | — | 100,118 | |||||||||
Total | $ | 258,159 | $ | (232 | ) | $ | 257,927 | |||||
The gross notional amount and/or the number of contracts for the Event Driven Fund as of December 31, 2019 are included on the Schedule of Investments. The quarterly average values of derivative investments for the period January 1, 2019 through December 31, 2019 is set forth in the table below:
Quarterly Derivative Averages | |||||
Derivative | Quarterly Average | $ Amount / | |||
Purchased options contracts | number of contracts | 32 | |||
Forward foreign currency contracts - Long | gross notional amount | $ | 30,995 | ||
Forward foreign currency contracts - Short | gross notional amount | $ | 99,082 | ||
Warrant contracts | number of contracts | $ | 24,999 | ||
The following table sets forth Emerging Markets Opportunities Fund’s change in net unrealized appreciation (depreciation) by primary risk exposure and by type of derivative contract for the period January 1, 2019 through December 31, 2019:
Change in net unrealized appreciation (depreciation) on derivatives | ||||||||||||||||||||
Risk exposure category | ||||||||||||||||||||
Derivative | Credit | Equity | Currency | Interest rate | Total | |||||||||||||||
Purchased options contracts | $ | — | $ | — | $ | 13,259 | $ | — | $ | 13,259 | ||||||||||
Equity certificates* | — | 10,431 | — | — | 10,431 | |||||||||||||||
Forward foreign currency contracts | — | — | 58,783 | — | 58,783 | |||||||||||||||
Swap contracts | — | — | — | 6,736 | 6,736 | |||||||||||||||
Total | $ | — | $ | 10,431 | $ | 72,042 | $ | 6,736 | $ | 89,209 | ||||||||||
* | Included in change in net unrealized appreciation (depreciation) on investments in the Statements of Operations. |
42
Driehaus Mutual Funds |
The gross notional amount and/or the number of contracts for the Emerging Markets Opportunities Fund as of December 31, 2019 are included on the Schedule of Investments. The quarterly average values of derivative investments for the period January 1, 2019 through December 31, 2019 is set forth in the table below:
Quarterly Derivative Averages | |||||
Derivative | Quarterly Average | $ Amount / | |||
Purchased options contracts | number of contracts | 3,064,000 | |||
Swap contracts | gross notional amount | $ | 52,222,129 | ||
Forward foreign currency contracts - Long | gross notional amount | $ | 1,625,392 | ||
Forward foreign currency contracts - Short | gross notional amount | $ | 1,958,029 | ||
Disclosures about Offsetting Assets and Liabilities
The Funds are party to various agreements, including International Swaps and Derivatives Association Agreements and related Credit Support Annexes (“Master Netting Agreements” or “MNA”), which govern the terms of certain transactions with select counterparties. MNAs are designed to reduce counterparty risk associated with the relevant transactions by establishing credit protection mechanisms and providing standardization as a means of improving legal certainty. As MNAs are specific to the unique operations of different asset types, they allow each Fund to close out and net its total exposure to a counterparty in the event of default with respect to all of the transactions governed under a single agreement with that counterparty. MNAs can also help reduce counterparty risk by specifying collateral posting requirements at pre-arranged exposure levels. Securities and cash pledged as collateral are reflected as assets in the Statements of Assets and Liabilities as either a component of Investment securities at fair value or Collateral held at custodian for the benefit of brokers.
The Funds’ derivative contracts held at December 31, 2019, are not accounted for as hedging instruments under U.S. GAAP. For financial reporting purposes, the Funds do not offset financial assets and financial liabilities that are subject to MNAs or similar arrangements on the Statements of Assets and Liabilities. The settlement of futures contracts, swap contracts and exchange-traded purchased options is guaranteed by the clearinghouse or exchange the instrument is traded on and is not subject to arrangements with particular counterparties. For that reason, these instruments are excluded from the below disclosure.
Netting Agreements by type, net of amounts available for offset under a MNA and net of the related collateral received by the Emerging Markets Opportunities Fund as of December 31, 2019:
Description | Gross Amounts | Derivatives | Collateral | Net Amount1 | ||||||||||||
Unrealized appreciation on open OTC swap contracts | $ | 8,313 | $ | — | $ | — | $ | 8,313 | ||||||||
1 | Net amount represents the net amount receivable from the counterparty in the event of default. |
C. INVESTMENT ADVISORY FEES, TRANSACTIONS WITH AFFILIATES, AND ADMINISTRATIVE FEES
Richard H. Driehaus is Chairman of Driehaus Capital Management LLC (“DCM” or the “Adviser”), a registered investment adviser, and of Driehaus Securities LLC (“DS LLC”), an entity that was registered as a broker-dealer and served as of the distributor of the Funds through December 31, 2019. As of December 31, 2019, Richard H. Driehaus held a controlling interest in the Driehaus Emerging Markets Opportunities Fund and substantial, non-controlling interests in certain other Funds.
DCM serves as the Funds’ investment adviser. In return for its services to the Funds, the Funds pay the Adviser an annual management fee on a monthly basis of 0.55%, for the Active Income Fund of average daily net assets and 1.00% for Event Driven Fund of average daily net assets. From January 1, 2019 to April 30, 2019, the Emerging Markets
43
Driehaus Mutual Funds |
Opportunities Fund paid the Adviser a management fee on a monthly basis of 1.00% of average daily net assets. Effective May 1, 2019, the Emerging Markets Opportunities Fund pays the Adviser a management fee on a monthly basis of 0.90% of average daily net assets.
From January 1, 2019 to April 30, 2019, the Emerging Markets Opportunities Fund annual operating expense limitation was 1.75%. Effective May 1, 2019, DCM entered into a written agreement to cap the Emerging Markets Opportunities Fund’s annual ordinary operating expenses (other than interest, taxes, brokerage commissions, dividends and interest on short sales, other investment-related costs, acquired fund fees and expenses, and extraordinary expenses such as litigation and other expenses not incurred in the ordinary course of the Fund’s business) at 0.99% of average daily net assets until at least April 30, 2022. For this same time period, DCM is entitled to reimbursement for previously waived fees and reimbursed expenses to the extent that the Emerging Markets Opportunities Fund’s expense ratio remains below the operating expense cap in place at the time of the waiver and the current operating expense cap. At December 31, 2019, DCM owes the Emerging Markets Opportunities Fund $1,051 under this agreement, which is included in due from affiliate in the Statements of Assets and Liabilities. As of December 31, 2019, DCM had waived a total of $412,355 in fees pursuant to these expense cap agreements. DCM may recapture all or a portion of this amount no later than April 30, of the years stated below:
Emerging Markets | ||||
2020 | $ | 58,341 | ||
2021 | 119,889 | |||
2022 | 234,125 | |||
Total | $ | 412,355 | ||
The Active Income Fund incurred $2,660,954 for investment advisory fees during the period January 1, 2019 through December 31, 2019, of which $135,743 was payable to DCM at December 31, 2019. The Event Driven Fund incurred $620,645 for investment advisory fees during the period January 1, 2019 through December 31, 2019, of which $57,085 was payable to DCM at December 31, 2019. The Emerging Markets Opportunities Fund incurred $330,930 for investment advisory fees during the period January 1, 2019 through December 31, 2019, of which $0 was payable to DCM at December 31, 2019.
The Funds direct certain portfolio trades, subject to obtaining the best price and execution, to brokers who have agreed to pay a portion of the Funds’ operating expenses using part of the commissions generated. For the year ended December 31, 2019, these arrangements reduced the expenses of Driehaus Active Income Fund, Driehaus Event Driven Fund and Emerging Markets Opportunities Fund by $16,985 (0.3%), $21,830 (1.9%) and $600 (0.1%), respectively.
The Funds are permitted to purchase or sell securities from or to certain affiliated funds under specified conditions outlined in procedures adopted by the Board. The procedures have been designed to ensure that any purchase or sale of securities by a Fund from or to another fund or portfolio that is or could be considered an affiliate by virtue of having a common investment adviser (or affiliated investment advisers), common trustees and/or common officers complies with Rule 17a-7 of the 1940 Act. Further, as defined under these procedures, each transaction is effected at the current market price to minimize trading costs, where permissible. For the year ended December 31, 2019, the Funds engaged in purchases and sales of securities, pursuant to Rule 17a-7 of the 1940 Act, as follows:
Fund | Purchases | Sales | Net Realized | |||||||||
Active Income Fund | $ | — | $ | 37,396,250 | $ | (1,735,635 | ) | |||||
Event Driven Fund | 7,213,415 | — | — | |||||||||
For the year ended December 31, 2019, Driehaus Securities LLC (“DS LLC”), an affiliate registered broker-dealer, served as the the Funds’ distributor. DS LLC did not earn any compensation from the Funds for these services. DS LLC was replaced as the Funds’ distributor by Foreside Financial Services, LLC (“Foreside”), an unaffiliated registered broker-dealer effective January 1, 2020. Foreside will similarly not receive any compensation from the Funds for these services. Prior to the Funds’ appointment of Foreside, DS LLC was a party to a Fee Reimbursement Agreement (“Agreement”)
44
Driehaus Mutual Funds |
with the Active Income Fund and Event Driven Fund. The Agreement with DS LLC was terminated on December 31, 2019, and the Adviser entered into the Agreement with the Active Income Fund and Event Driven Fund effective January 1, 2020. Under these Agreements, the Funds reimbursed DS LLC and will reimburse the Adviser for certain fees paid by each entity to intermediaries who provide shareholder administrative and/or sub-transfer agency services to the Funds. Currently, the amount to be reimbursed will not exceed 0.25% of the average daily net assets held by such intermediaries. The amounts incurred and payable to DS LLC during the period January 1, 2019 through December 31, 2019 are as follows:
Fund | Shareholder | Accrued | ||||||
Active Income Fund | $ | 636,539 | $ | 68,371 | ||||
Event Driven Fund | 57,273 | 5,372 | ||||||
Certain officers of the Trust are also officers of DCM and DS LLC. The Funds pay a portion of the Chief Compliance Officer’s salary. No other officers received compensation from the Funds during the period January 1, 2019 through December 31, 2019. The Independent Trustees are compensated for their services to the Trust and such compensation is reflected as Trustees’ fees in the Statements of Operations.
UMB Fund Services, Inc. (“UMBFS”), an affiliate of UMB Financial Corporation, serves as the Funds’ administrative and accounting agent. As compensation for these services, UMBFS earns the larger of a monthly minimum fee or a monthly fee based upon each Fund’s average daily net assets. UMBFS also acts as the transfer agent and dividend disbursing agent for the Funds. For these services, UMBFS earns a monthly fee based in part on shareholder processing activity during the month.
D. INVESTMENT TRANSACTIONS
Purchases and sales of investment securities (excluding swaps, options, futures, forwards, short-term securities and U.S. government obligations) for the Active Income Fund, Event Driven Fund and Emerging Markets Opportunities Fund for the period January 1, 2019 through December 31, 2019 were as follows:
Active Income Fund | Event Driven Fund | Emerging Markets Opportunities Fund | ||||||||||||
Purchases | $ | 364,571,719 | Purchases | $ | 64,294,079 | Purchases | $ | 52,162,227 | ||||||
Sales | $ | 895,816,029 | Sales | $ | 61,965,324 | Sales | $ | 48,736,424 | ||||||
The Funds had no purchases and sales of U.S. government obligations for the period January 1, 2019 through December 31, 2019.
E. RESTRICTED SECURITIES
Restricted securities are securities that are not registered for sale under the Securities Act of 1933 or applicable foreign law and that may be resold only in transactions exempt from applicable registration. Restricted securities include Rule 144A securities which may be sold normally to qualified institutional buyers. At December 31, 2019, the Funds held restricted securities as denoted on the Schedule of Investments.
F. LINE OF CREDIT
The Funds, together with the other funds in the Trust, obtained a committed line of credit in the amount of $50,000,000. The line of credit is available primarily to meet large, unexpected shareholder redemptions subject to certain restrictions. Interest is charged at a rate per annum equal to the Federal Funds Rate in effect at the time of the borrowings plus 1.5%, or 1.75%, whichever is greater. There is a commitment fee of 0.10% of the excess of the $50,000,000 committed amount over the sum of the average daily balance of any loans, which is allocated amongst all funds that have access to the line. The Funds did not borrow under the line of credit during the year ended December 31, 2019 and thus had no outstanding balances as of that date.
45
Driehaus Mutual Funds |
G. REDEMPTION FEES
The Emerging Markets Opportunities Fund may charge a redemption fee of 2.00% of the redemption amount for shares redeemed within 60 days of purchase. The redemption fees are recorded in paid-in capital and reflected in the Statements of Changes in Net Assets.
H. SUBSEQUENT EVENTS
Events or transactions that occurred after the date of this report through the date the report was issued have been evaluated for potential impact to the financial statements. Effective January 1, 2020, Foreside Financial Services, LLC replaced DS LLC as the Funds’ distributor.
46
Report of Independent Registered Public Accounting Firm |
To the Shareholders of Driehaus Active Income Fund, Driehaus Event Driven Fund, and Driehaus Emerging Markets Opportunities Fund (formerly Driehaus Multi-Asset Growth Economies Fund) and the Board of Trustees of the Driehaus Mutual Funds
Opinion on the Financial Statements
We have audited the accompanying statements of assets and liabilities of Driehaus Active Income Fund, Driehaus Event Driven Fund, and Driehaus Emerging Markets Opportunities Fund, (collectively referred to as the “Funds”), (three of the funds constituting the Driehaus Mutual Funds (the “Trust”)), including the schedules of investments, as of December 31, 2019, and the related statements of operations and changes in net assets, and the financial highlights for each of the periods indicated in the table below and the related notes (collectively referred to as the “financial statements”). In our opinion, the financial statements present fairly, in all material respects, the financial position of each of the Funds (three of the funds constituting the Driehaus Mutual Funds) at December 31, 2019, and the results of their operations, changes in net assets and financial highlights for each of the periods indicated in the table below, in conformity with U.S. generally accepted accounting principles.
Individual fund constituting | Statement of operations | Statement of changes | Financial highlights |
Driehaus Active Income Fund
Driehaus Event Driven Fund | For the year ended December 31, 2019 | For each of the two years in the period ended December 31, 2019 | For each of the five years in the period ended December 31, 2019 |
Driehaus Emerging Markets Opportunities Fund | For the year ended December 31, 2019 | For each of the two years in the period ended December 31, 2019 | For each of the two years in the period ended December 31, 2019 and the period from April 10, 2017 (commencement of operations) through December 31, 2017 |
Basis for Opinion
These financial statements are the responsibility of the Trust’s management. Our responsibility is to express an opinion on each of the Fund’s financial statements based on our audits. We are a public accounting firm registered with the Public Company Accounting Oversight Board (United States) (“PCAOB”) and are required to be independent with respect to the Trust in accordance with the U.S. federal securities laws and the applicable rules and regulations of the Securities and Exchange Commission and the PCAOB.
We conducted our audits in accordance with the standards of the PCAOB. Those standards require that we plan and perform the audit to obtain reasonable assurance about whether the financial statements are free of material misstatement, whether due to error or fraud. The Trust is not required to have, nor were we engaged to perform, an audit of the Trust’s internal control over financial reporting. As part of our audits, we are required to obtain an understanding of internal control over financial reporting, but not for the purpose of expressing an opinion on the effectiveness of the Trust’s internal control over financial reporting. Accordingly, we express no such opinion.
Our audits included performing procedures to assess the risks of material misstatement of the financial statements, whether due to error or fraud, and performing procedures that respond to those risks. Such procedures included examining, on a test basis, evidence regarding the amounts and disclosures in the financial statements. Our procedures included confirmation of securities owned as of December 31, 2019, by correspondence with the custodians, agent banks, others and brokers or by other appropriate auditing procedures where replies from brokers were not received. Our audits also included evaluating the accounting principles used and significant estimates made by management, as well as evaluating the overall presentation of the financial statements. We believe that our audits provide a reasonable basis for our opinion.

We have served as the auditor of one or more Driehaus investment companies since 2002.
Chicago, Illinois
February 21, 2020
47
Interested and Independent Trustees of the Trust |
The following table sets forth certain information with respect to the Trustees of the Trust as of December 31, 2019:
Name, Address | Position(s) | Term of | Number of | Principal Occupation(s) | Other Directorships |
Interested Trustee:* | |||||
Stephen J. Kneeley 25 East Erie Street Chicago, IL 60611 YOB: 1963 | Trustee and President | Since 2018
Since 2017 | 8 | President and Chief Executive Officer of the Adviser since January 2018; Interim President and Interim Chief Executive Officer of Adviser from March 2017 to December 2017; Chief Executive Officer, Context Asset Management, L.P. from 2014 to 2016. | Chairman of Board of Trustees, Context Capital Funds from 2014 to 2017; and Trustee, Copeland Trust from 2010 to 2017. |
Independent Trustees: | |||||
Daniel F. Zemanek c/o Driehaus Capital Management LLC 25 East Erie Street Chicago, IL 60611 YOB: 1942 | Trustee and Chairperson | Since 1996
Since 2014 | 8 | Retired; President of Ludan, Inc. (real estate development services specializing in senior housing) from April 2008 to December 2014. | None. |
Theodore J. Beck c/o Driehaus Capital Management LLC 25 East Erie Street Chicago, IL 60611 YOB: 1952 | Trustee | Since 2012 | 8 | Retired; President and Chief Executive Officer, National Endowment for Financial Education, 2005 to July 2018. | None. |
Francis J. Harmon c/o Driehaus Capital Management LLC 25 East Erie Street Chicago, IL 60611 YOB: 1942 | Trustee | Since 1998 | 8 | Consultant, Great Lakes Advisors, Inc. since January 2020; Relationship Manager, Great Lakes Advisors, Inc. through December 2019. | None. |
Dawn M. Vroegop c/o Driehaus Capital Management LLC 25 East Erie Street Chicago, IL 60611 YOB: 1966 | Trustee | Since 2012 | 8 | Private Investor. | Independent Trustee, Brighthouse Funds Trust I since December 2000 and Brighthouse Funds Trust II since May 2009. |
Christopher J. Towle, CFA c/o Driehaus Capital Management LLC 25 East Erie Street Chicago, IL 60611 YOB: 1957 | Trustee | Since 2016 | 8 | Retired; Partner, Portfolio Manager, Director of High Yield and Convertible Securities, Lord Abbett & Co. 1987 to 2014. | Independent Trustee, Brighthouse Funds Trust I and Brighthouse Funds Trust II, each from April 2018 to August 2019. |
* | Mr. Kneeley became a Trustee on March 6, 2018. Mr. Kneeley is an “interested person” of the Trust and the Adviser, as defined in the 1940 Act, because he is an officer of the Adviser. |
48
Officers of the Trust |
The following table sets forth certain information with respect to the officers of the Trust.
Name, Address | Position(s) Held | Length of | Principal Occupation(s) During Past 5 Years |
Robert M. Kurinsky 25 East Erie Street Chicago, IL 60611 YOB: 1972 | Vice President and Treasurer | Since January 2019 | Chief Financial Officer and Treasurer of the Adviser and Driehaus Securities LLC since January 2019; Treasurer, Secretary and Chief Legal Officer of the Keeley Funds, Inc. through December 2018; President and Chief Operating Officer of Keeley-Teton Advisors, LLC from March 2017 to December 2018; Treasurer and Secretary of Joley Corp. and Keeley Holdings, Inc. through February 2017; Secretary, Treasurer, Chief Financial Officer and General Counsel of Keeley Asset Management Corp. through February 2017; Secretary, Treasurer, Chief Financial Officer and General Counsel of Keeley Investment Corp. through February 2017. |
Janet L. McWilliams 25 East Erie Street Chicago, IL 60611 YOB: 1970 | Assistant Vice President and Chief Legal Officer | Since 2007 Since 2012 | General Counsel and Secretary of the Adviser and Driehaus Securities LLC since 2012. |
Anne S. Kochevar* 25 East Erie Street Chicago, IL 60611 YOB: 1963 | Chief Compliance Officer and Anti-Money Laundering Compliance Officer | Since 2019 | Anti-Money Laundering Compliance Officer of Driehaus Securities LLC since 2019; Chief Compliance Officer of the Adviser and Driehaus Securities LLC since 2019; Chief Compliance Officer of Confluence Investment Management from January 2018 to June 2019; and Chief Compliance Officer of Henderson Global Investors U.S. from November 2014 to January 2018. |
William H. Wallace, III 301 Bellevue Parkway Wilmington, DE 19809 YOB: 1969 | Secretary | Since 2015 | Vice President and Manager, The Bank of New York Mellon since 2010. |
Christine V. Mason 301 Bellevue Parkway Wilmington, DE 19809 YOB: 1956 | Assistant Secretary | Since 2015 | Vice President and Manager, The Bank of New York Mellon since March 2018; and Senior Specialist, The Bank of New York Mellon from 2013 to March 2018. |
Christina E.H. Jacobs 25 East Erie Street Chicago, IL 60611 YOB: 1985 | Assistant Secretary | Since January 2019 | Senior Attorney of the Adviser since January 2019; Senior Attorney, Aegon USA Investment Management, LLC from December 2014 to January 2019; Head of Corporate Strategy and Support, Aegon USA Investment Management, LLC from April 2015 to January 2017. |
* | Ms. Kochevar became Chief Compliance Officer and Anti-Money Laundering Compliance Officer on July 1, 2019, succeeding Michael R. Shoemaker. |
The Statement of Additional Information for Driehaus Mutual Funds contains more detail about the Trust’s Trustees and officers and is available upon request, without charge. For further information, please call 1-800-560-6111.
49
Fund Expense Examples (unaudited) |
As a mutual fund shareholder, you may incur two types of costs: (1) transaction costs, including sales charges; redemption fees; and exchange fees and (2) ongoing costs, including management fees; distribution (12b-1) and/or service fees; and other fund expenses. This example is intended to help you understand your ongoing costs (in dollars) of investing in the Fund and to compare these costs with the ongoing costs of investing in other mutual funds.
The example is based on an investment of $1,000 invested at the beginning of the period and held for the entire six month period ended December 31, 2019.
Actual Expenses
The first line of the table below (“Actual”) provides information about actual account values and actual expenses. You may use the information in this line, together with the amount you invested, to estimate the expense that you paid over the period. Simply divide your account value by $1,000 (for example, an $8,600 account value divided by $1,000 = 8.6), then multiply the result by the number in the first line under the heading entitled “Expenses Paid During Period” to estimate the expenses you paid on your account during this period.
Hypothetical Example for Comparison Purposes
The second line of the tables below (“Hypothetical”) provides information about hypothetical account values and hypothetical expenses based on the Fund’s actual expense ratio and an assumed rate of return of 5% per year before expenses, which is not the Fund’s actual return. You may use this information to compare the ongoing costs of investing in the Fund versus other funds. To do so, compare this 5% hypothetical example with the 5% hypothetical examples that appear in the shareholder reports of the other funds.
Please note that the expenses shown in the table are meant to highlight your ongoing costs only and do not reflect any transactional costs, such as sales charges, redemption fees or exchange fees. Therefore, the second line of the table is useful in comparing ongoing costs only, and will not help you determine the relative total costs of owning different funds. In addition, if these transactional costs were included, your costs would have been higher.
Driehaus Active Income Fund
| Beginning | Ending | Expenses |
Actual | $1,000.00 | $1,025.10 | $6.53 |
Hypothetical Example, assuming a 5% return before expenses | $1,000.00 | $1,018.73 | $6.51 |
Driehaus Event Driven Fund
| Beginning | Ending | Expenses |
Actual | $1,000.00 | $1,018.90 | $9.26 |
Hypothetical Example, assuming a 5% return before expenses | $1,000.00 | $1,016.04 | $9.25 |
50
Fund Expense Examples (unaudited) — (Continued) |
Driehaus Emerging Markets Opportunities Fund
| Beginning | Ending | Expenses |
Actual | $1,000.00 | $1,068.00 | $5.16 |
Hypothetical Example, assuming a 5% return before expenses | $1,000.00 | $1,020.21 | $5.04 |
* | Expenses are equal to the Funds’ annualized expense ratios for the six-month period in the table below multiplied by the average account value over the period, multiplied by the number of days in the most recent fiscal half-year (184), then divided by 365 to reflect the half-year period. These amounts exclude the reduction in expenses for fees paid indirectly and may differ from the Fund’s annualized ratio shown in the Financial Highlights. |
Driehaus Active Income Fund | 1.28% |
Driehaus Event Driven Fund | 1.82% |
Driehaus Emerging Markets Opportunities Fund | 0.99% |
51
Shareholder Information (unaudited) |
TAX INFORMATION FOR THE YEAR ENDED DECEMBER 31, 2019
We are providing this information as required by the Internal Revenue Code. The amounts shown may differ from those elsewhere in this report because of differences between tax and financial reporting requirements.
The Funds designate the following amounts as a long-term capital gain distribution:
Active Income Fund | Event Driven Fund | Emerging Markets | ||
$— | $— | $— |
For taxable non-corporate shareholders, the following percentages of income and short-term capital gains represent qualified dividend income subject to the 15% rate category:
Active Income Fund | Event Driven Fund | Emerging Markets | ||
5.90% | 5.31% | 51.42% |
For corporate shareholders, the following percentages of income and short-term capital gains qualified for the dividends-received deduction:
Active Income Fund | Event Driven Fund | Emerging Markets | ||
5.90% | 4.21% | 0.00% |
PROXY VOTING POLICIES AND PROCEDURES AND PROXY VOTING RECORD
A description of the Funds’ policies and procedures with respect to the voting of proxies relating to the Funds’ portfolio securities is available, without charge, upon request, by calling 1-877-779-0079. This information is also available on the Funds’ website at http://www.driehaus.com.
Information regarding how the Funds voted proxies related to portfolio securities during the 12-month period ended June 30, 2019 is available without charge, upon request, by calling 1-877-779-0079. This information is also available on the Securities and Exchange Commission’s (“SEC”) website at http://www.sec.gov.
HOW TO OBTAIN QUARTERLY PORTFOLIO HOLDINGS
Each Fund files a complete schedule of portfolio holdings with the SEC for the first and third quarters of each fiscal year on Form NPORT-EX. The Funds’ Form NPORT-EX is available electronically on the SEC’s website at http://www.sec.gov. Each Fund’s complete schedule of portfolio holdings is also available on the Funds’ website at http://www.driehaus.com.
52
Board Considerations in Connection with the Annual Review of the Investment Advisory Agreement |
The Board of Trustees of the Driehaus Mutual Funds (the “Trust”), including a majority of the Trustees who are not “interested persons” (as defined in the Investment Company Act of 1940, as amended) (the “Independent Trustees”), approved the renewal of the investment advisory agreement (the “Agreement”) with Driehaus Capital Management LLC (the “Adviser”) for Driehaus Active Income Fund (“LCMAX”), Driehaus Event Driven Fund (“DEVDX”), and Driehaus Emerging Markets Opportunities Fund, formerly Driehaus Multi-Asset Growth Economies Fund, (“DMAGX”) (LCMAX, DEVDX and DMAGX are each a “Fund” and collectively, the “Funds”) on September 12, 2019 for an additional one-year term ending September 30, 2020. As part of its review process, the Board requested and evaluated all information it deemed reasonably necessary to evaluate the Agreement. The Board reviewed comprehensive materials received from the Adviser and from independent legal counsel. The Board also received extensive information throughout the year regarding performance and operating results of each Fund. The Independent Trustees held a conference call with their independent legal counsel on in advance of September 12, 2019 to review the materials provided in response to their request and identified areas for further response by Fund management. Following receipt of further information from Fund management, the Independent Trustees, represented by independent legal counsel, met independent of Fund management to consider renewal of the Agreement for each Fund. After their consideration of all the information received, the Independent Trustees presented their findings and their recommendation to renew the Agreement at the Board meeting.
In connection with the contract review process, the Board considered the factors discussed below, among others. The Board also considered that the Adviser has managed each Fund for an extended period of time or since its inception, and the Board believes that a long-term relationship with a capable, conscientious adviser is in the best interests of each Fund. The Board considered, generally, that shareholders invested in each Fund, knowing that the Adviser managed the Fund and knowing the investment advisory fee schedule.
Nature, Quality and Extent of Services. The Board considered the nature, extent and quality of services provided under the Agreement, including portfolio management services and certain administrative services. The Board considered the experience and skills of senior management and investment personnel, the resources made available to such personnel, the ability of the Adviser to attract and retain high-quality personnel, and the organizational depth of the Adviser. The Board also considered the Trust’s compliance with legal and regulatory requirements, as well as the Adviser’s handling of portfolio brokerage, and noted the Adviser’s process for evaluating best execution. The Board noted the Adviser’s role in overseeing the Funds’ other service providers, including the Adviser’s review of expenses. The Board considered the Adviser’s risk management strategies and the process developed by the Adviser for analyzing, reviewing and assessing risk exposure for the Funds. The Board also considered the Funds’ process for fair valuation of portfolio securities and noted the Board’s review of Fund valuation matters throughout the year.
The Board received and considered performance information provided for each Fund, comparing it to the performance of a peer universe of funds (the “Performance Universe”) and a peer group of funds, as applicable, compiled by Broadridge Financial Solutions (“Broadridge”) using data from Lipper Analytical Services, Inc., an independent provider of mutual fund data (“Lipper”) and to each Fund’s primary benchmark index, as identified in reports to shareholders. The Board noted the Adviser’s statements that the benchmarks for Driehaus Active Income Fund and Driehaus Event Driven Fund are more representative for long-only funds and that the HFRX Event Driven Index is more representative of Driehaus Event Driven Fund than its benchmark index. The Board noted that the Adviser represented that, because the Funds’ performance can be volatile over shorter time periods, for Funds with longer performance records, it was also meaningful to analyze the performance over rolling time periods. The Board reviewed rolling performance for Driehaus Active Income Fund and Driehaus Emerging Markets Opportunities Fund for 1-year, 3-year and 5-year returns, as applicable, over the life of each Fund relative to its benchmark and noted that, in a majority of the time periods measured, each Fund outperformed its benchmark index. The Board also reviewed rolling performance for Driehaus Event Driven Fund for 1-year, 3-year and 5-year returns, over the life of the Fund relative to the HFRX Event Driven Index and noted that, in a majority of time periods measured, the Fund outperformed the HFRX Event Driven Index.
The Board considered that, as of June 30, 2019, although Driehaus Active Income Fund’s performance was in the fifth quintile of its Performance Universe for the 1-, 3- and 5-year periods (the first quintile being the best performers and the fifth quintile being the worst performers), the Fund outperformed its primary benchmark index, the FTSE 3-Month T-Bill Index, for the 3- and 5-year periods. The Board also noted that Driehaus Active Income Fund met its volatility objective of being less volatile than the Bloomberg Barclays U.S. Aggregate Bond Index for the 1- and 3-year periods.
The Board considered that, as of June 30, 2019, Driehaus Event Driven Fund’s performance was in the first quintile of its Performance Universe for the 1- and 3-year periods, in the second quintile for the since-inception period (the Fund’s inception date was August 26, 2013) and in the third quintile of its Performance Universe for the 5-year period. The Board noted that Driehaus Event Driven Fund underperformed its primary benchmark index, the S&P 500 Index,
53
for each period reviewed. The Board considered that the Fund’s objective of a positive return over a full market cycle had been met and that the Fund’s volatility target, as measured by having a standard deviation of two-thirds or less than that of the S&P 500 Index, had been met, or was in range, for each of the 5-year, 3-year, 1-year and year-to-date periods.
The Board considered that, as of June 30, 2019, Driehaus Emerging Markets Opportunities Fund’s performance was in the second quintile of its Performance Universe for the 1-year period and in the first quintile of its Performance Universe for the since-inception period (the Fund’s inception date was April 10, 2017). The Board noted that Driehaus Emerging Markets Opportunities Fund outperformed its primary benchmark index, the equally weighted MSCI Emerging Markets and JPMorgan Global Bond Index Emerging Markets Global Diversified blended index, for the since-inception period.
On the basis of this evaluation and its ongoing review of investment results, the Board concluded that the nature, quality and extent of services provided by the Adviser supported renewal of the Agreement for each Fund.
Fees. The Board considered each Fund’s contractual management fee rate, operating expenses and total expense ratio as of December 31, 2018 as compared to peer expense group information based on data compiled by Broadridge using data from Lipper as of the most recent fiscal year end of each fund in the peer group (with the fifth quintile being the highest fee). The Board noted that Driehaus Emerging Markets Opportunities Fund’s contractual management fee rate was in the third quintile of its peer group, that Driehaus Active Income Fund’s contractual management fee rate was in the third quintile of its peer group and equal to its peer group median and that Driehaus Event Driven Fund’s contractual management fee rate was in the second quintile of its peer group. In addition, the Board considered the expense reimbursement arrangement with the Adviser for Driehaus Emerging Markets Opportunities Fund and that the Adviser implemented a new advisory fee schedule, effective May 1, 2019, which lowered the Fund’s advisory fee rate to 0.90%.
The Board also considered that for the fiscal year ended December 31, 2018, Driehaus Active Income Fund’s total expense ratio was in the first quintile of its peer group and Driehaus Event Driven Fund’s and Driehaus Emerging Markets Opportunities Fund’s total expense ratios were in the fifth quintile of their respective peer groups. The Board noted the limited number of peers included in Driehaus Event Driven Fund’s peer group and the narrow margin among the total expense ratios of the Fund’s peer group, which resulted in the Fund’s total expense ratio of 1.566% being in the fifth quintile despite the peer group’s median total expense ratio of 1.440%. As to the Driehaus Emerging Markets Opportunities Fund, the Board noted that the Fund’s total expense ranking was in part driven by the non-management expenses (including transfer agent, custodian and other non-management fee expenses), which reflected the small size of the Fund. The Board also considered Driehaus Event Driven Fund’s advisory fee rate as compared to the fee charged by the Adviser for a similar sub-advised unaffiliated mutual fund. The Board noted that the mix of services provided, the level of responsibility, the legal, reputational and regulatory risks and the resources required under the Agreement were significantly greater as compared to the Adviser’s obligations for sub-advising the other mutual funds. In considering the reasonableness of the advisory fees, the Board took into account the Adviser’s substantial human and technological resources devoted to investing for the Funds and the assets under management in each Fund. In addition, the Board noted that the Adviser’s directed brokerage program had resulted in a total of approximately $33,000 in directed brokerage credits during calendar year 2018, which were used to reduce expenses of the Funds.
On the basis of the information reviewed, the Board concluded that the advisory fee schedule for each Fund was reasonable in light of the nature and quality of services provided by the Adviser.
Profitability. The Board reviewed information regarding revenues received by the Adviser under the Agreement from each Fund and discussed the Adviser’s methodology in allocating its costs to the management of the Funds. The Board considered the estimated costs to the Adviser of managing the Funds. The Board also noted that the Funds do not have a Rule 12b-1 fee and that the Adviser’s affiliate, Driehaus Securities LLC (“DS LLC”), serves as distributor of the Funds without compensation, that DS LLC provides compensation to intermediaries for shareholder services and for distribution of the Funds’ shares, and that DS LLC is reimbursed by Driehaus Active Income Fund and Driehaus Event Driven Fund under a Shareholder Services Plan (the “Plan”) for certain amounts paid for shareholder services covered under the Plan. The Board concluded that, based on the profitability calculated for the Trust as well as for the Funds individually, profitability was not excessive in light of the nature, extent and quality of the services provided to the Funds.
Economies of Scale. In considering the reasonableness of the advisory fee, the Board considered whether there are economies of scale with respect to the management of the Funds and whether the Funds benefit from any such economies of scale. Given the current size of the Funds and the capacity constraints of their investment styles, as well as the fee reduction for the Driehaus Emerging Markets Opportunities Fund, the Board concluded that the advisory fee rates under the Agreement are reasonable and reflect an appropriate sharing of any such economies of scale.
54
Other Benefits to the Adviser and its Affiliates. The Board also considered the character and amount of other incidental benefits received by the Adviser and its affiliates. The Board noted that payments to DS LLC under the Plan are in reimbursement of payments made to intermediaries for shareholder services. The Board also considered benefits to the Adviser related to soft dollar allocations. The Board concluded that the advisory fees were reasonable in light of any fall-out benefits.
Based on all of the information considered and the conclusions reached, the Board determined that the terms of the Agreement continue to be fair and reasonable and that the continuation of the Agreement is in the best interests of each Fund. No single factor was determinative in the Board’s analysis.
55
DRH-AR2019
Item 2. Code of Ethics.
| (a) | The registrant, as of the end of the period covered by this report, has adopted a code of ethics that applies to the registrant’s principal executive officer, principal financial officer, principal accounting officer or controller, or persons performing similar functions, regardless of whether these individuals are employed by the registrant or a third party. |
| (b) | No response required. |
| (c) | There have been no amendments, during the period covered by this report, to a provision of the code of ethics that applies to the registrant’s principal executive officer, principal financial officer, principal accounting officer or controller, or persons performing similar functions, regardless of whether these individuals are employed by the registrant or a third party, and that relates to any element of the code of ethics description. |
| (d) | The registrant has not granted any waivers, including an implicit waiver, from a provision of the code of ethics that applies to the registrant’s principal executive officer, principal financial officer, principal accounting officer or controller, or persons performing similar functions, regardless of whether these individuals are employed by the registrant or a third party, that relates to one or more of the items set forth in paragraph (b) of this item. |
| (e) | Not applicable. |
| (f) | The registrant’s Code of Ethics for Principal Executive and Financial Officers was filed as Exhibit 12(a)(1) to the registrant’s Certified Shareholder Report on Form N-CSR, Accession Number 0001193125-12-093739, on March 2, 2012, and is incorporated herein by reference. |
Item 3. Audit Committee Financial Expert.
The registrant’s Board of Trustees has designated Dawn M. Vroegop as an audit committee financial expert. Ms. Vroegop is “independent,” as defined by this Item 3.
Item 4. Principal Accountant Fees and Services.
| (a) | Audit Fees |
For the fiscal years ended December 31, 2019 and 2018, Ernst & Young LLP, the registrant’s principal accountant (“E&Y”), billed the registrant $376,800 and $418,800, respectively, for professional services rendered for the audit of the registrant’s annual financial statements or services that are normally provided in connection with statutory and regulatory filings.
| (b) | Audit-Related Fees |
For the fiscal years ended December 31, 2019 and 2018, E&Y billed the registrant $0 and $0, respectively, for assurance and related services that are reasonably related to the performance of the audit of the registrant’s financial statements and that are not reported above.
For engagements that Driehaus Capital Management LLC, the registrant’s investment adviser (“DCM”), or Driehaus Securities LLC, the registrant’s distributor (“DS”), entered into with E&Y for fiscal years 2019 and 2018, E&Y provided no audit-related services to DCM or DS that were for engagements directly related to the registrant’s operations and financial reporting.
| (c) | Tax Fees |
For the fiscal years ended December 31, 2019 and 2018, E&Y billed the registrant $113,375 and $94,505 respectively, for professional services rendered for tax compliance, tax advice, and tax planning. Such services consisted of review of the registrant’s income tax returns and tax distribution requirements and analysis related to passive foreign investment company status. The Audit Committee pre-approved all tax services that E&Y provided to the registrant.
For fiscal years 2019 and 2018, E&Y provided no tax services to DCM or DS that were for engagements directly related to the registrant’s operations and financial reporting.
| (d) | All Other Fees |
For the fiscal years ended December 31, 2019 and 2018, E&Y billed the registrant $0 and $0, respectively, for products and services provided, other than the services reported above.
For fiscal years 2019 and 2018, E&Y provided no other services to DCM or DS that were for engagements directly related to the registrant’s operations and financial reporting.
(e)(1)Audit Committee Pre-Approval Policies and Procedures
Pursuant to registrant’s Audit Committee Charter (the “Charter”), the Audit Committee is responsible for pre-approving any engagement of the principal accountant to provide non-prohibited services to the registrant, including the fees and other compensation to be paid to the principal accountant, to the extent required by Rule 2-01(c)(7) of Regulation S-X. The Chairperson of the Audit Committee may grant pre-approval for such engagements of $5,000 or less. All such delegated pre-approvals will be presented to the Audit Committee no later than the next Audit Committee meeting.
Pursuant to the Charter, the Audit Committee is also responsible for pre-approving any engagement of the principal accountant, including the fees and other compensation to be paid to the principal accountant, to provide non-audit services to the registrant’s investment adviser (or any entity controlling, controlled by, or under common control with the adviser that provides ongoing services to the registrant), if the engagement relates directly to the operations and financial reporting of the registrant, to the extent required by Rule 2-01(c)(7) of Regulation S-X. The Chairperson of the Audit Committee may grant pre-approval for engagements of $5,000 or less. All such delegated pre-approvals will be presented to the Audit Committee no later than the next Audit Committee meeting.
| (e)(2) | The percentage of services described in each of paragraphs (b) through (d) of this Item that were approved by the Audit Committee pursuant to paragraph (c)(7)(i)(C) of Rule 2-01 of Regulation S-X is 0%. |
| (f) | Not applicable. |
| (g) | Non-Audit Fees |
For the fiscal years ended December 31, 2019 and 2018, E&Y billed the registrant $113,375 and $94,505, respectively, in aggregate non-audit fees. For the fiscal years ended December 31, 2019 and 2018, E&Y billed DCM or DS $0 and $0, respectively, in aggregate non-audit fees.
| (h) | Not applicable. |
Item 5. Audit Committee of Listed Registrants.
Not applicable.
Item 6. Investments.
| (a) | Schedule of Investments in securities of unaffiliated issuers as of the close of the reporting period is included as part of the report to shareholders filed under Item 1 of this form. |
| (b) | Not applicable. |
Item 7. Disclosure of Proxy Voting Policies and Procedures for Closed-End Management Investment Companies.
Not applicable.
Item 8. Portfolio Managers of Closed-End Management Investment Companies.
Not applicable.
Item 9. Purchases of Equity Securities by Closed-End Management Investment Company and Affiliated Purchasers.
Not applicable.
Item 10. Submission of Matters to a Vote of Security Holders.
There have been no material changes to the procedures by which the shareholders may recommend nominees to the registrant’s board of directors, where those changes were implemented after the registrant last provided disclosure in response to the requirements of Item 407(c)(2)(iv) of Regulation S-K (17 CFR 229.407) (as required by Item 22(b)(15) of Schedule 14A (17 CFR 240.14a-101)), or this Item.
Item 11. Controls and Procedures.
| (a) | The registrant’s principal executive and principal financial officers, or persons performing similar functions, have concluded that the registrant’s disclosure controls and procedures (as defined in Rule 30a-3(c) under the Investment Company Act of 1940, as amended (the “1940 Act”) (17 CFR 270.30a-3(c))) are effective, as of a date within 90 days of the filing date of the report that includes the disclosure required by this paragraph, based on their evaluation of these controls and procedures required by Rule 30a-3(b) under the 1940 Act (17 CFR 270.30a-3(b)) and Rules 13a-15(b) or 15d-15(b) under the Securities Exchange Act of 1934, as amended (17 CFR 240.13a-15(b) or 240.15d-15(b)). |
| (b) | There were no changes in the registrant’s internal control over financial reporting (as defined in Rule 30a-3(d) under the 1940 Act (17 CFR 270.30a-3(d))) that occurred during the period covered by this report that has materially affected, or is reasonably likely to materially affect, the registrant’s internal control over financial reporting. |
Item 12. Disclosure of Securities Lending Activities for Closed-End Management Investment Companies.
Not applicable.
Item 13. Exhibits.
| (a)(1) | Code of ethics, or any amendment thereto, that is the subject of disclosure required by Item 2, was filed as Exhibit 12(a)(1) to the registrant’s Form N-CSR, on March 2, 2012 (Accession No. 0001193125-12-093738), and is incorporated herein by reference. |
| (a)(2) | Certifications pursuant to Rule 30a-2(a) under the 1940 Act and Section 302 of the Sarbanes-Oxley Act of 2002 are attached hereto. |
| (a)(3) | Not applicable. |
| (a)(4) | Not applicable. |
| (b) | Certifications pursuant to Rule 30a-2(b) under the 1940 Act and Section 1350 of Chapter 63 of Title 18 of the United States Code (18 U.S.C. 1350) are attached hereto. |
SIGNATURES
Pursuant to the requirements of the Securities Exchange Act of 1934 and the Investment Company Act of 1940, the registrant has duly caused this report to be signed on its behalf by the undersigned, thereunto duly authorized.
| (Registrant) | Driehaus Mutual Funds | ||
| By (Signature and Title)* | /s/Stephen T. Weber | ||
| Stephen T. Weber, President | |||
| (principal executive officer) | |||
| Date | March 4, 2020 | ||
| Pursuant to the requirements of the Securities Exchange Act of 1934 and the Investment Company Act of 1940, this report has been signed below by the following persons on behalf of the registrant and in the capacities and on the dates indicated. | |||
| By (Signature and Title)* | /s/Stephen T. Weber | ||
| Stephen T. Weber, President | |||
| (principal executive officer) | |||
| Date | March 4, 2020 | ||
| By (Signature and Title)* | /s/Robert M. Kurinsky | ||
| Robert M. Kurinsky, Vice President and Treasurer | |||
| (principal financial officer) | |||
| Date | March 4, 2020 | ||
| * | Print the name and title of each signing officer under his or her signature. |