UNITED STATES
SECURITIES AND EXCHANGE COMMISSION
Washington, D.C. 20549
FORMN-CSR
CERTIFIED SHAREHOLDER REPORT OF REGISTERED
MANAGEMENT INVESTMENT COMPANIES
Investment Company Act file number811-07655
Driehaus Mutual Funds
(Exact name of registrant as specified in charter)
25 East Erie Street
Chicago, IL 60611
(Address of principal executive offices) (Zip code)
Janet L. McWilliams
Driehaus Capital Management LLC
25 East Erie Street
Chicago, IL 60611
(Name and address of agent for service)
Registrant’s telephone number, including area code:312-587-3800
Date of fiscal year end: December 31
Date of reporting period: December 31, 2018
FormN-CSR is to be used by management investment companies to file reports with the Commission not later than 10 days after the transmission to stockholders of any report that is required to be transmitted to stockholders under Rule30e-1 under the Investment Company Act of 1940 (17 CFR270.30e-1). The Commission may use the information provided on FormN-CSR in its regulatory, disclosure review, inspection, and policymaking roles.
A registrant is required to disclose the information specified by FormN-CSR, and the Commission will make this information public. A registrant is not required to respond to the collection of information contained in FormN-CSR unless the Form displays a currently valid Office of Management and Budget (“OMB”) control number. Please direct comments concerning the accuracy of the information collection burden estimate and any suggestions for reducing the burden to Secretary, Securities and Exchange Commission, 450 Fifth Street, NW, Washington, DC 20549-0609. The OMB has reviewed this collection of information under the clearance requirements of 44 U.S.C. § 3507.
Item 1. Reports to Stockholders.
The Reports to Shareholders are attached herewith.
Driehaus Mutual Funds
Trustees & Officers
Theodore J. Beck
Trustee
Francis J. Harmon
Trustee
Christopher J. Towle
Trustee
Dawn M. Vroegop
Trustee
Daniel F. Zemanek
Chairman of the Board
Stephen J. Kneeley
President & Trustee
Robert M. Kurinsky
Vice President & Treasurer
Janet L. McWilliams
Chief Legal Officer &
Assistant Vice President
Michael R. Shoemaker
Chief Compliance Officer,
Anti-Money Laundering
Compliance Officer &
Assistant Vice President
William H. Wallace, III
Secretary
Christina E.H. Jacobs
Assistant Secretary
Christine V. Mason
Assistant Secretary
Investment Adviser
Driehaus Capital Management LLC
25 East Erie Street
Chicago, IL 60611
Distributor
Driehaus Securities LLC
25 East Erie Street
Chicago, IL 60611
Administrator
The Bank of New York Mellon
4400 Computer Drive
Westborough, MA 01581
Transfer Agent
BNY Mellon Investment Servicing (US) Inc.
4400 Computer Drive
Westborough, MA 01581
Custodian
The Northern Trust Company
50 South LaSalle Street
Chicago, IL 60603
Annual Report to Shareholders
December 31, 2018

Driehaus Emerging Markets Growth Fund
Driehaus Emerging Markets Small Cap Growth Fund
Driehaus Frontier Emerging Markets Fund
Driehaus International Small Cap Growth Fund
Driehaus Micro Cap Growth Fund
Driehaus Small Cap Growth Fund
Distributed by:
Driehaus Securities LLC
This report has been prepared for the shareholders of the Funds and is not an offer to sell or buy any Fund securities. Such offer is only made by the Funds’ prospectus.
Annual Report to Shareholders
December 31, 2018
Investment Philosophy:
The Adviser seeks to achieve superior investment returns primarily by investing in global companies that are currently demonstrating rapid growth in their sales and earnings and which, in its judgment, have the ability to continue or accelerate their growth rates in the future. The Adviser manages the portfolios actively (above average turnover) to ensure that the Funds are fully invested, under appropriate market conditions, in companies that meet these criteria. Investors should note that investments in overseas markets can pose more risks than U.S. investments, and the international Funds’ share prices are expected to be more volatile than those of the U.S.-only Funds. In addition, the Funds’ returns will fluctuate with changes in stock market conditions, currency values, interest rates, government regulations, and economic and political conditions in countries in which the Funds invest. These risks are generally greater when investing in emerging markets.
Driehaus Emerging Markets Growth Fund
Driehaus Emerging Markets Small Cap Growth Fund
Driehaus Frontier Emerging Markets Fund
Driehaus International Small Cap Growth Fund
Driehaus Micro Cap Growth Fund
Driehaus Small Cap Growth Fund
Portfolio Manager Letter, Performance Overview and Schedule of Investments: | ||||
| 1 | ||||
| 8 | ||||
| 15 | ||||
| 21 | ||||
| 28 | ||||
| 35 | ||||
| 42 | ||||
| 44 | ||||
| 46 | ||||
| 49 | ||||
| 57 | ||||
| 71 | ||||
| 73 | ||||
| 74 | ||||
| 75 | ||||
| 78 | ||||
| 79 | ||||
Driehaus Emerging Markets Growth Fund — Portfolio Managers’ Letter
Dear Fellow Shareholders,
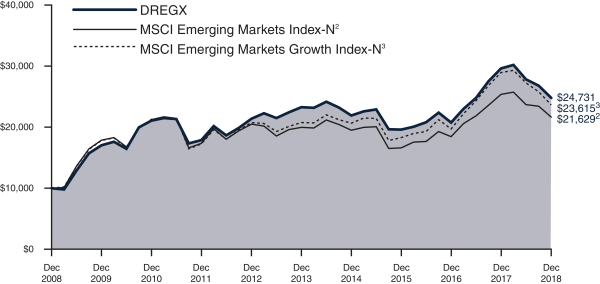
The Driehaus Emerging Markets Growth Fund (“Fund”) Investor class (DREGX) returned -16.26% and the Institutional class (DIEMX) returned -16.08% for the year ended December 31, 2018. The Fund’s primary benchmark, the Morgan Stanley Capital International (“MSCI”) Emerging Markets Index (“Benchmark”), returned -14.57% for the year, while the MSCI Emerging Markets Growth Index returned -18.26%.
Global markets suffered rising volatility that seemed to trigger a sharp sell-off in the final quarter of 2018. We believe risk sentiment was dampened by several issues including: a slowdown in global growth, high corporate leverage in the US, the US Federal Reserve continuing to tighten, and the ongoing trade war with China. The US government shutdown was an unwelcome, but fitting, finale to close out the year. While the fourth quarter of 2018 was negative across the board for global equities, the one silver lining for emerging markets investors was a rebound in performance relative to developed markets.
Over the course of 2018, security selection within the consumer discretionary and health care sectors contributed to the Fund’s returns versus the Benchmark. From a country perspective, holdings in Saudi Arabia and Indonesia made key contributions to performance versus the Benchmark in the past year.
Lojas Renner S.A. (Ticker: LREN3-BR) made a notable contribution to the Fund’s relative and absolute returns for the year. The Brazil-based company is engaged in the retail apparel industry. Management continues to execute on their growth strategy, consistently outperforming the apparel market and delivering stable earnings. Overall, the company continues to develop structural competitive edges, such as building digital omnichannel experiences and growing e-commerce, which has resulted in market share gains in an improving macro environment.
Tata Consultancy Services Limited (Ticker: 2318 HK) was also a significant contributor to the Fund’s return. The India-based consulting company focuses on IT services and business solutions. Strong performance that exceeded investor expectations led to a solid 2018 for the company. Growth momentum, stemming from an uptick in deal pipeline for the US banking and financial services segment that had previously been lagging, drove much of the performance.
During 2018, stock selection within the industrials and communication services sectors detracted from the Fund’s returns versus the Benchmark. At the country level, holdings in Taiwan and China detracted from Fund performance versus the Benchmark.
Fund holding Tencent Holdings Ltd. (Ticker: 700-HK) was a notable detractor from returns. The China-based company provides online advertising services through a variety of internet and mobile platforms. The stock underperformed in 2018 as growth was impacted by a freeze on new game approvals. Despite the recent underperformance, the Fund added to its position in the stock during the sell-off as we believe that the company’s long-term growth potential remains unchanged by current short term set-backs.
Another significant detractor from the Fund’s return for the year was Sberbank Russia OJSC (Ticker: SBER-RU). The Russia-based company provides commercial banking and financial services. Escalated US sanctions in April saw the company’s stock tumble in concert with the broader Russian market. We still perceive the company to have solid fundamentals and results, although external volatility of the market has weighed on the company’s shares.
After a pronounced relative derating in the first three quarters of the year, we were pleased to see emerging equities regain some momentum heading into 2019. We continue to believe that the relative case for emerging markets versus developed economies looks increasingly attractive as emerging market equities have cheapened considerably on a historical basis. Furthermore, recent pressure on the Federal Open Market Committee to pause its rate hiking cycle may have capped US dollar appreciation and subsequently alleviated some of the financial stresses that plagued emerging markets in 2018.
1
We see China remaining as the most critical variable for emerging markets in the upcoming year. Domestically, China appeared determined to deleverage its economy in 2018, and these efforts (plus emerging concerns on the trade war) stressed the economy and consumer. Recently, it appears that the pendulum may be starting to swing back in the other direction as the government has reiterated its support for the private sector, announced selective stimulus measures, and eased up on certain regulations in areas such as property. While we suspect volatility will remain elevated versus the past decade, we nonetheless anticipate a more constructive backdrop for emerging market assets in 2019, given the potential easing of financial conditions. Importantly, the slope and breadth of earnings revisions across emerging markets trended negatively for nearly all of 2018, and we believe that this has subsequently created a relatively constructive starting point for positive earnings inflections to evolve over the course of 2019. Given our core belief that positive earnings/growth changes drive stock prices, we enter 2019 with an optimistic view of our opportunity set within emerging markets.
We thank you for investing alongside us in the Driehaus Emerging Markets Growth Fund and would like to express our gratitude for your continued confidence in our management capabilities.
Sincerely,
 |  |  | ||
| Howard Schwab | Chad Cleaver | Rich Thies | ||
| Lead Portfolio Manager | Portfolio Manager | Portfolio Manager |
Performance is historical and does not represent future results.
Please see the following performance overview page for index descriptions.
2
Driehaus Emerging Markets Growth Fund
Performance Overview (unaudited)
The performance summarized below is historical and does not represent future results. Investment returns and principal value vary, and you may have a gain or loss when you sell shares. Performance data presented measures the change in the value of an investment in the Fund, assuming reinvestment of all dividends and capital gains. Average annual total return reflects annualized change.
The table does not reflect the deduction of taxes that a shareholder would pay on Fund distributions or the redemption of Fund shares. The graph compares the results of a $10,000 investment in the Fund over the last 10 fiscal year periods, with all dividends and capital gains reinvested, with the indicated indices (and dividends reinvested) for the same period.
| Average Annual Total Returns as of 12/31/18 | 1 Year | 3 Years | 5 Years | 10 Years | ||||||||||||
Driehaus Emerging Markets Growth Fund Investor Class (DREGX) | –16.26% | 8.11% | 1.24% | 9.48% | ||||||||||||
Driehaus Emerging Markets Growth Fund Institutional Class (DIEMX)1 | –16.08% | 8.21% | 1.29% | 9.51% | ||||||||||||
MSCI Emerging MarketsIndex-N2 | –14.57% | 9.25% | 1.65% | 8.02% | ||||||||||||
MSCI Emerging Markets GrowthIndex-N3 | –18.26% | 8.89% | 2.67% | 8.97% | ||||||||||||
| 1 | The returns for the periods prior to July 17, 2017 (institutional share class inception date) include the performance of the investor share class. |
| 2 | The Morgan Stanley Capital International Emerging Markets Index-Net (MSCI Emerging Markets Index-N) is a market capitalization-weighted index designed to measure equity market performance in emerging markets. Data is in U.S. dollars and is calculated with net dividend reinvestment. Source: Morgan Stanley Capital International Inc. |
| 3 | The Morgan Stanley Capital International Emerging Markets Growth Index-Net (MSCI Emerging Markets GrowthIndex-N) is a subset of the MSCI Emerging Markets Index and includes only the MSCI Emerging Markets Index stocks which are categorized as growth stocks. Data is in U.S. dollars and is calculated with net dividend reinvestment. Source: Morgan Stanley Capital International Inc. |
3
Driehaus Emerging Markets Growth Fund
Schedule of Investments
December 31, 2018
| Number of Shares | Value (Note A) | |||||||
| EQUITY SECURITIES — 92.6% |
| |||||||
| FAR EAST — 62.7% | ||||||||
China — 26.2% | ||||||||
AIA Group, Ltd. | 3,255,794 | $ | 27,025,938 | |||||
Aier Eye Hospital Group Co., Ltd. — A | 3,188,822 | 12,215,217 | ||||||
Alibaba Group Holding, Ltd. — SP ADR** | 381,382 | 52,276,031 | ||||||
China Construction Bank Corp. — H | 27,897,625 | 23,014,961 | ||||||
China Resources Beer Holdings Co., Ltd. | 2,338,476 | 8,167,718 | ||||||
China Shenhua Energy Co., Ltd. — H | 5,107,525 | 11,192,788 | ||||||
CNOOC, Ltd. | 13,683,257 | 21,143,913 | ||||||
Foshan Haitian Flavouring & Food Co., Ltd. — A | 521,726 | 5,228,127 | ||||||
Galaxy Entertainment Group, Ltd. | 1,633,447 | 10,388,310 | ||||||
Huazhu Group Ltd. — ADR | 265,737 | 7,608,050 | ||||||
Industrial & Commercial Bank of China, Ltd. — H | 21,832,621 | 15,585,767 | ||||||
Noah Holdings, Ltd. — SP ADR** | 189,390 | 8,204,375 | ||||||
Ping An Insurance Group Co. of China, Ltd. — H | 4,346,503 | 38,383,332 | ||||||
Shenzhou International Group Holdings, Ltd. | 870,835 | 9,869,945 | ||||||
Sunac China Holdings, Ltd. | 3,968,451 | 12,923,249 | ||||||
TAL Education Group — ADR** | 707,192 | 18,867,883 | ||||||
Techtronic Industries Co., Ltd. | 1,505,389 | 7,997,469 | ||||||
Tencent Holdings, Ltd. | 2,116,689 | 84,878,404 | ||||||
Zhejiang Supor Co., Ltd. — A | 455,400 | 3,482,311 | ||||||
|
| |||||||
| 378,453,788 | ||||||||
|
| |||||||
India — 13.7% | ||||||||
Apollo Hospitals Enterprise, Ltd. | 528,811 | 9,530,944 | ||||||
Bandhan Bank, Ltd.1 | 340,278 | 2,681,429 | ||||||
Biocon, Ltd. | 702,470 | 6,329,424 | ||||||
Dabur India, Ltd. | 921,174 | 5,682,211 | ||||||
HDFC Bank, Ltd. — ADR | 442,223 | 45,809,881 | ||||||
ICICI Bank, Ltd. — SP ADR | 3,269,937 | 33,647,652 | ||||||
ITC, Ltd. | 2,147,813 | 8,664,779 | ||||||
Larsen & Toubro, Ltd. | 700,196 | 14,417,628 | ||||||
Maruti Suzuki India, Ltd. | 79,005 | 8,448,211 | ||||||
Nestle India, Ltd. | 62,242 | 9,882,450 | ||||||
| Number of Shares | Value (Note A) | |||||||
Petronet LNG, Ltd. | 3,564,911 | $ | 11,445,603 | |||||
Reliance Industries, Ltd. | 1,037,744 | 16,666,482 | ||||||
Tata Consultancy Services, Ltd. | 922,865 | 25,023,700 | ||||||
|
| |||||||
| 198,230,394 | ||||||||
|
| |||||||
South Korea — 8.1% | ||||||||
Douzone Bizon Co., Ltd. | 113,734 | 5,290,191 | ||||||
KB Financial Group, Inc. | 414,110 | 17,257,676 | ||||||
Macquarie Korea Infrastructure Fund2 | 772,950 | 6,435,477 | ||||||
Orion Corp. | 85,043 | 9,146,048 | ||||||
S-Oil Corp. | 67,374 | 5,899,301 | ||||||
Samsung Electro-Mechanics Co., Ltd. | 90,342 | 8,379,994 | ||||||
Samsung Electronics Co., Ltd. | 1,356,959 | 47,064,271 | ||||||
Samsung SDI Co., Ltd. | 52,727 | 10,348,820 | ||||||
SK Hynix, Inc. | 127,744 | 6,926,431 | ||||||
|
| |||||||
| 116,748,209 | ||||||||
|
| |||||||
Taiwan — 5.5% | ||||||||
Cathay Financial Holding Co., Ltd. | 6,523,331 | 9,974,837 | ||||||
Formosa Plastics Corp. | 2,890,424 | 9,497,766 | ||||||
Hiwin Technologies Corp. | 1,132,340 | 8,141,560 | ||||||
Taiwan Semiconductor Manufacturing Co., Ltd. — SP ADR | 1,423,848 | 52,554,230 | ||||||
|
| |||||||
| 80,168,393 | ||||||||
|
| |||||||
Indonesia — 4.3% | ||||||||
PT Bank Central Asia Tbk | 14,727,066 | 26,627,519 | ||||||
PT Bank Mandiri Persero Tbk | 37,176,101 | 19,066,324 | ||||||
PT Telekomunikasi Indonesia Persero Tbk | 62,296,572 | 16,245,629 | ||||||
|
| |||||||
| 61,939,472 | ||||||||
|
| |||||||
Thailand — 3.3% | ||||||||
Bangkok Dusit Medical Services PCL — NVDR | 18,713,904 | 14,253,834 | ||||||
CP ALL PCL — NVDR | 8,097,671 | 17,098,123 | ||||||
Kasikornbank PCL — NVDR | 3,036,835 | 17,254,744 | ||||||
|
| |||||||
| 48,606,701 | ||||||||
|
| |||||||
Philippines — 1.6% | ||||||||
BDO Unibank, Inc. | 5,804,884 | 14,439,076 | ||||||
SM Prime Holdings, Inc. | 12,836,382 | 8,739,041 | ||||||
|
| |||||||
| 23,178,117 | ||||||||
|
| |||||||
Total FAR EAST | 907,325,074 | |||||||
|
| |||||||
Notes to Financial Statements are an integral part of this Schedule.
4
Driehaus Emerging Markets Growth Fund
Schedule of Investments
December 31, 2018
| Number of Shares | Value (Note A) | |||||||
| SOUTH AMERICA — 10.7% | ||||||||
Brazil — 8.7% | ||||||||
B3 SA — Brasil Bolsa Balcao | 2,350,470 | $ | 16,259,073 | |||||
BK Brasil Operacao e Assessoria a Restaurantes SA | 1,763,891 | 9,411,666 | ||||||
Estacio Participacoes SA | 747,275 | 4,581,114 | ||||||
Itau Unibanco Holding SA — SP PREF ADR | 2,659,849 | 24,311,020 | ||||||
Linx SA | 864,951 | 7,275,341 | ||||||
Lojas Renner SA | 1,449,411 | 15,856,293 | ||||||
Petroleo Brasileiro SA — SP ADR | 1,015,287 | 13,208,884 | ||||||
Rumo SA** | 1,707,354 | 7,488,878 | ||||||
Transmissora Alianca de Energia Eletrica SA | 2,713,453 | 16,522,606 | ||||||
Vale SA — SP ADR | 824,367 | 10,873,401 | ||||||
|
| |||||||
| 125,788,276 | ||||||||
|
| |||||||
Argentina — 1.2% | ||||||||
Grupo Financiero Galicia SA — ADR | 276,795 | 7,631,238 | ||||||
MercadoLibre, Inc. | 30,251 | 8,859,005 | ||||||
|
| |||||||
| 16,490,243 | ||||||||
|
| |||||||
Peru — 0.8% | ||||||||
Credicorp, Ltd. | 53,831 | 11,932,717 | ||||||
|
| |||||||
Total SOUTH AMERICA | 154,211,236 | |||||||
|
| |||||||
| EUROPE — 9.3% | ||||||||
Russia — 5.2% | ||||||||
Alrosa PJSC | 2,520,961 | 3,568,241 | ||||||
Lukoil PJSC — SP ADR | 306,904 | 21,937,498 | ||||||
Novatek PJSC — SP GDR | 130,592 | 22,331,232 | ||||||
Sberbank of Russia PJSC — SP ADR | 1,050,846 | 11,517,272 | ||||||
X5 Retail Group NV — GDR | 299,004 | 7,409,319 | ||||||
Yandex NV — A** | 317,092 | 8,672,466 | ||||||
|
| |||||||
| 75,436,028 | ||||||||
|
| |||||||
United Kingdom — 0.8% | ||||||||
Mondi PLC | 576,492 | 12,002,902 | ||||||
France — 0.8% | ||||||||
LVMH Moet Hennessy Louis Vuitton SE | 39,070 | 11,558,192 | ||||||
Turkey — 0.8% | ||||||||
BIM Birlesik Magazalar AS | 692,019 | 11,375,655 | ||||||
Netherlands — 0.7% | ||||||||
Heineken NV | 115,815 | 10,244,066 | ||||||
Poland — 0.6% | ||||||||
CD Projekt SA** | 202,036 | 7,860,420 | ||||||
Hungary — 0.4% | ||||||||
OTP Bank PLC | 130,017 | 5,238,714 | ||||||
|
| |||||||
Total EUROPE | 133,715,977 | |||||||
|
| |||||||
| Number of Shares | Value (Note A) | |||||||
| NORTH AMERICA — 4.4% | ||||||||
United States — 2.3% | ||||||||
Abbott Laboratories | 125,668 | $ | 9,089,566 | |||||
Intel Corp. | 235,845 | 11,068,206 | ||||||
Newmont Mining Corp. | 267,088 | 9,254,599 | ||||||
NIKE, Inc. — B | 62,435 | 4,628,931 | ||||||
|
| |||||||
| 34,041,302 | ||||||||
|
| |||||||
Mexico — 2.1% | ||||||||
Grupo Aeroportuario del Centro Norte SAB de CV | 866,358 | 4,134,783 | ||||||
Mexichem SAB de CV | 1,501,091 | 3,812,355 | ||||||
Wal-Mart de Mexico SAB de CV | 8,773,678 | 22,313,963 | ||||||
|
| |||||||
| 30,261,101 | ||||||||
|
| |||||||
Total NORTH AMERICA | 64,302,403 | |||||||
|
| |||||||
| AFRICA — 4.4% | ||||||||
South Africa — 3.9% | ||||||||
Anglo American Platinum, Ltd. | 320,121 | 11,968,910 | ||||||
Clicks Group, Ltd. | 629,030 | 8,370,307 | ||||||
FirstRand, Ltd. | 4,265,179 | 19,435,283 | ||||||
Mr. Price Group, Ltd. | 968,954 | 16,577,448 | ||||||
|
| |||||||
| 56,351,948 | ||||||||
|
| |||||||
Egypt — 0.5% | ||||||||
Commercial International Bank Egypt SAE | 1,778,224 | 7,355,155 | ||||||
|
| |||||||
Total AFRICA | 63,707,103 | |||||||
|
| |||||||
| MIDDLE EAST — 1.1% | ||||||||
Israel — 0.5% | ||||||||
Israel Chemicals, Ltd. | 1,304,542 | 7,396,312 | ||||||
United Arab Emirates — 0.3% |
| |||||||
NMC Health PLC | 115,479 | 4,027,105 | ||||||
Saudi Arabia — 0.3% | ||||||||
Al Rajhi Bank | 166,166 | 3,875,863 | ||||||
|
| |||||||
Total MIDDLE EAST | 15,299,280 | |||||||
|
| |||||||
Total EQUITY SECURITIES | 1,338,561,073 | |||||||
|
| |||||||
| ||||||||
TOTAL INVESTMENTS | 92.6 | % | $ | 1,338,561,073 | ||||
Other Assets In Excess Of Liabilities | 7.4 | % | 107,540,132 | |||||
|
|
|
| |||||
Net Assets | 100.0 | % | $ | 1,446,101,205 | ||||
| ||||||||
| 1 | 144A — This security was purchased pursuant to Rule 144A of the Securities Act of 1933 and may not be resold subject to that rule except to qualified institutional buyers. At December 31, 2018, this security amounted to $2,681,429 or 0.2% of net assets. This 144A security has not been deemed illiquid. |
Notes to Financial Statements are an integral part of this Schedule.
5
Driehaus Emerging Markets Growth Fund
Schedule of Investments
December 31, 2018
| 2 | Pursuant to procedures adopted by Driehaus Mutual Funds’ (the “Trust”) Board of Trustees, this security has been determined to be illiquid by Driehaus Capital Management LLC, the Fund’s investment adviser. |
| ** | Non-income producing security |
ADR — American Depository Receipt
GDR — Global Depository Receipt
NVDR —Non-Voting Depository Receipt
SP ADR — Sponsored American Depository Receipt
SP GDR — Sponsored Global Depository Receipt
SP PREF ADR — Sponsored Preferred American Depository Receipt
Regional Weightings*
Asia/Far EastEx-Japan | 62.7% | |||
South America | 10.7% | |||
Eastern Europe | 7.0% | |||
North America | 4.4% | |||
Africa | 4.4% | |||
Western Europe | 2.3% | |||
Middle East | 1.1% |
Top Ten Holdings*
Tencent Holdings, Ltd. | 5.9% | |||
Taiwan Semiconductor Manufacturing Co., Ltd. — SP ADR | 3.6% | |||
Alibaba Group Holding, Ltd. — SP ADR | 3.6% | |||
Samsung Electronics Co., Ltd. | 3.3% | |||
HDFC Bank, Ltd. — ADR | 3.2% | |||
Ping An Insurance Group Co. of China, Ltd. — H | 2.7% | |||
ICICI Bank, Ltd. — SP ADR | 2.3% | |||
AIA Group, Ltd. | 1.9% | |||
PT Bank Central Asia Tbk | 1.8% | |||
Tata Consultancy Services, Ltd. | 1.7% |
| * | All percentages are stated as a percent of net assets at December 31, 2018 |
Notes to Financial Statements are an integral part of this Schedule.
6
Driehaus Emerging Markets Growth Fund
Schedule of Investments
December 31, 2018
Industry | Percent of Net Assets | |||
Automobiles | 0.6% | |||
Beverages | 1.3% | |||
Biotechnology | 0.4% | |||
Capital Markets | 2.1% | |||
Chemicals | 1.4% | |||
Commercial Banks | 19.9% | |||
Computers & Peripherals | 3.3% | |||
Construction & Engineering | 1.0% | |||
Diversified Consumer Services | 1.6% | |||
Diversified Financial Services | 1.3% | |||
Diversified Telecommunication Services | 1.1% | |||
Electric Utilities | 1.1% | |||
Electronic Equipment, Instruments & Components | 1.3% | |||
Entertainment | 0.5% | |||
Food & Staples Retailing | 4.6% | |||
Food Products | 1.7% | |||
Health Care Equipment & Supplies | 0.6% | |||
Health Care Providers & Services | 2.8% | |||
Hotels, Restaurants & Leisure | 1.9% | |||
Household Durables | 0.8% | |||
Industry | Percent of Net Assets | |||
Information Technology Services | 1.7% | |||
Insurance | 5.2% | |||
Interactive Media & Services | 6.5% | |||
Internet & Catalog Retail | 4.2% | |||
Machinery. | 0.6% | |||
Metals & Mining | 2.5% | |||
Multiline Retail | 1.1% | |||
Oil, Gas & Consumable Fuels | 8.6% | |||
Paper & Forest Products | 0.8% | |||
Personal Products | 0.4% | |||
Real Estate Management & Development | 1.5% | |||
Road & Rail | 0.5% | |||
Semiconductors & Semiconductor Equipment | 4.9% | |||
Software | 0.9% | |||
Specialty Retail. | 1.2% | |||
Textiles, Apparel & Luxury Goods | 1.8% | |||
Tobacco | 0.6% | |||
Transportation Infrastructure | 0.3% | |||
Other Assets in Excess of Liabilities | 7.4% | |||
|
| |||
TOTAL | 100.0% | |||
|
| |||
Notes to Financial Statements are an integral part of this Schedule.
7
Driehaus Emerging Markets Small Cap Growth Fund — Portfolio Managers’ Letter
Dear Fellow Shareholders,
The Driehaus Emerging Markets Small Cap Growth Fund (“Fund”) returned -24.00% for the year ended December 31, 2018. The Fund’s primary benchmark, the Morgan Stanley Capital International (“MSCI”) Emerging Markets Small Cap Index (“Benchmark”), returned -18.59% for the same period, and the Fund’s secondary benchmark, the MSCI Emerging Markets Index, returned -14.57%.
The fourth quarter of 2018 brought about a continuation of headwinds that faced emerging market equities throughout much of the year, namely rising trade tensions between China and the United States, a slowing of economic growth across many emerging market economies, and a tightening regulatory environment in countries including China, India, and Mexico. The growing trends of protectionism, automation, and the relocation of manufacturing capacity outside of China seem to have contributed to a deterioration in consumer confidence. However, against this backdrop, Chinese government authorities have undertaken both fiscal and monetary stimulus, the lagged effects of which should act to help offset these headwinds.
On a relative basis, after decoupling from emerging markets over the prior six months and handily outperforming emerging markets over seven out of the last eight years, US equity markets succumbed to an intense selloff into year-end, leading emerging markets to outperform the US in the last quarter.
For 2018, at the sector level, key contributions to performance versus the Benchmark came from security selection within the consumer staples and materials sectors. In addition, an overweight to Brazil and security selection in Russia and South Africa contributed to the Fund’s performance.
Lojas Renner S.A. (Ticker: LREN3-BR) made a notable contribution to the Fund’s relative and absolute returns for the year. The Brazil-based company is engaged in the retail apparel industry. Management continues to execute on their growth strategy, consistently outperforming the apparel market and delivering stable earnings. Overall, the company continues to develop structural competitive edges, such as building digital omnichannel experiences and growing e-commerce, resulting in increased market share in an improving macro environment.
TCI Co. Ltd. (Ticker: 8436-TW) made a notable contribution to the Fund’s relative and absolute returns for the year. The Taiwan-based company manufactures and sells dietary supplements and skin care products. Strong performance and growth momentum throughout the year propelled this stock, driven by US and EU demand for facemasks and China-based demand for functional health drinks. Additionally, with WeChat as a primary source of demand, we expect that recent regulations in e-commerce will benefit the company as weaker competitors are eliminated.
Certain areas detracted from Fund performance during the year. On a sector level, selection within the information technology and consumer discretionary sectors detracted from the performance of the Fund versus the Benchmark. In addition, an overweight to China and security selection in Taiwan and India detracted from Fund performance versus the Benchmark.
Wisdom Education International Holdings Co. Ltd. (Ticker: 6068-HK) was a significant detractor from Fund performance for the year. The China-based company provides private education at the primary and secondary school levels. A correction in the education sector in August caused its share price to fall. While enrollment figures and expansion plans appear positive, weakness in share price may have been primarily due to uncertainty from the upcoming Law of Promoting Private Education. Until this regulation is ultimately finalized, it remains difficult to quantify its overall impact on the price of the stock.
Chroma ATE Inc. (Ticker: 2360-TW) was also a detractor from Fund performance for the year. The Taiwan-based company designs and manufactures precision electronic measuring instruments. After August sales figures were reported lower than expected, a decline in share price led to a technical breakdown and a more severe price fall. Additionally, overall weakness in the semi-conductor industry and softer global demand weighed on the stock.
The Fund used derivatives primarily to hedge a portion of the portfolio, dampen volatility, and manage downside risk. Derivatives held in the Fund generally consisted of put options on exchange-traded funds (ETFs), currency forwards and swaps. During 2018, these positions, in the aggregate, contributed to
8
performance. Effective November 1, 2018, the Fund discontinued using derivatives as part of its principal investment strategy.
A number of emerging market countries have adopted a prudent policy mix throughout 2018, which we believe positions their economies to benefit as the backdrop for growth incrementally improves. Amid these macroeconomic policy changes, the long-term growth trajectory for industries such as healthcare, infrastructure, education, tourism, and financial services appears strong throughout many of the emerging markets in which the Fund invests.
While it has been a disappointing 18 months for investors in small caps within emerging markets, we are enthusiastic that the growth, inefficiency, low correlation, and increasingly compelling valuations make this segment of emerging markets a potential source of alpha in the years ahead.
We thank you for investing alongside us in the Driehaus Emerging Markets Small Cap Growth Fund and would like to express our gratitude for your continued confidence in our management capabilities.
Sincerely,
| | | ||
| Chad Cleaver, CFA | Howard Schwab | Rich Thies | ||
| Lead Portfolio Manager | Portfolio Manager | Portfolio Manager |
Performance is historical and does not represent future results.
Please see the following performance overview page for index descriptions.
9
Driehaus Emerging Markets Small Cap Growth Fund
Performance Overview (unaudited)
The performance summarized below is historical and does not represent future results. Investment returns and principal value vary, and you may have a gain or loss when you sell shares. Performance data presented measures the change in the value of an investment in the Fund, assuming reinvestment of all dividends and capital gains. Average annual total return reflects annualized change.
The table does not reflect the deduction of taxes that a shareholder would pay on Fund distributions or the redemption of Fund shares. The graph compares the results of a $10,000 investment in the Fund since December 1, 2008 (the date of the Predecessor Limited Partnership’s inception), with all dividends and capital gains reinvested, with the indicated indices (and dividends reinvested) for the same period.
| Fund Only | Including Predecessor Limited Partnership | |||||||||||||||||||
| Average Annual Total Returns as of 12/31/18 | 1 Year | 3 Years | 5 Years | Since Inception (8/22/11 - 12/31/18) | 10 Years | |||||||||||||||
Driehaus Emerging Markets Small Cap Growth Fund (DRESX)1 | –24.00% | –3.02% | –2.83% | 1.33% | 8.08% | |||||||||||||||
MSCI Emerging Markets Small CapIndex-N2 | –18.59% | 3.68% | 0.95% | 1.50% | 9.87% | |||||||||||||||
MSCI Emerging MarketsIndex-N3 | –14.57% | 9.25% | 1.65% | 2.37% | 8.02% | |||||||||||||||
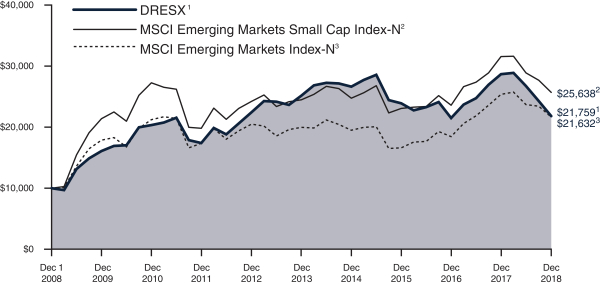
| 1 | The Driehaus Emerging Markets Small Cap Growth Fund (the “Fund”) performance shown above includes the performance of the Driehaus Emerging Markets Small Cap Growth Fund, L.P. (the “Predecessor Limited Partnership”), the Fund’s predecessor, for the periods before the Fund’s registration statement became effective. The Predecessor Limited Partnership, which was established on December 1, 2008, was managed with substantially the same investment objective, policies and philosophies as are followed by the Fund. The Fund succeeded to the Predecessor Limited Partnership’s assets on August 22, 2011. The Predecessor Limited Partnership was not registered under the Investment Company Act of 1940, as amended (“1940 Act”), and thus was not subject to certain investment and operational restrictions that are imposed by the 1940 Act. If the Predecessor Limited Partnership had been registered under the 1940 Act, its performance may have been adversely affected. The Predecessor Limited Partnership’s performance has been restated to reflect estimated expenses of the Fund. The returns for the periods prior to August 21, 2014, reflect fee waivers and/or reimbursements without which performance would have been lower. |
| 2 | The Morgan Stanley Capital International Emerging Markets Small Cap Index-Net (MSCI Emerging Markets Small Cap Index-N) is a market capitalization-weighted index designed to measure equity market performance of small cap stocks in emerging markets. Data is in U.S. dollars and is calculated with net dividend reinvestment. Source: Morgan Stanley Capital International Inc. |
| 3 | The Morgan Stanley Capital International Emerging Markets Index-Net (MSCI Emerging Markets Index-N) is a market capitalization weighted index designed to measure equity market performance in emerging markets. Data is in U.S. dollars and is calculated with net dividend reinvestment. Source: Morgan Stanley Capital International Inc. |
10
Driehaus Emerging Markets Small Cap Growth Fund
Schedule of Investments
December 31, 2018
| Number of Shares | Value (Note A) | |||||||
| EQUITY SECURITIES — 95.5% |
| |||||||
| FAR EAST — 67.2% | ||||||||
India — 22.8% | ||||||||
Aarti Industries | 26,842 | $ | 555,064 | |||||
Bandhan Bank, Ltd.1 | 189,092 | 1,490,066 | ||||||
Berger Paints India, Ltd. | 189,324 | 895,706 | ||||||
Bharat Financial Inclusion, Ltd.** | 63,122 | 915,615 | ||||||
Britannia Industries, Ltd. | 25,248 | 1,126,658 | ||||||
Colgate-Palmolive India, Ltd. | 40,366 | 776,821 | ||||||
Dabur India, Ltd. | 142,291 | 877,714 | ||||||
Future Consumer, Ltd.** | 425,458 | 277,585 | ||||||
ICICI Lombard General Insurance Co., Ltd.1 | 133,007 | 1,646,894 | ||||||
India Grid Trust1,2 | 2,995,461 | 3,662,001 | ||||||
Info Edge India, Ltd. | 60,897 | 1,256,625 | ||||||
Ipca Laboratories, Ltd. | 53,544 | 615,164 | ||||||
L&T Technology Services, Ltd.1 | 29,149 | 713,266 | ||||||
Page Industries, Ltd. | 2,422 | 875,578 | ||||||
Radico Khaitan, Ltd. | 274,779 | 1,576,097 | ||||||
RBL Bank, Ltd.1 | 184,595 | 1,521,921 | ||||||
Sterlite Technologies, Ltd. | 396,207 | 1,665,358 | ||||||
|
| |||||||
| 20,448,133 | ||||||||
|
| |||||||
China — 22.0% | ||||||||
3SBio, Inc.1 | 767,500 | 984,062 | ||||||
51Job, Inc. — ADR** | 17,800 | 1,111,432 | ||||||
China Oriental Group Co., Ltd. | 888,850 | 528,963 | ||||||
China Resources Cement Holdings, Ltd. | 1,218,914 | 1,097,420 | ||||||
Country Garden Services Holdings Co., Ltd.** | 554,000 | 880,117 | ||||||
Fu Shou Yuan International Group, Ltd. | 1,031,617 | 777,286 | ||||||
GDS Holdings, Ltd. — ADR** | 61,319 | 1,415,856 | ||||||
Greentown Service Group Co., Ltd. | 964,696 | 739,183 | ||||||
Hua Hong Semiconductor, Ltd.1 | 635,000 | 1,175,851 | ||||||
Huazhu Group Ltd. — ADR | 42,378 | 1,213,282 | ||||||
Kingdee International Software Group Co., Ltd. | 881,966 | 779,414 | ||||||
Li Ning Co., Ltd.** | 1,998,810 | 2,144,180 | ||||||
Maanshan Iron & Steel Co., Ltd. — H | 2,417,546 | 1,065,134 | ||||||
Microport Scientific Corp. | 983,000 | 966,618 | ||||||
Silergy Corp. | 35,000 | 515,828 | ||||||
SSY Group, Ltd. | 658,157 | 487,493 | ||||||
Times China Holdings, Ltd. | 1,424,000 | 1,582,121 | ||||||
Yihai International Holding, Ltd. | 532,157 | 1,300,745 | ||||||
Zhejiang Supor Co., Ltd. — A | 126,490 | 967,232 | ||||||
|
| |||||||
| 19,732,217 | ||||||||
|
| |||||||
| Number of Shares | Value (Note A) | |||||||
Taiwan — 6.1% | ||||||||
Chroma ATE, Inc. | 268,000 | $ | 1,028,858 | |||||
Eclat Textile Co., Ltd. | 54,672 | 618,989 | ||||||
Hiwin Technologies Corp. | 173,876 | 1,250,174 | ||||||
Parade Technologies, Ltd. | 81,584 | 1,141,332 | ||||||
TCI Co., Ltd. | 85,900 | 1,450,438 | ||||||
|
| |||||||
| 5,489,791 | ||||||||
|
| |||||||
Indonesia — 5.6% | ||||||||
PT Ace Hardware Indonesia Tbk | 6,552,100 | 678,903 | ||||||
PT Bank Tabungan Negara Persero Tbk | 8,456,500 | 1,493,707 | ||||||
PT Bank Tabungan Pensiunan Nasional Syariah Tbk** | 10,779,000 | 1,345,501 | ||||||
PT Indo Tambangraya Megah Tbk | 407,100 | 573,281 | ||||||
PT Kresna Graha Investama Tbk** | 19,603,600 | 892,932 | ||||||
|
| |||||||
| 4,984,324 | ||||||||
|
| |||||||
South Korea — 4.3% | ||||||||
Douzone Bizon Co., Ltd. | 13,150 | 611,655 | ||||||
Fila Korea, Ltd. | 31,329 | 1,502,152 | ||||||
Koh Young Technology, Inc. | 7,667 | 566,882 | ||||||
Orion Corp. | 10,598 | 1,139,774 | ||||||
|
| |||||||
| 3,820,463 | ||||||||
|
| |||||||
Cambodia — 2.7% | ||||||||
NagaCorp, Ltd. | 2,222,276 | 2,389,575 | ||||||
Thailand — 2.5% | ||||||||
Bangkok Chain Hospital PCL — NVDR | 2,569,266 | 1,317,775 | ||||||
IRPC PCL — NVDR | 2,710,845 | 478,727 | ||||||
Land & Houses PCL — NVDR | 1,485,679 | 451,727 | ||||||
|
| |||||||
| 2,248,229 | ||||||||
|
| |||||||
Philippines — 0.6% | ||||||||
Puregold Price Club, Inc. | 697,400 | 570,280 | ||||||
Malaysia — 0.6% | ||||||||
Top Glove Corp. BHD | 410,900 | 556,815 | ||||||
|
| |||||||
Total FAR EAST | 60,239,827 | |||||||
|
| |||||||
| SOUTH AMERICA — 12.3% | ||||||||
Brazil — 11.2% | ||||||||
Banco Inter SA — Pref.1 | 54,200 | 539,658 | ||||||
Bradespar SA — Pref. | 126,000 | 1,030,237 | ||||||
Cia de Locacao das Americas | 107,900 | 1,049,559 | ||||||
Cyrela Brazil Realty SA Empreendimentos e Participacoes | 434,600 | 1,734,700 | ||||||
Energisa SA | 104,200 | 997,438 | ||||||
Gol Linhas Aereas Inteligentes SA — Pref.** | 89,800 | 581,560 | ||||||
Lojas Renner SA | 139,200 | 1,522,823 | ||||||
Notes to Financial Statements are an integral part of this Schedule.
11
Driehaus Emerging Markets Small Cap Growth Fund
Schedule of Investments
December 31, 2018
| Number of Shares | Value (Note A) | |||||||
Metalurgica Gerdau SA — Pref. | 634,447 | $ | 1,136,054 | |||||
Rumo SA** | 325,200 | 1,426,408 | ||||||
|
| |||||||
| 10,018,437 | ||||||||
|
| |||||||
Argentina — 1.1% | ||||||||
Grupo Financiero Galicia SA — ADR | 19,893 | 548,450 | ||||||
Pampa Energia SA — SP ADR** | 15,182 | 482,939 | ||||||
|
| |||||||
| 1,031,389 | ||||||||
|
| |||||||
Total SOUTH AMERICA | 11,049,826 | |||||||
|
| |||||||
| AFRICA — 6.7% | ||||||||
South Africa — 6.7% | ||||||||
Clicks Group, Ltd. | 140,183 | 1,865,372 | ||||||
Impala Platinum Holdings, Ltd.** | 450,034 | 1,147,332 | ||||||
Kumba Iron Ore, Ltd. | 29,633 | 582,980 | ||||||
Mr. Price Group, Ltd. | 78,096 | 1,336,113 | ||||||
The Foschini Group, Ltd. | 96,476 | 1,114,729 | ||||||
|
| |||||||
Total AFRICA | 6,046,526 | |||||||
|
| |||||||
| EUROPE — 6.3% | ||||||||
Poland — 2.6% | ||||||||
CD Projekt SA** | 29,739 | 1,157,026 | ||||||
Dino Polska SA1** | 44,564 | 1,141,384 | ||||||
|
| |||||||
| 2,298,410 | ||||||||
|
| |||||||
Russia — 1.8% | ||||||||
Globaltrans Investment PLC — SP GDR | 84,798 | 768,270 | ||||||
TCS Group Holding PLC — GDR | 56,103 | 872,963 | ||||||
|
| |||||||
| 1,641,233 | ||||||||
|
| |||||||
Turkey — 1.0% | ||||||||
Sok Marketler Ticaret AS** | 444,018 | 901,879 | ||||||
United Kingdom — 0.9% | ||||||||
KAZ Minerals PLC | 113,523 | 769,785 | ||||||
|
| |||||||
Total EUROPE | 5,611,307 | |||||||
|
| |||||||
| NORTH AMERICA — 3.0% | ||||||||
Mexico — 2.4% | ||||||||
Banco del Bajio SA1 | 338,400 | 658,487 | ||||||
Grupo Aeroportuario del Centro Norte SAB de CV — ADR | 40,196 | 1,528,252 | ||||||
|
| |||||||
| 2,186,739 | ||||||||
|
| |||||||
| Number of Shares | Value (Note A) | |||||||
Canada — 0.6% | ||||||||
Gran Tierra Energy, Inc.** | 227,183 | $ | 492,987 | |||||
|
| |||||||
Total NORTH AMERICA | 2,679,726 | |||||||
|
| |||||||
Total EQUITY SECURITIES (Cost $85,872,158) | 85,627,212 | |||||||
|
| |||||||
| ||||||||
TOTAL INVESTMENTS | 95.5 | % | $ | 85,627,212 | ||||
Other Assets In Excess Of Liabilities | 4.5 | % | 4,025,918 | |||||
|
|
|
| |||||
Net Assets | 100.0 | % | $ | 89,653,130 | ||||
| ||||||||
| 1 | 144A — This security was purchased pursuant to Rule 144A of the Securities Act of 1933 and may not be resold subject to that rule except to qualified institutional buyers. At December 31, 2018, these securities amounted to $13,533,590 or 15.1% of net assets. These 144A securities have not been deemed illiquid, unless otherwise noted. |
| 2 | Pursuant to procedures adopted by Driehaus Mutual Funds’ (the “Trust”) Board of Trustees, this security has been determined to be illiquid by Driehaus Capital Management LLC, the Fund’s investment adviser. |
| ** | Non-income producing security |
| ADR | — American Depository Receipt |
| GDR | — Global Depository Receipt |
| NVDR | —Non-Voting Depository Receipt |
| SP | ADR — Sponsored American Depository Receipt |
| SP | GDR — Sponsored Global Depository Receipt |
Notes to Financial Statements are an integral part of this Schedule.
12
Driehaus Emerging Markets Small Cap Growth Fund
Schedule of Investments
December 31, 2018
Regional Weightings*
Asia/Far EastEx-Japan | 67.2% | |||
South America | 12.3% | |||
Africa | 6.7% | |||
Eastern Europe | 5.4% | |||
North America | 3.0% | |||
Western Europe | 0.9% |
Top Ten Holdings*
India Grid Trust | 4.1% | |||
NagaCorp, Ltd. | 2.7% | |||
Li Ning Co., Ltd. | 2.4% | |||
Clicks Group, Ltd. | 2.1% | |||
Cyrela Brazil Realty SA Empreendimentos e Participacoes | 1.9% | |||
Sterlite Technologies, Ltd. | 1.9% | |||
ICICI Lombard General Insurance Co., Ltd. | 1.8% | |||
Times China Holdings, Ltd. | 1.8% | |||
Radico Khaitan, Ltd. | 1.8% | |||
Grupo Aeroportuario del Centro Norte SAB de CV — ADR | 1.7% |
| * | All percentages are stated as a percent of net assets at December 31, 2018 |
Notes to Financial Statements are an integral part of this Schedule.
13
Driehaus Emerging Markets Small Cap Growth Fund
Schedule of Investments
December 31, 2018
Industry | Percent of Net Assets | |||
Airlines | 0.7% | |||
Beverages | 1.8% | |||
Biotechnology | 1.1% | |||
Capital Markets | 1.0% | |||
Chemicals | 1.6% | |||
Commercial Banks | 9.4% | |||
Commercial Services & Supplies | 1.8% | |||
Communications Equipment | 1.9% | |||
Construction Materials | 1.2% | |||
Consumer Finance | 1.0% | |||
Diversified Consumer Services | 0.9% | |||
Electric Utilities | 5.7% | |||
Electronic Equipment, Instruments & Components | 1.1% | |||
Entertainment | 1.3% | |||
Food & Staples Retailing | 5.0% | |||
Food Products | 4.3% | |||
Health Care Equipment & Supplies | 1.7% | |||
Health Care Providers & Services | 1.5% | |||
Hotels, Restaurants & Leisure | 4.0% | |||
Household Durables | 3.0% | |||
Industry | Percent of Net Assets | |||
Information Technology Services | 1.6% | |||
Insurance | 1.8% | |||
Interactive Media & Services | 1.4% | |||
Machinery | 1.4% | |||
Metals & Mining | 7.0% | |||
Multiline Retail | 1.7% | |||
Oil, Gas & Consumable Fuels | 1.7% | |||
Personal Products. | 3.5% | |||
Pharmaceuticals | 1.2% | |||
Professional Services | 2.0% | |||
Real Estate Management & Development | 2.3% | |||
Road & Rail | 3.6% | |||
Semiconductors & Semiconductor Equipment | 3.8% | |||
Software | 1.6% | |||
Specialty Retail | 3.5% | |||
Textiles, Apparel & Luxury Goods | 5.7% | |||
Transportation Infrastructure | 1.7% | |||
Other Assets in Excess of Liabilities | 4.5% | |||
|
| |||
TOTAL | 100.0% | |||
|
| |||
Notes to Financial Statements are an integral part of this Schedule.
14
Driehaus Frontier Emerging Markets Fund — Portfolio Managers’ Letter
Dear Fellow Shareholders,
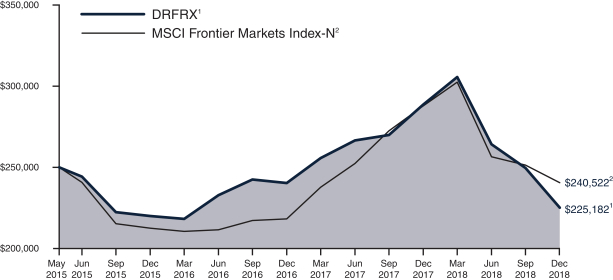
The Driehaus Frontier Emerging Markets Fund (“Fund”) returned -21.96% for the year ended December 31, 2018. This return underperformed the Morgan Stanley Capital International (“MSCI”) Frontier Markets Index (“Benchmark”), which returned -16.41% for the same period.
The fourth quarter of 2018 was characterized by a sharp pullback in global equities, led by developed markets, as the US succumbed to declines after decoupling from frontier and emerging markets for most of the year. Over the course of 2018, escalating trade tensions between the US and China, a deterioration of external balances, and slowing economic growth were factors that weighed on frontier markets.
Frontier markets exhibit a varying degree of openness and sensitivity to global trade. While the picture appears to be improving for many frontier markets such as Vietnam, Bangladesh, Morocco, and Egypt, countries such as Kenya, Nigeria, Sri Lanka, and Romania remain saddled with deteriorating fiscal balances and challenging regulatory environments.
Over the course of 2018, key contributions to performance versus the Benchmark came from the Fund’s security selection in the industrials and consumer discretionary sectors and an underweight to the utilities sector. From a country perspective, an underweight to Argentina and an overweight to Cambodia contributed to performance.
A notable contribution to the Fund’s return for the year came from holding NagaCorp Ltd. (Ticker: 3918-HK). The Cambodia-based company operates casinos under a long-term license. After having operated at full capacity since 2014, the company completed construction of its second casino in 2018, and the new casino ramped up ahead of expectations. With continued strength in tourist arrivals from the region, the company exhibited and continues to exhibit growth acceleration.
El Sewedy Electric Company (Ticker: SWDY-EG) was a significant contributor to returns during 2018. The Egypt-based country manufactures cables and electrical products. On top of strong earnings, the company won a substation contract worth EGP1.2 billion with the Egyptian government in March that caused its share price to increase. Later in the year, the company entered final negotiations with Tanzania to build a hydroelectric dam along with two other projects in the Middle East.
Certain areas detracted from Fund performance during the year. Security selection in the financials, materials, and consumer staples sectors hurt performance of the Fund relative to the Benchmark. An underweight to Kuwait, an overweight to Vietnam, and security selection in Jordan also detracted from Fund performance versus the Benchmark.
Ceylon Cold Stores PLC (Ticker: CCS.N0000-LK) was a significant detractor from the Fund’s performance during 2018. The Sri Lanka-based company manufactures and sells carbonated soft drinks and frozen confectionary food products. The company’s bottom line declined for consecutive quarters, due to increased operating expenditures and decreased revenue. Additionally, shifting consumer preference toward healthy beverages and a sugar tax weighed on the company.
Vincom Retail JSC (Ticker: VRE-VN) was a significant detractor from the Fund’s performance during 2018. The Vietnam-based company provides real estate business services. Concerns over the real estate cycle, changing consumption patterns along with limited prime locations and wildly fluctuating property sales weighed down this stock, which fell in concert with general weakness in the broader Vietnam market. However, we believe that growth potential remains steady due to a currently stable macro environment and the growing Vietnamese middle class. Moreover, the company has seen revenue and inventory growth throughout the year.
Following a disappointing year for frontier markets, we see improvements in both the absolute and relative attractiveness of the asset class. In aggregate, frontier markets may benefit from rising trade tensions, as countries such as Bangladesh and Vietnam see rising foreign direct investment. Additionally, a tightening labor force in Europe may make countries such as Morocco, Romania, and Egypt well-positioned to benefit from shifting manufacturing capacity and a changing global labor force. We continue to believe that the reduced correlation and unique opportunities in frontier markets offer a source of alpha in the years ahead.
15
We thank you for investing alongside us in the Driehaus Frontier Emerging Markets Fund and would like to express our gratitude for your continued confidence in our management capabilities.
Sincerely,
| |  | ||
| Chad Cleaver, CFA | Rich Thies | James Woods | ||
| Lead Portfolio Manager | Portfolio Manager | Assistant Portfolio Manager |
Performance is historical and does not represent future results.
Please see the following performance overview page for index descriptions.
16
Driehaus Frontier Emerging Markets Fund
Performance Overview (unaudited)
The performance summarized below is historical and does not represent future results. Investment returns and principal value vary, and you may have a gain or loss when you sell shares. Performance data presented measures the change in the value of an investment in the Fund, assuming reinvestment of all dividends and capital gains. Average annual total return reflects annualized change.
The table does not reflect the deduction of taxes that a shareholder would pay on Fund distributions or the redemption of Fund shares. The graph compares the results of a $250,000 investment (minimum investment) in the Fund since May 4, 2015 (the date of the Fund’s inception), with all dividends and capital gains reinvested, with the indicated index (and dividends reinvested) for the same period.
| Average Annual Total Returns as of 12/31/18 | 1 Year | 3 Years | Since Inception (5/4/15 - 12/31/18) | |||||||||
Driehaus Frontier Emerging Markets Fund (DRFRX)1 | –21.96% | 0.78% | –2.81% | |||||||||
MSCI Frontier MarketsIndex-N2 | –16.41% | 4.21% | –1.05% | |||||||||
| 1 | The returns for the period reflect fee waivers and/or reimbursements without which performance would have been lower. |
| 2 | The Morgan Stanley Capital International Frontier Markets Index-Net (MSCI Frontier Markets Index-N) provides broad representation of the equity opportunity set in frontier markets while taking investability requirements into consideration within each market. Data is in U.S. dollars and is calculated with net dividend reinvestment. Source: Morgan Stanley Capital International Inc. |
17
Driehaus Frontier Emerging Markets Fund
Schedule of Investments
December 31, 2018
Number Shares | Value (Note A) | |||||||
| EQUITY SECURITIES — 94.4% |
| |||||||
| FAR EAST — 50.7% |
| |||||||
Vietnam — 33.4% |
| |||||||
Airports Corp. of Vietnam JSC | 450,600 | $ | 1,748,394 | |||||
Bank for Foreign Trade of Vietnam JSC | 96,070 | 221,588 | ||||||
Mobile World Investment Corp. | 133,333 | 640,136 | ||||||
Nam Long Investment Corp. | 236,458 | 263,014 | ||||||
Refrigeration Electrical Engineering Corp. | 125,000 | 165,984 | ||||||
Saigon Beer Alcohol Beverage Corp. | 6,810 | 78,537 | ||||||
SSI Securities Corp. | 293,450 | 337,161 | ||||||
Viet Capital Securities JSC | 4 | 8 | ||||||
Vietjet Aviation JSC | 49,457 | 255,867 | ||||||
Vietnam Prosperity JSC Bank** | 175,845 | 151,244 | ||||||
Vincom Retail JSC** | 256,135 | 308,091 | ||||||
Vingroup JSC** | 64,060 | 263,200 | ||||||
Vinhomes JSC1** | 100,000 | 316,448 | ||||||
|
| |||||||
| 4,749,672 | ||||||||
|
| |||||||
Bangladesh — 11.0% |
| |||||||
BRAC Bank, Ltd.** | 346,438 | 300,191 | ||||||
British American Tobacco Bangladesh Co., Ltd. | 12,839 | 541,977 | ||||||
Delta Brac Housing Finance Corp., Ltd. | 155,644 | 240,052 | ||||||
IFAD Autos, Ltd. | 193,470 | 249,966 | ||||||
Square Pharmaceuticals, Ltd. | 76,866 | 232,888 | ||||||
|
| |||||||
| 1,565,074 | ||||||||
|
| |||||||
Cambodia — 4.8% |
| |||||||
NagaCorp, Ltd. | 626,000 | 673,127 | ||||||
Sri Lanka — 1.5% |
| |||||||
Ceylon Cold Stores PLC2 | 54,336 | 213,304 | ||||||
|
| |||||||
Total FAR EAST | 7,201,177 | |||||||
|
| |||||||
| MIDDLE EAST — 18.6% | ||||||||
Kuwait — 11.3% |
| |||||||
Human Soft Holding Co. KSC | 10,623 | 114,749 | ||||||
Kuwait Finance House KSCP | 162,318 | 326,614 | ||||||
National Bank of Kuwait SAKP | 425,357 | 1,168,278 | ||||||
|
| |||||||
| 1,609,641 | ||||||||
|
| |||||||
Pakistan — 5.2% |
| |||||||
Bank Al Habib, Ltd. | 140,000 | 69,385 | ||||||
Bank Alfalah, Ltd. | 219,050 | 64,058 | ||||||
Meezan Bank, Ltd. | 913,000 | 607,724 | ||||||
|
| |||||||
| 741,167 | ||||||||
|
| |||||||
Number Shares | Value (Note A) | |||||||
Kazakhstan — 0.9% |
| |||||||
NAC Kazatomprom JSC — GDR** | 9,298 | $ | 126,564 | |||||
Oman — 0.7% |
| |||||||
Bank Muscat SAOG | 98,548 | 104,947 | ||||||
United Arab Emirates — 0.5% |
| |||||||
NMC Health PLC | 1,883 | 65,666 | ||||||
|
| |||||||
Total MIDDLE EAST | 2,647,985 | |||||||
|
| |||||||
| EUROPE — 9.3% |
| |||||||
Romania — 6.8% |
| |||||||
Banca Transilvania | 838,607 | 413,936 | ||||||
BRD-Groupe Societe Generale SA | 96,910 | 271,978 | ||||||
Fondul Proprietatea SA | 1,313,133 | 285,450 | ||||||
|
| |||||||
| 971,364 | ||||||||
|
| |||||||
United Kingdom — 1.0% |
| |||||||
KAZ Minerals PLC | 20,137 | 136,546 | ||||||
Norway — 0.9% |
| |||||||
DNO ASA | 87,814 | 127,458 | ||||||
Luxembourg — 0.6% |
| |||||||
Globant SA** | 1,551 | 87,352 | ||||||
|
| |||||||
Total EUROPE | 1,322,720 | |||||||
|
| |||||||
| AFRICA — 8.9% | ||||||||
Egypt — 3.0% |
| |||||||
Cairo Investment & Real Estate Development Co. SAE** | 149,166 | 74,958 | ||||||
Eastern Tobacco | 91,382 | 82,963 | ||||||
ElSewdy Electric Co. | 73,627 | 73,874 | ||||||
Ghabbour Auto** | 294,102 | 84,404 | ||||||
Ibnsina Pharma SAE** | 202,699 | 114,874 | ||||||
|
| |||||||
| 431,073 | ||||||||
|
| |||||||
Kenya — 2.2% |
| |||||||
Safaricom PLC | 1,441,361 | 314,016 | ||||||
Nigeria — 2.1% |
| |||||||
Guaranty Trust Bank PLC | 1,201,235 | 113,845 | ||||||
Zenith Bank PLC | 2,787,209 | 176,740 | ||||||
|
| |||||||
| 290,585 | ||||||||
|
| |||||||
Morocco — 1.6% |
| |||||||
Societe d’Exploitation des Ports | 13,059 | 224,034 | ||||||
|
| |||||||
Total AFRICA | 1,259,708 | |||||||
|
| |||||||
| SOUTH AMERICA — 6.5% |
| |||||||
Argentina — 6.5% |
| |||||||
Bolsas y Mercados Argentinos SA | 14,957 | 150,286 | ||||||
Grupo Financiero Galicia SA — ADR | 9,307 | 256,594 | ||||||
MercadoLibre, Inc. | 889 | 260,344 | ||||||
Pampa Energia SA — SP ADR** | 8,211 | 261,192 | ||||||
|
| |||||||
Total SOUTH AMERICA | 928,416 | |||||||
|
| |||||||
Notes to Financial Statements are an integral part of this Schedule.
18
Driehaus Frontier Emerging Markets Fund
Schedule of Investments
December 31, 2018
Number Shares | Value (Note A) | |||||||
| NORTH AMERICA — 0.4% |
| |||||||
Canada — 0.4% |
| |||||||
Gran Tierra Energy, Inc.** | 23,826 | $ | 51,702 | |||||
|
| |||||||
Total NORTH AMERICA | 51,702 | |||||||
|
| |||||||
Total EQUITY SECURITIES | 13,411,708 | |||||||
|
| |||||||
| ||||||||
| EQUITY CERTIFICATES — 0.6% |
| |||||||
| FAR EAST — 0.6% | ||||||||
Vietnam — 0.6% |
| |||||||
Nam Long Investment Corp.3 | 78,080 | 86,849 | ||||||
|
| |||||||
Total FAR EAST | 86,849 | |||||||
|
| |||||||
Total EQUITY CERTIFICATES | 86,849 | |||||||
|
| |||||||
| ||||||||
TOTAL INVESTMENTS | 95.0 | % | $ | 13,498,557 | ||||
Other Assets In Excess Of Liabilities | 5.0 | % | 708,566 | |||||
|
|
|
| |||||
Net Assets | 100.0 | % | $ | 14,207,123 | ||||
| ||||||||
| 1 | 144A — This security was purchased pursuant to Rule 144A of the Securities Act of 1933 and may not be resold subject to that rule except to qualified institutional buyers. At December 31, 2018, this security amounted to $316,448 or 2.2% of net assets. This 144A security has not been deemed illiquid. |
| 2 | Pursuant to procedures adopted by Driehaus Mutual Funds’ (the “Trust”) Board of Trustees, this security has been determined to be illiquid by Driehaus Capital Management LLC, the Fund’s investment adviser. |
| 3 | Restricted security — Investments in securities not registered under the Securities Act of 1933, excluding 144A securities. At December 31, 2018, the value of this restricted security amounted to $86,849 or 0.6% of net assets. This restricted security has not been deemed illiquid. |
| ** | Non-income producing security |
Additional information on each restricted security (excluding 144A securities) is as follows:
Security | Counter- Party | Acquisition Date(s) | Acquisition Cost | |||||||||
Nam Long Investment Corp. | MACQ | | 05/04/15 to 04/10/18 | | $ | 57,058 | ||||||
ADR — American Depository Receipt
GDR — Global Depository Receipt
MACQ — Macquarie Capital Group, Ltd.
SP ADR — Sponsored American Depository Receipt
Regional Weightings*
Asia/Far EastEx-Japan | 51.3% | |||
Middle East | 18.6% | |||
Africa | 8.9% | |||
Eastern Europe | 6.8% | |||
South America | 6.5% | |||
Western Europe | 2.5% | |||
North America | 0.4% |
Top Ten Holdings*
Airports Corp. of Vietnam JSC | 12.3% | |||
National Bank of Kuwait SAKP | 8.2% | |||
NagaCorp, Ltd. | 4.7% | |||
Mobile World Investment Corp. | 4.5% | |||
Meezan Bank, Ltd. | 4.3% | |||
British American Tobacco Bangladesh Co., Ltd. | 3.8% | |||
Banca Transilvania | 2.9% | |||
Saigon Securities, Inc. | 2.4% | |||
Kuwait Finance House KSCP | 2.3% | |||
Vinhomes JSC | 2.2% |
| * | All percentages are stated as a percent of net assets at December 31, 2018 |
Notes to Financial Statements are an integral part of this Schedule.
19
Driehaus Frontier Emerging Markets Fund
Schedule of Investments
December 31, 2018
Industry | Percent of Net Assets | |||
Airlines | 1.8% | |||
Automobiles | 0.6% | |||
Beverages | 2.1% | |||
Capital Markets | 3.4% | |||
Commercial Banks | 29.9% | |||
Consumer Finance | 1.7% | |||
Diversified Consumer Services | 0.8% | |||
Diversified Financial Services | 2.0% | |||
Electric Utilities | 1.8% | |||
Electrical Equipment | 0.5% | |||
Health Care Providers & Services | 1.3% | |||
Hotels, Restaurants & Leisure | 4.7% | |||
Industrial Conglomerates | 1.2% | |||
Industry | Percent of Net Assets | |||
Internet & Catalog Retail | 1.8% | |||
Metals & Mining | 1.0% | |||
Oil, Gas & Consumable Fuels | 2.2% | |||
Pharmaceuticals | 1.6% | |||
Real Estate Management & Development | 9.2% | |||
Software | 0.6% | |||
Specialty Retail | 6.3% | |||
Tobacco | 4.4% | |||
Transportation Infrastructure | 13.9% | |||
Wireless Telecommunication Services | 2.2% | |||
Other Assets in Excess of Liabilities | 5.0% | |||
|
| |||
TOTAL | 100.0% | |||
|
| |||
Notes to Financial Statements are an integral part of this Schedule.
20
Driehaus International Small Cap Growth Fund — Portfolio Managers’ Letter
Dear Fellow Shareholders,
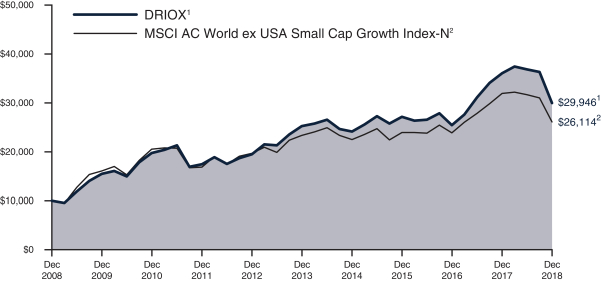
The Driehaus International Small Cap Growth Fund (“Fund”) returned -16.92% for the year ended December 31, 2018. The Fund’s benchmark, the Morgan Stanley Capital International (“MSCI”) All Country World ex USA Small Cap Growth Index (“Benchmark”), returned -18.27%.
Global markets suffered rising volatility that triggered a sharp sell-off in the final quarter of 2018. A potential monetary policy misstep by the Federal Reserve along with fears that the trade war with China would accelerate and further slow global trade seemed to work in concert to increase negative market sentiment.
Over the course of 2018, key contributors to performance versus the Benchmark were the Fund’s holdings in the materials and financials sectors. In addition, holdings in Germany, Brazil, Isle of Man and the United Kingdom contributed positively to the performance of the Fund compared to the Benchmark.
Burford Capital Limited (Ticker: BUR-GB) made significant contributions to the Fund’s return during 2018. The UK-based company provides investment capital, financial and risk solutions for litigation. Consistently strong performance, driven by strong demand, has exceeded investor expectations and buoyed the stock all year. The company has also entered a new strategic relationship with a sovereign wealth fund and established an opportunities fund, both of which expand capability and visibility of investment capital for new clients.
Fenner PLC (Ticker: FENR-GB) also made significant contributions to the Fund’s return during 2018. The UK-based company manufactures and distributes conveyor belting and reinforced precision polymer products. In March 2018, the company announced an agreement to be acquired by Michelin in an all cash transaction that represented a premium of approximately 30% as of the announcement date. The transaction closed in May of 2018.
For 2018, security selection in the energy and allocation in the health care sectors detracted from the Fund’s performance versus the Benchmark. At the country level, selection in Japan and Portugal and overweight allocations to Luxembourg and Denmark detracted value.
A significant detractor from returns for the year was Nichias Corporation (Ticker: 5393-JP). The Japan-based company manufactures thermal insulation materials. The company lost some profit momentum in the second half of the year, mostly due to higher costs from initiatives to strengthen operations. The stock also de-rated on concerns over slowing automotive and construction end markets.
Petroleum Geo-Services ASA (Ticker: PGS-NO) was also a notable detractor from the Fund. The Norway-based company provides geophysical services including the licensing of seismic data and related surveys, which are used by energy companies in their searches for oil and gas reserves. Weak performance results and low orders weighed on the company’s share price. Falling oil prices due to US shale production also created a client base of oil companies more cautious with exploration spending, causing much of the lag in project orders.
Looking into 2019, it appears that global growth may have peaked as the benefits from Chinese stimulus and lower US taxes fade. Other key uncertainties include the path of the US Federal Reserve’s policy on interest rate increases, continued fallout from US/China trade wars, and tightening financial conditions in the Eurozone. On the optimistic side, however, an upside may exist from the US Federal Reserve embracing enhanced flexibility in its policy rate hike pace, further easing measures by China, and/or an overall easing of trade tensions between the US and China.
On a relative basis, we believe that the case for international stocks becomes more appealing as significant US economic outperformance may not persist through 2019, as the fiscal stimulus wears off. It is also our view that international valuations are also more appealing on a relative basis. We are optimistic that should volatility continue, we will be afforded the opportunity to find high quality investment opportunities at more compelling valuations.
21
As always, we thank you for investing alongside us in the Driehaus International Small Cap Growth Fund and would like to express our gratitude for your continued confidence in our management capabilities.
Sincerely,
 |  |  | ||
| David Mouser | Daniel Burr | Ryan Carpenter | ||
| Portfolio Manager | Portfolio Manager | Assistant Portfolio Manager |
Performance is historical and does not represent future results.
Please see the following performance overview page for index description.
22
Driehaus International Small Cap Growth Fund
Performance Overview (unaudited)
The performance summarized below is historical and does not represent future results. Investment returns and principal value vary, and you may have a gain or loss when you sell shares. Performance data presented measures the change in the value of an investment in the Fund, assuming reinvestment of all dividends and capital gains. Average annual total return reflects annualized change.
The table does not reflect the deduction of taxes that a shareholder would pay on Fund distributions or the redemption of Fund shares. The graph compares the results of a $10,000 investment in the Fund over the last 10 fiscal year periods, with all dividends and capital gains reinvested, with the indicated index (and dividends reinvested) for the same period.
| Average Annual Total Returns as of 12/31/18 | 1 Year | 3 Years | 5 Years | 10 Years | ||||||||||||
Driehaus International Small Cap Growth Fund (DRIOX)1 | –16.92% | 3.29% | 3.49% | 11.59% | ||||||||||||
MSCI AC World ex USA Small Cap GrowthIndex-N2 | –18.27% | 2.89% | 2.26% | 10.07% | ||||||||||||
| 1 | The returns for the periods prior to January 1, 2010, reflect fee waivers and/or reimbursements without which performance would have been lower. |
| 2 | The Morgan Stanley Capital International All Country World ex USA Small Cap Growth Index-Net (MSCI AC World ex USA Small Cap Growth Index-N) is a market capitalization-weighted index designed to measure equity market performance in global developed markets and emerging markets, excluding the U.S., and is composed of stocks which are categorized as small capitalization growth stocks. Data is in U.S. dollars and is calculated with net dividend reinvestment. Source: Morgan Stanley Capital International Inc. |
23
Driehaus International Small Cap Growth Fund
Schedule of Investments
December 31, 2018
| Number of Shares | Value (Note A) | |||||||
| EQUITY SECURITIES — 98.1% |
| |||||||
| EUROPE — 48.0% | ||||||||
United Kingdom — 13.1% | ||||||||
Aveva Group PLC | 153,182 | $ | 4,724,947 | |||||
Balfour Beatty PLC | 1,075,692 | 3,418,094 | ||||||
Burford Capital, Ltd. | 157,338 | 3,320,992 | ||||||
Cranswick PLC | 35,632 | 1,195,363 | ||||||
Croda International PLC | 85,072 | 5,080,074 | ||||||
Oxford Biomedica PLC** | 174,940 | 1,576,904 | ||||||
Rentokil Initial PLC | 854,746 | 3,673,656 | ||||||
Spirax-Sarco Engineering PLC | 24,231 | 1,927,213 | ||||||
Stock Spirits Group PLC | 498,519 | 1,321,657 | ||||||
Vesuvius PLC | 362,171 | 2,338,121 | ||||||
|
| |||||||
| 28,577,021 | ||||||||
|
| |||||||
Germany — 9.7% | ||||||||
ADO Properties SA1 | 28,735 | 1,498,662 | ||||||
Carl Zeiss Meditec AG | 43,747 | 3,423,412 | ||||||
MTU Aero Engines AG | 19,620 | 3,560,774 | ||||||
Puma SE | 9,810 | 4,799,402 | ||||||
Scout24 AG1 | 95,372 | 4,388,386 | ||||||
TAG Immobilien AG | 156,374 | 3,567,188 | ||||||
|
| |||||||
| 21,237,824 | ||||||||
|
| |||||||
Italy — 4.3% | ||||||||
Amplifon SpA | 41,065 | 661,056 | ||||||
Davide Campari-Milano SpA | 332,435 | 2,812,856 | ||||||
DiaSorin SpA | 20,988 | 1,700,124 | ||||||
Maire Tecnimont SpA | 486,202 | 1,788,183 | ||||||
Prysmian SpA | 130,733 | 2,526,915 | ||||||
|
| |||||||
| 9,489,134 | ||||||||
|
| |||||||
Sweden — 3.0% | ||||||||
Elekta AB — B | 297,434 | 3,535,468 | ||||||
Tele2 AB — B | 231,140 | 2,945,663 | ||||||
|
| |||||||
| 6,481,131 | ||||||||
|
| |||||||
Netherlands — 2.8% | ||||||||
Aalberts Industries NV | 46,715 | 1,554,865 | ||||||
Argenx SE** | 11,822 | 1,154,040 | ||||||
OCI NV** | 47,954 | 978,541 | ||||||
QIAGEN NV** | 73,775 | 2,508,785 | ||||||
|
| |||||||
| 6,196,231 | ||||||||
|
| |||||||
Luxembourg — 2.8% | ||||||||
B&M European Value Retail SA | 814,754 | 2,923,336 | ||||||
Befesa SA1 | 39,119 | 1,680,774 | ||||||
Corestate Capital Holding SA | 43,385 | 1,506,165 | ||||||
|
| |||||||
| 6,110,275 | ||||||||
|
| |||||||
Norway — 2.4% | ||||||||
PetroleumGeo-Services ASA** | 529,236 | 722,868 | ||||||
Sbanken ASA1 | 108,408 | 940,334 | ||||||
| Number of Shares | Value (Note A) | |||||||
Schibsted ASA | 106,729 | $ | 3,579,646 | |||||
|
| |||||||
| 5,242,848 | ||||||||
|
| |||||||
Switzerland — 2.3% | ||||||||
Galenica AG1 | 34,498 | 1,519,049 | ||||||
Tecan Group AG | 17,837 | 3,462,509 | ||||||
|
| |||||||
| 4,981,558 | ||||||||
|
| |||||||
France — 2.3% | ||||||||
JCDecaux SA | 37,751 | 1,060,570 | ||||||
Teleperformance | 24,107 | 3,855,838 | ||||||
|
| |||||||
| 4,916,408 | ||||||||
|
| |||||||
Spain — 2.0% | ||||||||
Masmovil Ibercom SA** | 195,413 | 4,365,945 | ||||||
Denmark — 1.6% | ||||||||
FLSmidth & Co., AS | 45,234 | 2,034,541 | ||||||
Royal Unibrew AS | 21,499 | 1,481,325 | ||||||
|
| |||||||
| 3,515,866 | ||||||||
|
| |||||||
Poland — 0.6% | ||||||||
Dino Polska SA1** | 51,620 | 1,322,104 | ||||||
Russia — 0.6% | ||||||||
Globaltrans Investment PLC — SP GDR | 136,414 | 1,235,911 | ||||||
Malta — 0.5% | ||||||||
Kambi Group PLC** | 52,899 | 1,134,025 | ||||||
|
| |||||||
Total EUROPE | 104,806,281 | |||||||
|
| |||||||
| FAR EAST — 23.0% | ||||||||
Japan — 12.6% | ||||||||
Minebea Mitsumi, Inc. | 113,210 | 1,642,296 | ||||||
Miura Co., Ltd. | 91,936 | 2,101,179 | ||||||
NET One Systems Co., Ltd. | 157,265 | 2,774,969 | ||||||
Nichias Corp. | 154,179 | 2,645,962 | ||||||
Nihon Unisys, Ltd. | 46,400 | 1,037,602 | ||||||
PALTAC Corp. | 63,463 | 3,005,091 | ||||||
Sato Holdings Corp. | 72,534 | 1,727,236 | ||||||
SG Holdings Co., Ltd. | 101,359 | 2,648,530 | ||||||
Shimadzu Corp. | 79,998 | 1,586,749 | ||||||
TechnoPro Holdings, Inc. | 72,480 | 2,992,309 | ||||||
Tokyo Tatemono Co., Ltd. | 237,664 | 2,471,940 | ||||||
United Arrows, Ltd. | 89,659 | 2,875,338 | ||||||
|
| |||||||
| 27,509,201 | ||||||||
|
| |||||||
South Korea — 3.2% | ||||||||
CJ Logistics Corp.** | 20,571 | 3,078,829 | ||||||
Douzone Bizon Co., Ltd. | 30,786 | 1,431,971 | ||||||
Koh Young Technology, Inc. | 16,699 | 1,234,690 | ||||||
Orion Corp. | 12,322 | 1,325,184 | ||||||
|
| |||||||
| 7,070,674 | ||||||||
|
| |||||||
Australia — 2.8% | ||||||||
Bapcor, Ltd. | 894,031 | 3,708,993 | ||||||
NEXTDC, Ltd.** | 563,658 | 2,425,744 | ||||||
|
| |||||||
| 6,134,737 | ||||||||
|
| |||||||
Notes to Financial Statements are an integral part of this Schedule.
24
Driehaus International Small Cap Growth Fund
Schedule of Investments
December 31, 2018
| Number of Shares | Value (Note A) | |||||||
China — 2.3% | ||||||||
CIMC Enric Holdings, Ltd. | 2,054,317 | $ | 1,571,465 | |||||
Li Ning Co., Ltd.** | 3,255,572 | 3,492,345 | ||||||
|
| |||||||
| 5,063,810 | ||||||||
|
| |||||||
Cambodia — 1.0% | ||||||||
NagaCorp, Ltd. | 2,048,214 | 2,202,409 | ||||||
Philippines — 0.6% | ||||||||
Megawide Construction Corp. | 3,541,029 | 1,245,774 | ||||||
Taiwan — 0.5% | ||||||||
Hiwin Technologies Corp. | 155,818 | 1,120,336 | ||||||
|
| |||||||
Total FAR EAST | 50,346,941 | |||||||
|
| |||||||
| NORTH AMERICA — 17.1% | ||||||||
Canada — 16.6% | ||||||||
Aritzia, Inc.** | 208,215 | 2,501,264 | ||||||
ATS Automation Tooling Systems, Inc.** | 173,687 | 1,830,762 | ||||||
CAE, Inc. | 269,148 | 4,946,472 | ||||||
Canada Goose Holdings, Inc.** | 43,938 | 1,920,969 | ||||||
Cargojet, Inc. | 41,587 | 2,156,419 | ||||||
CES Energy Solutions Corp. | 361,335 | 833,728 | ||||||
Empire Co., Ltd. — A | 105,525 | 2,228,454 | ||||||
Kinaxis, Inc.** | 66,618 | 3,215,739 | ||||||
Kirkland Lake Gold, Ltd. | 162,796 | 4,245,193 | ||||||
Morneau Shepell, Inc. | 124,831 | 2,289,605 | ||||||
Parkland Fuel Corp. | 197,554 | 5,113,946 | ||||||
TFI International, Inc. | 99,964 | 2,584,771 | ||||||
Wheaton Precious Metals Corp. | 116,171 | 2,267,768 | ||||||
|
| |||||||
| 36,135,090 | ||||||||
|
| |||||||
Mexico — 0.5% | ||||||||
Grupo Cementos de Chihuahua SAB de CV | 222,900 | 1,145,252 | ||||||
|
| |||||||
Total NORTH AMERICA | 37,280,342 | |||||||
|
| |||||||
| SOUTH AMERICA — 5.8% | ||||||||
Brazil — 5.8% | ||||||||
BK Brasil Operacao e Assessoria a Restaurantes SA | 333,083 | 1,777,245 | ||||||
Cyrela Brazil Realty SA Empreendimentos e Participacoes | 835,008 | 3,332,922 | ||||||
Marcopolo SA — Pref. | 2,250,098 | 2,368,677 | ||||||
Rumo SA** | 719,839 | 3,157,392 | ||||||
Sul America SA | 266,749 | 1,968,399 | ||||||
|
| |||||||
Total SOUTH AMERICA | 12,604,635 | |||||||
|
| |||||||
| AFRICA — 2.7% | ||||||||
South Africa — 2.7% | ||||||||
Clicks Group, Ltd. | 201,463 | 2,680,806 | ||||||
Pick n Pay Stores, Ltd. | 453,572 | 2,136,478 | ||||||
| Number of Shares | Value (Note A) | |||||||
The Foschini Group, Ltd. | 94,514 | $ | 1,092,060 | |||||
|
| |||||||
Total AFRICA | 5,909,344 | |||||||
|
| |||||||
| MIDDLE EAST — 1.5% | ||||||||
Israel — 1.5% | ||||||||
CyberArk Software, Ltd.** | 44,154 | 3,273,578 | ||||||
|
| |||||||
Total MIDDLE EAST | 3,273,578 | |||||||
|
| |||||||
Total EQUITY SECURITIES | 214,221,121 | |||||||
|
| |||||||
| ||||||||
| RIGHTS — 0.0% | ||||||||
| SOUTH AMERICA — 0.0% | ||||||||
Brazil — 0.0% | ||||||||
Marcopolo SA Expires January 18, 2019** | 54,838 | 12,168 | ||||||
|
| |||||||
Total SOUTH AMERICA | 12,168 | |||||||
|
| |||||||
Total RIGHTS | 12,168 | |||||||
|
| |||||||
| ||||||||
TOTAL INVESTMENTS | 98.1 | % | $ | 214,233,289 | ||||
Other Assets In Excess Of Liabilities | 1.9 | % | 4,197,198 | |||||
|
|
|
| |||||
Net Assets | 100.0 | % | $ | 218,430,487 | ||||
| ||||||||
| 1 | 144A — This security was purchased pursuant to Rule 144A of the Securities Act of 1933 and may not be resold subject to that rule except to qualified institutional buyers. At December 31, 2018, these securities amounted to $11,349,309 or 5.2% of net assets. These 144A securities have not been deemed illiquid. |
| ** | Non-income producing security |
SP GDR — Sponsored Global Depository Receipt
Notes to Financial Statements are an integral part of this Schedule.
25
Driehaus International Small Cap Growth Fund
Schedule of Investments
December 31, 2018
Regional Weightings*
Western Europe | 46.8% | |||
North America | 17.1% | |||
Japan | 12.6% | |||
Asia/Far EastEx-Japan | 10.4% | |||
South America | 5.8% | |||
Africa | 2.7% | |||
Middle East | 1.5% | |||
Eastern Europe | 1.2% |
Top Ten Holdings*
Parkland Fuel Corp. | 2.3% | |||
Croda International PLC | 2.3% | |||
CAE, Inc. | 2.3% | |||
Puma SE | 2.2% | |||
Aveva Group PLC | 2.2% | |||
Scout24 AG | 2.0% | |||
Masmovil Ibercom SA | 2.0% | |||
Kirkland Lake Gold, Ltd. | 1.9% | |||
Teleperformance | 1.8% | |||
Bapcor, Ltd. | 1.7% |
| * | All percentages are stated as a percent of net assets at December 31, 2018 |
Notes to Financial Statements are an integral part of this Schedule.
26
Driehaus International Small Cap Growth Fund
Schedule of Investments
December 31, 2018
Industry | Percent of Net Assets | |||
Aerospace & Defense | 3.9% | |||
Air Freight & Logistics | 2.2% | |||
Beverages | 2.6% | |||
Biotechnology | 1.3% | |||
Building Products | 1.2% | |||
Capital Markets | 1.5% | |||
Chemicals | 2.8% | |||
Commercial Banks | 0.4% | |||
Commercial Services & Supplies | 3.3% | |||
Construction & Engineering | 3.9% | |||
Construction Materials | 0.5% | |||
Distributors | 3.1% | |||
Diversified Telecommunication Services | 2.0% | |||
Electrical Equipment | 1.2% | |||
Electronic Equipment, Instruments & Components | 0.7% | |||
Energy Equipment & Services | 0.7% | |||
Food & Staples Retailing | 3.8% | |||
Food Products | 1.2% | |||
Health Care Equipment & Supplies | 4.0% | |||
Health Care Providers & Services | 0.3% | |||
Hotels, Restaurants & Leisure | 2.3% | |||
Industry | Percent of Net Assets | |||
Household Durables | 1.5% | |||
Information Technology Services | 2.9% | |||
Insurance | 0.9% | |||
Interactive Media & Services. | 2.0% | |||
Life Sciences Tools & Services | 2.7% | |||
Machinery | 7.5% | |||
Media | 2.1% | |||
Metals & Mining | 3.0% | |||
Multiline Retail | 1.3% | |||
Oil, Gas & Consumable Fuels | 2.3% | |||
Pharmaceuticals | 0.7% | |||
Professional Services | 4.2% | |||
Real Estate Management & Development | 4.1% | |||
Road & Rail | 4.6% | |||
Semiconductors & Semiconductor Equipment | 0.6% | |||
Software | 5.8% | |||
Specialty Retail | 1.8% | |||
Textiles, Apparel & Luxury Goods | 5.8% | |||
Wireless Telecommunication Services | 1.4% | |||
Other Assets in Excess of Liabilities | 1.9% | |||
|
| |||
TOTAL | 100.0% | |||
|
| |||
Notes to Financial Statements are an integral part of this Schedule.
27
Driehaus Micro Cap Growth Fund — Portfolio Managers’ Letter
Dear Fellow Shareholders,
The Driehaus Micro Cap Growth Fund (“Fund”) returned 3.88% for the year ended December 31, 2018. This return outperformed the Fund’s benchmark, the Russell Microcap® Growth Index (the “Benchmark”), which returned -14.18% for the same period.
After robust US market performance for most of the year, the fourth quarter experienced one of the largest fourth quarter declines in market history. Market breadth was poor as all major sectors and market caps sold off sharply. Micro caps and small caps declined more than large caps and value declined less than growth and the most defensive areas of the market outperformed.
It appears that monetary and trade policy missteps by the Federal Reserve and the White House, along with fears that the trade war with China is slowing overall global trade weighed down market sentiment in the fourth quarter. Additionally, the significant economic growth slowdown in the EU and more notably in China seem to signal a weakening in end-demand growth for most cyclical industries that are essential for global growth. However, for 2018, US equities still experienced more broad-based strength and outperformed relative to the rest of the world.
For the year 2018, key contributors to performance versus the Benchmark were the Fund’s selection of holdings in the health care and information technology sectors.
Loxo Oncology, Inc. (Ticker: LOXO) was the top contributor to Fund performance for the period. The biopharmaceutical company develops medicines for patients with genetically defined cancers. Lartrectinib, the company’s lead product, received FDA approval in November and is prepared for launch. The targeted therapy is tumor-agnostic and treats reselectable or locally advanced microsatellite instability-high solid tumors. Additionally, the company’s LOXO-292 was granted “Breakthrough Therapy Designation” by the FDA, adding to gains for the company.
Everbridge, Inc. (Ticker: EVBG) also contributed to the Fund’s performance for the period. The company provides a critical events management software-as-a-service platform that aggregates and assesses threat data, locates people and responders and executes pre-defined communication plans. Strong results quarter after quarter led to share price increases while solid growth in new customers and multi-product sales along with robust demand domestically and internationally support continued growth for the company.
During the period, the two sectors that detracted the most value from Fund performance versus the Benchmark were selections within the industrials and energy sectors.
The holding that detracted the most from the Fund’s return during the period was Solaris Oilfield Infrastructure, Inc. (Ticker: SOI). The company supplies mobile proppant management systems that unload, store, and deliver proppant at oil and natural gas well sites. Falling oil prices have led to difficulties for oil field services companies overall. While the company did deliver solid fundamental performance that exceeded Street expectations as it continues to gain market share, the stock underperformed due to weak energy sector performance and as crude oil weighed on overall earnings estimates.
Mesa Air Group, Inc. (Ticker: MESA) was also a detractor to the Fund’s returns for the period. The company provides regional air carrier and passenger transportation services. Its stock fell after United Airlines announced it was purchasing ExpressJet from SkyWest. The company’s contract with United expires next year, making this acquisition a threat to renewal prospects for the 20 aircraft currently flying with United, but we believe the risks are low and overblown.
As we enter 2019, we believe that the outlook for US equities will depend on key items such as the Federal Open Market Committee’s monetary policy, the slope of the yield curve, US/China trade policy, stabilization of the US and Global economies and the health of corporate earnings. We further perceive trade and geopolitical uncertainty to be a significant deterrent to capital expenditure and consumer spending growth.
28
Although current conditions may have created a “growth scare”, it is our view that other factors suggest a recession is not yet around the corner. While GDP and the Purchasing Manager’s Index have weakened, they both remain expansionary. Meanwhile, the labor market remains robust and consumer spending is still positive. The US consumer and economy may also benefit from larger tax refunds due to 2018 tax reforms, lower crude oil prices, lower interest rates and a weaker US dollar. The much more dovish tone of the Federal Reserve on rate hikes was a major positive for the market and signals what was once a headwind could become a tailwind in 2019. Other economic data has also shown some signs of strength and stabilization. As a US-centric fund, we are minimally exposed to continued weakness in Europe, China, and other regions outside the US. We continue to hold and discover an exciting number of companies across a wide number of industries that are hitting growth inflections and appear poised to exceed expectations.
Thank you for investing alongside us in the Driehaus Micro Cap Growth Fund. We appreciate your continued confidence in our management capabilities.
Sincerely,
 |  | |
| Jeff James | Michael Buck | |
| Portfolio Manager | Assistant Portfolio Manager |
Performance is historical and does not represent future results.
Please see the following performance overview page for index description.
29
Driehaus Micro Cap Growth Fund
Performance Overview (unaudited)
The performance summarized below is historical and does not represent future results. Investment returns and principal value vary, and you may have a gain or loss when you sell shares. Performance data presented measures the change in the value of an investment in the Fund, assuming reinvestment of all dividends and capital gains. Average annual total return reflects annualized change.
The table does not reflect the deduction of taxes that a shareholder would pay on Fund distributions or the redemption of Fund shares. The graph compares the results of a $10,000 investment in the Fund over the last 10 fiscal year periods (which includes performance of the Predecessor Limited Partnership), with all dividends and capital gains reinvested, with the indicated index (and dividends reinvested) for the same period.
| Fund Only | Including Predecessor Limited Partnership | |||||||||||||||||||
| Average Annual Total Returns as of 12/31/18 | 1 Year | 3 Years | 5 Years | Since Inception (11/18/13 - 12/31/18) | 10 Years | |||||||||||||||
Driehaus Micro Cap Growth Fund (DMCRX)1 | 3.88% | 15.00% | 10.36% | 11.65% | 17.11% | |||||||||||||||
Russell Microcap® Growth Index2 | –14.18% | 2.27% | 1.41% | 2.74% | 12.04% | |||||||||||||||
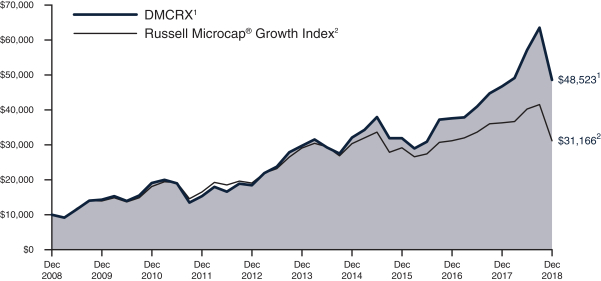
| 1 | The Driehaus Micro Cap Growth Fund (the “Fund”) performance shown above includes the performance of the Driehaus Micro Cap Fund, L.P. (the “Predecessor Limited Partnership”), one of the Fund’s predecessors, for the periods before the Fund’s registration statement became effective. The Predecessor Limited Partnership, which was established on July 1, 1996, was managed with substantially the same investment objective, policies and philosophies as are followed by the Fund. The Fund succeeded to the Predecessor Limited Partnership’s assets together with the assets of the Driehaus Institutional Micro Cap Fund, L.P. on November 18, 2013. The Predecessor Limited Partnership was not registered under the Investment Company Act of 1940, as amended (“1940 Act”), and thus was not subject to certain investment and operational restrictions that are imposed by the 1940 Act. If the Predecessor Limited Partnership had been registered under the 1940 Act, its performance may have been adversely affected. The Predecessor Limited Partnership’s performance has been restated to reflect estimated expenses of the Fund. The returns for periods prior to November 18, 2016, reflect fee waivers and/or reimbursements without which performance would have been lower. |
| 2 | The Russell Microcap® Growth Index is constructed to provide a comprehensive and unbiased barometer of the micro cap growth market. Based on ongoing empirical research of investment manager behavior, the methodology used to determine growth probability approximates the aggregate microcap growth manager's opportunity set. |
30
Driehaus Micro Cap Growth Fund
Schedule of Investments
December 31, 2018
| Number of Shares | Value (Note A) | |||||||
| EQUITY SECURITIES — 99.4% |
| |||||||
| HEALTH CARE — 40.5% |
| |||||||
Biotechnology — 15.0% |
| |||||||
Allakos, Inc.** | 41,020 | $ | 2,144,115 | |||||
Argenx SE — ADR** | 51,975 | 4,993,238 | ||||||
Array BioPharma, Inc.** | 331,412 | 4,722,621 | ||||||
Atara Biotherapeutics, Inc.** | 42,332 | 1,470,614 | ||||||
Avid Bioservices, Inc.** | 236,192 | 968,387 | ||||||
Avrobio, Inc.** | 43,915 | 731,185 | ||||||
CareDx, Inc.** | 158,773 | 3,991,553 | ||||||
Clementia Pharmaceuticals, Inc.** | 172,127 | 2,024,214 | ||||||
Deciphera Pharmaceuticals, Inc.** | 47,977 | 1,007,037 | ||||||
Global Blood Therapeutics, Inc.** | 33,200 | 1,362,860 | ||||||
Loxo Oncology, Inc.** | 33,744 | 4,726,522 | ||||||
Mirati Therapeutics, Inc.** | 43,003 | 1,824,187 | ||||||
Orchard Therapeutics PLC — ADR** | 115,353 | 1,814,503 | ||||||
Principia Biopharma, Inc.** | 50,792 | 1,391,193 | ||||||
Sesen Bio, Inc.** | 633,414 | 899,448 | ||||||
Sutro Biopharma, Inc.** | 51,319 | 462,897 | ||||||
Twist Bioscience Corp.** | 24,292 | 560,902 | ||||||
Vericel Corp.** | 267,857 | 4,660,712 | ||||||
|
| |||||||
| 39,756,188 | ||||||||
|
| |||||||
Health Care Equipment & Supplies — 14.3% |
| |||||||
AxoGen, Inc.** | 27,890 | 569,793 | ||||||
BioLife Solutions, Inc.** | 132,625 | 1,595,479 | ||||||
Cerus Corp.** | 176,077 | 892,710 | ||||||
CryoLife, Inc.** | 66,192 | 1,878,529 | ||||||
Establishment Labs Holdings, Inc.1** | 100,224 | 2,748,142 | ||||||
Inogen, Inc.** | 16,360 | 2,031,421 | ||||||
IntriCon Corp.** | 33,024 | 871,173 | ||||||
iRhythm Technologies, Inc.** | 52,055 | 3,616,781 | ||||||
Nuvectra Corp.** | 166,161 | 2,715,071 | ||||||
OrthoPediatrics Corp.1** | 138,238 | 4,821,741 | ||||||
SI-BONE, Inc.** | 145,083 | 3,030,784 | ||||||
Sientra, Inc.** | 148,650 | 1,889,342 | ||||||
STAAR Surgical Co.** | 46,298 | 1,477,369 | ||||||
Tactile Systems Technology, Inc.** | 100,976 | 4,599,457 | ||||||
Tandem Diabetes Care, Inc.** | 94,928 | 3,604,416 | ||||||
Vapotherm, Inc.** | 75,628 | 1,508,779 | ||||||
|
| |||||||
| 37,850,987 | ||||||||
|
| |||||||
Health Care Technology — 3.9% |
| |||||||
Inspire Medical Systems, Inc.** | 90,693 | 3,831,779 | ||||||
Tabula Rasa HealthCare, Inc.** | 21,557 | 1,374,474 | ||||||
Teladoc Health, Inc.** | 33,504 | 1,660,793 | ||||||
| Number of Shares | Value (Note A) | |||||||
Vocera Communications, Inc.** | 89,365 | $ | 3,516,513 | |||||
|
| |||||||
| 10,383,559 | ||||||||
|
| |||||||
Life Sciences Tools & Services — 3.8% |
| |||||||
Codexis, Inc.** | 230,387 | 3,847,463 | ||||||
Fluidigm Corp.** | 403,458 | 3,477,808 | ||||||
NeoGenomics, Inc.** | 221,287 | 2,790,429 | ||||||
|
| |||||||
| 10,115,700 | ||||||||
|
| |||||||
Pharmaceuticals — 2.6% |
| |||||||
Acer Therapeutics, Inc.1** | 76,795 | 1,545,115 | ||||||
MyoKardia, Inc.** | 52,311 | 2,555,915 | ||||||
Reata Pharmaceuticals, Inc. — A** | 30,193 | 1,693,827 | ||||||
Tricida, Inc.** | 48,009 | 1,132,052 | ||||||
|
| |||||||
| 6,926,909 | ||||||||
|
| |||||||
Health Care Providers & Services — 0.9% |
| |||||||
PetIQ, Inc.** | 94,355 | 2,214,512 | ||||||
|
| |||||||
Total HEALTH CARE | 107,247,855 | |||||||
|
| |||||||
| INFORMATION TECHNOLOGY — 17.5% |
| |||||||
Software — 12.3% |
| |||||||
Altair Engineering, Inc. — A** | 110,204 | 3,039,426 | ||||||
Alteryx, Inc. — A** | 72,493 | 4,311,159 | ||||||
Everbridge, Inc.** | 94,739 | 5,377,386 | ||||||
Five9, Inc.** | 118,248 | 5,169,803 | ||||||
SendGrid, Inc.** | 93,619 | 4,041,532 | ||||||
ShotSpotter, Inc.** | 38,110 | 1,188,270 | ||||||
Smartsheet, Inc. — A** | 105,066 | 2,611,941 | ||||||
Upland Software, Inc.** | 110,204 | 2,995,345 | ||||||
Zscaler, Inc.** | 96,914 | 3,799,998 | ||||||
|
| |||||||
| 32,534,860 | ||||||||
|
| |||||||
Information Technology Services — 3.4% |
| |||||||
Endava PLC — SP ADR1** | 113,242 | 2,744,986 | ||||||
I3 Verticals, Inc. — A** | 149,481 | 3,602,492 | ||||||
Virtusa Corp.** | 63,090 | 2,687,003 | ||||||
|
| |||||||
| 9,034,481 | ||||||||
|
| |||||||
Semiconductors & Semiconductor Equipment — 1.8% |
| |||||||
Inphi Corp.** | 61,315 | 1,971,277 | ||||||
SMART Global Holdings, Inc.** | 88,742 | 2,635,637 | ||||||
|
| |||||||
| 4,606,914 | ||||||||
|
| |||||||
Total INFORMATION TECHNOLOGY | 46,176,255 | |||||||
|
| |||||||
| CONSUMER DISCRETIONARY — 13.8% |
| |||||||
Hotels, Restaurants & Leisure — 5.2% |
| |||||||
BJ’s Restaurants, Inc. | 25,220 | 1,275,375 | ||||||
Century Casinos, Inc.1** | 212,556 | 1,570,789 | ||||||
Eldorado Resorts, Inc.** | 43,099 | 1,560,615 | ||||||
Monarch Casino & Resort, Inc.** | 36,382 | 1,387,610 | ||||||
Notes to Financial Statements are an integral part of this Schedule.
31
Driehaus Micro Cap Growth Fund
Schedule of Investments
December 31, 2018
| Number of Shares | Value (Note A) | |||||||
Noodles & Co.** | 236,960 | $ | 1,656,350 | |||||
PlayAGS, Inc.** | 142,780 | 3,283,940 | ||||||
Wingstop, Inc. | 47,115 | 3,024,312 | ||||||
|
| |||||||
| 13,758,991 | ||||||||
|
| |||||||
Textiles, Apparel & Luxury Goods — 3.2% |
| |||||||
Crocs, Inc.** | 230,083 | 5,977,556 | ||||||
Movado Group, Inc. | 81,433 | 2,574,911 | ||||||
|
| |||||||
| 8,552,467 | ||||||||
|
| |||||||
Leisure Equipment & Products — 2.2% |
| |||||||
Malibu Boats, Inc. — A** | 110,651 | 3,850,655 | ||||||
MasterCraft Boat Holdings, Inc.** | 110,092 | 2,058,720 | ||||||
|
| |||||||
| 5,909,375 | ||||||||
|
| |||||||
Household Durables — 1.7% |
| |||||||
Legacy Housing Corp.** | 70,158 | 836,985 | ||||||
Skyline Champion Corp. | 112,491 | 1,652,493 | ||||||
The Lovesac Co.1** | 84,904 | 1,947,698 | ||||||
|
| |||||||
| 4,437,176 | ||||||||
|
| |||||||
Internet & Catalog Retail — 0.6% |
| |||||||
Duluth Holdings, Inc. — B** | 63,266 | 1,596,201 | ||||||
Specialty Retail — 0.6% |
| |||||||
Boot Barn Holdings, Inc.** | 86,487 | 1,472,874 | ||||||
Distributors — 0.3% |
| |||||||
Funko, Inc. — A** | 65,633 | 863,074 | ||||||
|
| |||||||
Total CONSUMER DISCRETIONARY | 36,590,158 | |||||||
|
| |||||||
| INDUSTRIALS — 12.9% |
| |||||||
Machinery — 3.0% |
| |||||||
Columbus McKinnon Corp. | 79,498 | 2,396,070 | ||||||
Kadant, Inc. | 27,666 | 2,253,672 | ||||||
Kornit Digital, Ltd.** | 139,534 | 2,612,076 | ||||||
Luxfer Holdings PLC | 40,780 | 718,951 | ||||||
|
| |||||||
| 7,980,769 | ||||||||
|
| |||||||
Construction & Engineering — 2.7% |
| |||||||
Ameresco, Inc. — A** | 91,492 | 1,290,037 | ||||||
Comfort Systems USA, Inc. | 56,645 | 2,474,254 | ||||||
NV5 Global, Inc.** | 38,701 | 2,343,346 | ||||||
Sterling Construction Co., Inc.** | 104,574 | 1,138,811 | ||||||
|
| |||||||
| 7,246,448 | ||||||||
|
| |||||||
Aerospace & Defense — 2.5% |
| |||||||
Cubic Corp. | 25,220 | 1,355,323 | ||||||
Kratos Defense & Security | ||||||||
Solutions, Inc.** | 254,392 | 3,584,383 | ||||||
Mercury Systems, Inc.** | 33,088 | 1,564,732 | ||||||
|
| |||||||
| 6,504,438 | ||||||||
|
| |||||||
Electrical Equipment — 1.2% |
| |||||||
Sunrun, Inc.** | 164,034 | 1,786,330 | ||||||
| Number of Shares | Value (Note A) | |||||||
TPI Composites, Inc.** | 59,316 | $ | 1,457,987 | |||||
|
| |||||||
| 3,244,317 | ||||||||
|
| |||||||
Professional Services — 1.0% |
| |||||||
Willdan Group, Inc.** | 73,725 | 2,578,901 | ||||||
Airlines — 0.8% |
| |||||||
Mesa Air Group, Inc.** | 258,966 | 1,996,628 | ||||||
Commercial Services & Supplies — 0.7% |
| |||||||
Casella Waste Systems, Inc. — A** | 65,217 | 1,858,032 | ||||||
Building Products — 0.5% |
| |||||||
PGT Innovations, Inc.** | 90,149 | 1,428,862 | ||||||
Trading Companies & Distributors — 0.5% |
| |||||||
SiteOne Landscape Supply, Inc.** | 23,664 | 1,307,909 | ||||||
|
| |||||||
Total INDUSTRIALS | 34,146,304 | |||||||
|
| |||||||
| CONSUMER STAPLES — 5.6% |
| |||||||
Food Products — 2.5% |
| |||||||
Calavo Growers, Inc. | 15,848 | 1,156,270 | ||||||
Freshpet, Inc.** | 105,054 | 3,378,537 | ||||||
Limoneira Co. | 109,756 | 2,145,730 | ||||||
|
| |||||||
| 6,680,537 | ||||||||
|
| |||||||
Food & Staples Retailing — 1.5% |
| |||||||
The Chefs’ Warehouse, Inc.** | 120,519 | 3,854,198 | ||||||
Beverages — 0.9% |
| |||||||
Primo Water Corp.** | 176,636 | 2,474,670 | ||||||
Personal Products — 0.7% |
| |||||||
Medifast, Inc. | 14,920 | 1,865,298 | ||||||
|
| |||||||
Total CONSUMER STAPLES | 14,874,703 | |||||||
|
| |||||||
| FINANCIALS — 4.0% |
| |||||||
Insurance — 1.6% |
| |||||||
Goosehead Insurance, Inc. — A** | 89,541 | 2,354,033 | ||||||
Kinsale Capital Group, Inc. | 32,576 | 1,809,923 | ||||||
|
| |||||||
| 4,163,956 | ||||||||
|
| |||||||
Real Estate Investment Trust — 0.9% |
| |||||||
Innovative Industrial Properties, Inc. | 50,520 | 2,293,103 | ||||||
Thrifts & Mortgage Finance — 0.8% |
| |||||||
NMI Holdings, Inc. — A** | 126,740 | 2,262,309 | ||||||
Commercial Banks — 0.7% |
| |||||||
Live Oak Bancshares, Inc. | 38,206 | 565,831 | ||||||
TriState Capital Holdings, Inc.** | 71,198 | 1,385,513 | ||||||
|
| |||||||
| 1,951,344 | ||||||||
|
| |||||||
Total FINANCIALS | 10,670,712 | |||||||
|
| |||||||
| COMMUNICATION SERVICES — 3.4% |
| |||||||
Interactive Media & Services — 2.2% |
| |||||||
QuinStreet, Inc.** | 354,681 | 5,756,473 | ||||||
Notes to Financial Statements are an integral part of this Schedule.
32
Driehaus Micro Cap Growth Fund
Schedule of Investments
December 31, 2018
| Number of Shares | Value (Note A) | |||||||
Diversified Telecommunication Services — 1.2% |
| |||||||
Bandwidth, Inc. — A** | 78,587 | $ | 3,202,420 | |||||
|
| |||||||
Total COMMUNICATION SERVICES | 8,958,893 | |||||||
|
| |||||||
| ENERGY — 1.4% |
| |||||||
Energy Equipment & Services — 1.1% |
| |||||||
Cactus, Inc. — A** | 63,250 | 1,733,683 | ||||||
Solaris Oilfield Infrastructure, Inc. — A | 95,666 | 1,156,602 | ||||||
|
| |||||||
| 2,890,285 | ||||||||
|
| |||||||
Oil, Gas & Consumable Fuels — 0.3% |
| |||||||
Berry Petroleum Corp. | 95,379 | 834,566 | ||||||
|
| |||||||
Total ENERGY | 3,724,851 | |||||||
|
| |||||||
| MATERIALS — 0.3% |
| |||||||
Metals & Mining — 0.3% |
| |||||||
Materion Corp. | 14,601 | 656,899 | ||||||
|
| |||||||
Total MATERIALS | 656,899 | |||||||
|
| |||||||
Total EQUITY SECURITIES | 263,046,630 | |||||||
|
| |||||||
| ||||||||
TOTAL INVESTMENTS | 99.4 | % | $ | 263,046,630 | ||||
Other Assets In Excess Of Liabilities | 0.6 | % | 1,560,215 | |||||
|
|
|
| |||||
Net Assets | 100.0 | % | $ | 264,606,845 | ||||
| ||||||||
| 1 | Pursuant to procedures adopted by Driehaus Mutual Funds’ (the “Trust”) Board of Trustees, this security has been determined to be illiquid by Driehaus Capital Management LLC, the Fund’s investment adviser. |
| ** | Non-income producing security |
ADR — American Depository Receipt
SP ADR — Sponsored American Depository Receipt
Top Ten Holdings*
Crocs, Inc. | 2.3% | |||
QuinStreet, Inc. | 2.2% | |||
Everbridge, Inc. | 2.0% | |||
Five9, Inc. | 2.0% | |||
Argenx SE — ADR | 1.9% | |||
OrthoPediatrics Corp. | 1.8% | |||
Loxo Oncology, Inc. | 1.8% | |||
Array BioPharma, Inc. | 1.8% | |||
Vericel Corp. | 1.8% | |||
Tactile Systems Technology, Inc. | 1.7% |
| * | All percentages are stated as a percent of net assets at December 31, 2018. |
Notes to Financial Statements are an integral part of this Schedule.
33
Driehaus Micro Cap Growth Fund
Schedule of Investments
December 31, 2018
Industry | Percent of Net Assets | |||
Aerospace & Defense | 2.5% | |||
Airlines | 0.8% | |||
Beverages | 0.9% | |||
Biotechnology | 15.0% | |||
Building Products | 0.5% | |||
Commercial Banks | 0.7% | |||
Commercial Services & Supplies | 0.7% | |||
Construction & Engineering | 2.7% | |||
Distributors | 0.3% | |||
Diversified Telecommunication Services | 1.2% | |||
Electrical Equipment | 1.2% | |||
Energy Equipment & Services | 1.1% | |||
Food & Staples Retailing | 1.5% | |||
Food Products | 2.5% | |||
Health Care Equipment & Supplies | 14.3% | |||
Health Care Providers & Services | 0.9% | |||
Health Care Technology | 3.9% | |||
Hotels, Restaurants & Leisure | 5.2% | |||
Household Durables | 1.7% | |||
Information Technology Services | 3.4% | |||
Industry | Percent of Net Assets | |||
Insurance | 1.6% | |||
Interactive Media & Services | 2.2% | |||
Internet & Catalog Retail | 0.6% | |||
Leisure Equipment & Products | 2.2% | |||
Life Sciences Tools & Services | 3.8% | |||
Machinery | 3.0% | |||
Metals & Mining | 0.3% | |||
Oil, Gas & Consumable Fuels | 0.3% | |||
Personal Products | 0.7% | |||
Pharmaceuticals | 2.6% | |||
Professional Services | 1.0% | |||
Real Estate Investment Trust | 0.9% | |||
Semiconductors & Semiconductor Equipment | 1.8% | |||
Software | 12.3% | |||
Specialty Retail | 0.6% | |||
Textiles, Apparel & Luxury Goods | 3.2% | |||
Thrifts & Mortgage Finance. | 0.8% | |||
Trading Companies & Distributors | 0.5% | |||
Other Assets in Excess of Liabilities | 0.6% | |||
|
| |||
TOTAL | 100.0% | |||
|
| |||
Notes to Financial Statements are an integral part of this Schedule.
34
Driehaus Small Cap Growth Fund — Portfolio Managers’ Letter
Dear Fellow Shareholders,
The Driehaus Small Cap Growth Fund (“Fund”) Investor class (DVSMX) returned 3.33% and Institutional class (DNSMX) returned 3.59% for the year ended December 31, 2018. This return outperformed the Fund’s benchmark, the Russell 2000® Growth Index (the “Benchmark”), which returned -9.31% for the same period.
After robust US market performance for most of the year, the fourth quarter experienced one of the largest fourth quarter declines in market history. Market breadth was poor as all major sectors and market caps sold off sharply. Small caps declined more than large caps and value declined less than growth and the most defensive areas of the market outperformed.
It appears that potential monetary and trade policy missteps by the Federal Reserve and the White House, along with fears that the trade war with China is slowing overall global trade weighed down market sentiment in the fourth quarter. Additionally, the significant economic growth slowdown in the EU and more notably in China signal a weakening in end-demand growth for most cyclical industries that are essential for global growth. However, for 2018, US equities still experienced more broad-based strength and outperformed relative to the rest of the world.
For the year 2018, key contributors to performance versus the Benchmark were the Fund’s selection of holdings in the health care and information technology services sectors.
Loxo Oncology, Inc. (Ticker: LOXO) was the top contributor to Fund performance for the period. The biopharmaceutical company develops medicines for patients with genetically defined cancers. Lartrectinib, the company’s lead product, received FDA approval in November and is prepared for launch. The targeted therapy is tumor-agnostic and treats reselectable or locally advanced microsatellite instability-high solid tumors. Additionally, the company’s LOXO-292 was granted “Breakthrough Therapy Designation” by the FDA, adding to gains for the company.
RingCentral, Inc. (Ticker: RNG) also contributed to the Fund’s performance for the period. The company provides global enterprise cloud communications and collaboration solutions. Company performance in 2018 was driven by a year of strong growth, exceeding investor expectations. Enterprise subscription growth and channel partnership successes were the main drivers of growth. The announced acquisition of Dimelo, a cloud-based digital customer engagement platform, should also expand the company’s digital engagement capabilities.
During the period, the two sectors that detracted the most value from Fund performance versus the Benchmark were selections within the industrials and energy sectors.
The holding that detracted the most from the Fund’s return during the period was Solaris Oilfield Infrastructure, Inc. (Ticker: SOI). The company supplies mobile proppant management systems that unload, store, and deliver proppant at oil and natural gas well sites. Falling oil prices have led to difficulties for oil field services companies overall. While the company did deliver solid fundamental performance that exceeded Street expectations as it continues to gain market share, the stock underperformed due to weak energy sector performance and as crude oil weighed on overall earnings estimates.
Ensco plc (Ticker: ESV) was also a detractor to the Fund’s returns for the period. The company provides offshore drilling services to the petroleum industry. Its share price fell in concert with other offshore drillers, due to lower oil prices. Performance results for the third quarter were still in line with estimates and although fourth quarter estimates have been reduced, long term forecasts remain solid.
As we enter 2019, we believe that the outlook for US equities will depend on key items such as the Federal Open Market Committee’s monetary policy, the slope of the yield curve, US/China trade policy, stabilization of the US and Global economies and the health of corporate earnings. We further perceive trade and geopolitical uncertainty to be a significant hurdle for capital expenditure and consumer spending growth.
Although current conditions may have created a “growth scare” it is our view that other factors suggest a recession is not yet around the corner. While GDP and the Purchasing Manager’s Index have weakened, they both remain expansionary. Meanwhile, the labor market remains robust and consumer spending is still positive. The US consumer and economy may benefit from larger tax refunds due to 2018 tax reforms, lower crude oil prices, lower interest rates and a weaker US dollar. The much more dovish tone of the Federal
35
Reserve on rate hikes was a major positive for the market and signals what was once a headwind could become a tailwind in 2019. Other economic data has also shown some signs of strength and stabilization. As a US-centric fund, we are minimally exposed to continued weakness in Europe, China, and other regions outside the US. We continue to hold and discover an exciting number of companies across a wide number of industries that are hitting growth inflections and appear poised to exceed expectations.
Thank you for investing alongside us in the Driehaus Small Cap Growth Fund. We appreciate your continued confidence in our management capabilities.
Sincerely,
| | |
| Jeff James | Michael Buck | |
| Portfolio Manager | Assistant Portfolio Manager |
Performance is historical and does not represent future results.
Please see the following performance overview page for index description.
36
Driehaus Small Cap Growth Fund
Performance Overview (unaudited)
The performance summarized below is historical and does not represent future results. Investment returns and principal value vary, and you may have a gain or loss when you sell shares. Performance data presented measures the change in the value of an investment in the Fund, assuming reinvestment of all dividends and capital gains. Average annual total return reflects annualized change.
The table does not reflect the deduction of taxes that a shareholder would pay on Fund distributions or the redemption of Fund shares. The graph compares the results of a $10,000 investment in the Fund over the last 10 fiscal year periods (which includes performance of the Predecessor Partnership), with all dividends and capital gains reinvested, with the indicated index (and dividends reinvested) for the same period.
| Fund Only | Including Predecessor Limited Partnership | |||||||||||||||||||
| Average Annual Total Returns as of 12/31/18 | 1 Year | Since Inception (8/21/17 - 12/31/18) | 3 Years | 5 Years | 10 Years | |||||||||||||||
Driehaus Small Cap Growth Fund Investor Class (DVSMX)1 | 3.33% | 15.77% | 14.34% | 9.22% | 15.44% | |||||||||||||||
Driehaus Small Cap Growth Fund Institutional Class (DNSMX)1 | 3.59% | 16.05% | 14.46% | 9.29% | 15.48% | |||||||||||||||
Russell 2000® Growth Index2 | –9.31% | 3.00% | 7.24% | 5.13% | 13.52% | |||||||||||||||
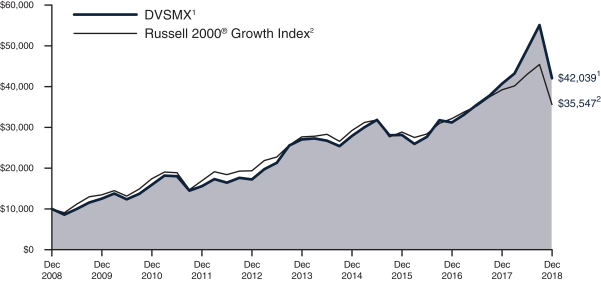
| 1 | The Driehaus Small Cap Growth Fund (“the Fund”) performance shown above includes the performance of the Driehaus Institutional Small Cap, L.P. (the “Predecessor Partnership”), one of the Fund’s predecessors, for the periods before the Fund’s registration statement became effective. The Predecessor Partnership was managed by the same investment team with substantially the same investment objective, policies and philosophies as are followed by the Fund. The Fund succeeded to the Predecessor Partnership’s assets together with the assets of the Driehaus Institutional Small Cap Recovery Fund, L.P., Driehaus Small Cap Recovery Fund, L.P. and Driehaus Small Cap Investors, L.P. (together, the “Limited Partnerships”) on August 21, 2017. The investment portfolios of the Limited Partnerships were identical and therefore had similar performance. The performance of the Predecessor Partnership is shown here because it has been in operation the longest. The Predecessor Partnership was not registered under the Investment Company Act of 1940, as amended (“1940 Act”), and thus was not subject to certain investment and operational restrictions that are imposed by the 1940 Act. If the Predecessor Partnership had been registered under the 1940 Act, its performance may have been adversely affected. The Predecessor Partnership’s performance has not been restated to reflect estimated expenses applicable to each class of shares of the Fund. The returns reflect fee waivers and/or reimbursements without which performance would have been lower. |
| 2 | The Russell 2000® Growth Index measures the performance of those Russell 2000® companies with higherprice-to-book ratios and higher forecasted growth values. The performance data includes reinvested dividends. The Russell 2000® Index measures the performance of the 2,000 smallest companies in the Russell 3000® Index. |
37
Driehaus Small Cap Growth Fund
Schedule of Investments
December 31, 2018
| Number of Shares | Value (Note A) | |||||||
| EQUITY SECURITIES — 97.7% |
| |||||||
| HEALTH CARE — 28.7% | ||||||||
Biotechnology — 12.6% | ||||||||
Allakos, Inc.** | 17,027 | $ | 890,001 | |||||
Argenx SE — ADR** | 25,214 | 2,422,309 | ||||||
Array BioPharma, Inc.** | 164,794 | 2,348,314 | ||||||
Ascendis Pharma AS — ADR** | 9,744 | 610,462 | ||||||
Atara Biotherapeutics, Inc.** | 25,340 | 880,312 | ||||||
CareDx, Inc.** | 64,689 | 1,626,281 | ||||||
Global Blood Therapeutics, Inc.** | 17,400 | 714,270 | ||||||
Loxo Oncology, Inc.** | 19,329 | 2,707,413 | ||||||
Mirati Therapeutics, Inc.** | 15,889 | 674,011 | ||||||
Orchard Therapeutics PLC — ADR** | 57,586 | 905,828 | ||||||
Repligen Corp.** | 13,114 | 691,632 | ||||||
Sarepta Therapeutics, Inc.** | 12,930 | 1,411,051 | ||||||
Vericel Corp.** | 31,467 | 547,526 | ||||||
|
| |||||||
| 16,429,410 | ||||||||
|
| |||||||
Health Care Equipment & Supplies — 7.7% |
| |||||||
AxoGen, Inc.** | 13,968 | 285,366 | ||||||
Glaukos Corp.** | 16,517 | 927,760 | ||||||
Haemonetics Corp.** | 8,053 | 805,703 | ||||||
Inogen, Inc.** | 7,400 | 918,858 | ||||||
Insulet Corp.** | 9,079 | 720,146 | ||||||
iRhythm Technologies, Inc.** | 19,781 | 1,374,384 | ||||||
SI-BONE, Inc.** | 72,148 | 1,507,172 | ||||||
Sientra, Inc.** | 55,397 | 704,096 | ||||||
Tactile Systems Technology, Inc.** | 47,357 | 2,157,111 | ||||||
Tandem Diabetes Care, Inc.** | 16,230 | 616,253 | ||||||
|
| |||||||
| 10,016,849 | ||||||||
|
| |||||||
Health Care Technology — 4.4% |
| |||||||
HMS Holdings Corp.** | 22,891 | 643,924 | ||||||
Inspire Medical Systems, Inc.** | 44,858 | 1,895,250 | ||||||
Omnicell, Inc.** | 20,866 | 1,277,834 | ||||||
Teladoc Health, Inc.** | 13,536 | 670,980 | ||||||
Vocera Communications, Inc.** | 32,657 | 1,285,053 | ||||||
|
| |||||||
| 5,773,041 | ||||||||
|
| |||||||
Pharmaceuticals — 2.1% | ||||||||
MyoKardia, Inc.** | 30,986 | 1,513,976 | ||||||
Reata Pharmaceuticals, Inc. — A** | 12,318 | 691,040 | ||||||
Tricida, Inc.** | 24,762 | 583,888 | ||||||
|
| |||||||
| 2,788,904 | ||||||||
|
| |||||||
Health Care Providers & Services — 1.9% |
| |||||||
BioTelemetry, Inc.** | 18,120 | 1,082,126 | ||||||
Guardant Health, Inc.** | 37,650 | 1,415,263 | ||||||
|
| |||||||
| 2,497,389 | ||||||||
|
| |||||||
Total HEALTH CARE | 37,505,593 | |||||||
|
| |||||||
| Number of Shares | Value (Note A) | |||||||
| CONSUMER DISCRETIONARY — 23.6% |
| |||||||
Hotels, Restaurants & Leisure — 7.0% |
| |||||||
BJ’s Restaurants, Inc. | 9,309 | $ | 470,756 | |||||
Eldorado Resorts, Inc.** | 56,038 | 2,029,136 | ||||||
Planet Fitness, Inc. — A** | 47,892 | 2,567,969 | ||||||
PlayAGS, Inc.** | 47,156 | 1,084,588 | ||||||
SeaWorld Entertainment, Inc.** | 53,924 | 1,191,181 | ||||||
Wingstop, Inc. | 27,985 | 1,796,357 | ||||||
|
| |||||||
| 9,139,987 | ||||||||
|
| |||||||
Diversified Consumer Services — 4.1% |
| |||||||
Bright Horizons Family Solutions, Inc.** | 6,944 | 773,909 | ||||||
Chegg, Inc.** | 55,293 | 1,571,427 | ||||||
Grand Canyon Education, Inc.** | 16,772 | 1,612,460 | ||||||
Strategic Education, Inc. | 12,231 | 1,387,240 | ||||||
|
| |||||||
| 5,345,036 | ||||||||
|
| |||||||
Textiles, Apparel & Luxury Goods — 4.0% |
| |||||||
Canada Goose Holdings, Inc.** | 14,202 | 620,911 | ||||||
Crocs, Inc.** | 69,047 | 1,793,841 | ||||||
Deckers Outdoor Corp.** | 16,764 | 2,144,954 | ||||||
Movado Group, Inc. | 20,912 | 661,237 | ||||||
|
| |||||||
| 5,220,943 | ||||||||
|
| |||||||
Specialty Retail — 3.1% | ||||||||
Five Below, Inc.** | 8,363 | 855,702 | ||||||
Monro, Inc. | 33,782 | 2,322,513 | ||||||
RH** | 7,794 | 933,877 | ||||||
|
| |||||||
| 4,112,092 | ||||||||
|
| |||||||
Leisure Equipment & Products — 1.9% |
| |||||||
Callaway Golf Co. | 48,545 | 742,739 | ||||||
Malibu Boats, Inc. — A** | 48,365 | 1,683,102 | ||||||
|
| |||||||
| 2,425,841 | ||||||||
|
| |||||||
Auto Components — 1.3% | ||||||||
Fox Factory Holding Corp.** | 28,216 | 1,661,076 | ||||||
Distributors — 0.9% | ||||||||
Pool Corp. | 8,279 | 1,230,673 | ||||||
Internet & Catalog Retail — 0.9% |
| |||||||
Etsy, Inc.** | 25,168 | 1,197,242 | ||||||
Household Durables — 0.4% | ||||||||
Roku, Inc.** | 18,496 | 566,717 | ||||||
|
| |||||||
Total CONSUMER DISCRETIONARY | 30,899,607 | |||||||
|
| |||||||
| INFORMATION TECHNOLOGY — 20.5% |
| |||||||
Software — 13.3% | ||||||||
Altair Engineering, Inc. — A** | 38,169 | 1,052,701 | ||||||
Alteryx, Inc. — A** | 31,334 | 1,863,433 | ||||||
Coupa Software, Inc.** | 12,842 | 807,248 | ||||||
Elastic NV** | 10,360 | 740,533 | ||||||
Everbridge, Inc.** | 39,944 | 2,267,221 | ||||||
Notes to Financial Statements are an integral part of this Schedule.
38
Driehaus Small Cap Growth Fund
Schedule of Investments
December 31, 2018
| Number of Shares | Value (Note A) | |||||||
Five9, Inc.** | 60,675 | $ | 2,652,711 | |||||
RingCentral, Inc. — A** | 31,409 | 2,589,358 | ||||||
SendGrid, Inc.** | 46,633 | 2,013,147 | ||||||
Smartsheet, Inc. — A** | 30,262 | 752,313 | ||||||
Zscaler, Inc.** | 69,294 | 2,717,018 | ||||||
|
| |||||||
| 17,455,683 | ||||||||
|
| |||||||
Information Technology Services — 5.1% |
| |||||||
Endava PLC — SP ADR1** | 50,513 | 1,224,435 | ||||||
EPAM Systems, Inc.** | 15,462 | 1,793,747 | ||||||
EVERTEC, Inc. | 68,821 | 1,975,163 | ||||||
Evo Payments, Inc. — A** | 40,195 | 991,611 | ||||||
MongoDB, Inc.** | 8,083 | 676,870 | ||||||
|
| |||||||
| 6,661,826 | ||||||||
|
| |||||||
Semiconductors & Semiconductor Equipment — 1.4% |
| |||||||
Inphi Corp.** | 26,299 | 845,513 | ||||||
SMART Global Holdings, Inc.** | 32,439 | 963,438 | ||||||
|
| |||||||
| 1,808,951 | ||||||||
|
| |||||||
Communications Equipment — 0.7% |
| |||||||
Acacia Communications, Inc.** | 23,540 | 894,520 | ||||||
|
| |||||||
Total INFORMATION TECHNOLOGY | 26,820,980 | |||||||
|
| |||||||
| INDUSTRIALS — 11.3% |
| |||||||
Machinery — 2.8% |
| |||||||
Columbus McKinnon Corp. | 24,457 | 737,134 | ||||||
Gates Industrial Corp. PLC** | 51,588 | 683,025 | ||||||
Harsco Corp.** | 39,894 | 792,295 | ||||||
Kornit Digital, Ltd.** | 76,104 | 1,424,667 | ||||||
|
| |||||||
| 3,637,121 | ||||||||
|
| |||||||
Aerospace & Defense — 2.6% |
| |||||||
Axon Enterprise, Inc.** | 12,950 | 566,563 | ||||||
Cubic Corp. | 15,428 | 829,101 | ||||||
Kratos Defense & Security Solutions, Inc.** | 94,282 | 1,328,433 | ||||||
Mercury Systems, Inc.** | 15,571 | 736,353 | ||||||
|
| |||||||
| 3,460,450 | ||||||||
|
| |||||||
Electrical Equipment — 2.0% |
| |||||||
Generac Holdings, Inc.** | 38,931 | 1,934,871 | ||||||
Sunrun, Inc.** | 57,239 | 623,333 | ||||||
|
| |||||||
| 2,558,204 | ||||||||
|
| |||||||
Commercial Services & Supplies — 1.3% |
| |||||||
Clean Harbors, Inc.** | 22,410 | 1,105,934 | ||||||
MSA Safety, Inc. | 6,605 | 622,653 | ||||||
|
| |||||||
| 1,728,587 | ||||||||
|
| |||||||
Trading Companies & Distributors — 1.1% |
| |||||||
Beacon Roofing Supply, Inc.** | 20,702 | 656,667 | ||||||
| Number of Shares | Value (Note A) | |||||||
SiteOne Landscape Supply, Inc.** | 14,491 | $ | 800,918 | |||||
|
| |||||||
| 1,457,585 | ||||||||
|
| |||||||
Airlines — 1.0% |
| |||||||
Spirit Airlines, Inc.** | 21,925 | 1,269,896 | ||||||
Construction & Engineering — 0.5% |
| |||||||
NV5 Global, Inc.** | 11,598 | 702,259 | ||||||
|
| |||||||
Total INDUSTRIALS | 14,814,102 | |||||||
|
| |||||||
| CONSUMER STAPLES — 4.9% |
| |||||||
Food Products — 2.5% |
| |||||||
Calavo Growers, Inc. | 8,183 | 597,032 | ||||||
Freshpet, Inc.** | 40,036 | 1,287,558 | ||||||
The Simply Good Foods Co.** | 75,539 | 1,427,687 | ||||||
|
| |||||||
| 3,312,277 | ||||||||
|
| |||||||
Food & Staples Retailing — 1.1% |
| |||||||
Casey’s General Stores, Inc. | 10,912 | 1,398,264 | ||||||
Personal Products — 0.7% |
| |||||||
Medifast, Inc. | 7,388 | 923,648 | ||||||
Beverages — 0.6% |
| |||||||
Primo Water Corp.** | 57,741 | 808,951 | ||||||
|
| |||||||
Total CONSUMER STAPLES | 6,443,140 | |||||||
|
| |||||||
| FINANCIALS — 2.6% |
| |||||||
Consumer Finance — 1.5% |
| |||||||
Green Dot Corp. — A** | 24,063 | 1,913,490 | ||||||
Real Estate Investment Trust — 1.1% |
| |||||||
Americold Realty Trust | 59,097 | 1,509,337 | ||||||
|
| |||||||
Total FINANCIALS | 3,422,827 | |||||||
|
| |||||||
| COMMUNICATION SERVICES — 2.3% |
| |||||||
Interactive Media & Services — 2.3% |
| |||||||
ANGI Homeservices, Inc. — A** | 61,521 | 988,642 | ||||||
QuinStreet, Inc.** | 125,327 | 2,034,057 | ||||||
|
| |||||||
Total COMMUNICATION SERVICES | 3,022,699 | |||||||
|
| |||||||
| MATERIALS — 2.2% |
| |||||||
Chemicals — 1.7% |
| |||||||
Ingevity Corp.** | 26,931 | 2,253,855 | ||||||
Metals & Mining — 0.5% |
| |||||||
Allegheny Technologies, Inc.** | 30,765 | 669,754 | ||||||
|
| |||||||
Total MATERIALS | 2,923,609 | |||||||
|
| |||||||
| UTILITIES — 1.1% |
| |||||||
Water Utilities — 1.1% |
| |||||||
AquaVenture Holdings, Ltd.** | 71,822 | 1,356,718 | ||||||
|
| |||||||
Total UTILITIES | 1,356,718 | |||||||
|
| |||||||
Notes to Financial Statements are an integral part of this Schedule.
39
Driehaus Small Cap Growth Fund
Schedule of Investments
December 31, 2018
| Number of Shares | Value (Note A) | |||||||
| ENERGY — 0.5% |
| |||||||
Energy Equipment & Services — 0.5% |
| |||||||
Cactus, Inc. — A** | 25,344 | $ | 694,679 | |||||
|
| |||||||
Total ENERGY | 694,679 | |||||||
|
| |||||||
Total EQUITY SECURITIES | 127,903,954 | |||||||
|
| |||||||
| ||||||||
TOTAL INVESTMENTS | 97.7 | % | $ | 127,903,954 | ||||
Other Assets In Excess Of Liabilities | 2.3 | % | 3,029,243 | |||||
|
|
|
| |||||
Net Assets | 100.0 | % | $ | 130,933,197 | ||||
| ||||||||
| 1 | Pursuant to procedures adopted by Driehaus Mutual Funds’ (the “Trust”) Board of Trustees, this security has been determined to be illiquid by Driehaus Capital Management LLC, the Fund’s investment adviser. |
| ** | Non-income producing security |
ADR — American Depository Receipt
SP ADR — Sponsored American Depository Receipt
Top Ten Holdings*
Zscaler, Inc. | 2.1% | |||
Loxo Oncology, Inc. | 2.1% | |||
Five9, Inc. | 2.0% | |||
RingCentral, Inc. — A | 2.0% | |||
Planet Fitness, Inc. — A | 2.0% | |||
Argenx SE — ADR | 1.9% | |||
Array BioPharma, Inc. | 1.8% | |||
Monro, Inc. | 1.8% | |||
Everbridge, Inc. | 1.7% | |||
Ingevity Corp. | 1.7% |
| * | All percentages are stated as a percent of net assets at December 31, 2018. |
Notes to Financial Statements are an integral part of this Schedule.
40
Driehaus Small Cap Growth Fund
Schedule of Investments
December 31, 2018
Industry | Percent of Net Assets | |||
Aerospace & Defense | 2.6% | |||
Airlines | 1.0% | |||
Auto Components | 1.3% | |||
Beverages | 0.6% | |||
Biotechnology | 12.6% | |||
Chemicals | 1.7% | |||
Commercial Services & Supplies | 1.3% | |||
Communications Equipment | 0.7% | |||
Construction & Engineering | 0.5% | |||
Consumer Finance | 1.5% | |||
Distributors | 0.9% | |||
Diversified Consumer Services | 4.1% | |||
Electrical Equipment | 2.0% | |||
Energy Equipment & Services | 0.5% | |||
Food & Staples Retailing | 1.1% | |||
Food Products | 2.5% | |||
Health Care Equipment & Supplies | 7.7% | |||
Health Care Providers & Services | 1.9% | |||
Health Care Technology | 4.4% | |||
Hotels, Restaurants & Leisure | 7.0% | |||
Industry | Percent of Net Assets | |||
Household Durables | 0.4% | |||
Information Technology Services | 5.1% | |||
Interactive Media & Services | 2.3% | |||
Internet & Catalog Retail | 0.9% | |||
Leisure Equipment & Products | 1.9% | |||
Machinery | 2.8% | |||
Metals & Mining | 0.5% | |||
Personal Products | 0.7% | |||
Pharmaceuticals | 2.1% | |||
Real Estate Investment Trust | 1.1% | |||
Semiconductors & Semiconductor Equipment | 1.4% | |||
Software | 13.3% | |||
Specialty Retail | 3.1% | |||
Textiles, Apparel & Luxury Goods | 4.0% | |||
Trading Companies & Distributors | 1.1% | |||
Water Utilities | 1.1% | |||
Other Assets in Excess of Liabilities | 2.3% | |||
|
| |||
TOTAL | 100.0% | |||
|
| |||
Notes to Financial Statements are an integral part of this Schedule.
41
Statements of Assets and Liabilities
December 31, 2018
| Driehaus Emerging Markets Growth Fund | Driehaus Emerging Markets Small Cap Growth Fund | |||||||
ASSETS: | ||||||||
Investments, at cost | $ | 1,172,445,389 | $ | 85,872,158 | ||||
|
|
|
| |||||
Investments, at fair value | $ | 1,338,561,073 | $ | 85,627,212 | ||||
Foreign currency, at fair value* | 8,995,098 | 1,269,923 | ||||||
Cash and cash equivalents | 123,897,795 | 3,791,326 | ||||||
Receivables: | ||||||||
Dividends | 2,707,338 | 202,044 | ||||||
Investment securities sold | 4,867,215 | 3,987,329 | ||||||
Fund shares sold | 3,117,065 | 825,128 | ||||||
Foreign taxes | 669,951 | 665,722 | ||||||
Due from affiliates | — | — | ||||||
Net unrealized appreciation on unsettled foreign currency transactions | — | 5,828 | ||||||
Prepaid expenses | 53,517 | 6,179 | ||||||
|
|
|
| |||||
| ||||||||
TOTAL ASSETS | 1,482,869,052 | 96,380,691 | ||||||
|
|
|
| |||||
| ||||||||
LIABILITIES: | ||||||||
Payables: | ||||||||
Investment securities purchased | 26,297,210 | — | ||||||
Fund shares redeemed | 8,710,782 | 1,459,368 | ||||||
Net unrealized depreciation on unsettled foreign currency transactions | 1,998 | — | ||||||
Line of credit and accrued interest | — | 5,002,222 | ||||||
Due to affiliates | 1,510,315 | 128,906 | ||||||
Accrued foreign capital gains taxes | — | — | ||||||
Audit and tax fees | 53,545 | 55,595 | ||||||
Accrued expenses | 193,997 | 81,470 | ||||||
|
|
|
| |||||
| ||||||||
TOTAL LIABILITIES | 36,767,847 | 6,727,561 | ||||||
|
|
|
| |||||
| ||||||||
NET ASSETS | $ | 1,446,101,205 | $ | 89,653,130 | ||||
|
|
|
| |||||
| ||||||||
NET ASSETS CONSISTED OF THE FOLLOWING AT DECEMBER 31, 2018: | ||||||||
Paid-in capital | $ | 1,354,408,505 | $ | 145,357,729 | ||||
Total distributable earnings (deficit) | 91,692,700 | (55,704,599 | ) | |||||
|
|
|
| |||||
NET ASSETS | $ | 1,446,101,205 | $ | 89,653,130 | ||||
|
|
|
| |||||
| ||||||||
NET ASSETS | — | $ | 89,653,130 | |||||
SHARES OUTSTANDING (Unlimited shares authorized, no par value) | — | 8,299,025 | ||||||
NET ASSET VALUE | — | $ | 10.80 | |||||
INVESTOR CLASS SHARES: | ||||||||
NET ASSETS | $ | 791,655,713 | — | |||||
SHARES OUTSTANDING (Unlimited shares authorized, no par value) | 24,892,882 | — | ||||||
NET ASSET VALUE | $ | 31.80 | — | |||||
INSTITUTIONAL CLASS SHARES: | ||||||||
NET ASSETS | $ | 654,445,492 | — | |||||
SHARES OUTSTANDING (Unlimited shares authorized, no par value) | 20,606,549 | — | ||||||
NET ASSET VALUE | $ | 31.76 | — | |||||
| * | The cost of foreign currency was $8,965,224, $1,265,808, $288,587, $127,459, $0 and $0, respectively. |
Notes to Financial Statements are an integral part of this Statement.
42
Statements of Assets and Liabilities
December 31, 2018
| Driehaus Frontier Emerging Markets Fund | Driehaus International Small Cap Growth Fund | Driehaus Micro Cap Growth Fund | Driehaus Small Cap Growth Fund | |||||||||||
| $ | 12,403,592 | $ | 216,428,285 | $ | 209,853,958 | $ | 124,925,927 | |||||||
|
|
|
|
|
|
|
| |||||||
| $ | 13,498,557 | $ | 214,233,289 | $ | 263,046,630 | $ | 127,903,954 | |||||||
| 289,911 | 128,989 | — | — | |||||||||||
| 425,335 | 2,556,688 | 5,537,447 | 7,162,412 | |||||||||||
| 15,121 | 707,823 | 68,229 | 21,471 | |||||||||||
| 265,713 | 415,975 | 91,491 | — | |||||||||||
| — | 1,108,024 | 57,257 | 591,172 | |||||||||||
| — | — | — | — | |||||||||||
| 6,869 | — | — | — | |||||||||||
| — | — | — | — | |||||||||||
| 4,544 | 9,100 | 24,000 | 23,800 | |||||||||||
|
|
|
|
|
|
|
| |||||||
|
| |||||||||||||
| 14,506,050 | 219,159,888 | 268,825,054 | 135,702,809 | |||||||||||
|
|
|
|
|
|
|
| |||||||
|
| |||||||||||||
| 137,533 | — | 2,306,213 | 4,531,650 | |||||||||||
| 22,134 | 434,450 | 1,558,116 | 146,926 | |||||||||||
| 725 | 1,825 | — | — | |||||||||||
| — | — | — | — | |||||||||||
| — | 192,755 | 318,158 | 33,824 | |||||||||||
| 22,025 | — | — | — | |||||||||||
| 49,498 | 44,845 | 35,135 | 37,955 | |||||||||||
| 67,012 | 55,526 | 587 | 19,257 | |||||||||||
|
|
|
|
|
|
|
| |||||||
|
| |||||||||||||
| 298,927 | 729,401 | 4,218,209 | 4,769,612 | |||||||||||
|
|
|
|
|
|
|
| |||||||
|
| |||||||||||||
| $ | 14,207,123 | $ | 218,430,487 | $ | 264,606,845 | $ | 130,933,197 | |||||||
|
|
|
|
|
|
|
| |||||||
|
| |||||||||||||
| $ | 13,572,633 | $ | 227,742,315 | $ | 223,561,156 | $ | 138,579,263 | |||||||
| 634,490 | (9,311,828 | ) | 41,045,689 | (7,646,066 | ) | |||||||||
|
|
|
|
|
|
|
| |||||||
| $ | 14,207,123 | $ | 218,430,487 | $ | 264,606,845 | $ | 130,933,197 | |||||||
|
|
|
|
|
|
|
| |||||||
|
| |||||||||||||
| $ | 14,207,123 | $ | 218,430,487 | $ | 264,606,845 | — | ||||||||
| 1,991,275 | 26,858,496 | 23,827,711 | — | |||||||||||
| $ | 7.13 | $ | 8.13 | $ | 11.11 | — | ||||||||
| — | — | — | $ | 7,537,710 | ||||||||||
| — | — | — | 646,350 | |||||||||||
| — | — | — | $ | 11.66 | ||||||||||
| — | — | — | $ | 123,395,487 | ||||||||||
| — | — | — | 10,543,259 | |||||||||||
| — | — | — | $ | 11.70 | ||||||||||
Notes to Financial Statements are an integral part of this Statement.
43
For the Year Ended December 31, 2018
| Driehaus Emerging Markets Growth Fund | Driehaus Emerging Markets Small Cap Growth Fund | |||||||
INVESTMENT INCOME (LOSS): | ||||||||
Income: | ||||||||
Dividends* | $ | 34,962,259 | $ | 4,172,470 | ||||
|
|
|
| |||||
| ||||||||
Total income | 34,962,259 | 4,172,470 | ||||||
|
|
|
| |||||
| ||||||||
Expenses: | ||||||||
Investment advisory fee | 17,243,889 | 3,140,761 | ||||||
Administration fee | 884,975 | 237,744 | ||||||
Professional fees | 290,201 | 51,441 | ||||||
Audit and tax fees | 80,159 | 89,623 | ||||||
Federal and state registration fees | 69,000 | 30,000 | ||||||
Custodian fees | 463,743 | 1,091,626 | ||||||
Transfer agent fees | 415,202 | 61,507 | ||||||
Trustees’ fees | 191,197 | 62,384 | ||||||
Chief compliance officer fees | 20,000 | 20,000 | ||||||
Reports to shareholders | 128,267 | 28,208 | ||||||
Interest expense | — | 7,454 | ||||||
Shareholder services fees (Investor Class) | 2,183,482 | — | ||||||
Miscellaneous | 100,696 | 42,428 | ||||||
|
|
|
| |||||
Total expenses | 22,070,811 | 4,863,176 | ||||||
|
|
|
| |||||
| ||||||||
Investment advisory fees recaptured (waived) | — | — | ||||||
Administration fees waived | — | — | ||||||
Transfer agent fees waived | — | — | ||||||
Fees paid indirectly | (200,522 | ) | (38,797 | ) | ||||
|
|
|
| |||||
Net expenses | 21,870,289 | 4,824,379 | ||||||
|
|
|
| |||||
| ||||||||
Net investment income (loss) | 13,091,970 | (651,909 | ) | |||||
|
|
|
| |||||
| ||||||||
| NET REALIZED AND UNREALIZED GAIN (LOSS) ON INVESTMENT TRANSACTIONS: | ||||||||
Net realized gain (loss) from security transactions | (40,316,284 | ) | (5,801,862 | ) | ||||
Net realized foreign exchange gain (loss) | (4,240,355 | ) | (1,194,822 | ) | ||||
Net realized gain (loss) on forward foreign currency contracts | — | 399,999 | ||||||
Net realized gain (loss) on written options | — | (1,611,211 | ) | |||||
Net realized gain (loss) on purchased options | — | 1,665,600 | ||||||
Net realized gain (loss) on swap contracts | — | (593,215 | ) | |||||
Net change in unrealized foreign exchange gain (loss) | (201,755 | ) | (61,429 | ) | ||||
Net change in unrealized appreciation (depreciation) on swap contracts | — | 949,854 | ||||||
Net change in unrealized appreciation (depreciation) on purchased options | — | 5,208 | ||||||
Net change in unrealized appreciation (depreciation) on investments | (260,478,343 | ) | (46,098,260 | ) | ||||
|
|
|
| |||||
| ||||||||
Net realized and unrealized gain (loss) on investment transactions | (305,236,737 | ) | (52,340,138 | ) | ||||
|
|
|
| |||||
| ||||||||
NET INCREASE (DECREASE) IN NET ASSETS RESULTING FROM OPERATIONS | $ | (292,144,767 | ) | $ | (52,992,047 | ) | ||
|
|
|
| |||||
| ||||||||
| * | Dividends are net of $3,877,103, $297,540, $100,489, $563,590, $0 and $1,779non-reclaimable foreign taxes withheld, respectively. |
Notes to Financial Statements are an integral part of this Statement.
44
Statements of Operations
For the Year Ended December 31, 2018
| Driehaus Frontier Emerging Markets Fund | Driehaus International Small Cap Growth Fund | Driehaus Micro Cap Growth Fund | Driehaus Small Cap Growth Fund | |||||||||||
| $ | 948,480 | $ | 3,953,385 | $ | 884,128 | $ | 292,429 | |||||||
|
|
|
|
|
|
|
| |||||||
|
| |||||||||||||
| 948,480 | 3,953,385 | 884,128 | 292,429 | |||||||||||
|
|
|
|
|
|
|
| |||||||
|
| |||||||||||||
| 493,186 | 3,923,060 | 4,831,153 | 571,524 | |||||||||||
| 100,416 | 293,660 | 307,914 | 122,117 | |||||||||||
| 22,398 | 67,436 | 80,473 | 32,743 | |||||||||||
| 77,841 | 57,773 | 47,850 | 48,420 | |||||||||||
| 21,000 | 23,000 | 26,000 | 54,000 | |||||||||||
| 106,510 | 52,191 | 36,671 | 27,460 | |||||||||||
| 37,603 | 49,636 | 61,176 | 79,666 | |||||||||||
| 45,383 | 70,611 | 75,953 | 49,195 | |||||||||||
| 20,000 | 20,000 | 20,000 | 20,000 | |||||||||||
| 9,868 | 20,288 | 30,465 | 11,461 | |||||||||||
| — | — | 2,158 | — | |||||||||||
| — | — | — | 1,201 | |||||||||||
| 31,457 | 44,576 | 48,378 | 26,640 | |||||||||||
|
|
|
|
|
|
|
| |||||||
| 965,662 | 4,622,231 | 5,568,191 | 1,044,427 | |||||||||||
|
|
|
|
|
|
|
| |||||||
|
| |||||||||||||
| (308,095 | ) | — | — | (80,104 | ) | |||||||||
| — | — | — | (2,057 | ) | ||||||||||
| — | — | — | (48,225 | ) | ||||||||||
| (1,005 | ) | (21,372 | ) | (87,461 | ) | (21,419 | ) | |||||||
|
|
|
|
|
|
|
| |||||||
| 656,562 | 4,600,859 | 5,480,730 | 892,622 | |||||||||||
|
|
|
|
|
|
|
| |||||||
|
| |||||||||||||
| 291,918 | (647,474 | ) | (4,596,602 | ) | (600,193 | ) | ||||||||
|
|
|
|
|
|
|
| |||||||
|
| |||||||||||||
| |
|
| ||||||||||||
| 1,922,840 | 15,062,277 | 57,475,280 | (9,010,176 | ) | ||||||||||
| (178,994 | ) | (90,603 | ) | — | — | |||||||||
| — | — | — | — | |||||||||||
| — | — | — | — | |||||||||||
| — | — | — | — | |||||||||||
| — | — | — | — | |||||||||||
| (2,725 | ) | (4,112 | ) | — | — | |||||||||
| | — | — | — | — | ||||||||||
| | — | — | — | — | ||||||||||
| (8,816,255 | ) | (62,116,449 | ) | (31,956,231 | ) | (6,057,156 | ) | ||||||
|
|
|
|
|
|
|
| |||||||
|
| |||||||||||||
| (7,075,134 | ) | (47,148,887 | ) | 25,519,049 | (15,067,332 | ) | |||||||
|
|
|
|
|
|
|
| |||||||
|
| |||||||||||||
$ | (6,783,216 | ) | $ | (47,796,361 | ) | $ | 20,922,447 | $ | (15,667,525 | ) | ||||
|
|
|
|
|
|
|
| |||||||
|
| |||||||||||||
Notes to Financial Statements are an integral part of this Statement.
45
Statements of Changes in Net Assets
| Driehaus Emerging Markets Growth Fund | Driehaus Emerging Markets Small Cap Growth Fund | |||||||||||||||
| For the year ended December 31, 2018 | For the year ended December 31, 2017 | For the year ended December 31, 2018 | For the year ended December 31, 2017 | |||||||||||||
INCREASE (DECREASE) IN NET ASSETS: | ||||||||||||||||
Operations: | ||||||||||||||||
Net investment income (loss) | $ | 13,091,970 | $ | 5,778,516 | $ | (651,909 | ) | $ | 389,221 | |||||||
Net realized gain (loss) on investment transactions | (44,556,639 | ) | 216,606,652 | (7,135,511 | ) | 35,916,209 | ||||||||||
Net change in unrealized gain (loss) on investment transactions | (260,680,098 | ) | 322,194,791 | (45,204,627 | ) | 37,285,591 | ||||||||||
|
|
|
|
|
|
|
| |||||||||
| ||||||||||||||||
Net increase (decrease) in net assets resulting from operations | (292,144,767 | ) | 544,579,959 | (52,992,047 | ) | 73,591,021 | ||||||||||
|
|
|
|
|
|
|
| |||||||||
| ||||||||||||||||
Distributions from distributable earnings to shareholders: | ||||||||||||||||
Fund | — | — | — | — | ||||||||||||
Investor Class Shares | (33,373,513 | ) | (7,508,221 | ) | — | — | ||||||||||
Institutional Class Shares | (29,571,288 | ) | (3,509,534 | ) | — | — | ||||||||||
|
|
|
|
|
|
|
| |||||||||
Total distribution to shareholders** | (62,944,801 | ) | (11,017,755 | ) | — | — | ||||||||||
|
|
|
|
|
|
|
| |||||||||
| ||||||||||||||||
Capital share transactions: | ||||||||||||||||
Proceeds from shares sold: | ||||||||||||||||
Fund | — | — | 46,460,249 | 92,470,261 | ||||||||||||
Investor Class Shares | 248,502,111 | 271,797,882 | — | — | ||||||||||||
Institutional Class Shares | 435,408,153 | 491,937,774 | — | — | ||||||||||||
Reinvestment of distributions: | ||||||||||||||||
Fund | — | — | — | — | ||||||||||||
Investor Class Shares | 32,164,851 | 6,838,405 | — | — | ||||||||||||
Institutional Class Shares | 25,064,735 | 2,999,863 | — | — | ||||||||||||
Cost of shares redeemed: | ||||||||||||||||
Fund | — | — | (174,964,581 | ) | (156,312,117 | ) | ||||||||||
Investor Class Shares | (560,155,804 | ) | (844,792,483 | ) | — | — | ||||||||||
Institutional Class Shares | (159,370,078 | ) | (18,766,180 | ) | — | — | ||||||||||
Redemption fees: | ||||||||||||||||
Fund | — | — | 3,515 | 9,900 | ||||||||||||
Investor Class Shares | 47,011 | 44,733 | — | — | ||||||||||||
Institutional Class Shares | 29,188 | 5,674 | — | — | ||||||||||||
|
|
|
|
|
|
|
| |||||||||
Net increase (decrease) in net assets derived from capital share transactions | 21,690,167 | (89,934,332 | ) | (128,500,817 | ) | (63,831,956 | ) | |||||||||
|
|
|
|
|
|
|
| |||||||||
Total increase (decrease) in net assets | (333,399,401 | ) | 443,627,872 | (181,492,864 | ) | 9,759,065 | ||||||||||
|
|
|
|
|
|
|
| |||||||||
| ||||||||||||||||
NET ASSETS: | ||||||||||||||||
| ||||||||||||||||
Beginning of period | $ | 1,779,500,606 | $ | 1,335,872,734 | $ | 271,145,994 | $ | 261,386,929 | ||||||||
|
|
|
|
|
|
|
| |||||||||
End of period | $ | 1,446,101,205 | $ | 1,779,500,606 | $ | 89,653,130 | $ | 271,145,994 | ||||||||
|
|
|
|
|
|
|
| |||||||||
| ||||||||||||||||
| * | Fund commenced operations on August 21, 2017. |
| ** | The table on Page 48 of this report provides additional information regarding the characterization of distributions for the period ended December 31, 2017. |
Notes to Financial Statements are an integral part of this Statement.
46
Statements of Changes in Net Assets
| Driehaus Frontier Emerging Markets Fund | Driehaus International Small Cap Growth Fund | Driehaus Micro Cap Growth Fund | Driehaus Small Cap Growth Fund | |||||||||||||||||||||||||||
| For the year ended December 31, 2018 | For the year ended December 31, 2017 | For the year ended December 31, 2018 | For the year ended December 31, 2017 | For the year ended December 31, 2018 | For the year ended December 31, 2017 | For the year ended December 31, 2018 | For the period August 21, 2017 through December 31, 2017* | |||||||||||||||||||||||
| $ | 291,918 | $ | 904,665 | $ | (647,474 | ) | $ | (1,268,910 | ) | $ | (4,596,602 | ) | $ | (4,330,379 | ) | $ | (600,193 | ) | $ | (103,225 | ) | |||||||||
| | 1,743,846 | 3,691,591 | 14,971,674 | 57,904,888 | 57,475,280 | 54,316,286 | (9,010,176 | ) | 2,869,260 | |||||||||||||||||||||
| (8,818,980 | ) | | 6,823,367 | (62,120,561 | ) | 41,013,409 | (31,956,231 | ) | 15,229,939 | (6,057,156 | ) | 4,026,863 | ||||||||||||||||||
|
|
|
|
|
|
|
|
|
|
|
|
|
|
|
| |||||||||||||||
|
| |||||||||||||||||||||||||||||
| (6,783,216 | ) | | 11,419,623 | (47,796,361 | ) | 97,649,387 | 20,922,447 | 65,215,846 | (15,667,525 | ) | 6,792,898 | |||||||||||||||||||
|
|
|
|
|
|
|
|
|
|
|
|
|
|
|
| |||||||||||||||
|
| |||||||||||||||||||||||||||||
| |
|
| ||||||||||||||||||||||||||||
| (2,215,377 | ) | (2,425,809 | ) | (30,824,444 | ) | (45,275,762 | ) | (72,862,388 | ) | (26,974,093 | ) | — | — | |||||||||||||||||
| — | — | — | — | — | — | (209,521 | ) | (22,468 | ) | |||||||||||||||||||||
| — | — | — | — | — | — | (3,384,429 | ) | (642,608 | ) | |||||||||||||||||||||
|
|
|
|
|
|
|
|
|
|
|
|
|
|
|
| |||||||||||||||
| (2,215,377 | ) |
| (2,425,809 | ) | (30,824,444 | ) | (45,275,762 | ) | (72,862,388 | ) | (26,974,093 | ) | (3,593,950 | ) | (665,076 | ) | ||||||||||||||
|
|
|
|
|
|
|
|
|
|
|
|
|
|
|
| |||||||||||||||
|
| |||||||||||||||||||||||||||||
| 1,607,916 | 3,010,067 | 75,278,152 | 31,966,198 | 114,618,353 | 62,642,640 | — | — | |||||||||||||||||||||||
| — | — | — | — | — | — | 11,673,140 | 1,270,517 | |||||||||||||||||||||||
| — | — | — | — | — | — | 108,943,026 | 36,880,432 | |||||||||||||||||||||||
| 2,215,377 | 2,425,416 | 28,587,722 | 40,876,829 | 65,764,404 | 25,135,678 | — | — | |||||||||||||||||||||||
| — | — | — | — | — | — | 209,521 | 22,468 | |||||||||||||||||||||||
| — | — | — | — | — | — | 3,384,429 | 642,608 | |||||||||||||||||||||||
| (26,710,448 | ) | (41,654,531 | ) | (132,180,063 | ) | (70,258,314 | ) | (186,474,543 | ) | (200,086,696 | ) | — | — | |||||||||||||||||
| — | — | — | — | — | — | (3,748,523 | ) | (68,562 | ) | |||||||||||||||||||||
| — | — | — | — | — | — | (10,289,299 | ) | (4,900,123 | ) | |||||||||||||||||||||
| 864 | 70 | 4,036 | 1,731 | 105,720 | 9,825 | — | — | |||||||||||||||||||||||
| — | — | — | — | — | — | 2,471 | — | |||||||||||||||||||||||
| — | — | — | — | — | — | 44,745 | — | |||||||||||||||||||||||
|
|
|
|
|
|
|
|
|
|
|
|
|
|
|
| |||||||||||||||
| (22,886,291 | ) | (36,218,978 | ) | (28,310,153 | ) | 2,586,444 | (5,986,066 | ) | (112,298,553 | ) | 110,219,510 | 33,847,340 | |||||||||||||||||
|
|
|
|
|
|
|
|
|
|
|
|
|
|
|
| |||||||||||||||
| (31,884,884 | ) | (27,225,164 | ) | (106,930,958 | ) | 54,960,069 | (57,926,007 | ) | (74,056,800 | ) | 90,958,035 | 39,975,162 | |||||||||||||||||
|
|
|
|
|
|
|
|
|
|
|
|
|
|
|
| |||||||||||||||
|
| |||||||||||||||||||||||||||||
|
| |||||||||||||||||||||||||||||
| $ | 46,092,007 | $ | 73,317,171 | $ | 325,361,445 | $ | 270,401,376 | $ | 322,532,852 | $ | 396,589,652 | $ | 39,975,162 | $ | — | |||||||||||||||
|
|
|
|
|
|
|
|
|
|
|
|
|
|
|
| |||||||||||||||
| $ | 14,207,123 | $ | 46,092,007 | $ | 218,430,487 | $ | 325,361,445 | $ | 264,606,845 | $ | 322,532,852 | $ | 130,933,197 | $ | 39,975,162 | |||||||||||||||
|
|
|
|
|
|
|
|
|
|
|
|
|
|
|
| |||||||||||||||
|
| |||||||||||||||||||||||||||||
Notes to Financial Statements are an integral part of this Statement.
47
Statements of Changes in Net Assets
Distributions from net investment income and from realized gains are no longer required to be separately disclosed, and parenthetical disclosure of undistributed net investment income is no longer required. See Note A in the Notes to Financial Statements. The table below provides this information for the year or period ended December 31, 2017:
| Driehaus Emerging Markets Growth Fund | Driehaus Emerging Markets Small Cap Growth Fund | Driehaus Frontier Emerging Markets Fund | Driehaus International Small Cap Growth Fund | Driehaus Micro Cap Growth Fund | Driehaus Small Cap Growth Fund | |||||||||||||||||||
Net investment income: | ||||||||||||||||||||||||
Fund | $ | — | $ | — | $ | (112,019 | ) | $ | — | $ | — | $ | — | |||||||||||
Investor Class Shares | (7,508,221 | ) | — | — | — | — | — | |||||||||||||||||
Institutional Class Shares | (3,509,534 | ) | — | — | — | — | — | |||||||||||||||||
Net realized gains: | ||||||||||||||||||||||||
Fund | — | — | (2,313,790 | ) | (45,275,762 | ) | (26,974,093 | ) | — | |||||||||||||||
Investor Class Shares | — | — | — | — | — | (22,468 | ) | |||||||||||||||||
Institutional Class Shares | — | — | — | — | — | (642,608 | ) | |||||||||||||||||
|
|
|
|
|
|
|
|
|
|
|
| |||||||||||||
Total distributions | $ | (11,017,755 | ) | $ | — | $ | (2,425,809 | ) | $ | (45,275,762 | ) | $ | (26,974,093 | ) | $ | (665,076 | ) | |||||||
|
|
|
|
|
|
|
|
|
|
|
| |||||||||||||
Undistributed net investment income (loss) | $ | (668,759 | ) | $ | 181,870 | $ | (192,922 | ) | $ | (1,215,046 | ) | $ | (343,289 | ) | $ | — | ||||||||
|
|
|
|
|
|
|
|
|
|
|
| |||||||||||||
Notes to Financial Statements are an integral part of this Statement.
48
Driehaus Emerging Markets Growth Fund — Investor Class
Financial Highlights
| For the year ended December 31, 2018 | For the year ended December 31, 2017 | For the year ended December 31, 2016 | For the year ended December 31, 2015 | For the year ended December 31, 2014 | ||||||||||||||||
Net asset value, beginning of period | $ | 39.64 | $ | 27.98 | $ | 26.52 | $ | 29.63 | $ | 32.53 | ||||||||||
|
|
|
|
|
|
|
|
|
| |||||||||||
INCOME (LOSS) FROM INVESTMENT OPERATIONS: | ||||||||||||||||||||
Net investment income (loss) | 0.26 | ^ | 0.11 | ^ | 0.03 | 0.06 | 0.04 | |||||||||||||
Net realized and unrealized gain (loss) | (6.73 | ) | 11.78 | 1.54 | (3.17 | ) | (1.99 | ) | ||||||||||||
|
|
|
|
|
|
|
|
|
| |||||||||||
Total income (loss) from investment operations | (6.47 | ) | 11.89 | 1.57 | (3.11 | ) | (1.95 | ) | ||||||||||||
|
|
|
|
|
|
|
|
|
| |||||||||||
LESS DISTRIBUTIONS: | ||||||||||||||||||||
Dividends from net investment income | (0.16 | ) | (0.23 | ) | (0.11 | ) | — | — | ||||||||||||
Distributions from capital gains | (1.21 | ) | — | — | — | (0.95 | ) | |||||||||||||
|
|
|
|
|
|
|
|
|
| |||||||||||
Total distributions | (1.37 | ) | (0.23 | ) | (0.11 | ) | — | (0.95 | ) | |||||||||||
|
|
|
|
|
|
|
|
|
| |||||||||||
Redemption fees added topaid-in capital | 0.00 | ~ | 0.00 | ~ | 0.00 | ~ | 0.00 | ~ | 0.00 | ~ | ||||||||||
|
|
|
|
|
|
|
|
|
| |||||||||||
Net asset value, end of period | $ | 31.80 | $ | 39.64 | $ | 27.98 | $ | 26.52 | $ | 29.63 | ||||||||||
|
|
|
|
|
|
|
|
|
| |||||||||||
Total Return | (16.26 | )% | 42.52 | % | 5.88 | % | (10.49 | )% | (5.96 | )% | ||||||||||
RATIOS/SUPPLEMENTAL DATA | ||||||||||||||||||||
Net assets, end of period (in 000’s) | $ | 791,656 | $ | 1,266,365 | $ | 1,335,873 | $ | 1,362,421 | $ | 1,701,219 | ||||||||||
Ratio of expenses before reimbursements, waivers and fees paid indirectly to average net assets | 1.38 | % | 1.54 | % | 1.65 | % | 1.65 | % | 1.65 | % | ||||||||||
Ratio of net expenses to average net assets | 1.37 | %# | 1.53 | %# | 1.63 | %# | 1.64 | %# | 1.63 | %# | ||||||||||
Ratio of net investment income (loss) to average net assets | 0.69 | %# | 0.33 | %# | 0.11 | %# | 0.22 | %# | 0.11 | %# | ||||||||||
Portfolio turnover | 218 | % | 176 | % | 232 | % | 257 | % | 289 | % | ||||||||||
| ^ | Net investment income (loss) per share has been calculated using the average shares method. |
| ~ | Amount represents less than $0.01 per share |
| # | Such ratios are net of fees paid indirectly (see Note B in the Notes to Financial Statements). |
Notes to Financial Statements are an integral part of this Schedule.
49
Driehaus Emerging Markets Growth Fund — Institutional Class
Financial Highlights
| For the year ended December 31, 2018 | For the period July 17, 2017 through December 31, 2017 | |||||||
Net asset value, beginning of period | $ | 39.61 | $ | 34.85 | ||||
|
|
|
| |||||
INCOME (LOSS) FROM INVESTMENT OPERATIONS: | ||||||||
Net investment income (loss) | 0.32 | 0.12 | ^ | |||||
Net realized and unrealized gain (loss) | (6.71 | ) | 4.92 | |||||
|
|
|
| |||||
Total income (loss) from investment operations | (6.39 | ) | 5.04 | |||||
|
|
|
| |||||
LESS DISTRIBUTIONS: | ||||||||
Dividends from net investment income | (0.25 | ) | (0.28 | ) | ||||
Distributions from capital gains | (1.21 | ) | — | |||||
|
|
|
| |||||
Total distributions | (1.46 | ) | (0.28 | ) | ||||
|
|
|
| |||||
Redemption fees added topaid-in capital | 0.00 | ~ | 0.00 | ~ | ||||
|
|
|
| |||||
Net asset value, end of period | $ | 31.76 | $ | 39.61 | ||||
|
|
|
| |||||
Total Return | (16.08 | )% | 14.47 | %** | ||||
RATIOS/SUPPLEMENTAL DATA | ||||||||
Net assets, end of period (in 000’s) | $ | 654,445 | $ | 513,135 | ||||
Ratio of expenses before reimbursements, waivers and fees paid indirectly to average net assets | 1.17 | % | 1.17 | %* | ||||
Ratio of net expenses to average net assets | 1.16 | %# | 1.16 | %*# | ||||
Ratio of net investment income (loss) to average net assets | 0.89 | %# | 0.71 | %*# | ||||
Portfolio turnover | 218 | % | 176 | %** | ||||
| * | Annualized |
| ** | Not Annualized |
| ^ | Net investment income (loss) per share has been calculated using the average shares method. |
| ~ | Amount represents less than $0.01 per share |
| # | Such ratios are net of fees paid indirectly (see Note B in the Notes to Financial Statements). |
Notes to Financial Statements are an integral part of this Schedule.
50
Driehaus Emerging Markets Small Cap Growth Fund
Financial Highlights
For the year | For the year ended December 31, 2017 | For the year ended December 31, 2016 | For the year ended December 31, 2015 | For the year ended December 31, 2014 | ||||||||||||||||
Net asset value, beginning of period | $ | 14.21 | $ | 10.66 | $ | 11.85 | $ | 13.21 | $ | 12.49 | ||||||||||
|
|
|
|
|
|
|
|
|
| |||||||||||
INCOME (LOSS) FROM INVESTMENT OPERATIONS: | ||||||||||||||||||||
Net investment income (loss) | (0.04 | )^ | 0.02 | ^ | (0.03 | )^ | (0.05 | )^ | (0.02 | )^ | ||||||||||
Net realized and unrealized gain (loss) | (3.37 | ) | 3.53 | (1.14 | ) | (1.31 | ) | 0.74 | ||||||||||||
|
|
|
|
|
|
|
|
|
| |||||||||||
Total income (loss) from investment operations | (3.41 | ) | 3.55 | (1.17 | ) | (1.36 | ) | 0.72 | ||||||||||||
|
|
|
|
|
|
|
|
|
| |||||||||||
LESS DISTRIBUTIONS: | ||||||||||||||||||||
Dividends from net investment income | — | — | (0.02 | ) | — | — | ||||||||||||||
Distributions from capital gains | — | — | — | — | — | |||||||||||||||
|
|
|
|
|
|
|
|
|
| |||||||||||
Total distributions | — | — | (0.02 | ) | — | — | ||||||||||||||
|
|
|
|
|
|
|
|
|
| |||||||||||
Redemption fees added topaid-in capital | 0.00 | ~ | 0.00 | ~ | 0.00 | ~ | 0.00 | ~ | 0.00 | ~ | ||||||||||
|
|
|
|
|
|
|
|
|
| |||||||||||
Net asset value, end of period | $ | 10.80 | $ | 14.21 | $ | 10.66 | $ | 11.85 | $ | 13.21 | ||||||||||
|
|
|
|
|
|
|
|
|
| |||||||||||
Total Return | (24.00 | )% | 33.30 | % | (9.97 | )% | (10.22 | )% | 5.77 | % | ||||||||||
RATIOS/SUPPLEMENTAL DATA | ||||||||||||||||||||
Net assets, end of period (in 000’s) | $ | 89,653 | $ | 271,146 | $ | 261,387 | $ | 432,718 | $ | 510,175 | ||||||||||
Ratio of expenses before reimbursements and/or recapture, waivers and fees paid indirectly to average net assets | 2.27 | %¥ | 1.82 | % | 1.75 | % | 1.69 | %¥ | 1.73 | % | ||||||||||
Ratio of net expenses to average net assets | 2.26 | %#¥ | 1.80 | %# | 1.73 | %# | 1.68 | %#¥ | 1.71 | %+# | ||||||||||
Ratio of net investment income (loss) to average net assets | (0.30 | )%# | 0.15 | %# | (0.26 | )%# | (0.39 | )%# | (0.14 | )%+# | ||||||||||
Portfolio turnover | 207 | % | 243 | % | 240 | % | 306 | % | 265 | % | ||||||||||
| ^ | Net investment income (loss) per share has been calculated using the average shares method. |
| ~ | Amount represents less than $0.01 per share |
| + | Such ratios are after administrative and transfer agent waivers and adviser expense reimbursements, when applicable. BNY Mellon Investment Servicing (US) Inc., the administrative agent and transfer agent, waived a portion of its fees beginning with the Fund’s commencement of operations, August 22, 2011. The Adviser contractually agreed to waive its investment advisory fee or absorb other operating expenses to the extent necessary to ensure that total annual Fund operating expenses (other than interest, taxes, brokerage commissions and other portfolio transaction expenses, capital expenditures, and extraordinary expenses) would not exceed the Fund’s operating expense cap of 2.00% of average daily net assets until August 21, 2014. |
| # | Such ratios are net of fees paid indirectly (see Note B in the Notes to Financial Statements). |
| ¥ | Ratio of expenses to average net assets includes interest expense of less than 0.005% for the years ended December 31, 2018 and 2015. The interest expense is from utilizing the line of credit (see Note E in the Notes to Financial Statements). |
Notes to Financial Statements are an integral part of this Schedule.
51
Driehaus Frontier Emerging Markets Fund
Financial Highlights
For the year | For the year ended December 31, 2017 | For the year ended December 31, 2016 | For the period May 4, 2015 through December 31, 2015 | |||||||||||||
Net asset value, beginning of period | $ | 10.86 | $ | 9.56 | $ | 8.80 | $ | 10.00 | ||||||||
|
|
|
|
|
|
|
| |||||||||
INCOME (LOSS) FROM INVESTMENT OPERATIONS: | ||||||||||||||||
Net investment income (loss) | 0.09 | ^ | 0.15 | ^ | 0.12 | ^ | (0.01 | ) | ||||||||
Net realized and unrealized gain (loss) | (2.50 | ) | 1.76 | 0.69 | (1.19 | ) | ||||||||||
|
|
|
|
|
|
|
| |||||||||
Total income (loss) from investment operations | (2.41 | ) | 1.91 | 0.81 | (1.20 | ) | ||||||||||
|
|
|
|
|
|
|
| |||||||||
LESS DISTRIBUTIONS: | ||||||||||||||||
Dividends from net investment income | (0.14 | ) | (0.03 | ) | (0.05 | ) | — | |||||||||
Distributions from capital gains | (1.18 | ) | (0.58 | ) | — | — | ||||||||||
|
|
|
|
|
|
|
| |||||||||
Total distributions | (1.32 | ) | (0.61 | ) | (0.05 | ) | — | |||||||||
|
|
|
|
|
|
|
| |||||||||
Redemption fees added topaid-in capital | 0.00 | ~ | 0.00 | ~ | 0.00 | ~ | — | |||||||||
|
|
|
|
|
|
|
| |||||||||
Net asset value, end of period | $ | 7.13 | $ | 10.86 | $ | 9.56 | $ | 8.80 | ||||||||
|
|
|
|
|
|
|
| |||||||||
Total Return | (21.96 | )% | 20.04 | % | 9.26 | % | (12.00 | )%** | ||||||||
RATIOS/SUPPLEMENTAL DATA | ||||||||||||||||
Net assets, end of period (in 000’s) | $ | 14,207 | $ | 46,092 | $ | 73,317 | $ | 19,570 | ||||||||
Ratio of expenses before reimbursements, waivers and fees paid indirectly and fees recaptured, if any, to average net assets | 2.94 | % | 2.33 | % | 2.50 | % | 3.89 | %* | ||||||||
Ratio of net expenses to average net assets | 2.00 | %+# | 1.99 | %+# | 1.99 | %+# | 2.00 | %*+# | ||||||||
Ratio of net investment income (loss) to average net assets | 0.89 | %+# | 1.44 | %+# | 1.31 | %+# | (0.22 | )%*+# | ||||||||
Portfolio turnover | 108 | % | 105 | % | 90 | % | 66 | %** | ||||||||
| * | Annualized |
| ** | Not Annualized |
| ^ | Net investment income (loss) per share has been calculated using the average share method. |
| ~ | Amount represents less than $0.01 per share |
| + | Such ratios are after administrative and transfer agent waivers and adviser expense reimbursements, when applicable. BNY Mellon Investment Servicing (US) Inc., the administrative agent and transfer agent, waived a portion of its fees beginning with the Fund’s commencement of operations, May 4, 2015. The Adviser contractually agreed to waive its investment advisory fee or absorb other operating expenses to the extent necessary to ensure that total annual Fund operating expenses (other than interest, taxes, brokerage commissions and other portfolio transaction expenses, capital expenditures, and extraordinary expenses) would not exceed the Fund’s operating expense cap of 2.00% of average daily net assets until May 3, 2021. |
| # | Such ratios are net of fees paid indirectly (see Note B in the Notes to Financial Statements). |
Notes to Financial Statements are an integral part of this Schedule.
52
Driehaus International Small Cap Growth Fund
Financial Highlights
For the year | For the year ended December 31, 2017 | For the year ended December 31, 2016 | For the year ended December 31, 2015 | For the year ended December 31, 2014 | ||||||||||||||||
Net asset value, beginning of period | $ | 11.39 | $ | 9.33 | $ | 10.08 | $ | 9.20 | $ | 10.84 | ||||||||||
|
|
|
|
|
|
|
|
|
| |||||||||||
INCOME (LOSS) FROM INVESTMENT OPERATIONS: | ||||||||||||||||||||
Net investment income (loss) | (0.02 | )^ | (0.04 | ) | (0.02 | ) | (0.02 | )^ | (0.04 | ) | ||||||||||
Net realized and unrealized gain (loss) | (1.92 | ) | 3.88 | (0.61 | ) | 1.17 | (0.42 | ) | ||||||||||||
|
|
|
|
|
|
|
|
|
| |||||||||||
Total income (loss) from investment operations | (1.94 | ) | 3.84 | (0.63 | ) | 1.15 | (0.46 | ) | ||||||||||||
|
|
|
|
|
|
|
|
|
| |||||||||||
LESS DISTRIBUTIONS: | ||||||||||||||||||||
Dividends from net investment income | — | — | — | (0.03 | ) | (0.06 | ) | |||||||||||||
Distributions from capital gains | (1.32 | ) | (1.78 | ) | (0.12 | ) | (0.24 | ) | (1.12 | ) | ||||||||||
|
|
|
|
|
|
|
|
|
| |||||||||||
Total distributions | (1.32 | ) | (1.78 | ) | (0.12 | ) | (0.27 | ) | (1.18 | ) | ||||||||||
|
|
|
|
|
|
|
|
|
| |||||||||||
Redemption fees added topaid-in capital | 0.00 | ~ | 0.00 | ~ | 0.00 | ~ | 0.00 | ~ | 0.00 | ~ | ||||||||||
|
|
|
|
|
|
|
|
|
| |||||||||||
Net asset value, end of period | $ | 8.13 | $ | 11.39 | $ | 9.33 | $ | 10.08 | $ | 9.20 | ||||||||||
|
|
|
|
|
|
|
|
|
| |||||||||||
Total Return | (16.92 | )% | 41.44 | % | (6.22 | )% | 12.58 | % | (4.32 | )% | ||||||||||
RATIOS/SUPPLEMENTAL DATA | ||||||||||||||||||||
Net assets, end of period (in 000’s) | $ | 218,430 | $ | 325,361 | $ | 270,401 | $ | 341,249 | $ | 218,979 | ||||||||||
Ratio of expenses before reimbursements, waivers and fees paid indirectly to average net assets | 1.50 | % | 1.73 | % | 1.72 | % | 1.71 | % | 1.74 | % | ||||||||||
Ratio of net expenses to average net assets | 1.49 | %# | 1.71 | %# | 1.70 | %# | 1.70 | %# | 1.72 | %# | ||||||||||
Ratio of net investment income (loss) to average net assets | (0.21 | )%# | (0.44 | )%# | (0.15 | )%# | (0.19 | )%# | (0.40 | )%# | ||||||||||
Portfolio turnover | 118 | % | 143 | % | 151 | % | 251 | % | 277 | % | ||||||||||
| ^ | Net investment income (loss) per share has been calculated using the average shares method. |
| ~ | Amount represents less than $0.01 per share |
| # | Such ratios are net of fees paid indirectly (see Note B in the Notes to Financial Statements). |
Notes to Financial Statements are an integral part of this Schedule.
53
Driehaus Micro Cap Growth Fund
Financial Highlights
For the year | For the year ended December 31, 2017 | For the year ended December 31, 2016 | For the year ended December 31, 2015 | For the year ended December 31, 2014 | ||||||||||||||||
Net asset value, beginning of period | $ | 14.44 | $ | 12.65 | $ | 10.74 | $ | 11.25 | $ | 10.74 | ||||||||||
|
|
|
|
|
|
|
|
|
| |||||||||||
INCOME (LOSS) FROM INVESTMENT OPERATIONS: | ||||||||||||||||||||
Net investment income (loss) | (0.19 | ) | (0.18 | )^ | (0.11 | )^ | (0.14 | )^ | (0.14 | ) | ||||||||||
Net realized and unrealized gain (loss) | 0.55 | 3.26 | 2.02 | 0.08 | 1.01 | |||||||||||||||
|
|
|
|
|
|
|
|
|
| |||||||||||
Total income (loss) from investment operations | 0.36 | 3.08 | 1.91 | (0.06 | ) | 0.87 | ||||||||||||||
|
|
|
|
|
|
|
|
|
| |||||||||||
LESS DISTRIBUTIONS: | ||||||||||||||||||||
Dividends from net investment income | — | — | — | — | — | |||||||||||||||
Distributions from capital gains | (3.69 | ) | (1.29 | ) | — | (0.45 | ) | (0.36 | ) | |||||||||||
|
|
|
|
|
|
|
|
|
| |||||||||||
Total distributions | (3.69 | ) | (1.29 | ) | — | (0.45 | ) | (0.36 | ) | |||||||||||
|
|
|
|
|
|
|
|
|
| |||||||||||
Redemption fees added topaid-in capital | 0.00 | ~ | 0.00 | ~ | 0.00 | ~ | 0.00 | ~ | 0.00 | ~ | ||||||||||
|
|
|
|
|
|
|
|
|
| |||||||||||
Net asset value, end of period | $ | 11.11 | $ | 14.44 | $ | 12.65 | $ | 10.74 | $ | 11.25 | ||||||||||
|
|
|
|
|
|
|
|
|
| |||||||||||
Total Return | 3.88 | % | 24.30 | % | 17.78 | % | (0.55 | )% | 8.21 | % | ||||||||||
RATIOS/SUPPLEMENTAL DATA | ||||||||||||||||||||
Net assets, end of period (in 000’s) | $ | 264,607 | $ | 322,533 | $ | 396,590 | $ | 282,178 | $ | 111,846 | ||||||||||
Ratio of expenses before reimbursements, waivers and fees paid indirectly and fees recaptured, if any, to average net assets | 1.44 | %¥ | 1.45 | %¥ | 1.48 | % | 1.53 | % | 1.59 | % | ||||||||||
Ratio of net expenses to average net assets | 1.42 | %#¥ | 1.43 | %#¥ | 1.44 | %+# | 1.52 | %+# | 1.60 | %+# | ||||||||||
Ratio of net investment income (loss) to average net assets | (1.19 | )%# | (1.33 | )%# | (1.00 | )%+# | (1.21 | )%+# | (1.39 | )%+# | ||||||||||
Portfolio turnover | 156 | % | 177 | % | 180 | % | 183 | % | 191 | % | ||||||||||
| ^ | Net investment income (loss) per share has been calculated using the average shares method. |
| ~ | Amount represents less than $0.01 per share |
| + | Such ratios are after administrative and transfer agent waivers and adviser expense reimbursements, when applicable. BNY Mellon Investment Servicing (US) Inc., the administrative agent and transfer agent, waived a portion of its fees beginning with the Fund’s commencement of operations, November 18, 2013. The Adviser contractually agreed to waive its investment advisory fee or absorb other operating expenses to the extent necessary to ensure that total annual Fund operating expenses (other than interest, taxes, brokerage commissions and other portfolio transaction expenses, capital expenditures, and extraordinary expenses) would not exceed the Fund’s operating expense cap of 1.70% of average daily net assets until November 17, 2016. |
| # | Such ratios are net of fees paid indirectly (see Note B in the Notes to Financial Statements). |
| ¥ | Ratio of expenses to average net assets includes interest expense of less than 0.005% for the years ended December 31, 2018 and 2017. The interest expense is from utilizing the line of credit (see Note E in the Notes to Financial Statements). |
Notes to Financial Statements are an integral part of this Schedule.
54
Driehaus Small Cap Growth Fund — Investor Class
Financial Highlights
| For the year ended December 31, 2018 | For the period August 21, 2017 through December 31, 2017 | |||||||
Net asset value, beginning of period | $ | 11.62 | $ | 10.00 | ||||
|
|
|
| |||||
INCOME (LOSS) FROM INVESTMENT OPERATIONS: | ||||||||
Net investment income (loss) | (0.12 | )^ | (0.04 | )^ | ||||
Net realized and unrealized gain (loss) | 0.48 | 1.86 | ||||||
|
|
|
| |||||
Total income (loss) from investment operations | 0.36 | 1.82 | ||||||
|
|
|
| |||||
LESS DISTRIBUTIONS: | ||||||||
Dividends from net investment income | — | — | ||||||
Distributions from capital gains | (0.33 | ) | (0.20 | ) | ||||
|
|
|
| |||||
Total distributions | (0.33 | ) | (0.20 | ) | ||||
|
|
|
| |||||
Redemption fees added topaid-in capital | 0.01 | — | ||||||
|
|
|
| |||||
Net asset value, end of period | $ | 11.66 | $ | 11.62 | ||||
|
|
|
| |||||
Total Return | 3.33 | % | 18.18 | %** | ||||
RATIOS/SUPPLEMENTAL DATA | ||||||||
Net assets, end of period (in 000’s) | $ | 7,538 | $ | 1,344 | ||||
Ratio of expenses before reimbursements, waivers and fees paid indirectly to average net assets | 2.57 | % | 7.86 | %* | ||||
Ratio of net expenses to average net assets | 1.18 | %+# | 1.20 | %*+ | ||||
Ratio of net investment income (loss) to average net assets | (0.87 | )%+# | (0.94 | )%*+ | ||||
Portfolio turnover | 193 | % | 66 | %** | ||||
| * | Annualized |
| ** | Not Annualized |
| ^ | Net investment loss per share has been calculated using the average share method. |
| + | Such ratios are after administrative and transfer agent waivers and adviser expense reimbursements, when applicable. BNY Mellon Investment Servicing (US) Inc., the administrative agent and transfer agent, waived a portion of its fees beginning with the Fund’s commencement of operations, August 21, 2017. The Adviser contractually agreed to waive its investment advisory fee or absorb other operating expenses to the extent necessary to ensure that total annual operating expenses for the Investor Class (other than interest, taxes, brokerage commissions and other portfolio transaction expenses, capital expenditures, and extraordinary expenses) would not exceed the Investor Class’s operating expense cap of 1.20% of average daily net assets until August 20, 2020. |
| # | Such ratios are net of fees paid indirectly (see Note B in the Notes to Financial Statements). |
Notes to Financial Statements are an integral part of this Schedule.
55
Driehaus Small Cap Growth Fund — Institutional Class
Financial Highlights
| For the year ended December 31, 2018 | For the period August 21, 2017 through December 31, 2017 | |||||||
Net asset value, beginning of period | $ | 11.63 | $ | 10.00 | ||||
|
|
|
| |||||
INCOME (LOSS) FROM INVESTMENT OPERATIONS: | ||||||||
Net investment income (loss) | (0.08 | )^ | (0.03 | )^ | ||||
Net realized and unrealized gain (loss) | 0.47 | 1.86 | ||||||
|
|
|
| |||||
Total income (loss) from investment operations | 0.39 | 1.83 | ||||||
|
|
|
| |||||
LESS DISTRIBUTIONS: | ||||||||
Dividends from net investment income | — | — | ||||||
Distributions from capital gains | (0.33 | ) | (0.20 | ) | ||||
|
|
|
| |||||
Total distributions | (0.33 | ) | (0.20 | ) | ||||
|
|
|
| |||||
Redemption fees added topaid-in capital | 0.01 | — | ||||||
|
|
|
| |||||
Net asset value, end of period | $ | 11.70 | $ | 11.63 | ||||
|
|
|
| |||||
Total Return | 3.59 | % | 18.28 | %** | ||||
RATIOS/SUPPLEMENTAL DATA | ||||||||
Net assets, end of period (in 000’s) | $ | 123,395 | $ | 38,631 | ||||
Ratio of expenses before reimbursements, waivers and fees paid indirectly to average net assets | 1.04 | % | 1.48 | %* | ||||
Ratio of net expenses to average net assets | 0.93 | %+# | 0.95 | %*+ | ||||
Ratio of net investment income (loss) to average net assets | (0.62 | )%+# | (0.69 | )%*+ | ||||
Portfolio turnover | 193 | % | 66 | %** | ||||
| * | Annualized |
| ** | Not Annualized |
| ^ | Net investment loss per share has been calculated using the average share method. |
| + | Such ratios are after administrative and transfer agent waivers and adviser expense reimbursements, when applicable. BNY Mellon Investment Servicing (US) Inc., the administrative agent and transfer agent, waived a portion of its fees beginning with the Fund’s commencement of operations, August 21, 2017. The Adviser contractually agreed to waive its investment advisory fee or absorb other operating expenses to the extent necessary to ensure that total annual operating expenses for the Institutional Class (other than interest, taxes, brokerage commissions and other portfolio transaction expenses, capital expenditures, and extraordinary expenses) would not exceed the Institutional Class’s operating expense cap of 0.95% of average daily net assets until August 20, 2020. |
| # | Such ratios are net of fees paid indirectly (see Note B in the Notes to Financial Statements). |
Notes to Financial Statements are an integral part of this Schedule.
56
Notes to Financial Statements
A. SUMMARY OF SIGNIFICANT ACCOUNTING POLICIES
Organization
The Driehaus Mutual Funds(the “Trust”) is anopen-end registered management investment company under the Investment Company Act of 1940, as amended, organized as a Delaware statutory trust, with nine separate series currently in operation. The Trustwas organized under an Agreement and Declaration of Trust dated May 31, 1996, as subsequently amended and restated as of June 6, 2013, and amended as of June 4, 2015, and may issue an unlimited number of full and fractional units of beneficial interest (shares) without par value. The six series (“Funds” or each a “Fund”) included in this report are as follows:
| Fund | Commencement of Operations | |||
Driehaus Emerging Markets Growth Fund | 12/31/97 | |||
Driehaus Emerging Markets Small Cap Growth Fund | 08/22/11 | |||
Driehaus Frontier Emerging Markets Fund | 05/04/15 | |||
Driehaus International Small Cap Growth Fund | 09/17/07 | |||
Driehaus Micro Cap Growth Fund* | 11/18/13 | |||
Driehaus Small Cap Growth Fund | 08/21/17 | |||
| * | On September 29, 2017, the Driehaus Micro Cap Growth Fund was closed to new investors. |
The Driehaus Emerging Markets Growth Fund and Driehaus Small Cap Growth Fund each offer two classes of shares, designated as Institutional Class and Investor Class. Each class of shares represents an interest in the same portfolio of investments of the respective Fund and voting privileges with respect to the Fund in general. Each class of shares has exclusive voting rights with respect to any matters involving only that class. The classes of each Fund pay pro rata the costs of management of that Fund’s portfolio, including the management fee. Each class of a Fund bears the cost of its own transfer agency and shareholder servicing arrangements, and any other class-specific expenses, which will result in differing expenses by class.
The investment objective of each Fundis to maximize capital appreciation.
Driehaus Emerging Markets Growth Fundseeks to achieve its objective by investing primarily in equity securities of emerging markets companies.
Driehaus Emerging Markets Small Cap Growth Fundseeks to achieve its objective by investing primarily in equity securities of small capitalization emerging markets companies.
Driehaus Frontier Emerging Markets Fundseeks to achieve its objective by investing primarily in equity securities of frontier emerging markets companies.
Driehaus International Small Cap Growth Fundseeks to achieve its objective by investing primarily in equity securities of smaller capitalizationnon-U.S. companies exhibiting strong growth characteristics.
Driehaus Micro Cap Growth Fundseeks to achieve its objective by investing primarily in equity securities of micro capitalization U.S. companies exhibiting strong growth characteristics.
Driehaus Small Cap Growth Fundseeks to achieve its objective by investing primarily in equity securities of U.S. small capitalization companies.
The Funds, which are investment companies within the scope of Financial Accounting Standards Board (“FASB”) Accounting Standards Update2013-08, follow accounting and reporting guidance under FASB Accounting Standards Codification Topic 946,Financial Services-Investment Companies.
Cash is held at U.S. financial institutions, and at times, may exceed the amount insured by the U.S. Federal Deposit Insurance Corporation. The Funds consider highly liquid investments, with maturities of ninety days or less when purchased to be cash equivalents, and such investments may include money market mutual fund investments. All such investments are categorized in Level 1 of the fair value hierarchy.
57
Driehaus Mutual Funds
Notes to Financial Statements — (Continued)
Securities Valuation and Transactions
Equity securities and exchange-traded options are valued at the last sale price as of the close of the primary exchange or other designated time. Equity certificates are valued at the last sale price of the underlying security as of the close of the primary exchange. Investments initially valued in currencies other than the U.S. dollar are converted to the U.S. dollar using exchange rates obtained from an independent pricing service. In addition, if quotations are not readily available, if the values have been materially affected by events occurring after the closing of a foreign market, or if there has been a movement in the U.S. market that exceeds a certain threshold, assets may be valued at fair value as determined in good faith by or under the direction of the Trust’sBoard of Trustees. Events that may materially affect asset values that could cause a fair value determination include, but are not limited to: corporate announcements relating to a specific security; natural and other disasters which may impact an entire market or region; and political and other events which may be global or impact a particular country or region. The frequency with which these procedures are used cannot be predicted and may be utilized to a significant extent. To the extent utilized, securities would be considered level 2 in the hierarchy described below.
Each Fund is subject to fair value accounting standards that define fair value, establish the framework for measuring fair value and provide a three-level hierarchy for fair valuation based upon the inputs to the valuation as of the measurement date. The three levels of the fair value hierarchy are as follows:
Level 1 — quoted prices in active markets for identical securities
Level 2 — significant observable inputs (including quoted prices for similar securities, interest rates, prepayment speeds, credit risk, etc.)
Level 3 — significant unobservable inputs (including the Funds’own assumptions in determining the fair value of investments)
The inputs or methodology used for valuing securities are not necessarily an indication of the risk associated with investing in those securities.
The summary of the Funds’ investments that are measured at fair value by level within the fair value hierarchy as of December 31, 2018 is as follows:
Fund | Total Value at December 31, 2018 | Level 1 Quoted Price | Level 2 Significant Observable Inputs | Level 3 Significant Unobservable Inputs | ||||||||||||
Driehaus Emerging Markets Growth Fund |
| |||||||||||||||
Equity Securities: | ||||||||||||||||
Africa | $ | 63,707,103 | $ | 63,707,103 | $ | — | $ | — | ||||||||
Europe | 133,715,977 | 130,147,736 | 3,568,241 | — | ||||||||||||
Far East | 907,325,074 | 907,325,074 | — | — | ||||||||||||
North America | 64,302,403 | 64,302,403 | — | — | ||||||||||||
South America | 154,211,236 | 154,211,236 | — | — | ||||||||||||
Middle East | 15,299,280 | 15,299,280 | — | — | ||||||||||||
|
|
|
|
|
|
|
| |||||||||
Total Investments | $ | 1,338,561,073 | $ | 1,334,992,832 | $ | 3,568,241 | $ | — | ||||||||
|
|
|
|
|
|
|
| |||||||||
Driehaus Emerging Markets Small Cap Growth Fund | ||||||||||||||||
Investments in Securities* | $ | 85,627,212 | $ | 85,627,212 | $ | — | $ | — | ||||||||
|
|
|
|
|
|
|
| |||||||||
58
Driehaus Mutual Funds
Notes to Financial Statements — (Continued)
Fund | Total Value at December 31, 2018 | Level 1 Quoted Price | Level 2 Significant Observable Inputs | Level 3 Significant Unobservable Inputs | ||||||||||||
Driehaus Frontier Emerging Markets Fund |
| |||||||||||||||
Equity Securities: | ||||||||||||||||
Africa | $ | 1,259,708 | $ | 1,259,708 | $ | — | $ | — | ||||||||
Europe | 1,322,720 | 1,322,720 | — | — | ||||||||||||
Far East | 7,201,177 | 6,561,041 | 640,136 | — | ||||||||||||
Middle East | 2,647,985 | 2,647,985 | — | — | ||||||||||||
North America | 51,702 | 51,702 | — | — | ||||||||||||
South America | 928,416 | 928,416 | — | — | ||||||||||||
Equity Certificates* | 86,849 | — | 86,849 | — | ||||||||||||
|
|
|
|
|
|
|
| |||||||||
Total Investments | $ | 13,498,557 | $ | 12,771,572 | $ | 726,985 | $ | — | ||||||||
|
|
|
|
|
|
|
| |||||||||
Driehaus International Small Cap Growth Fund |
| |||||||||||||||
Investments in Securities* | $ | 214,233,289 | $ | 214,233,289 | $ | — | $ | — | ||||||||
|
|
|
|
|
|
|
| |||||||||
Driehaus Micro Cap Growth Fund | ||||||||||||||||
Investments in Securities* | $ | 263,046,630 | $ | 263,046,630 | $ | — | $ | — | ||||||||
|
|
|
|
|
|
|
| |||||||||
Driehaus Small Cap Growth Fund | ||||||||||||||||
Investments in Securities* | $ | 127,903,954 | $ | 127,903,954 | $ | — | $ | — | ||||||||
|
|
|
|
|
|
|
| |||||||||
| * | See Schedule of Investments for industry and/or country breakout. |
The Funds used observable inputs in their valuation methodologies whenever they were available and deemed reliable.
When fair value pricing is employed, the prices of securities used by a Fund to calculate its net asset value may differ from closing prices for the same securities, which means that a Fund may value those securities higher or lower than another fund that does not employ fair value. In addition, the fair value price may differ materially from the value a Fund may ultimately realize.
Securities transactions are accounted for on trade date. The cost of investments sold is determined by the use of the specific identification method for both financial reporting and income tax purposes. Interest income is recorded on an accrual basis. Dividend income, net ofnon-reclaimable foreign taxes withheld, is recorded on theex-dividend date or as soon as the information is available. Income and expenses are accrued daily. The Funds’ investment income, expenses (other than class-specific expenses) and unrealized and realized gains and losses are allocated daily to each class of shares based upon the relative proportion of net assets of each class at the beginning of the day.
Options Contracts
The Funds are subject to equity and other risk exposures in the normal course of pursuing their investment objective. The Funds may use options contracts to hedge their portfolio or a portion thereof or speculatively for the purpose of profiting from a decline in the market value of a security. The Driehaus Emerging Markets Small Cap Growth Fundused both purchased and written options during the year ended December 31, 2018 to hedge exposure to certain countries, sectors or currencies.
The Funds may write covered call and put options on futures, securities or currencies the Funds own or in which they may invest. Writing put options tends to increase a Fund’s exposure to the underlying instrument. Writing call options tends to decrease a Fund’s exposure to the underlying instrument. When a
59
Driehaus Mutual Funds
Notes to Financial Statements — (Continued)
Fund writes a call or put option, an amount equal to the premium received is recorded as a liability and subsequentlymarked-to-market to reflect the current value of the option written. These liabilities are reflected as written options outstanding in the Schedule of Investments. Payments received or made, if any, from writing options with premiums to be determined on a future date are reflected as such in the Schedule of Investments. Premiums received from writing options that expire are treated as realized gains. Premiums received from writing options that are exercised or closed are added to the proceeds or offset against amounts paid on the underlying future, security or currency transaction to determine the realized gain or loss. A Fund, as a writer of an option, has no control over whether the underlying future, security or currency may be sold (call) or purchased (put) and, as a result, bears the market risk of an unfavorable change in the price of the future, security or currency underlying the written option. The risk exists that a Fund may not be able to enter into a closing transaction because of an illiquid market.
For the year ended December 31, 2018, the average monthly volume of purchased and written options based on premium value for Driehaus Emerging Markets Small Cap Growth Fundwere $699,920 and $186,406, respectively.
The Funds may also purchase put and call options. Purchasing call options tends to increase a Fund’s exposure to the underlying instrument. Purchasing put options tends to decrease a Fund’s exposure to the underlying instrument. A Fund pays a premium which is included in its Schedule of Investments as an investment and subsequentlymarked-to-market to reflect the current value of the option. Premiums paid for purchasing options that expire are treated as realized losses. Premiums paid for purchasing options that are exercised or closed are added to the amounts paid or offset against the proceeds on the underlying future, security or currency transaction to determine the realized gain or loss. When entering into purchased option contracts, a Fund bears the risk of securities prices moving unexpectedly, in which case, a Fund may not achieve the anticipated benefits of the purchased option contracts; however, the risk of loss is limited to the premium paid. As of December 31, 2018, the Funds had no outstanding option contracts.
Swap Contracts
The Driehaus Emerging Markets Small Cap Growth Fund may engage in various swap transactions, including forward rate agreements and interest rate, primarily to manage risk, or as alternatives to direct investments. The Fund may also engage in credit default swaps, which involve the exchange of a periodic premium for protection against a defined credit event (such as payment default, refinancing or bankruptcy). The Fund engaged in credit default swaps during the year ended December 31, 2018 to protect against credit events and interest rate swaps to hedge currency risks.
Under the terms of a credit default swap contract, one party acts as a guarantor receiving a periodic payment that is a fixed percentage applied to a notional amount. In return, the party agrees to purchase the notional amount of the underlying instrument, at par, if a credit event occurs during the term of the contract. The Fund may enter into credit default swaps in which the Fund acts as guarantor (a seller of protection), and may enter into credit default swaps in which the counterparty acts as guarantor (a buyer of protection). Premiums paid to or by the Fund are accrued daily and included in realized gain (loss) on swaps. The contracts aremarked-to-market daily using fair value estimates provided by an independent pricing service. Changes in value are recorded as net change in unrealized appreciation (depreciation) on the Statements of Operations. Unrealized gains are reported as an asset and unrealized losses are reported as a liability on the Statements of Assets and Liabilities. Gains or losses are realized upon termination of the contracts. The risk of loss under a swap contract may exceed the amount recorded as an asset or a liability. The notional amount of a swap contract is the reference amount pursuant to which the counterparties make payments. For swaps in which the referenced obligation is an index, in the event of default of any debt security included in the corresponding index, the Fund pays or receives the percentage of the corresponding index that the defaulted security comprises (1) multiplied by the notional value and (2) multiplied by the ratio of one minus the ratio of the fair value of the defaulted debt security to its par value. The maximum exposure to loss of the notional value as a seller of credit default swaps outstanding at December 31, 2018, for the Driehaus Emerging Markets Small Cap Growth Fund was $0.
60
Driehaus Mutual Funds
Notes to Financial Statements — (Continued)
Interest rate swaps are agreements between two parties to exchange cash flows based on a notional principal amount. The Fund may elect to pay a fixed rate and receive a floating rate or receive a fixed rate and pay a floating rate on a notional principal amount. The net interest received or paid on interest rate swap agreements is accrued daily as interest income/expense. Interest rate swaps aremarked-to-market daily using fair value estimates provided by an independent pricing service. Changes in value, including accrued interest, are recorded as net change in unrealized appreciation (depreciation) on the Statements of Operations. Unrealized gains are reported as an asset and unrealized losses are reported as a liability on the Statements of Assets and Liabilities. Gains or losses are realized upon termination of the contracts. The risk of loss under a swap contract may exceed the amount recorded as an asset or a liability.
Risks associated with swap contracts include changes in the returns of underlying instruments, failure of the counterparties to perform under the contracts’ terms and the possible lack of liquidity with respect to the contracts. Credit default swaps can involve greater risks than if an investor had invested in the reference obligation directly since, in addition to general market risks, credit default swaps are subject to counterparty credit risk, leverage risk, hedging risk, correlation risk and liquidity risk. The Fund discloses swap contracts on a gross basis, with no netting of contracts held with the same counterparty. As of December 31, 2018, the Driehaus Emerging Markets Small Cap Growth Fund had no outstanding swap contracts.
Forward Foreign Currency Contracts
The Driehaus Emerging Markets Small Cap Growth Fund used forward foreign currency contracts during the year ended December 31, 2018 to hedge foreign currency exposure in the portfolio. A forward foreign currency contract involves an obligation to purchase or sell a specific currency at a future date, which may be any fixed number of days from the date of the contract agreed upon by the parties, at a price set at the time of the contract. These contracts are principally traded in the inter-bank market conducted directly between currency traders (usually large commercial banks) and their customers.
The fair value of a forward foreign currency contract fluctuates with changes in currency exchange rates. Outstanding forward foreign currency contracts are valued daily at current market rates and the resulting change in fair value is recorded as net change in unrealized appreciation or depreciation on the Statements of Operations. When a forward foreign currency contract is settled, the Fund records a realized gain or loss equal to the difference between the value at the time the forward foreign currency contract was opened and the value at the time it was settled. A forward foreign currency contract may involve market risk in excess of the unrealized gain or loss reflected on the Statements of Assets and Liabilities. In addition, the Fund could be exposed to credit risk if the counterparties are unable or unwilling to meet the terms of the contracts or market risk if the value of the foreign currency changes unfavorably. As of December 31, 2018, the Driehaus Emerging Markets Small Cap Growth Fund had no outstanding forward foreign currency contracts.
Foreign Currency Spot Contracts
The Fundsenter into foreign currency spot contracts to facilitate transactions in foreign currency denominated securities. These spot contracts are typically open for 2 to 5 days, depending on the settlement terms of the underlying security transaction. On December 31, 2018, the Fundshad foreign currency spot contracts outstanding under which they are obligated to exchange currencies at specified future dates. The net unrealized appreciation or depreciation on spot contracts is reflected as Net unrealized appreciation or depreciation on unsettled foreign currency transactions in the Statements of Assets and Liabilities.
Equity Certificates
The Funds may invest in equity certificates, which allow the Fundsto participate in the appreciation (depreciation) of the underlying security without actually owning the underlying security. These derivative instruments are purchased pursuant to an agreement with a financial institution and are valued at a calculated market price based on the value of the underlying security in accordance with the agreement. These equity certificates are subject to the credit risk of the issuing financial institution. There is nooff-balance sheet risk associated with equity certificates and the Funds’ potential loss is limited to the purchase price of the
61
Driehaus Mutual Funds
Notes to Financial Statements — (Continued)
securities. The Funds are exposed to credit risk associated with the counterparty to the transaction, which is monitored by the Funds’ management on a periodic basis. A Fund’s equity certificates are not subject to any master netting agreement.
On December 31, 2018, Driehaus Frontier Emerging Markets Fundhad unrealized appreciation (depreciation) of $29,791 as a result of its investments in these financial instruments. The aggregate market values of these certificates for Driehaus Frontier Emerging Markets Funds represented 0.6% of its total market value of investments at December 31, 2018.
Derivative Investment Holdings Categorized by Risk Exposure
Each Fund is subject to the FASB’s “Disclosures about Derivative Instruments and Hedging Activities” (the “Derivatives Statement”). The Derivatives Statement amends and expands disclosures about derivative instruments and hedging activities. The Derivatives Statement is intended to improve financial reporting about derivative instruments requiring enhanced disclosures to enable investors to better understand how and why the Funds use derivative instruments, how these derivative instruments are accounted for and their effects on the Funds’ financial position and results of operations.
The following table sets forth the fair value and the location in the Statements of Assets and Liabilities of the Driehaus Frontier Emerging Markets Fund’s derivative contracts by primary risk exposure as of December 31, 2018:
Risk exposure category | Asset derivatives | Fair value | ||||
Equity contracts | Investments, at fair value | $ | 86,849 | |||
The following table sets forth the Driehaus Emerging Markets Small Cap Growth Fund’s net realized gain (loss) by primary risk exposure and by type of derivative contract for the year ended December 31, 2018.
| Amount of realized gain (loss) on derivatives | ||||||||||||||||||||
Risk exposure category | Credit Default Swap Contracts | Interest Rate Swap Contracts | Purchased Options | Written Options | Forward Foreign Currency Contracts | |||||||||||||||
Credit contracts | $ | (1,073,421 | ) | $ | — | $ | — | $ | — | $ | — | |||||||||
Equity contracts | — | — | 1,665,600 | (1,611,211 | ) | — | ||||||||||||||
Foreign currency contracts | — | — | — | — | 399,999 | |||||||||||||||
Interest contracts | — | 480,206 | — | — | — | |||||||||||||||
The following table sets forth the Driehaus Emerging Markets Small Cap Growth Fund’s change in net unrealized appreciation (depreciation) by primary risk exposure and by type of derivative contract for the year ended December 31, 2018.
| Change in unrealized appreciation (depreciation) on derivatives | ||||||||||||
Risk exposure category | Credit Default Swap Contracts | Interest Rate Swap Contracts | Purchased Options | |||||||||
Credit contracts | $ | 937,408 | $ | — | $ | — | ||||||
Equity contracts | — | — | 5,208 | |||||||||
Interest rate contracts | — | 12,446 | — | |||||||||
62
Driehaus Mutual Funds
Notes to Financial Statements — (Continued)
The following table sets forth the Driehaus Frontier Emerging Markets Fund’s change in net unrealized appreciation (depreciation) by primary risk exposure and by type of derivative contract for the year ended December 31, 2018.
| Change in unrealized appreciation (depreciation) on securities transactions | ||||
Risk exposure category | Equity Certificates | |||
Equity contracts | $ | 70 | ||
Federal Income Taxes
No provision is made for Federal income taxes since each Fundhas elected to be taxed as a “regulated investment company” under Subchapter M of the Internal Revenue Code (the “Code”) and has made and declared all the required distributions to its shareholders in amounts sufficient to relieve each Fundfrom all or substantially all Federal income and excise taxes under provisions of current Federal tax law.
Each Fund is subject to accounting standards that establish a minimum threshold for recognizing, and a system for measuring, the benefits of a tax position taken or expected to be taken in a tax return. Taxable years ending 2018, 2017, 2016 and 2015 remain open to Federal and state audit. As of December 31, 2018, management has evaluated the application of these standards to each Fund, and has determined that no provision for income tax is required in each Fund’s financial statements for uncertain tax provisions. The Funds recognize interest and penalties, if any, related to unrecognized tax benefits as income tax expense in the Statements of Operations. During the year, the Funds did not incur any interest or penalties. The Funds may be subject to foreign taxes on income, gains on investments or currency repatriation, a portion of which may be recoverable. Foreign taxes are provided for based on the Funds’ understanding of the tax rules and regulations that exist in the foreign markets in which they invest.
The amount of dividends and distributions from net investment income and net realized capital gains are determined in accordance with Federal income tax regulations, which may differ from United States Generally Accepted Accounting Principles (“U.S. GAAP”).
For the year ended December 31, 2018, reclassifications were recorded to distributable earnings (deficit) andpaid-in capital for any permanent tax differences. These reclassifications relate primarily to foreign currency losses, sales of passive foreign investment companies, net operating losses and foreign capital gain taxes paid. Results of operations and net assets were not affected by these reclassifications.
| Driehaus Emerging Markets Growth Fund | Driehaus Emerging Markets Small Cap Growth Fund | Driehaus Frontier Emerging Markets Fund | Driehaus International Small Cap Growth Fund | Driehaus Micro Cap Growth Fund | Driehaus Small Cap Growth Fund | |||||||||||||||||||
Distributable earnings (deficit) | $ | 842,422 | $ | 931,799 | $ | — | $ | 738,077 | $ | 3,318,245 | $ | 651,287 | ||||||||||||
Paid-in capital | (842,422 | ) | (931,799 | ) | — | (738,077 | ) | (3,318,245 | ) | (651,287 | ) | |||||||||||||
Accumulated capital losses represent net capital loss carryovers that may be available for an unlimited period to offset future realized capital gains and thereby reduce future capital gains distributions. Capital loss carryover retains the character of the original loss. The following table shows the amounts of capital loss carryover, if any, by each of the applicable Funds as of December 31, 2018:
| Unlimited Period of Net Capital Loss Carryover | ||||||||||||
| Fund | Short-Term | Long- Term | Accumulated Capital Loss Carryover | |||||||||
Driehaus Emerging Markets Small Cap Growth Fund | $ | 54,441,364 | $ | — | $ | 54,441,364 | ||||||
63
Driehaus Mutual Funds
Notes to Financial Statements — (Continued)
Pursuant to Federal income tax rules applicable to regulated investment companies, the Funds may elect to treat certain capital losses between November 1 and December 31 as occurring on the first day of the following tax year. For the year ended December 31, 2018, the following qualified late-year losses were deferred and recognized on January 1, 2019:
| Fund | Late-Year Ordinary Loss Deferral | Total Capital Loss Deferral | Total | |||||||||
Driehaus Emerging Markets Growth Fund | $ | — | $ | 57,688,347 | $ | 57,688,347 | ||||||
Driehaus Emerging Markets Small Cap Growth Fund | 149,500 | — | 149,500 | |||||||||
Driehaus Frontier Emerging Markets Fund | — | 408,807 | 408,807 | |||||||||
Driehaus International Small Cap Growth Fund | — | 6,704,891 | 6,704,891 | |||||||||
Driehaus Micro Cap Growth Fund | 11,898 | 8,462,610 | 8,474,508 | |||||||||
Driehaus Small Cap Growth Fund | — | 9,458,398 | 9,458,398 | |||||||||
Distributions to Shareholders
The tax character of distributions paid during the fiscal year ended December 31, 2018 was as follows:
Distributions paid from: | Driehaus Emerging Markets Growth Fund | Driehaus Emerging Markets Small Cap Growth Fund | Driehaus Frontier Emerging Markets Fund | Driehaus International Small Cap Growth Fund | Driehaus Micro Cap Growth Fund | Driehaus Small Cap Growth Fund | ||||||||||||||||||
Ordinary income | $ | 8,970,853 | $ | — | $ | 233,541 | $ | 5,657,722 | $ | 22,348,104 | $ | 1,454,358 | ||||||||||||
Net long-term capital gain | 53,973,948 | — | 1,981,836 | 25,166,722 | 50,514,284 | 2,139,592 | ||||||||||||||||||
|
|
|
|
|
|
|
|
|
|
|
| |||||||||||||
Total distributions paid | $ | 62,944,801 | $ | — | $ | 2,215,377 | $ | 30,824,444 | $ | 72,862,388 | $ | 3,593,950 | ||||||||||||
|
|
|
|
|
|
|
|
|
|
|
| |||||||||||||
The tax character of distributions paid during the fiscal year ended December 31, 2017 was as follows:
Distributions paid from: | Driehaus Emerging Markets Growth Fund | Driehaus Emerging Markets Small Cap Growth Fund | Driehaus Frontier Emerging Markets Fund | Driehaus International Small Cap Growth Fund | Driehaus Micro Cap Growth Fund | Driehaus Small Cap Growth Fund | ||||||||||||||||||
Ordinary income | $ | 11,017,755 | $ | — | $ | 112,002 | $ | 21,815,148 | $ | — | $ | 222,898 | ||||||||||||
Net long-term capital gain | — | — | 2,313,807 | 23,460,614 | 26,974,093 | 442,178 | ||||||||||||||||||
|
|
|
|
|
|
|
|
|
|
|
| |||||||||||||
Total distributions paid | $ | 11,017,755 | $ | — | $ | 2,425,809 | $ | 45,275,762 | $ | 26,974,093 | $ | 665,076 | ||||||||||||
|
|
|
|
|
|
|
|
|
|
|
| |||||||||||||
As of December 31, 2018, the components of net assets on a tax basis were as follows:
| Driehaus Emerging Markets Growth Fund | Driehaus Emerging Markets Small Cap Growth Fund | Driehaus Frontier Emerging Markets Fund | Driehaus International Small Cap Growth Fund | Driehaus Micro Cap Growth Fund | Driehaus Small Cap Growth Fund | |||||||||||||||||||
Undistributed ordinary income | $ | — | $ | — | $ | 38,003 | $ | — | $ | — | $ | — | ||||||||||||
Undistributed long-term capital gain | — | — | — | 51,014 | — | 412,411 | ||||||||||||||||||
|
|
|
|
|
|
|
|
|
|
|
| |||||||||||||
Accumulated earnings | $ | — | $ | — | $ | 38,003 | $ | 51,014 | $ | — | $ | 412,411 | ||||||||||||
Paid-in capital | 1,354,408,505 | 145,357,729 | 13,572,633 | 227,742,315 | 223,561,156 | 138,579,263 | ||||||||||||||||||
Accumulated capital and other losses | (57,688,347 | ) | (54,590,864 | ) | (408,807 | ) | (6,704,891 | ) | (8,474,508 | ) | (9,458,398 | ) | ||||||||||||
Unrealized appreciation (depreciation) on foreign currency | (60,409 | ) | (2,916 | ) | 398 | (3,316 | ) | — | — | |||||||||||||||
64
Driehaus Mutual Funds
Notes to Financial Statements — (Continued)
| Driehaus Emerging Markets Growth Fund | Driehaus Emerging Markets Small Cap Growth Fund | Driehaus Frontier Emerging Markets Fund | Driehaus International Small Cap Growth Fund | Driehaus Micro Cap Growth Fund | Driehaus Small Cap Growth Fund | |||||||||||||||||||
Unrealized appreciation on investments | $ | 149,441,456 | $ | (1,110,819 | ) | $ | 1,004,896 | $ | (2,654,635 | ) | $ | 49,520,197 | $ | 1,399,921 | ||||||||||
Other temporary differences | — | — | — | — | — | — | ||||||||||||||||||
|
|
|
|
|
|
|
|
|
|
|
| |||||||||||||
Net assets | $ | 1,446,101,205 | $ | 89,653,130 | $ | 14,207,123 | $ | 218,430,487 | $ | 264,606,845 | $ | 130,933,197 | ||||||||||||
|
|
|
|
|
|
|
|
|
|
|
| |||||||||||||
The differences between book-basis andtax-basis unrealized appreciation are attributable primarily to the tax deferral of losses on wash sales and passive foreign investment company (“PFIC”)mark-to-market.
The aggregate cost of investments and the composition of unrealized appreciation and depreciation on investments and net unrealized appreciation and/or depreciation on derivatives for Federal income tax purposes as of December 31, 2018, were as follows:
| Fund | Basis | Gross Appreciation | Gross Depreciation | Net Appreciation/ Depreciation | ||||||||||||
Driehaus Emerging Markets Growth Fund | $ | 1,189,119,617 | $ | 214,707,050 | $ | (65,265,594 | ) | $ | 149,441,456 | |||||||
Driehaus Emerging Markets Small Cap Growth Fund | $ | 86,738,031 | $ | 8,552,964 | $ | (9,663,783 | ) | $ | (1,110,819 | ) | ||||||
Driehaus Frontier Emerging Markets Fund | $ | 12,493,661 | $ | 2,153,436 | $ | (1,148,540 | ) | $ | 1,004,896 | |||||||
Driehaus International Small Cap Growth Fund | $ | 216,887,924 | $ | 24,592,670 | $ | (27,247,305 | ) | $ | (2,654,635 | ) | ||||||
Driehaus Micro Cap Growth Fund | $ | 213,526,433 | $ | 65,873,091 | $ | (16,352,894 | ) | $ | 49,520,197 | |||||||
Driehaus Small Cap Growth Fund | $ | 126,504,033 | $ | 9,942,825 | $ | (8,542,904 | ) | $ | 1,399,921 | |||||||
Foreign Currency Translation
Foreign currency and equity securities not denominated in U.S. dollars are translated into U.S. dollar values based upon the current rates of exchange on the date of the Funds’valuations.
Net realized foreign exchange gains or losses which are reported by the Fundsresult from currency gains and losses on transaction hedges arising from changes in exchange rates between the trade and settlement dates on spot contracts underlying securities transactions and the difference between the amounts accrued for dividends, interest, and foreign taxes and the amounts actually received or paid in U.S. dollars for these items. Net unrealized foreign exchange gains and losses result from changes in the U.S. dollar value of assets and liabilities (other than investments in securities), which are denominated in foreign currencies, as a result of changes in exchange rates.
The Fundsdo not isolate that portion of the results of operations which results from fluctuations in foreign exchange rates on investments. These fluctuations are included with the net realized gain (loss) from security transactions and the net change in unrealized appreciation (depreciation) of investments.
Use of Estimates
The preparation of financial statements, in conformity with U.S. GAAP, requires management to make estimates and assumptions that affect the reported amount of assets and liabilities and disclosure of contingent assets and liabilities at the date of the financial statements and the reported amounts of net increases or decreases in net assets from operations during the reporting period. Actual results could differ from those estimates.
Indemnifications
Under the Trust’s organizational documents, the officers and Trustees are indemnified against certain liabilities arising out of the performance of their duties to the Trust. In addition, in the normal course of
65
Driehaus Mutual Funds
Notes to Financial Statements — (Continued)
business, the Trust enters into contracts that provide general indemnifications to other parties. The Funds’ maximum exposure under these agreements is unknown as this would involve future claims that may be made against the Funds that have not yet occurred. However, the Funds have not had prior claims or losses pursuant to these contracts and expect the risk of loss to be remote.
Recent Accounting Pronouncements
In August 2018, the Securities and Exchange Commission released its Final Rule on Disclosure Update and Simplification (the “Final Rule”) which is intended to simplify an issuer’s disclosure compliance efforts by removing redundant or outdated disclosure requirements without significantly altering the mix of information provided to investors. Effective with the current reporting period, the Fund adopted the Final Rule with the most notable impacts being that the Fund is no longer required to present the components of distributable earnings on the Statements of Assets and Liabilities or the sources of distributions to shareholders and the amount of undistributed net investment income on the Statements of Changes in Net Assets. The tax components of distributable earnings and distributions to shareholders continue to be disclosed within the Notes to Financial Statements.
In August 2018, the Financial Accounting Standards Board issued Accounting Standards Update (“ASU”) No. 2018-13 “Changes to the Disclosure Requirements for Fair Value Measurement” which modifies disclosure requirements for fair value measurements. The guidance is effective for fiscal years beginning after December 15, 2019 and for interim periods within those fiscal years. Management has evaluated the implications of certain provisions of ASUNo. 2018-13 and has determined to early adopt all aspects related to the removal and modification of certain fair value measurement disclosures under the ASU effective immediately.
B. INVESTMENT ADVISORY FEES, TRANSACTIONS WITH AFFILIATES, AND ADMINISTRATIVE FEES
Richard H. Driehaus is Chairman of Driehaus Capital Management LLC (“DCM” or the “Adviser”), a registered investment adviser, and of Driehaus Securities LLC (“DS LLC” or the “Distributor”), a registered broker-dealer. As of December 31, 2018, Richard H. Driehaus controls the Driehaus Frontier Emerging Markets Fund due to his power to vote a majority of the shares of the Fund.
DCM serves as the Funds’ investment adviser. In return for its services to the Funds, DCM receives monthly fees. Driehaus Micro Cap Growth Fund pays the Adviser a monthly fee computed and accrued daily at an annual rate of 1.25% of the Fund’s average daily net assets. Driehaus Small Cap Growth Fund pays the Adviser a monthly fee computed and accrued daily at an annual rate of 0.60% of the Fund’s average daily net assets. From January 1, 2018 to October 31, 2018, the Driehaus Emerging Markets Small Cap Growth Fund paid the Adviser a monthly fee computed and accrued daily at the annual rate of 1.50% of the Fund’s average daily net assets. Effective November 1, 2018, the Driehaus Emerging Markets Small Cap Growth Fund pays the Adviser a monthly fee computed and accrued daily at the annual rate of 1.15% of the Fund’s average daily net assets. The Driehaus Frontier Emerging Markets Fund pays the Adviser a monthly fee computed and accrued daily at the annual rate of 1.50% of the Fund’s average daily net assets. Driehaus International Small Cap Growth Fund pays the Adviser a monthly fee computed and accrued daily at an annual rate of 1.00% of the Fund’s average daily net assets. Prior to July 2, 2018, the Driehaus International Small Cap Growth Fund paid the Adviser a monthly fee computed and accrued daily at an annual rate of 1.50% of the Fund’s average daily net assets. The Driehaus Emerging Markets Growth Fund pays the Adviser a monthly fee computed and accrued daily at an annual rate of 1.05% on the first $1.5 billion and 0.75% in excess of $1.5 billion of the Fund’s average daily net assets.
Effective November 1, 2018, DCM entered into a contractual agreement to cap Driehaus Emerging Markets Small Cap Growth Fund’s annual operating expenses (other than interest, taxes, brokerage commissions, dividends and interest on short sales, other investment-related costs, acquired fund fees and expenses, and extraordinary expenses such as litigation and other expenses not incurred in the ordinary course of the Fund’s business) at 1.45% of average daily net assets until October 31, 2021. DCM is entitled to reimbursement for previously waived fees and reimbursed expenses to the extent that the Fund’s expense ratio remains below the operating expense cap in place at the time of the waiver and the current operating expense cap. For the year ended December 31, 2018, DCM waived fees for Driehaus Emerging Markets Small Cap Growth Fund totaling $0 under this agreement. The amount of potential recovery expiring October 31, 2021 was $0.
66
Driehaus Mutual Funds
Notes to Financial Statements — (Continued)
DCM has entered into a contractual agreement to cap Driehaus Frontier Emerging Markets Fund’s annual operating expenses (other than interest, taxes, brokerage commissions, dividends and interest on short sales and other portfolio transaction expenses and extraordinary expenses such as litigation and other expenses not incurred in the ordinary course of the Fund’s business) at 2.00% of average daily net assets until May 3, 2021. For a period not to exceed three years from the date on which the waiver or reimbursement was made, DCM is entitled to reimbursement for previously waived fees and reimbursed expenses to the extent that the Fund’s expense ratio remains below the operating expense cap in place at the time of the waiver and the current operating expense cap. For the year ended December 31, 2018, DCM waived fees for Driehaus Frontier Emerging Markets Fund totaling $308,095 under this agreement. The amount of potential recovery expiring May 3, 2021 was $747,024.
DCM has entered into a contractual agreement to cap Driehaus Small Cap Growth Fund’s annual operating expenses (other than interest, taxes, brokerage commissions, dividends and interest on short sales and other portfolio transaction expenses and extraordinary expenses such as litigation and other expenses not incurred in the ordinary course of the Fund’s business) at 1.20% of average daily net assets for the Investor Class and 0.95% of average daily net assets for the Institutional Class until August 20, 2020. For a period of three years subsequent to the Fund’s commencement of operations on August 21, 2017, DCM is entitled to reimbursement for previously waived fees and reimbursed expenses to the extent that each share class’s expense ratio remains below the respective operating expense cap in place at the time of the waiver and the current operating expense cap. For the year ended December 31, 2018, DCM waived fees for Driehaus Small Cap Growth Fund totaling $80,104 under this agreement. The amount of potential recovery expiring August 20, 2020 was $147,277.
The amounts incurred and payable to DCM during the year ended December 31, 2018 are as follows:
| Fund | Advisory Fees | Advisory Fees Payable/(Receivable) (included in Due to affiliate/(Due from affiliate)) | ||||||
Driehaus Emerging Markets Growth Fund | $ | 17,243,889 | $ | 1,312,610 | ||||
Driehaus Emerging Markets Small Cap Growth Fund | 3,140,761 | 128,906 | ||||||
Driehaus Frontier Emerging Markets Fund | 493,186 | (6,869 | ) | |||||
Driehaus International Small Cap Growth Fund | 3,923,060 | 192,755 | ||||||
Driehaus Micro Cap Growth Fund | 4,831,153 | 318,158 | ||||||
Driehaus Small Cap Growth Fund | 571,524 | 33,824 | ||||||
The Funds direct certain portfolio trades, subject to obtaining the best price and execution, to brokers who have agreed to pay a portion of the Funds’ operating expenses using part of the commissions generated. For the year ended December 31, 2018, these arrangements reduced the expenses of Driehaus Emerging Markets Growth Fund, Driehaus Emerging Markets Small Cap Growth Fund, Driehaus Frontier Emerging Markets Fund, Driehaus International Small Cap Growth Fund, Driehaus Micro Cap Growth Fund and Driehaus Small Cap Growth Fund by $200,522 (0.9%), $38,797 (0.8%), $1,005 (0.1%), $21,372 (0.5%), $87,461 (1.6%) and $21,419 (2.1%), respectively.
Certain officers of the Trust are also officers of DCM and DS LLC. The Funds pay a portion of the Chief Compliance Officer’s salary and bonus. No other officers received compensation from the Funds. The Independent Trustees are compensated for their services to the Trust and such compensation is reflected as Trustees’ fees in the Statements of Operations.
BNY Mellon Investment Servicing (US) Inc. (“BNY Mellon”) serves as the Funds’ administrative and accounting agent. In compensation for these services, BNY Mellon earns the greater of a monthly minimum fee or a monthly fee based upon average daily net assets. BNY Mellon has agreed to waive a portion of its monthly fee for administrative services for the first two years of operations for Driehaus Small Cap Growth Fund. For the year ended December 31, 2018, BNY Mellon waived $2,057 for Driehaus Small Cap Growth Fund. BNY Mellon also acts as the transfer agent and dividend disbursing agent for the Funds. For these services, BNY Mellon earns a monthly fee based on shareholder processing activity during the month. BNY Mellon has agreed to waive a portion of its monthly fee for transfer agent services for the first two years of
67
Driehaus Mutual Funds
Notes to Financial Statements — (Continued)
operations for Driehaus Small Cap Growth Fund. For the year ended December 31, 2018, BNY Mellon waived $48,225 for Driehaus Small Cap Growth Fund.
DS LLC is the Funds’ distributor. DS LLC does not earn any compensation from the Funds for these services. DS LLC has entered into a Fee Reimbursement Agreement (“Agreement”) with the Driehaus Emerging Markets Growth Fund and Driehaus Small Cap Growth Fund. Under these Agreements, the Funds reimburse DS LLC for certain fees paid by DS LLC to intermediaries who provide shareholder administrative and/orsub-transfer agency services to the Investor Class shares of the Driehaus Emerging Markets Growth Fund and Driehaus Small Cap Growth Fund. Currently, the amount to be reimbursed will not exceed 0.25% of the Investor Class’ average daily net assets held by such intermediaries.
The amounts incurred and payable to DS LLC during the year ended December 31, 2018 are as follows:
| Fund | Shareholder Services Fees | Accrued Shareholder Services Fees (included in Due to affiliate) | ||||||
Driehaus Emerging Markets Growth Fund | $ | 2,183,482 | $ | 197,705 | ||||
Driehaus Small Cap Growth Fund | 1,201 | — | ||||||
C. INVESTMENT TRANSACTIONS
The aggregate purchases and sales of investment securities, other than short-term obligations and options, for the year ended December 31, 2018 were as follows:
| Fund | Purchases | Sales | ||||||
Driehaus Emerging Markets Growth Fund | $ | 3,459,874,578 | $ | 3,466,440,788 | ||||
Driehaus Emerging Markets Small Cap Growth Fund | 406,907,855 | 525,878,824 | ||||||
Driehaus Frontier Emerging Markets Fund | 32,506,930 | 53,198,347 | ||||||
Driehaus International Small Cap Growth Fund | 346,160,306 | 401,494,349 | ||||||
Driehaus Micro Cap Growth Fund | 583,978,346 | 668,395,145 | ||||||
Driehaus Small Cap Growth Fund | 285,800,077 | 182,740,434 | ||||||
D. CAPITAL SHARE TRANSACTIONS
For the years ended December 31, 2018 and 2017, transactions in capital shares (authorized shares unlimited) were as follows:
| Driehaus Emerging Markets Growth Fund | Driehaus Emerging Markets Small Cap Growth Fund | Driehaus Frontier Emerging Markets Fund | ||||||||||||||||||||||
| 2018 | 2017 | 2018 | 2017 | 2018 | 2017 | |||||||||||||||||||
Fund | ||||||||||||||||||||||||
Shares issued | — | — | 3,442,832 | 7,441,081 | 153,635 | 293,210 | ||||||||||||||||||
Shares reinvested | — | — | — | — | 313,793 | 227,525 | ||||||||||||||||||
Shares redeemed | — | — | (14,229,116 | ) | (12,881,043 | ) | (2,721,351 | ) | (3,942,460 | ) | ||||||||||||||
|
|
|
|
|
|
|
|
|
|
|
| |||||||||||||
Net increase (decrease) | — | — | (10,786,284 | ) | (5,439,962 | ) | (2,253,923 | ) | (3,421,725 | ) | ||||||||||||||
|
|
|
|
|
|
|
|
|
|
|
| |||||||||||||
Investor Class | ||||||||||||||||||||||||
Shares issued | 6,511,231 | 53,291,270 | — | — | — | — | ||||||||||||||||||
Shares reinvested | 1,023,706 | 175,258 | — | — | — | — | ||||||||||||||||||
Shares redeemed | (14,592,102 | ) | (69,265,507 | ) | — | — | — | — | ||||||||||||||||
|
|
|
|
|
|
|
|
|
|
|
| |||||||||||||
Net increase (decrease) | (7,057,165 | ) | (15,798,979 | ) | — | — | — | — | ||||||||||||||||
|
|
|
|
|
|
|
|
|
|
|
| |||||||||||||
Institutional Class | ||||||||||||||||||||||||
Shares issued | 11,261,606 | 13,364,735 | — | — | — | — | ||||||||||||||||||
Shares reinvested | 798,753 | 76,939 | — | — | — | — | ||||||||||||||||||
Shares redeemed | (4,408,218 | ) | (487,266 | ) | — | — | — | — | ||||||||||||||||
|
|
|
|
|
|
|
|
|
|
|
| |||||||||||||
Net increase (decrease) | 7,652,141 | 12,954,408 | — | — | — | — | ||||||||||||||||||
|
|
|
|
|
|
|
|
|
|
|
| |||||||||||||
Total net increase (decrease) | 594,976 | (2,844,571 | ) | — | — | — | — | |||||||||||||||||
|
|
|
|
|
|
|
|
|
|
|
| |||||||||||||
68
Driehaus Mutual Funds
Notes to Financial Statements — (Continued)
| Driehaus International Small Cap Growth Fund | Driehaus Micro Cap Growth Fund | Driehaus Small Cap Growth Fund | ||||||||||||||||||||||
| 2018 | 2017 | 2018 | 2017 | 2018 | 2017 | |||||||||||||||||||
Fund | ||||||||||||||||||||||||
Shares issued | 6,768,601 | 2,719,395 | 6,979,421 | 4,641,406 | — | — | ||||||||||||||||||
Shares reinvested | 3,560,115 | 3,643,211 | 6,239,529 | 1,738,290 | — | — | ||||||||||||||||||
Shares redeemed | (12,040,667 | ) | (6,783,946 | ) | (11,725,708 | ) | (15,385,865 | ) | — | — | ||||||||||||||
|
|
|
|
|
|
|
|
|
|
|
| |||||||||||||
Net increase (decrease) | (1,711,951 | ) | (421,340 | ) | 1,493,242 | (9,006,169 | ) | — | — | |||||||||||||||
|
|
|
|
|
|
|
|
|
|
|
| |||||||||||||
Investor Class | ||||||||||||||||||||||||
Shares issued | — | — | — | — | 802,721 | 120,209 | ||||||||||||||||||
Shares reinvested | — | — | — | — | 18,657 | 1,942 | ||||||||||||||||||
Shares redeemed | — | — | — | — | (290,721 | ) | (6,458 | ) | ||||||||||||||||
|
|
|
|
|
|
|
|
|
|
|
| |||||||||||||
Net increase (decrease) | — | — | — | — | 530,657 | 115,693 | ||||||||||||||||||
|
|
|
|
|
|
|
|
|
|
|
| |||||||||||||
Institutional Class | ||||||||||||||||||||||||
Shares issued | — | — | — | — | 7,683,576 | 3,684,462 | ||||||||||||||||||
Shares reinvested | — | — | — | — | 300,304 | 55,493 | ||||||||||||||||||
Shares redeemed | — | — | — | — | (762,745 | ) | (417,831 | ) | ||||||||||||||||
|
|
|
|
|
|
|
|
|
|
|
| |||||||||||||
Net increase (decrease) | — | — | — | — | 7,221,135 | 3,322,124 | ||||||||||||||||||
|
|
|
|
|
|
|
|
|
|
|
| |||||||||||||
Total net increase (decrease) | — | — | — | — | 7,751,792 | 3,437,817 | ||||||||||||||||||
|
|
|
|
|
|
|
|
|
|
|
| |||||||||||||
E. LINE OF CREDIT
The Funds, together with other funds in the Trust, obtained a committed line of credit in the amount of $50,000,000. The line of credit is available primarily to meet large, unexpected shareholder redemptions subject to certain restrictions. Interest is charged at a rate per annum equal to the Federal Funds Rate in effect at the time of the borrowings plus 1.5%, or 1.75%, whichever is greater. There is a commitment fee of 0.10% of the excess of the $50,000,000 committed amount over the sum of the average daily balance of any loans, which is allocated amongst all funds that have access to the line. Driehaus Emerging Markets Small Cap Growth Fund utilized the line of credit during the periods October 19, 2018 to October 24, 2018 and December 28, 2018 to December 31, 2018. For the period October 19, 2018 to October 24, 2018, the average daily loan balance outstanding on days where borrowings existed was $8,500,000 and the weighted average interest rate was 3.70%. For the period December 28, 2018 to December 31, 2018, the average daily loan balance outstanding on days where borrowings existed was $5,000,000 and the weighted average interest rate was 4.00%. The interest expense, which is included on the Statements of Operations, was $7,454 for Driehaus Emerging Markets Small Cap Growth Fund. Driehaus Micro Cap Fund utilized the line of credit during the period November 6, 2018 to November 7, 2018. For the period November 6, 2018 to November 7, 2018, the average daily loan balance outstanding on days where borrowings existed was $10,500,000 and the weighted average interest rate was 3.70%. The interest expense, which is included on the Statements of Operations, was $2,158 for Driehaus Micro Cap Fund.
F. FOREIGN INVESTMENT RISKS
To the extent a Fundinvests in foreign securities, it may entail risks due to the potential for political and economic instability in the countries where the issuers of these securities are located. In addition, foreign exchange fluctuations could affect the value of positions held. These risks are generally intensified in emerging markets.
G. REDEMPTION FEES
The Fundsmay charge a redemption fee of 2.00% of the redemption amount for shares redeemed within 60 days of purchase. The redemption fees are recorded inpaid-in capital and reflected in the Statements of Changes in Net Assets.
69
Driehaus Mutual Funds
Notes to Financial Statements — (Continued)
H. SUBSEQUENT EVENTS
Events or transactions that occurred after the date of this report through the date the report was issued have been evaluated for potential impact to the financial statements. There are no subsequent events that require recognition or disclosure in the financial statements.
70
Report of Independent Registered Public Accounting Firm
To the Shareholders of Driehaus Emerging Markets Growth Fund, Driehaus Emerging Markets Small Cap Growth Fund, Driehaus Frontier Emerging Markets Fund, Driehaus International Small Cap Growth Fund, Driehaus Micro Cap Growth Fund, and Driehaus Small Cap Growth Fund and the Board of Trustees of the Driehaus Mutual Funds
Opinion on the Financial Statements
We have audited the accompanying statements of assets and liabilities of Driehaus Emerging Markets Growth Fund, Driehaus Emerging Markets Small Cap Growth Fund, Driehaus Frontier Emerging Markets Fund, Driehaus International Small Cap Growth Fund, Driehaus Micro Cap Growth Fund, and Driehaus Small Cap Growth Fund, (collectively referred to as the “Funds”), (six of the funds constituting the Driehaus Mutual Funds (the “Trust”)), including the schedules of investments, as of December 31, 2018, and the related statements of operations and changes in net assets, and the financial highlights for each of the periods indicated in the table below and the related notes (collectively referred to as the “financial statements”). In our opinion, the financial statements present fairly, in all material respects, the financial position of each of the Funds (six of the funds constituting the Driehaus Mutual Funds) at December 31, 2018, and the results of their operations, changes in net assets and financial highlights for each of the periods indicated in the table below, in conformity with U.S. generally accepted accounting principles.
Funds constituting the | Statement of operations | Statement of changes | Financial highlights | |||
Driehaus Emerging Markets Growth Fund
Driehaus Emerging Markets Small Cap Growth Fund
Driehaus International Small Cap Growth Fund
Driehaus Micro Cap Growth Fund | For the year ended December 31, 2018
| For each of the two years in the period ended December 31, 2018 | For each of the five years in the period ended December 31, 2018 | |||
| Driehaus Frontier Emerging Markets Fund | For the year ended December 31, 2018 | For each of the two years in the period ended December 31, 2018 | For each of the three years in the period ended December 31, 2018 and the period from May 4, 2015 (commencement of operations) through December 31, 2015 | |||
| Driehaus Small Cap Growth Fund | For the year ended December 31, 2018 | For the year ended December 31, 2018 and the period from August 21, 2017 (commencement of operations) through December 31, 2017 | ||||
Basis for Opinion
These financial statements are the responsibility of the Trust’s management. Our responsibility is to express an opinion on each of the Fund’s financial statements based on our audits. We are a public accounting firm registered with the Public Company Accounting Oversight Board (United States) (“PCAOB”) and are required to be independent with respect to the Trust in accordance with the U.S. federal securities laws and the applicable rules and regulations of the Securities and Exchange Commission and the PCAOB.
We conducted our audits in accordance with the standards of the PCAOB. Those standards require that we plan and perform the audit to obtain reasonable assurance about whether the financial statements are free of material misstatement, whether due to error or fraud. The Trust is not required to have, nor were we engaged to perform, an audit of the Trust’s internal control over financial reporting. As part of our audits, we are required to obtain an understanding of internal control over financial reporting, but not for the purpose of expressing an opinion on the effectiveness of the Trust’s internal control over financial reporting. Accordingly, we express no such opinion.
71
Report of Independent Registered Public Accounting Firm — (Continued)
Our audits included performing procedures to assess the risks of material misstatement of the financial statements, whether due to error or fraud, and performing procedures that respond to those risks. Such procedures included examining, on a test basis, evidence regarding the amounts and disclosures in the financial statements. Our procedures included confirmation of securities owned as of December 31, 2018, by correspondence with the custodians and brokers or by other appropriate auditing procedures where replies from brokers were not received. Our audits also included evaluating the accounting principles used and significant estimates made by management, as well as evaluating the overall presentation of the financial statements. We believe that our audits provide a reasonable basis for our opinion.

We have served as the auditor of one or more Driehaus investment companies since 2002.
Chicago, Illinois
February 22, 2019
72
Interested and Independent Trustees of the Trust
The following table sets forth certain information with respect to the Trustees of the Trustas of December 31, 2018:
Name, Address | Position(s) | Term of | Number of Portfolios in Trust Overseen by Trustee | Principal Occupation(s) | Other Directorships | |||||||
Interested Trustee:* | ||||||||||||
Stephen J. Kneeley 25 East Erie Street Chicago, IL 60611 YOB: 1963 | Trustee and President | Since 2018 Since 2017 | 9 | President and Chief Executive Officer of the Adviser since January 2018; Interim President and Interim Chief Executive Officer of Adviser March 2017 to December 2017; Chief Executive Officer, Context Asset Management, L.P. from 2014 to 2016. | Chairman of Board of Trustees, Context Capital Funds from 2014 to 2017; and Trustee, Copeland Trust from 2010 to 2017. | |||||||
Independent Trustees: | ||||||||||||
Daniel F. Zemanek c/o Driehaus Capital Management LLC 25 East Erie Street Chicago, IL 60611 YOB: 1942 | Trustee and Chairman | Since 1996 Since 2014 | 9 | Retired; President of Ludan, Inc. (real estate development services specializing in senior housing) from April 2008 to December 2014. | None. | |||||||
Theodore J. Beck c/o Driehaus Capital Management LLC 25 East Erie Street Chicago, IL 60611 YOB: 1952 | Trustee | Since 2012 | 9 | Retired; President and Chief Executive Officer, National Endowment for Financial Education, 2005 to July 2018. | None. | |||||||
Francis J. Harmon c/o Driehaus Capital Management LLC 25 East Erie Street Chicago, IL 60611 YOB: 1942 | Trustee | Since 1998 | 9 | Relationship Manager, Great Lakes Advisors, Inc. since February 2008. | None. | |||||||
Dawn M. Vroegop c/o Driehaus Capital Management LLC 25 East Erie Street Chicago, IL 60611 YOB: 1966 | Trustee | Since 2012 | 9 | Private Investor. | Independent Trustee, Brighthouse Funds Trust I since December 2000 and Brighthouse Funds Trust II since May 2009. | |||||||
Christopher J. Towle, CFA c/o Driehaus Capital Management LLC 25 East Erie Street Chicago, IL 60611 YOB: 1957 | Trustee | Since 2016 | 9 | Retired; Partner, Portfolio Manager, Director of High Yield and Convertible Securities, Lord Abbett & Co. 1987 to 2014. | Independent Trustee, Brighthouse Funds Trust I and Brighthouse Funds Trust II, each since April 2018. | |||||||
| * | Mr. Kneeley became a Trustee on March 6, 2018. Mr. Kneeley is an “interested person” of the Trust, the Adviser and the Distributor, as defined in the 1940 Act, because he is an officer of the Adviser. |
73
The following table sets forth certain information with respect to the officers of the Trust:
Name, Address and | Position(s) Held | Length of | Principal Occupation(s) During Past 5 Years | |||
Robert M. Kurinsky* 25 East Erie Street Chicago, IL 60611 YOB: 1972 | Vice President and Treasurer | Since January 2019 | Chief Financial Officer and Treasurer of the Adviser and Distributor since January 2019; Treasurer, Secretary and Chief Legal Officer of the Keeley Funds, Inc. through December 2018; President and Chief Operating Officer of Keeley-Teton Advisors, LLC from March 2017 to December 2018; Treasurer and Secretary of Joley Corp. and Keeley Holdings, Inc. through February 2017; Secretary, Treasurer, Chief Financial Officer and General Counsel of Keeley Asset Management Corp. through February 2017; Secretary, Treasurer, Chief Financial Officer and General Counsel of Keeley Investment Corp. through February 2017. | |||
Janet L. McWilliams 25 East Erie Street Chicago, IL 60611 YOB: 1970 | Assistant Vice President and Chief Legal Officer | Since 2007 Since 2012 | General Counsel and Secretary of the Adviser and Distributor since 2012. | |||
Michael R. Shoemaker 25 East Erie Street Chicago, IL 60611 YOB: 1981 | Chief Compliance Officer, Assistant Vice President and Anti-Money Laundering Compliance Officer | Since 2012 Since 2018 | Anti-Money Laundering Compliance Officer of the Distributor since 2018; Assistant Vice President and Chief Compliance Officer of the Adviser and Distributor since 2012. | |||
| William H. Wallace, III 301 Bellevue Parkway Wilmington, DE 19809 YOB: 1969 | Secretary | Since 2015 | Vice President and Manager, The Bank of New York Mellon since 2010. | |||
Christine V. Mason 301 Bellevue Parkway Wilmington, DE 19809 YOB: 1956 | Assistant Secretary | Since 2015 | Vice President and Manager, The Bank of New York Mellon since March 2018; and Senior Specialist, The Bank of New York Mellon from 2013 to March 2018. | |||
Christina E.H. Jacobs** 25 East Erie Street Chicago, IL 60611 YOB: 1985 | Assistant Secretary | Since January 2019 | Senior Attorney of the Adviser since January 2019; Senior Attorney, Aegon USA Investment Management, LLC from December 2014 to January 2019; Head of Corporate Strategy and Support, Aegon USA Investment Management, LLC from April 2015 to January 2017; Attorney, Transamerica Life Insurance Company from May 2013 to December 2014. | |||
| * | Mr. Kurinsky became the Vice President and Treasurer on January 7, 2019, succeeding Michelle L. Cahoon. |
| ** | Ms. Jacobs became the Assistant Secretary on January 7, 2019. |
The Statement of Additional Information for Driehaus Mutual Funds contains more detail about the Trust’s Trustees and officers and is available upon request, without charge. For further information, please call1-800-560-6111.
74
Fund Expense Examples (unaudited)
As a mutual fund shareholder, you may incur two types of costs: (1) transaction costs, including sales charges; redemption fees; and exchange fees and (2) ongoing costs, including management fees; distribution(12b-1) fees; and other fund expenses. This example is intended to help you understand your ongoing costs (in dollars) of investing in each Fundand to compare these costs with the ongoing costs of investing in other mutual funds.
The example is based on an investment of $1,000 invested at the beginning of the period and held for the entire six months ended December 31, 2018.
Actual Expenses
The first line of the tables below (“Actual”) provides information about actual account values and actual expenses. You may use the information in this line, together with the amount you invested, to estimate the expenses that you paid over the period. Simply divide your account value by $1,000 (for example, an $8,600 account value divided by $1,000 = 8.6), then multiply the result by the number in the first line under the heading entitled “Expenses Paid During Period” to estimate the expenses you paid on your account during this period.
Hypothetical Example for Comparison Purposes
The second line of the tables below (“Hypothetical”) provides information about hypothetical account values and hypothetical expenses based on the Fund’sactual expense ratio and an assumed rate of return of 5% per year before expenses, which is not the Fund’sactual return. You may use this information to compare the ongoing costs of investing in the Fundsversus other funds. To do so, compare this 5% hypothetical example with the 5% hypothetical examples that appear in the shareholder reports of the other funds.
Please note that the expenses shown in the table are meant to highlight your ongoing costs only and do not reflect any transactional costs, such as sales charges, redemption fees or exchange fees. Therefore, the second line of the table is useful in comparing ongoing costs only, and will not help you determine the relative total costs of owning different funds. In addition, if these transactional costs were included, your costs would have been higher.
Driehaus Emerging Markets Growth Fund — Investor Class
| Beginning Account Value July 1, 2018 | Ending Account Value December 31, 2018 | Expenses Paid During Six Months Ended December 31, 2018* | ||||||||||
Actual | $ | 1,000 | $ | 889.90 | $ | 6.53 | ||||||
Hypothetical (5% return before expenses) | $ | 1,000 | $ | 1,018.30 | $ | 6.97 | ||||||
Driehaus Emerging Markets Growth Fund — Institutional Class
| Beginning Account Value July 1, 2018 | Ending Account Value December 31, 2018 | Expenses Paid During Period Ended December 31, 2018* | ||||||||||
Actual | $ | 1,000 | $ | 891.00 | $ | 5.67 | ||||||
Hypothetical (5% return before expenses) | $ | 1,000 | $ | 1,019.21 | $ | 6.06 | ||||||
75
Fund Expense Examples (unaudited) — (Continued)
Driehaus Emerging Markets Small Cap Growth Fund
| Beginning Account Value July 1, 2018 | Ending Account Value December 31, 2018 | Expenses Paid During Six Months Ended December 31, 2018* | ||||||||||
Actual | $ | 1,000 | $ | 815.10 | $ | 10.39 | ||||||
Hypothetical (5% return before expenses) | $ | 1,000 | $ | 1,013.76 | $ | 11.52 | ||||||
Driehaus Frontier Emerging Markets Fund
| Beginning Account Value July 1, 2018 | Ending Account Value December 31, 2018 | Expenses Paid During Six Months Ended December 31, 2018* | ||||||||||
Actual | $ | 1,000 | $ | 852.60 | $ | 9.29 | ||||||
Hypothetical (5% return before expenses) | $ | 1,000 | $ | 1,015.17 | $ | 10.11 | ||||||
Driehaus International Small Cap Growth Fund
| Beginning Account Value July 1, 2018 | Ending Account Value December 31, 2018 | Expenses Paid During Six Months Ended December 31, 2018* | ||||||||||
Actual | $ | 1,000 | $ | 812.90 | $ | 5.62 | ||||||
Hypothetical (5% return before expenses) | $ | 1,000 | $ | 1,019.00 | $ | 6.26 | ||||||
Driehaus Micro Cap Growth Fund
| Beginning Account Value July 1, 2018 | Ending Account Value December 31, 2018 | Expenses Paid During Six Months Ended December 31, 2018* | ||||||||||
Actual | $ | 1,000 | $ | 849.90 | $ | 6.57 | ||||||
Hypothetical (5% return before expenses) | $ | 1,000 | $ | 1,018.10 | $ | 7.17 | ||||||
Driehaus Small Cap Growth Fund — Investor Class
| Beginning Account Value July 1, 2018 | Ending Account Value December 31, 2018 | Expenses Paid During Period Ended December 31, 2018* | ||||||||||
Actual | $ | 1,000 | $ | 857.00 | $ | 5.48 | ||||||
Hypothetical (5% return before expenses) | $ | 1,000 | $ | 1,019.31 | $ | 5.96 | ||||||
76
Fund Expense Examples (unaudited) — (Continued)
Driehaus Small Cap Growth Fund — Institutional Class
| Beginning Account Value July 1, 2018 | Ending Account Value December 31, 2018 | Expenses Paid During Period Ended December 31, 2018* | ||||||||||
Actual | $ | 1,000 | $ | 858.00 | $ | 4.31 | ||||||
Hypothetical (5% return before expenses) | $ | 1,000 | $ | 1,020.57 | $ | 4.69 | ||||||
| * | Expenses are equal to the Fund’s annualized expense ratios for thesix-month period in the table below multiplied by the average account value over the period, multiplied by the number of days in the most recent fiscal half-year (184), then divided by 365 to reflect the half-year period. |
Driehaus Emerging Markets Growth Fund — Investor Class | 1.37% | |||
Driehaus Emerging Markets Growth Fund — Institutional Class | 1.19% | |||
Driehaus Emerging Markets Small Cap Growth Fund | 2.27% | |||
Driehaus Frontier Emerging Markets Fund | 1.99% | |||
Driehaus International Small Cap Growth Fund | 1.23% | |||
Driehaus Micro Cap Growth Fund | 1.41% | |||
Driehaus Small Cap Growth Fund — Investor Class | 1.17% | |||
Driehaus Small Cap Growth Fund — Institutional Class | 0.92% |
77
Shareholder Information (unaudited)
TAX INFORMATION FOR THE YEAR ENDED DECEMBER 31, 2018
We are providing this information as required by the Internal Revenue Code. The amounts shown may differ from those elsewhere in this report because of differences between tax and financial reporting requirements.
The Funds designate the following amounts as a long-term capital gain distribution:
Driehaus | Driehaus Emerging Markets Small Cap Growth Fund | Driehaus Frontier Emerging Markets Fund | Driehaus International Small Cap Growth Fund | Driehaus Micro Cap Growth Fund | Driehaus Small Cap Growth Fund | |||||||||||||||||
| $ | 53,973,948 | $ | — | $ | 1,981,836 | $ | 25,166,722 | $ | 50,514,284 | $ | 2,139,592 | |||||||||||
For taxablenon-corporate shareholders, the following percentages of income and short-term capital gains represent qualified dividend income subject to the 15% rate category:
Driehaus | Driehaus Emerging Markets Small Cap Growth Fund | Driehaus Frontier Emerging Markets Fund | Driehaus International Small Cap Growth Fund | Driehaus Micro Cap Growth Fund | Driehaus Small Cap Growth Fund | |||||||||||||||||
| 100.00% | 0.00% | 100.00% | 65.11% | 3.30% | 13.67% | |||||||||||||||||
For corporate shareholders, the following percentages of income and short-term capital gains qualified for the dividends-received deduction:
Driehaus | Driehaus Emerging Markets Small Cap Growth Fund | Driehaus Frontier Emerging Markets Fund | Driehaus International Small Cap Growth Fund | Driehaus Micro Cap Growth Fund | Driehaus Small Cap Growth Fund | |||||||||||||||||
| 2.67% | 0.00% | 0.00% | 0.00% | 3.33% | 12.89% | |||||||||||||||||
PROXY VOTING POLICIES AND PROCEDURES AND PROXY VOTING RECORD
A description of the Funds’ policies and procedures with respect to the voting of proxies relating to the Funds’ portfolio securities is available without charge, upon request, by calling1-800-560-6111. This information is also available on the Funds’ website athttp://www.driehaus.com.
Information regarding how the Funds voted proxies related to portfolio securities during the12-month period ended June 30, 2018 is available without charge, upon request, by calling1-800-560-6111. This information is also available on the Securities and Exchange Commission’s (“SEC”) website athttp://www.sec.gov.
HOW TO OBTAIN QUARTERLY PORTFOLIO HOLDINGS
Each Fund files a complete schedule of portfolio holdings with the SEC for the first and third quarters of each fiscal year on FormN-Q. The Funds’ FormN-Q is available electronically on the SEC’s website athttp://www.sec.gov. Each Fund’s complete schedule of portfolio holdings is also available on the Fund’s website athttp://www.driehaus.com.
78
Board Considerations in Connection with the Annual Review of the Investment Advisory Agreement and Review of an Amendment to the Investment Advisory Agreement for Driehaus Emerging Markets Small Cap Growth Fund
The Board of Trustees of Driehaus Mutual Funds (the “Trust”), including a majority of the Trustees who are not “interested persons” (as defined in the Investment Company Act of 1940, as amended) (the “Independent Trustees”), approved the renewal of the investment advisory agreement (the “Agreement”) with Driehaus Capital Management LLC (the “Adviser”) for Driehaus Emerging Markets Growth Fund (“DREGX”), Driehaus International Small Cap Growth Fund (“DRIOX”), Driehaus Micro Cap Growth Fund (“DMCRX”), Driehaus Emerging Markets Small Cap Growth Fund (“DRESX”) and Driehaus Frontier Emerging Markets Fund (“DRFRX”) (DREGX, DRIOX, DMCRX, DRESX and DRFRX are each a “Fund” and collectively, the “Funds”) on September 13, 2018 for an additionalone-year term ending September 30, 2019. As part of its review process, the Board requested and evaluated all information it deemed reasonably necessary to evaluate the Agreement. The Board reviewed comprehensive materials received from the Adviser and from independent legal counsel. The Board also received extensive information throughout the year regarding performance and operating results of each Fund. The Independent Trustees held a conference call with their independent legal counsel on September 6, 2018 to review the materials provided in response to their request, and identified areas for further response by Fund management. Following receipt of further information from Fund management, the Independent Trustees, represented by independent legal counsel, met independent of Fund management to consider renewal of the Agreement for each Fund. After their consideration of all the information received, the Independent Trustees presented their findings and their recommendation to renew the Agreement at the Board meeting.
In connection with the contract review process, the Board considered the factors discussed below, among others. The Board also considered that the Adviser has managed each Fund since its inception, and the Board believes that a long-term relationship with a capable, conscientious adviser is in the best interests of each Fund. The Board considered, generally, that shareholders invested in each Fund, knowing that the Adviser managed the Fund and knowing the investment advisory fee schedule.
Nature, Quality and Extent of Services. The Board considered the nature, extent and quality of services provided under the Agreement, including portfolio management services and certain administrative services. The Board considered the experience and skills of senior management and investment personnel, the resources made available to such personnel, the ability of the Adviser to attract and retain high-quality personnel, and the organizational depth of the Adviser. The Board also considered the Trust’s compliance with legal and regulatory requirements, as well as the Adviser’s handling of portfolio brokerage, and noted the Adviser’s process for evaluating best execution. The Board considered the Adviser’s risk management strategies and the process developed by the Adviser for analyzing, reviewing and assessing risk exposure for the Funds. The Board also considered the Funds’ process for fair valuation of portfolio securities and noted the Board’s review of Fund valuation matters throughout the year.
The Board received and considered performance information provided for each Fund (and share class, as applicable), comparing it to the performance of a peer universe of funds (the “Performance Universe”) and a peer group of funds (the “Performance Group”) as applicable, compiled by Broadridge using data from Lipper Analytical Services, Inc., (“Lipper”) and to each Fund’s primary benchmark index, as identified in reports to shareholders. The Board noted that the Adviser represented that because the Funds’ performance can be volatile over shorter time periods, for Funds with longer performance records, it was meaningful to also analyze the performance over rolling time periods. The Board reviewed rolling performance for all the Funds other than Driehaus Emerging Markets Growth Fund (Institutional Shares) and Driehaus Small Cap Growth Fund (Investor Shares and Institutional Shares) for the1-year,3-year and5-year returns, as applicable, over the life of each Fund relative to its benchmark and noted that, in a majority of the time periods measured, each Fund outperformed its benchmark index. The Board also noted that the rolling performance information for Driehaus Micro Cap Growth Fund included the performance of the Fund’s predecessor limited partnership for the5-year period. Because the predecessor limited partnership did not operate as a mutual fund and was not subject to certain investment and operational restrictions, the Board factored those differences into its evaluation of the Fund’s longer-term performance information. The Board also considered whether investment results were consistent with each Fund’s investment objective and policies.
As to the specific Funds, the Board considered that, as of June 30, 2018, Driehaus Emerging Markets Growth Fund’s (Investor Shares) performance was in the first quintile of its Performance Universe for the
79
1-year period and in the second quintile of its Performance Universe for the3- and5-year periods (the first quintile being the best performers and the fifth quintile being the worst performers). The Board noted that Driehaus Emerging Markets Growth Fund’s (Investor Shares) outperformed its benchmark index, the MSCI Emerging Markets Index, for the1-,3- and5-year periods. The Board further noted that, as of June 30, 2018, Driehaus Emerging Markets Growth Fund’s (Institutional Shares) performance was in the first quintile of its Performance Universe for the since-inception period (the Fund’s Institutional Shares inception date was July 17, 2017) and that Driehaus Emerging Markets Growth Fund (Institutional Shares) outperformed its benchmark index for the since-inception period.
The Board considered that, as of June 30, 2018, Driehaus International Small Cap Growth Fund’s performance was in the first quintile of its Performance Universe for the1-,3- and5-year periods. The Board noted that Driehaus International Small Cap Growth Fund outperformed its benchmark index, the MSCI All Country World ex USA Small Cap Growth Index, for the 1,3- and5-year periods.
The Board considered that, as of June 30, 2018, Driehaus Micro Cap Growth Fund’s performance was in the first quintile of its Performance Universe for the1- and3-year and since-inception periods (the Fund’s inception date was November 18, 2013). In addition, the Board noted that Driehaus Micro Cap Growth Fund outperformed its benchmark index, the Russell Microcap Growth Index, for the1- and3-year and since-inception periods.
The Board considered that, as of June 30, 2018, Driehaus Emerging Markets Small Cap Growth Fund’s performance was in the second quintile of its Performance Universe for the1-year period, but in the fifth quintile of its Performance Universe for the3- and5-year periods reviewed. In addition, the Board noted that Driehaus Emerging Markets Small Cap Growth Fund outperformed its benchmark index, the MSCI Emerging Markets Small Cap Index (“MSCI EM Small Cap Index”) for the1-year period, but underperformed the MSCI EM Small Cap Index for the3- and5-year periods. The Board also considered rolling relative performance, which for the majority of time periods outperformed the benchmark. The Board also noted the Adviser’s decisions to change the Fund’s strategy, effective November 1, 2018, to no longer use options as a principal investment strategy and to reduce the advisory fee and put into place an expense cap, which should decrease expenses and have a favorable impact on performance.
The Board considered that, as of June 30, 2018, Driehaus Frontier Emerging Markets Fund’s performance was in the first quintile of its Performance Group for the1- and3-year and since-inception periods (the Fund’s inception date was May 4, 2015). The Board noted that, due to the Fund’s unique investment strategy and limited investment universe, the Lipper Performance Group, as opposed to Performance Universe, provided a more relevant comparison of Fund performance. The Board also noted that Driehaus Frontier Emerging Markets Fund outperformed its benchmark index, the MSCI Frontier Markets Index, for the3-year and since-inception periods and underperformed its benchmark index for the1-year period. The Board also considered rolling relative performance, which measured over a3-year period showed outperformance to the benchmark.
The Board considered that, as of June 30, 2018, Driehaus Small Cap Growth Fund’s (Investor Shares and Institutional Shares) performance was in the first quintile of its Performance Universe for the since-inception period (the Fund’s inception date was August 21, 2017). The Board noted that Driehaus Small Cap Growth Fund (Investor Shares and Institutional Shares) outperformed its benchmark index, the Russell 2000 Growth Index, for the since-inception period.
As to the Funds in general, the Board concluded that the Adviser had consistently implemented its investment philosophy, and that over the long term, the investment philosophy produces value for shareholders.
On the basis of this evaluation and its ongoing review of investment results, the Board concluded that the nature, quality and extent of services provided by the Adviser supported renewal of the Agreement for each Fund.
Fees. The Board considered each Fund’s contractual management fee rate, operating expenses and total expense ratio as of December 31, 2017 as compared to peer expense group information based on data compiled by Broadridge using data from Lipper Analytical Services, Inc., an independent provider of mutual fund data (“Lipper”), as of the most recent fiscal year end of each fund in the peer group (with fifth quintile being the highest fee). The Board noted that Driehaus Small Cap Growth Fund’s (Investor Shares and Institutional Shares) contractual management fee rate was in the first quintile of its peer group, that Driehaus Emerging Markets Growth Fund’s (Investor Shares and Institutional Shares), Driehaus Frontier Emerging Markets Fund’s, Driehaus International Small Cap Growth Fund’s and Driehaus Micro Cap Growth Fund’s
80
contractual management fee rates were in the fourth quintile of their respective peer group and that Driehaus Emerging Markets Small Cap Growth Fund’s contractual management fee rate was in the fifth quintile of its peer group. The Board further noted that the Adviser had implemented a new advisory fee schedule for Driehaus International Small Cap Growth Fund, effective July 2, 2018, which lowered the Fund’s advisory fee rate to 1.00%. In addition, the Board noted that the Adviser implemented a new advisory fee schedule for Driehaus Emerging Markets Small Cap Growth Fund, effective November 1, 2018, which lowered the advisory fee rate to 1.15% (the “Revised Agreement”), and that the Adviser implemented an expense reimbursement arrangement, effective the same date. The Board considered that Driehaus Emerging Markets Small Cap Growth Fund’s contractual management fee rate under the Revised Agreement was lower than the median of its peer group.
The Board also considered that for the fiscal year ended December 31, 2017, Driehaus Frontier Emerging Markets Fund’s and Driehaus Small Cap Growth Fund’s (Investor Shares) total expense ratios were in the first quintile of their respective peer group, Driehaus Emerging Markets Growth Fund’s (Investor Shares and Institutional Shares) and Driehaus Micro Cap Growth Fund’s total expense ratios were in the second quintile of their respective peer group, Driehaus Emerging Markets Small Cap Growth Fund’s and Driehaus Small Cap Growth Fund’s (Institutional Shares) total expense ratios were in the third quintile of their respective peer group and Driehaus International Small Cap Growth Fund’s total expense ratio was in the fifth quintile of its peer group. The Board noted that the total expense ratio for Driehaus Emerging Markets Small Cap Growth Fund under the Revised Agreement was in the first quintile of its peer group. In addition, the Board considered the expense reimbursement arrangement with the Adviser for Driehaus Frontier Emerging Markets Fund and Driehaus Small Cap Growth Fund (Investor Shares and Institutional Shares). The Board also considered the Funds’ advisory fee rates as compared to fees charged by the Adviser for similarly managed institutional accounts andsub-advised unaffiliated mutual funds, as applicable. With respect to institutional accounts and other mutual funds, the Board noted that the mix of services provided, the level of responsibility, the legal, reputational and regulatory risks and the resources required under the Agreement were significantly greater as compared to the Adviser’s obligations for managing the other accounts. In considering the reasonableness of the advisory fees, the Board took into account the Adviser’s substantial human and technological resources devoted to investing for the Funds, the relatively small amount of assets under management and the limited capacity of the investment style. In addition, the Board noted that the Adviser’s directed brokerage program had resulted in a total of approximately $363,000 in directed brokerage credits during calendar year 2017, which were used to reduce expenses of the Funds.
On the basis of the information reviewed, the Board concluded that the advisory fee schedule for each Fund was reasonable in light of the nature and quality of services provided by the Adviser.
Profitability. The Board reviewed information regarding revenues received by the Adviser under the Agreement from each Fund and discussed the Adviser’s methodology in allocating its costs to the management of the Funds. The Board considered the estimated costs to the Adviser of managing the Funds. The Board noted that Driehaus Micro Cap Growth Fund is currently closed to new investors in order to maintain assets at a level that the Adviser feels is prudent, which limits the Fund’s profitability to the Adviser. The Board also noted that the Funds do not have a Rule12b-1 fee or shareholder service fee (except for Investor Shares of Driehaus Emerging Markets Growth Fund and Driehaus Small Cap Growth Fund), that the Adviser’s affiliate, Driehaus Securities LLC (“DS LLC”), serves as distributor of the Funds without compensation and that DS LLC provides compensation to intermediaries for distribution of Fund shares and for shareholder and administrative services to shareholders, the expense of which is reimbursed by the Adviser under an expense sharing arrangement with DS LLC, except for Driehaus Emerging Markets Growth Fund (Investor Shares) and Driehaus Small Cap Growth Fund (Investor Shares), which reimburse DS LLC under a Shareholder Services Plan (the “Plan”) for certain amounts paid for shareholder services covered under the Plan. The Board concluded that, based on the profitability calculated for the Trust as well as for the Funds individually (noting Driehaus Emerging Markets Small Cap Growth Fund, Driehaus Frontier Emerging Markets Fund and Driehaus Small Cap Growth Fund operated at a loss and that profitability for Driehaus International Small Cap Growth Fund was expected to decline due to the decrease in its advisory fee rate), the profitability was not excessive in light of the nature, extent and quality of the services provided to the Funds.
Economies of Scale. In considering the reasonableness of the advisory fee, the Board considered whether there are economies of scale with respect to the management of the Funds and whether the Funds benefit from any such economies of scale. Given the size of the Funds and the capacity constraints of the investment style, the Board concluded that the advisory fee rates under the Agreement are reasonable and reflect an appropriate sharing of any such economies of scale.
81
Other Benefits to the Adviser and its Affiliates. The Board also considered the character and amount of other incidental benefits received by the Adviser and its affiliates. The Board also considered benefits to the Adviser related to soft dollar allocations. The Board concluded that advisory fees were reasonable in light of thesefall-out benefits.
Based on all of the information considered and the conclusions reached, the Board determined that the terms of the Agreement continue to be fair and reasonable and that the continuation of the Agreement is in the best interests of each Fund. The Board also determined that the terms of the Revised Agreement are fair and reasonable and that the approval of the Revised Agreement is in the best interests of the Driehaus Emerging Markets Small Cap Growth Fund. No single factor was determinative in the Board’s analysis.
82
DRH-AR2018
Driehaus Mutual Funds
Trustees & Officers
Theodore J. Beck
Trustee
Francis J. Harmon
Trustee
Christopher J. Towle
Trustee
Dawn M. Vroegop
Trustee
Daniel F. Zemanek
Chairman of the Board
Stephen J. Kneeley
President & Trustee
Robert M. Kurinsky
Vice President & Treasurer
Janet L. McWilliams
Chief Legal Officer &
Assistant Vice President
Michael R. Shoemaker
Chief Compliance Officer,
Anti-Money Laundering
Compliance Officer &
Assistant Vice President
William H. Wallace, III
Secretary
Christina E.H. Jacobs
Assistant Secretary
Christine V. Mason
Assistant Secretary
Investment Adviser
Driehaus Capital Management LLC
25 East Erie Street
Chicago, IL 60611
Distributor
Driehaus Securities LLC
25 East Erie Street
Chicago, IL 60611
Administrator & Transfer Agent
UMB Fund Services, Inc.
235 W. Galena Street
Milwaukee, WI 53212
Custodian
The Northern Trust Company
50 South LaSalle Street
Chicago, IL 60603
Annual Report to Shareholders
December 31, 2018
Driehaus Active Income Fund
Driehaus Event Driven Fund
Driehaus Multi-Asset Growth Economies Fund
Distributed by:
Driehaus Securities LLC
This report has been prepared for the shareholders of the Funds and is not an offer to sell or buy any Fund securities. Such offer is only made by the Funds’ prospectus.
Driehaus Active Income Fund — Portfolio Managers’ Letter
Dear Fellow Shareholders,
The Driehaus Active Income Fund (“Fund”) returned-1.26% for the year ended December 31, 2018. This return underperformed the Fund’s benchmark, the FTSE3-MonthT-Bill Index, which returned 1.86% for the same period and the Bloomberg Barclays US Aggregate Bond Index, which returned 0.01% for the year.
2018 was a tale of two markets. The first three quarters of the year exhibited relatively low volatility and tepid risk sentiment. However, in November, credit market sentiment reversed course dramatically and indiscriminately; no class of corporate credit was spared from the ensuingsell-off. The formerly insatiable demand for corporate credit exposure ground to a halt, with investors shunning the opportunity to buy attractive securities at discounted prices. During the first three quarters of the year, the option-adjusted spread (“OAS”) of the ICE BofA ML US High Yield Index tightened by 35 basis points from 363 to 328; during the fourth quarter, capital appreciation from spread tightening was erased as the index widened by 205 basis points from 328 to 533. Similarly, the yield to maturity on the10-year US Treasury Bond rose 63 basis points from 2.43% to 3.06% during the first three quarters of the year, and then tightened 37 basis points to end the fourth quarter at 2.69% as risk sentiment grew increasingly negative throughout the quarter. Returns across corporate credit indexes were negative for 2018 with the S&P/LSTA U.S. Leveraged Loan 100 Index returning-59 basis points for the year, the BAML US Corporate (Investment Grade) Index returning-225 basis points for the year and the BAML High Yield Index returning-227 basis points during 2018.
The interest rate hedge, which is constructed with US Treasury futures, was the most significant contributor for the year, driven by effective hedging techniques, Federal Reserve rate hikes and inflationary macroeconomic conditions. The convertible arbitrage strategy, which is an attempt to profit from changes in a company’s stock volatility or credit quality by purchasing a convertible bond and simultaneously shorting the same company’s stock, was the second most significant contributor, driven primarily by spread-tightening in long leaning positions in the technology industry.
On the negative side, the directional long strategy, which involves taking long positions in corporate debt or equity instruments with the anticipation of profiting from price movements in such assets, detracted the largest amount from performance. Gains in the bonds of two consumer companies and an aerospace and defense company were offset by losses in the bonds of two industrial companies and two financial companies. The event driven strategy, which focuses on generating gains from the consummation of an event such as a takeover, merger, reorganization or other pending corporate event, also detracted from performance due primarily to one large merger arbitrage position in the semiconductor industry. The capital structure arbitrage strategy, which is constructed to exploit potential price inefficiencies between two different securities of the same company, detracted from performance, as gains on the short side of these positions were not enough to offset losses on the long side. No other strategy detracted meaningfully from 2018 performance.
Although there seems to be an elevated amount of noise in the market today, we believe that today’s corporate credit market offers a much more attractive risk-adjusted return profile than it did for most of the last six years. While volatility abounds, and we believe it may persist, the tumult of the fourth quarter enabled us to position the Fund to achieve a portfolio yield of approximately 6% and remain conservatively hedged with net long exposure of approximately 60%. It is our view that the Fund is conservatively positioned, yet it carries an attractive portfolio yield and exposure to capital appreciation. In recent years, achieving an attractive level of yield while maintaining low net exposure and spread duration was challenging due to the combination of low rates and tight credit spreads. In contrast, today’s environment seems to facilitate it.
We believe that running this portfolio with conservative positioning and a yield above 6% provides the optionality to generate attractive risk-adjusted returns, regardless of the market’s future path. Low net exposure and a high coupon should buffer the Fund’s return profile in arisk-off scenario, while the potential for capital appreciation and a high coupon should in turn boost the Fund’s returns in arisk-on scenario. In a market of heightened volatility and uncertainty, maintaining flexibility and nimbleness is critical. Thanks in part to the very compelling opportunity set created in the fourth quarter, we believe we have positioned the portfolio to navigate the range of market situations that might unfold in the year ahead.
As we start 2019, we anticipate adding new long positions. The new positions being considered are composed of both loans and bonds but are centered in credits that are perceived to be less risky due to their higher position in creditor priority and shorter duration. Less risky positions such as these, however, were not
1
spared from the fourth quarter 2018 selloff and consequently we believe that they now offer attractive returns relative to their associated risk. We are also considering new capital structure arbitrage positions as the strategy is designed to thrive with increased volatility.
We continue to hedge duration of the portfolio to approximately zero. In 2019, we will continue to focus on minimizing hedging costs. Also, we are focusing on higher quality companies and higher priority securities that we expect will perform better inrisk-off environments, which should also decrease our hedging costs. Finally, we continue to have approximately 10% of the Fund’s assets devoted to a directional short strategy, which is divided between investment grade bonds,non-investment grade bonds, and ETFs.
As always, we thank you for investing alongside us in the Driehaus Active Income Fund and would like to express our gratitude for your continued confidence in our management capabilities.
Sincerely,
 |  |
| ||
| Thomas McCauley | Yoav Sharon | John Khym | ||
| Portfolio Manager | Portfolio Manager | Assistant Portfolio Manager |

Performance is historical and does not represent future results.
Please see the following performance overview page for index description.
2
Performance Overview (unaudited)
The performance summarized below is historical and does not represent future results. Investment returns and principal value vary, and you may have a gain or loss when you sell shares. Performance data presented measures the change in the value of an investment in the Fund, assuming reinvestment of all dividends and capital gains. Average annual total return reflects annualized change.
The table does not reflect the deduction of taxes that a shareholder would pay on Fund distributions or the redemption of Fund shares. The graph compares the results of a $25,000 investment (minimum investment) in the Fund over the last 10 fiscal year periods (which includes performance of the Predecessor Fund), with all dividends and capital gains reinvested, with the indicated indices (and dividends reinvested) for the same period.
| Average Annual Total Returns as of 12/31/18 | 1 Year | 3 Years | 5 Years | 10 Years | ||||||||||||
Driehaus Active Income Fund (LCMAX)1 | –1.26% | 1.61% | 0.57% | 3.46% | ||||||||||||
FTSE 3-Month T-Bill Index2 | 1.86% | 0.99% | 0.60% | 0.35% | ||||||||||||
Bloomberg Barclays U.S. Aggregate Bond Index3 | 0.01% | 2.06% | 2.52% | 3.48% | ||||||||||||
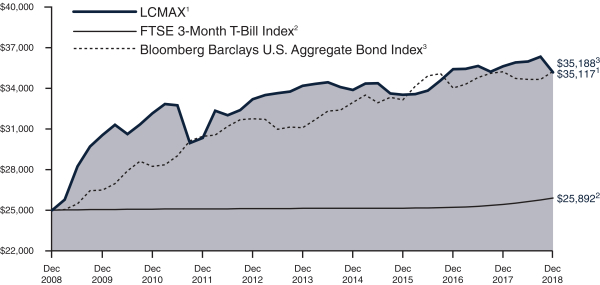
| 1 | The Driehaus Active Income Fund (the “Fund”) performance shown above includes the performance of the Lotsoff Capital Management Active Income Fund (the “Predecessor Fund”) for the periods before the Fund’s registration statement became effective. The Fund received the assets and liabilities of the Predecessor Fund on June 1, 2009 through a reorganization of the Predecessor Fund into the Fund. The Predecessor Fund was a nondiversified fund that was a series of another management investment company registered under the Investment Company Act of 1940, as amended. The Fund had no prior operating history prior to succeeding to the assets of the Predecessor Fund. The Fund has substantially similar investment objectives, strategies, and policies as the Predecessor Fund. Financial and performance information of the Fund includes the Predecessor Fund information. |
| 2 | The FTSE 3-Month T-Bill Index is designed to mirror the performance of the 3-month U.S. Treasury Bill. The FTSE3-Month T-Bill Index is unmanaged and its returns reflect reinvestment of all distributions and changes in market prices. |
| 3 | The Bloomberg Barclays U.S. Aggregate Bond Index, an unmanaged index, represents securities that are SEC-registered, taxable and dollar denominated. This index covers the U.S. investment grade fixed rate bond market, with index components for government and corporate securities, mortgage pass-through securities and asset-backed securities. These major sectors are subdivided into more specific indices that are calculated and reported on a regular basis. |
3
Driehaus Active Income Fund
Schedule of Investments
December 31, 2018
| Shares, Principal Amount, or Number of Contracts | Value | |||||||
| BANK LOANS — 36.81% | ||||||||
Advertising — 3.39% | ||||||||
Affinion Group, Inc. | $ | 2,841,996 | $ | 2,797,604 | ||||
Getty Images, Inc. | 24,794,063 | 24,197,518 | ||||||
|
| |||||||
| 26,995,122 | ||||||||
|
| |||||||
Apparel — 1.44% | ||||||||
Boardriders, Inc. | 11,476,987 | 11,448,295 | ||||||
Coal — 1.25% | ||||||||
Contura Energy, Inc. | 10,000,000 | 9,925,000 | ||||||
Computers — 2.98% | ||||||||
DynCorp International, Inc. | 6,467,782 | 6,435,443 | ||||||
McAfee LLC | 9,842,757 | 9,608,991 | ||||||
McAfee LLC | 7,700,000 | 7,667,930 | ||||||
|
| |||||||
| 23,712,364 | ||||||||
|
| |||||||
Distribution/Wholesale — 4.09% |
| |||||||
Fossil Group, Inc. | 32,317,683 | 32,533,080 | ||||||
Entertainment — 1.96% | ||||||||
Golden Entertainment, Inc. | 16,118,000 | 15,594,165 | ||||||
Healthcare — Services — 0.93% |
| |||||||
Envision Healthcare | 5,000,000 | 4,673,200 | ||||||
Heartland Dental LLC | 2,567,684 | 2,468,186 | ||||||
| Shares, Principal Amount, or Number of Contracts | Value | |||||||
Heartland Dental LLC | $ | 235,644 | $ | 226,513 | ||||
|
| |||||||
| 7,367,899 | ||||||||
|
| |||||||
Insurance — 6.35% | ||||||||
Acrisure LLC | 16,787,500 | 16,315,436 | ||||||
Acrisure LLC | 2,537,250 | 2,404,044 | ||||||
Asurion LLC | 29,128,049 | 28,891,530 | ||||||
Genworth Holdings, Inc. | 2,912,913 | 2,876,501 | ||||||
|
| |||||||
| 50,487,511 | ||||||||
|
| |||||||
Internet — 2.04% | ||||||||
EIG Investors Corp. | 9,904,831 | 9,613,877 | ||||||
Hoya Midco LLC | 4,860,885 | 4,642,145 | ||||||
Uber Technologies, Inc. | 2,029,795 | 1,952,419 | ||||||
|
| |||||||
| 16,208,441 | ||||||||
|
| |||||||
Investment Companies — 2.97% |
| |||||||
Larchmont Resources LLC | 6,345,333 | 6,218,426 | ||||||
UFC Holdings LLC | 17,537,000 | 17,427,394 | ||||||
|
| |||||||
| 23,645,820 | ||||||||
|
| |||||||
Leisure Time — 0.95% | ||||||||
Equinox Holdings, Inc. | 7,500,000 | 7,524,975 | ||||||
Notes to Financial Statements are an integral part of this Schedule.
4
Driehaus Active Income Fund
Schedule of Investments
December 31, 2018
| Shares, Principal Amount, or Number of Contracts | Value | |||||||
Media — 3.02% | ||||||||
Cumulus Media New Holdings, Inc. | $ | 17,956,743 | $ | 16,901,785 | ||||
NEP Group, Inc. | 7,500,000 | 7,087,500 | ||||||
|
| |||||||
| 23,989,285 | ||||||||
|
| |||||||
Retail — 1.71% | ||||||||
Ascena Retail Group, Inc. | 14,587,418 | 13,613,197 | ||||||
Telecommunications — 3.73% |
| |||||||
Avaya, Inc. | 19,284,800 | 18,670,097 | ||||||
Consolidated Communications, Inc. | 11,664,623 | 10,957,455 | ||||||
|
| |||||||
| 29,627,552 | ||||||||
|
| |||||||
Total BANK LOANS | 292,672,706 | |||||||
|
| |||||||
| CORPORATE BONDS — 44.90% |
| |||||||
Aerospace & Defense — 1.22% |
| |||||||
Bombardier, Inc. (Canada) | 9,590,000 | 9,733,850 | ||||||
Agriculture — 2.39% | ||||||||
Vector Group Ltd. | 22,360,000 | 19,006,000 | ||||||
Auto Manufacturers — 0.13% |
| |||||||
Aston Martin Capital Holdings Ltd. (United Kingdom) | 1,100,000 | 1,039,500 | ||||||
Banks — 7.43% | ||||||||
JPMorgan Chase & Co. | 21,081,000 | 20,791,136 | ||||||
State Street Corp. | 21,383,000 | 16,785,655 | ||||||
USB Realty Corp. | 24,835,000 | 21,482,275 | ||||||
|
| |||||||
| 59,059,066 | ||||||||
|
| |||||||
| Shares, Principal Amount, or Number of Contracts | Value | |||||||
Building Materials — 0.56% |
| |||||||
Builders FirstSource, Inc. | $ | 4,769,000 | $ | 4,423,248 | ||||
Computers — 2.30% | ||||||||
DynCorp International, Inc. | 17,708,906 | 18,240,173 | ||||||
Diversified Financial Services — 3.90% |
| |||||||
Curo Group Holdings Corp. | 15,000,000 | 11,775,000 | ||||||
ILFCE-Capital Trust I | 22,826,000 | 17,747,215 | ||||||
ILFCE-Capital Trust I | 1,950,000 | 1,516,125 | ||||||
|
| |||||||
| 31,038,340 | ||||||||
|
| |||||||
Healthcare — Products — 1.81% |
| |||||||
DJO Finance LLC / DJO Finance Corp. | 14,000,000 | 14,420,000 | ||||||
Household Products/Wares — 2.81% |
| |||||||
Spectrum Brands Holdings, Inc. | 22,075,000 | 22,350,938 | ||||||
Insurance — 0.97% | ||||||||
Genworth Holdings, Inc. | 7,619,000 | 7,695,190 | ||||||
Internet — 2.43% | ||||||||
EIG Investors Corp. | 18,060,000 | 19,324,200 | ||||||
Investment Companies — 1.63% |
| |||||||
Compass Group Diversified Holdings LLC | 13,098,000 | 12,967,020 | ||||||
Media — 5.49% | ||||||||
Altice France S.A. (France) | 11,320,000 | 10,386,100 | ||||||
Altice Luxembourg S.A. (Luxembourg) | 12,005,000 | 10,924,550 | ||||||
Lee Enterprises, Inc. | 14,075,000 | 14,356,500 | ||||||
Sinclair Television Group, Inc. | 8,535,000 | 8,001,562 | ||||||
|
| |||||||
| 43,668,712 | ||||||||
|
| |||||||
Mining — 1.42% | ||||||||
Mountain Province Diamonds, Inc. (Canada) | 11,260,000 | 11,293,780 | ||||||
Notes to Financial Statements are an integral part of this Schedule.
5
Driehaus Active Income Fund
Schedule of Investments
December 31, 2018
| Shares, Principal Amount, or Number of Contracts | Value | |||||||
Oil & Gas — 0.00% | ||||||||
Rio Oil Finance Trust Series2014-1 (Brazil) | $ | 3,127 | $ | 3,335 | ||||
Packaging & Containers — 1.54% |
| |||||||
Ardagh Packaging Finance PLC / Ardagh Holdings USA, Inc. (Ireland) | 13,260,000 | 12,240,571 | ||||||
Pharmaceuticals — 1.66% | ||||||||
HLF Financing Sarl LLC / Herbalife International, Inc. | 13,365,000 | 13,164,525 | ||||||
Software — 1.04% | ||||||||
Donnelley Financial Solutions, Inc. | 8,300,000 | 8,237,750 | ||||||
Telecommunications — 4.11% |
| |||||||
Consolidated Communications, Inc. | 13,751,000 | 12,100,880 | ||||||
HC2 Holdings, Inc. | 22,000,000 | 20,560,320 | ||||||
|
| |||||||
| 32,661,200 | ||||||||
|
| |||||||
Transportation — 2.06% | ||||||||
XPO CNW, Inc. | 19,277,000 | 16,385,450 | ||||||
|
| |||||||
Total CORPORATE BONDS | 356,952,848 | |||||||
|
| |||||||
| CONVERTIBLE CORPORATE BONDS — 0.68% |
| |||||||
Software — 0.68% |
| |||||||
Avaya Holdings Corp. | 6,375,000 | 5,438,825 | ||||||
|
| |||||||
Total CONVERTIBLE CORPORATE BONDS | 5,438,825 | |||||||
|
| |||||||
| U.S. GOVERNMENT AND AGENCY SECURITIES — 0.85% |
| |||||||
United States Treasury Note | 7,047,000 | 6,793,752 | ||||||
|
| |||||||
Total U.S. GOVERNMENT AND AGENCY SECURITIES | 6,793,752 | |||||||
|
| |||||||
| COMMON STOCK — 0.45% | ||||||||
Banks — 0.32% | ||||||||
Kearny Financial Corp. | 200,000 | 2,564,000 | ||||||
| Shares, Principal Amount, or Number of Contracts | Value | |||||||
Media — 0.13% | ||||||||
Altice USA, Inc. | 60,336 | $ | 996,750 | |||||
Software — 0.00% | ||||||||
Avaya Holdings Corp. | 632 | 9,202 | ||||||
|
| |||||||
Total COMMON STOCK | 3,569,962 | |||||||
|
| |||||||
| CONVERTIBLE PREFERRED STOCK — 0.00% |
| |||||||
Auto Manufacturers — 0.00% |
| |||||||
General Motors Corp. Senior Convertible Preferred Escrow — B | 475,000 | — | ||||||
General Motors Corp. Senior Convertible Preferred Escrow — C | 11,790,650 | — | ||||||
|
| |||||||
| — | ||||||||
|
| |||||||
Total CONVERTIBLE PREFERRED STOCK | — | |||||||
|
| |||||||
| PREFERRED STOCKS — 4.45% |
| |||||||
Banks — 4.45% | ||||||||
GMAC Capital Trust I | 1,393,979 | 35,337,368 | ||||||
|
| |||||||
Total PREFERRED STOCKS | 35,337,368 | |||||||
|
| |||||||
| PRIVATE STOCK — 0.25% |
| |||||||
Investment Companies — 0.25% |
| |||||||
Larchmont Resources LLC4 | 7,824 | 1,956,000 | ||||||
|
| |||||||
Total PRIVATE STOCK | 1,956,000 | |||||||
|
| |||||||
| ||||||||
TOTAL INVESTMENTS | 88.39 | % | $ | 702,721,451 | ||||
Other Assets less Liabilities | 11.61 | % | 92,301,765 | |||||
|
|
|
| |||||
Net Assets | 100.00 | % | $ | 795,023,216 | ||||
| ||||||||
| INVESTMENT SECURITIES SOLD SHORT — (13.70)% |
| |||||||
| CORPORATE BONDS — (7.95)% |
| |||||||
Commercial Services — (0.66)% |
| |||||||
Avis Budget Car Rental LLC / Avis Budget Finance, Inc. | $ | (2,000,000 | ) | $ | (1,745,000 | ) | ||
Notes to Financial Statements are an integral part of this Schedule.
6
Driehaus Active Income Fund
Schedule of Investments
December 31, 2018
| Shares, Principal Amount, or Number of Contracts | Value | |||||||
United Rentals North America, Inc. | $ | (4,000,000 | ) | $ | (3,530,000 | ) | ||
|
| |||||||
| (5,275,000 | ) | |||||||
|
| |||||||
Food — (1.72)% | ||||||||
General Mills, Inc. | (7,500,000 | ) | (7,377,353 | ) | ||||
Kroger Co. | (7,000,000 | ) | (6,254,724 | ) | ||||
|
| |||||||
| (13,632,077 | ) | |||||||
|
| |||||||
Healthcare — Services — (1.54)% |
| |||||||
DaVita, Inc. | (4,000,000 | ) | (3,770,000 | ) | ||||
Hadrian Merger Sub, Inc. | (7,200,000 | ) | (6,516,000 | ) | ||||
HCA, Inc. | (2,000,000 | ) | (1,960,000 | ) | ||||
|
| |||||||
| (12,246,000 | ) | |||||||
|
| |||||||
Media — (0.54)% | ||||||||
Meredith Corp. | (4,336,000 | ) | (4,260,120 | ) | ||||
Packaging & Containers — (1.78)% |
| |||||||
Berry Global, Inc. | (4,000,000 | ) | (3,986,200 | ) | ||||
Westrock Co. | (10,000,000 | ) | (10,183,100 | ) | ||||
|
| |||||||
| (14,169,300 | ) | |||||||
|
| |||||||
Pharmaceuticals — (0.47)% |
| |||||||
Bausch Health Cos., Inc. | (4,000,000 | ) | (3,760,000 | ) | ||||
Retail — (0.22)% | ||||||||
Beacon Roofing Supply, Inc. | (2,000,000 | ) | (1,772,500 | ) | ||||
Telecommunications — (1.02)% |
| |||||||
Sprint Corp. | (4,000,000 | ) | (3,981,360 | ) | ||||
T-Mobile USA, Inc. | (4,000,000 | ) | (4,100,000 | ) | ||||
|
| |||||||
| (8,081,360 | ) | |||||||
|
| |||||||
Total CORPORATE BONDS | (63,196,357 | ) | ||||||
|
| |||||||
| COMMON STOCK — (0.16)% |
| |||||||
Pharmaceuticals — (0.16)% |
| |||||||
Herbalife Nutrition Ltd.* | (22,000 | ) | (1,296,900 | ) | ||||
|
| |||||||
Total COMMON STOCK | (1,296,900 | ) | ||||||
|
| |||||||
| Shares, Principal Amount, or Number of Contracts | Value | |||||||
| EXCHANGE-TRADED FUNDS — (5.59)% |
| |||||||
Invesco Senior Loan ETF | (1,150,000 | ) | $ | (25,047,000 | ) | |||
iShares iBoxx High Yield Corporate Bond ETF | (239,571 | ) | (19,429,208 | ) | ||||
|
| |||||||
| (44,476,208 | ) | |||||||
|
| |||||||
Total EXCHANGE-TRADED FUNDS | (44,476,208 | ) | ||||||
|
| |||||||
| ||||||||
TOTAL INVESTMENT SECURITIES SOLD SHORT | (13.70 | )% | $ | (108,969,465 | ) | |||
| ||||||||
| * | Non-income producing security. |
US LIBOR — U.S. Dollar London Interbank Offered Rate.
LIBOR 3 Month — 3 Month U.S. Dollar London Interbank Offered Rate.
| 1 | Security is exempt from registration under Rule 144A of the Securities Act of 1933, as amended. Unless otherwise indicated, this security has been determined to be liquid under procedures established by Driehaus Mutual Funds’ (the “Trust”) Board of Trustees and may be resold in transactions exempt from registration, normally to qualified institutional buyers. |
| 2 | Variable or Floating rate security. Rates disclosed as of December 31, 2018. |
| 3 | All or a portion of this security is pledged as collateral for short sales or derivatives transactions. |
| 4 | Pursuant to procedures adopted by the Trust’s Board of Trustees, this security has been determined to be illiquid by Driehaus Capital Management LLC (the “Adviser”), investment adviser to the Fund. |
| 5 | Security is in default. |
| 6 | Security valued at fair value as determined in good faith by the Adviser, in accordance with procedures established by, and under the general supervision of, the Trust’s Board of Trustees. |
| 7 | Bank loans in which the Fund invests pay interest at rates which are periodically predetermined by reference to a base lending rate plus a premium. These base lending rates are generally (i) the lending rate offered by one or more major European banks, such as the London Inter-Bank Offered Rate (“LIBOR”), (ii) the prime rate offered by one or more United States banks or (iii) the certificate of deposit rate. Certain bank loans are subject to a LIBOR floor that establishes a |
Notes to Financial Statements are an integral part of this Schedule.
7
Driehaus Active Income Fund
Schedule of Investments
December 31, 2018
| minimum LIBOR rate. The interest rate shown reflects the rate in effect at December 31, 2018. Bank loans generally are subject to mandatory and/or optional repayment. As a result, the actual remaining maturity may be substantially less than the stated maturities shown. |
| 8 | Foreign security denominated in U.S. dollars and traded in the U.S. |
| 9 | The coupon rate equals 155 basis points plus the highest of the LIBOR 3 Month, the Constant Maturity Treasury 10 year rate, or the Constant Maturity Treasury 30 year rate, with a maximum of 12.95%. |
| 10 | The coupon rate equals 155 basis points plus the highest of the LIBOR 3 Month, the Constant Maturity Treasury 10 year rate, or the Constant Maturity Treasury 30 year rate, with a maximum of 14.5%. |
Percentages are stated as a percent of net assets.
Security Type | Percent of Total Net Assets | |||
Bank Loans | 36.81 | % | ||
Corporate Bonds | 44.90 | % | ||
Convertible Corporate Bonds | 0.68 | % | ||
U.S. Government and Agency Securities | 0.85 | % | ||
Common Stock | 0.45 | % | ||
Convertible Preferred Stock | 0.00 | % | ||
Preferred Stocks | 4.45 | % | ||
Private Stock | 0.25 | % | ||
|
| |||
Total Investments | 88.39 | % | ||
Other Assets less Liabilities | 11.61 | % | ||
|
| |||
Total Net Assets | 100.00 | % | ||
|
| |||
Percentages are stated as a percent of net assets.
FUTURES CONTRACTS
| Counterparty | Futures Contracts | Number of Contracts (Short) | Expiration Date | Notional Amount | Value at December 31, 2018 | Unrealized Appreciation/ (Depreciation) | ||||||||||||||
Goldman Sachs | U.S. 5 Year Treasury Note | (520 | ) | March 29, 2019 | $ | (58,722,216 | ) | $ | (59,637,500 | ) | $ | (915,284 | ) | |||||||
Goldman Sachs | U.S. 10 Year Treasury Note | (165 | ) | March 20, 2019 | (19,678,436 | ) | (20,132,574 | ) | (454,138 | ) | ||||||||||
Goldman Sachs | U.S. Treasury Long Bond | (72 | ) | March 20, 2019 | (10,029,206 | ) | (10,512,000 | ) | (482,794 | ) | ||||||||||
|
|
|
|
|
| |||||||||||||||
TOTAL FUTURES CONTRACTS | $ | (88,429,858 | ) | $ | (90,282,074 | ) | $ | (1,852,216 | ) | |||||||||||
|
|
|
|
|
| |||||||||||||||
Notes to Financial Statements are an integral part of this Schedule.
8
Driehaus Event Driven Fund — Portfolio Managers’ Letter
Dear Fellow Shareholders,
The Driehaus Event Driven Fund (“Fund”) returned-4.03% for the year ended December 31, 2018. This return is in comparison to the performance of the Fund’s benchmark, the S&P 500 Index (the “Benchmark”), which returned-4.38% for the same period, and the FTSE3-MonthT-Bill Index, an additional index against which the Fund’s performance may be compared, which returned 1.86%
As financial markets closed the tenth year of the bull market, activity in the event-driven investing category continued to be robust. However, although 2018 ended as the third best year ever for the merger and acquisitions (M&A) market, activity slowed considerably in the second half of the year. According to Deal Logic and Citigroup, 35 of the 50 largest deals occurred in the first half of the year, with M&A volume decreasing by 30% on average in the second part of the year. The impact of increasingly mixed economic and credit cycle signals, culminating in the worst period of performance for asset classes since the financial crisis, took their toll on the event driven space.
Additionally, a backdrop of escalating geopolitical tensions and more restrictive antitrust environments continued to impact dynamics of cross-border M&A. U.S. inbound and China outbound activity has fallen by approximately 50% in the last 2 years, with Europe taking the baton as the largest inbound market. The heightened geopolitical tension and regulatory environment seems to have been felt via a few high-profile cross border deals being blocked and/or delayed. Ultimately, a handful of large contentious deals closed, albeit with what some perceived to be significant risk attached to them.
Within the Fund, bond with catalyst positions, which are event driven trades that are expressed predominantly through bond issues, were the most significant long exposure contributors to performance during the year. The largest single contributor from this strategy was a long position in a company that provides digital and media content. The credit structure of the company rallied throughout the year as operations improved, while it also received a preferred equity investment ahead of a global refinance of the structure. The second largest contributor from this strategy was a wireline telecommunications company integrating a recent acquisition. The company exceeded its synergies target and has committed to pausing future M&A as it decreases leverage. As we head into 2019, this strategy type composes nearly 40% of Fund assets, and given the opportunity set for continued corporate credit actions at this point in the cycle, we anticipate allocation to this strategy will remain healthy.
The equity catalyst driven strategy, which seeks to place event driven trades that are expressed predominantly through equity issues, was the largest detractor for the fund during 2018. Throughout the year, equity event driven situations became increasingly more difficult as investors seemed to question the longevity and sustainability of the already lengthy bull market. As such, favored rollup andpro-forma equity stories were met with significant headwinds, particularly in cyclical sectors such as industrials and semiconductors, which experienced multi-turn valuation deratings. As the narrative for these investments became more challenged throughout the year, the Fund pared down its exposures, and in certain cases exited positions entirely. Among the top detractors in the strategy, the Fund had exposures in the financials, chemicals, trucking and semiconductors industries.
Risk arbitrage trades, which strive to capture valuation discrepancies between similar securities, also detracted from performance for the year. The biggest detractor was a trade in which the merger spread of a semiconductor company widened after geopolitical and trade war tensions between the US and China significantly altered the probability of deal closure. Ultimately, the all cash takeout was denied regulatory approval, and the Fund exited the position.
Portfolio hedges contributed the most to Fund returns during the year. Biotech ETFs used as a hedge to the Fund’s long single-stock equity exposure in the healthcare space shielded our equity catalyst driven holdings. Portfolio hedges typically utilize sector or market ETFs, as well as options or futures. These securities are generally used to hedge unwanted exposures, such as to the equity market, foreign currencies or credit risks, or to help dampen market volatility.
Within the Fund, we seek volatility below that of the Benchmark. In 2018, Fund volatility was 10.47% versus the Benchmark volatility of 17.03%. 2018 was a year of increasing volatility, as markets returned to more normalized levels, versus the previous year’s historically low volatility. The Fund’s100-day volatility was
9
limited to 64% of the benchmark’s volatility. Additionally, we also seek to provide some diversification from the Benchmark. For 2018, the Fund’s correlation to the Benchmark was 0.74.
As the Fund enters 2019, our focus remains committed to capitalizing on our repeatable process for investment ideas and trade structures. Creating asymmetric risk/reward opportunities in holdings that are being led by incentivized key executives who have demonstrated histories of successful capital stewardship will continue to be a focal point of the Fund. Likewise, an emphasis on producing outcomes with limited correlation to the broader markets and keying in on optimal structuring across asset classes will remain an area of attention.
On the heels of the worst period of performance in financial markets since the financial crisis, we believe that the event driven space finds itself in a unique position. As investors digest concerns about late cycle conditions and the changing path of the Federal Reserve, opportunities across a broad set of assets seem to be emerging. Corporate actions addressing credit conditions are increasingly becoming a focal point, while equity driven catalyst situations are facing increasingly complicated treatment. Acquisition stock prices, for both cash and stock deals in the US, generated a-2.7% excess return. This was the largest negative reaction to deal announcements since the 2008 financial crisis.
As we look ahead into 2019, we believe the more normalized volatility environment will sustain itself, as investors grapple with economic concerns and potential financial tightening conditions. We expect that this regime change will be supportive of our strategy, specifically as it relates to the differing asset classes in which the Fund invests and the uniquely idiosyncratic nature of our event driven strategy. Our team looks forward to opportunities that may arise as a result.
As always, we thank you for investing alongside us in the Driehaus Event Driven Fund and appreciate your continued confidence in our management capabilities.
Sincerely,
|
|
| ||
| Michael Caldwell | Tom McCauley | Yoav Sharon | ||
| Portfolio Manager | Portfolio Manager | Portfolio Manager |

Performance is historical and does not represent future results.
Please see the following performance page for index definitions.
10
Performance Overview (unaudited)
The performance summarized below is historical and does not represent future results. Investment returns and principal value vary, and you may have a gain or loss when you sell shares. Performance data presented measures the change in the value of an investment in the Fund, assuming reinvestment of all dividends and capital gains.
The table does not reflect the deduction of taxes that a shareholder would pay on Fund distributions or the redemption of Fund shares. The graph compares the results of a $10,000 investment in the Fund since August 26, 2013 (the date of the Fund’s inception), with all dividends and capital gains reinvested, with the indicated indices (and dividends reinvested) for the same period.
| Cumulative Total Returns as of 12/31/18 | 1 Year | 3 Years | 5 Years | Since Inception (8/26/13 - 12/31/18) | ||||||||||||
Driehaus Event Driven Fund (DEVDX)1 | –4.03% | 2.09% | –0.29% | 1.58% | ||||||||||||
S&P 500 Index2 | –4.38% | 9.26% | 8.49% | 10.21% | ||||||||||||
FTSE3-MonthT-Bill Index3 | 1.86% | 0.99% | 0.60% | 0.57% | ||||||||||||
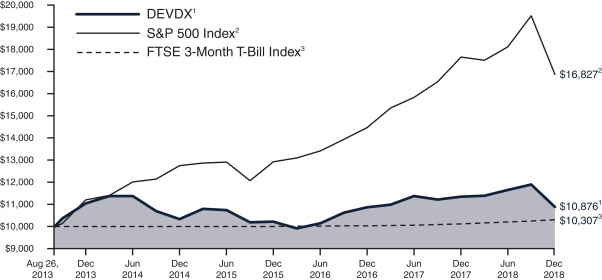
| 1 | The returns for the periods prior to March 1, 2014, reflect fee waivers and/or reimbursements without which performance would have been lower. |
| 2 | The S&P 500 Index consists of 500 stocks chosen for market size, liquidity and industry group. It is a market-weighted index, with each stock’s weight in the index proportionate to its market value. |
| 3 | The FTSE 3-Month T-Bill Index is designed to mirror the performance of the 3-month U.S. Treasury Bill. The FTSE3-Month T-Bill Index is unmanaged and its returns reflect reinvestment of all distributions and changes in market prices. |
11
Driehaus Event Driven Fund
Schedule of Investments
December 31, 2018
| Shares, Principal Amount, or Number of Contracts | Value | |||||||
| BANK LOANS — 14.64% |
| |||||||
Advertising — 4.50% |
| |||||||
Getty Images, Inc. | $ | 2,382,842 | $ | 2,325,511 | ||||
Distribution/Wholesale — 5.59% |
| |||||||
Fossil Group, Inc. | 2,872,500 | 2,891,645 | ||||||
Entertainment — 2.29% |
| |||||||
Golden Entertainment, Inc. | 1,221,320 | 1,181,627 | ||||||
Retail — 0.72% |
| |||||||
Ascena Retail Group, Inc. | 400,000 | 373,286 | ||||||
Telecommunications — 1.54% |
| |||||||
Consolidated Communications, Inc. | 847,843 | 796,442 | ||||||
|
| |||||||
Total BANK LOANS | 7,568,511 | |||||||
|
| |||||||
| CORPORATE BONDS — 24.78% |
| |||||||
Agriculture — 2.07% |
| |||||||
Vector Group Ltd. | 1,260,000 | 1,071,000 | ||||||
Banks — 2.76% |
| |||||||
USB Realty Corp. | 1,648,000 | 1,425,520 | ||||||
Diversified Financial Services — 8.26% |
| |||||||
Abe Investment Holdings, Inc./Getty Images, Inc. | 1,049,000 | 991,305 | ||||||
Curo Group Holdings Corp. | 809,000 | 635,065 | ||||||
ILFCE-Capital Trust I | 3,400,000 | 2,643,500 | ||||||
|
| |||||||
| 4,269,870 | ||||||||
|
| |||||||
Telecommunications — 11.69% |
| |||||||
Consolidated Communications, Inc. | 2,677,000 | 2,355,760 | ||||||
| Shares, Principal Amount, or Number of Contracts | Value | |||||||
HC2 Holdings, Inc. | $ | 3,940,000 | $ | 3,682,166 | ||||
|
| |||||||
| 6,037,926 | ||||||||
|
| |||||||
Total CORPORATE BONDS | 12,804,316 | |||||||
|
| |||||||
| COMMON STOCK — 52.57% |
| |||||||
Banks — 2.19% |
| |||||||
Kearny Financial Corp./MD | 88,093 | 1,129,352 | ||||||
Biotechnology — 15.05% |
| |||||||
Acer Therapeutics, Inc.* | 30,346 | 610,562 | ||||||
Argenx SE ADR (Netherlands)*4 | 22,112 | 2,124,300 | ||||||
Atara Biotherapeutics, Inc.* | 7,996 | 277,781 | ||||||
Blueprint Medicines Corp.* | 5,444 | 293,486 | ||||||
Deciphera Pharmaceuticals, Inc.* | 5,462 | 114,647 | ||||||
Loxo Oncology, Inc.*4 | 19,998 | 2,801,120 | ||||||
Orchard Therapeutics plc ADR (United Kingdom)* | 70,851 | 1,114,479 | ||||||
Sesen Bio, Inc.* | 311,617 | 442,496 | ||||||
|
| |||||||
| 7,778,871 | ||||||||
|
| |||||||
Computers — 1.10% |
| |||||||
Perspecta, Inc. | 32,896 | 566,469 | ||||||
Electronics — 3.53% |
| |||||||
Fluidigm Corp.* | 200,871 | 1,731,508 | ||||||
IntriCon Corp.* | 3,600 | 94,968 | ||||||
|
| |||||||
| 1,826,476 | ||||||||
|
| |||||||
Healthcare—Products — 6.20% |
| |||||||
Inspire Medical Systems, Inc.* | 13,451 | 568,305 | ||||||
IRIDEX Corp.* | 58,660 | 275,702 | ||||||
Nuvectra Corp.* | 27,196 | 444,383 | ||||||
SI-BONE, Inc.* | 66,292 | 1,384,840 | ||||||
Sientra, Inc.* | 41,813 | 531,443 | ||||||
|
| |||||||
| 3,204,673 | ||||||||
|
| |||||||
Healthcare — Services — 0.97% |
| |||||||
Vapotherm, Inc.* | 25,141 | 501,563 | ||||||
Insurance — 5.44% | ||||||||
FGL Holdings (Bermuda)*4 | 422,112 | 2,811,266 | ||||||
Media — 1.19% | ||||||||
Altice NV, Class A (Netherlands)* | 72,730 | 141,577 | ||||||
Altice USA, Inc. | 28,673 | 473,678 | ||||||
|
| |||||||
| 615,255 | ||||||||
|
| |||||||
Pharmaceuticals — 8.42% | ||||||||
Aclaris Therapeutics, Inc.*4 | 52,072 | 384,812 | ||||||
Notes to Financial Statements are an integral part of this Schedule.
12
Driehaus Event Driven Fund
Schedule of Investments
December 31, 2018
| Shares, Principal Amount, or Number of Contracts | Value | |||||||
Array Biopharma, Inc.*4 | 149,060 | $ | 2,124,105 | |||||
Clementia Pharmaceuticals, Inc. (Canada)* | 92,638 | 1,089,423 | ||||||
Histogenics Corp.* | 24,092 | 2,130 | ||||||
Mirati Therapeutics, Inc.* | 10,467 | 444,010 | ||||||
Sutro Biopharma, Inc.* | 33,955 | 306,274 | ||||||
|
| |||||||
| 4,350,754 | ||||||||
|
| |||||||
Savings & Loans — 5.11% |
| |||||||
OceanFirst Financial Corp.4 | 69,330 | 1,560,618 | ||||||
Waterstone Financial, Inc.4 | 64,540 | 1,081,691 | ||||||
|
| |||||||
| 2,642,309 | ||||||||
|
| |||||||
Semiconductors — 2.07% |
| |||||||
Marvell Technology Group Ltd. (Bermuda) | 66,075 | 1,069,754 | ||||||
Software — 0.83% |
| |||||||
Avaya Holdings Corp.* | 29,390 | 427,918 | ||||||
Telecommunications — 0.47% |
| |||||||
HC2 Holdings, Inc.* | 91,714 | 242,125 | ||||||
|
| |||||||
Total COMMON STOCK (Cost $29,814,398) | 27,166,785 | |||||||
|
| |||||||
| CONVERTIBLE PREFERRED STOCK — 0.00% |
| |||||||
Auto Manufacturers — 0.00% |
| |||||||
General Motors Corp. Senior Convertible Preferred Escrow — B | 25,000 | — | ||||||
General Motors Corp. Senior Convertible Preferred Escrow — C | 162,750 | — | ||||||
|
| |||||||
| — | ||||||||
|
| |||||||
Total CONVERTIBLE PREFERRED STOCK | — | |||||||
|
| |||||||
| PRIVATE PREFERRED STOCK — 1.61% |
| |||||||
Biotechnology — 1.61% |
| |||||||
Ideaya Biosciences, Inc. Private Equity5,7 | 1,544,998 | 830,745 | ||||||
|
| |||||||
Total PRIVATE PREFERRED STOCK | 830,745 | |||||||
|
| |||||||
| Shares, Principal Amount, or Number of Contracts | Value | |||||||
| PURCHASED CALL OPTIONS — 0.00% |
| |||||||
United Technologies Corp., Exercise Price: $135.00, Notional Amount $2,160,000, Expiration Date: January 18, 2019* | 160 | $ | 160 | |||||
|
| |||||||
Total PURCHASED CALL OPTIONS | 160 | |||||||
|
| |||||||
| ||||||||
TOTAL INVESTMENTS | 93.60 | % | $ | 48,370,517 | ||||
Other Assets less Liabilities | 6.40 | % | 3,304,891 | |||||
|
|
|
| |||||
Net Assets | 100.00 | % | $ | 51,675,408 | ||||
| ||||||||
| INVESTMENT SECURITIES SOLD SHORT — (18.30)% |
| |||||||
| EXCHANGE-TRADED FUNDS — (18.30)% |
| |||||||
iShares Nasdaq Biotechnology ETF | (32,760 | ) | $ | (3,159,047 | ) | |||
SPDR S&P Biotech ETF | (72,240 | ) | (5,183,220 | ) | ||||
SPDR S&P Regional Banking ETF | (23,788 | ) | (1,113,041 | ) | ||||
|
| |||||||
| (9,455,308 | ) | |||||||
|
| |||||||
Total EXCHANGE-TRADED FUNDS | (9,455,308 | ) | ||||||
|
| |||||||
| ||||||||
TOTAL INVESTMENT SECURITIES SOLD SHORT | (18.30 | )% | $ | (9,455,308 | ) | |||
| ||||||||
| * | Non-income producing security. |
US LIBOR — U.S. Dollar London Interbank Offered Rate.
LIBOR 3 Month — 3 Month U.S. Dollar London Interbank Offered Rate.
| 1 | Security is exempt from registration under Rule 144A of the Securities Act of 1933, as amended. Unless otherwise indicated, this security has been determined to be liquid under procedures established by Driehaus Mutual Funds’ (the “Trust”) Board of Trustees and may be resold in transactions exempt from registration, normally to qualified institutional buyers. |
| 2 | Variable or floating rate security. Rates disclosed as of December 31, 2018. |
| 3 | Bank loans in which the Fund invests pay interest at rates which are periodically predetermined by reference to a base lending rate plus a premium. These base lending rates are generally (i) the lending rate offered by one or more major European banks, such as the London Inter-Bank Offered Rate |
Notes to Financial Statements are an integral part of this Schedule.
13
Driehaus Event Driven Fund
Schedule of Investments
December 31, 2018
| (“LIBOR”), (ii) the prime rate offered by one or more United States banks or (iii) the certificate of deposit rate. Certain bank loans are subject to a LIBOR floor that establishes a minimum LIBOR rate. The interest rate shown reflects the rate in effect at December 31, 2018. Bank loans generally are subject to mandatory and/or optional repayment. As a result, the actual remaining maturity may be substantially less than the stated maturities shown. |
| 4 | All or a portion of this security is pledged as collateral for short sales or derivatives transactions. |
| 5 | Pursuant to procedures adopted by the Trust’s Board of Trustees, this security has been determined to be illiquid by Driehaus Capital Management LLC (the “Adviser”), investment adviser to the Fund. |
| 6 | Security is in default. |
| 7 | Security valued at fair value as determined in good faith by the Adviser, in accordance with procedures established by, and under the general supervision of, the Trust’s Board of Trustees. |
| 8 | The coupon rate equals 155 basis points plus the highest of the LIBOR 3 Month, the Constant Maturity Treasury 10 year rate, or the Constant Maturity Treasury 30 year rate, with a maximum of 12.95%. |
Percentages are stated as a percent of net assets.
Security Type | Percent of Total Net Assets | |||
Corporate Bonds | 24.78 | % | ||
Common Stock | 52.57 | % | ||
Convertible Preferred Stock | 0.00 | % | ||
Private Preferred Stock | 1.61 | % | ||
Purchased Call Options | 0.00 | % | ||
Bank Loans | 14.64 | % | ||
|
| |||
Total Investments | 93.60 | % | ||
Other Assets less Liabilities | 6.40 | % | ||
|
| |||
Total Net Assets | 100.00 | % | ||
|
| |||
Percentages are stated as a percent of net assets.
FORWARD FOREIGN CURRENCY CONTRACTS
| Counterparty | Currency Purchased | Currency Sold | Settlement Date | Unrealized Appreciation/ (Depreciation) | ||||||||||||||||||||
Goldman Sachs | USD | 181,260 | EUR | 157,500 | February 7, 2019 | $ | 232 | |||||||||||||||||
|
| |||||||||||||||||||||||
TOTAL FORWARD FOREIGN CURRENCY CONTRACTS |
| $ | 232 | |||||||||||||||||||||
|
| |||||||||||||||||||||||
EUR = Euro
USD = United States Dollar
Notes to Financial Statements are an integral part of this Schedule.
14
Driehaus Multi-Asset Growth Economies Fund — Portfolio Managers’ Letter
Dear Fellow Shareholders,
The Driehaus Multi-Asset Growth Economies Fund (“Fund”) returned-13.22% for the year ended December 31, 2018. The Fund’s primary benchmark, which is an equally weighted benchmark comprised 50% by the Morgan Stanley Capital International (“MSCI”) Emerging Markets Index and 50% by the JP Morgan Global Bond Index Emerging Markets Global Diversified (“Benchmark”), returned-10.32% for the year, while the MSCI Emerging Markets Index returned-14.57%.
Global markets suffered rising volatility and a sharpsell-off in the final quarter of 2018. It is our view that risk sentiment was dampened by several issues including: a slowdown in global growth, high corporate leverage in the US, the US Federal Reserve continuing to signal further interest rate increases and the trade war with China. On top of these factors, the US government shutdown was an unwelcome, but fitting, finale to close out the year.
In 2018, equity security selection in the healthcare and consumer discretionary sectors contributed to the Fund’s return versus the Benchmark. From a country perspective, holdings in Egypt and an overweight in South Korea made key contributions to performance versus the Benchmark.
Tata Consultancy Services Limited (Ticker: B01NPJ1) was one of the most significant contributors to the Fund’s return on an absolute basis. The India-based company is a leader in IT services, consulting and business solutions with a large network of innovation and delivery centers. The company’s digital services are also emerging as a new growth driver as more clients are looking to overhaul their existing business processes with technology-driven solutions.
For 2018, stock selection within the communication services and energy sectors detracted from the Fund’s returns versus the Benchmark. At the country level, holdings in China and Russia detracted from Fund performance versus the Benchmark.
One of the most significant detractors from Fund performance was an equity holding in China, Tencent Holdings Ltd. (Ticker: BMMV2K8). Tencent is a multinational investment holdings company that specializes in internet related services. The stock underperformed in 2018 as growth was impacted by a freeze on new game approvals. However, we expect this to be just a temporary headwind and believe that the company’s long-term growth potential is not adequately reflected in its stock’s price.
Thenon-equity allocations in the Fund generally consist of sovereign bonds and derivatives, including purchased and written options on currencies and index ETFs, interest rate swaps and foreign currency forward contracts. These positions are primarily utilized to gain exposure to certain market segments, hedge against interest rate fluctuations and manage currency risk in the Fund’s equity holdings. In 2018, these positions, in aggregate, contributed to the Fund’s return. From a country perspective, the top contributors were in Egypt and Mexico. Egypt has been the top performing active allocation within fixed income for four straight quarters. We remain constructive in the fixed income positions, given the retrace of inflation back into the tolerance band and recent uptick of foreign buying within the fixed income space. We continue to watch foreign exchange (FX) reserves for signs of stress, but we are currently comfortable with the reserve adequacy. Going into 2019, we expect to be more constructive on emerging market assets. While the growth outlook may currently appear poor, it is our view that many countries have priced in this slowdown. We thus expect a higher likelihood that policy support will begin to reverse what was a steady deterioration in earnings throughout 2018. We further see increased dispersion across countries and asset classes. Given very different growth outlooks across countries, we perceive opportunities in both equities and fixed income in different geographies. In short, we remain committed to our belief that 2019 will be a year where the flexibility provided by a multi-asset approach to emerging markets will generate value for investors.
15
We thank you for investing alongside us in the Driehaus Multi-Asset Growth Economies Fund and express our gratitude for your continued confidence in our management capabilities.
Sincerely,
|
| |
| Richard Thies | Chad Cleaver | |
| Lead Portfolio Manager | Portfolio Manager |


|
| |
| Howard Schwab | Ayman Ahmed | |
| Portfolio Manager | Assistant Portfolio Manager |


Performance is historical and does not represent future results.
Please see the following performance overview page for index descriptions.
16
Driehaus Multi-Asset Growth Economies Fund
Performance Overview (unaudited)
The performance summarized below is historical and does not represent future results. Investment returns and principal value vary, and you may have a gain or loss when you sell shares. Performance data presented measures the change in the value of an investment in the Fund, assuming reinvestment of all dividends and capital gains.
The table does not reflect the deduction of taxes that a shareholder would pay on Fund distributions or the redemption of Fund shares. The graph compares the results of a $10,000 investment in the Fund since April 10, 2017 (the date of the Fund’s inception), with all dividends and capital gains reinvested, with the indicated indices (and dividends reinvested) for the same period.
| Cumulative Total Returns as of 12/31/18 | 1 Year | Since Inception (4/10/17 - 12/31/18) | ||||||
Driehaus Multi-Asset Growth Economies Fund (DMAGX)1 | –13.22% | 2.93% | ||||||
MSCI EM/JP Morgan GBI Blended Index2 | –10.32% | 2.05% | ||||||
MSCI Emerging MarketsIndex-N3 | –14.57% | 2.77% | ||||||
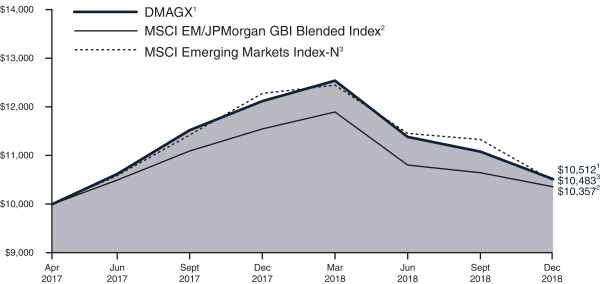
| 1 | The returns for the period reflect fee waivers and/or reimbursements without which performance would have been lower. |
| 2 | The MSCI EM/JPMorgan GBI Blended Index is an equally weighted benchmark comprised of 50 percent by the Morgan Stanley Capital International Emerging Markets Index-Net (MSCI EM) and 50 percent by the JPMorgan Global Bond Index Emerging Markets Global Diversified (JPMorgan GBI). The MSCI EM is a market capitalization-weighted index designed to measure equity market performance in emerging markets and the JPMorgan GBI tracks debt instruments in the emerging markets. Source: Morgan Stanley Capital International Inc. and JPMorgan. |
| 3 | The Morgan Stanley Capital International Emerging Markets Index-Net (MSCI Emerging Markets Index-N) is a market capitalization-weighted index designed to measure equity market performance in emerging markets. Data is in U.S. dollars and is calculated with net dividend reinvestment. Source: Morgan Stanley Capital International Inc. |
17
Driehaus Multi-Asset Growth Economies Fund
Schedule of Investments
December 31, 2018
| Shares, Principal Amount, or Number of Contracts | Value | |||||||
| SOVEREIGN BONDS — 32.96% |
| |||||||
Argentina — 2.21% | ||||||||
Argentine Republic Government International Bond | $ | 830,000 | $ | 700,312 | ||||
Brazil — 3.58% | ||||||||
Brazil Notas do Tesouro Nacional | 2,400,000 | 5 | 651,821 | |||||
Brazilian Government International Bond | 500,000 | 480,755 | ||||||
|
| |||||||
| 1,132,576 | ||||||||
|
| |||||||
Egypt — 4.28% | ||||||||
Egypt Treasury Bills | 25,000,000 | 5 | 1,353,900 | |||||
Hungary — 2.17% | ||||||||
Hungary Government Bond | 193,000,000 | 5 | 688,376 | |||||
Indonesia — 4.11% | ||||||||
Indonesia Treasury Bond | 18,400,000,000 | 5 | 1,300,973 | |||||
Mexico — 2.68% | ||||||||
Mexican Bonos | 170,500 | 5 | 846,748 | |||||
Nigeria — 2.62% | ||||||||
Nigeria Government International Bond | 950,000 | 828,014 | ||||||
Peru — 3.06% | ||||||||
Peruvian Government International Bond | 3,000,000 | 5 | 967,186 | |||||
Poland — 3.48% | ||||||||
Republic of Poland Government Bond | 4,150,000 | 5 | 1,102,261 | |||||
South Africa — 3.82% | ||||||||
Republic of South Africa Government Bond | 12,351,000 | 5 | 762,558 | |||||
Republic of South Africa Government International Bond | 500,000 | 445,246 | ||||||
|
| |||||||
| 1,207,804 | ||||||||
|
| |||||||
| Shares, Principal Amount, or Number of Contracts | Value | |||||||
Thailand — 0.95% | ||||||||
Thailand Government Bond | 10,000,000 | 5 | $ | 300,080 | ||||
|
| |||||||
Total SOVEREIGN BONDS | 10,428,230 | |||||||
|
| |||||||
| EQUITY SECURITIES — 57.74% |
| |||||||
Argentina — 0.63% | ||||||||
MercadoLibre, Inc.2 | 684 | 200,309 | ||||||
Brazil — 5.61% | ||||||||
Cyrela Brazil Realty SA Empreendimentos e Participacoes | 65,491 | 261,403 | ||||||
Itau Unibanco Holding SA — SP ADR2,3 | 56,007 | 511,904 | ||||||
Linx SA | 20,286 | 170,629 | ||||||
Petroleo Brasileiro SA — SP ADR2,3 | 31,972 | 415,956 | ||||||
Transmissora Alianca de Energia Eletrica SA | 42,843 | 260,874 | ||||||
Vale SA — ADR2,3 | 11,765 | 155,180 | ||||||
|
| |||||||
| 1,775,946 | ||||||||
|
| |||||||
China — 19.47% | ||||||||
AIA Group, Ltd. | 77,720 | 645,144 | ||||||
Aier Eye Hospital Group Co., Ltd. — A | 37,348 | 143,067 | ||||||
Alibaba Group Holding, Ltd. — SP ADR*2,3 | 6,560 | 899,179 | ||||||
China Merchants Bank Co., Ltd. | 60,500 | 221,742 | ||||||
CNOOC, Ltd. ADR2,3 | 1,575 | 240,109 | ||||||
Huazhu Group, Ltd. ADR3 | 6,295 | 180,226 | ||||||
Industrial & Commercial Bank of China, Ltd. | 461,202 | 329,241 | ||||||
Kunlun Energy Co., Ltd. | 210,000 | 222,591 | ||||||
Meituan Dianping — B* | 18,041 | 101,143 | ||||||
Noah Holdings, Ltd. —SP ADR*2,3 | 3,264 | 141,396 | ||||||
PetroChina Co., Ltd. — H | 294,000 | 183,222 | ||||||
Ping An Insurance Group Co. of China, Ltd. — H | 78,272 | 691,208 | ||||||
Sands China, Ltd. | 42,210 | 184,893 | ||||||
Sunac China Holdings, Ltd. | 82,724 | 269,390 | ||||||
Tencent Holdings, Ltd. | 34,360 | 1,377,823 | ||||||
Weibo Corp. SP ADR*2,3 | 5,621 | 328,435 | ||||||
|
| |||||||
| 6,158,809 | ||||||||
|
| |||||||
Notes to Financial Statements are an integral part of this Schedule.
18
Driehaus Multi-Asset Growth Economies Fund
Schedule of Investments
December 31, 2018
| Shares, Principal Amount, or Number of Contracts | Value | |||||||
Cyprus — 0.56% | ||||||||
TCS Group Holding PLC GDR3 | 11,295 | $ | 175,750 | |||||
Egypt — 0.44% | ||||||||
Commercial International Bank Egypt SAE —GDR3 | 32,956 | 139,898 | ||||||
India — 7.87% | ||||||||
Biocon, Ltd. | 21,475 | 193,495 | ||||||
Coal India, Ltd. | 71,334 | 245,988 | ||||||
Dabur India, Ltd. | 22,289 | 137,488 | ||||||
HDFC Bank, Ltd. —ADR2,3 | 4,102 | 424,926 | ||||||
Housing Development Finance Corp., Ltd. | 8,550 | 241,057 | ||||||
ICICI Bank, Ltd. — SP ADR2,3 | 47,458 | 488,343 | ||||||
ICICI Lombard General Insurance Co., Ltd.1 | 15,288 | 189,296 | ||||||
ITC, Ltd. | 27,185 | 109,671 | ||||||
Reliance Industries, Ltd. | 10,233 | 164,345 | ||||||
Tata Consultancy Services, Ltd. | 10,907 | 295,746 | ||||||
|
| |||||||
| 2,490,355 | ||||||||
|
| |||||||
Indonesia — 1.86% | ||||||||
PT Bank Central Asia Tbk | 234,497 | 423,986 | ||||||
Telekomunikasi Indonesia Persero Tbk | 630,836 | 164,509 | ||||||
|
| |||||||
| 588,495 | ||||||||
|
| |||||||
Japan — 0.53% | ||||||||
Sony Corp. | 3,447 | 167,499 | ||||||
Kuwait — 1.07% | ||||||||
National Bank of Kuwait SAKP | 123,259 | 338,485 | ||||||
Mexico — 0.79% | ||||||||
Wal-Mart de Mexico SAB de CV | 98,253 | 249,835 | ||||||
Netherlands — 0.88% | ||||||||
Heineken NV | 3,133 | 277,117 | ||||||
Philippines — 1.24% | ||||||||
BDO Unibank, Inc. | 157,185 | 390,982 | ||||||
Poland — 0.45% | ||||||||
CD Projekt SA* | 3,655 | 142,200 | ||||||
Russia — 2.83% | ||||||||
Sberbank of Russia PJSC — SP ADR3 | 16,681 | 182,824 | ||||||
Tatneft PJSC — ADR3 | 5,128 | 323,064 | ||||||
X5 Retail Group NV GDR3 | 9,645 | 239,003 | ||||||
Yandex NV — A*2,3 | 5,546 | 151,683 | ||||||
|
| |||||||
| 896,574 | ||||||||
|
| |||||||
South Africa — 0.62% | ||||||||
Naspers, Ltd. — N | 982 | 197,408 | ||||||
| Shares, Principal Amount, or Number of Contracts | Value | |||||||
South Korea — 6.17% | ||||||||
KB Financial Group, Inc.* | 8,590 | $ | 357,981 | |||||
Koh Young Technology, Inc. | 3,616 | 267,360 | ||||||
Macquarie Korea Infrastructure Fund | 51,186 | 426,168 | ||||||
Samsung Electronics Co., Ltd. | 17,699 | 613,866 | ||||||
Samsung SDI Co., Ltd.* | 804 | 157,802 | ||||||
SK Hynix, Inc.* | 2,365 | 128,233 | ||||||
|
| |||||||
| 1,951,410 | ||||||||
|
| |||||||
Taiwan — 4.36% | ||||||||
Cathay Financial Holding Co., Ltd. | 120,022 | 183,526 | ||||||
Hiwin Technologies Corp. | 28,000 | 201,321 | ||||||
Taiwan Semiconductor Manufacturing Co., Ltd. | 135,432 | 993,588 | ||||||
|
| |||||||
| 1,378,435 | ||||||||
|
| |||||||
Thailand — 2.36% | ||||||||
CP ALL PCL — NVDR | 132,613 | 280,011 | ||||||
Indorama Ventures PCL — NVDR | 104,430 | 173,996 | ||||||
Kasikornbank PCL —NVDR | 51,715 | 293,835 | ||||||
|
| |||||||
| 747,842 | ||||||||
|
| |||||||
Total EQUITY SECURITIES | 18,267,349 | |||||||
|
| |||||||
| PURCHASED PUT OPTIONS — 0.05% |
| |||||||
OTC EUR vs USD Exercise Price: $1.12, Notional Amount: $43,904 Expiration Date: March 18, 2019 Counterparty: Goldman Sachs | 3,920,000 | 14,569 | ||||||
|
| |||||||
Total PURCHASED PUT OPTIONS | 14,569 | |||||||
|
| |||||||
Notes to Financial Statements are an integral part of this Schedule.
19
Driehaus Multi-Asset Growth Economies Fund
Schedule of Investments
December 31, 2018
| Shares, Principal Amount, or Number of Contracts | Value | |||||||
| EQUITY CERTIFICATES — 0.62% |
| |||||||
India — 0.62% | ||||||||
ITC, Ltd.4 | 48,407 | $ | 195,285 | |||||
|
| |||||||
Total EQUITY CERTIFICATES | 195,285 | |||||||
|
| |||||||
| ||||||||
TOTAL INVESTMENTS | 91.37 | % | $ | 28,905,433 | ||||
Other Assets less Liabilities | 8.63 | % | 2,731,640 | |||||
|
|
|
| |||||
Net Assets | 100.00 | % | $ | 31,637,073 | ||||
| ||||||||
| * | Non-income producing security. |
ADR — American Depository Receipt
CALY — Calyon Securities
GDR — Global Depository Receipt
NVDR —Non-Voting Depository Receipt
SP ADR — Sponsored American Depository Receipt
| 1 | Security is exempt from registration under Rule 144A of the Securities Act of 1933, as amended. Unless otherwise indicated, this security has been determined to be liquid under procedures established by Driehaus Mutual Funds’ (the “Trust”) Board of Trustees and may be resold in transactions exempt from registration, normally to qualified institutional buyers. |
| 2 | All or a portion of this security is pledged as collateral for short sales or derivatives transactions. |
| 3 | Foreign security denominated in U.S. dollars and traded on a U.S. exchange. |
| 4 | Restricted security — Investments in securities not registered under the Securities Act of 1933, excluding 144A securities. At December 31, 2018, the value of these restricted securities amounted to $195,285 or 0.62% of net assets. These restricted securities have not been deemed illiquid. |
| 5 | Foreign security, par value shown in local currency. |
Percentages are stated as a percent of net assets.
Security Type/Sector | Percent of Total Net Assets | |||
Sovereign Bonds | 32.96 | % | ||
Equity Securities | 57.74 | % | ||
Purchased Put Options | 0.05 | % | ||
Equity Certificates | 0.62 | % | ||
|
| |||
Total Investments | 91.37 | % | ||
Other Assets less Liabilities | 8.63 | % | ||
|
| |||
Total Net Assets | 100.00 | % | ||
|
| |||
Percentages are stated as a percent of net assets.
Regional Weightings(a)
Asia/Far EastEx-Japan | 49.54% | |||
South America | 15.09% | |||
Africa | 11.78% | |||
Eastern Europe | 8.93% | |||
North America | 3.52% | |||
Middle East | 1.63% | |||
Western Europe | 0.88% |
| (a) | All percentages are stated as a percent of net assets at December 31, 2018. |
Additional information on each restricted security is as follows:
Security | Counter- Party | Acquisition Date(s) | Acquisition Costs | |||||||||
ITC, Ltd. | CALY | 4/11/17 | $ | 205,716 | ||||||||
Notes to Financial Statements are an integral part of this Schedule.
20
Driehaus Multi-Asset Growth Economies Fund
Schedule of Investments
December 31, 2018
CENTRALLY CLEARED SWAP CONTRACTS
| Interest Rate Swaps | ||||||||||||||||||||||||
| Clearing Exchange | Notional Amount | Fixed Rate | Floating Rate Index | Payment Frequency | Expiration Date | Value/ Unrealized Appreciation/ (Depreciation) | ||||||||||||||||||
Chicago Mercantile Exchange | COP | 6,100,000,000 | 6.50 | %2 | 3-Month COP DTFRATE2 | Quarterly | 11/9/2028 | $ | (65,057 | ) | ||||||||||||||
Chicago Mercantile Exchange | COP | 21,200,000,000 | 5.825 | %1 | 3-Month COP DTFRATE1 | Quarterly | 11/9/2023 | 163,851 | ||||||||||||||||
Chicago Mercantile Exchange | COP | 48,100,000,000 | 4.64 | %2 | 3-Month COP DTFRATE2 | Quarterly | 11/12/2019 | (34,782 | ) | |||||||||||||||
LCH Clearnet Limited | INR | 2,320,000,000 | 6.67 | %1 | 1-Day INR MIBOR1 | Daily | 12/12/2019 | 71,944 | ||||||||||||||||
LCH Clearnet Limited | INR | 517,000,000 | 6.653 | %2 | 1-Day INR MIBOR2 | Daily | 12/12/2023 | (120,674 | ) | |||||||||||||||
LCH Clearnet Limited | ZAR | 212,000,000 | 7.265 | %1 | 3-Months ZAR JIBAR Safex1 | Quarterly | 8/1/2020 | 1,558 | ||||||||||||||||
LCH Clearnet Limited | ZAR | 47,000,000 | 8.12 | %2 | 3-Months ZAR JIBAR Safex2 | Quarterly | 8/1/2028 | 2,556 | ||||||||||||||||
|
| |||||||||||||||||||||||
TOTAL INTEREST RATE SWAPS |
| $ | 19,396 | |||||||||||||||||||||
|
| |||||||||||||||||||||||
| 1 | Fund pays the floating rate and receives the fixed rate. |
| 2 | Fund pays the fixed rate and receives the floating rate. |
COP — Colombian Peso
INR — Indian Rupee
ZAR — South African Rand
DTFRATE — Columbia 90 Days DTF Rate
IN00O/N — FBIL Overnight Mumbai Interbank Outright Rate
JIBA3M — SAFE South Africa Johannesburg Interbank Agreed Rate
FORWARD FOREIGN CURRENCY CONTRACTS
| Counterparty | Currency Purchased | Currency Sold | Settlement Date | Unrealized Appreciation/ (Depreciation) | ||||||||||||||||||||
Bank of America | ARS | 24,350,000 | USD | 1,000,000 | March 8, 2019 | $ | (406,566 | ) | ||||||||||||||||
Goldman Sachs | USD | 330,000 | ARS | 8,184,000 | March 8, 2019 | 130,548 | ||||||||||||||||||
Goldman Sachs | USD | 670,000 | ARS | 18,257,500 | March 8, 2019 | 225,046 | ||||||||||||||||||
Bank of America | CNH | 6,893,500 | USD | 996,934 | January 14, 2019 | 6,684 | ||||||||||||||||||
Goldman Sachs | USD | 990,559 | CNH | 6,893,500 | January 14, 2019 | (13,059 | ) | |||||||||||||||||
Goldman Sachs | HUF | 141,234,830 | USD | 500,000 | February 14, 2019 | 5,614 | ||||||||||||||||||
Goldman Sachs | USD | 498,564 | HUF | 141,234,830 | February 14, 2019 | (7,050 | ) | |||||||||||||||||
|
| |||||||||||||||||||||||
TOTAL FORWARD FOREIGN CURRENCY CONTRACTS |
| $ | (58,783 | ) | ||||||||||||||||||||
|
| |||||||||||||||||||||||
ARS — Argentine Peso
CNH — Chinese Yuan Renminbi
HUF — Hungarian Forint
USD — United States Dollar
Notes to Financial Statements are an integral part of this Schedule.
21
Statements of Assets and Liabilities
December 31, 2018
| Driehaus Active Income Fund | Driehaus Event Driven Fund | Driehaus Multi-Asset Growth Economies Fund | ||||||||||
ASSETS: | ||||||||||||
Investment securities, at fair value (cost $741,900,569, $52,858,812 and $27,644,638, respectively) | $ | 702,721,451 | $ | 48,370,357 | $ | 28,890,864 | ||||||
Purchased options contracts, at fair value (premiums paid $0, $158,201 and $27,828, respectively) | — | 160 | 14,569 | |||||||||
Foreign currency, at fair value (cost $0, $0 and $41,366, respectively) | — | — | 41,005 | |||||||||
Unrealized appreciation on forward foreign currency contracts | — | 232 | 367,892 | |||||||||
Receivable for variation margin on centrally cleared swaps | — | — | 453 | |||||||||
Cash and cash equivalents | 64,616,757 | 872,346 | 2,456,789 | |||||||||
Collateral held at custodian for the benefit of brokers | 127,587,654 | 11,686,637 | 319,548 | |||||||||
Receivable for investment securities sold | 34,353,531 | 143,138 | — | |||||||||
Receivable for fund shares sold | 525,695 | 39,425 | — | |||||||||
Receivable for interest and dividends | 8,502,129 | 203,485 | 246,818 | |||||||||
Prepaid expenses | 40,985 | 18,482 | 10,703 | |||||||||
|
|
|
|
|
| |||||||
| ||||||||||||
TOTAL ASSETS | 938,348,202 | 61,334,262 | 32,348,641 | |||||||||
|
|
|
|
|
| |||||||
| ||||||||||||
LIABILITIES: | ||||||||||||
Payable for investment securities sold short, at fair value (proceeds $110,244,823, $10,573,194 and $0, respectively) | 108,969,465 | 9,455,308 | — | |||||||||
Foreign currency due to custodian, at fair value (proceeds $0, $0 and $283, respectively) | — | — | 287 | |||||||||
Unrealized depreciation on forward foreign currency contracts | — | — | 426,675 | |||||||||
Payable for investment securities purchased | 21,861,157 | — | 188,601 | |||||||||
Payable for fund shares redeemed | 10,543,829 | 90,593 | — | |||||||||
Payable to affiliate | 437,758 | 43,894 | 5,244 | |||||||||
Payable for interest and dividends on securities sold short | 945,856 | 2,527 | — | |||||||||
Payable for variation margin on futures contracts | 230,447 | — | — | |||||||||
Accrued shareholder services plan fees | 153,192 | 4,826 | — | |||||||||
Accrued administration and accounting fees | 45,985 | 5,572 | 5,951 | |||||||||
Accrued foreign capital gains taxes | — | — | 21,034 | |||||||||
Accrued expenses | 137,297 | 56,134 | 63,776 | |||||||||
|
|
|
|
|
| |||||||
| ||||||||||||
TOTAL LIABILITIES | 143,324,986 | 9,658,854 | 711,568 | |||||||||
|
|
|
|
|
| |||||||
| ||||||||||||
NET ASSETS | $ | 795,023,216 | $ | 51,675,408 | $ | 31,637,073 | ||||||
|
|
|
|
|
| |||||||
SHARES OUTSTANDING (Unlimited shares authorized, no par value) | 85,338,922 | 5,175,085 | 3,184,539 | |||||||||
|
|
|
|
|
| |||||||
NET ASSET VALUE, OFFERING AND REDEMPTION PRICE PER SHARE | $ | 9.32 | $ | 9.99 | $ | 9.93 | ||||||
|
|
|
|
|
| |||||||
| ||||||||||||
NET ASSETS CONSISTED OF THE FOLLOWING AT DECEMBER 31, 2018: | ||||||||||||
Paid-in-capital | $ | 1,307,827,223 | $ | 60,537,950 | $ | 31,847,023 | ||||||
Total distributable earnings (deficit) | (512,804,007 | ) | (8,862,542 | ) | (209,950 | ) | ||||||
|
|
|
|
|
| |||||||
NET ASSETS | $ | 795,023,216 | $ | 51,675,408 | $ | 31,637,073 | ||||||
|
|
|
|
|
| |||||||
| ||||||||||||
Notes to Financial Statements are an integral part of these Statements.
22
For the year ended December 31, 2018
| Driehaus Active Income Fund | Driehaus Event Driven Fund | Driehaus Multi-Asset Growth Economies Fund | ||||||||||
INVESTMENT INCOME (LOSS): | ||||||||||||
Interest income (net of $0, $0, and $15,677 ofnon-reclaimable foreign taxes withheld, respectively) | $ | 65,158,196 | $ | 1,985,572 | $ | 877,511 | ||||||
Dividend income (net of $0, $0, and $99,191 ofnon-reclaimable foreign taxes withheld, respectively) | 15,234,080 | 2,185,621 | 725,820 | |||||||||
|
|
|
|
|
| |||||||
| ||||||||||||
Total investment income | 80,392,276 | 4,171,193 | 1,603,331 | |||||||||
|
|
|
|
|
| |||||||
| ||||||||||||
Expenses: | ||||||||||||
Investment advisory fees | 7,622,889 | 1,008,106 | 406,890 | |||||||||
Shareholder services plan fees | 2,072,178 | 166,073 | — | |||||||||
Administration and fund accounting fees | 658,518 | 84,411 | 64,745 | |||||||||
Transfer agent fees and expenses | 299,724 | 64,190 | 29,866 | |||||||||
Trustees’ fees | 152,152 | 49,402 | 42,976 | |||||||||
Reports to shareholders | 84,897 | 24,532 | 13,889 | |||||||||
Custody fees | 74,780 | 11,521 | 47,173 | |||||||||
Legal fees | 73,506 | 23,737 | 21,527 | |||||||||
Federal and state registration fees | 69,917 | 31,969 | 35,728 | |||||||||
Audit and tax fees | 63,385 | 67,385 | 79,689 | |||||||||
Chief compliance officer fees | 20,000 | 20,000 | 20,000 | |||||||||
Dividends on short positions | 2,042,539 | 245,476 | — | |||||||||
Interest on short positions | 1,637,671 | 15,116 | — | |||||||||
Interest expense | 224,590 | 60,411 | — | |||||||||
Miscellaneous | 146,648 | 48,325 | 71,481 | |||||||||
|
|
|
|
|
| |||||||
Total expenses | 15,243,394 | 1,920,654 | 833,964 | |||||||||
Fees paid indirectly | (15,919 | ) | (20,818 | ) | (1,550 | ) | ||||||
Fees waived by Adviser | — | — | (119,889 | ) | ||||||||
|
|
|
|
|
| |||||||
Net expenses | 15,227,475 | 1,899,836 | 712,525 | |||||||||
|
|
|
|
|
| |||||||
| ||||||||||||
Net investment income (loss) | 65,164,801 | 2,271,357 | 890,806 | |||||||||
|
|
|
|
|
| |||||||
| ||||||||||||
NET REALIZED AND UNREALIZED GAIN (LOSS) ON INVESTMENTS: |
| |||||||||||
Net realized gain (loss) on transactions from: | ||||||||||||
Investments | (3,143,620 | ) | 11,429,843 | (2,658,060 | ) | |||||||
Purchased options contracts | (3,174,326 | ) | 87,286 | 370,983 | ||||||||
Purchased swaptions contracts | 2,724,715 | — | — | |||||||||
Securities sold short | (27,476,059 | ) | (2,337,342 | ) | — | |||||||
Written options contracts | 464,352 | (252,292 | ) | (145,585 | ) | |||||||
Futures contracts | 10,228,589 | — | — | |||||||||
Swap contracts | 6,660,683 | — | 548,368 | |||||||||
Forward foreign currency contracts | 594,945 | (283,063 | ) | (431,208 | ) | |||||||
Foreign currency | 82,138 | 70,686 | (17,562 | ) | ||||||||
|
|
|
|
|
| |||||||
| ||||||||||||
Net realized gain (loss) on investments | (13,038,583 | ) | 8,715,118 | (2,333,064 | ) | |||||||
|
|
|
|
|
| |||||||
| ||||||||||||
Change in net unrealized appreciation (depreciation) on: | ||||||||||||
Investments | (69,970,108 | ) | (14,797,233 | ) | (3,997,104 | ) | ||||||
Purchased options contracts | 151,991 | (158,041 | ) | (30,580 | ) | |||||||
Purchased swaptions contracts | 202,126 | — | — | |||||||||
Securities sold short | 20,623,434 | 2,629,491 | — | |||||||||
Written options contracts | 2,419,963 | 683,374 | — | |||||||||
Futures contracts | (2,790,446 | ) | — | — | ||||||||
Swap contracts | (5,804,056 | ) | — | (204,622 | ) | |||||||
Forward foreign currency contracts | 245,022 | 204,145 | (78,136 | ) | ||||||||
Foreign currency | 2 | — | 1,825 | |||||||||
Foreign currency translations | (1,888 | ) | (228 | ) | (2,836 | ) | ||||||
|
|
|
|
|
| |||||||
Net change in net unrealized appreciation (depreciation) on investments | (54,923,960 | ) | (11,438,492 | ) | (4,311,453 | ) | ||||||
|
|
|
|
|
| |||||||
| ||||||||||||
Net realized and unrealized gain (loss) on investments | (67,962,543 | ) | (2,723,374 | ) | (6,644,517 | ) | ||||||
|
|
|
|
|
| |||||||
| ||||||||||||
NET INCREASE (DECREASE) IN NET ASSETS RESULTING FROM OPERATIONS | $ | (2,797,742 | ) | $ | (452,017 | ) | $ | (5,753,711 | ) | |||
|
|
|
|
|
| |||||||
| ||||||||||||
Notes to Financial Statements are an integral part of these Statements.
23
Statements of Changes in Net Assets
| Driehaus Active Income Fund | Driehaus Event Driven Fund | |||||||||||||||
| Year Ended December 31, 2018 | Year Ended December 31, 2017 | Year Ended December 31, 2018 | Year Ended December 31, 2017 | |||||||||||||
Operations: | ||||||||||||||||
Net investment income (loss) | $ | 65,164,801 | $ | 69,974,396 | $ | 2,271,357 | $ | 316,090 | ||||||||
Net realized gain (loss) on investments | (13,038,583 | ) | (80,635,900 | ) | 8,715,118 | 17,590,679 | ||||||||||
Net change in unrealized appreciation (depreciation) on investments | (54,923,960 | ) | 17,210,449 | (11,438,492 | ) | (9,979,767 | ) | |||||||||
|
|
|
|
|
|
|
| |||||||||
| ||||||||||||||||
Net increase (decrease) in net assets resulting from operations | (2,797,742 | ) | 6,548,945 | (452,017 | ) | 7,927,002 | ||||||||||
|
|
|
|
|
|
|
| |||||||||
| ||||||||||||||||
Distributions from distributable earnings to shareholders** | (61,286,044 | ) | (74,683,208 | ) | (1,805,482 | ) | — | |||||||||
|
|
|
|
|
|
|
| |||||||||
| ||||||||||||||||
Capital share transactions: | ||||||||||||||||
Proceeds from shares sold | 409,022,218 | 533,408,414 | 24,110,692 | 66,521,757 | ||||||||||||
Reinvested distributions | 30,925,792 | 40,540,265 | 1,595,256 | — | ||||||||||||
Cost of shares redeemed | (1,115,111,267 | ) | (1,246,371,265 | ) | (137,420,790 | ) | (165,282,973 | ) | ||||||||
|
|
|
|
|
|
|
| |||||||||
Net increase (decrease) from capital transactions | (675,163,257 | ) | (672,422,586 | ) | (111,714,842 | ) | (98,761,216 | ) | ||||||||
|
|
|
|
|
|
|
| |||||||||
Total increase (decrease) in net assets | (739,247,043 | ) | (740,556,849 | ) | (113,972,341 | ) | (90,834,214 | ) | ||||||||
|
|
|
|
|
|
|
| |||||||||
| ||||||||||||||||
NET ASSETS: | ||||||||||||||||
| ||||||||||||||||
Beginning of period | $ | 1,534,270,259 | $ | 2,274,827,108 | $ | 165,647,749 | $ | 256,481,963 | ||||||||
|
|
|
|
|
|
|
| |||||||||
End of period** | $ | 795,023,216 | $ | 1,534,270,259 | $ | 51,675,408 | $ | 165,647,749 | ||||||||
|
|
|
|
|
|
|
| |||||||||
| ||||||||||||||||
Capital share transactions in shares: | ||||||||||||||||
Shares sold | 41,609,514 | 53,202,812 | 2,212,662 | 6,332,559 | ||||||||||||
Reinvested distributions | 3,181,505 | 4,096,719 | 163,616 | — | ||||||||||||
Shares redeemed | (115,102,939 | ) | (125,133,149 | ) | (12,552,010 | ) | (15,782,409 | ) | ||||||||
|
|
|
|
|
|
|
| |||||||||
Net increase (decrease) | (70,311,920 | ) | (67,833,618 | ) | (10,175,732 | ) | (9,449,850 | ) | ||||||||
|
|
|
|
|
|
|
| |||||||||
| ||||||||||||||||
| * | Fund commenced operations on April 10, 2017 |
| ** | Distributions from net investment income and from realized gains are no longer required to be separately disclosed and parenthetical disclosure of undistributed net investment income is no longer required. See Note A to the Financial Statements. The table below provides this information for the year ended December 31, 2017. |
| Driehaus Active Income Fund | Driehaus Event Driven Fund | Driehaus Multi-Asset Growth Economies Fund | ||||||||||
Net investment income | $ | (74,683,208 | ) | $ | — | $ | (555,003 | ) | ||||
Net realized gains | — | — | (1,463,728 | ) | ||||||||
|
|
|
|
|
| |||||||
Total distributions | $ | (74,683,208 | ) | $ | — | $ | (2,018,731 | ) | ||||
|
|
|
|
|
| |||||||
Undistributed net investment income (loss) | $ | 1,884,025 | $ | (467,790 | ) | $ | (9,632 | ) | ||||
|
|
|
|
|
| |||||||
Notes to Financial Statements are an integral part of these Statements.
24
Statements of Changes in Net Assets
| Driehaus Multi-Asset Growth Economies Fund | ||||||
| Year Ended December 31, 2018 | For the Period April 10, 2017* through December 31, 2017 | |||||
| $ | 890,806 | $ | 420,295 | |||
| (2,333,064 | ) | 1,779,638 | ||||
| (4,311,453 | ) | 3,050,200 | |||
|
|
|
| |||
|
| |||||
| (5,753,711 | ) | 5,250,133 | |||
|
|
|
| |||
|
| |||||
| (263,384 | ) | (2,018,731 | ) | |||
|
|
|
| |||
|
| |||||
| 1,507,595 | 38,153,988 | |||||
| 263,384 | 2,018,731 | |||||
| (7,300,204 | ) | (220,728 | ) | |||
|
|
|
| |||
| (5,529,225 | ) | 39,951,991 | |||
|
|
|
| |||
| (11,546,320 | ) | 43,183,393 | |||
|
|
|
| |||
|
| |||||
|
| |||||
| $ | 43,183,393 | $ | — | |||
|
|
|
| |||
| $ | 31,637,073 | $ | 43,183,393 | |||
|
|
|
| |||
|
| |||||
| 132,325 | 3,586,704 | |||||
| 26,740 | 177,393 | |||||
| (718,082 | ) | (20,541 | ) | |||
|
|
|
| |||
| (559,017 | ) | 3,743,556 | ||||
|
|
|
| |||
|
| |||||
Notes to Financial Statements are an integral part of these Statements.
25
Driehaus Active Income Fund
| For the year ended December 31, 2018 | For the year ended December 31, 2017 | For the year ended December 31, 2016 | For the year ended December 31, 2015 | For the year ended December 31, 2014 | ||||||||||||||||
Net asset value, beginning of period | $ | 9.86 | $ | 10.18 | $ | 9.95 | $ | 10.42 | $ | 10.77 | ||||||||||
|
|
|
|
|
|
|
|
|
| |||||||||||
INCOME (LOSS) FROM INVESTMENT OPERATIONS: | ||||||||||||||||||||
Net investment income1 | 0.46 | 0.35 | 0.32 | 0.38 | 0.27 | |||||||||||||||
Net realized and unrealized gain (loss) on investments | (0.57 | ) | (0.29 | ) | 0.23 | (0.49 | ) | (0.36 | ) | |||||||||||
|
|
|
|
|
|
|
|
|
| |||||||||||
Total from investment operations | (0.11 | ) | 0.06 | 0.55 | (0.11 | ) | (0.09 | ) | ||||||||||||
|
|
|
|
|
|
|
|
|
| |||||||||||
LESS DISTRIBUTIONS TO SHAREHOLDERS FROM: | ||||||||||||||||||||
Net investment income | (0.43 | ) | (0.38 | ) | (0.32 | ) | (0.36 | ) | (0.26 | ) | ||||||||||
Net realized gain | — | — | — | — | — | |||||||||||||||
|
|
|
|
|
|
|
|
|
| |||||||||||
Total distributions | (0.43 | ) | (0.38 | ) | (0.32 | ) | (0.36 | ) | (0.26 | ) | ||||||||||
|
|
|
|
|
|
|
|
|
| |||||||||||
Net asset value, end of period | $ | 9.32 | $ | 9.86 | $ | 10.18 | $ | 9.95 | $ | 10.42 | ||||||||||
|
|
|
|
|
|
|
|
|
| |||||||||||
Total Return | (1.26 | )% | 0.59 | % | 5.63 | % | (1.07 | )% | (0.87 | )% | ||||||||||
SUPPLEMENTAL DATA AND RATIOS: | ||||||||||||||||||||
Net assets, end of period (in 000’s) | $ | 795,023 | $ | 1,534,270 | $ | 2,274,827 | $ | 2,875,993 | $ | 3,982,787 | ||||||||||
Ratio of total expenses before reimbursements, waivers, recaptures and/or fees paid indirectly to average net assets | 1.10 | % | 1.18 | % | 1.38 | % | 1.05 | % | 1.05 | % | ||||||||||
Ratio of total expenses net of reimbursements, waivers, recaptures and/or fees paid indirectly to average net assets | 1.10 | %2 | 1.17 | %2 | 1.38 | %2 | 1.05 | % | 1.05 | % | ||||||||||
Ratio of expenses (excluding dividends and interest on short positions and interest expense) before reimbursements, waivers, recaptures and/or fees paid indirectly to average net assets | 0.82 | % | 0.81 | % | 0.80 | % | 0.78 | % | 0.77 | % | ||||||||||
Ratio of expenses (excluding dividends and interest on short positions and interest expense) net of reimbursements, waivers, recaptures and/or fees paid indirectly to average net assets | 0.82 | %2 | 0.81 | %2 | 0.80 | %2 | 0.78 | % | 0.77 | % | ||||||||||
Ratio of net investment income (including dividends and interest on short positions and interest expense) net of reimbursements, waivers, recaptures and/or fees paid indirectly to average net assets | 4.70 | % | 3.53 | % | 3.20 | % | 3.69 | % | 2.51 | % | ||||||||||
Ratio of net investment income (excluding dividends and interest on short positions and interest expense) net of reimbursements, waivers, recaptures and/or fees paid indirectly to average net assets | 4.99 | % | 3.89 | % | 3.78 | % | 3.96 | % | 2.79 | % | ||||||||||
Portfolio turnover rate | 74 | % | 89 | % | 115 | % | 76 | % | 43 | % | ||||||||||
| 1 | Calculated based on average shares outstanding. |
| 2 | Such ratios are net of fees paid indirectly (see Note C in the Notes to Financial Statements). |
Notes to Financial Statements are an integral part of this Schedule.
26
Driehaus Event Driven Fund
Financial Highlights
| For the year ended December 31, 2018 | For the year ended December 31, 2017 | For the year ended December 31, 2016 | For the year ended December 31, 2015 | For the year ended December 31, 2014 | ||||||||||||||||
Net asset value, beginning of period | $ | 10.79 | $ | 10.34 | $ | 9.85 | $ | 10.01 | $ | 10.74 | ||||||||||
|
|
|
|
|
|
|
|
|
| |||||||||||
INCOME (LOSS) FROM INVESTMENT OPERATIONS: | ||||||||||||||||||||
Net investment income (loss)1 | 0.25 | 0.02 | 0.02 | 0.05 | (0.02 | ) | ||||||||||||||
Net realized and unrealized gain (loss) on investments | (0.69 | ) | 0.43 | 0.59 | (0.15 | ) | (0.67 | ) | ||||||||||||
|
|
|
|
|
|
|
|
|
| |||||||||||
Total from investment operations | (0.44 | ) | 0.45 | 0.61 | (0.10 | ) | (0.69 | ) | ||||||||||||
|
|
|
|
|
|
|
|
|
| |||||||||||
LESS DISTRIBUTIONS TO SHAREHOLDERS FROM: | ||||||||||||||||||||
Net investment income | (0.36 | ) | — | (0.09 | ) | (0.06 | ) | — | ||||||||||||
Net realized gain | — | — | — | — | (0.04 | ) | ||||||||||||||
Tax return of capital | — | — | (0.03 | ) | — | — | ||||||||||||||
|
|
|
|
|
|
|
|
|
| |||||||||||
Total distributions | (0.36 | ) | — | (0.12 | ) | (0.06 | ) | (0.04 | ) | |||||||||||
|
|
|
|
|
|
|
|
|
| |||||||||||
Net asset value, end of period | $ | 9.99 | $ | 10.79 | $ | 10.34 | $ | 9.85 | $ | 10.01 | ||||||||||
|
|
|
|
|
|
|
|
|
| |||||||||||
Total Return | (4.03 | )% | 4.35 | % | 6.25 | % | (1.08 | )% | (6.35 | )% | ||||||||||
SUPPLEMENTAL DATA AND RATIOS: | ||||||||||||||||||||
Net assets, end of period (in 000’s) | $ | 51,675 | $ | 165,648 | $ | 256,482 | $ | 232,456 | $ | 166,300 | ||||||||||
Ratio of total expenses before reimbursements, waivers, recaptures and/or fees paid indirectly to average net assets | 1.90 | % | 1.77 | % | 2.03 | % | 1.86 | % | 1.80 | % | ||||||||||
Ratio of total expenses net of reimbursements, waivers, recaptures and/or fees paid indirectly to average net assets | 1.88 | %2 | 1.76 | %2 | 2.01 | %2 | 1.86 | % | 1.80 | % | ||||||||||
Ratio of expenses (excluding dividends and interest on short positions and interest expense) before reimbursements, waivers, recaptures and/or fees paid indirectly to average net assets | 1.59 | % | 1.46 | % | 1.44 | % | 1.43 | % | 1.35 | % | ||||||||||
Ratio of expenses (excluding dividends and interest on short positions and interest expense) net of reimbursements, waivers, recaptures and/or fees paid indirectly to average net assets | 1.57 | %2 | 1.45 | %2 | 1.42 | %2 | 1.43 | % | 1.35 | % | ||||||||||
Ratio of net investment income (including dividends and interest on short positions and interest expense) net of reimbursements, waivers, recaptures and/or fees paid indirectly to average net assets | 2.25 | % | 0.17 | % | 0.19 | % | 0.45 | % | (0.17 | )% | ||||||||||
Ratio of net investment income (excluding dividends and interest on short positions and interest expense) net of reimbursements, waivers, recaptures and/or fees paid indirectly to average net assets | 2.57 | % | 0.48 | % | 0.78 | % | 0.89 | % | 0.28 | % | ||||||||||
Portfolio turnover rate | 101 | % | 198 | % | 246 | % | 400 | % | 315 | % | ||||||||||
| 1 | Calculated based on average shares outstanding. |
| 2 | Such ratios are net of fees paid indirectly (see Note C in the Notes to Financial Statements). |
Notes to Financial Statements are an integral part of this Schedule.
27
Driehaus Multi-Asset Growth Economies Fund
Financial Highlights
For the Year | For the period April 10, 2017* through December 31, 2017 | |||||||
Net asset value, beginning of period | $ | 11.54 | $ | 10.00 | ||||
|
|
|
| |||||
INCOME (LOSS) FROM INVESTMENT OPERATIONS: | ||||||||
Net investment income (loss)1 | 0.24 | 0.17 | ||||||
Net realized and unrealized gain (loss) on investments | (1.77 | ) | 1.94 | |||||
|
|
|
| |||||
Total from investment operations | (1.53 | ) | 2.11 | |||||
|
|
|
| |||||
LESS DISTRIBUTIONS TO SHAREHOLDERS FROM: | ||||||||
Net investment income | — | (0.16 | ) | |||||
Net realized gain | (0.08 | ) | (0.41 | ) | ||||
|
|
|
| |||||
Total distributions | (0.08 | ) | (0.57 | ) | ||||
|
|
|
| |||||
Redemption fees added topaid-in capital | 0.00 | 0.00 | 4 | |||||
|
|
|
| |||||
Net asset value, end of period | $ | 9.93 | $ | 11.54 | ||||
|
|
|
| |||||
Total Return | (13.22 | )% | 21.14 | %2 | ||||
SUPPLEMENTAL DATA AND RATIOS: | ||||||||
Net assets, end of period (in 000’s) | $ | 31,637 | $ | 43,183 | ||||
Ratio of total expenses before reimbursements, waivers, recaptures and/or fees paid indirectly to average net assets | 2.05 | % | 2.04 | %3 | ||||
Ratio of total expenses net of reimbursements, waivers, recaptures and/or fees paid indirectly to average net assets | 1.75 | %5,6 | 1.75 | %3,5 | ||||
Ratio of expenses (excluding dividends and interest on short positions and interest expense) before reimbursements, waivers, recaptures and/or fees paid indirectly to average net assets | 2.05 | % | 2.04 | %3 | ||||
Ratio of expenses (excluding dividends and interest on short positions and interest expense) net of reimbursements, waivers, recaptures and/or fees paid indirectly to average net assets | 1.75 | %5,6 | 1.75 | %3,5 | ||||
Ratio of net investment income (including dividends and interest on short positions and interest expense) net of reimbursements, waivers, recaptures and/or fees paid indirectly to average net assets | 2.19 | % | 2.12 | %3 | ||||
Ratio of net investment income (excluding dividends and interest on short positions and interest expense) net of reimbursements, waivers, recaptures and/or fees paid indirectly to average net assets | 2.19 | %5 | 2.12 | %3,5 | ||||
Portfolio turnover rate | 169 | % | 99 | %2 | ||||
| * | Fund commenced operations on April 10, 2017. |
| 1 | Calculated based on average shares outstanding. |
| 2 | Not annualized. |
| 3 | Annualized. |
| 4 | Amount represents less than $0.01 per share. |
| 5 | The Adviser contractually agreed to waive its investment advisory fee or absorb other operating expenses to the extent necessary to ensure that total annual Fund operating expenses (other than interest, taxes, brokerage commissions, dividends and interest on short sales, other investment-related expenses, acquired fund fees and expenses, and extraordinary expenses such as litigation and other expenses not incurred in the ordinary course of the Fund’s business) would not exceed the Fund’s operating expense cap of 1.75% of average daily net assets until April 9, 2020. |
| 6 | Such ratios are net of fees paid indirectly (see Note C in the Notes to Financial Statements). |
Notes to Financial Statements are an integral part of this Schedule.
28
Driehaus Mutual Funds
A. ORGANIZATION AND SUMMARY OF SIGNIFICANT ACCOUNTING POLICIES
Organization
The Driehaus Mutual Funds (the “Trust”) is anopen-end registered management investment company under the Investment Company Act of 1940, as amended, organized as a Delaware statutory trust, with nine separate series currently in operation. The Trust was organized under an Agreement and Declaration of Trust dated May 31, 1996, as subsequently amended and restated as of June 6, 2013 and amended as of June 4, 2015, and may issue an unlimited number of full and fractional units of beneficial interest (shares) without par value. The three series (“Funds” or each a “Fund”) included in this report are as follows: the Driehaus Active Income Fund (the “Active Income Fund”) commenced operations on June 1, 2009 following the receipt of the assets and liabilities of the Lotsoff Capital Management Active Income Fund (the “Acquired Fund”) pursuant to a plan of reorganization approved by the shareholders of the Acquired Fund. The reorganization was accomplished by atax-free exchange of Acquired Fund shares for an equal number of shares of the Active Income Fund as of June 1, 2009. The Active Income Fund seeks to provide current income and capital appreciation. The Driehaus Event Driven Fund (the “Event Driven Fund”) commenced operations on August 26, 2013, following atax-free exchange with the Driehaus Credit Opportunities Fund, L.P. The Event Driven Fund seeks to provide positive returns over full market cycles. The Driehaus Multi-Asset Growth Economies Fund (the “Multi-Asset Growth Economies Fund”) commenced operations on April 10, 2017, after succeeding to the assets of the Driehaus Emerging Markets Dividend Growth Fund, L.P. The transaction was structured to be atax-free exchange and the cost basis and holding period of the underlying securities were carried over to the Multi-Asset Growth Economies Fund. The Multi-Asset Growth Economies Fund seeks to maximize total return.
Significant Accounting Policies
The presentation of financial statements in conformity with U.S. generally accepted accounting principles (“U.S. GAAP”) requires management to make estimates and assumptions that affect the reported amounts of assets and liabilities at the date of the financial statements and the reported amounts of income and expenses. Actual results may differ from those estimates.
The Funds, which are investment companies within the scope of Financial Accounting Standards Board (“FASB”) Accounting Standards Update2013-08, follow accounting and reporting guidance under FASB Accounting Standards Codification Topic 946,Financial Services-Investment Companies.
Cash is held at U.S. financial institutions, and at times, may exceed the amount insured by the U.S. Federal Deposit Insurance Corporation. The Funds consider highly liquid investments, with maturities of ninety days or less when purchased to be cash equivalents, and such investments may include money market mutual fund investments. All such investments are categorized in Level 1 of the fair value hierarchy.
Securities Valuation
Investments in securities traded on a national securities exchange, including exchange-traded futures and options, are valued at the last reported sales or settlement price on the day of valuation and are generally classified as level 1. Exchange-traded securities for which no sale was reported are valued at the mean of the closing bid and ask prices from the exchange the security is primarily traded on and are generally classified as level 1. Equity certificates are valued at the last sale price of the underlying security as of the close of the primary exchange. Long-term fixed income securities are valued at the representative quoted bid price when held long or the representative quoted ask price if sold short or, if such prices are not available, at prices for securities of comparable maturity, quality and type or as determined by an independent pricing service. The pricing service provider may employ methodologies that utilize actual market transactions, broker-dealer supplied valuations or other techniques. Such techniques generally consider factors such as composite security prices, yields, maturities, call features, credit ratings and developments relating to specific securities, in arriving at valuations. Fixed income securities are generally classified as level 2. Short-term investments with remaining maturities of 60 days or less at the time of purchase are stated at amortized cost, which approximates fair value. If amortized cost does not approximate fair value, short-term securities are reported at fair value. These securities are generally classified as level 2. Swaps, forward foreign currency contracts and other financial derivatives are valued daily, primarily by an independent pricing service using pricing models and are
29
Driehaus Mutual Funds
Notes to Financial Statements — (Continued)
generally classified as level 2. The pricing models use inputs that are observed from actively quoted markets such as issuer details, indices, spreads, interest rates, yield curves, dividends and exchange rates. If valuations are not available from the independent pricing service or values received are deemed not representative of fair value, values will be obtained from a third party broker-dealer or counterparty. Investments initially valued in currencies other than the U.S. dollar are converted to the U.S. dollar using exchange rates obtained from an independent pricing service. In addition, for Multi-Asset Growth Economies Fund, if quotations are not readily available, if the values have been materially affected by events occurring after the closing of a foreign market, or if there has been a movement in the U.S. market that exceeds a certain threshold, assets may be valued at fair value as determined in good faith by or under the direction of the Trust’s Board of Trustees. Events that may materially affect asset values that could cause a fair value determination include, but are not limited to: corporate announcements relating to a specific security; natural and other disasters which may impact an entire market or region; and political and other events which may be global or impact a particular country or region. The frequency with which these procedures are used cannot be predicted and may be utilized to a significant extent. To the extent utilized, securities would be considered level 2 in the hierarchy described below. Securities for which market quotations are not readily available are valued at fair value as determined in good faith in accordance with procedures established by or under the direction of the Trust’s Board of Trustees and are generally classified as level 3. Under these procedures, the Funds primarily employ a market-based approach, which may use related or comparable assets or liabilities, recent transactions, market multiples, book values and other relevant information for the investment to determine the fair value of the investment. It is possible that the estimated values may differ significantly from the values that would have been used had a ready market existed for the investments, and such differences could be material.
Each Fund is subject to fair value accounting standards that define fair value, establish the framework for measuring fair value and provide a three-level hierarchy for fair valuation based upon the inputs to the valuation as of the measurement date. The three levels of the fair value hierarchy are as follows:
Level 1 — quoted prices for active markets for identical securities
Level 2 — significant observable inputs (including quoted prices for similar securities, interest rates, prepayment speeds, credit risk, etc.)
Level 3 — significant unobservable inputs (including the Fund’s own assumptions in determining the fair value of investments).
The inputs or methodology used for valuing securities are not necessarily an indication of the risk associated with investing in those securities. The following is a summary of the inputs used to value the Active Income Fund’s investments as of December 31, 2018:
Assets | Level 1 | Level 2 | Level 3 | Total | ||||||||||||
Bank Loans | $ | — | $ | 292,672,706 | $ | — | $ | 292,672,706 | ||||||||
Common Stocks | ||||||||||||||||
Banks | 2,564,000 | — | — | 2,564,000 | ||||||||||||
Media | 996,750 | — | — | 996,750 | ||||||||||||
Software | 9,202 | — | — | 9,202 | ||||||||||||
Convertible Corporate Bonds | — | 5,438,825 | — | 5,438,825 | ||||||||||||
Convertible Preferred Stocks | ||||||||||||||||
Auto Manufacturers | — | — | 0 | 0 | ||||||||||||
Corporate Bonds | — | 356,952,848 | — | 356,952,848 | ||||||||||||
Preferred Stocks | ||||||||||||||||
Banks | 35,337,368 | — | — | 35,337,368 | ||||||||||||
Private Stock | ||||||||||||||||
Investment Companies | — | — | 1,956,000 | 1,956,000 | ||||||||||||
U.S. Government and Agency Securities | — | 6,793,752 | — | 6,793,752 | ||||||||||||
|
|
|
|
|
|
|
| |||||||||
Total | $ | 38,907,320 | $ | 661,858,131 | $ | 1,956,000 | $ | 702,721,451 | ||||||||
|
|
|
|
|
|
|
| |||||||||
30
Driehaus Mutual Funds
Notes to Financial Statements — (Continued)
Liabilities | Level 1 | Level 2 | Level 3 | Total | ||||||||||||
Common Stocks Sold Short | ||||||||||||||||
Pharmaceuticals | $ | (1,296,900 | ) | $ | — | $ | — | $ | (1,296,900 | ) | ||||||
Corporate Bonds Sold Short | — | (63,196,357 | ) | — | (63,196,357 | ) | ||||||||||
Exchange-Traded Funds Sold Short | (44,476,208 | ) | — | — | (44,476,208 | ) | ||||||||||
|
|
|
|
|
|
|
| |||||||||
Total | $ | (45,773,108 | ) | $ | (63,196,357 | ) | $ | — | $ | (108,969,465 | ) | |||||
|
|
|
|
|
|
|
| |||||||||
Other Financial Instruments* | ||||||||||||||||
Futures Contracts | $ | (1,852,216 | ) | $ | — | $ | — | $ | (1,852,216 | ) | ||||||
|
|
|
|
|
|
|
| |||||||||
Total Other Financial Instruments | $ | (1,852,216 | ) | $ | — | $ | — | $ | (1,852,216 | ) | ||||||
|
|
|
|
|
|
|
| |||||||||
| * | Other financial instruments are futures contracts, which are detailed in the Schedule of Investments. |
The following is a reconciliation of Level 3 assets for which significant unobservable inputs were used to determine fair value in the Active Income Fund:
| Investments, at Value | ||||
Balance as of December 31, 2017 | $ | 0 | ||
Realized gain (loss) | — | |||
Change in net unrealized appreciation (depreciation) | — | |||
Purchases | — | |||
Sales | — | |||
Transfers in and/or out of Level 3 | 1,956,000 | |||
|
| |||
Balance as of December 31, 2018 | $ | 1,956,000 | ||
|
| |||
As of December 31, 2018 and December 31, 2017, the Active Income Fund held Level 3 investments in General Motors Corp. senior convertible preferred stock and Larchmont Resources LLC private stock, valued at fair value as determined in good faith in accordance with procedures established by or under the direction of the Trust’s Board of Trustees. As a part of the ongoing restructuring of General Motors, any value previously ascribed to these holdings has been transferred to the General Motors Co. Motors Liquidation Co. GUC Trust common stock, which is freely and actively traded, and therefore the senior convertible preferred stock was fair valued at $0. As of December 31, 2018, the Active Income Fund’s common stock investment in Larchmont Resources LLC of $1,956,000 transferred from Level 2 to Level 3 based on availability of market participants quoting the investment. The common stock investment in Larchmont Resources LLC has been valued using an unadjusted third-party pricing vendor quote. The following table summarizes the quantitative inputs and assumptions used for items categorized as Level 3 of the fair value hierarchy as of December 31, 2018:
Financial Assets | Fair Value at December 31, 2018 | Valuation | Unobservable | Price/Range | ||||||||
Convertible Preferred Stock | $ | 0 | Cash available in relation to claim | Estimated recovery | $ | 0 | ||||||
Private Stock | $ | 1,956,000 | Broker quote | N/A | N/A | |||||||
31
Driehaus Mutual Funds
Notes to Financial Statements — (Continued)
The following is a summary of the inputs used to value the Event Driven Fund’s investments as of December 31, 2018:
Assets | Level 1 | Level 2 | Level 3 | Total | ||||||||||||
Bank Loans | $ | — | $ | 7,568,511 | $ | — | $ | 7,568,511 | ||||||||
Common Stocks | ||||||||||||||||
Banks | 1,129,352 | — | — | 1,129,352 | ||||||||||||
Biotechnology | 7,778,871 | — | — | 7,778,871 | ||||||||||||
Computers | 566,469 | — | — | 566,469 | ||||||||||||
Electronics | 1,826,476 | — | — | 1,826,476 | ||||||||||||
Healthcare — Products | 3,204,673 | — | — | 3,204,673 | ||||||||||||
Healthcare — Services | 501,563 | — | — | 501,563 | ||||||||||||
Insurance | 2,811,266 | — | — | 2,811,266 | ||||||||||||
Media | 615,255 | — | — | 615,255 | ||||||||||||
Pharmaceuticals | 4,350,754 | — | — | 4,350,754 | ||||||||||||
Savings & Loans | 2,642,309 | — | — | 2,642,309 | ||||||||||||
Semiconductors | 1,069,754 | — | — | 1,069,754 | ||||||||||||
Software | 427,918 | — | — | 427,918 | ||||||||||||
Telecommunications | 242,125 | — | — | 242,125 | ||||||||||||
Convertible Preferred Stocks | ||||||||||||||||
Auto Manufacturers | — | — | 0 | 0 | ||||||||||||
Corporate Bonds | — | 12,804,316 | — | 12,804,316 | ||||||||||||
Private Preferred Stock | ||||||||||||||||
Biotechnology | — | — | 830,745 | 830,745 | ||||||||||||
Purchased Call Options | 160 | — | — | 160 | ||||||||||||
|
|
|
|
|
|
|
| |||||||||
Total | $ | 27,166,945 | $ | 20,372,827 | $ | 830,745 | $ | 48,370,517 | ||||||||
|
|
|
|
|
|
|
| |||||||||
Liabilities | ||||||||||||||||
Exchange-Traded Funds Sold Short | $ | (9,455,308 | ) | $ | — | $ | — | $ | (9,455,308 | ) | ||||||
|
|
|
|
|
|
|
| |||||||||
Total | $ | (9,455,308 | ) | $ | — | $ | — | $ | (9,455,308 | ) | ||||||
|
|
|
|
|
|
|
| |||||||||
Other Financial Instruments* | ||||||||||||||||
Forward Foreign Currency Contracts — Assets | $ | — | $ | 232 | $ | — | $ | 232 | ||||||||
|
|
|
|
|
|
|
| |||||||||
Total Other Financial Instruments | $ | — | $ | 232 | $ | — | $ | 232 | ||||||||
|
|
|
|
|
|
|
| |||||||||
| * | Other financial instruments are forward foreign currency contracts, which are detailed in the Schedule of Investments. |
The following is a reconciliation of Level 3 assets for which significant unobservable inputs were used to determine fair value in the Event Driven Fund:
| Investments, at Value | ||||
Balance as of December 31, 2017 | $ | 0 | ||
Realized gain (loss) | — | |||
Change in net unrealized appreciation (depreciation) | (1,169,255 | ) | ||
Purchases | 2,000,000 | |||
Sales | — | |||
Transfers in and/or out of Level 3 | — | |||
|
| |||
Balance as of December 31, 2018 | $ | 830,745 | ||
|
| |||
32
Driehaus Mutual Funds
Notes to Financial Statements — (Continued)
As of December 31, 2018, the Event Driven Fund held Level 3 investments in General Motors Corp. senior convertible preferred stock and Ideaya Biosciences, Inc. private preferred stock. The General Motors Corp. senior convertible preferred stock was valued in the same manner described for the Active Income Fund. The Ideaya Biosciences, Inc. private preferred stock was valued using a third-party valuation source that is provided on a monthly recurring basis. The evaluated price included in the third-party report is adjusted daily for market movements of a biotechnology index. The following table summarizes the quantitative inputs and assumptions used for items categorized as Level 3 of the fair value hierarchy as of December 31, 2018:
Financial Assets | Fair Value at December 31, 2018 | Valuation Technique(s) | Unobservable Inputs | Price/Median | ||||||||
Convertible Preferred Stock | $ | 0 | Cash available in relation to claim | Estimated recovery | $ | 0 | ||||||
| Transaction price | $ | 1.2945 | ||||||||||
| Median comparable market capitalization adjustment | (18.4% | ) | ||||||||||
Private Preferred Stock | $ | 830,745 | Adjusted transaction price (a) | Company specific discount | (45.4% | ) | ||||||
| (a) | - The valuation technique for this security includes using valuation information provided by an independent third-party. The report is prepared using the index performance method of comparable companies and a company specific discount. To adjust to fair value on a daily basis, the value presented in the third-party report is adjusted based upon the daily price change of an exchange traded fund containing a basket of publicly traded companies in the same sector. |
The following is a summary of the inputs used to value the Multi-Asset Growth Economies Fund’s investments as of December 31, 2018:
Assets | Level 1 | Level 2 | Level 3 | Total | ||||||||||||
Sovereign Bonds | ||||||||||||||||
Argentina | $ | — | $ | 700,312 | $ | — | $ | 700,312 | ||||||||
Brazil | — | 1,132,576 | — | 1,132,576 | ||||||||||||
Egypt | — | 1,353,900 | — | 1,353,900 | ||||||||||||
Hungary | — | 688,376 | — | 688,376 | ||||||||||||
Indonesia | — | 1,300,973 | — | 1,300,973 | ||||||||||||
Mexico | — | 846,748 | — | 846,748 | ||||||||||||
Nigeria | — | 828,014 | — | 828,014 | ||||||||||||
Peru | — | 967,186 | — | 967,186 | ||||||||||||
Poland | — | 1,102,261 | — | 1,102,261 | ||||||||||||
South Africa | — | 1,207,804 | — | 1,207,804 | ||||||||||||
Thailand | — | 300,080 | — | 300,080 | ||||||||||||
Equity Securities | ||||||||||||||||
Argentina | 200,309 | — | — | 200,309 | ||||||||||||
Brazil | 1,775,946 | — | — | �� | 1,775,946 | |||||||||||
China | 6,158,809 | — | — | 6,158,809 | ||||||||||||
Cyprus | 175,750 | — | — | 175,750 | ||||||||||||
Egypt | 139,898 | — | — | 139,898 | ||||||||||||
India | 2,490,355 | — | — | 2,490,355 | ||||||||||||
Indonesia | 588,495 | — | — | 588,495 | ||||||||||||
33
Driehaus Mutual Funds
Notes to Financial Statements — (Continued)
Assets (continued) | Level 1 | Level 2 | Level 3 | Total | ||||||||||||
Japan | $ | 167,499 | $ | — | $ | — | $ | 167,499 | ||||||||
Kuwait | 338,485 | — | — | 338,485 | ||||||||||||
Mexico | 249,835 | — | — | 249,835 | ||||||||||||
Netherlands | 277,117 | — | — | 277,117 | ||||||||||||
Philippines | 390,982 | — | — | 390,982 | ||||||||||||
Poland | 142,200 | — | — | 142,200 | ||||||||||||
Russia | 896,574 | — | — | 896,574 | ||||||||||||
South Africa | 197,408 | — | — | 197,408 | ||||||||||||
South Korea | 1,951,410 | — | — | 1,951,410 | ||||||||||||
Taiwan | 1,378,435 | — | — | 1,378,435 | ||||||||||||
Thailand | 747,842 | — | — | 747,842 | ||||||||||||
Purchased Put Options | — | 14,569 | — | 14,569 | ||||||||||||
Equity Certificates** | — | 195,285 | — | 195,285 | ||||||||||||
|
|
|
|
|
|
|
| |||||||||
Total | $ | 18,267,349 | $ | 10,638,084 | $ | — | $ | 28,905,433 | ||||||||
|
|
|
|
|
|
|
| |||||||||
Other Financial Instruments* | ||||||||||||||||
Interest Rate Swaps — Asset*** | $ | — | $ | 239,909 | $ | — | $ | 239,909 | ||||||||
Interest Rate Swaps — Liabilities*** | — | (220,513 | ) | — | (220,513 | ) | ||||||||||
Forward Foreign Currency Contracts — Assets | — | 367,892 | — | 367,892 | ||||||||||||
Forward Foreign Currency Contracts — Liabilities | — | (426,675 | ) | — | (426,675 | ) | ||||||||||
|
|
|
|
|
|
|
| |||||||||
Total Other Financial Instruments | $ | — | $ | (39,387 | ) | $ | — | $ | (39,387 | ) | ||||||
|
|
|
|
|
|
|
| |||||||||
| * | Other financial instruments are swap and forward foreign currency contracts, which are detailed in the Schedule of Investments. |
| ** | See Schedule of Investments for industry and/or country breakout. |
| *** | Includes cumulative appreciation (depreciation) of centrally cleared swap contracts as shown in the Schedule of Investments. Only current day’s variation margin is reported in the Statements of Assets and Liabilities. |
Securities Sold Short
The Funds are engaged in selling securities short, which obligates them to replace a borrowed security by purchasing it at market price at the time of replacement. Each Fund incurs a loss if the price of the security increases between the date of the short sale and the date on which the Fund replaces the borrowed security. Each Fund realizes a gain if the price of the security declines between those dates. Gains are limited to the price at which the Fund sold the security short, while losses are potentially unlimited in size.
The Funds are required to establish a margin account with the broker lending the security sold short. While the short sale is outstanding, the broker retains the proceeds of the short sale and the Fund must maintain a deposit with the broker consisting of cash and securities having a value equal to a specified percentage of the value of the securities sold short. Such deposit is included in “Collateral held at custodian for the benefit of brokers” on the Statements of Assets and Liabilities. Each Fund is obligated to pay any dividends or interest due on securities sold short. Such dividends and interest are recorded as an expense to the Funds on the Statements of Operations.
Federal Income Taxes
The Funds’ policy is to comply with the requirements of Subchapter M of the Internal Revenue Code that are applicable to regulated investment companies and to distribute substantially all their taxable income to their shareholders. Therefore, no Federal income tax provision is required.
34
Driehaus Mutual Funds
Notes to Financial Statements — (Continued)
The FASB’s “Accounting for Uncertainty in Income Taxes” (“Tax Statement”) requires the evaluation of tax positions taken or expected to be taken in the course of preparing the Funds’ tax returns to determine whether the tax positions are“more-likely-than-not” of being sustained by the applicable tax authority. Tax positions not deemed to meet themore-likely-than-not threshold would be recorded as a tax benefit or expense in the current year. Management has evaluated the implications of the Tax Statement and all of the uncertain tax positions and has determined that no liability is required to be recorded in the financial statements as of December 31, 2018. The Funds file tax returns with the U.S. Internal Revenue Service and various states. Taxable years ending 2018, 2017, 2016, and 2015 remain subject to examination by taxing authorities.
For Federal income tax purposes, capital loss carryforwards represent net capital losses of a fund that may be carried forward and applied against future net realized gains. On December 22, 2010, the Regulated Investment Company Modernization Act of 2010 was enacted to modernize several of the Federal income and excise tax provisions related to regulated investment companies. Underpre-enactment law, capital losses could be carried forward for up to eight years, and were required to be carried forward as short-term capital losses, irrespective of the character of the original loss. New net capital losses (those earned in taxable years beginning after December 22, 2010) may be carried forward indefinitely and must retain the character of the original loss.
At December 31, 2018, gross unrealized appreciation (depreciation) on investments, based on cost for Federal income tax purposes, were as follows:
| Active Income Fund | Event Driven Fund | Multi-Asset Growth Economies Fund | ||||||||||
Cost of investments | $ | 631,697,751 | $ | 42,845,997 | $ | 27,813,056 | ||||||
|
|
|
|
|
| |||||||
Gross unrealized appreciation | $ | 4,164,618 | $ | 4,323,715 | $ | 2,411,386 | ||||||
Gross unrealized depreciation | (42,110,383 | ) | (8,254,503 | ) | (1,319,009 | ) | ||||||
|
|
|
|
|
| |||||||
Net unrealized appreciation (depreciation) on investments | $ | (37,945,765 | ) | $ | (3,930,788 | ) | $ | 1,092,377 | ||||
|
|
|
|
|
| |||||||
The difference between cost amounts for financial statements and federal income tax purposes is due primarily to the tax deferral of losses on wash sales and timing differences in recognizing certain gains and losses on security transactions.
The amount of dividends and distributions from net investment income and net realized capital gains are determined in accordance with Federal income tax regulations, which may differ from U.S. GAAP.
For the year ended December 31, 2018, reclassifications were recorded to total distributable earnings (deficit) andpaid-in capital for any permanent tax differences. These reclassifications relate primarily to the differing tax treatment of income from paydowns and swaps, return of capital and capital gain distributions on real estate investment trusts and regulated investment companies, net operating losses, sales of passive foreign investment companies and foreign currency gains and losses. Results of operations and net assets were not affected by these reclassifications.
| Active Income Fund | Event Driven Fund | Multi-Asset Growth Economies Fund | ||||||||||
Paid-in capital | $ | 6,545 | $ | — | $ | (105,367 | ) | |||||
Total distributable earnings (deficit) | (6,545 | ) | — | 105,367 | ||||||||
35
Driehaus Mutual Funds
Notes to Financial Statements — (Continued)
The tax character of distributions paid were as follows:
Active Income Fund | ||||||||
Distributions paid from: | January 1, 2018 to December 31, 2018 | January 1, 2017 to December 31, 2017 | ||||||
Ordinary income | $ | 61,286,044 | $ | 74,683,208 | ||||
|
|
|
| |||||
Total distributions paid | $ | 61,286,044 | $ | 74,683,208 | ||||
|
|
|
| |||||
Event Driven Fund | ||||||||
Distributions paid from: | January 1, 2018 to December 31, 2018 | January 1, 2017 to December 31, 2017 | ||||||
Ordinary income | $ | 1,805,482 | $ | — | ||||
|
|
|
| |||||
Total distributions paid | $ | 1,805,482 | $ | — | ||||
|
|
|
| |||||
Multi-Asset Growth Economies Fund | ||||||||
Distributions paid from: | January 1, 2018 to December 31, 2018 | April 10, 2017* to December 31, 2017 | ||||||
Ordinary income | $ | 233,414 | $ | 1,804,830 | ||||
Long term capital gains distribution | 29,970 | 213,901 | ||||||
|
|
|
| |||||
Total distributions paid | $ | 263,384 | $ | 2,018,731 | ||||
|
|
|
| |||||
| * | The Fund commenced operations on April 10, 2017. |
As of December 31, 2018, the components of accumulated earnings (deficit) were as follows:
| Active Income Fund | Event Driven Fund | Multi-Asset Growth Economies Fund | ||||||||||
Undistributed ordinary income | $ | 4,870,359 | $ | 167,459 | $ | — | ||||||
Undistributed long-term capital gains | — | — | — | |||||||||
|
|
|
|
|
| |||||||
Accumulated earnings | 4,870,359 | 167,459 | — | |||||||||
Accumulated capital and other losses | (479,728,601 | ) | (5,099,213 | ) | (1,270,704 | ) | ||||||
Unrealized appreciation (depreciation) on currency and foreign currency translations | — | — | (51 | ) | ||||||||
Unrealized appreciation (depreciation) on swap and swaptions contracts | — | — | 19,396 | |||||||||
Unrealized appreciation (depreciation) on forward foreign currency contracts | — | — | (58,783 | ) | ||||||||
Unrealized appreciation (depreciation) on investments, securities sold short and futures contracts | (37,945,765 | ) | (3,930,788 | ) | 1,100,192 | |||||||
|
|
|
|
|
| |||||||
Total accumulated earnings (deficit) | $ | (512,804,007 | ) | $ | (8,862,542 | ) | $ | (209,950 | ) | |||
|
|
|
|
|
| |||||||
As of December 31, 2018, the Funds had net capital loss carryforwards to offset future net capital gains, if any, to the extent provided by Treasury regulations:
| Not Subject to Expiration | ||||||||
| Short-Term | Long-Term | |||||||
Active Income Fund | $ | 316,195,125 | $ | 163,533,476 | ||||
Event Driven Fund | 5,099,213 | — | ||||||
Multi-Asset Growth Economies Fund | 1,242,459 | — | ||||||
36
Driehaus Mutual Funds
Notes to Financial Statements — (Continued)
Post-October capital losses and late-year ordinary losses incurred after October 31 and within the taxable year are deemed to arise on the first business day of the Funds’ taxable year. As of December 31, 2018, the Funds had the following post-October capital losses and late-year ordinary losses:
| Post-October Capital Losses | Late-Year Ordinary Losses | |||||||
Active Income Fund | $ | — | $ | — | ||||
Event Driven Fund | — | — | ||||||
Multi-Asset Growth Economies Fund | — | 28,245 | ||||||
Foreign Currency Translation
The value of securities, currencies and other assets and liabilities not denominated in U.S. dollars are translated into U.S. dollar values based upon the current rates of exchange on the date of the Funds’ valuations.
Net realized foreign exchange gains or losses which are reported by the Funds result from currency gains and losses on transaction hedges arising from changes in exchange rates between the trade and settlement dates on forward contract transactions, and the difference between the amounts accrued for dividends, interest, and foreign taxes and the amounts actually received or paid in U.S. dollars for these items. Net unrealized foreign exchange gains and losses result from changes in the U.S. dollar value of assets and liabilities (other than investments in securities), which are denominated in foreign currencies, as a result of changes in exchange rates.
Net realized gain (loss) on foreign currency contracts on portfolio hedges result from the use of forward contracts to hedge portfolio positions denominated or quoted in a particular currency in order to reduce or limit exposure in that currency. The Event Driven Fund and Multi-Asset Growth Economies Fund held portfolio hedges as of December 31, 2018 as disclosed in the Schedule of Investments.
The Funds do not isolate that portion of the results of operations which results from fluctuations in foreign exchange rates on investments. These fluctuations are included with the net realized gain (loss) on investments and the net change in unrealized appreciation (depreciation) on investments.
Indemnifications
Under the Trust’s organizational documents, the officers and Trustees are indemnified against certain liabilities arising out of the performance of their duties to the Trust. In addition, in the normal course of business, the Trust enters into contracts that provide general indemnifications to other parties. A Fund’s maximum exposure under these agreements is unknown as this would involve future claims that may be made against a Fund that have not yet occurred. However, the Funds have not had prior claims or losses pursuant to these contracts and expect the risk of loss to be remote.
Recent Accounting Pronouncements
In August 2018, the Securities and Exchange Commission released its Final Rule on Disclosure Update and Simplification (the “Final Rule”) which is intended to simplify an issuer’s disclosure compliance efforts by removing redundant or outdated disclosure requirements without significantly altering the mix of information provided to investors. Effective with the current reporting period, the Funds adopted the Final Rule with the most notable impacts being that the Funds are no longer required to present the components of distributable earnings on the Statements of Assets and Liabilities or the sources of distributions to shareholders and the amount of undistributed net investment income on the Statements of Changes in Net Assets. The tax components of distributable earnings and distributions to shareholders continue to be disclosed within the Notes to Financial Statements.
In August 2018, the FASB issued Accounting Standards Update (“ASU”)No. 2018-13 “Changes to the Disclosure Requirements for Fair Value Measurement” which modifies disclosure requirements for fair value measurements. The guidance is effective for fiscal years beginning after December 15, 2019 and for interim periods within those fiscal years. Management has evaluated the implications of certain provisions ofASU No. 2018-13
37
Driehaus Mutual Funds
Notes to Financial Statements — (Continued)
and has determined to early adopt all aspects related to the removal and modification of certain fair value measurement disclosures under the ASU effective immediately.
In March 2017, the FASB issued ASUNo. 2017-08 “Premium Amortization on Purchased Callable Debt Securities” which provides guidance related to the amortization period for certain purchased callable debt securities held at a premium. This ASU is effective for annual periods beginning after December 15, 2018, and interim periods within those annual periods, however, early adoption is permitted. The amendments in this ASU should be applied on a modified retrospective basis through a cumulative-effect adjustment directly to retained earnings as of the beginning of the period of adoption. At this time, management is evaluating the implications of these changes on the financial statements.
Securities Transactions and Income
The Trust records security transactions based on trade date. Dividend income is recognized on theex-dividend date, and interest income is recognized on an accrual basis. Discounts and premiums on securities purchased are accreted and amortized over the lives of the respective securities using the effective yield method. Withholding taxes on foreign dividends and interest have been provided for in accordance with the Trust’s understanding of the applicable country’s tax rules and rates.
Pursuant to the terms of certain of the senior unsecured loan agreements, the Funds may have unfunded loan commitments, which are callable on demand. Each Fund will have available with its custodian, cash and/or liquid securities having an aggregate value at least equal to the amount of the unfunded senior loan commitments. At December 31, 2018, the Funds had no unfunded senior loan commitments.
With respect to the senior loans held in each Fund’s portfolio, the Funds may: 1) invest in assignments; 2) act as a participant in primary lending syndicates; or 3) invest in participations. If a Fund purchases a participation of a senior loan interest, the Fund would typically enter into a contractual agreement with the lender or other third party selling the participation, rather than directly with the borrower. As such, the Fund not only assumes the credit risk of the borrower, but also that of the selling participant or other persons interpositioned between the Fund and the borrower. At December 31, 2018, the Funds had no such outstanding senior loan participation commitments.
B. INVESTMENTS IN DERIVATIVES
Each Fund uses derivative instruments such as swaps, futures, options, swaptions and forward foreign currency contracts in connection with their respective investment strategies. For the year ended December 31, 2018, the Active Income Fund primarily utilized: 1) credit default swaps as alternatives to direct investments to manage exposure to specific sectors/markets/industries and/or credit events and manage volatility; 2) total return swaps to gain exposure to certain sectors and manage volatility; 3) futures to hedge its interest rate and/or commodity risk and manage volatility; 4) options to hedge downside risk and manage volatility; and 5) forward foreign currency contracts to manage currency risk in portfolio holdings. For the year ended December 31, 2018, the Event Driven Fund primarily utilized: 1) options to both hedge exposure and provide exposure to certain market segments or specific securities; and 2) forward foreign currency contracts to manage currency risk in portfolio holdings. For the year ended December 31, 2018, the Multi-Asset Growth Economies Fund primarily utilized: 1) interest rate swaps to hedge against interest rate fluctuation and enable the parties involved to exchange fixed and floating cash flows; 2) credit default swaps as alternatives to direct investments to manage exposure to specific sectors/markets/industries and/or credit events and manage volatility; 3) options to both hedge exposure and provide exposure to certain market segments or specific securities; and 4) forward foreign currency contracts to manage currency risk in portfolio holdings. Detail regarding each derivative type is included below.
Swap Contracts
The Funds are subject to credit risk, volatility risk and interest rate risk exposure in the normal course of pursuing their investment objectives. The Funds engage in various swap transactions, including forward rate agreements and interest rate, currency, volatility, index and total return swaps, primarily to manage duration and yield curve risk, or as alternatives to direct investments. Swaps that are centrally cleared are exposed to
38
Driehaus Mutual Funds
Notes to Financial Statements — (Continued)
the creditworthiness of the clearing organizations (and, consequentially, that of their members — generally, banks and broker-dealers) involved in the transaction. Centrally cleared swaps are valued daily and unrealized gains or losses are recorded in a “variation margin” account. The Fund receives from or pays to the clearing organization a specified amount of cash based upon changes in the variation margin account. When a contract is closed, the Fund recognizes a realized gain or loss.
Interest rate swaps are agreements between two parties to exchange cash flows based on a notional principal amount. The Funds may elect to pay a fixed rate and receive a floating rate or receive a fixed rate and pay a floating rate on a notional principal amount. The net interest received or paid on interest rate swap agreements is accrued daily as interest income/expense. Interest rate swaps aremarked-to-market daily using fair value estimates provided by an independent pricing service. Changes in value, including accrued interest, are recorded as changes in net unrealized appreciation (depreciation) on the Statements of Operations. Unrealized appreciation is reported as an asset and unrealized depreciation is reported as a liability on the Statements of Assets and Liabilities. Gains or losses are realized upon termination of the contracts. The risk of loss under a swap contract may exceed the amount recorded as an asset or a liability.
Total return swap contracts are arrangements to exchange a market linked return for a periodic payment, both based on a notional principal amount, to hedge sector exposure and to manage exposure to specific sectors or industries and/or to gain exposure to specific markets/countries and to specific sectors/industries. To the extent that the total return of the security, index or other financial measure underlying the transaction exceeds or falls short of the offsetting interest rate obligation, the Fund will receive a payment from or make a payment to the counterparty. Total return swap contracts are marked to market daily based upon quotations from market makers and the change, if any, is recorded as a change in net unrealized appreciation (depreciation) on the Statements of Operations. Unrealized appreciation is reported as an asset and unrealized depreciation is reported as a liability on the Statements of Assets and Liabilities. Payments received or made are recorded as realized gains or losses. Gains or losses are realized upon termination of the contracts. Each Fund’s maximum risk of loss from counterparty risk is the fair value of the contract.
Volatility swaps are forward contracts on the future realized volatility of an underlying instrument. Volatility swaps are generally used to speculate on future volatility levels, trade the spread between realized and implied volatility or hedge volatility exposure of other positions. Changes in value are recorded as changes in net unrealized appreciation (depreciation) on the Statements of Operations. Unrealized gains are reported as an asset and unrealized losses are reported as a liability on the Statements of Assets and Liabilities. Gains or losses are realized upon termination of the contracts. The risk of loss under a volatility swap contract is dependent upon the volatility of the underlying instrument.
Under the terms of a credit default swap contract, one party acts as a guarantor receiving a periodic payment that is a fixed percentage applied to a notional amount. In return, the party agrees to purchase the notional amount of the underlying instrument, at par, if a credit event occurs during the term of the contract. Each Fund may enter into credit default swaps in which the Fund acts as guarantor (a seller of protection), and may enter into credit default swaps in which the counterparty acts as guarantor (a buyer of protection). Premiums paid to or by the Funds are accrued daily and included in net realized gain (loss) on swap contracts. The contracts aremarked-to-market daily using fair value estimates provided by an independent pricing service. Changes in value are recorded as unrealized appreciation (depreciation) on the Statements of Operations. Unrealized gains are reported as an asset and unrealized losses are reported as a liability on the Statements of Assets and Liabilities. Gains or losses are realized upon termination of the contracts. The risk of loss under a swap contract may exceed the amount recorded as an asset or a liability. The notional amount of a swap contract is the reference amount pursuant to which the counterparties make payments. For swaps in which the referenced obligation is an index, in the event of default of any debt security included in the corresponding index, the Fund pays or receives the percentage of the corresponding index that the defaulted security comprises (1) multiplied by the notional value and (2) multiplied by the ratio of one minus the ratio of the market value of the defaulted debt security to its par value. The Funds held no credit default swaps at December 31, 2018.
Risks associated with swap contracts include changes in the returns of underlying instruments and/or interest rates, failure of the counterparties to perform under the contracts’ terms and the possible lack of
39
Driehaus Mutual Funds
Notes to Financial Statements — (Continued)
liquidity with respect to the contracts. For centrally cleared swap contracts, counterparty risk is limited due to the role of the clearinghouse. Credit default swaps can involve greater risks than if an investor had invested in the reference obligation directly since, in addition to general market risks, credit default swaps are subject to counterparty credit risk, leverage risk, hedging risk, correlation risk and liquidity risk. The Funds disclose swap contracts on a gross basis, with no netting of contracts held with the same counterparty. As of December 31, 2018, the Multi-Asset Growth Economies Fund had outstanding swap contracts as listed on the Schedule of Investments and the required collateral is included in the Statements of Assets and Liabilities. The Active Income Fund and Event Driven Fund had no outstanding swap contracts at December 31, 2018.
Futures Contracts
The Funds may enter into futures contracts to produce incremental earnings, hedge existing positions or protect against market changes in the value of equities or interest rates. Upon entering into a futures contract with a broker, a Fund is required to deposit in a segregated account a specified amount of cash or U.S. government securities. Futures contracts are valued daily and unrealized gains or losses are recorded in a “variation margin” account. Daily, the Fund receives from or pays to the broker a specified amount of cash based upon changes in the variation margin account. When a contract is closed, the Fund recognizes a realized gain or loss. Futures contracts have market risks, including the risk that the change in the value of the contract may not correlate with changes in the value of the underlying securities. With futures contracts, there is minimal counterparty credit risk to the Funds since futures contracts are exchange-traded and the exchange’s clearinghouse, as counterparty to all exchange-traded futures contracts, guarantees the futures contract against default. As of December 31, 2018, the Active Income Fund had outstanding futures contracts as listed in the Schedule of Investments and the required collateral is included in the Statements of Assets and Liabilities. The Event Driven Fund and Multi-Asset Growth Economies Fund had no outstanding futures contracts at December 31, 2018.
Options Contracts
The Funds may use options contracts to hedge downside risk, produce incremental earnings or protect against market changes in the value of equities or interest rates. The Funds may write covered call and put options on futures, swaps, securities or currencies the Funds own or in which they may invest. Writing put options tends to increase a Fund’s exposure to the underlying instrument. Writing call options tends to decrease a Fund’s exposure to the underlying instrument. When a Fund writes a call or put option, an amount equal to the premium received is recorded as a liability and subsequently marked to market to reflect the current value of the option written. These liabilities are reflected as written options outstanding in the Schedule of Investments. Premiums received from writing options that expire are treated as realized gains. Premiums received from writing options that are exercised or closed are added to the proceeds or offset against amounts paid on the underlying future, swap, security or currency transaction to determine the realized gain or loss. A Fund, as a writer of an option, has no control over whether the underlying future, swap, security or currency may be sold (call) or purchased (put) and, as a result, bears the market risk of an unfavorable change in the price of the future, swap, security or currency underlying the written option. The risk exists that a Fund may not be able to enter into a closing transaction because of an illiquid market. In addition, to the extent a Fund purchases anover-the-counter (“OTC”) option, it is subject to credit risk that the counterparty to the trade does not perform under the contract’s terms. The Funds are not subject to credit risk on OTC options written as the counterparty has already performed its obligation by paying the premium at the inception of the contract.
The Funds may also purchase put and call options. Purchasing call options tends to increase a Fund’s exposure to the underlying instrument. Purchasing put options tends to decrease a Fund’s exposure to the underlying instrument. A Fund pays a premium, which is included in its Schedule of Investments as an investment and subsequentlymarked-to-market to reflect the current value of the option. Premiums paid for purchasing options that expire are treated as realized losses. The risk associated with purchasing put and call options is limited to the premium paid. Premiums paid for purchasing options that are exercised or closed are added to the amounts paid or offset against the proceeds on the underlying future, swap, security or currency transaction to determine the realized gain or loss. When entering into purchased option contracts, a Fund
40
Driehaus Mutual Funds
Notes to Financial Statements — (Continued)
bears the risk of securities prices moving unexpectedly, in which case, a Fund may not achieve the anticipated benefits of the purchased option contracts; however, the risk of loss is limited to the premium paid. As of December 31, 2018, the Event Driven Fund and Multi-Asset Economies Fund had outstanding options as listed on the Schedule of Investments and the required collateral is included in the Statements of Assets and Liabilities. The Active Income Fund had no outstanding options at December 31, 2018.
Swaptions
An option on a swap contract, also called a “swaption,” is an option that gives the buyer the right, but not the obligation, to enter into a swap on a future date in exchange for paying a market-based “premium.” A call or receiver swaption gives the owner the right to receive the total return of a specified asset, reference rate, or index swap. A put or payer swaption gives the owner the right to pay the total return of a specified asset, reference rate, or index swap. Swaptions also include options that allow an existing swap to be terminated or extended by one of the counterparties. The Funds had no outstanding swaptions at December 31, 2018.
Forward Foreign Currency Contracts
The Funds use forward foreign currency contracts to manage foreign currency, to produce incremental earnings or to hedge existing positions. A forward foreign currency contract involves an obligation to purchase or sell a specific currency at a future date, which may be any fixed number of days from the date of the contract agreed upon by the parties, at a price set at the time of the contract. These contracts are principally traded in the inter-bank market conducted directly between currency traders (usually large commercial banks) and their customers.
The market value of a forward foreign currency contract fluctuates with changes in currency exchange rates. Outstanding forward foreign currency contracts are valued daily at current market rates and the resulting change in market value is recorded as change in net unrealized appreciation or depreciation on the Statements of Operations. When a forward foreign currency contract is settled, the Fund records a realized gain or loss equal to the difference between the value at the time the forward foreign currency contract was opened and the value at the time it was settled. A forward foreign currency contract may involve market risk in excess of the unrealized appreciation (depreciation) reflected on the Statements of Assets and Liabilities. In addition, the Funds could be exposed to credit risk if the counterparties are unable or unwilling to meet the terms of the contracts or market risk if the value of the foreign currency changes unfavorably. As of December 31, 2018, the Event Driven Fund and Multi-Asset Economies Fund had forward foreign currency contracts as listed in the Schedule of Investments. The Active Income Fund had no outstanding forward foreign currency contracts at December 31, 2018.
Equity Certificates
The Funds may invest in equity certificates, which allow the Funds to participate in the appreciation (depreciation) of the underlying security without actually owning the underlying security. These derivative instruments are purchased pursuant to an agreement with a financial institution and are valued at a calculated market price based on the value of the underlying security in accordance with the agreement. These equity certificates are subject to the credit risk of the issuing financial institution. There is nooff-balance sheet risk associated with equity certificates and the Funds’ potential loss is limited to the purchase price of the securities. The Funds are exposed to credit risk associated with the counterparty to the transaction, which is monitored by the Funds’ management on a periodic basis. A Fund’s equity certificates are not subject to any master netting agreement.
On December 31, 2018, Multi-Asset Growth Economies Fund had unrealized depreciation of $10,431 as a result of its investments in these financial instruments. The aggregate market values of these certificates for Multi-Asset Growth Economies Fund represented 0.68% of its total market value of investments at December 31, 2018.
41
Driehaus Mutual Funds
Notes to Financial Statements — (Continued)
Derivative Investment Holdings Categorized by Risk Exposure
Each Fund is subject to the FASB’s “Disclosures about Derivative Instruments and Hedging Activities” (the “Derivatives Statement”). The Derivatives Statement amends and expands disclosures about derivative instruments and hedging activities. The Derivatives Statement is intended to improve financial reporting about derivative instruments by requiring enhanced disclosures to enable investors to better understand how and why the Fund uses derivative instruments, how these derivative instruments are accounted for and their effects on the Funds’ financial position and results of operations.
The following table sets forth the fair value and the location in the Statements of Assets and Liabilities of the Active Income Fund’s derivative contracts by primary risk exposure as of December 31, 2018:
Liability derivatives | ||||||
Risk exposure category | Statements of Assets and Liabilities location | Fair Value | ||||
Interest rate contracts | N/A* | $ | 1,852,216 | |||
Total | $ | 1,852,216 | ||||
| * | Includes cumulative appreciation/depreciation of futures contracts as shown in the Schedule of Investments. Only current day’s variation margin is reported in the Statements of Assets and Liabilities. |
The following table sets forth the fair value and the location in the Statements of Assets and Liabilities of the Event Driven Fund’s derivative contracts by primary risk exposure as of December 31, 2018:
Asset derivatives | ||||||
Risk exposure category | Statements of Assets and Liabilities location | Fair Value | ||||
Currency contracts | Unrealized appreciation on forward foreign currency contracts | $ | 232 | |||
Equity contracts | Purchased options, at fair value | 160 | ||||
Total | $ | 392 | ||||
The following table sets forth the fair value and the location in the Statements of Assets and Liabilities of the Multi-Asset Growth Economies Fund’s derivative contracts by primary risk exposure as of December 31, 2018:
Asset derivatives | ||||||
Risk exposure category | Statements of Assets and Liabilities location | Fair Value | ||||
Interest contracts | N/A* | $ | 239,909 | |||
Currency contracts | Unrealized appreciation on forward foreign currency contracts | 367,892 | ||||
Equity contracts | Investments, at fair value | 195,285 | ||||
Currency contracts | Purchased options, at fair value | 14,569 | ||||
Total | $ | 817,655 | ||||
Liability derivatives | ||||||
Risk exposure category | Statements of Assets and Liabilities location | Fair Value | ||||
Interest contracts | N/A* | $ | 220,513 | |||
Currency contracts | Unrealized depreciation on forward foreign currency contracts | 426,675 | ||||
Total | $ | 647,188 | ||||
| * | Includes cumulative appreciation (depreciation) of centrally cleared swaps as shown in the Schedule of Investments. Only current day’s variation margin is reported in the Statements of Assets and Liabilities. |
42
Driehaus Mutual Funds
Notes to Financial Statements — (Continued)
The following table sets forth the Active Income Fund’s net realized gain (loss) by primary risk exposure and by type of derivative contract for the year ended December 31, 2018:
Amount of net realized gain (loss) on derivatives | ||||||||||||||||||||
| Risk exposure category | ||||||||||||||||||||
Derivative | Credit contracts | Currency contracts | Equity contracts | Interest rate contracts | Total | |||||||||||||||
Purchased options contracts | $ | — | $ | — | $ | (3,174,326 | ) | $ | — | $ | (3,174,326 | ) | ||||||||
Written options contracts | — | — | 464,352 | — | 464,352 | |||||||||||||||
Purchased swaptions contracts | — | — | — | 2,724,715 | 2,724,715 | |||||||||||||||
Forward foreign currency contracts | — | 594,945 | — | — | 594,945 | |||||||||||||||
Futures contracts | — | — | — | 10,228,589 | 10,228,589 | |||||||||||||||
Swap contracts | 2,719,533 | — | 2,494,047 | 1,447,103 | 6,660,683 | |||||||||||||||
|
|
|
|
|
|
|
|
|
| |||||||||||
Total | $ | 2,719,533 | $ | 594,945 | $ | (215,927 | ) | $ | 14,400,407 | $ | 17,498,958 | |||||||||
|
|
|
|
|
|
|
|
|
| |||||||||||
The following table sets forth the Event Driven Fund’s net realized gain (loss) by primary risk exposure and by type of derivative contract for the year ended December 31, 2018:
Amount of net realized gain (loss) on derivatives | ||||||||||||
| Risk exposure category | ||||||||||||
Derivative | Currency contracts | Equity contracts | Total | |||||||||
Purchased options contracts | $ | — | $ | 87,286 | $ | 87,286 | ||||||
Written options contracts | — | (252,292 | ) | (252,292 | ) | |||||||
Forward foreign currency contracts | (283,063 | ) | — | (283,063 | ) | |||||||
|
|
|
|
|
| |||||||
Total | $ | (283,063 | ) | $ | (165,006 | ) | $ | (448,069 | ) | |||
|
|
|
|
|
| |||||||
The following table sets forth the Multi-Asset Growth Economies Fund’s net realized gain (loss) by primary risk exposure and by type of derivative contract for the year ended December 31, 2018:
Amount of net realized gain (loss) on derivatives | ||||||||||||||||||||
| Risk exposure category | ||||||||||||||||||||
Derivative | Credit contracts | Currency contracts | Equity contracts | Interest rate contracts | Total | |||||||||||||||
Purchased options contracts | $ | — | $ | 28,121 | $ | 342,862 | $ | — | $ | 370,983 | ||||||||||
Written options contracts | — | — | (145,585 | ) | — | (145,585 | ) | |||||||||||||
Forward foreign currency contracts | — | (431,208 | ) | — | — | (431,208 | ) | |||||||||||||
Equity certificates* | — | — | 50,639 | — | 50,639 | |||||||||||||||
Swap contracts | (15,498 | ) | — | — | 563,866 | 548,368 | ||||||||||||||
|
|
|
|
|
|
|
|
|
| |||||||||||
Total | $ | (15,498 | ) | $ | (403,087 | ) | $ | 247,916 | $ | 563,866 | $ | 393,197 | ||||||||
|
|
|
|
|
|
|
|
|
| |||||||||||
| * | Included in change in net realized gain (loss) on investments in the Statements of Operations. |
43
Driehaus Mutual Funds
Notes to Financial Statements — (Continued)
The following table sets forth the Active Income Fund’s change in net unrealized appreciation (depreciation) by primary risk exposure and by type of derivative contract for the year ended December 31, 2018:
Change in net unrealized appreciation (depreciation) on derivatives | ||||||||||||||||||||
| Risk exposure category | ||||||||||||||||||||
Derivative | Credit contracts | Equity contracts | Currency contracts | Interest rate contracts | Total | |||||||||||||||
Purchased options contracts | $ | — | $ | 151,991 | $ | — | $ | — | $ | 151,991 | ||||||||||
Purchased swaptions contracts | — | — | — | 202,126 | 202,126 | |||||||||||||||
Written options contracts | — | 2,419,963 | — | — | 2,419,963 | |||||||||||||||
Futures contracts | — | — | — | (2,790,446 | ) | (2,790,446 | ) | |||||||||||||
Swap contracts | (4,661,960 | ) | (1,080,096 | ) | — | (62,000 | ) | (5,804,056 | ) | |||||||||||
Forward foreign currency contracts | — | — | 245,022 | — | 245,022 | |||||||||||||||
|
|
|
|
|
|
|
|
|
| |||||||||||
Total | $ | (4,661,960 | ) | $ | 1,491,858 | $ | 245,022 | $ | (2,650,320 | ) | $ | (5,575,400 | ) | |||||||
|
|
|
|
|
|
|
|
|
| |||||||||||
The gross notional amount and/or the number of contracts for the Active Income Fund as of December 31, 2018 are included on the Schedule of Investments. The quarterly average values of derivative investments for the year ended December 31, 2018 is set forth in the table below:
Quarterly Derivative Averages | ||||||
Derivative | Quarterly Average | $ Amount / Number | ||||
Purchased options contracts | number of contracts | 8,666 | ||||
Written options contracts | number of contracts | (9,606 | ) | |||
Futures contracts — Short | number of contracts | (2,030 | ) | |||
Swap contracts | gross notional amount | 153,280,240 | ||||
Purchased swaptions contracts | gross notional amount | $ | 84,400,000 | |||
Forward foreign currency contracts — Long | fair value | $ | 3,873,091 | |||
Forward foreign currency contracts — Short | fair value | $ | (12,199,590 | ) | ||
The following table sets forth the Event Driven Fund’s change in net unrealized appreciation (depreciation) by primary risk exposure and by type of derivative contract for the year ended December 31, 2018:
Change in net unrealized appreciation (depreciation) on derivatives | ||||||||||||
| Risk exposure category | ||||||||||||
Derivative | Equity contracts | Currency contracts | Total | |||||||||
Purchased options contracts | $ | (158,041 | ) | $ | — | $ | (158,041 | ) | ||||
Written options contracts | 683,374 | — | 683,374 | |||||||||
Forward foreign currency contracts | — | 204,145 | 204,145 | |||||||||
|
|
|
|
|
| |||||||
Total | $ | 525,333 | $ | 204,145 | $ | 729,478 | ||||||
|
|
|
|
|
| |||||||
The gross notional amount and/or the number of contracts for the Event Driven Fund as of December 31, 2018 are included on the Schedule of Investments. The quarterly average values of derivative investments for the year ended December 31, 2018 is set forth in the table below:
Quarterly Derivative Averages | ||||||
Derivative | Quarterly Average | $ Amount / Number | ||||
Purchased options contracts | number of contracts | 290 | ||||
Written options contracts | number of contracts | (546 | ) | |||
Forward foreign currency contracts — Long | fair value | $ | 254,215 | |||
Forward foreign currency contracts — Short | fair value | $ | (2,400,201 | ) | ||
44
Driehaus Mutual Funds
Notes to Financial Statements — (Continued)
The following table sets forth Multi-Asset Growth Economies Fund’s change in net unrealized appreciation (depreciation) by primary risk exposure and by type of derivative contract for the year ended December 31, 2018:
Change in net unrealized appreciation (depreciation) on derivatives | ||||||||||||||||||||
| Risk exposure category | ||||||||||||||||||||
Derivative | Credit contracts | Equity contracts | Currency contracts | Interest rate contracts | Total | |||||||||||||||
Purchased options contracts | $ | — | $ | — | $ | (30,580 | ) | $ | — | $ | (30,580 | ) | ||||||||
Equity certificates* | — | (95,120 | ) | — | — | (95,120 | ) | |||||||||||||
Forward foreign currency contracts | — | — | (78,136 | ) | — | (78,136 | ) | |||||||||||||
Swap contracts | 9,721 | — | — | (214,343 | ) | (204,622 | ) | |||||||||||||
|
|
|
|
|
|
|
|
|
| |||||||||||
Total | $ | 9,721 | $ | (95,120 | ) | $ | (108,716 | ) | $ | (214,343 | ) | $ | (408,458 | ) | ||||||
|
|
|
|
|
|
|
|
|
| |||||||||||
| * | Included in change in net unrealized appreciation (depreciation) on investments in the Statements of Operations. |
The gross notional amount and/or the number of contracts for the Multi-Asset Growth Economies Fund as of December 31, 2018 are included on the Schedule of Investments. The quarterly average values of derivative investments for the year ended December 31, 2018 is set forth in the table below:
Quarterly Derivative Averages | ||||||
Derivative | Quarterly Average | $ Amount / Number | ||||
Purchased options contracts | number of contracts | 1,684,160 | ||||
Written options contracts | number of contracts | (200 | ) | |||
Swap contracts | gross notional amount | 18,200,654,172 | ||||
Forward foreign currency contracts — Long | fair value | $ | 3,980,363 | |||
Forward foreign currency contracts — Short | fair value | $ | (4,199,112 | ) | ||
Disclosures about Offsetting Assets and Liabilities
The Funds are party to various agreements, including International Swaps and Derivatives Association Agreements and related Credit Support Annexes (“Master Netting Agreements” or “MNA”), which govern the terms of certain transactions with select counterparties. MNAs are designed to reduce counterparty risk associated with the relevant transactions by establishing credit protection mechanisms and providing standardization as a means of improving legal certainty. As MNAs are specific to the unique operations of different asset types, they allow each Fund to close out and net its total exposure to a counterparty in the event of default with respect to all of the transactions governed under a single agreement with that counterparty. MNAs can also help reduce counterparty risk by specifying collateral posting requirements atpre-arranged exposure levels. Securities and cash pledged as collateral are reflected as assets in the Statements of Assets and Liabilities as either a component of Investment securities at fair value or Collateral held at custodian for the benefit of brokers.
The Funds’ derivative contracts held at December 31, 2018, are not accounted for as hedging instruments under U.S. GAAP. For financial reporting purposes, the Funds do not offset financial assets and financial liabilities that are subject to MNAs or similar arrangements on the Statements of Assets and Liabilities. The settlement of futures contracts and exchange-traded purchased options is guaranteed by the clearinghouse or exchange the instrument is traded on and is not subject to arrangements with particular counterparties. For that reason, these instruments are excluded from the below disclosure.
45
Driehaus Mutual Funds
Notes to Financial Statements — (Continued)
The following table presents the Event Driven Fund’s financial and derivative assets subject to Master Netting Agreements by type, net of amounts available for offset under a MNA and net of the related collateral received by the Event Driven Fund as of December 31, 2018:
Description | Gross Amounts Recognized in Statements of Assets and Liabilities | Derivatives Available for Offset | Collateral Pledged | Net Amount1 | ||||||||||||
Unrealized appreciation on forward foreign currency contracts | $ | 232 | $ | — | $ | — | $ | 232 | ||||||||
| 1 | Net amount represents the net amount payable to the counterparty in the event of default. |
The following table presents the Multi-Asset Growth Economies Fund’s financial and derivative assets subject to Master Netting Agreements by type, net of amounts available for offset under a MNA and net of the related collateral received by the Multi-Asset Growth Economies Fund as of December 31, 2018:
Description | Gross Amounts Recognized in Statements of Assets and Liabilities | Derivatives Available for Offset | Collateral Received | Net Amount1 | ||||||||||||
Unrealized appreciation on forward foreign currency contracts | $ | 367,892 | $ | (26,793 | ) | $ | — | $ | 341,099 | |||||||
The following table presents the Multi-Asset Growth Economies Fund’s financial and derivative liabilities subject to Master Netting Agreements by type, net of amounts available for offset under a MNA and net of the related collateral pledged by the Multi-Asset Growth Economies Fund as of December 31, 2018:
Description | Gross Amounts Recognized in Statements of Assets and Liabilities | Derivatives Available for Offset | Collateral Pledged | Net Amount2 | ||||||||||||
Unrealized depreciation on forward foreign currency contracts | $ | 426,675 | $ | (26,793 | ) | $ | — | $ | 399,882 | |||||||
| 1 | Net amount represents the net amount receivable from the counterparty in the event of default. |
| 2 | Net amount represents the net amount payable to the counterparty in the event of default. |
C. INVESTMENT ADVISORY FEES, TRANSACTIONS WITH AFFILIATES, AND ADMINISTRATIVE FEES
Richard H. Driehaus, is the Chairman of the Board of Driehaus Capital Management LLC (“DCM” or the “Adviser”), a registered investment adviser, and of Driehaus Securities LLC (“DS LLC” or the “Distributor”), a registered broker-dealer. As of December 31, 2018, Richard H. Driehaus controls the Driehaus Multi-Asset Growth Economies Fund due to his power to vote a majority of the shares of the Fund.
DCM serves as the Funds’ investment adviser. In return for its services to the Funds, the Funds pay the Adviser an annual management fee on a monthly basis of 0.55%, 1.00% and 1.00% of average daily net assets, respectively, for the Active Income Fund, Event Driven Fund and Multi-Asset Growth Economies Fund.
DCM entered into a written agreement to cap the Multi-Asset Growth Economies Fund’s annual ordinary operating expenses (other than interest, taxes, brokerage commissions, dividends and interest on short sales, other investment-related costs, acquired fund fees and expenses, and extraordinary expenses such as litigation and other expenses not incurred in the ordinary course of the Fund’s business) at 1.75% of average daily net assets until at least April 9, 2020. For this same time period, DCM is entitled to reimbursement for previously waived fees and reimbursed expenses to the extent that the Multi-Asset Growth Economies Fund’s expense ratio remains below the operating expense cap in place at the time of the waiver and the current operating expense
46
Driehaus Mutual Funds
Notes to Financial Statements — (Continued)
cap. For the year ended December 31, 2018, DCM waived fees for Multi-Asset Growth Economies Fund totaling $119,889 under this agreement. The amount of potential recovery expiring April 9, 2020 was $178,230.
The Active Income Fund incurred $7,622,889 for investment advisory fees during the year ended December 31, 2018, of which $437,758 was payable to DCM at December 31, 2018. The Event Driven Fund incurred $1,008,106 for investment advisory fees during the year ended December 31, 2018, of which $43,894 was payable to DCM at December 31, 2018. The Multi-Asset Growth Economies Fund incurred $406,890 for investment advisory fees during the year ended December 31, 2018, of which $5,244 was payable to DCM at December 31, 2018.
The Funds direct certain portfolio trades, subject to obtaining the best price and execution, to brokers who have agreed to pay a portion of the Funds’ operating expenses using part of the commissions generated. For the year ended December 31, 2018, these arrangements reduced the expenses of Driehaus Active Income Fund, Driehaus Event Driven Fund and Multi-Asset Growth Economies Fund by $15,919 (0.1%), $20,818 (1.1%) and $1,550 (0.2%), respectively.
The Funds are permitted to purchase or sell securities from or to certain affiliated funds under specified conditions outlined in procedures adopted by the Board. The procedures have been designed to ensure that any purchase or sale of securities by a Fund from or to another fund or portfolio that is or could be considered an affiliate by virtue of having a common investment adviser (or affiliated investment advisers), common trustees and/or common officers complies with Rule17a-7 of the 1940 Act. Further, as defined under these procedures, each transaction is effected at the current market price to minimize trading costs, where permissible. For the year ended December 31, 2018, the Funds engaged in purchases and sales of securities, pursuant to Rule17a-7 of the 1940 Act, as follows:
Fund | Purchases | Sales | Net Realized Gain (Loss) | |||||||||
Active Income Fund | $ | 37,883,505 | $ | 29,540,481 | $ | (2,170,343 | ) | |||||
Event Driven Fund | 2,918,875 | 4,446,194 | (72,002 | ) | ||||||||
Multi-Asset Growth Economies Fund | — | — | — | |||||||||
DS LLC is the Funds’ distributor. DS LLC does not earn any compensation from the Funds for these services. DS LLC has entered into a Fee Reimbursement Agreement (“Agreement”) with the Active Income Fund and Event Driven Fund. Under these Agreements, the Funds reimburse DS LLC for certain fees paid by DS LLC to intermediaries who provide shareholder administrative and/orsub-transfer agency services to the Funds. Currently, the amount to be reimbursed will not exceed 0.25% of the average daily net assets held by such intermediaries. The amounts incurred and payable to DS LLC during the year ended December 31, 2018 are as follows:
Fund | Shareholder services plan fees | Accrued shareholder services plan fees | ||||||
Active Income Fund | $ | 2,072,178 | $ | 153,192 | ||||
Event Driven Fund | 166,073 | 4,826 | ||||||
Certain officers of the Trust are also officers of DCM and DS LLC. The Funds pay a portion of the Chief Compliance Officer’s salary. No other officers received compensation from the Funds during the year ended December 31, 2018. The Independent Trustees are compensated for their services to the Trust and such compensation is reflected as Trustees’ fees in the Statements of Operations.
UMB Fund Services, Inc. (“UMBFS”), an affiliate of UMB Financial Corporation, serves as the Funds’ administrative and accounting agent. As compensation for these services, UMBFS earns the larger of a monthly minimum fee or a monthly fee based upon each Fund’s average daily net assets. UMBFS also acts as the transfer agent and dividend disbursing agent for the Funds. For these services, UMBFS earns a monthly fee based in part on shareholder processing activity during the month.
47
Driehaus Mutual Funds
Notes to Financial Statements — (Continued)
D. INVESTMENT TRANSACTIONS
Purchases and sales of investment securities (excluding swaps, options, futures, forwards, short-term securities and U.S. government obligations) for the Active Income Fund, Event Driven Fund and Multi-Asset Growth Economies Fund for the year ended December 31, 2018 were as follows:
Active Income Fund | Event Driven Fund | Multi-Asset Growth | ||||||||||||||
| Purchases | $ | 869,954,269 | Purchases | $ | 92,506,043 | Purchases | $ | 60,012,029 | ||||||||
| Sales | $ | 1,549,629,874 | Sales | $ | 190,123,365 | Sales | $ | 62,442,209 | ||||||||
The Funds had no purchases and sales of U.S. government obligations for the year ended December 31, 2018.
E. RESTRICTED SECURITIES
Restricted securities are securities that are not registered for sale under the Securities Act of 1933 or applicable foreign law and that may be resold only in transactions exempt from applicable registration. Restricted securities include Rule 144A securities which may be sold normally to qualified institutional buyers. At December 31, 2018, the Funds held restricted securities as denoted on the Schedule of Investments.
F. LINE OF CREDIT
The Funds, together with the other funds in the Trust, obtained a committed line of credit in the amount of $50,000,000. The line of credit is available primarily to meet large, unexpected shareholder redemptions subject to certain restrictions. Interest is charged at a rate per annum equal to the Federal Funds Rate in effect at the time of the borrowings plus 1.5%, or 1.75%, whichever is greater. There is a commitment fee of 0.10% of the excess of the $50,000,000 committed amount over the sum of the average daily balance of any loans, which is allocated amongst all funds that have access to the line. At December 31, 2018, the Funds had no outstanding borrowings under the line of credit.
G. REDEMPTION FEES
The Multi-Asset Growth Economies Fund may charge a redemption fee of 2.00% of the redemption amount for shares redeemed within 60 days of purchase. The redemption fees are recorded inpaid-in capital and reflected in the Statements of Changes in Net Assets.
H. SUBSEQUENT EVENTS
Events or transactions that occurred after the date of this report through the date the report was issued have been evaluated for potential impact to the financial statements. There are no subsequent events that require recognition or disclosure in the financial statements.
48
Report of Independent Registered Public Accounting Firm
To the Shareholders of Driehaus Active Income Fund, Driehaus Event Driven Fund, and Driehaus Multi-Asset Growth Economies Fund and the Board of Trustees of the Driehaus Mutual Funds
Opinion on the Financial Statements
We have audited the accompanying statements of assets and liabilities of Driehaus Active Income Fund, Driehaus Event Driven Fund, and Driehaus Multi-Asset Growth Economies Fund, (collectively referred to as the “Funds”), (three of the funds constituting the Driehaus Mutual Funds (the “Trust”)), including the schedules of investments, as of December 31, 2018, and the related statements of operations and changes in net assets, and the financial highlights for each of the periods indicated in the table below and the related notes (collectively referred to as the “financial statements”). In our opinion, the financial statements present fairly, in all material respects, the financial position of each of the Funds (three of the funds constituting the Driehaus Mutual Funds) at December 31, 2018, and the results of their operations, changes in net assets and financial highlights for each of the periods indicated in the table below, in conformity with U.S. generally accepted accounting principles.
Funds | Statement of operations | Statement of changes | Financial highlights | |||
Driehaus Active Income Fund
Driehaus Event Driven Fund | For the year ended December 31, 2018 | For each of the two years in the period ended December 31, 2018 | For each of the five years in the period ended December 31, 2018 | |||
| Driehaus Multi-Asset Growth Economies Fund | For the year ended December 31, 2018 | For the year ended December 31, 2018 and the period from April 10, 2017 (commencement of operations) through December 31, 2017 | ||||
Basis for Opinion
These financial statements are the responsibility of the Trust’s management. Our responsibility is to express an opinion on each of the Fund’s financial statements based on our audits. We are a public accounting firm registered with the Public Company Accounting Oversight Board (United States) (“PCAOB”) and are required to be independent with respect to the Trust in accordance with the U.S. federal securities laws and the applicable rules and regulations of the Securities and Exchange Commission and the PCAOB.
We conducted our audits in accordance with the standards of the PCAOB. Those standards require that we plan and perform the audit to obtain reasonable assurance about whether the financial statements are free of material misstatement, whether due to error or fraud. The Trust is not required to have, nor were we engaged to perform, an audit of the Trust’s internal control over financial reporting. As part of our audits, we are required to obtain an understanding of internal control over financial reporting, but not for the purpose of expressing an opinion on the effectiveness of the Trust’s internal control over financial reporting. Accordingly, we express no such opinion.
49
Report of Independent Registered Public Accounting Firm — (Continued)
Our audits included performing procedures to assess the risks of material misstatement of the financial statements, whether due to error or fraud, and performing procedures that respond to those risks. Such procedures included examining, on a test basis, evidence regarding the amounts and disclosures in the financial statements. Our procedures included confirmation of securities owned as of December 31, 2018, by correspondence with the custodians, agent banks, others and brokers or by other appropriate auditing procedures where replies from agent banks or brokers were not received. Our audits also included evaluating the accounting principles used and significant estimates made by management, as well as evaluating the overall presentation of the financial statements. We believe that our audits provide a reasonable basis for our opinion.

We have served as the auditor of one or more Driehaus investment companies since 2002.
Chicago, Illinois
February 22, 2019
50
Interested andIndependent Trustees of the Trust
The following table sets forth certain information with respect to the Trustees of the Trustas of December 31, 2018:
Name, Address | Position(s) | Term of | Number of Portfolios in Trust Overseen by Trustee | Principal Occupation(s) | Other Directorships | |||||||
Interested Trustee:* | ||||||||||||
Stephen J. Kneeley 25 East Erie Street Chicago, IL 60611 YOB: 1963 | Trustee and President | Since 2018 Since 2017 | 9 | President and Chief Executive Officer of the Adviser since January 2018; Interim President and Interim Chief Executive Officer of Adviser March 2017 to December 2017; Chief Executive Officer, Context Asset Management, L.P. from 2014 to 2016. | Chairman of Board of Trustees, Context Capital Funds from 2014 to 2017; and Trustee, Copeland Trust from 2010 to 2017. | |||||||
Independent Trustees: | ||||||||||||
Daniel F. Zemanek c/o Driehaus Capital Management LLC 25 East Erie Street Chicago, IL 60611 YOB: 1942 | Trustee and Chairman | Since 1996 Since 2014 | 9 | Retired; President of Ludan, Inc. (real estate development services specializing in senior housing) from April 2008 to December 2014. | None. | |||||||
Theodore J. Beck c/o Driehaus Capital Management LLC 25 East Erie Street Chicago, IL 60611 YOB: 1952 | Trustee | Since 2012 | 9 | Retired; President and Chief Executive Officer, National Endowment for Financial Education, 2005 to July 2018. | None. | |||||||
Francis J. Harmon c/o Driehaus Capital Management LLC 25 East Erie Street Chicago, IL 60611 YOB: 1942 | Trustee | Since 1998 | 9 | Relationship Manager, Great Lakes Advisors, Inc. since February 2008. | None. | |||||||
Dawn M. Vroegop c/o Driehaus Capital Management LLC 25 East Erie Street Chicago, IL 60611 YOB: 1966 | Trustee | Since 2012 | 9 | Private Investor. | Independent Trustee, Brighthouse Funds Trust I since December 2000 and Brighthouse Funds Trust II since May 2009. | |||||||
Christopher J. Towle, CFA c/o Driehaus Capital Management LLC 25 East Erie Street Chicago, IL 60611 YOB: 1957 | Trustee | Since 2016 | 9 | Retired; Partner, Portfolio Manager, Director of High Yield and Convertible Securities, Lord Abbett & Co. 1987 to 2014. | Independent Trustee, Brighthouse Funds Trust I and Brighthouse Funds Trust II, each since April 2018. | |||||||
| * | Mr. Kneeley became a Trustee on March 6, 2018. Mr. Kneeley is an “interested person” of the Trust, the Adviser and the Distributor, as defined in the 1940 Act, because he is an officer of the Adviser. |
51
The following table sets forth certain information with respect to the officers of the Trust:
Name, Address | Position(s) | Length of | Principal Occupation(s) During Past 5 Years | |||
Robert M. Kurinsky* 25 East Erie Street Chicago, IL 60611 YOB: 1972 | Vice President and Treasurer | Since January 2019 | Chief Financial Officer and Treasurer of the Adviser and Distributor since January 2019; Treasurer, Secretary and Chief Legal Officer of the Keeley Funds, Inc. through December 2018; President and Chief Operating Officer of Keeley-Teton Advisors, LLC from March 2017 to December 2018; Treasurer and Secretary of Joley Corp. and Keeley Holdings, Inc. through February 2017; Secretary, Treasurer, Chief Financial Officer and General Counsel of Keeley Asset Management Corp. through February 2017; Secretary, Treasurer, Chief Financial Officer and General Counsel of Keeley Investment Corp. through February 2017. | |||
Janet L. McWilliams 25 East Erie Street Chicago, IL 60611 YOB: 1970 | Assistant Vice President and Chief Legal Officer | Since 2007 Since 2012 | General Counsel and Secretary of the Adviser and Distributor since 2012. | |||
Michael R. Shoemaker 25 East Erie Street Chicago, IL 60611 YOB: 1981 | Chief Compliance Officer, Assistant Vice President and Anti-Money Laundering Compliance Officer | Since 2012 Since 2018 | Anti-Money Laundering Compliance Officer of the Distributor since 2018; Assistant Vice President and Chief Compliance Officer of the Adviser and Distributor since 2012. | |||
William H. Wallace, III 301 Bellevue Parkway Wilmington, DE 19809 YOB: 1969 | Secretary | Since 2015 | Vice President and Manager, The Bank of New York Mellon since 2010. | |||
Christine V. Mason 301 Bellevue Parkway Wilmington, DE 19809 YOB: 1956 | Assistant Secretary | Since 2015 | Vice President and Manager, The Bank of New York Mellon since March 2018; and Senior Specialist, The Bank of New York Mellon from 2013 to March 2018. | |||
Christina E.H. Jacobs** 25 East Erie Street Chicago, IL 60611 YOB: 1985 | Assistant Secretary | Since January 2019 | Senior Attorney of the Adviser since January 2019; Senior Attorney, Aegon USA Investment Management, LLC from December 2014 to January 2019; Head of Corporate Strategy and Support, Aegon USA Investment Management, LLC from April 2015 to January 2017; Attorney, Transamerica Life Insurance Company from May 2013 to December 2014. | |||
| * | Mr. Kurinsky became the Vice President and Treasurer on January 7, 2019, succeeding Michelle L. Cahoon. |
| ** | Ms. Jacobs became the Assistant Secretary on January 7, 2019. |
The Statement of Additional Information for Driehaus Mutual Funds contains more detail about the Trust’s Trustees and officers and is available upon request, without charge. For further information, please call1-877-779-0079.
52
Fund Expense Examples (unaudited)
As a mutual fund shareholder, you may incur two types of costs: (1) transaction costs, including sales charges; redemption fees; and exchange fees and (2) ongoing costs, including management fees; distribution(12b-1) and/or service fees; and other fund expenses. This example is intended to help you understand your ongoing costs (in dollars) of investing in the Fund and to compare these costs with the ongoing costs of investing in other mutual funds.
The example is based on an investment of $1,000 invested at the beginning of the period and held for the entire six month period ended December 31, 2018.
Actual Expenses
The first line of the table below (“Actual”) provides information about actual account values and actual expenses. You may use the information in this line, together with the amount you invested, to estimate the expense that you paid over the period. Simply divide your account value by $1,000 (for example, an $8,600 account value divided by $1,000 = 8.6), then multiply the result by the number in the first line under the heading entitled “Expenses Paid During Period” to estimate the expenses you paid on your account during this period.
Hypothetical Example for Comparison Purposes
The second line of the tables below (“Hypothetical”) provides information about hypothetical account values and hypothetical expenses based on the Fund’s actual expense ratio and an assumed rate of return of 5% per year before expenses, which is not the Fund’s actual return. You may use this information to compare the ongoing costs of investing in the Fund versus other funds. To do so, compare this 5% hypothetical example with the 5% hypothetical examples that appear in the shareholder reports of the other funds.
Please note that the expenses shown in the table are meant to highlight your ongoing costs only and do not reflect any transactional costs, such as sales charges, redemption fees or exchange fees. Therefore, the second line of the table is useful in comparing ongoing costs only, and will not help you determine the relative total costs of owning different funds. In addition, if these transactional costs were included, your costs would have been higher.
Driehaus Active Income Fund
| Beginning Account Value July 1, 2018 | Ending Account Value December 31, 2018 | Expenses Paid During Six Months Ended December 31, 2018* | ||||||||||
Actual | $ | 1,000.00 | $ | 977.60 | $ | 5.53 | ||||||
Hypothetical Example, assuming a 5% return before expenses | $ | 1,000.00 | $ | 1,019.62 | $ | 5.65 | ||||||
Driehaus Event Driven Fund
| Beginning Account Value July 1, 2018 | Ending Account Value December 31, 2018 | Expenses Paid During Six Months Ended December 31, 2018* | ||||||||||
Actual | $ | 1,000.00 | $ | 934.60 | $ | 8.58 | ||||||
Hypothetical Example, assuming a 5% return before expenses | $ | 1,000.00 | $ | 1,016.32 | $ | 8.94 | ||||||
53
Fund Expense Examples (unaudited) — (Continued)
Driehaus Multi-Asset Growth Economies Fund
| Beginning Account Value July 1, 2018 | Ending Account Value December 31, 2018 | Expenses Paid During Six Months Ended December 31, 2018* | ||||||||||
Actual | $ | 1,000.00 | $ | 923.80 | $ | 8.49 | ||||||
Hypothetical Example, assuming a 5% return before expenses | $ | 1,000.00 | $ | 1,016.37 | $ | 8.89 | ||||||
| * | Expenses are equal to the Funds’ annualized expense ratios for thesix-month period in the table below multiplied by the average account value over the period, multiplied by the number of days in the most recent fiscal half-year (184), then divided by 365 to reflect the half-year period. |
Driehaus Active Income Fund | 1.11% | |||
Driehaus Event Driven Fund | 1.76% | |||
Driehaus Multi-Asset Growth Economies Fund . | 1.75% |
54
Shareholder Information (unaudited)
TAX INFORMATION FOR THE YEAR ENDED DECEMBER 31, 2018
We are providing this information as required by the Internal Revenue Code. The amounts shown may differ from those elsewhere in this report because of differences between tax and financial reporting requirements.
The Funds designate the following amounts as a long-term capital gain distribution:
Active Income Fund | Event Driven Fund | Multi-Asset Growth Economies Fund | ||||||||
| $ | — | $ | — | $ | 29,970 | |||||
For taxablenon-corporate shareholders, the following percentages of income and short-term capital gains represent qualified dividend income subject to the 15% rate category:
Active Income Fund | Event Driven Fund | Multi-Asset Growth Economies Fund | ||||||||
| 24.64% | 100.00% | 100.00% | ||||||||
For corporate shareholders, the following percentages of income and short-term capital gains qualified for the dividends-received deduction:
Active Income Fund | Event Driven Fund | Multi-Asset Growth Economies Fund | ||||||||
| 6.26% | 22.95% | 1.82% | ||||||||
PROXY VOTING POLICIES AND PROCEDURES AND PROXY VOTING RECORD
A description of the Funds’ policies and procedures with respect to the voting of proxies relating to the Funds’ portfolio securities is available, without charge, upon request, by calling1-877-779-0079. This information is also available on the Funds’ website athttp://www.driehaus.com.
Information regarding how the Funds voted proxies related to portfolio securities during the12-month period ended June 30, 2018 is available without charge, upon request, by calling1-877-779-0079. This information is also available on the Securities and Exchange Commission’s (“SEC”) website athttp://www.sec.gov.
HOW TO OBTAIN QUARTERLY PORTFOLIO HOLDINGS
Each Fund files a complete schedule of portfolio holdings with the SEC for the first and third quarters of each fiscal year on FormN-Q. The Funds’ FormN-Q is available electronically on the SEC’s website athttp://www.sec.gov. Each Fund’s complete schedule of portfolio holdings is also available on the Funds’ website athttp://www.driehaus.com.
55
Board Considerations in Connection with the Annual Review of the Investment Advisory Agreement
The Board of Trustees of the Driehaus Mutual Funds (the “Trust”), including a majority of the Trustees who are not “interested persons” (as defined in the Investment Company Act of 1940, as amended) (the “Independent Trustees”), approved the renewal of the investment advisory agreement (the “Agreement”) with Driehaus Capital Management LLC (the “Adviser”) for Driehaus Active Income Fund (“LCMAX”), Driehaus Event Driven Fund (“DEVDX”), and Driehaus Multi-Asset Growth Economies Fund (“DMAGX”) (LCMAX, DEVDX and DMAGX are each a “Fund” and collectively, the “Funds”) on September 13, 2018 for an additionalone-year term ending September 30, 2019. As part of its review process, the Board requested and evaluated all information it deemed reasonably necessary to evaluate the Agreement. The Board reviewed comprehensive materials received from the Adviser and from independent legal counsel. The Board also received extensive information throughout the year regarding performance and operating results of each Fund. The Independent Trustees held a conference call with their independent legal counsel on September 6, 2018 to review the materials provided in response to their request and identified areas for further response by Fund management. Following receipt of further information from Fund management, the Independent Trustees, represented by independent legal counsel, met independent of Fund management to consider renewal of the Agreement for each Fund. After their consideration of all the information received, the Independent Trustees presented their findings and their recommendation to renew the Agreement at the Board meeting.
In connection with the contract review process, the Board considered the factors discussed below, among others. The Board also considered that the Adviser has managed each Fund for an extended period or since inception, and the Board believes that a long-term relationship with a capable, conscientious adviser is in the best interests of each Fund.
Nature, Quality and Extent of Services. The Board considered the nature, extent and quality of services provided under the Agreement, including portfolio management services and certain administrative services. The Board considered the experience and skills of senior management and investment personnel, the resources made available to such personnel, the ability of the Adviser to attract and retain high-quality personnel, and the organizational depth of the Adviser. The Board also considered the Trust’s compliance with legal and regulatory requirements, as well as the Adviser’s handling of portfolio brokerage, and noted the Adviser’s process for evaluating best execution. The Board considered the Adviser’s risk management strategies and the process developed by the Adviser for analyzing, reviewing and assessing risk exposure for the Funds. The Board also considered the Funds’ process for fair valuation of portfolio securities and noted the Board’s review of Fund valuation matters throughout the year.
The Board received and considered performance information provided for each Fund, comparing it to the performance of a peer universe of funds (the “Performance Universe”) compiled by Broadridge using data from Lipper Analytical Services, Inc., an independent provider of mutual fund data (“Lipper”) and to each Fund’s primary benchmark index, as identified in reports to shareholders. The Board noted the Adviser’s statement that the benchmarks for Driehaus Active Income Fund and Driehaus Event Driven Fund are more representative for long-only funds.
The Board considered that, as of June 30, 2018, although Driehaus Active Income Fund’s performance was in the third quintile of its Performance Universe for the1-year period and the fourth quintile of its Performance Universe for the3- and5-year periods (the first quintile being the best performers and the fifth quintile being the worst performers), the Fund outperformed its primary benchmark index, the FTSE3-MonthT-Bill Index, for the3- and5-year periods. The Board also noted that Driehaus Active Income Fund outperformed its other benchmark index, the Bloomberg Barclays U.S. Aggregate Bond Index (“Barclays Index”) for theyear-to-date and1-year periods and had met its volatility objective of being less volatile than the Barclays Index for the1-year period.
The Board considered that, as of June 30, 2018, Driehaus Event Driven Fund’s performance was in the second quintile of its Performance Universe for the1-year and since-inception periods (the Fund’s inception date was August 26, 2013) and in the third quintile of its Performance Universe for the3-year period. The Board noted that Driehaus Event Driven Fund underperformed its primary benchmark index, the S&P 500 Index, for the1- and3-year and since-inception periods. The Board noted that for the3-year period, Driehaus Event Driven Fund had met its volatility objective of being less volatile than the S&P 500 Index, but slightly missed its target of having a standard deviation oftwo-thirds or less than that of the S&P 500 Index.
56
The Board considered that, as of June 30, 2018, Driehaus Multi-Asset Growth Economies Fund’s performance was in the second quintile of its Performance Universe for the1-year period and in the first quintile of its Performance Universe for the since-inception period (the Fund’s inception date was April 10, 2017). The Board noted that Driehaus Multi-Asset Growth Economies Fund outperformed its primary benchmark index, the equally weighted MSCI Emerging Markets and JPMorgan Global Bond Index Emerging Markets Global Diversified blended index, for the1-year and since-inception periods.
On the basis of this evaluation and its ongoing review of investment results, the Board concluded that the nature, quality and extent of services provided by the Adviser supported renewal of the Agreement for each Fund.
Fees. The Board considered each Fund’s contractual management fee rate, operating expenses and total expense ratio as of December 31, 2017 as compared to peer expense group information based on data compiled from Lipper as of the most recent fiscal year end of each fund in the peer group (with fifth quintile being the highest fee). The Board noted that Driehaus Active Income Fund’s contractual management fee rate was in the first quintile of its peer group, Driehaus Event Driven Fund’s contractual management fee rate was in the second quintile of its peer group and Driehaus Multi-Asset Growth Economies Fund’s contractual management fee rate was in the fifth quintile of its peer group. In addition, the Board considered the expense reimbursement arrangement with the Adviser for Driehaus Multi-Asset Growth Economies Fund.
The Board also considered that for the fiscal year ended December 31, 2017, Driehaus Active Income Fund’s total expense ratio was in the first quintile of its peer group and Driehaus Event Driven Fund’s and Driehaus Multi-Asset Growth Economies Fund’s total expense ratios were in the fifth quintile of their respective peer groups. The Board noted the narrow margin among the total expense ratios of Driehaus Event Driven Fund’s peer group, which resulted in the Fund’s total expense ratio of 1.447% being in the fifth quintile despite the peer group’s median total expense ratio of 1.419%. As to the Driehaus Multi-Asset Growth Economies Fund, the Board noted that the Fund’s total expense ranking was in part driven by thenon-management expenses (including transfer agent, custodian and othernon-management fee expenses), which reflected the small size of the Fund. The Board also considered Driehaus Active Income Fund’s and Driehaus Event Driven Fund’s advisory fee rate as compared to the fee charged by the Adviser for a similarsub-advised unaffiliated mutual fund. The Board noted that the mix of services provided, the level of responsibility, the legal, reputational and regulatory risks and the resources required under the Agreement were significantly greater as compared to the Adviser’s obligations forsub-advising the other mutual funds. In considering the reasonableness of the advisory fees, the Board took into account the Adviser’s substantial human and technological resources devoted to investing for the Funds and the relatively small amount of assets under management for Driehaus Event Driven Fund and Driehaus Multi-Asset Growth Economies Fund. In addition, the Board noted that the Adviser’s directed brokerage program had resulted in a total of approximately $78,000 in directed brokerage credits during calendar year 2017, which were used to reduce expenses of the Funds.
On the basis of the information reviewed, the Board concluded that the advisory fee schedule for each Fund was reasonable in light of the nature and quality of services provided by the Adviser.
Profitability. The Board reviewed information regarding revenues received by the Adviser under the Agreement from each Fund and discussed the Adviser’s methodology in allocating its costs to the management of the Funds. The Board considered the estimated costs to the Adviser of managing the Funds. The Board also noted that the Funds do not have a Rule12b-1 fee and that the Adviser’s affiliate, Driehaus Securities LLC (“DS LLC”), serves as distributor of the Funds without compensation, that DS LLC provides compensation to intermediaries for shareholder services and for distribution of the Funds’ shares, and that DS LLC is reimbursed by Driehaus Active Income Fund and Driehaus Event Driven Fund under a Shareholder Services Plan (the “Plan”) for certain amounts paid for shareholder services covered under the Plan. The Board concluded that, based on the profitability calculated for the Trust as well as for the Funds individually (noting that Driehaus Event Driven Fund and Driehaus Multi-Asset Growth Economies Fund operated at a loss), profitability was not excessive in light of the nature, extent and quality of the services provided to the Funds.
Economies of Scale. In considering the reasonableness of the advisory fee, the Board considered whether there are economies of scale with respect to the management of the Funds and whether the Funds benefit from any such economies of scale. Given the current size of the Funds, the Board concluded that the advisory fee rates under the Agreement are reasonable and reflect an appropriate sharing of any such economies of scale.
57
Other Benefits to the Adviser and its Affiliates. The Board also considered the character and amount of other incidental benefits received by the Adviser and its affiliates. The Board noted that payments to DS LLC under the Plan are in reimbursement of payments made to intermediaries for shareholder services. The Board also considered benefits to the Adviser related to soft dollar allocations. The Board concluded that the advisory fees were reasonable in light of anyfall-out benefits.
Based on all of the information considered and the conclusions reached, the Board determined that the terms of the Agreement continue to be fair and reasonable and that the continuation of the Agreement is in the best interests of each Fund. No single factor was determinative in the Board’s analysis.
58
Item 2. Code of Ethics.
| (a) | The registrant, as of the end of the period covered by this report, has adopted a code of ethics that applies to the registrant’s principal executive officer, principal financial officer, principal accounting officer or controller, or persons performing similar functions, regardless of whether these individuals are employed by the registrant or a third party. |
| (b) | No response required. |
| (c) | There have been no amendments, during the period covered by this report, to a provision of the code of ethics that applies to the registrant’s principal executive officer, principal financial officer, principal accounting officer or controller, or persons performing similar functions, regardless of whether these individuals are employed by the registrant or a third party, and that relates to any element of the code of ethics description. |
| (d) | The registrant has not granted any waivers, including an implicit waiver, from a provision of the code of ethics that applies to the registrant’s principal executive officer, principal financial officer, principal accounting officer or controller, or persons performing similar functions, regardless of whether these individuals are employed by the registrant or a third party, that relates to one or more of the items set forth in paragraph (b) of this item. |
| (e) | Not applicable. |
| (f) | The registrant’s Code of Ethics for Principal Executive and Financial Officers was filed as Exhibit 12(a)(1) to the registrant’s Certified Shareholder Report on FormN-CSR, Accession Number0001193125-12-093739, on March 2, 2012, and is incorporated herein by reference. |
Item 3. Audit Committee Financial Expert.
The registrant’s Board of Trustees has designated Dawn M. Vroegop as an audit committee financial expert. Ms. Vroegop is “independent,” as defined by this Item 3.
Item 4. Principal Accountant Fees and Services.
| (a) | Audit Fees |
For the fiscal years ended December 31, 2018 and 2017, Ernst & Young LLP, the registrant’s principal accountant (“E&Y”), billed the registrant $418,800 and $383,500, respectively, for professional services rendered for the audit of the registrant’s annual financial statements or services that are normally provided in connection with statutory and regulatory filings.
| (b) | Audit-Related Fees |
For the fiscal years ended December 31, 2018 and 2017, E&Y billed the registrant $0 and $0, respectively, for assurance and related services that are reasonably related to the performance of the audit of the registrant’s financial statements and that are not reported above.
For engagements that Driehaus Capital Management LLC, the registrant’s investment adviser (“DCM”), or Driehaus Securities LLC, the registrant’s distributor (“DS”), entered into with E&Y for fiscal years 2018 and 2017, E&Y provided no audit-related services to DCM or DS that were for engagements directly related to the registrant’s operations and financial reporting, except for the following services for which E&Y billed DCM a total of $17,500 in 2017: i) the issuance of three consents to be included in the registration statements for two series of the registrant, and ii) the audits of the full schedule of investments for two predecessor partnerships to new series of the registrant.
| (c) | Tax Fees |
For the fiscal years ended December 31, 2018 and 2017, E&Y billed the registrant $94,505 and $97,045 respectively, for professional services rendered for tax compliance, tax advice, and tax planning. Such services consisted of review of the registrant’s income tax returns and tax distribution requirements and analysis related to passive foreign investment company status. The Audit Committeepre-approved all tax services that E&Y provided to the registrant.
For fiscal years 2018 and 2017, E&Y provided no tax services to DCM or DS that were for engagements directly related to the registrant’s operations and financial reporting.
| (d) | All Other Fees |
For the fiscal years ended December 31, 2018 and 2017, E&Y billed the registrant $0 and $0, respectively, for products and services provided, other than the services reported above.
For fiscal years 2018 and 2017, E&Y provided no other services to DCM or DS that were for engagements directly related to the registrant’s operations and financial reporting.
(e)(1) Audit CommitteePre-Approval Policies and Procedures
Pursuant to registrant’s Audit Committee Charter (the “Charter”), the Audit Committee is responsible forpre-approving any engagement of the principal accountant to providenon-prohibited services to the registrant, including the fees and other compensation to be paid to the principal accountant, to the extent required by Rule2-01(c)(7) of RegulationS-X. The Chairperson of the Audit Committee may grantpre-approval for such engagements of $5,000 or less. All such delegatedpre-approvals will be presented to the Audit Committee no later than the next Audit Committee meeting.
Pursuant to the Charter, the Audit Committee is also responsible forpre-approving any engagement of the principal accountant, including the fees and other compensation to be paid to the principal accountant, to providenon-audit services to the registrant’s investment adviser (or any entity controlling, controlled by, or under common control with the adviser that provides ongoing services to the registrant), if the engagement relates directly to the operations and financial reporting of the registrant, to the extent required by Rule2-01(c)(7) of RegulationS-X. The Chairperson of the Audit Committee may grantpre-approval for engagements of $5,000 or less. All such delegatedpre-approvals will be presented to the Audit Committee no later than the next Audit Committee meeting.
| (e)(2) | The percentage of services described in each of paragraphs (b) through (d) of this Item that were approved by the Audit Committee pursuant to paragraph (c)(7)(i)(C) of Rule2-01 of RegulationS-X is 0%. |
| (f) | Not applicable. |
| (g) | Non-Audit Fees |
For the fiscal years ended December 31, 2018 and 2017, E&Y billed the registrant $94,505 and $97,045, respectively, in aggregatenon-audit fees. For the fiscal years ended December 31, 2018 and 2017, E&Y billed DCM or DS $0 and $0, respectively, in aggregatenon-audit fees.
| (h) | Not applicable. |
Item 5. Audit Committee of Listed Registrants.
Not applicable.
Item 6. Investments.
| (a) | Schedule of Investments in securities of unaffiliated issuers as of the close of the reporting period is included as part of the report to shareholders filed under Item 1 of this form. |
| (b) | Not applicable. |
| Item 7. | Disclosure of Proxy Voting Policies and Procedures forClosed-End Management Investment Companies. |
Not applicable.
| Item 8. | Portfolio Managers ofClosed-End Management Investment Companies. |
Not applicable.
| Item 9. | Purchases of Equity Securities byClosed-End Management Investment Company and Affiliated Purchasers. |
Not applicable.
Item 10. Submission of Matters to a Vote of Security Holders.
There have been no material changes to the procedures by which the shareholders may recommend nominees to the registrant’s board of directors, where those changes were implemented after the registrant last provided disclosure in response to the requirements of Item 407(c)(2)(iv) of RegulationS-K (17 CFR 229.407) (as required by Item 22(b)(15) of Schedule 14A (17 CFR240.14a-101)), or this Item.
Item 11. Controls and Procedures.
| (a) | The registrant’s principal executive and principal financial officers, or persons performing similar functions, have concluded that the registrant’s disclosure controls and procedures (as defined in Rule30a-3(c) under the Investment Company Act of 1940, as amended (the “1940 Act”) (17 CFR270.30a-3(c))) are effective, as of a date within 90 days of the filing date of the report that includes the disclosure required by this paragraph, based on their evaluation of these controls and procedures required by Rule30a-3(b) under the 1940 Act (17 CFR270.30a-3(b)) and Rules13a-15(b) or15d-15(b) under the Securities Exchange Act of 1934, as amended (17 CFR240.13a-15(b) or240.15d-15(b)). |
| (b) | There were no changes in the registrant’s internal control over financial reporting (as defined in Rule30a-3(d) under the 1940 Act (17 CFR270.30a-3(d))) that occurred during the registrant’s last fiscal quarter that has materially affected, or is reasonably likely to materially affect, the registrant’s internal control over financial reporting. |
Item 12. Disclosure of Securities Lending Activities forClosed-End Management Investment Companies.
Not applicable.
Item 13. Exhibits.
| (a)(1) | Code of ethics, or any amendment thereto, that is the subject of disclosure required by Item 2, was filed as Exhibit 12(a)(1) to the registrant’s FormN-CSR, on March 2, 2012 (AccessionNo. 0001193125-12-093738), and is incorporated herein by reference. | |
| (a)(2) | Certifications pursuant to Rule30a-2(a) under the 1940 Act and Section 302 of the Sarbanes-Oxley Act of 2002 are attached hereto. | |
| (a)(3) | Not applicable. | |
| (a)(4) | Not applicable. | |
| (b) | Certifications pursuant to Rule30a-2(b) under the 1940 Act and Section 1350 of Chapter 63 of Title 18 of the United States Code (18 U.S.C. 1350) are attached hereto. | |
SIGNATURES
Pursuant to the requirements of the Securities Exchange Act of 1934 and the Investment Company Act of 1940, the registrant has duly caused this report to be signed on its behalf by the undersigned, thereunto duly authorized.
| (Registrant) | Driehaus Mutual Funds | |
| By (Signature and Title)* | /s/Stephen J. Kneeley | |
| Stephen J. Kneeley, President (principal executive officer) | ||
| Date | March 4, 2019 | |
Pursuant to the requirements of the Securities Exchange Act of 1934 and the Investment Company Act of 1940, this report has been signed below by the following persons on behalf of the registrant and in the capacities and on the dates indicated.
| By (Signature and Title)* | /s/Stephen J. Kneeley | |
| Stephen J. Kneeley, President (principal executive officer) |
| Date | March 4, 2019 | |
| By (Signature and Title)* | /s/Robert M. Kurinsky | |
| Robert M. Kurinsky, Vice President and Treasurer (principal financial officer) |
| Date | March 4, 2019 | |
| * | Print the name and title of each signing officer under his or her signature. |