Table of Contents
UNITED STATES
SECURITIES AND EXCHANGE COMMISSION
Washington, D.C. 20549
FORM N-CSR
CERTIFIED SHAREHOLDER REPORT OF REGISTERED
MANAGEMENT INVESTMENT COMPANIES
Investment Company Act file number 811-07655
Driehaus Mutual Funds
(Exact name of registrant as specified in charter)
25 East Erie Street
Chicago, IL 60611
(Address of principal executive offices) (Zip code)
Janet L. McWilliams
Driehaus Capital Management LLC
25 East Erie Street
Chicago, IL 60611
(Name and address of agent for service)
Registrant’s telephone number, including area code: 312-587-3800
Date of fiscal year end: December 31
Date of reporting period: December 31, 2015
Form N-CSR is to be used by management investment companies to file reports with the Commission not later than 10 days after the transmission to stockholders of any report that is required to be transmitted to stockholders under Rule 30e-1 under the Investment Company Act of 1940 (17 CFR 270.30e-1). The Commission may use the information provided on Form N-CSR in its regulatory, disclosure review, inspection, and policymaking roles.
A registrant is required to disclose the information specified by Form N-CSR, and the Commission will make this information public. A registrant is not required to respond to the collection of information contained in Form N-CSR unless the Form displays a currently valid Office of Management and Budget (“OMB”) control number. Please direct comments concerning the accuracy of the information collection burden estimate and any suggestions for reducing the burden to Secretary, Securities and Exchange Commission, 100 F Street, NE, Washington, DC 20549. The OMB has reviewed this collection of information under the clearance requirements of 44 U.S.C. § 3507.
Table of Contents
| Item 1. | Reports to Stockholders. |
The Reports to Shareholders are attached herewith.
Table of Contents
Driehaus Mutual Funds
Trustees & Officers
Richard H. Driehaus
Trustee
Theodore J. Beck
Trustee
Francis J. Harmon
Trustee
Christopher J. Towle*
Trustee
Dawn M. Vroegop
Trustee
Daniel F. Zemanek
Chairman of the Board
Robert H. Gordon
President
Michelle L. Cahoon
Vice President & Treasurer
Janet L. McWilliams
Chief Legal Officer &
Assistant Vice President
Michael R. Shoemaker
Chief Compliance Officer &
Assistant Vice President
William H. Wallace, III
Secretary
Michael P. Kailus
Assistant Secretary & Anti-Money
Laundering Compliance Officer
Christine Mason
Assistant Secretary
Investment Adviser
Driehaus Capital Management LLC
25 East Erie Street
Chicago, IL 60611
Distributor
Driehaus Securities LLC
25 East Erie Street
Chicago, IL 60611
Administrator & Transfer Agent
BNY Mellon Investment Servicing (US) Inc.
4400 Computer Drive
Westborough, MA 01581
Custodian
The Northern Trust Company
50 South LaSalle Street
Chicago, IL 60603
* Effective January 1, 2016
Annual Report to Shareholders
December 31, 2015

Driehaus Emerging Markets Growth Fund
Driehaus Emerging Markets Small Cap Growth Fund
Driehaus Frontier Emerging Markets Fund
Driehaus International Small Cap Growth Fund
Driehaus Micro Cap Growth Fund
Distributed by:
Driehaus Securities LLC
This report has been prepared for the shareholders of the Funds and is not an offer to sell or buy any Fund securities. Such offer is only made by the Funds’ prospectus.
Table of Contents
Annual Report to Shareholders
December 31, 2015
Investment Philosophy:
The Adviser seeks to achieve superior investment returns primarily by investing in global companies that are currently demonstrating rapid growth in their sales and earnings and which, in its judgement, have the ability to continue or accelerate their growth rates in the future. The Adviser manages the portfolios actively (above average turnover) to ensure that the Funds are fully invested, under appropriate market conditions, in companies that meet these criteria. Investors should note that investments in overseas markets can pose more risks than U.S. investments, and the international Funds’ share prices are expected to be more volatile than those of the U.S.-only Funds. In addition, the Funds’ returns will fluctuate with changes in stock market conditions, currency values, interest rates, government regulations, and economic and political conditions in countries in which the Funds invest. These risks are generally greater when investing in emerging markets.
Driehaus Emerging Markets Growth Fund
Driehaus Emerging Markets Small Cap Growth Fund
Driehaus Frontier Emerging Markets Fund
Driehaus International Small Cap Growth Fund
Driehaus Micro Cap Growth Fund
Table of Contents
Performance Overview and Schedule of Investments: | ||||
| 1 | ||||
| 8 | ||||
| 16 | ||||
| 23 | ||||
| 30 | ||||
| 36 | ||||
| 38 | ||||
| 40 | ||||
| 42 | ||||
| 47 | ||||
| 59 | ||||
| 60 | ||||
| 61 | ||||
| 62 | ||||
| 64 | ||||
Board Considerations in Connection with the Annual Review of the Investment Advisory Agreement | 65 | |||
Table of Contents
Driehaus Emerging Markets Growth Fund — Portfolio Managers’ Letter
Dear Fellow Shareholders,
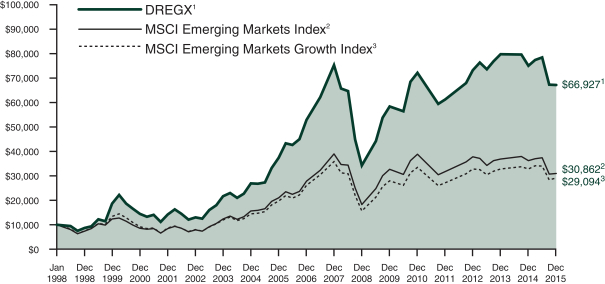
The Driehaus Emerging Markets Growth Fund (“Fund”) returned -10.49% for the year ended December 31, 2015. The Fund’s benchmark, the Morgan Stanley Capital International (“MSCI”) Emerging Markets Index (“Benchmark”), returned -14.60% for the year, while the MSCI Emerging Markets Growth Index returned -11.12%.
This past year investors struggled through heightened volatility, a global economic growth slowdown, particularly in China and other emerging markets, a troubled and deflationary Europe, and dramatically lower crude oil and overall commodity prices. For emerging markets, it was one of the worst years for the asset class as a whole since the 2008 global financial crisis. China’s slowing demand for commodities, along with the fall in crude oil prices, led to lower commodity prices and general macroeconomic concern regarding global growth.
Over the course of 2015, security selection within the financials and information technology sectors contributed to the Fund’s returns versus the Benchmark. From a country perspective, holdings in China and Taiwan made key contributions to performance versus the Benchmark in the past year.
Tencent Holdings, Ltd. (Ticker: 700 HK) made a notable contribution to the Fund’s returns for the year. The China-based company is the country’s largest provider of Internet, telecommunications and mobile services. Robust ad revenue was the key to Tencent’s growth and strong results in 2015, providing a substantial portion of overall revenue. Additionally, the company’s new mobile game strategy seems to have generated a reacceleration in that segment of the business, positioning it well for the coming year.
HDFC Bank, Ltd. (Ticker: HDFCB IN) was a significant contributor to the Fund’s return. The company is engaged in providing a range of corporate banking and financial services. Strong balance sheet growth and increases in non-interest income drove results in 2015. As the year progressed, solid quarterly earnings and continued improvement in operating efficiency increasingly made the stock attractive to investors.
During 2015, stock selection within the energy and consumer staples sectors detracted from the Fund’s returns versus the Benchmark. At the country level, holdings in South Korea and Russia detracted from Fund performance versus the Benchmark.
Fund holding Lukoil PJSC (Ticker: LKOD LI) was a large detractor from returns. Lukoil is a Russia-based oil and gas company primarily engaged in the exploration and production of oil, gas and related products. Although the company announced positive revenue and earnings results throughout the year, free cash flow issues plagued Lukoil, including a dip into negative territory mid-year. These low capital levels were made worse by dramatic drops in the price of oil.
A significant detractor from the Fund’s return for the year was SK Hynix Inc. (Ticker: 000660 KS). The South Korea-based company develops and manufactures memory and non-memory semiconductors. After the company posted lackluster results in the second quarter of 2015, its share price began a negative trajectory that continued throughout the rest of the year. Prices for its products remain low while the company also engaged in wage hikes during the year.
We believe 2016 will see a continuation of the elevated volatility and return dispersion that materialized last year. Evolution of Federal Reserve monetary policy, and accordingly the US dollar, will likely be a key factor. Despite the challenging environment for emerging markets as a whole, we continue to find companies with differentiated business models, idiosyncratic fundamental drivers and structural growth potential. In terms of the asset class as a whole, with valuations relative to the rest of the world at decade lows, we see the relative valuation case for emerging markets beginning to strengthen. What is needed to further bolster the case for emerging markets is stabilization in growth rates and improvement in return on invested capital.
1
Table of Contents
We thank you for your interest in the Driehaus Emerging Markets Growth Fund and would like to express our gratitude to you as shareholders for your confidence in our management capabilities.
Sincerely,
 |  |  | ||
| Howard Schwab | Chad Cleaver | Rich Thies | ||
| Lead Portfolio Manager | Co-Portfolio Manager | Assistant Portfolio Manager |
Performance is historical and does not represent future results.
Please see the following performance overview page for index descriptions.
2
Table of Contents
Driehaus Emerging Markets Growth Fund
Performance Overview (unaudited)
The performance summarized below is historical and does not represent future results. Investment returns and principal value vary, and you may have a gain or loss when you sell shares. Performance data presented measures the change in the value of an investment in the Fund, assuming reinvestment of all dividends and capital gains. Average annual total return reflects annualized change.
The table does not reflect the deduction of taxes that a shareholder would pay on Fund distributions or the redemption of Fund shares. The graph compares the results of a $10,000 investment in the Fund since December 31, 1997 (the date of the Fund’s inception), with all dividends and capital gains reinvested, with the indicated indices (and dividends reinvested) for the same period.
| Average Annual Total Returns as of 12/31/15 | 1 Year | 3 Years | 5 Years | 10 Years | Since Inception (12/31/97 - 12/31/15) | |||||||||||||||
Driehaus Emerging Markets Growth Fund (DREGX)1 | –10.49% | –2.85% | –1.42% | 6.01% | 11.14% | |||||||||||||||
MSCI Emerging Markets Index2 | –14.60% | –6.42% | –4.47% | 3.95% | 6.46% | |||||||||||||||
MSCI Emerging Markets Growth Index3 | –11.12% | –3.86% | –2.70% | 4.01% | 6.11% | |||||||||||||||
| 1 | The returns for the periods prior to July 1, 2003, reflect fee waivers and/or reimbursements without which performance would have been lower. |
| 2 | The Morgan Stanley Capital International Emerging Markets Index (MSCI Emerging Markets Index) is a market capitalization-weighted index designed to measure equity market performance in 23 global emerging markets. Data is in U.S. dollars. Source: Morgan Stanley Capital International Inc. |
| 3 | The Morgan Stanley Capital International Emerging Markets Growth Index (MSCI Emerging Markets Growth Index) is a subset of the MSCI Emerging Markets Index and includes only the MSCI Emerging Markets Index stocks which are categorized as growth stocks. Data is in U.S. dollars. Source: Morgan Stanley Capital International Inc. |
3
Table of Contents
Driehaus Emerging Markets Growth Fund
Schedule of Investments
December 31, 2015
Number of Shares | Value (Note A) | |||||||
| EQUITY SECURITIES — 93.9% | ||||||||
| FAR EAST — 61.8% | ||||||||
China — 23.3% |
| |||||||
58.com, Inc. — ADR** | 104,690 | $ | 6,905,352 | |||||
AIA Group, Ltd. | 4,330,487 | 26,038,628 | ||||||
Anta Sports Products, Ltd. | 1,315,311 | 3,614,960 | ||||||
China Construction Bank | 36,152,402 | 24,770,067 | ||||||
China Life Insurance Co., | 2,941,618 | 9,508,007 | ||||||
China Mobile, Ltd. | 2,416,115 | 27,278,542 | ||||||
China Overseas Land & Investment, Ltd. | 3,140,412 | 11,021,762 | ||||||
CNOOC, Ltd. | 6,745,611 | 7,024,094 | ||||||
CSPC Pharmaceutical Group, Ltd. | 5,560,854 | 5,682,797 | ||||||
Ctrip.com International, Ltd. — ADR** | 186,298 | 8,631,186 | ||||||
JD.com, Inc. — ADR** | 446,617 | 14,410,098 | ||||||
Kweichow Moutai Co. Ltd. — A | 847,734 | 28,484,520 | ||||||
NetEase, Inc. — ADR | 38,140 | 6,912,494 | ||||||
Ping An Insurance Group Co. of China, Ltd. — H | 3,820,365 | 21,196,727 | ||||||
Sands China, Ltd. | 7,104,215 | 24,337,509 | ||||||
Techtronic Industries Co., Ltd. | 2,751,141 | 11,217,483 | ||||||
Tencent Holdings, Ltd. | 3,037,997 | 59,779,555 | ||||||
Xinyi Solar Holdings, Ltd. | 6,879,519 | 2,813,927 | ||||||
Zhengzhou Yutong Bus Co., | 3,278,153 | 11,353,588 | ||||||
Zhuzhou CSR Times Electric Co., Ltd. — H | 1,180,236 | 6,860,553 | ||||||
|
| |||||||
| 317,841,849 | ||||||||
|
| |||||||
India — 11.9% |
| |||||||
Axis Bank, Ltd. | 954,288 | 6,478,160 | ||||||
Britannia Industries, Ltd. | 105,950 | 4,750,564 | ||||||
HDFC Bank, Ltd. — ADR | 838,277 | 51,637,863 | ||||||
Infosys, Ltd. — SP ADR | 902,888 | 15,123,374 | ||||||
ITC, Ltd. | 2,422,629 | 12,003,972 | ||||||
LIC Housing Finance, Ltd. | 1,612,137 | 12,429,218 | ||||||
Marksans Pharma, Ltd. | 2,692,951 | 4,261,910 | ||||||
Strides Shasun, Ltd. | 338,853 | 6,604,064 | ||||||
Sun Pharmaceutical Industries, Ltd. | 875,278 | 10,850,966 | ||||||
Suzlon Energy, Ltd.** | 32,592,139 | 10,271,835 | ||||||
Tata Motors, Ltd. — SP ADR** | 344,011 | 10,138,004 | ||||||
Ultratech Cement, Ltd. | 161,199 | 6,775,201 | ||||||
Zee Entertainment Enterprises, Ltd. | 1,733,870 | 11,459,759 | ||||||
|
| |||||||
| 162,784,890 | ||||||||
|
| |||||||
Number of Shares | Value (Note A) | |||||||
South Korea — 11.6% |
| |||||||
Amorepacific Corp. | 62,687 | $ | 22,160,046 | |||||
CJ CGV Co., Ltd. | 58,806 | 6,319,181 | ||||||
Cosmax, Inc. | 67,956 | 10,663,856 | ||||||
Hyundai Development Co. — Engineering & Construction | 79,987 | 2,646,792 | ||||||
Kangwon Land, Inc. | 298,572 | 9,777,975 | ||||||
KEPCO Plant Service & Engineering Co., Ltd. | 75,834 | 5,756,024 | ||||||
Kia Motors Corp. | 235,271 | 10,554,138 | ||||||
Korea Electric Power Corp. | 239,176 | 10,198,968 | ||||||
Korea Investment Holdings Co., Ltd. | 116,421 | 4,919,757 | ||||||
Macquarie Korea Infrastructure Fund | 1,000,069 | 6,848,795 | ||||||
Samsung Electronics Co., Ltd. | 32,052 | 34,442,472 | ||||||
Samsung Electronics Co., Ltd. — Pref. | 24,344 | 22,650,893 | ||||||
Samsung Fire & Marine Insurance Co., Ltd. | 41,084 | 10,774,236 | ||||||
|
| |||||||
| 157,713,133 | ||||||||
|
| |||||||
Taiwan — 7.6% |
| |||||||
Delta Electronics, Inc. | 1,415,663 | 6,701,848 | ||||||
E.Sun Financial Holding Co., Ltd. | 21,717,428 | 12,661,392 | ||||||
Ennoconn Corp. | 639,455 | 7,241,978 | ||||||
Far EasTone Telecommunications Co., Ltd. | 4,348,248 | 8,948,810 | ||||||
Hon Hai Precision Industry Co., Ltd. | 4,207,172 | 10,349,179 | ||||||
Land Mark Optoelectronics Corp. | 243,084 | 3,641,043 | ||||||
Largan Precision Co., Ltd. | 56,210 | 3,884,577 | ||||||
Taiwan Semiconductor Manufacturing Co., Ltd. — SP ADR | 2,172,562 | 49,425,786 | ||||||
|
| |||||||
| 102,854,613 | ||||||||
|
| |||||||
Indonesia — 3.0% |
| |||||||
PT Bank Central Asia Tbk | 12,393,628 | 11,957,581 | ||||||
PT Telekomunikasi Indonesia Persero Tbk | 129,074,271 | 29,073,312 | ||||||
|
| |||||||
| 41,030,893 | ||||||||
|
| |||||||
Thailand — 1.8% |
| |||||||
CP ALL PCL — NVDR | 16,174,052 | 17,641,560 | ||||||
Siam Cement PCL — NVDR | 549,466 | 7,023,881 | ||||||
|
| |||||||
| 24,665,441 | ||||||||
|
| |||||||
Notes to Financial Statements are an integral part of this Schedule.
4
Table of Contents
Driehaus Emerging Markets Growth Fund
Schedule of Investments
December 31, 2015
Number of Shares | Value (Note A) | |||||||
Singapore — 1.2% |
| |||||||
Avago Technologies, Ltd. | 115,084 | $ | 16,704,443 | |||||
Malaysia — 1.1% | ||||||||
IHH Healthcare BHD | 9,481,467 | 14,530,815 | ||||||
Philippines — 0.3% |
| |||||||
Universal Robina Corp. | 1,050,712 | 4,153,277 | ||||||
|
| |||||||
Total FAR EAST | 842,279,354 | |||||||
|
| |||||||
| NORTH AMERICA — 14.7% | ||||||||
Mexico — 7.8% |
| |||||||
Alfa SAB de CV | 6,775,787 | 13,418,295 | ||||||
Alsea SAB de CV | 4,165,646 | 14,499,817 | ||||||
Fibra Uno Administracion SA de CV — REIT | 6,302,171 | 13,891,872 | ||||||
Fomento Economico Mexicano SAB de CV — SP ADR | 107,241 | 9,903,706 | ||||||
Gruma SAB de CV — B | 756,654 | 10,645,708 | ||||||
Grupo Financiero Banorte SAB de CV — O | 3,831,658 | 21,076,398 | ||||||
Grupo Televisa SAB — SP ADR | 488,360 | 13,288,276 | ||||||
Promotora y Operadora de Infraestructura SAB de CV** | 767,108 | 9,031,974 | ||||||
|
| |||||||
| 105,756,046 | ||||||||
|
| |||||||
United States — 6.9% |
| |||||||
Cognizant Technology Solutions Corp. — A** | 141,100 | 8,468,822 | ||||||
Eli Lilly & Co. | 79,195 | 6,672,971 | ||||||
Facebook, Inc. — A** | 190,672 | 19,955,732 | ||||||
Newmont Mining Corp. | 462,851 | 8,326,689 | ||||||
NIKE, Inc. — B | 53,270 | 3,329,375 | ||||||
Philip Morris International, Inc. | 295,338 | 25,963,164 | ||||||
Schlumberger, Ltd. | 194,778 | 13,585,766 | ||||||
Visa, Inc. — A | 100,544 | 7,797,187 | ||||||
|
| |||||||
| 94,099,706 | ||||||||
|
| |||||||
Total NORTH AMERICA | 199,855,752 | |||||||
|
| |||||||
| EUROPE — 9.5% | ||||||||
Russia — 2.8% |
| |||||||
Lukoil PJSC — SP ADR | 446,101 | 14,364,452 | ||||||
Moscow Exchange MICEX- RTS PJSC | 5,158,867 | 6,459,184 | ||||||
Sberbank PAO — SP ADR | 2,044,725 | 12,022,983 | ||||||
Yandex NV — A** | 355,898 | 5,594,717 | ||||||
|
| |||||||
| 38,441,336 | ||||||||
|
| |||||||
Turkey — 1.6% |
| |||||||
Aselsan Elektronik Sanayi Ve Ticaret AS | 1,875,482 | 10,848,780 | ||||||
TAV Havalimanlari Holding AS | 901,879 | 5,625,147 | ||||||
Tofas Turk Otomobil Fabrikasi AS | 771,459 | 5,012,738 | ||||||
|
| |||||||
| 21,486,665 | ||||||||
|
| |||||||
Number of Shares | Value (Note A) | |||||||
Austria — 1.5% |
| |||||||
Erste Group Bank AG** | 648,952 | $ | 20,388,844 | |||||
Norway — 1.0% |
| |||||||
Marine Harvest ASA | 990,912 | 13,388,812 | ||||||
Netherlands — 0.9% |
| |||||||
Heineken NV | 81,087 | 6,941,351 | ||||||
Steinhoff International Holdings NV — H | 1,091,707 | 5,542,187 | ||||||
|
| |||||||
| 12,483,538 | ||||||||
|
| |||||||
Hungary — 0.8% |
| |||||||
OTP Bank PLC | 525,319 | 10,861,171 | ||||||
Czech Republic — 0.7% |
| |||||||
Komercni Banka AS | 46,400 | 9,237,266 | ||||||
Poland — 0.2% |
| |||||||
Eurocash SA | 232,695 | 2,877,062 | ||||||
|
| |||||||
Total EUROPE | 129,164,694 | |||||||
|
| |||||||
| SOUTH AMERICA — 5.1% | ||||||||
Brazil — 4.2% |
| |||||||
Ambev SA — ADR | 3,412,123 | 15,218,069 | ||||||
BB Seguridade Participacoes SA | 958,700 | 5,895,778 | ||||||
CETIP SA | 589,099 | 5,583,877 | ||||||
Itau Unibanco Holding SA — PREF ADR | 1,548,789 | 10,082,616 | ||||||
Tractebel Energia SA | 1,648,757 | 13,956,871 | ||||||
Ultrapar Participacoes SA | 405,105 | 6,189,851 | ||||||
|
| |||||||
| 56,927,062 | ||||||||
|
| |||||||
Chile — 0.7% |
| |||||||
Banco Santander Chile — ADR | 558,380 | 9,849,823 | ||||||
Argentina — 0.2% |
| |||||||
Banco Macro SA — ADR** | 34,218 | 1,988,750 | ||||||
Pampa Energia SA — SP ADR** | 41,830 | 859,607 | ||||||
|
| |||||||
| 2,848,357 | ||||||||
|
| |||||||
Total SOUTH AMERICA | 69,625,242 | |||||||
|
| |||||||
| AFRICA — 2.0% | ||||||||
South Africa — 1.5% |
| |||||||
FirstRand, Ltd. | 4,870,358 | 13,343,490 | ||||||
Sasol, Ltd. — ADR | 291,009 | 7,804,861 | ||||||
|
| |||||||
| 21,148,351 | ||||||||
|
| |||||||
Egypt — 0.5% |
| |||||||
Commercial International Bank Egypt SAE | 1,271,321 | 6,184,458 | ||||||
|
| |||||||
Total AFRICA | 27,332,809 | |||||||
|
| |||||||
| MIDDLE EAST — 0.8% | ||||||||
United Arab Emirates — 0.5% |
| |||||||
Abu Dhabi Commercial Bank PJSC | 3,768,227 | 6,760,854 | ||||||
Notes to Financial Statements are an integral part of this Schedule.
5
Table of Contents
Driehaus Emerging Markets Growth Fund
Schedule of Investments
December 31, 2015
Number of Shares | Value (Note A) | |||||||
Jordan — 0.3% |
| |||||||
Hikma Pharmaceuticals PLC | 128,896 | $ | 4,372,351 | |||||
|
| |||||||
Total MIDDLE EAST | 11,133,205 | |||||||
|
| |||||||
Total EQUITY SECURITIES (Cost $1,254,812,610) | 1,279,391,056 | |||||||
|
| |||||||
| ||||||||
TOTAL INVESTMENTS (COST $1,254,812,610) | 93.9 | % | $ | 1,279,391,056 | ||||
Other Assets In Excess Of Liabilities | 6.1 | % | 83,029,959 | |||||
|
|
|
| |||||
Net Assets | 100.0 | % | $ | 1,362,421,015 | ||||
| ||||||||
The federal income tax basis and unrealized appreciation (depreciation) for all investments is as follows:
Basis: | $ | 1,268,630,582 | ||
|
| |||
Gross Appreciation | $ | 104,544,410 | ||
Gross Depreciation | (93,783,936 | ) | ||
|
| |||
Net Appreciation | $ | 10,760,474 | ||
|
|
| ** | Non-income producing security |
ADR — American Depository Receipt
NVDR — Non-Voting Depository Receipt
PREF ADR — Preferred American Depository Receipt
REIT — Real Estate Investment Trust
SP ADR — Sponsored American Depository Receipt
Regional Weightings*
Asia/Far East Ex-Japan | 61.8% | |||
North America | 14.7% | |||
Eastern Europe | 6.1% | |||
South America | 5.1% | |||
Western Europe | 3.4% | |||
Africa | 2.0% | |||
Middle East | 0.8% |
Top Ten Holdings*
Tencent Holdings, Ltd. | 4.4% | |||
HDFC Bank, Ltd. — ADR | 3.8% | |||
Taiwan Semiconductor Manufacturing Co., Ltd. — SP ADR | 3.6% | |||
Samsung Electronics Co., Ltd. | 2.5% | |||
PT Telekomunikasi Indonesia Persero Tbk | 2.1% | |||
Kweichow Moutai Co. Ltd. — A | 2.1% | |||
China Mobile, Ltd. | 2.0% | |||
AIA Group, Ltd. | 1.9% | |||
Philip Morris International, Inc. | 1.9% | |||
China Construction Bank Corp. — H | 1.8% |
| * | All percentages are stated as a percent of net assets at December 31, 2015. |
Notes to Financial Statements are an integral part of this Schedule.
6
Table of Contents
Driehaus Emerging Markets Growth Fund
Schedule of Investments
December 31, 2015
Industry | Percent of Net Assets | |||
Aerospace & Defense | 0.8% | |||
Automobiles | 1.9% | |||
Beverages | 4.4% | |||
Capital Markets | 1.3% | |||
Commercial Banks | 15.9% | |||
Commercial Services & Supplies | 0.4% | |||
Computers & Peripherals | 0.5% | |||
Construction & Engineering | 0.9% | |||
Construction Materials | 1.0% | |||
Diversified Financial Services | 1.5% | |||
Diversified Telecommunication Services | 2.1% | |||
Electric Utilities | 0.8% | |||
Electrical Equipment | 1.3% | |||
Electronic Equipment, Instruments & Components | 1.5% | |||
Energy Equipment & Services | 1.0% | |||
Food & Staples Retailing | 1.5% | |||
Food Products | 2.4% | |||
Health Care Providers & Services | 1.1% | |||
Hotels, Restaurants & Leisure | 3.6% | |||
Household Durables | 1.2% | |||
Industry | Percent of Net Assets | |||
Independent Power Producers & Energy Traders | 1.0% | |||
Industrial Conglomerates | 1.0% | |||
Insurance | 5.4% | |||
Internet & Catalog Retail | 1.7% | |||
Internet Software & Services | 7.3% | |||
Information Technology Services | 2.3% | |||
Machinery | 0.8% | |||
Media | 2.3% | |||
Metals & Mining | 0.6% | |||
Oil, Gas & Consumable Fuels | 2.6% | |||
Personal Products | 2.4% | |||
Pharmaceuticals | 2.8% | |||
Real Estate Investment Trusts | 1.0% | |||
Real Estate Management & Development | 0.8% | |||
Semiconductors & Semiconductor Equipment | 9.5% | |||
Textiles, Apparel & Luxury Goods | 0.5% | |||
Thrifts & Mortgage Finance | 0.9% | |||
Tobacco | 2.8% | |||
Transportation Infrastructure | 0.4% | |||
Wireless Telecommunication Services | 2.7% | |||
Other Assets in Excess of Liabilities | 6.1% | |||
|
| |||
TOTAL | 100.0% | |||
|
| |||
Notes to Financial Statements are an integral part of this Schedule.
7
Table of Contents
Driehaus Emerging Markets Small Cap Growth Fund — Portfolio Managers’ Letter
Dear Fellow Shareholders,
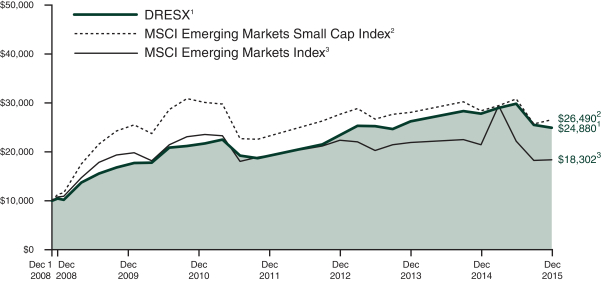
The Driehaus Emerging Markets Small Cap Growth Fund (“Fund”) returned -10.22% for the year ended December 31, 2015. This return underperformed the Morgan Stanley Capital International (“MSCI”) Emerging Markets Small Cap Index (“Benchmark”), which returned -6.57% for the same period. The Fund outperformed its secondary benchmark, the MSCI Emerging Markets Index, which returned -14.60% for the same period.
This past year investors struggled through heightened volatility, a global economic growth slowdown, particularly in China and other emerging markets, a troubled and deflationary Europe, and dramatically lower crude oil and overall commodity prices. For emerging markets, it was one of the worst years for the asset class as a whole since the 2008 global financial crisis. China’s slowing demand for commodities, along with the fall in crude oil prices, led to lower commodity prices and general macroeconomic concern regarding global growth.
For 2015, at the sector level, key contributions to performance versus the Benchmark came from security selection within the consumer discretionary and utilities sectors. In addition, stock selection in Taiwan contributed positively to the Fund’s performance versus the Benchmark. An underweight allocation to South Africa also made a significant contribution to performance versus the Benchmark during the year.
Tung Thih Electronic Co., Ltd. (Ticker: 3552 TT) was the most significant contributor to returns for 2015. The Taiwan-based company manufactures and distributes electronic products and components for automobiles. Its share price has been steadily increasing since 2014 with multiple revenue growth drivers. In particular, a seven-year contract for parking sensors and warning systems from GM began in late 2014 and has contributed significantly to the company’s positive performance. Additionally, sales to Chinese automakers provide the company with diversified revenue sources.
CJ CGV Co., Ltd. (Ticker: 079160 KS) made a notable contribution to the Fund’s relative and absolute returns for the year. The Korea-based company operates multiplex movie theatres throughout Korea as well as in China, Vietnam and the United States. Throughout the year, the company’s share price rose on continued positive quarterly results and revenue gains. In Korea, the increase of young moviegoers and directly managed movie theatres contributed positively to performance. However, the big story for the year was the company’s expansion into China. Costs from the expansion were offset by impressive box office earnings, which are expected to increase.
Certain areas detracted from Fund performance during the year. Two sectors that detracted from the performance of the Fund versus the Benchmark were health care and consumer staples. Holdings in South Korea and Brazil also detracted from Fund performance versus the Benchmark.
Naturalendo Tech Co., Ltd. (Ticker: 168330 KS) was a significant detractor from relative performance for the year. The Korea-based company engages in the research, development and manufacture of hormone-based biotechnology products. The company’s share price declined significantly after news was released that the Korea Consumer Agency found the company’s EstroG products tainted with a hazardous herb. The negative effect on the share price was immediate.
Banco Estado do Rio Grande do Sul (Ticker: BRSR6 BZ) was a significant detractor from Fund performance for the year. The Brazil-based company provides a variety of banking services in Brazil. Its share price began to decline at the end of 2014 and continued its downward trajectory through most of 2015, moving in concert with the floundering Brazilian economy. Additionally, the share price fell mid-year as the company raised estimates for its loan-loss provisions. Loan book growth and average borrowing rates also came in below expectations.
The Fund uses option strategies primarily to hedge a portion of the portfolio, dampen volatility, and manage downside risk. These strategies primarily consisted of puts and put spreads on exchange-traded funds (ETFs), though a few call options were held to add select exposures to the Fund. During 2015, options detracted from performance while helping the portfolio realize less volatility than the Benchmark.
We believe 2016 will see a continuation of the elevated volatility and return dispersion that materialized last year. Evolution of Federal Reserve monetary policy, and accordingly the US dollar, will likely be a key factor. Despite the challenging environment for emerging markets as a whole, we continue to find companies
8
Table of Contents
with differentiated business models, idiosyncratic fundamental drivers and structural growth potential. In terms of the asset class as a whole, with valuations relative to the rest of the world at decade lows, we see the relative valuation case for emerging markets beginning to strengthen. What is needed to further bolster the case for emerging markets is stabilization in growth rates and improvement in return on invested capital. We remain on the lookout for where this is happening on a company and country level.
We thank you for your interest in the Driehaus Emerging Markets Small Cap Growth Fund and would like to express our gratitude to you as shareholders for your confidence in our management capabilities.
Sincerely,
| |  | ||
| Chad Cleaver, CFA | Howard Schwab | Trent DeBruin, CFA | ||
| Lead Portfolio Manager | Co-Portfolio Manager | Assistant Portfolio Manager |
Performance is historical and does not represent future results.
Please see the following performance overview page for index descriptions.
9
Table of Contents
Driehaus Emerging Markets Small Cap Growth Fund
Performance Overview (unaudited)
The performance summarized below is historical and does not represent future results. Investment returns and principal value vary, and you may have a gain or loss when you sell shares. Performance data presented measures the change in the value of an investment in the Fund, assuming reinvestment of all dividends and capital gains. Average annual total return reflects annualized change.
The table does not reflect the deduction of taxes that a shareholder would pay on Fund distributions or the redemption of Fund shares. The graph compares the results of a $10,000 investment in the Fund since December 1, 2008 (the date of the Predecessor Limited Partnership’s inception), with all dividends and capital gains reinvested, with the indicated indices (and dividends reinvested) for the same period.
| Fund Only | Including Predecessor Limited Partnership | |||||||||||||||||||
Average Annual Total Returns as of 12/31/15 | 1 Year | 3 Years | Since Inception (08/22/11 - 12/31/15) | 5 Years | Since Inception (12/01/08 - 12/31/15) | |||||||||||||||
Driehaus Emerging Markets Small Cap Growth Fund (DRESX)1 | –10.22% | 2.11% | 4.43% | 3.29% | 13.73% | |||||||||||||||
MSCI Emerging Markets Small Cap Index2 | –6.57% | –1.37% | 0.33% | –2.99% | 14.73% | |||||||||||||||
MSCI Emerging Markets Index3 | –14.60% | –6.42% | –1.78% | –4.47% | 8.90% | |||||||||||||||
| 1 | The Driehaus Emerging Markets Small Cap Growth Fund (the “Fund”) performance shown above includes the performance of the Driehaus Emerging Markets Small Cap Growth Fund, L.P. (the “Predecessor Limited Partnership”), the Fund’s predecessor, for the periods before the Fund’s registration statement became effective. The Predecessor Limited Partnership, which was established on December 1, 2008, was managed with substantially the same investment objective, policies and philosophies as are followed by the Fund. The Fund succeeded to the Predecessor Limited Partnership’s assets on August 22, 2011. The Predecessor Limited Partnership was not registered under the Investment Company Act of 1940, as amended (“1940 Act”), and thus was not subject to certain investment and operational restrictions that are imposed by the 1940 Act. If the Predecessor Limited Partnership had been registered under the 1940 Act, its performance may have been adversely affected. The Predecessor Limited Partnership’s performance has been restated to reflect estimated expenses of the Fund. The returns for the periods prior to August 21, 2014, reflect fee waivers and/or reimbursements without which performance would have been lower. |
| 2 | The Morgan Stanley Capital International Emerging Markets Small Cap Index (MSCI Emerging Markets Small Cap Index) is a market capitalization-weighted index designed to measure equity market performance of small cap stocks in 23 global emerging markets. Data is in U.S. dollars. Source: Morgan Stanley Capital International Inc. |
| 3 | The Morgan Stanley Capital International Emerging Markets Index (MSCI Emerging Markets Index) is a market capitalization weighted index designed to measure equity market performance in 23 global emerging markets. Data is in U.S. dollars. Source: Morgan Stanley Capital International Inc. |
10
Table of Contents
Driehaus Emerging Markets Small Cap Growth Fund
Schedule of Investments
December 31, 2015
Number Shares | Value (Note A) | |||||||
| EQUITY SECURITIES — 87.3% | ||||||||
| FAR EAST — 65.9% | ||||||||
India — 17.9% |
| |||||||
Alembic Pharmaceuticals, Ltd. | 124,027 | $ | 1,304,926 | |||||
Arvind, Ltd. | 264,216 | 1,430,585 | ||||||
Bajaj Finance, Ltd. | 26,322 | 2,391,216 | ||||||
Bharat Electronics, Ltd. | 323,224 | 6,698,875 | ||||||
Blue Dart Express, Ltd. | 33,329 | 3,416,945 | ||||||
CCL Products India, Ltd. | 544,355 | 1,795,832 | ||||||
Colgate-Palmolive India, Ltd. | 282,719 | 4,157,478 | ||||||
Crompton Greaves, Ltd. | 1,114,815 | 3,239,651 | ||||||
Dr Lal PathLabs, Ltd.** | 14,959 | 181,899 | ||||||
Emami, Ltd. | 127,899 | 1,932,320 | ||||||
GRUH Finance, Ltd. | 337,000 | 1,393,973 | ||||||
Kajaria Ceramics, Ltd. | 117,062 | 1,738,512 | ||||||
LIC Housing Finance, Ltd. | 432,080 | 3,331,241 | ||||||
Mahindra CIE Automotive, Ltd.** | 499,372 | 1,895,396 | ||||||
Marico, Ltd. | 461,892 | 1,578,942 | ||||||
Marksans Pharma, Ltd. | 1,436,227 | 2,272,997 | ||||||
Max India, Ltd. | 581,489 | 4,464,253 | ||||||
Natco Pharma, Ltd. | 411,128 | 3,600,060 | ||||||
Omkar Speciality Chemicals, Ltd. | 730,155 | 2,484,389 | ||||||
PI Industries, Ltd. | 230,609 | 2,262,474 | ||||||
Prabhat Dairy, Ltd.** | 674,046 | 1,474,304 | ||||||
PVR, Ltd. | 182,900 | 2,216,572 | ||||||
SKS Microfinance, Ltd.** | 953,458 | 7,192,415 | ||||||
Strides Arcolab, Ltd. | 76,381 | 1,488,625 | ||||||
Suzlon Energy, Ltd.** | 13,941,572 | 4,393,867 | ||||||
TVS Motor Co., Ltd. | 537,252 | 2,353,453 | ||||||
United Breweries, Ltd. | 180,152 | 2,580,301 | ||||||
WABCO India, Ltd. | 14,019 | 1,290,580 | ||||||
Wonderla Holidays, Ltd. | 262,511 | 1,576,306 | ||||||
Zee Learn, Ltd.** | 2,152,599 | 1,282,001 | ||||||
|
| |||||||
| 77,420,388 | ||||||||
|
| |||||||
China — 15.1% |
| |||||||
3SBio, Inc.** | 4,814,000 | 6,758,191 | ||||||
Beijing Enterprises Water Group, Ltd. | 6,352,203 | 4,450,612 | ||||||
China Lodging Group, Ltd. — SP ADR | 135,355 | 4,231,197 | ||||||
CT Environmental Group, Ltd. | 23,074,547 | 7,562,448 | ||||||
Fu Shou Yuan International Group, Ltd. | 6,133,000 | 4,771,839 | ||||||
IMAX China Holding, Inc.** | 690,400 | 4,868,402 | ||||||
KWG Property Holding, Ltd. | 7,056,000 | 5,235,063 | ||||||
Man Wah Holdings, Ltd. | 3,920,248 | 4,613,217 | ||||||
PAX Global Technology, Ltd. | 116,006 | 119,598 | ||||||
Silergy Corp. | 580,000 | 6,003,592 | ||||||
Wasion Group Holdings, Ltd. | 2,976,000 | 3,102,700 | ||||||
Number Shares | Value (Note A) | |||||||
Xinyi Solar Holdings, Ltd. | 17,713,493 | $ | 7,245,343 | |||||
Zhuzhou CSR Times Electric Co., Ltd. — H | 1,115,225 | 6,482,653 | ||||||
|
| |||||||
| 65,444,855 | ||||||||
|
| |||||||
Taiwan — 13.7% |
| |||||||
Basso Industry Corp. | 2,018,600 | 3,877,787 | ||||||
Cub Elecparts, Inc. | 435,126 | 5,206,092 | ||||||
E.Sun Financial Holding Co., Ltd. | 5,620,338 | 3,276,691 | ||||||
Egis Technology Inc.** | 522,000 | 2,272,536 | ||||||
eMemory Technology, Inc. | 245,000 | 2,759,765 | ||||||
Ennoconn Corp. | 888,015 | 10,056,979 | ||||||
Gigasolar Materials Corp. | 76,000 | 1,672,847 | ||||||
Hota Industrial Manufacturing Co., Ltd. | 2,750,000 | 10,130,301 | ||||||
Land Mark Optoelectronics Corp. | 468,000 | 7,009,955 | ||||||
Sporton International, Inc. | 257,000 | 1,576,567 | ||||||
Tung Thih Electronic Co., Ltd. | 640,000 | 6,234,968 | ||||||
Voltronic Power Technology Corp. | 350,807 | 5,227,875 | ||||||
|
| |||||||
| 59,302,363 | ||||||||
|
| |||||||
South Korea — 11.8% |
| |||||||
AeroSpace Technology of Korea, Inc.** | 66,169 | 1,326,145 | ||||||
CJ CGV Co., Ltd. | 127,028 | 13,650,188 | ||||||
Cosmax, Inc. | 60,640 | 9,515,807 | ||||||
Hana Tour Service, Inc. | 14,342 | 1,406,618 | ||||||
InBody Co., Ltd. | 119,922 | 5,931,923 | ||||||
Innocean Worldwide, Inc.** | 87,252 | 5,208,853 | ||||||
Medy-Tox, Inc. | 21,901 | 9,578,127 | ||||||
Modetour Network, Inc. | 80,311 | 2,308,201 | ||||||
Osstem Implant Co., Ltd.** | 32,696 | 2,258,647 | ||||||
|
| |||||||
| 51,184,509 | ||||||||
|
| |||||||
Thailand — 4.0% |
| |||||||
Beauty Community PCL — NVDR | 16,963,400 | 2,710,561 | ||||||
Central Plaza Hotel PCL — NVDR | 1,803,800 | 2,205,563 | ||||||
Chularat Hospital PCL — NVDR | 41,698,000 | 3,082,303 | ||||||
Forth Smart Service PCL — NVDR | 3,836,600 | 1,641,896 | ||||||
Muangthai Leasing PCL — NVDR | 2,403,735 | 1,422,803 | ||||||
Plan B Media | 13,872,911 | 2,737,187 | ||||||
Sino-Thai Engineering & Construction PCL — NVDR | 2,022,100 | 1,404,821 | ||||||
Srisawad Power 1979 PCL — NVDR | 1,622,300 | 2,152,698 | ||||||
|
| |||||||
| 17,357,832 | ||||||||
|
| |||||||
Notes to Financial Statements are an integral part of this Schedule.
11
Table of Contents
Driehaus Emerging Markets Small Cap Growth Fund
Schedule of Investments
December 31, 2015
Number Shares | Value (Note A) | |||||||
Indonesia — 2.0% |
| |||||||
PT Bumi Serpong Damai Tbk | 13,356,700 | $ | 1,744,074 | |||||
PT Jasa Marga Persero Tbk | 3,940,552 | 1,493,608 | ||||||
PT Matahari Department Store Tbk | 1,244,272 | 1,588,624 | ||||||
PT Waskita Karya Persero Tbk | 17,411,900 | 2,109,385 | ||||||
PT Wijaya Karya Persero Tbk | 7,666,200 | 1,468,173 | ||||||
|
| |||||||
| 8,403,864 | ||||||||
|
| |||||||
Philippines — 1.4% |
| |||||||
Metro Pacific Investments Corp. | 42,344,600 | 4,679,459 | ||||||
Xurpas, Inc. | 4,577,400 | 1,480,566 | ||||||
|
| |||||||
| 6,160,025 | ||||||||
|
| |||||||
Total FAR EAST | 285,273,836 | |||||||
|
| |||||||
| NORTH AMERICA — 7.0% | ||||||||
Mexico — 6.0% |
| |||||||
Alsea SAB de CV | 1,921,204 | 6,687,344 | ||||||
Controladora Vuela Cia de Aviacion SAB de CV — ADR** | 247,284 | 4,243,393 | ||||||
Credito Real SAB de CV SOFOM ER | 541,800 | 1,374,109 | ||||||
Gentera SAB de CV | 1,793,653 | 3,450,033 | ||||||
Grupo Aeroportuario del Centro Norte SAB de CV — ADR | 58,413 | 2,245,980 | ||||||
PLA Administradora Industrial S de RL de CV — REIT | 1,404,622 | 2,267,347 | ||||||
Promotora y Operadora de Infraestructura SAB de CV | 194,968 | 2,295,565 | ||||||
Unifin Financiera SAPI de CV Sofom ENR** | 1,115,031 | 3,453,559 | ||||||
|
| |||||||
| 26,017,330 | ||||||||
|
| |||||||
British Virgin Islands — 0.5% |
| |||||||
Luxoft Holding, Inc.** | 28,267 | 2,180,234 | ||||||
United States — 0.5% |
| |||||||
EPAM Systems, Inc.** | 27,258 | 2,143,024 | ||||||
|
| |||||||
Total NORTH AMERICA | 30,340,588 | |||||||
|
| |||||||
| EUROPE — 6.6% | ||||||||
Turkey — 2.9% |
| |||||||
Aselsan Elektronik Sanayi Ve Ticaret AS | 1,234,245 | 7,139,526 | ||||||
Emlak Konut Gayrimenkul Yatirim Ortakligi AS — REIT | 2,464,158 | 2,196,822 | ||||||
Tofas Turk Otomobil Fabrikasi AS | 530,515 | 3,447,147 | ||||||
|
| |||||||
| 12,783,495 | ||||||||
|
| |||||||
Number Shares | Value (Note A) | |||||||
Russia — 2.9% |
| |||||||
Lenta, Ltd. — GDR** | 312,852 | $ | 2,111,751 | |||||
Mail.ru Group, Ltd. — GDR** | 147,407 | 3,324,028 | ||||||
Moscow Exchange MICEX- RTS PJSC | 5,558,771 | 6,959,886 | ||||||
|
| |||||||
| 12,395,665 | ||||||||
|
| |||||||
United Kingdom — 0.5% |
| |||||||
BGEO Group PLC | 78,133 | 2,193,110 | ||||||
Poland — 0.3% |
| |||||||
Eurocash SA | 98,576 | 1,218,803 | ||||||
|
| |||||||
Total EUROPE | 28,591,073 | |||||||
|
| |||||||
| SOUTH AMERICA — 3.8% | ||||||||
Brazil — 2.5% |
| |||||||
Equatorial Energia SA | 494,100 | 4,276,268 | ||||||
Lojas Renner SA | 490,600 | 2,120,508 | ||||||
Raia Drogasil SA | 346,540 | 3,107,801 | ||||||
Tupy SA | 261,800 | 1,237,450 | ||||||
|
| |||||||
| 10,742,027 | ||||||||
|
| |||||||
Argentina — 1.3% |
| |||||||
Grupo Financiero Galicia SA — ADR | 162,267 | 4,394,190 | ||||||
Pampa Energia SA — SP ADR** | 67,406 | 1,385,193 | ||||||
|
| |||||||
| 5,779,383 | ||||||||
|
| |||||||
Total SOUTH AMERICA | 16,521,410 | |||||||
|
| |||||||
| MIDDLE EAST — 2.1% | ||||||||
Pakistan — 2.1% |
| |||||||
Engro Foods, Ltd.** | 1,797,959 | 2,516,473 | ||||||
Lucky Cement, Ltd. | 553,200 | 2,614,753 | ||||||
Pak Elektron, Ltd. | 4,018,500 | 2,399,551 | ||||||
United Bank, Ltd. | 890,500 | 1,317,449 | ||||||
|
| |||||||
| 8,848,226 | ||||||||
|
| |||||||
Total MIDDLE EAST | 8,848,226 | |||||||
|
| |||||||
| AFRICA — 1.9% | ||||||||
South Africa — 1.0% |
| |||||||
AVI, Ltd. | 422,081 | 2,111,906 | ||||||
Clicks Group, Ltd. | 370,537 | 2,132,415 | ||||||
|
| |||||||
| 4,244,321 | ||||||||
|
| |||||||
Kenya — 0.5% |
| |||||||
Safaricom, Ltd. | 14,570,800 | 2,321,643 | ||||||
Nigeria — 0.4% |
| |||||||
Zenith Bank PLC | 23,607,671 | 1,666,354 | ||||||
|
| |||||||
Total AFRICA | 8,232,318 | |||||||
|
| |||||||
Total EQUITY SECURITIES (Cost $352,607,759) | 377,807,451 | |||||||
|
| |||||||
Notes to Financial Statements are an integral part of this Schedule.
12
Table of Contents
Driehaus Emerging Markets Small Cap Growth Fund
Schedule of Investments
December 31, 2015
Number Shares | Value (Note A) | |||||||
| EQUITY CERTIFICATES — 0.9% | ||||||||
| MIDDLE EAST — 0.6% | ||||||||
Saudi Arabia — 0.6% |
| |||||||
BUPA Arabia for Cooperative Insurance Co.† | 79,406 | $ | 2,430,830 | |||||
|
| |||||||
Total MIDDLE EAST | 2,430,830 | |||||||
|
| |||||||
| FAR EAST — 0.3% | ||||||||
India — 0.3% |
| |||||||
Dr Lal PathLabs, Ltd.† | 118,180 | 1,437,051 | ||||||
|
| |||||||
Total FAR EAST | 1,437,051 | |||||||
|
| |||||||
Total EQUITY CERTIFICATES | 3,867,881 | |||||||
|
| |||||||
| ||||||||
| PURCHASED CALL OPTIONS — 0.3% | ||||||||
Equity Volatility Index Fund, Exercise Price $20.00, Expiration Date January, 2016** | 10,000 | 1,390,000 | ||||||
PowerShares DB US Dollar Index Bullish Fund, Exercise Price $26.00, Expiration Date January, 2016** | 30,000 | 150,000 | ||||||
|
| |||||||
Total PURCHASED CALL OPTIONS | 1,540,000 | |||||||
|
| |||||||
| ||||||||
| PURCHASED PUT OPTIONS — 0.9% | ||||||||
Industrial Select Sector SPDR Fund, Exercise Price $52.00, Expiration Date January, 2016** | 10,000 | 280,000 | ||||||
iShares China Large-Cap Index Fund, Exercise Price $35.50, Expiration Date January, 2016** | 7,500 | 510,000 | ||||||
iShares MSCI Emerging Markets Index Fund, Exercise Price $32.00, Expiration Date January, 2016** | 10,000 | 390,000 | ||||||
iShares MSCI Emerging Markets Index Fund, Exercise Price $32.50, Expiration Date January, 2016** | 10,000 | 660,000 | ||||||
iShares MSCI Taiwan Index Fund, Exercise Price $13.00, Expiration Date January, 2016** | 15,000 | 495,000 | ||||||
iShares Russell 2000 Index Fund, Exercise Price $110.00, Expiration Date January, 2016** | 5,000 | 440,000 | ||||||
Number Shares | Value (Note A) | |||||||
iShares Russell 2000 Index Fund, Exercise Price $112.00, Expiration Date January, 2016** | 7,000 | $ | 1,071,000 | |||||
|
| |||||||
Total PURCHASED PUT OPTIONS | 3,846,000 | |||||||
| ||||||||
TOTAL INVESTMENTS | 89.4 | % | $ | 387,061,332 | ||||
Other Assets In Excess Of Liabilities | 10.6 | % | 45,656,420 | |||||
|
|
|
| |||||
Net Assets | 100.0 | % | $ | 432,717,752 | ||||
| ||||||||
| WRITTEN CALL OPTION — (0.1%) | ||||||||
Equity Volatility Index Fund, Exercise Price $25.00, Expiration Date January, 2016** | (6,500 | ) | $ | (455,000 | ) | |||
|
| |||||||
Total WRITTEN CALL OPTIONS (Premiums received $480,720) | (455,000 | ) | ||||||
|
| |||||||
| ||||||||
| WRITTEN PUT OPTIONS — (0.1%) | ||||||||
iShares Russell 2000 Index Fund, Exercise Price $108.00, Expiration Date January, 2016** | (7,000 | ) | (343,000 | ) | ||||
|
| |||||||
Total WRITTEN PUT OPTIONS (Premiums received $223,704) | (343,000 | ) | ||||||
|
| |||||||
| ||||||||
The federal income tax basis and unrealized appreciation (depreciation) for all investments is as follows:
Basis: | $ | 362,303,486 | ||
|
| |||
Gross Appreciation | $ | 44,422,469 | ||
Gross Depreciation | (19,664,623 | ) | ||
|
| |||
Net Appreciation | $ | 24,757,846 | ||
|
|
| ** | Non-income producing security |
| † | Restricted security — Investments in securities not registered under the Securities Act of 1933, excluding 144A securities. At December 31, 2015, the value of these restricted securities amounted to $3,867,881 or 0.89% of net assets. |
Additional information on each restricted security is as follows:
Security | Counter- party | Acquisition Date(s) | Acquisition Cost | |||||||||
BUPA Arabia for Cooperative Insurance Co. | HSBC | | 08/04/14 to 09/10/15 | | $ | 1,384,356 | ||||||
Dr Lal PathLabs, Ltd. | MLCO | 12/07/15 | $ | 978,696 | ||||||||
Notes to Financial Statements are an integral part of this Schedule.
13
Table of Contents
Driehaus Emerging Markets Small Cap Growth Fund
Schedule of Investments
December 31, 2015
ADR — American Depository Receipt
GDR — Global Depository Receipt
HSBC — Hong Kong Shanghai Banking Corporation
MLCO — Merrill Lynch & Co., Inc.
NVDR — Non-Voting Depository Receipt
REIT — Real Estate Investment Trust
SP ADR — Sponsored American Depository Receipt
Regional Weightings(a)(b)
Asia/Far East Ex-Japan | 66.2% | |||
North America | 7.0% | |||
Eastern Europe | 6.1% | |||
South America | 3.8% | |||
Middle East | 2.7% | |||
Africa | 1.9% | |||
Western Europe | 0.5% |
Top Ten Holdings(a)
CJ CGV Co., Ltd. | 3.2% | |||
Hota Industrial Manufacturing Co., Ltd. | 2.3% | |||
Ennoconn Corp. | 2.3% | |||
Medy-Tox, Inc. | 2.2% | |||
Cosmax, Inc. | 2.2% | |||
CT Environmental Group, Ltd. | 1.7% | |||
Xinyi Solar Holdings, Ltd. | 1.7% | |||
SKS Microfinance, Ltd. | 1.7% | |||
Aselsan Elektronik Sanayi Ve Ticaret AS | 1.6% | |||
Land Mark Optoelectronics Corp. | 1.6% |
| (a) | All percentages are stated as a percent of net assets at December 31, 2015. |
| (b) | Excludes purchased options. |
Notes to Financial Statements are an integral part of this Schedule.
14
Table of Contents
Driehaus Emerging Markets Small Cap Growth Fund
Schedule of Investments
December 31, 2015
Industry | Percent of Net Assets | |||
Aerospace & Defense | 3.5% | |||
Air Freight & Logistics | 0.8% | |||
Airlines | 1.0% | |||
Auto Components | 6.0% | |||
Automobiles | 1.3% | |||
Beverages | 0.6% | |||
Biotechnology | 3.8% | |||
Building Products | 0.4% | |||
Chemicals | 1.1% | |||
Commercial Banks | 3.0% | |||
Computers & Peripherals | 2.3% | |||
Construction & Engineering | 1.7% | |||
Construction Materials | 0.6% | |||
Consumer Finance | 5.0% | |||
Diversified Consumer Services | 1.4% | |||
Diversified Financial Services | 2.7% | |||
Electric Utilities | 1.3% | |||
Electrical Equipment | 5.0% | |||
Electronic Equipment, Instruments & Components | 1.3% | |||
Food & Staples Retailing | 2.0% | |||
Food Products | 1.8% | |||
Health Care Equipment & Supplies | 1.9% | |||
Health Care Providers & Services | 1.1% | |||
Industry | Percent of Net Assets | |||
Hotels, Restaurants & Leisure | 4.3% | |||
Household Durables | 2.0% | |||
Insurance | 1.6% | |||
Internet Software & Services | 0.8% | |||
Information Technology Services | 1.4% | |||
Media | 6.6% | |||
Multiline Retail | 0.9% | |||
Other | 1.0% | |||
Personal Products | 4.0% | |||
Pharmaceuticals | 2.0% | |||
Professional Services | 0.4% | |||
Real Estate Investment Trusts | 1.0% | |||
Real Estate Management & Development | 1.6% | |||
Semiconductors & Semiconductor Equipment | 5.7% | |||
Software | 0.3% | |||
Specialty Retail | 0.6% | |||
Textiles, Apparel & Luxury Goods | 0.3% | |||
Thrifts & Mortgage Finance | 1.1% | |||
Transportation Infrastructure | 0.9% | |||
Water Utilities | 2.8% | |||
Wireless Telecommunication Services | 0.5% | |||
Other Assets in Excess of Liabilities | 10.6% | |||
|
| |||
TOTAL | 100.0% | |||
|
| |||
Notes to Financial Statements are an integral part of this Schedule.
15
Table of Contents
Driehaus Frontier Emerging Markets Fund — Portfolio Managers’ Letter
Dear Fellow Shareholders,
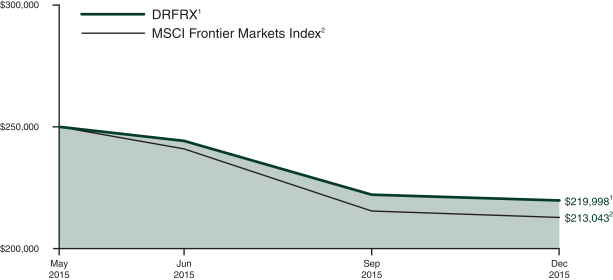
The Driehaus Frontier Emerging Markets Fund (“Fund”) returned -12.00% from its May 4, 2015 inception date through December 31, 2015.1 This return outperformed the Morgan Stanley Capital International (“MSCI”) Frontier Markets Index (“Benchmark”), which returned -14.78% for the same period.
This past year investors struggled through heightened volatility, a global economic growth slowdown, particularly in China and other emerging markets, a troubled and deflationary Europe, and dramatically lower crude oil and overall commodity prices. The backdrop for frontier markets remains highly selective, with the divide between commodity producers and commodity consumers being the overarching driver of relative returns within the asset class for the past year.
Over the course of 2015 since the Fund’s inception, key contributors to performance versus the Benchmark were the Fund’s holdings in the financials and telecommunication sectors. In addition, stock selection in Bangladesh and an overweight to Thailand contributed to the performance of the Fund.
The most notable contribution to the Fund’s return for the period came from holding BRAC Bank, Ltd. (Ticker: BRAC BD). The Bangladesh-based company is engaged in banking and related activities in personal finance, retail and corporate credit, and trade finance. Although political instability affected business from January through April of 2015, the company’s operating profit increased notably during the year. Growth in loans was particularly impressive in a slow credit environment, while deposit and net interest income experienced modest growth.
Thailand-based Group Lease PCL (Ticker: GL TB) was a significant contributor to returns during 2015. The company provides financing for new motorcycles under the Honda, Yamaha, Suzuki and Kawazaki brands. The company reported strong second and third quarter results this past year, citing year-over-year earnings growth of more than 100%.
Certain areas detracted from Fund performance during the period. Selection within the health care sector and an underweight to information technology hurt performance of the Fund relative to the Benchmark. Additionally, holdings in Nigeria and an overweight to Botswana detracted from Fund performance versus the Benchmark.
Zenith Bank PLC (Ticker: ZENITHBA NL) was the most significant detractor to the Fund’s performance during 2015. The Nigeria-based company provides banking and financial services to corporate and individual customers. Nigeria’s economy came under pressure throughout 2015 as a result of the ongoing decline in oil prices. This led to increasing concerns over the asset quality and loan growth prospects of Nigerian banks, as well as a rising equity risk premium in the country.
Letshego Holdings, Ltd. (Ticker: LETSHEGO BG) was a significant detractor from the Fund’s return during the period. Letshego is a Botswana-based financial services company engaged in providing short- to medium-term secured and unsecured loans. Its share price skyrocketed early in the year after it announced a share buyback and a possible acquisition of a Tanzanian micro-finance bank. However, as the company entered the last quarter of the year, shares fell on lower earnings. Currency volatility, increases in loan-loss provisions, and operating challenges in markets such as South Sudan, which required premature exits, contributed to the decline in share price.
The Fund maintains a positive bias toward domestic demand and commodity-importing countries. We continue to find a strong pipeline of ideas in Bangladesh, Pakistan, Vietnam and Romania, and the Fund remains overweight these countries. The Fund maintains underweight positions in many of the commodity-centric countries in the Middle East and Sub-Saharan Africa. We believe that country selection will prove to be an important differentiating factor of frontier market returns in the year ahead.
16
Table of Contents
We thank you for your interest in the Driehaus Frontier Emerging Markets Fund and would like to express our gratitude to you as shareholders for your confidence in our management capabilities.
Sincerely,
| | |
| Chad Cleaver, CFA | Rich Thies | |
| Portfolio Manager | Assistant Portfolio Manager |
| 1 | During this period, the Fund’s returns reflect fee waivers and/or expense reimbursements without which performance would have been lower. |
Performance is historical and does not represent future results.
Please see the following performance overview page for index descriptions.
17
Table of Contents
Driehaus Frontier Emerging Markets Fund
Performance Overview (unaudited)
The performance summarized below is historical and does not represent future results. Investment returns and principal value vary, and you may have a gain or loss when you sell shares. Performance data presented measures the change in the value of an investment in the Fund, assuming reinvestment of all dividends and capital gains. Average annual total return reflects annualized change.
The table does not reflect the deduction of taxes that a shareholder would pay on Fund distributions or the redemption of Fund shares. The graph compares the results of a $250,000 investment (minimum investment) in the Fund since May 4, 2015 (the date of the Fund’s inception), with all dividends and capital gains reinvested, with the indicated index (and dividends reinvested) for the same period.
| Cumulative Total Returns as of 12/31/15 | Since Inception (05/04/15 - 12/31/15) | |||
Driehaus Frontier Emerging Markets Fund (DRFRX)1 | –12.00% | |||
MSCI Frontier Markets Index2 | –14.78% | |||
| 1 | The returns for the period reflect fee waivers and/or reimbursements without which performance would have been lower. |
| 2 | The Morgan Stanley Capital International (MSCI) Frontier Markets Index provides broad representation of the equity opportunity set while taking investability requirements into consideration within each market. MSCI classifies 33 countries as frontier markets, 24 of which are included in the MSCI Frontier Markets Index. |
18
Table of Contents
Driehaus Frontier Emerging Markets Fund
Schedule of Investments
December 31, 2015
Number of Shares | Value (Note A) | |||||||
| EQUITY SECURITIES — 83.0% | ||||||||
| FAR EAST — 25.0% | ||||||||
Bangladesh — 14.5% |
| |||||||
Bata Shoe Co. Bangladesh, Ltd. | 9,688 | $ | 162,674 | |||||
Berger Paints Bangladesh, Ltd. | 3,970 | 96,302 | ||||||
Beximco Pharmaceuticals, Ltd. | 202,327 | 216,830 | ||||||
BRAC Bank, Ltd. | 1,039,186 | 644,898 | ||||||
British American Tobacco Bangladesh Co., Ltd. | 5,396 | 202,879 | ||||||
Delta Brac Housing Finance Corp., Ltd. | 140,348 | 207,280 | ||||||
IDLC Finance, Ltd. | 368,014 | 298,257 | ||||||
Marico Bangladesh, Ltd. | 13,639 | 248,239 | ||||||
Olympic Industries, Ltd. | 64,123 | 211,796 | ||||||
Square Pharmaceuticals, Ltd. | 79,821 | 258,051 | ||||||
Summit Power, Ltd. | 569,125 | 287,917 | ||||||
|
| |||||||
| 2,835,123 | ||||||||
|
| |||||||
Sri Lanka — 4.8% |
| |||||||
Ceylon Cold Stores PLC | 56,423 | 164,908 | ||||||
Chevron Lubricants Lanka PLC | 72,846 | 173,719 | ||||||
Commercial Bank of Ceylon PLC | 130,547 | 126,882 | ||||||
Distilleries Co. of Sri Lanka PLC | 150,055 | 255,900 | ||||||
Hemas Holdings PLC | 327,793 | 211,105 | ||||||
|
| |||||||
| 932,514 | ||||||||
|
| |||||||
Vietnam — 3.1% |
| |||||||
Bank for Foreign Trade of Vietnam JSC | 102,870 | 200,845 | ||||||
Ho Chi Minh City Infrastructure Investment JSC | 89,920 | 86,381 | ||||||
Nam Long Investment Corp. | 161,080 | 163,337 | ||||||
PetroVietnam Nhon Trach 2 Power JSC | 77,400 | 91,565 | ||||||
Vingroup JSC** | 30,890 | 62,783 | ||||||
|
| |||||||
| 604,911 | ||||||||
|
| |||||||
Thailand — 2.6% |
| |||||||
Beauty Community PCL — NVDR | 1,868,700 | 298,597 | ||||||
Group Lease PCL — NVDR | 414,700 | 209,741 | ||||||
|
| |||||||
| 508,338 | ||||||||
|
| |||||||
Total FAR EAST | 4,880,886 | |||||||
|
| |||||||
| AFRICA — 19.1% | ||||||||
Kenya — 6.7% |
| |||||||
East African Breweries, Ltd. | 89,718 | 239,423 | ||||||
Equity Group Holdings, Ltd. | 669,200 | 261,662 | ||||||
Jubilee Holdings, Ltd. | 30,300 | 143,536 | ||||||
Safaricom, Ltd. | 4,213,931 | 671,428 | ||||||
|
| |||||||
| 1,316,049 | ||||||||
|
| |||||||
Number of Shares | Value (Note A) | |||||||
Nigeria — 4.1% |
| |||||||
Lekoil, Ltd.** | 616,861 | $ | 169,372 | |||||
Zenith Bank PLC | 8,871,289 | 626,182 | ||||||
|
| |||||||
| 795,554 | ||||||||
|
| |||||||
Botswana — 2.7% |
| |||||||
Letshego Holdings, Ltd. | 2,066,739 | 534,025 | ||||||
Egypt — 2.5% |
| |||||||
Commercial International Bank Egypt SAE — GDR | 63,568 | 273,342 | ||||||
Edita Food Industries SAE — GDR** | 5,825 | 107,762 | ||||||
Six of October Development & Investment Co.** | 81,567 | 98,651 | ||||||
|
| |||||||
| 479,755 | ||||||||
|
| |||||||
Senegal — 1.4% |
| |||||||
Sonatel | 6,666 | 276,096 | ||||||
Tanzania — 1.0% |
| |||||||
Tanzania Breweries, Ltd. | 29,053 | 199,067 | ||||||
Togo — 0.7% |
| |||||||
Ecobank Transnational, Inc.** | 1,691,072 | 142,728 | ||||||
|
| |||||||
Total AFRICA | 3,743,274 | |||||||
|
| |||||||
| MIDDLE EAST — 18.2% | ||||||||
Pakistan — 13.3% |
| |||||||
Bank Alfalah, Ltd. | 762,500 | 209,818 | ||||||
Berger Paints Pakistan, Ltd. | 117,500 | 110,056 | ||||||
DG Khan Cement Co., Ltd. | 185,500 | 261,402 | ||||||
Engro Foods, Ltd.** | 205,441 | 287,541 | ||||||
Fauji Cement Co., Ltd. | 282,500 | 99,314 | ||||||
Habib Bank, Ltd. | 51,815 | 99,004 | ||||||
Honda Atlas Cars Pakistan, Ltd. | 41,900 | 95,590 | ||||||
HUB Power Co., Ltd. | 247,500 | 242,455 | ||||||
Lucky Cement, Ltd. | 52,300 | 247,201 | ||||||
Maple Leaf Cement Factory, Ltd. | 285,500 | 203,300 | ||||||
Nestle Pakistan, Ltd. | 2,160 | 160,863 | ||||||
Pak Elektron, Ltd. | 296,000 | 176,749 | ||||||
Pakistan Tobacco Co., Ltd. | 21,600 | 229,785 | ||||||
United Bank, Ltd. | 122,700 | 181,528 | ||||||
|
| |||||||
| 2,604,606 | ||||||||
|
| |||||||
United Arab Emirates — 2.8% |
| |||||||
Abu Dhabi Commercial Bank PJSC | 47,880 | 85,905 | ||||||
Aramex PJSC | 163,429 | 140,603 | ||||||
Emirates Telecommunications Group Co. PJSC | 31,385 | 137,571 | ||||||
First Gulf Bank PJSC | 27,584 | 95,001 | ||||||
NMC Health PLC | 7,327 | 90,787 | ||||||
|
| |||||||
| 549,867 | ||||||||
|
| |||||||
Kuwait — 1.1% |
| |||||||
National Bank of Kuwait SAK | 78,339 | 206,495 | ||||||
Notes to Financial Statements are an integral part of this Schedule.
19
Table of Contents
Driehaus Frontier Emerging Markets Fund
Schedule of Investments
December 31, 2015
Number of Shares | Value (Note A) | |||||||
Qatar — 1.0% |
| |||||||
Qatar Electricity & Water Co. QSC | 3,338 | $ | 198,334 | |||||
|
| |||||||
Total MIDDLE EAST | 3,559,302 | |||||||
|
| |||||||
| EUROPE — 14.0% | ||||||||
Romania — 7.7% |
| |||||||
Albalact SA | 1,165,697 | 95,313 | ||||||
Banca Transilvania** | 578,669 | 338,163 | ||||||
BRD-Groupe Societe Generale SA** | 136,330 | 396,704 | ||||||
Fondul Proprietatea SA | 2,468,481 | 480,844 | ||||||
Transgaz SA Medias | 2,886 | 192,250 | ||||||
|
| |||||||
| 1,503,274 | ||||||||
|
| |||||||
Luxembourg — 2.6% |
| |||||||
Adecoagro SA** | 41,948 | 515,541 | ||||||
Poland — 1.4% |
| |||||||
KRUK SA | 6,248 | 277,147 | ||||||
United Kingdom — 1.4% |
| |||||||
BGEO Group PLC | 9,487 | 266,290 | ||||||
Ukraine — 0.5% |
| |||||||
Kernel Holding SA | 7,573 | 92,861 | ||||||
Georgia — 0.4% |
| |||||||
Georgia Healthcare Group PLC** | 37,661 | 86,056 | ||||||
|
| |||||||
Total EUROPE | 2,741,169 | |||||||
|
| |||||||
| SOUTH AMERICA — 6.7% | ||||||||
Argentina — 6.5% |
| |||||||
Banco Macro SA — ADR** | 7,150 | 415,558 | ||||||
Grupo Financiero Galicia SA — ADR | 15,806 | 428,026 | ||||||
Pampa Energia SA — SP ADR** | 21,418 | 440,140 | ||||||
|
| |||||||
| 1,283,724 | ||||||||
|
| |||||||
Colombia — 0.2% |
| |||||||
Banco Davivienda SA | 5,034 | 34,633 | ||||||
|
| |||||||
Total SOUTH AMERICA | 1,318,357 | |||||||
|
| |||||||
Total EQUITY SECURITIES (Cost $16,713,275) | 16,242,988 | |||||||
|
| |||||||
| ||||||||
| EQUITY CERTIFICATES — 10.5% | ||||||||
| FAR EAST — 5.6% | ||||||||
Vietnam — 5.6% |
| |||||||
Bank for Foreign Trade of Vietnam JSC† | 85,680 | 167,283 | ||||||
Ho Chi Minh City Infrastructure Investment JSC† | 93,200 | 89,532 | ||||||
Nam Long Investment Corp.† | 53,190 | 53,935 | ||||||
Saigon Securities, Inc.**† | 379,653 | 374,841 | ||||||
Vingroup JSC**† | 137,942 | 280,362 | ||||||
Number of Shares | Value (Note A) | |||||||
Vndirect Securities Corp.† | 232,000 | $ | 124,848 | |||||
|
| |||||||
| 1,090,801 | ||||||||
|
| |||||||
Total FAR EAST | 1,090,801 | |||||||
|
| |||||||
| MIDDLE EAST — 4.9% | ||||||||
Saudi Arabia — 1.0% |
| |||||||
BUPA Arabia for Cooperative Insurance Co.**† | 3,400 | 104,083 | ||||||
Saudi Co. for Hardware LLC† | 3,481 | 92,292 | ||||||
|
| |||||||
| 196,375 | ||||||||
|
| |||||||
Kuwait — 3.9% |
| |||||||
Kuwait Projects Company Holdings KSC† | 97,606 | 186,529 | ||||||
National Bank of Kuwait SAK† | 80,569 | 212,373 | ||||||
VIVA Kuwait Telecom Co.**† | 110,651 | 360,937 | ||||||
|
| |||||||
| 759,839 | ||||||||
|
| |||||||
Total MIDDLE EAST | 956,214 | |||||||
|
| |||||||
Total EQUITY CERTIFICATES (Cost $2,153,007) | 2,047,015 | |||||||
|
| |||||||
| ||||||||
TOTAL INVESTMENTS (COST $18,866,282) | 93.5 | % | $ | 18,290,003 | ||||
Other Assets In Excess Of Liabilities | 6.5 | % | 1,279,629 | |||||
|
|
|
| |||||
Net Assets | 100.0 | % | $ | 19,569,632 | ||||
| ||||||||
The federal income tax basis and unrealized appreciation (depreciation) for all investments is as follows:
Basis: | $ | 18,897,812 | ||
|
| |||
Gross Appreciation | $ | 1,007,208 | ||
Gross Depreciation | (1,615,017 | ) | ||
|
| |||
Net Depreciation | $ | (607,809 | ) | |
|
|
| ** | Non-income producing security |
| † | Restricted security — Investments in securities not registered under the Securities Act of 1933, excluding 144A securities. At December 31, 2015, the value of these restricted securities amounted to $2,047,015 or 10.5% of net assets. |
Notes to Financial Statements are an integral part of this Schedule.
20
Table of Contents
Driehaus Frontier Emerging Markets Fund
Schedule of Investments
December 31, 2015
Additional information on each restricted security is as follows:
Security | Counter- party | Acquisition Date (s) | Acquisition Cost | |||||||||
Bank for Foreign Trade of Vietnam JSC | MACQ | | 05/08/15 to 07/28/15 | | $ | 178,004 | ||||||
BUPA Arabia for Cooperative Insurance Co. | MSCO | 05/04/15 | $ | 100,338 | ||||||||
Ho Chi Minh City Infrastructure Investment JSC | MACQ | 08/03/15 | $ | 113,079 | ||||||||
Kuwait Projects Company Holdings KSC | MLCO | | 05/04/15 to 07/28/15 | | $ | 218,199 | ||||||
Nam Long Investment Corp. | MACQ | | 05/04/15 to 05/07/15 | | $ | 47,802 | ||||||
National Bank of Kuwait SAK | MLCO | | 05/04/15 to 05/11/15 | | $ | 229,720 | ||||||
Saigon Securities, Inc. | MACQ | | 05/04/15 to 07/24/15 | | $ | 395,628 | ||||||
Saudi Co. for Hardware LLC. | MSCO | 10/0715 | $ | 103,968 | ||||||||
Vingroup JSC | JPMS | | 05/04/15 to 07/28/15 | | $ | 268,761 | ||||||
VIVA Kuwait Telecom Co. | MLCO | | 05/04/15 to 07/28/15 | | $ | 331,043 | ||||||
Vndirect Securities Corp. | MACQ | | 07/27/15 to 07/28/15 | | $ | 166,465 | ||||||
ADR — American Depository Receipt
GDR — Global Depository Receipt
JPMS — J.P. Morgan Securities, Inc.
MACQ — Macquaeie Capital Group Ltd.
MLCO — Merrill Lynch & Co., Inc.
MSCO — Morgan Stanley
NVDR — Non-Voting Depository Receipt
SP ADR — Sponsored American Depository Receipt
Regional Weightings*
Asia/Far East Ex-Japan | 30.6% | |||
Middle East | 23.1% | |||
Africa | 19.1% | |||
Eastern Europe | 10.0% | |||
South America | 6.7% | |||
Western Europe | 4.0% |
Top Ten Holdings*
Safaricom, Ltd. | 3.4% | |||
BRAC Bank, Ltd. | 3.3% | |||
Zenith Bank PLC | 3.2% | |||
Letshego Holdings, Ltd. | 2.7% | |||
Adecoagro SA | 2.6% | |||
Fondul Proprietatea SA | 2.5% | |||
Pampa Energia SA — SP ADR | 2.2% | |||
Grupo Financiero Galicia SA — ADR | 2.2% | |||
Banco Macro SA — ADR | 2.1% | |||
BRD-Groupe Societe Generale SA | 2.0% |
| * | All percentages are stated as a percent of net assets at December 31, 2015. |
Notes to Financial Statements are an integral part of this Schedule.
21
Table of Contents
Driehaus Frontier Emerging Markets Fund
Schedule of Investments
December 31, 2015
Industry | Percent of Net Assets | |||
Air Freight & Logistics | 0.7% | |||
Automobiles | 0.5% | |||
Beverages | 4.4% | |||
Capital Markets | 2.6% | |||
Chemicals | 1.1% | |||
Commercial Banks | 26.8% | |||
Commercial Services & Supplies | 1.4% | |||
Construction Materials | 4.2% | |||
Consumer Finance | 6.4% | |||
Diversified Financial Services | 3.4% | |||
Diversified Telecommunication Services | 2.1% | |||
Electric Utilities | 2.7% | |||
Electrical Equipment | 0.9% | |||
Food Products | 7.5% | |||
Health Care Providers & Services | 0.9% | |||
Industry | Percent of Net Assets | |||
Independent Power Producers & Energy Traders | 2.7% | |||
Industrial Conglomerates | 1.1% | |||
Insurance | 1.3% | |||
Multi-Utilities | 1.0% | |||
Oil, Gas & Consumable Fuels | 2.7% | |||
Personal Products | 1.3% | |||
Pharmaceuticals | 2.4% | |||
Real Estate Management & Development | 4.2% | |||
Specialty Retail | 2.0% | |||
Textiles, Apparel & Luxury Goods | 0.8% | |||
Tobacco | 2.2% | |||
Transportation Infrastructure | 0.9% | |||
Wireless Telecommunication Services | 5.3% | |||
Other Assets in Excess of Liabilities | 6.5% | |||
|
| |||
TOTAL | 100.0% | |||
|
| |||
Notes to Financial Statements are an integral part of this Schedule.
22
Table of Contents
Driehaus International Small Cap Growth Fund — Portfolio Managers’ Letter
Dear Fellow Shareholders,
The Driehaus International Small Cap Growth Fund (“Fund”) returned 12.58% for the year ended December 31, 2015. The Fund’s benchmark, the Morgan Stanley Capital International (“MSCI”) All Country World ex USA Small Cap Growth Index (“Benchmark”), returned 6.74%.
The past year contained no shortage of surprises for investors as the calm of the first half of 2015 gave way to heightened volatility that lasted for the remainder of the year. Outperforming the broad global market required nimble positioning within Japan and Germany, and a few other select European countries, while navigating a volatile currency environment. In short, 2015 was a year in which good, active stock picking drove outperformance as markets globally became far more selective about rewarding companies.
Over the course of 2015, key contributors to performance versus the Benchmark were the Fund’s holdings in the consumer discretionary and financials sectors. In addition, stock selection in Germany and Japan contributed positively to the performance of the Fund compared to the Benchmark.
DIP Corp. (Ticker: 2379 JP) provided a significant contribution to the Fund’s return during 2015. The Japan-based company provides information regarding employment to recruiting and staffing agencies as well as Internet portals for workers and employers. It is benefiting from a migration to Internet-enabled matching services from traditional legacy staffing firms. As a result, the company experienced accelerating top and bottom line growth trends throughout most of the year, and these structural growth trends are expected to continue over the medium to longer term.
Stroeer SE (Ticker: SAX DE) made significant contributions to the Fund’s return during 2015. The Germany-based company offers communications solutions to brands in the form of promotional media used outside of private homes. Since the middle of 2014, the company has exhibited steady growth, which has been reflected in its share price. Growth initiatives, particularly digital media and advertising, contributed to higher margins and strong market share gains in both regional and national markets.
For 2015, the health care sector detracted from the Fund’s performance versus the Benchmark. At the country level, security selection within Norway and Sweden as well as an underweight in Sweden detracted value relative to the Benchmark.
The holding that most significantly detracted from returns for the year was Opera Software (Ticker: OPERA NO). The Norway-based company develops Internet browsers for desktop and mobile devices. Its share price fell early in 2015 due to deteriorating operating trends experienced in their two main product segments during the fourth quarter of 2014. This subsequently led to reduced financial forecasts for the remainder of 2015.
Concordia Healthcare Corp. (Ticker: CXR CN) was a significant detractor from the Fund. The Canada-based health care company is engaged in legacy pharmaceutical products and orphan drugs. In September, 2015, the company’s share price declined sharply as the pharmaceutical industry came under fire after Turing Pharmaceuticals increased a legacy drug’s price astronomically and brought the industry under political scrutiny. The timing was particularly sensitive as the company was in the midst of a share offering to purchase all outstanding shares of Amdipharm Mercury Limited.
Looking ahead, in the near term we maintain a preference for developed over emerging markets — despite strong developed market outperformance in recent years. We are mindful of the potential for positive change at the margin and resulting mean reversions, not just for the “EM versus developed market” positioning but from a sector perspective as well (i.e., energy and industrials versus consumer and financials).
Monetary policy and earnings growth trends are supportive across the eurozone and Japan and we believe these regions will remain a major source of new ideas for the Fund. However, we expect even further narrowing and concentration in terms of participation and performance at the individual stock level as we progress throughout the year. Security selection will likely continue to drive performance and, similar to 2015, we believe companies that execute on their growth strategy will be rewarded in a low growth world.
23
Table of Contents
As always, we thank you for your interest in the Driehaus International Small Cap Growth Fund and would like to express our gratitude to you as shareholders for your continued confidence in our management capabilities.
Sincerely,
 |  |  | ||
| David Mouser | Daniel Burr | Ryan Carpenter | ||
| Lead Portfolio Manager | Co-Portfolio Manager | Assistant Portfolio Manager |
Performance is historical and does not represent future results.
Please see the following performance overview page for index description.
24
Table of Contents
Driehaus International Small Cap Growth Fund
Performance Overview (unaudited)
The performance summarized below is historical and does not represent future results. Investment returns and principal value vary, and you may have a gain or loss when you sell shares. Performance data presented measures the change in the value of an investment in the Fund, assuming reinvestment of all dividends and capital gains. Average annual total return reflects annualized change.
The table does not reflect the deduction of taxes that a shareholder would pay on Fund distributions or the redemption of Fund shares. The graph compares the results of a $10,000 investment in the Fund since August 1, 2002 (the date of the Predecessor Limited Partnership’s inception), with all dividends and capital gains reinvested, with the indicated index (and dividends reinvested) for the same period.
| Fund Only | Including Predecessor Limited Partnership | |||||||||||||||||||||||
| Average Annual Total Returns as of 12/31/15 | 1 Year | 3 Years | 5 Years | Since Inception (09/17/07 - 12/31/15) | 10 Years | Since Inception (08/1/02 - 12/31/15) | ||||||||||||||||||
Driehaus International Small Cap Growth Fund (DRIOX)1 | 12.58% | 11.66% | 6.62% | 5.13% | 9.73% | 16.25% | ||||||||||||||||||
MSCI AC World ex USA Small Cap Growth Index2 | 6.74% | 7.02% | 3.41% | 2.03% | 5.12% | 10.12% | ||||||||||||||||||
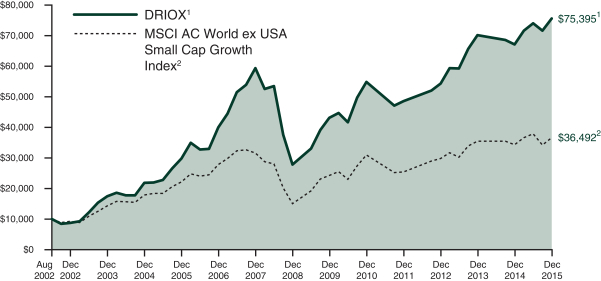
| 1 | The Driehaus International Small Cap Growth Fund (the “Fund”) performance shown above includes the performance of the Driehaus International Opportunities Fund, L.P. (the “Predecessor Limited Partnership”), the Fund’s predecessor, for the periods before the Fund’s registration statement became effective. The Predecessor Limited Partnership, which was established on August 1, 2002, was managed with substantially the same investment objective, policies and philosophies as are followed by the Fund. The Fund succeeded to the Predecessor Limited Partnership’s assets on September 17, 2007. The Predecessor Limited Partnership was not registered under the Investment Company Act of 1940, as amended (“1940 Act”), and thus was not subject to certain investment and operational restrictions that are imposed by the 1940 Act. If the Predecessor Limited Partnership had been registered under the 1940 Act, its performance may have been adversely affected. The Predecessor Limited Partnership’s performance has been restated to reflect estimated expenses of the Fund. The returns for the periods prior to January 1, 2010, reflect fee waivers and/or reimbursements without which performance would have been lower. |
| 2 | The Morgan Stanley Capital International All Country World ex USA Small Cap Growth Index (MSCI AC World ex USA Small Cap Growth Index) is a market capitalization-weighted index designed to measure equity performance in 45 global developed markets and emerging markets, excluding the U.S., and is composed of stocks which are categorized as small capitalization growth stocks. Data is in U.S. dollars. Source: Morgan Stanley Capital International, Inc. |
25
Table of Contents
Driehaus International Small Cap Growth Fund
Schedule of Investments
December 31, 2015
Number of Shares | Value (Note A) | |||||||
| EQUITY SECURITIES — 95.1% | ||||||||
| EUROPE — 64.6% | ||||||||
United Kingdom — 17.0% |
| |||||||
Auto Trader Group PLC | 382,939 | $ | 2,506,522 | |||||
Booker Group PLC | 1,207,959 | 3,232,122 | ||||||
Croda International PLC | 73,270 | 3,285,825 | ||||||
Domino’s Pizza Group PLC | 211,311 | 3,277,154 | ||||||
Greggs PLC | 185,096 | 3,585,514 | ||||||
Halma PLC | 279,850 | 3,568,621 | ||||||
IG Group Holdings PLC | 272,122 | 3,219,346 | ||||||
Inchcape PLC | 134,092 | 1,551,785 | ||||||
Informa PLC | 326,509 | 2,950,629 | ||||||
Intermediate Capital Group PLC | 333,994 | 3,087,203 | ||||||
Moneysupermarket.com Group PLC | 635,494 | 3,438,242 | ||||||
Provident Financial PLC | 33,038 | 1,639,894 | ||||||
Rightmove PLC | 59,376 | 3,610,720 | ||||||
RPC Group PLC | 133,712 | 1,642,005 | ||||||
Spirax-Sarco Engineering PLC | 70,426 | 3,408,497 | ||||||
SSP Group PLC | 527,998 | 2,529,733 | ||||||
SuperGroup PLC | 127,150 | 3,085,355 | ||||||
Ted Baker PLC | 36,708 | 1,616,964 | ||||||
Unite Group PLC | 337,792 | 3,266,722 | ||||||
Worldpay Group PLC** | 774,003 | 3,506,422 | ||||||
|
| |||||||
| 58,009,275 | ||||||||
|
| |||||||
Germany — 15.2% |
| |||||||
ADO Properties SA** | 64,509 | 1,857,796 | ||||||
Aurelius SE & Co., KGaA | 123,489 | 6,457,818 | ||||||
Covestro AG** | 91,828 | 3,356,592 | ||||||
CTS Eventim AG & Co., KGaA | 32,818 | 1,310,338 | ||||||
Deutsche Wohnen AG | 129,464 | 3,603,921 | ||||||
Drillisch AG | 34,072 | 1,447,422 | ||||||
Gerresheimer AG | 54,758 | 4,295,924 | ||||||
GFT Technologies SE | 87,050 | 2,988,007 | ||||||
KION Group AG | 31,764 | 1,588,597 | ||||||
LEG Immobilien AG | 43,454 | 3,565,403 | ||||||
Norma Group SE | 59,397 | 3,301,734 | ||||||
SMA Solar Technology AG** | 76,057 | 4,274,936 | ||||||
Stroeer SE | 101,657 | 6,396,579 | ||||||
Wirecard AG | 67,803 | 3,426,366 | ||||||
Zalando SE** | 98,983 | 3,915,560 | ||||||
|
| |||||||
| 51,786,993 | ||||||||
|
| |||||||
Netherlands — 5.2% |
| |||||||
Aalberts Industries NV | 98,721 | 3,410,610 | ||||||
Euronext NV | 99,528 | 5,114,470 | ||||||
GrandVision NV | 153,474 | 4,613,377 | ||||||
TomTom NV** | 367,977 | 4,640,852 | ||||||
|
| |||||||
| 17,779,309 | ||||||||
|
| |||||||
France — 4.3% |
| |||||||
Atos SE | 34,340 | 2,890,371 | ||||||
Rubis SCA | 52,547 | 3,993,405 | ||||||
SEB SA | 39,519 | 4,062,833 | ||||||
Teleperformance | 45,017 | 3,791,492 | ||||||
|
| |||||||
| 14,738,101 | ||||||||
|
| |||||||
Number of Shares | Value (Note A) | |||||||
Italy — 3.7% |
| |||||||
Banca Popolare di Milano Scarl | 2,500,558 | $ | 2,502,814 | |||||
Brembo SpA | 54,839 | 2,662,776 | ||||||
Davide Campari-Milano SpA | 260,861 | 2,267,937 | ||||||
De’ Longhi SpA | 62,893 | 1,891,226 | ||||||
Yoox Net-A-Porter Group SpA** | 91,502 | 3,435,663 | ||||||
|
| |||||||
| 12,760,416 | ||||||||
|
| |||||||
Switzerland — 3.7% |
| |||||||
Tecan Group AG | 23,159 | 3,766,575 | ||||||
Temenos Group AG | 104,222 | 5,405,684 | ||||||
U-Blox AG | 15,470 | 3,313,014 | ||||||
|
| |||||||
| 12,485,273 | ||||||||
|
| |||||||
Ireland — 3.5% |
| |||||||
DCC PLC | 48,033 | 4,007,884 | ||||||
Fleetmatics Group PLC** | 30,800 | 1,564,332 | ||||||
Greencore Group PLC | 497,929 | 2,600,744 | ||||||
Kingspan Group PLC | 135,866 | 3,589,448 | ||||||
|
| |||||||
| 11,762,408 | ||||||||
|
| |||||||
Sweden — 3.0% |
| |||||||
Axfood AB | 131,947 | 2,294,608 | ||||||
BillerudKorsnas AB | 104,612 | 1,948,126 | ||||||
Swedish Orphan Biovitrum AB** | 182,648 | 2,912,346 | ||||||
Trelleborg AB — B | 161,021 | 3,143,567 | ||||||
|
| |||||||
| 10,298,647 | ||||||||
|
| |||||||
Finland — 1.9% |
| |||||||
Amer Sports OYJ | 115,705 | 3,391,291 | ||||||
Huhtamaki OYJ | 80,593 | 2,934,094 | ||||||
|
| |||||||
| 6,325,385 | ||||||||
|
| |||||||
Denmark — 1.7% |
| |||||||
H Lundbeck AS** | 99,986 | 3,427,409 | ||||||
Royal Unibrew AS | 58,195 | 2,373,663 | ||||||
|
| |||||||
| 5,801,072 | ||||||||
|
| |||||||
Luxembourg — 1.5% |
| |||||||
APERAM SA** | 44,873 | 1,603,913 | ||||||
Grand City Properties SA | 158,044 | 3,673,844 | ||||||
|
| |||||||
| 5,277,757 | ||||||||
|
| |||||||
Belgium — 1.5% |
| |||||||
Ontex Group NV | 139,249 | 4,957,559 | ||||||
Spain — 1.4% |
| |||||||
Merlin Properties Socimi SA — REIT | 264,438 | 3,317,796 | ||||||
NH Hotel Group SA** | 289,724 | 1,586,890 | ||||||
|
| |||||||
| 4,904,686 | ||||||||
|
| |||||||
Austria — 0.5% |
| |||||||
Wienerberger AG | 99,878 | 1,855,000 | ||||||
Norway — 0.5% |
| |||||||
XXL ASA | 146,673 | 1,690,153 | ||||||
|
| |||||||
Total EUROPE | 220,432,034 | |||||||
|
| |||||||
Notes to Financial Statements are an integral part of this Schedule.
26
Table of Contents
Driehaus International Small Cap Growth Fund
Schedule of Investments
December 31, 2015
Number of Shares | Value (Note A) | |||||||
| FAR EAST — 21.0% | ||||||||
Japan — 18.7% |
| |||||||
Adastria Co., Ltd. | 33,688 | $ | 1,905,890 | |||||
Ariake Japan Co., Ltd. | 67,887 | 3,789,856 | ||||||
Create Restaurants Holdings, Inc. | 14,457 | 404,139 | ||||||
Daifuku Co., Ltd. | 202,800 | 3,501,061 | ||||||
Hoshizaki Electric Co., Ltd. | 47,193 | 2,968,335 | ||||||
Kajima Corp. | 549,000 | 3,306,926 | ||||||
Kyoritsu Maintenance Co., Ltd. | 40,600 | 3,519,714 | ||||||
Matsumotokiyoshi Holdings Co., Ltd. | 64,300 | 3,316,777 | ||||||
Morinaga & Co., Ltd. | 611,580 | 3,256,468 | ||||||
Nichirei Corp. | 594,436 | 4,441,146 | ||||||
Nihon M&A Center, Inc. | 67,033 | 3,268,134 | ||||||
NS Solutions Corp. | 72,134 | 1,662,392 | ||||||
Obic Co., Ltd. | 62,400 | 3,343,367 | ||||||
Open House Co., Ltd. | 166,647 | 3,252,663 | ||||||
Relo Holdings Inc. | 11,866 | 1,450,240 | ||||||
SCSK Corp. | 83,457 | 3,391,884 | ||||||
SMS Co., Ltd. | 142,012 | 3,004,589 | ||||||
Start Today Co., Ltd. | 51,435 | 1,681,763 | ||||||
Taisei Corp. | 486,000 | 3,234,744 | ||||||
TechnoPro Holdings, Inc. | 142,610 | 4,217,967 | ||||||
Temp Holdings Co., Ltd. | 108,600 | 1,703,157 | ||||||
Trend Micro, Inc.** | 81,659 | 3,349,381 | ||||||
|
| |||||||
| 63,970,593 | ||||||||
|
| |||||||
China — 1.5% |
| |||||||
Man Wah Holdings, Ltd. | 1,455,099 | 1,712,312 | ||||||
Techtronic Industries Co., Ltd. | 841,500 | 3,431,126 | ||||||
|
| |||||||
| 5,143,438 | ||||||||
|
| |||||||
Australia — 0.8% |
| |||||||
Domino’s Pizza Enterprises, Ltd. | 61,439 | 2,585,496 | ||||||
|
| |||||||
Total FAR EAST | 71,699,527 | |||||||
|
| |||||||
| NORTH AMERICA — 9.5% | ||||||||
Canada — 6.8% |
| |||||||
Boyd Group Income Fund | 42,594 | 2,034,735 | ||||||
CCL Industries, Inc. — B | 25,992 | 4,214,660 | ||||||
Colliers International Group, Inc. | 89,155 | 3,977,407 | ||||||
Descartes Systems Group, Inc.** | 51,462 | 1,035,414 | ||||||
Element Financial Corp. | 127,508 | 1,538,906 | ||||||
FirstService Corp. | 45,430 | 1,835,323 | ||||||
Metro, Inc. | 118,868 | 3,327,995 | ||||||
Parex Resources, Inc.** | 233,452 | 1,714,152 | ||||||
Raging River Exploration, Inc.** | 285,117 | 1,724,673 | ||||||
Uni-Select, Inc. | 34,900 | 1,727,975 | ||||||
|
| |||||||
| 23,131,240 | ||||||||
|
| |||||||
Number of Shares | Value (Note A) | |||||||
Mexico — 1.7% |
| |||||||
Alsea SAB de CV | 861,894 | $ | 3,000,088 | |||||
Gruma SAB de CV — B | 212,140 | 2,984,694 | ||||||
|
| |||||||
| 5,984,782 | ||||||||
|
| |||||||
British Virgin Islands — 1.0% |
| |||||||
Luxoft Holding, Inc.** | 42,901 | 3,308,954 | ||||||
|
| |||||||
Total NORTH AMERICA | 32,424,976 | |||||||
|
| |||||||
Total EQUITY SECURITIES (Cost $287,491,268) | 324,556,537 | |||||||
|
| |||||||
| ||||||||
TOTAL INVESTMENTS | 95.1 | % | $ | 324,556,537 | ||||
Other Assets In Excess Of Liabilities | 4.9 | % | 16,692,117 | |||||
|
|
|
| |||||
Net Assets | 100.0 | % | $ | 341,248,654 | ||||
| ||||||||
The federal income tax basis and unrealized appreciation (depreciation) for all investments is as follows:
Basis: | $ | 288,824,287 | ||
|
| |||
Gross Appreciation | $ | 46,228,678 | ||
Gross Depreciation | (10,496,428 | ) | ||
|
| |||
Net Appreciation | $ | 35,732,250 | ||
|
|
** Non-income producing security
REIT — Real Estate Investment Trust
Notes to Financial Statements are an integral part of this Schedule.
27
Table of Contents
Driehaus International Small Cap Growth Fund
Schedule of Investments
December 31, 2015
Regional Weightings*
Western Europe | 64.6% | |||
Japan | 18.7% | |||
North America | 9.5% | |||
Asia/Far East Ex-Japan | 2.3% |
Top Ten Holdings*
Aurelius AG | 1.9% | |||
Stroeer SE | 1.9% | |||
Temenos Group AG | 1.6% | |||
Euronext NV | 1.5% | |||
Ontex Group NV | 1.5% | |||
TomTom NV | 1.4% | |||
GrandVision NV | 1.4% | |||
Nichirei Corp. | 1.3% | |||
Gerresheimer AG | 1.3% | |||
SMA Solar Technology AG | 1.3% |
| * | All percentages are stated as a percent of net assets at December 31, 2015. |
Notes to Financial Statements are an integral part of this Schedule.
28
Table of Contents
Driehaus International Small Cap Growth Fund
Schedule of Investments
December 31, 2015
Industry | Percent of Net Assets | |||
Auto Components | 0.8% | |||
Beverages | 1.4% | |||
Biotechnology | 0.8% | |||
Building Products | 1.6% | |||
Capital Markets | 2.8% | |||
Chemicals | 2.0% | |||
Commercial Banks | 0.7% | |||
Commercial Services & Supplies | 0.6% | |||
Construction & Engineering | 1.9% | |||
Consumer Finance | 0.5% | |||
Containers & Packaging | 3.1% | |||
Distributors | 1.0% | |||
Diversified Financial Services | 2.9% | |||
Electronic Equipment, Instruments & Components | 1.0% | |||
Food & Staples Retailing | 4.6% | |||
Food Products | 5.0% | |||
Gas Utilities | 1.2% | |||
Hotels, Restaurants & Leisure | 5.0% | |||
Household Durables | 4.6% | |||
Industrial Conglomerates | 1.2% | |||
Internet and Catalog Retail | 2.6% | |||
Industry | Percent of Net Assets | |||
Internet Software & Services | 2.6% | |||
Information Technology Services | 7.2% | |||
Leisure Equipment & Products | 1.0% | |||
Life Sciences Tools & Services | 2.4% | |||
Machinery | 6.2% | |||
Media | 4.2% | |||
Metals & Mining | 0.5% | |||
Oil, Gas & Consumable Fuels | 1.0% | |||
Personal Products | 1.4% | |||
Pharmaceuticals | 1.0% | |||
Professional Services | 3.8% | |||
Real Estate Investment Trusts | 1.0% | |||
Real Estate Management & Development | 7.8% | |||
Semiconductors & Semiconductor Equipment | 2.2% | |||
Software | 3.3% | |||
Specialty Retail | 3.3% | |||
Textiles, Apparel & Luxury Goods | 0.5% | |||
Wireless Telecommunication Services | 0.4% | |||
Other Assets in Excess of Liabilities | 4.9% | |||
|
| |||
TOTAL | 100.0% | |||
|
| |||
Notes to Financial Statements are an integral part of this Schedule.
29
Table of Contents
Driehaus Micro Cap Growth Fund — Portfolio Managers’ Letter
Dear Fellow Shareholders,
The Driehaus Micro Cap Growth Fund (“Fund”) returned -0.55% for the year ended December 31, 2015.1 This return was above the performance of the Fund’s benchmark index, the Russell Microcap® Growth Index (the “Benchmark”), which returned -3.85% for the same period.
Micro cap stocks experienced significant volatility during 2015 as equity markets faced a global economic growth slowdown that was largely driven by China and other emerging markets, as well as dramatically lower crude oil and overall commodity prices. Large cap growth stocks generally outperformed smaller cap stocks as a few mega-cap names propelled the broad indices higher during the year. While the vast majority of the US economy is consumer-driven and services-based, the weakness overseas still hurt the US industrial, manufacturing and transportation industries. The drop in crude oil and natural gas prices drove significant underperformance within the energy sector. These factors all contributed to the negative returns for the year.
For the year 2015, key contributors to performance versus the Benchmark were the Fund’s selection of holdings in the information technology and health care sectors.
Ambarella, Inc. (Ticker: AMBA) was a significant contributor to Fund performance for the period. The company enables high definition and ultra-high definition video compression through low power processing solutions. Ambarella’s HD video compression processer operates on very low power and is particularly well suited for active cameras such as GoPro and flying cameras (drones). GoPro sales early this year surpassed all estimates and were a major driving force behind strong revenue results for Ambarella. Strong revenue and continued demand for wearable and drone cameras contributed to the stock’s advance during the year.
bluebird bio, Inc. (Ticker: BLUE) also contributed significantly to the Fund’s performance for the period. The company uses gene therapy to develop treatment options for patients with rare diseases, cancer, and severe genetic disorders. Stock price appreciation this past year was linked to the anticipation of and positive results from clinical trials of LentiGlobin in the treatment of sickle cell disease. Results presented at the European Hematology Association meeting in June were particularly promising.
During the year, the two sectors that detracted the most value from Fund performance versus the Benchmark were selections within the consumer discretionary and financials sectors.
A holding that detracted significantly from the Fund’s return relative to the Benchmark during the period was Patriot National, Inc. (Ticker: PN). The company provides outsourcing solutions within the worker’s compensation insurance marketplace with a portfolio of services that help clients with the claims process, regulations, and other aspects of worker’s compensation. Third quarter earnings fell below some analyst estimates accompanied by lower margins. News regarding the company’s private capital raise further spooked investors at the end of the year, causing another decline in the company’s share price.
Sequential Brands Group, Inc. (Ticker: SQBG) was also a main detractor for the period. The company owns and markets prominent consumer brands to retailers, wholesalers and distributors within a diversified global portfolio across consumer sectors. A significant selloff occurred in October, caused by unease over the company’s proposed acquisition of Martha Stewart brand and worries over debt costs.
Looking ahead, near-term US equity market performance will depend on various US-centric factors that we are monitoring closely, such as the health of corporate earnings, the pace of economic growth, the dovishness of the Federal Reserve, as well as the US dollar, crude oil, interest rates and the slope of the yield curve. Overseas, the key issue is overall global growth, namely in China, and whether that nation can stabilize economically. We are focusing on companies with higher levels of revenue and earnings visibility, stronger end markets and healthy balance sheets. We have an abundant number of well positioned growth companies that are innovative market leaders and that we believe will continue to exceed forward expectations. Overall, we continue to discover many exciting businesses that have strong, sustainable earnings growth and we have high conviction in the dynamic and innovative companies we hold.
30
Table of Contents
Thank you for your interest in the Driehaus Micro Cap Growth Fund. We appreciate your confidence in our management capabilities.
Sincerely,
 |  | |
| Jeff James | Michael Buck | |
| Portfolio Manager | Assistant Portfolio Manager |
| 1 | During this period, the Fund’s returns reflect fee waivers from the transfer agent without which performance may have been lower. |
Performance is historical and does not represent future results.
Please see the following performance overview page for index description.
31
Table of Contents
Driehaus Micro Cap Growth Fund
Performance Overview (unaudited)
The performance summarized below is historical and does not represent future results. Investment returns and principal value vary, and you may have a gain or loss when you sell shares. Performance data presented measures the change in the value of an investment in the Fund, assuming reinvestment of all dividends and capital gains. Average annual total return reflects annualized change.
The table does not reflect the deduction of taxes that a shareholder would pay on Fund distributions or the redemption of Fund shares. The graph compares the results of a $10,000 investment in the Fund since January 1, 2003 (which includes performance of the Predecessor Limited Partnership), with all dividends and capital gains reinvested, with the indicated index (and dividends reinvested) for the same period.
| Fund Only | Including Predecessor Limited Partnership | |||||||||||||||||||||||
| Average Annual Total Returns as of 12/31/15 | 1 Year | Since Inception (11/18/13 - 12/31/15) | 3 Years | 5 Years | 10 Years | Since Inception (01/01/03 - 12/31/15) | ||||||||||||||||||
Driehaus Micro Cap Growth Fund | –0.55% | 15.58% | 20.11% | 10.82% | 10.20% | 16.88% | ||||||||||||||||||
Russell Microcap® Growth Index2 | –3.85% | 3.41% | 15.30% | 10.08% | 5.74% | 9.53% | ||||||||||||||||||
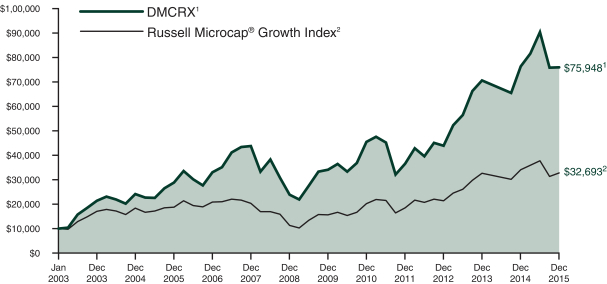
| 1 | The Driehaus Micro Cap Growth Fund (the “Fund”) performance shown above includes the performance of the Driehaus Micro Cap Fund, L.P. (the “Predecessor Limited Partnership”), one of the Fund’s predecessors, for the periods before the Fund’s registration statement became effective. The Predecessor Limited Partnership, which was established on July 1, 1996, was managed with substantially the same investment objective, policies and philosophies as are followed by the Fund. The Fund succeeded to the Predecessor Limited Partnership’s assets together with the assets of the Driehaus Institutional Micro Cap Fund, L.P. on November 18, 2013. The Predecessor Limited Partnership was not registered under the Investment Company Act of 1940, as amended (“1940 Act”), and thus was not subject to certain investment and operational restrictions that are imposed by the 1940 Act. If the Predecessor Limited Partnership had been registered under the 1940 Act, its performance may have been adversely affected. The Predecessor Limited Partnership’s performance has been restated to reflect estimated expenses of the Fund. The returns reflect fee waivers and/or reimbursements without which performance would have been lower. |
| 2 | The Russell Microcap® Growth Index is constructed to provide a comprehensive and unbiased barometer of the micro cap growth market. Based on ongoing empirical research of investment manager behavior, the methodology used to determine growth probability approximates the aggregate microcap growth manager's opportunity set. |
32
Table of Contents
Driehaus Micro Cap Growth Fund
Schedule of Investments
December 31, 2015
Number of Shares | Value (Note A) | |||||||
| EQUITY SECURITIES — 97.3% | ||||||||
| HEALTH CARE — 32.0% | ||||||||
Biotechnology — 14.9% |
| |||||||
Blueprint Medicines Corp.** | 154,786 | $ | 4,077,062 | |||||
Dimension Therapeutics, Inc.** | 97,279 | 1,097,307 | ||||||
Dynavax Technologies Corp.** | 153,427 | 3,706,796 | ||||||
Exelixis, Inc.** | 211,178 | 1,191,044 | ||||||
Five Prime Therapeutics, Inc.** | 105,663 | 4,385,015 | ||||||
Flexion Therapeutics, Inc.** | 196,970 | 3,795,612 | ||||||
Global Blood Therapeutics, Inc.** | 62,377 | 2,016,648 | ||||||
Heron Therapeutics, Inc.** | 79,155 | 2,113,439 | ||||||
Idera Pharmaceuticals, Inc.** | 353,180 | 1,091,326 | ||||||
Loxo Oncology, Inc.** | 152,032 | 4,325,310 | ||||||
MacroGenics, Inc.** | 107,939 | 3,342,871 | ||||||
Mirati Therapeutics, Inc.** | 88,921 | 2,809,904 | ||||||
Otonomy, Inc.** | 71,575 | 1,986,206 | ||||||
Sunesis Pharmaceuticals, Inc.** | 701,351 | 629,463 | ||||||
Synergy Pharmaceuticals, Inc.** | 246,130 | 1,395,557 | ||||||
Vitae Pharmaceuticals, Inc.** | 122,396 | 2,215,368 | ||||||
Xencor, Inc.** | 120,715 | 1,764,853 | ||||||
|
| |||||||
| 41,943,781 | ||||||||
|
| |||||||
Health Care Equipment & Supplies — 7.1% |
| |||||||
AtriCure, Inc.** | 115,722 | 2,596,802 | ||||||
Avinger, Inc.** | 176,227 | 4,002,115 | ||||||
Cerus Corp.** | 194,309 | 1,228,033 | ||||||
GenMark Diagnostics, Inc.** | 54,190 | 420,514 | ||||||
K2M Group Holdings, Inc.** | 146,489 | 2,891,693 | ||||||
LeMaitre Vascular, Inc. | 273,996 | 4,726,431 | ||||||
Vascular Solutions, Inc.** | 95,456 | 3,282,732 | ||||||
Veracyte, Inc.** | 141,899 | 1,021,673 | ||||||
|
| |||||||
| 20,169,993 | ||||||||
|
| |||||||
Pharmaceuticals — 5.0% |
| |||||||
Dermira, Inc.** | 48,279 | 1,670,936 | ||||||
Foamix Pharmaceuticals, Ltd.** | 322,054 | 2,611,858 | ||||||
Intersect ENT, Inc.** | 52,437 | 1,179,833 | ||||||
Intra-Cellular Therapies, Inc.** | 48,462 | 2,606,771 | ||||||
KemPharm, Inc.** | 124,884 | 2,480,196 | ||||||
MyoKardia, Inc.** | 144,249 | 2,114,690 | ||||||
Revance Therapeutics, Inc.** | 39,431 | 1,346,963 | ||||||
|
| |||||||
| 14,011,247 | ||||||||
|
| |||||||
Health Care Providers & Services — 2.9% |
| |||||||
Aceto Corp. | 74,676 | 2,014,758 | ||||||
AMN Healthcare Services, Inc.** | 87,009 | 2,701,629 | ||||||
Cross Country Healthcare, Inc.** | 208,094 | 3,410,661 | ||||||
|
| |||||||
| 8,127,048 | ||||||||
|
| |||||||
Life Sciences Tools & Services — 2.1% |
| |||||||
NeoGenomics, Inc.** | 764,898 | 6,019,747 | ||||||
|
| |||||||
Total HEALTH CARE | 90,271,816 | |||||||
|
| |||||||
Number of Shares | Value (Note A) | |||||||
| INFORMATION TECHNOLOGY — 24.4% | ||||||||
Software — 7.9% |
| |||||||
Callidus Software, Inc.** | 273,078 | $ | 5,071,058 | |||||
Globant SA** | 179,715 | 6,741,110 | ||||||
Mitek Systems, Inc.** | 293,022 | 1,204,320 | ||||||
Paycom Software, Inc.** | 126,406 | 4,756,658 | ||||||
Proofpoint, Inc.** | 39,210 | 2,549,042 | ||||||
Zix Corp.** | 371,141 | 1,885,396 | ||||||
|
| |||||||
| 22,207,584 | ||||||||
|
| |||||||
Internet Software & Services — 6.4% |
| |||||||
Autobytel, Inc.** | 167,195 | 3,771,919 | ||||||
Instructure, Inc.** | 128,535 | 2,676,099 | ||||||
Q2 Holdings, Inc.** | 191,757 | 5,056,632 | ||||||
QuinStreet, Inc.** | 328,259 | 1,408,231 | ||||||
SPS Commerce, Inc.** | 27,866 | 1,956,472 | ||||||
Stamps.com, Inc.** | 29,151 | 3,195,241 | ||||||
|
| |||||||
| 18,064,594 | ||||||||
|
| |||||||
Semiconductors & Semiconductor Equipment — 5.4% |
| |||||||
Applied Micro Circuits Corp.** | 126,222 | 804,034 | ||||||
CEVA, Inc.** | 154,052 | 3,598,655 | ||||||
Inphi Corp.** | 192,344 | 5,197,135 | ||||||
MaxLinear, Inc. — A** | 70,087 | 1,032,382 | ||||||
NeoPhotonics Corp.** | 214,042 | 2,324,496 | ||||||
Silicon Motion Technology Corp. — ADR | 74,566 | 2,338,390 | ||||||
|
| |||||||
| 15,295,092 | ||||||||
|
| |||||||
Information Technology Services — 1.7% |
| |||||||
ExlService Holdings, Inc.** | 52,317 | 2,350,603 | ||||||
Hackett Group, Inc. | 153,024 | 2,459,096 | ||||||
|
| |||||||
| 4,809,699 | ||||||||
|
| |||||||
Computers & Peripherals — 1.1% |
| |||||||
CPI Card Group, Inc.** | 132,831 | 1,415,978 | ||||||
Immersion Corp.** | 155,269 | 1,810,437 | ||||||
|
| |||||||
| 3,226,415 | ||||||||
|
| |||||||
Communications Equipment — 1.0% |
| |||||||
CalAmp Corp.** | 99,489 | 1,982,816 | ||||||
Oclaro, Inc.** | 239,686 | 834,107 | ||||||
|
| |||||||
| 2,816,923 | ||||||||
|
| |||||||
Electronic Equipment, Instruments & Components —0.9% |
| |||||||
Mercury Systems, Inc.** | 138,154 | 2,536,507 | ||||||
|
| |||||||
Total INFORMATION TECHNOLOGY | 68,956,814 | |||||||
|
| |||||||
| CONSUMER DISCRETIONARY — 13.9% | ||||||||
Leisure Equipment & Products — 2.7% |
| |||||||
MCBC Holdings, Inc.** | 109,481 | 1,499,890 | ||||||
Nautilus, Inc.** | 108,490 | 1,813,953 | ||||||
Smith & Wesson Holding Corp.** | 192,547 | 4,232,183 | ||||||
|
| |||||||
| 7,546,026 | ||||||||
|
| |||||||
Notes to Financial Statements are an integral part of this Schedule.
33
Table of Contents
Driehaus Micro Cap Growth Fund
Schedule of Investments
December 31, 2015
Number of Shares | Value (Note A) | |||||||
Auto Components — 2.5% |
| |||||||
Motorcar Parts of America, Inc.** | 125,635 | $ | 4,247,719 | |||||
Standard Motor Products, Inc. | 46,406 | 1,765,748 | ||||||
Unique Fabricating, Inc. | 83,970 | 1,036,190 | ||||||
|
| |||||||
| 7,049,657 | ||||||||
|
| |||||||
Hotels, Restaurants & Leisure — 2.5% |
| |||||||
Carrols Restaurant Group, Inc.** | 210,297 | 2,468,887 | ||||||
Chuy’s Holdings, Inc.** | 114,658 | 3,593,382 | ||||||
Good Times Restaurants, Inc.** | 182,766 | 877,277 | ||||||
|
| |||||||
| 6,939,546 | ||||||||
|
| |||||||
Specialty Retail — 2.0% |
| |||||||
Francesca’s Holdings Corp.** | 103,680 | 1,805,069 | ||||||
MarineMax, Inc.** | 105,955 | 1,951,691 | ||||||
Tile Shop Holdings, Inc.** | 122,147 | 2,003,211 | ||||||
|
| |||||||
| 5,759,971 | ||||||||
|
| |||||||
Household Durables — 1.2% |
| |||||||
Bassett Furniture Industries, Inc. | 67,307 | 1,688,060 | ||||||
Universal Electronics, Inc.** | 32,565 | 1,672,213 | ||||||
|
| |||||||
| 3,360,273 | ||||||||
|
| |||||||
Internet & Catalog Retail — 0.9% |
| |||||||
Duluth Holdings, Inc.** | 102,380 | 1,493,724 | ||||||
Nutrisystem, Inc. | 55,180 | 1,194,095 | ||||||
|
| |||||||
| 2,687,819 | ||||||||
|
| |||||||
Diversified Consumer Services — 0.9% |
| |||||||
Chegg, Inc.** | 206,296 | 1,388,372 | ||||||
Weight Watchers International, Inc.** | 50,335 | 1,147,638 | ||||||
|
| |||||||
| 2,536,010 | ||||||||
|
| |||||||
Textiles, Apparel & Luxury Goods — 0.9% |
| |||||||
Cherokee, Inc.** | 144,241 | 2,488,157 | ||||||
Media — 0.3% | ||||||||
Xcel Brands, Inc.** | 98,478 | 738,585 | ||||||
|
| |||||||
Total CONSUMER DISCRETIONARY | 39,106,044 | |||||||
|
| |||||||
| INDUSTRIALS — 12.3% | ||||||||
Building Products — 4.5% |
| |||||||
American Woodmark Corp.** | 18,173 | 1,453,477 | ||||||
Gibraltar Industries, Inc.** | 147,039 | 3,740,672 | ||||||
Griffon Corp. | 140,321 | 2,497,714 | ||||||
Insteel Industries, Inc. | 32,110 | 671,741 | ||||||
Patrick Industries, Inc.** | 59,978 | 2,609,043 | ||||||
PGT, Inc.** | 156,071 | 1,777,649 | ||||||
|
| |||||||
| 12,750,296 | ||||||||
|
| |||||||
Professional Services — 2.5% |
| |||||||
Heidrick & Struggles International, Inc. | 47,191 | 1,284,539 | ||||||
Kforce, Inc. | 88,664 | 2,241,426 | ||||||
Number of Shares | Value (Note A) | |||||||
Paylocity Holding Corp.** | 51,106 | $ | 2,072,348 | |||||
Resources Connection, Inc. | 80,587 | 1,316,792 | ||||||
|
| |||||||
| 6,915,105 | ||||||||
|
| |||||||
Airlines — 2.0% |
| |||||||
Controladora Vuela Cia de Aviacion SAB de CV — ADR** | 194,731 | 3,341,584 | ||||||
SkyWest, Inc. | 123,873 | 2,356,064 | ||||||
|
| |||||||
| 5,697,648 | ||||||||
|
| |||||||
Construction & Engineering — 1.6% |
| |||||||
Argan, Inc. | 61,349 | 1,987,708 | ||||||
Comfort Systems USA, Inc. | 89,802 | 2,552,173 | ||||||
|
| |||||||
| 4,539,881 | ||||||||
|
| |||||||
Aerospace & Defense — 0.5% |
| |||||||
TASER International, Inc.** | 84,772 | 1,465,708 | ||||||
Machinery — 0.5% |
| |||||||
Lydall, Inc.** | 39,394 | 1,397,699 | ||||||
Electrical Equipment — 0.4% |
| |||||||
LSI Industries, Inc. | 80,488 | 981,149 | ||||||
Trading Companies & Distributors — 0.3% |
| |||||||
Lawson Products, Inc.** | 39,064 | 912,144 | ||||||
|
| |||||||
Total INDUSTRIALS | 34,659,630 | |||||||
|
| |||||||
| TELECOMMUNICATION SERVICES — 5.9% | ||||||||
Diversified Telecommunication Services — 3.9% |
| |||||||
8X8, Inc.** | 215,621 | 2,468,860 | ||||||
GTT Communications, Inc.** | 228,260 | 3,894,116 | ||||||
Inteliquent, Inc. | 261,366 | 4,644,474 | ||||||
|
| |||||||
| 11,007,450 | ||||||||
|
| |||||||
Wireless Telecommunication Services — 2.0% |
| |||||||
RingCentral, Inc. — A** | 242,202 | 5,711,123 | ||||||
|
| |||||||
Total TELECOMMUNICATIONS SERVICES | 16,718,573 | |||||||
|
| |||||||
| FINANCIALS — 4.9% | ||||||||
Commercial Banks — 2.3% |
| |||||||
BNC Bancorp | 88,353 | 2,242,399 | ||||||
Hanmi Financial Corp. | 110,068 | 2,610,813 | ||||||
Live Oak Bancshares, Inc. | 121,927 | 1,731,363 | ||||||
|
| |||||||
| 6,584,575 | ||||||||
|
| |||||||
Thrifts & Mortgage Finance — 1.4% |
| |||||||
LendingTree, Inc.** | 44,681 | 3,989,120 | ||||||
Insurance — 1.2% |
| |||||||
Atlas Financial Holdings, Inc.** | 162,936 | 3,242,426 | ||||||
|
| |||||||
Total FINANCIALS | 13,816,121 | |||||||
|
| |||||||
| MATERIALS — 1.6% | ||||||||
Construction Materials — 0.7% |
| |||||||
US Concrete, Inc.** | 39,431 | 2,076,436 | ||||||
Metals & Mining — 0.5% |
| |||||||
US Silica Holdings, Inc. | 74,272 | 1,391,115 | ||||||
Notes to Financial Statements are an integral part of this Schedule.
34
Table of Contents
Driehaus Micro Cap Growth Fund
Schedule of Investments
December 31, 2015
Number of Shares | Value (Note A) | |||||||
Chemicals — 0.4% |
| |||||||
Flotek Industries, Inc.** | 101,000 | $ | 1,155,440 | |||||
|
| |||||||
Total MATERIALS | 4,622,991 | |||||||
|
| |||||||
| CONSUMER STAPLES — 1.5% | ||||||||
Food Products — 1.5% |
| |||||||
Calavo Growers, Inc. | 30,403 | 1,489,747 | ||||||
John B Sanfilippo & Son, Inc. | 48,536 | 2,622,400 | ||||||
|
| |||||||
| 4,112,147 | ||||||||
|
| |||||||
Total CONSUMER STAPLES | 4,112,147 | |||||||
|
| |||||||
| ENERGY — 0.8% | ||||||||
Oil, Gas & Consumable Fuels — 0.5% |
| |||||||
Callon Petroleum Co.** | 155,983 | 1,300,898 | ||||||
Energy Equipment & Services — 0.3% |
| |||||||
TETRA Technologies, | 126,296 | 949,746 | ||||||
|
| |||||||
Total ENERGY | 2,250,644 | |||||||
|
| |||||||
Total EQUITY SECURITIES (Cost $257,117,233) | 274,514,780 | |||||||
|
| |||||||
| ||||||||
TOTAL INVESTMENTS (COST $257,117,233) | 97.3 | % | $ | 274,514,780 | ||||
Other Assets In Excess Of Liabilities | 2.7 | % | 7,663,357 | |||||
|
|
|
| |||||
Net Assets | 100.0 | % | $ | 282,178,137 | ||||
| ||||||||
The federal income tax basis and unrealized appreciation (depreciation) for all investments is as follows:
Basis: | $ | 262,918,598 | ||
|
| |||
Gross Appreciation | $ | 26,899,390 | ||
Gross Depreciation | (15,303,208 | ) | ||
|
| |||
Net Appreciation | $ | 11,596,182 | ||
|
|
** Non-income producing security
ADR — American Depository Receipt
Top Ten Holdings*
Globant SA | 2.4 | % | ||
NeoGenomics, Inc. | 2.1 | % | ||
RingCentral, Inc. — A | 2.0 | % | ||
Inphi Corp. | 1.8 | % | ||
Callidus Software, Inc. | 1.8 | % | ||
Q2 Holdings, Inc. | 1.8 | % | ||
Paycom Software, Inc. | 1.7 | % | ||
LeMaitre Vascular, Inc. | 1.7 | % | ||
Inteliquent, Inc. | 1.6 | % | ||
Five Prime Therapeutics, Inc. | 1.6 | % |
| * | All percentages are stated as a percent of net assets at December 31, 2015. |
Notes to Financial Statements are an integral part of this Schedule.
35
Table of Contents
Statements of Assets and Liabilities
December 31, 2015
| Driehaus Emerging Markets Growth Fund | Driehaus Emerging Markets Small Cap Growth Fund | |||||||
ASSETS: | ||||||||
Investments, at cost | $ | 1,254,812,610 | $ | 360,559,374 | ||||
|
|
|
| |||||
Investments, at market value | $ | 1,279,391,056 | $ | 387,061,332 | ||||
Foreign currency, at value* | — | 3,899,117 | ||||||
Cash | 66,435,995 | 23,129,463 | ||||||
Collateral held at custodian for the benefit of brokers | — | 14,452,873 | ||||||
Receivables: | ||||||||
Dividends | 3,459,227 | 291,731 | ||||||
Investment securities sold | 30,133,332 | 17,359,236 | ||||||
Fund shares sold | 13,707,104 | 1,733,521 | ||||||
Due from affiliate | — | — | ||||||
Prepaid expenses | 13,927 | 30,120 | ||||||
|
|
|
| |||||
| ||||||||
TOTAL ASSETS | 1,393,140,641 | 447,957,393 | ||||||
|
|
|
| |||||
| ||||||||
LIABILITIES: | ||||||||
Payables: | ||||||||
Investment securities purchased | 17,138,671 | 8,544,065 | ||||||
Fund shares redeemed | 10,038,214 | 3,611,713 | ||||||
Net unrealized depreciation on unsettled foreign currency transactions | 245,756 | 8,991 | ||||||
Due to affiliate | 1,770,415 | 563,460 | ||||||
Accrued foreign capital gains taxes | 1,177,151 | 1,575,315 | ||||||
Audit and tax fees | 39,936 | 25,740 | ||||||
Accrued expenses | 309,483 | 112,357 | ||||||
Outstanding options written, at value (premiums received $704,424) | — | 798,000 | ||||||
|
|
|
| |||||
| ||||||||
TOTAL LIABILITIES | 30,719,626 | 15,239,641 | ||||||
|
|
|
| |||||
| ||||||||
NET ASSETS | $ | 1,362,421,015 | $ | 432,717,752 | ||||
|
|
|
| |||||
SHARES OUTSTANDING (Unlimited shares authorized, no par value) | 51,369,065 | 36,503,251 | ||||||
|
|
|
| |||||
NET ASSET VALUE | $ | 26.52 | $ | 11.85 | ||||
|
|
|
| |||||
| ||||||||
NET ASSETS CONSISTED OF THE FOLLOWING AT DECEMBER 31, 2015: | ||||||||
Paid-in capital | $ | 1,524,308,976 | $ | 474,766,553 | ||||
Accumulated net investment income (loss) | 129,107 | (35,177 | ) | |||||
Accumulated net realized gain (loss) | (186,315,993 | ) | (68,400,042 | ) | ||||
Unrealized net foreign exchange gain (loss) | (279,521 | ) | (21,964 | ) | ||||
Unrealized net appreciation (depreciation) on written options | — | (93,576 | ) | |||||
Unrealized net appreciation (depreciation) on investments | 24,578,446 | 26,501,958 | ||||||
|
|
|
| |||||
NET ASSETS | $ | 1,362,421,015 | $ | 432,717,752 | ||||
|
|
|
| |||||
| ||||||||
| * | The cost of foreign currency was $0, $3,885,735, $261,996, $0 and $0, respectively. |
Notes to Financial Statements are an integral part of this Statement.
36
Table of Contents
Statements of Assets and Liabilities
December 31, 2015
| Driehaus Frontier Emerging Markets Fund | Driehaus International Small Cap Growth Fund | Driehaus Micro Cap Growth Fund | ||||||||
| $ | 18,866,282 | $ | 287,491,268 | $ | 257,117,233 | |||||
|
|
|
|
|
| |||||
| $ | 18,290,003 | $ | 324,556,537 | $ | 274,514,780 | |||||
| 261,464 | — | — | ||||||||
| 1,073,629 | 19,787,017 | 8,609,183 | ||||||||
| — | — | — | ||||||||
| 8,824 | 533,807 | 41,975 | ||||||||
| 151,493 | 2,346,804 | — | ||||||||
| 11,575 | 171,207 | 1,227,946 | ||||||||
| 5,789 | — | — | ||||||||
| 13,422 | 13,804 | 59,472 | ||||||||
|
|
|
|
|
| |||||
|
|
|
| |||||||
| 19,816,199 | 347,409,176 | 284,453,356 | ||||||||
|
|
|
|
|
| |||||
|
|
|
| |||||||
| 189,190 | 5,600,477 | 467,848 | ||||||||
| — | 28,714 | 1,433,960 | ||||||||
| | 703 | | 7,810 | — | ||||||
| — | 424,876 | 304,105 | ||||||||
| — | — | — | ||||||||
| 22,010 | 24,310 | 20,560 | ||||||||
| 34,664 | 74,335 | 48,746 | ||||||||
| — | — | — | ||||||||
|
|
|
|
|
| |||||
|
|
|
| |||||||
| 246,567 | 6,160,522 | 2,275,219 | ||||||||
|
|
|
|
|
| |||||
|
|
|
| |||||||
| $ | 19,569,632 | $ | 341,248,654 | $ | 282,178,137 | |||||
|
|
|
|
|
| |||||
| 2,223,564 | 33,844,520 | 26,276,429 | ||||||||
|
|
|
|
|
| |||||
| $ | 8.80 | $ | 10.08 | $ | 10.74 | |||||
|
|
|
|
|
| |||||
|
|
|
| |||||||
| $ | 21,902,053 | $ | 304,569,864 | $ | 281,916,621 | |||||
| — | (876,346 | ) | — | |||||||
| (1,755,578 | ) | 524,522 | (17,136,031 | ) | ||||||
| (564 | ) | (34,655 | ) | — | ||||||
| — | — | — | ||||||||
| (576,279 | ) | 37,065,269 | 17,397,547 | |||||||
|
|
|
|
|
| |||||
| $ | 19,569,632 | $ | 341,248,654 | $ | 282,178,137 | |||||
|
|
|
|
|
| |||||
|
|
|
| |||||||
Notes to Financial Statements are an integral part of this Statement.
37
Table of Contents
For the Year Ended December 31, 2015
| Driehaus Emerging Markets Growth Fund | Driehaus Emerging Markets Small Cap Growth Fund | |||||||
INVESTMENT INCOME (LOSS): | ||||||||
Income: | ||||||||
Dividends** | $ | 30,719,234 | $ | 7,361,595 | ||||
Other | 28,263 | — | ||||||
|
|
|
| |||||
| ||||||||
Total income | 30,747,497 | 7,361,595 | ||||||
|
|
|
| |||||
| ||||||||
Expenses: | ||||||||
Investment advisory fee | 24,839,831 | 8,532,130 | ||||||
Administration fee | 852,851 | 421,537 | ||||||
Professional fees | 275,026 | 109,852 | ||||||
Audit and tax fees | 84,912 | 72,938 | ||||||
Federal and state registration fees | 67,789 | 10,935 | ||||||
Custodian fees | 460,907 | 258,002 | ||||||
Transfer agent fees | 383,198 | 76,417 | ||||||
Trustees’ fees | 92,077 | 53,361 | ||||||
Chief compliance officer fees | 12,813 | 12,813 | ||||||
Reports to shareholders | 117,385 | 36,707 | ||||||
Interest expense | — | 2,917 | ||||||
Miscellaneous | 69,486 | 38,064 | ||||||
|
|
|
| |||||
Total expenses | 27,256,275 | 9,625,673 | ||||||
|
|
|
| |||||
| ||||||||
Investment advisory fees recaptured (waived) | — | — | ||||||
Administration fees waived | — | — | ||||||
Transfer agent fees waived | — | — | ||||||
Other expenses reimbursed by adviser | — | — | ||||||
Fees paid indirectly | (173,865 | ) | (69,017 | ) | ||||
|
|
|
| |||||
Net expenses | 27,082,410 | 9,556,656 | ||||||
|
|
|
| |||||
| ||||||||
Net investment income (loss) | 3,665,087 | (2,195,061 | ) | |||||
|
|
|
| |||||
| ||||||||
| NET REALIZED AND UNREALIZED GAIN (LOSS) ON INVESTMENTS, WRITTEN OPTIONS AND FOREIGN CURRENCY TRANSACTIONS: | ||||||||
Net realized gain (loss) from security transactions | (134,527,471 | ) | (44,586,400 | ) | ||||
Net realized foreign exchange gain (loss) | (5,503,532 | ) | (2,660,794 | ) | ||||
Net realized gain (loss) on written options | — | (15,760,935 | ) | |||||
Net change in unrealized foreign exchange gain (loss) | 107,192 | (37,465 | ) | |||||
Net change in unrealized appreciation (depreciation) on written options | — | (93,576 | ) | |||||
Net change in unrealized appreciation (depreciation) on investments*** | (34,711,198 | ) | (8,156,595 | ) | ||||
|
|
|
| |||||
| ||||||||
Net realized and unrealized gain (loss) on investments, written options and foreign currency transactions | (174,635,009 | ) | (71,295,765 | ) | ||||
|
|
|
| |||||
| ||||||||
NET INCREASE (DECREASE) IN NET ASSETS RESULTING FROM OPERATIONS | $ | (170,969,922 | ) | $ | (73,490,826 | ) | ||
|
|
|
| |||||
| ||||||||
| * | Fund commenced operations on May 4, 2015. |
| ** | Dividends are net of $4,247,093, $717,713, $19,194, $428,976 and $0 non-reclaimable foreign taxes withheld, respectively. |
| *** | Net change in unrealized appreciation (depreciation) does not include net unrealized appreciation of $4,962,609 for the Driehaus International Small Cap Growth Fund in connection with the Fund’s merger. See Note I in the Notes to Financial Statements. |
Notes to Financial Statements are an integral part of this Statement.
38
Table of Contents
Statements of Operations
For the Year Ended December 31, 2015
| Driehaus Frontier Emerging Markets Fund* | Driehaus International Small Cap Growth Fund | Driehaus Micro Cap Growth Fund | ||||||||
| $ | 200,844 | $ | 4,619,056 | $ | 504,819 | |||||
| — | 14,958 | — | ||||||||
|
|
|
|
|
| |||||
|
|
|
| |||||||
| 200,844 | 4,634,014 | 504,819 | ||||||||
|
|
|
|
|
| |||||
|
|
|
| |||||||
| 169,023 | 4,598,043 | 2,049,928 | ||||||||
| 51,631 | 276,524 | 156,420 | ||||||||
| 17,475 | 69,719 | 47,916 | ||||||||
| 46,065 | 46,700 | 48,395 | ||||||||
| 16,781 | 18,000 | 19,304 | ||||||||
| 62,675 | 69,395 | 48,056 | ||||||||
| 24,908 | 54,774 | 48,731 | ||||||||
| 20,306 | 42,991 | 37,895 | ||||||||
| 9,609 | 12,813 | 12,813 | ||||||||
| 9,581 | 21,586 | 17,160 | ||||||||
| — | — | — | ||||||||
| 10,596 | 32,153 | 27,807 | ||||||||
|
|
|
|
|
| |||||
| 438,650 | 5,242,698 | 2,514,425 | ||||||||
|
|
|
|
|
| |||||
|
|
|
| |||||||
| (169,023 | ) | — | — | |||||||
| (7,500 | ) | — | — | |||||||
| (22,500 | ) | — | (10,500 | ) | ||||||
| (14,263 | ) | — | — | |||||||
| (95 | ) | (36,420 | ) | (7,897 | ) | |||||
|
|
|
|
|
| |||||
| 225,269 | 5,206,278 | 2,496,028 | ||||||||
|
|
|
|
|
| |||||
|
|
|
| |||||||
| (24,425 | ) | (572,264 | ) | (1,991,209 | ) | |||||
|
|
|
|
|
| |||||
|
|
|
| |||||||
| (1,756,638 | ) | 21,053,262 | (6,843,839 | ) | ||||||
| (72,228 | ) | (359,390 | ) | — | ||||||
| — | — | — | ||||||||
| (564 | ) | (14,758 | ) | — | ||||||
| — | — | — | ||||||||
| (576,279 | ) | 14,372,532 | (8,070,470 | ) | ||||||
|
|
|
|
|
| |||||
|
|
|
| |||||||
| (2,405,709 | ) | 35,051,646 | (14,914,309 | ) | ||||||
|
|
|
|
|
| |||||
|
|
|
| |||||||
| $ | (2,430,134 | ) | $ | 34,479,382 | $ | (16,905,518 | ) | |||
|
|
|
|
|
| |||||
|
|
|
| |||||||
Notes to Financial Statements are an integral part of this Statement.
39
Table of Contents
Statements of Changes in Net Assets
| Driehaus Emerging Markets Growth Fund | Driehaus Emerging Markets Small Cap Growth Fund | |||||||||||||||
| For the year ended December 31, 2015 | For the year ended December 31, 2014 | For the year | For the year ended December 31, 2014 | |||||||||||||
INCREASE (DECREASE) IN NET ASSETS: | ||||||||||||||||
Operations: | ||||||||||||||||
Net investment income (loss) | $ | 3,665,087 | $ | 2,062,220 | $ | (2,195,061 | ) | $ | (506,094 | ) | ||||||
Net realized gain (loss) on investments, written options and foreign currency transactions | (140,031,003 | ) | (23,211 | ) | (63,008,129 | ) | (2,474,594 | ) | ||||||||
Net change in unrealized gain (loss) on investments, written options and foreign currency transactions | (34,604,006 | ) | (116,879,122 | ) | (8,287,636 | ) | 7,398,856 | |||||||||
|
|
|
|
|
|
|
| |||||||||
| ||||||||||||||||
Net increase (decrease) in net assets resulting from operations | (170,969,922 | ) | (114,840,113 | ) | (73,490,826 | ) | 4,418,168 | |||||||||
|
|
|
|
|
|
|
| |||||||||
| ||||||||||||||||
Distributions to shareholders: | ||||||||||||||||
Net investment income | — | — | — | — | ||||||||||||
Capital gains | — | (54,103,175 | ) | — | — | |||||||||||
|
|
|
|
|
|
|
| |||||||||
Total distributions to shareholders | — | (54,103,175 | ) | — | — | |||||||||||
|
|
|
|
|
|
|
| |||||||||
| ||||||||||||||||
Capital share transactions: | ||||||||||||||||
Proceeds from shares sold | 495,687,975 | 693,446,944 | 391,387,204 | 426,167,539 | ||||||||||||
Proceeds from shares issued in connection with merger (see Note I) | — | — | — | — | ||||||||||||
Reinvestment of distributions | — | 51,221,013 | — | — | ||||||||||||
Cost of shares redeemed | (663,624,481 | ) | (509,558,324 | ) | (395,407,314 | ) | (111,716,374 | ) | ||||||||
Redemption fees | 108,595 | 186,630 | 54,128 | 20,494 | ||||||||||||
|
|
|
|
|
|
|
| |||||||||
Net increase (decrease) in net assets derived from capital share transactions | (167,827,911 | ) | 235,296,263 | (3,965,982 | ) | 314,471,659 | ||||||||||
|
|
|
|
|
|
|
| |||||||||
Total increase (decrease) in net assets | (338,797,833 | ) | 66,352,975 | (77,456,808 | ) | 318,889,827 | ||||||||||
|
|
|
|
|
|
|
| |||||||||
| ||||||||||||||||
NET ASSETS: | ||||||||||||||||
| ||||||||||||||||
Beginning of period | $ | 1,701,218,848 | $ | 1,634,865,873 | $ | 510,174,560 | $ | 191,284,733 | ||||||||
|
|
|
|
|
|
|
| |||||||||
End of period | $ | 1,362,421,015 | $ | 1,701,218,848 | $ | 432,717,752 | $ | 510,174,560 | ||||||||
|
|
|
|
|
|
|
| |||||||||
Accumulated net investment income (loss) | $ | 129,107 | $ | (4,591,578 | ) | $ | (35,177 | ) | $ | (1,279,354 | ) | |||||
|
|
|
|
|
|
|
| |||||||||
| ||||||||||||||||
Capital share transactions are as follows: | ||||||||||||||||
Shares issued | 17,103,216 | 21,385,832 | 29,084,670 | 31,805,044 | ||||||||||||
Shares issued in connection with merger (see Note I) | — | — | — | — | ||||||||||||
Shares reinvested | — | 1,731,026 | — | — | ||||||||||||
Shares redeemed | (23,146,134 | ) | (15,968,610 | ) | (31,207,479 | ) | (8,496,865 | ) | ||||||||
|
|
|
|
|
|
|
| |||||||||
Net increase (decrease) from capital share transactions | (6,042,918 | ) | 7,148,248 | (2,122,809 | ) | 23,308,179 | ||||||||||
|
|
|
|
|
|
|
| |||||||||
| ||||||||||||||||
| * | Fund commenced operations on May 4, 2015. |
Notes to Financial Statements are an integral part of this Statement.
40
Table of Contents
Statements of Changes in Net Assets
| Driehaus Frontier Emerging Markets Fund | Driehaus International Small Cap Growth Fund | Driehaus Micro Cap Growth Fund | ||||||||||||||||
| For the period May 4, 2015 through December 31, 2015* | For the year ended December 31, 2015 | For the year ended December 31, 2014 | For the year ended December 31, 2015 | For the year ended December 31, 2014 | ||||||||||||||
| $ | (24,425 | ) | $ | (572,264 | ) | $ | (975,535 | ) | $ | (1,991,209 | ) | $ | (1,404,609 | ) | ||||
| | (1,828,866 | ) | 20,693,872 | 12,613,057 | (6,843,839 | ) | 1,492,816 | |||||||||||
| (576,843 | ) | 14,357,774 | (22,136,892 | ) | (8,070,470 | ) | 7,233,238 | |||||||||||
|
|
|
|
|
|
|
|
|
| |||||||||
|
| |||||||||||||||||
| (2,430,134 | ) | 34,479,382 | (10,499,370 | ) | (16,905,518 | ) | 7,321,445 | |||||||||||
|
|
|
|
|
|
|
|
|
| |||||||||
|
| |||||||||||||||||
| — | (972,621 | ) | (1,354,663 | ) | — | — | ||||||||||||
| — | (7,898,573 | ) | (24,445,714 | ) | (11,379,419 | ) | (3,527,388 | ) | ||||||||||
|
|
|
|
|
|
|
|
|
| |||||||||
| | — | | (8,871,194 | ) | (25,800,377 | ) | (11,379,419 | ) | (3,527,388 | ) | ||||||||
|
|
|
|
|
|
|
|
|
| |||||||||
|
| |||||||||||||||||
| 22,685,066 | 46,284,910 | 15,508,526 | 280,545,434 | 62,163,421 | ||||||||||||||
| — | 79,717,913 | — | — | — | ||||||||||||||
| — | 8,097,062 | 22,612,764 | 10,743,663 | 3,082,937 | ||||||||||||||
| (685,300 | ) | (37,438,916 | ) | (53,517,412 | ) | (92,767,630 | ) | (31,884,076 | ) | |||||||||
| — | 920 | 3,732 | 95,940 | 12,543 | ||||||||||||||
|
|
|
|
|
|
|
|
|
| |||||||||
| | 21,999,766 | | 96,661,889 | (15,392,390 | ) | 198,617,407 | 33,374,825 | |||||||||||
|
|
|
|
|
|
|
|
|
| |||||||||
| 19,569,632 |
| 122,270,077 | (51,692,137 | ) | 170,332,470 | 37,168,882 | |||||||||||
|
|
|
|
|
|
|
|
|
| |||||||||
|
| |||||||||||||||||
|
| |||||||||||||||||
| $ | — | $ | 218,978,577 | $ | 270,670,714 | $ | 111,845,667 | $ | 74,676,785 | |||||||||
|
|
|
|
|
|
|
|
|
| |||||||||
| $ | 19,569,632 | $ | 341,248,654 | $ | 218,978,577 | $ | 282,178,137 | $ | 111,845,667 | |||||||||
|
|
|
|
|
|
|
|
|
| |||||||||
| $ | — | $ | (876,346 | ) | $ | (1,226,081 | ) | $ | — | $ | — | |||||||
|
|
|
|
|
|
|
|
|
| |||||||||
|
| |||||||||||||||||
| 2,300,043 | 4,649,732 | 1,427,397 | 23,283,839 | 5,750,668 | ||||||||||||||
| — | 8,325,014 | — | — | — | ||||||||||||||
| — | 814,593 | 2,436,720 | 994,767 | 278,999 | ||||||||||||||
| (76,479 | ) | (3,741,175 | ) | (5,035,552 | ) | (7,946,334 | ) | (3,035,803 | ) | |||||||||
|
|
|
|
|
|
|
|
|
| |||||||||
| 2,223,564 | 10,048,164 | (1,171,435 | ) | 16,332,272 | 2,993,864 | |||||||||||||
|
|
|
|
|
|
|
|
|
| |||||||||
|
| |||||||||||||||||
Notes to Financial Statements are an integral part of this Statement.
41
Table of Contents
Driehaus Emerging Markets Growth Fund
| For the year ended December 31, 2015 | For the year ended December 31, 2014 | For the year ended December 31, 2013 | For the year ended December 31, 2012 | For the year ended December 31, 2011 | ||||||||||||||||
Net asset value, beginning of period | $ | 29.63 | $ | 32.53 | $ | 30.61 | $ | 25.72 | $ | 32.20 | ||||||||||
|
|
|
|
|
|
|
|
|
| |||||||||||
INCOME (LOSS) FROM INVESTMENT OPERATIONS: | ||||||||||||||||||||
Net investment income (loss) | 0.06 | 0.04 | 0.10 | 0.13 | 0.16 | |||||||||||||||
Net realized and unrealized gain (loss) on investments and foreign currency transactions | (3.17 | ) | (1.99 | ) | 2.62 | 4.88 | (4.97 | ) | ||||||||||||
|
|
|
|
|
|
|
|
|
| |||||||||||
Total income (loss) from investment operations | (3.11 | ) | (1.95 | ) | 2.72 | 5.01 | (4.81 | ) | ||||||||||||
|
|
|
|
|
|
|
|
|
| |||||||||||
LESS DISTRIBUTIONS: | ||||||||||||||||||||
Dividends from net investment income | — | — | — | (0.12 | ) | — | ||||||||||||||
Distributions from capital gains | — | (0.95 | ) | (0.80 | ) | — | (1.67 | ) | ||||||||||||
|
|
|
|
|
|
|
|
|
| |||||||||||
Total distributions | — | (0.95 | ) | (0.80 | ) | (0.12 | ) | (1.67 | ) | |||||||||||
|
|
|
|
|
|
|
|
|
| |||||||||||
Redemption fees added to paid-in capital | 0.00 | ~ | 0.00 | ~ | 0.00 | ~ | 0.00 | ~ | 0.00 | ~ | ||||||||||
|
|
|
|
|
|
|
|
|
| |||||||||||
Net asset value, end of period | $ | 26.52 | $ | 29.63 | $ | 32.53 | $ | 30.61 | $ | 25.72 | ||||||||||
|
|
|
|
|
|
|
|
|
| |||||||||||
Total Return | (10.49 | )% | (5.96 | )% | 8.92 | % | 19.51 | % | (15.02 | )% | ||||||||||
RATIOS/SUPPLEMENTAL DATA | ||||||||||||||||||||
Net assets, end of period (in 000’s) | $ | 1,362,421 | $ | 1,701,219 | $ | 1,634,866 | $ | 989,258 | $ | 741,291 | ||||||||||
Ratio of expenses before reimbursements, waivers and fees paid indirectly to average net assets | 1.65 | % | 1.65 | % | 1.66 | % | 1.68 | % | 1.68 | % | ||||||||||
Ratio of net expenses to average net assets | 1.64 | %# | 1.63 | %# | 1.64 | %# | 1.66 | %# | 1.64 | %# | ||||||||||
Ratio of net investment income (loss) to average net assets | 0.22 | %# | 0.11 | %# | 0.33 | %# | 0.48 | %# | 0.49 | %# | ||||||||||
Portfolio turnover | 257 | % | 289 | % | 264 | % | 278 | % | 342 | % | ||||||||||
|
|
|
|
|
|
|
|
|
|
| ||||||||||
| ~ | Amount represents less than $0.01 per share |
| # | Such ratios are net of fees paid indirectly (see Note B in the Notes to Financial Statements). |
Notes to Financial Statements are an integral part of this Schedule.
42
Table of Contents
Driehaus Emerging Markets Small Cap Growth Fund
Financial Highlights
| For the year ended December 31, 2015 | For the year ended December 31, 2014 | For the year ended December 31, 2013 | For the year ended December 31, 2012 | For the period August 22, 2011 through December 31, 2011 | ||||||||||||||||
Net asset value, beginning of period | $ | 13.21 | $ | 12.49 | $ | 11.15 | $ | 8.81 | $ | 10.00 | ||||||||||
|
|
|
|
|
|
|
|
|
| |||||||||||
INCOME (LOSS) FROM INVESTMENT OPERATIONS: | ||||||||||||||||||||
Net investment income (loss) | (0.05 | )^ | (0.02 | )^ | (0.00 | )^~ | 0.00 | ^~ | (0.03 | ) | ||||||||||
Net realized and unrealized gain (loss) on investments | (1.31 | ) | 0.74 | 1.36 | 2.52 | (1.16 | ) | |||||||||||||
|
|
|
|
|
|
|
|
|
| |||||||||||
Total income (loss) from investment operations | (1.36 | ) | 0.72 | 1.36 | 2.52 | (1.19 | ) | |||||||||||||
|
|
|
|
|
|
|
|
|
| |||||||||||
LESS DISTRIBUTIONS: | ||||||||||||||||||||
Dividends from net investment income | — | — | (0.02 | ) | (0.18 | ) | — | |||||||||||||
Distributions from capital gains | — | — | — | — | — | |||||||||||||||
|
|
|
|
|
|
|
|
|
| |||||||||||
Total distributions | — | — | (0.02 | ) | (0.18 | ) | — | |||||||||||||
|
|
|
|
|
|
|
|
|
| |||||||||||
Redemption fees added to paid-in capital | 0.00 | ~ | 0.00 | ~ | 0.00 | ~ | 0.00 | ~ | — | |||||||||||
|
|
|
|
|
|
|
|
|
| |||||||||||
Net asset value, end of period | $ | 11.85 | $ | 13.21 | $ | 12.49 | $ | 11.15 | $ | 8.81 | ||||||||||
|
|
|
|
|
|
|
|
|
| |||||||||||
Total Return | (10.22 | )% | 5.77 | % | 12.11 | % | 28.83 | % | (11.90 | )%** | ||||||||||
RATIOS/SUPPLEMENTAL DATA | ||||||||||||||||||||
Net assets, end of period (in 000’s) | $ | 432,718 | $ | 510,175 | $ | 191,285 | $ | 80,997 | $ | 32,720 | ||||||||||
Ratio of expenses before reimbursements and/or recapture, waivers and fees paid indirectly to average net assets | 1.69 | %¥ | 1.73 | % | 1.85 | % | 2.15 | % | 2.74 | %* | ||||||||||
Ratio of net expenses to average net assets | 1.68 | %#¥ | 1.71 | %+# | 1.90 | %+# | 1.99 | %+# | 1.97 | %*+# | ||||||||||
Ratio of net investment loss to average net assets | (0.39 | )%# | (0.14 | )%+# | (0.02 | )%+# | (0.02 | )%+# | (0.91 | )%*+# | ||||||||||
Portfolio turnover | 306 | % | 265 | % | 223 | % | 183 | % | 74 | %** | ||||||||||
|
|
|
|
|
|
|
|
|
|
| ||||||||||
| * | Annualized |
| ** | Not Annualized |
| ^ | Net investment income (loss) per share has been calculated using the average shares method. |
| ~ | Amount represents less than $0.01 per share |
| + | Such ratios are after administrative and transfer agent waivers and adviser expense reimbursements, when applicable. BNY Mellon Investment Servicing (US) Inc., the administrative agent and transfer agent, waived a portion of its fees beginning with the Fund’s commencement of operations, August 22, 2011. The Adviser contractually agreed to waive its investment advisory fee or absorb other operating expenses to the extent necessary to ensure that total annual Fund operating expenses (other than interest, taxes, brokerage commissions and other portfolio transaction expenses, capital expenditures, and extraordinary expenses) would not exceed the Fund’s operating expense cap of 2.00% of average daily net assets until August 21, 2014. |
| # | Such ratios are net of fees paid indirectly (see Note B in the Notes to Financial Statements). |
| ¥ | Ratio of expenses to average net assets includes interest expense of less than 0.005% for the year ended December 31, 2015. The interest expense is from utilizing the line of credit (see Note F in the Notes to Financial Statements). |
Notes to Financial Statements are an integral part of this Schedule.
43
Table of Contents
Driehaus Frontier Emerging Markets Fund
Financial Highlights
| For the period May 4, 2015 through December 31, 2015 | ||||
Net asset value, beginning of period | $ | 10.00 | ||
|
| |||
INCOME (LOSS) FROM INVESTMENT OPERATIONS: | ||||
Net investment income (loss) | (0.01 | ) | ||
Net realized and unrealized gain (loss) on investments | (1.19 | ) | ||
|
| |||
Total income (loss) from investment operations | (1.20 | ) | ||
|
| |||
LESS DISTRIBUTIONS: | ||||
Dividends from net investment income | — | |||
Distributions from capital gains | — | |||
|
| |||
Total distributions | — | |||
|
| |||
Redemption fees added to paid-in capital | — | |||
|
| |||
Net asset value, end of period | $ | 8.80 | ||
|
| |||
Total Return | (12.00 | )%** | ||
RATIOS/SUPPLEMENTAL DATA | ||||
Net assets, end of period (in 000’s) | $ | 19,570 | ||
Ratio of expenses before reimbursements and waivers and fees recaptured, if any, to average net assets | 3.89 | %* | ||
Ratio of net expenses to average net assets | 2.00 | %*+# | ||
Ratio of net investment income (loss) to average net assets | (0.22 | )%*+# | ||
Portfolio turnover | 66 | %** | ||
| ||||
| * | Annualized |
| ** | Not Annualized |
| + | Such ratios are after administrative and transfer agent waivers and adviser expense reimbursements, when applicable. BNY Mellon Investment Servicing (US) Inc., the administrative agent and transfer agent, waived a portion of its fees beginning with the Fund’s commencement of operations, May 4, 2015. The Adviser contractually agreed to waive its investment advisory fee or absorb other operating expenses to the extent necessary to ensure that total annual Fund operating expenses (other than interest, taxes, brokerage commissions and other portfolio transaction expenses, capital expenditures, and extraordinary expenses) would not exceed the Fund’s operating expense cap of 2.00% of average daily net assets until May 4, 2018. |
| # | Such ratios are net of fees paid indirectly (see Note B in the Notes to Financial Statements). |
Notes to Financial Statements are an integral part of this Schedule.
44
Table of Contents
Driehaus International Small Cap Growth Fund
Financial Highlights
| For the year ended December 31, 2015 | For the year ended December 31, 2014 | For the year ended December 31, 2013 | For the year ended December 31, 2012 | For the year ended December 31, 2011 | ||||||||||||||||
Net asset value, beginning of period | $ | 9.20 | $ | 10.84 | $ | 9.45 | $ | 8.51 | $ | 9.66 | ||||||||||
|
|
|
|
|
|
|
|
|
| |||||||||||
INCOME (LOSS) FROM INVESTMENT OPERATIONS: | ||||||||||||||||||||
Net investment income (loss) | (0.02 | )^ | (0.04 | ) | (0.01 | )^ | 0.03 | 0.07 | ||||||||||||
Net realized and unrealized gain (loss) on investments and foreign currency transactions | 1.17 | (0.42 | ) | 2.74 | 0.95 | (1.17 | ) | |||||||||||||
|
|
|
|
|
|
|
|
|
| |||||||||||
Total income (loss) from investment operations | 1.15 | (0.46 | ) | 2.73 | 0.98 | (1.10 | ) | |||||||||||||
|
|
|
|
|
|
|
|
|
| |||||||||||
LESS DISTRIBUTIONS: | ||||||||||||||||||||
Dividends from net investment income | (0.03 | ) | (0.06 | ) | (0.13 | ) | (0.04 | ) | (0.05 | ) | ||||||||||
Distributions from capital gains | (0.24 | ) | (1.12 | ) | (1.21 | ) | — | — | ||||||||||||
|
|
|
|
|
|
|
|
|
| |||||||||||
Total distributions | (0.27 | ) | (1.18 | ) | (1.34 | ) | (0.04 | ) | (0.05 | ) | ||||||||||
|
|
|
|
|
|
|
|
|
| |||||||||||
Redemption fees added to paid-in capital | 0.00 | ~ | 0.00 | ~ | 0.00 | ~ | 0.00 | ~ | 0.00 | ~ | ||||||||||
|
|
|
|
|
|
|
|
|
| |||||||||||
Net asset value, end of period | $ | 10.08 | $ | 9.20 | $ | 10.84 | $ | 9.45 | $ | 8.51 | ||||||||||
|
|
|
|
|
|
|
|
|
| |||||||||||
Total Return | 12.58 | % | (4.32 | )% | 29.24 | % | 11.67 | % | (11.39 | )% | ||||||||||
RATIOS/SUPPLEMENTAL DATA | ||||||||||||||||||||
Net assets, end of period (in 000’s) | $ | 341,249 | $ | 218,979 | $ | 270,671 | $ | 234,959 | $ | 232,729 | ||||||||||
Ratio of expenses before reimbursements, waivers and fees paid indirectly to average net assets | 1.71 | % | 1.74 | % | 1.73 | % | 1.76 | % | 1.73 | % | ||||||||||
Ratio of net expenses to average net assets | 1.70 | %# | 1.72 | %# | 1.70 | %# | 1.74 | %# | 1.69 | %# | ||||||||||
Ratio of net investment income (loss) to average net assets | (0.19 | )%# | (0.40 | )%# | (0.11 | )%# | 0.31 | %# | 0.66 | %# | ||||||||||
Portfolio turnover | 251 | % | 277 | % | 320 | % | 280 | % | 311 | % | ||||||||||
|
|
|
|
|
|
|
|
|
|
| ||||||||||
| ^ | Net investment income (loss) per share has been calculated using the average shares method. |
| ~ | Amount represents less than $0.01 per share |
| # | Such ratios are net of fees paid indirectly (see Note B in the Notes to Financial Statements). |
Notes to Financial Statements are an integral part of this Schedule.
45
Table of Contents
Driehaus Micro Cap Growth Fund
Financial Highlights
| For the year ended December 31, 2015 | For the year ended December 31, 2014 | For the period November 18, 2013 through December 31, 2013 | ||||||||||
Net asset value, beginning of period | $ | 11.25 | $ | 10.74 | $ | 10.00 | ||||||
|
|
|
|
|
| |||||||
INCOME (LOSS) FROM INVESTMENT OPERATIONS: | ||||||||||||
Net investment income (loss) | (0.14 | )^ | (0.14 | ) | (0.02 | ) | ||||||
Net realized and unrealized gain (loss) on investments | 0.08 | 1.01 | 0.76 | |||||||||
|
|
|
|
|
| |||||||
Total income (loss) from investment operations | (0.06 | ) | 0.87 | 0.74 | ||||||||
|
|
|
|
|
| |||||||
LESS DISTRIBUTIONS: | ||||||||||||
Dividends from net investment income | — | — | — | |||||||||
Distributions from capital gains | (0.45 | ) | (0.36 | ) | — | |||||||
|
|
|
|
|
| |||||||
Total distributions | (0.45 | ) | (0.36 | ) | — | |||||||
|
|
|
|
|
| |||||||
Redemption fees added to paid-in capital | 0.00 | ~ | 0.00 | ~ | — | |||||||
|
|
|
|
|
| |||||||
Net asset value, end of period | $ | 10.74 | $ | 11.25 | $ | 10.74 | ||||||
|
|
|
|
|
| |||||||
Total Return | (0.55 | )% | 8.21 | % | 7.40 | %** | ||||||
RATIOS/SUPPLEMENTAL DATA | ||||||||||||
Net assets, end of period (in 000’s) | $ | 282,178 | $ | 111,846 | $ | 74,677 | ||||||
Ratio of expenses before reimbursements and waivers and fees recaptured, if any, to average net assets | 1.53 | % | 1.59 | % | 2.28 | %* | ||||||
Ratio of net expenses to average net assets | 1.52 | %+# | 1.60 | %+# | 1.70 | %*+# | ||||||
Ratio of net investment income (loss) to average net assets | (1.21 | )%+# | (1.39 | )%+# | (1.55 | )%*+# | ||||||
Portfolio turnover | 183 | % | 191 | % | 21 | %** | ||||||
|
|
|
|
|
|
| ||||||
| * | Annualized |
| ** | Not Annualized |
| ^ | Net investment income (loss) per share has been calculated using the average shares method. |
| ~ | Amount represents less than $0.01 per share |
| + | Such ratios are after administrative and transfer agent waivers and adviser expense reimbursements, when applicable. BNY Mellon Investment Servicing (US) Inc., the administrative agent and transfer agent, waived a portion of its fees beginning with the Fund’s commencement of operations, November 18, 2013. The Adviser contractually agreed to waive its investment advisory fee or absorb other operating expenses to the extent necessary to ensure that total annual Fund operating expenses (other than interest, taxes, brokerage commissions and other portfolio transaction expenses, capital expenditures, and extraordinary expenses) would not exceed the Fund’s operating expense cap of 1.70% of average daily net assets until November 18, 2016. |
| # | Such ratios are net of fees paid indirectly (see Note B in the Notes to Financial Statements). |
Notes to Financial Statements are an integral part of this Schedule.
46
Table of Contents
Driehaus Mutual Funds
A. SUMMARY OF SIGNIFICANT ACCOUNTING POLICIES
Organization
The Driehaus Mutual Funds (the “Trust”) is a registered management investment company under the Investment Company Act of 1940, as amended, organized as a Delaware statutory trust, with eight separate series currently in operation. The Trust was organized under an Agreement and Declaration of Trust dated May 31, 1996, as subsequently amended and restated as of June 6, 2013, and amended as of June 4, 2015, and may issue an unlimited number of full and fractional units of beneficial interest (shares) without par value. The five series (“Funds” or each a “Fund”) included in this report are as follows:
| Fund | Commencement of Operations | |||
Driehaus Emerging Markets Growth Fund | 12/31/97 | |||
Driehaus Emerging Markets Small Cap Growth Fund | 08/22/11 | |||
Driehaus Frontier Emerging Markets Fund | 05/04/15 | |||
Driehaus International Small Cap Growth Fund* | 09/17/07 | |||
Driehaus Micro Cap Growth | 11/18/13 | |||
| ||||
| * | On December 29, 2010, the Driehaus International Small Cap Growth Fund was closed to new investors. |
The investment objective of each Fund is to maximize capital appreciation.
Driehaus Emerging Markets Growth Fund seeks to achieve its objective by investing primarily in equity securities of emerging markets companies.
Driehaus Emerging Markets Small Cap Growth Fund seeks to achieve its objective by investing primarily in equity securities of small capitalization emerging markets companies.
Driehaus Frontier Emerging Markets Fund seeks to achieve its objective by investing primarily in equity securities of frontier emerging markets companies.
Driehaus International Small Cap Growth Fund seeks to achieve its objective by investing primarily in equity securities of smaller capitalization non-U.S. companies exhibiting strong growth characteristics.
Driehaus Micro Cap Growth Fund seeks to achieve its objective by investing primarily in equity securities of micro capitalization U.S. companies exhibiting strong growth characteristics.
The Funds, which are investment companies within the scope of Financial Accounting Standards Board (“FASB”) Accounting Standards Update 2013-08, follow accounting and reporting guidance under FASB Accounting Standards Codification Topic 946, Financial Services-Investment Companies.
Fiscal Year-End
The fiscal year-end for the Funds is December 31.
Securities Valuation and Transactions
Equity securities and exchange-traded options are valued at the last sale price as of the close of the primary exchange or other designated time. Equity Certificates are valued at the last sale price of the underlying security as of the close of the primary exchange. In addition, if quotations are not readily available, if the values have been materially affected by events occurring after the closing of a foreign market, or if there has been a movement in the United States market that exceeds a certain threshold, assets may be valued at fair value as determined in good faith by or under the direction of the Trust’s Board of Trustees. Events that may materially affect asset values that could cause a fair value determination include, but are not limited to: corporate announcements relating to a specific security; natural and other disasters which may impact an entire market or region; and political and other events which may be global or impact a particular country or region. The frequency with which these procedures are used cannot be predicted and may be utilized to a significant extent. To the extent utilized, securities would be considered level 2 in the hierarchy described below. Substantially all transfers between level 1 and level 2 relate to the use of these procedures.
47
Table of Contents
Driehaus Mutual Funds
Notes to Financial Statements — (Continued)
Each Fund is subject to fair value accounting standards that define fair value, establish the framework for measuring fair value and provide a three-level hierarchy for fair valuation based upon the inputs to the valuation as of the measurement date. The three levels of the fair value hierarchy are as follows:
Level 1 — quoted prices in active markets for identical securities
Level 2 — significant observable inputs (including quoted prices for similar securities, interest rates, prepayment speeds, credit risk, etc.)
Level 3 — significant unobservable inputs (including the Funds’ own assumptions in determining the fair value of investments)
The inputs or methodology used for valuing securities are not necessarily an indication of the risk associated with investing in those securities.
The summary of the Funds’ investments that are measured at fair value by level within the fair value hierarchy as of December 31, 2015 is as follows:
Fund | Total Value at December 31, 2015 | Level 1 Quoted Price | Level 2 Significant Observable Inputs | Level 3 Significant Unobservable Inputs | ||||||||||||
Driehaus Emerging Markets Growth Fund | ||||||||||||||||
Equity Securities: | ||||||||||||||||
Africa | $ | 27,332,809 | $ | 27,332,809 | $ | — | $ | — | ||||||||
Europe | 129,164,694 | 122,705,510 | 6,459,184 | — | ||||||||||||
Far East | 842,279,354 | 842,279,354 | — | — | ||||||||||||
Middle East | 11,133,205 | 11,133,205 | — | — | ||||||||||||
North America | 199,855,752 | 199,855,752 | — | — | ||||||||||||
South America | 69,625,242 | 69,625,242 | — | — | ||||||||||||
|
|
|
|
|
|
|
| |||||||||
Total Investments | $ | 1,279,391,056 | $ | 1,272,931,872 | $ | 6,459,184 | $ | — | ||||||||
|
|
|
|
|
|
|
| |||||||||
Driehaus Emerging Markets Small Cap Growth Fund | ||||||||||||||||
Assets: | ||||||||||||||||
Equity Securities: | ||||||||||||||||
Africa | $ | 8,232,318 | $ | 8,232,318 | $ | — | $ | — | ||||||||
Europe | 28,591,073 | 21,631,187 | 6,959,886 | — | ||||||||||||
Far East | 285,273,836 | 285,273,836 | — | — | ||||||||||||
Middle East | 8,848,226 | 8,848,226 | — | — | ||||||||||||
North America | 30,340,588 | 30,340,588 | — | — | ||||||||||||
South America | 16,521,410 | 16,521,410 | — | — | ||||||||||||
Equity Certificates* | 3,867,881 | — | 3,867,881 | — | ||||||||||||
Purchased Call Options by Risk Category: | ||||||||||||||||
Equity Contracts | 1,390,000 | 1,390,000 | — | — | ||||||||||||
Foreign Currency Contracts | 150,000 | 150,000 | — | — | ||||||||||||
Purchased Put Options by Risk Category: | ||||||||||||||||
Equity Contracts | 3,846,000 | 3,846,000 | — | — | ||||||||||||
|
|
|
|
|
|
|
| |||||||||
Total Investments | $ | 387,061,332 | $ | 376,233,565 | $ | 10,827,767 | $ | — | ||||||||
|
|
|
|
|
|
|
| |||||||||
48
Table of Contents
Driehaus Mutual Funds
Notes to Financial Statements — (Continued)
Fund | Total Value at December 31, 2015 | Level 1 Quoted Price | Level 2 Significant Observable Inputs | Level 3 Significant Unobservable Inputs | ||||||||||||
Liabilities: | ||||||||||||||||
Written Call Options by Risk Category: | ||||||||||||||||
Equity Contracts | $ | (455,000 | ) | $ | (455,000 | ) | $ | — | $ | — | ||||||
Written Put Options by Risk Category: | ||||||||||||||||
Equity Contracts | (343,000 | ) | (343,000 | ) | — | — | ||||||||||
|
|
|
|
|
|
|
| |||||||||
Total Liabilities | $ | (798,000 | ) | $ | (798,000 | ) | $ | — | $ | — | ||||||
|
|
|
|
|
|
|
| |||||||||
Driehaus Frontier Emerging Markets Fund | ||||||||||||||||
Equity Securities | ||||||||||||||||
Africa | $ | 3,743,274 | $ | 3,400,671 | $ | 342,603 | $ | — | ||||||||
Europe | 2,741,169 | 2,741,169 | — | |||||||||||||
Far East | 4,880,886 | 4,880,886 | — | — | ||||||||||||
Middle East | 3,559,302 | 3,559,302 | — | — | ||||||||||||
South America | 1,318,357 | 1,318,357 | — | — | ||||||||||||
Equity Certificates* | 2,047,015 | — | 2,047,015 | — | ||||||||||||
|
|
|
|
|
|
|
| |||||||||
Total Investments | $ | 18,290,003 | $ | 15,900,385 | $ | 2,389,618 | $ | — | ||||||||
|
|
|
|
|
|
|
| |||||||||
Driehaus International Small Cap Growth Fund | ||||||||||||||||
Investments in Securities* | $ | 324,556,537 | $ | 324,556,537 | $ | — | $ | — | ||||||||
|
|
|
|
|
|
|
| |||||||||
Driehaus Micro Cap Growth Fund | ||||||||||||||||
Investments in Securities* | $ | 274,514,780 | $ | 274,514,780 | $ | — | $ | — | ||||||||
|
|
|
|
|
|
|
| |||||||||
| * | See Schedule of Investments for industry and/or country breakout. |
Transfers between levels, if any, are recognized as of the last day in the fiscal quarter of the period in which the event or change in circumstances that caused the reclassification occurred. The Funds used observable inputs in their valuation methodologies whenever they were available and deemed reliable.
When fair value pricing is employed, the prices of securities used by a Fund to calculate its net asset value may differ from closing prices for the same securities, which means that a Fund may value those securities higher or lower than another fund that does not employ fair value. In addition, the fair value price may differ materially from the value a Fund may ultimately realize.
For the year ended December 31, 2015, securities with end of period values of $193,767,401, $76,860,337 and $62,478,120 held by Driehaus Emerging Markets Growth Fund, Driehaus Emerging Markets Small Cap Growth Fund and Driehaus International Small Cap Growth Fund, respectively, were transferred from level 2 to level 1.
Securities transactions are accounted for on trade date. Gains and losses realized on sales of securities are determined by the use of the specific identification method for both financial reporting and income tax purposes. Interest income is recorded on an accrual basis. Dividend income, net of non-reclaimable foreign taxes withheld, is recorded on the ex-dividend date. Corporate actions involving foreign securities, including dividends, are recorded as soon as the information becomes available. Income and expenses are accrued daily.
49
Table of Contents
Driehaus Mutual Funds
Notes to Financial Statements — (Continued)
Options Contracts
The Funds are subject to equity and other risk exposures in the normal course of pursuing their investment objective. The Funds may use options contracts to hedge their portfolio or a portion thereof or speculatively for the purpose of profiting from a decline in the market value of a security.
The Funds may write covered call and put options on futures, securities or currencies the Funds own or in which they may invest. Writing put options tends to increase a Fund’s exposure to the underlying instrument. Writing call options tends to decrease a Fund’s exposure to the underlying instrument. When a Fund writes a call or put option, an amount equal to the premium received is recorded as a liability and subsequently marked-to-market to reflect the current value of the option written. These liabilities are reflected as written options outstanding in the Schedule of Investments. Payments received or made, if any, from writing options with premiums to be determined on a future date are reflected as such in the Schedule of Investments. Premiums received from writing options that expire are treated as realized gains. Premiums received from writing options that are exercised or closed are added to the proceeds or offset against amounts paid on the underlying future, security or currency transaction to determine the realized gain or loss. A Fund, as a writer of an option, has no control over whether the underlying future, security or currency may be sold (call) or purchased (put) and, as a result, bears the market risk of an unfavorable change in the price of the future, security or currency underlying the written option. The risk exists that a Fund may not be able to enter into a closing transaction because of an illiquid market.
For the year ended December 31, 2015, the average monthly volume of purchased and written options for Driehaus Emerging Markets Small Cap Growth Fund were $5,885,278 and $335,589, respectively.
The premiums received and the number of option contracts written during the year ended December 31, 2015 were as follows:
Driehaus Emerging Markets Small Cap Growth Fund | Number of Contracts | Premiums Received | ||||||
Options outstanding at December 31, 2014 | — | $ | — | |||||
Options written | 606,918 | 24,423,358 | ||||||
Options closed | 593,418 | (23,718,934 | ) | |||||
Options expired | — | — | ||||||
|
|
|
| |||||
Options outstanding at December 31, 2015 | 13,500 | $ | 704,424 | |||||
|
|
|
| |||||
The Funds may also purchase put and call options. Purchasing call options tends to increase a Fund’s exposure to the underlying instrument. Purchasing put options tends to decrease a Fund’s exposure to the underlying instrument. A Fund pays a premium which is included in its Schedule of Investments as an investment and subsequently marked-to-market to reflect the current value of the option. Premiums paid for purchasing options that expire are treated as realized losses. Premiums paid for purchasing options that are exercised or closed are added to the amounts paid or offset against the proceeds on the underlying future, security or currency transaction to determine the realized gain or loss. When entering into purchased option contracts, a Fund bears the risk of securities prices moving unexpectedly, in which case, a Fund may not achieve the anticipated benefits of the purchased option contracts; however, the risk of loss is limited to the premium paid. As of December 31, 2015, Driehaus Emerging Markets Small Cap Growth Fund had outstanding options as listed on the Schedule of Investments.
Equity Certificates
The Funds may invest in equity certificates, which allow the Funds to participate in the appreciation (depreciation) of the underlying security without actually owning the underlying security. These derivative instruments are purchased pursuant to an agreement with a financial institution and are valued at a calculated market price based on the value of the underlying security in accordance with the agreement. These equity certificates are subject to the credit risk of the issuing financial institution. There is no off-balance sheet risk associated with equity certificates and the Funds’ potential loss is limited to the purchase price of the securities. The Funds are exposed to credit risk associated with the counterparty to the transaction, which is monitored by the Funds’ management on a periodic basis.
50
Table of Contents
Driehaus Mutual Funds
Notes to Financial Statements — (Continued)
On December 31, 2015, Driehaus Emerging Markets Small Cap Growth Fund and Driehaus Frontier Emerging Markets Fund had unrealized appreciation (depreciation) of $1,504,829 and $(105,992), respectively, as a result of their investments in these financial instruments. The aggregate market values of these certificates for Driehaus Emerging Markets Small Cap Growth Fund and Driehaus Frontier Emerging Markets Funds represented 1.0% and 11.2%, respectively, of their total market value of investments at December 31, 2015.
Derivative Investment Holdings Categorized by Risk Exposure
Each Fund is subject to the FASB’s “Disclosures about Derivative Instruments and Hedging Activities” (the “Derivatives Statement”). The Derivatives Statement amends and expands disclosures about derivative instruments and hedging activities. The Derivatives Statement is intended to improve financial reporting about derivative instruments requiring enhanced disclosures to enable investors to better understand how and why the Funds use derivative instruments, how these derivative instruments are accounted for and their effects on the Funds’ financial position and results of operations.
The following table sets forth the fair value and the location in the Statement of Assets and Liabilities of the Driehaus Emerging Markets Small Cap Growth Fund’s derivative contracts by primary risk exposure as of December 31, 2015:
Asset derivatives | Liability derivatives | |||||||||||
Risk exposure category | Statement of Assets and | Fair value | Statement of Assets and Liabilities location | Fair value | ||||||||
Equity contracts | Investments, at market value | $ | 9,103,881 | Outstanding options written, at value | $ | 798,000 | ||||||
Foreign currency contracts | Investments, at market value | $ | 150,000 | |||||||||
|
|
|
|
|
|
| ||||||
The following table sets forth the fair value and the location in the Statement of Assets and Liabilities of the Driehaus Frontier Emerging Markets Fund’s derivative contracts by primary risk exposure as of December 31, 2015:
Asset derivatives | ||||||
Risk exposure category | Statement of Assets and Liabilities location | Fair value | ||||
Equity contracts | Investments, at market value | $ | 2,047,015 | |||
|
|
|
| |||
The following table sets forth the Driehaus Emerging Markets Growth Fund’s realized gain (loss) by primary risk exposure and by type of derivative contract for the year ended December 31, 2015.
| Amount of net realized gain (loss) on derivatives | ||||
Risk exposure category | Equity Certificates | |||
Equity contracts | $ | (5,378,211 | ) | |
|
|
| ||
The following table sets forth the Driehaus Emerging Markets Small Cap Growth Fund’s realized gain (loss) by primary risk exposure and by type of derivative contract for the year ended December 31, 2015.
| Amount of net realized gain (loss) on derivatives | ||||||||||||
Risk exposure category | Equity Certificates | Purchased Options | Written Options | |||||||||
Equity contracts | $ | 13,561,667 | $ | 6,593,882 | $ | (15,760,935 | ) | |||||
Commodity contracts | — | 2,894,434 | — | |||||||||
Foreign currency contracts | — | 752,578 | — | |||||||||
|
|
|
|
|
|
| ||||||
51
Table of Contents
Driehaus Mutual Funds
Notes to Financial Statements — (Continued)
The following table sets forth the Driehaus Frontier Emerging Markets Fund’s realized gain (loss) by primary risk exposure and by type of derivative contract for the period May 4, 2015 through December 31, 2015.
| Amount of net realized gain (loss) on derivatives | ||||
Risk exposure category | Equity Certificates | |||
Equity contracts | $ | (276,840 | ) | |
|
|
| ||
The following table sets forth the Driehaus Emerging Markets Growth Fund’s change in unrealized appreciation (depreciation) by primary risk exposure and by type of derivative contract for the year ended December 31, 2015.
| Change in net unrealized appreciation (depreciation) on derivatives | ||||
Risk exposure category | Equity Certificates | |||
Equity contracts | $ | 1,293,961 | ||
|
|
| ||
The following table sets forth the Driehaus Emerging Markets Small Cap Growth Fund’s change in unrealized appreciation (depreciation) by primary risk exposure and by type of derivative contract for the year ended December 31, 2015.
| Change in net unrealized appreciation (depreciation) on derivatives | ||||||||||||
Risk exposure category | Equity Certificates | Purchase Options | Written Options | |||||||||
Equity contracts | $ | (13,927,559 | ) | $ | 558,079 | $ | (93,576 | ) | ||||
Foreign currency contracts | — | (301,251 | ) | — | ||||||||
|
|
|
|
|
|
| ||||||
The following table sets forth the Driehaus Frontier Emerging Markets Fund’s change in unrealized appreciation (depreciation) by primary risk exposure and by type of derivative contract for the period May 4, 2015 through December 31, 2015.
| Change in net unrealized appreciation (depreciation) on derivatives | ||||
Risk exposure category | Equity Certificates | |||
Equity contracts | $ | (105,992 | ) | |
|
|
| ||
Federal Income Taxes
No provision is made for Federal income taxes since each Fund has elected or will elect to be taxed as a “regulated investment company” under Subchapter M of the Internal Revenue Code (the “Code”) and has made and declared all the required distributions to its shareholders in amounts sufficient to relieve each Fund from all or substantially all Federal income and excise taxes under provisions of current Federal tax law.
Each Fund is subject to accounting standards that establish a minimum threshold for recognizing, and a system for measuring, the benefits of a tax position taken or expected to be taken in a tax return. Taxable years ending 2015, 2014, 2013 and 2012 remain open to Federal and state audit. As of December 31, 2015, management has evaluated the application of these standards to each Fund, and has determined that no provision for income tax is required in each Fund’s financial statements for uncertain tax provisions. The Funds recognize interest and penalties, if any, related to unrecognized tax benefits as income tax expense in the Statements of Operations. During the year, the Funds did not incur any interest or penalties. The Funds may be subject to foreign taxes on income, gains on investments or currency repatriation, a portion of which may be recoverable. Foreign taxes are provided for based on the Funds’ understanding of the tax rules and regulations that exist in the foreign markets in which they invest.
The amount of dividends and distributions from net investment income and net realized capital gains are determined in accordance with Federal income tax regulations, which may differ from U.S. generally accepted accounting principles (“U.S. GAAP”).
52
Table of Contents
Driehaus Mutual Funds
Notes to Financial Statements — (Continued)
For the year ended December 31, 2015, reclassifications were recorded to undistributed net investment income, undistributed net realized gain and paid-in capital for any permanent tax differences. These reclassifications relate primarily to foreign currency losses, sales of passive foreign investment companies, net operating losses and foreign capital gain taxes paid. Results of operations and net assets were not affected by these reclassifications.
| Driehaus Emerging Markets Growth Fund | Driehaus Emerging Markets Small Cap Growth Fund | Driehaus Frontier Emerging Markets Fund | Driehaus International Small Cap Growth Fund | Driehaus Micro Cap Growth Fund | ||||||||||||||||
Undistributed net investment income | $ | 1,055,598 | $ | 3,439,238 | $ | 24,425 | $ | 1,894,620 | $ | 1,991,209 | ||||||||||
Undistributed net realized gain | 10,168,947 | 2,787,470 | 73,288 | (8,770,091 | ) | (592 | ) | |||||||||||||
Paid-in capital | (11,224,545 | ) | (6,226,708 | ) | (97,713 | ) | 6,875,471 | (1,990,617 | ) | |||||||||||
For Federal income tax purposes, capital loss carryforwards represent net capital losses of a fund that may be carried forward for a maximum period of eight years and applied against future net realized gains. On December 22, 2010, the Regulated Investment Company Modernization Act of 2010 was enacted to modernize several of the Federal income and excise tax provisions related to regulated investment companies. Under pre-enactment law, capital losses could be carried forward for up to eight years, and carried forward as short-term capital losses, irrespective of the character of the original loss. New net capital losses (those earned in taxable years beginning after December 22, 2010) may be carried forward indefinitely and must retain the character of the original loss. Such new net capital losses generally must be used by a regulated investment company before it uses any net capital losses incurred in taxable years beginning on or before December 22, 2010. This increases the likelihood that net capital losses incurred in taxable years beginning on or before December 22, 2010 will expire unused. The following table shows the expiration dates for capital loss carryover from pre-enactment taxable years and the amounts of capital loss carryover, if any, by each of the applicable Funds as of December 31, 2015:
| Pre-Enactment Net Capital Loss Carryover Expiring In | Post-Enactment Unlimited Period of Net Capital Loss Carryover | |||||||||||||||
Fund | 2016 | Short- Term | Long-Term | Accumulated Capital Loss Carryover | ||||||||||||
Driehaus Emerging Markets Growth Fund | $ | — | $ | 172,498,021 | $ | — | $ | 172,498,021 | ||||||||
Driehaus Emerging Markets Small Cap Growth Fund | $ | — | $ | 66,943,305 | $ | — | $ | 66,943,305 | ||||||||
Driehaus Frontier Emerging Markets Fund | $ | — | $ | 1,724,048 | $ | — | $ | 1,724,048 | ||||||||
Driehaus International Small Cap Growth Fund | $ | 2,128,468 | $ | — | $ | — | $ | — | ||||||||
During the year ended December 31, 2015, Driehaus International Small Cap Growth Fund utilized $4,385,278 of capital loss carryforwards.
The capital loss carryforward amounts stated above for Driehaus International Small Cap Growth Fund are capital losses inherited from its merger with Driehaus International Discovery Fund on March 6, 2015, which may be applied against any realized net taxable capital gains in future years. Section 382 of the Code imposes certain limitations that reduced the Fund’s ability to use the capital loss carryforwards from Driehaus International Discovery Fund and a total of $213,228,955 expired unused.
Pursuant to Federal income tax rules applicable to regulated investment companies, the Funds may elect to treat certain capital losses between November 1 and December 31 as occurring on the first day of the
53
Table of Contents
Driehaus Mutual Funds
Notes to Financial Statements — (Continued)
following tax year. For the year ended December 31, 2015, the following qualified late-year losses were deferred and recognized on January 1, 2016:
Fund | Late-Year Ordinary Loss Deferral | Total Net Capital Loss Deferral | Total | |||||||||
Driehaus International Small Cap Growth Fund | $ | 429,841 | $ | — | $ | 429,841 | ||||||
Driehaus Micro Cap Growth Fund | — | 11,334,666 | 11,334,666 | |||||||||
Distributions to Shareholders
The tax character of distributions paid during the fiscal year ended December 31, 2015 was as follows:
Distributions paid from: | Driehaus Emerging Markets Growth Fund | Driehaus Emerging Markets Small Cap Growth Fund | Driehaus Frontier Emerging Markets Fund | Driehaus International Small Cap Growth Fund | Driehaus Micro Cap Growth Fund | |||||||||||||||
Ordinary income | $ | — | $ | — | $ | — | $ | 474,717 | $ | — | ||||||||||
Net long-term capital gain | — | — | — | 8,396,477 | 11,379,419 | |||||||||||||||
|
|
|
|
|
|
|
|
|
| |||||||||||
Total distributions paid | $ | — | $ | — | $ | — | $ | 8,871,194 | $ | 11,379,419 | ||||||||||
|
|
|
|
|
|
|
|
|
| |||||||||||
The tax character of distributions paid during the fiscal year ended December 31, 2014 was as follows:
Distributions paid from: | Driehaus Emerging Markets Growth Fund | Driehaus Emerging Markets Small Cap Growth Fund | Driehaus International Small Cap Growth Fund | Driehaus Micro Cap Growth Fund | ||||||||||||
Ordinary income | $ | 1,569,189 | $ | — | $ | 10,021,652 | $ | 1,275,778 | ||||||||
Net long-term capital gain | 52,533,986 | — | 15,778,725 | 2,251,610 | ||||||||||||
|
|
|
|
|
|
|
| |||||||||
Total distributions paid | $ | 54,103,175 | $ | — | $ | 25,800,377 | $ | 3,527,388 | ||||||||
|
|
|
|
|
|
|
| |||||||||
As of December 31, 2015, the components of net assets on a tax basis were as follows:
| Driehaus Emerging Markets Growth Fund | Driehaus Emerging Markets Small Cap Growth Fund | Driehaus Frontier Emerging Markets Fund | Driehaus International Small Cap Growth Fund | Driehaus Micro Cap Growth Fund | ||||||||||||||||
Undistributed ordinary income | $ | — | $ | — | $ | — | $ | — | $ | — | ||||||||||
Undistributed long-term capital gain | — | — | — | 3,539,504 | — | |||||||||||||||
|
|
|
|
|
|
|
|
|
| |||||||||||
Accumulated earnings | $ | — | $ | — | $ | — | $ | 3,539,504 | $ | — | ||||||||||
Paid-in capital | 1,524,308,976 | 474,766,553 | 21,902,053 | 304,569,864 | 281,916,621 | |||||||||||||||
Accumulated capital and other losses | (172,498,021 | ) | (66,943,305 | ) | (1,724,048 | ) | (2,558,309 | ) | (11,334,666 | ) | ||||||||||
Unrealized appreciation (depreciation) on foreign currency | (150,414 | ) | (115,540 | ) | (564 | ) | (34,655 | ) | — | |||||||||||
Unrealized appreciation on investments | 10,760,474 | 24,757,846 | (607,809 | ) | 35,732,250 | 11,596,182 | ||||||||||||||
Other temporary differences | — | 252,198 | — | — | — | |||||||||||||||
|
|
|
|
|
|
|
|
|
| |||||||||||
Net assets | $ | 1,362,421,015 | $ | 432,717,752 | $ | 19,569,632 | $ | 341,248,654 | $ | 282,178,137 | ||||||||||
|
|
|
|
|
|
|
|
|
| |||||||||||
The differences between book-basis and tax-basis unrealized appreciation are attributable primarily to the tax deferral of losses on wash sales and passive foreign investment company (PFIC) mark-to-market.
54
Table of Contents
Driehaus Mutual Funds
Notes to Financial Statements — (Continued)
Foreign Currency Translation
Foreign currency and equity securities not denominated in U.S. dollars are translated into U.S. dollar values based upon the current rates of exchange on the date of the Funds’ valuations.
Net realized foreign exchange gains or losses which are reported by the Funds result from currency gains and losses on transaction hedges arising from changes in exchange rates between the trade and settlement dates on spot contracts underlying securities transactions and the difference between the amounts accrued for dividends, interest, and foreign taxes and the amounts actually received or paid in U.S. dollars for these items. Net unrealized foreign exchange gains and losses result from changes in the U.S. dollar value of assets and liabilities (other than investments in securities), which are denominated in foreign currencies, as a result of changes in exchange rates.
Net realized foreign exchange gains or losses on portfolio hedges result from the use of spot contracts to hedge portfolio positions denominated or quoted in a particular currency in order to reduce or limit exposure in that currency. The Funds had no portfolio hedges during the year ended December 31, 2015.
The Funds do not isolate that portion of the results of operations which results from fluctuations in foreign exchange rates on investments. These fluctuations are included with the net realized gain (loss) from security transactions and the net change in unrealized appreciation (depreciation) of investments.
Use of Estimates
The preparation of financial statements, in conformity with U.S. GAAP, requires management to make estimates and assumptions that affect the reported amount of assets and liabilities and disclosure of contingent assets and liabilities at the date of the financial statements and the reported amounts of net increases or decreases in net assets from operations during the reporting period. Actual results could differ from those estimates.
Indemnifications
Under the Trust’s organizational documents, the officers and Trustees are indemnified against certain liabilities arising out of the performance of their duties to the Trust. In addition, in the normal course of business, the Trust enters into contracts that provide general indemnifications to other parties. The Funds’ maximum exposure under these agreements is unknown as this would involve future claims that may be made against the Funds that have not yet occurred. However, the Funds have not had prior claims or losses pursuant to these contracts and expect the risk of loss to be remote.
B. INVESTMENT ADVISORY FEES, TRANSACTIONS WITH AFFILIATES, AND ADMINISTRATIVE FEES
Richard H. Driehaus, an Interested Trustee of the Trust, is also the Chairman of the Board of Driehaus Capital Management LLC (“DCM” or the “Adviser”), a registered investment adviser, and of Driehaus Securities LLC (“DS LLC” or the “Distributor”), a registered broker-dealer.
DCM serves as the Funds’ investment adviser. In return for its services to the Funds, DCM receives monthly fees. Driehaus Micro Cap Growth Fund pays the Adviser a monthly fee computed and accrued daily at an annual rate of 1.25% of the Fund’s average daily net assets. Driehaus Emerging Markets Growth Fund, Driehaus Emerging Markets Small Cap Growth Fund, Driehaus Frontier Emerging Markets Fund and Driehaus International Small Cap Growth Fund each pay the Adviser a monthly fee computed and accrued daily at an annual rate of 1.50% of each Fund’s average daily net assets.
DCM has entered into an agreement to cap Driehaus Micro Cap Growth Fund’s annual operating expenses (other than interest, taxes, brokerage commissions and other portfolio transaction expenses, capital expenditures and extraordinary expenses) at 1.70% of average daily net assets until November 18, 2016. For a period of three years subsequent to the Fund’s commencement of operations, DCM is entitled to reimbursement for previously waived fees and reimbursed expenses to the extent that the Fund’s expense ratio remains below the operating expense cap. For the year ended December 31, 2015, DCM did not waive or recapture fees for Driehaus Micro Cap Growth Fund under this agreement and there are no amounts still subject to recapture.
55
Table of Contents
Driehaus Mutual Funds
Notes to Financial Statements — (Continued)
DCM has entered into a contractual agreement to cap Driehaus Frontier Emerging Markets Fund’s annual operating expenses (other than interest, taxes, brokerage commissions, dividends and interest on short sales and other portfolio transaction expenses and extraordinary expenses) at 2.00% of average daily net assets until May 4, 2018. For a period of three years subsequent to the Fund’s commencement of operations on May 4, 2015, DCM is entitled to reimbursement for previously waived fees and reimbursed expenses to the extent that the Fund’s expense ratio remains below the operating expense cap. For the period ended December 31, 2015, DCM waived fees for Driehaus Frontier Emerging Markets Fund totaling $169,023 and reimbursed expenses of $14,263 under this agreement, and the amount of potential recovery expiring May 4, 2018 was $183,286.
The amounts accrued and payable to DCM during the year ended December 31, 2015 are as follows:
| Fund | Advisory Fees | Advisory Fees Payable (included in Due to affiliate) | ||||||
Driehaus Emerging Markets Growth Fund | $ | 24,839,831 | $ | 1,770,415 | ||||
Driehaus Emerging Markets Small Cap Growth Fund | 8,532,130 | 563,460 | ||||||
Driehaus Frontier Emerging Markets Fund | 169,023 | — | ||||||
Driehaus International Small Cap Growth Fund | 4,598,043 | 424,876 | ||||||
Driehaus Micro Cap Growth Fund | 2,049,928 | 304,105 | ||||||
| ||||||||
The Funds direct certain portfolio trades, subject to obtaining the best price and execution, to brokers who have agreed to pay a portion of the Funds’ operating expenses using part of the commissions generated. For the year ended December 31, 2015, these arrangements reduced the expenses of Driehaus Emerging Markets Growth Fund, Driehaus Emerging Markets Small Cap Growth Fund, Driehaus Frontier Emerging Markets Fund, Driehaus International Small Cap Growth Fund and Driehaus Micro Cap Growth Fund by $173,865 (0.6%), $69,017 (0.7%), $95 (0.0%), $36,420 (0.7%) and $7,897 (0.3%), respectively.
Certain officers of the Trust are also officers of DCM and DS LLC. The Funds pay a portion of the Chief Compliance Officer’s salary and bonus. No other officers received compensation from the Funds. The Independent Trustees are compensated for their services to the Trust and such compensation is reflected as Trustees’ fees in the Statements of Operations.
BNY Mellon Investment Servicing (US) Inc. (“BNY Mellon”) serves as the Funds’ administrative and accounting agent. In compensation for these services, BNY Mellon earns the larger of a monthly minimum fee or a monthly fee based upon average daily net assets. For the period ended December 31, 2015, BNY Mellon waived $7,500 for administrative and accounting fees for Driehaus Frontier Emerging Markets Fund. BNY Mellon also acts as the transfer agent and dividend disbursing agent for the Funds. For these services, BNY Mellon earns a monthly fee based on shareholder processing activity during the month. BNY Mellon has agreed to waive a portion of its monthly fee for transfer agent service for the first two years of operations for Driehaus Frontier Emerging Markets Fund and Driehaus Micro Cap Growth Fund. For the year ended December 31, 2015, BNY Mellon waived $22,500 and $10,500, respectively, for Driehaus Frontier Emerging Markets Fund and Driehaus Micro Cap Growth Fund.
C. OTHER FINANCIAL INSTRUMENTS
The Funds enter into foreign currency spot contracts to facilitate transactions in foreign currency denominated securities. These spot contracts are typically open for 2 to 5 days, depending on the settlement terms of the underlying security transaction. On December 31, 2015, the Funds had foreign currency spot contracts outstanding under which they are obligated to exchange currencies at specified future dates. The unrealized appreciation or depreciation on spot contracts is reflected as a separate line item in the Statements of Assets and Liabilities. On December 31, 2015, the Funds’ currency transactions were limited to transaction hedges.
56
Table of Contents
Driehaus Mutual Funds
Notes to Financial Statements — (Continued)
D. INVESTMENT TRANSACTIONS
The aggregate purchases and sales of investment securities, other than short-term obligations and options, for the year ended December 31, 2015 were as follows:
| Fund | Purchases | Sales | ||||||
Driehaus Emerging Markets Growth Fund | $ | 3,955,812,307 | $ | 4,143,273,987 | ||||
Driehaus Emerging Markets Small Cap Growth Fund | 1,583,350,886 | 1,609,362,426 | ||||||
Driehaus Frontier Emerging Markets Fund | 30,926,373 | 10,304,513 | ||||||
Driehaus International Small Cap Growth Fund | 756,998,975 | 732,962,808 | ||||||
Driehaus Micro Cap Growth Fund | 477,295,135 | 299,931,875 | ||||||
| ||||||||
E. RESTRICTED SECURITIES
Restricted securities are securities that are not registered for sale under the Securities Act of 1933 or applicable foreign law and that may be re-sold only in transactions exempt from applicable registration. Restricted securities include Rule 144A securities which may be sold normally to qualified institutional buyers. On December 31, 2015, the Funds held no restricted securities, other than equity certificates. Since an investment in equity certificates represents an agreement entered into with a financial institution, with terms set by such financial institution, these instruments are also deemed to be restricted (see Note A).
F. LINE OF CREDIT
Driehaus Emerging Markets Growth Fund, Driehaus Emerging Markets Small Cap Growth Fund, Driehaus International Small Cap Growth Fund and Driehaus Micro Cap Growth Fund have, with certain other funds in the Trust, together obtained a committed line of credit in the amount of $50,000,000. This line of credit is available primarily to meet large, unexpected shareholder withdrawals subject to certain restrictions. Interest is charged at a rate per annum equal to the Federal Funds Rate in effect at the time of the borrowings plus 1.5%, or 1.75%, whichever is greater. Driehaus Emerging Markets Small Cap Growth Fund utilized the line of credit during the period October 9, 2015 to October 15, 2015. For the period October 9, 2015 to October 15, 2015, the average daily loan balance outstanding on days where borrowings existed was $10,000,000 and the weighted average interest rate was 0.1%. The interest expense, which is included on the Statements of Operations, was $2,917 for Driehaus Emerging Markets Small Cap Growth Fund.
G. FOREIGN INVESTMENT RISKS
To the extent a Fund invests in foreign securities, it may be subject to risks due to the potential for political and economic instability in the countries where the issuers of these securities are located. In addition, foreign exchange fluctuations could affect the value of positions held. These risks are generally intensified in emerging markets.
H. REDEMPTION FEES
The Funds may charge a redemption fee of 2.00% of the redemption amount for shares redeemed within 60 days of purchase. The redemption fees are recorded in paid-in capital and reflected in the Statements of Changes in Net Assets.
I. FUND MERGERS
At a meeting of the Board of Trustees of the Trust held on October 23, 2014, the Board of Trustees approved an Agreement and Plan of Reorganization (the “Agreement”) of the Driehaus International Discovery Fund with and into the Driehaus International Small Cap Growth Fund (the “Merger”), each a series of the Trust. The shareholders of the Driehaus International Discovery Fund approved the Agreement during a special meeting of the shareholders held on February 11, 2015.
57
Table of Contents
Driehaus Mutual Funds
Notes to Financial Statements — (Continued)
The Merger, which occurred after the close of business on March 6, 2015, was accomplished by a tax-free exchange of 8,325,014 shares of the Driehaus International Small Cap Growth Fund for 2,568,861 shares of the Driehaus International Discovery Fund outstanding at that date. The following is a summary of shares outstanding, net assets and net asset value per share for these Funds before and after the Merger:
| Before Reorganization | After Reorganization | |||||||||||
| Driehaus International Discovery Fund | Driehaus International Small Cap Growth Fund | Driehaus International Small Cap Growth Fund | ||||||||||
Shares Outstanding | 2,568,861 | 23,904,657 | 32,229,671 | |||||||||
Net Assets | $ | 79,717,913 | $ | 228,904,169 | $ | 308,622,082 | ||||||
Net Asset Value | $ | 31.03 | $ | 9.58 | $ | 9.58 | ||||||
Unrealized Appreciation | $ | 4,962,609 | $ | 25,939,590 | $ | 30,902,199 | ||||||
Assuming this reorganization had been completed on January 1, 2015, the Driehaus International Small Cap Growth Fund’s results of operations for the year ended December 31, 2015 would have been as follows:
Net investment loss | $ | (704,311) | ||
Net realized and change in unrealized gains (losses) on investments | $ | 44,149,693 | ||
Net increase in assets from operations | $ | 43,445,382 |
Because the combined portfolios of investments have been managed as a single portfolio since the merger was completed, it is not practical to separate the amounts of revenue and earnings to the Driehaus International Small Cap Growth Fund that have been included in its statement of operations since the mergers.
J. SUBSEQUENT EVENTS
Events or transactions that occurred after the date of this report through the date the report was issued have been evaluated for potential impact to the financial statements. There are no subsequent events that require recognition or disclosure in the financial statements.
58
Table of Contents
Report of Independent Registered Public Accounting Firm
The Board of Trustees and Shareholders of Driehaus Mutual Funds
We have audited the accompanying statements of assets and liabilities, including the schedules of investments, of Driehaus Emerging Markets Growth Fund, Driehaus Emerging Markets Small Cap Growth Fund, Driehaus Frontier Emerging Markets Fund, Driehaus International Small Cap Growth Fund, and Driehaus Micro Cap Growth Fund, (collectively, the “Funds”) as of December 31, 2015, and the related statements of operations, statements of changes in net assets and financial highlights for the each of the periods indicated therein. These financial statements and financial highlights are the responsibility of the Funds’ management. Our responsibility is to express an opinion on these financial statements and financial highlights based on our audits.
We conducted our audits in accordance with the standards of the Public Company Accounting Oversight Board (United States). Those standards require that we plan and perform the audit to obtain reasonable assurance about whether the financial statements and financial highlights are free of material misstatement. We were not engaged to perform an audit of the Funds’ internal control over financial reporting. Our audits included consideration of internal control over financial reporting as a basis for designing audit procedures that are appropriate in the circumstances, but not for the purpose of expressing an opinion on the effectiveness of the Funds’ internal control over financial reporting. Accordingly, we express no such opinion. An audit also includes examining, on a test basis, evidence supporting the amounts and disclosures in the financial statements and financial highlights, assessing the accounting principles used and significant estimates made by management, and evaluating the overall financial statement presentation. Our procedures included confirmation of securities owned as of December 31, 2015, by correspondence with the custodian and brokers or by other appropriate auditing procedures where replies from brokers were not received. We believe that our audits provide a reasonable basis for our opinion.
In our opinion, the financial statements and financial highlights referred to above present fairly, in all material respects, the financial position of each of the respective Funds noted above at December 31, 2015, and the results of their operations, the changes in their net assets, and the financial highlights for the periods indicated therein, in conformity with U.S. generally accepted accounting principles.

Chicago, Illinois
February 23, 2016
59
Table of Contents
Interested and Independent Trustees of the Trust
The following table sets forth certain information with respect to the Trustees of the Trust as of January 1, 2016:
Name, Address and | Position(s) Held with the Trust | Term of Office and Length of Time Served** | Number of Portfolios in Trust Overseen by Trustee | Principal Occupation(s) | Other Directorships Held by Trustee During the Past 5 Years | |||||
Interested Trustee:* | ||||||||||
Richard H. Driehaus 25 East Erie Street Chicago, IL 60611 YOB: 1942 | Trustee | Since 1996 | 8 | Chairman of the Board of the Adviser, the Distributor and Driehaus Capital Management (USVI) LLC (“USVI”); Chief Investment Officer and Portfolio Manager of the Adviser. President of the Trust from 1996-2011. | None | |||||
Independent Trustees: | ||||||||||
Daniel F. Zemanek c/o Driehaus Capital Management LLC 25 East Erie Street Chicago, IL 60611 YOB: 1942 | Trustee and Chairman | Since 1996 Since 2014 | 8 | Retired; President of Ludan, Inc. (real estate services specializing in senior housing) from April 2008 to December 2014. | None | |||||
Theodore J. Beck c/o Driehaus Capital Management LLC 25 East Erie Street Chicago, IL 60611 YOB: 1952 | Trustee | Since 2012 | 8 | President and Chief Executive Officer, National Endowment for Financial Education, 2005 to present. | Wilshire Variable Insurance Trust, 2008-2010; Wilshire Mutual Funds Inc., 2008- 2010; Advisory Board of the Trust, 2011-2012. | |||||
| Francis J. Harmon c/o Driehaus Capital Management LLC 25 East Erie Street Chicago, IL 60611 YOB: 1942 | Trustee | Since 1998 | 8 | Relationship Manager, Great Lakes Advisors, Inc. since February 2008. | None | |||||
Dawn M. Vroegop c/o Driehaus Capital Management LLC 25 East Erie Street Chicago, IL 60611 YOB: 1966 | Trustee | Since 2012 | 8 | Private Investor since September 2003. | Independent Trustee, Met Investors Series Trust since December 2000; Independent Trustee, Metropolitan Series Fund, Inc. since May 2009; Advisory Board of the Trust, 2011-2012. | |||||
Christopher J. Towle, CFA c/o Driehaus Capital Management LLC 25 East Erie Street Chicago, IL 60611 YOB: 1957 | Trustee | Since 2016 | 8 | Retired; Partner, Portfolio Manager, Director of High Yield and Convertible Securities, Lord Abbett & Co.; 35 years professional investment experience, 1980-2014. | None |
| * | Mr. Driehaus is an “interested person” of the Trust, the Adviser and the Distributor, as defined in the 1940 Act, because he is an officer of the Adviser and the Distributor. In addition, Mr. Driehaus has a controlling interest in the Adviser and the Distributor. |
| ** | Each Trustee will serve as a Trustee of the Trust until (i) termination of the Trust, (ii) the Trustee’s retirement, resignation, or death, or (iii) as otherwise specified in the Trust’s governing documents. |
60
Table of Contents
The following table sets forth certain information with respect to the officers of the Trust:
Name, Address and Year of Birth | Position(s) Held with the Trust | Length of Time Served | Principal Occupation(s) During Past 5 Years | |||
Robert H. Gordon 25 East Erie Street Chicago, IL 60611 YOB: 1961 | President | Since 2011 | President and Chief Executive Officer of Adviser, Distributor and USVI since October 2006; Senior Vice President of the Trust from 2006-2011. | |||
Michelle L. Cahoon 25 East Erie Street Chicago, IL 60611 YOB: 1966 | Vice President and Treasurer | Since 2006 Since 2002 | Managing Director, Treasurer and Chief Financial Officer of the Adviser and Distributor since 2012; Vice President, Treasurer and Chief Financial Officer of USVI since 2004; Vice President, Treasurer and Chief Financial Officer of the Adviser and Distributor from 2004-2012. | |||
Janet L. McWilliams 25 East Erie Street Chicago, IL 60611 YOB: 1970 | Assistant Vice President and Chief Legal Officer | Since 2007 Since 2012 | Managing Director, Secretary and General Counsel of the Adviser since 2012; Chief Compliance Officer of the Trust, Adviser and Distributor from 2006-2012. | |||
Michael R. Shoemaker 25 East Erie Street Chicago, IL 60611 YOB: 1981 | Chief Compliance Officer and Assistant Vice President | Since 2012 | Assistant Vice President and Chief Compliance Officer of the Adviser and Distributor since 2012; Associate Chief Compliance Officer of the Adviser and Distributor from 2011-2012; Compliance Officer, Pacific Investment Management Company LLC and PIMCO Investments LLC from 2010-2011; Senior Compliance Analyst of the Adviser and Distributor from 2007-2010. | |||
William H. Wallace, III 301 Bellevue Parkway Wilmington, DE 19809 YOB: 1969 | Secretary | Since 2015 | Vice President and Manager, BNY Mellon Investment Servicing (US) Inc. (formerly PNC, a financial services company) since 2010; Assistant Vice President and Manager, PNC from 2008-2010. | |||
Michael P. Kailus 25 East Erie Street Chicago, IL 60611 YOB: 1971 | Assistant Secretary and Anti-Money Laundering Compliance Officer | Since 2010 Since 2011 | Assistant Secretary of the Adviser, Distributor and USVI since 2010; Senior Attorney with the Adviser since 2010. | |||
Christine V. Mason 301 Bellevue Parkway Wilmington, DE 19809 YOB: 1956 | Assistant Secretary | Since 2015 | Senior Specialist, BNY Mellon Investment Servicing (US) Inc. (formerly PNC, a financial services company) since 2013; Senior Paralegal, Foreside Funds Distributors LLC (formerly BNY Mellon Distributors Inc.) from 2004-2013. |
The Statement of Additional Information for Driehaus Mutual Funds contains more detail about the Trust’s Trustees and officers and is available upon request, without charge. For further information, please call 1-800-560-6111.
61
Table of Contents
As a mutual fund shareholder, you may incur two types of costs: (1) transaction costs, including sales charges; redemption fees; and exchange fees and (2) ongoing costs, including management fees; distribution (12b-1) fees; and other fund expenses. This example is intended to help you understand your ongoing costs (in dollars) of investing in each Fund and to compare these costs with the ongoing costs of investing in other mutual funds.
The example is based on an investment of $1,000 invested at the beginning of the period and held for the entire six months ended December 31, 2015.
Actual Expenses
The first line of the tables below (“Actual”) provides information about actual account values and actual expenses. You may use the information in this line, together with the amount you invested, to estimate the expenses that you paid over the period. Simply divide your account value by $1,000 (for example, an $8,600 account value divided by $1,000 = 8.6), then multiply the result by the number in the first line under the heading entitled “Expenses Paid During Period” to estimate the expenses you paid on your account during this period.
Hypothetical Example for Comparison Purposes
The second line of the tables below (“Hypothetical”) provides information about hypothetical account values and hypothetical expenses based on the Fund’s actual expense ratio and an assumed rate of return of 5% per year before expenses, which is not the Fund’s actual return. You may use this information to compare the ongoing costs of investing in the Funds versus other funds. To do so, compare this 5% hypothetical example with the 5% hypothetical examples that appear in the shareholder reports of the other funds.
Please note that the expenses shown in the table are meant to highlight your ongoing costs only and do not reflect any transactional costs, such as sales charges, redemption fees or exchange fees. Therefore, the second line of the table is useful in comparing ongoing costs only, and will not help you determine the relative total costs of owning different funds. In addition, if these transactional costs were included, your costs would have been higher.
Driehaus Emerging Markets Growth Fund
| Beginning Account Value July 1, 2015 | Ending Account Value December 31, 2015 | Expenses Paid During Six Months Ended December 31, 2015* | ||||||||||
Actual | $ | 1,000 | $ | 856.10 | $ | 7.63 | ||||||
Hypothetical (5% return before expenses) | $ | 1,000 | $ | 1,016.99 | $ | 8.29 | ||||||
Driehaus Emerging Markets Small Cap Growth Fund
| Beginning Account Value July 1, 2015 | Ending Account Value December 31, 2015 | Expenses Paid During Six Months Ended December 31, 2015* | ||||||||||
Actual | $ | 1,000 | $ | 836.40 | $ | 7.92 | ||||||
Hypothetical (5% return before expenses) | $ | 1,000 | $ | 1,016.59 | $ | 8.69 | ||||||
62
Table of Contents
Fund Expense Examples — (Continued)
Driehaus Frontier Emerging Markets Fund
| Beginning Account Value July 1, 2015 | Ending Account Value December 31, 2015 | Expenses Paid During Six Months Ended December 31, 2015* | ||||||||||
Actual | $ | 1,000 | $ | 900.70 | $ | 9.58 | ||||||
Hypothetical (5% return before expenses) | $ | 1,000 | $ | 1,015.12 | $ | 10.16 | ||||||
Driehaus International Small Cap Growth Fund
| Beginning Account Value July 1, 2015 | Ending Account Value December 31, 2015 | Expenses Paid During Six Months Ended December 31, 2015* | ||||||||||
Actual | $ | 1,000 | $ | 995.00 | $ | 8.55 | ||||||
Hypothetical (5% return before expenses) | $ | 1,000 | $ | 1,016.64 | $ | 8.64 | ||||||
Driehaus Micro Cap Growth Fund
Beginning Account Value | Ending Account Value December 31, 2015 | Expenses Paid During Six Months Ended December 31, 2015* | ||||||||||
Actual | $ | 1,000 | $ | 841.20 | $ | 6.96 | ||||||
Hypothetical (5% return before expenses) | $ | 1,000 | $ | 1,017.64 | $ | 7.63 | ||||||
| * | Expenses are equal to the Fund’s annualized expense ratios for the six-month period in the table below multiplied by the average account value over the period, multiplied by the number of days in the most recent fiscal half-year (184), then divided by 365 to reflect the half-year period. |
Driehaus Emerging Markets Growth Fund | 1.63% | |
Driehaus Emerging Markets Small Cap Growth Fund | 1.71% | |
Driehaus Frontier Emerging Markets Fund | 2.00% | |
Driehaus International Small Cap Growth Fund | 1.70% | |
Driehaus Micro Cap Growth Fund | 1.50% |
63
Table of Contents
TAX INFORMATION (UNAUDITED) FOR THE YEAR ENDED DECEMBER 31, 2015
We are providing this information as required by the Internal Revenue Code. The amounts shown may differ from those elsewhere in this report because of differences between tax and financial reporting requirements.
The Funds designate the following amounts as a long-term capital gain distribution:
Driehaus | Driehaus Emerging Markets Small Cap Growth Fund | Driehaus Frontier Emerging Markets Fund | Driehaus International Small Cap Growth Fund | Driehaus Micro Cap Growth Fund | ||||||||||||||
| $ | — | $ | — | $ | — | $ | 9,888,252 | $ | 11,379,419 | |||||||||
For taxable non-corporate shareholders, the following percentages of income and short-term capital gains represent qualified dividend income subject to the 15% rate category:
Driehaus | Driehaus Emerging Markets Small Cap Growth Fund | Driehaus Frontier Emerging Markets Fund | Driehaus International Small Cap Growth Fund | Driehaus Micro Cap Growth Fund | ||||||||||||||
| 0.00% | 0.00% | 0.00% | 100.00% | 0.00% | ||||||||||||||
For corporate shareholders, the following percentages of income and short-term capital gains qualified for the dividends-received deduction:
Driehaus | Driehaus Emerging Markets Small Cap Growth Fund | Driehaus Frontier Emerging Markets Fund | Driehaus International Small Cap Growth Fund | Driehaus Micro Cap Growth Fund | ||||||||||||||
| 0.00% | 0.00% | 0.00% | 0.00% | 0.00% | ||||||||||||||
RESULTS OF SPECIAL MEETING OF SHAREHOLDERS OF DRIEHAUS FRONTIER EMERGING MARKETS FUND
At a Special Meeting of Shareholders of Driehaus Frontier Emerging Markets Fund (the “Fund”) held on August 10, 2015, the Fund’s shareholders approved a change in the Fund’s fundamental investment policy regarding concentration by the following votes:
Affirmative (Shares Voted / % of Outstanding | Against (Shares Voted / % of Outstanding Shares) | Abstain (Shares Voted / % of Outstanding Shares) | ||||||
| 1,049,233.682 / 91.98% | 0.000 / 0.00% | 0.000 / 0.00% | ||||||
PROXY VOTING POLICIES AND PROCEDURES AND PROXY VOTING RECORD
A description of the Funds’ policies and procedures with respect to the voting of proxies relating to the Funds’ portfolio securities is available without charge, upon request, by calling 1-800-560-6111. This information is also available on the Funds’ website at http://www.driehaus.com.
Information regarding how the Funds voted proxies related to portfolio securities during the 12-month period ended June 30, 2015 is available without charge, upon request, by calling 1-800-560-6111. This information is also available on the Securities and Exchange Commission’s (“SEC”) website at http://www.sec.gov.
HOW TO OBTAIN QUARTERLY PORTFOLIO HOLDINGS
Each Fund files a complete schedule of portfolio holdings with the SEC for the first and third quarters of each fiscal year on Form N-Q. The Funds’ Form N-Q is available electronically on the SEC’s website at http://www.sec.gov; hard copies may be reviewed and copied at the SEC’s Public Reference Room in Washington, DC 20549. For more information on the Public Reference Room, call 1-800-SEC-0330. Each Fund’s complete schedule of portfolio holdings is also available on the Fund’s website at http://www.driehaus.com.
64
Table of Contents
Board Considerations in Connection with the Annual Review of the Investment Advisory Agreement
The Board of Trustees of Driehaus Mutual Funds (the “Trust”), including a majority of the Trustees who are not “interested persons” (as defined in the Investment Company Act of 1940, as amended) (the “Independent Trustees”), approved the renewal of the investment advisory agreement (the “Agreement”) with Driehaus Capital Management LLC (the “Adviser”) for Driehaus Emerging Markets Growth Fund (“DREGX”), Driehaus International Small Cap Growth Fund (“DRIOX”), Driehaus Micro Cap Growth Fund (“DMCRX”) and Driehaus Emerging Markets Small Cap Growth Fund (“DRESX”) (DREGX, DRIOX, DMCRX and DRESX are each a “Fund” and collectively, the “Funds”) on September 22, 2015 for an additional one-year term ending September 30, 2016 for each Fund. As part of its review process, the Board requested and evaluated all information it deemed reasonably necessary to evaluate the Agreement. The Board reviewed comprehensive materials received from the Adviser and from independent legal counsel. The Board also received extensive information throughout the year regarding performance and operating results of each Fund. The Independent Trustees held a conference call with their independent legal counsel on September 17, 2015 to review the materials provided in response to their request, and identified areas for further response by Fund management. Following receipt of further responses from Fund management, the Independent Trustees, represented by independent legal counsel, met independent of Fund management to consider renewal of the Agreement for each Fund. After their consideration of all the information received, the Independent Trustees presented their findings and their recommendation to renew the Agreement to the full Board.
In connection with the contract review process, the Board considered the factors discussed below, among others. The Board also considered that the Adviser has managed each Fund since its inception, and the Board believes that a long-term relationship with a capable, conscientious adviser is in the best interests of each Fund. The Board considered, generally, that shareholders invested in each Fund, knowing that the Adviser managed the Fund and knowing the investment advisory fee schedule.
Nature, Quality and Extent of Services. The Board considered the nature, extent and quality of services provided under the Agreement, including portfolio management services and administrative services. The Board considered the experience and skills of senior management and investment personnel, the resources made available to such personnel, the ability of the Adviser to attract and retain high-quality personnel, and the organizational depth of the Adviser. The Board also considered the Trust’s compliance with legal and regulatory requirements, as well as the Adviser’s handling of portfolio brokerage, and noted the Adviser’s process for evaluating best execution. The Board considered the Adviser’s risk management strategies and the process developed by the Adviser for analyzing, reviewing and assessing risk exposure for the Funds. The Board also considered the Funds’ process for fair valuation of portfolio securities and noted the Board’s review of Fund valuation matters throughout the year.
The Board reviewed DREGX’s and DRIOX’s performance on a net return basis over the 1-, 3- and 5 year and year-to-date periods ended June 30, 2015. For DRESX, the Board considered the performance on a net return basis for the 1- and 3-year and year-to-date periods ended June 30, 2015. For DMCRX, the Board considered the performance on a net return basis for the 1-year and year-to-date periods ended June 30, 2015. The Board also reviewed performance for DMCRX that included one of its predecessor limited partnerships for the 3 and 5-year periods ended June 30, 2015; and performance for DRESX, including that of its predecessor limited partnership, for the 5-year period ended June 30, 2015. Because the predecessor limited partnerships to DMCRX and DRESX did not operate as mutual funds and were not subject to certain investment and operational restrictions, the Board factored those differences into its evaluation of these Funds’ longer-term performance information. The Board also received update performance information through August 31, 2015. The Board noted that the Adviser represented that because the Funds’ performance can be volatile over shorter time periods, for Funds with longer performance records, it was meaningful to also analyze the performance over rolling time periods, and the Board reviewed rolling relative performance to benchmark information for certain Funds. The Board compared short-term and longer-term returns to various agreed-upon performance measures, including market indices and peer groups. Peer group data was compiled from Lipper Fund Data, an independent provider of mutual fund data that is a service of Thomson Reuters Corporation (“Lipper”). The Board also considered whether investment results were consistent with each Fund’s investment objective and policies.
65
Table of Contents
On the basis of this evaluation and its ongoing review of investment results, the Board concluded that the nature, quality and extent of services provided by the Adviser for each Fund continue to be satisfactory.
As to the specific Funds, the Board noted that DREGX’s performance was in the top decile of its peer group for the 3- and 5-year periods and in the second quartile for the 1-year period. The Board also noted that DREGX outperformed its benchmark index for the 3-, 5- and 10-year and since-inception (December 31, 1997) periods, while underperforming its benchmark index for the 1-year period. With respect to DRIOX, the Board noted that, although its performance for the 5-year period was below the median of its peer group, its performance was above the median for the 1- and 3-year and year-to-date periods (second, second and first quartiles, respectively). The Board also noted that DRIOX outperformed its benchmark index for the 1, 3-, 5- and 10-year periods (the latter of which includes the performance of its predecessor partnership). The Board considered that DMCRX’s performance for the 1-, 3- and 5-year and year-to-date periods was in the top decile of its peer group (noting that the 3- and 5-year periods include the performance of a predecessor partnership). In addition, the Board noted that DMCRX outperformed its benchmark index for the since-inception, and 1-, 3-, 5- and 10-year periods (all of which except the 1-year period include the performance of a predecessor partnership). For DRESX, the Board noted that the Fund’s performance was in the top decile of its peer group for the year-to-date and 1, 3- and 5-year periods (the 5-year period includes the performance of its predecessor limited partnership). In addition, the Fund outperformed its benchmark for the 1-, 3- and 5-year periods (the latter of which includes the performance of its predecessor limited partnership).
The Board also considered each Fund’s rolling 1-year, 3-year and 5-year returns over the life of the Fund relative to its benchmark and noted that, in a majority of the time periods measured, each Fund outperformed its benchmark index. As to the Funds in general, the Board concluded that the Adviser had consistently implemented its investment philosophy, and that over the long term, the investment philosophy produces value for shareholders.
Fees. The Board considered each Fund’s advisory fee rates, operating expenses and total expense ratio as of June 30, 2015, and compared the advisory fee and total expense ratio to the fees and expense ratios of peer group funds based on data compiled from Lipper as of June 30, 2015. The information provided to the Board showed that each Fund’s advisory fee rate ranked high as compared to its peer group; however, because of the Funds’ fee structures, total expense ratios are relatively competitive, as they all fall between the 30th and 46th percentiles (1st percentile being the highest expense ratio). The Board considered, among other factors, the Funds’ asset size and noted for DRESX that asset growth has resulted in a decrease in the Fund’s expense ratio. In addition, the Board considered, for DMCRX, the expense reimbursement arrangements with the Adviser. The Board also considered the Funds’ advisory fee rates as compared to fees charged by the Adviser for similarly managed institutional accounts, as applicable. With respect to institutional accounts, the Board noted that: (i) both the mix of services provided and the level of responsibility and resources required under the Agreement were significantly greater as compared to the Adviser’s obligations for managing the other accounts; and (ii) the advisory fees for the other accounts are less relevant to the Board’s consideration because they reflect significantly different competitive forces than those in the mutual fund marketplace. In considering the reasonableness of the advisory fees, the Board took into account the Adviser’s substantial human and technological resources devoted to investing for the Funds, the relatively small amount of assets under management and the limited capacity of the investment style. In addition, the Board noted that the Adviser’s directed brokerage program had resulted in a total of approximately $435,000 in directed brokerage credits during calendar year 2014, which were used to reduce expenses of the Funds.
On the basis of the information reviewed, the Board concluded that the advisory fee schedule for each Fund was reasonable and appropriate in light of the nature and quality of services provided by the Adviser.
Profitability. The Board reviewed information regarding revenues received by the Adviser under the Agreement from each Fund and discussed the Adviser’s methodology in allocating its costs to the management of the Funds. The Board considered the estimated costs to the Adviser of managing the Funds. The Board noted that DRIOX is currently closed to new investors in order to maintain assets at a level that the Adviser feels is prudent, which limits the Fund’s profitability to the Adviser. The Board also noted that the Funds do not have a Rule 12b-1 fee or shareholder service fee, and that the Adviser’s affiliate, Driehaus Securities LLC (“DS LLC”), serves as distributor of the Funds without compensation and that DS LLC provides compensation to intermediaries for distribution of Fund shares and for shareholder and administrative services to shareholders, the expense of which is reimbursed by the Adviser under an expense sharing arrangement with DS LLC. The Board concluded that, based on the projected profitability calculated for the Trust as well as for the Funds individually (noting that DMCRX was expected to be operated at a loss), the advisory fees appeared to be reasonable.
66
Table of Contents
Economies of Scale. In considering the reasonableness of the advisory fee, the Board considered whether there are economies of scale with respect to the management of the Funds and whether the Funds benefit from any such economies of scale. Given the size of the Funds and the capacity constraints of the investment style, the Board concluded that the advisory fee rates under the Agreement are reasonable and reflect an appropriate sharing of any such economies of scale.
Other Benefits to the Adviser and its Affiliates. The Board also considered the character and amount of other incidental benefits received by the Adviser and its affiliates. The Board also considered benefits to the Adviser related to soft dollar allocations. The Board concluded that advisory fees were reasonable in light of these fall-out benefits.
Based on all of the information considered and the conclusions reached, the Board determined that the terms of the Agreement continue to be fair and reasonable and that the continuation of the Agreement is in the best interests of each Fund. No single factor was determinative in the Board’s analysis.
67
Table of Contents
DRH-AR2015
Table of Contents
Driehaus Mutual Funds
Trustees & Officers
Richard H. Driehaus
Trustee
Theodore J. Beck
Trustee
Francis J. Harmon
Trustee
Christopher J. Towle*
Trustee
Dawn M. Vroegop
Trustee
Daniel F. Zemanek
Chairman of the Board
Robert H. Gordon
President
Michelle L. Cahoon
Vice President & Treasurer
Janet L. McWilliams
Chief Legal Officer &
Assistant Vice President
Michael R. Shoemaker
Chief Compliance Officer &
Assistant Vice President
William H. Wallace, III
Secretary
Michael P. Kailus
Assistant Secretary & Anti-Money
Laundering Compliance Officer
Christine Mason
Assistant Secretary
Investment Adviser
Driehaus Capital Management LLC
25 East Erie Street
Chicago, IL 60611
Distributor
Driehaus Securities LLC
25 East Erie Street
Chicago, IL 60611
Administrator & Transfer Agent
UMB Fund Services, Inc.
235 W. Galena Street
Milwaukee, WI 53212
Custodian
The Northern Trust Company
50 South LaSalle Street
Chicago, IL 60603
* Effective January 1, 2016
Annual Report to Shareholders
December 31, 2015

Driehaus Active Income Fund
Driehaus Select Credit Fund
Driehaus Event Driven Fund
Distributed by:
Driehaus Securities LLC
This report has been prepared for the shareholders of the Funds and is not an offer to sell or buy any Fund securities. Such offer is only made by the Funds’ prospectus.
Table of Contents
Portfolio Managers’ Letter, Performance Overview and Schedule of Investments: | ||||
| 1 | ||||
| 14 | ||||
| 23 | ||||
| 29 | ||||
| 30 | ||||
| 32 | ||||
| 34 | ||||
| 37 | ||||
| 58 | ||||
| 59 | ||||
| 60 | ||||
| 61 | ||||
| 63 | ||||
Board Considerations in Connection with the Annual Review of the Investment Advisory Agreement | 64 | |||
Table of Contents
Driehaus Active Income Fund — Portfolio Managers’ Letter
Dear Shareholders,
The Driehaus Active Income Fund (“Fund”) returned -1.07% for the year ended December 31, 2015. This return was below the performance of the Fund’s benchmark index, the Citigroup 3-Month T-Bill Index, which returned 0.03% for the same period. The Fund also underperformed the Barclays Capital US Aggregate Bond Index, which returned 0.55% for the same period.
Credit and equity markets experienced heightened volatility throughout much of the year over concerns about global economic growth, an impending rise in US interest rates, steep drops in the price of oil and most other commodities, and a potential “hard landing” by China. High yield returned -4.64% for 2015, the first negative annual return since 2008. Spreads widened nearly 300 basis points from their tights at 438 in late February to their wides of 733 in mid-December. Similarly, investment grade spreads widened approximately 50 basis points from their tights in early March at 129 to the wides in late September at 180, and the market returned -0.63% for the year. During the year, 37 US companies defaulted, representing $38 billion of bonds. Energy and coal companies represented 70% of the default volume in 2015. Including distressed exchanges, the high yield default rate was 2.56% at year-end.
The event-driven strategy was the largest contributor to performance for the year, followed by the capital structure arbitrage strategy. Event trades focus on catalyst-driven corporate events, such as mergers and acquisitions (M&A) or company announcements. Depending on the anticipated timing and nature of the event, these trades can be structured using a single security type or a combination of bonds, options, bank loans, swaps and equities. The largest contributors to performance in the event-driven strategy were several risk arbitrage trades that performed well as M&A deals closed or as M&A spreads contracted. In the capital structure arbitrage strategy, gains on bearish trades on energy and retail companies were largely offset by losses in long-leaning trades. Capital structure arbitrage trades are created with a long and short side to the trade, which will typically move inversely to each other, allowing us to hedge risk and dampen volatility. While one side of the trade will often detract from the trade, the overall trade is designed for the contributor to be larger than the detractor.
The directional long, pairs trading and convertible arbitrage strategies detracted from performance. High yield spread widening caused losses in many of the directional long trades. Losses in energy, retail, e-learning and health care companies were not offset by gains in positions in pharmacy, emerging markets, gaming, gym, payment processing, amusement park, publishing and industrial manufacturing companies. The pairs trading performance was driven primarily by a trade related to office supply stores as well as a position in an emerging markets energy company. The convertible arbitrage strategy detracted from performance as many of the trades were long-leaning and underperformed as credit spreads widened. Convertible arbitrage trades attempt to profit from changes in a company’s equity volatility by purchasing a convertible bond and simultaneously shorting the same company’s common stock.
Both of the hedging strategies detracted from performance in 2015. The interest rate hedge, which is constructed with US Treasury futures and US Treasury swaptions, lost value as rates contracted sharply during the first nine months of the year before stabilizing and widening marginally in the fourth quarter in anticipation of the Federal Reserve raising interest rates. Gains on volatility trades focused on West Texas Intermediate crude oil prices were offset by losses on trades that were focused on equity indices. Volatility trades are generally constructed by implementing various option strategies, such as straddles or strangles on various market indices or through the use of credit default swaps on indices. In general, the volatility trades had a positive contribution to performance during some of the more volatile months during the year.
Looking ahead, we believe the difficult environment seen over the past year has created considerable opportunities. Market stress experienced during 2015 differed greatly from prior risk-off episodes in recent memory, such as the Taper Tantrum of 2013, the Euro Sovereign Crisis of 2011, and the Credit Crisis of 2008. Those episodes were dominated by a concentrated set of explosive systemic risks. Consequently, when those risks were reduced asset prices rebounded sharply. Now there are many risks and they are not at all concentrated, nor are they particularly explosive. Therefore, there is no quick solution to the market’s stresses, but importantly, we’d argue the potential damage from this episode is far less than those of 2011 and 2008. As such, we start the year focused on trades that have more idiosyncratic risk and less market risk. We also continue to seek out risk arbitrage opportunities in low and mid-risk M&A trades as well as positions with
1
Table of Contents
sizable carry that can withstand a reasonable amount of spread widening without a material increase in default risk. Finally, we are maintaining a sharp focus on liquidity within the Fund as we seek to capitalize on what we believe is an excellent environment for our investment strategy.
As always, we at Driehaus Capital Management LLC thank you for your interest in the Driehaus Active Income Fund and would like to express our gratitude to you as shareholders for your continued confidence in our management capabilities.
Sincerely,
 | 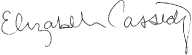 | |
| K.C. Nelson | Elizabeth Cassidy | |
| Portfolio Manager | Co-Portfolio Manager |
Performance is historical and does not represent future results.
Please see the following performance page for index definitions.
2
Table of Contents
Performance Overview (unaudited)
The performance summarized below is historical and does not represent future results. Investment returns and principal value vary, and you may have a gain or loss when you sell shares. Performance data presented measures the change in the value of an investment in the Fund, assuming reinvestment of all dividends and capital gains. Average annual total return reflects annualized change.
The table does not reflect the deduction of taxes that a shareholder would pay on Fund distributions or the redemption of Fund shares. The graph compares the results of a $25,000 investment (minimum investment) in the Fund since November 8, 2005 (the date of the Predecessor Fund’s inception), with all dividends and capital gains reinvested, with the indicated indices (and dividends reinvested) for the same period.
| Average Annual Total Returns as of 12/31/15 | 1 Year | 3 Years | 5 Years | 10 Years | Since Inception (11/08/05 - 12/31/15) | |||||||||||||||
Driehaus Active Income Fund (LCMAX)1 | –1.07% | 0.33% | 0.83% | 3.60% | 3.59% | |||||||||||||||
Citigroup 3-Month T-Bill Index2 | 0.03% | 0.04% | 0.05% | 1.17% | 1.21% | |||||||||||||||
Barclays Capital U.S. Aggregate Bond Index3 | 0.55% | 1.44% | 3.25% | 4.52% | 4.79% | |||||||||||||||
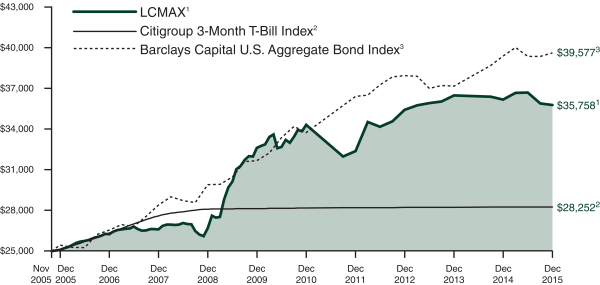
| 1 | The Driehaus Active Income Fund (the “Fund”) performance shown above includes the performance of the Lotsoff Capital Management Active Income Fund (the “Predecessor Fund”) for the periods before the Fund’s registration statement became effective. The Fund received the assets and liabilities of the Predecessor Fund on June 1, 2009 through a reorganization of the Predecessor Fund into the Fund. The Predecessor Fund was a nondiversified fund that was a series of another management investment company registered under the Investment Company Act of 1940, as amended. The Fund had no prior operating history prior to succeeding to the assets of the Predecessor Fund. The Fund has substantially similar investment objectives, strategies, and policies as the Predecessor Fund. Financial and performance information of the Fund includes the Predecessor Fund information. The returns for the periods prior to October 1, 2006, reflect fee waivers and/or reimbursements without which performance would have been lower. |
| 2 | The Citigroup 3-Month T-Bill Index is designed to mirror the performance of the 3-month U.S. Treasury Bill. The Citigroup 3-Month T-Bill Index is unmanaged and its returns reflect reinvestment of all distributions and changes in market prices. |
| 3 | The Barclays Capital U.S. Aggregate Bond Index, an unmanaged index, represents securities that are SEC-registered, taxable and dollar denominated. This index covers the U.S. investment grade fixed rate bond market, with index components for government and corporate securities, mortgage pass-through securities and asset-backed securities. These major sectors are subdivided into more specific indices that are calculated and reported on a regular basis. |
3
Table of Contents
Driehaus Active Income Fund
Schedule of Investments
December 31, 2015
| Shares, Principal Amount, or Number of Contracts | Value | |||||||
| ASSET-BACKED SECURITIES — 1.13% | ||||||||
Citigroup Mortgage Loan Trust 2007-OPX1 | $ | 307,857 | $ | 177,409 | ||||
CWABS, Inc. Asset-Backed Certificates | 122,988 | 110,842 | ||||||
Fannie Mae REMICS | 2,734,983 | 2,749,528 | ||||||
Fannie Mae REMICS | 6,869,892 | �� | 6,862,301 | |||||
JP Morgan Resecuritization Trust | 8,072,368 | 8,141,112 | ||||||
Merrill Lynch Mortgage Investors Trust | 124,929 | 120,045 | ||||||
Wells Fargo Mortgage Loan 2012-RR2 Trust | 14,881,737 | 14,418,766 | ||||||
|
| |||||||
Total ASSET-BACKED SECURITIES | 32,580,003 | |||||||
|
| |||||||
| BANK LOANS — 24.20% | ||||||||
Apparel — 0.85% |
| |||||||
Calceus Acquisition, Inc. | 27,185,709 | 24,331,210 | ||||||
Computers — 0.07% |
| |||||||
DynCorp International, Inc. | 2,000,000 | 1,916,250 | ||||||
Electronics — 1.20% |
| |||||||
NuSil Technology LLC | 35,077,967 | 34,617,569 | ||||||
Entertainment — 0.48% |
| |||||||
Peninsula Gaming LLC | 6,673,788 | 6,657,103 | ||||||
Scientific Games International, Inc. | 4,000,000 | 3,672,140 | ||||||
Scientific Games International, Inc. | 1,500,000 | 1,372,230 | ||||||
WMG Acquisition Corp. | 2,214,647 | 2,105,299 | ||||||
|
| |||||||
| 13,806,772 | ||||||||
|
| |||||||
Healthcare — Services — 2.02% |
| |||||||
Kindred Healthcare, Inc. | 21,897,388 | 21,185,723 | ||||||
National Mentor Holdings, Inc. | 37,866,966 | 36,794,195 | ||||||
|
| |||||||
| 57,979,918 | ||||||||
|
| |||||||
| Shares, Principal Amount, or Number of Contracts | Value | |||||||
Holding Companies — Diversified — 1.36% |
| |||||||
MGOC, Inc. | $ | 39,398,559 | $ | 39,004,574 | ||||
Internet — 0.91% |
| |||||||
ProQuest LLC | 26,729,558 | 26,295,202 | ||||||
Investment Companies — 0.53% |
| |||||||
Larchmont Resources LLC | 21,600,000 | 15,336,000 | ||||||
Leisure Time — 2.58% |
| |||||||
Equinox Holdings, Inc. | 64,397,043 | 63,860,616 | ||||||
Equinox Holdings, Inc. | 10,000,000 | 10,225,000 | ||||||
|
| |||||||
| 74,085,616 | ||||||||
|
| |||||||
Media — 0.87% |
| |||||||
Springer Science+Business Media GmbH (Germany) 4.75%, 8/15/202 | 16,276,262 | 15,657,764 | ||||||
Tribune Media Co. | 9,420,081 | 9,302,331 | ||||||
|
| |||||||
| 24,960,095 | ||||||||
|
| |||||||
Packaging & Containers — 1.27% |
| |||||||
SIG Combibloc PurchaseCo Sarl (Luxembourg) | 21,791,248 | 21,496,739 | ||||||
SIG Combibloc PurchaseCo Sarl (Luxembourg) | 13,895,000 | 6 | 15,104,206 | |||||
|
| |||||||
| 36,600,945 | ||||||||
|
| |||||||
Retail — 5.13% |
| |||||||
J.C. Penney Corp., Inc. | 42,544,174 | 41,906,011 | ||||||
Neiman Marcus Group Ltd. LLC | 68,405,980 | 60,745,879 | ||||||
Rite Aid Corp. | 7,830,000 | 7,856,426 | ||||||
Rite Aid Corp. | 37,200,000 | 37,176,750 | ||||||
|
| |||||||
| 147,685,066 | ||||||||
|
| |||||||
Semiconductors — 0.57% |
| |||||||
VAT Holding A.G. (Switzerland) | 16,538,617 | 16,290,538 | ||||||
Software — 4.63% |
| |||||||
Applied Systems, Inc. | 46,893,501 | 46,131,482 | ||||||
Notes to Financial Statements are an integral part of this Schedule.
4
Table of Contents
Driehaus Active Income Fund
Schedule of Investments
December 31, 2015
| Shares, Principal Amount, or Number of Contracts | Value | |||||||
BMC Foreign Holding Co. (Ireland) | $ | 7,840,000 | $ | 6,448,400 | ||||
BMC Software Finance, Inc. | 17,508,308 | 14,481,822 | ||||||
Evergreen Skills Lux Sarl (Luxembourg) | 39,500,000 | 31,007,500 | ||||||
First Data Corp. | 35,413,433 | 35,012,554 | ||||||
|
| |||||||
| 133,081,758 | ||||||||
|
| |||||||
Storage/Warehousing — 0.34% |
| |||||||
Westway Group, Inc. | 10,982,222 | 9,938,911 | ||||||
Telecommunications — 1.39% |
| |||||||
Cincinnati Bell, Inc. | 41,361,490 | 40,068,943 | ||||||
|
| |||||||
Total BANK LOANS | 695,999,367 | |||||||
|
| |||||||
| CORPORATE BONDS — 35.65% | ||||||||
Auto Manufacturers — 0.70% |
| |||||||
General Motors Co. | 19,000,000 | 20,074,184 | ||||||
Banks — 1.54% |
| |||||||
Chase Capital II | 6,879,000 | 5,881,545 | ||||||
JPMorgan Chase & Co. | 37,813,000 | 38,493,634 | ||||||
|
| |||||||
| 44,375,179 | ||||||||
|
| |||||||
Building Materials — 0.62% |
| |||||||
Cemex S.A.B. de C.V. (Mexico) | 18,180,000 | 17,770,950 | ||||||
Chemicals — 0.21% |
| |||||||
Kissner Milling Co., Ltd. (Canada) | 6,500,000 | 6,093,750 | ||||||
Momentive Performance Materials, Inc. | 4,540,000 | — | ||||||
|
| |||||||
| 6,093,750 | ||||||||
|
| |||||||
Commercial Services — 1.22% |
| |||||||
AA Bond Co., Ltd. (Jersey) | 25,000,000 | 6 | 34,967,935 | |||||
Computers — 0.70% |
| |||||||
DynCorp International, Inc. | 27,373,000 | 20,256,020 | ||||||
Diversified Financial Services — 4.26% |
| |||||||
American Express Co. | 68,799,000 | 69,314,992 | ||||||
| Shares, Principal Amount, or Number of Contracts | Value | |||||||
Rio Oil Finance Trust | $ | 72,000,000 | $ | 53,280,000 | ||||
|
| |||||||
| 122,594,992 | ||||||||
|
| |||||||
Entertainment — 1.19% |
| |||||||
Six Flags Entertainment Corp. | 33,757,000 | 34,178,962 | ||||||
Healthcare — Products — 2.14% |
| |||||||
ConvaTec Healthcare E S.A. (Luxembourg) | 35,166,000 | 35,488,121 | ||||||
Sterigenics-Nordion Holdings LLC | 27,262,000 | 26,035,210 | ||||||
|
| |||||||
| 61,523,331 | ||||||||
|
| |||||||
Healthcare — Services — 2.32% |
| |||||||
Kindred Healthcare, Inc. | 5,000,000 | 4,675,000 | ||||||
Kindred Healthcare, Inc. | 20,277,000 | 16,829,910 | ||||||
Tenet Healthcare Corp. | 45,266,000 | 45,152,835 | ||||||
|
| |||||||
| 66,657,745 | ||||||||
|
| |||||||
Insurance — 0.65% |
| |||||||
Chubb Corp. | 19,500,000 | 18,726,435 | ||||||
Media — 1.81% |
| |||||||
CBS Corp. | 16,877,000 | 14,478,626 | ||||||
Clear Channel Worldwide Holdings, Inc. | 810,000 | 781,650 | ||||||
Sinclair Television Group, Inc. | 8,600,000 | 8,363,500 | ||||||
Tribune Media Co. | 26,250,000 | 26,250,000 | ||||||
VTR Finance BV (Netherlands) | 2,500,000 | 2,300,000 | ||||||
|
| |||||||
| 52,173,776 | ||||||||
|
| |||||||
Miscellaneous Manufacturing — 1.80% |
| |||||||
Amsted Industries, Inc. | 44,000,000 | 44,000,000 | ||||||
Textron Financial Corp. | 10,824,000 | 7,685,040 | ||||||
|
| |||||||
| 51,685,040 | ||||||||
|
| |||||||
Oil & Gas — 6.31% |
| |||||||
California Resources Corp. | 8,097,000 | 2,884,556 | ||||||
Notes to Financial Statements are an integral part of this Schedule.
5
Table of Contents
Driehaus Active Income Fund
Schedule of Investments
December 31, 2015
| Shares, Principal Amount, or Number of Contracts | Value | |||||||
California Resources Corp. | $ | 21,722,000 | $ | 11,431,203 | ||||
Calumet Specialty Products Partners LP / Calumet Finance Corp. 6.50%, 4/15/21 | 65,186,500 | 56,712,255 | ||||||
Concho Resources, Inc. | 5,000,000 | 4,800,000 | ||||||
Concho Resources, Inc. | 40,167,000 | 37,154,475 | ||||||
Continental Resources, Inc. | 14,000,000 | 8,441,664 | ||||||
Denbury Resources, Inc. | 5,957,000 | 1,917,439 | ||||||
Newfield Exploration Co. 5.63%, 7/1/24 | 50,412,000 | 42,976,230 | ||||||
Sanchez Energy Corp. | 27,949,000 | 15,092,460 | ||||||
|
| |||||||
| 181,410,282 | ||||||||
|
| |||||||
Pipelines — 0.90% |
| |||||||
Enbridge Energy Partners LP | 31,500,000 | 25,830,000 | ||||||
Restaurants — 0.22% |
| |||||||
Ruby Tuesday, Inc. | 6,500,000 | 6,337,500 | ||||||
Retail — 4.86% |
| |||||||
Claire’s Stores, Inc. | 11,400,000 | 6,897,000 | ||||||
Claire’s Stores, Inc. | 18,972,000 | 10,244,880 | ||||||
Conn’s, Inc. | 7,000,000 | 5,967,500 | ||||||
Michaels Stores, Inc. | 25,000,000 | 25,843,750 | ||||||
Neiman Marcus Group, Inc. | 27,175,000 | 20,109,500 | ||||||
Rite Aid Corp. | 48,820,000 | 51,138,950 | ||||||
Rite Aid Corp. | 19,000,000 | 19,665,000 | ||||||
|
| |||||||
| 139,866,580 | ||||||||
|
| |||||||
Software — 1.96% |
| |||||||
First Data Corp. | 9,444,000 | 9,904,395 | ||||||
Nuance Communications, Inc. | 46,502,000 | 46,563,383 | ||||||
|
| |||||||
| 56,467,778 | ||||||||
|
| |||||||
| Shares, Principal Amount, or Number of Contracts | Value | |||||||
Telecommunications — 2.24% |
| |||||||
Frontier Communications Corp. | $ | 32,000,000 | $ | 31,680,000 | ||||
Verizon Communications, Inc. | 12,500,000 | 14,840,125 | ||||||
Wind Acquisition Finance S.A. (Luxembourg) | 17,970,000 | 17,790,300 | ||||||
|
| |||||||
| 64,310,425 | ||||||||
|
| |||||||
Total CORPORATE | 1,025,300,864 | |||||||
|
| |||||||
| CONVERTIBLE CORPORATE BONDS — 2.17% | ||||||||
Building Materials — 1.01% |
| |||||||
Cemex S.A.B. de CV (Mexico) | 31,000,000 | 28,926,875 | ||||||
Electrical Components & Equipment — 0.00% |
| |||||||
Suntech Power Holdings Co., Ltd. (China) | 27,872,000 | 136,573 | ||||||
Semiconductors — 0.73% |
| |||||||
Microchip Technology, Inc. | 21,200,000 | 21,067,500 | ||||||
Software — 0.43% |
| |||||||
Verint Systems, Inc. | 13,057,000 | 12,240,937 | ||||||
|
| |||||||
Total CONVERTIBLE CORPORATE BONDS (Cost $99,680,654) | 62,371,885 | |||||||
|
| |||||||
| U.S. GOVERNMENT AND AGENCY SECURITIES — 0.68% | ||||||||
Freddie Mac Non Gold Pool | 507,782 | 539,259 | ||||||
United States Treasury Bond | 12,070,000 | 12,014,840 | ||||||
United States Treasury Note | 7,047,000 | 6,871,100 | ||||||
|
| |||||||
Total U.S. GOVERNMENT AND AGENCY SECURITIES | 19,425,199 | |||||||
|
| |||||||
| COMMON STOCK — 23.91% | ||||||||
Auto Manufacturers — 1.04% |
| |||||||
General Motors Co. | 876,769 | 29,818,914 | ||||||
Notes to Financial Statements are an integral part of this Schedule.
6
Table of Contents
Driehaus Active Income Fund
Schedule of Investments
December 31, 2015
| Shares, Principal Amount, or Number of Contracts | Value | |||||||
Commercial Services — 3.18% |
| |||||||
Towers Watson & Co., Class A | 713,070 | $ | 91,600,972 | |||||
Computers — 2.72% |
| |||||||
EMC Corp. | 3,049,000 | 78,298,320 | ||||||
Electric — 0.46% |
| |||||||
Cleco Corp. | 252,044 | 13,159,217 | ||||||
Gas — 0.65% |
| |||||||
AGL Resources, Inc. | 293,000 | 18,696,330 | ||||||
Healthcare — Services — 2.64% |
| |||||||
Cigna Corp. | 307,500 | 44,996,475 | ||||||
Health Net, Inc.* | 99,000 | 6,777,540 | ||||||
Humana, Inc. | 135,000 | 24,098,850 | ||||||
|
| |||||||
| 75,872,865 | ||||||||
|
| |||||||
Insurance — 0.96% |
| |||||||
Willis Group Holdings PLC (United Kingdom)3 | 570,000 | 27,684,900 | ||||||
Internet — 1.14% |
| |||||||
Youku Tudou, Inc. ADR* | 1,213,000 | 32,908,690 | ||||||
Media — 3.07% |
| |||||||
Cablevision Systems Corp., Class A | 743,000 | 23,701,700 | ||||||
Meredith Corp. | 122,852 | 5,313,349 | ||||||
Time Warner Cable, Inc. | 319,000 | 59,203,210 | ||||||
|
| |||||||
| 88,218,259 | ||||||||
|
| |||||||
Metal Fabricate/Hardware — 2.82% |
| |||||||
Precision Castparts Corp. | 349,000 | 80,971,490 | ||||||
Oil & Gas Services — 0.42% |
| |||||||
Baker Hughes, Inc. | 262,000 | 12,091,300 | ||||||
Packaging & Containers — 0.24% |
| |||||||
Ball Corp. | 95,300 | 6,931,169 | ||||||
Real Estate Investment Trusts — 1.40% |
| |||||||
BioMed Realty Trust, Inc. | 1,701,000 | 40,296,690 | ||||||
Retail — 1.22% |
| |||||||
Rite Aid Corp.* | 2,888,091 | 22,642,634 | ||||||
Staples, Inc. | 1,313,000 | 12,434,110 | ||||||
|
| |||||||
| 35,076,744 | ||||||||
|
| |||||||
Semiconductors — 0.78% |
| |||||||
KLA-Tencor Corp. | 325,000 | 22,538,750 | ||||||
Software — 1.17% |
| |||||||
SolarWinds, Inc.* | 379,000 | 22,323,100 | ||||||
Solera Holdings, Inc. | 199,658 | 10,947,248 | ||||||
Verint Systems, Inc.* | 8,000 | 324,480 | ||||||
|
| |||||||
| 33,594,828 | ||||||||
|
| |||||||
Total COMMON STOCK | 687,759,438 | |||||||
|
| |||||||
| Shares, Principal Amount, or Number of Contracts | Value | |||||||
| CONVERTIBLE PREFERRED STOCK — 1.83% | ||||||||
Auto Manufacturers — 0.20% |
| |||||||
Fiat Chrysler Automobile 7.88%, 12/15/16 | 50,000 | $ | 5,902,750 | |||||
General Motors Corp. Senior Convertible Preferred Escrow — B | 475,000 | — | ||||||
General Motors Corp. Senior Convertible Preferred Escrow — C | 11,790,650 | — | ||||||
|
| |||||||
| 5,902,750 | ||||||||
|
| |||||||
Pharmaceuticals — 0.83% |
| |||||||
Teva Pharmaceutical Industries Ltd. (Israel) | 23,500 | 23,907,922 | ||||||
Telecommunications — 0.80% |
| |||||||
Frontier Communications Corp. | 250,000 | 22,895,000 | ||||||
|
| |||||||
Total CONVERTIBLE PREFERRED STOCK (Cost $56,182,543) | 52,705,672 | |||||||
|
| |||||||
| PREFERRED STOCKS — 2.78% | ||||||||
Banks — 1.26% |
| |||||||
GMAC Capital Trust I | 1,428,511 | 36,227,039 | ||||||
Telecommunications — 1.52% |
| |||||||
Centaur Funding Corp. (Cayman Islands) | 36,242 | 43,626,308 | ||||||
|
| |||||||
Total PREFERRED STOCKS (Cost $75,166,597) | 79,853,347 | |||||||
|
| |||||||
| PURCHASED PUT OPTIONS — 0.11% | ||||||||
iShares MSCI Brazil Capped ETF, Exercise Price: $20.00, Expiration Date: January, 2016* | 41,500 | 1,535,500 | ||||||
S&P 500 Index, Exercise Price: $1,800.00, Expiration Date: January, 2016* | 2,550 | 191,250 | ||||||
S&P 500 Index, Exercise Price: $1,950.00, Expiration Date: January, 2016* | 2,550 | 1,504,500 | ||||||
|
| |||||||
Total PURCHASED PUT OPTIONS | 3,231,250 | |||||||
|
| |||||||
Notes to Financial Statements are an integral part of this Schedule.
7
Table of Contents
Driehaus Active Income Fund
Schedule of Investments
December 31, 2015
| Shares, Principal Amount, or Number of Contracts | Value | |||||||
| WARRANTS — 0.00% | ||||||||
General Motors Co. — CW 16, Strike Price: $10.00, Expiration Date: 7/10/16 | 1 | $ | 24 | |||||
|
| |||||||
Total WARRANTS | 24 | |||||||
|
| |||||||
| ||||||||
TOTAL INVESTMENTS (Cost $2,853,313,602) | 92.46 | % | 2,659,227,049 | |||||
Other Assets less Liabilities | 7.54 | % | 216,765,861 | |||||
|
|
|
| |||||
NET ASSETS | 100.00 | % | $ | 2,875,992,910 | ||||
| ||||||||
| ||||||||
| SECURITIES SOLD SHORT — (9.63)% | ||||||||
| CORPORATE BONDS — (2.61)% | ||||||||
Lodging — (0.08)% |
| |||||||
MGM Resorts International | $ | (2,065,000 | ) | (2,163,088 | ) | |||
Oil & Gas — (0.61)% |
| |||||||
Denbury Resources, Inc. | (11,326,000 | ) | (4,190,620 | ) | ||||
Petrobras Global Finance BV (Netherlands) | (18,000,000 | ) | (13,500,000 | ) | ||||
|
| |||||||
| (17,690,620 | ) | |||||||
|
| |||||||
Oil & Gas Services — (1.00)% |
| |||||||
National Oilwell Varco, Inc. | (16,575,000 | ) | (14,515,937 | ) | ||||
National Oilwell Varco, Inc. | (18,700,000 | ) | (14,307,968 | ) | ||||
|
| |||||||
| (28,823,905 | ) | |||||||
|
| |||||||
Packaging & Containers — (0.24)% |
| |||||||
SIG Combibloc Holdings SCA (Luxembourg) | (6,000,000 | )6 | (6,861,987 | ) | ||||
Sovereign — (0.68)% |
| |||||||
Brazilian Government International Bond (Brazil) | (29,000,000 | ) | (19,647,500 | ) | ||||
|
| |||||||
Total CORPORATE BONDS | (75,187,100 | ) | ||||||
|
| |||||||
| Shares, Principal Amount, or Number of Contracts | Value | |||||||
| U.S. GOVERNMENT AND AGENCY SECURITIES — (1.36)% | ||||||||
United States Treasury Bond | ||||||||
3.00%, 11/15/44 | $ | (16,000,000 | ) | $ | (15,951,872 | ) | ||
3.00%, 5/15/45 | (23,363,000 | ) | (23,256,231 | ) | ||||
|
| |||||||
| �� | (39,208,103 | ) | ||||||
|
| |||||||
Total U.S. GOVERNMENT AND AGENCY SECURITIES | (39,208,103 | ) | ||||||
|
| |||||||
| COMMON STOCK — (5.62)% | ||||||||
Healthcare — Services — (1.28)% |
| |||||||
Aetna, Inc. | (113,063 | ) | (12,224,371 | ) | ||||
Anthem, Inc. | (158,208 | ) | (22,060,523 | ) | ||||
Kindred Healthcare, | (221,974 | ) | (2,643,710 | ) | ||||
|
| |||||||
| (36,928,604 | ) | |||||||
|
| |||||||
Media — (1.10)% |
| |||||||
Charter Communications, Inc., Class A* | (172,546 | ) | (31,593,173 | ) | ||||
Oil & Gas Services — (0.35)% |
| |||||||
Halliburton Co. | (293,440 | ) | (9,988,698 | ) | ||||
Packaging & Containers — (0.20)% |
| |||||||
Rexam PLC (United Kingdom)3 | (635,000 | ) | (5,659,111 | ) | ||||
Pharmaceuticals — (0.61)% |
| |||||||
Teva Pharmaceutical Industries Ltd. ADR (Israel)3 | (265,850 | ) | (17,450,394 | ) | ||||
Retail — (0.39)% |
| |||||||
Office Depot, Inc.* | (1,990,556 | ) | (11,226,736 | ) | ||||
Semiconductors — (0.94)% |
| |||||||
Lam Research Corp. | (162,500 | ) | (12,905,750 | ) | ||||
Microchip Technology, Inc. | (304,000 | ) | (14,148,160 | ) | ||||
|
| |||||||
| (27,053,910 | ) | |||||||
|
| |||||||
Software — (0.15)% |
| |||||||
Verint Systems, Inc.* | (108,662 | ) | (4,407,331 | ) | ||||
Telecommunications — (0.60)% |
| |||||||
Frontier Communications Corp. | (3,685,853 | ) | (17,212,934 | ) | ||||
|
| |||||||
Total COMMON STOCK | (161,520,891 | ) | ||||||
|
| |||||||
| WRITTEN CALL OPTIONS — 0.00% | ||||||||
Cemex S.A.B. de C.V., Exercise Price: $7.00, Expiration Date: January, 2016* | (5,000 | ) | (17,500 | ) | ||||
Notes to Financial Statements are an integral part of this Schedule.
8
Table of Contents
Driehaus Active Income Fund
Schedule of Investments
December 31, 2015
| Shares, Principal Amount, or Number of Contracts | Value | |||||||
Cemex S.A.B. de C.V., Exercise Price: $9.62, Expiration Date: January, 2016* | (17,525 | ) | $ | (72,904 | ) | |||
|
| |||||||
Total WRITTEN CALL OPTIONS | (90,404 | ) | ||||||
|
| |||||||
| WRITTEN PUT OPTIONS — (0.04)% | ||||||||
iShares MSCI Brazil Capped ETF, Exercise Price: $15.00, Expiration Date: January, 2016* | (41,500 | ) | (41,500 | ) | ||||
S&P 500 Index, Exercise Price: $1,875.00, Expiration Date: January, 2016* | (5,100 | ) | (1,020,000 | ) | ||||
|
| |||||||
Total WRITTEN PUT OPTIONS | (1,061,500 | ) | ||||||
|
| |||||||
| ||||||||
TOTAL INVESTMENT SECURITIES SOLD SHORT | (9.63 | )% | $ | (277,067,998 | ) | |||
| ||||||||
| * | Non-income producing security. |
| 1 | 144A restricted security. |
| 2 | Variable rate security. Rates disclosed are as of December 31, 2015. |
| 3 | Foreign security denominated in U.S. dollars and traded on a U.S. exchange. |
| 4 | Security valued at fair value as determined in good faith by Driehaus Capital Management LLC, investment adviser to the Fund, in accordance with procedures established by or under the general supervision of the Trust’s Board of Trustees. |
| 5 | Security is in default. |
| 6 | Foreign security, par value shown in local currency |
Percentages are stated as a percent of net assets.
Notes to Financial Statements are an integral part of this Schedule.
9
Table of Contents
Driehaus Active Income Fund
Schedule of Investments
December 31, 2015
SWAP CONTRACTS
Credit Default SwapsA
| Counterparty | Reference Instrument | Currency | Notional AmountB | Pay/ ReceiveC Fixed Rate | Fixed Rate | Expiration Date | Premium Paid/ (Received) | Unrealized Appreciation/ (Depreciation) | RatingD | |||||||||||||||||||||
Bank of America | Ally Financial, Inc. 7.50%, 9/15/20 | USD | 10,000,000 | Pay | 5.00 | % | 12/20/2018 | $ | (1,492,458 | ) | $ | 477,207 | BB+ | |||||||||||||||||
Morgan Stanley | American Express Co. 5.50%, 9/12/16 | USD | 20,000,000 | Pay | 1.00 | 12/20/2016 | 263,406 | (449,233 | ) | BBB+ | ||||||||||||||||||||
Goldman Sachs | American Express Co. 5.50%, 9/12/16 | USD | 5,000,000 | Pay | 1.00 | 12/20/2016 | 61,174 | (107,631 | ) | BBB+ | ||||||||||||||||||||
Barclays | Ardargh Packaging Finance PLC 9.25%, 10/15/20 | EUR | 1,000,000 | Pay | 5.00 | 12/20/2019 | (33,508 | ) | (44,078 | ) | CCC+ | |||||||||||||||||||
Barclays | Ardagh Packaging Finance PLC 9.25%, 10/15/20 | EUR | 5,000,000 | Pay | 5.00 | 12/20/2019 | (168,445 | ) | (219,486 | ) | CCC+ | |||||||||||||||||||
Barclays | Ardagh Packaging Finance PLC 9.25%, 10/15/20 | EUR | 3,000,000 | Pay | 5.00 | 3/20/2020 | (69,423 | ) | (148,586 | ) | CCC+ | |||||||||||||||||||
Barclays | Ardagh Packaging Finance PLC 9.25%, 10/15/20 | EUR | 3,000,000 | Pay | 5.00 | 3/20/2020 | (88,734 | ) | (129,276 | ) | CCC+ | |||||||||||||||||||
Barclays | Banco Bilbao Vizcaya Argentaria SA 5 Year Subordinated Debt | EUR | 5,000,000 | Pay | 1.00 | 3/20/2020 | 221,046 | 34,360 | BBB+ | |||||||||||||||||||||
Barclays | Banco Bilbao Vizcaya Argentaria SA 5 Year Subordinated Debt | EUR | 10,000,000 | Pay | 1.00 | 3/20/2020 | 458,796 | 52,016 | BBB+ | |||||||||||||||||||||
Bank of America | Banco Bilbao Vizcaya Argentaria SA 5 Year Subordinated Debt | EUR | 10,000,000 | Pay | 1.00 | 3/20/2020 | 397,363 | 113,449 | BBB+ | |||||||||||||||||||||
Barclays | Banco Bilbao Vizcaya Argentaria SA 5 Year Senior Debt | EUR | (5,000,000 | ) | Receive | 1.00 | 3/20/2020 | 39,492 | (73,902 | ) | BBB+ | |||||||||||||||||||
Barclays | Banco Bilbao Vizcaya Argentaria SA 5 Year Senior Debt | EUR | (10,000,000 | ) | Receive | 1.00 | 3/20/2020 | 62,054 | (130,875 | ) | BBB+ | |||||||||||||||||||
Bank of America | Banco Bilbao Vizcaya Argentaria SA 5 Year Senior Debt | EUR | (10,000,000 | ) | Receive | 1.00 | 3/20/2020 | 84,333 | (153,154 | ) | BBB+ | |||||||||||||||||||
Barclays | Banco Santander SA 5 Year Subordinated Debt | EUR | 5,000,000 | Pay | 1.00 | 3/20/2020 | 218,619 | 94,049 | A- | |||||||||||||||||||||
Bank of America | Banco Santander SA 5 Year Subordinated Debt | EUR | 10,000,000 | Pay | 1.00 | 3/20/2020 | 386,569 | 238,766 | A- | |||||||||||||||||||||
Bank of America | Banco Santander SA 5 Year Senior Debt | EUR | (10,000,000 | ) | Receive | 1.00 | 3/20/2020 | 84,333 | (189,462 | ) | A- | |||||||||||||||||||
Barclays | Banco Santander SA 5 Year Senior Debt | EUR | (5,000,000 | ) | Receive | 1.00 | 3/20/2020 | 33,862 | (86,427 | ) | A- | |||||||||||||||||||
Goldman Sachs | Bank of America Corp. 6.25%, 4/15/12 | USD | 10,000,000 | Pay | 1.00 | 12/20/2016 | 1,499,776 | (1,574,177 | ) | NR | ||||||||||||||||||||
Bank of America | Citigroup, Inc. 6.13%, 5/15/18 | USD | 5,000,000 | Pay | 1.00 | 12/20/2016 | 432,520 | (468,902 | ) | BBB+ | ||||||||||||||||||||
Goldman Sachs | Citigroup, Inc. 6.13%, 5/15/18 | USD | 5,000,000 | Pay | 1.00 | 12/20/2016 | 379,663 | (416,045 | ) | BBB+ | ||||||||||||||||||||
JP Morgan | Federative Republic of Brazil 12.25%, 3/6/30 | USD | 2,500,000 | Pay | 1.00 | 12/20/2019 | 81,916 | 231,092 | BB+ | |||||||||||||||||||||
JP Morgan | Hess Corp. 7.00%, 2/15/14 | USD | 8,000,000 | Pay | 1.00 | 6/20/2018 | 154,644 | (24,238 | ) | NR | ||||||||||||||||||||
Morgan Stanley | Hess Corp. | |||||||||||||||||||||||||||||
| 7.00%, 2/15/14 | USD | 4,000,000 | Pay | 1.00 | 6/20/2018 | 77,280 | (12,077 | ) | NR | |||||||||||||||||||||
Morgan Stanley | Hess Corp. 7.00%, 2/15/14 | USD | 4,000,000 | Pay | 1.00 | 6/20/2018 | 80,701 | (15,498 | ) | NR | ||||||||||||||||||||
Morgan Stanley | Hess Corp. 7.00%, 2/15/14 | USD | 4,000,000 | Pay | 1.00 | 6/20/2018 | 91,702 | (26,500 | ) | NR | ||||||||||||||||||||
Notes to Financial Statements are an integral part of this Schedule.
10
Table of Contents
Driehaus Active Income Fund
Schedule of Investments
December 31, 2015
Credit Default SwapsA (continued)
| Counterparty | Reference Instrument | Currency | Notional AmountB | Pay/ ReceiveC Fixed Rate | Fixed Rate | Expiration Date | Premium Paid/ (Received) | Unrealized Appreciation/ (Depreciation) | RatingD | |||||||||||||||||||||
Credit Suisse | Hess Corp. 7.00%, 2/15/14 | USD | 20,000,000 | Pay | 1.00 | % | 9/20/2018 | $ | 309,975 | $ | 125,793 | NR | ||||||||||||||||||
Goldman Sachs | Host Hotels & Resorts, Inc. 6.75%, 6/1/16 | USD | 10,000,000 | Pay | 1.00 | 12/20/2016 | 1,067,644 | (1,141,461 | ) | BBB | ||||||||||||||||||||
Goldman Sachs | Huntsman Corp. 11.50%, 7/15/12 | USD | 5,000,000 | Pay | 5.00 | 12/20/2016 | 124,119 | (336,443 | ) | NR | ||||||||||||||||||||
Barclays | Intesa Sanpaolo SpA 5 Year Subordinated Debt | EUR | 5,000,000 | Pay | 1.00 | 3/20/2020 | 202,397 | (44,844 | ) | BBB- | ||||||||||||||||||||
Bank of America | Intesa Sanpaolo SpA 5 Year Subordinated Debt | EUR | 10,000,000 | Pay | 1.00 | 3/20/2020 | 413,529 | (98,423 | ) | BBB- | ||||||||||||||||||||
Barclays | Intesa Sanpaolo SpA 5 Year Senior Debt | EUR | (5,000,000 | ) | Receive | 1.00 | 3/20/2020 | 31,027 | 9,500 | BBB- | ||||||||||||||||||||
Bank of America | Intesa Sanpaolo SpA 5 Year Senior Debt | EUR | (10,000,000 | ) | Receive | 1.00 | 3/20/2020 | 84,333 | (3,278 | ) | BBB- | |||||||||||||||||||
Credit Suisse | J.C. Penney Corp., Inc. 6.38%, 10/15/36 | USD | 6,667,000 | Pay | 5.00 | 12/20/2016 | 700,035 | (801,625 | ) | CCC- | ||||||||||||||||||||
Goldman Sachs | Pitney Bowes, Inc. 6.25%, 3/15/19 | USD | 5,000,000 | Pay | 1.00 | 9/20/2016 | 164,656 | (198,743 | ) | BBB | ||||||||||||||||||||
Morgan Stanley | Pitney Bowes, Inc. 6.25%, 3/15/19 | USD | 5,000,000 | Pay | 1.00 | 12/20/2016 | 244,614 | (289,428 | ) | BBB | ||||||||||||||||||||
Bank of America | Pitney Bowes, Inc. 4.63%, 10/01/12 | USD | 20,000,000 | Pay | 1.00 | 3/20/2016 | 436,253 | (483,156 | ) | BBB | ||||||||||||||||||||
Goldman Sachs | Saks, Inc. 2.00%, 3/15/24 | USD | 10,000,000 | Pay | 5.00 | 12/20/2016 | 406,250 | (898,107 | ) | NR | ||||||||||||||||||||
Goldman Sachs | The Markit CDX NA High Yield Series 17 Index | USD | 13,600,000 | Pay | 5.00 | 12/20/2016 | 1,437,500 | (1,866,220 | ) | NA | ||||||||||||||||||||
Bank of America | The Markit CDX NA High Yield Series 17 Index | USD | 4,800,000 | Pay | 5.00 | 12/20/2016 | 528,000 | (679,314 | ) | NA | ||||||||||||||||||||
Goldman Sachs | The Markit iTraxx Europe Crossover IndexSeries 19 | EUR | 24,500,000 | Pay | 5.00 | 6/20/2018 | (1,602,328 | ) | (589,156 | ) | NA | |||||||||||||||||||
Goldman Sachs | The Markit iTraxx Europe Crossover IndexSeries 20 | EUR | 10,000,000 | Pay | 5.00 | 12/20/2018 | (2,134,040 | ) | 743,767 | NA | ||||||||||||||||||||
Morgan Stanley | The Markit iTraxx Europe Crossover IndexSeries 20 | EUR | 10,000,000 | Pay | 5.00 | 12/20/2018 | (2,137,029 | ) | 746,756 | NA | ||||||||||||||||||||
Morgan Stanley | The Markit iTraxx Europe Crossover IndexSeries 20 | EUR | 10,000,000 | Pay | 5.00 | 12/20/2018 | (2,252,200 | ) | 861,928 | NA | ||||||||||||||||||||
Goldman Sachs | The Markit iTraxx Europe Crossover IndexSeries 22 | EUR | 16,500,000 | Pay | 5.00 | 12/20/2019 | (1,322,302 | ) | 225,469 | NA | ||||||||||||||||||||
Barclays | UniCredit SpA 5 Year Subordinated Debt | EUR | 5,000,000 | Pay | 1.00 | 3/20/2020 | 469,337 | (167,470 | ) | BBB- | ||||||||||||||||||||
Barclays | UniCredit SpA 5 Year Subordinated Debt | EUR | 10,000,000 | Pay | 1.00 | 3/20/2020 | 914,405 | (310,672 | ) | BBB- | ||||||||||||||||||||
Bank of America | UniCredit SpA 5 Year Subordinated Debt | EUR | 10,000,000 | Pay | 1.00 | 3/20/2020 | 859,000 | (255,266 | ) | BBB- | ||||||||||||||||||||
Barclays | UniCredit SpA 5 Year Senior Debt | EUR | (5,000,000 | ) | Receive | 1.00 | 3/20/2020 | (52,853 | ) | 12,463 | BBB- | |||||||||||||||||||
Barclays | UniCredit SpA 5 Year Senior Debt | EUR | (10,000,000 | ) | Receive | 1.00 | 3/20/2020 | (105,835 | ) | 25,056 | BBB- | |||||||||||||||||||
Bank of America | UniCredit SpA 5 Year Senior Debt | EUR | (10,000,000 | ) | Receive | 1.00 | 3/20/2020 | (83,273 | ) | 2,493 | BBB- | |||||||||||||||||||
|
|
|
| |||||||||||||||||||||||||||
Total Credit Default Swaps |
| 1,959,895 | (8,438,989 | ) | ||||||||||||||||||||||||||
|
|
|
| |||||||||||||||||||||||||||
Total Swap Contracts |
| $ | 1,959,895 | $ | (8,438,989 | ) | ||||||||||||||||||||||||
|
|
|
| |||||||||||||||||||||||||||
Notes to Financial Statements are an integral part of this Schedule.
11
Table of Contents
Driehaus Active Income Fund
Schedule of Investments
December 31, 2015
| A | The triggering credit event for each swap is bankruptcy/failure to pay. |
| B | For contracts to sell protection, the notional amout is equal to the maximum potential amount of the future payments and no recourse has been entered into in association with the contracts. |
| C | If the Fund is paying a fixed rate, the counterparty acts as guarantor of the variable instrument and thus the Fund is a buyer of protection. If the Fund is receiving a fixed rate, the Fund acts as guarantor of the variable instrument and thus is a seller of protection. |
| D | Based on Moody’s or Standard & Poor’s credit rating for the underlying reference instrument entity (unaudited). |
NR=Not Rated
NA=Not Applicable
EUR — Euro
USD — United States Dollar
SWAPTIONS
Interest Rate Swaptions
| Counterparty | Floating Rate Index | Currency | Notional Amount | Pay/ Receive Fixed Rate | Exercise Rate | Expiration Date | Premium Paid/ (Received) | Market Value | ||||||||||||||||||||
Morgan Stanley | 3-Month USD-LIBOR-BBA | USD | 43,499,650 | Pay | 2.07 | % | 1/26/2016 | $ | 622,045 | $ | 615,950 | |||||||||||||||||
Morgan Stanley | 3-Month USD-LIBOR-BBA | USD | 82,500,000 | Pay | 1.51 | 1/26/2016 | 610,500 | 1,006,687 | ||||||||||||||||||||
Morgan Stanley | 3-Month USD-LIBOR-BBA | USD | 85,000,000 | Pay | 1.80 | 1/26/2016 | 867,000 | 1,050,996 | ||||||||||||||||||||
|
|
|
| |||||||||||||||||||||||||
Total Interest Rate Swaptions |
| 2,099,545 | 2,673,633 | |||||||||||||||||||||||||
|
|
|
| |||||||||||||||||||||||||
TOTAL SWAPTIONS |
| $ | 2,099,545 | $ | 2,673,633 | |||||||||||||||||||||||
|
|
|
| |||||||||||||||||||||||||
USD — United States Dollar
FUTURES CONTRACTS
| Futures Contracts | Number of Contracts (Short) | Expiration Date | Unrealized Appreciation/ (Depreciation) | |||||||||
U.S. 5 Year Treasury Note | (1,585 | ) | March 2016 | $ | 615,416 | |||||||
U.S. 10 Year Treasury Note | (1,322 | ) | March 2016 | 771,503 | ||||||||
U.S. Treasury Long Bond | (101 | ) | March 2016 | 10,325 | ||||||||
|
| |||||||||||
Total Futures Contracts | $ | 1,397,244 | ||||||||||
|
| |||||||||||
Notes to Financial Statements are an integral part of this Schedule.
12
Table of Contents
Driehaus Active Income Fund
Schedule of Investments
December 31, 2015
FORWARD FOREIGN CURRENCY CONTRACTS
| Purchase Contracts | Settlement Date | Currency Amount Purchased | Value At Settlement Date | Value At December 31, 2015 | Unrealized Appreciation/ (Depreciation) | |||||||||||||||
British Pound | March 1, 2016 | 3,700,000 | $ | 5,574,438 | $ | 5,455,195 | $ | (119,243 | ) | |||||||||||
Euro | March 1, 2016 | 6,400,000 | 6,785,280 | 6,966,298 | 181,018 | |||||||||||||||
Euro | March 1, 2016 | 4,500,000 | 4,927,730 | 4,898,179 | (29,551 | ) | ||||||||||||||
Euro | March 1, 2016 | 3,000,000 | 3,177,549 | 3,265,452 | 87,903 | |||||||||||||||
Euro | March 1, 2016 | 1,000,000 | 1,066,345 | 1,088,484 | 22,139 | |||||||||||||||
|
|
|
|
|
| |||||||||||||||
Total Purchase Contracts |
| 21,531,342 | 21,673,608 | 142,266 | ||||||||||||||||
|
|
|
|
|
| |||||||||||||||
| Sale Contracts | Settlement Date | Currency Amount Sold | Value At Settlement Date | Value At December 31, 2015 | Unrealized Appreciation/ (Depreciation) | |||||||||||||||
British Pound | March 1, 2016 | (32,750,000 | ) | $ | (49,341,314 | ) | $ | (48,285,848 | ) | $ | 1,055,466 | |||||||||
Euro | March 1, 2016 | (14,000,000 | ) | (14,842,800 | ) | (15,238,777 | ) | (395,977 | ) | |||||||||||
Euro | March 1, 2016 | (8,700,000 | ) | (9,223,740 | ) | (9,469,812 | ) | (246,072 | ) | |||||||||||
|
|
|
|
|
| |||||||||||||||
Total Sale Contracts |
| (73,407,854 | ) | (72,994,437 | ) | 413,417 | ||||||||||||||
|
|
|
|
|
| |||||||||||||||
TOTAL FORWARD FOREIGN CURRENCY CONTRACTS |
| $ | (51,876,512 | ) | $ | (51,320,829 | ) | $ | 555,683 | |||||||||||
|
|
|
|
|
| |||||||||||||||
Notes to Financial Statements are an integral part of this Schedule.
13
Table of Contents
Driehaus Select Credit Fund — Portfolio Managers’ Letter
Dear Shareholders,
The Driehaus Select Credit Fund (“Fund”) returned -7.13% for the year ended December 31, 2015. This return was below the performance of the Fund’s benchmark index, the Citigroup 3-Month T-Bill Index, which returned 0.03% for the same period. The Fund underperformed the BofA Merrill Lynch US High Yield Index, which returned -4.64% for the same period.
Credit and equity markets experienced heightened volatility throughout much of the year over concerns about global economic growth, an impending rise in US interest rates, steep drops in the price of oil and most other commodities, and a potential “hard landing” by China. High yield returned -4.64% for 2015, the first negative annual return since 2008. Spreads widened nearly 300 basis points from their tights at 438 in late February to their wides of 733 in mid-December. Similarly, investment grade spreads widened approximately 50 basis points from their tights in early March at 129 to the wides in late September at 180, and the market returned -0.63% for the year. During the year, 37 US companies defaulted, representing $38 billion of bonds. Energy and coal companies represented 70% of the default volume in 2015. Including distressed exchanges, the high yield default rate was 2.56% at year-end.
The directional long strategy was the most significant detractor from returns for the year. High yield spread widening caused losses in many of the directional long trades, particularly in lower quality or second lien energy, retail, e-learning, emerging markets and health care names. Gains from positions in pharmacy, gaming, retail, gym and telecom companies were not enough to offset these losses.
The pairs strategy also detracted from performance. The loss was driven primarily by a trade related to office supply stores as well as a position in an emerging markets energy company. The directional short strategy also detracted from performance. Although several short positions in energy companies generated positive returns, they were offset by losses from trades initiated in the first half of the year when high yield spreads were flat or contracting.
On the positive side, the event-driven strategy contributed to performance. Event trades focus on catalyst-driven corporate events, such as mergers and acquisitions (M&A) or company announcements. Depending on the anticipated timing and nature of the event, these trades can be structured using a single security type or a combination of bonds, options, bank loans, swaps and equities. The largest contributors to performance in this strategy were several risk arbitrage trades that performed well as M&A spreads contracted and from several trades in the telecom industry.
The hedging strategies had mixed results in 2015. The interest rate hedge, which is constructed with US Treasury futures and US Treasury swaptions, detracted from returns as rates contracted sharply during the first nine months of the year before stabilizing and widened marginally in the fourth quarter in anticipation of the Federal Reserve raising interest rates. In contrast, the volatility hedges contributed to performance. Volatility trades are generally constructed by implementing various option strategies, such as straddles or strangles on various market indices or through the use of credit default swaps on indices. Hedges focused on West Texas Intermediate crude oil prices and the S&P 500 Index added to returns, though they were partially offset by a trade focused on the relative volatility between the Russell 2000 and the S&P 500 indices. In general, volatility trades had a positive contribution to performance during some of the more volatile months during the year.
Looking ahead, we believe the difficult environment seen over the past year has created considerable opportunities. Market stress experienced during 2015 differed greatly from prior risk-off episodes in recent memory, such as the Taper Tantrum of 2013, the Euro Sovereign Crisis of 2011, and the Credit Crisis of 2008. Those episodes were dominated by a concentrated set of explosive systemic risks. Consequently, when those risks were reduced asset prices rebounded sharply. Now there are many risks and they are not at all concentrated, nor are they particularly explosive. Therefore, there is no quick solution to the market’s stresses, but importantly, we’d argue the potential damage from this episode is far less than those of 2011 and 2008. As such, we start the year focused on trades that have more idiosyncratic risk and less market risk. We also continue to seek out risk arbitrage opportunities in low and mid-risk M&A trades as well as positions with sizable carry that can withstand a reasonable amount of spread widening without a material increase in default risk. Finally, we are maintaining a sharp focus on liquidity within the Fund as we seek to capitalize on what we believe is an excellent environment for our investment strategy.
14
Table of Contents
As always, we at Driehaus Capital Management LLC thank you for your interest in the Driehaus Select Credit Fund and would like to express our gratitude to you as shareholders for your continued confidence in our management capabilities.
Sincerely,
| | |
| K.C. Nelson | Elizabeth Cassidy | |
| Portfolio Manager | Assistant Portfolio Manager |
Performance is historical and does not represent future results.
Please see the following performance page for index definitions.
15
Table of Contents
Performance Overview (unaudited)
The performance summarized below is historical and does not represent future results. Investment returns and principal value vary, and you may have a gain or loss when you sell shares. Performance data presented measures the change in the value of an investment in the Fund, assuming reinvestment of all dividends and capital gains.
The table does not reflect the deduction of taxes that a shareholder would pay on Fund distributions or the redemption of Fund shares. The graph compares the results of a $25,000 investment (minimum investment) in the Fund since September 30, 2010 (the date of the Fund’s inception), with all dividends and capital gains reinvested, with the indicated indices (and dividends reinvested) for the same period.
| Average Annual Total Returns as of 12/31/15 | 1 Year | 3 Years | 5 Years | Since Inception (09/30/10 - 12/31/15) | ||||||||||||
Driehaus Select Credit Fund (DRSLX)1 | –7.13% | –2.56% | –0.48% | 0.18% | ||||||||||||
Citigroup 3-Month T-Bill Index2 | 0.03% | 0.04% | 0.05% | 0.06% | ||||||||||||
BofA Merrill Lynch U.S. High Yield Index3 | –4.64% | 1.64% | 4.84% | 5.21% | ||||||||||||
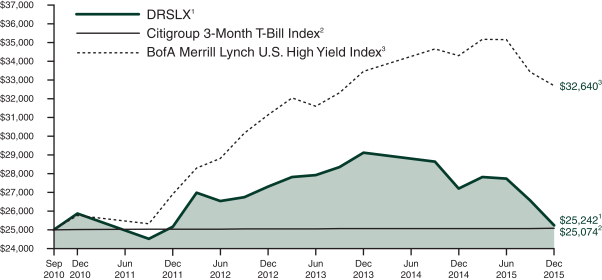
| 1 | The returns for the periods prior to February 1, 2011, reflect fee waivers and/or reimbursements without which performance would have been lower. |
| 2 | The Citigroup 3-Month T-Bill Index is designed to mirror the performance of the 3-month U.S. Treasury Bill. The Citigroup 3-Month T-Bill Index is unmanaged and its returns reflect reinvestment of all distributions and changes in market prices. |
| 3 | The BofA Merrill Lynch U.S. High Yield Index is an unmanaged index that tracks the performance of below-investment grade, U.S.-dollar denominated corporate bonds publicly issued in the U.S. domestic market. |
16
Table of Contents
Driehaus Select Credit Fund
Schedule of Investments
December 31, 2015
| Shares, Principal Amount, or Number of Contracts | Value | |||||||
| BANK LOANS — 16.98% | ||||||||
Entertainment — 1.68% |
| |||||||
Scientific Games International, Inc. | $ | 4,000,000 | $ | 3,672,140 | ||||
Scientific Games International, Inc. | 1,500,000 | 1,372,230 | ||||||
|
| |||||||
| 5,044,370 | ||||||||
|
| |||||||
Leisure Time — 5.35% |
| |||||||
Equinox Holdings, Inc. | 15,748,824 | 16,103,172 | ||||||
Software — 9.95% |
| |||||||
Applied Systems, Inc. | 22,231,022 | 20,674,851 | ||||||
Evergreen Skills Lux Sarl (Luxembourg) | 13,900,000 | 9,278,250 | ||||||
|
| |||||||
| 29,953,101 | ||||||||
|
| |||||||
Total BANK LOANS | 51,100,643 | |||||||
|
| |||||||
| CORPORATE BONDS — 35.21% | ||||||||
Airlines — 1.57% |
| |||||||
Gol LuxCo SA (Luxembourg) | 11,000,000 | 4,730,000 | ||||||
Chemicals — 3.89% |
| |||||||
Kissner Milling Co., Ltd. (Canada) | 12,500,000 | 11,718,750 | ||||||
Momentive Performance Materials, Inc. | 5,530,000 | — | ||||||
|
| |||||||
| 11,718,750 | ||||||||
|
| |||||||
Diversified Financial Services — 4.06% |
| |||||||
Rio Oil Finance Trust | 16,500,000 | 12,210,000 | ||||||
Food — 2.20% |
| |||||||
Wm Morrison Supermarkets PLC (United Kingdom) | 5,000,000 | 6 | 6,634,881 | |||||
Healthcare — Services — 3.58% |
| |||||||
Kindred Healthcare, Inc. | 12,973,000 | 10,767,590 | ||||||
Oil & Gas — 8.20% |
| |||||||
Calumet Specialty Products Partners LP / Calumet Finance Corp. | 12,019,500 | 10,456,965 | ||||||
Sanchez Energy Corp. | 17,100,000 | 10,431,000 | ||||||
| Shares, Principal Amount, or Number of Contracts | Value | |||||||
Sanchez Energy Corp. | $ | 7,000,000 | $ | 3,780,000 | ||||
|
| |||||||
| 24,667,965 | ||||||||
|
| |||||||
Restaurants — 4.15% |
| |||||||
Ruby Tuesday, Inc. | 12,800,000 | 12,480,000 | ||||||
Retail — 7.56% |
| |||||||
Claire’s Stores, Inc. | 10,600,000 | 6,413,000 | ||||||
Conn’s, Inc. | 6,100,000 | 5,200,250 | ||||||
Neiman Marcus Group, Inc. 8.00%, 10/15/211 | 15,050,000 | 11,137,000 | ||||||
|
| |||||||
| 22,750,250 | ||||||||
|
| |||||||
Total CORPORATE BONDS | 105,959,436 | |||||||
|
| |||||||
| CONVERTIBLE CORPORATE BONDS — 0.01% | ||||||||
Electrical Components & Equipment — 0.00% |
| |||||||
Suntech Power Holdings Co., Ltd. (China) | 4,000,000 | 19,600 | ||||||
Mining — 0.01% |
| |||||||
Great Western Minerals Group Ltd. (Canada) | 2,000,000 | 20,000 | ||||||
|
| |||||||
Total CONVERTIBLE CORPORATE BONDS (Cost $5,991,108) | 39,600 | |||||||
|
| |||||||
| U.S. GOVERNMENT AND AGENCY SECURITIES — 1.11% | ||||||||
United States Treasury Bond | 2,130,000 | 2,120,266 | ||||||
United States Treasury Note | 1,243,000 | 1,211,973 | ||||||
|
| |||||||
Total U.S. GOVERNMENT AND AGENCY SECURITIES | 3,332,239 | |||||||
|
| |||||||
| COMMON STOCK — 25.80% | ||||||||
Airlines — 0.25% |
| |||||||
Wizz Air Holdings Plc (Switzerland)*1,3 | 27,550 | 737,997 | ||||||
Auto Manufacturers — 1.06% |
| |||||||
General Motors Co. | 93,344 | 3,174,626 | ||||||
Commercial Services — 3.07% |
| |||||||
Towers Watson & Co., Class A | 72,000 | 9,249,120 | ||||||
Computers — 1.89% |
| |||||||
EMC Corp. | 222,000 | 5,700,960 | ||||||
Diversified Financial Services — 0.77% |
| |||||||
FNFV Group* | 205,500 | 2,307,765 | ||||||
Notes to Financial Statements are an integral part of this Schedule.
17
Table of Contents
Driehaus Select Credit Fund
Schedule of Investments
December 31, 2015
| Shares, Principal Amount, or Number of Contracts | Value | |||||||
Electric — 1.04% |
| |||||||
Cleco Corp. | 60,000 | $ | 3,132,600 | |||||
Entertainment — 0.93% |
| |||||||
Pinnacle Entertainment, Inc.* | 90,000 | 2,800,800 | ||||||
Gas — 1.65% |
| |||||||
AGL Resources, Inc. | 78,000 | 4,977,180 | ||||||
Healthcare — Services — 2.72% |
| |||||||
Cigna Corp. | 42,500 | 6,219,025 | ||||||
Humana, Inc. | 11,000 | 1,963,610 | ||||||
|
| |||||||
| 8,182,635 | ||||||||
|
| |||||||
Household Products/Wares — 0.44% |
| |||||||
Jarden Corp.* | 23,000 | 1,313,760 | ||||||
Internet — 1.11% |
| |||||||
Youku Tudou, Inc. | 123,000 | 3,336,990 | ||||||
Media — 2.48% |
| |||||||
Cablevision Systems Corp., Class A | 40,000 | 1,276,000 | ||||||
Meredith Corp. | 27,298 | 1,180,639 | ||||||
Time Warner Cable, | 27,000 | 5,010,930 | ||||||
|
| |||||||
| 7,467,569 | ||||||||
|
| |||||||
Metal Fabricate/Hardware — 1.57% |
| |||||||
Precision Castparts Corp. | 20,300 | 4,709,803 | ||||||
Oil & Gas Services — 0.58% |
| |||||||
Baker Hughes, Inc. | 38,000 | 1,753,700 | ||||||
Restaurants — 2.21% |
| |||||||
Ruby Tuesday, Inc.* | 1,204,571 | 6,637,186 | ||||||
Retail — 1.88% |
| |||||||
Rite Aid Corp.* | 343,887 | 2,696,074 | ||||||
Staples, Inc. | 313,000 | 2,964,110 | ||||||
|
| |||||||
| 5,660,184 | ||||||||
|
| |||||||
Semiconductors — 0.92% |
| |||||||
KLA-Tencor Corp. | 40,000 | 2,774,000 | ||||||
Software — 1.23% |
| |||||||
SolarWinds, Inc.* | 63,000 | 3,710,700 | ||||||
|
| |||||||
Total COMMON STOCK | 77,627,575 | |||||||
|
| |||||||
| CONVERTIBLE PREFERRED STOCK — 0.00% | ||||||||
Auto Manufacturers — 0.00% |
| |||||||
General Motors Corp. Senior Convertible Preferred Escrow — C | 94,958 | — | ||||||
|
| |||||||
Total CONVERTIBLE PREFERRED STOCK | — | |||||||
|
| |||||||
| Shares, Principal Amount, or Number of Contracts | Value | |||||||
| PURCHASED PUT OPTIONS — 0.26% | ||||||||
Cablevision Systems Corp., Exercise Price: $17.00, Expiration Date: January, 2016* | 7,400 | $ | 37,000 | |||||
iShares MSCI Brazil Capped ETF, Exercise Price: $20.00, Expiration Date: January, 2016* | 11,500 | 425,500 | ||||||
S&P 500 Index, Exercise Price: $1,800.00, Expiration Date: January, 2016* | 450 | 33,750 | ||||||
S&P 500 Index, Exercise Price: $1,950.00, Expiration Date: January, 2016* | 450 | 265,500 | ||||||
UnitedHealth Group, Inc., Exercise Price: $105.00, Expiration Date: January, 2016* | 1,000 | 14,000 | ||||||
|
| |||||||
Total PURCHASED PUT OPTIONS | 775,750 | |||||||
|
| |||||||
| ||||||||
TOTAL INVESTMENTS | 79.37 | % | 238,835,243 | |||||
Other Assets less Liabilities | 20.63 | % | 62,088,623 | |||||
|
|
|
| |||||
NET ASSETS | 100.00 | % | $ | 300,923,866 | ||||
| ||||||||
| ||||||||
| SECURITIES SOLD SHORT — (10.00)% | ||||||||
| CORPORATE BONDS — (5.28)% | ||||||||
Oil & Gas — (1.79)% |
| |||||||
Denbury Resources, Inc. | $ | (2,965,000 | ) | $ | (1,097,050 | ) | ||
Petrobras Global Finance BV (Netherlands) | (2,000,000 | ) | (1,500,000 | ) | ||||
Petrobras Global Finance BV (Netherlands) | (2,000,000 | ) | (1,330,000 | ) | ||||
Petrobras Global Finance BV (Netherlands) | (2,000,000 | ) | (1,445,000 | ) | ||||
|
| |||||||
| (5,372,050 | ) | |||||||
|
| |||||||
Oil & Gas Services — (1.69)% |
| |||||||
National Oilwell Varco, Inc. 2.60%, 12/1/22 | (2,925,000 | ) | (2,561,636 | ) | ||||
National Oilwell Varco, Inc. 3.95%, 12/1/42 | (3,300,000 | ) | (2,524,936 | ) | ||||
|
| |||||||
| (5,086,572 | ) | |||||||
|
| |||||||
Notes to Financial Statements are an integral part of this Schedule.
18
Table of Contents
Driehaus Select Credit Fund
Schedule of Investments
December 31, 2015
| Shares, Principal Amount, or Number of Contracts | Value | |||||||
Sovereign — (1.80)% |
| |||||||
Brazilian Government International Bond (Brazil) | $ | (8,000,000 | ) | $ | (5,420,000 | ) | ||
|
| |||||||
Total CORPORATE BONDS (Proceeds $20,116,942) | (15,878,622 | ) | ||||||
|
| |||||||
| U.S. GOVERNMENT AND AGENCY SECURITY — (0.70)% | ||||||||
United States Treasury Bond | (2,100,000 | ) | (2,093,683 | ) | ||||
|
| |||||||
Total U.S. GOVERNMENT AND AGENCY SECURITIES | (2,093,683 | ) | ||||||
|
| |||||||
| COMMON STOCK — (3.96)% | ||||||||
Healthcare — Services — (1.47)% |
| |||||||
Aetna, Inc. | (9,212 | ) | (996,001 | ) | ||||
Anthem, Inc. | (21,850 | ) | (3,046,764 | ) | ||||
Kindred Healthcare, Inc. | (31,223 | ) | (371,866 | ) | ||||
|
| |||||||
| (4,414,631 | ) | |||||||
|
| |||||||
Media — (0.89)% |
| |||||||
Charter Communications, Inc., Class A* | (14,605 | ) | (2,674,176 | ) | ||||
Oil & Gas Services — (0.48)% |
| |||||||
Halliburton Co. | (42,560 | ) | (1,448,742 | ) | ||||
Retail — (0.59)% |
| |||||||
Office Depot, Inc.* | (315,000 | ) | (1,776,600 | ) | ||||
Semiconductors — (0.53)% |
| |||||||
Lam Research Corp. | (20,000 | ) | (1,588,400 | ) | ||||
|
| |||||||
Total COMMON STOCK (Proceeds $13,770,766) | (11,902,549 | ) | ||||||
|
| |||||||
| WRITTEN PUT OPTIONS — (0.06)% | ||||||||
iShares MSCI Brazil Capped ETF, Exercise Price: $15.00, Expiration Date: January, 2016* | (11,500 | ) | (11,500 | ) | ||||
S&P 500 Index, Exercise Price: $1,875.00, Expiration Date: January, 2016* | (900 | ) | (180,000 | ) | ||||
|
| |||||||
Total WRITTEN PUT OPTIONS | (191,500 | ) | ||||||
|
| |||||||
| ||||||||
TOTAL INVESTMENT SECURITIES SOLD SHORT | (10.00 | )% | $ | (30,066,354 | ) | |||
| ||||||||
| * | Non-income producing security. |
| 1 | 144A restricted security. |
| 2 | Variable rate security. Rates disclosed as of December 31, 2015. |
| 3 | Foreign security denominated in U.S. dollars and traded on a U.S. exchange. |
| 4 | Security valued at fair value as determined in good faith by Driehaus Capital Management LLC, investment adviser to the Fund, in accordance with procedures established by, and under the general supervision of, the Trust’s Board of Trustees. |
| 5 | Security is in default. |
| 6 | Foreign security, par value shown in local currency. |
Percentages are stated as a percent of net assets.
Notes to Financial Statements are an integral part of this Schedule.
19
Table of Contents
Driehaus Select Credit Fund
Schedule of Investments
December 31, 2015
SWAP CONTRACTS
Credit Default SwapsA
| Counterparty | Reference Instrument | Currency | Notional AmountB | Pay/ ReceiveC Fixed Rate | Fixed Rate | Expiration Date | Premium Paid (Received) | Unrealized Appreciation/ (Depreciation) | RatingD | |||||||||||||||||||||
Bank of America | Ardagh Packaging Finance PLC 9.25%, 10/15/20 | EUR | 2,000,000 | Pay | 5.00 | % | 9/20/2019 | (116,527 | ) | (41,694 | ) | CCC+ | ||||||||||||||||||
Bank of America | Ardagh Packaging Finance PLC 9.25%, 10/15/20 | EUR | 3,000,000 | Pay | 5.00 | 9/20/2019 | (178,328 | ) | (59,004 | ) | CCC+ | |||||||||||||||||||
Morgan Stanley | Ardagh Packaging Finance PLC 9.25%, 10/15/20 | EUR | 3,000,000 | Pay | 5.00 | 9/20/2019 | (165,973 | ) | (71,359 | ) | CCC+ | |||||||||||||||||||
Barclays | Ardagh Packaging Finance PLC 9.25%, 10/15/20 | EUR | 2,000,000 | Pay | 5.00 | 9/20/2019 | (88,220 | ) | (70,002 | ) | CCC+ | |||||||||||||||||||
Goldman Sachs | Banco Bilbao Vizcaya Argentaria SA 5 Year Subordinated Debt | EUR | 5,000,000 | Pay | 1.00 | 3/20/2020 | 207,316 | 48,090 | BBB+ | |||||||||||||||||||||
Bank of America | Banco Bilbao Vizcaya Argentaria SA 5 Year Subordinated Debt | EUR | 10,000,000 | Pay | 1.00 | 9/20/2020 | 717,064 | (102,664 | ) | BBB+ | ||||||||||||||||||||
Goldman Sachs | Banco Bilbao Vizcaya Argentaria SA 5 Year Senior Debt | EUR | (5,000,000 | ) | Receive | 1.00 | 3/20/2020 | 42,280 | (76,690 | ) | BBB+ | |||||||||||||||||||
Bank of America | Banco Bilbao Vizcaya Argentaria SA 5 Year Senior Debt | EUR | (10,000,000 | ) | Receive | 1.00 | 9/20/2020 | (93,278 | ) | (22,015 | ) | BBB+ | ||||||||||||||||||
Goldman Sachs | Banco Santander SA 5 Year Subordinated Debt | EUR | 5,000,000 | Pay | 1.00 | 3/20/2020 | 207,316 | 105,351 | A- | |||||||||||||||||||||
Bank of America | Banco Santander SA 5 Year Subordinated Debt | EUR | 10,000,000 | Pay | 1.00 | 9/20/2020 | 691,412 | 55,300 | A- | |||||||||||||||||||||
Goldman Sachs | Banco Santander SA 5 Year Senior Debt | EUR | (5,000,000 | ) | Receive | 1.00 | 3/20/2020 | 42,280 | (94,844 | ) | A- | |||||||||||||||||||
Bank of America | Banco Santander SA 5 Year Senior Debt | EUR | (10,000,000 | ) | Receive | 1.00 | 9/20/2020 | (82,375 | ) | (72,643 | ) | A- | ||||||||||||||||||
Goldman Sachs | Federative Republic of Brazil 12.25%, 3/6/30 | USD | 7,500,000 | Pay | 1.00 | 12/20/2019 | 252,803 | 686,220 | BB+ | |||||||||||||||||||||
JP Morgan | Hess Corp. 7.00%, 2/15/14 | USD | 2,000,000 | Pay | 1.00 | 6/20/2018 | 38,660 | (6,058 | ) | NR | ||||||||||||||||||||
Morgan Stanley | Hess Corp. 7.00%, 2/15/14 | USD | 1,000,000 | Pay | 1.00 | 6/20/2018 | 19,320 | (3,019 | ) | NR | ||||||||||||||||||||
Morgan Stanley | Hess Corp. 7.00%, 2/15/14 | USD | 1,000,000 | Pay | 1.00 | 6/20/2018 | 20,175 | (3,875 | ) | NR | ||||||||||||||||||||
Morgan Stanley | Hess Corp. 7.00%, 2/15/14 | USD | 1,000,000 | Pay | 1.00 | 6/20/2018 | 22,925 | (6,625 | ) | NR | ||||||||||||||||||||
Credit Suisse | Hess Corp. 7.00%, 2/15/14 | USD | 5,000,000 | Pay | 1.00 | 9/20/2018 | 77,494 | 31,448 | NR | |||||||||||||||||||||
Morgan Stanley | Masco Corp. 6.13%, 10/3/16 | USD | 1,000,000 | Pay | 1.00 | 3/20/2016 | 66,735 | (71,393 | ) | BBB | ||||||||||||||||||||
Barclays | Safeway Ltd. 6.13%, 12/17/18 | EUR | 10,000,000 | Pay | 1.00 | 9/20/2019 | 284,033 | (190,169 | ) | NR | ||||||||||||||||||||
|
|
|
| |||||||||||||||||||||||||||
Total Credit Default Swaps |
| 1,965,112 | 34,355 | |||||||||||||||||||||||||||
|
|
|
| |||||||||||||||||||||||||||
Total Swap Contracts |
| $ | 1,965,112 | $ | 34,355 | |||||||||||||||||||||||||
|
|
|
| |||||||||||||||||||||||||||
| A | The triggering credit event for each swap is bankruptcy/failure to pay. |
| B | For contracts to sell protection, the notional amount is equal to the maximum potential amount of the future payments and no recourse has been entered into in association with the contracts. |
Notes to Financial Statements are an integral part of this Schedule.
20
Table of Contents
Driehaus Select Credit Fund
Schedule of Investments
December 31, 2015
| C | If the Fund is paying a fixed rate, the counterparty acts as guarantor of the variable instrument and thus the Fund is a buyer of protection. If the Fund is receiving a fixed rate, the Fund acts as guarantor of the variable instrument and thus is a seller of protection. |
| D | Based on Moody’s or Standard & Poor’s credit rating for the underlying reference instrument entity (unaudited). |
NR=Not Rated
NA=Not Applicable
EUR — Euro
USD — United States Dollar
SWAPTIONS
Interest Rate Swaptions
| Counterparty | Floating Rate Index | Currency | Notional Amount | Pay/ Receive Fixed Rate | Exercise Rate | Expiration Date | Premium Paid/ (Received) | Market Value | ||||||||||||||||||||
Morgan Stanley | 3-Month USD-LIBOR-BBA | USD | 5,000,350 | Pay | 2.07 | % | 1/26/2016 | $ | 71,500 | $ | 70,804 | |||||||||||||||||
Morgan Stanley | 3-Month USD-LIBOR-BBA | USD | 11,500,000 | Pay | 1.51 | 1/26/2016 | 85,100 | 140,326 | ||||||||||||||||||||
Morgan Stanley | 3-Month USD-LIBOR-BBA | USD | 8,500,000 | Pay | 1.80 | 1/26/2016 | 86,700 | 105,100 | ||||||||||||||||||||
|
|
|
| |||||||||||||||||||||||||
Total Interest Rate Swaptions |
| 243,300 | 316,230 | |||||||||||||||||||||||||
|
|
|
| |||||||||||||||||||||||||
TOTAL SWAPTIONS |
| $ | 243,300 | $ | 316,230 | |||||||||||||||||||||||
|
|
|
| |||||||||||||||||||||||||
USD — United States Dollar
FUTURES CONTRACTS
| Futures Contracts | Number of Contracts Long/(Short) | Expiration Date | Unrealized Appreciation/ (Depreciation) | |||||||||
S&P 500 E-mini | (125 | ) | March 2016 | $ | 9,337 | |||||||
U.S. 5 Year Treasury Note | (220 | ) | March 2016 | 85,421 | ||||||||
U.S. 10 Year Treasury Note | (95 | ) | March 2016 | 55,441 | ||||||||
U.S. Treasury Long Bond | (15 | ) | March 2016 | 1,488 | ||||||||
|
| |||||||||||
Total Futures Contracts | $ | 151,687 | ||||||||||
|
| |||||||||||
Notes to Financial Statements are an integral part of this Schedule.
21
Table of Contents
Driehaus Select Credit Fund
Schedule of Investments
December 31, 2015
FORWARD FOREIGN CURRENCY CONTRACTS
| Purchase Contracts | Settlement Date | Currency Amount Purchased | Value At Settlement Date | Value At December 31, 2015 | Unrealized Appreciation/ (Depreciation) | |||||||||||||||
Euro | March 1, 2016 | 5,000,000 | $ | 5,331,725 | $ | 5,442,420 | $ | 110,695 | ||||||||||||
British Pound | March 1, 2016 | 1,500,000 | 2,259,908 | 2,211,566 | (48,342 | ) | ||||||||||||||
|
|
|
|
|
| |||||||||||||||
Total Purchase Contracts |
| 7,591,633 | 7,653,986 | 62,353 | ||||||||||||||||
|
|
|
|
|
| |||||||||||||||
| Sale Contracts | Settlement Date | Currency Amount Sold | Value At Settlement Date | Value At December 31, 2015 | Unrealized Appreciation/ (Depreciation) | |||||||||||||||
Euro | March 1, 2016 | (5,000,000 | ) | $ | (5,301,000 | ) | $ | (5,442,420 | ) | $ | (141,420 | ) | ||||||||
British Pound | March 1, 2016 | (500,000 | ) | (753,303 | ) | (737,189 | ) | 16,114 | ||||||||||||
British Pound | March 1, 2016 | (6,400,000 | ) | (9,642,272 | ) | (9,436,013 | ) | 206,259 | ||||||||||||
|
|
|
|
|
| |||||||||||||||
Total Sale Contracts |
| (15,696,575 | ) | (15,615,622 | ) | 80,953 | ||||||||||||||
|
|
|
|
|
| |||||||||||||||
TOTAL FORWARD FOREIGN CURRENCY CONTRACTS |
| $ | (8,104,942 | ) | $ | (7,961,636 | ) | $ | 143,306 | |||||||||||
|
|
|
|
|
| |||||||||||||||
Notes to Financial Statements are an integral part of this Schedule.
22
Table of Contents
Driehaus Event Driven Fund — Portfolio Managers’ Letter
Dear Shareholders,
The Driehaus Event Driven Fund (“Fund”) returned -1.08% for the year ended December 31, 2015. This return is in comparison to the performance of the Fund’s benchmark index, the S&P 500 Index (the “Benchmark”), which returned 1.38% for the same period, and the Citigroup 3-Month T-Bill Index, an additional index against which the Fund’s performance may be compared, which returned 0.03%.
Despite record merger and acquisition (M&A) activity during 2015, it was a difficult period for event-driven investors. The challenging environment was most acutely felt in the second half of the year as popular (crowded) event trades came under pressure. This resulted in a more stringent risk environment for many event-driven funds, which further removed event capital from the market. As this occurred, record-breaking deal volume, accompanied by a relatively low level of deal completion, tied up much of the event-driven capital seeking trades. The resulting draw of capital to more attractive spreads on M&A deals depressed other segments of the event space, such as most catalyst-driven event trades.
Within the Fund, risk arbitrage trades made the most significant contribution to the Fund’s return for the year. While 2015 was a challenging period for risk arbitrage, the Fund benefited from two concentrated high-conviction merger-arbitrage trades. Merger-arb trades are constructed by buying and selling the stocks of two merging companies simultaneously in an effort to create a low-risk profit.
Two trade types that provided smaller contributions to Fund returns were deep value and catalyst-driven bond trades. The largest contributor from these two groups was a deep value long position in a large pharmaceutical company. The position was initiated in late 2014 amid a steep decline in its share price and was sold near the end of the first quarter of 2015 after the share price had recovered. Our investment thesis was based in large part on our confidence in the company’s ability to maintain its dividend in 2015 despite broad investor skepticism.
The equity catalyst-driven trade type was the most significant detractor from performance for 2015. The most significant losses in this trade type were from positions in the retail industry. The trades were predicated on two retailers taking steps to unlock value from their real estate portfolios but their shares suffered amid disappointing fourth quarter results in the broader retail space.
Portfolio hedges detracted from performance during the year. During the tumultuous period beginning in early August and lasting through the end of September, we added significant downside protection via out-of-the money put options on biotech and consumer staples exchange-traded funds. Despite significant initial profits on the hedges, an October rally led to losses on the put option positions.
Within the Fund, we seek to have lower volatility than the Benchmark. For the year, Fund volatility was 8.22% versus the Benchmark volatility of 15.58%. We also seek to provide some diversification from the Benchmark. For 2015, the Fund’s correlation to the Benchmark was 0.80.
Looking ahead, we believe the factors that produced dramatic headwinds in 2015 will either subside or serve as tailwinds to event trades in 2016. The M&A cycle should turn from an absorber of capital to a provider of liquidity. Also, we believe the fallout from this past fall’s concentrated trades will subside. Finally, we believe catalyst-driven equities will likely benefit from a normalization within the event space. We are encouraged by the potential beginning of a virtuous cycle for event trades and look forward to capitalizing on the many new opportunities we are discovering.
23
Table of Contents
Thank you for your interest in the Driehaus Event Driven Fund. We appreciate your confidence in our management capabilities.
Sincerely,
|  |  |  | |||
| K.C. Nelson | Michael Caldwell | Matt Schoenfeld | Yoav Sharon | |||
| Portfolio Manager | Assistant Portfolio Manager | Assistant Portfolio Manager | Assistant Portfolio Manager |
Performance is historical and does not represent future results.
Please see the following performance page for index definitions.
24
Table of Contents
Performance Overview (unaudited)
The performance summarized below is historical and does not represent future results. Investment returns and principal value vary, and you may have a gain or loss when you sell shares. Performance data presented measures the change in the value of an investment in the Fund, assuming reinvestment of all dividends and capital gains.
The table does not reflect the deduction of taxes that a shareholder would pay on Fund distributions or the redemption of Fund shares. The graph compares the results of a $10,000 investment in the Fund since August 26, 2013 (the date of the Fund’s inception), with all dividends and capital gains reinvested, with the indicated indices (and dividends reinvested) for the same period.
| Cumulative Total Returns as of 12/31/15 | 1 Year | Since Inception (08/26/13 - 12/31/15) | ||||||
Driehaus Event Driven Fund (DEVDX)1 | –1.08% | 0.94% | ||||||
S&P 500 Index2 | 1.38% | 11.45% | ||||||
Citigroup 3-Month T-Bill Index3 | 0.03% | 0.03% | ||||||
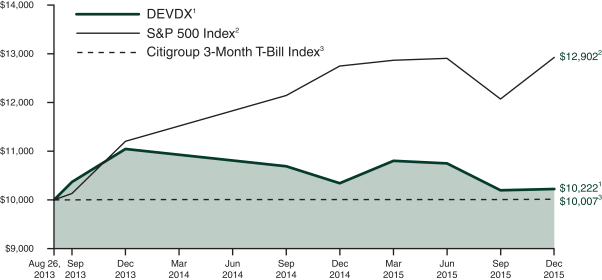
| 1 | The returns for the periods reflect fee waivers and/or reimbursements without which performance would have been lower. |
| 2 | The S&P 500 Index consists of 500 stocks chosen for market size, liquidity and industry group. It is a market-weighted index, with each stock’s weight in the index proportionate to its market value. |
| 3 | The Citigroup 3-Month T-Bill Index is designed to mirror the performance of the 3-month U.S. Treasury Bill. The Citigroup 3-Month T-Bill Index is unmanaged and its returns reflect reinvestment of all distributions and changes in market prices. |
25
Table of Contents
Driehaus Event Driven Fund
Schedule of Investments
December 31, 2015
| Shares, Principal Amount, or Number of Contracts | Value | |||||||
| CORPORATE BONDS — 3.09% | ||||||||
Diversified Financial Services — 0.96% |
| |||||||
Rio Oil Finance Trust | $ | 3,000,000 | $ | 2,220,000 | ||||
Telecommunications — 2.13% |
| |||||||
Frontier Communications Corp. | 5,000,000 | 4,950,000 | ||||||
|
| |||||||
Total CORPORATE BONDS (Cost $7,451,109) | 7,170,000 | |||||||
|
| |||||||
| COMMON STOCK — 78.63% | ||||||||
Biotechnology — 3.18% |
| |||||||
Blueprint Medicines Corp.* | 233,000 | 6,137,220 | ||||||
Dimension Therapeutics, Inc.* | 56,921 | 642,069 | ||||||
Sunesis Pharmaceuticals, Inc.* | 675,000 | 605,812 | ||||||
|
| |||||||
| 7,385,101 | ||||||||
|
| |||||||
Commercial Services — 6.24% |
| |||||||
Towers Watson & Co., Class A | 113,000 | 14,515,980 | ||||||
Computers — 4.89% |
| |||||||
EMC Corp. | 443,000 | 11,376,240 | ||||||
Electric — 2.09% |
| |||||||
Cleco Corp. | 93,000 | 4,855,530 | ||||||
Entertainment — 5.56% |
| |||||||
Lions Gate Entertainment Corp. | 233,000 | 7,546,870 | ||||||
Pinnacle Entertainment, Inc.* | 172,600 | 5,371,312 | ||||||
|
| |||||||
| 12,918,182 | ||||||||
|
| |||||||
Food — 8.00% |
| |||||||
Ingredion, Inc. | 93,000 | 8,913,120 | ||||||
Kraft Heinz Co. | 133,000 | 9,677,080 | ||||||
|
| |||||||
| 18,590,200 | ||||||||
|
| |||||||
Healthcare — Products — 0.17% |
| |||||||
Ocular Therapeutix, Inc.* | 41,345 | 387,402 | ||||||
Healthcare — Services — 2.07% |
| |||||||
Humana, Inc. | 27,000 | 4,819,770 | ||||||
Household Products/Wares — 3.71% |
| |||||||
Jarden Corp.* | 151,000 | 8,625,120 | ||||||
Insurance — 1.48% |
| |||||||
Willis Group Holdings PLC (United Kingdom) | 71,000 | 3,448,470 | ||||||
Internet — 0.58% |
| |||||||
New Media Investment Group, Inc. | 69,000 | 1,342,740 | ||||||
Lodging — 3.96% |
| |||||||
Starwood Hotels & Resorts Worldwide, Inc. | 133,000 | 9,214,240 | ||||||
Media — 19.06% |
| |||||||
Altice NV, Class A (Netherlands)* | 393,000 | 5,658,824 | ||||||
| Shares, Principal Amount, or Number of Contracts | Value | |||||||
Cablevision Systems Corp., Class A | 103,000 | $ | 3,285,700 | |||||
Media General, Inc.* | 323,000 | 5,216,450 | ||||||
Meredith Corp. | 237,000 | 10,250,250 | ||||||
Starz, Class A* | 133,999 | 4,488,967 | ||||||
Time Warner Cable, Inc. | 83,000 | 15,403,970 | ||||||
|
| |||||||
| 44,304,161 | ||||||||
|
| |||||||
Pharmaceuticals — 9.93% |
| |||||||
BioDelivery Sciences International, Inc.* | 138,500 | 663,415 | ||||||
Flexion Therapeutics, Inc.* | 250,000 | 4,817,500 | ||||||
Johnson & Johnson | 83,000 | 8,525,760 | ||||||
MyoKardia, Inc.* | 293,345 | 4,300,438 | ||||||
Perrigo Co. PLC (Ireland) | 33,000 | 4,775,100 | ||||||
|
| |||||||
| 23,082,213 | ||||||||
|
| |||||||
Restaurants — 2.28% |
| |||||||
Ruby Tuesday, Inc.* | 963,171 | 5,307,072 | ||||||
Retail — 1.99% |
| |||||||
Rite Aid Corp.* | 588,120 | 4,610,861 | ||||||
Semiconductors — 1.64% |
| |||||||
KLA-Tencor Corp. | 55,000 | 3,814,250 | ||||||
Software — 1.80% |
| |||||||
SolarWinds, Inc.* | 71,000 | 4,181,900 | ||||||
|
| |||||||
Total COMMON STOCK (Cost $180,262,412) | 182,779,432 | |||||||
|
| |||||||
| CONVERTIBLE PREFERRED STOCK — 4.88% | ||||||||
Auto Manufacturers — 0.51% |
| |||||||
Fiat Chrysler Automobile | 10,000 | 1,180,550 | ||||||
General Motors Corp. Senior Convertible Preferred Escrow — B | 25,000 | — | ||||||
General Motors Corp. Senior Convertible Preferred Escrow — C | 162,750 | — | ||||||
|
| |||||||
| 1,180,550 | ||||||||
|
| |||||||
Pharmaceuticals — 4.37% |
| |||||||
Teva Pharmaceutical Industries Ltd. (Israel) | 10,000 | 10,173,584 | ||||||
|
| |||||||
Total CONVERTIBLE PREFERRED STOCK | 11,354,134 | |||||||
|
| |||||||
| PURCHASED CALL OPTIONS — 0.80% | ||||||||
American Airlines Group, Inc., Exercise Price: $46.00, Expiration Date: February, 2016* | 7,875 | 637,875 | ||||||
Notes to Financial Statements are an integral part of this Schedule.
26
Table of Contents
Driehaus Event Driven Fund
Schedule of Investments
December 31, 2015
| Shares, Principal Amount, or Number of Contracts | Value | |||||||
Baxter International, Inc., Exercise Price: $80.00, Expiration Date: January, 2016* | 1,010 | $ | 126,755 | |||||
Darden Restaurants, Inc., Exercise Price: $57.50, Expiration Date: January, 2016* | 5 | 3,175 | ||||||
Dynavax Technologies Corp., Exercise Price: $30.00, Expiration Date: January, 2016* | 850 | 125,375 | ||||||
Dynavax Technologies Corp., Exercise Price: $25.00, Expiration Date: February, 2016* | 1,700 | 799,000 | ||||||
Frontier Communications Corp., Exercise Price: $6.00, Expiration Date: January, 2016* | 5,000 | 12,500 | ||||||
Halliburton Co., Exercise Price: $50.00, Expiration Date: January, 2016* | 500 | 500 | ||||||
Halliburton Co., Exercise Price: $60.00, Expiration Date: January, 2017* | 2,500 | 37,500 | ||||||
Hertz Global Holdings, Inc., Exercise Price: $20.00, Expiration Date: January, 2016* | 4,950 | 9,900 | ||||||
Pilgrim’s Pride Corp., Exercise Price: $25.00, Expiration Date: January, 2016* | 6,175 | 30,875 | ||||||
Twenty-First Century Fox, Inc., Exercise Price: $32.00, Expiration Date: January, 2016* | 3,300 | 6,600 | ||||||
Valeant Pharmaceuticals International, Inc., Exercise Price: $110.00, Expiration Date: January, 2016* | 300 | 70,500 | ||||||
|
| |||||||
Total PURCHASED CALL OPTIONS | 1,860,555 | |||||||
|
| |||||||
| PURCHASED PUT OPTIONS — 0.01% | ||||||||
Cablevision Systems Corp., Exercise Price: $17.00, Expiration Date: January, 2016* | 2,600 | 13,000 | ||||||
Darden Restaurants, Inc., Exercise Price: $57.50, Expiration Date: January, 2016*3 | 7,805 | 7,805 | ||||||
| Shares, Principal Amount, or Number of Contracts | Value | |||||||
UnitedHealth Group, Inc., Exercise Price: $105.00, Expiration Date: January, 2016* | 150 | $ | 2,100 | |||||
|
| |||||||
Total PURCHASED PUT OPTIONS | 22,905 | |||||||
|
| |||||||
| ||||||||
TOTAL INVESTMENTS (Cost $205,528,764) | 87.41 | % | 203,187,026 | |||||
Other Assets less Liabilities | 12.59 | % | 29,268,847 | |||||
|
|
|
| |||||
NET ASSETS | 100.00 | % | $ | 232,455,873 | ||||
| ||||||||
| ||||||||
| SECURITIES SOLD SHORT — (13.68)% | ||||||||
| U.S. GOVERNMENT AND AGENCY SECURITIES — (2.75)% | ||||||||
United States Treasury Bond | ||||||||
3.13%, 8/15/44 | $ | (4,200,000 | ) | $ | (4,294,828 | ) | ||
3.00%, 11/15/44 | (2,100,000 | ) | (2,093,683 | ) | ||||
|
| |||||||
| (6,388,511 | ) | |||||||
|
| |||||||
Total U.S. GOVERNMENT AND AGENCY SECURITIES | (6,388,511 | ) | ||||||
|
| |||||||
| COMMON STOCK — (7.50)% | ||||||||
Auto Manufacturers — (0.42)% |
| |||||||
Fiat Chrysler Automobiles NV (United Kingdom)* | (70,000 | ) | (979,300 | ) | ||||
Healthcare — Services — (1.05)% |
| |||||||
Aetna, Inc. | (22,612 | ) | (2,444,810 | ) | ||||
Media — (3.54)% |
| |||||||
Charter Communications, Inc., Class A* | (44,894 | ) | (8,220,091 | ) | ||||
Pharmaceuticals — (1.55)% |
| |||||||
Teva Pharmaceutical Industries Ltd. ADR (Israel) | (55,000 | ) | (3,610,200 | ) | ||||
Semiconductors — (0.94)% |
| |||||||
Lam Research Corp. | (27,500 | ) | (2,184,050 | ) | ||||
|
| |||||||
Total COMMON STOCK (Proceeds $17,364,427) | (17,438,451 | ) | ||||||
|
| |||||||
| WRITTEN CALL OPTIONS — (0.11)% | ||||||||
Dynavax Technologies Corp., Exercise Price: $35.00, Expiration Date: February, 2016* | (1,700 | ) | (246,500 | ) | ||||
|
| |||||||
Total WRITTEN CALL OPTIONS | (246,500 | ) | ||||||
|
| |||||||
Notes to Financial Statements are an integral part of this Schedule.
27
Table of Contents
Driehaus Event Driven Fund
Schedule of Investments
December 31, 2015
| Shares, Principal Amount, or Number of Contracts | Value | |||||||
| EXCHANGE-TRADED FUND — (3.32)% | ||||||||
Consumer Staples Select Sector SPDR Fund | (153,000 | ) | $ | (7,724,970 | ) | |||
|
| |||||||
Total EXCHANGE-TRADED FUND | (7,724,970 | ) | ||||||
|
| |||||||
| ||||||||
TOTAL INVESTMENT SECURITIES SOLD SHORT | (13.68 | )% | $ | (31,798,432 | ) | |||
| ||||||||
| * | Non-income producing security. |
| 1 | 144A restricted security. |
| 2 | Security is in default. |
| 3 | Security valued at fair value as determined in good faith by Driehaus Capital Management LLC, investment adviser to the Fund, in accordance with procedures established by or under the direction of the Trust’s Board of Trustees. |
Percentages are stated as a percent of net assets.
SWAP CONTRACTS
Total Return Swaps
| Counterparty | Reference Index | Currency | Notional Amount | Pay/ Receive Total Return on Reference IndexA | Financing RateB | Maturity Date | Unrealized Appreciation/ (Depreciation) | |||||||||||||||
Goldman Sachs | Goldman Sachs Custom Biotech Index | USD | (125,499 | ) | Receive | 1-Month USD-LIBOR minus 1.55% | 8/18/2020 | $ | (40,536 | ) | ||||||||||||
|
| |||||||||||||||||||||
TOTAL TOTAL RETURN SWAPS |
| $ | (40,536 | ) | ||||||||||||||||||
|
| |||||||||||||||||||||
| A | If the Fund is paying a floating rate, the value of the total return of the reference index has increased. If the Fund is receiving a floating rate, the value of the total return the value of the total return of the reference index has decreased. |
| B | Financing rate is based upon predetermined notional amounts. |
| USD | — United States Dollar |
FORWARD FOREIGN CURRENCY CONTRACTS
| Sale Contracts | Settlement Date | Currency Amount Sold | Value At Settlement Date | Value At December 31, 2015 | Unrealized Appreciation/ (Depreciation) | |||||||||||||||
Euro | March 1, 2016 | (4,000,000 | ) | $ | (4,368,353 | ) | $ | (4,353,936 | ) | $ | 14,416 | |||||||||
|
|
|
|
|
| |||||||||||||||
TOTAL FORWARD FOREIGN CURRENCY CONTRACTS |
| $ | (4,368,353 | ) | $ | (4,353,936 | ) | $ | 14,416 | |||||||||||
|
|
|
|
|
| |||||||||||||||
Notes to Financial Statements are an integral part of this Schedule.
28
Table of Contents
Statements of Assets and Liabilities
December 31, 2015
Driehaus Active Income Fund | Driehaus Select Credit Fund | Driehaus Event Driven Fund | ||||||||||
ASSETS: | ||||||||||||
Investment securities, at fair value (cost $2,836,948,306, $289,925,124 and $198,889,749, respectively) | $ | 2,655,995,799 | $ | 238,059,493 | $ | 201,303,566 | ||||||
Purchased options contracts, at fair value (premiums paid $16,365,296, $4,805,363 and $6,639,015, respectively) | 3,231,250 | 775,750 | 1,883,460 | |||||||||
Purchased swaptions contracts, at fair value (premiums paid $2,099,545, $243,300 and $0, respectively) | 2,673,633 | 316,230 | — | |||||||||
Foreign currency, at fair value (cost $1,219,766, $1,006,006 and $0, respectively) | 1,219,369 | 1,005,678 | — | |||||||||
Unrealized appreciation on forward foreign currency contracts | 1,346,526 | 333,068 | 14,416 | |||||||||
Unrealized appreciation on open swap contracts | 3,994,164 | 926,409 | — | |||||||||
Premiums paid on open swap contracts | 13,502,323 | 2,689,813 | — | |||||||||
Cash | 131,942,171 | 62,690,701 | 30,352,908 | |||||||||
Collateral held at custodian for the benefit of brokers | 360,374,539 | 40,538,217 | 34,527,972 | |||||||||
Receivable for investment securities sold | 43,478,518 | 13,199,315 | 3,678,670 | |||||||||
Receivable for fund shares sold | 4,216,875 | 1,202,340 | 227,712 | |||||||||
Receivable for interest and dividends | 24,721,368 | 2,867,569 | 465,749 | |||||||||
Receivable for variation margin | — | 53,361 | — | |||||||||
Receivable from custodian | — | 406,259 | — | |||||||||
Prepaid expenses | 57,513 | 26,045 | 22,228 | |||||||||
|
|
|
|
|
| |||||||
| ||||||||||||
TOTAL ASSETS | 3,246,754,048 | 365,090,248 | 272,476,681 | |||||||||
|
|
|
|
|
| |||||||
| ||||||||||||
LIABILITIES: | ||||||||||||
Payable for investment securities sold short, at fair value (proceeds $310,767,023, $36,153,124 and $31,956,433, respectively) | 275,916,094 | 29,874,854 | 31,551,932 | |||||||||
Written options outstanding, at fair value (premiums received $12,518,350, $1,866,185 and $217,525, respectively) | 1,151,904 | 191,500 | 246,500 | |||||||||
Unrealized depreciation on open swap contracts | 12,433,153 | 892,054 | 40,536 | |||||||||
Unrealized depreciation on forward foreign currency contracts | 790,843 | 189,762 | — | |||||||||
Premiums received on open swap contracts | 11,542,428 | 724,701 | — | |||||||||
Payable for investment securities purchased | 46,273,326 | 29,258,209 | 7,467,379 | |||||||||
Payable for fund shares redeemed | 17,670,562 | 2,142,383 | 299,851 | |||||||||
Payable to affiliate | 1,398,569 | 245,534 | 199,320 | |||||||||
Payable for interest and dividends on securities sold short | 2,010,766 | 359,915 | 57,710 | |||||||||
Payable for variation margin | 665,859 | — | — | |||||||||
Accrued shareholder services plan fees | 511,967 | 81,339 | 37,369 | |||||||||
Accrued administration and accounting fees | 88,997 | 24,958 | 13,970 | |||||||||
Accrued expenses | 306,670 | 181,173 | 106,241 | |||||||||
|
|
|
|
|
| |||||||
| ||||||||||||
TOTAL LIABILITIES | 370,761,138 | 64,166,382 | 40,020,808 | |||||||||
|
|
|
|
|
| |||||||
| ||||||||||||
NET ASSETS | $ | 2,875,992,910 | $ | 300,923,866 | $ | 232,455,873 | ||||||
|
|
|
|
|
| |||||||
SHARES OUTSTANDING (Unlimited shares authorized, no par value) | 288,992,706 | 37,053,503 | 23,592,924 | |||||||||
|
|
|
|
|
| |||||||
NET ASSET VALUE, OFFERING AND REDEMPTION PRICE PER SHARE | $ | 9.95 | $ | 8.12 | $ | 9.85 | ||||||
|
|
|
|
|
| |||||||
| ||||||||||||
NET ASSETS CONSISTED OF THE FOLLOWING AT DECEMBER 31, 2015: | ||||||||||||
Paid-in-capital | 3,301,664,028 | $ | 469,680,770 | $ | 258,573,925 | |||||||
Undistributed net investment income (loss) | 27,682,736 | 1,254,922 | 6,946 | |||||||||
Undistributed net realized gain (loss) on investments, options, swaptions, securities sold short, futures contracts, swap contracts, forward foreign currency contracts and foreign currency | (299,543,523 | ) | (122,467,250 | ) | (24,134,214 | ) | ||||||
Net unrealized appreciation (depreciation) on: | ||||||||||||
Investments | (180,952,507 | ) | (51,865,631 | ) | 2,413,817 | |||||||
Purchased options contracts | (13,134,046 | ) | (4,029,613 | ) | (4,755,555 | ) | ||||||
Purchased swaptions contracts | 574,088 | 72,930 | — | |||||||||
Securities sold short | 34,850,929 | 6,278,270 | 404,501 | |||||||||
Written options contracts | 11,366,446 | 1,674,685 | (28,975 | ) | ||||||||
Futures contracts | 1,397,244 | 151,687 | — | |||||||||
Swap contracts | (8,438,989 | ) | 34,355 | (40,536 | ) | |||||||
Forward foreign currency contracts | 555,683 | 143,306 | 14,416 | |||||||||
Foreign currency | (397 | ) | (328 | ) | — | |||||||
Foreign currency translations | (28,782 | ) | (4,237 | ) | 1,548 | |||||||
|
|
|
|
|
| |||||||
NET ASSETS | $ | 2,875,992,910 | $ | 300,923,866 | $ | 232,455,873 | ||||||
|
|
|
|
|
| |||||||
| ||||||||||||
Notes to Financial Statements are an integral part of these Statements.
29
Table of Contents
For the year ended December 31, 2015
| Driehaus Active Income Fund | Driehaus Select Credit Fund | Driehaus Event Driven Fund | ||||||||||
INVESTMENT INCOME (LOSS): | ||||||||||||
Interest income (net of $16,945, $0 and $0 of non-reclaimable foreign taxes withheld, respectively) | $ | 138,336,060 | $ | 35,415,032 | $ | 1,333,138 | ||||||
Dividend income (net of $0, $0 and $9,572 of non-reclaimable foreign taxes withheld, respectively) | 28,192,752 | 3,186,881 | 3,846,349 | |||||||||
|
|
|
|
|
| |||||||
| ||||||||||||
Total investment income | 166,528,812 | 38,601,913 | 5,179,487 | |||||||||
|
|
|
|
|
| |||||||
| ||||||||||||
Expenses: | ||||||||||||
Investment advisory fees | 19,296,189 | 5,077,107 | 2,234,144 | |||||||||
Shareholder services plan fees | 5,231,979 | 1,255,289 | 387,633 | |||||||||
Administration and fund accounting fees | 1,177,100 | 403,694 | 156,395 | |||||||||
Transfer agent fees and expenses | 708,022 | 180,637 | 77,466 | |||||||||
Reports to shareholders | 223,741 | 70,143 | 82,178 | |||||||||
Trustees’ fees | 181,862 | 64,558 | 44,286 | |||||||||
Custody fees | 142,319 | 41,087 | 19,813 | |||||||||
Legal fees | 134,809 | 58,711 | 39,041 | |||||||||
Federal and state registration fees | 120,495 | 62,877 | 41,334 | |||||||||
Audit and tax fees | 62,170 | 62,175 | 62,175 | |||||||||
Chief compliance officer fees | 13,125 | 13,125 | 13,144 | |||||||||
Interest on short positions | 4,185,484 | 519,143 | 260,699 | |||||||||
Dividends on short positions | 3,746,637 | 771,636 | 442,390 | |||||||||
Interest expense | 1,496,880 | 221,277 | 261,824 | |||||||||
Miscellaneous | 216,775 | 100,007 | 40,670 | |||||||||
|
|
|
|
|
| |||||||
Total expenses | 36,937,587 | 8,901,466 | 4,163,192 | |||||||||
|
|
|
|
|
| |||||||
| ||||||||||||
Net investment income (loss) | 129,591,225 | 29,700,447 | 1,016,295 | |||||||||
|
|
|
|
|
| |||||||
| ||||||||||||
| NET REALIZED AND UNREALIZED GAIN (LOSS) ON INVESTMENTS: | ||||||||||||
Net realized gain (loss) on transactions from: | ||||||||||||
Investments | (3,315,488 | ) | (75,656,383 | ) | (17,661,138 | ) | ||||||
Purchased options contracts | (81,807,831 | ) | (21,373,140 | ) | (434,689 | ) | ||||||
Purchased swaptions contracts | (17,573,245 | ) | (5,925,905 | ) | (980,200 | ) | ||||||
Securities sold short | (686,473 | ) | (124,785 | ) | 1,884,631 | |||||||
Written options contracts | 73,058,564 | 27,023,904 | 906,675 | |||||||||
Futures contracts | (9,462,761 | ) | (5,702,439 | ) | (1,067,658 | ) | ||||||
Swap contracts | (14,539,198 | ) | (4,740,158 | ) | (876,515 | ) | ||||||
Forward foreign currency contracts | 3,283,553 | 9,663,370 | 322,004 | |||||||||
Foreign currency | 1,114,344 | 60,830 | 91,361 | |||||||||
|
|
|
|
|
| |||||||
| ||||||||||||
Total net realized gain (loss) on investments | (49,928,535 | ) | (76,774,706 | ) | (17,815,529 | ) | ||||||
|
|
|
|
|
| |||||||
| ||||||||||||
Change in net unrealized appreciation (depreciation) on: | ||||||||||||
Investments | (172,578,198 | ) | 17,319,004 | 13,093,630 | ||||||||
Purchased options contracts | (13,134,046 | ) | (5,546,753 | ) | (4,298,583 | ) | ||||||
Purchased swaptions contracts | 3,174,573 | 1,301,498 | 980,078 | |||||||||
Securities sold short | 53,868,799 | 5,583,086 | 1,578,774 | |||||||||
Written options contracts | 11,366,446 | 860,835 | (28,975 | ) | ||||||||
Futures contracts | 2,010,005 | 289,110 | 138,492 | |||||||||
Swap contracts | 10,294,889 | 1,395,993 | 154,811 | |||||||||
Forward foreign currency contracts | 378,995 | (4,943,878 | ) | 3,648 | ||||||||
Foreign currency | 8,911 | 2,426 | 2,461 | |||||||||
Foreign currency translations | (22,389 | ) | 25,349 | 2,478 | ||||||||
|
|
|
|
|
| |||||||
Total change in net unrealized appreciation (depreciation) on investments | (104,632,015 | ) | 16,286,670 | 11,626,814 | ||||||||
|
|
|
|
|
| |||||||
| ||||||||||||
Net realized and unrealized gain (loss) on investments | (154,560,550 | ) | (60,488,036 | ) | (6,188,715 | ) | ||||||
|
|
|
|
|
| |||||||
| ||||||||||||
NET INCREASE (DECREASE) IN NET ASSETS RESULTING FROM OPERATIONS | $ | (24,969,325 | ) | $ | (30,787,589 | ) | $ | (5,172,420 | ) | |||
|
|
|
|
|
| |||||||
| ||||||||||||
Notes to Financial Statements are an integral part of these Statements.
30
Table of Contents
(This page intentionally left blank)
31
Table of Contents
Statements of Changes in Net Assets
| Driehaus Active Income Fund | Driehaus Select Credit Fund | |||||||||||||||
| Year Ended December 31, 2015 | Year Ended December 31, 2014 | Year Ended December 31, | Year Ended December 31, 2014 | |||||||||||||
Operations: | ||||||||||||||||
Net investment income (loss) | $ | 129,591,225 | $ | 115,910,036 | $ | 29,700,447 | $ | 39,313,241 | ||||||||
Net realized gain (loss) on investments | (49,928,535 | ) | (42,513,474 | ) | (76,774,706 | ) | (43,801,091 | ) | ||||||||
Net change in unrealized appreciation (depreciation) on investments | (104,632,015 | ) | (112,582,385 | ) | 16,286,670 | (72,880,262 | ) | |||||||||
|
|
|
|
|
|
|
| |||||||||
| ||||||||||||||||
Net increase (decrease) in net assets resulting from operations | (24,969,325 | ) | (39,185,823 | ) | (30,787,589 | ) | (77,368,112 | ) | ||||||||
|
|
|
|
|
|
|
| |||||||||
| ||||||||||||||||
Distributions: | ||||||||||||||||
Net investment income | (121,665,387 | ) | (110,661,412 | ) | (28,789,661 | ) | (36,843,162 | ) | ||||||||
Net capital gains | — | — | — | (3,723,776 | ) | |||||||||||
|
|
|
|
|
|
|
| |||||||||
Total distributions | (121,665,387 | ) | (110,661,412 | ) | (28,789,661 | ) | (40,566,938 | ) | ||||||||
|
|
|
|
|
|
|
| |||||||||
| ||||||||||||||||
Capital share transactions: | ||||||||||||||||
Proceeds from shares sold | 969,148,795 | 1,645,298,003 | 211,986,482 | 684,999,625 | ||||||||||||
Reinvested distributions | 62,836,403 | 54,829,331 | 19,994,716 | 25,753,542 | ||||||||||||
Cost of shares redeemed | (1,992,144,093 | ) | (2,175,296,465 | ) | (671,187,778 | ) | (816,545,648 | ) | ||||||||
|
|
|
|
|
|
|
| |||||||||
Net increase (decrease) from capital transactions | (960,158,895 | ) | (475,169,131 | ) | (439,206,580 | ) | (105,792,481 | ) | ||||||||
|
|
|
|
|
|
|
| |||||||||
Total increase (decrease) in net assets | (1,106,793,607 | ) | (625,016,366 | ) | (498,783,830 | ) | (223,727,531 | ) | ||||||||
|
|
|
|
|
|
|
| |||||||||
| ||||||||||||||||
NET ASSETS: | ||||||||||||||||
| ||||||||||||||||
Beginning of period | $ | 3,982,786,517 | $ | 4,607,802,883 | $ | 799,707,696 | $ | 1,023,435,227 | ||||||||
|
|
|
|
|
|
|
| |||||||||
End of period | $ | 2,875,992,910 | $ | 3,982,786,517 | $ | 300,923,866 | $ | 799,707,696 | ||||||||
|
|
|
|
|
|
|
| |||||||||
Undistributed net investment income (loss) | $ | 27,682,736 | $ | 38,254,474 | $ | 1,254,922 | $ | (1,580,237 | ) | |||||||
|
|
|
|
|
|
|
| |||||||||
| ||||||||||||||||
Capital share transactions in shares: | ||||||||||||||||
Shares sold | 94,017,920 | 153,456,745 | 23,649,209 | 67,850,452 | ||||||||||||
Reinvested distributions | 6,120,243 | 5,163,250 | 2,231,124 | 2,690,795 | ||||||||||||
Shares redeemed | (193,457,904 | ) | (204,063,976 | ) | (76,243,162 | ) | (83,743,182 | ) | ||||||||
|
|
|
|
|
|
|
| |||||||||
Net increase (decrease) | (93,319,741 | ) | (45,443,981 | ) | (50,362,829 | ) | (13,201,935 | ) | ||||||||
|
|
|
|
|
|
|
| |||||||||
| ||||||||||||||||
Notes to Financial Statements are an integral part of these Statements.
32
Table of Contents
Statements of Changes in Net Assets
| Driehaus Event Driven Fund | ||||||
Year Ended December 31, | Year Ended December 31, 2014 | |||||
| $ | 1,016,295 | $ | (354,528 | ) | ||
| (17,815,529 | ) | (6,407,895 | ) | ||
| 11,626,814 |
| (15,218,540 | ) | ||
|
|
|
| |||
|
|
|
| |||
| (5,172,420 | ) | (21,980,963 | ) | ||
|
|
|
| |||
|
|
|
| |||
| (1,333,974 | ) | — | ||||
| — | (661,102 | ) | ||||
|
|
|
| |||
| (1,333,974 | ) | (661,102 | ) | |||
|
|
|
| |||
|
|
|
| |||
| 158,435,485 | 313,193,192 | |||||
| 1,116,574 | 612,519 | |||||
| (86,889,627 | ) | (166,896,936 | ) | |||
|
|
|
| |||
| 72,662,432 |
| 146,908,775 | |||
|
|
|
| |||
| 66,156,038 |
| 124,266,710 | |||
|
|
|
| |||
|
|
|
| |||
|
|
|
| |||
| $ | 166,299,835 | $ | 42,033,125 | |||
|
|
|
| |||
| $ | 232,455,873 | $ | 166,299,835 | |||
|
|
|
| |||
$ | 6,946 |
| $ | 19,689 | ||
|
|
|
| |||
|
|
|
| |||
| 15,452,822 | 28,570,565 | |||||
| 107,673 | 60,466 | |||||
| (8,576,682 | ) | (15,936,011 | ) | |||
|
|
|
| |||
| 6,983,813 | 12,695,020 | |||||
|
|
|
| |||
|
|
|
| |||
Notes to Financial Statements are an integral part of these Statements.
33
Table of Contents
Financial Highlights
| For the year ended December 31, 2015 | For the year ended December 31, 2014 | For the year ended December 31, 2013 | For the year ended December 31, 2012 | For the year ended December 31, 2011 | ||||||||||||||||
Net asset value, beginning of period | $ | 10.42 | $ | 10.77 | $ | 10.67 | $ | 10.01 | $ | 11.05 | ||||||||||
|
|
|
|
|
|
|
|
|
| |||||||||||
INCOME FROM INVESTMENT OPERATIONS: | ||||||||||||||||||||
Net investment income | 0.38 | 0.27 | 0.30 | 0.44 | 0.48 | |||||||||||||||
Net realized and unrealized gain (loss) on investments | (0.49 | ) | (0.36 | ) | 0.02 | 0.49 | (1.09 | ) | ||||||||||||
|
|
|
|
|
|
|
|
|
| |||||||||||
Total from investment operations | (0.11 | ) | (0.09 | ) | 0.32 | 0.93 | (0.61 | ) | ||||||||||||
|
|
|
|
|
|
|
|
|
| |||||||||||
LESS DISTRIBUTIONS TO SHAREHOLDERS FROM: | ||||||||||||||||||||
Net investment income | (0.36 | ) | (0.26 | ) | (0.22 | ) | (0.27 | ) | (0.43 | ) | ||||||||||
Net realized gains | — | — | — | — | — | † | ||||||||||||||
|
|
|
|
|
|
|
|
|
| |||||||||||
Total distributions | (0.36 | ) | (0.26 | ) | (0.22 | ) | (0.27 | ) | (0.43 | ) | ||||||||||
|
|
|
|
|
|
|
|
|
| |||||||||||
Net asset value, end of period | $ | 9.95 | $ | 10.42 | $ | 10.77 | $ | 10.67 | $ | 10.01 | ||||||||||
|
|
|
|
|
|
|
|
|
| |||||||||||
Total Return | (1.07 | )% | (0.87 | )% | 2.99 | % | 9.34 | % | (5.61 | )% | ||||||||||
SUPPLEMENTAL DATA AND RATIOS: | ||||||||||||||||||||
Net assets, end of period (in 000’s) | $ | 2,875,993 | $ | 3,982,787 | $ | 4,607,803 | $ | 2,867,021 | $ | 2,429,734 | ||||||||||
Ratio of total expenses to average net assets | 1.05 | %1 | 1.05 | %3 | 1.14 | %5 | 1.31 | %7 | 1.01 | %9 | ||||||||||
Ratio of net investment income to average net assets | 3.69 | %2 | 2.51 | %4 | 2.80 | %6 | 4.22 | %8 | 4.44 | %10 | ||||||||||
Portfolio turnover rate | 76 | % | 43 | % | 48 | % | 42 | % | 55 | % | ||||||||||
| ||||||||||||||||||||
| † | Represents less than $0.01 per share. |
| 1 | The ratio of expenses to average net assets includes dividends and interest on short positions and interest expense. Excluding dividends and interest on short positions and interest expense, the ratio of expenses to average net assets was 0.78%. |
| 2 | The ratio of net investment income to average net assets includes dividends and interest on short positions and interest expense. Excluding dividends and interest on short positions and interest expense, the net investment income to average net assets was 3.96%. |
| 3 | The ratio of expenses to average net assets includes dividends and interest on short positions and interest expense. Excluding dividends and interest on short positions and interest expense, the ratio of expenses to average net assets was 0.77%. |
| 4 | The ratio of net investment income to average net assets includes dividends and interest on short positions and interest expense. Excluding dividends and interest on short positions and interest expense, the net investment income to average net assets was 2.79%. |
| 5 | The ratio of expenses to average net assets includes dividends and interest on short positions and interest expense. Excluding dividends and interest on short positions and interest expense, the ratio of expenses to average net assets was 0.79%. |
| 6 | The ratio of net investment income to average net assets includes dividends and interest on short positions and interest expense. Excluding dividends and interest on short positions and interest expense, the net investment income to average net assets was 3.15%. |
| 7 | The ratio of expenses to average net assets includes dividends and interest on short positions and interest expense. Excluding dividends and interest on short positions and interest expense, the ratio of expenses to average net assets was 0.91%. |
| 8 | The ratio of net investment income to average net assets includes dividends and interest on short positions and interest expense. Excluding dividends and interest on short positions and interest expense, the net investment income to average net assets was 4.63%. |
| 9 | The ratio of expenses to average net assets includes dividends and interest on short positions and interest expense. Excluding dividends and interest on short positions and interest expense, the ratio of expenses to average net assets was 0.88%. |
| 10 | The ratio of net investment income to average net assets includes dividends and interest on short positions and interest expense. Excluding dividends and interest on short positions and interest expense, the net investment income to average net assets was 4.58%. |
Notes to Financial Statements are an integral part of this Schedule.
34
Table of Contents
Driehaus Select Credit Fund
Financial Highlights
| For the year ended December 31, 2015 | For the year ended December 31, 2014 | For the year ended December 31, 2013 | For the year ended December 31, 2012 | For the year ended December 31, 2011 | ||||||||||||||||
Net asset value, beginning of period | $ | 9.15 | $ | 10.17 | $ | 9.87 | $ | 9.57 | $ | 10.26 | ||||||||||
|
|
|
|
|
|
|
|
|
| |||||||||||
INCOME FROM INVESTMENT OPERATIONS: | ||||||||||||||||||||
Net investment income | 0.42 | 0.32 | 0.32 | 0.58 | 0.57 | |||||||||||||||
Net realized and unrealized gain (loss) on investments | (1.04 | ) | (0.98 | ) | 0.33 | 0.21 | (0.84 | ) | ||||||||||||
|
|
|
|
|
|
|
|
|
| |||||||||||
Total from investment operations | (0.62 | ) | (0.66 | ) | 0.65 | 0.79 | (0.27 | ) | ||||||||||||
|
|
|
|
|
|
|
|
|
| |||||||||||
LESS DISTRIBUTIONS TO SHAREHOLDERS FROM: | ||||||||||||||||||||
Net investment income | (0.41 | ) | (0.32 | ) | (0.31 | ) | (0.49 | ) | (0.42 | ) | ||||||||||
Net realized gain | — | (0.04 | ) | (0.04 | ) | — | — | |||||||||||||
|
|
|
|
|
|
|
|
|
| |||||||||||
Total distributions | (0.41 | ) | (0.36 | ) | (0.35 | ) | (0.49 | ) | (0.42 | ) | ||||||||||
|
|
|
|
|
|
|
|
|
| |||||||||||
Net asset value, end of period | $ | 8.12 | $ | 9.15 | $ | 10.17 | $ | 9.87 | $ | 9.57 | ||||||||||
|
|
|
|
|
|
|
|
|
| |||||||||||
Total Return | (7.13 | )% | (6.56 | )% | 6.62 | % | 8.37 | % | (2.64 | )% | ||||||||||
SUPPLEMENTAL DATA AND RATIOS: | ||||||||||||||||||||
Net assets, end of period (in 000’s) | $ | 300,924 | $ | 799,708 | $ | 1,023,435 | $ | 325,123 | $ | 184,111 | ||||||||||
Ratio of total expenses to average net assets including waivers and recapture | 1.40 | %1 | 1.32 | %3 | 1.81 | %5 | 1.69 | %7 | 1.87 | %9 | ||||||||||
Ratio of total expenses to average net assets before waivers and recapture | 1.40 | %1 | 1.32 | %3 | 1.81 | %5 | 1.69 | %7 | 1.81 | %9 | ||||||||||
Ratio of net investment income to average net assets, including waivers and recapture | 4.68 | %2 | 3.24 | %4 | 3.17 | %6 | 5.82 | %8 | 5.75 | %10 | ||||||||||
Ratio of net investment income to average net assets, before waivers and recapture | 4.68 | %2 | 3.24 | %4 | 3.17 | %6 | 5.82 | %8 | 5.81 | %10 | ||||||||||
Portfolio turnover rate | 77 | % | 79 | % | 54 | % | 78 | % | 64 | % | ||||||||||
| ||||||||||||||||||||
| 1 | The ratio of expenses to average net assets includes dividends and interest on short positions and interest expense. Excluding dividends and interest on short positions and interest expense, the ratio of expenses to average net assets was 1.16%. |
| 2 | The ratio of net investment income to average net assets includes dividends and interest on short positions and interest expense. Excluding dividends and interest on short positions and interest expense, the ratio of net investment income to average net assets was 4.92%. |
| 3 | The ratio of expenses to average net assets includes dividends and interest on short positions and interest expense. Excluding dividends and interest on short positions and interest expense, the ratio of expenses to average net assets was 1.12%. |
| 4 | The ratio of net investment income to average net assets includes dividends and interest on short positions and interest expense. Excluding dividends and interest on short positions and interest expense, the ratio of net investment income to average net assets was 3.43%. |
| 5 | The ratio of expenses to average net assets includes dividends and interest on short positions and interest expense. Excluding dividends and interest on short positions and interest expense, the ratio of expenses to average net assets was 1.13%. |
| 6 | The ratio of net investment income to average net assets includes dividends and interest on short positions and interest expense. Excluding dividends and interest on short positions and interest expense, the ratio of net investment income to average net assets was 3.85%. |
| 7 | The ratio of expenses to average net assets includes dividends and interest on short positions and interest expense. Excluding dividends and interest on short positions and interest expense, the ratio of expenses to average net assets was 1.23%. |
| 8 | The ratio of net investment income to average net assets includes dividends and interest on short positions and interest expense. Excluding dividends and interest on short positions and interest expense, the ratio of net investment income to average net assets was 6.28%. |
| 9 | The ratio of expenses to average net assets includes dividends and interest on short positions and interest expense. Excluding dividends and interest on short positions and interest expense, the ratio of expenses to average net assets, including recapture, was 1.43%. Excluding dividends and interest on short positions and interest expense, the ratio of expenses to average net assets before recapture was 1.37%. |
| 10 | The ratio of net investment income to average net assets includes dividends and interest on short positions and interest expense. Excluding dividends and interest on short positions and interest expense, the ratio of net investment income to average net assets, including recapture, was 6.20%. Excluding dividends and interest on short positions and interest expense, the ratio of net investment income to average net assets before recapture was 6.26%. |
Notes to Financial Statements are an integral part of this Schedule.
35
Table of Contents
Driehaus Event Driven Fund
Financial Highlights
| For the year ended December 31, 2015 | For the year ended December 31, 2014 | For the period August 26, 2013* through December 31, 2013 | ||||||||||
Net asset value, beginning of period | $ | 10.01 | $ | 10.74 | $ | 10.00 | ||||||
|
|
|
|
|
| |||||||
INCOME FROM INVESTMENT OPERATIONS: | ||||||||||||
Net investment income (loss) | 0.05 | (0.02 | ) | (0.06 | ) | |||||||
Net realized and unrealized gain (loss) on investments | (0.15 | ) | (0.67 | ) | 1.09 | |||||||
|
|
|
|
|
| |||||||
Total from investment operations | (0.10 | ) | (0.69 | ) | 1.03 | |||||||
|
|
|
|
|
| |||||||
LESS DISTRIBUTIONS TO SHAREHOLDERS FROM: | ||||||||||||
Net investment income | (0.06 | ) | — | — | ||||||||
Net realized gains | — | (0.04 | ) | (0.29 | ) | |||||||
|
|
|
|
|
| |||||||
Net asset value, end of period | $ | 9.85 | $ | 10.01 | $ | 10.74 | ||||||
|
|
|
|
|
| |||||||
Total Return | (1.08 | )% | (6.35 | )% | 10.35 | %1 | ||||||
SUPPLEMENTAL DATA AND RATIOS: | ||||||||||||
Net assets, end of period (in 000’s) | $ | 232,456 | $ | 166,300 | $ | 42,033 | ||||||
Ratio of total expenses to average net assets including waivers and recapture | 1.86 | %3 | 1.80 | %5 | 3.00 | %2,7 | ||||||
Ratio of total expenses to average net assets before waivers and recapture | 1.86 | %3 | 1.80 | %5 | 3.03 | %2,7 | ||||||
Ratio of net investment income (loss) to average net assets, including waivers and recapture | 0.45 | %4 | (0.17 | )%6 | (1.75 | )%2,8 | ||||||
Ratio of net investment income (loss) to average net assets, before waivers and recapture | 0.45 | %4 | (0.17 | )%6 | (1.78 | )%2,8 | ||||||
Portfolio turnover rate | 400 | % | 315 | % | 104 | %1 | ||||||
| ||||||||||||
| * | Fund commenced operations on August 26, 2013. |
| 1 | Not annualized. |
| 2 | Annualized. |
| 3 | The ratio of expenses to average net assets includes dividends and interest on short positions and interest expense. Excluding dividends and interest on short positions and interest expense, the ratio of expenses to average net assets was 1.43%. |
| 4 | The ratio of net investment income to average net assets includes dividends and interest on short positions and interest expense. Excluding dividends and interest on short positions and interest expense, the ratio of net investment income to average net assets was 0.89%. |
| 5 | The ratio of expenses to average net assets includes dividends and interest on short positions and interest expense. Excluding dividends and interest on short positions and interest expense, the ratio of expenses to average net assets, including recapture, was 1.35%. Excluding dividends and interest on short positions and interest expense, the ratio of expenses to average net assets before recapture was 1.35%. |
| 6 | The ratio of net investment income to average net assets includes dividends and interest on short positions and interest expense. Excluding dividends and interest on short positions and interest expense, the ratio of net investment income (loss) to average net assets, including recapture, was 0.28%. Excluding dividends and interest on short positions and interest expense, the ratio of net investment income (loss) to average net assets before recapture was 0.28%. |
| 7 | The ratio of expenses to average net assets includes dividends and interest on short positions. Excluding dividends and interest on short positions the ratio of expenses to average net assets, less waivers, was 2.00%. Excluding dividends and interest on short positions, the ratio of expenses to average net assets before waivers was 2.03%. |
| 8 | The ratio of net investment income to average net assets includes dividends and interest on short positions. Excluding dividends and interest on short positions, the ratio of net investment income (loss) to average net assets, less waivers, was (0.75)%. Excluding dividends and interest on short positions, the ratio of net investment income (loss) to average net assets before waivers was (0.78)%. |
Notes to Financial Statements are an integral part of this Schedule.
36
Table of Contents
Notes to Financial Statements
A. ORGANIZATION AND SUMMARY OF SIGNIFICANT ACCOUNTING POLICIES
Organization
The Driehaus Mutual Funds (the “Trust”) is an open-end registered management investment company under the Investment Company Act of 1940, as amended, organized as a Delaware statutory trust, with eight separate series currently in operation. The Trust was organized under an Agreement and Declaration of Trust dated May 31, 1996, as subsequently amended and restated as of June 6, 2013 and amended as of June 4, 2015, and may issue an unlimited number of full and fractional units of beneficial interest (shares) without par value. The Driehaus Active Income Fund (the “Active Income Fund”) commenced operations on June 1, 2009 following the receipt of the assets and liabilities of the Lotsoff Capital Management Active Income Fund (the “Acquired Fund”) pursuant to a plan of reorganization approved by the shareholders of the Acquired Fund. The reorganization was accomplished by a tax-free exchange of Acquired Fund shares for an equal number of shares of the Active Income Fund as of June 1, 2009. The Active Income Fund seeks to provide current income and capital appreciation. The Active Income Fund was closed to new investors as of March 1, 2011. The Driehaus Select Credit Fund (the “Select Credit Fund”) commenced operations on September 30, 2010. The Select Credit Fund seeks to provide positive returns under a variety of market conditions. The Select Credit Fund was closed to new investors as of January 31, 2014. The Driehaus Event Driven Fund (the “Event Driven Fund” and together with the Active Income Fund and Select Credit Fund, the “Funds”) commenced operations on August 26, 2013, following the receipt of the assets and liabilities of the Driehaus Credit Opportunities Fund, L.P. The Event Driven Fund seeks to provide positive returns over full market cycles.
Significant Accounting Policies
The presentation of financial statements in conformity with U.S. generally accepted accounting principles (“U.S. GAAP”) requires management to make estimates and assumptions that affect the reported amounts of assets and liabilities at the date of the financial statements and the reported amounts of income and expenses. Actual results may differ from those estimates.
The Funds, which are investment companies within the scope of Financial Accounting Standards Board (“FASB”) Accounting Standards Update 2013-08, follow accounting and reporting guidance under FASB Accounting Standards Codification Topic 946, Financial Services-Investment Companies.
Securities Valuation
Investments in securities traded on a national securities exchange, including exchange-traded futures and options, are valued at the last reported sales or settlement price on the day of valuation and are generally classified as level 1. Securities traded on the Nasdaq markets are valued at the Nasdaq Official Closing Price (“NOCP”) and are generally classified as level 1. Exchange-traded securities for which no sale was reported and Nasdaq-traded securities for which there is no NOCP are valued at the mean of the closing bid and ask prices from the exchange the security is primarily traded on and are generally classified as level 1. Long-term fixed income securities are valued at the representative quoted bid price when held long or the representative quoted ask price if sold short or, if such prices are not available, at prices for securities of comparable maturity, quality and type or as determined by an independent pricing service. The pricing service provider may employ methodologies that utilize actual market transactions, broker-dealer supplied valuations or other techniques. Such techniques generally consider factors such as composite security prices, yields, maturities, call features, credit ratings and developments relating to specific securities, in arriving at valuations. Fixed income securities are generally classified as level 2. Short-term investments with remaining maturities of 60 days or less at the time of purchase are stated at amortized cost, which approximates fair value. If amortized cost does not approximate fair value, short-term securities are reported at fair value. These securities are generally classified as level 2. Swaps, forward foreign currency contracts and other financial derivatives are valued daily, primarily by an independent pricing service using pricing models and are generally classified as level 2. The pricing models use inputs that are observed from actively quoted markets such as issuer details, indices, spreads, interest rates, yield curves, dividends and exchange rates. If valuations are not available from the independent pricing service or values received are deemed not representative of market value, values will be obtained from a third party broker-dealer or counterparty. Investments initially valued in currencies other than the U.S. dollar are converted to the U.S. dollar using exchange rates obtained from an independent pricing service. Securities for which market quotations are not readily available are valued at their fair value as determined in good faith in accordance with procedures established by or under the direction of the Trust’s Board of Trustees and are generally classified as level 3. Under these procedures,
37
Table of Contents
Driehaus Mutual Funds
Notes to Financial Statements — (Continued)
the Funds primarily employ a market-based approach, which may use related or comparable assets or liabilities, recent transactions, market multiples, book values and other relevant information for the investment to determine the fair value of the investment. It is possible that the estimated values may differ significantly from the values that would have been used had a ready market existed for the investments, and such differences could be material.
Each Fund is subject to fair value accounting standards that define fair value, establish the framework for measuring fair value and provide a three-level hierarchy for fair valuation based upon the inputs to the valuation as of the measurement date. The three levels of the fair value hierarchy are as follows:
Level 1 — quoted prices for active markets for identical securities
Level 2 — significant observable inputs (including quoted prices for similar securities, interest rates, prepayment speeds, credit risk, etc.)
Level 3 — significant unobservable inputs (including the Fund’s own assumptions in determining the fair value of investments).
The Funds adopted the FASB amendments to authoritative guidance which require the Funds to disclose details of transfers in and out of Level 1 and Level 2 measurements and Level 2 and Level 3 measurements and the reasons for the transfers. During the period ended December 31, 2015, there were no transfers between levels for the Active Income Fund, Select Credit Fund and Event Driven Fund. It is the Funds’ policy to recognize transfers into and out of all levels at the end of the reporting period.
The inputs or methodology used for valuing securities are not necessarily an indication of the risk associated with investing in those securities. The following is a summary of the inputs used to value the Active Income Fund’s investments as of December 31, 2015:
Assets | Level 1 | Level 2 | Level 3 | Total | ||||||||||||
Asset-Backed Securities | $ | — | $ | 32,580,003 | $ | — | $ | 32,580,003 | ||||||||
Bank Loans | — | 695,999,367 | — | 695,999,367 | ||||||||||||
Common Stocks | ||||||||||||||||
Auto Manufacturers | 29,818,914 | — | — | 29,818,914 | ||||||||||||
Commercial Services | 91,600,972 | — | — | 91,600,972 | ||||||||||||
Computers | 78,298,320 | — | — | 78,298,320 | ||||||||||||
Electric | 13,159,217 | — | — | 13,159,217 | ||||||||||||
Gas | 18,696,330 | — | — | 18,696,330 | ||||||||||||
Healthcare — Services | 75,872,865 | — | — | 75,872,865 | ||||||||||||
Insurance | 27,684,900 | — | — | 27,684,900 | ||||||||||||
Internet | 32,908,690 | — | — | 32,908,690 | ||||||||||||
Media | 88,218,259 | — | — | 88,218,259 | ||||||||||||
Metal Fabricate/Hardware | 80,971,490 | — | — | 80,971,490 | ||||||||||||
Oil & Gas Services | 12,091,300 | — | — | 12,091,300 | ||||||||||||
Packaging & Containers | 6,931,169 | — | — | 6,931,169 | ||||||||||||
Real Estate Investment Trusts | 40,296,690 | — | — | 40,296,690 | ||||||||||||
Retail | 35,076,744 | — | — | 35,076,744 | ||||||||||||
Semiconductors | 22,538,750 | — | — | 22,538,750 | ||||||||||||
Software | 33,594,828 | — | — | 33,594,828 | ||||||||||||
Convertible Corporate Bonds | — | 62,371,885 | — | 62,371,885 | ||||||||||||
38
Table of Contents
Driehaus Mutual Funds
Notes to Financial Statements — (Continued)
Assets (continued) | Level 1 | Level 2 | Level 3 | Total | ||||||||||||
Convertible Preferred Stocks | ||||||||||||||||
Auto Manufacturers | $ | — | $ | 5,902,750 | $ | 0 | $ | 5,902,750 | ||||||||
Pharmaceuticals | — | 23,907,922 | — | 23,907,922 | ||||||||||||
Telecommunications | 22,895,000 | — | — | 22,895,000 | ||||||||||||
Corporate Bonds | — | 1,025,300,864 | 0 | 1,025,300,864 | ||||||||||||
Preferred Stocks | ||||||||||||||||
Banks | 36,227,039 | — | — | 36,227,039 | ||||||||||||
Telecommunications | — | 43,626,308 | — | 43,626,308 | ||||||||||||
Purchased Put Options | 1,695,750 | 1,535,500 | — | 3,231,250 | ||||||||||||
U.S. Government and Agency Securities | — | 19,425,199 | — | 19,425,199 | ||||||||||||
Warrants | 24 | — | — | 24 | ||||||||||||
|
|
|
|
|
|
|
| |||||||||
Total | $ | 748,577,251 | $ | 1,910,649,798 | $ | 0 | $ | 2,659,227,049 | ||||||||
|
|
|
|
|
|
|
| |||||||||
Liabilities | ||||||||||||||||
Common Stocks | ||||||||||||||||
Healthcare-Services | $ | (36,928,604 | ) | $ | — | $ | — | $ | (36,928,604 | ) | ||||||
Media | (31,593,173 | ) | — | — | (31,593,173 | ) | ||||||||||
Oil & Gas Services | (9,988,698 | ) | — | — | (9,988,698 | ) | ||||||||||
Packaging & Containers | (5,659,111 | ) | — | — | (5,659,111 | ) | ||||||||||
Pharmaceuticals | (17,450,394 | ) | — | — | (17,450,394 | ) | ||||||||||
Retail | (11,226,736 | ) | — | — | (11,226,736 | ) | ||||||||||
Semiconductors | (27,053,910 | ) | — | — | (27,053,910 | ) | ||||||||||
Software | (4,407,331 | ) | — | — | (4,407,331 | ) | ||||||||||
Telecommunications | (17,212,934 | ) | — | — | (17,212,934 | ) | ||||||||||
Corporate Bonds | — | (75,187,100 | ) | — | (75,187,100 | ) | ||||||||||
U.S. Government and Agency Securities | — | (39,208,103 | ) | — | (39,208,103 | ) | ||||||||||
Written Call Options | — | (90,404 | ) | — | (90,404 | ) | ||||||||||
Written Put Options | (1,020,000 | ) | (41,500 | ) | — | (1,061,500 | ) | |||||||||
|
|
|
|
|
|
|
| |||||||||
Total | $ | (162,540,891 | ) | $ | (114,527,107 | ) | $ | — | $ | (277,067,998 | ) | |||||
|
|
|
|
|
|
|
| |||||||||
Other Financial Instruments* | ||||||||||||||||
Credit Default Swaps — Assets | $ | — | $ | 17,496,487 | $ | — | $ | 17,496,487 | ||||||||
Credit Default Swaps — Liabilities | — | (23,975,581 | ) | — | (23,975,581 | ) | ||||||||||
Forward Foreign Currency Contracts — Assets | — | 1,346,526 | — | 1,346,526 | ||||||||||||
Forward Foreign Currency Contracts — Liabilities | — | (790,843 | ) | — | (790,843 | ) | ||||||||||
Futures Contracts | 1,397,244 | — | — | 1,397,244 | ||||||||||||
Interest Rate Swaptions | — | 2,673,633 | — | 2,673,633 | ||||||||||||
|
|
|
|
|
|
|
| |||||||||
Total Other Financial Instruments | $ | 1,397,244 | $ | (3,249,778 | ) | $ | — | $ | (1,852,534 | ) | ||||||
|
|
|
|
|
|
|
| |||||||||
| * | Other financial instruments are swap, forward foreign currency and futures contracts and interest rate swaptions, which are detailed in the Schedule of Investments. |
39
Table of Contents
Driehaus Mutual Funds
Notes to Financial Statements — (Continued)
The following is a reconciliation of Level 3 assets for which significant unobservable inputs were used to determine fair value in the Active Income Fund:
| Investments, at Value | ||||
Balance as of December 31, 2014 | $ | 0 | ||
Realized gain (loss) | — | |||
Change in net unrealized appreciation (depreciation) | — | |||
Purchase | — | |||
Sales | — | |||
Transfers in and/or out of Level 3 | — | |||
|
| |||
Balance as of December 31, 2015 | $ | 0 | ||
|
| |||
As of December 31, 2015, the Active Income Fund held Level 3 investments in General Motors Corp. senior convertible preferred stock, valued at fair value as determined in good faith in accordance with procedures established by or under the direction of the Trust’s Board of Trustees. As a part of the ongoing restructuring of General Motors, any value previously ascribed to these holdings has been transferred to the General Motors Co. Motors Liquidation Co. GUC Trust common stock, which is freely and actively traded, and therefore the senior convertible preferred stock was fair valued at $0.
As of December 31, 2015, the Active Income Fund held Level 3 investments in Momentive Performance Materials, Inc. corporate bonds, valued at fair value as determined in good faith in accordance with procedures established by or under the direction of the Trust’s Board of Trustees. Momentive filed for Chapter 11 bankruptcy and emerged in 2014. As a part of the ongoing restructuring of the company, the bankruptcy court assigned a zero recovery to these holdings, therefore the corporate bond was fair valued at $0.
The following is a summary of the inputs used to value the Select Credit Fund’s investments as of December 31, 2015:
Assets | Level 1 | Level 2 | Level 3 | Total | ||||||||||||
Bank Loans | $ | — | $ | 51,100,643 | $ | — | $ | 51,100,643 | ||||||||
Common Stocks | ||||||||||||||||
Airlines | 737,997 | — | — | 737,997 | ||||||||||||
Auto Manufacturers | 3,174,626 | — | — | 3,174,626 | ||||||||||||
Commercial Services | 9,249,120 | — | — | 9,249,120 | ||||||||||||
Computers | 5,700,960 | — | — | 5,700,960 | ||||||||||||
Diversified Financial Services | 2,307,765 | — | — | 2,307,765 | ||||||||||||
Electric | 3,132,600 | — | — | 3,132,600 | ||||||||||||
Entertainment | 2,800,800 | — | — | 2,800,800 | ||||||||||||
Gas | 4,977,180 | — | — | 4,977,180 | ||||||||||||
Healthcare — Services | 8,182,635 | — | — | 8,182,635 | ||||||||||||
Household Products/Wares | 1,313,760 | — | — | 1,313,760 | ||||||||||||
Internet | 3,336,990 | — | — | 3,336,990 | ||||||||||||
Media | 7,467,569 | — | — | 7,467,569 | ||||||||||||
Metal Fabricate/Hardware | 4,709,803 | — | — | 4,709,803 | ||||||||||||
Oil & Gas Services | 1,753,700 | — | — | 1,753,700 | ||||||||||||
Restaurants | 6,637,186 | — | — | 6,637,186 | ||||||||||||
Retail | 5,660,184 | — | — | 5,660,184 | ||||||||||||
Semiconductors | 2,774,000 | — | — | 2,774,000 | ||||||||||||
Software | 3,710,700 | — | — | 3,710,700 | ||||||||||||
40
Table of Contents
Driehaus Mutual Funds
Notes to Financial Statements — (Continued)
Assets (continued) | Level 1 | Level 2 | Level 3 | Total | ||||||||||||
Convertible Corporate Bonds | $ | — | $ | 39,600 | $ | — | $ | 39,600 | ||||||||
Convertible Preferred Stocks | ||||||||||||||||
Auto Manufacturers | — | — | 0 | 0 | ||||||||||||
Corporate Bonds | — | 105,959,436 | 0 | 105,959,436 | ||||||||||||
Purchased Put Options | 738,750 | 37,000 | — | 775,750 | ||||||||||||
U.S. Government and Agency Securities | — | 3,332,239 | — | 3,332,239 | ||||||||||||
|
|
|
|
|
|
|
| |||||||||
Total | $ | 78,366,325 | $ | 160,468,918 | $ | 0 | $ | 238,835,243 | ||||||||
|
|
|
|
|
|
|
| |||||||||
Liabilities | ||||||||||||||||
Common Stocks | ||||||||||||||||
Healthcare — Services | $ | (4,414,631 | ) | $ | — | $ | — | $ | (4,414,631 | ) | ||||||
Media | (2,674,176 | ) | — | — | (2,674,176 | ) | ||||||||||
Oil & Gas Services | (1,448,742 | ) | — | — | (1,448,742 | ) | ||||||||||
Retail | (1,776,600 | ) | — | — | (1,776,600 | ) | ||||||||||
Semiconductors | (1,588,400 | ) | — | — | (1,588,400 | ) | ||||||||||
Corporate Bonds | — | (15,878,622 | ) | — | (15,878,622 | ) | ||||||||||
U.S. Government and Agency Securities | — | (2,093,683 | ) | — | (2,093,683 | ) | ||||||||||
Written Put Options | (180,000 | ) | (11,500 | ) | — | (191,500 | ) | |||||||||
|
|
|
|
|
|
|
| |||||||||
Total | $ | (12,082,549 | ) | $ | (17,983,805 | ) | $ | — | $ | (30,066,354 | ) | |||||
|
|
|
|
|
|
|
| |||||||||
Other Financial Instruments* | ||||||||||||||||
Credit Default Swaps — Assets | $ | — | $ | 3,616,222 | $ | — | $ | 3,616,222 | ||||||||
Credit Default Swaps — Liabilities | — | (1,616,755 | ) | — | (1,616,755 | ) | ||||||||||
Forward Foreign Currency Contracts — Asset | — | 333,068 | — | 333,068 | ||||||||||||
Forward Foreign Currency Contracts — Liability | — | (189,762 | ) | — | (189,762 | ) | ||||||||||
Futures Contracts | 151,687 | — | — | 151,687 | ||||||||||||
Interest Rate Swaptions | — | 316,230 | — | 316,230 | ||||||||||||
|
|
|
|
|
|
|
| |||||||||
Total Other Financial Instruments | $ | 151,687 | $ | 2,459,003 | $ | — | $ | 2,610,690 | ||||||||
|
|
|
|
|
|
|
| |||||||||
| * | Other financial instruments are swap, forward foreign currency, futures contracts and interest rate swaptions, which are detailed in the Schedule of Investments. |
The following is a reconciliation of Level 3 assets for which significant unobservable inputs were used to determine fair value in the Select Credit Fund:
| Investments, at Value | ||||
Balance as of December 31, 2014 | $ | 0 | ||
Realized gain (loss) | — | |||
Change in net unrealized appreciation (depreciation) | — | |||
Purchase | — | |||
Sales | — | |||
Transfers in and/or out of Level 3 | — | |||
|
| |||
Balance as of December 31, 2015 | $ | 0 | ||
|
| |||
As of December 31, 2015, the Select Credit Fund held Level 3 investments in General Motors Corp. senior convertible preferred stock and Momentive Performance Materials, Inc. corporate bonds, which were valued in the same manner as described above for the Active Income Fund.
41
Table of Contents
Driehaus Mutual Funds
Notes to Financial Statements — (Continued)
The following is a summary of the inputs used to value the Event Driven Fund’s investments as of December 31, 2015:
Assets | Level 1 | Level 2 | Level 3 | Total | ||||||||||||
Common Stocks | ||||||||||||||||
Biotechnology | $ | 7,385,101 | $ | — | $ | — | $ | 7,385,101 | ||||||||
Commercial Services | 14,515,980 | — | — | 14,515,980 | ||||||||||||
Computers | 11,376,240 | — | — | 11,376,240 | ||||||||||||
Electric | 4,855,530 | — | — | 4,855,530 | ||||||||||||
Entertainment | 12,918,182 | — | — | 12,918,182 | ||||||||||||
Food | 18,590,200 | — | — | 18,590,200 | ||||||||||||
Healthcare — Products | 387,402 | — | — | 387,402 | ||||||||||||
Healthcare — Services | 4,819,770 | — | — | 4,819,770 | ||||||||||||
Household Products/Wares | 8,625,120 | — | — | 8,625,120 | ||||||||||||
Insurance | 3,448,470 | — | — | 3,448,470 | ||||||||||||
Internet | 1,342,740 | — | — | 1,342,740 | ||||||||||||
Lodging | 9,214,240 | — | — | 9,214,240 | ||||||||||||
Media | 44,304,161 | — | — | 44,304,161 | ||||||||||||
Pharmaceuticals | 23,082,213 | — | — | 23,082,213 | ||||||||||||
Restaurants | 5,307,072 | — | — | 5,307,072 | ||||||||||||
Retail | 4,610,861 | — | — | 4,610,861 | ||||||||||||
Semiconductors | 3,814,250 | — | — | 3,814,250 | ||||||||||||
Software | 4,181,900 | — | — | 4,181,900 | ||||||||||||
Convertible Preferred Stocks | ||||||||||||||||
Auto Manufacturers | — | 1,180,550 | 0 | 1,180,550 | ||||||||||||
Pharmaceuticals | 10,173,584 | — | — | 10,173,584 | ||||||||||||
Corporate Bonds | — | 7,170,000 | — | 7,170,000 | ||||||||||||
Purchased Call Options | 1,817,180 | 43,375 | — | 1,860,555 | ||||||||||||
Purchased Put Options | 2,100 | 20,805 | — | 22,905 | ||||||||||||
|
|
|
|
|
|
|
| |||||||||
Total | $ | 194,772,296 | $ | 8,414,730 | $ | 0 | $ | 203,187,026 | ||||||||
|
|
|
|
|
|
|
| |||||||||
Liabilities | ||||||||||||||||
Common Stocks | ||||||||||||||||
Auto Manufacturers | $ | (979,300 | ) | $ | — | $ | — | $ | (979,300 | ) | ||||||
Healthcare — Services | (2,444,810 | ) | — | — | (2,444,810 | ) | ||||||||||
Media | (8,220,091 | ) | (8,220,091 | ) | ||||||||||||
Pharmaceuticals | (3,610,200 | ) | — | — | (3,610,200 | ) | ||||||||||
Semiconductors | (2,184,050 | ) | — | — | (2,184,050 | ) | ||||||||||
U.S. Government & Agency Securities | — | (6,388,511 | ) | — | (6,388,511 | ) | ||||||||||
Written Call Options | (246,500 | ) | — | — | (246,500 | ) | ||||||||||
Exchange-Traded Fund | (7,724,970 | ) | — | — | (7,724,970 | ) | ||||||||||
|
|
|
|
|
|
|
| |||||||||
Total | $ | (25,409,921 | ) | $ | (6,388,511 | ) | $ | — | $ | (31,798,432 | ) | |||||
|
|
|
|
|
|
|
| |||||||||
42
Table of Contents
Driehaus Mutual Funds
Notes to Financial Statements — (Continued)
Other Financial Instruments* | Level 1 | Level 2 | Level 3 | Total | ||||||||||||
Total Return Swap — Liabilities | $ | — | $ | (40,536 | ) | $ | — | $ | (40,536 | ) | ||||||
Forward Foreign Currency Contracts — Asset | — | 14,416 | — | 14,416 | ||||||||||||
|
|
|
|
|
|
|
| |||||||||
Total Other Financial Instruments | $ | — | $ | (26,120 | ) | $ | — | $ | (26,120 | ) | ||||||
|
|
|
|
|
|
|
| |||||||||
| * | Other financial instruments are swap and forward foreign currency contracts, which are detailed in the Schedule of Investments. |
The following is a reconciliation of Level 3 assets for which significant unobservable inputs were used to determine fair value in the Event Driven Fund:
| Investments, at Value | ||||
Balance as of December 31, 2014 | $ | 0 | ||
Realized gain (loss) | — | |||
Change in net unrealized appreciation (depreciation) | — | |||
Purchase | — | |||
Sales | — | |||
Transfers in and/or out of Level 3 | — | |||
|
| |||
Balance as of December 31, 2015 | $ | 0 | ||
|
| |||
As of December 31, 2015, the Event Driven Fund held Level 3 investments in General Motors Corp. senior convertible preferred stock, which were valued in the same manner as described above for the Active Income Fund.
Securities Sold Short
The Funds are engaged in selling securities short, which obligates them to replace a borrowed security with the same security at current market value. Each Fund incurs a loss if the price of the security increases between the date of the short sale and the date on which the Fund replaces the borrowed security. Each Fund realizes a gain if the price of the security declines between those dates. Gains are limited to the price at which the Fund sold the security short, while losses are potentially unlimited in size.
The Funds are required to establish a margin account with the broker lending the security sold short. While the short sale is outstanding, the broker retains the proceeds of the short sale and the Fund must maintain a deposit with the broker consisting of cash and securities having a value equal to a specified percentage of the value of the securities sold short. Such deposit is included in “Collateral held at custodian for the benefit of brokers” on the Statements of Assets and Liabilities. Each Fund is obligated to pay any dividends or interest due on securities sold short. Such dividends and interest are recorded as an expense to the Funds on the Statements of Operations.
Federal Income Taxes
The Funds’ policy is to comply with the requirements of Subchapter M of the Internal Revenue Code that are applicable to regulated investment companies and to distribute substantially all their taxable income to their shareholders. Therefore, no Federal income tax provision is required.
The FASB’s “Accounting for Uncertainty in Income Taxes” (“Tax Statement”) requires the evaluation of tax positions taken or expected to be taken in the course of preparing the Funds’ tax returns to determine whether the tax positions are “more-likely-than-not” of being sustained by the applicable tax authority. Tax positions not deemed to meet the more-likely-than-not threshold would be recorded as a tax benefit or expense in the current year. Management has evaluated the implications of the Tax Statement and all of the uncertain tax positions and has determined that no liability is required to be recorded in the financial statements as of December 31, 2015. The Funds file tax returns with the U.S. Internal Revenue Service and various states. Taxable years ending 2015, 2014, 2013 and 2012 remain subject to examination by taxing authorities.
For Federal income tax purposes, capital loss carryforwards represent net capital losses of a fund that may be carried forward and applied against future net realized gains. On December 22, 2010, the Regulated
43
Table of Contents
Driehaus Mutual Funds
Notes to Financial Statements — (Continued)
Investment Company Modernization Act of 2010 was enacted to modernize several of the Federal income and excise tax provisions related to regulated investment companies. Under pre-enactment law, capital losses could be carried forward for up to eight years, and were required to be carried forward as short-term capital losses, irrespective of the character of the original loss. New net capital losses (those earned in taxable years beginning after December 22, 2010) may be carried forward indefinitely and must retain the character of the original loss.
At December 31, 2015, gross unrealized appreciation and depreciation on investments, based on cost for Federal income tax purposes, were as follows:
| Active Income Fund | Select Credit Fund | Event Driven Fund | ||||||||||
Cost of investments | $ | 2,871,366,432 | $ | 295,368,289 | $ | 206,578,138 | ||||||
|
|
|
|
|
| |||||||
Gross unrealized appreciation | $ | 25,195,796 | $ | 1,952,065 | $ | 5,999,399 | ||||||
Gross unrealized depreciation | (237,335,179 | ) | (58,485,111 | ) | (9,390,511 | ) | ||||||
|
|
|
|
|
| |||||||
Net unrealized appreciation (depreciation) on investments | $ | (212,139,383 | ) | $ | (56,533,046 | ) | $ | (3,391,112 | ) | |||
|
|
|
|
|
| |||||||
The difference between cost amounts for financial statement and Federal income tax purposes is due primarily to the tax deferral of losses on wash sales.
The amount of dividends and distributions from net investment income and net realized capital gains are determined in accordance with Federal income tax regulations, which may differ from U.S. GAAP.
For the year ended December 31, 2015, reclassifications were recorded to undistributed net investment income, undistributed net realized gain and paid-in capital for any permanent tax differences. These reclassifications relate primarily to the differing tax treatment of income from paydowns and swaps, return of capital and capital gain distributions on real estate investment trusts and regulated investment companies, net operating losses and foreign currency gains and losses. Results of operations and net assets were not affected by these reclassifications.
| Active Income Fund | Select Credit Fund | Event Driven Fund | ||||||||||
Paid-in capital | $ | 9,000,001 | $ | (2,448 | ) | $ | 9,334 | |||||
Undistributed net investment income (loss) | (18,767,576 | ) | 1,924,373 | 304,936 | ||||||||
Undistributed net realized gain (loss) on investments, futures, swap contracts and foreign currency | 9,767,575 | (1,921,925 | ) | (314,270 | ) | |||||||
The tax character of distributions paid were as follows:
| Active Income Fund | ||||||||
Distributions paid from: | January 1, 2015 to December 31, 2015 | January 1, 2014 to December 31, 2014 | ||||||
Ordinary income | $ | 121,665,387 | $ | 110,661,412 | ||||
|
|
|
| |||||
Total distributions paid | $ | 121,665,387 | $ | 110,661,412 | ||||
|
|
|
| |||||
| Select Credit Fund | ||||||||
Distributions paid from: | January 1, 2015 to December 31, 2015 | January 1, 2014 to December 31, 2014 | ||||||
Ordinary income | $ | 28,789,661 | $ | 40,566,938 | ||||
|
|
|
| |||||
Total distributions paid | $ | 28,789,661 | $ | 40,566,938 | ||||
|
|
|
| |||||
44
Table of Contents
Driehaus Mutual Funds
Notes to Financial Statements — (Continued)
| Event Driven Fund | ||||||||
Distributions paid from: | January 1, 2015 to December 31, 2015 | January 1, 2014 to December 31, 2014 | ||||||
Ordinary income | $ | 1,333,974 | $ | 638,265 | ||||
Long-term capital gains | — | 22,837 | ||||||
|
|
|
| |||||
Total distributions paid | $ | 1,333,974 | $ | 661,102 | ||||
|
|
|
| |||||
As of December 31, 2015, the components of accumulated earnings (deficit) were as follows:
| Active Income Fund | Select Credit Fund | Event Driven Fund | ||||||||||
Undistributed ordinary income | $ | 19,799,430 | $ | 1,432,583 | $ | — | ||||||
Undistributed long-term capital gains | — | — | — | |||||||||
|
|
|
|
|
| |||||||
Accumulated earnings | 19,799,430 | 1,432,583 | — | |||||||||
Accumulated capital and other losses | (280,929,758 | ) | (121,849,327 | ) | (23,104,014 | ) | ||||||
Unrealized appreciation (depreciation) | (212,139,383 | ) | (56,533,046 | ) | (3,391,112 | ) | ||||||
|
|
|
|
|
| |||||||
Total accumulated earnings (deficit) | $ | (473,269,711 | ) | $ | (176,949,790 | ) | $ | (26,495,126 | ) | |||
|
|
|
|
|
| |||||||
As of December 31, 2015, the Funds had net capital loss carryforwards to offset future net capital gains, if any, to the extent provided by Treasury regulations:
| Not Subject to Expiration | ||||||||
| Short-Term | Long-Term | |||||||
Active Income Fund | $ | 225,485,388 | $ | 55,444,370 | ||||
Select Credit Fund | 69,201,895 | 52,647,432 | ||||||
Event Driven Fund | 15,832,149 | 7,252,691 | ||||||
Qualified late-year losses incurred after October 31 and within the taxable year are deemed to arise on the first business day of the Funds’ following taxable year. As of December 31, 2015, the Funds had the following qualified late-year ordinary losses:
| Late-Year Ordinary Losses | ||||
Active Income Fund | $ | — | ||
Select Credit Fund | — | |||
Event Driven Fund | 19,174 | |||
Foreign Currency Translation
The value of securities, currencies and other assets and liabilities not denominated in U.S. dollars are translated into U.S. dollar values based upon the current rates of exchange on the date of the Funds’ valuations.
Net realized foreign exchange gains or losses which are reported by the Funds result from currency gains and losses on transaction hedges arising from changes in exchange rates between the trade and settlement dates on forward contract transactions, and the difference between the amounts accrued for dividends, interest, and foreign taxes and the amounts actually received or paid in U.S. dollars for these items. Net unrealized foreign exchange gains and losses result from changes in the U.S. dollar value of assets and liabilities (other than investments in securities), which are denominated in foreign currencies, as a result of changes in exchange rates.
Net realized foreign exchange gains or losses on portfolio hedges result from the use of forward contracts to hedge portfolio positions denominated or quoted in a particular currency in order to reduce or limit exposure in that currency. The Active Income Fund, Select Credit Fund and Event Driven Fund held portfolio hedges as of December 31, 2015 as disclosed in the Schedule of Investments.
45
Table of Contents
Driehaus Mutual Funds
Notes to Financial Statements — (Continued)
The Funds do not isolate that portion of the results of operations which results from fluctuations in foreign exchange rates on investments. These fluctuations are included with the net realized gain (loss) on investments and the net change in unrealized appreciation (depreciation) on investments.
Indemnifications
Under the Trust’s organizational documents, the officers and Trustees are indemnified against certain liabilities arising out of the performance of their duties to the Trust. In addition, in the normal course of business, the Trust enters into contracts that provide general indemnifications to other parties. A Fund’s maximum exposure under these agreements is unknown as this would involve future claims that may be made against a Fund that have not yet occurred. However, the Funds have not had prior claims or losses pursuant to these contracts and expect the risk of loss to be remote.
Other
The Trust records security transactions based on trade date. Dividend income is recognized on the ex-dividend date, and interest income is recognized on an accrual basis. Discounts and premiums on securities purchased are accreted and amortized over the lives of the respective securities using the effective yield method. Withholding taxes on foreign dividends and interest have been provided for in accordance with the Trust’s understanding of the applicable country’s tax rules and rates.
Pursuant to the terms of certain of the senior unsecured loan agreements, the Funds may have unfunded loan commitments, which are callable on demand. Each Fund will have available with its custodian, cash and/or liquid securities having an aggregate value at least equal to the amount of the unfunded senior loan commitments. At December 31, 2015, the Active Income Fund, Select Credit Fund and Event Driven Fund had no unfunded senior loan commitments.
With respect to the senior loans held in each Fund’s portfolio, the Funds may: 1) invest in assignments; 2) act as a participant in primary lending syndicates; or 3) invest in participations. If a Fund purchases a participation of a senior loan interest, the Fund would typically enter into a contractual agreement with the lender or other third party selling the participation, rather than directly with the borrower. As such, the Fund not only assumes the credit risk of the borrower, but also that of the selling participant or other persons interpositioned between the Fund and the borrower. At December 31, 2015, the Funds had no such outstanding senior loan participation commitments.
B. INVESTMENTS IN DERIVATIVES
Swap Contracts
The Funds are subject to credit risk, volatility risk and interest rate risk exposure in the normal course of pursuing their investment objectives. The Funds may engage in various swap transactions, including forward rate agreements and interest rate, currency, volatility, index and total return swaps, primarily to manage duration and yield curve risk, or as alternatives to direct investments. In addition to the swap contracts described above, the Funds may also engage in credit default swaps, which involve the exchange of a periodic premium for protection against a defined credit event (such as payment default, refinancing or bankruptcy).
Interest rate swaps are agreements between two parties to exchange cash flows based on a notional principal amount. The Funds may elect to pay a fixed rate and receive a floating rate or receive a fixed rate and pay a floating rate on a notional principal amount. The net interest received or paid on interest rate swap agreements is accrued daily as interest income/expense. Interest rate swaps are marked-to-market daily using fair value estimates provided by an independent pricing service. Changes in value, including accrued interest, are recorded as unrealized appreciation (depreciation). Unrealized gains are reported as an asset and unrealized losses are reported as a liability. The change in value of swaps, including accruals of periodic amounts of interest to be paid or received on swaps, is reported as unrealized gains or losses. Gains or losses are realized upon termination of the contracts. The risk of loss under a swap contract may exceed the amount recorded as an asset or a liability.
46
Table of Contents
Driehaus Mutual Funds
Notes to Financial Statements — (Continued)
Total return swap contracts are arrangements to exchange a market linked return for a periodic payment, both based on a notional principal amount to hedge sector exposure and to manage exposure to specific sectors or industries and/or to gain exposure to specific markets/countries and to specific sectors/industries. To the extent that the total return of the security, index or other financial measure underlying the transaction exceeds or falls short of the offsetting interest rate obligation, the Fund will receive a payment from or make a payment to the counterparty. Total return swap contracts are marked to market daily based upon quotations from market makers and the change, if any, is recorded as an unrealized gain or loss. Payments received or made are recorded as realized gains or losses. Gains or losses are realized upon termination of the contracts. Each Fund’s maximum risk of loss from counterparty risk is the fair value of the contract.
Volatility swaps are forward contracts on the future realized volatility of an underlying instrument. Volatility swaps are generally used to speculate on future volatility levels, trade the spread between realized and implied volatility or hedge volatility exposure of other positions. Changes in value are recorded as unrealized appreciation (depreciation). Unrealized gains are reported as an asset and unrealized losses are reported as a liability. The change in value of swaps is reported as unrealized gains or losses. Gains or losses are realized upon termination of the contracts. The risk of loss under a volatility swap contract is dependent upon the volatility of the underlying instrument.
Under the terms of a credit default swap contract, one party acts as a guarantor receiving a periodic payment that is a fixed percentage applied to a notional amount. In return, the party agrees to purchase the notional amount of the underlying instrument, at par, if a credit event occurs during the term of the contract. Each Fund may enter into credit default swaps in which the Fund acts as guarantor (a seller of protection), and may enter into credit default swaps in which the counterparty acts as guarantor (a buyer of protection). Premiums paid to or by the Funds are accrued daily and included in realized gain (loss) on swaps. The contracts are marked-to-market daily using fair value estimates provided by an independent pricing service. Changes in value are recorded as unrealized appreciation (depreciation). Unrealized gains are reported as an asset and unrealized losses are reported as a liability. The change in value of swaps, including accruals of periodic amounts of interest to be paid or received on swaps is reported as unrealized gains or losses. Gains or losses are realized upon termination of the contracts. The risk of loss under a swap contract may exceed the amount recorded as an asset or a liability. The notional amount of a swap contract is the reference amount pursuant to which the counterparties make payments. For swaps in which the referenced obligation is an index, in the event of default of any debt security included in the corresponding index, the Fund pays or receives the percentage of the corresponding index that the defaulted security comprises (1) multiplied by the notional value and (2) multiplied by the ratio of one minus the ratio of the market value of the defaulted debt security to its par value. The maximum exposure to loss of the notional value as a seller of credit default swaps outstanding at December 31, 2015 for the Active Income Fund, Select Credit Fund and Event Driven Fund was 80,000,000 Euros, 30,000,000 Euros and $0, respectively.
Risks associated with swap contracts include changes in the returns of underlying instruments and/or interest rates, failure of the counterparties to perform under the contracts’ terms and the possible lack of liquidity with respect to the contracts. Credit default swaps can involve greater risks than if an investor had invested in the reference obligation directly since, in addition to general market risks, credit default swaps are subject to counterparty credit risk, leverage risk, hedging risk, correlation risk and liquidity risk. The Funds disclose swap contracts on a gross basis, with no netting of contracts held with the same counterparty. As of December 31, 2015, the Funds had outstanding swap contracts as listed on the Schedule of Investments and the required collateral is included in the Statements of Assets and Liabilities.
Futures Contracts
The Funds may enter into futures contracts to produce incremental earnings, hedge existing positions or protect against market changes in the value of equities or interest rates. Upon entering into a futures contract with a broker, a Fund is required to deposit in a segregated account a specified amount of cash or U.S. government securities. Futures contracts are valued daily and unrealized gains or losses are recorded in a “variation margin” account. Daily, the Fund receives from or pays to the broker a specified amount of cash based upon changes in the variation margin account. When a contract is closed, the Fund recognizes a realized gain or loss. Futures contracts have market risks, including the risk that the change in the value of the
47
Table of Contents
Driehaus Mutual Funds
Notes to Financial Statements — (Continued)
contract may not correlate with changes in the value of the underlying securities. With futures contracts, there is minimal counterparty credit risk to the Funds since futures contracts are exchange traded and the exchange’s clearinghouse, as counterparty to all exchange traded futures contracts, guarantees the futures contract against default. As of December 31, 2015, the Active Income Fund and Select Credit Fund had outstanding futures contracts as listed in the Schedule of Investments and the required collateral is included in the Statements of Assets and Liabilities. The Event Driven Fund had no outstanding futures contracts at December 31, 2015.
Options Contracts
The Funds may use options contracts to hedge downside risk on their fixed income holdings, produce incremental earnings or protect against market changes in the value of equities or interest rates. The Funds may write covered call and put options on futures, swaps, securities or currencies the Funds own or in which they may invest. Writing put options tends to increase a Fund’s exposure to the underlying instrument. Writing call options tends to decrease a Fund’s exposure to the underlying instrument. When a Fund writes a call or put option, an amount equal to the premium received is recorded as a liability and subsequently marked to market to reflect the current value of the option written. These liabilities are reflected as written options outstanding in the Schedule of Investments. Payments received or made, if any, from writing options with premiums to be determined on a future date are reflected as such in the Schedule of Investments. Premiums received from writing options that expire are treated as realized gains. Premiums received from writing options that are exercised or closed are added to the proceeds or offset against amounts paid on the underlying future, swap, security or currency transaction to determine the realized gain or loss. A Fund, as a writer of an option, has no control over whether the underlying future, swap, security or currency may be sold (call) or purchased (put) and, as a result, bears the market risk of an unfavorable change in the price of the future, swap, security or currency underlying the written option. The risk exists that a Fund may not be able to enter into a closing transaction because of an illiquid market. In addition, to the extent a Fund purchases an over-the-counter (“OTC”) option, it is subject to credit risk that the counterparty to the trade does not perform under the contract’s terms. The Funds are not subject to credit risk on OTC options written as the counterparty has already performed its obligation by paying the premium at the inception of the contract.
The premium amount and the number of option contracts written by the Active Income Fund for the year ended December 31, 2015, were as follows:
Active Income Fund | Number of Contracts | Premium Amount | ||||||
Options outstanding at December 31, 2014 | — | $ | — | |||||
Options written | 131,375 | 100,773,609 | ||||||
Options closed | (38,147 | ) | (59,216,985 | ) | ||||
Options expired | (22,526 | ) | (28,913,759 | ) | ||||
Options exercised | (1,577 | ) | (124,515 | ) | ||||
|
|
|
| |||||
Options outstanding at December 31, 2015 | 69,125 | $ | 12,518,350 | |||||
|
|
|
| |||||
The premium amount and the number of option contracts written by the Select Credit Fund for the year ended December 31, 2015, were as follows:
Select Credit Fund | Number of Contracts | Premium Amount | ||||||
Options outstanding at December 31, 2014 | 10,320 | $ | 829,949 | |||||
Options written | 34,090 | 41,670,323 | ||||||
Options closed | (19,340 | ) | (34,622,996 | ) | ||||
Options expired | (12,670 | ) | (6,011,091 | ) | ||||
|
|
|
| |||||
Options outstanding at December 31, 2015 | 12,400 | $ | 1,866,185 | |||||
|
|
|
| |||||
48
Table of Contents
Driehaus Mutual Funds
Notes to Financial Statements — (Continued)
The premium amount and the number of option contracts written by the Event Driven Fund for the year ended December 31, 2015, were as follows:
Event Driven Fund | Number of Contracts | Premium Amount | ||||||
Options outstanding at December 31, 2014 | — | $ | — | |||||
Options written | 8,394 | 1,464,452 | ||||||
Options closed | (2,680 | ) | (817,484 | ) | ||||
Options expired | (2,014 | ) | (289,826 | ) | ||||
Options exercised | (2,000 | ) | (139,617 | ) | ||||
|
|
|
| |||||
Options outstanding at December 31, 2015 | 1,700 | $ | 217,525 | |||||
|
|
|
| |||||
The Funds may also purchase put and call options. Purchasing call options tends to increase a Fund’s exposure to the underlying instrument. Purchasing put options tends to decrease a Fund’s exposure to the underlying instrument. A Fund pays a premium which is included in its Schedule of Investments as an investment and subsequently marked-to-market to reflect the current value of the option. Premiums paid for purchasing options which expire are treated as realized losses. The risk associated with purchasing put and call options is limited to the premium paid. Premiums paid for purchasing options which are exercised or closed are added to the amounts paid or offset against the proceeds on the underlying future, swap, security or currency transaction to determine the realized gain or loss. When entering into purchased option contracts, a Fund bears the risk of securities prices moving unexpectedly, in which case, a Fund may not achieve the anticipated benefits of the purchased option contracts; however, the risk of loss is limited to the premium paid. As of December 31, 2015, the Funds had outstanding options as listed on the Schedule of Investments and the required collateral is included in the Statements of Assets and Liabilities.
Swaptions
An option on a swap contract, also called a “swaption,” is an option that gives the buyer the right, but not the obligation, to enter into a swap on a future date in exchange for paying a market-based “premium.” A call or receiver swaption gives the owner the right to receive the total return of a specified asset, reference rate, or index swap. A put or payer swaption gives the owner the right to pay the total return of a specified asset, reference rate, or index swap. Swaptions also include options that allow an existing swap to be terminated or extended by one of the counterparties. As of December 31, 2015, the Active Income Fund and Select Credit Fund had outstanding swaptions as listed on the Schedule of Investments. The Event Driven Fund had no outstanding swaptions at December 31, 2015.
Forward Foreign Currency Contracts
The Funds may use forward foreign currency contracts to manage foreign currency, to produce incremental earnings or to hedge existing positions. A forward foreign currency contract involves an obligation to purchase or sell a specific currency at a future date, which may be any fixed number of days from the date of the contract agreed upon by the parties, at a price set at the time of the contract. These contracts are principally traded in the inter-bank market conducted directly between currency traders (usually large commercial banks) and their customers.
The market value of a forward foreign currency contract fluctuates with changes in currency exchange rates. Outstanding forward foreign currency contracts are valued daily at current market rates and the resulting change in market value is recorded as unrealized appreciation or depreciation. When a forward foreign currency contract is settled, the Fund records a realized gain or loss equal to the difference between the value at the time the forward foreign currency contract was opened and the value at the time it was settled. A forward foreign currency contract may involve market risk in excess of the unrealized gain or loss reflected on the Statements of Assets and Liabilities. In addition, the Funds could be exposed to credit risk if the counterparties are unable or unwilling to meet the terms of the contracts or market risk if the value of the foreign currency changes unfavorably. As of December 31, 2015, the Funds had forward foreign currency contracts as listed in the Schedule of Investments.
49
Table of Contents
Driehaus Mutual Funds
Notes to Financial Statements — (Continued)
Derivative Investment Holdings Categorized by Risk Exposure
Each Fund is subject to the FASB’s “Disclosures about Derivative Instruments and Hedging Activities” (the “Derivatives Statement”). The Derivatives Statement amends and expands disclosures about derivative instruments and hedging activities. The Derivatives Statement is intended to improve financial reporting about derivative instruments by requiring enhanced disclosures to enable investors to better understand how and why the Fund uses derivative instruments, how these derivative instruments are accounted for and their effects on the Funds’ financial position and results of operations.
The following table sets forth the fair value and the location in the Statement of Assets and Liabilities of the Active Income Fund’s derivative contracts by primary risk exposure as of December 31, 2015:
Asset derivatives | ||||||
Risk exposure category | Statement of Assets and Liabilities location | Fair Value | ||||
Credit contracts | Unrealized appreciation on open swap contracts | $ | 3,994,164 | |||
Currency contracts | Unrealized appreciation on forward foreign currency contracts | 1,346,526 | ||||
Equity contracts | Purchased options, at fair value | 3,231,250 | ||||
Interest rate contracts | Purchased swaptions, at fair value | 2,673,633 | ||||
Interest rate contracts | N/A* | 1,397,244 | ||||
|
|
|
| |||
Total | $ | 12,642,817 | ||||
|
|
|
| |||
Liability derivatives | ||||||
Risk exposure category | Statement of Assets and Liabilities location | Fair Value | ||||
Credit contracts | Unrealized depreciation on open swap contracts | $ | 12,433,153 | |||
Currency contracts | Unrealized depreciation on forward foreign currency contracts | 790,843 | ||||
Equity contracts | Written options, at fair value | 1,151,904 | ||||
|
|
|
| |||
Total | $ | 14,375,900 | ||||
|
|
|
| |||
| * | Includes cumulative appreciation/depreciation of futures contracts as shown in the Schedule of Investments. Only current day’s variation margin is reported in the Statement of Assets and Liabilities |
The following table sets forth the fair value and the location in the Statement of Assets and Liabilities of the Select Credit Fund’s derivative contracts by primary risk exposure as of December 31, 2015:
Asset derivatives | ||||||
Risk exposure category | Statement of Assets and Liabilities location | Fair Value | ||||
Credit contracts | Unrealized appreciation on open swap contracts | $ | 926,409 | |||
Equity contracts | Purchased options, at fair value | 775,750 | ||||
Currency contracts | Unrealized appreciation on forward foreign currency contracts | 333,068 | ||||
Interest rate contracts | Purchased swaptions, at fair value | 316,230 | ||||
Interest rate contracts | N/A* | 151,687 | ||||
|
|
|
| |||
Total | $ | 2,503,144 | ||||
|
|
|
| |||
50
Table of Contents
Driehaus Mutual Funds
Notes to Financial Statements — (Continued)
Liability derivatives | ||||||
Risk exposure category | Statement of Assets and Liabilities location | Fair Value | ||||
Credit contracts | Unrealized depreciation on open swap contracts | $ | 892,054 | |||
Currency contracts | Unrealized depreciation on forward foreign currency contracts | 189,762 | ||||
Equity contracts | Written options, at fair value | 191,500 | ||||
|
|
|
| |||
Total | $ | 1,273,316 | ||||
|
|
|
| |||
| * | Includes cumulative appreciation/depreciation of futures contracts as shown in the Schedule of Investments. Only current day’s variation margin is reported in the Statement of Assets and Liabilities |
The following table sets forth the fair value and the location in the Statement of Assets and Liabilities of the Event Driven Fund’s derivative contracts by primary risk exposure as of December 31, 2015:
Asset derivatives | ||||||
Risk exposure category | Statement of Assets and Liabilities location | Fair Value | ||||
Currency contracts | Unrealized appreciation on forward foreign currency contracts | $ | 14,416 | |||
Equity contracts | Purchased options, at fair value | 1,883,460 | ||||
|
|
|
| |||
Total | $ | 1,897,876 | ||||
|
|
|
| |||
Liability derivatives | ||||||
Risk exposure category | Statement of Assets and Liabilities location | Fair Value | ||||
Equity contracts | Unrealized depreciation on open swap contracts | $ | 40,536 | |||
Equity contracts | Written options, at fair value | 246,500 | ||||
|
|
|
| |||
Total | $ | 287,036 | ||||
|
|
|
| |||
The following table sets forth the Active Income Fund’s net realized gain/loss by primary risk exposure and by type of derivative contract for the year ended December 31, 2015:
Amount of net realized gain (loss) on derivatives | ||||||||||||||||||||||||
| Risk exposure category | ||||||||||||||||||||||||
Derivative | Credit contracts | Commodity contracts | Currency contracts | Equity contracts | Interest rate contracts | Total | ||||||||||||||||||
Purchased options contracts | $ | — | $ | 284,028 | $ | — | $ | (82,091,859 | ) | $ | — | $ | (81,807,831 | ) | ||||||||||
Purchased swaptions contracts | — | — | — | — | (17,573,245 | ) | (17,573,245 | ) | ||||||||||||||||
Written options contracts | — | 358,883 | — | 72,699,681 | — | 73,058,564 | ||||||||||||||||||
Forward foreign currency contracts | — | — | 3,283,553 | — | — | 3,283,553 | ||||||||||||||||||
Futures contracts | — | — | — | — | (9,462,761 | ) | (9,462,761 | ) | ||||||||||||||||
Swap contracts | (14,539,198 | ) | — | — | — | — | (14,539,198 | ) | ||||||||||||||||
|
|
|
|
|
|
|
|
|
|
|
| |||||||||||||
Total | $ | (14,539,198 | ) | $ | 642,911 | $ | 3,283,553 | $ | (9,392,178 | ) | $ | (27,036,006 | ) | $ | (47,040,918 | ) | ||||||||
|
|
|
|
|
|
|
|
|
|
|
| |||||||||||||
51
Table of Contents
Driehaus Mutual Funds
Notes to Financial Statements — (Continued)
The following table sets forth the Select Credit Fund’s net realized gain/loss by primary risk exposure and by type of derivative contract for the year ended December 31, 2015:
Amount of net realized gain (loss) on derivatives | ||||||||||||||||||||||||
| Risk exposure category | ||||||||||||||||||||||||
Derivative | Credit contracts | Commodity contracts | Currency contracts | Equity contracts | Interest rate contracts | Total | ||||||||||||||||||
Purchased options contracts | $ | — | $ | 1,671,445 | $ | — | $ | (23,044,585 | ) | $ | — | $ | (21,373,140 | ) | ||||||||||
Purchased swaption contracts | — | — | — | — | (5,925,905 | ) | (5,925,905 | ) | ||||||||||||||||
Written options contracts | — | 209,803 | — | 26,814,101 | — | 27,023,904 | ||||||||||||||||||
Forward foreign currency contracts | — | — | 9,663,370 | — | — | 9,663,370 | ||||||||||||||||||
Futures contracts | — | — | — | — | (5,702,439 | ) | (5,702,439 | ) | ||||||||||||||||
Swap contracts | (4,740,158 | ) | — | — | — | — | (4,740,158 | ) | ||||||||||||||||
|
|
|
|
|
|
|
|
|
|
|
| |||||||||||||
Total | $ | (4,740,158 | ) | $ | 1,881,248 | $ | 9,663,370 | $ | 3,769,516 | $ | (11,628,344 | ) | $ | (1,054,368 | ) | |||||||||
|
|
|
|
|
|
|
|
|
|
|
| |||||||||||||
The following table sets forth the Event Driven Fund’s net realized gain/loss by primary risk exposure and by type of derivative contract for the year ended December 31, 2015:
Amount of net realized gain (loss) on derivatives | ||||||||||||||||||||
| Risk exposure category | ||||||||||||||||||||
Derivative | Credit contracts | Currency contracts | Equity contracts | Interest rate contracts | Total | |||||||||||||||
Purchased options contracts | $ | — | $ | — | $ | (434,689 | ) | $ | — | $ | (434,689 | ) | ||||||||
Purchased swaption contracts | — | — | — | (980,200 | ) | (980,200 | ) | |||||||||||||
Written options contracts | — | — | 906,675 | — | 906,675 | |||||||||||||||
Forward foreign currency contract | — | 322,004 | — | — | 322,004 | |||||||||||||||
Futures contracts | — | — | (1,067,658 | ) | — | (1,067,658 | ) | |||||||||||||
Swap contracts | (715,965 | ) | — | (160,550 | ) | — | (876,515 | ) | ||||||||||||
|
|
|
|
|
|
|
|
|
| |||||||||||
Total | $ | (715,965 | ) | $ | 322,004 | $ | (756,222 | ) | $ | (980,200 | ) | $ | (2,130,383 | ) | ||||||
|
|
|
|
|
|
|
|
|
| |||||||||||
The following table sets forth the Active Income Fund’s change in net unrealized appreciation/depreciation by primary risk exposure and by type of derivative contract for the year ended December 31, 2015:
Change in net unrealized appreciation (depreciation) on derivatives | ||||||||||||||||||||
| Risk exposure category | ||||||||||||||||||||
Derivative | Credit contracts | Equity contracts | Currency contracts | Interest rate contracts | Total | |||||||||||||||
Purchased options contracts | $ | — | $ | (13,134,046 | ) | $ | — | $ | — | $ | (13,134,046 | ) | ||||||||
Purchased swaption contracts | — | — | — | 3,174,573 | 3,174,573 | |||||||||||||||
Written options contracts | — | 11,366,446 | — | — | 11,366,446 | |||||||||||||||
Futures contracts | — | — | — | 2,010,005 | 2,010,005 | |||||||||||||||
Swap contracts | 10,294,889 | — | — | — | 10,294,889 | |||||||||||||||
Forward foreign currency contracts | — | — | 378,995 | — | 378,995 | |||||||||||||||
|
|
|
|
|
|
|
|
|
| |||||||||||
Total | $ | 10,294,889 | $ | (1,767,600 | ) | $ | 378,995 | $ | 5,184,578 | $ | 14,090,862 | |||||||||
|
|
|
|
|
|
|
|
|
| |||||||||||
52
Table of Contents
Driehaus Mutual Funds
Notes to Financial Statements — (Continued)
The gross notional amount and the number of contracts for the Active Income Fund as of December 31, 2015 are included on the Schedule of Investments. The fair value of such contracts at December 31, 2015 is set forth in the table below.
Quarterly Derivative Averages | ||||||
Derivative | Quarterly Average | $ Amount / Number | ||||
Options Contracts — Purchased | number of contracts | 16,997 | ||||
Options Contracts — Written | number of contracts | (32,742 | ) | |||
Futures Contracts — Short | number of contracts | (3,127 | ) | |||
Swap Contracts | gross notional amount | $ | 320,460,200 | |||
Swaptions Contracts — Purchased | gross notional amount | $ | 410,199,930 | |||
Forward Contracts — Long | fair value | $ | 18,343,763 | |||
Forward Contracts — Short | fair value | $ | (59,531,313 | ) | ||
The following table sets forth the Select Credit Fund’s change in net unrealized appreciation/depreciation by primary risk exposure and by type of derivative contract for the year ended December 31, 2015:
Change in net unrealized appreciation (depreciation) on derivatives | ||||||||||||||||||||
| Risk exposure category | ||||||||||||||||||||
Derivative | Credit contracts | Equity contracts | Interest rate contracts | Currency contracts | Total | |||||||||||||||
Purchased options contracts | $ | — | $ | (5,546,753 | ) | $ | — | $ | — | $ | (5,546,753 | ) | ||||||||
Purchased swaptions contracts | — | — | 1,301,498 | — | 1,301,498 | |||||||||||||||
Written options contracts | — | 860,835 | — | — | 860,835 | |||||||||||||||
Forward foreign currency contracts | — | — | — | (4,943,878 | ) | (4,943,878 | ) | |||||||||||||
Futures contracts | — | 9,337 | 279,773 | — | 289,110 | |||||||||||||||
Swap contracts | 1,395,993 | — | — | — | 1,395,993 | |||||||||||||||
|
|
|
|
|
|
|
|
|
| |||||||||||
Total | $ | 1,395,993 | $ | (4,676,581 | ) | $ | 1,581,271 | $ | (4,943,878 | ) | $ | (6,643,195 | ) | |||||||
|
|
|
|
|
|
|
|
|
| |||||||||||
The gross notional amount and the number of contracts for the Select Credit Fund as of December 31, 2015 are included on the Schedule of Investments. The fair value of such contracts at December 31, 2015 is set forth in the table below.
Quarterly Derivative Averages | ||||||
Derivative | Quarterly Average | $ Amount / Number | ||||
Options Contracts — Purchased | number of contracts | 12,210 | ||||
Options Contracts — Written | number of contracts | (7,524 | ) | |||
Futures Contracts — Short | number of contracts | (1,029 | ) | |||
Swap Contracts | gross notional amount | $ | 73,342,400 | |||
Swaptions Contracts — Purchased | gross notional amount | $ | 131,200,070 | |||
Forward Contracts — Long | fair value | $ | 5,521,632 | |||
Forward Contracts — Short | fair value | $ | (48,464,008 | ) | ||
The following table sets forth the Event Driven Fund’s change in net unrealized appreciation/depreciation by primary risk exposure and by type of derivative contract for the year ended December 31, 2015:
Change in net unrealized appreciation (depreciation) on derivatives | ||||||||||||||||||||
| Risk exposure category | ||||||||||||||||||||
Derivative | Credit contracts | Equity contracts | Currency contracts | Interest rate contracts | Total | |||||||||||||||
Purchased options contracts | $ | — | $ | (4,298,583 | ) | $ | — | $ | — | $ | (4,298,583 | ) | ||||||||
Purchased swaptions contracts | — | — | — | 980,078 | 980,078 | |||||||||||||||
Written options contracts | — | (28,975 | ) | — | — | (28,975 | ) | |||||||||||||
Futures contracts | — | 138,492 | — | — | 138,492 | |||||||||||||||
Swap contracts | 195,347 | (40,536 | ) | — | — | 154,811 | ||||||||||||||
Forward foreign currency contracts | — | — | 3,648 | — | 3,648 | |||||||||||||||
|
|
|
|
|
|
|
|
|
| |||||||||||
Total | $ | 195,347 | $ | (4,229,602 | ) | $ | 3,648 | $ | 980,078 | $ | (3,050,529 | ) | ||||||||
|
|
|
|
|
|
|
|
|
| |||||||||||
53
Table of Contents
Driehaus Mutual Funds
Notes to Financial Statements — (Continued)
The gross notional amount and the number of contracts for the Event Driven Fund as of December 31, 2015 are included on the Schedule of Investments. The fair value of such contracts at December 31, 2015 is set forth in the table below.
Quarterly Derivative Averages | ||||||
Derivative | Quarterly Average | $ Amount / Number | ||||
Options Contracts — Purchased | number of contracts | 30,742 | ||||
Options Contracts — Written | number of contracts | (516 | ) | |||
Futures Contracts — Short | number of contracts | (91 | ) | |||
Swap Contracts | gross notional amount | $ | 16,938,053 | |||
Swaptions Contracts — Purchased | gross notional amount | $ | 11,600,000 | |||
Forward Contracts — Long | fair value | $ | 686,824 | |||
Forward Contracts — Short | fair value | $ | (7,364,991 | ) | ||
Disclosures about Offsetting Assets and Liabilities
Each Fund is subject to the FASB’s “Disclosures about Offsetting Assets and Liabilities,” which requires an entity to disclose information about offsetting and related arrangements to enable users of its financial statements to understand the effect of those arrangements on its financial position.
For financial reporting purposes, the Funds do not offset derivative assets and liabilities that are subject to Master Netting Agreements (“MNA”) or similar arrangements in the Statements of Assets and Liabilities.
The following table presents the Active Income Fund’s derivative assets by type, net of amounts available for offset under a MNA and net of the related collateral received by the Active Income Fund as of December 31, 2015:
Description | Gross Amounts Recognized in Statement of Assets and Liabilities | Derivatives Available for Offset | Collateral Received | Net Amount1 | ||||||||||||
Unrealized appreciation on open swap contracts | $ | 3,994,164 | $ | (2,971,362 | ) | $ | — | $ | 1,022,802 | |||||||
The following table presents the Active Income Fund’s derivative liabilities by type, net of amounts available for offset under a MNA and net of the related collateral pledged by the Active Income Fund as of December 31, 2015:
Description | Gross Amounts Recognized in Statement of Assets and Liabilities | Derivatives Available for Offset | Collateral Pledged | Net Amount2 | ||||||||||||
Unrealized depreciation on open swap contracts | $ | 12,433,153 | $ | (2,971,362 | ) | $ | (9,461,791 | ) | $ | — | ||||||
Unrealized depreciation on forward foreign currency contracts | 790,843 | — | (790,843 | ) | — | |||||||||||
Written options, at fair value | 1,151,904 | — | (1,151,904 | ) | — | |||||||||||
| 1 | Net amount represents the net amount receivable from the counterparty in the event of default. |
| 2 | Net amount represents the net amount payable to the counterparty in the event of default. |
The following table presents the Select Credit Fund’s derivative assets by type, net of amounts available for offset under a MNA and net of the related collateral received by the Select Credit Fund as of December 31, 2015:
Description | Gross Amounts Recognized in Statement of Assets and Liabilities | Derivatives Available for Offset | Collateral Received | Net Amount1 | ||||||||||||
Unrealized appreciation on open swap contracts | $ | 926,409 | $ | (226,835 | ) | $ | — | $ | 699,574 | |||||||
54
Table of Contents
Driehaus Mutual Funds
Notes to Financial Statements — (Continued)
The following table presents the Select Credit Fund’s derivative liabilities by type, net of amounts available for offset under a MNA and net of the related collateral pledged by the Select Credit Fund as of December 31, 2015:
Description | Gross Amounts Recognized in Statement of Assets and Liabilities | Derivatives Available for Offset | Collateral Pledged | Net Amount2 | ||||||||||||
Unrealized depreciation on open swap contracts | $ | 892,054 | $ | (226,835 | ) | $ | (665,219 | ) | $ | — | ||||||
Written options, at fair value | 191,500 | — | (191,500 | ) | — | |||||||||||
| 1 | Net amount represents the net amount receivable from the counterparty in the event of default. |
| 2 | Net amount represents the net amount payable to the counterparty in the event of default. |
The following table presents the Event Driven Fund’s derivative liabilities by type, net of amounts available for offset under a MNA and net of the related collateral pledged by the Event Driven Fund as of December 31, 2015:
Description | Gross Amounts Recognized in Statement of Assets and Liabilities | Derivatives Available for Offset | Collateral Pledged | Net Amount1 | ||||||||||||
Unrealized depreciation on open swap contracts | $ | 40,536 | $ | — | $ | (40,536 | ) | $ | — | |||||||
Written options, at fair value | 246,500 | — | (246,500 | ) | — | |||||||||||
| 1 | Net amount represents the net amount payable to the counterparty in the event of default. |
C. INVESTMENT ADVISORY FEES, TRANSACTIONS WITH AFFILIATES, AND ADMINISTRATIVE FEES
Richard H. Driehaus, an Interested Trustee of the Trust, is also the Chairman of the Board of Driehaus Capital Management LLC (“DCM” or the “Adviser”), a registered investment adviser, and of Driehaus Securities LLC (“DS LLC” or the “Distributor”), a registered broker-dealer.
DCM serves as the Funds’ investment adviser. In return for its services to the Funds, the Funds pay the Adviser an annual management fee on a monthly basis of 0.55%, 0.80% and 1.00% of average daily net assets, respectively, for the Active Income Fund, Select Credit Fund and Event Driven Fund.
DCM has entered into a written agreement to cap the Event Driven Fund’s annual ordinary operating expenses (other than interest, taxes, brokerage commissions, dividends and interest on short sales, other investment-related expenses and extraordinary expenses) at 2.00% of average daily net assets until at least August 25, 2016. For this same time period, DCM is entitled to reimbursement for previously waived fees and reimbursed expenses to the extent that the Event Driven Fund’s expense ratio remains below the operating expense cap. For the year ended December 31, 2015, the Event Driven Fund did not have any fees waived by DCM and as of December 31, 2015, there are no amounts subject to recapture.
The Active Income Fund incurred $19,296,189 for investment advisory fees during the year ended December 31, 2015, of which $1,398,569 was payable to DCM at December 31, 2015. The Select Credit Fund incurred $5,077,107 for investment advisory fees during the year ended December 31, 2015, and $245,534 was payable to DCM at December 31, 2015. The Event Driven Fund incurred $2,234,144 for investment advisory fees during the year ended December 31, 2015, and $199,320 was payable to DCM at December 31, 2015.
DS LLC is the Funds’ distributor. DS LLC does not earn any compensation from the Funds for these services. DS LLC has entered into a Fee Reimbursement Agreement (“Agreement”) with each of the Funds. Under these agreements, the Funds reimburse DS LLC for certain fees paid by DS LLC to intermediaries who provide shareholder administrative and/or sub-transfer agency services to the Funds. Currently, the amount to be reimbursed will not exceed 0.25% of the average daily net assets held by such intermediaries. The amounts
55
Table of Contents
Driehaus Mutual Funds
Notes to Financial Statements — (Continued)
incurred and payable to DS LLC under the Agreement during the year ended December 31, 2015 are as follows:
Fund | Shareholder services plan fees | Accrued shareholder services plan fees | ||||||
Active Income Fund | $ | 5,176,600 | $ | 511,967 | ||||
Select Credit Fund | 1,252,113 | 81,339 | ||||||
Event Driven Fund | 387,633 | 37,369 | ||||||
Also included in shareholders services plan fees on the Statement of Operations are $55,379 and $3,176 for the Active Income Fund and Select Credit Fund, respectively, which are attributable to an unaffiliated party.
Certain officers of the Trust are also officers of DCM and DS LLC. The Funds pay a portion of the Chief Compliance Officer’s salary. No other officers received compensation from the Funds during the period January 1, 2015 through December 31, 2015. The Independent Trustees are compensated for their services to the Trust and such compensation is reflected as Trustees’ fees in the Statement of Operations.
UMB Fund Services, Inc. (“UMBFS”), an affiliate of UMB Financial Corporation, serves as the Funds’ administrative and accounting agent. In compensation for these services, UMBFS earns the larger of a monthly minimum fee or a monthly fee based upon each Fund’s average daily net assets. UMBFS also acts as the transfer agent and dividend disbursing agent for the Funds. For these services, UMBFS earns a monthly fee based in part on shareholder processing activity during the month.
D. INVESTMENT TRANSACTIONS
Purchases and sales of investment securities (excluding swaps, options, futures, short-term securities and U.S. government obligations) for the Active Income Fund, Select Credit Fund and Event Driven Fund for the year ended December 31, 2015, were as follows:
Active Income Fund | Select Credit Fund | Event Driven Fund | ||||||||||||||
| Purchases | $ | 2,371,692,696 | Purchases | $ | 408,537,668 | Purchases | $ | 823,129,427 | ||||||||
| Sales | $ | 2,941,256,286 | Sales | $ | 801,580,591 | Sales | $ | 751,294,384 | ||||||||
The aggregate purchases and sales of U.S. government obligations for the Active Income Fund, Select Credit Fund and Event Driven Fund for the year ended December 31, 2015, were as follows:
Active Income Fund | Select Credit Fund | Event Driven Fund | ||||||||||||||
| Purchases | $ | 19,483,127 | Purchases | $ | 3,437,620 | Purchases | $ | — | ||||||||
| Sales | $ | — | Sales | $ | — | Sales | $ | — | ||||||||
E. RESTRICTED SECURITIES
Restricted securities are securities that are not registered for sale under the Securities Act of 1933 or applicable foreign law and that may be re-sold only in transactions exempt from applicable registration. Restricted securities include Rule 144A securities which may be sold normally to qualified institutional buyers. At December 31, 2015, the Funds held restricted securities as denoted on the Schedule of Investments.
F. LINE OF CREDIT
Active Income Fund, Select Credit Fund and Event Driven Fund have, together with certain other funds in the Trust, obtained a committed line of credit in the amount of $50,000,000. The line of credit is available primarily to meet large, unexpected shareholder withdrawals subject to certain restrictions. Interest is charged at a rate per annum equal to the Federal Funds Rate in effect at the time of the borrowings plus 1.5%, or 1.75%, whichever is greater. At December 31, 2015 the Funds had no outstanding borrowings under the line of credit.
56
Table of Contents
Driehaus Mutual Funds
Notes to Financial Statements — (Continued)
G. SUBSEQUENT EVENTS
Events or transactions that occurred after the date of this report through the date the report was issued have been evaluated for potential impact to the financial statements. There are no subsequent events that require recognition or disclosure in the financial statements.
57
Table of Contents
Report of Independent Registered Public Accounting Firm
The Board of Trustees and Shareholders of Driehaus Mutual Funds
We have audited the accompanying statements of assets and liabilities, including the schedules of investments, of Driehaus Active Income Fund, Driehaus Select Credit Fund, and Driehaus Event Driven Fund (collectively, the “Funds”) as of December 31, 2015, and the related statements of operations for the year then ended, the statements of changes in net assets for each of the two years in the period then ended, and the financial highlights for each of the periods indicated therein. These financial statements and financial highlights are the responsibility of the Funds’ management. Our responsibility is to express an opinion on these financial statements and financial highlights based on our audits.
We conducted our audits in accordance with the standards of the Public Company Accounting Oversight Board (United States). Those standards require that we plan and perform the audits to obtain reasonable assurance about whether the financial statements and financial highlights are free of material misstatement. We were not engaged to perform an audit of the Funds’ internal control over financial reporting. Our audits included consideration of internal control over financial reporting as a basis for designing audit procedures that are appropriate in the circumstances, but not for the purpose of expressing an opinion on the effectiveness of the Funds’ internal control over financial reporting. Accordingly, we express no such opinion. An audit also includes examining, on a test basis, evidence supporting the amounts and disclosures in the financial statements and financial highlights, assessing the accounting principles used and significant estimates made by management, and evaluating the overall financial statement presentation. Our procedures included confirmation of securities owned as of December 31, 2015, by correspondence with the custodian, brokers, and agent banks or by other appropriate auditing procedures where replies from brokers and agent banks were not received. We believe that our audits provide a reasonable basis for our opinion.
In our opinion, the financial statements and financial highlights referred to above present fairly, in all material respects, the financial position of each of the respective Funds noted above at December 31, 2015, and the results of their operations for the year then ended, the changes in their net assets for each of the two years in the period then ended, and the financial highlights for each of the periods indicated therein, in conformity with U.S. generally accepted accounting principles.

Chicago, Illinois
February 23, 2016
58
Table of Contents
Interested and Independent Trustees of the Trust
The following table sets forth certain information with respect to the Trustees of the Trust as of January 1, 2016:
Name, Address and | Position(s) Held with the Trust | Term of Office and Length of Time Served** | Number of Portfolios in Trust Overseen by Trustee | Principal Occupation(s) | Other Directorships Held by Trustee During the Past 5 Years | |||||
Interested Trustee:* | ||||||||||
Richard H. Driehaus 25 East Erie Street Chicago, IL 60611 YOB: 1942 | Trustee | Since 1996 | 8 | Chairman of the Board of the Adviser, the Distributor and Driehaus Capital Management (USVI) LLC (“USVI”); Chief Investment Officer and Portfolio Manager of the Adviser. President of the Trust from 1996-2011. | None | |||||
Independent Trustees: | ||||||||||
Daniel F. Zemanek c/o Driehaus Capital Management LLC 25 East Erie Street Chicago, IL 60611 YOB: 1942 | Trustee and Chairman | Since 1996 Since 2014 | 8 | Retired; President of Ludan, Inc. (real estate services specializing in senior housing) from April 2008 to December 2014. | None | |||||
Theodore J. Beck c/o Driehaus Capital Management LLC 25 East Erie Street Chicago, IL 60611 YOB: 1952 | Trustee | Since 2012 | 8 | President and Chief Executive Officer, National Endowment for Financial Education, 2005 to present. | Wilshire Variable Insurance Trust, 2008-2010; Wilshire Mutual Funds Inc., 2008- 2010; Advisory Board of the Trust, 2011-2012. | |||||
| Francis J. Harmon c/o Driehaus Capital Management LLC 25 East Erie Street Chicago, IL 60611 YOB: 1942 | Trustee | Since 1998 | 8 | Relationship Manager, Great Lakes Advisors, Inc. since February 2008. | None | |||||
Dawn M. Vroegop c/o Driehaus Capital Management LLC 25 East Erie Street Chicago, IL 60611 YOB: 1966 | Trustee | Since 2012 | 8 | Private Investor since September 2003. | Independent Trustee, Met Investors Series Trust since December 2000; Independent Trustee, Metropolitan Series Fund, Inc. since May 2009; Advisory Board of the Trust, 2011-2012. | |||||
Christopher J. Towle, CFA c/o Driehaus Capital Management LLC 25 East Erie Street Chicago, IL 60611 YOB: 1957 | Trustee | Since 2016 | 8 | Retired; Partner, Portfolio Manager, Director of High Yield and Convertible Securities, Lord Abbett & Co.; 35 years professional investment experience, 1980-2014. | None |
| * | Mr. Driehaus is an “interested person” of the Trust, the Adviser and the Distributor, as defined in the 1940 Act, because he is an officer of the Adviser and the Distributor. In addition, Mr. Driehaus has a controlling interest in the Adviser and the Distributor. |
| ** | Each Trustee will serve as a Trustee of the Trust until (i) termination of the Trust, (ii) the Trustee’s retirement, resignation, or death, or (iii) as otherwise specified in the Trust’s governing documents. |
59
Table of Contents
The following table sets forth certain information with respect to the officers of the Trust:
Name, Address and Year of Birth | Position(s) Held with the Trust | Length of Time Served | Principal Occupation(s) During Past 5 Years | |||
Robert H. Gordon 25 East Erie Street Chicago, IL 60611 YOB: 1961 | President | Since 2011 | President and Chief Executive Officer of Adviser, Distributor and USVI since October 2006; Senior Vice President of the Trust from 2006-2011. | |||
Michelle L. Cahoon 25 East Erie Street Chicago, IL 60611 YOB: 1966 | Vice President and Treasurer | Since 2006 Since 2002 | Managing Director, Treasurer and Chief Financial Officer of the Adviser and Distributor since 2012; Vice President, Treasurer and Chief Financial Officer of USVI since 2004; Vice President, Treasurer and Chief Financial Officer of the Adviser and Distributor from 2004-2012. | |||
Janet L. McWilliams 25 East Erie Street Chicago, IL 60611 YOB: 1970 | Assistant Vice President and Chief Legal Officer | Since 2007 Since 2012 | Managing Director, Secretary and General Counsel of the Adviser since 2012; Chief Compliance Officer of the Trust, Adviser and Distributor from 2006-2012. | |||
Michael R. Shoemaker 25 East Erie Street Chicago, IL 60611 YOB: 1981 | Chief Compliance Officer and Assistant Vice President | Since 2012 | Assistant Vice President and Chief Compliance Officer of the Adviser and Distributor since 2012; Associate Chief Compliance Officer of the Adviser and Distributor from 2011-2012; Compliance Officer, Pacific Investment Management Company LLC and PIMCO Investments LLC from 2010-2011; Senior Compliance Analyst of the Adviser and Distributor from 2007-2010. | |||
William H. Wallace, III 301 Bellevue Parkway Wilmington, DE 19809 YOB: 1969 | Secretary | Since 2015 | Vice President and Manager, BNY Mellon Investment Servicing (US) Inc. (formerly PNC, a financial services company) since 2010; Assistant Vice President and Manager, PNC from 2008-2010. | |||
Michael P. Kailus 25 East Erie Street Chicago, IL 60611 YOB: 1971 | Assistant Secretary and Anti-Money Laundering Compliance Officer | Since 2010 Since 2011 | Assistant Secretary of the Adviser, Distributor and USVI since 2010; Senior Attorney with the Adviser since 2010. | |||
Christine V. Mason 301 Bellevue Parkway Wilmington, DE 19809 YOB: 1956 | Assistant Secretary | Since 2015 | Senior Specialist, BNY Mellon Investment Servicing (US) Inc. (formerly PNC, a financial services company) since 2013; Senior Paralegal, Foreside Funds Distributors LLC (formerly BNY Mellon Distributors Inc.) from 2004-2013. |
The Statement of Additional Information for Driehaus Mutual Funds contains more detail about the Trust’s Trustees and officers and is available upon request, without charge. For further information, please call 1-877-779-0079.
60
Table of Contents
As a mutual fund shareholder, you may incur two types of costs: (1) transaction costs, including sales charges; redemption fees; and exchange fees and (2) ongoing costs, including management fees; distribution (12b-1) and/or service fees; and other fund expenses. This example is intended to help you understand your ongoing costs (in dollars) of investing in the Fund and to compare these costs with the ongoing costs of investing in other mutual funds.
The example is based on an investment of $1,000 invested at the beginning of the period and held for the entire six month period ended December 31, 2015.
Actual Expenses
The first line of the table below (“Actual”) provides information about actual account values and actual expenses. You may use the information in this line, together with the amount you invested, to estimate the expense that you paid over the period. Simply divide your account value by $1,000 (for example, an $8,600 account value divided by $1,000 = 8.6), then multiply the result by the number in the first line under the heading entitled “Expenses Paid During Period” to estimate the expenses you paid on your account during this period.
Hypothetical Example for Comparison Purposes
The second line of the tables below (“Hypothetical”) provides information about hypothetical account values and hypothetical expenses based on the Fund’s actual expense ratio and an assumed rate of return of 5% per year before expenses, which is not the Fund’s actual return. You may use this information to compare the ongoing costs of investing in the Fund versus other funds. To do so, compare this 5% hypothetical example with the 5% hypothetical examples that appear in the shareholder reports of the other funds.
Please note that the expenses shown in the table are meant to highlight your ongoing costs only and do not reflect any transactional costs, such as sales charges, redemption fees or exchange fees. Therefore, the second line of the table is useful in comparing ongoing costs only, and will not help you determine the relative total costs of owning different funds. In addition, if these transactional costs were included, your costs would have been higher.
Driehaus Active Income Fund
Beginning Account Value July 1, 2015 | Ending Account Value December 31, 2015 | Expenses Paid During Six Months Ended December 31, 2015* | ||||||||||
Actual | $ | 1,000.00 | $ | 975.20 | $ | 5.78 | ||||||
Hypothetical Example, assuming a 5% return before expenses | $ | 1,000.00 | $ | 1,019.35 | $ | 5.90 | ||||||
Driehaus Select Credit Fund
Beginning Account Value July 1, 2015 | Ending Account Value December 31, 2015 | Expenses Paid During Six Months Ended December 31, 2015* | ||||||||||
Actual | $ | 1,000.00 | $ | 911.00 | $ | 7.75 | ||||||
Hypothetical Example, assuming a 5% return before expenses | $ | 1,000.00 | $ | 1,017.09 | $ | 8.19 | ||||||
61
Table of Contents
Fund Expense Examples — (Continued)
Driehaus Event Driven Fund
Beginning Account Value July 1, 2015 | Ending Account Value December 31, 2015 | Expenses Paid During Six Months Ended December 31, 2015* | ||||||||||
Actual | $ | 1,000.00 | $ | 951.70 | $ | 9.74 | ||||||
Hypothetical Example, assuming a 5% return before expenses | $ | 1,000.00 | $ | 1,015.21 | $ | 10.06 | ||||||
| * | Expenses are equal to the Funds’ annualized expense ratios for the six-month period in the table below multiplied by the average account value over the period, multiplied by the number of days in the most recent fiscal half-year (184), then divided by 365 to reflect the half-year period. |
Driehaus Active Income Fund | 1.16% | |
Driehaus Select Credit Fund | 1.61% | |
Driehaus Event Driven Fund | 1.98% |
62
Table of Contents
TAX INFORMATION (UNAUDITED) FOR THE YEAR ENDED DECEMBER 31, 2015
We are providing this information as required by the Internal Revenue Code. The amounts shown may differ from those elsewhere in this report because of differences between tax and financial reporting requirements.
For taxable non-corporate shareholders, the following percentages of income and short-term capital gains represent qualified dividend income subject to the 15% rate category:
Active Income Fund | Select Credit Fund | Event Driven Fund | ||||||
| 21.71% | 8.76% | 100% | ||||||
For corporate shareholders, the following percentages of income and short-term capital gains qualified for the dividends-received deduction:
Active Income Fund | Select Credit Fund | Event Driven Fund | ||||||
| 21.75% | 8.80% | 100% | ||||||
PROXY VOTING POLICIES AND PROCEDURES AND PROXY VOTING RECORD
A description of the Funds’ policies and procedures with respect to the voting of proxies relating to the Funds’ portfolio securities is available, without charge, upon request, by calling 1-877-779-0079. This information is also available on the Funds’ website at http://www.driehaus.com.
Information regarding how the Funds voted proxies related to portfolio securities during the 12-month period ended June 30, 2015 is available without charge, upon request, by calling 1-877-779-0079. This information is also available on the Securities and Exchange Commission’s (“SEC”) website at http://www.sec.gov.
HOW TO OBTAIN QUARTERLY PORTFOLIO HOLDINGS
Each Fund files a complete schedule of portfolio holdings with the SEC for the first and third quarters of each fiscal year on Form N-Q. The Funds’ Form N-Q is available electronically on the SEC’s website at http://www.sec.gov; hard copies may be reviewed and copied at the SEC’s Public Reference Room in Washington, DC. For more information on the Public Reference Room, call 1-800-SEC-0330. Each Fund’s complete schedule of portfolio holdings is also available on the Funds’ website at http://www.driehaus.com.
63
Table of Contents
Board Considerations in Connection with the Annual Review of the
Investment Advisory Agreement
The Board of Trustees of the Driehaus Mutual Funds (the “Trust”), including a majority of the Trustees who are not “interested persons” (as defined in the Investment Company Act of 1940, as amended) (the “Independent Trustees”), approved the renewal of the investment advisory agreement (the “Agreement”) with Driehaus Capital Management LLC (the “Adviser”) for Driehaus Active Income Fund (“LCMAX”), Driehaus Select Credit Fund (“DRSLX”) and Driehaus Event Driven Fund (“DEVDX”) (LCMAX, DRSLX and DEVDX are each a “Fund” and collectively, the “Funds”) on September 22, 2015 for an additional one-year term ending September 30, 2016. As part of its review process, the Board requested and evaluated all information it deemed reasonably necessary to evaluate the Agreement. The Board reviewed comprehensive materials received from the Adviser and from independent legal counsel. The Board also received extensive information throughout the year regarding performance and operating results of each Fund. The Independent Trustees held a conference call with their independent legal counsel on September 17, 2015 to review the materials provided in response to their request and identified areas for further response by Fund management. Following receipt of further responses from Fund management, the Independent Trustees, represented by independent legal counsel, met independent of Fund management to consider renewal of the Agreement for each Fund. After their consideration of all the information received, the Independent Trustees presented their findings and their recommendation to renew the Agreement to the full Board.
In connection with the contract review process, the Board considered the factors discussed below, among others. The Board also considered that the Adviser has managed each Fund for an extended period or since inception, and the Board believes that a long-term relationship with a capable, conscientious adviser is in the best interests of each Fund.
Nature, Quality and Extent of Services. The Board considered the nature, extent and quality of services provided under the Agreement, including portfolio management services and administrative services. The Board considered the experience and skills of senior management and investment personnel, the resources made available to such personnel, the ability of the Adviser to attract and retain high-quality personnel, and the organizational depth of the Adviser. The Board also considered the Trust’s compliance with legal and regulatory requirements, as well as the Adviser’s handling of portfolio brokerage, and noted the Adviser’s process for evaluating best execution. The Board considered the Adviser’s risk management strategies and the process developed by the Adviser for analyzing, reviewing and assessing risk exposure for the Funds. The Board also considered the Funds’ process for fair valuation of portfolio securities and noted the Board’s review of Fund valuation matters throughout the year.
The Board reviewed LCMAX’s performance, comparing it to the peer group of alternative credit focus funds compiled from Lipper Fund Data, an independent provider of mutual fund data that is a service of Thomson Reuters Corporation (“Lipper”), and to two benchmark indices for the year-to-date and 1-, 3- and 5-year periods ended June 30, 2015. The Board also received updated performance information through August 31, 2015. The Board noted the Adviser’s statement that there are limitations in comparing the performance of LCMAX to a peer group which consists of a broad collection of funds that may differ significantly by objective and portfolio characteristics. The Board considered that, although LCMAX underperformed the median of its peer group for the 3- and 5-year periods, it outperformed the median of its peer group for the year-to-date and 1-year periods and one of its benchmark indices, the Citigroup 3-Month T-Bill Index, for the year-to-date and 3- and 5-year periods. The Board also noted that, while LCMAX underperformed its other benchmark index, the Barclays Capital U.S. Aggregate Bond Index (“Barclays Index”), for the 1- and 5-year periods, LCMAX outperformed the Barclays Index for the 3-year period and had met its volatility objective of being less volatile than the Barclays Index. The Board also noted the significant level of assets retained in the Fund by existing shareholders, despite outflows in the industry category, reflecting their continuing satisfaction with the Fund, which has been closed to new investors because of capacity constraints.
The Board reviewed DRSLX’s performance, comparing it to the alternative credit focus funds peer group compiled from Lipper, and to two benchmark indices for the year-to-date and 1- and 3-year periods ended June 30, 2015 (the Fund’s inception date was September 30, 2010). The Board considered the Adviser’s statement regarding the limitations of the peer group. The Board noted that, although DRSLX’s performance was below the median of its peer group for the 1- and 3-year periods, performance was in the top quartile for the year-to-date period. The Board also noted that the Fund had outperformed one of its benchmark indices, the Citigroup 3-Month T-Bill Index, for the year-to-date and 3-year periods and underperformed the other benchmark index, the BofA Merrill Lynch US High Yield Index (“BofA Index”), for all periods reviewed. The Board noted that DRSLX had met its volatility objective of being less volatile than the BofA Index.
64
Table of Contents
The Board also reviewed DEVDX’s performance, comparing it to a peer group of alternative event driven funds compiled from Lipper and to two benchmark indices for the year-to-date and 1-year periods ended June 30, 2015 (the Fund’s inception date was August 26, 2013). The Board noted that the Fund’s performance was in the top decile of the peer group for the year-to-date period and below the median of the peer group for the 1-year period. The Board also noted that DEVDX underperformed both of its benchmark indices, the S&P 500 Index and the Citigroup 3-Month T-Bill Index, for the 1-year period, but considered that DEVDX had met its volatility objective.
The Board considered whether investment results for LCMAX, DRSLX and DEVDX, were consistent with each Fund’s investment objective and policies. The Board concluded that performance was satisfactory.
On the basis of this evaluation and its ongoing review of investment results, the Board concluded that the nature, quality and extent of services provided by the Adviser continue to be satisfactory.
Fees. The Board considered the Funds’ advisory fees, operating expenses and total expense ratios, and compared the advisory fees and expense ratios to peer groups based on data compiled from Lipper as of the fiscal year end of each fund in the peer groups. The Board noted certain limitations in comparing the fees and expense ratios of LCMAX and DRSLX to the peer group of funds designated by Lipper (the alternative credit focus funds peer group), as noted above. The Board noted that LCMAX’s annual advisory fee rate of .55% is in the 23rd percentile of the actual fees of its peer group (1st percentile being the highest fee), DRSLX’s advisory fee rate of .80% was in the 11th percentile of the actual fees of its peer group, and DEVDX’s advisory fee rate of 1.00% is in the 34th percentile of the actual fees of its peer group. In considering the reasonableness of the advisory fees, the Board took into account the substantial human and technological resources devoted to investing for the Funds and the limited capacity of the investment styles, noting that LCMAX and DRSLX are currently closed to new investors.
The Board also considered that for the fiscal year ended December 31, 2014, LCMAX and DRSLX’s expense ratios (excluding dividends and interest on short sales) were in the 85th and 58th percentile of their peer group, respectively. The Board noted that DEVDX’s expense ratio of 1.38% (excluding dividends and interest on short sales) for the six months ended June 30, 2015, was in the 70th percentile. The Board considered that the Adviser has agreed to reimburse DEVDX for any expenses in excess of 2.00% of average daily net assets (excluding interest, taxes, brokerage commissions, dividends and interest on short sales, other investment-related costs and extraordinary expenses) through August 25, 2016. The Board noted that the Adviser does not manage other accounts that are similar to the Funds. On the basis of the information provided, the Board concluded that the advisory fees were reasonable and appropriate in light of the nature and quality of services provided by the Adviser.
Profitability. The Board reviewed information regarding the revenues received by the Adviser under the Agreement and discussed the methodology in allocating its costs to the management of the Funds. The Board considered the estimated costs to the Adviser of each Fund. The Board noted that LCMAX and DRSLX are currently closed to new investors in order to maintain assets at a level that the Adviser feels is prudent, which limits these Funds’ profitability to the Adviser. The Board also noted that the Funds do not have a Rule 12b-1 fee and that the Adviser’s affiliate, Driehaus Securities LLC (“DS LLC”), serves as distributor of the Funds without compensation, that DS LLC provides compensation to intermediaries for distribution of the Funds’ shares and for shareholder services, and that DS LLC is reimbursed by the Funds under a Shareholder Services Plan for certain amounts paid for shareholder services covered under the Plan. The Board concluded that, based on the projected profitability calculated for the Trust as well as the Funds individually (noting that DEVDX was expected to be operated at a loss), the advisory fees appeared to be reasonable.
Economies of Scale. In considering the reasonableness of the advisory fee, the Board considered whether there are economies of scale with respect to the management of the Funds and whether the Funds benefit from any economies of scale. Given the capacity constraints of LCMAX and DRSLX and the current size of DEVDX, the Board concluded that the advisory fee rates under the Agreement are reasonable and reflect an appropriate sharing of any such economies of scale.
Other Benefits to the Adviser and its Affiliates. The Board also considered the character and amount of other incidental benefits received by the Adviser and its affiliates. The Board noted that payments to DS LLC under a Shareholder Services Plan are in reimbursement of payments made to intermediaries for shareholder services. The Board noted that there are no benefits to the Adviser related to soft dollar allocations for LCMAX or DRSLX and that the soft dollar amounts for DEVDX were limited during this period. The Board concluded that the advisory fees were reasonable in light of any fall-out benefits.
Based on all of the information considered and the conclusions reached, the Board determined that the terms of the Agreement continue to be fair and reasonable and that the continuation of the Agreement is in the best interests of each Fund. No single factor was determinative in the Board’s analysis.
65
Table of Contents
| Item 2. | Code of Ethics. |
| (a) | The registrant, as of the end of the period covered by this report, has adopted a code of ethics that applies to the registrant’s principal executive officer, principal financial officer, principal accounting officer or controller, or persons performing similar functions, regardless of whether these individuals are employed by the registrant or a third party. |
| (b) | No response required. |
| (c) | There have been no amendments, during the period covered by this report, to a provision of the code of ethics that applies to the registrant’s principal executive officer, principal financial officer, principal accounting officer or controller, or persons performing similar functions, regardless of whether these individuals are employed by the registrant or a third party, and that relates to any element of the code of ethics description. |
| (d) | The registrant has not granted any waivers, including an implicit waiver, from a provision of the code of ethics that applies to the registrant’s principal executive officer, principal financial officer, principal accounting officer or controller, or persons performing similar functions, regardless of whether these individuals are employed by the registrant or a third party, that relates to one or more of the items set forth in paragraph (b) of this item’s instructions. |
| (e) | Not applicable. |
| (f) | The registrant’s Code of Ethics for Principal Executive and Financial Officers was filed as Exhibit 12(a)(1) to the registrant’s Certified Shareholder Report on Form N-CSR, Accession Number 0001193125-12-093739, on March 2, 2012, and is incorporated herein by reference. |
| Item 3. | Audit Committee Financial Expert. |
The registrant’s Board of Trustees has designated Dawn M. Vroegop as an audit committee financial expert. Ms. Vroegop is “independent,” as defined by this Item 3.
| Item 4. | Principal Accountant Fees and Services. |
| (a) | Audit Fees |
For the fiscal years ended December 31, 2015 and 2014, Ernst & Young LLP, the registrant’s principal accountant (“E&Y”), billed the registrant $348,000 and $343,000, respectively, for professional services rendered for the audit of the registrant’s annual financial statements or services that are normally provided in connection with statutory and regulatory filings.
Table of Contents
| (b) | Audit-Related Fees |
For the fiscal years ended December 31, 2015 and 2014, E&Y billed the registrant $0 and $0, respectively, for assurance and related services that are reasonably related to the performance of the audit of the registrant’s financial statements and that are not reported above.
For engagements that Driehaus Capital Management LLC, the registrant’s investment adviser (“DCM”), or Driehaus Securities LLC, the registrant’s distributor (“DS”), entered into with E&Y for fiscal years 2015 and 2014, E&Y provided no audit-related services to DCM or DS that were for engagements directly related to the registrant’s operations and financial reporting, except for the issuance of a consent in connection with the filing of a Form N-14 in 2014 for the registrant, for which E&Y billed DCM $10,500. This engagement was pre-approved by the registrant’s Audit Committee.
| (c) | Tax Fees |
For the fiscal years ended December 31, 2015 and 2014, E&Y billed the registrant $68,995 and $75,961, respectively, for professional services rendered for tax compliance, tax advice, and tax planning. Such services consisted of review of the registrant’s income tax returns and tax distribution requirements and analysis related to passive foreign investment company status. The Audit Committee pre-approved all tax services that E&Y provided to the registrant.
For fiscal years 2015 and 2014, E&Y provided no tax services to DCM or DS that were for engagements directly related to the registrant’s operations and financial reporting.
| (d) | All Other Fees |
For the fiscal years ended December 31, 2015 and 2014, E&Y billed the registrant $0 and $0, respectively, for products and services provided, other than the services reported above.
For fiscal years 2015 and 2014, E&Y provided no other services to DCM or DS that were for engagements directly related to the registrant’s operations and financial reporting.
| (e)(1) | Audit Committee Pre-Approval Policies and Procedures |
Pursuant to registrant’s Audit Committee Charter (the “Charter”), the Audit Committee is responsible for pre-approving any engagement of the principal accountant to provide non-prohibited services to the registrant, including the fees and other compensation to be paid to the principal accountant, to the extent required by Rule 2-01(c)(7) of Regulation S-X. The Chairman of the Audit Committee may grant pre-approval for such engagements of $5,000 or less. All such delegated pre-approvals will be presented to the Audit Committee no later than the next Audit Committee meeting.
Pursuant to the Charter, the Audit Committee is also responsible for pre-approving any engagement of the principal accountant, including the fees and other compensation to be paid to the principal accountant, to provide non-audit services to the registrant’s investment adviser (or any entity controlling, controlled by, or under common control with the adviser that provides ongoing services to the registrant), if the engagement relates directly to the operations and
Table of Contents
financial reporting of the registrant, to the extent required by Rule 2-01(c)(7) of Regulation S-X. The Chairman of the Audit Committee may grant pre-approval for engagements of $5,000 or less. All such delegated pre-approvals will be presented to the Audit Committee no later than the next Audit Committee meeting.
| (e)(2) | The percentage of services described in each of paragraphs (b) through (d) of this Item that were approved by the audit committee pursuant to paragraph (c)(7)(i)(C) of Rule 2-01 of Regulation S-X is 0%. |
| (f) | Not applicable. |
| (g) | Non-Audit Fees |
For the fiscal years ended December 31, 2015 and 2014, E&Y billed the registrant $68,995 and $75,961, respectively, in aggregate non-audit fees. For the fiscal years ended December 31, 2015 and 2014, E&Y billed DCM or DS $0 and $0, respectively, in aggregate non-audit fees.
| (h) | Not applicable. |
| Item 5. | Audit Committee of Listed Registrants. |
Not applicable.
| Item 6. | Investments. |
| (a) | Schedule of Investments in securities of unaffiliated issuers as of the close of the reporting period is included as part of the report to shareholders filed under Item 1 of this form. |
| (b) | Not applicable. |
| Item 7. | Disclosure of Proxy Voting Policies and Procedures for Closed-End Management Investment Companies. |
Not applicable.
| Item 8. | Portfolio Managers of Closed-End Management Investment Companies. |
Not applicable.
| Item 9. | Purchases of Equity Securities by Closed-End Management Investment Company and Affiliated Purchasers. |
Not applicable.
Table of Contents
| Item 10. | Submission of Matters to a Vote of Security Holders. |
There have been no material changes to the procedures by which the shareholders may recommend nominees to the registrant’s board of directors, where those changes were implemented after the registrant last provided disclosure in response to the requirements of Item 407(c)(2)(iv) of Regulation S-K (17 CFR 229.407) (as required by Item 22(b)(15) of Schedule 14A (17 CFR 240.14a-101)), or this Item.
| Item 11. | Controls and Procedures. |
| (a) | The registrant’s principal executive and principal financial officers, or persons performing similar functions, have concluded that the registrant’s disclosure controls and procedures (as defined in Rule 30a-3(c) under the Investment Company Act of 1940, as amended (the “1940 Act”) (17 CFR 270.30a-3(c))) are effective, as of a date within 90 days of the filing date of the report that includes the disclosure required by this paragraph, based on their evaluation of these controls and procedures required by Rule 30a-3(b) under the 1940 Act (17 CFR 270.30a-3(b)) and Rules 13a-15(b) or 15d-15(b) under the Securities Exchange Act of 1934, as amended (17 CFR 240.13a-15(b) or 240.15d-15(b)). |
| (b) | There were no changes in the registrant’s internal control over financial reporting (as defined in Rule 30a-3(d) under the 1940 Act (17 CFR 270.30a-3(d)) that occurred during the registrant’s second fiscal quarter of the period covered by this report that has materially affected, or is reasonably likely to materially affect, the registrant’s internal control over financial reporting. |
| Item 12. | Exhibits. |
| (a)(1) | Code of ethics, or any amendment thereto, that is the subject of disclosure required by Item 2, filed as Exhibit 12(a)(1) to the Registrant’s Form N-CSR, filed on March 2, 2012 (Accession No. 0001193125-12-093738) incorporated herein by reference. |
| (a)(2) | Certifications pursuant to Rule 30a-2(a) under the 1940 Act and Section 302 of the Sarbanes-Oxley Act of 2002 are attached hereto. |
| (a)(3) | Not applicable. |
| (b) | Certifications pursuant to Rule 30a-2(b) under the 1940 Act and Section 906 of the Sarbanes-Oxley Act of 2002 are attached hereto. |
Table of Contents
SIGNATURES
Pursuant to the requirements of the Securities Exchange Act of 1934 and the Investment Company Act of 1940, the registrant has duly caused this report to be signed on its behalf by the undersigned, thereunto duly authorized.
| (Registrant) | Driehaus Mutual Funds | |
| By (Signature and Title) * | /s/ Robert H. Gordon | |
Robert H. Gordon, President (principal executive officer) | ||
| Date March 4, 2016 | ||
Pursuant to the requirements of the Securities Exchange Act of 1934 and the Investment Company Act of 1940, this report has been signed below by the following persons on behalf of the registrant and in the capacities and on the dates indicated.
| By (Signature and Title) * | /s/ Robert H. Gordon | |
Robert H. Gordon, President (principal executive officer) | ||
| Date March 4, 2016 | ||
| By (Signature and Title) * | /s/ Michelle L. Cahoon | |
Michelle L. Cahoon, Vice President and Treasurer (principal financial officer) | ||
| Date March 4, 2016 | ||
| * | Print the name and title of each signing officer under his or her signature. |