UNITED STATES
SECURITIES AND EXCHANGE COMMISSION
Washington, D.C. 20549
FORM N-CSR
CERTIFIED SHAREHOLDER REPORT OF REGISTERED MANAGEMENT
INVESTMENT COMPANIES
Investment Company Act file number 811-07655
Driehaus Mutual Funds
(Exact name of registrant as specified in charter)
25 East Erie Street
Chicago, IL 60611
(Address of principal executive offices) (Zip code)
Janet L. McWilliams
Driehaus Capital Management LLC
25 East Erie Street
Chicago, IL 60611
(Name and address of agent for service)
Registrant’s telephone number, including area code: 312-587-3800
Date of fiscal year end: December 31
Date of reporting period: December 31, 2013
Form N-CSR is to be used by management investment companies to file reports with the Commission not later than 10 days after the transmission to stockholders of any report that is required to be transmitted to stockholders under Rule 30e-1 under the Investment Company Act of 1940 (17 CFR 270.30e-1). The Commission may use the information provided on Form N-CSR in its regulatory, disclosure review, inspection, and policymaking roles.
A registrant is required to disclose the information specified by Form N-CSR, and the Commission will make this information public. A registrant is not required to respond to the collection of information contained in Form N-CSR unless the Form displays a currently valid Office of Management and Budget (“OMB”) control number. Please direct comments concerning the accuracy of the information collection burden estimate and any suggestions for reducing the burden to Secretary, Securities and Exchange Commission, 100 F Street, NE, Washington, DC 20549. The OMB has reviewed this collection of information under the clearance requirements of 44 U.S.C. § 3507.
Item 1. Reports to Stockholders.
Driehaus Mutual Funds
Trustees & Officers
Richard H. Driehaus
Trustee
A.R. Umans
Chairman of the Board
Theodore J. Beck
Trustee
Francis J. Harmon
Trustee
Dawn M. Vroegop
Trustee
Daniel F. Zemanek
Trustee
Robert H. Gordon
President
Michelle L. Cahoon
Vice President & Treasurer
Janet L. McWilliams
Assistant Vice President &
Chief Legal Officer
Michael R. Shoemaker
Chief Compliance Officer &
Assistant Vice President
Diane J. Drake
Secretary
Michael P. Kailus
Assistant Secretary &
Anti-Money Laundering Compliance Officer
William H. Wallace, III
Assistant Secretary
Investment Adviser
Driehaus Capital Management LLC
25 East Erie Street
Chicago, IL 60611
Distributor
Driehaus Securities LLC
25 East Erie Street
Chicago, IL 60611
Administrator & Transfer agent
BNY Mellon Investment Servicing (US) Inc.
4400 Computer Drive
Westborough, MA 01581
Custodian
The Northern Trust Company
50 South LaSalle Street
Chicago, IL 60603
Annual Report to Shareholders
December 31, 2013

Driehaus International Discovery Fund
Driehaus Emerging Markets Growth Fund
Driehaus Emerging Markets Small Cap Growth Fund
Driehaus International Small Cap Growth Fund
Driehaus Global Growth Fund
Driehaus Mid Cap Growth Fund
Driehaus Micro Cap Growth Fund
Distributed by:
Driehaus Securities LLC
This report has been prepared for the shareholders of the Funds and is not an offering to sell or buy any Fund securities. Such offering is only made by the Funds' prospectus.
Investment Philosophy:
The Adviser seeks to achieve superior investment returns primarily by investing in global companies that are currently demonstrating rapid growth in their sales and earnings and which, in its judgement, have the ability to continue or accelerate their growth rates in the future. The Adviser manages the portfolios actively (above average turnover) to ensure that the Funds are fully invested, under appropriate market conditions, in companies that meet these criteria. Investors should note that investments in overseas markets can pose more risks than U.S. investments, and the international Funds’ share prices are expected to be more volatile than those of the U.S.-only Funds. In addition, the Funds’ returns will fluctuate with changes in stock market conditions, currency values, interest rates, government regulations, and economic and political conditions in countries in which the Funds invest. These risks are generally greater when investing in emerging markets.
Annual Report to Shareholders December 31, 2013
Driehaus International Discovery Fund
Driehaus Emerging Markets Growth Fund
Driehaus Emerging Markets Small Cap Growth Fund
Driehaus International Small Cap Growth Fund
Driehaus Global Growth Fund
Driehaus Mid Cap Growth Fund
Driehaus Micro Cap Growth Fund
Portfolio Managers’ Letter, Performance Overview and Schedule of Investments: | ||||
| 1 | ||||
| 7 | ||||
| 15 | ||||
| 23 | ||||
| 29 | ||||
| 35 | ||||
| 40 | ||||
| 46 | ||||
| 48 | ||||
| 50 | ||||
| 53 | ||||
| 60 | ||||
| 72 | ||||
| 73 | ||||
| 75 | ||||
| 76 | ||||
| 78 | ||||
Board Considerations in Connection with the Annual Review of the Investment Advisory Agreement | 79 | |||
Board Considerations in Connection with the Initial Approval of the Investment Advisory Agreement for Driehaus Micro Cap Growth Fund | 82 | |||
Driehaus International Discovery Fund — Portfolio Managers’ Letter
Dear Fellow Shareholders,
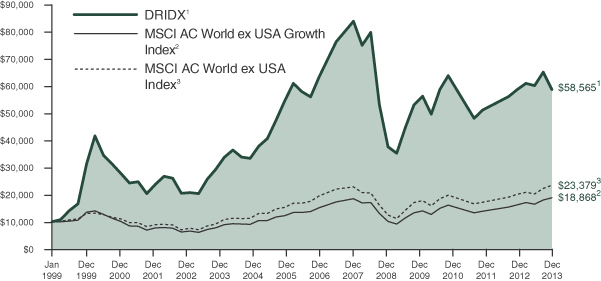
The Driehaus International Discovery Fund (“Fund”) returned 17.09% for the year ended December 31, 2013. This return was above the performance of the Morgan Stanley Capital International (“MSCI”) All Country World ex USA Growth Index (“Benchmark”), which returned 15.86% for the year, as well as the MSCI All Country World ex USA Index, which returned 15.78%.
International equities closed 2013 on a strong note. Risk sentiment was aided by continuing positive data and a lack of destabilizing events during the year, with one of the largest positive surprises coming in the form of the European Central Bank’s (ECB) rate cut in November. Developed markets led global equities during 2013. For the year, German equities posted some of the strongest returns. The Japanese market also brought investors a stunning return in Japanese yen terms. Equity advances were broad-based across developed markets, with only commodity-driven countries failing to see substantial advances. All of the countries with negative returns were found within the emerging markets, with Indonesia and Brazil posting the worst returns for the year.
Over the course of 2013, key contributors to performance versus the Benchmark were the Fund’s holdings in the financials and industrials sectors. In addition, stock selection in China and Taiwan contributed to the performance of the Fund.
A notable contribution to the Fund’s return for the year came from industrials holding Safran SA (Ticker: SAF FP). Safran is a leading provider of engines and equipment to the aerospace market. During the last three years, Safran’s revenues increased at an average growth rate of 9% and its net operating margin has improved from 7% to 9%. Consensus earnings growth estimates have been revised higher.
China-based New Oriental Education & Technology Group, Inc. (Ticker: EDU) was a significant contributor to returns relative to the Benchmark during 2013. New Oriental Education is a provider of private educational services in China, offering a range of educational programs teaching English, test preparation courses and K-12 after school tutoring. After several years of pursuing revenue growth at the expense of margins, in 2013 the market rewarded New Oriental Education’s renewed focus on margin expansion in addition to revenue growth.
Certain areas detracted from Fund performance during the year. Two sectors that negatively affected the performance of the Fund relative to the Benchmark were the information technology and energy sectors. Additionally, holdings in Switzerland and Germany detracted from Fund performance versus the Benchmark.
Holding Brasil Pharma SA (Ticker: BPHA3 BZ) was the most significant detractor to the Fund’s performance during 2013. Brasil Pharma is a Brazil-based company engaged in the pharmaceutical retail sector. The company operates proprietary drugstores, and provides supply chain and logistics services for franchised stores. The share price suffered from a series of operational challenges during the year, with gross margins impacted early on, inflated operating expenses in the middle of the year, and a deceleration in store openings late in the year. The stock failed to recover as each operational problem solved was followed by a new challenge. Moreover, when slower store openings brought future growth into question, the stock did not rebound to its historical valuation multiple relative to earnings power.
Energy holding Subsea 7 SA (Ticker: SUBC NO) was a significant detractor from the Fund’s return during the year. Subsea 7 is a seabed-to-surface engineering, construction and services contractor for the energy industry. Subsea 7 faced cost management challenges in its Brazilian operations, causing investors to question the underlying profitability of its booked project backlog. During the year, the offshore engineering and services industry faced increasing investor skepticism regarding growth beyond the current fiscal year in oil companies’ offshore capital expenditures.
As we enter 2014, many of last year’s macro concerns look likely to fade. Encouraging signs include the Federal Reserve’s announcement that it will finally commence tapering bond purchases amid stronger and more sustainable U.S. growth, as well as broad euro zone growth — including in the U.K. — starting to gain some traction. At the same time, there remains uncertainty surrounding China’s ongoing commitment to economic rebalancing and Japan’s continuing implementation of monetary stimulus and tax reform. All of these taken together present challenges and opportunities as we begin the year. While mindful of the ongoing macro risks, we are encouraged by the opportunities we see in the global equity markets. That said, 2013 saw
1
strong broad gains, particularly in developed markets, driven more by multiple expansion and less by earnings growth. We believe 2014 will see more company differentiation and be more of a stock picker’s market.
As always, we remain committed to uncovering attractive growth equity investment opportunities that we believe will adequately compensate our shareholders for the risk taken with their capital. Thank you for your continued confidence in our management capabilities and your interest in the Driehaus International Discovery Fund.
Sincerely,
 |  |  | ||
| Daniel M. Rea | Sebastien Pigeon | Joshua Rubin | ||
| Portfolio Manager | Assistant Portfolio Manager | Assistant Portfolio Manager |
Performance is historical and does not represent future results.
Please see the following performance overview page for index descriptions.
2
Driehaus International Discovery Fund
Performance Overview (unaudited)
The performance summarized below is historical and does not represent future results. Investment returns and principal value vary, and you may have a gain or loss when you sell shares. Performance data presented measures the change in the value of an investment in the Fund, assuming reinvestment of all dividends and capital gains. Average annual total return reflects annualized change.
The table does not reflect the deduction of taxes that a shareholder would pay on Fund distributions or the redemption of Fund shares. The graph compares the results of a $10,000 investment in the Fund since December 31, 1998 (the date of the Fund’s inception), with all dividends and capital gains reinvested, with the indicated indices (and dividends reinvested) for the same period.
| Average Annual Total Returns as of 12/31/13 | 1 Year | 3 Years | 5 Years | 10 Years | Since Inception (12/31/98 - 12/31/13) | |||||||||||||||
Driehaus International Discovery Fund (DRIDX)1 | 17.09% | 2.50% | 12.78% | 7.36% | 13.70% | |||||||||||||||
MSCI AC World ex USA Growth Index2 | 15.86% | 5.29% | 13.28% | 7.70% | 4.32% | |||||||||||||||
MSCI AC World ex USA Index3 | 15.78% | 5.61% | 13.32% | 8.03% | 5.82% | |||||||||||||||
| 1 | The returns for the periods prior to July 1, 2003, reflect fee waivers and/or reimbursements without which performance would have been lower. |
| 2 | The Morgan Stanley Capital International All Country World ex USA Growth Index (MSCI AC World ex USA Growth Index) is a subset of the MSCI AC World ex USA Index and is composed only of the MSCI AC World ex USA Index stocks which are categorized as growth stocks. Data is in U.S. dollars. Source: Morgan Stanley Capital International Inc. |
| 3 | The Morgan Stanley Capital International All Country World ex USA Index (MSCI AC World ex USA Index) is a market capitalization-weighted index designed to measure equity market performance in 44 global developed and emerging markets, excluding the U.S. Data is in U.S. dollars. Source: Morgan Stanley Capital International Inc. |
3
Driehaus International Discovery Fund
Schedule of Investments
December 31, 2013
| Number of Shares | Value (Note A) | |||||||
| EQUITY SECURITIES — 98.2% | ||||||||
| EUROPE — 49.5% | ||||||||
United Kingdom — 19.8% |
| |||||||
Aberdeen Asset Management PLC | 263,792 | $ | 2,184,142 | |||||
African Minerals, Ltd.** | 209,508 | 687,802 | ||||||
ARM Holdings PLC | 102,402 | 1,863,612 | ||||||
Ashtead Group PLC | 197,855 | 2,490,061 | ||||||
Associated British Foods PLC | 36,518 | 1,478,547 | ||||||
Barratt Developments PLC | 278,622 | 1,610,238 | ||||||
Booker Group PLC | 252,704 | 680,009 | ||||||
Countrywide PLC | 237,581 | 2,340,874 | ||||||
Croda International PLC | 44,214 | 1,798,930 | ||||||
Genel Energy PLC** | 115,600 | 2,057,859 | ||||||
Halma PLC | 204,966 | 2,048,370 | ||||||
Hays PLC | 714,574 | 1,535,929 | ||||||
Rolls-Royce Holdings PLC | 75,493 | 1,593,919 | ||||||
St. James’s Place PLC | 236,982 | 2,856,907 | ||||||
Tullow Oil PLC | 95,406 | 1,350,800 | ||||||
|
| |||||||
| 26,577,999 | ||||||||
|
| |||||||
France — 6.3% |
| |||||||
Casino Guichard Perrachon SA | 19,764 | 2,277,659 | ||||||
Edenred | 54,226 | 1,814,993 | ||||||
Eurofins Scientific | 5,169 | 1,397,315 | ||||||
Ingenico | 9,378 | 751,891 | ||||||
Safran SA | 32,422 | 2,252,903 | ||||||
|
| |||||||
| 8,494,761 | ||||||||
|
| |||||||
Netherlands — 4.5% |
| |||||||
Airbus Group NV | 13,992 | 1,074,279 | ||||||
ASML Holding NV | 7,205 | 674,409 | ||||||
LyondellBasell Industries NV — A | 27,550 | 2,211,714 | ||||||
Sensata Technologies Holding NV** | 54,963 | 2,130,916 | ||||||
|
| |||||||
| 6,091,318 | ||||||||
|
| |||||||
Ireland — 4.1% |
| |||||||
Covidien PLC | 15,061 | 1,025,654 | ||||||
Eaton Corp. PLC | 29,934 | 2,278,576 | ||||||
Experian PLC | 72,714 | 1,341,382 | ||||||
Jazz Pharmaceuticals PLC** | 6,214 | 786,444 | ||||||
|
| |||||||
| 5,432,056 | ||||||||
|
| |||||||
Norway — 3.9% |
| |||||||
Gjensidige Forsikring ASA | 70,623 | 1,347,185 | ||||||
Seadrill, Ltd. | 44,068 | 1,798,961 | ||||||
Telenor ASA | 84,780 | 2,021,201 | ||||||
|
| |||||||
| 5,167,347 | ||||||||
|
| |||||||
Switzerland — 3.7% |
| |||||||
Cie Financiere Richemont SA | 14,798 | 1,473,082 | ||||||
Glencore Xstrata PLC | 131,354 | 680,175 | ||||||
Roche Holding AG | 10,081 | 2,816,193 | ||||||
|
| |||||||
| 4,969,450 | ||||||||
|
| |||||||
| Number of Shares | Value (Note A) | |||||||
Germany — 2.8% |
| |||||||
Adidas AG | 17,118 | $ | 2,181,609 | |||||
Aurelius AG | 37,824 | 1,535,023 | ||||||
|
| |||||||
| 3,716,632 | ||||||||
|
| |||||||
Denmark — 2.8% |
| |||||||
Christian Hansen Holding AS | 27,700 | 1,100,287 | ||||||
GN Store Nord AS | 105,174 | 2,583,408 | ||||||
|
| |||||||
| 3,683,695 | ||||||||
|
| |||||||
Italy — 1.0% |
| |||||||
Moncler SpA** | 63,498 | 1,380,201 | ||||||
Spain — 0.6% |
| |||||||
Viscofan SA | 13,144 | 747,702 | ||||||
|
| |||||||
Total EUROPE | 66,261,161 | |||||||
|
| |||||||
| FAR EAST — 37.8% | ||||||||
Japan — 19.5% |
| |||||||
Calbee, Inc. | 52,258 | 1,267,868 | ||||||
Daikin Industries, Ltd. | 16,208 | 1,008,094 | ||||||
Denso Corp. | 27,695 | 1,459,569 | ||||||
Digital Garage, Inc. | 58,553 | 1,519,565 | ||||||
Hulic Co., Ltd. | 182,868 | 2,700,216 | ||||||
Kakaku.com, Inc. | 47,363 | 830,685 | ||||||
Kanamoto Co., Ltd. | 67,355 | 1,709,618 | ||||||
M3, Inc. | 548 | 1,371,171 | ||||||
Sawai Pharmaceutical Co., Ltd. | 16,776 | 1,083,248 | ||||||
Seiko Holdings Corp. | 133,716 | 657,724 | ||||||
Seino Holdings Co., Ltd. | 83,245 | 871,895 | ||||||
Softbank Corp. | 26,990 | 2,357,877 | ||||||
Sugi Holdings Co., Ltd. | 32,315 | 1,311,809 | ||||||
Tokai Tokyo Financial Holdings, Inc. | 252,979 | 2,440,667 | ||||||
Tokio Marine Holdings, Inc. | 57,769 | 1,928,193 | ||||||
Tokyo Tatemono Co., Ltd. | 66,057 | 732,642 | ||||||
TS Tech Co., Ltd. | 36,485 | 1,228,177 | ||||||
Yaskawa Electric Corp. | 44,364 | 700,573 | ||||||
Zenkoku Hosho Co., Ltd. | 21,487 | 938,564 | ||||||
|
| |||||||
| 26,118,155 | ||||||||
|
| |||||||
China — 10.3% |
| |||||||
AIA Group, Ltd. | 417,639 | 2,095,116 | ||||||
Baidu, Inc. — SP ADR** | 12,416 | 2,208,558 | ||||||
New Oriental Education & Technology Group, Inc. — SP ADR | 93,254 | 2,937,501 | ||||||
Sohu.com, Inc.** | 19,418 | 1,416,155 | ||||||
Techtronic Industries Co. | 375,433 | 1,065,154 | ||||||
Tencent Holdings, Ltd. | 30,840 | 1,967,097 | ||||||
Vipshop Holdings, Ltd. — ADR** | 24,555 | 2,054,762 | ||||||
|
| |||||||
| 13,744,343 | ||||||||
|
| |||||||
Notes to Financial Statements are an integral part of this Schedule.
4
Driehaus International Discovery Fund
Schedule of Investments
December 31, 2013
| Number of Shares | Value (Note A) | |||||||
Philippines — 2.2% |
| |||||||
Puregold Price Club, Inc. | 1,673,179 | $ | 1,428,795 | |||||
Robinsons Retail Holdings, Inc.** | 1,256,558 | 1,562,823 | ||||||
|
| |||||||
| 2,991,618 | ||||||||
|
| |||||||
Taiwan — 1.6% |
| |||||||
Chailease Holding Co., Ltd. | 359,469 | 945,606 | ||||||
Ginko International Co., Ltd. | 61,350 | 1,158,926 | ||||||
|
| |||||||
| 2,104,532 | ||||||||
|
| |||||||
Singapore — 1.2% |
| |||||||
Global Logistic Properties, Ltd. | 717,757 | 1,643,740 | ||||||
Cambodia — 1.0% |
| |||||||
NagaCorp, Ltd. | 1,332,635 | 1,404,076 | ||||||
Australia — 1.0% |
| |||||||
CSL, Ltd. | 21,377 | 1,316,271 | ||||||
Malaysia — 0.9% |
| |||||||
Astro Malaysia Holdings BHD | 1,341,555 | 1,228,718 | ||||||
Thailand — 0.1% |
| |||||||
Minor International PCL — NVDR | 171,520 | 108,048 | ||||||
|
| |||||||
Total FAR EAST | 50,659,501 | |||||||
|
| |||||||
| NORTH AMERICA — 8.4% | ||||||||
Canada — 5.6% |
| |||||||
Canadian Pacific Railway, Ltd. | 13,087 | 1,980,325 | ||||||
Dollarama, Inc. | 29,180 | 2,423,128 | ||||||
Intact Financial Corp. | 26,833 | 1,752,323 | ||||||
Methanex Corp. | 6,865 | 406,683 | ||||||
Pacific Rubiales Energy Corp. | 52,991 | 912,907 | ||||||
|
| |||||||
| 7,475,366 | ||||||||
|
| |||||||
Mexico — 2.8% |
| |||||||
Bolsa Mexicana de Valores SAB de CV | 537,600 | 1,232,365 | ||||||
| Number of Shares | Value (Note A) | |||||||
Fibra Uno Administracion SA de CV — REIT | 783,946 | $ | 2,510,981 | |||||
|
| |||||||
| 3,743,346 | ||||||||
|
| |||||||
Total NORTH AMERICA | 11,218,712 | |||||||
|
| |||||||
| SOUTH AMERICA — 2.0% | ||||||||
Peru — 1.5% |
| |||||||
Credicorp, Ltd. | 14,746 | 1,957,237 | ||||||
Brazil — 0.5% |
| |||||||
Kroton Educacional SA | 44,898 | 747,142 | ||||||
|
| |||||||
Total SOUTH AMERICA | 2,704,379 | |||||||
|
| |||||||
| MIDDLE EAST — 0.5% | ||||||||
Israel — 0.5% |
| |||||||
CaesarStone Sdot-Yam, Ltd. | 13,404 | 665,777 | ||||||
|
| |||||||
Total MIDDLE EAST | 665,777 | |||||||
|
| |||||||
Total EQUITY SECURITIES (Cost $111,616,188) | 131,509,530 | |||||||
|
| |||||||
| ||||||||
TOTAL INVESTMENTS (COST $111,616,188) | 98.2 | % | $ | 131,509,530 | ||||
Other Assets In Excess Of Liabilities | 1.8 | % | 2,377,822 | |||||
|
|
|
| |||||
| Net Assets | 100.0 | % | $ | 133,887,352 | ||||
| ||||||||
The federal income tax basis and unrealized appreciation (depreciation) for all investments is as follows:
| Basis: | $ | 112,681,386 | ||
|
| |||
| Gross Appreciation | $ | 21,280,134 | ||
| Gross Depreciation | (2,451,990 | ) | ||
|
| |||
Net Appreciation | $ | 18,828,144 | ||
|
|
** Non-income producing security
ADR — American Depository Receipt
NVDR — Non-Voting Depository Receipt
REIT — Real Estate Investment Trust
SP ADR — Sponsored American Depository Receipt
Regional Weightings*
Western Europe | 49.5% | |||
Japan | 19.5% | |||
Asia/Far East Ex-Japan | 18.3% | |||
North America | 8.4% | |||
South America | 2.0% | |||
Middle East | 0.5% |
Top Ten Holdings*
New Oriental Education & Technology Group, Inc. — SP ADR | 2.2% | |||
St. James’s Place PLC | 2.1% | |||
Roche Holding AG | 2.1% | |||
Hulic Co., Ltd. | 2.0% | |||
GN Store Nord AS | 2.0% | |||
Fibra Uno Administracion SA de CV — REIT | 1.9% | |||
Ashtead Group PLC | 1.9% | |||
Tokai Tokyo Financial Holdings, Inc. | 1.8% | |||
Dollarama, Inc. | 1.8% | |||
Softbank Corp. | 1.8% |
| * | All percentages are stated as a percent of net assets at December 31, 2013. |
Notes to Financial Statements are an integral part of this Schedule.
5
Driehaus International Discovery Fund
Schedule of Investments
December 31, 2013
Industry | Percent of Net Assets | |||
Aerospace & Defense | 3.7% | |||
Auto Components | 2.0% | |||
Biotechnology | 1.0% | |||
Building Products | 0.8% | |||
Capital Markets | 4.6% | |||
Chemicals | 4.1% | |||
Commercial Banks | 1.5% | |||
Commercial Services & Supplies | 1.4% | |||
Construction Materials | 0.5% | |||
Diversified Consumer Services | 2.8% | |||
Diversified Financial Services | 2.3% | |||
Diversified Telecommunication Services | 1.5% | |||
Electrical Equipment | 3.3% | |||
Electronic Equipment, Instruments & Components | 2.6% | |||
Energy Equipment & Services | 1.3% | |||
Food & Staples Retailing | 5.4% | |||
Food Products | 2.6% | |||
Health Care Equipment & Supplies | 3.6% | |||
Health Care Technology | 1.0% | |||
Hotels, Restaurants & Leisure | 1.1% | |||
Industry | Percent of Net Assets | |||
Household Durables | 2.0% | |||
Insurance | 7.5% | |||
Internet & Catalog Retail | 1.5% | |||
Internet Software & Services | 4.8% | |||
Information Technology Services | 1.1% | |||
Life Sciences Tools & Services | 1.0% | |||
Media | 1.0% | |||
Metals & Mining | 1.0% | |||
Multi-line Retail | 1.8% | |||
Oil, Gas & Consumable Fuels | 3.2% | |||
Pharmaceuticals | 3.5% | |||
Professional Services | 2.1% | |||
Real Estate Investment Trusts | 1.9% | |||
Real Estate Management & Development | 5.5% | |||
Road & Rail | 2.1% | |||
Semiconductors & Semiconductor Equipment | 1.9% | |||
Textiles, Apparel & Luxury Goods | 4.3% | |||
Trading Companies & Distributors | 3.1% | |||
Wireless Telecommunication Services | 1.8% | |||
Other Assets in Excess of Liabilities | 1.8% | |||
|
| |||
TOTAL | 100.0% | |||
|
| |||
Notes to Financial Statements are an integral part of this Schedule.
6
Driehaus Emerging Markets Growth Fund — Portfolio Managers’ Letter
Dear Fellow Shareholders,
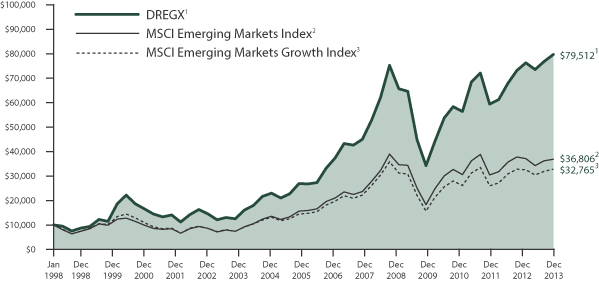
The Driehaus Emerging Markets Growth Fund (“Fund”) returned 8.92% for the year ended December 31, 2013. This return was above the performance of the Morgan Stanley Capital International (“MSCI”) Emerging Markets Index (“Benchmark”), which returned -2.27% for the year, as well as the MSCI Emerging Markets Growth Index return of 0.07%.
During 2013, the global economy finally started showing signs of self-sustaining growth. While still quite tepid and below trend, the acceleration in growth was a welcome change from the slowdown of the past several years. Similar to the relative performances of equity markets, the economic rebound was most clearly visible in the U.S., somewhat less convincing in other developed markets, and non-existent in the emerging markets as external demand remained insufficient to overpower other headwinds.
A deteriorating growth outlook throughout most of the year combined with a normalizing Federal Reserve interest rate policy contributed to the underperformance of developing economies. The Fed’s talk of tapering bond purchases was particularly damaging to developing countries running high current account and fiscal deficits, as these economies saw their currencies come under pressure. All of the countries with negative returns for the year were found within the emerging markets, with Indonesia, Brazil and Thailand posting the steepest losses.
Within China, the economy’s slowing growth fueled worries that global growth might stall. While signs of slowing economies were seen across the region, data releases during the second half of the year indicated that China’s growth rate was beginning to firm. India struggled during the year as a weakening currency and inflation hurt growth within the country. Actions by its central bank did not stop the country’s equity market from posting a negative return for the year, in U.S. dollar terms. Within Latin America, Brazil’s equity market also was pushed lower by inflation and rising interest rates.
Over the course of 2013, key contributors to performance versus the Benchmark were the Fund’s holdings in the information technology and consumer discretionary sectors. In addition, stock selection in China and Hong Kong contributed positively to the performance of the Fund.
The largest contributor to the Fund’s absolute returns in 2013 was information technology holding Tencent Holdings, Ltd. (Ticker: 700 HK). Tencent Holdings is a Chinese investment holding company whose subsidiaries provide mass media, entertainment, Internet and mobile phone value-added services, and operate online advertising services in China. The company’s shares advanced steadily throughout the year as it saw strong revenue and earnings per share growth. Notably, Tencent Holding’s e-commerce market share expanded during the year and it is now the third largest in the e-commerce market.
Within the consumer discretionary sector, Sands China, Ltd. (Ticker: 1928 HK) was a significant contributor to the Fund’s return. Sands China is an investment holding company that, along with its subsidiaries, is engaged in the development and operation of integrated resorts in Macao, which is a Special Administration Region within China. Sands China is one of Macao’s premium resorts. Revenue and earnings growth remain robust and the company continues to expand its gaming and entertainment options.
Relative to the Benchmark, all sectors contributed to returns for 2013. On an absolute basis, the materials and energy sector detracted from returns. At the country level, South Korea and Poland detracted from Fund performance versus the Benchmark.
The most significant detractor from the Fund’s return for the year was the South Korean company Samsung Electronics Co., Ltd. (Ticker: 005930 KS). Samsung is mainly engaged in the production of consumer electronic products. While the Fund maintained an average underweight to Samsung during the year, the company’s weak performance hurt absolute returns for the period. The strength of the South Korean Won and market share gains by competitor Apple weighed on Samsung, whose share price declined in the fourth quarter.
Fund holding China Shenhua Energy Co., Ltd. (1088 HK) was the largest detractor from absolute returns within the energy sector. China Shenhua is an integrated energy company, whose businesses include coal mining, thermal energy production and coal transportation. The company’s share price fell and margins came under pressure as coal prices faced headwinds during much of 2013.
7
At the close of 2013, developed markets are viewed with seemingly universal optimism while the emerging economies attract little in the way of positive sentiment. The negativity in many cases is well founded: a slowing China hurts emerging markets disproportionately through the commodities channel, many banking sectors used the low global rate environment to build up excess leverage, and the political cycle is also unfavorable. However, these headwinds already have resulted in extreme performance discrepancies that are unlikely to be repeated in 2014. This past year, the performance of emerging markets trailed developed markets near levels not seen since the depths of the credit crisis in 2009.
Looking ahead, we expect inflation to decline more than anticipated in the emerging markets, which will be an unexpected positive in many markets. We also think emerging markets’ correlation to improving developed markets, while less than it was last decade and unlikely to drive entire economies forward, will benefit select companies. With China, the world’s second-biggest economy, slowing and the euro zone still in the doldrums, operating conditions will remain trying for many businesses. The ability to identify companies with outsized and underappreciated earnings growth profiles will continue to be rewarded in this environment, as will the ability to nimbly react to the unforeseen risks presented by, among other things, a Federal Reserve in transition.
We at Driehaus Capital Management LLC thank you for your interest in the Driehaus Emerging Markets Growth Fund and would like to express our gratitude to you as shareholders for your confidence in our management capabilities.
Sincerely,
 |  | |
| Howard Schwab | Chad Cleaver | |
| Lead Portfolio Manager | Co-Portfolio Manager |
Performance is historical and does not represent future results.
Please see the following performance overview page for index descriptions.
8
Driehaus Emerging Markets Growth Fund
Performance Overview (unaudited)
The performance summarized below is historical and does not represent future results. Investment returns and principal value vary, and you may have a gain or loss when you sell shares. Performance data presented measures the change in the value of an investment in the Fund, assuming reinvestment of all dividends and capital gains. Average annual total return reflects annualized change.
The table does not reflect the deduction of taxes that a shareholder would pay on Fund distributions or the redemption of Fund shares. The graph compares the results of a $10,000 investment in the Fund since December 31, 1997 (the date of the Fund’s inception), with all dividends and capital gains reinvested, with the indicated indices (and dividends reinvested) for the same period.
| Average Annual Total Returns as of 12/31/13 | 1 Year | 3 Years | 5 Years | 10 Years | Since Inception (12/31/97 - 12/31/13) | |||||||||||||||
Driehaus Emerging Markets Growth Fund (DREGX)1 | 8.92% | 3.42% | 18.38% | 13.89% | 13.83% | |||||||||||||||
MSCI Emerging Markets Index2 | –2.27% | –1.74% | 15.15% | 11.53% | 8.48% | |||||||||||||||
MSCI Emerging Markets Growth Index3 | 0.07% | -0.59% | 15.95% | 10.57% | 7.69% | |||||||||||||||
| 1 | The returns for the periods prior to July 1, 2003, reflect fee waivers and/or reimbursements without which performance would have been lower. |
| 2 | The Morgan Stanley Capital International Emerging Markets Index (MSCI Emerging Markets Index) is a market capitalization-weighted index designed to measure equity market performance in 21 global emerging markets. Data is in U.S. dollars. Source: Morgan Stanley Capital International Inc. |
| 3 | The Morgan Stanley Capital International Emerging Markets Growth Index (MSCI Emerging Markets Growth Index) is a subset of the MSCI Emerging Markets Index and includes only the MSCI Emerging Markets Index stocks which are categorized as growth stocks. Data is in U.S. dollars. Source: Morgan Stanley Capital International Inc. |
9
Driehaus Emerging Markets Growth Fund
Schedule of Investments
December 31, 2013
| Number of Shares | Value (Note A) | |||||||
| EQUITY SECURITIES — 94.7% | ||||||||
| FAR EAST — 48.8% | ||||||||
China — 20.3% |
| |||||||
AIA Group, Ltd. | 3,888,510 | $ | 19,506,988 | |||||
Airtac International Group | 667,000 | 5,415,941 | ||||||
AviChina Industry & Technology Co., Ltd. — H | 18,743,025 | 10,901,183 | ||||||
Baidu, Inc. — SP ADR** | 128,444 | 22,847,619 | ||||||
Cathay Pacific Airways, Ltd. | 4,923,715 | 10,413,438 | ||||||
China Longyuan Power Group Corp. — H | 16,140,583 | 20,794,195 | ||||||
China Mengniu Dairy Co., Ltd. | 2,194,000 | 10,412,184 | ||||||
China Modern Dairy Holdings, Ltd.** | 26,520,736 | 14,364,558 | ||||||
China State Construction International Holdings, Ltd. | 8,163,230 | 14,633,029 | ||||||
CT Environmental Group, Ltd.** | 20,270,990 | 10,142,945 | ||||||
ENN Energy Holdings, Ltd. | 1,634,606 | 12,089,377 | ||||||
Haitong Securities Co., Ltd. — H | 4,827,709 | 8,404,894 | ||||||
Hengan International Group Co., Ltd. | 829,312 | 9,796,497 | ||||||
Hilong Holding, Ltd. | 11,058,335 | 9,469,242 | ||||||
Home Inns & Hotels Management, Inc. — ADR** | 354,971 | 15,490,934 | ||||||
Hong Kong Exchanges & Clearing, Ltd. | 1,388,760 | 23,157,044 | ||||||
Industrial & Commercial Bank of China, Ltd. — H | 28,738,000 | 19,419,821 | ||||||
New Oriental Education & Technology Group, Inc. — SP ADR | 481,454 | 15,165,801 | ||||||
Nine Dragons Paper Holdings, Ltd. | 9,277,086 | 8,075,562 | ||||||
Sands China, Ltd. | 2,531,386 | 20,680,565 | ||||||
Shandong Weigao Group Medical Polymer Co., Ltd. — H | 4,681,519 | 6,315,037 | ||||||
Sino Biopharmaceutical, Ltd. | 13,214,273 | 10,480,350 | ||||||
Tencent Holdings, Ltd. | 325,912 | 20,787,960 | ||||||
Vipshop Holdings, Ltd. — ADR** | 141,850 | 11,870,008 | ||||||
|
| |||||||
| 330,635,172 | ||||||||
|
| |||||||
South Korea — 8.0% |
| |||||||
E-Mart Co., Ltd. | 63,783 | 16,106,666 | ||||||
Hotel Shilla Co., Ltd. | 324,846 | 20,469,284 | ||||||
Hyundai Mobis Co., Ltd. | 44,424 | 12,354,616 | ||||||
| Number of Shares | Value (Note A) | |||||||
NAVER Corp. | 14,369 | $ | 9,857,541 | |||||
Samchuly Bicycle Co., Ltd. | 382,539 | 7,013,910 | ||||||
Samsung Electronics Co., Ltd. | 14,317 | 18,612,711 | ||||||
Shinhan Financial Group Co., Ltd. | 693,470 | 31,080,808 | ||||||
SK Hynix, Inc.** | 229,352 | 7,997,492 | ||||||
Sung Kwang Bend Co., Ltd. | 267,940 | 6,778,792 | ||||||
|
| |||||||
| 130,271,820 | ||||||||
|
| |||||||
Taiwan — 6.9% |
| |||||||
Delta Electronics, Inc. | 4,787,937 | 27,310,527 | ||||||
E.Sun Financial Holding Co., Ltd. | 13,918,700 | 9,246,909 | ||||||
Ginko International Co., Ltd. | 662,000 | 12,505,444 | ||||||
Hermes Microvision, Inc. | 505,000 | 16,402,100 | ||||||
Hiwin Technologies Corp. | 2,019,000 | 17,037,546 | ||||||
MediaTek, Inc. | 850,000 | 12,648,682 | ||||||
Taiwan Semiconductor Manufacturing Co., Ltd. — SP ADR | 1,019,101 | 17,773,121 | ||||||
|
| |||||||
| 112,924,329 | ||||||||
|
| |||||||
India — 5.4% |
| |||||||
HCL Technologies, Ltd. | 1,203,413 | 24,563,400 | ||||||
ICICI Bank, Ltd. | 948,786 | 16,853,587 | ||||||
Mahindra & Mahindra Financial Services, Ltd. | 1,252,381 | 6,492,215 | ||||||
Sun Pharmaceutical Industries, Ltd. | 1,678,657 | 15,399,788 | ||||||
Tech Mahindra, Ltd. | 580,432 | 17,245,929 | ||||||
Zee Entertainment Enterprises, Ltd. | 1,838,281 | 8,220,330 | ||||||
|
| |||||||
| 88,775,249 | ||||||||
|
| |||||||
Philippines — 2.1% |
| |||||||
Bank of Philippine Islands | 3,414,101 | 6,538,581 | ||||||
International Container Terminal Services, Inc. | 2,402,455 | 5,521,330 | ||||||
Puregold Price Club, Inc. | 8,446,006 | 7,212,384 | ||||||
Robinsons Retail Holdings, Inc.** | 5,178,754 | 6,440,990 | ||||||
Universal Robina Corp. | 3,669,462 | 9,350,896 | ||||||
|
| |||||||
| 35,064,181 | ||||||||
|
| |||||||
Malaysia — 1.9% |
| |||||||
IOI Corp. BHD | 6,504,725 | 9,353,459 | ||||||
IOI Properties Group SDN BHD** | 2,168,241 | 1,661,513 | ||||||
Sapurakencana Petroleum BHD** | 7,664,509 | 11,465,759 | ||||||
Tenaga Nasional BHD | 2,355,438 | 8,183,448 | ||||||
|
| |||||||
| 30,664,179 | ||||||||
|
| |||||||
Notes to Financial Statements are an integral part of this Schedule.
10
Driehaus Emerging Markets Growth Fund
Schedule of Investments
December 31, 2013
| Number of Shares | Value (Note A) | |||||||
Indonesia — 1.1% |
| |||||||
PT Bank Mandiri Persero Tbk | 16,432,319 | $ | 10,599,318 | |||||
PT Telekomunikasi Indonesia Persero Tbk — SP ADR | 204,567 | 7,333,727 | ||||||
|
| |||||||
| 17,933,045 | ||||||||
|
| |||||||
Singapore — 0.9% |
| |||||||
Global Logistic Properties, Ltd. | 6,587,959 | 15,087,128 | ||||||
Japan — 0.9% |
| |||||||
Kansai Paint Co., Ltd. | 1,000,536 | 14,773,844 | ||||||
Thailand — 0.7% |
| |||||||
Airports of Thailand PCL — NVDR | 2,217,900 | 10,698,027 | ||||||
Cambodia — 0.5% |
| |||||||
NagaCorp, Ltd. | 8,075,763 | 8,508,696 | ||||||
Vietnam — 0.1% |
| |||||||
Viet Nam Dairy Products JSC | 280,000 | 1,791,894 | ||||||
|
| |||||||
Total FAR EAST | 797,127,564 | |||||||
|
| |||||||
| NORTH AMERICA — 13.3% | ||||||||
Mexico — 7.6% |
| |||||||
Banregio Grupo Financiero SAB de CV | 1,647,999 | 9,794,717 | ||||||
Cemex SAB de CV** | 28,612,406 | 33,616,536 | ||||||
Fibra Uno Administracion SA de CV — REIT | 5,594,449 | 17,919,033 | ||||||
Fomento Economico Mexicano SAB de CV — SP ADR | 100,641 | 9,849,735 | ||||||
Genomma Lab Internacional SAB de CV — B** | 4,672,946 | 13,106,367 | ||||||
Grupo Financiero Banorte SAB de CV — O | 3,456,691 | 24,187,438 | ||||||
Wal-Mart de Mexico SAB de CV — V | 5,999,000 | 15,741,258 | ||||||
|
| |||||||
| 124,215,084 | ||||||||
|
| |||||||
United States — 3.9% |
| |||||||
Cognizant Technology Solutions Corp. — A** | 236,973 | 23,929,534 | ||||||
Mead Johnson Nutrition Co. | 236,779 | 19,832,609 | ||||||
Schlumberger, Ltd. | 227,333 | 20,484,977 | ||||||
|
| |||||||
| 64,247,120 | ||||||||
|
| |||||||
Canada — 1.8% |
| |||||||
Gran Tierra Energy, Inc.** | 2,765,339 | 20,175,455 | ||||||
SEMAFO, Inc. | 3,378,727 | 8,874,228 | ||||||
|
| |||||||
| 29,049,683 | ||||||||
|
| |||||||
Total NORTH AMERICA | 217,511,887 | |||||||
|
| |||||||
| Number of Shares | Value (Note A) | |||||||
| EUROPE — 13.2% | ||||||||
Russia — 6.8% |
| |||||||
Eurasia Drilling Co., Ltd. — GDR | 326,298 | $ | 14,683,410 | |||||
Magnit — SP GDR | 435,208 | 28,810,770 | ||||||
MegaFon — GDR | 384,372 | 12,876,462 | ||||||
NovaTek — SP GDR | 249,595 | 34,169,556 | ||||||
Sberbank RF — SP ADR | 1,568,530 | 19,732,107 | ||||||
|
| |||||||
| 110,272,305 | ||||||||
|
| |||||||
United Kingdom — 2.8% |
| |||||||
Afren PLC** | 6,014,700 | 16,852,473 | ||||||
Bank of Georgia Holdings, PLC | 398,423 | 15,801,534 | ||||||
Hikma Pharmaceuticals PLC | 663,268 | 13,191,111 | ||||||
|
| |||||||
| 45,845,118 | ||||||||
|
| |||||||
Netherlands — 1.4% |
| |||||||
Yandex NV — A** | 547,202 | 23,611,766 | ||||||
Turkey — 0.9% |
| |||||||
BIM Birlesik Magazalar AS | 703,545 | 14,208,401 | ||||||
Italy — 0.7% |
| |||||||
Prada SpA | 1,293,679 | 11,511,529 | ||||||
Czech Republic — 0.6% |
| |||||||
Komercni Banka AS | 44,938 | 10,003,897 | ||||||
|
| |||||||
Total EUROPE | 215,453,016 | |||||||
|
| |||||||
| SOUTH AMERICA — 10.6% | ||||||||
Brazil — 8.3% |
| |||||||
BB Seguridade Participacoes SA | 1,543,375 | 16,027,419 | ||||||
BRF SA | 270,700 | 5,650,938 | ||||||
Cia Brasileira de Distribuicao Grupo Pao de Acucar — PREF ADR | 251,230 | 11,222,444 | ||||||
Estacio Participacoes SA | 3,754,748 | 32,482,529 | ||||||
Gerdau SA — SP ADR | 2,588,946 | 20,297,337 | ||||||
Hypermarcas SA | 2,281,400 | 17,067,589 | ||||||
Itau Unibanco Holding SA — PREF ADR | 1,185,950 | 16,093,342 | ||||||
Linx SA | 139,551 | 2,833,904 | ||||||
Ultrapar Participacoes SA | 600,409 | 14,238,798 | ||||||
|
| |||||||
| 135,914,300 | ||||||||
|
| |||||||
Peru — 1.5% |
| |||||||
Credicorp, Ltd. | 174,585 | 23,172,667 | ||||||
Colombia — 0.8% |
| |||||||
Cementos Argos | 2,688,340 | 13,288,479 | ||||||
|
| |||||||
Total SOUTH AMERICA | 172,375,446 | |||||||
|
| |||||||
Notes to Financial Statements are an integral part of this Schedule.
11
Driehaus Emerging Markets Growth Fund
Schedule of Investments
December 31, 2013
| Number of Shares | Value (Note A) | |||||||
| AFRICA — 5.4% | ||||||||
South Africa — 5.1% |
| |||||||
Anglo American Platinum, Ltd.** | 228,180 | $ | 8,568,387 | |||||
Bidvest Group, Ltd. | 570,502 | 14,594,300 | ||||||
FirstRand, Ltd. | 4,037,102 | 13,812,354 | ||||||
MTN Group, Ltd. | 998,528 | 20,657,821 | ||||||
Naspers, Ltd.— N | 245,571 | 25,657,605 | ||||||
|
| |||||||
| 83,290,467 | ||||||||
|
| |||||||
Kenya — 0.3% |
| |||||||
Safaricom, Ltd. | 41,405,300 | 5,205,649 | ||||||
|
| |||||||
Total AFRICA | 88,496,116 | |||||||
|
| |||||||
| MIDDLE EAST — 2.0% | ||||||||
United Arab Emirates — 1.1% |
| |||||||
Al Noor Hospitals Group PLC** | 1,203,469 | 17,886,225 | ||||||
Qatar — 0.9% |
| |||||||
Qatar National Bank SAQ | 328,585 | 15,520,148 | ||||||
|
| |||||||
Total MIDDLE EAST | 33,406,373 | |||||||
|
| |||||||
| CENTRAL AMERICA — 1.4% | ||||||||
Panama — 1.4% |
| |||||||
Copa Holdings, SA — A | 146,090 | 23,390,470 | ||||||
|
| |||||||
Total CENTRAL AMERICA | 23,390,470 | |||||||
|
| |||||||
Total EQUITY SECURITIES | 1,547,760,872 | |||||||
|
| |||||||
| ||||||||
| EQUITY CERTIFICATES — 1.2% | ||||||||
| MIDDLE EAST — 1.2% | ||||||||
Saudi Arabia — 1.2% |
| |||||||
Saudi Airlines Catering Co.† | 508,770 | 19,195,285 | ||||||
|
| |||||||
Total MIDDLE EAST | 19,195,285 | |||||||
|
| |||||||
Total EQUITY CERTIFICATES | 19,195,285 | |||||||
|
| |||||||
| ||||||||
| Number of Shares | Value (Note A) | |||||||
| RIGHTS — 0.0% | ||||||||
| FAR EAST — 0.0% | ||||||||
Malaysia — 0.0% |
| |||||||
IOI Properties Group SDN BHD — Rights, Expires January 8, 2014 | 1,084,120 | $ | 248,234 | |||||
|
| |||||||
Total RIGHTS | 248,234 | |||||||
| ||||||||
TOTAL INVESTMENTS | 95.9 | % | $ | 1,567,204,391 | ||||
Other Assets In Excess Of Liabilities | 4.1 | % | 67,661,482 | |||||
|
|
|
| |||||
| Net Assets | 100.0 | % | $ | 1,634,865,873 | ||||
| ||||||||
The federal income tax basis and unrealized appreciation (depreciation) for all investments is as follows:
| Basis: | $ | 1,395,078,895 | ||
|
| |||
| Gross Appreciation | $ | 194,431,611 | ||
| Gross Depreciation | (22,306,115 | ) | ||
|
| |||
Net Appreciation | $ | 172,125,496 | ||
|
|
| ** | Non-income producing security |
| † | Restricted security — Investments in securities not registered under the Securities Act of 1933, excluding 144A securities. At December 31, 2013, the value of these restricted securities amounted to $19,195,285 or 1.2% of net assets. |
Additional information on each restricted security is as follows (see Note A in Notes to Financial Statements):
Security | Counter- party | Acquisition Date(s) | Acquisition Cost | |||||||||
Saudi Airlines Catering Co. | MLCO | | 11/20/13 to 12/18/13 | | $ | 19,085,174 | ||||||
ADR — American Depository Receipt
GDR — Global Depository Receipt
MLCO — Merrill Lynch & Co., Inc.
NVDR — Non-Voting Depository Receipt
PREF ADR — Preferred American Depository Receipt
REIT — Real Estate Investment Trust
SP ADR — Sponsored American Depository Receipt
SP GDR — Sponsored Global Depository Receipt
Notes to Financial Statements are an integral part of this Schedule.
12
Driehaus Emerging Markets Growth Fund
Schedule of Investments
December 31, 2013
Regional Weightings*
Asia/Far East Ex-Japan | 47.9% | |||
North America | 13.3% | |||
South America | 10.6% | |||
Eastern Europe | 8.3% | |||
Africa | 5.4% | |||
Western Europe | 4.9% | |||
Middle East | 3.2% | |||
Central America | 1.4% | |||
Japan | 0.9% |
Top Ten Holdings*
NovaTek — SP GDR | 2.1% | |||
Cemex SAB de CV | 2.1% | |||
Estacio Participacoes SA | 2.0% | |||
Shinhan Financial Group Co., Ltd. | 1.9% | |||
Magnit — SP GDR | 1.8% | |||
Delta Electronics, Inc. | 1.7% | |||
Naspers, Ltd.— N | 1.6% | |||
HCL Technologies, Ltd. | 1.5% | |||
Grupo Financiero Banorte SAB de CV — O | 1.5% | |||
Cognizant Technology Solutions Corp. — A | 1.5% |
| * | All percentages are stated as a percent of net assets at December 31, 2013. |
Notes to Financial Statements are an integral part of this Schedule.
13
Driehaus Emerging Markets Growth Fund
Schedule of Investments
December 31, 2013
Industry | Percent of Net Assets | |||
Aerospace & Defense | 0.7% | |||
Airlines | 2.1% | |||
Auto Components | 0.8% | |||
Beverages | 0.6% | |||
Buliding Products | 0.4% | |||
Capital Markets | 0.5% | |||
Chemicals | 0.9% | |||
Commercial Banks | 13.9% | |||
Commercial Services & Supplies | 1.2% | |||
Construction & Engineering | 1.6% | |||
Construction Materials | 2.9% | |||
Consumer Finance | 0.4% | |||
Diversified Consumer Services | 2.9% | |||
Diversified Financial Services | 2.3% | |||
Diversified Telecommunication Services | 0.5% | |||
Electric Utilities | 0.5% | |||
Electronic Equipment, Instruments & Components | 1.7% | |||
Energy Equipment & Services | 3.4% | |||
Food & Staples Retailing | 5.4% | |||
Food Products | 4.3% | |||
Gas Utilities | 0.8% | |||
Health Care Equipment & Supplies | 1.1% | |||
Health Care Providers & Services | 1.1% | |||
Hotels, Restaurants & Leisure | 4.0% | |||
Industry | Percent of Net Assets | |||
Independent Power Producers & Energy Traders | 1.3% | |||
Industrial Conglomerates | 0.9% | |||
Insurance | 2.2% | |||
Internet & Catalog Retail | 0.7% | |||
Internet Software & Services | 4.7% | |||
IT Services | 4.0% | |||
Leisure Equipment & Products | 0.4% | |||
Machinery | 1.3% | |||
Media | 2.1% | |||
Metals & Mining | 2.3% | |||
Oil, Gas & Consumable Fuels | 5.2% | |||
Paper & Forest Products | 0.5% | |||
Personal Products | 1.6% | |||
Pharmaceuticals | 3.2% | |||
Real Estate Investment Trusts | 1.1% | |||
Real Estate Management & Development | 1.0% | |||
Semiconductors & Semiconductor Equipment | 4.5% | |||
Software | 0.2% | |||
Textiles, Apparel & Luxury Goods | 0.7% | |||
Transportation Infrastructure | 1.0% | |||
Water Utilities | 0.6% | |||
Wireless Telecommunication Services | 2.4% | |||
Other Assets in Excess of Liabilities | 4.1% | |||
|
| |||
TOTAL | 100.0% | |||
|
| |||
Notes to Financial Statements are an integral part of this Schedule.
14
Driehaus Emerging Markets Small Cap Growth Fund — Portfolio Managers’ Letter
Dear Fellow Shareholders,
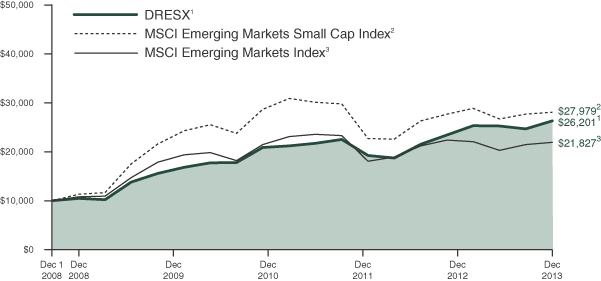
The Driehaus Emerging Markets Small Cap Growth Fund (“Fund”) returned 12.11% for the year ended December 31, 2013.1 This return was above the performance of the Morgan Stanley Capital International (“MSCI”) Emerging Markets Small Cap Index (“Benchmark”), which returned 1.35% for the same period. The Fund’s return also was above the performance of the secondary benchmark, the MSCI Emerging Markets Index, which returned -2.27% for the same period.
During 2013, the global economy finally started showing signs of self-sustaining growth. While still quite tepid and below trend, the acceleration in growth was a welcome change from the slowdown of the past several years. Similar to the relative performances of equity markets, the economic rebound was most clearly visible in the U.S., somewhat less convincing in other developed markets, and non-existent in the emerging markets as external demand remained insufficient to overpower other headwinds.
A deteriorating growth outlook throughout most of the year combined with a normalizing Federal Reserve interest rate policy contributed to the underperformance of developing economies. The Fed’s talk of tapering bond purchases was particularly damaging to developing countries running high current account and fiscal deficits, as these economies saw their currencies come under pressure. All of the countries with negative returns for the year were found within the emerging markets, with Indonesia, Brazil and Thailand posting the steepest losses.
Within China, the economy’s slowing growth fueled worries that global growth might stall. While signs of slowing economies were seen across the region, data releases during the second half of the year indicated that China’s growth rate was beginning to firm. India struggled during the year as a weakening currency and inflation hurt growth within the country. Actions by its central bank did not stop the country’s equity market from posting a negative return for the year, in U.S. dollar terms. Within Latin America, Brazil’s equity market was also pushed lower by inflation and rising interest rates.
For 2013, key contributors to performance versus the Benchmark were the Fund’s holdings in the consumer discretionary, financials and energy sectors. In addition, stock selection in South Korea, Brazil and India contributed to the Fund’s outperformance. An overweight allocation to Saudi Arabia also made a significant contribution to performance during the year.
South Korean Kolao Holdings (Ticker: 900140 KS) was the most significant contributor to returns within the consumer discretionary sector for 2013. Kolao Holdings manages its wholly-owned subsidiary, Kolao Developing Co., Ltd., which is one of the largest automotive distributors in Laos. The company benefits from a first-mover advantage in Laos as well as favorable demographics within the country. The company’s share price started to advance late in the third quarter in what appeared to be anticipation of strong growth and earnings momentum.
Energy holding DNO International ASA (Ticker: DNO NO) made a notable contribution to the Fund’s relative and absolute returns for the year. DNO International is an oil and gas exploration and production company. It is engaged in the acquisition, development and operation of oil and gas properties, with activities primarily undertaken in the Middle East and the North African region. Stable production in Oman and Yemen provide the company with diversified revenue streams, while efforts in Kurdistan may yield the country’s first billion barrel oil field. Importantly, DNO International has shown a steady growth in reserves and production capacity while maintaining a strong balance sheet.
Certain areas detracted from Fund performance during the year. Two sectors that negatively affected performance of the Fund versus the Benchmark were information technology and consumer staples. Additionally, Taiwan, Vietnam and China allocations detracted from Fund performance versus the Benchmark.
Information technology holding NQ Mobile, Inc. (Ticker: NQ) was the most significant detractor from relative performance for the year. NQ Mobile is a global provider of mobile Internet services focusing on security, privacy and productivity. The company’s share price advanced through the first three quarters of the year. However, early in the fourth quarter, a well know short seller issued a report that accused the company of serious irregularities, including inflating the firm’s revenue data. The company’s shares saw a steep selloff when the report was issued and we have since exited the position.
15
Consumer staples holding Masan Group Corp. (Ticker: MSN VN) was a significant detractor for the year. The Vietnam-based company is engaged in the food processing industry, and it also has interests within the finance and mining industries. The company issued mixed results for its 2012 fiscal year. While top line growth appeared strong, there was some pressure on its bottom line. Masan Group’s consumer business maintained profitability but its finance business disappointed, with a decline of 76% in its year-over-year pretax profit. We exited this position in July.
We utilized option strategies in the Fund primarily to hedge a portion of the Fund’s portfolio, dampen volatility, and manage downside risk. These strategies primarily consisted of puts and put spreads on exchange-traded funds (ETFs). During 2013, options detracted from performance while helping the portfolio realize less volatility than the Benchmark.
At the close of 2013, developed markets are viewed with seemingly universal optimism while the emerging economies attract little in the way of positive sentiment. The negativity in many cases is well founded: a slowing China hurts emerging markets disproportionately through the commodities channel, many banking sectors used the low global rate environment to build up excess leverage, and the political cycle is also unfavorable. However, these headwinds already have resulted in extreme performance discrepancies that are unlikely to be repeated in 2014. This past year, the performance of emerging markets trailed developed markets near levels not seen since the depths of the credit crisis in 2009.
Looking ahead, we expect inflation to decline more than anticipated in the emerging markets, which will be an unexpected positive in many markets. We also think emerging markets’ correlation to improving developed markets, while less than it was last decade and unlikely to drive entire economies forward, will benefit select companies. With China, the world’s second-biggest economy, slowing and the euro zone still in the doldrums, operating conditions will remain trying for many businesses. The ability to identify companies with outsized and underappreciated earnings growth profiles will continue to be rewarded in this environment, as will the ability to nimbly react to the unforeseen risks presented by, among other things, a Federal Reserve in transition.
We at Driehaus Capital Management LLC thank you for your interest in the Driehaus Emerging Markets Small Cap Growth Fund and would like to express our gratitude to you as shareholders for your confidence in our management capabilities.
Sincerely,
| | |
| Chad Cleaver | Howard Schwab | |
| Lead Portfolio Manager | Co-Portfolio Manager |
| 1 | During this period, the Fund’s returns reflect fee waivers and/or expense reimbursements without which performance would have been lower. |
Performance is historical and does not represent future results.
Please see the following performance overview page for index descriptions.
16
Driehaus Emerging Markets Small Cap Growth Fund
Performance Overview (unaudited)
The performance summarized below is historical and does not represent future results. Investment returns and principal value vary, and you may have a gain or loss when you sell shares. Performance data presented measures the change in the value of an investment in the Fund, assuming reinvestment of all dividends and capital gains. Average annual total return reflects annualized change.
The table does not reflect the deduction of taxes that a shareholder would pay on Fund distributions or the redemption of Fund shares. The graph compares the results of a $10,000 investment in the Fund since December 1, 2008 (the date of the Predecessor Limited Partnership’s inception), with all dividends and capital gains reinvested, with the indicated indices (and dividends reinvested) for the same period.
| Fund Only | Including Predecessor Limited Partnership | |||||||||||||||||||
| Average Annual Total Returns as of 12/31/13 | 1 Year | Since Inception (08/22/11 - 12/31/13) | 3 Years | 5 Years | Since Inception (12/01/08 - 12/31/13) | |||||||||||||||
Driehaus Emerging Markets Small Cap Growth Fund (DRESX)1 | 12.11% | 10.74% | 7.37% | 20.23% | 20.86% | |||||||||||||||
MSCI Emerging Markets Small Cap Index2 | 1.35% | 2.97% | –3.18% | 19.91% | 22.41% | |||||||||||||||
MSCI Emerging Markets Index3 | –2.27% | 4.23% | –1.74% | 15.15% | 16.58% | |||||||||||||||
| 1 | The Driehaus Emerging Markets Small Cap Growth Fund (the “Fund”) performance shown above includes the performance of the Driehaus Emerging Markets Small Cap Growth Fund, L.P. (the “Predecessor Limited Partnership”), the Fund’s predecessor, for the periods before the Fund’s registration statement became effective. The Predecessor Limited Partnership, which was established on December 1, 2008, was managed with substantially the same investment objective, policies and philosophies as are followed by the Fund. The Fund succeeded to the Predecessor Limited Partnership’s assets on August 22, 2011. The Predecessor Limited Partnership was not registered under the Investment Company Act of 1940, as amended (“1940 Act”), and thus was not subject to certain investment and operational restrictions that are imposed by the 1940 Act. If the Predecessor Limited Partnership had been registered under the 1940 Act, its performance may have been adversely affected. The Predecessor Limited Partnership’s performance has been restated to reflect estimated expenses of the Fund. The returns reflect fee waivers and/or reimbursements without which performance would have been lower. |
| 2 | The Morgan Stanley Capital International Emerging Markets Small Cap Index (MSCI Emerging Markets Small Cap Index) is a market capitalization-weighted index designed to measure equity market performance of small cap stocks in 21 global emerging markets. Data is in U.S. dollars. Source: Morgan Stanley Capital International Inc. |
| 3 | The Morgan Stanley Capital International Emerging Markets Index (MSCI Emerging Markets Index) is a market capitalization weighted index designed to measure equity market performance in 21 global emerging markets. Data is in U.S. dollars. Source: Morgan Stanley Capital International Inc. |
17
Driehaus Emerging Markets Small Cap Growth Fund
Schedule of Investments
December 31, 2013
Number of Shares | Value (Note A) | |||||||
| EQUITY SECURITIES — 77.8% | ||||||||
| FAR EAST — 43.9% | ||||||||
China — 21.8% |
| |||||||
Airtac International Group | 326,000 | $ | 2,647,072 | |||||
Anton Oilfield Services Group | 1,440,940 | 877,092 | ||||||
Bonjour Holdings, Ltd. | 4,724,000 | 1,029,566 | ||||||
China Hongqiao Group, Ltd. | 2,845,500 | 1,959,554 | ||||||
China Medical System Holdings, Ltd. | 2,663,000 | 2,846,971 | ||||||
CIMC Enric Holdings, Ltd. | 894,000 | 1,441,136 | ||||||
CT Environmental Group, Ltd.** | 3,453,669 | 1,728,104 | ||||||
Haitian International Holdings, Ltd. | 400,000 | 903,757 | ||||||
Hilong Holding, Ltd. | 4,856,808 | 4,158,880 | ||||||
Home Inns & Hotels Management, Inc. — ADR** | 84,390 | 3,682,780 | ||||||
Li Ning Co., Ltd. ** | 2,334,500 | 1,842,480 | ||||||
New Oriental Education & Technology Group, Inc. — SP ADR | 31,133 | 980,690 | ||||||
Nine Dragons Paper Holdings, Ltd. | 2,833,009 | 2,466,091 | ||||||
Qunar Cayman Islands, Ltd. — ADR** | 52,354 | 1,388,952 | ||||||
Sino Oil and Gas Holdings, Ltd.** | 46,385,000 | 1,495,461 | ||||||
SPT Energy Group, Inc. | 4,874,000 | 2,897,636 | ||||||
Termbray Petro-King Oilfield Services, Ltd.** | 2,965,000 | 1,567,711 | ||||||
Vipshop Holdings, Ltd. — ADR** | 32,677 | 2,734,411 | ||||||
Xinjiang Goldwind Science & Technology Co., Ltd. — H | 2,450,800 | 2,793,943 | ||||||
Xinyi Glass Holdings, Ltd. | 2,106,000 | 1,857,684 | ||||||
Xinyi Solar Holdings, Ltd.** | 2,106,000 | 434,546 | ||||||
|
| |||||||
| 41,734,517 | ||||||||
|
| |||||||
South Korea — 5.0% |
| |||||||
Hotel Shilla Co., Ltd. | 34,135 | 2,150,924 | ||||||
i-SENS, Inc.** | 59,639 | 2,348,037 | ||||||
Kolao Holdings | 35,241 | 903,267 | ||||||
Samchuly Bicycle Co., Ltd. | 162,451 | 2,978,563 | ||||||
Sung Kwang Bend Co., Ltd. | 36,253 | 917,189 | ||||||
Taewoong Co., Ltd. | 8,900 | 238,238 | ||||||
|
| |||||||
| 9,536,218 | ||||||||
|
| |||||||
Number of Shares | Value (Note A) | |||||||
Taiwan — 4.5% |
| |||||||
Giga Solar Materials Corp. | 117,000 | $ | 1,884,342 | |||||
Ginko International Co., Ltd. | 90,000 | 1,700,136 | ||||||
Hermes Microvision, Inc. | 60,000 | 1,948,764 | ||||||
Hiwin Technologies Corp. | 357,000 | 3,012,582 | ||||||
|
| |||||||
| 8,545,824 | ||||||||
|
| |||||||
Malaysia — 2.6% |
| |||||||
Dayang Enterprise Holdings, BHD | 279,200 | 493,533 | ||||||
Dialog Group BHD | 2,420,800 | 2,645,845 | ||||||
Oldtown BHD | 2,258,600 | 1,792,813 | ||||||
|
| |||||||
| 4,932,191 | ||||||||
|
| |||||||
Sri Lanka — 2.5% |
| |||||||
Commercial Bank of Ceylon PLC | 1,689,221 | 1,554,910 | ||||||
Hatton National Bank PLC | 1,695,335 | 1,905,308 | ||||||
John Keells Holdings PLC | 814,836 | 1,415,996 | ||||||
|
| |||||||
| 4,876,214 | ||||||||
|
| |||||||
Philippines — 2.5% |
| |||||||
Emperador, Inc.** | 3,895,500 | 939,151 | ||||||
Philippine Seven Corp. | 338,260 | 771,217 | ||||||
Puregold Price Club, Inc. | 823,100 | 702,878 | ||||||
Robinsons Retail Holdings, Inc.** | 396,873 | 493,604 | ||||||
Security Bank Corp. | 353,400 | 920,476 | ||||||
Vista Land & Lifescapes, Inc. | 7,610,497 | 891,671 | ||||||
|
| |||||||
| 4,718,997 | ||||||||
|
| |||||||
Thailand — 2.2% |
| |||||||
Beauty Community PCL — NVDR | 2,522,000 | 1,550,347 | ||||||
MC Group PCL — NVDR | 3,724,500 | 1,314,796 | ||||||
Pruksa Real Estate PCL — NVDR | 1,360,800 | 753,699 | ||||||
Sino Thai Engineering & Construction PCL — NVDR | 1,349,900 | 542,260 | ||||||
|
| |||||||
| 4,161,102 | ||||||||
|
| |||||||
Indonesia — 1.3% |
| |||||||
PT Pakuwon Jati Tbk | 86,029,000 | 1,908,614 | ||||||
PT Tempo Scan Pacific Tbk | 2,530,000 | 675,637 | ||||||
|
| |||||||
| 2,584,251 | ||||||||
|
| |||||||
Cambodia — 1.0% |
| |||||||
NagaCorp, Ltd. | 1,788,583 | 1,884,467 | ||||||
|
| |||||||
Notes to Financial Statements are an integral part of this Schedule.
18
Driehaus Emerging Markets Small Cap Growth Fund
Schedule of Investments
December 31, 2013
Number of Shares | Value (Note A) | |||||||
Singapore — 0.5% |
| |||||||
Ezion Holdings, Ltd. | 567,600 | $ | 998,512 | |||||
|
| |||||||
Total FAR EAST | 83,972,293 | |||||||
|
| |||||||
| EUROPE — 12.4% | ||||||||
United Kingdom — 4.4% |
| |||||||
Afren PLC** | 1,472,215 | 4,124,971 | ||||||
Genel Energy PLC** | 111,075 | 1,977,307 | ||||||
Hikma Pharmaceuticals PLC | 112,928 | 2,245,918 | ||||||
|
| |||||||
| 8,348,196 | ||||||||
|
| |||||||
Norway — 1.5% |
| |||||||
DNO International ASA** | 726,116 | 2,897,137 | ||||||
Cyprus — 1.5% |
| |||||||
QIWI PLC — SP ADR | 50,295 | 2,816,520 | ||||||
Greece — 1.4% |
| |||||||
Diana Shipping, Inc.** | 207,938 | 2,763,496 | ||||||
Turkey — 1.4% |
| |||||||
Pegasus Hava Tasimaciligi AS** | 44,543 | 752,402 | ||||||
Ulker Biskuvi Sanayi AS | 277,430 | 1,962,278 | ||||||
|
| |||||||
| 2,714,680 | ||||||||
|
| |||||||
Austria — 1.2% |
| |||||||
C.A.T. oil AG | 80,470 | 2,236,200 | ||||||
Kazakhstan — 1.0% |
| |||||||
Halyk Savings Bank of Kazakhstan — GDR | 188,605 | 1,933,201 | ||||||
|
| |||||||
Total EUROPE | 23,709,430 | |||||||
|
| |||||||
| NORTH AMERICA — 10.6% | ||||||||
Mexico — 4.3% |
| |||||||
Alsea SAB de CV | 699,000 | 2,183,756 | ||||||
Banregio Grupo Financiero SAB de CV | 441,660 | 2,624,962 | ||||||
Compartamos SAB de CV | 503,700 | 942,087 | ||||||
Grupo Aeroportuario del Centro Norte SAB de CV — ADR | 59,789 | 1,596,366 | ||||||
Qualitas Controladora SAB de CV | 362,700 | 878,380 | ||||||
|
| |||||||
| 8,225,551 | ||||||||
|
| |||||||
Canada — 4.2% |
| |||||||
Africa Oil Corp.** | 369,695 | 3,204,443 | ||||||
Americas Petrogas, Inc.** | 981,864 | 1,589,839 | ||||||
Gran Tierra Energy, Inc.** | 176,809 | 1,292,474 | ||||||
SEMAFO, Inc. | 731,633 | 1,921,634 | ||||||
|
| |||||||
| 8,008,390 | ||||||||
|
| |||||||
British Virgin Islands — 1.1% |
| |||||||
Luxoft Holding, Inc.** | 58,178 | 2,209,600 | ||||||
|
| |||||||
Number of Shares | Value (Note A) | |||||||
United States — 1.0% |
| |||||||
Nexteer Automotive Group, Ltd.** | 3,211,000 | $ | 1,834,431 | |||||
|
| |||||||
Total NORTH AMERICA | 20,277,972 | |||||||
|
| |||||||
| AFRICA — 5.1% | ||||||||
Nigeria — 2.5% |
| |||||||
Guaranty Trust Bank PLC | 10,696,929 | 1,807,009 | ||||||
Unilever Nigeria PLC | 1,966,977 | 661,603 | ||||||
Zenith Bank PLC | 13,535,303 | 2,318,645 | ||||||
|
| |||||||
| 4,787,257 | ||||||||
|
| |||||||
Kenya — 2.2% |
| |||||||
Equity Bank, Ltd. | 3,609,600 | 1,286,155 | ||||||
Safaricom, Ltd. | 22,854,400 | 2,873,352 | ||||||
|
| |||||||
| 4,159,507 | ||||||||
|
| |||||||
Egypt — 0.4% |
| |||||||
Commercial International Bank Egypt SAE | 167,000 | 783,021 | ||||||
|
| |||||||
Total AFRICA | 9,729,785 | |||||||
|
| |||||||
| SOUTH AMERICA — 3.3% | ||||||||
Brazil — 3.3% |
| |||||||
Alpargatas SA — Pref. | 157,100 | 985,517 | ||||||
BR Properties SA | 108,800 | 857,764 | ||||||
Estacio Participacoes SA | 311,900 | 2,698,264 | ||||||
Linx SA | 90,041 | 1,828,490 | ||||||
|
| |||||||
| 6,370,035 | ||||||||
|
| |||||||
Total SOUTH AMERICA | 6,370,035 | |||||||
|
| |||||||
| MIDDLE EAST — 2.5% | ||||||||
Qatar — 1.0% |
| |||||||
Gulf International Services OSC | 112,304 | 1,881,242 | ||||||
Pakistan — 0.8% |
| |||||||
Lucky Cement, Ltd. | 537,717 | 1,532,822 | ||||||
United Arab Emirates — 0.7% |
| |||||||
Al Noor Hospitals Group PLC** | 88,018 | 1,308,143 | ||||||
|
| |||||||
Total MIDDLE EAST | 4,722,207 | |||||||
|
| |||||||
Total EQUITY SECURITIES |
| 148,781,722 | ||||||
|
| |||||||
| ||||||||
| EQUITY CERTIFICATES — 17.0% | ||||||||
| FAR EAST — 9.6% | ||||||||
India — 9.6% |
| |||||||
Aurobindo Pharma, Ltd.† | 492,183 | 3,125,527 | ||||||
Divi’s Laboratories, Ltd.† | 151,023 | 2,982,005 | ||||||
Eicher Motors, Ltd.† | 11,394 | 916,576 | ||||||
Emami, Ltd.† | 109,313 | 837,763 | ||||||
IndusInd Bank, Ltd.† | 269,422 | 1,832,444 | ||||||
Notes to Financial Statements are an integral part of this Schedule.
19
Driehaus Emerging Markets Small Cap Growth Fund
Schedule of Investments
December 31, 2013
Number of Shares | Value (Note A) | |||||||
Ipca Laboratories, Ltd.† | 79,744 | $ | 933,838 | |||||
Jain Irrigation Systems, Ltd.† | 1,523,529 | 1,788,185 | ||||||
Kaveri Seed Co., Ltd.† | 90,722 | 2,702,740 | ||||||
SKS Microfinance, Ltd.†** | 761,426 | 2,333,948 | ||||||
Zee Entertainment Enterprises, Ltd.† | 211,668 | 946,526 | ||||||
|
| |||||||
| 18,399,552 | ||||||||
|
| |||||||
Total FAR EAST |
| 18,399,552 | ||||||
|
| |||||||
| MIDDLE EAST — 7.4% | ||||||||
Saudi Arabia — 7.4% |
| |||||||
Al Mouwasat Medical Services Co.† | 86,056 | 2,110,987 | ||||||
Al Tayyar Travel Group† | 61,590 | 1,757,157 | ||||||
Bank Al-Jazira†** | 202,877 | 2,033,936 | ||||||
Dallah Healthcare Holding Co.† | 98,971 | 1,840,640 | ||||||
Emaar Economic City†** | 561,347 | 1,990,672 | ||||||
Fawaz Abdulaziz Alhokair & Co.† | 25,611 | 949,201 | ||||||
Jarir Marketing Co.† | 30,429 | 1,290,035 | ||||||
Saudi Airlines Catering Co.† | 59,582 | 2,247,958 | ||||||
|
| |||||||
| 14,220,586 | ||||||||
|
| |||||||
Total MIDDLE EAST |
| 14,220,586 | ||||||
|
| |||||||
Total EQUITY CERTIFICATES (Cost $26,864,385) |
| 32,620,138 | ||||||
|
| |||||||
| ||||||||
| PURCHASED CALL OPTIONS — 0.3% | ||||||||
Market Vectors Russia Index Fund, Exercise Price: $29.00, Expiration Date January, 2014** | 10,000 | 450,000 | ||||||
iShares MSCI Taiwan ETF Index Fund, Exercise Price: $14.00, Expiration Date January, 2014** | 2,500 | 120,000 | ||||||
|
| |||||||
Total PURCHASED CALL OPTIONS (Premiums paid $375,441) |
| 570,000 | ||||||
|
| |||||||
| ||||||||
| PURCHASED PUT OPTIONS — 0.5% | ||||||||
iShares MSCI Emerging Markets Index Fund, Exercise Price: $40.50, Expiration Date January, 2014** | 5,000 | 125,000 | ||||||
iShares MSCI Emerging Markets Index Fund, Exercise Price: $41.00, Expiration Date January, 2014** | 8,000 | 288,000 | ||||||
Number of Shares | Value (Note A) | |||||||
iShares China Large-Cap Index Fund, Exercise Price: $38.00, Expiration Date January, 2014** | 10,000 | $ | 530,000 | |||||
|
| |||||||
Total PURCHASED PUT OPTIONS |
| 943,000 | ||||||
|
| |||||||
| ||||||||
TOTAL INVESTMENTS (COST $155,653,459) | 95.6 | % | $ | 182,914,860 | ||||
Other Assets In Excess Of Liabilities | 4.4 | % | 8,369,873 | |||||
|
|
|
| |||||
| Net Assets | 100.0 | % | $ | 191,284,733 | ||||
| ||||||||
The federal income tax basis and unrealized appreciation (depreciation) for all investments is as follows:
| Basis: | $ | 156,787,571 | ||
|
| |||
| Gross Appreciation | $ | 31,783,989 | ||
| Gross Depreciation | (5,656,700 | ) | ||
|
| |||
Net Appreciation | $ | 26,127,289 | ||
|
|
| ** | Non-income producing security |
| † | Restricted security — Investments in securities not registered under the Securities Act of 1933, excluding 144A securities. At December 31, 2013, the value of these restricted securities amounted to $32,620,138 or 17.0% of net assets. |
Additional information on each restricted security is as follows (see Note A in Notes to Financial Statements):
Security | Counter- party | Acquisition Date(s) | Acquisition Cost | |||||||||
Al Mouwasat Medical Services Co. | MLCO | | 03/11/13 to 05/28/13 | | $ | 1,573,201 | ||||||
Al Tayyar Travel Group | MLCO | | 07/11/13 to 10/02/13 | | $ | 1,373,809 | ||||||
Aurobindo Pharma, Ltd. | MLCO | | 10/03/13 to 10/22/13 | | $ | 1,715,937 | ||||||
Bank Al-Jazira | MSCO | | 02/19/13 to 05/28/13 | | $ | 1,454,953 | ||||||
Dallah Healthcare Holding Co. | HSBC | | 12/18/13 to 12/24/13 | | $ | 1,843,376 | ||||||
Divi’s Laboratories, Ltd. | MLCO | | 11/12/13 to 11/25/13 | | $ | 2,732,978 | ||||||
Eicher Motors, Ltd. | MLCO | | 04/29/13 to 08/27/13 | | $ | 614,903 | ||||||
Emaar Economic City | MSCO | | 05/29/13 to 06/04/13 | | $ | 1,458,128 | ||||||
Emami, Ltd. | MLCO | | 03/13/13 to 04/26/13 | | $ | 823,149 | ||||||
Notes to Financial Statements are an integral part of this Schedule.
20
Driehaus Emerging Markets Small Cap Growth Fund
Schedule of Investments
December 31, 2013
Security | Counter- party | Acquisition Date(s) | Acquisition Cost | |||||||||
Fawaz Abdulaziz Alhokair & | MLCO | | 10/09/12 to 10/16/12 | | $ | 440,676 | ||||||
IndusInd Bank, | MLCO | | 11/25/13 to 12/05/13 | | $ | 1,861,040 | ||||||
Ipca Laboratories, Ltd. | MLCO | | 03/04/13 to 03/14/13 | | $ | 721,207 | ||||||
Jain Irrigation Systems, Ltd. | MLCO | | 04/17/13 to 12/09/13 | | $ | 1,627,440 | ||||||
Jarir Marketing | HSBC | 12/16/13 | $ | 1,322,408 | ||||||||
Kaveri Seed Co., Ltd. | MLCO | | 10/05/12 to 11/14/13 | | $ | 2,210,132 | ||||||
Saudi Airlines Catering Co. | MSCO | | 11/18/13 to 12/17/13 | | $ | 2,211,861 | ||||||
SKS Microfinance, Ltd. | MLCO | | 11/05/13 to 12/23/13 | | $ | 2,008,203 | ||||||
Zee Entertainment Enterprises, | MLCO | | 07/10/13 to 07/18/13 | | $ | 870,984 | ||||||
ADR — American Depository Receipt
GDR — Global Depository Receipt
HSBC — Hong Kong Shanghai Banking Corporation
MLCO — Merrill Lynch & Co., Inc.
MSCO — Morgan Stanley
NVDR — Non-Voting Depository Receipt
SP ADR — Sponsored American Depository Receipt
Regional Weightings(a)(b)
Asia/Far East Ex-Japan | 53.5% | |||
North America | 10.6% | |||
Western Europe | 10.0% | |||
Middle East | 9.9% | |||
Africa | 5.1% | |||
South America | 3.3% | |||
Eastern Europe | 2.4% |
Top Ten Holdings(a)
Hilong Holding, Ltd. | 2.2% | |||
Afren PLC | 2.2% | |||
Home Inns & Hotels Management, Inc. — ADR | 1.9% | |||
Africa Oil Corp. | 1.7% | |||
Aurobindo Pharma, Ltd. | 1.6% | |||
Hiwin Technologies Corp. | 1.6% | |||
Divi’s Laboratories, Ltd. | 1.6% | |||
Samchuly Bicycle Co., Ltd. | 1.6% | |||
SPT Energy Group, Inc. | 1.5% | |||
DNO International ASA | 1.5% |
| (a) | All percentages are stated as a percent of net assets at December 31, 2013. |
| (b) | Excludes purchased options. |
Notes to Financial Statements are an integral part of this Schedule.
21
Driehaus Emerging Markets Small Cap Growth Fund
Schedule of Investments
December 31, 2013
Industry | Percent of Net Assets | |||
Airlines | 0.4% | |||
Auto Components | 1.9% | |||
Beverages | 0.5% | |||
Building Products | 0.5% | |||
Commercial Banks | 9.9% | |||
Commercial Services & Supplies | 0.7% | |||
Construction & Engineering | 1.7% | |||
Construction Materials | 0.8% | |||
Consumer Finance | 1.7% | |||
Diversified Consumer Services | 1.9% | |||
Electrical Equipment | 1.5% | |||
Energy Equipment & Services | 7.9% | |||
Food & Staples Retailing | 1.0% | |||
Food Products | 3.4% | |||
Health Care Equipment & Supplies | 2.1% | |||
Health Care Providers & Services | 2.7% | |||
Hotels, Restaurants & Leisure | 6.1% | |||
Household Products | 0.3% | |||
Industrial Conglomerates | 0.7% | |||
Insurance | 0.5% | |||
Internet & Catalog Retail | 2.2% | |||
IT Services | 2.6% | |||
Industry | Percent of Net Assets | |||
Leisure Equipment & Products | 1.6% | |||
Life Sciences Tools & Services | 1.6% | |||
Machinery | 5.7% | |||
Marine | 1.5% | |||
Media | 0.5% | |||
Metals & Mining | 2.0% | |||
Oil, Gas & Consumable Fuels | 8.7% | |||
Other | 0.8% | |||
Paper & Forest Products | 1.3% | |||
Personal Products | 0.4% | |||
Pharmaceuticals | 5.1% | |||
Real Estate Management & Development | 4.5% | |||
Semiconductors & Semiconductor Equipment | 2.2% | |||
Software | 1.0% | |||
Specialty Retail | 2.3% | |||
Textiles, Apparel & Luxury Goods | 2.2% | |||
Transportation Infrastructure | 0.8% | |||
Water Utilities | 0.9% | |||
Wireless Telecommunication Services | 1.5% | |||
Other Assets in Excess of Liabilities | 4.4% | |||
|
| |||
TOTAL | 100.0% | |||
|
| |||
Notes to Financial Statements are an integral part of this Schedule.
22
Driehaus International Small Cap Growth Fund — Portfolio Managers’ Letter
Dear Fellow Shareholders,
The Driehaus International Small Cap Growth Fund (“Fund”) returned 29.24% for the year ended December 31, 2013. This return was above the performance of the Morgan Stanley Capital International (“MSCI”) All Country World ex USA Small Cap Growth Index (“Benchmark”), which returned 18.82%.
International equities closed 2013 on a very strong note. Risk sentiment was aided by continuing positive data and a lack of destabilizing events during the year, with one of the largest positive surprises coming in the form of the European Central Bank’s (ECB) rate cut in November. Developed markets led global equities during 2013. For the year, German equities posted some of the strongest returns. The Japanese market also brought investors a stunning return in Japanese yen terms. Equity advances were broad-based across developed markets, with only commodity-driven countries failing to see substantial advances. All of the countries with negative returns were found within the emerging markets, with Indonesia and Brazil posting the worst returns for the year.
Over the course of 2013, key contributors to performance versus the Benchmark were the Fund’s holdings in the financials and materials sectors. In addition, stock selection in Japan and Canada contributed positively to the performance of the Fund compared to the Benchmark. The Fund was significantly underweight the materials sector throughout the year, which also proved beneficial.
AerCap Holdings NV (Ticker: AER) was the most significant contributor to the Fund’s performance during 2013. AerCap Holdings is an integrated global aviation company. It is engaged in the business of acquiring aviation assets at attractive prices, leasing the assets to suitable lessees, and managing the funding and other lease-related costs efficiently. It also provides aircraft management services. AerCap’s share price jumped dramatically in December on the announced acquisition of International Lease Finance Corporation from AIG. The acquisition should leave AerCap well positioned to take advantage of the growing demand for leasing aircraft.
Financials holding Hulic Co., Ltd. (Ticker: 3003 JP) made a significant contribution to the Fund’s return during 2013. Hulic is a Japan-based company mainly engaged in the leasing of condominiums, office buildings, shopping centers, hotels, distribution centers and land, the development of office buildings and other properties, and the investment of real estate securitized products, as well as the real estate investment advisory business. Hulic has been expanding its property portfolio and has a number of development projects in the pipeline. While continuing to make several acquisitions, the company has maintained a healthy balance sheet.
For 2013, the industrials and health care sectors detracted from the Fund’s performance versus the Benchmark. At the country level, security selection within France and Brazil detracted value.
The holding that was the most significant detractor from returns for the year was LightInTheBox Holding Co., Ltd. (Ticker: LITB). LightInTheBox is a global online retail company that offers lifestyle products, primarily within the categories of apparel, small accessories, and home and garden. The company’s initial public offering was in June 2013. In August 2013, LightInTheBox issued revenue guidance that was below market expectations. The company’s shares, which had rallied strongly on high expectations since its public offering, sold off on the news and remained below the share’s offering price for the remainder of 2013.
Brazil-based holding Mills Estruturas e Servicos de Engenharia SA (Ticker: MILS3 BZ) was the most significant detractor from the Fund within the industrials sector. Mills Estruturas provides scaffolding and concrete forms for Brazil’s oil, shipbuilding and construction industries. During the spring and summer, protests within Brazil fueled uncertainty about planned infrastructure projects within the country. The fear of reduced public infrastructure spending sparked a selloff in companies that depend heavily on government projects, such as Mills Estruturas.
As we enter 2014, a few of last year’s macro concerns are starting to fade. Encouraging signs include the Federal Reserve’s announcement that it will finally commence tapering bond purchases amid stronger and more sustainable U.S. growth, as well as broad euro zone growth — including in the U.K. — starting to gain some traction. At the same time, there remains uncertainty surrounding China’s ongoing commitment to economic rebalancing and Japan’s continuing implementation of monetary stimulus and tax reform. All of
23
these taken together present challenges and opportunities as we begin the year. While mindful of the ongoing macro risks, we are encouraged by the opportunities we see in the global equity markets. That said, 2013 saw strong broad gains, particularly in developed markets, driven more by multiple expansion and less by earnings growth. We believe 2014 will see even more differentiation and be more of a stock picker’s market.
As always, we at Driehaus Capital Management LLC thank you for your interest in the Driehaus International Small Cap Growth Fund and would like to express our gratitude to you as shareholders for your continued confidence in our management capabilities.
Sincerely,
 | |  | ||
| David Mouser | Howard Schwab | Ryan Carpenter | ||
| Lead Portfolio Manager | Co-Portfolio Manager | Assistant Portfolio Manager |
Performance is historical and does not represent future results.
Please see the following performance overview page for index description.
24
Driehaus International Small Cap Growth Fund
Performance Overview (unaudited)
The performance summarized below is historical and does not represent future results. Investment returns and principal value vary, and you may have a gain or loss when you sell shares. Performance data presented measures the change in the value of an investment in the Fund, assuming reinvestment of all dividends and capital gains. Average annual total return reflects annualized change.
The table does not reflect the deduction of taxes that a shareholder would pay on Fund distributions or the redemption of Fund shares. The graph compares the results of a $10,000 investment in the Fund since August 1, 2002 (the date of the Predecessor Limited Partnership’s inception), with all dividends and capital gains reinvested, with the indicated index (and dividends reinvested) for the same period.
| Fund Only | Including Predecessor Limited Partnership | |||||||||||||||||||||||
| Average Annual Total Returns as of 12/31/13 | 1 Year | 3 Years | 5 Years | Since Inception (09/17/07 - 12/31/13) | 10 Years | Since Inception (08/1/02 - 12/31/13) | ||||||||||||||||||
Driehaus International Small Cap Growth Fund (DRIOX)1 | 29.24% | 8.54% | 20.33% | 5.57% | 14.90% | 18.58% | ||||||||||||||||||
MSCI AC World ex USA Small Cap Growth Index2 | 18.82% | 4.67% | 18.77% | 2.18% | 9.50% | 11.69% | ||||||||||||||||||
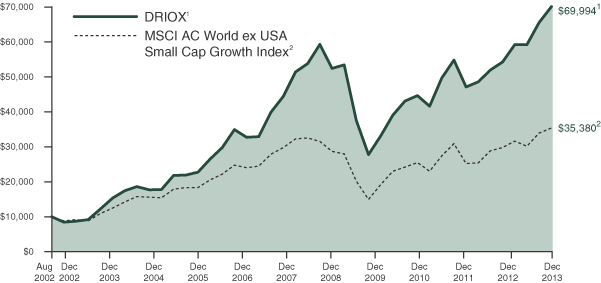
| 1 | The Driehaus International Small Cap Growth Fund (the “Fund”) performance shown above includes the performance of the Driehaus International Opportunities Fund, L.P. (the “Predecessor Limited Partnership”), the Fund’s predecessor, for the periods before the Fund’s registration statement became effective. The Predecessor Limited Partnership, which was established on August 1, 2002, was managed with substantially the same investment objective, policies and philosophies as are followed by the Fund. The Fund succeeded to the Predecessor Limited Partnership’s assets on September 17, 2007. The Predecessor Limited Partnership was not registered under the Investment Company Act of 1940, as amended (“1940 Act”), and thus was not subject to certain investment and operational restrictions that are imposed by the 1940 Act. If the Predecessor Limited Partnership had been registered under the 1940 Act, its performance may have been adversely affected. The Predecessor Limited Partnership’s performance has been restated to reflect estimated expenses of the Fund. The returns for the periods prior to January 1, 2010, reflect fee waivers and/or reimbursements without which performance would have been lower. |
| 2 | The Morgan Stanley Capital International All Country World ex USA Small Cap Growth Index (MSCI AC World ex USA Small Cap Growth Index) is a market capitalization-weighted index designed to measure equity performance in 44 global developed markets and emerging markets, excluding the U.S., and is composed of stocks which are categorized as small capitalization growth stocks. Data is in U.S. dollars. Source: Morgan Stanley Capital International, Inc. |
25
Driehaus International Small Cap Growth Fund
Schedule of Investments
December 31, 2013
Number of Shares | Value (Note A) | |||||||
| EQUITY SECURITIES — 98.8% | ||||||||
| EUROPE — 42.5% | ||||||||
United Kingdom — 19.5% |
| |||||||
Afren PLC** | 1,027,676 | $ | 2,879,426 | |||||
Bellway PLC | 112,889 | 2,934,949 | ||||||
Berkeley Group Holdings PLC | 48,546 | 2,135,162 | ||||||
Blinkx PLC** | 519,269 | 1,764,919 | ||||||
Booker Group PLC | 1,109,854 | 2,986,541 | ||||||
Britvic PLC | 360,572 | 4,134,863 | ||||||
Countrywide PLC | 280,385 | 2,762,619 | ||||||
Elementis PLC | 656,257 | 2,922,228 | ||||||
Essentra PLC | 339,910 | 4,835,111 | ||||||
Genel Energy PLC** | 155,797 | 2,773,428 | ||||||
Great Portland Estates PLC — REIT | 277,599 | 2,753,557 | ||||||
Halma PLC | 430,760 | 4,304,889 | ||||||
Hays PLC | 1,364,301 | 2,932,474 | ||||||
IG Group Holdings PLC | 140,514 | 1,433,341 | ||||||
Jupiter Fund Management PLC | 447,269 | 2,851,536 | ||||||
Monitise PLC** | 2,390,014 | 2,651,701 | ||||||
Ocado Group PLC** | 364,688 | 2,666,858 | ||||||
Rightmove PLC | 67,683 | 3,070,998 | ||||||
|
| |||||||
| 52,794,600 | ||||||||
|
| |||||||
Germany — 5.5% |
| |||||||
Drillisch AG | 85,920 | 2,482,212 | ||||||
Duerr AG | 30,224 | 2,694,755 | ||||||
Freenet AG | 125,281 | 3,753,777 | ||||||
Leoni AG | 19,085 | 1,426,452 | ||||||
Norma Group SE | 32,171 | 1,597,043 | ||||||
Wirecard AG | 72,991 | 2,883,390 | ||||||
|
| |||||||
| 14,837,629 | ||||||||
|
| |||||||
Denmark — 3.6% |
| |||||||
GN Store Nord AS | 172,221 | 4,230,296 | ||||||
Matas AS** | 87,158 | 2,410,899 | ||||||
SimCorp AS | 75,515 | 2,973,114 | ||||||
|
| |||||||
| 9,614,309 | ||||||||
|
| |||||||
Italy — 3.3% |
| |||||||
Brembo SpA | 76,731 | 2,066,850 | ||||||
Maire Tecnimont SpA** | 905,002 | 2,029,376 | ||||||
Moncler SpA** | 123,152 | 2,676,849 | ||||||
Yoox SpA** | 48,719 | 2,184,949 | ||||||
|
| |||||||
| 8,958,024 | ||||||||
|
| |||||||
France — 3.3% |
| |||||||
Ingenico | 39,992 | 3,206,402 | ||||||
Plastic Omnium SA | 91,348 | 2,551,058 | ||||||
Teleperformance | 52,202 | 3,181,026 | ||||||
|
| |||||||
| 8,938,486 | ||||||||
|
| |||||||
Netherlands — 2.0% |
| |||||||
AerCap Holdings NV** | 68,704 | 2,634,798 | ||||||
Arcadis NV | 82,186 | 2,896,692 | ||||||
|
| |||||||
| 5,531,490 | ||||||||
|
| |||||||
Number of Shares | Value (Note A) | |||||||
Norway — 1.8% |
| |||||||
Opera Software ASA | 351,630 | $ | 4,808,947 | |||||
Switzerland — 1.3% |
| |||||||
Dufry AG** | 20,142 | 3,535,942 | ||||||
Ireland — 1.2% | ||||||||
Henderson Group PLC | 893,243 | 3,381,389 | ||||||
Malta — 1.0% | ||||||||
Unibet Group PLC | 53,467 | 2,581,140 | ||||||
|
| |||||||
Total EUROPE | 114,981,956 | |||||||
|
| |||||||
| FAR EAST — 38.8% | ||||||||
Japan — 26.0% |
| |||||||
Alpine Electronics, Inc. | 249,250 | 3,486,328 | ||||||
Century Tokyo Leasing Corp. | 83,650 | 2,756,296 | ||||||
Disco Corp. | 30,011 | 1,989,144 | ||||||
DMG Mori Seiki Co., Ltd. | 158,800 | 2,853,002 | ||||||
Ebara Corp. | 430,000 | 2,760,232 | ||||||
Exedy Corp. | 38,899 | 1,135,832 | ||||||
F@N Communications, Inc. | 99,200 | 2,948,400 | ||||||
Izumi Co., Ltd. | 87,200 | 2,732,504 | ||||||
Kanamoto Co., Ltd. | 137,220 | 3,482,946 | ||||||
Kose Corp. | 85,100 | 2,699,022 | ||||||
Mabuchi Motor Co., Ltd. | 24,580 | 1,458,788 | ||||||
Minebea Co., Ltd. | 384,000 | 2,804,064 | ||||||
Next Co., Ltd. | 179,524 | 1,904,172 | ||||||
Nippon Shinyaku Co., Ltd. | 105,000 | 2,042,968 | ||||||
Obara Group, Inc. | 86,725 | 2,709,384 | ||||||
OSG Corp. | 154,800 | 2,625,323 | ||||||
Seiko Holdings, Corp. | 259,314 | 1,275,517 | ||||||
Seino Holdings Co., Ltd. | 288,000 | 3,016,466 | ||||||
Shinmaywa Industries, Ltd. | 340,000 | 2,947,678 | ||||||
Sumitomo Real Estate Sales Co., Ltd. | 30,995 | 947,715 | ||||||
Sun Frontier Fudousan Co., Ltd. | 226,393 | 3,600,876 | ||||||
Tadano, Ltd. | 272,724 | 3,651,513 | ||||||
Tokai Tokyo Financial Holdings, Inc. | 453,201 | 4,372,350 | ||||||
Tokyo Tatemono Co., Ltd. | 391,621 | 4,343,494 | ||||||
Yaskawa Electric Corp. | 138,000 | 2,179,223 | ||||||
Zenkoku Hosho Co., Ltd. | 85,029 | 3,714,114 | ||||||
|
| |||||||
| 70,437,351 | ||||||||
|
| |||||||
China — 8.6% |
| |||||||
Airtac International Group | 351,000 | 2,850,068 | ||||||
Ajisen China Holdings, Ltd. | 1,319,517 | 1,364,730 | ||||||
China Modern Dairy Holdings, Ltd.** | 5,515,302 | 2,987,280 | ||||||
Hilong Holding, Ltd. | 3,457,055 | 2,960,273 | ||||||
Home Inns & Hotels Management, Inc. — ADR** | 67,766 | 2,957,308 | ||||||
Li Ning Co., Ltd.** | 1,202,600 | 949,139 | ||||||
Nine Dragons Paper Holdings, Ltd. | 2,179,465 | 1,897,191 | ||||||
Sino Biopharmaceutical, Ltd. | 1,666,756 | 1,321,918 | ||||||
Notes to Financial Statements are an integral part of this Schedule.
26
Driehaus International Small Cap Growth Fund
Schedule of Investments
December 31, 2013
Number of Shares | Value (Note A) | |||||||
Soufun Holdings, Ltd. — ADR | 31,947 | $ | 2,632,752 | |||||
Techtronic Industries Co. | 510,500 | 1,448,358 | ||||||
Vipshop Holdings, Ltd. — ADR** | 22,262 | 1,862,884 | ||||||
|
| |||||||
| 23,231,901 | ||||||||
|
| |||||||
Taiwan — 1.7% |
| |||||||
Ginko International Co., Ltd. | 104,000 | 1,964,601 | ||||||
Hiwin Technologies Corp. | 312,000 | 2,632,845 | ||||||
|
| |||||||
| 4,597,446 | ||||||||
|
| |||||||
South Korea — 1.0% |
| |||||||
Hotel Shilla Co., Ltd. | 45,154 | 2,845,256 | ||||||
Singapore — 1.0% |
| |||||||
Ezion Holdings, Ltd. | 1,470,000 | 2,585,998 | ||||||
Philippines — 0.5% |
| |||||||
Emperador, Inc.** | 5,127,100 | 1,236,072 | ||||||
|
| |||||||
Total FAR EAST | 104,934,024 | |||||||
|
| |||||||
| NORTH AMERICA — 14.6% | ||||||||
Canada — 10.0% |
| |||||||
Aecon Group, Inc. | 142,935 | 2,165,050 | ||||||
Avigilon Corp.** | 100,424 | 2,907,073 | ||||||
CCL Industries, Inc. — B | 34,359 | 2,562,410 | ||||||
Cineplex, Inc. | 65,442 | 2,714,403 | ||||||
Constellation Software, Inc. | 14,530 | 3,077,529 | ||||||
DeeThree Exploration Ltd.** | 287,824 | 2,593,058 | ||||||
Element Financial Corp.** | 203,272 | 2,679,038 | ||||||
Linamar Corp. | 87,298 | 3,631,630 | ||||||
Secure Energy Services, Inc. | 181,389 | 3,017,316 | ||||||
Stantec, Inc. | 26,187 | 1,623,606 | ||||||
|
| |||||||
| 26,971,113 | ||||||||
|
| |||||||
Mexico — 3.7% |
| |||||||
Alsea SAB de CV | 1,101,400 | 3,440,900 | ||||||
Compartamos SAB de CV | 708,771 | 1,325,638 | ||||||
Number of Shares | Value (Note A) | |||||||
Fibra Uno Administracion SA de CV — REIT | 819,742 | $ | 2,625,636 | |||||
Genomma Lab Internacional SAB de CV — B** | 962,577 | 2,699,772 | ||||||
|
| |||||||
| 10,091,946 | ||||||||
|
| |||||||
United States — 0.9% |
| |||||||
Samsonite International SA | 819,079 | 2,492,845 | ||||||
|
| |||||||
Total NORTH AMERICA | 39,555,904 | |||||||
|
| |||||||
| SOUTH AMERICA — 2.9% | ||||||||
Brazil — 2.9% |
| |||||||
Estacio Participacoes SA | 600,685 | 5,196,559 | ||||||
Smiles SA | 188,800 | 2,600,026 | ||||||
|
| |||||||
| 7,796,585 | ||||||||
|
| |||||||
Total SOUTH AMERICA | 7,796,585 | |||||||
|
| |||||||
Total EQUITY SECURITIES (Cost $227,429,922) | 267,268,469 | |||||||
|
| |||||||
| ||||||||
TOTAL INVESTMENTS (COST $227,429,922) | 98.8 | % | $ | 267,268,469 | ||||
Other Assets In Excess Of Liabilities | 1.2 | % | 3,402,245 | |||||
|
|
|
| |||||
| Net Assets | 100.0 | % | $ | 270,670,714 | ||||
| ||||||||
The federal income tax basis and unrealized appreciation (depreciation) for all investments is as follows:
| Basis: | $ | 230,149,839 | ||
|
| |||
| Gross Appreciation | $ | 40,938,592 | ||
| Gross Depreciation | (3,819,962 | ) | ||
|
| |||
Net Appreciation | $ | 37,118,630 | ||
|
|
| ** | Non-income producing security |
ADR — American Depository Receipt
REIT — Real Estate Investment Trust
Regional Weightings*
Western Europe | 42.5% | |||
Japan | 26.0% | |||
North America | 14.6% | |||
Asia/Far East Ex-Japan | 12.8% | |||
South America | 2.9% |
Top Ten Holdings*
Estacio Participacoes SA | 1.9% | |||
Essentra PLC | 1.8% | |||
Opera Software ASA | 1.8% | |||
Tokai Tokyo Financial Holdings, Inc. | 1.6% | |||
Tokyo Tatemono Co., Ltd. | 1.6% | |||
Halma PLC | 1.6% | |||
GN Store Nord AS | 1.6% | |||
Britvic PLC | 1.5% | |||
Freenet AG | 1.4% | |||
Zenkoku Hosho Co., Ltd. | 1.4% |
| * | All percentages are stated as a percent of net assets at December 31, 2013. |
Notes to Financial Statements are an integral part of this Schedule.
27
Driehaus International Small Cap Growth Fund
Schedule of Investments
December 31, 2013
Industry | Percent of Net Assets | |||
Auto Components | 4.0% | |||
Beverages | 2.0% | |||
Capital Markets | 3.9% | |||
Chemicals | 2.9% | |||
Construction & Engineering | 2.6% | |||
Consumer Finance | 0.5% | |||
Containers & Packaging | 0.9% | |||
Diversified Consumer Services | 1.9% | |||
Diversified Financial Services | 3.9% | |||
Electrical Equipment | 0.5% | |||
Electronic Equipment, Instruments & Components | 4.7% | |||
Energy Equipment & Services | 3.2% | |||
Food & Staples Retailing | 1.1% | |||
Food Products | 1.1% | |||
Health Care Equipment & Supplies | 2.3% | |||
Hotels, Restaurants & Leisure | 4.9% | |||
Household Durables | 3.7% | |||
Internet & Catalog Retail | 2.5% | |||
Internet Software & Services | 4.5% | |||
IT Services | 1.1% | |||
Industry | Percent of Net Assets | |||
Machinery | 11.1% | |||
Media | 3.8% | |||
Multiline Retail | 1.0% | |||
Oil, Gas & Consumable Fuels | 3.1% | |||
Paper & Forest Products | 0.7% | |||
Personal Products | 1.0% | |||
Pharmaceuticals | 2.2% | |||
Professional Services | 2.9% | |||
Real Estate Investment Trusts | 2.0% | |||
Real Estate Management & Development | 4.3% | |||
Road & Rail | 1.1% | |||
Semiconductors & Semiconductor Equipment | 0.7% | |||
Software | 3.2% | |||
Specialty Retail | 2.2% | |||
Textiles, Apparel & Luxury Goods | 2.7% | |||
Trading Companies & Distributors | 2.3% | |||
Wireless Telecommunication Services | 2.3% | |||
Other Assets in Excess of Liabilities | 1.2% | |||
|
| |||
TOTAL | 100.0% | |||
|
| |||
Notes to Financial Statements are an integral part of this Schedule.
28
Driehaus Global Growth Fund — Portfolio Managers’ Letter
Dear Fellow Shareholders,
The Driehaus Global Growth Fund (“Fund”) returned 17.79% for the year ended December 31, 2013. This return was below the performance of the Fund’s benchmark index, the Morgan Stanley Capital International All Country World Growth Index (“Benchmark”), which returned 23.62% for the year.
Global equities closed 2013 at new highs. Risk sentiment was aided by continuing positive data and a lack of destabilizing events during the year, with one of the largest positive surprises coming in the form of the European Central Bank’s (ECB) rate cut in November. Developed markets led global equities during 2013. For the year, U.S. and German equities posted some of the strongest returns. The Japanese market also brought investors a stunning return in Japanese yen terms. Equity advances were broad-based across developed markets, with only commodity-driven countries failing to see substantial advances. All of the countries with negative returns were found within the emerging markets, with Indonesia and Brazil posting the worst returns for the year.
Certain areas detracted from Fund performance during the year. Two sectors in which stock selection negatively affected the performance of the Fund versus the Benchmark were the health care and information technology sectors. Additionally, certain holdings in the United States, Japan and Brazil detracted from Fund performance versus the Benchmark.
Information technology holding Apple Inc. (Ticker: AAPL) was the most significant detractor from returns for the year. Apple designs, manufactures and markets mobile communication and media devices, personal computers, and portable digital music players. The first half of 2013 proved difficult for the company. The market worried about Apple’s ability to continue to innovate and maintain its leadership position in many of the industries it created, such as smart phones and tablets.
Health care holding Brasil Pharma SA (Ticker: BPHA3 BZ) was a significant detractor to the Fund’s performance during 2013. Brasil Pharma is a Brazil-based company engaged in the pharmaceutical retail sector. The company operates proprietary drugstores, and provides supply chain and logistics services for franchised stores. The share price suffered from a series of operational challenges during the year, with gross margins impacted early on, inflated operating expenses in the middle of the year, and a deceleration in store openings late in the year. The stock failed to recover as each operational problem solved was followed by a new challenge. Moreover, when slower store openings brought future growth into question, the stock did not rebound to its historical valuation multiple relative to earnings power.
Over the course of 2013, key contributors to performance versus the Benchmark were the Fund’s positioning in the financials and materials sectors. In addition, stock selection in China, Australia and Hong Kong positively contributed to the performance of the Fund versus the Benchmark.
A notable contribution to the Fund’s return for the year came from holding Safran, SA (Ticker: SAF FP). Safran is a leading provider of engines and equipment to the aerospace market. During the last three years, Safran’s revenues increased at an average growth rate of 9% and its net operating margin has improved from 7% to 9%. Consensus earnings growth estimates have been revised higher.
New Oriental Education & Technology Group, Inc. (Ticker: EDU) was a significant contributor to returns relative to the Benchmark during 2013. New Oriental Education is a provider of private educational services in China, offering a range of educational programs teaching English, test preparation courses and K-12 after school tutoring. After several years of pursuing revenue growth at the expense of margins, in 2013 the market rewarded New Oriental Education’s renewed focus on margin expansion in addition to revenue growth.
As we enter 2014, many of last year’s macro concerns look likely to fade. Encouraging signs include the Federal Reserve’s announcement that it will finally commence tapering bond purchases amid stronger and more sustainable U.S. growth, as well as broad euro zone growth — including in the U.K. — starting to gain some traction. At the same time, there remains uncertainty surrounding China’s ongoing commitment to economic rebalancing and Japan’s continuing implementation of monetary stimulus and tax reform. All of these taken together present challenges and opportunities as we begin the year. While mindful of the ongoing macro risks, we are encouraged by the opportunities we see in the global equity markets. That said, 2013 saw strong broad gains, particularly in developed markets, driven more by multiple expansion and less by earnings growth. We believe 2014 will see more company differentiation and be more of a stock picker’s market.
29
As always, we remain committed to uncovering attractive global growth equity investment opportunities that we believe will adequately compensate our shareholders for the risk taken with their capital. Thank you for your continued confidence in our management capabilities.
Sincerely,
| | | ||
| Daniel M. Rea | Sebastien Pigeon | Joshua Rubin | ||
| Portfolio Manager | Assistant Portfolio Manager | Assistant Portfolio Manager |
Performance is historical and does not represent future results.
Please see the following performance overview page for index description.
30
Performance Overview (unaudited)
The performance summarized below is historical and does not represent future results. Investment returns and principal value vary, and you may have a gain or loss when you sell shares. Performance data presented measures the change in the value of an investment in the Fund, assuming reinvestment of all dividends and capital gains. Average annual total return reflects annualized change.
The table does not reflect the deduction of taxes that a shareholder would pay on Fund distributions or the redemption of Fund shares. The graph compares the results of a $10,000 investment in the Fund since May 1, 2008 (the date of the Fund’s inception), with all dividends and capital gains reinvested, with the indicated index (and dividends reinvested) for the same period.
| Average Annual Total Returns as of 12/31/13 | 1 Year | 3 Years | 5 Years | Since Inception (05/01/08 - 12/31/13) | ||||||||||||
Driehaus Global Growth Fund (DRGGX)1 | 17.79% | 3.31% | 14.87% | –0.07% | ||||||||||||
MSCI AC World Growth Index2 | 23.62% | 10.43% | 16.52% | 4.45% | ||||||||||||
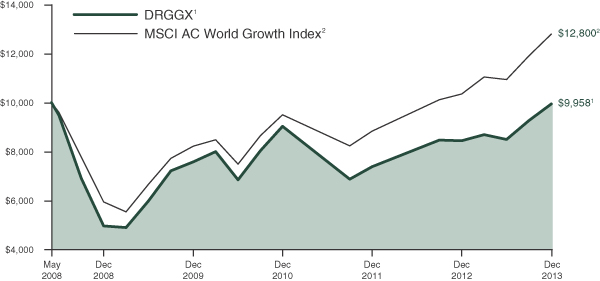
| 1 | The returns for the periods prior to September 1, 2009, reflect fee waivers and/or reimbursements without which performance would have been lower. |
| 2 | The Morgan Stanley Capital International All Country World Growth Index (MSCI AC World Growth Index) is a subset of the MSCI All Country World Index (MSCI ACWI) and includes only the MSCI ACWI stocks which are categorized as growth stocks. The MSCI ACWI is a free float-adjusted market-capitalization weighted index that is designed to measure the equity market performance of 24 developed and 21 emerging markets. Data is in U.S. dollars. Source: Morgan Stanley Capital International Inc. |
31
Driehaus Global Growth Fund
Schedule of Investments
December 31, 2013
| Number of Shares | Value (Note A) | |||||||
| EQUITY SECURITIES — 99.1% | ||||||||
| NORTH AMERICA — 55.8% | ||||||||
United States — 50.2% |
| |||||||
B/E Aerospace, Inc.** | 4,445 | $ | 386,848 | |||||
Biogen Idec, Inc.** | 2,359 | 659,930 | ||||||
BioMarin Pharmaceutical, Inc.** | 4,649 | 326,685 | ||||||
Bristol-Myers Squibb Co. | 5,355 | 284,618 | ||||||
Celgene Corp.** | 2,908 | 491,336 | ||||||
Celldex Therapeutics, Inc.** | 7,008 | 169,664 | ||||||
Citigroup, Inc. | 10,379 | 540,850 | ||||||
Concho Resources, Inc.** | 9,526 | 1,028,808 | ||||||
Constellation Brands, Inc. — A** | 7,375 | 519,052 | ||||||
Demandware, Inc.** | 10,302 | 660,564 | ||||||
DexCom, Inc.** | 8,762 | 310,262 | ||||||
Diamondback Energy Inc.** | 14,477 | 765,254 | ||||||
Epizyme, Inc.** | 6,125 | 127,400 | ||||||
Facebook, Inc. — A** | 6,992 | 382,183 | ||||||
Gilead Sciences, Inc.** | 16,331 | 1,227,275 | ||||||
GNC Holdings, Inc. — A | 3,295 | 192,593 | ||||||
Google, Inc. — A** | 668 | 748,634 | ||||||
Guidewire Software, Inc.** | 12,890 | 632,512 | ||||||
Interactive Intelligence Group, Inc.** | 4,997 | 336,598 | ||||||
Las Vegas Sands Corp. | 8,556 | 674,812 | ||||||
LinkedIn Corp. — A** | 1,722 | 373,381 | ||||||
Lowe’s Companies, Inc. | 16,222 | 803,800 | ||||||
Marathon Petroleum Corp. | 3,145 | 288,491 | ||||||
Mead Johnson Nutrition Co. | 7,483 | 626,776 | ||||||
Medivation, Inc.** | 5,027 | 320,823 | ||||||
Mondelez International, | 18,303 | 646,096 | ||||||
Morgan Stanley | 17,685 | 554,602 | ||||||
Pharmacyclics, Inc.** | 2,594 | 274,393 | ||||||
priceline.com, Inc.** | 455 | 528,892 | ||||||
Roper Industries, Inc. | 3,017 | 418,398 | ||||||
Ross Stores, Inc. | 7,868 | 589,549 | ||||||
Salesforce.com, Inc.** | 11,126 | 614,044 | ||||||
ServiceNow, Inc.** | 11,006 | 616,446 | ||||||
Starbucks Corp. | 3,480 | 272,797 | ||||||
Twitter, Inc.** | 1,312 | 83,509 | ||||||
Valero Energy Corp. | 12,806 | 645,422 | ||||||
Visa, Inc. — A | 3,407 | 758,671 | ||||||
Whirlpool Corp. | 4,065 | 637,636 | ||||||
Yum! Brands, Inc. | 5,401 | 408,370 | ||||||
|
| |||||||
| 19,927,974 | ||||||||
|
| |||||||
Canada — 4.2% |
| |||||||
Canadian Pacific Railway, Ltd. | 3,828 | 579,253 | ||||||
Dollarama, Inc. | 6,920 | 574,642 | ||||||
Intact Financial Corp. | 7,849 | 512,577 | ||||||
|
| |||||||
| 1,666,472 | ||||||||
|
| |||||||
Mexico — 1.4% |
| |||||||
Fibra Uno Administracion SA de CV — REIT | 174,322 | 558,354 | ||||||
|
| |||||||
Total NORTH AMERICA | 22,152,800 | |||||||
|
| |||||||
| Number of Shares | Value (Note A) | |||||||
| EUROPE — 20.9% | ||||||||
United Kingdom — 8.3% |
| |||||||
Aberdeen Asset Management PLC | 51,238 | $ | 424,240 | |||||
African Minerals, Ltd.** | 58,574 | 192,295 | ||||||
Ashtead Group PLC | 52,299 | 658,198 | ||||||
Booker Group PLC | 36,530 | 98,300 | ||||||
Countrywide PLC | 57,236 | 563,943 | ||||||
Genel Energy PLC** | 25,000 | 445,039 | ||||||
Hays PLC | 151,183 | 324,958 | ||||||
St. James’s Place PLC | 47,527 | 572,956 | ||||||
|
| |||||||
| 3,279,929 | ||||||||
|
| |||||||
Netherlands — 3.5% |
| |||||||
Airbus Group NV | 3,822 | 293,446 | ||||||
LyondellBasell Industries | 7,645 | 613,741 | ||||||
Sensata Technologies Holding NV** | 12,315 | 477,452 | ||||||
|
| |||||||
| 1,384,639 | ||||||||
|
| |||||||
Norway — 1.8% |
| |||||||
Seadrill, Ltd. | 7,971 | 325,395 | ||||||
Telenor ASA | 16,600 | 395,753 | ||||||
|
| |||||||
| 721,148 | ||||||||
|
| |||||||
France — 1.6% |
| |||||||
Safran SA | 9,097 | 632,122 | ||||||
Ireland — 1.5% |
| |||||||
Eaton Corp. PLC | 7,923 | 603,099 | ||||||
Denmark — 1.2% |
| |||||||
GN Store Nord AS | 19,769 | 485,590 | ||||||
Switzerland — 1.2% |
| |||||||
Glencore Xstrata PLC | 38,381 | 198,744 | ||||||
Roche Holding AG | 1,001 | 279,636 | ||||||
|
| |||||||
| 478,380 | ||||||||
|
| |||||||
Italy — 1.0% |
| |||||||
Moncler SpA** | 18,930 | 411,465 | ||||||
Germany — 0.8% |
| |||||||
Adidas AG | 2,385 | 303,957 | ||||||
|
| |||||||
Total EUROPE | 8,300,329 | |||||||
|
| |||||||
| FAR EAST — 20.8% | ||||||||
China — 8.6% |
| |||||||
AIA Group, Ltd. | 115,393 | 578,877 | ||||||
Baidu, Inc. — SP ADR** | 3,918 | 696,934 | ||||||
New Oriental Education & Technology Group, Inc. — SP ADR | 24,802 | 781,263 | ||||||
Sohu.com, Inc.** | 5,443 | 396,958 | ||||||
Tencent Holdings, Ltd. | 5,525 | 352,406 | ||||||
Vipshop Holdings, | 7,136 | 597,140 | ||||||
|
| |||||||
| 3,403,578 | ||||||||
|
| |||||||
Japan — 8.1% |
| |||||||
Calbee, Inc. | 15,572 | 377,803 | ||||||
Daikin Industries, Ltd. | 3,156 | 196,295 | ||||||
Notes to Financial Statements are an integral part of this Schedule.
32
Driehaus Global Growth Fund
Schedule of Investments
December 31, 2013
| Number of Shares | Value (Note A) | |||||||
Denso Corp. | 5,836 | $ | 307,566 | |||||
Hulic Co., Ltd. | 47,136 | 696,007 | ||||||
M3, Inc. | 155 | 387,831 | ||||||
Sugi Holdings Co., Ltd. | 8,688 | 352,684 | ||||||
Tokai Tokyo Financial Holdings, Inc. | 39,671 | 382,734 | ||||||
Tokio Marine Holdings, Inc. | 15,475 | 516,519 | ||||||
|
| |||||||
| 3,217,439 | ||||||||
|
| |||||||
Philippines — 2.0% |
| |||||||
Puregold Price Club, Inc. | 491,560 | 419,763 | ||||||
Robinsons Retail Holdings, Inc.** | 285,261 | 354,789 | ||||||
|
| |||||||
| 774,552 | ||||||||
|
| |||||||
Cambodia — 1.0% |
| |||||||
NagaCorp, Ltd. | 389,429 | 410,306 | ||||||
Singapore — 1.0% |
| |||||||
Global Logistic Properties, Ltd. | 176,738 | 404,749 | ||||||
Thailand — 0.1% |
| |||||||
Minor International PCL —NVDR | 36,556 | 23,028 | ||||||
|
| |||||||
Total FAR EAST | 8,233,652 | |||||||
|
| |||||||
| SOUTH AMERICA — 1.6% | ||||||||
Peru — 1.1% |
| |||||||
Credicorp, Ltd. | 3,095 | 410,799 | ||||||
| Number of Shares | Value (Note A) | |||||||
Brazil — 0.5% |
| |||||||
Kroton Educacional SA | 12,705 | $ | 211,422 | |||||
|
| |||||||
Total SOUTH AMERICA | 622,221 | |||||||
|
| |||||||
Total EQUITY SECURITIES (Cost $32,806,100) | 39,309,002 | |||||||
|
| |||||||
| ||||||||
TOTAL INVESTMENTS (COST $32,806,100) | 99.1 | % | $ | 39,309,002 | ||||
Other Assets In Excess Of Liabilities | 0.9 | % | 376,922 | |||||
|
|
|
| |||||
| Net Assets | 100.0 | % | $ | 39,685,924 | ||||
| ||||||||
The federal income tax basis and unrealized appreciation (depreciation) for all investments is as follows:
| Basis: | $ | 32,949,979 | ||
|
| |||
| Gross Appreciation | $ | 6,789,244 | ||
| Gross Depreciation | (430,221 | ) | ||
|
| |||
Net Appreciation | $ | 6,359,023 | ||
|
|
| ** | Non-income producing security |
ADR — American Depository Receipt
NVDR — Non-Voting Depository Receipt
REIT — Real Estate Investment Trust
SP ADR — Sponsored American Depository Receipt
Regional Weightings*
North America | 55.8% | |||
Western Europe | 20.9% | |||
Asia/Far East Ex-Japan | 12.7% | |||
Japan | 8.1% | |||
South America | 1.6% |
Top Ten Holdings*
Gilead Sciences, Inc. | 3.1% | |||
Concho Resources, Inc. | 2.6% | |||
Lowe’s Cos Inc | 2.0% | |||
New Oriental Education & Technology Group, Inc. — SP ADR | 2.0% | |||
Diamondback Energy Inc | 1.9% | |||
Visa, Inc. — A | 1.9% | |||
Google, Inc. — A | 1.9% | |||
Baidu, Inc. — SP ADR | 1.8% | |||
Hulic Co., Ltd. | 1.8% | |||
Las Vegas Sands Corp. | 1.7% |
| * | All percentages are stated as a percent of net assets at December 31, 2013. |
Notes to Financial Statements are an integral part of this Schedule.
33
Driehaus Global Growth Fund
Schedule of Investments
December 31, 2013
Industry | Percent of Net Assets | |||
Aerospace & Defense | 3.3% | |||
Auto Components | 0.8% | |||
Beverages | 1.3% | |||
Biotechnology | 9.1% | |||
Building Products | 0.5% | |||
Capital Markets | 3.4% | |||
Chemicals | 1.6% | |||
Commercial Banks | 1.0% | |||
Diversified Consumer Services | 2.5% | |||
Diversified Financial Services | 1.4% | |||
Diversified Telecommunication Services | 1.0% | |||
Electrical Equipment | 3.8% | |||
Energy Equipment & Services | 0.8% | |||
Food & Staples Retailing | 3.1% | |||
Food Products | 4.2% | |||
Health Care Equipment & Supplies | 2.0% | |||
Health Care Technology | 1.0% | |||
Hotels, Restaurants & Leisure | 4.5% | |||
Industry | Percent of Net Assets | |||
Household Durables | 1.6% | |||
Insurance | 5.5% | |||
Internet & Catalog Retail | 2.8% | |||
Internet Software & Services. | 9.3% | |||
IT Services | 1.9% | |||
Metals & Mining | 1.0% | |||
Multi-line Retail | 1.5% | |||
Oil, Gas & Consumable Fuels | 8.0% | |||
Pharmaceuticals | 1.4% | |||
Professional Services | 0.8% | |||
Real Estate Investment Trusts | 1.4% | |||
Real Estate Management & Development | 4.2% | |||
Road & Rail | 1.4% | |||
Software | 5.5% | |||
Specialty Retail | 4.0% | |||
Textiles, Apparel & Luxury Goods | 1.8% | |||
Trading Companies & Distributors | 1.7% | |||
Other Assets in Excess of Liabilities | 0.9% | |||
|
| |||
TOTAL | 100.0% | |||
|
| |||
Notes to Financial Statements are an integral part of this Schedule.
34
Driehaus Mid Cap Growth Fund — Portfolio Managers’ Letter
Dear Fellow Shareholders,
The Driehaus Mid Cap Growth Fund (“Fund”) returned 36.61% for the year ended December 31, 2013.1 This return was above the performance of the Fund’s benchmark index, the Russell Midcap® Growth Index (the “Benchmark”), which returned 35.74% for the same period.
U.S. equities posted some of the strongest returns of any equity market in 2013, with the cyclical sectors providing leadership. The economy is finally showing signs of self-sustaining growth and investors and policymakers alike appear justifiably enthusiastic. While still quite tepid and below trend, the acceleration in growth is a welcome change from the slowdown of the past several years. Similar to the relative performances of equity markets, the economic rebound has been most clearly visible in the U.S., somewhat less convincing in other developed markets, and non-existent in the emerging markets as external demand remains insufficient to overpower other headwinds.
Over the course of 2013, key contributors to performance versus the Benchmark were the Fund’s selection of holdings in the consumer discretionary and information technology sectors.
Consumer discretionary holding Tesla Motors, Inc. (Ticker: TSLA) was the most significant contributor to Fund performance for the year. Tesla Motors is an electric car and components manufacturer addressing the large luxury car market. Tesla launched their Model S electric car in late 2012 and saw strong demand throughout 2013, which has meaningfully accelerated revenue and earnings growth for the company. The Model S received the Motor Trend 2013 car of the year award, as well as the highest safety rating possible from the National Highway Traffic Safety Administration (NHTSA). We see significant revenue and earnings growth for years to come driven by continued demand for the Model S, and the upcoming launches of the Model X (SUV) in 2014/2015 and Gen III (lower priced mass marketed electric vehicle) in 2017. The company has higher than peer margins driven by a differentiated distribution model and cost reductions of its batteries.
Additionally, within the information technology sector, Cornerstone OnDemand, Inc. (Ticker: CSOD) was a holding that contributed significantly to the Fund’s performance in 2013. Cornerstone OnDemand is a provider of talent management solutions delivered as Software-as-a-Service. Cornerstone OnDemand’s shares steadily advanced throughout the year as the company reported strong sales growth. Cornerstone continues to benefit from the consolidation of its competitors and solid execution in its core businesses.
During 2013, the two sectors that detracted the most value from Fund performance versus the Benchmark were energy and consumer staples.
Within the energy sector, one of the Fund’s most significant detractors from performance was Rosetta Resources, Inc. (Ticker: ROSE). Rosetta Resources is an independent exploration and production company engaged in the acquisition and development of U.S. onshore energy resources, with operations primarily located in South Texas. During the fourth quarter, the company announced operational issues. Specifically, the company said third party processing downtime and extended shut-ins for completion activities would decrease production volumes. This news, coupled with a 2014 budget that was above consensus expectations, pushed the company’s share price lower.
Within consumer staples, one of the most significant detractors from relative performance for the year was Beam, Inc. (Ticker: BEAM). Beam is a premium spirits company that makes and sells branded distilled spirits products in markets worldwide. While Beam contributed to the Fund’s performance on an absolute basis, the stock underperformed its industry peers and detracted from relative returns. Beam struggled mid-year as it reported second quarter results in line with consensus expectations and mixed third quarter results.
The outlook for the U.S. economy remains positive. Strong fundamentals should support increased consumer and corporate spending, bolstering U.S. corporate earnings growth. Consumer debt service ratios are the strongest they have been in decades. Consumers also stand to benefit from the wealth effect driven by equity gains, housing improvement and low inflation. Some added support for 2014 being a positive year is that historically strong return years, like 2013, are often followed by positive returns the following year. In addition, cyclical sectors like technology, industrials and energy historically do well during the 12 months preceding the first interest rate hike by the Federal Reserve. Market and economic trends can change, but at this point the trends appear constructive going into 2014.
35
From a thematic perspective, there are numerous sustainable trends we are excited about. The secular growth trends of the shale energy revolution, cloud computing, and next generation biotech continue to be powerful mega-themes generating many dynamic investment ideas throughout the Fund portfolio. In addition, the manufacturing and industrials sectors remain attractive, led by auto suppliers, building suppliers and non-residential construction companies. Overall, we continue to discover many exciting businesses that have strong, sustainable earnings growth, and we have high conviction in the dynamic and innovative companies we hold.
As always, we at Driehaus Capital Management LLC thank you for your interest in the Driehaus Mid Cap Growth Fund and would like to express our gratitude to you as shareholders for your continued confidence in our management capabilities.
Sincerely,
 |  | |
| Dan Wasiolek | Brad Jackson | |
| Portfolio Manager | Assistant Portfolio Manager |
| 1 | During this period, the Fund’s returns reflect fee waivers and/or expense reimbursements without which performance would have been lower. |
Performance is historical and does not represent future results.
Please see the following performance overview page for index description.
36
Performance Overview (unaudited)
The performance summarized below is historical and does not represent future results. Investment returns and principal value vary, and you may have a gain or loss when you sell shares. Performance data presented measures the change in the value of an investment in the Fund, assuming reinvestment of all dividends and capital gains. Average annual total return reflects annualized change.
The table does not reflect the deduction of taxes that a shareholder would pay on Fund distributions or the redemption of Fund shares. The graph compares the results of a $10,000 investment in the Fund since January 1, 1999, with all dividends and capital gains reinvested, with the indicated index (and dividends reinvested) for the same period.
| Fund Only | Including Predecessor Limited Partnership | |||||||||||||||||||||||
| Average Annual Total Returns as of 12/31/13 | 1 Year | 3 Years | Since Inception (04/27/09 - 12/31/13) | 5 Years | 10 Years | From 01/01/99 - 12/31/13 | ||||||||||||||||||
Driehaus Mid Cap Growth Fund (DRMGX)1 | 36.61% | 14.39% | 20.76% | 18.52% | 10.57% | 9.90% | ||||||||||||||||||
Russell Midcap® Growth Index2 | 35.74% | 15.63% | 22.85% | 23.38% | 9.77% | 7.11% | ||||||||||||||||||
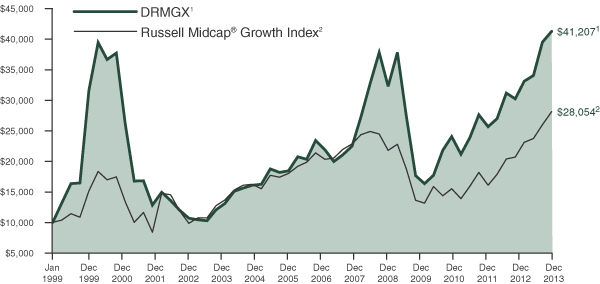
| 1 | The Driehaus Mid Cap Growth Fund (the “Fund”) performance shown above includes the performance of the Driehaus Institutional Mid Cap, L.P. (the “Predecessor Limited Partnership”), one of the Fund’s predecessors, for the periods before the Fund’s registration statement became effective. The Predecessor Limited Partnership, which was established on July 1, 1986, was managed with substantially the same investment objective, policies and philosophies as are followed by the Fund. The Fund succeeded to the Predecessor Limited Partnership’s assets together with the assets of the Driehaus Mid Cap Investors, L.P. on April 27, 2009. The Predecessor Limited Partnership was not registered under the Investment Company Act of 1940, as amended (“1940 Act”), and thus was not subject to certain investment and operational restrictions that are imposed by the 1940 Act. If the Predecessor Limited Partnership had been registered under the 1940 Act, its performance may have been adversely affected. The Predecessor Limited Partnership’s performance has been restated to reflect estimated expenses of the Fund. The returns reflect fee waivers and/or reimbursements without which performance would have been lower. |
| 2 | The Russell Midcap® Growth Index measures the performance of those Russell Midcap® Index companies with higher price-to-book ratios and higher forecasted growth values. The Russell Midcap® Index measures the performance of the 800 smallest companies in the Russell 1000® Index. Source: Russell Indices |
37
Driehaus Mid Cap Growth Fund
Schedule of Investments
December 31, 2013
| Number of Shares | Value (Note A) | |||||||
| EQUITY SECURITIES — 99.9% | ||||||||
| CONSUMER DISCRETIONARY — 28.9% | ||||||||
Specialty Retail — 9.0% |
| |||||||
Conn’s, Inc.** | 10,981 | $ | 865,193 | |||||
GNC Holdings, Inc. — A | 9,361 | 547,150 | ||||||
Lumber Liquidators Holdings, Inc.** | 8,422 | 866,540 | ||||||
Restoration Hardware Holdings, Inc.** | 12,028 | 809,484 | ||||||
|
| |||||||
| 3,088,367 | ||||||||
|
| |||||||
Hotels, Restaurants & Leisure — 3.1% |
| |||||||
Chipotle Mexican Grill, Inc.** | 988 | 526,387 | ||||||
Dunkin’ Brands Group, Inc. | 10,940 | 527,308 | ||||||
|
| |||||||
| 1,053,695 | ||||||||
|
| |||||||
Household Durables — 2.9% |
| |||||||
Harman International Industries, Inc. | 5,929 | 485,288 | ||||||
Whirlpool Corp. | 3,295 | 516,854 | ||||||
|
| |||||||
| 1,002,142 | ||||||||
|
| |||||||
Automobiles — 2.6% |
| |||||||
Tesla Motors, Inc.** | 5,922 | 890,550 | ||||||
Auto Components — 2.6% |
| |||||||
Gentex Corp. | 16,423 | 541,795 | ||||||
Goodyear Tire & Rubber Co. | 14,515 | 346,183 | ||||||
|
| |||||||
| 887,978 | ||||||||
|
| |||||||
Media — 2.5% |
| |||||||
AMC Networks, Inc. — A** | 7,736 | 526,899 | ||||||
Discovery Communications, Inc. — A** | 3,856 | 348,660 | ||||||
|
| |||||||
| 875,559 | ||||||||
|
| |||||||
Distributors — 2.4% |
| |||||||
LKQ Corp.** | 25,185 | 828,587 | ||||||
Leisure Equipment & Products — 2.2% |
| |||||||
Hasbro, Inc. | 11,086 | 609,841 | ||||||
Polaris Industries, Inc. | 978 | 142,436 | ||||||
|
| |||||||
| 752,277 | ||||||||
|
| |||||||
Textiles, Apparel & Luxury Goods — 1.1% |
| |||||||
Fifth & Pacific Companies, Inc.** | 11,536 | 369,959 | ||||||
Internet & Catalog Retail — 0.5% |
| |||||||
TripAdvisor, Inc.** | 2,113 | 175,020 | ||||||
|
| |||||||
Total CONSUMER DISCRETIONARY | 9,924,134 | |||||||
|
| |||||||
| INFORMATION TECHNOLOGY — 19.2% | ||||||||
Software — 9.4% |
| |||||||
Guidewire Software, Inc.** | 17,219 | 844,936 | ||||||
NetSuite, Inc.** | 3,019 | 311,017 | ||||||
ServiceNow, Inc.** | 5,332 | 298,645 | ||||||
Splunk, Inc.** | 2,945 | 202,233 | ||||||
Tableau Software, Inc. — A** | 11,409 | 786,422 | ||||||
| Number of Shares | Value (Note A) | |||||||
Ultimate Software Group, Inc.** | 1,658 | $ | 254,039 | |||||
Workday, Inc. — A** | 6,519 | 542,120 | ||||||
|
| |||||||
| 3,239,412 | ||||||||
|
| |||||||
Internet Software & Services — 7.8% |
| |||||||
Cornerstone OnDemand, Inc.** | 13,654 | 728,304 | ||||||
CoStar Group, Inc.** | 3,610 | 666,334 | ||||||
Demandware, Inc.** | 9,799 | 628,312 | ||||||
Qihoo 360 Technology Co., Ltd.** | 2,697 | 221,289 | ||||||
Yelp, Inc.** | 6,248 | 430,799 | ||||||
|
| |||||||
| 2,675,038 | ||||||||
|
| |||||||
Semiconductors & Semiconductor Equipment —1.0% |
| |||||||
Cree, Inc.** | 5,544 | 346,888 | ||||||
Computers & Peripherals — 1.0% |
| |||||||
Stratasys, Ltd.** | 2,439 | 328,533 | ||||||
|
| |||||||
Total INFORMATION TECHNOLOGY | 6,589,871 | |||||||
|
| |||||||
| INDUSTRIALS — 18.9% | ||||||||
Electrical Equipment — 5.3% |
| |||||||
Generac Holdings, Inc. | 11,737 | 664,783 | ||||||
Roper Industries, Inc. | 4,026 | 558,326 | ||||||
SolarCity, Corp.** | 10,203 | 579,734 | ||||||
|
| |||||||
| 1,802,843 | ||||||||
|
| |||||||
Professional Services — 3.8% |
| |||||||
Manpowergroup, Inc. | 4,952 | 425,179 | ||||||
Towers Watson & Co. — A | 6,985 | 891,356 | ||||||
|
| |||||||
| 1,316,535 | ||||||||
|
| |||||||
Marine — 2.4% |
| |||||||
Kirby Corp.** | 8,387 | 832,410 | ||||||
Trading Companies & Distributors — 1.5% |
| |||||||
WW Grainger, Inc. | 1,953 | 498,835 | ||||||
Construction & Engineering — 1.4% |
| |||||||
Quanta Services, Inc.** | 15,626 | 493,157 | ||||||
Building Products — 1.3% |
| |||||||
USG Corp.** | 16,292 | 462,367 | ||||||
Machinery — 1.1% |
| |||||||
WABCO Holdings, Inc.** | 3,926 | 366,728 | ||||||
Aerospace & Defense — 1.1% |
| |||||||
Hexcel Corp.** | 8,187 | 365,877 | ||||||
Airlines — 1.0% |
| |||||||
Alaska Air Group, Inc. | 4,601 | 337,575 | ||||||
|
| |||||||
Total INDUSTRIALS | 6,476,327 | |||||||
|
| |||||||
| HEALTH CARE — 11.1% | ||||||||
Biotechnology — 5.0% |
| |||||||
Alnylam Pharmaceuticals, Inc.** | 3,739 | 240,530 | ||||||
BioMarin Pharmaceutical, Inc.** | 8,515 | 598,349 | ||||||
Celldex Therapeutics, Inc.** | 10,505 | 254,326 | ||||||
Incyte Corp., Ltd.** | 3,910 | 197,963 | ||||||
Notes to Financial Statements are an integral part of this Schedule.
38
Driehaus Mid Cap Growth Fund
Schedule of Investments
December 31, 2013
| Number of Shares | Value (Note A) | |||||||
Pharmacyclics, Inc.** | 3,870 | $ | 409,369 | |||||
|
| |||||||
| 1,700,537 | ||||||||
|
| |||||||
Health Care Technology — 2.8% |
| |||||||
Medidata Solutions, Inc.** | 16,153 | 978,387 | ||||||
Health Care Equipment & Supplies — 2.3% |
| |||||||
DexCom, Inc.** | 22,641 | 801,718 | ||||||
Health Care Providers & Services — 1.0% |
| |||||||
Catamaran Corp.** | 7,281 | 345,702 | ||||||
|
| |||||||
Total HEALTH CARE | 3,826,344 | |||||||
|
| |||||||
| CONSUMER STAPLES — 8.0% | ||||||||
Beverages — 4.4% |
| |||||||
Beam, Inc. | 7,160 | 487,310 | ||||||
Constellation Brands, | 14,516 | 1,021,636 | ||||||
|
| |||||||
| 1,508,946 | ||||||||
|
| |||||||
Food Products — 2.1% |
| |||||||
The Hain Celestial Group, Inc.** | 7,726 | 701,366 | ||||||
Food & Staples Retailing — 1.5% |
| |||||||
Sprouts Farmers Market, Inc.** | 13,644 | 524,339 | ||||||
|
| |||||||
Total CONSUMER STAPLES | 2,734,651 | |||||||
|
| |||||||
| ENERGY — 7.4% | ||||||||
Oil, Gas & Consumable Fuels — 4.5% |
| |||||||
Laredo Petroleum Holdings, Inc.** | 18,839 | 521,652 | ||||||
Rosetta Resources, Inc.** | 10,570 | 507,783 | ||||||
Whiting Petroleum Corp.** | 8,434 | 521,812 | ||||||
|
| |||||||
| 1,551,247 | ||||||||
|
| |||||||
Energy Equipment & Services — 2.9% |
| |||||||
CARBO Ceramics, Inc. | 3,105 | 361,826 | ||||||
Oceaneering International, Inc. | 4,436 | 349,912 | ||||||
Seadrill, Ltd. | 6,650 | 273,182 | ||||||
|
| |||||||
| 984,920 | ||||||||
|
| |||||||
Total ENERGY | 2,536,167 | |||||||
|
| |||||||
| FINANCIALS — 4.7% | ||||||||
Real Estate Management & Development — 2.0% |
| |||||||
Altisource Portfolio Solutions SA** | 4,386 | 695,751 | ||||||
Diversified Financial Services — 1.8% |
| |||||||
CBOE Holdings, Inc. | 11,496 | 597,332 | ||||||
Capital Markets — 0.9% |
| |||||||
Financial Engines, Inc. | 4,461 | 309,950 | ||||||
|
| |||||||
Total FINANCIALS | 1,603,033 | |||||||
|
| |||||||
| Number of Shares | Value (Note A) | |||||||
| MATERIALS — 1.7% | ||||||||
Construction Materials — 1.7% |
| |||||||
Eagle Materials, Inc. | 7,362 | $ | 570,040 | |||||
|
| |||||||
Total MATERIALS | 570,040 | |||||||
|
| |||||||
Total EQUITY SECURITIES (Cost $28,007,441) | 34,260,567 | |||||||
|
| |||||||
| ||||||||
TOTAL INVESTMENTS (COST $28,007,441) | 99.9 | % | $ | 34,260,567 | ||||
Other Assets In Excess Of Liabilities | 0.1 | % | 18,469 | |||||
|
|
|
| |||||
| Net Assets | 100.0 | % | $ | 34,279,036 | ||||
| ||||||||
The federal income tax basis and unrealized appreciation (depreciation) for all investments is as follows:
| Basis: | $ | 28,061,565 | ||
|
| |||
| Gross Appreciation | $ | 6,471,069 | ||
| Gross Depreciation | (272,067 | ) | ||
|
| |||
Net Appreciation | $ | 6,199,002 | ||
|
|
| ** | Non-income producing security |
Top Ten Holdings*
Constellation Brands, Inc. — A | 3.0% | |||
Medidata Solutions, Inc. | 2.9% | |||
Towers Watson & Co. — A | 2.6% | |||
Tesla Motors, Inc. | 2.6% | |||
Lumber Liquidators Holdings, Inc. | 2.5% | |||
Conn’s, Inc. | 2.5% | |||
Guidewire Software, Inc. | 2.5% | |||
Kirby Corp. | 2.4% | |||
LKQ Corp. | 2.4% | |||
Restoration Hardware Holdings, Inc. | 2.4% |
| * | All percentages are stated as a percent of net assets at December 31, 2013. |
Notes to Financial Statements are an integral part of this Schedule.
39
Driehaus Micro Cap Growth Fund — Portfolio Managers’ Letter
Dear Fellow Shareholders,
The Driehaus Micro Cap Growth Fund (“Fund”) returned 7.40% for the period from its November 18, 2013 inception through December 31, 2013.1 This return was above the performance of the Fund’s benchmark index, the Russell Microcap® Growth Index (the “Benchmark”), which returned 7.07% for the same period.
U.S. equities posted some of the strongest returns of any equity market in 2013, with the cyclical sectors providing leadership. The economy is finally showing signs of self-sustaining growth and investors and policymakers alike appear justifiably enthusiastic. While still quite tepid and below trend, the acceleration in growth is a welcome change from the slowdown of the past several years. Similar to the relative performances of equity markets, the economic rebound has been most clearly visible in the U.S., somewhat less convincing in other developed markets, and non-existent in the emerging markets as external demand remains insufficient to overpower other headwinds.
For the period from the Fund’s November 18, 2013 launch through December 31, 2013, key contributors to performance versus the Benchmark were the Fund’s selection of holdings in the information technology and industrials sectors.
Technology holding Responsys, Inc. (Ticker: MKTG) was the most significant contributor to Fund performance for the period. Responsys is a provider of on-demand marketing software and services. The company’s product offering allows clients to create, execute and automate marketing campaigns across interactive channels, including e-mail, mobile, social and the Web. Early in December, management increased its quarterly guidance due to encouraging online transaction volumes on early Christmas purchases, specifically in mobile sales. Later in the month, Oracle announced its intent to purchase Responsys for roughly $1.5 billion in cash, representing a 38% premium to the prior day’s closing price.
Additionally, Acceleron Pharma, Inc. (Ticker: XLRN) was a holding that contributed significantly to the Fund’s performance for the period. Acceleron Pharma is a clinical stage biopharmaceutical company focused on the discovery, development and commercialization of protein therapeutics for cancer and rare diseases. The company reported positive Phase II data, with research indicating a measurable clinical benefit from a recent trial.
During the period, the two sectors that detracted the most value from Fund performance versus the Benchmark were energy and consumer discretionary.
The holding that detracted most from the Fund’s return relative to the Benchmark during the period was BioTelemetry, Inc. (Ticker: BEAT). BioTelemetry provides cardiac monitoring services, cardiac monitoring device manufacturing, and centralized cardiac core laboratory services. During December, Medicare announced it will reduce its reimbursement for remote cardiac monitoring services, which will negatively affect BioTelemetry and all other providers of remote cardiac monitoring services in 2014.
Energy holding Triangle Petroleum Corp. (Ticker: TPLM) was a significant detractor for the period. Triangle Petroleum is an exploration and production company focused on the development of unconventional shale oil and natural gas resources. Early in December, the company announced quarterly earnings that showed strong revenue growth but below consensus estimates of earnings per share. Shares sold off on the news.
The outlook for the U.S. economy remains positive. Strong fundamentals should support increased consumer and corporate spending, bolstering U.S. corporate earnings growth. Consumer debt service ratios are the strongest they have been in decades. Consumers also stand to benefit from the wealth effect driven by equity gains, housing improvement and low inflation. Some added support for 2014 being a positive year is that historically strong return years, like 2013, are often followed by positive returns the following year. In addition, cyclical sectors like technology, industrials and energy historically do well during the 12 months preceding the first interest rate hike by the Federal Reserve. Market and economic trends can change, but at this point the trends appear constructive going into 2014.
From a thematic perspective, there are numerous sustainable trends we are excited about. The secular growth trends of the shale energy revolution, cloud computing, and next generation biotech continue to be powerful mega-themes generating many dynamic investment ideas throughout the Fund portfolio. In addition,
40
the manufacturing and industrials sectors remain attractive, led by auto suppliers, building suppliers and non-residential construction companies. Overall, we continue to discover many exciting businesses that have strong, sustainable earnings growth, and we have high conviction in the dynamic and innovative companies we hold.
Thank you for your interest in the Driehaus Micro Cap Growth Fund. We appreciate your confidence in our management capabilities.
Sincerely,
 |  | |
| Jeff James | Michael Buck | |
| Portfolio Manager | Assistant Portfolio Manager |
| 1 | During this period, the Fund’s returns reflect fee waivers and/or expense reimbursements without which performance would have been lower. |
Performance is historical and does not represent future results.
Please see the following performance overview page for index description.
41
Driehaus Micro Cap Growth Fund
Performance Overview (unaudited)
The performance summarized below is historical and does not represent future results. Investment returns and principal value vary, and you may have a gain or loss when you sell shares. Performance data presented measures the change in the value of an investment in the Fund, assuming reinvestment of all dividends and capital gains. Average annual total return reflects annualized change.
The table does not reflect the deduction of taxes that a shareholder would pay on Fund distributions or the redemption of Fund shares. The graph compares the results of a $10,000 investment in the Fund since January 1, 2003, with all dividends and capital gains reinvested, with the indicated index (and dividends reinvested) for the same period.
| Fund Only | Including Predecessor Limited Partnership | |||||||||||||||||||||||
| Average Annual Total Returns as of 12/31/13 | Since Inception (11/18/13 - 12/31/13) | 1 Year | 3 Years | 5 Years | 10 Years | From 01/01/03 - 12/31/13 | ||||||||||||||||||
Driehaus Micro Cap Growth Fund (DMCRX)1 | 7.40% | 61.03% | 15.81% | 24.28% | 12.72% | 9.90% | ||||||||||||||||||
Russell Microcap® Growth Index2 | 7.07% | 52.84% | 17.25% | 23.78% | 6.74% | 11.33% | ||||||||||||||||||
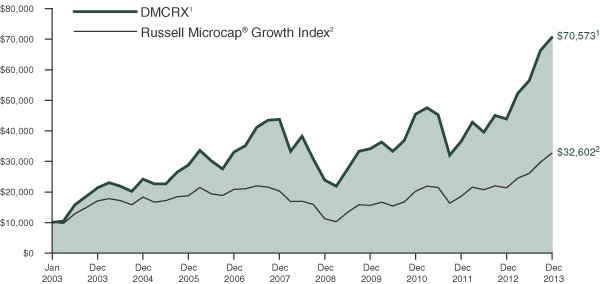
| 1 | The Driehaus Micro Cap Growth Fund (the “Fund”) performance shown above includes the performance of the Driehaus Micro Cap Fund, L.P. (the “Predecessor Limited Partnership”), one of the Fund’s predecessors, for the periods before the Fund’s registration statement became effective. The Predecessor Limited Partnership, which was established on July 1, 1996, was managed with substantially the same investment objective, policies and philosophies as are followed by the Fund. The Fund succeeded to the Predecessor Limited Partnership’s assets together with the assets of the Driehaus Institutional Micro Cap Fund, L.P. on November 18, 2013. The Predecessor Limited Partnership was not registered under the Investment Company Act of 1940, as amended (“1940 Act”), and thus was not subject to certain investment and operational restrictions that are imposed by the 1940 Act. If the Predecessor Limited Partnership had been registered under the 1940 Act, its performance may have been adversely affected. The Predecessor Limited Partnership’s performance has been restated to reflect estimated expenses of the Fund. The returns reflect fee waivers and/or reimbursements without which performance would have been lower. |
| 2 | The Russell Microcap® Growth Index is constructed to provide a comprehensive and unbiased barometer of the micro cap growth market. Based on ongoing empirical research of investment manager behavior, the methodology used to determine growth probability approximates the aggregate microcap growth manager's opportunity set. |
42
Driehaus Micro Cap Growth Fund
Schedule of Investments
December 31, 2013
| Number of Shares | Value (Note A) | |||||||
| EQUITY SECURITIES — 98.5% | ||||||||
| HEALTH CARE — 25.8% | ||||||||
Biotechnology — 12.9% |
| |||||||
ACADIA Pharmaceuticals, Inc.** | 16,266 | $ | 406,486 | |||||
Acceleron Pharma, Inc.** | 22,107 | 875,436 | ||||||
Agios Pharmaceuticals, Inc.** | 20,412 | 488,866 | ||||||
Alnylam Pharmaceuticals, Inc.** | 6,192 | 398,330 | ||||||
Arrowhead Research Corp.** | 37,966 | 411,932 | ||||||
Enzymotec, Ltd.** | 18,878 | 509,895 | ||||||
Epizyme, Inc.** | 18,847 | 392,018 | ||||||
Insmed, Inc.** | 35,640 | 606,236 | ||||||
Insys Therapeutics, Inc.** | 11,599 | 448,997 | ||||||
Karyopharm Therapeutics, Inc.** | 16,420 | 376,346 | ||||||
Kindred Biosciences, Inc.** | 27,742 | 309,046 | ||||||
KYTHERA Biopharmaceuticals, Inc.** | 15,175 | 565,269 | ||||||
Ligand Pharmaceuticals, Inc.** | 12,778 | 672,123 | ||||||
NewLink Genetics Corp.** | 15,128 | 332,967 | ||||||
Receptos, Inc.** | 13,726 | 397,917 | ||||||
Sangamo Biosciences, Inc.** | 35,068 | 487,095 | ||||||
Stemline Therapeutics, Inc.** | 20,858 | 408,817 | ||||||
TetraLogic Pharmaceuticals Corp.** | 54,926 | 522,896 | ||||||
XOMA Corp.** | 149,391 | 1,005,401 | ||||||
|
| |||||||
| 9,616,073 | ||||||||
|
| |||||||
Health Care Equipment & Supplies — 8.1% |
| |||||||
AtriCure, Inc.** | 15,265 | 285,150 | ||||||
Cerus Corp.** | 135,067 | 871,182 | ||||||
GenMark Diagnostics, Inc.** | 33,631 | 447,629 | ||||||
Novadaq Technologies, Inc.** | 47,002 | 775,063 | ||||||
Oxford Immunotec Global PLC** | 22,824 | 442,329 | ||||||
Spectranetics Corp.** | 35,641 | 891,025 | ||||||
Staar Surgical Co.** | 38,482 | 623,024 | ||||||
Unilife Corp.** | 78,045 | 343,398 | ||||||
Zeltiq Aesthetics, Inc.** | 71,644 | 1,354,788 | ||||||
|
| |||||||
| 6,033,588 | ||||||||
|
| |||||||
Pharmaceuticals — 2.3% |
| |||||||
AcelRx Pharmaceuticals, Inc.** | 95,340 | 1,078,295 | ||||||
AVANIR Pharmaceuticals, Inc.** | 107,331 | 360,632 | ||||||
Repros Therapeutics, Inc.** | 15,289 | 279,789 | ||||||
|
| |||||||
| 1,718,716 | ||||||||
|
| |||||||
Life Sciences Tools & Services — 1.4% |
| |||||||
Cambrex Corp.** | 17,444 | 311,027 | ||||||
Fluidigm Corp.** | 19,326 | 740,572 | ||||||
|
| |||||||
| 1,051,599 | ||||||||
|
| |||||||
Health Care Technology — 0.7% |
| |||||||
HealthStream, Inc.** | 16,484 | 540,181 | ||||||
| Number of Shares | Value (Note A) | |||||||
Health Care Providers & Services — 0.4% |
| |||||||
BioTelemetry, Inc.** | 42,456 | $ | 337,101 | |||||
|
| |||||||
Total HEALTH CARE | 19,297,258 | |||||||
|
| |||||||
| INFORMATION TECHNOLOGY — 24.4% | ||||||||
Software — 9.3% |
| |||||||
Callidus Software, Inc.** | 118,054 | 1,620,881 | ||||||
Datawatch Corp.** | 11,423 | 388,496 | ||||||
Gigamon, Inc.** | 13,794 | 387,336 | ||||||
Interactive Intelligence Group, Inc.** | 19,896 | 1,340,195 | ||||||
Proofpoint, Inc.** | 42,136 | 1,397,651 | ||||||
PROS Holdings, Inc.** | 36,843 | 1,470,036 | ||||||
Rally Software Development Corp.** | 19,039 | 370,309 | ||||||
|
| |||||||
| 6,974,904 | ||||||||
|
| |||||||
Internet Software & Services — 8.0% |
| |||||||
Autobytel, Inc.** | 25,172 | 380,852 | ||||||
eGain Corp.** | 50,513 | 517,253 | ||||||
Envestnet, Inc.** | 13,656 | 550,337 | ||||||
Marketo, Inc.** | 26,883 | 996,553 | ||||||
Move, Inc.** | 39,756 | 635,698 | ||||||
SciQuest, Inc.** | 18,331 | 522,067 | ||||||
SPS Commerce, Inc.** | 8,550 | 558,315 | ||||||
Tucows, Inc.** | 21,388 | 299,432 | ||||||
Wix.com, Ltd.** | 16,707 | 448,583 | ||||||
Xoom Corp.** | 37,351 | 1,022,297 | ||||||
|
| |||||||
| 5,931,387 | ||||||||
|
| |||||||
Semiconductors & Semiconductor Equipment — 3.3% |
| |||||||
Applied Micro Circuits Corp.** | 89,040 | 1,191,355 | ||||||
Montage Technology Group, Ltd.** | 30,686 | 500,489 | ||||||
PDF Solutions, Inc.** | 30,217 | 774,160 | ||||||
|
| |||||||
| 2,466,004 | ||||||||
|
| |||||||
Communications Equipment — 2.2% |
| |||||||
CalAmp Corp.** | 30,665 | 857,700 | ||||||
ShoreTel, Inc.** | 86,854 | 806,005 | ||||||
|
| |||||||
| 1,663,705 | ||||||||
|
| |||||||
Electronic Equipment, Instruments & Components — 1.0% |
| |||||||
Methode Electronics, Inc. | 21,506 | 735,290 | ||||||
IT Services — 0.6% |
| |||||||
Virtusa Corp.** | 11,923 | 454,147 | ||||||
|
| |||||||
Total INFORMATION TECHNOLOGY | 18,225,437 | |||||||
|
| |||||||
| INDUSTRIALS — 17.2% | ||||||||
Machinery — 3.2% |
| |||||||
Adept Technology, Inc.** | 33,083 | 558,772 | ||||||
Federal Signal Corp.** | 20,425 | 299,226 | ||||||
FreightCar America, Inc. | 16,029 | 426,692 | ||||||
Manitex International, Inc.** | 48,075 | 763,431 | ||||||
Wabash National Corp.** | 24,879 | 307,256 | ||||||
|
| |||||||
| 2,355,377 | ||||||||
|
| |||||||
Notes to Financial Statements are an integral part of this Schedule.
43
Driehaus Micro Cap Growth Fund
Schedule of Investments
December 31, 2013
| Number of Shares | Value (Note A) | |||||||
Electrical Equipment — 2.3% |
| |||||||
Powell Industries, Inc. | 7,664 | $ | 513,411 | |||||
Power Solutions International, Inc.** | 9,597 | 720,735 | ||||||
PowerSecure International, Inc.** | 26,100 | 448,137 | ||||||
|
| |||||||
| 1,682,283 | ||||||||
|
| |||||||
Building Products — 2.2% |
| |||||||
Insteel Industries, Inc. | 15,483 | 351,929 | ||||||
Norcraft Companies., Inc.** | 24,925 | 489,029 | ||||||
Patrick Industries, Inc.** | 27,946 | 808,478 | ||||||
|
| |||||||
| 1,649,436 | ||||||||
|
| |||||||
Aerospace & Defense — 2.0% |
| |||||||
Astronics Corp.** | 11,361 | 579,411 | ||||||
Erickson Air-Crane, Inc.** | 23,037 | 478,939 | ||||||
Taser International, Inc.** | 27,882 | 442,766 | ||||||
|
| |||||||
| 1,501,116 | ||||||||
|
| |||||||
Trading Companies & Distributors — 1.7% |
| |||||||
H&E Equipment Services, Inc.** | 27,377 | 811,181 | ||||||
Stock Building Supply Holdings, Inc.** | 27,243 | 496,367 | ||||||
|
| |||||||
| 1,307,548 | ||||||||
|
| |||||||
Professional Services — 1.2% |
| |||||||
Barrett Business Services, Inc. | 10,055 | 932,501 | ||||||
Road & Rail — 1.0% |
| |||||||
Marten Transport, Ltd. | 36,681 | 740,589 | ||||||
Construction & Engineering — 1.0% |
| |||||||
Argan, Inc. | 13,517 | 372,529 | ||||||
Furmanite, Corp.** | 32,801 | 348,347 | ||||||
|
| |||||||
| 720,876 | ||||||||
|
| |||||||
Marine — 1.0% |
| |||||||
Safe Bulkers, Inc. | 68,977 | 717,361 | ||||||
Air Freight & Logistics — 0.9% |
| |||||||
Pacer International, Inc.** | 81,634 | 674,297 | ||||||
Transportation Infrastructure — 0.7% |
| |||||||
Aegean Marine Petroleum Network, Inc. | 47,494 | 532,883 | ||||||
|
| |||||||
Total INDUSTRIALS | 12,814,267 | |||||||
|
| |||||||
| CONSUMER DISCRETIONARY — 15.2% | ||||||||
Specialty Retail — 5.3% |
| |||||||
Cache, Inc.** | 51,385 | 279,021 | ||||||
Christopher & Banks, Corp.** | 111,930 | 955,882 | ||||||
Destination XLGroup, Inc.** | 45,502 | 298,948 | ||||||
Kirkland’s, Inc.** | 21,417 | 506,940 | ||||||
MarineMax, Inc.** | 53,053 | 853,092 | ||||||
Stein Mart, Inc. | 27,435 | 369,001 | ||||||
Zale Corp.** | 42,351 | 667,875 | ||||||
|
| |||||||
| 3,930,759 | ||||||||
|
| |||||||
Auto Components — 2.3% |
| |||||||
Gentherm, Inc.** | 43,869 | 1,176,128 | ||||||
| Number of Shares | Value (Note A) | |||||||
Quantum Fuel Systems Technologies Worldwide, Inc.** | 71,883 | $ | 560,687 | |||||
|
| |||||||
| 1,736,815 | ||||||||
|
| |||||||
Hotels, Restaurants & Leisure — 2.2% |
| |||||||
Fiesta Restaurant Group, Inc.** | 22,870 | 1,194,729 | ||||||
Multimedia Games Holding Co., Inc.** | 14,335 | 449,546 | ||||||
|
| |||||||
| 1,644,275 | ||||||||
|
| |||||||
Household Durables — 1.4% |
| |||||||
Dixie Group, Inc.** | 79,276 | 1,046,443 | ||||||
Multiline Retail — 1.2% |
| |||||||
Tuesday Morning Corp.** | 56,364 | 899,569 | ||||||
Textiles, Apparel & Luxury Goods — 1.2% |
| |||||||
Movado Group, Inc. | 19,696 | 866,821 | ||||||
Media — 1.0% |
| |||||||
Rentrak Corp.** | 19,065 | 722,373 | ||||||
Automobiles — 0.6% |
| |||||||
Winnebago Industries, Inc.** | 17,737 | 486,881 | ||||||
|
| |||||||
Total CONSUMER DISCRETIONARY | 11,333,936 | |||||||
|
| |||||||
| ENERGY — 5.7% | ||||||||
Oil, Gas & Consumable Fuels — 4.4% |
| |||||||
Ardmore Shipping Corp. | 51,394 | 799,691 | ||||||
Callon Petroleum Co.** | 95,446 | 623,262 | ||||||
Goodrich Petroleum Corp.** | 30,507 | 519,229 | ||||||
Synergy Resources Corp.** | 98,808 | 914,962 | ||||||
Triangle Petroleum Corp.** | 51,042 | 424,669 | ||||||
|
| |||||||
| 3,281,813 | ||||||||
|
| |||||||
Energy Equipment & Services — 1.3% |
| |||||||
Basic Energy Services, Inc.** | 38,652 | 609,928 | ||||||
Era Group, Inc.** | 10,683 | 329,677 | ||||||
|
| |||||||
| 939,605 | ||||||||
|
| |||||||
Total ENERGY | 4,221,418 | |||||||
|
| |||||||
| TELECOMMUNICATION SERVICES — 3.9% | ||||||||
Diversified Telecommunication Services — 3.1% |
| |||||||
8X8, Inc.** | 122,168 | 1,241,227 | ||||||
inContact, Inc.** | 139,488 | 1,089,401 | ||||||
|
| |||||||
| 2,330,628 | ||||||||
|
| |||||||
Wireless Telecommunication Services — 0.8% |
| |||||||
RingCentral, Inc.** | 31,398 | 576,781 | ||||||
|
| |||||||
Total TELECOMMUNICATION SERVICES | 2,907,409 | |||||||
|
| |||||||
| CONSUMER STAPLES — 2.6% | ||||||||
Food & Staples Retailing — 1.1% |
| |||||||
Natural Grocers by Vitamin Cottage, Inc.** | 19,365 | 822,044 | ||||||
Food Products — 1.0% |
| |||||||
Boulder Brands, Inc.** | 45,039 | 714,319 | ||||||
Notes to Financial Statements are an integral part of this Schedule.
44
Driehaus Micro Cap Growth Fund
Schedule of Investments
December 31, 2013
| Number of Shares | Value (Note A) | |||||||
Beverages — 0.5% |
| |||||||
Craft Brew Alliance, Inc.** | 23,914 | $ | 392,668 | |||||
|
| |||||||
Total CONSUMER STAPLES | 1,929,031 | |||||||
|
| |||||||
| MATERIALS — 2.5% | ||||||||
Chemicals — 2.5% |
| |||||||
Advanced Emissions Solutions, Inc.** | 20,051 | 1,087,366 | ||||||
Flotek Industries, Inc.** | 17,922 | 359,695 | ||||||
Quaker Chemical Corp. | 5,622 | 433,288 | ||||||
|
| |||||||
| 1,880,349 | ||||||||
|
| |||||||
Total MATERIALS | 1,880,349 | |||||||
|
| |||||||
| FINANCIALS — 1.2% | ||||||||
Capital Markets — 1.2% |
| |||||||
ICG Group, Inc.** | 29,910 | 557,223 | ||||||
Marcus & Millichap, Inc.** | 24,993 | 372,396 | ||||||
|
| |||||||
| 929,619 | ||||||||
|
| |||||||
Total FINANCIALS | 929,619 | |||||||
|
| |||||||
Total EQUITY SECURITIES (Cost $55,303,945) | 73,538,724 | |||||||
|
| |||||||
| ||||||||
TOTAL INVESTMENTS (COST $55,303,945) | 98.5 | % | $ | 73,538,724 | ||||
Other Assets In Excess Of Liabilities | 1.5 | % | 1,138,061 | |||||
|
|
|
| |||||
| Net Assets | 100.0 | % | $ | 74,676,785 | ||||
| ||||||||
The federal income tax basis and unrealized appreciation (depreciation) for all investments is as follows:
| Basis: | $ | 55,708,874 | ||
|
| |||
| Gross Appreciation | $ | 19,106,399 | ||
| Gross Depreciation | (1,276,549 | ) | ||
|
| |||
Net Appreciation | $ | 17,829,850 | ||
|
|
| ** | Non-income producing security |
Top Ten Holdings*
Callidus Software, Inc. | 2.2% | |||
PROS Holdings, Inc. | 2.0% | |||
Proofpoint, Inc. | 1.9% | |||
Zeltiq Aesthetics, Inc. | 1.8% | |||
Interactive Intelligence Group, Inc. | 1.8% | |||
8X8, Inc. | 1.7% | |||
Fiesta Restaurant Group, Inc. | 1.6% | |||
Applied Micro Circuits Corp. | 1.6% | |||
Gentherm, Inc. | 1.6% | |||
inContact, Inc. | 1.5% |
| * | All percentages are stated as a percent of net assets at December 31, 2013. |
Notes to Financial Statements are an integral part of this Schedule.
45
Statements of Assets and Liabilities
December 31, 2013
| Driehaus International Discovery Fund | Driehaus Emerging Markets Growth Fund | |||||||
ASSETS: | ||||||||
Investments, at cost | $ | 111,616,188 | $ | 1,391,425,469 | ||||
|
|
|
| |||||
Investments, at market value | $ | 131,509,530 | $ | 1,567,204,391 | ||||
Foreign currency** | 1,035,769 | 24,659,240 | ||||||
Cash | 3,340,007 | 54,236,406 | ||||||
Segregated cash | — | — | ||||||
Receivables: | ||||||||
Dividends | 345,699 | 998,074 | ||||||
Investment securities sold | 1,600,294 | 11,541,247 | ||||||
Fund shares sold | 13,783 | 9,793,594 | ||||||
Net unrealized appreciation on unsettled foreign currency transactions | — | — | ||||||
Prepaid expenses | 10,744 | 24,575 | ||||||
|
|
|
| |||||
| ||||||||
TOTAL ASSETS | 137,855,826 | 1,668,457,527 | ||||||
|
|
|
| |||||
| ||||||||
LIABILITIES: | ||||||||
Payables: | ||||||||
Investment securities purchased | 3,346,037 | 28,779,045 | ||||||
Fund shares redeemed | 370,667 | 2,402,058 | ||||||
Net unrealized depreciation on unsettled foreign currency transactions | 14,798 | 51,875 | ||||||
Due to custodian | — | — | ||||||
Due to affiliate | 151,968 | 2,029,878 | ||||||
Audit and tax fees | 51,450 | 48,115 | ||||||
Accrued expenses | 33,554 | 280,683 | ||||||
|
|
|
| |||||
| ||||||||
TOTAL LIABILITIES | 3,968,474 | 33,591,654 | ||||||
|
|
|
| |||||
| ||||||||
NET ASSETS | $ | 133,887,352 | $ | 1,634,865,873 | ||||
|
|
|
| |||||
SHARES OUTSTANDING (Unlimited shares authorized, no par value) | 4,106,111 | 50,263,735 | ||||||
|
|
|
| |||||
NET ASSET VALUE | $ | 32.61 | $ | 32.53 | ||||
|
|
|
| |||||
| ||||||||
NET ASSETS CONSISTED OF THE FOLLOWING AT DECEMBER 31, 2013: | ||||||||
Paid-in capital | $ | 343,103,912 | $ | 1,475,045,072 | ||||
Accumulated net investment income (loss) | 368,561 | (188,729 | ) | |||||
Accumulated net realized gain (loss) | (229,499,512 | ) | (15,772,523 | ) | ||||
Unrealized net foreign exchange gain (loss) | 21,049 | 3,131 | ||||||
Unrealized net appreciation (depreciation) on investments | 19,893,342 | 175,778,922 | ||||||
|
|
|
| |||||
NET ASSETS | $ | 133,887,352 | $ | 1,634,865,873 | ||||
|
|
|
| |||||
| ||||||||
| * | Fund commenced operations on November 18, 2013. |
| ** | The cost of foreign currency was $1,032,356, $24,641,815, $1,725,618, $1,737,483, $194,397, $0, and $0, respectively. |
Notes to Financial Statements are an integral part of these Statements.
46
Statements of Assets and Liabilities
December 31, 2013
| Driehaus Emerging Markets Small Cap Growth Fund | Driehaus International Small Cap Growth Fund | Driehaus Global Growth Fund | Driehaus Mid Cap Growth Fund | Driehaus Micro Cap* Growth Fund | ||||||||||||||
| $ | 155,653,459 | $ | 227,429,922 | $ | 32,806,100 | $ | 28,007,441 | $ | 55,303,945 | |||||||||
|
|
|
|
|
|
|
|
|
| |||||||||
| $ | 182,914,860 | $ | 267,268,469 | $ | 39,309,002 | $ | 34,260,567 | $ | 73,538,724 | |||||||||
| 1,728,111 | 1,747,481 | 193,027 | — | — | ||||||||||||||
| 5,289,668 | 2,313,346 | — | 205,572 | 880,247 | ||||||||||||||
| 499,993 | — | — | — | — | ||||||||||||||
| 56,876 | 467,671 | 20,009 | 7,552 | 1,381 | ||||||||||||||
| 2,771,185 | 4,032,145 | 624,715 | 600,390 | 789,805 | ||||||||||||||
| 1,219,928 | 1,016,529 | — | — | 51,274 | ||||||||||||||
| 4,446 | — | — | — | — | ||||||||||||||
| 11,307 | 9,632 | 7,839 | 7,805 | 20,697 | ||||||||||||||
|
|
|
|
|
|
|
|
|
| |||||||||
|
|
|
| |||||||||||||||
| 194,496,374 | 276,855,273 | 40,154,592 | 35,081,886 | 75,282,128 | ||||||||||||||
|
|
|
|
|
|
|
|
|
| |||||||||
|
|
|
| |||||||||||||||
| 2,770,269 | 5,594,440 | 274,087 | 623,697 | 448,945 | ||||||||||||||
| 111,806 | 150,046 | — | 100,000 | 42,640 | ||||||||||||||
| — | 9,349 | 2,270 | — | — | ||||||||||||||
| — | — | 90,902 | — | — | ||||||||||||||
| 233,477 | 336,745 | 37,702 | 21,843 | 48,303 | ||||||||||||||
| 46,950 | 48,950 | 46,950 | 42,700 | 42,700 | ||||||||||||||
| 49,139 | 45,029 | 16,757 | 14,610 | 22,755 | ||||||||||||||
|
|
|
|
|
|
|
|
|
| |||||||||
|
|
|
| |||||||||||||||
| 3,211,641 | 6,184,559 | 468,668 | 802,850 | 605,343 | ||||||||||||||
|
|
|
|
|
|
|
|
|
| |||||||||
|
|
|
| |||||||||||||||
| $ | 191,284,733 | $ | 270,670,714 | $ | 39,685,924 | $ | 34,279,036 | $ | 74,676,785 | |||||||||
|
|
|
|
|
|
|
|
|
| |||||||||
| 15,317,881 | 24,967,791 | 5,216,966 | 2,337,358 | 6,950,293 | ||||||||||||||
|
|
|
|
|
|
|
|
|
| |||||||||
| $ | 12.49 | $ | 10.84 | $ | 7.61 | $ | 14.67 | $ | 10.74 | |||||||||
|
|
|
|
|
|
|
|
|
| |||||||||
|
|
|
| |||||||||||||||
| $ | 171,947,827 | $ | 221,387,503 | $ | 32,628,019 | $ | 27,029,960 | $ | 53,319,615 | |||||||||
| (530,093 | ) | (828,338 | ) | (53,409 | ) | — | — | |||||||||||
| (7,408,199 | ) | 10,264,426 | 610,267 | 995,950 | 3,122,391 | |||||||||||||
| 13,797 | 8,576 | (1,855 | ) | — | — | |||||||||||||
| 27,261,401 | 39,838,547 | 6,502,902 | 6,253,126 | 18,234,779 | ||||||||||||||
|
|
|
|
|
|
|
|
|
| |||||||||
| $ | 191,284,733 | $ | 270,670,714 | $ | 39,685,924 | $ | 34,279,036 | $ | 74,676,785 | |||||||||
|
|
|
|
|
|
|
|
|
| |||||||||
|
|
|
| |||||||||||||||
Notes to Financial Statements are an integral part of these Statements.
47
For the year ended December 31, 2013
| Driehaus International Discovery Fund | Driehaus Emerging Markets Growth Fund | |||||||
INVESTMENT INCOME (LOSS): | ||||||||
Income: | ||||||||
Dividends** | $ | 2,876,347 | $ | 25,044,947 | ||||
|
|
|
| |||||
| ||||||||
Total income | 2,876,347 | 25,044,947 | ||||||
|
|
|
| |||||
| ||||||||
Expenses: | ||||||||
Investment advisory fee | 2,231,145 | 19,091,401 | ||||||
Administration fee | 184,894 | 702,017 | ||||||
Professional fees | 39,986 | 217,641 | ||||||
Audit and tax fees | 48,800 | 56,735 | ||||||
Federal and state registration fees | 19,430 | 116,779 | ||||||
Custodian fees | 44,391 | 389,408 | ||||||
Transfer agent fees | 61,760 | 317,390 | ||||||
Trustees’ fees | 33,418 | 74,504 | ||||||
Chief compliance officer fees | 5,598 | 5,052 | ||||||
Reports to shareholders | 18,009 | 100,565 | ||||||
Interest expense | 14,197 | — | ||||||
Miscellaneous | 31,317 | 52,289 | ||||||
|
|
|
| |||||
Total expenses | 2,732,945 | 21,123,781 | ||||||
|
|
|
| |||||
| ||||||||
Investment advisory fees recaptured (waived) | — | — | ||||||
Administration fees waived | — | — | ||||||
Transfer agent fees waived | — | — | ||||||
Fees paid indirectly | (39,485 | ) | (277,328 | ) | ||||
|
|
|
| |||||
Net expenses | 2,693,460 | 20,846,453 | ||||||
|
|
|
| |||||
| ||||||||
Net investment income (loss) | 182,887 | 4,198,494 | ||||||
|
|
|
| |||||
| ||||||||
| NET REALIZED AND UNREALIZED GAIN (LOSS) ON INVESTMENTS, WRITTEN OPTIONS AND FOREIGN CURRENCY TRANSACTIONS: | ||||||||
Net realized gain (loss) from security transactions | 33,140,638 | 78,192,294 | ||||||
Net realized foreign exchange gain (loss) | (229,221 | ) | (4,856,157 | ) | ||||
Net realized gain (loss) on written options | — | — | ||||||
Net change in unrealized foreign exchange gain (loss) | (81,950 | ) | (206,312 | ) | ||||
Net change in unrealized appreciation (depreciation) on investments | (7,789,541 | ) | 29,850,559 | |||||
|
|
|
| |||||
| ||||||||
Net realized and unrealized gain (loss) on investments, written options and foreign currency transactions | 25,039,926 | 102,980,384 | ||||||
|
|
|
| |||||
| ||||||||
NET INCREASE (DECREASE) IN NET ASSETS RESULTING FROM OPERATIONS | $ | 25,222,813 | $ | 107,178,878 | ||||
|
|
|
| |||||
| ||||||||
| * | Fund commenced operations on November 18, 2013. |
| ** | Dividends are net of $280,979, $2,639,487, $178,022, $251,409, $24,153, $0 and $0 nonreclaimable foreign taxes withheld, respectively. |
Notes to Financial Statements are an integral part of these Statements.
48
Statements of Operations
For the year ended December 31, 2013
| Driehaus Emerging Markets Small Cap Growth Fund | Driehaus International Small Cap Growth Fund | Driehaus Global Growth Fund | Driehaus Mid Cap Growth Fund | Driehaus Micro Cap* Growth Fund | ||||||||||||||
| $ | 2,760,273 | $ | 4,040,178 | $ | 439,643 | $ | 121,752 | $ | 12,026 | |||||||||
|
|
|
|
|
|
|
|
|
| |||||||||
|
|
|
| |||||||||||||||
|
|
|
| |||||||||||||||
| 2,760,273 | 4,040,178 | 439,643 | 121,752 | 12,026 | ||||||||||||||
|
|
|
|
|
|
|
|
|
| |||||||||
|
|
|
| |||||||||||||||
| 2,203,464 | 3,794,929 | 420,570 | 289,322 | 102,489 | ||||||||||||||
| 173,740 | 244,223 | 83,446 | 60,034 | 12,469 | ||||||||||||||
| 45,790 | 53,846 | 19,576 | 17,473 | 3,264 | ||||||||||||||
| 51,428 | 47,800 | 47,300 | 41,100 | 42,700 | ||||||||||||||
| 40,163 | 19,444 | 17,280 | 19,420 | 9,351 | ||||||||||||||
| 89,523 | 66,638 | 16,450 | 7,330 | 2,000 | ||||||||||||||
| 40,040 | 50,199 | 37,471 | 37,826 | 6,000 | ||||||||||||||
| 31,318 | 36,354 | 27,551 | 27,193 | 3,904 | ||||||||||||||
| 5,765 | 5,052 | 5,537 | 5,731 | 313 | ||||||||||||||
| 18,172 | 17,109 | 10,521 | 9,693 | 3,664 | ||||||||||||||
| — | — | — | — | — | ||||||||||||||
| 20,987 | 32,370 | 19,832 | 19,572 | 756 | ||||||||||||||
|
|
|
|
|
|
|
|
|
| |||||||||
| 2,720,390 | 4,367,964 | 705,534 | 534,694 | 186,910 | ||||||||||||||
|
|
|
|
|
|
|
|
|
| |||||||||
|
|
|
| |||||||||||||||
| 108,124 | — | — | (27,897 | ) | (39,026 | ) | ||||||||||||
| — | — | — | — | (2,500 | ) | |||||||||||||
| (6,000 | ) | — | — | — | (6,000 | ) | ||||||||||||
| (32,223 | ) | (56,916 | ) | (3,750 | ) | (41 | ) | — | ||||||||||
|
|
|
|
|
|
|
|
|
| |||||||||
| 2,790,291 | 4,311,048 | 701,784 | 506,756 | 139,384 | ||||||||||||||
|
|
|
|
|
|
|
|
|
| |||||||||
|
|
|
| |||||||||||||||
| (30,018 | ) | (270,870 | ) | (262,141 | ) | (385,004 | ) | (127,358 | ) | |||||||||
|
|
|
|
|
|
|
|
|
| |||||||||
|
|
|
| |||||||||||||||
| (2,562,914 | ) | 56,856,593 | 4,954,368 | 6,878,923 | 3,463,074 | |||||||||||||
| (441,557 | ) | (153,716 | ) | (23,292 | ) | — | — | |||||||||||
| 1,024,491 | — | — | — | — | ||||||||||||||
| 13,741 | 9,806 | (11,107 | ) | — | — | |||||||||||||
| 13,614,700 | 8,727,943 | 1,421,757 | 2,428,262 | 18,234,779 | ||||||||||||||
|
|
|
|
|
|
|
|
|
| |||||||||
|
|
|
| |||||||||||||||
| 11,648,461 | 65,440,626 | 6,341,726 | 9,307,185 | 21,697,853 | ||||||||||||||
|
|
|
|
|
|
|
|
|
| |||||||||
|
|
|
| |||||||||||||||
| $ | 11,618,443 | $ | 65,169,756 | $ | 6,079,585 | $ | 8,922,181 | $ | 21,570,495 | |||||||||
|
|
|
|
|
|
|
|
|
| |||||||||
|
|
|
| |||||||||||||||
Notes to Financial Statements are an integral part of these Statements.
49
Statements of Changes in Net Assets
| Driehaus International Discovery Fund | Driehaus Emerging Markets Growth Fund | |||||||||||||||
| For the year ended December 31, 2013 | For the year ended December 31, 2012 | For the year ended December 31, 2013 | For the year ended December 31, 2012 | |||||||||||||
INCREASE (DECREASE) IN NET ASSETS: | ||||||||||||||||
Operations: | ||||||||||||||||
Net investment income (loss) | $ | 182,887 | $ | 244,710 | $ | 4,198,494 | $ | 4,157,563 | ||||||||
Net realized gain (loss) on investments, written options and foreign currency transactions | 32,911,417 | 8,527,491 | 73,336,137 | 19,369,938 | ||||||||||||
Net change in unrealized gain (loss) on investments, written options and foreign currency transactions | (7,871,491 | ) | 20,521,222 | 29,644,247 | 125,738,544 | |||||||||||
|
|
|
|
|
|
|
| |||||||||
| ||||||||||||||||
Net increase (decrease) in net assets resulting from operations | 25,222,813 | 29,293,423 | 107,178,878 | 149,266,045 | ||||||||||||
|
|
|
|
|
|
|
| |||||||||
| ||||||||||||||||
Distributions to shareholders: | ||||||||||||||||
Net investment income | — | — | — | (3,661,528 | ) | |||||||||||
Capital gains | — | — | (38,958,248 | ) | — | |||||||||||
|
|
|
|
|
|
|
| |||||||||
Total distributions to shareholders | — | — | (38,958,248 | ) | (3,661,528 | ) | ||||||||||
|
|
|
|
|
|
|
| |||||||||
| ||||||||||||||||
Capital share transactions: | ||||||||||||||||
Proceeds from shares sold | 11,537,101 | 24,049,036 | 798,853,985 | 312,726,256 | ||||||||||||
Reinvestment of distributions | — | — | 36,327,537 | 3,382,086 | ||||||||||||
Cost of shares redeemed | (109,272,884 | ) | (58,882,173 | ) | (257,928,242 | ) | (213,801,609 | ) | ||||||||
Redemption fees | 7,011 | 6,317 | 133,953 | 55,671 | ||||||||||||
|
|
|
|
|
|
|
| |||||||||
Net increase (decrease) in net assets derived from capital share transactions | (97,728,772 | ) | (34,826,820 | ) | 577,387,233 | 102,362,404 | ||||||||||
|
|
|
|
|
|
|
| |||||||||
Total increase (decrease) in net assets | (72,505,959 | ) | (5,533,397 | ) | 645,607,863 | 247,966,921 | ||||||||||
|
|
|
|
|
|
|
| |||||||||
| ||||||||||||||||
NET ASSETS: | ||||||||||||||||
| ||||||||||||||||
Beginning of period | $ | 206,393,311 | $ | 211,926,708 | $ | 989,258,010 | $ | 741,291,089 | ||||||||
|
|
|
|
|
|
|
| |||||||||
End of period | $ | 133,887,352 | $ | 206,393,311 | $ | 1,634,865,873 | $ | 989,258,010 | ||||||||
|
|
|
|
|
|
|
| |||||||||
Accumulated net investment income (loss) | $ | 368,561 | $ | (124,055 | ) | $ | (188,729 | ) | $ | (1,325,050 | ) | |||||
|
|
|
|
|
|
|
| |||||||||
| ||||||||||||||||
Capital share transactions are as follows: | ||||||||||||||||
Shares issued | 393,225 | 911,174 | 24,927,434 | 11,029,785 | ||||||||||||
Shares reinvested | — | — | 1,125,389 | 111,842 | ||||||||||||
Shares redeemed | (3,697,504 | ) | (2,232,234 | ) | (8,112,206 | ) | (7,645,029 | ) | ||||||||
|
|
|
|
|
|
|
| |||||||||
Net increase (decrease) from capital share transactions | (3,304,279 | ) | (1,321,060 | ) | 17,940,617 | 3,496,598 | ||||||||||
|
|
|
|
|
|
|
| |||||||||
| ||||||||||||||||
Notes to Financial Statements are an integral part of these Statements.
50
Statements of Changes in Net Assets
| Driehaus Emerging Markets Small Cap Growth Fund | Driehaus International Small Cap Growth Fund | Driehaus Global Growth Fund | ||||||||||||||||||||
| For the year ended December 31, 2013 | For the year ended December 31, 2012 | For the year ended December 31, 2013 | For the year ended December 31, 2012 | For the year ended December 31, 2013 | For the year ended December 31, 2012 | |||||||||||||||||
| $ | (30,018 | ) | $ | (10,729 | ) | $ | (270,870 | ) | $ | 713,843 | $ | (262,141 | ) | $ | (221,099 | ) | ||||||
| (1,979,980 | ) | (816,569 | ) | 56,702,877 | 845,340 | 4,931,076 | 2,055,406 | |||||||||||||||
| 13,628,441 | 14,288,099 | 8,737,749 | 23,642,149 | 1,410,650 | 3,299,298 | |||||||||||||||||
|
|
|
|
|
|
|
|
|
|
|
| |||||||||||
|
| |||||||||||||||||||||
| 11,618,443 | 13,460,801 | 65,169,756 | 25,201,332 | 6,079,585 | 5,133,605 | |||||||||||||||||
|
|
|
|
|
|
|
|
|
|
|
| |||||||||||
|
| |||||||||||||||||||||
| (309,776 | ) | (1,246,733 | ) | (2,881,066 | ) | (1,069,444 | ) | — | — | |||||||||||||
| — | — | (27,524,912 | ) | — | (4,062,770 | ) | (1,436,164 | ) | ||||||||||||||
|
|
|
|
|
|
|
|
|
|
|
| |||||||||||
| (309,776 | ) | (1,246,733 | ) | (30,405,978 | ) | (1,069,444 | ) | (4,062,770 | ) | (1,436,164 | ) | |||||||||||
|
|
|
|
|
|
|
|
|
|
|
| |||||||||||
|
| |||||||||||||||||||||
| 131,452,307 | 53,977,441 | 16,017,728 | 35,435,959 | 710,860 | 7,015,096 | |||||||||||||||||
| 255,145 | 1,219,637 | 25,648,585 | 935,098 | 4,062,771 | 1,436,164 | |||||||||||||||||
| (32,737,622 | ) | (19,133,876 | ) | (40,720,045 | ) | (58,279,425 | ) | (2,454,266 | ) | (12,378,753 | ) | |||||||||||
| 8,846 | 350 | 2,085 | 5,968 | 66 | 61 | |||||||||||||||||
|
|
|
|
|
|
|
|
|
|
|
| |||||||||||
| 98,978,676 | 36,063,552 | 948,353 | (21,902,400 | ) | 2,319,431 | (3,927,432 | ) | |||||||||||||||
|
|
|
|
|
|
|
|
|
|
|
| |||||||||||
| 110,287,343 | 48,277,620 | 35,712,131 | 2,229,488 | 4,336,246 | (229,991 | ) | ||||||||||||||||
|
|
|
|
|
|
|
|
|
|
|
| |||||||||||
|
| |||||||||||||||||||||
|
| |||||||||||||||||||||
| $ | 80,997,390 | $ | 32,719,770 | $ | 234,958,583 | $ | 232,729,095 | $ | 35,349,678 | $ | 35,579,669 | |||||||||||
|
|
|
|
|
|
|
|
|
|
|
| |||||||||||
| $ | 191,284,733 | $ | 80,997,390 | $ | 270,670,714 | $ | 234,958,583 | $ | 39,685,924 | $ | 35,349,678 | |||||||||||
|
|
|
|
|
|
|
|
|
|
|
| |||||||||||
| $ | (530,093 | ) | $ | (611,537 | ) | $ | (828,338 | ) | $ | 847,767 | $ | (53,409 | ) | $ | — | |||||||
|
|
|
|
|
|
|
|
|
|
|
| |||||||||||
|
| |||||||||||||||||||||
| 10,815,539 | 5,222,635 | 1,486,659 | 3,956,697 | 93,997 | 969,774 | |||||||||||||||||
| 20,760 | 112,513 | 2,447,384 | 98,847 | 550,511 | 198,365 | |||||||||||||||||
| (2,780,050 | ) | (1,788,732 | ) | (3,826,073 | ) | (6,557,312 | ) | (326,797 | ) | (1,680,121 | ) | |||||||||||
|
|
|
|
|
|
|
|
|
|
|
| |||||||||||
| 8,056,249 | 3,546,416 | 107,970 | (2,501,768 | ) | 317,711 | (511,982 | ) | |||||||||||||||
|
|
|
|
|
|
|
|
|
|
|
| |||||||||||
|
| |||||||||||||||||||||
Notes to Financial Statements are an integral part of these Statements.
51
Statements of Changes in Net Assets
| Driehaus Mid Cap Growth Fund | Driehaus Micro Cap Growth Fund | |||||||||||
| For the year ended December 31, 2013 | For the year ended December 31, 2012 | For the period 2013 | ||||||||||
INCREASE (DECREASE) IN NET ASSETS: | ||||||||||||
Operations: | ||||||||||||
Net investment income (loss) | $ | (385,004 | ) | $ | (185,450 | ) | $ | (127,358 | ) | |||
Net realized gain (loss) on investments, written options and foreign currency transactions | 6,878,923 | 1,946,830 | 3,463,074 | |||||||||
Net change in unrealized gain (loss) on investments, written options and foreign currency transactions | 2,428,262 | 837,646 | 18,234,779 | |||||||||
|
|
|
|
|
| |||||||
| ||||||||||||
Net increase (decrease) in net assets resulting from operations | 8,922,181 | 2,599,026 | 21,570,495 | |||||||||
|
|
|
|
|
| |||||||
|
|
| ||||||||||
Distributions to shareholders: | ||||||||||||
Net investment income | — | — | — | |||||||||
Capital gains | (5,564,780 | ) | (2,022,728 | ) | — | |||||||
|
|
|
|
|
| |||||||
Total distributions to shareholders | (5,564,780 | ) | (2,022,728 | ) | — | |||||||
|
|
|
|
|
| |||||||
|
|
| ||||||||||
Capital share transactions: | ||||||||||||
Proceeds from shares sold | 2,615,263 | 728,944 | 53,149,020 | |||||||||
Reinvestment of distributions | 5,410,540 | 1,961,290 | — | |||||||||
Cost of shares redeemed | (1,285,889 | ) | (980,231 | ) | (42,730 | ) | ||||||
Redemption fees | 814 | — | — | |||||||||
|
|
|
|
|
| |||||||
Net increase (decrease) in net assets derived from capital share transactions | 6,740,728 | 1,710,003 | 53,106,290 | |||||||||
|
|
|
|
|
| |||||||
Total increase (decrease) in net assets | 10,098,129 | 2,286,301 | 74,676,785 | |||||||||
|
|
|
|
|
| |||||||
| ||||||||||||
NET ASSETS: | ||||||||||||
| ||||||||||||
Beginning of period | $ | 24,180,907 | $ | 21,894,606 | $ | — | ||||||
|
|
|
|
|
| |||||||
End of period | $ | 34,279,036 | $ | 24,180,907 | $ | 74,676,785 | ||||||
|
|
|
|
|
| |||||||
Accumulated net investment income (loss) | $ | — | $ | — | $ | — | ||||||
|
|
|
|
|
| |||||||
| ||||||||||||
Capital share transactions are as follows: | ||||||||||||
Shares issued | 166,620 | 52,589 | 6,954,301 | |||||||||
Shares reinvested | 379,687 | 151,568 | — | |||||||||
Shares redeemed | (87,563 | ) |
|
(73,229 |
) |
|
(4,008 |
) | ||||
|
|
|
|
|
| |||||||
Net increase (decrease) from capital share transactions | 458,744 | 130,928 | 6,950,293 | |||||||||
|
|
|
|
|
| |||||||
|
|
| ||||||||||
| * | Fund commenced operations on November 18, 2013. |
Notes to Financial Statements are an integral part of these Statements.
52
Driehaus International Discovery Fund
| For the year ended December 31, 2013 | For the year ended December 31, 2012 | For the year ended December 31, 2011 | For the year ended December 31, 2010 | For the year ended December 31, 2009 | ||||||||||||||||
Net asset value, beginning of period | $ | 27.85 | $ | 24.27 | $ | 30.27 | $ | 27.19 | $ | 18.28 | ||||||||||
|
|
|
|
|
|
|
|
|
| |||||||||||
INCOME (LOSS) FROM INVESTMENT OPERATIONS: | ||||||||||||||||||||
Net investment income (loss) | 0.03 | 0.03^ | 0.13 | ^ | (0.22 | ) | 0.00 | ~ | ||||||||||||
Net realized and unrealized gain (loss) on investments and foreign currency transactions | 4.73 | 3.55 | (6.13 | ) | 3.86 | 9.02 | ||||||||||||||
|
|
|
|
|
|
|
|
|
| |||||||||||
Total income (loss) from investment operations | 4.76 | 3.58 | (6.00 | ) | 3.64 | 9.02 | ||||||||||||||
|
|
|
|
|
|
|
|
|
| |||||||||||
LESS DISTRIBUTIONS: | ||||||||||||||||||||
Dividends from net investment income | — | — | — | (0.56 | ) | (0.11 | ) | |||||||||||||
Distributions from capital gains | — | — | — | — | — | |||||||||||||||
|
|
|
|
|
|
|
|
|
| |||||||||||
Total distributions | — | — | — | (0.56 | ) | (0.11 | ) | |||||||||||||
|
|
|
|
|
|
|
|
|
| |||||||||||
Redemption fees added to paid-in capital | 0.00 | ~ | 0.00 | ~ | 0.00 | ~ | 0.00 | ~ | 0.00 | ~ | ||||||||||
|
|
|
|
|
|
|
|
|
| |||||||||||
Net asset value, end of period | $ | 32.61 | $ | 27.85 | $ | 24.27 | $ | 30.27 | $ | 27.19 | ||||||||||
|
|
|
|
|
|
|
|
|
| |||||||||||
Total Return | 17.09 | % | 14.75 | % | (19.85 | )% | 13.47 | % | 49.28 | % | ||||||||||
RATIOS/SUPPLEMENTAL DATA | ||||||||||||||||||||
Net assets, end of period (in 000’s) | $ | 133,887 | $ | 206,393 | $ | 211,927 | $ | 338,840 | $ | 364,411 | ||||||||||
Ratio of expenses before reimbursements, waivers and fees paid indirectly to average net assets | 1.65 | %¥ | 1.76 | %¥ | 1.72 | %¥ | 1.71 | % | 1.75 | % | ||||||||||
Ratio of net expenses to average net assets | 1.62 | %#¥ | 1.75 | %#¥ | 1.71 | %#¥ | 1.70 | %# | 1.74 | %# | ||||||||||
Ratio of net investment income (loss) to average net assets | 0.11 | %# | 0.11 | %# | 0.44 | %# | (0.77 | )%# | 0.07 | %# | ||||||||||
Portfolio turnover | 156 | % | 112 | % | 119 | % | 93 | % | 145 | % | ||||||||||
| ||||||||||||||||||||
| ^ | Net investment income (loss) per share has been calculated using the average shares method. |
| ~ | Amount represents less than $0.01 per share |
| # | Such ratios are net of fees paid indirectly (see Note B in the Notes to Financial Statements). |
| ¥ | Ratio of expenses to average net assets includes interest expense of less than 0.005% for the years ended December 31, 2013, 2012 and 2011. The interest expense is from utilizing the line of credit (see Note F in the Notes to Financial Statements). |
Notes to Financial Statements are an integral part of this Schedule.
53
Driehaus Emerging Markets Growth Fund
Financial Highlights
| For the year ended December 31, 2013 | For the year ended December 31, 2012 | For the year ended December 31, 2011 | For the year ended December 31, 2010 | For the year ended December 31, 2009 | ||||||||||||||||
Net asset value, beginning of period | $ | 30.61 | $ | 25.72 | $ | 32.20 | $ | 29.24 | $ | 17.19 | ||||||||||
|
|
|
|
|
|
|
|
|
| |||||||||||
INCOME (LOSS) FROM INVESTMENT OPERATIONS: | ||||||||||||||||||||
Net investment income (loss) | 0.10 | 0.13 | 0.16 | (0.04 | )^ | (0.05 | ) | |||||||||||||
Net realized and unrealized gain (loss) on investments and foreign currency transactions | 2.62 | 4.88 | (4.97 | ) | 6.84 | 12.09 | ||||||||||||||
|
|
|
|
|
|
|
|
|
| |||||||||||
Total income (loss) from investment operations | 2.72 | 5.01 | (4.81 | ) | 6.80 | 12.04 | ||||||||||||||
|
|
|
|
|
|
|
|
|
| |||||||||||
LESS DISTRIBUTIONS: | ||||||||||||||||||||
Dividends from net investment income | — | (0.12 | ) | — | (0.69 | ) | — | |||||||||||||
Distributions from capital gains | (0.80 | ) | — | (1.67 | ) | (3.15 | ) | — | ||||||||||||
|
|
|
|
|
|
|
|
|
| |||||||||||
Total distributions | (0.80 | ) | (0.12 | ) | (1.67 | ) | (3.84 | ) | — | |||||||||||
|
|
|
|
|
|
|
|
|
| |||||||||||
Redemption fees added to paid-in capital | 0.00 | ~ | 0.00 | ~ | 0.00 | ~ | 0.00 | ~ | 0.01 | |||||||||||
|
|
|
|
|
|
|
|
|
| |||||||||||
Net asset value, end of period | $ | 32.53 | $ | 30.61 | $ | 25.72 | $ | 32.20 | $ | 29.24 | ||||||||||
|
|
|
|
|
|
|
|
|
| |||||||||||
Total Return | 8.92 | % | 19.51 | % | (15.02 | )% | 23.56 | % | 70.10 | % | ||||||||||
RATIOS/SUPPLEMENTAL DATA | ||||||||||||||||||||
Net assets, end of period (in 000’s) | $ | 1,634,866 | $ | 989,258 | $ | 741,291 | $ | 834,311 | $ | 575,842 | ||||||||||
Ratio of expenses before reimbursements, waivers and fees paid indirectly to average net assets | 1.66 | % | 1.68 | % | 1.68 | % | 1.69 | % | 1.78 | % | ||||||||||
Ratio of net expenses to average net assets | 1.64 | %# | 1.66 | %# | 1.64 | %# | 1.63 | %# | 1.75 | %# | ||||||||||
Ratio of net investment income (loss) to average net assets | 0.33 | %# | 0.48 | %# | 0.49 | %# | (0.15 | )%# | (0.30 | )%# | ||||||||||
Portfolio turnover | 264 | % | 278 | % | 342 | % | 293 | % | 275 | % | ||||||||||
| ||||||||||||||||||||
| ^ | Net investment income (loss) per share has been calculated using the average shares method. |
| ~ | Amount represents less than $0.01 per share |
| # | Such ratios are net of fees paid indirectly (see Note B in the Notes to Financial Statements). |
Notes to Financial Statements are an integral part of this Schedule.
54
Driehaus Emerging Markets Small Cap Growth Fund
Financial Highlights
| For the year ended December 31, 2013 | For the year ended December 31, 2012 | For the period August 22, 2011 through December 31, 2011 | ||||||||||
Net asset value, beginning of period | $ | 11.15 | $ | 8.81 | $ | 10.00 | ||||||
|
|
|
|
|
| |||||||
INCOME (LOSS) FROM INVESTMENT OPERATIONS: | ||||||||||||
Net investment income (loss) | (0.00 | )^~ | 0.00 | ^~ | (0.03 | ) | ||||||
Net realized and unrealized gain (loss) on investments | 1.36 | 2.52 | (1.16 | ) | ||||||||
|
|
|
|
|
| |||||||
Total income (loss) from investment operations | 1.36 | 2.52 | (1.19 | ) | ||||||||
|
|
|
|
|
| |||||||
LESS DISTRIBUTIONS: | ||||||||||||
Dividends from net investment income | (0.02 | ) | (0.18 | ) | — | |||||||
Distributions from capital gains | — | — | — | |||||||||
|
|
|
|
|
| |||||||
Total distributions | (0.02 | ) | (0.18 | ) | — | |||||||
|
|
|
|
|
| |||||||
Redemption fees added to paid-in capital | 0.00 | ~ | 0.00 | ~ | — | |||||||
|
|
|
|
|
| |||||||
Net asset value, end of period | $ | 12.49 | $ | 11.15 | $ | 8.81 | ||||||
|
|
|
|
|
| |||||||
Total Return | 12.11 | % | 28.83 | % | (11.90 | )%** | ||||||
RATIOS/SUPPLEMENTAL DATA | ||||||||||||
Net assets, end of period (in 000’s) | $ | 191,285 | $ | 80,997 | $ | 32,720 | ||||||
Ratio of expenses before reimbursements and/or recapture, waivers and fees paid indirectly to average net assets | 1.85 | % | 2.15 | % | 2.74 | %* | ||||||
Ratio of net expenses to average net assets | 1.90 | %+# | 1.99 | %+# | 1.97 | %*+# | ||||||
Ratio of net investment loss to average net assets | (0.02 | )%+# | (0.02 | )%+# | (0.91 | )%*+# | ||||||
Portfolio turnover | 223 | % | 183 | % | 74 | %** | ||||||
| ||||||||||||
| * | Annualized |
| ** | Not Annualized |
| ^ | Net investment income (loss) per share has been calculated using the average shares method. |
| ~ | Amount represents less than $0.01 per share |
| + | Such ratios are after administrative and transfer agent waivers and adviser expense reimbursements, when applicable. BNY Mellon Investment Servicing (US) Inc., the administrative agent and transfer agent, waived a portion of its fees beginning with the Fund’s commencement of operations, August 22, 2011. The Adviser contractually agreed to waive its investment advisory fee or absorb other operating expenses to the extent necessary to ensure that total annual Fund operating expenses (other than interest, taxes, brokerage commissions and other portfolio transaction expenses, capital expenditures, and extraordinary expenses) would not exceed the Fund’s operating expense cap of 2.00% of average daily net assets until August 21, 2014. |
| # | Such ratios are net of fees paid indirectly (see Note B in the Notes to Financial Statements). |
Notes to Financial Statements are an integral part of this Schedule.
55
Driehaus International Small Cap Growth Fund
Financial Highlights
| For the year ended December 31, 2013 | For the year ended December 31, 2012 | For the year ended December 31, 2011 | For the year ended December 31, 2010 | For the year ended December 31, 2009 | ||||||||||||||||
Net asset value, beginning of period | $ | 9.45 | $ | 8.51 | $ | 9.66 | $ | 7.64 | $ | 4.93 | ||||||||||
|
|
|
|
|
|
|
|
|
| |||||||||||
INCOME (LOSS) FROM INVESTMENT OPERATIONS: | ||||||||||||||||||||
Net investment income (loss) | (0.01 | )^ | 0.03 | 0.07 | (0.06 | ) | (0.02 | ) | ||||||||||||
Net realized and unrealized gain (loss) on investments and foreign currency transactions | 2.74 | 0.95 | (1.17 | ) | 2.14 | 2.73 | ||||||||||||||
|
|
|
|
|
|
|
|
|
| |||||||||||
Total income (loss) from investment operations | 2.73 | 0.98 | (1.10 | ) | 2.08 | 2.71 | ||||||||||||||
|
|
|
|
|
|
|
|
|
| |||||||||||
LESS DISTRIBUTIONS: | ||||||||||||||||||||
Dividends from net investment income | (0.13 | ) | (0.04 | ) | (0.05 | ) | (0.06 | ) | — | |||||||||||
Distributions from capital gains | (1.21 | ) | — | — | — | — | ||||||||||||||
|
|
|
|
|
|
|
|
|
| |||||||||||
Total distributions | (1.34 | ) | (0.04 | ) | (0.05 | ) | (0.06 | ) | — | |||||||||||
|
|
|
|
|
|
|
|
|
| |||||||||||
Redemption fees added to paid-in capital | 0.00 | ~ | 0.00 | ~ | 0.00 | ~ | 0.00 | ~ | 0.00 | ~ | ||||||||||
|
|
|
|
|
|
|
|
|
| |||||||||||
Net asset value, end of period | $ | 10.84 | $ | 9.45 | $ | 8.51 | $ | 9.66 | $ | 7.64 | ||||||||||
|
|
|
|
|
|
|
|
|
| |||||||||||
Total Return | 29.24 | % | 11.67 | % | (11.39 | )% | 27.13 | % | 55.17 | % | ||||||||||
RATIOS/SUPPLEMENTAL DATA | ||||||||||||||||||||
Net assets, end of period (in 000’s) | $ | 270,671 | $ | 234,959 | $ | 232,729 | $ | 258,446 | $ | 201,020 | ||||||||||
Ratio of expenses before reimbursements, waivers and fees paid indirectly to average net assets | 1.73 | % | 1.76 | % | 1.73 | % | 1.75 | % | 1.87 | % | ||||||||||
Ratio of net expenses to average net assets | 1.70 | %# | 1.74 | %# | 1.69 | %# | 1.72 | %+# | 1.85 | %+# | ||||||||||
Ratio of net investment income (loss) to average net assets | (0.11 | )%# | 0.31 | %# | 0.66 | %# | (0.76 | )%+# | (0.54 | )%+# | ||||||||||
Portfolio turnover | 320 | % | 280 | % | 311 | % | 298 | % | 265 | % | ||||||||||
| ||||||||||||||||||||
| ^ | Net investment income (loss) per share has been calculated using the average shares method. |
| ~ | Amount represents less than $0.01 per share |
| + | Such ratios are after administrative and transfer agent waivers and adviser expense reimbursements, when applicable. BNY Mellon Investment Servicing (US) Inc., the administrative agent and transfer agent, waived a portion of its fees beginning with the Fund’s commencement of operations, September 17, 2007. The Adviser contractually agreed to waive its investment advisory fee or absorb other operating expenses to the extent necessary to ensure that total annual Fund oprating expenses (other than interest, taxes, brokerage commissions and other portfolio transaction expenses, capital expenditures, and extraordinary expenses) would not exceed the Fund’s operating expense cap of 2.00% of average daily net assets until September 16, 2010. |
| # | Such ratios are net of fees paid indirectly (see Note B in the Notes to Financial Statements). |
Notes to Financial Statements are an integral part of this Schedule.
56
Driehaus Global Growth Fund
Financial Highlights
| For the year ended December 31, 2013 | For the year ended December 31, 2012 | For the year ended December 31, 2011 | For the year ended December 31, 2010 | For the year ended December 31, 2009 | ||||||||||||||||
Net asset value, beginning of period | $ | 7.22 | $ | 6.58 | $ | 9.01 | $ | 7.59 | $ | 4.98 | ||||||||||
|
|
|
|
|
|
|
|
|
| |||||||||||
INCOME (LOSS) FROM INVESTMENT OPERATIONS: | ||||||||||||||||||||
Net investment income (loss) | (0.05 | ) | (0.05 | ) | (0.10 | ) | (0.11 | ) | (0.05 | ) | ||||||||||
Net realized and unrealized gain (loss) on investments and foreign currency transactions | 1.31 | 1.00 | (1.53 | ) | 1.55 | 2.66 | ||||||||||||||
|
|
|
|
|
|
|
|
|
| |||||||||||
Total income (loss) from investment operations | 1.26 | 0.95 | (1.63 | ) | 1.44 | 2.61 | ||||||||||||||
|
|
|
|
|
|
|
|
|
| |||||||||||
LESS DISTRIBUTIONS: | ||||||||||||||||||||
Dividends from net investment income | — | — | — | (0.02 | ) | — | ||||||||||||||
Distributions from capital gains | (0.87 | ) | (0.31 | ) | (0.80 | ) | — | — | ||||||||||||
|
|
|
|
|
|
|
|
|
| |||||||||||
Total distributions | (0.87 | ) | (0.31 | ) | (0.80 | ) | (0.02 | ) | — | |||||||||||
|
|
|
|
|
|
|
|
|
| |||||||||||
Redemption fees added to paid-in capital | 0.00 | ~ | 0.00 | ~ | 0.00 | ~ | — | 0.00 | ~ | |||||||||||
|
|
|
|
|
|
|
|
|
| |||||||||||
Net asset value, end of period | $ | 7.61 | $ | 7.22 | $ | 6.58 | $ | 9.01 | $ | 7.59 | ||||||||||
|
|
|
|
|
|
|
|
|
| |||||||||||
Total Return | 17.79 | % | 14.36 | % | (18.15 | )% | 19.00 | % | 52.41 | % | ||||||||||
RATIOS/SUPPLEMENTAL DATA | ||||||||||||||||||||
Net assets, end of period (in 000’s) | $ | 39,686 | $ | 35,350 | $ | 35,580 | $ | 52,719 | $ | 40,301 | ||||||||||
Ratio of expenses before reimbursements and/or recapture, waivers and fees paid indirectly to average net assets | 1.93 | % | 2.02 | %¥ | 1.88 | %¥ | 1.81 | % | 2.34 | % | ||||||||||
Ratio of net expenses to average net assets | 1.92 | %# | 2.01 | %#¥ | 1.97 | %+#¥ | 2.00 | %+# | 2.00 | %+# | ||||||||||
Ratio of net investment income (loss) to average net assets | (0.72 | )%# | (0.62 | )%# | (1.08 | )%+# | (1.37 | )%+# | (1.09 | )%+# | ||||||||||
Portfolio turnover | 163 | % | 103 | % | 142 | % | 145 | % | 119 | % | ||||||||||
| ||||||||||||||||||||
| ~ | Amount represents less than $0.01 per share |
| + | Such ratios are after administrative and transfer agent waivers and adviser expense reimbursements and/or recapture, when applicable. BNY Mellon Investment Servicing (US) Inc., the administrative agent and transfer agent, waived a portion of its fees beginning with the Fund’s commencement of operations, May 1, 2008. The Adviser contractually agreed to waive its investment advisory fee or absorb other operating expenses to the extent necessary to ensure that total annual Fund operating expenses (other than interest, taxes, brokerage commissions and other portfolio transaction expenses, capital expenditures, and extraordinary expenses) would not exceed the Fund’s operating expense cap of 2.00% of average daily net assets until April 30, 2011. |
| # | Such ratios are net of fees paid indirectly (see Note B in the Notes to Financial Statements). |
| ¥ | Ratio of expenses to average net assets includes interest expense of less than 0.005% for the years ended December 31, 2012 and 2011. The interest expense is from utilizing the line of credit (see Note F in the Notes to Financial Statements). |
Notes to Financial Statements are an integral part of this Schedule.
57
Driehaus Mid Cap Growth Fund
Financial Highlights
| For the year ended December 31, 2013 | For the year ended December 31, 2012 | For the year ended December 31, 2011 | For the year ended December 31, 2010 | For the period April 27, 2009 through December 31, 2009 | ||||||||||||||||
Net asset value, beginning of period | $ | 12.87 | $ | 12.53 | $ | 13.69 | $ | 11.63 | $ | 10.00 | ||||||||||
|
|
|
|
|
|
|
|
|
| |||||||||||
INCOME (LOSS) FROM INVESTMENT OPERATIONS: | ||||||||||||||||||||
Net investment income (loss) | (0.16 | ) | (0.10 | ) | (0.16 | ) | (0.14 | ) | (0.08 | ) | ||||||||||
Net realized and unrealized gain (loss) on investments | 4.79 | 1.61 | (0.14 | ) | 3.25 | 2.85 | ||||||||||||||
|
|
|
|
|
|
|
|
|
| |||||||||||
Total income (loss) from investment operations | 4.63 | 1.51 | (0.30 | ) | 3.11 | 2.77 | ||||||||||||||
|
|
|
|
|
|
|
|
|
| |||||||||||
LESS DISTRIBUTIONS: | ||||||||||||||||||||
Dividends from net investment income | — | — | — | — | — | |||||||||||||||
Distributions from capital gains | (2.83 | ) | (1.17 | ) | (0.86 | ) | (1.05 | ) | (1.14 | ) | ||||||||||
|
|
|
|
|
|
|
|
|
| |||||||||||
Total distributions | (2.83 | ) | (1.17 | ) | (0.86 | ) | (1.05 | ) | (1.14 | ) | ||||||||||
|
|
|
|
|
|
|
|
|
| |||||||||||
Redemption fees added to paid-in capital | 0.00 | ~ | 0.00 | ~ | 0.00 | ~ | 0.00 | ~ | 0.00 | ~ | ||||||||||
|
|
|
|
|
|
|
|
|
| |||||||||||
Net asset value, end of period | $ | 14.67 | $ | 12.87 | $ | 12.53 | $ | 13.69 | $ | 11.63 | ||||||||||
|
|
|
|
|
|
|
|
|
| |||||||||||
Total Return | 36.61 | % | 11.97 | % | (2.15 | )% | 26.59 | % | 27.66 | %** | ||||||||||
RATIOS/SUPPLEMENTAL DATA | ||||||||||||||||||||
Net assets, end of period (in 000’s) | $ | 34,279 | $ | 24,181 | $ | 21,895 | $ | 21,573 | $ | 14,821 | ||||||||||
Ratio of expenses before reimbursements and waivers to average net assets | 1.85 | % | 1.97 | % | 1.95 | % | 2.47 | % | 2.82 | %* | ||||||||||
Ratio of net expenses to average net assets | 1.75 | %+ | 1.75 | %+ | 1.75 | %+ | 1.75 | %+ | 1.75 | %*+ | ||||||||||
Ratio of net investment income (loss) to average net assets | (1.33 | )%+ | (0.78 | )%+ | (1.13 | )%+ | (1.39 | )%+ | (1.15 | )%*+ | ||||||||||
Portfolio turnover | 199 | % | 123 | % | 193 | % | 182 | % | 208 | %** | ||||||||||
| ||||||||||||||||||||
| * | Annualized |
| ** | Not Annualized |
| ~ | Amount represents less than $0.01 per share |
| + | Such ratios are after administrative and transfer agent waivers and adviser expense reimbursements, when applicable. BNY Mellon Investment Servicing (US) Inc., the administrative agent and transfer agent, waived a portion of its fees beginning with the Fund’s commencement of operations, April 27, 2009. The Adviser contractually agreed to waive its investment advisory fee or absorb other operating expenses to the extent necessary to ensure that total annual Fund operating expenses (other than interest, taxes, brokerage commissions and other portfolio transaction expenses, capital expenditures, and extraordinary expenses) would not exceed the Fund’s operating expense cap of 1.75% of average daily net assets until April 30, 2015. |
Notes to Financial Statements are an integral part of this Schedule.
58
Driehaus Micro Cap Growth Fund
Financial Highlights
| For the period November 18, 2013 through December 31, 2013 | ||||
Net asset value, beginning of period | $ | 10.00 | ||
|
| |||
INCOME (LOSS) FROM INVESTMENT OPERATIONS: | ||||
Net investment income (loss) | (0.02 | ) | ||
Net realized and unrealized gain (loss) on investments | 0.76 | |||
|
| |||
Total income (loss) from investment operations | 0.74 | |||
|
| |||
LESS DISTRIBUTIONS: | ||||
Dividends from net investment income | — | |||
Distributions from capital gains | — | |||
|
| |||
Total distributions | — | |||
|
| |||
Net asset value, end of period | $ | 10.74 | ||
|
| |||
Total Return | 7.40 | %** | ||
RATIOS/SUPPLEMENTAL DATA | ||||
Net assets, end of period (in 000’s) | $ | 74,677 | ||
Ratio of expenses before reimbursements and waivers to average net assets | 2.28 | %* | ||
Ratio of net expenses to average net assets | 1.70 | %*+ | ||
Ratio of net investment income (loss) to average net assets | (1.55 | )%*+ | ||
Portfolio turnover | 21 | %** | ||
| ||||
| * | Annualized |
| ** | Not Annualized |
| + | Such ratios are after administrative and transfer agent waivers and adviser expense reimbursements, when applicable. BNY Mellon Investment Servicing (US) Inc., the administrative agent and transfer agent, waived a portion of its fees beginning with the Fund’s commencement of operations, November 18, 2013. The Adviser contractually agreed to waive its investment advisory fee or absorb other operating expenses to the extent necessary to ensure that total annual Fund operating expenses (other than interest, taxes, brokerage commissions and other portfolio transaction expenses, capital expenditures, and extraordinary expenses) would not exceed the Fund’s operating expense cap of 1.70% of average daily net assets until November 18, 2016. |
Notes to Financial Statements are an integral part of this Schedule.
59
Driehaus Mutual Funds
A. SUMMARY OF SIGNIFICANT ACCOUNTING POLICIES
Organization
The Driehaus Mutual Funds (the “Trust”) is a registered investment management company, organized as a Delaware statutory trust, with ten separate series currently in operation. The Trust was organized under an Agreement and Declaration of Trust dated May 31, 1996, as subsequently amended and restated as of June 6, 2013, and may issue an unlimited number of full and fractional units of beneficial interest (shares) without par value. The seven series (“Funds” or each a “Fund”) included in this report are as follows:
| Fund | Commencement of Operations | |||
Driehaus International Discovery Fund | 12/31/98 | |||
Driehaus Emerging Markets Growth Fund | 12/31/97 | |||
Driehaus Emerging Markets Small Cap Growth Fund | 08/22/11 | |||
Driehaus International Small Cap Growth Fund* | 09/17/07 | |||
Driehaus Global Growth Fund | 05/01/08 | |||
Driehaus Mid Cap Growth Fund | 04/27/09 | |||
Driehaus Micro Cap Growth | 11/18/13 | |||
| ||||
| * | On December 29, 2010, the Driehaus International Small Cap Growth Fund was closed to new investors. |
The investment objective of each Fund is to maximize capital appreciation.
Driehaus International Discovery Fund seeks to achieve its objective by generally investing in equity securities of non-U.S. companies exhibiting strong growth characteristics.
Driehaus Emerging Markets Growth Fund seeks to achieve its objective by investing primarily in equity securities of emerging markets companies.
Driehaus Emerging Markets Small Cap Growth Fund seeks to achieve its objective by investing primarily in equity securities of small capitalization emerging markets companies.
Driehaus International Small Cap Growth Fund seeks to achieve its objective by investing primarily in equity securities of smaller capitalization non-U.S. companies exhibiting strong growth characteristics.
Driehaus Global Growth Fund seeks to achieve its objective by investing primarily in equity securities of both U.S. and non-U.S. companies exhibiting strong growth characteristics.
Driehaus Mid Cap Growth Fund seeks to achieve its objective by investing primarily in equity securities of mid capitalization U.S. companies exhibiting strong growth characteristics.
Driehaus Micro Cap Growth Fund seeks to achieve its objective by investing primarily in equity securities of micro capitalization U.S. companies exhibiting strong growth characteristics.
Fiscal Year-End
The fiscal year-end for the Funds is December 31.
Securities Valuation and Transactions
Equity securities and exchange-traded options are valued at the last sale price as of the close of the primary exchange or other designated time. In addition, if quotations are not readily available, if the values have been materially affected by events occurring after the closing of a foreign market, or if there has been a movement in the United States market that exceeds a certain threshold, assets may be valued at fair value as determined in good faith by or under the direction of the Trust’s Board of Trustees. Events that may materially affect asset values that could cause a fair value determination include, but are not limited to: corporate announcements relating to a specific security; natural and other disasters which may impact an entire market or region; and political and other events which may be global or impact a particular country or region. The frequency with which these procedures are used cannot be predicted and may be utilized to a significant extent. To the extent utilized, securities would be considered level 2 in the hierarchy described below. Substantially all transfers between level 1 and level 2 relate to the use of these procedures.
60
Driehaus Mutual Funds
Notes to Financial Statements — (Continued)
Each Fund is subject to fair value accounting standards that define fair value, establish the framework for measuring fair value and provide a three-level hierarchy for fair valuation based upon the inputs to the valuation as of the measurement date. The three levels of the fair value hierarchy are as follows:
Level 1 — quoted prices in active markets for identical securities
Level 2 — significant observable inputs (including quoted prices for similar securities, interest rates, prepayment speeds, credit risk, etc.)
Level 3 — significant unobservable inputs (including the Funds’ own assumptions in determining the fair value of investments)
The inputs or methodology used for valuing securities are not necessarily an indication of the risk associated with investing in those securities.
The summary of the Funds’ investments that are measured at fair value by level within the fair value hierarchy as of December 31, 2013 is as follows:
Fund | Total Value at December 31, 2013 | Level 1 Quoted Price | Level 2 Significant Observable Inputs | Level 3 Significant Unobservable Inputs | ||||||||||||
Driehaus International Discovery Fund | ||||||||||||||||
Investments in Securities* | $ | 131,509,530 | $ | 131,509,530 | $ | — | $ | — | ||||||||
|
|
|
|
|
|
|
| |||||||||
Driehaus Emerging Markets Growth Fund | ||||||||||||||||
Equity Securities: | ||||||||||||||||
Africa | $ | 88,496,116 | $ | 88,496,116 | $ | — | $ | — | ||||||||
Central America | 23,390,470 | 23,390,470 | — | — | ||||||||||||
Europe | 215,453,016 | 215,453,016 | — | — | ||||||||||||
Far East | 797,127,564 | 795,466,051 | 1,661,513 | — | ||||||||||||
Middle East | 33,406,373 | 33,406,373 | — | |||||||||||||
North America | 217,511,887 | 217,511,887 | — | — | ||||||||||||
South America | 172,375,446 | 172,375,446 | — | — | ||||||||||||
Equity Certificates* | 19,195,285 | — | 19,195,285 | — | ||||||||||||
Rights | 248,234 | — | 248,234 | — | ||||||||||||
|
|
|
|
|
|
|
| |||||||||
Total Investments | $ | 1,567,204,391 | $ | 1,546,099,359 | $ | 21,105,032 | $ | — | ||||||||
|
|
|
|
|
|
|
| |||||||||
Driehaus Emerging Markets Small Cap Growth Fund | ||||||||||||||||
Assets: | ||||||||||||||||
Equity Securities: | ||||||||||||||||
Africa | $ | 9,729,785 | $ | 9,729,785 | $ | — | $ | — | ||||||||
Europe | 23,709,430 | 23,709,430 | — | — | ||||||||||||
Far East | 83,972,293 | 83,201,076 | 771,217 | — | ||||||||||||
Middle East | 4,722,207 | 4,722,207 | — | |||||||||||||
North America | 20,277,972 | 20,277,972 | — | — | ||||||||||||
South America | 6,370,035 | 6,370,035 | — | — | ||||||||||||
Equity Certificates* | 32,620,138 | — | 32,620,138 | — | ||||||||||||
61
Driehaus Mutual Funds
Notes to Financial Statements — (Continued)
Fund | Total Value at December 31, 2013 | Level 1 Quoted Price | Level 2 Significant Observable Inputs | Level 3 Significant Unobservable Inputs | ||||||||||||
Purchased Call Options by Risk Category: | ||||||||||||||||
Equity Contracts | $ | 570,000 | $ | 570,000 | $ | — | $ | — | ||||||||
Purchased Put Options by Risk Category: | ||||||||||||||||
Equity Contracts | 943,000 | 943,000 | — | — | ||||||||||||
|
|
|
|
|
|
|
| |||||||||
Total Investments | $ | 182,914,860 | $ | 149,523,505 | $ | 33,391,355 | $ | — | ||||||||
|
|
|
|
|
|
|
| |||||||||
Driehaus International Small Cap Growth Fund | ||||||||||||||||
Investments in Securities* | ||||||||||||||||
Total Investments | $ | 267,268,469 | $ | 267,268,469 | $ | — | $ | — | ||||||||
|
|
|
|
|
|
|
| |||||||||
Driehaus Global Growth Fund | ||||||||||||||||
Investments in Securities* | $ | 39,309,002 | $ | 39,309,002 | $ | — | $ | — | ||||||||
|
|
|
|
|
|
|
| |||||||||
Driehaus Mid Cap Growth Fund | ||||||||||||||||
Investments in Securities* | $ | 34,260,567 | $ | 34,260,567 | $ | — | $ | — | ||||||||
|
|
|
|
|
|
|
| |||||||||
Driehaus Micro Cap Growth Fund | ||||||||||||||||
Investments in Securities* | $ | 73,538,724 | $ | 73,538,724 | $ | — | $ | — | ||||||||
|
|
|
|
|
|
|
| |||||||||
| * | See Schedule of Investments for industry and/or country breakout. |
Transfers between levels, if any, are recognized as of the last day in the fiscal quarter of the period in which the event or change in circumstances that caused the reclassification occurred. The Funds used observable inputs in their valuation methodologies whenever they were available and deemed reliable.
When fair value pricing is employed, the prices of securities used by a Fund to calculate its net asset value may differ from closing prices for the same securities, which means that a Fund may value those securities higher or lower than another fund that does not employ fair value. In addition, the fair value price may differ materially from the value a Fund may ultimately realize.
For the period ended December 31, 2013, securities with end of period values of $25,534,524, $286,526,143, $26,455,787, $37,339,389 and $1,606,752 held by Driehaus International Discovery Fund, Driehaus Emerging Markets Growth Fund, Driehaus Emerging Markets Small Cap Growth Fund, Driehaus International Small Cap Growth Fund, and Driehaus Global Growth Fund, respectively, were transferred from level 2 to level 1.
Securities transactions are accounted for on trade date. The cost of investments sold is determined by the use of the specific identification method for both financial reporting and income tax purposes. Interest income is recorded on an accrual basis. Dividend income, net of non-reclaimable foreign taxes withheld, is recorded on the ex-dividend date or as soon as the information is available. Income and expenses are accrued daily.
Options Contracts
The Funds are subject to equity and other risk exposures in the normal course of pursuing their investment objective. The Funds may use options contracts to hedge their portfolio or a portion thereof or speculatively for the purpose of profiting from a decline in the market value of a security.
The Funds may write covered call and put options on futures, securities or currencies the Funds own or in which they may invest. Writing put options tends to increase a Fund’s exposure to the underlying instrument. Writing call options tends to decrease a Fund’s exposure to the underlying instrument. When a
62
Driehaus Mutual Funds
Notes to Financial Statements — (Continued)
Fund writes a call or put option, an amount equal to the premium received is recorded as a liability and subsequently marked-to-market to reflect the current value of the option written. These liabilities are reflected as written options outstanding in the Schedule of Investments. Payments received or made, if any, from writing options with premiums to be determined on a future date are reflected as such in the Schedule of Investments. Premiums received from writing options which expire are treated as realized gains. Premiums received from writing options which are exercised or closed are added to the proceeds or offset against amounts paid on the underlying future, security or currency transaction to determine the realized gain or loss. A Fund, as a writer of an option, has no control over whether the underlying future, security or currency may be sold (call) or purchased (put) and, as a result, bears the market risk of an unfavorable change in the price of the future, security or currency underlying the written option. The risk exists that a Fund may not be able to enter into a closing transaction because of an illiquid market.
For the year ended December 31, 2013, the average value of purchased and written options for Driehaus Emerging Markets Small Cap Growth Fund is $1,949,988 and $110,963, respectively.
The premiums received and the number of option contracts written during the period ended December 31, 2013, were as follows:
Driehaus Emerging Markets Small Cap Growth Fund | Number of Contracts | Premiums Received | ||||||
Options outstanding at December 31, 2012 | — | $ | — | |||||
Options written | 130,000 | 6,324,546 | ||||||
Options closed | (130,000 | ) | (6,324,546 | ) | ||||
Options expired | — | — | ||||||
|
|
|
| |||||
Options outstanding at December 31, 2013 | — | $ | — | |||||
|
|
|
| |||||
The Funds may also purchase put and call options. Purchasing call options tends to increase a Fund’s exposure to the underlying instrument. Purchasing put options tends to decrease a Fund’s exposure to the underlying instrument. A Fund pays a premium which is included in its Schedule of Investments as an investment and subsequently marked-to-market to reflect the current value of the option. Premiums paid for purchasing options which expire are treated as realized losses. Premiums paid for purchasing options which are exercised or closed are added to the amounts paid or offset against the proceeds on the underlying future, security or currency transaction to determine the realized gain or loss. When entering into purchased option contracts, a Fund bears the risk of securities prices moving unexpectedly, in which case, a Fund may not achieve the anticipated benefits of the purchased option contracts; however, the risk of loss is limited to the premium paid. As of December 31, 2013, the Funds had outstanding options as listed on the Schedule of Investments.
Equity Certificates
The Funds may invest in equity certificates, which allow the Funds to participate in the appreciation (depreciation) of the underlying security without actually owning the underlying security. These derivative instruments are purchased pursuant to an agreement with a financial institution and are valued at a calculated market price based on the value of the underlying security in accordance with the agreement. These equity certificates are subject to the credit risk of the issuing financial institution. There is no off-balance sheet risk associated with equity certificates and the Funds’ potential loss is limited to the purchase price of the securities. The Funds are exposed to credit risk associated with the counterparty to the transaction, which is monitored by the Funds’ management on a periodic basis.
On December 31, 2013, Driehaus Emerging Markets Growth Fund and Driehaus Emerging Markets Small Cap Growth Fund had unrealized appreciation of $110,111 and $5,755,753, respectively, as a result of their investments in these financial instruments. The aggregate market values of these certificates for Driehaus Emerging Markets Growth Fund and Driehaus Emerging Markets Small Cap Growth Fund represented 1.2% and 17.8%, respectively, of their total market values at December 31, 2013.
63
Driehaus Mutual Funds
Notes to Financial Statements — (Continued)
Derivative Investment Holdings Categorized by Risk Exposure
Each Fund is subject to the Financial Accounting Standards Board’s (“FASB”) “Disclosures about Derivative Instruments and Hedging Activities” (the “Derivatives Statement”). The Derivatives Statement amends and expands disclosures about derivative instruments and hedging activities. The Derivatives Statement is intended to improve financial reporting about derivative instruments requiring enhanced disclosures to enable investors to better understand how and why the Funds use derivative instruments, how these derivative instruments are accounted for and their effects on the Funds’ financial position and results of operations.
The following table sets forth the fair value and the location in the Statement of Assets and Liabilities of the Driehaus Emerging Markets Growth Fund’s derivative contracts by primary risk exposure as of December 31, 2013:
Asset derivatives | ||||||
Risk exposure category | Statement of Assets and Liabilities location | Fair value | ||||
Equity contracts | Investments, at market value | $ | 19,195,285 | |||
|
|
|
| |||
The following table sets forth the fair value and the location in the Statement of Assets and Liabilities of the Driehaus Emerging Markets Small Cap Growth Fund’s derivative contracts by primary risk exposure as of December 31, 2013:
Asset derivatives | ||||||
Risk exposure category | Statement of Assets and Liabilities location | Fair value | ||||
Equity contracts* | Investments, at market value | $ | 34,133,138 | |||
|
|
|
| |||
| * | Includes cumulative appreciation (depreciation) of options contracts shown in the Schedule of Investments. |
The following table sets forth the Driehaus Emerging Markets Growth Fund’s realized gain (loss) by primary risk exposure and by type of derivative contract for the year ended December 31, 2013:
| Amount of net realized gain (loss) on derivatives | ||||
Risk exposure category | Equity Certificates | |||
Equity contracts | $ | 3,968,764 | ||
|
|
| ||
The following table sets forth the Driehaus Emerging Markets Small Cap Growth Fund’s realized gain (loss) by primary risk exposure and by type of derivative contract for the year ended December 31, 2013:
| Amount of net realized gain (loss) on derivatives | ||||||||||||
Risk exposure category | Equity Certificates | Purchased Options | Written Options | |||||||||
Equity contracts | $ | (310,063 | ) | $ | (10,929,910 | ) | $ | 1,024,491 | ||||
Commodity contracts | — | (232,637 | ) | — | ||||||||
Foreign currency contracts. | — | (230,181 | ) | — | ||||||||
|
|
|
|
|
|
| ||||||
The following table sets forth the Driehaus Emerging Markets Growth Fund’s change in unrealized appreciation (depreciation) by primary risk exposure and by type of derivative contract for the year ended December 31, 2013:
| Change in net unrealized appreciation (depreciation) on derivatives | ||||
Risk exposure category | Equity Certificates | |||
Equity contracts | $ | (672,775 | ) | |
|
|
| ||
64
Driehaus Mutual Funds
Notes to Financial Statements — (Continued)
The following table sets forth the Driehaus Emerging Markets Small Cap Growth Fund’s change in unrealized appreciation (depreciation) by primary risk exposure and by type of derivative contract for the year ended December 31, 2013:
| Change net in unrealized appreciation (depreciation) on derivatives | ||||||||
Risk exposure category | Equity Certificates | Purchased Options | ||||||
Equity contracts | $ | 4,990,457 | $ | (666,085 | ) | |||
Foreign currency contracts | — | 64,280 | ||||||
|
|
|
|
| ||||
Federal Income Taxes
No provision is made for Federal income taxes since each Fund has elected or will elect to be taxed as a “regulated investment company” under Subchapter M of the Internal Revenue Code (the “Code”) and has made and declared all the required distributions to its shareholders in amounts sufficient to relieve each Fund from all or substantially all Federal income and excise taxes under provisions of current Federal tax law.
Each Fund is subject to accounting standards that establish a minimum threshold for recognizing, and a system for measuring, the benefits of a tax position taken or expected to be taken in a tax return. Taxable years ending 2013, 2012, 2011 and 2010 remain open to Federal and state audit. As of December 31, 2013, management has evaluated the application of these standards to each Fund, and has determined that no provision for income tax is required in each Fund’s financial statements for uncertain tax provisions. The Funds recognize interest and penalties, if any, related to unrecognized tax benefits as income tax expense in the Statement of Operations. During the year, the Funds did not incur any interest or penalties. The Funds may be subject to foreign taxes on income, gains on investments or currency repatriation, a portion of which may be recoverable. Foreign taxes are provided for based on the Funds’ understanding of the tax rules and regulations that exist in the foreign markets in which they invest.
The amount of dividends and distributions from net investment income and net realized capital gains are determined in accordance with Federal income tax regulations, which may differ from U.S. generally accepted accounting principles.
For the year ended December 31, 2013, reclassifications were recorded to undistributed net investment income, undistributed net realized gain and paid-in capital for any permanent tax differences. These reclassifications relate primarily to foreign currency losses, sales of passive foreign investment companies, net operating losses and capital loss carryforwards expiring. Results of operations and net assets were not affected by these reclassifications.
| Driehaus International Discovery Fund | Driehaus Emerging Markets Growth Fund | Driehaus Emerging Markets Small Cap Growth Fund | Driehaus International Small Cap Growth Fund | Driehaus Global Growth Fund | Driehaus Mid Cap Growth Fund | Driehaus Micro Cap Growth Fund | ||||||||||||||||||||||
Undistributed net investment income | $ | 309,729 | $ | (3,062,173 | ) | $ | 421,238 | $ | 1,475,831 | $ | 208,732 | $ | 385,004 | $ | 127,358 | |||||||||||||
Undistributed net realized gain | (358,334 | ) | 1,103,444 | (409,140 | ) | (1,475,831 | ) | (208,732 | ) | (385,004 | ) | (340,683 | ) | |||||||||||||||
Paid-in capital | 48,605 | 1,958,729 | (12,098 | ) | — | — | — | 213,325 | ||||||||||||||||||||
For Federal income tax purposes, capital loss carryforwards represent net capital losses of a Fund that may be carried forward for a maximum period of eight years and applied against future net realized gains. On December 22, 2010, the Regulated Investment Company Modernization Act of 2010 was enacted to modernize several of the Federal income and excise tax provisions related to regulated investment companies. Under pre-enactment law, capital losses could be carried forward for up to eight years, and carried forward as short-term capital losses, irrespective of the character of the original loss. New net capital losses (those earned in taxable years beginning after December 22, 2010) may be carried forward indefinitely and must retain the character of the original loss. Such new net capital losses generally must be used by a regulated investment company before it uses any net capital losses incurred in taxable years beginning on or before December 22, 2010. This
65
Driehaus Mutual Funds
Notes to Financial Statements — (Continued)
increases the likelihood that net capital losses incurred in taxable years beginning on or before December 22, 2010 will expire unused. The following table shows the expiration dates for capital loss carryover from pre-enactment taxable years and the amounts of capital loss carryover, if any, by each of the applicable Funds as of December 31, 2013:
| Pre-Enactment Net Capital Loss Carryover Expiring In | Post-Enactment Unlimited Period of Net Capital Loss Carryover | |||||||||||||||||||
Fund | 2016 | 2017 | Short- Term | Long- Term | Accumulated Capital Loss Carryover | |||||||||||||||
Driehaus International Discovery Fund | $ | 119,874,502 | $ | 109,113,076 | $ | — | $ | — | $ | 228,987,578 | ||||||||||
Driehaus Emerging Markets Small Cap Growth Fund | — | — | 6,730,035 | — | 6,730,035 | |||||||||||||||
During the year ended December 31, 2013, Driehaus International Discovery Fund, Driehaus Emerging Markets Growth Fund and Driehaus International Small Cap Growth Fund utilized $32,972,648, $46,914,023 and $16,027,905 of capital loss carryforwards, respectively.
Pursuant to federal income tax rules applicable to regulated investment companies, the Funds may elect to treat certain capital losses between November 1 and December 31 as occurring on the first day of the following tax year. For the year ended December 31, 2013, the following qualified late-year losses were deferred and recognized on January 1, 2014:
Fund | Late-Year Ordinary Loss Deferral | Short-Term Capital Loss Deferral | Long-Term Capital Losses Deferral | Total | ||||||||||||
Driehaus Emerging Markets Growth Fund | $ | 188,729 | $ | 12,119,097 | $ | — | $ | 12,307,826 | ||||||||
Driehaus Emerging Markets Small Cap Growth Fund | 75,337 | — | — | 75,337 | ||||||||||||
Driehaus Global Growth Fund | — | 146,129 | — | 146,129 | ||||||||||||
Distributions to Shareholders
The tax character of distributions paid during the fiscal year ended December 31, 2013 was as follows:
Distributions paid from: | Driehaus International Discovery Fund | Driehaus Emerging Markets Growth Fund | Driehaus Emerging Markets Small Cap Growth Fund | Driehaus International Small Cap Growth Fund | Driehaus Global Growth Fund | Driehaus Mid Cap Growth Fund | Driehaus Micro Cap Growth Fund | |||||||||||||||||||||
Ordinary income | $ | — | $ | — | $ | 309,776 | $ | 16,561,929 | $ | 302,140 | $ | 2,203,195 | $ | — | ||||||||||||||
Net long-term capital gain | — | 38,958,248 | — | 13,844,049 | 3,760,630 | 3,361,585 | — | |||||||||||||||||||||
|
|
|
|
|
|
|
|
|
|
|
|
|
| |||||||||||||||
Total distributions paid | $ | — | $ | 38,958,248 | $ | 309,776 | $ | 30,405,978 | $ | 4,062,770 | $ | 5,564,780 | $ | — | ||||||||||||||
|
|
|
|
|
|
|
|
|
|
|
|
|
| |||||||||||||||
The tax character of distributions paid during the fiscal year ended December 31, 2012 was as follows:
Distributions paid from: | Driehaus International Discovery Fund | Driehaus Emerging Markets Growth Fund | Driehaus Emerging Markets Small Cap Growth Fund | Driehaus International Small Cap Growth Fund | Driehaus Global Growth Fund | Driehaus Mid Cap Growth Fund | Driehaus Large Cap Growth Fund | |||||||||||||||||||||
Ordinary income | $ | — | $ | 3,661,528 | $ | 1,246,733 | $ | 1,069,444 | $ | — | $ | — | $ | 116,590 | ||||||||||||||
Net long-term capital gain | — | — | — | — | 1,436,164 | 2,022,728 | 1,667,897 | |||||||||||||||||||||
|
|
|
|
|
|
|
|
|
|
|
|
|
| |||||||||||||||
Total distributions paid | $ | — | $ | 3,661,528 | $ | 1,246,733 | $ | 1,069,444 | $ | 1,436,164 | $ | 2,022,728 | $ | 1,784,487 | ||||||||||||||
|
|
|
|
|
|
|
|
|
|
|
|
|
| |||||||||||||||
66
Driehaus Mutual Funds
Notes to Financial Statements — (Continued)
As of December 31, 2013, the components of net assets on a tax basis were as follows:
Distributions paid from: | Driehaus International Discovery Fund | Driehaus Emerging Markets Growth Fund | Driehaus Emerging Markets Small Cap Growth Fund | Driehaus International Small Cap Growth Fund | Driehaus Global Growth Fund | Driehaus Mid Cap Growth Fund | Driehaus Micro Cap Growth Fund | |||||||||||||||||||||
Undistributed ordinary income | $ | 906,878 | $ | — | $ | — | $ | 9,608,595 | $ | 212,176 | $ | 620,178 | $ | 1,275,778 | ||||||||||||||
Undistributed long-term capital gain | — | — | — | 2,538,174 | 633,199 | 429,896 | 2,251,542 | |||||||||||||||||||||
|
|
|
|
|
|
|
|
|
|
|
|
|
| |||||||||||||||
Accumulated earnings | $ | 906,878 | $ | — | $ | — | $ | 12,146,769 | $ | 845,375 | $ | 1,050,074 | $ | 3,527,320 | ||||||||||||||
Paid-in capital | 343,103,912 | 1,475,045,072 | 171,947,827 | 221,387,503 | 32,628,019 | 27,029,960 | 53,319,615 | |||||||||||||||||||||
Accumulated capital and other losses | (228,987,578 | ) | (12,307,826 | ) | (6,805,372 | ) | — | (146,129 | ) | — | — | |||||||||||||||||
Unrealized appreciation (depreciation) on foreign currency | 35,996 | 3,131 | 14,989 | 17,812 | (364 | ) | — | — | ||||||||||||||||||||
Unrealized appreciation on investments | 18,828,144 | 172,125,496 | 26,127,289 | 37,118,630 | 6,359,023 | 6,199,002 | 17,829,850 | |||||||||||||||||||||
|
|
|
|
|
|
|
|
|
|
|
|
|
| |||||||||||||||
Net assets | $ | 133,887,352 | $ | 1,634,865,873 | $ | 191,284,733 | $ | 270,670,714 | $ | 39,685,924 | $ | 34,279,036 | $ | 74,676,785 | ||||||||||||||
|
|
|
|
|
|
|
|
|
|
|
|
|
| |||||||||||||||
The differences between book-basis and tax-basis unrealized appreciation are attributable primarily to the tax deferral of losses on wash sales and passive foreign investment company (PFIC) mark-to-market.
Foreign Currency Translation
Foreign currency and equity securities not denominated in U.S. dollars are translated into U.S. dollar values based upon the current rates of exchange on the date of the Funds’ valuations.
Net realized foreign exchange gains or losses, which are reported by the Funds, result from currency gains and losses on transaction hedges arising from changes in exchange rates between the trade and settlement dates on spot contracts underlying securities transactions and the difference between the amounts accrued for dividends, interest, and foreign taxes and the amounts actually received or paid in U.S. dollars for these items. Net unrealized foreign exchange gains and losses result from changes in the U.S. dollar value of assets and liabilities (other than investments in securities), which are denominated in foreign currencies, as a result of changes in exchange rates.
Net realized foreign exchange gains or losses on portfolio hedges result from the use of spot contracts to hedge portfolio positions denominated or quoted in a particular currency in order to reduce or limit exposure in that currency. The Funds had no portfolio hedges during the year ended December 31, 2013.
The Funds do not isolate that portion of the results of operations which results from fluctuations in foreign exchange rates on investments. These fluctuations are included with the net realized gain (loss) from security transactions and the net change in unrealized appreciation (depreciation) of investments.
Use of Estimates
The preparation of financial statements, in conformity with U.S. generally accepted accounting principles, (“U.S. GAAP”) requires management to make estimates and assumptions that affect the reported amount of assets and liabilities and disclosure of contingent assets and liabilities at the date of the financial statements and the reported amounts of net increases or decreases in net assets from operations during the reporting period. Actual results could differ from those estimates.
Indemnifications
Under the Trust’s organizational documents, the officers and Trustees are indemnified against certain liabilities arising out of the performance of their duties to the Trust. In addition, in the normal course of business, the Trust enters into contracts that provide general indemnifications to other parties. The Funds’
67
Driehaus Mutual Funds
Notes to Financial Statements — (Continued)
maximum exposure under these agreements is unknown as this would involve future claims that may be made against the Funds that have not yet occurred. However, the Funds have not had prior claims or losses pursuant to these contracts and expect the risk of loss to be remote.
New Accounting Pronouncements
In June 2013, FASB issued guidance that creates a two-tiered approach to assess whether an entity is an investment company. The guidance will also require an investment company to measure noncontrolling ownership interests in other investment companies at fair value and will require additional disclosures relating to investment company status, any changes thereto and information about financial support provided or contractually required to be provided to any of the investment company’s investees. The guidance is effective for financial statements with fiscal years beginning on or after December 15, 2013 and interim periods within those fiscal years. Management is evaluating the impact of this guidance on the Fund’s financial statement disclosures.
Effective January 1, 2013, the Funds adopted FASB’s Accounting Standards Update 2013-01 (“ASU 2013-01”), “Clarifying the Scope of Disclosures about Offsetting Assets and Liabilities”, which replaced Accounting Standards Update 2011-11 (“ASU 2011-11”) “Disclosures about Offsetting Assets and Liabilities”. ASU 2011-11 was intended to enhance disclosure requirements on the offsetting of financial assets and liabilities. ASU 2013-01 limits the scope of the new balance sheet offsetting disclosures to derivatives, repurchase agreements, and securities lending transactions to the extent that they are (1) offset in the financial statements or (2) subject to an enforceable master netting arrangement or similar agreement. The adoption of the standard did not have a material effect on the Funds’ financial statements as of December 31, 2013.
Subsequent Events
On September 11, 2013, the Board of Trustees of the Trust approved reductions in the management fees for the Driehaus International Discovery Fund and the Driehaus Global Growth Fund pursuant to the amended investment advisory agreement between the Trust, on behalf of the Funds, and Driehaus Capital Management LLC (the “Adviser”). The reduction in each Fund’s management fee became effective on January 1, 2014.
Effective January 1, 2014, the Driehaus International Discovery Fund pays the Adviser an annual management fee on a monthly basis computed and accrued daily at an annual rate of 1.25% of the Fund’s average daily net assets.
Effective January 1, 2014, the Driehaus Global Growth Fund pays the Adviser an annual management fee on a monthly basis computed and accrued daily at an annual rate of 1.00% of the Fund’s average daily net assets.
B. INVESTMENT ADVISORY FEES, TRANSACTIONS WITH AFFILIATES, AND ADMINISTRATIVE FEES
Richard H. Driehaus, an Interested Trustee of the Trust, is also the Chairman of the Board of Driehaus Capital Management LLC (“DCM” or the “Adviser”), a registered investment adviser, and of Driehaus Securities LLC (“DS LLC” or the “Distributor”), a registered broker-dealer.
DCM serves as the Funds’ investment adviser. In return for its services to the Funds, DCM receives monthly fees. Driehaus International Discovery Fund pays the Adviser an annual management fee on a monthly basis computed and accrued daily as follows: 1.35% on the first $1 billion of average daily net assets and 1.25% of average daily net assets in excess of $1 billion. Driehaus Emerging Markets Growth Fund, Driehaus Emerging Markets Small Cap Growth Fund and Driehaus International Small Cap Growth Fund each pay the Adviser a monthly fee computed and accrued daily at an annual rate of 1.50% of each Fund’s average daily net assets. Driehaus Global Growth Fund pays the Adviser a monthly fee computed and accrued daily at an annual rate of 1.15% of the Fund’s average daily net assets. Driehaus Mid Cap Growth Fund pays the Adviser a monthly fee computed and accrued daily at an annual rate of 1.00% of the Fund’s average daily net assets. Driehaus Micro Cap Growth Fund pays the Adviser a monthly fee computed and accrued daily at an annual rate of 1.25% of the Fund’s average daily net assets.
68
Driehaus Mutual Funds
Notes to Financial Statements — (Continued)
DCM has entered into an agreement to cap Driehaus Emerging Markets Small Cap Growth Fund’s annual operating expenses (other than interest, taxes, brokerage commissions and other portfolio transaction expenses, capital expenditures and extraordinary expenses) at 2.00% of average daily net assets until August 21, 2014. For a period of three years subsequent to the Fund’s commencement of operations, DCM is entitled to reimbursement for previously waived fees and reimbursed expenses to the extent that the Fund’s expense ratio remains below the operating expense cap. For the year ended December 31, 2013, DCM recaptured fees for Driehaus Emerging Markets Small Cap Growth Fund totaling $108,124 under this agreement and there are no additional amounts subject to recapture.
DCM has entered into an agreement to cap Driehaus Mid Cap Growth Fund’s annual operating expenses (other than interest, taxes, brokerage commissions and other portfolio transaction expenses, capital expenditures and extraordinary expenses) at 1.75% of average daily net assets until April 30, 2015. For a period of three years subsequent to the date the waiver or reimbursement was made, DCM is entitled to reimbursement for previously waived fees and reimbursed expenses to the extent that the Fund’s expense ratio remains below the operating expense cap. For the year ended December 31, 2013, DCM waived fees for Driehaus Mid Cap Growth Fund totaling $27,897 under this agreement and the amount of potential recovery expiring December 31, 2014, December 31, 2015, and December 31, 2016 was $48,478, $52,090 and $27,897, respectively.
DCM has entered into an agreement to cap Driehaus Micro Cap Growth Fund’s annual operating expenses (other than interest, taxes, brokerage commissions and other portfolio transaction expenses, capital expenditures and extraordinary expenses) at 1.70% of average daily net assets until November 18, 2016. For a period of three years subsequent to the Fund’s commencement of operations, DCM is entitled to reimbursement for previously waived fees and reimbursed expenses to the extent that the Fund’s expense ratio remains below the operating expense cap. For the period ended December 31, 2013, DCM waived fees for Driehaus Micro Cap Growth Fund totaling $39,026 under this agreement, all of which was subject to recapture.
The amounts accrued and payable to DCM during the year ended December 31, 2013, are as follows:
| Fund | Advisory Fees | Advisory Fees Payable (included in Due to affiliate) | ||||||
Driehaus International Discovery Fund | $ | 2,231,145 | $ | 151,968 | ||||
Driehaus Emerging Markets Growth Fund | 19,091,401 | 2,029,878 | ||||||
Driehaus Emerging Markets Small Cap Growth Fund | 2,203,464 | 233,477 | ||||||
Driehaus International Small Cap Growth Fund | 3,794,929 | 336,745 | ||||||
Driehaus Global Growth Fund | 420,570 | 37,702 | ||||||
Driehaus Mid Cap Growth Fund | 289,322 | 21,843 | ||||||
Driehaus Micro Cap Growth Fund | 102,489 | 48,303 | ||||||
|
|
|
|
| ||||
The Funds direct certain portfolio trades, subject to obtaining the best price and execution, to brokers who have agreed to pay a portion of the Funds’ operating expenses using part of the commissions generated. For the year ended December 31, 2013, these arrangements reduced the expenses of Driehaus International Discovery Fund, Driehaus Emerging Markets Growth Fund, Driehaus Emerging Markets Small Cap Growth Fund, Driehaus International Small Cap Growth Fund, Driehaus Global Growth Fund, Driehaus Mid Cap Growth Fund and Driehaus Micro Cap Growth Fund by $39,485 (1.4%), $277,328 (1.3%), $32,223 (1.2%), $56,916 (1.3%), $3,750 (0.5%), $41 (0.0%) and $0 (0.0%), respectively.
Certain officers of the Trust are also officers of DCM and DS LLC. The Funds pay a portion of the Chief Compliance Officer’s salary and bonus. No other officers received compensation from the Funds.
BNY Mellon Investment Servicing (US) Inc. (“BNY Mellon”) serves as the Funds’ administrative and accounting agent. In compensation for these services, BNY Mellon earns the larger of a monthly minimum fee or a monthly fee based upon average net assets. For the year ended, December 31, 2013, BNY Mellon waived $2,500 for administrative and accounting fees for Driehaus Micro Cap Growth Fund. BNY Mellon also acts
69
Driehaus Mutual Funds
Notes to Financial Statements — (Continued)
as the transfer agent and dividend disbursing agent for the Funds. For these services, BNY Mellon earns a monthly fee based on shareholder processing activity during the month. BNY Mellon has agreed to waive a portion of its monthly fee for transfer agent service for the first two years of operations for Driehaus Emerging Markets Small Cap Growth Fund and Driehaus Micro Cap Growth Fund. For the year ended December 31, 2013, BNY Mellon waived $6,000 for Driehaus Emerging Markets Small Cap Growth Fund and $6,000 for Driehaus Micro Cap Growth Fund.
C. OTHER FINANCIAL INSTRUMENTS
The Funds enter into foreign currency spot contracts to facilitate transactions in foreign denominated securities. These spot contracts are typically open for 2 to 5 days, depending on the settlement terms of the underlying security transaction. On December 31, 2013, the Funds had foreign currency spot contracts outstanding under which they are obligated to exchange currencies at specified future dates. The unrealized appreciation or depreciation on spot contracts is reflected as a separate line item in the Statements of Assets and Liabilities. On December 31, 2013, the Funds’ currency transactions were limited to transaction hedges.
D. INVESTMENT TRANSACTIONS
The aggregate purchases and sales of investment securities, other than short-term obligations and option contracts, for the year ended December 31, 2013 were as follows:
| Fund | Purchases | Sales | ||||||
Driehaus International Discovery Fund | $ | 251,079,018 | $ | 344,671,915 | ||||
Driehaus Emerging Markets Growth Fund | 3,731,937,757 | 3,202,793,697 | ||||||
Driehaus Emerging Markets Small Cap Growth Fund | 388,587,421 | 304,851,715 | ||||||
Driehaus International Small Cap Growth Fund | 777,384,362 | 803,198,427 | ||||||
Driehaus Global Growth Fund | 58,759,635 | 60,085,487 | ||||||
Driehaus Mid Cap Growth Fund | 57,874,183 | 55,993,347 | ||||||
Driehaus Micro Cap Growth Fund | 19,261,188 | 13,885,241 | ||||||
|
|
|
|
| ||||
E. RESTRICTED SECURITIES
Restricted securities are securities that are not registered for sale under the Securities Act of 1933 or applicable foreign law and that may be re-sold only in transactions exempt from applicable registration. Restricted securities include Rule 144A securities which may be sold normally to qualified institutional buyers. On December 31, 2013, the Funds held no restricted securities, other than equity certificates. Since an investment in equity certificates represents an agreement entered into with a financial institution, with terms set by such financial institution, these instruments are also deemed to be restricted (see Note A).
F. LINES OF CREDIT
Driehaus International Discovery Fund, Driehaus Emerging Markets Growth Fund and Driehaus International Small Cap Growth Fund have together obtained an uncommitted line of credit in the amount of $25,000,000 and Driehaus Emerging Markets Small Cap Growth Fund, Driehaus Global Growth Fund and Driehaus Mid Cap Growth Fund have together obtained an uncommitted line of credit in the amount of $5,000,000. These lines of credit are available primarily to meet large, unexpected shareholder withdrawals subject to certain restrictions. Interest is charged at a rate per annum equal to the Federal Funds Rate in effect at the time of the borrowings plus 1.5%. Driehaus International Discovery Fund utilized the line of credit during the periods March 22, 2013 to April 3, 2013 and August 9, 2013 to August 15, 2013. For the period March 22, 2013 to April 3, 2013, the average daily loan balance outstanding on days where borrowings existed was $14,000,000 and the weighted average interest rate was 1.65%. For the period August 9, 2013 to August 15, 2013, the average daily loan balance outstanding on days where borrowings existed was $25,000,000 and the weighted average interest rate was 1.60%. The interest expense, which is included on the Statements of Operations, was $14,197 for Driehaus International Discovery Fund.
70
Driehaus Mutual Funds
Notes to Financial Statements — (Continued)
G. FOREIGN INVESTMENT RISKS
To the extent a Fund invests in foreign securities, it may entail risks due to the potential for political and economic instability in the countries where the issuers of these securities are located. In addition, foreign exchange fluctuations could affect the value of positions held. These risks are generally intensified in emerging markets.
H. REDEMPTION FEES
The Funds may charge a redemption fee of 2.00% of the redemption amount for shares redeemed within 60 days of purchase. The redemption fees are recorded in paid-in capital.
71
Report of Independent Registered Public Accounting Firm
The Board of Trustees and Shareholders of Driehaus Mutual Funds
We have audited the accompanying statements of assets and liabilities, including the schedules of investments, of Driehaus International Discovery Fund, Driehaus Emerging Markets Growth Fund, Driehaus Emerging Markets Small Cap Growth Fund, Driehaus International Small Cap Growth Fund, Driehaus Global Growth Fund, Driehaus Mid Cap Growth Fund, and Driehaus Micro Cap Growth Fund, (collectively, the “Funds”) as of December 31, 2013, and the related statements of operations, statements of changes in net assets and financial highlights for the each of the periods indicated therein. These financial statements and financial highlights are the responsibility of the Funds’ management. Our responsibility is to express an opinion on these financial statements and financial highlights based on our audits.
We conducted our audits in accordance with the standards of the Public Company Accounting Oversight Board (United States). Those standards require that we plan and perform the audit to obtain reasonable assurance about whether the financial statements and financial highlights are free of material misstatement. We were not engaged to perform an audit of the Funds’ internal control over financial reporting. Our audits included consideration of internal control over financial reporting as a basis for designing audit procedures that are appropriate in the circumstances, but not for the purpose of expressing an opinion on the effectiveness of the Funds’ internal control over financial reporting. Accordingly, we express no such opinion. An audit also includes examining, on a test basis, evidence supporting the amounts and disclosures in the financial statements and financial highlights, assessing the accounting principles used and significant estimates made by management, and evaluating the overall financial statement presentation. Our procedures included confirmation of securities owned as of December 31, 2013, by correspondence with the custodian and brokers or by other appropriate auditing procedures where replies from brokers were not received. We believe that our audits provide a reasonable basis for our opinion.
In our opinion, the financial statements and financial highlights referred to above present fairly, in all material respects, the financial position of each of the respective Funds noted above at December 31, 2013, and the results of their operations, the changes in their net assets, and the financial highlights for the periods indicated therein, in conformity with U.S. generally accepted accounting principles.

Chicago, Illinois
February 24, 2014
72
Interested and Independent Trustees of the Trust
The following table sets forth certain information with respect to the Trustees of the Trust:
Name, Address and | Position(s) the Trust | Term of Office and Time | Number of Overseen | Principal Occupation(s) During Past 5 Years | Other Directorships Held by Trustee During the Past 5 Years | |||||
Interested Trustee:* | ||||||||||
Richard H. Driehaus 25 East Erie Street Chicago, IL 60611 YOB: 1942 | Trustee | Since 1996 | 10 | Chairman of the Board of the Adviser, the Distributor and Driehaus Capital Management (USVI) LLC (“USVI”); Chief Investment Officer and Portfolio Manager of the Adviser. President of the Trust from 1996-2011. | Driehaus Capital Holdings LLC; Driehaus Enterprise Management, Inc.; Driehaus Trust Company, LLC; The Richard H. Driehaus Foundation; and The Richard H. Driehaus Museum | |||||
Independent Trustees: | ||||||||||
A.R. Umans c/o Driehaus Capital Management LLC 25 East Erie Street Chicago, IL 60611 YOB: 1927 | Trustee and Chairman | Since 1996 Since 2005 | 10 | Chairman of the Board, Commerce National Group (investment company) since 2005; Chairman of the Board and Chief Executive Officer, RHC/Spacemaster Corporation (manufacturing corporation) prior thereto. | Sinai Health System; Schwab Rehabilitation Hospital | |||||
Theodore J. Beck c/o Driehaus Capital Management LLC 25 East Erie Street Chicago, IL 60611 YOB: 1952 | Trustee | Since 2012 | 10 | President and Chief Executive Officer, National Endowment for Financial Education, 2005 to present; Associate Dean for Executive Education and Corporate Relations and President for the Center for Advanced Studies in Business at the University of Wisconsin-Madison, 1999-2005. | President’s Advisory Council on Financial Capability, 2010-2013; Federal Deposit Insurance Corporation Advisory Committee on Economic Inclusion since 2007; Jump$tart Coalition for Personal Financial Literacy since 2006, Chairman Since 2012; Wisconsin Alumni Association Board, 2006-2012; President’s Advisory Council on Financial Literacy, 2008-2010; Wilshire Variable Insurance Trust, 2008-2010; Wilshire Mutual Funds Inc., 2008-2010; Advisory Board of the Trust, 2011-2012. | |||||
Francis J. Harmon c/o Driehaus Capital Management LLC 25 East Erie Street Chicago, IL 60611 YOB: 1942 | Trustee | Since 1998 | 10 | Relationship Manager, Great Lakes Advisors, Inc. since February 2008; Principal Account Executive – Labor Affairs, Blue Cross and Blue Shield of Illinois prior thereto. | None | |||||
73
Interested and Independent Trustees of the Trust
Name, Address and | Position(s) the Trust | Term of Office and Time | Number of Overseen | Principal Occupation(s) During Past 5 Years | Other Directorships Held by Trustee During the Past 5 Years | |||||
Independent Trustees: | ||||||||||
Dawn M. Vroegop c/o Driehaus Capital Management LLC 25 East Erie Street Chicago, IL 60611 YOB: 1966 | Trustee | Since 2012 | 10 | Managing Director, Dresdner RCM Global Investors from September 1999 to September 2003. | Independent Trustee, Met Investors Series Trust since December 2000; Director, Metropolitan Series Fund, Inc. since May 2009; Director and Investment Committee Chair, City College of San Francisco Foundation since 2003; Advisory Board of the Trust, 2011-2012. | |||||
Daniel F. Zemanek c/o Driehaus Capital Management LLC 25 East Erie Street Chicago, IL 60611 YOB: 1942 | Trustee | Since 1996 | 10 | President of Ludan, Inc. (real estate services specializing in senior housing) since April 2008; Senior Vice President of Sunrise Development, Inc. (senior living) from 2003-2007; Consultant, real estate development prior thereto. | None | |||||
| * | Mr. Driehaus is an “interested person” of the Trust, the Adviser and the Distributor, as defined in the 1940 Act, because he is an officer of the Adviser and the Distributor. In addition, Mr. Driehaus has a controlling interest in the Adviser and the Distributor. |
| ** | Each Trustee will serve as a Trustee of the Trust until (i) termination of the Trust, or (ii) the Trustee’s retirement, resignation, or death, or (iii) as otherwise specified in the Trust’s governing documents. |
74
The following table sets forth certain information with respect to the officers of the Trust.
Name, Address and Year of Birth | Position(s) the Trust | Length of | Principal Occupation(s) During Past 5 Years | |||
Robert H. Gordon 25 East Erie Street Chicago, IL 60611 YOB: 1961 | President | Since 2011 | President and Chief Executive Officer of Adviser, Distributor and USVI since October 2006; Senior Vice President of the Trust from 2006-2011. | |||
Michelle L. Cahoon 25 East Erie Street Chicago, IL 60611 YOB: 1966 | Vice President and Treasurer | Since 2006 Since 2002 | Managing Director, Treasurer and Chief Financial Officer of the Adviser and Distributor since 2012; Vice President, Treasurer and Chief Financial Officer of USVI since 2004; Vice President, Treasurer and Chief Financial Officer of the Adviser and Distributor from 2004-2012. | |||
Janet L. McWilliams 25 East Erie Street Chicago, IL 60611 YOB: 1970 | Assistant Vice President and Chief Legal Officer | Since 2007 Since 2012 | Managing Director, Secretary and General Counsel of the Adviser since 2012; Chief Compliance Officer of the Trust, Adviser and Distributor from 2006-2012. | |||
Michael R. Shoemaker 25 East Erie Street Chicago, IL 60611 YOB: 1981 | Chief Compliance Officer and Assistant Vice President | Since 2012 | Assistant Vice President and Chief Compliance Officer of the Adviser and Distributor since 2012; Associate Chief Compliance Officer of the Adviser and Distributor from 2011-2012; Compliance Officer, Pacific Investment Management Company LLC and PIMCO Investments LLC from 2010-2011; Senior Compliance Analyst of the Adviser and Distributor from 2007-2010. | |||
Diane J. Drake 301 Bellevue Parkway Wilmington, DE 19809 YOB: 1967 | Secretary | Since 2006 | Managing Director and Senior Counsel, BNY Mellon Investment Servicing (US) Inc. (formerly, PNC Global Investment Servicing (U.S.) Inc. (“PNC”), (financial services company)) since 2010; Vice President and Counsel, PNC from 2008-2010. | |||
Michael P. Kailus 25 East Erie Street Chicago, IL 60611 YOB: 1971 | Assistant Secretary and Anti-Money Laundering Compliance Officer | Since 2010 Since 2011 | Assistant Secretary of the Adviser, Distributor and USVI since 2010; Senior Attorney with the Adviser since 2010; Associate General Counsel of Superfund Group (formerly, Quadriga Group, a financial services company) from 2005-2010. | |||
William H. Wallace, III 301 Bellevue Parkway Wilmington, DE 19809 YOB: 1969 | Assistant Secretary | Since 2008 | Vice President and Manager, BNY Mellon Investment Servicing (US) Inc. (formerly, PNC, a financial services company) since 2010; Assistant Vice President and Manager, PNC from 2008-2010. |
The Statement of Additional Information for Driehaus Mutual Funds contains more detail about the Trust’s Trustees and officers and is available upon request, without charge. For further information, please call 1-800-560-6111.
75
As a mutual fund shareholder, you may incur two types of costs: (1) transaction costs, including sales charges; redemption fees; and exchange fees and (2) ongoing costs, including management fees; distribution (12b-1) fees; and other fund expenses. This example is intended to help you understand your ongoing costs (in dollars) of investing in each Fund and to compare these costs with the ongoing costs of investing in other mutual funds.
The example is based on an investment of $1,000 invested at the beginning of the period and held for the entire six months ended December 31, 2013.
Actual Expenses
The first line of the tables below (“Actual”) provides information about actual account values and actual expenses. You may use the information in this line, together with the amount you invested, to estimate the expense that you paid over the period. Simply divide your account value by $1,000 (for example, an $8,600 account value divided by $1,000 = 8.6), then multiply the result by the number in the first line under the heading entitled “Expenses Paid During Period” to estimate the expenses you paid on your account during this period.
Hypothetical Example for Comparison Purposes
The second line of the tables below (“Hypothetical”) provides information about hypothetical account values and hypothetical expenses based on the Fund’s actual expense ratio and an assumed rate of return of 5% per year before expenses, which is not the Fund’s actual return. You may use this information to compare the ongoing costs of investing in the Funds versus other funds. To do so, compare this 5% hypothetical example with the 5% hypothetical examples that appear in the shareholder reports of the other funds.
Please note that the expenses shown in the table are meant to highlight your ongoing costs only and do not reflect any transactional costs, such as sales charges, redemption fees or exchange fees. Therefore, the second line of the table is useful in comparing ongoing costs only, and will not help you determine the relative total costs of owning different funds. In addition, if these transactional costs were included, your costs would have been higher.
Driehaus International Discovery Fund
Beginning Account Value July 1, 2013 | Ending Account Value December 31, 2013 | Expenses Paid During December 31, 2013* | ||||||||||
Actual | $ | 1,000 | $ | 1,142.20 | $ | 8.86 | ||||||
Hypothetical (5% return before expenses) | $ | 1,000 | $ | 1,016.94 | $ | 8.34 | ||||||
Driehaus Emerging Markets Growth Fund
Beginning Account Value July 1, 2013 | Ending Account Value December 31, 2013 | Expenses Paid During December 31, 2013* | ||||||||||
Actual | $ | 1,000 | $ | 1,083.50 | $ | 8.67 | ||||||
Hypothetical (5% return before expenses) | $ | 1,000 | $ | 1,016.89 | $ | 8.39 | ||||||
Driehaus Emerging Markets Small Cap Growth Fund
Beginning Account Value July 1, 2013 | Ending Account Value December 31, 2013 | Expenses Paid During December 31, 2013* | ||||||||||
Actual | $ | 1,000 | $ | 1,040.90 | $ | 9.47 | ||||||
Hypothetical (5% return before expenses) | $ | 1,000 | $ | 1,015.93 | $ | 9.35 | ||||||
76
Fund Expense Examples — (Continued)
Driehaus International Small Cap Growth Fund
Beginning Account Value July 1, 2013 | Ending Account Value December 31, 2013 | Expenses Paid During December 31, 2013* | ||||||||||
Actual | $ | 1,000 | $ | 1,183.50 | $ | 9.30 | ||||||
Hypothetical (5% return before expenses) | $ | 1,000 | $ | 1,016.69 | $ | 8.59 | ||||||
Driehaus Global Growth Fund
Beginning Account Value July 1, 2013 | Ending Account Value December 31, 2013 | Expenses Paid During December 31, 2013* | ||||||||||
Actual | $ | 1,000 | $ | 1,171.40 | $ | 10.56 | ||||||
Hypothetical (5% return before expenses) | $ | 1,000 | $ | 1,015.48 | $ | 9.80 | ||||||
Driehaus Mid Cap Growth Fund
Beginning Account Value July 1, 2013 | Ending Account Value December 31, 2013 | Expenses Paid During December 31, 2013* | ||||||||||
Actual | $ | 1,000 | $ | 1,213.40 | $ | 9.76 | ||||||
Hypothetical (5% return before expenses) | $ | 1,000 | $ | 1,016.38 | $ | 8.89 | ||||||
Driehaus Micro Cap Growth Fund**
Beginning Account Value July 1, 2013 | Ending Account Value December 31, 2013 | Expenses Paid During December 31, 2013* | ||||||||||
Actual | $ | 1,000 | $ | 1,074.00 | $ | 2.13 | ||||||
Hypothetical (5% return before expenses) | $ | 1,000 | $ | 1,016.64 | $ | 8.64 | ||||||
| * | Expenses are equal to the Fund’s annualized expense ratios for the six-month period in the table below multiplied by the average account value over the period, multiplied by the number of days in the most recent fiscal half-year (184), then divided by 365 to reflect the half-year period. |
| ** | The Driehaus Micro Cap Growth Fund commenced operations on November 18, 2013. The actual return and expenses are paid during the period by this Fund were for the period from November 18, 2013 to December 31, 2013 (44 days) instead of the entire six-month period. The hypothetical return is based on the entire six-month period for comparison purposes. |
Driehaus International Discovery Fund.. | 1.64% | |
Driehaus Emerging Markets Growth Fund | 1.65% | |
Driehaus Emerging Markets Small Cap Growth Fund | 1.84% | |
Driehaus International Small Cap Growth Fund | 1.69% | |
Driehaus Global Growth Fund | 1.93% | |
Driehaus Mid Cap Growth Fund | 1.75% | |
Driehaus Micro Cap Growth Fund | 1.70% |
77
TAX INFORMATION (UNAUDITED) FOR THE YEAR ENDED DECEMBER 31, 2013
We are providing this information as required by the Internal Revenue Code. The amounts shown may differ from those elsewhere in this report because of differences between tax and financial reporting requirements.
The Funds’ designate the following amounts as a long-term capital gain distribution:
Driehaus | Driehaus Emerging Markets Growth Fund | Driehaus Emerging Markets Small Cap Growth Fund | Driehaus International Small Cap Growth Fund | Driehaus Global Growth Fund | Driehaus Mid Cap Growth Fund | Driehaus Micro Cap Growth Fund | ||||||||||||||||||||
| $ | — | $ | 40,916,978 | $ | — | $ | 16,382,221 | $ | 4,356,241 | $ | 3,631,334 | $ | 2,251,542 | |||||||||||||
For taxable non-corporate shareholders, the following percentages of income and short-term capital gains represent qualified dividend income subject to the 15% rate category:
Driehaus | Driehaus Emerging Markets Growth Fund | Driehaus Emerging Markets Small Cap Growth Fund | Driehaus International Small Cap Growth Fund | Driehaus Global Growth Fund | Driehaus Mid Cap Growth Fund | Driehaus Micro Cap Growth Fund | ||||||||||||||||||||
| 0.00% | �� | 0.00% | 60.78% | 22.75% | 66.21% | 3.99% | 0.00% | |||||||||||||||||||
For corporate shareholders, the following percentages of income and short-term capital gains qualified for the dividends-received deduction:
Driehaus | Driehaus Emerging Markets Growth Fund | Driehaus Emerging Markets Small Cap Growth Fund | Driehaus International Small Cap Growth Fund | Driehaus Global Growth Fund | Driehaus Mid Cap Growth Fund | Driehaus Micro Cap Growth Fund | ||||||||||||||||||||
| 0.00% | 0.00% | 45.81% | 0.00% | 26.81% | 3.78% | 0.00% | ||||||||||||||||||||
PROXY VOTING POLICIES AND PROCEDURES AND PROXY VOTING RECORD
A description of the Funds’ policies and procedures with respect to the voting of proxies relating to the Funds’ portfolio securities is available without charge, upon request, by calling 1-800-560-6111. This information is also available on the Funds’ website at http://www.driehaus.com.
Information regarding how the Funds voted proxies related to portfolio securities during the 12-month period ended June 30, 2013 is available without charge, upon request, by calling 1-800-560-6111. This information is also available on the Securities and Exchange Commission’s (“SEC”) website at http://www.sec.gov.
HOW TO OBTAIN QUARTERLY PORTFOLIO HOLDINGS
Each Fund files a complete schedule of portfolio holdings with the SEC for the first and third quarters of each fiscal year on Form N-Q. The Funds’ Form N-Q is available electronically on the SEC’s website at http://www.sec.gov; hard copies may be reviewed and copied at the SEC’s Public Reference Room in Washington, DC 20549. For more information on the Public Reference Room, call 1-800-SEC-0330. Each Fund’s complete schedule of portfolio holdings is also available on the Fund’s website at http://www.driehaus.com.
78
Board Considerations in Connection with the Annual Review of the Investment Advisory Agreement
The Board of Trustees of Driehaus Mutual Funds (the “Trust”), including a majority of the Trustees who are not “interested persons” (as defined in the Investment Company Act of 1940, as amended) (the “Independent Trustees”), approved the renewal of the investment advisory agreement (the “Agreement”) with Driehaus Capital Management LLC (the “Adviser”) for Driehaus Emerging Markets Growth Fund (“DREGX”), Driehaus International Discovery Fund (“DRIDX”), Driehaus International Small Cap Growth Fund (“DRIOX”), Driehaus Global Growth Fund (“DRGGX”), Driehaus Mid Cap Growth Fund (“DRMGX”) and Driehaus Emerging Markets Small Cap Growth Fund (“DRESX”) (DREGX, DRIDX, DRIOX, DRGGX, DRMGX and DRESX are each a “Fund” and collectively the “Funds”) and the amended Letter Agreements for DRIDX and DRGGX, effective January 1, 2014, on September 11, 2013. As part of its review process, the Board requested and evaluated all information it deemed reasonably necessary to evaluate the Agreement. The Board reviewed comprehensive materials received from the Adviser and from independent legal counsel. The Board also received extensive information throughout the year regarding performance and operating results of each Fund. The Independent Trustees held a conference call with their independent legal counsel on August 28, 2013 to review the materials provided in response to their request, and identified areas for further response by Fund management. Following receipt of further responses from Fund management, the Independent Trustees, represented by independent legal counsel, met independent of Fund management to consider renewal of the Agreement. After their consideration of all the information received, the Independent Trustees presented their findings and their recommendation to renew the Agreement to the full Board.
In connection with the contract review process, the Board considered the factors discussed below, among others. The Board also considered that the Adviser has managed each Fund since its inception, and the Board believes that a long-term relationship with a capable, conscientious adviser is in the best interests of each Fund. The Board considered, generally, that shareholders invested in each Fund, knowing that the Adviser managed the Fund and knowing the investment advisory fee schedule, and noted that the Adviser had agreed to reduce its advisory fee for DRIDX and DRGGX.
Nature, Quality and Extent of Services. The Board considered the nature, extent and quality of services provided under the Agreement, including portfolio management services and administrative services. The Board considered the experience and skills of senior management and investment personnel, the resources made available to such personnel, the ability of the Adviser to attract and retain high-quality personnel, and the organizational depth of the Adviser. The Board also considered compliance with legal and regulatory requirements, as well as the Adviser’s handling of portfolio brokerage, and noted the Adviser’s process for evaluating best execution. The Board considered the Adviser’s risk management strategies and the process developed by the Adviser for analyzing, reviewing and assessing risk exposure for the Funds. The Board also considered the Funds’ process for fair valuation of portfolio securities and noted the Board’s review of Fund valuation matters throughout the year.
The Board reviewed DREGX’s, DRIDX’s, DRGGX’s and DRIOX’s performance on a net return basis over the 1-, 3- and 5-year and year-to-date periods ended June 30, 2013. For DRMGX, the Board considered the performance on a net return basis for the 1- and 3-year and year-to-date periods ended June 30, 2013, and for DRESX, the Board considered the performance on a net return basis for the 1-year and year-to-date periods ended June 30, 2013. The Board also reviewed performance for DRMGX that included one of its predecessor limited partnerships for the 5-year period ended June 30, 2013; performance for DRESX, including that of its predecessor limited partnership, for the 3-year period ended June 30, 2013; and 10-year performance of DRIOX, which included that of its predecessor limited partnership. Because the predecessor limited partnerships to DRMGX, DRIOX and DRESX did not operate as mutual funds and were not subject to certain investment and operational restrictions, the Board factored those differences into its evaluation of these Funds’ longer-term performance information. The Board noted that the Adviser represented that because the Funds’ performance can be volatile over shorter time periods, for Funds with longer performance records, it was meaningful to also analyze the performance over rolling time periods, and the Board reviewed rolling relative performance to benchmark information for certain Funds. The Board compared short-term and longer-term returns to various agreed-upon performance measures, including market indices and peer groups. Peer group data was compiled from Lipper Inc., an independent provider of mutual fund data. The Board also considered whether investment results were consistent with each Fund’s investment objective and policies.
79
On the basis of this evaluation and its ongoing review of investment results, the Board concluded that the nature, quality and extent of services provided by the Adviser for DREGX, DRIOX, DRMGX and DRESX continue to be satisfactory.
As to the specific Funds, the Board noted that DREGX’s performance was in the top decile of its peer group for the 1-, 3- and 5-year periods. The Board also noted that DREGX outperformed its benchmark index for the 1-, 3-, 5- and 10-year and since-inception (December 31, 1997) periods. With respect to DRIOX, the Board noted that, although its performance for the 1-, 3- and 5-year periods was below the median of its peer group, underperformance was largely attributable to a particular period of underperformance, and the peer group was small and dispersion within the peer group can be small. The Board noted that DRIOX’s year-to-date performance was above the median of its peer group and that 1-year performance was competitive. The Board also noted that DRIOX outperformed its benchmark index for the 1-, 3-, 5- and 10-year periods (the latter of which includes the performance of its predecessor partnership). The Board considered that DRMGX’s performance for the 1-, 3- and 5-year and year-to-date periods was below the median of its peer group (the 5-year period includes the performance of a predecessor partnership), although it was competitive for the year-to-date, 1-year and 3-year periods. In addition, the Board noted that although DRMGX underperformed its benchmark index for the 1-, 3- and 5-year periods, the Fund outperformed its benchmark index for the 10-year period (the 5- and 10-year periods include the performance of a predecessor partnership). For DRESX, the Board noted that the Fund was in the top decile of its peer group for the 1-year and 3-year and year-to-date periods and outperformed its benchmark index for the 1-year and 3-year periods (the 3-year period includes the performance of its predecessor limited partnership).
On the basis of its evaluation of the information presented and its ongoing review of investment results, the Board concluded that based on the nature, quality and extent of services provided by the Adviser for DRIDX and DRGGX, it continues to be in the best interests of these Funds to continue the Agreement. The Board noted the Adviser’s ongoing adherence to its investment style, including maintaining its high ratio of active share in comparison to each Fund’s benchmark. Recognizing that this investment style produces a differentiated outcome from the benchmarks, the Board noted that, although DRIDX underperformed its benchmark index (the MSCI AC World ex USA Index) for the 1-, 3-, 5- and 10-year periods, it outperformed the MSCI AC World ex USA Growth Index for the 10-year period. The Board also noted that although DRIDX’s performance was below the median of its peer group for the 1-, 3- and 5-year and year-to-date periods, performance was on an improving trend, with competitive short-term performance, ranking in the 54th percentile of its peer group for the year-to-date period. For DRGGX, the Board noted that performance was below the median for the 1-, 3- and 5-year and year-to-date periods. The Board reviewed the reasons for the periods of peer group and benchmark underperformance of DRIDX and DRGGX, which during the past year included the Funds’ bias to emerging market and small capitalization stocks and stocks with medium term momentum. The Board also reviewed the steps taken to improve performance, including personnel changes within the analyst team and enhancements to the operations of the investment team.
The Board also considered each Fund’s rolling 1-year, 3-year and 5-year returns over the life of the Fund relative to its benchmark and noted that, in a majority of the time periods measured, each Fund (with the exception of DRGGX) outperformed its benchmark index. For DRGGX, the Board noted the underperformance to the index over a majority of the rolling periods, but took into consideration the Adviser’s statement that the limited number of periods did not provide a sufficient basis upon which to make a judgment. As to the Funds in general, the Board concluded that the Adviser had consistently implemented its investment philosophy, and that over the long term, the investment philosophy produces value for shareholders.
Fees. The Board considered each Fund’s advisory fee rates, operating expenses and total expense ratio as of June 30, 2013, and compared the advisory fee and total expense ratio to the fees and expense ratios of peer group funds based on data compiled from Lipper Inc. as of June 30, 2013. The information provided to the Board showed that each Fund’s advisory fee rate ranked high as compared to its peer group; however, because of the Funds’ fee structures, total expense ratios are relatively competitive, as they all fall between the 21st and 45th percentiles (1st percentile being the highest expense ratio). The Board considered that the Adviser proposed a reduction in advisory fee rates for DRIDX and DRGGX and also considered the Funds’ asset size and, for DRMGX and DRESX, the expense reimbursement arrangements with the Adviser. The Board also considered the Funds’ advisory fee rates as compared to fees charged by the Adviser for similarly managed institutional accounts. With respect to institutional accounts, the Board noted that: (i) both the mix of services provided and the level of responsibility required under the Agreement were significantly greater as compared to the Adviser’s obligations for managing the other accounts; and (ii) the advisory fees for the other accounts are less relevant to the Board’s consideration because they reflect significantly different competitive
80
forces than those in the mutual fund marketplace. In considering the reasonableness of the advisory fees, the Board took into account the Adviser’s aggressive growth style and the substantial human and technological resources devoted to investing for the Funds, the relatively small amount of assets under management and the limited capacity of the investment style. In addition, the Board noted that the Adviser’s directed brokerage program had resulted in a total of approximately $330,000 in directed brokerage credits, which are used to reduce expenses of the Funds.
The Board noted that the Adviser stated that, with the fee reduction which is to take effect on January 1, 2014, there will be no diminution in the quality or quantity of the services provided to DRIDX or DRGGX. On the basis of the information reviewed, the Board concluded that the advisory fee schedule for each Fund, and as amended for DRIDX and DRGGX, was reasonable and appropriate in light of the nature and quality of services provided by the Adviser.
Profitability. The Board reviewed information regarding revenues received by the Adviser under the Agreement from each Fund and discussed the Adviser’s methodology in allocating its costs to the management of the Funds. The Board considered the estimated costs to the Adviser of managing the Funds. The Board noted that DRIOX is currently closed to new investors in order to maintain assets at a level that the Adviser feels is prudent, which limits the Fund’s profitability to the Adviser. The Board also noted that the Funds do not have a Rule 12b-1 fee or shareholder service fee, and that the Adviser’s affiliate, Driehaus Securities LLC (“DS LLC”), serves as distributor of the Funds without compensation and that DS LLC provides compensation to intermediaries for distribution of Fund shares and for shareholder and administrative services to shareholders, the expense of which is reimbursed by the Adviser under an expense sharing arrangement with DS LLC. The Board concluded that, based on the projected profitability calculated for the Trust as well as for the Funds individually (noting that DRESX, DRGGX and DRMGX were expected to continue to be operated at a loss), the advisory fees appeared to be reasonable.
Economies of Scale. The Board considered whether there are economies of scale with respect to the management of the Funds and whether the Funds benefit from any such economies of scale. Given the size of the Funds and the capacity constraints of the investment style, the Board concluded that the advisory fee rates under the Agreement are reasonable and reflect an appropriate sharing of any such economies of scale.
Other Benefits to the Adviser and its Affiliates. The Board also considered the character and amount of other incidental benefits received by the Adviser and its affiliates. The Board also considered benefits to the Adviser related to soft dollar allocations. The Board concluded that advisory fees were reasonable in light of these fall-out benefits.
Based on all of the information considered and the conclusions reached, the Board determined that the terms of the Agreement continue to be fair and reasonable and that the continuation of the Agreement is in the best interests of each Fund. No single factor was determinative in the Board’s analysis.
81
Board Considerations in Connection with the Initial Approval of the
Investment Advisory Agreement for Driehaus Micro Cap Growth Fund
The Board of Trustees of the Driehaus Mutual Funds (the “Trust”), including a majority of the Trustees who are not “interested persons” (as defined in the Investment Company Act of 1940, as amended) (the “Independent Trustees”), approved the investment advisory agreement (the “Agreement”) with Driehaus Capital Management LLC (the “Adviser”) for the Driehaus Micro Cap Growth Fund (the “Fund”) on September 11, 2013. As part of its review process, the Board requested and evaluated all information it deemed reasonably necessary to evaluate the Agreement. The Board reviewed comprehensive materials received from the Adviser and from independent legal counsel. The Independent Trustees, represented by independent legal counsel, met independent of Fund management to consider approval of the Agreement. After their review of the information received, the Independent Trustees presented their findings and their recommendation to approve the Agreement to the full Board. In connection with the review, the Board considered the factors discussed below, among others.
Nature, Quality and Extent of Services. The Board considered the nature, extent and quality of services to be provided under the Agreement, including portfolio management services and administrative services. The Board considered the experience and skills of senior management and investment personnel, the resources made available to such personnel, the ability of the Adviser to attract and retain high-quality personnel, and the organizational depth of the Adviser. The Board also considered the Trust’s compliance with legal and regulatory requirements as well as the Adviser’s risk management processes developed for analyzing, reviewing and assessing risk exposure for the Fund. In particular, the Board considered the management team’s experience relevant to managing other products with a micro cap growth strategy, including the performance of one of its predecessor partnerships (restated to reflect Fund expenses) compared to a peer group of micro cap growth funds based on data compiled from Lipper Inc. (“Lipper”) for the one-, three-, five- and ten-year periods ended June 30, 2013. Because the predecessor limited partnership did not operate as a mutual fund and was not subject to certain investment and operational restrictions, the Board factored those differences into its evaluation of the performance information.
On the basis of this evaluation and the Board’s experience with the Adviser in managing other series of the Trust, the Board concluded that the nature, quality and extent of services to be provided by the Adviser are expected to be satisfactory.
Fees. The Board considered the Fund’s proposed advisory fee, operating expenses and estimated total expense ratio, and compared the advisory fee and expense ratio to fees and expense ratios of the Lipper peer group as of the fiscal year end of each fund in the peer group. The Board noted that the Fund’s proposed advisory fee of 1.25% would be in the 14th percentile of the Lipper Micro Cap Growth peer group (1st percentile being the highest fee) as of June 30, 2013. The Board considered that the Adviser will reimburse the Fund for annual expenses in excess of 1.70% of average daily net assets (excluding interest, taxes, brokerage commissions, other investment-related costs and extraordinary expenses) for a three-year period. The Board also considered the fact that the Adviser has agreed to absorb the organizational costs of the Fund, including legal costs. In addition, the Board considered the Fund’s proposed advisory fee rate as compared to fees charged by the Adviser to other accounts with similar investment objectives and policies as the Fund and noted that the rate for the Fund was less than or equal to rates charged in connection with the predecessor partnerships to the Fund. In addition, the Board considered that the expense ratio of 1.70% would rank the Fund in the 42nd percentile of the Lipper Micro Cap Growth peer group (1st percentile being the highest expense ratio).
On the basis of the information provided, the Board concluded that the proposed advisory fee was reasonable and appropriate in light of the nature and quality of services expected to be provided by the Adviser.
Profitability and Economies of Scale. In considering the reasonableness of the proposed advisory fee, the Board considered the undertaking by the Adviser to assume Fund organizational expenses as well as to reimburse Fund expenses exceeding a 1.70% cap (other than interest, taxes, brokerage commissions, other investment-related costs and extraordinary expenses ) for a three-year period. The Board noted that the Fund will not have a Rule 12b-1 fee or shareholder service fee. The Board also noted that the Adviser’s affiliate, Driehaus Securities LLC (“DS LLC”), will serve as distributor of the Fund without compensation and that DS LLC will provide compensation to intermediaries for distribution of Fund shares and for shareholder and
82
administrative services to shareholders, the expense of which will be reimbursed by the Adviser under an expense sharing arrangement with DS LLC.
The Board also considered potential economies of scale with respect to the management of the Fund and whether the Fund will benefit from any economies of scale. The Board noted the capacity constraints of the Fund and the Adviser’s conclusion that it will not earn its full fee until net assets reach approximately $60 million.
Other Benefits to the Adviser and its Affiliates. The Board also considered the character and amount of other incidental benefits to be received by the Adviser and its affiliates. The Board noted that the Adviser expects to earn fall-out benefits in the form of soft dollar credits from its relationship with the Fund. The Board concluded that the proposed advisory fee was reasonable in light of any anticipated fall-out benefits.
Based on all of the information considered and the conclusions reached, the Board determined that the terms of the Agreement for the Fund were fair and reasonable and that the approval of the Agreement is in the best interests of the Fund. No single factor was determinative in the Board’s analysis.
83
DRH-AR2013
Driehaus Mutual Funds
Trustees & Officers
Richard H. Driehaus
Trustee
A.R. Umans
Chairman of the Board
Theodore J. Beck
Trustee
Francis J. Harmon
Trustee
Dawn M. Vroegop
Trustee
Daniel F. Zemanek
Trustee
Robert H. Gordon
President
Michelle L. Cahoon
Vice President & Treasurer
Janet L. McWilliams
Assistant Vice President &
Chief Legal Officer
Michael R. Shoemaker
Chief Compliance Officer &
Assistant Vice President
Diane J. Drake
Secretary
Michael P. Kailus
Assistant Secretary & Anti-Money Laundering Compliance Officer
William H. Wallace, III
Assistant Secretary
Investment Adviser
Driehaus Capital Management LLC
25 East Erie Street
Chicago, IL 60611
Distributor
Driehaus Securities LLC
25 East Erie Street
Chicago, IL 60611
Administrator & Transfer Agent
UMB Fund Services, Inc.
803 W. Michigan St.
Milwaukee, WI 53233
Custodians
UMB Bank, n.a.
928 Grand Blvd.
Kansas City, MO 64106
The Northern Trust Company
50 South LaSalle Street
Chicago, IL 60603
Annual Report to Shareholders
December 31, 2013

Driehaus Active Income Fund
Driehaus Select Credit Fund
Driehaus Event Driven Fund
Distributed by:
Driehaus Securities LLC
This report has been prepared for the shareholders of the Funds and is not an offering to sell or buy any Fund securities. Such offering is only made by the Funds’ prospectus.
Portfolio Managers’ Letter, Performance Overview and Schedule of Investments: | ||||
| 1 | ||||
| 15 | ||||
| 25 | ||||
| �� | 31 | |||
| 32 | ||||
| 34 | ||||
| 36 | ||||
| 39 | ||||
| 58 | ||||
| 59 | ||||
| 61 | ||||
| 62 | ||||
| 64 | ||||
Board Considerations in Connection with the Annual Review of the Investment Advisory Agreement | 65 | |||
| 67 | ||||
Driehaus Active Income Fund — Portfolio Managers’ Letter
Dear Shareholders,
The Driehaus Active Income Fund (“Fund”) returned 2.99% for the year ending December 31, 2013. This return was above the performance of the Fund’s benchmark index, the Citigroup 3-Month T-Bill Index (the “Benchmark”), which returned 0.05% for the same period. The Fund also outperformed the Barclays Capital U.S. Aggregate Bond Index (the “Index”), which returned -2.02% for the same period.
For the first time in many, many years, Treasuries lost value in 2013. While the year was generally disappointing for fixed income investors, we were at least able to provide Fund investors with a positive return for the year. We started 2013 with much the same outlook as we held at the conclusion of the year, looking at a low volatility, low yield, compressed spread environment. This was not an inspiring opportunity set then or at year end, but is one in which at least we believe we were able to provide our investors with low correlations to major asset classes and low volatility of the Fund’s returns.
For the year, the most significant contributions to returns came from the directional long trading strategy. Security selection and continued interest in risk assets helped this strategy generate strong returns. Additionally, the directional long trades benefited as spreads broadly contracted and defaults remained extraordinarily low within the credit markets. Other meaningful contributions to the Fund came from the capital structure arbitrage strategy, interest rate hedges and event driven trades. Capital structure arbitrage trades are created with a long and short side of the trade, which will move inversely to each other, allowing us to hedge some risks and dampen volatility. During 2013, some swaps that were used to hedge the long leg of these capital structure arbitrage trades detracted from returns, but the overall strategy was positive for the Fund. The interest rate hedge, which is executed by shorting U.S. Treasury futures and U.S. Treasury securities, as well as by utilizing various interest rate options strategies, contributed to returns, as the 10-year U.S. Treasury bond yields rose during year. Event driven trading, which focuses on corporate events such as mergers or company announcements, is an area of the market where we are increasingly finding attractive investment opportunities. Depending on the anticipated timing and nature of the event, these trades are structured using a combination of bonds, options, bank loans, swaps and equities.
The detractors from performance for the year were the volatility trading strategy and the directional short strategy. Volatility trades are generally constructed by implementing various option strategies, such as straddles or strangles on the S&P 500 Index or other indices or through the use of credit default swaps on indices. During the year, as market pressures eased and investors grew more optimistic, market volatility decreased significantly. The Fund generally held long volatility trades that benefit performance only when volatility increases. The directional short strategies, which include being short bonds or swaps, detracted value as assets generally rose during the year, hurting trades that were structured to benefit if the securities decreased in value.
The Fund was generally conservatively positioned for much of the year, including holding an above-average cash position relative to the Fund’s past cash balances. On a selective, individual name basis, we did find some attractive opportunities. However, in aggregate, we found the massive amount of new issuance during the year, and the call constrained nature of the market, to be fairly problematic for valuations. In our estimation, “reaching for return” brought considerable credit risk with significant downside worries, meriting a cautious approach to the market. Additionally, given our view was and remains that interest rates will grind higher over time, we felt no need to invest this excess cash, merely for the sake of saying that we have invested our excess cash, and saddle our investors with losses that would likely accompany a high-quality fixed income investment, as was largely the case last year.
One of the benefits of the Fund for investors is the diversification it offers through low correlations to other asset classes. We were particularly pleased with the low correlations of many major asset classes to the Fund during 2013. For the year, the Fund had a correlation between 0.5 and -0.5 (based on daily return data) to the S&P 500 Index, the 10-Year U.S. Treasury, the Barclays Aggregate ETF (AGG), the High Yield Bond ETF (JNK), the HFRX Global Hedge Fund Index, the CBOE Volatility Index (VIX), and the U.S. Dollar Index (DXY).
In addition to achieving low correlations to many asset classes, the Fund exhibited rather low volatility throughout 2013. The 100-day volatility of the Fund averaged 1.5%. The largest drawdown for the year was 1.0%
1
Looking ahead, we expect a low return environment for fixed income to continue in 2014. Spreads and all-in yields are still quite low, with spreads in high yield and investment grade bonds near their lowest levels since 2007. We expect that volatility will remain muted this year. We would prefer to be in a higher volatility regime, as market volatility typically widens some of the relationships that we try to arbitrage in many of our trades. Last year was a miserable year for most asset volatility. Treasury and some currency volatility were above average, but volatility in U.S. credit and equities was virtually non-existent. Given that the U.S. economy appears to be improving, macroeconomic risks appear to be declining, and monetary policy remains quite accommodative, it seems likely that we will see more of the same this year. However, while the opportunity set today looks much as it did a year ago, our guess is that it will improve by year end.
As always, we at Driehaus Capital Management LLC thank you for your interest in the Driehaus Active Income Fund and would like to express our gratitude to you as shareholders for your continued confidence in our management capabilities.
Sincerely,
 |  |  | ||
| K.C. Nelson | Mirsada Durakovic | Elizabeth Cassidy | ||
| Portfolio Manager | Assistant Portfolio Manager | Assistant Portfolio Manager |
Performance is historical and does not represent future results.
Please see the following performance page for index definitions.
2
Driehaus Active Income Fund
Performance Overview (unaudited)
The performance summarized below is historical and does not represent future results. Investment returns and principal value vary, and you may have a gain or loss when you sell shares. Performance data presented measures the change in the value of an investment in the Fund, assuming reinvestment of all dividends and capital gains. Average annual total return reflects annualized change.
The table does not reflect the deduction of taxes that a shareholder would pay on Fund distributions or the redemption of Fund shares. The graph compares the results of a $25,000 investment (minimum investment) in the Fund since November 8, 2005 (the date of the Predecessor Fund’s inception), with all dividends and capital gains reinvested, with the indicated indices (and dividends reinvested) for the same period.
| Average Annual Total Returns as of 12/31/13 | 1 Year | 3 Years | 5 Years | Since Inception (11/08/05 - 12/31/13) | ||||||||||||
Driehaus Active Income Fund (LCMAX)1 | 2.99% | 2.05% | 6.42% | 4.74% | ||||||||||||
Citigroup 3-Month T-Bill Index2 | 0.05% | 0.07% | 0.10% | 1.50% | ||||||||||||
Barclays Capital U.S. Aggregate Bond Index3 | –2.02% | 3.27% | 4.45% | 5.14% | ||||||||||||
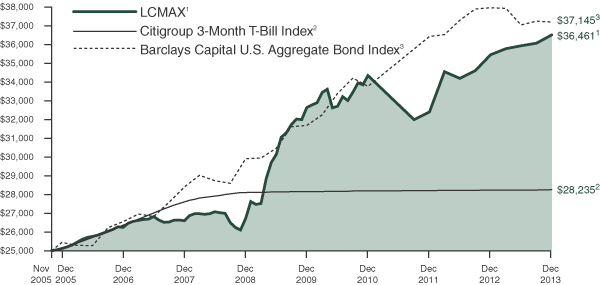
| 1 | The Driehaus Active Income Fund (the “Fund”) performance shown above includes the performance of the Lotsoff Capital Management Active Income Fund (the “Predecessor Fund”) for the periods before the Fund’s registration statement became effective. The Fund received the assets and liabilities of the Predecessor Fund on June 1, 2009 through a reorganization of the Predecessor Fund into the Fund. The Predecessor Fund was a nondiversified fund that was a series of another management investment company registered under the Investment Company Act of 1940, as amended. The Fund had no prior operating history prior to succeeding to the assets of the Predecessor Fund. The Fund has substantially similar investment objectives, strategies, and policies as the Predecessor Fund. Financial and performance information of the Fund includes the Predecessor Fund information. The returns for the periods prior to October 1, 2006, reflect fee waivers and/or reimbursements without which performance would have been lower. |
| 2 | The Citigroup 3-Month T-Bill Index is designed to mirror the performance of the 3-month U.S. Treasury Bill. The Citigroup 3-Month T-Bill Index is unmanaged and its returns reflect reinvestment of all distributions and changes in market prices. |
| 3 | The Barclays Capital U.S. Aggregate Bond Index, an unmanaged index, represents securities that are SEC-registered, taxable and dollar denominated. This index covers the U.S. investment grade fixed rate bond market, with index components for government and corporate securities, mortgage pass-through securities and asset-backed securities. These major sectors are subdivided into more specific indices that are calculated and reported on a regular basis. |
3
Driehaus Active Income Fund
Schedule of Investments
December 31, 2013
| Shares, Principal Amount, or Number of Contracts | Value | |||||||
| ASSET-BACKED SECURITIES — 4.54% | ||||||||
Citigroup Mortgage Loan Trust, Inc. 0.23%, 1/25/372 | $ | 355,053 | $ | 183,691 | ||||
Cobalt CMBS Commercial Mortgage Trust 2006-C1 5.20%, 8/15/482 | 21,785,693 | 23,263,678 | ||||||
Countrywide Asset-Backed Certificates 0.64%, 4/25/342 | 122,988 | 112,425 | ||||||
Fannie Mae REMICS 0.81%, 9/25/232 | 7,629,565 | 7,674,236 | ||||||
Fannie Mae REMICS 0.48%, 6/25/362 | 9,943,345 | 9,926,312 | ||||||
Freddie Mac REMICS 2.00%, 2/15/27 | 57,230,404 | 56,340,013 | ||||||
Freddie Mac REMICS 2.00%, 4/15/28 | 69,154,222 | 67,748,247 | ||||||
Freddie Mac REMICS 0.37%, 1/15/352 | 5,851,990 | 5,824,971 | ||||||
JP Morgan Resecuritization Trust Series 2009-10 2.53%, 8/26/361,2 | 15,935,521 | 16,145,535 | ||||||
Merrill Lynch Mortgage Investors, Inc. 1.10%, 8/25/352 | 124,929 | 117,142 | ||||||
Wells Fargo Mortgage Loan Trust 0.48%, 8/27/371,2 | 23,466,410 | 21,910,423 | ||||||
|
| |||||||
Total ASSET-BACKED SECURITIES (Cost $212,258,960) | 209,246,673 | |||||||
|
| |||||||
| BANK LOANS — 26.93% | ||||||||
Apparel — 0.60% |
| |||||||
Calceus Acquisition, Inc. | 27,741,939 | 27,822,390 | ||||||
|
| |||||||
Banks — 0.95% |
| |||||||
CIT Group, Inc. 2.50%, 8/14/152 | 38,000,000 | 36,765,000 | ||||||
CIT Group, Inc. 2.50%, 8/14/152 | 7,000,000 | 6,772,500 | ||||||
|
| |||||||
| 43,537,500 | ||||||||
|
| |||||||
Commercial Services — 1.98% |
| |||||||
Altegrity, Inc. 7.75%, 2/21/152 | 61,441,588 | 61,172,781 | ||||||
Ceridian Corp. 4.42%, 5/9/172 | 19,956,219 | 20,022,733 | ||||||
Westway Group, Inc. 5.00%, 2/5/202 | 9,925,000 | 9,968,422 | ||||||
|
| |||||||
| 91,163,936 | ||||||||
|
| |||||||
| Shares, Principal Amount, or Number of Contracts | Value | |||||||
Diversified Financial Services — 2.08% |
| |||||||
Ocwen Financial Corp. | $ | 64,673,862 | $ | 65,482,285 | ||||
Sears Roebuck Acceptance Corp. | 30,200,000 | 30,334,813 | ||||||
|
| |||||||
| 95,817,098 | ||||||||
|
| |||||||
Electronics — 0.85% |
| |||||||
NuSil Technology LLC 5.25%, 3/28/172 | 40,090,284 | 39,371,986 | ||||||
|
| |||||||
Entertainment — 1.17% |
| |||||||
Graton Resort & Casino 9.00%, 8/14/182 | 31,080,000 | 32,750,550 | ||||||
Peninsula Gaming LLC 4.25%, 11/20/172 | 8,085,303 | 8,125,730 | ||||||
WMG Acquisition Corp. | 13,100,168 | 13,087,067 | ||||||
|
| |||||||
| 53,963,347 | ||||||||
|
| |||||||
Environmental Control — 0.22% |
| |||||||
WTG Holdings III Corp. | 10,000,000 | 10,025,000 | ||||||
|
| |||||||
Food — 0.26% |
| |||||||
Fairway Group Acquisition Co. | 990,000 | 991,237 | ||||||
SUPERVALU, Inc. 5.00%, 3/21/192 | 10,898,385 | 10,989,855 | ||||||
|
| |||||||
| 11,981,092 | ||||||||
|
| |||||||
Healthcare — Services — 0.77% |
| |||||||
Gentiva Health Services, Inc. | 36,000,000 | 35,460,000 | ||||||
|
| |||||||
Holding Companies — Diversified — 0.46% |
| |||||||
Osmose Holdings, Inc. | 20,984,564 | 21,010,795 | ||||||
|
| |||||||
Internet — 0.27% |
| |||||||
Mood Media Corp. (Canada) 7.00%, 3/24/182,3 | 12,444,548 | 12,460,103 | ||||||
|
| |||||||
Investment Companies — 0.54% |
| |||||||
Larchmont Resources LLC | 24,875,000 | 25,030,469 | ||||||
|
| |||||||
Leisure Time — 1.13% |
| |||||||
Equinox Holdings, Inc. 4.50%, 2/1/202 | 41,685,000 | 42,049,744 | ||||||
Equinox Holdings, Inc. 9.75%, 5/16/202 | 10,000,000 | 10,125,000 | ||||||
|
| |||||||
| 52,174,744 | ||||||||
|
| |||||||
Notes to Financial Statements are an integral part of this Schedule.
4
Driehaus Active Income Fund
Schedule of Investments
December 31, 2013
| Shares, Principal Amount, or Number of Contracts | Value | |||||||
Lodging — 1.59% |
| |||||||
MGM Resorts International 3.50%, 12/20/192 | $ | 73,336,942 | $ | 73,291,107 | ||||
|
| |||||||
Media — 1.46% |
| |||||||
Springer Science+Business Media GmbH (Germany) 5.00%, 8/15/202,3 | 66,832,500 | 67,055,253 | ||||||
|
| |||||||
Oil & Gas — 1.84% |
| |||||||
Chesapeake Energy Corp. | 57,500,000 | 58,524,247 | ||||||
Shelf Drilling Midco Ltd. (United Arab Emirates) 10.00%, 10/7/182,3 | 26,000,000 | 26,325,000 | ||||||
|
| |||||||
| 84,849,247 | ||||||||
|
| |||||||
Real Estate Investment Trusts — 0.91% |
| |||||||
Starwood Property Trust, Inc. 3.50%, 4/11/202 | 41,847,437 | 41,742,819 | ||||||
|
| |||||||
Retail — 6.00% |
| |||||||
Gymboree Corp. 5.00%, 2/23/182 | 20,918,025 | 19,528,942 | ||||||
Hudson’s Bay Co. (Canada) 4.75%, 10/7/202,3 | 15,000,000 | 15,225,000 | ||||||
JC Penney Corp., Inc. 6.00%, 5/21/182 | 41,416,875 | 40,415,954 | ||||||
Michaels Stores, Inc. 3.75%, 1/31/202 | 995,000 | 998,725 | ||||||
Neiman Marcus Group Ltd., Inc. 5.00%, 10/18/202 | 91,718,000 | 92,667,923 | ||||||
Party City Holdings, Inc. | 38,657,280 | 38,775,417 | ||||||
Rite Aid Corp. 4.00%, 2/28/202 | 992,500 | 996,718 | ||||||
Rite Aid Corp. 5.75%, 8/29/202 | 17,830,000 | 18,259,043 | ||||||
Rite Aid Corp. 4.88%, 6/13/212 | 48,950,000 | 49,647,538 | ||||||
|
| |||||||
| 276,515,260 | ||||||||
|
| |||||||
Software — 1.72% |
| |||||||
BMC Software, Inc. 5.00%, 9/10/202 | 71,000,000 | 71,281,018 | ||||||
BMC Software, Inc. (Ireland) 5.00%, 9/10/202,3 | 8,000,000 | 7,980,000 | ||||||
|
| |||||||
| 79,261,018 | ||||||||
|
| |||||||
| Shares, Principal Amount, or Number of Contracts | Value | |||||||
Telecommunications — 2.13% |
| |||||||
Alcatel-Lucent USA, Inc. | $ | 67,974,686 | $ | 68,290,293 | ||||
Cincinnati Bell Inc 4.00%, 9/10/202 | 29,925,000 | 29,962,406 | ||||||
|
| |||||||
| 98,252,699 | ||||||||
|
| |||||||
Total BANK LOANS (Cost $1,234,482,361) | 1,240,785,863 | |||||||
|
| |||||||
| CORPORATE BONDS — 26.93% | ||||||||
Banks — 2.43% |
| |||||||
Chase Capital II 0.74%, 2/1/272 | 11,879,000 | 9,681,385 | ||||||
First Chicago NBD Institutional Capital I 0.79%, 2/1/272 | 725,000 | 590,875 | ||||||
JP Morgan Chase Capital XXIII | 4,000,000 | 2,880,000 | ||||||
JPMorgan Chase & Co. 7.90%, 4/29/492 | 43,813,000 | 48,303,832 | ||||||
JPMorgan Chase Capital XXI | 15,000,000 | 11,100,000 | ||||||
Royal Bank of Scotland Group PLC (United Kingdom) 7.65%, 8/29/492,3 | 36,708,000 | 38,359,860 | ||||||
Wachovia Capital Trust III 5.57%, 3/29/492 | 1,000,000 | 915,000 | ||||||
|
| |||||||
| 111,830,952 | ||||||||
|
| |||||||
Biotechnology — 0.83% |
| |||||||
STHI Holding Corp. 8.00%, 3/15/181 | 35,673,000 | 38,170,110 | ||||||
|
| |||||||
Chemicals — 0.11% |
| |||||||
Hexion U.S. Finance Corp./Hexion Nova Scotia Finance ULC | 2,000,000 | 2,077,500 | ||||||
Momentive Performance Materials, Inc. 11.50%, 12/1/16 | 4,540,000 | 3,087,200 | ||||||
|
| |||||||
| 5,164,700 | ||||||||
|
| |||||||
Commercial Services — 1.07% |
| |||||||
DynCorp International, Inc. | 22,780,000 | 23,292,550 | ||||||
Wyle Services Corp. 10.50%, 4/1/181 | 25,285,000 | 25,853,913 | ||||||
|
| |||||||
| 49,146,463 | ||||||||
|
| |||||||
Notes to Financial Statements are an integral part of this Schedule.
5
Driehaus Active Income Fund
Schedule of Investments
December 31, 2013
| Shares, Principal Amount, or Number of Contracts | Value | |||||||
Computers — 0.74% |
| |||||||
Seagate HDD Cayman (Cayman Islands) 7.75%, 12/15/183 | $ | 16,330,000 | $ | 17,963,000 | ||||
Seagate HDD Cayman (Cayman Islands) 6.88%, 5/1/203 | 15,000,000 | 16,218,750 | ||||||
|
| |||||||
| 34,181,750 | ||||||||
|
| |||||||
Diversified Financial Services — 3.92% |
| |||||||
American Express Co. 6.80%, 9/1/662 | 67,984,000 | 72,436,952 | ||||||
Denver Parent Corp. 12.25%, 8/15/181 | 10,650,000 | 10,383,750 | ||||||
E*TRADE Financial Corp. 6.00%, 11/15/17 | 26,000,000 | 27,625,000 | ||||||
E*TRADE Financial Corp. 6.38%, 11/15/19 | 33,452,000 | 35,919,085 | ||||||
General Electric Capital Corp. | 22,000,000 | 24,585,000 | ||||||
Textron Financial Corp. | 10,824,000 | 9,633,360 | ||||||
|
| |||||||
| 180,583,147 | ||||||||
|
| |||||||
Electronics — 0.24% |
| |||||||
Flextronics International Ltd. (Singapore) 5.00%, 2/15/233 | 12,000,000 | 11,250,000 | ||||||
|
| |||||||
Engineering & Construction — 0.04% |
| |||||||
MasTec, Inc. 4.88%, 3/15/23 | 2,000,000 | 1,890,000 | ||||||
|
| |||||||
Entertainment — 0.57% |
| |||||||
Churchill Downs, Inc. 5.38%, 12/15/211 | 1,250,000 | 1,271,875 | ||||||
Gala Group Finance PLC (United Kingdom) 8.88%, 9/1/183 | 9,000,000 | 16,050,969 | ||||||
Production Resource Group, Inc. 8.88%, 5/1/19 | 12,220,000 | 8,828,950 | ||||||
|
| |||||||
| 26,151,794 | ||||||||
|
| |||||||
Healthcare — Products — 0.74% |
| |||||||
ConvaTec Healthcare E S.A. (Luxembourg) | 30,166,000 | 33,899,043 | ||||||
|
| |||||||
Healthcare — Services — 1.76% |
| |||||||
Aurora Diagnostics Holdings / Aurora Diagnostics Financing, Inc. | 17,035,000 | 12,180,025 | ||||||
| Shares, Principal Amount, or Number of Contracts | Value | |||||||
Healthsouth Corp. 7.25%, 10/1/18 | $ | 1,210,000 | $ | 1,293,187 | ||||
Healthsouth Corp. 7.75%, 9/15/22 | 15,639,000 | 17,124,705 | ||||||
Kindred Healthcare, Inc. | 29,913,000 | 31,857,345 | ||||||
National Mentor, Inc. 12.50%, 2/15/181 | 17,600,000 | 18,832,000 | ||||||
|
| |||||||
| 81,287,262 | ||||||||
|
| |||||||
Household Products/Wares — 0.04% |
| |||||||
Armored Autogroup, Inc. | 2,150,000 | 2,069,375 | ||||||
|
| |||||||
Insurance — 0.69% |
| |||||||
Chubb Corp. | 29,500,000 | 31,933,750 | ||||||
|
| |||||||
Internet — 0.05% |
| |||||||
Mood Media Corp. (Canada) | 2,500,000 | 2,206,250 | ||||||
|
| |||||||
Iron/Steel — 0.70% |
| |||||||
Edgen Murray Corp. 8.75%, 11/1/201 | 28,000,000 | 32,060,000 | ||||||
|
| |||||||
Media — 0.96% |
| |||||||
Clear Channel Worldwide Holdings, Inc. 6.50%, 11/15/22 | 810,000 | 821,138 | ||||||
Clear Channel Worldwide Holdings, Inc. 6.50%, 11/15/22 | 2,190,000 | 2,236,537 | ||||||
ProQuest LLC/ProQuest Notes Co. 9.00%, 10/15/181 | 39,790,000 | 41,182,650 | ||||||
|
| |||||||
| 44,240,325 | ||||||||
|
| |||||||
Metal Fabricate/Hardware — 0.12% |
| |||||||
Dynacast International LLC/Dynacast Finance, Inc. 9.25%, 7/15/19 | 5,130,000 | 5,655,825 | ||||||
|
| |||||||
Miscellaneous Manufacturing — 1.60% |
| |||||||
Amsted Industries, Inc. 8.13%, 3/15/181 | 34,990,000 | 36,870,712 | ||||||
GE Capital Trust I 6.38%, 11/15/672 | 34,140,000 | 36,871,200 | ||||||
|
| |||||||
| 73,741,912 | ||||||||
|
| |||||||
Oil & Gas — 1.10% |
| |||||||
Chesapeake Energy Corp. | 9,820,000 | 10,642,425 | ||||||
Notes to Financial Statements are an integral part of this Schedule.
6
Driehaus Active Income Fund
Schedule of Investments
December 31, 2013
| Shares, Principal Amount, or Number of Contracts | Value | |||||||
Venoco, Inc. 8.88%, 2/15/19 | $ | 40,670,000 | $ | 40,059,950 | ||||
|
| |||||||
| 50,702,375 | ||||||||
|
| |||||||
Packaging & Containers — 1.21% |
| |||||||
Berry Plastics Corp. 9.50%, 5/15/18 | 14,199,000 | 15,228,428 | ||||||
Berry Plastics Corp. 9.75%, 1/15/21 | 34,988,400 | 40,499,073 | ||||||
|
| |||||||
| 55,727,501 | ||||||||
|
| |||||||
Pipelines — 0.86% |
| |||||||
Enbridge Energy Partners LP 8.05%, 10/1/772 | 31,500,000 | 34,869,083 | ||||||
Sabine Pass Liquefaction LLC 5.63%, 2/1/211 | 3,000,000 | 2,932,500 | ||||||
Sabine Pass Liquefaction LLC 5.63%, 4/15/231 | 2,000,000 | 1,870,000 | ||||||
|
| |||||||
| 39,671,583 | ||||||||
|
| |||||||
Retail — 3.27% |
| |||||||
Claire’s Stores, Inc. 9.00%, 3/15/191 | 12,000,000 | 13,020,000 | ||||||
Claire’s Stores, Inc. 6.13%, 3/15/201 | 16,972,000 | 16,377,980 | ||||||
Michaels Stores, Inc. 11.38%, 11/1/16 | 12,015,000 | 12,300,597 | ||||||
Michaels Stores, Inc. 7.75%, 11/1/18 | 55,747,000 | 60,485,495 | ||||||
Michaels Stores, Inc. 5.88%, 12/15/201 | 6,000,000 | 6,030,000 | ||||||
Rite Aid Corp. 10.25%, 10/15/19 | 3,000,000 | 3,360,000 | ||||||
Rite Aid Corp. 9.25%, 3/15/20 | 14,800,000 | 16,983,000 | ||||||
Rite Aid Corp. 8.00%, 8/15/20 | 3,425,000 | 3,853,125 | ||||||
Rite Aid Corp. 6.75%, 6/15/21 | 17,250,000 | 18,090,937 | ||||||
|
| |||||||
| 150,501,134 | ||||||||
|
| |||||||
Software — 2.13% |
| |||||||
First Data Corp. 11.25%, 3/31/16 | 1,188,000 | 1,190,970 | ||||||
First Data Corp. 6.75%, 11/1/201 | 22,250,000 | 23,140,000 | ||||||
Nuance Communications, Inc. | 62,187,000 | 60,787,792 | ||||||
SSI Investments II/SSI Co. — Issuer LLC 11.13%, 6/1/18 | 12,000,000 | 13,020,000 | ||||||
|
| |||||||
| 98,138,762 | ||||||||
| �� |
|
| ||||||
| Shares, Principal Amount, or Number of Contracts | Value | |||||||
Telecommunications — 1.75% |
| |||||||
Alcatel-Lucent USA, Inc. | $ | 5,000,000 | $ | 5,006,250 | ||||
Alcatel-Lucent USA, Inc. | 5,000,000 | 4,375,000 | ||||||
CommScope, Inc. 8.25%, 1/15/191 | 38,356,000 | 42,047,765 | ||||||
Nortel Networks Ltd. (Canada) 10.75%, 7/15/163,5 | 11,000,000 | 12,870,000 | ||||||
Nortel Networks Ltd. (Canada) 10.13%, 7/15/143,5 | 14,000,000 | 16,310,000 | ||||||
|
| |||||||
| 80,609,015 | ||||||||
|
| |||||||
Total CORPORATE BONDS (Cost $1,186,769,233) | 1,240,813,028 | |||||||
|
| |||||||
| CONVERTIBLE CORPORATE BONDS — 4.92% | ||||||||
Auto Manufacturers — 1.53% |
| |||||||
Ford Motor Co. 4.25%, 11/15/16 | 38,150,000 | 70,386,750 | ||||||
|
| |||||||
Electrical Components & Equipment — 0.06% |
| |||||||
Suntech Power Holdings Co., Ltd. (China) 3.00%, 3/15/143,5 | 27,872,000 | 2,787,200 | ||||||
|
| |||||||
Internet — 0.47% |
| |||||||
Equinix, Inc. 3.00%, 10/15/14 | 13,600,000 | 21,471,000 | ||||||
|
| |||||||
Lodging — 0.92% |
| |||||||
MGM Resorts International 4.25%, 4/15/15 | 31,000,000 | 42,625,000 | ||||||
|
| |||||||
Real Estate Investment Trusts — 1.34% |
| |||||||
Gaylord Entertainment Co. | 13,730,000 | 26,807,825 | ||||||
Host Hotels & Resorts LP | 23,000,000 | 34,816,250 | ||||||
|
| |||||||
| 61,624,075 | ||||||||
|
| |||||||
Telecommunications — 0.60% |
| |||||||
Nortel Networks Corp. (Canada) 1.75%, 4/15/143,5 | 19,125,000 | 18,933,750 | ||||||
Nortel Networks Corp. (Canada) 2.13%, 4/15/143,5 | 9,000,000 | 8,938,125 | ||||||
|
| |||||||
| 27,871,875 | ||||||||
|
| |||||||
Total CONVERTIBLE CORPORATE BONDS (Cost $192,354,427) | 226,765,900 | |||||||
|
| |||||||
Notes to Financial Statements are an integral part of this Schedule.
7
Driehaus Active Income Fund
Schedule of Investments
December 31, 2013
| Shares, Principal Amount, or Number of Contracts | Value | |||||||
| U.S. GOVERNMENT AND AGENCY SECURITIES — 4.18% | ||||||||
Fannie Mae Pool 2.50%, 1/1/23 | $ | 43,398,635 | $ | 44,308,704 | ||||
Fannie Mae REMICS 1.50%, 4/25/28 | 107,722,009 | 103,474,314 | ||||||
Freddie Mac Non Gold Pool | 729,420 | 774,064 | ||||||
Freddie Mac REMICS 1.50%, 3/15/28 | 46,085,369 | 43,986,042 | ||||||
|
| |||||||
Total U.S. GOVERNMENT AND AGENCY SECURITIES (Cost $199,436,559) | 192,543,124 | |||||||
|
| |||||||
| COMMON STOCKS — 0.77% | ||||||||
Auto Manufacturers — 0.77% |
| |||||||
General Motors Co.* | 737,291 | 30,133,099 | ||||||
Motors Liquidation Co. GUC Trust* | 167,113 | 5,372,683 | ||||||
|
| |||||||
| 35,505,782 | ||||||||
|
| |||||||
Total COMMON STOCK (Cost $15,534,416) | 35,505,782 | |||||||
|
| |||||||
| CONVERTIBLE PREFERRED STOCKS — 0.90% | ||||||||
Auto Manufacturers — 0.00% |
| |||||||
General Motors Corp. Senior Convertible Preferred Escrow — B 5.25%, 3/6/344 | 475,000 | — | ||||||
General Motors Corp. Senior Convertible Preferred Escrow — C | 11,790,650 | — | ||||||
|
| |||||||
| — | ||||||||
|
| |||||||
Banks — 0.60% |
| |||||||
Bank of America Corp. 7.25%, 12/31/49 | 25,822 | 27,397,142 | ||||||
|
| |||||||
Telecommunications — 0.30% |
| |||||||
Lucent Technologies Capital Trust I 7.75%, 3/15/17 | 13,912 | 13,981,560 | ||||||
|
| |||||||
Total CONVERTIBLE PREFERRED STOCK (Cost $36,798,632) | 41,378,702 | |||||||
|
| |||||||
| PREFERRED STOCKS — 3.78% | ||||||||
Banks — 0.99% | ||||||||
GMAC Capital Trust I 8.13%, 2/15/402 | 1,710,062 | 45,727,058 | ||||||
|
| |||||||
| Shares, Principal Amount, or Number of Contracts | Value | |||||||
Diversified Financial Services — 0.52% |
| |||||||
RBS Capital Funding Trust V 5.90%, 12/31/49 | 300,000 | $ | 6,132,000 | |||||
RBS Capital Funding Trust VII 6.08%, 12/31/49 | 858,377 | 18,008,750 | ||||||
|
| |||||||
| 24,140,750 | ||||||||
|
| |||||||
Holding Companies — Diversified — 1.31% |
| |||||||
Pitney Bowes International Holdings, Inc. | 57,905 | 60,514,344 | ||||||
|
| |||||||
Telecommunications — 0.96% |
| |||||||
Centaur Funding Corp. (Cayman Islands) 9.08%, 4/21/201,3 | 36,242 | 44,147,286 | ||||||
|
| |||||||
Total PREFERRED STOCKS (Cost $164,398,857) | 174,529,438 | |||||||
|
| |||||||
| SHORT-TERM INVESTMENTS — 25.08% | ||||||||
UMB Money Market Fiduciary 0.01% | 1,155,768,679 | 1,155,768,679 | ||||||
|
| |||||||
Total SHORT-TERM INVESTMENTS (Cost $1,155,768,679) | 1,155,768,679 | |||||||
|
| |||||||
WARRANTS — 0.61% | ||||||||
General Motors Co. —CW 16, Strike Price $10.00, Expiration Date 7/10/16 | 32,132 | 1,001,238 | ||||||
General Motors Co. —CW 19, Strike Price $18.33, Expiration Date 7/10/19 | 1,168,287 | 27,022,482 | ||||||
|
| |||||||
Total WARRANTS (Cost $21,643,013) | 28,023,720 | |||||||
|
| |||||||
| ||||||||
TOTAL INVESTMENTS (Cost $4,419,445,137) | 98.64 | % | 4,545,360,909 | |||||
Other Assets less Liabilities | 1.36 | % | 62,441,974 | |||||
|
|
|
| |||||
| Net Assets | 100.00 | % | $ | 4,607,802,883 | ||||
| ||||||||
| ||||||||
| SECURITIES SOLD SHORT — (6.27)% | ||||||||
| CORPORATE BONDS — (2.54)% | ||||||||
Chemicals — (0.15)% |
| |||||||
Huntsman International LLC | (6,000,000 | ) | (6,840,000 | ) | ||||
|
| |||||||
Notes to Financial Statements are an integral part of this Schedule.
8
Driehaus Active Income Fund
Schedule of Investments
December 31, 2013
| Shares, Principal Amount, or Number of Contracts | Value | |||||||
Food — (0.46)% |
| |||||||
Safeway, Inc. 6.35%, 8/15/17 | $ | (18,975,000 | ) | $ | (21,264,713 | ) | ||
|
| |||||||
Healthcare — Products — (0.31)% |
| |||||||
Kinetic Concepts, Inc./ KCI USA, Inc. 10.50%, 11/1/18 | (12,500,000 | ) | (14,500,000 | ) | ||||
|
| |||||||
Household Products/Wares — (0.26)% |
| |||||||
Reynolds Group Issuer, Inc./Reynolds Group Issuer LLC 9.88%, 8/15/19 | (10,796,000 | ) | (12,118,510 | ) | ||||
|
| |||||||
Lodging — (0.18)% |
| |||||||
MGM Resorts International 7.63%, 1/15/17 | (7,315,000 | ) | (8,393,963 | ) | ||||
|
| |||||||
Media — (0.24)% |
| |||||||
DISH DBS Corp. 6.75%, 6/1/21 | (10,339,000 | ) | (11,062,730 | ) | ||||
|
| |||||||
Oil & Gas — (0.47)% |
| |||||||
Chesapeake Energy Corp. | (13,700,000 | ) | (15,446,750 | ) | ||||
Chesapeake Energy Corp. | (5,500,000 | ) | (5,953,750 | ) | ||||
|
| |||||||
| (21,400,500 | ) | |||||||
|
| |||||||
Retail — (0.47)% |
| |||||||
Party City Holdings, Inc. | (6,330,000 | ) | (7,152,900 | ) | ||||
Sears Holdings Corp. 6.63%, 10/15/18 | (15,800,000 | ) | (14,457,000 | ) | ||||
|
| |||||||
| (21,609,900 | ) | |||||||
|
| |||||||
Total CORPORATE BONDS (Proceeds $111,483,670) | (117,190,316 | ) | ||||||
|
| |||||||
| COMMON STOCKS — (3.24)% | ||||||||
Auto Manufacturers — (1.17)% |
| |||||||
Ford Motor Co. | (3,491,935 | ) | (53,880,557 | ) | ||||
|
| |||||||
Banks — (0.21)% |
| |||||||
Bank of America Corp. | (628,321 | ) | (9,782,958 | ) | ||||
|
| |||||||
Healthcare — Services — (0.11)% |
| |||||||
Kindred Healthcare, Inc. | (258,474 | ) | (5,102,277 | ) | ||||
|
| |||||||
| Shares, Principal Amount, or Number of Contracts | Value | |||||||
Internet — (0.54)% |
| |||||||
Equinix, Inc.* | (126,233 | ) | $ | (22,400,046 | ) | |||
WebMD Health Corp.* | (60,447 | ) | (2,387,656 | ) | ||||
|
| |||||||
| (24,787,702 | ) | |||||||
|
| |||||||
Lodging — (0.31)% |
| |||||||
MGM Resorts International* | (593,974 | ) | (13,970,268 | ) | ||||
|
| |||||||
Real Estate Investment Trusts — (0.90)% |
| |||||||
Host Hotels & Resorts, Inc. | (1,193,449 | ) | (23,200,649 | ) | ||||
Ryman Hospitality Properties | (438,718 | ) | (18,329,638 | ) | ||||
|
| |||||||
| (41,530,287 | ) | |||||||
|
| |||||||
Total COMMON STOCKS (Proceeds $121,265,003) | (149,054,049 | ) | ||||||
|
| |||||||
| EXCHANGE-TRADED FUND — (0.49)% | ||||||||
SPDR Barclays High Yield Bond ETF | (557,235 | ) | (22,601,452 | ) | ||||
|
| |||||||
Total EXCHANGE-TRADED FUND (Proceeds $21,731,230) | (22,601,452 | ) | ||||||
|
| |||||||
| ||||||||
TOTAL INVESTMENT SECURITIES SOLD SHORT (Proceeds $254,479,903) | (6.27 | )% | $ | (288,845,817 | ) | |||
| ||||||||
| * | Non-income producing security. |
| 1 | 144A restricted security. |
| 2 | Variable rate security. Rates disclosed are as of December 31, 2013. |
| 3 | Foreign security denominated in U.S. dollars. |
| 4 | Security valued at fair value as determined in good faith by Driehaus Capital Management LLC, investment adviser to the Fund, in accordance with procedures established by, and under the general supervision of, the Trust’s Board of Trustees. |
| 5 | Security is in default. |
Percentages are stated as a percent of net assets.
Notes to Financial Statements are an integral part of this Schedule.
9
Driehaus Active Income Fund
Schedule of Investments
December 31, 2013
SWAP CONTRACTS
Credit Default Swaps
| Counterparty | Reference Instrument | Currency | Notional AmountB | Pay/ ReceiveA Fixed Rate | Fixed Rate | Expiration Date | Premium Paid (Received) | Unrealized Appreciation/ (Depreciation) | Credit Event | RatingC | ||||||||||||||||||||||
Goldman Sachs | Alcatel-Lucent USA, Inc. 6.50%, 1/15/28 | USD | 43,500,000 | Pay | 5.00 | % | 9/20/2014 | $ | 3,756,250 | $ | (5,242,796 | ) | Bankruptcy/FTP | CCC+ | ||||||||||||||||||
Merrill Lynch | Ally Financial, Inc. 7.50%, 9/15/20 | USD | 10,000,000 | Pay | 5.00 | 3/20/2019 | (1,581,464 | ) | (131,215 | ) | Bankruptcy/FTP | BB | ||||||||||||||||||||
Merrill Lynch | Ally Financial, Inc. 7.50%, 9/15/20 | USD | 10,000,000 | Pay | 5.00 | 12/20/2018 | (1,492,458 | ) | (178,518 | ) | Bankruptcy/FTP | BB | ||||||||||||||||||||
Morgan Stanley | American Express Co. 5.50%, 9/12/16 | USD | 20,000,000 | Pay | 1.00 | 12/20/2016 | 263,406 | (747,203 | ) | Bankruptcy/FTP | BBB+ | |||||||||||||||||||||
Goldman Sachs | American Express Co. 5.50%, 9/12/16 | USD | 5,000,000 | Pay | 1.00 | 12/20/2016 | 61,174 | (182,124 | ) | Bankruptcy/FTP | BBB+ | |||||||||||||||||||||
Goldman Sachs | Bank of America Corp. 6.25%, 4/15/12 | USD | 10,000,000 | Pay | 1.00 | 12/20/2016 | 1,499,776 | (1,657,105 | ) | Bankruptcy/FTP | NR | |||||||||||||||||||||
Goldman Sachs | Boston Properties L.P. 6.25%, 1/15/13 | USD | 11,000,000 | Pay | 1.00 | 9/20/2014 | 848,323 | (925,497 | ) | Bankruptcy/FTP | NR | |||||||||||||||||||||
Goldman Sachs | Brunswick Corp. 7.13%, 8/1/27 | USD | 10,000,000 | Pay | 5.00 | 12/20/2014 | 40,542 | (536,173 | ) | Bankruptcy/FTP | BB | |||||||||||||||||||||
Goldman Sachs | Brunswick Corp. 7.13%, 8/1/27 | USD | 10,000,000 | Pay | 5.00 | 12/20/2014 | (143,212 | ) | (352,419 | ) | Restructuring/ Bankruptcy/FTP | BB | ||||||||||||||||||||
Merrill Lynch | Citigroup, Inc. 6.13%, 5/15/18 | USD | 5,000,000 | Pay | 1.00 | 12/20/2016 | 432,520 | (517,414 | ) | Bankruptcy/FTP | A- | |||||||||||||||||||||
Goldman Sachs | Citigroup, Inc. 6.13%, 5/15/18 | USD | 5,000,000 | Pay | 1.00 | 12/20/2016 | 379,663 | (464,559 | ) | Bankruptcy/FTP | A- | |||||||||||||||||||||
Goldman Sachs | CVS Caremark Corp. 4.88%, 9/15/14 | USD | 10,000,000 | Pay | 1.00 | 9/20/2014 | (286,840 | ) | 212,218 | Bankruptcy/FTP | BBB+ | |||||||||||||||||||||
Morgan Stanley | Enbridge Energy, L.P. 4.75%, 6/1/13 | USD | 10,000,000 | Pay | 1.00 | 6/20/2015 | 56,732 | (181,188 | ) | Bankruptcy/FTP | NR | |||||||||||||||||||||
Goldman Sachs | First Data Corp. 9.88%, 9/24/15 | USD | 3,000,000 | Pay | 5.00 | 3/20/2017 | 540,000 | (743,384 | ) | Bankruptcy/FTP | B- | |||||||||||||||||||||
Morgan Stanley | First Data Corp. 9.88%, 9/24/15 | USD | 10,000,000 | Pay | 5.00 | 3/20/2017 | 1,150,000 | (1,827,949 | ) | Bankruptcy/FTP | B- | |||||||||||||||||||||
Goldman Sachs | First Data Corp. 9.88%, 9/24/15 | USD | 5,000,000 | Pay | 5.00 | 6/20/2016 | 350,000 | (704,628 | ) | Bankruptcy/FTP | B- | |||||||||||||||||||||
Goldman Sachs | H.J. Heinz Co. 6.38%, 7/15/28 | USD | 10,000,000 | Pay | 1.00 | 9/20/2014 | (320,193 | ) | 248,035 | Bankruptcy/FTP | BB- | |||||||||||||||||||||
JP Morgan | Hess Corp. 7.00%, 2/15/14 | USD | 8,000,000 | Pay | 1.00 | 6/20/2018 | 154,644 | (263,299 | ) | Bankruptcy/FTP | BBB | |||||||||||||||||||||
Morgan Stanley | Hess Corp. 7.00%, 2/15/14 | USD | 4,000,000 | Pay | 1.00 | 6/20/2018 | 77,280 | (131,608 | ) | Bankruptcy/FTP | BBB | |||||||||||||||||||||
Morgan Stanley | Hess Corp. 7.00%, 2/15/14 | USD | 4,000,000 | Pay | 1.00 | 6/20/2018 | 80,701 | (135,029 | ) | Bankruptcy/FTP | BBB | |||||||||||||||||||||
Notes to Financial Statements are an integral part of this Schedule.
10
Driehaus Active Income Fund
Schedule of Investments
December 31, 2013
Credit Default Swaps (continued)
| Counterparty | Reference Instrument | Currency | Notional AmountB | Pay/ ReceiveA Fixed Rate | Fixed Rate | Expiration Date | Premium Paid (Received) | Unrealized Appreciation/ (Depreciation) | Credit Event | RatingC | ||||||||||||||||||||||
Morgan Stanley | Hess Corp. 7.00%, 2/15/14 | USD | 4,000,000 | Pay | 1.00 | % | 6/20/2018 | $ | 91,702 | $ | (146,030 | ) | Bankruptcy/FTP | BBB | ||||||||||||||||||
Credit Suisse | Hess Corp. 5.60%, 2/15/41 | USD | 4,000,000 | Pay | 1.00 | 6/20/2018 | 15,350 | (69,678 | ) | Bankruptcy/FTP | BBB | |||||||||||||||||||||
Credit Suisse | Hess Corp. 7.00%, 2/15/14 | USD | 20,000,000 | Pay | 1.00 | 9/20/2018 | 309,975 | (542,651 | ) | Bankruptcy/FTP | BBB | |||||||||||||||||||||
Goldman Sachs | Host Hotels & Resorts, Inc. 6.75%, 6/1/16 | USD | 10,000,000 | Pay | 1.00 | 12/20/2016 | 1,067,644 | (1,247,856 | ) | Bankruptcy/FTP | BBB- | |||||||||||||||||||||
Goldman Sachs | Huntsman Corp. 11.50%, 7/15/12 | USD | 5,000,000 | Pay | 5.00 | 12/20/2016 | 124,119 | (697,376 | ) | Bankruptcy/FTP | NR | |||||||||||||||||||||
Morgan Stanley | J.C. Penney Corp., Inc. 6.38%, 10/15/36 | USD | 7,500,000 | Pay | 5.00 | 6/20/2018 | 768,750 | 742,863 | Bankruptcy/FTP | CCC- | ||||||||||||||||||||||
Credit Suisse | J.C. Penney Corp., Inc. 6.38%, 10/15/36 | USD | 3,750,000 | Pay | 5.00 | 6/20/2018 | 346,875 | 408,931 | Bankruptcy/FTP | CCC- | ||||||||||||||||||||||
Credit Suisse | J.C. Penney Corp., Inc. 6.38%, 10/15/36 | USD | 3,750,000 | Pay | 5.00 | 6/20/2018 | 309,375 | 446,431 | Bankruptcy/FTP | CCC- | ||||||||||||||||||||||
Credit Suisse | J.C. Penney Corp., Inc. 6.38%, 10/15/36 | USD | 3,750,000 | Pay | 5.00 | 6/20/2018 | 234,375 | 521,431 | Restructuring/ Bankruptcy/FTP | CCC- | ||||||||||||||||||||||
Morgan Stanley | J.C. Penney Corp., Inc. 6.38%, 10/15/36 | USD | 3,750,000 | Pay | 5.00 | 6/20/2018 | 365,625 | 390,181 | Restructuring/ Bankruptcy/FTP | CCC- | ||||||||||||||||||||||
Credit Suisse | J.C. Penney Corp., Inc. 6.38%, 10/15/36 | USD | 6,667,000 | Pay | 5.00 | 12/20/2016 | 700,035 | 380,840 | Bankruptcy/FTP | CCC- | ||||||||||||||||||||||
Morgan Stanley | J.C. Penney Corp., Inc. 6.38%, 10/15/36 | USD | (10,000,000 | ) | Receive | 5.00 | 12/20/2014 | (375,000 | ) | (162,184 | ) | Bankruptcy/FTP | CCC- | |||||||||||||||||||
Goldman Sachs | J.C. Penney Corp., Inc. 6.38%, 10/15/36 | USD | 13,334,000 | Pay | 5.00 | 3/20/2017 | 2,633,465 | (354,114 | ) | Bankruptcy/FTP | CCC- | |||||||||||||||||||||
Credit Suisse | J.C. Penney Corp., Inc. 6.38%, 10/15/36 | USD | 6,667,000 | Pay | 5.00 | 3/20/2017 | 1,366,735 | (227,060 | ) | Bankruptcy/FTP | CCC- | |||||||||||||||||||||
Goldman Sachs | J.C. Penney Corp., Inc. 6.38%, 10/15/36 | USD | (13,334,000 | ) | Receive | 5.00 | 3/20/2015 | (933,380 | ) | (37,738 | ) | Bankruptcy/FTP | CCC- | |||||||||||||||||||
Goldman Sachs | Limited Brands, Inc. 6.90%, 7/15/17 | USD | 15,000,000 | Pay | 1.00 | 12/20/2015 | 679,159 | (862,756 | ) | Bankruptcy/FTP | NR | |||||||||||||||||||||
Goldman Sachs | Liz Claiborne, Inc. 5.00%, 7/8/13 | USD | 15,000,000 | Pay | 5.00 | 9/20/2014 | 1,875,000 | (2,436,340 | ) | Bankruptcy/FTP | NR | |||||||||||||||||||||
Goldman Sachs | Liz Claiborne, Inc. 5.00%, 7/8/13 | USD | 15,000,000 | Pay | 5.00 | 12/20/2014 | 1,087,500 | (1,829,452 | ) | Bankruptcy/FTP | NR | |||||||||||||||||||||
Notes to Financial Statements are an integral part of this Schedule.
11
Driehaus Active Income Fund
Schedule of Investments
December 31, 2013
Credit Default Swaps (continued)
| Counterparty | Reference Instrument | Currency | Notional AmountB | Pay/ ReceiveA Fixed Rate | Fixed Rate | Expiration Date | Premium Paid (Received) | Unrealized Appreciation/ (Depreciation) | Credit Event | RatingC | ||||||||||||||||||||||
Goldman Sachs | The Markit CDX NA High Yield Series 17 Index | USD | 14,400,000 | Pay | 5.00 | % | 12/20/2016 | $ | 1,500,750 | $ | (2,802,864 | ) | Bankruptcy/FTP | NA | ||||||||||||||||||
Merrill Lynch | The Markit CDX NA High Yield Series 17 Index | USD | 4,800,000 | Pay | 5.00 | 12/20/2016 | 550,000 | (1,008,491 | ) | Bankruptcy/FTP | NA | |||||||||||||||||||||
Goldman Sachs | The Markit iTraxx Europe Crossover IndexSeries 19 | EUR | 24,500,000 | Pay | 5.00 | 6/20/2018 | (1,602,328 | ) | (1,688,744 | ) | Bankruptcy/FTP | NA | ||||||||||||||||||||
Morgan Stanley | The Markit iTraxx Europe Crossover IndexSeries 20 | EUR | 10,000,000 | Pay | 5.00 | 12/20/2018 | (2,056,849 | ) | (396,157 | ) | Bankruptcy/FTP | NA | ||||||||||||||||||||
Morgan Stanley | The Markit iTraxx Europe Crossover IndexSeries 20 | EUR | 10,000,000 | Pay | 5.00 | 12/20/2018 | (2,137,029 | ) | (315,977 | ) | Bankruptcy/FTP | NA | ||||||||||||||||||||
Morgan Stanley | The Markit iTraxx Europe Crossover IndexSeries 20 | EUR | 10,000,000 | Pay | 5.00 | 12/20/2018 | (2,252,200 | ) | (200,806 | ) | Bankruptcy/FTP | NA | ||||||||||||||||||||
Morgan Stanley | The Markit iTraxx Europe Crossover IndexSeries 20 | EUR | 5,000,000 | Pay | 5.00 | 12/20/2018 | (1,001,806 | ) | (224,697 | ) | Bankruptcy/FTP | NA | ||||||||||||||||||||
Goldman Sachs | The Markit iTraxx Europe Crossover IndexSeries 20 | EUR | 15,000,000 | Pay | 5.00 | 12/20/2018 | (3,201,060 | ) | (478,449 | ) | Bankruptcy/FTP | NA | ||||||||||||||||||||
Goldman Sachs | Masco Corp. 6.13%, 10/3/16 | USD | 15,000,000 | Pay | 1.00 | 12/20/2015 | 1,047,333 | (1,244,541 | ) | Bankruptcy/FTP | BBB- | |||||||||||||||||||||
Morgan Stanley | Masco Corp. 6.13%, 10/3/16 | USD | 4,500,000 | Pay | 1.00 | 3/20/2016 | 273,169 | (336,868 | ) | Bankruptcy/FTP | BBB- | |||||||||||||||||||||
Goldman Sachs | Newell Rubbermaid, Inc. 5.50%, 4/15/13 | USD | 30,000,000 | Pay | 1.00 | 6/20/2014 | 620,488 | (766,236 | ) | Bankruptcy/FTP | NR | |||||||||||||||||||||
Merrill Lynch | Pitney Bowes, Inc. 6.25%, 3/15/19 | USD | 5,000,000 | Pay | 1.00 | 9/20/2016 | 164,656 | (240,421 | ) | Bankruptcy/FTP | NR | |||||||||||||||||||||
Morgan Stanley | Pitney Bowes, Inc. 6.25%, 3/15/19 | USD | 5,000,000 | Pay | 1.00 | 12/20/2016 | 244,614 | (319,482 | ) | Bankruptcy/FTP | BBB | |||||||||||||||||||||
Merrill Lynch | Pitney Bowes, Inc. 4.63%, 10/01/12 | USD | 20,000,000 | Pay | 1.00 | 3/20/2016 | 436,253 | (746,377 | ) | Bankruptcy/FTP | BBB | |||||||||||||||||||||
Goldman Sachs | Realogy Corp. 10.50%, 4/15/14 | USD | 3,000,000 | Pay | 5.00 | 3/20/2016 | 285,000 | (440,754 | ) | Bankruptcy/FTP | NR | |||||||||||||||||||||
Merrill Lynch | Realogy Corp. 10.50%, 4/15/14 | USD | 2,000,000 | Pay | 5.00 | 3/20/2016 | 190,000 | (293,836 | ) | Bankruptcy/FTP | NR | |||||||||||||||||||||
Goldman Sachs | Royal Bank of Scotland 6.93%, 4/9/18 | EUR | 5,000,000 | Pay | 5.00 | 12/20/2018 | (763,879 | ) | (295,353 | ) | Bankruptcy/FTP | BBB- | ||||||||||||||||||||
Goldman Sachs | Saks, Inc. 2.00%, 3/15/24 | USD | 10,000,000 | Pay | 5.00 | 12/20/2016 | 406,250 | (1,806,580 | ) | Bankruptcy/FTP | NR | |||||||||||||||||||||
Morgan Stanley | Sprint Nextel Corp. 6.00%, 12/1/16 | USD | 5,000,000 | Pay | 5.00 | 3/20/2016 | (354,760 | ) | (137,360 | ) | Bankruptcy/FTP | BB- | ||||||||||||||||||||
Notes to Financial Statements are an integral part of this Schedule.
12
Driehaus Active Income Fund
Schedule of Investments
December 31, 2013
Credit Default Swaps (continued)
| Counterparty | Reference Instrument | Currency | Notional AmountB | Pay/ ReceiveA Fixed Rate | Fixed Rate | Expiration Date | Premium Paid (Received) | Unrealized Appreciation/ (Depreciation) | Credit Event | RatingC | ||||||||||||||||||||||
Morgan Stanley | SUPERVALU, Inc. 8.00%, 5/1/16 | USD | 2,500,000 | Pay | 5.00 | % | 9/20/2018 | $ | (103,413 | ) | $ | (20,284 | ) | Bankruptcy/FTP | B- | |||||||||||||||||
Goldman Sachs | SUPERVALU, Inc. 8.00%, 5/1/16 | USD | 2,500,000 | Pay | 5.00 | 9/20/2018 | (109,079 | ) | (14,618 | ) | Bankruptcy/FTP | B- | ||||||||||||||||||||
Goldman Sachs | SUPERVALU, Inc. 8.00%, 5/1/16 | USD | 2,500,000 | Pay | 5.00 | 9/20/2018 | (142,039 | ) | 18,343 | Bankruptcy/FTP | B- | |||||||||||||||||||||
Goldman Sachs | The Chubb Corp. 6.60%, 8/15/18 | USD | 10,000,000 | Pay | 1.00 | 12/20/2014 | (242,813 | ) | 146,327 | Bankruptcy/FTP | A+ | |||||||||||||||||||||
Goldman Sachs | The Chubb Corp. 6.60%, 8/15/18 | USD | 10,000,000 | Pay | 1.00 | 3/20/2015 | (257,326 | ) | 137,220 | Bankruptcy/FTP | A+ | |||||||||||||||||||||
Goldman Sachs | TRW Automotive, Inc. 7.25%, 3/15/17 | USD | 5,000,000 | Pay | 5.00 | 3/20/2015 | 92,579 | (390,650 | ) | Bankruptcy/FTP | BBB- | |||||||||||||||||||||
Goldman Sachs | TRW Automotive, Inc. 7.25%, 3/15/17 | USD | 3,000,000 | Pay | 5.00 | 6/20/2015 | (133,100 | ) | (78,546 | ) | Bankruptcy/FTP | BBB- | ||||||||||||||||||||
Morgan Stanley | Vulcan Materials Co. 6.40%, 11/30/17 | USD | 5,000,000 | Pay | 5.00 | 12/20/2016 | 255,000 | (895,454 | ) | Bankruptcy/FTP | BB | |||||||||||||||||||||
|
|
|
| |||||||||||||||||||||||||||||
Total Credit Default Swaps |
| 8,242,559 | (35,026,068 | ) | ||||||||||||||||||||||||||||
|
|
|
| |||||||||||||||||||||||||||||
Total Swap Contracts |
| $ | 8,242,559 | $ | (35,026,068 | ) | ||||||||||||||||||||||||||
|
|
|
| |||||||||||||||||||||||||||||
| A | If the Fund is paying a fixed rate, the counterparty acts as guarantor of the variable instrument and thus the Fund is a buyer of protection. If the Fund is receiving a fixed rate, the Fund acts as guarantor of the variable instrument and thus is a seller of protection. |
| B | For contracts to sell protection, the notional amout is equal to the maximum potential amount of the future payments and no recourse has been entered into in association with the contracts. |
| C | Based on Moody’s or Standard & Poor’s credit rating for the underlying reference instrument entity (unaudited). |
FTP=Failure to Pay
NR=Not Rated
NA=Not Applicable
EUR — Euro
USD — United States Dollar
Notes to Financial Statements are an integral part of this Schedule.
13
Driehaus Active Income Fund
Schedule of Investments
December 31, 2013
SWAPTIONS
Interest Rate Swaptions
| Counterparty | Floating Rate Index | Currency | Notional Amount | Pay/ Receive Fixed rate | Exercise Price | Expiration Date | Premium Paid (Received) | Market Value | ||||||||||||||||||||
Morgan Stanley | 3-Month USD-LIBOR-BBA | USD | 184,120,000 | Pay | 3.35 | 3/20/2014 | $ | 4,000,000 | $ | 1,433,719 | ||||||||||||||||||
|
|
|
| |||||||||||||||||||||||||
Total Interest Rate Swaptions |
| 4,000,000 | 1,433,719 | |||||||||||||||||||||||||
|
|
|
| |||||||||||||||||||||||||
TOTAL SWAPTIONS |
| $ | 4,000,000 | $ | 1,433,719 | |||||||||||||||||||||||
|
|
|
| |||||||||||||||||||||||||
USD - United States Dollar
FUTURES CONTRACTS
| Futures Contracts | Number of Contracts Long/(Short) | Expiration Date | Unrealized Appreciation/ (Depreciation) | |||||||||
U.S. 5 Year Treasury Note | (1,452 | ) | March 2014 | $ | 2,301,127 | |||||||
U.S. 10 Year Treasury Note | (2,654 | ) | March 2014 | 6,263,246 | ||||||||
U.S. Treasury Long Bond | (368 | ) | March 2014 | 880,944 | ||||||||
|
| |||||||||||
Total Futures Contracts | $ | 9,445,317 | ||||||||||
|
| |||||||||||
Notes to Financial Statements are an integral part of this Schedule.
14
Driehaus Select Credit Fund — Portfolio Managers’ Letter
Dear Shareholders,
The Driehaus Select Credit Fund1 (“Fund”) returned 6.62% for the year ending December 31, 2013. This return was above the performance of the Fund’s benchmark index, the Citigroup 3-Month T-Bill Index (the “Benchmark”), which returned 0.05% for the same period. The Fund underperformed the BofA Merrill Lynch U.S. High Yield Index (the “Index”), which returned 7.42% for the same period.
For the first time in many, many years, Treasuries lost value in 2013. While the year was generally disappointing for fixed income investors, we were at least able to provide Fund investors with a positive return for the year. We started 2013 with much the same outlook as we held at the conclusion of the year, looking at a low volatility, low yield, compressed spread environment. This was not an inspiring opportunity set then or at year end, but is one in which at least we believe we were able to provide our investors with low correlations to major asset classes and low volatility of the Fund’s returns.
For the year, the most significant contributions to returns came from the directional long trading strategy. Security selection and continued interest in risk assets helped this strategy generate strong returns. Additionally, the directional long trades benefited as spreads broadly contracted and defaults remained extraordinarily low within the credit markets. The second most significant contributor to returns was the event driven trading strategy. Event driven trading, which focuses on corporate events such as mergers or company announcements, is an area of the market where we are increasingly finding attractive investment opportunities. Depending on the anticipated timing and nature of the event, these trades are structured using a combination of bonds, options, bank loans, swaps and equities.
The detractors from performance for the year were the volatility trading strategy and the directional short strategy. Volatility trades are generally constructed by implementing various option strategies, such as straddles or strangles on the S&P 500 Index or other indices or through the use of credit default swaps on indices. During the year, as market pressures eased and investors grew more optimistic, market volatility decreased significantly. The Fund generally held long volatility trades that benefit performance only when volatility increases. The directional short strategies detracted value as assets generally rose during the year, hurting trades that were structured to benefit if the securities decreased in value.
The Fund was generally conservatively positioned for much of the year, including holding an above-average cash position relative to the Fund’s past cash balances. On a selective, individual name basis, we did find some attractive opportunities. However, in aggregate, we found the massive amount of new issuance during the year, and the call constrained nature of the market, to be fairly problematic for valuations. In our estimation, “reaching for return” brought considerable credit risk with significant downside worries, meriting a cautious approach to the market. Additionally, given our view was and remains that interest rates will grind higher over time, we felt no need to invest this excess cash, merely for the sake of saying that we have invested our excess cash, and saddle our investors with losses that would likely accompany a high-quality fixed income investment, as was largely the case last year.
One of the benefits of the Fund for investors is the diversification it offers through low correlations to other asset classes. We were particularly pleased with the low correlations of many major asset classes to the Fund during 2013. For the year, the Fund had a correlation between 0.5 and -0.5 (based on daily return data) to the S&P 500 Index, the 10-Year U.S. Treasury, the Barclays Aggregate ETF (AGG), the Investment Grade Bond ETF (LQD), the High Yield Bond ETF (JNK), the HFRX Global Hedge Fund Index, and the Dow Jones-UBS Commodity Index.
In addition to achieving low correlations to many asset classes, the Fund exhibited rather low volatility throughout 2013. The 100-day volatility of the Fund averaged 2.4%. The largest drawdown for the year was 2.0%.
Looking ahead, we expect a low return environment for fixed income to continue in 2014. Spreads and all-in yields are still quite low, with spreads in high yield and investment grade bonds near their lowest levels since 2007. We expect that volatility will remain muted this year. We would prefer to be in a higher volatility regime, as market volatility typically widens some of the relationships that we try to arbitrage in many of our trades. Last year was a miserable year for most asset volatility. Treasury and some currency volatility were above average, but volatility in U.S. credit and equities was virtually non-existent. Given that the U.S. economy
15
appears to be improving, macroeconomic risks appear to be declining, and monetary policy remains quite accommodative, it seems likely that we will see more of the same this year. However, while the opportunity set today looks much as it did a year ago, our guess is that it will improve by year end.
As always, we at Driehaus Capital Management LLC thank you for your interest in the Driehaus Select Credit Fund and would like to express our gratitude to you as shareholders for your continued confidence in our management capabilities.
Sincerely,
| | | ||
| K.C. Nelson | Mirsada Durakovic | Elizabeth Cassidy | ||
| Portfolio Manager | Assistant Portfolio Manager | Assistant Portfolio Manager |
| 1 | The Driehaus Select Credit Fund closed to new investors on January 31, 2014. |
Performance is historical and does not represent future results.
Please see the following performance page for index definitions.
16
Driehaus Select Credit Fund
Performance Overview (unaudited)
The performance summarized below is historical and does not represent future results. Investment returns and principal value vary, and you may have a gain or loss when you sell shares. Performance data presented measures the change in the value of an investment in the Fund, assuming reinvestment of all dividends and capital gains.
The table does not reflect the deduction of taxes that a shareholder would pay on Fund distributions or the redemption of Fund shares. The graph compares the results of a $25,000 investment (minimum investment) in the Fund since September 30, 2010 (the date of the Fund’s inception), with all dividends and capital gains reinvested, with the indicated indices (and dividends reinvested) for the same period.
| Average Annual Total Returns as of 12/31/13 | 1 Year | 3 Years | Since Inception (09/30/10 - 12/31/13) | |||||||||
Driehaus Select Credit Fund (DRSLX)1 | 6.62% | 4.00% | 4.77% | |||||||||
Citigroup 3-Month T-Bill Index2 | 0.05% | 0.07% | 0.07% | |||||||||
BofA Merrill Lynch U.S. High Yield Index3 | 7.42% | 9.03% | 9.31% | |||||||||
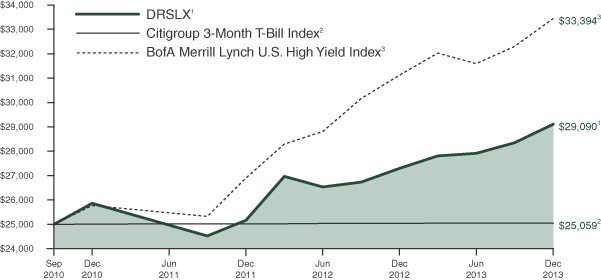
| 1 | The returns for the periods prior to February 1, 2011, reflect fee waivers and/or reimbursements without which performance would have been lower. |
| 2 | The Citigroup 3-Month T-Bill Index is designed to mirror the performance of the 3-month U.S. Treasury Bill. The Citigroup 3-Month T-Bill Index is unmanaged and its returns reflect reinvestment of all distributions and changes in market prices. |
| 3 | The BofA Merrill Lynch U.S. High Yield Index is an unmanaged index that tracks the performance of below-investment grade, U.S.-dollar denominated corporate bonds publicly issued in the U.S. domestic market. |
17
Driehaus Select Credit Fund
Schedule of Investments
December 31, 2013
| Shares, Principal Amount, or Number of Contracts | Value | |||||||
| ASSET-BACKED SECURITIES — 1.35% | ||||||||
Freddie Mac REMICS 2.00%, 2/15/27 | $ | 6,358,933 | $ | 6,260,001 | ||||
Freddie Mac REMICS 2.00%, 4/15/28 | 7,683,802 | 7,527,583 | ||||||
|
| |||||||
Total ASSET-BACKED SECURITIES | 13,787,584 | |||||||
|
| |||||||
| BANK LOANS — 13.87% | ||||||||
Commercial Services — 1.07% |
| |||||||
Westway Group, Inc. 5.00%, 2/5/202 | 10,917,500 | 10,965,264 | ||||||
|
| |||||||
Diversified Financial Services — 0.74% |
| |||||||
Sears Roebuck Acceptance Corp. 5.50%, 6/30/182 | 7,550,000 | 7,583,703 | ||||||
|
| |||||||
Environmental Control — 0.20% |
| |||||||
WTG Holdings III Corp. 8.50%, 12/12/212 | 2,000,000 | 2,020,000 | ||||||
|
| |||||||
Food — 3.81% |
| |||||||
Fairway Group Acquisition Co. 5.00%, 8/17/182 | 22,744,437 | 22,772,868 | ||||||
Hostess Brands, Inc. 6.75%, 3/12/202 | 7,000,000 | 7,223,125 | ||||||
SUPERVALU, Inc. 5.00%, 3/21/192 | 8,940,525 | 9,015,563 | ||||||
|
| |||||||
| 39,011,556 | ||||||||
|
| |||||||
Leisure Time — 0.99% |
| |||||||
Equinox Holdings, Inc. 9.75%, 5/16/202 | 10,000,000 | 10,125,000 | ||||||
Oil & Gas — 2.48% |
| |||||||
Bennu Oil & Gas LLC 10.25%, 10/31/182 | 10,105,714 | 10,156,243 | ||||||
Shelf Drilling Midco Ltd. (United Arab Emirates) 10.00%, 10/7/182 | 15,000,000 | 15,187,500 | ||||||
|
| |||||||
| 25,343,743 | ||||||||
|
| |||||||
Retail — 3.61% |
| |||||||
Hudson’s Bay Co. (Canada) 8.25%, 10/7/212 | 10,000,000 | 10,266,670 | ||||||
JC Penney Corp., Inc. 6.00%, 5/21/182 | 13,308,125 | 12,986,507 | ||||||
Targus Group International 12.00%, 5/12/162 | 16,670,923 | 13,670,157 | ||||||
|
| |||||||
| 36,923,334 | ||||||||
|
| |||||||
Telecommunications — 0.97% |
| |||||||
Alcatel-Lucent USA, Inc. 5.75%, 1/30/192 | 9,929,887 | 9,975,991 | ||||||
|
| |||||||
Total BANK LOANS | 141,948,591 | |||||||
|
| |||||||
| Shares, Principal Amount, or Number of Contracts | Value | |||||||
| CORPORATE BONDS — 37.95% | ||||||||
Agriculture — 1.25% |
| |||||||
American Rock Salt Co. LLC/American Rock Capital Corp. 8.25%, 5/1/181 | $ | 12,667,000 | $ | 12,809,504 | ||||
|
| |||||||
Apparel — 0.94% |
| |||||||
Jones Group, Inc./Apparel Group Holdings, Inc. 6.88%, 3/15/19 | 9,040,000 | 9,582,400 | ||||||
|
| |||||||
Banks — 1.77% |
| |||||||
Credit Suisse Group AG (Switzerland) 7.50%, 12/11/491,2,3 | 2,000,000 | 2,112,500 | ||||||
Royal Bank of Scotland Group PLC (United Kingdom) 5.50%, 11/29/493 | 13,702,000 | 15,975,299 | ||||||
|
| |||||||
| 18,087,799 | ||||||||
|
| |||||||
Building Materials — 1.71% |
| |||||||
Cemex Finance LLC 9.38%, 10/12/221 | 11,000,000 | 12,402,500 | ||||||
Cemex SAB de CV (Mexico) 5.25%, 9/30/151,2,3 | 4,930,000 | 5,090,225 | ||||||
|
| |||||||
| 17,492,725 | ||||||||
|
| |||||||
Chemicals — 0.37% |
| |||||||
Momentive Performance Materials, Inc. 11.50%, 12/1/16 | 5,530,000 | 3,760,400 | ||||||
Commercial Services — 1.33% |
| |||||||
Ceridian Corp. 8.88%, 7/15/191 | 4,000,000 | 4,600,000 | ||||||
DynCorp International, Inc. | 8,147,000 | 8,330,308 | ||||||
Empark Funding SA (Spain) 6.75%, 12/15/191,3 | 500,000 | 706,768 | ||||||
|
| |||||||
| 13,637,076 | ||||||||
|
| |||||||
Diversified Financial Services — 2.32% |
| |||||||
Bantrab Senior Trust (Cayman Islands) 9.00%, 11/14/201,3 | 1,000,000 | 997,500 | ||||||
Cementos Progreso Trust (Cayman Islands) 7.13%, 11/6/231,3 | 6,500,000 | 6,589,375 | ||||||
Denali Borrower LLC/Denali Finance Corp. 5.63%, 10/15/201 | 4,000,000 | 3,965,000 | ||||||
Denver Parent Corp. 12.25%, 8/15/181 | 12,500,000 | 12,187,500 | ||||||
|
| |||||||
| 23,739,375 | ||||||||
|
| |||||||
Notes to Financial Statements are an integral part of this Schedule.
18
Driehaus Select Credit Fund
Schedule of Investments
December 31, 2013
| Shares, Principal Amount, or Number of Contracts | Value | |||||||
Entertainment — 3.28% |
| |||||||
Graton Economic Development Authority 9.63%, 9/1/191 | $ | 20,955,000 | $ | 24,307,800 | ||||
Production Resource Group, Inc. 8.88%, 5/1/19 | 7,255,000 | 5,241,737 | ||||||
WMG Acquisition Corp. 11.50%, 10/1/18 | 3,500,000 | 4,025,000 | ||||||
|
| |||||||
| 33,574,537 | ||||||||
|
| |||||||
Healthcare — Products — 0.87% |
| |||||||
ConvaTec Healthcare E S.A. (Luxembourg) 10.50%, 12/15/181,3 | 7,930,000 | 8,911,338 | ||||||
|
| |||||||
Healthcare — Services — 3.25% |
| |||||||
Aurora Diagnostics Holdings/Aurora Diagnostics Financing, Inc. | 8,500,000 | 6,077,500 | ||||||
Kindred Healthcare, Inc. 8.25%, 6/1/19 | 16,867,000 | 17,963,355 | ||||||
National Mentor, Inc. 12.50%, 2/15/181 | 8,625,000 | 9,228,750 | ||||||
|
| |||||||
| 33,269,605 | ||||||||
|
| |||||||
Household Products/Wares — 0.27% |
| |||||||
Armored Autogroup, Inc. 9.25%, 11/1/18 | 2,900,000 | 2,791,250 | ||||||
|
| |||||||
Internet — 0.73% |
| |||||||
Mood Media Corp. (Canada) 9.25%, 10/15/201,3 | 8,500,000 | 7,501,250 | ||||||
|
| |||||||
Iron/Steel — 1.12% |
| |||||||
Edgen Murray Corp. 8.75%, 11/1/201 | 10,000,000 | 11,450,000 | ||||||
|
| |||||||
Media — 0.78% |
| |||||||
Nara Cable Funding II Ltd. (Ireland) 8.50%, 3/1/203 | 5,000,000 | 7,979,089 | ||||||
|
| |||||||
Mining — 0.26% |
| |||||||
Cuco Resources Ltd. 14.00%, 12/1/144 | 3,500,000 | 2,625,000 | ||||||
|
| |||||||
Oil & Gas — 4.46% |
| |||||||
ATP Oil & Gas Corp. 11.88%, 5/1/155 | 6,640,000 | 33,200 | ||||||
Chesapeake Energy Corp. | 1,150,000 | 1,246,312 | ||||||
Newfield Exploration Co. | 1,000,000 | 1,030,000 | ||||||
Sanchez Energy Corp. 7.75%, 6/15/211 | 9,000,000 | 9,202,500 | ||||||
| Shares, Principal Amount, or Number of Contracts | Value | |||||||
Shelf Drilling Holdings Ltd. (United Arab Emirates) 8.63%, 11/1/181,3 | $ | 5,000,000 | $ | 5,400,000 | ||||
United Refining Co. 10.50%, 2/28/18 | 11,417,000 | 12,787,040 | ||||||
Venoco, Inc. 8.88%, 2/15/19 | 16,173,000 | 15,930,405 | ||||||
|
| |||||||
| 45,629,457 | ||||||||
|
| |||||||
Packaging & Containers — 0.48% |
| |||||||
Berry Plastics Corp. 9.75%, 1/15/21 | 4,292,600 | 4,968,685 | ||||||
|
| |||||||
Retail — 4.57% |
| |||||||
Claire’s Stores, Inc. 7.75%, 6/1/201 | 14,000,000 | 13,020,000 | ||||||
Michaels Stores, Inc. 11.38%, 11/1/16 | 1,951,000 | 1,997,375 | ||||||
Neiman Marcus Group, Inc. | 10,000,000 | 10,450,000 | ||||||
Rite Aid Corp. 9.25%, 3/15/20 | 4,200,000 | 4,819,500 | ||||||
Rite Aid Corp. 6.75%, 6/15/21 | 15,750,000 | 16,517,813 | ||||||
|
| |||||||
| 46,804,688 | ||||||||
|
| |||||||
Software — 3.70% |
| |||||||
First Data Corp. 10.63%, 6/15/211 | 5,000,000 | 5,418,750 | ||||||
First Data Corp. 11.75%, 8/15/211 | 2,000,000 | 2,110,000 | ||||||
First Data Corp. 11.75%, 8/15/211 | 11,000,000 | 11,605,000 | ||||||
Nuance Communications, Inc. 5.38%, 8/15/201 | 19,168,000 | 18,736,720 | ||||||
|
| |||||||
| 37,870,470 | ||||||||
|
| |||||||
Telecommunications — 4.49% |
| |||||||
Alcatel-Lucent USA, Inc. 8.88%, 1/1/201 | 8,270,000 | 9,221,050 | ||||||
Alcatel-Lucent USA, Inc. 6.75%, 11/15/201 | 6,000,000 | 6,232,500 | ||||||
Cincinnati Bell, Inc. 8.75%, 3/15/18 | 13,050,000 | 13,702,500 | ||||||
Intelsat Luxembourg SA (Luxembourg) 7.75%, 6/1/211,3 | 6,401,000 | 6,865,072 | ||||||
Nortel Networks Ltd. (Canada) 10.13%, 7/15/143,5 | 8,500,000 | 9,902,500 | ||||||
|
| |||||||
| 45,923,622 | ||||||||
|
| |||||||
Total CORPORATE BONDS | 388,408,270 | |||||||
|
| |||||||
Notes to Financial Statements are an integral part of this Schedule.
19
Driehaus Select Credit Fund
Schedule of Investments
December 31, 2013
| Shares, Principal Amount, or Number of Contracts | Value | |||||||
| CONVERTIBLE CORPORATE BONDS — 3.99% | ||||||||
Electrical Components & Equipment — 1.25% |
| |||||||
SunPower Corp. 4.50%, 3/15/15 | $ | 8,836,000 | $ | 12,375,923 | ||||
Suntech Power Holdings Co., Ltd. (China) 3.00%, 3/15/143,5 | 4,000,000 | 400,000 | ||||||
|
| |||||||
| 12,775,923 | ||||||||
|
| |||||||
Internet — 0.24% |
| |||||||
Equinix, Inc. 3.00%, 10/15/14 | 1,600,000 | 2,526,000 | ||||||
|
| |||||||
Lodging — 1.95% |
| |||||||
MGM Resorts International 4.25%, 4/15/15 | 14,500,000 | 19,937,500 | ||||||
|
| |||||||
Mining — 0.08% |
| |||||||
Great Western Minerals Group Ltd. (Canada) 8.00%, 4/6/173 | 2,000,000 | 800,000 | ||||||
|
| |||||||
Telecommunications — 0.47% |
| |||||||
Nortel Networks Corp. (Canada) 1.75%, 4/15/143,5 | 1,875,000 | 1,856,250 | ||||||
Nortel Networks Corp. (Canada) 2.13%, 4/15/143,5 | 3,000,000 | 2,979,375 | ||||||
|
| |||||||
| 4,835,625 | ||||||||
|
| |||||||
Total CONVERTIBLE CORPORATE BONDS | 40,875,048 | |||||||
|
| |||||||
| COMMON STOCKS — 1.95% | ||||||||
Auto Manufacturers — 1.17% |
| |||||||
General Motors Co.* | 291,099 | 11,897,211 | ||||||
Motors Liquidation Co. GUC Trust* | 1,276 | 41,024 | ||||||
|
| |||||||
| 11,938,235 | ||||||||
|
| |||||||
Packaging & Containers — 0.11% |
| |||||||
Berry Plastics Group, Inc.* | 50,000 | 1,189,500 | ||||||
|
| |||||||
Telecommunications — 0.67% |
| |||||||
Cincinnati Bell, Inc.* | 1,930,111 | 6,871,195 | ||||||
|
| |||||||
Total COMMON STOCK | 19,998,930 | |||||||
|
| |||||||
| CONVERTIBLE PREFERRED STOCKS — 1.51% | ||||||||
Auto Manufacturers — 0.00% |
| |||||||
General Motors Corp. Senior Convertible Preferred Escrow — C 7.25%, 4/15/414 | 94,958 | — | ||||||
| Shares, Principal Amount, or Number of Contracts | Value | |||||||
Real Estate Investment Trusts — 0.72% |
| |||||||
Alexandria Real Estate Equities, Inc. 7.00%, 12/31/49 | 295,167 | $ | 7,408,692 | |||||
|
| |||||||
Telecommunications — 0.79% |
| |||||||
Lucent Technologies Capital Trust I 7.75%, 3/15/17 | 8,000 | 8,040,000 | ||||||
|
| |||||||
Total CONVERTIBLE PREFERRED STOCKS | 15,448,692 | |||||||
|
| |||||||
| PURCHASED CALL OPTIONS — 0.36% | ||||||||
MGM Resorts International, Exercise Price: $21.00, Expiration Date: March, 2014* | 5,000 | 1,475,000 | ||||||
Ocwen Financial Corp., Exercise Price: $55.00, Expiration Date: January, 2015* | 2,425 | 2,182,500 | ||||||
|
| |||||||
Total PURCHASED CALL OPTIONS | 3,657,500 | |||||||
|
| |||||||
| SHORT-TERM INVESTMENTS — 36.05% | ||||||||
UMB Money Market Fiduciary 0.01% | 368,969,787 | 368,969,787 | ||||||
|
| |||||||
Total SHORT-TERM INVESTMENTS | 368,969,787 | |||||||
|
| |||||||
| WARRANTS — 0.05% | ||||||||
Cuco Resources Ltd. — Strike Price $4.00, Expiration Date 12/1/16*4 | 600,000 | — | ||||||
General Motors Co. —CW 16, Strike Price $10.00, Expiration Date 7/10/16* | 8,920 | 277,958 | ||||||
General Motors Co. — CW 19, Strike Price $18.33, Expiration Date 7/10/19* | 8,920 | 206,328 | ||||||
|
| |||||||
Total WARRANTS | 484,286 | |||||||
|
| |||||||
| ||||||||
TOTAL INVESTMENTS | 97.08 | % | 993,578,688 | |||||
Other Assets less Liabilities | 2.92 | % | 29,856,539 | |||||
|
|
|
| |||||
| Net Assets | 100.00 | % | $ | 1,023,435,227 | ||||
| ||||||||
Notes to Financial Statements are an integral part of this Schedule.
20
Driehaus Select Credit Fund
Schedule of Investments
December 31, 2013
| Shares, Principal Amount, or Number of Contracts | Value | |||||||
| SECURITIES SOLD SHORT — (5.99)% | ||||||||
| CORPORATE BONDS — (3.99)% | ||||||||
Healthcare — Products — (1.42)% |
| |||||||
Kinetic Concepts, Inc./KCI USA, Inc. 10.50%, 11/1/18 | $ | (12,500,000 | ) | $ | (14,500,000 | ) | ||
|
| |||||||
Household Products/Wares — (0.29)% |
| |||||||
Reynolds Group Issuer, Inc./Reynolds Group Issuer LLC 9.88%, 8/15/19 | (2,699,000 | ) | (3,029,628 | ) | ||||
|
| |||||||
Media — (0.21)% |
| |||||||
DISH DBS Corp. 6.75%, 6/1/21 | (2,000,000 | ) | (2,140,000 | ) | ||||
|
| |||||||
Oil & Gas — (1.03)% |
| |||||||
Chesapeake Energy Corp. | (2,600,000 | ) | (2,931,500 | ) | ||||
Chesapeake Energy Corp. | (2,015,000 | ) | (2,181,237 | ) | ||||
Newfield Exploration Co. | (5,000,000 | ) | (5,406,250 | ) | ||||
|
| |||||||
| (10,518,987 | ) | |||||||
|
| |||||||
Retail — (1.04)% |
| |||||||
Party City Holdings, Inc. 8.88%, 8/1/20 | (6,250,000 | ) | (7,062,500 | ) | ||||
Sears Holdings Corp. 6.63%, 10/15/18 | (3,950,000 | ) | (3,614,250 | ) | ||||
|
| |||||||
| (10,676,750 | ) | |||||||
|
| |||||||
Total CORPORATE BONDS (Proceeds $39,013,772) | (40,865,365 | ) | ||||||
|
| |||||||
| COMMON STOCKS — (1.45)% | ||||||||
Electrical Components & Equipment — (0.54)% |
| |||||||
SunPower Corp.* | (185,133 | ) | (5,518,815 | ) | ||||
|
| |||||||
Healthcare — Services — (0.11)% |
| |||||||
Kindred Healthcare, Inc. | (55,723 | ) | (1,099,972 | ) | ||||
|
| |||||||
Internet — (0.26)% |
| |||||||
Equinix, Inc.* | (14,850 | ) | (2,635,132 | ) | ||||
|
| |||||||
Lodging — (0.54)% |
| |||||||
MGM Resorts International* | (235,258 | ) | (5,533,268 | ) | ||||
|
| |||||||
Total COMMON STOCKS (Proceeds $11,419,532) | (14,787,187 | ) | ||||||
|
| |||||||
| Shares, Principal Amount,or Number of Contracts | Value | |||||||
EXCHANGE-TRADED FUND — (0.55)% |
| |||||||
SPDR Barclays High Yield Bond ETF | (139,308 | ) | $ | (5,650,333 | ) | |||
|
| |||||||
Total EXCHANGE-TRADED FUND (Proceeds $5,432,778) | (5,650,333 | ) | ||||||
|
| |||||||
| ||||||||
TOTAL INVESTMENT SECURITIES SOLD SHORT (Proceeds $55,866,082) | (5.99 | )% | $ | (61,302,885 | ) | |||
| ||||||||
| * | Non-income producing security. |
| 1 | 144A restricted security. |
| 2 | Variable rate security. Rates disclosed are as of December 31, 2013. |
| 3 | Foreign security denominated in U.S. dollars. |
| 4 | Security valued at fair value as determined in good faith by Driehaus Capital Management LLC, investment adviser to the Fund, in accordance with procedures established by, and under the general supervision of, the Trust’s Board of Trustees. |
| 5 | Security is in default. |
Percentages are stated as a percent of net assets.
Notes to Financial Statements are an integral part of this Schedule.
21
Driehaus Select Credit Fund
Schedule of Investments
December 31, 2013
SWAP CONTRACTS
Credit Default Swaps
| Counterparty | Reference Instrument | Currency | Notional AmountB | Pay/ ReceiveA Fixed Rate | Fixed Rate | Expiration Date | Premium Paid (Received) | Unrealized Appreciation/ (Depreciation) | Credit Event | RatingC | ||||||||||||||||||||||
Merrill Lynch | Freeport-McMoRan Copper & Gold, Inc. 8.38%, 3/14/12 | USD | 2,000,000 | Pay | 1.00 | % | 3/20/2017 | $ | 40,381 | $ | (66,991 | ) | Bankruptcy/FTP | NR | ||||||||||||||||||
JP Morgan | Hess Corp. 7.00%, 2/15/14 | USD | 2,000,000 | Pay | 1.00 | 6/20/2018 | 38,660 | (65,824 | ) | Bankruptcy/FTP | BBB | |||||||||||||||||||||
Morgan Stanley | Hess Corp. 7.00%, 2/15/14 | USD | 1,000,000 | Pay | 1.00 | 6/20/2018 | 19,320 | (32,902 | ) | Bankruptcy/FTP | BBB | |||||||||||||||||||||
Morgan Stanley | Hess Corp. 7.00%, 2/15/14 | USD | 1,000,000 | Pay | 1.00 | 6/20/2018 | 20,175 | (33,757 | ) | Bankruptcy/FTP | BBB | |||||||||||||||||||||
Morgan Stanley | Hess Corp. 7.00%, 2/15/14 | USD | 1,000,000 | Pay | 1.00 | 6/20/2018 | 22,925 | (36,507 | ) | Bankruptcy/FTP | BBB | |||||||||||||||||||||
Credit Suisse | Hess Corp. 7.00%, 2/15/14 | USD | 5,000,000 | Pay | 1.00 | 9/20/2018 | 77,494 | (135,663 | ) | Bankruptcy/FTP | BBB | |||||||||||||||||||||
Credit Suisse | Hess Corp. 5.60%, 2/15/41 | USD | 1,000,000 | Pay | 1.00 | 6/20/2018 | 3,838 | (17,419 | ) | Bankruptcy/FTP | BBB | |||||||||||||||||||||
Goldman Sachs | JC Penney Corp., Inc. 6.38%, 10/15/36 | USD | (6,666,000 | ) | Receive | 5.00 | 3/20/2015 | (466,620 | ) | (18,866 | ) | Bankruptcy/FTP | CCC- | |||||||||||||||||||
Goldman Sachs | JC Penney Corp., Inc. 6.38%, 10/15/36 | USD | 6,666,000 | Pay | 5.00 | 3/20/2017 | 1,316,535 | (177,031 | ) | Bankruptcy/FTP | CCC- | |||||||||||||||||||||
Credit Suisse | JC Penney Corp., Inc. 6.38%, 10/15/36 | USD | 3,333,000 | Pay | 5.00 | 3/20/2017 | 683,265 | (113,513 | ) | Bankruptcy/FTP | CCC- | |||||||||||||||||||||
Morgan Stanley | JC Penney Corp., Inc. 6.38%, 10/15/36 | USD | 2,500,000 | Pay | 5.00 | 6/20/2018 | 256,250 | 247,621 | Bankruptcy/FTP | CCC- | ||||||||||||||||||||||
Credit Suisse | JC Penney Corp., Inc. 6.38%, 10/15/36 | USD | 1,250,000 | Pay | 5.00 | 6/20/2018 | 115,625 | 136,310 | Bankruptcy/FTP | CCC- | ||||||||||||||||||||||
Credit Suisse | JC Penney Corp., Inc. 6.38%, 10/15/36 | USD | 1,250,000 | Pay | 5.00 | 6/20/2018 | 103,125 | 148,810 | Bankruptcy/FTP | CCC- | ||||||||||||||||||||||
Credit Suisse | JC Penney Corp., Inc. 6.38%, 10/15/36 | USD | 1,250,000 | Pay | 5.00 | 6/20/2018 | 78,125 | 173,811 | Bankruptcy/FTP | CCC- | ||||||||||||||||||||||
Morgan Stanley | JC Penney Corp., Inc. 6.38%, 10/15/36 | USD | 1,250,000 | Pay | 5.00 | 6/20/2018 | 121,875 | 130,061 | Bankruptcy/FTP | CCC- | ||||||||||||||||||||||
Morgan Stanley | JC Penney Corp., Inc. 6.38%, 10/15/36 | USD | (5,000,000 | ) | Receive | 5.00 | 12/20/2014 | (187,500 | ) | (81,092 | ) | Bankruptcy/FTP | CCC- | |||||||||||||||||||
Credit Suisse | JC Penney Corp., Inc. 6.38%, 10/15/36 | USD | 3,333,000 | Pay | 5.00 | 12/20/2016 | 349,965 | 190,391 | Bankruptcy/FTP | CCC- | ||||||||||||||||||||||
Notes to Financial Statements are an integral part of this Schedule.
22
Driehaus Select Credit Fund
Schedule of Investments
December 31, 2013
Credit Default Swaps (continued)
| Counterparty | Reference Instrument | Currency | Notional AmountB | Pay/ ReceiveA Fixed Rate | Fixed Rate | Expiration Date | Premium Paid (Received) | Unrealized Appreciation/ (Depreciation) | Credit Event | RatingC | ||||||||||||||||||||||
Goldman Sachs | Masco Corp. 6.13%, 10/3/16 | USD | 500,000 | Pay | 1.00 | % | 12/20/2015 | $ | 39,569 | $ | (46,143 | ) | Bankruptcy/FTP | BBB- | ||||||||||||||||||
Morgan Stanley | Masco Corp. 6.13%, 10/3/16 | USD | 500,000 | Pay | 1.00 | 3/20/2016 | 30,352 | (37,430 | ) | Bankruptcy/FTP | BBB- | |||||||||||||||||||||
Morgan Stanley | Masco Corp. 6.13%, 10/3/16 | USD | 1,000,000 | Pay | 1.00 | 6/20/2016 | 66,736 | (80,263 | ) | Bankruptcy/FTP | BBB- | |||||||||||||||||||||
Morgan Stanley | SUPERVALU, Inc. 8.00%, 5/1/16 | USD | 2,500,000 | Pay | 5.00 | 12/20/2018 | (103,413 | ) | (20,284 | ) | Bankruptcy/FTP | B- | ||||||||||||||||||||
Goldman Sachs | SUPERVALU, Inc. 8.00%, 5/1/16 | USD | 2,500,000 | Pay | 5.00 | 12/20/2018 | (109,079 | ) | (14,618 | ) | Bankruptcy/FTP | B- | ||||||||||||||||||||
Goldman Sachs | SUPERVALU, Inc. 8.00%, 5/1/16 | USD | 2,500,000 | Pay | 5.00 | 12/20/2018 | (142,039 | ) | 18,343 | Bankruptcy/FTP | B- | |||||||||||||||||||||
Goldman Sachs | The Markit iTraxx Europe Crossover Index Series 19 | EUR | 5,096,000 | Pay | 5.00 | 6/20/2018 | (333,284 | ) | (351,311 | ) | Bankruptcy/FTP | NA | ||||||||||||||||||||
Morgan Stanley | The Markit iTraxx Europe Sub Financials Series 20 | EUR | 10,000,000 | Pay | 5.00 | 12/20/2018 | (2,003,612 | ) | (449,497 | ) | Bankruptcy/FTP | NA | ||||||||||||||||||||
Morgan Stanley | Vulcan Materials Co. 6.40%, 11/30/17 | USD | 3,000,000 | Pay | 5.00 | 12/20/2016 | 202,500 | (586,772 | ) | Bankruptcy/FTP | BB | |||||||||||||||||||||
|
|
|
| |||||||||||||||||||||||||||||
Total Credit Default Swaps |
| 241,168 | (1,320,536 | ) | ||||||||||||||||||||||||||||
|
|
|
| |||||||||||||||||||||||||||||
Total Swap Contracts |
| $ | 241,168 | $ | (1,320,536 | ) | ||||||||||||||||||||||||||
|
|
|
| |||||||||||||||||||||||||||||
| A | If the Fund is paying a fixed rate, the counterparty acts as guarantor of the variable instrument and thus the Fund is a buyer of protection. If the Fund is receiving a fixed rate, the Fund acts as guarantor of the variable instrument and thus is a seller of protection. |
| B | For contracts to sell protection, the notional amout is equal to the maximum potential amount of the future payments and no recourse has been entered into in association with the contracts. |
| C | Based on Moody’s or Standard & Poor’s credit rating for the underlying reference instrument entity (unaudited). |
FTP=Failure to Pay
NR=Not Rated
NA=Not Applicable
EUR — Euro
USD — United States Dollar
Notes to Financial Statements are an integral part of this Schedule.
23
Driehaus Select Credit Fund
Schedule of Investments
December 31, 2013
SWAPTIONS
Interest Rate Swaptions
| Counterparty | Floating Rate Index | Currency | Notional Amount | Pay/ Receive Fixed Rate | Exercise Rate | Expiration Date | Premium Paid (Received) | Market Value | ||||||||||||||||||||
Morgan Stanley | 3-Month USD-LIBOR-BBA | USD | 69,045,000 | Pay | 3.35 | % | 3/20/2014 | $ | 1,500,000 | $ | 537,644 | |||||||||||||||||
|
|
|
| |||||||||||||||||||||||||
Total Interest Rate Swaptions |
| 1,500,000 | 537,644 | |||||||||||||||||||||||||
|
|
|
| |||||||||||||||||||||||||
TOTAL SWAPTIONS |
| $ | 1,500,000 | $ | 537,644 | |||||||||||||||||||||||
|
|
|
| |||||||||||||||||||||||||
USD — United States Dollar
FUTURES CONTRACTS
| Futures Contracts | Number of Contracts Long/(Short) | Expiration Date | Unrealized Appreciation/ (Depreciation) | |||||||||
U.S. 5 Year Treasury Note | (406 | ) | March 2014 | $ | 665,030 | |||||||
U.S. 10 Year Treasury Note | (491 | ) | March 2014 | 1,203,787 | ||||||||
U.S. Treasury Long Bond | (132 | ) | March 2014 | 348,537 | ||||||||
|
| |||||||||||
Total Futures Contracts | $ | 2,217,354 | ||||||||||
|
| |||||||||||
Notes to Financial Statements are an integral part of this Schedule.
24
Driehaus Event Driven Fund — Portfolio Managers’ Letter
Dear Shareholders,
The Driehaus Event Driven Fund (“Fund”) returned 10.35% from its August 26, 2013 commencement of operations through December 31, 2013.1 This return is in comparison to the performance of the Fund’s benchmark index, the S&P 500 Index (the “Benchmark”), which returned 11.94% for the same period. The Citigroup 3-Month T-Bill Index, an additional index against which the Fund’s performance may be compared, returned 0.01% for the same period.
While the Fund was launched this past August, we conceived the idea of assembling a portfolio of catalyst-driven opportunities more than a year ago. The idea was to build a portfolio with an asymmetric risk/reward profile, and have the risk come from idiosyncratic (company-specific) factors, as opposed to market factors. The end result, we hoped, would be a portfolio that would have little correlation to the broader markets, with less volatility, yet still offer plenty of expected return.
Based on our initial results, we are pleased with the Fund. So far, it appears to be meeting or exceeding the targets we had in mind when it launched. Further, the reception by our investors has been quite positive. We continue to believe the Fund is fairly unique and is meeting a need in the market that is underserved.
For the period since inception, the trades that made the most significant contributions to returns were those in the corporate action and market dislocation event categories. Corporate action trades center on changes to a company’s strategy or capital structure as a result of mergers, acquisitions, spin-offs, lawsuits, etc., while market dislocation trades are based on a mispricing between securities, often caused by non-fundamental factors. While a rising equity market generally helped trades in both of these event categories, strong security selection was the most important factor to returns. All of our trades can be structured with one or multiple legs that may include bonds, equities, options or other securities. We continue to find attractive trades in these areas, as we believe the market is mispricing investor reactions to several pending events.
The most significant detractors from performance since inception were the portfolio hedges and earnings trades. Within the portfolio hedges category, trades structured to protect against increased market volatility detracted, as volatility remained muted. Volatility trades are generally constructed by implementing option strategies, such as straddles or strangles on the S&P 500 Index or other indices. Earnings trades, which are based on a thesis involving an upside or downside surprise to earnings versus market expectations, also detracted because, in a few instances, the market reactions to earnings announcements worked against our positions. Earnings trades are typically structured using options to help isolate the event, minimize our capital at risk and incorporate our views on volatility and market expectations into the trade.
We expect that cash holdings of the Fund will vary significantly based on the use of equity and credit derivatives. Generally, the more derivatives held within the Fund, the higher its cash balance. At year end, the Fund had a cash balance of approximately 30%, which is within the range we would anticipate for this Fund and appropriate based on the Fund’s derivative exposures.
Within the Fund, we seek to have lower volatility than the Benchmark. Since the Fund’s August 26, 2013 commencement of operations through December 31, 2013, it has seen average volatility of 6.56% versus the Benchmark’s average volatility of 10.17% for the same period. We also seek to provide some diversification. For the since-inception time period, the Fund’s correlation to the Benchmark is 0.60.
Looking ahead, we are encouraged by a relatively healthy backdrop for opportunities across event types, which should help sustain a healthy pipeline of ideas for the Fund in 2014. Recently, the bulk of our new positions have had an equity flavor to them, but as market conditions change, so too will the composition of the opportunity set. A post-taper market is likely to see increasing opportunities for trades between asset classes, which will benefit managers with the expertise and flexibility to invest across a company’s capital structure.
25
Thank you for your interest in the Driehaus Event Driven Fund. We appreciate your confidence in our management capabilities.
Sincerely,
|  |  | ||
| K.C. Nelson | Adam Abbas | Michael Caldwell | ||
| Portfolio Manager | Assistant Portfolio Manager | Assistant Portfolio Manager |
| 1 | During this period, the Fund’s returns reflect fee waivers and/or expense reimbursements without which performance would have been lower. |
Performance is historical and does not represent future results.
Please see the following performance page for index definitions.
26
Driehaus Event Driven Fund
Performance Overview (unaudited)
The performance summarized below is historical and does not represent future results. Investment returns and principal value vary, and you may have a gain or loss when you sell shares. Performance data presented measures the change in the value of an investment in the Fund, assuming reinvestment of all dividends and capital gains.
The table does not reflect the deduction of taxes that a shareholder would pay on Fund distributions or the redemption of Fund shares. The graph compares the results of a $10,000 investment in the Fund since August 26, 2013 (the date of the Fund’s inception), with all dividends and capital gains reinvested, with the indicated indices (and dividends reinvested) for the same period.
| Cumulative Total Returns as of 12/31/13 | Since Inception (08/26/13 - 12/31/13) | |||
Driehaus Event Driven Fund (DEVDX)1 | 10.35% | |||
S&P 500 Index2 | 11.94% | |||
Citigroup 3-Month T-Bill Index3 | 0.01% | |||
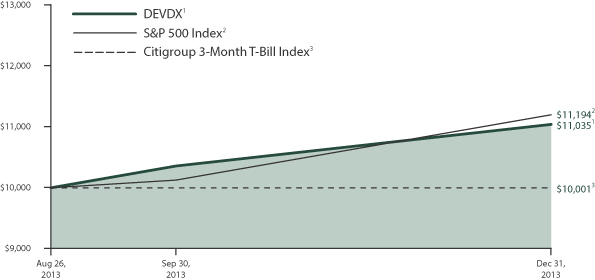
| 1 | The returns for the periods reflect fee waivers and/or reimbursements without which performance would have been lower. |
| 2 | The S&P 500 Index consists of 500 stocks chosen for market size, liquidity and industry group. It is a market-weighted index, with each stock’s weight in the index proportionate to its market value. |
| 3 | The Citigroup 3-Month T-Bill Index is designed to mirror the performance of the 3-month U.S. Treasury Bill. The Citigroup 3-Month T-Bill Index is unmanaged and its returns reflect reinvestment of all distributions and changes in market prices. |
27
Driehaus Event Driven Fund
Schedule of Investments
December 31, 2013
| Shares, Principal Amount, or Number of Contracts | Value | |||||||
| BANK LOANS — 4.80% | ||||||||
Diversified Financial Services — 2.39% |
| |||||||
Sears Roebuck Acceptance Corp. | $ | 1,000,000 | $ | 1,004,464 | ||||
|
| |||||||
Oil & Gas — 2.41% |
| |||||||
Shelf Drilling Midco Ltd. (United Arab Emirates) 10.00%, 10/7/182 | 1,000,000 | 1,012,500 | ||||||
|
| |||||||
Total BANK LOANS (Cost $1,976,584) | 2,016,964 | |||||||
|
| |||||||
| CORPORATE BONDS — 17.40% | ||||||||
Banks — 1.39% |
| |||||||
Royal Bank of Scotland Group PLC (United Kingdom) 5.50%, 11/29/49 | 500,000 | 582,955 | ||||||
|
| |||||||
Diversified Financial Services — 2.32% |
| |||||||
Denver Parent Corp. 12.25%, 8/15/181 | 1,000,000 | 975,000 | ||||||
|
| |||||||
Leisure Time — 1.34% |
| |||||||
Viking Cruises Ltd. 8.50%, 10/15/221 | 500,000 | 565,000 | ||||||
|
| |||||||
Oil & Gas — 1.75% |
| |||||||
ATP Oil & Gas Corp. 11.88%, 5/1/154 | 1,360,000 | 6,800 | ||||||
United Refining Co. 10.50%, 2/28/18 | 650,000 | 728,000 | ||||||
|
| |||||||
| 734,800 | ||||||||
|
| |||||||
Real Estate Management — 1.17% |
| |||||||
Newland International Properties Corp. (Panama) | 739,980 | 490,237 | ||||||
|
| |||||||
Software — 2.58% |
| |||||||
First Data Corp. 10.63%, 6/15/211 | 1,000,000 | 1,083,750 | ||||||
|
| |||||||
Telecommunications — 6.85% |
| |||||||
Alcatel-Lucent USA, Inc. 8.88%, 1/1/201 | 1,000,000 | 1,115,000 | ||||||
Axtel SAB de CV (Mexico) 9.00%, 9/22/19 | 750,000 | 600,000 | ||||||
Nortel Networks Ltd. (Canada) | 1,000,000 | 1,165,000 | ||||||
|
| |||||||
| 2,880,000 | ||||||||
|
| |||||||
Total CORPORATE BONDS (Cost $6,962,185) | 7,311,742 | |||||||
|
| |||||||
| CONVERTIBLE CORPORATE BONDS — 6.18% | ||||||||
Auto Manufacturers — 2.20% |
| |||||||
Ford Motor Co. 4.25%, 11/15/16 | 500,000 | 922,500 | ||||||
|
| |||||||
| Shares, Principal Amount, or Number of Contracts | Value | |||||||
Electronics — 2.77% |
| |||||||
InvenSense, Inc. 1.75%, 11/1/181 | $ | 1,000,000 | $ | 1,165,625 | ||||
|
| |||||||
Oil & Gas — 1.21% |
| |||||||
Alon USA Energy, Inc. 3.00%, 9/15/181 | 400,000 | 508,000 | ||||||
|
| |||||||
Total CONVERTIBLE CORPORATE BONDS (Cost $2,295,374) | 2,596,125 | |||||||
|
| |||||||
| COMMON STOCKS — 28.06% | ||||||||
Auto Manufacturers — 4.44% |
| |||||||
Ford Otomotiv Sanayi AS (Turkey) | 30,000 | 316,891 | ||||||
General Motors Co.* | 35,898 | 1,467,168 | ||||||
Motors Liquidation Co. GUC Trust* | 2,555 | 82,143 | ||||||
|
| |||||||
| 1,866,202 | ||||||||
|
| |||||||
Biotechnology — 3.73% |
| |||||||
Ambit Biosciences Corp.* | 20,000 | 192,800 | ||||||
Epizyme, Inc.* | 27,500 | 572,000 | ||||||
XOMA Corp.* | 119,231 | 802,425 | ||||||
|
| |||||||
| 1,567,225 | ||||||||
|
| |||||||
Commercial Services — 2.54% |
| |||||||
Anhanguera Educacional Participacoes SA | 81,000 | 511,550 | ||||||
Monro Muffler Brake, | 6,000 | 338,160 | ||||||
Xoom Corp.* | 8,000 | 218,960 | ||||||
|
| |||||||
| 1,068,670 | ||||||||
|
| |||||||
Internet — 3.64% |
| |||||||
Digital Garage, Inc. | 36,332 | 942,886 | ||||||
RingCentral, Inc., | 32,000 | 587,840 | ||||||
|
| |||||||
| 1,530,726 | ||||||||
|
| |||||||
Mining — 1.17% |
| |||||||
African Minerals Ltd. (United Kingdom)* | 150,000 | 492,424 | ||||||
|
| |||||||
Oil & Gas — 1.74% |
| |||||||
Genel Energy PLC (United Kingdom)* | 14,000 | 249,213 | ||||||
Pacific Rubiales Energy Corp. (Colombia) | 28,000 | 483,404 | ||||||
|
| |||||||
| 732,617 | ||||||||
|
| |||||||
Pharmaceuticals — 3.62% |
| |||||||
AcelRx Pharmaceuticals, Inc.* | 107,482 | 1,215,622 | ||||||
TetraLogic Pharmaceuticals Corp.* | 32,143 | 306,001 | ||||||
|
| |||||||
| 1,521,623 | ||||||||
|
| |||||||
Notes to Financial Statements are an integral part of this Schedule.
28
Driehaus Event Driven Fund
Schedule of Investments
December 31, 2013
| Shares, Principal Amount, or Number of Contracts | Value | |||||||
Semiconductors — 4.09% |
| |||||||
Applied Micro Circuits Corp.* | 128,600 | $ | 1,720,668 | |||||
|
| |||||||
Software — 3.09% |
| |||||||
inContact, Inc.* | 166,000 | 1,296,460 | ||||||
|
| |||||||
Total COMMON STOCKS (Cost $10,783,350) | 11,796,615 | |||||||
|
| |||||||
| CONVERTIBLE PREFERRED STOCKS — 0.00% | ||||||||
Auto Manufacturers — 0.00% |
| |||||||
General Motors Corp. | 25,000 | — | ||||||
General Motors Corp. Senior Convertible Preferred Escrow — C 7.25%, 4/15/413 | 162,750 | — | ||||||
|
| |||||||
| — | ||||||||
|
| |||||||
Total CONVERTIBLE PREFERRED STOCKS (Cost $1,877) | — | |||||||
|
| |||||||
| PREFERRED STOCKS — 2.49% | ||||||||
Holding Companies — Diversified — 2.49% |
| |||||||
Pitney Bowes International Holdings, Inc. | 1,000 | 1,045,062 | ||||||
|
| |||||||
Total PREFERRED STOCKS (Cost $994,750) | 1,045,062 | |||||||
|
| |||||||
| PURCHASED CALL OPTIONS — 0.12% | ||||||||
Aeropostale, Inc., Exercise Price: $16.00, Expiration Date: January, 2014* | 1,275 | — | ||||||
Xoom Corp., Exercise Price: $30.00, Expiration Date: January, 2014* | 500 | 47,500 | ||||||
Xoom Corp., Exercise Price: $35.00, Expiration Date: April, 2014* | 150 | 4,500 | ||||||
|
| |||||||
Total PURCHASED CALL OPTIONS (Premiums paid $198,823) | 52,000 | |||||||
|
| |||||||
| PURCHASED PUT OPTIONS — 0.05% | ||||||||
iShares 20+ Year Treasury Bond ETF, Exercise Price: $98.00, Expiration Date: March, 2014* | 187 | 20,570 | ||||||
|
| |||||||
Total PURCHASED PUT OPTIONS (Premiums paid $56,294) | 20,570 | |||||||
|
| |||||||
| Shares, Principal Amount, or Number of Contracts | Value | |||||||
| SHORT-TERM INVESTMENTS — 29.86% | ||||||||
Northern Institutional U.S. Government Select Portfolio 0.01% | 12,550,328 | $ | 12,550,328 | |||||
|
| |||||||
Total SHORT-TERM INVESTMENTS (Cost $12,550,328) | 12,550,328 | |||||||
|
| |||||||
| WARRANTS — 0.06% | ||||||||
General Motors Co. — CW 16, Strike Price $10.00, Expiration Date7/10/16* | 491 | 15,308 | ||||||
General Motors Co. — CW 19, Strike Price $18.33, Expiration Date | 491 | 11,363 | ||||||
|
| |||||||
Total WARRANTS (Cost $15,970) | 26,671 | |||||||
| ||||||||
TOTAL INVESTMENTS (Cost $35,835,535) | 89.02 | % | $ | 37,416,077 | ||||
Other Assets less Liabilities | 10.98 | % | 4,617,048 | |||||
|
|
|
| |||||
| Net Assets | 100.00 | % | $ | 42,033,125 | ||||
| ||||||||
| ||||||||
| SECURITIES SOLD SHORT — (11.55)% | ||||||||
| CORPORATE BONDS — (3.41)% | ||||||||
Leisure Time — (1.24)% |
| |||||||
MISA Investments Ltd. 8.63%, 8/15/18 1 | (500,000 | ) | (520,000 | ) | ||||
|
| |||||||
Retail — (2.17)% |
| |||||||
Sears Holdings Corp. 6.63%, 10/15/18 | (1,000,000 | ) | (915,000 | ) | ||||
|
| |||||||
Total CORPORATE BONDS (Proceeds $1,445,595) | (1,435,000 | ) | ||||||
|
| |||||||
| COMMON STOCKS — (2.83)% | ||||||||
Auto Manufacturers — (1.49)% |
| |||||||
Ford Motor Co. | (40,583 | ) | (626,196 | ) | ||||
|
| |||||||
Internet — (1.34)% |
| |||||||
Kakaku.com, Inc. (Japan) | (32,100 | ) | (562,992 | ) | ||||
|
| |||||||
Total COMMON STOCKS (Proceeds $1,270,664) | (1,189,188 | ) | ||||||
|
| |||||||
| WRITTEN CALL OPTIONS — (0.10)% | ||||||||
XOMA Corp., Exercise Price: $7.50, Expiration Date: March, 2014* | (500 | ) | (42,500 | ) | ||||
|
| |||||||
Total WRITTEN CALL OPTIONS (Premiums received $34,482) | (42,500 | ) | ||||||
|
| |||||||
Notes to Financial Statements are an integral part of this Schedule.
29
Driehaus Event Driven Fund
Schedule of Investments
December 31, 2013
| Shares, Principal Amount, or Number of Contracts | Value | |||||||
EXCHANGE-TRADED FUND — (5.21)% |
| |||||||
iShares Russell 2000 Value ETF | (22,000 | ) | $ | (2,189,000 | ) | |||
|
| |||||||
Total EXCHANGE-TRADED FUND (Proceeds $2,125,461) | (2,189,000 | ) | ||||||
|
| |||||||
| ||||||||
TOTAL INVESTMENT SECURITIES SOLD SHORT (Proceeds $4,876,202) | (11.55 | )% | $ | (4,855,688 | ) | |||
| ||||||||
| * | Non-income producing security. |
| 1 | 144A restricted security. |
| 2 | Variable rate security. Rates disclosed are as of December 31, 2013. |
| 3 | Security valued at fair value as determined in good faith by Driehaus Capital Management LLC, investment adviser to the Fund, in accordance with procedures established by, and under the general supervision of, the Trust’s Board of Trustees. |
| 4 | Security is in default. |
Percentages are stated as a percent of net assets.
Notes to Financial Statements are an integral part of this Schedule.
30
Statements of Assets and Liabilities
December 31, 2013
Driehaus Active Income Fund | Driehaus Select Credit Fund | Driehaus Event Driven | ||||||||||
ASSETS: | ||||||||||||
Investment securities, at fair value (cost $4,419,445,137, $976,333,171 and $35,580,418, respectively) | $ | 4,545,360,909 | $ | 989,921,188 | $ | 37,343,507 | ||||||
Purchased options, at fair value (premiums paid $0, $2,695,541 and $255,117, respectively) | — | 3,657,500 | 72,570 | |||||||||
Purchased swaptions, at fair value (cost $4,000,000, $1,500,000 and $0, respectively) | 1,433,719 | 537,644 | — | |||||||||
Foreign currency at fair value (cost $0, $0 and $37,947) | — | — | 37,832 | |||||||||
Unrealized appreciation on open swap contracts | 3,652,820 | 1,045,347 | — | |||||||||
Premiums paid on open swap contracts | 27,732,787 | 3,586,715 | — | |||||||||
Cash | 594,637 | — | — | |||||||||
Collateral held at custodian for the benefit of brokers | 424,201,175 | 77,029,208 | 8,443,505 | |||||||||
Receivable for investment securities sold | 6,461,606 | — | — | |||||||||
Receivable for fund shares sold | 13,794,561 | 15,353,011 | 1,659,500 | |||||||||
Receivable for interest and dividends | 29,043,514 | 10,528,167 | 232,591 | |||||||||
Receivable for variation margin | 764,768 | 184,326 | — | |||||||||
Prepaid expenses | 72,610 | 35,075 | 15,525 | |||||||||
|
|
|
|
|
| |||||||
| ||||||||||||
TOTAL ASSETS | 5,053,113,106 | 1,101,878,181 | 47,805,030 | |||||||||
|
|
|
|
|
| |||||||
| ||||||||||||
LIABILITIES: | ||||||||||||
Payable for investment securities sold short, at fair value (proceeds $254,479,903, $55,866,082 and $4,841,720, respectively) | 288,845,817 | 61,302,885 | 4,813,188 | |||||||||
Written options outstanding, at fair value (premiums received $0, $0 and $34,482, respectively) | — | — | 42,500 | |||||||||
Unrealized depreciation on open swap contracts | 38,678,888 | 2,365,883 | — | |||||||||
Premiums received on open swap contracts | 19,490,228 | 3,345,547 | — | |||||||||
Payable for fund shares redeemed | 4,371,949 | 220,468 | 3,400 | |||||||||
Payable for investment securities purchased | 87,556,933 | 9,242,923 | 756,582 | |||||||||
Payable for interest and dividends on securities sold short | 3,095,274 | 965,480 | 34,292 | |||||||||
Payable to affiliate | 2,121,050 | 649,035 | 48,663 | |||||||||
Accrued shareholder services plan fees | 628,934 | 136,662 | 860 | |||||||||
Accrued administration and accounting fees | 121,836 | 55,079 | 5,096 | |||||||||
Accrued chief compliance officer fees | 121 | 122 | 121 | |||||||||
Accrued expenses | 399,193 | 158,870 | 67,203 | |||||||||
|
|
|
|
|
| |||||||
| ||||||||||||
TOTAL LIABILITIES | 445,310,223 | 78,442,954 | 5,771,905 | |||||||||
|
|
|
|
|
| |||||||
| ||||||||||||
NET ASSETS | $ | 4,607,802,883 | $ | 1,023,435,227 | 42,033,125 | |||||||
|
|
|
|
|
| |||||||
SHARES OUTSTANDING (Unlimited shares authorized, no par value) | 427,756,428 | 100,618,267 | 3,914,091 | |||||||||
|
|
|
|
|
| |||||||
NET ASSET VALUE, OFFERING AND REDEMPTION PRICE PER SHARE | $ | 10.77 | $ | 10.17 | $ | 10.74 | ||||||
|
|
|
|
|
| |||||||
| ||||||||||||
NET ASSETS CONSISTED OF THE FOLLOWING AT DECEMBER 31, 2013: | ||||||||||||
Paid-in-capital | $ | 4,728,628,404 | $ | 1,013,655,827 | $ | 39,798,644 | ||||||
Undistributed net investment income (loss) | 39,781,769 | (558,062 | ) | (27,560 | ) | |||||||
Undistributed net realized gain (loss) on investments, option, futures, swap contracts and foreign currency | (224,011,359 | ) | 1,288,446 | 661,099 | ||||||||
Net unrealized appreciation (depreciation) on: | ||||||||||||
Investments | 125,915,772 | 13,588,017 | 1,763,089 | |||||||||
Purchased options | — | 961,959 | (182,547 | ) | ||||||||
Securities sold short | (34,365,914 | ) | (5,436,803 | ) | 28,532 | |||||||
Written options | — | — | (8,018 | ) | ||||||||
Purchased swaptions | (2,566,281 | ) | (962,356 | ) | — | |||||||
Futures contracts | 9,445,317 | 2,217,354 | — | |||||||||
Swap contracts | (35,026,068 | ) | (1,320,536 | ) | — | |||||||
Foreign currency | — | — | (115 | ) | ||||||||
Foreign currency translations | 1,243 | 1,381 | 1 | |||||||||
|
|
|
|
|
| |||||||
NET ASSETS | $ | 4,607,802,883 | $ | 1,023,435,227 | $ | 42,033,125 | ||||||
|
|
|
|
|
| |||||||
| ||||||||||||
Notes to Financial Statements are an integral part of these Statements.
31
For year ended December 31, 2013
| Driehaus Active Income Fund | Driehaus Select Credit Fund | Driehaus Event Driven Fund* | ||||||||||
INVESTMENT INCOME (LOSS): | ||||||||||||
Interest income (net of $0, $0 and $214 of non-reclaimable foreign taxes withheld, respectively) | $ | 131,332,703 | $ | 29,573,901 | $ | 107,850 | ||||||
Dividend income (net of $0, $0 and $692 of non-reclaimable foreign taxes withheld, respectively) | 10,539,777 | 898,835 | 35,206 | |||||||||
|
|
|
|
|
| |||||||
| ||||||||||||
Total investment income | 141,872,480 | 30,472,736 | 143,056 | |||||||||
|
|
|
|
|
| |||||||
| ||||||||||||
Expenses: | ||||||||||||
Investment advisory fees | 19,794,830 | 4,887,663 | 114,621 | |||||||||
Shareholder services plan fees | 5,577,524 | 981,902 | 1,206 | |||||||||
Administration and fund accounting fees | 1,199,765 | 394,383 | 21,041 | |||||||||
Transfer agent fees and expenses | 751,737 | 256,298 | 8,794 | |||||||||
Federal and state registration fees | 357,595 | 138,473 | 13,736 | |||||||||
Reports to shareholders | 165,910 | 60,746 | 6,500 | |||||||||
Trustees’ fees | 159,181 | 44,289 | 4,519 | |||||||||
Custody fees | 131,288 | 29,649 | 1,056 | |||||||||
Legal fees | 90,626 | 27,464 | 2,325 | |||||||||
Audit and tax fees | 49,450 | 49,450 | 52,000 | |||||||||
Chief compliance officer fees | 6,111 | 6,111 | 1,476 | |||||||||
Interest on short positions | 6,621,021 | 3,409,191 | 75,958 | |||||||||
Dividends on short positions | 3,784,865 | 231,809 | 20,707 | |||||||||
Interest expense | 2,056,112 | 515,671 | 18,296 | |||||||||
Miscellaneous | 172,269 | 51,355 | 6,169 | |||||||||
|
|
|
|
|
| |||||||
Total expenses | 40,918,284 | 11,084,454 | 348,404 | |||||||||
Investment advisory fees waived | — | — | (4,008 | ) | ||||||||
|
|
|
|
|
| |||||||
Net expenses | 40,918,284 | 11,084,454 | 344,396 | |||||||||
|
|
|
|
|
| |||||||
| ||||||||||||
Net investment income (loss) | 100,954,196 | 19,388,282 | (201,340 | ) | ||||||||
|
|
|
|
|
| |||||||
| ||||||||||||
NET REALIZED AND UNREALIZED GAIN (LOSS) ON INVESTMENTS: | ||||||||||||
Net realized gain (loss) on transactions from: | ||||||||||||
Investments | 21,969,993 | 5,050,391 | 1,554,592 | |||||||||
Purchased options | (87,577,911 | ) | (14,255,128 | ) | 78,247 | |||||||
Securities sold short | (12,587,383 | ) | 2,976,913 | 275,088 | ||||||||
Written options | 91,272,977 | 16,091,218 | 484,208 | |||||||||
Futures contracts | (13,699,587 | ) | (3,749,557 | ) | (437,699 | ) | ||||||
Swap contracts | (21,549,037 | ) | (1,358,280 | ) | (112,027 | ) | ||||||
Foreign currency | (408,651 | ) | (14,579 | ) | (3,569 | ) | ||||||
|
|
|
|
|
| |||||||
| ||||||||||||
Total net realized gain (loss) on investments | (22,579,599 | ) | 4,740,978 | 1,838,840 | ||||||||
|
|
|
|
|
| |||||||
| ||||||||||||
Change in net unrealized appreciation (depreciation) on: | ||||||||||||
Investments | 52,986,565 | 16,799,875 | 1,763,089 | |||||||||
Purchased options | 12,352,402 | 2,723,633 | (182,547 | ) | ||||||||
Short positions | (22,109,172 | ) | (4,822,114 | ) | 28,532 | |||||||
Written options | (15,312,963 | ) | (936,921 | ) | (8,018 | ) | ||||||
Futures contracts | 6,043,724 | 2,127,839 | — | |||||||||
Swap contracts | (3,285,246 | ) | (424,854 | ) | — | |||||||
Purchased swaptions | (2,566,281 | ) | (962,356 | ) | — | |||||||
Foreign currency | — | — | (115 | ) | ||||||||
Foreign currency translations | 1,243 | 1,381 | 1 | |||||||||
|
|
|
|
|
| |||||||
Total change in net unrealized appreciation (depreciation) on investments | 28,110,272 | 14,506,483 | 1,600,942 | |||||||||
|
|
|
|
|
| |||||||
| ||||||||||||
Net realized and unrealized gain (loss) on investments | 5,530,673 | 19,247,461 | 3,439,782 | |||||||||
|
|
|
|
|
| |||||||
| ||||||||||||
NET INCREASE (DECREASE) IN NET ASSETS RESULTING FROM OPERATIONS | $ | 106,484,869 | $ | 38,635,743 | $ | 3,238,442 | ||||||
|
|
|
|
|
| |||||||
| ||||||||||||
| * | Fund commenced operations on August 26, 2013. |
Notes to Financial Statements are an integral part of these Statements.
32
(This page intentionally left blank)
33
Statements of Changes in Net Assets
| Driehaus Active Income Fund | Driehaus Select Credit Fund | |||||||||||||||
December 31, 2013 | Year ended December 31, 2012 | Year ended December 31, 2013 | Year ended December 31, 2012 | |||||||||||||
Operations: | ||||||||||||||||
Net investment income (loss) | $ | 100,954,196 | $ | 110,690,096 | $ | 19,388,282 | $ | 15,968,716 | ||||||||
Net realized gain (loss) on investments | (22,579,599 | ) | (110,761,706 | ) | 4,740,978 | (982,060 | ) | |||||||||
Net change in unrealized appreciation (depreciation) on investments | 28,110,272 | 230,980,504 | 14,506,483 | 4,735,460 | ||||||||||||
|
|
|
|
|
|
|
| |||||||||
| ||||||||||||||||
Net increase (decrease) in net assets resulting from operations | 106,484,869 | 230,908,894 | 38,635,743 | 19,722,116 | ||||||||||||
|
|
|
|
|
|
|
| |||||||||
| ||||||||||||||||
Distributions: | ||||||||||||||||
Net investment income | (74,335,357 | ) | (67,114,475 | ) | (20,366,889 | ) | (14,216,095 | ) | ||||||||
Net capital gains | — | — | (3,845,894 | ) | — | |||||||||||
|
|
|
|
|
|
|
| |||||||||
Total distributions | (74,335,357 | ) | (67,114,475 | ) | (24,212,783 | ) | (14,216,095 | ) | ||||||||
|
|
|
|
|
|
|
| |||||||||
| ||||||||||||||||
Capital share transactions: | ||||||||||||||||
Proceeds from shares sold | 2,722,918,458 | 1,321,631,772 | 820,203,191 | 236,144,860 | ||||||||||||
Reinvested distributions | 43,039,239 | 54,187,169 | 17,481,030 | 11,378,976 | ||||||||||||
Cost of shares redeemed | (1,057,325,798 | ) | (1,102,326,211 | ) | (153,795,032 | ) | (112,017,532 | ) | ||||||||
|
|
|
|
|
|
|
| |||||||||
Net increase from capital transactions | 1,708,631,899 | 273,492,730 | 683,889,189 | 135,506,304 | ||||||||||||
|
|
|
|
|
|
|
| |||||||||
Total increase in net assets | 1,740,781,411 | 437,287,149 | 698,312,149 | 141,012,325 | ||||||||||||
|
|
|
|
|
|
|
| |||||||||
| ||||||||||||||||
NET ASSETS: | ||||||||||||||||
| ||||||||||||||||
Beginning of period | $ | 2,867,021,472 | $ | 2,429,734,323 | $ | 325,123,078 | $ | 184,110,753 | ||||||||
|
|
|
|
|
|
|
| |||||||||
End of period | $ | 4,607,802,883 | $ | 2,867,021,472 | $ | 1,023,435,227 | $ | 325,123,078 | ||||||||
|
|
|
|
|
|
|
| |||||||||
Undistributed net investment income (loss) | $ | 39,781,769 | $ | 31,636,794 | $ | (558,062 | ) | $ | 1,255,836 | |||||||
|
|
|
|
|
|
|
| |||||||||
| ||||||||||||||||
Capital share transactions in shares: | ||||||||||||||||
Shares sold | 253,362,227 | 125,838,382 | 81,193,431 | 23,833,725 | ||||||||||||
Reinvested distributions | 4,010,113 | 5,173,996 | 1,733,262 | 1,149,636 | ||||||||||||
Shares redeemed | (98,271,129 | ) | (105,128,123 | ) | (15,242,049 | ) | (11,282,895 | ) | ||||||||
|
|
|
|
|
|
|
| |||||||||
Net increase | 159,101,211 | 25,884,255 | 67,684,644 | 13,700,466 | ||||||||||||
|
|
|
|
|
|
|
| |||||||||
| ||||||||||||||||
| * | Fund commenced operations on August 26, 2013. |
Notes to Financial Statements are an integral part of these Statements.
34
Statements of Changes in Net Assets
| Driehaus Event Driven Fund | ||
For the period 2013* | ||
|
| |
| $ | (201,340 | ) |
| 1,838,840 |
|
| 1,600,942 |
|
|
| |
| 3,238,442 |
|
|
| |
| — | ||
| (1,024,950 | ) | |
|
| |
| (1,024,950 | ) | |
|
| |
| 40,436,692 | ||
| 1,024,404 | ||
| (1,641,463 | ) | |
|
| |
| | 39,819,633 | |
|
| |
| | 42,033,125 | |
|
| |
| $ | — | |
|
| |
| $ | 42,033,125 | |
|
| |
$ | (27,560 | ) |
|
| |
| 3,972,158 | ||
| 97,100 | ||
| (155,167 | ) | |
|
| |
| 3,914,091 | ||
|
| |
Notes to Financial Statements are an integral part of these Statements.
35
Driehaus Active Income Fund
| For the year ended December 31, 2013 | For the year ended December 31, 2012 | For the year ended December 31, 2011 | For the year ended December 31, 2010 | For the period December 31, | For the year ended September 30, 2009 | |||||||||||||||||||
Net asset value, beginning of period | $ | 10.67 | $ | 10.01 | $ | 11.05 | $ | 10.81 | $ | 12.12 | $ | 10.17 | ||||||||||||
|
|
|
|
|
|
|
|
|
|
|
| |||||||||||||
INCOME (LOSS) FROM INVESTMENT OPERATIONS: | ||||||||||||||||||||||||
Net investment income | 0.30 | 0.44 | 0.48 | 0.36 | 0.09 | 0.38 | ||||||||||||||||||
Net realized and unrealized gain (loss) on investments | 0.02 | 0.49 | (1.09 | ) | 0.20 | 0.26 | 1.61 | |||||||||||||||||
|
|
|
|
|
|
|
|
|
|
|
| |||||||||||||
Total from investment operations | 0.32 | 0.93 | (0.61 | ) | 0.56 | 0.35 | 1.99 | |||||||||||||||||
|
|
|
|
|
|
|
|
|
|
|
| |||||||||||||
LESS DISTRIBUTIONS TO SHAREHOLDERS FROM: | ||||||||||||||||||||||||
Net investment income | (0.22 | ) | (0.27 | ) | (0.43 | ) | (0.26 | ) | (1.66 | ) | (0.04 | ) | ||||||||||||
Net realized gains | — | — | — | † | (0.06 | ) | — | — | ||||||||||||||||
|
|
|
|
|
|
|
|
|
|
|
| |||||||||||||
Total distributions | (0.22 | ) | (0.27 | ) | (0.43 | ) | (0.32 | ) | (1.66 | ) | (0.04 | ) | ||||||||||||
|
|
|
|
|
|
|
|
|
|
|
| |||||||||||||
Net asset value, end of period | $ | 10.77 | $ | 10.67 | $ | 10.01 | $ | 11.05 | $ | 10.81 | $ | 12.12 | ||||||||||||
|
|
|
|
|
|
|
|
|
|
|
| |||||||||||||
Total Return | 2.99 | % | 9.34 | % | (5.61 | )% | 5.18 | % | 2.87 | %1 | 19.66 | % | ||||||||||||
SUPPLEMENTAL DATA AND RATIOS: | ||||||||||||||||||||||||
Net assets, end of period (in 000’s) | $ | 4,607,803 | $ | 2,867,021 | $ | 2,429,734 | $ | 2,183,062 | $ | 1,259,714 | $ | 1,036,182 | ||||||||||||
Ratio of total expenses to average net assets | 1.14 | %3 | 1.31 | %5 | 1.01 | %7 | 1.79 | %9 | 1.99 | %2,11 | 1.96 | %13 | ||||||||||||
Ratio of net investment income to average net assets | 2.80 | %4 | 4.22 | %6 | 4.44 | %8 | 3.24 | %10 | 2.85 | %2,12 | 3.52 | %14 | ||||||||||||
Portfolio turnover rate | 48 | % | 42 | % | 55 | % | 51 | % | 7 | %1 | 150 | % | ||||||||||||
| ||||||||||||||||||||||||
| * | Fiscal year end change to December 31. |
| † | Represents less than $0.01 per share. |
| 1 | Not annualized. |
| 2 | Annualized. |
| 3 | The ratio of expenses to average net assets includes dividends and interest on short positions and interest expense. Excluding dividends and interest on short positions and interest expense, the ratio of expenses to average net assets was 0.79%. |
| 4 | The ratio of net investment income to average net assets includes dividends and interest on short positions and interest expense. Excluding dividends and interest on short positions and interest expense, the net investment income to average net assets was 3.15%. |
| 5 | The ratio of expenses to average net assets includes dividends and interest on short positions and interest expense. Excluding dividends and interest on short positions and interest expense, the ratio of expenses to average net assets was 0.91%. |
| 6 | The ratio of net investment income to average net assets includes dividends and interest on short positions and interest expense. Excluding dividends and interest on short positions and interest expense, the net investment income to average net assets was 4.63%. |
| 7 | The ratio of expenses to average net assets includes dividends and interest on short positions and interest expense. Excluding dividends and interest on short positions and interest expense, the ratio of expenses to average net assets was 0.88%. |
| 8 | The ratio of net investment income to average net assets includes dividends and interest on short positions and interest expense. Excluding dividends and interest on short positions and interest expense, the net investment income to average net assets was 4.58%. |
| 9 | The ratio of expenses to average net assets includes dividends and interest on short positions and interest expense. Excluding dividends and interest on short positions and interest expense, the ratio of expenses to average net assets was 0.92%. |
| 10 | The ratio of net investment income to average net assets includes dividends and interest on short positions and interest expense. Excluding dividends and interest on short positions and interest expense, the net investment income to average net assets was 4.12%. |
| 11 | The ratio of expenses to average net assets includes dividends and interest on short positions and interest expense. Excluding dividends and interest on short positions and interest expense, the ratio of expenses to average net assets was 0.96%. |
| 12 | The ratio of net investment income to average net assets includes dividends and interest on short positions and interest expense. Excluding dividends and interest on short positions and interest expense, the net investment income to average net assets was 3.88%. |
| 13 | The ratio of expenses to average net assets includes dividends and interest on short positions and interest expense. Excluding dividends and interest on short positions and interest expense, the ratio of expenses to average net assets was 0.91%. |
| 14 | The ratio of net investment income to average net assets includes dividends and interest on short positions and interest expense. Excluding dividends and interest on short positions and interest expense, the net investment income to average net assets was 4.56%. |
Notes to Financial Statements are an integral part of this Schedule.
36
Driehaus Select Credit Fund
Financial Highlights
| For the year ended December 31, 2013 | For the year ended December 31, 2012 | For the year ended December 31, 2011 | For the period September 30, 2010* to December 31, 2010 | |||||||||||||
Net asset value, beginning of period | $ | 9.87 | $ | 9.57 | $ | 10.26 | $ | 10.00 | ||||||||
|
|
|
|
|
|
|
| |||||||||
INCOME (LOSS) FROM INVESTMENT OPERATIONS: | ||||||||||||||||
Net investment income | 0.32 | 0.58 | 0.57 | 0.05 | ||||||||||||
Net realized and unrealized gain (loss) on investments | 0.33 | 0.21 | (0.84 | ) | 0.29 | |||||||||||
|
|
|
|
|
|
|
| |||||||||
Total from investment operations | 0.65 | 0.79 | (0.27 | ) | 0.34 | |||||||||||
|
|
|
|
|
|
|
| |||||||||
LESS DISTRIBUTIONS TO SHAREHOLDERS FROM: | ||||||||||||||||
Net investment income | (0.31 | ) | (0.49 | ) | (0.42 | ) | (0.06 | ) | ||||||||
Net realized gain | (0.04 | ) | — | — | — | |||||||||||
Tax return of capital | — | — | — | (0.02 | ) | |||||||||||
|
|
|
|
|
|
|
| |||||||||
Total distributions | (0.35 | ) | (0.49 | ) | (0.42 | ) | (0.08 | ) | ||||||||
|
|
|
|
|
|
|
| |||||||||
Net asset value, end of period | $ | 10.17 | $ | 9.87 | $ | 9.57 | $ | 10.26 | ||||||||
|
|
|
|
|
|
|
| |||||||||
Total Return | 6.62 | % | 8.37 | % | (2.64 | )% | 3.43 | %1 | ||||||||
SUPPLEMENTAL DATA AND RATIOS: | ||||||||||||||||
Net assets, end of period (in 000’s) | $ | 1,023,435 | $ | 325,123 | $ | 184,111 | $ | 23,639 | ||||||||
Ratio of total expenses to average net assets including waivers and recapture | 1.81 | %3 | 1.69 | %5 | 1.87 | %7 | 2.15 | %2,9 | ||||||||
Ratio of total expenses to average net assets before waivers and recapture | 1.81 | %3 | 1.69 | %5 | 1.81 | %7 | 3.54 | %2,9 | ||||||||
Ratio of net investment income to average net assets, including waivers and recapture | 3.17 | %4 | 5.82 | %6 | 5.75 | %8 | 1.98 | %2,10 | ||||||||
Ratio of net investment income to average net assets, before waivers and recapture | 3.17 | %4 | 5.82 | %6 | 5.81 | %8 | 0.59 | %2,10 | ||||||||
Portfolio turnover rate | 54 | % | 78 | % | 64 | % | 52 | %1 | ||||||||
| ||||||||||||||||
| * | Fund commenced operations on September 30, 2010. |
| 1 | Not annualized. |
| 2 | Annualized. |
| 3 | The ratio of expenses to average net assets includes dividends and interest on short positions and interest expense. Excluding dividends and interest on short positions and interest expense, the ratio of expenses to average net assets was 1.13%. |
| 4 | The ratio of net investment income to average net assets includes dividends and interest on short positions and interest expense. Excluding dividends and interest on short positions and interest expense, the ratio of net investment income to average net assets was 3.85%. |
| 5 | The ratio of expenses to average net assets includes dividends and interest on short positions and interest expense. Excluding dividends and interest on short positions and interest expense, the ratio of expenses to average net assets was 1.23%. |
| 6 | The ratio of net investment income to average net assets includes dividends and interest on short positions and interest expense. Excluding dividends and interest on short positions and interest expense, the ratio of net investment income to average net assets was 6.28%. |
| 7 | The ratio of expenses to average net assets includes dividends and interest on short positions and interest expense. Excluding dividends and interest on short positions and interest expense, the ratio of expenses to average net assets, including recapture, was 1.43%. Excluding dividends and interest on short positions and interest expense, the ratio of expenses to average net assets before recapture was 1.37%. |
| 8 | The ratio of net investment income to average net assets includes dividends and interest on short positions and interest expense. Excluding dividends and interest on short positions and interest expense, the ratio of net investment income to average net assets, including recapture, was 6.20%. Excluding dividends and interest on short positions and interest expense, the ratio of net investment income to average net assets before recapture was 6.26%. |
| 9 | The ratio of expenses to average net assets includes dividends and interest on short positions and interest expense. Excluding dividends and interest on short positions and interest expense, the ratio of expenses to average net assets, less waivers, was 1.75%. Excluding dividends and interest on short positions and interest expense, the ratio of expenses to average net assets before waivers was 3.14%. |
| 10 | The ratio of net investment income to average net assets includes dividends and interest on short positions and interest expense. Excluding dividends and interest on short positions and interest expense, the ratio of net investment income to average net assets, less waivers, was 2.38%. Excluding dividends and interest on short positions and interest expense, the ratio of net investment income to average net assets before waivers was 0.99%. |
Notes to Financial Statements are an integral part of this Schedule.
37
Driehaus Event Driven Fund
Financial Highlights
For the period August 26, December 31, | ||||
Net asset value, beginning of period | $ | 10.00 | ||
|
| |||
INCOME (LOSS) FROM INVESTMENT OPERATIONS: | ||||
Net investment loss | (0.06 | ) | ||
Net realized and unrealized gain (loss) on investments | 1.09 | |||
|
| |||
Total from investment operations | 1.03 | |||
|
| |||
LESS DISTRIBUTIONS TO SHAREHOLDERS FROM: | ||||
Net realized gains | (0.29 | ) | ||
|
| |||
Net asset value, end of period | $ | 10.74 | ||
|
| |||
Total Return | 10.35 | %1 | ||
SUPPLEMENTAL DATA AND RATIOS: | ||||
Net assets, end of period (in 000’s) | $ | 42,033 | ||
Ratio of total expenses to average net assets including waivers | 3.00 | %2,3 | ||
Ratio of total expenses to average net assets before waivers | 3.03 | %2,3 | ||
Ratio of net investment income (loss) to average net assets including waivers | (1.75 | )%2,4 | ||
Ratio of net investment income (loss) to average net assets before waivers | (1.78 | )%2,4 | ||
Portfolio turnover rate | 104 | %1 | ||
| ||||
| * | Fund commenced operations on August 26, 2013. |
| 1 | Not annualized. |
| 2 | Annualized. |
| 3 | The ratio of expenses to average net assets includes dividends and interest on short positions. Excluding dividends and interest on short positions, the ratio of expenses to average net assets, less waivers, was 2.00%. Excluding dividends and interest on short positions, the ratio of expenses to average net assets before waivers was 2.03%. |
| 4 | The ratio of net investment income (loss) to average net assets includes dividends and interest on short positions. Excluding dividends and interest on short positions, the ratio of net investment income (loss) to average net assets, less waivers, was (0.75)%. Excluding dividends and interest on short positions, the ratio of net investment income (loss) to average net assets before waivers was (0.78)%. |
Notes to Financial Statements are an integral part of this Schedule.
38
Driehaus Mutual Funds
A. ORGANIZATION AND SUMMARY OF SIGNIFICANT ACCOUNTING POLICIES
Organization
The Driehaus Mutual Funds (the “Trust”) is an open-end registered management investment company, organized as a Delaware statutory trust, with ten separate series currently in operation. The Trust was organized under an Agreement and Declaration of Trust dated May 31, 1996, as subsequently amended and restated as of June 6, 2013, and may issue an unlimited number of full and fractional units of beneficial interest (shares) without par value. The Driehaus Active Income Fund (the “Active Income Fund”) commenced operations on June 1, 2009 following the receipt of the assets and liabilities of the Lotsoff Capital Management Active Income Fund (the “Acquired Fund”) pursuant to a plan of reorganization approved by the shareholders of the Acquired Fund. The reorganization was accomplished by a tax-free exchange of Acquired Fund shares for an equal number of shares of the Active Income Fund as of June 1, 2009. The Active Income Fund seeks to provide current income and capital appreciation. The Active Income Fund was closed to new investors as of March 1, 2011. The Driehaus Select Credit Fund (the “Select Credit Fund”) commenced operations on September 30, 2010. The Select Credit Fund seeks to provide positive returns under a variety of market conditions. The Select Credit Fund was closed to new investors as of January 31, 2014. The Driehaus Event Driven Fund (the “Event Driven Fund” and together with the Active Income Fund and Select Credit Fund, the “Funds”) commenced operations on August 26, 2013, following the receipt of the assets and liabilities of the Driehaus Credit Opportunities Fund, L.P. The Event Driven Fund seeks to provide positive returns over full market cycles.
Significant Accounting Policies
The presentation of financial statements in conformity with U.S. generally accepted accounting principles (“GAAP”) requires management to make estimates and assumptions that affect the reported amounts of assets and liabilities at the date of the financial statements and the reported amounts of income and expenses. Actual results may differ from those estimates.
Securities Valuation
Investments in securities traded on a national securities exchange, including exchange-traded futures and options, are valued at the last reported sales or settlement price on the day of valuation and are generally classified as level 1. Securities traded on the Nasdaq markets are valued at the Nasdaq Official Closing Price (“NOCP”) and are generally classified as level 1. Exchange-traded securities for which no sale was reported and Nasdaq-traded securities for which there is no NOCP are valued at the mean of the closing bid and ask prices from the exchange the security is primarily traded on and are generally classified as level 1. Long-term fixed income securities are valued at the representative quoted bid price when held long or the representative quoted ask price if sold short or, if such prices are not available, at prices for securities of comparable maturity, quality and type or as determined by an independent pricing service and are generally classified as level 2. Short-term investments with remaining maturities of 60 days or less at the time of purchase are stated at amortized cost, which approximates fair value. If amortized cost does not approximate fair value, short-term securities are reported at fair value. These securities are generally classified as level 2. Swaps, forward foreign currency contracts and other financial derivatives are valued daily, primarily by an independent pricing service using pricing models and are generally classified as level 2. The pricing models use inputs that are observed from actively quoted markets such as issuer details, indices, spreads, interest rates, yield curves, dividends and exchange rates. If valuations are not available from the independent pricing service or values received are deemed not representative of market value, values will be obtained from a third party broker-dealer or counterparty. Investments initially valued in currencies other than the U.S. dollar are converted to the U.S. dollar using exchange rates obtained from an independent pricing service. Securities for which market quotations are not readily available are valued at their fair value as determined in good faith in accordance with procedures established by or under the direction of the Trust’s Board of Trustees and are generally classified as level 3. Under these procedures, the Funds primarily employ a market-based approach, which may use related or comparable assets or liabilities, recent transactions, market multiples, book values and other relevant information for the investment to determine the fair value of the investment. It is possible that the estimated values may differ significantly from the values that would have been used had a ready market existed for the investments, and such differences could be material.
39
Driehaus Mutual Funds
Notes to Financial Statements — (Continued)
Each Fund is subject to fair value accounting standards that define fair value, establish the framework for measuring fair value and provide a three-level hierarchy for fair valuation based upon the inputs to the valuation as of the measurement date. The three levels of the fair value hierarchy are as follows:
Level 1 — quoted prices for active markets for identical securities
Level 2 — significant observable inputs (including quoted prices for similar securities, interest rates, prepayment speeds, credit risk, etc.)
Level 3 — significant unobservable inputs (including the Fund’s own assumptions in determining the fair value of investments).
The Funds adopted the Financial Accounting Standards Board (“FASB”) amendments to authoritative guidance which require the Funds to disclose details of transfers in and out of Level 1 and Level 2 measurements and Level 2 and Level 3 measurements and the reasons for the transfers. During the period ended December 31, 2013, there were no significant transfers between levels for the Active Income Fund, Select Credit Fund or Event Driven Fund. It is the Funds’ policy to recognize transfers into and out of all levels at the end of the reporting period.
The inputs or methodology used for valuing securities are not necessarily an indication of the risk associated with investing in those securities. The following is a summary of the inputs used to value the Active Income Fund’s investments as of December 31, 2013:
Assets | Level 1 | Level 2 | Level 3 | Total | ||||||||||||
Asset-Backed Securities | $ | — | $ | 209,246,673 | $ | — | $ | 209,246,673 | ||||||||
Bank Loans | — | 1,240,785,863 | — | 1,240,785,863 | ||||||||||||
Common Stocks | ||||||||||||||||
Auto Manufacturers | 35,505,782 | — | — | 35,505,782 | ||||||||||||
Convertible Corporate Bonds | — | 226,765,900 | — | 226,765,900 | ||||||||||||
Convertible Preferred Stocks | ||||||||||||||||
Auto Manufacturers | — | — | — | — | ||||||||||||
Banks | 27,397,142 | — | — | 27,397,142 | ||||||||||||
Telecommunications | 13,981,560 | — | — | 13,981,560 | ||||||||||||
Corporate Bonds | — | 1,240,813,028 | — | 1,240,813,028 | ||||||||||||
Short-Term Investments | 1,155,768,679 | — | — | 1,155,768,679 | ||||||||||||
Preferred Stocks | ||||||||||||||||
Banks | 45,727,058 | — | — | 45,727,058 | ||||||||||||
Diversified Financial Services | 24,140,750 | — | — | 24,140,750 | ||||||||||||
Holding Companies — Diversified | — | 60,514,344 | — | 60,514,344 | ||||||||||||
Telecommunications | — | 44,147,286 | — | 44,147,286 | ||||||||||||
U.S. Government and Agency Securities | — | 192,543,124 | — | 192,543,124 | ||||||||||||
Warrants | 28,023,720 | — | — | 28,023,720 | ||||||||||||
|
|
|
|
|
|
|
| |||||||||
Total | $ | 1,330,544,691 | $ | 3,214,816,218 | $ | — | $ | 4,545,360,909 | ||||||||
|
|
|
|
|
|
|
| |||||||||
40
Driehaus Mutual Funds
Notes to Financial Statements — (Continued)
Liabilities | Level 1 | Level 2 | Level 3 | Total | ||||||||||||
Common Stocks | ||||||||||||||||
Auto Manufacturers | $ | (53,880,557 | ) | $ | — | $ | — | $ | (53,880,557 | ) | ||||||
Banks | (9,782,958 | ) | — | — | (9,782,958 | ) | ||||||||||
Healthcare — Services | (5,102,277 | ) | — | — | (5,102,277 | ) | ||||||||||
Internet | (24,787,702 | ) | — | — | (24,787,702 | ) | ||||||||||
Lodging | (13,970,268 | ) | — | — | (13,970,268 | ) | ||||||||||
Real Estate Investment Trusts | (41,530,287 | ) | — | — | (41,530,287 | ) | ||||||||||
Corporate Bonds | — | (117,190,316 | ) | — | (117,190,316 | ) | ||||||||||
Exchange-Traded Fund | (22,601,452 | ) | — | — | (22,601,452 | ) | ||||||||||
|
|
|
|
|
|
|
| |||||||||
Total | $ | (171,655,501 | ) | $ | (117,190,316 | ) | — | $ | (288,845,817 | ) | ||||||
|
|
|
|
|
|
|
| |||||||||
Other Financial Instruments* | ||||||||||||||||
Credit Default Swaps — Assets | $ | — | $ | 31,385,607 | — | $ | 31,385,607 | |||||||||
Credit Default Swaps — Liabilities | — | (58,169,116 | ) | — | (58,169,116 | ) | ||||||||||
Futures Contracts | 9,445,317 | — | — | 9,445,317 | ||||||||||||
Interest Rate Swaptions | — | 1,433,719 | — | 1,433,719 | ||||||||||||
|
|
|
|
|
|
|
| |||||||||
Total | $ | 9,445,317 | $ | (25,349,790 | ) | $ | — | $ | (15,904,473 | ) | ||||||
|
|
|
|
|
|
|
| |||||||||
| * | Other financial instruments are swap and futures contracts and interest rate swaptions, which are detailed in the Schedule of Investments. |
Following is a reconciliation of Level 3 assets for which significant unobservable inputs were used to determine fair value in the Active Income Fund:
| Investments, at Value | ||||
Balance as of December 31, 2012 | $ | — | ||
Net realized gain (loss) | — | |||
Change in net unrealized appreciation (depreciation) | — | |||
Purchases | — | |||
Sales | — | |||
Transfers in and/or out of Level 3 | — | |||
|
| |||
Balance as of December 31, 2013 | $ | — | ||
|
| |||
As of December 31, 2013, the Active Income Fund held Level 3 investments in General Motors Corp. senior convertible preferred stock, valued at fair value as determined in good faith in accordance with procedures established by or under the direction of the Trust’s Board of Trustees. As a part of the ongoing restructuring of General Motors, any value previously ascribed to these holdings has been transferred to the General Motors Co. Motors Liquidation Co. GUC Trust common stock, which is freely and actively traded, and therefore the senior convertible preferred stock was fair valued at $0.
41
Driehaus Mutual Funds
Notes to Financial Statements — (Continued)
The following is a summary of the inputs used to value the Select Credit Fund’s investments as of December 31, 2013:
Assets | Level 1 | Level 2 | Level 3 | Total | ||||||||||||
Asset-Backed Securities | $ | — | $ | 13,787,584 | $ | — | $ | 13,787,584 | ||||||||
Bank Loans | — | 141,948,591 | — | 141,948,591 | ||||||||||||
Common Stocks | ||||||||||||||||
Auto Manufacturers | 11,938,235 | — | — | 11,938,235 | ||||||||||||
Packaging & Containers | 1,189,500 | — | — | 1,189,500 | ||||||||||||
Telecommunications | 6,871,195 | — | — | 6,871,195 | ||||||||||||
Convertible Corporate Bonds | — | 40,875,048 | — | 40,875,048 | ||||||||||||
Convertible Preferred Stocks | ||||||||||||||||
Auto Manufacturers | — | — | — | — | ||||||||||||
Real Estate Investment Trusts | 7,408,692 | — | — | 7,408,692 | ||||||||||||
Telecommunications | 8,040,000 | — | — | 8,040,000 | ||||||||||||
Corporate Bonds | — | 385,783,270 | 2,625,000 | 388,408,270 | ||||||||||||
Purchased Call Options | 3,657,500 | — | — | 3,657,500 | ||||||||||||
Short-Term Investments | 368,969,787 | — | — | 368,969,787 | ||||||||||||
Warrants | 484,286 | — | — | 484,286 | ||||||||||||
|
|
|
|
|
|
|
| |||||||||
Total | $ | 408,559,195 | $ | 582,394,493 | $ | 2,625,000 | $ | 993,578,688 | ||||||||
|
|
|
|
|
|
|
| |||||||||
Liabilities | ||||||||||||||||
Common Stocks | ||||||||||||||||
Electrical Components & Equipment | $ | (5,518,815 | ) | $ | — | $ | — | $ | (5,518,815 | ) | ||||||
Health Care — Services | (1,099,972 | ) | — | — | (1,099,972 | ) | ||||||||||
Internet | (2,635,132 | ) | — | — | (2,635,132 | ) | ||||||||||
Lodging | (5,533,268 | ) | — | — | (5,533,268 | ) | ||||||||||
Corporate Bonds | — | (40,865,365 | ) | — | (40,865,365 | ) | ||||||||||
Exchange-Traded Fund | (5,650,333 | ) | — | — | (5,650,333 | ) | ||||||||||
|
|
|
|
|
|
|
| |||||||||
Total | $ | (20,437,520 | ) | $ | (40,865,365 | ) | $ | — | $ | (61,302,885 | ) | |||||
|
|
|
|
|
|
|
| |||||||||
Other Financial Instruments* | ||||||||||||||||
Credit Default Swaps — Assets | $ | — | $ | 4,632,062 | $ | — | $ | 4,632,062 | ||||||||
Credit Default Swaps — Liabilities | — | (5,711,430 | ) | — | (5,711,430 | ) | ||||||||||
Futures Contracts | 2,217,354 | — | — | 2,217,354 | ||||||||||||
Interest Rate Swaptions | — | 537,644 | — | 537,644 | ||||||||||||
|
|
|
|
|
|
|
| |||||||||
Total | $ | 2,217,354 | $ | (541,724 | ) | $ | — | $ | 1,675,630 | |||||||
|
|
|
|
|
|
|
| |||||||||
| * | Other financial instruments are swap and futures contracts and interest rate swaptions, which are detailed in the Schedule of Investments. |
42
Driehaus Mutual Funds
Notes to Financial Statements — (Continued)
Following is a reconciliation of Level 3 assets for which significant unobservable inputs were used to determine fair value in the Select Credit Fund:
| Investments, at Value | ||||
Balance as of December 31, 2012 | $ | 4,500,000 | ||
Net realized gain (loss) | (157 | ) | ||
Change in net unrealized appreciation (depreciation) | 625,000 | |||
Purchases | — | |||
Sales | (2,499,843 | ) | ||
Transfers in and/or out of Level 3 | — | |||
|
| |||
Balance as of December 31, 2013 | $ | 2,625,000 | ||
|
| |||
As of December 31, 2013, the Select Credit Fund held Level 3 investments, including Cuco Resources Ltd. (corporate bond and warrant), valued at fair value as determined in good faith in accordance with procedures established by or under the direction of the Trust’s Board of Trustees. Factors considered in fair valuing the bond position included the likelihood and pricing of a successful equity raise by the company and the implications of failing to raise additional equity, including a possible restructuring. Given these considerations, the likelihood of the various scenarios and the expected outcome for each scenario, the bond position was fair valued at 75% of its principal amount. In addition, taking into consideration the strike price for the warrants, the current equity valuations in the mining space, the uncertainty regarding the potential success of a future equity raise and the potential for a future restructuring, the warrant was fair valued at $0. The Select Credit Fund also held an investment in General Motors Corp. senior convertible preferred stock, which was valued in the same manner as described above for the Active Income Fund.
The following is a summary of the inputs used to value the Event Driven Fund’s investments as of December 31, 2013:
Assets | Level 1 | Level 2 | Level 3 | Total | ||||||||||||
Bank Loans | $ | — | $ | 2,016,964 | $ | — | $ | 2,016,964 | ||||||||
Common Stocks | ||||||||||||||||
Auto Manufacturers | 1,866,202 | — | — | 1,866,202 | ||||||||||||
Biotechnology | 1,567,225 | — | — | 1,567,225 | ||||||||||||
Commercial Services | 1,068,670 | — | — | 1,068,670 | ||||||||||||
Internet | 1,530,726 | — | — | 1,530,726 | ||||||||||||
Mining | 492,424 | — | — | 492,424 | ||||||||||||
Oil & Gas | 732,617 | — | — | 732,617 | ||||||||||||
Pharmaceuticals | 1,521,623 | — | — | 1,521,623 | ||||||||||||
Semiconductors | 1,720,668 | — | — | 1,720,668 | ||||||||||||
Software | 1,296,460 | — | — | 1,296,460 | ||||||||||||
Convertible Corporate Bonds | — | 2,596,125 | — | 2,596,125 | ||||||||||||
Convertible Preferred Stocks | ||||||||||||||||
Auto Manufacturers | — | — | — | — | ||||||||||||
Corporate Bonds | — | 7,311,742 | — | 7,311,742 | ||||||||||||
Preferred Stocks | ||||||||||||||||
Holding Companies — Diversified | — | 1,045,062 | — | 1,045,062 | ||||||||||||
Purchased Call Options | 52,000 | — | — | 52,000 | ||||||||||||
Purchased Put Options | 20,570 | — | — | 20,570 | ||||||||||||
Short-Term Investments | 12,550,328 | — | — | 12,550,328 | ||||||||||||
Warrants | 26,671 | — | — | 26,671 | ||||||||||||
|
|
|
|
|
|
|
| |||||||||
Total | $ | 24,446,184 | $ | 12,969,893 | $ | — | $ | 37,416,077 | ||||||||
|
|
|
|
|
|
|
| |||||||||
43
Driehaus Mutual Funds
Notes to Financial Statements — (Continued)
Liabilities | Level 1 | Level 2 | Level 3 | Total | ||||||||||||
Common Stocks | ||||||||||||||||
Auto Manufacturers | $ | (626,196 | ) | $ | — | $ | — | $ | (626,196 | ) | ||||||
Internet | (562,992 | ) | — | — | (562,992 | ) | ||||||||||
Corporate Bonds | — | (1,435,000 | ) | — | (1,435,000 | ) | ||||||||||
Exchange-Traded Fund | (2,189,000 | ) | — | — | (2,189,000 | ) | ||||||||||
Written Call Options | (42,500 | ) | — | — | (42,500 | ) | ||||||||||
|
|
|
|
|
|
|
| |||||||||
Total | $ | (3,420,688 | ) | $ | (1,435,000 | ) | $ | — | $ | (4,855,688 | ) | |||||
|
|
|
|
|
|
|
| |||||||||
Following is a reconciliation of Level 3 assets for which significant unobservable inputs were used to determine fair value in the Event Driven Fund:
| Investments, at Value | ||||
Balance at inception on August 26, 2013 | $ | 1,878 | ||
Net realized gain (loss) | — | |||
Change in net unrealized appreciation (depreciation) | (1,878 | ) | ||
Purchases | — | |||
Sales | — | |||
Transfers in and/or out of Level 3 | — | |||
|
| |||
Balance as of December 31, 2013 | $ | — | ||
|
| |||
As of December 31, 2013, the Event Driven Fund held Level 3 investments in General Motors Corp. senior convertible preferred stock, which were valued in the same manner as described above for the Active Income Fund.
Securities Sold Short
The Funds are engaged in selling securities short, which obligates them to replace a borrowed security with the same security at current market value. Each Fund incurs a loss if the price of the security increases between the date of the short sale and the date on which the Fund replaces the borrowed security. Each Fund realizes a gain if the price of the security declines between those dates. Gains are limited to the price at which the Fund sold the security short, while losses are potentially unlimited in size.
The Funds are required to establish a margin account with the broker lending the security sold short. While the short sale is outstanding, the broker retains the proceeds of the short sale and the Fund must maintain a deposit with the broker consisting of cash and securities having a value equal to a specified percentage of the value of the securities sold short. Such deposit is included in “Collateral held at custodian for the benefit of brokers” on the Statements of Assets and Liabilities. Each Fund is obligated to pay any dividends or interest due on securities sold short. Such dividends and interest are recorded as an expense to the Funds on the Statements of Operations.
Federal Income Taxes
The Funds’ policy is to comply or continue to comply with the requirements of Subchapter M of the Internal Revenue Code that are applicable to regulated investment companies and to distribute substantially all their taxable income to their shareholders. Therefore, no Federal income tax provision is required.
The FASB’s “Accounting for Uncertainty in Income Taxes” (“Tax Statement”) requires the evaluation of tax positions taken or expected to be taken in the course of preparing the Funds’ tax returns to determine whether the tax positions are “more-likely-than-not” of being sustained by the applicable tax authority. Tax positions not deemed to meet the more-likely-than-not threshold would be recorded as a tax benefit or expense in the current year. Management has evaluated the implications of the Tax Statement and all of the uncertain tax positions and has determined that no liability is required to be recorded in the financial
44
Driehaus Mutual Funds
Notes to Financial Statements — (Continued)
statements as of December 31, 2013. The Funds file tax returns with the U.S. Internal Revenue Service and various states. Generally, the tax years ended December 31, 2010, December 31, 2011, December 31, 2012 and December 31, 2013 remain subject to examination by taxing authorities.
For Federal income tax purposes, capital loss carryforwards represent net capital losses of a fund that may be carried forward for a maximum period of eight years and applied against future net realized gains. On December 22, 2010, the Regulated Investment Company Modernization Act of 2010 was enacted to modernize several of the Federal income and excise tax provisions related to regulated investment companies. Under pre-enactment law, capital losses could be carried forward for up to eight years, and were required to be carried forward as short-term capital losses, irrespective of the character of the original loss. New net capital losses (those earned in taxable years beginning after December 22, 2010) may be carried forward indefinitely and must retain the character of the original loss. Such new net capital losses generally must be used by a regulated investment company before it uses any net capital losses incurred in taxable years beginning on or before December 22, 2010. This increases the likelihood that net capital losses incurred in taxable years beginning on or before December 22, 2010 will expire unused.
At December 31, 2013, gross unrealized appreciation and depreciation on investments, based on cost for Federal income tax purposes, were as follows:
| Active Income Fund | Select Credit Fund | Event Driven Fund | ||||||||||
Cost of investments | $ | 4,436,320,419 | $ | 979,153,577 | $ | 35,863,095 | ||||||
|
|
|
|
|
| |||||||
Gross unrealized appreciation | $ | 168,131,223 | $ | 35,822,948 | $ | 2,322,422 | ||||||
Gross unrealized depreciation | (59,090,733) | (21,397,837) | (769,440) | |||||||||
|
|
|
|
|
| |||||||
Net unrealized appreciation (depreciation) on investments | $ | 109,040,490 | $ | 14,425,111 | $ | 1,552,982 | ||||||
|
|
|
|
|
| |||||||
The difference between cost amounts for financial statement and Federal income tax purposes is due primarily to the tax deferral of losses on wash sales.
The amount of dividends and distributions from net investment income and net realized capital gains are determined in accordance with Federal income tax regulations, which may differ from U.S. GAAP.
For the year ended December 31, 2013, reclassifications were recorded to undistributed net investment income (loss), undistributed net realized gain (loss) and paid-in capital for any permanent tax differences. These reclassifications relate primarily to the differing tax treatment of income from paydowns and swaps, return of capital and capital gain distributions on real estate investment trusts and regulated investment companies, and foreign currency gains and losses. Results of operations and net assets were not affected by these reclassifications.
| Active Income Fund | Select Credit Fund | Event Driven Fund | ||||||||||
Paid-in capital | $ | 150,995 | $ | (543,648 | ) | $ | (20,989 | ) | ||||
Undistributed net investment income (loss) | (18,473,864 | ) | (835,291 | ) | 173,780 | |||||||
Undistributed net realized gain (loss) on investments, options, futures, swap contracts and foreign currency | 18,322,869 | 1,378,939 | (152,791 | ) | ||||||||
The tax character of distributions paid were as follows:
| Active Income Fund | ||||||||
Distributions paid from: | January 1, 2013 to December 31, 2013 | January 1, 2012 to December 31, 2012 | ||||||
Ordinary income | $ | 74,335,357 | $ | 67,114,475 | ||||
|
|
|
| |||||
Total distributions paid | $ | 74,335,357 | $ | 67,114,475 | ||||
|
|
|
| |||||
45
Driehaus Mutual Funds
Notes to Financial Statements — (Continued)
| Select Credit Fund | ||||||||
Distributions paid from: | January 1, 2013 to December 31, 2013 | January 1, 2012 to December 31, 2012 | ||||||
Ordinary income | $ | 24,212,783 | $ | 14,216,095 | ||||
|
|
|
| |||||
Total distributions paid | $ | 24,212,783 | $ | 14,216,095 | ||||
|
|
|
| |||||
| Event Driven Fund | ||||
Distributions paid from: | August 26, 2013 to December��31, 2013* | |||
Ordinary income | $ | 871,553 | ||
Long Term Capital Gains | 153,397 | |||
|
| |||
Total distributions paid | $ | 1,024,950 | ||
|
| |||
| * | The Event Driven Fund commenced operations on August 26, 2013. |
As of December 31, 2013, the components of accumulated earnings (deficit) were as follows:
| Active Income Fund | Select Credit Fund | Event Driven Fund | ||||||||||
Undistributed ordinary income | $ | 9,089,049 | $ | 3,913,229 | $ | 638,262 | ||||||
Undistributed long-term capital gains | — | — | 22,837 | |||||||||
|
|
|
|
|
| |||||||
Accumulated earnings | 9,089,049 | 3,913,229 | 661,099 | |||||||||
Accumulated capital and other losses | (203,798,745 | ) | (2,068,104 | ) | — | |||||||
Unrealized appreciation (depreciation) | 109,040,490 | 14,425,111 | 1,552,982 | |||||||||
|
|
|
|
|
| |||||||
Total accumulated earnings (deficit) | $ | (85,669,206 | ) | $ | 16,270,236 | $ | 2,214,081 | |||||
|
|
|
|
|
| |||||||
As of December 31, 2013, the Funds had net capital loss carryforwards to offset future net capital gains, if any, to the extent provided by Treasury regulations:
| Not Subject to Expiration | ||||||||
| Short-Term | Long-Term | |||||||
Active Income Fund | $ | 116,022,288 | $ | 83,443,109 | ||||
Select Credit Fund | — | — | ||||||
Event Driven Fund | — | — | ||||||
The Select Credit Fund utilized $770,317 of its capital loss carryforwards during the year ended December 31, 2013.
Post-October capital losses and late-year ordinary losses incurred after October 31 and within the taxable year are deemed to arise on the first business day of the Funds’ taxable year. As of December 31, 2013, the Funds had the following post-October capital losses and late-year ordinary losses:
| Post-October Capital Losses | Late-Year Ordinary Losses | |||||||
Active Income Fund | — | $ | 4,333,348 | |||||
Select Credit Fund | — | 2,068,104 | ||||||
Event Driven Fund | — | — | ||||||
Foreign Currency Translation
The value of securities, currencies and other assets and liabilities not denominated in U.S. dollars are translated into U.S. dollar values based upon the current rates of exchange on the date of the Funds’ valuations.
46
Driehaus Mutual Funds
Notes to Financial Statements — (Continued)
Net realized foreign exchange gains or losses which are reported by the Funds result from currency gains and losses on transaction hedges arising from changes in exchange rates between the trade and settlement dates on forward contract transactions, and the difference between the amounts accrued for dividends, interest, and foreign taxes and the amounts actually received or paid in U.S. dollars for these items. Net unrealized foreign exchange gains and losses result from changes in the U.S. dollar value of assets and liabilities (other than investments in securities), which are denominated in foreign currencies, as a result of changes in exchange rates.
Net realized foreign exchange gains or losses on portfolio hedges result from the use of forward contracts to hedge portfolio positions denominated or quoted in a particular currency in order to reduce or limit exposure in that currency. The Active Income Fund, Select Credit Fund and Event Driven Fund had no portfolio hedges during the period January 1, 2013 through December 31, 2013.
The Funds do not isolate that portion of the results of operations which results from fluctuations in foreign exchange rates on investments. These fluctuations are included with the net realized gain (loss) on investments and the net change in unrealized appreciation (depreciation) on investments.
Indemnifications
Under the Trust’s organizational documents, the officers and Trustees are indemnified against certain liabilities arising out of the performance of their duties to the Trust. In addition, in the normal course of business, the Trust enters into contracts that provide general indemnifications to other parties. A Fund’s maximum exposure under these agreements is unknown as this would involve future claims that may be made against a Fund that have not yet occurred. However, the Funds have not had prior claims or losses pursuant to these contracts and expect the risk of loss to be remote.
New Accounting Pronouncements
In June 2013, the FASB issued guidance that creates a two-tiered approach to assess whether an entity is an investment company. The guidance will also require an investment company to measure noncontrolling ownership interests in other investment companies at fair value and will require additional disclosures relating to investment company status, any changes thereto and information about financial support provided or contractually required to be provided to any of the investment company’s investees. The guidance is effective for financial statements with fiscal years beginning on or after December 15, 2013 and interim periods within those fiscal years. Management is evaluating the impact of this guidance on the Funds’ financial statement disclosures.
Effective January 1, 2013, the Funds adopted the FASB’s Accounting Standards Update 2013-01 (“ASU 2013-01”), “Clarifying the Scope of Disclosures about Offsetting Assets and Liabilities”, which replaced Accounting Standards Update 2011-11 (“ASU 2011-11”) “Disclosures about Offsetting Assets and Liabilities”. ASU 2011-11 was intended to enhance disclosure requirements on the offsetting of financial assets and liabilities. ASU 2013-01 limits the scope of the new balance sheet offsetting disclosures to derivatives, repurchase agreements, and securities lending transactions to the extent that they are (1) offset in the financial statements or (2) subject to an enforceable master netting arrangement or similar agreement. The adoption of the standard did not have a material effect on the Funds’ financial statements as of December 31, 2013.
Other
The Trust records security transactions based on trade date. Realized gains and losses on sales of securities are calculated using the first-in, first-out method. Dividend income is recognized on the ex-dividend date, and interest income is recognized on an accrual basis. Discounts and premiums on securities purchased are amortized over the lives of the respective securities using the effective yield method. Withholding taxes on foreign dividends and interest have been provided for in accordance with the Trust’s understanding of the applicable country’s tax rules and rates.
47
Driehaus Mutual Funds
Notes to Financial Statements — (Continued)
Pursuant to the terms of certain of the senior unsecured loan agreements, the Funds may have unfunded loan commitments, which are callable on demand. Each Fund would have available with its custodian, cash and/or liquid securities having an aggregate value at least equal to the amount of the unfunded senior loan commitments. At December 31, 2013, the Active Income Fund, Select Credit Fund and Event Driven Fund had no unfunded senior loan commitments.
With respect to the senior loans held in each Fund’s portfolio, the Funds may: 1) invest in assignments; 2) act as a participant in primary lending syndicates; or 3) invest in participations. If a Fund purchases a participation of a senior loan interest, the Fund would typically enter into a contractual agreement with the lender or other third party selling the participation, rather than directly with the borrower. As such, the Fund not only assumes the credit risk of the borrower, but also that of the selling participant or other persons interpositioned between the Fund and the borrower. At December 31, 2013, the Funds had no such outstanding senior loan participation commitments.
B. INVESTMENTS IN DERIVATIVES
Swap Contracts
The Funds are subject to credit risk and interest rate risk exposure in the normal course of pursuing their investment objectives. The Funds may engage in various swap transactions, including forward rate agreements and interest rate, currency, index and total return swaps, primarily to manage duration and yield curve risk, or as alternatives to direct investments. In addition to the swap contracts described above, the Funds may also engage in credit default swaps which involve the exchange of a periodic premium for protection against a defined credit event (such as payment default, refinancing or bankruptcy).
Interest rate swaps are agreements between two parties to exchange cash flows based on a notional principal amount. The Funds may elect to pay a fixed rate and receive a floating rate or receive a floating rate and pay a fixed rate on a notional principal amount. The net interest received or paid on interest rate swap agreements is accrued daily as interest income/expense. Interest rate swaps are marked-to-market daily using fair value estimates provided by an independent pricing service. Changes in value, including accrued interest, are recorded as unrealized appreciation (depreciation). Unrealized gains are reported as an asset and unrealized losses are reported as a liability. The change in value of swaps, including accruals of periodic amounts of interest to be paid or received on swaps, is reported as unrealized gains or losses. Gains or losses are realized upon termination of the contracts. The risk of loss under a swap contract may exceed the amount recorded as an asset or a liability.
Under the terms of a credit default swap contract, one party acts as a guarantor receiving a periodic payment that is a fixed percentage applied to a notional amount. In return, the party agrees to purchase the notional amount of the underlying instrument, at par, if a credit event occurs during the term of the contract. Each Fund may enter into credit default swaps in which the Fund acts as guarantor (a seller of protection), and may enter into credit default swaps in which the counterparty acts as guarantor (a buyer of protection). Premiums paid to or by the Funds are accrued daily and included in realized gain (loss) on swaps. The contracts are marked-to-market daily using fair value estimates provided by an independent pricing service. Changes in value are recorded as unrealized appreciation (depreciation). Unrealized gains are reported as an asset and unrealized losses are reported as a liability. The change in value of swaps, including accruals of periodic amounts of interest to be paid or received on swaps is reported as unrealized gains or losses. Gains or losses are realized upon termination of the contracts. The risk of loss under a swap contract may exceed the amount recorded as an asset or a liability. The notional amount of a swap contract is the reference amount pursuant to which the counterparties make payments. For swaps in which the referenced obligation is an index, in the event of default of any debt security included in the corresponding index, the Fund pays or receives the percentage of the corresponding index that the defaulted security comprises (1) multiplied by the notional value and (2) multiplied by the ratio of one minus the ratio of the market value of the defaulted debt security to its par value. The maximum exposure to loss of the notional value as a seller of credit default swaps outstanding at December 31, 2013 for the Active Income Fund, Select Credit Fund and Event Driven Fund was $23,334,000, $11,666,000 and $0, respectively.
48
Driehaus Mutual Funds
Notes to Financial Statements — (Continued)
Risks associated with swap contracts include changes in the returns of underlying instruments, failure of the counterparties to perform under the contracts’ terms and the possible lack of liquidity with respect to the contracts. Credit default swaps can involve greater risks than if an investor had invested in the reference obligation directly since, in addition to general market risks, credit default swaps are subject to counterparty credit risk, leverage risk, hedging risk, correlation risk and liquidity risk. The Funds disclose swap contracts on a gross basis, with no netting of contracts held with the same counterparty. As of December 31, 2013, the Funds had outstanding swap contracts as listed on the Schedule of Investments and the required collateral is included in the Statements of Assets and Liabilities.
Futures Contracts
The Funds may enter into futures contracts to produce incremental earnings, hedge existing positions or protect against market changes in the value of equities or interest rates. Upon entering into a futures contract with a broker, a Fund is required to deposit in a segregated account a specified amount of cash or U.S. government securities. Futures contracts are valued daily and unrealized gains or losses are recorded in a “variation margin” account. Daily, the Fund receives from or pays to the broker a specified amount of cash based upon changes in the variation margin account. When a contract is closed, the Fund recognizes a realized gain or loss. Futures contracts have market risks, including the risk that the change in the value of the contract may not correlate with changes in the value of the underlying securities. With futures, there is minimal counterparty credit risk to the Funds since futures are exchange traded and the exchange’s clearinghouse, as counterparty to all exchange traded futures, guarantees the futures contract against default. As of December 31, 2013, the Funds had outstanding futures contracts as listed in the Schedule of Investments and the required collateral is included in the Statements of Assets and Liabilities.
Options Contracts
The Funds may use options contracts to hedge downside risk on their fixed income holdings, produce incremental earnings or protect against market changes in the value of equities or interest rates. The Funds may write covered call and put options on futures, swaps, securities or currencies the Funds own or in which they may invest. Writing put options tends to increase a Fund’s exposure to the underlying instrument. Writing call options tends to decrease a Fund’s exposure to the underlying instrument. When a Fund writes a call or put option, an amount equal to the premium received is recorded as a liability and subsequently marked to market to reflect the current value of the option written. These liabilities are reflected as written options outstanding in the Schedule of Investments. Payments received or made, if any, from writing options with premiums to be determined on a future date are reflected as such in the Schedule of Investments. Premiums received from writing options that expire are treated as realized gains. Premiums received from writing options that are exercised or closed are added to the proceeds or offset against amounts paid on the underlying future, swap, security or currency transaction to determine the realized gain or loss. A Fund, as a writer of an option, has no control over whether the underlying future, swap, security or currency may be sold (call) or purchased (put) and, as a result, bears the market risk of an unfavorable change in the price of the future, swap, security or currency underlying the written option. The risk exists that a Fund may not be able to enter into a closing transaction because of an illiquid market. In addition, to the extent a Fund purchases an over-the-counter (“OTC”) option, it is subject to credit risk that the counterparty to the trade does not perform under the contract’s terms. The Funds are not subject to credit risk on OTC options written as the counterparty has already performed its obligation by paying the premium at the inception of the contract.
The premium amount and the number of option contracts written by the Active Income Fund during the period January 1, 2013 through December 31, 2013, were as follows:
Active Income Fund | Number of Contracts | Premium Amount | ||||||
Options outstanding at December 31, 2012 | 10,047 | $ | 20,798,313 | |||||
Options written | 43,201 | 81,095,951 | ||||||
Options closed | (14,428 | ) | (43,872,851 | ) | ||||
Options expired | (38,820 | ) | (58,021,413 | ) | ||||
|
|
|
| |||||
Options outstanding at December 31, 2013 | — | $ | — | |||||
|
|
|
| |||||
49
Driehaus Mutual Funds
Notes to Financial Statements — (Continued)
The premium amount and the number of option contracts written by the Select Credit Fund during the period January 1, 2013 through December 31, 2013, were as follows:
Select Credit Fund | Number of Contracts | Premium Amount | ||||||
Options outstanding at December 31, 2012 | 507 | $ | 1,063,671 | |||||
Options written | 8,874 | 16,966,565 | ||||||
Options closed | (3,052 | ) | (9,248,987 | ) | ||||
Options expired | (6,329 | ) | (8,781,249 | ) | ||||
|
|
|
| |||||
Options outstanding at December 31, 2013 | — | $ | — | |||||
|
|
|
| |||||
The premium amount and the number of option contracts written by the Event Driven Fund during the period from inception through December 31, 2013, were as follows:
Event Driven Fund | Number of Contracts | Premium Amount | ||||||
Options outstanding at inception on August 26, 2013 | 412 | $ | 408,200 | |||||
Options written | 3,419 | 169,543 | ||||||
Options closed | — | — | ||||||
Options expired | (2,260 | ) | (484,208 | ) | ||||
Options exercised | (1,071 | ) | (59,053 | ) | ||||
|
|
|
| |||||
Options outstanding at December 31, 2013 | 500 | $ | 34,482 | |||||
|
|
|
| |||||
The Funds may also purchase put and call options. Purchasing call options tends to increase a Fund’s exposure to the underlying instrument. Purchasing put options tends to decrease a Fund’s exposure to the underlying instrument. A Fund pays a premium which is included in its Schedule of Investments as an investment and subsequently marked-to-market to reflect the current value of the option. Premiums paid for purchasing options which expire are treated as realized losses. The risk associated with purchasing put and call options is limited to the premium paid. Premiums paid for purchasing options which are exercised or closed are added to the amounts paid or offset against the proceeds on the underlying future, swap, security or currency transaction to determine the realized gain or loss. When entering into purchased option contracts, a Fund bears the risk of securities prices moving unexpectedly, in which case, a Fund may not achieve the anticipated benefits of the purchased option contracts; however, the risk of loss is limited to the premium paid. As of December 31, 2013, the Funds had outstanding options as listed on the Schedule of Investments and the required collateral is included in the Statements of Assets and Liabilities.
Swaptions
An option on a swap contract, also called a “swaption,” is an option that gives the buyer the right, but not the obligation, to enter into a swap on a future date in exchange for paying a market-based “premium.” A call or receiver swaption gives the owner the right to receive the total return of a specified asset, reference rate, or index swap. A put or payer swaption gives the owner the right to pay the total return of a specified asset, reference rate, or index swap. Swaptions also include options that allow an existing swap to be terminated or extended by one of the counterparties. As of December 31, 2013, the Funds had outstanding swaptions as listed on the Schedule of Investments.
Forward Foreign Currency Contracts
The Funds may use forward foreign currency contracts to manage foreign currency, to produce incremental earnings or hedge existing positions. A forward foreign currency contract involves an obligation to purchase or sell a specific currency at a future date, which may be any fixed number of days from the date of the contract agreed upon by the parties, at a price set at the time of the contract. These contracts are principally traded in the inter-bank market conducted directly between currency traders (usually large commercial banks) and their customers.
50
Driehaus Mutual Funds
Notes to Financial Statements — (Continued)
The market value of a forward foreign currency contract fluctuates with changes in currency exchange rates. Outstanding forward foreign currency contracts are valued daily at current market rates and the resulting change in market value is recorded as unrealized appreciation or depreciation. When a forward foreign currency contract is settled, the Fund records a realized gain or loss equal to the difference between the value at the time the forward foreign currency contract was opened and the value at the time it was settled. A forward foreign currency contract may involve market risk in excess of the unrealized gain or loss reflected on the Statements of Assets and Liabilities. In addition, the Funds could be exposed to credit risk if the counterparties are unable or unwilling to meet the terms of the contracts or if the value of the foreign currency changes unfavorably. At December 31, 2013, the Active Income Fund had no open forward foreign currency contracts. The Select Credit Fund and Event Driven Fund did not enter into any forward foreign currency contracts during the period January 1, 2013 through December 31, 2013.
Derivative Investment Holdings Categorized by Risk Exposure
Each Fund is subject to the FASB’s “Disclosures about Derivative Instruments and Hedging Activities” (the “Derivatives Statement”). The Derivatives Statement amends and expands disclosures about derivative instruments and hedging activities. The Derivatives Statement is intended to improve financial reporting about derivative instruments by requiring enhanced disclosures to enable investors to better understand how and why the Fund uses derivative instruments, how these derivative instruments are accounted for and their effects on the Funds’ financial position and results of operations.
The following table sets forth the fair value and the location in the Statements of Assets and Liabilities of the Active Income Fund’s derivative contracts by primary risk exposure as of December 31, 2013:
| Asset derivatives | Liability derivatives | |||||||||||
Risk exposure category | Statement of Assets and Liabilities location | Fair value | Statement of Assets and Liabilities location | Fair value | ||||||||
Credit contracts | Unrealized appreciation on open swap contracts | $ | 3,652,820 | Unrealized depreciation on open swap contracts | $ | 38,678,888 | ||||||
Interest rate contracts | Purchased swaptions, at fair value | 1,433,719 | ||||||||||
| N/A* | 9,445,317 | |||||||||||
Total | $ | 14,531,856 | $ | 38,678,888 | ||||||||
| * | Includes cumulative appreciation/depreciation of futures contracts as shown in the Schedule of Investments. Only current day’s variation margin is reported in the Statements of Assets and Liabilities. |
The following table sets forth the fair value and the location in the Statements of Assets and Liabilities of the Select Credit Fund’s derivative contracts by primary risk exposure as of December 31, 2013:
| Asset derivatives | Liability derivatives | |||||||||||
Risk exposure category | Statement of Assets and Liabilities location | Fair value | Statement of Assets and Liabilities location | Fair value | ||||||||
Credit contracts | Unrealized appreciation on open swap contracts | $ | 1,045,347 | Unrealized depreciation on open swap contracts | $ | 2,365,883 | ||||||
Equity contracts | Purchased options, at fair value | 3,657,500 | ||||||||||
Interest rate contracts | Purchased swaptions, at fair value | 537,644 | ||||||||||
| N/A* | 2,217,354 | |||||||||||
Total | $ | 7,457,845 | $ | 2,365,883 | ||||||||
| * | Includes cumulative appreciation/depreciation of futures contracts as shown in the Schedule of Investments. Only current day’s variation margin is reported in the Statements of Assets and Liabilities. |
51
Driehaus Mutual Funds
Notes to Financial Statements — (Continued)
The following table sets forth the fair value and the location in the Statements of Assets and Liabilities of the Event Driven Fund’s derivative contracts by primary risk exposure as of December 31, 2013:
| Asset derivatives | Liability derivatives | |||||||||||
Risk exposure category | Statement of Assets and Liabilities location | Fair value | Statement of Assets and Liabilities location | Fair value | ||||||||
Equity contracts | Purchased options, at fair value | $ | 52,000 | Written options, at fair value | $ | 42,500 | ||||||
Interest rate contracts | Purchased options, at fair value | 20,570 | ||||||||||
Total | $ | 72,570 | $ | 42,500 | ||||||||
The following table sets forth the Active Income Fund’s net realized gain/loss by primary risk exposure and by type of derivative contract for the period January 1, 2013 through December 31, 2013:
| Amount of net realized gain (loss) on derivatives | ||||||||||||||||||||||||
Risk exposure category | Purchased Options | Written Options | Foreign Currency Contracts | Futures Contracts | Swap Contracts | Total | ||||||||||||||||||
Credit contracts | $ | — | $ | — | $ | — | $ | — | $ | (21,549,037 | ) | $ | (21,549,037 | ) | ||||||||||
Foreign currency contracts | — | — | (408,651 | ) | — | — | (408,651 | ) | ||||||||||||||||
Equity contracts | (87,577,911 | ) | 91,272,977 | — | (28,005,119 | ) | — | (24,310,053 | ) | |||||||||||||||
Interest rate contracts | — | — | — | 14,305,532 | — | 14,305,532 | ||||||||||||||||||
|
|
|
|
|
|
|
|
|
|
|
| |||||||||||||
Total | $ | (87,577,911 | ) | $ | 91,272,977 | $ | (408,651 | ) | $ | (13,699,587 | ) | $ | (21,549,037 | ) | $ | (31,962,209 | ) | |||||||
|
|
|
|
|
|
|
|
|
|
|
| |||||||||||||
The following table sets forth the Select Credit Fund’s net realized gain/loss by primary risk exposure and by type of derivative contract for the period January 1, 2013 through December 31, 2013:
| Amount of net realized gain (loss) on derivatives | ||||||||||||||||||||
Risk exposure category | Purchased Options | Written Options | Futures Contracts | Swap Contracts | Total | |||||||||||||||
Credit contracts | $ | — | $ | — | $ | — | $ | (1,358,280 | ) | $ | (1,358,280 | ) | ||||||||
Equity contracts | (14,255,128 | ) | 16,091,218 | (4,564,184 | ) | — | (2,728,094 | ) | ||||||||||||
Interest rate contracts | — | — | 814,627 | — | 814,627 | |||||||||||||||
|
|
|
|
|
|
|
|
|
| |||||||||||
Total | $ | (14,255,128 | ) | $ | 16,091,218 | $ | (3,749,557 | ) | $ | (1,358,280 | ) | $ | (3,271,747 | ) | ||||||
|
|
|
|
|
|
|
|
|
| |||||||||||
The following table sets forth the Event Driven Fund’s net realized gain/loss by primary risk exposure and by type of derivative contract for the period from inception (August 26, 2013) through December 31, 2013:
| Amount of net realized gain (loss) on derivatives | ||||||||||||||||||||
Risk exposure category | Purchased Options | Written Options | Futures Contracts | Swap Contracts | Total | |||||||||||||||
Credit contracts | $ | — | $ | — | $ | — | $ | (112,027 | ) | $ | (112,027 | ) | ||||||||
Equity contracts | 78,247 | 484,208 | (437,699 | ) | — | 124,756 | ||||||||||||||
Interest rate contracts | — | — | — | — | — | |||||||||||||||
|
|
|
|
|
|
|
|
|
| |||||||||||
Total | $ | 78,247 | $ | 484,208 | $ | (437,699 | ) | $ | (112,027 | ) | $ | 12,729 | ||||||||
|
|
|
|
|
|
|
|
|
| |||||||||||
52
Driehaus Mutual Funds
Notes to Financial Statements — (Continued)
The following table sets forth the Active Income Fund’s change in net unrealized appreciation/depreciation by primary risk exposure and by type of derivative contract for the period January 1, 2013 through December 31, 2013:
| Change in net unrealized appreciation (depreciation) on derivatives | ||||||||||||||||||||||||||||
Risk exposure | Purchased Options | Written Options | Foreign Currency Contracts | Futures Contracts | Swap Contracts | Purchased Swaptions | Total | |||||||||||||||||||||
Credit contracts | $ | — | $ | — | $ | — | $ | — | $ | (3,285,246 | ) | $ | — | $ | (3,285,246 | ) | ||||||||||||
Foreign currency contracts | — | — | 1,243 | — | — | — | 1,243 | |||||||||||||||||||||
Equity contracts | 12,352,402 | (15,312,963 | ) | — | — | — | — | (2,960,561 | ) | |||||||||||||||||||
Interest rate contracts | — | — |
| — |
| 6,043,724 | — | (2,566,281 | ) | 3,477,443 | ||||||||||||||||||
|
|
|
|
|
|
|
|
|
|
|
|
|
| |||||||||||||||
Total | $ | 12,352,402 | $ | (15,312,963 | ) | $ | 1,243 | $ | 6,043,724 | $ | (3,285,246 | ) | $ | (2,566,281 | ) | $ | (2,767,121 | ) | ||||||||||
|
|
|
|
|
|
|
|
|
|
|
|
|
| |||||||||||||||
The gross notional amount of swap contracts and the number of option contracts for the Active Income Fund as of December 31, 2013 is included on the Schedule of Investments. The quarterly average gross notional amount of the swap contracts for the Active Income Fund was $517,473,820 for the period January 1, 2013 through December 31, 2013. The quarterly average number of purchased futures contracts for the Active Income Fund was 0 for the period January 1, 2013 through December 31, 2013. The quarterly average number of short futures contracts for the Active Income Fund was (5,342) for the period January 1, 2013 through December 31, 2013. The quarterly average value of short forward contracts for the Active Income Fund was $(1,000,000) for the period January 1, 2013 through December 31, 2013. The quarterly average number of purchased option contracts for the Active Income Fund was 10,332 for the period January 1, 2013 through December 31, 2013. The quarterly average number of purchased swaption contracts for the Active Income Fund was 73,648,000 for the period January 1, 2013 through December 31, 2013. The fair value of such contracts at December 31, 2013 is set forth in the table above.
The following table sets forth the Select Credit Fund’s change in net unrealized appreciation/depreciation by primary risk exposure and by type of derivative contract for the period January 1, 2013 through December 31, 2013:
| Change in net unrealized appreciation (depreciation) on derivatives | ||||||||||||||||||||||||
Risk exposure category | Purchased Options | Written Options | Futures Contracts | Swap Contracts | Purchased Swaptions | Total | ||||||||||||||||||
Credit contracts | $ | — | $ | — | $ | — | $ | (424,854 | ) | $ | (962,356 | ) | $ | (1,387,210 | ) | |||||||||
Equity contracts | 2,723,633 | (936,921 | ) | — | — | — | 1,786,712 | |||||||||||||||||
Interest rate contracts | — | — | 2,127,839 | — | — | 2,127,839 | ||||||||||||||||||
|
|
|
|
|
|
|
|
|
|
|
| |||||||||||||
Total | $ | 2,723,633 | $ | (936,921 | ) | $ | 2,127,839 | $ | (424,854 | ) | $ | (962,356 | ) | $ | 2,527,341 | |||||||||
|
|
|
|
|
|
|
|
|
|
|
| |||||||||||||
The gross notional amount of swap contracts and the number of option contracts for the Select Credit Fund as of December 31, 2013 is included on the Schedule of Investments. The quarterly average gross notional amount of the swap contracts for the Select Credit Fund was $33,021,215 for the period January 1, 2013 through December 31, 2013. The quarterly average number of purchased futures contracts for the Select Credit Fund was 0 for the period January 1, 2013 through December 31, 2013. The quarterly average number of short futures contracts for the Select Credit Fund was (658) for the period January 1, 2013 through December 31, 2013. The quarterly average number of purchased option contracts for the Select Credit Fund was 7,095 for the period January 1, 2013 through December 31, 2013. The quarterly average number of purchased swaption contracts for the Select Credit Fund was 27,618,000 for the period January 1, 2013 through December 31, 2013. The fair value of such contracts at December 31, 2013 is set forth in the table above.
53
Driehaus Mutual Funds
Notes to Financial Statements — (Continued)
The following table sets forth the Event Driven Fund’s change in net unrealized appreciation/depreciation by primary risk exposure and by type of derivative contract for the period from inception (August 26, 2013) through December 31, 2013:
| Change in net unrealized appreciation (depreciation) on derivatives | ||||||||||||||||||||||||
Risk exposure category | Purchased Options | Written Options | Futures Contracts | Swap Contracts | Purchased Swaptions | Total | ||||||||||||||||||
Credit contracts | $ | — | $ | — | $ | — | $ | — | $ | — | $ | — | ||||||||||||
Equity contracts | (182,547 | ) | (8,018 | ) | — | — | — | (190,565 | ) | |||||||||||||||
Interest rate contracts | — | — | — | — | — | — | ||||||||||||||||||
|
|
|
|
|
|
|
|
|
|
|
| |||||||||||||
Total | $ | (182,547 | ) | $ | (8,018 | ) | $ | — | $ | — | $ | — | $ | (190,565 | ) | |||||||||
|
|
|
|
|
|
|
|
|
|
|
| |||||||||||||
The gross notional amount of swap contracts and the number of option contracts for the Event Driven Fund as of December 31, 2013 is included on the Schedule of Investments. The quarterly average gross notional amount of the swap contracts for the Event Driven Fund was $1,347,346 for the period from August 26, 2013 through December 31, 2013. The quarterly average number of purchased futures contracts for the Event Driven Fund was 0 for the period from August 26, 2013 through December 31, 2013. The quarterly average number of short futures contracts for the Event Driven Fund was (34) for the period from August 26, 2013 through December 31, 2013. The quarterly average number of purchased option contracts for the Event Driven Fund was 2,167 for the period from August 26, 2013 through December 31, 2013. The fair value of such contracts at December 31, 2013 is set forth in the table above.
Disclosures about Offsetting Assets and Liabilities
Each Fund is subject to the FASB’s “Disclosures about Offsetting Assets and Liabilities”, which requires an entity to disclose information about offsetting and related arrangements to enable users of its financial statements to understand the effect of those arrangements on its financial position. The guidance requires retrospective application for all comparative periods presented.
For financial reporting purposes, the Funds do not offset derivative assets and liabilities that are subject to Master Netting Agreements (“MNA”) or similar arrangements in the Statements of Assets and Liabilities. The Funds have adopted the new disclosure requirements on offsetting in the following tables:
The following table presents the Active Income Fund’s derivative assets by type, net of amounts available for offset under a MNA and net of the related collateral received by the Active Income Fund as of December 31, 2013:
Description | Gross Amounts Recognized in Statement of Assets and Liabilities | Derivatives Available for Offset | Collateral Received | Net Amount1 | ||||||||||||
Unrealized appreciation on open swap contracts | $ | 3,652,820 | $ | (2,734,576 | ) | $ | — | $ | 918,244 | |||||||
|
|
|
|
|
|
|
| |||||||||
The following table presents the Active Income Fund’s derivative liabilities by type, net of amounts available for offset under a MNA and net of the related collateral pledged by the Active Income Fund as of December 31, 2013:
Description | Gross Amounts Recognized in Statement of Assets and Liabilities | Derivatives Available for Offset | Collateral Pledged | Net Amount2 | ||||||||||||
Unrealized depreciation on open swap contracts | $ | 38,678,888 | $ | (2,734,576 | ) | $ | (35,944,312 | ) | $ | — | ||||||
|
|
|
|
|
|
|
| |||||||||
| 1 | Net amount represents the net amount receivable from the counterparty in the event of default. |
| 2 | Net amount represents the net amount payable to the counterparty in the event of default. |
54
Driehaus Mutual Funds
Notes to Financial Statements — (Continued)
The following table presents the Select Credit Fund’s derivative assets by type, net of amounts available for offset under a MNA and net of the related collateral received by the Select Credit Fund as of December 31, 2013:
Description | Gross Amounts Recognized in Statement of Assets and Liabilities | Derivatives Available for Offset | Collateral Received | Net Amount1 | ||||||||||||
Unrealized appreciation on open swap contracts | $ | 1,045,347 | $ | (662,620 | ) | $ | — | $ | 382,727 | |||||||
|
|
|
|
|
|
|
| |||||||||
The following table presents the Select Credit Fund’s derivative liabilities by type, net of amounts available for offset under a MNA and net of the related collateral pledged by the Select Credit Fund as of December 31, 2013:
Description | Gross Amounts Recognized in Statement of Assets and Liabilities | Derivatives Available for Offset | Collateral Pledged | Net Amount2 | ||||||||||||
Unrealized depreciation on open swap contracts | $ | 2,365,883 | $ | (662,620 | ) | $ | (1,703,263 | ) | $ | — | ||||||
|
|
|
|
|
|
|
| |||||||||
| 1 | Net amount represents the net amount receivable from the counterparty in the event of default. |
| 2 | Net amount represents the net amount payable to the counterparty in the event of default. |
The following table presents the Event Driven Fund’s derivative liabilities by type, net of amounts available for offset under a MNA and net of the related collateral pledged by the Event Driven Fund as of December 31, 2013:
Description | Gross Amounts Recognized in Statement of Assets and Liabilities | Derivatives Available for Offset | Collateral Pledged | Net Amount1 | ||||||||||||
Written options, at fair value | $ | 42,500 | $ | — | $ | 42,500 | $ | — | ||||||||
|
|
|
|
|
|
|
| |||||||||
| 1 | Net amount represents the net amount payable to the counterparty in the event of default. |
C. INVESTMENT ADVISORY FEES, TRANSACTIONS WITH AFFILIATES, AND ADMINISTRATIVE FEES
Richard H. Driehaus, an Interested Trustee of the Trust, is also the Chairman of the Board of Driehaus Capital Management LLC (“DCM” or the “Adviser”), a registered investment adviser, and of Driehaus Securities LLC (“DS LLC” or the “Distributor”), a registered broker-dealer.
DCM serves as the Funds’ investment adviser. In return for its services to the Funds, the Funds pay the Adviser an annual management fee on a monthly basis of 0.55%, 0.80% and 1.00% of average net assets, respectively, for the Active Income Fund, Select Credit Fund and Event Driven Fund.
DCM entered into a written agreement to cap the Select Credit Fund’s annual ordinary operating expenses (other than interest, taxes, brokerage commissions, dividends and interest on short sales, other investment-related expenses and extraordinary expenses) at 1.75% of average daily net assets until September 30, 2013. For this same time period, DCM was entitled to reimbursement for previously waived fees and reimbursed expenses to the extent that the Select Credit Fund’s expense ratio remains below the operating expense cap. During the period January 1, 2013 through December 31, 2013, the Select Credit Fund did not have any fees waived by DCM and as of December 31, 2013, there are no amounts subject to recapture.
DCM has entered into a written agreement to cap the Event Driven Fund’s annual ordinary operating expenses (other than interest, taxes, brokerage commissions, dividends and interest on short sales, other investment-related expenses and extraordinary expenses) at 2.00% of average daily net assets until at least August 25, 2016. For this same time period, DCM is entitled to reimbursement for previously waived fees and reimbursed expenses to the extent that the Event Driven Fund’s expense ratio remains below the operating expense cap. During the period from inception through December 31, 2013, the Event Driven Fund had fees waived by DCM in the amount of $4,008 and as of December 31, 2013, this entire amount is subject to recapture.
55
Driehaus Mutual Funds
Notes to Financial Statements — (Continued)
The Active Income Fund accrued $19,794,830 for investment advisory fees during the period January 1, 2013 through December 31, 2013, of which $2,121,050 was payable to DCM at December 31, 2013. The Select Credit Fund accrued $4,887,663 for investment advisory fees during the period January 1, 2013 through December 31, 2013, and $649,035 was payable to DCM at December 31, 2013. The Event Driven Fund accrued $114,621 for investment advisory fees during the period from inception through December 31, 2013, and $48,663 was payable to DCM at December 31, 2013.
DS LLC is the Funds’ distributor. DS LLC does not earn any compensation from the Funds for these services. DS LLC has entered into a Fee Reimbursement Agreement with each of the Funds. Under these agreements, the Funds reimburse DS LLC for certain fees paid by DS LLC to intermediaries who provide shareholder administrative and/or sub-transfer agency services to the Funds. Currently, the amount to be reimbursed will not exceed 0.25% of the average daily net assets held by such intermediaries. As of December 31, 2013, the Active Income Fund, Select Credit Fund and Event Driven Fund owe $583,190, $135,382 and $860, respectively, in reimbursements to DS LLC under these agreements, which are included in accrued shareholder services plan fees on the Statements of Assets and Liabilities.
Certain officers of the Trust are also officers of DCM and DS LLC. The Funds pay a portion of the Chief Compliance Officer’s salary. No other officers received compensation from the Funds during the period January 1, 2013 through December 31, 2013.
UMB Fund Services, Inc. (“UMBFS”), an affiliate of UMB Financial Corporation, serves as the Funds’ administrative and accounting agent. In compensation for these services, UMBFS earns the larger of a monthly minimum fee or a monthly fee based upon each Fund’s average daily net assets. UMBFS also acts as the transfer agent and dividend disbursing agent for the Funds. For these services, UMBFS earns a monthly fee based in part on shareholder processing activity during the month.
D. INVESTMENT TRANSACTIONS
Purchases and sales of investment securities (excluding swaps, options, futures, short-term securities and U.S. government obligations) for the Active Income Fund and Select Credit Fund for the period January 1, 2013 through December 31, 2013, were as follows, and the Event Driven Fund for the period from inception through December 31, 2013:
Active Income Fund | Select Credit Fund | Event Driven Fund | ||||||||||||||
| Purchases | $ | 2,320,240,624 | Purchases | $ | 593,127,654 | Purchases | $ | 21,000,343 | ||||||||
| Sales | $ | 1,314,639,778 | Sales | $ | 226,462,961 | Sales | $ | 18,049,180 | ||||||||
The aggregate purchases and sales of U.S. government obligations for the Active Income Fund and Select Credit Fund for the period January 1, 2013 through December 31, 2013, were as follows, and the Event Driven Fund for the period from inception through December 31, 2013:
Active Income Fund | Select Credit Fund | Event Driven Fund | ||||||||||||||
| Purchases | $ | 168,210,999 | Purchases | $ | — | Purchases | $ | — | ||||||||
| Sales | $ | 16,244,323 | Sales | $ | — | Sales | $ | — | ||||||||
E. RESTRICTED SECURITIES
Restricted securities are securities that are not registered for sale under the Securities Act of 1933 or applicable foreign law and that may be re-sold only in transactions exempt from applicable registration. Restricted securities include Rule 144A securities which may be sold normally to qualified institutional buyers. At December 31, 2013, the Funds held restricted securities as denoted on the Schedule of Investments.
F. SHAREHOLDER SERVICING AGREEMENTS
The Active Income Fund and Select Credit Fund have a Shareholder Servicing Agreement (the “Agreement”) in place with a shareholder. Under the terms of this Agreement, the Active Income Fund and Select Credit Fund make payments for services provided on behalf of the Active Income Fund and Select Credit Fund. Such services may include, but shall not be limited to: transfer agent and sub-transfer agent
56
Driehaus Mutual Funds
Notes to Financial Statements — (Continued)
services; aggregating and processing purchase and redemption orders; providing periodic statements; receiving and transmitting funds; processing dividend payments; providing sub-accounting services; forwarding shareholder communications; receiving, tabulating and transmitting proxies; responding to inquiries and performing such other related services as the Active Income Fund and Select Credit Fund may request. The Shareholder Services Plan allows for annual payments not to exceed 0.25% of average daily net assets of the Funds. For the period January 1, 2013 through December 31, 2013, the Active Income Fund and Select Credit Fund had expenses of $596,922 and $27,098, respectively, under the terms of this Agreement with this shareholder.
57
Report of Independent Registered Public Accounting Firm
The Board of Trustees and Shareholders of Driehaus Mutual Funds
We have audited the accompanying statements of assets and liabilities, including the schedules of investments, of Driehaus Active Income Fund, Driehaus Select Credit Fund, and Driehaus Event Driven Fund (collectively, the “Funds”) as of December 31, 2013, and the related statements of operations, statements of changes in net assets and financial highlights for the each of the periods indicated therein. These financial statements and financial highlights are the responsibility of the Funds’ management. Our responsibility is to express an opinion on these financial statements and financial highlights based on our audits.
We conducted our audits in accordance with the standards of the Public Company Accounting Oversight Board (United States). Those standards require that we plan and perform the audit to obtain reasonable assurance about whether the financial statements and financial highlights are free of material misstatement. We were not engaged to perform an audit of the Funds’ internal control over financial reporting. Our audits included consideration of internal control over financial reporting as a basis for designing audit procedures that are appropriate in the circumstances, but not for the purpose of expressing an opinion on the effectiveness of the Funds’ internal control over financial reporting. Accordingly, we express no such opinion. An audit also includes examining, on a test basis, evidence supporting the amounts and disclosures in the financial statements and financial highlights, assessing the accounting principles used and significant estimates made by management, and evaluating the overall financial statement presentation. Our procedures included confirmation of securities owned as of December 31, 2013, by correspondence with the custodian, brokers, and agent banks or by other appropriate auditing procedures where replies from brokers and agent banks were not received. We believe that our audits provide a reasonable basis for our opinion.
In our opinion, the financial statements and financial highlights referred to above present fairly, in all material respects, the financial position of each of the respective Funds noted above at December 31, 2013, and the results of their operations, the changes in their net assets, and the financial highlights for the periods indicated therein, in conformity with U.S. generally accepted accounting principles.

Chicago, Illinois
February 24, 2014
58
Interested and Independent Trustees of the Trust
The following table sets forth certain information with respect to the Trustees of the Trust:
Name, Address and | Position(s) the Trust | Term of Office and Time | Number of Overseen | Principal Occupation(s) During Past 5 Years | Other Directorships Held by Trustee During the Past 5 Years | |||||
Interested Trustee:* | ||||||||||
Richard H. Driehaus 25 East Erie Street Chicago, IL 60611 YOB: 1942 | Trustee | Since 1996 | 10 | Chairman of the Board of the Adviser, the Distributor and Driehaus Capital Management (USVI) LLC (“USVI”); Chief Investment Officer and Portfolio Manager of the Adviser. President of the Trust from 1996-2011. | Driehaus Capital Holdings LLC; Driehaus Enterprise Management, Inc.; Driehaus Trust Company, LLC; The Richard H. Driehaus Foundation; and The Richard H. Driehaus Museum | |||||
Independent Trustees: | ||||||||||
A.R. Umans c/o Driehaus Capital Management LLC 25 East Erie Street Chicago, IL 60611 YOB: 1927 | Trustee and Chairman | Since 1996 Since 2005 | 10 | Chairman of the Board, Commerce National Group (investment company) since 2005; Chairman of the Board and Chief Executive Officer, RHC/Spacemaster Corporation (manufacturing corporation) prior thereto. | Sinai Health System; Schwab Rehabilitation Hospital | |||||
Theodore J. Beck c/o Driehaus Capital Management LLC 25 East Erie Street Chicago, IL 60611 YOB: 1952 | Trustee | Since 2012 | 10 | President and Chief Executive Officer, National Endowment for Financial Education, 2005 to present; Associate Dean for Executive Education and Corporate Relations and President for the Center for Advanced Studies in Business at the University of Wisconsin-Madison, 1999-2005. | President’s Advisory Council on Financial Capability, 2010-2013; Federal Deposit Insurance Corporation Advisory Committee on Economic Inclusion since 2007; Jump$tart Coalition for Personal Financial Literacy since 2006, Chairman Since 2012; Wisconsin Alumni Association Board, 2006-2012; President’s Advisory Council on Financial Literacy, 2008-2010; Wilshire Variable Insurance Trust, 2008-2010; Wilshire Mutual Funds Inc., 2008-2010; Advisory Board of the Trust, 2011-2012. | |||||
Francis J. Harmon c/o Driehaus Capital Management LLC 25 East Erie Street Chicago, IL 60611 YOB: 1942 | Trustee | Since 1998 | 10 | Relationship Manager, Great Lakes Advisors, Inc. since February 2008; Principal Account Executive – Labor Affairs, Blue Cross and Blue Shield of Illinois prior thereto. | None | |||||
59
Interested and Independent Trustees of the Trust
Name, Address and | Position(s) the Trust | Term of Office and Time | Number of Overseen | Principal Occupation(s) During Past 5 Years | Other Directorships Held by Trustee During the Past 5 Years | |||||
Independent Trustees: | ||||||||||
Dawn M. Vroegop c/o Driehaus Capital Management LLC 25 East Erie Street Chicago, IL 60611 YOB: 1966 | Trustee | Since 2012 | 10 | Managing Director, Dresdner RCM Global Investors from September 1999 to September 2003. | Independent Trustee, Met Investors Series Trust since December 2000; Director, Metropolitan Series Fund, Inc. since May 2009; Director and Investment Committee Chair, City College of San Francisco Foundation since 2003; Advisory Board of the Trust, 2011-2012. | |||||
Daniel F. Zemanek c/o Driehaus Capital Management LLC 25 East Erie Street Chicago, IL 60611 YOB: 1942 | Trustee | Since 1996 | 10 | President of Ludan, Inc. (real estate services specializing in senior housing) since April 2008; Senior Vice President of Sunrise Development, Inc. (senior living) from 2003-2007; Consultant, real estate development prior thereto. | None | |||||
| * | Mr. Driehaus is an “interested person” of the Trust, the Adviser and the Distributor, as defined in the 1940 Act, because he is an officer of the Adviser and the Distributor. In addition, Mr. Driehaus has a controlling interest in the Adviser and the Distributor. |
| ** | Each Trustee will serve as a Trustee of the Trust until (i) termination of the Trust, or (ii) the Trustee’s retirement, resignation, or death, or (iii) as otherwise specified in the Trust’s governing documents. |
60
The following table sets forth certain information with respect to the officers of the Trust.
Name, Address and Year of Birth | Position(s) the Trust | Length of | Principal Occupation(s) During Past 5 Years | |||
Robert H. Gordon 25 East Erie Street Chicago, IL 60611 YOB: 1961 | President | Since 2011 | President and Chief Executive Officer of Adviser, Distributor and USVI since October 2006; Senior Vice President of the Trust from 2006-2011. | |||
Michelle L. Cahoon 25 East Erie Street Chicago, IL 60611 YOB: 1966 | Vice President and Treasurer | Since 2006 Since 2002 | Managing Director, Treasurer and Chief Financial Officer of the Adviser and Distributor since 2012; Vice President, Treasurer and Chief Financial Officer of USVI since 2004; Vice President, Treasurer and Chief Financial Officer of the Adviser and Distributor from 2004-2012. | |||
Janet L. McWilliams 25 East Erie Street Chicago, IL 60611 YOB: 1970 | Assistant Vice President and Chief Legal Officer | Since 2007 Since 2012 | Managing Director, Secretary and General Counsel of the Adviser since 2012; Chief Compliance Officer of the Trust, Adviser and Distributor from 2006-2012. | |||
Michael R. Shoemaker 25 East Erie Street Chicago, IL 60611 YOB: 1981 | Chief Compliance Officer and Assistant Vice President | Since 2012 | Assistant Vice President and Chief Compliance Officer of the Adviser and Distributor since 2012; Associate Chief Compliance Officer of the Adviser and Distributor from 2011-2012; Compliance Officer, Pacific Investment Management Company LLC and PIMCO Investments LLC from 2010-2011; Senior Compliance Analyst of the Adviser and Distributor from 2007-2010. | |||
Diane J. Drake 301 Bellevue Parkway Wilmington, DE 19809 YOB: 1967 | Secretary | Since 2006 | Managing Director and Senior Counsel, BNY Mellon Investment Servicing (US) Inc. (formerly, PNC Global Investment Servicing (U.S.) Inc. (“PNC”), (financial services company)) since 2010; Vice President and Counsel, PNC from 2008-2010. | |||
Michael P. Kailus 25 East Erie Street Chicago, IL 60611 YOB: 1971 | Assistant Secretary and Anti-Money Laundering Compliance Officer | Since 2010 Since 2011 | Assistant Secretary of the Adviser, Distributor and USVI since 2010; Senior Attorney with the Adviser since 2010; Associate General Counsel of Superfund Group (formerly, Quadriga Group, a financial services company) from 2005-2010. | |||
William H. Wallace, III 301 Bellevue Parkway Wilmington, DE 19809 YOB: 1969 | Assistant Secretary | Since 2008 | Vice President and Manager, BNY Mellon Investment Servicing (US) Inc. (formerly, PNC, a financial services company) since 2010; Assistant Vice President and Manager, PNC from 2008-2010. |
The Statement of Additional Information for Driehaus Mutual Funds contains more detail about the Trust’s Trustees and officers and is available upon request, without charge. For further information, please call 1-877-779-0079.
61
As a mutual fund shareholder, you may incur two types of costs: (1) transaction costs, including sales charges; redemption fees; and exchange fees and (2) ongoing costs, including management fees; distribution (12b-1) and/or service fees; and other fund expenses. This example is intended to help you understand your ongoing costs (in dollars) of investing in the Fund and to compare these costs with the ongoing costs of investing in other mutual funds.
The example is based on an investment of $1,000 invested at the beginning of the period and held for the entire six month period ending December 31, 2013.
Actual Expenses
The first line of the table below (“Actual”) provides information about actual account values and actual expenses. You may use the information in this line, together with the amount you invested, to estimate the expense that you paid over the period. Simply divide your account value by $1,000 (for example, an $8,600 account value divided by $1,000 = 8.6), then multiply the result by the number in the first line under the heading entitled “Expenses Paid During Period” to estimate the expenses you paid on your account during this period.
Hypothetical Example for Comparison Purposes
The second line of the tables below (“Hypothetical”) provides information about hypothetical account values and hypothetical expenses based on the Fund’s actual expense ratio and an assumed rate of return of 5% per year before expenses, which is not the Fund’s actual return. You may use this information to compare the ongoing costs of investing in the Fund versus other funds. To do so, compare this 5% hypothetical example with the 5% hypothetical examples that appear in the shareholder reports of the other funds.
Please note that the expenses shown in the table are meant to highlight your ongoing costs only and do not reflect any transactional costs, such as sales charges, redemption fees or exchange fees. Therefore, the second line of the table is useful in comparing ongoing costs only, and will not help you determine the relative total costs of owning different funds. In addition, if these transactional costs were included, your costs would have been higher.
Driehaus Active Income Fund
Beginning Account Value July 1, 2013 | Ending Account Value December 31, 2013 | Expenses Paid During Six Months Ended December 31, 2013* | ||||||||||
Actual | $ | 1,000.00 | $ | 1,016.10 | $ | 5.79 | ||||||
Hypothetical Example, assuming a 5% return before expenses | $ | 1,000.00 | $ | 1,019.46 | $ | 5.80 | ||||||
Driehaus Select Credit Fund
Beginning Account Value July 1, 2013 | Ending Account Value December 31, 2013 | Expenses Paid During Six Months Ended December 31, 2013* | ||||||||||
Actual | $ | 1,000.00 | $ | 1,042.40 | $ | 9.73 | ||||||
Hypothetical Example, assuming a 5% return before expenses | $ | 1,000.00 | $ | 1,015.68 | $ | 9.60 | ||||||
62
Fund Expense Examples — (Continued)
Driehaus Event Driven Fund
Beginning Account Value July 1, 2013** | Ending Account Value December 31, 2013 | Expenses Paid During Six Months Ended December 31, 2013* | ||||||||||
Actual | $ | 1,000.00 | $ | 1,103.50 | $ | 11.06 | ||||||
Hypothetical Example, assuming a 5% return before expenses | $ | 1,000.00 | $ | 1,010.08 | $ | 15.20 | ||||||
| * | Expenses are equal to the Funds’ annualized expense ratios for the six-month period in the table below multiplied by the average account value over the period, multiplied by the number of days in the most recent fiscal half-year (184), then divided by 365 to reflect the half-year period. |
| ** | The Driehaus Event Driven Fund commenced operations on August 26, 2013. The actual return and expenses paid during the period by this Fund were for the period from August 26, 2013 (128 days) instead of the entire six-month period. The hypothetical return is based on the entire six-month period for comparison purposes. |
Driehaus Active Income Fund | 1.14% | |
Driehaus Select Credit Fund | 1.89% | |
Driehaus Event Driven Fund | 3.00% |
63
TAX INFORMATION (UNAUDITED) FOR THE YEAR ENDED DECEMBER 31, 2013
We are providing this information as required by the Internal Revenue Code. The amounts shown may differ from those elsewhere in this report because of differences between tax and financial reporting requirements.
For taxable non-corporate shareholders, the following percentages of income and short-term capital gains represent qualified dividend income subject to the 15% rate category:
Active Income Fund | Select Credit Fund | Event Driven Fund | ||||||
| 13.80% | 3.07% | 4.04% | ||||||
For corporate shareholders, the following percentages of income and short-term capital gains qualified for the dividends-received deduction:
Active Income Fund | Select Credit Fund | Event Driven Fund | ||||||
| 13.80% | 3.07% | 3.59% | ||||||
Long-term Capital Gain
The Event Driven Fund designates $153,394 as a long-term capital gain distribution.
PROXY VOTING POLICIES AND PROCEDURES AND PROXY VOTING RECORD
A description of the Funds’ policies and procedures with respect to the voting of proxies relating to the Funds’ portfolio securities is available, without charge, upon request, by calling 1-877-779-0079. This information is also available on the Funds’ website at http://www.driehaus.com.
Information regarding how the Driehaus Active Income Fund and Driehaus Select Credit Fund voted proxies related to portfolio securities during the 12-month period ended June 30, 2013 is available without charge, upon request, by calling 1-877-779-0079. This information is also available on the Securities and Exchange Commission’s (“SEC”) website at http://www.sec.gov.
HOW TO OBTAIN QUARTERLY PORTFOLIO HOLDINGS
Each Fund files a complete schedule of portfolio holdings with the SEC for the first and third quarters of each fiscal year on Form N-Q. The Funds’ Form N-Q is available electronically on the SEC’s website at http://www.sec.gov; hard copies may be reviewed and copied at the SEC’s Public Reference Room in Washington, DC. For more information on the Public Reference Room, call 1-800-SEC-0330. Each Fund’s complete schedule of portfolio holdings is also available on the Funds’ website at http://www.driehaus.com.
64
Board Considerations in Connection with the Annual Review of the
Investment Advisory Agreement
The Board of Trustees of the Driehaus Mutual Funds (the “Trust”), including a majority of the Trustees who are not “interested persons” (as defined in the Investment Company Act of 1940, as amended) (the “Independent Trustees”), approved the renewal of the investment advisory agreement (the “Agreement”) with Driehaus Capital Management LLC (the “Adviser”) for Driehaus Active Income Fund (“LCMAX”) and Driehaus Select Credit Fund (“DRSLX,” and together with LCMAX, the “Funds”) on September 11, 2013. As part of its review process, the Board requested and evaluated all information it deemed reasonably necessary to evaluate the Agreement. The Board reviewed comprehensive materials received from the Adviser and from independent legal counsel. The Board also received extensive information throughout the year regarding performance and operating results of each Fund. The Independent Trustees held a conference call with their independent legal counsel on August 28, 2013 to review the materials provided in response to their request and identified areas for further response by Fund management. Following receipt of further responses from Fund management, the Independent Trustees, represented by independent legal counsel, met independent of Fund management to consider renewal of the Agreement. After their consideration of all the information received, the Independent Trustees presented their findings and their recommendation to renew the Agreement to the full Board.
In connection with the contract review process, the Board considered the factors discussed below, among others. The Board also considered that the Adviser has managed each Fund for an extended period or since inception, and the Board believes that a long-term relationship with a capable, conscientious adviser is in the best interests of each Fund.
Nature, Quality and Extent of Services. The Board considered the nature, extent and quality of services provided under the Agreement, including portfolio management services and administrative services. The Board considered the experience and skills of senior management and investment personnel, the resources made available to such personnel, the ability of the Adviser to attract and retain high-quality personnel, and the organizational depth of the Adviser. The Board also considered the Trust’s compliance with legal and regulatory requirements, as well as the Adviser’s handling of portfolio brokerage, and noted the Adviser’s process for evaluating best execution. The Board considered the Adviser’s risk management strategies and the process developed by the Adviser for analyzing, reviewing and assessing risk exposure for the Funds. The Board also considered the Funds’ process for fair valuation of portfolio securities and noted the Board’s review of Fund valuation matters throughout the year.
The Board reviewed LCMAX’s performance, including that of LCMAX’s predecessor fund (which was reorganized into LCMAX on June 1, 2009), given that a core portion of the portfolio management team managed the predecessor fund of LCMAX from 2007 to 2009. Given the investment strategies of LCMAX, the Board noted the limitations in comparing the performance of LCMAX to a peer group of general bond funds, which consists primarily of long-only bond funds that invest in high-grade fixed income securities, compiled from Lipper Inc., an independent provider of mutual fund data, and the Board also considered LCMAX’s performance compared to an additional Lipper peer group, which includes long/short funds. The Board compared LCMAX’s performance to peer groups of funds for the 1-, 3- and 5-year and year-to-date periods ended June 30, 2013 and to two benchmark indices for the 1-, 3- and 5-year and since-inception periods ended June 30, 2013. The Board considered that, although LCMAX underperformed its general bond fund peer group for the 3- and 5-year periods, it outperformed the general bond fund peer group for the 1-year and year-to-date periods and the long/short peer group for the 1-, 3- and 5-year and year-to-date periods. The Board also considered that LCMAX outperformed one of its benchmark indices for all periods reviewed and outperformed the other benchmark index for the 1-year period. The Board noted that LCMAX had adhered to its volatility objective of being less volatile than the Barclays Capital U.S. Aggregate Bond Index. The Board also reviewed DRSLX’s performance, comparing it to a peer group of funds compiled from Lipper Inc. and to benchmark indices for the year-to-date and 1-year periods ended June 30, 2013 (the Fund’s inception date was September 30, 2010). The Board noted that DRSLX’s performance was above the median of its peer group for these periods, and that the Fund had outperformed one of its benchmark indices and underperformed the other benchmark index for the 1-year period. The Board also noted that DRSLX had adhered to its volatility objective of being less volatile than the BofA Merrill Lynch US High Yield Index. For both LCMAX and DRSLX, the Board considered whether investment results were consistent with each Fund’s investment objective and policies. The Board concluded that performance was satisfactory.
65
On the basis of this evaluation and its ongoing review of investment results, the Board concluded that the nature, quality and extent of services provided by the Adviser continue to be satisfactory.
Fees. The Board considered the Funds’ advisory fees, operating expenses and total expense ratios, and compared the advisory fees and expense ratios to peer groups based on data compiled from Lipper Inc. as of the fiscal year end of each fund in the peer groups. The Board noted the limitations in comparing the fees and expense ratios of LCMAX to the peer group of funds designated by Lipper (the general bond funds peer group), as noted above, so the Board also compared the Fund’s advisory fees and expense ratios to the Lipper-designated peer group for DRSLX, which is a long/short funds category that the Adviser believes also is applicable to LCMAX. The Board noted that LCMAX’s annual advisory fee rate of .55% is in the 14th percentile and the 48th percentile, respectively, of the general bond funds peer group and the long/short funds peer group (1st percentile being the highest fee) and that the long/short funds peer group was more applicable to LCMAX. The Board noted that DRSLX’s advisory fee rate of .80% was in the 30th percentile of its peer group. In considering the reasonableness of the advisory fees, the Board took into account the substantial human and technological resources devoted to investing for the Funds and the limited capacity of the investment styles, noting that LCMAX is currently closed to new investors and that at the September Board meeting, the Adviser received Board approval to also close DRSLX to new investors.
The Board also considered that for the fiscal year ended December 31, 2012, LCMAX’s expense ratio was in the 41st percentile and 85th percentile, respectively, of the general bond funds peer group and the long/short funds peer group (1st percentile would be the highest expense ratio) and that the Adviser has represented that the second peer group was more applicable to LCMAX. The Board noted that DRSLX’s expense ratio for the fiscal year ended December 31, 2012 was in the 67th percentile and for the six months ended June 30, 2013 was in the 70th percentile. On the basis of the information provided, the Board concluded that the advisory fees were reasonable and appropriate in light of the nature and quality of services provided by the Adviser.
Profitability. The Board reviewed information regarding the revenues received by the Adviser under the Agreement and discussed the methodology in allocating its costs to the management of the Funds. The Board considered the estimated costs to the Adviser of each Fund. The Board also noted that the Funds do not have a Rule 12b-1 fee and that the Adviser’s affiliate, Driehaus Securities LLC (“DS LLC”), serves as distributor of the Funds without compensation, that DS LLC provides compensation to intermediaries for distribution of the Funds’ shares and for shareholder services, and that DS LLC is reimbursed by the Funds under a Shareholder Services Plan for certain amounts paid for shareholder services covered under the Plan. The Board concluded that, based on the projected profitability calculated for the Trust as well as the Funds individually (noting that DRSLX was expected to continue to be operated at a loss), the advisory fees appeared to be reasonable.
Economies of Scale. In considering the reasonableness of the advisory fee, the Board considered whether there are economies of scale with respect to the management of the Funds and whether the Funds benefit from any economies of scale. Given the size of DRSLX and the capacity constraints of the Funds, the Board concluded that the advisory fee rates under the Agreement are reasonable and reflect an appropriate sharing of any such economies of scale.
Other Benefits to the Adviser and its Affiliates. The Board also considered the character and amount of other incidental benefits received by the Adviser and its affiliates. The Board noted that payments to DS LLC under a Shareholder Services Plan are in reimbursement of payments made to intermediaries for shareholder services. The Board noted that there are no benefits to the Adviser related to soft dollar allocations. The Board concluded that the advisory fees were reasonable in light of any fall-out benefits.
Based on all of the information considered and the conclusions reached, the Board determined that the terms of the Agreement continue to be fair and reasonable and that the continuation of the Agreement is in the best interests of each Fund. No single factor was determinative in the Board’s analysis.
66
Board Considerations in Connection with the Initial Approval of the Investment
Advisory Agreement for Driehaus Event Driven Fund
The Board of Trustees of the Driehaus Mutual Funds (the “Trust”) approved the investment advisory agreement (the “Agreement”) with Driehaus Capital Management LLC (the “Adviser”) for the Driehaus Event Driven Fund (“DEVDX”) on February 21, 2013. As part of its review process, the Board requested and evaluated all information it deemed reasonably necessary to evaluate the Agreement. The Board reviewed comprehensive materials received from the Adviser and from independent legal counsel. After their review of the information received, the Independent Trustees presented their findings and their recommendation to approve the Agreement to the full Board. In connection with the review, the Board considered the factors discussed below, among others.
Nature, Quality and Extent of Services. The Board considered the nature, extent and quality of services to be provided under the Agreement, including portfolio management services and administrative services. The Board considered the experience and skills of senior management and investment personnel, the resources made available to such personnel, the ability of the Adviser to attract and retain high-quality personnel, and the organizational depth of the Adviser. The Board also considered the Trust’s compliance with legal and regulatory requirements as well as the Adviser’s risk management processes developed for analyzing, reviewing and assessing risk exposure for DEVDX. In particular, the Board considered the management team’s experience relevant to managing an absolute (positive) return credit strategy.
On the basis of this evaluation and the Board’s experience with the Adviser in managing other series of the Trust, the Board concluded that the nature, quality and extent of services to be provided by the Adviser are expected to be satisfactory.
Fees. The Board considered DEVDX’s proposed advisory fee, operating expenses and estimated total expense ratio, and compared the advisory fee and expense ratio to fees and expense ratios of a peer group of absolute return funds based on data compiled from Lipper Inc. (“Lipper”) as of the fiscal year end of each fund in the peer group. The Board noted that DEVDX’s proposed advisory fee of 1.00% would be in the 36th percentile of the Lipper Absolute Return Funds universe (1st percentile being the highest fee) as of December 31, 2012. The Board considered that the Adviser will reimburse DEVDX for annual expenses in excess of 2.00% of average daily net assets (excluding interest, taxes, brokerage commissions, dividends and interest on short sales, other investment-related costs and extraordinary expenses) for a three-year period. In addition, the Board considered DEVDX’s proposed advisory fee rate as compared to fees charged by the Adviser to the Driehaus Select Credit Fund, Driehaus Active Income Fund, Driehaus International Credit Opportunities Fund and to the predecessor partnership of DEVDX, a limited partnership managed by the Adviser with similar strategies. The Board noted that although both the Driehaus Select Credit Fund and the Driehaus Active Income Fund have a lower advisory fee, those Funds invest primarily in the U.S. In addition, the Driehaus Active Income Fund’s advisory fee is a legacy fee carried over from a predecessor fund, reorganized into the Driehaus Active Income Fund, that originally pursued a less complex investment style. Furthermore, the Board considered that the strategy for DEVDX is more resource-intensive than that of the Driehaus International Credit Opportunities Fund, which supported a higher advisory fee. Finally, the Board noted that the advisory fee rate for the predecessor partnership is higher than DEVDX’s advisory fee. The Board also considered the estimated expense ratio of DEVDX after reaching the first year projected asset level, which would still be within the expense cap and would rank the Fund in the 28th percentile of the Lipper Absolute Return universe.
On the basis of the information provided, the Board concluded that the proposed advisory fee was reasonable and appropriate in light of the nature and quality of services expected to be provided by the Adviser.
Profitability and Economies of Scale. In considering the reasonableness of the proposed advisory fee, the Board considered the undertaking by the Adviser to assume DEVDX organizational expenses as well as to reimburse DEVDX expenses exceeding a 2.00% cap (other than interest, taxes, brokerage commissions, dividends and interest on short sales, other investment-related costs and extraordinary expenses ) for a three-year period.
The Board also considered potential economies of scale with respect to the management of DEVDX and whether DEVDX will benefit from any economies of scale. The Board noted the Adviser’s conclusion that it will not earn its full fee until net assets reach approximately $50 million.
67
Other Benefits to the Adviser and its Affiliates. The Board also considered the character and amount of other incidental benefits to be received by the Adviser and its affiliates. The Board noted that the Adviser’s affiliated broker-dealer is not expected to execute any portfolio transactions for DEVDX and the Adviser does not expect to earn any fall-out benefits in the form of soft dollar credits from its relationship with DEVDX. The Board concluded that the proposed advisory fee was reasonable in light of any anticipated fall-out benefits.
Based on all of the information considered and the conclusions reached, the Board determined that the terms of the Agreement for DEVDX were fair and reasonable and that the approval of the Agreement is in the best interests of DEVDX. No single factor was determinative in the Board’s analysis.
68
| Item 2. | Code of Ethics. |
| (a) | The registrant, as of the end of the period covered by this report, has adopted a code of ethics that applies to the registrant’s principal executive officer, principal financial officer, principal accounting officer or controller, or persons performing similar functions, regardless of whether these individuals are employed by the registrant or a third party. |
| (b) | No response required. |
| (c) | None |
| (d) | None. |
| (e) | Not applicable. |
| (f) | The registrant’s Code of Ethics for Principal Executive and Financial Officers was filed as Exhibit 12(a)(1) to the registrant’s Certified Shareholder Report on Form N-CSR, Accession Number 0001193125-12-093739, on March 2, 2012, and is incorporated herein by reference. |
| Item 3. | Audit Committee Financial Expert. |
The registrant’s Board of Trustees has designated A.R. Umans as an audit committee financial expert. Mr. Umans is “independent,” as defined by this Item 3.
| Item 4. | Principal Accountant Fees and Services. |
| (a) | Audit Fees |
For the fiscal years ended December 31, 2013 and 2012, Ernst & Young LLP, the registrant’s principal accountant (“E&Y”), billed the registrant $402,700 and $394,100, respectively, for professional services rendered for the audit of the registrant’s annual financial statements or services that are normally provided in connection with statutory and regulatory filings.
| (b) | Audit-Related Fees |
For the fiscal years ended December 31, 2013 and 2012, E&Y billed the registrant $0 and $0, respectively, for assurance and related services that are reasonably related to the performance of the audit of the registrant’s financial statements and that are not reported above.
For engagements that Driehaus Capital Management LLC, the registrant’s investment adviser (“DCM”), or Driehaus Securities LLC, the registrant’s distributor (“DS”), entered into with E&Y for fiscal years 2013 and 2012, E&Y provided no audit-related services to DCM or DS that were for engagements directly related to the registrant’s operations and financial reporting.
| (c) | Tax Fees |
For the fiscal years ended December 31, 2013 and 2012, E&Y billed the registrant $82,450 and $93,350, respectively, for professional services rendered for tax compliance, tax advice, and tax planning. Such services consisted of review of the registrant’s income tax returns and tax distribution requirements and analysis related to passive foreign investment company status. The Audit Committee pre-approved all tax services that E&Y provided to the registrant.
For fiscal years 2013 and 2012, E&Y provided no tax services to DCM or DS that were for engagements directly related to the registrant’s operations and financial reporting.
| (d) | All Other Fees |
For the fiscal years ended December 31, 2013 and 2012, E&Y billed the registrant $0 and $0, respectively, for products and services provided, other than the services reported above.
For fiscal years 2013 and 2012, E&Y provided no other services to DCM or DS that were for engagements directly related to the registrant’s operations and financial reporting.
| (e)(1) | Audit Committee Pre-Approval Policies and Procedures |
Pursuant to registrant’s Audit Committee Charter (the “Charter”), the Audit Committee is responsible for pre-approving any engagement of the principal accountant to provide non-prohibited services to the registrant, including the fees and other compensation to be paid to the principal accountant, to the extent required by Rule 2-01(c)(7) of Regulation S-X. The Chairman of the Audit Committee may grant pre-approval for engagements of $5,000 or less. All such delegated pre-approvals will be presented to the Audit Committee no later than the next Audit Committee meeting.
Pursuant to the Charter, the Audit Committee is also responsible for pre-approving any engagement of the principal accountant, including the fees and other compensation to be paid to the principal accountant, to provide non-audit services to the registrant’s investment adviser (or any entity controlling, controlled by, or under common control with the adviser that provides ongoing services to the registrant), if the engagement relates directly to the operations and financial reporting of the registrant, to the extent required by Rule 2-01(c)(7) of Regulation S-X. The Chairman of the Audit Committee may grant pre-approval for engagements of $5,000 or less. All such delegated pre-approvals will be presented to the Audit Committee no later than the next Audit Committee meeting.
| (e)(2) | The percentage of services described in each of paragraphs (b) through (d) of this Item that were approved by the audit committee pursuant to paragraph (c)(7)(i)(C) of Rule 2-01 of Regulation S-X is 0%. |
| (f) | Not applicable. |
| (g) | Non-Audit Fees |
For the fiscal years ended December 31, 2013 and 2012, E&Y billed the registrant $82,450 and $93,350, respectively, in aggregate non-audit fees. For the fiscal years ended December 31, 2013 and 2012, E&Y billed DCM or DS $0 and $0, respectively, in aggregate non-audit fees.
| (h) | Not applicable. |
| Item 5. | Audit Committee of Listed Registrants. |
Not applicable.
| Item 6. | Investments. |
| (a) | Schedule of Investments in securities of unaffiliated issuers as of the close of the reporting period is included as part of the report to shareholders filed under Item 1 of this form. |
| (b) | Not applicable. |
| Item 7. | Disclosure of Proxy Voting Policies and Procedures for Closed-End Management Investment Companies. |
Not applicable.
| Item 8. | Portfolio Managers of Closed-End Management Investment Companies. |
Not applicable.
| Item 9. | Purchases of Equity Securities by Closed-End Management Investment Company and Affiliated Purchasers. |
Not applicable.
| Item 10. | Submission of Matters to a Vote of Security Holders. |
There have been no material changes to the procedures by which the shareholders may recommend nominees to the registrant’s board of directors, where those changes were implemented after the registrant last provided disclosure in response to the requirements of Item 407(c)(2)(iv) of Regulation S-K (17 CFR 229.407) (as required by Item 22(b)(15) of Schedule 14A (17 CFR 240.14a-101)), or this Item.
| Item 11. | Controls and Procedures. |
| (a) | The registrant’s principal executive and principal financial officers, or persons performing similar functions, have concluded that the registrant’s disclosure controls and procedures (as defined in Rule 30a-3(c) under the Investment Company Act of 1940, as amended (the “1940 Act”) (17 CFR 270.30a-3(c))) are effective, as of a date within 90 days of the filing date of the report that includes the disclosure required by this paragraph, based on their evaluation of these controls and procedures required by Rule 30a-3(b) under the 1940 Act (17 CFR 270.30a-3(b)) and Rules 13a-15(b) or 15d-15(b) under the Securities Exchange Act of 1934, as amended (17 CFR 240.13a-15(b) or 240.15d-15(b)). |
| (b) | There were no changes in the registrant’s internal control over financial reporting (as defined in Rule 30a-3(d) under the 1940 Act (17 CFR 270.30a-3(d)) that occurred during the registrant’s second fiscal quarter of the period covered by this report that has materially affected, or is reasonably likely to materially affect, the registrant’s internal control over financial reporting. |
| Item 12. | Exhibits. |
| (a)(1) | Code of ethics, or any amendment thereto, that is the subject of disclosure required by Item 2, filed as Exhibit 12(a)(1) to the Registrant’s Form N-CSR, filed on March 2, 2012 (Accession No. 0001193125-12-093738) incorporated herein by reference. |
| (a)(2) | Certifications pursuant to Rule 30a-2(a) under the 1940 Act and Section 302 of the Sarbanes-Oxley Act of 2002 are attached hereto. |
| (a)(3) | Not applicable. |
| (b) | Certifications pursuant to Rule 30a-2(b) under the 1940 Act and Section 906 of the Sarbanes-Oxley Act of 2002 are attached hereto. |
SIGNATURES
Pursuant to the requirements of the Securities Exchange Act of 1934 and the Investment Company Act of 1940, the registrant has duly caused this report to be signed on its behalf by the undersigned, thereunto duly authorized.
(Registrant) | Driehaus Mutual Funds | |||
By (Signature and Title)* | /s/Robert H. Gordon | |||
| Robert H. Gordon, President | ||||
| (principal executive officer) | ||||
Date | March 4, 2014 | |||
Pursuant to the requirements of the Securities Exchange Act of 1934 and the Investment Company Act of 1940, this report has been signed below by the following persons on behalf of the registrant and in the capacities and on the dates indicated.
By (Signature and Title)* | /s/Robert H. Gordon | |||
| Robert H. Gordon, President | ||||
| (principal executive officer) | ||||
Date | March 4, 2014 | |||
By (Signature and Title)* | /s/Michelle L. Cahoon | |||
| Michelle L. Cahoon, Vice President and Treasurer | ||||
| (principal financial officer) | ||||
Date | March 4, 2014 | |||
| * | Print the name and title of each signing officer under his or her signature. |