Table of Contents
UNITED STATES
SECURITIES AND EXCHANGE COMMISSION
Washington, D.C. 20549
FORM N-CSR
CERTIFIED SHAREHOLDER REPORT OF REGISTERED
MANAGEMENT INVESTMENT COMPANIES
Investment Company Act file number 811-07655
Driehaus Mutual Funds
(Exact name of registrant as specified in charter)
25 East Erie Street
Chicago, IL 60611
(Address of principal executive offices) (Zip code)
Janet L. McWilliams
Driehaus Capital Management LLC
25 East Erie Street
Chicago, IL 60611
(Name and address of agent for service)
Registrant’s telephone number, including area code: 312-587-3800
Date of fiscal year end: December 31
Date of reporting period: June 30, 2014
Form N-CSR is to be used by management investment companies to file reports with the Commission not later than 10 days after the transmission to stockholders of any report that is required to be transmitted to stockholders under Rule 30e-1 under the Investment Company Act of 1940 (17 CFR 270.30e-1). The Commission may use the information provided on Form N-CSR in its regulatory, disclosure review, inspection, and policymaking roles.
A registrant is required to disclose the information specified by Form N-CSR, and the Commission will make this information public. A registrant is not required to respond to the collection of information contained in Form N-CSR unless the Form displays a currently valid Office of Management and Budget (“OMB”) control number. Please direct comments concerning the accuracy of the information collection burden estimate and any suggestions for reducing the burden to Secretary, Securities and Exchange Commission, 100 F Street, NE, Washington, DC 20549. The OMB has reviewed this collection of information under the clearance requirements of 44 U.S.C. § 3507.
Table of Contents
Item 1. Reports to Stockholders.
Driehaus Mutual Funds
Trustees & Officers
Richard H. Driehaus
Trustee
Theodore J. Beck
Trustee
Francis J. Harmon
Trustee
A.R. Umans
Trustee
Dawn M. Vroegop
Trustee
Daniel F. Zemanek
Chairman of the Board
Robert H. Gordon
President
Michelle L. Cahoon
Vice President & Treasurer
Janet L. McWilliams
Assistant Vice President &
Chief Legal Officer
Michael R. Shoemaker
Chief Compliance Officer &
Assistant Vice President
Diane J. Drake
Secretary
Michael P. Kailus
Assistant Secretary &
Anti-Money Laundering Compliance Officer
William H. Wallace, III
Assistant Secretary
Investment Adviser
Driehaus Capital Management LLC
25 East Erie Street
Chicago, IL 60611
Distributor
Driehaus Securities LLC
25 East Erie Street
Chicago, IL 60611
Administrator & Transfer agent
BNY Mellon Investment Servicing (US) Inc.
4400 Computer Drive
Westborough, MA 01581
Custodian
The Northern Trust Company
50 South LaSalle Street
Chicago, IL 60603
Semi-Annual Report to Shareholders
June 30, 2014

Driehaus International Discovery Fund
Driehaus Emerging Markets Growth Fund
Driehaus Emerging Markets Small Cap Growth Fund
Driehaus International Small Cap Growth Fund
Driehaus Global Growth Fund
Driehaus Mid Cap Growth Fund
Driehaus Micro Cap Growth Fund
Distributed by:
Driehaus Securities LLC
This report has been prepared for the shareholders of the Funds and is not an offering to sell or buy any Fund securities. Such offering is only made by the Funds' prospectus.
Table of Contents
Investment Philosophy:
The Adviser seeks to achieve superior investment returns primarily by investing in global companies that are currently demonstrating rapid growth in their sales and earnings and which, in its judgement, have the ability to continue or accelerate their growth rates in the future. The Adviser manages the portfolios actively (above average turnover) to ensure that the Funds are fully invested, under appropriate market conditions, in companies that meet these criteria. Investors should note that investments in overseas markets can pose more risks than U.S. investments, and the international Funds’ share prices are expected to be more volatile than those of the U.S.-only Funds. In addition, the Funds’ returns will fluctuate with changes in stock market conditions, currency values, interest rates, government regulations, and economic and political conditions in countries in which the Funds invest. These risks are generally greater when investing in emerging markets.
Semi-Annual Report to Shareholders
June 30, 2014
Driehaus International Discovery Fund
Driehaus Emerging Markets Growth Fund
Driehaus Emerging Markets Small Cap Growth Fund
Driehaus International Small Cap Growth Fund
Driehaus Global Growth Fund
Driehaus Mid Cap Growth Fund
Driehaus Micro Cap Growth Fund
Table of Contents
| 1 | ||||
| 6 | ||||
| 12 | ||||
| 18 | ||||
| 22 | ||||
| 26 | ||||
| 30 | ||||
| 34 | ||||
| 36 | ||||
| 38 | ||||
| 41 | ||||
| 48 | ||||
| 59 | ||||
PROXY VOTING POLICIES AND PROCEDURES AND PROXY VOTING RECORD
A description of the Funds’ policies and procedures with respect to the voting of proxies relating to the Funds’ portfolio securities is available without charge, upon request, by calling 1-800-560-6111. This information is also available on the Funds’ website at http://www.driehaus.com.
Information regarding how the Funds voted proxies related to portfolio securities during the 12-month period ended June 30, 2014 is available without charge, upon request, by calling 1-800-560-6111. This information is also available on the Securities and Exchange Commission’s (“SEC”) website at http://www.sec.gov.
HOW TO OBTAIN QUARTERLY PORTFOLIO HOLDINGS
Each Fund files a complete schedule of portfolio holdings with the SEC for the first and third quarters of each fiscal year on Form N-Q. The Funds’ Form N-Q is available electronically on the SEC’s website at http://www.sec.gov; hard copies may be reviewed and copied at the SEC’s Public Reference Room in Washington, DC 20549. For more information on the Public Reference Room, call 1-800-SEC-0330. Each Fund’s complete schedule of portfolio holdings is also available on the Fund’s website at http://www.driehaus.com.
Table of Contents
Driehaus International Discovery Fund
Performance Overview (unaudited)
The performance summarized below is historical and does not represent future results. Investment returns and principal value vary, and you may have a gain or loss when you sell shares. Performance data presented measures the change in the value of an investment in the Fund, assuming reinvestment of all dividends and capital gains. Average annual total return reflects annualized change.
The table does not reflect the deduction of taxes that a shareholder would pay on Fund distributions or the redemption of Fund shares. The graph compares the results of a $10,000 investment in the Fund since December 31, 1998 (the date of the Fund’s inception), with all dividends and capital gains reinvested, with the indicated indices (and dividends reinvested) for the same period.
| Average Annual Total Returns as of 06/30/14 | 1 Year | 3 Years | 5 Years | 10 Years | Since Inception (12/31/98 - 06/30/14) | |||||||||||||||
Driehaus International Discovery Fund (DRIDX)1 | 12.22% | 1.46% | 8.59% | 7.16% | 13.10% | |||||||||||||||
MSCI AC World ex USA Growth Index2 | 19.74% | 5.84% | 11.71% | 8.01% | 4.51% | |||||||||||||||
MSCI AC World ex USA Index3 | 22.27% | 6.21% | 11.59% | 8.22% | 6.02% | |||||||||||||||
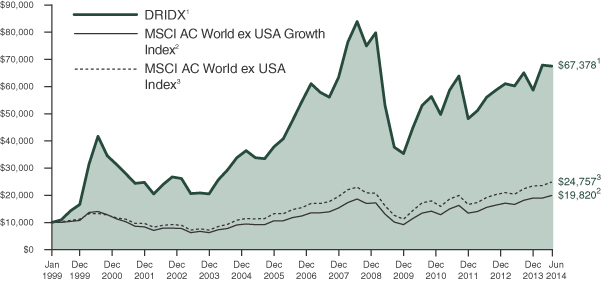
| 1 | The returns for the periods prior to July 1, 2003, reflect fee waivers and/or reimbursements without which performance would have been lower. |
| 2 | The Morgan Stanley Capital International All Country World ex USA Growth Index (MSCI AC World ex USA Growth Index) is a subset of the MSCI AC World ex USA Index and is composed only of the MSCI AC World ex USA Index stocks which are categorized as growth stocks. Data is in U.S. dollars. Source: Morgan Stanley Capital International Inc. |
| 3 | The Morgan Stanley Capital International All Country World ex USA Index (MSCI AC World ex USA Index) is a market capitalization-weighted index designed to measure equity market performance in 45 global developed and emerging markets, excluding the U.S. Data is in U.S. dollars. Source: Morgan Stanley Capital International Inc. |
1
Table of Contents
Driehaus International Discovery Fund
Schedule of Investments
June 30, 2014 (unaudited)
| Number of Shares | Value (Note A) | |||||||
| EQUITY SECURITIES — 97.7% | ||||||||
| EUROPE — 43.8% | ||||||||
United Kingdom — 12.5% |
| |||||||
Abengoa Yield PLC** | 17,065 | $ | 645,398 | |||||
Aberdeen Asset Management PLC | 79,149 | 614,830 | ||||||
Ashtead Group PLC | 143,773 | 2,152,953 | ||||||
ASOS PLC** | 13,529 | 685,341 | ||||||
Barratt Developments PLC | 55,187 | 352,947 | ||||||
Britvic PLC | 96,364 | 1,199,767 | ||||||
Countrywide PLC | 132,869 | 1,169,926 | ||||||
Genel Energy PLC** | 99,813 | 1,733,814 | ||||||
Halma PLC | 193,617 | 1,953,334 | ||||||
Jazztel PLC** | 120,641 | 1,718,015 | ||||||
Ocado Group PLC** | 93,958 | 597,046 | ||||||
Pets at Home Group PLC** | 238,346 | 836,202 | ||||||
St. James’s Place PLC | 85,620 | 1,116,553 | ||||||
|
| |||||||
| 14,776,126 | ||||||||
|
| |||||||
Germany — 7.8% |
| |||||||
Aareal Bank AG | 25,134 | 1,158,442 | ||||||
Aurelius AG | 47,981 | 1,752,887 | ||||||
Continental AG | 5,589 | 1,294,508 | ||||||
Deutsche Annington Immobilien SE | 40,334 | 1,186,879 | ||||||
MorphoSys AG** | 12,936 | 1,213,359 | ||||||
Symrise AG | 21,546 | 1,174,070 | ||||||
Wirecard AG | 33,868 | 1,462,218 | ||||||
|
| |||||||
| 9,242,363 | ||||||||
|
| |||||||
Denmark — 4.0% |
| |||||||
Christian Hansen Holding AS | 27,508 | 1,158,450 | ||||||
Coloplast AS — B | 10,008 | 905,064 | ||||||
GN Store Nord AS | 31,971 | 915,999 | ||||||
Matas AS** | 21,105 | 598,864 | ||||||
Pandora AS | 15,611 | 1,197,020 | ||||||
|
| |||||||
| 4,775,397 | ||||||||
|
| |||||||
France — 4.0% |
| |||||||
Eurofins Scientific | 6,418 | 1,973,823 | ||||||
JC Decaux SA | 29,049 | 1,083,918 | ||||||
Numericable Group SA** | 8,960 | 533,698 | ||||||
Safran SA | 17,486 | 1,144,863 | ||||||
|
| |||||||
| 4,736,302 | ||||||||
|
| |||||||
Italy — 3.6% |
| |||||||
Azimut Holding SpA | 41,229 | 1,062,481 | ||||||
Brembo SpA | 31,326 | 1,143,573 | ||||||
Intesa Sanpaolo SpA | 376,780 | 1,163,927 | ||||||
Moncler SpA | 53,052 | 879,720 | ||||||
|
| |||||||
| 4,249,701 | ||||||||
|
| |||||||
Netherlands — 3.2% |
| |||||||
James Hardie Industries PLC | 62,503 | 815,692 | ||||||
LyondellBasell Industries NV — A | 11,781 | 1,150,415 | ||||||
| Number of Shares | Value (Note A) | |||||||
Sensata Technologies Holding NV** | 40,185 | $ | 1,879,854 | |||||
|
| |||||||
| 3,845,961 | ||||||||
|
| |||||||
Ireland — 3.2% |
| |||||||
Eaton Corp. PLC | 15,989 | 1,234,031 | ||||||
Endo International PLC** | 27,100 | 1,897,542 | ||||||
Perrigo Co., PLC | 4,151 | 605,050 | ||||||
|
| |||||||
| 3,736,623 | ||||||||
|
| |||||||
Switzerland — 2.9% |
| |||||||
Roche Holding AG | 11,624 | 3,467,014 | ||||||
Sweden — 1.5% |
| |||||||
Assa Abloy AB — B | 35,128 | 1,787,537 | ||||||
Belgium — 0.7% |
| |||||||
Anheuser-Busch Inbev NV | 7,178 | 824,639 | ||||||
Norway — 0.4% |
| |||||||
Opera Software ASA | 35,647 | 475,382 | ||||||
|
| |||||||
Total EUROPE | 51,917,045 | |||||||
|
| |||||||
| FAR EAST — 34.0% | ||||||||
China — 17.0% |
| |||||||
21Vianet Group, Inc. — ADR** | 58,121 | 1,741,886 | ||||||
AIA Group, Ltd. | 395,439 | 1,987,297 | ||||||
Baidu, Inc. — SP ADR** | 9,509 | 1,776,376 | ||||||
Haitong Securities Co., Ltd. — H | 631,496 | 979,379 | ||||||
Melco Crown Entertainment, Ltd. — ADR | 51,936 | 1,854,635 | ||||||
Michael Kors Holdings, Ltd.** | 19,006 | 1,684,882 | ||||||
New Oriental Education & Technology Group, Inc. — SP ADR | 48,650 | 1,292,631 | ||||||
Qihoo 360 Technology Co., Ltd. — ADR** | 18,169 | 1,672,275 | ||||||
Sands China, Ltd. | 308,130 | 2,327,752 | ||||||
Tencent Holdings, Ltd. | 240,210 | 3,663,401 | ||||||
Vipshop Holdings, Ltd. — ADR** | 6,244 | 1,172,249 | ||||||
|
| |||||||
| 20,152,763 | ||||||||
|
| |||||||
Japan — 11.4% |
| |||||||
Astellas Pharma, Inc. | 44,630 | 586,373 | ||||||
Dainippon Sumitomo Pharma Co., Ltd. | 49,554 | 569,867 | ||||||
Digital Garage, Inc. | 21,269 | 348,937 | ||||||
F@N Communications, Inc. | 57,919 | 951,357 | ||||||
Hoshizaki Electric Co., Ltd. | 15,538 | 774,561 | ||||||
Hulic Co., Ltd. | 142,091 | 1,872,479 | ||||||
Kanamoto Co., Ltd. | 40,239 | 1,602,728 | ||||||
M3, Inc. | 42,399 | 674,667 | ||||||
Ono Pharmaceutical Co., Ltd. | 14,534 | 1,279,732 | ||||||
Softbank Corp. | 31,973 | 2,380,656 | ||||||
Notes to Financial Statements are an integral part of this Schedule.
2
Table of Contents
Driehaus International Discovery Fund
Schedule of Investments
June 30, 2014 (unaudited)
| Number of Shares | Value (Note A) | |||||||
Tokai Tokyo Financial Holdings, Inc. | 154,881 | $ | 1,204,740 | |||||
Zenkoku Hosho Co., Ltd. | 46,268 | 1,258,720 | ||||||
|
| |||||||
| 13,504,817 | ||||||||
|
| |||||||
Philippines — 1.7% |
| |||||||
Puregold Price Club, Inc. | 979,804 | 974,192 | ||||||
Robinsons Retail Holdings, Inc. | 632,959 | 1,057,832 | ||||||
|
| |||||||
| 2,032,024 | ||||||||
|
| |||||||
Malaysia — 1.0% |
| |||||||
Astro Malaysia Holdings BHD | 1,149,093 | 1,256,094 | ||||||
Singapore — 1.0% |
| |||||||
Global Logistic Properties, Ltd. | 541,086 | 1,171,651 | ||||||
Cambodia — 1.0% |
| |||||||
NagaCorp, Ltd. | 1,304,635 | 1,149,703 | ||||||
Taiwan — 0.9% |
| |||||||
Ginko International Co., Ltd. | 60,350 | 1,044,978 | ||||||
|
| |||||||
Total FAR EAST | 40,312,030 | |||||||
|
| |||||||
| NORTH AMERICA — 15.6% | ||||||||
Canada — 13.1% |
| |||||||
Badger Daylighting, Ltd. | 34,818 | 1,146,950 | ||||||
Birchcliff Energy, Ltd.** | 43,337 | 572,655 | ||||||
Canadian Pacific Railway, Ltd. | 11,434 | 2,071,155 | ||||||
Intact Financial Corp. | 21,878 | 1,508,630 | ||||||
Interfor Corp.** | 84,810 | 1,181,880 | ||||||
Methanex Corp. | 28,591 | 1,766,352 | ||||||
Pembina Pipeline Corp. | 48,862 | 2,102,296 | ||||||
PrairieSky Royalty, Ltd. | 32,351 | 1,176,345 | ||||||
Trinidad Drilling, Ltd. | 166,463 | 1,889,196 | ||||||
Valeant Pharmaceuticals International, Inc.** | 17,285 | 2,185,875 | ||||||
|
| |||||||
| 15,601,334 | ||||||||
|
| |||||||
Mexico — 2.5% |
| |||||||
Cemex SAB de CV — SP ADR** | 44,273 | 585,732 | ||||||
Fibra Uno Administracion SA de CV — REIT | 680,502 | 2,386,098 | ||||||
|
| |||||||
| 2,971,830 | ||||||||
|
| |||||||
Total NORTH AMERICA | 18,573,164 | |||||||
|
| |||||||
| MIDDLE EAST — 2.7% | ||||||||
Israel — 2.7% |
| |||||||
CaesarStone Sdot-Yam, Ltd. | 33,452 | 1,641,824 | ||||||
Plus500, Ltd | 49,176 | 385,660 | ||||||
| Number of Shares | Value (Note A) | |||||||
Teva Pharmaceutical Industries, Ltd. — SP ADR | 22,806 | $ | 1,195,491 | |||||
|
| |||||||
| 3,222,975 | ||||||||
|
| |||||||
Total MIDDLE EAST | 3,222,975 | |||||||
|
| |||||||
| SOUTH AMERICA — 1.6% | ||||||||
Brazil — 1.6% |
| |||||||
Anhanguera Educacional Participacoes SA | 113,565 | 945,219 | ||||||
Kroton Educacional SA | 32,818 | 922,229 | ||||||
|
| |||||||
| 1,867,448 | ||||||||
|
| |||||||
Total SOUTH AMERICA | 1,867,448 | |||||||
|
| |||||||
Total EQUITY SECURITIES (Cost $103,557,543) | 115,892,662 | |||||||
|
| |||||||
| ||||||||
TOTAL INVESTMENTS | 97.7 | % | $ | 115,892,662 | ||||
Other Assets In Excess Of Liabilities | 2.3 | % | 2,685,734 | |||||
|
|
|
| |||||
| Net Assets | 100.0 | % | $ | 118,578,396 | ||||
| ||||||||
The federal income tax basis and unrealized appreciation (depreciation) for all investments is as follows:
| Basis: | $ | 104,622,741 | ||
|
| |||
| Gross Appreciation | $ | 16,037,761 | ||
| Gross Depreciation | (4,767,840 | ) | ||
|
| |||
Net Appreciation | $ | 11,269,921 | ||
|
|
** Non-income producing security
ADR — American Depository Receipt
REIT — Real Estate Investment Trust
SP ADR — Sponsored American Depository Receipt
Notes to Financial Statements are an integral part of this Schedule.
3
Table of Contents
Driehaus International Discovery Fund
Schedule of Investments
June 30, 2014 (unaudited)
Regional Weightings*
Western Europe | 43.8% | |||
Asia/Far East Ex-Japan | 22.6% | |||
North America | 15.6% | |||
Japan | 11.4% | |||
Middle East | 2.7% | |||
South America | 1.6% |
Top Ten Holdings*
Tencent Holdings, Ltd. | 3.1% | |||
Roche Holding AG | 2.9% | |||
Fibra Uno Administracion SA de CV — REIT | 2.0% | |||
Softbank Corp. | 2.0% | |||
Sands China, Ltd. | 2.0% | |||
Valeant Pharmaceuticals International, Inc. | 1.8% | |||
Ashtead Group PLC | 1.8% | |||
Pembina Pipeline Corp. | 1.8% | |||
Canadian Pacific Railway, Ltd. | 1.7% | |||
AIA Group, Ltd. | 1.7% |
| * | All percentages are stated as a percent of net assets at June 30, 2014. |
Notes to Financial Statements are an integral part of this Schedule.
4
Table of Contents
Driehaus International Discovery Fund
Schedule of Investments
June 30, 2014 (unaudited)
Industry | Percent of Net Assets | |||
Aerospace & Defense | 1.0% | |||
Auto Components | 2.1% | |||
Banks | 1.0% | |||
Beverages | 1.7% | |||
Building Products | 1.5% | |||
Capital Markets | 4.7% | |||
Chemicals | 4.4% | |||
Construction & Engineering | 1.0% | |||
Construction Materials | 2.6% | |||
Diversified Consumer Services | 2.7% | |||
Diversified Financial Services | 1.4% | |||
Diversified Telecommunication Services | 1.4% | |||
Electrical Equipment | 2.6% | |||
Electronic Equipment, Instruments & Components | 1.6% | |||
Energy Equipment & Services | 1.6% | |||
Food & Staples Retailing | 1.7% | |||
Health Care Equipment & Supplies | 2.4% | |||
Health Care Technology | 0.6% | |||
Hotels, Restaurants & Leisure | 4.5% | |||
Household Durables | 0.3% | |||
Industry | Percent of Net Assets | |||
Independent Power and Renewable Electricity Producers | 0.5% | |||
Information Technology Services | 1.5% | |||
Insurance | 3.9% | |||
Internet & Catalog Retail | 2.1% | |||
Internet Software & Services | 8.7% | |||
Life Sciences Tools & Services | 2.7% | |||
Machinery | 0.7% | |||
Media | 2.4% | |||
Oil, Gas & Consumable Fuels | 4.7% | |||
Paper & Forest Products | 1.0% | |||
Pharmaceuticals | 9.9% | |||
Real Estate Investment Trusts | 2.0% | |||
Real Estate Management & Development | 4.5% | |||
Road & Rail | 1.7% | |||
Specialty Retail | 1.2% | |||
Textiles, Apparel & Luxury Goods | 3.2% | |||
Thrifts & Mortgage Finance | 1.0% | |||
Trading Companies & Distributors | 3.2% | |||
Wireless Telecommunication Services | 2.0% | |||
Other Assets in Excess of Liabilities | 2.3% | |||
|
| |||
TOTAL | 100.0% | |||
|
| |||
Notes to Financial Statements are an integral part of this Schedule.
5
Table of Contents
Driehaus Emerging Markets Growth Fund
Performance Overview (unaudited)
The performance summarized below is historical and does not represent future results. Investment returns and principal value vary, and you may have a gain or loss when you sell shares. Performance data presented measures the change in the value of an investment in the Fund, assuming reinvestment of all dividends and capital gains. Average annual total return reflects annualized change.
The table does not reflect the deduction of taxes that a shareholder would pay on Fund distributions or the redemption of Fund shares. The graph compares the results of a $10,000 investment in the Fund since December 31, 1997 (the date of the Fund’s inception), with all dividends and capital gains reinvested, with the indicated indices (and dividends reinvested) for the same period.
| Average Annual Total Returns as of 06/30/14 | 1 Year | 3 Years | 5 Years | 10 Years | Since Inception (12/31/97 - 06/30/14) | |||||||||||||||
Driehaus Emerging Markets Growth Fund (DREGX)1 | 12.42% | 4.23% | 13.37% | 14.64% | 13.65% | |||||||||||||||
MSCI Emerging Markets Index2 | 14.68% | –0.06% | 9.58% | 12.30% | 8.62% | |||||||||||||||
MSCI Emerging Markets Growth Index3 | 14.45% | 1.04% | 10.40% | 11.51% | 7.85% | |||||||||||||||
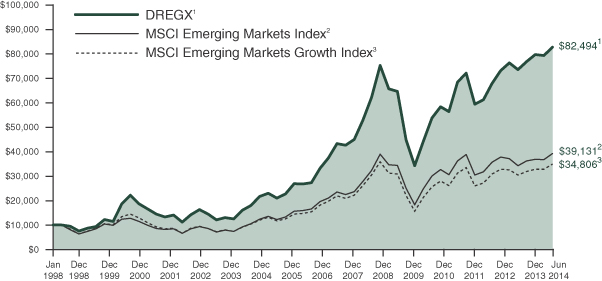
| 1 | The returns for the periods prior to July 1, 2003, reflect fee waivers and/or reimbursements without which performance would have been lower. |
| 2 | The Morgan Stanley Capital International Emerging Markets Index (MSCI Emerging Markets Index) is a market capitalization-weighted index designed to measure equity market performance in 23 global emerging markets. Data is in U.S. dollars. Source: Morgan Stanley Capital International Inc. |
| 3 | The Morgan Stanley Capital International Emerging Markets Growth Index (MSCI Emerging Markets Growth Index) is a subset of the MSCI Emerging Markets Index and includes only the MSCI Emerging Markets Index stocks which are categorized as growth stocks. Data is in U.S. dollars. Source: Morgan Stanley Capital International Inc. |
6
Table of Contents
Driehaus Emerging Markets Growth Fund
Schedule of Investments
June 30, 2014 (unaudited)
Number Shares | Value (Note A) | |||||||
| EQUITY SECURITIES — 94.0% | ||||||||
| FAR EAST — 49.4% | ||||||||
China — 17.4% |
| |||||||
21Vianet Group, Inc. — ADR** | 359,422 | $ | 10,771,877 | |||||
51 Job, Inc. — ADR** | 102,697 | 6,773,894 | ||||||
AIA Group, Ltd. | 6,976,908 | 35,062,780 | ||||||
Angang Steel Co., Ltd. — H | 10,960,052 | 7,070,636 | ||||||
AviChina Industry & Technology Co., Ltd. — H | 16,404,857 | 9,270,912 | ||||||
Baidu, Inc. — SP ADR** | 157,164 | 29,359,807 | ||||||
Biostime International Holdings, Ltd. | 1,607,255 | 8,917,213 | ||||||
China Medical System Holdings, Ltd. | 15,053,952 | 18,432,856 | ||||||
China Oilfield Services, Ltd. — H | 8,064,955 | 19,396,516 | ||||||
Galaxy Entertainment Group, Ltd. | 2,640,853 | 21,125,734 | ||||||
Hong Kong Exchanges & Clearing, Ltd. | 1,415,821 | 26,396,848 | ||||||
PetroChina Co., Ltd. —ADR | 154,825 | 19,438,279 | ||||||
Ping An Insurance Group Co. — H | 999,308 | 7,736,179 | ||||||
Sands China, Ltd. | 4,648,000 | 35,113,078 | ||||||
Shenzhou International Group Holdings, Ltd. | 6,943,951 | 23,697,810 | ||||||
TAL Education Group — ADR** | 392,774 | 10,801,285 | ||||||
Tencent Holdings, Ltd. | 2,506,145 | 38,220,781 | ||||||
Vipshop Holdings, Ltd. — ADR** | 79,407 | 14,907,870 | ||||||
|
| |||||||
| 342,494,355 | ||||||||
|
| |||||||
India — 8.8% |
| |||||||
Bharti Infratel, Ltd. | 3,500,953 | 14,878,104 | ||||||
Glenmark Pharmaceuticals, Ltd. | 1,671,092 | 15,839,879 | ||||||
HCL Technologies, Ltd. | 776,694 | 19,372,475 | ||||||
HDFC Bank, Ltd. — ADR | 589,457 | 27,598,377 | ||||||
Housing Development Finance Corp. | 1,192,138 | 19,673,399 | ||||||
ITC, Ltd. | 2,742,565 | 14,822,026 | ||||||
Maruti Suzuki India, Ltd. | 535,701 | 21,726,864 | ||||||
SKS Microfinance, Ltd.** | 2,878,613 | 13,231,234 | ||||||
Tech Mahindra, Ltd. | 585,025 | 20,932,310 | ||||||
Titan Co., Ltd. | 942,278 | 5,531,154 | ||||||
|
| |||||||
| 173,605,822 | ||||||||
|
| |||||||
Taiwan — 8.3% |
| |||||||
Advantech Co., Ltd. | 1,410,000 | 12,041,999 | ||||||
Delta Electronics, Inc. | 2,164,937 | 15,770,440 | ||||||
Eclat Textile Co., Ltd. | 1,338,216 | 16,224,603 | ||||||
Number Shares | Value (Note A) | |||||||
Hermes Microvision, Inc. | 246,000 | $ | 9,763,213 | |||||
Hiwin Technologies Corp. | 1,267,000 | 15,636,998 | ||||||
Hota Industrial Manufacturing Co., Ltd. | 6,743,000 | 11,969,288 | ||||||
Largan Precision Co., Ltd. | 230,000 | 18,333,445 | ||||||
MediaTek, Inc. | 1,403,000 | 23,729,486 | ||||||
Taiwan Semiconductor Manufacturing Co., | 1,804,875 | 38,606,276 | ||||||
|
| |||||||
| 162,075,748 | ||||||||
|
| |||||||
South Korea — 5.0% |
| |||||||
Hyundai Mobis Co., Ltd. | 66,617 | 18,698,585 | ||||||
LG Chem, Ltd. | 59,080 | 17,283,732 | ||||||
Samsung Electronics Co., Ltd. — Pref. | 18,004 | 18,861,672 | ||||||
Shinhan Financial Group Co., Ltd. | 417,786 | 19,345,003 | ||||||
SK Hynix, Inc.** | 490,204 | 23,521,846 | ||||||
|
| |||||||
| 97,710,838 | ||||||||
|
| |||||||
Philippines — 2.7% |
| |||||||
Alliance Global Group, Inc. | 32,905,741 | 21,937,161 | ||||||
Ayala Land, Inc. | 7,358,203 | 5,141,471 | ||||||
Metropolitan Bank & Trust Co. | 6,564,541 | 13,144,121 | ||||||
Robinsons Retail Holdings, Inc. | 8,195,456 | 13,696,644 | ||||||
|
| |||||||
| 53,919,397 | ||||||||
|
| |||||||
Indonesia — 2.6% |
| |||||||
PT Astra International Tbk | 38,282,700 | 23,492,758 | ||||||
PT Kalbe Farma Tbk | 53,773,300 | 7,529,623 | ||||||
PT Matahari Department Store Tbk | 15,808,022 | 18,401,578 | ||||||
PT Matahari Putra Prima Tbk | 8,719,698 | 2,298,529 | ||||||
|
| |||||||
| 51,722,488 | ||||||||
|
| |||||||
Thailand — 2.4% |
| |||||||
Bangkok Dusit Medical Services PCL — NVDR | 29,720,000 | 15,292,682 | ||||||
Kasikornbank PCL — NVDR | 2,691,826 | 16,919,812 | ||||||
Thai Beverage PCL | 29,439,000 | 14,638,046 | ||||||
|
| |||||||
| 46,850,540 | ||||||||
|
| |||||||
Malaysia — 1.2% |
| |||||||
Malayan Banking BHD | 7,754,300 | 23,738,639 | ||||||
Cambodia — 0.5% |
| |||||||
NagaCorp, Ltd. | 10,647,425 | 9,382,988 | ||||||
Vietnam — 0.3% |
| |||||||
Vietnam Dairy Products JSC | 865,410 | 4,949,837 | ||||||
Notes to Financial Statements are an integral part of this Schedule.
7
Table of Contents
Driehaus Emerging Markets Growth Fund
Schedule of Investments
June 30, 2014 (unaudited)
Number Shares | Value (Note A) | |||||||
Sri Lanka — 0.2% |
| |||||||
John Keells Holdings PLC | 2,798,737 | $ | 4,722,365 | |||||
|
| |||||||
Total FAR EAST | 971,173,017 | |||||||
|
| |||||||
| EUROPE — 13.1% | ||||||||
Russia — 4.7% |
| |||||||
Alrosa** | 11,365,459 | 13,983,111 | ||||||
Magnit — SP GDR | 260,927 | 15,394,693 | ||||||
MegaFon — GDR | 290,405 | 9,263,920 | ||||||
MMC Norilsk | 939,288 | 18,607,295 | ||||||
Moscow Exchange MICEX | 9,145,419 | 18,156,248 | ||||||
NovaTek — SP GDR | 130,396 | 16,221,262 | ||||||
|
| |||||||
| 91,626,529 | ||||||||
|
| |||||||
Switzerland — 2.3% |
| |||||||
Dufry AG** | 94,284 | 17,138,679 | ||||||
Roche Holding AG | 90,571 | 27,014,016 | ||||||
|
| |||||||
| 44,152,695 | ||||||||
|
| |||||||
United Kingdom — 2.1% |
| |||||||
Bank of Georgia Holdings, PLC | 167,232 | 6,725,685 | ||||||
British American Tobacco PLC | 342,247 | 20,371,287 | ||||||
Hikma Pharmaceuticals PLC | 494,214 | 14,192,413 | ||||||
|
| |||||||
| 41,289,385 | ||||||||
|
| |||||||
Turkey — 1.4% |
| |||||||
BIM Birlesik Magazalar AS | 516,949 | 11,858,643 | ||||||
Turkiye Halk Bankasi AS | 1,984,258 | 14,891,769 | ||||||
|
| |||||||
| 26,750,412 | ||||||||
|
| |||||||
Norway — 1.0% |
| |||||||
DNO ASA** | 5,226,262 | 20,099,533 | ||||||
Netherlands — 0.9% |
| |||||||
Heineken NV | 245,174 | 17,601,633 | ||||||
Hungary — 0.7% |
| |||||||
OTP Bank PLC | 730,740 | 14,047,622 | ||||||
Romania — 0.0% |
| |||||||
Fondul Proprietatea SA | 3,049,500 | 812,349 | ||||||
|
| |||||||
Total EUROPE | 256,380,158 | |||||||
|
| |||||||
| SOUTH AMERICA — 12.2% | ||||||||
Brazil — 9.2% |
| |||||||
B2W Cia Digital** | 416,887 | 5,266,040 | ||||||
Banco Bradesco SA — ADR | 929,071 | 13,490,111 | ||||||
BB Seguridade Participacoes SA | 1,823,675 | 26,643,236 | ||||||
BRF SA | 1,117,300 | 27,109,506 | ||||||
CCR SA | 1,584,264 | 12,942,279 | ||||||
Estacio Participacoes SA | 1,469,348 | 19,371,852 | ||||||
Number Shares | Value (Note A) | |||||||
Gol Linhas Aereas Inteligentes SA — ADR** | 3,240,726 | $ | 17,759,178 | |||||
Linx SA | 591,416 | 13,921,496 | ||||||
Lojas Renner SA | 443,600 | 14,218,489 | ||||||
Marcopolo SA — Pref. | 1,788,206 | 3,480,102 | ||||||
Qualicorp SA** | 1,124,070 | 13,288,395 | ||||||
Vale SA — SP ADR | 1,049,313 | 13,882,411 | ||||||
|
| |||||||
| 181,373,095 | ||||||||
|
| |||||||
Colombia — 1.6% |
| |||||||
Bancolombia SA — SP ADR | 257,508 | 14,883,962 | ||||||
Cementos Argos SA — Pref. | 2,688,340 | 16,294,705 | ||||||
|
| |||||||
| 31,178,667 | ||||||||
|
| |||||||
Peru — 1.4% |
| |||||||
Credicorp, Ltd. | 171,997 | 26,740,374 | ||||||
|
| |||||||
Total SOUTH AMERICA | 239,292,136 | |||||||
|
| |||||||
| NORTH AMERICA — 11.4% | ||||||||
Mexico — 6.7% |
| |||||||
Banregio Grupo Financiero SAB de CV | 2,815,561 | 16,697,827 | ||||||
Cemex SAB de CV** | 14,672,921 | 19,419,128 | ||||||
Fibra Uno Administracion SA de CV — REIT | 9,564,049 | 33,535,175 | ||||||
Grupo Televisa SAB — SP ADR | 977,278 | 33,530,408 | ||||||
Infraestructura Energetica Nova SAB de CV | 1,570,755 | 8,714,915 | ||||||
Wal-Mart de Mexico SAB de CV — V | 7,126,700 | 19,105,610 | ||||||
|
| |||||||
| 131,003,063 | ||||||||
|
| |||||||
United States — 4.0% |
| |||||||
Cognizant Technology Solutions Corp. — A** | 272,783 | 13,341,817 | ||||||
Mead Johnson Nutrition Co. | 107,960 | 10,058,633 | ||||||
Samsonite International SA | 3,958,875 | 13,050,843 | ||||||
Schlumberger, Ltd. | 222,074 | 26,193,628 | ||||||
SunEdison, Inc.** | 753,111 | 17,020,309 | ||||||
|
| |||||||
| 79,665,230 | ||||||||
|
| |||||||
Canada — 0.7% |
| |||||||
Gran Tierra Energy, Inc.** | 1,751,324 | 14,229,867 | ||||||
|
| |||||||
Total NORTH AMERICA | 224,898,160 | |||||||
|
| |||||||
| AFRICA — 6.2% | ||||||||
South Africa — 5.1% |
| |||||||
Anglo American Platinum, Ltd.** | 316,397 | 13,717,082 | ||||||
Aspen Pharmacare Holdings, Ltd. | 465,499 | 13,082,557 | ||||||
MTN Group, Ltd. | 926,907 | 19,522,134 | ||||||
Notes to Financial Statements are an integral part of this Schedule.
8
Table of Contents
Driehaus Emerging Markets Growth Fund
Schedule of Investments
June 30, 2014 (unaudited)
Number Shares | Value (Note A) | |||||||
Naspers, Ltd. — N | 258,475 | $ | 30,428,839 | |||||
Sanlam, Ltd. | 4,139,980 | 24,037,966 | ||||||
|
| |||||||
| 100,788,578 | ||||||||
|
| |||||||
Nigeria — 0.6% |
| |||||||
Guaranty Trust Bank PLC | 70,328,674 | 12,494,723 | ||||||
Kenya — 0.5% |
| |||||||
Safaricom, Ltd. | 62,716,000 | 8,908,319 | ||||||
|
| |||||||
Total AFRICA | 122,191,620 | |||||||
|
| |||||||
| MIDDLE EAST — 1.7% | ||||||||
United Arab Emirates — 0.9% |
| |||||||
Al Noor Hospitals Group PLC | 297,548 | 5,204,238 | ||||||
Emaar Properties PJSC | 5,706,723 | 13,067,289 | ||||||
|
| |||||||
| 18,271,527 | ||||||||
|
| |||||||
Pakistan — 0.5% |
| |||||||
United Bank, Ltd. | 5,218,814 | 8,914,956 | ||||||
Qatar — 0.3% |
| |||||||
Al Meera Consumer Goods Co. | 119,340 | 5,546,429 | ||||||
|
| |||||||
Total MIDDLE EAST | 32,732,912 | |||||||
|
| |||||||
Total EQUITY SECURITIES (Cost $1,642,341,377) | 1,846,668,003 | |||||||
|
| |||||||
| ||||||||
| EQUITY CERTIFICATES — 1.0% | ||||||||
| MIDDLE EAST — 1.0% | ||||||||
Saudi Arabia — 1.0% |
| |||||||
Aldrees Petroleum and Transport Services Co.† | 438,009 | 5,815,984 | ||||||
Saudi Airlines Catering Co.† | 302,617 | 13,878,183 | ||||||
|
| |||||||
Total MIDDLE EAST | 19,694,167 | |||||||
|
| |||||||
Total EQUITY CERTIFICATES (Cost $15,776,371) | 19,694,167 | |||||||
|
| |||||||
| ||||||||
TOTAL INVESTMENTS (COST $1,658,117,748) | 95.0 | % | $ | 1,866,362,170 | ||||
Other Assets In Excess Of Liabilities | 5.0 | % | 98,672,929 | |||||
|
|
|
| |||||
| Net Assets | 100.0 | % | $ | 1,965,035,099 | ||||
| ||||||||
The federal income tax basis and unrealized appreciation (depreciation) for all investments is as follows:
| Basis: | $ | 1,661,771,174 | ||
|
| |||
| Gross Appreciation | $ | 225,663,512 | ||
| Gross Depreciation | (21,072,516 | ) | ||
|
| |||
Net Appreciation | $ | 204,590,996 | ||
|
|
| ** | Non-income producing security |
| † | Restricted security — Investments in securities not registered under the Securities Act of 1933, excluding 144A securities. At June 30, 2014, the value of these restricted securities amounted to $19,694,167 or 1.0% of net assets. |
Additional information on each restricted securities is as follows (see Note A in the Notes to Financial Statements)
Security | Counter- Party | Acquisition Date (s) | Acquisition Cost | |||||||||
Aldrees Petroleum and Transport Services Co. | MLCO |
| 2/11/14 to 3/24/14 |
| $ | 4,641,091 | ||||||
Saudi Airline Catering Co. | MLCO |
| 11/20/13 to 12/10/13 |
| $ | 11,135,280 | ||||||
ADR — American Depository Receipt
GDR — Global Depository Receipt
MLCO — Merrill Lynch & Co., Inc.
NVDR — Non-Voting Depository Receipt
REIT — Real Estate Investment Trust
SP ADR — Sponsored American Depository Receipt
SP GDR — Sponsored Global Depository Receipt
Notes to Financial Statements are an integral part of this Schedule.
9
Table of Contents
Driehaus Emerging Markets Growth Fund
Schedule of Investments
June 30, 2014 (unaudited)
Regional Weightings*
Asia/Far East Ex-Japan | 49.4% | |||
South America | 12.2% | |||
North America | 11.4% | |||
Eastern Europe | 6.8% | |||
Western Europe | 6.3% | |||
Africa | 6.2% | |||
Middle East | 2.7% |
Top Ten Holdings*
Taiwan Semiconductor Manufacturing | 2.0% | |||
Tencent Holdings, Ltd. | 1.9% | |||
Sands China, Ltd. | 1.8% | |||
AIA Group, Ltd. | 1.8% | |||
Fibra Uno Administracion SA de CV — REIT | 1.7% | |||
Grupo Televisa SAB — SP ADR | 1.7% | |||
Naspers, Ltd. — N | 1.5% | |||
Baidu, Inc. — SP ADR | 1.5% | |||
HDFC Bank, Ltd. — ADR | 1.4% | |||
BRF SA | 1.4% |
| * | All percentages are stated as a percent of net assets at June 30, 2014. |
Notes to Financial Statements are an integral part of this Schedule.
10
Table of Contents
Driehaus Emerging Markets Growth Fund
Schedule of Investments
June 30, 2014 (unaudited)
Industry | Percent of Net Assets | |||
Aerospace & Defense | 0.5% | |||
Airlines | 0.9% | |||
Auto Components | 1.6% | |||
Automobiles | 2.3% | |||
Banks | 11.7% | |||
Beverages | 1.6% | |||
Chemicals | 0.9% | |||
Commercial Services & Supplies | 0.7% | |||
Construction Materials | 1.8% | |||
Consumer Finance | 0.7% | |||
Diversified Consumer Services | 1.5% | |||
Diversified Financial Services | 2.3% | |||
Electronic Equipment, Instruments & Components | 1.7% | |||
Energy Equipment & Services | 2.3% | |||
Food & Staples Retailing | 3.3% | |||
Food Products | 2.6% | |||
Gas Utilities | 0.4% | |||
Health Care Providers & Services | 1.7% | |||
Hotels, Restaurants & Leisure | 3.3% | |||
Industrial Conglomerates | 1.4% | |||
Information Technology Services | 2.7% | |||
Insurance | 4.8% | |||
Internet & Catalog Retail | 1.0% | |||
Industry | Percent of Net Assets | |||
Internet Software & Services | 4.0% | |||
Machinery | 1.0% | |||
Media | 3.3% | |||
Metals & Mining | 3.4% | |||
Multiline Retail | 1.8% | |||
Oil, Gas & Consumable Fuels | 3.9% | |||
Pharmaceuticals | 4.9% | |||
Professional Services | 0.3% | |||
Real Estate Investment Trusts | 1.7% | |||
Real Estate Management & Development | 0.9% | |||
Semiconductors & Semiconductor Equipment | 6.7% | |||
Software | 0.7% | |||
Specialty Retail | 0.9% | |||
Technology, Hardware Storage & Peripherals | 0.6% | |||
Textiles, Apparel & Luxury Goods | 3.0% | |||
Thrifts & Mortgage Finance | 1.0% | |||
Tobacco | 1.8% | |||
Transportation Infrastructure | 0.7% | |||
Wireless Telecommunication Services | 2.7% | |||
Other Assets in Excess of Liabilities | 5.0% | |||
|
| |||
TOTAL | 100.0% | |||
|
| |||
Notes to Financial Statements are an integral part of this Schedule.
11
Table of Contents
Driehaus Emerging Markets Small Cap Growth Fund
Performance Overview (unaudited)
The performance summarized below is historical and does not represent future results. Investment returns and principal value vary, and you may have a gain or loss when you sell shares. Performance data presented measures the change in the value of an investment in the Fund, assuming reinvestment of all dividends and capital gains. Average annual total return reflects annualized change.
The table does not reflect the deduction of taxes that a shareholder would pay on Fund distributions or the redemption of Fund shares. The graph compares the results of a $10,000 investment in the Fund since December 1, 2008 (the date of the Predecessor Limited Partnership’s inception), with all dividends and capital gains reinvested, with the indicated indices (and dividends reinvested) for the same period.
| Fund Only | Including Predecessor Limited Partnership | |||||||||||||||||||
| Average Annual Total Returns as of 06/30/14 | 1 Year | Since Inception (08/22/11 - 06/30/14) | 3 Years | 5 Years | Since Inception (12/01/08 - 06/30/14) | |||||||||||||||
Driehaus Emerging Markets Small Cap Growth Fund (DRESX)1 | 12.75% | 11.87% | 8.15% | 15.64% | 20.55% | |||||||||||||||
MSCI Emerging Markets Small Cap Index2 | 14.53% | 5.62% | 0.89% | 11.79% | 22.12% | |||||||||||||||
MSCI Emerging Markets Index3 | 14.68% | 5.72% | –0.06% | 9.58% | 16.27% | |||||||||||||||
| 1 | The Driehaus Emerging Markets Small Cap Growth Fund (the “Fund”) performance shown above includes the performance of the Driehaus Emerging Markets Small Cap Growth Fund, L.P. (the “Predecessor Limited Partnership”), the Fund’s predecessor, for the periods before the Fund’s registration statement became effective. The Predecessor Limited Partnership, which was established on December 1, 2008, was managed with substantially the same investment objective, policies and philosophies as are followed by the Fund. The Fund succeeded to the Predecessor Limited Partnership’s assets on August 22, 2011. The Predecessor Limited Partnership was not registered under the Investment Company Act of 1940, as amended (“1940 Act”), and thus was not subject to certain investment and operational restrictions that are imposed by the 1940 Act. If the Predecessor Limited Partnership had been registered under the 1940 Act, its performance may have been adversely affected. The Predecessor Limited Partnership’s performance has been restated to reflect estimated expenses of the Fund. The returns reflect fee waivers and/or reimbursements without which performance would have been lower. |
| 2 | The Morgan Stanley Capital International Emerging Markets Small Cap Index (MSCI Emerging Markets Small Cap Index) is a market capitalization-weighted index designed to measure equity market performance of small cap stocks in 23 global emerging markets. Data is in U.S. dollars. Source: Morgan Stanley Capital International Inc. |
| 3 | The Morgan Stanley Capital International Emerging Markets Index (MSCI Emerging Markets Index) is a market capitalization weighted index designed to measure equity market performance in 23 global emerging markets. Data is in U.S. dollars. Source: Morgan Stanley Capital International Inc. |
12
Table of Contents
Driehaus Emerging Markets Small Cap Growth Fund
Schedule of Investments
June 30, 2014 (unaudited)
Number of Shares | Value (Note A) | |||||||
| EQUITY SECURITIES — 82.5% | ||||||||
| FAR EAST — 47.8% | ||||||||
China — 17.3% |
| |||||||
21Vianet Group, Inc. — ADR** | 141,183 | $ | 4,231,255 | |||||
Airtac International Group | 157,000 | 1,690,518 | ||||||
Angang Steel Co., Ltd. — H | 6,763,656 | 4,363,424 | ||||||
Anton Oilfield Services Group | 3,647,940 | 2,485,178 | ||||||
AviChina Industry & Technology Co., Ltd. — H | 3,380,000 | 1,910,147 | ||||||
Biostime International Holdings, Ltd. | 243,500 | 1,350,963 | ||||||
China Animal Healthcare, Ltd. | 4,681,000 | 3,255,392 | ||||||
China Distance Education Holdings, Ltd. — ADR | 101,417 | 1,699,749 | ||||||
China Hongqiao Group, Ltd. | 4,135,000 | 2,971,711 | ||||||
China Medical System Holdings, Ltd. | 4,050,591 | 4,959,758 | ||||||
China Singyes Solar Technologies Holdings, Ltd. | 4,036,000 | 6,800,960 | ||||||
CT Environmental Group, Ltd. | 10,586,975 | 7,704,188 | ||||||
Hilong Holding, Ltd. | 4,617,353 | 2,293,663 | ||||||
TAL Education Group — ADR** | 143,236 | 3,938,990 | ||||||
Vipshop Holdings, Ltd. — ADR** | 22,233 | 4,174,023 | ||||||
Wasion Group Holdings, Ltd. | 2,382,000 | 1,788,713 | ||||||
Xinchen China Power Holdings, Ltd.** | 3,974,000 | 2,568,866 | ||||||
Xinyi Solar Holdings, Ltd. | 6,352,000 | 1,630,946 | ||||||
|
| |||||||
| 59,818,444 | ||||||||
|
| |||||||
Taiwan — 8.0% |
| |||||||
Chroma ATE, Inc. | 1,193,000 | 3,340,304 | ||||||
Eclat Textile Co., Ltd. | 314,000 | 3,806,953 | ||||||
Epistar Corp. | 1,169,000 | 2,897,247 | ||||||
Giant Manufacturing Co., Ltd. | 396,000 | 3,083,596 | ||||||
Gigasolar Materials Corp. | 89,000 | 1,773,562 | ||||||
Hermes Microvision, Inc. | 48,000 | 1,905,017 | ||||||
Hota Industrial Manufacturing Co., Ltd. | 986,000 | 1,750,218 | ||||||
Shin Zu Shing Co., Ltd. | 837,000 | 2,480,893 | ||||||
Vanguard International Semiconductor Corp. | 1,960,000 | 3,147,632 | ||||||
Voltronic Power Technology Corp. | 209,000 | 1,616,954 | ||||||
Zhen Ding Technology Holding, Ltd. | 529,000 | 1,741,600 | ||||||
|
| |||||||
| 27,543,976 | ||||||||
|
| |||||||
Number of Shares | Value (Note A) | |||||||
South Korea — 4.1% |
| |||||||
Cosmax, Inc.** | 25,563 | $ | 2,405,216 | |||||
Hansae Co., Ltd. | 100,110 | 2,706,077 | ||||||
Hotel Shilla Co., Ltd. | 23,865 | 2,155,822 | ||||||
i-SENS, Inc.** | 31,366 | 1,593,410 | ||||||
Wonik IPS Co., Ltd.** | 272,985 | 3,129,696 | ||||||
Youngone Corp. | 52,655 | 2,365,260 | ||||||
|
| |||||||
| 14,355,481 | ||||||||
|
| |||||||
Malaysia — 4.0% |
| |||||||
Berjaya Auto BHD | 2,490,000 | 1,775,802 | ||||||
Bonia Corp. BHD | 999,900 | 1,665,981 | ||||||
Dialog Group BHD | 2,347,400 | 2,770,678 | ||||||
KNM Group BHD** | 18,548,500 | 5,227,777 | ||||||
Oldtown BHD | 3,516,650 | 2,409,415 | ||||||
|
| |||||||
| 13,849,653 | ||||||||
|
| |||||||
Indonesia — 3.7% |
| |||||||
PT Ace Hardware Indonesia Tbk | 33,242,100 | 2,467,571 | ||||||
PT Bumi Serpong Damai Tbk | 20,330,100 | 2,546,622 | ||||||
PT Matahari Department Store Tbk | 3,179,966 | 3,701,690 | ||||||
PT Pakuwon Jati Tbk | 53,462,700 | 1,573,891 | ||||||
PT Vale Indonesia Tbk | 8,591,500 | 2,576,363 | ||||||
|
| |||||||
| 12,866,137 | ||||||||
|
| |||||||
Philippines — 3.5% |
| |||||||
GT Capital Holdings, Inc. | 213,020 | 4,245,759 | ||||||
Megaworld Corp. | 16,238,462 | 1,674,068 | ||||||
Nickel Asia Corp. | 3,151,200 | 2,382,351 | ||||||
Philippine Seven Corp. | 338,260 | 681,170 | ||||||
Vista Land & Lifescapes, Inc. | 21,420,368 | 3,003,268 | ||||||
|
| |||||||
| 11,986,616 | ||||||||
|
| |||||||
Thailand — 2.4% |
| |||||||
Bumrungrad Hospital PCL — NVDR | 434,900 | 1,567,811 | ||||||
Indorama Ventures PCL — NVDR | 3,936,500 | 3,365,826 | ||||||
MC Group PCL — NVDR | 5,652,400 | 3,256,813 | ||||||
|
| |||||||
| 8,190,450 | ||||||||
|
| |||||||
Sri Lanka — 1.5% |
| |||||||
Commercial Bank of Ceylon PLC | 1,715,776 | 1,851,050 | ||||||
Hatton National Bank PLC | 1,695,335 | 2,042,337 | ||||||
John Keells Holdings PLC | 814,836 | 1,374,889 | ||||||
|
| |||||||
| 5,268,276 | ||||||||
|
| |||||||
Singapore — 1.3% |
| |||||||
First Real Estate Investment Trust — REIT | 1,545,000 | 1,468,301 | ||||||
Silverlake Axis, Ltd. | 3,050,000 | 2,935,279 | ||||||
|
| |||||||
| 4,403,580 | ||||||||
|
| |||||||
Notes to Financial Statements are an integral part of this Schedule.
13
Table of Contents
Driehaus Emerging Markets Small Cap Growth Fund
Schedule of Investments
June 30, 2014 (unaudited)
Number of Shares | Value (Note A) | |||||||
Vietnam — 1.2% |
| |||||||
Hatien 1 Cement JSC** | 1,672,200 | $ | 1,081,873 | |||||
Kinh Do Corp. | 1,163,260 | 3,272,180 | ||||||
|
| |||||||
| 4,354,053 | ||||||||
|
| |||||||
Cambodia — 0.8% |
| |||||||
NagaCorp, Ltd. | 2,994,577 | 2,638,956 | ||||||
|
| |||||||
Total FAR EAST | 165,275,622 | |||||||
|
| |||||||
| SOUTH AMERICA — 9.0% | ||||||||
Brazil — 9.0% |
| |||||||
Aliansce Shopping Centers SA | 89,200 | 712,550 | ||||||
Arezzo Industria e Comercio SA | 345,900 | 4,862,482 | ||||||
B2W Cia Digital** | 129,677 | 1,638,056 | ||||||
BR Properties SA | 359,000 | 2,162,611 | ||||||
Cyrela Brazil Realty SA Empreendimentos e Participacoes | 544,000 | 3,417,389 | ||||||
Estacio Participacoes SA | 231,700 | 3,054,728 | ||||||
Gol Linhas Aereas Inteligentes SA — ADR** | 620,542 | 3,400,570 | ||||||
Linx SA | 115,841 | 2,726,812 | ||||||
Lojas Renner SA | 130,600 | 4,186,057 | ||||||
Marcopolo SA — Pref. | 813,800 | 1,583,770 | ||||||
Qualicorp SA** | 287,900 | 3,403,461 | ||||||
|
| |||||||
| 31,148,486 | ||||||||
|
| |||||||
Total SOUTH AMERICA | 31,148,486 | |||||||
|
| |||||||
| EUROPE — 8.8% | ||||||||
Turkey — 3.0% |
| |||||||
Turk Traktor ve Ziraat Makineleri AS | 137,219 | 4,469,041 | ||||||
Turkiye Sinai Kalkinma Bankasi AS | 2,067,298 | 1,688,108 | ||||||
Ulker Biskuvi Sanayi AS | 487,389 | 4,083,430 | ||||||
|
| |||||||
| 10,240,579 | ||||||||
|
| |||||||
United Kingdom — 2.4% |
| |||||||
Afren PLC** | 970,956 | 2,409,444 | ||||||
Eros International PLC** | 137,393 | 2,084,252 | ||||||
Genel Energy PLC** | 138,860 | 2,412,084 | ||||||
Hikma Pharmaceuticals PLC | 48,422 | 1,390,541 | ||||||
|
| |||||||
| 8,296,321 | ||||||||
|
| |||||||
Norway — 2.0% |
| |||||||
DNO ASA** | 1,832,395 | 7,047,156 | ||||||
Austria — 1.4% |
| |||||||
C.A.T. oil AG | 195,350 | 5,027,527 | ||||||
|
| |||||||
Total EUROPE | 30,611,583 | |||||||
|
| |||||||
| NORTH AMERICA — 8.1% | ||||||||
Canada — 3.3% |
| |||||||
Africa Oil Corp.** | 467,744 | 3,255,247 | ||||||
Number of Shares | Value (Note A) | |||||||
Gran Tierra Energy, Inc.** | 542,707 | $ | 4,406,781 | |||||
SEMAFO, Inc. | 791,208 | 3,714,870 | ||||||
|
| |||||||
| 11,376,898 | ||||||||
|
| |||||||
Mexico — 2.6% |
| |||||||
Banregio Grupo Financiero SAB de CV | 797,660 | 4,730,563 | ||||||
Qualitas Controladora SAB de CV | 970,900 | 2,802,652 | ||||||
TF Administradora Industrial S de RL de CV — REIT | 772,900 | 1,725,896 | ||||||
|
| |||||||
| 9,259,111 | ||||||||
|
| |||||||
United States — 1.2% |
| |||||||
Tahoe Resources, Inc.** | 155,792 | 4,079,311 | ||||||
British Virgin Islands — 1.0% |
| |||||||
Luxoft Holding, Inc.** | 94,261 | 3,399,052 | ||||||
|
| |||||||
Total NORTH AMERICA | 28,114,372 | |||||||
|
| |||||||
| AFRICA — 4.7% | ||||||||
South Africa — 1.7% |
| |||||||
Clicks Group, Ltd. | 284,626 | 1,699,459 | ||||||
Mr. Price Group, Ltd. | 151,155 | 2,569,848 | ||||||
PPC, Ltd. | 578,825 | 1,706,268 | ||||||
|
| |||||||
| 5,975,575 | ||||||||
|
| |||||||
Nigeria — 1.5% |
| |||||||
Guaranty Trust Bank PLC | 5,786,540 | 1,028,047 | ||||||
Seplat Petroleum Development Co. PLC** | 525,425 | 2,346,932 | ||||||
Zenith Bank PLC | 10,794,998 | 1,659,495 | ||||||
|
| |||||||
| 5,034,474 | ||||||||
|
| |||||||
Egypt — 1.1% |
| |||||||
Egyptian Financial Group-Hermes Holding SAE** | 766,055 | 1,641,382 | ||||||
Six of October Development & Investment Co.** | 452,664 | 2,049,319 | ||||||
|
| |||||||
| 3,690,701 | ||||||||
|
| |||||||
Kenya — 0.4% |
| |||||||
Safaricom, Ltd. | 10,543,400 | 1,497,608 | ||||||
|
| |||||||
Total AFRICA | 16,198,358 | |||||||
|
| |||||||
| MIDDLE EAST — 4.1% | ||||||||
Pakistan — 2.5% |
| |||||||
Fauji Fertilizer Co., Ltd. | 1,236,800 | 1,406,950 | ||||||
Lucky Cement, Ltd. | 731,417 | 3,041,301 | ||||||
MCB Bank, Ltd. | 816,000 | 2,492,035 | ||||||
United Bank, Ltd. | 993,000 | 1,696,276 | ||||||
|
| |||||||
| 8,636,562 | ||||||||
|
| |||||||
Qatar — 1.1% |
| |||||||
Al Meera Consumer Goods Co. | 30,000 | 1,394,276 | ||||||
Gulf International Services OSC | 87,011 | 2,201,207 | ||||||
|
| |||||||
| 3,595,483 | ||||||||
|
| |||||||
Notes to Financial Statements are an integral part of this Schedule.
14
Table of Contents
Driehaus Emerging Markets Small Cap Growth Fund
Schedule of Investments
June 30, 2014 (unaudited)
Number of Shares | Value (Note A) | |||||||
United Arab Emirates — 0.5% |
| |||||||
Air Arabia PJSC | 5,321,562 | $ | 1,796,650 | |||||
|
| |||||||
Total MIDDLE EAST | 14,028,695 | |||||||
|
| |||||||
Total EQUITY SECURITIES (Cost $254,255,006) | 285,377,116 | |||||||
|
| |||||||
| ||||||||
| EQUITY CERTIFICATES — 14.9% | ||||||||
| FAR EAST — 11.6% | ||||||||
India — 11.6% |
| |||||||
Amara Raja Batteries, Ltd.† | 225,609 | 1,766,011 | ||||||
Aurobindo Pharma, Ltd.† | 150,806 | 1,857,588 | ||||||
Divi’s Laboratories, Ltd.† | 84,976 | 2,061,563 | ||||||
Eicher Motors, Ltd.† | 13,454 | 1,788,323 | ||||||
Ipca Laboratories, Ltd.† | 79,744 | 1,163,908 | ||||||
Jaiprakash Associates, Ltd.† | 2,718,199 | 3,488,984 | ||||||
Just Dial, Ltd.**† | 147,831 | 3,592,850 | ||||||
Kaveri Seed Co., Ltd.† | 366,925 | 4,646,273 | ||||||
Phoenix Mills, Ltd.† | 23,670 | 126,408 | ||||||
Shriram Transport Finance Co., Ltd.† | 226,856 | 3,413,684 | ||||||
SKS Microfinance, Ltd.**† | 1,862,967 | 8,562,927 | ||||||
Sobha Developers, Ltd.† | 213,952 | 1,770,275 | ||||||
UPL, Ltd.† | 323,902 | 1,838,828 | ||||||
Va Tech Wabag, Ltd.† | 73,972 | 1,608,640 | ||||||
Yes Bank, Ltd.† | 280,980 | 2,527,629 | ||||||
|
| |||||||
| 40,213,891 | ||||||||
|
| |||||||
Total FAR EAST | 40,213,891 | |||||||
|
| |||||||
| MIDDLE EAST — 3.3% | ||||||||
Saudi Arabia — 3.3% |
| |||||||
Al Khleej Training and Education Co.† | 103,748 | 1,645,915 | ||||||
Al Tayyar Travel Group† | 106,646 | 3,419,326 | ||||||
Bank Al-Jazira**† | 201,645 | 1,645,204 | ||||||
Emaar Economic City**† | 387,075 | 1,563,575 | ||||||
Jarir Marketing Co.† | 28,307 | 1,486,863 | ||||||
Saudi Airlines Catering Co.† | 34,273 | 1,571,779 | ||||||
|
| |||||||
| 11,332,662 | ||||||||
|
| |||||||
Total MIDDLE EAST | 11,332,662 | |||||||
|
| |||||||
Total EQUITY CERTIFICATES (Cost $38,292,767) | 51,546,553 | |||||||
|
| |||||||
| ||||||||
Number of Shares | Value (Note A) | |||||||
| PURCHASED CALL OPTIONS — 0.1% | ||||||||
Equity Volatility Index Fund, Exercise Price $15.00, Expiration Date July, 2014** | 12,500 | $ | 375,000 | |||||
|
| |||||||
Total PURCHASED CALL OPTIONS | 375,000 | |||||||
| ||||||||
| PURCHASED PUT OPTIONS — 0.6% | ||||||||
iShares China Large-Cap Index Fund, Exercise Price $37.00, Expiration Date July, 2014** | 10,000 | 470,000 | ||||||
iShares MSCI Emerging Markets Index Fund, Exercise Price $42.00, Expiration Date July, 2014** | 15,000 | 225,000 | ||||||
iShares MSCI Emerging Markets Index Fund, Exercise Price $43.00, Expiration Date July, 2014** | 10,000 | 390,000 | ||||||
iShares MSCI Emerging Markets Index Fund, Exercise Price $41.00, Expiration Date August, 2014** | 10,000 | 260,000 | ||||||
Market Vectors Russia Index Fund, Exercise Price $25.00, Expiration Date August, 2014** | 10,000 | 400,000 | ||||||
United States Oil Fund LP, Exercise Price $36.00, Expiration Date July, 2014** | 10,000 | 40,000 | ||||||
Wisdom Tree India Earnings Fund, Exercise Price $22.00, Expiration Date July, 2014** | 5,000 | 125,000 | ||||||
|
| |||||||
Total PURCHASED PUT | 1,910,000 | |||||||
|
| |||||||
| ||||||||
TOTAL INVESTMENTS (COST $296,773,423) | 98.1 | % | $ | 339,208,669 | ||||
Other Assets In Excess Of Liabilities | 1.9 | % | 6,709,823 | |||||
|
|
|
| |||||
| Net Assets | 100.0 | % | $ | 345,918,492 | ||||
| ||||||||
Notes to Financial Statements are an integral part of this Schedule.
15
Table of Contents
Driehaus Emerging Markets Small Cap Growth Fund
Schedule of Investments
June 30, 2014 (unaudited)
The federal income tax basis and unrealized appreciation (depreciation) for all investments is as follows:
| Basis: | $ | 297,907,535 | ||
|
| |||
| Gross Appreciation | $ | 48,021,156 | ||
| Gross Depreciation | (6,720,022 | ) | ||
|
| |||
Net Appreciation | $ | 41,301,134 | ||
|
|
| ** | Non-income producing security |
| † | Restricted security — Investments in securities not registered under the Securities Act of 1933, excluding 144A securities. At June 30, 2014, the value of these restricted securities amounted to $51,546,553 or 14.9% of net assets. |
Additional information on each restricted security is as follows (see Note A in Notes to Financial Statements):
Security | Counter- party | Acquisition Date(s) | Acquisition Cost | |||||||||
Al Khleej Training and Education Co. | CSFB | 02/24/14 | $ | 1,400,298 | ||||||||
Al Tayyar Travel Group | MLCO | | 10/02/13 to 01/27/14 | | $ | 2,064,929 | ||||||
Amara Raja Batteries Ltd. | MLCO | 05/29/14 | $ | 1,599,297 | ||||||||
Aurobindo Pharma, Ltd. | MLCO | 10/03/13 | $ | 518,365 | ||||||||
Bank Al-Jazira | MSCO | | 02/19/13 to 05/28/13 | | $ | 1,079,842 | ||||||
Divi’s Laboratories, Ltd. | MLCO | | 11/12/13 to 06/30/14 | | $ | 1,701,253 | ||||||
Eicher Motors, Ltd. | MLCO | | 04/30/13 to 03/03/14 | | $ | 786,950 | ||||||
Emaar Economic City | MSCO | 05/29/13 | $ | 1,001,040 | ||||||||
Security | Counter- party | Acquisition Date(s) | Acquisition Cost | |||||||||
Ipca Laboratories, Ltd. | MLCO | | 03/04/13 to 03/14/13 | | $ | 721,207 | ||||||
Jaiprakash Associates, Ltd. | MLCO | | 06/24/14 to 06/30/14 | | $ | 3,354,594 | ||||||
Jarir Marketing Co. | HSBC | 12/16/13 | $ | 1,230,188 | ||||||||
Just Dial, Ltd. | MLCO | | 02/06/14 to 05/13/14 | | $ | 2,844,944 | ||||||
Kaveri Seed Co., Ltd. | MLCO | | 10/05/12 to 06/30/14 | | $ | 2,193,443 | ||||||
Phoenix Mills, Ltd. | MSCO | | 05/22/14 to 05/29/14 | | $ | 112,388 | ||||||
Saudi Airlines Catering Co. | MSCO | 03/20/14 | $ | 1,406,722 | ||||||||
Shriram Transport Finance Co., Ltd. | MLCO | | 05/20/14 to 06/19/14 | | $ | 3,401,089 | ||||||
SKS Microfinance, Ltd. | | CLSA, MLCO & MSCO | | | 11/05/13 to 06/25/14 | | $ | 6,240,869 | ||||
Sobha Developers, Ltd. | MSCO | | 05/22/14 to 06/06/14 | | $ | 1,654,577 | ||||||
UPL, Ltd. | MLCO | | 05/16/14 to 05/19/14 | | $ | 1,586,476 | ||||||
Va Tech Wabag, Ltd. | MLCO | | 03/06/14 to 03/10/14 | | $ | 839,485 | ||||||
Yes Bank, Ltd. | MLCO | 06/30/14 | $ | 2,554,811 | ||||||||
ADR — American Depository Receipt
CLSA — Credit Lyonnais Securities Asia
CSFB — CS First Boston
MLCO — Merrill Lynch & Co., Inc.
MSCO — Morgan Stanley
NVDR — Non-Voting Depository Receipt
REIT — Real Estate Investment Trust
Regional Weightings(a)(b)
Asia/Far East Ex-Japan | 59.4% | |||
South America | 9.0% | |||
North America | 8.1% | |||
Middle East | 7.4% | |||
Western Europe | 5.8% | |||
Africa | 4.7% | |||
Eastern Europe | 3.0% |
Top Ten Holdings(a)
SKS Microfinance, Ltd. | 2.5% | |||
CT Environmental Group, Ltd. | 2.2% | |||
DNO ASA | 2.0% | |||
China Singyes Solar Technologies Holdings, Ltd. | 2.0% | |||
KNM Group BHD | 1.5% | |||
C.A.T. oil AG | 1.5% | |||
China Medical System Holdings, Ltd. | 1.4% | |||
Arezzo Industria e Comercio SA | 1.4% | |||
Banregio Grupo Financiero SAB de CV | 1.4% | |||
Kaveri Seed Co., Ltd. | 1.3% |
| (a) | All percentages are stated as a percent of net assets at June 30, 2014. |
| (b) | Excludes purchased options. |
Notes to Financial Statements are an integral part of this Schedule.
16
Table of Contents
Driehaus Emerging Markets Small Cap Growth Fund
Schedule of Investments
June 30, 2014 (unaudited)
Industry | Percent of Net Assets | |||
Aerospace & Defense | 0.5% | |||
Airlines | 1.5% | |||
Auto Components | 1.2% | |||
Banks | 6.2% | |||
Capital Markets | 0.5% | |||
Chemicals | 1.9% | |||
Commercial Services & Supplies | 0.4% | |||
Construction & Engineering | 2.8% | |||
Construction Materials | 1.7% | |||
Consumer Finance | 3.5% | |||
Diversified Consumer Services | 3.0% | |||
Diversified Financial Services | 1.2% | |||
Electrical Equipment | 1.0% | |||
Electronic Equipment, Instruments & Components | 2.0% | |||
Energy Equipment & Services | 5.0% | |||
Food & Staples Retailing | 1.1% | |||
Food Products | 4.5% | |||
Health Care Equipment & Supplies | 0.5% | |||
Health Care Providers & Services | 1.4% | |||
Hotels, Restaurants & Leisure | 2.4% | |||
Household Durables | 1.0% | |||
Industrial Conglomerates | 1.4% | |||
Insurance | 0.8% | |||
Industry | Percent of Net Assets | |||
Internet & Catalog Retail | 1.7% | |||
Internet Software & Services | 2.3% | |||
IT Services | 1.0% | |||
Leisure Products | 0.9% | |||
Life Sciences Tools & Services | 0.6% | |||
Machinery | 3.5% | |||
Media | 0.6% | |||
Metals & Mining | 5.8% | |||
Multiline Retail | 2.3% | |||
Oil, Gas & Consumable Fuels | 6.3% | |||
Other | 0.7% | |||
Personal Products | 0.7% | |||
Pharmaceuticals | 3.6% | |||
Real Estate Investment Trusts | 0.9% | |||
Real Estate Management & Development | 5.0% | |||
Semiconductors & Semiconductor Equipment | 4.2% | |||
Software | 1.6% | |||
Specialty Retail | 2.9% | |||
Textiles, Apparel & Luxury Goods | 4.9% | |||
Water Utilities | 2.7% | |||
Wireless Telecommunication Services | 0.4% | |||
Other Assets in Excess of Liabilities | 1.9% | |||
|
| |||
TOTAL | 100.0% | |||
|
| |||
Notes to Financial Statements are an integral part of this Schedule.
17
Table of Contents
Driehaus International Small Cap Growth Fund
Performance Overview (unaudited)
The performance summarized below is historical and does not represent future results. Investment returns and principal value vary, and you may have a gain or loss when you sell shares. Performance data presented measures the change in the value of an investment in the Fund, assuming reinvestment of all dividends and capital gains. Average annual total return reflects annualized change.
The table does not reflect the deduction of taxes that a shareholder would pay on Fund distributions or the redemption of Fund shares. The graph compares the results of a $10,000 investment in the Fund since August 1, 2002 (the date of the Predecessor Limited Partnership’s inception), with all dividends and capital gains reinvested, with the indicated index (and dividends reinvested) for the same period.
| Fund Only | Including Predecessor Limited Partnership | |||||||||||||||||||||||
| Average Annual Total Returns as of 06/30/14 | 1 Year | 3 Years | 5 Years | Since Inception (09/17/07 - 06/30/14) | 10 Years | Since Inception (08/1/02��- 06/30/14) | ||||||||||||||||||
Driehaus International Small Cap Growth Fund (DRIOX)1 | 24.79% | 7.66% | 17.44% | 5.97% | 15.36% | 18.27% | ||||||||||||||||||
MSCI AC World ex USA Small Cap Growth Index2 | 25.54% | 6.56% | 14.57% | 3.03% | 9.25% | 11.81% | ||||||||||||||||||
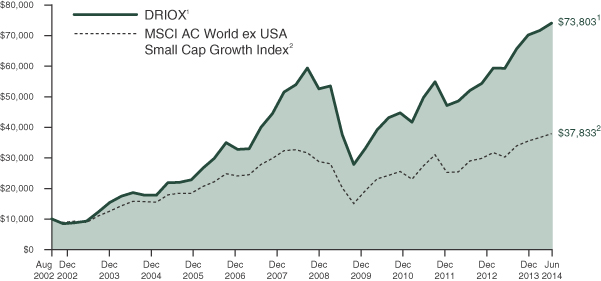
| 1 | The Driehaus International Small Cap Growth Fund (the “Fund”) performance shown above includes the performance of the Driehaus International Opportunities Fund, L.P. (the “Predecessor Limited Partnership”), the Fund’s predecessor, for the periods before the Fund’s registration statement became effective. The Predecessor Limited Partnership, which was established on August 1, 2002, was managed with substantially the same investment objective, policies and philosophies as are followed by the Fund. The Fund succeeded to the Predecessor Limited Partnership’s assets on September 17, 2007. The Predecessor Limited Partnership was not registered under the Investment Company Act of 1940, as amended (“1940 Act”), and thus was not subject to certain investment and operational restrictions that are imposed by the 1940 Act. If the Predecessor Limited Partnership had been registered under the 1940 Act, its performance may have been adversely affected. The Predecessor Limited Partnership’s performance has been restated to reflect estimated expenses of the Fund. The returns for the periods prior to January 1, 2010, reflect fee waivers and/or reimbursements without which performance would have been lower. |
| 2 | The Morgan Stanley Capital International All Country World ex USA Small Cap Growth Index (MSCI AC World ex USA Small Cap Growth Index) is a market capitalization-weighted index designed to measure equity performance in 45 global developed markets and emerging markets, excluding the U.S., and is composed of stocks which are categorized as small capitalization growth stocks. Data is in U.S. dollars. Source: Morgan Stanley Capital International, Inc. |
18
Table of Contents
Driehaus International Small Cap Growth Fund
Schedule of Investments
June 30, 2014 (unaudited)
| Number of Shares | Value (Note A) | |||||||
| EQUITY SECURITIES — 98.1% | ||||||||
| EUROPE — 54.2% | ||||||||
Germany — 16.3% |
| |||||||
Aareal Bank AG | 52,013 | $ | 2,397,313 | |||||
Aurelius AG | 70,468 | 2,574,403 | ||||||
Deutsche Annington Immobilien SE | 130,097 | 3,828,269 | ||||||
Dialog Semiconductor PLC** | 77,827 | 2,698,848 | ||||||
DMG Mori Seiki AG | 72,463 | 2,523,256 | ||||||
Drillisch AG | 97,158 | 3,871,420 | ||||||
Gerry Weber International AG | 25,426 | 1,243,273 | ||||||
Jungheinrich AG | 31,784 | 2,241,375 | ||||||
Krones AG | 36,835 | 3,651,220 | ||||||
KUKA AG | 64,174 | 3,885,765 | ||||||
LEG Immobilien AG | 51,675 | 3,480,969 | ||||||
MorphoSys AG** | 28,507 | 2,673,873 | ||||||
Nordex SE** | 167,269 | 3,717,343 | ||||||
Wirecard AG | 57,105 | 2,465,453 | ||||||
|
| |||||||
| 41,252,780 | ||||||||
|
| |||||||
United Kingdom — 11.4% |
| |||||||
Abengoa Yield PLC** | 50,100 | 1,894,782 | ||||||
AMEC PLC | 89,717 | 1,865,522 | ||||||
Ashtead Group PLC | 204,014 | 3,055,043 | ||||||
Barratt Developments PLC | 200,946 | 1,285,144 | ||||||
Bodycote PLC | 185,734 | 2,185,312 | ||||||
Britvic PLC | 396,398 | 4,935,302 | ||||||
Elementis PLC | 607,270 | 2,705,237 | ||||||
Great Portland Estates PLC — REIT | 256,235 | 2,824,058 | ||||||
Halma PLC | 307,250 | 3,099,738 | ||||||
Hays PLC | 766,630 | 1,916,837 | ||||||
Jazztel PLC** | 174,729 | 2,488,267 | ||||||
Zoopla Property Group PLC** | 139,867 | 551,741 | ||||||
|
| |||||||
| 28,806,983 | ||||||||
|
| |||||||
Switzerland — 5.3% |
| |||||||
Dufry AG** | 13,403 | 2,436,359 | ||||||
Forbo Holding AG | 4,662 | 4,970,592 | ||||||
Georg Fischer AG | 3,170 | 2,271,690 | ||||||
Temenos Group AG | 95,189 | 3,708,593 | ||||||
|
| |||||||
| 13,387,234 | ||||||||
|
| |||||||
France — 4.4% |
| |||||||
Montupet | 34,066 | 2,902,817 | ||||||
Numericable Group SA** | 37,673 | 2,243,976 | ||||||
Plastic Omnium SA | 66,520 | 2,088,599 | ||||||
Teleperformance | 61,975 | 3,798,016 | ||||||
|
| |||||||
| 11,033,408 | ||||||||
|
| |||||||
Denmark — 4.0% |
| |||||||
GN Store Nord AS | 90,348 | 2,588,554 | ||||||
Matas AS | 89,923 | 2,551,604 | ||||||
Pandora AS | 64,419 | 4,939,518 | ||||||
|
| |||||||
| 10,079,676 | ||||||||
|
| |||||||
| Number of Shares | Value (Note A) | |||||||
Luxembourg — 3.3% |
| |||||||
Aperam** | 141,058 | $ | 4,761,166 | |||||
GAGFAH SA** | 188,649 | 3,434,326 | ||||||
|
| |||||||
| 8,195,492 | ||||||||
|
| |||||||
Sweden — 3.2% |
| |||||||
Hexpol AB | 34,743 | 3,151,104 | ||||||
Husqvarna AB | 312,646 | 2,430,867 | ||||||
Trelleborg AB | 111,655 | 2,376,296 | ||||||
|
| |||||||
| 7,958,267 | ||||||||
|
| |||||||
Italy — 2.4% |
| |||||||
Anima Holding SpA** | 350,251 | 2,114,071 | ||||||
Brembo SpA | 107,366 | 3,919,454 | ||||||
|
| |||||||
| 6,033,525 | ||||||||
|
| |||||||
Spain — 1.2% |
| |||||||
Gamesa Corp Tecnologica SA** | 251,669 | 3,142,503 | ||||||
Ireland — 1.1% |
| |||||||
Greencore Group PLC | 628,744 | 2,857,927 | ||||||
Finland — 1.0% |
| |||||||
Outokumpu OYJ** | 248,539 | 2,499,688 | ||||||
Norway — 0.6% |
| |||||||
DNO ASA** | 171,128 | 658,136 | ||||||
Opera Software ASA | 68,315 | 911,037 | ||||||
|
| |||||||
| 1,569,173 | ||||||||
|
| |||||||
Total EUROPE | 136,816,656 | |||||||
|
| |||||||
| FAR EAST — 25.7% | ||||||||
Japan — 20.0% |
| |||||||
Calbee, Inc. | 111,600 | 3,077,937 | ||||||
Hoshizaki Electric Co., Ltd. | 50,576 | 2,521,187 | ||||||
Japan Aviation Electronics Industry, Ltd. | 114,919 | 2,471,828 | ||||||
Kajima Corp. | 718,033 | 3,175,350 | ||||||
Kanamoto Co., Ltd. | 64,657 | 2,575,302 | ||||||
Kose Corp. | 65,200 | 2,490,736 | ||||||
M3, Inc. | 107,700 | 1,713,759 | ||||||
Mabuchi Motor Co., Ltd. | 32,928 | 2,496,294 | ||||||
Minebea Co., Ltd. | 238,169 | 2,675,449 | ||||||
Nifco, Inc. | 93,493 | 3,119,356 | ||||||
Nihon M&A Center, Inc. | 106,802 | 3,048,925 | ||||||
Nishimatsu Construction Co., Ltd. | 438,257 | 1,864,555 | ||||||
Pigeon Corp. | 55,900 | 2,946,607 | ||||||
Tadano, Ltd. | 282,919 | 4,705,775 | ||||||
Topcon Corp. | 122,600 | 2,831,884 | ||||||
Tsuruha Holdings, Inc. | 48,080 | 2,653,050 | ||||||
Ulvac, Inc.** | 156,015 | 3,321,893 | ||||||
Zenkoku Hosho Co., Ltd. | 102,600 | 2,791,230 | ||||||
|
| |||||||
| 50,481,117 | ||||||||
|
| |||||||
Australia — 1.8% |
| |||||||
G8 Education, Ltd. | 1,060,956 | 4,601,978 | ||||||
Indonesia — 1.0% |
| |||||||
PT Matahari Department Store Tbk | 2,227,093 | 2,592,483 | ||||||
Notes to Financial Statements are an integral part of this Schedule.
19
Table of Contents
Driehaus International Small Cap Growth Fund
Schedule of Investments
June 30, 2014 (unaudited)
| Number of Shares | Value (Note A) | |||||||
South Korea — 1.0% |
| |||||||
Cosmax, Inc.** | 27,500 | $ | 2,587,468 | |||||
Philippines — 0.7% |
| |||||||
Jollibee Foods Corp. | 432,240 | 1,742,823 | ||||||
China — 0.7% |
| |||||||
AAC Technologies Holdings, Inc. | 251,000 | 1,633,845 | ||||||
Taiwan — 0.5% |
| |||||||
Eclat Textile Co., Ltd. | 109,000 | 1,321,522 | ||||||
|
| |||||||
Total FAR EAST | 64,961,236 | |||||||
|
| |||||||
| NORTH AMERICA — 14.5% | ||||||||
Canada — 14.5% |
| |||||||
Aecon Group, Inc. | 104,754 | 1,664,009 | ||||||
Air Canada** | 147,177 | 1,314,462 | ||||||
Badger Daylighting, Ltd. | 124,551 | 4,102,870 | ||||||
Canadian Energy Services & Technology Corp. | 121,712 | 3,812,019 | ||||||
Canyon Services Group, Inc. | 183,999 | 3,259,061 | ||||||
CCL Industries, Inc. — B | 50,290 | 4,842,601 | ||||||
DeeThree Exploration, Ltd.** | 120,569 | 1,288,118 | ||||||
Interfor Corp.** | 88,517 | 1,233,539 | ||||||
Linamar Corp. | 98,370 | 5,803,281 | ||||||
PrairieSky Royalty, Ltd. | 52,871 | 1,922,492 | ||||||
Secure Energy Services, Inc. | 166,475 | 3,658,534 | ||||||
Trinidad Drilling, Ltd. | 321,900 | 3,653,258 | ||||||
|
| |||||||
| 36,554,244 | ||||||||
|
| |||||||
Total NORTH AMERICA | 36,554,244 | |||||||
|
| |||||||
| Number of Shares | Value (Note A) | |||||||
| SOUTH AMERICA — 3.7% | ||||||||
Brazil — 3.7% |
| |||||||
Estacio Participacoes SA | 189,341 | $ | 2,496,268 | |||||
Gol Linhas Aereas Inteligentes SA — ADR** | 412,659 | 2,261,371 | ||||||
Lojas Renner SA | 83,400 | 2,673,179 | ||||||
Qualicorp SA** | 172,000 | 2,033,326 | ||||||
|
| |||||||
| 9,464,144 | ||||||||
|
| |||||||
Total SOUTH AMERICA | 9,464,144 | |||||||
|
| |||||||
Total EQUITY SECURITIES | 247,796,280 | |||||||
|
| |||||||
| ||||||||
TOTAL INVESTMENTS (COST $215,707,105) | 98.1 | % | $ | 247,796,280 | ||||
Other Assets In Excess Of Liabilities | 1.9 | % | 4,833,132 | |||||
|
|
|
| |||||
| Net Assets | 100.0 | % | $ | 252,629,412 | ||||
|
| |||||||
| ||||||||
The federal income tax basis and unrealized appreciation (depreciation) for all investments is as follows:
| Basis: | $ | 218,427,022 | ||
|
| |||
| Gross Appreciation | $ | 34,052,536 | ||
| Gross Depreciation | (4,683,278 | ) | ||
|
| |||
Net Appreciation | $ | 29,369,258 | ||
|
|
| ** | Non-income producing security |
ADR — American Depository Receipt
REIT — Real Estate Investment Trust
Regional Weightings*
Western Europe | 54.2% | |||
Japan | 20.0% | |||
North America | 14.5% | |||
Asia/Far East Ex-Japan | 5.7% | |||
South America | 3.7% |
Top Ten Holdings*
Linamar Corp. | 2.3% | |||
Forbo Holding AG | 2.0% | |||
Pandora AS | 2.0% | |||
Britvic PLC | 2.0% | |||
CCL Industries, Inc. — B | 1.9% | |||
Aperam | 1.9% | |||
Tadano, Ltd. | 1.9% | |||
G8 Education, Ltd. | 1.8% | |||
Badger Daylighting, Ltd. | 1.6% | |||
Brembo SpA | 1.6% |
| * | All percentages are stated as a percent of net assets at June 30, 2014. |
Notes to Financial Statements are an integral part of this Schedule.
20
Table of Contents
Driehaus International Small Cap Growth Fund
Schedule of Investments
June 30, 2014 (unaudited)
Industry | Percent of Net Assets | |||
Airlines | 1.4% | |||
Auto Components | 7.1% | |||
Beverages | 2.0% | |||
Capital Markets | 1.9% | |||
Chemicals | 2.3% | |||
Construction & Engineering | 4.3% | |||
Containers & Packaging | 1.9% | |||
Diversified Consumer Services | 2.8% | |||
Diversified Financial Services | 1.1% | |||
Diversified Telecommunication Services | 1.0% | |||
Electrical Equipment | 3.7% | |||
Electronic Equipment, Instruments & Components | 4.0% | |||
Energy Equipment & Services | 6.4% | |||
Food & Staples Retailing | 1.0% | |||
Food Products | 2.3% | |||
Health Care Equipment & Supplies | 1.0% | |||
Health Care Providers & Services | 0.8% | |||
Health Care Technology | 0.7% | |||
Hotels, Restaurants & Leisure | 0.7% | |||
Household Durables | 3.4% | |||
Household Products | 1.2% | |||
Independent Power and Renewable Electricity Producers | 0.7% | |||
Industry | Percent of Net Assets | |||
Information Technology Services | 1.0% | |||
Internet Software & Services | 0.6% | |||
Life Sciences Tools & Services | 1.1% | |||
Machinery | 11.5% | |||
Media | 0.9% | |||
Metals & Mining | 2.9% | |||
Multiline Retail | 2.1% | |||
Oil, Gas & Consumable Fuels | 1.5% | |||
Paper & Forest Products | 0.5% | |||
Personal Products | 2.0% | |||
Professional Services | 3.5% | |||
Real Estate Investment Trusts | 1.1% | |||
Real Estate Management & Development | 4.2% | |||
Semiconductors & Semiconductor Equipment | 2.4% | |||
Software | 1.5% | |||
Specialty Retail | 2.0% | |||
Textiles, Apparel & Luxury Goods | 3.0% | |||
Thrifts & Mortgage Finance | 0.9% | |||
Trading Companies & Distributors | 2.2% | |||
Wireless Telecommunication Services | 1.5% | |||
Other Assets in Excess of Liabilities | 1.9% | |||
|
| |||
TOTAL | 100.0% | |||
|
| |||
Notes to Financial Statements are an integral part of this Schedule.
21
Table of Contents
Performance Overview (unaudited)
The performance summarized below is historical and does not represent future results. Investment returns and principal value vary, and you may have a gain or loss when you sell shares. Performance data presented measures the change in the value of an investment in the Fund, assuming reinvestment of all dividends and capital gains. Average annual total return reflects annualized change.
The table does not reflect the deduction of taxes that a shareholder would pay on Fund distributions or the redemption of Fund shares. The graph compares the results of a $10,000 investment in the Fund since May 1, 2008 (the date of the Fund’s inception), with all dividends and capital gains reinvested, with the indicated index (and dividends reinvested) for the same period.
| Average Annual Total Returns as of 06/30/14 | 1 Year | 3 Years | 5 Years | Since Inception (05/01/08 - 06/30/14) | ||||||||||||
Driehaus Global Growth Fund (DRGGX)1 | 17.14% | 3.93% | 10.70% | –0.07% | ||||||||||||
MSCI AC World Growth Index2 | 23.50% | 10.82% | 15.18% | 5.01% | ||||||||||||
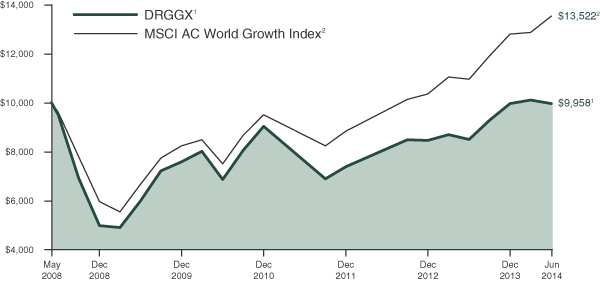
| 1 | The returns for the periods prior to September 1, 2009, reflect fee waivers and/or reimbursements without which performance would have been lower. |
| 2 | The Morgan Stanley Capital International All Country World Growth Index (MSCI AC World Growth Index) is a subset of the MSCI All Country World Index (MSCI ACWI) and includes only the MSCI ACWI stocks which are categorized as growth stocks. The MSCI ACWI is a free float-adjusted market-capitalization weighted index that is designed to measure the equity market performance of 23 developed and 23 emerging markets. Data is in U.S. dollars. Source: Morgan Stanley Capital International Inc. |
22
Table of Contents
Driehaus Global Growth Fund
Schedule of Investments
June 30, 2014 (unaudited)
| Number of Shares | Value (Note A) | |||||||
| EQUITY SECURITIES — 99.1% | ||||||||
| NORTH AMERICA — 66.4% | ||||||||
United States — 56.7% |
| |||||||
Actavis PLC** | 2,201 | $ | 490,933 | |||||
Allergan, Inc. | 2,416 | 408,835 | ||||||
Alnylam Pharmaceuticals, Inc.** | 2,688 | 169,801 | ||||||
AMERCO | 677 | 196,845 | ||||||
B/E Aerospace, Inc.** | 4,325 | 400,019 | ||||||
Biogen Idec, Inc.** | 1,227 | 386,885 | ||||||
C&J Energy Services, Inc.** | 7,395 | 249,803 | ||||||
Cabela’s, Inc.** | 7,747 | 483,413 | ||||||
Celgene Corp.** | 5,669 | 486,854 | ||||||
Chipotle Mexican Grill, Inc.** | 679 | 402,314 | ||||||
Concho Resources, Inc.** | 1,134 | 163,863 | ||||||
Constellation Brands, Inc. — A** | 3,898 | 343,531 | ||||||
Cornerstone OnDemand, Inc.** | 6,380 | 293,608 | ||||||
CoStar Group, Inc.** | 2,222 | 351,454 | ||||||
Delta Air Lines, Inc. | 6,146 | 237,973 | ||||||
Demandware, Inc.** | 7,414 | 514,309 | ||||||
DexCom, Inc.** | 6,347 | 251,722 | ||||||
Facebook, Inc. — A** | 5,259 | 353,878 | ||||||
FleetCor Technologies, Inc.** | 1,201 | 158,292 | ||||||
Gilead Sciences, Inc.** | 6,197 | 513,793 | ||||||
Google, Inc. — A** | 1,706 | 997,447 | ||||||
Guidewire Software, Inc.** | 8,217 | 334,103 | ||||||
Intercept Pharmaceuticals, Inc.** | 1,122 | 265,499 | ||||||
Jazz Pharmaceuticals PLC** | 1,140 | 167,591 | ||||||
Kirby Corp.** | 5,648 | 661,607 | ||||||
Las Vegas Sands Corp. | 10,821 | 824,777 | ||||||
LinkedIn Corp. — A** | 1,518 | 260,291 | ||||||
Lowe’s Companies, Inc. | 10,286 | 493,625 | ||||||
Lumber Liquidators Holdings, Inc.** | 5,792 | 439,902 | ||||||
Marathon Petroleum Corp. | 4,888 | 381,606 | ||||||
Mead Johnson Nutrition Co. | 2,895 | 269,727 | ||||||
Microsoft Corp. | 7,893 | 329,138 | ||||||
Mobile Mini, Inc. | 10,803 | 517,356 | ||||||
Plains GP Holdings LP — A | 10,412 | 333,080 | ||||||
Regeneron Pharmaceuticals Inc.** | 1,046 | 295,464 | ||||||
Rite Aid Corp.** | 135,923 | 974,568 | ||||||
Roper Industries, Inc. | 3,340 | 487,673 | ||||||
salesforce.com, Inc.** | 3,991 | 231,797 | ||||||
ServiceNow, Inc.** | 8,148 | 504,850 | ||||||
Targa Resources Corp. | 1,175 | 163,995 | ||||||
The Hain Celestial Group, Inc.** | 1,809 | 160,531 | ||||||
The Priceline Group, Inc.** | 351 | 422,253 | ||||||
The Williams Companies, Inc. | 2,783 | 161,998 | ||||||
TripAdvisor, Inc.** | 3,479 | 378,028 | ||||||
United Continental Holdings, Inc.** | 7,798 | 320,264 | ||||||
Valero Energy Corp. | 6,099 | 305,560 | ||||||
| Number of Shares | Value (Note A) | |||||||
Visa, Inc. — A | 2,320 | $ | 488,847 | |||||
Workday, Inc. — A** | 2,017 | 181,248 | ||||||
Yahoo!, Inc.** | 9,204 | 323,337 | ||||||
|
| |||||||
| 18,534,287 | ||||||||
|
| |||||||
Canada — 7.0% |
| |||||||
Canadian Pacific Railway, Ltd. | 2,778 | 503,207 | ||||||
Methanex Corp. | 5,558 | 343,373 | ||||||
PrairieSky Royalty, Ltd. | 8,892 | 323,330 | ||||||
Trinidad Drilling, Ltd. | 44,752 | 507,893 | ||||||
Valeant Pharmaceuticals International, Inc.** | 4,873 | 616,243 | ||||||
|
| |||||||
| 2,294,046 | ||||||||
|
| |||||||
Mexico — 2.7% |
| |||||||
Cemex SAB de CV — SP ADR** | 17,169 | 227,146 | ||||||
Fibra Uno Administracion SA de CV — REIT | 187,604 | 657,811 | ||||||
|
| |||||||
| 884,957 | ||||||||
|
| |||||||
Total NORTH AMERICA | 21,713,290 | |||||||
|
| |||||||
| FAR EAST — 17.1% | ||||||||
China — 11.8% |
| |||||||
21Vianet Group, Inc. — ADR** | 10,737 | 321,788 | ||||||
AIA Group, Ltd. | 67,231 | 337,873 | ||||||
Baidu, Inc. — SP ADR** | 2,355 | 439,938 | ||||||
Melco Crown Entertainment, Ltd. — ADR | 10,068 | 359,528 | ||||||
Michael Kors Holdings, Ltd.** | 5,029 | 445,821 | ||||||
New Oriental Education & Technology Group, Inc. — SP ADR | 13,091 | 347,828 | ||||||
Qihoo 360 Technology Co., Ltd. — ADR** | 3,706 | 341,100 | ||||||
Sands China, Ltd. | 46,673 | 352,589 | ||||||
Tencent Holdings, Ltd. | 44,480 | 678,357 | ||||||
Vipshop Holdings, Ltd. — ADR** | 1,361 | 255,514 | ||||||
|
| |||||||
| 3,880,336 | ||||||||
|
| |||||||
Japan — 3.3% |
| |||||||
F@N Communications, Inc. | 11,635 | 191,112 | ||||||
Hulic Co., Ltd. | 24,356 | 320,964 | ||||||
M3, Inc. | 11,730 | 186,652 | ||||||
Tokai Tokyo Financial Holdings, Inc. | 47,642 | 370,583 | ||||||
|
| |||||||
| 1,069,311 | ||||||||
|
| |||||||
Philippines — 1.3% |
| |||||||
Robinsons Retail Holdings, Inc. | 248,093 | 414,625 | ||||||
Cambodia — 0.7% |
| |||||||
NagaCorp, Ltd. | 270,966 | 238,787 | ||||||
|
| |||||||
Total FAR EAST | 5,603,059 | |||||||
|
| |||||||
Notes to Financial Statements are an integral part of this Schedule.
23
Table of Contents
Driehaus Global Growth Fund
Schedule of Investments
June 30, 2014 (unaudited)
| Number of Shares | Value (Note A) | |||||||
| EUROPE — 14.8% | ||||||||
United Kingdom — 5.3% |
| |||||||
Abengoa Yield PLC** | 4,682 | $ | 177,073 | |||||
Ashtead Group PLC | 32,930 | 493,116 | ||||||
ASOS PLC** | 3,223 | 163,268 | ||||||
Countrywide PLC | 27,271 | 240,124 | ||||||
Genel Energy PLC** | 20,315 | 352,884 | ||||||
St. James’s Place PLC | 24,652 | 321,482 | ||||||
|
| |||||||
| 1,747,947 | ||||||||
|
| |||||||
Italy — 1.8% |
| |||||||
Azimut Holding SpA | 9,558 | 246,312 | ||||||
Intesa Sanpaolo SpA | 105,612 | 326,250 | ||||||
|
| |||||||
| 572,562 | ||||||||
|
| |||||||
Sweden — 1.7% |
| |||||||
Assa Abloy AB — B | 11,113 | 565,501 | ||||||
Switzerland — 1.5% |
| |||||||
Roche Holding AG | 1,648 | 491,538 | ||||||
Germany — 1.5% |
| |||||||
Aurelius AG | 4,348 | 158,845 | ||||||
Continental AG | 1,412 | 327,043 | ||||||
|
| |||||||
| 485,888 | ||||||||
|
| |||||||
Ireland — 1.0% |
| |||||||
Perrigo Co., PLC | 2,316 | 337,580 | ||||||
Denmark — 1.0% |
| |||||||
GN Store Nord AS | 11,671 | 334,385 | ||||||
France — 1.0% |
| |||||||
JC Decaux SA | 8,243 | 307,575 | ||||||
|
| |||||||
Total EUROPE | 4,842,976 | |||||||
|
| |||||||
| Number of Shares | Value (Note A) | |||||||
| SOUTH AMERICA — 0.8% | ||||||||
Brazil — 0.8% |
| |||||||
Kroton Educacional SA | 8,800 | $ | 247,292 | |||||
|
| |||||||
Total SOUTH AMERICA | 247,292 | |||||||
|
| |||||||
Total EQUITY SECURITIES | 32,406,617 | |||||||
|
| |||||||
| ||||||||
TOTAL INVESTMENTS | 99.1 | % | $ | 32,406,617 | ||||
Other Assets In Excess Of Liabilities | 0.9 | % | 291,376 | |||||
|
|
|
| |||||
| Net Assets | 100.0 | % | $ | 32,697,993 | ||||
| ||||||||
The federal income tax basis and unrealized appreciation (depreciation) for all investments is as follows:
| Basis: | $ | 29,295,355 | ||
|
| |||
| Gross Appreciation | $ | 4,137,455 | ||
| Gross Depreciation | (1,026,193 | ) | ||
|
| |||
Net Appreciation | $ | 3,111,262 | ||
|
|
| ** | Non-income producing security |
ADR — American Depository Receipt
REIT— Real Estate Investment Trust
SP ADR — Sponsored American Depository Receipt
Regional Weightings*
North America | 66.4% | |||
Western Europe | 14.8% | |||
Asia/Far East Ex-Japan | 13.8% | |||
Japan | 3.3% | |||
South America | 0.8% |
Top Ten Holdings*
Google, Inc. — A | 3.1% | |||
Rite Aid Corp. | 3.0% | |||
Las Vegas Sands Corp. | 2.5% | |||
Tencent Holdings, Ltd. | 2.1% | |||
Kirby Corp. | 2.0% | |||
Fibra Uno Administracion SA de CV — REIT | 2.0% | |||
Valeant Pharmaceuticals International, Inc. | 1.9% | |||
Assa Abloy AB — B | 1.7% | |||
Mobile Mini, Inc. | 1.6% | |||
Demandware, Inc. | 1.6% |
| * | All percentages are stated as a percent of net assets at June 30, 2014. |
Notes to Financial Statements are an integral part of this Schedule.
24
Table of Contents
Driehaus Global Growth Fund
Schedule of Investments
June 30, 2014 (unaudited)
Industry | Percent of Net Assets | |||
Aerospace & Defense | 1.2% | |||
Airlines | 1.7% | |||
Auto Components | 1.0% | |||
Banks | 1.0% | |||
Beverages | 1.1% | |||
Biotechnology | 6.5% | |||
Building Products | 1.7% | |||
Capital Markets | 2.4% | |||
Chemicals | 1.1% | |||
Commercial Services & Supplies | 1.6% | |||
Construction Materials | 0.7% | |||
Diversified Consumer Services | 1.8% | |||
Energy Equipment & Services | 2.3% | |||
Food & Staples Retailing | 4.3% | |||
Food Products | 1.3% | |||
Health Care Equipment & Supplies | 1.8% | |||
Health Care Technology | 0.6% | |||
Hotels, Restaurants & Leisure | 6.7% | |||
Independent Power and Renewable Electricity Producers | 0.5% | |||
Industry | Percent of Net Assets | |||
Industrial Conglomerates | 1.5% | |||
Insurance | 2.0% | |||
Internet & Catalog Retail | 3.7% | |||
Internet Software & Services | 15.5% | |||
IT Services | 2.0% | |||
Marine | 2.0% | |||
Media | 0.9% | |||
Oil, Gas & Consumable Fuels | 6.7% | |||
Pharmaceuticals | 7.7% | |||
Real Estate Investment Trusts | 2.0% | |||
Real Estate Management & Development | 1.7% | |||
Road & Rail | 2.1% | |||
Software | 4.8% | |||
Specialty Retail | 4.3% | |||
Textiles, Apparel & Luxury Goods | 1.4% | |||
Trading Companies & Distributors | 1.5% | |||
Other Assets in Excess of Liabilities | 0.9% | |||
|
| |||
TOTAL | 100.0% | |||
|
| |||
Notes to Financial Statements are an integral part of this Schedule.
25
Table of Contents
Performance Overview (unaudited)
The performance summarized below is historical and does not represent future results. Investment returns and principal value vary, and you may have a gain or loss when you sell shares. Performance data presented measures the change in the value of an investment in the Fund, assuming reinvestment of all dividends and capital gains. Average annual total return reflects annualized change.
The table does not reflect the deduction of taxes that a shareholder would pay on Fund distributions or the redemption of Fund shares. The graph compares the results of a $10,000 investment in the Fund since January 1, 1999, with all dividends and capital gains reinvested, with the indicated index (and dividends reinvested) for the same period.
| Fund Only | Including Predecessor Limited Partnership | |||||||||||||||||||||||
| Average Annual Total Returns as of 06/30/14 | 1 Year | 3 Years | 5 Years | Since Inception (04/27/09 - 06/30/14) | 10 Years | From (01/01/99 - 06/30/14) | ||||||||||||||||||
Driehaus Mid Cap Growth Fund (DRMGX)1 | 17.54% | 9.30% | 17.70% | 17.87% | 9.51% | 9.34% | ||||||||||||||||||
Russell Midcap Growth Index2 | 26.04% | 14.54% | 21.16% | 21.92% | 9.83% | 7.31% | ||||||||||||||||||
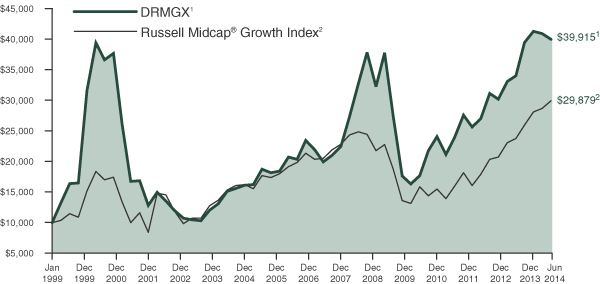
| 1 | The Driehaus Mid Cap Growth Fund (the “Fund”) performance shown above includes the performance of the Driehaus Institutional Mid Cap, L.P. (the “Predecessor Limited Partnership”), one of the Fund’s predecessors, for the periods before the Fund’s registration statement became effective. The Predecessor Limited Partnership, which was established on July 1, 1986, was managed with substantially the same investment objective, policies and philosophies as are followed by the Fund. The Fund succeeded to the Predecessor Limited Partnership’s assets together with the assets of the Driehaus Mid Cap Investors, L.P. on April 27, 2009. The Predecessor Limited Partnership was not registered under the Investment Company Act of 1940, as amended (“1940 Act”), and thus was not subject to certain investment and operational restrictions that are imposed by the 1940 Act. If the Predecessor Limited Partnership had been registered under the 1940 Act, its performance may have been adversely affected. The Predecessor Limited Partnership’s performance has been restated to reflect estimated expenses of the Fund. The returns reflect fee waivers and/or reimbursements without which performance would have been lower. |
| 2 | The Russell Midcap® Growth Index measures the performance of those Russell Midcap® Index companies with higher price-to-book ratios and higher forecasted growth values. The Russell Midcap® Index measures the performance of the 800 smallest companies in the Russell 1000® Index. Source: Russell Indices |
26
Table of Contents
Driehaus Mid Cap Growth Fund
Schedule of Investments
June 30, 2014 (unaudited)
| Number of Shares | Value (Note A) | |||||||
| EQUITY SECURITIES — 98.6% | ||||||||
| CONSUMER DISCRETIONARY — 23.6% | ||||||||
Specialty Retail — 5.7% |
| |||||||
O’Reilly Automotive, Inc.** | 2,339 | $ | 352,253 | |||||
Penske Automotive Group, Inc. | 8,297 | 410,702 | ||||||
Restoration Hardware Holdings, Inc.** | 3,533 | 328,746 | ||||||
Signet Jewelers, Ltd. | 3,415 | 377,665 | ||||||
|
| |||||||
| 1,469,366 | ||||||||
|
| |||||||
Auto Components — 4.1% |
| |||||||
Delphi Automotive PLC | 6,771 | 465,439 | ||||||
The Goodyear Tire & Rubber Co. | 21,458 | 596,103 | ||||||
|
| |||||||
| 1,061,542 | ||||||||
|
| |||||||
Automobiles — 2.6% |
| |||||||
Tesla Motors, Inc.** | 2,755 | 661,365 | ||||||
Textiles, Apparel & Luxury Goods — 2.6% |
| |||||||
Kate Spade & Co.** | 7,034 | 268,277 | ||||||
Michael Kors Holdings, Ltd.** | 4,345 | 385,184 | ||||||
|
| |||||||
| 653,461 | ||||||||
|
| |||||||
Internet & Catalog Retail — 2.3% |
| |||||||
Netflix, Inc.** | 649 | 285,949 | ||||||
Vipshop Holdings, Ltd. — ADR** | 1,645 | 308,832 | ||||||
|
| |||||||
| 594,781 | ||||||||
|
| |||||||
Hotels, Restaurants & Leisure — 2.2% |
| |||||||
Chipotle Mexican Grill, Inc.** | 538 | 318,770 | ||||||
Melco Crown Entertainment, Ltd. — ADR | 6,912 | 246,828 | ||||||
|
| |||||||
| 565,598 | ||||||||
|
| |||||||
Multiline Retail — 1.5% |
| |||||||
Big Lots, Inc. | 8,114 | 370,810 | ||||||
Household Durables — 0.9% |
| |||||||
Harman International Industries, Inc. | 2,236 | 240,214 | ||||||
Media — 0.9% |
| |||||||
Discovery Communications, Inc. — A** | 2,938 | 218,235 | ||||||
Leisure Products — 0.8% |
| |||||||
Hasbro, Inc. | 3,830 | 203,182 | ||||||
|
| |||||||
Total CONSUMER DISCRETIONARY | 6,038,554 | |||||||
|
| |||||||
| INDUSTRIALS — 19.4% | ||||||||
Professional Services — 3.3% |
| |||||||
Manpowergroup, Inc. | 5,291 | 448,941 | ||||||
Towers Watson & Co. — A | 3,693 | 384,921 | ||||||
|
| |||||||
| 833,862 | ||||||||
|
| |||||||
Machinery — 2.8% |
| |||||||
The Middleby Corp.** | 1,569 | 129,788 | ||||||
Trinity Industries, Inc. | 2,959 | 129,368 | ||||||
| Number of Shares | Value (Note A) | |||||||
WABCO Holdings, Inc.** | 4,261 | $ | 455,160 | |||||
|
| |||||||
| 714,316 | ||||||||
|
| |||||||
Commercial Services & Supplies — 2.6% |
| |||||||
Stericycle, Inc.** | 1,496 | 177,156 | ||||||
Waste Connections, Inc. | 10,037 | 487,296 | ||||||
|
| |||||||
| 664,452 | ||||||||
|
| |||||||
Electrical Equipment — 2.5% |
| |||||||
Generac Holdings, Inc.** | 6,600 | 321,684 | ||||||
SolarCity Corp.** | 4,540 | 320,524 | ||||||
|
| |||||||
| 642,208 | ||||||||
|
| |||||||
Construction & Engineering — 2.5% |
| |||||||
Quanta Services, Inc.** | 18,021 | 623,166 | ||||||
Marine — 1.9% |
| |||||||
Kirby Corp.** | 4,208 | 492,925 | ||||||
Road & Rail — 1.9% |
| |||||||
Swift Transportation Co.** | 19,459 | 490,951 | ||||||
Airlines — 0.8% |
| |||||||
Southwest Airlines Co. | 8,049 | 216,196 | ||||||
Transportation Infrastructure — 0.6% |
| |||||||
Macquarie Infrastructure Co. LLC | 2,495 | 155,613 | ||||||
Trading Companies & Distributors — 0.5% |
| |||||||
Air Lease Corp. | 3,246 | 125,231 | ||||||
|
| |||||||
Total INDUSTRIALS | 4,958,920 | |||||||
|
| |||||||
| INFORMATION TECHNOLOGY — 14.6% | ||||||||
Software — 4.6% |
| |||||||
Splunk, Inc.** | 5,699 | 315,326 | ||||||
Tableau Software, Inc. — A** | 3,235 | 230,753 | ||||||
Tyler Technologies, Inc.** | 2,121 | 193,456 | ||||||
Workday, Inc. — A** | 4,795 | 430,879 | ||||||
|
| |||||||
| 1,170,414 | ||||||||
|
| |||||||
Internet Software & Services — 4.0% |
| |||||||
Demandware, Inc.** | 3,125 | 216,781 | ||||||
Qihoo 360 Technology Co., Ltd. — ADR** | 4,540 | 417,862 | ||||||
Rackspace Hosting, Inc.** | 3,338 | 112,357 | ||||||
Yelp, Inc.** | 3,731 | 286,093 | ||||||
|
| |||||||
| 1,033,093 | ||||||||
|
| |||||||
Semiconductors & Semiconductor Equipment — 2.8% |
| |||||||
Cavium, Inc.** | 6,899 | 342,604 | ||||||
Integrated Device Technology, Inc.** | 23,747 | 367,129 | ||||||
|
| |||||||
| 709,733 | ||||||||
|
| |||||||
Communications Equipment — 1.6% |
| |||||||
Arista Networks, Inc.** | 1,923 | 119,976 | ||||||
F5 Networks, Inc.** | 2,434 | 271,245 | ||||||
|
| |||||||
| 391,221 | ||||||||
|
| |||||||
Technology Hardware, Storage & Peripherals — 1.0% |
| |||||||
Nimble Storage, Inc.** | 8,484 | 260,629 | ||||||
Notes to Financial Statements are an integral part of this Schedule.
27
Table of Contents
Driehaus Mid Cap Growth Fund
Schedule of Investments
June 30, 2014 (unaudited)
| Number of Shares | Value (Note A) | |||||||
Information Technology Services — 0.6% |
| |||||||
FleetCor Technologies, Inc.** | 1,198 | $ | 157,896 | |||||
|
| |||||||
Total INFORMATION TECHNOLOGY | 3,722,986 | |||||||
|
| |||||||
| HEALTH CARE — 11.1% | ||||||||
Health Care Equipment & Supplies — 4.2% |
| |||||||
DexCom, Inc.** | 8,934 | 354,322 | ||||||
IDEXX Laboratories, Inc.** | 4,365 | 583,033 | ||||||
STERIS Corp. | 2,396 | 128,138 | ||||||
|
| |||||||
| 1,065,493 | ||||||||
|
| |||||||
Biotechnology — 3.6% |
| |||||||
ACADIA Pharmaceuticals, Inc.** | 10,495 | 237,082 | ||||||
Alnylam Pharmaceuticals, Inc.** | 3,739 | 236,193 | ||||||
Intercept Pharmaceuticals, Inc.** | 924 | 218,646 | ||||||
Medivation, Inc.** | 3,117 | 240,258 | ||||||
|
| |||||||
| 932,179 | ||||||||
|
| |||||||
Health Care Providers & Services — 2.1% |
| |||||||
Envision Healthcare Holdings, Inc.** | 9,225 | 331,270 | ||||||
Universal Health Services, Inc. — B | 2,270 | 217,375 | ||||||
|
| |||||||
| 548,645 | ||||||||
|
| |||||||
Health Care Technology — 1.2% |
| |||||||
Veeva Systems, Inc. — A** | 11,765 | 299,419 | ||||||
|
| |||||||
Total HEALTH CARE | 2,845,736 | |||||||
|
| |||||||
| CONSUMER STAPLES — 10.9% | ||||||||
Food Products — 5.6% |
| |||||||
Keurig Green Mountain, Inc. | 2,882 | 359,126 | ||||||
The Hershey Co. | 5,482 | 533,782 | ||||||
The WhiteWave Foods Co.** | 16,941 | 548,380 | ||||||
|
| |||||||
| 1,441,288 | ||||||||
|
| |||||||
Beverages — 2.8% |
| |||||||
Constellation Brands, Inc. — A** | 8,217 | 724,164 | ||||||
Food & Staples Retailing — 2.5% |
| |||||||
Rite Aid Corp.** | 87,084 | 624,392 | ||||||
|
| |||||||
Total CONSUMER STAPLES | 2,789,844 | |||||||
|
| |||||||
| ENERGY — 8.4% | ||||||||
Oil, Gas & Consumable Fuels — 4.4% |
| |||||||
Athlon Energy, Inc.** | 3,712 | 177,062 | ||||||
Eclipse Resources Corp.** | 3,303 | 83,004 | ||||||
Rice Energy, Inc.** | 11,590 | 352,916 | ||||||
Whiting Petroleum Corp.** | 6,405 | 514,001 | ||||||
|
| |||||||
| 1,126,983 | ||||||||
|
| |||||||
Energy Equipment & Services — 4.0% |
| |||||||
CARBO Ceramics, Inc. | 1,378 | 212,377 | ||||||
Nabors Industries, Ltd. | 11,253 | 330,501 | ||||||
| Number of Shares | Value (Note A) | |||||||
RPC, Inc. | 20,615 | $ | 484,246 | |||||
|
| |||||||
| 1,027,124 | ||||||||
|
| |||||||
Total ENERGY | 2,154,107 | |||||||
|
| |||||||
| FINANCIALS — 6.2% | ||||||||
Real Estate Investment Trusts — 3.9% |
| |||||||
Crown Castle International Corp. — REIT | 8,088 | 600,615 | ||||||
Ryman Hospitality Properties, Inc. — REIT | 8,076 | 388,859 | ||||||
|
| |||||||
| 989,474 | ||||||||
|
| |||||||
Capital Markets — 1.6% |
| |||||||
Lazard, Ltd. MLP — A | 8,023 | 413,666 | ||||||
Banks — 0.7% |
| |||||||
BankUnited, Inc. | 5,353 | 179,219 | ||||||
|
| |||||||
Total FINANCIALS | 1,582,359 | |||||||
|
| |||||||
| MATERIALS — 4.4% | ||||||||
Construction Materials — 2.5% |
| |||||||
Eagle Materials, Inc. | 6,722 | 633,750 | ||||||
Containers & Packaging — 1.9% |
| |||||||
Crown Holdings, Inc.** | 9,773 | 486,305 | ||||||
|
| |||||||
Total MATERIALS | 1,120,055 | |||||||
|
| |||||||
Total EQUITY SECURITIES (Cost $21,919,379) | 25,212,561 | |||||||
|
| |||||||
| ||||||||
TOTAL INVESTMENTS (COST $21,919,379) | 98.6 | % | $ | 25,212,561 | ||||
Other Assets In Excess Of Liabilities | 1.4 | % | 370,463 | |||||
|
|
|
| |||||
| Net Assets | 100.0 | % | $ | 25,583,024 | ||||
| ||||||||
The federal income tax basis and unrealized appreciation (depreciation) for all investments is as follows:
| Basis: | $ | 21,973,503 | ||
|
| |||
| Gross Appreciation | $ | 3,593,777 | ||
| Gross Depreciation | (354,719 | ) | ||
|
| |||
Net Appreciation | $ | 3,293,058 | ||
|
|
| ** | Non-income producing security |
ADR — American Depository Receipt
REIT — Real Estate Investment Trust
Notes to Financial Statements are an integral part of this Schedule.
28
Table of Contents
Driehaus Mid Cap Growth Fund
Schedule of Investments
June 30, 2014 (unaudited)
Top Ten Holdings*
Constellation Brands, Inc. — A | 2.8% | |||
Tesla Motors, Inc. | 2.6% | |||
Eagle Materials, Inc. | 2.5% | |||
Rite Aid Corp. | 2.4% | |||
Quanta Services, Inc. | 2.4% | |||
Crown Castle International Corp. — REIT | 2.3% | |||
The Goodyear Tire & Rubber Co. | 2.3% | |||
IDEXX Laboratories, Inc. | 2.3% | |||
The WhiteWave Foods Co. — A | 2.1% | |||
The Hershey Co. | 2.1% |
| * | All percentages are stated as a percent of net assets at June 30, 2014. |
Notes to Financial Statements are an integral part of this Schedule.
29
Table of Contents
Driehaus Micro Cap Growth Fund
Performance Overview (unaudited)
The performance summarized below is historical and does not represent future results. Investment returns and principal value vary, and you may have a gain or loss when you sell shares. Performance data presented measures the change in the value of an investment in the Fund, assuming reinvestment of all dividends and capital gains. Average annual total return reflects annualized change.
The table does not reflect the deduction of taxes that a shareholder would pay on Fund distributions or the redemption of Fund shares. The graph compares the results of a $10,000 investment in the Fund since January 1, 2003, with all dividends and capital gains reinvested, with the indicated index (and dividends reinvested) for the same period.
| Fund Only | Including Predecessor Limited Partnership | |||||||||||||||||||||||
| Average Annual Total Returns as of 06/30/14 | Since Inception (11/18/13 - 06/30/14) | 1 Year | 3 Years | 5 Years | 10 Years | From (01/01/03 - 06/30/14) | ||||||||||||||||||
Driehaus Micro Cap Growth Fund (DMCRX)1 | 6.00% | 23.58% | 15.49% | 20.47% | 12.29% | 18.39% | ||||||||||||||||||
Russell Microcap® Growth Index2 | 8.32% | 26.70% | 15.42% | 19.93% | 6.73% | 10.93% | ||||||||||||||||||
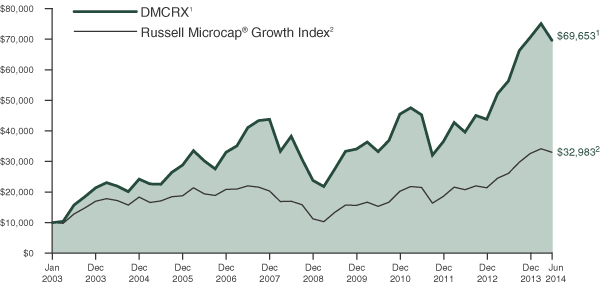
| 1 | The Driehaus Micro Cap Growth Fund (the “Fund”) performance shown above includes the performance of the Driehaus Micro Cap Fund, L.P. (the “Predecessor Limited Partnership”), one of the Fund’s predecessors, for the periods before the Fund’s registration statement became effective. The Predecessor Limited Partnership, which was established on July 1, 1996, was managed with substantially the same investment objective, policies and philosophies as are followed by the Fund. The Fund succeeded to the Predecessor Limited Partnership’s assets together with the assets of the Driehaus Institutional Micro Cap Fund, L.P. on November 18, 2013. The Predecessor Limited Partnership was not registered under the Investment Company Act of 1940, as amended (“1940 Act”), and thus was not subject to certain investment and operational restrictions that are imposed by the 1940 Act. If the Predecessor Limited Partnership had been registered under the 1940 Act, its performance may have been adversely affected. The Predecessor Limited Partnership’s performance has been restated to reflect estimated expenses of the Fund. The returns reflect fee waivers and/or reimbursements without which performance would have been lower. |
| 2 | The Russell Microcap® Growth Index is constructed to provide a comprehensive and unbiased barometer of the micro cap growth market. Based on ongoing empirical research of investment manager behavior, the methodology used to determine growth probability approximates the aggregate microcap growth manager's opportunity set. |
30
Table of Contents
Driehaus Micro Cap Growth Fund
Schedule of Investments
June 30, 2014 (unaudited)
| Number of Shares | Value (Note A) | |||||||
| EQUITY SECURITIES — 98.4% | ||||||||
| HEALTH CARE — 30.4% | ||||||||
Biotechnology — 17.6% |
| |||||||
ACADIA Pharmaceuticals, Inc.** | 22,794 | $ | 514,916 | |||||
Acceleron Pharma, Inc.** | 18,282 | 621,040 | ||||||
Agenus, Inc.** | 189,841 | 611,288 | ||||||
Agios Pharmaceuticals, Inc.** | 26,081 | 1,195,031 | ||||||
Alder Biopharmaceuticals, Inc.** | 28,094 | 563,847 | ||||||
Aquinox Pharmaceuticals, Inc.** | 40,149 | 376,196 | ||||||
Arrowhead Research Corp.** | 61,388 | 878,462 | ||||||
Auspex Pharmaceuticals, Inc.** | 26,234 | 584,231 | ||||||
Bluebird Bio, Inc.** | 23,926 | 922,826 | ||||||
Cytokinetics, Inc.** | 58,311 | 278,727 | ||||||
Dyax Corp.** | 117,428 | 1,127,309 | ||||||
Epizyme, Inc.** | 31,602 | 983,454 | ||||||
Heron Therapeutics, Inc.** | 75,876 | 934,792 | ||||||
Karyopharm Therapeutics, Inc.** | 17,646 | 821,421 | ||||||
Kindred Biosciences, Inc.** | 40,638 | 757,492 | ||||||
Ligand Pharmaceuticals, Inc.** | 24,704 | 1,538,812 | ||||||
MacroGenics, Inc.** | 17,222 | 374,234 | ||||||
Mirati Therapeutics, Inc.** | 26,459 | 529,180 | ||||||
NewLink Genetics Corp.** | 21,202 | 562,913 | ||||||
Oncothyreon, Inc.** | 180,446 | 584,645 | ||||||
Orexigen Therapeutics, Inc.** | 107,782 | 666,093 | ||||||
Receptos, Inc.** | 24,237 | 1,032,496 | ||||||
Rigel Pharmaceuticals, Inc.** | 127,753 | 463,743 | ||||||
Sangamo BioSciences, Inc.** | 18,175 | 277,532 | ||||||
Tekmira Pharmaceuticals Corp.** | 9,727 | 127,035 | ||||||
XOMA Corp.** | 210,846 | 967,783 | ||||||
|
| |||||||
| 18,295,498 | ||||||||
|
| |||||||
Pharmaceuticals — 6.5% |
| |||||||
AcelRx Pharmaceuticals, Inc.** | 94,919 | 972,920 | ||||||
ANI Pharmaceuticals, Inc.** | 34,443 | 1,186,217 | ||||||
Aratana Therapeutics, Inc.** | 40,361 | 630,035 | ||||||
AVANIR Pharmaceuticals, Inc. — A** | 103,881 | 585,889 | ||||||
Corium International, Inc.** | 78,488 | 609,852 | ||||||
Horizon Pharma, Inc.** | 60,168 | 951,858 | ||||||
Parnell Pharmaceuticals Holdings Ltd.** | 32,156 | 221,876 | ||||||
Repros Therapeutics, Inc.** | 21,097 | 364,978 | ||||||
Revance Therapeutics, Inc.** | 37,063 | 1,260,142 | ||||||
|
| |||||||
| 6,783,767 | ||||||||
|
| |||||||
| Number of Shares | Value (Note A) | |||||||
Health Care Equipment & Supplies — 5.0% |
| |||||||
AtriCure, Inc.** | 37,291 | $ | 685,409 | |||||
Novadaq Technologies, Inc.** | 39,165 | 645,439 | ||||||
Oxford Immunotec Global PLC** | 43,135 | 725,962 | ||||||
STAAR Surgical Co.** | 40,987 | 688,582 | ||||||
The Spectranetics Corp.** | 53,182 | 1,216,804 | ||||||
TriVascular Technologies, Inc.** | 37,275 | 580,372 | ||||||
Zeltiq Aesthetics, Inc.** | 39,650 | 602,284 | ||||||
|
| |||||||
| 5,144,852 | ||||||||
|
| |||||||
Life Sciences Tools & Services — 1.3% |
| |||||||
Cambrex Corp.** | 29,261 | 605,703 | ||||||
Fluidigm Corp.** | 17,192 | 505,445 | ||||||
NanoString Technologies, Inc.** | 16,697 | 249,620 | ||||||
|
| |||||||
| 1,360,768 | ||||||||
|
| |||||||
Total HEALTH CARE | 31,584,885 | |||||||
|
| |||||||
| CONSUMER DISCRETIONARY — 17.7% | ||||||||
Hotels, Restaurants & Leisure — 5.1% |
| |||||||
Century Casinos, Inc.** | 82,711 | 478,897 | ||||||
Del Frisco’s Restaurant Group, Inc.** | 36,081 | 994,392 | ||||||
Fiesta Restaurant Group, Inc.** | 22,493 | 1,043,900 | ||||||
Ignite Restaurant Group, Inc.** | 29,187 | 424,963 | ||||||
Kona Grill, Inc.** | 39,290 | 762,619 | ||||||
Ruby Tuesday, Inc.** | 94,303 | 715,760 | ||||||
Zoe’s Kitchen, Inc.** | 24,220 | 832,684 | ||||||
|
| |||||||
| 5,253,215 | ||||||||
|
| |||||||
Auto Components — 3.2% |
| |||||||
Gentherm, Inc.** | 41,776 | 1,856,943 | ||||||
Motorcar Parts of America, Inc.** | 23,930 | 582,695 | ||||||
Tower International, Inc.** | 24,758 | 912,085 | ||||||
|
| |||||||
| 3,351,723 | ||||||||
|
| |||||||
Media — 2.5% |
| |||||||
Carmike Cinemas, Inc.** | 25,826 | 907,267 | ||||||
Rentrak Corp.** | 32,444 | 1,701,688 | ||||||
|
| |||||||
| 2,608,955 | ||||||||
|
| |||||||
Specialty Retail — 1.8% |
| |||||||
Christopher & Banks Corp.** | 58,338 | 511,041 | ||||||
MarineMax, Inc.** | 84,326 | 1,411,617 | ||||||
|
| |||||||
| 1,922,658 | ||||||||
|
| |||||||
Leisure Products — 1.6% |
| |||||||
JAKKS Pacific, Inc. | 133,771 | 1,035,388 | ||||||
Malibu Boats, Inc. — A** | 33,244 | 668,204 | ||||||
|
| |||||||
| 1,703,592 | ||||||||
|
| |||||||
Notes to Financial Statements are an integral part of this Schedule.
31
Table of Contents
Driehaus Micro Cap Growth Fund
Schedule of Investments
June 30, 2014 (unaudited)
| Number of Shares | Value (Note A) | |||||||
Multiline Retail — 1.4% |
| |||||||
Tuesday Morning Corp.** | 79,356 | $ | 1,414,124 | |||||
Household Durables — 1.3% |
| |||||||
Universal Electronics, Inc.** | 27,036 | 1,321,520 | ||||||
Distributors — 0.8% |
| |||||||
Core-Mark Holding Co., Inc. | 17,296 | 789,216 | ||||||
|
| |||||||
Total CONSUMER DISCRETIONARY | 18,365,003 | |||||||
|
| |||||||
| INFORMATION TECHNOLOGY — 17.4% | ||||||||
Software — 6.3% |
| |||||||
Callidus Software, Inc.** | 134,226 | 1,602,658 | ||||||
ClickSoftware Technologies, Ltd. | 106,603 | 860,286 | ||||||
Interactive Intelligence Group, Inc.** | 40,383 | 2,266,698 | ||||||
Materialise NV — ADR** | 40,216 | 462,484 | ||||||
Proofpoint, Inc.** | 35,182 | 1,317,918 | ||||||
|
| |||||||
| 6,510,044 | ||||||||
|
| |||||||
Internet Software & Services — 3.6% |
| |||||||
GTT Communications, Inc.** | 104,544 | 1,067,394 | ||||||
Marketo, Inc.** | 21,795 | 633,799 | ||||||
SPS Commerce, Inc.** | 17,298 | 1,093,061 | ||||||
Tucows, Inc. — A** | 29,957 | 366,674 | ||||||
Wix.com, Ltd.** | 27,641 | 548,397 | ||||||
|
| |||||||
| 3,709,325 | ||||||||
|
| |||||||
Semiconductors & Semiconductor Equipment — 3.4% |
| |||||||
Ambarella, Inc.** | 20,123 | 627,435 | ||||||
Applied Micro Circuits Corp.** | 73,424 | 793,713 | ||||||
Inphi Corp.** | 48,482 | 711,716 | ||||||
Silicon Motion Technology Corp. — ADR | 71,062 | 1,451,797 | ||||||
|
| |||||||
| 3,584,661 | ||||||||
|
| |||||||
Technology Hardware, Storage & Peripherals — 1.4% |
| |||||||
Super Micro Computer, Inc.** | 57,635 | 1,456,436 | ||||||
Information Technology Services — 0.9% |
| |||||||
Virtusa Corp.** | 27,490 | 984,142 | ||||||
Electronic Equipment, Instruments & Components — 0.9% |
| |||||||
Methode Electronics, Inc. | 24,110 | 921,243 | ||||||
Communications Equipment — 0.9% |
| |||||||
Alliance Fiber Optic Products, Inc. | 19,290 | 349,149 | ||||||
ShoreTel, Inc.** | 81,467 | 531,165 | ||||||
|
| |||||||
| 880,314 | ||||||||
|
| |||||||
Total INFORMATION TECHNOLOGY | 18,046,165 | |||||||
|
| |||||||
| INDUSTRIALS — 12.7% | ||||||||
Machinery — 3.2% |
| |||||||
Columbus McKinnon Corp. | 17,462 | 472,347 | ||||||
Lydall, Inc.** | 19,719 | 539,709 | ||||||
Manitex International, Inc.** | 77,643 | 1,260,922 | ||||||
| Number of Shares | Value (Note A) | |||||||
NN, Inc. | 27,295 | $ | 698,206 | |||||
Twin Disc, Inc. | 10,537 | 348,248 | ||||||
|
| |||||||
| 3,319,432 | ||||||||
|
| |||||||
Building Products — 1.9% |
| |||||||
Insteel Industries, Inc. | 27,457 | 539,530 | ||||||
Patrick Industries, Inc.** | 30,870 | 1,438,233 | ||||||
|
| |||||||
| 1,977,763 | ||||||||
|
| |||||||
Electrical Equipment — 1.8% |
| |||||||
Hydrogenics Corp.** | 21,425 | 400,219 | ||||||
Plug Power, Inc.** | 87,732 | 410,586 | ||||||
Power Solutions International, Inc.** | 9,709 | 698,757 | ||||||
TCP International Holdings, Ltd.** | 39,649 | 406,799 | ||||||
|
| |||||||
| 1,916,361 | ||||||||
|
| |||||||
Trading Companies & Distributors — 1.7% |
| |||||||
H&E Equipment Services, Inc.** | 32,216 | 1,170,729 | ||||||
Stock Building Supply Holdings, Inc.** | 29,128 | 574,695 | ||||||
|
| |||||||
| 1,745,424 | ||||||||
|
| |||||||
Road & Rail — 1.4% |
| |||||||
Marten Transport, Ltd. | 43,060 | 962,391 | ||||||
Quality Distribution, Inc.** | 37,034 | 550,325 | ||||||
|
| |||||||
| 1,512,716 | ||||||||
|
| |||||||
Professional Services — 1.1% |
| |||||||
Paylocity Holding Corp.** | 53,711 | 1,161,769 | ||||||
Construction & Engineering — 0.7% |
| |||||||
Argan, Inc. | 18,932 | 705,974 | ||||||
Aerospace & Defense — 0.5% |
| |||||||
Taser International, Inc.** | 36,259 | 482,245 | ||||||
Air Freight & Logistics — 0.4% |
| |||||||
Air Transport Services Group, Inc.** | 46,161 | 386,368 | ||||||
|
| |||||||
Total INDUSTRIALS | 13,208,052 | |||||||
|
| |||||||
| ENERGY — 10.0% | ||||||||
Oil, Gas & Consumable Fuels — 8.4% |
| |||||||
Ardmore Shipping Corp. | 48,468 | 670,312 | ||||||
Callon Petroleum Co.** | 156,983 | 1,828,852 | ||||||
Green Plains, Inc. | 31,610 | 1,039,021 | ||||||
Nordic American Offshore, Ltd. | 31,265 | 598,099 | ||||||
Penn Virginia Corp.** | 47,729 | 809,007 | ||||||
PetroQuest Energy, Inc.** | 131,952 | 992,279 | ||||||
Synergy Resources Corp.** | 116,375 | 1,541,969 | ||||||
Triangle Petroleum Corp.** | 79,666 | 936,076 | ||||||
Warren Resources, Inc.** | 54,512 | 337,974 | ||||||
|
| |||||||
| 8,753,589 | ||||||||
|
| |||||||
Energy Equipment & Services — 1.6% |
| |||||||
Basic Energy Services, Inc.** | 14,662 | 428,424 | ||||||
Enservco Corp.** | 19,390 | 50,026 | ||||||
Notes to Financial Statements are an integral part of this Schedule.
32
Table of Contents
Driehaus Micro Cap Growth Fund
Schedule of Investments
June 30, 2014 (unaudited)
| Number of Shares | Value (Note A) | |||||||
Natural Gas Services Group, Inc.** | 36,019 | $ | 1,190,788 | |||||
|
| |||||||
| 1,669,238 | ||||||||
|
| |||||||
Total ENERGY | 10,422,827 | |||||||
|
| |||||||
| CONSUMER STAPLES — 3.4% | ||||||||
Food Products — 2.9% |
| |||||||
Boulder Brands, Inc.** | 35,349 | 501,249 | ||||||
Inventure Foods, Inc.** | 72,112 | 812,702 | ||||||
SunOpta, Inc.** | 123,354 | 1,736,824 | ||||||
|
| |||||||
| 3,050,775 | ||||||||
|
| |||||||
Beverages — 0.5% |
| |||||||
Craft Brew Alliance, Inc.** | 48,166 | 532,716 | ||||||
|
| |||||||
Total CONSUMER STAPLES | 3,583,491 | |||||||
|
| |||||||
| TELECOMMUNICATION SERVICES — 3.2% | ||||||||
Diversified Telecommunication Services — 3.2% |
| |||||||
8X8, Inc.** | 184,452 | 1,490,372 | ||||||
inContact, Inc.** | 205,851 | 1,891,771 | ||||||
|
| |||||||
| 3,382,143 | ||||||||
|
| |||||||
Total TELECOMMUNICATION SERVICES |
| 3,382,143 | ||||||
|
| |||||||
| FINANCIALS — 2.9% | ||||||||
Capital Markets — 1.9% |
| |||||||
ICG Group, Inc.** | 70,085 | 1,463,375 | ||||||
Marcus & Millichap, Inc.** | 19,927 | 508,338 | ||||||
|
| |||||||
| 1,971,713 | ||||||||
|
| |||||||
| Number of Shares | Value (Note A) | |||||||
Real Estate Investment Trusts — 1.0% |
| |||||||
Summit Hotel Properties, Inc. — REIT | 97,125 | $ | 1,029,525 | |||||
|
| |||||||
Total FINANCIALS | 3,001,238 | |||||||
|
| |||||||
| MATERIALS — 0.7% | ||||||||
Chemicals — 0.7% |
| |||||||
Rentech, Inc.** | 281,537 | $ | 729,181 | |||||
|
| |||||||
Total ENERGY | 729,181 | |||||||
|
| |||||||
Total EQUITY SECURITIES (Cost $85,964,786) | 102,322,985 | |||||||
|
| |||||||
| ||||||||
TOTAL INVESTMENTS (COST $85,964,786) | 98.4 | % | $ | 102,322,985 | ||||
Other Assets In Excess Of Liabilities | 1.6 | % | 1,630,696 | |||||
|
|
|
| |||||
| Net Assets | 100.0 | % | $ | 103,953,681 | ||||
| ||||||||
The federal income tax basis and unrealized appreciation (depreciation) for all investments is as follows:
| Basis: | $ | 86,369,715 | ||
|
| |||
| Gross Appreciation | $ | 19,081,296 | ||
| Gross Depreciation | (3,128,026 | ) | ||
|
| |||
Net Appreciation | $ | 15,953,270 | ||
|
|
| ** | Non-income producing security |
| ADR | — American Depository Receipt |
| REIT | — Real Estate Investment Trust |
Top Ten Holdings*
Interactive Intelligence Group, Inc. | 2.2% | |||
inContact, Inc. | 1.8% | |||
Gentherm, Inc. | 1.8% | |||
Callon Petroleum Co. | 1.8% | |||
SunOpta, Inc. | 1.7% | |||
Rentrak Corp. | 1.6% | |||
Callidus Software, Inc. | 1.5% | |||
Synergy Resources Corp. | 1.5% | |||
Ligand Pharmaceuticals, Inc. | 1.5% | |||
8X8, Inc. | 1.4% |
| * | All percentages are stated as a percent of net assets at June 30, 2014. |
Notes to Financial Statements are an integral part of this Schedule.
33
Table of Contents
Statements of Assets and Liabilities
June 30, 2014 (unaudited)
| Driehaus International Discovery Fund | Driehaus Emerging Markets Growth Fund | |||||||
ASSETS: | ||||||||
Investments, at cost | $ | 103,557,543 | $ | 1,658,117,748 | ||||
|
|
|
| |||||
Investments, at market value | $ | 115,892,662 | $ | 1,866,362,170 | ||||
Foreign currency* | 689,956 | 42,430,862 | ||||||
Cash | 2,548,699 | 72,638,962 | ||||||
Segregated cash | — | — | ||||||
Receivables: | ||||||||
Dividends | 339,115 | 3,306,492 | ||||||
Interest | — | — | ||||||
Investment securities sold | 1,742,021 | 79,479,893 | ||||||
Fund shares sold | 2,740 | 8,223,750 | ||||||
Net unrealized appreciation on unsettled foreign currency transactions | — | — | ||||||
Prepaid expenses | 8,535 | 57,810 | ||||||
|
|
|
| |||||
| ||||||||
TOTAL ASSETS | 121,223,728 | 2,072,499,939 | ||||||
|
|
|
| |||||
| ||||||||
LIABILITIES: | ||||||||
Payables: | ||||||||
Investment securities purchased | 2,405,017 | 102,776,902 | ||||||
Fund shares redeemed | 43,464 | 1,974,561 | ||||||
Net unrealized depreciation on unsettled foreign currency transactions | 1,676 | 88,501 | ||||||
Due to affiliates | 120,807 | 2,351,124 | ||||||
Audit and tax fees | 35,220 | 37,150 | ||||||
Accrued expenses | 39,148 | 236,602 | ||||||
|
|
|
| |||||
| ||||||||
TOTAL LIABILITIES | 2,645,332 | 107,464,840 | ||||||
|
|
|
| |||||
| ||||||||
NET ASSETS | $ | 118,578,396 | $ | 1,965,035,099 | ||||
|
|
|
| |||||
SHARES OUTSTANDING (Unlimited shares authorized, no par value) | 3,700,739 | 58,221,025 | ||||||
|
|
|
| |||||
NET ASSET VALUE | $ | 32.04 | $ | 33.75 | ||||
|
|
|
| |||||
| ||||||||
NET ASSETS CONSISTED OF THE FOLLOWING AT JUNE 30, 2014: | ||||||||
Paid-in capital | $ | 330,219,676 | $ | 1,733,895,206 | ||||
Accumulated net investment income (loss) | 245,686 | 1,679,790 | ||||||
Accumulated net realized gain (loss) | (224,254,982 | ) | 21,510,942 | |||||
Unrealized net foreign exchange gain (loss) | 32,897 | (295,261 | ) | |||||
Unrealized net appreciation (depreciation) on investments | 12,335,119 | 208,244,422 | ||||||
|
|
|
| |||||
NET ASSETS | $ | 118,578,396 | $ | 1,965,035,099 | ||||
|
|
|
| |||||
| ||||||||
| * | The cost of foreign currency was $680,961, $42,385,930, $5,201,260, $2,547,408, $97,627, $0 and $0, respectively. |
Notes to Financial Statements are an integral part of these Statements.
34
Table of Contents
Statements of Assets and Liabilities
June 30, 2014 (unaudited)
| Driehaus Emerging Markets Small Cap Growth Fund | Driehaus International Small Cap Growth Fund | Driehaus Global Growth Fund | Driehaus Mid Cap Growth Fund | Driehaus Micro Cap Growth Fund | ||||||||||||||
| $ | 296,773,423 | $ | 215,707,105 | $ | 29,151,476 | $ | 21,919,379 | $ | 85,964,786 | |||||||||
|
|
|
|
|
|
|
|
|
| |||||||||
| $ | 339,208,669 | $ | 247,796,280 | $ | 32,406,617 | $ | 25,212,561 | $ | 102,322,985 | |||||||||
| 5,205,820 | 2,560,012 | 96,800 | — | — | ||||||||||||||
| 25,032,923 | 6,211,771 | 906,421 | 400,737 | 2,198,486 | ||||||||||||||
| 755,002 | — | — | — | — | ||||||||||||||
| 258,692 | 544,689 | 11,653 | 6,528 | 17 | ||||||||||||||
| — | — | — | — | — | ||||||||||||||
| 5,201,301 | 549,869 | 373,288 | 308,212 | 2,218,160 | ||||||||||||||
| 2,231,839 | 64,830 | — | — | 17,603 | ||||||||||||||
| | 3,742 | | — | — | — | — | ||||||||||||
| 19,336 | 1,239 | 9,880 | 7,733 | 14,011 | ||||||||||||||
|
|
|
|
|
|
|
|
|
| |||||||||
|
|
|
| |||||||||||||||
| 377,917,324 | 257,728,690 | 33,804,659 | 25,935,771 | 106,771,262 | ||||||||||||||
|
|
|
|
|
|
|
|
|
| |||||||||
|
|
|
| |||||||||||||||
| 30,844,815 | 3,968,050 | 1,025,645 | 286,953 | 2,628,842 | ||||||||||||||
| 655,499 | 745,747 | — | 2,979 | 33,189 | ||||||||||||||
| | — | | 1,378 | 1 | — | — | ||||||||||||
| 410,381 | 309,846 | 26,546 | 21,958 | 102,572 | ||||||||||||||
| 30,998 | 32,720 | 30,488 | 24,210 | 24,210 | ||||||||||||||
| 57,139 | 41,537 | 23,986 | 16,647 | 28,768 | ||||||||||||||
|
|
|
|
|
|
|
|
|
| |||||||||
|
|
|
| |||||||||||||||
| 31,998,832 | 5,099,278 | 1,106,666 | 352,747 | 2,817,581 | ||||||||||||||
|
|
|
|
|
|
|
|
|
| |||||||||
|
|
|
| |||||||||||||||
| $ | 345,918,492 | $ | 252,629,412 | $ | 32,697,993 | $ | 25,583,024 | $ | 103,953,681 | |||||||||
|
|
|
|
|
|
|
|
|
| |||||||||
| 25,568,975 | 22,107,999 | 4,299,857 | 1,800,288 | 9,804,025 | ||||||||||||||
|
|
|
|
|
|
|
|
|
| |||||||||
| $ | 13.53 | $ | 11.43 | $ | 7.60 | $ | 14.21 | $ | 10.60 | |||||||||
|
|
|
|
|
|
|
|
|
| |||||||||
|
|
|
| |||||||||||||||
| $ | 309,416,521 | $ | 190,597,191 | $ | 25,819,830 | $ | 19,345,366 | $ | 84,874,947 | |||||||||
| 489,596 | (730,643 | ) | (202,250 | ) | (199,170 | ) | (695,946 | ) | ||||||||||
| (6,400,711 | ) | 30,662,064 | 3,825,912 | 3,143,646 | 3,416,481 | |||||||||||||
| (22,160 | ) | 11,625 | (640 | ) | — | — | ||||||||||||
| 42,435,246 | 32,089,175 | 3,255,141 | 3,293,182 | 16,358,199 | ||||||||||||||
|
|
|
|
|
|
|
|
|
| |||||||||
| $ | 345,918,492 | $ | 252,629,412 | $ | 32,697,993 | $ | 25,583,024 | $ | 103,953,681 | |||||||||
|
|
|
|
|
|
|
|
|
| |||||||||
|
|
|
| |||||||||||||||
Notes to Financial Statements are an integral part of these Statements.
35
Table of Contents
For the Six Months Ended June 30, 2014 (unaudited)
| Driehaus International Discovery Fund | Driehaus Emerging Markets Growth Fund | |||||||
INVESTMENT INCOME (LOSS): | ||||||||
Income: | ||||||||
Dividends* | $ | 850,677 | $ | 15,905,983 | ||||
|
|
|
| |||||
| ||||||||
Total income | 850,677 | 15,905,983 | ||||||
|
|
|
| |||||
| ||||||||
Expenses: | ||||||||
Investment advisory fee | 763,251 | 13,004,474 | ||||||
Administration fee | 76,551 | 442,259 | ||||||
Professional fees | 14,770 | 135,506 | ||||||
Audit and tax fees | 28,365 | 35,505 | ||||||
Federal and state registration fees | 10,838 | 39,784 | ||||||
Custodian fees | 17,063 | 190,093 | ||||||
Transfer agent fees | 30,241 | 213,210 | ||||||
Trustees’ fees | 14,889 | 39,672 | ||||||
Chief compliance officer fees | 3,162 | 3,162 | ||||||
Reports to shareholders | 7,743 | 46,740 | ||||||
Miscellaneous | 13,779 | 28,681 | ||||||
|
|
|
| |||||
Total expenses | 980,652 | 14,179,086 | ||||||
|
|
|
| |||||
| ||||||||
Investment advisory fees recaptured (waived) | — | — | ||||||
Administration fees waived | — | — | ||||||
Transfer agent fees waived | — | — | ||||||
Fees paid indirectly | (7,100 | ) | (141,622 | ) | ||||
|
|
|
| |||||
Net expenses | 973,552 | 14,037,464 | ||||||
|
|
|
| |||||
| ||||||||
Net investment income (loss) | (122,875 | ) | 1,868,519 | |||||
|
|
|
| |||||
| ||||||||
| NET REALIZED AND UNREALIZED GAIN (LOSS) ON INVESTMENTS, WRITTEN OPTIONS AND FOREIGN CURRENCY TRANSACTIONS: | ||||||||
Net realized gain (loss) from security transactions | 5,250,505 | 38,610,920 | ||||||
Net realized foreign exchange gain (loss) | (5,975 | ) | (1,327,455 | ) | ||||
Net realized gain (loss) on written options | — | — | ||||||
Net change in unrealized foreign exchange gain (loss) | 11,848 | (298,392 | ) | |||||
Net change in unrealized appreciation (depreciation) on investments | (7,558,223 | ) | 32,465,500 | |||||
|
|
|
| |||||
| ||||||||
Net realized and unrealized gain (loss) on investments, written options and foreign currency transactions | (2,301,845 | ) | 69,450,573 | |||||
|
|
|
| |||||
| ||||||||
NET INCREASE (DECREASE) IN NET ASSETS RESULTING FROM OPERATIONS | $ | (2,424,720 | ) | $ | 71,319,092 | |||
|
|
|
| |||||
| ||||||||
| * | Dividends are net of $99,121, $1,213,313, $159,779, $202,618, $13,184, $0 and $0 nonreclaimable foreign taxes withheld, respectively. |
Notes to Financial Statements are an integral part of these Statements.
36
Table of Contents
Statements of Operations
For the Six Months Ended June 30, 2014 (unaudited)
| Driehaus Emerging Markets Small Cap Growth Fund | Driehaus International Small Cap Growth Fund | Driehaus Global Growth Fund | Driehaus Mid Cap Growth Fund | Driehaus Micro Cap Growth Fund | ||||||||||||||
| $ | 3,260,002 | $ | 2,230,919 | $ | 170,199 | $ | 69,697 | $ | 62,257 | |||||||||
|
|
|
|
|
|
|
|
|
| |||||||||
|
| |||||||||||||||||
| 3,260,002 | 2,230,919 | 170,199 | 69,697 | 62,257 | ||||||||||||||
|
|
|
|
|
|
|
|
|
| |||||||||
|
| |||||||||||||||||
| 1,953,030 | 1,864,996 | 179,857 | 153,658 | 584,417 | ||||||||||||||
| 122,256 | 119,476 | 40,947 | 29,684 | 51,655 | ||||||||||||||
| 29,010 | 24,807 | 7,831 | 7,419 | 11,931 | ||||||||||||||
| 28,068 | 28,365 | 26,133 | 21,175 | 21,175 | ||||||||||||||
| 14,212 | 12,245 | 9,294 | 10,270 | 13,774 | ||||||||||||||
| 44,077 | 33,720 | 7,835 | 4,362 | 4,711 | ||||||||||||||
| 26,650 | 26,674 | 18,737 | 18,732 | 19,836 | ||||||||||||||
| 15,917 | 17,734 | 12,799 | 12,686 | 13,425 | ||||||||||||||
| 3,162 | 3,162 | 3,162 | 3,162 | 3,162 | ||||||||||||||
| 7,483 | 7,593 | 4,900 | 4,858 | 6,004 | ||||||||||||||
| 10,897 | 14,921 | 8,545 | 8,205 | 5,719 | ||||||||||||||
|
|
|
|
|
|
|
|
|
| |||||||||
| 2,254,762 | 2,153,693 | 320,040 | 274,211 | 735,809 | ||||||||||||||
|
|
|
|
|
|
|
|
|
| |||||||||
|
| |||||||||||||||||
| — | — | — | (5,309 | ) | 39,026 | |||||||||||||
| — | — | — | — | (2,500 | ) | |||||||||||||
| — | — | — | — | (14,132 | ) | |||||||||||||
| (14,449 | ) | (20,469 | ) | (1,000 | ) | (35 | ) | — | ||||||||||
|
|
|
|
|
|
|
|
|
| |||||||||
| 2,240,313 | 2,133,224 | 319,040 | 268,867 | 758,203 | ||||||||||||||
|
|
|
|
|
|
|
|
|
| |||||||||
|
| |||||||||||||||||
| 1,019,689 | 97,695 | (148,841 | ) | (199,170 | ) | (695,946 | ) | |||||||||||
|
|
|
|
|
|
|
|
|
| |||||||||
|
| |||||||||||||||||
| 530,320 | 20,399,969 | 3,226,684 | 2,147,696 | 294,090 | ||||||||||||||
| (238,715 | ) | (2,331 | ) | (11,039 | ) | — | — | |||||||||||
| 715,883 | — | — | — | — | ||||||||||||||
| (35,957 | ) | 3,049 | 1,215 | — | — | |||||||||||||
| | 15,173,845 | | (7,749,372 | ) | (3,247,761 | ) | (2,959,944 | ) | (1,876,580 | ) | ||||||||
|
|
|
|
|
|
|
|
|
| |||||||||
|
| |||||||||||||||||
| | 16,145,376 | | 12,651,315 | (30,901 | ) | (812,248 | ) | (1,582,490 | ) | |||||||||
|
|
|
|
|
|
|
|
|
| |||||||||
|
| |||||||||||||||||
| $ | 17,165,065 | | $ | 12,749,010 | $ | (179,742 | ) | $ | (1,011,418 | ) | $ | (2,278,436 | ) | |||||
|
|
|
|
|
|
|
|
|
| |||||||||
|
| |||||||||||||||||
Notes to Financial Statements are an integral part of these Statements.
37
Table of Contents
Statements of Changes in Net Assets
| Driehaus International Discovery Fund | Driehaus Emerging Markets Growth Fund | |||||||||||||||
| For the six month period January 1, 2014 through June 30, 2014 (unaudited) | For the year ended December 31, 2013 | For the six month period January 1, 2014 through June 30, 2014 (unaudited) | For the year ended December 31, 2013 | |||||||||||||
INCREASE (DECREASE) IN NET ASSETS: | ||||||||||||||||
Operations: | ||||||||||||||||
Net investment income (loss) | $ | (122,875 | ) | $ | 182,887 | $ | 1,868,519 | $ | 4,198,494 | |||||||
Net realized gain (loss) on investments, written options and foreign currency transactions | 5,244,530 | 32,911,417 | 37,283,465 | 73,336,137 | ||||||||||||
Net change in unrealized gain (loss) on investments, written options and foreign currency transactions | (7,546,375 | ) | (7,871,491 | ) | 32,167,108 | 29,644,247 | ||||||||||
|
|
|
|
|
|
|
| |||||||||
| ||||||||||||||||
Net increase (decrease) in net assets resulting from operations | (2,424,720 | ) | 25,222,813 | 71,319,092 | 107,178,878 | |||||||||||
|
|
|
|
|
|
|
| |||||||||
| ||||||||||||||||
Distributions to shareholders: | ||||||||||||||||
Net investment income | — | — | — | — | ||||||||||||
Capital gains | — | — | — | (38,958,248 | ) | |||||||||||
|
|
|
|
|
|
|
| |||||||||
Total distributions to shareholders | — | — | — | (38,958,248 | ) | |||||||||||
|
|
|
|
|
|
|
| |||||||||
| ||||||||||||||||
Capital share transactions: | ||||||||||||||||
Proceeds from shares sold | 1,158,809 | 11,537,101 | 457,853,047 | 798,853,985 | ||||||||||||
Reinvestment of distributions | — | — | — | 36,327,537 | ||||||||||||
Cost of shares redeemed | (14,043,384 | ) | (109,272,884 | ) | (199,090,268 | ) | (257,928,242 | ) | ||||||||
Redemption fees | 339 | 7,011 | 87,355 | 133,953 | ||||||||||||
|
|
|
|
|
|
|
| |||||||||
Net increase (decrease) in net assets derived from capital share transactions | (12,884,236 | ) | (97,728,772 | ) | 258,850,134 | 577,387,233 | ||||||||||
|
|
|
|
|
|
|
| |||||||||
Total increase (decrease) in net assets | (15,308,956 | ) | (72,505,959 | ) | 330,169,226 | 645,607,863 | ||||||||||
|
|
|
|
|
|
|
| |||||||||
| ||||||||||||||||
NET ASSETS: | ||||||||||||||||
| ||||||||||||||||
Beginning of period | $ | 133,887,352 | $ | 206,393,311 | $ | 1,634,865,873 | $ | 989,258,010 | ||||||||
|
|
|
|
|
|
|
| |||||||||
End of period | $ | 118,578,396 | $ | 133,887,352 | $ | 1,965,035,099 | $ | 1,634,865,873 | ||||||||
|
|
|
|
|
|
|
| |||||||||
Accumulated net investment income (loss) | $ | 245,686 | $ | 368,561 | $ | 1,679,790 | $ | (188,729 | ) | |||||||
|
|
|
|
|
|
|
| |||||||||
| ||||||||||||||||
Capital share transactions are as follows: |
| |||||||||||||||
Shares issued | 36,319 | 393,225 | 14,199,398 | 24,927,434 | ||||||||||||
Shares reinvested | — | — | — | 1,125,389 | ||||||||||||
Shares redeemed | (441,691 | ) | (3,697,504 | ) | (6,242,108 | ) | (8,112,206 | ) | ||||||||
|
|
|
|
|
|
|
| |||||||||
Net increase (decrease) from capital share transactions | (405,372 | ) | (3,304,279 | ) | 7,957,290 | 17,940,617 | ||||||||||
|
|
|
|
|
|
|
| |||||||||
| ||||||||||||||||
Notes to Financial Statements are an integral part of these Statements.
38
Table of Contents
Statements of Changes in Net Assets
| Driehaus Emerging Markets Small Cap Growth Fund | Driehaus International Small Cap Growth Fund | Driehaus Global Growth Fund | ||||||||||||||||||||
| For the six month period January 1, 2014 through June 30, 2014 (unaudited) | For the year ended December 31, 2013 | For the six month period January 1, 2014 through June 30, 2014 (unaudited) | For the year ended December 31, 2013 | For the six month period January 1, 2014 through June 30, 2014 (unaudited) | For the year ended December 31, 2013 | |||||||||||||||||
| $ | 1,019,689 | $ | (30,018 | ) | $ | 97,695 | $ | (270,870 | ) | $ | (148,841 | ) | $ | (262,141 | ) | |||||||
| 1,007,488 | (1,979,980 | ) | 20,397,638 | 56,702,877 | 3,215,645 | 4,931,076 | ||||||||||||||||
| 15,137,888 | 13,628,441 | (7,746,323 | ) | 8,737,749 | (3,246,546 | ) | 1,410,650 | |||||||||||||||
|
|
|
|
|
|
|
|
|
|
|
| |||||||||||
|
| |||||||||||||||||||||
| 17,165,065 | 11,618,443 | 12,749,010 | 65,169,756 | (179,742 | ) | 6,079,585 | ||||||||||||||||
|
|
|
|
|
|
|
|
|
|
|
| |||||||||||
|
| |||||||||||||||||||||
| — | (309,776 | ) | — | (2,881,066 | ) | — | — | |||||||||||||||
| — | — | — | (27,524,912 | ) | — | (4,062,770 | ) | |||||||||||||||
|
|
|
|
|
|
|
|
|
|
|
| |||||||||||
| — | (309,776 | ) | — | (30,405,978 | ) | — | (4,062,770 | ) | ||||||||||||||
|
|
|
|
|
|
|
|
|
|
|
| |||||||||||
|
| |||||||||||||||||||||
| 178,829,056 | 131,452,307 | 7,686,968 | 16,017,728 | 722,714 | 710,860 | |||||||||||||||||
| — | 255,145 | — | 25,648,585 | — | 4,062,771 | |||||||||||||||||
| (41,365,021 | ) | (32,737,622 | ) | (38,479,728 | ) | (40,720,045 | ) | (7,530,903 | ) | (2,454,266 | ) | |||||||||||
| 4,659 | 8,846 | 2,448 | 2,085 | — | 66 | |||||||||||||||||
|
|
|
|
|
|
|
|
|
|
|
| |||||||||||
| 137,468,694 | 98,978,676 | (30,790,312 | ) | 948,353 | (6,808,189 | ) | 2,319,431 | |||||||||||||||
|
|
|
|
|
|
|
|
|
|
|
| |||||||||||
| 154,633,759 | 110,287,343 | (18,041,302 | ) | 35,712,131 | (6,987,931 | ) | 4,336,246 | |||||||||||||||
|
|
|
|
|
|
|
|
|
|
|
| |||||||||||
|
| |||||||||||||||||||||
|
| |||||||||||||||||||||
| $ | 191,284,733 | $ | 80,997,390 | $ | 270,670,714 | $ | 234,958,583 | $ | 39,685,924 | $ | 35,349,678 | |||||||||||
|
|
|
|
|
|
|
|
|
|
|
| |||||||||||
| $ | 345,918,492 | $ | 191,284,733 | $ | 252,629,412 | $ | 270,670,714 | $ | 32,697,993 | $ | 39,685,924 | |||||||||||
|
|
|
|
|
|
|
|
|
|
|
| |||||||||||
| $ | 489,596 | $ | (530,093 | ) | $ | (730,643 | ) | $ | (828,338 | ) | $ | (202,250 | ) | $ | (53,409 | ) | ||||||
|
|
|
|
|
|
|
|
|
|
|
| |||||||||||
|
| |||||||||||||||||||||
| 13,471,230 | 10,815,539 | 700,436 | 1,486,659 | 92,597 | 93,997 | |||||||||||||||||
| — | 20,760 | — | 2,447,384 | — | 550,511 | |||||||||||||||||
| (3,220,136 | ) | (2,780,050 | ) | (3,560,228 | ) | (3,826,073 | ) | (1,009,706 | ) | (326,797 | ) | |||||||||||
|
|
|
|
|
|
|
|
|
|
|
| |||||||||||
| 10,251,094 | 8,056,249 | (2,859,792 | ) | 107,970 | (917,109 | ) | 317,711 | |||||||||||||||
|
|
|
|
|
|
|
|
|
|
|
| |||||||||||
|
| |||||||||||||||||||||
Notes to Financial Statements are an integral part of these Statements.
39
Table of Contents
Statements of Changes in Net Assets
| Driehaus Mid Cap Growth Fund | Driehaus Micro Cap Growth Fund | |||||||||||||||
| For the six month period January 1, 2014 through June 30, 2014 (unaudited) | For the year ended December 31, 2013 | For the six month period January 1, 2014 through June 30, 2014 (unaudited) | For the period November 18, 2013 | |||||||||||||
INCREASE (DECREASE) IN NET ASSETS: | ||||||||||||||||
Operations: | ||||||||||||||||
Net investment income (loss) | $ | (199,170 | ) | $ | (385,004 | ) | $ | (695,946 | ) | $ | (127,358 | ) | ||||
Net realized gain (loss) on investments, written options and foreign currency transactions | 2,147,696 | 6,878,923 | 294,090 | 3,463,074 | ||||||||||||
Net change in unrealized gain (loss) on investments, written options and foreign currency transactions | (2,959,944 | ) | 2,428,262 | (1,876,580 | ) | 18,234,779 | ||||||||||
|
|
|
|
|
|
|
| |||||||||
| ||||||||||||||||
Net increase (decrease) in net assets resulting from operations | (1,011,418 | ) | 8,922,181 | (2,278,436 | ) | 21,570,495 | ||||||||||
|
|
|
|
|
|
|
| |||||||||
| ||||||||||||||||
Distributions to shareholders: | ||||||||||||||||
Net investment income | — | — | — | — | ||||||||||||
Capital gains | — | (5,564,780 | ) | — | — | |||||||||||
|
|
|
|
|
|
|
| |||||||||
Total distributions to shareholders | — | (5,564,780 | ) | — | — | |||||||||||
|
|
|
|
|
|
|
| |||||||||
| ||||||||||||||||
Capital share transactions: | ||||||||||||||||
Proceeds from shares sold | 397,579 | 2,615,263 | 41,923,386 | 53,149,020 | ||||||||||||
Reinvestment of distributions | — | 5,410,540 | — | — | ||||||||||||
Cost of shares redeemed | (8,082,193 | ) | (1,285,889 | ) | (10,378,191 | ) | (42,730 | ) | ||||||||
Redemption fees | 20 | 814 | 10,137 | — | ||||||||||||
|
|
|
|
|
|
|
| |||||||||
Net increase (decrease) in net assets derived from capital share transactions | (7,684,594 | ) | 6,740,728 | 31,555,332 | 53,106,290 | |||||||||||
|
|
|
|
|
|
|
| |||||||||
Total increase (decrease) in net assets | (8,696,012 | ) | 10,098,129 | 29,276,896 | 74,676,785 | |||||||||||
|
|
|
|
|
|
|
| |||||||||
| ||||||||||||||||
NET ASSETS: | ||||||||||||||||
| ||||||||||||||||
Beginning of period | $ | 34,279,036 | $ | 24,180,907 | $ | 74,676,785 | $ | — | ||||||||
|
|
|
|
|
|
|
| |||||||||
End of period | $ | 25,583,024 | $ | 34,279,036 | $ | 103,953,681 | $ | 74,676,785 | ||||||||
|
|
|
|
|
|
|
| |||||||||
Accumulated net investment income (loss) | $ | (199,170 | ) | $ | — | $ | (695,946 | ) | $ | — | ||||||
|
|
|
|
|
|
|
| |||||||||
| ||||||||||||||||
Capital share transactions are as follows: |
| |||||||||||||||
Shares issued | 26,843 | 166,620 | 3,813,654 | 6,954,301 | ||||||||||||
Shares reinvested | — | 379,687 | — | — | ||||||||||||
Shares redeemed | (563,913 | ) | (87,563 | ) | (959,922 | ) | (4,008 | ) | ||||||||
|
|
|
|
|
|
|
| |||||||||
Net increase (decrease) from capital share transactions | (537,070 | ) | 458,744 | 2,853,732 | 6,950,293 | |||||||||||
|
|
|
|
|
|
|
| |||||||||
| ||||||||||||||||
| * | Fund commenced operations on November 18, 2013. |
Notes to Financial Statements are an integral part of these Statements.
40
Table of Contents
Driehaus International Discovery Fund
| For the six month period January 1, 2014 through June 30, 2014 (unaudited) | For the year ended December 31, 2013 | For the year ended December 31, 2012 | For the year ended December 31, 2011 | For the year ended December 31, 2010 | For the year ended December 31, 2009 | |||||||||||||||||||
Net asset value, beginning of period | $ | 32.61 | $ | 27.85 | $ | 24.27 | $ | 30.27 | $ | 27.19 | $ | 18.28 | ||||||||||||
|
|
|
|
|
|
|
|
|
|
|
| |||||||||||||
INCOME (LOSS) FROM INVESTMENT OPERATIONS: | ||||||||||||||||||||||||
Net investment income (loss) | (0.02 | ) | 0.03 | 0.03^ | 0.13 | ^ | (0.22 | ) | 0.00 | ~ | ||||||||||||||
Net realized and unrealized gain (loss) on investments and foreign currency transactions | (0.55 | ) | 4.73 | 3.55 | (6.13 | ) | 3.86 | 9.02 | ||||||||||||||||
|
|
|
|
|
|
|
|
|
|
|
| |||||||||||||
Total income (loss) from investment operations | (0.57 | ) | 4.76 | 3.58 | (6.00 | )�� | 3.64 | 9.02 | ||||||||||||||||
|
|
|
|
|
|
|
|
|
|
|
| |||||||||||||
LESS DISTRIBUTIONS: | ||||||||||||||||||||||||
Dividends from net investment income | — | — | — | — | (0.56 | ) | (0.11 | ) | ||||||||||||||||
Distributions from capital gains | — | — | — | — | — | — | ||||||||||||||||||
|
|
|
|
|
|
|
|
|
|
|
| |||||||||||||
Total distributions | — | — | — | — | (0.56 | ) | (0.11 | ) | ||||||||||||||||
|
|
|
|
|
|
|
|
|
|
|
| |||||||||||||
Redemption fees added to paid-in capital | 0.00 | ~ | 0.00 | ~ | 0.00 | ~ | 0.00 | ~ | 0.00 | ~ | 0.00 | ~ | ||||||||||||
|
|
|
|
|
|
|
|
|
|
|
| |||||||||||||
Net asset value, end of period | $ | 32.04 | $ | 32.61 | $ | 27.85 | $ | 24.27 | $ | 30.27 | $ | 27.19 | ||||||||||||
|
|
|
|
|
|
|
|
|
|
|
| |||||||||||||
Total Return | (1.75 | )%** | 17.09 | % | 14.75 | % | (19.85 | )% | 13.47 | % | 49.28 | % | ||||||||||||
RATIOS/SUPPLEMENTAL DATA | ||||||||||||||||||||||||
Net assets, end of period (in 000’s) | $ | 118,578 | $ | 133,887 | $ | 206,393 | $ | 211,927 | $ | 338,840 | $ | 364,411 | ||||||||||||
Ratio of expenses before reimbursements, waivers and fees paid indirectly to average net assets | 1.61 | %* | 1.65 | %¥ | 1.76 | %¥ | 1.72 | %¥ | 1.71 | % | 1.75 | % | ||||||||||||
Ratio of net expenses to average net assets | 1.59 | %*# | 1.62 | %#¥ | 1.75 | %#¥ | 1.71 | %#¥ | 1.70 | %# | 1.74 | %# | ||||||||||||
Ratio of net investment income (loss) to average net assets | (0.20 | )%*# | 0.11 | %# | 0.11 | %# | 0.44 | %# | (0.77 | )%# | 0.07 | %# | ||||||||||||
Portfolio turnover | 75 | %** | 156 | % | 112 | % | 119 | % | 93 | % | 145 | % | ||||||||||||
|
|
|
|
|
|
|
|
|
|
|
|
| ||||||||||||
| * | Annualized |
| ** | Not Annualized |
| ^ | Net investment income (loss) per share has been calculated using the average shares method. |
| ~ | Amount represents less than $0.01 per share |
| # | Such ratios are net of fees paid indirectly (see Note B in the Notes to Financial Statements). |
| ¥ | Ratio of expenses to average net assets includes interest expense of less than 0.005% for the years ended December 31, 2013, 2012 and 2011. The interest expense is from utilizing the line of credit (see Note F in the Notes to Financial Statements). |
Notes to Financial Statements are an integral part of this Schedule.
41
Table of Contents
Driehaus Emerging Markets Growth Fund
Financial Highlights
| For the six month period January 1, 2014 through June 30, 2014 (unaudited) | For the year ended December 31, 2013 | For the year ended December 31, 2012 | For the year ended December 31, 2011 | For the year ended December 31, 2010 | For the year ended December 31, 2009 | |||||||||||||||||||
Net asset value, beginning of period | $ | 32.53 | $ | 30.61 | $ | 25.72 | $ | 32.20 | $ | 29.24 | $ | 17.19 | ||||||||||||
|
|
|
|
|
|
|
|
|
|
|
| |||||||||||||
INCOME (LOSS) FROM INVESTMENT OPERATIONS: | ||||||||||||||||||||||||
Net investment income (loss) | 0.03 | 0.10 | 0.13 | 0.16 | (0.04 | )^ | (0.05 | ) | ||||||||||||||||
Net realized and unrealized gain (loss) on investments and foreign currency transactions | 1.19 | 2.62 | 4.88 | (4.97 | ) | 6.84 | 12.09 | |||||||||||||||||
|
|
|
|
|
|
|
|
|
|
|
| |||||||||||||
Total income (loss) from investment operations | 1.22 | 2.72 | 5.01 | (4.81 | ) | 6.80 | 12.04 | |||||||||||||||||
|
|
|
|
|
|
|
|
|
|
|
| |||||||||||||
LESS DISTRIBUTIONS: | ||||||||||||||||||||||||
Dividends from net investment income | — | — | (0.12 | ) | — | (0.69 | ) | — | ||||||||||||||||
Distributions from capital gains | — | (0.80 | ) | — | (1.67 | ) | (3.15 | ) | — | |||||||||||||||
|
|
|
|
|
|
|
|
|
|
|
| |||||||||||||
Total distributions | — | (0.80 | ) | (0.12 | ) | (1.67 | ) | (3.84 | ) | — | ||||||||||||||
|
|
|
|
|
|
|
|
|
|
|
| |||||||||||||
Redemption fees added to paid-in capital | 0.00 | ~ | 0.00 | ~ | 0.00 | ~ | 0.00 | ~ | 0.00 | ~ | 0.01 | |||||||||||||
|
|
|
|
|
|
|
|
|
|
|
| |||||||||||||
Net asset value, end of period | $ | 33.75 | $ | 32.53 | $ | 30.61 | $ | 25.72 | $ | 32.20 | $ | 29.24 | ||||||||||||
|
|
|
|
|
|
|
|
|
|
|
| |||||||||||||
Total Return | 3.75 | %** | 8.92 | % | 19.51 | % | (15.02 | )% | 23.56 | % | 70.10 | % | ||||||||||||
RATIOS/SUPPLEMENTAL DATA | ||||||||||||||||||||||||
Net assets, end of period (in 000’s) | $ | 1,965,035 | $ | 1,634,866 | $ | 989,258 | $ | 741,291 | $ | 834,311 | $ | 575,842 | ||||||||||||
Ratio of expenses before reimbursements, waivers and fees paid indirectly to average net assets | 1.64 | %* | 1.66 | % | 1.68 | % | 1.68 | % | 1.69 | % | 1.78 | % | ||||||||||||
Ratio of net expenses to average net assets | 1.62 | %# | 1.64 | %# | 1.66 | %# | 1.64 | %# | 1.63 | %# | 1.75 | %# | ||||||||||||
Ratio of net investment income (loss) to average net assets | 0.22 | %# | 0.33 | %# | 0.48 | %# | 0.49 | %# | (0.15 | )%# | (0.30 | )%# | ||||||||||||
Portfolio turnover | 139 | %** | 264 | % | 278 | % | 342 | % | 293 | % | 275 | % | ||||||||||||
|
|
|
|
|
|
|
|
|
|
|
|
| ||||||||||||
| * | Annualized |
| ** | Not Annualized |
| ^ | Net investment income (loss) per share has been calculated using the average shares method. |
| ~ | Amount represents less than $0.01 per share |
| # | Such ratios are net of fees paid indirectly (see Note B in the Notes to Financial Statements). |
Notes to Financial Statements are an integral part of this Schedule.
42
Table of Contents
Driehaus Emerging Markets Small Cap Growth Fund
Financial Highlights
| For the six month period January 1, 2014 through June 30, 2014 (unaudited) | For the year ended December 31, 2013 | For the year ended December 31, 2012 | For the period August 22, 2011 through December 31, 2011 | |||||||||||||
Net asset value, beginning of period | $ | 12.49 | $ | 11.15 | $ | 8.81 | $ | 10.00 | ||||||||
|
|
|
|
|
|
|
| |||||||||
INCOME (LOSS) FROM INVESTMENT OPERATIONS: | ||||||||||||||||
Net investment income (loss) | 0.05 | (0.00 | )^~ | 0.00 | ^~ | (0.03 | ) | |||||||||
Net realized and unrealized gain (loss) on investments | 0.99 | 1.36 | 2.52 | (1.16 | ) | |||||||||||
|
|
|
|
|
|
|
| |||||||||
Total income (loss) from investment operations | 1.04 | 1.36 | 2.52 | (1.19 | ) | |||||||||||
|
|
|
|
|
|
|
| |||||||||
LESS DISTRIBUTIONS: | ||||||||||||||||
Dividends from net investment income | — | (0.02 | ) | (0.18 | ) | — | ||||||||||
Distributions from capital gains | — | — | — | — | ||||||||||||
|
|
|
|
|
|
|
| |||||||||
Total distributions | — | (0.02 | ) | (0.18 | ) | — | ||||||||||
|
|
|
|
|
|
|
| |||||||||
Redemption fees added to paid-in capital | 0.00 | ~ | 0.00 | ~ | 0.00 | ~ | — | |||||||||
|
|
|
|
|
|
|
| |||||||||
Net asset value, end of period | $ | 13.53 | $ | 12.49 | $ | 11.15 | $ | 8.81 | ||||||||
|
|
|
|
|
|
|
| |||||||||
Total Return | 8.33 | %** | 12.11 | % | 28.83 | % | (11.90 | )%** | ||||||||
RATIOS/SUPPLEMENTAL DATA | ||||||||||||||||
Net assets, end of period (in 000’s) | $ | 345,918 | $ | 191,285 | $ | 80,997 | $ | 32,720 | ||||||||
Ratio of expenses before reimbursements and/or recapture, waivers and fees paid indirectly to average net assets | 1.73 | %* | 1.85 | % | 2.15 | % | 2.74 | %* | ||||||||
Ratio of net expenses to average net assets | 1.72 | %*# | 1.90 | %+# | 1.99 | %+# | 1.97 | %*+# | ||||||||
Ratio of net investment loss to average net assets | 0.78 | %*# | (0.02 | )%+# | (0.02 | )%+# | (0.91 | )%*+# | ||||||||
Portfolio turnover | 129 | %** | 223 | % | 183 | % | 74 | %** | ||||||||
| ||||||||||||||||
| * | Annualized |
| ** | Not Annualized |
| ^ | Net investment income (loss) per share has been calculated using the average shares method. |
| ~ | Amount represents less than $0.01 per share |
| + | Such ratios are after administrative and transfer agent waivers and adviser expense reimbursements, when applicable. BNY Mellon Investment Servicing (US) Inc., the administrative agent and transfer agent, waived a portion of its fees beginning with the Fund’s commencement of operations, August 22, 2011. The Adviser contractually agreed to waive its investment advisory fee or absorb other operating expenses to the extent necessary to ensure that total annual Fund operating expenses (other than interest, taxes, brokerage commissions and other portfolio transaction expenses, capital expenditures, and extraordinary expenses) would not exceed the Fund’s operating expense cap of 2.00% of average daily net assets until August 21, 2014. |
| # | Such ratios are net of fees paid indirectly (see Note B in the Notes to Financial Statements). |
Notes to Financial Statements are an integral part of this Schedule.
43
Table of Contents
Driehaus International Small Cap Growth Fund
Financial Highlights
| For the six month period January 1, 2014 through June 30, 2014 (unaudited) | For the year ended December 31, 2013 | For the year ended December 31, 2012 | For the year ended December 31, 2011 | For the year ended December 31, 2010 | For the year ended December 31, 2009 | |||||||||||||||||||
Net asset value, beginning of period | $ | 10.84 | $ | 9.45 | $ | 8.51 | $ | 9.66 | $ | 7.64 | $ | 4.93 | ||||||||||||
|
|
|
|
|
|
|
|
|
|
|
| |||||||||||||
INCOME (LOSS) FROM INVESTMENT OPERATIONS: | ||||||||||||||||||||||||
Net investment income (loss) | 0.00 | ~ | (0.01 | )^ | 0.03 | 0.07 | (0.06 | ) | (0.02 | ) | ||||||||||||||
Net realized and unrealized gain (loss) on investments and foreign currency transactions | 0.59 | 2.74 | 0.95 | (1.17 | ) | 2.14 | 2.73 | |||||||||||||||||
|
|
|
|
|
|
|
|
|
|
|
| |||||||||||||
Total income (loss) from investment operations | 0.59 | 2.73 | 0.98 | (1.10 | ) | 2.08 | 2.71 | |||||||||||||||||
|
|
|
|
|
|
|
|
|
|
|
| |||||||||||||
LESS DISTRIBUTIONS: | ||||||||||||||||||||||||
Dividends from net investment income | — | (0.13 | ) | (0.04 | ) | (0.05 | ) | (0.06 | ) | — | ||||||||||||||
Distributions from capital gains | — | (1.21 | ) | — | — | — | — | |||||||||||||||||
|
|
|
|
|
|
|
|
|
|
|
| |||||||||||||
Total distributions | — | (1.34 | ) | (0.04 | ) | (0.05 | ) | (0.06 | ) | — | ||||||||||||||
|
|
|
|
|
|
|
|
|
|
|
| |||||||||||||
Redemption fees added to paid-in capital | 0.00 | ~ | 0.00 | ~ | 0.00 | ~ | 0.00 | ~ | 0.00 | ~ | 0.00 | ~ | ||||||||||||
|
|
|
|
|
|
|
|
|
|
|
| |||||||||||||
Net asset value, end of period | $ | 11.43 | $ | 10.84 | $ | 9.45 | $ | 8.51 | $ | 9.66 | $ | 7.64 | ||||||||||||
|
|
|
|
|
|
|
|
|
|
|
| |||||||||||||
Total Return | 5.44 | %** | 29.24 | % | 11.67 | % | (11.39 | )% | 27.13 | % | 55.17 | % | ||||||||||||
RATIOS/SUPPLEMENTAL DATA | ||||||||||||||||||||||||
Net assets, end of period (in 000’s) | $ | 252,629 | $ | 270,671 | $ | 234,959 | $ | 232,729 | $ | 258,446 | $ | 201,020 | ||||||||||||
Ratio of expenses before reimbursements, waivers and fees paid indirectly to average net assets | 1.73 | %* | 1.73 | % | 1.76 | % | 1.73 | % | 1.75 | % | 1.87 | % | ||||||||||||
Ratio of net expenses to average net assets | 1.72 | %*# | 1.70 | %# | 1.74 | %# | 1.69 | %# | 1.72 | %+# | 1.85 | %+# | ||||||||||||
Ratio of net investment income (loss) to average net assets | 0.08 | %*# | (0.11 | )%# | 0.31 | %# | 0.66 | %# | (0.76 | )%+# | (0.54 | )%+# | ||||||||||||
Portfolio turnover | 136 | %** | 320 | % | 280 | % | 311 | % | 298 | % | 265 | % | ||||||||||||
|
|
|
|
|
|
|
|
|
|
|
|
| ||||||||||||
| * | Annualized |
| ** | Not Annualized |
| ^ | Net investment income (loss) per share has been calculated using the average shares method. |
| ~ | Amount represents less than $0.01 per share |
| + | Such ratios are after administrative and transfer agent waivers and adviser expense reimbursements, when applicable. BNY Mellon Investment Servicing (US) Inc., the administrative agent and transfer agent, waived a portion of its fees beginning with the Fund’s commencement of operations, September 17, 2007. The Adviser contractually agreed to waive its investment advisory fee or absorb other operating expenses to the extent necessary to ensure that total annual Fund operating expenses (other than interest, taxes, brokerage commissions and other portfolio transaction expenses, capital expenditures, and extraordinary expenses) would not exceed the Fund’s operating expense cap of 2.00% of average daily net assets until September 16, 2010. |
| # | Such ratios are net of fees paid indirectly (see Note B in the Notes to Financial Statements). |
Notes to Financial Statements are an integral part of this Schedule.
44
Table of Contents
Driehaus Global Growth Fund
Financial Highlights
| For the six month period January 1, 2014 through June 30, 2014 (unaudited) | For the year ended December 31, 2013 | For the year ended December 31, 2012 | For the year ended December 31, 2011 | For the year ended December 31, 2010 | For the year ended December 31, 2009 | |||||||||||||||||||
Net asset value, beginning of period | $ | 7.61 | $ | 7.22 | $ | 6.58 | $ | 9.01 | $ | 7.59 | $ | 4.98 | ||||||||||||
|
|
|
|
|
|
|
|
|
|
|
| |||||||||||||
INCOME (LOSS) FROM INVESTMENT OPERATIONS: | ||||||||||||||||||||||||
Net investment income (loss) | (0.04 | ) | (0.05 | ) | (0.05 | ) | (0.10 | ) | (0.11 | ) | (0.05 | ) | ||||||||||||
Net realized and unrealized gain (loss) on investments and foreign currency transactions | 0.03 | 1.31 | 1.00 | (1.53 | ) | �� | 1.55 | 2.66 | ||||||||||||||||
|
|
|
|
|
|
|
|
|
|
|
| |||||||||||||
Total income (loss) from investment operations | (0.01 | ) | 1.26 | 0.95 | (1.63 | ) | 1.44 | 2.61 | ||||||||||||||||
|
|
|
|
|
|
|
|
|
|
|
| |||||||||||||
LESS DISTRIBUTIONS: | ||||||||||||||||||||||||
Dividends from net investment income | — | — | — | — | (0.02 | ) | — | |||||||||||||||||
Distributions from capital gains | — | (0.87 | ) | (0.31 | ) | (0.80 | ) | — | — | |||||||||||||||
|
|
|
|
|
|
|
|
|
|
|
| |||||||||||||
Total distributions | — | (0.87 | ) | (0.31 | ) | (0.80 | ) | (0.02 | ) | — | ||||||||||||||
|
|
|
|
|
|
|
|
|
|
|
| |||||||||||||
Redemption fees added to paid-in capital | — | 0.00 | ~ | 0.00 | ~ | 0.00 | ~ | — | 0.00 | ~ | ||||||||||||||
|
|
|
|
|
|
|
|
|
|
|
| |||||||||||||
Net asset value, end of period | $ | 7.60 | $ | 7.61 | $ | 7.22 | $ | 6.58 | $ | 9.01 | $ | 7.59 | ||||||||||||
|
|
|
|
|
|
|
|
|
|
|
| |||||||||||||
Total Return | 0.00 | %** | 17.79 | % | 14.36 | % | (18.15 | )% | 19.00 | % | 52.41 | % | ||||||||||||
RATIOS/SUPPLEMENTAL DATA | ||||||||||||||||||||||||
Net assets, end of period (in 000’s) | $ | 32,698 | $ | 39,686 | $ | 35,350 | $ | 35,580 | $ | 52,719 | $ | 40,301 | ||||||||||||
Ratio of expenses before reimbursements and/or recapture, waivers and fees paid indirectly to average net assets | 1.78 | %* | 1.93 | % | 2.02 | %¥ | 1.88 | %¥ | 1.81 | % | 2.34 | % | ||||||||||||
Ratio of net expenses to average net assets | 1.77 | %*# | 1.92 | %# | 2.01 | %#¥ | 1.97 | %+#¥ | 2.00 | %+# | 2.00 | %+# | ||||||||||||
Ratio of net investment income (loss) to average net assets | (0.83 | )%*# | (0.72 | )%# | (0.62 | )%# | (1.08 | )%+# | (1.37 | )%+# | (1.09 | )%+# | ||||||||||||
Portfolio turnover | 99 | %** | 163 | % | 103 | % | 142 | % | 145 | % | 119 | % | ||||||||||||
|
|
|
|
|
|
|
|
|
|
|
|
| ||||||||||||
| * | Annualized |
| ** | Not Annualized |
| ~ | Amount represents less than $0.01 per share |
| + | Such ratios are after administrative and transfer agent waivers and adviser expense reimbursements and/or recapture, when applicable. BNY Mellon Investment Servicing (US) Inc., the administrative agent and transfer agent, waived a portion of its fees beginning with the Fund’s commencement of operations, May 1, 2008. The Adviser contractually agreed to waive its investment advisory fee or absorb other operating expenses to the extent necessary to ensure that total annual Fund operating expenses (other than interest, taxes, brokerage commissions and other portfolio transaction expenses, capital expenditures, and extraordinary expenses) would not exceed the Fund’s operating expense cap of 2.00% of average daily net assets until April 30, 2011. |
| # | Such ratios are net of fees paid indirectly (see Note B in the Notes to Financial Statements). |
| ¥ | Ratio of expenses to average net assets includes interest expense of less than 0.005% for the years ended December 31, 2012 and 2011. The interest expense is from utilizing the line of credit (see Note F in the Notes to Financial Statements). |
Notes to Financial Statements are an integral part of this Schedule.
45
Table of Contents
Driehaus Mid Cap Growth Fund
Financial Highlights
| For the six month period January 1, 2014 through June 30, 2014 (unaudited) | For the year ended December 31, 2013 | For the year ended December 31, 2012 | For the year ended December 31, 2011 | For the year ended December 31, 2010 | For the period April 27, 2009 through December 31, 2009 | |||||||||||||||||||
Net asset value, beginning of period | $ | 14.67 | $ | 12.87 | $ | 12.53 | $ | 13.69 | $ | 11.63 | $ | 10.00 | ||||||||||||
|
|
|
|
|
|
|
|
|
|
|
| |||||||||||||
INCOME (LOSS) FROM INVESTMENT OPERATIONS: | ||||||||||||||||||||||||
Net investment income (loss) | (0.11 | ) | (0.16 | ) | (0.10 | ) | (0.16 | ) | (0.14 | ) | (0.08 | ) | ||||||||||||
Net realized and unrealized gain (loss) on investments | (0.35 | ) | 4.79 | 1.61 | (0.14 | ) | 3.25 | 2.85 | ||||||||||||||||
|
|
|
|
|
|
|
|
|
|
|
| |||||||||||||
Total income (loss) from investment operations | (0.46 | ) | 4.63 | 1.51 | (0.30 | ) | 3.11 | 2.77 | ||||||||||||||||
|
|
|
|
|
|
|
|
|
|
|
| |||||||||||||
LESS DISTRIBUTIONS: | ||||||||||||||||||||||||
Dividends from net investment income | — | — | — | — | — | — | ||||||||||||||||||
Distributions from capital gains | — | (2.83 | ) | (1.17 | ) | (0.86 | ) | (1.05 | ) | (1.14 | ) | |||||||||||||
|
|
|
|
|
|
|
|
|
|
|
| |||||||||||||
Total distributions | — | (2.83 | ) | (1.17 | ) | (0.86 | ) | (1.05 | ) | (1.14 | ) | |||||||||||||
|
|
|
|
|
|
|
|
|
|
|
| |||||||||||||
Redemption fees added to paid-in capital | 0.00 | ~ | 0.00 | ~ | 0.00 | ~ | 0.00 | ~ | 0.00 | ~ | 0.00 | ~ | ||||||||||||
|
|
|
|
|
|
|
|
|
|
|
| |||||||||||||
Net asset value, end of period | $ | 14.21 | $ | 14.67 | $ | 12.87 | $ | 12.53 | $ | 13.69 | $ | 11.63 | ||||||||||||
|
|
|
|
|
|
|
|
|
|
|
| |||||||||||||
Total Return | (3.14 | )%** | 36.61 | % | 11.97 | % | (2.15 | )% | 26.59 | % | 27.66 | %** | ||||||||||||
RATIOS/SUPPLEMENTAL DATA | ||||||||||||||||||||||||
Net assets, end of period (in 000’s) | $ | 25,583 | $ | 34,279 | $ | 24,181 | $ | 21,895 | $ | 21,573 | $ | 14,821 | ||||||||||||
Ratio of expenses before reimbursements and waivers to average net assets | 1.78 | %* | 1.85 | % | 1.97 | % | 1.95 | % | 2.47 | % | 2.82 | %* | ||||||||||||
Ratio of net expenses to average net assets | 1.75 | %*+ | 1.75 | %+ | 1.75 | %+ | 1.75 | %+ | 1.75 | %+ | 1.75 | %*+ | ||||||||||||
Ratio of net investment income (loss) to average net assets | (1.30 | )%*+ | (1.33 | )%+ | (0.78 | )%+ | (1.13 | )%+ | (1.39 | )%+ | (1.15 | )%*+ | ||||||||||||
Portfolio turnover | 97 | %** | 199 | % | 123 | % | 193 | % | 182 | % | 208 | %** | ||||||||||||
|
|
|
|
|
|
|
|
|
|
|
|
| ||||||||||||
| * | Annualized |
| ** | Not Annualized |
| ~ | Amount represents less than $0.01 per share |
| + | Such ratios are after administrative and transfer agent waivers and adviser expense reimbursements, when applicable. BNY Mellon Investment Servicing (US) Inc., the administrative agent and transfer agent, waived a portion of its fees beginning with the Fund’s commencement of operations, April 27, 2009. The Adviser contractually agreed to waive its investment advisory fee or absorb other operating expenses to the extent necessary to ensure that total annual Fund operating expenses (other than interest, taxes, brokerage commissions and other portfolio transaction expenses, capital expenditures, and extraordinary expenses) would not exceed the Fund’s operating expense cap of 1.75% of average daily net assets until April 30, 2015. |
Notes to Financial Statements are an integral part of this Schedule.
46
Table of Contents
Driehaus Micro Cap Growth Fund
Financial Highlights
| For the six month period January 1, 2014 through June 30, 2014 (unaudited) | For the period November 18, 2013 through December 31, 2013 | |||||||
Net asset value, beginning of period | $ | 10.74 | $ | 10.00 | ||||
|
|
|
| |||||
INCOME (LOSS) FROM INVESTMENT OPERATIONS: | ||||||||
Net investment income (loss) | (0.07 | ) | (0.02 | ) | ||||
Net realized and unrealized gain (loss) on investments | (0.07 | ) | 0.76 | |||||
|
|
|
| |||||
Total income (loss) from investment operations | (0.14 | ) | 0.74 | |||||
|
|
|
| |||||
LESS DISTRIBUTIONS: | ||||||||
Dividends from net investment income | — | — | ||||||
Distributions from capital gains | — | — | ||||||
|
|
|
| |||||
Total distributions | — | — | ||||||
|
|
|
| |||||
Net asset value, end of period | $ | 10.60 | $ | 10.74 | ||||
|
|
|
| |||||
Total Return | (1.30 | )%** | 7.40 | %** | ||||
RATIOS/SUPPLEMENTAL DATA | ||||||||
Net assets, end of period (in 000’s) | $ | 103,954 | $ | 74,677 | ||||
Ratio of expenses before reimbursements and waivers and fees recaptured, if any to average net assets | 1.57 | %* | 2.28 | %* | ||||
Ratio of net expenses to average net assets | 1.62 | %*+ | 1.70 | %*+ | ||||
Ratio of net investment income (loss) to average net assets | (1.49 | )%*+ | (1.55 | )%*+ | ||||
Portfolio turnover | 91 | %** | 21 | %** | ||||
| ||||||||
| * | Annualized |
| ** | Not Annualized |
| + | Such ratios are after administrative and transfer agent waivers and adviser expense reimbursements, when applicable. BNY Mellon Investment Servicing (US) Inc., the administrative agent and transfer agent, waived a portion of its fees beginning with the Fund’s commencement of operations, November 18, 2013. The Adviser contractually agreed to waive its investment advisory fee or absorb other operating expenses to the extent necessary to ensure that total annual Fund operating expenses (other than interest, taxes, brokerage commissions and other portfolio transaction expenses, capital expenditures, and extraordinary expenses) would not exceed the Fund’s operating expense cap of 1.70% of average daily net assets until November 18, 2016. |
Notes to Financial Statements are an integral part of this Schedule.
47
Table of Contents
Driehaus Mutual Funds
Notes to Financial Statements (unaudited)
A. SUMMARY OF SIGNIFICANT ACCOUNTING POLICIES
Organization
The Driehaus Mutual Funds (the “Trust”) is a registered management investment company, organized as a Delaware statutory trust, with ten separate series currently in operation. The Trust was organized under an Agreement and Declaration of Trust dated May 31, 1996, as subsequently amended and restated as of June 6, 2013, and may issue an unlimited number of full and fractional units of beneficial interest (shares) without par value. The seven series (“Funds” or each a “Fund”) included in this report are as follows:
| Fund | Commencement of Operations | |||
Driehaus International Discovery Fund | 12/31/98 | |||
Driehaus Emerging Markets Growth Fund | 12/31/97 | |||
Driehaus Emerging Markets Small Cap Growth Fund | 08/22/11 | |||
Driehaus International Small Cap Growth Fund* | 09/17/07 | |||
Driehaus Global Growth Fund | 05/01/08 | |||
Driehaus Mid Cap Growth Fund** | 04/27/09 | |||
Driehaus Micro Cap Growth | 11/18/13 | |||
| ||||
| * | On December 29, 2010, the Driehaus International Small Cap Growth Fund was closed to new investors. |
| ** | On July 11, 2014, the Driehaus Mid Cap Growth Fund was closed to new investors and was liquidated on August 13, 2014. |
The investment objective of each Fund is to maximize capital appreciation.
Driehaus International Discovery Fund seeks to achieve its objective by generally investing in equity securities of non-U.S. companies exhibiting strong growth characteristics.
Driehaus Emerging Markets Growth Fund seeks to achieve its objective by investing primarily in equity securities of emerging markets companies.
Driehaus Emerging Markets Small Cap Growth Fund seeks to achieve its objective by investing primarily in equity securities of small capitalization emerging markets companies.
Driehaus International Small Cap Growth Fund seeks to achieve its objective by investing primarily in equity securities of smaller capitalization non-U.S. companies exhibiting strong growth characteristics.
Driehaus Global Growth Fund seeks to achieve its objective by investing primarily in equity securities of both U.S. and non-U.S. companies exhibiting strong growth characteristics.
Driehaus Mid Cap Growth Fund seeks to achieve its objective by investing primarily in equity securities of mid capitalization U.S. companies exhibiting strong growth characteristics.
Driehaus Micro Cap Growth Fund seeks to achieve its objective by investing primarily in equity securities of micro capitalization U.S. companies exhibiting strong growth characteristics.
Fiscal Year-End
The fiscal year-end for the Funds is December 31.
Securities Valuation and Transactions
Equity securities and exchange-traded options are valued at the last sale price as of the close of the primary exchange or other designated time. In addition, if quotations are not readily available, if the values have been materially affected by events occurring after the closing of a foreign market, or if there has been a movement in the United States market that exceeds a certain threshold, assets may be valued at fair value as determined in good faith by or under the direction of the Trust’s Board of Trustees. Events that may materially affect asset values that could cause a fair value determination include, but are not limited to: corporate announcements relating to a specific security; natural and other disasters which may impact an
48
Table of Contents
Driehaus Mutual Funds
Notes to Financial Statements (unaudited) — (Continued)
entire market or region; and political and other events which may be global or impact a particular country or region. The frequency with which these procedures are used cannot be predicted and may be utilized to a significant extent. To the extent utilized, securities would be considered level 2 in the hierarchy described below. Substantially all transfers between level 1 and level 2 relate to the use of these procedures.
Each Fund is subject to fair value accounting standards that define fair value, establish the framework for measuring fair value and provide a three-level hierarchy for fair valuation based upon the inputs to the valuation as of the measurement date. The three levels of the fair value hierarchy are as follows:
Level 1 — quoted prices in active markets for identical securities
Level 2 — significant observable inputs (including quoted prices for similar securities, interest rates, prepayment speeds, credit risk, etc.)
Level 3 — significant unobservable inputs (including the Funds’ own assumptions in determining the fair value of investments)
The inputs or methodology used for valuing securities are not necessarily an indication of the risk associated with investing in those securities.
The summary of the Funds’ investments that are measured at fair value by level within the fair value hierarchy as of June 30, 2014 is as follows:
Fund | Total Value at June 30, 2014 | Level 1 Quoted Price | Level 2 Significant Observable Inputs | Level 3 Significant Unobservable Inputs | ||||||||||||
Driehaus International Discovery Fund | ||||||||||||||||
Investments in Securities* | $ | 115,892,662 | $ | 115,892,662 | $ | — | $ | — | ||||||||
|
|
|
|
|
|
|
| |||||||||
Driehaus Emerging Markets Growth Fund | ||||||||||||||||
Equity Securities: | ||||||||||||||||
Africa | $ | 122,191,620 | $ | 122,191,620 | $ | — | $ | — | ||||||||
Europe | 256,380,158 | 224,240,799 | 32,139,359 | |||||||||||||
Far East | 971,173,017 | 971,173,017 | — | — | ||||||||||||
Middle East | 32,732,912 | 32,732,912 | — | — | ||||||||||||
North America | 224,898,160 | 224,898,160 | — | — | ||||||||||||
South America | 239,292,136 | 239,292,136 | — | — | ||||||||||||
Equity Certificates* | 19,694,167 | — | 19,694,167 | — | ||||||||||||
|
|
|
|
|
|
|
| |||||||||
Total Investments | $ | 1,866,362,170 | $ | 1,814,528,644 | $ | 51,833,526 | $ | — | ||||||||
|
|
|
|
|
|
|
| |||||||||
Driehaus Emerging Markets Small Cap Growth Fund | ||||||||||||||||
Assets: | ||||||||||||||||
Equity Securities* | $ | 285,377,116 | $ | 285,377,116 | $ | — | $ | — | ||||||||
Equity Certificates* | 51,546,553 | — | 51,546,553 | — | ||||||||||||
Purchased Call Options by Risk Category Equity Contracts | 375,000 | 375,000 | — | — | ||||||||||||
Purchased Put Options by Risk Category Commodity Contracts | 40,000 | 40,000 | — | — | ||||||||||||
Equity Contracts | 1,870,000 | 1,870,000 | — | — | ||||||||||||
|
|
|
|
|
|
|
| |||||||||
Total Investments | $ | 339,208,669 | $ | 287,662,116 | $ | 51,546,553 | $ | — | ||||||||
|
|
|
|
|
|
|
| |||||||||
49
Table of Contents
Driehaus Mutual Funds
Notes to Financial Statements (unaudited) — (Continued)
Fund | Total Value at June 30, 2014 | Level 1 Quoted Price | Level 2 Significant Observable Inputs | Level 3 Significant Unobservable Inputs | ||||||||||||
Driehaus International Small Cap Growth Fund | ||||||||||||||||
Investments in Securities* | $ | 247,796,280 | $ | 247,796,280 | $ | — | $ | — | ||||||||
|
|
|
|
|
|
|
| |||||||||
Driehaus Global Growth Fund | ||||||||||||||||
Investments in Securities* | $ | 32,406,617 | $ | 32,406,617 | $ | — | $ | — | ||||||||
|
|
|
|
|
|
|
| |||||||||
Driehaus Mid Cap Growth Fund | ||||||||||||||||
Investments in Securities* | $ | 25,212,561 | $ | 25,212,561 | $ | — | $ | — | ||||||||
|
|
|
|
|
|
|
| |||||||||
Driehaus Micro Cap Growth Fund | ||||||||||||||||
Investments in Securities* | $ | 102,322,985 | $ | 102,322,985 | $ | — | $ | — | ||||||||
|
|
|
|
|
|
|
| |||||||||
| * | See Schedule of Investments for industry and/or country breakout. |
Transfers between levels, if any, are recognized as of the last day in the fiscal quarter of the period in which the event or change in circumstances that caused the reclassification occurred. The Funds used observable inputs in their valuation methodologies whenever they were available and deemed reliable.
When fair value pricing is employed, the prices of securities used by a Fund to calculate its net asset value may differ from closing prices for the same securities, which means that a Fund may value those securities higher or lower than another fund that does not employ fair value. In addition, the fair value price may differ materially from the value a Fund may ultimately realize.
For the period ended June 30, 2014, securities with the end of period value of $681,170 held by Driehaus Emerging Markets Small Cap Growth Fund were transferred from level 2 to level 1. For the period ended June 30, 2014, securities with end of period values of $13,878,183 and $24,438,533 held by Driehaus Emerging Markets Growth Fund and Driehaus Emerging Markets Small Cap Growth Fund, respectively, were transferred from level 1 to level 2.
Securities transactions are accounted for on trade date. The cost of investments sold is determined by the use of the specific identification method for both financial reporting and income tax purposes. Interest income is recorded on an accrual basis. Dividend income, net of non-reclaimable foreign taxes withheld, is recorded on the ex-dividend date or as soon as the information is available. Income and expenses are accrued daily.
Options Contracts
The Funds are subject to equity and other risk exposures in the normal course of pursuing their investment objective. The Funds may use options contracts to hedge their portfolio or a portion thereof or speculatively for the purpose of profiting from a decline in the market value of a security.
The Funds may write covered call and put options on futures, securities or currencies the Funds own or in which they may invest. Writing put options tends to increase a Fund’s exposure to the underlying instrument. Writing call options tends to decrease a Fund’s exposure to the underlying instrument. When a Fund writes a call or put option, an amount equal to the premium received is recorded as a liability and subsequently marked-to-market to reflect the current value of the option written. These liabilities are reflected as written options outstanding in the Schedule of Investments. Payments received or made, if any, from writing options with premiums to be determined on a future date are reflected as such in the Schedule of Investments. Premiums received from writing options which expire are treated as realized gains. Premiums received from writing options which are exercised or closed are added to the proceeds or offset against amounts paid on the underlying future, security or currency transaction to determine the realized gain or loss. A Fund, as a writer of an option, has no control over whether the underlying future, security or currency may be sold (call) or purchased (put) and, as a result, bears the market risk of an unfavorable change in the price
50
Table of Contents
Driehaus Mutual Funds
Notes to Financial Statements (unaudited) — (Continued)
of the future, security or currency underlying the written option. The risk exists that a Fund may not be able to enter into a closing transaction because of an illiquid market.
For the period January 1, 2014 through June 30, 2014, the average volume of purchased and written options for Driehaus Emerging Markets Small Cap Growth Fund was $3,368,024 and $94,338, respectively.
The premiums received and the number of option contracts written during the period ended June 30, 2014, were as follows:
Driehaus Emerging Markets Small Cap Growth Fund | Number of Contracts | Premiums Received | ||||||
Options outstanding at December 31, 2013 | — | $ | — | |||||
Options written | 99,215 | 3,309,804 | ||||||
Options closed | (82,215 | ) | (3,026,790 | ) | ||||
Options expired | (17,000 | ) | (283,014 | ) | ||||
|
|
|
| |||||
Options outstanding at June 30, 2014 | — | $ | — | |||||
|
|
|
| |||||
The Funds may also purchase put and call options. Purchasing call options tends to increase a Fund’s exposure to the underlying instrument. Purchasing put options tends to decrease a Fund’s exposure to the underlying instrument. A Fund pays a premium which is included in its Schedule of Investments as an investment and subsequently marked-to-market to reflect the current value of the option. Premiums paid for purchasing options which expire are treated as realized losses. Premiums paid for purchasing options which are exercised or closed are added to the amounts paid or offset against the proceeds on the underlying future, security or currency transaction to determine the realized gain or loss. When entering into purchased option contracts, a Fund bears the risk of securities prices moving unexpectedly, in which case, a Fund may not achieve the anticipated benefits of the purchased option contracts; however, the risk of loss is limited to the premium paid. As of June 30, 2014, the Funds had outstanding options as listed on the Schedule of Investments.
Equity Certificates
The Funds may invest in equity certificates which allow the Funds to participate in the appreciation (depreciation) of the underlying security without actually owning the underlying security. These derivative instruments are purchased pursuant to an agreement with a financial institution and are valued at a calculated market price based on the value of the underlying security in accordance with the agreement. These equity certificates are subject to the credit risk of the issuing financial institution. There is no off-balance sheet risk associated with equity certificates and the Funds’ potential loss is limited to the purchase price of the securities. The Funds are exposed to credit risk associated with the counterparty to the transaction, which is monitored by the Funds’ management on a periodic basis.
On June 30, 2014, Driehaus Emerging Markets Growth Fund and Driehaus Emerging Markets Small Cap Growth Fund had unrealized appreciation of $3,917,796 and $13,253,786, respectively, as a result of their investments in these financial instruments. The aggregate market values of these certificates for Driehaus Emerging Markets Growth Fund and Driehaus Emerging Markets Small Cap Growth Fund represented 1.1% and 15.2%, respectively, of their total market values at June 30, 2014.
Derivative Investment Holdings Categorized by Risk Exposure
Each Fund is subject to the Financial Accounting Standards Board’s (“FASB”) “Disclosures about Derivative Instruments and Hedging Activities” (the “Derivatives Statement”). The Derivatives Statement amends and expands disclosures about derivative instruments and hedging activities. The Derivatives Statement is intended to improve financial reporting about derivative instruments requiring enhanced disclosures to enable investors to better understand how and why the Funds use derivative instruments, how these derivative instruments are accounted for and their effects on the Funds’ financial position and results of operations.
51
Table of Contents
Driehaus Mutual Funds
Notes to Financial Statements (unaudited) — (Continued)
The following table sets forth the fair value and the location in the Statement of Assets and Liabilities of the Driehaus Emerging Markets Growth Fund’s derivative contracts by primary risk exposure as of June 30, 2014:
Asset derivatives | ||||||
Risk exposure category | Statement of Assets and Liabilities location | Fair value | ||||
Equity contracts | Investments, at market value | $ | 19,694,167 | |||
|
|
|
| |||
The following table sets forth the fair value and the location in the Statement of Assets and Liabilities of the Driehaus Emerging Markets Small Cap Growth Fund’s derivative contracts by primary risk exposure as of June 30, 2014:
Asset derivatives | ||||||
Risk exposure category | Statement of Assets and Liabilities location | Fair value | ||||
Equity contracts* | Investments, at market value | $ | 53,791,553 | |||
Commodity contracts* | Investments, at market value | 40,000 | ||||
|
|
|
| |||
| * | Includes cumulative appreciation (depreciation) of options contracts shown in the Schedule of Investments. |
The following table sets forth the Driehaus Emerging Markets Growth Fund’s realized gain (loss) by primary risk exposure and by type of derivative contract for the period January 1, 2014 through June 30, 2014.
| Amount of realized gain (loss) on derivatives | ||||
Risk exposure category | Equity Certificates | |||
Equity contracts | $ | 10,520,997 | ||
|
|
| ||
The following table sets forth the Driehaus Emerging Markets Small Cap Growth Fund’s realized gain (loss) by primary risk exposure and by type of derivative contract for the period January 1, 2014 through June 30, 2014.
| Amount of realized gain (loss) on derivatives | ||||||||||||
Risk exposure category | Equity Certificates | Purchased Options | Written Options | |||||||||
Equity contracts | $ | 5,317,758 | $ | (9,003,459 | ) | $ | 715,883 | |||||
Commodity contracts | — | 221,554 | — | |||||||||
|
|
|
|
|
|
| ||||||
The following table sets forth the Driehaus Emerging Markets Growth Fund’s change in unrealized appreciation (depreciation) by primary risk exposure and by type of derivative contract for the period January 1, 2014 through June 30, 2014.
| Change in unrealized appreciation (depreciation) on derivatives | ||||
Risk exposure category | Equity Certificates | |||
Equity contracts | $ | 3,807,685 | ||
|
|
| ||
The following table sets forth the Driehaus Emerging Markets Small Cap Growth Fund’s change in unrealized appreciation (depreciation) by primary risk exposure and by type of derivative contract for the period January 1, 2014 through June 30, 2014.
| Change in unrealized appreciation (depreciation) on derivatives | ||||||||
Risk exposure category | Equity Certificates | Purchased Options | ||||||
Equity contracts | $ | 7,498,033 | $ | (857,819 | ) | |||
Commodity contracts | — | (190,401 | ) | |||||
|
|
|
|
| ||||
Federal Income Taxes
No provision is made for Federal income taxes since each Fund has elected or will elect to be taxed as a “regulated investment company” under Subchapter M of the Internal Revenue Code (the “Code”) and has
52
Table of Contents
Driehaus Mutual Funds
Notes to Financial Statements (unaudited) — (Continued)
made and declared all the required distributions to its shareholders in amounts sufficient to relieve each Fund from all or substantially all Federal income and excise taxes under provisions of current Federal tax law.
Each Fund is subject to accounting standards that establish a minimum threshold for recognizing, and a system for measuring, the benefits of a tax position taken or expected to be taken in a tax return. Taxable years ending 2013, 2012, 2011 and 2010 remain open to Federal and state audit. As of June 30, 2014, management has evaluated the application of these standards to each Fund, and has determined that no provision for income tax is required in each Fund’s financial statements for uncertain tax provisions. The Funds recognize interest and penalties, if any, related to unrecognized tax benefits as income tax expense in the Statement of Operations. During the year, the Funds did not incur any interest or penalties. The Funds may be subject to foreign taxes on income, gains on investments or currency repatriation, a portion of which may be recoverable. Foreign taxes are provided for based on the Funds’ understanding of the tax rules and regulations that exist in the foreign markets in which they invest.
The amount of dividends and distributions from net investment income and net realized capital gains are determined in accordance with Federal income tax regulations, which may differ from U.S. generally accepted accounting principles.
For the year ended December 31, 2013, reclassifications were recorded to undistributed net investment income, undistributed net realized gain and paid-in capital for any permanent tax differences. These reclassifications relate primarily to foreign currency losses, sales of passive foreign investment companies, net operating losses and capital loss carryforwards expiring. Results of operations and net assets were not affected by these reclassifications.
For Federal income tax purposes, capital loss carryforwards represent net capital losses of a Fund that may be carried forward for a maximum period of eight years and applied against future net realized gains. On December 22, 2010, the Regulated Investment Company Modernization Act of 2010 was enacted to modernize several of the Federal income and excise tax provisions related to regulated investment companies. Under pre-enactment law, capital losses could be carried forward for up to eight years, and carried forward as short-term capital losses, irrespective of the character of the original loss. New net capital losses (those earned in taxable years beginning after December 22, 2010) may be carried forward indefinitely and must retain the character of the original loss. Such new net capital losses generally must be used by a regulated investment company before it uses any net capital losses incurred in taxable years beginning on or before December 22, 2010. This increases the likelihood that net capital losses incurred in taxable years beginning on or before December 22, 2010 will expire unused. The following table shows the expiration dates for capital loss carryover from pre-enactment taxable years and the amounts of capital loss carryover, if any, by each of the applicable Funds as of December 31, 2013.
| Pre-Enactment Net Capital Loss Carryover Expiring In | Post-Enactment Unlimited Period of Net Capital Loss Carryover | |||||||||||||||||||
Fund | 2016 | 2017 | Short- Term | Long- Term | Accumulated Capital Loss Carryover | |||||||||||||||
Driehaus International Discovery Fund | $ | 119,874,502 | $ | 109,113,076 | $ | — | $ | — | $ | 228,987,578 | ||||||||||
Driehaus Emerging Markets Small Cap Growth Fund | — | — | 6,730,035 | — | 6,730,035 | |||||||||||||||
During the year ended December 31, 2013, Driehaus International Discovery Fund, Driehaus Emerging Markets Growth Fund and Driehaus International Small Cap Growth Fund utilized $32,972,648, $46,914,023 and $16,027,905 of capital loss carryforwards, respectively.
Pursuant to federal income tax rules applicable to regulated investment companies, the Funds may elect to treat certain capital losses between November 1 and December 31 as occurring on the first day of the
53
Table of Contents
Driehaus Mutual Funds
Notes to Financial Statements (unaudited) — (Continued)
following tax year. For the year ended December 31, 2013, the following qualified late-year losses were deferred and recognized on January 1, 2014.
Fund | Late-Year Ordinary Loss Deferral | Short-Term Capital Loss Deferral | Long-Term Capital Loss Deferral | Total | ||||||||||||
Driehaus Emerging Markets Growth Fund | $ | 188,729 | $ | 12,119,097 | $ | — | $ | 12,307,826 | ||||||||
Driehaus Emerging Markets Small Cap Growth Fund | 75,337 | — | — | 75,337 | ||||||||||||
Driehaus Global Growth Fund | — | 146,129 | — | 146,129 | ||||||||||||
Distributions to Shareholders
The Funds had no distributions during the six months ended June 30, 2014.
The tax character of distributions paid during the fiscal year ended December 31, 2013 was as follows:
Distributions paid from: | Driehaus International Discovery Fund | Driehaus Emerging Markets Growth Fund | Driehaus Emerging Markets Small Cap Growth Fund | Driehaus International Small Cap Growth Fund | Driehaus Global Growth Fund | Driehaus Mid Cap Growth Fund | Driehaus Micro Cap Growth Fund | |||||||||||||||||||||
Ordinary income | $ | — | $ | — | $ | 309,776 | $ | 16,561,929 | $ | 302,140 | $ | 2,203,195 | $ | — | ||||||||||||||
Net long-term capital gain | — | 38,958,248 | — | 13,844,049 | 3,760,630 | 3,361,585 | — | |||||||||||||||||||||
|
|
|
|
|
|
|
|
|
|
|
|
|
| |||||||||||||||
Total distributions paid | $ | — | $ | 38,958,248 | $ | 309,776 | $ | 30,405,978 | $ | 4,062,770 | $ | 5,564,780 | $ | — | ||||||||||||||
|
|
|
|
|
|
|
|
|
|
|
|
|
| |||||||||||||||
The tax character of distributions paid during the fiscal year ended December 31, 2012 was as follows:
Distributions paid from: | Driehaus International Discovery Fund | Driehaus Emerging Markets Growth Fund | Driehaus Emerging Markets Small Cap Growth Fund | Driehaus International Small Cap Growth Fund | Driehaus Global Growth Fund | Driehaus Mid Cap Growth Fund | Driehaus Large Cap Growth Fund | |||||||||||||||||||||
Ordinary income | $ | — | $ | 3,661,528 | $ | 1,246,733 | $ | 1,069,444 | $ | — | $ | — | $ | 116,590 | ||||||||||||||
Net long-term capital gain | — | — | — | — | 1,436,164 | 2,022,728 | 1,667,897 | |||||||||||||||||||||
|
|
|
|
|
|
|
|
|
|
|
|
|
| |||||||||||||||
Total distributions paid | $ | — | $ | 3,661,528 | $ | 1,246,733 | $ | 1,069,444 | $ | 1,436,164 | $ | 2,022,728 | $ | 1,784,487 | ||||||||||||||
|
|
|
|
|
|
|
|
|
|
|
|
|
| |||||||||||||||
As of December 31, 2013, the components of net assets on a tax basis were as follows:
Distributions paid from: | Driehaus International Discovery Fund | Driehaus Emerging Markets Growth Fund | Driehaus Emerging Markets Small Cap Growth Fund | Driehaus International Small Cap Growth Fund | Driehaus Global Growth Fund | Driehaus Mid Cap Growth Fund | Driehaus Micro Cap Growth Fund | |||||||||||||||||||||
Undistributed ordinary income | $ | 906,878 | $ | — | $ | — | $ | 9,608,595 | $ | 212,176 | $ | 620,178 | $ | 1,275,778 | ||||||||||||||
Undistributed long-term capital gain | — | — | — | 2,538,174 | 633,199 | 429,896 | 2,251,542 | |||||||||||||||||||||
|
|
|
|
|
|
|
|
|
|
|
|
|
| |||||||||||||||
Accumulated earnings | $ | 906,878 | $ | — | $ | — | $ | 12,146,769 | $ | 845,375 | $ | 1,050,074 | $ | 3,527,320 | ||||||||||||||
Paid-in capital | 343,103,912 | 1,475,045,072 | 171,947,827 | 221,387,503 | 32,628,019 | 27,029,960 | 53,319,615 | |||||||||||||||||||||
Accumulated capital and other losses | (228,987,578 | ) | (12,307,826 | ) | (6,805,372 | ) | — | (146,129 | ) | — | — | |||||||||||||||||
Unrealized appreciation (depreciation) on foreign currency | 35,996 | 3,131 | 14,989 | 17,812 | (364 | ) | — | — | ||||||||||||||||||||
Unrealized appreciation on investments | 18,828,144 | 172,125,496 | 26,127,289 | 37,118,630 | 6,539,023 | 6,199,002 | 17,829,850 | |||||||||||||||||||||
|
|
|
|
|
|
|
|
|
|
|
|
|
| |||||||||||||||
Net assets | $ | 133,887,352 | $ | 1,634,865,873 | $ | 191,284,733 | $ | 270,670,714 | $ | 39,685,924 | $ | 34,279,036 | $ | 74,676,785 | ||||||||||||||
|
|
|
|
|
|
|
|
|
|
|
|
|
| |||||||||||||||
54
Table of Contents
Driehaus Mutual Funds
Notes to Financial Statements (unaudited) — (Continued)
The differences between book-basis and tax-basis unrealized appreciation are attributable primarily to the tax deferral of losses on wash sales and passive foreign investment company (PFIC) mark-to-market.
Foreign Currency Translation
Foreign currency and equity securities not denominated in U.S. dollars are translated into U.S. dollar values based upon the current rates of exchange on the date of the Funds’ valuations.
Net realized foreign exchange gains or losses which are reported by the Funds result from currency gains and losses on transaction hedges arising from changes in exchange rates between the trade and settlement dates on spot contracts underlying securities transactions and the difference between the amounts accrued for dividends, interest, and foreign taxes and the amounts actually received or paid in U.S. dollars for these items. Net unrealized foreign exchange gains and losses result from changes in the U.S. dollar value of assets and liabilities (other than investments in securities), which are denominated in foreign currencies, as a result of changes in exchange rates.
Net realized foreign exchange gains or losses on portfolio hedges result from the use of spot contracts to hedge portfolio positions denominated or quoted in a particular currency in order to reduce or limit exposure in that currency. The Funds had no portfolio hedges during the six months ended June 30, 2014.
The Funds do not isolate that portion of the results of operations which results from fluctuations in foreign exchange rates on investments. These fluctuations are included with the net realized gain (loss) from security transactions and the net change in unrealized appreciation (depreciation) of investments.
Use of Estimates
The preparation of financial statements, in conformity with U.S. generally accepted accounting principles, requires management to make estimates and assumptions that affect the reported amount of assets and liabilities and disclosure of contingent assets and liabilities at the date of the financial statements and the reported amounts of net increases or decreases in net assets from operations during the reporting period. Actual results could differ from those estimates.
Indemnifications
Under the Trust’s organizational documents, the officers and Trustees are indemnified against certain liabilities arising out of the performance of their duties to the Trust. In addition, in the normal course of business, the Trust enters into contracts that provide general indemnifications to other parties. The Funds’ maximum exposure under these agreements is unknown as this would involve future claims that may be made against the Funds that have not yet occurred. However, the Funds have not had prior claims or losses pursuant to these contracts and expect the risk of loss to be remote.
Subsequent Event
The Board of Trustees of the Trust (the “Board”) has determined to terminate and liquidate the Driehaus Mid Cap Growth Fund (the “Mid Cap Fund”). The Mid Cap Fund ceased accepting purchase orders as of July 11, 2014 and, as of August 1, 2014, began the process of liquidating the portfolio. The Mid Cap Fund made a liquidating distribution to its shareholders on August 13, 2014 and has terminated.
B. INVESTMENT ADVISORY FEES, TRANSACTIONS WITH AFFILIATES, AND ADMINISTRATIVE FEES
Richard H. Driehaus, an Interested Trustee of the Trust, is also the Chairman of the Board of Driehaus Capital Management LLC (“DCM” or the “Adviser”), a registered investment adviser, and of Driehaus Securities LLC (“DS LLC” or the “Distributor”), a registered broker-dealer.
DCM serves as the Funds’ investment adviser. In return for its services to the Funds, DCM receives monthly fees. Driehaus International Discovery Fund and Driehaus Micro Cap Growth Fund each pay the Adviser a monthly fee computed and accrued daily at an annual rate of 1.25% of each Fund’s average daily net assets. Driehaus Emerging Markets Growth Fund, Driehaus Emerging Markets Small Cap
55
Table of Contents
Driehaus Mutual Funds
Notes to Financial Statements (unaudited) — (Continued)
Growth Fund and Driehaus International Small Cap Growth Fund each pay the Adviser a monthly fee computed and accrued daily at an annual rate of 1.50% of each Fund’s average daily net assets. Driehaus Global Growth Fund and Driehaus Mid Cap Growth Fund each pay the Adviser a monthly fee computed and accrued daily at an annual rate of 1.00% of each Fund’s average daily net assets.
DCM has entered into an agreement to cap Driehaus Emerging Markets Small Cap Growth Fund’s annual operating expenses (other than interest, taxes, brokerage commissions and other portfolio transaction expenses, capital expenditures and extraordinary expenses) at 2.00% of average daily net assets until August 21, 2014. For a period of three years subsequent to the Fund’s commencement of operations, DCM is entitled to reimbursement for previously waived fees and reimbursed expenses to the extent that the Fund’s expense ratio remains below the operating expense cap. For the six months ended June 30, 2014, DCM did not waive or recapture fees for Driehaus Emerging Markets Small Cap Growth Fund under this agreement.
DCM has entered into an agreement to cap Driehaus Mid Cap Growth Fund’s annual operating expenses (other than interest, taxes, brokerage commissions and other portfolio transaction expenses, capital expenditures and extraordinary expenses) at 1.75% of average daily net assets until April 30, 2015. For a period of three years subsequent to the date the waiver or reimbursement was made, DCM is entitled to reimbursement for previously waived fees and reimbursed expenses to the extent that the Fund’s expense ratio remains below the operating expense cap. For the six months ended June 30, 2014, DCM waived fees for Driehaus Mid Cap Growth Fund totaling $5,309 under this agreement and the amount of potential recovery expiring December 31, 2014, December 31, 2015, December 31, 2016 and December 31, 2017 was $48,478, $52,090, $27,897 and $5,309 respectively.
DCM has entered into an agreement to cap Driehaus Micro Cap Growth Fund’s annual operating expenses (other than interest, taxes, brokerage commissions and other portfolio transaction expenses, capital expenditures and extraordinary expenses) at 1.70% of average daily net assets until November 18, 2016. For a period of three years subsequent to the Fund’s commencement of operations, DCM is entitled to reimbursement for previously waived fees and reimbursed expenses to the extent that the Fund’s expense ratio remains below the operating expense cap. For the period ended June 30, 2014, DCM recaptured fees for Driehaus Micro Cap Growth Fund totaling $39,026 under this agreement and there are no additional amounts subject to recapture.
The amounts accrued and payable to DCM during the six months ended June 30, 2014, are as follows:
| Fund | Advisory Fees | Advisory Fees Payable (included in Due to affiliates) | ||||||
Driehaus International Discovery Fund | $ | 763,251 | $ | 120,807 | ||||
Driehaus Emerging Markets Growth Fund | 13,004,474 | 2,351,124 | ||||||
Driehaus Emerging Markets Small Cap Growth Fund | 1,953,030 | 410,381 | ||||||
Driehaus International Small Cap Growth Fund | 1,864,996 | 309,846 | ||||||
Driehaus Global Growth Fund | 179,857 | 26,546 | ||||||
Driehaus Mid Cap Growth Fund | 153,658 | 21,958 | ||||||
Driehaus Micro Cap Growth Fund | 584,417 | 102,572 | ||||||
|
|
|
|
| ||||
The Funds direct certain portfolio trades, subject to obtaining the best price and execution, to brokers who have agreed to pay a portion of the Funds’ operating expenses using part of the commissions generated. For the six months ended June 30, 2014, these arrangements reduced the expenses of Driehaus International Discovery Fund, Driehaus Emerging Markets Growth Fund, Driehaus Emerging Markets Small Cap Growth Fund, Driehaus International Small Cap Growth Fund, Driehaus Global Growth Fund, Driehaus Mid Cap Growth Fund and Driehaus Micro Cap Growth Fund by $7,100 (0.7%), $141,622 (1.0%), $14,449 (0.6%), $20,469 (1.0%), $1,000 (0.3%), $35 (0.0%) and $0 (0.0%), respectively.
Certain officers of the Trust are also officers of DCM and DS LLC. The Funds pay a portion of the Chief Compliance Officer’s salary and bonus. No other officers received compensation from the Funds.
56
Table of Contents
Driehaus Mutual Funds
Notes to Financial Statements (unaudited) — (Continued)
BNY Mellon Investment Servicing (US) Inc. (“BNY Mellon”) serves as the Funds’ administrative and accounting agent. In compensation for these services, BNY Mellon receives the larger of a monthly minimum fee or a monthly fee based upon average net assets. For the six months ended June 30, 2014, BNY Mellon waived $2,500 for administrative and accounting fees for Driehaus Micro Cap Growth Fund. BNY Mellon also acts as the transfer agent and dividend disbursing agent for the Funds. For these services, BNY Mellon earns a monthly fee based on shareholder processing activity during the month. BNY Mellon has agreed to waive a portion of its monthly fee for transfer agent service for the first two years of operations for Driehaus Micro Cap Growth Fund. For the six months ended June 30, 2014, BNY Mellon waived $14,132 for Driehaus Micro Cap Growth Fund.
C. OTHER FINANCIAL INSTRUMENTS
The Funds enter into foreign currency spot contracts to facilitate transactions in foreign denominated securities. These spot contracts are typically open for 2 to 5 days, depending on the settlement terms of the underlying security transaction. On June 30, 2014, the Funds had foreign currency spot contracts outstanding under which they are obligated to exchange currencies at specified future dates. The unrealized appreciation or depreciation on spot contracts is reflected as a separate line item in the Statement of Assets and Liabilities. On June 30, 2014, the Funds’ currency transactions were limited to transaction hedges.
D. INVESTMENT TRANSACTIONS
The aggregate purchases and sales of investment securities, other than short-term obligations and options, for the six months ended June 30, 2014 were as follows:
| Fund | Purchases | Sales | ||||||
Driehaus International Discovery Fund | $ | 91,435,924 | $ | 104,745,074 | ||||
Driehaus Emerging Markets Growth Fund | 2,532,111,478 | 2,305,873,814 | ||||||
Driehaus Emerging Markets Small Cap Growth Fund | 437,242,530 | 308,215,361 | ||||||
Driehaus International Small Cap Growth Fund | 330,853,210 | 362,975,997 | ||||||
Driehaus Global Growth Fund | 35,229,118 | 42,108,743 | ||||||
Driehaus Mid Cap Growth Fund | 28,599,419 | 36,835,177 | ||||||
Driehaus Micro Cap Growth Fund | 112,702,489 | 82,335,738 | ||||||
|
|
|
|
| ||||
E. RESTRICTED SECURITIES
Restricted securities are securities that are not registered for sale under the Securities Act of 1933 or applicable foreign law and that may be re-sold only in transactions exempt from applicable registration. Restricted securities include Rule 144A securities which may be sold normally to qualified institutional buyers. On June 30, 2014, the Funds held no restricted securities, other than equity certificates. Since an investment in equity certificates represents an agreement entered into with a financial institution, with terms set by such financial institution, these instruments are also deemed to be restricted (see Note A).
F. LINE OF CREDIT
Driehaus International Discovery Fund, Driehaus Emerging Markets Growth Fund and Driehaus International Small Cap Growth Fund have together obtained an uncommitted line of credit in the amount of $25,000,000 and Driehaus Emerging Markets Small Cap Growth Fund, Driehaus Global Growth Fund, Driehaus Mid Cap Growth Fund and Driehaus Micro Cap Growth Fund have together obtained an uncommitted line of credit in the amount of $5,000,000. These lines of credit are available primarily to meet large, unexpected shareholder withdrawals subject to certain restrictions. Interest is charged at a rate per annum equal to the Federal Funds Rate in effect at the time of the borrowings plus 1.5%. At June 30, 2014, the Funds had no outstanding borrowings under the lines of credit.
57
Table of Contents
Driehaus Mutual Funds
Notes to Financial Statements (unaudited) — (Continued)
G. FOREIGN INVESTMENT RISKS
To the extent a Fund invests in foreign securities, it may entail risks due to the potential for political and economic instability in the countries where the issuers of these securities are located. In addition, foreign exchange fluctuations could affect the value of positions held. These risks are generally intensified in emerging markets.
H. REDEMPTION FEES
The Funds may charge a redemption fee of 2.00% of the redemption amount for shares redeemed within 60 days of purchase. The redemption fees are recorded in paid-in capital.
58
Table of Contents
Fund Expense Examples (unaudited)
As a mutual fund shareholder, you may incur two types of costs: (1) transaction costs, including sales charges; redemption fees; and exchange fees and (2) ongoing costs, including management fees; distribution (12b-1) fees; and other fund expenses. This example is intended to help you understand your ongoing costs (in dollars) of investing in each Fund and to compare these costs with the ongoing costs of investing in other mutual funds.
The example is based on an investment of $1,000 invested at the beginning of the period and held for the entire six months ended June 30, 2014.
Actual Expenses
The first line of the tables below (“Actual”) provides information about actual account values and actual expenses. You may use the information in this line, together with the amount you invested, to estimate the expense that you paid over the period. Simply divide your account value by $1,000 (for example, an $8,600 account value divided by $1,000 = 8.6), then multiply the result by the number in the first line under the heading entitled “Expenses Paid During Period” to estimate the expenses you paid on your account during this period.
Hypothetical Example for Comparison Purposes
The second line of the tables below (“Hypothetical”) provides information about hypothetical account values and hypothetical expenses based on the Fund’s actual expense ratio and an assumed rate of return of 5% per year before expenses, which is not the Fund’s actual return. You may use this information to compare the ongoing costs of investing in the Funds versus other funds. To do so, compare this 5% hypothetical example with the 5% hypothetical examples that appear in the shareholder reports of the other funds.
Please note that the expenses shown in the table are meant to highlight your ongoing costs only and do not reflect any transactional costs, such as sales charges, redemption fees or exchange fees. Therefore, the second line of the table is useful in comparing ongoing costs only, and will not help you determine the relative total costs of owning different funds. In addition, if these transactional costs were included, your costs would have been higher.
Driehaus International Discovery Fund
Beginning Account Value January 1, 2014 | Ending Account Value June 30, 2014 | Expenses Paid During Six Months Ended June 30, 2014* | ||||||||||
Actual | $ | 1,000 | $ | 982.50 | $ | 7.82 | ||||||
Hypothetical (5% return before expenses) | $ | 1,000 | $ | 1,016.91 | $ | 7.95 | ||||||
Driehaus Emerging Markets Growth Fund
Beginning Account Value January 1, 2014 | Ending Account Value June 30, 2014 | Expenses Paid During June 30, 2014* | ||||||||||
Actual | $ | 1,000 | $ | 1,037.50 | $ | 8.18 | ||||||
Hypothetical (5% return before expenses) | $ | 1,000 | $ | 1,016.76 | $ | 8.10 | ||||||
59
Table of Contents
Fund Expense Examples (unaudited) — (Continued)
Driehaus Emerging Markets Small Cap Growth Fund
Beginning Account Value January 1, 2014 | Ending Account Value June 30, 2014 | Expenses Paid During June 30, 2014* | ||||||||||
Actual | $ | 1,000 | $ | 1,083.30 | $ | 8.88 | ||||||
Hypothetical (5% return before expenses) | $ | 1,000 | $ | 1,016.27 | $ | 8.60 | ||||||
Driehaus International Small Cap Growth Fund
Beginning Account Value January 1, 2014 | Ending Account Value June 30, 2014 | Expenses Paid During June 30, 2014* | ||||||||||
Actual | $ | 1,000 | $ | 1,054.40 | $ | 8.76 | ||||||
Hypothetical (5% return before expenses) | $ | 1,000 | $ | 1,016.27 | $ | 8.60 | ||||||
Driehaus Global Growth Fund
| Beginning Account Value January 1, 2014 | Ending Account Value June 30, 2014 | Expenses Paid During June 30, 2014* | ||||||||||
Actual | $ | 1,000 | $ | 1,000.00 | $ | 8.78 | ||||||
Hypothetical (5% return before expenses) | $ | 1,000 | $ | 1,016.02 | $ | 8.85 | ||||||
Driehaus Mid Cap Growth Fund
| Beginning Account Value January 1, 2014 | Ending Account Value June 30, 2014 | Expenses Paid During Six Months Ended June 30, 2014* | ||||||||||
Actual | $ | 1,000 | $ | 968.60 | $ | 8.54 | ||||||
Hypothetical (5% return before expenses) | $ | 1,000 | $ | 1,016.12 | $ | 8.75 | ||||||
Driehaus Micro Cap Growth Fund
| Beginning Account Value January 1, 2014 | Ending Account Value June 30, 2014 | Expenses Paid During June 30, 2014* | ||||||||||
Actual | $ | 1,000 | $ | 987.00 | $ | 7.98 | ||||||
Hypothetical (5% return before expenses) | $ | 1,000 | $ | 1,016.76 | $ | 8.10 | ||||||
| * | Expenses are equal to the Fund’s annualized expense ratios for the six-month period in the table below multiplied by the average account value over the period, multiplied by the number of days in the most recent fiscal half-year (181), then divided by 365 to reflect the half-year period. |
60
Table of Contents
Fund Expense Examples (unaudited) — (Continued)
Driehaus International Discovery Fund | 1.59% | |
Driehaus Emerging Markets Growth Fund | 1.62% | |
Driehaus Emerging Markets Small Cap Growth Fund | 1.72% | |
Driehaus International Small Cap Growth Fund | 1.72% | |
Driehaus Global Growth Fund | 1.77% | |
Driehaus Mid Cap Growth Fund | 1.75% | |
Driehaus Micro Cap Growth Fund | 1.62% |
61
Table of Contents
DRH-SAR2014
Table of Contents
Driehaus Mutual Funds
Trustees & Officers
Richard H. Driehaus
Trustee
Theodore J. Beck
Trustee
Francis J. Harmon
Trustee
A.R. Umans
Trustee
Dawn M. Vroegop
Trustee
Daniel F. Zemanek
Chairman of the Board
Robert H. Gordon
President
Michelle L. Cahoon
Vice President & Treasurer
Janet L. McWilliams
Assistant Vice President &
Chief Legal Officer
Michael R. Shoemaker
Chief Compliance Officer &
Assistant Vice President
Diane J. Drake
Secretary
Michael P. Kailus
Assistant Secretary & Anti-Money Laundering Compliance Officer
William H. Wallace, III
Assistant Secretary
Investment Adviser
Driehaus Capital Management LLC
25 East Erie Street
Chicago, IL 60611
Distributor
Driehaus Securities LLC
25 East Erie Street
Chicago, IL 60611
Administrator & Transfer Agent
UMB Fund Services, Inc.
235 W. Galena Street
Milwaukee, WI 53212
Custodian
The Northern Trust Company
50 South LaSalle Street
Chicago, IL 60603
Semi-Annual Report to Shareholders
June 30, 2014

Driehaus Active Income Fund
Driehaus Select Credit Fund
Driehaus Event Driven Fund
Distributed by:
Driehaus Securities LLC
This report has been prepared for the shareholders of the Funds and is not an offering to sell or buy any Fund securities. Such offering is only made by the Funds’ prospectus.
Table of Contents
Performance Overview and Schedule of Investments: | ||||
| 1 | ||||
| 13 | ||||
| 22 | ||||
| 28 | ||||
| 29 | ||||
| 30 | ||||
| 32 | ||||
| 37 | ||||
| 57 | ||||
PROXY VOTING POLICIES AND PROCEDURES AND PROXY VOTING RECORD
A description of the Funds’ policies and procedures with respect to the voting of proxies relating to the Funds’ portfolio securities is available without charge, upon request, by calling 1-877-779-0079. This information is also available on the Funds’ website at http://www.driehaus.com.
Information regarding how the Funds voted proxies related to portfolio securities during the 12-month period ended June 30, 2014 is available without charge, upon request, by calling 1-877-779-0079. This information is also available on the Securities and Exchange Commission’s (“SEC”) website at http://www.sec.gov.
HOW TO OBTAIN QUARTERLY PORTFOLIO HOLDINGS
Each Fund files a complete schedule of portfolio holdings with the SEC for the first and third quarters of each fiscal year on Form N-Q. The Funds’ Form N-Q is available electronically on the SEC’s website at http://www.sec.gov; hard copies may be reviewed and copied at the SEC’s Public Reference Room in Washington, DC 20549. For more information on the Public Reference Room, call 1-800-SEC-0330. Each Fund’s complete schedule of portfolio holdings is also available on the Fund’s website at http://www.driehaus.com.
Table of Contents
Performance Overview (unaudited)
The performance summarized below is historical and does not represent future results. Investment returns and principal value vary, and you may have a gain or loss when you sell shares. Performance data presented measures the change in the value of an investment in the Fund, assuming reinvestment of all dividends and capital gains. Average annual total return reflects annualized change.
The table does not reflect the deduction of taxes that a shareholder would pay on Fund distributions or the redemption of Fund shares. The graph compares the results of a $25,000 investment (minimum investment) in the Fund since November 8, 2005 (the date of the Predecessor Fund’s inception), with all dividends and capital gains reinvested, with the indicated indices (and dividends reinvested) for the same period.
| Average Annual Total Returns as of 06/30/14 | 1 Year | 3 Years | 5 Years | Since Inception (11/08/05 - 06/30/14) | ||||||||||||
Driehaus Active Income Fund (LCMAX)1 | 2.42% | 1.69% | 4.05% | 4.56% | ||||||||||||
Citigroup 3-Month T-Bill Index2 | 0.04% | 0.05% | 0.08% | 1.42% | ||||||||||||
Barclays Capital U.S. Aggregate Bond Index3 | 4.37% | 3.67% | 4.86% | 5.31% | ||||||||||||
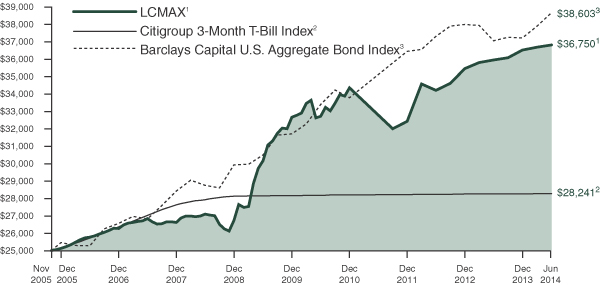
| 1 | The Driehaus Active Income Fund (the “Fund”) performance shown above includes the performance of the Lotsoff Capital Management Active Income Fund (the “Predecessor Fund”) for the periods before the Fund’s registration statement became effective. The Fund received the assets and liabilities of the Predecessor Fund on June 1, 2009 through a reorganization of the Predecessor Fund into the Fund. The Predecessor Fund was a nondiversified fund that was a series of another management investment company registered under the Investment Company Act of 1940, as amended. The Fund had no prior operating history prior to succeeding to the assets of the Predecessor Fund. The Fund has substantially similar investment objectives, strategies, and policies as the Predecessor Fund. Financial and performance information of the Fund includes the Predecessor Fund information. The returns for the periods prior to October 1, 2006, reflect fee waivers and/or reimbursements without which performance would have been lower. |
| 2 | The Citigroup 3-Month T-Bill Index is designed to mirror the performance of the 3-month U.S. Treasury Bill. The Citigroup 3-Month T-Bill Index is unmanaged and its returns reflect reinvestment of all distributions and changes in market prices. |
| 3 | The Barclays Capital U.S. Aggregate Bond Index, an unmanaged index, represents securities that are SEC-registered, taxable and dollar denominated. This index covers the U.S. investment grade fixed rate bond market, with index components for government and corporate securities, mortgage pass-through securities and asset-backed securities. These major sectors are subdivided into more specific indices that are calculated and reported on a regular basis. |
1
Table of Contents
Schedule of Investments
June 30, 2014 (unaudited)
| Shares, Principal Amount, or Number of Contracts | Value | |||||||
| ASSET-BACKED SECURITIES — 4.83% | ||||||||
Citigroup Mortgage Loan Trust, Inc. | $ | 343,624 | $ | 223,284 | ||||
Cobalt CMBS Commercial Mortgage Trust 2006-C1 | 17,020,069 | 18,369,471 | ||||||
Countrywide Asset-Backed Certificates | 122,988 | 113,531 | ||||||
Fannie Mae REMICS 0.80%, 9/25/232 | 6,164,985 | 6,197,296 | ||||||
Fannie Mae REMICS 0.47%, 6/25/362 | 9,052,064 | 9,036,684 | ||||||
Freddie Mac REMICS 2.00%, 2/15/27 | 53,127,662 | 53,028,367 | ||||||
Freddie Mac REMICS 2.00%, 4/15/28 | 63,639,360 | 63,157,738 | ||||||
Freddie Mac REMICS 0.35%, 1/15/352 | 5,408,713 | 5,387,452 | ||||||
JP Morgan Resecuritization Trust Series 2009-10 | 14,135,461 | 14,303,843 | ||||||
Merrill Lynch Mortgage Investors, Inc. | 124,929 | 120,002 | ||||||
Oak Hill Advisors Residential Loan Trust 2014-NPL1 | 35,000,000 | 35,000,350 | ||||||
Wells Fargo Mortgage Loan Trust | 22,030,946 | 20,866,500 | ||||||
|
| |||||||
Total ASSET-BACKED SECURITIES | 225,804,518 | |||||||
|
| |||||||
| BANK LOANS — 25.84% | ||||||||
Apparel — 1.15% |
| |||||||
Calceus Acquisition, Inc. 5.00%, 2/1/202 | 27,602,881 | 27,395,860 | ||||||
Stuart Weitzman Acquisition Co. LLC 4.50%, 3/4/202 | 26,750,000 | 26,549,375 | ||||||
|
| |||||||
| 53,945,235 | ||||||||
|
| |||||||
Building Materials — 1.24% |
| |||||||
Cemex Espana S.A. (Spain) | 43,962,691 | 43,779,499 | ||||||
Cemex S.A.B. de C.V. (Mexico) | 14,042,898 | 13,984,381 | ||||||
|
| |||||||
| 57,763,880 | ||||||||
|
| |||||||
Commercial Services — 1.54% |
| |||||||
Altegrity, Inc. | 44,441,588 | 44,024,948 | ||||||
| Shares, Principal Amount, or Number of Contracts | Value | |||||||
Ceridian Corp. | $ | 19,330,467 | $ | 19,342,548 | ||||
Westway Group, Inc. | 8,562,963 | 8,568,315 | ||||||
|
| |||||||
| 71,935,811 | ||||||||
|
| |||||||
Diversified Financial Services — 2.12% |
| |||||||
Ocwen Financial Corp. | 64,348,049 | 64,589,354 | ||||||
Sears Roebuck Acceptance Corp. | 34,038,975 | 34,391,517 | ||||||
|
| |||||||
| 98,980,871 | ||||||||
|
| |||||||
Electronics — 0.90% |
| |||||||
NuSil Technology LLC | 42,733,182 | 41,914,115 | ||||||
Entertainment — 1.11% |
| |||||||
Graton Resort & Casino | 30,470,666 | 31,575,228 | ||||||
Peninsula Gaming LLC | 7,733,068 | 7,742,734 | ||||||
WMG Acquisition Corp. | 13,034,503 | 12,806,399 | ||||||
|
| |||||||
| 52,124,361 | ||||||||
|
| |||||||
Environmental Control — 0.21% |
| |||||||
WTG Holdings III Corp. | 9,950,000 | 9,956,219 | ||||||
Food — 0.25% |
| |||||||
Fairway Group Acquisition Co. | 985,000 | 972,687 | ||||||
SUPERVALU, Inc. | 10,804,661 | 10,800,156 | ||||||
|
| |||||||
| 11,772,843 | ||||||||
|
| |||||||
Healthcare — Services — 1.54% |
| |||||||
Gentiva Health Services, Inc. | 22,852,581 | 22,776,414 | ||||||
Kindred Healthcare, Inc. | 20,000,000 | 19,962,500 | ||||||
National Mentor Holdings, Inc. | 28,927,500 | 29,035,978 | ||||||
|
| |||||||
| 71,774,892 | ||||||||
|
| |||||||
Holding Companies — Diversified — 0.44% |
| |||||||
Osmose Holdings, Inc. | 20,508,821 | 20,470,367 | ||||||
Investment Companies — 0.53% |
| |||||||
Larchmont Resources LLC | 24,750,000 | 24,966,563 | ||||||
Leisure Time — 1.23% |
| |||||||
Equinox Holdings, Inc. | 47,475,000 | 47,564,016 | ||||||
Equinox Holdings, Inc. | 10,000,000 | 10,125,000 | ||||||
|
| |||||||
| 57,689,016 | ||||||||
|
| |||||||
Notes to Financial Statements are an integral part of this Schedule.
2
Table of Contents
Driehaus Active Income Fund
Schedule of Investments
June 30, 2014 (unaudited)
| Shares, Principal Amount, or Number of Contracts | Value | |||||||
Lodging — 1.56% |
| |||||||
MGM Resorts International | $ | 72,966,554 | $ | 72,814,564 | ||||
Media — 1.49% |
| |||||||
Springer Science+Business Media GmbH (Germany) | 69,482,462 | 69,540,341 | ||||||
Oil & Gas — 0.57% |
| |||||||
Shelf Drilling Midco Ltd. (United Arab Emirates) 10.00%, 10/7/182 | 26,000,000 | 26,520,000 | ||||||
Real Estate Investment Trusts — 0.88% |
| |||||||
Starwood Property Trust, Inc. | 41,586,621 | 41,339,721 | ||||||
Retail — 4.73% |
| |||||||
Hudson’s Bay Co. (Canada) | 13,875,000 | 14,021,465 | ||||||
JC Penney Corp., Inc. 6.00%, 5/21/182 | 43,198,700 | 43,675,700 | ||||||
Michaels Stores, Inc. 4.00%, 1/28/202 | 4,000,000 | 3,991,668 | ||||||
Michaels Stores, Inc. 3.75%, 1/31/202 | 990,000 | 986,213 | ||||||
Neiman Marcus Group Ltd. LLC | 91,259,983 | 91,010,387 | ||||||
Rite Aid Corp. | 17,830,000 | 18,147,606 | ||||||
Rite Aid Corp. | 48,950,000 | 49,439,500 | ||||||
|
| |||||||
| 221,272,539 | ||||||||
|
| |||||||
Semiconductors — 0.45% |
| |||||||
VAT Holding A.G. (Switzerland) | 21,147,000 | 21,213,084 | ||||||
Software — 3.26% |
| |||||||
Applied Systems, Inc. 4.25%, 1/15/212 | 48,999,813 | 49,171,312 | ||||||
BMC Software, Inc. (Ireland) | 7,960,000 | 7,910,250 | ||||||
BMC Software, Inc. | 70,645,000 | 70,413,214 | ||||||
Evergreen Skills Lux Sarl (Luxembourg) | 25,000,000 | 24,989,575 | ||||||
|
| |||||||
| 152,484,351 | ||||||||
|
| |||||||
Telecommunications — 0.64% |
| |||||||
Cincinnati Bell, Inc. | 29,775,000 | 29,745,225 | ||||||
|
| |||||||
Total BANK LOANS | 1,208,223,998 | |||||||
|
| |||||||
| Shares, Principal Amount, or Number of Contracts | Value | |||||||
| CORPORATE BONDS — 28.81% | ||||||||
Banks — 2.85% |
| |||||||
Chase Capital II | $ | 11,879,000 | $ | 10,382,246 | ||||
First Chicago NBD Institutional Capital I 0.79%, 2/1/272 | 725,000 | 633,650 | ||||||
JP Morgan Chase Capital XXIII | 4,000,000 | 3,190,000 | ||||||
JPMorgan Chase & Co. 7.90%, 4/29/492 | 43,813,000 | 48,961,027 | ||||||
JPMorgan Chase Capital XXI | 15,000,000 | 12,519,750 | ||||||
Royal Bank of Scotland Group PLC (United Kingdom) | 46,708,000 | 56,516,680 | ||||||
Wachovia Capital Trust III | 1,000,000 | 970,000 | ||||||
|
| |||||||
| 133,173,353 | ||||||||
|
| |||||||
Biotechnology — 0.81% |
| |||||||
STHI Holding Corp. | 35,673,000 | 37,813,380 | ||||||
Building Materials — 0.72% |
| |||||||
Cemex S.A.B. de C.V. (Mexico) | 20,180,000 | 21,693,500 | ||||||
Cemex S.A.B. de C.V. (Mexico) | 11,345,000 | 12,153,331 | ||||||
|
| |||||||
| 33,846,831 | ||||||||
|
| |||||||
Chemicals — 0.08% |
| |||||||
Hexion U.S. Finance Corp. / Hexion Nova Scotia Finance ULC | 2,000,000 | 2,080,000 | ||||||
Momentive Performance Materials, Inc. | 4,540,000 | 1,430,100 | ||||||
|
| |||||||
| 3,510,100 | ||||||||
|
| |||||||
Commercial Services — 0.54% |
| |||||||
DynCorp International, Inc. | 24,123,000 | 25,208,535 | ||||||
Computers — 0.72% |
| |||||||
Seagate HDD Cayman (Cayman Islands) | 16,330,000 | 17,500,861 | ||||||
Seagate HDD Cayman (Cayman Islands) | 15,000,000 | 16,218,750 | ||||||
|
| |||||||
| 33,719,611 | ||||||||
|
| |||||||
Notes to Financial Statements are an integral part of this Schedule.
3
Table of Contents
Driehaus Active Income Fund
Schedule of Investments
June 30, 2014 (unaudited)
| Shares, Principal Amount, or Number of Contracts | Value | |||||||
Diversified Financial Services — 5.54% |
| |||||||
American Express Co. | $ | 67,984,000 | $ | 74,782,400 | ||||
Denver Parent Corp. | 10,650,000 | 10,170,750 | ||||||
E*TRADE Financial Corp. 6.00%, 11/15/17 | 26,000,000 | 27,040,000 | ||||||
E*TRADE Financial Corp. 6.38%, 11/15/19 | 48,487,000 | 52,487,177 | ||||||
General Electric Capital Corp. | 22,000,000 | 25,964,400 | ||||||
Rio Oil Finance Trust Series 2014-1 | 56,000,000 | 58,817,920 | ||||||
Textron Financial Corp. | 10,824,000 | 9,849,840 | ||||||
|
| |||||||
| 259,112,487 | ||||||||
|
| |||||||
Entertainment — 0.50% |
| |||||||
Gala Group Finance PLC (United Kingdom) | 8,100,000 | 14,753,839 | ||||||
Production Resource Group, Inc. | 10,220,000 | 8,482,600 | ||||||
|
| |||||||
| 23,236,439 | ||||||||
|
| |||||||
Healthcare — Products — 0.70% |
| |||||||
ConvaTec Healthcare | 30,166,000 | 32,654,695 | ||||||
Healthcare — Services — 1.30% |
| |||||||
Aurora Diagnostics Holdings / Aurora Diagnostics Financing, Inc. | 14,333,650 | 11,968,598 | ||||||
Healthsouth Corp. | 1,210,000 | 1,264,450 | ||||||
Healthsouth Corp. | 15,639,000 | 17,066,059 | ||||||
Kindred Healthcare, Inc. 6.38%, 4/15/221 | 14,715,000 | 14,788,575 | ||||||
National Mentor, Inc. | 14,928,000 | 15,861,000 | ||||||
|
| |||||||
| 60,948,682 | ||||||||
|
| |||||||
Insurance — 0.70% |
| |||||||
Chubb Corp. | 29,500,000 | 32,781,875 | ||||||
Internet — 0.05% |
| |||||||
Mood Media Corp. (Canada) | 2,500,000 | 2,250,000 | ||||||
Iron/Steel — 0.60% |
| |||||||
Edgen Murray Corp. | 24,621,000 | 28,129,493 | ||||||
Lodging — 0.16% |
| |||||||
Station Casinos LLC | 7,000,000 | 7,647,500 | ||||||
| Shares, Principal Amount, or Number of Contracts | Value | |||||||
Media — 0.97% |
| |||||||
Clear Channel Worldwide Holdings, Inc. | $ | 810,000 | $ | 864,675 | ||||
Clear Channel Worldwide Holdings, Inc. | 2,190,000 | 2,359,725 | ||||||
ProQuest LLC/ProQuest Notes Co. | 39,790,000 | 42,077,925 | ||||||
|
| |||||||
| 45,302,325 | ||||||||
|
| |||||||
Metal Fabricate/Hardware — 0.12% |
| |||||||
Dynacast International LLC / Dynacast Finance, Inc. | 5,130,000 | 5,643,000 | ||||||
Miscellaneous Manufacturing — 1.73% |
| |||||||
Amsted Industries, Inc. | 43,000,000 | 43,000,000 | ||||||
GE Capital Trust I | 34,140,000 | 37,980,750 | ||||||
|
| |||||||
| 80,980,750 | ||||||||
|
| |||||||
Oil & Gas — 2.62% |
| |||||||
Calumet Specialty Products Partners LP / Calumet Finance Corp. | 49,016,000 | 49,996,320 | ||||||
Chesapeake Energy Corp. | 15,000,000 | 15,525,000 | ||||||
United Refining Co. | 15,891,000 | 17,360,917 | ||||||
Venoco, Inc. | 40,670,000 | 39,551,575 | ||||||
|
| |||||||
| 122,433,812 | ||||||||
|
| |||||||
Packaging & Containers — 0.94% |
| |||||||
Berry Plastics Corp. | 38,488,400 | 43,876,776 | ||||||
Pipelines — 0.88% |
| |||||||
Enbridge Energy Partners LP | 31,500,000 | 35,634,375 | ||||||
Sabine Pass Liquefaction LLC | 3,000,000 | 3,172,500 | ||||||
Sabine Pass Liquefaction LLC | 2,000,000 | 2,085,000 | ||||||
|
| |||||||
| 40,891,875 | ||||||||
|
| |||||||
Retail — 3.40% |
| |||||||
Claire’s Stores, Inc. | 14,000,000 | 14,577,500 | ||||||
Claire’s Stores, Inc. | 16,972,000 | 15,996,110 | ||||||
Michaels Stores, Inc. | 58,100,000 | 61,440,750 | ||||||
Michaels Stores, Inc. | 14,000,000 | 14,315,000 | ||||||
Notes to Financial Statements are an integral part of this Schedule.
4
Table of Contents
Driehaus Active Income Fund
Schedule of Investments
June 30, 2014 (unaudited)
| Shares, Principal Amount, or Number of Contracts | Value | |||||||
Rite Aid Corp. | $ | 3,000,000 | $ | 3,225,000 | ||||
Rite Aid Corp. | 22,800,000 | 25,992,000 | ||||||
Rite Aid Corp. | 3,425,000 | 3,767,500 | ||||||
Rite Aid Corp. | 18,250,000 | 19,755,625 | ||||||
|
| |||||||
| 159,069,485 | ||||||||
|
| |||||||
Software — 1.99% |
| |||||||
First Data Corp. | 22,250,000 | 24,085,625 | ||||||
Nuance Communications, Inc. | 66,687,000 | 69,021,045 | ||||||
|
| |||||||
| 93,106,670 | ||||||||
|
| |||||||
Telecommunications — 0.89% |
| |||||||
Alcatel-Lucent USA, Inc. 4.63%, 7/1/171 | 5,000,000 | 5,162,500 | ||||||
Alcatel-Lucent USA, Inc. 6.50%, 1/15/28 | 5,000,000 | 4,950,000 | ||||||
CommScope, Inc. | 2,000,000 | 2,040,000 | ||||||
CommScope, Inc. | 1,000,000 | 1,016,250 | ||||||
Nortel Networks Ltd. (Canada) | 14,000,000 | 16,030,000 | ||||||
Nortel Networks Ltd. (Canada) | 11,000,000 | 12,622,500 | ||||||
|
| |||||||
| 41,821,250 | ||||||||
|
| |||||||
Total CORPORATE BONDS | 1,347,158,924 | |||||||
|
| |||||||
| CONVERTIBLE CORPORATE BONDS — 5.30% | ||||||||
Auto Manufacturers — 1.63% |
| |||||||
Ford Motor Co. | 38,150,000 | 76,228,468 | ||||||
Electrical Components & Equipment — 0.03% |
| |||||||
Suntech Power Holdings Co., Ltd. (China) | 27,872,000 | 1,715,856 | ||||||
Internet — 0.55% |
| |||||||
Equinix, Inc. | 13,600,000 | 25,755,000 | ||||||
Lodging — 0.97% |
| |||||||
MGM Resorts International | 31,000,000 | 45,511,875 | ||||||
Real Estate Investment Trusts — 1.51% |
| |||||||
Gaylord Entertainment Co. | 13,730,000 | 31,544,675 | ||||||
Host Hotels & Resorts LP 2.50%, 10/15/291 | 23,000,000 | 38,941,875 | ||||||
|
| |||||||
| 70,486,550 | ||||||||
|
| |||||||
| Shares, Principal Amount, or Number of Contracts | Value | |||||||
Telecommunications — 0.61% |
| |||||||
Nortel Networks Corp. (Canada) | $ | 19,125,000 | $ | 19,292,344 | ||||
Nortel Networks Corp. (Canada) | 9,000,000 | 9,101,250 | ||||||
|
| |||||||
| 28,393,594 | ||||||||
|
| |||||||
Total CONVERTIBLE CORPORATE BONDS (Cost $187,605,322) | 248,091,343 | |||||||
|
| |||||||
| U.S. GOVERNMENT AND AGENCY SECURITIES — 3.87% | ||||||||
Fannie Mae Pool | 39,729,885 | 41,054,480 | ||||||
Fannie Mae REMICS | 99,685,497 | 96,740,987 | ||||||
Freddie Mac Non Gold Pool | 638,552 | 681,730 | ||||||
Freddie Mac REMICS | 43,742,497 | 42,339,500 | ||||||
|
| |||||||
Total U.S. GOVERNMENT AND AGENCY SECURITIES | 180,816,697 | |||||||
|
| |||||||
| COMMON STOCKS — 0.76% | ||||||||
Auto Manufacturers — 0.76% |
| |||||||
General Motors Co. | 857,291 | 31,119,678 | ||||||
Motors Liquidation Co. GUC Trust* | 167,113 | 4,278,093 | ||||||
|
| |||||||
| 35,397,771 | ||||||||
|
| |||||||
Total COMMON STOCKS (Cost $19,829,148) | 35,397,771 | |||||||
|
| |||||||
| CONVERTIBLE PREFERRED STOCK — 0.64% | ||||||||
Auto Manufacturers — 0.00% |
| |||||||
General Motors Corp. Senior Convertible Preferred Escrow — B | 475,000 | — | ||||||
General Motors Corp. Senior Convertible Preferred Escrow — C | 11,790,650 | — | ||||||
|
| |||||||
| — | ||||||||
|
| |||||||
Banks — 0.64% |
| |||||||
Bank of America Corp. | 25,822 | 30,134,274 | ||||||
|
| |||||||
Total CONVERTIBLE PREFERRED STOCK (Cost $24,790,887) | 30,134,274 | |||||||
|
| |||||||
Notes to Financial Statements are an integral part of this Schedule.
5
Table of Contents
Driehaus Active Income Fund
Schedule of Investments
June 30, 2014 (unaudited)
Shares, Contracts | Value | |||||||
| PREFERRED STOCK — 3.88% | ||||||||
Banks — 1.00% |
| |||||||
GMAC Capital Trust I 8.13%, 2/15/402 | 1,710,062 | $ | 46,684,693 | |||||
Diversified Financial Services — 0.60% |
| |||||||
RBS Capital Funding | 300,000 | 7,233,000 | ||||||
RBS Capital Funding | 865,912 | 20,868,479 | ||||||
|
| |||||||
| 28,101,479 | ||||||||
|
| |||||||
Holding Companies — Diversified — 1.31% |
| |||||||
Pitney Bowes International Holdings, Inc. | 57,905 | 61,256,252 | ||||||
Telecommunications — 0.97% |
| |||||||
Centaur Funding Corp. (Cayman Islands) | 36,242 | 45,381,779 | ||||||
|
| |||||||
Total PREFERRED STOCK (Cost $164,567,823) | 181,424,203 | |||||||
|
| |||||||
| PURCHASED CALL OPTIONS — 0.17% | ||||||||
iShares MSCI Emerging Markets ETF, Exercise Price: $42.50, Expiration Date: August, 2014* | 21,000 | 2,814,000 | ||||||
iShares Russell 2000 ETF, Exercise Price: $112.00, Expiration Date: August, 2014* | 7,200 | 5,061,600 | ||||||
|
| |||||||
Total PURCHASED CALL OPTIONS | 7,875,600 | |||||||
|
| |||||||
| PURCHASED PUT OPTIONS — 0.04% | ||||||||
iShares MSCI Emerging Markets ETF, Exercise Price: $42.50, Expiration Date: August, 2014* | 21,000 | 1,155,000 | ||||||
iShares Russell 2000 ETF, Exercise Price: $112.00, Expiration Date: August, 2014* | 7,200 | 655,200 | ||||||
|
| |||||||
Total PURCHASED PUT OPTIONS | 1,810,200 | |||||||
|
| |||||||
| SHORT-TERM INVESTMENTS — 0.68% | ||||||||
UMB Money Market Fiduciary 0.01% | 31,628,451 | 31,628,451 | ||||||
|
| |||||||
Total SHORT-TERM INVESTMENTS | 31,628,451 | |||||||
|
| |||||||
| Shares, Principal Amount, or Number of Contracts | Value | |||||||
| WARRANTS — 0.48% | ||||||||
General Motors Co. —CW 16, Strike Price $10.00, Expiration Date 7/10/16* | 32,132 | $ | 855,037 | |||||
General Motors Co. —CW 19, Strike Price $18.33, Expiration Date 7/10/19* | 1,168,287 | 21,683,409 | ||||||
|
| |||||||
Total WARRANTS | 22,538,446 | |||||||
|
| |||||||
| ||||||||
TOTAL INVESTMENTS | 75.30 | % | 3,520,904,425 | |||||
Other Assets less Liabilities | 24.70 | % | 1,154,621,388 | |||||
|
|
|
| |||||
| Net Assets | 100.00 | % | $ | 4,675,525,813 | ||||
| ||||||||
| SECURITIES SOLD SHORT — (5.81)% | ||||||||
| CORPORATE BONDS — (1.71)% | ||||||||
Chemicals — (0.14)% |
| |||||||
Huntsman International LLC | $ | (6,000,000 | ) | $ | (6,690,000 | ) | ||
Healthcare — Products — (0.15)% |
| |||||||
Kinetic Concepts, Inc. / KCI USA, Inc. | (6,100,000 | ) | (6,923,500 | ) | ||||
Household Products/Wares — (0.26)% |
| |||||||
Reynolds Group Issuer, Inc. / Reynolds Group Issuer LLC | (10,796,000 | ) | (12,064,530 | ) | ||||
Lodging — (0.18)% |
| |||||||
MGM Resorts International | (7,315,000 | ) | (8,302,525 | ) | ||||
Media — (0.25)% |
| |||||||
DISH DBS Corp. | (10,339,000 | ) | (11,838,155 | ) | ||||
Oil & Gas — (0.36)% |
| |||||||
Chesapeake Energy Corp. | (9,131,240 | ) | (10,592,238 | ) | ||||
Chesapeake Energy Corp. | (5,500,000 | ) | (6,215,000 | ) | ||||
|
| |||||||
| (16,807,238 | ) | |||||||
|
| |||||||
Retail — (0.37)% |
| |||||||
Party City Holdings, Inc. 8.88%, 8/1/20 | (2,340,000 | ) | (2,614,950 | ) | ||||
Sears Holdings Corp. 6.63%, 10/15/18 | (15,800,000 | ) | (14,713,750 | ) | ||||
|
| |||||||
| (17,328,700 | ) | |||||||
|
| |||||||
Total CORPORATE BONDS | (79,954,648 | ) | ||||||
|
| |||||||
Notes to Financial Statements are an integral part of this Schedule.
6
Table of Contents
Driehaus Active Income Fund
Schedule of Investments
June 30, 2014 (unaudited)
| Shares, Principal Amount, or Number of Contracts | Value | |||||||
| COMMON STOCKS — (3.60)% | ||||||||
Auto Manufacturers — (1.29)% |
| |||||||
Ford Motor Co. | (3,491,935 | ) | $ | (60,200,959 | ) | |||
Banks — (0.21)% |
| |||||||
Bank of America | (628,321 | ) | (9,657,294 | ) | ||||
Healthcare — Services — (0.13)% |
| |||||||
Kindred Healthcare, | (258,474 | ) | (5,970,749 | ) | ||||
Internet — (0.63)% |
| |||||||
Equinix, Inc.* | (126,233 | ) | (26,520,291 | ) | ||||
WebMD Health | (60,447 | ) | (2,919,590 | ) | ||||
|
| |||||||
| (29,439,881 | ) | |||||||
|
| |||||||
Lodging — (0.33)% |
| |||||||
MGM Resorts International* | (593,974 | ) | (15,680,914 | ) | ||||
Real Estate Investment Trusts — (1.01)% |
| |||||||
Host Hotels & Resorts, Inc. | (1,193,449 | ) | (26,267,812 | ) | ||||
Ryman Hospitality Properties | (438,718 | ) | (21,124,272 | ) | ||||
|
| |||||||
| (47,392,084 | ) | |||||||
|
| |||||||
Total COMMON STOCKS (Proceeds $121,265,003) | (168,341,881 | ) | ||||||
|
| |||||||
| Shares, Principal Amount, or Number of Contracts | Value | |||||||
| EXCHANGE-TRADED FUND — (0.50)% | ||||||||
SPDR Barclays High Yield Bond ETF | (557,235 | ) | $ | (23,253,417 | ) | |||
|
| |||||||
Total EXCHANGE-TRADED FUND (Proceeds $21,731,230) | (23,253,417 | ) | ||||||
|
| |||||||
| ||||||||
TOTAL INVESTMENT SECURITIES SOLD SHORT | (5.81 | )% | $ | (271,549,946 | ) | |||
| ||||||||
| * | Non-income producing security. |
| 1 | 144A restricted security. |
| 2 | Variable rate security. Rates disclosed are as of June 30, 2014. |
| 3 | Foreign security denominated in U.S. dollars. |
| 4 | Security valued at fair value as determined in good faith by Driehaus Capital Management LLC, investment adviser to the Fund, in accordance with procedures established by, and under the general supervision of, the Trust’s Board of Trustees. |
| 5 | Security is in default. |
Percentages are stated as a percent of net assets.
Notes to Financial Statements are an integral part of this Schedule.
7
Table of Contents
Driehaus Active Income Fund
Schedule of Investments
June 30, 2014 (unaudited)
SWAP CONTRACTS
Volatility Swaps
| Counterparty | Reference Instrument | Currency | Notional AmountB | Strike Price | Expiration Date | Premium Paid (Received) | Unrealized Appreciation/ (Depreciation) | |||||||||||||||||
Morgan Stanley | ISDAFIX USD Morning Fixing 10Y | USD | 2,000,000,000 | 71.50 | 9/4/2014 | $ | — | $ | (2,587,260 | ) | ||||||||||||||
|
|
|
| |||||||||||||||||||||
Total Volatility Swaps |
| — | (2,587,260 | ) | ||||||||||||||||||||
|
|
|
| |||||||||||||||||||||
Credit Default Swaps
| Counterparty | Reference Instrument | Currency | Notional AmountB | Pay/ ReceiveA Fixed Rate | Fixed Rate | Expiration Date | Premium Paid (Received) | Unrealized Appreciation/ (Depreciation) | Credit Event | RatingC | ||||||||||||||||||||||
Goldman Sachs | Alcatel-Lucent USA, Inc. 6.50%, 1/15/28 | USD | 43,500,000 | Pay | 5.00 | % | 9/20/2014 | $ | 3,756,250 | $ | (4,269,794 | ) | Bankruptcy/FTP | CCC+ | ||||||||||||||||||
Merrill Lynch | Ally Financial, Inc. | USD | 10,000,000 | Pay | 5.00 | 3/20/2019 | (1,581,464 | ) | (141,286 | ) | Bankruptcy/FTP | BB | ||||||||||||||||||||
Merrill Lynch | Ally Financial, Inc. 7.50%, 9/15/20 | USD | 10,000,000 | Pay | 5.00 | 12/20/2018 | (1,492,458 | ) | (184,138 | ) | Bankruptcy/FTP | BB | ||||||||||||||||||||
Morgan Stanley | American Express Co. | USD | 20,000,000 | Pay | 1.00 | 12/20/2016 | 263,406 | (691,159 | ) | Bankruptcy/FTP | BBB+ | |||||||||||||||||||||
Goldman Sachs | American Express Co. | USD | 5,000,000 | Pay | 1.00 | 12/20/2016 | 61,174 | (161,653 | ) | Bankruptcy/FTP | BBB+ | |||||||||||||||||||||
Goldman Sachs | Bank of America Corp. | USD | 10,000,000 | Pay | 1.00 | 12/20/2016 | 1,499,776 | (1,663,944 | ) | Bankruptcy/FTP | NR | |||||||||||||||||||||
Goldman Sachs | Boston Properties L.P. 6.25%, 1/15/13 | USD | 11,000,000 | Pay | 1.00 | 9/20/2014 | 848,323 | (875,046 | ) | Bankruptcy/FTP | NR | |||||||||||||||||||||
Goldman Sachs | Brunswick Corp. 7.13%, 8/1/27 | USD | 10,000,000 | Pay | 5.00 | 12/20/2014 | 40,542 | (291,032 | ) | Bankruptcy/FTP | BB+ | |||||||||||||||||||||
Goldman Sachs | Brunswick Corp. 7.13%, 8/1/27 | USD | 10,000,000 | Pay | 5.00 | 12/20/2014 | (143,212 | ) | (107,277 | ) | Restructuring/Bankruptcy/FTP | BB+ | ||||||||||||||||||||
Merrill Lynch | Citigroup, Inc. 6.13%, 5/15/18 | USD | 5,000,000 | Pay | 1.00 | 12/20/2016 | 432,520 | (516,831 | ) | Bankruptcy/FTP | A- | |||||||||||||||||||||
Goldman Sachs | Citigroup, Inc. 6.13%, 5/15/18 | USD | 5,000,000 | Pay | 1.00 | 12/20/2016 | 379,663 | (463,975 | ) | Bankruptcy/FTP | A- | |||||||||||||||||||||
Goldman Sachs | CVS Caremark Corp. 4.88%, 9/15/14 | USD | 10,000,000 | Pay | 1.00 | 9/20/2014 | (286,840 | ) | 261,785 | Bankruptcy/FTP | BBB+ | |||||||||||||||||||||
Morgan Stanley | Enbridge Energy, L.P. 4.75%, 6/1/13 | USD | 10,000,000 | Pay | 1.00 | 6/20/2015 | 56,732 | (146,229 | ) | Bankruptcy/FTP | NR | |||||||||||||||||||||
Goldman Sachs | First Data Corp. 9.88%, 9/24/15 | USD | 3,000,000 | Pay | 5.00 | 3/20/2017 | 540,000 | (818,574 | ) | Bankruptcy/FTP | B- | |||||||||||||||||||||
Morgan Stanley | First Data Corp. 9.88%, 9/24/15 | USD | 10,000,000 | Pay | 5.00 | 3/20/2017 | 1,150,000 | (2,078,580 | ) | Bankruptcy/FTP | B- | |||||||||||||||||||||
Goldman Sachs | First Data Corp. 9.88%, 9/24/15 | USD | 5,000,000 | Pay | 5.00 | 6/20/2016 | 350,000 | (743,236 | ) | Bankruptcy/FTP | B- | |||||||||||||||||||||
Notes to Financial Statements are an integral part of this Schedule.
8
Table of Contents
Driehaus Active Income Fund
Schedule of Investments
June 30, 2014 (unaudited)
Credit Default Swaps (continued)
| Counterparty | Reference Instrument | Currency | Notional AmountB | Pay/ ReceiveA Fixed Rate | Fixed Rate | Expiration Date | Premium Paid (Received) | Unrealized Appreciation/ (Depreciation) | Credit Event | RatingC | ||||||||||||||||||||||
Goldman Sachs | H.J. Heinz Co. 6.38%, 7/15/28 | USD | 10,000,000 | Pay | 1.00 | % | 9/20/2014 | $ | (320,193 | ) | $ | 297,594 | Bankruptcy/FTP | BB- | ||||||||||||||||||
JP Morgan | Hess Corp. 7.00%, 2/15/14 | USD | 8,000,000 | Pay | 1.00 | 6/20/2018 | 154,644 | (336,916 | ) | Bankruptcy/FTP | NR | |||||||||||||||||||||
Morgan Stanley | Hess Corp. 7.00%, 2/15/14 | USD | 4,000,000 | Pay | 1.00 | 6/20/2018 | 77,280 | (168,417 | ) | Bankruptcy/FTP | NR | |||||||||||||||||||||
Morgan Stanley | Hess Corp. 7.00%, 2/15/14 | USD | 4,000,000 | Pay | 1.00 | 6/20/2018 | 80,701 | (171,838 | ) | Bankruptcy/FTP | NR | |||||||||||||||||||||
Morgan Stanley | Hess Corp. 7.00%, 2/15/14 | USD | 4,000,000 | Pay | 1.00 | 6/20/2018 | 91,702 | (182,839 | ) | Bankruptcy/FTP | NR | |||||||||||||||||||||
Credit Suisse | Hess Corp. 5.60%, 2/15/41 | USD | 4,000,000 | Pay | 1.00 | 6/20/2018 | 15,350 | (106,486 | ) | Bankruptcy/FTP | NR | |||||||||||||||||||||
Credit Suisse | Hess Corp. 7.00%, 2/15/14 | USD | 20,000,000 | Pay | 1.00 | 9/20/2018 | 309,975 | (764,954 | ) | Bankruptcy/FTP | NR | |||||||||||||||||||||
Goldman Sachs | Host Hotels & Resorts, Inc. 6.75%, 6/1/16 | USD | 10,000,000 | Pay | 1.00 | 12/20/2016 | 1,067,644 | (1,259,380 | ) | Bankruptcy/FTP | BBB | |||||||||||||||||||||
Goldman Sachs | Huntsman Corp. 11.50%, 7/15/12 | USD | 5,000,000 | Pay | 5.00 | 12/20/2016 | 124,119 | (661,733 | ) | Bankruptcy/FTP | NR | |||||||||||||||||||||
Morgan Stanley | J.C. Penney Corp., Inc. 6.38%, 10/15/36 | USD | 7,500,000 | Pay | 5.00 | 6/20/2018 | 768,750 | (242,227 | ) | Bankruptcy/FTP | CCC- | |||||||||||||||||||||
Credit Suisse | J.C. Penney Corp., Inc. 6.38%, 10/15/36 | USD | 3,750,000 | Pay | 5.00 | 6/20/2018 | 346,875 | (83,614 | ) | Bankruptcy/FTP | CCC- | |||||||||||||||||||||
Credit Suisse | J.C. Penney Corp., Inc. 6.38%, 10/15/36 | USD | 3,750,000 | Pay | 5.00 | 6/20/2018 | 309,375 | (46,114 | ) | Bankruptcy/FTP | CCC- | |||||||||||||||||||||
Credit Suisse | J.C. Penney Corp., Inc. 6.38%, 10/15/36 | USD | 3,750,000 | Pay | 5.00 | 6/20/2018 | 234,375 | 28,886 | Bankruptcy/FTP Restructuring/ | CCC- | ||||||||||||||||||||||
Morgan Stanley | J.C. Penney Corp., Inc. 6.38%, 10/15/36 | USD | 3,750,000 | Pay | 5.00 | 6/20/2018 | 365,625 | (102,364 | ) | Bankruptcy/FTP Restructuring/ | CCC- | |||||||||||||||||||||
Credit Suisse | J.C. Penney Corp., Inc. 6.38%, 10/15/36 | USD | 6,667,000 | Pay | 5.00 | 12/20/2016 | 700,035 | (580,869 | ) | Bankruptcy/FTP | CCC- | |||||||||||||||||||||
Morgan Stanley | J.C. Penney Corp., Inc. 6.38%, 10/15/36 | USD | (10,000,000 | ) | Receive | 5.00 | 12/20/2014 | (375,000 | ) | 438,983 | Bankruptcy/FTP | CCC- | ||||||||||||||||||||
Goldman Sachs | J.C. Penney Corp., Inc. 6.38%, 10/15/36 | USD | 13,334,000 | Pay | 5.00 | 3/20/2017 | 2,633,465 | (2,277,810 | ) | Bankruptcy/FTP | CCC- | |||||||||||||||||||||
Credit Suisse | J.C. Penney Corp., Inc. 6.38%, 10/15/36 | USD | 6,667,000 | Pay | 5.00 | 3/20/2017 | 1,366,735 | (1,188,908 | ) | Bankruptcy/FTP | CCC- | |||||||||||||||||||||
Goldman Sachs | J.C. Penney Corp., Inc. 6.38%, 10/15/36 | USD | (13,334,000 | ) | Receive | 5.00 | 3/20/2015 | (933,380 | ) | 1,051,649 | Bankruptcy/FTP | CCC- | ||||||||||||||||||||
Goldman Sachs | Limited Brands, Inc. 6.90%, 7/15/17 | USD | 15,000,000 | Pay | 1.00 | 12/20/2015 | 679,159 | (834,181 | ) | Bankruptcy/FTP | BB- | |||||||||||||||||||||
Notes to Financial Statements are an integral part of this Schedule.
9
Table of Contents
Driehaus Active Income Fund
Schedule of Investments
June 30, 2014 (unaudited)
Credit Default Swaps (continued)
| Counterparty | Reference Instrument | Currency | Notional AmountB | Pay/ ReceiveA Fixed Rate | Fixed Rate | Expiration Date | Premium Paid (Received) | Unrealized Appreciation/ (Depreciation) | Credit Event | RatingC | ||||||||||||||||||||||
Goldman Sachs | Liz Claiborne, Inc. 5.00%, 7/8/13 | USD | 15,000,000 | Pay | 5.00 | % | 9/20/2014 | $ | 1,875,000 | $ | (2,063,843 | ) | Bankruptcy/FTP | NR | ||||||||||||||||||
Goldman Sachs | Liz Claiborne, Inc. 5.00%, 7/8/13 | USD | 15,000,000 | Pay | 5.00 | 12/20/2014 | 1,087,500 | (1,460,328 | ) | Bankruptcy/FTP | NR | |||||||||||||||||||||
Goldman Sachs | The Markit CDX NA High Yield Series 17 Index | USD | 14,200,000 | Pay | 5.00 | 12/20/2016 | 1,475,875 | (2,583,872 | ) | Bankruptcy/FTP | NA | |||||||||||||||||||||
Merrill Lynch | The Markit CDX NA High Yield Series 17 Index | USD | 4,800,000 | Pay | 5.00 | 12/20/2016 | 550,000 | (927,211 | ) | Bankruptcy/FTP | NA | |||||||||||||||||||||
Goldman Sachs | The Markit iTraxx Europe Crossover IndexSeries 19 | EUR | 24,500,000 | Pay | 5.00 | 6/20/2018 | (1,602,328 | ) | (2,194,869 | ) | Bankruptcy/FTP | NA | ||||||||||||||||||||
Goldman Sachs | The Markit iTraxx Europe Crossover IndexSeries 20 | EUR | 10,000,000 | Pay | 5.00 | 12/20/2018 | (2,134,040 | ) | (349,252 | ) | Bankruptcy/FTP | NA | ||||||||||||||||||||
Morgan Stanley | The Markit iTraxx Europe Crossover IndexSeries 20 | EUR | 10,000,000 | Pay | 5.00 | 12/20/2018 | (2,137,029 | ) | (346,263 | ) | Bankruptcy/FTP | NA | ||||||||||||||||||||
Morgan Stanley | The Markit iTraxx Europe Crossover IndexSeries 20 | EUR | 10,000,000 | Pay | 5.00 | 12/20/2018 | (2,252,200 | ) | (231,092 | ) | Bankruptcy/FTP | NA | ||||||||||||||||||||
Goldman Sachs | Masco Corp. 6.13%, 10/3/16 | USD | 15,000,000 | Pay | 1.00 | 12/20/2015 | 1,047,333 | (1,217,115 | ) | Bankruptcy/FTP | BBB- | |||||||||||||||||||||
Morgan Stanley | Masco Corp. 6.13%, 10/3/16 | USD | 4,500,000 | Pay | 1.00 | 3/20/2016 | 273,169 | (328,196 | ) | Bankruptcy/FTP | BBB- | |||||||||||||||||||||
Merrill Lynch | Pitney Bowes, Inc. 6.25%, 3/15/19 | USD | 5,000,000 | Pay | 1.00 | 9/20/2016 | 164,656 | (248,802 | ) | Bankruptcy/FTP | NR | |||||||||||||||||||||
Morgan Stanley | Pitney Bowes, Inc. 6.25%, 3/15/19 | USD | 5,000,000 | Pay | 1.00 | 12/20/2016 | 244,614 | (329,612 | ) | Bankruptcy/FTP | BBB | |||||||||||||||||||||
Merrill Lynch | Pitney Bowes, Inc. 4.63%, 10/1/12 | USD | 20,000,000 | Pay | 1.00 | 3/20/2016 | 436,253 | (718,308 | ) | Bankruptcy/FTP | BBB | |||||||||||||||||||||
Goldman Sachs | Realogy Corp. 10.50%, 4/15/14 | USD | 3,000,000 | Pay | 5.00 | 3/20/2016 | 285,000 | (498,280 | ) | Bankruptcy/FTP | B | |||||||||||||||||||||
Merrill Lynch | Realogy Corp. 10.50%, 4/15/14 | USD | 2,000,000 | Pay | 5.00 | 3/20/2016 | 190,000 | (332,187 | ) | Bankruptcy/FTP | B | |||||||||||||||||||||
Goldman Sachs | Saks, Inc. 2.00%, 3/15/24 | USD | 10,000,000 | Pay | 5.00 | 12/20/2016 | 406,250 | (1,597,914 | ) | Bankruptcy/FTP | NR | |||||||||||||||||||||
Goldman Sachs | Sears Roebuck Acceptance Corp. 7.00%, 6/1/32 | USD | 1,600,000 | Pay | 5.00 | 3/20/2019 | 380,000 | 66,119 | Bankruptcy/FTP | CCC+ | ||||||||||||||||||||||
Merrill Lynch | Sears Roebuck Acceptance Corp. 7.00%, 6/1/32 | USD | 1,600,000 | Pay | 5.00 | 3/20/2019 | 372,000 | 74,119 | Bankruptcy/FTP | CCC+ | ||||||||||||||||||||||
Barclays | Sears Roebuck Acceptance Corp. 7.00%, 6/1/32 | USD | 8,000,000 | Pay | 5.00 | 3/20/2019 | 1,500,000 | 730,594 | Bankruptcy/FTP | CCC+ | ||||||||||||||||||||||
Notes to Financial Statements are an integral part of this Schedule.
10
Table of Contents
Driehaus Active Income Fund
Schedule of Investments
June 30, 2014 (unaudited)
Credit Default Swaps (continued)
| Counterparty | Reference Instrument | Currency | Notional AmountB | Pay/ ReceiveA Fixed Rate | Fixed Rate | Expiration Date | Premium Paid (Received) | Unrealized Appreciation/ (Depreciation) | Credit Event | RatingC | ||||||||||||||||||||||
Goldman Sachs | Sears Roebuck Acceptance Corp. 7.00%, 6/1/32 | USD | 4,000,000 | Pay | 5.00 | % | 3/20/2019 | $ | 760,000 | $ | 355,297 | Bankruptcy/FTP | CCC+ | |||||||||||||||||||
Barclays | Sears Roebuck Acceptance Corp. 7.00%, 6/1/32 | USD | 1,600,000 | Pay | 5.00 | 3/20/2019 | 296,000 | 150,119 | Bankruptcy/FTP | CCC+ | ||||||||||||||||||||||
Barclays | Sears Roebuck Acceptance Corp. 7.00%, 6/1/32 | USD | 2,400,000 | Pay | 5.00 | 3/20/2019 | 456,000 | 213,178 | Bankruptcy/FTP | CCC+ | ||||||||||||||||||||||
Goldman Sachs | Sears Roebuck Acceptance Corp. 7.00%, 6/1/32 | USD | 1,600,000 | Pay | 5.00 | 3/20/2019 | 292,000 | 154,119 | Bankruptcy/FTP | CCC+ | ||||||||||||||||||||||
Barclays | Sears Roebuck Acceptance Corp. 7.00%, 6/1/32 | USD | 1,600,000 | Pay | 5.00 | 3/20/2019 | 284,000 | 162,119 | Bankruptcy/FTP | CCC+ | ||||||||||||||||||||||
Barclays | Sears Roebuck Acceptance Corp. 7.00%, 6/1/32 | USD | 4,000,000 | Pay | 5.00 | 6/20/2019 | 740,000 | 405,060 | Bankruptcy/FTP | CCC+ | ||||||||||||||||||||||
Morgan Stanley | Sprint Nextel Corp. 6.00%, 12/1/16 | USD | 5,000,000 | Pay | 5.00 | 3/20/2016 | (354,760 | ) | (68,976 | ) | Bankruptcy/FTP | BB- | ||||||||||||||||||||
Morgan Stanley | SUPERVALU, Inc. 8.00%, 5/1/16 | USD | 2,500,000 | Pay | 5.00 | 9/20/2018 | (103,413 | ) | (58,908 | ) | Bankruptcy/FTP | B- | ||||||||||||||||||||
Goldman Sachs | SUPERVALU, Inc. 8.00%, 5/1/16 | USD | 2,500,000 | Pay | 5.00 | 9/20/2018 | (109,079 | ) | (53,242 | ) | Bankruptcy/FTP | B- | ||||||||||||||||||||
Goldman Sachs | SUPERVALU, Inc. 8.00%, 5/1/16 | USD | 2,500,000 | Pay | 5.00 | 9/20/2018 | (142,039 | ) | (20,282 | ) | Bankruptcy/FTP | B- | ||||||||||||||||||||
Goldman Sachs | The Chubb Corp. 6.60%, 8/15/18 | USD | 10,000,000 | Pay | 1.00 | 12/20/2014 | (242,813 | ) | 193,238 | Bankruptcy/FTP | A+ | |||||||||||||||||||||
Goldman Sachs | The Chubb Corp. 6.60%, 8/15/18 | USD | 10,000,000 | Pay | 1.00 | 3/20/2015 | (257,326 | ) | 183,567 | Bankruptcy/FTP | A+ | |||||||||||||||||||||
Goldman Sachs | TRW Automotive, Inc. 7.25%, 3/15/17 | USD | 5,000,000 | Pay | 5.00 | 3/20/2015 | 92,579 | (276,582 | ) | Bankruptcy/FTP | BBB- | |||||||||||||||||||||
Goldman Sachs | TRW Automotive, Inc. 7.25%, 3/15/17 | USD | 3,000,000 | Pay | 5.00 | 6/20/2015 | (133,100 | ) | (13,649 | ) | Bankruptcy/FTP | BBB- | ||||||||||||||||||||
Morgan Stanley | Vulcan Materials Co. 6.40%, 11/30/17 | USD | 5,000,000 | Pay | 5.00 | 12/20/2016 | 255,000 | (842,992 | ) | Bankruptcy/FTP | BB+ | |||||||||||||||||||||
|
|
|
| |||||||||||||||||||||||||||||
Total Credit Default Swaps |
| 17,566,750 | (34,156,753 | ) | ||||||||||||||||||||||||||||
|
|
|
| |||||||||||||||||||||||||||||
Total Swap Contracts |
| $ | 17,566,750 | $ | (36,744,013 | ) | ||||||||||||||||||||||||||
|
|
|
| |||||||||||||||||||||||||||||
| A | If the Fund is paying a fixed rate, the counterparty acts as guarantor of the variable instrument and thus the Fund is a buyer of protection. If the Fund is receiving a fixed rate, the Fund acts as guarantor of the variable instrument and thus is a seller of protection. |
| B | For contracts to sell protection, the notional amout is equal to the maximum potential amount of the future payments and no recourse has been entered into in association with the contracts. |
| C | Based on Moody’s or Standard & Poor’s credit rating for the underlying reference instrument entity (unaudited). |
FTP=Failure to Pay
NR=Not Rated
NA=Not Applicable
EUR — Euro
USD — United States Dollar
Notes to Financial Statements are an integral part of this Schedule.
11
Table of Contents
Driehaus Active Income Fund
Schedule of Investments
June 30, 2014 (unaudited)
SWAPTIONS
Credit Default Swaptions
| Counterparty | Floating Rate Index | Currency | Notional Amount | Pay/ Receive Fixed rate | Exercise Price | Expiration Date | Premium Paid (Received) | Market Value | ||||||||||||||||||||
Goldman Sachs | Markit CDX.NA.HY.22 - 5 year Index | USD | 250,000,000 | Pay | 106.00 | 8/20/2014 | $ | 1,559,250 | $ | 443,923 | ||||||||||||||||||
Goldman Sachs | Markit CDX.NA.HY.22 - 5 year Index | USD | (250,000,000 | ) | Receive | 108.50 | 8/20/2014 | (853,875 | ) | (1,149,978 | ) | |||||||||||||||||
|
|
|
| |||||||||||||||||||||||||
Total Credit Default Swaptions |
| 705,375 | (706,055 | ) | ||||||||||||||||||||||||
|
|
|
| |||||||||||||||||||||||||
Interest Rate Swaptions
| Counterparty | Floating Rate Index | Currency | Notional Amount | Pay/ Receive Fixed rate | Exercise Price | Expiration Date | Premium Paid (Received) | Market Value | ||||||||||||||||||||
Morgan Stanley | 3-Month USD-LIBOR-BBA | USD | 326,000,000 | Pay | 2.16 | 8/29/2014 | $ | 3,080,700 | $ | 3,301,633 | ||||||||||||||||||
Morgan Stanley | 3-Month USD-LIBOR-BBA | USD | 152,000,000 | Pay | 1.71 | 8/29/2014 | 1,048,800 | 1,071,781 | ||||||||||||||||||||
Morgan Stanley | 3-Month USD-LIBOR-BBA | USD | 58,000,000 | Pay | 2.60 | 8/29/2014 | 719,200 | 736,382 | ||||||||||||||||||||
Morgan Stanley | 6-Month USD-LIBOR-BBA | USD | 300,000,000 | Pay | 3.00 | 9/29/2014 | 5,640,000 | 985,860 | ||||||||||||||||||||
|
|
|
| |||||||||||||||||||||||||
Total Interest Rate Swaptions |
| 10,488,700 | 6,095,656 | |||||||||||||||||||||||||
|
|
|
| |||||||||||||||||||||||||
TOTAL SWAPTIONS |
| $ | 11,194,075 | $ | 5,389,601 | |||||||||||||||||||||||
|
|
|
| |||||||||||||||||||||||||
USD — United States Dollar
FUTURES CONTRACTS
| Futures Contracts | Number of Contracts Long/(Short) | Expiration Date | Unrealized Appreciation/ (Depreciation) | |||||||||
U.S. 5 Year Treasury Note | (662 | ) | September 2014 | $ | 288,400 | |||||||
U.S. 10 Year Treasury Note | (1,247 | ) | September 2014 | 670,431 | ||||||||
U.S. Treasury Long Bond | (182 | ) | September 2014 | 129,054 | ||||||||
|
| |||||||||||
Total Futures Contracts | $ | 1,087,886 | ||||||||||
|
| |||||||||||
Notes to Financial Statements are an integral part of this Schedule.
12
Table of Contents
Performance Overview (unaudited)
The performance summarized below is historical and does not represent future results. Investment returns and principal value vary, and you may have a gain or loss when you sell shares. Performance data presented measures the change in the value of an investment in the Fund, assuming reinvestment of all dividends and capital gains.
The table does not reflect the deduction of taxes that a shareholder would pay on Fund distributions or the redemption of Fund shares. The graph compares the results of a $25,000 investment (minimum investment) in the Fund since September 30, 2010 (the date of the Fund’s inception), with all dividends and capital gains reinvested, with the indicated indices (and dividends reinvested) for the same period.
| Average Annual Total Returns as of 06/30/14 | 1 Year | 3 Years | Since Inception (09/30/10 - 06/30/14) | |||||||||
Driehaus Select Credit Fund (DRSLX)1 | 5.33% | 3.39% | 4.41% | |||||||||
Citigroup 3-Month T-Bill Index2 | 0.04% | 0.05% | 0.07% | |||||||||
BofA Merrill Lynch U.S. High Yield Index3 | 11.80% | 9.27% | 9.62% | |||||||||
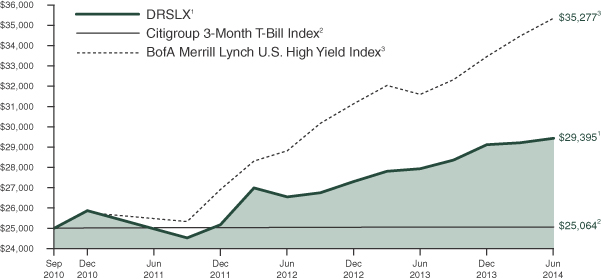
| 1 | The returns for the periods prior to February 1, 2011, reflect fee waivers and/or reimbursements without which performance would have been lower. |
| 2 | The Citigroup 3-Month T-Bill Index is designed to mirror the performance of the 3-month U.S. Treasury Bill. The Citigroup 3-Month T-Bill Index is unmanaged and its returns reflect reinvestment of all distributions and changes in market prices. |
| 3 | The BofA Merrill Lynch U.S. High Yield Index is an unmanaged index that tracks the performance of below-investment grade, U.S.-dollar denominated corporate bonds publicly issued in the U.S. domestic market. |
13
Table of Contents
Schedule of Investments
June 30, 2014 (unaudited)
Shares, Amount, or Number of Contracts | Value | |||||||
| ASSET-BACKED SECURITIES — 0.95% | ||||||||
Freddie Mac REMICS 2.00%, 2/15/27 | $ | 5,903,073 | $ | 5,892,041 | ||||
Freddie Mac REMICS 2.00%, 4/15/28 | 7,071,040 | 7,017,526 | ||||||
|
| |||||||
Total ASSET-BACKED SECURITIES (Cost $13,092,334) | 12,909,567 | |||||||
|
| |||||||
| BANK LOANS — 16.94% | ||||||||
Commercial Services — 0.69% |
| |||||||
Westway Group, Inc. 4.50%, 2/5/20 2 | 9,419,259 | 9,425,146 | ||||||
Diversified Financial Services — 0.63% |
| |||||||
Sears Roebuck Acceptance Corp. | 8,509,744 | 8,597,879 | ||||||
Engineering & Construction — 0.81% |
| |||||||
Deutsche Raststatten Gruppe III GmbH (Germany) | 7,442,330 | 11,006,047 | ||||||
Environmental Control — 0.15% |
| |||||||
WTG Holdings III Corp. 8.50%, 12/12/21 2 | 2,000,000 | 2,007,500 | ||||||
Food — 4.77% |
| |||||||
Fairway Group Acquisition Co. | 22,617,035 | 22,334,322 | ||||||
Hostess Brands, Inc. 6.75%, 3/12/20 2 | 16,957,500 | 17,572,210 | ||||||
Roundy’s Supermarkets, Inc. | 15,960,000 | 15,979,950 | ||||||
SUPERVALU, Inc. | 8,863,639 | 8,859,943 | ||||||
|
| |||||||
| 64,746,425 | ||||||||
|
| |||||||
Internet — 0.91% |
| |||||||
Mood Media Corp. (Canada) | 12,381,607 | 12,397,084 | ||||||
Leisure Time — 0.75% |
| |||||||
Equinox Holdings, Inc. 9.75%, 5/16/20 2 | 10,000,000 | 10,125,000 | ||||||
Oil & Gas — 2.26% |
| |||||||
Bennu Oil & Gas LLC 8.75%, 11/1/18 2 | 12,494,756 | 12,598,875 | ||||||
Shelf Drilling Midco Ltd. (United Arab Emirates) 10.00%, 10/7/18 2 | 17,750,000 | 18,105,000 | ||||||
|
| |||||||
| 30,703,875 | ||||||||
|
| |||||||
Retail — 1.28% |
| |||||||
JC Penney Corp., Inc. 6.00%, 5/21/18 2 | 17,221,150 | 17,411,305 | ||||||
Software — 4.69% |
| |||||||
Applied Systems, Inc. 7.50%, 1/15/22 2 | 44,000,000 | 44,825,000 | ||||||
Shares, Amount, or Number of Contracts | Value | |||||||
Evergreen Skills Lux Sarl (Luxembourg) | $ | 19,000,000 | $ | 18,841,673 | ||||
|
| |||||||
| 63,666,673 | ||||||||
|
| |||||||
Total BANK LOANS (Cost $229,091,873) | 230,086,934 | |||||||
|
| |||||||
| CORPORATE BONDS — 40.07% | ||||||||
Banks — 2.40% |
| |||||||
Credit Suisse Group AG (Switzerland) | 2,000,000 | 2,213,800 | ||||||
Royal Bank of Scotland Group PLC (United Kingdom) | 22,757,000 | 30,428,879 | ||||||
|
| |||||||
| 32,642,679 | ||||||||
|
| |||||||
Building Materials — 2.15% |
| |||||||
Cemex Finance LLC | 16,000,000 | 18,820,000 | ||||||
Cemex Finance LLC | 5,000,000 | 5,206,250 | ||||||
Cemex SAB de CV (Mexico) | 4,930,000 | 5,127,200 | ||||||
|
| |||||||
| 29,153,450 | ||||||||
|
| |||||||
Chemicals — 1.83% |
| |||||||
Kissner Milling Co., Ltd. (Canada) | 22,465,000 | 23,138,950 | ||||||
Momentive Performance Materials, Inc. | 5,530,000 | 1,741,950 | ||||||
|
| |||||||
| 24,880,900 | ||||||||
|
| |||||||
Commercial Services — 1.06% |
| |||||||
Ceridian Corp. | 4,000,000 | 4,520,000 | ||||||
DynCorp International, Inc. | 9,490,000 | 9,917,050 | ||||||
|
| |||||||
| 14,437,050 | ||||||||
|
| |||||||
Diversified Financial Services — 2.93% |
| |||||||
Cementos Progreso Trust (Cayman Islands) | 8,500,000 | 9,180,000 | ||||||
Denver Parent Corp. 12.25%, 8/15/18 1 | 15,500,000 | 14,802,500 | ||||||
Rio Oil Finance Trust Series 2014-1 | 15,000,000 | 15,754,800 | ||||||
|
| |||||||
| 39,737,300 | ||||||||
|
| |||||||
Entertainment — 2.79% |
| |||||||
Graton Economic Development Authority 9.63%, 9/1/19 1 | 27,955,000 | 31,798,813 | ||||||
Production Resource Group, Inc. | 7,255,000 | 6,021,650 | ||||||
|
| |||||||
| 37,820,463 | ||||||||
|
| |||||||
Notes to Financial Statements are an integral part of this Schedule.
14
Table of Contents
Driehaus Select Credit Fund
Schedule of Investments
June 30, 2014 (unaudited)
Shares, Amount, or Number of Contracts | Value | |||||||
Food — 0.92% |
| |||||||
WM Morrison Supermarkets PLC (United Kingdom) 3.50%, 7/27/26 3 | $ | 8,000,000 | $ | 12,522,006 | ||||
Healthcare—Products — 0.63% |
| |||||||
ConvaTec Healthcare | 7,930,000 | 8,584,225 | ||||||
Healthcare—Services — 1.63% |
| |||||||
Aurora Diagnostics Holdings / Aurora Diagnostics Financing, Inc. 10.75%, 1/15/18 | 7,151,350 | 5,971,377 | ||||||
Kindred Healthcare, Inc. 6.38%, 4/15/22 1 | 8,285,000 | 8,326,425 | ||||||
National Mentor, Inc. 12.50%, 2/15/18 1 | 7,311,000 | 7,767,938 | ||||||
|
| |||||||
| 22,065,740 | ||||||||
|
| |||||||
Internet — 0.56% |
| |||||||
Mood Media Corp. (Canada) | 8,500,000 | 7,650,000 | ||||||
Iron/Steel — 0.55% |
| |||||||
Edgen Murray Corp. 8.75%, 11/1/20 1 | 6,490,000 | 7,414,825 | ||||||
Media — 0.60% |
| |||||||
Nara Cable Funding II Ltd. (Ireland) | 5,000,000 | 8,154,183 | ||||||
Oil & Gas — 6.77% |
| |||||||
Calumet Specialty Products Partners LP / Calumet Finance Corp. 6.50%, 4/15/21 1 | 40,000,000 | 40,800,000 | ||||||
Memorial Resource Development Corp. 5.88%, 7/1/22 1 | 7,000,000 | 7,052,500 | ||||||
Newfield Exploration Co. 5.75%, 1/30/22 | 1,000,000 | 1,105,000 | ||||||
Sanchez Energy Corp. 7.75%, 6/15/21 1 | 12,600,000 | 13,671,000 | ||||||
Sanchez Energy Corp. 6.13%, 1/15/23 1 | 8,000,000 | 8,260,000 | ||||||
Shelf Drilling Holdings Ltd. (United Arab Emirates) | 5,000,000 | 5,350,000 | ||||||
Venoco, Inc. | 16,173,000 | 15,728,242 | ||||||
|
| |||||||
| 91,966,742 | ||||||||
|
| |||||||
Packaging & Containers — 0.36% |
| |||||||
Berry Plastics Corp. | 4,292,600 | 4,893,564 | ||||||
Retail — 6.46% |
| |||||||
Claire’s Stores, Inc. | 14,000,000 | 10,185,000 | ||||||
Conn’s, Inc. | 15,000,000 | 15,037,500 | ||||||
Neiman Marcus Group, Inc. | 18,000,000 | 19,395,000 | ||||||
Rite Aid Corp. | 4,200,000 | 4,788,000 | ||||||
Shares, Amount, or Number of Contracts | Value | |||||||
Rite Aid Corp. | $ | 17,250,000 | $ | 18,673,125 | ||||
Ruby Tuesday, Inc. | 19,650,000 | 19,650,000 | ||||||
|
| |||||||
| 87,728,625 | ||||||||
|
| |||||||
Software — 3.46% |
| |||||||
First Data Corp. | 5,000,000 | 5,825,000 | ||||||
First Data Corp. | 9,000,000 | 10,676,250 | ||||||
First Data Holdings, Inc. 14.50%, 9/24/19 1 | 9,431,374 | 10,480,614 | ||||||
Nuance Communications, Inc. | 19,388,000 | 20,066,580 | ||||||
|
| |||||||
| 47,048,444 | ||||||||
|
| |||||||
Telecommunications — 4.97% |
| |||||||
Alcatel-Lucent USA, Inc. 8.88%, 1/1/20 1 | 8,270,000 | 9,365,775 | ||||||
Alcatel-Lucent USA, Inc. 6.75%, 11/15/20 1 | 11,000,000 | 11,715,000 | ||||||
Cincinnati Bell, Inc. | 19,365,000 | 20,309,044 | ||||||
Intelsat Luxembourg SA (Luxembourg) | 15,401,000 | 16,305,809 | ||||||
Nortel Networks Ltd. (Canada) | 8,500,000 | 9,732,500 | ||||||
|
| |||||||
| 67,428,128 | ||||||||
|
| |||||||
Total CORPORATE BONDS (Cost $527,334,672) | 544,128,324 | |||||||
|
| |||||||
| CONVERTIBLE CORPORATE BONDS — 6.15% | ||||||||
Building Materials — 1.11% |
| |||||||
Cemex SAB de CV (Mexico) | 12,000,000 | 15,022,500 | ||||||
Electrical Components & Equipment — 1.89% |
| |||||||
SunPower Corp. | 13,836,000 | 25,406,355 | ||||||
Suntech Power Holdings Co., Ltd. (China) | 4,000,000 | 246,248 | ||||||
|
| |||||||
| 25,652,603 | ||||||||
|
| |||||||
Holding Companies—Diversified — 0.96% |
| |||||||
Gala Electric Casinos PLC (United Kingdom) 11.50%, 6/1/193 | 7,000,000 | 13,070,820 | ||||||
Internet — 0.22% |
| |||||||
Equinix, Inc. | 1,600,000 | 3,030,000 | ||||||
Lodging — 1.57% |
| |||||||
MGM Resorts International 4.25%, 4/15/15 | 14,500,000 | 21,287,813 | ||||||
Mining — 0.04% |
| |||||||
Great Western Minerals Group Ltd. (Canada) 8.00%, 4/6/173 | 2,000,000 | 500,000 | ||||||
Notes to Financial Statements are an integral part of this Schedule.
15
Table of Contents
Driehaus Select Credit Fund
Schedule of Investments
June 30, 2014 (unaudited)
Shares, Amount, or Number of Contracts | Value | |||||||
Telecommunications — 0.36% |
| |||||||
Nortel Networks Corp. (Canada) | $ | 1,875,000 | $ | 1,891,406 | ||||
Nortel Networks Corp. (Canada) | 3,000,000 | 3,033,750 | ||||||
|
| |||||||
| 4,925,156 | ||||||||
|
| |||||||
Total CONVERTIBLE CORPORATE BONDS (Cost $69,250,428) | 83,488,892 | |||||||
|
| |||||||
| COMMON STOCK — 2.69% | ||||||||
Auto Manufacturers — 1.64% |
| |||||||
General Motors Co. | 611,099 | 22,182,889 | ||||||
Motors Liquidation Co. GUC Trust* | 1,276 | 32,666 | ||||||
|
| |||||||
| 22,215,555 | ||||||||
|
| |||||||
Oil & Gas — 0.17% |
| |||||||
Calumet Specialty Products Partners LP | 72,987 | 2,320,987 | ||||||
Packaging & Containers — 0.09% |
| |||||||
Berry Plastics Group, | 50,000 | 1,290,000 | ||||||
Telecommunications — 0.79% |
| |||||||
Cincinnati Bell, Inc.* | 2,718,684 | 10,684,428 | ||||||
|
| |||||||
Total COMMON STOCK (Cost $33,897,181) | 36,510,970 | |||||||
|
| |||||||
| CONVERTIBLE PREFERRED STOCK — 0.60% | ||||||||
Auto Manufacturers — 0.00% |
| |||||||
General Motors Corp. Senior Convertible Preferred Escrow—C 7.25%, 4/15/144 | 94,958 | — | ||||||
Real Estate Investment Trusts — 0.60% |
| |||||||
Alexandria Real Estate Equities, Inc. | 295,167 | 8,087,576 | ||||||
|
| |||||||
Total CONVERTIBLE PREFERRED STOCK (Cost $7,531,201) | 8,087,576 | |||||||
|
| |||||||
| PURCHASED CALL OPTIONS — 0.24% | ||||||||
iShares MSCI Emerging Markets ETF, Exercise Price: $42.50, Expiration Date: August, 2014* | 8,000 | 1,072,000 | ||||||
iShares Russell 2000 ETF, Exercise Price: $112.00, Expiration Date: August, 2014* | 2,800 | 1,968,400 | ||||||
Ocwen Financial Corp., Exercise Price: $55.00, Expiration Date: January, 2015* | 2,425 | 97,000 | ||||||
Shares, Amount, or Number of Contracts | Value | |||||||
Ocwen Financial Corp., Exercise Price: $47.50, Expiration Date: January, 2015* | 1,200 | $ | 150,000 | |||||
|
| |||||||
Total PURCHASED CALL OPTIONS (Premiums paid $4,444,717) | 3,287,400 | |||||||
|
| |||||||
| PURCHASED PUT OPTIONS — 0.05% | ||||||||
iShares MSCI Emerging Markets ETF, Exercise Price: $42.50, Expiration Date: August, 2014* | 8,000 | 440,000 | ||||||
iShares Russell 2000 ETF, Exercise Price: $112.00, Expiration Date: August, 2014* | 2,800 | 254,800 | ||||||
|
| |||||||
Total PURCHASED PUT OPTIONS (Premiums paid $2,162,993) | 694,800 | |||||||
|
| |||||||
| SHORT-TERM INVESTMENTS — 1.82% | ||||||||
UMB Money Market Fiduciary 0.01% | 24,668,303 | 24,668,303 | ||||||
|
| |||||||
Total SHORT-TERM INVESTMENTS (Cost $24,668,303) | 24,668,303 | |||||||
|
| |||||||
| WARRANTS — 0.03% | ||||||||
General Motors Co.—CW 16, Strike Price $10.00, Expiration Date 7/10/16* | 8,920 | 237,370 | ||||||
General Motors Co.—CW 19, Strike Price $18.33, Expiration Date 7/10/19* | 8,920 | 165,562 | ||||||
|
| |||||||
Total WARRANTS (Cost $398,024) | 402,932 | |||||||
|
| |||||||
| ||||||||
| TOTAL INVESTMENTS (Cost $911,871,726) | 69.54 | % | 944,265,698 | |||||
| Other Assets less Liabilities | 30.46 | % | 413,619,577 | |||||
|
|
|
| |||||
| Net Assets | 100.00 | % | $ | 1,357,885,275 | ||||
| ||||||||
| SECURITIES SOLD SHORT — (4.32)% | ||||||||
| CORPORATE BONDS — (1.67)% | ||||||||
Healthcare—Products — (0.51)% |
| |||||||
Kinetic Concepts, Inc. / KCI USA, Inc. | $ | (6,100,000 | ) | $ | (6,923,500 | ) | ||
Household Products/Wares — (0.22)% |
| |||||||
Reynolds Group Issuer, Inc. / Reynolds Group Issuer LLC | (2,699,000 | ) | (3,016,133 | ) | ||||
Notes to Financial Statements are an integral part of this Schedule.
16
Table of Contents
Driehaus Select Credit Fund
Schedule of Investments
June 30, 2014 (unaudited)
Shares, Amount, or Number of Contracts | Value | |||||||
Media — (0.17)% |
| |||||||
DISH DBS Corp. | $ | (2,000,000 | ) | $ | (2,290,000 | ) | ||
Oil & Gas — (0.31)% |
| |||||||
Chesapeake Energy Corp. 6.63%, 8/15/20 | (1,729,760 | ) | (2,006,522 | ) | ||||
Chesapeake Energy Corp. 6.13%, 2/15/21 | (2,015,000 | ) | (2,276,950 | ) | ||||
|
| |||||||
| (4,283,472 | ) | |||||||
|
| |||||||
Retail — (0.46)% |
| |||||||
Party City Holdings, Inc. 8.88%, 8/1/20 | (2,260,000 | ) | (2,525,550 | ) | ||||
Sears Holdings Corp. | (3,950,000 | ) | (3,678,437 | ) | ||||
|
| |||||||
| (6,203,987 | ) | |||||||
|
| |||||||
Total CORPORATE BONDS (Proceeds $21,767,736) | (22,717,092 | ) | ||||||
|
| |||||||
| COMMON STOCK — (2.18)% | ||||||||
Electrical Components & Equipment — (1.20)% |
| |||||||
SunPower Corp.* | (397,133 | ) | (16,274,510 | ) | ||||
Healthcare—Services — (0.09)% |
| |||||||
Kindred Healthcare, Inc. | (55,723 | ) | (1,287,201 | ) | ||||
Internet — (0.23)% |
| |||||||
Equinix, Inc.* | (14,850 | ) | (3,119,837 | ) | ||||
Lodging — (0.46)% |
| |||||||
MGM Resorts | (235,258 | ) | (6,210,811 | ) | ||||
Real Estate Investment Trusts — (0.20)% |
| |||||||
Alexandria Real Estate Equities, Inc. | (35,523 | ) | (2,758,006 | ) | ||||
|
| |||||||
Total COMMON STOCK (Proceeds $20,536,936) | (29,650,365 | ) | ||||||
|
| |||||||
Shares, Principal Amount, or Number of Contracts | Value | |||||||
| EXCHANGE- TRADED FUND — (0.43)% | ||||||||
SPDR Barclays High Yield Bond ETF | (139,308 | ) | $ | (5,813,323 | ) | |||
|
| |||||||
Total EXCHANGE-TRADED FUND (Proceeds $5,432,778) | (5,813,323 | ) | ||||||
|
| |||||||
WRITTEN CALL OPTIONS — (0.04)% |
| |||||||
Cemex SAB de CV (Mexico), Exercise Price: $14.42, Expiration Date: January, 2015*3 | (10,320 | ) | (536,640 | ) | ||||
|
| |||||||
Total WRITTEN CALL OPTIONS (Premiums received $829,949) | (536,640 | ) | ||||||
|
| |||||||
| ||||||||
| TOTAL INVESTMENT SECURITIES SOLD SHORT (Proceeds $48,567,399) | (4.32 | )% | $ | (58,717,420 | ) | |||
| ||||||||
| * | Non-income producing security. |
| 1 | 144A restricted security. |
| 2 | Variable rate security. Rates disclosed are as of June 30, 2014. |
| 3 | Foreign security denominated in U.S. dollars. |
| 4 | Security valued at fair value as determined in good faith by Driehaus Capital Management LLC, investment adviser to the Fund, in accordance with procedures established by, and under the general supervision of, the Trust’s Board of Trustees. |
| 5 | Security is in default. |
Percentages are stated as a percent of net assets.
Notes to Financial Statements are an integral part of this Schedule.
17
Table of Contents
Driehaus Select Credit Fund
Schedule of Investments
June 30, 2014 (unaudited)
SWAP CONTRACTS
Volatility Swaps
Counterparty | Reference Instrument | Currency | Notional AmountB | Strike Price | Expiration Date | Premium Paid (Received) | Unrealized Appreciation/ (Depreciation) | |||||||||||||||||
Morgan Stanley | ISDAFIX USD Morning Fixing 10Y | USD | 750,000,000 | $71.50 | 9/4/2014 | $ | — | $ | (970,223 | ) | ||||||||||||||
|
|
|
| |||||||||||||||||||||
Total Volatility Swaps |
| $ | — | $ | (970,223 | ) | ||||||||||||||||||
|
|
|
| |||||||||||||||||||||
Credit Default Swaps
| Counterparty | Reference Instrument | Currency | Notional AmountB | Pay/ ReceiveA Rate | Fixed Rate | Expiration Date | Premium Paid (Received) | Unrealized Appreciation/ (Depreciation) | Credit Event | RatingC | ||||||||||||||||||||||
Goldman Sachs | First Data Corp. 12.63%, 1/15/21 | USD | 2,000,000 | Pay | 5.00 | % | 3/20/2019 | $ | — | $ | (159,120 | ) | Bankruptcy/FTP | B- | ||||||||||||||||||
Goldman Sachs | First Data Corp. 12.63%, 1/15/21 | USD | 2,000,000 | Pay | 5.00 | 3/20/2019 | — | (159,120 | ) | Bankruptcy/FTP | B- | |||||||||||||||||||||
Goldman Sachs | First Data Corp. 12.63%, 1/15/21 | USD | 5,000,000 | Pay | 5.00 | 3/20/2019 | 16,475 | (414,277 | ) | Bankruptcy/FTP | B- | |||||||||||||||||||||
Bank of America | Freeport-McMoRan Copper & Gold, Inc. 8.38%, 3/14/12 | USD | 2,000,000 | Pay | 1.00 | 3/20/2017 | 40,381 | (72,814 | ) | Bankruptcy/FTP | NR | |||||||||||||||||||||
JP Morgan | Hess Corp. 7.00%, 2/15/14 | USD | 2,000,000 | Pay | 1.00 | 6/20/2018 | 38,660 | (84,228 | ) | Bankruptcy/FTP | NR | |||||||||||||||||||||
Morgan Stanley | Hess Corp. 7.00%, 2/15/14 | USD | 1,000,000 | Pay | 1.00 | 6/20/2018 | 19,320 | (42,104 | ) | Bankruptcy/FTP | NR | |||||||||||||||||||||
Morgan Stanley | Hess Corp. 7.00%, 2/15/14 | USD | 1,000,000 | Pay | 1.00 | 6/20/2018 | 20,175 | (42,959 | ) | Bankruptcy/FTP | NR | |||||||||||||||||||||
Morgan Stanley | Hess Corp. 7.00%, 2/15/14 | USD | 1,000,000 | Pay | 1.00 | 6/20/2018 | 22,925 | (45,710 | ) | Bankruptcy/FTP | NR | |||||||||||||||||||||
Credit Suisse | Hess Corp. 7.00%, 2/15/14 | USD | 5,000,000 | Pay | 1.00 | 9/20/2018 | 77,494 | (191,239 | ) | Bankruptcy/FTP | NR | |||||||||||||||||||||
Credit Suisse | Hess Corp. 5.60%, 2/15/41 | USD | 1,000,000 | Pay | 1.00 | 6/20/2018 | 3,838 | (26,622 | ) | Bankruptcy/FTP | BBB | |||||||||||||||||||||
Goldman Sachs | JC Penney Corp., Inc. 6.38%, 10/15/36 | USD | 8,000,000 | Pay | 5.00 | 3/20/2018 | 1,450,000 | (956,799 | ) | Bankruptcy/FTP | CCC- | |||||||||||||||||||||
Credit Suisse | JC Penney Corp., Inc. 6.38%, 10/15/36 | USD | (5,000,000 | ) | Receive | 5.00 | 3/20/2015 | (206,250 | ) | 250,598 | Bankruptcy/FTP | CCC- | ||||||||||||||||||||
Barclays | JC Penney Corp., Inc. 6.38%, 10/15/36 | USD | (5,000,000 | ) | Receive | 5.00 | 3/20/2015 | (206,250 | ) | 250,598 | Bankruptcy/FTP | CCC- | ||||||||||||||||||||
Barclays | JC Penney Corp., Inc. 6.38%, 10/15/36 | USD | (3,000,000 | ) | Receive | 5.00 | 3/20/2015 | (120,000 | ) | 146,609 | Bankruptcy/FTP | CCC- | ||||||||||||||||||||
Goldman Sachs | JC Penney Corp., Inc. 6.38%, 10/15/36 | USD | (6,666,000 | ) | Receive | 5.00 | 3/20/2015 | (466,620 | ) | 525,745 | Bankruptcy/FTP | CCC- | ||||||||||||||||||||
Goldman Sachs | JC Penney Corp., Inc. 6.38%, 10/15/36 | USD | 6,666,000 | Pay | 5.00 | 3/20/2017 | 1,316,535 | (1,138,734 | ) | Bankruptcy/FTP | CCC- | |||||||||||||||||||||
Credit Suisse | JC Penney Corp., Inc. 6.38%, 10/15/36 | USD | 3,333,000 | Pay | 5.00 | 3/20/2017 | 683,265 | (594,365 | ) | Bankruptcy/FTP | CCC- | |||||||||||||||||||||
Goldman Sachs | JC Penney Corp., Inc. 6.38%, 10/15/36 | USD | 5,000,000 | Pay | 5.00 | 3/20/2018 | 900,000 | (591,750 | ) | Bankruptcy/FTP | CCC- | |||||||||||||||||||||
Notes to Financial Statements are an integral part of this schedule.
18
Table of Contents
Driehaus Select Credit Fund
Schedule of Investments
June 30, 2014 (unaudited)
| Counterparty | Reference Instrument | Currency | Notional AmountB | Pay/ ReceiveA Rate | Fixed Rate | Expiration Date | Premium Paid (Received) | Unrealized Appreciation/ (Depreciation) | Credit Event | RatingC | ||||||||||||||||||||||
Morgan Stanley | JC Penney Corp., Inc. 6.38%, 10/15/36 | USD | 2,500,000 | Pay | 5.00 | % | 6/20/2018 | $ | 256,250 | $ | (80,742 | ) | Bankruptcy/FTP | CCC- | ||||||||||||||||||
Credit Suisse | JC Penney Corp., Inc. 6.38%, 10/15/36 | USD | 1,250,000 | Pay | 5.00 | 6/20/2018 | 115,625 | (27,871 | ) | Bankruptcy/FTP | CCC- | |||||||||||||||||||||
Credit Suisse | JC Penney Corp., Inc. 6.38%, 10/15/36 | USD | 1,250,000 | Pay | 5.00 | 6/20/2018 | 103,125 | (15,371 | ) | Bankruptcy/FTP | CCC- | |||||||||||||||||||||
Credit Suisse | JC Penney Corp., Inc. 6.38%, 10/15/36 | USD | 1,250,000 | Pay | 5.00 | 6/20/2018 | 78,125 | 9,629 | Bankruptcy/FTP | CCC- | ||||||||||||||||||||||
Morgan Stanley | JC Penney Corp., Inc. 6.38%, 10/15/36 | USD | 1,250,000 | Pay | 5.00 | 6/20/2018 | 121,875 | (34,121 | ) | Bankruptcy/FTP | CCC- | |||||||||||||||||||||
Morgan Stanley | JC Penney Corp., Inc. 6.38%, 10/15/36 | USD | (5,000,000 | ) | Receive | 5.00 | 12/20/2014 | (187,500 | ) | 219,491 | Bankruptcy/FTP | CCC- | ||||||||||||||||||||
Credit Suisse | JC Penney Corp., Inc. 6.38%, 10/15/36 | USD | 3,333,000 | Pay | 5.00 | 12/20/2016 | 349,965 | (290,391 | ) | Bankruptcy/FTP | CCC- | |||||||||||||||||||||
Goldman Sachs | Masco Corp. 6.13%, 10/3/16 | USD | 500,000 | Pay | 1.00 | 12/20/2015 | 39,569 | (45,229 | ) | Bankruptcy/FTP | BBB- | |||||||||||||||||||||
Morgan Stanley | Masco Corp. 6.13%, 10/3/16 | USD | 500,000 | Pay | 1.00 | 3/20/2016 | 30,352 | (36,466 | ) | Bankruptcy/FTP | BBB- | |||||||||||||||||||||
Morgan Stanley | Masco Corp. 6.13%, 10/3/16 | USD | 1,000,000 | Pay | 1.00 | 6/20/2016 | 66,736 | (79,879 | ) | Bankruptcy/FTP | BBB- | |||||||||||||||||||||
Goldman Sachs | Sears Holdings Corp. 7.00%, 6/1/32 | USD | 400,000 | Pay | 5.00 | 3/20/2019 | 95,000 | 16,530 | Bankruptcy/FTP | CCC+ | ||||||||||||||||||||||
Bank of America | Sears Holdings Corp. 7.00%, 6/1/32 | USD | 400,000 | Pay | 5.00 | 3/20/2019 | 93,000 | 18,530 | Bankruptcy/FTP | CCC+ | ||||||||||||||||||||||
Barclays | Sears Holdings Corp. 7.00%, 6/1/32 | USD | 2,000,000 | Pay | 5.00 | 3/20/2019 | 375,000 | 182,648 | Bankruptcy/FTP | CCC+ | ||||||||||||||||||||||
Goldman Sachs | Sears Holdings Corp. 7.00%, 6/1/32 | USD | 1,000,000 | Pay | 5.00 | 3/20/2019 | 190,000 | 88,824 | Bankruptcy/FTP | CCC+ | ||||||||||||||||||||||
Barclays | Sears Holdings Corp. 7.00%, 6/1/32 | USD | 400,000 | Pay | 5.00 | 3/20/2019 | 74,000 | 37,530 | Bankruptcy/FTP | CCC+ | ||||||||||||||||||||||
Barclays | Sears Holdings Corp. 7.00%, 6/1/32 | USD | 600,000 | Pay | 5.00 | 3/20/2019 | 114,000 | 53,295 | Bankruptcy/FTP | CCC+ | ||||||||||||||||||||||
Goldman Sachs | Sears Holdings Corp. 7.00%, 6/1/32 | USD | 400,000 | Pay | 5.00 | 3/20/2019 | 73,000 | 38,530 | Bankruptcy/FTP | CCC+ | ||||||||||||||||||||||
Barclays | Sears Holdings Corp. 7.00%, 6/1/32 | USD | 400,000 | Pay | 5.00 | 3/20/2019 | 71,000 | 40,530 | Bankruptcy/FTP | CCC+ | ||||||||||||||||||||||
Barclays | Sears Holdings Corp. 7.00%, 6/1/32 | USD | 1,000,000 | Pay | 5.00 | 6/20/2019 | 185,000 | 101,265 | Bankruptcy/FTP | CCC+ | ||||||||||||||||||||||
Morgan Stanley | SUPERVALU, Inc. 8.00%, 5/1/16 | USD | 2,500,000 | Pay | 5.00 | 12/20/2018 | (103,413 | ) | (58,908 | ) | Bankruptcy/FTP | B- | ||||||||||||||||||||
Goldman Sachs | SUPERVALU, Inc. 8.00%, 5/1/16 | USD | 2,500,000 | Pay | 5.00 | 12/20/2018 | (109,079 | ) | (53,242 | ) | Bankruptcy/FTP | B- | ||||||||||||||||||||
Goldman Sachs | SUPERVALU, Inc. 8.00%, 5/1/16 | USD | 2,500,000 | Pay | 5.00 | 12/20/2018 | (142,039 | ) | (20,282 | ) | Bankruptcy/FTP | B- | ||||||||||||||||||||
Notes to Financial Statements are an integral part of this schedule.
19
Table of Contents
Driehaus Select Credit Fund
Schedule of Investments
June 30, 2014 (unaudited)
| Counterparty | Reference Instrument | Currency | Notional AmountB | Pay/ ReceiveA Rate | Fixed Rate | Expiration Date | Premium Paid (Received) | Unrealized Appreciation/ (Depreciation) | Credit Event | RatingC | ||||||||||||||||||||||
Goldman Sachs | The Markit iTraxx Europe Crossover Index Series 19 | EUR | 5,096,000 | Pay | 5.00 | % | 6/20/2018 | $ | (333,284 | ) | $ | (456,533 | ) | Bankruptcy/FTP | NA | |||||||||||||||||
Morgan Stanley | The Markit iTraxx Europe Sub Financials Series 20 | EUR | 10,000,000 | Pay | 5.00 | 12/20/2018 | (2,003,612 | ) | (479,680 | ) | Bankruptcy/FTP | NA | ||||||||||||||||||||
Morgan Stanley | Vulcan Materials Co. 6.40%, 11/30/17 | USD | 3,000,000 | Pay | 5.00 | 12/20/2016 | 202,500 | (555,295 | ) | Bankruptcy/FTP | BB+ | |||||||||||||||||||||
|
|
|
| |||||||||||||||||||||||||||||
Total Credit Default Swaps |
| 3,345,143 | (4,773,499 | ) | ||||||||||||||||||||||||||||
|
|
|
| |||||||||||||||||||||||||||||
Total Swap Contracts |
| $ | 3,345,143 | $ | (5,743,722 | ) | ||||||||||||||||||||||||||
|
|
|
| |||||||||||||||||||||||||||||
| A | If the Fund is paying a fixed rate, the counterparty acts as guarantor of the variable instrument and thus the Fund is a buyer of protection. If the Fund is receiving a fixed rate, the Fund acts as guarantor of the variable instrument and thus is a seller of protection. |
| B | For contracts to sell protection, the notional amout is equal to the maximum potential amount of the future payments and no recourse has been entered into in association with the contracts. |
| C | Based on Moody’s or Standard & Poor’s credit rating for the underlying reference instrument entity (unaudited). |
FTP=Failure to Pay
NR=Not Rated
NA=Not Applicable
EUR — Euro
USD — United States Dollar
Notes to Financial Statements are an integral part of this schedule.
20
Table of Contents
Driehaus Select Credit Fund
Schedule of Investments
June 30, 2014 (unaudited)
SWAPTIONS
Credit Default Swaptions
| Counterparty | Floating Rate Index | Currency | Notional Amount | Pay/Receive Fixed Rate | Exercise Price | Expiration Date | Premium Paid (Received) | Market Value | ||||||||||||||||||||
Goldman Sachs | Markit CDX.NA.HY.22 - 5 Year Index | USD | 100,000,000 | Pay | $ | 106.00 | 8/20/2014 | $ | 623,700 | $ | 177,569 | |||||||||||||||||
Goldman Sachs | Markit CDX.NA.HY.22 - 5 Year Index | USD | (100,000,000) | Receive | 108.50 | 8/20/2014 | (341,550) | (459,991) | ||||||||||||||||||||
|
|
|
| |||||||||||||||||||||||||
Total Credit Default Swaptions |
| 282,150 | (282,422) | |||||||||||||||||||||||||
|
|
|
| |||||||||||||||||||||||||
Interest Rate Swaptions
| Counterparty | Floating Rate Index | Currency | Notional Amount | Pay/Receive Fixed Rate | Exercise Rate | Expiration Date | Premium Paid (Received) | Market Value | ||||||||||||||||||||
Morgan Stanley | 3-Month USD- LIBOR-BBA | USD | 21,000,000 | Pay | 2.60% | 8/29/2014 | $ | 260,400 | $ | 266,621 | ||||||||||||||||||
Morgan Stanley | 3-Month USD- LIBOR-BBA | USD | 42,000,000 | Pay | 1.71 | 8/29/2014 | 289,800 | 296,150 | ||||||||||||||||||||
Morgan Stanley | 3-Month USD- LIBOR-BBA | USD | 60,000,000 | Pay | 2.16 | 8/29/2014 | 567,000 | 607,663 | ||||||||||||||||||||
Morgan Stanley | 6-Month USD- LIBOR-BBA | USD | 100,000,000 | Pay | 3.00 | 9/29/2014 | 1,880,000 | 328,620 | ||||||||||||||||||||
|
|
|
| |||||||||||||||||||||||||
Total Interest Rate Swaptions |
| 2,997,200 | 1,499,054 | |||||||||||||||||||||||||
|
|
|
| |||||||||||||||||||||||||
TOTAL SWAPTIONS |
| $ | 3,279,350 | $ | 1,216,632 | |||||||||||||||||||||||
|
|
|
| |||||||||||||||||||||||||
USD - United States Dollar
FUTURES CONTRACTS
Futures Contracts | Number of Contracts Long/(Short) | Expiration Date | Unrealized Appreciation/ (Depreciation) | |||||||||
U.S. 5 Year Treasury Note | (185 | ) | September 2014 | $ | 80,595 | |||||||
U.S. 10 Year Treasury Note | (231 | ) | September 2014 | 124,194 | ||||||||
U.S. Treasury Long Bond | (65 | ) | September 2014 | 46,091 | ||||||||
|
| |||||||||||
Total Futures Contracts | $ | 250,880 | ||||||||||
|
| |||||||||||
Notes to Financial Statements are an integral part of this Schedule.
21
Table of Contents
Performance Overview (unaudited)
The performance summarized below is historical and does not represent future results. Investment returns and principal value vary, and you may have a gain or loss when you sell shares. Performance data presented measures the change in the value of an investment in the Fund, assuming reinvestment of all dividends and capital gains.
The table does not reflect the deduction of taxes that a shareholder would pay on Fund distributions or the redemption of Fund shares. The graph compares the results of a $10,000 investment in the Fund since August 26, 2013 (the date of the Fund’s inception), with all dividends and capital gains reinvested, with the indicated indices (and dividends reinvested) for the same period.
| Cumulative Total Returns as of 06/30/14 | Since Inception (08/26/13 - 06/30/14) | |||
Driehaus Event Driven Fund (DEVDX)1 | 13.63% | |||
S&P 500 Index2 | 19.92% | |||
Citigroup 3-Month T-Bill Index3 | 0.03% | |||
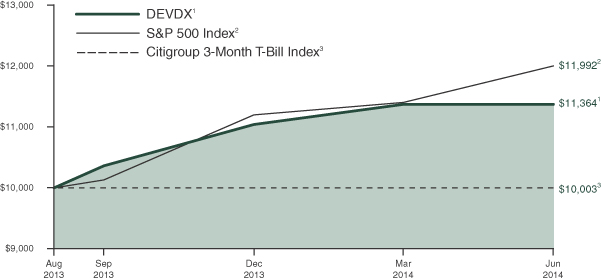
| 1 | The returns for the periods reflect fee waivers and/or reimbursements without which performance would have been lower. |
| 2 | The S&P 500 Index consists of 500 stocks chosen for market size, liquidity and industry group. It is a market-weighted index, with each stock’s weight in the index proportionate to its market value. |
| 3 | The Citigroup 3-Month T-Bill Index is designed to mirror the performance of the 3-month U.S. Treasury Bill. The Citigroup 3-Month T-Bill Index is unmanaged and its returns reflect reinvestment of all distributions and changes in market prices. |
22
Table of Contents
Schedule of Investments
June 30, 2014 (unaudited)
Shares, Principal Number of Contracts | Value | |||||||
| BANK LOANS — 3.27% | ||||||||
Diversified Financial Services — 1.86% |
| |||||||
Sears Roebuck Acceptance Corp. | $ | 4,984,975 | $ | 5,036,604 | ||||
Oil & Gas — 1.41% |
| |||||||
Shelf Drilling Midco Ltd. (United Arab Emirates) 10.00%, 10/7/181 | 3,750,000 | 3,825,000 | ||||||
|
| |||||||
Total BANK LOANS | 8,861,604 | |||||||
|
| |||||||
| CORPORATE BONDS — 18.75% | ||||||||
Banks — 2.39% |
| |||||||
Royal Bank of Scotland Group PLC (United Kingdom) | 4,850,000 | 6,485,040 | ||||||
Diversified Financial Services — 2.47% |
| |||||||
Denver Parent Corp. | 7,000,000 | 6,685,000 | ||||||
Food — 1.16% |
| |||||||
WM Morrison Supermarkets PLC (United Kingdom) 3.50%, 7/27/26 | 2,000,000 | 3,130,502 | ||||||
Leisure Time — 0.20% |
| |||||||
Viking Cruises Ltd. | 500,000 | 552,500 | ||||||
Media — 1.59% |
| |||||||
Columbus International, Inc. (Barbados) | 4,000,000 | 4,310,000 | ||||||
Oil & Gas — 2.63% |
| |||||||
Calumet Specialty Products Partners LP / Calumet Finance Corp. | 7,000,000 | 7,140,000 | ||||||
Real Estate Management — 0.11% |
| |||||||
Newland International Properties Corp. (Panama) | 702,000 | 308,880 | ||||||
Restaurants — 2.40% |
| |||||||
Ruby Tuesday, Inc. | 6,500,000 | 6,500,000 | ||||||
Software — 2.28% |
| |||||||
First Data Holdings, Inc. 14.50%, 9/24/192 | 5,547,929 | 6,165,136 | ||||||
Telecommunications — 3.52% |
| |||||||
Axtel SAB de CV (Mexico) 8.00%, 1/31/201 | 6,000,000 | 6,105,000 | ||||||
Nortel Networks Ltd. (Canada) | 3,000,000 | 3,435,000 | ||||||
|
| |||||||
| 9,540,000 | ||||||||
|
| |||||||
Total CORPORATE BONDS (Cost $48,906,073) | 50,817,058 | |||||||
|
| |||||||
Shares, Principal Number of Contracts | Value | |||||||
| CONVERTIBLE CORPORATE BONDS — 5.59% | ||||||||
Auto Manufacturers — 1.84% |
| |||||||
Ford Motor Co. | $ | 2,500,000 | $ | 4,995,313 | ||||
Building Materials — 3.75% |
| |||||||
Cemex SAB de CV (Mexico) | 6,700,000 | 10,163,062 | ||||||
|
| |||||||
Total CONVERTIBLE CORPORATE BONDS | 15,158,375 | |||||||
|
| |||||||
| COMMON STOCK — 43.06% | ||||||||
Auto Manufacturers — 3.93% |
| |||||||
General Motors Co. | 291,398 | 10,577,747 | ||||||
Motors Liquidation Co. GUC Trust* | 2,555 | 65,408 | ||||||
|
| |||||||
| 10,643,155 | ||||||||
|
| |||||||
Biotechnology — 1.39% |
| |||||||
XOMA Corp.* | 822,338 | 3,774,531 | ||||||
Distribution/Wholesale — 2.11% |
| |||||||
Rentrak Corp.* | 108,954 | 5,714,637 | ||||||
Food — 3.42% |
| |||||||
SunOpta, Inc. (Canada)* | 659,064 | 9,279,621 | ||||||
Household Products/Wares — 2.20% |
| |||||||
CSS Industries, Inc. | 225,673 | 5,950,997 | ||||||
Internet — 2.16% |
| |||||||
Rackspace Hosting, Inc.* | 174,285 | 5,866,433 | ||||||
Media — 3.86% |
| |||||||
Grupo Televisa SAB — Spon. ADR (Mexico) | 305,000 | 10,464,550 | ||||||
Mining — 0.90% |
| |||||||
African Minerals Ltd. (United Kingdom)* | 2,057,676 | 2,447,518 | ||||||
Oil & Gas — 4.26% |
| |||||||
Africa Oil Corp. | 700,000 | 4,871,588 | ||||||
Calumet Specialty Products Partners LP | 37,488 | 1,192,118 | ||||||
Genel Energy PLC (United Kingdom)* | 316,162 | 5,492,118 | ||||||
|
| |||||||
| 11,555,824 | ||||||||
|
| |||||||
Pharmaceuticals — 5.28% |
| |||||||
AcelRx Pharmaceuticals, | 464,837 | 4,764,579 | ||||||
Aquinox Pharmaceuticals, Inc. (Canada)* | 192,735 | 1,805,927 | ||||||
Heron Therapeutics, Inc.* | 466,942 | 5,752,726 | ||||||
Mirati Therapeutics, | 25,043 | 500,860 | ||||||
Revance Therapeutics, | 43,916 | 1,493,144 | ||||||
|
| |||||||
| 14,317,236 | ||||||||
|
| |||||||
Real Estate Investment Trusts — 3.01% |
| |||||||
Fibra Uno Administracion SA de CV (Mexico) | 2,337,521 | 8,156,594 | ||||||
Restaurants — 1.24% |
| |||||||
Ruby Tuesday, Inc.* | 441,632 | 3,351,987 | ||||||
Notes to Financial Statements are an integral part of this Schedule.
23
Table of Contents
Driehaus Event Driven Fund
Schedule of Investments
June 30, 2014 (unaudited)
Shares, Principal Number of Contracts | Value | |||||||
Retail — 2.92% |
| |||||||
MarineMax, Inc.* | 472,754 | $ | 7,913,902 | |||||
Semiconductors — 6.38% |
| |||||||
Applied Micro Circuits Corp.* | 346,227 | 3,742,714 | ||||||
Mellanox Technologies Ltd. (Israel)* | 153,102 | 5,337,136 | ||||||
Tokyo Electron Ltd.—ADR (Japan) | 480,000 | 8,203,200 | ||||||
|
| |||||||
| 17,283,050 | ||||||||
|
| |||||||
Total COMMON STOCK | 116,720,035 | |||||||
|
| |||||||
| CONVERTIBLE PREFERRED STOCK — 0.00% | ||||||||
Auto Manufacturers — 0.00% |
| |||||||
General Motors Corp. Senior Convertible Preferred Escrow — B 5.25%, 3/6/344 | 25,000 | — | ||||||
General Motors Corp. Senior Convertible Preferred Escrow — C 7.25%, 4/15/414 | 162,750 | — | ||||||
|
| |||||||
| — | ||||||||
|
| |||||||
Total CONVERTIBLE PREFERRED STOCK (Cost $1,878) | — | |||||||
|
| |||||||
| PURCHASED CALL OPTIONS — 0.90% | ||||||||
Applied Micro Circuits Corp., Exercise Price: $12.50, Expiration Date: November, 2014* | 7,500 | 637,500 | ||||||
Nuance Communications, Inc., Exercise Price: $19.00, Expiration Date: July, 2014* | 513 | 23,085 | ||||||
OTC ZAR versus USD, Exercise Price: $11.05, Expiration Date: September, 2014* | 10,000,000 | 115,553 | ||||||
Rackspace Hosting, Inc., Exercise Price: $41.00, Expiration Date: September, 2014* | 1,136 | 107,920 | ||||||
Rentrak Corp., Exercise Price: $55.00, Expiration Date: January, 2015* | 1,750 | 1,067,500 | ||||||
SPDR Gold Shares, Exercise Price: $125.00, Expiration Date: January, 2015* | 750 | 495,000 | ||||||
World Wresting Entertainment, Inc., Exercise Price: $22.50, Expiration Date: July, 2014* | 1,800 | — | ||||||
World Wrestling Entertainment, Inc., Exercise Price: $20.00, Expiration Date: July, 2014* | 1,302 | — | ||||||
|
| |||||||
Total PURCHASED CALL OPTIONS | 2,446,558 | |||||||
|
| |||||||
Shares, Principal Number of Contracts | Value | |||||||
| PURCHASED PUT OPTIONS — 0.21% | ||||||||
OTC BRL versus USD, Exercise Price: $2.24, Expiration Date: September, 2014* | 10,000,000 | $ | 128,637 | |||||
SPDR Gold Shares, Exercise Price: $125.00, Expiration Date: January, 2015* | 750 | 300,000 | ||||||
SPDR S&P Biotech ETF, Exercise Price: $115.00, Expiration Date: September, 2014* | 1,060 | 90,100 | ||||||
SPDR S&P Biotech ETF, Exercise Price: $135.00, Expiration Date: September, 2014* | 200 | 58,400 | ||||||
|
| |||||||
Total PURCHASED PUT OPTIONS (Premiums paid $1,801,908) | 577,137 | |||||||
|
| |||||||
WARRANTS — 0.01% |
| |||||||
General Motors Co. — CW 16, Strike Price $10.00, Expiration Date 7/10/16* | 491 | 13,066 | ||||||
General Motors Co. — CW 19, Strike Price $18.33, Expiration Date 7/10/19* | 491 | 9,113 | ||||||
|
| |||||||
Total WARRANTS | 22,179 | |||||||
|
| |||||||
| ||||||||
| TOTAL INVESTMENTS (Cost $193,462,125) | 71.79 | % | 194,602,946 | |||||
| Other Assets less Liabilities | 28.21 | % | 76,451,330 | |||||
|
|
|
| |||||
| Net Assets | 100.00 | % | $ | 271,054,276 | ||||
| ||||||||
| SECURITIES SOLD SHORT — (19.23)% | ||||||||
| CORPORATE BONDS — (0.88)% | ||||||||
Leisure Time — (0.19)% |
| |||||||
MISA Investments Ltd. (Bermuda) | $ | (500,000 | ) | $ | (514,375 | ) | ||
Retail — (0.69)% |
| |||||||
Sears Holdings Corp. | (2,000,000 | ) | (1,862,500 | ) | ||||
|
| |||||||
Total CORPORATE BONDS (Proceeds $2,396,248) | (2,376,875 | ) | ||||||
|
| |||||||
| CONVERTIBLE CORPORATE BONDS — (0.39)% | ||||||||
Software — (0.39)% |
| |||||||
Nuance Communications, Inc. | (1,000,000 | ) | (1,062,500 | ) | ||||
|
| |||||||
Total CONVERTIBLE CORPORATE BONDS (Proceeds $1,015,528) | (1,062,500 | ) | ||||||
|
| |||||||
Notes to Financial Statements are an integral part of this Schedule.
24
Table of Contents
Driehaus Event Driven Fund
Schedule of Investments
June 30, 2014 (unaudited)
Shares, Principal Number of Contracts | Value | |||||||
| COMMON STOCK — (10.97)% | ||||||||
Auto Manufacturers — (1.61)% |
| |||||||
Ford Motor Co. | (252,683 | ) | $ | (4,356,255 | ) | |||
Food — (1.31)% |
| |||||||
Annie’s, Inc. * | (105,213 | ) | (3,558,304 | ) | ||||
Leisure Time — (2.89)% |
| |||||||
Brunswick Corp. | (185,761 | ) | (7,826,111 | ) | ||||
Semiconductors — (3.24)% |
| |||||||
Applied Materials, Inc. | (390,000 | ) | (8,794,500 | ) | ||||
Telecommunications — (1.92)% |
| |||||||
America Movil SAB de CV—ADR (Mexico) | (251,000 | ) | (5,208,250 | ) | ||||
|
| |||||||
Total COMMON STOCK (Proceeds $27,537,838) | (29,743,420 | ) | ||||||
|
| |||||||
| WRITTEN CALL OPTIONS — (0.20)% | ||||||||
Rackspace Hosting, Inc., Exercise Price: $46.00, Expiration Date: September, 2014* | (2,272 | ) | (56,800 | ) | ||||
Rentrak Corp., Exercise Price: $65.00, Expiration Date: January, 2015* | (1,750 | ) | (481,250 | ) | ||||
World Wrestling Entertainment, Inc., Exercise Price: $40.00, Expiration Date: July, 2014* | (200 | ) | — | |||||
Shares, Principal Number of Contracts | Value | |||||||
World Wrestling Entertainment, Inc., Exercise Price: $35.00, Expiration Date: July, 2014* | (650 | ) | $ | — | ||||
|
| |||||||
Total WRITTEN CALL OPTIONS (Premiums received $728,835) | (538,050 | ) | ||||||
|
| |||||||
| EXCHANGE-TRADED FUND — (6.79)% | ||||||||
iShares Russell 2000 ETF | (155,000 | ) | (18,415,550 | ) | ||||
|
| |||||||
Total EXCHANGE-TRADED FUND (Proceeds $18,166,298) | (18,415,550 | ) | ||||||
|
| |||||||
| ||||||||
TOTAL INVESTMENT SECURITIES SOLD SHORT (Proceeds $49,844,747) | (19.23 | )% | $ | (52,136,395 | ) | |||
| ||||||||
| * | Non-income producing security. |
| 1 | Variable rate security. |
| 2 | 144A restricted security. |
| 3 | Security is in default. |
| 4 | Security valued at fair value as determined in good faith by Driehaus Capital Management LLC, investment adviser to the Fund, in accordance with procedures established by, and under the general supervision of, the Trust’s Board of Trustees. |
Percentages are stated as a percent of net assets.
Notes to Financial Statements are an integral part of this Schedule.
25
Table of Contents
Driehaus Event Driven Fund
Schedule of Investments
June 30, 2014 (unaudited)
SWAP CONTRACTS
Credit Default Swaps
| Counterparty | Reference Instrument | Currency | Notional AmountB | Pay/ ReceiveA | Fixed Rate | Expiration Date | Premium Paid (Received) | Unrealized Appreciation/ (Depreciation) | Credit Event | RatingC | ||||||||||||||||||||||
Goldman Sachs | First Data Corp. 12.63%, 1/15/21 | USD | 1,000,000 | Pay | 5.00 | % | 3/20/2019 | $ | — | $ | (79,560 | ) | Bankruptcy/FTP | B- | ||||||||||||||||||
Goldman Sachs | First Data Corp. 12.63%, 1/15/21 | USD | 1,500,000 | Pay | 5.00 | 6/20/2019 | (10,133 | ) | (100,181 | ) | Bankruptcy/FTP | B- | ||||||||||||||||||||
Goldman Sachs | First Data Corp. 12.63%, 1/15/21 | USD | 2,000,000 | Pay | 5.00 | 6/20/2019 | (25,335 | ) | (121,750 | ) | Bankruptcy/FTP | B- | ||||||||||||||||||||
Barclays | Sears Holdings Corp. 7.00%, 6/1/32 | USD | 3,000,000 | Pay | 5.00 | 6/20/2019 | 750,000 | 108,795 | Bankruptcy/FTP | CCC+ | ||||||||||||||||||||||
|
|
|
| |||||||||||||||||||||||||||||
Total Credit Default Swaps |
| 714,532 | (192,696 | ) | ||||||||||||||||||||||||||||
|
|
|
| |||||||||||||||||||||||||||||
Total Swap Contracts |
| $ | 714,532 | $ | (192,696 | ) | ||||||||||||||||||||||||||
|
|
|
| |||||||||||||||||||||||||||||
| A | If the Fund is paying a fixed rate, the counterparty acts as guarantor of the variable instrument and thus the Fund is a buyer of protection. If the Fund is receiving a fixed rate, the Fund acts as guarantor of the variable instrument and thus is a seller of protection. |
| B | For contracts to sell protection, the notional amout is equal to the maximum potential amount of the future payments and no recourse has been entered into in association with the contracts. |
| C | Based on Moody’s or Standard & Poor’s credit rating for the underlying reference instrument entity (unaudited). |
FTP=Failure to Pay
NR=Not Rated
NA=Not Applicable
EUR — Euro
USD — United States Dollar
Notes to Financial Statements are an integral part of this Schedule.
26
Table of Contents
Driehaus Event Driven Fund
Schedule of Investments
June 30, 2014 (unaudited)
SWAPTIONS
Interest Rate Swaptions
| Counterparty | Fixed Rate Index | Currency | Notional Amount | Pay/ Receive Fixed Rate | Exercise Rate | Expiration Date | Premium Paid (Received) | Market Value | ||||||||||||||||||
Goldman Sachs | 6-Month 10-Year Payor Swaption | USD | 55,000,000 | Pay | 2.94 | % | 10/16/2024 | $ | 973,500 | $300,816 | ||||||||||||||||
|
|
| ||||||||||||||||||||||||
Total Interest Rate Swaptions |
| 973,500 | 300,816 | |||||||||||||||||||||||
|
|
| ||||||||||||||||||||||||
TOTAL SWAPTIONS |
| $ | 973,500 | $300,816 | ||||||||||||||||||||||
|
|
| ||||||||||||||||||||||||
USD — United States Dollar
Notes to Financial Statements are an integral part of this Schedule.
27
Table of Contents
Statements of Assets and Liabilities
June 30, 2014 (unaudited)
Driehaus Active Income Fund | Driehaus Select Credit Fund | Driehaus Event Driven Fund | ||||||||||
ASSETS: | ||||||||||||
Investment securities, at fair value (cost $3,342,487,249, $905,264,016 and $187,891,034, respectively) | $ | 3,511,218,625 | $ | 940,283,498 | $ | 191,579,251 | ||||||
Purchased options, at fair value (premiums paid $10,639,953, $6,607,710 and $5,571,091, respectively) | 9,685,800 | 3,982,200 | 3,023,695 | |||||||||
Purchased swaptions, at fair value (premiums paid $12,047,950, $3,620,900 and $973,500, respectively) | 6,539,579 | 1,676,623 | 300,816 | |||||||||
Foreign currency at fair value (cost $0, $1,429 and $0, respectively) | — | 1,436 | — | |||||||||
Unrealized appreciation on open swap contracts | 4,766,426 | 1,980,352 | 108,795 | |||||||||
Premiums paid on open swap contracts | 32,167,424 | 7,223,190 | 750,000 | |||||||||
Cash | 1,093,613,296 | 430,658,348 | 66,956,535 | |||||||||
Collateral held at custodian for the benefit of brokers | 340,615,563 | 67,539,148 | 59,071,890 | |||||||||
Receivable for investment securities sold | 10,735,710 | 114,519 | 894,735 | |||||||||
Receivable for fund shares sold | 5,032,006 | 1,630,645 | 548,009 | |||||||||
Receivable for interest and dividends | 31,943,504 | 11,840,123 | 1,197,324 | |||||||||
Prepaid expenses | 66,941 | 30,639 | 83,425 | |||||||||
|
|
|
|
|
| |||||||
| ||||||||||||
TOTAL ASSETS | 5,046,384,874 | 1,466,960,721 | 324,514,475 | |||||||||
|
|
|
|
|
| |||||||
| ||||||||||||
LIABILITIES: | ||||||||||||
Payable for investment securities sold short, at fair value (proceeds $217,776,485, $47,737,450 and $49,115,912, respectively) | 271,549,946 | 58,180,780 | 51,598,345 | |||||||||
Written options outstanding, at fair value (premiums received $0, $829,949 and $728,835, respectively) | — | 536,640 | 538,050 | |||||||||
Written swaptions outstanding, at fair value (premiums received $853,875, $341,550 and $0, respectively) | 1,149,978 | 459,991 | — | |||||||||
Unrealized depreciation on open swap contracts | 41,510,439 | 7,724,074 | 301,491 | |||||||||
Premiums received on open swap contracts | 14,600,674 | 3,878,047 | 35,468 | |||||||||
Payable for fund shares redeemed | 2,752,596 | 622,697 | 240,776 | |||||||||
Payable for investment securities purchased | 33,114,067 | 35,848,195 | 384,042 | |||||||||
Payable for interest and dividends on securities sold short | 2,231,706 | 514,316 | 86,623 | |||||||||
Payable for variation margin | 195,161 | 49,337 | — | |||||||||
Payable to affiliate | 2,181,006 | 877,628 | 219,423 | |||||||||
Accrued shareholder services plan fees | 712,860 | 273,995 | 28,174 | |||||||||
Accrued administration and accounting fees | 123,740 | 52,025 | 11,156 | |||||||||
Accrued expenses | 736,888 | 57,721 | 16,651 | |||||||||
|
|
|
|
|
| |||||||
| ||||||||||||
TOTAL LIABILITIES | 370,859,061 | 109,075,446 | 53,460,199 | |||||||||
|
|
|
|
|
| |||||||
| ||||||||||||
NET ASSETS | $ | 4,675,525,813 | $ | 1,357,885,275 | $ | 271,054,276 | ||||||
|
|
|
|
|
| |||||||
SHARES OUTSTANDING (Unlimited shares authorized, no par value) | 435,662,076 | 133,050,248 | 24,506,417 | |||||||||
|
|
|
|
|
| |||||||
NET ASSET VALUE, OFFERING AND REDEMPTION PRICE PER SHARE | $ | 10.73 | $ | 10.21 | $ | 11.06 | ||||||
|
|
|
|
|
| |||||||
| ||||||||||||
NET ASSETS CONSISTED OF THE FOLLOWING AT JUNE 30, 2014: | ||||||||||||
Paid-in-capital | $ | 4,813,723,167 | $ | 1,344,108,198 | $ | 267,596,291 | ||||||
Undistributed net investment income (loss) | 43,809,893 | 7,300,162 | (308,930 | ) | ||||||||
Undistributed net realized gain (loss) on investments, options, swaptions, futures, swap contracts and foreign currency | (254,551,728 | ) | (8,213,425 | ) | 5,783,111 | |||||||
Net unrealized appreciation (depreciation) on: | ||||||||||||
Investments | 168,731,376 | 35,019,482 | 3,688,217 | |||||||||
Purchased options | (954,153 | ) | (2,625,510 | ) | (2,547,396 | ) | ||||||
Purchased swaptions | (5,508,371 | ) | (1,944,277 | ) | (672,684 | ) | ||||||
Securities sold short | (53,773,461 | ) | (10,443,330 | ) | (2,482,433 | ) | ||||||
Written options | — | 293,309 | 190,785 | |||||||||
Written swaptions | (296,103 | ) | (118,441 | ) | — | |||||||
Futures contracts | 1,087,886 | 250,880 | — | |||||||||
Swap contracts | (36,744,013 | ) | (5,743,531 | ) | (192,696 | ) | ||||||
Foreign currency | — | 7 | — | |||||||||
Foreign currency translations | 1,320 | 1,751 | 11 | |||||||||
|
|
|
|
|
| |||||||
NET ASSETS | $ | 4,675,525,813 | $ | 1,357,885,275 | $ | 271,054,276 | ||||||
|
|
|
|
|
| |||||||
| ||||||||||||
Notes to Financial Statements are an integral part of these Statements.
28
Table of Contents
For six months ended June 30, 2014 (unaudited)
Driehaus Active Income Fund | Driehaus Select Credit Fund | Driehaus Event Driven Fund | ||||||||||
INVESTMENT INCOME (LOSS): | ||||||||||||
Interest income (net of $55,704, $0 and $14,987 of non-reclaimable foreign taxes withheld, respectively) | $ | 75,934,517 | $ | 23,815,434 | $ | 897,461 | ||||||
Dividend income (net of $0, $0 and $2,086 of non-reclaimable foreign taxes withheld, respectively) | 7,569,135 | 732,313 | 202,738 | |||||||||
|
|
|
|
|
| |||||||
| ||||||||||||
Total investment income | 83,503,652 | 24,547,747 | 1,100,199 | |||||||||
|
|
|
|
|
| |||||||
| ||||||||||||
Expenses: | ||||||||||||
Investment advisory fees | 12,967,478 | 4,871,034 | 855,573 | |||||||||
Shareholder services plan fees | 3,267,473 | 965,251 | 9,532 | |||||||||
Administration and fund accounting fees | 738,198 | 300,987 | 59,890 | |||||||||
Transfer agent fees and expenses | 397,195 | 147,993 | 17,338 | |||||||||
Reports to shareholders | 122,698 | 48,353 | 6,322 | |||||||||
Federal and state registration fees | 101,372 | 70,107 | 23,026 | |||||||||
Trustees’ fees | 82,269 | 26,284 | 10,832 | |||||||||
Custody fees | 68,116 | 22,670 | 4,590 | |||||||||
Legal fees | 50,410 | 17,699 | 7,722 | |||||||||
Audit and tax fees | 25,786 | 25,787 | 25,786 | |||||||||
Chief compliance officer fees | 2,209 | 2,209 | 2,209 | |||||||||
Interest on short positions | 3,389,498 | 1,213,203 | 84,545 | |||||||||
Dividends on short positions | 2,326,902 | 201,473 | 144,711 | |||||||||
Interest expense | 895,248 | 288,942 | 116,856 | |||||||||
Miscellaneous | 104,576 | 40,699 | 8,629 | |||||||||
|
|
|
|
|
| |||||||
Total expenses | 24,539,428 | 8,242,691 | 1,377,561 | |||||||||
Fees recouped by advisor | — | — | 4,008 | |||||||||
|
|
|
|
|
| |||||||
Net expenses | 24,539,428 | 8,242,691 | 1,381,569 | |||||||||
|
|
|
|
|
| |||||||
| ||||||||||||
Net investment income (loss) | 58,964,224 | 16,305,056 | (281,370 | ) | ||||||||
|
|
|
|
|
| |||||||
| ||||||||||||
NET REALIZED AND UNREALIZED GAIN (LOSS) ON INVESTMENTS: | ||||||||||||
Net realized gain (loss) on transactions from: | ||||||||||||
Investments | 8,787,417 | (884,884 | ) | 3,639,202 | ||||||||
Purchased options | (9,948,721 | ) | (1,947,393 | ) | 1,603,232 | |||||||
Purchased swaptions | (4,000,000 | ) | (1,500,000 | ) | — | |||||||
Securities sold short | (3,024,139 | ) | (980,022 | ) | 183,514 | |||||||
Written options | — | — | (213,501 | ) | ||||||||
Futures contracts | (11,672,784 | ) | (2,768,338 | ) | — | |||||||
Swap contracts | (10,692,682 | ) | (1,384,796 | ) | (90,347 | ) | ||||||
Foreign currency | 10,540 | (36,438 | ) | (88 | ) | |||||||
|
|
|
|
|
| |||||||
| ||||||||||||
Total net realized gain (loss) on investments | (30,540,369 | ) | (9,501,871 | ) | 5,122,012 | |||||||
|
|
|
|
|
| |||||||
| ||||||||||||
Change in net unrealized appreciation (depreciation) on: | ||||||||||||
Investments | 42,815,604 | 21,431,465 | 1,925,128 | |||||||||
Purchased options | (954,153 | ) | (3,587,469 | ) | (2,364,849 | ) | ||||||
Purchased swaptions | (2,942,090 | ) | (981,921 | ) | (672,684 | ) | ||||||
Short positions | (19,407,547 | ) | (5,006,527 | ) | (2,510,965 | ) | ||||||
Written options | — | 293,309 | 198,803 | |||||||||
Written swaptions | (296,103 | ) | (118,441 | ) | — | |||||||
Futures contracts | (8,357,431 | ) | (1,966,474 | ) | — | |||||||
Swap contracts | (1,717,945 | ) | (4,422,995 | ) | (192,696 | ) | ||||||
Foreign currency | — | 7 | 115 | |||||||||
Foreign currency translations | 77 | 370 | 10 | |||||||||
|
|
|
|
|
| |||||||
Total change in net unrealized appreciation (depreciation) on investments | 9,140,412 | 5,641,324 | (3,617,138 | ) | ||||||||
|
|
|
|
|
| |||||||
| ||||||||||||
Net realized and unrealized gain (loss) on investments | (21,399,957 | ) | (3,860,547 | ) | 1,504,874 | |||||||
|
|
|
|
|
| |||||||
| ||||||||||||
NET INCREASE (DECREASE) IN NET ASSETS RESULTING FROM OPERATIONS | $ | 37,564,267 | $ | 12,444,509 | $ | 1,223,504 | ||||||
|
|
|
|
|
| |||||||
| ||||||||||||
Notes to Financial Statements are an integral part of these Statements.
29
Table of Contents
Statements of Changes in Net Assets
| Driehaus Active Income Fund | Driehaus Select Credit Fund | |||||||||||||||
Six Months Ended June 30, 2014 (unaudited) | Year Ended December 31, 2013 | Six Months Ended June 30, 2014 (unaudited) | Year Ended December 31, 2013 | |||||||||||||
Operations: | ||||||||||||||||
Net investment income | $ | 58,964,224 | $ | 100,954,196 | $ | 16,305,056 | $ | 19,388,282 | ||||||||
Net realized gain (loss) on investments | (30,540,369 | ) | (22,579,599 | ) | (9,501,871 | ) | 4,740,978 | |||||||||
Net change in unrealized appreciation (depreciation) on investments | 9,140,412 | 28,110,272 | 5,641,324 | 14,506,483 | ||||||||||||
|
|
|
|
|
|
|
| |||||||||
| ||||||||||||||||
Net increase (decrease) in net assets resulting from operations | 37,564,267 | 106,484,869 | 12,444,509 | 38,635,743 | ||||||||||||
|
|
|
|
|
|
|
| |||||||||
| ||||||||||||||||
Distributions: | ||||||||||||||||
Net investment income | (54,936,100 | ) | (74,335,357 | ) | (8,446,832 | ) | (20,366,889 | ) | ||||||||
Net capital gains | — | — | — | (3,845,894 | ) | |||||||||||
|
|
|
|
|
|
|
| |||||||||
Total distributions | (54,936,100 | ) | (74,335,357 | ) | (8,446,832 | ) | (24,212,783 | ) | ||||||||
|
|
|
|
|
|
|
| |||||||||
| ||||||||||||||||
Capital share transactions: | ||||||||||||||||
Proceeds from shares sold | 1,105,298,467 | 2,722,918,458 | 493,955,102 | 820,203,191 | ||||||||||||
Reinvested distributions | 27,795,881 | 43,039,239 | 5,641,169 | 17,481,030 | ||||||||||||
Cost of shares redeemed | (1,047,999,585 | ) | (1,057,325,798 | ) | (169,143,900 | ) | (153,795,032 | ) | ||||||||
|
|
|
|
|
|
|
| |||||||||
Net increase from capital transactions | 85,094,763 | 1,708,631,899 | 330,452,371 | 683,889,189 | ||||||||||||
|
|
|
|
|
|
|
| |||||||||
Total increase in net assets | 67,722,930 | 1,740,781,411 | 334,450,048 | 698,312,149 | ||||||||||||
|
|
|
|
|
|
|
| |||||||||
| ||||||||||||||||
NET ASSETS: | ||||||||||||||||
Beginning of period | $ | 4,607,802,883 | $ | 2,867,021,472 | $ | 1,023,435,227 | $ | 325,123,078 | ||||||||
|
|
|
|
|
|
|
| |||||||||
End of period | $ | 4,675,525,813 | $ | 4,607,802,883 | $ | 1,357,885,275 | $ | 1,023,435,227 | ||||||||
|
|
|
|
|
|
|
| |||||||||
Undistributed net investment income (loss) | $ | 43,809,893 | $ | 39,781,769 | $ | 7,300,162 | $ | (558,062 | ) | |||||||
|
|
|
|
|
|
|
| |||||||||
| ||||||||||||||||
Capital share transactions in shares: | ||||||||||||||||
Shares sold | 102,509,053 | 253,362,227 | 48,482,376 | 81,193,431 | ||||||||||||
Reinvested distributions | 2,588,071 | 4,010,113 | 554,214 | 1,733,262 | ||||||||||||
Shares redeemed | (97,191,476 | ) | (98,271,129 | ) | (16,604,609 | ) | (15,242,049 | ) | ||||||||
|
|
|
|
|
|
|
| |||||||||
Net increase | 7,905,648 | 159,101,211 | 32,431,981 | 67,684,644 | ||||||||||||
|
|
|
|
|
|
|
| |||||||||
| ||||||||||||||||
| *Fund | commenced operations on August 26, 2013. |
Notes to Financial Statements are an integral part of these Statements.
30
Table of Contents
Statements of Changes in Net Assets
| Driehaus Event Driven Fund | ||||||
Six Months Ended June 30, 2014 (unaudited) | For the period August 26, 2013* through December 31, 2013 | |||||
| $ | (281,370 | ) | $ | (201,340 | ) | |
| 5,122,012 |
| 1,838,840 | |||
| (3,617,138 | ) | 1,600,942 | |||
|
|
|
| |||
| 1,223,504 |
| 3,238,442 | |||
|
|
|
| |||
| — | — | |||||
| — | (1,024,950 | ) | ||||
|
|
|
| |||
| — | (1,024,950 | ) | ||||
|
|
|
| |||
| 247,317,865 | 40,436,692 | |||||
| — | 1,024,404 | |||||
| (19,520,218 | ) | (1,641,463 | ) | |||
|
|
|
| |||
| 227,797,647 |
| 39,819,633 | |||
|
|
|
| |||
| 229,021,151 | 42,033,125 | |||||
|
|
|
| |||
| $ | 42,033,125 | $ | — | |||
|
|
|
| |||
| $ | 271,054,276 | $ | 42,033,125 | |||
|
|
|
| |||
$ | (308,930 | ) | $ | (27,560 | ) | |
|
|
|
| |||
|
| |||||
| 22,374,210 | 3,972,158 | |||||
| — | 97,100 | |||||
| (1,781,884 | ) | (155,167 | ) | |||
|
|
|
| |||
| 20,592,326 | 3,914,091 | |||||
|
|
|
| |||
|
| |||||
Notes to Financial Statements are an integral part of these Statements.
31
Table of Contents
Financial Highlights
For the six | For the year ended December 31, 2013 | For the year ended December 31, 2012 | For the year ended December 31, 2011 | For the year ended December 31, 2010 | For the period ended October 1, 2009* through December 31, 2009 | For the year ended September 30, 2009 | ||||||||||||||||||||||
Net asset value, beginning of period | $ | 10.77 | $ | 10.67 | $ | 10.01 | $ | 11.05 | $ | 10.81 | $ | 12.12 | $ | 10.17 | ||||||||||||||
|
|
|
|
|
|
|
|
|
|
|
|
|
| |||||||||||||||
INCOME FROM INVESTMENT OPERATIONS: | ||||||||||||||||||||||||||||
Net investment income | 0.13 | 0.30 | 0.44 | 0.48 | 0.36 | 0.09 | 0.38 | |||||||||||||||||||||
Net realized and unrealized gain (loss) on investments | (0.04 | ) | 0.02 | 0.49 | (1.09 | ) | 0.20 | 0.26 | 1.61 | |||||||||||||||||||
|
|
|
|
|
|
|
|
|
|
|
|
|
| |||||||||||||||
Total from | 0.09 | 0.32 | 0.93 | (0.61 | ) | 0.56 | 0.35 | 1.99 | ||||||||||||||||||||
|
|
|
|
|
|
|
|
|
|
|
|
|
| |||||||||||||||
LESS DISTRIBUTIONS TO SHAREHOLDERS FROM: | ||||||||||||||||||||||||||||
Net investment income | (0.13 | ) | (0.22 | ) | (0.27 | ) | (0.43 | ) | (0.26 | ) | (1.66 | ) | (0.04 | ) | ||||||||||||||
Net realized gains | — | — | — | — | † | (0.06 | ) | — | — | |||||||||||||||||||
|
|
|
|
|
|
|
|
|
|
|
|
|
| |||||||||||||||
Total distributions | (0.13 | ) | (0.22 | ) | (0.27 | ) | (0.43 | ) | (0.32 | ) | (1.66 | ) | (0.04 | ) | ||||||||||||||
|
|
|
|
|
|
|
|
|
|
|
|
|
| |||||||||||||||
Net asset value, end of period | $ | 10.73 | $ | 10.77 | $ | 10.67 | $ | 10.01 | $ | 11.05 | $ | 10.81 | $ | 12.12 | ||||||||||||||
|
|
|
|
|
|
|
|
|
|
|
|
|
| |||||||||||||||
Total Return | 0.79 | %1 | 2.99 | % | 9.34 | % | (5.61 | )% | 5.18 | % | 2.87 | %1 | 19.66 | % | ||||||||||||||
SUPPLEMENTAL DATA AND RATIOS: | ||||||||||||||||||||||||||||
Net assets, end of period (in 000’s) | $ | 4,675,526 | $ | 4,607,803 | $ | 2,867,021 | $ | 2,429,734 | $ | 2,183,062 | $ | 1,259,714 | $ | 1,036,182 | ||||||||||||||
Ratio of total expenses to average net assets | 1.04 | %2,3 | 1.14 | %5 | 1.31 | %7 | 1.01 | %9 | 1.79 | %11 | 1.99 | %2,13 | 1.96 | %15 | ||||||||||||||
Ratio of net investment income to average net assets | 2.50 | %2,4 | 2.80 | %6 | 4.22 | %8 | 4.44 | %10 | 3.24 | %12 | 2.85 | %2,14 | 3.52 | %16 | ||||||||||||||
Portfolio turnover rate | 17 | %1 | 48 | % | 42 | % | 55 | % | 51 | % | 7 | %1 | 150 | % | ||||||||||||||
| ||||||||||||||||||||||||||||
| * | Fiscal year end change to December 31. |
| † | Represents less than $0.01 per share. |
| 1 | Not annualized. |
| 2 | Annualized. |
| 3 | The ratio of expenses to average net assets includes dividends and interest on short positions and interest expense. Excluding dividends and interest on short positions and interest expense, the ratio of expenses to average net assets was 0.76%. |
| 4 | The ratio of net investment income to average net assets includes dividends and interest on short positions and interest expense. Excluding dividends and interest on short positions and interest expense, the net investment income to average net assets was 2.78%. |
| 5 | The ratio of expenses to average net assets includes dividends and interest on short positions and interest expense. Excluding dividends and interest on short positions and interest expense, the ratio of expenses to average net assets was 0.79%. |
| 6 | The ratio of net investment income to average net assets includes dividends and interest on short positions and interest expense. Excluding dividends and interest on short positions and interest expense, the net investment income to average net assets was 3.15%. |
Notes to Financial Statements are an integral part of this Schedule.
32
Table of Contents
Driehaus Active Income Fund
Financial Highlights — (Continued)
| 7 | The ratio of expenses to average net assets includes dividends and interest on short positions and interest expense. Excluding dividends and interest on short positions and interest expense, the ratio of expenses to average net assets was 0.91%. |
| 8 | The ratio of net investment income to average net assets includes dividends and interest on short positions and interest expense. Excluding dividends and interest on short positions and interest expense, the net investment income to average net assets was 4.63%. |
| 9 | The ratio of expenses to average net assets includes dividends and interest on short positions and interest expense. Excluding dividends and interest on short positions and interest expense, the ratio of expenses to average net assets was 0.88%. |
| 10 | The ratio of net investment income to average net assets includes dividends and interest on short positions and interest expense. Excluding dividends and interest on short positions and interest expense, the net investment income to average net assets was 4.58%. |
| 11 | The ratio of expenses to average net assets includes dividends and interest on short positions and interest expense. Excluding dividends and interest on short positions and interest expense, the ratio of expenses to average net assets was 0.92%. |
| 12 | The ratio of net investment income to average net assets includes dividends and interest on short positions and interest expense. Excluding dividends and interest on short positions and interest expense, the net investment income to average net assets was 4.12%. |
| 13 | The ratio of expenses to average net assets includes dividends and interest on short positions and interest expense. Excluding dividends and interest on short positions and interest expense, the ratio of expenses to average net assets was 0.96%. |
| 14 | The ratio of net investment income to average net assets includes dividends and interest on short positions and interest expense. Excluding dividends and interest on short positions and interest expense, the net investment income to average net assets was 3.88%. |
| 15 | The ratio of expenses to average net assets includes dividends and interest on short positions and interest expense. Excluding dividends and interest on short positions and interest expense, the ratio of expenses to average net assets was 0.91%. |
| 16 | The ratio of net investment income to average net assets includes dividends and interest on short positions and interest expense. Excluding dividends and interest on short positions and interest expense, the net investment income to average net assets was 4.56%. |
Notes to Financial Statements are an integral part of this Schedule.
33
Table of Contents
Driehaus Select Credit Fund
Financial Highlights
For the six June 30, 2014 | For the year ended December 31, 2013 | For the year ended December 31, 2012 | For the year December 31, | For the period September 30, 2010* to December 31, 2010 | ||||||||||||||||
Net asset value, beginning of period | $ | 10.17 | $ | 9.87 | $ | 9.57 | $ | 10.26 | $ | 10.00 | ||||||||||
|
|
|
|
|
|
|
|
|
| |||||||||||
INCOME FROM INVESTMENT OPERATIONS: | ||||||||||||||||||||
Net investment income | 0.14 | 0.32 | 0.58 | 0.57 | 0.05 | |||||||||||||||
Net realized and unrealized gain/(loss) on investments | (0.03 | ) | 0.33 | 0.21 | (0.84 | ) | 0.29 | |||||||||||||
|
|
|
|
|
|
|
|
|
| |||||||||||
Total from investment operations | 0.11 | 0.65 | 0.79 | (0.27 | ) | 0.34 | ||||||||||||||
|
|
|
|
|
|
|
|
|
| |||||||||||
LESS DISTRIBUTIONS TO SHAREHOLDERS FROM: | ||||||||||||||||||||
Net investment income | (0.07 | ) | (0.31 | ) | (0.49 | ) | (0.42 | ) | (0.06 | ) | ||||||||||
Net realized gain | — | (0.04 | ) | — | — | — | ||||||||||||||
Tax return of capital | — | — | — | — | (0.02 | ) | ||||||||||||||
|
|
|
|
|
|
|
|
|
| |||||||||||
Total distributions | (0.07 | ) | (0.35 | ) | (0.49 | ) | (0.42 | ) | (0.08 | ) | ||||||||||
|
|
|
|
|
|
|
|
|
| |||||||||||
Net asset value, end of period | $ | 10.21 | $ | 10.17 | $ | 9.87 | $ | 9.57 | $ | 10.26 | ||||||||||
|
|
|
|
|
|
|
|
|
| |||||||||||
Total Return | 1.05 | %1 | 6.62 | % | 8.37 | % | (2.64 | ) % | 3.43 | %1 | ||||||||||
SUPPLEMENTAL DATA AND RATIOS: | ||||||||||||||||||||
Net assets, end of period (in 000’s) | 1,357,885 | $ | 1,023,435 | $ | 325,123 | $ | 184,111 | $ | 23,639 | |||||||||||
Ratio of total expenses to average net assets including waivers and recapture | 1.35 | %2,3 | 1.81 | %5 | 1.69 | %7 | 1.87 | %9 | 2.15 | %2,11 | ||||||||||
Ratio of total expenses to average net assets before waivers and recapture | 1.35 | %2,3 | 1.81 | %5 | 1.69 | %7 | 1.81 | %9 | 3.54 | %2,11 | ||||||||||
Ratio of net investment income to average net assets, including waivers and recapture | 2.68 | %2,4 | 3.17 | %6 | 5.82 | %8 | 5.75 | %10 | 1.98 | %2,12 | ||||||||||
Ratio of net investment income to average net assets, before waivers and recapture | 2.68 | %2,4 | 3.17 | %6 | 5.82 | %8 | 5.81 | %10 | 0.59 | %2,12 | ||||||||||
Portfolio turnover rate | 21 | %1 | 54 | % | 78 | % | 64 | % | 52 | %1 | ||||||||||
| ||||||||||||||||||||
| * | Fund commenced operations on September 30, 2010. |
| 1 | Not annualized. |
| 2 | Annualized. |
| 3 | The ratio of expenses to average net assets includes dividends and interest on short positions and interest expense. Excluding dividends and interest on short positions and interest expense, the ratio of expenses to average net assets was 1.07%. |
| 4 | The ratio of net investment income to average net assets includes dividends and interest on short positions and interest expense. Excluding dividends and interest on short positions and interest expense, the ratio of expenses to average net assets was 2.96%. |
| 5 | The ratio of expenses to average net assets includes dividends and interest on short positions and interest expense. Excluding dividends and interest on short positions and interest expense, the ratio of expenses to average net assets was 1.13%. |
Notes to Financial Statements are an integral part of this Schedule.
34
Table of Contents
Driehaus Select Credit Fund
Financial Highlights — (Continued)
| 6 | The ratio of net investment income to average net assets includes dividends and interest on short positions and interest expense. Excluding dividends and interest on short positions and interest expense, the ratio of net investment income to average net assets was 3.85%. |
| 7 | The ratio of expenses to average net assets includes dividends and interest on short positions and interest expense. Excluding dividends and interest on short positions and interest expense, the ratio of expenses to average net assets was 1.23%. |
| 8 | The ratio of net investment income to average net assets includes dividends and interest on short positions and interest expense. Excluding dividends and interest on short positions and interest expense, the ratio of net investment income to average net assets was 6.28%. |
| 9 | The ratio of expenses to average net assets includes dividends and interest on short positions and interest expense. Excluding dividends and interest on short positions and interest expense, the ratio of expenses to average net assets, including recapture, was 1.43%. Excluding dividends and interest on short positions and interest expense, the ratio of expenses to average net assets before recapture was 1.37%. |
| 10 | The ratio of net investment income to average net assets includes dividends and interest on short positions and interest expense. Excluding dividends and interest on short positions and interest expense, the ratio of net investment income to average net assets, including recapture, was 6.20%. Excluding dividends and interest on short positions and interest expense, the ratio of net investment income to average net assets before recapture was 6.26%. |
| 11 | The ratio of expenses to average net assets includes dividends and interest on short positions and interest expense. Excluding dividends and interest on short positions and interest expense, the ratio of expenses to average net assets, less waivers, was 1.75%. Excluding dividends and interest on short positions and interest expense, the ratio of expenses to average net assets before waivers was 3.14%. |
| 12 | The ratio of net investment income to average net assets includes dividends and interest on short positions and interest expense. Excluding dividends and interest on short positions and interest expense, the ratio of net investment income to average net assets, less waivers, was 2.38%. Excluding dividends and interest on short positions and interest expense, the ratio of net investment income to average net assets before waivers was 0.99%. |
Notes to Financial Statements are an integral part of this Schedule.
35
Table of Contents
Driehaus Event Driven Fund
Financial Highlights
For the six January 1, through June 30, (unaudited) | For the August 26, through December 31, | |||||||
Net asset value, beginning of period | $ | 10.74 | $ | 10.00 | ||||
|
|
|
| |||||
INCOME FROM INVESTMENT OPERATIONS: | ||||||||
Net investment loss | (0.02 | ) | (0.06 | ) | ||||
Net realized and unrealized gain (loss) on investments | 0.34 | 1.09 | ||||||
|
|
|
| |||||
Total from investment operations | 0.32 | 1.03 | ||||||
|
|
|
| |||||
LESS DISTRIBUTIONS TO SHAREHOLDERS FROM: | ||||||||
Net realized gains | — | (0.29 | ) | |||||
|
|
|
| |||||
Net asset value, end of period | $ | 11.06 | $ | 10.74 | ||||
|
|
|
| |||||
Total Return | 2.98 | %1 | 10.35 | %1 | ||||
SUPPLEMENTAL DATA AND RATIOS: | ||||||||
Net assets, end of period (in 000’s) | $ | 271,054 | $ | 42,033 | ||||
Ratio of total expenses to average net assets including waivers and recapture | 1.62 | %2,3 | 3.00 | %2,5 | ||||
Ratio of total expenses to average net assets before waivers and recapture | 1.61 | %2,3 | 3.03 | %2,5 | ||||
Ratio of net investment income (loss) to average net assets, including waivers and recapture | (0.33 | )%2,4 | (1.75 | )%2,6 | ||||
Ratio of net investment income (loss) to average net assets, before waivers and recapture | (0.32 | )%2,4 | (1.78 | )%2,6 | ||||
Portfolio turnover rate | 77 | %1 | 104 | %1 | ||||
| ||||||||
| * | Fund commenced operations on August 26, 2013. |
| 1 | Not annualized. |
| 2 | Annualized. |
| 3 | The ratio of expenses to average net assets includes dividends and interest on short positions and interest expense. Excluding dividends and interest on short positions and interest expense, the ratio of expenses to average net assets, including recapture, was 1.21%. Excluding dividends and interest on short positions and interest expense, the ratio of expenses to average net assets before recapture was 1.20%. |
| 4 | The ratio of net investment income to average net assets includes dividends and interest on short positions and interest expense. Excluding dividends and interest on short positions and interest expense, the ratio of net investment income (loss) to average net assets, including recapture, was 0.07%. Excluding dividends and interest on short positions and interest expense, the ratio of net investment income (loss) to average net assets before recapture was 0.08%. |
| 5 | The ratio of expenses to average net assets includes dividends and interest on short positions. Excluding dividends and interest on short positions the ratio of expenses to average net assets, less waivers, was 2.00%. Excluding dividends and interest on short positions, the ratio of expenses to average net assets before waivers was 2.03%. |
| 6 | The ratio of net investment income to average net assets includes dividends and interest on short positions. Excluding dividends and interest on short positions, the ratio of net investment income (loss) to average net assets, less waivers, was (0.75)%. Excluding dividends and interest on short positions, the ratio of net investment income (loss) to average net assets before waivers was (0.78)%. |
Notes to Financial Statements are an integral part of this Schedule.
36
Table of Contents
Notes to Financial Statements (unaudited)
A. ORGANIZATION AND SUMMARY OF SIGNIFICANT ACCOUNTING POLICIES
Organization
The Driehaus Mutual Funds (the “Trust”) is an open-end registered management investment company, organized as a Delaware statutory trust, with ten separate series currently in operation. The Trust was organized under an Agreement and Declaration of Trust dated May 31, 1996, as subsequently amended and restated as of June 6, 2013, and may issue an unlimited number of full and fractional units of beneficial interest (shares) without par value. The Driehaus Active Income Fund (the “Active Income Fund”) commenced operations on June 1, 2009 following the receipt of the assets and liabilities of the Lotsoff Capital Management Active Income Fund (the “Acquired Fund”) pursuant to a plan of reorganization approved by the shareholders of the Acquired Fund. The reorganization was accomplished by a tax-free exchange of Acquired Fund shares for an equal number of shares of the Active Income Fund as of June 1, 2009. The Active Income Fund seeks to provide current income and capital appreciation. The Active Income Fund was closed to new investors as of March 1, 2011. The Driehaus Select Credit Fund (the “Select Credit Fund”) commenced operations on September 30, 2010. The Select Credit Fund seeks to provide positive returns under a variety of market conditions. The Select Credit Fund was closed to new investors as of January 31, 2014. The Driehaus Event Driven Fund (the “Event Driven Fund” and together with the Active Income Fund and Select Credit Fund, the “Funds”) commenced operations on August 26, 2013, following the receipt of the assets and liabilities of the Driehaus Credit Opportunities Fund, L.P. The Event Driven Fund seeks to provide positive returns over full market cycles.
Significant Accounting Policies
The presentation of financial statements in conformity with U.S. generally accepted accounting principles (“GAAP”) requires management to make estimates and assumptions that affect the reported amounts of assets and liabilities at the date of the financial statements and the reported amounts of income and expenses. Actual results may differ from those estimates.
Securities Valuation
Investments in securities traded on a national securities exchange, including exchange-traded futures and options, are valued at the last reported sales or settlement price on the day of valuation and are generally classified as level 1. Securities traded on the Nasdaq markets are valued at the Nasdaq Official Closing Price (“NOCP”) and are generally classified as level 1. Exchange-traded securities for which no sale was reported and Nasdaq-traded securities for which there is no NOCP are valued at the mean of the closing bid and ask prices from the exchange the security is primarily traded on and are generally classified as level 1. Long-term fixed income securities are valued at the representative quoted bid price when held long or the representative quoted ask price if sold short or, if such prices are not available, at prices for securities of comparable maturity, quality and type or as determined by an independent pricing service and are generally classified as level 2. Short-term investments with remaining maturities of 60 days or less at the time of purchase are stated at amortized cost, which approximates fair value. If amortized cost does not approximate fair value, short-term securities are reported at fair value. These securities are generally classified as level 2. Swaps, forward foreign currency contracts and other financial derivatives are valued daily, primarily by an independent pricing service using pricing models and are generally classified as level 2. The pricing models use inputs that are observed from actively quoted markets such as issuer details, indices, spreads, interest rates, yield curves, dividends and exchange rates. If valuations are not available from the independent pricing service or values received are deemed not representative of market value, values will be obtained from a third party broker-dealer or counterparty. Investments initially valued in currencies other than the U.S. dollar are converted to the U.S. dollar using exchange rates obtained from an independent pricing service. Securities for which market quotations are not readily available are valued at their fair value as determined in good faith in accordance with procedures established by or under the direction of the Trust’s Board of Trustees and are generally classified as level 3. Under these procedures, the Funds primarily employ a market-based approach which may use related or comparable assets or liabilities, recent transactions, market multiples, book values and other relevant information for the investment to determine the fair value of the investment. It is possible that the estimated values may differ significantly from the values that would have been used had a ready market existed for the investments, and such differences could be material.
37
Table of Contents
Driehaus Mutual Funds
Notes to Financial Statements (unaudited) — (Continued)
Each Fund is subject to fair value accounting standards that define fair value, establish the framework for measuring fair value and provide a three-level hierarchy for fair valuation based upon the inputs to the valuation as of the measurement date. The three levels of the fair value hierarchy are as follows:
Level 1 — quoted prices for active markets for identical securities
Level 2 — significant observable inputs (including quoted prices for similar securities, interest rates, prepayment speeds, credit risk, etc.)
Level 3 — significant unobservable inputs (including the Fund’s own assumptions in determining the fair value of investments).
The Funds adopted the Financial Accounting Standards Board (“FASB”) amendments to authoritative guidance which require the Funds to disclose details of transfers in and out of Level 1 and Level 2 measurements and Level 2 and Level 3 measurements and the reasons for the transfers. During the period ended June 30, 2014, there were no significant transfers between levels for the Active Income Fund, Select Credit Fund or Event Driven Fund. It is the Funds’ policy to recognize transfers into and out of all levels at the end of the reporting period.
The inputs or methodology used for valuing securities are not necessarily an indication of the risk associated with investing in those securities. The following is a summary of the inputs used to value the Active Income Fund’s investments as of June 30, 2014:
Assets | Level 1 | Level 2 | Level 3 | Total | ||||||||||||
Asset-Backed Securities | $ | — | $ | 225,804,518 | $ | — | $ | 225,804,518 | ||||||||
Bank Loans | — | 1,208,223,998 | — | 1,208,223,998 | ||||||||||||
Common Stocks | ||||||||||||||||
Auto Manufacturers | 35,397,771 | — | — | 35,397,771 | ||||||||||||
Convertible Corporate Bonds | — | 248,091,343 | — | 248,091,343 | ||||||||||||
Convertible Preferred Stocks | ||||||||||||||||
Auto Manufacturers | — | — | — | — | ||||||||||||
Banks | 30,134,274 | — | — | 30,134,274 | ||||||||||||
Corporate Bonds | — | 1,347,158,924 | — | 1,347,158,924 | ||||||||||||
Preferred Stocks | ||||||||||||||||
Banks | 46,684,693 | — | — | 46,684,693 | ||||||||||||
Diversified Financial Services | 28,101,479 | — | — | 28,101,479 | ||||||||||||
Holding Companies — Diversified | — | 61,256,252 | — | 61,256,252 | ||||||||||||
Telecommunications | — | 45,381,779 | — | 45,381,779 | ||||||||||||
Purchased Call Options | 7,875,600 | — | — | 7,875,600 | ||||||||||||
Purchased Put Options | 1,810,200 | — | — | 1,810,200 | ||||||||||||
Short-Term Investments | 31,628,451 | — | — | 31,628,451 | ||||||||||||
U.S. Government and Agency Securities | — | 180,816,697 | — | 180,816,697 | ||||||||||||
Warrants | 22,538,446 | — | — | 22,538,446 | ||||||||||||
|
|
|
|
|
|
|
| |||||||||
Total | $ | 204,170,914 | $ | 3,316,733,511 | $ | — | $ | 3,520,904,425 | ||||||||
|
|
|
|
|
|
|
| |||||||||
38
Table of Contents
Driehaus Mutual Funds
Notes to Financial Statements (unaudited) — (Continued)
Liabilities | Level 1 | Level 2 | Level 3 | Total | ||||||||||||
Common Stocks | ||||||||||||||||
Auto Manufacturers | $ | (60,200,959 | ) | $ | — | $ | — | $ | (60,200,959 | ) | ||||||
Banks | (9,657,294 | ) | — | — | (9,657,294 | ) | ||||||||||
Healthcare-Services | (5,970,749 | ) | — | — | (5,970,749 | ) | ||||||||||
Internet | (29,439,881 | ) | — | — | (29,439,881 | ) | ||||||||||
Lodging | (15,680,914 | ) | — | — | (15,680,914 | ) | ||||||||||
Real Estate Investment Trusts | (47,392,084 | ) | — | — | (47,392,084 | ) | ||||||||||
Corporate Bonds | — | (79,954,648 | ) | — | (79,954,648 | ) | ||||||||||
Exchange-Traded Fund | (23,253,417 | ) | — | — | (23,253,417 | ) | ||||||||||
|
|
|
|
|
|
|
| |||||||||
Total | $ | (191,595,298 | ) | $ | (79,954,648 | ) | $ | — | $ | (271,549,946 | ) | |||||
|
|
|
|
|
|
|
| |||||||||
Other Financial Instruments* | ||||||||||||||||
Credit Default Swaps — Assets | $ | — | $ | 36,933,850 | $ | — | $ | 36,933,850 | ||||||||
Credit Default Swaps — Liabilities | — | (53,523,853 | ) | — | (53,523,853 | ) | ||||||||||
Volatility Swaps — Liabilities | — | (2,587,260 | ) | — | (2,587,260 | ) | ||||||||||
Futures Contracts | 1,087,886 | — | — | 1,087,886 | ||||||||||||
Credit Default Swaptions | — | (706,055 | ) | — | (706,055 | ) | ||||||||||
Interest Rate Swaptions | — | 6,095,656 | — | 6,095,656 | ||||||||||||
|
|
|
|
|
|
|
| |||||||||
Total Other Financial Instruments | $ | 1,087,886 | $ | (13,787,662 | ) | $ | — | $ | (12,699,776 | ) | ||||||
|
|
|
|
|
|
|
| |||||||||
| * | Other financial instruments are swap and futures contracts and credit default and interest rate swaptions, which are detailed in the Schedule of Investments. |
Following is a reconciliation of Level 3 assets for which significant unobservable inputs were used to determine fair value in the Active Income Fund:
| Investments, at Value | ||||
Balance as of December 31, 2013 | $ | — | ||
Realized gain (loss) | — | |||
Change in net unrealized appreciation (depreciation) | — | |||
Purchase | — | |||
Sales | — | |||
Transfers in and/or out of Level 3 | — | |||
|
| |||
Balance as of June 30, 2014 | $ | — | ||
|
| |||
As of June 30, 2014, the Active Income Fund held Level 3 investments in General Motors Corp. senior convertible preferred stock, valued at fair value as determined in good faith in accordance with procedures established by or under the direction of the Trust’s Board of Trustees. As a part of the ongoing restructuring of General Motors, any value previously ascribed to these holdings has been transferred to the General Motors Co. Motors Liquidation Co. GUC Trust common stock, which is freely and actively traded, and therefore the senior convertible preferred stock was fair valued at $0.
39
Table of Contents
Driehaus Mutual Funds
Notes to Financial Statements (unaudited) — (Continued)
The following is a summary of the inputs used to value the Select Credit Fund’s investments as of June 30, 2014:
Assets | Level 1 | Level 2 | Level 3 | Total | ||||||||||||
Asset-Backed Securities | $ | — | $ | 12,909,567 | $ | — | $ | 12,909,567 | ||||||||
Bank Loans | — | 230,086,934 | — | 230,086,934 | ||||||||||||
Common Stocks | ||||||||||||||||
Auto Manufacturers | 22,215,555 | — | — | 22,215,555 | ||||||||||||
Oil & Gas | 2,320,987 | — | — | 2,320,987 | ||||||||||||
Packaging & Containers | 1,290,000 | — | — | 1,290,000 | ||||||||||||
Telecommunications | 10,684,428 | — | — | 10,684,428 | ||||||||||||
Convertible Corporate Bonds | — | 83,488,892 | — | 83,488,892 | ||||||||||||
Convertible Preferred Stocks | ||||||||||||||||
Auto Manufacturers | — | — | — | — | ||||||||||||
Real Estate Investment Trusts | 8,087,576 | — | — | 8,087,576 | ||||||||||||
Corporate Bonds | — | 544,128,324 | — | 544,128,324 | ||||||||||||
Purchased Call Options | 3,287,400 | — | — | 3,287,400 | ||||||||||||
Purchased Put Options | 694,800 | — | — | 694,800 | ||||||||||||
Short-Term Investments | 24,668,303 | — | — | 24,668,303 | ||||||||||||
Warrants | 402,932 | — | — | 402,932 | ||||||||||||
|
|
|
|
|
|
|
| |||||||||
Total | $ | 73,651,981 | $ | 870,613,717 | $ | — | $ | 944,265,698 | ||||||||
|
|
|
|
|
|
|
| |||||||||
Liabilities | ||||||||||||||||
Common Stocks | ||||||||||||||||
Electrical Components & Equipment | $ | (16,274,510 | ) | $ | — | $ | — | $ | (16,274,510 | ) | ||||||
Health Care — Services | (1,287,201 | ) | — | — | (1,287,201 | ) | ||||||||||
Internet | (3,119,837 | ) | — | — | (3,119,837 | ) | ||||||||||
Lodging | (6,210,811 | ) | — | — | (6,210,811 | ) | ||||||||||
Real Estate Investment Trusts | (2,758,006 | ) | — | — | (2,758,006 | ) | ||||||||||
Corporate Bonds | — | (22,717,092 | ) | — | (22,717,092 | ) | ||||||||||
Exchange-Traded Fund | (5,813,323 | ) | — | — | (5,813,323 | ) | ||||||||||
Written Call Options | (536,640 | ) | — | — | (536,640 | ) | ||||||||||
|
|
|
|
|
|
|
| |||||||||
Total | $ | (36,000,328 | ) | $ | (22,717,092 | ) | $ | — | $ | (58,717,420 | ) | |||||
|
|
|
|
|
|
|
| |||||||||
Other Financial Instruments* | ||||||||||||||||
Credit Default Swaps — Assets | $ | — | $ | 9,203,542 | $ | — | $ | 9,203,542 | ||||||||
Credit Default Swaps — Liabilities | — | (10,631,898 | ) | — | (10,631,898 | ) | ||||||||||
Volatility Swaps — Liabilities | — | (970,223 | ) | — | (970,223 | ) | ||||||||||
Futures Contracts | 250,880 | — | — | 250,880 | ||||||||||||
Credit Default Swaptions | — | (282,422 | ) | — | (282,422 | ) | ||||||||||
Interest Rate Swaptions | — | 1,499,054 | — | 1,499,054 | ||||||||||||
|
|
|
|
|
|
|
| |||||||||
Total Other Financial Instruments | $ | 250,880 | $ | (1,181,947 | ) | $ | — | $ | (931,067 | ) | ||||||
|
|
|
|
|
|
|
| |||||||||
| * | Other financial instruments are swap and futures contracts and credit default and interest rate swaptions, which are detailed in the Schedule of Investments. |
40
Table of Contents
Driehaus Mutual Funds
Notes to Financial Statements (unaudited) — (Continued)
Following is a reconciliation of Level 3 assets for which significant unobservable inputs were used to determine fair value in the Select Credit Fund:
| Investments, at Value | ||||
Balance as of December 31, 2013 | $ | 2,625,000 | ||
Realized gain (loss) | (1,050,010 | ) | ||
Change in net unrealized appreciation (depreciation) | 875,000 | |||
Purchase | — | |||
Sales | (2,449,990 | ) | ||
Transfers in and/or out of Level 3 | — | |||
|
| |||
Balance as of June 30, 2014 | $ | — | ||
|
| |||
As of June 30, 2014, the Select Credit Fund held Level 3 investments in General Motors Corp. senior convertible preferred stock, which were valued in the same manner as described above for the Active Income Fund.
The following is a summary of the inputs used to value the Event Driven Fund’s investments as of June 30, 2014:
Assets | Level 1 | Level 2 | Level 3 | Total | ||||||||||||
Bank Loans | $ | — | $ | 8,861,604 | $ | — | $ | 8,861,604 | ||||||||
Common Stocks | ||||||||||||||||
Auto Manufacturers | 10,643,155 | — | — | 10,643,155 | ||||||||||||
Biotechnology | 3,774,531 | — | — | 3,774,531 | ||||||||||||
Distribution/Wholesale | 5,714,637 | — | — | 5,714,637 | ||||||||||||
Food | 9,279,621 | — | — | 9,279,621 | ||||||||||||
Household Products/Wares | 5,950,997 | — | — | 5,950,997 | ||||||||||||
Internet | 5,866,433 | — | — | 5,866,433 | ||||||||||||
Media | 10,464,550 | — | — | 10,464,550 | ||||||||||||
Mining | 2,447,518 | — | — | 2,447,518 | ||||||||||||
Oil & Gas | 11,555,824 | — | — | 11,555,824 | ||||||||||||
Pharmaceuticals | 14,317,236 | — | — | 14,317,236 | ||||||||||||
Real Estate Investment Trusts | 8,156,594 | — | — | 8,156,594 | ||||||||||||
Restaurants | 3,351,987 | — | — | 3,351,987 | ||||||||||||
Retail | 7,913,902 | — | — | 7,913,902 | ||||||||||||
Semiconductors | 17,283,050 | — | — | 17,283,050 | ||||||||||||
Convertible Corporate Bonds | — | 15,158,375 | — | 15,158,375 | ||||||||||||
Convertible Preferred Stocks | ||||||||||||||||
Auto Manufacturers | — | — | — | — | ||||||||||||
Corporate Bonds | — | 50,817,058 | — | 50,817,058 | ||||||||||||
Purchased Call Options | 2,331,005 | 115,553 | — | 2,446,558 | ||||||||||||
Purchased Put Options | 448,500 | 128,637 | — | 577,137 | ||||||||||||
Warrants | 22,179 | — | — | 22,179 | ||||||||||||
|
|
|
|
|
|
|
| |||||||||
Total | $ | 119,521,719 | $ | 75,081,227 | $ | — | $ | 194,602,946 | ||||||||
|
|
|
|
|
|
|
| |||||||||
41
Table of Contents
Driehaus Mutual Funds
Notes to Financial Statements (unaudited) — (Continued)
Liabilities | Level 1 | Level 2 | Level 3 | Total | ||||||||||||
Common Stocks | ||||||||||||||||
Auto Manufacturers | $ | (4,356,255 | ) | $ | — | $ | — | $ | (4,356,255 | ) | ||||||
Food | (3,558,304 | ) | — | — | (3,558,304 | ) | ||||||||||
Leisure Time | (7,826,111 | ) | — | — | (7,826,111 | ) | ||||||||||
Semiconductors | (8,794,500 | ) | — | — | (8,794,500 | ) | ||||||||||
Telecommunications | (5,208,250 | ) | — | — | (5,208,250 | ) | ||||||||||
Convertible Corporate Bonds | — | (1,062,500 | ) | — | (1,062,500 | ) | ||||||||||
Corporate Bonds | — | (2,376,875 | ) | — | (2,376,875 | ) | ||||||||||
Exchange-Traded Fund | (18,415,550 | ) | — | — | (18,415,550 | ) | ||||||||||
Written Call Options | (538,050 | ) | — | — | (538,050 | ) | ||||||||||
|
|
|
|
|
|
|
| |||||||||
Total | $ | (48,697,020 | ) | $ | (3,439,375 | ) | $ | — | $ | (52,136,395 | ) | |||||
|
|
|
|
|
|
|
| |||||||||
Other Financial Instruments* | ||||||||||||||||
Credit Default Swaps — Assets | $ | — | $ | 858,795 | $ | — | $ | 858,795 | ||||||||
Credit Default Swaps — Liabilities | — | (336,959 | ) | (336,959 | ) | |||||||||||
Interest Rate Swaptions | — | 300,816 | — | 300,816 | ||||||||||||
|
|
|
|
|
|
|
| |||||||||
Total Other Financial Instruments | $ | — | $ | 822,652 | $ | — | $ | 822,652 | ||||||||
|
|
|
|
|
|
|
| |||||||||
| * | Other financial instruments are swap contracts and interest rate swaptions, which are detailed in the Schedule of Investments. |
Following is a reconciliation of Level 3 assets for which significant unobservable inputs were used to determine fair value in the Event Driven Fund:
| Investments, at Value | ||||
Balance as of December 31, 2013 | $ | — | ||
Realized gain (loss) | — | |||
Change in net unrealized appreciation (depreciation) | — | |||
Purchase | — | |||
Sales | — | |||
Transfers in and/or out of Level 3 | — | |||
|
| |||
Balance as of June 30, 2014 | $ | — | ||
|
| |||
As of June 30, 2014, the Event Driven Fund held Level 3 investments in General Motors Corp. senior convertible preferred stock, which were valued in the same manner as described above for the Active Income Fund.
Securities Sold Short
The Funds are engaged in selling securities short, which obligates them to replace a borrowed security with the same security at current market value. Each Fund incurs a loss if the price of the security increases between the date of the short sale and the date on which the Fund replaces the borrowed security. Each Fund realizes a gain if the price of the security declines between those dates. Gains are limited to the price at which the Fund sold the security short, while losses are potentially unlimited in size.
The Funds are required to establish a margin account with the broker lending the security sold short. While the short sale is outstanding, the broker retains the proceeds of the short sale and the Fund must maintain a deposit with the broker consisting of cash and securities having a value equal to a specified percentage of the value of the securities sold short. Such deposit is included in “Collateral held at custodian
42
Table of Contents
Driehaus Mutual Funds
Notes to Financial Statements (unaudited) — (Continued)
for the benefit of brokers” on the Statements of Assets and Liabilities. Each Fund is obligated to pay any dividends or interest due on securities sold short. Such dividends and interest are recorded as an expense to the Funds on the Statements of Operations.
Federal Income Taxes
The Funds’ policy is to comply or continue to comply with the requirements of Subchapter M of the Internal Revenue Code that are applicable to regulated investment companies and to distribute substantially all their taxable income to their shareholders. Therefore, no Federal income tax provision is required.
The FASB’s “Accounting for Uncertainty in Income Taxes” (“Tax Statement”) requires the evaluation of tax positions taken or expected to be taken in the course of preparing the Funds’ tax returns to determine whether the tax positions are “more-likely-than-not” of being sustained by the applicable tax authority. Tax positions not deemed to meet the more-likely-than-not threshold would be recorded as a tax benefit or expense in the current year. Management has evaluated the implications of the Tax Statement and all of the uncertain tax positions and has determined that no liability is required to be recorded in the financial statements as of June 30, 2014. The Funds file tax returns with the U.S. Internal Revenue Service and various states. Generally, the tax years ended December 31, 2010, December 31, 2011, December 31, 2012 and December 31, 2013 remain subject to examination by taxing authorities.
For Federal income tax purposes, capital loss carryforwards represent net capital losses of a fund that may be carried forward for a maximum period of eight years and applied against future net realized gains. On December 22, 2010, the Regulated Investment Company Modernization Act of 2010 was enacted to modernize several of the Federal income and excise tax provisions related to regulated investment companies. Under pre-enactment law, capital losses could be carried forward for up to eight years, and were required to be carried forward as short-term capital losses, irrespective of the character of the original loss. New net capital losses (those earned in taxable years beginning after December 22, 2010) may be carried forward indefinitely and must retain the character of the original loss. Such new net capital losses generally must be used by a regulated investment company before it uses any net capital losses incurred in taxable years beginning on or before December 22, 2010. This increases the likelihood that net capital losses incurred in taxable years beginning on or before December 22, 2010 will expire unused.
At June 30, 2014, gross unrealized appreciation and depreciation on investments, based on cost for Federal income tax purposes, were as follows:
| Active Income Fund | Select Credit Fund | Event Driven Fund | ||||||||||
Cost of investments | $ | 3,369,622,241 | $ | 911,871,726 | $ | 193,632,697 | ||||||
|
|
|
|
|
| |||||||
Gross unrealized appreciation | $ | 204,225,129 | $ | 53,260,989 | $ | 11,200,639 | ||||||
Gross unrealized depreciation | (52,942,945 | ) | (20,867,017 | ) | (10,230,390 | ) | ||||||
|
|
|
|
|
| |||||||
Net unrealized appreciation (depreciation) on investments | $ | 151,282,184 | $ | 32,393,972 | $ | 970,249 | ||||||
|
|
|
|
|
| |||||||
The difference between cost amounts for financial statement and Federal income tax purposes is due primarily to the tax deferral of losses on wash sales.
The amount of dividends and distributions from net investment income and net realized capital gains are determined in accordance with Federal income tax regulations, which may differ from U.S. GAAP.
The tax character of distributions paid were as follows:
| Active Income Fund | ||||||||
Distributions paid from: | January 1, 2013 to December 31, 2013 | January 1, 2012 to December 31, 2012 | ||||||
Ordinary income | $ | 74,335,357 | $ | 67,114,475 | ||||
|
|
|
| |||||
Total distributions paid | $ | 74,335,357 | $ | 67,114,475 | ||||
|
|
|
| |||||
43
Table of Contents
Driehaus Mutual Funds
Notes to Financial Statements (unaudited) — (Continued)
| Select Credit Fund | ||||||||
Distributions paid from: | January 1, 2013 to December 31, 2013 | January 1, 2012 to December 31, 2012 | ||||||
Ordinary income | $ | 24,212,783 | $ | 14,216,095 | ||||
|
|
|
| |||||
Total distributions paid | $ | 24,212,783 | $ | 14,216,095 | ||||
|
|
|
| |||||
| Event Driven Fund | ||||
Distributions paid from: | August 26, 2013 to December 31, 2013* | |||
Ordinary income | $ | 871,553 | ||
Long-term capital gains | 153,397 | |||
|
| |||
Total distributions paid | $ | 1,024,950 | ||
|
| |||
| * | The Fund commenced operations on August 26, 2013. |
As of December 31, 2013, the components of accumulated earnings (deficit) were as follows:
| Active Income Fund | Select Credit Fund | Event Driven Fund | ||||||||||
Undistributed ordinary income | $ | 9,089,049 | $ | 3,913,229 | $ | 638,262 | ||||||
Undistributed long-term capital gains | — | — | 22,837 | |||||||||
|
|
|
|
|
| |||||||
Accumulated earnings | 9,089,049 | 3,913,229 | 661,099 | |||||||||
Accumulated capital and other losses | (203,798,745 | ) | (2,068,104 | ) | — | |||||||
Unrealized appreciation (depreciation) | 109,040,490 | 14,425,111 | 1,552,982 | |||||||||
|
|
|
|
|
| |||||||
Total accumulated earnings (deficit) | $ | (85,669,206 | ) | $ | 16,270,236 | $ | 2,214,081 | |||||
|
|
|
|
|
| |||||||
As of December 31, 2013, the Funds had net capital loss carryforwards to offset future net capital gains, if any, to the extent provided by Treasury regulations:
| Not Subject to Expiration | ||||||||
| Short-Term | Long-Term | |||||||
Active Income Fund | $ | 116,022,288 | $ | 83,443,109 | ||||
Select Credit Fund | — | — | ||||||
Event Driven Fund | — | — | ||||||
The Select Credit Fund utilized $770,317 of its capital loss carryforwards during the year ended December 31, 2013.
Post-October capital losses and late-year ordinary losses incurred after October 31 and within the taxable year are deemed to arise on the first business day of the Funds’ taxable year. As of December 31, 2013, the Funds had the following post-October capital losses and late-year ordinary losses:
| Post-October Capital Losses | Late-Year Ordinary Losses | |||||||
Active Income Fund | $ | — | $ | 4,333,348 | ||||
Select Credit Fund | — | 2,068,104 | ||||||
Event Driven Fund | — | — | ||||||
Foreign Currency Translation
The value of securities, currencies and other assets and liabilities not denominated in U.S. dollars are translated into U.S. dollar values based upon the current rates of exchange on the date of the Funds’ valuations.
Net realized foreign exchange gains or losses which are reported by the Funds result from currency gains and losses on transaction hedges arising from changes in exchange rates between the trade and settlement dates on forward contract transactions, and the difference between the amounts accrued for dividends,
44
Table of Contents
Driehaus Mutual Funds
Notes to Financial Statements (unaudited) — (Continued)
interest, and foreign taxes and the amounts actually received or paid in U.S. dollars for these items. Net unrealized foreign exchange gains and losses result from changes in the U.S. dollar value of assets and liabilities (other than investments in securities), which are denominated in foreign currencies, as a result of changes in exchange rates.
Net realized foreign exchange gains or losses on portfolio hedges result from the use of forward contracts to hedge portfolio positions denominated or quoted in a particular currency in order to reduce or limit exposure in that currency. The Active Income Fund, Select Credit Fund and Event Driven Fund had no portfolio hedges during the period January 1, 2014 through June 30, 2014.
The Funds do not isolate that portion of the results of operations which results from fluctuations in foreign exchange rates on investments. These fluctuations are included with the net realized gain (loss) on investments and the net change in unrealized appreciation (depreciation) on investments.
Indemnifications
Under the Trust’s organizational documents, the officers and Trustees are indemnified against certain liabilities arising out of the performance of their duties to the Trust. In addition, in the normal course of business, the Trust enters into contracts that provide general indemnifications to other parties. A Fund’s maximum exposure under these agreements is unknown as this would involve future claims that may be made against a Fund that have not yet occurred. However, the Funds have not had prior claims or losses pursuant to these contracts and expect the risk of loss to be remote.
Other
The Trust records security transactions based on trade date. Realized gains and losses on sales of securities are calculated using the first-in, first-out method. Dividend income is recognized on the ex-dividend date, and interest income is recognized on an accrual basis. Discounts and premiums on securities purchased are amortized over the lives of the respective securities using the effective yield method. Withholding taxes on foreign dividends and interest have been provided for in accordance with the Trust’s understanding of the applicable country’s tax rules and rates.
Pursuant to the terms of certain of the senior unsecured loan agreements, the Funds may have unfunded loan commitments, which are callable on demand. Each Fund would have available with its custodian, cash and/or liquid securities having an aggregate value at least equal to the amount of the unfunded senior loan commitments. At June 30, 2014, the Active Income Fund, Select Credit Fund and Event Driven Fund had no unfunded senior loan commitments.
With respect to the senior loans held in each Fund’s portfolio, the Funds may: 1) invest in assignments; 2) act as a participant in primary lending syndicates; or 3) invest in participations. If a Fund purchases a participation of a senior loan interest, the Fund would typically enter into a contractual agreement with the lender or other third party selling the participation, rather than directly with the borrower. As such, the Fund not only assumes the credit risk of the borrower, but also that of the selling participant or other persons interpositioned between the Fund and the borrower. At June 30, 2014, the Funds had no such outstanding senior loan participation commitments.
B. INVESTMENTS IN DERIVATIVES
Swap Contracts
The Funds are subject to credit risk, volatility risk and interest rate risk exposure in the normal course of pursuing their investment objectives. The Funds may engage in various swap transactions, including forward rate agreements and interest rate, currency, volatility, index and total return swaps, primarily to manage duration and yield curve risk, or as alternatives to direct investments. In addition to the swap contracts described above, the Funds may also engage in credit default swaps which involve the exchange of a periodic premium for protection against a defined credit event (such as payment default, refinancing or bankruptcy).
45
Table of Contents
Driehaus Mutual Funds
Notes to Financial Statements (unaudited) — (Continued)
Interest rate swaps are agreements between two parties to exchange cash flows based on a notional principal amount. The Funds may elect to pay a fixed rate and receive a floating rate or receive a floating rate and pay a fixed rate on a notional principal amount. The net interest received or paid on interest rate swap agreements is accrued daily as interest income/expense. Interest rate swaps are marked-to-market daily using fair value estimates provided by an independent pricing service. Changes in value, including accrued interest, are recorded as unrealized appreciation (depreciation). Unrealized gains are reported as an asset and unrealized losses are reported as a liability. The change in value of swaps, including accruals of periodic amounts of interest to be paid or received on swaps, is reported as unrealized gains or losses. Gains or losses are realized upon termination of the contracts. The risk of loss under a swap contract may exceed the amount recorded as an asset or a liability.
Volatility swaps are forward contracts on the future realized volatility of an underlying instrument. Volatility swaps are generally used to speculate on future volatility levels, trade the spread between realized and implied volatility or hedge volatility exposure of other positions. Changes in value are recorded as unrealized appreciation (depreciation). Unrealized gains are reported as an asset and unrealized losses are reported as a liability. The change in value of swaps is reported as unrealized gains or losses. Gains or losses are realized upon termination of the contracts. The risk of loss under a volatility swap contract is dependent upon volatility of the underlying instrument.
Under the terms of a credit default swap contract, one party acts as a guarantor receiving a periodic payment that is a fixed percentage applied to a notional amount. In return, the party agrees to purchase the notional amount of the underlying instrument, at par, if a credit event occurs during the term of the contract. Each Fund may enter into credit default swaps in which the Fund acts as guarantor (a seller of protection), and may enter into credit default swaps in which the counterparty acts as guarantor (a buyer of protection). Premiums paid to or by the Funds are accrued daily and included in realized gain (loss) on swaps. The contracts are marked-to-market daily using fair value estimates provided by an independent pricing service. Changes in value are recorded as unrealized appreciation (depreciation). Unrealized gains are reported as an asset and unrealized losses are reported as a liability. The change in value of swaps, including accruals of periodic amounts of interest to be paid or received on swaps is reported as unrealized gains or losses. Gains or losses are realized upon termination of the contracts. The risk of loss under a swap contract may exceed the amount recorded as an asset or a liability. The notional amount of a swap contract is the reference amount pursuant to which the counterparties make payments. For swaps in which the referenced obligation is an index, in the event of default of any debt security included in the corresponding index, the Fund pays or receives the percentage of the corresponding index that the defaulted security comprises (1) multiplied by the notional value and (2) multiplied by the ratio of one minus the ratio of the market value of the defaulted debt security to its par value. The maximum exposure to loss of the notional value as a seller of credit default swaps outstanding at June 30, 2014 for the Active Income Fund, Select Credit Fund and Event Driven Fund was $23,334,000, $24,666,000 and $0, respectively.
Risks associated with swap contracts include changes in the returns of underlying instruments, failure of the counterparties to perform under the contracts’ terms and the possible lack of liquidity with respect to the contracts. Credit default swaps can involve greater risks than if an investor had invested in the reference obligation directly since, in addition to general market risks, credit default swaps are subject to counterparty credit risk, leverage risk, hedging risk, correlation risk and liquidity risk. The Funds disclose swap contracts on a gross basis, with no netting of contracts held with the same counterparty. As of June 30, 2014, the Funds had outstanding swap contracts as listed on the Schedule of Investments and the required collateral is included in the Statements of Assets and Liabilities.
Futures Contracts
The Funds may enter into futures contracts to produce incremental earnings, hedge existing positions or protect against market changes in the value of equities or interest rates. Upon entering into a futures contract with a broker, a Fund is required to deposit in a segregated account a specified amount of cash or U.S. government securities. Futures contracts are valued daily and unrealized gains or losses are recorded in a “variation margin” account. Daily, the Fund receives from or pays to the broker a specified amount of cash based upon changes in the variation margin account. When a contract is closed, the Fund recognizes a
46
Table of Contents
Driehaus Mutual Funds
Notes to Financial Statements (unaudited) — (Continued)
realized gain or loss. Futures contracts have market risks, including the risk that the change in the value of the contract may not correlate with changes in the value of the underlying securities. With futures, there is minimal counterparty credit risk to the Funds since futures are exchange traded and the exchange’s clearinghouse, as counterparty to all exchange traded futures, guarantees the futures contract against default. As of June 30, 2014, the Funds had outstanding futures contracts as listed in the Schedule of Investments and the required collateral is included in the Statements of Assets and Liabilities.
Options Contracts
The Funds may use options contracts to hedge downside risk on their fixed income holdings, produce incremental earnings or protect against market changes in the value of equities or interest rates. The Funds may write covered call and put options on futures, swaps, securities or currencies the Funds own or in which they may invest. Writing put options tends to increase a Fund’s exposure to the underlying instrument. Writing call options tends to decrease a Fund’s exposure to the underlying instrument. When a Fund writes a call or put option, an amount equal to the premium received is recorded as a liability and subsequently marked to market to reflect the current value of the option written. These liabilities are reflected as written options outstanding in the Schedule of Investments. Payments received or made, if any, from writing options with premiums to be determined on a future date are reflected as such in the Schedule of Investments. Premiums received from writing options that expire are treated as realized gains. Premiums received from writing options that are exercised or closed are added to the proceeds or offset against amounts paid on the underlying future, swap, security or currency transaction to determine the realized gain or loss. A Fund, as a writer of an option, has no control over whether the underlying future, swap, security or currency may be sold (call) or purchased (put) and, as a result, bears the market risk of an unfavorable change in the price of the future, swap, security or currency underlying the written option. The risk exists that a Fund may not be able to enter into a closing transaction because of an illiquid market. In addition, to the extent a Fund purchases an over-the-counter (“OTC”) option, it is subject to credit risk that the counterparty to the trade does not perform under the contract’s terms. The Funds are not subject to credit risk on OTC options written as the counterparty has already performed its obligation by paying the premium at the inception of the contract.
The premium amount and the number of option contracts written by the Active Income Fund during the period January 1, 2014 through June 30, 2014, were as follows:
Active Income Fund | Number of Contracts | Premium Amount | ||||||
Options outstanding at December 31, 2013 | — | $ | — | |||||
Options written | — | — | ||||||
Options closed | — | — | ||||||
Options expired | — | — | ||||||
|
|
|
| |||||
Options outstanding at June 30, 2014 | — | $ | — | |||||
|
|
|
| |||||
The premium amount and the number of option contracts written by the Select Credit Fund during the period January 1, 2014 through June 30, 2014, were as follows:
Select Credit Fund | Number of Contracts | Premium Amount | ||||||
Options outstanding at December 31, 2013 | — | $ | — | |||||
Options written | 10,320 | 829,949 | ||||||
Options closed | — | — | ||||||
Options expired | — | — | ||||||
|
|
|
| |||||
Options outstanding at June 30, 2014 | 10,320 | $ | 829,949 | |||||
|
|
|
| |||||
47
Table of Contents
Driehaus Mutual Funds
Notes to Financial Statements (unaudited) — (Continued)
The premium amount and the number of option contracts written by the Event Driven Fund during the period from inception through June 30, 2014, were as follows:
Event Driven Fund | Number of Contracts | Premium Amount | ||||||
Options outstanding at December 31, 2013 | 500 | $ | 34,482 | |||||
Options written | 10,257 | 1,275,525 | ||||||
Options closed | (2,976 | ) | (423,072 | ) | ||||
Options expired | (2,409 | ) | (103,121 | ) | ||||
Options exercised | (500 | ) | (54,979 | ) | ||||
|
|
|
| |||||
Options outstanding at June 30, 2014 | 4,872 | $ | 728,835 | |||||
|
|
|
| |||||
The Funds may also purchase put and call options. Purchasing call options tends to increase a Fund’s exposure to the underlying instrument. Purchasing put options tends to decrease a Fund’s exposure to the underlying instrument. A Fund pays a premium which is included in its Schedule of Investments as an investment and subsequently marked-to-market to reflect the current value of the option. Premiums paid for purchasing options which expire are treated as realized losses. The risk associated with purchasing put and call options is limited to the premium paid. Premiums paid for purchasing options which are exercised or closed are added to the amounts paid or offset against the proceeds on the underlying future, swap, security or currency transaction to determine the realized gain or loss. When entering into purchased option contracts, a Fund bears the risk of securities prices moving unexpectedly, in which case, a Fund may not achieve the anticipated benefits of the purchased option contracts; however, the risk of loss is limited to the premium paid. As of June 30, 2014, the Funds had outstanding options as listed on the Schedule of Investments and the required collateral is included in the Statements of Assets and Liabilities.
Swaptions
An option on a swap contract, also called a “swaption,” is an option that gives the buyer the right, but not the obligation, to enter into a swap on a future date in exchange for paying a market-based “premium.” A call or receiver swaption gives the owner the right to receive the total return of a specified asset, reference rate, or index swap. A put or payer swaption gives the owner the right to pay the total return of a specified asset, reference rate, or index swap. Swaptions also include options that allow an existing swap to be terminated or extended by one of the counterparties. As of June 30, 2014, the Funds had outstanding swaptions as listed on the Schedule of Investments.
The premium amount and the number of swaption contracts written by the Active Income Fund during the period January 1, 2014 through June 30, 2014, were as follows:
Active Income Fund | Number of Contracts | Premium Amount | ||||||
Swaptions outstanding at December 31, 2013 | — | $ | — | |||||
Swaptions written | 250,000,000 | 853,875 | ||||||
Swaptions closed | — | — | ||||||
Swaptions expired | — | — | ||||||
|
|
|
| |||||
Swaptions outstanding at June 30, 2014 | 250,000,000 | $ | 853,875 | |||||
|
|
|
| |||||
The premium amount and the number of swaption contracts written by the Select Credit Fund during the period January 1, 2014 through June 30, 2014, were as follows:
Select Credit Fund | Number of Contracts | Premium Amount | ||||||
Swaptions outstanding at December 31, 2013 | — | $ | — | |||||
Swaptions written | 100,000,000 | 341,550 | ||||||
Swaptions closed | — | — | ||||||
Swaptions expired | — | — | ||||||
|
|
|
| |||||
Swaptions outstanding at June 30, 2014 | 100,000,000 | $ | 341,550 | |||||
|
|
|
| |||||
48
Table of Contents
Driehaus Mutual Funds
Notes to Financial Statements (unaudited) — (Continued)
Forward Foreign Currency Contracts
The Funds may use forward foreign currency contracts to manage foreign currency, to produce incremental earnings or hedge existing positions. A forward foreign currency contract involves an obligation to purchase or sell a specific currency at a future date, which may be any fixed number of days from the date of the contract agreed upon by the parties, at a price set at the time of the contract. These contracts are principally traded in the inter-bank market conducted directly between currency traders (usually large commercial banks) and their customers.
The market value of a forward foreign currency contract fluctuates with changes in currency exchange rates. Outstanding forward foreign currency contracts are valued daily at current market rates and the resulting change in market value is recorded as unrealized appreciation or depreciation. When a forward foreign currency contract is settled, the Fund records a realized gain or loss equal to the difference between the value at the time the forward foreign currency contract was opened and the value at the time it was settled. A forward foreign currency contract may involve market risk in excess of the unrealized gain or loss reflected on the Statements of Assets and Liabilities. In addition, the Funds could be exposed to a credit risk if the counterparties are unable or unwilling to meet the terms of the contracts or if the value of the foreign currency changes unfavorably. The Active Income Fund, Select Credit Fund and Event Driven Fund did not enter into any forward foreign currency contracts during the period January 1, 2014 through June 30, 2014.
Derivative Investment Holdings Categorized by Risk Exposure
Each Fund is subject to the FASB’s “Disclosures about Derivative Instruments and Hedging Activities” (the “Derivatives Statement”). The Derivatives Statement amends and expands disclosures about derivative instruments and hedging activities. The Derivatives Statement is intended to improve financial reporting about derivative instruments by requiring enhanced disclosures to enable investors to better understand how and why the Fund uses derivative instruments, how these derivative instruments are accounted for and their effects on the Funds’ financial position and results of operations.
The following table sets forth the fair value and the location in the Statement of Assets and Liabilities of the Active Income Fund’s derivative contracts by primary risk exposure as of June 30, 2014:
Asset derivatives | ||||||
Risk exposure category | Statement of Assets and Liabilities location | Fair Value | ||||
Credit contracts | Unrealized appreciation on open swap contracts | $ | 4,766,426 | |||
Credit contracts | Purchased swaptions, at fair value | 443,923 | ||||
Equity contracts | Purchased options, at fair value | 9,685,800 | ||||
Interest rate contracts | Purchased swaptions, at fair value | 6,095,656 | ||||
Interest rate contracts | N/A* | 1,087,886 | ||||
Total | $ | 22,079,691 | ||||
| * | Includes cumulative appreciation/depreciation of futures contracts as shown in the Schedule of Investments. Only current day’s variation margin is reported in the Statement of Assets and Liabilities. |
Liability derivatives | ||||||
Risk exposure category | Statement of Assets and Liabilities location | Fair Value | ||||
Credit contracts | Unrealized depreciation on open swap contracts | $ | 38,923,179 | |||
Credit contracts | Written swaptions, at fair value | 1,149,978 | ||||
Interest rate contracts | Unrealized depreciation on open swap contracts | 2,587,260 | ||||
Total | $ | 42,660,417 | ||||
49
Table of Contents
Driehaus Mutual Funds
Notes to Financial Statements (unaudited) — (Continued)
The following table sets forth the fair value and the location in the Statement of Assets and Liabilities of the Select Credit Fund’s derivative contracts by primary risk exposure as of June 30, 2014:
Asset derivatives | ||||||
Risk exposure category | Statement of Assets and Liabilities location | Fair Value | ||||
Credit contracts | Unrealized appreciation on open swap contracts | $ | 1,980,352 | |||
Credit contracts | Purchased swaptions, at fair value | 177,569 | ||||
Equity contracts | Purchased options, at fair value | 3,982,200 | ||||
Interest rate contracts | Purchased swaptions, at fair value | 1,499,054 | ||||
Interest rate contracts | N/A* | 250,880 | ||||
Total | $ | 7,890,055 | ||||
| * | Includes cumulative appreciation/depreciation of futures contracts as shown in the Schedule of Investments. Only current day’s variation margin is reported in the Statement of Assets and Liabilties. |
Liability derivatives | ||||||
Risk exposure category | Statement of Assets and Liabilities location | Fair Value | ||||
Credit contracts | Unrealized depreciation on open swap contracts | $ | 6,753,851 | |||
Credit contracts | Written swaptions, at fair value | 459,991 | ||||
Interest rate contracts | Unrealized depreciation on open swap contracts | 970,223 | ||||
Equity contracts | Written options, at fair value | 536,640 | ||||
Total | $ | 8,720,705 | ||||
The following table sets forth the fair value and the location in the Statement of Assets and Liabilities of the Event Driven Fund’s derivative contracts by primary risk exposure as of June 30, 2014:
Asset derivatives | ||||||
Risk exposure category | Statement of Assets and Liabilities location | Fair Value | ||||
Credit contracts | Unrealized appreciation on open swap contracts | $ | 108,795 | |||
Equity contracts | Purchased options, at fair value | 3,023,695 | ||||
Interest rate contracts | Purchased swaptions, at fair value | 300,816 | ||||
Total | $ | 3,433,306 | ||||
Liability derivatives | ||||||
Risk exposure category | Statement of Assets and Liabilities location | Fair Value | ||||
Credit contracts | Unrealized depreciation on open swap contracts | $ | 301,491 | |||
Equity contracts | Written options, at fair value | 538,050 | ||||
Total | $ | 839,541 | ||||
50
Table of Contents
Driehaus Mutual Funds
Notes to Financial Statements (unaudited) — (Continued)
The following table sets forth the Active Income Fund’s net realized gain/loss by primary risk exposure and by type of derivative contract for the period January 1, 2014 through June 30, 2014:
Amount of net realized gain (loss) on derivatives | ||||||||||||||||
| Risk exposure category | ||||||||||||||||
Derivative | Credit contracts | Equity contracts | Interest rate contracts | Total | ||||||||||||
Purchased options | $ | — | $ | (9,948,721 | ) | $ | — | $ | (9,948,721 | ) | ||||||
Purchased swaption contracts | — | — | (4,000,000 | ) | (4,000,000 | ) | ||||||||||
Futures contracts | — | — | (11,672,784 | ) | (11,672,784 | ) | ||||||||||
Swap contracts | (10,692,682 | ) | — | — | (10,692,682 | ) | ||||||||||
|
|
|
|
|
|
|
| |||||||||
Total | $ | (10,692,682 | ) | $ | (9,948,721 | ) | $ | (15,672,784 | ) | $ | (36,314,187 | ) | ||||
|
|
|
|
|
|
|
| |||||||||
The following table sets forth the Select Credit Fund’s net realized gain/loss by primary risk exposure and by type of derivative contract for the period January 1, 2014 through June 30, 2014:
Amount of net realized gain (loss) on derivatives | ||||||||||||||||
| Risk exposure category | ||||||||||||||||
Derivative | Credit contracts | Equity contracts | Interest rate contracts | Total | ||||||||||||
Purchased options | $ | — | $ | (1,947,393 | ) | $ | — | $ | (1,947,393 | ) | ||||||
Purchased swaption contracts | — | — | (1,500,000 | ) | (1,500,000 | ) | ||||||||||
Futures contracts | — | — | (2,768,338 | ) | (2,768,338 | ) | ||||||||||
Swap contracts | (1,384,796 | ) | — | — | (1,384,796 | ) | ||||||||||
|
|
|
|
|
|
|
| |||||||||
Total | $ | (1,384,796 | ) | $ | (1,947,393 | ) | $ | (4,268,338 | ) | $ | (7,600,527 | ) | ||||
|
|
|
|
|
|
|
| |||||||||
The following table sets forth the Event Driven Fund’s net realized gain/loss by primary risk exposure and by type of derivative contract for the period from inception through June 30, 2014:
Amount of net realized gain (loss) on derivatives | ||||||||||||
| Risk exposure category | ||||||||||||
Derivative | Credit contracts | Equity contracts | Total | |||||||||
Purchased options | $ | — | $ | 1,603,232 | $ | 1,603,232 | ||||||
Written options | — | (213,501 | ) | (213,501 | ) | |||||||
Swap contracts | (90,347 | ) | — | (90,347 | ) | |||||||
|
|
|
|
|
| |||||||
Total | $ | (90,347 | ) | $ | 1,389,731 | $ | 1,299,384 | |||||
|
|
|
|
|
| |||||||
The following table sets forth the Active Income Fund’s change in net unrealized appreciation/depreciation by primary risk exposure and by type of derivative contract for the period January 1, 2014 through June 30, 2014:
Change in net unrealized appreciation (depreciation) on derivatives | ||||||||||||||||
| Risk exposure category | ||||||||||||||||
Derivative | Credit contracts | Equity contracts | Interest rate contracts | Total | ||||||||||||
Purchased options | $ | — | $ | (954,153 | ) | $ | — | $ | (954,153 | ) | ||||||
Purchased swaption contracts | (1,115,327 | ) | — | (1,826,763 | ) | (2,942,090 | ) | |||||||||
Written swaption contracts | (296,103 | ) | — | — | (296,103 | ) | ||||||||||
Futures contracts | — | — | (8,357,431 | ) | (8,357,431 | ) | ||||||||||
Swap contracts | (1,717,945 | ) | — | — | (1,717,945 | ) | ||||||||||
|
|
|
|
|
|
|
| |||||||||
Total | $ | (3,129,375 | ) | $ | (954,153 | ) | $ | (10,184,194 | ) | $ | (14,267,722 | ) | ||||
|
|
|
|
|
|
|
| |||||||||
51
Table of Contents
Driehaus Mutual Funds
Notes to Financial Statements (unaudited) — (Continued)
The gross notional amount of swap contracts and the number of option contracts for the Active Income Fund as of June 30, 2014 is included on the Schedule of Investments. The fair value of such contracts at June 30, 2014 is set forth in the table below.
Quarterly Derivative Averages | ||||||
Derivative | Quarterly Average | $ Amount / Number | ||||
Option contracts — purchased | number of contracts | 18,465 | ||||
Swaption contracts — purchased | number of contracts | 350,848,000 | ||||
Futures contracts — long | number of contracts | — | ||||
Futures contracts — short | number of contracts | (4,609 | ) | |||
Swap contracts | gross notional amount | $ | 941,818,892 | |||
The following table sets forth the Select Credit Fund’s change in net unrealized appreciation/depreciation by primary risk exposure and by type of derivative contract for the period January 1, 2014 through June 30, 2014:
Change in net unrealized appreciation (depreciation) on derivatives | ||||||||||||||||
| Risk exposure category | ||||||||||||||||
Derivative | Credit contracts | Equity contracts | Interest rate contracts | Total | ||||||||||||
Purchased options | $ | — | $ | (3,587,469 | ) | $ | — | $ | (3,587,469 | ) | ||||||
Purchased swaption contracts | (446,131 | ) | — | (535,790 | ) | (981,921 | ) | |||||||||
Written options | — | 293,309 | — | 293,309 | ||||||||||||
Written swaption contracts | (118,441 | ) | — | — | (118,441 | ) | ||||||||||
Futures contracts | — | — | (1,966,474 | ) | (1,966,474 | ) | ||||||||||
Swap contracts | (4,422,995 | ) | — | — | (4,422,995 | ) | ||||||||||
|
|
|
|
|
|
|
| |||||||||
Total | $ | (4,987,567 | ) | $ | (3,294,160 | ) | $ | (2,502,264 | ) | $ | (10,783,991 | ) | ||||
|
|
|
|
|
|
|
| |||||||||
The gross notional amount of swap contracts and the number of option contracts for the Select Credit Fund as of June 30, 2014 is included on the Schedule of Investments. The fair value of such contracts at June 30, 2014 is set forth in the table below.
Quarterly Derivative Averages | ||||||||
Derivative | Quarterly Average | $ Amount /Number | ||||||
Option contracts — purchased | number of contracts | 14,161 | ||||||
Swaption contracts — purchased | number of contracts | 112,218,000 | ||||||
Futures contracts — long | number of contracts | — | ||||||
Futures contracts — short | number of contracts | (793 | ) | |||||
Swap contracts | gross notional amount | $ | 203,790,865 | |||||
The following table sets forth the Event Driven Fund’s change in net unrealized appreciation/depreciation by primary risk exposure and by type of derivative contract for the period January 1, 2014 through June 30, 2014:
Change in net unrealized appreciation (depreciation) on derivatives | ||||||||||||||||
| Risk exposure category | ||||||||||||||||
Derivative | Credit contracts | Equity contracts | Interest rate contracts | Total | ||||||||||||
Purchased options | $ | — | $ | (2,364,849 | ) | $ | — | $ | (2,364,849 | ) | ||||||
Purchased swaptions | — | — | (672,684 | ) | (672,684 | ) | ||||||||||
Written options | — | 198,803 | — | 198,803 | ||||||||||||
Swap contracts | (192,696 | ) | — | — | (192,696 | ) | ||||||||||
|
|
|
|
|
|
|
| |||||||||
Total | $ | (192,696 | ) | $ | (2,166,046 | ) | $ | (672,684 | ) | $ | (3,031,426 | ) | ||||
|
|
|
|
|
|
|
| |||||||||
52
Table of Contents
Driehaus Mutual Funds
Notes to Financial Statements (unaudited) — (Continued)
The gross notional amount of swap contracts and the number of option contracts for the Event Driven Fund as of June 30, 2014 is included on the Schedule of Investments. The fair value of such contracts at June 30, 2014 is set forth in the table below.
Quarterly Derivative Averages | ||||||||
Derivative | Quarterly Average | $ Amount /Number | ||||||
Option contracts — purchased | number of contracts | $ | 5,007,434 | |||||
Swaption contracts — purchased | number of contracts | 13,750,000 | ||||||
Futures contracts — long | number of contracts | — | ||||||
Futures contracts — short | number of contracts | (17 | ) | |||||
Swap contracts | gross notional amount | 3,673,673 | ||||||
Disclosures about Offsetting Assets and Liabilities
Each Fund is subject to the FASB’s “Disclosures about Offsetting Assets and Liabilities” which requires an entity to disclose information about offsetting and related arrangements to enable users of its financial statements to understand the effect of those arrangements on its financial position. The guidance requires retrospective application for all comparative periods presented.
For financial reporting purposes, the Funds’ do not offset derivative assets and liabilities that are subject to Master Netting Agreements (“MNA”) or similar arrangements in the Statements of Assets and Liabilities. The Funds have adopted the new disclosure requirements on offsetting in the following tables:
The following table presents the Active Income Fund’s derivative assets by type, net of amounts available for offset under a MNA and net of the related collateral received by the Active Income Fund as of June 30, 2014:
Description | Gross Amounts Recognized in Statement of Assets and Liabilities | Derivatives Available for Offset | Collateral Received | Net Amount1 | ||||||||||||
Unrealized appreciation on open swap contracts | $ | 4,766,426 | $ | (3,105,356 | ) | $ | — | $ | 1,661,070 | |||||||
The following table presents the Active Income Fund’s derivative liabilities by type, net of amounts available for offset under a MNA and net of the related collateral pledged by the Active Income Fund as of June 30, 2014:
Description | Gross Amounts Recognized in Statement of Assets and Liabilities | Derivatives Available for Offset | Collateral Pledged | Net Amount2 | ||||||||||||
Written swaptions, at fair value | $ | 1,149,978 | $ | — | $ | (1,149,978 | ) | $ | — | |||||||
Unrealized depreciation on open swap contracts | 41,510,439 | (3,105,356 | ) | (38,405,083 | ) | — | ||||||||||
| 1 | Net amount represents the net amount receivable from the counterparty in the event of default. |
| 2 | Net amount represents the net amount payable to the counterparty in the event of default. |
The following table presents the Select Credit Fund’s derivative assets by type, net of amounts available for offset under a MNA and net of the related collateral received by the Select Credit Fund as of June 30, 2014:
Description | Gross Amounts Recognized in Statement of Assets and Liabilities | Derivatives Available for Offset | Collateral Received | Net Amount1 | ||||||||||||
Unrealized appreciation on open swap contracts | $ | 1,980,352 | $ | (1,980,352 | ) | $ | — | $ | — | |||||||
53
Table of Contents
Driehaus Mutual Funds
Notes to Financial Statements (unaudited) — (Continued)
The following table presents the Select Credit Fund’s derivative liabilities by type, net of amounts available for offset under a MNA and net of the related collateral pledged by the Select Credit Fund as of June 30, 2014:
Description | Gross Amounts Recognized in Statement of Assets and Liabilities | Derivatives Available for Offset | Collateral Pledged | Net Amount2 | ||||||||||||
Unrealized depreciation on open swap contracts | $ | 7,724,074 | $ | (1,980,352 | ) | $ | (5,743,722 | ) | $ | — | ||||||
Written options, at fair value | 536,640 | — | (536,640 | ) | — | |||||||||||
Written swaptions, at fair value | 459,991 | — | (459,991 | ) | — | |||||||||||
| 1 | Net amount represents the net amount receivable from the counterparty in the event of default. |
| 2 | Net amount represents the net amount payable to the counterparty in the event of default. |
The following table presents the Event Driven Fund’s derivative assets by type, net of amounts available for offset under a MNA and net of the related collateral pledged by the Event Driven Fund as of June 30, 2014:
Description | Gross Amounts Recognized in Statement of Assets and Liabilities | Derivatives Available for Offset | Collateral Received | Net Amount1 | ||||||||||||
Unrealized appreciation on open swap contracts | $ | 108,795 | $ | — | $ | — | $ | 108,795 | ||||||||
The following table presents the Event Driven Fund’s derivative liabilities by type, net of amounts available for offset under a MNA and net of the related collateral pledged by the Event Driven Fund as of June 30, 2014:
Description | Gross Amounts Recognized in Statement of Assets and Liabilities | Derivatives Available for Offset | Collateral Pledged | Net Amount2 | ||||||||||||
Unrealized depreciation on open swap contracts | $ | 301,491 | $ | — | $ | (301,491 | ) | $ | — | |||||||
Written options, at fair value | 538,050 | $ | — | (538,050 | ) | — | ||||||||||
| 1 | Net amount represents the net amount receivable from the counterparty in the event of default. |
| 2 | Net amount represents the net amount payable to the counterparty in the event of default. |
C. INVESTMENT ADVISORY FEES, TRANSACTIONS WITH AFFILIATES, AND ADMINISTRATIVE FEES
Richard H. Driehaus, an Interested Trustee of the Trust, is also the Chairman of the Board of Driehaus Capital Management LLC (“DCM” or the “Adviser”), a registered investment adviser, and of Driehaus Securities LLC (“DS LLC” or the “Distributor”), a registered broker-dealer.
DCM serves as the Funds’ investment adviser. In return for its services to the Funds, the Funds pay the Adviser an annual management fee on a monthly basis of 0.55%, 0.80% and 1.00% of average net assets, respectively, for the Active Income Fund, Select Credit Fund and Event Driven Fund.
DCM has entered into a written agreement to cap the Event Driven Fund’s annual ordinary operating expenses (other than interest, taxes, brokerage commissions, dividends and interest on short sales, other investment-related expenses and extraordinary expenses) at 2.00% of average daily net assets until at least August 25, 2016. For this same time period, DCM is entitled to reimbursement for previously waived fees and reimbursed expenses to the extent that the Event Driven Fund’s expense ratio remains below the operating expense cap. During the period January 1, 2014 through June 30, 2014, DCM recaptured $4,008 of the Event Driven Fund’s fees waived in the prior year, and there are no additional amounts subject to recapture.
The Active Income Fund accrued $12,967,478 for investment advisory fees during the period January 1, 2014 through June 30, 2014, of which $2,181,006 was payable to DCM at June 30, 2014. The Select Credit Fund
54
Table of Contents
Driehaus Mutual Funds
Notes to Financial Statements (unaudited) — (Continued)
accrued $4,871,034 for investment advisory fees during the period January 1, 2014 through June 30, 2014, and $877,628 was payable to DCM at June 30, 2014. The Event Driven Fund accrued $855,573 for investment advisory fees during the period from January 1, 2014 through June 30, 2014, and $219,423 was payable to DCM at June 30, 2014.
DS LLC is the Funds’ distributor. DS LLC does not earn any compensation from the Funds for these services. DS LLC has entered into a Fee Reimbursement Agreement with each of the Funds. Under these agreements, the Funds reimburse DS LLC for certain fees paid by DS LLC to intermediaries who provide shareholder administrative and/or sub-transfer agency services to the Fund. Currently, the amount to be reimbursed will not exceed 0.25% of the average daily net assets held by such intermediaries. As of June 30, 2014, the Active Income Fund, Select Credit Fund and Event Driven Fund owe $680,944, $272,300 and $28,174, respectively, in reimbursements to DS LLC under these agreements, which are included in accrued shareholder services plan fees on the Statement of Assets and Liabilities.
Certain officers of the Trust are also officers of DCM and DS LLC. The Funds pay a portion of the Chief Compliance Officer’s salary. No other officers received compensation from the Funds during the period January 1, 2014 through June 30, 2014.
UMB Fund Services, Inc. (“UMBFS”), an affiliate of UMB Financial Corporation, serves as the Funds’ administrative and accounting agent. In compensation for these services, UMBFS earns the larger of a monthly minimum fee or a monthly fee based upon each Fund’s average daily net assets. UMBFS also acts as the transfer agent and dividend disbursing agent for the Funds. For these services, UMBFS earns a monthly fee based in part on shareholder processing activity during the month.
D. INVESTMENT TRANSACTIONS
Purchases and sales of investment securities (excluding swaps, options, futures, short-term securities and U.S. government obligations) for the Active Income Fund, Select Credit Fund and Event Driven Fund for the period January 1, 2014 through June 30, 2014, were as follows:
Active Income Fund | Select Credit Fund | Event Driven Fund | ||||||||||||||
| Purchases | $ | 638,558,009 | Purchases | $ | 441,835,624 | Purchases | $ | 247,452,566 | ||||||||
| Sales | $ | 589,974,624 | Sales | $ | 165,462,653 | Sales | $ | 85,824,398 | ||||||||
The aggregate purchases and sales of U.S. government obligations for the Active Income Fund and Select Credit Fund for the period January 1, 2014 through June 30, 2014, were as follows, and the Event Driven Fund for the period from inception through June 30, 2014:
Active Income Fund | Select Credit Fund | Event Driven Fund | ||||||||||||||
| Purchases | $ | — | Purchases | $ | — | Purchases | $ | — | ||||||||
| Sales | $ | — | Sales | $ | — | Sales | $ | — | ||||||||
E. RESTRICTED SECURITIES
Restricted securities are securities that are not registered for sale under the Securities Act of 1933 or applicable foreign law and that may be re-sold only in transactions exempt from applicable registration. Restricted securities include Rule 144A securities which may be sold normally to qualified institutional buyers. At June 30, 2014, the Funds held restricted securities as denoted on the Schedule of Investments.
F. SHAREHOLDER SERVICING AGREEMENTS
The Active Income Fund and Select Credit Fund have a Shareholder Servicing Agreement (the “Agreement”) in place with a shareholder. Under the terms of this Agreement, the Active Income Fund and Select Credit Fund make payments for services provided on behalf of the Active Income Fund and Select Credit Fund. Such services may include, but shall not be limited to: transfer agent and sub-transfer agent services; aggregating and processing purchase and redemption orders; providing periodic statements; receiving and transmitting funds; processing dividend payments; providing sub-accounting services; forwarding shareholder communications; receiving, tabulating and transmitting proxies; responding to inquiries and
55
Table of Contents
Driehaus Mutual Funds
Notes to Financial Statements (unaudited) — (Continued)
performing such other related services as the Active Income Fund and Select Credit Fund may request. The Shareholder Services Plan allows for annual payments not to exceed 0.25% of average daily net assets of the Funds. For the period January 1, 2014 through June 30, 2014, the Active Income Fund and Select Credit Fund had expenses of $224,341 and $8,876, respectively, under the terms of this Agreement with this shareholder.
56
Table of Contents
As a mutual fund shareholder, you may incur two types of costs: (1) transaction costs, including sales charges; redemption fees; and exchange fees and (2) ongoing costs, including management fees; distribution (12b-1) and/or service fees; and other fund expenses. This example is intended to help you understand your ongoing costs (in dollars) of investing in the Fund and to compare these costs with the ongoing costs of investing in other mutual funds.
The example is based on an investment of $1,000 invested at the beginning of the period and held for the entire six month period ended June 30, 2014.
Actual Expenses
The first line of the table below (“Actual”) provides information about actual account values and actual expenses. You may use the information in this line, together with the amount you invested, to estimate the expense that you paid over the period. Simply divide your account value by $1,000 (for example, an $8,600 account value divided by $1,000 = 8.6), then multiply the result by the number in the first line under the heading entitled “Expenses Paid During Period” to estimate the expenses you paid on your account during this period.
Hypothetical Example for Comparison Purposes
The second line of the tables below (“Hypothetical”) provides information about hypothetical account values and hypothetical expenses based on the Fund’s actual expense ratio and an assumed rate of return of 5% per year before expenses, which is not the Fund’s actual return. You may use this information to compare the ongoing costs of investing in the Fund versus other funds. To do so, compare this 5% hypothetical example with the 5% hypothetical examples that appear in the shareholder reports of the other funds.
Please note that the expenses shown in the table are meant to highlight your ongoing costs only and do not reflect any transactional costs, such as sales charges, redemption fees or exchange fees. Therefore, the second line of the table is useful in comparing ongoing costs only, and will not help you determine the relative total costs of owning different funds. In addition, if these transactional costs were included, your costs would have been higher.
Driehaus Active Income Fund
Beginning Account Value January 1, 2014 | Ending Account Value June 30, 2014 | Expenses Paid During Six Months Ended June 30, 2014* | ||||||||||
Actual | $ | 1,000.00 | $ | 1,007.90 | $ | 5.18 | ||||||
Hypothetical Example, assuming a 5% return before expenses | $ | 1,000.00 | $ | 1,019.64 | $ | 5.21 | ||||||
Driehaus Select Credit Fund
Beginning Account Value January 1, 2014 | Ending Account Value June 30, 2014 | Expenses Paid During Six Months Ended June 30, 2014* | ||||||||||
Actual | $ | 1,000.00 | $ | 1,010.50 | $ | 6.73 | ||||||
Hypothetical Example, assuming a 5% return before expenses | $ | 1,000.00 | $ | 1,018.10 | $ | 6.76 | ||||||
57
Table of Contents
Fund Expense Examples — (Continued)
Driehaus Event Driven Fund
Beginning Account Value January 1, 2014 | Ending Account Value June 30, 2014 | Expenses Paid During Six Months Ended June 30, 2014* | ||||||||||
Actual | $ | 1,000.00 | $ | 1,029.80 | $ | 8.15 | ||||||
Hypothetical Example, assuming a 5% return before expenses | $ | 1,000.00 | $ | 1,016.76 | $ | 8.10 | ||||||
| * | Expenses are equal to the Funds’ annualized expense ratios for the six-month period in the table below multiplied by the average account value over the period, multiplied by the number of days in the most recent fiscal half-year (181), then divided by 365 to reflect the half-year period. |
Driehaus Active Income Fund | 1.04% | |
Driehaus Select Credit Fund | 1.35% | |
Driehaus Event Driven Fund | 1.62% |
58
Table of Contents
| Item 2. | Code of Ethics. |
Not applicable.
| Item 3. | Audit Committee Financial Expert. |
Not applicable.
| Item 4. | Principal Accountant Fees and Services. |
Not applicable.
| Item 5. | Audit Committee of Listed Registrants. |
Not applicable.
| Item 6. | Investments. |
| (a) | Schedule of Investments in securities of unaffiliated issuers as of the close of the reporting period is included as part of the report to shareholders filed under Item 1 of this form. |
| (b) | Not applicable. |
| Item 7. | Disclosure of Proxy Voting Policies and Procedures for Closed-End Management Investment Companies. |
Not applicable.
| Item 8. | Portfolio Managers of Closed-End Management Investment Companies. |
Not applicable.
| Item 9. | Purchases of Equity Securities by Closed-End Management Investment Company and Affiliated Purchasers. |
Not applicable.
Table of Contents
| Item 10. | Submission of Matters to a Vote of Security Holders. |
There have been no material changes to the procedures by which the shareholders may recommend nominees to the registrant’s board of directors, where those changes were implemented after the registrant last provided disclosure in response to the requirements of Item 407(c)(2)(iv) of Regulation S-K (17 CFR 229.407) (as required by Item 22(b)(15) of Schedule 14A (17 CFR 240.14a-101)), or this Item.
| Item 11. | Controls and Procedures. |
| (a) | The registrant’s principal executive and principal financial officers, or persons performing similar functions, have concluded that the registrant’s disclosure controls and procedures (as defined in Rule 30a-3(c) under the Investment Company Act of 1940, as amended (the “1940 Act”) (17 CFR 270.30a-3(c))) are effective, as of a date within 90 days of the filing date of the report that includes the disclosure required by this paragraph, based on their evaluation of these controls and procedures required by Rule 30a-3(b) under the 1940 Act (17 CFR 270.30a-3(b)) and Rules 13a-15(b) or 15d-15(b) under the Securities Exchange Act of 1934, as amended (17 CFR 240.13a-15(b) or 240.15d-15(b)). |
| (b) | There were no changes in the registrant’s internal control over financial reporting (as defined in Rule 30a-3(d) under the 1940 Act (17 CFR 270.30a-3(d)) that occurred during the registrant’s second fiscal quarter of the period covered by this report that has materially affected, or is reasonably likely to materially affect, the registrant’s internal control over financial reporting. |
| Item 12. | Exhibits. |
| (a)(1) | Not applicable. |
| (a)(2) | Certifications pursuant to Rule 30a-2(a) under the 1940 Act and Section 302 of the Sarbanes-Oxley Act of 2002 are attached hereto. |
| (a)(3) | Not applicable. |
| (b) | Certifications pursuant to Rule 30a-2(b) under the 1940 Act and Section 906 of the Sarbanes-Oxley Act of 2002 are attached hereto. |
Table of Contents
SIGNATURES
Pursuant to the requirements of the Securities Exchange Act of 1934 and the Investment Company Act of 1940, the registrant has duly caused this report to be signed on its behalf by the undersigned, thereunto duly authorized.
| (registrant) | Driehaus Mutual Funds | |
| By (Signature and Title)* | /s/ Robert H. Gordon | |
| Robert H. Gordon, President | ||
| (principal executive officer) | ||
| Date September 4, 2014 | ||
Pursuant to the requirements of the Securities Exchange Act of 1934 and the Investment Company Act of 1940, this report has been signed below by the following persons on behalf of the registrant and in the capacities and on the dates indicated.
| By (Signature and Title)* | /s/ Robert H. Gordon | |
| Robert H. Gordon, President | ||
| (principal executive officer) | ||
Date September 4, 2014 | ||
| By (Signature and Title)* | /s/ Michelle L. Cahoon | |
| Michelle L. Cahoon, Vice President and Treasurer | ||
| (principal financial officer) | ||
Date September 4, 2014 | ||
| * | Print the name and title of each signing officer under his or her signature. |