UNITED STATES
SECURITIES AND EXCHANGE COMMISSION
Washington, D.C. 20549
FORM N-CSR
CERTIFIED SHAREHOLDER REPORT OF REGISTERED
MANAGEMENT INVESTMENT COMPANIES
Investment Company Act file number 811-07655
Driehaus Mutual Funds
(Exact name of registrant as specified in charter)
25 East Erie Street
Chicago, IL 60611
(Address of principal executive offices) (Zip code)
Janet L. McWilliams
Driehaus Capital Management LLC
25 East Erie Street
Chicago, IL 60611
(Name and address of agent for service)
Registrant’s telephone number, including area code: 312-587-3800
Date of fiscal year end: December 31
Date of reporting period: June 30, 2016
Form N-CSR is to be used by management investment companies to file reports with the Commission not later than 10 days after the transmission to stockholders of any report that is required to be transmitted to stockholders under Rule 30e-1 under the Investment Company Act of 1940 (17 CFR 270.30e-1). The Commission may use the information provided on Form N-CSR in its regulatory, disclosure review, inspection, and policymaking roles.
A registrant is required to disclose the information specified by Form N-CSR, and the Commission will make this information public. A registrant is not required to respond to the collection of information contained in Form N-CSR unless the Form displays a currently valid Office of Management and Budget (“OMB”) control number. Please direct comments concerning the accuracy of the information collection burden estimate and any suggestions for reducing the burden to Secretary, Securities and Exchange Commission, 100 F Street, NE, Washington, DC 20549. The OMB has reviewed this collection of information under the clearance requirements of 44 U.S.C. § 3507.
| Item 1. | Reports to Stockholders. |
The Reports to Shareholders are attached herewith.
Driehaus Mutual Funds
Trustees & Officers
Richard H. Driehaus
Trustee
Theodore J. Beck
Trustee
Francis J. Harmon
Trustee
Christopher J. Towle
Trustee
Dawn M. Vroegop
Trustee
Daniel F. Zemanek
Chairman of the Board
Robert H. Gordon
President
Michelle L. Cahoon
Vice President & Treasurer
Janet L. McWilliams
Chief Legal Officer &
Assistant Vice President
Michael R. Shoemaker
Chief Compliance Officer &
Assistant Vice President
William H. Wallace, III
Secretary
Michael P. Kailus
Assistant Secretary & Anti-Money
Laundering Compliance Officer
Christine Mason
Assistant Secretary
Investment Adviser
Driehaus Capital Management LLC
25 East Erie Street
Chicago, IL 60611
Distributor
Driehaus Securities LLC
25 East Erie Street
Chicago, IL 60611
Administrator & Transfer Agent
BNY Mellon Investment Servicing (US) Inc.
4400 Computer Drive
Westborough, MA 01581
Custodian
The Northern Trust Company
50 South LaSalle Street
Chicago, IL 60603
Semi-Annual Report to Shareholders
June 30, 2016

Driehaus Emerging Markets Growth Fund
Driehaus Emerging Markets Small Cap Growth Fund
Driehaus Frontier Emerging Markets Fund
Driehaus International Small Cap Growth Fund
Driehaus Micro Cap Growth Fund
Distributed by:
Driehaus Securities LLC
This report has been prepared for the shareholders of the Funds and is not an offer to sell or buy any Fund securities. Such offer is only made by the Funds’ prospectus.
Semi-Annual Report to Shareholders
June 30, 2016
Investment Philosophy:
The Adviser seeks to achieve superior investment returns primarily by investing in global companies that are currently demonstrating rapid growth in their sales and earnings and which, in its judgment, have the ability to continue or accelerate their growth rates in the future. The Adviser manages the portfolios actively (above average turnover) to ensure that the Funds are fully invested, under appropriate market conditions, in companies that meet these criteria. Investors should note that investments in overseas markets can pose more risks than U.S. investments, and the international Funds’ share prices are expected to be more volatile than those of the U.S.-only Funds. In addition, the Funds’ returns will fluctuate with changes in stock market conditions, currency values, interest rates, government regulations, and economic and political conditions in countries in which the Funds invest. These risks are generally greater when investing in emerging markets.
Driehaus Emerging Markets Growth Fund
Driehaus Emerging Markets Small Cap Growth Fund
Driehaus Frontier Emerging Markets Fund
Driehaus International Small Cap Growth Fund
Driehaus Micro Cap Growth Fund
Performance Overview and Schedule of Investments: | ||||
| 1 | ||||
| 6 | ||||
| 13 | ||||
| 19 | ||||
| 24 | ||||
| 30 | ||||
| 32 | ||||
| 34 | ||||
| 36 | ||||
| 41 | ||||
| 54 | ||||
PROXY VOTING POLICIES AND PROCEDURES AND PROXY VOTING RECORD
A description of the Funds’ policies and procedures with respect to the voting of proxies relating to the Funds’ portfolio securities is available without charge, upon request, by calling 1-800-560-6111. This information is also available on the Funds’ website at http://www.driehaus.com.
Information regarding how the Funds voted proxies related to portfolio securities during the 12-month period ended June 30, 2016 is available without charge, upon request, by calling 1-800-560-6111. This information is also available on the Securities and Exchange Commission’s (“SEC”) website at http://www.sec.gov.
HOW TO OBTAIN QUARTERLY PORTFOLIO HOLDINGS
Each Fund files a complete schedule of portfolio holdings with the SEC for the first and third quarters of each fiscal year on Form N-Q. The Funds’ Form N-Q is available electronically on the SEC’s website at http://www.sec.gov; hard copies may be reviewed and copied at the SEC’s Public Reference Room in Washington, DC 20549. For more information on the Public Reference Room, call 1-800-SEC-0330. Each Fund’s complete schedule of portfolio holdings is also available on the Fund’s website at http://www.driehaus.com.
Driehaus Emerging Markets Growth Fund
Performance Overview (unaudited)
The performance summarized below is historical and does not represent future results. Investment returns and principal value vary, and you may have a gain or loss when you sell shares. Performance data presented measures the change in the value of an investment in the Fund, assuming reinvestment of all dividends and capital gains. Average annual total return reflects annualized change.
The table does not reflect the deduction of taxes that a shareholder would pay on Fund distributions or the redemption of Fund shares. The graph compares the results of a $10,000 investment in the Fund since December 31, 1997 (the date of the Fund’s inception), with all dividends and capital gains reinvested, with the indicated indices (and dividends reinvested) for the same period.
| Average Annual Total Returns as of 6/30/16 | 1 Year | 3 Years | 5 Years | 10 Years | Since Inception (12/31/97 - 6/30/16) | |||||||||||||||
Driehaus Emerging Markets Growth Fund (DREGX)1 | –9.17% | –1.09% | –0.51% | 5.26% | 11.18% | |||||||||||||||
MSCI Emerging Markets Index-G2 | –11.71% | –1.21% | –3.44% | 3.88% | 6.64% | |||||||||||||||
MSCI Emerging Markets Growth Index-G3 | –9.60% | 0.33% | –1.86% | 3.96% | 6.25% | |||||||||||||||
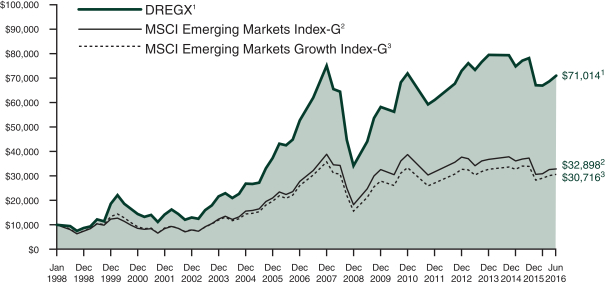
| 1 | The returns for the periods prior to July 1, 2003, reflect fee waivers and/or reimbursements without which performance would have been lower. |
| 2 | The Morgan Stanley Capital International Emerging Markets Index-Gross (MSCI Emerging Markets Index-G) is a market capitalization-weighted index designed to measure equity market performance in emerging markets. Data is in U.S. dollars and is calculated with gross dividend reinvestment. Source: Morgan Stanley Capital International Inc. |
| 3 | The Morgan Stanley Capital International Emerging Markets Growth Index-Gross (MSCI Emerging Markets Growth Index-G) is a subset of the MSCI Emerging Markets Index and includes only the MSCI Emerging Markets Index stocks which are categorized as growth stocks. Data is in U.S. dollars and is calculated with gross dividend reinvestment. Source: Morgan Stanley Capital International Inc. |
1
Driehaus Emerging Markets Growth Fund
Schedule of Investments
June 30, 2016 (unaudited)
| Number of Shares | Value (Note A) | |||||||
| EQUITY SECURITIES — 91.9% | ||||||||
| FAR EAST — 54.2% | ||||||||
China — 22.9% |
| |||||||
AIA Group, Ltd. | 7,276,301 | $ | 43,757,673 | |||||
Alibaba Group Holding, Ltd. — SP ADR** | 395,201 | 31,430,336 | ||||||
Baidu, Inc. — SP ADR** | 53,365 | 8,813,230 | ||||||
China Biologic Products Inc.** | 54,748 | 5,820,807 | ||||||
China Longyuan Power Group Corp. — H | 1,949,509 | 1,627,453 | ||||||
China Mobile, Ltd. | 1,644,523 | 19,001,173 | ||||||
China Petroleum & Chemical Corp. — H | 20,708,830 | 14,964,598 | ||||||
CNOOC, Ltd. | 13,853,021 | 17,291,613 | ||||||
Ctrip.com International, Ltd. — ADR** | 151,109 | 6,225,691 | ||||||
Hong Kong Exchanges & Clearing, Ltd. | 420,020 | 10,234,025 | ||||||
Inner Mongolia Yili Industrial Group Co., Ltd. | 4,240,938 | 10,659,417 | ||||||
Kweichow Moutai Co., Ltd. — A | 725,508 | 31,922,449 | ||||||
New Oriental Education & Technology Group, Inc. — SP ADR | 236,003 | 9,883,806 | ||||||
Sands China, Ltd. | 5,738,029 | 19,417,000 | ||||||
SINA Corp.** | 253,608 | 13,154,647 | ||||||
Sinopharm Group Co., Ltd. — H | 2,502,124 | 12,019,426 | ||||||
Sunny Optical Technology Group Co., Ltd. | 1,599,567 | 5,631,833 | ||||||
Tencent Holdings, Ltd. | 3,004,372 | 68,919,312 | ||||||
|
| |||||||
| 330,774,489 | ||||||||
|
| |||||||
India — 9.4% |
| |||||||
HDFC Bank, Ltd. — ADR | 882,328 | 58,542,463 | ||||||
ITC, Ltd. | 1,422,589 | 7,788,518 | ||||||
Larsen & Toubro, Ltd. | 475,784 | 10,596,486 | ||||||
Petronet LNG, Ltd. | 1,734,907 | 7,578,647 | ||||||
Power Grid Corp. of India, Ltd. | 8,865,914 | 21,466,232 | ||||||
Sun Pharmaceutical Industries, Ltd. | 497,078 | 5,636,060 | ||||||
UltraTech Cement, Ltd. | 161,199 | 8,169,934 | ||||||
Yes Bank, Ltd. | 467,464 | 7,702,116 | ||||||
Zee Entertainment Enterprises, Ltd. | 1,180,989 | 8,016,306 | ||||||
|
| |||||||
| 135,496,762 | ||||||||
|
| |||||||
Taiwan — 8.0% |
| |||||||
Airtac International Group | 628,732 | 4,691,652 | ||||||
Basso Industry Corp.1 | 2,270,471 | 6,466,767 | ||||||
Egis Technology Inc.** | 555,805 | 2,690,320 | ||||||
Ennoconn Corp. | 759,589 | 10,207,217 | ||||||
| Number of Shares | Value (Note A) | |||||||
Far EasTone Telecommunications Co., Ltd. | 4,206,442 | $ | 10,185,468 | |||||
Hon Hai Precision Industry Co., Ltd. | 4,944,242 | 12,737,776 | ||||||
President Chain Store Corp. | 1,630,311 | 12,738,201 | ||||||
St. Shine Optical Co., Ltd. | 332,080 | 7,504,385 | ||||||
Sunny Friend Environmental Technology Co., Ltd. | 2,306,695 | 10,928,155 | ||||||
Taiwan Semiconductor Manufacturing Co., Ltd. — SP ADR | 1,447,635 | 37,971,466 | ||||||
|
| |||||||
| 116,121,407 | ||||||||
|
| |||||||
South Korea — 7.0% |
| |||||||
Amorepacific Corp. | 34,165 | 12,879,844 | ||||||
CJ Korea Express Corp.** | 37,759 | 7,139,328 | ||||||
Hyundai Mobis Co., Ltd. | 5,859 | 1,289,000 | ||||||
Korea Aerospace Industries, Ltd. | 307,243 | 19,698,107 | ||||||
Macquarie Korea Infrastructure Fund1 | 948,708 | 7,223,015 | ||||||
Samsung Electronics Co., Ltd. — Pref. | 32,995 | 34,037,230 | ||||||
SK Hynix, Inc. | 669,106 | 19,040,740 | ||||||
|
| |||||||
| 101,307,264 | ||||||||
|
| |||||||
Indonesia — 3.3% |
| |||||||
PT Astra International Tbk | 23,227,381 | 13,094,711 | ||||||
PT Bank Central Asia Tbk | 15,250,096 | 15,441,605 | ||||||
PT Bumi Serpong Damai Tbk | 8,501,741 | 1,368,084 | ||||||
PT Telekomunikasi Indonesia Persero Tbk | 58,678,097 | 17,852,563 | ||||||
|
| |||||||
| 47,756,963 | ||||||||
|
| |||||||
Thailand — 1.9% |
| |||||||
Central Pattana PCL — NVDR | 4,498,576 | 7,665,325 | ||||||
CP ALL PCL — NVDR | 14,188,649 | 20,351,839 | ||||||
|
| |||||||
| 28,017,164 | ||||||||
|
| |||||||
Philippines — 1.2% |
| |||||||
Puregold Price Club, Inc. | 6,733,126 | 6,032,228 | ||||||
SM Prime Holdings, Inc. | 18,132,270 | 10,592,912 | ||||||
|
| |||||||
| 16,625,140 | ||||||||
|
| |||||||
Malaysia — 0.5% |
| |||||||
IHH Healthcare BHD | 4,249,690 | 6,962,270 | ||||||
|
| |||||||
Total FAR EAST | 783,061,459 | |||||||
|
| |||||||
Notes to Financial Statements are an integral part of this Schedule.
2
Driehaus Emerging Markets Growth Fund
Schedule of Investments
June 30, 2016 (unaudited)
| Number of Shares | Value (Note A) | |||||||
| SOUTH AMERICA — 12.3% | ||||||||
Brazil — 9.2% |
| |||||||
Ambev SA — ADR | 1,976,800 | $ | 11,682,888 | |||||
BRF SA | 461,868 | 6,448,582 | ||||||
CCR SA | 2,418,584 | 12,648,947 | ||||||
CETIP SA | 602,296 | 8,184,236 | ||||||
Cielo SA | 1,621,619 | 17,037,525 | ||||||
Estacio Participacoes SA | 1,063,983 | 5,600,957 | ||||||
Lojas Renner SA | 3,475,051 | 25,714,274 | ||||||
Qualicorp SA | 533,433 | 3,103,653 | ||||||
Telefonica Brasil SA — ADR | 243,087 | 3,305,983 | ||||||
Tractebel Energia SA | 1,444,881 | 17,236,198 | ||||||
Ultrapar Participacoes SA | 1,012,794 | 22,385,323 | ||||||
|
| |||||||
| 133,348,566 | ||||||||
|
| |||||||
Peru — 1.8% |
| |||||||
Credicorp, Ltd. | 173,909 | 26,839,376 | ||||||
Argentina — 1.3% |
| |||||||
MercadoLibre, Inc. | 64,403 | 9,059,570 | ||||||
Pampa Energia SA — SP ADR** | 145,058 | 3,965,886 | ||||||
YPF SA — SP ADR | 280,077 | 5,377,478 | ||||||
|
| |||||||
| 18,402,934 | ||||||||
|
| |||||||
Total SOUTH AMERICA | 178,590,876 | |||||||
|
| |||||||
| NORTH AMERICA — 11.1% | ||||||||
Mexico — 5.3% |
| |||||||
Fibra Uno Administracion SA de CV — REIT | 6,054,299 | 12,898,362 | ||||||
Fresnillo PLC | 73,389 | 1,616,144 | ||||||
Grupo Aeroportuario del Centro Norte SAB de CV | 746,513 | 4,448,646 | ||||||
Grupo Aeroportuario del Sureste SAB de CV —ADR | 32,000 | 5,105,600 | ||||||
Grupo Financiero Banorte SAB de CV — O | 3,306,618 | 18,480,476 | ||||||
Kimberly-Clark de Mexico SAB de CV — A | 3,638,763 | 8,596,075 | ||||||
Wal-Mart de Mexico SAB de CV | 10,598,613 | 25,495,732 | ||||||
|
| |||||||
| 76,641,035 | ||||||||
|
| |||||||
United States — 5.2% |
| |||||||
Facebook, Inc. — A** | 97,597 | 11,153,385 | ||||||
Freeport-McMoRan, Inc. | 643,874 | 7,172,756 | ||||||
Kansas City Southern | 183,949 | 16,571,965 | ||||||
Philip Morris International, Inc. | 138,698 | 14,108,361 | ||||||
PriceSmart, Inc. | 92,099 | 8,617,703 | ||||||
Schlumberger, Ltd. | 216,826 | 17,146,600 | ||||||
|
| |||||||
| 74,770,770 | ||||||||
|
| |||||||
| Number of Shares | Value (Note A) | |||||||
Canada — 0.6% |
| |||||||
SEMAFO, Inc.** | 1,931,670 | $ | 9,269,983 | |||||
|
| |||||||
Total NORTH AMERICA | 160,681,788 | |||||||
|
| |||||||
| EUROPE — 10.3% | ||||||||
Russia — 3.6% |
| |||||||
Moscow Exchange MICEX- RTS PJSC | 8,008,826 | 14,092,353 | ||||||
Sberbank of Russia PJSC — SP ADR | 1,984,406 | 17,404,157 | ||||||
Yandex NV — A** | 933,708 | 20,401,520 | ||||||
|
| |||||||
| 51,898,030 | ||||||||
|
| |||||||
United Kingdom — 2.3% |
| |||||||
BGEO Group PLC | 234,048 | 8,196,881 | ||||||
Unilever NV | 546,499 | 25,417,571 | ||||||
|
| |||||||
| 33,614,452 | ||||||||
|
| |||||||
Turkey — 1.3% |
| |||||||
KOC Holding AS | 3,985,710 | 18,227,646 | ||||||
Hungary — 1.2% |
| |||||||
OTP Bank PLC | 158,621 | 3,549,522 | ||||||
Richter Gedeon Nyrt | 705,545 | 14,033,360 | ||||||
|
| |||||||
| 17,582,882 | ||||||||
|
| |||||||
France — 0.9% |
| |||||||
LVMH Moet Hennessy Louis Vuitton SE | 86,869 | 13,094,233 | ||||||
Greece — 0.6% |
| |||||||
Hellenic Telecommunications Organization SA | 961,857 | 8,788,221 | ||||||
Switzerland — 0.4% |
| |||||||
Coca-Cola HBC AG | 299,227 | 6,054,739 | ||||||
|
| |||||||
Total EUROPE | 149,260,203 | |||||||
|
| |||||||
| AFRICA — 2.3% | ||||||||
South Africa — 1.9% |
| |||||||
Anglo American Platinum, Ltd.** | 278,611 | 6,965,363 | ||||||
Mr. Price Group, Ltd. | 462,509 | 6,498,385 | ||||||
Sanlam, Ltd. | 3,391,412 | 14,010,628 | ||||||
|
| |||||||
| 27,474,376 | ||||||||
|
| |||||||
Egypt — 0.4% |
| |||||||
Commercial International Bank Egypt SAE | 1,271,321 | 5,723,380 | ||||||
|
| |||||||
Total AFRICA | 33,197,756 | |||||||
|
| |||||||
| MIDDLE EAST — 1.7% | ||||||||
United Arab Emirates — 1.3% |
| |||||||
DP World, Ltd. | 471,774 | 7,841,745 | ||||||
Emaar Properties PJSC | 6,012,213 | 10,226,220 | ||||||
|
| |||||||
| 18,067,965 | ||||||||
|
| |||||||
Notes to Financial Statements are an integral part of this Schedule.
3
Driehaus Emerging Markets Growth Fund
Schedule of Investments
June 30, 2016 (unaudited)
| Number of Shares | Value (Note A) | |||||||
Pakistan — 0.4% |
| |||||||
Maple Leaf Cement Factory, Ltd.1 | 6,126,834 | $ | 6,186,010 | |||||
|
| |||||||
Total MIDDLE EAST | 24,253,975 | |||||||
|
| |||||||
Total EQUITY SECURITIES (Cost $1,155,863,963) | 1,329,046,057 | |||||||
|
| |||||||
| ||||||||
| RIGHTS — 0.0% | ||||||||
| FAR EAST — 0.0% | ||||||||
Taiwan — 0.0% |
| |||||||
Ennoconn Corp Expires July, 2016** | 38,453 | 54,224 | ||||||
|
| |||||||
Total FAR EAST | 54,224 | |||||||
|
| |||||||
Total RIGHTS | 54,224 | |||||||
|
| |||||||
| ||||||||
| EXCHANGE-TRADED FUNDS — 0.7% | ||||||||
| NORTH AMERICA — 0.7% | ||||||||
United States — 0.7% |
| |||||||
VanEck Vectors Vietnam ETF | 668,458 | 9,766,171 | ||||||
|
| |||||||
Total NORTH AMERICA | 9,766,171 | |||||||
|
| |||||||
Total EXCHANGE-TRADED FUNDS | 9,766,171 | |||||||
|
| |||||||
| ||||||||
TOTAL INVESTMENTS (COST $1,165,675,653) | 92.6 | % | $ | 1,338,866,452 | ||||
Other Assets In Excess Of Liabilities | 7.4 | % | 106,609,802 | |||||
|
|
|
| |||||
Net Assets | 100.0 | % | $ | 1,445,476,254 | ||||
| ||||||||
The federal income tax basis and unrealized appreciation (depreciation) for all investments is as follows:
Basis: | $ | 1,179,493,625 | ||
|
| |||
Gross Appreciation | $ | 181,972,139 | ||
Gross Depreciation | (22,599,312 | ) | ||
|
| |||
Net Appreciation | $ | 159,372,827 | ||
|
|
| 1 | Pursuant to procedures adopted by Driehaus Mutual Funds’ (the “Trust”) Board of Trustees, this security has been determined to be illiquid by Driehaus Capital Management LLC (the “Adviser”), the Fund’s investment adviser. |
| ** | Non-income producing security |
ADR — American Depository Receipt
NVDR — Non-Voting Depository Receipt
REIT — Real Estate Investment Trust
SP ADR — Sponsored American Depository Receipt
Regional Weightings*
Asia/Far East Ex-Japan | 54.2% | |||
South America | 12.3% | |||
North America | 11.8% | |||
Eastern Europe | 6.1% | |||
Western Europe | 4.2% | |||
Africa | 2.3% | |||
Middle East | 1.7% |
Top Ten Holdings*
Tencent Holdings, Ltd. | 4.8% | |||
HDFC Bank, Ltd. — ADR | 4.1% | |||
AIA Group, Ltd. | 3.0% | |||
Taiwan Semiconductor Manufacturing Co., Ltd. — SP ADR | 2.6% | |||
Samsung Electronics Co., Ltd. — Pref. | 2.3% | |||
Alibaba Group Holding, Ltd. — SP ADR | 2.2% | |||
Kweichow Moutai Co., Ltd. — A | 2.2% | |||
Credicorp, Ltd. | 1.9% | |||
Lojas Renner SA | 1.8% | |||
Wal-Mart de Mexico SAB de CV | 1.8% |
| * | All percentages are stated as a percent of net assets at June 30, 2016. |
Notes to Financial Statements are an integral part of this Schedule.
4
Driehaus Emerging Markets Growth Fund
Schedule of Investments
June 30, 2016 (unaudited)
Industry | Percent of Net Assets | |||
Aerospace & Defense | 1.4% | |||
Auto Components | 0.1% | |||
Automobiles | 0.9% | |||
Beverages | 3.4% | |||
Biotechnology | 0.4% | |||
Capital Markets | 1.1% | |||
Commercial Banks | 11.2% | |||
Commercial Services & Supplies | 0.7% | |||
Computers & Peripherals | 0.7% | |||
Construction & Engineering | 0.7% | |||
Construction Materials | 1.0% | |||
Diversified Consumer Services | 1.1% | |||
Diversified Financial Services | 1.7% | |||
Diversified Telecommunication Services | 2.1% | |||
Electric Utilities | 1.8% | |||
Electronic Equipment, Instruments & Components | 1.5% | |||
Energy Equipment & Services | 1.2% | |||
Food & Staples Retailing | 5.1% | |||
Food Products | 2.9% | |||
Health Care Equipment & Supplies | 0.5% | |||
Health Care Providers & Services | 1.5% | |||
Hotels, Restaurants & Leisure | 1.3% | |||
Household Durables | 0.4% | |||
Household Products | 0.6% | |||
Independent Power Producers & Energy Traders | 1.3% | |||
Industry | Percent of Net Assets | |||
Industrial Conglomerates | 1.3% | |||
Insurance | 4.0% | |||
Internet & Catalog Retail | 0.4% | |||
Internet Software & Services | 11.3% | |||
Information Technology Services | 1.2% | |||
Machinery | 0.3% | |||
Media | 0.5% | |||
Metals & Mining | 1.7% | |||
Multiline Retail | 1.8% | |||
Oil, Gas & Consumable Fuels | 4.7% | |||
Other | 0.7% | |||
Personal Products | 0.9% | |||
Pharmaceuticals | 1.4% | |||
Real Estate Investment Trusts | 0.9% | |||
Real Estate Management & Development | 2.1% | |||
Road & Rail | 1.6% | |||
Semiconductors & Semiconductor Equipment | 6.3% | |||
Specialty Retail | 0.4% | |||
Textiles, Apparel & Luxury Goods | 0.9% | |||
Tobacco | 1.5% | |||
Transportation Infrastructure | 2.1% | |||
Wireless Telecommunication Services | 2.0% | |||
Other Assets in Excess of Liabilities | 7.4% | |||
|
| |||
TOTAL | 100.0% | |||
|
| |||
Notes to Financial Statements are an integral part of this Schedule.
5
Driehaus Emerging Markets Small Cap Growth Fund
Performance Overview (unaudited)
The performance summarized below is historical and does not represent future results. Investment returns and principal value vary, and you may have a gain or loss when you sell shares. Performance data presented measures the change in the value of an investment in the Fund, assuming reinvestment of all dividends and capital gains. Average annual total return reflects annualized change.
The table does not reflect the deduction of taxes that a shareholder would pay on Fund distributions or the redemption of Fund shares. The graph compares the results of a $10,000 investment in the Fund since December 1, 2008 (the date of the Predecessor Limited Partnership’s inception), with all dividends and capital gains reinvested, with the indicated indices (and dividends reinvested) for the same period.
| Fund Only | Including Predecessor Limited Partnership | |||||||||||||||||||
| Average Annual Total Returns as of 6/30/16 | 1 Year | 3 Years | Since Inception (8/22/11 - 6/30/16) | 5 Years | Since Inception (12/01/08 - 6/30/16) | |||||||||||||||
Driehaus Emerging Markets Small Cap Growth Fund (DRESX)1 | –18.55% | –1.26% | 3.40% | 1.55% | 12.38% | |||||||||||||||
MSCI Emerging Markets Small Cap Index-G2 | –12.50% | 0.28% | 0.60% | –1.99% | 13.92% | |||||||||||||||
MSCI Emerging Markets Index-G3 | –11.71% | –1.21% | –0.30% | –3.44% | 9.21% | |||||||||||||||
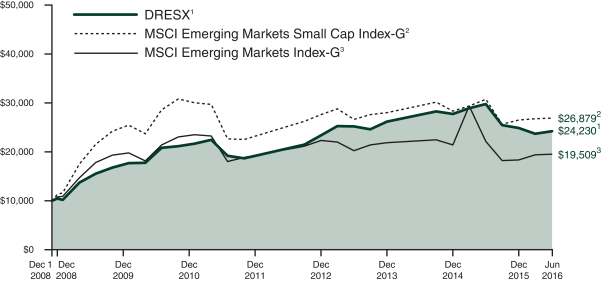
| 1 | The Driehaus Emerging Markets Small Cap Growth Fund (the “Fund”) performance shown above includes the performance of the Driehaus Emerging Markets Small Cap Growth Fund, L.P. (the “Predecessor Limited Partnership”), the Fund’s predecessor, for the periods before the Fund’s registration statement became effective. The Predecessor Limited Partnership, which was established on December 1, 2008, was managed with substantially the same investment objective, policies and philosophies as are followed by the Fund. The Fund succeeded to the Predecessor Limited Partnership’s assets on August 22, 2011. The Predecessor Limited Partnership was not registered under the Investment Company Act of 1940, as amended (“1940 Act”), and thus was not subject to certain investment and operational restrictions that are imposed by the 1940 Act. If the Predecessor Limited Partnership had been registered under the 1940 Act, its performance may have been adversely affected. The Predecessor Limited Partnership’s performance has been restated to reflect estimated expenses of the Fund. The returns for the periods prior to August 21, 2014, reflect fee waivers and/or reimbursements without which performance would have been lower. |
| 2 | The Morgan Stanley Capital International Emerging Markets Small Cap Index-Gross (MSCI Emerging Markets Small Cap Index-G) is a market capitalization-weighted index designed to measure equity market performance of small cap stocks in emerging markets. Data is in U.S. dollars and is calculated with gross dividend reinvestment. Source: Morgan Stanley Capital International Inc. |
| 3 | The Morgan Stanley Capital International Emerging Markets Index-Gross (MSCI Emerging Markets Index-G) is a market capitalization weighted index designed to measure equity market performance in emerging markets. Data is in U.S. dollars and is calculated with gross dividend reinvestment. Source: Morgan Stanley Capital International Inc. |
6
Driehaus Emerging Markets Small Cap Growth Fund
Schedule of Investments
June 30, 2016 (unaudited)
| Number of Shares | Value (Note A) | |||||||
| EQUITY SECURITIES — 97.3% | ||||||||
| FAR EAST — 69.9% | ||||||||
China — 14.9% |
| |||||||
AviChina Industry & Technology Co., Ltd. — H | 3,078,496 | $ | 2,150,826 | |||||
Brilliance China Automotive Holdings, Ltd. | 2,082,000 | 2,149,617 | ||||||
China Lodging Group, Ltd. — SP ADR2 | 178,398 | 6,499,039 | ||||||
CT Environmental Group, Ltd. | 15,040,150 | 4,375,737 | ||||||
Fu Shou Yuan International Group, Ltd. | 4,991,000 | 3,534,888 | ||||||
Geely Automobile Holdings, Ltd. | 9,505,000 | 5,184,426 | ||||||
Guangzhou R&F Properties Co., Ltd. — H | 3,040,079 | 3,853,925 | ||||||
IMAX China Holding, Inc.3** | 799,669 | 3,946,600 | ||||||
Lee & Man Paper Manufacturing, Ltd. | 7,470,305 | 5,580,881 | ||||||
Man Wah Holdings, Ltd. | 2,748,008 | 3,964,721 | ||||||
Minth Group, Ltd. | 1,408,000 | 4,560,508 | ||||||
Ningbo Joyson Electronic Corp. | 369,383 | 2,162,293 | ||||||
Silergy Corp. | 275,690 | 3,261,020 | ||||||
Sunny Optical Technology Group Co., Ltd. | 1,162,475 | 4,092,898 | ||||||
TAL Education Group —ADR2** | 35,192 | 2,184,016 | ||||||
Tongda Group Holdings, Ltd. | 10,439,112 | 2,050,921 | ||||||
Travelsky Technology, Ltd. — H | 1,043,000 | 2,016,350 | ||||||
|
| |||||||
| 61,568,666 | ||||||||
|
| |||||||
Taiwan — 14.6% |
| |||||||
Aerospace Industrial Develop Corp. | 1,566,000 | 2,148,041 | ||||||
Basso Industry Corp. | 982,600 | 2,798,646 | ||||||
Chin-Poon Industrial Co., Ltd | 1,993,636 | 4,315,210 | ||||||
Cub Elecparts, Inc. | 262,512 | 2,958,022 | ||||||
Eclat Textile Co., Ltd. | 151,000 | 1,464,372 | ||||||
Ennoconn Corp. | 556,015 | 7,471,627 | ||||||
FLEXium Interconnect, Inc. | 804,000 | 2,098,763 | ||||||
Gourmet Master Co., Ltd. | 401,708 | 3,555,953 | ||||||
Hermes Microvision, Inc. | 57,000 | 2,363,459 | ||||||
Hota Industrial | ||||||||
Manufacturing Co., Ltd. | 1,073,000 | 5,034,936 | ||||||
Land Mark Optoelectronics Corp. | 141,000 | 1,998,893 | ||||||
Nien Made Enterprise Co., Ltd.** | 465,000 | 4,242,337 | ||||||
Silicon Motion Technology Corp. — ADR2 | 90,847 | 4,342,487 | ||||||
| Number of Shares | Value (Note A) | |||||||
Sporton International, Inc. | 264,000 | $ | 1,368,050 | |||||
Sunny Friend Environmental Technology Co., Ltd. | 1,350,610 | 6,398,625 | ||||||
Superalloy Industrial Co., Ltd | 387,940 | 2,047,444 | ||||||
Taiwan Paiho, Ltd.** | 786,000 | 2,117,296 | ||||||
Tung Thih Electronic Co., Ltd. | 208,000 | 3,349,089 | ||||||
|
| |||||||
| 60,073,250 | ||||||||
|
| |||||||
India — 13.8% |
| |||||||
ACC, Ltd. | 91,108 | 2,185,956 | ||||||
Bharat Financial Inclusion, Ltd.** | 922,220 | 10,157,328 | ||||||
Ceat, Ltd. | 122,950 | 1,534,238 | ||||||
City Union Bank, Ltd. | 124,166 | 214,451 | ||||||
Eicher Motors, Ltd. | 14,892 | 4,253,738 | ||||||
Emami, Ltd. | 206,313 | 3,372,455 | ||||||
GRUH Finance, Ltd. | 337,000 | 1,435,823 | ||||||
Havells India, Ltd. | 962,722 | 5,146,388 | ||||||
Kajaria Ceramics, Ltd. | 71,441 | 1,279,854 | ||||||
LIC Housing Finance, Ltd. | 279,894 | 2,059,855 | ||||||
Max India Ltd/New1** | 282,998 | 245,983 | ||||||
Max Ventures & Industries, Ltd.** | 56,599 | 52,997 | ||||||
Omkar Speciality Chemicals, Ltd.1 | 730,155 | 1,828,605 | ||||||
Petronet LNG, Ltd. | 1,956,446 | 8,546,402 | ||||||
PI Industries, Ltd. | 140,845 | 1,512,770 | ||||||
PVR, Ltd. | 130,828 | 1,962,865 | ||||||
TVS Motor Co., Ltd. | 260,706 | 1,199,794 | ||||||
Voltas, Ltd. | 404,974 | 1,941,909 | ||||||
WABCO India, Ltd. | 14,019 | 1,212,499 | ||||||
Wonderla Holidays, Ltd. | 262,511 | 1,580,858 | ||||||
Zee Entertainment | ||||||||
Enterprises, Ltd. | 770,916 | 5,232,817 | ||||||
|
| |||||||
| 56,957,585 | ||||||||
|
| |||||||
Thailand — 8.8% |
| |||||||
Asia Aviation PCL — NVDR | 29,197,100 | 5,204,554 | ||||||
Bangkok Chain Hospital PCL — NVDR | 6,668,100 | 2,358,640 | ||||||
Beauty Community PCL — NVDR | 13,895,169 | 3,271,143 | ||||||
Chularat Hospital PCL — NVDR | 28,923,916 | 2,556,659 | ||||||
Forth Smart Service PCL — NVDR | 2,734,900 | 1,247,185 | ||||||
IRPC PCL — NVDR | 28,307,800 | 3,848,934 | ||||||
KCE Electronics PCL — NVDR | 1,750,454 | 4,162,090 | ||||||
Land & Houses PCL — NVDR | 11,937,779 | 3,079,876 | ||||||
Muangthai Leasing PCL — NVDR | 2,364,633 | 1,336,978 | ||||||
Plan B Media PCL — NVDR | 7,241,111 | 1,094,958 | ||||||
Notes to Financial Statements are an integral part of this Schedule.
7
Driehaus Emerging Markets Small Cap Growth Fund
Schedule of Investments
June 30, 2016 (unaudited)
| Number of Shares | Value (Note A) | |||||||
Srisawad Power 1979 PCL — NVDR | 1,077,340 | $ | 1,169,554 | |||||
Star Petroleum Refining PCL — NVDR | 17,518,293 | 4,780,241 | ||||||
Supalai PCL — NVDR | 3,166,453 | 2,159,017 | ||||||
|
| |||||||
| 36,269,829 | ||||||||
|
| |||||||
South Korea — 8.0% |
| |||||||
Caregen Co., Ltd. | 27,546 | 2,829,228 | ||||||
Cell Biotech Co., Ltd. | 6,185 | 323,066 | ||||||
CJ CGV Co., Ltd. | 21,536 | 1,952,314 | ||||||
Hugel Inc.** | 18,408 | 5,106,223 | ||||||
Innocean Worldwide, Inc. | 55,020 | 3,896,361 | ||||||
Korea Aerospace Industries, Ltd. | 69,150 | 4,433,377 | ||||||
LG Life Sciences, Ltd.** | 66,554 | 4,196,105 | ||||||
Loen Entertainment, Inc.** | 24,095 | 1,538,195 | ||||||
Osstem Implant Co., Ltd.** | 65,843 | 4,484,937 | ||||||
Tera Semicon Co., Ltd.** | 205,707 | 4,368,160 | ||||||
|
| |||||||
| 33,127,966 | ||||||||
|
| |||||||
Philippines — 5.1% |
| |||||||
Cemex Holdings Philippines, Inc.3** | 7,390,597 | 1,688,696 | ||||||
Megaworld Corp. | 31,650,000 | 3,149,151 | ||||||
Metro Pacific Investments Corp. | 32,341,689 | 4,816,234 | ||||||
Metropolitan Bank & Trust Co. | 2,882,356 | 5,551,450 | ||||||
Security Bank Corp. | 962,020 | 3,935,591 | ||||||
Xurpas, Inc. | 5,588,300 | 1,990,606 | ||||||
|
| |||||||
| 21,131,728 | ||||||||
|
| |||||||
Indonesia — 3.5% |
| |||||||
PT Bank Tabungan Negara Tbk | 8,568,598 | 1,118,610 | ||||||
PT Bumi Serpong Damai Tbk | 16,804,284 | 2,704,113 | ||||||
PT Matahari Department Store Tbk | 2,760,794 | 4,207,750 | ||||||
PT Summarecon Agung Tbk | 30,284,137 | 4,187,875 | ||||||
PT Waskita Karya Persero Tbk | 10,971,216 | 2,129,842 | ||||||
|
| |||||||
| 14,348,190 | ||||||||
|
| |||||||
Malaysia — 1.2% |
| |||||||
Dialog Group BHD | 3,154,582 | 1,207,616 | ||||||
Top Glove Corp. BHD | 3,373,600 | 3,849,327 | ||||||
|
| |||||||
| 5,056,943 | ||||||||
|
| |||||||
Total FAR EAST | 288,534,157 | |||||||
|
| |||||||
| SOUTH AMERICA — 9.1% | ||||||||
Brazil — 6.6% |
| |||||||
EcoRodovias Infraestrutura E Logistica SA** | 1,082,359 | 2,813,466 | ||||||
| Number of Shares | Value (Note A) | |||||||
Equatorial Energia SA | 319,500 | $ | 4,846,756 | |||||
Iochpe-Maxion SA | 725,700 | 3,099,525 | ||||||
Lojas Renner SA | 1,569,366 | 11,612,810 | ||||||
Marcopolo SA** — Pref. | 2,835,292 | 2,118,327 | ||||||
Qualicorp SA | 479,374 | 2,789,123 | ||||||
|
| |||||||
| 27,280,007 | ||||||||
|
| |||||||
Argentina — 2.5% |
| |||||||
Grupo Financiero Galicia SA — ADR2 | 132,737 | 4,053,788 | ||||||
Pampa Energia SA — SP ADR2** | 230,521 | 6,302,444 | ||||||
|
| |||||||
| 10,356,232 | ||||||||
|
| |||||||
Total SOUTH AMERICA | 37,636,239 | |||||||
|
| |||||||
| NORTH AMERICA — 6.8% | ||||||||
Mexico — 4.3% |
| |||||||
Alsea SAB de CV | 548,804 | 2,089,247 | ||||||
Banregio Grupo Financiero SAB de CV | 211,461 | 1,220,242 | ||||||
Credito Real SAB de CV SOFOM ER | 951,100 | 1,820,780 | ||||||
Gentera SAB de CV | 1,758,044 | 3,149,229 | ||||||
Grupo Aeroportuario del Centro Norte SAB de CV — ADR2 | 46,529 | 2,207,336 | ||||||
Promotora y Operadora de Infraestructura SAB de CV | 315,344 | 3,881,226 | ||||||
Unifin Financiera SAB de | ||||||||
CV SOFOM ENR | 1,330,531 | 3,333,869 | ||||||
|
| |||||||
| 17,701,929 | ||||||||
|
| |||||||
Canada — 2.0% |
| |||||||
Gran Tierra Energy, Inc.2** | 599,773 | 2,027,234 | ||||||
SEMAFO, Inc.** | 1,283,828 | 6,161,023 | ||||||
|
| |||||||
| 8,188,257 | ||||||||
|
| |||||||
United States — 0.5% |
| |||||||
Bizlink Holding, Inc. | 358,000 | 2,208,694 | ||||||
|
| |||||||
Total NORTH AMERICA | 28,098,880 | |||||||
|
| |||||||
| AFRICA — 5.3% | ||||||||
South Africa — 2.7% |
| |||||||
Impala Platinum Holdings, Ltd.** | 833,126 | 2,684,271 | ||||||
Mr. Price Group, Ltd. | 106,511 | 1,496,510 | ||||||
Pioneer Foods Group, Ltd. | 251,336 | 2,949,218 | ||||||
The Spar Group, Ltd. | 298,804 | 4,098,208 | ||||||
|
| |||||||
| 11,228,207 | ||||||||
|
| |||||||
Egypt — 1.8% |
| |||||||
Commercial International Bank Egypt SAE — GDR | 1,136,233 | 4,051,476 | ||||||
Egyptian Financial Group- Hermes Holding Co.** | 1,534,035 | 1,844,931 | ||||||
Notes to Financial Statements are an integral part of this Schedule.
8
Driehaus Emerging Markets Small Cap Growth Fund
Schedule of Investments
June 30, 2016 (unaudited)
| Number of Shares | Value (Note A) | |||||||
Six of October Development & Investment Co.** | 1,333,134 | $ | 1,514,797 | |||||
|
| |||||||
| 7,411,204 | ||||||||
|
| |||||||
Kenya — 0.8% |
| |||||||
Safaricom, Ltd. | 17,370,800 | 3,062,318 | ||||||
|
| |||||||
Total AFRICA | 21,701,729 | |||||||
|
| |||||||
| EUROPE — 4.2% | ||||||||
Turkey — 1.9% |
| |||||||
Aselsan Elektronik Sanayi Ve Ticaret AS | 895,886 | 2,933,669 | ||||||
Coca-Cola Icecek AS | 56,340 | 688,223 | ||||||
Turk Traktor Ve Ziraat Makineleri AS | 70,783 | 2,067,016 | ||||||
Ulker Biskuvi Sanayi AS | 286,942 | 2,096,849 | ||||||
|
| |||||||
| 7,785,757 | ||||||||
|
| |||||||
Russia — 1.0% |
| |||||||
Moscow Exchange MICEX- RTS PJSC | 2,296,984 | 4,041,779 | ||||||
United Kingdom — 0.9% |
| |||||||
BGEO Group PLC | 53,207 | 1,863,427 | ||||||
Tullow Oil PLC** | 562,964 | 1,985,513 | ||||||
|
| |||||||
| 3,848,940 | ||||||||
|
| |||||||
Czech Republic — 0.4% |
| |||||||
Moneta Money Bank AS3** | 638,755 | 1,880,717 | ||||||
|
| |||||||
Total EUROPE | 17,557,193 | |||||||
|
| |||||||
| MIDDLE EAST — 2.0% | ||||||||
Pakistan — 2.0% |
| |||||||
Engro Foods, Ltd.** | 1,426,559 | 2,225,249 | ||||||
Lucky Cement, Ltd. | 377,200 | 2,339,309 | ||||||
Pak Elektron, Ltd. | 3,401,000 | 2,107,254 | ||||||
United Bank, Ltd. | 930,505 | 1,573,635 | ||||||
|
| |||||||
| 8,245,447 | ||||||||
|
| |||||||
Total MIDDLE EAST | 8,245,447 | |||||||
|
| |||||||
Total EQUITY SECURITIES (Cost $355,575,221) | 401,773,645 | |||||||
|
| |||||||
| ||||||||
| RIGHTS — 0.0% | ||||||||
| FAR EAST — 0.0% | ||||||||
Taiwan — 0.0% |
| |||||||
Ennoconn Corp Expires July, 2016 ** | 35,082 | 49,471 | ||||||
|
| |||||||
Total FAR EAST | 49,471 | |||||||
|
| |||||||
Total RIGHTS | 49,471 | |||||||
|
| |||||||
| ||||||||
| Number of Shares | Value (Note A) | |||||||
| PURCHASED PUT OPTIONS — 0.7% | ||||||||
Energy Select Sector SPDR ETF, Exercise Price $65.00, Expiration Date July, 2016** | 15,000 | $ | 420,000 | |||||
Industrial Select Sector SPDR ETF, Exercise Price $54.00, Expiration Date July, 2016** | 15,000 | 300,000 | ||||||
iShares China Large-Cap Index ETF, Exercise Price $32.00, Expiration Date July, 2016** | 10,000 | 120,000 | ||||||
iShares China Large-Cap Index ETF, Exercise Price $33.50, Expiration Date July, 2016** | 15,000 | 615,000 | ||||||
iShares MSCI Brazil Capped Index ETF, Exercise Price $26.00, Expiration Date July, 2016** | 15,000 | 90,000 | ||||||
iShares MSCI Brazil Capped Index ETF, Exercise Price $28.50, Expiration Date July, 2016** | 15,000 | 435,000 | ||||||
iShares MSCI Emerging Markets Index ETF, Exercise Price $32.50, Expiration Date July, 2016** | 15,000 | 210,000 | ||||||
iShares MSCI Emerging Markets Index ETF, Exercise Price $34.00, Expiration Date July, 2016** | 10,000 | 450,000 | ||||||
|
| |||||||
Total PURCHASED PUT OPTIONS | 2,640,000 | |||||||
|
| |||||||
| ||||||||
TOTAL INVESTMENTS | 98.0 | % | $ | 404,463,116 | ||||
Other Assets In Excess Of Liabilities | 2.0 | % | 8,453,746 | |||||
|
|
|
| |||||
Net Assets | 100.0 | % | $ | 412,916,862 | ||||
| ||||||||
| WRITTEN PUT OPTIONS — 0.0% | ||||||||
Industrial Select Sector SPDR ETF, Exercise Price $24.00, Expiration Date July, 2016** | (15,000 | ) | (30,000 | ) | ||||
|
| |||||||
Total WRITTEN PUT OPTIONS (Premiums received $784,377) | (30,000 | ) | ||||||
|
| |||||||
| ||||||||
Notes to Financial Statements are an integral part of this Schedule.
9
Driehaus Emerging Markets Small Cap Growth Fund
Schedule of Investments
June 30, 2016 (unaudited)
The federal income tax basis and unrealized appreciation (depreciation) for all investments is as follows:
Basis: | $ | 362,303,486 | ||
|
| |||
Gross Appreciation | $ | 52,646,888 | ||
Gross Depreciation | (10,487,258 | ) | ||
|
| |||
Net Appreciation | $ | 42,159,630 | ||
|
|
| 1 | Pursuant to procedures adopted by Driehaus Mutual Funds’ (the “Trust”) Board of Trustees, this security has been determined to be illiquid by Driehaus Capital Management LLC (the “Adviser”), the Fund’s investment adviser. |
| 2 | All or a portion of the security is pledged as collateral for derivatives transactions. |
| 3 | 144A — Security was purchased pursuant to Rule 144A under the Securities Act of 1933 and may not be resold subject to that rule except to qualified institutional buyers. As of June 30, 2016, these securities amounted to $7,516,013 or 1.8% of net assets. |
| ** | Non-income producing security |
ADR — American Depository Receipt
GDR — Global Depository Receipt
NVDR — Non-Voting Depository Receipt
SP ADR — Sponsored American Depository Receipt
Regional Weightings(a)(b)
Asia/Far East Ex-Japan | 69.9% | |||
South America | 9.1% | |||
North America | 6.8% | |||
Africa | 5.3% | |||
Eastern Europe | 3.3% | |||
Middle East | 2.0% | |||
Western Europe | 0.9% |
Top Ten Holdings(a)
Lojas Renner SA | 2.8% | |||
Bharat Financial Inclusion, Ltd. | 2.5% | |||
Petronet LNG, Ltd. | 2.1% | |||
Ennoconn Corp. | 1.8% | |||
China Lodging Group, Ltd. — SP ADR | 1.6% | |||
Sunny Friend Environmental Technology Co., Ltd. | 1.6% | |||
Pampa Energia SA — SP ADR | 1.5% | |||
SEMAFO, Inc. | 1.5% | |||
Lee & Man Paper Manufacturing, Ltd. | 1.4% | |||
Metropolitan Bank & Trust Co. | 1.3% |
| (a) | All percentages are stated as a percent of net assets at June 30, 2016. |
| (b) | Excludes purchased options. |
SWAP CONTRACTS
Credit Default Swaps
| Counterparty | Reference Instrument | Notional Amount(4) | Buy/Sell Protection(1)(2) | Pay (Receive) Fixed Rate | Expiration Date | Implied Credit Spread(3) | Upfront Premium Paid (Received) | Unrealized Appreciation (Depreciation) | Value | |||||||||||||||||||||
Goldman Sachs | Republic of Turkey, 11.875%, 1/15/30 | $ | 5,000,000 | Buy | 1.00% | 12/20/2020 | 2.22 | % | $ | 381,066 | $ | (124,254 | ) | $256,812 | ||||||||||||||||
Goldman Sachs | Republic of Turkey, 11.875%, 1/15/30 | $ | 5,000,000 | Buy | 1.00% | 12/20/2020 | 2.22 | % | 313,737 | (56,925 | ) | 256,812 | ||||||||||||||||||
Goldman Sachs | Republic of Turkey, 11.875%, 1/15/30 | $ | 5,000,000 | Buy | 1.00% | 6/20/2021 | 2.40 | % | 348,107 | (24,370 | ) | 323,737 | ||||||||||||||||||
Goldman Sachs | Republic of Turkey, 11.875%, 1/15/30 | $ | 3,500,000 | Buy | 1.00% | 6/20/2021 | 2.40 | % | 278,816 | (52,200 | ) | 226,616 | ||||||||||||||||||
|
|
|
|
| ||||||||||||||||||||||||||
Total Credit Default Swaps |
| $ | 1,321,726 | $ | (257,749 | ) | $1,063,977 | |||||||||||||||||||||||
|
|
|
|
| ||||||||||||||||||||||||||
Total Swap Contracts |
| $ | 1,321,726 | $ | (257,749 | ) | $1,063,977 | |||||||||||||||||||||||
|
|
|
|
| ||||||||||||||||||||||||||
| (1) | If the Fund is a buyer of protection and a credit event occurs, as defined under the terms of that particular swap agreement, the Fund will either (i) receive from the seller of protection an amount equal to the notional amount of the swap and deliver the referenced obligation or underlying investments comprising the referenced index or (ii) receive a net settlement amount in the form of cash or investments equal to the notional amount of the swap less the recovery value of the referenced obligation or underlying investments comprising the referenced index. |
Notes to Financial Statements are an integral part of this Schedule.
10
Driehaus Emerging Markets Small Cap Growth Fund
Schedule of Investments
June 30, 2016 (unaudited)
| (2) | If the Fund is a seller of protection and a credit event occurs, as defined under the terms of that particular swap agreement, the Fund will either (i) pay to the buyer of protection an amount equal to the notional amount of the swap and take delivery of the referenced obligation or underlying investments comprising the referenced index or (ii) pay a net settlement amount in the form of cash or investments equal to the notional amount of the swap less the recovery value of the referenced obligation or underlying investments comprising the referenced index. |
| (3) | An implied credit spread is the spread in yield between a U.S. Treasury security and the referenced obligation or underlying investment that are identical in all respects except for the quality rating. Implied credit spreads, represented in absolute terms, utilized in determining the value of credit default swap agreements on corporate and sovereign issues as of period end serve as an indicator of the current status of the payment/performance risk and represent the likelihood of risk of default for the credit derivative. The implied credit spread of a particular referenced entity reflects the cost of buying/selling protection and may include upfront payments required to be made to enter into the agreement. Wider credit spreads, in comparison to narrower credit spreads, represent a deterioration of the referenced entity’s credit soundness and a greater likelihood of risk of default or other credit event occurring as defined under the terms of the agreement. A credit spread identified as “Defaulted” indicates a credit event has occurred for the referenced entity or obligation. |
| (4) | The maximum potential amount the Fund could be required to pay as a seller of credit protection or receive as a buyer of credit protection if a credit event occurs as defined under the terms of that particular swap agreement. |
FORWARD FOREIGN CURRENCY EXCHANGE CONTRACTS
| Currency Purchased | Currency Sold | Counterparty | Settlement Date | Unrealized Appreciation (Depreciation) | ||||||||||||||||||||||
USD | 8,000,000 | TWD | 269,680,000 | GSC | 02/24/17 | $ | (397,826 | ) | ||||||||||||||||||
USD | 5,000,000 | KRW | 5,851,000,000 | GSC | 05/10/17 | (67,908 | ) | |||||||||||||||||||
USD | 10,000,000 | KRW | 11,819,000,000 | GSC | 05/18/17 | (237,124 | ) | |||||||||||||||||||
USD | 10,000,000 | TWD | 328,850,000 | GSC | 05/23/17 | (243,336 | ) | |||||||||||||||||||
|
| |||||||||||||||||||||||||
| $ | (946,194 | ) | ||||||||||||||||||||||||
|
| |||||||||||||||||||||||||
GSC — Goldman Sachs & Co.
KRW — South Korean Won
TWD — Taiwanese Dollar
USD — United States Dollar
Notes to Financial Statements are an integral part of this Schedule.
11
Driehaus Emerging Markets Small Cap Growth Fund
Schedule of Investments
June 30, 2016 (unaudited)
Industry | Percent of Net Assets | |||
Aerospace & Defense | 2.8% | |||
Airlines | 1.3% | |||
Auto Components | 5.5% | |||
Automobiles | 2.1% | |||
Beverages | 0.2% | |||
Biotechnology | 1.3% | |||
Building Products | 0.3% | |||
Capital Markets | 0.4% | |||
Chemicals | 0.8% | |||
Commercial Banks | 6.2% | |||
Commercial Services & Supplies | 1.6% | |||
Computers & Peripherals | 1.8% | |||
Construction & Engineering | 2.2% | |||
Construction Materials | 1.5% | |||
Consumer Finance | 5.1% | |||
Diversified Consumer Services | 1.4% | |||
Diversified Financial Services | 2.1% | |||
Electric Utilities | 2.7% | |||
Electrical Equipment | 2.3% | |||
Electronic Equipment, Instruments & Components | 4.0% | |||
Food & Staples Retailing | 1.0% | |||
Food Products | 1.8% | |||
Health Care Equipment & Supplies | 2.0% | |||
Health Care Providers & Services | 1.9% | |||
Hotels, Restaurants & Leisure | 3.3% | |||
Industry | Percent of Net Assets | |||
Household Durables | 2.7% | |||
Insurance | 0.1% | |||
Information Technology Services | 0.8% | |||
Machinery | 2.8% | |||
Media | 4.8% | |||
Metals & Mining | 2.1% | |||
Multiline Retail | 3.8% | |||
Oil, Gas & Consumable Fuels | 5.1% | |||
Other | 0.6% | |||
Paper & Forest Products | 1.4% | |||
Personal Products | 0.8% | |||
Pharmaceuticals | 1.7% | |||
Professional Services | 0.3% | |||
Real Estate Management & Development | 5.0% | |||
Semiconductors & Semiconductor Equipment | 4.0% | |||
Software | 0.5% | |||
Specialty Retail | 1.2% | |||
Textiles, Apparel & Luxury Goods | 0.9% | |||
Thrifts & Mortgage Finance | 0.8% | |||
Transportation Infrastructure | 1.2% | |||
Water Utilities | 1.1% | |||
Wireless Telecommunication Services | 0.7% | |||
Other Assets in Excess of Liabilities | 2.0% | |||
|
| |||
TOTAL | 100.0% | |||
|
| |||
Notes to Financial Statements are an integral part of this Schedule.
12
Driehaus Frontier Emerging Markets Fund
Performance Overview (unaudited)
The performance summarized below is historical and does not represent future results. Investment returns and principal value vary, and you may have a gain or loss when you sell shares. Performance data presented measures the change in the value of an investment in the Fund, assuming reinvestment of all dividends and capital gains. Average annual total return reflects annualized change.
The table does not reflect the deduction of taxes that a shareholder would pay on Fund distributions or the redemption of Fund shares. The graph compares the results of a $250,000 investment (minimum investment) in the Fund since May 4, 2015 (the date of the Fund’s inception), with all dividends and capital gains reinvested, with the indicated index (and dividends reinvested) for the same period.
| Average Annual Total Returns as of 6/30/16 | 1 Year | Since Inception (5/4/15 - 6/30/16) | ||||||
Driehaus Frontier Emerging Markets Fund (DRFRX)1 | –4.71% | –5.98% | ||||||
MSCI Frontier Markets Index-G2 | –11.69% | –12.96% | ||||||
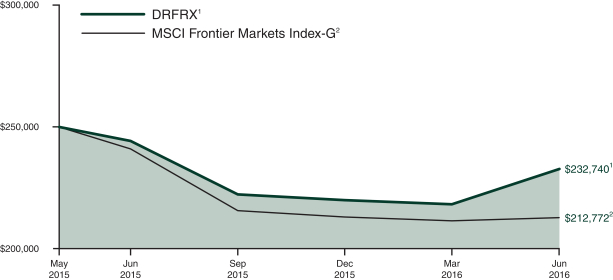
| 1 | The returns for the period reflect fee waivers and/or reimbursements without which performance would have been lower. |
| 2 | The Morgan Stanley Capital International (MSCI) Frontier Markets Index-Gross (MSCI Frontier Markets Index-G) provides broad representation of the equity opportunity set in frontier markets while taking investability requirements into consideration within each market. Data is in U.S. dollars and is calculated with gross dividend reinvestment. Source: Morgan Stanley Capital International Inc. |
13
Driehaus Frontier Emerging Markets Fund
Schedule of Investments
June 30, 2016 (unaudited)
Number of Shares | Value (Note A) | |||||||
| EQUITY SECURITIES — 96.4% | ||||||||
| FAR EAST — 28.3% | ||||||||
Vietnam — 12.8% |
| |||||||
Bank for Foreign Trade of Vietnam JSC | 604,770 | $ | 1,286,542 | |||||
Bao Viet Holdings | 161,890 | 430,490 | ||||||
Cotec Construction JSC | 25,260 | 218,994 | ||||||
HA TIEN 1 Cement JSC** | 176,730 | 231,371 | ||||||
Ho Chi Minh City Infrastructure Investment JSC | 195,310 | 230,776 | ||||||
Khang Dien House Tradingand Investment JSC | 97,290 | 99,537 | ||||||
Nam Long Investment Corp. | 161,080 | 162,474 | ||||||
PetroVietnam Nhon Trach 2 Power JSC | 306,136 | 476,225 | ||||||
Superdong Fast Ferry Kien Giang JSC | 78,862 | 350,533 | ||||||
Thong Nhat Production and Investment JSC** | 366,260 | 358,527 | ||||||
Vietnam Dairy Products JSC | 139,790 | 884,159 | ||||||
Vingroup JSC** | 376,523 | 834,540 | ||||||
|
| |||||||
| 5,564,168 | ||||||||
|
| |||||||
Bangladesh — 10.9% |
| |||||||
Bata Shoe Co. Bangladesh, Ltd. | 5,975 | 91,895 | ||||||
Berger Paints Bangladesh, Ltd. | 3,970 | 112,411 | ||||||
Beximco Pharmaceuticals, Ltd. | 403,567 | 429,937 | ||||||
BRAC Bank, Ltd. | 2,116,360 | 1,434,642 | ||||||
British American Tobacco Bangladesh Co., Ltd. | 6,245 | 215,922 | ||||||
Delta Brac Housing Finance Corp., Ltd. | 483,098 | 657,691 | ||||||
IDLC Finance, Ltd. | 305,108 | 228,515 | ||||||
Linde Bangladesh, Ltd. | 12,322 | 225,923 | ||||||
Marico Bangladesh, Ltd. | 13,639 | 222,731 | ||||||
Olympic Industries, Ltd. | 101,969 | 449,249 | ||||||
Square Pharmaceuticals, Ltd. | 160,158 | 543,396 | ||||||
Summit Power, Ltd. | 242,860 | 105,046 | ||||||
|
| |||||||
| 4,717,358 | ||||||||
|
| |||||||
Sri Lanka — 1.3% |
| |||||||
Ceylon Cold Stores PLC | 56,423 | 216,683 | ||||||
Chevron Lubricants Lanka PLC | 145,692 | 149,043 | ||||||
Distilleries Co. of Sri Lanka PLC1 | 150,055 | 213,363 | ||||||
|
| |||||||
| 579,089 | ||||||||
|
| |||||||
Number of Shares | Value (Note A) | |||||||
Thailand — 1.3% |
| |||||||
Beauty Community PCL —NVDR | 1,227,300 | $ | 288,926 | |||||
Group Lease PCL — NVDR | 253,400 | 260,523 | ||||||
|
| |||||||
| 549,449 | ||||||||
|
| |||||||
Singapore — 1.0% |
| |||||||
Yoma Strategic Holdings, Ltd.** | 1,060,600 | 445,029 | ||||||
Cambodia — 1.0% |
| |||||||
NagaCorp, Ltd. | 612,000 | 408,652 | ||||||
|
| |||||||
Total FAR EAST | 12,263,745 | |||||||
|
| |||||||
| AFRICA — 21.1% | ||||||||
Kenya — 8.0% |
| |||||||
East African Breweries, Ltd. | 265,118 | 729,009 | ||||||
Equity Group Holdings, Ltd. | 2,169,800 | 826,575 | ||||||
Jubilee Holdings, Ltd. | 30,300 | 136,365 | ||||||
Safaricom, Ltd. | 10,083,031 | 1,777,549 | ||||||
|
| |||||||
| 3,469,498 | ||||||||
|
| |||||||
Egypt — 5.2% |
| |||||||
Commercial International Bank Egypt SAE — GDR | 285,349 | 1,017,472 | ||||||
Edita Food Industries SAE — GDR | 11,650 | 83,880 | ||||||
Egyptian Financial Group- Hermes Holding Co.** | 458,263 | 551,137 | ||||||
Egyptian International Pharmaceuticals EIPICO | 11,781 | 103,164 | ||||||
Medinet Nasr Housing | 143,124 | 194,877 | ||||||
Six of October Development & Investment Co.** | 257,807 | 292,938 | ||||||
|
| |||||||
| 2,243,468 | ||||||||
|
| |||||||
Nigeria — 3.1% |
| |||||||
Guaranty Trust Bank PLC | 5,333,622 | 441,233 | ||||||
Zenith Bank PLC | 16,413,401 | 920,417 | ||||||
|
| |||||||
| 1,361,650 | ||||||||
|
| |||||||
Botswana — 1.1% |
| |||||||
Letshego Holdings, Ltd. | 2,066,739 | 472,934 | ||||||
Senegal — 1.0% |
| |||||||
Sonatel | 10,758 | 416,790 | ||||||
Morocco — 0.9% |
| |||||||
Maroc Telecom | 33,753 | 409,956 | ||||||
Tanzania — 0.9% |
| |||||||
Tanzania Breweries, Ltd. | 60,923 | 381,395 | ||||||
South Africa — 0.8% |
| |||||||
MTN Group, Ltd. | 36,284 | 352,622 | ||||||
Togo — 0.1% |
| |||||||
Ecobank Transnational, | ||||||||
Inc.** | 1,082,139 | 61,344 | ||||||
|
| |||||||
Total AFRICA | 9,169,657 | |||||||
|
| |||||||
Notes to Financial Statements are an integral part of this Schedule.
14
Driehaus Frontier Emerging Markets Fund
Schedule of Investments
June 30, 2016 (unaudited)
Number of Shares | Value (Note A) | |||||||
| MIDDLE EAST — 18.1% | ||||||||
Pakistan — 15.0% |
| |||||||
DG Khan Cement Co., Ltd. | 247,400 | $ | 450,939 | |||||
Engro Foods, Ltd.** | 456,041 | 711,366 | ||||||
Fauji Cement Co., Ltd. | 257,000 | 87,927 | ||||||
Hascol Petroleum, Ltd. | 182,000 | 340,308 | ||||||
HUB Power Co., Ltd. | 959,200 | 1,100,290 | ||||||
Hum Network, Ltd. | 1,932,500 | 189,725 | ||||||
Lucky Cement, Ltd. | 108,900 | 675,373 | ||||||
Maple Leaf Cement Factory, Ltd. | 452,000 | 456,366 | ||||||
Nestle Pakistan, Ltd. | 2,160 | 150,587 | ||||||
Pak Elektron, Ltd. | 842,000 | 521,702 | ||||||
Pakistan Tobacco Co., Ltd.1 | 21,600 | 260,031 | ||||||
Searle Co., Ltd. | 42,042 | 216,006 | ||||||
Shifa International Hospitals, Ltd. | 77,700 | 222,615 | ||||||
United Bank, Ltd. | 652,174 | 1,102,932 | ||||||
|
| |||||||
| 6,486,167 | ||||||||
|
| |||||||
United Arab Emirates — 1.6% |
| |||||||
Agthia Group PJSC | 157,013 | 330,974 | ||||||
Aramex PJSC | 163,429 | 144,638 | ||||||
NMC Health PLC | 12,873 | 221,928 | ||||||
|
| |||||||
| 697,540 | ||||||||
|
| |||||||
Saudi Arabia — 1.0% |
| |||||||
Al Khaleej Training and Education Co | 16,061 | 119,980 | ||||||
Al Tayyar Travel Group Holding Co** | 10,272 | 99,265 | ||||||
Bupa Arabia for Cooperative Insurance Co2 | 5,728 | 215,002 | ||||||
|
| |||||||
| 434,247 | ||||||||
|
| |||||||
Qatar — 0.5% |
| |||||||
Qatar Electricity & Water Co. QSC | 3,818 | 218,162 | ||||||
|
| |||||||
Total MIDDLE EAST | 7,836,116 | |||||||
|
| |||||||
| EUROPE — 14.4% | ||||||||
Romania — 6.2% |
| |||||||
Albalact SA | 1,165,697 | 128,399 | ||||||
Banca Transilvania | 1,653,165 | 844,882 | ||||||
BRD-Groupe Societe Generale SA | 136,330 | 327,963 | ||||||
Fondul Proprietatea SA | 2,318,969 | 413,834 | ||||||
New Europe Property Investments PLC | 34,182 | 389,909 | ||||||
Transgaz SA Medias | 9,033 | 603,097 | ||||||
|
| |||||||
| 2,708,084 | ||||||||
|
| |||||||
United Kingdom — 1.4% |
| |||||||
BGEO Group PLC | 8,723 | 305,499 | ||||||
Tullow Oil PLC** | 92,423 | 325,966 | ||||||
|
| |||||||
| 631,465 | ||||||||
|
| |||||||
Number of Shares | Value (Note A) | |||||||
Luxembourg — 1.9% |
| |||||||
Adecoagro SA** | 75,273 | $ | 825,745 | |||||
Ukraine — 1.2% |
| |||||||
Kernel Holding SA | 38,516 | 517,285 | ||||||
Estonia — 0.9% |
| |||||||
Tallink Grupp AS | 379,838 | 385,276 | ||||||
Georgia — 0.7% |
| |||||||
Georgia Healthcare Group PLC2** | 37,661 | 145,106 | ||||||
TBC Bank JSC | 10,315 | 136,158 | ||||||
|
| |||||||
| 281,264 | ||||||||
|
| |||||||
Jersey — 1.5% |
| |||||||
Centamin PLC | 207,309 | 365,211 | ||||||
Randgold Resources, Ltd. — ADR** | 2,508 | 280,996 | ||||||
|
| |||||||
| 646,207 | ||||||||
|
| |||||||
Croatia — 0.6% |
| |||||||
Adris Grupa DD **—Pref. | 4,459 | 249,117 | ||||||
|
| |||||||
Total EUROPE | 6,244,443 | |||||||
|
| |||||||
| SOUTH AMERICA — 11.6% | ||||||||
Argentina — 10.1% |
| |||||||
Banco Macro SA — ADR | 16,089 | 1,194,126 | ||||||
Grupo Financiero Galicia SA — ADR | 36,875 | 1,126,163 | ||||||
Pampa Energia SA — SP ADR** | 47,315 | 1,293,592 | ||||||
YPF SA — SP ADR | 40,568 | 778,906 | ||||||
|
| |||||||
| 4,392,787 | ||||||||
|
| |||||||
Colombia — 1.0% |
| |||||||
Banco Davivienda SA | 47,816 | 438,400 | ||||||
Peru — 0.5% |
| |||||||
Grana y Montero SAA — SP ADR | 29,912 | 213,572 | ||||||
|
| |||||||
Total SOUTH AMERICA | 5,044,759 | |||||||
|
| |||||||
| NORTH AMERICA — 2.9% | ||||||||
Canada — 2.9% |
| |||||||
First Quantum Minerals, Ltd. | 48,157 | 338,081 | ||||||
Gran Tierra Energy, Inc.** | 71,079 | 240,247 | ||||||
SEMAFO, Inc.** | 142,004 | 681,470 | ||||||
|
| |||||||
| 1,259,798 | ||||||||
|
| |||||||
Total NORTH AMERICA | 1,259,798 | |||||||
|
| |||||||
Total EQUITY SECURITIES | 41,818,518 | |||||||
|
| |||||||
Notes to Financial Statements are an integral part of this Schedule.
15
Driehaus Frontier Emerging Markets Fund
Schedule of Investments
June 30, 2016 (unaudited)
Number of Shares | Value (Note A) | |||||||
| WARRANTS — 0.0% | ||||||||
| FAR EAST — 0.0% | ||||||||
Thailand — 0.0% |
| |||||||
Group Lease Expires December, 2021** | 28,156 | $ | — | |||||
|
| |||||||
Total FAR EAST | — | |||||||
|
| |||||||
Total WARRANTS | — | |||||||
|
| |||||||
| ||||||||
| EQUITY CERTIFICATES — 1.4% | ||||||||
| FAR EAST — 1.4% | ||||||||
Vietnam — 1.4% |
| |||||||
Bank for Foreign Trade of Vietnam JSC3 | 85,680 | 181,701 | ||||||
Ho Chi Minh City Infrastructure Investment JSC3 | 93,200 | 109,898 | ||||||
Nam Long Investment Corp.3 | 53,190 | 53,657 | ||||||
Vingroup JSC3** | 117,447 | 260,127 | ||||||
|
| |||||||
Total FAR EAST | 605,383 | |||||||
|
| |||||||
Total EQUITY CERTIFICATES | 605,383 | |||||||
|
| |||||||
| ||||||||
TOTAL INVESTMENTS | 97.8 | % | $ | 42,423,901 | ||||
Other Assets In Excess Of Liabilities | 2.2 | % | 959,364 | |||||
|
|
|
| |||||
Net Assets | 100.0 | % | $ | 43,383,265 | ||||
| ||||||||
The federal income tax basis and unrealized appreciation (depreciation) for all investments is as follows:
Basis: | $ | 41,228,388 | ||
|
| |||
Gross Appreciation | $ | 3,030,584 | ||
Gross Depreciation | (1,835,071 | ) | ||
|
| |||
Net Appreciation | $ | 1,195,513 | ||
|
|
| 1 | Pursuant to procedures adopted by Driehaus Mutual Funds’ (the “Trust”) Board of Trustees, this security has been determined to be illiquid by Driehaus Capital Management LLC (the “Adviser”), the Fund’s investment adviser. |
| 2 | 144A — Security was purchased pursuant to Rule 144A under the Securities Act of 1933 and may not be resold subject to that rule except to qualified institutional buyers. As of June 30, 2016, these securities amounted to $360,108 or 0.8% of net assets. |
| 3 | Restricted security — Investments in securities not registered under the Securities Act of 1933, excluding 144A securities. At June 30, 2016, the value of these restricted securities amounted to $605,383 or 1.4% of net assets. |
| ** | Non-income producing security |
Additional information on each restricted security is as follows:
Security | Counter- party | Acquisition Date(s) | Acquisition Cost | |||||||||
Bank of Foreign Trade of Vietnam Ltd. | MACQ |
| 05/18/15 to 07/28/15 |
| $ | 178,004 | ||||||
Ho Chi Minh City Infrastructure Investment JSC | MACQ | 08/03/15 | $ | 113,080 | ||||||||
Nam Long Investment Corp. | MACQ | | 05/04/15 to 05/07/15 | | $ | 47,802 | ||||||
Vingroup JSC | JPMS | | 05/04/15 to 07/28/15 | | $ | 202,583 | ||||||
ADR — American Depository Receipt
GDR — Global Depository Receipt
JPMS — J.P. Morgan Securities, Inc.
MACQ — Macquarie Capital Group, Ltd.
NVDR — Non-Voting Depository Receipt
SP ADR — Sponsored American Depository Receipt
Notes to Financial Statements are an integral part of this Schedule.
16
Driehaus Frontier Emerging Markets Fund
Schedule of Investments
June 30, 2016 (unaudited)
Regional Weightings*
Asia/Far East Ex-Japan | 29.7% | |||
Africa | 21.1% | |||
Middle East | 18.1% | |||
South America | 11.6% | |||
Eastern Europe | 9.6% | |||
Western Europe | 4.8% | |||
North America | 2.9% |
Top Ten Holdings*
Safaricom, Ltd. | 4.1% | |||
BRAC Bank, Ltd. | 3.3% | |||
Pampa Energia SA — SP ADR | 3.0% | |||
Bank for Foreign Trade of Vietnam JSC | 3.0% | |||
Banco Macro SA — ADR | 2.8% | |||
Grupo Financiero Galicia SA — ADR | 2.6% | |||
United Bank, Ltd. | 2.5% | |||
HUB Power Co., Ltd. | 2.5% | |||
Commercial International Bank Egypt SAE — GDR | 2.3% | |||
Zenith Bank PLC | 2.1% |
| * | All percentages are stated as a percent of net assets at June 30, 2016. |
Notes to Financial Statements are an integral part of this Schedule.
17
Driehaus Frontier Emerging Markets Fund
Schedule of Investments
June 30, 2016 (unaudited)
Industry | Percent of Net Assets | |||
Air Freight & Logistics | 0.3% | |||
Beverages | 3.5% | |||
Capital Markets | 1.3% | |||
Chemicals | 0.8% | |||
Commercial Banks | 26.4% | |||
Construction & Engineering | 2.0% | |||
Construction Materials | 4.4% | |||
Consumer Finance | 3.7% | |||
Diversified Consumer Services | 0.3% | |||
Diversified Financial Services | 1.0% | |||
Diversified Telecommunication Services | 1.9% | |||
Electric Utilities | 4.1% | |||
Electrical Equipment | 1.2% | |||
Food Products | 10.2% | |||
Health Care Providers & Services | 1.4% | |||
Hotels, Restaurants & Leisure | 1.2% | |||
Industry | Percent of Net Assets | |||
Independent Power Producers & Energy Traders | 2.8% | |||
Insurance | 1.8% | |||
Marine | 1.7% | |||
Media | 0.4% | |||
Metals & Mining | 3.8% | |||
Multi-Utilities | 0.5% | |||
Oil, Gas & Consumable Fuels | 4.8% | |||
Personal Products | 0.5% | |||
Pharmaceuticals | 3.0% | |||
Real Estate Management & Development | 5.7% | |||
Specialty Retail | 1.5% | |||
Textiles, Apparel & Luxury Goods | 0.2% | |||
Tobacco | 1.7% | |||
Transportation Infrastructure | 0.8% | |||
Wireless Telecommunication Services | 4.9% | |||
Other Assets in Excess of Liabilities | 2.2% | |||
|
| |||
TOTAL | 100.0% | |||
|
| |||
Notes to Financial Statements are an integral part of this Schedule.
18
Driehaus International Small Cap Growth Fund
Performance Overview (unaudited)
The performance summarized below is historical and does not represent future results. Investment returns and principal value vary, and you may have a gain or loss when you sell shares. Performance data presented measures the change in the value of an investment in the Fund, assuming reinvestment of all dividends and capital gains. Average annual total return reflects annualized change.
The table does not reflect the deduction of taxes that a shareholder would pay on Fund distributions or the redemption of Fund shares. The graph compares the results of a $10,000 investment in the Fund since August 1, 2002 (the date of the Predecessor Limited Partnership’s inception), with all dividends and capital gains reinvested, with the indicated index (and dividends reinvested) for the same period.
| Fund Only | Including Predecessor Limited Partnership | |||||||||||||||||||||||
| Average Annual Total Returns as of 6/30/16 | 1 Year | 3 Years | 5 Years | Since Inception (9/17/07 - 6/30/16) | 10 Years | Since Inception (8/1/02 - 6/30/16) | ||||||||||||||||||
Driehaus International Small Cap Growth Fund (DRIOX)1 | –2.77% | 7.60% | 4.49% | 4.56% | 8.46% | 15.44% | ||||||||||||||||||
MSCI AC World ex USA Small Cap Growth Index-G2 | –3.68% | 6.37% | 3.01% | 1.84% | 4.22% | 9.69% | ||||||||||||||||||
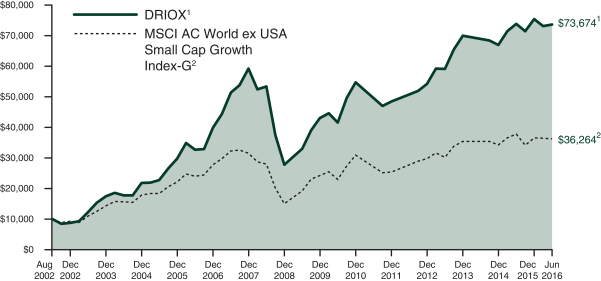
| 1 | The Driehaus International Small Cap Growth Fund (the “Fund”) performance shown above includes the performance of the Driehaus International Opportunities Fund, L.P. (the “Predecessor Limited Partnership”), the Fund’s predecessor, for the periods before the Fund’s registration statement became effective. The Predecessor Limited Partnership, which was established on August 1, 2002, was managed with substantially the same investment objective, policies and philosophies as are followed by the Fund. The Fund succeeded to the Predecessor Limited Partnership’s assets on September 17, 2007. The Predecessor Limited Partnership was not registered under the Investment Company Act of 1940, as amended (“1940 Act”), and thus was not subject to certain investment and operational restrictions that are imposed by the 1940 Act. If the Predecessor Limited Partnership had been registered under the 1940 Act, its performance may have been adversely affected. The Predecessor Limited Partnership’s performance has been restated to reflect estimated expenses of the Fund. The returns for the periods prior to January 1, 2010, reflect fee waivers and/or reimbursements without which performance would have been lower. |
| 2 | The Morgan Stanley Capital International All Country World ex USA Small Cap Growth Index-Gross (MSCI AC World ex USA Small Cap Growth Index-G) is a market capitalization-weighted index designed to measure equity performance in global developed markets and emerging markets, excluding the U.S., and is composed of stocks which are categorized as small capitalization growth stocks. Data is in U.S. dollars and is calculated with gross dividend reinvestment. Source: Morgan Stanley Capital International, Inc. |
19
Driehaus International Small Cap Growth Fund
Schedule of Investments
June 30, 2016 (unaudited)
Number of Shares | Value (Note A) | |||||||
| EQUITY SECURITIES — 95.9% | ||||||||
| EUROPE — 51.3% | ||||||||
United Kingdom — 15.5% |
| |||||||
Auto Trader Group PLC† | 303,454 | $ | 1,434,520 | |||||
Centamin PLC | 1,108,854 | 1,953,438 | ||||||
Domino’s Pizza Group PLC | 317,292 | 1,409,702 | ||||||
Fevertree Drinks PLC | 380,762 | 3,661,526 | ||||||
Halma PLC | 227,716 | 3,097,184 | ||||||
IG Group Holdings PLC | 425,206 | 4,604,272 | ||||||
Informa PLC | 488,167 | 4,760,308 | ||||||
Intermediate Capital Group PLC | 236,703 | 1,550,856 | ||||||
JD Sports Fashion PLC | 191,121 | 2,946,609 | ||||||
Randgold Resources, Ltd. | 16,645 | 1,867,869 | ||||||
Rentokil Initial PLC | 1,259,032 | 3,251,354 | ||||||
RPC Group PLC | 446,852 | 4,676,992 | ||||||
Sage Group PLC | 361,857 | 3,127,749 | ||||||
Spirax-Sarco Engineering PLC | 70,426 | 3,526,565 | ||||||
SSP Group PLC | 696,526 | 2,613,873 | ||||||
Tullow Oil PLC** | 754,524 | 2,661,124 | ||||||
Unite Group PLC | 337,792 | 2,794,397 | ||||||
|
| |||||||
| 49,938,338 | ||||||||
|
| |||||||
France — 6.1% |
| |||||||
Remy Cointreau SA | 40,234 | 3,463,401 | ||||||
SEB SA | 39,519 | 4,765,069 | ||||||
Sopra Steria Group | 24,769 | 2,553,023 | ||||||
Teleperformance | 58,854 | 5,013,327 | ||||||
UbiSoft Entertainment SA** | 105,097 | 3,828,799 | ||||||
|
| |||||||
| 19,623,619 | ||||||||
|
| |||||||
Germany — 5.8% |
| |||||||
ADO Properties SA† | 50,630 | 1,951,639 | ||||||
Alstria Office AG — REIT | 117,347 | 1,584,187 | ||||||
Aurelius SE & Co., KGaA | 82,200 | 4,830,943 | ||||||
Deutsche Wohnen AG | 53,612 | 1,825,394 | ||||||
Gerresheimer AG | 20,817 | 1,603,571 | ||||||
KION Group AG | 71,634 | 3,471,969 | ||||||
Sartorius AG — Pref. | 48,496 | 3,583,457 | ||||||
|
| |||||||
| 18,851,160 | ||||||||
|
| |||||||
Italy — 4.6% |
| |||||||
Amplifon SpA | 342,210 | 3,202,718 | ||||||
Brembo SpA | 54,839 | 3,020,855 | ||||||
Davide Campari-Milano SpA | 376,769 | 3,729,500 | ||||||
Prysmian SpA | 223,801 | 4,912,265 | ||||||
|
| |||||||
| 14,865,338 | ||||||||
|
| |||||||
Switzerland — 3.7% |
| |||||||
Flughafen Zuerich AG | 22,515 | 3,984,502 | ||||||
Gategroup Holding AG | 57,699 | 3,044,703 | ||||||
Temenos Group AG | 68,059 | 3,396,943 | ||||||
Ypsomed Holding AG | 8,749 | 1,651,788 | ||||||
|
| |||||||
| 12,077,936 | ||||||||
|
| |||||||
Number of Shares | Value (Note A) | |||||||
Sweden — 3.7% |
| |||||||
Indutrade AB | 163,248 | $ | 3,227,885 | |||||
Peab AB | 228,280 | 1,731,982 | ||||||
Saab AB — B | 94,841 | 2,957,590 | ||||||
Trelleborg AB — B | 228,144 | 4,048,522 | ||||||
|
| |||||||
| 11,965,979 | ||||||||
|
| |||||||
Finland — 2.8% |
| |||||||
Amer Sports OYJ | 57,875 | 1,587,823 | ||||||
Huhtamaki OYJ | 71,002 | 2,946,583 | ||||||
Valmet OYJ | 335,404 | 4,476,329 | ||||||
|
| |||||||
| 9,010,735 | ||||||||
|
| |||||||
Denmark — 2.4% |
| |||||||
Genmab AS** | 9,070 | 1,653,889 | ||||||
H Lundbeck AS** | 48,600 | 1,821,885 | ||||||
Rockwool International AS —B | 13,048 | 2,361,030 | ||||||
Royal Unibrew AS | 39,671 | 1,774,657 | ||||||
|
| |||||||
| 7,611,461 | ||||||||
|
| |||||||
Spain — 2.0% |
| |||||||
Gamesa Corp. Tecnologica SA | 187,751 | 3,740,774 | ||||||
Merlin Properties Socimi SA — REIT | 264,438 | 2,790,602 | ||||||
|
| |||||||
| 6,531,376 | ||||||||
|
| |||||||
Netherlands — 1.9% |
| |||||||
Aalberts Industries NV | 98,721 | 2,959,497 | ||||||
GrandVision NV† | 120,941 | 3,128,327 | ||||||
|
| |||||||
| 6,087,824 | ||||||||
|
| |||||||
Ireland — 1.5% |
| |||||||
DCC PLC | 19,344 | 1,702,273 | ||||||
Smurfit Kappa Group PLC | 148,847 | 3,277,382 | ||||||
|
| |||||||
| 4,979,655 | ||||||||
|
| |||||||
Belgium — 0.8% |
| |||||||
Tessenderlo Chemie NV** | 72,966 | 2,504,837 | ||||||
Norway — 0.5% |
| |||||||
XXL ASA† | 146,673 | 1,671,091 | ||||||
|
| |||||||
Total EUROPE | 165,719,349 | |||||||
|
| |||||||
| FAR EAST — 28.7% | ||||||||
Japan — 18.3% |
| |||||||
Adastria Co., Ltd. | 83,511 | 3,309,266 | ||||||
Ariake Japan Co., Ltd. | 36,182 | 2,154,128 | ||||||
Asahi Intecc Co., Ltd. | 61,518 | 3,006,165 | ||||||
Daifuku Co., Ltd. | 243,615 | 4,363,097 | ||||||
Hoshizaki Electric Co., Ltd. | 47,193 | 4,619,919 | ||||||
Kajima Corp. | 259,720 | 1,804,205 | ||||||
Koito Manufacturing Co., Ltd. | 64,243 | 2,958,034 | ||||||
Nichirei Corp. | 392,962 | 3,625,395 | ||||||
Nihon M&A Center, Inc. | 40,876 | 2,654,933 | ||||||
Nishimatsuya Chain Co., Ltd. | 58,764 | 833,358 | ||||||
Notes to Financial Statements are an integral part of this Schedule.
20
Driehaus International Small Cap Growth Fund
Schedule of Investments
June 30, 2016 (unaudited)
Number of Shares | Value (Note A) | |||||||
Open House Co., Ltd. | 136,270 | $ | 3,732,732 | |||||
PALTAC Corp. | 78,048 | 1,584,645 | ||||||
Relo Group, Inc. | 26,243 | 4,644,816 | ||||||
Seria Co., Ltd. | 41,831 | 3,462,183 | ||||||
Start Today Co., Ltd. | 55,726 | 2,945,603 | ||||||
Sundrug Co., Ltd. | 40,892 | 3,839,554 | ||||||
Taisei Corp. | 508,954 | 4,181,922 | ||||||
TechnoPro Holdings, Inc. | 107,760 | 3,355,471 | ||||||
Topre Corp. | 98,848 | 2,104,695 | ||||||
|
| |||||||
| 59,180,121 | ||||||||
|
| |||||||
Australia — 3.3% |
| |||||||
Aristocrat Leisure, Ltd. | 356,216 | 3,705,739 | ||||||
Bapcor Group, Ltd. | 570,957 | 2,366,654 | ||||||
Orora, Ltd. | 2,114,489 | 4,390,310 | ||||||
|
| |||||||
| 10,462,703 | ||||||||
|
| |||||||
China — 3.1% |
| |||||||
Lee & Man Paper Manufacturing, Ltd. | 4,325,666 | 3,231,599 | ||||||
Man Wah Holdings, Ltd. | 1,455,099 | 2,099,364 | ||||||
Sunny Optical Technology | ||||||||
Group Co., Ltd. | 489,166 | 1,722,279 | ||||||
Techtronic Industries Co., Ltd. | 683,326 | 2,853,569 | ||||||
|
| |||||||
| 9,906,811 | ||||||||
|
| |||||||
Philippines — 1.8% |
| |||||||
GT Capital Holdings, Inc. | 51,600 | 1,586,276 | ||||||
Metro Pacific Investments Corp. | 27,986,873 | 4,167,727 | ||||||
|
| |||||||
| 5,754,003 | ||||||||
|
| |||||||
Indonesia — 1.5% |
| |||||||
PT Bumi Serpong Damai Tbk | 14,863,841 | 2,391,861 | ||||||
PT Matahari Department Store Tbk | 1,688,563 | 2,573,554 | ||||||
|
| |||||||
| 4,965,415 | ||||||||
|
| |||||||
South Korea — 0.7% |
| |||||||
Innocean Worldwide, Inc. | 33,388 | 2,364,444 | ||||||
|
| |||||||
Total FAR EAST | 92,633,497 | |||||||
|
| |||||||
| NORTH AMERICA — 15.9% | ||||||||
Canada — 11.8% |
| |||||||
Advantage Oil & Gas, Ltd.** | 143,276 | 800,691 | ||||||
Bellatrix Exploration, Ltd.** | 650,442 | 639,391 | ||||||
Boyd Group Income Fund | 66,694 | 3,833,505 | ||||||
CCL Industries, Inc. — B | 17,922 | 3,118,993 | ||||||
Cott Corp. | 148,741 | 2,079,231 | ||||||
Descartes Systems Group, Inc.** | 101,462 | 1,940,575 | ||||||
Dollarama, Inc. | 45,468 | 3,174,437 | ||||||
Kinaxis, Inc.** | 84,935 | 3,410,680 | ||||||
Number of Shares | Value (Note A) | |||||||
Maple Leaf Foods, Inc. | 223,046 | $ | 4,763,218 | |||||
Metro, Inc. | 99,661 | 3,472,071 | ||||||
New Flyer Industries, Inc. | 182,189 | 5,673,178 | ||||||
Parex Resources, Inc.** | 136,906 | 1,325,666 | ||||||
Raging River Exploration, Inc.** | 146,674 | 1,167,080 | ||||||
Uni-Select, Inc. | 100,957 | 2,559,969 | ||||||
|
| |||||||
| 37,958,685 | ||||||||
|
| |||||||
Mexico — 2.7% |
| |||||||
Gruma SAB de CV — B | 148,399 | 2,134,764 | ||||||
Kimberly-Clark de Mexico SAB de CV — A | 1,347,500 | 3,183,283 | ||||||
Promotora y Operadora de Infraestructura SAB de CV | 270,200 | 3,325,598 | ||||||
|
| |||||||
| 8,643,645 | ||||||||
|
| |||||||
United States — 1.4% |
| |||||||
Tahoe Resources, Inc. | 307,667 | 4,608,039 | ||||||
|
| |||||||
Total NORTH AMERICA | 51,210,369 | |||||||
|
| |||||||
Total EQUITY SECURITIES | 309,563,215 | |||||||
|
| |||||||
| ||||||||
TOTAL INVESTMENTS | 95.9 | % | $ | 309,563,215 | ||||
Other Assets In Excess Of Liabilities | 4.1 | % | 13,182,266 | |||||
|
|
|
| |||||
Net Assets | 100.0 | % | $ | 322,745,481 | ||||
| ||||||||
The federal income tax basis and unrealized appreciation (depreciation) for all investments is as follows:
Basis: | $ | 278,215,666 | ||
|
| |||
Gross Appreciation | $ | 39,761,382 | ||
Gross Depreciation | (8,413,833 | ) | ||
|
| |||
Net Appreciation | $ | 31,347,549 | ||
|
|
| ** | Non-income producing security |
| † | 144A — Security was purchased pursuant to Rule 144A under the Securities Act of 1933 and may not be resold subject to that rule except to qualified institutional buyers. As of June 30, 2016, these securities amounted to $8,185,577 or 2.5% of net assets. These 144A securities have not been deemed illiquid. |
REIT — Real Estate Investment Trust
Notes to Financial Statements are an integral part of this Schedule.
21
Driehaus International Small Cap Growth Fund
Schedule of Investments
June 30, 2016 (unaudited)
Regional Weightings*
Western Europe | 51.3% | |||
Japan | 18.3% | |||
North America | 15.9% | |||
Asia/Far East Ex-Japan | 10.4% |
Top Ten Holdings*
New Flyer Industries, Inc. | 1.8% | |||
Teleperformance | 1.6% | |||
Prysmian SpA | 1.5% | |||
Aurelius SE & Co., KGaA | 1.5% | |||
SEB SA | 1.5% | |||
Maple Leaf Foods, Inc. | 1.5% | |||
Informa PLC | 1.5% | |||
RPC Group PLC | 1.4% | |||
Relo Group, Inc. | 1.4% | |||
Hoshizaki Electric Co., Ltd. | 1.4% |
| * | All percentages are stated as a percent of net assets at June 30, 2016. |
Notes to Financial Statements are an integral part of this Schedule.
22
Driehaus International Small Cap Growth Fund
Schedule of Investments
June 30, 2016 (unaudited)
Industry | Percent of Net Assets | |||
Aerospace & Defense | 0.9% | |||
Auto Components | 2.5% | |||
Beverages | 4.5% | |||
Biotechnology | 0.5% | |||
Building Products | 0.7% | |||
Capital Markets | 2.0% | |||
Chemicals | 0.8% | |||
Commercial Services & Supplies | 3.1% | |||
Construction & Engineering | 3.4% | |||
Containers & Packaging | 5.7% | |||
Distributors | 2.0% | |||
Diversified Financial Services | 3.2% | |||
Electrical Equipment | 2.7% | |||
Electronic Equipment, Instruments & Components | 1.5% | |||
Food & Staples Retailing | 2.3% | |||
Food Products | 3.9% | |||
Health Care Equipment & Supplies | 2.6% | |||
Health Care Providers & Services | 1.0% | |||
Hotels, Restaurants & Leisure | 2.4% | |||
Household Durables | 3.0% | |||
Household Products | 1.0% | |||
Industry | Percent of Net Assets | |||
Industrial Conglomerates | 0.5% | |||
Internet and Catalog Retail | 0.9% | |||
Internet Software & Services | 0.4% | |||
Information Technology Services | 0.8% | |||
Leisure Equipment & Products | 0.5% | |||
Life Sciences Tools & Services | 0.5% | |||
Machinery | 10.3% | |||
Media | 2.2% | |||
Metals & Mining | 2.6% | |||
Multiline Retail | 2.9% | |||
Oil, Gas & Consumable Fuels | 2.0% | |||
Paper & Forest Products | 1.0% | |||
Pharmaceuticals | 0.6% | |||
Professional Services | 3.4% | |||
Real Estate Investment Trusts | 1.4% | |||
Real Estate Management & Development | 5.4% | |||
Software | 4.9% | |||
Specialty Retail | 3.7% | |||
Trading Companies & Distributors | 1.0% | |||
Transportation Infrastructure | 1.2% | |||
Other Assets in Excess of Liabilities | 4.1% | |||
|
| |||
TOTAL | 100.0% | |||
|
| |||
Notes to Financial Statements are an integral part of this Schedule.
23
Driehaus Micro Cap Growth Fund
Performance Overview (unaudited)
The performance summarized below is historical and does not represent future results. Investment returns and principal value vary, and you may have a gain or loss when you sell shares. Performance data presented measures the change in the value of an investment in the Fund, assuming reinvestment of all dividends and capital gains. Average annual total return reflects annualized change.
The table does not reflect the deduction of taxes that a shareholder would pay on Fund distributions or the redemption of Fund shares. The graph compares the results of a $10,000 investment in the Fund since January 1, 2003 (which includes performance of the Predecessor Limited Partnership), with all dividends and capital gains reinvested, with the indicated index (and dividends reinvested) for the same period.
| Fund Only | Including Predecessor Limited Partnership | |||||||||||||||||||||||
| Average Annual Total Returns as of 6/30/16 | 1 Year | Since Inception (11/18/13 - 6/30/16) | 3 Years | 5 Years | 10 Years | From (1/1/03 - 6/30/16) | ||||||||||||||||||
Driehaus Micro Cap Growth Fund (DMCRX)1 | –18.70% | 4.32% | 9.21% | 10.17% | 9.31% | 15.92% | ||||||||||||||||||
Russell Microcap® Growth Index2 | –18.47% | 0.40% | 5.73% | 7.48% | 4.76% | 8.68% | ||||||||||||||||||
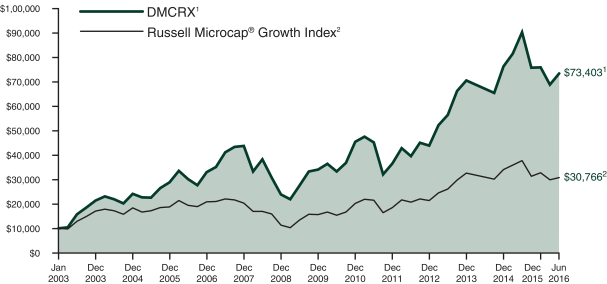
| 1 | The Driehaus Micro Cap Growth Fund (the “Fund”) performance shown above includes the performance of the Driehaus Micro Cap Fund, L.P. (the “Predecessor Limited Partnership”), one of the Fund’s predecessors, for the periods before the Fund’s registration statement became effective. The Predecessor Limited Partnership, which was established on July 1, 1996, was managed with substantially the same investment objective, policies and philosophies as are followed by the Fund. The Fund succeeded to the Predecessor Limited Partnership’s assets together with the assets of the Driehaus Institutional Micro Cap Fund, L.P. on November 18, 2013. The Predecessor Limited Partnership was not registered under the Investment Company Act of 1940, as amended (“1940 Act”), and thus was not subject to certain investment and operational restrictions that are imposed by the 1940 Act. If the Predecessor Limited Partnership had been registered under the 1940 Act, its performance may have been adversely affected. The Predecessor Limited Partnership’s performance has been restated to reflect estimated expenses of the Fund. The returns reflect fee waivers and/or reimbursements without which performance would have been lower. |
| 2 | The Russell Microcap® Growth Index is constructed to provide a comprehensive and unbiased barometer of the micro cap growth market. Based on ongoing empirical research of investment manager behavior, the methodology used to determine growth probability approximates the aggregate microcap growth manager's opportunity set. |
24
Driehaus Micro Cap Growth Fund
Schedule of Investments
June 30, 2016 (unaudited)
Number of Shares | Value (Note A) | |||||||
| EQUITY SECURITIES — 98.5% | ||||||||
| INFORMATION TECHNOLOGY — 29.0% | ||||||||
Semiconductors & Semiconductor Equipment — 8.1% |
| |||||||
Acacia Communications, Inc.** | 149,495 | $ | 5,970,830 | |||||
CEVA, Inc.** | 123,246 | 3,348,594 | ||||||
Inphi Corp.** | 122,623 | 3,927,615 | ||||||
MaxLinear, Inc. — A** | 178,683 | 3,212,720 | ||||||
Silicon Motion Technology Corp. — ADR | 103,861 | 4,964,556 | ||||||
|
| |||||||
| 21,424,315 | ||||||||
|
| |||||||
Software — 7.9% |
| |||||||
Callidus Software, Inc.** | 259,602 | 5,186,848 | ||||||
Gigamon, Inc.** | 75,485 | 2,822,384 | ||||||
Globant SA** | 68,804 | 2,707,437 | ||||||
Interactive Intelligence Group, Inc.** | 50,510 | 2,070,405 | ||||||
Mitek Systems, Inc.** | 173,316 | 1,232,277 | ||||||
Paycom Software, Inc.** | 83,676 | 3,615,640 | ||||||
Proofpoint, Inc.** | 53,384 | 3,367,997 | ||||||
|
| |||||||
| 21,002,988 | ||||||||
|
| |||||||
Internet Software & Services — 7.0% |
| |||||||
Autobytel, Inc.** | 162,637 | 2,255,775 | ||||||
Care.com, Inc.** | 76,110 | 888,965 | ||||||
Five9, Inc.** | 208,705 | 2,483,589 | ||||||
Instructure, Inc.** | 119,163 | 2,264,097 | ||||||
Q2 Holdings, Inc.** | 68,998 | 1,933,324 | ||||||
Quotient Technology, Inc.** | 316,525 | 4,244,600 | ||||||
Stamps.com, Inc.** | 21,546 | 1,883,551 | ||||||
Twilio, Inc. — A** | 31,871 | 1,163,292 | ||||||
Xactly Corp.** | 123,533 | 1,582,458 | ||||||
|
| |||||||
| 18,699,651 | ||||||||
|
| |||||||
Electronic Equipment, Instruments & Components — 3.0% |
| |||||||
Fabrinet** | 114,329 | 4,243,892 | ||||||
Mercury Systems, Inc.** | 149,433 | 3,714,904 | ||||||
|
| |||||||
| 7,958,796 | ||||||||
|
| |||||||
Information Technology Services — 1.7% |
| |||||||
ExlService Holdings, Inc.** | 57,972 | 3,038,313 | ||||||
Hackett Group, Inc. | 99,137 | 1,375,030 | ||||||
|
| |||||||
| 4,413,343 | ||||||||
|
| |||||||
Communications Equipment — 1.3% |
| |||||||
Oclaro, Inc.** | 706,822 | 3,449,291 | ||||||
|
| |||||||
Total INFORMATION TECHNOLOGY | 76,948,384 | |||||||
|
| |||||||
| HEALTH CARE — 27.0% | ||||||||
Biotechnology — 9.7% |
| |||||||
Alder Biopharmaceuticals, Inc.** | 53,838 | 1,344,335 | ||||||
Blueprint Medicines Corp.** | 167,494 | 3,391,753 | ||||||
Number of Shares | Value (Note A) | |||||||
Exelixis, Inc.** | 321,387 | $ | 2,510,032 | |||||
Five Prime Therapeutics, Inc.** | 57,156 | 2,363,401 | ||||||
Flexion Therapeutics, Inc.** | 239,492 | 3,583,998 | ||||||
Global Blood Therapeutics, Inc.** | 73,855 | 1,225,254 | ||||||
Loxo Oncology, Inc.** | 131,388 | 3,045,574 | ||||||
Natera, Inc. ** | 405,441 | 4,891,646 | ||||||
Otonomy, Inc.** | 105,461 | 1,674,721 | ||||||
Sage Therapeutics, Inc.** | 44,463 | 1,339,670 | ||||||
Sunesis Pharmaceuticals, Inc.1** | 654,215 | 358,314 | ||||||
|
| |||||||
| 25,728,698 | ||||||||
|
| |||||||
Health Care Equipment & Supplies — 7.7% |
| |||||||
Avinger, Inc.** | 105,139 | 1,254,308 | ||||||
Cerus Corp.** | 429,736 | 2,681,553 | ||||||
CryoLife, Inc. ** | 124,674 | 1,472,400 | ||||||
Cynosure, Inc. — A** | 64,855 | 3,154,871 | ||||||
Endologix, Inc.** | 106,524 | 1,327,289 | ||||||
Inogen, Inc.** | 45,769 | 2,293,485 | ||||||
LeMaitre Vascular, Inc.1 | 205,089 | 2,926,620 | ||||||
Orthofix International NV** | 67,411 | 2,858,226 | ||||||
Vascular Solutions, Inc.** | 61,979 | 2,582,045 | ||||||
|
| |||||||
| 20,550,797 | ||||||||
|
| |||||||
Health Care Providers & Services — 3.3% |
| |||||||
AMN Healthcare Services, Inc.** | 82,531 | 3,298,764 | ||||||
BioTelemetry, Inc.** | 125,467 | 2,045,112 | ||||||
Cross Country Healthcare, Inc.** | 135,888 | 1,891,561 | ||||||
US Physical Therapy, Inc. | 23,550 | 1,417,946 | ||||||
|
| |||||||
| 8,653,383 | ||||||||
|
| |||||||
Pharmaceuticals — 2.8% |
| |||||||
Cynapsus Therapeutics, Inc.** | 61,162 | 1,024,463 | ||||||
Foamix Pharmaceuticals, Ltd.1** | 313,126 | 1,988,350 | ||||||
Heska Corp.** | 30,970 | 1,151,155 | ||||||
Intra-Cellular Therapies, Inc.** | 46,498 | 1,805,052 | ||||||
KemPharm, Inc.** | 74,292 | 295,682 | ||||||
MyoKardia, Inc.1** | 103,366 | 1,281,738 | ||||||
|
| |||||||
| 7,546,440 | ||||||||
|
| |||||||
Life Sciences Tools & Services — 2.6% |
| |||||||
NanoString Technologies, Inc.** | 96,030 | 1,209,978 | ||||||
NeoGenomics, Inc.** | 710,654 | 5,713,658 | ||||||
|
| |||||||
| 6,923,636 | ||||||||
|
| |||||||
Health Care Technology — 0.9% |
| |||||||
Evolent Health, Inc. — A** | 70,889 | 1,361,069 | ||||||
Vocera Communications, Inc.** | 77,364 | 994,127 | ||||||
|
| |||||||
| 2,355,196 | ||||||||
|
| |||||||
Total HEALTH CARE | 71,758,150 | |||||||
|
| |||||||
Notes to Financial Statements are an integral part of this Schedule.
25
Driehaus Micro Cap Growth Fund
Schedule of Investments
June 30, 2016 (unaudited)
Number of Shares | Value (Note A) | |||||||
| INDUSTRIALS — 17.2% | ||||||||
Building Products — 5.4% |
| |||||||
Gibraltar Industries, Inc.** | 151,781 | $ | 4,791,726 | |||||
Insteel Industries, Inc. | 67,661 | 1,934,428 | ||||||
Patrick Industries, Inc.** | 74,267 | 4,477,557 | ||||||
PGT, Inc.** | 127,139 | 1,309,532 | ||||||
Ply Gem Holdings, Inc.** | 129,515 | 1,887,034 | ||||||
|
| |||||||
| 14,400,277 | ||||||||
|
| |||||||
Machinery — 3.0% |
| |||||||
Astec Industries, Inc. | 46,481 | 2,609,908 | ||||||
Chart Industries, Inc.** | 86,604 | 2,089,755 | ||||||
Douglas Dynamics, Inc. | 66,905 | 1,721,466 | ||||||
Lydall, Inc.** | 38,959 | 1,502,259 | ||||||
|
| |||||||
| 7,923,388 | ||||||||
|
| |||||||
Trading Companies & Distributors — 1.9% |
| |||||||
BMC Stock Holdings, Inc.** | 135,236 | 2,409,906 | ||||||
Lawson Products, Inc.1** | 41,760 | 829,354 | ||||||
SiteOne Landscape Supply, Inc.** | 56,032 | 1,904,528 | ||||||
|
| |||||||
| 5,143,788 | ||||||||
|
| |||||||
Airlines — 1.7% |
| |||||||
Controladora Vuela Cia de Aviacion SAB de CV — ADR** | 54,926 | 1,026,567 | ||||||
SkyWest, Inc. | 130,388 | 3,450,066 | ||||||
|
| |||||||
| 4,476,633 | ||||||||
|
| |||||||
Aerospace & Defense — 1.6% |
| |||||||
Aerovironment, Inc.** | 46,176 | 1,283,693 | ||||||
TASER International, Inc.** | 117,022 | 2,911,507 | ||||||
|
| |||||||
| 4,195,200 | ||||||||
|
| |||||||
Air Freight & Logistics — 1.1% |
| |||||||
Air Transport Services Group, Inc.** | 129,234 | 1,674,873 | ||||||
Echo Global Logistics, Inc.** | 57,068 | 1,279,465 | ||||||
|
| |||||||
| 2,954,338 | ||||||||
|
| |||||||
Construction & Engineering — 1.1% |
| |||||||
Comfort Systems USA, Inc. | 41,731 | 1,359,179 | ||||||
NV5 Global, Inc.** | 55,651 | 1,582,714 | ||||||
|
| |||||||
| 2,941,893 | ||||||||
|
| |||||||
Electrical Equipment — 0.6% |
| |||||||
LSI Industries, Inc. | 130,388 | 1,443,395 | ||||||
Professional Services — 0.4% |
| |||||||
BG Staffing, Inc. | 59,752 | 1,130,508 | ||||||
Commercial Services & Supplies — 0.4% |
| |||||||
Casella Waste Systems, Inc. — A** | 141,290 | 1,109,126 | ||||||
|
| |||||||
Total INDUSTRIALS | 45,718,546 | |||||||
|
| |||||||
Number of Shares | Value (Note A) | |||||||
| CONSUMER DISCRETIONARY — 9.9% | ||||||||
Household Durables — 2.4% |
| |||||||
Installed Building Products, Inc.** | 39,744 | $ | 1,442,310 | |||||
Universal Electronics, Inc.** | 67,356 | 4,868,492 | ||||||
|
| |||||||
| 6,310,802 | ||||||||
|
| |||||||
Specialty Retail — 2.3% |
| |||||||
MarineMax, Inc.** | 142,011 | 2,409,927 | ||||||
Tile Shop Holdings, Inc.** | 181,665 | 3,611,500 | ||||||
|
| |||||||
| 6,021,427 | ||||||||
|
| |||||||
Internet & Catalog Retail — 2.0% |
| |||||||
Duluth Holdings, Inc. — B** | 69,491 | 1,699,750 | ||||||
Nutrisystem, Inc. | 144,674 | 3,668,933 | ||||||
|
| |||||||
| 5,368,683 | ||||||||
|
| |||||||
Hotels, Restaurants & Leisure — 1.1% |
| |||||||
Carrols Restaurant Group, Inc.** | 115,651 | 1,376,247 | ||||||
Good Times Restaurants, Inc.1** | 203,800 | 711,262 | ||||||
Wingstop, Inc. | 35,555 | 968,874 | ||||||
|
| |||||||
| 3,056,383 | ||||||||
|
| |||||||
Leisure Equipment & Products — 1.1% |
| |||||||
MCBC Holdings, Inc. | 107,013 | 1,182,494 | ||||||
Nautilus, Inc.** | 93,241 | 1,663,419 | ||||||
|
| |||||||
| 2,845,913 | ||||||||
|
| |||||||
Auto Components — 0.4% |
| |||||||
Unique Fabricating, Inc.1 | 83,970 | 1,124,358 | ||||||
Textiles, Apparel & Luxury Goods — 0.4% |
| |||||||
Sequential Brands Group, Inc.** | 117,538 | 937,953 | ||||||
Media — 0.2% |
| |||||||
Xcel Brands, Inc.1** | 98,478 | 495,344 | ||||||
|
| |||||||
Total CONSUMER DISCRETIONARY | 26,160,863 | |||||||
|
| |||||||
| MATERIALS — 3.6% | ||||||||
Construction Materials — 1.9% |
| |||||||
Summit Materials, Inc. — A** | 124,230 | 2,541,746 | ||||||
US Concrete, Inc.** | 43,138 | 2,627,536 | ||||||
|
| |||||||
| 5,169,282 | ||||||||
|
| |||||||
Metals & Mining — 1.7% |
| |||||||
Cliffs Natural Resources, Inc. ** | 368,809 | 2,091,147 | ||||||
US Silica Holdings, Inc. | 66,927 | 2,306,974 | ||||||
|
| |||||||
| 4,398,121 | ||||||||
|
| |||||||
Total MATERIALS | 9,567,403 | |||||||
|
| |||||||
Notes to Financial Statements are an integral part of this Schedule.
26
Driehaus Micro Cap Growth Fund
Schedule of Investments
June 30, 2016 (unaudited)
Number of Shares | Value (Note A) | |||||||
| FINANCIALS — 3.2% | ||||||||
Commercial Banks — 1.0% |
| |||||||
Live Oak Bancshares, Inc.1 | 119,208 | $ | 1,682,025 | |||||
Pacific Premier Bancorp, Inc.** | 43,832 | 1,051,968 | ||||||
|
| |||||||
| 2,733,993 | ||||||||
|
| |||||||
Insurance — 1.0% |
| |||||||
Atlas Financial Holdings, Inc.1** | 158,495 | 2,729,284 | ||||||
Thrifts & Mortgage Finance — 0.8% |
| |||||||
LendingTree, Inc.** | 23,173 | 2,046,871 | ||||||
Real Estate Investment Trust — 0.4% |
| |||||||
National Storage Affiliates Trust | 49,218 | 1,024,719 | ||||||
|
| |||||||
Total FINANCIALS | 8,534,867 | |||||||
|
| |||||||
| ENERGY — 3.0% | ||||||||
Oil, Gas & Consumable Fuels — 2.2% |
| |||||||
Callon Petroleum Co.** | 233,671 | 2,624,125 | ||||||
KLR Energy Acquisition Co.1** | 119,048 | 1,202,385 | ||||||
Ring Energy, Inc.** | 231,745 | 2,043,991 | ||||||
|
| |||||||
| 5,870,501 | ||||||||
|
| |||||||
Energy Equipment & Services — 0.8% |
| |||||||
Fairmount Santrol Holdings, Inc.** | 146,148 | 1,126,801 | ||||||
Helix Energy Solutions Group, Inc.** | 147,778 | 998,979 | ||||||
|
| |||||||
| 2,125,780 | ||||||||
|
| |||||||
Total ENERGY | 7,996,281 | |||||||
|
| |||||||
| TELECOMMUNICATION SERVICES — 2.9% | ||||||||
Diversified Telecommunication Services — 2.9% |
| |||||||
8X8, Inc.** | 245,326 | 3,584,213 | ||||||
GTT Communications, Inc.** | 212,878 | 3,933,985 | ||||||
|
| |||||||
| 7,518,198 | ||||||||
|
| |||||||
Total TELECOMMUNICATION SERVICES | 7,518,198 | |||||||
|
| |||||||
Number of Shares | Value (Note A) | |||||||
| CONSUMER STAPLES — 2.7% | ||||||||
Food Products — 1.7% |
| |||||||
Calavo Growers, Inc. ** | 65,638 | $ | 4,397,746 | |||||
Beverages — 1.0% |
| |||||||
MGP Ingredients, Inc. | 22,800 | 871,644 | ||||||
Primo Water Corp.** | 162,209 | 1,915,688 | ||||||
|
| |||||||
| 2,787,332 | ||||||||
|
| |||||||
Total CONSUMER STAPLES |
| 7,185,078 | ||||||
|
| |||||||
Total EQUITY SECURITIES | 261,387,770 | |||||||
|
| |||||||
| ||||||||
TOTAL INVESTMENTS | 98.5 | % | $ | 261,387,770 | ||||
Other Assets In Excess Of Liabilities | 1.5 | % | 4,104,829 | |||||
|
|
|
| |||||
Net Assets | 100.0 | % | $ | 265,492,599 | ||||
| ||||||||
The federal income tax basis and unrealized appreciation (depreciation) for all investments is as follows:
Basis: | $ | 230,891,840 | ||
|
| |||
Gross Appreciation | $ | 45,555,232 | ||
Gross Depreciation | (15,059,302 | ) | ||
|
| |||
Net Appreciation | $ | 30,495,930 | ||
|
|
1 Pursuant to procedures adopted by Driehaus Mutual Funds’ (the “Trust”) Board of Trustees, this security has been determined to be illiquid by Driehaus Capital Management LLC (the “Adviser”), the Fund’s investment adviser.
| ** | Non-income producing security |
ADR — American Depository Receipt
Notes to Financial Statements are an integral part of this Schedule.
27
Driehaus Micro Cap Growth Fund
Schedule of Investments
June 30, 2016 (unaudited)
Top Ten Holdings*
Acacia Communications, Inc. | 2.2% | |||
NeoGenomics, Inc. | 2.2% | |||
Callidus Software, Inc. | 2.0% | |||
Silicon Motion Technology, Corp. | 1.9% | |||
Natera, Inc. | 1.8% | |||
Universal Electronics, Inc. | 1.8% | |||
Gibraltar Industries, Inc. | 1.8% | |||
Patrick Industries, Inc. | 1.7% | |||
Calavo Growers, Inc. | 1.7% | |||
Quotient Technology, Inc. | 1.6% |
| * | All percentages are stated as a percent of net assets at June 30, 2016. |
Notes to Financial Statements are an integral part of this Schedule.
28
Driehaus Micro Cap Growth Fund
Schedule of Investments
June 30, 2016 (unaudited)
Industry | Percent of Net Assets | |||
Aerospace & Defense | 1.6% | |||
Air Freight & Logistics | 1.1% | |||
Airlines | 1.7% | |||
Auto Components | 0.4% | |||
Beverages | 1.0% | |||
Biotechnology | 9.7% | |||
Building Products | 5.4% | |||
Commercial Banks | 1.0% | |||
Commercial Services & Supplies | 0.4% | |||
Communications Equipment | 1.3% | |||
Construction & Engineering | 1.1% | |||
Construction Materials | 1.9% | |||
Diversified Telecommunication Services | 2.9% | |||
Electrical Equipment | 0.6% | |||
Electronic Equipment, Instruments & Components | 3.0% | |||
Energy Equipment & Services | 0.8% | |||
Food Products | 1.7% | |||
Health Care Equipment & Supplies | 7.7% | |||
Health Care Providers & Services | 3.3% | |||
Health Care Technology | 0.9% | |||
Hotels, Restaurants & Leisure | 1.1% | |||
Industry | Percent of Net Assets | |||
Household Durables | 2.4% | |||
Information Technology Services | 1.7% | |||
Insurance | 1.0% | |||
Internet and Catalog Retail | 2.0% | |||
Internet Software & Services | 7.0% | |||
Leisure Equipment & Products | 1.1% | |||
Life Sciences Tools & Services | 2.6% | |||
Machinery | 3.0% | |||
Media | 0.2% | |||
Metals & Mining | 1.7% | |||
Oil, Gas & Consumable Fuels | 2.2% | |||
Pharmaceuticals | 2.8% | |||
Professional Services | 0.4% | |||
Real Estate Investment Trusts | 0.4% | |||
Semiconductors & Semiconductor Equipment | 8.1% | |||
Software | 7.9% | |||
Specialty Retail | 2.3% | |||
Textiles, Apparel & Luxury Goods | 0.4% | |||
Thrifts & Mortgage Finance | 0.8% | |||
Trading Companies & Distributors | 1.9% | |||
Other Assets in Excess of Liabilities | 1.5% | |||
|
| |||
TOTAL | 100.0% | |||
|
| |||
Notes to Financial Statements are an integral part of this Schedule.
29
Statements of Assets and Liabilities
June 30, 2016 (unaudited)
| Driehaus Emerging Markets Growth Fund | Driehaus Emerging Markets Small Cap Growth Fund | |||||||
ASSETS: | ||||||||
Investments, at cost | $ | 1,165,675,653 | $ | 362,605,308 | ||||
|
|
|
| |||||
Investments, at market value | $ | 1,338,866,452 | $ | 404,463,116 | ||||
Foreign currency, at value* | 6,552,419 | 7,797,249 | ||||||
Cash | 93,968,971 | 3,889,428 | ||||||
Swaps, at value | — | 1,063,977 | ||||||
Collateral held at custodian for the benefit of brokers | — | 14,019,110 | ||||||
Receivables: | ||||||||
Dividends | 3,340,011 | 1,002,334 | ||||||
Investment securities sold | 42,555,161 | 1,807,053 | ||||||
Fund shares sold | 1,696,993 | 988,582 | ||||||
Foreign taxes | 563,882 | 443,107 | ||||||
Prepaid expenses | 281 | 34,485 | ||||||
|
|
|
| |||||
| ||||||||
TOTAL ASSETS | 1,487,544,170 | 435,508,441 | ||||||
|
|
|
| |||||
| ||||||||
LIABILITIES: | ||||||||
Payables: | ||||||||
Investment securities purchased | 36,808,582 | 17,087,033 | ||||||
Fund shares redeemed | 3,149,089 | 3,889,194 | ||||||
Unrealized depreciation on forward foreign currency contracts | — | 946,194 | ||||||
Net unrealized depreciation on unsettled foreign currency transactions | 10,593 | 6,285 | ||||||
Due to affiliates | 1,732,999 | 509,484 | ||||||
Audit and tax fees | 22,001 | 17,500 | ||||||
Accrued expenses | 344,652 | 105,889 | ||||||
Outstanding options written, at value (premiums received $784,377) | — | 30,000 | ||||||
|
|
|
| |||||
| ||||||||
TOTAL LIABILITIES | 42,067,916 | 22,591,579 | ||||||
|
|
|
| |||||
| ||||||||
NET ASSETS | $ | 1,445,476,254 | $ | 412,916,862 | ||||
|
|
|
| |||||
SHARES OUTSTANDING (Unlimited shares authorized, no par value) | 51,364,633 | 35,786,338 | ||||||
|
|
|
| |||||
NET ASSET VALUE | $ | 28.14 | $ | 11.54 | ||||
|
|
|
| |||||
| ||||||||
NET ASSETS CONSISTED OF THE FOLLOWING AT JUNE 30, 2016: | ||||||||
Paid-in capital | $ | 1,526,074,248 | $ | 465,845,963 | ||||
Accumulated net investment income (loss) | 2,872,132 | (410,649 | ) | |||||
Accumulated net realized gain (loss) | (256,903,031 | ) | (93,945,664 | ) | ||||
Unrealized net foreign exchange gain (loss) | 242,106 | 18,970 | ||||||
Unrealized net appreciation (depreciation) on forward foreign currency contracts | — | (946,194 | ) | |||||
Unrealized net appreciation (depreciation) on swap contracts | — | (257,749 | ) | |||||
Unrealized net appreciation (depreciation) on written options | — | 754,377 | ||||||
Unrealized net appreciation (depreciation) on investments | 173,190,799 | 41,857,808 | ||||||
|
|
|
| |||||
NET ASSETS | $ | 1,445,476,254 | $ | 412,916,862 | ||||
|
|
|
| |||||
| ||||||||
| * | The cost of foreign currency was $6,550,429, $7,791,294, $473,064, $71,252 and $0, respectively. |
Notes to Financial Statements are an integral part of this Statement.
30
Statements of Assets and Liabilities
June 30, 2016 (unaudited)
| Driehaus Frontier Emerging Markets Fund | Driehaus International Small Cap Growth Fund | Driehaus Micro Cap Growth Fund | ||||||||
| $ | 41,196,858 | $ | 276,882,647 | $ | 225,090,475 | |||||
|
|
|
|
|
| |||||
| $ | 42,423,901 | $ | 309,563,215 | $ | 261,387,770 | |||||
| 473,439 | 71,262 | — | ||||||||
| 591,676 | 15,460,687 | 6,239,764 | ||||||||
| — | — | — | ||||||||
| — | — | — | ||||||||
| 157,430 | 668,622 | 26,105 | ||||||||
| — | — | 4,312,563 | ||||||||
| 341 | 32,955 | 291,805 | ||||||||
| — | — | — | ||||||||
| 12,243 | 1,968 | 53,623 | ||||||||
|
|
|
|
|
| |||||
|
| |||||||||
| 43,659,030 | 325,798,709 | 272,311,630 | ||||||||
|
|
|
|
|
| |||||
|
| |||||||||
| 180,151 | 2,550,641 | 6,134,262 | ||||||||
| — | 15,720 | 375,768 | ||||||||
| — | — | — | ||||||||
| 33 | 1,668 | — | ||||||||
| 40,904 | 403,946 | 272,583 | ||||||||
| 17,763 | 22,268 | 24,585 | ||||||||
| 36,914 | 58,985 | 11,833 | ||||||||
| — | — | — | ||||||||
|
|
|
|
|
| |||||
|
| |||||||||
| 275,765 | 3,053,228 | 6,819,031 | ||||||||
|
|
|
|
|
| |||||
|
| |||||||||
| $ | 43,383,265 | $ | 322,745,481 | $ | 265,492,599 | |||||
|
|
|
|
|
| |||||
| 4,659,346 | 32,763,161 | 25,563,271 | ||||||||
|
|
|
|
|
| |||||
| $ | 9.31 | $ | 9.85 | $ | 10.39 | |||||
|
|
|
|
|
| |||||
|
| |||||||||
| $ | 44,180,060 | $ | 294,209,389 | $ | 275,158,075 | |||||
| 361,613 | (463,041 | ) | (964,987 | ) | ||||||
| (2,384,718 | ) | (3,665,096 | ) | (44,997,784 | ) | |||||
| (733 | ) | (16,339 | ) | — | ||||||
| — |
| — | — | ||||||
| — | — | — | ||||||||
| — | — | — | ||||||||
| 1,227,043 | 32,680,568 | 36,297,295 | ||||||||
|
|
|
|
|
| |||||
| $ | 43,383,265 | $ | 322,745,481 | $ | 265,492,599 | |||||
|
|
|
|
|
| |||||
|
| |||||||||
Notes to Financial Statements are an integral part of this Statement.
31
For the Six Months Ended June 30, 2016 (unaudited)
| Driehaus Emerging Markets Growth Fund | Driehaus Emerging Markets Small Cap Growth Fund | |||||||
INVESTMENT INCOME (LOSS): | ||||||||
Income: | ||||||||
Dividends* | $ | 13,683,774 | $ | 3,114,759 | ||||
|
|
|
| |||||
| ||||||||
Total income | 13,683,774 | 3,114,759 | ||||||
|
|
|
| |||||
| ||||||||
Expenses: | ||||||||
Investment advisory fee | 10,025,946 | 3,044,746 | ||||||
Administration fee | 363,588 | 171,284 | ||||||
Professional fees | 113,443 | 39,566 | ||||||
Audit and tax fees | 33,810 | 26,350 | ||||||
Federal and state registration fees | 30,485 | 27,171 | ||||||
Custodian fees | 217,750 | 127,445 | ||||||
Transfer agent fees | 189,256 | 37,405 | ||||||
Trustees’ fees | 51,324 | 28,503 | ||||||
Chief compliance officer fees | 7,646 | 7,646 | ||||||
Reports to shareholders | 61,012 | 18,620 | ||||||
Miscellaneous | 36,034 | 21,927 | ||||||
|
|
|
| |||||
Total expenses | 11,130,294 | 3,550,663 | ||||||
|
|
|
| |||||
| ||||||||
Investment advisory fees recaptured (waived) | — | — | ||||||
Transfer agent fees waived | — | — | ||||||
Fees paid indirectly | (189,545 | ) | (60,432 | ) | ||||
|
|
|
| |||||
Net expenses | 10,940,749 | 3,490,231 | ||||||
|
|
|
| |||||
| ||||||||
Net investment income (loss) | 2,743,025 | (375,472 | ) | |||||
|
|
|
| |||||
| ||||||||
| NET REALIZED AND UNREALIZED GAIN (LOSS) ON INVESTMENTS, WRITTEN OPTIONS AND FOREIGN CURRENCY TRANSACTIONS: | ||||||||
Net realized gain (loss) from security transactions | (68,799,933 | ) | (22,004,326 | ) | ||||
Net realized foreign exchange gain (loss) | (1,787,105 | ) | (515,177 | ) | ||||
Net realized gain (loss) on written options | — | (2,912,083 | ) | |||||
Net realized gain (loss) on swap contracts | — | (114,036 | ) | |||||
Net change in unrealized foreign exchange gain (loss) | 521,627 | 40,934 | ||||||
Net change in unrealized appreciation (depreciation) on swap contracts | — | (257,749 | ) | |||||
Net change in unrealized appreciation (depreciation) on forward foreign currency contracts | — | (946,194 | ) | |||||
Net change in unrealized appreciation (depreciation) on written options | — | 847,953 | ||||||
Net change in unrealized appreciation (depreciation) on investments | 148,612,353 | 15,355,850 | ||||||
|
|
|
| |||||
| ||||||||
Net realized and unrealized gain (loss) on investments, written options and foreign currency transactions | 78,546,942 | (10,504,828 | ) | |||||
|
|
|
| |||||
| ||||||||
NET INCREASE (DECREASE) IN NET ASSETS RESULTING FROM OPERATIONS | $ | 81,289,967 | $ | (10,880,300 | ) | |||
|
|
|
| |||||
| ||||||||
| * | Dividends are net of $1,464,707, $315,431, $48,141, $328,667 and $0 nonreclaimable foreign taxes withheld, respectively. |
Notes to Financial Statements are an integral part of this Statement.
32
Statements of Operations
For the Six Months Ended June 30, 2016 (unaudited)
| Driehaus Frontier Emerging Markets Fund | Driehaus International Small Cap Growth Fund | Driehaus Micro Cap Growth Fund | ||||||||
| $ | 594,570 | $ | 3,078,707 | $ | 737,026 | |||||
|
|
|
|
|
| |||||
|
| |||||||||
| 594,570 | 3,078,707 | 737,026 | ||||||||
|
|
|
|
|
| |||||
|
| |||||||||
| 175,426 | 2,374,035 | 1,488,211 | ||||||||
| 41,535 | 142,401 | 102,491 | ||||||||
| 8,752 | 32,160 | 26,408 | ||||||||
| 25,393 | 25,540 | 22,555 | ||||||||
| 12,985 | 14,899 | 29,182 | ||||||||
| 47,866 | 34,338 | 30,907 | ||||||||
| 18,468 | 27,564 | 23,343 | ||||||||
| 18,329 | 25,775 | 24,650 | ||||||||
| 7,646 | 7,646 | 7,646 | ||||||||
| 5,416 | 11,873 | 10,005 | ||||||||
| 10,591 | 17,373 | 15,596 | ||||||||
|
|
|
|
|
| |||||
| 372,407 | 2,713,604 | 1,780,994 | ||||||||
|
|
|
|
|
| |||||
|
| |||||||||
| (128,808 | ) | — | — | |||||||
| (9,697 | ) | — | — | |||||||
| (945 | ) | (48,202 | ) | (78,981 | ) | |||||
|
|
|
|
|
| |||||
| 232,957 | 2,665,402 | 1,702,013 | ||||||||
|
|
|
|
|
| |||||
|
| |||||||||
| 361,613 | 413,305 | (964,987 | ) | |||||||
|
|
|
|
|
| |||||
|
| |||||||||
| (526,043 | ) | (4,235,470 | ) | (27,861,753 | ) | |||||
| (103,097 | ) | 45,852 | — | |||||||
| — | — | — | ||||||||
| — | — | — | ||||||||
| (169 | ) | 18,316 | — | |||||||
| — |
| — | — | ||||||
| — |
| — | — | ||||||
| — | — | — | ||||||||
| 1,803,322 |
| (4,384,701 | ) | 18,899,748 | |||||
|
|
|
|
|
| |||||
|
| |||||||||
| 1,174,013 | (8,556,003 | ) | (8,962,005 | ) | ||||||
|
|
|
|
|
| |||||
|
| |||||||||
| $ | 1,535,626 | $ | (8,142,698 | ) | $ | (9,926,992 | ) | |||
|
|
|
|
|
| |||||
|
| |||||||||
Notes to Financial Statements are an integral part of this Statement.
33
Statements of Changes in Net Assets
| Driehaus Emerging Markets Growth Fund | Driehaus Emerging Markets Small Cap Growth Fund | |||||||||||||||
| For the six month period January 1, 2016 through June 30, 2016 (unaudited) | For the year ended December 31, 2015 | For the six month period January 1, 2016 through June 30, 2016 (unaudited) | For the year ended December 31, 2015 | |||||||||||||
INCREASE (DECREASE) IN NET ASSETS: | ||||||||||||||||
Operations: | ||||||||||||||||
Net investment income (loss) | $ | 2,743,025 | $ | 3,665,087 | $ | (375,472 | ) | $ | (2,195,061 | ) | ||||||
Net realized gain (loss) on investments, written options and foreign currency transactions | (70,587,038 | ) | (140,031,003 | ) | (25,545,622 | ) | (63,008,129 | ) | ||||||||
Net change in unrealized gain (loss) on investments, written options and foreign currency transactions | 149,133,980 | (34,604,006 | ) | 15,040,794 | (8,287,636 | ) | ||||||||||
|
|
|
|
|
|
|
| |||||||||
| ||||||||||||||||
Net increase (decrease) in net assets resulting from operations | 81,289,967 | (170,969,922 | ) | (10,880,300 | ) | (73,490,826 | ) | |||||||||
|
|
|
|
|
|
|
| |||||||||
| ||||||||||||||||
Distributions to shareholders: | ||||||||||||||||
Net investment income | — | — | — | — | ||||||||||||
Capital gains | — | — | — | — | ||||||||||||
|
|
|
|
|
|
|
| |||||||||
Total distributions to shareholders | — | — | — | — | ||||||||||||
|
|
|
|
|
|
|
| |||||||||
| ||||||||||||||||
Capital share transactions: | ||||||||||||||||
Proceeds from shares sold | 193,940,104 | 495,687,975 | 93,311,132 | 391,387,204 | ||||||||||||
Proceeds from shares issued in connection with merger (see Note G) | — | — | — | — | ||||||||||||
Reinvestment of distributions | — | — | — | — | ||||||||||||
Cost of shares redeemed | (192,223,959 | ) | (663,624,481 | ) | (102,239,434 | ) | (395,407,314 | ) | ||||||||
Redemption fees | 49,127 | 108,595 | 7,712 | 54,128 | ||||||||||||
|
|
|
|
|
|
|
| |||||||||
Net increase (decrease) in net assets derived from capital share transactions | 1,765,272 | (167,827,911 | ) | (8,920,590 | ) | (3,965,982 | ) | |||||||||
|
|
|
|
|
|
|
| |||||||||
Total increase (decrease) in net assets | 83,055,239 | (338,797,833 | ) | (19,800,890 | ) | (77,456,808 | ) | |||||||||
|
|
|
|
|
|
|
| |||||||||
| ||||||||||||||||
NET ASSETS: | ||||||||||||||||
| ||||||||||||||||
Beginning of period | $ | 1,362,421,015 | $ | 1,701,218,848 | $ | 432,717,752 | $ | 510,174,560 | ||||||||
|
|
|
|
|
|
|
| |||||||||
End of period | $ | 1,445,476,254 | $ | 1,362,421,015 | $ | 412,916,862 | $ | 432,717,752 | ||||||||
|
|
|
|
|
|
|
| |||||||||
Accumulated net investment income (loss) | $ | 2,872,132 | $ | 129,107 | $ | (410,649 | ) | $ | (35,177 | ) | ||||||
|
|
|
|
|
|
|
| |||||||||
| ||||||||||||||||
Capital share transactions are as follows: | ||||||||||||||||
Shares issued | 7,389,438 | 17,103,216 | 8,261,246 | 29,084,670 | ||||||||||||
Shares issued in connection with merger (see Note G) | — | — | — | — | ||||||||||||
Shares reinvested | — | — | — | — | ||||||||||||
Shares redeemed | (7,393,870 | ) | (23,146,134 | ) | (8,978,159 | ) | (31,207,479 | ) | ||||||||
|
|
|
|
|
|
|
| |||||||||
Net increase (decrease) from capital share transactions | (4,432 | ) | (6,042,918 | ) | (716,913 | ) | (2,122,809 | ) | ||||||||
|
|
|
|
|
|
|
| |||||||||
| ||||||||||||||||
| * | Fund commenced operations on May 4, 2015. |
Notes to Financial Statements are an integral part of this Statement.
34
Statements of Changes in Net Assets
| Driehaus Frontier Emerging Markets Fund | Driehaus International Small Cap Growth Fund | Driehaus Micro Cap Growth Fund | ||||||||||||||||||||
| For the six month period January 1, 2016 through June 30, 2016 (unaudited) | For the period May 4, 2015 through December 31, 2015* | For the six month period January 1, 2016 through June 30, 2016 (unaudited) | For the year ended December 31, 2015 | For the six month period January 1, 2016 through June 30, 2016 (unaudited) | For the year ended December 31, 2015 | |||||||||||||||||
| $ | 361,613 | $ | (24,425 | ) | $ | 413,305 | $ | (572,264 | ) | $ | (964,987 | ) | $ | (1,991,209 | ) | |||||||
| (629,140 | ) | (1,828,866 | ) | (4,189,618 | ) | 20,693,872 | (27,861,753 | ) | (6,843,839 | ) | |||||||||||
| 1,803,153 |
| (576,843 | ) | (4,366,385 | ) | 14,357,774 | 18,899,748 | (8,070,470 | ) | ||||||||||||
|
|
|
|
|
|
|
|
|
|
|
| |||||||||||
|
| |||||||||||||||||||||
| 1,535,626 |
| (2,430,134 | ) | (8,142,698 | ) | 34,479,382 | (9,926,992 | ) | (16,905,518 | ) | |||||||||||
|
|
|
|
|
|
|
|
|
|
|
| |||||||||||
|
| |||||||||||||||||||||
| — | — | — | (972,621 | ) | — | — | ||||||||||||||||
| — | — | — | (7,898,573 | ) | — | (11,379,419 | ) | |||||||||||||||
|
|
|
|
|
|
|
|
|
|
|
| �� | ||||||||||
| — |
| — | — | (8,871,194 | ) | — | (11,379,419 | ) | |||||||||||||
|
|
|
|
|
|
|
|
|
|
|
| |||||||||||
|
| |||||||||||||||||||||
| 22,304,049 | 22,685,066 | 10,129,000 | 46,284,910 | 48,959,967 | 280,545,434 | |||||||||||||||||
| — |
| — | — | 79,717,913 | — | — | |||||||||||||||
| — | — | — | 8,097,062 | — | 10,743,663 | |||||||||||||||||
| (26,044 | ) | (685,300 | ) | (20,492,503 | ) | (37,438,916 | ) | (55,727,270 | ) | (92,767,630 | ) | |||||||||||
| 2 | — | 3,028 | 920 | 8,757 | 95,940 | |||||||||||||||||
|
|
|
|
|
|
|
|
|
|
|
| |||||||||||
| 22,278,007 |
| 21,999,766 | (10,360,475 | ) | 96,661,889 | (6,758,546 | ) | 198,617,407 | |||||||||||||
|
|
|
|
|
|
|
|
|
|
|
| |||||||||||
| 23,813,633 |
| 19,569,632 | (18,503,173 | ) | 122,270,077 | (16,685,538 | ) | 170,332,470 | |||||||||||||
|
|
|
|
|
|
|
|
|
|
|
| |||||||||||
|
| |||||||||||||||||||||
|
| |||||||||||||||||||||
| $ | 19,569,632 | $ | — | $ | 341,248,654 | $ | 218,978,577 | $ | 282,178,137 | $ | 111,845,667 | |||||||||||
|
|
|
|
|
|
|
|
|
|
|
| |||||||||||
| $ | 43,383,265 | $ | 19,569,632 | $ | 322,745,481 | $ | 341,248,654 | $ | 265,492,599 | $ | 282,178,137 | |||||||||||
|
|
|
|
|
|
|
|
|
|
|
| |||||||||||
$ | 361,613 |
| $ | — | $ | (463,041 | ) | $ | (876,346 | ) | $ | (964,987 | ) | $ | — | |||||||
|
|
|
|
|
|
|
|
|
|
|
| |||||||||||
|
| |||||||||||||||||||||
| 2,438,730 | 2,300,043 | 1,080,606 | 4,649,732 | 5,077,621 | 23,283,839 | |||||||||||||||||
| — |
| — | — | 8,325,014 | — | — | |||||||||||||||
| — | — | — | 814,593 | — | 994,767 | |||||||||||||||||
| (2,948 | ) | (76,479 | ) | (2,161,965 | ) | (3,741,175 | ) | (5,790,779 | ) | (7,946,334 | ) | |||||||||||
|
|
|
|
|
|
|
|
|
|
|
| |||||||||||
| 2,435,782 |
| 2,223,564 | (1,081,359 | ) | 10,048,164 | (713,158 | ) | 16,332,272 | |||||||||||||
|
|
|
|
|
|
|
|
|
|
|
| |||||||||||
|
| |||||||||||||||||||||
Notes to Financial Statements are an integral part of this Statement.
35
Driehaus Emerging Markets Growth Fund
Financial Highlights
| For the six month period January 1, 2016 through June 30, 2016 (unaudited) | For the year ended December 31, 2015 | For the year ended December 31, 2014 | For the year ended December 31, 2013 | For the year ended December 31, 2012 | For the year ended December 31, 2011 | |||||||||||||||||||
Net asset value, beginning of period | $ | 26.52 | $ | 29.63 | $ | 32.53 | $ | 30.61 | $ | 25.72 | $ | 32.20 | ||||||||||||
|
|
|
|
|
|
|
|
|
|
|
| |||||||||||||
INCOME (LOSS) FROM INVESTMENT OPERATIONS: | ||||||||||||||||||||||||
Net investment income (loss) | 0.05 | 0.06 | 0.04 | 0.10 | 0.13 | 0.16 | ||||||||||||||||||
Net realized and unrealized gain (loss) on investments and foreign currency transactions | 1.57 | (3.17 | ) | (1.99 | ) | 2.62 | 4.88 | (4.97 | ) | |||||||||||||||
|
|
|
|
|
|
|
|
|
|
|
| |||||||||||||
Total income (loss) from investment operations | 1.62 | (3.11 | ) | (1.95 | ) | 2.72 | 5.01 | (4.81 | ) | |||||||||||||||
|
|
|
|
|
|
|
|
|
|
|
| |||||||||||||
LESS DISTRIBUTIONS: | ||||||||||||||||||||||||
Dividends from net investment income | — | — | — | — | (0.12 | ) | — | |||||||||||||||||
Distributions from capital gains | — | — | (0.95 | ) | (0.80 | ) | — | (1.67 | ) | |||||||||||||||
|
|
|
|
|
|
|
|
|
|
|
| |||||||||||||
Total distributions | — | — | (0.95 | ) | (0.80 | ) | (0.12 | ) | (1.67 | ) | ||||||||||||||
|
|
|
|
|
|
|
|
|
|
|
| |||||||||||||
Redemption fees added to paid-in capital | 0.00 | ~ | 0.00 | ~ | 0.00 | ~ | 0.00 | ~ | 0.00 | ~ | 0.00 | ~ | ||||||||||||
|
|
|
|
|
|
|
|
|
|
|
| |||||||||||||
Net asset value, end of period | $ | 28.14 | $ | 26.52 | $ | 29.63 | $ | 32.53 | $ | 30.61 | $ | 25.72 | ||||||||||||
|
|
|
|
|
|
|
|
|
|
|
| |||||||||||||
Total Return | 6.11 | %** | (10.49 | )% | (5.96 | )% | 8.92 | % | 19.51 | % | (15.02 | )% | ||||||||||||
RATIOS/SUPPLEMENTAL DATA | ||||||||||||||||||||||||
Net assets, end of period (in 000’s) | $ | 1,445,476 | $ | 1,362,421 | $ | 1,701,219 | $ | 1,634,866 | $ | 989,258 | $ | 741,291 | ||||||||||||
Ratio of expenses before reimbursements, waivers and fees paid indirectly to average net assets | 1.67 | %* | 1.65 | % | 1.65 | % | 1.66 | % | 1.68 | % | 1.68 | % | ||||||||||||
Ratio of net expenses to average net assets | 1.64 | %*# | 1.64 | %# | 1.63 | %# | 1.64 | %# | 1.66 | %# | 1.64 | %# | ||||||||||||
Ratio of net investment income (loss) to average net assets | 0.41 | %*# | 0.22 | %# | 0.11 | %# | 0.33 | %# | 0.48 | %# | 0.49 | %# | ||||||||||||
Portfolio turnover | 121 | %** | 257 | % | 289 | % | 264 | % | 278 | % | 342 | % | ||||||||||||
|
|
|
|
|
|
|
|
|
|
|
|
| ||||||||||||
| * | Annualized |
| ** | Not annualized |
| ~ | Amount represents less than $0.01 per share |
| # | Such ratios are net of fees paid indirectly (see Note B in the Notes to Financial Statements). |
Notes to Financial Statements are an integral part of this Schedule.
36
Driehaus Emerging Markets Small Cap Growth Fund
Financial Highlights
| For the six month period January 1, 2016 through June 30, 2016 (unaudited) | For the year ended December 31, 2015 | For the year ended December 31, 2014 | For the year ended December 31, 2013 | For the year ended December 31, 2012 | For the period August 22, 2011 through December 31, 2011 | |||||||||||||||||||
Net asset value, beginning of period | $ | 11.85 | $ | 13.21 | $ | 12.49 | $ | 11.15 | $ | 8.81 | $ | 10.00 | ||||||||||||
|
|
|
|
|
|
|
|
|
|
|
| |||||||||||||
INCOME (LOSS) FROM INVESTMENT OPERATIONS: | ||||||||||||||||||||||||
Net investment income (loss) | (0.01 | ) | (0.05 | )^ | (0.02 | )^ | (0.00 | )^ ~ | 0.00 | ^~ | (0.03 | ) | ||||||||||||
Net realized and unrealized gain (loss) on investments | (0.30 | ) | (1.31 | ) | 0.74 | 1.36 | 2.52 | (1.16 | ) | |||||||||||||||
|
|
|
|
|
|
|
|
|
|
|
| |||||||||||||
Total income (loss) from investment operations | (0.31 | ) | (1.36 | ) | 0.72 | 1.36 | 2.52 | (1.19 | ) | |||||||||||||||
|
|
|
|
|
|
|
|
|
|
|
| |||||||||||||
LESS DISTRIBUTIONS: | ||||||||||||||||||||||||
Dividends from net investment income | — | — | — | (0.02 | ) | (0.18 | ) | — | ||||||||||||||||
Distributions from capital gains | — | — | — | — | — | — | ||||||||||||||||||
|
|
|
|
|
|
|
|
|
|
|
| |||||||||||||
Total distributions | — | — | — | (0.02 | ) | (0.18 | ) | — | ||||||||||||||||
|
|
|
|
|
|
|
|
|
|
|
| |||||||||||||
Redemption fees added to paid-in capital | 0.00 | ~ | 0.00 | ~ | 0.00 | ~ | 0.00 | ~ | 0.00 | ~ | — | |||||||||||||
|
|
|
|
|
|
|
|
|
|
|
| |||||||||||||
Net asset value, end of period | $ | 11.54 | $ | 11.85 | $ | 13.21 | $ | 12.49 | $ | 11.15 | $ | 8.81 | ||||||||||||
|
|
|
|
|
|
|
|
|
|
|
| |||||||||||||
Total Return | (2.61 | )%** | (10.22 | )% | 5.77 | % | 12.11 | % | 28.83 | % | (11.90 | )%** | ||||||||||||
RATIOS/SUPPLEMENTAL DATA | ||||||||||||||||||||||||
Net assets, end of period (in 000’s) | $ | 412,917 | $ | 432,718 | $ | 510,175 | $ | 191,285 | $ | 80,997 | $ | 32,720 | ||||||||||||
Ratio of expenses before reimbursements and/or recapture, waivers and fees paid indirectly to average net assets | 1.75 | %* | 1.69 | %¥ | 1.73 | % | 1.85 | % | 2.15 | % | 2.74 | %* | ||||||||||||
Ratio of net expenses to average net assets | 1.72 | %*# | 1.68 | %+#¥ | 1.71 | %+# | 1.90 | %+# | 1.99 | %+# | 1.97 | %*+# | ||||||||||||
Ratio of net investment loss to average net assets | (0.18 | )%*# | (0.39 | )%+# | (0.14 | )%+# | (0.02 | )%+# | (0.02 | )%+# | (0.91 | )%*+# | ||||||||||||
Portfolio turnover | 129 | %** | 306 | % | 265 | % | 223 | % | 183 | % | 74 | %** | ||||||||||||
|
|
|
|
|
|
|
|
|
|
|
|
| ||||||||||||
| * | Annualized |
| ** | Not annualized |
| ^ | Net investment income (loss) per share has been calculated using the average shares method. |
| ~ | Amount represents less than $0.01 per share |
| + | Such ratios are after administrative and transfer agent waivers and adviser expense reimbursements, when applicable. BNY Mellon Investment Servicing (US) Inc., the administrative agent and transfer agent, waived a portion of its fees beginning with the Fund’s commencement of operations, August 22, 2011. The Adviser contractually agreed to waive its investment advisory fee or absorb other operating expenses to the extent necessary to ensure that total annual Fund operating expenses (other than interest, taxes, brokerage commissions and other portfolio transaction expenses, capital expenditures, and extraordinary expenses) would not exceed the Fund’s operating expense cap of 2.00% of average daily net assets until August 21, 2014. |
| # | Such ratios are net of fees paid indirectly (see Note B in the Notes to Financial Statements). |
| ¥ | Ratio of expenses to average net assets includes interest expense of less than 0.005% for the year ended December 31, 2015. The interest expense is from utilizing the line of credit (see Note D in the Notes to Financial Statements). |
Notes to Financial Statements are an integral part of this Schedule.
37
Driehaus Frontier Emerging Markets Fund
Financial Highlights
| For the six month period January 1, 2016 through June 30, 2016 (unaudited) | For the period May 4, 2015 through December 31, 2015 | |||||||
Net asset value, beginning of period | $ | 8.80 | $ | 10.00 | ||||
|
|
|
| |||||
INCOME (LOSS) FROM INVESTMENT OPERATIONS: | ||||||||
Net investment income (loss) | 0.14 | ^ | (0.01 | ) | ||||
Net realized and unrealized gain (loss) on investments | 0.37 | (1.19 | ) | |||||
|
|
|
| |||||
Total income (loss) from investment operations | 0.51 | (1.20 | ) | |||||
|
|
|
| |||||
LESS DISTRIBUTIONS: | ||||||||
Dividends from net investment income | — | — | ||||||
Distributions from capital gains | — | — | ||||||
|
|
|
| |||||
Total distributions | — | — | ||||||
|
|
|
| |||||
Redemption fees added to paid-in capital | 0.00 | ~ | — | |||||
|
|
|
| |||||
Net asset value, end of period | $ | 9.31 | $ | 8.80 | ||||
|
|
|
| |||||
Total Return | 5.80 | %** | (12.00 | )%** | ||||
RATIOS/SUPPLEMENTAL DATA | ||||||||
Net assets, end of period (in 000’s) | $ | 43,383 | $ | 19,570 | ||||
Ratio of expenses before reimbursements and waivers and fees recaptured, if any, to average net assets | 3.18 | %* | 3.89 | %* | ||||
Ratio of net expenses to average net assets | 1.99 | %*+# | 2.00 | %*+# | ||||
Ratio of net investment income (loss) to average net assets | 3.09 | %*+# | (0.22 | )%*+# | ||||
Portfolio turnover | 39 | %** | 66 | %** | ||||
| ||||||||
| * | Annualized |
| ** | Not annualized |
| ^ | Net investment income (loss) per share has been calculated using the average shares method. |
| ~ | Amount represents less than $0.01 per share |
| + | Such ratios are after administrative and transfer agent waivers and adviser expense reimbursements, when applicable. BNY Mellon Investment Servicing (US) Inc., the administrative agent and transfer agent, waived a portion of its fees beginning with the Fund’s commencement of operations, May 4, 2015. The Adviser contractually agreed to waive its investment advisory fee or absorb other operating expenses to the extent necessary to ensure that total annual Fund operating expenses (other than interest, taxes, brokerage commissions and other portfolio transaction expenses, capital expenditures, and extraordinary expenses) would not exceed the Fund’s operating expense cap of 2.00% of average daily net assets until May 3, 2018. |
| # | Such ratios are net of fees paid indirectly (see Note B in the Notes to Financial Statements). |
Notes to Financial Statements are an integral part of this Schedule.
38
Driehaus International Small Cap Growth Fund
Financial Highlights
| For the six month period January 1, 2016 through June 30, 2016 (unaudited) | For the year ended December 31, 2015 | For the year ended December 31, 2014 | For the year ended December 31, 2013 | For the year ended December 31, 2012 | For the year ended December 31, 2011 | |||||||||||||||||||
Net asset value, beginning of period | $ | 10.08 | $ | 9.20 | $ | 10.84 | $ | 9.45 | $ | 8.51 | $ | 9.66 | ||||||||||||
|
|
|
|
|
|
|
|
|
|
|
| |||||||||||||
INCOME (LOSS) FROM INVESTMENT OPERATIONS: | ||||||||||||||||||||||||
Net investment income (loss) | 0.01 | (0.02 | )^ | (0.04 | ) | (0.01 | )^ | 0.03 | 0.07 | |||||||||||||||
Net realized and unrealized gain (loss) on investments and foreign currency transactions | (0.24 | ) | 1.17 | (0.42 | ) | 2.74 | 0.95 | (1.17 | ) | |||||||||||||||
|
|
|
|
|
|
|
|
|
|
|
| |||||||||||||
Total income (loss) from investment operations | (0.23 | ) | 1.15 | (0.46 | ) | 2.73 | 0.98 | (1.10 | ) | |||||||||||||||
|
|
|
|
|
|
|
|
|
|
|
| |||||||||||||
LESS DISTRIBUTIONS: | ||||||||||||||||||||||||
Dividends from net investment income | — | (0.03 | ) | (0.06 | ) | (0.13 | ) | (0.04 | ) | (0.05 | ) | |||||||||||||
Distributions from capital gains | — | (0.24 | ) | (1.12 | ) | (1.21 | ) | — | — | |||||||||||||||
|
|
|
|
|
|
|
|
|
|
|
| |||||||||||||
Total distributions | — | (0.27 | ) | (1.18 | ) | (1.34 | ) | (0.04 | ) | (0.05 | ) | |||||||||||||
|
|
|
|
|
|
|
|
|
|
|
| |||||||||||||
Redemption fees added to paid-in capital | 0.00 | ~ | 0.00 | ~ | 0.00 | ~ | 0.00 | ~ | 0.00 | ~ | 0.00 | ~ | ||||||||||||
|
|
|
|
|
|
|
|
|
|
|
| |||||||||||||
Net asset value, end of period | $ | 9.85 | $ | 10.08 | $ | 9.20 | $ | 10.84 | $ | 9.45 | $ | 8.51 | ||||||||||||
|
|
|
|
|
|
|
|
|
|
|
| |||||||||||||
Total Return | (2.28 | )%** | 12.58 | % | (4.32 | )% | 29.24 | % | 11.67 | % | (11.39 | )% | ||||||||||||
RATIOS/SUPPLEMENTAL DATA | ||||||||||||||||||||||||
Net assets, end of period (in 000’s) | $ | 322,745 | $ | 341,249 | $ | 218,979 | $ | 270,671 | $ | 234,959 | $ | 232,729 | ||||||||||||
Ratio of expenses before reimbursements, waivers and fees paid indirectly to average net assets | 1.71 | %* | 1.71 | % | 1.74 | % | 1.73 | % | 1.76 | % | 1.73 | % | ||||||||||||
Ratio of net expenses to average net assets | 1.68 | %*# | 1.70 | %# | 1.72 | %# | 1.70 | %# | 1.74 | %# | 1.69 | %# | ||||||||||||
Ratio of net investment income (loss) to average net assets | 0.26 | %*# | (0.19 | )%# | (0.40 | )%# | (0.11 | )%# | 0.31 | %# | 0.66 | %# | ||||||||||||
Portfolio turnover | 77 | %** | 251 | % | 277 | % | 320 | % | 280 | % | 311 | % | ||||||||||||
|
|
|
|
|
|
|
|
|
|
|
|
| ||||||||||||
| * | Annualized |
| ** | Not annualized |
| ^ | Net investment income (loss) per share has been calculated using the average shares method. |
| ~ | Amount represents less than $0.01 per share |
| # | Such ratios are net of fees paid indirectly (see Note B in the Notes to Financial Statements). |
Notes to Financial Statements are an integral part of this Schedule.
39
Driehaus Micro Cap Growth Fund
Financial Highlights
| For the six month period January 1, 2016 through June 30, 2016 (unaudited) | For the year ended December 31, 2015 | For the year ended December 31, 2014 | For the period November 18, 2013 through December 31, 2013 | |||||||||||||
Net asset value, beginning of period | $ | 10.74 | $ | 11.25 | $ | 10.74 | $ | 10.00 | ||||||||
|
|
|
|
|
|
|
| |||||||||
INCOME (LOSS) FROM INVESTMENT OPERATIONS: | ||||||||||||||||
Net investment income (loss) | (0.04 | ) | (0.14 | )^ | (0.14 | ) | (0.02 | ) | ||||||||
Net realized and unrealized gain (loss) on investments | (0.31 | ) | 0.08 | 1.01 | 0.76 | |||||||||||
|
|
|
|
|
|
|
| |||||||||
Total income (loss) from investment operations | (0.35 | ) | (0.06 | ) | 0.87 | 0.74 | ||||||||||
|
|
|
|
|
|
|
| |||||||||
LESS DISTRIBUTIONS: | ||||||||||||||||
Dividends from net investment income | — | — | — | — | ||||||||||||
Distributions from capital gains | — | (0.45 | ) | (0.36 | ) | — | ||||||||||
|
|
|
|
|
|
|
| |||||||||
Total distributions | — | (0.45 | ) | (0.36 | ) | — | ||||||||||
|
|
|
|
|
|
|
| |||||||||
Redemption fees added to paid-in capital | 0.00 | ~ | 0.00 | ~ | 0.00 | ~ | — | |||||||||
|
|
|
|
|
|
|
| |||||||||
Net asset value, end of period | $ | 10.39 | $ | 10.74 | $ | 11.25 | $ | 10.74 | ||||||||
|
|
|
|
|
|
|
| |||||||||
Total Return | (3.35 | )%** | (0.55 | )% | 8.21 | % | 7.40 | %** | ||||||||
RATIOS/SUPPLEMENTAL DATA | ||||||||||||||||
Net assets, end of period (in 000’s) | $ | 265,493 | $ | 282,178 | $ | 111,846 | $ | 74,677 | ||||||||
Ratio of expenses before reimbursements and waivers and fees recaptured, if any, to average net assets | 1.50 | %* | 1.53 | % | 1.59 | % | 2.28 | %* | ||||||||
Ratio of net expenses to average net assets | 1.43 | %*+# | 1.52 | %+# | 1.60 | %+# | 1.70 | %*+# | ||||||||
Ratio of net investment income (loss) to average net assets | (0.81 | )%*+# | (1.21 | )%+# | (1.39 | )%+# | (1.55 | )%*+# | ||||||||
Portfolio turnover | 90 | %** | 183 | % | 191 | % | 21 | %** | ||||||||
| ||||||||||||||||
| * | Annualized |
| ** | Not annualized |
| ^ | Net investment income (loss) per share has been calculated using the average shares method. |
| ~ | Amount represents less than $0.01 per share |
| + | Such ratios are after administrative and transfer agent waivers and adviser expense reimbursements, when applicable. BNY Mellon Investment Servicing (US) Inc., the administrative agent and transfer agent, waived a portion of its fees beginning with the Fund’s commencement of operations, November 18, 2013. The Adviser contractually agreed to waive its investment advisory fee or absorb other operating expenses to the extent necessary to ensure that total annual Fund operating expenses (other than interest, taxes, brokerage commissions and other portfolio transaction expenses, capital expenditures, and extraordinary expenses) would not exceed the Fund’s operating expense cap of 1.70% of average daily net assets until November 17, 2016. |
| # | Such ratios are net of fees paid indirectly (see Note B in the Notes to Financial Statements). |
Notes to Financial Statements are an integral part of this Schedule.
40
Driehaus Mutual Funds
Notes to Financial Statements (unaudited)
A. SUMMARY OF SIGNIFICANT ACCOUNTING POLICIES
Organization
The Driehaus Mutual Funds (the “Trust”) is a registered management investment company under the Investment Company Act of 1940, as amended, organized as a Delaware statutory trust, with eight separate series currently in operation. The Trust was organized under an Agreement and Declaration of Trust dated May 31, 1996, as subsequently amended and restated as of June 6, 2013, and amended as of June 4, 2016, and may issue an unlimited number of full and fractional units of beneficial interest (shares) without par value. The five series (“Funds” or each a “Fund”) included in this report are as follows:
| Fund | Commencement of Operations | |||
Driehaus Emerging Markets Growth Fund | 12/31/97 | |||
Driehaus Emerging Markets Small Cap Growth Fund | 08/22/11 | |||
Driehaus Frontier Emerging Markets Fund | 05/04/15 | |||
Driehaus International Small Cap Growth Fund* | 09/17/07 | |||
Driehaus Micro Cap Growth | 11/18/13 | |||
|
|
| ||
| * | On December 29, 2010, the Driehaus International Small Cap Growth Fund was closed to new investors. |
The investment objective of each Fund is to maximize capital appreciation.
Driehaus Emerging Markets Growth Fund seeks to achieve its objective by investing primarily in equity securities of emerging markets companies.
Driehaus Emerging Markets Small Cap Growth Fund seeks to achieve its objective by investing primarily in equity securities of small capitalization emerging markets companies.
Driehaus Frontier Emerging Markets Fund seeks to achieve its objective by investing primarily in equity securities of frontier emerging markets companies.
Driehaus International Small Cap Growth Fund seeks to achieve its objective by investing primarily in equity securities of smaller capitalization non-U.S. companies exhibiting strong growth characteristics.
Driehaus Micro Cap Growth Fund seeks to achieve its objective by investing primarily in equity securities of micro capitalization U.S. companies exhibiting strong growth characteristics.
Fiscal Year-End
The fiscal year-end for the Funds is December 31.
Securities Valuation and Transactions
Equity securities and exchange-traded options are valued at the last sale price as of the close of the primary exchange or other designated time. Equity certificates are valued at the last sale price of the underlying security as of the close of the primary exchange. Swaps, forward foreign currency contracts and other financial derivatives are valued daily, primarily by an independent pricing service using pricing models and are generally classified as level 2. The pricing models use inputs that are observed from actively quoted markets such as issuer details, indices, spreads, interest rates, yield curves, dividends and exchange rates. If valuations are not available from the independent pricing service or values received are deemed not representative of market value, values will be obtained from a third party broker-dealer or counterparty. In addition, if quotations are not readily available, if the values have been materially affected by events occurring after the closing of a foreign market, or if there has been a movement in the United States market that exceeds a certain threshold, assets may be valued at fair value as determined in good faith by or under the direction of the Trust’s Board of Trustees. Events that may materially affect asset values that could cause a fair value determination include, but are not limited to: corporate announcements relating to a specific security; natural and other disasters which may impact an entire market or region; and political and other events which may be global or impact a particular country or region. The frequency with which these procedures are used cannot
41
Driehaus Mutual Funds
Notes to Financial Statements (unaudited) — (Continued)
be predicted and may be utilized to a significant extent. To the extent utilized, securities would be considered level 2 in the hierarchy described below. Substantially all transfers between level 1 and level 2 relate to the use of these procedures.
Each Fund is subject to fair value accounting standards that define fair value, establish the framework for measuring fair value and provide a three-level hierarchy for fair valuation based upon the inputs to the valuation as of the measurement date. The three levels of the fair value hierarchy are as follows:
Level 1 — quoted prices in active markets for identical securities
Level 2 — significant observable inputs (including quoted prices for similar securities, interest rates, prepayment speeds, credit risk, etc.)
Level 3 — significant unobservable inputs (including the Funds’ own assumptions in determining the fair value of investments) The inputs or methodology used for valuing securities are not necessarily an indication of the risk associated with investing in those securities.
The summary of the Funds’ investments that are measured at fair value by level within the fair value hierarchy as of June 30, 2016 is as follows:
Fund | Total Value at June 30, 2016 | Level 1 Quoted Price | Level 2 Significant Observable Inputs | Level 3 Significant Unobservable Inputs | ||||||||||||
Driehaus Emerging Markets Growth Fund | ||||||||||||||||
Equity Securities: | ||||||||||||||||
Africa | $ | 33,197,756 | $ | — | $ | 33,197,756 | $ | — | ||||||||
Europe | 149,260,203 | 45,819,091 | 103,441,112 | — | ||||||||||||
Far East | 783,061,459 | 177,874,674 | 605,186,785 | — | ||||||||||||
Middle East | 24,253,975 | — | 24,253,975 | — | ||||||||||||
North America | 160,681,788 | 159,065,644 | 1,616,144 | — | ||||||||||||
South America | 178,590,876 | 178,590,876 | — | — | ||||||||||||
Rights | 54,224 | — | 54,224 | — | ||||||||||||
Exchange-Traded Funds | 9,766,171 | 9,766,171 | — | — | ||||||||||||
|
|
|
|
|
|
|
| |||||||||
Total Investments | $ | 1,338,866,452 | $ | 571,116,456 | $ | 767,749,996 | $ | — | ||||||||
|
|
|
|
|
|
|
| |||||||||
Driehaus Emerging Markets Small Cap Growth Fund | ||||||||||||||||
Assets: | ||||||||||||||||
Equity Securities: | ||||||||||||||||
Africa | $ | 21,701,729 | $ | 5,613,005 | $ | 16,088,724 | $ | — | ||||||||
Europe | 17,557,193 | 3,947,733 | 13,609,460 | |||||||||||||
Far East | 288,534,157 | 16,874,869 | 271,659,288 | — | ||||||||||||
Middle East | 8,245,447 | — | 8,245,447 | — | ||||||||||||
North America | 28,098,880 | 25,890,186 | 2,208,694 | — | ||||||||||||
South America | 37,636,239 | 37,636,239 | — | — | ||||||||||||
Rights | 49,471 | — | 49,471 | — | ||||||||||||
Purchased Put Options | 2,640,000 | 2,640,000 | — | — | ||||||||||||
Swap Contracts | 1,063,977 | — | 1,063,977 | — | ||||||||||||
|
|
|
|
|
|
|
| |||||||||
Total Investments | $ | 405,527,093 | $ | 92,602,032 | $ | 312,925,061 | $ | — | ||||||||
|
|
|
|
|
|
|
| |||||||||
42
Driehaus Mutual Funds
Notes to Financial Statements (unaudited) — (Continued)
Fund | Total Value at June 30, 2016 | Level 1 Quoted Price | Level 2 Significant Observable Inputs | Level 3 Significant Unobservable Inputs | ||||||||||||
Liabilities: | ||||||||||||||||
Written Put Options | $ | (30,000 | ) | $ | (30,000 | ) | $ | — | $ | — | ||||||
Forward Foreign Exchange Contracts | (946,194 | ) | — | (946,194 | ) | — | ||||||||||
|
|
|
|
|
|
|
| |||||||||
Total Liabilities | $ | (976,194 | ) | $ | (30,000 | ) | $ | (946,194 | ) | $ | — | |||||
|
|
|
|
|
|
|
| |||||||||
Driehaus Frontier Emerging Markets Fund | ||||||||||||||||
Equity Securities: | ||||||||||||||||
Africa | $ | 9,169,657 | $ | 2,677,819 | $ | 6,491,838 | $ | — | ||||||||
Europe | 6,244,443 | 2,146,483 | 4,097,960 | — | ||||||||||||
Far East | 12,263,745 | 2,687,238 | 9,576,507 | — | ||||||||||||
Middle East | 7,836,116 | 1,044,886 | 6,791,230 | — | ||||||||||||
North America | 1,259,798 | 1,259,798 | — | — | ||||||||||||
South America | 5,044,759 | 5,044,759 | — | — | ||||||||||||
Equity Certificates* | 605,383 | — | 605,383 | — | ||||||||||||
|
|
|
|
|
|
|
| |||||||||
Total Investments | $ | 42,423,901 | $ | 14,860,983 | $ | 27,562,918 | $ | — | ||||||||
|
|
|
|
|
|
|
| |||||||||
Driehaus International Small Cap Growth Fund | ||||||||||||||||
Equity Securities: | ||||||||||||||||
Europe | $ | 165,719,349 | $ | — | $ | 165,719,349 | $ | — | ||||||||
Far East | 92,633,497 | — | 92,633,497 | — | ||||||||||||
North America | 51,210,369 | 51,210,369 | — | — | ||||||||||||
|
|
|
|
|
|
|
| |||||||||
Total Investments | $ | 309,563,215 | $ | 51,210,369 | $ | 258,352,846 | $ | — | ||||||||
|
|
|
|
|
|
|
| |||||||||
Driehaus Micro Cap Growth Fund | ||||||||||||||||
Investments in Securities* | $ | 261,387,770 | $ | 261,387,770 | $ | — | $ | — | ||||||||
|
|
|
|
|
|
|
| |||||||||
| * | See Schedule of Investments for industry and/or country breakout. |
Transfers between levels, if any, are recognized as of the last day in the fiscal quarter of the period in which the event or change in circumstances that caused the reclassification occurred. The Funds used observable inputs in their valuation methodologies whenever they were available and deemed reliable.
When fair value pricing is employed, the prices of securities used by a Fund to calculate its net asset value may differ from closing prices for the same securities, which means that a Fund may value those securities higher or lower than another fund that does not employ fair value. In addition, the fair value price may differ materially from the value a Fund may ultimately realize.
For the period ended June 30, 2016, securities with end of period values of $404,475,925, $124,628,430, $19,093,593 and $134,853,559 held by Driehaus Emerging Markets Growth Fund, Driehaus Emerging Markets Small Cap Growth Fund, Driehaus Frontier Emerging Markets Fund and Driehaus International Small Cap Growth Fund, respectively, were transferred from level 1 to level 2. For the period ended June 30, 2016, a security with end of period value of $517,760 held by Driehaus Frontier Emerging Markets Fund was transferred from level 2 to level 1.
Securities transactions are accounted for on trade date. The cost of investments sold is determined by the use of the specific identification method for both financial reporting and income tax purposes. Interest income
43
Driehaus Mutual Funds
Notes to Financial Statements (unaudited) — (Continued)
is recorded on an accrual basis. Dividend income, net of non-reclaimable foreign taxes withheld, is recorded on the ex-dividend date or as soon as the information is available. Income and expenses are accrued daily.
Options Contracts
The Funds are subject to equity and other risk exposures in the normal course of pursuing their investment objective. The Funds may use options contracts to hedge their portfolio or a portion thereof or speculatively for the purpose of profiting from a decline in the market value of a security. The Driehaus Emerging Markets Small Cap Growth Fund used both purchased and written options during the period January 1, 2016 through June 30, 2016 to hedge exposure to certain countries or sectors as well as gain exposure to certain countries or sectors.
The Funds may write covered call and put options on futures, securities or currencies the Funds own or in which they may invest. Writing put options tends to increase a Fund’s exposure to the underlying instrument. Writing call options tends to decrease a Fund’s exposure to the underlying instrument. When a Fund writes a call or put option, an amount equal to the premium received is recorded as a liability and subsequently marked-to-market to reflect the current value of the option written. These liabilities are reflected as written options outstanding in the Schedule of Investments. Payments received or made, if any, from writing options with premiums to be determined on a future date are reflected as such in the Schedule of Investments. Premiums received from writing options which expire are treated as realized gains. Premiums received from writing options which are exercised or closed are added to the proceeds or offset against amounts paid on the underlying future, security or currency transaction to determine the realized gain or loss. A Fund, as a writer of an option, has no control over whether the underlying future, security or currency may be sold (call) or purchased (put) and, as a result, bears the market risk of an unfavorable change in the price of the future, security or currency underlying the written option. The risk exists that a Fund may not be able to enter into a closing transaction because of an illiquid market.
For the period January 1, 2016 through June 30, 2016, the average volume of purchased and written options for Driehaus Emerging Markets Small Cap Growth Fund were $6,567,431 and $506,267, respectively.
The premiums received and the number of option contracts written during the period ended June 30, 2016 were as follows:
Driehaus Emerging Markets Small Cap Growth Fund | Number of Contracts | Premiums Received | ||||||
Options outstanding at December 31, 2015 | 13,500 | $ | 704,424 | |||||
Options written | 10,412,750 | 13,576,763 | ||||||
Options closed | (411,250 | ) | (13,466,810 | ) | ||||
Options expired | (10,000,000 | ) | (30,000 | ) | ||||
|
|
|
| |||||
Options outstanding at June 30, 2016 | 15,000 | $ | 784,377 | |||||
|
|
|
| |||||
The Funds may also purchase put and call options. Purchasing call options tends to increase a Fund’s exposure to the underlying instrument. Purchasing put options tends to decrease a Fund’s exposure to the underlying instrument. A Fund pays a premium which is included in its Schedule of Investments as an investment and subsequently marked-to-market to reflect the current value of the option. Premiums paid for purchasing options which expire are treated as realized losses. Premiums paid for purchasing options which are exercised or closed are added to the amounts paid or offset against the proceeds on the underlying future, security or currency transaction to determine the realized gain or loss. When entering into purchased option contracts, a Fund bears the risk of securities prices moving unexpectedly, in which case, a Fund may not achieve the anticipated benefits of the purchased option contracts; however, the risk of loss is limited to the premium paid. As of June 30, 2016, the Funds had outstanding options as listed on the Schedule of Investments.
44
Driehaus Mutual Funds
Notes to Financial Statements (unaudited) — (Continued)
Swap Contracts
The Driehaus Emerging Markets Small Cap Growth Fund may engage in various swap transactions, including forward rate agreements and interest rate, currency, volatility, index and total return swaps, primarily to manage risk, or as alternatives to direct investments. The Fund may also engage in credit default swaps which involve the exchange of a periodic premium for protection against a defined credit event (such as payment default, refinancing or bankruptcy). The Fund did engage in credit default swaps during the period January 1, 2016 through June 30, 2016 to protect against credit events.
Under the terms of a credit default swap contract, one party acts as a guarantor receiving a periodic payment that is a fixed percentage applied to a notional amount. In return, the party agrees to purchase the notional amount of the underlying instrument, at par, if a credit event occurs during the term of the contract. The Fund may enter into credit default swaps in which the Fund acts as guarantor (a seller of protection), and may enter into credit default swaps in which the counterparty acts as guarantor (a buyer of protection). Premiums paid to or by the Fund are accrued daily and included in realized gain (loss) on swaps. The contracts are marked-to-market daily using fair value estimates provided by an independent pricing service. Changes in value are recorded as unrealized appreciation (depreciation). Unrealized gains are reported as an asset and unrealized losses are reported as a liability. The change in value of swaps, including accruals of periodic amounts of interest to be paid or received on swaps is reported as unrealized gains or losses. Gains or losses are realized upon termination of the contracts. The risk of loss under a swap contract may exceed the amount recorded as an asset or a liability. The notional amount of a swap contract is the reference amount pursuant to which the counterparties make payments. For swaps in which the referenced obligation is an index, in the event of default of any debt security included in the corresponding index, the Fund pays or receives the percentage of the corresponding index that the defaulted security comprises (1) multiplied by the notional value and (2) multiplied by the ratio of one minus the ratio of the market value of the defaulted debt security to its par value. The maximum exposure to loss of the notional value as a seller of credit default swaps outstanding at June 30, 2016, for the Driehaus Emerging Markets Small Cap Growth Fund was $0.
Risks associated with swap contracts include changes in the returns of underlying instruments, failure of the counterparties to perform under the contracts’ terms and the possible lack of liquidity with respect to the contracts. Credit default swaps can involve greater risks than if an investor had invested in the reference obligation directly since, in addition to general market risks, credit default swaps are subject to counterparty credit risk, leverage risk, hedging risk, correlation risk and liquidity risk. The Fund discloses swap contracts on a gross basis, with no netting of contracts held with the same counterparty. As of June 30, 2016, the Driehaus Emerging Markets Small Cap Growth Fund had outstanding swap contracts as listed on the Schedule of Investments.
Forward Foreign Currency Contracts
The Driehaus Emerging Markets Small Cap Growth Fund used forward foreign currency contracts during the period January 1, 2016 through June 30, 2016 to hedge foreign currency exposure in the portfolio. A forward foreign currency contract involves an obligation to purchase or sell a specific currency at a future date, which may be any fixed number of days from the date of the contract agreed upon by the parties, at a price set at the time of the contract. These contracts are principally traded in the inter-bank market conducted directly between currency traders (usually large commercial banks) and their customers.
The market value of a forward foreign currency contract fluctuates with changes in currency exchange rates. Outstanding forward foreign currency contracts are valued daily at current market rates and the resulting change in market value is recorded as unrealized appreciation or depreciation. When a forward foreign currency contract is settled, the Fund records a realized gain or loss equal to the difference between the value at the time the forward foreign currency contract was opened and the value at the time it was settled. A forward foreign currency contract may involve market risk in excess of the unrealized gain or loss reflected on the Statements of Assets and Liabilities. In addition, the Fund could be exposed to credit risk if the counterparties are unable or unwilling to meet the terms of the contracts or market risk if the value of the foreign currency changes unfavorably. As of June 30, 2016, the Driehaus Emerging Markets Small Cap Growth Fund had forward foreign currency contracts as listed in the Schedule of Investments.
45
Driehaus Mutual Funds
Notes to Financial Statements (unaudited) — (Continued)
Foreign Currency Spot Contracts
The Funds enter into foreign currency spot contracts to facilitate transactions in foreign currency denominated securities. These spot contracts are typically open for 2 to 5 days, depending on the settlement terms of the underlying security transaction. On June 30, 2016, the Funds had foreign currency spot contracts outstanding under which they are obligated to exchange currencies at specified future dates. The unrealized appreciation or depreciation on spot contracts is reflected as a separate line item in the Statements of Assets and Liabilities.
Equity Certificates
The Funds may invest in equity certificates which allow the Funds to participate in the appreciation (depreciation) of the underlying security without actually owning the underlying security. These derivative instruments are purchased pursuant to an agreement with a financial institution and are valued at a calculated market price based on the value of the underlying security in accordance with the agreement. These equity certificates are subject to the credit risk of the issuing financial institution. There is no off-balance sheet risk associated with equity certificates and the Funds’ potential loss is limited to the purchase price of the securities. The Funds are exposed to credit risk associated with the counterparty to the transaction, which is monitored by the Funds’ management on a periodic basis.
On June 30, 2016, Driehaus Frontier Emerging Markets Fund had unrealized appreciation of $63,914 as a result of its investments in these financial instruments. The aggregate market values of these certificates for Driehaus Frontier Emerging Markets Funds represented 1.4% of its total market value of investments at June 30, 2016.
Derivative Investment Holdings Categorized by Risk Exposure
Each Fund is subject to the Financial Accounting Standards Board’s (“FASB”) “Disclosures about Derivative Instruments and Hedging Activities” (the “Derivatives Statement”). The Derivatives Statement amends and expands disclosures about derivative instruments and hedging activities. The Derivatives Statement is intended to improve financial reporting about derivative instruments requiring enhanced disclosures to enable investors to better understand how and why the Funds use derivative instruments, how these derivative instruments are accounted for and their effects on the Funds’ financial position and results of operations.
The following table sets forth the fair value and the location in the Statement of Assets and Liabilities of the Driehaus Emerging Markets Small Cap Growth Fund’s derivative contracts by primary risk exposure as of June 30, 2016:
Risk exposure category | Asset derivatives | Fair value | Liability derivatives | Fair value | ||||||||
Commodity contracts | Investments, at market value | $ | 420,000 | |||||||||
Credit contracts | Swaps, at value | $ | 1,063,977 | |||||||||
Equity contracts | Investments, at market value | $ | 2,220,000 | Outstanding options written, at value | $ | 30,000 | ||||||
Foreign currency contracts | Unrealized depreciation on forward foreign currency contracts | $ | 946,194 | |||||||||
| ||||||||||||
The following table sets forth the fair value and the location in the Statement of Assets and Liabilities of the Driehaus Frontier Emerging Markets Fund’s derivative contracts by primary risk exposure as of June 30, 2016:
Asset derivatives | ||||||
Risk exposure category | Statement of Assets and Liabilities location | Fair value | ||||
Equity contracts | Investments, at market value | $ | 605,383 | |||
| ||||||
46
Driehaus Mutual Funds
Notes to Financial Statements (unaudited) — (Continued)
The following table sets forth the Driehaus Emerging Markets Small Cap Growth Fund’s realized gain (loss) by primary risk exposure and by type of derivative contract for the period January 1, 2016 through June 30, 2016.
| Amount of realized gain (loss) on derivatives | ||||||||||||||||||||
Risk exposure category | Equity Certificates | Credit Default Swaps Contracts | Purchased Options | Written Options | Forward Foreign Currency Contracts | |||||||||||||||
Commodity contracts | $ | — | $ | — | $ | (1,777,702 | ) | $ | (186,247 | ) | $ | — | ||||||||
Credit contracts | — | (114,036 | ) | — | — | — | ||||||||||||||
Equity contracts | 757,762 | — | (10,699,950 | ) | (2,755,836 | ) | — | |||||||||||||
Foreign currency contracts | — | — | (88,000 | ) | 30,000 | 37,259 | ||||||||||||||
Interest contracts | — | — | 1,034,172 | — | — | |||||||||||||||
| ||||||||||||||||||||
The following table sets forth the Driehaus Frontier Emerging Markets Fund’s realized gain (loss) by primary risk exposure and by type of derivative contract for the period January 1, 2016 through June 30, 2016.
| Amount of realized gain (loss) on derivatives | ||||
Risk exposure category | Equity Certificates | |||
Equity contracts | $ | (186,426 | ) | |
| ||||
The following table sets forth the Driehaus Emerging Markets Small Cap Growth Fund’s change in unrealized appreciation (depreciation) by primary risk exposure and by type of derivative contract for the period January 1, 2016 through June 30, 2016.
| Change in unrealized appreciation (depreciation) on derivatives | ||||||||||||||||||||
Risk exposure category | Equity Certificates | Credit Default Swaps Contracts | Purchased Options | Written Options | Forward Foreign Currency Contracts | |||||||||||||||
Commodity contracts | $ | — | $ | — | $ | (44,856 | ) | $ | — | $ | — | |||||||||
Credit contracts | — | (257,749 | ) | — | — | — | ||||||||||||||
Equity contracts | (1,504,829 | ) | — | (4,443,919 | ) | 847,953 | — | |||||||||||||
Foreign currency contracts | — | — | 301,251 | — | (946,194 | ) | ||||||||||||||
| ||||||||||||||||||||
The following table sets forth the Driehaus Frontier Emerging Markets Fund’s change in unrealized appreciation (depreciation) by primary risk exposure and by type of derivative contract for the period January 1, 2016 through June 30, 2016.
| Change in unrealized appreciation (depreciation) on derivatives | ||||
Risk exposure category | Equity Certificates | |||
Equity contracts | $ | 169,906 | ||
| ||||
Disclosures about Offsetting Assets and Liabilities
The Driehaus Emerging Markets Small Cap Growth Fund is party to various agreements, including International Swaps and Derivatives Association Agreements and related Credit Support Annexes (“Master Netting Agreements” or “MNA”), which govern the terms of certain transactions with select counterparties. MNAs are designed to reduce counterparty risk associated with the relevant transactions by establishing credit protection mechanisms and providing standardization as a means of improving legal certainty. As MNAs are specific to the unique operations of different asset types, they allow the Fund to close out and net its total exposure to a counterparty in the event of default with respect to all of the transactions governed under a single agreement with that counterparty. MNAs can also help reduce counterparty risk by specifying collateral posting requirements at pre-arranged exposure levels. Securities and cash pledged as collateral are reflected as assets in the Statement of Assets and Liabilities as either a component of Investments at market value or Collateral held at custodian for the benefit of brokers.
47
Driehaus Mutual Funds
Notes to Financial Statements (unaudited) — (Continued)
The Funds’ derivative contracts held at June 30, 2016, are not accounted for as hedging instruments under GAAP. For financial reporting purposes, the Funds do not offset financial assets and financial liabilities that are subject to MNAs or similar arrangements on the Statements of Assets and Liabilities. The settlement of exchange-traded options is guaranteed by the exchange the option is traded on and is not subject to arrangements with particular counterparties. For that reason, these options are excluded from the below disclosure.
The following table presents the Driehaus Emerging Markets Small Cap Growth Fund’s financial and derivative assets subject to Master Netting Agreements by type, net of amounts available for offset under a MNA and net of the related collateral received by the Fund as of June 30, 2016:
Description | Gross Amounts Recognized in Statement of Assets and Liabilities | Derivatives Available for Offset | Collateral Received | Net Amount1 | ||||||||||||
Swap contracts | $ | 1,063,977 | $ | (946,194 | ) | $ | — | $ | 117,783 | |||||||
| 1 | Net amount represents the net amount receivable from the counterparty in the event of default. |
The following table presents the Driehaus Emerging Markets Small Cap Growth Fund’s financial and derivative liabilities subject to Master Netting Agreements by type, net of amounts available for offset under a MNA and net of the related collateral pledged by the Fund as of June 30, 2016:
Description | Gross Amounts Recognized in Statement of Assets and Liabilities | Derivatives Available for Offset | Collateral Pledged | Net Amount2 | ||||||||||||
Forward foreign currency contracts | $ | 946,194 | $ | (946,194 | ) | $ | — | $ | — | |||||||
| 2 | Net amount represents the net amount payable to the counterparty in the event of default. |
Federal Income Taxes
No provision is made for Federal income taxes since each Fund has elected or will elect to be taxed as a “regulated investment company” under Subchapter M of the Internal Revenue Code (the “Code”) and has made and declared all the required distributions to its shareholders in amounts sufficient to relieve each Fund from all or substantially all Federal income and excise taxes under provisions of current Federal tax law.
Each Fund is subject to accounting standards that establish a minimum threshold for recognizing, and a system for measuring, the benefits of a tax position taken or expected to be taken in a tax return. Taxable years ending 2015, 2014, 2013 and 2012 remain open to Federal and state audit. As of June 30, 2016, management has evaluated the application of these standards to each Fund, and has determined that no provision for income tax is required in each Fund’s financial statements for uncertain tax provisions. The Funds recognize interest and penalties, if any, related to unrecognized tax benefits as income tax expense in the Statements of Operations. During the year, the Funds did not incur any interest or penalties. The Funds may be subject to foreign taxes on income, gains on investments or currency repatriation, a portion of which may be recoverable. Foreign taxes are provided for based on the Funds’ understanding of the tax rules and regulations that exist in the foreign markets in which they invest.
The amount of dividends and distributions from net investment income and net realized capital gains are determined in accordance with Federal income tax regulations, which may differ from U.S. generally accepted accounting principles (“U.S. GAAP”).
For the year ended December 31, 2015, reclassifications were recorded to undistributed net investment income, undistributed net realized gain and paid-in capital for any permanent tax differences. These
48
Driehaus Mutual Funds
Notes to Financial Statements (unaudited) — (Continued)
reclassifications relate primarily to foreign currency losses, sales of passive foreign investment companies, net operating losses and foreign capital gain taxes paid. Results of operations and net assets were not affected by these reclassifications.
For Federal income tax purposes, capital loss carryforwards represent net capital losses of a Fund that may be carried forward for a maximum period of eight years and applied against future net realized gains. On December 22, 2010, the Regulated Investment Company Modernization Act of 2010 was enacted to modernize several of the Federal income and excise tax provisions related to regulated investment companies. Under pre-enactment law, capital losses could be carried forward for up to eight years, and carried forward as short-term capital losses, irrespective of the character of the original loss. New net capital losses (those earned in taxable years beginning after December 22, 2010) may be carried forward indefinitely and must retain the character of the original loss. Such new net capital losses generally must be used by a regulated investment company before it uses any net capital losses incurred in taxable years beginning on or before December 22, 2010. This increases the likelihood that net capital losses incurred in taxable years beginning on or before December 22, 2010 will expire unused. The following table shows the expiration dates for capital loss carryover from pre-enactment taxable years and the amounts of capital loss carryover, if any, by each of the applicable Funds as of December 31, 2015:
| Pre-Enactment Net Capital Loss Carryover Expiring In | Post-Enactment Unlimited Period of Net Capital Loss Carryover | |||||||||||||||
Fund | 2016 | Short-Term | Long- Term | Accumulated Capital Loss Carryover | ||||||||||||
Driehaus Emerging Markets | ||||||||||||||||
Growth Fund | $ | — | $ | 172,498,021 | $ | — | $ | 172,498,021 | ||||||||
Driehaus Emerging Markets Small | ||||||||||||||||
Cap Growth Fund | $ | — | $ | 66,943,305 | $ | — | $ | 66,943,305 | ||||||||
Driehaus Frontier Emerging | ||||||||||||||||
Markets Fund | $ | — | $ | 1,724,048 | $ | — | $ | 1,724,048 | ||||||||
Driehaus International Small Cap | ||||||||||||||||
Growth Fund | $ | 2,128,468 | $ | — | $ | — | $ | — | ||||||||
During the year ended December 31, 2015, Driehaus International Small Cap Growth Fund utilized $4,385,278 of capital loss carryforwards.
Included in the capital loss carryforward amounts stated above are capital losses that Driehaus International Small Cap Growth Fund inherited from its merger with Driehaus International Discovery Fund on March 6, 2015 of approximately $2,128,468, which may be applied against any realized net taxable capital gains in future years. Section 382 of the Code imposes certain limitations that will likely reduce the Fund’s ability to use these capital loss carryforwards.
Pursuant to Federal income tax rules applicable to regulated investment companies, the Funds may elect to treat certain capital losses between November 1 and December 31 as occurring on the first day of the following tax year. For the year ended December 31, 2015, the following qualified late-year losses were deferred and recognized on January 1, 2016:
Fund | Late-Year Ordinary Loss Deferral | Total Capital Loss Deferral | Total | |||||||||
Driehaus International Small Cap Growth Fund | $ | 429,841 | $ | — | $ | 429,841 | ||||||
Driehaus Micro Cap Growth Fund | — | 11,334,666 | 11,334,666 | |||||||||
Distributions to Shareholders
The Funds had no distributions during the six months ended June 30, 2016.
49
Driehaus Mutual Funds
Notes to Financial Statements (unaudited) — (Continued)
The tax character of distributions paid during the fiscal year ended December 31, 2015 was as follows:
Distributions paid from: | Driehaus Emerging Markets Growth Fund | Driehaus Emerging Markets Small Cap Growth Fund | Driehaus Frontier Emerging Markets Fund | Driehaus International Small Cap Growth Fund | Driehaus Micro Cap Growth Fund | |||||||||||||||
Ordinary income …………………… | $ | — | $ | — | $ | — | $ | 474,717 | $ | — | ||||||||||
Net long-term capital gain………… | — | — | — | 8,396,477 | 11,379,419 | |||||||||||||||
|
|
|
|
|
|
|
|
|
| |||||||||||
Total distributions paid………… | $ | — | $ | — | $ | — | $ | 8,871,194 | $ | 11,379,419 | ||||||||||
|
|
|
|
|
|
|
|
|
| |||||||||||
The tax character of distributions paid during the fiscal year ended December 31, 2014 was as follows:
Distributions paid from: | Driehaus Emerging Markets Growth Fund | Driehaus Emerging Markets Small Cap Growth Fund | Driehaus International Small Cap Growth Fund | Driehaus Micro Cap Growth Fund | ||||||||||||
Ordinary income …………………… | $ | 1,569,189 | $ | — | $ | 10,021,652 | $ | 1,275,778 | ||||||||
Net long-term capital gain………… | 52,533,986 | — | 15,778,725 | 2,251,610 | ||||||||||||
|
|
|
|
|
|
|
| |||||||||
Total distributions paid………… | $ | 54,103,175 | $ | — | $ | 25,800,377 | $ | 3,527,388 | ||||||||
|
|
|
|
|
|
|
| |||||||||
As of December 31, 2015, the components of net assets on a tax basis were as follows:
| Driehaus Emerging Markets Growth Fund | Driehaus Emerging Markets Small Cap Growth Fund | Driehaus Frontier Emerging Markets Fund | Driehaus International Small Cap Growth Fund | Driehaus Micro Cap Growth Fund | ||||||||||||||||
Undistributed ordinary income | $ | — | $ | — | $ | — | $ | — | $ | — | ||||||||||
Undistributed long-term capital gain | — | — | — | 3,539,504 | — | |||||||||||||||
|
|
|
|
|
|
|
|
|
| |||||||||||
Accumulated earnings | $ | — | $ | — | $ | — | $ | 3,539,504 | $ | — | ||||||||||
Paid-in capital | 1,524,308,977 | 474,766,553 | 21,902,053 | 304,569,864 | 281,916,621 | |||||||||||||||
Accumulated capital and other losses | (172,498,021 | ) | (66,943,305 | ) | (1,724,048 | ) | (2,558,309 | ) | (11,334,666 | ) | ||||||||||
Unrealized appreciation | ||||||||||||||||||||
(depreciation) on foreign currency | (239,988 | ) | (115,540 | ) | (564 | ) | (34,655 | ) | — | |||||||||||
Unrealized appreciation on investments | 10,760,474 | 24,757,846 | (607,809 | ) | 35,732,250 | 11,596,182 | ||||||||||||||
Other temporary differences | — | 252,198 | — | — | — | |||||||||||||||
|
|
|
|
|
|
|
|
|
| |||||||||||
Net assets | $ | 1,362,331,442 | $ | 432,717,752 | $ | 19,569,632 | $ | 341,248,654 | $ | 282,178,137 | ||||||||||
|
|
|
|
|
|
|
|
|
| |||||||||||
The differences between book-basis and tax-basis unrealized appreciation are attributable primarily to the tax deferral of losses on wash sales and passive foreign investment company (PFIC) mark-to-market.
Foreign Currency Translation
Foreign currency and equity securities not denominated in U.S. dollars are translated into U.S. dollar values based upon the current rates of exchange on the date of the Funds’ valuations.
Net realized foreign exchange gains or losses which are reported by the Funds result from currency gains and losses on transaction hedges arising from changes in exchange rates between the trade and settlement dates on spot contracts underlying securities transactions and the difference between the amounts accrued for dividends, interest, and foreign taxes and the amounts actually received or paid in U.S. dollars for these items. Net unrealized foreign exchange gains and losses result from changes in the U.S. dollar value of assets and
50
Driehaus Mutual Funds
Notes to Financial Statements (unaudited) — (Continued)
liabilities (other than investments in securities), which are denominated in foreign currencies, as a result of changes in exchange rates.
Net realized foreign exchange gains or losses on portfolio hedges result from the use of spot contracts to hedge portfolio positions denominated or quoted in a particular currency in order to reduce or limit exposure in that currency. The Funds had no portfolio hedges during the six months ended June 30, 2016.
The Funds do not isolate that portion of the results of operations which results from fluctuations in foreign exchange rates on investments. These fluctuations are included with the net realized gain (loss) from security transactions and the net change in unrealized appreciation (depreciation) of investments.
Use of Estimates
The preparation of financial statements, in conformity with U.S. GAAP, requires management to make estimates and assumptions that affect the reported amount of assets and liabilities and disclosure of contingent assets and liabilities at the date of the financial statements and the reported amounts of net increases or decreases in net assets from operations during the reporting period. Actual results could differ from those estimates.
Indemnifications
Under the Trust’s organizational documents, the officers and Trustees are indemnified against certain liabilities arising out of the performance of their duties to the Trust. In addition, in the normal course of business, the Trust enters into contracts that provide general indemnifications to other parties. The Funds’ maximum exposure under these agreements is unknown as this would involve future claims that may be made against the Funds that have not yet occurred. However, the Funds have not had prior claims or losses pursuant to these contracts and expect the risk of loss to be remote.
B. INVESTMENT ADVISORY FEES, TRANSACTIONS WITH AFFILIATES, AND ADMINISTRATIVE FEES
Richard H. Driehaus, an Interested Trustee of the Trust, is also the Chairman of the Board of Driehaus Capital Management LLC (“DCM” or the “Adviser”), a registered investment adviser, and of Driehaus Securities LLC (“DS LLC” or the “Distributor”), a registered broker-dealer.
DCM serves as the Funds’ investment adviser. In return for its services to the Funds, DCM receives monthly fees. Driehaus Micro Cap Growth Fund pays the Adviser a monthly fee computed and accrued daily at an annual rate of 1.25% of the Fund’s average daily net assets. Driehaus Emerging Markets Small Cap Growth Fund, Driehaus Frontier Emerging Markets Fund and Driehaus International Small Cap Growth Fund each pay the Adviser a monthly fee computed and accrued daily at an annual rate of 1.50% of each Fund’s average daily net assets. Prior to May 1, 2016, the Driehaus Emerging Markets Growth Fund paid the Adviser a monthly fee computed and accrued daily at an annual rate of 1.50% of the Fund’s average daily net assets. Beginning May 1, 2016, the Driehaus Emerging Markets Growth Fund pays the Adviser a monthly fee computed and accrued daily at an annual rate of 1.50% on the first $1.5 billion, 1.00% on the next $500 million and 0.75% in excess of $2 billion of the Fund’s average daily net assets.
DCM has entered into an agreement to cap Driehaus Micro Cap Growth Fund’s annual operating expenses (other than interest, taxes, brokerage commissions and other portfolio transaction expenses, capital expenditures and extraordinary expenses such as litigation and other expenses not incurred in the ordinary course of the Fund`s business) at 1.70% of average daily net assets until November 17, 2016. For a period of three years subsequent to the Fund’s commencement of operations, DCM is entitled to reimbursement for previously waived fees and reimbursed expenses to the extent that the Fund’s expense ratio remains below the operating expense cap in place at the time of the waiver and the current operating expense cap. For the six months ended June��30, 2016, DCM did not waive or recapture fees for Driehaus Micro Cap Growth Fund under this agreement and there are no amounts still subject to recapture.
DCM has entered into a contractual agreement to cap Driehaus Frontier Emerging Markets Fund’s annual operating expenses (other than interest, taxes, brokerage commissions, dividends and interest on short sales and other portfolio transaction expenses and extraordinary expenses such as litigation and other
51
Driehaus Mutual Funds
Notes to Financial Statements (unaudited) — (Continued)
expenses not incurred in the ordinary course of the Fund`s business) at 2.00% of average daily net assets until May 3, 2018. For a period of three years subsequent to the Fund’s commencement of operations on May 4, 2015, DCM is entitled to reimbursement for previously waived fees and reimbursed expenses to the extent that the Fund’s expense ratio remains below the operating expense cap in place at the time of the waiver and the current operating expense cap. For the six months ended June 30, 2016, DCM waived fees for Driehaus Frontier Emerging Markets Fund totaling $128,808 under this agreement. The amount of potential recovery expiring May 3, 2018 was $312,094.
The amounts accrued and payable to DCM during the six months ended June 30, 2016 are as follows:
| Fund | Advisory Fees | Advisory Fees Payable (included in Due to affiliates) | ||||||
Driehaus Emerging Markets Growth Fund | $ | 10,025,946 | $ | 1,729,546 | ||||
Driehaus Emerging Markets Small Cap Growth Fund | 3,044,746 | 506,031 | ||||||
Driehaus Frontier Emerging Markets Fund | 175,426 | 37,451 | ||||||
Driehaus International Small Cap Growth Fund | 2,374,035 | 400,493 | ||||||
Driehaus Micro Cap Growth Fund | 1,488,211 | 269,130 | ||||||
The Funds direct certain portfolio trades, subject to obtaining the best price and execution, to brokers who have agreed to pay a portion of the Funds’ operating expenses using part of the commissions generated. For the six months ended June 30, 2016, these arrangements reduced the expenses of Driehaus Emerging Markets Growth Fund, Driehaus Emerging Markets Small Cap Growth Fund, Driehaus Frontier Emerging Markets Fund, Driehaus International Small Cap Growth Fund and Driehaus Micro Cap Growth Fund by $189,545 (1.7%), $60,432 (1.7%), $945 (0.3%), $48,202 (1.8%) and $78,981 (4.4%), respectively.
Certain officers of the Trust are also officers of DCM and DS LLC. The Funds pay a portion of the Chief Compliance Officer’s salary and bonus. No other officers received compensation from the Funds.
BNY Mellon Investment Servicing (US) Inc. (“BNY Mellon”) serves as the Funds’ administrative and accounting agent. In compensation for these services, BNY Mellon earns the larger of a monthly minimum fee or a monthly fee based upon average net assets. BNY Mellon also acts as the transfer agent and dividend disbursing agent for the Funds. For these services, BNY Mellon earns a monthly fee based on shareholder processing activity during the month. BNY Mellon has agreed to waive a portion of its monthly fee for transfer agent service for the first two years of operations for Driehaus Frontier Emerging Markets Fund. For the six months ended June 30, 2016, BNY Mellon waived $9,697 for Driehaus Frontier Emerging Markets Fund.
C. INVESTMENT TRANSACTIONS
The aggregate purchases and sales of investment securities, other than short-term obligations and options, for the six months ended June 30, 2016 were as follows:
| Fund | Purchases | Sales | ||||||
Driehaus Emerging Markets Growth Fund | $ | 1,544,444,827 | $ | 1,562,973,560 | ||||
Driehaus Emerging Markets Small Cap Growth Fund | 487,543,668 | 474,241,499 | ||||||
Driehaus Frontier Emerging Markets Fund | 31,379,972 | 8,529,177 | ||||||
Driehaus International Small Cap Growth Fund | 237,043,460 | 243,298,414 | ||||||
Driehaus Micro Cap Growth Fund | 218,140,290 | 222,305,295 | ||||||
D. LINE OF CREDIT
Driehaus Emerging Markets Growth Fund, Driehaus Emerging Markets Small Cap Growth Fund, Driehaus International Small Cap Growth Fund and Driehaus Micro Cap Growth Fund have, with certain other funds in the Trust, together obtained a committed line of credit in the amount of $50,000,000.
52
Driehaus Mutual Funds
Notes to Financial Statements (unaudited) — (Continued)
This line of credit is available primarily to meet large, unexpected shareholder withdrawals subject to certain restrictions. Interest is charged at a rate per annum equal to the Federal Funds Rate in effect at the time of the borrowings plus 1.5%, or 1.75%, whichever is greater. There is a commitment fee of 0.10% of the excess of the $50,000,000 committed amount over the sum of the average daily balance of any loans, which is allocated amongst all funds that have access to the line. At June 30, 2016, the Funds had no outstanding borrowings under the line of credit.
E. FOREIGN INVESTMENT RISKS
To the extent a Fund invests in foreign securities, it may entail risks due to the potential for political and economic instability in the countries where the issuers of these securities are located. In addition, foreign exchange fluctuations could affect the value of positions held. These risks are generally intensified in emerging markets.
F. REDEMPTION FEES
The Funds may charge a redemption fee of 2.00% of the redemption amount for shares redeemed within 60 days of purchase. The redemption fees are recorded in paid-in capital and reflected in the Statements of Changes in Net Assets.
G. FUND MERGERS
At a meeting of the Board of Trustees of the Trust held on October 23, 2014, the Board of Trustees approved an Agreement and Plan of Reorganization (the “Agreement”) of the Driehaus International Discovery Fund with and into the Driehaus International Small Cap Growth Fund (the “Merger”), each a series of the Trust. The shareholders of the Driehaus International Discovery Fund approved the Agreement during a special meeting of the shareholders held on February 11, 2015.
The Merger, which occurred after the close of business on March 6, 2015, was accomplished by a tax-free exchange of 8,325,014 shares of the Driehaus International Small Cap Growth Fund for 2,568,861 shares of the Driehaus International Discovery Fund outstanding at that date. The following is a summary of shares outstanding, net assets and net asset value per share for these Funds before and after the Merger:
| Before Reorganization | After Reorganization | |||||||||||
| Driehaus International Discovery Fund | Driehaus International Small Cap Growth Fund | Driehaus International Small Cap Growth Fund | ||||||||||
Shares Outstanding | 2,568,861 | 23,904,657 | 32,229,671 | |||||||||
Net Assets | $ | 79,717,913 | $ | 228,904,169 | $ | 308,622,082 | ||||||
Net Asset Value | $ | 31.03 | $ | 9.58 | $ | 9.58 | ||||||
Unrealized Appreciation | $ | 4,962,609 | $ | 25,939,590 | $ | 30,902,199 | ||||||
H. SUBSEQUENT EVENTS
Events or transactions that occurred after the date of this report through the date the report was issued have been evaluated for potential impact to the financial statements. There are no subsequent events that require recognition or disclosure in the financial statements.
53
Fund Expense Examples (unaudited)
As a mutual fund shareholder, you may incur two types of costs: (1) transaction costs, including sales charges; redemption fees; and exchange fees and (2) ongoing costs, including management fees; distribution (12b-1) fees; and other fund expenses. This example is intended to help you understand your ongoing costs (in dollars) of investing in each Fund and to compare these costs with the ongoing costs of investing in other mutual funds.
The example is based on an investment of $1,000 invested at the beginning of the period and held for the entire six months ended June 30, 2016.
Actual Expenses
The first line of the tables below (“Actual”) provides information about actual account values and actual expenses. You may use the information in this line, together with the amount you invested, to estimate the expenses that you paid over the period. Simply divide your account value by $1,000 (for example, an $8,600 account value divided by $1,000 = 8.6), then multiply the result by the number in the first line under the heading entitled “Expenses Paid During Period” to estimate the expenses you paid on your account during this period.
Hypothetical Example for Comparison Purposes
The second line of the tables below (“Hypothetical”) provides information about hypothetical account values and hypothetical expenses based on the Fund’s actual expense ratio and an assumed rate of return of 5% per year before expenses, which is not the Fund’s actual return. You may use this information to compare the ongoing costs of investing in the Funds versus other funds. To do so, compare this 5% hypothetical example with the 5% hypothetical examples that appear in the shareholder reports of the other funds.
Please note that the expenses shown in the table are meant to highlight your ongoing costs only and do not reflect any transactional costs, such as sales charges, redemption fees or exchange fees. Therefore, the second line of the table is useful in comparing ongoing costs only, and will not help you determine the relative total costs of owning different funds. In addition, if these transactional costs were included, your costs would have been higher.
Driehaus Emerging Markets Growth Fund
| Beginning Account Value January 1, 2016 | Ending Account Value June 30, 2016 | Expenses Paid During Six Months Ended June 30, 2016* | ||||||||||
Actual | $ | 1,000 | $ | 1,061.10 | $ | 8.40 | ||||||
Hypothetical (5% return before expenses) | $ | 1,000 | $ | 1,016.71 | $ | 8.22 | ||||||
Driehaus Emerging Markets Small Cap Growth Fund
| Beginning Account Value January 1, 2016 | Ending Account Value June 30, 2016 | Expenses Paid During Six Months Ended June 30, 2016* | ||||||||||
Actual | $ | 1,000 | $ | 973.90 | $ | 8.44 | ||||||
Hypothetical (5% return before expenses) | $ | 1,000 | $ | 1,016.31 | $ | 8.62 | ||||||
54
Fund Expense Examples (unaudited) — (Continued)
Driehaus Frontier Emerging Markets Fund
| Beginning Account Value January 1, 2016 | Ending Account Value June 30, 2016 | Expenses Paid During Six Months Ended June 30, 2016* | ||||||||||
Actual | $ | 1,000 | $ | 1,058.00 | $ | 10.18 | ||||||
Hypothetical (5% return before expenses) | $ | 1,000 | $ | 1,014.97 | $ | 9.97 | ||||||
Driehaus International Small Cap Growth Fund
| Beginning Account Value January 1, 2016 | Ending Account Value June 30, 2016 | Expenses Paid During Six Months Ended June 30, 2016* | ||||||||||
Actual | $ | 1,000 | $ | 977.20 | $ | 8.26 | ||||||
Hypothetical (5% return before expenses) | $ | 1,000 | $ | 1,016.51 | $ | 8.42 | ||||||
Driehaus Micro Cap Growth Fund
| Beginning Account Value January 1, 2016 | Ending Account Value June 30, 2016 | Expenses Paid During Six Months Ended June 30, 2016* | ||||||||||
Actual | $ | 1,000 | $ | 966.50 | $ | 6.99 | ||||||
Hypothetical (5% return before expenses) | $ | 1,000 | $ | 1,017.75 | $ | 7.17 | ||||||
| * | Expenses are equal to the Fund’s annualized expense ratio for the six-month period in the table below multiplied by the average account value over the period, multiplied by the number of days in the most recent fiscal half-year (182), then divided by 366 to reflect the half-year period. |
Driehaus Emerging Markets Growth Fund | 1.64% | |
Driehaus Emerging Markets Small Cap Growth Fund | 1.72% | |
Driehaus Frontier Emerging Markets Fund | 1.99% | |
Driehaus International Small Cap Growth Fund | 1.68% | |
Driehaus Micro Cap Growth Fund.. | 1.43% |
55
DRH-SAR2016
Driehaus Mutual Funds
Trustees & Officers
Richard H. Driehaus
Trustee
Theodore J. Beck
Trustee
Francis J. Harmon
Trustee
Christopher J. Towle
Trustee
Dawn M. Vroegop
Trustee
Daniel F. Zemanek
Chairman of the Board
Robert H. Gordon
President
Michelle L. Cahoon
Vice President & Treasurer
Janet L. McWilliams
Chief Legal Officer &
Assistant Vice President
Michael R. Shoemaker
Chief Compliance Officer &
Assistant Vice President
William H. Wallace, III
Secretary
Michael P. Kailus
Assistant Secretary & Anti-Money
Laundering Compliance Officer
Christine Mason
Assistant Secretary
Investment Adviser
Driehaus Capital Management LLC
25 East Erie Street
Chicago, IL 60611
Distributor
Driehaus Securities LLC
25 East Erie Street
Chicago, IL 60611
Administrator & Transfer Agent
UMB Fund Services, Inc.
235 W. Galena Street
Milwaukee, WI 53212
Custodian
The Northern Trust Company
50 South LaSalle Street
Chicago, IL 60603
Semi-Annual Report to Shareholders
June 30, 2016

Driehaus Active Income Fund
Driehaus Select Credit Fund
Driehaus Event Driven Fund
Distributed by:
Driehaus Securities LLC
This report has been prepared for the shareholders of the Funds and is not an offer to sell or buy any Fund securities. Such offer is only made by the Funds’ prospectus.
Performance Overview and Schedule of Investments: | ||||
| 1 | ||||
| 13 | ||||
| 20 | ||||
| 24 | ||||
| 25 | ||||
| 26 | ||||
| 28 | ||||
| 31 | ||||
| 52 | ||||
PROXY VOTING POLICIES AND PROCEDURES AND PROXY VOTING RECORD
A description of the Funds’ policies and procedures with respect to the voting of proxies relating to the Funds’ portfolio securities is available without charge, upon request, by calling 1-877-779-0079. This information is also available on the Funds’ website at http://www.driehaus.com.
Information regarding how the Funds voted proxies related to portfolio securities during the 12-month period ended June 30, 2016 is available without charge, upon request, by calling 1-877-779-0079. This information is also available on the Securities and Exchange Commission’s (“SEC”) website at http://www.sec.gov.
HOW TO OBTAIN QUARTERLY PORTFOLIO HOLDINGS
Each Fund files a complete schedule of portfolio holdings with the SEC for the first and third quarters of each fiscal year on Form N-Q. The Funds’ Form N-Q is available electronically on the SEC’s website at http://www.sec.gov; hard copies may be reviewed and copied at the SEC’s Public Reference Room in Washington, DC 20549. For more information on the Public Reference Room, call 1-800-SEC-0330. Each Fund’s complete schedule of portfolio holdings is also available on the Fund’s website at http://www.driehaus.com.
Performance Overview (unaudited)
The performance summarized below is historical and does not represent future results. Investment returns and principal value vary, and you may have a gain or loss when you sell shares. Performance data presented measures the change in the value of an investment in the Fund, assuming reinvestment of all dividends and capital gains. Average annual total return reflects annualized change.
The table does not reflect the deduction of taxes that a shareholder would pay on Fund distributions or the redemption of Fund shares. The graph compares the results of a $25,000 investment (minimum investment) in the Fund since November 8, 2005 (the date of the Predecessor Fund’s inception), with all dividends and capital gains reinvested, with the indicated indices (and dividends reinvested) for the same period.
Average Annual Total Returns as of 6/30/16 | 1 Year | 3 Years | 5 Years | 10 Years | Since Inception | |||||||||||||||
Driehaus Active Income Fund (LCMAX)1 | –1.55% | 0.20% | 0.65% | 3.43% | 3.51% | |||||||||||||||
Citigroup 3-Month T-Bill Index2 | 0.14% | 0.07% | 0.06% | 0.96% | 1.16% | |||||||||||||||
Barclays Capital U.S. Aggregate Bond Index3 | 6.00% | 4.06% | 3.76% | 5.16% | 4.92% | |||||||||||||||
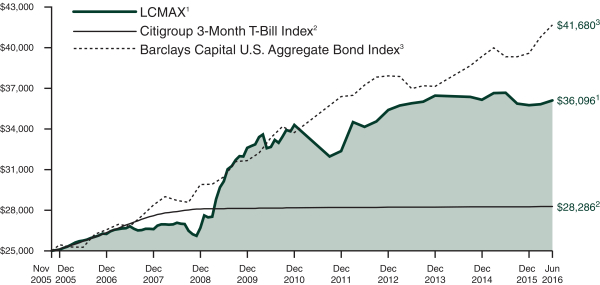
| 1 | The Driehaus Active Income Fund (the “Fund”) performance shown above includes the performance of the Lotsoff Capital Management Active Income Fund (the “Predecessor Fund”) for the periods before the Fund’s registration statement became effective. The Fund received the assets and liabilities of the Predecessor Fund on June 1, 2009 through a reorganization of the Predecessor Fund into the Fund. The Predecessor Fund was a nondiversified fund that was a series of another management investment company registered under the Investment Company Act of 1940, as amended. The Fund had no prior operating history prior to succeeding to the assets of the Predecessor Fund. The Fund has substantially similar investment objectives, strategies, and policies as the Predecessor Fund. Financial and performance information of the Fund includes the Predecessor Fund information. The returns for the periods prior to October 1, 2006, reflect fee waivers and/or reimbursements without which performance would have been lower. |
| 2 | The Citigroup 3-Month T-Bill Index is designed to mirror the performance of the 3-month U.S. Treasury Bill. The Citigroup 3-Month T-Bill Index is unmanaged and its returns reflect reinvestment of all distributions and changes in market prices. |
| 3 | The Barclays Capital U.S. Aggregate Bond Index, an unmanaged index, represents securities that are SEC-registered, taxable and dollar denominated. This index covers the U.S. investment grade fixed rate bond market, with index components for government and corporate securities, mortgage pass-through securities and asset-backed securities. These major sectors are subdivided into more specific indices that are calculated and reported on a regular basis. |
1
Driehaus Active Income Fund
Schedule of Investments
June 30, 2016 (unaudited)
| Shares, Principal Amount, or Number of Contracts | Value | |||||||
| ASSET-BACKED SECURITIES — 0.01% | ||||||||
CWABS, Inc. Asset-Backed Certificates Series 2004-1 0.93%, 4/25/342,9 | $ | 122,988 | $ | 111,870 | ||||
Merrill Lynch Mortgage Investors Trust Series 2004-HE2 1.39%, 8/25/352,9 | 124,929 | 120,229 | ||||||
|
| |||||||
Total ASSET-BACKED SECURITIES | 232,099 | |||||||
|
| |||||||
| BANK LOANS — 22.85% | ||||||||
Apparel — 0.45% |
| |||||||
Calceus Acquisition, Inc. | 14,601,662 | 10,951,247 | ||||||
Computers — 0.39% |
| |||||||
DynCorp International, Inc. | 10,000,000 | 9,550,000 | ||||||
Electronics — 1.54% |
| |||||||
NuSil Technology LLC | 37,384,900 | 37,431,631 | ||||||
Entertainment — 2.23% |
| |||||||
Delta 2 Lux Sarl (Luxembourg) | 12,000,000 | 11,574,360 | ||||||
Scientific Games International, Inc. | 41,554,041 | 41,099,647 | ||||||
Scientific Games International, Inc. | 1,488,665 | 1,470,243 | ||||||
|
| |||||||
| 54,144,250 | ||||||||
|
| |||||||
Healthcare — Services — 1.54% |
| |||||||
National Mentor Holdings, Inc. | 37,674,259 | 37,391,702 | ||||||
Insurance — 2.61% |
| |||||||
Asurion LLC | 15,000,000 | 14,950,050 | ||||||
Asurion LLC | 27,869,370 | 26,949,681 | ||||||
Asurion LLC | 21,860,406 | 21,603,546 | ||||||
|
| |||||||
| 63,503,277 | ||||||||
|
| |||||||
Internet — 1.05% |
| |||||||
ProQuest LLC | 26,594,328 | 25,530,554 | ||||||
Investment Companies — 0.33% |
| |||||||
Larchmont Resources LLC | 21,537,500 | 8,112,422 | ||||||
| Shares, Principal Amount, or Number of Contracts | Value | |||||||
Leisure Time — 2.92% |
| |||||||
Equinox Holdings, Inc. | $ | 56,110,755 | $ | 56,040,617 | ||||
Equinox Holdings, Inc. | 15,000,000 | 14,995,350 | ||||||
|
| |||||||
| 71,035,967 | ||||||||
|
| |||||||
Lodging — 0.41% |
| |||||||
Intrawest Operations Group LLC | 10,000,000 | 10,010,000 | ||||||
Media — 0.06% |
| |||||||
Tribune Media Co. | 1,372,744 | 1,371,886 | ||||||
Packaging & Containers — 1.52% |
| |||||||
SIG Combibloc PurchaseCo Sarl (Luxembourg) | 13,825,000 | 6 | 15,351,948 | |||||
SIG Combibloc PurchaseCo Sarl (Luxembourg) | 21,681,468 | 21,562,979 | ||||||
|
| |||||||
| 36,914,927 | ||||||||
|
| |||||||
Retail — 4.00% |
| |||||||
J.C. Penney Corp., Inc. | 12,000,000 | 11,921,280 | ||||||
Neiman Marcus Group Ltd. LLC | 68,057,858 | 61,306,179 | ||||||
Rite Aid Corp. | 7,830,000 | 7,844,681 | ||||||
Rite Aid Corp. | 16,200,000 | 16,228,350 | ||||||
|
| |||||||
| 97,300,490 | ||||||||
|
| |||||||
Semiconductors — 0.51% |
| |||||||
VAT Holding A.G. (Switzerland) | 12,444,790 | 12,405,900 | ||||||
Software — 3.29% |
| |||||||
Applied Systems, Inc. | 42,280,457 | 41,998,658 | ||||||
BMC Foreign Holding Co. (Ireland) | 7,800,000 | 6,985,875 | ||||||
BMC Software Finance, Inc. | 17,415,699 | 15,499,972 | ||||||
Evergreen Skills Lux Sarl (Luxembourg) | 19,350,761 | 15,432,232 | ||||||
|
| |||||||
| 79,916,737 | ||||||||
|
| |||||||
Total BANK LOANS (Cost $584,052,556) | 555,570,990 | |||||||
|
| |||||||
Notes to Financial Statements are an integral part of this Schedule.
2
Driehaus Active Income Fund
Schedule of Investments
June 30, 2016 (unaudited)
| Shares, Principal Amount, or Number of Contracts | Value | |||||||
| CORPORATE BONDS — 33.63% | ||||||||
Auto Manufacturers — 0.64% |
| |||||||
General Motors Co. | $ | 14,000,000 | $ | 15,551,942 | ||||
Banks — 2.95% |
| |||||||
Chase Capital II | 6,879,000 | 5,778,360 | ||||||
JPMorgan Chase & Co. | 37,813,000 | 38,569,260 | ||||||
PNC Capital Trust C | 4,000,000 | 3,520,000 | ||||||
PNC Preferred Funding Trust II | 6,050,000 | 5,324,000 | ||||||
Royal Bank of Scotland Group PLC (United Kingdom) | 19,450,000 | 18,477,500 | ||||||
|
| |||||||
| 71,669,120 | ||||||||
|
| |||||||
Chemicals — 0.39% |
| |||||||
Kissner Milling Co., Ltd. (Canada) | 9,618,000 | 9,618,000 | ||||||
Momentive Performance Materials, Inc. | 4,540,000 | — | ||||||
|
| |||||||
| 9,618,000 | ||||||||
Commercial Services — 0.47% |
| |||||||
AA Bond Co., Ltd. (Jersey) | 9,000,000 | 6 | 11,411,741 | |||||
Computers — 1.42% | ||||||||
DynCorp International, Inc. | 24,409,705 | 20,382,104 | ||||||
Harland Clarke Holdings Corp. | 14,000,000 | 14,210,000 | ||||||
|
| |||||||
| 34,592,104 | ||||||||
|
| |||||||
Diversified Financial Services — 3.11% |
| |||||||
American Express Co. | 75,799,000 | 75,704,251 | ||||||
Rio Oil Finance Trust Series 2014-1 (Brazil) | 34,650 | 29,626 | ||||||
|
| |||||||
| 75,733,877 | ||||||||
|
| |||||||
Entertainment — 2.07% |
| |||||||
Isle of Capri Casinos, Inc. | 12,950,000 | 13,500,375 | ||||||
| Shares, Principal Amount, or Number of Contracts | Value | |||||||
Peninsula Gaming LLC / Peninsula Gaming Corp. | $ | 24,388,000 | $ | 24,509,940 | ||||
Penn National Gaming, Inc. | 12,081,000 | 12,292,417 | ||||||
|
| |||||||
| 50,302,732 | ||||||||
|
| |||||||
Healthcare — Products — 2.65% |
| |||||||
ConvaTec Healthcare E S.A. (Luxembourg) | 36,016,000 | 36,826,360 | ||||||
Sterigenics-Nordion Holdings LLC | 27,262,000 | 27,602,775 | ||||||
|
| |||||||
| 64,429,135 | ||||||||
|
| |||||||
Healthcare — Services — 2.06% |
| |||||||
Kindred Healthcare, Inc. | 8,000,000 | 7,960,000 | ||||||
Kindred Healthcare, Inc. | 25,277,000 | 22,559,723 | ||||||
LifePoint Health, Inc. | 18,786,000 | 19,537,440 | ||||||
|
| |||||||
| 50,057,163 | ||||||||
|
| |||||||
Insurance — 0.89% |
| |||||||
Chubb Corp. | 25,000,000 | 21,750,000 | ||||||
Media — 5.71% |
| |||||||
Altice U.S. Finance I Corp. | 17,000,000 | 17,000,000 | ||||||
Neptune Finco Corp. | 18,900,000 | 21,168,000 | ||||||
Neptune Finco Corp. | 9,000,000 | 10,288,080 | ||||||
Sinclair Television Group, Inc. | 15,810,000 | 16,165,725 | ||||||
Tribune Media Co. | 26,250,000 | 26,118,750 | ||||||
Unitymedia Hessen GmbH & Co. KG / Unitymedia NRW GmbH (Germany) | 8,980,000 | 9,024,900 | ||||||
UPCB Finance IV Ltd. (Cayman Islands) | 15,297,000 | 15,144,030 | ||||||
VTR Finance BV (Netherlands) | 24,000,000 | 23,927,520 | ||||||
|
| |||||||
| 138,837,005 | ||||||||
|
| |||||||
Notes to Financial Statements are an integral part of this Schedule.
3
Driehaus Active Income Fund
Schedule of Investments
June 30, 2016 (unaudited)
| Shares, Principal Amount, or Number of Contracts | Value | |||||||
Miscellaneous Manufacturing — 2.08% |
| |||||||
Amsted Industries, Inc. | $ | 44,000,000 | $ | 44,000,000 | ||||
Textron Financial Corp. | 10,824,000 | 6,602,640 | ||||||
|
| |||||||
| 50,602,640 | ||||||||
|
| |||||||
Oil & Gas — 1.52% |
| |||||||
California Resources Corp. | 2,097,000 | 1,106,168 | ||||||
Calumet Specialty Products Partners LP / Calumet Finance Corp. | 15,108,500 | 10,802,577 | ||||||
Continental Resources, Inc. | 14,000,000 | 11,550,000 | ||||||
Newfield Exploration Co. 5.63%, 7/1/24 | 13,412,000 | 13,412,000 | ||||||
|
| |||||||
| 36,870,745 | ||||||||
|
| |||||||
Packaging & Containers — 0.74% |
| |||||||
Ardagh Packaging Finance PLC / Ardagh Holdings USA, Inc. (Ireland) | 8,000,000 | 7,880,000 | ||||||
Reynolds Group Issuer, Inc. / Reynolds Group Issuer LLC | 10,000,000 | 10,125,000 | ||||||
|
| |||||||
| 18,005,000 | ||||||||
|
| |||||||
Pipelines — 1.00% |
| |||||||
Enbridge Energy Partners LP | 31,500,000 | 24,255,000 | ||||||
Restaurants — 0.50% |
| |||||||
Ruby Tuesday, Inc. | 12,500,000 | 12,093,750 | ||||||
Retail — 4.61% |
| |||||||
Conn’s, Inc. | 13,100,000 | 9,694,000 | ||||||
J.C. Penney Corp., Inc. | 5,000,000 | 5,031,250 | ||||||
Michaels Stores, Inc. | 7,497,000 | 7,759,395 | ||||||
Neiman Marcus Group Ltd. LLC | 27,175,000 | 22,147,625 | ||||||
Rite Aid Corp. | 48,820,000 | 51,383,050 | ||||||
Rite Aid Corp. | 15,000,000 | 16,012,500 | ||||||
|
| |||||||
| 112,027,820 | ||||||||
|
| |||||||
| Shares, Principal Amount, or Number of Contracts | Value | |||||||
Software — 0.47% |
| |||||||
Nuance Communications, Inc. | $ | 11,300,000 | $ | 11,356,500 | ||||
Telecommunications — 0.35% |
| |||||||
Wind Acquisition Finance S.A. (Luxembourg) | 8,770,000 | 8,594,600 | ||||||
|
| |||||||
Total CORPORATE BONDS | 817,758,874 | |||||||
|
| |||||||
| CONVERTIBLE CORPORATE BONDS — 3.32% | ||||||||
Building Materials — 1.16% |
| |||||||
Cemex S.A.B. de C.V. (Mexico) | 27,500,000 | 28,221,875 | ||||||
Electrical Components & Equipment — 0.00% |
| |||||||
Suntech Power Holdings Co., Ltd. (China) | 27,872,000 | 1,393 | ||||||
Semiconductors — 0.97% |
| |||||||
Microchip Technology, Inc. | 21,200,000 | 23,465,750 | ||||||
Software — 0.49% |
| |||||||
Verint Systems, Inc. | 13,057,000 | 11,890,031 | ||||||
Telecommunications — 0.70% |
| |||||||
Ciena Corp. | 14,681,000 | 17,130,892 | ||||||
|
| |||||||
Total CONVERTIBLE CORPORATE BONDS | 80,709,941 | |||||||
|
| |||||||
| U.S. GOVERNMENT AND AGENCY SECURITIES — 0.30% | ||||||||
United States Treasury Note | 7,047,000 | 7,367,145 | ||||||
|
| |||||||
Total U.S. GOVERNMENT AND AGENCY SECURITIES | 7,367,145 | |||||||
|
| |||||||
| COMMON STOCK — 26.23% | ||||||||
Auto Manufacturers — 0.68% |
| |||||||
General Motors Co.10 | 585,409 | 16,567,075 | ||||||
Beverages — 0.24% |
| |||||||
SABMiller PLC (United Kingdom)3 | 100,000 | 5,817,359 | ||||||
Commercial Services — 1.91% |
| |||||||
Apollo Education Group, Inc.* | 5,085,539 | 46,380,116 | ||||||
Notes to Financial Statements are an integral part of this Schedule.
4
Driehaus Active Income Fund
Schedule of Investments
June 30, 2016 (unaudited)
| Shares, Principal Amount, or Number of Contracts | Value | |||||||
Distribution/Wholesale — 2.51% |
| |||||||
Ingram Micro, Inc., Class A | 1,751,028 | $ | 60,900,754 | |||||
Electric — 1.49% |
| |||||||
Westar Energy, Inc. | 645,861 | 36,226,343 | ||||||
Entertainment — 10.10% |
| |||||||
Carmike Cinemas, | 1,735,011 | 52,258,531 | ||||||
Gaming and Leisure Properties, Inc.10 | 4,078,145 | 140,614,440 | ||||||
Pinnacle Entertainment, Inc.*8 | 4,765,928 | 52,806,482 | ||||||
|
| |||||||
| 245,679,453 | ||||||||
|
| |||||||
Gas — 0.98% |
| |||||||
Piedmont Natural Gas Co., Inc.10 | 396,972 | 23,865,957 | ||||||
Healthcare — Services — 1.30% |
| |||||||
Centene Corp.* | 191,578 | 13,672,922 | ||||||
Cigna Corp. | 32,500 | 4,159,675 | ||||||
Humana, Inc.10 | 76,500 | 13,760,820 | ||||||
|
| |||||||
| 31,593,417 | ||||||||
|
| |||||||
Insurance — 1.97% |
| |||||||
Willis Towers Watson PLC (United Kingdom)3,10 | 385,072 | 47,868,300 | ||||||
Internet — 0.41% |
| |||||||
LinkedIn Corp.* | 53,098 | 10,048,797 | ||||||
Media — 0.00% |
| |||||||
Charter Communications, Inc., | — | 82 | ||||||
Restaurants — 0.27% |
| |||||||
Ruby Tuesday, Inc.*9 | 1,830,171 | 6,606,917 | ||||||
Retail — 2.79% |
| |||||||
Rite Aid Corp.*10 | 8,188,091 | 61,328,802 | ||||||
Staples, Inc.10 | 763,000 | 6,577,060 | ||||||
|
| |||||||
| 67,905,862 | ||||||||
|
| |||||||
Semiconductors — 1.58% |
| |||||||
Rovi Corp.* | 2,455,807 | 38,408,821 | ||||||
|
| |||||||
Total COMMON STOCK | 637,869,253 | |||||||
|
| |||||||
| CONVERTIBLE PREFERRED STOCK — 3.52% | ||||||||
Auto Manufacturers — 0.44% |
| |||||||
Fiat Chrysler Automobile | 180,000 | 10,623,600 | ||||||
General Motors Corp. Senior Convertible Preferred Escrow — B | 475,000 | — | ||||||
General Motors Corp. Senior Convertible Preferred Escrow — C | 11,790,650 | — | ||||||
|
| |||||||
| 10,623,600 | ||||||||
|
| |||||||
| Shares, Principal Amount, or Number of Contracts | Value | |||||||
Environmental Control — 1.28% |
| |||||||
Stericycle, Inc. | 375,000 | $ | 31,192,500 | |||||
Investment Companies — 0.78% |
| |||||||
Mandatory Exchangeable Trust | 185,000 | 18,913,475 | ||||||
Pharmaceuticals — 1.02% |
| |||||||
Teva Pharmaceutical Industries Ltd. (Israel) | 30,000 | 24,810,000 | ||||||
|
| |||||||
Total CONVERTIBLE PREFERRED STOCK | 85,539,575 | |||||||
|
| |||||||
| PREFERRED STOCKS — 2.93% | ||||||||
Banks — 1.46% |
| |||||||
GMAC Capital Trust I 6.41%, 2/15/402,10 | 1,428,511 | 35,455,643 | ||||||
Telecommunications — 1.47% |
| |||||||
Centaur Funding Corp. (Cayman Islands) | 30,242 | 35,770,616 | ||||||
|
| |||||||
Total PREFERRED STOCKS | 71,226,259 | |||||||
|
| |||||||
| PURCHASED PUT OPTIONS — 0.43% | ||||||||
Alibaba Group Holding Ltd. ADR, Exercise Price: $30.00, Expiration Date: January, 2018* | 1,000 | 96,000 | ||||||
ROVI Corp., Exercise Price: $15.00, Expiration Date: July, 2016* | 2,500 | 125,000 | ||||||
S&P 500 Index, | 1,705 | 10,178,850 | ||||||
|
| |||||||
Total PURCHASED PUT OPTIONS | 10,399,850 | |||||||
|
| |||||||
| ||||||||
TOTAL INVESTMENTS (Cost $2,341,285,347) | 93.22 | % | $ | 2,266,673,986 | ||||
Other Assets less Liabilities | 6.78 | % | 164,820,014 | |||||
|
|
|
| |||||
Net Assets | 100.00 | % | $ | 2,431,494,000 | ||||
| ||||||||
Notes to Financial Statements are an integral part of this Schedule.
5
Driehaus Active Income Fund
Schedule of Investments
June 30, 2016 (unaudited)
| Shares, Principal Amount, or Number of Contracts | Value | |||||||
| SECURITIES SOLD SHORT — (10.70)% | ||||||||
| CORPORATE BONDS — (5.23)% | ||||||||
Oil & Gas — (0.90)% |
| |||||||
ConocoPhillips Co. | $ | (5,000,000 | ) | $ | (5,099,960 | ) | ||
ConocoPhillips Co. | (5,000,000 | ) | (5,168,985 | ) | ||||
Denbury Resources, Inc. | (5,327,000 | ) | (3,728,900 | ) | ||||
Devon Energy Corp. | (8,000,000 | ) | (7,778,848 | ) | ||||
|
| |||||||
| (21,776,693 | ) | |||||||
|
| |||||||
Oil & Gas Services — (1.54)% |
| |||||||
National Oilwell Varco, Inc. | (20,575,000 | ) | (19,241,267 | ) | ||||
National Oilwell Varco, Inc. | (18,700,000 | ) | (14,960,318 | ) | ||||
Weatherford International Ltd. (Bermuda) | (3,322,000 | ) | (3,172,510 | ) | ||||
|
| |||||||
| (37,374,095 | ) | |||||||
|
| |||||||
Packaging & Containers — (0.29)% |
| |||||||
SIG Combibloc Holdings SCA (Luxembourg) | (6,000,000 | ) | (7,058,040 | ) | ||||
Pipelines — (0.54)% |
| |||||||
Enbridge Energy Partners LP | (12,000,000 | ) | (13,318,092 | ) | ||||
Sovereign — (1.96)% |
| |||||||
Turkey Government International Bond (Turkey) | (45,000,000 | ) | (47,643,750 | ) | ||||
|
| |||||||
Total CORPORATE BONDS | (127,170,670 | ) | ||||||
|
| |||||||
| U.S. GOVERNMENT AND AGENCY SECURITIES — (1.29)% | ||||||||
United States Treasury Bond | ||||||||
3.00%, 11/15/44 | (16,000,000 | ) | (18,407,504 | ) | ||||
3.00%, 5/15/45 | (11,293,000 | ) | (12,989,152 | ) | ||||
|
| |||||||
Total U.S. GOVERNMENT AND AGENCY SECURITIES (Proceeds $28,492,486) | (31,396,656 | ) | ||||||
|
| |||||||
| Shares, Principal Amount, or Number of Contracts | Value | |||||||
| COMMON STOCK — (4.18)% | ||||||||
Auto Manufacturers — (0.31)% |
| |||||||
Fiat Chrysler Automobiles NV (United Kingdom)3 | (1,250,000 | ) | $ | (7,650,000 | ) | |||
Building Materials — (0.16)% |
| |||||||
Cemex S.A.B. de C.V. ADR* | (628,000 | ) | (3,874,760 | ) | ||||
Environmental Control — (0.97)% |
| |||||||
Stericycle, Inc.* | (226,000 | ) | (23,531,120 | ) | ||||
Healthcare — Services — (0.41)% |
| |||||||
Aetna, Inc. | (64,031 | ) | (7,820,106 | ) | ||||
Anthem, Inc. | (16,528 | ) | (2,170,788 | ) | ||||
|
| |||||||
| (9,990,894 | ) | |||||||
|
| |||||||
Internet — (0.63)% |
| |||||||
Alibaba Group Holding Ltd. ADR* | (193,000 | ) | (15,349,290 | ) | ||||
Media — 0.00% |
| |||||||
Charter Communications, Inc., Class A* | — | (83 | ) | |||||
Rizzoli Corriere Della Sera Mediagroup SpA (Italy)*3 | (79,684 | ) | (71,141 | ) | ||||
|
| |||||||
| (71,224 | ) | |||||||
|
| |||||||
Pharmaceuticals — (0.56)% |
| |||||||
Teva Pharmaceutical Industries Ltd. ADR | (268,698 | ) | (13,496,701 | ) | ||||
Retail — (0.07)% |
| |||||||
Office Depot, Inc.* | (490,556 | ) | (1,623,740 | ) | ||||
Semiconductors — (0.65)% |
| |||||||
Microchip Technology, Inc. | (312,000 | ) | (15,837,120 | ) | ||||
Software — (0.12)% |
| |||||||
Verint Systems, Inc.* | (89,162 | ) | (2,953,937 | ) | ||||
Telecommunications — (0.30)% |
| |||||||
Ciena Corp.* | (386,700 | ) | (7,250,625 | ) | ||||
|
| |||||||
Total COMMON STOCK (Proceeds $109,520,697) | (101,629,411 | ) | ||||||
|
| |||||||
| ||||||||
TOTAL INVESTMENT SECURITIES SOLD SHORT (Proceeds $258,097,282) | (10.70 | )% | $ | (260,196,737 | ) | |||
|
| |||||||
| ||||||||
Notes to Financial Statements are an integral part of this Schedule.
6
Driehaus Active Income Fund
Schedule of Investments
June 30, 2016 (unaudited)
| Shares, Principal Amount, or Number of Contracts | Value | |||||||
| WRITTEN PUT OPTIONS — (0.12)% | ||||||||
S&P 500 Index, Exercise Price: $1,900.00, Expiration Date: September, 2016* | (1,705 | ) | $ | (2,898,500 | ) | |||
|
| |||||||
Total WRITTEN PUT OPTIONS | (2,898,500 | ) | ||||||
|
| |||||||
| ||||||||
TOTAL WRITTEN PUT OPTIONS | (0.12 | )% | $ | (2,898,500 | ) | |||
| ||||||||
| * | Non-income producing security. |
| 1 | Security is exempt from registration under Rule 144A of the Securities Act of 1933, as amended. Unless otherwise indicated, this security has been determined to be liquid under procedures established by Driehaus Mutual Funds’ (the “Trust”) Board of Trustees and may be resold in transactions exempt from registration, normally to qualified institutional buyers. |
| 2 | Variable rate security. Rates disclosed as of June 30, 2016. |
| 3 | Foreign security denominated in U.S. dollars and traded on a U.S. exchange. |
| 4 | Security valued at fair value as determined in good faith by Driehaus Capital Management LLC (the “Adviser”), investment adviser to the Fund, in accordance with procedures established by, and under the general supervision of, the Trust’s Board of Trustees. |
| 5 | Security is in default. |
| 6 | Foreign security, par value shown in local currency. |
| 7 | Bank loans in which the Fund invests pay interest at rates which are periodically predetermined by reference to a base lending rate plus a premium. These base lending rates are generally (i) the lending rate offered by one or more major European banks, such as the London Inter-Bank Offered Rate (“LIBOR”), (ii) the prime rate offered by one or more United States banks or (iii) the certificate of deposit rate. Certain bank loans are subject to a LIBOR floor that establishes a minimum LIBOR rate. The interest rate shown reflects the rate in effect at June 30, 2016. Bank loans generally are subject to mandatory and/or optional repayment. As a result, the actual remaining maturity may be substantially less than the stated maturities shown. |
| 8 | Affiliated company. (See Note C) |
| 9 | Pursuant to procedures adopted by the Trust’s Board of Trustees, this security has been determined to be illiquid by the Adviser. |
| 10 | All or a portion of this security is pledged as collateral for short sales or derivatives transactions. |
Percentages are stated as a percent of net assets.
Security Type | Percent of Total Net Assets | |||
Asset-Backed Securities | 0.01 | % | ||
Bank Loans | 22.85 | % | ||
Corporate Bonds | 33.63 | % | ||
Convertible Corporate Bonds | 3.32 | % | ||
U.S. Government and Agency Securities | 0.30 | % | ||
Common Stock | 26.23 | % | ||
Convertible Preferred Stock | 3.52 | % | ||
Preferred Stocks | 2.93 | % | ||
Purchased Put Options | 0.43 | % | ||
|
| |||
Total Investments | 93.22 | % | ||
Other Assets less Liabilities | 6.78 | % | ||
|
| |||
Total Net Assets | 100.00 | % | ||
|
| |||
Percentages are stated as a percent of net assets.
Notes to Financial Statements are an integral part of this Schedule.
7
Driehaus Active Income Fund
Schedule of Investments
June 30, 2016 (unaudited)
SWAP CONTRACTS
Credit Default SwapsA
| Counterparty | Reference Instrument | Currency | Notional AmountB | Pay/ ReceiveC Fixed Rate | Fixed Rate | Expiration Date | Premium Paid/ (Received) | Unrealized Appreciation/ (Depreciation) | RatingD | |||||||||||||||||||||
Bank of America | Ally Financial, Inc. | |||||||||||||||||||||||||||||
| 7.50%, 9/15/20 | USD | 10,000,000 | Pay | 5.00 | % | 12/20/2018 | $ | (1,492,458 | ) | $ | 746,361 | BB+ | ||||||||||||||||||
Morgan Stanley | American Express Co. | |||||||||||||||||||||||||||||
| 5.50%, 9/12/16 | USD | 20,000,000 | Pay | 1.00 | 12/20/2016 | 263,406 | (356,121 | ) | BBB+ | |||||||||||||||||||||
Goldman Sachs | American Express Co. | |||||||||||||||||||||||||||||
| 5.50%, 9/12/16 | USD | 5,000,000 | Pay | 1.00 | 12/20/2016 | 61,174 | (84,353 | ) | BBB+ | |||||||||||||||||||||
Goldman Sachs | Anadarko Petroleum Corp. | |||||||||||||||||||||||||||||
| 6.95%, 6/15/19 | USD | 5,000,000 | Pay | 1.00 | 12/20/2020 | 726,985 | (460,573 | ) | BBB | |||||||||||||||||||||
JP Morgan | Anadarko Petroleum Corp. | |||||||||||||||||||||||||||||
| 6.95%, 6/15/19 | USD | 3,000,000 | Pay | 1.00 | 12/20/2020 | 446,586 | (286,739 | ) | BBB | |||||||||||||||||||||
JP Morgan | Anadarko Petroleum Corp. | |||||||||||||||||||||||||||||
| 6.95%, 6/15/19 | USD | 3,000,000 | Pay | 1.00 | 12/20/2020 | 487,229 | (327,381 | ) | BBB | |||||||||||||||||||||
Morgan Stanley | Anadarko Petroleum Corp. | |||||||||||||||||||||||||||||
| 6.95%, 6/15/19 | USD | 3,000,000 | Pay | 1.00 | 12/20/2020 | 506,728 | (346,880 | ) | BBB | |||||||||||||||||||||
Barclays | Anadarko Petroleum Corp. | |||||||||||||||||||||||||||||
| 6.95%, 6/15/19 | USD | 3,000,000 | Pay | 1.00 | 12/20/2020 | 215,516 | (55,669 | ) | BBB | |||||||||||||||||||||
Barclays | Banco Bilbao Vizcaya Argentaria SA | |||||||||||||||||||||||||||||
| 5 Year Subordinated Debt | EUR | 5,000,000 | Pay | 1.00 | 3/20/2020 | 221,046 | 120,530 | BBB+ | ||||||||||||||||||||||
Barclays | Banco Bilbao Vizcaya Argentaria SA | |||||||||||||||||||||||||||||
| 5 Year Subordinated Debt | EUR | 10,000,000 | Pay | 1.00 | 3/20/2020 | 458,796 | 224,356 | BBB+ | ||||||||||||||||||||||
Bank of America | Banco Bilbao Vizcaya Argentaria SA | |||||||||||||||||||||||||||||
| 5 Year Subordinated Debt | EUR | 10,000,000 | Pay | 1.00 | 3/20/2020 | 397,363 | 285,789 | BBB+ | ||||||||||||||||||||||
Barclays | Banco Bilbao Vizcaya Argentaria SA | |||||||||||||||||||||||||||||
| 5 Year Senior Debt | EUR | (5,000,000 | ) | Receive | 1.00 | 3/20/2020 | 39,492 | (109,366 | ) | BBB+ | ||||||||||||||||||||
Barclays | Banco Bilbao Vizcaya Argentaria SA | |||||||||||||||||||||||||||||
| 5 Year Senior Debt | EUR | (10,000,000 | ) | Receive | 1.00 | 3/20/2020 | 62,054 | (201,803 | ) | BBB+ | ||||||||||||||||||||
Bank of America | Banco Bilbao Vizcaya Argentaria SA | |||||||||||||||||||||||||||||
| 5 Year Senior Debt | EUR | (10,000,000 | ) | Receive | 1.00 | 3/20/2020 | 84,333 | (224,082 | ) | BBB+ | ||||||||||||||||||||
Barclays | Banco Santander SA | |||||||||||||||||||||||||||||
| 5 Year Subordinated Debt | EUR | 5,000,000 | Pay | 1.00 | 3/20/2020 | 218,619 | 193,867 | A- | ||||||||||||||||||||||
Bank of America | Banco Santander SA | |||||||||||||||||||||||||||||
| 5 Year Subordinated Debt | EUR | 10,000,000 | Pay | 1.00 | 3/20/2020 | 386,569 | 438,402 | A- | ||||||||||||||||||||||
Bank of America | Banco Santander SA | |||||||||||||||||||||||||||||
| 5 Year Senior Debt | EUR | (10,000,000 | ) | Receive | 1.00 | 3/20/2020 | 84,333 | (274,388 | ) | A- | ||||||||||||||||||||
Barclays | Banco Santander SA | |||||||||||||||||||||||||||||
| 5 Year Senior Debt | EUR | (5,000,000 | ) | Receive | 1.00 | 3/20/2020 | 33,862 | (128,890 | ) | A- | ||||||||||||||||||||
Goldman Sachs | Bank of America Corp. | |||||||||||||||||||||||||||||
| 6.25%, 4/15/12 | USD | 10,000,000 | Pay | 1.00 | 12/20/2016 | 1,499,776 | (1,536,303 | ) | BBB+ | |||||||||||||||||||||
Bank of America | Citigroup, Inc. | |||||||||||||||||||||||||||||
| 6.13%, 5/15/18 | USD | 5,000,000 | Pay | 1.00 | 12/20/2016 | 432,520 | (450,790 | ) | BBB+ | |||||||||||||||||||||
Goldman Sachs | Citigroup, Inc. | |||||||||||||||||||||||||||||
| 6.13%, 5/15/18 | USD | 5,000,000 | Pay | 1.00 | 12/20/2016 | 379,663 | (397,933 | ) | BBB+ | |||||||||||||||||||||
JP Morgan | ConocoPhillips Company | |||||||||||||||||||||||||||||
| 5.90%, 10/15/32 | USD | 3,000,000 | Pay | 1.00 | 12/20/2020 | 293,043 | (242,980 | ) | A- | |||||||||||||||||||||
Notes to Financial Statements are an integral part of this Schedule.
8
Driehaus Active Income Fund
Schedule of Investments
June 30, 2016 (unaudited)
Credit Default SwapsA (continued)
| Counterparty | Reference Instrument | Currency | Notional AmountB | Pay/ ReceiveC Fixed Rate | Fixed Rate | Expiration Date | Premium Paid/ (Received) | Unrealized Appreciation/ (Depreciation) | RatingD | |||||||||||||||||||||
JP Morgan | ConocoPhillips Company | |||||||||||||||||||||||||||||
| 5.90%, 10/15/32 | USD | 5,000,000 | Pay | 1.00 | % | 12/20/2020 | $ | 673,047 | $ | (589,611 | ) | A- | ||||||||||||||||||
Morgan Stanley | ConocoPhillips Company | |||||||||||||||||||||||||||||
| 5.90%, 10/15/32 | USD | 3,000,000 | Pay | 1.00 | 12/20/2020 | 327,105 | (277,043 | ) | A- | |||||||||||||||||||||
JP Morgan | ConocoPhillips Company | |||||||||||||||||||||||||||||
| 5.90%, 10/15/32 | USD | 3,000,000 | Pay | 1.00 | 12/20/2020 | 285,850 | (235,788 | ) | A- | |||||||||||||||||||||
JP Morgan | ConocoPhillips Company | |||||||||||||||||||||||||||||
| 5.90%, 10/15/32 | USD | 5,000,000 | Pay | 1.00 | 12/20/2020 | 457,091 | (373,654 | ) | A- | |||||||||||||||||||||
Barclays | ConocoPhillips Company | |||||||||||||||||||||||||||||
| 5.90%, 10/15/32 | USD | 3,000,000 | Pay | 1.00 | 12/20/2020 | 92,233 | (42,171 | ) | A- | |||||||||||||||||||||
Goldman Sachs | Devon Energy Corp. | |||||||||||||||||||||||||||||
| 7.95%, 4/15/32 | USD | 5,000,000 | Pay | 1.00 | 12/20/2020 | 877,992 | (614,299 | ) | BBB | |||||||||||||||||||||
Morgan Stanley | Devon Energy Corp. | |||||||||||||||||||||||||||||
| 7.95%, 4/15/32 | USD | 5,000,000 | Pay | 1.00 | 12/20/2020 | 1,068,817 | (805,124 | ) | BBB | |||||||||||||||||||||
Morgan Stanley | Devon Energy Corp. | |||||||||||||||||||||||||||||
| 7.95%, 4/15/32 | USD | 3,000,000 | Pay | 1.00 | 12/20/2020 | 605,992 | (447,776 | ) | BBB | |||||||||||||||||||||
Barclays | Devon Energy Corp. | |||||||||||||||||||||||||||||
| 7.95%, 4/15/32 | USD | 5,000,000 | Pay | 1.00 | 12/20/2020 | 1,103,689 | (839,996 | ) | BBB | |||||||||||||||||||||
JP Morgan | Hess Corp. | |||||||||||||||||||||||||||||
| 7.00%, 2/15/14 | USD | 8,000,000 | Pay | 1.00 | 6/20/2018 | 154,644 | (146,495 | ) | BBB- | |||||||||||||||||||||
Morgan Stanley | Hess Corp. | |||||||||||||||||||||||||||||
| 7.00%, 2/15/14 | USD | 4,000,000 | Pay | 1.00 | 6/20/2018 | 77,280 | (73,206 | ) | BBB- | |||||||||||||||||||||
Morgan Stanley | Hess Corp. | |||||||||||||||||||||||||||||
| 7.00%, 2/15/14 | USD | 4,000,000 | Pay | 1.00 | 6/20/2018 | 80,701 | (76,627 | ) | BBB- | |||||||||||||||||||||
Morgan Stanley | Hess Corp. | |||||||||||||||||||||||||||||
| 7.00%, 2/15/14 | USD | 4,000,000 | Pay | 1.00 | 6/20/2018 | 91,702 | (87,628 | ) | BBB- | |||||||||||||||||||||
Credit Suisse | Hess Corp. | |||||||||||||||||||||||||||||
| 7.00%, 2/15/14 | USD | 20,000,000 | Pay | 1.00 | 9/20/2018 | 309,975 | (189,917 | ) | BBB- | |||||||||||||||||||||
Goldman Sachs | Host Hotels & Resorts, Inc. | |||||||||||||||||||||||||||||
| 6.75%, 6/1/16 | USD | 10,000,000 | Pay | 1.00 | 12/20/2016 | 1,067,644 | (1,111,816 | ) | BB+ | |||||||||||||||||||||
Goldman Sachs | Huntsman Corp. | |||||||||||||||||||||||||||||
| 11.50%, 7/15/12 | USD | 5,000,000 | Pay | 5.00 | 12/20/2016 | 124,119 | (235,036 | ) | BB- | |||||||||||||||||||||
Barclays | Intesa Sanpaolo SpA | |||||||||||||||||||||||||||||
| 5 Year Subordinated Debt | EUR | 5,000,000 | Pay | 1.00 | 3/20/2020 | 202,397 | 155,102 | BBB- | ||||||||||||||||||||||
Bank of America | Intesa Sanpaolo SpA | |||||||||||||||||||||||||||||
| 5 Year Subordinated Debt | EUR | 10,000,000 | Pay | 1.00 | 3/20/2020 | 413,529 | 301,469 | BBB- | ||||||||||||||||||||||
Barclays | Intesa Sanpaolo SpA | |||||||||||||||||||||||||||||
| 5 Year Senior Debt | EUR | (5,000,000 | ) | Receive | 1.00 | 3/20/2020 | 31,027 | (98,192 | ) | BBB- | ||||||||||||||||||||
Bank of America | Intesa Sanpaolo SpA | |||||||||||||||||||||||||||||
| 5 Year Senior Debt | EUR | (10,000,000 | ) | Receive | 1.00 | 3/20/2020 | 84,333 | (218,662 | ) | BBB- | ||||||||||||||||||||
Credit Suisse | J.C. Penney Corp., Inc. | |||||||||||||||||||||||||||||
| 6.38%, 10/15/36 | USD | 6,667,000 | Pay | 5.00 | 12/20/2016 | 700,035 | (844,966 | ) | B- | |||||||||||||||||||||
Barclays | Nordstrom, Inc. | |||||||||||||||||||||||||||||
| 6.95%, 3/15/28 | USD | 2,850,000 | Pay | 1.00 | 12/20/2020 | 64,602 | 33,597 | BBB+ | ||||||||||||||||||||||
JP Morgan | Nordstrom, Inc. | |||||||||||||||||||||||||||||
| 6.95%, 3/15/28 | USD | 6,650,000 | Pay | 1.00 | 12/20/2020 | 135,159 | 93,972 | BBB+ | ||||||||||||||||||||||
JP Morgan | Nordstrom, Inc. | |||||||||||||||||||||||||||||
| 6.95%, 3/15/28 | USD | 1,900,000 | Pay | 1.00 | 12/20/2020 | 55,340 | 10,126 | BBB+ | ||||||||||||||||||||||
Goldman Sachs | Nordstrom, Inc. | |||||||||||||||||||||||||||||
| 6.95%, 3/15/28 | USD | 2,850,000 | Pay | 1.00 | 12/20/2020 | 83,041 | 15,158 | BBB+ | ||||||||||||||||||||||
Citigroup | Nordstrom, Inc. | |||||||||||||||||||||||||||||
| 6.95%, 3/15/28 | USD | 4,750,000 | Pay | 1.00 | 12/20/2020 | 134,249 | 29,416 | BBB+ | ||||||||||||||||||||||
Notes to Financial Statements are an integral part of this Schedule.
9
Driehaus Active Income Fund
Schedule of Investments
June 30, 2016 (unaudited)
Credit Default SwapsA (continued)
| Counterparty | Reference Instrument | Currency | Notional AmountB | Pay/ ReceiveC Fixed Rate | Fixed Rate | Expiration Date | Premium Paid/ (Received) | Unrealized Appreciation/ (Depreciation) | RatingD | |||||||||||||||||||||
JP Morgan | Nordstrom, Inc. | |||||||||||||||||||||||||||||
| 6.95%, 3/15/28 | USD | 2,850,000 | Pay | 1.00 | % | 12/20/2020 | $ | 57,742 | $ | 40,457 | BBB+ | |||||||||||||||||||
Bank of America | Nordstrom, Inc. | |||||||||||||||||||||||||||||
| 6.95%, 3/15/28 | USD | 4,750,000 | Pay | 1.00 | 12/20/2020 | 96,237 | 67,428 | BBB+ | ||||||||||||||||||||||
Barclays | Nordstrom, Inc. | |||||||||||||||||||||||||||||
| 6.95%, 3/15/28 | USD | 4,500,000 | Pay | 1.00 | 12/20/2020 | 50,731 | 104,320 | BBB+ | ||||||||||||||||||||||
Citigroup | Nordstrom, Inc. | |||||||||||||||||||||||||||||
| 6.95%, 3/15/28 | USD | 2,700,000 | Pay | 1.00 | 12/20/2020 | 24,386 | 68,645 | BBB+ | ||||||||||||||||||||||
Goldman Sachs | Pitney Bowes, Inc. | |||||||||||||||||||||||||||||
| 6.25%, 3/15/19 | USD | 5,000,000 | Pay | 1.00 | 9/20/2016 | 164,656 | (176,322 | ) | BBB | |||||||||||||||||||||
Morgan Stanley | Pitney Bowes, Inc. | |||||||||||||||||||||||||||||
| 6.25%, 3/15/19 | USD | 5,000,000 | Pay | 1.00 | 12/20/2016 | 244,614 | (267,533 | ) | BBB | |||||||||||||||||||||
Goldman Sachs | Saks, Inc. | |||||||||||||||||||||||||||||
| 2.00%, 3/15/24 | USD | 10,000,000 | Pay | 5.00 | 12/20/2016 | 406,250 | (655,214 | ) | NR | |||||||||||||||||||||
Goldman Sachs | The Markit CDX NA | |||||||||||||||||||||||||||||
| High Yield Series 17 Index | USD | 13,600,000 | Pay | 5.00 | 12/20/2016 | 1,437,500 | (1,702,147 | ) | NA | |||||||||||||||||||||
Bank of America | The Markit CDX NA | |||||||||||||||||||||||||||||
| High Yield Series 17 Index | USD | 4,800,000 | Pay | 5.00 | 12/20/2016 | 528,000 | (621,405 | ) | NA | |||||||||||||||||||||
Goldman Sachs | The Markit iTraxx Europe | |||||||||||||||||||||||||||||
| Crossover IndexSeries 19 | EUR | 24,000,000 | Pay | 5.00 | 6/20/2018 | (1,569,627 | ) | (51,981 | ) | NA | ||||||||||||||||||||
Goldman Sachs | The Markit iTraxx Europe | |||||||||||||||||||||||||||||
| Crossover IndexSeries 20 | EUR | 10,000,000 | Pay | 5.00 | 12/20/2018 | (2,134,040 | ) | 1,113,261 | NA | |||||||||||||||||||||
Morgan Stanley | The Markit iTraxx Europe | |||||||||||||||||||||||||||||
| Crossover IndexSeries 20 | EUR | 10,000,000 | Pay | 5.00 | 12/20/2018 | (2,137,029 | ) | 1,116,250 | NA | |||||||||||||||||||||
Morgan Stanley | The Markit iTraxx Europe | |||||||||||||||||||||||||||||
| Crossover IndexSeries 20 | EUR | 10,000,000 | Pay | 5.00 | 12/20/2018 | (2,252,200 | ) | 1,231,421 | NA | |||||||||||||||||||||
Goldman Sachs | The Markit iTraxx Europe | |||||||||||||||||||||||||||||
| Crossover IndexSeries 22 | EUR | 16,059,945 | Pay | 5.00 | 12/20/2019 | (1,287,036 | ) | 444,083 | NA | |||||||||||||||||||||
Barclays | UniCredit SpA | |||||||||||||||||||||||||||||
| 5 Year Subordinated Debt | EUR | 5,000,000 | Pay | 1.00 | 3/20/2020 | 469,337 | 70,051 | BBB- | ||||||||||||||||||||||
Barclays | UniCredit SpA | |||||||||||||||||||||||||||||
| 5 Year Subordinated Debt | EUR | 10,000,000 | Pay | 1.00 | 3/20/2020 | 914,405 | 164,372 | BBB- | ||||||||||||||||||||||
Bank of America | UniCredit SpA | |||||||||||||||||||||||||||||
| 5 Year Subordinated Debt | EUR | 10,000,000 | Pay | 1.00 | 3/20/2020 | 859,000 | 219,777 | BBB- | ||||||||||||||||||||||
Barclays | UniCredit SpA | |||||||||||||||||||||||||||||
| 5 Year Senior Debt | EUR | (5,000,000 | ) | Receive | 1.00 | 3/20/2020 | (52,853 | ) | (105,238 | ) | BBB- | |||||||||||||||||||
Barclays | UniCredit SpA | |||||||||||||||||||||||||||||
| 5 Year Senior Debt | EUR | (10,000,000 | ) | Receive | 1.00 | 3/20/2020 | (105,835 | ) | (210,348 | ) | BBB- | |||||||||||||||||||
Bank of America | UniCredit SpA | |||||||||||||||||||||||||||||
| 5 Year Senior Debt | EUR | (10,000,000 | ) | Receive | 1.00 | 3/20/2020 | (83,273 | ) | (232,910 | ) | BBB- | |||||||||||||||||||
JP Morgan | Weatherford International PLC | |||||||||||||||||||||||||||||
| 4.50%, 4/15/22 | USD | 3,500,000 | Pay | 1.00 | 12/20/2020 | 1,120,000 | (316,157 | ) | BB- | |||||||||||||||||||||
Barclays | Weatherford International PLC | |||||||||||||||||||||||||||||
| 4.50%, 4/15/22 | USD | 3,000,000 | Pay | 1.00 | 12/20/2020 | 1,080,000 | (390,992 | ) | BB- | |||||||||||||||||||||
Barclays | Weatherford International PLC | |||||||||||||||||||||||||||||
| 4.50%, 4/15/22 | USD | 4,000,000 | Pay | 1.00 | 12/20/2020 | 1,280,000 | (361,323 | ) | BB- | |||||||||||||||||||||
Notes to Financial Statements are an integral part of this Schedule.
10
Driehaus Active Income Fund
Schedule of Investments
June 30, 2016 (unaudited)
Credit Default SwapsA (continued)
| Counterparty | Reference Instrument | Currency | Notional AmountB | Pay/ ReceiveC Fixed Rate | Fixed Rate | Expiration Date | Premium Paid/ (Received) | Unrealized Appreciation/ (Depreciation) | RatingD | |||||||||||||||||||||
Barclays | Weatherford International PLC | |||||||||||||||||||||||||||||
| 4.50%, 4/15/22 | USD | 2,000,000 | Pay | 1.00 | % | 12/20/2020 | $ | 520,000 | $ | (60,661 | ) | BB- | ||||||||||||||||||
|
|
|
| |||||||||||||||||||||||||||
Total Credit Default Swaps |
| 14,739,193 | (10,656,279 | ) | ||||||||||||||||||||||||||
|
|
|
| |||||||||||||||||||||||||||
Total Swap Contracts |
| $ | 14,739,193 | $ | (10,656,279 | ) | ||||||||||||||||||||||||
|
|
|
| |||||||||||||||||||||||||||
| A | The triggering credit event for each swap is bankruptcy/failure to pay. |
| B | For contracts to sell protection, the notional amout is equal to the maximum potential amount of the future payments and no recourse has been entered into in association with the contracts. |
| C | If the Fund is paying a fixed rate, the counterparty acts as guarantor of the variable instrument and thus the Fund is a buyer of protection. If the Fund is receiving a fixed rate, the Fund acts as guarantor of the variable instrument and thus is a seller of protection. |
| D | Based on Moody’s or Standard & Poor’s credit rating for the underlying reference instrument entity (unaudited). |
NR=Not Rated
NA=Not Applicable
EUR — Euro
USD — United States Dollar
Total Return Swaps
| Counterparty | Reference Index | Currency | Notional Amount | Pay/ Receive Total Return on Reference Index | Financing RateB | Maturity Date | Unrealized Appreciation/ (Depreciation) | |||||||||||||||
Goldman Sachs | Goldman Sachs Catch-Up Energy IndexC | USD | 37,225 | See Note A | 1-Month USD-LIBOR plus 1.40% | 8/18/2020 | $ | (681,111 | ) | |||||||||||||
Goldman Sachs | Goldman Sachs Stable Energy IndexD | USD | 54,229 | See Note A | 1-Month USD-LIBOR plus 1.40% | 8/18/2020 | (137,942 | ) | ||||||||||||||
|
| |||||||||||||||||||||
|
| |||||||||||||||||||||
TOTAL TOTAL RETURN SWAPS |
| $ | (819,053 | ) | ||||||||||||||||||
|
| |||||||||||||||||||||
| A | The Fund pays the financing rate. The Fund receives payment from the counterparty if the value of the total return of the reference index has increased and makes payment if the value has decreased. |
| B | Financing rate is based upon predetermined notional amounts. |
| C | The Goldman Sachs Catch-Up Energy Index is a customized index comprised of 5 U.S. energy equity securities. |
| D | The Goldman Sachs Stable Energy Index is a customized index comprised of 5 U.S. energy equity securities. |
USD — United States Dollar
Notes to Financial Statements are an integral part of this Schedule.
11
Driehaus Active Income Fund
Schedule of Investments
June 30, 2016 (unaudited)
SWAPTIONS
Interest Rate Swaptions
| Counterparty | Floating Rate Index | Currency | Notional Amount | Pay/ Receive Fixed Rate | Exercise Rate | Expiration Date | Premium Paid/ (Received) | Market Value | ||||||||||||||||||||
Morgan Stanley | 3-Month USD-LIBOR-BBA | USD | 14,000,000 | Pay | 1.36 | % | 7/28/2016 | $ | 105,000 | $ | 1,905 | |||||||||||||||||
Morgan Stanley | 3-Month USD-LIBOR-BBA | USD | 10,000,000 | Pay | 1.55 | 7/28/2016 | 104,000 | 1,482 | ||||||||||||||||||||
Morgan Stanley | 3-Month USD-LIBOR-BBA | USD | 7,700,000 | Pay | 1.78 | 7/28/2016 | 113,575 | 1,603 | ||||||||||||||||||||
|
|
|
| |||||||||||||||||||||||||
Total Interest Rate Swaptions |
| 322,575 | 4,990 | |||||||||||||||||||||||||
|
|
|
| |||||||||||||||||||||||||
TOTAL SWAPTIONS |
| $ | 322,575 | $ | 4,990 | |||||||||||||||||||||||
|
|
|
| |||||||||||||||||||||||||
USD — United States Dollar
FUTURES CONTRACTS
| Futures Contracts | Number of Contracts (Short) | Expiration Date | Unrealized Appreciation/ (Depreciation) | |||||||
U.S. 5 Year Treasury Note | (952) | September 2016 | $ | (2,136,800 | ) | |||||
U.S. 10 Year Treasury Note | (191) | September 2016 | (690,941 | ) | ||||||
|
| |||||||||
TOTAL FUTURES CONTRACTS | $ | (2,827,741 | ) | |||||||
|
| |||||||||
FORWARD FOREIGN CURRENCY CONTRACTS
| Counterparty | Currency Purchased | Currency Sold | Settlement Date | Value at June 30, 2016 | Unrealized Appreciation/ (Depreciation) | |||||||||||||||||||||
Goldman Sachs | GBP | 4,000,000 | USD | 5,766,816 | September 1, 2016 | $ | 5,328,339 | $ | (438,477 | ) | ||||||||||||||||
Goldman Sachs | EUR | 6,400,000 | USD | 7,173,268 | September 1, 2016 | 7,119,354 | (53,914 | ) | ||||||||||||||||||
Goldman Sachs | USD | 12,254,484 | GBP | 8,500,000 | September 1, 2016 | (11,322,720 | ) | 931,764 | ||||||||||||||||||
Goldman Sachs | USD | 5,682,622 | GBP | 4,300,000 | September 1, 2016 | (5,727,964 | ) | (45,342 | ) | |||||||||||||||||
Goldman Sachs | USD | 15,579,440 | EUR | 13,900,000 | September 1, 2016 | (15,462,347 | ) | 117,093 | ||||||||||||||||||
|
|
|
| |||||||||||||||||||||||
TOTAL FORWARD FOREIGN CURRENCY CONTRACTS |
| $ | (20,065,338 | ) | $ | 511,124 | ||||||||||||||||||||
|
|
|
| |||||||||||||||||||||||
EUR = Euro
GBP = British Pound
USD = United States Dollar
Notes to Financial Statements are an integral part of this Schedule.
12
Performance Overview (unaudited)
The performance summarized below is historical and does not represent future results. Investment returns and principal value vary, and you may have a gain or loss when you sell shares. Performance data presented measures the change in the value of an investment in the Fund, assuming reinvestment of all dividends and capital gains.
The table does not reflect the deduction of taxes that a shareholder would pay on Fund distributions or the redemption of Fund shares. The graph compares the results of a $25,000 investment (minimum investment) in the Fund since September 30, 2010 (the date of the Fund’s inception), with all dividends and capital gains reinvested, with the indicated indices (and dividends reinvested) for the same period.
Average Annual Total Returns as of 6/30/16 | 1 Year | 3 Years | 5 Years | Since Inception | ||||||||||||
Driehaus Select Credit Fund (DRSLX)1 | –10.43% | –3.83% | –1.37% | –0.13% | ||||||||||||
Citigroup 3-Month T-Bill Index2 | 0.14% | 0.07% | 0.06% | 0.07% | ||||||||||||
BofA Merrill Lynch U.S. High Yield Index3 | 1.71% | 4.18% | 5.70% | 6.38% | ||||||||||||
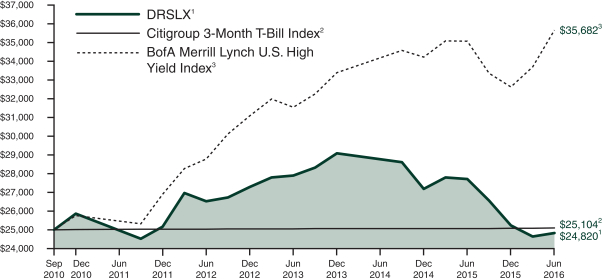
| 1 | The returns for the periods prior to February 1, 2011, reflect fee waivers and/or reimbursements without which performance would have been lower. |
| 2 | The Citigroup 3-Month T-Bill Index is designed to mirror the performance of the 3-month U.S. Treasury Bill. The Citigroup 3-Month T-Bill Index is unmanaged and its returns reflect reinvestment of all distributions and changes in market prices. |
| 3 | The BofA Merrill Lynch U.S. High Yield Index is an unmanaged index that tracks the performance of below-investment grade, U.S.-dollar denominated corporate bonds publicly issued in the U.S. domestic market. |
13
Driehaus Select Credit Fund
Schedule of Investments
June 30, 2016 (unaudited)
| Shares, Principal Amount, or Number of Contracts | Value | |||||||
| BANK LOANS — 20.83% | ||||||||
Entertainment — 4.25% |
| |||||||
Vivid Seats Ltd. | $ | 6,000,000 | $ | 5,940,000 | ||||
Insurance — 5.25% |
| |||||||
Asurion LLC | 7,600,000 | 7,349,200 | ||||||
Leisure Time — 5.71% |
| |||||||
Equinox Holdings, Inc. | 7,998,824 | 7,996,344 | ||||||
Software — 5.62% |
| |||||||
Applied Systems, Inc. | 7,893,846 | 7,856,863 | ||||||
|
| |||||||
Total BANK LOANS | 29,142,407 | |||||||
|
| |||||||
| CORPORATE BONDS — 42.38% | ||||||||
Airlines — 1.68% |
| |||||||
Gol LuxCo SA (Luxembourg) | 5,850,000 | 2,347,020 | ||||||
Banks — 3.23% |
| |||||||
Royal Bank of Scotland Group PLC (United Kingdom) | 4,750,000 | 4,512,500 | ||||||
Chemicals — 4.65% |
| |||||||
Kissner Milling Co., Ltd. (Canada) | 6,500,000 | 6,500,000 | ||||||
Momentive Performance Materials, Inc. | 5,530,000 | — | ||||||
|
| |||||||
| 6,500,000 | ||||||||
|
| |||||||
Computers — 4.07% |
| |||||||
Harland Clarke Holdings Corp. | 5,605,000 | 5,689,075 | ||||||
Healthcare — Products — 2.08% |
| |||||||
ConvaTec Healthcare E S.A. (Luxembourg) | 2,850,000 | 2,914,125 | ||||||
Healthcare — Services — 5.09% |
| |||||||
Kindred Healthcare, Inc. | 7,973,000 | 7,115,902 | ||||||
Media — 2.50% |
| |||||||
Neptune Finco Corp. 10.13%, 1/15/231,8 | 2,100,000 | 2,352,000 | ||||||
Neptune Finco Corp. | 1,000,000 | 1,143,120 | ||||||
|
| |||||||
| 3,495,120 | ||||||||
|
| |||||||
Oil & Gas — 1.80% |
| |||||||
Calumet Specialty Products Partners LP / Calumet Finance Corp. | 3,527,500 | 2,522,163 | ||||||
| Shares, Principal Amount, or Number of Contracts | Value | |||||||
Restaurants — 4.70% |
| |||||||
Ruby Tuesday, Inc. | $ | 6,800,000 | $ | 6,579,000 | ||||
Retail — 8.14% |
| |||||||
Neiman Marcus Group Ltd. LLC | 10,050,000 | 8,190,750 | ||||||
Rite Aid Corp. | 3,000,000 | 3,202,500 | ||||||
|
| |||||||
| 11,393,250 | ||||||||
|
| |||||||
Telecommunications — 4.44% |
| |||||||
FairPoint Communications, Inc. | 6,310,000 | 6,215,350 | ||||||
|
| |||||||
Total CORPORATE BONDS (Cost $69,823,556) | 59,283,505 | |||||||
|
| |||||||
| CONVERTIBLE CORPORATE BONDS — 0.01% | ||||||||
Electrical Components & Equipment — 0.00% |
| |||||||
Suntech Power Holdings Co., Ltd. (China) | 4,000,000 | 200 | ||||||
Mining — 0.01% |
| |||||||
Great Western Minerals Group Ltd. (Canada) | 2,000,000 | 10,000 | ||||||
|
| |||||||
Total CONVERTIBLE CORPORATE BONDS (Cost $5,991,108) | 10,200 | |||||||
|
| |||||||
| U.S. GOVERNMENT AND AGENCY SECURITIES — 2.68% | ||||||||
United States Treasury Bond | 2,130,000 | 2,448,252 | ||||||
United States Treasury Note | 1,243,000 | 1,299,469 | ||||||
|
| |||||||
Total U.S. GOVERNMENT AND AGENCY SECURITIES (Cost $3,436,033) | 3,747,721 | |||||||
|
| |||||||
| COMMON STOCK — 20.29% | ||||||||
Auto Manufacturers — 1.08% |
| |||||||
General Motors Co.8 | 53,381 | 1,510,679 | ||||||
Distribution/Wholesale — 0.59% |
| |||||||
Ingram Micro, Inc., | 23,618 | 821,434 | ||||||
Entertainment — 9.04% |
| |||||||
Carmike Cinemas, Inc.*8 | 139,842 | 4,212,041 | ||||||
Gaming and Leisure Properties, Inc.8 | 179,974 | 6,205,504 | ||||||
Pinnacle Entertainment, Inc.*8 | 201,055 | 2,227,689 | ||||||
|
| |||||||
| 12,645,234 | ||||||||
|
| |||||||
Notes to Financial Statements are an integral part of this Schedule.
14
Driehaus Select Credit Fund
Schedule of Investments
June 30, 2016 (unaudited)
| Shares, Principal Amount, or Number of Contracts | Value | |||||||
Gas — 0.71% |
| |||||||
AGL Resources, Inc. | 15,000 | $ | 989,550 | |||||
Healthcare — Services — 1.80% |
| |||||||
Humana, Inc.8 | 14,000 | 2,518,320 | ||||||
Internet — 0.51% |
| |||||||
LinkedIn Corp.* | 3,793 | 717,825 | ||||||
Media — 0.66% |
| |||||||
Meredith Corp.8 | 17,726 | 920,157 | ||||||
Retail — 3.15% |
| |||||||
Rite Aid Corp.*8 | 343,887 | 2,575,714 | ||||||
Staples, Inc.8 | 213,000 | 1,836,060 | ||||||
|
| |||||||
| 4,411,774 | ||||||||
|
| |||||||
Semiconductors — 2.75% |
| |||||||
KLA-Tencor Corp. | 40,000 | 2,930,000 | ||||||
Rovi Corp.*8 | 59,177 | 925,528 | ||||||
|
| |||||||
| 3,855,528 | ||||||||
|
| |||||||
Total COMMON STOCK (Cost $29,367,328) | 28,390,501 | |||||||
|
| |||||||
| CONVERTIBLE PREFERRED STOCK — 2.66% | ||||||||
Auto Manufacturers — 0.00% |
| |||||||
General Motors Corp. Senior Convertible Preferred Escrow — C | 94,958 | — | ||||||
Pharmaceuticals — 2.66% |
| |||||||
Teva Pharmaceutical Industries Ltd. (Israel) | 4,500 | 3,721,500 | ||||||
|
| |||||||
Total CONVERTIBLE PREFERRED STOCK (Cost $4,453,804) | 3,721,500 | |||||||
|
| |||||||
| PURCHASED PUT OPTIONS — 0.51% | ||||||||
S&P 500 Index, Exercise Price: $2,100.00, Expiration Date: September, 2016* | 120 | 716,400 | ||||||
|
| |||||||
Total PURCHASED PUT OPTIONS (Premiums paid $729,845) | 716,400 | |||||||
|
| |||||||
| ||||||||
TOTAL INVESTMENTS (Cost $142,978,686) | 89.36 | % | $ | 125,012,234 | ||||
Other Assets less Liabilities | 10.64 | % | 14,886,630 | |||||
|
|
|
| |||||
Net Assets | 100.00 | % | $ | 139,898,864 | ||||
|
|
|
|
| ||||
| Shares, Principal Amount, or Number of Contracts | Value | |||||||
| SECURITIES SOLD SHORT — (17.64)% | ||||||||
| CORPORATE BONDS — (8.58)% | ||||||||
Oil & Gas — (0.59)% |
| |||||||
Denbury Resources, Inc. | $ | (1,179,000 | ) | $ | (825,300 | ) | ||
Oil & Gas Services — (4.96)% |
| |||||||
National Oilwell Varco, Inc. | (3,925,000 | ) | (3,670,570 | ) | ||||
National Oilwell Varco, Inc. | (3,300,000 | ) | (2,640,056 | ) | ||||
Weatherford International Ltd. (Bermuda) | (662,000 | ) | (632,210 | ) | ||||
|
| |||||||
| (6,942,836 | ) | |||||||
|
| |||||||
Sovereign — (3.03)% |
| |||||||
Turkey Government International Bond (Turkey) | (4,000,000 | ) | (4,235,000 | ) | ||||
|
| |||||||
Total CORPORATE BONDS | (12,003,136 | ) | ||||||
|
| |||||||
| U.S. GOVERNMENT AND AGENCY SECURITIES — (1.73)% | ||||||||
United States Treasury Bond | (2,100,000 | ) | (2,415,985 | ) | ||||
|
| |||||||
Total U.S. GOVERNMENT AND AGENCY SECURITIES (Proceeds $2,263,483) | (2,415,985 | ) | ||||||
|
| |||||||
| COMMON STOCK — (7.33)% | ||||||||
Banks — (1.31)% |
| |||||||
BOK Financial Corp. | (29,310 | ) | (1,837,737 | ) | ||||
Healthcare — Services — (1.02)% |
| |||||||
Aetna, Inc. | (11,724 | ) | (1,431,852 | ) | ||||
Media — (0.01)% |
| |||||||
Rizzoli Corriere Della Sera Mediagroup | (21,340 | ) | (19,052 | ) | ||||
Pharmaceuticals — (1.44)% |
| |||||||
Teva Pharmaceutical Industries Ltd. ADR | (40,178 | ) | (2,018,141 | ) | ||||
Retail — (0.51)% |
| |||||||
Office Depot, Inc.* | (215,000 | ) | (711,650 | ) | ||||
Semiconductors — (1.20)% |
| |||||||
Lam Research Corp. | (20,000 | ) | (1,681,200 | ) | ||||
Telecommunications — (1.84)% |
| |||||||
FairPoint Communications, Inc.* | (175,000 | ) | (2,569,000 | ) | ||||
|
| |||||||
Total COMMON STOCK (Proceeds $11,846,146) | (10,268,632 | ) | ||||||
|
| |||||||
| ||||||||
TOTAL INVESTMENT SECURITIES SOLD SHORT Proceeds ($26,004,146) | (17.64 | )% | $ | (24,687,753 | ) | |||
| ||||||||
Notes to Financial Statements are an integral part of this Schedule.
15
Driehaus Select Credit Fund
Schedule of Investments
June 30, 2016 (unaudited)
| Shares, Principal Amount, or Number of Contracts | Value | |||||||
| WRITTEN PUT OPTIONS — (0.15)% | ||||||||
S&P 500 Index, Exercise Price: $1,900.00, Expiration Date: September, 2016* | (120 | ) | $ | (204,000 | ) | |||
|
| |||||||
Total WRITTEN PUT OPTIONS | (204,000 | ) | ||||||
|
| |||||||
| ||||||||
TOTAL WRITTEN PUT OPTIONS | (0.15 | )% | $ | (204,000 | ) | |||
| ||||||||
| * | Non-income producing security. |
| 1 | Security is exempt from registration under Rule 144A of the Securities Act of 1933, as amended. Unless otherwise indicated, this security has been determined to be liquid under procedures established by Driehaus Mutual Funds’ (the “Trust”) Board of Trustees and may be resold in transactions exempt from registration, normally to qualified institutional buyers. |
| 2 | Variable rate security. Rates disclosed as June 30, 2016. |
| 3 | Foreign security denominated in U.S. dollars and traded on a U.S. exchange. |
| 4 | Security valued at fair value as determined in good faith by Driehaus Capital Management LLC (the “Adviser”), investment adviser to the Fund, in accordance with procedures established by, and under the general supervision of, the Trust’s Board of Trustees. |
| 5 | Security is in default. |
| 6 | Bank loans in which the Fund invests pay interest at rates which are periodically predetermined by reference to a base lending rate plus a premium. These base lending rates are generally (i) the lending rate offered by one or more major European banks, such as the London Inter-Bank Offered Rate (“LIBOR”), (ii) the prime rate offered by one or more United States banks or (iii) the certificate of deposit rate. Certain bank loans are subject to a LIBOR floor that establishes a minimum LIBOR rate. The interest rate shown reflects the rate in effect at June 30, 2016. Bank loans generally are subject to mandatory and/or optional repayment. As a result, the actual remaining maturity may be substantially less than the stated maturities shown. |
| 7 | Pursuant to procedures adopted by the Trust’s Board of Trustees, this security has been determined to be illiquid by the Adviser. |
| 8 | All or a portion of this security is pledged as collateral for short sales or derivatives transactions. |
Percentages are stated as a percent of net assets.
Security Type | Percent of Total Net Assets | |||
Bank Loans | 20.83 | % | ||
Corporate Bonds | 42.38 | % | ||
Convertible Corporate Bonds | 0.01 | % | ||
U.S. Government and Agency Securities | 2.68 | % | ||
Common Stock | 20.29 | % | ||
Convertible Preferred Stock | 2.66 | % | ||
Written Put Options | 0.51 | % | ||
|
| |||
Total Investments | 89.36 | % | ||
Other Assets less Liabilities | 10.64 | % | ||
|
| |||
Total Net Assets | 100.00 | % | ||
|
| |||
Percentages are stated as a percent of net assets.
Notes to Financial Statements are an integral part of this Schedule.
16
Driehaus Select Credit Fund
Schedule of Investments
June 30, 2016 (unaudited)
SWAP CONTRACTS
Credit Default SwapsA
| Counterparty | Reference Instrument | Currency | Notional AmountB | Pay/ ReceiveC Fixed Rate | Fixed Rate | Expiration Date | Premium Paid (Received) | Unrealized Appreciation/ (Depreciation) | RatingD | |||||||||||||||||||||
Goldman Sachs | Banco Bilbao Vizcaya Argentaria SA | |||||||||||||||||||||||||||||
| 5 Year Subordinated Debt | EUR | 5,000,000 | Pay | 1.00 | % | 3/20/2020 | $ | 207,316 | $ | 134,260 | BBB+ | |||||||||||||||||||
Bank of America | Banco Bilbao Vizcaya Argentaria SA | |||||||||||||||||||||||||||||
| 5 Year Subordinated Debt | EUR | 2,500,000 | Pay | 1.00 | 9/20/2020 | 179,266 | 29,793 | BBB+ | ||||||||||||||||||||||
Goldman Sachs | Banco Bilbao Vizcaya Argentaria SA | |||||||||||||||||||||||||||||
| 5 Year Senior Debt | EUR | (5,000,000 | ) | Receive | 1.00 | 3/20/2020 | 42,280 | (112,154 | ) | BBB+ | ||||||||||||||||||||
Bank of America | Banco Bilbao Vizcaya Argentaria SA | |||||||||||||||||||||||||||||
| 5 Year Senior Debt | EUR | (2,500,000 | ) | Receive | 1.00 | 9/20/2020 | (23,319 | ) | (27,356 | ) | BBB+ | |||||||||||||||||||
Goldman Sachs | Banco Santander SA | |||||||||||||||||||||||||||||
| 5 Year Subordinated Debt | EUR | 5,000,000 | Pay | 1.00 | 3/20/2020 | 207,316 | 205,169 | A- | ||||||||||||||||||||||
Bank of America | Banco Santander SA | |||||||||||||||||||||||||||||
| 5 Year Subordinated Debt | EUR | 2,500,000 | Pay | 1.00 | 9/20/2020 | 172,853 | 76,849 | A- | ||||||||||||||||||||||
Goldman Sachs | Banco Santander SA | |||||||||||||||||||||||||||||
| 5 Year Senior Debt | EUR | (5,000,000 | ) | Receive | 1.00 | 3/20/2020 | 42,280 | (137,308 | ) | A- | ||||||||||||||||||||
Bank of America | Banco Santander SA | |||||||||||||||||||||||||||||
| 5 Year Senior Debt | EUR | (2,500,000 | ) | Receive | 1.00 | 9/20/2020 | (20,594 | ) | (44,244 | ) | A- | |||||||||||||||||||
JP Morgan | Hess Corp. | |||||||||||||||||||||||||||||
| 7.00%, 2/15/14 | USD | 2,000,000 | Pay | 1.00 | 6/20/2018 | 38,660 | (36,623 | ) | BBB- | |||||||||||||||||||||
Morgan Stanley | Hess Corp. | |||||||||||||||||||||||||||||
| 7.00%, 2/15/14 | USD | 1,000,000 | Pay | 1.00 | 6/20/2018 | 19,320 | (18,301 | ) | BBB- | |||||||||||||||||||||
Morgan Stanley | Hess Corp. | |||||||||||||||||||||||||||||
| 7.00%, 2/15/14 | USD | 1,000,000 | Pay | 1.00 | 6/20/2018 | 20,175 | (19,157 | ) | BBB- | |||||||||||||||||||||
Morgan Stanley | Hess Corp. | |||||||||||||||||||||||||||||
| 7.00%, 2/15/14 | USD | 1,000,000 | Pay | 1.00 | 6/20/2018 | 22,925 | (21,907 | ) | BBB- | |||||||||||||||||||||
Credit Suisse | Hess Corp. | |||||||||||||||||||||||||||||
| 7.00%, 2/15/14 | USD | 5,000,000 | Pay | 1.00 | 9/20/2018 | 77,494 | (47,479 | ) | BBB- | |||||||||||||||||||||
Barclays | Nordstrom, Inc. | |||||||||||||||||||||||||||||
| 6.95%, 3/15/28 | USD | 150,000 | Pay | 1.00 | 12/20/2020 | 3,400 | 1,768 | BBB+ | ||||||||||||||||||||||
JP Morgan | Nordstrom, Inc. | |||||||||||||||||||||||||||||
| 6.95%, 3/15/28 | USD | 350,000 | Pay | 1.00 | 12/20/2020 | 7,114 | 4,946 | BBB+ | ||||||||||||||||||||||
JP Morgan | Nordstrom, Inc. | |||||||||||||||||||||||||||||
| 6.95%, 3/15/28 | USD | 100,000 | Pay | 1.00 | 12/20/2020 | 2,913 | 533 | BBB+ | ||||||||||||||||||||||
Goldman Sachs | Nordstrom, Inc. | |||||||||||||||||||||||||||||
| 6.95%, 3/15/28 | USD | 150,000 | Pay | 1.00 | 12/20/2020 | 4,370 | 798 | BBB+ | ||||||||||||||||||||||
Citigroup | Nordstrom, Inc. | |||||||||||||||||||||||||||||
| 6.95%, 3/15/28 | USD | 250,000 | Pay | 1.00 | 12/20/2020 | 7,066 | 1,548 | BBB+ | ||||||||||||||||||||||
Citigroup | Nordstrom, Inc. | |||||||||||||||||||||||||||||
| 6.95%, 3/15/28 | USD | 300,000 | Pay | 1.00 | 12/20/2020 | 2,710 | 7,627 | BBB+ | ||||||||||||||||||||||
JP Morgan | Nordstrom, Inc. | |||||||||||||||||||||||||||||
| 6.95%, 3/15/28 | USD | 150,000 | Pay | 1.00 | 12/20/2020 | 3,039 | 2,129 | BBB+ | ||||||||||||||||||||||
Bank of America | Nordstrom, Inc. | |||||||||||||||||||||||||||||
| 6.95%, 3/15/28 | USD | 250,000 | Pay | 1.00 | 12/20/2020 | 5,065 | 3,549 | BBB+ | ||||||||||||||||||||||
Barclays | Nordstrom, Inc. | |||||||||||||||||||||||||||||
| 6.95%, 3/15/28 | USD | 500,000 | Pay | 1.00 | 12/20/2020 | 5,637 | 11,591 | BBB+ | ||||||||||||||||||||||
JP Morgan | Weatherford International Ltd. | |||||||||||||||||||||||||||||
| 4.50%, 4/15/22 | USD | 1,500,000 | Pay | 1.00 | 12/20/2020 | 480,000 | (135,496 | ) | BB- | |||||||||||||||||||||
|
|
|
| |||||||||||||||||||||||||||
Total Credit Default Swaps |
| 1,507,286 | (119,465 | ) | ||||||||||||||||||||||||||
|
|
|
| |||||||||||||||||||||||||||
Total Swap Contracts |
| $ | 1,507,286 | $ | (119,465 | ) | ||||||||||||||||||||||||
|
|
|
| |||||||||||||||||||||||||||
Notes to Financial Statements are an integral part of this Schedule.
17
Driehaus Select Credit Fund
Schedule of Investments
June 30, 2016 (unaudited)
| A | The triggering credit event for each swap is bankruptcy/failure to pay. |
| B | For contracts to sell protection, the notional amount is equal to the maximum potential amount of the future payments and no recourse has been entered into in association with the contracts. |
| C | If the Fund is paying a fixed rate, the counterparty acts as guarantor of the variable instrument and thus the Fund is a buyer of protection. If the Fund is receiving a fixed rate, the Fund acts as guarantor of the variable instrument and thus is a seller of protection. |
| D | Based on Moody’s or Standard & Poor’s credit rating for the underlying reference instrument entity (unaudited). |
EUR — Euro
USD — United States Dollar
SWAP CONTRACTS
Total Return Swaps
| Counterparty | Reference Index | Currency | Notional Amount | Pay/ Receive Total Return on Reference Index | Financing RateB | Maturity Date | Unrealized Appreciation/ (Depreciation) | |||||||||||||||
Goldman Sachs | Goldman Sachs Catch-Up Energy IndexC | USD | 2,238 | See Note A | 1-Month USD-LIBOR plus 1.40% | 8/18/2020 | $ | (40,948 | ) | |||||||||||||
Goldman Sachs | Goldman Sachs Stable Energy IndexD | USD | 3,260 | See Note A | 1-Month USD-LIBOR plus 1.40% | 8/18/2020 | (8,293 | ) | ||||||||||||||
|
| |||||||||||||||||||||
|
| |||||||||||||||||||||
TOTAL RETURN SWAPS |
| $ | (49,241 | ) | ||||||||||||||||||
|
| |||||||||||||||||||||
| A | The Fund pays the financing rate. The Fund receives payment from the counterparty if the value of the total return of the reference index has increased and makes payment if the value has decreased. |
| B | Financing rate is based upon predetermined notional amounts. |
| C | The Goldman Sachs Catch-Up Energy Index is a customized index comprised of 5 U.S. equity energy securities. |
| D | The Goldman Sachs Stable Energy Index is a customized index comprised of 5 U.S. equity energy securities. |
USD — United States Dollar
SWAPTIONS
Interest Rate Swaptions
| Counterparty | Floating Rate Index | Currency | Notional Amount | Pay/ Receive Fixed Rate | Exercise Rate | Expiration Date | Premium Paid/ (Received) | Market Value | ||||||||||||||||||||
Morgan Stanley | 3-Month USD-LIBOR-BBA | USD | 1,000,000 | Pay | 1.78 | % | 7/28/2016 | $ | 14,750 | $ | 208 | |||||||||||||||||
Morgan Stanley | 3-Month USD-LIBOR-BBA | USD | 1,600,000 | Pay | 1.36 | 7/28/2016 | 12,000 | 218 | ||||||||||||||||||||
Morgan Stanley | 3-Month USD-LIBOR-BBA | USD | 1,000,000 | Pay | 1.55 | 7/28/2016 | 10,400 | 148 | ||||||||||||||||||||
|
|
|
| |||||||||||||||||||||||||
Total Interest Rate Swaptions |
| 37,150 | 574 | |||||||||||||||||||||||||
|
|
|
| |||||||||||||||||||||||||
TOTAL SWAPTIONS |
| $ | 37,150 | $ | 574 | |||||||||||||||||||||||
|
|
|
| |||||||||||||||||||||||||
USD — United States Dollar
Notes to Financial Statements are an integral part of this Schedule.
18
Driehaus Select Credit Fund
Schedule of Investments
June 30, 2016 (unaudited)
FUTURES CONTRACTS
| Futures Contracts | Number of Contracts Long/(Short) | Expiration Date | Unrealized Appreciation/ (Depreciation) | |||||||||
S&P 500 E-mini | (50 | ) | September 2016 | $ | (50,765 | ) | ||||||
U.S. 5 Year Treasury Note | (100 | ) | September 2016 | (224,454 | ) | |||||||
U.S. 10 Year Treasury Note | (20 | ) | September 2016 | (72,351 | ) | |||||||
|
| |||||||||||
TOTAL FUTURES CONTRACTS | $ | (347,570 | ) | |||||||||
|
| |||||||||||
FORWARD FOREIGN CURRENCY CONTRACTS
| Counterparty | Currency Purchased | Currency Sold | Settlement Date | Value at June 30, 2016 | Unrealized Appreciation/ (Depreciation) | |||||||||||||||||||||||
Goldman Sachs | GBP | 2,770,000 | USD | 4,010,090 | September 1, 2016 | $ | 3,689,875 | $ | (320,215 | ) | ||||||||||||||||||
Goldman Sachs | GBP | 2,675,000 | USD | 3,929,449 | September 1, 2016 | 3,563,326 | (366,123 | ) | ||||||||||||||||||||
Goldman Sachs | USD | 764,103 | GBP | 530,000 | September 1, 2016 | (706,005 | ) | 58,098 | ||||||||||||||||||||
Goldman Sachs | USD | 6,876,928 | GBP | 4,770,000 | September 1, 2016 | (6,354,044 | ) | 522,884 | ||||||||||||||||||||
Goldman Sachs | USD | 214,606 | GBP | 145,000 | September 1, 2016 | (193,152 | ) | 21,454 | ||||||||||||||||||||
|
|
|
| |||||||||||||||||||||||||
TOTAL FORWARD FOREIGN CURRENCY CONTRACTS |
| $ | — | $ | (83,902 | ) | ||||||||||||||||||||||
|
|
|
| |||||||||||||||||||||||||
GBP = British Pound
USD = United States Dollar
Notes to Financial Statements are an integral part of this Schedule.
19
Performance Overview (unaudited)
The performance summarized below is historical and does not represent future results. Investment returns and principal value vary, and you may have a gain or loss when you sell shares. Performance data presented measures the change in the value of an investment in the Fund, assuming reinvestment of all dividends and capital gains.
The table does not reflect the deduction of taxes that a shareholder would pay on Fund distributions or the redemption of Fund shares. The graph compares the results of a $10,000 investment in the Fund since August 26, 2013 (the date of the Fund’s inception), with all dividends and capital gains reinvested, with the indicated indices (and dividends reinvested) for the same period.
| Average Annual Total Returns as of 6/30/16 | 1 Year | Since Inception (8/26/13 - 6/30/16) | ||||||
Driehaus Event Driven Fund (DEVDX)1 | –5.51% | 0.52% | ||||||
S&P 500 Index2 | 3.99% | 10.82% | ||||||
Citigroup 3-Month T-Bill Index3 | 0.14% | 0.07% | ||||||
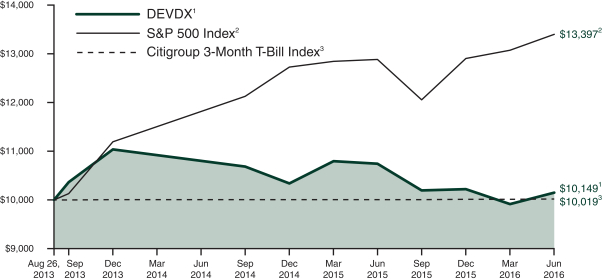
| 1 | The returns for the periods reflect fee waivers and/or reimbursements without which performance would have been lower. |
| 2 | The S&P 500 Index consists of 500 stocks chosen for market size, liquidity and industry group. It is a market-weighted index, with each stock’s weight in the index proportionate to its market value. |
| 3 | The Citigroup 3-Month T-Bill Index is designed to mirror the performance of the 3-month U.S. Treasury Bill. The Citigroup 3-Month T-Bill Index is unmanaged and its returns reflect reinvestment of all distributions and changes in market prices. |
20
Driehaus Event Driven Fund
Schedule of Investments
June 30, 2016 (unaudited)
| Shares, Principal Amount, or Number of Contracts | Value | |||||||
| CORPORATE BONDS — 10.67% | ||||||||
Banks — 8.30% |
| |||||||
PNC Capital Trust C | $ | 4,295,000 | $ | 3,779,600 | ||||
PNC Preferred Funding Trust II | 6,350,000 | 5,588,000 | ||||||
Royal Bank of Scotland Group PLC (United Kingdom) | 8,600,000 | 8,170,000 | ||||||
|
| |||||||
| 17,537,600 | ||||||||
|
| |||||||
Diversified Financial Services — 2.37% |
| |||||||
American Express Co. | 5,000,000 | 4,993,750 | ||||||
|
| |||||||
Total CORPORATE BONDS | 22,531,350 | |||||||
|
| |||||||
| COMMON STOCK — 81.10% | ||||||||
Beverages — 3.03% |
| |||||||
SABMiller PLC (United Kingdom) | 110,000 | 6,399,095 | ||||||
Biotechnology — 3.05% |
| |||||||
Blueprint Medicines Corp.*5,6 | 300,100 | 6,077,025 | ||||||
Sunesis Pharmaceuticals, Inc.* | 675,000 | 369,697 | ||||||
|
| |||||||
| 6,446,722 | ||||||||
|
| |||||||
Commercial Services — 5.99% |
| |||||||
Apollo Education Group, Inc.*6 | 1,387,165 | 12,650,945 | ||||||
Computers — 1.68% |
| |||||||
CSRA, Inc. | 151,000 | 3,537,930 | ||||||
Distribution/Wholesale — 4.08% |
| |||||||
Ingram Micro, Inc., Class A | 248,022 | 8,626,205 | ||||||
Electric — 6.49% |
| |||||||
ITC Holdings Corp.6 | 155,000 | 7,257,100 | ||||||
Westar Energy, Inc. | 115,000 | 6,450,350 | ||||||
|
| |||||||
| 13,707,450 | ||||||||
|
| |||||||
Entertainment — 21.37% |
| |||||||
Carmike Cinemas, Inc.* | 390,625 | 11,765,625 | ||||||
Gaming and Leisure Properties, Inc.6 | 714,287 | 24,628,616 | ||||||
Pinnacle Entertainment, Inc.* | 787,760 | 8,728,381 | ||||||
|
| |||||||
| 45,122,622 | ||||||||
|
| |||||||
Food — 4.11% |
| |||||||
Ingredion, Inc.6 | 67,000 | 8,670,470 | ||||||
Healthcare — Products — 2.95% |
| |||||||
St. Jude Medical, Inc. | 80,000 | 6,240,000 | ||||||
| Shares, Principal Amount, or Number of Contracts | Value | |||||||
Healthcare — Services — 1.92% |
| |||||||
Humana, Inc. | 17,500 | $ | 3,147,900 | |||||
Natera, Inc.* | 75,000 | 904,875 | ||||||
|
| |||||||
| 4,052,775 | ||||||||
|
| |||||||
Insurance — 4.77% |
| |||||||
Willis Towers Watson PLC (United Kingdom) | 81,002 | 10,069,359 | ||||||
Internet — 4.93% |
| |||||||
LinkedIn Corp.* | 55,000 | 10,408,750 | ||||||
Media — 4.17% |
| |||||||
Altice NV, Class A (Netherlands)*6 | 387,999 | 5,804,269 | ||||||
Charter Communications, Inc., Class A* | 5 | 1,143 | ||||||
Starz, Class A* | 100,099 | 2,994,962 | ||||||
|
| |||||||
| 8,800,374 | ||||||||
|
| |||||||
Pharmaceuticals — 1.84% |
| |||||||
Flexion Therapeutics, Inc.*5,6 | 259,700 | 3,886,410 | ||||||
Retail — 3.84% |
| |||||||
Rite Aid Corp.*6 | 1,083,120 | 8,112,569 | ||||||
Semiconductors — 3.71% |
| |||||||
Rovi Corp.* | 501,341 | 7,840,973 | ||||||
Software — 3.17% |
| |||||||
IMS Health Holdings, | 264,400 | 6,705,184 | ||||||
|
| |||||||
Total COMMON STOCK | 171,277,833 | |||||||
|
| |||||||
| CONVERTIBLE PREFERRED STOCK — 3.53% | ||||||||
Auto Manufacturers — 0.00% |
| |||||||
General Motors Corp. Senior Convertible Preferred Escrow — B 5.25%, 3/6/343,4,5 | 25,000 | — | ||||||
General Motors Corp. Senior Convertible Preferred Escrow — C 7.25%, 4/15/413,4,5 | 162,750 | — | ||||||
|
| |||||||
| — | ||||||||
|
| |||||||
Pharmaceuticals — 3.53% |
| |||||||
Teva Pharmaceutical Industries Ltd. (Israel) | 9,000 | 7,443,000 | ||||||
|
| |||||||
Total CONVERTIBLE PREFERRED STOCK | 7,443,000 | |||||||
|
| |||||||
Notes to Financial Statements are an integral part of this Schedule.
21
Driehaus Event Driven Fund
Schedule of Investments
June 30, 2016 (unaudited)
| Shares, Principal Amount, or Number of Contracts | Value | |||||||
| PURCHASED CALL OPTIONS — 0.14% | ||||||||
Carmike Cinemas, Inc., Exercise Price: $30.00, Expiration Date: September, 2016* | 1,651 | $ | 214,630 | |||||
Halliburton Co., Exercise Price: $60.00, Expiration Date: January, 2017* | 2,500 | 82,500 | ||||||
|
| |||||||
Total PURCHASED CALL OPTIONS | 297,130 | |||||||
|
| |||||||
| PURCHASED PUT OPTIONS — 0.28% | ||||||||
ROVI Corp., Exercise Price: $15.00, Expiration Date: July, 2016* | 5,040 | 252,000 | ||||||
S&P 500 Index, Exercise Price: $2,050.00, Expiration Date: July, 2016* | 180 | 152,100 | ||||||
Wynn Resorts Ltd., Exercise Price: $55.00, Expiration Date: January, 2017* | 1,100 | 181,500 | ||||||
|
| |||||||
Total PURCHASED PUT OPTIONS | 585,600 | |||||||
|
| |||||||
| ||||||||
TOTAL INVESTMENTS | 95.72 | % | $ | 202,134,913 | ||||
Other Assets less Liabilities | 4.28 | % | 9,048,566 | |||||
|
|
|
| |||||
Net Assets | 100.00 | % | $ | 211,183,479 | ||||
| ||||||||
| SECURITIES SOLD SHORT — (11.73)% | ||||||||
| COMMON STOCK — (11.73)% | ||||||||
Banks — (2.48)% |
| |||||||
BOK Financial Corp. | (83,556 | ) | $ | (5,238,961 | ) | |||
Electric — (1.71)% |
| |||||||
Fortis, Inc. (Canada) | (106,660 | ) | (3,605,141 | ) | ||||
Healthcare — Products — (1.29)% |
| |||||||
Abbott Laboratories | (69,664 | ) | (2,738,492 | ) | ||||
Healthcare — Services — (0.85)% |
| |||||||
Aetna, Inc. | (14,657 | ) | (1,790,059 | ) | ||||
| Shares, Principal Amount, or Number of Contracts | Value | |||||||
Pharmaceuticals — (5.40)% |
| |||||||
Quintiles Transnational Holdings, Inc.* | (101,530 | ) | $ | (6,631,940 | ) | |||
Teva Pharmaceutical Industries Ltd. ADR (Israel) | (95,000 | ) | (4,771,850 | ) | ||||
|
| |||||||
| (11,403,790 | ) | |||||||
|
| |||||||
Total COMMON STOCK | (24,776,443 | ) | ||||||
|
| |||||||
| ||||||||
TOTAL INVESTMENT SECURITIES SOLD SHORT | (11.73 | )% | $ | (24,776,443 | ) | |||
| ||||||||
| * | Non-income producing security. |
| 1 | Security is exempt from registration under Rule 144A of the Securities Act of 1933, as amended. Unless otherwise indicated, this security has been determined to be liquid under procedures established by Driehaus Mutual Funds’ (the “Trust”) Board of Trustees and may be resold in transactions exempt from registration, normally to qualified institutional buyers. |
| 2 | Variable rate security. Rates disclosed as of June 30, 2016. |
| 3 | Security valued at fair value as determined in good faith by Driehaus Capital Management LLC (the “Adviser”), investment adviser to the Fund, in accordance with procedures established by, and under the general supervision of, the Trust’s Board of Trustees. |
| 4 | Security is in default. |
| 5 | Pursuant to procedures adopted by the Trust’s Board of Trustees, this security has been determined to be illiquid by the Adviser. |
| 6 | All or a portion of this security is pledged as collateral for short sales or derivatives transactions. |
Percentages are stated as a percent of net assets.
Security Type | Percent of Total Net Assets | |||
Corporate Bonds | 10.67 | % | ||
Common Stock | 81.10 | % | ||
Convertible Preferred Stock | 3.53 | % | ||
Purchased Call Options | 0.14 | % | ||
Purchased Put Options | 0.28 | % | ||
|
| |||
Total Investments | 95.72 | % | ||
Other Assets less Liabilities | 4.28 | % | ||
|
| |||
Total Net Assets | 100.00 | % | ||
|
| |||
Percentages are stated as a percent of net assets.
Notes to Financial Statements are an integral part of this Schedule.
22
Driehaus Event Driven Fund
Summary of Investments
June 30, 2016 (unaudited)
SWAP CONTRACTS
Total Return Swaps
| Counterparty | Reference Index | Currency | Notional Amount | Pay/ Receive Total Return on Reference Index | Financing RateB | Maturity Date | Unrealized Appreciation/ (Depreciation) | |||||||||||||||
Goldman Sachs | Goldman Sachs Custom Biotech Indexc | USD | (66,191 | ) | See Note A | 1-Month USD-LIBOR minus 1.55% | 8/18/2020 | $ | 436,927 | |||||||||||||
|
| |||||||||||||||||||||
TOTAL RETURN SWAPS |
| $ | 436,927 | |||||||||||||||||||
|
| |||||||||||||||||||||
| A | The Fund pays the financing rate. The Fund receives payment from the counterparty if the value of the total return of the reference index has decreased and makes payment if the value has increased. |
| B | Financing rate is based upon predetermined notional amounts. |
| C | The Goldman Sachs Custom Biotech Index is a customized index comprised of 26 U.S. biotech equity securities. |
USD — United States Dollar
FORWARD FOREIGN CURRENCY CONTRACTS
| Counterparty | Currency Purchased | Currency Sold | Settlement Date | Value at June 30, 2016 | Unrealized Appreciation/ (Depreciation) | |||||||||||||||||||||||
Goldman Sachs | USD | 5,500,000 | EURO | 6,241,697 | September 1, 2016 | $ | (6,118,195 | ) | $ | 123,502 | ||||||||||||||||||
Goldman Sachs | USD | 4,700,000 | GBP | 6,950,877 | September 1, 2016 | (6,260,798 | ) | 690,079 | ||||||||||||||||||||
|
|
|
| |||||||||||||||||||||||||
TOTAL FORWARD FOREIGN CURRENCY CONTRACTS |
| $ | (12,378,993 | ) | $ | 813,581 | ||||||||||||||||||||||
|
|
|
| |||||||||||||||||||||||||
Notes to Financial Statements are an integral part of this Schedule.
23
Statements of Assets and Liabilities
June 30, 2016 (unaudited)
Driehaus Active Income Fund | Driehaus Select Credit Fund | Driehaus Event Driven Fund | ||||||||||
ASSETS: | ||||||||||||
Investment securities, at fair value (cost $2,330,752,897, $142,248,841 and $195,109,605, respectively) | $ | 2,256,274,136 | $ | 124,295,834 | $ | 201,252,183 | ||||||
Purchased options contracts, at fair value (premiums paid $10,532,450, $729,845 and $1,794,264, respectively) | 10,399,850 | 716,400 | 882,730 | |||||||||
Purchased swaptions contracts, at fair value (premiums paid $322,575, $37,150 and $0, respectively) | 4,990 | 574 | — | |||||||||
Foreign currency, at fair value (cost $1,217,226, $0 and $0, respectively) | 1,194,016 | — | — | |||||||||
Unrealized appreciation on forward foreign currency contracts | 1,048,857 | 602,436 | 813,581 | |||||||||
Unrealized appreciation on open swap contracts | 7,288,210 | 480,560 | 436,927 | |||||||||
Premiums paid on open swap contracts | 25,853,544 | 1,551,199 | — | |||||||||
Unsettled gain on swap transactions | — | — | 7,207 | |||||||||
Cash | 64,613,363 | 15,932,916 | 9,557,721 | |||||||||
Collateral held at custodian for the benefit of brokers | 307,373,465 | 25,421,410 | 27,962,204 | |||||||||
Receivable for investment securities sold | 112,407,363 | 6,739,273 | 1,052,224 | |||||||||
Receivable for fund shares sold | 751,417 | 60,745 | 449,961 | |||||||||
Receivable for interest and dividends | 20,049,844 | 1,821,874 | 429,740 | |||||||||
Prepaid expenses | 50,978 | 17,914 | 25,323 | |||||||||
|
|
|
|
|
| |||||||
| ||||||||||||
TOTAL ASSETS | 2,807,310,033 | 177,641,135 | 242,869,801 | |||||||||
|
|
|
|
|
| |||||||
| ||||||||||||
LIABILITIES: | ||||||||||||
Payable for investment securities sold short, at fair value (proceeds $258,097,282, $26,004,146 and $23,843,837, respectively) | 260,196,737 | 24,687,753 | 24,776,443 | |||||||||
Written options outstanding, at fair value (premiums received $3,662,271, $257,755 and $0, respectively) | 2,898,500 | 204,000 | — | |||||||||
Unrealized depreciation on open swap contracts | 18,763,542 | 649,266 | — | |||||||||
Unrealized depreciation on forward foreign currency contracts | 537,733 | 686,338 | — | |||||||||
Premiums received on open swap contracts | 11,114,351 | 43,913 | — | |||||||||
Payable for investment securities purchased | 70,256,190 | 10,667,383 | 6,178,779 | |||||||||
Payable for fund shares redeemed | 8,359,564 | 307,133 | 428,026 | |||||||||
Payable to affiliate | 1,138,183 | 100,291 | 178,529 | |||||||||
Payable for interest and dividends on securities sold short | 1,701,350 | 126,463 | — | |||||||||
Payable for variation margin | 59,457 | 64,750 | — | |||||||||
Accrued shareholder services plan fees | 416,216 | 28,407 | 37,157 | |||||||||
Accrued administration and accounting fees | 76,087 | 7,434 | 12,229 | |||||||||
Accrued expenses | 298,123 | 169,140 | 75,159 | |||||||||
|
|
|
|
|
| |||||||
| ||||||||||||
TOTAL LIABILITIES | 375,816,033 | 37,742,271 | 31,686,322 | |||||||||
|
|
|
|
|
| |||||||
| ||||||||||||
NET ASSETS | $ | 2,431,494,000 | $ | 139,898,864 | $ | 211,183,479 | ||||||
|
|
|
|
|
| |||||||
SHARES OUTSTANDING (Unlimited shares authorized, no par value) | 247,646,527 | 18,053,318 | 21,602,100 | |||||||||
|
|
|
|
|
| |||||||
NET ASSET VALUE, OFFERING AND REDEMPTION PRICE PER SHARE | $ | 9.82 | $ | 7.75 | $ | 9.78 | ||||||
|
|
|
|
|
| |||||||
| ||||||||||||
NET ASSETS CONSISTED OF THE FOLLOWING AT JUNE 30, 2016: | ||||||||||||
Paid-in-capital | $ | 2,894,194,544 | $ | 322,077,967 | $ | 239,453,963 | ||||||
Undistributed net investment income (loss) | 20,523,916 | 1,261,469 | 1,404,609 | |||||||||
Undistributed net realized gain (loss) on investments, options, swaptions, securities sold short, futures contracts, swap contracts, forward foreign currency contracts and foreign currency | (393,124,721 | ) | (166,207,514 | ) | (35,224,039 | ) | ||||||
Net unrealized appreciation (depreciation) on: | ||||||||||||
Investments | (74,478,761 | ) | (17,953,007 | ) | 6,142,578 | |||||||
Purchased options contracts | (132,600 | ) | (13,445 | ) | (911,534 | ) | ||||||
Purchased swaptions contracts | (317,585 | ) | (36,576 | ) | — | |||||||
Securities sold short | (2,099,455 | ) | 1,316,393 | (932,606 | ) | |||||||
Written options contracts | 763,771 | 53,755 | — | |||||||||
Futures contracts | (2,827,741 | ) | (347,570 | ) | — | |||||||
Swap contracts | (11,475,332 | ) | (168,706 | ) | 436,927 | |||||||
Forward foreign currency contracts | 511,124 | (83,902 | ) | 813,581 | ||||||||
Foreign currency | (23,210 | ) | — | — | ||||||||
Foreign currency translations | (19,950 | ) | — | — | ||||||||
|
|
|
|
|
| |||||||
NET ASSETS | $ | 2,431,494,000 | $ | 139,898,864 | $ | 211,183,479 | ||||||
|
|
|
|
|
| |||||||
| ||||||||||||
Notes to Financial Statements are an integral part of these Statements.
24
For the six months ended June 30, 2016 (unaudited)
| Driehaus Active Income Fund | Driehaus Select Credit Fund | Driehaus Event Driven Fund | ||||||||||
INVESTMENT INCOME (LOSS): | ||||||||||||
Interest income (net of $0, $0 and $0 of non-reclaimable foreign taxes withheld, respectively) | $ | 45,659,827 | $ | 5,160,525 | $ | 354,764 | ||||||
Dividend income (net of $161,252, $24,678 and $53,471 of non-reclaimable foreign taxes withheld, respectively) | 23,696,848 | 2,040,783 | 3,140,558 | |||||||||
|
|
|
|
|
| |||||||
| ||||||||||||
Total investment income | 69,356,675 | 7,201,308 | 3,495,322 | |||||||||
|
|
|
|
|
| |||||||
| ||||||||||||
Expenses: | ||||||||||||
Investment advisory fees | 7,338,188 | 826,771 | 1,084,467 | |||||||||
Shareholder services plan fees | 2,046,982 | 154,525 | 217,990 | |||||||||
Administration and fund accounting fees | 482,734 | 72,342 | 75,913 | |||||||||
Transfer agent fees and expenses | 282,966 | 77,847 | 39,356 | |||||||||
Reports to shareholders | 114,342 | 39,240 | 34,944 | |||||||||
Trustees’ fees | 89,477 | 27,451 | 22,057 | |||||||||
Legal fees | 58,394 | 25,783 | 17,798 | |||||||||
Custody fees | 45,913 | 9,720 | 4,878 | |||||||||
Federal and state registration fees | 38,842 | 16,881 | 17,679 | |||||||||
Audit and tax fees | 32,175 | 32,224 | 32,685 | |||||||||
Chief compliance officer fees | 8,250 | 8,250 | 8,250 | |||||||||
Interest on short positions | 4,593,838 | 440,339 | 45,819 | |||||||||
Interest expense | 1,784,211 | 116,685 | 312,553 | |||||||||
Dividends on short positions | 1,042,925 | 104,879 | 189,240 | |||||||||
Miscellaneous | 120,126 | 49,718 | 22,430 | |||||||||
|
|
|
|
|
| |||||||
Total expenses | 18,079,363 | 2,002,655 | 2,126,059 | |||||||||
Fees paid indirectly | (17,000 | ) | (60 | ) | (28,400 | ) | ||||||
|
|
|
|
|
| |||||||
Net expenses | 18,062,363 | 2,002,595 | 2,097,659 | |||||||||
|
|
|
|
|
| |||||||
| ||||||||||||
Net investment income (loss) | 51,294,312 | 5,198,713 | 1,397,663 | |||||||||
|
|
|
|
|
| |||||||
| ||||||||||||
| NET REALIZED AND UNREALIZED GAIN (LOSS) ON INVESTMENTS: | ||||||||||||
Net realized gain (loss) on transactions from: | ||||||||||||
Investments | (72,339,655 | ) | (42,909,245 | ) | (3,592,479 | ) | ||||||
Purchased options contracts | (43,154,491 | ) | (7,282,494 | ) | (7,026,837 | ) | ||||||
Purchased swaptions contracts | (3,307,045 | ) | (289,075 | ) | — | |||||||
Securities sold short | 470,081 | 3,145,169 | (3,005,630 | ) | ||||||||
Written options contracts | 34,367,333 | 4,628,144 | 109,463 | |||||||||
Futures contracts | (6,876,048 | ) | (755,571 | ) | — | |||||||
Swap contracts | (3,693,813 | ) | (471,786 | ) | 2,531,943 | |||||||
Forward foreign currency contracts | 1,287,848 | 284,905 | — | |||||||||
Foreign currency | (335,408 | ) | (90,311 | ) | (106,285 | ) | ||||||
|
|
|
|
|
| |||||||
| ||||||||||||
Total net realized gain (loss) on investments | (93,581,198 | ) | (43,740,264 | ) | (11,089,825 | ) | ||||||
|
|
|
|
|
| |||||||
| ||||||||||||
Change in net unrealized appreciation (depreciation) on: | ||||||||||||
Investments | 106,473,747 | 33,912,624 | 3,728,762 | |||||||||
Purchased options contracts | 13,001,446 | 4,016,168 | 3,844,020 | |||||||||
Purchased swaptions contracts | (891,673 | ) | (109,506 | ) | — | |||||||
Securities sold short | (36,950,384 | ) | (4,961,877 | ) | (1,337,107 | ) | ||||||
Written options contracts | (10,602,675 | ) | (1,620,930 | ) | 28,975 | |||||||
Futures contracts | (4,224,985 | ) | (499,257 | ) | — | |||||||
Swap contracts | (3,036,343 | ) | (203,061 | ) | 477,463 | |||||||
Forward foreign currency contracts | (44,559 | ) | (227,208 | ) | 799,165 | |||||||
Foreign currency | (22,814 | ) | 328 | — | ||||||||
Foreign currency translations | 8,832 | 4,237 | (1,548 | ) | ||||||||
|
|
|
|
|
| |||||||
Total change in net unrealized appreciation (depreciation) on investments | 63,710,592 | 30,311,518 | 7,539,730 | |||||||||
|
|
|
|
|
| |||||||
| ||||||||||||
Net realized and unrealized gain (loss) on investments | (29,870,606 | ) | (13,428,746 | ) | (3,550,095 | ) | ||||||
|
|
|
|
|
| |||||||
| ||||||||||||
NET INCREASE (DECREASE) IN NET ASSETS RESULTING FROM OPERATIONS | $ | 21,423,706 | $ | (8,230,033 | ) | $ | (2,152,432 | ) | ||||
|
|
|
|
|
| |||||||
| ||||||||||||
Notes to Financial Statements are an integral part of these Statements.
25
Statements of Changes in Net Assets
| Driehaus Active Income Fund | Driehaus Select Criedit Fund | |||||||||||||||
| Six Months Ended June 30, 2016 (unaudited) | Year Ended December 31, 2015 | Six Months Ended June 30, 2016 (unaudited) | Year Ended December 31, 2015 | |||||||||||||
Operations: | ||||||||||||||||
Net investment income (loss) | $ | 51,294,312 | $ | 129,591,225 | $ | 5,198,713 | $ | 29,700,447 | ||||||||
Net realized gain (loss) on investments | (93,581,198 | ) | (49,928,535 | ) | (43,740,264 | ) | (76,774,706 | ) | ||||||||
Net change in unrealized appreciation (depreciation) on investments | 63,710,592 | (104,632,015 | ) | 30,311,518 | 16,286,670 | |||||||||||
|
|
|
|
|
|
|
| |||||||||
| ||||||||||||||||
Net increase (decrease) in net assets resulting from operations | 21,423,706 | (24,969,325 | ) | (8,230,033 | ) | (30,787,589 | ) | |||||||||
|
|
|
|
|
|
|
| |||||||||
| ||||||||||||||||
Distributions: | ||||||||||||||||
Net investment income | (58,453,132 | ) | (121,665,387 | ) | (5,192,166 | ) | (28,789,661 | ) | ||||||||
Net capital gains | — | — | — | — | ||||||||||||
|
|
|
|
|
|
|
| |||||||||
Total distributions | (58,453,132 | ) | (121,665,387 | ) | (5,192,166 | ) | (28,789,661 | ) | ||||||||
|
|
|
|
|
|
|
| |||||||||
| ||||||||||||||||
Capital share transactions: | ||||||||||||||||
Proceeds from shares sold | 378,333,239 | 969,148,795 | 19,933,310 | 211,986,482 | ||||||||||||
Reinvested distributions | 32,561,538 | 62,836,403 | 3,646,392 | 19,994,716 | ||||||||||||
Cost of shares redeemed | (818,364,261 | ) | (1,992,144,093 | ) | (171,182,505 | ) | (671,187,778 | ) | ||||||||
|
|
|
|
|
|
|
| |||||||||
Net increase (decrease) from capital transactions | (407,469,484 | ) | (960,158,895 | ) | (147,602,803 | ) | (439,206,580 | ) | ||||||||
|
|
|
|
|
|
|
| |||||||||
Total increase (decrease) in net assets | (444,498,910 | ) | (1,106,793,607 | ) | (161,025,002 | ) | (498,783,830 | ) | ||||||||
|
|
|
|
|
|
|
| |||||||||
| ||||||||||||||||
NET ASSETS: | ||||||||||||||||
Beginning of period | $ | 2,875,992,910 | $ | 3,982,786,517 | $ | 300,923,866 | $ | 799,707,696 | ||||||||
|
|
|
|
|
|
|
| |||||||||
End of period | $ | 2,431,494,000 | $ | 2,875,992,910 | $ | 139,898,864 | $ | 300,923,866 | ||||||||
|
|
|
|
|
|
|
| |||||||||
Undistributed net investment income (loss) | $ | 20,523,916 | $ | 27,682,736 | $ | 1,261,469 | $ | 1,254,922 | ||||||||
|
|
|
|
|
|
|
| |||||||||
| ||||||||||||||||
Capital share transactions in shares: | ||||||||||||||||
Shares sold | 38,546,919 | 94,017,920 | 2,554,623 | 23,649,209 | ||||||||||||
Reinvested distributions | 3,309,019 | 6,120,243 | 468,836 | 2,231,124 | ||||||||||||
Shares redeemed | (83,202,117 | ) | (193,457,904 | ) | (22,023,644 | ) | (76,243,162 | ) | ||||||||
|
|
|
|
|
|
|
| |||||||||
Net increase (decrease) | (41,346,179 | ) | (93,319,741 | ) | (19,000,185 | ) | (50,362,829 | ) | ||||||||
|
|
|
|
|
|
|
| |||||||||
| ||||||||||||||||
Notes to Financial Statements are an integral part of these Statements.
26
Statements of Changes in Net Assets
| Driehaus Event Driven Fund | ||||||
| Six Months Ended June 30, 2016 (unaudited) | Year Ended December 31, 2015 | |||||
| $ | 1,397,663 | $ | 1,016,295 | |||
| | (11,089,825 | ) | (17,815,529 | ) | ||
| | 7,539,730 | | 11,626,814 | |||
|
|
|
| |||
| | (2,152,432 | ) | (5,172,420 | ) | ||
|
|
|
| |||
| — | (1,333,974 | ) | ||||
| — | — | |||||
|
|
|
| |||
| — | (1,333,974 | ) | ||||
|
|
|
| |||
| 39,925,532 | 158,435,485 | |||||
| — | 1,116,574 | |||||
| (59,045,494 | ) | (86,889,627 | ) | |||
|
|
|
| |||
| | (19,119,962 | ) | 72,662,432 | |||
|
|
|
| |||
| | (21,272,394) | | 66,156,038 | |||
|
|
|
| |||
| $ | 232,455,873 | $ | 166,299,835 | |||
|
|
|
| |||
| $ | 211,183,479 | $ | 232,455,873 | |||
|
|
|
| |||
| $ | 1,404,609 | | $ | 6,946 | ||
|
|
|
| |||
|
| |||||
| 4,260,582 | 15,452,822 | |||||
| — | 107,673 | |||||
| (6,251,406 | ) | (8,576,682 | ) | |||
|
|
|
| |||
| (1,990,824 | ) | 6,983,813 | ||||
|
|
|
| |||
|
| |||||
Notes to Financial Statements are an integral part of these Statements.
27
Driehaus Active Income Fund
For the six June 30, 2016 (unaudited) | For the year December 31, | For the year December 31, | For the year December 31, | For the year December 31, | For the year December 31, | |||||||||||||||||||
Net asset value, beginning of period | $ | 9.95 | $ | 10.42 | $ | 10.77 | $ | 10.67 | $ | 10.01 | $ | 11.05 | ||||||||||||
|
|
|
|
|
|
|
|
|
|
|
| |||||||||||||
INCOME FROM INVESTMENT OPERATIONS: | ||||||||||||||||||||||||
Net investment income1 | 0.19 | 0.38 | 0.27 | 0.30 | 0.44 | 0.48 | ||||||||||||||||||
Net realized and unrealized gain (loss) on investments | (0.10 | ) | (0.49 | ) | (0.36 | ) | 0.02 | 0.49 | (1.09 | ) | ||||||||||||||
|
|
|
|
|
|
|
|
|
|
|
| |||||||||||||
Total from investment operations | 0.09 | (0.11 | ) | (0.09 | ) | 0.32 | 0.93 | (0.61 | ) | |||||||||||||||
|
|
|
|
|
|
|
|
|
|
|
| |||||||||||||
LESS DISTRIBUTIONS TO SHAREHOLDERS FROM: | ||||||||||||||||||||||||
Net investment income | (0.22 | ) | (0.36 | ) | (0.26 | ) | (0.22 | ) | (0.27 | ) | (0.43 | ) | ||||||||||||
Net realized gain | — | — | — | — | — | — | † | |||||||||||||||||
|
|
|
|
|
|
|
|
|
|
|
| |||||||||||||
Total distributions | (0.22 | ) | (0.36 | ) | (0.26 | ) | (0.22 | ) | (0.27 | ) | (0.43 | ) | ||||||||||||
|
|
|
|
|
|
|
|
|
|
|
| |||||||||||||
Net asset value, end of period | $ | 9.82 | $ | 9.95 | $ | 10.42 | $ | 10.77 | $ | 10.67 | $ | 10.01 | ||||||||||||
|
|
|
|
|
|
|
|
|
|
|
| |||||||||||||
Total Return | 0.95 | %4 | (1.07 | )% | (0.87 | )% | 2.99 | % | 9.34 | % | (5.61 | )% | ||||||||||||
SUPPLEMENTAL DATA AND RATIOS: | ||||||||||||||||||||||||
Net assets, end of period (in 000’s) | $ | 2,431,494 | $ | 2,875,993 | $ | 3,982,787 | $ | 4,607,803 | $ | 2,867,021 | $ | 2,429,734 | ||||||||||||
Ratio of total expenses before reimbursements, waivers, recaptures and/or fees paid indirectly to average net assets | 1.36 | %3 | 1.05 | % | 1.05 | % | 1.14 | % | 1.31 | % | 1.01 | % | ||||||||||||
Ratio of total expenses net of reimbursements, waivers, recaptures and/or fees paid indirectly to average net assets | 1.35 | %2,3 | 1.05 | % | 1.05 | % | 1.14 | % | 1.31 | % | 1.01 | % | ||||||||||||
Ratio of expenses (excluding dividends and interest on short positions and interest expense) before reimbursements, waivers, recaptures and/or fees paid indirectly to average net assets | 0.80 | %3 | 0.78 | % | 0.77 | % | 0.79 | % | 0.91 | % | 0.88 | % | ||||||||||||
Ratio of expenses (excluding dividends and interest on short positions and interest expense) net of reimbursements, waivers, recaptures and/or fees paid indirectly to average net assets | 0.80 | %2,3 | 0.78 | % | 0.77 | % | 0.79 | % | 0.91 | % | 0.88 | % | ||||||||||||
Ratio of net investment income (including dividends and interest on short positions and interest expense) net of reimbursements, waivers, recaptures and/or fees paid indirectly to average net assets | 3.85 | %3 | 3.69 | % | 2.51 | % | 2.80 | % | 4.22 | % | 4.44 | % | ||||||||||||
Ratio of net investment income (excluding dividends and interest on short positions and interest expense) net of reimbursements, waivers, recaptures and/or fees paid indirectly to average net assets | 4.40 | %3 | 3.96 | % | 2.79 | % | 3.15 | % | 4.63 | % | 4.58 | % | ||||||||||||
Portfolio turnover rate | 68 | %4 | 76 | % | 43 | % | 48 | % | 42 | % | 55 | % | ||||||||||||
| ||||||||||||||||||||||||
| † | Represents less than $0.01 per share. |
| 1 | Calculated based on average shares outstanding. |
| 2 | Such ratios are net of fees paid indirectly (see Note C in the Notes to Financial Statements). |
| 3 | Annualized. |
| 4 | Not Annualized. |
Notes to Financial Statements are an integral part of this Schedule.
28
Driehaus Select Credit Fund
Financial Highlights
For the six January 1, 2016 (unaudited) | For the year December 31, | For the year December 31, | For the year December 31, | For the year December 31, | For the year December 31, | |||||||||||||||||||
Net asset value, beginning of period | $ | 8.12 | $ | 9.15 | $ | 10.17 | $ | 9.87 | $ | 9.57 | $ | 10.26 | ||||||||||||
|
|
|
|
|
|
|
|
|
|
|
| |||||||||||||
INCOME FROM INVESTMENT OPERATIONS: | ||||||||||||||||||||||||
Net investment income1 | 0.20 | 0.42 | 0.32 | 0.32 | 0.58 | 0.57 | ||||||||||||||||||
Net realized and unrealized gain (loss) on investments | (0.80 | ) | (1.04 | ) | (0.98 | ) | 0.33 | 0.21 | (0.84 | ) | ||||||||||||||
|
|
|
|
|
|
|
|
|
|
|
| |||||||||||||
Total from investment operations | (0.60 | ) | (0.62 | ) | (0.66 | ) | 0.65 | 0.79 | (0.27 | ) | ||||||||||||||
|
|
|
|
|
|
|
|
|
|
|
| |||||||||||||
LESS DISTRIBUTIONS TO SHAREHOLDERS FROM: | ||||||||||||||||||||||||
Net investment income | 0.23 | (0.41 | ) | (0.32 | ) | (0.31 | ) | (0.49 | ) | (0.42 | ) | |||||||||||||
Net realized gain | — | — | (0.04 | ) | (0.04 | ) | — | — | ||||||||||||||||
|
|
|
|
|
|
|
|
|
|
|
| |||||||||||||
Total distributions | 0.23 | (0.41 | ) | (0.36 | ) | (0.35 | ) | (0.49 | ) | (0.42 | ) | |||||||||||||
|
|
|
|
|
|
|
|
|
|
|
| |||||||||||||
Net asset value, end of period | $ | 7.75 | $ | 8.12 | $ | 9.15 | $ | 10.17 | $ | 9.87 | $ | 9.57 | ||||||||||||
|
|
|
|
|
|
|
|
|
|
|
| |||||||||||||
Total Return | (1.67 | )%4 | (7.13 | )% | (6.56 | )% | 6.62 | % | 8.37 | % | (2.64 | )% | ||||||||||||
SUPPLEMENTAL DATA AND RATIOS: | ||||||||||||||||||||||||
Net assets, end of period (in 000’s) | $ | 139,899 | $ | 300,924 | $ | 799,708 | $ | 1,023,435 | $ | 325,123 | $ | 184,111 | ||||||||||||
Ratio of total expenses before reimbursements, waivers, recaptures and/or fees paid indirectly to average net assets | 1.94 | %3 | 1.40 | % | 1.32 | % | 1.81 | % | 1.69 | % | 1.81 | % | ||||||||||||
Ratio of total expenses net of reimbursements, waivers, recaptures and/or fees paid indirectly to average net assets | 1.94 | %2,3 | 1.40 | % | 1.32 | % | 1.81 | % | 1.69 | % | 1.87 | % | ||||||||||||
Ratio of expenses (excluding dividends and interest on short positions and interest expense) before reimbursements, waivers, recaptures and/or fees paid indirectly to average net assets | 1.30 | %3 | 1.16 | % | 1.12 | % | 1.13 | % | 1.23 | % | 1.37 | % | ||||||||||||
Ratio of expenses (excluding dividends and interest on short positions and interest expense) net of reimbursements, waivers, recaptures and/or fees paid indirectly to average net assets | 1.30 | %2,3 | 1.16 | % | 1.12 | % | 1.13 | % | 1.23 | % | 1.43 | % | ||||||||||||
Ratio of net investment income (including dividends and interest on short positions and interest expense) net of reimbursements, waivers, recaptures and/or fees paid indirectly to average net assets | 5.03 | %3 | 4.68 | % | 3.24 | % | 3.17 | % | 5.82 | % | 5.75 | % | ||||||||||||
Ratio of net investment income (excluding dividends and interest on short positions and interest expense) net of reimbursements, waivers, recaptures and/or fees paid indirectly to average net assets | 5.67 | %3 | 4.92 | % | 3.43 | % | 3.85 | % | 6.28 | % | 6.20 | % | ||||||||||||
Portfolio turnover rate | 58 | %4 | 77 | % | 79 | % | 54 | % | 78 | % | 64 | % | ||||||||||||
| ||||||||||||||||||||||||
| 1 | Calculated based on average shares outstanding. |
| 2 | Such ratios are net of fees paid indirectly (see Note C in the Notes to Financial Statements). |
| 3 | Annualized. |
| 4 | Not annualized. |
Notes to Financial Statements are an integral part of this Schedule.
29
Driehaus Event Driven Fund
Financial Highlights
For the six June 30, 2016 (unaudited) | For the year December 31, | For the year December 31, | For the period August 26, December 31, | |||||||||||||
Net asset value, beginning of period | $ | 9.85 | $ | 10.01 | $ | 10.74 | $ | 10.00 | ||||||||
|
|
|
|
|
|
|
| |||||||||
INCOME FROM INVESTMENT OPERATIONS: | ||||||||||||||||
Net investment income (loss)1 | 0.06 | 0.05 | (0.02 | ) | (0.06 | ) | ||||||||||
Net realized and unrealized gain (loss) on investments | (0.13 | ) | (0.15 | ) | (0.67 | ) | 1.09 | |||||||||
|
|
|
|
|
|
|
| |||||||||
Total from investment operations | (0.07 | ) | (0.10 | ) | (0.69 | ) | 1.03 | |||||||||
|
|
|
|
|
|
|
| |||||||||
LESS DISTRIBUTIONS TO SHAREHOLDERS FROM: | ||||||||||||||||
Net investment income | — | (0.06 | ) | — | — | |||||||||||
Net realized gain | — | — | (0.04 | ) | (0.29 | ) | ||||||||||
|
|
|
|
|
|
|
| |||||||||
Net asset value, end of period | $ | 9.78 | $ | 9.85 | $ | 10.01 | $ | 10.74 | ||||||||
|
|
|
|
|
|
|
| |||||||||
Total Return | (0.71 | )%3 | (1.08 | )% | (6.35 | )% | 10.35 | %3 | ||||||||
SUPPLEMENTAL DATA AND RATIOS: | ||||||||||||||||
Net assets, end of period (in 000’s) | $ | 211,183 | $ | 232,456 | $ | 166,300 | $ | 42,033 | ||||||||
Ratio of total expenses before reimbursements, waivers, recaptures and/or fees paid indirectly to average net assets | 1.96 | %4 | 1.86 | % | 1.80 | % | 3.03 | %4 | ||||||||
Ratio of total expenses net of reimbursements, waivers, recaptures and/or fees paid indirectly to average net assets | 1.93 | %2,4 | 1.86 | % | 1.80 | % | 3.00 | %4 | ||||||||
Ratio of expenses (excluding dividends and interest on short positions and interest expense) before reimbursements, waivers, recaptures and/or fees paid indirectly to average net assets | 1.46 | %4 | 1.43 | % | 1.35 | % | 2.03 | %4 | ||||||||
Ratio of expenses (excluding dividends and interest on short positions and interest expense) net of reimbursements, waivers, recaptures and/or fees paid indirectly to average net assets | 1.43 | %2,4 | 1.43 | % | 1.35 | % | 2.00 | %4 | ||||||||
Ratio of net investment income (including dividends and interest on short positions and interest expense) net of reimbursements, waivers, recaptures and/or fees paid indirectly to average net assets | 1.29 | %4 | 0.45 | % | (0.17 | ) % | (1.75 | )%4 | ||||||||
Ratio of net investment income (excluding dividends and interest on short positions and interest expense) net of reimbursements, waivers, recaptures and/or fees paid indirectly to average net assets | 1.79 | %4 | 0.89 | % | 0.28 | % | (0.75 | )%4 | ||||||||
Portfolio turnover rate | 131 | %3 | 400 | % | 315 | % | 104 | %3 | ||||||||
| ||||||||||||||||
| * | Fund commenced operations on August 26, 2013. |
| 1 | Calculated based on average shares outstanding. |
| 2 | Such ratios are net of fees paid indirectly (see Note C in the Notes to Financial Statements). |
| 3 | Not annualized. |
| 4 | Annualized. |
Notes to Financial Statements are an integral part of this Schedule.
30
Notes to Financial Statements (unaudited)
A. ORGANIZATION AND SUMMARY OF SIGNIFICANT ACCOUNTING POLICIES
Organization
The Driehaus Mutual Funds (the “Trust”) is an open-end registered management investment company under the Investment Company Act of 1940, as amended, organized as a Delaware statutory trust, with eight separate series currently in operation. The Trust was organized under an Agreement and Declaration of Trust dated May 31, 1996, as subsequently amended and restated as of June 6, 2013 and amended as of June 4, 2015, and may issue an unlimited number of full and fractional units of beneficial interest (shares) without par value. The Driehaus Active Income Fund (the “Active Income Fund”) commenced operations on June 1, 2009 following the receipt of the assets and liabilities of the Lotsoff Capital Management Active Income Fund (the “Acquired Fund”) pursuant to a plan of reorganization approved by the shareholders of the Acquired Fund. The reorganization was accomplished by a tax-free exchange of Acquired Fund shares for an equal number of shares of the Active Income Fund as of June 1, 2009. The Active Income Fund seeks to provide current income and capital appreciation. The Active Income Fund was closed to new investors as of March 1, 2011. The Driehaus Select Credit Fund (the “Select Credit Fund”) commenced operations on September 30, 2010. The Select Credit Fund seeks to provide positive returns under a variety of market conditions. The Select Credit Fund was closed to new investors as of January 31, 2014, and was opened to new investors as of June 7, 2016. The Driehaus Event Driven Fund (the “Event Driven Fund” and together with the Active Income Fund and Select Credit Fund, the “Funds”) commenced operations on August 26, 2013, following the receipt of the assets and liabilities of the Driehaus Credit Opportunities Fund, L.P. The Event Driven Fund seeks to provide positive returns over full market cycles.
Significant Accounting Policies
The presentation of financial statements in conformity with U.S. generally accepted accounting principles (“U.S. GAAP”) requires management to make estimates and assumptions that affect the reported amounts of assets and liabilities at the date of the financial statements and the reported amounts of income and expenses. Actual results may differ from those estimates.
The Funds, which are investment companies within the scope of Financial Accounting Standards Board (“FASB”) Accounting Standards Update 2013-08, follow accounting and reporting guidance under FASB Accounting Standards Codification Topic 946, Financial Services-Investment Companies.
Securities Valuation
Investments in securities traded on a national securities exchange, including exchange-traded futures and options, are valued at the last reported sales or settlement price on the day of valuation and are generally classified as level 1. Securities traded on the Nasdaq markets are valued at the Nasdaq Official Closing Price (“NOCP”) and are generally classified as level 1. Exchange-traded securities for which no sale was reported and Nasdaq-traded securities for which there is no NOCP are valued at the mean of the closing bid and ask prices from the exchange the security is primarily traded on and are generally classified as level 1. Long-term fixed income securities are valued at the representative quoted bid price when held long or the representative quoted ask price if sold short or, if such prices are not available, at prices for securities of comparable maturity, quality and type or as determined by an independent pricing service. The pricing service provider may employ methodologies that utilize actual market transactions, broker-dealer supplied valuations or other techniques. Such techniques generally consider factors such as composite security prices, yields, maturities, call features, credit ratings and developments relating to specific securities, in arriving at valuations. Fixed income securities are generally classified as level 2. Short-term investments with remaining maturities of 60 days or less at the time of purchase are stated at amortized cost, which approximates fair value. If amortized cost does not approximate fair value, short-term securities are reported at fair value. These securities are generally classified as level 2. Swaps, forward foreign currency contracts and other financial derivatives are valued daily, primarily by an independent pricing service using pricing models and are generally classified as level 2. The pricing models use inputs that are observed from actively quoted markets such as issuer details, indices, spreads, interest rates, yield curves, dividends and exchange rates. If valuations are not available from the independent pricing service or values received are deemed not representative of
31
Driehaus Mutual Funds
Notes to Financial Statements (unaudited) — (Continued)
market value, values will be obtained from a third party broker-dealer or counterparty. Investments initially valued in currencies other than the U.S. dollar are converted to the U.S. dollar using exchange rates obtained from an independent pricing service. Securities for which market quotations are not readily available are valued at their fair value as determined in good faith in accordance with procedures established by or under the direction of the Trust’s Board of Trustees and are generally classified as level 3. Under these procedures, the Funds primarily employ a market-based approach, which may use related or comparable assets or liabilities, recent transactions, market multiples, book values and other relevant information for the investment to determine the fair value of the investment. It is possible that the estimated values may differ significantly from the values that would have been used had a ready market existed for the investments, and such differences could be material.
Each Fund is subject to fair value accounting standards that define fair value, establish the framework for measuring fair value and provide a three-level hierarchy for fair valuation based upon the inputs to the valuation as of the measurement date. The three levels of the fair value hierarchy are as follows:
Level 1 — quoted prices for active markets for identical securities
Level 2 — significant observable inputs (including quoted prices for similar securities, interest rates, prepayment speeds, credit risk, etc.)
Level 3 — significant unobservable inputs (including the Fund’s own assumptions in determining the fair value of investments).
The Funds adopted the FASB amendments to authoritative guidance which require the Funds to disclose details of transfers in and out of Level 1 and Level 2 measurements and Level 2 and Level 3 measurements and the reasons for the transfers. During the period ended June 30, 2016, there were no transfers between levels for the Active Income Fund, Select Credit Fund and Event Driven Fund. It is the Funds’ policy to recognize transfers into and out of all levels at the end of the reporting period.
The inputs or methodology used for valuing securities are not necessarily an indication of the risk associated with investing in those securities. The following is a summary of the inputs used to value the Active Income Fund’s investments as of June 30, 2016:
Assets | Level 1 | Level 2 | Level 3 | Total | ||||||||||||
Asset-Backed Securities | $ | — | $ | 232,099 | $ | — | $ | 232,099 | ||||||||
Bank Loans | — | 555,570,990 | — | 555,570,990 | ||||||||||||
Common Stocks | ||||||||||||||||
Auto Manufacturers | 16,567,075 | — | — | 16,567,075 | ||||||||||||
Beverages | 5,817,359 | — | — | 5,817,359 | ||||||||||||
Commercial Services | 46,380,116 | — | — | 46,380,116 | ||||||||||||
Distribution/Wholesale | 60,900,754 | — | — | 60,900,754 | ||||||||||||
Electric | 36,226,343 | — | — | 36,226,343 | ||||||||||||
Entertainment | 245,679,453 | — | — | 245,679,453 | ||||||||||||
Gas | 23,865,957 | — | — | 23,865,957 | ||||||||||||
Healthcare — Services | 31,593,417 | — | — | 31,593,417 | ||||||||||||
Insurance | 47,868,300 | — | — | 47,868,300 | ||||||||||||
Internet | 10,048,797 | — | — | 10,048,797 | ||||||||||||
Media | 82 | — | — | 82 | ||||||||||||
Restaurants | 6,606,917 | — | — | 6,606,917 | ||||||||||||
Retail | 67,905,862 | — | — | 67,905,862 | ||||||||||||
Semiconductors | 38,408,821 | — | — | 38,408,821 | ||||||||||||
Convertible Corporate Bonds | — | 80,709,941 | — | 80,709,941 | ||||||||||||
32
Driehaus Mutual Funds
Notes to Financial Statements (unaudited) — (Continued)
Assets | Level 1 | Level 2 | Level 3 | Total | ||||||||||||
Convertible Preferred Stocks | ||||||||||||||||
Auto Manufacturers | $ | 10,623,600 | $ | — | $ | 0 | $ | 10,623,600 | ||||||||
Environmental Control | 31,192,500 | — | — | 31,192,500 | ||||||||||||
Investment Companies | 18,913,475 | — | — | 18,913,475 | ||||||||||||
Pharmaceuticals | 24,810,000 | — | — | 24,810,000 | ||||||||||||
Corporate Bonds | — | 817,758,874 | 0 | 817,758,874 | ||||||||||||
Preferred Stocks | ||||||||||||||||
Banks | 35,455,643 | — | — | 35,455,643 | ||||||||||||
Telecommunications | — | 35,770,616 | — | 35,770,616 | ||||||||||||
Purchased Put Options | 10,399,850 | — | — | 10,399,850 | ||||||||||||
U.S. Government and Agency Securities | — | 7,367,145 | — | 7,367,145 | ||||||||||||
|
|
|
|
|
|
|
| |||||||||
Total | $ | 769,264,321 | $ | 1,497,409,665 | $ | 0 | $ | 2,266,673,986 | ||||||||
|
|
|
|
|
|
|
| |||||||||
Liabilities | ||||||||||||||||
Common Stocks Sold Short | ||||||||||||||||
Auto Manufacturers | $ | (7,650,000 | ) | $ | — | $ | — | $ | (7,650,000 | ) | ||||||
Building Materials | (3,874,760 | ) | — | — | (3,874,760 | ) | ||||||||||
Environmental Control | (23,531,120 | ) | — | — | (23,531,120 | ) | ||||||||||
Healthcare — Services | (9,990,894 | ) | — | — | (9,990,894 | ) | ||||||||||
Internet | (15,349,290 | ) | — | — | (15,349,290 | ) | ||||||||||
Media | (71,224 | ) | — | — | (71,224 | ) | ||||||||||
Pharmaceuticals | (13,496,701 | ) | — | — | (13,496,701 | ) | ||||||||||
Retail | (1,623,740 | ) | — | — | (1,623,740 | ) | ||||||||||
Semiconductors | (15,837,120 | ) | — | — | (15,837,120 | ) | ||||||||||
Software | (2,953,937 | ) | — | — | (2,953,937 | ) | ||||||||||
Telecommunications | (7,250,625 | ) | — | — | (7,250,625 | ) | ||||||||||
Corporate Bonds Sold Short | — | (127,170,670 | ) | — | (127,170,670 | ) | ||||||||||
U.S. Government and Agency Securities Sold Short | — | (31,396,656 | ) | — | (31,396,656 | ) | ||||||||||
Written Put Options | (2,898,500 | ) | — | — | (2,898,500 | ) | ||||||||||
|
|
|
|
|
|
|
| |||||||||
Total | $ | (104,527,911 | ) | $ | (158,567,326 | ) | $ | — | $ | (263,095,237 | ) | |||||
|
|
|
|
|
|
|
| |||||||||
Other Financial Instruments* | ||||||||||||||||
Credit Default Swaps — Assets | $ | — | $ | 33,141,754 | $ | — | $ | 33,141,754 | ||||||||
Credit Default Swaps — Liabilities | — | (29,058,840 | ) | — | (29,058,840 | ) | ||||||||||
Forward Foreign Currency Contracts — Assets | — | 1,048,857 | — | 1,048,857 | ||||||||||||
Forward Foreign Currency Contracts — Liabilities | — | (537,733 | ) | — | (537,733 | ) | ||||||||||
Futures Contracts | (2,827,741 | ) | — | — | (2,827,741 | ) | ||||||||||
Interest Rate Swaptions | — | 4,990 | — | 4,990 | ||||||||||||
Total Return Swap — Liabilities | — | (819,053 | ) | — | (819,053 | ) | ||||||||||
|
|
|
|
|
|
|
| |||||||||
Total Other Financial Instruments | $ | (2,827,741 | ) | $ | 3,779,975 | $ | — | $ | 952,234 | |||||||
|
|
|
|
|
|
|
| |||||||||
| * | Other financial instruments are swap, forward foreign currency and futures contracts and interest rate swaptions, which are detailed in the Schedule of Investments. |
33
Driehaus Mutual Funds
Notes to Financial Statements (unaudited) — (Continued)
The following is a reconciliation of Level 3 assets for which significant unobservable inputs were used to determine fair value in the Active Income Fund:
| Investments, at Value | ||||
Balance as of December 31, 2015 | $ | 0 | ||
Realized gain (loss) | — | |||
Change in net unrealized appreciation (depreciation) | — | |||
Purchase | — | |||
Sales | — | |||
Transfers in and/or out of Level 3 | — | |||
|
| |||
Balance as of June 30, 2016 | $ | 0 | ||
|
| |||
As of June 30, 2016, the Active Income Fund held Level 3 investments in General Motors Corp. senior convertible preferred stock, valued at fair value as determined in good faith in accordance with procedures established by or under the direction of the Trust’s Board of Trustees. As a part of the ongoing restructuring of General Motors, any value previously ascribed to these holdings has been transferred to the General Motors Co. Motors Liquidation Co. GUC Trust common stock, which is freely and actively traded, and therefore the senior convertible preferred stock was fair valued at $0.
As of June 30, 2016, the Active Income Fund held Level 3 investments in Momentive Performance Materials, Inc. corporate bonds, valued at fair value as determined in good faith in accordance with procedures established by or under the direction of the Trust’s Board of Trustees. Momentive filed for Chapter 11 bankruptcy and emerged in 2014. As a part of the ongoing restructuring of the company, the bankruptcy court assigned a zero recovery to these holdings, therefore the corporate bond was fair valued at $0.
The following is a summary of the inputs used to value the Select Credit Fund’s investments as of June 30, 2016:
Assets | Level 1 | Level 2 | Level 3 | Total | ||||||||||||
Bank Loans | $ | — | $ | 29,142,407 | $ | — | $ | 29,142,407 | ||||||||
Common Stocks | ||||||||||||||||
Auto Manufacturers | 1,510,679 | — | — | 1,510,679 | ||||||||||||
Distribution/Wholesale | 821,434 | — | — | 821,434 | ||||||||||||
Entertainment | 12,645,234 | — | — | 12,645,234 | ||||||||||||
Gas | 989,550 | — | — | 989,550 | ||||||||||||
Healthcare — Services | 2,518,320 | — | — | 2,518,320 | ||||||||||||
Internet | 717,825 | — | — | 717,825 | ||||||||||||
Media | 920,157 | — | — | 920,157 | ||||||||||||
Retail | 4,411,774 | — | — | 4,411,774 | ||||||||||||
Semiconductors | 3,855,528 | — | — | 3,855,528 | ||||||||||||
Convertible Corporate Bonds | — | 10,200 | — | 10,200 | ||||||||||||
Convertible Preferred Stocks | ||||||||||||||||
Auto Manufacturers | — | — | 0 | 0 | ||||||||||||
Pharmaceuticals | — | 3,721,500 | — | 3,721,500 | ||||||||||||
Corporate Bonds | — | 59,283,505 | 0 | 59,283,505 | ||||||||||||
Purchased Put Options | 716,400 | — | — | 716,400 | ||||||||||||
U.S. Government and Agency Securities | — | 3,747,721 | — | 3,747,721 | ||||||||||||
|
|
|
|
|
|
|
| |||||||||
Total | $ | 29,106,901 | $ | 95,905,333 | $ | 0 | $ | 125,012,234 | ||||||||
|
|
|
|
|
|
|
| |||||||||
34
Driehaus Mutual Funds
Notes to Financial Statements (unaudited) — (Continued)
Liabilities | Level 1 | Level 2 | Level 3 | Total | ||||||||||||
Common Stocks Sold Short | ||||||||||||||||
Banks | $ | (1,837,737 | ) | $ | — | $ | — | $ | (1,837,737 | ) | ||||||
Healthcare — Services | (1,431,852 | ) | — | — | (1,431,852 | ) | ||||||||||
Media | (19,052 | ) | — | — | (19,052 | ) | ||||||||||
Pharmaceuticals | (2,018,141 | ) | — | — | (2,018,141 | ) | ||||||||||
Retail | (711,650 | ) | — | — | (711,650 | ) | ||||||||||
Semiconductors | (1,681,200 | ) | — | — | (1,681,200 | ) | ||||||||||
Telecommunications | (2,569,000 | ) | — | — | (2,569,000 | ) | ||||||||||
Corporate Bonds Sold Short | — | (12,003,136 | ) | — | (12,003,136 | ) | ||||||||||
U.S. Government and Agency Securities Sold Short | — | (2,415,985 | ) | — | (2,415,985 | ) | ||||||||||
Written Put Options | (204,000 | ) | — | — | (204,000 | ) | ||||||||||
|
|
|
|
|
|
|
| |||||||||
Total | $ | (10,472,632 | ) | $ | (14,419,121 | ) | $ | — | $ | (24,891,753 | ) | |||||
|
|
|
|
|
|
|
| |||||||||
Other Financial Instruments* | ||||||||||||||||
Credit Default Swaps — Assets | $ | — | $ | 2,031,759 | $ | — | $ | 2,031,759 | ||||||||
Credit Default Swaps — Liabilities | — | (643,938 | ) | — | (643,938 | ) | ||||||||||
Forward Foreign Currency Contracts — Asset | — | 602,436 | — | 602,436 | ||||||||||||
Forward Foreign Currency Contracts — Liability | — | (686,338 | ) | — | (686,338 | ) | ||||||||||
Futures Contracts | (347,570 | ) | — | — | (347,570 | ) | ||||||||||
Interest Rate Swaptions | — | 574 | — | 574 | ||||||||||||
Total Return Swap — Liabilities | — | (49,241 | ) | — | (49,241 | ) | ||||||||||
|
|
|
|
|
|
|
| |||||||||
Total Other Financial Instruments | $ | (347,570 | ) | $ | 1,255,252 | $ | — | $ | 907,682 | |||||||
|
|
|
|
|
|
|
| |||||||||
| * | Other financial instruments are swap, forward foreign currency, futures contracts and interest rate swaptions, which are detailed in the Schedule of Investments. |
The following is a reconciliation of Level 3 assets for which significant unobservable inputs were used to determine fair value in the Select Credit Fund:
| Investments, at Value | ||||
Balance as of December 31, 2015 | $ | 0 | ||
Realized gain (loss) | — | |||
Change in net unrealized appreciation (depreciation) | — | |||
Purchase | — | |||
Sales | — | |||
Transfers in and/or out of Level 3 | — | |||
|
| |||
Balance as of June 30, 2016 | $ | 0 | ||
|
| |||
As of June 30, 2016, the Select Credit Fund held Level 3 investments in General Motors Corp. senior convertible preferred stock and Momentive Performance Materials, Inc. corporate bonds, which were valued in the same manner as described above for the Active Income Fund.
35
Driehaus Mutual Funds
Notes to Financial Statements (unaudited) — (Continued)
The following is a summary of the inputs used to value the Event Driven Fund’s investments as of June 30, 2016:
Assets | Level 1 | Level 2 | Level 3 | Total | ||||||||||||
Common Stocks | ||||||||||||||||
Beverages | $ | 6,399,095 | $ | — | $ | — | $ | 6,399,095 | ||||||||
Biotechnology | 6,446,722 | — | — | 6,446,722 | ||||||||||||
Commercial Services | 12,650,945 | — | — | 12,650,945 | ||||||||||||
Computers | 3,537,930 | — | — | 3,537,930 | ||||||||||||
Distribution/Wholesale | 8,626,205 | — | — | 8,626,205 | ||||||||||||
Electric | 13,707,450 | — | — | 13,707,450 | ||||||||||||
Entertainment | 45,122,622 | — | — | 45,122,622 | ||||||||||||
Food | 8,670,470 | — | — | 8,670,470 | ||||||||||||
Healthcare — Products | 6,240,000 | — | — | 6,240,000 | ||||||||||||
Healthcare — Services | 4,052,775 | — | — | 4,052,775 | ||||||||||||
Insurance | 10,069,359 | — | — | 10,069,359 | ||||||||||||
Internet | 10,408,750 | — | — | 10,408,750 | ||||||||||||
Media | 8,800,374 | — | — | 8,800,374 | ||||||||||||
Pharmaceuticals | 3,886,410 | — | — | 3,886,410 | ||||||||||||
Retail | 8,112,569 | — | — | 8,112,569 | ||||||||||||
Semiconductors | 7,840,973 | — | — | 7,840,973 | ||||||||||||
Software | 6,705,184 | — | — | 6,705,184 | ||||||||||||
Convertible Preferred Stocks | ||||||||||||||||
Auto Manufacturers | — | — | 0 | 0 | ||||||||||||
Pharmaceuticals | 7,443,000 | — | — | 7,443,000 | ||||||||||||
Corporate Bonds | — | 22,531,350 | — | 22,531,350 | ||||||||||||
Purchased Call Options | 297,130 | — | — | 297,130 | ||||||||||||
Purchased Put Options | 585,600 | — | — | 585,600 | ||||||||||||
|
|
|
|
|
|
|
| |||||||||
Total | $ | 179,603,563 | $ | 22,531,350 | $ | — | $ | 202,134,913 | ||||||||
|
|
|
|
|
|
|
| |||||||||
Liabilities | ||||||||||||||||
Common Stocks Sold Short | ||||||||||||||||
Banks | $ | (5,238,961 | ) | $ | — | $ | — | $ | (5,238,961 | ) | ||||||
Electric | (3,605,141 | ) | — | — | (3,605,141 | ) | ||||||||||
Healthcare — Products | (2,738,492 | ) | — | — | (2,738,492 | ) | ||||||||||
Healthcare — Services | (1,790,059 | ) | — | — | (1,790,059 | ) | ||||||||||
Pharmaceuticals | (11,403,790 | ) | — | — | (11,403,790 | ) | ||||||||||
|
|
|
|
|
|
|
| |||||||||
Total | $ | (24,776,443 | ) | $ | — | $ | — | $ | (24,776,443 | ) | ||||||
|
|
|
|
|
|
|
| |||||||||
Other Financial Instruments* | ||||||||||||||||
Total Return Swap — Asset | $ | — | $ | 436,927 | $ | — | $ | 436,927 | ||||||||
Forward Foreign Currency Contracts — Assets | — | 813,581 | — | 813,581 | ||||||||||||
|
|
|
|
|
|
|
| |||||||||
Total Other Financial Instruments | $ | — | $ | 1,250,580 | $ | — | $ | 1,250,580 | ||||||||
|
|
|
|
|
|
|
| |||||||||
| * | Other financial instruments are swap and forward foreign currency contracts, which are detailed in the Schedule of Investments. |
36
Driehaus Mutual Funds
Notes to Financial Statements (unaudited) — (Continued)
The following is a reconciliation of Level 3 assets for which significant unobservable inputs were used to determine fair value in the Event Driven Fund:
| Investments, at Value | ||||
Balance as of December 31, 2015 | $ | 0 | ||
Realized gain (loss) | — | |||
Change in net unrealized appreciation (depreciation) | — | |||
Purchase | — | |||
Sales | — | |||
Transfers in and/or out of Level 3 | — | |||
|
| |||
Balance as of June 30, 2016 | $ | 0 | ||
|
| |||
As of June 30, 2016, the Event Driven Fund held Level 3 investments in General Motors Corp. senior convertible preferred stock, which were valued in the same manner as described above for the Active Income Fund.
Securities Sold Short
The Funds are engaged in selling securities short, which obligates them to replace a borrowed security with the same security at current market value. Each Fund incurs a loss if the price of the security increases between the date of the short sale and the date on which the Fund replaces the borrowed security. Each Fund realizes a gain if the price of the security declines between those dates. Gains are limited to the price at which the Fund sold the security short, while losses are potentially unlimited in size.
The Funds are required to establish a margin account with the broker lending the security sold short. While the short sale is outstanding, the broker retains the proceeds of the short sale and the Fund must maintain a deposit with the broker consisting of cash and securities having a value equal to a specified percentage of the value of the securities sold short. Such deposit is included in “Collateral held at custodian for the benefit of brokers” on the Statements of Assets and Liabilities. Each Fund is obligated to pay any dividends or interest due on securities sold short. Such dividends and interest are recorded as an expense to the Funds on the Statements of Operations.
Federal Income Taxes
The Funds’ policy is to comply with the requirements of Subchapter M of the Internal Revenue Code that are applicable to regulated investment companies and to distribute substantially all their taxable income to their shareholders. Therefore, no Federal income tax provision is required.
The FASB’s “Accounting for Uncertainty in Income Taxes” (“Tax Statement”) requires the evaluation of tax positions taken or expected to be taken in the course of preparing the Funds’ tax returns to determine whether the tax positions are “more-likely-than-not” of being sustained by the applicable tax authority. Tax positions not deemed to meet the more-likely-than-not threshold would be recorded as a tax benefit or expense in the current year. Management has evaluated the implications of the Tax Statement and all of the uncertain tax positions and has determined that no liability is required to be recorded in the financial statements as of June 30, 2016. The Funds file tax returns with the U.S. Internal Revenue Service and various states. Taxable years ending 2015, 2014, 2013 and 2012 remain subject to examination by taxing authorities.
For Federal income tax purposes, capital loss carryforwards represent net capital losses of a fund that may be carried forward and applied against future net realized gains. On December 22, 2010, the Regulated Investment Company Modernization Act of 2010 was enacted to modernize several of the Federal income and excise tax provisions related to regulated investment companies. Under pre-enactment law, capital losses could be carried forward for up to eight years, and were required to be carried forward as short-term capital losses, irrespective of the character of the original loss. New net capital losses (those earned in taxable years beginning after December 22, 2010) may be carried forward indefinitely and must retain the character of the original loss.
37
Driehaus Mutual Funds
Notes to Financial Statements (unaudited) — (Continued)
At June 30, 2016, gross unrealized appreciation and depreciation on investments, based on cost for Federal income tax purposes, were as follows:
| Active Income Fund | Select Credit Fund | Event Driven Fund | ||||||||||
Cost of investments | $ | 2,355,300,423 | $ | 143,168,369 | $ | 198,165,163 | ||||||
|
|
|
|
|
| |||||||
Gross unrealized appreciation | $ | 47,304,675 | $ | 2,069,920 | $ | 11,494,126 | ||||||
Gross unrealized depreciation | (135,931,112 | ) | (20,226,055 | ) | (7,524,376 | ) | ||||||
|
|
|
|
|
| |||||||
Net unrealized appreciation (depreciation) on investments | $ | (88,626,437 | ) | $ | (18,156,135 | ) | $ | 3,969,750 | ||||
|
|
|
|
|
| |||||||
The difference between cost amounts for financial statement and Federal income tax purposes is due primarily to the tax deferral of losses on wash sales.
The amount of dividends and distributions from net investment income and net realized capital gains are determined in accordance with Federal income tax regulations, which may differ from U.S. GAAP.
The tax character of distributions paid were as follows:
| Active Income Fund | ||||||||
Distributions paid from: | January 1, 2015 to December 31, 2015 | January 1, 2014 to December 31, 2014 | ||||||
Ordinary income | $ | 121,665,387 | $ | 110,661,412 | ||||
|
|
|
| |||||
Total distributions paid | $ | 121,665,387 | $ | 110,661,412 | ||||
|
|
|
| |||||
| Select Credit Fund | ||||||||
Distributions paid from: | January 1, 2015 to December 31, 2015 | January 1, 2014 to December 31, 2014 | ||||||
Ordinary income | $ | 28,789,661 | $ | 40,566,938 | ||||
|
|
|
| |||||
Total distributions paid | $ | 28,789,661 | $ | 40,566,938 | ||||
|
|
|
| |||||
| Event Driven Fund | ||||||||
Distributions paid from: | January 1, 2015 to December 31, 2015 | January 1, 2014 to December 31, 2014 | ||||||
Ordinary income | $ | 1,333,974 | $ | 638,265 | ||||
Long-term capital gains | — | 22,837 | ||||||
|
|
|
| |||||
Total distributions paid | $ | 1,333,974 | $ | 661,102 | ||||
|
|
|
| |||||
As of December 31, 2015, the components of accumulated earnings (deficit) were as follows:
| Active Income Fund | Select Credit Fund | Event Driven Fund | ||||||||||
Undistributed ordinary income | $ | 19,799,430 | $ | 1,432,583 | $ | — | ||||||
Undistributed long-term capital gains | — | — | — | |||||||||
|
|
|
|
|
| |||||||
Accumulated earnings | 19,799,430 | 1,432,583 | — | |||||||||
Accumulated capital and other losses | (280,929,758 | ) | (121,849,327 | ) | (23,104,014 | ) | ||||||
Unrealized appreciation (depreciation) | (212,139,383 | ) | (56,533,046 | ) | (3,391,112 | ) | ||||||
|
|
|
|
|
| |||||||
Total accumulated earnings (deficit) | $ | (473,269,711 | ) | $ | (176,949,790 | ) | $ | (26,495,126 | ) | |||
|
|
|
|
|
| |||||||
38
Driehaus Mutual Funds
Notes to Financial Statements (unaudited) — (Continued)
As of December 31, 2015, the Funds had net capital loss carryforwards to offset future net capital gains, if any, to the extent provided by Treasury regulations:
| Not Subject to Expiration | ||||||||
| Short-Term | Long-Term | |||||||
Active Income Fund | $ | 225,485,388 | $ | 55,444,370 | ||||
Select Credit Fund | 69,201,895 | 52,647,432 | ||||||
Event Driven Fund | 15,832,149 | 7,252,691 | ||||||
Qualified late-year losses incurred after October 31 and within the taxable year are deemed to arise on the first business day of the Funds’ following taxable year. As of December 31, 2015, the Funds had the following qualified late-year ordinary losses:
| Late-Year Ordinary Losses | ||||
Active Income Fund | $ | — | ||
Select Credit Fund | — | |||
Event Driven Fund | 232,488 | |||
Foreign Currency Translation
The value of securities, currencies and other assets and liabilities not denominated in U.S. dollars are translated into U.S. dollar values based upon the current rates of exchange on the date of the Funds’ valuations.
Net realized foreign exchange gains or losses which are reported by the Funds result from currency gains and losses on transaction hedges arising from changes in exchange rates between the trade and settlement dates on forward contract transactions, and the difference between the amounts accrued for dividends, interest, and foreign taxes and the amounts actually received or paid in U.S. dollars for these items. Net unrealized foreign exchange gains and losses result from changes in the U.S. dollar value of assets and liabilities (other than investments in securities), which are denominated in foreign currencies, as a result of changes in exchange rates.
Net realized foreign exchange gains or losses on portfolio hedges result from the use of forward contracts to hedge portfolio positions denominated or quoted in a particular currency in order to reduce or limit exposure in that currency. The Active Income Fund, Select Credit Fund and Event Driven Fund held portfolio hedges as of June 30, 2016 as disclosed in the Schedule of Investments.
The Funds do not isolate that portion of the results of operations which results from fluctuations in foreign exchange rates on investments. These fluctuations are included with the net realized gain (loss) on investments and the net change in unrealized appreciation (depreciation) on investments.
Indemnifications
Under the Trust’s organizational documents, the officers and Trustees are indemnified against certain liabilities arising out of the performance of their duties to the Trust. In addition, in the normal course of business, the Trust enters into contracts that provide general indemnifications to other parties. A Fund’s maximum exposure under these agreements is unknown as this would involve future claims that may be made against a Fund that have not yet occurred. However, the Funds have not had prior claims or losses pursuant to these contracts and expect the risk of loss to be remote.
Other
The Trust records security transactions based on trade date. Dividend income is recognized on the ex-dividend date, and interest income is recognized on an accrual basis. Discounts and premiums on securities purchased are accreted and amortized over the lives of the respective securities using the effective yield method. Withholding taxes on foreign dividends and interest have been provided for in accordance with the Trust’s understanding of the applicable country’s tax rules and rates.
39
Driehaus Mutual Funds
Notes to Financial Statements (unaudited) — (Continued)
Pursuant to the terms of certain of the senior unsecured loan agreements, the Funds may have unfunded loan commitments, which are callable on demand. Each Fund will have available with its custodian, cash and/or liquid securities having an aggregate value at least equal to the amount of the unfunded senior loan commitments. At June 30, 2016 the Active Income Fund, Select Credit Fund and Event Driven Fund had no unfunded senior loan commitments.
With respect to the senior loans held in each Fund’s portfolio, the Funds may: 1) invest in assignments; 2) act as a participant in primary lending syndicates; or 3) invest in participations. If a Fund purchases a participation of a senior loan interest, the Fund would typically enter into a contractual agreement with the lender or other third party selling the participation, rather than directly with the borrower. As such, the Fund not only assumes the credit risk of the borrower, but also that of the selling participant or other persons interpositioned between the Fund and the borrower. At June 30, 2016, the Funds had no such outstanding senior loan participation commitments.
B. INVESTMENTS IN DERIVATIVES
Each Fund uses derivative instruments such as swaps, futures, options, swaptions and forward foreign currency contracts in connection with their respective investment strategies. During the period January 1, 2016 through June 30, 2016, the Active Income Fund and Select Credit Fund primarily utilized: 1) credit default swaps as alternatives to direct investments to manage exposure to specific sectors/markets/industries and/or credit events and manage volatility; 2) total return swaps to gain exposure to certain sectors and manage volatility; 3) futures to hedge their interest rate risk and manage volatility; 4) options to hedge downside risk and manage market volatility; and 5) forward foreign currency contracts to manage currency risk in portfolio holdings. During the period January 1, 2016 through June 30, 2016, the Event Driven Fund primarily utilized: 1) total return swaps to manage exposure to certain sectors; 2) options to both hedge exposure and provide exposure to certain market segments or specific securities; and 3) forward foreign currency contracts to manage currency risk in portfolio holdings. Detail regarding each derivative type is included below.
Swap Contracts
The Funds are subject to credit risk, volatility risk and interest rate risk exposure in the normal course of pursuing their investment objectives. The Funds engage in various swap transactions, including forward rate agreements and interest rate, currency, volatility, index and total return swaps, primarily to manage duration and yield curve risk, or as alternatives to direct investments. In addition to the swap contracts described above, the Funds also engage in credit default swaps, which involve the exchange of a periodic premium for protection against a defined credit event (such as payment default, refinancing or bankruptcy).
Interest rate swaps are agreements between two parties to exchange cash flows based on a notional principal amount. The Funds may elect to pay a fixed rate and receive a floating rate or receive a fixed rate and pay a floating rate on a notional principal amount. The net interest received or paid on interest rate swap agreements is accrued daily as interest income/expense. Interest rate swaps are marked-to-market daily using fair value estimates provided by an independent pricing service. Changes in value, including accrued interest, are recorded as unrealized appreciation (depreciation). Unrealized gains are reported as an asset and unrealized losses are reported as a liability. The change in value of swaps, including accruals of periodic amounts of interest to be paid or received on swaps, is reported as unrealized gains or losses. Gains or losses are realized upon termination of the contracts. The risk of loss under a swap contract may exceed the amount recorded as an asset or a liability.
Total return swap contracts are arrangements to exchange a market linked return for a periodic payment, both based on a notional principal amount to hedge sector exposure and to manage exposure to specific sectors or industries and/or to gain exposure to specific markets/countries and to specific sectors/industries. To the extent that the total return of the security, index or other financial measure underlying the transaction exceeds or falls short of the offsetting interest rate obligation, the Fund will receive a payment from or make a payment to the counterparty. Total return swap contracts are marked to market daily based upon quotations from market makers and the change, if any, is recorded as an unrealized gain or loss. Payments received or made are recorded as realized gains or losses. Gains or losses are realized upon termination of the contracts. Each Fund’s maximum risk of loss from counterparty risk is the fair value of the contract.
40
Driehaus Mutual Funds
Notes to Financial Statements (unaudited) — (Continued)
Volatility swaps are forward contracts on the future realized volatility of an underlying instrument. Volatility swaps are generally used to speculate on future volatility levels, trade the spread between realized and implied volatility or hedge volatility exposure of other positions. Changes in value are recorded as unrealized appreciation (depreciation). Unrealized gains are reported as an asset and unrealized losses are reported as a liability. The change in value of swaps is reported as unrealized gains or losses. Gains or losses are realized upon termination of the contracts. The risk of loss under a volatility swap contract is dependent upon the volatility of the underlying instrument.
Under the terms of a credit default swap contract, one party acts as a guarantor receiving a periodic payment that is a fixed percentage applied to a notional amount. In return, the party agrees to purchase the notional amount of the underlying instrument, at par, if a credit event occurs during the term of the contract. Each Fund may enter into credit default swaps in which the Fund acts as guarantor (a seller of protection), and may enter into credit default swaps in which the counterparty acts as guarantor (a buyer of protection). Premiums paid to or by the Funds are accrued daily and included in realized gain (loss) on swaps. The contracts are marked-to-market daily using fair value estimates provided by an independent pricing service. Changes in value are recorded as unrealized appreciation (depreciation). Unrealized gains are reported as an asset and unrealized losses are reported as a liability. The change in value of swaps, including accruals of periodic amounts of interest to be paid or received on swaps is reported as unrealized gains or losses. Gains or losses are realized upon termination of the contracts. The risk of loss under a swap contract may exceed the amount recorded as an asset or a liability. The notional amount of a swap contract is the reference amount pursuant to which the counterparties make payments. For swaps in which the referenced obligation is an index, in the event of default of any debt security included in the corresponding index, the Fund pays or receives the percentage of the corresponding index that the defaulted security comprises (1) multiplied by the notional value and (2) multiplied by the ratio of one minus the ratio of the market value of the defaulted debt security to its par value. The maximum exposure to loss of the notional value as a seller of credit default swaps outstanding at June 30, 2016 for the Active Income Fund, Select Credit Fund and Event Driven Fund was 80,000,000 Euros, 15,000,000 Euros and $0, respectively.
Risks associated with swap contracts include changes in the returns of underlying instruments and/or interest rates, failure of the counterparties to perform under the contracts’ terms and the possible lack of liquidity with respect to the contracts. Credit default swaps can involve greater risks than if an investor had invested in the reference obligation directly since, in addition to general market risks, credit default swaps are subject to counterparty credit risk, leverage risk, hedging risk, correlation risk and liquidity risk. The Funds disclose swap contracts on a gross basis, with no netting of contracts held with the same counterparty. As of June 30, 2016, the Funds had outstanding swap contracts as listed on the Schedule of Investments and the required collateral is included in the Statements of Assets and Liabilities.
Futures Contracts
The Funds may enter into futures contracts to produce incremental earnings, hedge existing positions or protect against market changes in the value of equities or interest rates. Upon entering into a futures contract with a broker, a Fund is required to deposit in a segregated account a specified amount of cash or U.S. government securities. Futures contracts are valued daily and unrealized gains or losses are recorded in a “variation margin” account. Daily, the Fund receives from or pays to the broker a specified amount of cash based upon changes in the variation margin account. When a contract is closed, the Fund recognizes a realized gain or loss. Futures contracts have market risks, including the risk that the change in the value of the contract may not correlate with changes in the value of the underlying securities. With futures contracts, there is minimal counterparty credit risk to the Funds since futures contracts are exchange traded and the exchange’s clearinghouse, as counterparty to all exchange traded futures contracts, guarantees the futures contract against default. As of June 30, 2016, the Active Income Fund and Select Credit Fund had outstanding futures contracts as listed in the Schedule of Investments and the required collateral is included in the Statements of Assets and Liabilities. The Event Driven Fund had no outstanding futures contracts at June 30, 2016.
41
Driehaus Mutual Funds
Notes to Financial Statements (unaudited) — (Continued)
Options Contracts
The Funds may use options contracts to hedge downside risk, produce incremental earnings or protect against market changes in the value of equities or interest rates. The Funds may write covered call and put options on futures, swaps, securities or currencies the Funds own or in which they may invest. Writing put options tends to increase a Fund’s exposure to the underlying instrument. Writing call options tends to decrease a Fund’s exposure to the underlying instrument. When a Fund writes a call or put option, an amount equal to the premium received is recorded as a liability and subsequently marked to market to reflect the current value of the option written. These liabilities are reflected as written options outstanding in the Schedule of Investments. Payments received or made, if any, from writing options with premiums to be determined on a future date are reflected as such in the Schedule of Investments. Premiums received from writing options that expire are treated as realized gains. Premiums received from writing options that are exercised or closed are added to the proceeds or offset against amounts paid on the underlying future, swap, security or currency transaction to determine the realized gain or loss. A Fund, as a writer of an option, has no control over whether the underlying future, swap, security or currency may be sold (call) or purchased (put) and, as a result, bears the market risk of an unfavorable change in the price of the future, swap, security or currency underlying the written option. The risk exists that a Fund may not be able to enter into a closing transaction because of an illiquid market. In addition, to the extent a Fund purchases an over-the-counter (“OTC”) option, it is subject to credit risk that the counterparty to the trade does not perform under the contract’s terms. The Funds are not subject to credit risk on OTC options written as the counterparty has already performed its obligation by paying the premium at the inception of the contract.
The premium amount and the number of option contracts written by the Active Income Fund during the period January 1, 2016 through June 30, 2016, were as follows:
Active Income Fund | Number of Contracts | Premium Amount | ||||||
Options outstanding at December 31, 2015 | 69,125 | $ | 12,518,350 | |||||
Options written | 38,015 | 30,970,113 | ||||||
Options closed | (11,510 | ) | (15,718,855 | ) | ||||
Options expired | (86,757 | ) | (23,819,120 | ) | ||||
Options exercised | (7,168 | ) | (288,217 | ) | ||||
|
|
|
| |||||
Options outstanding at June 30, 2016 | 1,705 | $ | 3,662,271 | |||||
|
|
|
| |||||
The premium amount and the number of option contracts written by the Select Credit Fund during the period January 1, 2016 through June 30, 2016, were as follows:
Select Credit Fund | Number of Contracts | Premium Amount | ||||||
Options outstanding at December 31, 2015 | 12,400 | $ | 1,866,185 | |||||
Options written | 3,322 | 3,726,648 | ||||||
Options closed | (1,140 | ) | (2,016,073 | ) | ||||
Options expired | (13,666 | ) | (3,286,999 | ) | ||||
Options exercised | (796 | ) | (32,006 | ) | ||||
|
|
|
| |||||
Options outstanding at June 30, 2016 | 120 | $ | 257,755 | |||||
|
|
|
| |||||
42
Driehaus Mutual Funds
Notes to Financial Statements (unaudited) — (Continued)
The premium amount and the number of option contracts written by the Event Driven Fund during the period January 1, 2016 through June 30, 2016, were as follows:
Event Driven Fund | Number of Contracts | Premium Amount | ||||||
Options outstanding at December 31, 2015 | 1,700 | $ | 217,525 | |||||
Options written | 1,115 | 1,640,619 | ||||||
Options closed | (2,815 | ) | (1,858,144 | ) | ||||
Options expired | — | — | ||||||
Options exercised | — | — | ||||||
|
|
|
| |||||
Options outstanding at June 30, 2016 | — | $ | — | |||||
|
|
|
| |||||
The Funds also purchased put and call options. Purchasing call options tends to increase a Fund’s exposure to the underlying instrument. Purchasing put options tends to decrease a Fund’s exposure to the underlying instrument. A Fund pays a premium which is included in its Schedule of Investments as an investment and subsequently marked-to-market to reflect the current value of the option. Premiums paid for purchasing options which expire are treated as realized losses. The risk associated with purchasing put and call options is limited to the premium paid. Premiums paid for purchasing options which are exercised or closed are added to the amounts paid or offset against the proceeds on the underlying future, swap, security or currency transaction to determine the realized gain or loss. When entering into purchased option contracts, a Fund bears the risk of securities prices moving unexpectedly, in which case, a Fund may not achieve the anticipated benefits of the purchased option contracts; however, the risk of loss is limited to the premium paid. As of June 30, 2016, the Funds had outstanding options as listed on the Schedule of Investments and the required collateral is included in the Statements of Assets and Liabilities.
Swaptions
An option on a swap contract, also called a “swaption,” is an option that gives the buyer the right, but not the obligation, to enter into a swap on a future date in exchange for paying a market-based “premium.” A call or receiver swaption gives the owner the right to receive the total return of a specified asset, reference rate, or index swap. A put or payer swaption gives the owner the right to pay the total return of a specified asset, reference rate, or index swap. Swaptions also include options that allow an existing swap to be terminated or extended by one of the counterparties. As of June 30, 2016, the Active Income Fund and Select Credit Fund had outstanding swaptions as listed on the Schedule of Investments. The Event Driven Fund had no outstanding swaptions at June 30, 2016.
Forward Foreign Currency Contracts
The Funds use forward foreign currency contracts to manage foreign currency, to produce incremental earnings or to hedge existing positions. A forward foreign currency contract involves an obligation to purchase or sell a specific currency at a future date, which may be any fixed number of days from the date of the contract agreed upon by the parties, at a price set at the time of the contract. These contracts are principally traded in the inter-bank market conducted directly between currency traders (usually large commercial banks) and their customers.
The market value of a forward foreign currency contract fluctuates with changes in currency exchange rates. Outstanding forward foreign currency contracts are valued daily at current market rates and the resulting change in market value is recorded as unrealized appreciation or depreciation. When a forward foreign currency contract is settled, the Fund records a realized gain or loss equal to the difference between the value at the time the forward foreign currency contract was opened and the value at the time it was settled. A forward foreign currency contract may involve market risk in excess of the unrealized gain or loss reflected on the Statements of Assets and Liabilities. In addition, the Funds could be exposed to a credit risk if the counterparties are unable or unwilling to meet the terms of the contracts or market risk if the value of the foreign currency changes unfavorably. As of June 30, 2016, the Funds had forward foreign currency contracts as listed in the Schedule of Investments.
43
Driehaus Mutual Funds
Notes to Financial Statements (unaudited) — (Continued)
Derivative Investment Holdings Categorized by Risk Exposure
Each Fund is subject to the FASB’s “Disclosures about Derivative Instruments and Hedging Activities” (the “Derivatives Statement”). The Derivatives Statement amends and expands disclosures about derivative instruments and hedging activities. The Derivatives Statement is intended to improve financial reporting about derivative instruments by requiring enhanced disclosures to enable investors to better understand how and why the Fund uses derivative instruments, how these derivative instruments are accounted for and their effects on the Funds’ financial position and results of operations.
The following table sets forth the fair value and the location in the Statement of Assets and Liabilities of the Active Income Fund’s derivative contracts by primary risk exposure as of June 30, 2016:
Asset derivatives | ||||||
Risk exposure category | Statement of Assets and Liabilities location | Fair Value | ||||
Credit contracts | Unrealized appreciation on open swap contracts | $ | 7,288,210 | |||
Currency contracts | Unrealized appreciation on forward foreign currency contracts | 1,048,857 | ||||
Equity contracts | Purchased options, at fair value | 10,399,850 | ||||
Interest rate contracts | Purchased swaptions, at fair value | 4,990 | ||||
|
|
|
| |||
Total | $ | 18,741,907 | ||||
|
|
|
| |||
Liability derivatives | ||||||
Risk exposure category | Statement of Assets and Liabilities location | Fair Value | ||||
Credit contracts | Unrealized depreciation on open swap contracts | $ | 17,944,489 | |||
Currency contracts | Unrealized depreciation on forward foreign currency contracts | 537,733 | ||||
Equity contracts | Unrealized depreciation on open swap contracts | 819,053 | ||||
Equity contracts | Written options, at fair value | 2,898,500 | ||||
Interest rate contracts | N/A* | 2,827,741 | ||||
|
|
|
| |||
Total | $ | 25,027,516 | ||||
|
|
|
| |||
| * | Includes cumulative appreciation/depreciation of futures contracts as shown in the Schedule of Investments. Only current day’s variation margin is reported in the Statement of Assets and Liabilities. |
The following table sets forth the fair value and the location in the Statement of Assets and Liabilities of the Select Credit Fund’s derivative contracts by primary risk exposure as of June 30, 2016:
Asset derivatives | ||||||
Risk exposure category | Statement of Assets and Liabilities location | Fair Value | ||||
Credit contracts | Unrealized appreciation on open swap contracts | $ | 480,560 | |||
Equity contracts | Purchased options, at fair value | 716,400 | ||||
Currency contracts | Unrealized appreciation on forward foreign currency contracts | 602,436 | ||||
Interest rate contracts | Purchased swaptions, at fair value | 574 | ||||
|
|
|
| |||
Total | $ | 1,799,970 | ||||
|
|
|
| |||
44
Driehaus Mutual Funds
Notes to Financial Statements (unaudited) — (Continued)
Liability derivatives | ||||||
Risk exposure category | Statement of Assets and Liabilities location | Fair Value | ||||
Credit contracts | Unrealized depreciation on open swap contracts | $ | 600,025 | |||
Currency contracts | Unrealized depreciation on forward foreign currency contracts | 686,338 | ||||
Equity contracts | Unrealized depreciation on open swap contracts | 49,241 | ||||
Equity contracts | Written options, at fair value | 204,000 | ||||
Interest rate contracts | N/A* | 347,570 | ||||
|
|
|
| |||
Total | $ | 1,887,174 | ||||
|
|
|
| |||
| * | Includes cumulative appreciation/depreciation of futures contracts as shown in the Schedule of Investments. Only current day’s variation margin is reported in the Statement of Assets and Liabilities. |
The following table sets forth the fair value and the location in the Statement of Assets and Liabilities of the Event Driven Fund’s derivative contracts by primary risk exposure as of June 30, 2016:
Asset derivatives | ||||||
Risk exposure category | Statement of Assets and Liabilities location | Fair Value | ||||
Equity contracts | Unrealized appreciation on open swap contracts | $ | 436,927 | |||
Currency contracts | Unrealized appreciation on forward foreign currency contracts | 813,581 | ||||
Equity contracts | Purchased options, at fair value | 882,730 | ||||
|
|
|
| |||
Total | $ | 2,133,238 | ||||
|
|
|
| |||
The following table sets forth the Active Income Fund’s net realized gain/loss by primary risk exposure and by type of derivative contract for the period January 1, 2016 through June 30, 2016:
Amount of net realized gain (loss) on derivatives | ||||||||||||||||||||
| Risk exposure category | ||||||||||||||||||||
Derivative | Credit contracts | Currency contracts | Equity contracts | Interest rate contracts | Total | |||||||||||||||
Purchased options contracts | $ | — | $ | — | $ | (43,154,491 | ) | $ | — | $ | (43,154,491 | ) | ||||||||
Purchased swaptions contracts | — | — | — | (3,307,045 | ) | (3,307,045 | ) | |||||||||||||
Written options contracts | — | — | 34,367,333 | — | 34,367,333 | |||||||||||||||
Forward foreign currency contracts | — | 1,287,848 | — | — | 1,287,848 | |||||||||||||||
Futures contracts | — | — | — | (6,876,048 | ) | (6,876,048 | ) | |||||||||||||
Swap contracts | (4,323,813 | ) | — | 630,000 | — | (3,693,813 | ) | |||||||||||||
|
|
|
|
|
|
|
|
|
| |||||||||||
Total | $ | (4,323,813 | ) | $ | 1,287,848 | $ | (8,157,158 | ) | $ | (10,183,093 | ) | $ | (21,376,216 | ) | ||||||
|
|
|
|
|
|
|
|
|
| |||||||||||
The following table sets forth the Select Credit Fund’s net realized gain/loss by primary risk exposure and by type of derivative contract for the period January 1, 2016 through June 30, 2016:
Amount of net realized gain (loss) on derivatives | ||||||||||||||||||||
| Risk exposure category | ||||||||||||||||||||
Derivative | Credit contracts | Currency contracts | Equity contracts | Interest rate contracts | Total | |||||||||||||||
Purchased options contracts | $ | — | $ | — | $ | (7,282,494 | ) | $ | — | $ | (7,282,494 | ) | ||||||||
Purchased swaption contracts | — | — | — | (289,075 | ) | (289,075 | ) | |||||||||||||
Written options contracts | — | — | 4,628,144 | — | 4,628,144 | |||||||||||||||
Forward foreign currency contracts | — | 284,905 | — | — | 284,905 | |||||||||||||||
Futures contracts | — | — | — | (755,571 | ) | (755,571 | ) | |||||||||||||
Swap contracts | (541,786 | ) | — | 70,000 | — | (471,786 | ) | |||||||||||||
|
|
|
|
|
|
|
|
|
| |||||||||||
Total | $ | (541,786 | ) | $ | 284,905 | $ | (2,584,350 | ) | $ | (1,044,646 | ) | $ | (3,885,877 | ) | ||||||
|
|
|
|
|
|
|
|
|
| |||||||||||
45
Driehaus Mutual Funds
Notes to Financial Statements (unaudited) — (Continued)
The following table sets forth the Event Driven Fund’s net realized gain/loss by primary risk exposure and by type of derivative contract for the period January 1, 2016 through June 30, 2016:
Amount of net realized gain (loss) on derivatives | ||||||||
| Risk exposure category | ||||||||
Derivative | Equity contracts | Total | ||||||
Purchased options contracts | $ | (7,026,837 | ) | $ | (7,026,837 | ) | ||
Written options contracts | 109,463 | 109,463 | ||||||
Swap contracts | 2,531,943 | 2,531,943 | ||||||
|
|
|
| |||||
Total | $ | (4,385,431 | ) | $ | (4,385,431 | ) | ||
|
|
|
| |||||
The following table sets forth the Active Income Fund’s change in net unrealized appreciation/depreciation by primary risk exposure and by type of derivative contract for the period January 1, 2016 through June 30, 2016:
Change in net unrealized appreciation (depreciation) on derivatives | ||||||||||||||||||||
| Risk exposure category | ||||||||||||||||||||
Derivative | Credit contracts | Equity contracts | Currency contracts | Interest rate contracts | Total | |||||||||||||||
Purchased options contracts | $ | — | $ | 13,001,446 | $ | — | $ | — | $ | 13,001,446 | ||||||||||
Purchased swaption contracts | — | — | — | (891,673 | ) | (891,673 | ) | |||||||||||||
Written options contracts | — | (10,602,675 | ) | — | — | (10,602,675 | ) | |||||||||||||
Futures contracts | — | — | — | (4,224,985 | ) | (4,224,985 | ) | |||||||||||||
Swap contracts | (2,217,290 | ) | (819,053 | ) | — | — | (3,036,343 | ) | ||||||||||||
Forward foreign currency contracts | — | — | (44,559 | ) | — | (44,559 | ) | |||||||||||||
|
|
|
|
|
|
|
|
|
| |||||||||||
Total | $ | (2,217,290 | ) | $ | 1,579,718 | $ | (44,559 | ) | $ | (5,116,658 | ) | $ | (5,798,789 | ) | ||||||
|
|
|
|
|
|
|
|
|
| |||||||||||
The gross notional amount and/or the number of contracts for the Active Income Fund as of June 30, 2016 are included on the Schedule of Investments. The quarterly average values of derivative investments for the period January 1, 2016 through June 30, 2016 is set forth in the table below.
Quarterly Derivative Averages | ||||||
Derivative | Quarterly Average | $ Amount / Number | ||||
Options Contracts — Purchased | number of contracts | 16,069 | ||||
Options Contracts — Written | number of contracts | (28,209 | ) | |||
Futures Contracts — Short | number of contracts | (2,547 | ) | |||
Swap Contracts | gross notional amount | $ | 309,394,967 | |||
Swaptions Contracts — Purchased | gross notional amount | $ | 180,139,930 | |||
Forward Contracts — Long | fair value | $ | 27,071,827 | |||
Forward Contracts — Short | fair value | $ | (78,322,145 | ) | ||
The following table sets forth the Select Credit Fund’s change in net unrealized appreciation/depreciation by primary risk exposure and by type of derivative contract for the period January 1, 2016 through June 30, 2016:
Change in net unrealized appreciation (depreciation) on derivatives | ||||||||||||||||||||
| Risk exposure category | ||||||||||||||||||||
Derivative | Credit contracts | Equity contracts | Interest rate contracts | Currency contracts | Total | |||||||||||||||
Purchased options contracts | $ | — | $ | 4,016,168 | $ | — | $ | — | $ | 4,016,168 | ||||||||||
Purchased swaptions contracts | — | — | (109,506 | ) | — | (109,506 | ) | |||||||||||||
Written options contracts | — | (1,620,930 | ) | — | — | (1,620,930 | ) | |||||||||||||
Forward foreign currency contracts | — | — | — | (227,208 | ) | (227,208 | ) | |||||||||||||
Futures contracts | — | — | (499,257 | ) | — | (499,257 | ) | |||||||||||||
Swap contracts | (153,820 | ) | (49,241 | ) | — | — | (203,061 | ) | ||||||||||||
|
|
|
|
|
|
|
|
|
| |||||||||||
Total | $ | (153,820 | ) | $ | 2,345,997 | $ | (608,763 | ) | $ | (227,208 | ) | $ | 1,356,206 | |||||||
|
|
|
|
|
|
|
|
|
| |||||||||||
46
Driehaus Mutual Funds
Notes to Financial Statements (unaudited) — (Continued)
The gross notional amount and/or the number of contracts for the Select Credit Fund as of June 30, 2016 are included on the Schedule of Investments. The quarterly average values of derivative investments for the period January 1, 2016 through June 30, 2016 is set forth in the table below.
Quarterly Derivative Averages | ||||||
Derivative | Quarterly Average | $ Amount /Number | ||||
Options Contracts — Purchased | number of contracts | 10,188 | ||||
Options Contracts — Written | number of contracts | (4,738 | ) | |||
Futures Contracts — Short | number of contracts | (600 | ) | |||
Swap Contracts | gross notional amount | $ | 37,813,200 | |||
Swaptions Contracts — Purchased | gross notional amount | $ | 36,020,070 | |||
Forward Contracts — Long | fair value | $ | 6,679,416 | |||
Forward Contracts — Short | fair value | $ | (21,378,705 | ) | ||
The following table sets forth the Event Driven Fund’s change in net unrealized appreciation/depreciation by primary risk exposure and by type of derivative contract for the period January 1, 2016 through June 30, 2016:
Change in net unrealized appreciation (depreciation) on derivatives |
| |||||||||||
| Risk exposure category | ||||||||||||
Derivative | Equity contracts | Currency contracts | Total | |||||||||
Purchased options contracts | $ | 3,844,020 | $ | — | $ | 3,844,020 | ||||||
Written options contracts | 28,975 | — | 28,975 | |||||||||
Swap contracts | 477,463 | — | 477,463 | |||||||||
Forward foreign currency contracts | — | 799,165 | 799,165 | |||||||||
|
|
|
|
|
| |||||||
Total | $ | 4,350,458 | $ | 799,165 | $ | 5,149,623 | ||||||
|
|
|
|
|
| |||||||
The gross notional amount and/or the number of contracts for the Event Driven Fund as of June 30, 2016 are included on the Schedule of Investments. The quarterly average values of derivative investments for the period January 1, 2016 through June 30, 2016 is set forth in the table below.
Quarterly Derivative Averages | ||||||
Derivative | Quarterly Average | $ Amount /Number | ||||
Options Contracts — Purchased | number of contracts | 29,681 | ||||
Options Contracts — Written | number of contracts | (340 | ) | |||
Futures Contracts — Short | number of contracts | (48 | ) | |||
Swap Contracts | gross notional amount | $ | (93,749 | ) | ||
Forward Contracts — Short | fair value | $ | (4,543,752 | ) | ||
Disclosures about Offsetting Assets and Liabilities
The Funds are party to various agreements, including International Swaps and Derivatives Association Agreements and related Credit Support Annexes (“Master Netting Agreements” or “MNA”), which govern the terms of certain transactions with select counterparties. MNAs are designed to reduce counterparty risk associated with the relevant transactions by establishing credit protection mechanisms and providing standardization as a means of improving legal certainty. As MNAs are specific to the unique operations of different asset types, they allow each Fund to close out and net its total exposure to a counterparty in the event of default with respect to all of the transactions governed under a single agreement with that counterparty. MNAs can also help reduce counterparty risk by specifying collateral posting requirements at pre-arranged exposure levels. Securities and cash pledged as collateral are reflected as assets in the Statement of Assets and Liabilities as either a component of Investment securities at fair value or Collateral held at custodian for the benefit of brokers.
The Funds’ derivative contracts held at June 30, 2016, are not accounted for as hedging instruments under GAAP. For financial reporting purposes, the Funds do not offset financial assets and financial liabilities that are subject to MNAs or similar arrangements on the Statements of Assets and Liabilities. The settlement of futures
47
Driehaus Mutual Funds
Notes to Financial Statements (unaudited) — (Continued)
contracts and exchange-traded purchased options is guaranteed by the clearinghouse or exchange the instrument is traded on and is not subject to arrangements with particular counterparties. For that reason, these instruments are excluded from the below disclosure.
The following table presents the Active Income Fund’s financial and derivative assets subject to Master Netting Agreements by type, net of amounts available for offset under a MNA and net of the related collateral received by the Active Income Fund as of June 30, 2016:
Description | Gross Amounts Recognized in Statement of Assets and Liabilities | Derivatives Available for Offset | Collateral Received | Net Amount1 | ||||||||||||
Unrealized appreciation on open swap contracts | $ | 7,288,210 | $ | (7,153,160 | ) | $ | — | $ | 135,050 | |||||||
The following table presents the Active Income Fund’s financial and derivative liabilities subject to Master Netting Agreements by type, net of amounts available for offset under a MNA and net of the related collateral pledged by the Active Income Fund as of June 30, 2016:
Description | Gross Amounts Recognized in Statement of Assets and Liabilities | Derivatives Available for Offset | Collateral Pledged | Net Amount2 | ||||||||||||
Unrealized depreciation on open swap contracts | $ | 18,763,542 | $ | (7,153,160 | ) | $ | (11,610,382 | ) | $ | — | ||||||
Unrealized depreciation on forward foreign currency contracts | 537,733 | — | (537,733 | ) | — | |||||||||||
Written options, at fair value | 2,898,500 | — | (2,898,500 | ) | — | |||||||||||
| 1 | Net amount represents the net amount receivable from the counterparty in the event of default. |
| 2 | Net amount represents the net amount payable to the counterparty in the event of default. |
The following table presents the Select Credit Fund’s financial and derivative assets subject to Master Netting Agreements by type, net of amounts available for offset under a MNA and net of the related collateral received by the Select Credit Fund as of June 30, 2016:
Description | Gross Amounts Recognized in Statement of Assets and Liabilities | Derivatives Available for Offset | Collateral Received | Net Amount1 | ||||||||||||
Unrealized appreciation on open swap contracts | $ | 480,560 | $ | (328,670 | ) | $ | — | $ | 151,890 | |||||||
The following table presents the Select Credit Fund’s financial and derivative liabilities subject to Master Netting Agreements by type, net of amounts available for offset under a MNA and net of the related collateral pledged by the Select Credit Fund as of June 30, 2016:
Description | Gross Amounts Recognized in Statement of Assets and Liabilities | Derivatives Available for Offset | Collateral Pledged | Net Amount2 | ||||||||||||
Unrealized depreciation on open swap contracts | $ | 649,266 | $ | (328,670 | ) | $ | (320,596 | ) | $ | — | ||||||
Written options, at fair value | 204,000 | — | (204,000 | ) | — | |||||||||||
| 1 | Net amount represents the net amount receivable from the counterparty in the event of default. |
| 2 | Net amount represents the net amount payable to the counterparty in the event of default. |
48
Driehaus Mutual Funds
Notes to Financial Statements (unaudited) — (Continued)
The following table presents the Event Driven Fund’s financial and derivative assets subject to Master Netting Agreements by type, net of amounts available for offset under a MNA and net of the related collateral received by the Event Driven Fund as of June 30, 2016:
Description | Gross Amounts Recognized in Statement of Assets and Liabilities | Derivatives Available for Offset | Collateral Pledged | Net Amount1 | ||||||||||||
Unrealized appreciation on open swap contracts | $ | 436,927 | $ | — | $ | (436,927 | ) | $ | — | |||||||
| 1 | Net amount represents the net amount receivable from the counterparty in the event of default. |
C. INVESTMENT ADVISORY FEES, TRANSACTIONS WITH AFFILIATES, AND ADMINISTRATIVE FEES
Richard H. Driehaus, an Interested Trustee of the Trust, is also the Chairman of the Board of Driehaus Capital Management LLC (“DCM” or the “Adviser”), a registered investment adviser, and of Driehaus Securities LLC (“DS LLC” or the “Distributor”), a registered broker-dealer.
DCM serves as the Funds’ investment adviser. In return for its services to the Funds, the Funds pay the Adviser an annual management fee on a monthly basis of 0.55%, 0.80% and 1.00% of average daily net assets, respectively, for the Active Income Fund, Select Credit Fund and Event Driven Fund.
DCM has entered into a written agreement to cap the Event Driven Fund’s annual ordinary operating expenses (other than interest, taxes, brokerage commissions, dividends and interest on short sales, other investment-related expenses and extraordinary expenses such as litigation and other expenses not incurred in the ordinary course of the Fund’s business) at 2.00% of average daily net assets until at least August 25, 2016. For this same time period, DCM is entitled to reimbursement for previously waived fees and reimbursed expenses to the extent that the Event Driven Fund’s expense ratio remains below the operating expense cap in place at the time of the waiver and the current operating expense cap. For the year ended December 31, 2015, the Event Driven Fund did not have any fees waived by DCM and as of June 30, 2016, there are no amounts subject to recapture.
The Active Income Fund accrued $7,338,188 for investment advisory fees during the period January 1, 2016 through June 30, 2016, of which $1,134,126 was payable to DCM at June 30, 2016. The Select Credit Fund accrued $826,771 for investment advisory fees during the period January 1, 2016 through June 30, 2016, and $96,234 was payable to DCM at June 30, 2016. The Event Driven Fund accrued $1,084,467 for investment advisory fees during the period January 1, 2016 through June 30, 2016, and $174,452 was payable to DCM at June 30, 2016.
The Funds direct certain portfolio trades, subject to obtaining the best price and execution, to brokers who have agreed to pay a portion of the Funds’ operating expenses using part of the commissions generated. For the six months ended June 30, 2016, these arrangements reduced the expenses of Driehaus Active Income Fund, Driehaus Select Credit Fund, and Driehaus Event Driven Fund by $17,000 (0.1%), $60 (0.0%), and $28,400 (1.3%), respectively.
An affiliated issuer is an entity in which the Fund has ownership of at least 5% of the voting securities or any investment in a Driehaus Mutual Fund. Issuers that are affiliates of the Fund at period-end are noted in the Fund’s Schedule of Investments. Additional security purchases and the reduction of certain securities shares outstanding of existing portfolio holdings that were not considered affiliated in prior years may result in the Fund owning in excess of 5% of the outstanding shares at period-end. The table below reflects transactions during the period with entities that are affiliates as of June 30, 2016.
Fund/Security Description | Value Beginning of Period | Purchases | Sales Proceeds | Unrealized Appreciation (Depreciation) | Value End of Period | Dividends Credited to Income | Net Realized Gain | |||||||||||||||||||||
Active Income Fund: | ||||||||||||||||||||||||||||
Carmike Cinemas, Inc. | $ | — | $ | 51,742,250 | $ | — | $ | 516,281 | $ | 52,258,531 | $ | — | $ | — | ||||||||||||||
Pinnacle Entertainment, Inc. | — | 52,054,690 | — | 751,792 | 52,806,482 | — | — | |||||||||||||||||||||
49
Driehaus Mutual Funds
Notes to Financial Statements (unaudited) — (Continued)
Fund/Security Description | Shares Beginning of Period | Purchases | Sales | Shares End of Period | ||||||||||||
Active Income Fund: | ||||||||||||||||
Carmike Cinemas, Inc. | — | 1,735,011 | — | 1,735,011 | ||||||||||||
Pinnacle Entertainment, Inc. | — | 4,765,928 | — | 4,765,928 | ||||||||||||
DS LLC is the Funds’ distributor. DS LLC does not earn any compensation from the Funds for these services. DS LLC has entered into a Fee Reimbursement Agreement (“Agreement”) with each of the Funds. Under these agreements, the Funds reimburse DS LLC for certain fees paid by DS LLC to intermediaries who provide shareholder administrative and/or sub-transfer agency services to the Funds. Currently, the amount to be reimbursed will not exceed 0.25% of the average daily net assets held by such intermediaries. The amounts accrued and payable to DS LLC during the period January 1, 2016 through June 30, 2016 are as follows:
Fund | Shareholder services plan fees | Accrued shareholder services plan fees | ||||||
Active Income Fund | $ | 2,046,982 | $ | 416,216 | ||||
Select Credit Fund | 154,525 | 28,407 | ||||||
Event Driven Fund | 217,990 | 37,157 | ||||||
Certain officers of the Trust are also officers of DCM and DS LLC. The Funds pay a portion of the Chief Compliance Officer’s salary. No other officers received compensation from the Funds during the period January 1, 2016 through June 30, 2016. The Independent Trustees are compensated for their services to the Trust and such compensation is reflected as Trustees’ fees in the Statement of Operations.
UMB Fund Services, Inc. (“UMBFS”), an affiliate of UMB Financial Corporation, serves as the Funds’ administrative and accounting agent. In compensation for these services, UMBFS earns the larger of a monthly minimum fee or a monthly fee based upon each Fund’s average daily net assets. UMBFS also acts as the transfer agent and dividend disbursing agent for the Funds. For these services, UMBFS earns a monthly fee based in part on shareholder processing activity during the month.
D. INVESTMENT TRANSACTIONS
Purchases and sales of investment securities (excluding swaps, options, futures, short-term securities and U.S. government obligations) for the Active Income Fund, Select Credit Fund and Event Driven Fund for the period January 1, 2016 through June 30, 2016, were as follows:
Active Income Fund | Select Credit Fund | Event Driven Fund | ||||||||||||||
| Purchases | $ | 1,621,991,730 | Purchases | $ | 106,343,399 | Purchases | $ | 263,352,776 | ||||||||
| Sales | $ | 2,080,278,063 | Sales | $ | 212,076,584 | Sales | $ | 263,572,256 | ||||||||
The aggregate purchases and sales of U.S. government obligations for the Active Income Fund, Select Credit Fund and Event Driven Fund for the period January 1, 2016 through June 30, 2016, were as follows:
Active Income Fund | Select Credit Fund | Event Driven Fund | ||||||||||||||
| Purchases | $ | — | Purchases | $ | — | Purchases | $ | — | ||||||||
| Sales | $ | 12,543,123 | Sales | $ | — | Sales | $ | — | ||||||||
E. RESTRICTED SECURITIES
Restricted securities are securities that are not registered for sale under the Securities Act of 1933 or applicable foreign law and that may be re-sold only in transactions exempt from applicable registration. Restricted securities include Rule 144A securities which may be sold normally to qualified institutional buyers. At June 30, 2016, the Funds held restricted securities as denoted on the Schedule of Investments.
F. LINE OF CREDIT
Active Income Fund, Select Credit Fund and Event Driven Fund have, together with certain other funds in the Trust, obtained a committed line of credit in the amount of $50,000,000. The line of credit is available
50
Driehaus Mutual Funds
Notes to Financial Statements (unaudited) — (Continued)
primarily to meet large, unexpected shareholder withdrawals subject to certain restrictions. Interest is charged at a rate per annum equal to the Federal Funds Rate in effect at the time of the borrowings plus 1.5%, or 1.75%, whichever is greater. There is a commitment fee of 0.10% of the excess of the $50,000,000 committed amount over the sum of the average daily balance of any loans, which is allocated amongst all funds that have access to the line. At June 30, 2016, the Funds had no outstanding borrowings under the line of credit.
51
As a mutual fund shareholder, you may incur two types of costs: (1) transaction costs, including sales charges; redemption fees; and exchange fees and (2) ongoing costs, including management fees; distribution (12b-1) and/or service fees; and other fund expenses. This example is intended to help you understand your ongoing costs (in dollars) of investing in the Fund and to compare these costs with the ongoing costs of investing in other mutual funds.
The example is based on an investment of $1,000 invested at the beginning of the period and held for the entire six month period ended June 30, 2016.
Actual Expenses
The first line of the table below (“Actual”) provides information about actual account values and actual expenses. You may use the information in this line, together with the amount you invested, to estimate the expense that you paid over the period. Simply divide your account value by $1,000 (for example, an $8,600 account value divided by $1,000 = 8.6), then multiply the result by the number in the first line under the heading entitled “Expenses Paid During Period” to estimate the expenses you paid on your account during this period.
Hypothetical Example for Comparison Purposes
The second line of the tables below (“Hypothetical”) provides information about hypothetical account values and hypothetical expenses based on the Fund’s actual expense ratio and an assumed rate of return of 5% per year before expenses, which is not the Fund’s actual return. You may use this information to compare the ongoing costs of investing in the Fund versus other funds. To do so, compare this 5% hypothetical example with the 5% hypothetical examples that appear in the shareholder reports of the other funds.
Please note that the expenses shown in the table are meant to highlight your ongoing costs only and do not reflect any transactional costs, such as sales charges, redemption fees or exchange fees. Therefore, the second line of the table is useful in comparing ongoing costs only, and will not help you determine the relative total costs of owning different funds. In addition, if these transactional costs were included, your costs would have been higher.
Driehaus Active Income Fund
Beginning Account Value January 1, 2016 | Ending Account Value June 30, 2016 | Expenses Paid During Six Months Ended June 30, 2016* | ||||||||||
Actual | $ | 1,000.00 | $ | 1,009.50 | $ | 6.75 | ||||||
Hypothetical Example, assuming a 5% return before expenses | $ | 1,000.00 | $ | 1,018.15 | $ | 6.77 | ||||||
Driehaus Select Credit Fund
Beginning Account Value January 1, 2016 | Ending Account Value June 30, 2016 | Expenses Paid During Six Months Ended June 30, 2016* | ||||||||||
Actual | $ | 1,000.00 | $ | 983.30 | $ | 9.57 | ||||||
Hypothetical Example, assuming a 5% return before expenses | $ | 1,000.00 | $ | 1,015.22 | $ | 9.72 | ||||||
52
Fund Expense Examples — (Continued)
Driehaus Event Driven Fund
Beginning Account Value January 1, 2016 | Ending Account Value June 30, 2016 | Expenses Paid During Six Months Ended June 30, 2016* | ||||||||||
Actual | $ | 1,000.00 | $ | 992.90 | $ | 9.56 | ||||||
Hypothetical Example, assuming a 5% return before expenses | $ | 1,000.00 | $ | 1,015.27 | $ | 9.67 | ||||||
| * | Expenses are equal to the Funds’ annualized expense ratios for the six-month period in the table below multiplied by the average account value over the period, multiplied by the number of days in the most recent fiscal half-year (182), then divided by 366 to reflect the half-year period. |
Driehaus Active Income Fund | 1.35% | |
Driehaus Select Credit Fund | 1.94% | |
Driehaus Event Driven Fund | 1.93% |
53
| Item 2. | Code of Ethics. |
Not applicable.
| Item 3. | Audit Committee Financial Expert. |
Not applicable.
| Item 4. | Principal Accountant Fees and Services. |
Not applicable.
| Item 5. | Audit Committee of Listed Registrants. |
Not applicable.
| Item 6. | Investments. |
| (a) | Schedule of Investments in securities of unaffiliated issuers as of the close of the reporting period is included as part of the report to shareholders filed under Item 1 of this form. |
| (b) | Not applicable. |
| Item 7. | Disclosure of Proxy Voting Policies and Procedures for Closed-End Management Investment Companies. |
Not applicable.
| Item 8. | Portfolio Managers of Closed-End Management Investment Companies. |
Not applicable.
| Item 9. | Purchases of Equity Securities by Closed-End Management Investment Company and Affiliated Purchasers. |
Not applicable.
| Item 10. | Submission of Matters to a Vote of Security Holders. |
There have been no material changes to the procedures by which the shareholders may recommend nominees to the registrant’s board of directors, where those changes were implemented after the registrant last provided disclosure in response to the requirements of Item 407(c)(2)(iv) of Regulation S-K (17 CFR 229.407) (as required by Item 22(b)(15) of Schedule 14A (17 CFR 240.14a-101)), or this Item.
| Item 11. | Controls and Procedures. |
| (a) | The registrant’s principal executive and principal financial officers, or persons performing similar functions, have concluded that the registrant’s disclosure controls and procedures (as defined in Rule 30a-3(c) under the Investment Company Act of 1940, as amended (the “1940 Act”) (17 CFR 270.30a-3(c))) are effective, as of a date within 90 days of the filing date of the report that includes the disclosure required by this paragraph, based on their evaluation of these controls and procedures required by Rule 30a-3(b) under the 1940 Act (17 CFR 270.30a-3(b)) and Rules 13a-15(b) or 15d-15(b) under the Securities Exchange Act of 1934, as amended (17 CFR 240.13a-15(b) or 240.15d-15(b)). |
| (b) | There were no changes in the registrant’s internal control over financial reporting (as defined in Rule 30a-3(d) under the 1940 Act (17 CFR 270.30a-3(d)) that occurred during the registrant’s second fiscal quarter of the period covered by this report that has materially affected, or is reasonably likely to materially affect, the registrant’s internal control over financial reporting. |
| Item 12. | Exhibits. |
(a)(1) | Not applicable. | |
(a)(2) | Certifications pursuant to Rule 30a-2(a) under the 1940 Act and Section 302 of the Sarbanes-Oxley Act of 2002 are attached hereto. | |
(a)(3) | Not applicable. | |
(b) | Certifications pursuant to Rule 30a-2(b) under the 1940 Act and Section 906 of the Sarbanes-Oxley Act of 2002 are attached hereto. | |
SIGNATURES
Pursuant to the requirements of the Securities Exchange Act of 1934 and the Investment Company Act of 1940, the registrant has duly caused this report to be signed on its behalf by the undersigned, thereunto duly authorized.
| (Registrant) | Driehaus Mutual Funds |
| By (Signature and Title)* | /s/ Robert H. Gordon | |||
| Robert H. Gordon, President | ||||
| (principal executive officer) | ||||
| Date | August 31, 2016 | |||
Pursuant to the requirements of the Securities Exchange Act of 1934 and the Investment Company Act of 1940, this report has been signed below by the following persons on behalf of the registrant and in the capacities and on the dates indicated.
| By (Signature and Title)* | /s/ Robert H. Gordon | |||
| Robert H. Gordon, President | ||||
| (principal executive officer) |
| Date | August 31, 2016 | |||
| By (Signature and Title)* | /s/ Michelle L. Cahoon | |||
| Michelle L. Cahoon, Vice President and Treasurer | ||||
| (principal financial officer) | ||||
| Date | August 31, 2016 | |||
| * | Print the name and title of each signing officer under his or her signature. |