UNITED STATES
SECURITIES AND EXCHANGE COMMISSION
Washington, D.C. 20549
FORM N-CSR
CERTIFIED SHAREHOLDER REPORT OF REGISTERED MANAGEMENT INVESTMENT
COMPANIES
Investment Company Act file number 811-07655
Driehaus Mutual Funds
(Exact name of registrant as specified in charter)
25 East Erie Street
Chicago, IL 60611
(Address of principal executive offices) (Zip code)
Janet L. McWilliams
Driehaus Capital Management LLC
25 East Erie Street
Chicago, IL 60611
(Name and address of agent for service)
Registrant's telephone number, including area code: 312-587-3800
Date of fiscal year end: December 31
Date of reporting period: June 30, 2022
Item 1. Reports to Stockholders.
| (a) | The Report to Shareholders is attached herewith. |
| Average Annual Total Returns as of 6/30/22 | 1 Year | 3 Years | 5 Years | 10 Years |
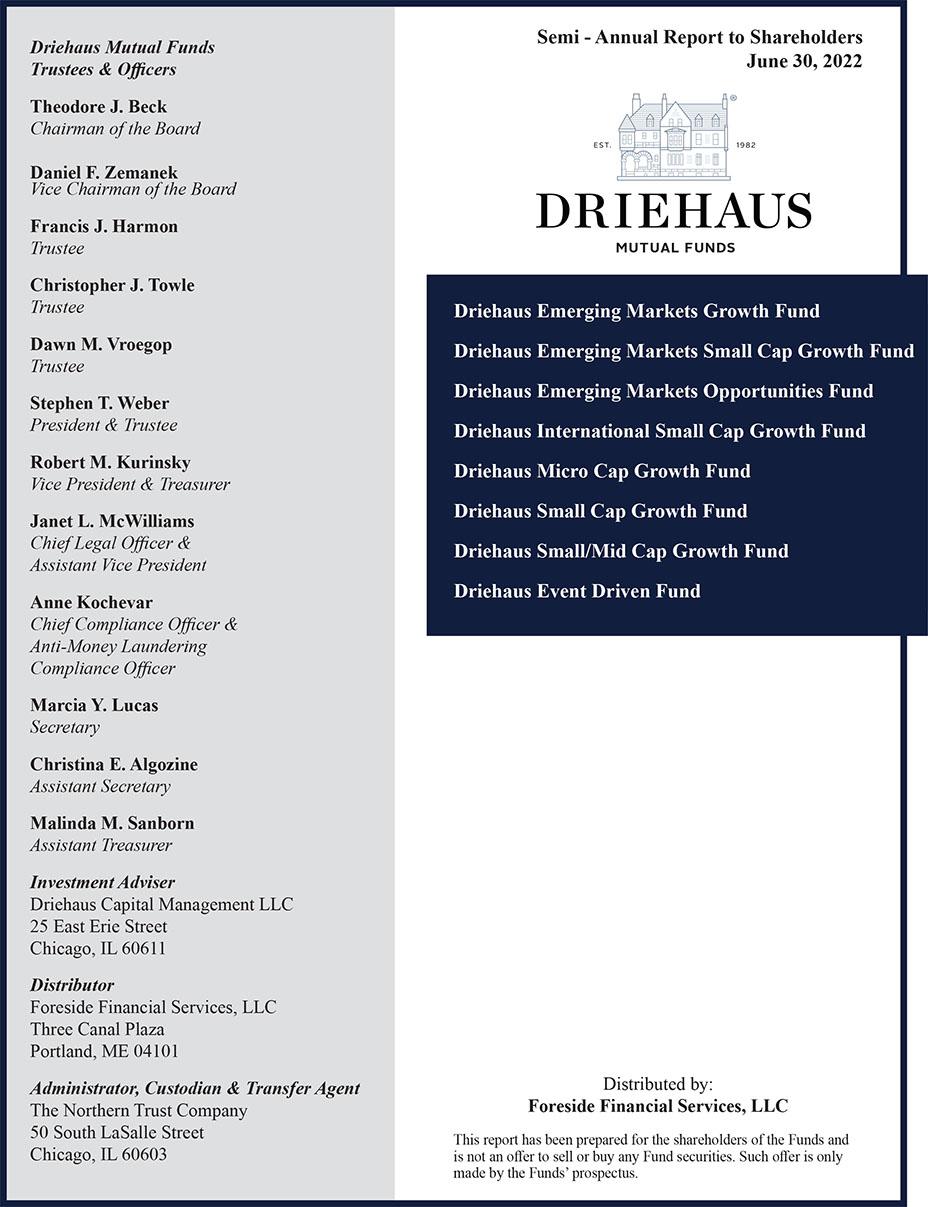
| Driehaus Emerging Markets Growth Fund Investor Class (DREGX) | -25.26% | 3.29% | 4.84% | 5.35% |
| Driehaus Emerging Markets Growth Fund Institutional Class (DIEMX)1 | -25.09% | 3.52% | 5.06% | 5.45% |
| MSCI Emerging Markets Index-N2 | -25.29% | 0.57% | 2.18% | 3.06% |
| MSCI Emerging Markets Growth Index-N3 | -31.17% | 1.88% | 2.92% | 4.54% |
| 1 | The returns for the periods prior to July 17, 2017 (institutional share class inception date) include the performance of the investor share class. |
| 2 | The Morgan Stanley Capital International Emerging Markets Index-Net (MSCI Emerging Markets Index-N) is a market capitalization-weighted index designed to measure equity market performance in emerging markets. Data is in U.S. dollars and is calculated with net dividend reinvestment. Source: Morgan Stanley Capital International Inc. |
| 3 | The Morgan Stanley Capital International Emerging Markets Growth Index-Net (MSCI Emerging Markets Growth Index-N) is a subset of the MSCI Emerging Markets Index and includes only the MSCI Emerging Markets Index stocks which are categorized as growth stocks. Data is in U.S. dollars and is calculated with net dividend reinvestment. Source: Morgan Stanley Capital International Inc. |
| Shares, Principal Amount, or Number of Contracts | Value | |
| COMMON STOCKS — 90.97% | ||
| FAR EAST — 64.60% | ||
| China — 27.40% | ||
| AIA Group Ltd. | 3,723,200 | $40,355,070 |
| Alibaba Group Holding Ltd. * | 1,857,300 | 26,486,194 |
| Autohome, Inc. - ADR 1 | 73,912 | 2,906,959 |
| BYD Co. Ltd. - H | 363,500 | 14,545,930 |
| Chacha Food Co. Ltd. - A | 438,800 | 3,731,665 |
| China Merchants Bank Co. Ltd. - H | 4,520,417 | 30,244,417 |
| China Power International Development Ltd. | 17,943,000 | 11,387,590 |
| Estun Automation Co. Ltd. - A | 3,920,441 | 14,348,148 |
| Jiumaojiu International Holdings Ltd. 2 | 6,572,000 | 17,462,685 |
| KE Holdings, Inc. - ADR 1,* | 523,679 | 9,400,038 |
| Kuaishou Technology 2,* | 1,434,200 | 15,974,548 |
| Kweichow Moutai Co. Ltd. - A | 135,100 | 41,270,857 |
| Link REIT | 2,165,200 | 17,659,785 |
| Meituan - B 2,* | 2,361,200 | 58,437,202 |
| NARI Technology Co. Ltd. - A | 2,414,070 | 9,736,625 |
| PetroChina Co. Ltd. - H | 12,354,000 | 5,888,255 |
| Pharmaron Beijing Co. Ltd. - A | 2,004,735 | 28,515,434 |
| Pinduoduo, Inc. - ADR 1,* | 154,094 | 9,523,009 |
| Proya Cosmetics Co. Ltd. - A | 929,647 | 22,938,782 |
| Shenzhen Kedali Industry Co. Ltd. - A | 385,790 | 9,163,110 |
| Suzhou Maxwell Technologies Co. Ltd. - A | 456,020 | 33,440,422 |
| Techtronic Industries Co. Ltd. | 1,402,169 | 14,626,030 |
| Tencent Holdings Ltd. | 1,115,745 | 50,392,520 |
| Trip.com Group Ltd. - ADR 1,* | 340,900 | 9,357,705 |
| Xpeng, Inc. - ADR 1,* | 402,252 | 12,767,479 |
| 510,560,459 | ||
| India — 12.05% | ||
| Bharti Airtel Ltd. * | 2,183,979 | 18,942,245 |
| Cipla Ltd. | 1,127,122 | 13,090,586 |
| HDFC Bank Ltd. - ADR 1 | 574,825 | 31,592,382 |
| Housing Development Finance Corp. Ltd. | 1,015,879 | 27,925,176 |
| ICICI Bank Ltd. - SP ADR 1 | 1,650,392 | 29,277,954 |
| Power Grid Corp. of India Ltd. | 8,604,639 | 23,088,075 |
| Reliance Industries Ltd. | 1,218,855 | 40,061,046 |
| Sun Pharmaceutical Industries Ltd. | 1,252,031 | 13,168,343 |
| Tata Consultancy Services Ltd. | 309,328 | 12,796,929 |
| United Spirits Ltd. * | 1,507,714 | 14,504,868 |
| 224,447,604 | ||
| Taiwan — 8.69% | ||
| Chailease Holding Co. Ltd. | 988,238 | 6,929,814 |
| China Airlines Ltd. * | 7,063,000 | 5,582,272 |
| Hon Hai Precision Industry Co. Ltd. | 5,659,000 | 20,745,321 |
| Merida Industry Co. Ltd. | 474,893 | 4,080,756 |
| Shares, Principal Amount, or Number of Contracts | Value | |
| Taiwan Semiconductor Manufacturing Co. Ltd. - SP ADR 1 | 1,523,220 | $124,523,235 |
| 161,861,398 | ||
| South Korea — 8.49% | ||
| Hyundai Mipo Dockyard Co. Ltd. * | 288,441 | 20,237,966 |
| KB Financial Group, Inc. | 606,921 | 22,507,121 |
| KT Corp. | 748,830 | 21,021,914 |
| Macquarie Korea Infrastructure Fund | 1,000,206 | 9,629,217 |
| Samsung Electronics Co. Ltd. | 1,930,012 | 84,727,884 |
| 158,124,102 | ||
| Indonesia — 3.34% | ||
| Bank Central Asia Tbk PT | 73,294,975 | 35,669,648 |
| Bank Mandiri Persero Tbk PT | 17,294,900 | 9,200,341 |
| Telkom Indonesia Persero Tbk PT | 65,051,100 | 17,466,313 |
| 62,336,302 | ||
| Thailand — 2.65% | ||
| Airports of Thailand PCL - NVDR * | 12,918,700 | 25,943,366 |
| SCB X PCL - NVDR | 7,966,200 | 23,433,313 |
| 49,376,679 | ||
| Japan — 0.99% | ||
| Keyence Corp. | 53,800 | 18,390,655 |
| Vietnam — 0.49% | ||
| Masan Group Corp. | 1,917,480 | 9,230,937 |
| Australia — 0.28% | ||
| Lynas Rare Earths Ltd. * | 881,785 | 5,313,533 |
| Philippines — 0.22% | ||
| International Container Terminal Services, Inc. | 1,240,557 | 4,151,359 |
| Total FAR EAST (Cost $1,037,806,007) | 1,203,793,028 | |
| NORTH AMERICA — 10.48% | ||
| United States — 6.06% | ||
| EPAM System, Inc. * | 35,932 | 10,592,035 |
| Legend Biotech Corp. - ADR * | 121,465 | 6,680,575 |
| Liberty Media Corp.-Liberty Formula One - C * | 174,038 | 11,046,192 |
| MELI Kaszek Pioneer Corp. - A * | 770,561 | 7,628,554 |
| Newmont Corp. | 490,449 | 29,265,092 |
| Pfizer, Inc. | 540,131 | 28,319,068 |
| Schlumberger NV | 325,349 | 11,634,480 |
| Tenaris SA - ADR | 303,693 | 7,801,873 |
| 112,967,869 | ||
| Mexico — 2.64% | ||
| America Movil SAB de CV - SP ADR - L 1 | 600,852 | 12,275,406 |
| Grupo Financiero Banorte SAB de CV - O | 5,916,592 | 33,070,188 |
| Shares, Principal Amount, or Number of Contracts | Value | |
| Wal-Mart de Mexico SAB de CV | 1,103,263 | $3,796,504 |
| 49,142,098 | ||
| Canada — 1.78% | ||
| Cameco Corp. 1 | 1,023,347 | 21,510,754 |
| Ivanhoe Mines Ltd. - A * | 763,000 | 4,392,348 |
| Nutrien Ltd. 1 | 90,187 | 7,187,002 |
| 33,090,104 | ||
| Total NORTH AMERICA (Cost $193,570,453) | 195,200,071 | |
| MIDDLE EAST — 6.02% | ||
| Saudi Arabia — 2.71% | ||
| Nahdi Medical Co. * | 265,965 | 11,469,081 |
| Saudi Arabian Oil Co. 2 | 2,642,937 | 27,330,283 |
| Saudi Telecom Co. | 448,377 | 11,603,477 |
| 50,402,841 | ||
| United Arab Emirates — 1.32% | ||
| Dubai Electricity & Water Authority PJSC * | 19,745,605 | 13,546,847 |
| Emaar Properties PJSC | 7,803,462 | 11,047,345 |
| 24,594,192 | ||
| Qatar — 1.18% | ||
| Qatar National Bank QPSC | 4,010,614 | 22,003,726 |
| Israel — 0.81% | ||
| Elbit Systems Ltd. | 28,542 | 6,514,173 |
| ICL Group Ltd. | 945,936 | 8,582,062 |
| 15,096,235 | ||
| Total MIDDLE EAST (Cost $112,491,379) | 112,096,994 | |
| SOUTH AMERICA — 5.12% | ||
| Brazil — 4.72% | ||
| Ambev SA - ADR 1 | 5,974,118 | 14,995,036 |
| Banco BTG Pactual SA * | 5,447,640 | 23,316,767 |
| Banco do Brasil SA | 1,729,200 | 11,015,970 |
| Iguatemi SA | 1,423,000 | 4,869,815 |
| Minerva SA | 953,800 | 2,413,000 |
| Petroleo Brasileiro SA - SP ADR 1 | 1,341,275 | 15,666,092 |
| SLC Agricola SA | 1,867,514 | 15,775,978 |
| 88,052,658 | ||
| Uruguay — 0.40% | ||
| Globant SA 1,* | 42,670 | 7,424,580 |
| Total SOUTH AMERICA (Cost $104,727,263) | 95,477,238 | |
| AFRICA — 2.65% | ||
| South Africa — 2.65% | ||
| Anglo American Platinum Ltd. | 54,820 | 4,801,752 |
| Capitec Bank Holdings Ltd. | 139,838 | 17,037,393 |
| MTN Group Ltd. | 1,160,041 | 9,415,094 |
| Sasol Ltd. * | 388,780 | 8,882,167 |
| Shares, Principal Amount, or Number of Contracts | Value | ||
| The Bidvest Group Ltd. | 720,714 | $9,284,945 | |
| 49,421,351 | |||
| Total AFRICA (Cost $52,616,404) | 49,421,351 | ||
| EUROPE — 2.10% | |||
| Netherlands — 0.87% | |||
| Heineken NV | 178,568 | 16,280,339 | |
| Switzerland — 0.78% | |||
| Nestle SA | 124,733 | 14,560,567 | |
| Greece — 0.45% | |||
| OPAP SA | 578,534 | 8,275,650 | |
| Russia — 0.00% | |||
| Polyus PJSC 1,^ | 63,751 | 0 | |
| Total EUROPE (Cost $57,203,105) | 39,116,556 | ||
| Total COMMON STOCKS (Cost $1,558,414,611) | 1,695,105,238 | ||
| SHORT TERM INVESTMENTS — 8.10% | |||
| Northern Institutional U.S. Government Select Portfolio (Shares Class), 1.11% 3 (Cost $150,921,464) | 150,921,464 | 150,921,464 | |
| TOTAL INVESTMENTS (Cost $1,709,336,075) | 99.07% | $1,846,026,702 | |
| Other Assets In Excess of Liabilities | 0.93% | 17,278,253 | |
| Net Assets | 100.00% | $1,863,304,955 | |
| ADR | American Depositary Receipt |
| NVDR | Non-Voting Depositary Receipt |
| PCL | Public Company Limited |
| PJSC | Public Joint Stock Company |
| REIT | Real Estate Investment Trust |
| SP ADR | Sponsored American Depositary Receipt |
| 1 | Foreign security denominated and/or traded in U.S. dollars. |
| 2 | Security is exempt from registration under Rule 144A of the Securities Act of 1933, as amended. The total value of these securities is $119,204,718, which represents 6% of Net Assets. |
| 3 | 7 day current yield as of June 30, 2022 is disclosed. |
| ^ | Security valued at fair value as determined in good faith by the Adviser, in accordance with procedures established by, and under the general supervision of, the Trust’s Board of Trustees. The security is valued using significant unobservable inputs. |
| * | Non-income producing security. |
| Security Type | Percent of Net Assets | |
| Common Stocks | 90.97% | |
| Short Term Investments | 8.10% | |
| Total Investments | 99.07% | |
| Other Assets In Excess of Liabilities | 0.93% | |
| Net Assets | 100.00% |
| Regional Weightings | Percent of Net Assets | |
| Far East | 64.60% | |
| North America | 18.58% | |
| Middle East | 6.02% | |
| South America | 5.12% | |
| Africa | 2.65% | |
| Europe | 2.10% |
| Industry | Percent of Net Assets | |
| Aerospace & Defense | 0.35 | |
| Airlines | 0.30 | |
| Auto Components | 0.49 | |
| Automobiles | 1.47 | |
| Banks | 14.21 | |
| Beverages | 4.66 | |
| Biotechnology | 0.36 | |
| Capital Markets | 1.77 | |
| Chemicals | 1.33 | |
| Diversified Financial Services | 0.37 | |
| Diversified Telecommunication Services | 2.69 | |
| Electric Utilities | 1.24 | |
| Electrical Equipment | 2.31 | |
| Electronic Equipment, Instruments & Components | 2.11 | |
| Energy Equipment & Services | 1.04 | |
| Entertainment | 0.59 | |
| Equity Real Estate Investment Trusts | 0.95 | |
| Food & Staples Retailing | 0.82 | |
| Food Products | 2.45 | |
| Holding Companies - Diversified | 0.41 | |
| Hotels, Restaurants & Leisure | 1.89 | |
| Independent Power and Renewable Electricity Producers | 0.61 |
| Industry | Percent of Net Assets | |
| Industrial Conglomerates | 0.50 | |
| Insurance | 2.17 | |
| Interactive Media & Services | 3.72 | |
| Internet & Direct Marketing Retail | 5.07 | |
| IT Services | 1.66 | |
| Leisure Products | 0.22 | |
| Life Sciences Tools & Services | 1.53 | |
| Machinery | 2.64 | |
| Metals & Mining | 2.35 | |
| Money Market Fund | 8.10 | |
| Multi-Utilities | 0.73 | |
| Oil, Gas & Consumable Fuels | 5.93 | |
| Personal Products | 1.23 | |
| Pharmaceuticals | 2.93 | |
| Real Estate Management & Development | 1.35 | |
| Semiconductors & Semiconductor Equipment | 6.68 | |
| Technology Hardware, Storage & Peripherals | 4.55 | |
| Thrifts & Mortgage Finance | 1.50 | |
| Transportation Infrastructure | 1.61 | |
| Wireless Telecommunication Services | 2.18 | |
| Other Assets In Excess of Liabilities | 0.93 | |
| TOTAL | 100.00 |
| Average Annual Total Returns as of 6/30/22 | 1 Year | 3 Years | 5 Years | 10 Years |
| Driehaus Emerging Markets Small Cap Growth Fund (DRESX)1 | -19.77% | 11.57% | 8.01% | 6.81% |
| MSCI Emerging Markets Small Cap Index-N2 | -20.72% | 5.78% | 3.48% | 4.31% |
| MSCI Emerging Markets Small Cap Growth Index-N3 | -23.61% | 6.82% | 3.53% | 3.90% |

| 1 | The returns reflect fee waivers and/or reimbursements without which performance would have been lower. |
| 2 | The Morgan Stanley Capital International Emerging Markets Small Cap Index-Net (MSCI Emerging Markets Small Cap Index-N) is a market capitalization-weighted index designed to measure equity market performance of small cap stocks in emerging markets. Data is in U.S. dollars and is calculated with net dividend reinvestment. Source: Morgan Stanley Capital International Inc. |
| 3 | The Morgan Stanley Capital International Emerging Markets Small Cap Growth Index-Net (MSCI Emerging Markets Small Cap Growth Index-N) is a market capitalization-weighted index designed to measure equity market performance of small cap growth stocks in emerging markets. Data is in U.S. dollars and is calculated with net dividend reinvestment. Source: Morgan Stanley Capital International Inc. |
| Shares, Principal Amount, or Number of Contracts | Value | |
| COMMON STOCKS — 90.08% | ||
| FAR EAST — 70.83% | ||
| China — 30.38% | ||
| Bethel Automotive Safety Systems Co. Ltd. - A | 54,906 | $657,628 |
| Bosideng International Holdings Ltd. | 2,630,000 | 1,632,270 |
| Centre Testing International Group Co. Ltd. - A | 189,500 | 657,021 |
| China National Building Material Co. Ltd. - H | 788,000 | 841,546 |
| China Power International Development Ltd. | 3,076,000 | 1,952,194 |
| CIMC Enric Holdings Ltd. | 744,000 | 799,296 |
| Estun Automation Co. Ltd. - A | 419,378 | 1,534,852 |
| Hygeia Healthcare Holdings Co. Ltd. 1 | 187,600 | 1,246,794 |
| Innovent Biologics, Inc. 1,* | 354,000 | 1,574,476 |
| Jiangsu Hengli Hydraulic Co. Ltd. - A | 204,750 | 1,887,751 |
| Jiumaojiu International Holdings Ltd. 1 | 581,000 | 1,543,795 |
| Longshine Technology Group Co. Ltd. - A | 488,725 | 1,839,025 |
| Maanshan Iron & Steel Co. Ltd. - H | 2,652,000 | 804,374 |
| Man Wah Holdings Ltd. | 1,446,400 | 1,563,118 |
| Ming Yang Smart Energy Group Ltd. - A | 256,200 | 1,293,572 |
| Ming Yuan Cloud Group Holdings Ltd. | 300,000 | 480,196 |
| Pacific Basin Shipping Ltd. | 1,513,000 | 578,452 |
| Pharmaron Beijing Co. Ltd. - H 1 | 135,750 | 1,358,919 |
| Proya Cosmetics Co. Ltd. - A | 92,020 | 2,270,568 |
| SITC International Holdings Co. Ltd. | 345,000 | 976,067 |
| Suzhou Maxwell Technologies Co. Ltd. - A | 28,080 | 2,059,136 |
| Wuhan DR Laser Technology Corp. Ltd. - A | 27,900 | 720,183 |
| Xinyi Energy Holdings Ltd. | 2,946,000 | 1,509,267 |
| 29,780,500 | ||
| India — 13.86% | ||
| Aavas Financiers Ltd. * | 24,432 | 623,527 |
| Amber Enterprises India Ltd. * | 15,645 | 445,077 |
| AU Small Finance Bank Ltd. 1,* | 65,585 | 491,394 |
| Dixon Technologies India Ltd. | 9,935 | 449,747 |
| Godrej Properties Ltd. * | 30,042 | 450,007 |
| Gujarat Fluorochemicals Ltd. | 22,370 | 786,041 |
| Hindustan Petroleum Corp. Ltd. | 260,883 | 717,513 |
| Indian Energy Exchange Ltd. 1 | 327,359 | 658,055 |
| Max Healthcare Institute Ltd. * | 123,368 | 573,236 |
| Oberoi Realty Ltd. * | 50,930 | 475,716 |
| PB Fintech Ltd. * | 145,283 | 1,054,037 |
| Radico Khaitan Ltd. | 45,535 | 503,078 |
| Shares, Principal Amount, or Number of Contracts | Value | |
| Sona Blw Precision Forgings Ltd. 1 | 70,840 | $496,770 |
| Syngene International Ltd. 1 | 71,241 | 500,439 |
| TVS Motor Co. Ltd. | 95,631 | 1,019,551 |
| UPL Ltd. | 70,962 | 568,253 |
| Varun Beverages Ltd. | 258,343 | 2,586,134 |
| Voltas Ltd. | 96,860 | 1,192,652 |
| 13,591,227 | ||
| Vietnam — 6.55% | ||
| Asia Commercial Bank JSC * | 619,593 | 683,909 |
| Dat Xanh Real Estate Services JSC * | 117,389 | 92,842 |
| FPT Corp. | 660,680 | 2,521,347 |
| Masan Group Corp. | 278,280 | 1,339,667 |
| Military Commercial Joint Stock Bank * | 918,157 | 1,021,911 |
| Mobile World Investment Corp. | 248,000 | 762,175 |
| 6,421,851 | ||
| Taiwan — 6.07% | ||
| Advanced Energy Solution Holding Co. Ltd. | 20,000 | 651,790 |
| ASPEED Technology, Inc. | 7,700 | 492,037 |
| Parade Technologies Ltd. | 12,455 | 481,721 |
| Silergy Corp. | 13,000 | 1,047,135 |
| Sinbon Electronics Co. Ltd. | 193,000 | 1,648,713 |
| Voltronic Power Technology Corp. | 33,550 | 1,630,476 |
| 5,951,872 | ||
| South Korea — 4.42% | ||
| DB HiTek Co. Ltd. | 18,239 | 701,662 |
| Hyundai Mipo Dockyard Co. Ltd. * | 21,191 | 1,486,830 |
| Iljin Materials Co. Ltd. | 8,887 | 477,752 |
| LEENO Industrial, Inc. | 4,463 | 446,850 |
| Samsung Engineering Co. Ltd. * | 73,691 | 1,223,075 |
| 4,336,169 | ||
| Indonesia — 3.85% | ||
| Adi Sarana Armada Tbk PT * | 3,186,600 | 364,702 |
| Bank BTPN Syariah Tbk PT | 3,627,000 | 686,568 |
| Merdeka Copper Gold Tbk PT * | 5,631,700 | 1,508,339 |
| Sumber Alfaria Trijaya Tbk PT | 8,903,200 | 1,219,166 |
| 3,778,775 | ||
| Thailand — 2.49% | ||
| Bangchak Corp PCL - NVDR | 844,600 | 746,535 |
| Chularat Hospital PCL - NVDR | 11,341,800 | 1,186,951 |
| Dohome PCL - NVDR | 1,046,700 | 509,214 |
| 2,442,700 | ||
| Australia — 1.96% | ||
| Lynas Rare Earths Ltd. * | 163,361 | 984,394 |
| Paladin Energy Ltd. * | 2,337,331 | 935,739 |
| 1,920,133 | ||
| Cambodia — 0.75% | ||
| NagaCorp Ltd. * | 892,000 | 729,806 |
| Shares, Principal Amount, or Number of Contracts | Value | |
| Philippines — 0.50% | ||
| Wilcon Depot, Inc. | 1,135,800 | $491,625 |
| Total FAR EAST (Cost $65,902,965) | 69,444,658 | |
| SOUTH AMERICA — 7.76% | ||
| Brazil — 7.76% | ||
| Arezzo Industria e Comercio SA | 69,500 | 927,074 |
| Cia Brasileira de Aluminio | 335,500 | 746,204 |
| Grupo SBF SA | 159,700 | 572,161 |
| Orizon Valorizacao de Residuos SA * | 196,000 | 1,050,886 |
| Petro Rio SA * | 440,000 | 1,847,118 |
| Petroreconcavo SA | 259,600 | 1,264,902 |
| SLC Agricola SA | 141,800 | 1,197,867 |
| 7,606,212 | ||
| Total SOUTH AMERICA (Cost $7,962,923) | 7,606,212 | |
| MIDDLE EAST — 5.57% | ||
| Saudi Arabia — 3.28% | ||
| Leejam Sports Co. JSC | 57,768 | 1,377,958 |
| Nahdi Medical Co. * | 42,681 | 1,840,512 |
| 3,218,470 | ||
| United Arab Emirates — 1.29% | ||
| Dana Gas PJSC | 4,263,815 | 1,265,296 |
| Qatar — 1.00% | ||
| Qatar Gas Transport Co. Ltd. | 948,814 | 974,672 |
| Total MIDDLE EAST (Cost $5,916,386) | 5,458,438 | |
| NORTH AMERICA — 4.32% | ||
| Canada — 2.64% | ||
| B2Gold Corp. | 395,290 | 1,338,925 |
| Ivanhoe Mines Ltd. - A * | 217,994 | 1,254,922 |
| 2,593,847 | ||
| Mexico — 1.68% | ||
| Grupo Traxion SAB de CV 1,* | 350,400 | 476,040 |
| Qualitas Controladora SAB de CV | 252,900 | 1,167,821 |
| 1,643,861 | ||
| Total NORTH AMERICA (Cost $5,260,027) | 4,237,708 | |
| AFRICA — 1.05% | ||
| South Africa — 1.05% | ||
| The Foschini Group Ltd. | 137,933 | 1,034,365 |
| Total AFRICA (Cost $1,284,619) | 1,034,365 | |
| Shares, Principal Amount, or Number of Contracts | Value | ||
| EUROPE — 0.55% | |||
| Poland — 0.55% | |||
| Dino Polska SA 1,* | 7,519 | $535,226 | |
| Total EUROPE (Cost $144,070) | 535,226 | ||
| Total COMMON STOCKS (Cost $86,470,990) | 88,316,607 | ||
| PREFERRED STOCKS — 1.06% | |||
| SOUTH AMERICA — 1.06% | |||
| Brazil — 1.06% | |||
| Metalurgica Gerdau SA, 3.77% 2 | 571,000 | 1,040,870 | |
| Total SOUTH AMERICA (Cost $1,250,100) | 1,040,870 | ||
| Total PREFERRED STOCKS (Cost $1,250,100) | 1,040,870 | ||
| SHORT TERM INVESTMENTS — 5.80% | |||
| Northern Institutional U.S. Government Select Portfolio (Shares Class), 1.11% 3 (Cost $5,682,919) | 5,682,919 | 5,682,919 | |
| TOTAL INVESTMENTS (Cost $93,404,009) | 96.94% | $95,040,396 | |
| Other Assets In Excess of Liabilities | 3.06% | 3,004,354 | |
| Net Assets | 100.00% | $98,044,750 | |
| JSC | Joint Stock Company |
| NVDR | Non-Voting Depositary Receipt |
| PCL | Public Company Limited |
| PJSC | Public Joint Stock Company |
| 1 | Security is exempt from registration under Rule 144A of the Securities Act of 1933, as amended. The total value of these securities is $8,881,908, which represents 9% of Net Assets. |
| 2 | Current yield is disclosed. Dividends are calculated based on a percentage of the issuer’s net income. |
| 3 | 7 day current yield as of June 30, 2022 is disclosed. |
| * | Non-income producing security. |
| Security Type | Percent of Net Assets | |
| Common Stocks | 90.08% | |
| Preferred Stocks | 1.06% | |
| Short Term Investments | 5.80% | |
| Total Investments | 96.94% | |
| Other Assets In Excess of Liabilities | 3.06% | |
| Net Assets | 100.00% |
| Regional Weightings | Percent of Net Assets | |
| Far East | 70.83% | |
| North America | 10.12% | |
| South America | 8.82% | |
| Middle East | 5.57% | |
| Africa | 1.05% | |
| Europe | 0.55% |
| Industry | Percent of Net Assets | |
| Auto Components | 1.18 | |
| Automobiles | 1.04 | |
| Banks | 2.94 | |
| Beverages | 3.15 | |
| Biotechnology | 1.61 | |
| Capital Markets | 0.67 | |
| Chemicals | 1.38 | |
| Commercial Services & Supplies | 1.07 | |
| Construction & Engineering | 2.47 | |
| Construction Materials | 0.86 | |
| Electrical Equipment | 5.75 | |
| Electronic Equipment, Instruments & Components | 2.90 | |
| Food & Staples Retailing | 3.67 | |
| Food Products | 2.59 | |
| Health Care Providers & Services | 3.06 | |
| Hotels, Restaurants & Leisure | 3.72 | |
| Household Durables | 2.50 | |
| Independent Power and Renewable Electricity Producers | 3.53 | |
| Insurance | 2.26 |
| Industry | Percent of Net Assets | |
| IT Services | 2.57 | |
| Life Sciences Tools & Services | 1.90 | |
| Machinery | 5.83 | |
| Marine | 1.59 | |
| Metals & Mining | 7.82 | |
| Money Market Fund | 5.80 | |
| Oil, Gas & Consumable Fuels | 7.92 | |
| Personal Products | 2.32 | |
| Professional Services | 0.67 | |
| Real Estate Management & Development | 1.04 | |
| Road & Rail | 0.86 | |
| Semiconductors & Semiconductor Equipment | 3.22 | |
| Software | 2.37 | |
| Specialty Retail | 3.43 | |
| Textiles, Apparel & Luxury Goods | 2.61 | |
| Thrifts & Mortgage Finance | 0.64 | |
| Other Assets In Excess of Liabilities | 3.06 | |
| TOTAL | 100.00 |
| Average Annual Total Returns as of 6/30/22 | 1 Year | 3 Years | 5 Years | Since Inception (4/10/17 - 6/30/22) |
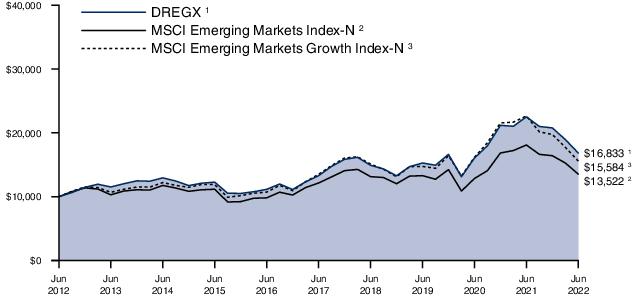
| Driehaus Emerging Markets Opportunities Fund (DMAGX)1 | -24.05% | 4.12% | 4.94% | 5.94% |
| MSCI Emerging Markets Index-N2 | -25.29% | 0.57% | 2.18% | 3.21% |
| MSCI EM/JP Morgan GBI Blended Index3 | -22.09% | -2.40% | 0.14% | 1.06% |
| 1 | Prior to January 29, 2020, the Driehaus Emerging Markets Opportunities Fund was known as the Driehaus Multi-Asset Growth Economies Fund. The returns for the period reflect fee waivers and/or reimbursements without which performance would have been lower. |
| 2 | The Morgan Stanley Capital International Emerging Markets Index-Net (MSCI Emerging Markets Index-N) is a market capitalization-weighted index designed to measure equity market performance in emerging markets. Data is in U.S. dollars and is calculated with net dividend reinvestment. Source: Morgan Stanley Capital International Inc. |
| 3 | The MSCI EM/JPMorgan Government Bond Index Blended Index is an equally weighted benchmark comprised of 50 percent by the Morgan Stanley Capital International Emerging Markets Index-Net (MSCI EM) and 50 percent by the JPMorgan Global Bond Index Emerging Markets Global Diversified (JPMorgan GBI). The MSCI EM is a market capitalization-weighted index designed to measure equity market performance in emerging markets and the JPMorgan GBI tracks debt instruments in the emerging markets. Source: Morgan Stanley Capital International Inc. and JPMorgan. |
| Shares, Principal Amount, or Number of Contracts | Value | |
| SOVEREIGN BONDS — 19.83% | ||
| Brazil — 1.65% | ||
| Brazil Notas do Tesouro Nacional Serie F 10.00%, 1/1/27 1 | 2,000,000 | $346,718 |
| Brazil Notas do Tesouro Nacional Serie F 10.00%, 1/1/31 1 | 2,500,000 | 406,955 |
| 753,673 | ||
| Chile — 1.08% | ||
| Chile Government International Bond 3.24%, 2/6/28 2 | 250,000 | 235,082 |
| Chile Government International Bond 2.45%, 1/31/31 2 | 300,000 | 255,797 |
| 490,879 | ||
| China — 4.46% | ||
| China Government Bond 2.68%, 5/21/30 1 | 7,000,000 | 1,029,896 |
| China Government Bond 3.27%, 11/19/30 1 | 6,500,000 | 1,000,265 |
| 2,030,161 | ||
| Czech Republic — 1.19% | ||
| Czech Republic Government Bond 2.40%, 9/17/25 1 | 10,000,000 | 383,980 |
| Czech Republic Government Bond 1.20%, 3/13/31 1 | 5,000,000 | 156,663 |
| 540,643 | ||
| Dominican Republic — 0.51% | ||
| Dominican Republic International Bond 4.88%, 9/23/32 2 | 300,000 | 230,831 |
| Egypt — 0.27% | ||
| Egypt Government International Bond 5.87%, 2/16/31 2 | 200,000 | 124,817 |
| Indonesia — 1.32% | ||
| Indonesia Treasury Bond 7.00%, 9/15/30 1 | 9,000,000,000 | 599,597 |
| Mexico — 2.55% | ||
| Mexican Bonos 8.50%, 11/18/38 1 | 11,000,000 | 519,308 |
| Mexico Government International Bond 4.50%, 4/22/29 2 | 260,000 | 252,488 |
| Petroleos Mexicanos 6.50%, 3/13/27 2 | 300,000 | 260,100 |
| Petroleos Mexicanos 6.70%, 2/16/32 2 | 169,000 | 128,862 |
| 1,160,758 | ||
| Shares, Principal Amount, or Number of Contracts | Value | |
| Oman — 0.63% | ||
| Oman Government International Bond 6.00%, 8/1/29 2 | 300,000 | $289,711 |
| Peru — 0.82% | ||
| Peruvian Government International Bond 6.95%, 8/12/31 1 | 1,500,000 | 371,794 |
| Poland — 0.63% | ||
| Republic of Poland Government Bond 1.75%, 4/25/32 1 | 2,000,000 | 287,165 |
| Qatar — 0.87% | ||
| Qatar Government International Bond 3.75%, 4/16/30 2 | 400,000 | 397,427 |
| Saudi Arabia — 1.82% | ||
| Saudi Government International Bond 3.25%, 10/22/30 2 | 500,000 | 471,232 |
| Saudi Government International Bond 2.75%, 2/3/32 2 | 400,000 | 356,855 |
| 828,087 | ||
| South Africa — 1.48% | ||
| Republic of South Africa Government Bond 8.50%, 1/31/37 1 | 13,900,000 | 675,445 |
| United Arab Emirates — 0.55% | ||
| Abu Dhabi Government International Bond 1.70%, 3/2/31 2 | 300,000 | 252,471 |
| Total SOVEREIGN BONDS (Cost $9,913,019) | 9,033,459 | |
| COMMON STOCKS — 72.20% | ||
| Australia — 0.48% | ||
| Lynas Rare Earths Ltd. * | 36,599 | 220,541 |
| Brazil — 3.46% | ||
| Banco do Brasil SA | 45,600 | 290,497 |
| Iguatemi SA | 58,600 | 200,542 |
| Petro Rio SA * | 71,000 | 298,058 |
| Petroleo Brasileiro SA - SP ADR 2,3 | 34,249 | 400,028 |
| SLC Agricola SA | 46,000 | 388,589 |
| 1,577,714 | ||
| Canada — 1.73% | ||
| B2Gold Corp. | 64,300 | 217,797 |
| Cameco Corp. 2 | 9,865 | 207,362 |
| Ivanhoe Mines Ltd. - A * | 27,400 | 157,733 |
| Nutrien Ltd. 2,3 | 2,598 | 207,035 |
| 789,927 | ||
| Shares, Principal Amount, or Number of Contracts | Value | |
| China — 18.23% | ||
| Alibaba Group Holding Ltd. * | 40,200 | $573,276 |
| Autohome, Inc. - ADR 2 | 11,492 | 451,980 |
| BYD Co. Ltd. - H | 14,061 | 562,669 |
| Contemporary Amperex Technology Co. Ltd. - A | 3,508 | 279,831 |
| Galaxy Entertainment Group Ltd. | 54,000 | 322,068 |
| Huazhu Group Ltd. - ADR 2 | 9,260 | 352,806 |
| JD Health International, Inc. 4,* | 41,772 | 327,658 |
| JD.com, Inc. - A | 1,783 | 57,443 |
| JD.com, Inc. - ADR 2,3 | 5,687 | 365,219 |
| KE Holdings, Inc. - ADR 2,* | 14,125 | 253,544 |
| Kuaishou Technology 4,* | 38,300 | 426,597 |
| Li Ning Co. Ltd. | 33,684 | 312,080 |
| Meituan - B 4,* | 36,052 | 892,249 |
| Ping An Insurance Group Co. of China Ltd. - H | 52,000 | 353,545 |
| Postal Savings Bank of China Co. Ltd. - H 4 | 523,000 | 415,238 |
| Techtronic Industries Co. Ltd. | 13,000 | 135,603 |
| Tencent Holdings Ltd. | 24,653 | 1,113,450 |
| Vipshop Holdings Ltd. - ADR 2,* | 27,591 | 272,875 |
| Yum China Holdings, Inc. 2 | 6,214 | 301,379 |
| Yunnan Botanee Bio-Technology Group Co. Ltd. - A | 8,400 | 272,956 |
| Zhangzhou Pientzehuang Pharmaceutical Co. Ltd. - A | 4,972 | 264,951 |
| 8,307,417 | ||
| Czech Republic — 0.95% | ||
| Komercni banka A/S | 15,335 | 430,339 |
| France — 0.49% | ||
| L'Oreal SA | 651 | 224,654 |
| India — 8.06% | ||
| Apollo Hospitals Enterprise Ltd. | 4,666 | 217,635 |
| Asian Paints Ltd. | 8,053 | 274,836 |
| Bharti Airtel Ltd. * | 28,289 | 245,358 |
| HDFC Bank Ltd. - ADR 2,3 | 11,267 | 619,234 |
| Housing Development Finance Corp. Ltd. | 16,751 | 460,463 |
| ICICI Bank Ltd. - SP ADR 2 | 34,466 | 611,427 |
| Power Grid Corp. of India Ltd. | 167,822 | 450,302 |
| Reliance Industries Ltd. | 24,096 | 791,982 |
| 3,671,237 | ||
| Indonesia — 2.23% | ||
| Bank Central Asia Tbk PT | 1,411,545 | 686,941 |
| Bank Negara Indonesia Persero Tbk PT | 623,800 | 328,701 |
| 1,015,642 | ||
| Shares, Principal Amount, or Number of Contracts | Value | |
| Japan — 0.72% | ||
| Tokyo Electron Ltd. | 1,000 | $326,504 |
| Mexico — 2.11% | ||
| America Movil SAB de CV - SP ADR - L 2 | 15,626 | 319,239 |
| Grupo Financiero Banorte SAB de CV - O | 114,871 | 642,060 |
| 961,299 | ||
| Netherlands — 0.92% | ||
| ASML Holding NV | 876 | 418,472 |
| Qatar — 1.13% | ||
| Qatar National Bank QPSC | 93,873 | 515,022 |
| Saudi Arabia — 3.71% | ||
| Nahdi Medical Co. * | 6,402 | 276,070 |
| Saudi Arabian Oil Co. 4 | 97,282 | 1,005,981 |
| Saudi Telecom Co. | 15,700 | 406,298 |
| 1,688,349 | ||
| South Africa — 0.54% | ||
| MTN Group Ltd. | 30,240 | 245,433 |
| South Korea — 9.22% | ||
| Hankook Tire & Technology Co. Ltd. | 12,863 | 326,429 |
| Hyundai Mipo Dockyard Co. Ltd. * | 6,007 | 421,471 |
| KB Financial Group, Inc. | 8,371 | 310,431 |
| Kia Corp. | 6,212 | 369,830 |
| LEENO Industrial, Inc. | 2,632 | 263,524 |
| Macquarie Korea Infrastructure Fund | 44,563 | 429,019 |
| Samsung Card Co. Ltd. | 14,533 | 341,387 |
| Samsung Electronics Co. Ltd. | 39,540 | 1,735,813 |
| SK Innovation Co. Ltd. * | 21 | 3,106 |
| 4,201,010 | ||
| Taiwan — 8.55% | ||
| Chailease Holding Co. Ltd. | 35,700 | 250,339 |
| Delta Electronics, Inc. | 35,986 | 268,078 |
| Hon Hai Precision Industry Co. Ltd. | 121,103 | 443,951 |
| Sinbon Electronics Co. Ltd. | 40,136 | 342,864 |
| Taiwan Semiconductor Manufacturing Co. Ltd. | 161,668 | 2,588,124 |
| 3,893,356 | ||
| Thailand — 0.89% | ||
| Airports of Thailand PCL - NVDR * | 201,600 | 404,854 |
| United Arab Emirates — 2.01% | ||
| Air Arabia PJSC | 983,661 | 557,027 |
| Dubai Electricity & Water Authority PJSC * | 524,580 | 359,898 |
| 916,925 | ||
| Shares, Principal Amount, or Number of Contracts | Value | ||
| United States — 6.30% | |||
| EPAM System, Inc. * | 917 | $270,313 | |
| Liberty Media Corp.-Liberty Formula One - C 3,* | 6,877 | 436,483 | |
| MELI Kaszek Pioneer Corp. - A 3,* | 18,498 | 183,130 | |
| Newmont Corp. 3 | 15,210 | 907,581 | |
| PriceSmart, Inc. | 6,121 | 438,447 | |
| Samsonite International SA 4,* | 318,354 | 633,722 | |
| 2,869,676 | |||
| Uruguay — 0.47% | |||
| Globant SA 2,3,* | 1,232 | 214,368 | |
| Total COMMON STOCKS (Cost $29,771,481) | 32,892,739 | ||
| SHORT TERM INVESTMENTS — 6.79% | |||
| Northern Institutional U.S. Government Select Portfolio (Shares Class), 1.11% 5 (Cost $3,095,420) | 3,095,420 | 3,095,420 | |
| TOTAL INVESTMENTS (Cost $42,779,920) | 98.82% | $45,021,618 | |
| Other Assets in Excess of Liabilities | 1.18% | 539,197 | |
| Net Assets | 100.00% | $45,560,815 | |
| ADR | American Depositary Receipt |
| NVDR | Non-Voting Depositary Receipt |
| PCL | Public Company Limited |
| PJSC | Public Joint Stock Company |
| SP ADR | Sponsored American Depositary Receipt |
| 1 | Foreign security, par value shown in local currency. |
| 2 | Foreign security denominated and/or traded in U.S. dollars. |
| 3 | All or a portion of this security is pledged as collateral for short sales or derivatives transactions. |
| 4 | Security is exempt from registration under Rule 144A of the Securities Act of 1933, as amended. The total value of these securities is $3,701,445, which represents 8% of Net Assets. |
| 5 | 7 day current yield as of June 30, 2022 is disclosed. |
| * | Non-income producing security. |
| Security Type | Percent of Net Assets | |
| Sovereign Bonds | 19.83% | |
| Common Stocks | 72.20% | |
| Short Term Investments | 6.79% | |
| Total Investments | 98.82% | |
| Other Assets In Excess of Liabilities | 1.18% | |
| Net Assets | 100.00% |
| Regional Weightings | Percent of Net Assets | |
| Far East | 54.16% | |
| North America | 19.99% | |
| Middle East | 10.72% | |
| South America | 7.48% | |
| Europe | 4.18% | |
| Africa | 2.29% |
| Industry | Percent of Net Assets | |
| Airlines | 1.22 | |
| Auto Components | 0.72 | |
| Automobiles | 2.04 | |
| Banks | 10.65 | |
| Capital Markets | 0.94 | |
| Chemicals | 1.05 | |
| Consumer Finance | 0.75 | |
| Diversified Financial Services | 0.55 | |
| Diversified Telecommunication Services | 0.89 | |
| Electric Utilities | 0.99 | |
| Electrical Equipment | 0.61 | |
| Electronic Equipment, Instruments & Components | 2.32 | |
| Entertainment | 0.96 | |
| Food & Staples Retailing | 1.57 | |
| Food Products | 0.85 | |
| Health Care Providers & Services | 0.48 | |
| Holding Companies - Diversified | 0.40 | |
| Hotels, Restaurants & Leisure | 2.14 | |
| Insurance | 0.78 | |
| Interactive Media & Services | 4.37 |
| Industry | Percent of Net Assets | |
| Internet & Direct Marketing Retail | 5.47 | |
| IT Services | 1.07 | |
| Machinery | 1.22 | |
| Metals & Mining | 3.30 | |
| Money Market Fund | 6.79 | |
| Multi-Utilities | 0.79 | |
| Oil, Gas & Consumable Fuels | 5.94 | |
| Personal Products | 1.09 | |
| Pharmaceuticals | 0.58 | |
| Real Estate Management & Development | 1.00 | |
| Semiconductors & Semiconductor Equipment | 7.90 | |
| Sovereign Bonds | 19.83 | |
| Technology Hardware, Storage & Peripherals | 3.81 | |
| Textiles, Apparel & Luxury Goods | 2.07 | |
| Thrifts & Mortgage Finance | 1.01 | |
| Transportation Infrastructure | 0.89 | |
| Wireless Telecommunication Services | 1.78 | |
| Other Assets In Excess of Liabilities | 1.18 | |
| TOTAL | 100.00 |
| Average Annual Total Returns as of 6/30/22 | 1 Year | 3 Years | 5 Years | 10 Years |
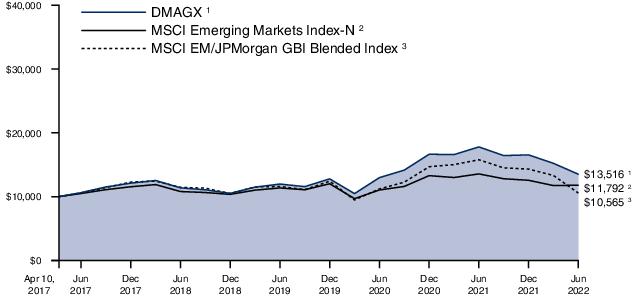
| Driehaus International Small Cap Growth Fund (DRIOX) | -28.59% | 5.34% | 5.56% | 8.81% |
| MSCI AC World ex USA Small Cap Growth Index-N1 | -27.34% | 2.84% | 2.97% | 6.31% |
| 1 | The Morgan Stanley Capital International All Country World ex USA Small Cap Growth Index-Net (MSCI AC World ex USA Small Cap Growth Index-N) is a market capitalization-weighted index designed to measure equity market performance in global developed markets and emerging markets, excluding the U.S., and is composed of stocks which are categorized as small capitalization growth stocks. Data is in U.S. dollars and is calculated with net dividend reinvestment. Source: Morgan Stanley Capital International Inc. |
| Shares, Principal Amount, or Number of Contracts | Value | |
| COMMON STOCKS — 96.19% | ||
| EUROPE — 59.31% | ||
| United Kingdom — 15.98% | ||
| Abcam PLC * | 323,862 | $4,644,115 |
| Auto Trader Group PLC 1 | 245,336 | 1,657,494 |
| Conduit Holdings Ltd. | 350,659 | 1,436,375 |
| ConvaTec Group PLC 1 | 897,027 | 2,450,338 |
| Cranswick PLC | 27,417 | 1,023,269 |
| Electrocomponents PLC | 233,468 | 2,469,703 |
| Ergomed PLC * | 78,825 | 963,375 |
| Fevertree Drinks PLC | 62,524 | 928,548 |
| Halfords Group PLC | 580,832 | 1,010,370 |
| Marks & Spencer Group PLC * | 599,970 | 989,616 |
| OSB Group PLC | 659,219 | 3,853,448 |
| Pets at Home Group PLC | 247,452 | 925,358 |
| Serco Group PLC | 2,268,755 | 4,810,979 |
| Serica Energy PLC | 280,928 | 974,625 |
| Synthomer PLC | 671,234 | 1,838,460 |
| The Restaurant Group PLC * | 1,740,739 | 943,803 |
| WH Smith PLC * | 151,391 | 2,591,093 |
| Yellow Cake PLC 1,* | 284,724 | 1,126,432 |
| 34,637,401 | ||
| France — 7.88% | ||
| Coface SA | 162,897 | 1,701,104 |
| Edenred | 37,018 | 1,744,522 |
| IPSOS | 96,909 | 4,600,477 |
| JCDecaux SA * | 112,476 | 1,889,444 |
| Lectra | 28,446 | 1,043,350 |
| Rexel SA * | 94,317 | 1,450,470 |
| Virbac SA | 8,795 | 3,424,012 |
| Waga Energy SA * | 37,051 | 1,219,186 |
| 17,072,565 | ||
| Germany — 7.10% | ||
| Befesa SA 1 | 30,079 | 1,462,588 |
| GFT Technologies SE | 68,906 | 2,733,150 |
| Hornbach Holding AG & Co. KGaA | 18,422 | 1,513,538 |
| HUGO BOSS AG | 44,711 | 2,359,612 |
| Ibu-Tec Advanced Materials AG * | 24,631 | 628,524 |
| Rheinmetall AG | 21,289 | 4,914,851 |
| SUESS MicroTec SE | 125,339 | 1,773,211 |
| 15,385,474 | ||
| Italy — 4.47% | ||
| FinecoBank Banca Fineco SpA | 87,301 | 1,044,783 |
| Intercos SpA * | 145,380 | 1,910,481 |
| Leonardo SpA | 398,656 | 4,043,193 |
| Saras SpA * | 820,054 | 1,191,954 |
| Seco SpA * | 224,672 | 1,490,367 |
| 9,680,778 | ||
| Netherlands — 3.95% | ||
| Corbion NV | 44,482 | 1,345,306 |
| Fugro NV * | 240,093 | 3,029,330 |
| Shares, Principal Amount, or Number of Contracts | Value | |
| OCI NV | 126,914 | $4,186,825 |
| 8,561,461 | ||
| Denmark — 3.87% | ||
| ISS A/S * | 168,325 | 2,653,812 |
| Matas A/S | 122,353 | 1,276,531 |
| Ossur HF * | 408,327 | 1,725,921 |
| Royal Unibrew A/S | 30,793 | 2,726,338 |
| 8,382,602 | ||
| Finland — 3.06% | ||
| Huhtamaki OYJ | 64,599 | 2,558,929 |
| Metso Outotec OYJ | 544,292 | 4,078,294 |
| 6,637,223 | ||
| Switzerland — 2.83% | ||
| Belimo Holding AG | 4,948 | 1,741,505 |
| Flughafen Zurich AG * | 13,596 | 2,055,102 |
| Siegfried Holding AG * | 1,402 | 895,846 |
| Tecan Group AG | 4,975 | 1,444,582 |
| 6,137,035 | ||
| Sweden — 2.63% | ||
| Hexatronic Group AB | 429,900 | 3,202,266 |
| Kindred Group PLC | 172,991 | 1,438,414 |
| Note AB * | 55,638 | 1,051,872 |
| 5,692,552 | ||
| Austria — 2.15% | ||
| BAWAG Group AG 1,* | 51,044 | 2,148,221 |
| DO & CO AG * | 30,134 | 2,510,524 |
| 4,658,745 | ||
| Norway — 1.58% | ||
| Aker Solutions ASA | 1,018,303 | 2,766,560 |
| SmartCraft ASA * | 404,795 | 657,555 |
| 3,424,115 | ||
| Spain — 1.44% | ||
| Indra Sistemas SA * | 326,709 | 3,124,169 |
| Ireland — 1.21% | ||
| Glanbia PLC | 236,376 | 2,619,536 |
| Belgium — 1.16% | ||
| Lotus Bakeries NV | 460 | 2,525,979 |
| Total EUROPE (Cost $145,393,690) | 128,539,635 | |
| FAR EAST — 18.25% | ||
| Japan — 15.62% | ||
| Asics Corp. | 197,900 | 3,577,894 |
| Azbil Corp. | 59,500 | 1,563,366 |
| Capcom Co. Ltd. | 69,200 | 1,680,528 |
| Fujitec Co. Ltd. | 52,850 | 1,170,506 |
| Fukuoka Financial Group, Inc. | 86,000 | 1,549,116 |
| IHI Corp. | 60,700 | 1,623,976 |
| Koito Manufacturing Co. Ltd. | 64,000 | 2,030,660 |
| MINEBEA MITSUMI, Inc. | 77,554 | 1,320,384 |
| MonotaRO Co. Ltd. | 196,390 | 2,918,059 |
| Morinaga & Co. Ltd. | 57,900 | 1,856,316 |
| Nichias Corp. | 64,530 | 1,072,963 |
| Shares, Principal Amount, or Number of Contracts | Value | |
| Shibaura Machine Co. Ltd. | 110,000 | $2,141,141 |
| Sundrug Co. Ltd. | 63,400 | 1,415,846 |
| Takeuchi Manufacturing Co. Ltd. | 55,800 | 954,539 |
| Tokai Carbon Co. Ltd. | 164,500 | 1,253,634 |
| Toyo Tire Corp. | 163,400 | 2,040,091 |
| Visional, Inc. * | 47,800 | 2,145,504 |
| Yokogawa Electric Corp. | 213,800 | 3,531,293 |
| 33,845,816 | ||
| Australia — 1.52% | ||
| Cochlear Ltd. | 19,794 | 2,714,801 |
| Paladin Energy Ltd. * | 1,439,591 | 576,333 |
| 3,291,134 | ||
| Taiwan — 1.11% | ||
| Giant Manufacturing Co. Ltd. | 297,589 | 2,402,050 |
| Total FAR EAST (Cost $46,939,674) | 39,539,000 | |
| NORTH AMERICA — 16.30% | ||
| Canada — 14.73% | ||
| Boardwalk REIT | 53,074 | 1,726,802 |
| Cameco Corp. | 90,800 | 1,908,832 |
| Converge Technology Solutions Corp. * | 323,188 | 1,288,032 |
| Docebo, Inc. * | 37,466 | 1,076,070 |
| Empire Co. Ltd. - A | 53,400 | 1,644,896 |
| Ensign Energy Services, Inc. * | 420,000 | 1,099,596 |
| K92 Mining, Inc. * | 359,954 | 2,172,811 |
| Kinaxis, Inc. * | 38,811 | 4,189,851 |
| Major Drilling Group International, Inc. * | 270,633 | 1,898,552 |
| Pason Systems, Inc. | 278,900 | 3,161,242 |
| Precision Drilling Corp. * | 61,800 | 3,971,005 |
| TELUS International CDA, Inc. 2,* | 130,991 | 3,283,944 |
| Tidewater Renewables Ltd. * | 82,114 | 730,427 |
| Trican Well Service Ltd. * | 701,500 | 2,010,981 |
| Xenon Pharmaceuticals, Inc. 2,* | 57,716 | 1,755,721 |
| 31,918,762 | ||
| Mexico — 1.57% | ||
| Banco del Bajio SA 1 | 1,159,746 | 2,333,968 |
| GCC SAB de CV | 173,286 | 1,073,607 |
| 3,407,575 | ||
| Total NORTH AMERICA (Cost $40,895,863) | 35,326,337 | |
| SOUTH AMERICA — 2.33% | ||
| Brazil — 2.33% | ||
| Cyrela Brazil Realty SA Empreendimentos e Participacoes | 453,000 | 1,030,913 |
| Minerva SA | 496,400 | 1,255,832 |
| Sendas Distribuidora SA | 544,000 | 1,485,399 |
| Shares, Principal Amount, or Number of Contracts | Value | ||
| SLC Agricola SA | 150,900 | $1,274,740 | |
| 5,046,884 | |||
| Total SOUTH AMERICA (Cost $7,289,412) | 5,046,884 | ||
| Total COMMON STOCKS (Cost $240,518,639) | 208,451,856 | ||
| SHORT TERM INVESTMENTS — 2.58% | |||
| Northern Institutional U.S. Government Select Portfolio (Shares Class), 1.11% 3 (Cost $5,590,673) | 5,590,673 | 5,590,673 | |
| TOTAL INVESTMENTS (Cost $246,109,312) | 98.77% | $214,042,529 | |
| Other Assets In Excess of Liabilities | 1.23% | 2,663,912 | |
| Net Assets | 100.00% | $216,706,441 | |
| PLC | Public Limited Company |
| REIT | Real Estate Investment Trust |
| 1 | Security is exempt from registration under Rule 144A of the Securities Act of 1933, as amended. The total value of these securities is $11,179,041, which represents 5% of Net Assets. |
| 2 | Foreign security denominated and/or traded in U.S. dollars. |
| 3 | 7 day current yield as of June 30, 2022 is disclosed. |
| * | Non-income producing security. |
| Security Type | Percent of Net Assets | |
| Common Stocks | 96.19% | |
| Short Term Investments | 2.58% | |
| Total Investments | 98.77% | |
| Other Assets In Excess of Liabilities | 1.23% | |
| Net Assets | 100.00% |
| Regional Weightings | Percent of Net Assets | |
| Europe | 59.31% | |
| North America | 18.88% | |
| Far East | 18.25% | |
| South America | 2.33% |
| Industry | Percent of Net Assets | |
| Aerospace & Defense | 4.14 | |
| Auto Components | 1.88 | |
| Banks | 3.26 | |
| Beverages | 1.69 | |
| Biotechnology | 2.95 | |
| Building Products | 1.29 | |
| Chemicals | 4.27 | |
| Commercial Services & Supplies | 5.27 | |
| Construction & Engineering | 1.40 | |
| Construction Materials | 0.49 | |
| Containers & Packaging | 1.18 | |
| Electrical Equipment | 1.48 | |
| Electronic Equipment, Instruments & Components | 2.84 | |
| Energy Equipment & Services | 6.01 | |
| Entertainment | 0.78 | |
| Food & Staples Retailing | 2.55 | |
| Food Products | 4.87 | |
| Health Care Equipment & Supplies | 3.18 | |
| Hotels, Restaurants & Leisure | 1.09 | |
| Household Durables | 0.48 | |
| Insurance | 1.45 | |
| Interactive Media & Services | 0.76 | |
| IT Services | 5.61 |
| Industry | Percent of Net Assets | |
| Leisure Products | 1.11 | |
| Life Sciences Tools & Services | 1.52 | |
| Machinery | 5.21 | |
| Media | 2.99 | |
| Metals & Mining | 1.88 | |
| Money Market Fund | 2.58 | |
| Oil, Gas & Consumable Fuels | 3.05 | |
| Personal Products | 0.88 | |
| Pharmaceuticals | 1.58 | |
| Professional Services | 0.99 | |
| Real Estate Investment Trusts (REITs) | 0.80 | |
| Semiconductors & Semiconductor Equipment | 0.82 | |
| Software | 3.21 | |
| Specialty Retail | 3.39 | |
| Technology Hardware, Storage & Peripherals | 0.69 | |
| Textiles, Apparel & Luxury Goods | 2.74 | |
| Thrifts & Mortgage Finance | 1.78 | |
| Trading Companies & Distributors | 3.68 | |
| Transportation Infrastructure | 0.95 | |
| Other Assets In Excess of Liabilities | 1.23 | |
| TOTAL | 100.00 |
| Fund Only | Including Predecessor Limited Partnership | |||||
| Average Annual Total Returns as of 6/30/22 | 1 Year | 3 Years | 5 Years | Since Inception (11/18/13 - 6/30/22) | 10 Years | |
| Driehaus Micro Cap Growth Fund (DMCRX)1 | -37.02% | 13.87% | 17.50% | 17.14% | 18.65% | |
| Russell Microcap® Growth Index2 | -43.98% | 0.07% | 1.58% | 7.48% | 7.02% | |
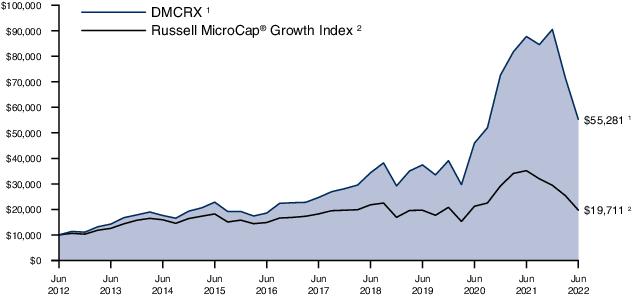
| 1 | The Driehaus Micro Cap Growth Fund (the “Fund”) performance shown above includes the performance of the Driehaus Micro Cap Fund, L.P. (the “Predecessor Limited Partnership”), one of the Fund’s predecessors, for the periods before the Fund’s registration statement became effective. The Predecessor Limited Partnership, which was established on July 1, 1996, was managed with substantially the same investment objective, policies and philosophies as are followed by the Fund. The Fund succeeded to the Predecessor Limited Partnership’s assets together with the assets of the Driehaus Institutional Micro Cap Fund, L.P. on November 18, 2013. The Predecessor Limited Partnership was not registered under the Investment Company Act of 1940, as amended (“1940 Act”), and thus was not subject to certain investment and operational restrictions that are imposed by the 1940 Act. If the Predecessor Limited Partnership had been registered under the 1940 Act, its performance may have been adversely affected. The Predecessor Limited Partnership’s performance has been restated to reflect estimated expenses of the Fund. The returns for periods prior to November 18, 2016, reflect fee waivers and/or reimbursements without which performance would have been lower. |
| 2 | The Russell Microcap® Growth Index measures the performance of the microcap growth segment of the U.S. equity market. It includes those Russell Microcap companies that are considered more growth oriented relative to the overall market as defined by FTSE Russell's leading style methodology. The Russell Microcap® Growth Index is constructed to provide a comprehensive and unbiased barometer for the microcap growth segment of the market. Data is calculated with net dividend reinvestment. Source: FTSE Russell. |
| Shares, Principal Amount, or Number of Contracts | Value | |
| COMMON STOCKS — 95.70% | ||
| HEALTH CARE — 28.36% | ||
| Biotechnology — 15.09% | ||
| Altimmune, Inc. * | 87,937 | $1,028,863 |
| Apellis Pharmaceuticals, Inc. * | 41,233 | 1,864,556 |
| Avid Bioservices, Inc. * | 83,514 | 1,274,424 |
| Biomea Fusion, Inc. * | 47,236 | 565,887 |
| C4 Therapeutics, Inc. * | 61,575 | 464,276 |
| Chinook Therapeutics, Inc. * | 47,247 | 826,350 |
| Crinetics Pharmaceuticals, Inc. * | 170,053 | 3,171,488 |
| Cytokinetics, Inc. * | 86,291 | 3,390,373 |
| Day One Biopharmaceuticals, Inc. * | 58,649 | 1,049,817 |
| Global Blood Therapeutics, Inc. * | 39,583 | 1,264,677 |
| Imago Biosciences, Inc. * | 41,175 | 551,333 |
| IVERIC bio, Inc. * | 130,387 | 1,254,323 |
| Merus NV 1,* | 82,777 | 1,874,071 |
| Morphic Holding, Inc. * | 14,587 | 316,538 |
| Nuvalent, Inc. - A * | 69,958 | 948,630 |
| Relay Therapeutics, Inc. * | 79,527 | 1,332,077 |
| SpringWorks Therapeutics, Inc. * | 39,833 | 980,689 |
| Vaxcyte, Inc. * | 46,464 | 1,011,057 |
| VectivBio Holding AG 1,* | 49,051 | 264,875 |
| Xenon Pharmaceuticals, Inc. 1,* | 132,449 | 4,029,099 |
| 27,463,403 | ||
| Health Care Equipment & Supplies — 6.11% | ||
| Alphatec Holdings, Inc. * | 160,754 | 1,051,331 |
| Cutera, Inc. * | 30,891 | 1,158,412 |
| Establishment Labs Holdings, Inc. 1,* | 14,075 | 765,399 |
| Lantheus Holdings, Inc. * | 39,787 | 2,627,136 |
| PROCEPT BioRobotics Corp. * | 55,964 | 1,829,463 |
| SeaSpine Holdings Corp. * | 101,765 | 574,972 |
| SI-BONE, Inc. * | 51,228 | 676,210 |
| TransMedics Group, Inc. * | 53,850 | 1,693,582 |
| Treace Medical Concepts, Inc. * | 52,438 | 751,961 |
| 11,128,466 | ||
| Health Care Providers & Services — 2.89% | ||
| AirSculpt Technologies, Inc. * | 154,267 | 914,803 |
| Cross Country Healthcare, Inc. * | 128,664 | 2,680,071 |
| PetIQ, Inc. * | 59,599 | 1,000,667 |
| RadNet, Inc. * | 38,773 | 669,998 |
| 5,265,539 | ||
| Health Care Technology — 2.39% | ||
| Inspire Medical Systems, Inc. * | 8,210 | 1,499,721 |
| OptimizeRx Corp. * | 52,969 | 1,450,821 |
| Phreesia, Inc. * | 56,016 | 1,400,960 |
| 4,351,502 | ||
| Shares, Principal Amount, or Number of Contracts | Value | |
| Pharmaceuticals — 1.58% | ||
| CinCor Pharma, Inc. * | 47,167 | $888,626 |
| DICE Therapeutics, Inc. * | 69,537 | 1,079,214 |
| Ventyx Biosciences, Inc. * | 74,302 | 908,714 |
| 2,876,554 | ||
| Life Sciences Tools & Services — 0.30% | ||
| Codexis, Inc. * | 51,453 | 538,199 |
| Total HEALTH CARE (Cost $52,758,624) | 51,623,663 | |
| INFORMATION TECHNOLOGY — 14.91% | ||
| IT Services — 5.09% | ||
| BigCommerce Holdings, Inc. * | 80,616 | 1,305,979 |
| Endava PLC - SP ADR 1,* | 13,297 | 1,173,726 |
| Flywire Corp. * | 70,102 | 1,235,898 |
| Grid Dynamics Holdings, Inc. * | 151,934 | 2,555,530 |
| I3 Verticals, Inc. - A * | 53,366 | 1,335,218 |
| International Money Express, Inc. * | 80,547 | 1,648,797 |
| 9,255,148 | ||
| Communications Equipment — 4.29% | ||
| Aviat Networks, Inc. * | 38,260 | 958,030 |
| Calix, Inc. * | 38,127 | 1,301,656 |
| Clearfield, Inc. * | 40,870 | 2,531,896 |
| Extreme Networks, Inc. * | 35,593 | 317,490 |
| Sierra Wireless, Inc. 1,* | 114,918 | 2,689,081 |
| 7,798,153 | ||
| Software — 2.91% | ||
| A10 Networks, Inc. | 51,752 | 744,194 |
| Agilysys, Inc. * | 9,020 | 426,375 |
| Alkami Technology, Inc. * | 64,786 | 899,878 |
| ChannelAdvisor Corp. * | 69,249 | 1,009,651 |
| Couchbase, Inc. * | 55,720 | 914,922 |
| Docebo, Inc. 1,* | 45,602 | 1,307,409 |
| 5,302,429 | ||
| Semiconductors & Semiconductor Equipment — 2.62% | ||
| Axcelis Technologies, Inc. * | 16,558 | 908,041 |
| Impinj, Inc. * | 42,137 | 2,472,178 |
| Photronics, Inc. * | 33,790 | 658,229 |
| SMART Global Holdings, Inc. * | 45,012 | 736,846 |
| 4,775,294 | ||
| Total INFORMATION TECHNOLOGY (Cost $25,982,241) | 27,131,024 | |
| CONSUMER DISCRETIONARY — 13.28% | ||
| Hotels, Restaurants & Leisure — 6.26% | ||
| Dave & Buster's Entertainment, Inc. * | 19,358 | 634,555 |
| Everi Holdings, Inc. * | 165,703 | 2,702,616 |
| Shares, Principal Amount, or Number of Contracts | Value | |
| Full House Resorts, Inc. * | 114,500 | $696,160 |
| Golden Entertainment, Inc. * | 23,017 | 910,322 |
| Kura Sushi USA, Inc. - A * | 33,288 | 1,648,755 |
| Monarch Casino & Resort, Inc. * | 8,935 | 524,216 |
| Playa Hotels & Resorts NV * | 376,798 | 2,588,602 |
| Xponential Fitness, Inc. - A * | 133,826 | 1,680,855 |
| 11,386,081 | ||
| Diversified Consumer Services — 2.28% | ||
| European Wax Center, Inc. - A | 121,765 | 2,145,499 |
| Stride, Inc. * | 49,126 | 2,003,850 |
| 4,149,349 | ||
| Specialty Retail — 1.95% | ||
| Arhaus, Inc. * | 46,459 | 209,066 |
| Boot Barn Holdings, Inc. * | 11,732 | 808,452 |
| Caleres, Inc. | 45,709 | 1,199,404 |
| Designer Brands, Inc. - A | 102,480 | 1,338,389 |
| 3,555,311 | ||
| Internet & Direct Marketing Retail — 1.35% | ||
| Liquidity Services, Inc. * | 63,505 | 853,507 |
| Xometry, Inc. - A * | 47,138 | 1,599,393 |
| 2,452,900 | ||
| Household Durables — 0.64% | ||
| Skyline Champion Corp. * | 22,929 | 1,087,293 |
| The Lovesac Co. * | 2,802 | 77,055 |
| 1,164,348 | ||
| Distributors — 0.44% | ||
| Funko, Inc. - A * | 36,261 | 809,345 |
| Auto Components — 0.36% | ||
| Gentherm, Inc. * | 10,595 | 661,234 |
| Total CONSUMER DISCRETIONARY (Cost $24,909,257) | 24,178,568 | |
| INDUSTRIALS — 12.11% | ||
| Machinery — 2.83% | ||
| Energy Recovery, Inc. * | 65,424 | 1,270,534 |
| The Greenbrier Cos., Inc. | 35,276 | 1,269,583 |
| The Shyft Group, Inc. | 56,822 | 1,056,321 |
| Titan International, Inc. * | 102,491 | 1,547,614 |
| 5,144,052 | ||
| Construction & Engineering — 2.42% | ||
| Dycom Industries, Inc. * | 21,560 | 2,005,942 |
| Infrastructure and Energy Alternatives, Inc. * | 40,052 | 321,618 |
| NV5 Global, Inc. * | 17,842 | 2,082,875 |
| 4,410,435 | ||
| Air Freight & Logistics — 1.74% | ||
| Air Transport Services Group, Inc. * | 70,085 | 2,013,542 |
| Shares, Principal Amount, or Number of Contracts | Value | |
| Forward Air Corp. | 12,513 | $1,150,696 |
| 3,164,238 | ||
| Aerospace & Defense — 1.58% | ||
| AAR Corp. * | 68,760 | 2,876,918 |
| Trading Companies & Distributors — 1.45% | ||
| H&E Equipment Services, Inc. | 19,939 | 577,633 |
| Karat Packaging, Inc. * | 71,750 | 1,224,055 |
| McGrath RentCorp | 10,923 | 830,148 |
| 2,631,836 | ||
| Commercial Services & Supplies — 1.00% | ||
| Montrose Environmental Group, Inc. * | 40,916 | 1,381,324 |
| Performant Financial Corp. * | 168,941 | 444,315 |
| 1,825,639 | ||
| Professional Services — 0.64% | ||
| HireRight Holdings Corp. * | 82,702 | 1,175,195 |
| Marine — 0.45% | ||
| Eagle Bulk Shipping, Inc. | 6,856 | 355,689 |
| Star Bulk Carriers Corp. 1 | 18,649 | 466,039 |
| 821,728 | ||
| Total INDUSTRIALS (Cost $22,346,167) | 22,050,041 | |
| CONSUMER STAPLES — 11.34% | ||
| Beverages — 4.50% | ||
| Celsius Holdings, Inc. * | 24,036 | 1,568,589 |
| MGP Ingredients, Inc. | 30,569 | 3,059,651 |
| The Duckhorn Portfolio, Inc. * | 127,012 | 2,674,873 |
| The Vita Coco Co., Inc. * | 91,038 | 891,262 |
| 8,194,375 | ||
| Personal Products — 2.92% | ||
| elf Beauty, Inc. * | 75,474 | 2,315,543 |
| The Beauty Health Co. * | 139,184 | 1,789,906 |
| Thorne HealthTech, Inc. * | 122,143 | 591,172 |
| Veru, Inc. * | 55,227 | 624,065 |
| 5,320,686 | ||
| Food Products — 2.66% | ||
| Sovos Brands, Inc. * | 155,684 | 2,470,705 |
| SunOpta, Inc. * | 224,329 | 1,745,280 |
| The Real Good Food Co., Inc. * | 87,720 | 616,671 |
| 4,832,656 | ||
| Food & Staples Retailing — 1.26% | ||
| The Chefs' Warehouse, Inc. * | 58,729 | 2,283,971 |
| Total CONSUMER STAPLES (Cost $18,632,262) | 20,631,688 | |
| ENERGY — 8.75% | ||
| Oil, Gas & Consumable Fuels — 7.56% | ||
| Civitas Resources, Inc. | 20,790 | 1,087,109 |
| Shares, Principal Amount, or Number of Contracts | Value | |
| Energy Fuels, Inc. * | 145,883 | $716,286 |
| Golar LNG Ltd. * | 112,199 | 2,552,527 |
| Green Plains, Inc. * | 67,803 | 1,842,207 |
| Matador Resources Co. | 64,767 | 3,017,494 |
| Ranger Oil Corp. - A * | 45,917 | 1,509,292 |
| Tellurian, Inc. * | 115,373 | 343,812 |
| Uranium Energy Corp. 1,* | 346,897 | 1,068,443 |
| Vertex Energy, Inc. * | 154,532 | 1,625,677 |
| 13,762,847 | ||
| Energy Equipment & Services — 1.19% | ||
| NexTier Oilfield Solutions, Inc. * | 128,428 | 1,221,350 |
| Patterson-UTI Energy, Inc. | 59,225 | 933,386 |
| 2,154,736 | ||
| Total ENERGY (Cost $15,079,596) | 15,917,583 | |
| FINANCIALS — 3.59% | ||
| Insurance — 2.46% | ||
| BRP Group, Inc. - A * | 74,884 | 1,808,448 |
| James River Group Holdings Ltd. | 30,851 | 764,488 |
| Palomar Holdings, Inc. * | 29,445 | 1,896,258 |
| 4,469,194 | ||
| Banks — 1.13% | ||
| Meta Financial Group, Inc. | 10,255 | 396,561 |
| Metropolitan Bank Holding Corp. * | 18,482 | 1,283,021 |
| Triumph Bancorp, Inc. * | 6,170 | 385,995 |
| 2,065,577 | ||
| Total FINANCIALS (Cost $5,905,304) | 6,534,771 | |
| MATERIALS — 2.69% | ||
| Metals & Mining — 2.37% | ||
| Allegheny Technologies, Inc. * | 101,345 | 2,301,545 |
| Carpenter Technology Corp. | 26,551 | 741,038 |
| TimkenSteel Corp. * | 68,122 | 1,274,563 |
| 4,317,146 | ||
| Chemicals — 0.32% | ||
| Aspen Aerogels, Inc. * | 59,052 | 583,434 |
| Total MATERIALS (Cost $5,665,195) | 4,900,580 | |
| Shares, Principal Amount, or Number of Contracts | Value | ||
| COMMUNICATION SERVICES — 0.67% | |||
| Media — 0.67% | |||
| Perion Network Ltd. 1,* | 66,749 | $1,213,497 | |
| Total COMMUNICATION SERVICES (Cost $767,614) | 1,213,497 | ||
| Total COMMON STOCKS (Cost $172,046,260) | 174,181,415 | ||
| WARRANTS — 0.02% | |||
| EQRx, Inc., Exp 12/31/2028, Strike $11.50 | 34,575 | 29,579 | |
| Total WARRANTS (Cost $0) | 29,579 | ||
| SHORT TERM INVESTMENTS — 4.02% | |||
| Northern Institutional U.S. Government Select Portfolio (Shares Class), 1.11% 2 (Cost $7,324,399) | 7,324,399 | 7,324,399 | |
| TOTAL INVESTMENTS (Cost $179,370,659) | 99.74% | $181,535,393 | |
| Other Assets In Excess of Liabilities | 0.26% | 477,609 | |
| Net Assets | 100.00% | $182,013,002 | |
| PLC | Public Limited Company |
| SP ADR | Sponsored American Depositary Receipt |
| 1 | Foreign security denominated and/or traded in U.S. dollars. |
| 2 | 7 day current yield as of June 30, 2022 is disclosed. |
| * | Non-income producing security. |
| Security Type | Percent of Net Assets | |
| Common Stocks | 95.70% | |
| Warrants | 0.02% | |
| Short Term Investments | 4.02% | |
| Total Investments | 99.74% | |
| Other Assets In Excess of Liabilities | 0.26% | |
| Net Assets | 100.00% |
| Industry | Percent of Net Assets | |
| Aerospace & Defense | 1.58 | |
| Air Freight & Logistics | 1.74 | |
| Auto Components | 0.36 | |
| Banks | 1.13 | |
| Beverages | 4.50 | |
| Biotechnology | 15.11 | |
| Chemicals | 0.32 | |
| Commercial Services & Supplies | 1.00 | |
| Communications Equipment | 4.29 | |
| Construction & Engineering | 2.42 | |
| Distributors | 0.44 | |
| Diversified Consumer Services | 2.28 | |
| Energy Equipment & Services | 1.19 | |
| Food & Staples Retailing | 1.26 | |
| Food Products | 2.66 | |
| Health Care Equipment & Supplies | 6.11 | |
| Health Care Providers & Services | 2.89 | |
| Health Care Technology | 2.39 | |
| Hotels, Restaurants & Leisure | 6.26 | |
| Household Durables | 0.64 |
| Industry | Percent of Net Assets | |
| Insurance | 2.46 | |
| Internet & Direct Marketing Retail | 1.35 | |
| IT Services | 5.09 | |
| Life Sciences Tools & Services | 0.30 | |
| Machinery | 2.83 | |
| Marine | 0.45 | |
| Media | 0.67 | |
| Metals & Mining | 2.37 | |
| Money Market Fund | 4.02 | |
| Oil, Gas & Consumable Fuels | 7.56 | |
| Personal Products | 2.92 | |
| Pharmaceuticals | 1.58 | |
| Professional Services | 0.64 | |
| Semiconductors & Semiconductor Equipment | 2.62 | |
| Software | 2.91 | |
| Specialty Retail | 1.95 | |
| Trading Companies & Distributors | 1.45 | |
| Other Assets In Excess of Liabilities | 0.26 | |
| TOTAL | 100.00 |
| Fund Only | Including Predecessor Limited Partnership | |||||
| Average Annual Total Returns as of 6/30/22 | 1 Year | 3 Years | Since Inception (8/21/17 - 6/30/22) | 5 Years | 10 Years | |
| Driehaus Small Cap Growth Fund Investor Class (DVSMX)1 | -33.03% | 9.54% | 17.08% | 15.78% | 16.29% | |
| Driehaus Small Cap Growth Fund Institutional Class (DNSMX)1 | -32.88% | 9.85% | 17.40% | 16.08% | 16.44% | |
| Russell 2000® Growth Index2 | -33.43% | 1.40% | 5.66% | 4.80% | 9.30% | |
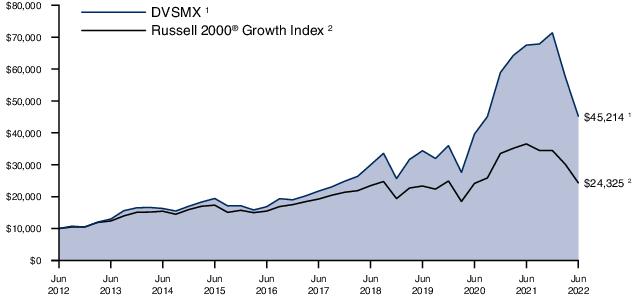
| 1 | The Driehaus Small Cap Growth Fund (“the Fund”) performance shown above includes the performance of the Driehaus Institutional Small Cap, L.P. (the “Predecessor Partnership”), one of the Fund’s predecessors, for the periods before the Fund’s registration statement became effective. The Predecessor Partnership was managed by the same investment team with substantially the same investment objective, policies and philosophies as are followed by the Fund. The Fund succeeded to the Predecessor Partnership’s assets together with the assets of the Driehaus Institutional Small Cap Recovery Fund, L.P., Driehaus Small Cap Recovery Fund, L.P. and Driehaus Small Cap Investors, L.P. (together, the “Limited Partnerships”) on August 21, 2017. The investment portfolios of the Limited Partnerships were identical and therefore had similar performance. The performance of the Predecessor Partnership is shown here because it has been in operation the longest. The Predecessor Partnership was not registered under the Investment Company Act of 1940, as amended (“1940 Act”), and thus was not subject to certain investment and operational restrictions that are imposed by the 1940 Act. If the Predecessor Partnership had been registered under the 1940 Act, its performance may have been adversely affected. The Predecessor Partnership’s performance has not been restated to reflect estimated expenses applicable to each class of shares of the Fund. The returns reflect fee waivers and/or reimbursements without which performance would have been lower. |
| 2 | The Russell 2000® Growth Index measures the performance of the small cap growth segment of the US Equity universe. It includes those Russell 2000® companies with higher price-value ratio and higher forecasted growth values. The Russell 2000® Index is constructed to provide a comprehensive and unbiased barometer for the small cap growth segment of the market. Data is calculated with net dividend reinvestment. Source: FTSE Russell. |
| Shares, Principal Amount, or Number of Contracts | Value | |
| COMMON STOCKS — 96.69% | ||
| HEALTH CARE — 22.81% | ||
| Biotechnology — 11.17% | ||
| Apellis Pharmaceuticals, Inc. * | 93,862 | $4,244,440 |
| Crinetics Pharmaceuticals, Inc. * | 225,071 | 4,197,574 |
| Cytokinetics, Inc. * | 209,402 | 8,227,405 |
| Galapagos NV - SP ADR 1,* | 75,339 | 4,203,916 |
| Global Blood Therapeutics, Inc. * | 69,645 | 2,225,158 |
| Halozyme Therapeutics, Inc. * | 204,314 | 8,989,816 |
| Merus NV 1,* | 88,735 | 2,008,960 |
| Nuvalent, Inc. - A * | 136,651 | 1,852,988 |
| Relay Therapeutics, Inc. * | 222,091 | 3,720,024 |
| SpringWorks Therapeutics, Inc. * | 98,394 | 2,422,460 |
| Xenon Pharmaceuticals, Inc. 1,* | 261,194 | 7,945,521 |
| 50,038,262 | ||
| Health Care Equipment & Supplies — 5.74% | ||
| AtriCure, Inc. * | 51,097 | 2,087,823 |
| Inari Medical, Inc. * | 61,741 | 4,197,771 |
| Lantheus Holdings, Inc. * | 123,482 | 8,153,516 |
| PROCEPT BioRobotics Corp. * | 65,529 | 2,142,143 |
| Shockwave Medical, Inc. * | 34,646 | 6,623,276 |
| STAAR Surgical Co. * | 35,113 | 2,490,565 |
| 25,695,094 | ||
| Health Care Technology — 2.26% | ||
| Allscripts Healthcare Solutions, Inc. * | 211,750 | 3,140,253 |
| Inspire Medical Systems, Inc. * | 38,282 | 6,992,973 |
| 10,133,226 | ||
| Pharmaceuticals — 2.15% | ||
| DICE Therapeutics, Inc. * | 151,600 | 2,352,832 |
| Intra-Cellular Therapies, Inc. * | 79,417 | 4,533,122 |
| Pacira BioSciences, Inc. * | 47,171 | 2,750,069 |
| 9,636,023 | ||
| Health Care Providers & Services — 1.49% | ||
| AMN Healthcare Services, Inc. * | 60,857 | 6,676,622 |
| Total HEALTH CARE (Cost $100,484,914) | 102,179,227 | |
| INDUSTRIALS — 17.83% | ||
| Professional Services — 4.33% | ||
| Exponent, Inc. | 24,987 | 2,285,561 |
| FTI Consulting, Inc. * | 48,307 | 8,736,321 |
| KBR, Inc. | 173,153 | 8,378,874 |
| 19,400,756 | ||
| Machinery — 3.12% | ||
| Chart Industries, Inc. * | 58,168 | 9,736,160 |
| Evoqua Water Technologies Corp. * | 84,720 | 2,754,247 |
| Shares, Principal Amount, or Number of Contracts | Value | |
| The Shyft Group, Inc. | 80,857 | $1,503,132 |
| 13,993,539 | ||
| Construction & Engineering — 3.10% | ||
| Fluor Corp. * | 245,639 | 5,978,853 |
| WillScot Mobile Mini Holdings Corp. * | 243,795 | 7,903,834 |
| 13,882,687 | ||
| Trading Companies & Distributors — 2.72% | ||
| Applied Industrial Technologies, Inc. | 20,063 | 1,929,459 |
| Core & Main, Inc. - A * | 240,765 | 5,369,059 |
| Triton International Ltd. | 43,623 | 2,296,751 |
| Univar Solutions, Inc. * | 104,202 | 2,591,504 |
| 12,186,773 | ||
| Aerospace & Defense — 1.50% | ||
| AAR Corp. * | 128,962 | 5,395,770 |
| Axon Enterprise, Inc. * | 14,154 | 1,318,728 |
| 6,714,498 | ||
| Commercial Services & Supplies — 1.47% | ||
| Casella Waste Systems, Inc. - A * | 30,921 | 2,247,338 |
| Ritchie Bros Auctioneers, Inc. 1 | 17,584 | 1,144,015 |
| Tetra Tech, Inc. | 23,383 | 3,192,949 |
| 6,584,302 | ||
| Marine — 0.92% | ||
| Kirby Corp. * | 68,180 | 4,148,071 |
| Electrical Equipment — 0.67% | ||
| Atkore, Inc. * | 36,047 | 2,992,261 |
| Total INDUSTRIALS (Cost $82,811,689) | 79,902,887 | |
| INFORMATION TECHNOLOGY — 13.94% | ||
| Software — 9.13% | ||
| Braze, Inc. - A * | 111,769 | 4,049,391 |
| Clear Secure, Inc. - A * | 113,432 | 2,268,640 |
| CyberArk Software Ltd. 1,* | 27,903 | 3,570,468 |
| Docebo, Inc. 1,* | 69,468 | 1,991,647 |
| EngageSmart, Inc. * | 88,622 | 1,425,042 |
| Five9, Inc. * | 62,183 | 5,667,359 |
| Gitlab, Inc. - A * | 79,923 | 4,247,108 |
| Monday.com Ltd. 1,* | 20,303 | 2,094,457 |
| nCino, Inc. * | 71,855 | 2,221,757 |
| Paylocity Holding Corp. * | 31,363 | 5,470,334 |
| Sprout Social, Inc. - A * | 68,981 | 4,005,727 |
| Tenable Holdings, Inc. * | 85,970 | 3,903,898 |
| 40,915,828 | ||
| IT Services — 2.63% | ||
| DigitalOcean Holdings, Inc. * | 115,124 | 4,761,529 |
| Endava PLC - SP ADR 1,* | 42,385 | 3,741,324 |
| Shares, Principal Amount, or Number of Contracts | Value | |
| Flywire Corp. * | 186,701 | $3,291,538 |
| 11,794,391 | ||
| Semiconductors & Semiconductor Equipment — 1.62% | ||
| Ambarella, Inc. * | 41,098 | 2,690,275 |
| Axcelis Technologies, Inc. * | 40,492 | 2,220,581 |
| Impinj, Inc. * | 39,519 | 2,318,580 |
| 7,229,436 | ||
| Communications Equipment — 0.56% | ||
| Calix, Inc. * | 73,849 | 2,521,205 |
| Total INFORMATION TECHNOLOGY (Cost $66,697,666) | 62,460,860 | |
| CONSUMER DISCRETIONARY — 11.56% | ||
| Hotels, Restaurants & Leisure — 3.28% | ||
| Dave & Buster's Entertainment, Inc. * | 46,754 | 1,532,596 |
| Everi Holdings, Inc. * | 201,208 | 3,281,703 |
| Krispy Kreme, Inc. | 211,334 | 2,874,142 |
| Playa Hotels & Resorts NV * | 615,681 | 4,229,728 |
| Xponential Fitness, Inc. - A * | 220,223 | 2,766,001 |
| 14,684,170 | ||
| Specialty Retail — 1.90% | ||
| Boot Barn Holdings, Inc. * | 37,764 | 2,602,317 |
| Murphy USA, Inc. | 16,502 | 3,842,821 |
| Petco Health & Wellness Co., Inc. * | 141,765 | 2,089,616 |
| 8,534,754 | ||
| Auto Components — 1.81% | ||
| Gentherm, Inc. * | 43,598 | 2,720,951 |
| Visteon Corp. * | 51,842 | 5,369,795 |
| 8,090,746 | ||
| Diversified Consumer Services — 1.32% | ||
| Duolingo, Inc. * | 34,923 | 3,057,509 |
| European Wax Center, Inc. - A | 161,688 | 2,848,942 |
| 5,906,451 | ||
| Multiline Retail — 1.21% | ||
| Ollie's Bargain Outlet Holdings, Inc. * | 92,473 | 5,432,789 |
| Leisure Products — 0.81% | ||
| Callaway Golf Co. * | 179,011 | 3,651,824 |
| Internet & Direct Marketing Retail — 0.63% | ||
| Xometry, Inc. - A * | 83,218 | 2,823,587 |
| Household Durables — 0.60% | ||
| Skyline Champion Corp. * | 56,274 | 2,668,513 |
| Total CONSUMER DISCRETIONARY (Cost $60,905,028) | 51,792,834 | |
| Shares, Principal Amount, or Number of Contracts | Value | |
| CONSUMER STAPLES — 9.13% | ||
| Beverages — 4.38% | ||
| Celsius Holdings, Inc. * | 98,798 | $6,447,557 |
| MGP Ingredients, Inc. | 67,107 | 6,716,740 |
| The Duckhorn Portfolio, Inc. * | 307,115 | 6,467,842 |
| 19,632,139 | ||
| Food & Staples Retailing — 1.84% | ||
| Grocery Outlet Holding Corp. * | 140,426 | 5,986,361 |
| Performance Food Group Co. * | 48,585 | 2,233,938 |
| 8,220,299 | ||
| Food Products — 1.69% | ||
| Freshpet, Inc. * | 32,411 | 1,681,807 |
| Hostess Brands, Inc. * | 166,158 | 3,524,211 |
| The Simply Good Foods Co. * | 62,764 | 2,370,596 |
| 7,576,614 | ||
| Personal Products — 1.22% | ||
| elf Beauty, Inc. * | 46,482 | 1,426,068 |
| The Beauty Health Co. * | 313,491 | 4,031,494 |
| 5,457,562 | ||
| Total CONSUMER STAPLES (Cost $41,685,140) | 40,886,614 | |
| ENERGY — 7.24% | ||
| Oil, Gas & Consumable Fuels — 5.59% | ||
| Cameco Corp. 1 | 297,039 | 6,243,760 |
| Civitas Resources, Inc. | 34,772 | 1,818,228 |
| Excelerate Energy, Inc. - A * | 84,708 | 1,687,383 |
| Golar LNG Ltd. * | 191,789 | 4,363,200 |
| Magnolia Oil & Gas Corp. - A | 194,107 | 4,074,306 |
| Matador Resources Co. | 103,899 | 4,840,654 |
| Southwestern Energy Co. * | 321,319 | 2,008,244 |
| 25,035,775 | ||
| Energy Equipment & Services — 1.65% | ||
| Helmerich & Payne, Inc. | 54,683 | 2,354,650 |
| Patterson-UTI Energy, Inc. | 155,312 | 2,447,717 |
| ProFrac Holding Corp. - A * | 141,954 | 2,599,178 |
| 7,401,545 | ||
| Total ENERGY (Cost $30,389,152) | 32,437,320 | |
| MATERIALS — 6.33% | ||
| Metals & Mining — 2.85% | ||
| Allegheny Technologies, Inc. * | 246,396 | 5,595,653 |
| MP Materials Corp. * | 223,518 | 7,170,458 |
| 12,766,111 | ||
| Chemicals — 2.73% | ||
| Aspen Aerogels, Inc. * | 122,611 | 1,211,396 |
| Cabot Corp. | 67,158 | 4,284,009 |
| Shares, Principal Amount, or Number of Contracts | Value | |
| Livent Corp. * | 296,862 | $6,735,799 |
| 12,231,204 | ||
| Containers & Packaging — 0.75% | ||
| O-I Glass, Inc. * | 239,742 | 3,356,388 |
| Total MATERIALS (Cost $32,415,642) | 28,353,703 | |
| FINANCIALS — 4.27% | ||
| Insurance — 3.85% | ||
| Kinsale Capital Group, Inc. | 48,850 | 11,217,914 |
| RLI Corp. | 51,804 | 6,039,829 |
| 17,257,743 | ||
| Banks — 0.42% | ||
| Triumph Bancorp, Inc. * | 29,722 | 1,859,408 |
| Total FINANCIALS (Cost $17,449,157) | 19,117,151 | |
| COMMUNICATION SERVICES — 2.87% | ||
| Media — 1.41% | ||
| Nexstar Media Group, Inc. - A | 38,711 | 6,305,248 |
| Interactive Media & Services — 0.92% | ||
| Bumble, Inc. - A * | 89,493 | 2,519,228 |
| Cargurus, Inc. * | 75,541 | 1,623,376 |
| 4,142,604 | ||
| Entertainment — 0.54% | ||
| World Wrestling Entertainment, Inc. - A | 38,560 | 2,409,614 |
| Total COMMUNICATION SERVICES (Cost $14,572,264) | 12,857,466 | |
| REAL ESTATE — 0.71% | ||
| Equity Real Estate Investment Trusts — 0.71% | ||
| Ryman Hospitality Properties, Inc. * | 42,120 | 3,202,383 |
| Total REAL ESTATE (Cost $3,785,409) | 3,202,383 | |
| Total COMMON STOCKS (Cost $451,196,061) | 433,190,445 | |
| Shares, Principal Amount, or Number of Contracts | Value | ||
| SHORT TERM INVESTMENTS — 6.03% | |||
| Northern Institutional U.S. Government Select Portfolio (Shares Class), 1.11% 2 (Cost $27,039,918) | 27,039,918 | $27,039,918 | |
| TOTAL INVESTMENTS (Cost $478,235,979) | 102.72% | $460,230,363 | |
| Liabilities In Excess of Other Assets | (2.72)% | (12,205,873) | |
| Net Assets | 100.00% | $448,024,490 | |
| PLC | Public Limited Company |
| SP ADR | Sponsored American Depositary Receipt |
| 1 | Foreign security denominated and/or traded in U.S. dollars. |
| 2 | 7 day current yield as of June 30, 2022 is disclosed. |
| * | Non-income producing security. |
| Security Type | Percent of Net Assets | |
| Common Stocks | 96.69% | |
| Short Term Investments | 6.03% | |
| Total Investments | 102.72% | |
| Liabilities In Excess of Other Assets | (2.72)% | |
| Net Assets | 100.00% |
| Industry | Percent of Net Assets | |
| Aerospace & Defense | 1.50 | |
| Auto Components | 1.81 | |
| Banks | 0.42 | |
| Beverages | 4.38 | |
| Biotechnology | 11.17 | |
| Chemicals | 2.73 | |
| Commercial Services & Supplies | 1.47 | |
| Communications Equipment | 0.56 | |
| Construction & Engineering | 3.10 | |
| Containers & Packaging | 0.75 | |
| Diversified Consumer Services | 1.32 | |
| Electrical Equipment | 0.67 | |
| Energy Equipment & Services | 1.65 | |
| Entertainment | 0.54 | |
| Equity Real Estate Investment Trusts | 0.71 | |
| Food & Staples Retailing | 1.84 | |
| Food Products | 1.69 | |
| Health Care Equipment & Supplies | 5.74 | |
| Health Care Providers & Services | 1.49 | |
| Health Care Technology | 2.26 | |
| Hotels, Restaurants & Leisure | 3.28 | |
| Household Durables | 0.60 |
| Industry | Percent of Net Assets | |
| Insurance | 3.85 | |
| Interactive Media & Services | 0.92 | |
| Internet & Direct Marketing Retail | 0.63 | |
| IT Services | 2.63 | |
| Leisure Products | 0.81 | |
| Machinery | 3.12 | |
| Marine | 0.92 | |
| Media | 1.41 | |
| Metals & Mining | 2.85 | |
| Money Market Fund | 6.03 | |
| Multiline Retail | 1.21 | |
| Oil, Gas & Consumable Fuels | 5.59 | |
| Personal Products | 1.22 | |
| Pharmaceuticals | 2.15 | |
| Professional Services | 4.33 | |
| Semiconductors & Semiconductor Equipment | 1.62 | |
| Software | 9.13 | |
| Specialty Retail | 1.90 | |
| Trading Companies & Distributors | 2.72 | |
| Liabilities In Excess of Other Assets | (2.72) | |
| TOTAL | 100.00 |
| Average Annual Total Returns as of 6/30/22 | 1 Year | Since Inception (5/1/20 - 6/30/22) |
| Driehaus Small/Mid Cap Growth Fund (DSMDX)1 | -29.43% | 16.48% |
| Russell 2500® Growth Index2 | -31.81% | 7.45% |
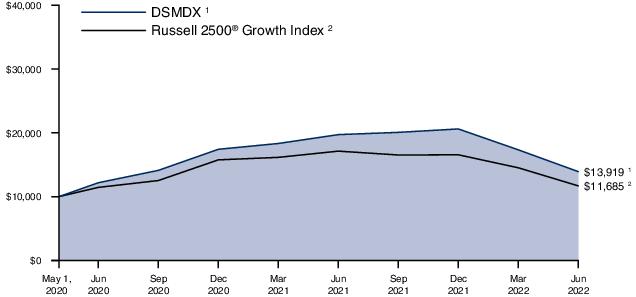
| 1 | The returns for the period reflect fee waivers and/or reimbursements without which performance would have been lower. |
| 2 | The Russell 2500® Growth Index measures the performance of the small to midcap growth segment of the US Equity universe. It measures the performance of those Russell 2500® Index companies with higher growth earning potential as defined by FTSE Russell’s leading style methodology. The Russell 2500® Growth Index is constructed to provide a comprehensive and unbiased barometer for the small to midcap growth segment of the market. Data is calculated with net dividend reinvestment. Source: FTSE Russell. |
| Shares, Principal Amount, or Number of Contracts | Value | |
| COMMON STOCKS — 94.79% | ||
| INDUSTRIALS — 19.16% | ||
| Professional Services — 5.29% | ||
| CACI International, Inc. - A * | 520 | $146,526 |
| Exponent, Inc. | 765 | 69,974 |
| FTI Consulting, Inc. * | 1,376 | 248,850 |
| KBR, Inc. | 4,404 | 213,109 |
| 678,459 | ||
| Construction & Engineering — 4.19% | ||
| Quanta Services, Inc. | 2,383 | 298,685 |
| WillScot Mobile Mini Holdings Corp. * | 7,352 | 238,352 |
| 537,037 | ||
| Machinery — 2.64% | ||
| Chart Industries, Inc. * | 1,642 | 274,838 |
| Westinghouse Air Brake Technologies Corp. | 783 | 64,269 |
| 339,107 | ||
| Trading Companies & Distributors — 1.92% | ||
| Core & Main, Inc. - A * | 8,312 | 185,358 |
| Univar Solutions, Inc. * | 2,473 | 61,503 |
| 246,861 | ||
| Building Products — 1.91% | ||
| Carlisle Cos., Inc. | 1,024 | 244,337 |
| Aerospace & Defense — 1.53% | ||
| Axon Enterprise, Inc. * | 463 | 43,138 |
| Curtiss-Wright Corp. | 1,161 | 153,321 |
| 196,459 | ||
| Commercial Services & Supplies — 0.88% | ||
| Tetra Tech, Inc. | 823 | 112,381 |
| Marine — 0.80% | ||
| Kirby Corp. * | 1,680 | 102,211 |
| Total INDUSTRIALS (Cost $2,385,983) | 2,456,852 | |
| HEALTH CARE — 18.60% | ||
| Biotechnology — 10.20% | ||
| Alnylam Pharmaceuticals, Inc. * | 658 | 95,969 |
| Argenx SE - ADR 1,* | 430 | 162,918 |
| Ascendis Pharma A/S - ADR 1,* | 661 | 61,447 |
| Crinetics Pharmaceuticals, Inc. * | 3,453 | 64,398 |
| Galapagos NV - SP ADR 1,* | 2,062 | 115,060 |
| Halozyme Therapeutics, Inc. * | 4,637 | 204,028 |
| Horizon Therapeutics PLC * | 961 | 76,649 |
| Neurocrine Biosciences, Inc. * | 1,068 | 104,109 |
| Relay Therapeutics, Inc. * | 4,883 | 81,790 |
| SpringWorks Therapeutics, Inc. * | 2,780 | 68,444 |
| United Therapeutics Corp. * | 432 | 101,796 |
| Shares, Principal Amount, or Number of Contracts | Value | |
| Xenon Pharmaceuticals, Inc. 1,* | 5,625 | $171,113 |
| 1,307,721 | ||
| Health Care Equipment & Supplies — 2.67% | ||
| Inari Medical, Inc. * | 1,567 | 106,540 |
| Insulet Corp. * | 266 | 57,972 |
| Shockwave Medical, Inc. * | 933 | 178,362 |
| 342,874 | ||
| Health Care Technology — 1.92% | ||
| Allscripts Healthcare Solutions, Inc. * | 3,438 | 50,986 |
| Inspire Medical Systems, Inc. * | 1,069 | 195,274 |
| 246,260 | ||
| Health Care Providers & Services — 1.47% | ||
| AMN Healthcare Services, Inc. * | 1,712 | 187,824 |
| Life Sciences Tools & Services — 1.45% | ||
| Bio-Techne Corp. | 313 | 108,498 |
| Repligen Corp. * | 479 | 77,790 |
| 186,288 | ||
| Pharmaceuticals — 0.89% | ||
| Intra-Cellular Therapies, Inc. * | 1,993 | 113,760 |
| Total HEALTH CARE (Cost $2,496,714) | 2,384,727 | |
| INFORMATION TECHNOLOGY — 16.86% | ||
| Software — 9.04% | ||
| Avalara, Inc. * | 1,159 | 81,825 |
| Bill.com Holdings, Inc. * | 1,357 | 149,189 |
| Braze, Inc. - A * | 1,708 | 61,881 |
| CyberArk Software Ltd. 1,* | 852 | 109,022 |
| Five9, Inc. * | 2,035 | 185,470 |
| Gitlab, Inc. - A * | 1,542 | 81,942 |
| Monday.com Ltd. 1,* | 703 | 72,521 |
| Paylocity Holding Corp. * | 1,070 | 186,629 |
| Sprout Social, Inc. - A * | 783 | 45,469 |
| Tenable Holdings, Inc. * | 2,139 | 97,132 |
| Zscaler, Inc. * | 587 | 87,762 |
| 1,158,842 | ||
| IT Services — 4.17% | ||
| DigitalOcean Holdings, Inc. * | 3,293 | 136,198 |
| Dlocal Ltd. 1,* | 2,186 | 57,383 |
| Endava PLC - SP ADR 1,* | 1,447 | 127,727 |
| Globant SA 1,* | 310 | 53,940 |
| MongoDB, Inc. * | 615 | 159,592 |
| 534,840 | ||
| Semiconductors & Semiconductor Equipment — 3.18% | ||
| Ambarella, Inc. * | 815 | 53,350 |
| Axcelis Technologies, Inc. * | 1,195 | 65,534 |
| Enphase Energy, Inc. * | 843 | 164,587 |
| ON Semiconductor Corp. * | 1,230 | 61,881 |
| Shares, Principal Amount, or Number of Contracts | Value | |
| Wolfspeed, Inc. * | 990 | $62,816 |
| 408,168 | ||
| Communications Equipment — 0.47% | ||
| Calix, Inc. * | 1,748 | 59,677 |
| Total INFORMATION TECHNOLOGY (Cost $2,190,641) | 2,161,527 | |
| CONSUMER DISCRETIONARY — 11.34% | ||
| Specialty Retail — 3.11% | ||
| Petco Health & Wellness Co., Inc. * | 4,000 | 58,960 |
| Tractor Supply Co. | 575 | 111,464 |
| Ulta Beauty, Inc. * | 592 | 228,204 |
| 398,628 | ||
| Leisure Products — 2.58% | ||
| Callaway Golf Co. * | 4,243 | 86,557 |
| Mattel, Inc. * | 10,933 | 244,134 |
| 330,691 | ||
| Hotels, Restaurants & Leisure — 1.85% | ||
| Hyatt Hotels Corp. - A * | 1,349 | 99,705 |
| Planet Fitness, Inc. - A * | 2,016 | 137,108 |
| 236,813 | ||
| Auto Components — 0.90% | ||
| Visteon Corp. * | 1,110 | 114,974 |
| Diversified Consumer Services — 0.70% | ||
| Duolingo, Inc. * | 1,021 | 89,388 |
| Automobiles — 0.68% | ||
| Harley-Davidson, Inc. | 2,747 | 86,970 |
| Distributors — 0.52% | ||
| LKQ Corp. | 1,370 | 67,253 |
| Household Durables — 0.51% | ||
| Skyline Champion Corp. * | 1,395 | 66,151 |
| Internet & Direct Marketing Retail — 0.49% | ||
| Chewy, Inc. - A * | 1,830 | 63,538 |
| Total CONSUMER DISCRETIONARY (Cost $1,642,203) | 1,454,406 | |
| FINANCIALS — 7.38% | ||
| Insurance — 5.89% | ||
| Kinsale Capital Group, Inc. | 1,217 | 279,472 |
| Ryan Specialty Group Holdings, Inc. - A * | 4,687 | 183,683 |
| W. R. Berkley Corp. | 4,279 | 292,085 |
| 755,240 | ||
| Capital Markets — 1.49% | ||
| LPL Financial Holdings, Inc. | 1,033 | 190,568 |
| Total FINANCIALS (Cost $887,376) | 945,808 | |
| Shares, Principal Amount, or Number of Contracts | Value | |
| MATERIALS — 6.72% | ||
| Chemicals — 2.47% | ||
| Albemarle Corp. | 1,088 | $227,370 |
| CF Industries Holdings, Inc. | 1,051 | 90,102 |
| 317,472 | ||
| Metals & Mining — 2.23% | ||
| Allegheny Technologies, Inc. * | 5,040 | 114,458 |
| MP Materials Corp. * | 5,333 | 171,083 |
| 285,541 | ||
| Containers & Packaging — 2.02% | ||
| Packaging Corp. of America | 1,139 | 156,613 |
| Sealed Air Corp. | 1,775 | 102,453 |
| 259,066 | ||
| Total MATERIALS (Cost $906,778) | 862,079 | |
| COMMUNICATION SERVICES — 5.90% | ||
| Entertainment — 3.36% | ||
| Liberty Media Corp.-Liberty Formula One - C * | 3,969 | 251,912 |
| Live Nation Entertainment, Inc. * | 1,337 | 110,409 |
| World Wrestling Entertainment, Inc. - A | 1,097 | 68,552 |
| 430,873 | ||
| Media — 1.41% | ||
| Nexstar Media Group, Inc. - A | 1,111 | 180,960 |
| Interactive Media & Services — 1.13% | ||
| Bumble, Inc. - A * | 3,487 | 98,159 |
| Cargurus, Inc. * | 2,192 | 47,106 |
| 145,265 | ||
| Total COMMUNICATION SERVICES (Cost $855,090) | 757,098 | |
| ENERGY — 5.66% | ||
| Oil, Gas & Consumable Fuels — 4.03% | ||
| Cameco Corp. 1 | 9,589 | 201,561 |
| Diamondback Energy, Inc. | 1,593 | 192,992 |
| New Fortress Energy, Inc. | 1,648 | 65,211 |
| Southwestern Energy Co. * | 9,118 | 56,987 |
| 516,751 | ||
| Energy Equipment & Services — 1.63% | ||
| Helmerich & Payne, Inc. | 3,104 | 133,658 |
| ProFrac Holding Corp. - A * | 4,106 | 75,181 |
| 208,839 | ||
| Total ENERGY (Cost $658,297) | 725,590 | |
| Shares, Principal Amount, or Number of Contracts | Value | ||
| CONSUMER STAPLES — 2.40% | |||
| Beverages — 1.52% | |||
| Celsius Holdings, Inc. * | 2,043 | $133,326 | |
| Molson Coors Beverage Co. - B | 1,131 | 61,651 | |
| 194,977 | |||
| Food Products — 0.88% | |||
| Freshpet, Inc. * | 914 | 47,427 | |
| The Simply Good Foods Co. * | 1,732 | 65,418 | |
| 112,845 | |||
| Total CONSUMER STAPLES (Cost $358,114) | 307,822 | ||
| REAL ESTATE — 0.77% | |||
| Equity Real Estate Investment Trusts — 0.77% | |||
| Ryman Hospitality Properties, Inc. * | 1,292 | 98,231 | |
| Total REAL ESTATE (Cost $117,404) | 98,231 | ||
| Total COMMON STOCKS (Cost $12,498,600) | 12,154,140 | ||
| SHORT TERM INVESTMENTS — 5.72% | |||
| Northern Institutional Government Portfolio (Shares Class), 1.12% 2 (Cost $733,708) | 733,708 | 733,708 | |
| TOTAL INVESTMENTS (Cost $13,232,308) | 100.51% | $12,887,848 | |
| Liabilities In Excess of Other Assets | (0.51)% | (65,829) | |
| Net Assets | 100.00% | $12,822,019 | |
| ADR | American Depositary Receipt |
| PLC | Public Limited Company |
| SP ADR | Sponsored American Depositary Receipt |
| 1 | Foreign security denominated and/or traded in U.S. dollars. |
| 2 | 7 day current yield as of June 30, 2022 is disclosed. |
| * | Non-income producing security. |
| Security Type | Percent of Net Assets | |
| Common Stocks | 94.79% | |
| Short Term Investments | 5.72% | |
| Total Investments | 100.51% | |
| Liabilities In Excess of Other Assets | (0.51)% | |
| Net Assets | 100.00% |
| Industry | Percent of Net Assets | |
| Aerospace & Defense | 1.53 | |
| Auto Components | 0.90 | |
| Automobiles | 0.68 | |
| Beverages | 1.52 | |
| Biotechnology | 10.20 | |
| Building Products | 1.91 | |
| Capital Markets | 1.49 | |
| Chemicals | 2.47 | |
| Commercial Services & Supplies | 0.88 | |
| Communications Equipment | 0.47 | |
| Construction & Engineering | 4.19 | |
| Containers & Packaging | 2.02 | |
| Distributors | 0.52 | |
| Diversified Consumer Services | 0.70 | |
| Energy Equipment & Services | 1.63 | |
| Entertainment | 3.36 | |
| Equity Real Estate Investment Trusts | 0.77 | |
| Food Products | 0.88 | |
| Health Care Equipment & Supplies | 2.67 | |
| Health Care Providers & Services | 1.47 | |
| Health Care Technology | 1.92 | |
| Hotels, Restaurants & Leisure | 1.85 |
| Industry | Percent of Net Assets | |
| Household Durables | 0.51 | |
| Insurance | 5.89 | |
| Interactive Media & Services | 1.13 | |
| Internet & Direct Marketing Retail | 0.49 | |
| IT Services | 4.17 | |
| Leisure Products | 2.58 | |
| Life Sciences Tools & Services | 1.45 | |
| Machinery | 2.64 | |
| Marine | 0.80 | |
| Media | 1.41 | |
| Metals & Mining | 2.23 | |
| Money Market Fund | 5.72 | |
| Oil, Gas & Consumable Fuels | 4.03 | |
| Pharmaceuticals | 0.89 | |
| Professional Services | 5.29 | |
| Semiconductors & Semiconductor Equipment | 3.18 | |
| Software | 9.04 | |
| Specialty Retail | 3.11 | |
| Trading Companies & Distributors | 1.92 | |
| Liabilities In Excess of Other Assets | (0.51) | |
| TOTAL | 100.00 |
| Average Annual Total Returns as of 6/30/22 | 1 Year | 3 Years | 5 Years | Since Inception (8/26/13 - 6/30/22) |
| Driehaus Event Driven Fund (DEVDX)1 | -9.77% | 6.76% | 6.44% | 5.10% |
| S&P 500 Index2 | -10.62% | 10.60% | 11.31% | 11.88% |
| FTSE 3-Month T-Bill Index3 | 0.19% | 0.61% | 1.09% | 0.69% |
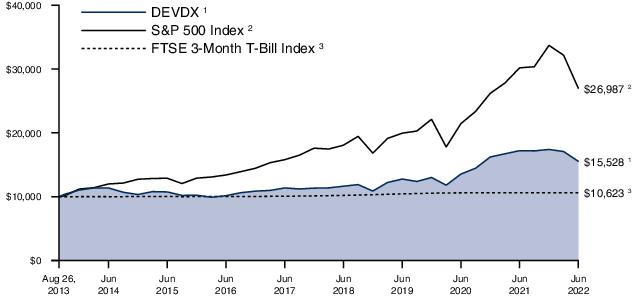
| 1 | The returns for the periods prior to March 1, 2014, reflect fee waivers and/or reimbursements without which performance would have been lower. |
| 2 | The S&P 500 Index consists of 500 stocks chosen for market size, liquidity and industry group. It is a market-weighted index, with each stock’s weight in the index proportionate to its market value. |
| 3 | The FTSE 3-Month T-Bill Index is designed to mirror the performance of the 3-month U.S. Treasury Bill. The FTSE 3-Month T-Bill Index is unmanaged and its returns reflect reinvestment of all distributions and changes in market prices. |
| Shares, Principal Amount, or Number of Contracts | Value | |
| BANK LOANS — 0.43% | ||
| Leisure Time — 0.43% | ||
| Topgolf International, Inc., Initial Term Loan 2/9/26 1,2 | $810,000 | $792,536 |
| Total BANK LOANS (Cost $807,975) | 792,536 | |
| CONVERTIBLE CORPORATE BONDS — 1.55% | ||
| Media — 1.55% | ||
| Twitter, Inc. 2.54%, 3/15/26 | 3,202,000 | 2,833,972 |
| Total CONVERTIBLE CORPORATE BONDS (Cost $2,899,637) | 2,833,972 | |
| CORPORATE BONDS — 23.84% | ||
| Commercial Services — 2.63% | ||
| MoneyGram International, Inc. 5.37%, 8/1/26 3,4 | 5,053,000 | 4,811,517 |
| Diversified Financial Services — 1.28% | ||
| Home Point Capital, Inc. 5.00%, 2/1/26 3,4 | 3,398,000 | 2,344,620 |
| Electric — 3.38% | ||
| Vistra Corp. 8.00%, (U.S. Treasury Yield Curve Rate CMT 5Y + 693 basis points), 10/15/26 3,5,6 | 645,000 | 620,813 |
| Vistra Corp. 7.00%, (U.S. Treasury Yield Curve Rate CMT 5Y + 574 basis points), 12/15/26 3,4,5,6 | 6,127,000 | 5,560,252 |
| 6,181,065 | ||
| Entertainment — 7.14% | ||
| Cinemark USA, Inc. 5.25%, 7/15/28 3,4 | 8,181,000 | 6,574,661 |
| Golden Entertainment, Inc. 7.62%, 4/15/26 3 | 6,561,000 | 6,495,390 |
| 13,070,051 | ||
| Lodging — 3.32% | ||
| Arrow Bidco LLC 9.50%, 3/15/24 3,4 | 6,189,000 | 6,080,693 |
| Media — 2.15% | ||
| Twitter, Inc. 5.00%, 3/1/30 3 | 4,155,000 | 3,942,056 |
| Oil & Gas Services — 0.27% | ||
| Oceaneering International, Inc. 4.65%, 11/15/24 | 532,000 | 492,105 |
| Pharmaceuticals — 0.93% | ||
| Curaleaf Holdings, Inc. 8.00%, 12/15/26 3,7 | 1,814,000 | 1,700,436 |
| Shares, Principal Amount, or Number of Contracts | Value | |
| Retail — 2.74% | ||
| Kohl's Corp. 3.38%, 5/1/31 | $5,785,000 | $5,017,096 |
| Total CORPORATE BONDS (Cost $47,515,764) | 43,639,639 | |
| FOREIGN ISSUER BONDS — 0.36% | ||
| Auto Manufacturers — 0.36% | ||
| Mclaren Finance PLC 7.50%, 8/1/26 3,7 | 883,000 | 652,449 |
| Total FOREIGN ISSUER BONDS (Cost $893,417) | 652,449 | |
| COMMON STOCKS — 54.77% | ||
| Auto Parts & Equipment — 2.73% | ||
| Holley, Inc. 4,* | 475,211 | 4,989,716 |
| Banks — 6.96% | ||
| Blue Foundry Bancorp 4,* | 390,560 | 4,682,814 |
| HarborOne Bancorp, Inc. 4 | 269,132 | 3,711,330 |
| Kearny Financial Corp./MD 4 | 391,252 | 4,346,810 |
| 12,740,954 | ||
| Biotechnology — 9.59% | ||
| Ascendis Pharma A/S - ADR 4,7,* | 13,514 | 1,256,261 |
| Biohaven Pharmaceutical Holding Co. Ltd. * | 14,337 | 2,089,044 |
| Crinetics Pharmaceuticals, Inc. * | 324,621 | 6,054,182 |
| DICE Therapeutics, Inc. 4,* | 77,220 | 1,198,454 |
| Relay Therapeutics, Inc. 4,* | 182,698 | 3,060,192 |
| Xenon Pharmaceuticals, Inc. 4,7,* | 128,193 | 3,899,631 |
| 17,557,764 | ||
| Commercial Services — 1.34% | ||
| Triton International Ltd. 7 | 46,634 | 2,455,280 |
| Engineering & Construction — 4.01% | ||
| WillScot Mobile Mini Holdings Corp. 4,* | 226,351 | 7,338,299 |
| Entertainment — 5.62% | ||
| Golden Entertainment, Inc. 4,* | 260,151 | 10,288,972 |
| Financial Services — 3.48% | ||
| FTAC Zeus Acquisition Corp. - A * | 133,692 | 1,322,214 |
| Screaming Eagle Acquisition Corp. - A * | 525,785 | 5,042,278 |
| 6,364,492 | ||
| Healthcare - Products — 0.31% | ||
| SomaLogic, Inc. 4,* | 124,795 | 564,073 |
| Holding Companies - Diversified — 10.89% | ||
| Class Acceleration Corp. - A 8,* | 108,472 | 1,065,195 |
| Corazon Capital V838 Monoceros Corp. - A 4,8,* | 189,734 | 1,855,599 |
| Shares, Principal Amount, or Number of Contracts | Value | |
| First Light Acquisition Group, Inc. - A 8,* | 386,250 | $3,839,325 |
| Flag U Founders *,^ | 24,357 | 0 |
| Jack Creek Investment Corp. - A 8,* | 302,994 | 2,979,946 |
| Live Oak Mobility Acquisition Corp. - A 4,8,* | 214,262 | 2,099,768 |
| Logistics Innovation Technologies Corp. - A 8,* | 192,225 | 1,868,427 |
| Senior Connect Acquisition Corp. I - A 4,8,* | 190,710 | 1,878,493 |
| Tekkorp Digital Acquisition Corp. - A 4,8,* | 189,734 | 1,882,161 |
| Tishman Speyer Innovation Corp. II - A 4,8,* | 184,448 | 1,805,746 |
| Z-Work Acquisition Corp. - A 8,* | 67,660 | 665,098 |
| 19,939,758 | ||
| Leisure Time — 0.98% | ||
| Callaway Golf Co. * | 88,234 | 1,799,974 |
| Metal Fabricate/Hardware — 1.74% | ||
| Hillman Solutions Corp. 4,* | 368,616 | 3,184,842 |
| Savings & Loans — 2.51% | ||
| Berkshire Hills Bancorp, Inc. 4 | 185,372 | 4,591,665 |
| Software — 1.12% | ||
| Sailpoint Technologies Holdings, Inc. * | 32,824 | 2,057,408 |
| Transportation — 3.49% | ||
| Air Transport Services Group, Inc. 4,* | 173,017 | 4,970,777 |
| XPO Logistics, Inc. 4,* | 29,442 | 1,417,927 |
| 6,388,704 | ||
| Total COMMON STOCKS (Cost $105,072,935) | 100,261,901 | |
| PRIVATE INVESTMENT IN PUBLIC EQUITY (PIPES) — 0.72% | ||
| Healthcare - Products — 0.33% | ||
| SomaLogic, Inc. * | 131,600 | 594,832 |
| Biotechnology — 0.39% | ||
| EQRx, Inc. * | 153,962 | 722,082 |
| Total PRIVATE INVESTMENT IN PUBLIC EQUITY (PIPES) (Cost $2,855,620) | 1,316,914 | |
| PREFERRED STOCKS — 2.00% | ||
| Retail — 0.67% | ||
| Qurate Retail, Inc. 8.00%, 9 | 20,967 | 1,225,521 |
| Telecommunications — 1.33% | ||
| Telephone and Data Systems, Inc. 6.63%, 9 | 22,999 | 465,500 |
| Shares, Principal Amount, or Number of Contracts | Value | |
| Telephone and Data Systems, Inc. 6.00%, 9 | 107,525 | $1,979,535 |
| 2,445,035 | ||
| Total PREFERRED STOCKS (Cost $5,370,056) | 3,670,556 |
| PURCHASED CALL OPTIONS — 0.02% | ||
| Consumer Discretionary Services — 0.02% | ||
| Kohl's Corp. Exercise Price: $50.00, Notional Amount: $4,665,000, Expiration Date: July 15, 2022 | 933 | $27,057 |
| Kohl's Corp. Exercise Price: $52.22, Notional Amount: $5,890,416, Expiration Date: July 15, 2022 | 1,128 | 15,792 |
| 42,849 | ||
| Total PURCHASED CALL OPTIONS (Premiums paid $627,285) | 42,849 | |
| WARRANTS — 0.15% | ||
| Class Acceleration Corp. - A, Exp. 3/31/28, Strike $11.50 * | 54,236 | 4,068 |
| Corazon Capital V838 Monoceros Corp. - A, Exp. 12/31/28, Strike $11.50 * | 53,713 | 4,297 |
| Deep Lake Capital Acquisition Corp. - B, Exp. 12/31/27, Strike $11.50 * | 10,795 | 864 |
| EQRx, Inc., Exp. 12/31/28, Strike $11.50 * | 26,680 | 22,825 |
| First Light Acquisition Group, Inc., Exp. 10/7/23, Strike $11.50 * | 193,125 | 17,381 |
| FTAC Zeus Acquisition Corp. - A, Exp. 11/23/26, Strike $11.50 * | 66,846 | 10,695 |
| Inspirato, Inc., Exp. 1/1/30, Strike $11.50 * | 35,733 | 23,237 |
| Jack Creek Investment Corp., Exp. 12/31/27, Strike $11.50 * | 151,497 | 11,877 |
| L&F Acquisition Corp. - A, Exp. 5/23/27, Strike $11.50 * | 65,250 | 10,107 |
| Live Oak Mobility Acquisition Corp., Exp. 3/4/28, Strike $11.50 * | 42,851 | 7,508 |
| Logistics Innovation Technologies Corp., Exp. 6/15/28, Strike $11.50 * | 64,075 | 10,252 |
| Longview Acquisition Corp. II - A, Exp. 5/10/26, Strike $11.50 * | 45,820 | 5,957 |
| Pagaya Technologies Ltd., Exp. 5/31/27, Strike $11.50 * | 110,040 | $43,092 | |
| Screaming Eagle Acquisition Corp. - A, Exp. 5/1/27, Strike $11.50 * | 175,261 | 66,599 | |
| Senior Connect Acquisition Corp. I - A, Exp. 12/31/27, Strike $11.50 * | 62,919 | 4,404 | |
| SomaLogic, Inc., Exp. 12/31/27, Strike $11.50 * | 22,690 | 17,244 | |
| Tekkorp Digital Acquisition Corp., Exp. 1/24/25, Strike $11.50 * | 59,550 | 9,534 | |
| Tishman Speyer Innovation Corp. II - A, Exp. 12/31/27, Strike $11.50 * | 36,889 | 4,833 | |
| X4 Pharmaceuticals, Inc., Exp. 4/12/24, Strike $13.20 * | 5,547 | 288 | |
| Z-Work Acquisition Corp. - A, Exp. 12/31/27, Strike $11.50 * | 22,553 | 3,157 | |
| Total WARRANTS (Cost $0) | 278,219 | ||
| SHORT TERM INVESTMENTS — 12.50% | |||
| Northern Institutional Treasury Portfolio (Premier Class), 1.16% 10 (Cost $22,877,045) | 22,877,045 | 22,877,045 | |
| TOTAL INVESTMENTS (Cost $188,919,734) | 96.34% | $176,366,080 | |
| Other Assets In Excess of Liabilities | 3.66% | 6,706,988 | |
| Net Assets | 100.00% | $183,073,068 | |
| INVESTMENT SECURITIES SOLD SHORT — (22.63)% | |||
| CORPORATE BONDS — (2.64)% | |||
| Consumer Discretionary Services — (1.50)% | |||
| AMC Entertainment Holdings, Inc. 7.50% 2/15/29 3 | (3,258,000) | (2,753,010) | |
| Diversified Financial Services — (1.14)% | |||
| United Wholesale Mortgage LLC 5.50% 4/15/29 3 | (2,726,000) | (2,087,162) | |
| Total CORPORATE BONDS (Proceeds $5,378,049) | (4,840,172) | ||
| WRITTEN CALL OPTIONS — (0.01)% | |||
| Consumer Discretionary Services — (0.01)% | |||
| Kohl's Corp. Exercise Price: $57.50, Notional Amount: $(5,364,750), Expiration Date: July 15, 2022 | (933) | (13,062) | |
| Kohl's Corp. Exercise Price: $60.00, Notional Amount: $(6,768,000), Expiration Date: July 15, 2022 | (1,128) | $(4,512) |
| (17,574) | ||
| Total WRITTEN CALL OPTIONS (Premiums received $(206,608)) | (17,574) | |
| COMMON STOCKS — (0.20)% | ||
| Internet — (0.20)% | ||
| Twitter, Inc. * | (9,996) | (373,751) |
| Total COMMON STOCKS (Proceeds $445,187) | (373,751) | |
| EXCHANGE-TRADED FUNDS — (19.78)% | ||
| Global X US Infrastructure Development ETF | (34,526) | (786,157) |
| iShares Russell 2000 ETF | (74,148) | (12,557,705) |
| iShares S&P Mid-Cap 400 Value ETF | (8,901) | (840,343) |
| SPDR S&P Biotech ETF * | (133,672) | (9,927,820) |
| SPDR S&P Regional Banking ETF | (208,146) | (12,091,201) |
| Total EXCHANGE-TRADED FUNDS (Proceeds $50,152,758) | (36,203,226) | |
| TOTAL INVESTMENT SECURITIES SOLD SHORT (Proceeds $56,182,602) | (22.63)% | $(41,434,723) |
| ADR | American Depositary Receipt |
| CMT | Constant Maturity |
| PLC | Public Limited Company |
| 1 | Bank loans in which the Fund invests pay interest at rates which are periodically predetermined by reference to a base lending rate plus a premium. These base lending rates are generally (i) the lending rate tied to a money market index like the Secured Overnight Financing Rate ("SOFR"), (ii) the prime rate offered by one or more United States banks or (iii) the certificate of deposit rate. The interest rate shown reflects the rate in effect at June 30, 2022. Bank loans generally are subject to mandatory and/or optional repayment. As a result, the actual remaining maturity may be substantially less than the stated maturities shown. |
| 2 | Position is unsettled. Contract rate was not determined at June 30, 2022 and does not take effect until settlement date. |
| 3 | Security is exempt from registration under Rule 144A of the Securities Act of 1933, as amended. The total value of these securities is $33,942,715, which represents 19% of Net Assets. |
| 4 | All or a portion of this security is pledged as collateral for short sales or derivatives transactions. |
| 5 | Perpetual security. Maturity date shown is the next call date or final legal maturity date, whichever comes first. |
| 6 | Variable rate security. Rates disclosed as of June 30, 2022. |
| 7 | Foreign security denominated and/or traded in U.S. dollars. |
| 8 | Special Purpose Acquisition Company (SPAC). |
| 9 | Current yield is disclosed. Dividends are calculated based on a percentage of the issuer’s net income. |
| 10 | 7 day current yield as of June 30, 2022 is disclosed. |
| ^ | Security valued at fair value as determined in good faith by the Adviser, in accordance with procedures established by, and under the general supervision of, the Trust’s Board of Trustees. The security is valued using significant unobservable inputs. |
| * | Non-income producing security. |
| Security Type | Percent of Net Assets | |
| Bank Loans | 0.43% | |
| Convertible Corporate Bonds | 1.55% | |
| Corporate Bonds | 23.84% | |
| Foreign Issuer Bonds | 0.36% | |
| Purchased Call Options | 0.02% | |
| Common Stocks | 54.77% | |
| Private Investment in Public Equity (PIPES) | 0.72% | |
| Preferred Stocks | 2.00% | |
| Warrants | 0.15% | |
| Short Term Investments | 12.50% | |
| Total Investments | 96.34% | |
| Other Assets In Excess of Liabilities | 3.66% | |
| Net Assets | 100.00% |
| Pay Rate Index/Pay Rate | Receive Rate/Receive Rate Index | Maturity Date | Counterparty | Currency | Notional Amount | Value | Upfront Premiums Paid/ (Received) | Unrealized Appreciation (Depreciation) | ||
| GSCBGDEN Index (Monthly) | Financing Index: 1-Month ICE LIBOR USD - 0.5% | 10/20/2022 | GSC | USD | 129,402 | $(144,659) | $— | $(144,659) | ||
| $(144,659) | $— | $(144,659) | ||||||||
| GSC - Goldman Sachs International | ||||||||||
| Driehaus Emerging Markets Growth Fund | Driehaus Emerging Markets Small Cap Growth Fund | ||
| ASSETS: | |||
| Investments, at cost | $1,558,414,611 | $87,721,090 | |
| Investments securities, at fair value | $1,695,105,238 | $89,357,477 | |
| Short-term securities, at fair value1 | 150,921,464 | 5,682,919 | |
| Purchased options, at fair value2 | — | — | |
| Warrant securities, at fair value3 | — | — | |
| Foreign currency, at fair value4 | 14,599,878 | 920,814 | |
| Cash | — | — | |
| Deposit at broker for securities sold short | — | — | |
| Receivable for investment securities sold | 11,326,860 | 1,180,843 | |
| Receivable for fund shares sold | 1,784,867 | 47,978 | |
| Receivable for interest and dividends | 5,473,491 | 948,745 | |
| Prepaid expenses | 174,997 | 40,053 | |
| TOTAL ASSETS | 1,879,386,795 | 98,178,829 | |
| LIABILITIES: | |||
| Payable for investment securities sold short, proceeds | — | — | |
| Payable for investment securities sold short, at fair value | — | — | |
| Written options, at fair value5 | — | — | |
| Unrealized depreciation on open OTC swap contracts | — | — | |
| Payable for fund shares redeemed | 1,097,326 | 17,259 | |
| Payable for investment securities purchased | 11,407,165 | 635 | |
| Advisory fees payable, net | 1,547,460 | 75,124 | |
| Payable for interest and dividends on securities sold short | — | — | |
| Accrued shareholder services plan fees | 245,108 | — | |
| Accrued administration and accounting fees | 176,384 | 12,284 | |
| Accrued foreign capital gains taxes | 1,334,789 | — | |
| Accrued expenses | 273,608 | 28,777 | |
| TOTAL LIABILITIES | 16,081,840 | 134,079 | |
| NET ASSETS | $1,863,304,955 | $98,044,750 | |
| NET ASSETS CONSISTED OF THE FOLLOWING AT JUNE 30, 2022: | |||
| Paid-in-capital | $1,828,358,115 | $121,027,271 | |
| Total distributable earnings (deficit) | 34,946,840 | (22,982,521) | |
| NET ASSETS | $1,863,304,955 | $98,044,750 | |
| NET ASSETS | $— | $98,044,750 | |
| SHARES OUTSTANDING (Unlimited shares authorized, no par value) | — | 5,506,558 | |
| NET ASSET VALUE | $— | $17.81 | |
| INVESTOR CLASS SHARES | |||
| NET ASSETS | $645,759,268 | $— | |
| SHARES OUTSTANDING (Unlimited shares authorized, no par value) | 19,345,600 | — | |
| NET ASSET VALUE | $33.38 | $— | |
| INSTITUTIONAL CLASS SHARES | |||
| NET ASSETS | $1,217,545,687 | $— | |
| SHARES OUTSTANDING (Unlimited shares authorized, no par value) | 36,297,227 | — | |
| NET ASSET VALUE | $33.54 | $— | |
| 1 | The cost of short-term securities was $150,921,464, $5,682,919, $3,095,420, $5,590,673, $7,324,399, $27,039,918, $733,708 and $22,877,045, respectively. |
| 2 | The cost of purchased options was $0, $0, $0, $0, $0, $0, $0 and $627,285, respectively. |
| 3 | The cost of warrants was $0, $0, $0, $0, $0, $0, $0 and $0, respectively. |
| 4 | The cost of foreign currency was $14,699,865, $922,796, $4,157, $1,957,857, $0, $0, $0 and $0, respectively. |
| 5 | The proceeds of written options was $0, $0, $0, $0, $0, $0, $0 and $(206,608), respectively. |
| Driehaus Emerging Markets Opportunities Fund | Driehaus International Small Cap Growth Fund | Driehaus Micro Cap Growth Fund | Driehaus Small Cap Growth Fund | Driehaus Small/Mid Cap Growth Fund | Driehaus Event Driven Fund | |||||
| $39,684,500 | $240,518,639 | $172,046,260 | $451,196,061 | $12,498,600 | $165,415,404 | |||||
| $41,926,198 | $208,451,856 | $174,181,415 | $433,190,445 | $12,154,140 | $153,167,967 | |||||
| 3,095,420 | 5,590,673 | 7,324,399 | 27,039,918 | 733,708 | 22,877,045 | |||||
| — | — | — | — | — | 42,849 | |||||
| — | — | 29,579 | — | — | 278,219 | |||||
| 4,156 | 1,957,857 | — | — | — | — | |||||
| 400,596 | — | — | — | — | — | |||||
| — | — | — | — | — | 47,966,637 | |||||
| 126,500 | 664,970 | 4,467,797 | 1,981,229 | 173,956 | 897,000 | |||||
| 50,000 | 543 | 3,602 | 420,745 | — | 136,056 | |||||
| 300,184 | 973,059 | 11,362 | 30,664 | 6,925 | 869,694 | |||||
| 47,023 | 33,205 | 37,474 | 74,316 | 34,555 | 74,479 | |||||
| 45,950,077 | 217,672,163 | 186,055,628 | 462,737,317 | 13,103,284 | 226,309,946 | |||||
| — | — | — | — | — | 55,975,994 | |||||
| — | — | — | — | — | 41,417,149 | |||||
| — | — | — | — | — | 17,574 | |||||
| — | — | — | — | — | 144,659 | |||||
| — | 30,370 | 25,803 | 292,011 | 2,983 | 452,610 | |||||
| 255,243 | 672,784 | 3,766,330 | 14,097,356 | 247,038 | 807,975 | |||||
| 22,765 | 189,039 | 197,542 | 227,574 | 2,386 | 152,471 | |||||
| — | — | — | — | — | 127,266 | |||||
| — | — | — | �� | 24,252 | — | 60,314 | ||||
| 7,463 | 24,414 | 17,500 | 28,771 | 9,604 | 12,239 | |||||
| 56,898 | — | — | — | — | — | |||||
| 46,893 | 49,115 | 35,451 | 42,863 | 19,254 | 44,621 | |||||
| 389,262 | 965,722 | 4,042,626 | 14,712,827 | 281,265 | 43,236,878 | |||||
| $45,560,815 | $216,706,441 | $182,013,002 | $448,024,490 | $12,822,019 | $183,073,068 | |||||
| $44,812,692 | $248,107,107 | $175,992,961 | $540,582,742 | $15,495,200 | $194,870,669 | |||||
| 748,123 | (31,400,666) | 6,020,041 | (92,558,252) | (2,673,181) | (11,797,601) | |||||
| $45,560,815 | $216,706,441 | $182,013,002 | $448,024,490 | $12,822,019 | $183,073,068 | |||||
| $45,560,815 | $216,706,441 | $182,013,002 | $— | $12,822,019 | $183,073,068 | |||||
| 3,913,897 | 27,337,346 | 18,261,863 | — | 1,012,538 | 15,441,645 | |||||
| $11.64 | $7.93 | $9.97 | $— | $12.66 | $11.86 | |||||
| $— | $— | $— | $61,290,054 | $— | $— | |||||
| — | — | — | 4,073,526 | — | — | |||||
| $— | $— | $— | $15.05 | $— | $— | |||||
| $— | $— | $— | $386,734,436 | $— | $— | |||||
| — | — | — | 25,261,888 | — | — | |||||
| $— | $— | $— | $15.31 | $— | $— | |||||
| Driehaus Emerging Markets Growth Fund | Driehaus Emerging Markets Small Cap Growth Fund | ||
| INVESTMENT INCOME: | |||
| Interest income | $187,619 | $14,345 | |
| Dividend income1 | 22,834,375 | 909,325 | |
| Total investment income | 23,021,994 | 923,670 | |
| Expenses: | |||
| Investment advisory fees | 9,969,191 | 583,240 | |
| Shareholder services fees | 809,615 | — | |
| Administration fees | 330,401 | 17,423 | |
| Transfer agent fees | 95,917 | 5,051 | |
| Trustees fees | 246,983 | 12,240 | |
| Custody fees | 253,904 | 30,022 | |
| Reports to shareholders | 60,870 | 4,541 | |
| Professional fees | 264,498 | 20,904 | |
| Audit and tax fees | 47,973 | 33,259 | |
| Federal and state registration fees | 32,127 | 10,148 | |
| Dividends and interest on short positions | — | — | |
| Miscellaneous | 127,802 | 23,292 | |
| Total expenses | 12,239,281 | 740,120 | |
| Investment advisory fees recoupment (reimbursement) | — | (82,550) | |
| Fees paid indirectly | (129,898) | (100) | |
| Net expenses | 12,109,383 | 657,470 | |
| Net investment income (loss) | 10,912,611 | 266,200 | |
| NET REALIZED AND UNREALIZED GAIN (LOSS) ON INVESTMENT TRANSACTIONS: | |||
| Net realized gain (loss) on transactions from: | |||
| Investments2 | (66,977,813) | (4,104,861) | |
| Warrants | — | — | |
| Purchased options contracts | — | — | |
| Securities sold short | — | — | |
| Written options contracts | — | — | |
| Swap contracts | — | — | |
| Foreign currency | (1,143,393) | (42,607) | |
| Net realized gain (loss) on investment transactions | (68,121,206) | (4,147,468) | |
| Change in net unrealized appreciation (depreciation) on: | |||
| Investments3 | (382,072,541) | (19,407,834) | |
| Warrants | — | — | |
| Securities sold short | — | — | |
| Purchased options contracts | — | — | |
| Written options contracts | — | — | |
| Swap contracts | — | — | |
| Foreign currency | (418,405) | (50,981) | |
| Foreign currency translations | 111,413 | — | |
| Net change in unrealized appreciation (depreciation) on investment transactions | (382,379,533) | (19,458,815) | |
| Net realized and unrealized gain (loss) on investment transactions | (450,500,739) | (23,606,283) | |
| NET INCREASE (DECREASE) IN NET ASSETS FROM OPERATIONS | $(439,588,128) | $(23,340,083) | |
| 1 | Net of $2,528,280, $77,677, $52,991, $319,667, $0, $5,321, $329, and $0 of non-reclaimable foreign taxes withheld, respectively. |
| 2 | Net realized gain (loss) from security transactions are net of $3,600,623, $311,329, $0, $0, $0, $0, $0 and $0 foreign capital gains tax paid, respectively. |
| 3 | Net unrealized gain (loss) from security transactions are net of $5,062,910, $792,813, $59,982, $0, $0, $0, $0 and $0 foreign capital gains tax paid, respectively. |
| Driehaus Emerging Markets Opportunities Fund | Driehaus International Small Cap Growth Fund | Driehaus Micro Cap Growth Fund | Driehaus Small Cap Growth Fund | Driehaus Small/Mid Cap Growth Fund | Driehaus Event Driven Fund | |||||
| $260,312 | $9,132 | $10,557 | $21,045 | $433 | $1,624,720 | |||||
| 484,051 | 2,895,674 | 860,408 | 1,482,856 | 46,425 | 509,969 | |||||
| 744,363 | 2,904,806 | 870,965 | 1,503,901 | 46,858 | 2,134,689 | |||||
| 228,111 | 1,354,296 | 1,488,785 | 1,496,013 | 54,401 | 965,285 | |||||
| — | — | — | 81,952 | — | 181,213 | |||||
| 8,135 | 43,583 | 36,741 | 82,049 | 2,835 | 31,611 | |||||
| 2,361 | 12,665 | 10,719 | 23,796 | 824 | 8,560 | |||||
| 6,079 | 32,552 | 29,821 | 55,242 | 2,154 | 22,041 | |||||
| 12,175 | 22,762 | 18,420 | 22,907 | 13,408 | 11,512 | |||||
| 2,787 | 7,180 | 6,751 | 17,288 | 2,679 | 9,353 | |||||
| 12,056 | 29,819 | 27,191 | 46,569 | 3,644 | 21,409 | |||||
| 31,623 | 20,442 | 17,108 | 17,108 | 17,108 | 25,290 | |||||
| 10,581 | 12,717 | 12,766 | 27,813 | 9,534 | 17,194 | |||||
| — | — | — | — | — | 300,559 | |||||
| 15,303 | 31,701 | 31,730 | 39,678 | 17,656 | 29,144 | |||||
| 329,211 | 1,567,717 | 1,680,032 | 1,910,415 | 124,243 | 1,623,171 | |||||
| (76,135) | — | — | — | (35,808) | — | |||||
| (2,154) | (6,769) | (34,698) | (45,752) | (2,300) | (33,319) | |||||
| 250,922 | 1,560,948 | 1,645,334 | 1,864,663 | 86,135 | 1,589,852 | |||||
| 493,441 | 1,343,858 | (774,369) | (360,762) | (39,277) | 544,837 | |||||
| (1,169,286) | (12,482,658) | (5,300,269) | (77,776,780) | (2,396,540) | (14,958,781) | |||||
| — | — | — | — | — | (236,545) | |||||
| 158,010 | — | — | — | — | (59,567) | |||||
| — | — | — | — | — | 2,476,805 | |||||
| — | — | — | — | — | — | |||||
| 63,890 | — | — | — | — | 1,277,972 | |||||
| (413) | 13,559 | — | — | — | — | |||||
| (947,799) | (12,469,099) | (5,300,269) | (77,776,780) | (2,396,540) | (11,500,116) | |||||
| (9,951,178) | (81,496,431) | (121,456,760) | (160,150,610) | (5,106,846) | (23,443,809) | |||||
| — | — | (6,379) | — | — | (486,752) | |||||
| — | — | — | — | — | 12,447,663 | |||||
| — | — | — | — | — | (584,436) | |||||
| — | — | — | — | — | 189,034 | |||||
| — | — | — | — | — | (106,741) | |||||
| (3,003) | (52,949) | — | — | — | — | |||||
| — | — | — | — | — | — | |||||
| (9,954,181) | (81,549,380) | (121,463,139) | (160,150,610) | (5,106,846) | (11,985,041) | |||||
| (10,901,980) | (94,018,479) | (126,763,408) | (237,927,390) | (7,503,386) | (23,485,157) | |||||
| $(10,408,539) | $(92,674,621) | $(127,537,777) | $(238,288,152) | $(7,542,663) | $(22,940,320) | |||||
| Driehaus Emerging Markets Growth Fund | Driehaus Emerging Markets Small Cap Growth Fund | ||||||
| For the six months ended June 30, 2022 (unaudited) | For the year ended December 31, 2021 | For the six months ended June 30, 2022 (unaudited) | For the year ended December 31, 2021 | ||||
| INCREASE (DECREASE) IN NET ASSETS: | |||||||
| Operations: | |||||||
| Net investment income (loss) | $10,912,611 | $307,977 | $266,200 | $294,442 | |||
| Net realized gain (loss) on investment transactions | (68,121,206) | 189,076,575 | (4,147,468) | 18,667,537 | |||
| Net change in unrealized appreciation (depreciation) on investment transactions | (382,379,533) | (241,356,919) | (19,458,815) | (3,691,089) | |||
| Net increase (decrease) in net assets resulting from operations | (439,588,128) | (51,972,367) | (23,340,083) | 15,270,890 | |||
| Distributions from distributable earnings to shareholders: | |||||||
| Fund | — | — | — | (49,512) | |||
| Investor Class Shares | — | (124,720,312) | — | — | |||
| Institutional Class Shares | — | (219,579,683) | — | — | |||
| Total distributions to shareholders | — | (344,299,995) | — | (49,512) | |||
| Capital share transactions: | |||||||
| Proceeds from shares sold: | |||||||
| Fund | — | — | 14,169,221 | 27,161,675 | |||
| Investor Class | 55,818,434 | 114,382,649 | — | — | |||
| Institutional Class | 170,047,796 | 456,095,754 | — | — | |||
| Reinvestment of distributions: | |||||||
| Fund | — | — | — | 43,116 | |||
| Investor Class | — | 120,092,702 | — | — | |||
| Institutional Class | — | 196,637,512 | — | — | |||
| Cost of shares redeemed: | |||||||
| Fund | — | — | (9,430,797) | (15,512,569) | |||
| Investor Class | (98,226,096) | (201,365,699) | — | — | |||
| Institutional Class | (151,885,773) | (245,809,899) | — | — | |||
| Redemption fees: | |||||||
| Fund | — | — | 2,028 | 1,535 | |||
| Investor Class | 17,467 | 23,718 | — | — | |||
| Institutional Fund | 17,212 | 58,326 | — | — | |||
| Net increase (decrease) in net assets resulting from capital transactions | (24,210,960) | 440,115,063 | 4,740,452 | 11,693,757 | |||
| Total increase (decrease) in net assets | (463,799,088) | 43,842,701 | (18,599,631) | 26,915,135 | |||
| NET ASSETS: | |||||||
| Beginning of period | $2,327,104,043 | $2,283,261,342 | $116,644,381 | $89,729,246 | |||
| End of period | $1,863,304,955 | $2,327,104,043 | $98,044,750 | $116,644,381 | |||
| Driehaus Emerging Markets Opportunities Fund | Driehaus International Small Cap Growth Fund | Driehaus Micro Cap Growth Fund | ||||||||
| For the six months ended June 30, 2022 (unaudited) | For the year ended December 31, 2021 | For the six months ended June 30, 2022 (unaudited) | For the year ended December 31, 2021 | For the six months ended June 30, 2022 (unaudited) | For the year ended December 31, 2021 | |||||
| $493,441 | $564,274 | $1,343,858 | $1,032,830 | $(774,369) | $(4,776,419) | |||||
| (947,799) | 441,572 | (12,469,099) | 63,535,651 | (5,300,269) | 114,688,268 | |||||
| (9,954,181) | (1,660,053) | (81,549,380) | (29,892,096) | (121,463,139) | (32,720,786) | |||||
| (10,408,539) | (654,207) | (92,674,621) | 34,676,385 | (127,537,777) | 77,191,063 | |||||
| — | (3,192,791) | — | (72,600,000) | — | (123,999,999) | |||||
| — | — | — | — | — | — | |||||
| — | — | — | — | — | — | |||||
| — | (3,192,791) | — | (72,600,000) | — | (123,999,999) | |||||
| 1,120,852 | 11,548,706 | 10,709,910 | 68,316,473 | 4,492,552 | 5,932,222 | |||||
| — | — | — | — | — | — | |||||
| — | — | — | — | — | — | |||||
| — | 3,192,291 | — | 64,761,613 | — | 89,300,107 | |||||
| — | — | — | — | — | — | |||||
| — | — | — | — | — | — | |||||
| (2,879,859) | (6,387,891) | (33,642,538) | (51,696,847) | (36,211,024) | (41,545,106) | |||||
| — | — | — | — | — | — | |||||
| — | — | — | — | — | — | |||||
| 795 | — | 1,551 | — | — | — | |||||
| — | — | — | — | — | — | |||||
| — | — | — | — | — | — | |||||
| (1,758,212) | 8,353,106 | (22,931,077) | 81,381,239 | (31,718,472) | 53,687,223 | |||||
| (12,166,751) | 4,506,108 | (115,605,698) | 43,457,624 | (159,256,249) | 6,878,287 | |||||
| $57,727,566 | $53,221,458 | $332,312,139 | $288,854,515 | $341,269,251 | $334,390,964 | |||||
| $45,560,815 | $57,727,566 | $216,706,441 | $332,312,139 | $182,013,002 | $341,269,251 | |||||
| Driehaus Small Cap Growth Fund | Driehaus Small/Mid Cap Growth Fund | ||||||
| For the six months ended June 30, 2022 (unaudited) | For the year ended December 31, 2021 | For the six months ended June 30, 2022 (unaudited) | For the year ended December 31, 2021 | ||||
| INCREASE (DECREASE) IN NET ASSETS: | |||||||
| Operations: | |||||||
| Net investment income (loss) | $(360,762) | $(2,917,475) | $(39,277) | $(155,857) | |||
| Net realized gain (loss) on investment transactions | (77,776,780) | 82,938,619 | (2,396,540) | 2,015,530 | |||
| Net change in unrealized appreciation (depreciation) on investment transactions | (160,150,610) | 2,862,750 | (5,106,846) | 1,216,089 | |||
| Net increase (decrease) in net assets resulting from operations | (238,288,152) | 82,883,894 | (7,542,663) | 3,075,762 | |||
| Distributions from distributable earnings to shareholders: | |||||||
| Fund | — | — | — | (1,753,267) | |||
| Investor Class Shares | — | (15,495,848) | — | — | |||
| Institutional Class Shares | — | (73,704,158) | — | — | |||
| Total distributions to shareholders | — | (89,200,006) | — | (1,753,267) | |||
| Capital share transactions: | |||||||
| Proceeds from shares sold: | |||||||
| Fund | — | — | 2,300,876 | 11,530,225 | |||
| Investor Class | 21,243,702 | 89,878,449 | — | — | |||
| Institutional Class | 137,498,364 | 208,019,662 | — | — | |||
| Reinvestment of distributions: | |||||||
| Fund | — | — | — | 1,753,267 | |||
| Investor Class | — | 15,479,510 | — | — | |||
| Institutional Class | — | 66,494,390 | — | — | |||
| Cost of shares redeemed: | |||||||
| Fund | — | — | (5,111,296) | (6,277,724) | |||
| Investor Class | (21,324,992) | (29,025,749) | — | — | |||
| Institutional Class | (60,453,571) | (90,522,445) | — | — | |||
| Redemption fees: | |||||||
| Fund | — | 2,412 | 1,353 | — | |||
| Investor Class | 24,912 | 58,498 | — | — | |||
| Institutional Fund | 12,586 | — | — | — | |||
| Net increase (decrease) in net assets resulting from capital transactions | 77,001,001 | 260,384,727 | (2,809,067) | 7,005,768 | |||
| Total increase (decrease) in net assets | (161,287,151) | 254,068,615 | (10,351,730) | 8,328,263 | |||
| NET ASSETS: | |||||||
| Beginning of period | $609,311,641 | $355,243,026 | $23,173,749 | $14,845,486 | |||
| End of period | $448,024,490 | $609,311,641 | $12,822,019 | $23,173,749 | |||
| Driehaus Event Driven Fund | ||
| For the six months ended June 30, 2022 (unaudited) | For the year ended December 31, 2021 | |
| $544,837 | $188,587 | |
| (11,500,116) | 15,108,809 | |
| (11,985,041) | (4,075,164) | |
| (22,940,320) | 11,222,232 | |
| — | (22,722,926) | |
| — | — | |
| — | — | |
| — | (22,722,926) | |
| 76,570,082 | 123,731,700 | |
| — | — | |
| — | — | |
| — | 21,829,123 | |
| — | — | |
| — | — | |
| (74,191,232) | (72,489,715) | |
| — | — | |
| — | — | |
| — | — | |
| — | — | |
| — | — | |
| 2,378,850 | 73,071,108 | |
| (20,561,470) | 61,570,414 | |
| $203,634,538 | $142,064,124 | |
| $183,073,068 | $203,634,538 | |
| For the six month period January 1, 2022 through June 30, 2022 (unaudited) | For the year ended December 31, 2021 | For the year ended December 31, 2020 | For the year ended December 31, 2019 | For the year ended December 31, 2018 | For the year ended December 31, 2017 | ||||||
| Net asset value, beginning of period | $ 41.20 | $ 49.09 | $ 39.53 | $ 31.80 | $ 39.64 | $ 27.98 | |||||
| INCOME (LOSS) FROM INVESTMENT OPERATIONS: | |||||||||||
| Net investment income (loss) | 0.171 | (0.07)1 | (0.09)1 | 0.301 | 0.261 | 0.111 | |||||
| Net realized and unrealized gain (loss) on investments | (7.99) | (0.93) | 10.87 | 7.76 | (6.73) | 11.78 | |||||
| Total income (loss) from investment operations | (7.82) | (1.00) | 10.78 | 8.06 | (6.47) | 11.89 | |||||
| LESS DISTRIBUTIONS: | |||||||||||
| Net investment income | — | — | — | (0.33) | (0.16) | (0.23) | |||||
| Net realized gain | — | (6.89) | (1.22) | — | (1.21) | — | |||||
| Total distributions | — | (6.89) | (1.22) | (0.33) | (1.37) | (0.23) | |||||
| Redemption fees added to paid-in capital | 0.002 | 0.002 | 0.002 | 0.002 | 0.002 | 0.002 | |||||
| Net asset value, end of period | $ 33.38 | $ 41.20 | $ 49.09 | $ 39.53 | $ 31.80 | $ 39.64 | |||||
| Total Return | (18.98)%3 | (1.90)% | 27.31% | 25.34% | (16.26)% | 42.52% | |||||
| RATIOS/SUPPLEMENTAL DATA: | |||||||||||
| Net assets, end of period (000’s) | $ 645,759 | $ 844,522 | $ 951,998 | $ 863,535 | $ 791,656 | $ 1,266,365 | |||||
| Ratio of total expenses before reimbursements, waivers, recoupments and/or fees paid indirectly to average net assets | 1.33%4 | 1.29% | 1.39% | 1.41% | 1.38% | 1.54% | |||||
| Ratio of total expenses net of reimbursements, waivers, recoupments and/or fees paid indirectly to average net assets5 | 1.32%4 | 1.28% | 1.38% | 1.40% | 1.37% | 1.53% | |||||
| Ratio of net investment income (loss) (including interest expense) net of reimbursements, waivers, recoupments and/or fees paid indirectly to average net assets5 | 0.89%4 | (0.13)% | (0.24)% | 0.85% | 0.69% | 0.33% | |||||
| Portfolio turnover | 73%3 | 169% | 203% | 167% | 218% | 176% |
| 1 | Net investment income (loss) per share has been calculated using the average shares method. |
| 2 | Amount represents less than $0.01 per share. |
| 3 | Not annualized. |
| 4 | Annualized. |
| 5 | Such ratios are net of fees paid indirectly (see Note C in the Notes to Financial Statements). The ratio for the Fund includes the effect of fees paid indirectly which impacted the ratio by 0.01% for the years 2017, 2018, 2019, 2020, 2021 and for the six month period June 30, 2022. |
| For the six month period January 1, 2022 through June 30, 2022 (unaudited) | For the year ended December 31, 2021 | For the year ended December 31, 2020 | For the year ended December 31, 2019 | For the year ended December 31, 2018 | For the period July 17, 2017 through December 31, 2017 | ||||||
| Net asset value, beginning of period | $ 41.36 | $ 49.14 | $ 39.48 | $ 31.76 | $ 39.61 | $ 34.85 | |||||
| INCOME (LOSS) FROM INVESTMENT OPERATIONS: | |||||||||||
| Net investment income (loss) | 0.211 | 0.051 | (0.01)1 | 0.381 | 0.32 | 0.121 | |||||
| Net realized and unrealized gain (loss) on investments | (8.03) | (0.94) | 10.89 | 7.75 | (6.71) | 4.92 | |||||
| Total income (loss) from investment operations | (7.82) | (0.89) | 10.88 | 8.13 | (6.39) | 5.04 | |||||
| LESS DISTRIBUTIONS: | |||||||||||
| Net investment income | — | — | — | (0.41) | (0.25) | (0.28) | |||||
| Net realized gain | — | (6.89) | (1.22) | — | (1.21) | — | |||||
| Total distributions | — | (6.89) | (1.22) | (0.41) | (1.46) | (0.28) | |||||
| Redemption fees added to paid-in capital | 0.002 | 0.002 | 0.002 | 0.002 | 0.002 | 0.002 | |||||
| Net asset value, end of period | $ 33.54 | $ 41.36 | $ 49.14 | $ 39.48 | $ 31.76 | $ 39.61 | |||||
| Total Return | (18.91)%3 | (1.67)% | 27.60% | 25.60% | (16.08)% | 14.47%3 | |||||
| RATIOS/SUPPLEMENTAL DATA: | |||||||||||
| Net assets, end of period (000’s) | $ 1,217,546 | $ 1,482,582 | $ 1,331,263 | $ 928,230 | $ 654,445 | $ 513,135 | |||||
| Ratio of total expenses before reimbursements, waivers, recoupments and/or fees paid indirectly to average net assets | 1.10%4 | 1.07% | 1.17% | 1.20% | 1.17% | 1.17%4 | |||||
| Ratio of total expenses net of reimbursements, waivers, recoupments and/or fees paid indirectly to average net assets5 | 1.09%4 | 1.06% | 1.16% | 1.19% | 1.16% | 1.16%4 | |||||
| Ratio of net investment income (loss) (including interest expense) net of reimbursements, waivers, recoupments and/or fees paid indirectly to average net assets5 | 1.15%4 | 0.10% | (0.02)% | 1.07% | 0.89% | 0.71%4 | |||||
| Portfolio turnover | 73%3 | 169% | 203% | 167% | 218% | 176%3 |
| 1 | Net investment income (loss) per share has been calculated using the average shares method. |
| 2 | Amount represents less than $0.01 per share. |
| 3 | Not annualized. |
| 4 | Annualized. |
| 5 | Such ratios are net of fees paid indirectly (see Note C in the Notes to Financial Statements). The ratio for the Fund includes the effect of fees paid indirectly which impacted the ratio by 0.01% for the years 2017, 2018, 2019, 2020, 2021 and for the six month period June 30, 2022. |
| For the six month period January 1, 2022 through June 30, 2022 (unaudited) | For the year ended December 31, 2021 | For the year ended December 31, 2020 | For the year ended December 31, 2019 | For the year ended December 31, 2018 | For the year ended December 31, 2017 | ||||||
| Net asset value, beginning of period | $ 22.11 | $ 19.08 | $ 14.38 | $ 10.80 | $ 14.21 | $ 10.66 | |||||
| INCOME (LOSS) FROM INVESTMENT OPERATIONS: | |||||||||||
| Net investment income (loss) | 0.05 | 0.06 | 0.02 | 0.06 | (0.04)1 | 0.021 | |||||
| Net realized and unrealized gain (loss) on investments | (4.35) | 2.98 | 4.80 | 3.58 | (3.37) | 3.53 | |||||
| Total income (loss) from investment operations | (4.30) | 3.04 | 4.82 | 3.64 | (3.41) | 3.55 | |||||
| LESS DISTRIBUTIONS: | |||||||||||
| Net investment income | — | (0.01) | (0.12) | (0.06) | — | — | |||||
| Total distributions | — | (0.01) | (0.12) | (0.06) | — | — | |||||
| Redemption fees added to paid-in capital | 0.002 | 0.002 | — | 0.002 | 0.002 | 0.002 | |||||
| Net asset value, end of period | $ 17.81 | $ 22.11 | $ 19.08 | $ 14.38 | $ 10.80 | $ 14.21 | |||||
| Total Return | (19.45)%3 | 15.93% | 33.56% | 33.71% | (24.00)% | 33.30% | |||||
| RATIOS/SUPPLEMENTAL DATA: | |||||||||||
| Net assets, end of period (000’s) | $ 98,045 | $ 116,644 | $ 89,729 | $ 62,407 | $ 89,653 | $ 271,146 | |||||
| Ratio of total expenses before reimbursements, waivers, recoupments and/or fees paid indirectly to average net assets | 1.40%4 | 1.37% | 1.72% | 1.80%5 | 2.27%5 | 1.82% | |||||
| Ratio of total expenses net of reimbursements, waivers, recoupments and/or fees paid indirectly to average net assets6 | 1.24%4,7 | 1.24% | 1.45%7 | 1.45%5,7 | 2.26%5 | 1.80% | |||||
| Ratio of net investment income (loss) (including interest expense) net of reimbursements, waivers, recoupments and/or fees paid indirectly to average net assets6 | 0.50%4,7 | 0.28%7 | 0.12%7 | 0.52%7 | (0.30)% | 0.15% | |||||
| Portfolio turnover | 80%3 | 178% | 248% | 220% | 207% | 243% |
| 1 | Net investment income (loss) per share has been calculated using the average shares method. |
| 2 | Amount represents less than $0.01 per share. |
| 3 | Not annualized. |
| 4 | Annualized. |
| 5 | Ratio of expenses to average net assets includes interest expense of 0.01% for the year ended December 31, 2019, and less than 0.005% for the year ended December 31, 2018. The interest expense is from utilizing the line of credit (see Note G in the Notes to Financial Statements). |
| 6 | Such ratios are net of fees paid indirectly (see Note C in the Notes to Financial Statements). The ratio for the Fund includes the effect of fees paid indirectly which impacted the ratio by 0.02%, 0.02%, 0.01%, 0.00%, 0.01%, and 0.00% for the years 2017, 2018, 2019, 2020, 2021 and for the six month period June 30, 2022. |
| 7 | Such ratios are after prior administrative and transfer agent waivers and adviser expense reimbursements, when applicable. BNY Mellon Investment Servicing (US) Inc., the prior administrative agent and transfer agent, waived a portion of its fees beginning with the Fund’s commencement of operations, August 22, 2011. Effective December 31, 2020, the Adviser contractually agreed to waive its investment advisory fee or absorb other operating expenses to the extent necessary to ensure that total annual Fund operating expenses (other than interest, taxes, brokerage commissions, dividends and interest on short sales, other investment-related expenses, acquired fund fees and expenses, and extraordinary expenses such as litigation and other expenses not incurred in the ordinary course of the Fund’s business) would not exceed the Fund’s operating expense cap of 1.24% of average daily net assets until April 30, 2023. From November 1, 2018, to December 31, 2020, the annual operating expense limitation was 1.45%. |
| For the six month period January 1, 2022 through June 30, 2022 (unaudited) | For the year ended December 31, 2021 | For the year ended December 31, 2020 | For the year ended December 31, 2019 | For the year ended December 31, 2018 | For the period April 10, 2017* through December 31, 2017 | ||||||
| Net asset value, beginning of period | $ 14.25 | $ 15.17 | $ 11.94 | $ 9.93 | $ 11.54 | $ 10.00 | |||||
| INCOME (LOSS) FROM INVESTMENT OPERATIONS: | |||||||||||
| Net investment income (loss) | 0.12 | 0.12 | 0.16 | 0.29 | 0.24 | 0.17 | |||||
| Net realized and unrealized gain (loss) on investments | (2.73) | (0.21) | 3.43 | 1.86 | (1.77) | 1.94 | |||||
| Total income (loss) from investment operations | (2.61) | (0.09) | 3.59 | 2.15 | (1.53) | 2.11 | |||||
| LESS DISTRIBUTIONS: | |||||||||||
| Net investment income | — | (0.22) | (0.11) | (0.14) | — | (0.16) | |||||
| Net realized gain | — | (0.61) | (0.25) | — | (0.08) | (0.41) | |||||
| Total distributions | — | (0.83) | (0.36) | (0.14) | (0.08) | (0.57) | |||||
| Redemption fees added to paid-in capital | 0.001 | — | — | — | — | 0.001 | |||||
| Net asset value, end of period | $ 11.64 | $ 14.25 | $ 15.17 | $ 11.94 | $ 9.93 | $ 11.54 | |||||
| Total Return | (18.32)%2 | (0.53)% | 30.09% | 21.64% | (13.22)% | 21.14%2 | |||||
| RATIOS/SUPPLEMENTAL DATA: | |||||||||||
| Net assets, end of period (000’s) | $ 45,561 | $ 57,728 | $ 53,221 | $ 39,043 | $ 31,637 | $ 43,183 | |||||
| Ratio of total expenses before reimbursements, waivers, recoupments and/or fees paid indirectly to average net assets | 1.30%3 | 1.31% | 1.62% | 1.89% | 2.05% | 2.04%3 | |||||
| Ratio of total expenses net of reimbursements, waivers, recoupments and/or fees paid indirectly to average net assets4,5 | 0.99%3 | 0.99% | 0.99% | 1.23% | 1.75% | 1.75%3 | |||||
| Ratio of net investment income (loss) (including interest expense) net of reimbursements, waivers, recoupments and/or fees paid indirectly to average net assets5 | 1.95%3 | 0.92% | 1.47% | 2.67% | 2.19% | 2.12%3 | |||||
| Portfolio turnover | 51%2 | 101% | 135% | 155% | 169% | 99%2 |
| * | Fund commenced operations on May 1, 2020. |
| 1 | Amount represents less than $0.01 per share. |
| 2 | Not annualized. |
| 3 | Annualized. |
| 4 | Effective May 1, 2019 the Adviser contractually agreed to waive its investment advisory fee or absorb other operating expenses to the extent necessary to ensure that total annual Fund operating expenses (other than interest, taxes, brokerage commissions, dividends and interest on short sales, other investment-related expenses, acquired fund fees and expenses, and extraordinary expenses such as litigation and other expenses not incurred in the ordinary course of the Fund’s business) would not exceed the Fund’s operating expense cap of 0.99% of average daily net assets until April 30, 2023. Prior to May 1, 2019. the annual operating expense limitation was 1.75%. |
| 5 | Such ratios are net of fees paid indirectly (see Note C in the Notes to Financial Statements). The expense ratio impacts of fees paid indirectly were 0.00%, 0.00%, 0.00%, 0.01% and 0.01% for the years 2018, 2019, 2020, 2021 and for the six month period June 30, 2022. |
| For the six month period January 1, 2022 through June 30, 2022 (unaudited) | For the year ended December 31, 2021 | For the year ended December 31, 2020 | For the year ended December 31, 2019 | For the year ended December 31, 2018 | For the year ended December 31, 2017 | ||||||
| Net asset value, beginning of period | $ 11.06 | $ 12.59 | $ 10.52 | $ 8.13 | $ 11.39 | $ 9.33 | |||||
| INCOME (LOSS) FROM INVESTMENT OPERATIONS: | |||||||||||
| Net investment income (loss) | 0.04 | 0.04 | 0.01 | 0.06 | (0.02)1 | (0.04) | |||||
| Net realized and unrealized gain (loss) on investments | (3.17) | 1.42 | 3.10 | 2.41 | (1.92) | 3.88 | |||||
| Total income (loss) from investment operations | (3.13) | 1.46 | 3.11 | 2.47 | (1.94) | 3.84 | |||||
| LESS DISTRIBUTIONS: | |||||||||||
| Net investment income | — | (0.04) | (0.08) | (0.01) | — | — | |||||
| Net realized gain | — | (2.95) | (0.96) | (0.07) | (1.32) | (1.78) | |||||
| Total distributions | — | (2.99) | (1.04) | (0.08) | (1.32) | (1.78) | |||||
| Redemption fees added to paid-in capital | 0.002 | 0.002 | 0.002 | 0.002 | 0.002 | 0.002 | |||||
| Net asset value, end of period | $ 7.93 | $ 11.06 | $ 12.59 | $ 10.52 | $ 8.13 | $ 11.39 | |||||
| Total Return | (28.30)%3 | 12.49% | 29.71% | 30.41% | (16.92)% | 41.44% | |||||
| RATIOS/SUPPLEMENTAL DATA: | |||||||||||
| Net assets, end of period (000’s) | $ 216,706 | $ 332,312 | $ 288,855 | $ 268,229 | $ 218,430 | $ 325,361 | |||||
| Ratio of total expenses before reimbursements, waivers, recoupments and/or fees paid indirectly to average net assets | 1.15%4 | 1.15% | 1.23% | 1.24% | 1.50% | 1.73% | |||||
| Ratio of total expenses net of reimbursements, waivers, recoupments and/or fees paid indirectly to average net assets5 | 1.15%4 | 1.14% | 1.23% | 1.24% | 1.49% | 1.71% | |||||
| Ratio of net investment income (loss) (including interest expense) net of reimbursements, waivers, recoupments and/or fees paid indirectly to average net assets5 | 0.99%4 | 0.32% | 0.02% | 0.65% | (0.21)% | (0.44)% | |||||
| Portfolio turnover | 39%3 | 93% | 104% | 96% | 118% | 143% |
| 1 | Net investment income (loss) per share has been calculated using the average shares method. |
| 2 | Amount represents less than $0.01 per share. |
| 3 | Not annualized. |
| 4 | Annualized. |
| 5 | Such ratios are net of fees paid indirectly (see Note C in the Notes to Financial Statements). The ratio for the Fund includes the effect of fees paid indirectly which impacted the ratio by 0.02%, 0.01%, 0.00%, 0.00%, 0.01% and 0.00% for the years 2017, 2018, 2019, 2020, 2021 and the six month period June 30, 2022. |
| For the six month period January 1, 2022 through June 30, 2022 (unaudited) | For the year ended December 31, 2021 | For the year ended December 31, 2020 | For the year ended December 31, 2019 | For the year ended December 31, 2018 | For the year ended December 31, 2017 | ||||||
| Net asset value, beginning of period | $ 16.33 | $ 19.99 | $ 12.95 | $ 11.11 | $ 14.44 | $ 12.65 | |||||
| INCOME (LOSS) FROM INVESTMENT OPERATIONS: | |||||||||||
| Net investment income (loss) | (0.04) | (0.22) | (0.20) | (0.16) | (0.19) | (0.18)1 | |||||
| Net realized and unrealized gain (loss) on investments | (6.32) | 4.44 | 11.20 | 3.90 | 0.55 | 3.26 | |||||
| Total income (loss) from investment operations | (6.36) | 4.22 | 11.00 | 3.74 | 0.36 | 3.08 | |||||
| LESS DISTRIBUTIONS: | |||||||||||
| Net investment income | — | — | — | (0.02) | — | — | |||||
| Net realized gain | — | (7.88) | (3.96) | (1.88) | (3.69) | (1.29) | |||||
| Total distributions | — | (7.88) | (3.96) | (1.90) | (3.69) | (1.29) | |||||
| Redemption fees added to paid-in capital | — | 0.002 | 0.002 | 0.002 | 0.002 | 0.002 | |||||
| Net asset value, end of period | $ 9.97 | $ 16.33 | $ 19.99 | $ 12.95 | $ 11.11 | $ 14.44 | |||||
| Total Return | (38.95)%3 | 24.73% | 85.60% | 33.89% | 3.88% | 24.30% | |||||
| RATIOS/SUPPLEMENTAL DATA: | |||||||||||
| Net assets, end of period (000’s) | $ 182,013 | $ 341,269 | $ 334,391 | $ 269,120 | $ 264,607 | $ 322,533 | |||||
| Ratio of total expenses before reimbursements, waivers, recoupments and/or fees paid indirectly to average net assets | 1.41%4 | 1.38% | 1.46% | 1.48% | 1.44%5 | 1.45%5 | |||||
| Ratio of total expenses net of reimbursements, waivers, recoupments and/or fees paid indirectly to average net assets6 | 1.38%4 | 1.35% | 1.43% | 1.43% | 1.42%5 | 1.43%5 | |||||
| Ratio of net investment income (loss) (including interest expense) net of reimbursements, waivers, recoupments and/or fees paid indirectly to average net assets6 | (0.65)%4 | (1.26)% | (1.33)% | (1.32)% | (1.19)% | (1.33)% | |||||
| Portfolio turnover | 57%3 | 109% | 141% | 165% | 156% | 177% |
| 1 | Net investment income (loss) per share has been calculated using the average shares method. |
| 2 | Amount represents less than $0.01 per share. |
| 3 | Not annualized. |
| 4 | Annualized. |
| 5 | Ratio of expenses to average net assets includes interest expense of less than 0.005% for the years ended December 31, 2018 and 2017. The interest expense is from utilizing the line of credit (see Note G in the Notes to Financial Statements). |
| 6 | Such ratios are net of fees paid indirectly (see Note C in the Notes to Financial Statements). The ratio for the Fund includes the effect of fees paid indirectly which impacted the ratio by 0.02%, 0.02%, 0.05%, 0.03%, 0.03%, and 0.03% for the years 2017, 2018, 2019, 2020, 2021, and for the six month period June 30, 2022. |
| For the six month period January 1, 2022 through June 30, 2022 (unaudited) | For the year ended December 31, 2021 | For the year ended December 31, 2020 | For the year ended December 31, 2019 | For the year ended December 31, 2018 | For the period August 21, 2017 through December 31, 2017 | ||||||
| Net asset value, beginning of period | $ 23.76 | $ 23.62 | $ 15.37 | $ 11.66 | $ 11.62 | $ 10.00 | |||||
| INCOME (LOSS) FROM INVESTMENT OPERATIONS: | |||||||||||
| Net investment income (loss) | (0.04)1 | (0.14) | (0.18)1 | (0.13) | (0.12)1 | (0.04)1 | |||||
| Net realized and unrealized gain (loss) on investments | (8.67) | 4.80 | 9.98 | 4.81 | 0.48 | 1.86 | |||||
| Total income (loss) from investment operations | (8.71) | 4.66 | 9.80 | 4.68 | 0.36 | 1.82 | |||||
| LESS DISTRIBUTIONS: | |||||||||||
| Net investment income | — | — | — | — | — | — | |||||
| Net realized gain | — | (4.52) | (1.55) | (0.97) | (0.33) | (0.20) | |||||
| Total distributions | — | (4.52) | (1.55) | (0.97) | (0.33) | (0.20) | |||||
| Redemption fees added to paid-in capital | 0.002 | — | — | 0.002 | 0.01 | — | |||||
| Net asset value, end of period | $ 15.05 | $ 23.76 | $ 23.62 | $ 15.37 | $ 11.66 | $ 11.62 | |||||
| Total Return | (36.66)%3 | 21.12% | 63.77% | 40.25% | 3.33% | 18.18%3 | |||||
| RATIOS/SUPPLEMENTAL DATA: | |||||||||||
| Net assets, end of period (000’s) | $ 61,290 | $ 96,371 | $ 28,088 | $ 10,899 | $ 7,538 | $ 1,344 | |||||
| Ratio of total expenses before reimbursements, waivers, recoupments and/or fees paid indirectly to average net assets | 0.99%4 | 0.99% | 1.35% | 1.59% | 2.57% | 7.86%4 | |||||
| Ratio of total expenses net of reimbursements, waivers, recoupments and/or fees paid indirectly to average net assets5 | 0.97%4,6 | 1.11%6 | 1.20%6 | 1.17%6 | 1.18%6 | 1.20%4,6 | |||||
| Ratio of net investment income (loss) (including interest expense) net of reimbursements, waivers, recoupments and/or fees paid indirectly to average net assets5 | (0.39)%4,6 | (0.97)%6 | (1.04)%6 | (0.95)%6 | (0.87)%6 | (0.94)%4,6 | |||||
| Portfolio turnover | 90%3 | 149% | 164% | 206% | 193% | 66%3 |
| 1 | Net investment income (loss) per share has been calculated using the average shares method. |
| 2 | Amount represents less than $0.01 per share. |
| 3 | Not annualized. |
| 4 | Annualized. |
| 5 | Such ratios are net of fees paid indirectly (see Note C in the Notes to Financial Statements). The ratio for the Fund includes the effect of fees paid indirectly which impacted the ratio by 0.00%, 0.02%, 0.03%, 0.02%, 0.02%, and 0.02% for the years 2017, 2018, 2019, 2020, 2021, and for the six month period June 30, 2022. |
| 6 | Such ratios are after administrative and transfer agent waivers and adviser expense reimbursements and recoupments, when applicable. BNY Mellon Investment Servicing (US) Inc., the prior administrative agent and transfer agent, waived a portion of its fees beginning with the Fund’s commencement of operations, August 21, 2017. The Adviser contractually agree to waive its investment advisory fee or absorb other operating expenses to the extent necessary to ensure that total annual operating expenses for the Investor Class (other than interest, taxes, brokerage commissions and other portfolio transaction expenses, capital expenditures, and extraordinary expenses) would not exceed the Investor Class’s operating expense cap of 1.20% of average daily net assets until April 30, 2023. |
| For the six month period January 1, 2022 through June 30, 2022 (unaudited) | For the year ended December 31, 2021 | For the year ended December 31, 2020 | For the year ended December 31, 2019 | For the year ended December 31, 2018 | For the period August 21, 2017 through December 31, 2017 | ||||||
| Net asset value, beginning of period | $ 24.15 | $ 23.88 | $ 15.47 | $ 11.70 | $ 11.63 | $ 10.00 | |||||
| INCOME (LOSS) FROM INVESTMENT OPERATIONS: | |||||||||||
| Net investment income (loss) | (0.01)1 | (0.11) | (0.11)1 | (0.10) | (0.08)1 | (0.03)1 | |||||
| Net realized and unrealized gain (loss) on investments | (8.83) | 4.90 | 10.07 | 4.84 | 0.47 | 1.86 | |||||
| Total income (loss) from investment operations | (8.84) | 4.79 | 9.96 | 4.74 | 0.39 | 1.83 | |||||
| LESS DISTRIBUTIONS: | |||||||||||
| Net investment income | — | — | — | — | — | — | |||||
| Net realized gain | — | (4.52) | (1.55) | (0.97) | (0.33) | (0.20) | |||||
| Total distributions | — | (4.52) | (1.55) | (0.97) | (0.33) | (0.20) | |||||
| Redemption fees added to paid-in capital | 0.002 | — | — | 0.002 | 0.01 | — | |||||
| Net asset value, end of period | $ 15.31 | $ 24.15 | $ 23.88 | $ 15.47 | $ 11.70 | $ 11.63 | |||||
| Total Return | (36.60)%3 | 21.44% | 64.39% | 40.62% | 3.59% | 18.28%3 | |||||
| RATIOS/SUPPLEMENTAL DATA: | |||||||||||
| Net assets, end of period (000’s) | $ 386,734 | $ 512,941 | $ 327,155 | $ 161,821 | $ 123,395 | $ 38,631 | |||||
| Ratio of total expenses before reimbursements, waivers, recoupments and/or fees paid indirectly to average net assets | 0.73%4 | 0.73% | 0.80% | 0.89% | 1.04% | 1.48%4 | |||||
| Ratio of total expenses net of reimbursements, waivers, recoupments and/or fees paid indirectly to average net assets5 | 0.71%4,6 | 0.71%6 | 0.81%6 | 0.92%6 | 0.93%6 | 0.95%4,6 | |||||
| Ratio of net investment income (loss) (including interest expense) net of reimbursements, waivers, recoupments and/or fees paid indirectly to average net assets5 | (0.10)%4,6 | (0.58)%6 | (0.64)%6 | (0.70)%6 | (0.62)%6 | (0.69)%4,6 | |||||
| Portfolio turnover | 90%3 | 149% | 164% | 206% | 193% | 66%3 |
| 1 | Net investment income (loss) per share has been calculated using the average shares method. |
| 2 | Amount represents less than $0.01 per share. |
| 3 | Not annualized. |
| 4 | Annualized. |
| 5 | Such ratios are net of fees paid indirectly (see Note C in the Notes to Financial Statements). The ratio for the Fund includes the effect of fees paid indirectly which impacted the ratio by 0.00%, 0.02%, 0.03%, 0.01%, 0.02%, and 0.02% for the years 2017, 2018, 2019, 2020, 2021 and for the six month period June, 30, 2022. |
| 6 | Such ratios are after administrative and transfer agent waivers and adviser expense reimbursements and recoupments, when applicable. BNY Mellon Investment Servicing (US) Inc., the prior administrative agent and transfer agent, waived a portion of its fees beginning with the Fund’s commencement of operations, August 21, 2017. The Adviser contractually agreed to waive its investment advisory fee or absorb other operating expenses to the extent necessary to ensure that total annual operating expenses for the Institutional Class (other than interest, taxes, brokerage commissions and other portfolio transaction expenses, capital expenditures, and extraordinary expenses) would not exceed the Institutional Class’s operating expense cap of 0.95% of average daily net assets until April 30, 2023. |
| For the six month period January 1, 2022 through June 30, 2022 (unaudited) | For the year ended December 31, 2021 | For the period May 1, 2020* through December 31, 2020 | |||
| Net asset value, beginning of period | $ 18.75 | $ 17.19 | $ 10.00 | ||
| INCOME (LOSS) FROM INVESTMENT OPERATIONS: | |||||
| Net investment income (loss) | (0.03) | (0.12) | (0.04) | ||
| Net realized and unrealized gain (loss) on investments | (6.06) | 3.17 | 7.47 | ||
| Total income (loss) from investment operations | (6.09) | 3.05 | 7.43 | ||
| LESS DISTRIBUTIONS: | |||||
| Net investment income | — | — | — | ||
| Net realized gain | — | (1.49) | (0.24) | ||
| Total distributions | — | (1.49) | (0.24) | ||
| Redemption fees added to paid-in capital | 0.001 | — | — | ||
| Net asset value, end of period | $ 12.66 | $ 18.75 | $ 17.19 | ||
| Total Return | (32.48)%2 | 18.32% | 74.23%2 | ||
| RATIOS/SUPPLEMENTAL DATA: | |||||
| Net assets, end of period (000’s) | $ 12,822 | $ 23,174 | $ 14,845 | ||
| Ratio of total expenses before reimbursements, waivers, recoupments and/or fees paid indirectly to average net assets | 1.37%3 | 1.31% | 2.58%3 | ||
| Ratio of total expenses net of reimbursements, waivers, recoupments and/or fees paid indirectly to average net assets4 | 0.95%3,5 | 0.95%5 | 0.95%3,5 | ||
| Ratio of net investment income (loss) (including interest expense) net of reimbursements, waivers, recoupments and/or fees paid indirectly to average net assets4 | (0.43)%3,5 | (0.70)%5 | (0.73)%3,5 | ||
| Portfolio turnover | 100%2 | 191% | 96%2 |
| * | Fund commenced operations on May 1, 2020. |
| 1 | Amount represents less than $0.01 per share. |
| 2 | Not annualized. |
| 3 | Annualized. |
| 4 | Such ratios are net of fees paid indirectly (see Note C in the Notes to Financial Statements). The ratio for the Fund includes the effect of fees paid indirectly which impacted the ratio by 0.00%, 0.01%, and 0.03% for the years 2020, 2021, and for the six month period June 30, 2022. |
| 5 | Such ratios are after administrative and transfer agent waivers and adviser expense reimbursements, when applicable. BNY Mellon Investment Servicing (US) Inc., the prior administrative agent and transfer agent, and The Northern Trust Company, the current administrative agent and transfer agent, waived a portion of its fees beginning with the Fund’s commencement of operations, May 1, 2020. The Adviser contractually agreed to waive its investment advisory fee or absorb other operating expenses to the extent necessary to ensure that total annual Fund operating expenses (other than interest, taxes, brokerage commissions and other portfolio transaction expenses, capital expenditures, and extraordinary expenses) would not exceed the Fund’s operating expense cap of 0.95% of average daily net assets until May 1, 2023. |
| For the six month period January 1, 2022 through June 30, 2022 (unaudited) | For the year ended December 31, 2021 | For the year ended December 31, 2020 | For the year ended December 31, 2019 | For the year ended December 31, 2018 | For the year ended December 31, 2017 | ||||||
| Net asset value, beginning of period | $ 13.29 | $ 13.93 | $ 11.55 | $ 9.99 | $ 10.79 | $ 10.34 | |||||
| INCOME (LOSS) FROM INVESTMENT OPERATIONS: | |||||||||||
| Net investment income (loss) | 0.03 | 0.04 | 0.12 | 0.26 | 0.25 | 0.02 | |||||
| Net realized and unrealized gain (loss) on investments | (1.46) | 0.93 | 2.74 | 1.69 | (0.69) | 0.43 | |||||
| Total income (loss) from investment operations | (1.43) | 0.97 | 2.86 | 1.95 | (0.44) | 0.45 | |||||
| LESS DISTRIBUTIONS: | |||||||||||
| Net investment income | — | (0.15) | (0.17) | (0.39) | (0.36) | — | |||||
| Net realized gain | — | (1.46) | (0.31) | — | — | — | |||||
| Total distributions | — | (1.61) | (0.48) | (0.39) | (0.36) | — | |||||
| Net asset value, end of period | $ 11.86 | $ 13.29 | $ 13.93 | $ 11.55 | $ 9.99 | $ 10.79 | |||||
| Total Return | (10.76)%1 | 7.21% | 24.84% | 19.53% | (4.03)% | 4.35% | |||||
| RATIOS/SUPPLEMENTAL DATA: | |||||||||||
| Net assets, end of period (000’s) | $ 183,073 | $ 203,635 | $ 142,064 | $ 69,455 | $ 51,675 | $ 165,648 | |||||
| Ratio of total expenses before reimbursements, waivers, recoupments and/or fees paid indirectly to average net assets | 1.68%2 | 1.49% | 1.59% | 1.93% | 1.90% | 1.77% | |||||
| Ratio of total expenses net of reimbursements, waivers, recoupments and/or fees paid indirectly to average net assets3,4 | 1.65%2 | 1.42% | 1.57% | 1.90% | 1.88% | 1.76% | |||||
| Ratio of net investment income (loss) (including dividends and interest on short positions and interest expense) net of reimbursements, waivers, recoupments and/or fees paid indirectly to average net assets3,4 | 0.56%2 | 0.10% | 0.67% | 2.63% | 2.57% | 0.48% | |||||
| Portfolio turnover | 41%1 | 109% | 136% | 111% | 101% | 198% |
| 1 | Not annualized. |
| 2 | Annualized. |
| 3 | The ratio for the fund includes the effect of dividends and interest on short positions, and interest expense which increased the expense ratios by 0.31%, 0.31%, 0.30%, 0.13%, 0.10% and 0.31% for the years 2017, 2018, 2019, 2020, 2021, and for the six month period June 30, 2022. |
| 4 | Such ratios are net of fees paid indirectly (see Note C in the Notes to Financial Statements). The ratio for the fund includes the effect of fees paid indirectly which impacted the expense ratios by 0.01%, 0.02%, 0.03%, 0.02%, 0.07% and 0.03% for the years 2017, 2018, 2019, 2020, 2021, and for the six month period June 30, 2022. |
| Fund | Commencement of Operations |
| Emerging Markets Growth Fund | 12/31/97 |
| Emerging Markets Small Cap Growth Fund | 08/22/11 |
| Emerging Markets Opportunities Fund | 04/10/17 |
| International Small Cap Growth Fund | 09/17/07 |
| Micro Cap Growth Fund | 11/18/13 |
| Small Cap Growth Fund | 08/21/17 |
| Small/Mid Cap Growth Fund | 05/01/20 |
| Event Driven Fund | 08/26/13 |
| Assets | Total Value at June 30, 2022 | Level 1 Quoted Price | Level 2 Significant Observable Inputs | Level 3 Significant Unobservable Inputs | ||||
| Common Stocks | ||||||||
| Africa | $49,421,351 | $49,421,351 | $— | $— | ||||
| Europe | 39,116,556 | 39,116,556 | — | —** | ||||
| Far East | 1,203,793,028 | 1,203,793,028 | — | — | ||||
| Middle East | 112,096,994 | 112,096,994 | — | — | ||||
| North America | 195,200,071 | 195,200,071 | — | — | ||||
| South America | 95,477,238 | 95,477,238 | — | — | ||||
| Short Term Investments | 150,921,464 | 150,921,464 | — | — | ||||
| Total | $1,846,026,702 | $1,846,026,702 | $— | $— |
| ** Level 3 security has zero value. |
| Assets | Total Value at June 30, 2022 | Level 1 Quoted Price | Level 2 Significant Observable Inputs | Level 3 Significant Unobservable Inputs | ||||
| Common Stocks | ||||||||
| Africa | $1,034,365 | $1,034,365 | $— | $— | ||||
| Europe | 535,226 | 535,226 | — | — | ||||
| Far East | ||||||||
| Australia | 1,920,133 | 1,920,133 | — | — | ||||
| Cambodia | 729,806 | 729,806 | — | — | ||||
| China | 29,780,500 | 29,780,500 | — | — | ||||
| India | 13,591,227 | 13,591,227 | — | — | ||||
| Indonesia | 3,778,775 | 3,778,775 | — | — | ||||
| Philippines | 491,625 | 491,625 | — | — | ||||
| South Korea | 4,336,169 | 4,336,169 | — | — | ||||
| Taiwan | 5,951,872 | 5,951,872 | — | — | ||||
| Thailand | 2,442,700 | 2,442,700 | — | — | ||||
| Vietnam | 6,421,851 | 2,194,684 | 4,227,167 | — | ||||
| Middle East | 5,458,438 | 5,458,438 | — | — | ||||
| North America | 4,237,708 | 4,237,708 | — | — | ||||
| South America | 7,606,212 | 7,606,212 | — | — | ||||
| Preferred Stocks | ||||||||
| South America | 1,040,870 | 1,040,870 | — | — | ||||
| Short Term Investments | 5,682,919 | 5,682,919 | — | — | ||||
| Total | $95,040,396 | $90,813,229 | $4,227,167 | $— |
| Assets | Total Value at June 30, 2022 | Level 1 Quoted Price | Level 2 Significant Observable Inputs | Level 3 Significant Unobservable Inputs | ||||
| Common Stocks | $32,892,739 | $32,892,739 | $— | $— | ||||
| Short Term Investments | 3,095,420 | 3,095,420 | — | — | ||||
| Sovereign Bonds | 9,033,459 | — | 9,033,459 | — | ||||
| Total | $45,021,618 | $35,988,159 | $9,033,459 | $— |
| Assets | Total Value at June 30, 2022 | Level 1 Quoted Price | Level 2 Significant Observable Inputs | Level 3 Significant Unobservable Inputs | ||||
| Common Stocks | ||||||||
| Europe | $128,539,635 | $128,539,635 | $— | $— | ||||
| Far East | 39,539,000 | 39,539,000 | — | — | ||||
| North America | 35,326,337 | 35,326,337 | — | — | ||||
| South America | 5,046,884 | 5,046,884 | — | — | ||||
| Short Term Investments | 5,590,673 | 5,590,673 | — | — | ||||
| Total | $214,042,529 | $214,042,529 | $— | $— |
| Assets* | Total Value at June 30, 2022 | Level 1 Quoted Price | Level 2 Significant Observable Inputs | Level 3 Significant Unobservable Inputs | ||||
| Common Stocks | $174,181,415 | $174,181,415 | $— | $— | ||||
| Short Term Investments | 7,324,399 | 7,324,399 | — | — | ||||
| Warrants | 29,579 | — | 29,579 | — | ||||
| Total | $181,535,393 | $181,505,814 | $29,579 | $— |
| * See Schedule of Investments for industry breakout. |
| Assets* | Total Value at June 30, 2022 | Level 1 Quoted Price | Level 2 Significant Observable Inputs | Level 3 Significant Unobservable Inputs | ||||
| Common Stocks | $433,190,445 | $433,190,445 | $— | $— | ||||
| Short Term Investments | 27,039,918 | 27,039,918 | — | — | ||||
| Total | $460,230,363 | $460,230,363 | $— | $— |
| * See Schedule of Investments for industry breakout. |
| Assets* | Total Value at June 30, 2022 | Level 1 Quoted Price | Level 2 Significant Observable Inputs | Level 3 Significant Unobservable Inputs | ||||
| Common Stocks | $12,154,140 | $12,154,140 | $— | $— | ||||
| Short Term Investments | 733,708 | 733,708 | — | — | ||||
| Total | $12,887,848 | $12,887,848 | $— | $— |
| * See Schedule of Investments for industry breakout. |
| Assets* | Total Value at June 30, 2022 | Level 1 Quoted Price | Level 2 Significant Observable Inputs | Level 3 Significant Unobservable Inputs | ||||
| Bank Loans | $792,536 | $— | $792,536 | $— | ||||
| Common Stocks | ||||||||
| Auto Parts & Equipment | 4,989,716 | 4,989,716 | — | — | ||||
| Banks | 12,740,954 | 12,740,954 | — | — | ||||
| Biotechnology | 17,557,764 | 17,557,764 | — | — | ||||
| Commercial Services | 2,455,280 | 2,455,280 | — | — | ||||
| Engineering & Construction | 7,338,299 | 7,338,299 | — | — | ||||
| Entertainment | 10,288,972 | 10,288,972 | — | — | ||||
| Financial Services | 6,364,492 | 6,364,492 | — | — | ||||
| Healthcare - Products | 564,073 | 564,073 | — | — | ||||
| Holding Companies - Diversified | 19,939,758 | 18,084,159 | 1,855,599 | —** | ||||
| Leisure Time | 1,799,974 | 1,799,974 | — | — | ||||
| Metal Fabricate/Hardware | 3,184,842 | 3,184,842 | — | — | ||||
| Savings & Loans | 4,591,665 | 4,591,665 | — | — | ||||
| Software | 2,057,408 | 2,057,408 | — | — | ||||
| Transportation | 6,388,704 | 6,388,704 | — | — | ||||
| Convertible Corporate Bonds | 2,833,972 | — | 2,833,972 | — | ||||
| Corporate Bonds | 43,639,639 | — | 43,639,639 | — | ||||
| Foreign Issuer Bonds | 652,449 | — | 652,449 | — | ||||
| Preferred Stocks | 3,670,556 | 3,670,556 | — | — | ||||
| Private Investment In Public Equity (PIPES) | 1,316,914 | 1,316,914 | — | — | ||||
| Purchased Call Options | 42,849 | 42,849 | — | — | ||||
| Short Term Investments | 22,877,045 | 22,877,045 | — | — | ||||
| Warrants | 278,219 | 241,572 | 36,647 | — | ||||
| Total | $176,366,080 | $126,555,238 | $49,810,842 | $— |
| Liabilities | ||||||||
| Common Stocks Sold Short | $(373,751) | $(373,751) | $— | $— | ||||
| Corporate Bonds Sold Short | (4,840,172) | — | (4,840,172) | — | ||||
| Exchange-Traded Funds Sold Short | (36,203,226) | (36,203,226) | — | — | ||||
| Written Call Options | (17,574) | (17,574) | — | — | ||||
| Total | $(41,434,723) | $(36,594,551) | $(4,840,172) | $— |
| Other Financial Instruments | TotalValue at June 30, 2022 | Level 1Quoted Price | Level 2Significant Observable Inputs | Level 3Significant Unobservable Inputs | ||||
| Total Return Swaps - Liabilities*** | $(144,659) | $— | $(144,659) | $— | ||||
| Total Other Financial Instruments | $(144,659) | $— | $(144,659) | $— |
| * See Schedule of Investments for industry breakout. |
| ** Level 3 security has zero value. |
| *** Swaps are reflected as the unrealized appreciation (depreciation) on the instrument. |
| Emerging Markets Growth Fund | Emerging Markets Small Cap Growth Fund | Emerging Markets Opportunities Fund | International Small Cap Growth Fund | ||||
| Paid-in capital | $— | $(960,936) | $— | $— | |||
| Total distributable earnings (deficit) | — | 960,936 | — | — |
| Micro Cap Growth Fund | Small Cap Growth Fund | Small/Mid Cap Growth Fund | Event Driven Fund | ||||
| Paid-in capital | $— | $— | $— | $28,067 | |||
| Total distributable earnings (deficit) | — | — | — | (28,067) |
| Not Subject to Expiration | ||||
| Fund | Short-Term | Long-Term | ||
| Emerging Markets Growth Fund | $— | $— | ||
| Emerging Markets Small Cap Growth Fund | (20,059,007) | — | ||
| Emerging Markets Opportunities Fund | — | — | ||
| International Small Cap Growth Fund | — | — | ||
| Micro Cap Growth Fund | — | — | ||
| Small Cap Growth Fund | — | — | ||
| Small/Mid Cap Growth Fund | — | — | ||
| Event Driven Fund | — | — | ||
| Fund | Total Capital Loss Deferral | Total | ||
| Emerging Markets Growth Fund | $29,373,954 | $29,373,954 | ||
| Emerging Markets Small Cap Growth Fund | — | — | ||
| Emerging Markets Opportunities Fund | 829,264 | 829,264 | ||
| International Small Cap Growth Fund | — | — | ||
| Micro Cap Growth Fund | 685,839 | 685,839 | ||
| Small Cap Growth Fund | 1,452,902 | 1,452,902 | ||
| Small/Mid Cap Growth Fund | 224,116 | 224,116 | ||
| Event Driven Fund | 621,985 | 621,985 |
| Fund | Year | Ordinary Income | Long-Term Capital Gain | Return of Capital | Total Distributions | |||||
| Emerging Markets Growth Fund | 2021 | $118,399,989 | $225,900,006 | $— | $344,299,995 | |||||
| 2020 | 16,886,001 | 38,607,483 | — | 55,493,484 | ||||||
| Emerging Markets Small Cap Growth Fund | 2021 | 49,512 | — | — | 49,512 | |||||
| 2020 | 556,757 | — | — | 556,757 | ||||||
| Emerging Markets Opportunities Fund | 2021 | 1,367,786 | 1,825,005 | — | 3,192,791 | |||||
| 2020 | 379,497 | 743,583 | — | 1,123,080 | ||||||
| International Small Cap Growth Fund | 2021 | 35,600,012 | 36,999,988 | — | 72,600,000 | |||||
| 2020 | 3,163,154 | 19,239,957 | — | 22,403,111 | ||||||
| Micro Cap Growth Fund | 2021 | 55,500,006 | 68,499,993 | — | 123,999,999 | |||||
| 2020 | 10,322,938 | 48,426,960 | — | 58,749,898 | ||||||
| Small Cap Growth Fund | 2021 | 41,199,996 | 48,000,010 | — | 89,200,006 | |||||
| 2020 | 2,296,873 | 19,232,110 | — | 21,528,983 | ||||||
| Small/Mid Cap Growth Fund | 2021 | 1,251,729 | 501,538 | — | 1,753,267 | |||||
| 2020 | 202,118 | — | — | 202,118 | ||||||
| Event Driven Fund | 2021 | 13,322,483 | 9,400,443 | — | 22,722,926 | |||||
| 2020 | 2,341,243 | 2,388,109 | — | 4,729,352 |
| Emerging Markets Growth Fund | Emerging Markets Small Cap Growth Fund | Emerging Markets Opportunities Fund | International Small Cap Growth Fund | ||||
| Undistributed ordinary income | $— | $— | $6,074 | $5,402,859 | |||
| Undistributed long-term capital gain | 2,015,660 | — | — | 6,858,913 | |||
| Accumulated earnings | 2,015,660 | — | 6,074 | 12,261,772 | |||
| Paid-in capital | 1,852,569,075 | 116,286,819 | 46,570,904 | 271,038,184 | |||
| Accumulated capital and other losses | (29,373,954) | (20,059,007) | (829,264) | — | |||
| Unrealized appreciation (depreciation) on investments, securities sold short, warrants and swaps | 501,893,262 | 20,416,569 | 11,979,852 | 49,012,183 | |||
| Net assets | $2,327,104,043 | $116,644,381 | $57,727,566 | $332,312,139 |
| Micro Cap Growth Fund | Small Cap Growth Fund | Small/Mid Cap Growth Fund | Event Driven Fund | ||||
| Undistributed ordinary income | $— | $— | $— | $178,672 | |||
| Undistributed long-term capital gain | 13,811,605 | 9,211,794 | 461,634 | 2,570,647 | |||
| Accumulated earnings | 13,811,605 | 9,211,794 | 461,634 | 2,749,319 | |||
| Paid-in capital | 207,711,433 | 463,581,741 | 18,304,267 | 192,491,819 | |||
| Accumulated capital and other losses | (685,839) | (1,452,902) | (224,116) | (621,985) | |||
| Unrealized appreciation (depreciation) on investments, securities sold short, warrants and swaps | 120,432,052 | 137,971,008 | 4,631,964 | 9,015,385 | |||
| Net assets | $341,269,251 | $609,311,641 | $23,173,749 | $203,634,538 |
| Fund | Basis | Gross Appreciation | Gross Depreciation | Net Appreciation/ Depreciation | ||||
| Emerging Markets Growth Fund | $1,732,284,845 | $225,731,307 | $(111,989,450) | $113,741,857 | ||||
| Emerging Markets Small Cap Growth Fund | 94,829,834 | 9,081,268 | (8,870,706) | 210,562 | ||||
| Emerging Markets Opportunities Fund | 42,869,835 | 4,950,175 | (2,798,392) | 2,151,783 | ||||
| International Small Cap Growth Fund | 247,304,229 | 13,120,056 | (46,381,756) | (33,261,700) | ||||
| Micro Cap Growth Fund | 181,883,821 | 21,940,471 | (22,288,899) | (348,428) | ||||
| Small Cap Growth Fund | 488,933,660 | 29,573,436 | (58,276,733) | (28,703,297) | ||||
| Small/Mid Cap Growth Fund | 13,615,839 | 732,378 | (1,460,369) | (727,991) | ||||
| Event Driven Fund | 133,727,909 | 16,215,351 | (14,829,326) | 1,386,025 |
| Asset derivatives | ||||
| Risk exposure category | Statements of Assets and Liabilities location | Fair Value | ||
| Equity contracts | Warrant securities, at fair value | $29,579 | ||
| Total | $29,579 | |||
| Asset derivatives | ||||
| Risk exposure category | Statements of Assets and Liabilities location | Fair Value | ||
| Equity contracts | Purchased options, at fair value | $42,849 | ||
| Equity contracts | Warrant securities, at fair value | 278,219 | ||
| Total | $321,068 | |||
| Liabilities derivatives | ||||
| Risk exposure category | Statements of Assets and Liabilities location | Fair Value | ||
| Equity contracts | Unrealized depreciation on open OTC swap contracts | $144,659 | ||
| Equity contracts | Written options, at fair value | 17,574 | ||
| Total | $162,233 | |||
| Amount of net realized gain (loss) on derivatives | ||||||
| Risk exposure category | ||||||
| Derivative | Equity contracts | Interest rate contracts | Total | |||
| Purchased options contracts | $158,010 | $— | $158,010 | |||
| Swap contracts | — | 63,890 | 63,890 | |||
| Total | $158,010 | $63,890 | $221,900 | |||
| Amount of net realized gain (loss) on derivatives | ||||
| Risk exposure category | ||||
| Derivative | Equity contracts | Total | ||
| Purchased options contracts | $(59,567) | $(59,567) | ||
| Swap contracts | 1,277,972 | 1,277,972 | ||
| Warrants | (236,545) | (236,545) | ||
| Total | $981,860 | $981,860 | ||
| Quarterly Derivative Averages | ||||
| Derivative | Quarterly Average | $ Amount/ Number | ||
| Purchased options contracts | number of contracts | 1,538,462 | ||
| Change in net unrealized appreciation (depreciation) on derivatives | ||||
| Risk exposure category | ||||
| Derivative | Equity contracts | Total | ||
| Warrants | $(6,379) | $(6,379) | ||
| Total | $(6,379) | $(6,379) | ||
| Quarterly Derivative Averages | ||||
| Derivative | Quarterly Average | $ Amount/ Number | ||
| Warrants | number of contracts | 25,355 | ||
| Change in net unrealized appreciation (depreciation) on derivatives | ||||
| Risk exposure category | ||||
| Derivative | Equity contracts | Total | ||
| Written options contracts | $189,034 | $189,034 | ||
| Purchased options contracts | (584,436) | (584,436) | ||
| Swap contracts | (106,741) | (106,741) | ||
| Warrants | (486,752) | (486,752) | ||
| Total | $(988,895) | $(988,895) | ||
| Quarterly Derivative Averages | ||||
| Derivative | Quarterly Average | $ Amount/ Number | ||
| Written options contracts | number of contracts | (758) | ||
| Purchased options contracts | number of contracts | 687 | ||
| Swap contracts | gross notional amount | $538,756 | ||
| Warrants | number of contracts | 1,244,024 | ||
| Description | Gross Amounts Recognized in Statements of Assets and Liabilities | Derivatives Available for Offset | Collateral Received/ (Pledged) | Net Amount | ||||
| Unrealized depreciation on open OTC swap contracts | $(144,659) | $— | $— | $(144,659) |
| Period ended December 31 | Emerging Markets Small Cap Growth Fund | Emerging Markets Opportunities Fund | Small/Mid Cap Growth Fund | |||
| 2023 | $171,531 | $230,617 | $73,297 | |||
| 2024 | 126,032 | 191,639 | 75,963 | |||
| 2025 | 82,550 | 76,135 | 35,808 | |||
| Total | $380,113 | $498,391 | $185,068 |
| Fund | Shareholder services plan fees | Accrued shareholder services plan fees | ||
| Emerging Markets Growth Fund | $ 809,615 | $ 245,108 | ||
| Small Cap Growth Fund | 81,952 | 24,252 | ||
| Event Driven Fund | 181,213 | 60,314 |
| Fund | Purchases | Sales | ||
| Emerging Markets Growth Fund | 1,429,264,859 | 1,562,365,003 | ||
| Emerging Markets Small Cap Growth Fund | 81,531,677 | 77,397,247 | ||
| Emerging Markets Opportunities Fund | 24,302,727 | 25,946,144 | ||
| International Small Cap Growth Fund | 106,137,351 | 130,071,699 | ||
| Micro Cap Growth Fund | 137,100,474 | 177,453,304 | ||
| Small Cap Growth Fund | 518,033,777 | 451,872,680 | ||
| Small/Mid Cap Growth Fund | 17,980,666 | 21,371,707 | ||
| Event Driven Fund | 89,481,860 | 98,109,166 |
| Emerging Markets Growth Fund | Emerging Markets Small Cap Growth Fund | Emerging Markets Opportunities Fund | |||||||||
| June 30, 2022 | December 31, 2021 | June 30, 2022 | December 31, 2021 | June 30, 2022 | December 31, 2021 | ||||||
| Fund | |||||||||||
| Shares issued | — | — | 719,885 | 1,315,978 | 89,526 | 729,015 | |||||
| Shares reinvested | — | — | — | 1,994 | — | 226,243 | |||||
| Shares redeemed | — | — | (488,754) | (745,256) | (225,964) | (413,309) | |||||
| Net increase (decrease) | — | — | 231,131 | 572,716 | (136,438) | 541,949 | |||||
| Investor Class | |||||||||||
| Shares issued | 1,512,255 | 2,286,494 | — | — | — | — | |||||
| Shares reinvested | — | 2,945,615 | — | — | — | — | |||||
| Shares redeemed | (2,664,118) | (4,126,250) | — | — | — | — | |||||
| Net increase (decrease) | (1,151,863) | 1,105,859 | — | — | — | — | |||||
| Institutional Class | |||||||||||
| Shares issued | 4,562,437 | 9,064,263 | — | — | — | — | |||||
| Shares reinvested | — | 4,805,413 | — | — | — | — | |||||
| Shares redeemed | (4,113,591) | (5,111,672) | — | — | — | — | |||||
| Net increase (decrease) | 448,846 | 8,758,004 | — | — | — | — | |||||
| Total net increase (decrease) | (703,017) | 9,863,863 | — | — | — | — | |||||
| International Small Cap Growth Fund | Micro Cap Growth Fund | Small Cap Growth Fund | |||||||||
| June 30, 2022 | December 31, 2021 | June 30, 2022 | December 31, 2021 | June 30, 2022 | December 31, 2021 | ||||||
| Fund | |||||||||||
| Shares issued | 1,144,014 | 4,892,868 | 366,766 | 261,767 | — | — | |||||
| Shares reinvested | — | 6,080,902 | — | 5,973,251 | — | — | |||||
| Shares redeemed | (3,841,334) | (3,880,440) | (3,002,868) | (2,061,238) | — | — | |||||
| Net increase (decrease) | (2,697,320) | 7,093,330 | (2,636,102) | 4,173,780 | — | — | |||||
| Investor Class | |||||||||||
| Shares issued | — | — | — | — | 1,151,682 | 3,283,526 | |||||
| Shares reinvested | — | — | — | — | — | 698,534 | |||||
| Shares redeemed | — | — | — | — | (1,133,642) | (1,115,793) | |||||
| Net increase (decrease) | — | — | — | — | 18,040 | 2,866,267 | |||||
| Institutional Class | |||||||||||
| Shares issued | — | — | — | — | 7,418,582 | 8,078,057 | |||||
| Shares reinvested | — | — | — | — | — | 2,952,682 | |||||
| Shares redeemed | — | — | — | — | (3,394,252) | (3,492,518) | |||||
| Net increase (decrease) | — | — | — | — | 4,024,330 | 7,538,221 | |||||
| Total net increase (decrease) | — | — | — | — | 4,042,370 | 10,404,488 | |||||
| Small/Mid Cap Growth Fund | Event Driven Fund | ||||||
| June 30, 2022 | December 31, 2021 | June 30, 2022 | December 31, 2021 | ||||
| Fund | |||||||
| Shares issued | 158,937 | 602,661 | 6,050,246 | 8,560,659 | |||
| Shares reinvested | — | 99,901 | — | 1,677,873 | |||
| Shares redeemed | (382,560) | (329,889) | (5,930,494) | (5,112,285) | |||
| Net increase (decrease) | (223,623) | 372,673 | 119,752 | 5,126,247 | |||
| Investor Class | |||||||
| Shares issued | — | — | — | — | |||
| Shares reinvested | — | — | — | — | |||
| Shares redeemed | — | — | — | — | |||
| Net increase (decrease) | — | — | — | — | |||
| Institutional Class | |||||||
| Shares issued | — | — | — | — | |||
| Shares reinvested | — | — | — | — | |||
| Shares redeemed | — | — | — | — | |||
| Net increase (decrease) | — | — | — | — | |||
| Total net increase (decrease) | — | — | — | — | |||
| Emerging Markets Growth Fund — Investor Class | ||||||
| Beginning Account Value January 1, 2022 | Ending Account Value June 30, 2022 | Expenses Paid During Six Months Ended June 30, 2022* | ||||
| Actual | $1,000.00 | $810.20 | $5.97 | |||
| Hypothetical Example, assuming a 5% return before expenses | $1,000.00 | $1,018.20 | $6.66 | |||
| Emerging Markets Growth Fund — Institutional Class | ||||||
| Beginning Account Value January 1, 2022 | Ending Account Value June 30, 2022 | Expenses Paid During Six Months Ended June 30, 2022* | ||||
| Actual | $1,000.00 | $810.90 | $4.94 | |||
| Hypothetical Example, assuming a 5% return before expenses | $1,000.00 | $1,019.34 | $5.51 | |||
| Emerging Markets Small Cap Growth Fund | ||||||
| Beginning Account Value January 1, 2022 | Ending Account Value June 30, 2022 | Expenses Paid During Six Months Ended June 30, 2022* | ||||
| Actual | $1,000.00 | $805.50 | $5.55 | |||
| Hypothetical Example, assuming a 5% return before expenses | $1,000.00 | $1,018.65 | $6.21 | |||
| Emerging Markets Opportunities Fund | ||||||
| Beginning Account Value January 1, 2022 | Ending Account Value June 30, 2022 | Expenses Paid During Six Months Ended June 30, 2022* | ||||
| Actual | $1,000.00 | $816.80 | $4.46 | |||
| Hypothetical Example, assuming a 5% return before expenses | $1,000.00 | $1,019.89 | $4.96 | |||
| International Small Cap Growth Fund | ||||||
| Beginning Account Value January 1, 2022 | Ending Account Value June 30, 2022 | Expenses Paid During Six Months Ended June 30, 2022* | ||||
| Actual | $1,000.00 | $717.00 | $4.90 | |||
| Hypothetical Example, assuming a 5% return before expenses | $1,000.00 | $1,019.09 | $5.76 | |||
| Micro Cap Growth Fund | ||||||
| Beginning Account Value January 1, 2022 | Ending Account Value June 30, 2022 | Expenses Paid During Six Months Ended June 30, 2022* | ||||
| Actual | $1,000.00 | $610.50 | $5.63 | |||
| Hypothetical Example, assuming a 5% return before expenses | $1,000.00 | $1,017.80 | $7.05 | |||
| Small Cap Growth Fund — Investor Class | ||||||
| Beginning Account Value January 1, 2022 | Ending Account Value June 30, 2022 | Expenses Paid During Six Months Ended June 30, 2022* | ||||
| Actual | $1,000.00 | $633.40 | $4.01 | |||
| Hypothetical Example, assuming a 5% return before expenses | $1,000.00 | $1,019.89 | $4.96 | |||
| Small Cap Growth Fund — Institutional Class | ||||||
| Beginning Account Value January 1, 2022 | Ending Account Value June 30, 2022 | Expenses Paid During Six Months Ended June 30, 2022* | ||||
| Actual | $1,000.00 | $634.00 | $2.96 | |||
| Hypothetical Example, assuming a 5% return before expenses | $1,000.00 | $1,021.17 | $3.66 | |||
| Small/Mid Cap Growth Fund | ||||||
| Beginning Account Value January 1, 2022 | Ending Account Value June 30, 2022 | Expenses Paid During Six Months Ended June 30, 2022* | ||||
| Actual | $1,000.00 | $675.20 | $3.95 | |||
| Hypothetical Example, assuming a 5% return before expenses | $1,000.00 | $1,020.08 | $4.76 | |||
| Event Driven Fund | ||||||
| Beginning Account Value January 1, 2022 | Ending Account Value June 30, 2022 | Expenses Paid During Six Months Ended June 30, 2022* | ||||
| Actual | $1,000.00 | $892.40 | $7.88 | |||
| Hypothetical Example, assuming a 5% return before expenses | $1,000.00 | $1,016.46 | $8.40 | |||
| Emerging Markets Growth Fund – Investor Class | 1.33% |
| Emerging Markets Growth Fund – Institutional Class | 1.10% |
| Emerging Markets Small Cap Growth Fund | 1.24% |
| Emerging Markets Opportunities Fund | 0.99% |
| International Small Cap Growth Fund | 1.15% |
| Micro Cap Growth Fund | 1.41% |
| Small Cap Growth Fund – Investor Class | 0.99% |
| Small Cap Growth Fund – Institutional Class | 0.73% |
| Small/Mid Cap Growth Fund | 0.95% |
| Event Driven Fund | 1.68% |
| Emerging Markets Growth Fund | Emerging Markets Small Cap Growth Fund | Emerging Markets Opportunities Fund | International Small Cap Growth Fund | |||
| $225,900,006 | $— | $1,825,007 | $36,999,988 |
| Micro Cap Growth Fund | Small Cap Growth Fund | Small/Mid Cap Growth Fund | Event Driven Fund | |||
| $68,499,993 | $48,000,010 | $501,538 | $9,400,443 |
| Emerging Markets Growth Fund | Emerging Markets Small Cap Growth Fund | Emerging Markets Opportunities Fund | International Small Cap Growth Fund | |||
| —% | 63.85% | 51.30% | 100.00% |
| Micro Cap Growth Fund | Small Cap Growth Fund | Small/Mid Cap Growth Fund | Event Driven Fund | |||
| —% | —% | —% | 31.88% |
| Emerging Markets Growth Fund | Emerging Markets Small Cap Growth Fund | Emerging Markets Opportunities Fund | International Small Cap Growth Fund | |||
| 18.15% | —% | —% | 9.93% |
| Micro Cap Growth Fund | Small Cap Growth Fund | Small/Mid Cap Growth Fund | Event Driven Fund | |||
| 0.53% | 1.35% | 3.82% | —% |
| Emerging Markets Growth Fund | Emerging Markets Small Cap Growth Fund | Emerging Markets Opportunities Fund | International Small Cap Growth Fund | |||
| —% | —% | 0.35% | —% |
| Micro Cap Growth Fund | Small Cap Growth Fund | Small/Mid Cap Growth Fund | Event Driven Fund | |||
| —% | —% | —% | 0.83% |
| • | the program supported each Fund’s ability to honor redemption requests timely; |
| • | the program supported the Adviser’s management of each Fund’s liquidity profile, including during periods of market volatility and net redemptions; |
| • | no material liquidity issues were identified during the period; |
| • | there were no material changes to the program during the period; |
| • | the implementation of the program was effective to manage each Fund’s liquidity risk; and |
| • | the program operated adequately during the period. |
| (b) | Not applicable. |
Item 2. Code of Ethics.
Not applicable.
Item 3. Audit Committee Financial Expert.
Not applicable.
Item 4. Principal Accountant Fees and Services.
Not applicable.
Item 5. Audit Committee of Listed Registrants.
Not applicable.
Item 6. Investments.
| (a) | Schedule of Investments in securities of unaffiliated issuers as of the close of the reporting period is included as part of the report to shareholders filed under Item 1 of this form. |
| (b) | Not applicable. |
Item 7. Disclosure of Proxy Voting Policies and Procedures for Closed-End Management Investment Companies.
Not applicable.
Item 8. Portfolio Managers of Closed-End Management Investment Companies.
Not applicable.
Item 9. Purchases of Equity Securities by Closed-End Management Investment Companies and Affiliated Purchasers.
Not applicable.
Item 10. Submission of Matters to a Vote of Security Holders.
There have been no material changes to the procedures by which the shareholders may recommend nominees to the registrant’s board of directors, where those changes were implemented after the registrant last provided disclosure in response to the requirements of Item 407(c)(2)(iv) of Regulation S-K (17 CFR 229.407) (as required by Item 22(b)(15) of Schedule 14A (17 CFR 240.14a-101)), or this Item.
Item 11. Controls and Procedures.
| (a) | The registrant’s principal executive and principal financial officers, or persons performing similar functions, have concluded that the registrant’s disclosure controls and procedures (as defined in Rule 30a-3(c) under the Investment Company Act of 1940, as amended (the “1940 Act”) (17 CFR 270.30a-3(c))) are effective, as of a date within 90 days of the filing date of the report that includes the disclosure required by this paragraph, based on their evaluation of these controls and procedures required by Rule 30a-3(b) under the 1940 Act (17 CFR 270.30a-3(b)) and Rules 13a-15(b) or 15d-15(b) under the Securities Exchange Act of 1934, as amended (17 CFR 240.13a-15(b) or 240.15d-15(b)). |
| (b) | There were no changes in the registrant’s internal control over financial reporting (as defined in Rule 30a-3(d) under the 1940 Act (17 CFR 270.30a-3(d))) that occurred during the period covered by this report that has materially affected, or is reasonably likely to materially affect, the registrant’s internal control over financial reporting. |
Item 12. Disclosure of Securities Lending Activities for Closed-End Management Investment Companies.
Not applicable.
Item 13. Exhibits.
| (a)(1) | Not applicable. |
| (a)(2) | Certifications pursuant to Rule 30a-2(a) under the 1940 Act and Section 302 of the Sarbanes- Oxley Act of 2002 are attached hereto. |
| (a)(3) | Not applicable. |
| (a)(4) | Not applicable. |
| (b) | Certifications pursuant to Rule 30a-2(b) under the 1940 Act and Section 906 of the Sarbanes- Oxley Act of 2002 are attached hereto. |
SIGNATURES
Pursuant to the requirements of the Securities Exchange Act of 1934 and the Investment Company Act of 1940, the registrant has duly caused this report to be signed on its behalf by the undersigned, thereunto duly authorized.
| (Registrant) | Driehaus Mutual Funds | |
| By (Signature and Title) | /s/ Stephen T. Weber | |
| Stephen T. Weber, President | ||
| (principal executive officer) | ||
| Date | September 2, 2022 |
Pursuant to the requirements of the Securities Exchange Act of 1934 and the Investment Company Act of 1940, this report has been signed below by the following persons on behalf of the registrant and in the capacities and on the dates indicated.
| By (Signature and Title) | /s/ Stephen T. Weber | |
| Stephen T. Weber, President | ||
| (principal executive officer) | ||
| Date | September 2, 2022 | |
| By (Signature and Title) | /s/ Robert M. Kurinsky | |
| Robert M. Kurinsky, Vice President and Treasurer | ||
| (principal financial officer) | ||
| Date | September 2, 2022 |