UNITED STATES
SECURITIES AND EXCHANGE COMMISSION
Washington, D.C. 20549
FORM N-CSR
CERTIFIED SHAREHOLDER REPORT OF REGISTERED MANAGEMENT INVESTMENT COMPANIES
Investment Company Act file number 811-07655
Driehaus Mutual Funds
(Exact name of registrant as specified in charter)
25 East Erie Street
Chicago, IL 60611
(Address of principal executive offices) (Zip code)
Janet L. McWilliams
Driehaus Capital Management LLC
25 East Erie Street
Chicago, IL 60611
(Name and address of agent for service)
Registrant's telephone number, including area code: 312-587-3800
Date of fiscal year end: December 31
Date of reporting period: June 30, 2020
Form N-CSR is to be used by management investment companies to file reports with the Commission not later than 10 days after the transmission to stockholders of any report that is required to be transmitted to stockholders under Rule 30e-1 under the Investment Company Act of 1940 (17 CFR 270.30e-1). The Commission may use the information provided on Form N-CSR in its regulatory, disclosure review, inspection, and policymaking roles.
A registrant is required to disclose the information specified by Form N-CSR, and the Commission will make this information public. A registrant is not required to respond to the collection of information contained in Form N-CSR unless the Form displays a currently valid Office of Management and Budget ("OMB") control number. Please direct comments concerning the accuracy of the information collection burden estimate and any suggestions for reducing the burden to Secretary, Securities and Exchange Commission, 450 Fifth Street, NW, Washington, DC 20549-0609. The OMB has reviewed this collection of information under the clearance requirements of 44 U.S.C. § 3507.
Item 1. Reports to Stockholders.
The Reports to Shareholders are attached herewith.

Beginning on May 1, 2021, as permitted by regulations adopted by the Securities and Exchange Commission, paper copies of shareholder reports will no longer be sent by mail, unless you specifically request paper copies of the reports. Instead, the reports will be made available on the Fund’s website (https://www.driehaus.com/fund-resources), and you will be notified by mail each time a report is posted and provided with a website link to access the report.
If you already elected to receive shareholder reports electronically, you will not be affected by this change and you need not take any action. You may elect to receive shareholder reports and other communications from a Fund electronically at any time by contacting your financial intermediary (such as a broker-dealer or bank) or, if you invest directly with a Fund, by calling 1-800-560-6111.
You may elect to receive all future reports in paper free of charge. If you invest through a financial intermediary, you can contact your financial intermediary to request that you continue to receive paper copies of your shareholder reports. If you invest directly with a Fund, you can call 1-800-560-6111 to inform the Fund that you wish to continue receiving paper copies of your shareholder reports. Your election to receive reports in paper will apply to all funds held in your account if you invest through a financial intermediary or all funds in the Driehaus Mutual Funds if you invest directly with a Fund.
Semi-Annual Report to Shareholders
June 30, 2020
Investment Philosophy:
The Adviser seeks to achieve superior investment returns primarily by investing in global companies that are currently demonstrating rapid growth in their sales and earnings and which, in its judgment, have the ability to continue or accelerate their growth rates in the future. The Adviser manages the portfolios actively (above average turnover) to ensure that the Funds are fully invested, under appropriate market conditions, in companies that meet these criteria. Investors should note that investments in overseas markets can pose more risks than U.S. investments, and the international Funds’ share prices are expected to be more volatile than those of the U.S.- only Funds. In addition, the Funds’ returns will fluctuate with changes in stock market conditions, currency values, interest rates, government regulations, and economic and political conditions in countries in which the Funds invest. These risks are generally greater when investing in emerging markets.
Driehaus Emerging Markets Growth Fund
Driehaus Emerging Markets Small Cap Growth Fund
Driehaus International Small Cap Growth Fund
Driehaus Micro Cap Growth Fund
Driehaus Small Cap Growth Fund
Driehaus Small/Mid Cap Growth Fund
Table of Contents |
PROXY VOTING POLICIES AND PROCEDURES AND PROXY VOTING RECORD
A description of the Funds’ policies and procedures with respect to the voting of proxies relating to the Funds’ portfolio securities is available without charge, upon request, by calling 1-800-560-6111. This information is also available on the Funds’ website at http://www.driehaus.com.
Information regarding how the Funds voted proxies related to portfolio securities during the 12-month period ended June 30, 2020 is available without charge, upon request, by calling 1-800-560-6111. This information is also available on the Securities and Exchange Commission’s (“SEC”) website at http://www.sec.gov.
HOW TO OBTAIN QUARTERLY PORTFOLIO HOLDINGS
Each Fund files a complete schedule of portfolio holdings with the SEC for the first and third quarters of each fiscal year on Form NPORT-EX. The Funds’ Form NPORT-EX is available electronically on the SEC’s website at http://www.sec.gov. Each Fund’s complete schedule of portfolio holdings is also available on the Fund’s website at http://www.driehaus.com.
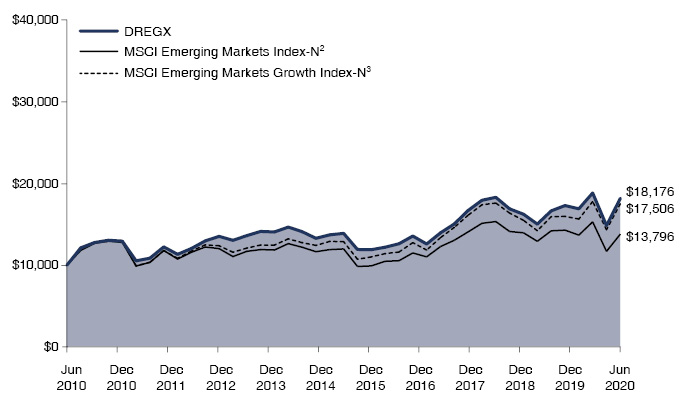
The performance summarized below is historical and does not represent future results. Investment returns and principal value vary, and you may have a gain or loss when you sell shares. Performance data presented measures the change in the value of an investment in the Fund, assuming reinvestment of all dividends and capital gains. Average annual total return reflects annualized change.
The table does not reflect the deduction of taxes that a shareholder would pay on Fund distributions or the redemption of Fund shares. The graph compares the results of a $10,000 investment in the Fund over the last 10 fiscal year periods, with all dividends and capital gains reinvested, with the indicated indices (and dividends reinvested) for the same period.
Average Annual Total Returns as of 6/30/20 | 1 Year | 3 Years | 5 Years | 10 Years |
Driehaus Emerging Markets Growth Fund Investor Class (DREGX) | 5.13% | 6.52% | 5.53% | 6.16% |
Driehaus Emerging Markets Growth Fund Institutional Class (DIEMX)1 | 5.43% | 6.74% | 5.66% | 6.22% |
MSCI Emerging Markets Index-N2 | -3.39% | 1.90% | 2.86% | 3.27% |
MSCI Emerging Markets Growth Index-N3 | 9.67% | 6.19% | 6.35% | 5.76% |
1 | The returns for the periods prior to July 17, 2017 (institutional share class inception date) include the performance of the investor share class. |
2 | The Morgan Stanley Capital International Emerging Markets Index-Net (MSCI Emerging Markets Index-N) is a market capitalization-weighted index designed to measure equity market performance in emerging markets. Data is in U.S. dollars and is calculated with net dividend reinvestment. Source: Morgan Stanley Capital International Inc. |
3 | The Morgan Stanley Capital International Emerging Markets Growth Index-Net (MSCI Emerging Markets Growth Index-N) is a subset of the MSCI Emerging Markets Index and includes only the MSCI Emerging Markets Index stocks which are categorized as growth stocks. Data is in U.S. dollars and is calculated with net dividend reinvestment. Source: Morgan Stanley Capital International Inc. |
1
Driehaus Emerging Markets Growth Fund |
Number of | Value | |||||||
EQUITY SECURITIES — 94.6% | ||||||||
FAR EAST — 74.1% | ||||||||
China — 44.0% | ||||||||
AIA Group, Ltd. | 1,856,151 | $ | 17,369,128 | |||||
Airtac International Group | 484,203 | 8,553,538 | ||||||
Alibaba Group Holding, Ltd. — SP ADR** | 557,751 | 120,306,891 | ||||||
Alibaba Health Information Technology, Ltd.** | 2,741,135 | 8,060,806 | ||||||
By-Health Co., Ltd. — A | 4,119,600 | 11,517,016 | ||||||
China Construction Bank Corp. — H | 19,685,333 | 16,011,718 | ||||||
China Feihe, Ltd.1 | 8,862,531 | 17,858,936 | ||||||
China Mengniu Dairy Co., Ltd. | 2,863,402 | 10,979,946 | ||||||
China Resources Cement Holdings, Ltd. | 10,228,788 | 12,615,409 | ||||||
China Resources Gas Group, Ltd. | 1,538,777 | 7,528,948 | ||||||
China Tourism Group Duty Free Corp., Ltd. — A | 1,016,335 | 22,274,327 | ||||||
CIFI Holdings Group Co., Ltd. | 8,402,057 | 6,618,816 | ||||||
Contemporary Amperex Technology Co., Ltd. — A | 591,410 | 14,740,376 | ||||||
Country Garden Services Holdings Co., Ltd. | 3,156,604 | 14,736,158 | ||||||
Foshan Haitian Flavouring & Food Co., Ltd. — A | 1,034,475 | 18,221,310 | ||||||
Galaxy Entertainment Group, Ltd. | 1,226,442 | 8,413,085 | ||||||
GDS Holdings, Ltd. — ADR** | 119,865 | 9,548,446 | ||||||
Hefei Meiya Optoelectronic Technology, Inc. — A | 1,237,623 | 9,210,315 | ||||||
Hong Kong Exchanges & Clearing, Ltd. | 208,699 | 8,888,852 | ||||||
Huazhu Group, Ltd. — ADR | 172,026 | 6,029,511 | ||||||
Hundsun Technologies, Inc. — A | 675,309 | 10,336,027 | ||||||
JD.com, Inc. — ADR** | 389,438 | 23,436,379 | ||||||
Jinxin Fertility Group, Ltd.1 | 2,550,213 | 3,862,912 | ||||||
Kweichow Moutai Co., Ltd. — A | 119,561 | 24,828,956 | ||||||
Li Ning Co., Ltd. | 3,130,624 | 10,025,637 | ||||||
Luxshare Precision Industry Co., Ltd. — A | 3,577,421 | 26,155,956 | ||||||
Mango Excellent Media Co., Ltd. — A** | 1,330,003 | 12,314,267 | ||||||
Meituan Dianping — B** | 536,173 | 11,981,524 | ||||||
NetEase, Inc. — ADR | 19,961 | 8,570,854 | ||||||
Ping An Healthcare and Technology Co., Ltd.1** | 626,840 | 9,610,419 | ||||||
Shenzhen Mindray Bio- Medical Electronics Co., Ltd. — A | 433,734 | 18,744,772 | ||||||
Silergy Corp. | 333,729 | 21,862,020 | ||||||
TAL Education Group — ADR | 144,726 | 9,896,364 | ||||||
Techtronic Industries Co., Ltd. | 1,208,855 | 11,961,083 | ||||||
Number of | Value | |||||||
Tencent Holdings, Ltd. | 2,161,225 | $ | 138,486,788 | |||||
Vipshop Holdings, Ltd. — ADR** | 439,511 | 8,750,664 | ||||||
Wuliangye Yibin Co., Ltd. — A | 463,804 | 11,269,018 | ||||||
Wuxi Biologics Cayman, Inc.1** | 1,252,773 | 22,995,420 | ||||||
Yum China Holdings, Inc. | 314,881 | 15,136,330 | ||||||
Zhangzhou Pientzehuang Pharmaceutical Co. Ltd. — A | 567,928 | 13,716,808 | ||||||
| 763,425,730 | ||||||||
India — 8.9% | ||||||||
Ashok Leyland, Ltd. | 3,172,163 | 1,975,951 | ||||||
Asian Paints, Ltd. | 549,653 | 12,288,696 | ||||||
Bajaj Finance, Ltd. | 459,627 | 17,299,517 | ||||||
Bharti Airtel, Ltd.** | 2,287,994 | 16,992,872 | ||||||
HDFC Bank, Ltd. — ADR | 476,375 | 21,656,008 | ||||||
Hindustan Unilever, Ltd. | 552,008 | 15,958,984 | ||||||
ICICI Bank, Ltd. — SP ADR | 2,259,643 | 20,992,083 | ||||||
Nestle India, Ltd. | 102,772 | 23,334,907 | ||||||
Reliance Industries, Ltd. | 827,886 | 18,831,443 | ||||||
Titan Co., Ltd. | 457,192 | 5,756,590 | ||||||
| 155,087,051 | ||||||||
South Korea — 8.9% | ||||||||
Kakao Corp. | 58,963 | 13,231,451 | ||||||
KB Financial Group, Inc. | 582,556 | 16,491,924 | ||||||
LG Chem, Ltd. | 27,166 | 11,210,840 | ||||||
Macquarie Korea Infrastructure Fund | 1,374,235 | 13,066,654 | ||||||
NCSoft Corp. | 25,484 | 18,958,242 | ||||||
Samsung Electronics Co., Ltd. | 1,136,575 | 50,313,484 | ||||||
SK Hynix, Inc. | 435,185 | 31,071,562 | ||||||
| 154,344,157 | ||||||||
Taiwan — 8.3% | ||||||||
Accton Technology Corp. | 1,007,165 | 7,821,243 | ||||||
Century Iron & Steel Industrial Co., Ltd. | 2,130,628 | 6,083,768 | ||||||
Chunghwa Telecom Co., Ltd. | 2,133,910 | 8,474,725 | ||||||
ITEQ Corp. | 2,078,321 | 10,439,275 | ||||||
MediaTek, Inc. | 850,491 | 16,814,742 | ||||||
Taiwan Semiconductor Manufacturing Co., Ltd. — SP ADR | 1,660,556 | 94,269,764 | ||||||
| 143,903,517 | ||||||||
Indonesia — 1.3% | ||||||||
PT Bank Central Asia Tbk | 11,480,708 | 22,970,614 | ||||||
Japan — 0.8% | ||||||||
Keyence Corp. | 31,800 | 13,326,157 | ||||||
Malaysia — 0.7% | ||||||||
Dialog Group BHD | 13,680,493 | 11,594,063 | ||||||
Singapore — 0.7% | ||||||||
Sea, Ltd. — ADR** | 106,668 | 11,439,076 | ||||||
Thailand — 0.5% | ||||||||
CP ALL PCL — NVDR** | 3,882,708 | 8,557,318 | ||||||
Total FAR EAST | 1,284,647,683 | |||||||
Notes to Financial Statements are an integral part of this Schedule.
2
Driehaus Emerging Markets Growth Fund |
Number of | Value | |||||||
EUROPE — 7.5% | ||||||||
Russia — 3.4% | ||||||||
Lukoil PJSC — SP ADR | 301,041 | $ | 22,377,631 | |||||
Sberbank of Russia PJSC — SP ADR | 1,606,639 | 18,219,286 | ||||||
Yandex NV — A** | 357,578 | 17,886,052 | ||||||
| 58,482,969 | ||||||||
Poland — 1.3% | ||||||||
CD Projekt SA** | 170,838 | 17,215,944 | ||||||
Dino Polska SA1** | 108,427 | 5,523,074 | ||||||
| 22,739,018 | ||||||||
Netherlands — 1.0% | ||||||||
ASML Holding NV | 47,983 | 17,552,729 | ||||||
Hungary — 0.7% | ||||||||
OTP Bank PLC** | 349,955 | 12,302,778 | ||||||
Sweden — 0.7% | ||||||||
Spotify Technology SA** | 44,790 | 11,564,330 | ||||||
Switzerland — 0.4% | ||||||||
Roche Holding AG | 22,419 | 7,767,052 | ||||||
Total EUROPE | 130,408,876 | |||||||
SOUTH AMERICA — 6.6% | ||||||||
Brazil — 5.6% | ||||||||
Arco Platform, Ltd. — A** | 93,552 | 4,067,641 | ||||||
B2W Cia Digital** | 579,660 | 11,554,614 | ||||||
B3 SA - Brasil Bolsa Balcao | 3,619,973 | 37,071,090 | ||||||
Cogna Educacao | 8,075,020 | 9,933,963 | ||||||
Lojas Renner SA | 1,473,937 | 11,424,292 | ||||||
Raia Drogasil SA | 861,474 | 17,688,565 | ||||||
XP, Inc. — A** | 112,207 | 4,713,816 | ||||||
| 96,453,981 | ||||||||
Argentina — 0.5% | ||||||||
MercadoLibre, Inc.** | 9,149 | 9,018,810 | ||||||
Chile — 0.5% | ||||||||
Sociedad Quimica y Minera de Chile SA — SP ADR | 340,611 | 8,879,729 | ||||||
Total SOUTH AMERICA | 114,352,520 | |||||||
NORTH AMERICA — 5.3% | ||||||||
United States — 3.8% | ||||||||
Analog Devices, Inc. | 139,376 | 17,093,073 | ||||||
Facebook, Inc. — A** | 70,620 | 16,035,683 | ||||||
Legend Biotech Corp. — ADR** | 144,106 | 6,133,151 | ||||||
NVIDIA Corp. | 47,814 | 18,165,017 | ||||||
The Estee Lauder Cos., Inc. — A | 43,998 | 8,301,543 | ||||||
| 65,728,467 | ||||||||
Mexico — 1.1% | ||||||||
Grupo Aeroportuario del Sureste SAB de CV — ADR | 50,042 | 5,619,216 | ||||||
Wal-Mart de Mexico SAB de CV | 5,461,946 | 13,062,854 | ||||||
| 18,682,070 | ||||||||
Canada — 0.4% | ||||||||
Wheaton Precious Metals Corp. | 177,173 | 7,804,471 | ||||||
Total NORTH AMERICA | 92,215,008 | |||||||
Number of | Value | |||||||
AFRICA — 1.1% | ||||||||
Egypt — 0.7% | ||||||||
Commercial International Bank Egypt SAE | 3,032,821 | $ | 12,135,387 | |||||
South Africa — 0.4% | ||||||||
Clicks Group, Ltd. | 592,618 | 7,194,769 | ||||||
Total AFRICA | 19,330,156 | |||||||
Total EQUITY SECURITIES | ||||||||
(Cost $1,191,567,412) | 1,640,954,243 | |||||||
| ||||||||
TOTAL INVESTMENTS | ||||||||
(COST $1,191,567,412) | 94.6 | % | $ | 1,640,954,243 | ||||
Other Assets In Excess Of Liabilities | 5.4 | % | 94,078,711 | |||||
Net Assets | 100.0 | % | $ | 1,735,032,954 | ||||
1 | 144A — This security was purchased pursuant to Rule 144A of the Securities Act of 1933 and may not be resold subject to that rule except to qualified institutional buyers. At June 30, 2020, these securities amounted to $59,850,761 or 3.4% of net assets. These 144A securities have not been deemed illiquid. |
** | Non-income producing security |
ADR — American Depository Receipt
NVDR — Non-Voting Depository Receipt
SP ADR — Sponsored American Depository Receipt
Notes to Financial Statements are an integral part of this Schedule.
3
Driehaus Emerging Markets Growth Fund |
Regional Weightings* | |
Asia/Far East Ex-Japan | 73.3% |
South America | 6.6% |
Eastern Europe | 5.4% |
North America | 5.3% |
Western Europe | 2.1% |
Africa | 1.1% |
Japan | 0.8% |
Top Ten Holdings* | |
Tencent Holdings, Ltd. | 8.0% |
Alibaba Group Holding, Ltd. — SP ADR | 6.9% |
Taiwan Semiconductor Manufacturing Co., Ltd. — SP ADR | 5.4% |
Samsung Electronics Co., Ltd. | 2.9% |
B3 SA - Brasil Bolsa Balcao | 2.1% |
SK Hynix, Inc. | 1.8% |
Luxshare Precision Industry Co., Ltd. — A | 1.5% |
Kweichow Moutai Co., Ltd. — A | 1.4% |
JD.com, Inc. — ADR | 1.4% |
Nestle India, Ltd. | 1.3% |
* | All percentages are stated as a percent of net assets at June 30, 2020. |
Notes to Financial Statements are an integral part of this Schedule.
4
Driehaus Emerging Markets Growth Fund |
Industry | Percent of |
Beverages | 2.1% |
Biotechnology | 0.4% |
Capital Markets | 3.7% |
Chemicals | 1.9% |
Commercial Banks | 8.1% |
Commercial Services & Supplies | 0.8% |
Communications Equipment | 0.5% |
Computers & Peripherals | 2.9% |
Construction Materials | 0.7% |
Consumer Finance | 1.0% |
Diversified Consumer Services | 1.4% |
Diversified Telecommunication Services | 0.5% |
Electrical Equipment | 0.8% |
Electronic Equipment, Instruments & Components | 2.9% |
Energy Equipment & Services | 0.7% |
Entertainment | 4.6% |
Food & Staples Retailing | 3.0% |
Food Products | 4.1% |
Gas Utilities | 0.4% |
Health Care Equipment & Supplies | 1.1% |
Health Care Providers & Services | 0.2% |
Health Care Technology | 1.0% |
Industry | Percent of |
Hotels, Restaurants & Leisure | 1.7% |
Household Products | 0.9% |
Information Technology Services | 0.5% |
Insurance | 1.0% |
Interactive Media & Services | 10.7% |
Internet & Catalog Retail | 10.7% |
Life Sciences Tools & Services | 1.3% |
Machinery | 1.8% |
Metals & Mining | 0.8% |
Multiline Retail | 0.7% |
Oil, Gas & Consumable Fuels | 2.4% |
Personal Products | 1.1% |
Pharmaceuticals | 1.2% |
Real Estate Management & Development | 0.4% |
Semiconductors & Semiconductor Equipment | 12.5% |
Software | 0.6% |
Specialty Retail | 1.3% |
Textiles, Apparel & Luxury Goods | 0.9% |
Transportation Infrastructure | 0.3% |
Wireless Telecommunication Services | 1.0% |
Other Assets in Excess of Liabilities | 5.4% |
TOTAL | 100.0% |
Notes to Financial Statements are an integral part of this Schedule.
5
The performance summarized below is historical and does not represent future results. Investment returns and principal value vary, and you may have a gain or loss when you sell shares. Performance data presented measures the change in the value of an investment in the Fund, assuming reinvestment of all dividends and capital gains. Average annual total return reflects annualized change.
The table does not reflect the deduction of taxes that a shareholder would pay on Fund distributions or the redemption of Fund shares. The graph compares the results of a $10,000 investment in the Fund over the last 10 fiscal year periods (which includes performance of the Predecessor Limited Partnership’s inception), with all dividends and capital gains reinvested, with the indicated indices (and dividends reinvested) for the same period.
Fund Only | Including Predecessor Limited Partnership | ||||
Average Annual Total Returns as of 6/30/20 | 1 Year | 3 Years | 5 Years | Since Inception | 10 Years |
Driehaus Emerging Markets Small Cap Growth Fund (DRESX)1 | 14.28% | 6.56% | 0.92% | 5.51% | 5.79% |
MSCI Emerging Markets Small Cap Index-N2 | -8.82% | -2.95% | -1.38% | 0.94% | 1.78% |
MSCI Emerging Markets Small Cap Growth Index-N3 | -2.81% | -1.76% | -2.26% | 0.81% | 1.39% |

1 | The Driehaus Emerging Markets Small Cap Growth Fund (the “Fund”) performance shown above includes the performance of the Driehaus Emerging Markets Small Cap Growth Fund, L.P. (the “Predecessor Limited Partnership”), the Fund’s predecessor, for the periods before the Fund’s registration statement became effective. The Predecessor Limited Partnership, which was established on December 1, 2008, was managed with substantially the same investment objective, policies and philosophies as are followed by the Fund. The Fund succeeded to the Predecessor Limited Partnership’s assets on August 22, 2011. The Predecessor Limited Partnership was not registered under the Investment Company Act of 1940, as amended (“1940 Act”), and thus was not subject to certain investment and operational restrictions that are imposed by the 1940 Act. If the Predecessor Limited Partnership had been registered under the 1940 Act, its performance may have been adversely affected. The Predecessor Limited Partnership’s performance has been restated to reflect estimated expenses of the Fund. The returns for the periods prior to August 21, 2014, reflect fee waivers and/or reimbursements without which performance would have been lower. |
2 | The Morgan Stanley Capital International Emerging Markets Small Cap Index-Net (MSCI Emerging Markets Small Cap Index-N) is a market capitalization-weighted index designed to measure equity market performance of small cap stocks in emerging markets. Data is in U.S. dollars and is calculated with net dividend reinvestment. Source: Morgan Stanley Capital International Inc. |
6
Driehaus Emerging Markets Small Cap Growth Fund |
Number of | Value | |||||||
EQUITY SECURITIES — 94.2% | ||||||||
FAR EAST — 75.4% | ||||||||
China — 34.7% | ||||||||
Airtac International Group | 40,000 | $ | 706,608 | |||||
Amoy Diagnostics Co., Ltd. — A | 61,150 | 666,146 | ||||||
Ausnutria Dairy Corp., Ltd. | 339,000 | 762,474 | ||||||
C&S Paper Co., Ltd. — A | 199,175 | 629,377 | ||||||
Changzhou Xingyu Automotive Lighting Systems Co., Ltd. — A | 33,900 | 611,518 | ||||||
China Meidong Auto Holdings, Ltd. | 190,000 | 468,639 | ||||||
China Resources Cement Holdings, Ltd. | 348,794 | 430,176 | ||||||
China Tian Lun Gas Holdings, Ltd. | 385,500 | 296,429 | ||||||
Ever Sunshine Lifestyle Services Group, Ltd. | 354,000 | 552,220 | ||||||
GDS Holdings, Ltd. — ADR** | 7,289 | 580,642 | ||||||
Hangzhou Tigermed Consulting Co., Ltd. — A | 36,232 | 521,556 | ||||||
Hefei Meiya Optoelectronic Technology, Inc. — A | 106,974 | 796,094 | ||||||
Innovent Biologics, Inc.1** | 90,500 | 673,564 | ||||||
Jiajiayue Group Co., Ltd. — A | 78,470 | 547,202 | ||||||
Jiangsu Hengli Hydraulic Co., Ltd. — A | 67,920 | 774,097 | ||||||
Kingdee International Software Group Co., Ltd. | 333,000 | 779,181 | ||||||
Laobaixing Pharmacy Chain JSC — A | 59,299 | 839,428 | ||||||
Li Ning Co., Ltd. | 224,471 | 718,855 | ||||||
Pharmaron Beijing Co., Ltd. — H1 | 33,700 | 349,011 | ||||||
Ping An Healthcare and Technology Co., Ltd.1** | 77,220 | 1,183,901 | ||||||
Proya Cosmetics Co., Ltd. — A | 32,100 | 820,214 | ||||||
Shanghai Putailai New Energy Technology Co., Ltd. — A | 20,400 | 298,136 | ||||||
Shenzhen SC New Energy Technology Corp. — A | 84,744 | 1,064,941 | ||||||
Silergy Corp. | 13,000 | 851,608 | ||||||
SITC International Holdings Co., Ltd. | 248,000 | 265,544 | ||||||
Times China Holdings, Ltd. | 323,000 | 602,290 | ||||||
Times Neighborhood Holdings, Ltd. | 489,000 | 668,597 | ||||||
West China Cement, Ltd. | 3,408,000 | 624,692 | ||||||
Yantai Jereh Oilfield Services Group Co., Ltd. — A | 98,500 | 435,418 | ||||||
Yihai International Holding, Ltd. | 76,157 | 784,802 | ||||||
Zhejiang Dingli Machinery Co., Ltd. — A | 75,457 | 813,116 | ||||||
Number of | Value | |||||||
Zoomlion Heavy Industry Science and Technology Co., Ltd. — H** | 541,600 | $ | 419,332 | |||||
| 20,535,808 | ||||||||
India — 12.4% | ||||||||
Aarti Industries, Ltd. | 23,590 | 291,446 | ||||||
Aarti Surfactants, Ltd.2,3** | 2,704 | 0 | ||||||
Amber Enterprises India, Ltd. | 38,249 | 728,821 | ||||||
Ashok Leyland, Ltd. | 874,304 | 544,607 | ||||||
AU Small Finance Bank, Ltd.1 | 44,779 | 320,783 | ||||||
Cholamandalam Investment and Finance Co., Ltd. | 107,503 | 269,640 | ||||||
Colgate-Palmolive India, Ltd. | 15,747 | 293,745 | ||||||
Dixon Technologies India, Ltd. | 9,769 | 744,802 | ||||||
Gujarat Gas, Ltd. | 144,289 | 609,970 | ||||||
IndiaMart InterMesh, Ltd.1 | 9,098 | 280,232 | ||||||
Indraprastha Gas, Ltd.** | 99,009 | 582,223 | ||||||
Info Edge India, Ltd. | 16,024 | 585,167 | ||||||
Ipca Laboratories, Ltd. | 26,861 | 596,208 | ||||||
Jubilant Foodworks, Ltd. | 17,343 | 396,903 | ||||||
Navin Fluorine International, Ltd. | 13,708 | 295,245 | ||||||
PI Industries, Ltd. | 38,393 | 763,744 | ||||||
| 7,303,536 | ||||||||
Taiwan — 11.9% | ||||||||
Accton Technology Corp. | 92,000 | 714,435 | ||||||
Advanced Ceramic X Corp. | 32,000 | 449,289 | ||||||
ASPEED Technology, Inc. | 12,000 | 508,143 | ||||||
Century Iron & Steel Industrial Co., Ltd. | 187,000 | 533,957 | ||||||
Huaku Development Co., Ltd. | 190,000 | 543,922 | ||||||
ITEQ Corp. | 146,000 | 733,349 | ||||||
Parade Technologies, Ltd. | 23,455 | 786,165 | ||||||
Sinbon Electronics Co., Ltd. | 112,000 | 569,688 | ||||||
Sporton International, Inc. | 91,000 | 745,207 | ||||||
Voltronic Power Technology Corp. | 26,000 | 749,194 | ||||||
Wiwynn Corp. | 25,509 | 697,364 | ||||||
| 7,030,713 | ||||||||
South Korea — 7.8% | ||||||||
Douzone Bizon Co., Ltd. | 3,353 | 286,482 | ||||||
Eugene Technology Co., Ltd. | 25,244 | 579,627 | ||||||
Koh Young Technology, Inc. | 10,132 | 846,814 | ||||||
LEENO Industrial, Inc. | 11,246 | 1,064,702 | ||||||
NICE Information Service Co., Ltd. | 63,679 | 973,021 | ||||||
Tesna, Inc. | 5,662 | 287,589 | ||||||
Tokai Carbon Korea Co., Ltd. | 7,697 | 560,494 | ||||||
| 4,598,729 | ||||||||
Indonesia — 3.3% | ||||||||
PT Bank Tabungan Pensiunan Nasional Syariah Tbk | 2,625,500 | 588,238 | ||||||
PT Bumi Serpong Damai Tbk** | 12,959,000 | 677,541 | ||||||
PT Waskita Karya Persero Tbk | 13,869,900 | 695,439 | ||||||
| 1,961,218 | ||||||||
Notes to Financial Statements are an integral part of this Schedule.
7
Driehaus Emerging Markets Small Cap Growth Fund |
Number of | Value | |||||||
Vietnam — 3.0% | ||||||||
FPT Corp. | 478,754 | $ | 1,128,613 | |||||
Military Commercial Joint Stock Bank** | 805,374 | 621,555 | ||||||
| 1,750,168 | ||||||||
Philippines — 0.9% | ||||||||
Megaworld Corp. | 4,199,000 | 258,284 | ||||||
Security Bank Corp. | 136,760 | 284,549 | ||||||
| 542,833 | ||||||||
Thailand — 0.5% | ||||||||
TQM Corp PCL — NVDR | 73,900 | 321,163 | ||||||
Malaysia — 0.5% | ||||||||
Dialog Group BHD | 314,806 | 266,794 | ||||||
Cambodia — 0.4% | ||||||||
NagaCorp, Ltd. | 222,403 | 259,444 | ||||||
Total FAR EAST | 44,570,406 | |||||||
EUROPE — 8.2% | ||||||||
Russia — 2.6% | ||||||||
Detsky Mir PJSC1 | 497,754 | 705,290 | ||||||
Globaltrans Investment PLC — SP GDR | 51,192 | 276,282 | ||||||
RusHydro PJSC | 54,102,812 | 558,936 | ||||||
| 1,540,508 | ||||||||
Poland — 2.5% | ||||||||
CD Projekt SA** | 4,279 | 431,210 | ||||||
Dino Polska SA1** | 20,664 | 1,052,587 | ||||||
| 1,483,797 | ||||||||
Turkey — 2.0% | ||||||||
Enerjisa Enerji AS1 | 445,417 | 558,924 | ||||||
Sok Marketler Ticaret AS** | 306,364 | 600,701 | ||||||
| 1,159,625 | ||||||||
Jersey — 1.1% | ||||||||
Centamin PLC | 282,353 | 644,518 | ||||||
Total EUROPE | 4,828,448 | |||||||
SOUTH AMERICA — 4.6% | ||||||||
Brazil — 3.6% | ||||||||
Arco Platform, Ltd. — A** | 8,390 | 364,797 | ||||||
Bradespar SA — Pref. | 42,400 | 284,273 | ||||||
Grupo SBF SA** | 63,500 | 383,819 | ||||||
Lojas Renner SA | 56,826 | 440,451 | ||||||
Metalurgica Gerdau SA — Pref. | 304,500 | 412,115 | ||||||
Randon SA Implementos e Participacoes — Pref. | 150,300 | 264,499 | ||||||
| 2,149,954 | ||||||||
Argentina — 1.0% | ||||||||
Globant SA** | 3,924 | 588,011 | ||||||
Total SOUTH AMERICA | 2,737,965 | |||||||
Number of | Value | |||||||
NORTH AMERICA — 4.0% | ||||||||
Canada — 2.6% | ||||||||
B2Gold Corp. | 121,106 | $ | 688,670 | |||||
Centerra Gold, Inc. | 78,797 | 879,327 | ||||||
| 1,567,997 | ||||||||
Mexico — 1.4% | ||||||||
Qualitas Controladora SAB de CV | 209,300 | 823,195 | ||||||
Total NORTH AMERICA | 2,391,192 | |||||||
AFRICA — 1.3% | ||||||||
South Africa — 1.3% | ||||||||
Clicks Group, Ltd. | 16,259 | 197,395 | ||||||
Sibanye Stillwater, Ltd.** | 262,936 | 570,906 | ||||||
Total AFRICA | 768,301 | |||||||
MIDDLE EAST — 0.7% | ||||||||
United Arab Emirates — 0.7% | ||||||||
Network International Holdings PLC1** | 71,485 | 391,330 | ||||||
Total MIDDLE EAST | 391,330 | |||||||
Total EQUITY SECURITIES | ||||||||
(Cost $44,047,053) | 55,687,642 | |||||||
| ||||||||
TOTAL INVESTMENTS | ||||||||
(COST $44,047,053) | 94.2 | % | $ | 55,687,642 | ||||
Other Assets In Excess Of Liabilities | 5.8 | % | 3,412,576 | |||||
Net Assets | 100.0 | % | $ | 59,100,218 | ||||
1 | 144A — This security was purchased pursuant to Rule 144A of the Securities Act of 1933 and may not be resold subject to that rule except to qualified institutional buyers. At June 30, 2020, these securities amounted to $5,515,622 or 9.3% of net assets. These 144A securities have not been deemed illiquid, unless otherwise noted. |
2 | Pursuant to procedures adopted by Driehaus Mutual Funds’ (the “Trust”) Board of Trustees, this security has been determined to be illiquid by Driehaus Capital Management LLC, the Fund’s investment adviser. |
3 | Investments categorized as Level 3 pricing (See Note A in the Notes to Financial Statements). |
** | Non-income producing security |
ADR — American Depository Receipt
NVDR — Non-Voting Depository Receipt
SP GDR — Sponsored Global Depository Receipt
Notes to Financial Statements are an integral part of this Schedule.
8
Driehaus Emerging Markets Small Cap Growth Fund |
Regional Weightings* | |
Asia/Far East Ex-Japan | 75.4% |
Eastern Europe | 7.1% |
South America | 4.6% |
North America | 4.0% |
Africa | 1.3% |
Western Europe | 1.1% |
Middle East | 0.7% |
Top Ten Holdings* | |
Ping An Healthcare and Technology Co., Ltd. | 2.0% |
FPT Corp. | 1.9% |
Shenzhen SC New Energy Technology Corp. — A | 1.8% |
LEENO Industrial, Inc. | 1.8% |
Dino Polska SA | 1.8% |
NICE Information Service Co., Ltd. | 1.6% |
Centerra Gold, Inc. | 1.5% |
Silergy Corp. | 1.4% |
Koh Young Technology, Inc. | 1.4% |
Laobaixing Pharmacy Chain JSC — A | 1.4% |
* | All percentages are stated as a percent of net assets at June 30, 2020. |
Notes to Financial Statements are an integral part of this Schedule.
9
Driehaus Emerging Markets Small Cap Growth Fund |
Industry | Percent of |
Auto Components | 1.0% |
Biotechnology | 2.3% |
Chemicals | 2.8% |
Commercial Banks | 3.1% |
Commercial Services & Supplies | 2.1% |
Communications Equipment | 2.0% |
Computers & Peripherals | 1.2% |
Construction & Engineering | 1.2% |
Construction Materials | 1.8% |
Consumer Finance | 0.4% |
Diversified Consumer Services | 0.6% |
Electric Utilities | 1.9% |
Electrical Equipment | 1.3% |
Electronic Equipment, Instruments & Components | 4.1% |
Energy Equipment & Services | 1.2% |
Entertainment | 0.7% |
Food & Staples Retailing | 5.5% |
Food Products | 2.6% |
Gas Utilities | 2.5% |
Health Care Technology | 2.0% |
Hotels, Restaurants & Leisure | 1.1% |
Industry | Percent of |
Household Durables | 2.5% |
Household Products | 1.1% |
Information Technology Services | 1.6% |
Insurance | 1.9% |
Interactive Media & Services | 1.0% |
Life Sciences Tools & Services | 1.5% |
Machinery | 7.3% |
Marine | 0.4% |
Metals & Mining | 6.8% |
Multiline Retail | 0.7% |
Personal Products | 1.9% |
Pharmaceuticals | 1.0% |
Professional Services | 2.9% |
Real Estate Management & Development | 3.5% |
Road & Rail | 0.5% |
Semiconductors & Semiconductor Equipment | 11.1% |
Software | 2.8% |
Specialty Retail | 2.6% |
Textiles, Apparel & Luxury Goods | 1.2% |
Trading Companies & Distributors | 0.5% |
Other Assets in Excess of Liabilities | 5.8% |
TOTAL | 100.0% |
Notes to Financial Statements are an integral part of this Schedule.
10
The performance summarized below is historical and does not represent future results. Investment returns and principal value vary, and you may have a gain or loss when you sell shares. Performance data presented measures the change in the value of an investment in the Fund, assuming reinvestment of all dividends and capital gains. Average annual total return reflects annualized change.
The table does not reflect the deduction of taxes that a shareholder would pay on Fund distributions or the redemption of Fund shares. The graph compares the results of a $10,000 investment in the Fund over the last 10 fiscal year periods, with all dividends and capital gains reinvested, with the indicated index (and dividends reinvested) for the same period.
Average Annual Total Returns as of 6/30/20 | 1 Year | 3 Years | 5 Years | 10 Years |
Driehaus International Small Cap Growth Fund (DRIOX)1 | 6.30% | 6.04% | 6.35% | 9.52% |
MSCI AC World ex USA Small Cap Growth Index-N2 | 3.30% | 3.21% | 4.36% | 7.19% |
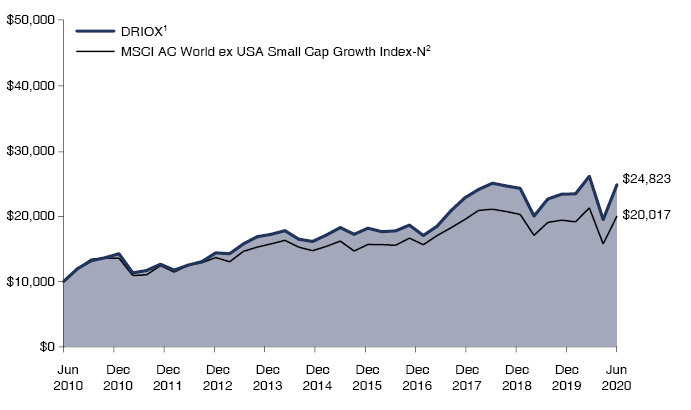
1 | The returns for the periods prior to January 1, 2010, reflect fee waivers and/or reimbursements without which performance would have been lower. |
2 | The Morgan Stanley Capital International All Country World ex USA Small Cap Growth Index-Net (MSCI AC World ex USA Small Cap Growth Index-N) is a market capitalization-weighted index designed to measure equity market performance in global developed markets and emerging markets, excluding the U.S., and is composed of stocks which are categorized as small capitalization growth stocks. Data is in U.S. dollars and is calculated with net dividend reinvestment. Source: Morgan Stanley Capital International Inc. |
11
Driehaus International Small Cap Growth Fund |
Number of | Value | |||||||
EQUITY SECURITIES — 97.9% | ||||||||
EUROPE — 62.7% | ||||||||
United Kingdom — 17.4% | ||||||||
ASOS PLC** | 63,000 | $ | 2,677,644 | |||||
Balfour Beatty PLC | 725,946 | 2,337,140 | ||||||
Bellway PLC | 89,185 | 2,808,983 | ||||||
Codemasters Group Holdings PLC** | 140,200 | 592,798 | ||||||
ConvaTec Group PLC1 | 1,504,302 | 3,633,021 | ||||||
Cranswick PLC | 56,691 | 2,539,413 | ||||||
Electrocomponents PLC | 373,945 | 3,112,845 | ||||||
Endava PLC — SP ADR** | 44,528 | 2,150,702 | ||||||
Fevertree Drinks PLC | 132,400 | 3,356,259 | ||||||
Halfords Group PLC | 496,000 | 934,179 | ||||||
Intermediate Capital Group PLC | 50,773 | 810,021 | ||||||
JD Sports Fashion PLC | 327,490 | 2,520,571 | ||||||
QinetiQ Group PLC | 622,451 | 2,292,757 | ||||||
Serco Group PLC** | 2,004,778 | 3,795,319 | ||||||
Spirax-Sarco Engineering PLC | 18,390 | 2,263,984 | ||||||
Stock Spirits Group PLC | 545,151 | 1,577,874 | ||||||
The Weir Group PLC | 223,512 | 2,937,221 | ||||||
Vesuvius PLC | 377,140 | 1,809,540 | ||||||
| 42,150,271 | ||||||||
Germany — 12.6% | ||||||||
Duerr AG | 82,563 | 2,155,141 | ||||||
DWS Group GmbH & Co. KGaA1 | 88,701 | 3,231,984 | ||||||
HelloFresh SE** | 80,423 | 4,302,200 | ||||||
Hornbach Holding AG & Co. KGaA | 46,879 | 3,886,685 | ||||||
Jungheinrich AG — Pref.** | 123,100 | 2,894,302 | ||||||
Puma SE** | 38,271 | 2,967,326 | ||||||
Rheinmetall AG | 10,742 | 933,446 | ||||||
Scout24 AG1 | 38,564 | 2,983,596 | ||||||
TAG Immobilien AG | 102,047 | 2,437,279 | ||||||
TeamViewer AG1** | 88,402 | 4,816,905 | ||||||
| 30,608,864 | ||||||||
Switzerland — 5.7% | ||||||||
Belimo Holding AG | 250 | 1,850,181 | ||||||
Comet Holding AG | 9,887 | 1,421,261 | ||||||
Galenica AG1 | 42,268 | 3,030,416 | ||||||
Softwareone Holding AG | 170,841 | 4,256,144 | ||||||
Tecan Group AG | 9,105 | 3,226,900 | ||||||
| 13,784,902 | ||||||||
Netherlands — 5.3% | ||||||||
Alfen Beheer BV1** | 68,522 | 2,765,365 | ||||||
Argenx SE** | 11,565 | 2,603,170 | ||||||
BE Semiconductor Industries NV | 44,095 | 1,955,151 | ||||||
OCI NV** | 99,469 | 1,044,861 | ||||||
PostNL NV | 1,276,800 | 2,753,525 | ||||||
Shop Apotheke Europe NV1** | 15,069 | 1,801,345 | ||||||
| 12,923,417 | ||||||||
Number of | Value | |||||||
France — 4.8% | ||||||||
Coface SA** | 313,405 | $ | 2,067,991 | |||||
Edenred | 24,400 | 1,070,134 | ||||||
Teleperformance | 7,841 | 1,996,952 | ||||||
Trigano SA | 20,923 | 2,201,724 | ||||||
Ubisoft Entertainment SA** | 22,873 | 1,894,115 | ||||||
Virbac SA** | 10,723 | 2,350,424 | ||||||
| 11,581,340 | ||||||||
Denmark — 3.5% | ||||||||
Ascendis Pharma AS — ADR** | 9,628 | 1,423,981 | ||||||
GN Store Nord AS | 27,570 | 1,475,833 | ||||||
Netcompany Group AS1** | 37,651 | 2,474,547 | ||||||
Royal Unibrew AS** | 38,541 | 3,212,852 | ||||||
| 8,587,213 | ||||||||
Sweden — 3.1% | ||||||||
BHG Group AB** | 93,297 | 826,825 | ||||||
NetEnt AB | 464,741 | 3,578,722 | ||||||
Tele2 AB — B | 230,951 | 3,074,385 | ||||||
| 7,479,932 | ||||||||
Luxembourg — 2.2% | ||||||||
B&M European Value Retail SA | 606,756 | 2,986,689 | ||||||
Befesa SA1 | 60,486 | 2,358,725 | ||||||
| 5,345,414 | ||||||||
Finland — 1.7% | ||||||||
Huhtamaki OYJ** | 47,394 | 1,874,940 | ||||||
Tokmanni Group Corp. | 158,241 | 2,347,575 | ||||||
| 4,222,515 | ||||||||
Italy — 1.6% | ||||||||
DiaSorin SpA | 4,555 | 874,764 | ||||||
FinecoBank Banca Fineco SpA** | 98,300 | 1,330,393 | ||||||
Leonardo SpA | 269,512 | 1,796,652 | ||||||
| 4,001,809 | ||||||||
Ireland — 1.3% | ||||||||
James Hardie Industries PLC | 161,500 | 3,111,871 | ||||||
Spain — 1.0% | ||||||||
Masmovil Ibercom SA** | 93,923 | 2,406,622 | ||||||
Turkey — 0.8% | ||||||||
Migros Ticaret AS** | 327,522 | 1,843,258 | ||||||
Austria — 0.7% | ||||||||
BAWAG Group AG1** | 49,300 | 1,705,874 | ||||||
Russia — 0.7% | ||||||||
Globaltrans Investment PLC — SP GDR | 120,195 | 648,690 | ||||||
X5 Retail Group NV — GDR | 27,139 | 962,555 | ||||||
| 1,611,245 | ||||||||
Belgium — 0.3% | ||||||||
Melexis NV | 10,600 | 806,320 | ||||||
Norway — 0.0% | ||||||||
Pexip Holding ASA** | 9,000 | 78,543 | ||||||
Total EUROPE | 152,249,410 | |||||||
Notes to Financial Statements are an integral part of this Schedule.
12
Driehaus International Small Cap Growth Fund |
Number of | Value | |||||||
FAR EAST — 25.2% | ||||||||
Japan — 16.9% | ||||||||
ASKUL Corp. | 64,025 | $ | 2,056,479 | |||||
BASE, Inc.** | 42,000 | 1,769,883 | ||||||
CKD Corp. | 171,849 | 3,058,280 | ||||||
Fujitec Co., Ltd. | 122,450 | 2,253,144 | ||||||
Harmonic Drive Systems, Inc. | 45,077 | 2,486,584 | ||||||
Kobe Bussan Co., Ltd. | 29,086 | 1,651,665 | ||||||
Lasertec Corp. | 33,506 | 3,167,342 | ||||||
Minebea Mitsumi, Inc. | 109,454 | 1,995,087 | ||||||
MonotaRO Co., Ltd. | 63,420 | 2,548,116 | ||||||
Nabtesco Corp. | 83,227 | 2,575,642 | ||||||
Nichias Corp. | 79,930 | 1,670,470 | ||||||
Nihon Unisys, Ltd. | 61,118 | 1,921,625 | ||||||
SCSK Corp. | 32,405 | 1,585,407 | ||||||
Square Enix Holdings Co., Ltd. | 45,677 | 2,314,186 | ||||||
Sugi Holdings Co., Ltd. | 46,378 | 3,145,086 | ||||||
TechnoPro Holdings, Inc. | 34,687 | 2,002,466 | ||||||
THK Co., Ltd. | 81,823 | 2,037,196 | ||||||
Tokyo Tatemono Co., Ltd. | 244,855 | 2,818,265 | ||||||
| 41,056,923 | ||||||||
Australia — 4.0% | ||||||||
Elmo Software., Ltd.** | 225,008 | 1,117,774 | ||||||
Megaport, Ltd.** | 379,153 | 3,188,912 | ||||||
NEXTDC, Ltd.** | 788,217 | 5,421,522 | ||||||
| 9,728,208 | ||||||||
Taiwan — 1.7% | ||||||||
Giant Manufacturing Co., Ltd. | 326,589 | 2,935,564 | ||||||
Hiwin Technologies Corp. | 121,838 | 1,221,571 | ||||||
| 4,157,135 | ||||||||
China — 1.1% | ||||||||
Li Ning Co., Ltd. | 845,898 | 2,708,938 | ||||||
New Zealand — 0.8% | ||||||||
Pushpay Holdings., Ltd.** | 318,305 | 1,817,677 | ||||||
South Korea — 0.7% | ||||||||
Douzone Bizon Co., Ltd. | 20,668 | 1,765,885 | ||||||
Total FAR EAST | 61,234,766 | |||||||
NORTH AMERICA — 5.6% | ||||||||
Canada — 5.3% | ||||||||
Boardwalk REIT | 49,224 | 1,077,228 | ||||||
Docebo, Inc.** | 54,065 | 1,432,866 | ||||||
Empire Co., Ltd. — A | 47,493 | 1,137,299 | ||||||
Kinaxis, Inc.** | 12,296 | 1,757,632 | ||||||
Methanex Corp. | 55,800 | 1,006,998 | ||||||
Morneau Shepell, Inc. | 100,427 | 2,344,234 | ||||||
Parkland Corp. | 114,463 | 2,842,183 | ||||||
Xebec Adsorption, Inc.** | 418,665 | 1,264,383 | ||||||
| 12,862,823 | ||||||||
Mexico — 0.3% | ||||||||
Grupo Cementos de | ||||||||
Chihuahua SAB de CV | 196,386 | 831,273 | ||||||
Total NORTH AMERICA | 13,694,096 | |||||||
Number of | Value | |||||||
MIDDLE EAST — 3.4% | ||||||||
Israel — 2.1% | ||||||||
Kornit Digital, Ltd.** | 41,737 | $ | 2,227,921 | |||||
Nice, Ltd. — SP ADR** | 15,352 | 2,905,212 | ||||||
| 5,133,133 | ||||||||
United Arab Emirates — 1.3% | ||||||||
Network International Holdings PLC1** | 555,410 | 3,040,479 | ||||||
Total MIDDLE EAST | 8,173,612 | |||||||
SOUTH AMERICA — 0.6% | ||||||||
Brazil — 0.6% | ||||||||
Rumo SA** | 337,872 | 1,400,422 | ||||||
Total SOUTH AMERICA | 1,400,422 | |||||||
AFRICA — 0.4% | ||||||||
South Africa — 0.4% | ||||||||
Clicks Group, Ltd. | 69,200 | 840,133 | ||||||
Total AFRICA | 840,133 | |||||||
Total EQUITY SECURITIES | ||||||||
(Cost $198,343,146) | 237,592,439 | |||||||
| ||||||||
TOTAL INVESTMENTS | ||||||||
(COST $198,343,146) | 97.9 | % | $ | 237,592,439 | ||||
Other Assets In Excess Of Liabilities | 2.1 | % | 5,146,724 | |||||
Net Assets | 100.0 | % | $ | 242,739,163 | ||||
1 | 144A — This security was purchased pursuant to Rule 144A of the Securities Act of 1933 and may not be resold subject to that rule except to qualified institutional buyers. At June 30, 2020, these securities amounted to $31,842,257 or 13.1% of net assets. These 144A securities have not been deemed illiquid. |
** | Non-income producing security |
ADR — American Depository Receipt
GDR — Global Depository Receipt
REIT — Real Estate Investment Trust
SP ADR — Sponsored American Depository Receipt
SP GDR — Sponsored Global Depository Receipt
Notes to Financial Statements are an integral part of this Schedule.
13
Driehaus International Small Cap Growth Fund |
Regional Weightings* | |
Western Europe | 61.2% |
Japan | 16.9% |
Asia/Far East Ex-Japan | 8.3% |
North America | 5.6% |
Middle East | 3.4% |
Eastern Europe | 1.5% |
South America | 0.6% |
Africa | 0.4% |
Top Ten Holdings* | |
NEXTDC, Ltd. | 2.2% |
TeamViewer AG | 2.0% |
HelloFresh SE | 1.8% |
Softwareone Holding AG | 1.8% |
Hornbach Holding AG & Co. KGaA | 1.6% |
Serco Group PLC | 1.6% |
ConvaTec Group PLC | 1.5% |
NetEnt AB | 1.5% |
Fevertree Drinks PLC | 1.4% |
DWS Group GmbH & Co. KGaA | 1.3% |
* | All percentages are stated as a percent of net assets at June 30, 2020. |
Notes to Financial Statements are an integral part of this Schedule.
14
Driehaus International Small Cap Growth Fund |
Industry | Percent of |
Aerospace & Defense | 1.7% |
Air Freight & Logistics | 1.1% |
Automobiles | 0.9% |
Beverages | 3.4% |
Biotechnology | 1.7% |
Building Products | 1.5% |
Capital Markets | 1.7% |
Chemicals | 0.8% |
Commercial Banks | 1.3% |
Commercial Services & Supplies | 2.5% |
Construction & Engineering | 1.0% |
Construction Materials | 1.6% |
Containers & Packaging | 0.8% |
Diversified Telecommunication Services | 1.0% |
Electrical Equipment | 1.1% |
Electronic Equipment, Instruments & Components | 2.3% |
Entertainment | 2.0% |
Food & Staples Retailing | 3.9% |
Food Products | 1.0% |
Health Care Equipment & Supplies | 2.5% |
Health Care Providers & Services | 1.2% |
Hotels, Restaurants & Leisure | 1.5% |
Household Durables | 1.2% |
Industry | Percent of |
Industrial Conglomerates | 0.4% |
Information Technology Services | 9.1% |
Insurance | 0.9% |
Interactive Media & Services | 1.2% |
Internet & Catalog Retail | 4.8% |
Leisure Equipment & Products | 1.2% |
Life Sciences Tools & Services | 1.3% |
Machinery | 12.8% |
Multiline Retail | 2.2% |
Oil, Gas & Consumable Fuels | 1.2% |
Pharmaceuticals | 1.0% |
Professional Services | 2.6% |
Real Estate Investment Trust | 0.5% |
Real Estate Management & Development | 2.2% |
Road & Rail | 0.8% |
Semiconductors & Semiconductor Equipment | 2.4% |
Software | 6.7% |
Specialty Retail | 3.0% |
Textiles, Apparel & Luxury Goods | 2.3% |
Trading Companies & Distributors | 2.3% |
Wireless Telecommunication Services | 1.3% |
Other Assets in Excess of Liabilities | 2.1% |
TOTAL | 100.0% |
Notes to Financial Statements are an integral part of this Schedule.
15
The performance summarized below is historical and does not represent future results. Investment returns and principal value vary, and you may have a gain or loss when you sell shares. Performance data presented measures the change in the value of an investment in the Fund, assuming reinvestment of all dividends and capital gains. Average annual total return reflects annualized change.
The table does not reflect the deduction of taxes that a shareholder would pay on Fund distributions or the redemption of Fund shares. The graph compares the results of a $10,000 investment in the Fund over the last 10 fiscal year periods (which includes performance of the Predecessor Limited Partnership), with all dividends and capital gains reinvested, with the indicated index (and dividends reinvested) for the same period.
Fund Only | Including Predecessor Limited Partnership | ||||
Average Annual Total Returns as of 6/30/20 | 1 Year | 3 Years | 5 Years | Since Inception (11/18/13 - 6/30/20) | 10 Years |
Driehaus Micro Cap Growth Fund (DMCRX)1 | 22.77% | 23.04% | 15.02% | 17.34% | 18.52% |
Russell Microcap® Growth Index2 | 7.89% | 5.20% | 3.10% | 5.70% | 11.12% |

1 | The Driehaus Micro Cap Growth Fund (the “Fund”) performance shown above includes the performance of the Driehaus Micro Cap Fund, L.P. (the “Predecessor Limited Partnership”), one of the Fund’s predecessors, for the periods before the Fund’s registration statement became effective. The Predecessor Limited Partnership, which was established on July 1, 1996, was managed with substantially the same investment objective, policies and philosophies as are followed by the Fund. The Fund succeeded to the Predecessor Limited Partnership’s assets together with the assets of the Driehaus Institutional Micro Cap Fund, L.P. on November 18, 2013. The Predecessor Limited Partnership was not registered under the Investment Company Act of 1940, as amended (“1940 Act”), and thus was not subject to certain investment and operational restrictions that are imposed by the 1940 Act. If the Predecessor Limited Partnership had been registered under the 1940 Act, its performance may have been adversely affected. The Predecessor Limited Partnership’s performance has been restated to reflect estimated expenses of the Fund. The returns for periods prior to November 18, 2016, reflect fee waivers and/or reimbursements without which performance would have been lower. |
2 | The Russell Microcap® Growth Index is constructed to provide a comprehensive and unbiased barometer of the micro cap growth market. Based on ongoing empirical research of investment manager behavior, the methodology used to determine growth probability approximates the aggregate microcap growth manager’s opportunity set. |
16
Driehaus Micro Cap Growth Fund |
Number of | Value | |||||||
EQUITY SECURITIES — 100.2% | ||||||||
HEALTH CARE — 35.9% | ||||||||
Biotechnology — 19.7% | ||||||||
Aeglea BioTherapeutics, Inc.** | 41,015 | $ | 379,389 | |||||
Apellis Pharmaceuticals, Inc.** | 48,097 | 1,570,848 | ||||||
Applied Therapeutics, Inc.** | 65,713 | 2,375,525 | ||||||
Argenx SE — ADR** | 14,025 | 3,158,851 | ||||||
BELLUS Health, Inc.** | 41,441 | 426,428 | ||||||
Bioxcel Therapeutics, Inc.** | 26,692 | 1,414,943 | ||||||
Black Diamond Therapeutics, Inc.** | 46,976 | 1,980,508 | ||||||
Castle Biosciences, Inc.** | 61,477 | 2,317,068 | ||||||
Crinetics Pharmaceuticals, Inc.** | 75,145 | 1,316,540 | ||||||
Cytokinetics, Inc.** | 243,915 | 5,749,077 | ||||||
Dicerna Pharmaceuticals, Inc.** | 129,134 | 3,280,004 | ||||||
Gamida Cell, Ltd.** | 118,491 | 541,504 | ||||||
Global Blood Therapeutics, Inc.** | 27,912 | 1,762,085 | ||||||
Immunovant, Inc.** | 78,389 | 1,908,772 | ||||||
Kodiak Sciences, Inc.** | 23,220 | 1,256,666 | ||||||
Merus NV** | 94,547 | 1,521,261 | ||||||
Mirati Therapeutics, Inc.** | 11,665 | 1,331,793 | ||||||
Momenta Pharmaceuticals, Inc.** | 34,111 | 1,134,873 | ||||||
Natera, Inc.** | 76,812 | 3,829,846 | ||||||
Principia Biopharma, Inc.** | 22,645 | 1,353,945 | ||||||
SpringWorks Therapeutics, Inc.** | 81,265 | 3,413,130 | ||||||
Turning Point Therapeutics, Inc.** | 25,581 | 1,652,277 | ||||||
Twist Bioscience Corp.** | 72,487 | 3,283,661 | ||||||
Xenon Pharmaceuticals, Inc.** | 57,024 | 715,081 | ||||||
Y-mAbs Therapeutics, Inc.** | 48,692 | 2,103,494 | ||||||
| 49,777,569 | ||||||||
Health Care Equipment & Supplies — 7.0% | ||||||||
Alphatec Holdings, Inc.** | 249,460 | 1,172,462 | ||||||
Axonics Modulation Technologies, Inc.** | 39,715 | 1,394,394 | ||||||
Inari Medical, Inc.** | 17,338 | 839,853 | ||||||
OrthoPediatrics Corp.** | 80,234 | 3,511,040 | ||||||
SeaSpine Holdings Corp.** | 120,683 | 1,263,551 | ||||||
SI-BONE, Inc.** | 93,575 | 1,491,586 | ||||||
Tandem Diabetes Care, Inc.** | 37,285 | 3,688,232 | ||||||
Vapotherm, Inc.** | 107,808 | 4,419,050 | ||||||
| 17,780,168 | ||||||||
Pharmaceuticals — 4.9% | ||||||||
Axsome Therapeutics, Inc.** | 33,992 | 2,796,862 | ||||||
MyoKardia, Inc.** | 42,998 | 4,154,467 | ||||||
Odonate Therapeutics, Inc.** | 65,673 | 2,780,595 | ||||||
Revance Therapeutics, Inc.** | 91,819 | 2,242,220 | ||||||
scPharmaceuticals, Inc.** | 64,096 | 471,747 | ||||||
| 12,445,891 | ||||||||
Number of | Value | |||||||
Health Care Technology — 2.7% | ||||||||
Inspire Medical Systems, Inc.** | 40,449 | $ | 3,519,872 | |||||
Phreesia, Inc.** | 51,618 | 1,459,757 | ||||||
Schrodinger, Inc.** | 20,949 | 1,918,300 | ||||||
| 6,897,929 | ||||||||
Health Care Providers & Services — 0.8% | ||||||||
PetIQ, Inc.** | 60,098 | 2,093,814 | ||||||
Life Sciences Tools & Services — 0.8% | ||||||||
NeoGenomics, Inc.** | 63,631 | 1,971,288 | ||||||
Total HEALTH CARE | 90,966,659 | |||||||
CONSUMER DISCRETIONARY — 20.3% | ||||||||
Specialty Retail — 5.5% | ||||||||
Camping World Holdings, Inc. — A | 82,912 | 2,251,890 | ||||||
GrowGeneration Corp.** | 267,489 | 1,829,625 | ||||||
MarineMax, Inc.** | 43,812 | 980,951 | ||||||
National Vision Holdings, Inc.** | 44,883 | 1,369,829 | ||||||
OneWater Marine, Inc.** | 62,816 | 1,525,172 | ||||||
Sonic Automotive, Inc. — A | 114,513 | 3,654,110 | ||||||
Sportsman’s Warehouse Holdings, Inc.** | 161,509 | 2,301,503 | ||||||
| 13,913,080 | ||||||||
Household Durables — 4.1% | ||||||||
Century Communities, Inc.** | 23,984 | 735,349 | ||||||
Installed Building Products, Inc.** | 23,270 | 1,600,511 | ||||||
LGI Homes, Inc.** | 20,244 | 1,782,079 | ||||||
Purple Innovation, Inc.** | 146,532 | 2,637,576 | ||||||
Skyline Champion Corp.** | 50,070 | 1,218,704 | ||||||
The Lovesac Co.** | 87,911 | 2,305,906 | ||||||
| 10,280,125 | ||||||||
Leisure Equipment & Products — 2.4% | ||||||||
Malibu Boats, Inc. — A** | 37,384 | 1,942,099 | ||||||
Nautilus, Inc.** | 250,581 | 2,322,886 | ||||||
Vista Outdoor, Inc.** | 133,349 | 1,926,893 | ||||||
| 6,191,878 | ||||||||
Internet & Catalog Retail — 2.4% | ||||||||
Fiverr International, Ltd.** | 20,393 | 1,505,411 | ||||||
The Rubicon Project, Inc.** | 362,694 | 2,419,169 | ||||||
US Auto Parts Network, Inc.** | 148,624 | 1,287,084 | ||||||
Waitr Holdings, Inc.** | 306,464 | 806,000 | ||||||
| 6,017,664 | ||||||||
Hotels, Restaurants & Leisure — 1.8% | ||||||||
El Pollo Loco Holdings, Inc.** | 56,667 | 836,405 | ||||||
GAN, Ltd.** | 99,357 | 2,528,636 | ||||||
Twin River Worldwide Holdings, Inc. | 50,636 | 1,128,676 | ||||||
| 4,493,717 | ||||||||
Auto Components — 1.3% | ||||||||
Fox Factory Holding Corp.** | 40,568 | 3,351,322 | ||||||
Automobiles — 0.8% | ||||||||
Winnebago Industries, Inc. | 31,026 | 2,066,952 | ||||||
Notes to Financial Statements are an integral part of this Schedule.
17
Driehaus Micro Cap Growth Fund |
Number of | Value | |||||||
Textiles, Apparel & Luxury Goods — 0.8% | ||||||||
Crocs, Inc.** | 55,695 | $ | 2,050,690 | |||||
Multiline Retail — 0.6% | ||||||||
Big Lots, Inc. | 37,593 | 1,578,906 | ||||||
Diversified Consumer Services — 0.6% | ||||||||
Aspen Group, Inc.** | 89,250 | 807,713 | ||||||
Universal Technical Institute, Inc.** | 110,923 | 770,915 | ||||||
| 1,578,628 | ||||||||
Total CONSUMER DISCRETIONARY | 51,522,962 | |||||||
INFORMATION TECHNOLOGY — 18.0% | ||||||||
Information Technology Services — 7.3% | ||||||||
Endava PLC — SP ADR** | 79,637 | 3,846,467 | ||||||
Fastly, Inc. — A** | 40,858 | 3,478,242 | ||||||
Grid Dynamics Holdings, Inc.** | 147,585 | 1,018,337 | ||||||
I3 Verticals, Inc. — A** | 84,787 | 2,564,807 | ||||||
Limelight Networks, Inc.** | 551,864 | 4,061,719 | ||||||
Perficient, Inc.** | 39,199 | 1,402,540 | ||||||
Repay Holdings Corp.** | 89,049 | 2,193,277 | ||||||
| 18,565,389 | ||||||||
Semiconductors & Semiconductor Equipment — 5.3% | ||||||||
FormFactor, Inc.** | 48,057 | 1,409,512 | ||||||
Inphi Corp.** | 24,569 | 2,886,857 | ||||||
Silicon Motion Technology Corp. — ADR | 38,069 | 1,856,625 | ||||||
SiTime Corp.** | 99,714 | 4,727,441 | ||||||
Ultra Clean Holdings, Inc.** | 108,651 | 2,458,772 | ||||||
| 13,339,207 | ||||||||
Software — 4.5% | ||||||||
Agilysys, Inc.** | 41,173 | 738,644 | ||||||
Everbridge, Inc.** | 19,748 | 2,732,333 | ||||||
Five9, Inc.** | 22,780 | 2,521,063 | ||||||
Model N, Inc.** | 41,134 | 1,429,818 | ||||||
PROS Holdings, Inc.** | 47,640 | 2,116,645 | ||||||
SVMK, Inc.** | 80,026 | 1,883,812 | ||||||
| 11,422,315 | ||||||||
Electronic Equipment, Instruments & Components — 0.9% | ||||||||
nLight, Inc.** | 105,686 | 2,352,570 | ||||||
Total INFORMATION TECHNOLOGY | 45,679,481 | |||||||
INDUSTRIALS — 10.8% | ||||||||
Electrical Equipment — 4.1% | ||||||||
Plug Power, Inc.** | 476,353 | 3,910,858 | ||||||
Tortoise Acquisition Corp. — A** | 38,713 | 1,062,285 | ||||||
TPI Composites, Inc.** | 77,636 | 1,814,353 | ||||||
Vicor Corp.** | 50,666 | 3,645,419 | ||||||
| 10,432,915 | ||||||||
Machinery — 1.6% | ||||||||
Chart Industries, Inc.** | 53,622 | 2,600,131 | ||||||
The Shyft Group, Inc. | 82,446 | 1,388,391 | ||||||
| 3,988,522 | ||||||||
Number of | Value | |||||||
Construction & Engineering — 0.9% | ||||||||
Ameresco, Inc. — A** | 44,518 | $ | 1,236,710 | |||||
WillScot Mobile Mini Holdings Corp.** | 94,924 | 1,166,616 | ||||||
| 2,403,326 | ||||||||
Building Products — 0.9% | ||||||||
Masonite International Corp.** | 11,790 | 917,026 | ||||||
PGT Innovations, Inc.** | 89,528 | 1,403,799 | ||||||
| 2,320,825 | ||||||||
Professional Services — 0.9% | ||||||||
Upwork, Inc.** | 149,507 | 2,158,881 | ||||||
Commercial Services & Supplies — 0.6% | ||||||||
Casella Waste Systems, Inc. — A** | 27,118 | 1,413,390 | ||||||
Road & Rail — 0.5% | ||||||||
Marten Transport, Ltd. | 48,850 | 1,229,066 | ||||||
Air Freight & Logistics — 0.5% | ||||||||
Atlas Air Worldwide Holdings, Inc.** | 28,140 | 1,210,864 | ||||||
Trading Companies & Distributors — 0.4% | ||||||||
Herc Holdings, Inc.** | 35,222 | 1,082,372 | ||||||
Aerospace & Defense — 0.4% | ||||||||
Vectrus, Inc.** | 20,532 | 1,008,737 | ||||||
Total INDUSTRIALS | 27,248,898 | |||||||
FINANCIALS — 7.8% | ||||||||
Insurance — 4.9% | ||||||||
BRP Group, Inc. — A** | 137,990 | 2,383,087 | ||||||
Goosehead Insurance, Inc. — A** | 32,147 | 2,416,168 | ||||||
James River Group Holdings, Ltd. | 39,834 | 1,792,530 | ||||||
Kinsale Capital Group, Inc. | 12,071 | 1,873,540 | ||||||
Palomar Holdings, Inc.** | 45,091 | 3,867,004 | ||||||
| 12,332,329 | ||||||||
Commercial Banks — 1.5% | ||||||||
Live Oak Bancshares, Inc. | 55,476 | 804,957 | ||||||
TriState Capital Holdings, Inc.** | 74,709 | 1,173,678 | ||||||
Triumph Bancorp, Inc.** | 70,989 | 1,722,903 | ||||||
| 3,701,538 | ||||||||
Capital Markets — 0.7% | ||||||||
Cohen & Steers, Inc. | 26,513 | 1,804,210 | ||||||
Thrifts & Mortgage Finance — 0.7% | ||||||||
NMI Holdings, Inc. — A** | 109,822 | 1,765,938 | ||||||
Total FINANCIALS | 19,604,015 | |||||||
COMMUNICATION SERVICES — 4.0% | ||||||||
Diversified Telecommunication Services — 1.4% | ||||||||
Bandwidth, Inc. — A** | 28,745 | 3,650,615 | ||||||
Interactive Media & Services — 1.2% | ||||||||
EverQuote, Inc. — A** | 51,697 | 3,006,697 | ||||||
Media — 0.9% | ||||||||
Cardlytics, Inc.** | 34,438 | 2,409,971 | ||||||
Notes to Financial Statements are an integral part of this Schedule.
18
Driehaus Micro Cap Growth Fund |
Number of | Value | |||||||
Entertainment — 0.5% | ||||||||
Glu Mobile, Inc.** | 124,353 | $ | 1,152,752 | |||||
Total COMMUNICATION SERVICES | 10,220,035 | |||||||
CONSUMER STAPLES — 2.3% | ||||||||
Personal Products — 1.2% | ||||||||
elf Beauty, Inc.** | 164,891 | 3,144,471 | ||||||
Food Products — 0.7% | ||||||||
Freshpet, Inc.** | 20,195 | 1,689,514 | ||||||
Beverages — 0.4% | ||||||||
Celsius Holdings, Inc.** | 88,903 | 1,046,388 | ||||||
Total CONSUMER STAPLES | 5,880,373 | |||||||
UTILITIES — 0.9% | ||||||||
Independent Power Producers & Energy Traders — 0.9% | ||||||||
Sunnova Energy International, Inc.** | 134,788 | 2,300,831 | ||||||
Total UTILITIES | 2,300,831 | |||||||
ENERGY — 0.2% | ||||||||
Energy Equipment & Services — 0.2% | ||||||||
Aspen Aerogels, Inc.** | 68,956 | 453,730 | ||||||
Total ENERGY | 453,730 | |||||||
Total EQUITY SECURITIES | ||||||||
(Cost $154,808,166) | 253,876,984 | |||||||
| ||||||||
TOTAL INVESTMENTS | ||||||||
(COST $154,808,166) | 100.2 | % | $ | 253,876,984 | ||||
Other Liabilities In Excess Of Assets | (0.2 | )% | (396,439 | ) | ||||
Net Assets | 100.0 | % | $ | 253,480,545 | ||||
** | Non-income producing security |
ADR — American Depository Receipt
SP ADR — Sponsored American Depository Receipt
Top Ten Holdings* | |
Cytokinetics, Inc. | 2.3% |
SiTime Corp. | 1.9% |
Vapotherm, Inc. | 1.7% |
MyoKardia, Inc. | 1.6% |
Limelight Networks, Inc. | 1.6% |
Plug Power, Inc. | 1.5% |
Palomar Holdings, Inc. | 1.5% |
Endava PLC — SP ADR | 1.5% |
Natera, Inc. | 1.5% |
Tandem Diabetes Care, Inc. | 1.5% |
* | All percentages are stated as a percent of net assets at June 30, 2020 |
Notes to Financial Statements are an integral part of this Schedule.
19
Driehaus Micro Cap Growth Fund |
Industry | Percent of |
Aerospace & Defense | 0.4% |
Air Freight & Logistics | 0.5% |
Auto Components | 1.3% |
Automobiles | 0.8% |
Beverages | 0.4% |
Biotechnology | 19.7% |
Building Products | 0.9% |
Capital Markets | 0.7% |
Commercial Banks | 1.5% |
Commercial Services & Supplies | 0.6% |
Construction & Engineering | 0.9% |
Diversified Consumer Services | 0.6% |
Diversified Telecommunication Services | 1.4% |
Electrical Equipment | 4.1% |
Electronic Equipment, Instruments & Components | 0.9% |
Energy Equipment & Services | 0.2% |
Entertainment | 0.5% |
Food Products | 0.7% |
Health Care Equipment & Supplies | 7.0% |
Health Care Providers & Services | 0.8% |
Health Care Technology | 2.7% |
Hotels, Restaurants & Leisure | 1.8% |
Household Durables | 4.1% |
Industry | Percent of |
Independent Power Producers & Energy Traders | 0.9% |
Information Technology Services | 7.3% |
Insurance | 4.9% |
Interactive Media & Services | 1.2% |
Internet & Catalog Retail | 2.4% |
Leisure Equipment & Products | 2.4% |
Life Sciences Tools & Services | 0.8% |
Machinery | 1.6% |
Media | 0.9% |
Multiline Retail | 0.6% |
Personal Products | 1.2% |
Pharmaceuticals | 4.9% |
Professional Services | 0.9% |
Road & Rail | 0.5% |
Semiconductors & Semiconductor Equipment | 5.3% |
Software | 4.5% |
Specialty Retail | 5.5% |
Textiles, Apparel & Luxury Goods | 0.8% |
Thrifts & Mortgage Finance | 0.7% |
Trading Companies & Distributors | 0.4% |
Other Liabilities in Excess of Assets | (0.2)% |
TOTAL | 100.0% |
Notes to Financial Statements are an integral part of this Schedule.
20
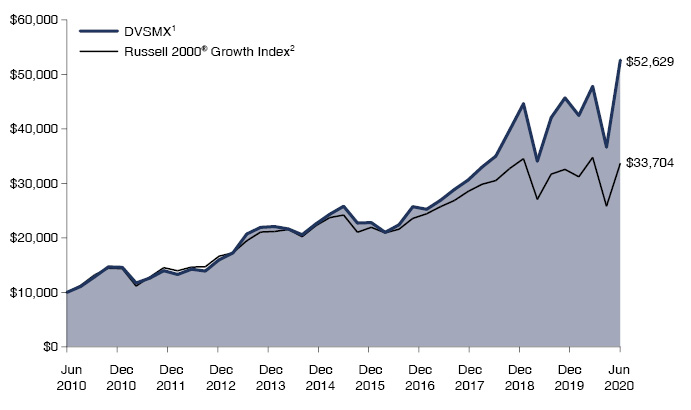
The performance summarized below is historical and does not represent future results. Investment returns and principal value vary, and you may have a gain or loss when you sell shares. Performance data presented measures the change in the value of an investment in the Fund, assuming reinvestment of all dividends and capital gains. Average annual total return reflects annualized change.
The table does not reflect the deduction of taxes that a shareholder would pay on Fund distributions or the redemption of Fund shares. The graph compares the results of a $10,000 investment in the Fund over the last 10 fiscal year periods (which includes performance of the Predecessor Partnership), with all dividends and capital gains reinvested, with the indicated index (and dividends reinvested) for the same period.
Fund Only | Including Predecessor | ||||
Average Annual Total Returns as of 6/30/20 | 1 Year | Since Inception (8/21/17 - 6/30/20) | 3 Years | 5 Years | 10 Years |
Driehaus Small Cap Growth Fund Investor Class (DVSMX)1 | 15.18% | 26.49% | 22.15% | 15.32% | 18.07% |
Driehaus Small Cap Growth Fund Institutional Class (DNSMX)1 | 15.49% | 26.85% | 22.47% | 15.50% | 18.16% |
Russell 2000® Growth Index2 | 3.48% | 9.50% | 7.86% | 6.86% | 12.92% |
1 | The Driehaus Small Cap Growth Fund (“the Fund”) performance shown above includes the performance of the Driehaus Institutional Small Cap, L.P. (the “Predecessor Partnership”), one of the Fund’s predecessors, for the periods before the Fund’s registration statement became effective. The Predecessor Partnership was managed by the same investment team with substantially the same investment objective, policies and philosophies as are followed by the Fund. The Fund succeeded to the Predecessor Partnership’s assets together with the assets of the Driehaus Institutional Small Cap Recovery Fund, L.P., Driehaus Small Cap Recovery Fund, L.P. and Driehaus Small Cap Investors, L.P. (together, the “Limited Partnerships”) on August 21, 2017. The investment portfolios of the Limited Partnerships were identical and therefore had similar performance. The performance of the Predecessor Partnership is shown here because it has been in operation the longest. The Predecessor Partnership was not registered under the Investment Company Act of 1940, as amended (“1940 Act”), and thus was not subject to certain investment and operational restrictions that are imposed by the 1940 Act. If the Predecessor Partnership had been registered under the 1940 Act, its performance may have been adversely affected. The Predecessor Partnership’s performance has not been restated to reflect estimated expenses applicable to each class of shares of the Fund. The returns reflect fee waivers and/or reimbursements without which performance would have been lower. |
2 | The Russell 2000® Growth Index measures the performance of those Russell 2000® companies with higher price-to-book ratios and higher forecasted growth values. The performance data includes reinvested dividends. The Russell 2000® Index measures the performance of the 2,000 smallest companies in the Russell 3000® Index. |
21
Driehaus Small Cap Growth Fund |
Number of | Value | |||||||
EQUITY SECURITIES — 99.9% | ||||||||
HEALTH CARE — 30.4% | ||||||||
Biotechnology — 17.8% | ||||||||
Apellis Pharmaceuticals, Inc.** | 35,330 | $ | 1,153,878 | |||||
Applied Therapeutics, Inc.** | 67,781 | 2,450,283 | ||||||
Argenx SE — ADR** | 13,570 | 3,056,371 | ||||||
Ascendis Pharma AS — ADR** | 20,366 | 3,012,131 | ||||||
Black Diamond Therapeutics, Inc.** | 43,836 | 1,848,126 | ||||||
Blueprint Medicines Corp.** | 15,260 | 1,190,280 | ||||||
Cytokinetics, Inc.** | 149,106 | 3,514,428 | ||||||
Dicerna Pharmaceuticals, Inc.** | 44,939 | 1,141,451 | ||||||
Global Blood Therapeutics, Inc.** | 20,941 | 1,322,005 | ||||||
Halozyme Therapeutics, Inc.** | 85,945 | 2,304,186 | ||||||
Immunovant, Inc.** | 92,382 | 2,249,502 | ||||||
Invitae Corp.** | 95,397 | 2,889,575 | ||||||
Kodiak Sciences, Inc.** | 15,809 | 855,583 | ||||||
Mirati Therapeutics, Inc.** | 11,146 | 1,272,539 | ||||||
Natera, Inc.** | 71,404 | 3,560,203 | ||||||
SpringWorks Therapeutics, Inc.** | 88,041 | 3,697,722 | ||||||
Turning Point Therapeutics, Inc.** | 29,991 | 1,937,119 | ||||||
Twist Bioscience Corp.** | 34,400 | 1,558,320 | ||||||
| 39,013,702 | ||||||||
Health Care Equipment & Supplies — 4.1% | ||||||||
AtriCure, Inc.** | 37,484 | 1,684,906 | ||||||
Inari Medical, Inc.** | 15,830 | 766,805 | ||||||
OrthoPediatrics Corp.** | 18,174 | 795,294 | ||||||
SI-BONE, Inc.** | 94,235 | 1,502,106 | ||||||
Tandem Diabetes Care, Inc.** | 42,516 | 4,205,683 | ||||||
| 8,954,794 | ||||||||
Pharmaceuticals — 3.1% | ||||||||
Axsome Therapeutics, Inc.** | 10,307 | 848,060 | ||||||
MyoKardia, Inc.** | 34,685 | 3,351,264 | ||||||
Odonate Therapeutics, Inc.** | 25,656 | 1,086,275 | ||||||
Revance Therapeutics, Inc.** | 65,183 | 1,591,769 | ||||||
| 6,877,368 | ||||||||
Health Care Technology — 2.9% | ||||||||
Inspire Medical Systems, Inc.** | 30,134 | 2,622,261 | ||||||
Livongo Health, Inc.** | 20,042 | 1,506,958 | ||||||
Teladoc Health, Inc.** | 11,315 | 2,159,354 | ||||||
| 6,288,573 | ||||||||
Life Sciences Tools & Services — 2.1% | ||||||||
10X Genomics, Inc. — A** | 17,979 | 1,605,704 | ||||||
NeoGenomics, Inc.** | 59,175 | 1,833,242 | ||||||
Repligen Corp.** | 9,578 | 1,183,937 | ||||||
| 4,622,883 | ||||||||
Health Care Providers & Services — 0.4% | ||||||||
Guardant Health, Inc.** | 12,287 | 996,844 | ||||||
Total HEALTH CARE | 66,754,164 | |||||||
Number of | Value | |||||||
INFORMATION TECHNOLOGY — 22.5% | ||||||||
Software — 9.8% | ||||||||
Alteryx, Inc. — A** | 13,718 | $ | 2,253,593 | |||||
Coupa Software, Inc.** | 5,185 | 1,436,452 | ||||||
Elastic NV** | 19,848 | 1,830,184 | ||||||
Everbridge, Inc.** | 28,772 | 3,980,894 | ||||||
Five9, Inc.** | 31,950 | 3,535,907 | ||||||
Paylocity Holding Corp.** | 8,089 | 1,180,104 | ||||||
Q2 Holdings, Inc.** | 18,734 | 1,607,190 | ||||||
RingCentral, Inc. — A** | 12,297 | 3,504,768 | ||||||
Zscaler, Inc.** | 19,748 | 2,162,406 | ||||||
| 21,491,498 | ||||||||
Information Technology Services — 6.5% | ||||||||
Endava PLC — SP ADR** | 65,844 | 3,180,265 | ||||||
EPAM Systems, Inc.** | 5,417 | 1,365,138 | ||||||
Fastly, Inc. — A** | 36,333 | 3,093,028 | ||||||
I3 Verticals, Inc. — A** | 60,732 | 1,837,143 | ||||||
KBR, Inc. | 112,589 | 2,538,882 | ||||||
Repay Holdings Corp.** | 93,364 | 2,299,556 | ||||||
| 14,314,012 | ||||||||
Semiconductors & Semiconductor Equipment — 5.8% | ||||||||
Cirrus Logic, Inc.** | 9,024 | 557,503 | ||||||
Inphi Corp.** | 25,382 | 2,982,385 | ||||||
Lattice Semiconductor Corp.** | 65,115 | 1,848,615 | ||||||
Power Integrations, Inc. | 11,136 | 1,315,495 | ||||||
Silicon Motion Technology Corp. — ADR | 29,706 | 1,448,761 | ||||||
SiTime Corp.** | 46,993 | 2,227,938 | ||||||
Synaptics, Inc.** | 14,890 | 895,187 | ||||||
Ultra Clean Holdings, Inc.** | 65,057 | 1,472,240 | ||||||
| 12,748,124 | ||||||||
Electronic Equipment, Instruments & Components — 0.4% | ||||||||
nLight, Inc.** | 38,603 | 859,303 | ||||||
Total INFORMATION TECHNOLOGY | 49,412,937 | |||||||
CONSUMER DISCRETIONARY — 19.4% | ||||||||
Hotels, Restaurants & Leisure — 3.9% | ||||||||
Churchill Downs, Inc. | 13,797 | 1,837,071 | ||||||
Eldorado Resorts, Inc.** | 46,508 | 1,863,110 | ||||||
Papa John’s International, Inc. | 13,665 | 1,085,138 | ||||||
Texas Roadhouse, Inc. | 37,230 | 1,957,181 | ||||||
Wingstop, Inc. | 12,625 | 1,754,496 | ||||||
| 8,496,996 | ||||||||
Specialty Retail — 3.7% | ||||||||
Carvana Co.** | 21,585 | 2,594,517 | ||||||
Lithia Motors, Inc. — A | 16,981 | 2,569,735 | ||||||
Murphy USA, Inc.** | 9,013 | 1,014,774 | ||||||
National Vision Holdings, Inc.** | 64,064 | 1,955,233 | ||||||
| 8,134,259 | ||||||||
Leisure Equipment & Products — 2.8% | ||||||||
BRP, Inc. | 112,372 | 4,784,800 | ||||||
YETI Holdings, Inc.** | 32,758 | 1,399,749 | ||||||
| 6,184,549 | ||||||||
Notes to Financial Statements are an integral part of this Schedule.
22
Driehaus Small Cap Growth Fund |
Number of | Value | |||||||
Textiles, Apparel & Luxury Goods — 2.2% | ||||||||
Crocs, Inc.** | 73,019 | $ | 2,688,560 | |||||
Deckers Outdoor Corp.** | 10,967 | 2,153,809 | ||||||
| 4,842,369 | ||||||||
Household Durables — 1.9% | ||||||||
LGI Homes, Inc.** | 18,998 | 1,672,394 | ||||||
Skyline Champion Corp.** | 42,241 | 1,028,146 | ||||||
TopBuild Corp.** | 11,880 | 1,351,587 | ||||||
| 4,052,127 | ||||||||
Auto Components — 1.2% | ||||||||
Fox Factory Holding Corp.** | 31,459 | 2,598,828 | ||||||
Internet & Catalog Retail — 1.1% | ||||||||
Fiverr International, Ltd.** | 18,327 | 1,352,899 | ||||||
Magnite, Inc.** | 167,983 | 1,120,447 | ||||||
| 2,473,346 | ||||||||
Multiline Retail — 0.9% | ||||||||
Ollie’s Bargain Outlet Holdings, Inc.** | 20,366 | 1,988,740 | ||||||
Automobiles — 0.9% | ||||||||
Winnebago Industries, Inc. | 29,373 | 1,956,829 | ||||||
Diversified Consumer Services — 0.8% | ||||||||
Chegg, Inc.** | 26,823 | 1,804,115 | ||||||
Total CONSUMER DISCRETIONARY | 42,532,158 | |||||||
INDUSTRIALS — 14.3% | ||||||||
Machinery — 3.9% | ||||||||
Astec Industries, Inc. | 33,608 | 1,556,386 | ||||||
Chart Industries, Inc.** | 55,120 | 2,672,769 | ||||||
Colfax Corp.** | 32,932 | 918,803 | ||||||
Kornit Digital, Ltd.** | 26,934 | 1,437,737 | ||||||
The Shyft Group, Inc. | 116,380 | 1,959,839 | ||||||
| 8,545,534 | ||||||||
Electrical Equipment — 2.8% | ||||||||
Generac Holdings, Inc.** | 24,785 | 3,022,035 | ||||||
Vicor Corp.** | 44,190 | 3,179,471 | ||||||
| 6,201,506 | ||||||||
Building Products — 2.3% | ||||||||
Advanced Drainage Systems, Inc. | 30,403 | 1,501,908 | ||||||
Masonite International Corp.** | 13,538 | 1,052,986 | ||||||
The AZEK Co., Inc.** | 28,677 | 913,649 | ||||||
Trex Co., Inc.** | 12,155 | 1,581,001 | ||||||
| 5,049,544 | ||||||||
Professional Services — 1.9% | ||||||||
Exponent, Inc. | 16,949 | 1,371,683 | ||||||
FTI Consulting, Inc.** | 10,286 | 1,178,261 | ||||||
Upwork, Inc.** | 109,134 | 1,575,895 | ||||||
| 4,125,839 | ||||||||
Aerospace & Defense — 1.7% | ||||||||
Axon Enterprise, Inc.** | 23,069 | 2,263,761 | ||||||
Mercury Systems, Inc.** | 18,012 | 1,416,824 | ||||||
| 3,680,585 | ||||||||
Number of | Value | |||||||
Road & Rail — 0.7% | ||||||||
Saia, Inc.** | 14,579 | $ | 1,620,893 | |||||
Commercial Services & Supplies — 0.5% | ||||||||
ABM Industries, Inc. | 29,030 | 1,053,789 | ||||||
Trading Companies & Distributors — 0.5% | ||||||||
SiteOne Landscape Supply, Inc.** | 8,622 | 982,649 | ||||||
Total INDUSTRIALS | 31,260,339 | |||||||
FINANCIALS — 5.6% | ||||||||
Insurance — 2.2% | ||||||||
Kinsale Capital Group, Inc. | 12,910 | 2,003,761 | ||||||
Palomar Holdings, Inc.** | 32,394 | 2,778,109 | ||||||
| 4,781,870 | ||||||||
Capital Markets — 2.1% | ||||||||
Cohen & Steers, Inc. | 24,901 | 1,694,513 | ||||||
Hamilton Lane, Inc. — A | 16,432 | 1,107,024 | ||||||
PJT Partners, Inc. — A | 32,711 | 1,679,383 | ||||||
| 4,480,920 | ||||||||
Thrifts & Mortgage Finance — 0.7% | ||||||||
NMI Holdings, Inc. — A** | 99,483 | 1,599,687 | ||||||
Commercial Banks — 0.6% | ||||||||
Triumph Bancorp, Inc.** | 54,507 | 1,322,885 | ||||||
Total FINANCIALS | 12,185,362 | |||||||
CONSUMER STAPLES — 2.4% | ||||||||
Personal Products — 1.0% | ||||||||
elf Beauty, Inc.** | 120,076 | 2,289,849 | ||||||
Food Products — 0.9% | ||||||||
Freshpet, Inc.** | 22,251 | 1,861,519 | ||||||
Beverages — 0.5% | ||||||||
The Boston Beer Co., Inc. — A** | 2,049 | 1,099,596 | ||||||
Total CONSUMER STAPLES | 5,250,964 | |||||||
MATERIALS — 2.3% | ||||||||
Chemicals — 1.4% | ||||||||
Ingevity Corp.** | 38,561 | 2,027,152 | ||||||
The Scotts Miracle-Gro Co. | 7,218 | 970,604 | ||||||
| 2,997,756 | ||||||||
Metals & Mining — 0.9% | ||||||||
Cleveland-Cliffs, Inc. | 197,367 | 1,089,466 | ||||||
Kirkland Lake Gold, Ltd. | 22,678 | 935,241 | ||||||
| 2,024,707 | ||||||||
Total MATERIALS | 5,022,463 | |||||||
COMMUNICATION SERVICES — 1.9% | ||||||||
Interactive Media & Services — 0.9% | ||||||||
EverQuote, Inc. — A** | 32,029 | 1,862,807 | ||||||
Entertainment — 0.6% | ||||||||
Roku, Inc.** | 11,875 | 1,383,794 | ||||||
Media — 0.4% | ||||||||
Cardlytics, Inc.** | 12,477 | 873,140 | ||||||
Total COMMUNICATION SERVICES | 4,119,741 | |||||||
Notes to Financial Statements are an integral part of this Schedule.
23
Driehaus Small Cap Growth Fund |
Number of | Value | |||||||
REAL ESTATE — 1.1% | ||||||||
Real Estate Management & Development — 1.1% | ||||||||
Redfin Corp.** | 59,602 | $ | 2,497,920 | |||||
Total REAL ESTATE | 2,497,920 | |||||||
Total EQUITY SECURITIES | ||||||||
(Cost $155,073,416) | 219,036,048 | |||||||
| ||||||||
TOTAL INVESTMENTS | ||||||||
(COST $155,073,416) | 99.9 | % | $ | 219,036,048 | ||||
Other Assets In Excess Of Liabilities | 0.1 | % | 254,989 | |||||
Net Assets | 100.0 | % | $ | 219,291,037 | ||||
** | Non-income producing security |
ADR — American Depository Receipt
SP ADR — Sponsored American Depository Receipt
Top Ten Holdings* | |
BRP, Inc. | 2.2% |
Tandem Diabetes Care, Inc. | 1.9% |
Everbridge, Inc. | 1.8% |
SpringWorks Therapeutics, Inc. | 1.7% |
Natera, Inc. | 1.6% |
Five9, Inc. | 1.6% |
Cytokinetics, Inc. | 1.6% |
RingCentral, Inc. — A | 1.6% |
MyoKardia, Inc. | 1.5% |
Endava PLC — SP ADR | 1.5% |
* | All percentages are stated as a percent of net assets at June 30, 2020. |
Notes to Financial Statements are an integral part of this Schedule.
24
Driehaus Small Cap Growth Fund |
Industry | Percent of |
Aerospace & Defense | 1.7% |
Auto Components | 1.2% |
Automobiles | 0.9% |
Beverages | 0.5% |
Biotechnology | 17.8% |
Building Products | 2.3% |
Capital Markets | 2.1% |
Chemicals | 1.4% |
Commercial Banks | 0.6% |
Commercial Services & Supplies | 0.5% |
Diversified Consumer Services | 0.8% |
Electrical Equipment | 2.8% |
Electronic Equipment, Instruments & Components | 0.4% |
Entertainment | 0.6% |
Food Products | 0.9% |
Health Care Equipment & Supplies | 4.1% |
Health Care Providers & Services | 0.4% |
Health Care Technology | 2.9% |
Hotels, Restaurants & Leisure | 3.9% |
Household Durables | 1.9% |
Information Technology Services | 6.5% |
Industry | Percent of |
Insurance | 2.2% |
Interactive Media & Services | 0.9% |
Internet & Catalog Retail | 1.1% |
Leisure Equipment & Products | 2.8% |
Life Sciences Tools & Services | 2.1% |
Machinery | 3.9% |
Media | 0.4% |
Metals & Mining | 0.9% |
Multiline Retail | 0.9% |
Personal Products | 1.0% |
Pharmaceuticals | 3.1% |
Professional Services | 1.9% |
Real Estate Management & Development | 1.1% |
Road & Rail | 0.7% |
Semiconductors & Semiconductor Equipment | 5.8% |
Software | 9.8% |
Specialty Retail | 3.7% |
Textiles, Apparel & Luxury Goods | 2.2% |
Thrifts & Mortgage Finance | 0.7% |
Trading Companies & Distributors | 0.5% |
Other Assets in Excess of Liabilities | 0.1% |
TOTAL | 100.0% |
Notes to Financial Statements are an integral part of this Schedule.
25
The performance summarized below is historical and does not represent future results. Investment returns and principal value vary, and you may have a gain or loss when you sell shares. Performance data presented measures the change in the value of an investment in the Fund, assuming reinvestment of all dividends and capital gains. Average annual total return reflects annualized change.
The table does not reflect the deduction of taxes that a shareholder would pay on Fund distributions or the redemption of Fund shares. The graph compares the results of a $10,000 investment (minimum investment) in the Fund since May 1, 2020 (the date of the Fund’s inception), with all dividends and capital gains reinvested, with the indicated index (and dividends reinvested) for the same period.
Cumulative Total Returns as of 6/30/20 | Since Inception (5/1/20 - 6/30/20) |
Driehaus Small/Mid Cap Growth Fund (DSMDX)1 | 21.80% |
Russell 2000® Growth Index2 | 18.11% |
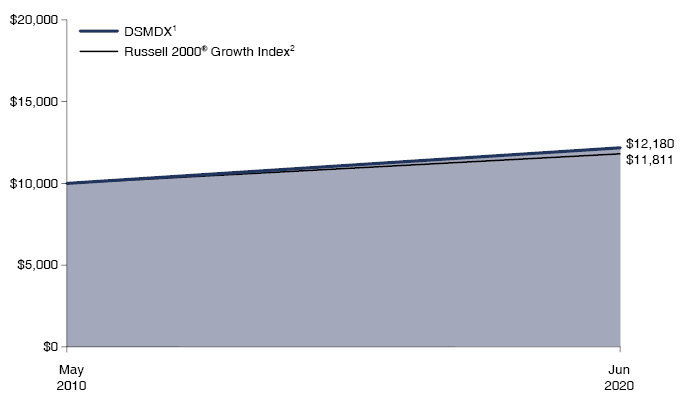
1 | The returns for the period reflect fee waivers and/or reimbursements without which performance would have been lower. |
2 | The Russell 2000® Growth Index measures the performance of those Russell 2000® companies with higher price-to-book ratios and higher forecasted growth values. The performance data includes reinvested dividends. The Russell 2000® Index measures the performance of the 2,000 smallest companies in the Russell 3000® Index. |
26
Driehaus Small/Mid Cap Growth Fund |
Number of | Value | |||||||
EQUITY SECURITIES — 98.5% | ||||||||
INFORMATION TECHNOLOGY — 26.4% | ||||||||
Software — 14.6% | ||||||||
Alteryx, Inc. — A** | 262 | $ | 43,041 | |||||
Coupa Software, Inc.** | 66 | 18,285 | ||||||
Datadog, Inc. — A** | 232 | 20,172 | ||||||
DocuSign, Inc.** | 275 | 47,358 | ||||||
Elastic NV** | 227 | 20,932 | ||||||
Everbridge, Inc.** | 306 | 42,338 | ||||||
Five9, Inc.** | 369 | 40,837 | ||||||
Paycom Software, Inc.** | 66 | 20,442 | ||||||
RingCentral, Inc. — A** | 205 | 58,427 | ||||||
The Trade Desk, Inc. — A** | 44 | 17,886 | ||||||
Zscaler, Inc.** | 307 | 33,616 | ||||||
| 363,334 | ||||||||
Semiconductors & Semiconductor Equipment — 6.6% | ||||||||
Cirrus Logic, Inc.** | 108 | 6,672 | ||||||
Inphi Corp.** | 357 | 41,948 | ||||||
Lattice Semiconductor Corp.** | 684 | 19,419 | ||||||
MKS Instruments, Inc. | 164 | 18,571 | ||||||
Monolithic Power Systems, Inc. | 55 | 13,035 | ||||||
Power Integrations, Inc. | 118 | 13,939 | ||||||
Synaptics, Inc.** | 187 | 11,242 | ||||||
Teradyne, Inc. | 477 | 40,311 | ||||||
| 165,137 | ||||||||
Information Technology Services — 4.7% | ||||||||
Endava PLC — SP ADR** | 337 | 16,277 | ||||||
EPAM Systems, Inc.** | 106 | 26,713 | ||||||
KBR, Inc. | 1,489 | 33,577 | ||||||
MongoDB, Inc.** | 179 | 40,515 | ||||||
| 117,082 | ||||||||
Electronic Equipment, Instruments & Components — 0.5% | ||||||||
FLIR Systems, Inc. | 319 | 12,942 | ||||||
Total INFORMATION TECHNOLOGY | 658,495 | |||||||
HEALTH CARE — 25.5% | ||||||||
Biotechnology — 12.4% | ||||||||
Alnylam Pharmaceuticals, Inc.** | 190 | 28,141 | ||||||
Argenx SE — ADR** | 152 | 34,235 | ||||||
Ascendis Pharma AS — ADR** | 275 | 40,672 | ||||||
Blueprint Medicines Corp.** | 172 | 13,416 | ||||||
Dicerna Pharmaceuticals, Inc.** | 452 | 11,481 | ||||||
Exact Sciences Corp.** | 108 | 9,390 | ||||||
Global Blood Therapeutics, Inc.** | 260 | 16,414 | ||||||
Invitae Corp.** | 1,061 | 32,138 | ||||||
Kodiak Sciences, Inc.** | 174 | 9,417 | ||||||
Moderna, Inc.** | 201 | 12,906 | ||||||
Neurocrine Biosciences, Inc.** | 156 | 19,032 | ||||||
Sarepta Therapeutics, Inc.** | 250 | 40,085 | ||||||
Seattle Genetics, Inc.** | 163 | 27,697 | ||||||
Number of | Value | |||||||
SpringWorks Therapeutics, Inc.** | 309 | $ | 12,978 | |||||
| 308,002 | ||||||||
Health Care Equipment & Supplies — 6.1% | ||||||||
AtriCure, Inc.** | 224 | 10,069 | ||||||
DexCom, Inc.** | 93 | 37,702 | ||||||
Insulet Corp.** | 130 | 25,254 | ||||||
Intuitive Surgical, Inc.** | 37 | 21,084 | ||||||
Penumbra, Inc.** | 52 | 9,299 | ||||||
Tandem Diabetes Care, Inc.** | 479 | 47,383 | ||||||
| 150,791 | ||||||||
Pharmaceuticals — 2.6% | ||||||||
Axsome Therapeutics, Inc.** | 112 | 9,215 | ||||||
Horizon Therapeutics PLC** | 255 | 14,173 | ||||||
MyoKardia, Inc.** | 423 | 40,870 | ||||||
| 64,258 | ||||||||
Health Care Technology — 2.4% | ||||||||
Livongo Health, Inc.** | 370 | 27,820 | ||||||
Teladoc Health, Inc.** | 165 | 31,489 | ||||||
| 59,309 | ||||||||
Life Sciences Tools & Services — 1.6% | ||||||||
10X Genomics, Inc. — A** | 220 | 19,648 | ||||||
Medpace Holdings, Inc.** | 91 | 8,465 | ||||||
Repligen Corp.** | 103 | 12,732 | ||||||
| 40,845 | ||||||||
Health Care Providers & Services — 0.4% | ||||||||
Guardant Health, Inc.** | 140 | 11,358 | ||||||
Total HEALTH CARE | 634,563 | |||||||
CONSUMER DISCRETIONARY — 20.7% | ||||||||
Hotels, Restaurants & Leisure — 4.5% | ||||||||
Chipotle Mexican Grill, Inc.** | 25 | 26,309 | ||||||
Churchill Downs, Inc. | 163 | 21,703 | ||||||
Eldorado Resorts, Inc.** | 575 | 23,035 | ||||||
Planet Fitness, Inc. — A** | 143 | 8,662 | ||||||
Texas Roadhouse, Inc. | 421 | 22,132 | ||||||
Vail Resorts, Inc. | 60 | 10,929 | ||||||
| 112,770 | ||||||||
Specialty Retail — 4.3% | ||||||||
Burlington Stores, Inc.** | 53 | 10,437 | ||||||
Carvana Co.** | 315 | 37,863 | ||||||
Floor & Decor Holdings, Inc. — A** | 247 | �� | 14,240 | |||||
Lithia Motors, Inc. — A | 214 | 32,385 | ||||||
National Vision Holdings, Inc.** | 373 | 11,384 | ||||||
| 106,309 | ||||||||
Leisure Equipment & Products — 3.9% | ||||||||
BRP, Inc. | 1,317 | 56,078 | ||||||
Brunswick Corp. | 196 | 12,546 | ||||||
Peloton Interactive, Inc. — A** | 474 | 27,383 | ||||||
| 96,007 | ||||||||
Notes to Financial Statements are an integral part of this Schedule.
27
Driehaus Small/Mid Cap Growth Fund |
Number of | Value | |||||||
Textiles, Apparel & Luxury Goods — 2.3% | ||||||||
Crocs, Inc.** | 621 | $ | 22,865 | |||||
Deckers Outdoor Corp.** | 84 | 16,497 | ||||||
Lululemon Athletica, Inc.** | 60 | 18,721 | ||||||
| 58,083 | ||||||||
Internet & Catalog Retail — 1.9% | ||||||||
Chewy, Inc. — A** | 499 | 22,300 | ||||||
Wayfair, Inc. — A** | 126 | 24,899 | ||||||
| 47,199 | ||||||||
Auto Components — 1.2% | ||||||||
Fox Factory Holding Corp.** | 150 | 12,392 | ||||||
Gentex Corp. | 714 | 18,400 | ||||||
| 30,792 | ||||||||
Diversified Consumer Services — 0.8% | ||||||||
Chegg, Inc.** | 302 | 20,313 | ||||||
Multiline Retail — 0.8% | ||||||||
Ollie’s Bargain Outlet Holdings, Inc.** | 204 | 19,921 | ||||||
Distributors — 0.5% | ||||||||
Pool Corp. | 47 | 12,778 | ||||||
Household Durables — 0.5% | ||||||||
DR Horton, Inc. | 212 | 11,755 | ||||||
Total CONSUMER DISCRETIONARY | 515,927 | |||||||
INDUSTRIALS — 13.4% | ||||||||
Professional Services — 3.1% | ||||||||
Clarivate PLC** | 1,617 | 36,108 | ||||||
CoreLogic, Inc. | 236 | 15,864 | ||||||
CoStar Group, Inc.** | 17 | 12,081 | ||||||
FTI Consulting, Inc.** | 113 | 12,944 | ||||||
| 76,997 | ||||||||
Machinery — 2.2% | ||||||||
Colfax Corp.** | 374 | 10,435 | ||||||
Nordson Corp. | 159 | 30,164 | ||||||
The Toro Co. | 203 | 13,467 | ||||||
| 54,066 | ||||||||
Electrical Equipment — 2.1% | ||||||||
Generac Holdings, Inc.** | 211 | 25,727 | ||||||
Vicor Corp.** | 385 | 27,701 | ||||||
| 53,428 | ||||||||
Building Products — 2.1% | ||||||||
Carrier Global Corp. | 645 | 14,332 | ||||||
Fortune Brands Home & Security, Inc. | 305 | 19,499 | ||||||
The AZEK Co., Inc.** | 43 | 1,370 | ||||||
Trex Co., Inc.** | 134 | 17,429 | ||||||
| 52,630 | ||||||||
Aerospace & Defense — 1.8% | ||||||||
Axon Enterprise, Inc.** | 258 | 25,318 | ||||||
Mercury Systems, Inc.** | 261 | 20,530 | ||||||
| 45,848 | ||||||||
Number of | Value | |||||||
Road & Rail — 1.4% | ||||||||
Kansas City Southern | 67 | $ | 10,002 | |||||
Old Dominion Freight Line, Inc. | 141 | 23,912 | ||||||
| 33,914 | ||||||||
Trading Companies & Distributors — 0.7% | ||||||||
United Rentals, Inc.** | 112 | 16,692 | ||||||
Total INDUSTRIALS | 333,575 | |||||||
FINANCIALS — 5.0% | ||||||||
Capital Markets — 2.9% | ||||||||
Cohen & Steers, Inc. | 238 | 16,196 | ||||||
Hamilton Lane, Inc. — A | 193 | 13,002 | ||||||
MarketAxess Holdings, Inc. | 41 | 20,538 | ||||||
MSCI, Inc. | 70 | 23,367 | ||||||
| 73,103 | ||||||||
Insurance — 1.7% | ||||||||
Kinsale Capital Group, Inc. | 154 | 23,902 | ||||||
RenaissanceRe Holdings, Ltd. | 104 | 17,787 | ||||||
| 41,689 | ||||||||
Commercial Banks — 0.4% | ||||||||
Western Alliance Bancorp | 224 | 8,483 | ||||||
Total FINANCIALS | 123,275 | |||||||
MATERIALS — 4.0% | ||||||||
Chemicals — 3.5% | ||||||||
FMC Corp. | 477 | 47,519 | ||||||
Ingevity Corp.** | 446 | 23,446 | ||||||
The Scotts Miracle-Gro Co. | 122 | 16,405 | ||||||
| 87,370 | ||||||||
Metals & Mining — 0.5% | ||||||||
Kirkland Lake Gold, Ltd. | 268 | 11,052 | ||||||
Total MATERIALS | 98,422 | |||||||
COMMUNICATION SERVICES — 2.4% | ||||||||
Interactive Media & Services — 1.3% | ||||||||
Snap, Inc. — A** | 1,421 | 33,379 | ||||||
Entertainment — 1.1% | ||||||||
Roku, Inc.** | 224 | 26,103 | ||||||
Total COMMUNICATION SERVICES | 59,482 | |||||||
CONSUMER STAPLES — 0.7% | ||||||||
Food Products — 0.7% | ||||||||
Beyond Meat, Inc.** | 138 | 18,489 | ||||||
Total CONSUMER STAPLES | 18,489 | |||||||
Notes to Financial Statements are an integral part of this Schedule.
28
Driehaus Small/Mid Cap Growth Fund |
Number of | Value | |||||||
REAL ESTATE — 0.4% | ||||||||
Real Estate Investment Trust — 0.4% | ||||||||
QTS Realty Trust, Inc. — A | 171 | $ | 10,959 | |||||
Total REAL ESTATE | 10,959 | |||||||
Total EQUITY SECURITIES | ||||||||
(Cost $2,236,311) | 2,453,187 | |||||||
| ||||||||
TOTAL INVESTMENTS | ||||||||
(COST $2,236,311) | 98.5 | % | $ | 2,453,187 | ||||
Other Assets In Excess Of Liabilities | 1.5 | % | 36,439 | |||||
Net Assets | 100.0 | % | $ | 2,489,626 | ||||
** | Non-income producing security |
ADR — American Depository Receipt
SP ADR — Sponsored American Depository Receipt
Top Ten Holdings* | |
RingCentral, Inc. — A | 2.3% |
BRP, Inc. | 2.3% |
FMC Corp. | 1.9% |
Tandem Diabetes Care, Inc. | 1.9% |
DocuSign, Inc. | 1.9% |
Alteryx, Inc. — A | 1.7% |
Everbridge, Inc. | 1.7% |
Inphi Corp. | 1.7% |
MyoKardia, Inc. | 1.6% |
Five9, Inc. | 1.6% |
* | All percentages are stated as a percent of net assets at June 30, 2020. |
Notes to Financial Statements are an integral part of this Schedule.
29
Driehaus Small/Mid Cap Growth Fund |
Industry | Percent of |
Aerospace & Defense | 1.8% |
Auto Components | 1.2% |
Biotechnology | 12.4% |
Building Products | 2.1% |
Capital Markets | 2.9% |
Chemicals | 3.5% |
Commercial Banks | 0.4% |
Distributors | 0.5% |
Diversified Consumer Services | 0.8% |
Electrical Equipment | 2.1% |
Electronic Equipment, Instruments & Components | 0.5% |
Entertainment | 1.1% |
Food Products | 0.7% |
Health Care Equipment & Supplies | 6.1% |
Health Care Providers & Services | 0.4% |
Health Care Technology | 2.4% |
Hotels, Restaurants & Leisure | 4.5% |
Household Durables | 0.5% |
Information Technology Services | 4.7% |
Industry | Percent of |
Insurance | 1.7% |
Interactive Media & Services | 1.3% |
Internet & Catalog Retail | 1.9% |
Leisure Equipment & Products | 3.9% |
Life Sciences Tools & Services | 1.6% |
Machinery | 2.2% |
Metal & Mining | 0.5% |
Multiline Retail | 0.8% |
Pharmaceuticals | 2.6% |
Professional Services | 3.1% |
Real Estate Investment Trust | 0.4% |
Road & Rail | 1.4% |
Semiconductors & Semiconductor Equipment | 6.6% |
Software | 14.6% |
Specialty Retail | 4.3% |
Textiles, Apparel & Luxury Goods | 2.3% |
Trading Companies & Distributors | 0.7% |
Other Assets in Excess of Liabilities | 1.5% |
TOTAL | 100.0% |
Notes to Financial Statements are an integral part of this Schedule.
30
[This page intentionally left blank]
Driehaus | Driehaus | |||||||
ASSETS: | ||||||||
Investments, at cost | $ | 1,191,567,412 | $ | 44,047,053 | ||||
Investments, at fair value | $ | 1,640,954,243 | $ | 55,687,642 | ||||
Foreign currency, at fair value* | 9,427,992 | 64,510 | ||||||
Cash and cash equivalents | 86,325,505 | 1,822,513 | ||||||
Receivables: | ||||||||
Dividends | 2,637,966 | 168,607 | ||||||
Investment securities sold | 25,323,625 | 1,425,503 | ||||||
Fund shares sold | 1,093,427 | 9,607 | ||||||
Foreign taxes | 1,201,740 | 858,787 | ||||||
Due from affiliates | — | — | ||||||
Prepaid expenses | 146,048 | 17,876 | ||||||
TOTAL ASSETS | 1,767,110,546 | 60,055,045 | ||||||
LIABILITIES: | ||||||||
Payables: | ||||||||
Investment securities purchased | 27,150,057 | 761,264 | ||||||
Fund shares redeemed | 2,771,849 | 24,044 | ||||||
Net unrealized depreciation on unsettled foreign currency transactions | 2,751 | — | ||||||
Due to affiliates | 1,749,709 | 30,827 | ||||||
Audit and tax fees | 19,896 | 31,389 | ||||||
Accrued expenses | 383,330 | 107,303 | ||||||
TOTAL LIABILITIES | 32,077,592 | 954,827 | ||||||
NET ASSETS | $ | 1,735,032,954 | $ | 59,100,218 | ||||
NET ASSETS CONSISTED OF THE FOLLOWING AT JUNE 30, 2020: | ||||||||
Paid-in capital | $ | 1,362,183,925 | $ | 93,903,752 | ||||
Total distributable earnings (deficit) | 372,849,029 | (34,803,534 | ) | |||||
NET ASSETS | $ | 1,735,032,954 | $ | 59,100,218 | ||||
NET ASSETS | — | $ | 59,100,218 | |||||
SHARES OUTSTANDING (Unlimited shares authorized, no par value) | — | 4,003,895 | ||||||
NET ASSET VALUE | — | $ | 14.76 | |||||
INVESTOR CLASS SHARES: | ||||||||
NET ASSETS | $ | 774,507,096 | — | |||||
SHARES OUTSTANDING (Unlimited shares authorized, no par value) | 20,296,275 | — | ||||||
NET ASSET VALUE | $ | 38.16 | — | |||||
INSTITUTIONAL CLASS SHARES: | ||||||||
NET ASSETS | $ | 960,525,858 | — | |||||
SHARES OUTSTANDING (Unlimited shares authorized, no par value) | 25,168,915 | — | ||||||
NET ASSET VALUE | $ | 38.16 | — | |||||
* | The cost of foreign currency was $9,423,747, $64,536, $38,862, $0, $0 and $0, respectively. |
Notes to Financial Statements are an integral part of this Statement.
32
Statements of Assets and Liabilities |
Driehaus | Driehaus | Driehaus | Driehaus | ||||||||||||
| $ | 198,343,146 | $ | 154,808,166 | $ | 155,073,416 | $ | 2,236,311 | ||||||||
| $ | 237,592,439 | $ | 253,876,984 | $ | 219,036,048 | $ | 2,453,187 | ||||||||
| 39,169 | — | — | — | ||||||||||||
| 4,501,343 | 1,024,629 | 328,761 | 15,031 | ||||||||||||
| 736,013 | 12,789 | 24,642 | 635 | ||||||||||||
| 1,002,110 | 2,152,239 | 1,767,171 | 24,230 | ||||||||||||
| 3,240 | 244 | 190,946 | — | ||||||||||||
| — | — | — | — | ||||||||||||
| — | — | — | 9,968 | ||||||||||||
| 4,583 | 41,745 | 70,133 | 20,735 | ||||||||||||
| 243,878,897 | 257,108,630 | 221,417,701 | 2,523,786 | ||||||||||||
| 813,240 | 2,760,357 | 1,440,573 | 18,389 | ||||||||||||
| 80,201 | 561,896 | 553,320 | — | ||||||||||||
| — | — | — | — | ||||||||||||
| 195,523 | 253,352 | 98,290 | — | ||||||||||||
| 8,711 | 25,170 | 24,423 | 8,168 | ||||||||||||
| 42,059 | 27,310 | 10,058 | 7,603 | ||||||||||||
| 1,139,734 | 3,628,085 | 2,126,664 | 34,160 | ||||||||||||
| $ | 242,739,163 | $ | 253,480,545 | $ | 219,291,037 | $ | 2,489,626 | ||||||||
| $ | 202,069,590 | $ | 147,047,031 | $ | 158,959,143 | $ | 2,282,388 | ||||||||
| 40,669,573 | 106,433,514 | 60,331,894 | 207,238 | ||||||||||||
| $ | 242,739,163 | $ | 253,480,545 | $ | 219,291,037 | $ | 2,489,626 | ||||||||
| $ | 242,739,163 | $ | 253,480,545 | — | $ | 2,489,626 | |||||||||
| 24,245,219 | 16,644,030 | — | 204,365 | ||||||||||||
| $ | 10.01 | $ | 15.23 | — | $ | 12.18 | |||||||||
| — | — | $ | 12,414,127 | — | |||||||||||
| — | — | 733,818 | — | ||||||||||||
| — | — | $ | 16.92 | — | |||||||||||
| — | — | $ | 206,876,910 | — | |||||||||||
| — | — | 12,126,527 | — | ||||||||||||
| — | — | $ | 17.06 | — | |||||||||||
Notes to Financial Statements are an integral part of this Statement.
33
Driehaus | Driehaus | |||||||
INVESTMENT INCOME (LOSS): | ||||||||
Income: | ||||||||
Dividends* | $ | 10,474,916 | $ | 392,228 | ||||
Total income | 10,474,916 | 392,228 | ||||||
Expenses: | ||||||||
Investment advisory fee | 8,400,622 | 322,913 | ||||||
Administration fee | 435,312 | 59,846 | ||||||
Professional fees | 272,575 | 7,981 | ||||||
Audit and tax fees | 36,519 | 47,915 | ||||||
Federal and state registration fees | 19,255 | 12,357 | ||||||
Custodian fees | 186,057 | 15,228 | ||||||
Transfer agent fees | 173,620 | 23,337 | ||||||
Trustees’ fees | 282,713 | 4,784 | ||||||
Chief compliance officer fees | 9,945 | 9,945 | ||||||
Reports to shareholders | 68,180 | 3,769 | ||||||
Interest expense | — | — | ||||||
Shareholder services fees (Investor Class) | 1,023,492 | — | ||||||
Miscellaneous | 151,436 | 6,447 | ||||||
Total expenses | 11,059,726 | 514,522 | ||||||
Investment advisory fees recoupment (reimbursement) | — | (107,370 | ) | |||||
Administration fees waived | — | — | ||||||
Transfer agent fees waived | — | — | ||||||
Fees paid indirectly | (88,547 | ) | (3,110 | ) | ||||
Net expenses | 10,971,179 | 404,042 | ||||||
Net investment income (loss) | (496,263 | ) | (11,814 | ) | ||||
NET REALIZED AND UNREALIZED GAIN (LOSS) ON INVESTMENT TRANSACTIONS: | ||||||||
Net realized gain (loss) from security transactions** | (71,514,466 | ) | (817,414 | ) | ||||
Net realized foreign exchange gain (loss) | (1,096,834 | ) | (121,016 | ) | ||||
Net change in unrealized foreign exchange gain (loss) | (95,867 | ) | (54,206 | ) | ||||
Net change in unrealized appreciation (depreciation) on investments | 1,514,071 | 1,581,100 | ||||||
Net realized and unrealized gain (loss) on investment transactions | (71,193,096 | ) | 588,464 | |||||
NET INCREASE (DECREASE) IN NET ASSETS RESULTING FROM OPERATIONS | $ | (71,689,359 | ) | $ | 576,650 | |||
* | Dividends are net of $1,303,743, $34,444, $185,854, $0, $425 and $6 non-reclaimable foreign taxes withheld, respectively. |
** | Net realized gain (loss) from security transactions are net of $(359,148), $0, $0, $0, $0 and $0 foreign capital gains tax withheld, respectively. |
*** | Fund commenced operations on May 1, 2020. |
Notes to Financial Statements are an integral part of this Statement.
34
Statements of Operations |
Driehaus | Driehaus | Driehaus | Driehaus | ||||||||||||
| $ | 1,633,071 | $ | 183,471 | $ | 173,593 | $ | 992 | ||||||||
| 1,633,071 | 183,471 | 173,593 | 992 | ||||||||||||
| 1,157,352 | 1,455,514 | 532,169 | 1,307 | ||||||||||||
| 124,563 | 112,709 | 93,917 | 9,474 | ||||||||||||
| 24,454 | 24,099 | 16,993 | 107 | ||||||||||||
| 28,483 | 23,867 | 23,120 | 8,167 | ||||||||||||
| 16,574 | 24,138 | 15,467 | 3,178 | ||||||||||||
| 19,564 | 18,353 | 16,954 | 262 | ||||||||||||
| 22,681 | 23,538 | 31,411 | 5,692 | ||||||||||||
| 25,569 | 24,925 | 13,219 | 215 | ||||||||||||
| 9,945 | 9,945 | 9,944 | 2,641 | ||||||||||||
| 4,680 | 5,802 | 5,026 | 108 | ||||||||||||
| — | 307 | — | — | ||||||||||||
| — | — | 12,130 | — | ||||||||||||
| 23,406 | 25,481 | 17,240 | 175 | ||||||||||||
| 1,457,271 | 1,748,678 | 787,590 | 31,326 | ||||||||||||
| — | — | (4,267 | ) | (21,304 | ) | ||||||||||
| — | — | — | (2,338 | ) | |||||||||||
| — | — | — | (5,613 | ) | |||||||||||
| (6,772 | ) | (37,498 | ) | (20,144 | ) | — | |||||||||
| 1,450,499 | 1,711,180 | 763,179 | 2,071 | ||||||||||||
| 182,572 | (1,527,709 | ) | (589,586 | ) | (1,079 | ) | |||||||||
| (9,433,882 | ) | 5,485,022 | (4,210,705 | ) | (8,559 | ) | |||||||||
| (25,164 | ) | — | — | — | |||||||||||
| (2,296 | ) | — | — | — | |||||||||||
| (4,668,453 | ) | 23,990,541 | 30,446,521 | 216,876 | |||||||||||
| (14,129,795 | ) | 29,475,563 | 26,235,816 | 208,317 | |||||||||||
| $ | (13,947,223 | ) | $ | 27,947,854 | $ | 25,646,230 | $ | 207,238 | |||||||
Notes to Financial Statements are an integral part of this Statement.
35
Driehaus | Driehaus | |||||||||||||||
For the | For the year | For the | For the year | |||||||||||||
INCREASE (DECREASE) IN NET ASSETS: | ||||||||||||||||
Operations: | ||||||||||||||||
Net investment income (loss) | $ | (496,263 | ) | $ | 15,788,913 | $ | (11,814 | ) | $ | 344,582 | ||||||
Net realized gain (loss) on investment transactions | (72,611,300 | ) | 71,686,094 | (938,430 | ) | 9,961,191 | ||||||||||
Net change in unrealized gain (loss) on investment transactions | 1,418,204 | 281,848,637 | 1,526,894 | 10,273,967 | ||||||||||||
Net increase (decrease) in net assets resulting from operations | (71,689,359 | ) | 369,323,644 | 576,650 | 20,579,740 | |||||||||||
Distributions from distributable earnings to shareholders: | ||||||||||||||||
Fund | — | — | — | (255,325 | ) | |||||||||||
Investor Class Shares | — | (7,060,076 | ) | — | — | |||||||||||
Institutional Class Shares | — | (9,417,880 | ) | — | — | |||||||||||
Total distributions to shareholders | — | (16,477,956 | ) | — | (255,325 | ) | ||||||||||
Capital share transactions: | ||||||||||||||||
Proceeds from shares sold: | ||||||||||||||||
Fund | — | — | 7,154,817 | 10,428,657 | ||||||||||||
Investor Class Shares | 68,547,435 | 102,153,849 | — | — | ||||||||||||
Institutional Class Shares | 176,293,755 | 247,854,903 | — | — | ||||||||||||
Reinvestment of distributions: | ||||||||||||||||
Fund | — | — | — | 209,523 | ||||||||||||
Investor Class Shares | — | 6,761,528 | — | — | ||||||||||||
Institutional Class Shares | — | 6,842,565 | — | — | ||||||||||||
Cost of shares redeemed: | ||||||||||||||||
Fund | — | — | (11,041,355 | ) | (58,228,599 | ) | ||||||||||
Investor Class Shares | (123,416,786 | ) | (215,941,727 | ) | — | — | ||||||||||
Institutional Class Shares | (106,514,633 | ) | (154,953,413 | ) | — | — | ||||||||||
Redemption fees: | ||||||||||||||||
Fund | — | — | 2,660 | 20,320 | ||||||||||||
Investor Class Shares | 21,842 | 53,415 | — | — | ||||||||||||
Institutional Class Shares | 25,708 | 46,979 | — | — | ||||||||||||
Net increase (decrease) in net assets derived from capital share transactions | 14,957,321 | (7,181,901 | ) | (3,883,878 | ) | (47,570,099 | ) | |||||||||
Total increase (decrease) in net assets | (56,732,038 | ) | 345,663,787 | (3,307,228 | ) | (27,245,684 | ) | |||||||||
NET ASSETS: | ||||||||||||||||
Beginning of period | $ | 1,791,764,992 | $ | 1,446,101,205 | $ | 62,407,446 | $ | 89,653,130 | ||||||||
End of period | $ | 1,735,032,954 | $ | 1,791,764,992 | $ | 59,100,218 | $ | 62,407,446 | ||||||||
* | Fund commenced operations on May 1, 2020. |
Notes to Financial Statements are an integral part of this Statement.
36
Statements of Changes in Net Assets |
Driehaus | Driehaus Micro | Driehaus Small | Driehaus Small/ | ||||||||||||||||||||||||
For the | For the year | For the | For the year | For the | For the year | For the period | |||||||||||||||||||||
| $ | 182,572 | $ | 1,632,146 | $ | (1,527,709 | ) | $ | (3,317,303 | ) | $ | (589,586 | ) | $ | (1,140,258 | ) | $ | (1,079 | ) | |||||||||
| (9,459,046 | ) | 18,156,966 | 5,485,022 | 50,822,845 | (4,210,705 | ) | 21,736,831 | (8,559 | ) | ||||||||||||||||||
| (4,670,749 | ) | 46,116,055 | 23,990,541 | 21,885,605 | 30,446,521 | 30,538,084 | 216,876 | ||||||||||||||||||||
| (13,947,223 | ) | 65,905,167 | 27,947,854 | 69,391,147 | 25,646,230 | 51,134,657 | 207,238 | ||||||||||||||||||||
| — | (1,976,543 | ) | — | (33,768,834 | ) | — | — | — | |||||||||||||||||||
| — | — | — | — | — | (640,385 | ) | — | ||||||||||||||||||||
| — | — | — | — | — | (9,268,936 | ) | — | ||||||||||||||||||||
| — | (1,976,543 | ) | — | (33,768,834 | ) | — | (9,909,321 | ) | — | ||||||||||||||||||
| 14,816,058 | 44,599,170 | 29,744,625 | 68,729,193 | — | — | 2,282,388 | |||||||||||||||||||||
| — | — | — | — | 3,513,098 | 7,758,179 | — | |||||||||||||||||||||
| — | — | — | — | 52,385,783 | 57,398,808 | — | |||||||||||||||||||||
| — | 1,754,974 | — | 29,366,777 | — | — | — | |||||||||||||||||||||
| — | — | — | — | — | 640,385 | — | |||||||||||||||||||||
| — | — | — | — | — | 9,197,963 | — | |||||||||||||||||||||
| (26,358,863 | ) | (60,484,970 | ) | (73,334,132 | ) | (129,214,201 | ) | — | — | — | |||||||||||||||||
| — | — | — | — | (3,136,558 | ) | (7,175,856 | ) | — | |||||||||||||||||||
| — | — | — | — | (31,842,653 | ) | (67,276,279 | ) | — | |||||||||||||||||||
| 500 | 406 | 2,028 | 9,243 | — | — | — | |||||||||||||||||||||
| — | — | — | — | 279 | 1,112 | — | |||||||||||||||||||||
| — | — | — | — | 4,673 | 17,340 | — | |||||||||||||||||||||
| (11,542,305 | ) | (14,130,420 | ) | (43,587,479 | ) | (31,108,988 | ) | 20,924,622 | 561,652 | 2,282,388 | |||||||||||||||||
| (25,489,528 | ) | 49,798,204 | (15,639,625 | ) | 4,513,325 | 46,570,852 | 41,786,988 | 2,489,626 | |||||||||||||||||||
| $ | 268,228,691 | $ | 218,430,487 | $ | 269,120,170 | $ | 264,606,845 | $ | 172,720,185 | $ | 130,933,197 | $ | — | ||||||||||||||
| $ | 242,739,163 | $ | 268,228,691 | $ | 253,480,545 | $ | 269,120,170 | $ | 219,291,037 | $ | 172,720,185 | $ | 2,489,626 | ||||||||||||||
Notes to Financial Statements are an integral part of this Statement.
37
Driehaus Emerging Markets Growth Fund — Investor Class |
For the six | For the year | For the year | For the year | For the year | For the year | |||||||||||||||||||
Net asset value, beginning of period | $ | 39.53 | $ | 31.80 | $ | 39.64 | $ | 27.98 | $ | 26.52 | $ | 29.63 | ||||||||||||
INCOME (LOSS) FROM INVESTMENT OPERATIONS: | ||||||||||||||||||||||||
Net investment income (loss) | (0.04 | )^ | 0.30 | ^ | 0.26 | ^ | 0.11 | ^ | 0.03 | 0.06 | ||||||||||||||
Net realized and unrealized gain (loss) | (1.33 | ) | 7.76 | (6.73 | ) | 11.78 | 1.54 | (3.17 | ) | |||||||||||||||
Total income (loss) from investment operations | (1.37 | ) | 8.06 | (6.47 | ) | 11.89 | 1.57 | (3.11 | ) | |||||||||||||||
LESS DISTRIBUTIONS: | ||||||||||||||||||||||||
Dividends from net investment income | — | (0.33 | ) | (0.16 | ) | (0.23 | ) | (0.11 | ) | — | ||||||||||||||
Distributions from capital gains | — | — | (1.21 | ) | — | — | — | |||||||||||||||||
Total distributions | — | (0.33 | ) | (1.37 | ) | (0.23 | ) | (0.11 | ) | — | ||||||||||||||
Redemption fees added to paid-in capital | 0.00 | ~ | 0.00 | ~ | 0.00 | ~ | 0.00 | ~ | 0.00 | ~ | 0.00 | ~ | ||||||||||||
Net asset value, end of period | $ | 38.16 | $ | 39.53 | $ | 31.80 | $ | 39.64 | $ | 27.98 | $ | 26.52 | ||||||||||||
Total Return | (3.47 | )%** | 25.34 | % | (16.26 | )% | 42.52 | % | 5.88 | % | (10.49 | )% | ||||||||||||
RATIOS/SUPPLEMENTAL DATA | ||||||||||||||||||||||||
Net assets, end of period (in 000’s) | $ | 774,507 | $ | 863,535 | $ | 791,656 | $ | 1,266,365 | $ | 1,335,873 | $ | 1,362,421 | ||||||||||||
Ratio of expenses before reimbursements, waivers and fees paid indirectly to average net assets | 1.49 | %* | 1.41 | % | 1.38 | % | 1.54 | % | 1.65 | % | 1.65 | % | ||||||||||||
Ratio of net expenses to average net assets | 1.48 | %*# | 1.40 | %# | 1.37 | %# | 1.53 | %# | 1.63 | %# | 1.64 | %# | ||||||||||||
Ratio of net investment income (loss) to average net assets | (0.20 | )%*# | 0.85 | %# | 0.69 | %# | 0.33 | %# | 0.11 | %# | 0.22 | %# | ||||||||||||
Portfolio turnover | 116 | %** | 167 | % | 218 | % | 176 | % | 232 | % | 257 | % | ||||||||||||
* | Annualized |
** | Not Annualized |
^ | Net investment income (loss) per share has been calculated using the average shares method. |
~ | Amount represents less than $0.01 per share |
# | Such ratios are net of fees paid indirectly (see Note B in the Notes to Financial Statements). |
Notes to Financial Statements are an integral part of this Schedule.
38
Driehaus Emerging Markets Growth Fund —Institutional Class |
For the six | For the year | For the year | For the period | |||||||||||||
Net asset value, beginning of period | $ | 39.48 | $ | 31.76 | $ | 39.61 | $ | 34.85 | ||||||||
INCOME (LOSS) FROM INVESTMENT OPERATIONS: | ||||||||||||||||
Net investment income (loss) | 0.01 | 0.38 | ^ | 0.32 | 0.12 | ^ | ||||||||||
Net realized and unrealized gain (loss) | (1.33 | ) | 7.75 | (6.71 | ) | 4.92 | ||||||||||
Total income (loss) from investment operations | (1.32 | ) | 8.13 | (6.39 | ) | 5.04 | ||||||||||
LESS DISTRIBUTIONS: | ||||||||||||||||
Dividends from net investment income | — | (0.41 | ) | (0.25 | ) | (0.28 | ) | |||||||||
Distributions from capital gains | — | — | (1.21 | ) | — | |||||||||||
Total distributions | — | (0.41 | ) | (1.46 | ) | (0.28 | ) | |||||||||
Redemption fees added to paid-in capital | 0.00 | ~ | 0.00 | ~ | 0.00 | ~ | 0.00 | ~ | ||||||||
Net asset value, end of period | $ | 38.16 | $ | 39.48 | $ | 31.76 | $ | 39.61 | ||||||||
Total Return | (3.32 | )%** | 25.60 | % | (16.08 | )% | 14.47 | %** | ||||||||
RATIOS/SUPPLEMENTAL DATA | ||||||||||||||||
Net assets, end of period (in 000’s) | $ | 960,526 | $ | 928,230 | $ | 654,445 | $ | 513,135 | ||||||||
Ratio of expenses before reimbursements, waivers and fees paid indirectly to average net assets | 1.22 | %* | 1.20 | % | 1.17 | % | 1.17 | %* | ||||||||
Ratio of net expenses to average net assets | 1.21 | %*# | 1.19 | %# | 1.16 | %# | 1.16 | %*# | ||||||||
Ratio of net investment income (loss) to average net assets | 0.06 | %*# | 1.07 | %# | 0.89 | %# | 0.71 | %*# | ||||||||
Portfolio turnover | 116 | %** | 167 | % | 218 | % | 176 | %** | ||||||||
* | Annualized |
** | Not Annualized |
^ | Net investment income (loss) per share has been calculated using the average shares method. |
~ | Amount represents less than $0.01 per share |
# | Such ratios are net of fees paid indirectly (see Note B in the Notes to Financial Statements). |
Notes to Financial Statements are an integral part of this Schedule.
39
Driehaus Emerging Markets Small Cap Growth Fund |
For the six | For the year | For the year | For the year | For the year | For the year | |||||||||||||||||||
Net asset value, beginning of period | $ | 14.38 | $ | 10.80 | $ | 14.21 | $ | 10.66 | $ | 11.85 | $ | 13.21 | ||||||||||||
INCOME (LOSS) FROM INVESTMENT OPERATIONS: | ||||||||||||||||||||||||
Net investment income (loss) | 0.00 | ~ | 0.06 | (0.04 | )^ | 0.02 | ^ | (0.03 | )^ | (0.05 | )^ | |||||||||||||
Net realized and unrealized gain (loss) | 0.38 | 3.58 | (3.37 | ) | 3.53 | (1.14 | ) | (1.31 | ) | |||||||||||||||
Total income (loss) from investment operations | 0.38 | 3.64 | (3.41 | ) | 3.55 | (1.17 | ) | (1.36 | ) | |||||||||||||||
LESS DISTRIBUTIONS: | ||||||||||||||||||||||||
Dividends from net investment income | — | (0.06 | ) | — | — | (0.02 | ) | — | ||||||||||||||||
Distributions from capital gains | — | — | — | — | — | — | ||||||||||||||||||
Total distributions | — | (0.06 | ) | — | — | (0.02 | ) | — | ||||||||||||||||
Redemption fees added to paid-in capital | 0.00 | ~ | 0.00 | ~ | 0.00 | ~ | 0.00 | ~ | 0.00 | ~ | 0.00 | ~ | ||||||||||||
Net asset value, end of period | $ | 14.76 | $ | 14.38 | $ | 10.80 | $ | 14.21 | $ | 10.66 | $ | 11.85 | ||||||||||||
Total Return | 2.64 | %** | 33.71 | % | (24.00 | )% | 33.30 | % | (9.97 | )% | (10.22 | )% | ||||||||||||
RATIOS/SUPPLEMENTAL DATA | ||||||||||||||||||||||||
Net assets, end of period (in 000’s) | $ | 59,100 | $ | 62,407 | $ | 89,653 | $ | 271,146 | $ | 261,387 | $ | 432,718 | ||||||||||||
Ratio of expenses before reimbursements, waivers and fees paid indirectly and recoupments, if any, to average net assets | 1.83 | %* | 1.80 | %∞ | 2.27 | %∞ | 1.82 | % | 1.75 | % | 1.69 | %∞ | ||||||||||||
Ratio of net expenses to average net assets | 1.44 | %*+# | 1.45 | %+#∞ | 2.26 | %#∞ | 1.80 | %# | 1.73 | %# | 1.68 | %#∞ | ||||||||||||
Ratio of net investment income (loss) to average net assets | (0.04 | )%*+# | 0.52 | %+# | (0.30 | )%# | 0.15 | %# | (0.26 | )%# | (0.39 | )%# | ||||||||||||
Portfolio turnover | 133 | %** | 220 | % | 207 | % | 243 | % | 240 | % | 306 | % | ||||||||||||
* | Annualized |
** | Not Annualized |
^ | Net investment income (loss) per share has been calculated using the average shares method. |
~ | Amount represents less than $0.01 per share |
+ | Such ratios are after administrative and transfer agent waivers and adviser expense reimbursements, when applicable. BNY Mellon Investment Servicing (US) Inc., the administrative agent and transfer agent, waived a portion of its fees beginning with the Fund’s commencement of operations, August 22, 2011. The Adviser contractually agreed to waive its investment advisory fee or absorb other operating expenses to the extent necessary to ensure that total annual Fund operating expenses (other than interest, taxes, brokerage commissions and other portfolio transaction expenses, capital expenditures, and extraordinary expenses) would not exceed the Fund’s operating expense cap of 1.45% of average daily net assets from November 1, 2018 until October 31, 2021. |
# | Such ratios are net of fees paid indirectly (see Note B in the Notes to Financial Statements). |
∞ | Ratio of expenses to average net assets includes interest expense of 0.01% for the year ended December 31, 2019, and less than 0.005% for the years ended December 31, 2018 and 2015. The interest expense is from utilizing the line of credit (see Note E in the Notes to Financial Statements). |
Notes to Financial Statements are an integral part of this Schedule.
40
Driehaus International Small Cap Growth Fund |
For the six | For the year | For the year | For the year | For the year | For the year | |||||||||||||||||||
Net asset value, beginning of period | $ | 10.52 | $ | 8.13 | $ | 11.39 | $ | 9.33 | $ | 10.08 | $ | 9.20 | ||||||||||||
INCOME (LOSS) FROM INVESTMENT OPERATIONS: | ||||||||||||||||||||||||
Net investment income (loss) | 0.01 | 0.06 | (0.02 | )^ | (0.04 | ) | (0.02 | ) | (0.02 | )^ | ||||||||||||||
Net realized and unrealized gain (loss) | (0.52 | ) | 2.41 | (1.92 | ) | 3.88 | (0.61 | ) | 1.17 | |||||||||||||||
Total income (loss) from investment operations | (0.51 | ) | 2.47 | (1.94 | ) | 3.84 | (0.63 | ) | 1.15 | |||||||||||||||
LESS DISTRIBUTIONS: | ||||||||||||||||||||||||
Dividends from net investment income | — | (0.01 | ) | — | — | — | (0.03 | ) | ||||||||||||||||
Distributions from capital gains | — | (0.07 | ) | (1.32 | ) | (1.78 | ) | (0.12 | ) | (0.24 | ) | |||||||||||||
Total distributions | — | (0.08 | ) | (1.32 | ) | (1.78 | ) | (0.12 | ) | (0.27 | ) | |||||||||||||
Redemption fees added to paid-in capital | 0.00 | ~ | 0.00 | ~ | 0.00 | ~ | 0.00 | ~ | 0.00 | ~ | 0.00 | ~ | ||||||||||||
Net asset value, end of period | $ | 10.01 | $ | 10.52 | $ | 8.13 | $ | 11.39 | $ | 9.33 | $ | 10.08 | ||||||||||||
Total Return | (4.85 | )%** | 30.41 | % | (16.92 | )% | 41.44 | % | (6.22 | )% | 12.58 | % | ||||||||||||
RATIOS/SUPPLEMENTAL DATA | ||||||||||||||||||||||||
Net assets, end of period (in 000’s) | $ | 242,739 | $ | 268,229 | $ | 218,430 | $ | 325,361 | $ | 270,401 | $ | 341,249 | ||||||||||||
Ratio of expenses before reimbursements, waivers and fees paid indirectly to average net assets | 1.26 | %* | 1.24 | % | 1.50 | % | 1.73 | % | 1.72 | % | 1.71 | % | ||||||||||||
Ratio of net expenses to average net assets | 1.25 | %*# | 1.24 | %# | 1.49 | %# | 1.71 | %# | 1.70 | %# | 1.70 | %# | ||||||||||||
Ratio of net investment income (loss) to average net assets | 0.16 | %*# | 0.65 | %# | (0.21 | )%# | (0.44 | )%# | (0.15 | )%# | (0.19 | )%# | ||||||||||||
Portfolio turnover | 46 | %** | 96 | % | 118 | % | 143 | % | 151 | % | 251 | % | ||||||||||||
* | Annualized |
** | Not annualized |
^ | Net investment income (loss) per share has been calculated using the average shares method. |
~ | Amount represents less than $0.01 per share |
# | Such ratios are net of fees paid indirectly (see Note B in the Notes to Financial Statements). |
Notes to Financial Statements are an integral part of this Schedule.
41
Driehaus Micro Cap Growth Fund |
For the six | For the year | For the year | For the year | For the year | For the year | |||||||||||||||||||
Net asset value, beginning of period | $ | 12.95 | $ | 11.11 | $ | 14.44 | $ | 12.65 | $ | 10.74 | $ | 11.25 | ||||||||||||
INCOME (LOSS) FROM INVESTMENT OPERATIONS: | ||||||||||||||||||||||||
Net investment income (loss) | (0.09 | ) | (0.16 | ) | (0.19 | ) | (0.18 | )^ | (0.11 | )^ | (0.14 | )^ | ||||||||||||
Net realized and unrealized gain (loss) | 2.37 | 3.90 | 0.55 | 3.26 | 2.02 | 0.08 | ||||||||||||||||||
Total income (loss) from investment operations | 2.28 | 3.74 | 0.36 | 3.08 | 1.91 | (0.06 | ) | |||||||||||||||||
LESS DISTRIBUTIONS: | ||||||||||||||||||||||||
Dividends from net investment income | — | (0.02 | ) | — | — | — | — | |||||||||||||||||
Distributions from capital gains | — | (1.88 | ) | (3.69 | ) | (1.29 | ) | — | (0.45 | ) | ||||||||||||||
Total distributions | — | (1.90 | ) | (3.69 | ) | (1.29 | ) | — | (0.45 | ) | ||||||||||||||
Redemption fees added to paid-in capital | 0.00 | ~ | 0.00 | ~ | 0.00 | ~ | 0.00 | ~ | 0.00 | ~ | 0.00 | ~ | ||||||||||||
Net asset value, end of period | $ | 15.23 | $ | 12.95 | $ | 11.11 | $ | 14.44 | $ | 12.65 | $ | 10.74 | ||||||||||||
Total Return | 17.53 | %** | 33.89 | % | 3.88 | % | 24.30 | % | 17.78 | % | (0.55 | )% | ||||||||||||
RATIOS/SUPPLEMENTAL DATA | ||||||||||||||||||||||||
Net assets, end of period (in 000’s) | $ | 253,481 | $ | 269,120 | $ | 264,607 | $ | 322,533 | $ | 396,590 | $ | 282,178 | ||||||||||||
Ratio of expenses before reimbursements, waivers and fees paid indirectly and recoupments, if any, to average net assets | 1.50 | %* | 1.48 | % | 1.44 | %∞ | 1.45 | %∞ | 1.48 | % | 1.53 | % | ||||||||||||
Ratio of net expenses to average net assets | 1.47 | %*#∞ | 1.43 | %# | 1.42 | %#∞ | 1.43 | %#∞ | 1.44 | %+# | 1.52 | %+# | ||||||||||||
Ratio of net investment income (loss) to average net assets | (1.31 | )%*# | (1.32 | )%# | (1.19 | )%# | (1.33 | )%# | (1.00 | )%+# | (1.21 | )%+# | ||||||||||||
Portfolio turnover | 79 | %** | 165 | % | 156 | % | 177 | % | 180 | % | 183 | % | ||||||||||||
* | Annualized |
** | Not Annualized |
^ | Net investment income (loss) per share has been calculated using the average shares method. |
~ | Amount represents less than $0.01 per share |
+ | Such ratios are after administrative and transfer agent waivers and adviser expense reimbursements, when applicable. BNY Mellon Investment Servicing (US) Inc., the administrative agent and transfer agent, waived a portion of its fees beginning with the Fund’s commencement of operations, November 18, 2013. The Adviser contractually agreed to waive its investment advisory fee or absorb other operating expenses to the extent necessary to ensure that total annual Fund operating expenses (other than interest, taxes, brokerage commissions and other portfolio transaction expenses, capital expenditures, and extraordinary expenses) would not exceed the Fund’s operating expense cap of 1.70% of average daily net assets until November 17, 2016. |
# | Such ratios are net of fees paid indirectly (see Note B in the Notes to Financial Statements). |
∞ | Ratio of expenses to average net assets includes interest expense of less than 0.005% for the six months ended June 30,2020, and the years ended December 31, 2018 and 2017. The interest expense is from utilizing the line of credit (see Note E in the Notes to Financial Statements). |
Notes to Financial Statements are an integral part of this Schedule.
42
Driehaus Small Cap Growth Fund — Investor Class |
For the six | For the year | For the year | For the period | |||||||||||||
Net asset value, beginning of period | $ | 15.37 | $ | 11.66 | $ | 11.62 | $ | 10.00 | ||||||||
INCOME (LOSS) FROM INVESTMENT OPERATIONS: | ||||||||||||||||
Net investment income (loss) | (0.07 | ) | (0.13 | ) | (0.12 | )^ | (0.04 | )^ | ||||||||
Net realized and unrealized gain (loss) | 1.62 | 4.81 | 0.48 | 1.86 | ||||||||||||
Total income (loss) from investment operations | 1.55 | 4.68 | 0.36 | 1.82 | ||||||||||||
LESS DISTRIBUTIONS: | ||||||||||||||||
Dividends from net investment income | — | — | — | — | ||||||||||||
Distributions from capital gains | — | (0.97 | ) | (0.33 | ) | (0.20 | ) | |||||||||
Total distributions | — | (0.97 | ) | (0.33 | ) | (0.20 | ) | |||||||||
Redemption fees added to paid-in capital | 0.00 | ~ | 0.00 | ~ | 0.01 | — | ||||||||||
Net asset value, end of period | $ | 16.92 | $ | 15.37 | $ | 11.66 | $ | 11.62 | ||||||||
Total Return | 10.09 | %** | 40.25 | % | 3.33 | % | 18.18 | %** | ||||||||
RATIOS/SUPPLEMENTAL DATA | ||||||||||||||||
Net assets, end of period (in 000’s) | $ | 12,414 | $ | 10,899 | $ | 7,538 | $ | 1,344 | ||||||||
Ratio of expenses before reimbursements, waivers and fees paid indirectly to average net assets | 1.47 | %* | 1.59 | % | 2.57 | % | 7.86 | %* | ||||||||
Ratio of net expenses to average net assets | 1.18 | %*+# | 1.17 | %+# | 1.18 | %+# | 1.20 | %*+ | ||||||||
Ratio of net investment income (loss) to average net assets | (0.98 | )%*+# | (0.95 | )%+# | (0.87 | )%+# | (0.94 | )%*+ | ||||||||
Portfolio turnover | 89 | %** | 206 | % | 193 | % | 66 | %** | ||||||||
* | Annualized |
** | Not Annualized |
^ | Net investment loss per share has been calculated using the average share method. |
~ | Amount represents less than $0.01 per share |
+ | Such ratios are after administrative and transfer agent waivers and adviser expense reimbursements, when applicable. BNY Mellon Investment Servicing (US) Inc., the administrative agent and transfer agent, waived a portion of its fees beginning with the Fund’s commencement of operations, August 21, 2017. The Adviser contractually agree to waive its investment advisory fee or absorb other operating expenses to the extent necessary to ensure that total annual operating expenses for the Investor Class (other than interest, taxes, brokerage commissions and other portfolio transaction expenses, capital expenditures, and extraordinary expenses) would not exceed the Investor Class’s operating expense cap of 1.20% of average daily net assets until August 20, 2021. |
# | Such ratios are net of fees paid indirectly (see Note B in the Notes to Financial Statements). |
Notes to Financial Statements are an integral part of this Schedule.
43
Driehaus Small Cap Growth Fund — Institutional Class |
For the six | For the year | For the year | For the period | |||||||||||||
Net asset value, beginning of period | $ | 15.47 | $ | 11.70 | $ | 11.63 | $ | 10.00 | ||||||||
INCOME (LOSS) FROM INVESTMENT OPERATIONS: | ||||||||||||||||
Net investment income (loss) | (0.04 | ) | (0.10 | ) | (0.08 | )^ | (0.03 | )^ | ||||||||
Net realized and unrealized gain (loss) | 1.63 | 4.84 | 0.47 | 1.86 | ||||||||||||
Total income (loss) from investment operations | 1.59 | 4.74 | 0.39 | 1.83 | ||||||||||||
LESS DISTRIBUTIONS: | ||||||||||||||||
Dividends from net investment income | — | — | — | — | ||||||||||||
Distributions from capital gains | — | (0.97 | ) | (0.33 | ) | (0.20 | ) | |||||||||
Total distributions | — | (0.97 | ) | (0.33 | ) | (0.20 | ) | |||||||||
Redemption fees added to paid-in capital | 0.00 | ~ | 0.00 | ~ | 0.01 | — | ||||||||||
Net asset value, end of period | $ | 17.06 | $ | 15.47 | $ | 11.70 | $ | 11.63 | ||||||||
Total Return | 10.28 | %** | 40.62 | % | 3.59 | % | 18.28 | %** | ||||||||
RATIOS/SUPPLEMENTAL DATA | ||||||||||||||||
Net assets, end of period (in 000’s) | $ | 206,877 | $ | 161,821 | $ | 123,395 | $ | 38,631 | ||||||||
Ratio of expenses before reimbursements, waivers and fees paid indirectly and recoupments, if any, to average net assets | 0.85 | %* | 0.89 | % | 1.04 | % | 1.48 | %* | ||||||||
Ratio of net expenses to average net assets | 0.84 | %*+# | 0.92 | %+# | 0.93 | %+# | 0.95 | %*+ | ||||||||
Ratio of net investment income (loss) to average net assets | (0.65 | )%*+# | (0.70 | )%+# | (0.62 | )%+# | (0.69 | )%*+ | ||||||||
Portfolio turnover | 89 | %** | 206 | % | 193 | % | 66 | %** | ||||||||
* | Annualized |
** | Not Annualized |
^ | Net investment loss per share has been calculated using the average share method. |
~ | Amount represents less than $0.01 per share |
+ | Such ratios are after administrative and transfer agent waivers and adviser expense reimbursements, when applicable. BNY Mellon Investment Servicing (US) Inc., the administrative agent and transfer agent, waived a portion of its fees beginning with the Fund’s commencement of operations, August 21, 2017. The Adviser contractually agreed to waive its investment advisory fee or absorb other operating expenses to the extent necessary to ensure that total annual operating expenses for the Institutional Class (other than interest, taxes, brokerage commissions and other portfolio transaction expenses, capital expenditures, and extraordinary expenses) would not exceed the Institutional Class’s operating expense cap of 0.95% of average daily net assets until August 20, 2021. |
# | Such ratios are net of fees paid indirectly (see Note B in the Notes to Financial Statements). |
Notes to Financial Statements are an integral part of this Schedule.
44
Driehaus Small/Mid Cap Growth Fund |
For the period | ||||
Net asset value, beginning of period | $ | 10.00 | ||
INCOME (LOSS) FROM INVESTMENT OPERATIONS: | ||||
Net investment income (loss) | (0.01 | ) | ||
Net realized and unrealized gain (loss) | 2.19 | |||
Total income (loss) from investment operations | 2.18 | |||
LESS DISTRIBUTIONS: | ||||
Dividends from net investment income | — | |||
Distributions from capital gains | — | |||
Total distributions | — | |||
Net asset value, end of period | $ | 12.18 | ||
Total Return | 21.80 | %** | ||
RATIOS/SUPPLEMENTAL DATA | ||||
Net assets, end of period (in 000’s) | $ | 2,490 | ||
Ratio of expenses before reimbursements and waivers to average net assets | 14.37 | %* | ||
Ratio of net expenses to average net assets | 0.95 | %*+ | ||
Ratio of net investment income (loss) to average net assets | (0.50 | )%*+ | ||
Portfolio turnover | 26 | %** | ||
* | Annualized |
** | Not Annualized |
+ | Such ratios are after administrative and transfer agent waivers and adviser expense reimbursements, when applicable. BNY Mellon Investment Servicing (US) Inc., the administrative agent and transfer agent, waived a portion of its fees beginning with the Fund’s commencement of operations, May 1, 2020. The Adviser contractually agreed to waive its investment advisory fee or absorb other operating expenses to the extent necessary to ensure that total annual Fund operating expenses (other than interest, taxes, brokerage commissions and other portfolio transaction expenses, capital expenditures, and extraordinary expenses) would not exceed the Fund’s operating expense cap of 0.95% of average daily net assets until May 1, 2023. |
Notes to Financial Statements are an integral part of this Schedule.
45
Driehaus Mutual Funds |
A. SUMMARY OF SIGNIFICANT ACCOUNTING POLICIES
Organization
The Driehaus Mutual Funds (the “Trust”) is an open-end registered management investment company under the Investment Company Act of 1940, as amended, organized as a Delaware statutory trust, with nine separate series currently in operation. The Trust was organized under an Agreement and Declaration of Trust dated May 31, 1996, as subsequently amended and restated as of June 6, 2013, and amended as of June 4, 2015, and may issue an unlimited number of full and fractional units of beneficial interest (shares) without par value. The six series (“Funds” or each a “Fund”) included in this report are as follows:
Fund | Commencement of Operations |
Driehaus Emerging Markets Growth Fund* | 12/31/97 |
Driehaus Emerging Markets Small Cap Growth Fund | 08/22/11 |
Driehaus International Small Cap Growth Fund | 09/17/07 |
Driehaus Micro Cap Growth Fund* | 11/18/13 |
Driehaus Small Cap Growth Fund | 08/21/17 |
Driehaus Small/Mid Cap Growth Fund | 05/01/20 |
* | The Driehaus Emerging Markets Growth Fund and the Driehaus Micro Cap Growth Fund closed to new investors on February 28, 2020 and September 29, 2017, respectively. |
The Driehaus Emerging Markets Growth Fund and Driehaus Small Cap Growth Fund each has two classes of shares, designated as Institutional Class and Investor Class. Each class of shares represents an interest in the same portfolio of investments of the respective Fund and voting privileges with respect to the Fund in general. Each class of shares has exclusive voting rights with respect to any matters involving only that class. The classes of each Fund pay pro rata the costs of management of that Fund’s portfolio, including the management fee. Each class of a Fund bears the cost of its own transfer agency and shareholder servicing arrangements, and any other class-specific expenses, which will result in differing expenses by class.
The investment objective of each Fund is to maximize capital appreciation.
Driehaus Emerging Markets Growth Fund seeks to achieve its objective by investing primarily in equity securities of emerging markets companies.
Driehaus Emerging Markets Small Cap Growth Fund seeks to achieve its objective by investing primarily in equity securities of small capitalization emerging markets companies.
Driehaus International Small Cap Growth Fund seeks to achieve its objective by investing primarily in equity securities of smaller capitalization non-U.S. companies exhibiting strong growth characteristics.
Driehaus Micro Cap Growth Fund seeks to achieve its objective by investing primarily in equity securities of micro capitalization U.S. companies exhibiting strong growth characteristics.
Driehaus Small Cap Growth Fund seeks to achieve its objective by investing primarily in equity securities of U.S. small capitalization companies.
Driehaus Small/Mid Cap Growth Fund seeks to achieve its objective by investing primarily in equity securities of U.S. small/medium capitalization companies.
The Funds, which are investment companies within the scope of Financial Accounting Standards Board (“FASB”) Accounting Standards Update 2013-08, follow accounting and reporting guidance under FASB Accounting Standards Codification Topic 946, Financial Services-Investment Companies.
Cash is held at U.S. financial institutions, and at times, may exceed the amount insured by the U.S. Federal Deposit Insurance Corporation. The Funds consider highly liquid investments, with maturities of ninety days or less when purchased to be cash equivalents, and such investments may include money market mutual fund investments. All such investments are categorized in Level 1 of the fair value hierarchy.
46
Driehaus Mutual Funds |
Securities Valuation and Transactions
Equity securities and exchange-traded options are valued at the last sale price as of the close of the primary exchange or other designated time. Equity certificates are valued at the last sale price of the underlying security as of the close of the primary exchange. Investments initially valued in currencies other than the U.S. dollar are converted to the U.S. dollar using exchange rates obtained from an independent pricing service. In addition, if quotations are not readily available, if the values have been materially affected by events occurring after the closing of a foreign market, or if there has been a movement in the U.S. market that exceeds a certain threshold, assets may be valued at fair value as determined in good faith by or under the direction of the Trust’s Board of Trustees (the “Board”). Events that may materially affect asset values that could cause a fair value determination include, but are not limited to: corporate announcements relating to a specific security; natural and other disasters which may impact an entire market or region; and political and other events which may be global or impact a particular country or region. The frequency with which these procedures are used cannot be predicted and may be utilized to a significant extent. To the extent utilized, securities would be considered level 2 or Level 3 in the hierarchy described below.
Each Fund is subject to fair value accounting standards that define fair value, establish the framework for measuring fair value and provide a three-level hierarchy for fair valuation based upon the inputs to the valuation as of the measurement date. The three levels of the fair value hierarchy are as follows:
Level 1 — quoted prices in active markets for identical securities
Level 2 — significant observable inputs (including quoted prices for similar securities, interest rates, prepayment speeds, credit risk, etc.)
Level 3 — significant unobservable inputs (including the Funds’ own assumptions in determining the fair value of investments)
The inputs or methodology used for valuing securities are not necessarily an indication of the risk associated with investing in those securities.
The summary of the Funds’ investments that are measured at fair value by level within the fair value hierarchy as of June 30, 2020 is as follows:
Fund | Total | Level 1 | Level 2 | Level 3 | ||||||||||||
Driehaus Emerging Markets Growth Fund | ||||||||||||||||
Equity Securities: | ||||||||||||||||
Africa | $ | 19,330,156 | $ | — | $ | 19,330,156 | $ | — | ||||||||
Europe | 130,408,876 | 47,669,668 | 82,739,208 | — | ||||||||||||
Far East | 1,284,647,683 | 350,032,370 | 934,615,313 | — | ||||||||||||
North America | 92,215,008 | 92,215,008 | — | — | ||||||||||||
South America | 114,352,520 | 114,352,520 | — | — | ||||||||||||
Total Investments | $ | 1,640,954,243 | $ | 604,269,566 | $ | 1,036,684,677 | $ | — | ||||||||
Driehaus Emerging Markets Small Cap Growth Fund | ||||||||||||||||
Equity Securities: | ||||||||||||||||
Africa | $ | 768,301 | $ | — | $ | 768,301 | $ | — | ||||||||
Europe | 4,828,448 | 558,924 | 4,269,524 | — | ||||||||||||
Far East | 44,570,406 | 580,642 | 43,989,764 | 0 | ||||||||||||
Middle East | 391,330 | — | 391,330 | — | ||||||||||||
North America | 2,391,192 | 2,391,192 | — | — | ||||||||||||
South America | 2,737,965 | 2,737,965 | — | — | ||||||||||||
Total Investments | $ | 55,687,642 | $ | 6,268,723 | $ | 49,418,919 | $ | 0 | ||||||||
47
Driehaus Mutual Funds |
Fund | Total | Level 1 | Level 2 | Level 3 | ||||||||||||
Driehaus International Small Cap Growth Fund | ||||||||||||||||
Equity Securities: | ||||||||||||||||
Africa | $ | 840,133 | $ | — | $ | 840,133 | $ | — | ||||||||
Europe | 152,249,410 | 6,388,750 | 145,860,660 | — | ||||||||||||
Far East | 61,234,766 | — | 61,234,766 | — | ||||||||||||
Middle East | 8,173,612 | 5,133,133 | 3,040,479 | — | ||||||||||||
North America | 13,694,096 | 13,694,096 | — | — | ||||||||||||
South America | 1,400,422 | 1,400,422 | — | — | ||||||||||||
Total Investments | $ | 237,592,439 | $ | 26,616,401 | $ | 210,976,038 | $ | — | ||||||||
Driehaus Micro Cap Growth Fund | ||||||||||||||||
Investments in Securities* | $ | 253,876,984 | $ | 253,876,984 | $ | — | $ | — | ||||||||
Driehaus Small Cap Growth Fund | ||||||||||||||||
Investments in Securities* | $ | 219,036,048 | $ | 219,036,048 | $ | — | $ | — | ||||||||
Driehaus Small/Mid Cap Growth Fund | ||||||||||||||||
Investments in Securities* | $ | 2,453,187 | $ | 2,453,187 | $ | — | $ | — | ||||||||
* | See Schedule of Investments for industry breakout. |
At June 30, 2020, the Driehaus Emerging Markets Small Cap Growth Fund held a Level 3 investment in Aarti Surfactants, Ltd. The shares were received as part of a spin-off in mid-September 2019 but have not yet commenced trading and were valued at $0.
The Funds used observable inputs in their valuation methodologies whenever they were available and deemed reliable.
When fair value pricing is employed, the prices of securities used by a Fund to calculate its net asset value may differ from closing prices for the same securities, which means that a Fund may value those securities higher or lower than another fund that does not employ fair value. In addition, the fair value price may differ materially from the value a Fund may ultimately realize.
Securities transactions are accounted for on trade date. The cost of investments sold is determined by the use of the specific identification method for both financial reporting and income tax purposes. Interest income is recorded on an accrual basis. Dividend income, net of non-reclaimable foreign taxes withheld, is recorded on the ex-dividend date or as soon as the information is available. Income and expenses are accrued daily. The Funds’ investment income, expenses (other than class-specific expenses) and unrealized and realized gains and losses are allocated daily to each class of shares based upon the relative proportion of net assets of each class at the beginning of the day.
Forward Foreign Currency Contracts
The Funds may use forward foreign currency contracts to hedge foreign currency exposure in the portfolio. A forward foreign currency contract involves an obligation to purchase or sell a specific currency at a future date, which may be any fixed number of days from the date of the contract agreed upon by the parties, at a price set at the time of the contract. These contracts are principally traded in the inter-bank market conducted directly between currency traders (usually large commercial banks) and their customers.
The fair value of a forward foreign currency contract fluctuates with changes in currency exchange rates. Outstanding forward foreign currency contracts are valued daily at current market rates and the resulting change in fair value is recorded as net change in unrealized appreciation or depreciation on the Statements of Operations. When a forward foreign currency contract is settled, the Funds record a realized gain or loss equal to the difference between the value
48
Driehaus Mutual Funds |
at the time the forward foreign currency contract was opened and the value at the time it was settled. A forward foreign currency contract may involve market risk in excess of the unrealized gain or loss reflected on the Statements of Assets and Liabilities. In addition, the Funds could be exposed to credit risk if the counterparties are unable or unwilling to meet the terms of the contracts or market risk if the value of the foreign currency changes unfavorably. As of June 30, 2020, the Funds had no outstanding forward foreign currency contracts.
Foreign Currency Spot Contracts
The Funds enter into foreign currency spot contracts to facilitate transactions in foreign currency denominated securities. These spot contracts are typically open for 2 to 5 days, depending on the settlement terms of the underlying security transaction. On June 30, 2020, the Funds had foreign currency spot contracts outstanding under which they are obligated to exchange currencies at specified future dates. The net unrealized appreciation or depreciation on spot contracts is reflected as Net unrealized appreciation or depreciation on unsettled foreign currency transactions in the Statements of Assets and Liabilities.
Equity Certificates
The Funds may invest in equity certificates, which allow the Funds to participate in the appreciation (depreciation) of the underlying security without actually owning the underlying security. These derivative instruments are purchased pursuant to an agreement with a financial institution and are valued at a calculated market price based on the value of the underlying security in accordance with the agreement. These equity certificates are subject to the credit risk of the issuing financial institution. There is no off-balance sheet risk associated with equity certificates and the Funds’ potential loss is limited to the purchase price of the securities. The Funds are exposed to credit risk associated with the counterparty to the transaction, which is monitored by the Funds’ management on a periodic basis. A Fund’s equity certificates are not subject to any master netting agreement.
Federal Income Taxes
No provision is made for Federal income taxes since each Fund has elected to be taxed as a “regulated investment company” under Subchapter M of the Internal Revenue Code (the “Code”) and has made and declared all the required distributions to its shareholders in amounts sufficient to relieve each Fund from all or substantially all Federal income and excise taxes under provisions of current Federal tax law.
Each Fund is subject to accounting standards that establish a minimum threshold for recognizing, and a system for measuring, the benefits of a tax position taken or expected to be taken in a tax return. Taxable years ending 2019, 2018, 2017 and 2016 remain open to Federal and state audit. As of June 30, 2020, management has evaluated the application of these standards to each Fund, and has determined that no provision for income tax is required in each Fund’s financial statements for uncertain tax provisions. The Funds recognize interest and penalties, if any, related to unrecognized tax benefits as income tax expense in the Statements of Operations. During the year, the Funds did not incur any interest or penalties. The Funds may be subject to foreign taxes on income, gains on investments or currency repatriation, a portion of which may be recoverable. Foreign taxes are provided for based on the Funds’ understanding of the tax rules and regulations that exist in the foreign markets in which they invest.
The amount of dividends and distributions from net investment income and net realized capital gains are determined in accordance with Federal income tax regulations, which may differ from United States Generally Accepted Accounting Principles (“U.S. GAAP”).
For the year ended December 31, 2019, reclassifications were recorded to distributable earnings (deficit) and paid -in capital for any permanent tax differences. These reclassifications relate primarily to foreign currency losses, sales of passive foreign investment companies (“PFIC”), net operating losses and foreign capital gain taxes paid. Results of operations and net assets were not affected by these reclassifications.
Driehaus | Driehaus | Driehaus | Driehaus | Driehaus | ||||||||||||||||
Distributable earnings (deficit) | $ | — | $ | — | $ | — | $ | 1,817,658 | $ | 1,106,394 | ||||||||||
Paid-in capital | — | — | — | (1,817,658 | ) | (1,106,394 | ) | |||||||||||||
49
Driehaus Mutual Funds |
Accumulated capital losses represent net capital loss carryovers that may be available for an unlimited period to offset future realized capital gains and thereby reduce future capital gains distributions. Capital loss carryover retains the character of the original loss. The following table shows the amounts of capital loss carryover, if any, by each of the applicable Funds as of December 31, 2019:
Unlimited Period of Net Capital Loss Carryover | ||||||||||||
Fund | Short-Term | Long- Term | Accumulated | |||||||||
Driehaus Emerging Markets Small Cap Growth Fund | $ | 45,337,455 | $ | — | $ | 45,337,455 | ||||||
During the year ended December 31, 2019, Driehaus Emerging Markets Small Cap Growth Fund utilized $9,103,909 of capital loss carryforwards.
Pursuant to Federal income tax rules applicable to regulated investment companies, the Funds may elect to treat certain capital losses between November 1 and December 31 as occurring on the first day of the following tax year. For the year ended December 31, 2019, the following qualified late-year losses were deferred and recognized on January 1, 2020:
Fund | Late-Year | Total Capital | Total | |||||||||
Driehaus Emerging Markets Growth Fund | $ | 187,752 | $ | — | $ | 187,752 | ||||||
Driehaus Emerging Markets Small Cap Growth Fund | — | — | — | |||||||||
Driehaus International Small Cap Growth Fund | — | — | — | |||||||||
Driehaus Micro Cap Growth Fund | — | — | — | |||||||||
Driehaus Small Cap Growth Fund | — | — | — | |||||||||
Distributions to Shareholders
The Funds had no distributions during the six months ended June 30, 2020.
The tax character of distributions paid during the fiscal year ended December 31, 2019 was as follows:
Distributions paid from: | Driehaus | Driehaus | Driehaus | Driehaus | Driehaus | |||||||||||||||
Ordinary income | $ | 15,701,188 | $ | 255,325 | $ | 343,991 | $ | — | $ | — | ||||||||||
Net long-term capital gain | 776,768 | — | 1,632,552 | 33,768,834 | 9,909,321 | |||||||||||||||
Total distributions paid | $ | 16,477,956 | $ | 255,325 | $ | 1,976,543 | $ | 33,768,834 | $ | 9,909,321 | ||||||||||
The tax character of distributions paid during the fiscal year ended December 31, 2018 was as follows:
Distributions paid from: | Driehaus | Driehaus | Driehaus | Driehaus | Driehaus | |||||||||||||||
Ordinary income | $ | 8,970,853 | $ | — | $ | 5,657,722 | $ | 22,348,104 | $ | 1,454,358 | ||||||||||
Net long-term capital gain | 53,973,948 | — | 25,166,722 | 50,514,284 | 2,139,592 | |||||||||||||||
Total distributions paid | $ | 62,944,801 | $ | — | $ | 30,824,444 | $ | 72,862,388 | $ | 3,593,950 | ||||||||||
50
Driehaus Mutual Funds |
As of December 31, 2019, the components of net assets on a tax basis were as follows:
Driehaus | Driehaus | Driehaus | Driehaus | Driehaus | ||||||||||||||||
Undistributed ordinary income | $ | — | $ | 246,959 | $ | 1,663,136 | $ | — | $ | — | ||||||||||
Undistributed long-term capital gain | 7,126,649 | — | 9,929,217 | 5,257,541 | 2,747,088 | |||||||||||||||
Accumulated earnings | $ | 7,126,649 | $ | 246,959 | $ | 11,592,353 | $ | 5,257,541 | $ | 2,747,088 | ||||||||||
Paid-in capital | 1,347,226,604 | 97,787,630 | 213,611,895 | 190,634,510 | 138,034,521 | |||||||||||||||
Accumulated capital and other losses | (187,752 | ) | (45,337,455 | ) | — | — | — | |||||||||||||
Unrealized appreciation (depreciation) on foreign currency | 31,152 | (32,620 | ) | 1,409 | — | — | ||||||||||||||
Unrealized appreciation on Investments | 437,568,339 | 9,742,932 | 43,023,034 | 73,228,119 | 31,934,101 | |||||||||||||||
Other temporary differences. | — | — | — | — | 4,475 | |||||||||||||||
Net assets | $ | 1,791,764,992 | $ | 62,407,446 | $ | 268,228,691 | $ | 269,120,170 | $ | 172,720,185 | ||||||||||
The differences between book-basis and tax-basis unrealized appreciation are attributable primarily to the tax deferral of losses on wash sales and PFIC mark-to-market.
The aggregate cost of investments and the composition of unrealized appreciation and depreciation on investments and net unrealized appreciation and/or depreciation on derivatives for Federal income tax purposes as of June 30, 2020, were as follows:
Fund | Basis | Gross | Gross | Net | ||||||||||||
Driehaus Emerging Markets Growth Fund | $ | 1,201,871,833 | $ | 457,088,875 | $ | (18,006,465 | ) | $ | 439,082,410 | |||||||
Driehaus Emerging Markets Small Cap Growth Fund | $ | 44,363,610 | $ | 12,336,911 | $ | (1,012,879 | ) | $ | 11,324,032 | |||||||
Driehaus International Small Cap Growth Fund | $ | 199,237,858 | $ | 50,793,248 | $ | (12,438,667 | ) | $ | 38,354,581 | |||||||
Driehaus Micro Cap Growth Fund | $ | 156,658,324 | $ | 101,346,802 | $ | (4,128,142 | ) | $ | 97,218,660 | |||||||
Driehaus Small Cap Growth Fund | $ | 156,655,426 | $ | 65,649,714 | $ | (3,269,092 | ) | $ | 62,380,622 | |||||||
Driehaus Small/Mid Cap Growth Fund | $ | 2,236,311 | $ | 233,965 | $ | (17,089 | ) | $ | 216,876 | |||||||
Foreign Currency Translation
Foreign currency and equity securities not denominated in U.S. dollars are translated into U.S. dollar values based upon the current rates of exchange on the date of the Funds’ valuations.
Net realized foreign exchange gains or losses which are reported by the Funds result from currency gains and losses on transaction hedges arising from changes in exchange rates between the trade and settlement dates on spot contracts underlying securities transactions and the difference between the amounts accrued for dividends, interest, and foreign taxes and the amounts actually received or paid in U.S. dollars for these items. Net unrealized foreign exchange gains and losses result from changes in the U.S. dollar value of assets and liabilities (other than investments in securities), which are denominated in foreign currencies, as a result of changes in exchange rates.
The Funds do not isolate that portion of the results of operations which results from fluctuations in foreign exchange rates on investments. These fluctuations are included with the net realized gain (loss) from security transactions and the net change in unrealized appreciation (depreciation) of investments.
Use of Estimates
The preparation of financial statements, in conformity with U.S. GAAP, requires management to make estimates and assumptions that affect the reported amount of assets and liabilities and disclosure of contingent assets and liabilities at the date of the financial statements and the reported amounts of net increases or decreases in net assets from operations during the reporting period. Actual results could differ from those estimates.
51
Driehaus Mutual Funds |
Indemnifications
Under the Trust’s organizational documents, the officers and Trustees are indemnified against certain liabilities arising out of the performance of their duties to the Trust. In addition, in the normal course of business, the Trust enters into contracts that provide general indemnifications to other parties. The Funds’ maximum exposure under these agreements is unknown as this would involve future claims that may be made against the Funds that have not yet occurred. However, the Funds have not had prior claims or losses pursuant to these contracts and expect the risk of loss to be remote.
B. INVESTMENT ADVISORY FEES, TRANSACTIONS WITH AFFILIATES, AND ADMINISTRATIVE FEES
Richard H. Driehaus is Chairman of Driehaus Capital Management LLC (“DCM” or the “Adviser”), a registered investment adviser, and was Chairman of Driehaus Securities LLC (“DS LLC”), an entity that was registered as a broker-dealer and served as the distributor of the Funds through December 31, 2019. As of June 30, 2020, employees of the Adviser held a controlling interest in the Driehaus Small/Mid Cap Growth Fund, and Richard H. Driehaus together with certain employees of the Adviser held substantial, non-controlling interests in certain other Funds.
DCM serves as the Funds’ investment adviser. In return for its services to the Funds, DCM receives monthly fees. Driehaus Micro Cap Growth Fund pays the Adviser a monthly fee computed and accrued daily at an annual rate of 1.25% of the Fund’s average daily net assets. Driehaus Small Cap Growth Fund and Driehaus Small/Mid Cap Growth Fund pay the Adviser a monthly fee computed and accrued daily at an annual rate of 0.60% of the Fund’s average daily net assets. Driehaus Emerging Markets Small Cap Growth Fund pays the Adviser a monthly fee computed and accrued daily at the annual rate of 1.15% of the Fund’s average daily net assets. Driehaus International Small Cap Growth Fund pays the Adviser a monthly fee computed and accrued daily at an annual rate of 1.00% of the Fund’s average daily net assets. Driehaus Emerging Markets Growth Fund pays the Adviser a monthly fee computed and accrued daily at an annual rate of 1.05% on the first $1.5 billion and 0.75% in excess of $1.5 billion of the Fund’s average daily net assets.
DCM entered into a contractual agreement to cap Driehaus Small/Mid Cap Growth Fund’s annual operating expenses (other than interest, taxes, brokerage commissions, dividends and interest on short sales and other portfolio transaction expenses and extraordinary expenses such as litigation and other expenses not incurred in the ordinary course of the Fund’s business) at 0.95% of average daily net assets until May 1, 2023. For a period of three years subsequent to the Fund’s commencement of operations on May 1, 2020, DCM is entitled to recoupment of previously waived fees and reimbursed expenses to the extent that the expense ratio remains below the operating expense cap in place at the time of the waiver and the current operating expense cap for a period not to exceed three years from the date on which the waiver or reimbursement was made. For the six months ended June 30, 2020, DCM waived fees for Driehaus Small/Mid Cap Growth Fund totaling $21,304 under this agreement.
DCM entered into a contractual agreement to cap Driehaus Emerging Markets Small Cap Growth Fund’s annual operating expenses (other than interest, taxes, brokerage commissions, dividends and interest on short sales and other portfolio transaction expenses and extraordinary expenses such as litigation and other expenses not incurred in the ordinary course of the Fund’s business) at 1.45% of average daily net assets until October 31, 2021. DCM is entitled to recoupment for previously waived fees and reimbursed expenses to the extent that the Fund’s expense ratio remains below the operating expense cap in place at the time of the waiver and the current operating expense cap for a period not to exceed three years from the date on which the waiver or reimbursement was made. For the six months ended June 30, 2020, DCM waived fees for Driehaus Emerging Markets Small Cap Growth Fund totaling $107,370 under this agreement.
DCM has entered into a contractual agreement to cap Driehaus Small Cap Growth Fund’s annual operating expenses (other than interest, taxes, brokerage commissions, dividends and interest on short sales and other portfolio transaction expenses and extraordinary expenses such as litigation and other expenses not incurred in the ordinary course of the Fund’s business) at 1.20% of average daily net assets for the Investor Class and 0.95% of average daily net assets for the Institutional Class until April 30, 2021. DCM is entitled to recoupment for previously waived fees and reimbursed expenses to the extent that the Fund’s expense ratio remains below the operating expense cap in place at the time of the waiver and the current operating expense cap for a period not to exceed three years from the date on which the waiver or reimbursement was made. For the six months ended June 30, 2020, DCM waived fees for the Investor Class shares of the Driehaus Small Cap Growth Fund totaling $13,771 and recouped fees for the Institutional Class shares of the Driehaus Small Cap Growth Fund totaling $9,504 under this agreement.
52
Driehaus Mutual Funds |
The table below indicates the amount of fees available for potential recoupment by DCM in future periods:
Six Months Ended June 30 | Driehaus | Driehaus | Driehaus | |||||||||
2021 | $ | — | $ | 34,463 | $ | — | ||||||
2022 | 227,780 | 31,856 | — | |||||||||
2023 | 107,370 | 13,771 | 21,304 | |||||||||
Total | $ | 335,150 | $ | 80,090 | $ | 21,304 | ||||||
The amounts incurred and payable to DCM during the six months ended June 30, 2020 are as follows:
Fund | Advisory Fees | Advisory Fees | ||||||
Driehaus Emerging Markets Growth Fund | $ | 8,400,622 | $ | 1,411,750 | ||||
Driehaus Emerging Markets Small Cap Growth Fund | 322,913 | 30,827 | ||||||
Driehaus International Small Cap Growth Fund | 1,157,352 | 195,523 | ||||||
Driehaus Micro Cap Growth Fund | 1,455,514 | 253,352 | ||||||
Driehaus Small Cap Growth Fund | 532,169 | 100,102 | ||||||
Driehaus Small/Mid Cap Growth Fund | 1,307 | (9,968 | ) | |||||
The Funds direct certain portfolio trades, subject to obtaining the best price and execution, to brokers who have agreed to pay a portion of the Funds’ operating expenses using part of the commissions generated. For the six months ended June 30, 2020, these arrangements reduced the expenses of Driehaus Emerging Markets Growth Fund, Driehaus Emerging Markets Small Cap Growth Fund, Driehaus International Small Cap Growth Fund, Driehaus Micro Cap Growth Fund, Driehaus Small Cap Growth Fund and Driehaus Small/Mid Cap Growth Fund by $88,547 (0.8%), $3,110 (0.6%), $6,772 (0.5%), $37,498 (2.1%), $20,144 (2.6%) and $0 (0.0%), respectively.
Certain officers of the Trust are also officers of DCM. The Funds pay a portion of the Chief Compliance Officer’s salary and bonus. No other officers received compensation from the Funds. The Independent Trustees are compensated for their services to the Trust and such compensation is reflected as Trustees’ fees in the Statements of Operations. During the period covered by this shareholder report, BNY Mellon Investment Servicing (US) Inc. (“BNY Mellon”) served as the Funds’ administrative and accounting agent. In compensation for these services, BNY Mellon earned the greater of a monthly minimum fee or a monthly fee based upon average daily net assets. BNY Mellon agreed to waive a portion of its monthly fee for administrative services for the first two years of operations for Driehaus Small/Mid Cap Growth Fund. For the six months ended June 30, 2020, BNY Mellon waived $2,338 for Driehaus Small/Mid Cap Growth Fund. BNY Mellon also acted as the transfer agent and dividend disbursing agent for the Funds. For these services, BNY Mellon earned a monthly fee based on shareholder processing activity during the month. BNY Mellon agreed to waive a portion of its monthly fee for transfer agent services for the first two years of operations for Driehaus Small/Mid Cap Growth Fund. For the six months ended June 30, 2020, BNY Mellon waived $5,613 for Driehaus Small/Mid Cap Growth Fund.
Effective January 1, 2020, the Adviser entered into a Fee Reimbursement Agreement (“Agreement”) with the Driehaus Emerging Markets Growth Fund and the Driehaus Small Cap Growth Fund. Prior to January 1, 2020, DS LLC was a party to the Agreements instead of the Adviser. Under these Agreements, the Funds reimbursed the Adviser for certain fees paid to intermediaries who provide shareholder administrative and /or sub-transfer agency services to the
53
Driehaus Mutual Funds |
Funds. Currently, the amount to be reimbursed will not exceed 0.25% of the average daily net assets held by such intermediaries. The amounts incurred and payable to the Adviser during the period January 1, 2020 through June 30, 2020 are as follows:
Fund | Shareholder | Accrued | ||||||
Driehaus Emerging Markets Growth Fund | $ | 1,023,492 | $ | 337,959 | ||||
Driehaus Small Cap Growth Fund | 12,130 | — | ||||||
C. INVESTMENT TRANSACTIONS
The aggregate purchases and sales of investment securities, other than short-term obligations and options, for the six months ended June 30, 2020 were as follows:
Fund | Purchases | Sales | ||||||
Driehaus Emerging Markets Growth Fund | $ | 1,801,582,136 | $ | 1,801,575,785 | ||||
Driehaus Emerging Markets Small Cap Growth Fund | 70,761,364 | 75,617,006 | ||||||
Driehaus International Small Cap Growth Fund | 102,234,830 | 101,824,897 | ||||||
Driehaus Micro Cap Growth Fund | 186,748,571 | 229,740,197 | ||||||
Driehaus Small Cap Growth Fund | 179,393,154 | 158,923,923 | ||||||
Driehaus Small/Mid Cap Growth Fund | 2,601,702 | 356,833 | ||||||
D. CAPITAL SHARE TRANSACTIONS
For the six-month period ended June 30, 2020, and the year ended December 31, 2019, transactions in capital shares (authorized shares unlimited) were as follows:
Driehaus Emerging | Driehaus Emerging Markets | Driehaus International | ||||||||||||||||||||||
June 30, | December 31, | June 30, | December 31, | June 30, | December 31, | |||||||||||||||||||
Fund | ||||||||||||||||||||||||
Shares issued | — | — | 522,648 | 874,262 | 1,706,711 | 4,710,527 | ||||||||||||||||||
Shares reinvested | — | — | — | 14,891 | — | 169,235 | ||||||||||||||||||
Shares redeemed | — | — | (857,381 | ) | (4,849,550 | ) | (2,956,826 | ) | (6,242,924 | ) | ||||||||||||||
Net increase (decrease) | — | — | (334,733 | ) | (3,960,397 | ) | (1,250,115 | ) | (1,363,162 | ) | ||||||||||||||
Investor Class | ||||||||||||||||||||||||
Shares issued | 1,990,277 | 2,872,532 | — | — | — | — | ||||||||||||||||||
Shares reinvested | — | 172,532 | — | — | — | — | ||||||||||||||||||
Shares redeemed | (3,537,714 | ) | (6,094,234 | ) | — | — | — | — | ||||||||||||||||
Net increase (decrease) | (1,547,437 | ) | (3,049,170 | ) | — | — | — | — | ||||||||||||||||
Institutional Class | ||||||||||||||||||||||||
Shares issued | 4,728,833 | 7,006,838 | — | — | — | — | ||||||||||||||||||
Shares reinvested | — | 174,824 | — | — | — | — | ||||||||||||||||||
Shares redeemed | (3,070,207 | ) | (4,277,922 | ) | — | — | — | — | ||||||||||||||||
Net increase (decrease) | 1,658,626 | 2,903,740 | — | — | — | — | ||||||||||||||||||
Total net increase (decrease) | 111,189 | 594,976 | — | — | — | — | ||||||||||||||||||
54
Driehaus Mutual Funds |
Driehaus Micro Cap | Driehaus Small Cap | Driehaus | ||||||||||||||||||
June 30, | December 31, | June 30, | December 31, | June 30, | ||||||||||||||||
Fund | ||||||||||||||||||||
Shares issued | 2,803,298 | 5,178,977 | — | — | 204,365 | |||||||||||||||
Shares reinvested | — | 2,292,488 | — | — | — | |||||||||||||||
Shares redeemed | (6,945,017 | ) | (10,513,427 | ) | — | — | — | |||||||||||||
Net increase (decrease) | (4,141,719 | ) | (3,041,962 | ) | — | — | 204,365 | |||||||||||||
Investor Class | ||||||||||||||||||||
Shares issued | — | — | 237,899 | 526,045 | — | |||||||||||||||
Shares reinvested | — | — | — | 42,020 | — | |||||||||||||||
Shares redeemed | — | — | (213,381 | ) | (505,115 | ) | — | |||||||||||||
Net increase (decrease) | — | — | 24,518 | 62,950 | — | |||||||||||||||
Institutional Class | ||||||||||||||||||||
Shares issued | — | — | 3,938,553 | 3,970,530 | — | |||||||||||||||
Shares reinvested | — | — | — | 599,613 | — | |||||||||||||||
Shares redeemed | — | — | (2,273,586 | ) | (4,651,842 | ) | — | |||||||||||||
Net increase (decrease) | — | — | 1,664,967 | (81,699 | ) | — | ||||||||||||||
Total net increase (decrease) | — | — | 1,689,485 | (18,749 | ) | — | ||||||||||||||
* | Fund commenced operations on May 1, 2020 |
E. LINE OF CREDIT
The Funds, together with other funds in the Trust, obtained a committed line of credit in the amount of $50,000,000. The line of credit is available primarily to meet large, unexpected shareholder redemptions subject to certain restrictions. Interest is charged at a rate per annum equal to the Federal Funds Rate in effect at the time of the borrowings plus 1.5%, or 1.75%, whichever is greater. There is a commitment fee of 0.10% of the excess of the $50,000,000 committed amount over the sum of the average daily balance of any loans, which is allocated amongst all funds that have access to the line. Driehaus Micro Cap Growth Fund utilized the line of credit on June 25, 2020. For the period of June 25, 2020, the average daily loan balance outstanding on days where borrowings existed was $7,000,000 and the weighted average interest rate was 1.58%. The interest expense, which is included on the Statements of Operations, was $307 for Driehaus Micro Cap Growth Fund.
F. FOREIGN INVESTMENT RISKS
To the extent a Fund invests in foreign securities, it may entail risks due to the potential for political and economic instability in the countries where the issuers of these securities are located. In addition, foreign exchange fluctuations could affect the value of positions held. These risks are generally intensified in emerging markets.
G. REDEMPTION FEES
The Funds may charge a redemption fee of 2.00% of the redemption amount for shares redeemed within 60 days of purchase. The redemption fees are recorded in paid-in capital and reflected in the Statements of Changes in Net Assets.
H. SUBSEQUENT EVENTS
Events or transactions that occurred after the date of this report through the date the report was issued have been evaluated for potential impact to the financial statements. Effective August 1, 2020, The Northern Trust Company replaced BNY Mellon Investment Servicing (US) Inc. as the Funds’ administrative and accounting agent and transfer agent and dividend disbursing agent for the Funds.
55
As a mutual fund shareholder, you may incur two types of costs: (1) transaction costs, including sales charges; redemption fees; and exchange fees and (2) ongoing costs, including management fees; distribution (12b-1) fees; and other fund expenses. This example is intended to help you understand your ongoing costs (in dollars) of investing in each Fund and to compare these costs with the ongoing costs of investing in other mutual funds.
The example is based on an investment of $1,000 invested at the beginning of the period and held for the entire six months ended June 30, 2020.
Actual Expenses
The first line of the tables below (“Actual”) provides information about actual account values and actual expenses. You may use the information in this line, together with the amount you invested, to estimate the expenses that you paid over the period. Simply divide your account value by $1,000 (for example, an $8,600 account value divided by $1,000 = 8.6), then multiply the result by the number in the first line under the heading entitled “Expenses Paid During Period” to estimate the expenses you paid on your account during this period.
Hypothetical Example for Comparison Purposes
The second line of the tables below (“Hypothetical”) provides information about hypothetical account values and hypothetical expenses based on the Fund’s actual expense ratio and an assumed rate of return of 5% per year before expenses, which is not the Fund’s actual return. You may use this information to compare the ongoing costs of investing in the Funds versus other funds. To do so, compare this 5% hypothetical example with the 5% hypothetical examples that appear in the shareholder reports of the other funds.
Please note that the expenses shown in the table are meant to highlight your ongoing costs only and do not reflect any transactional costs, such as sales charges, redemption fees or exchange fees. Therefore, the second line of the table is useful in comparing ongoing costs only, and will not help you determine the relative total costs of owning different funds. In addition, if these transactional costs were included, your costs would have been higher.
Driehaus Emerging Markets Growth Fund — Investor Class
| Beginning | Ending | Expenses |
Actual | $1,000 | $ 965.30 | $7.28 |
Hypothetical (5% return before expenses) | $1,000 | $ 1,017.45 | $7.47 |
Driehaus Emerging Markets Growth Fund — Institutional Class
| Beginning | Ending | Expenses |
Actual | $1,000 | $ 966.80 | $5.97 |
Hypothetical (5% return before expenses) | $1,000 | $ 1,018.80 | $6.12 |
Driehaus Emerging Markets Small Cap Growth Fund
| Beginning | Ending | Expenses |
Actual | $1,000 | $ 1,026.40 | $7.31 |
Hypothetical (5% return before expenses) | $1,000 | $ 1,017.65 | $7.27 |
56
Fund Expense Examples (unaudited) — (Continued) |
Driehaus International Small Cap Growth Fund
| Beginning | Ending | Expenses |
Actual | $1,000 | $ 951.50 | $6.11 |
Hypothetical (5% return before expenses) | $1,000 | $ 1,018.60 | $6.32 |
Driehaus Micro Cap Growth Fund
| Beginning | Ending | Expenses |
Actual | $1,000 | $ 1,175.30 | $8.11 |
Hypothetical (5% return before expenses) | $1,000 | $ 1,017.40 | $7.52 |
Driehaus Small Cap Growth Fund – Investor Class
| Beginning | Ending | Expenses |
Actual | $1,000 | $ 1,100.90 | $6.27 |
Hypothetical (5% return before expenses) | $1,000 | $ 1,018.90 | $6.02 |
Driehaus Small Cap Growth Fund – Institutional Class
| Beginning | Ending | Expenses |
Actual | $1,000 | $ 1,102.80 | $4.50 |
Hypothetical (5% return before expenses) | $1,000 | $ 1,020.59 | $4.32 |
Driehaus Small/Mid Cap Growth Fund
| Beginning | Ending | Expenses |
Actual | $1,000 | $ 1,218.00 | $1.67 |
Hypothetical (5% return before expenses) | $1,000 | $ 1,020.14 | $4.77 |
* | Expenses are equal to the Fund’s annualized expense ratios for the six-month period in the table below multiplied by the average account value over the period, multiplied by the number of days in the most recent fiscal half-year (182), then divided by 366 to reflect the half-year period. These amounts exclude the reduction in expenses for fees paid indirectly and may differ from the Fund’s annualized expense ratio shown in the Financial Highlights. |
** | The Driehaus Small/Mid Cap Growth Fund commenced operations on May 1, 2020. The actual return and expenses paid during the period by this Fund were for the period from May 1, 2020 through June 30, 2020 (58 days) instead of the entire six-month period. The hypothetical return is based on the entire six-month period for comparison purposes. |
Driehaus Emerging Markets Growth Fund – Investor Class | 1.49% |
Driehaus Emerging Markets Growth Fund – Institutional Class | 1.22% |
Driehaus Emerging Markets Small Cap Growth Fund | 1.45% |
Driehaus International Small Cap Growth Fund | 1.26% |
Driehaus Micro Cap Growth Fund | 1.50% |
Driehaus Small Cap Growth Fund – Investor Class | 1.20% |
Driehaus Small Cap Growth Fund – Institutional Class | 0.86% |
Driehaus Small/Mid Cap Growth Fund | 0.95% |
57
Board Considerations in Connection with the Approval of the Investment Advisory |
The Board of Trustees of Driehaus Mutual Funds (the “Trust”), including a majority of the Trustees who are not “interested persons” (as defined in the Investment Company Act of 1940, as amended) (the “Independent Trustees”), approved a new investment advisory agreement (the “Agreement”) with Driehaus Capital Management LLC (the “Adviser”) for Driehaus Small/Mid Cap Growth Fund (the “New Fund”) on March 11, 2020. As part of its review process, the Board requested and evaluated all information it deemed reasonably necessary to evaluate the Agreement. The Board reviewed comprehensive materials received from the Adviser and from independent legal counsel. The Board also received extensive information throughout the year regarding performance and operating results of each Fund. The Independent Trustees held a conference call with their independent legal counsel on March 5, 2020 to review the materials provided in response to their request, and identified areas for further response by Fund management. Following receipt of further information from Fund management, the Independent Trustees, represented by independent legal counsel, met independent of Fund management to consider renewal of the Agreement for each Fund. After their consideration of all the information received, the Independent Trustees presented their findings and their recommendation to renew the Agreement at the Board meeting.
In connection with the contract review process, the Board considered the factors discussed below, among others. The Board also considered that the Adviser has managed each Fund since its inception, and the Board believes that a long-term relationship with a capable, conscientious adviser is in the best interests of each Fund. The Board considered, generally, that shareholders invested in each Fund, knowing that the Adviser managed the Fund and knowing the investment advisory fee schedule.
Nature, Quality and Extent of Services. The Board considered the nature, extent and quality of services to be provided under the Agreement, including portfolio management services and administrative services. The Board considered the experience and skills of senior management and investment personnel, the resources made available to such personnel, the ability of the Adviser to attract and retain high-quality personnel, and the organizational depth of the Adviser. The Board also considered the Trust’s compliance with legal and regulatory requirements as well as the Adviser’s risk management processes developed for analyzing, reviewing and assessing risk exposure for the New Fund. In particular, the Board considered the management team’s experience relevant to managing other products with a small/mid-cap growth investment strategy (the “Composite”) as compared to the Russell 2500 Growth Index for the 1-, 3- and 5-year periods ended December 31, 2019. The Board noted that the Composite outperformed the Russell 2500 Growth Index for all periods reviewed. The Board also considered the performance of the Composite as compared to peer group information based on data compiled from Lipper Analytical Services, Inc., an independent provider of mutual fund data that is a service of Broadridge Financial Solutions (“Lipper”) and noted that the Composite outperformed the median of the Lipper small/mid cap growth peer group for all periods reviewed. Because the Composite did not operate as a mutual fund and was not subject to certain investment and operational restrictions, the Board factored those differences into its evaluation of the performance information.
On the basis of this evaluation and the Board’s experience with the Adviser in managing other series of the Trust, the Board concluded that the nature, quality and extent of services to be provided by the Adviser are expected to be satisfactory.
Fees. The Board considered the New Fund’s proposed advisory fee, estimated operating expenses and total expense ratio, and compared the advisory fee and expense ratio to fees and expense ratios of a peer group of funds based on data compiled from Lipper, as of the fiscal year end of each fund in the peer group. The Board noted that the New Fund’s proposed advisory fee of 0.60% would rank in the 49th percentile of the Lipper peer group actual management fees as of December 30, 2019 (1st percentile would be the highest advisory fee). The Board considered that the Adviser will reimburse the New Fund for annual expenses in excess of 0.95% of average daily net (excluding interest, taxes, brokerage commissions, other investment-related expenses, acquired fund fees and expenses, and extraordinary expenses, such as litigation and other expenses not incurred in the ordinary course of the New Fund’s business) for a three-year period, which would rank the New Fund’s expense ratio in the 64th percentile (1st percentile would be the highest expense ratio). In addition, the New Fund’s advisory fee rate as compared to fees charged by the Adviser for similarly managed institutional accounts. With respect to institutional accounts, the Board noted that: (i) both the mix of services provided and the level of responsibility and resources required under the Agreement were significantly greater as compared to the Adviser’s obligations for managing the other accounts; and (ii) the advisory fees for the other accounts are less relevant to the Board’s consideration because they reflect significantly different competitive forces than those in the mutual fund marketplace.
On the basis of the information provided, the Board concluded that the proposed advisory fee was reasonable and appropriate in light of the nature and quality of services expected to be provided by the Adviser.
58
Profitability and Economies of Scale. In considering the reasonableness of the proposed advisory fee, the Board considered the undertaking by the Adviser to assume the New Fund’s organizational expenses as well as to reimburse New Fund expenses exceeding a 0.95% cap (excluding interest, taxes, brokerage commissions, other investment-related expenses, acquired fund fees and expenses, and extraordinary expenses, such as litigation and other expenses not incurred in the ordinary course of the New Fund’s business) for a three-year period.
The Board also considered potential economies of scale with respect to the management of the New Fund and whether the New Fund will benefit from any economies of scale. The Board noted the Adviser’s estimation that it will not earn its full fee until net assets reach approximately $75 million.
Other Benefits to the Adviser and its Affiliates. The Board also considered the character and amount of other incidental benefits to be received by the Adviser and its affiliates. The Board noted that the Adviser expects to earn fall-out benefits in the form of soft dollar credits from its relationship with the New Fund. The Board concluded that the proposed advisory fee was reasonable in light of any anticipated fall-out benefits.
Based on all of the information considered and the conclusions reached, the Board determined that the terms of the Agreement for the New Fund were fair and reasonable and that the approval of the Agreement is in the best interests of the New Fund. No single factor was determinative in the Board’s analysis.
59
Pursuant to Rule 22e-4 under the 1940 Act, the Funds have adopted a liquidity risk management program. The program’s principal objectives include assessing, managing and periodically reviewing each Fund’s liquidity risk, based on factors specific to the circumstances of the Fund. Liquidity risk is defined as the risk that a Fund could not meet redemption requests without significant dilution of remaining investors’ interests in the Fund.
The Adviser has been designated by the Board to administer the Funds’ liquidity risk management program. At a board meeting during the period ended June 30, 2020, The Adviser provided the Board with a report addressing the operations of the program and assessing its adequacy and effectiveness of implementation, including:
● | the program supported each Fund’s ability to honor redemption requests timely; |
● | the program supported the Adviser’s management of each Fund’s liquidity profile, including during periods of market volatility and net redemptions; |
● | no material liquidity issues were identified during the period; |
● | there were no material changes to the program during the period; |
● | the implementation of the program was effective to manage each Fund’s liquidity risk; and |
● | the program operated adequately during the period. |
There can be no assurance that the program will achieve its objectives in the future. Please refer to the prospectus for more information regarding each Fund’s exposure to liquidity risk and other principal risks to which an investment in the Funds may be subject.
60
[This page intentionally left blank]
DRH-SAR2020
| Cumulative Total Returns as of 6/30/20 | 1 Year | 3 Years | Since Inception (4/10/17 - 6/30/20) |
| Driehaus Emerging Markets Opportunities Fund (DMAGX)1 | 8.41% | 6.92% | 8.42% |
| MSCI EM/JP Morgan GBI Blended Index2 | (2.82)% | 1.72% | 3.12% |
| MSCI Emerging Markets Index-N3 | (3.39)% | 1.90% | 3.58% |

| 1 | Prior to January 29, 2020, the Driehaus Emerging Markets Opportunities Fund was known as the Driehaus Multi-Asset Growth Economies Fund. The returns for the period reflect fee waivers and/or reimbursements without which performance would have been lower. |
| 2 | The MSCI EM/JPMorgan GBI Blended Index is an equally weighted benchmark comprised of 50 percent by the Morgan Stanley Capital International Emerging Markets Index-Net (MSCI EM) and 50 percent by the JPMorgan Global Bond Index Emerging Markets Global Diversified (JPMorgan GBI). The MSCI EM is a market capitalization-weighted index designed to measure equity market performance in emerging markets and the JPMorgan GBI tracks debt instruments in the emerging markets. Source: Morgan Stanley Capital International Inc. and JPMorgan. |
| 3 | The Morgan Stanley Capital International Emerging Markets Index-Net (MSCI Emerging Markets Index-N) is a market capitalization-weighted index designed to measure equity market performance in emerging markets. Data is in U.S. dollars and is calculated with net dividend reinvestment. Source: Morgan Stanley Capital International Inc. |
| Shares, Principal Amount, or Number of Contracts | Value | |
| SOVEREIGN BONDS — 17.85% | ||
| Brazil — 2.15% | ||
| Brazilian Government International Bond 4.62, 1/13/281 | $500,000 | $522,755 |
| Brazilian Government International Bond 4.50, 5/30/291 | 200,000 | 204,988 |
| 727,743 | ||
| China — 1.30% | ||
| China Government Bond 3.20, 3/16/242 | 1,200,0002 | 173,963 |
| China Government Bond 3.54, 8/16/282 | 1,800,0002 | 265,777 |
| 439,740 | ||
| Czech Republic — 1.10% | ||
| Czech Republic Government Bond 4.70, 9/12/222 | 8,000,0002 | 371,485 |
| Egypt — 2.36% | ||
| Egypt Government Bond 17.00, 4/3/222 | 6,500,0002 | 426,355 |
| Egypt Government International Bond 8.70, 3/1/491 | 380,000 | 374,078 |
| 800,433 | ||
| Indonesia — 1.42% | ||
| Indonesia Treasury Bond 8.37, 9/15/262 | 3,400,000,0002 | 257,172 |
| Indonesia Treasury Bond 8.25, 5/15/292 | 3,000,000,0002 | 224,249 |
| 481,421 | ||
| Malaysia — 1.04% | ||
| Malaysia Government Bond 3.89, 8/15/292 | 1,400,0002 | 352,621 |
| Mexico — 3.62% | ||
| Mexican Bonos 8.50, 11/18/382 | 14,800,0002 | 764,646 |
| Mexico Government International Bond 4.50, 4/22/291 | 260,000 | 282,490 |
| Petroleos Mexicanos 6.50, 3/13/271 | 200,000 | 180,504 |
| 1,227,640 | ||
| Peru — 1.01% | ||
| Peruvian Government International Bond 6.95, 8/12/312 | 1,000,0002 | 343,693 |
| South Africa — 0.81% | ||
| Republic of South Africa Government Bond 8.50, 1/31/372 | 5,900,0002 | 275,340 |
| Shares, Principal Amount, or Number of Contracts | Value | |
| Turkey — 1.40% | ||
| Turkey Government International Bond 7.63, 4/26/291 | $450,000 | $473,246 |
| Ukraine — 1.64% | ||
| Ukraine Government International Bond 7.38, 9/25/321 | 550,000 | 554,255 |
| Total SOVEREIGN BONDS (Cost $6,029,314) | 6,047,617 | |
| EQUITY SECURITIES — 77.47% | ||
| Brazil — 4.35% | ||
| Cia de Saneamento Basico do Estado de Sao Paulo - ADR*,1,3 | 17,803 | 187,110 |
| Gerdau SA - SP ADR1 | 79,438 | 235,136 |
| LOG Commercial Properties e Participacoes SA | 65,796 | 398,665 |
| Magazine Luiza SA* | 24,652 | 324,804 |
| Pagseguro Digital Ltd. - A*,1,3 | 9,230 | 326,188 |
| 1,471,903 | ||
| Canada — 1.06% | ||
| B2Gold Corp. | 63,377 | 360,394 |
| Chile — 0.97% | ||
| Sociedad Quimica y Minera de Chile SA - SP ADR 2.71%1,3,4 | 12,549 | 327,152 |
| China — 29.70% | ||
| Alibaba Group Holding Ltd.* | 21,500 | 580,152 |
| Alibaba Group Holding Ltd. - SP ADR*,1,3 | 4,462 | 962,453 |
| BGI Genomics Co. Ltd. - A* | 9,527 | 209,996 |
| China Construction Bank Corp. - H | 307,142 | 249,824 |
| China Feihe Ltd.5 | 87,753 | 176,832 |
| China Merchants Bank Co. Ltd. - H | 45,500 | 210,853 |
| China Tourism Group Duty Free Corp. Ltd. - A | 22,094 | 484,219 |
| CIFI Holdings Group Co. Ltd. | 164,107 | 129,277 |
| Contemporary Amperex Technology Co. Ltd. - A | 11,100 | 276,658 |
| Hundsun Technologies, Inc - A | 21,730 | 332,591 |
| Innovent Biologics, Inc.*,5 | 48,500 | 360,971 |
| JD.com, Inc. - ADR*,1,3 | 5,722 | 344,350 |
| Jinxin Fertility Group Ltd.5 | 204,000 | 310,071 |
| Li Ning Co. Ltd. | 51,016 | 163,376 |
| Luxshare Precision Industry Co. Ltd. - A | 41,258 | 301,654 |
| Meituan Dianping - B* | 16,990 | 379,665 |
| Ping An Healthcare and Technology Co. Ltd.*,5 | 32,823 | 503,227 |
| Shares, Principal Amount, or Number of Contracts | Value | |
| Ping An Insurance Group Co. of China Ltd. - H | 29,959 | $298,661 |
| Sany Heavy Industry Co. Ltd. - A | 96,700 | 257,929 |
| Silergy Corp. | 3,953 | 258,954 |
| TAL Education Group - ADR*,1,3 | 4,740 | 324,121 |
| Tencent Holdings Ltd. | 32,700 | 2,095,348 |
| Wuxi Biologics Cayman, Inc.*,5 | 17,129 | 314,413 |
| Yum China Holdings, Inc.1,3 | 5,796 | 278,614 |
| Zhangzhou Pientzehuang Pharmaceutical Co. Ltd. - A | 10,629 | 256,716 |
| 10,060,925 | ||
| France — 1.31% | ||
| L'Oreal SA* | 1,372 | 442,808 |
| Hong Kong — 3.98% | ||
| AIA Group Ltd. | 35,794 | 334,946 |
| Alibaba Health Information Technology Ltd.* | 90,000 | 264,661 |
| Galaxy Entertainment Group Ltd. | 25,233 | 173,092 |
| Hong Kong Exchanges & Clearing Ltd. | 6,602 | 281,191 |
| Sun Art Retail Group Ltd. | 171,840 | 294,813 |
| 1,348,703 | ||
| India — 6.52% | ||
| Bharti Airtel Ltd.* | 34,528 | 256,438 |
| HDFC Bank Ltd. - ADR1,3 | 7,673 | 348,815 |
| Hindustan Unilever Ltd. | 17,763 | 513,542 |
| ICICI Bank Ltd. - SP ADR1,3 | 37,702 | 350,252 |
| Reliance Industries Ltd. | 22,826 | 519,210 |
| Tech Mahindra Ltd. | 30,614 | 220,272 |
| 2,208,529 | ||
| Indonesia — 0.99% | ||
| Bank Central Asia Tbk PT | 167,449 | 335,032 |
| Mexico — 0.46% | ||
| Wal-Mart de Mexico SAB de CV | 64,835 | 155,568 |
| Netherlands — 0.94% | ||
| ASML Holding NV | 874 | 319,721 |
| Poland — 1.58% | ||
| CD Projekt SA* | 2,494 | 251,329 |
| Dino Polska SA*,5 | 5,559 | 283,165 |
| 534,494 | ||
| Russia — 3.73% | ||
| LUKOIL PJSC - SP ADR1 | 4,935 | 366,839 |
| Sberbank of Russia PJSC - SP ADR1 | 29,970 | 340,691 |
| Tatneft PJSC - SP ADR1 | 3,941 | 183,535 |
| Yandex NV - A*,1,3 | 7,450 | 372,649 |
| 1,263,714 | ||
| Shares, Principal Amount, or Number of Contracts | Value | ||
| Singapore — 1.09% | |||
| Sea Ltd. - ADR*,1,3 | 3,425 | $367,297 | |
| Slovenia — 0.57% | |||
| Nova Ljubljanska Banka dd - GDR | 22,452 | 193,379 | |
| South Africa — 1.10% | |||
| Anglo American Platinum Ltd. | 5,117 | 372,404 | |
| South Korea — 7.34% | |||
| KB Financial Group, Inc. | 6,445 | 182,455 | |
| Kia Motors Corp. | 6,498 | 175,593 | |
| Macquarie Korea Infrastructure Fund | 44,563 | 423,719 | |
| NAVER Corp. | 1,515 | 340,850 | |
| NICE Information Service Co. Ltd. | 15,539 | 237,437 | |
| Samsung Electronics Co. Ltd. | 16,314 | 722,182 | |
| SK Hynix, Inc. | 5,671 | 404,901 | |
| 2,487,137 | |||
| Sweden — 0.97% | |||
| Spotify Technology SA*,1,3 | 1,268 | 327,385 | |
| Taiwan — 8.42% | |||
| Accton Technology Corp. | 39,705 | 308,333 | |
| Kindom Development Co. Ltd. | 365,000 | 386,082 | |
| MediaTek, Inc. | 21,839 | 431,771 | |
| Parade Technologies Ltd. | 11,000 | 368,698 | |
| Taiwan Semiconductor Manufacturing Co. Ltd. | 107,445 | 1,147,461 | |
| Taiwan Union Technology Corp. | 43,000 | 211,120 | |
| 2,853,465 | |||
| United Arab Emirates — 0.44% | |||
| Network International Holdings PLC*,5 | 27,486 | 150,467 | |
| United States — 1.95% | |||
| Facebook, Inc. - A*,3 | 1,290 | 292,920 | |
| NVIDIA Corp.3 | 969 | 368,134 | |
| 661,054 | |||
| Total EQUITY SECURITIES (Cost $19,471,967) | 26,241,531 | ||
| SHORT TERM INVESTMENTS — 4.94% | |||
| Northern Institutional U.S. Government Select Portfolio (Shares Class), 0.13% | 1,672,200 | 1,672,200 | |
| TOTAL INVESTMENTS (Cost $27,173,481) | 33,961,348 | ||
| Other Assets In Excess Liabilities | (0.26)% | (87,717) | |
| Net Assets | 100.00% | $33,873,631 | |
| ADR | American Depositary Receipt |
| GDR | Global Depositary Receipt |
| PJSC | Public Joint Stock Company |
| PLC | Public Limited Company |
| SP ADR | Sponsored American Depositary Receipt |
| * | Non-income producing security. |
| 1 | Foreign security denominated in U.S. dollars and traded in the U.S. |
| 2 | Foreign security, par value shown in local currency. |
| 3 | All or a portion of this security is pledged as collateral for short sales or derivatives transactions. |
| 4 | Current yield is disclosed. Dividends are calculated based on a percentage of the issuer’s net income. |
| 5 | Security is exempt from registration under Rule 144A of the Securities Act of 1933, as amended. Unless otherwise indicated, this security has been determined to be liquid under procedures established by Driehaus Mutual Funds’ Board of Trustees and may be resold in transactions exempt from registration, normally to qualified institutional buyers. The total value of these securities is $2,099,146, which represents 6% of Net Assets. |
| Security Type | Percent of Total Net Assets | |
| Sovereign Bonds | 17.85% | |
| Equity Securities | 77.47% | |
| Short Term Investments | 4.94% | |
| Total Investments | 100.26% | |
| Other Assets less Liabilities | (0.26)% | |
| Total Net Assets | 100.00% |
| FORWARD FOREIGN CURRENCY CONTRACTS | ||||||
| Counterparty | Currency Purchased | Currency Sold | Settlement Date | Unrealized Appreciation/ (Depreciation) | ||
| Goldman Sachs | EUR | 301,635 | JPY | 35,019,603 | 7/20/2020 | $14,627 |
| Goldman Sachs | CNH | 21,400,248 | USD | 3,020,294 | 7/3/2020 | 5,837 |
| SUBTOTAL APPRECIATION | $20,464 | |||||
| Goldman Sachs | JPY | 35,019,603 | EUR | 300,000 | 7/20/2020 | (12,789) |
| Goldman Sachs | USD | 3,000,000 | CNH | 21,400,248 | 7/3/2020 | (26,131) |
| SUBTOTAL DEPRECIATION | $(38,920) | |||||
| TOTAL FORWARD FOREIGN CURRENCY CONTRACTS | $(18,456) | |||||
| EUR = Euro |
| JPY = Japanese Yen |
| CNH = Chinese Offshore Yuan |
| USD = United States Dollar |
| Cumulative Total Returns as of 6/30/20 | 1 Year | 3 Years | 5 Years | Since Inception (8/26/13 - 6/30/20) |
| Driehaus Event Driven Fund (DEVDX)1 | 6.12% | 6.01% | 4.74% | 4.53% |
| S&P 500 Index2 | 7.51% | 10.73% | 10.73% | 11.79% |
| FTSE 3-Month T-Bill Index3 | 1.55% | 1.72% | 1.15% | 0.85% |

| 1 | The returns for the periods prior to March 1, 2014, reflect fee waivers and/or reimbursements without which performance would have been lower. |
| 2 | The S&P 500 Index consists of 500 stocks chosen for market size, liquidity and industry group. It is a market-weighted index, with each stock’s weight in the index proportionate to its market value. |
| 3 | The FTSE 3-Month T-Bill Index is designed to mirror the performance of the 3-month U.S. Treasury Bill. The FTSE 3-Month T-Bill Index is unmanaged and its returns reflect reinvestment of all distributions and changes in market prices. |
| Shares, Principal Amount, or Number of Contracts | Value | |
| CONVERTIBLE BONDS — 1.59% | ||
| Pharmaceuticals — 1.59% | ||
| Cytokinetics, Inc. 4.00%, 11/15/261 | $700,000 | $1,662,679 |
| CORPORATE BONDS — 18.35% | ||
| Agriculture — 0.66% | ||
| Vector Group Ltd. 6.12%, 2/1/251,2 | 715,000 | 686,400 |
| Banks — 5.13% | ||
| JPMorgan Chase & Co. 4.23%, (3-Month USD Libor + 347 basis points), 10/30/201,3,4 | 3,773,000 | 3,434,562 |
| USB Realty Corp. 2.37%, (3-Month USD Libor + 115 basis points), 1/15/221,2,3,4 | 2,428,000 | 1,936,330 |
| 5,370,892 | ||
| Diversified Financial Services — 1.07% | ||
| ILFC E-Capital Trust I 3.02%, 12/21/651,2,4,5 | 2,269,000 | 1,115,236 |
| Insurance — 2.16% | ||
| Fidelity & Guaranty Life Holdings, Inc. 5.50%, 5/1/251,2 | 2,092,000 | 2,259,360 |
| Internet — 0.37% | ||
| Uber Technologies, Inc. 7.50%, 11/1/231,2 | 380,000 | 383,800 |
| Lodging — 1.48% | ||
| Arrow Bidco LLC 9.50%, 3/15/241,2 | 1,985,000 | 1,548,300 |
| Telecommunications — 7.48% | ||
| Cincinnati Bell, Inc. 7.00%, 7/15/241,2 | 1,674,000 | 1,707,480 |
| Consolidated Communications, Inc. 6.50%, 10/1/221 | 4,739,000 | 4,358,932 |
| HC2 Holdings, Inc. 11.50%, 12/1/211,2 | 1,842,500 | 1,754,982 |
| 7,821,394 | ||
| Total CORPORATE BONDS (Cost $20,016,532) | 19,185,382 | |
| FOREIGN ISSUER BONDS — 1.24% | ||
| Oil & Gas — 1.24% | ||
| Transocean Pontus Ltd. (Cayman Islands) 6.12%, 8/1/251,2,6 | 1,490,475 | 1,296,713 |
| COMMON STOCKS — 42.00% | ||
| Advertising — 0.26% | ||
| Clear Channel Outdoor Holdings, Inc.*,1 | 263,472 | 274,011 |
| Shares, Principal Amount, or Number of Contracts | Value | |
| Banks — 1.07% | ||
| HarborOne Bancorp, Inc.*,1 | $131,735 | $1,125,017 |
| Biotechnology — 7.28% | ||
| Argenx SE - ADR (Netherlands)*,1,6 | 7,105 | 1,600,259 |
| Ascendis Pharma A/S - ADR (Denmark)*,1,6 | 9,653 | 1,427,679 |
| Black Diamond Therapeutics, Inc.*,1 | 28,947 | 1,220,405 |
| Crinetics Pharmaceuticals, Inc.*,1 | 60,631 | 1,062,255 |
| Gamida Cell Ltd. (Israel)*,1,6 | 205,628 | 939,720 |
| Orchard Therapeutics PLC (United Kingdom)*,1,6 | 100,065 | 600,390 |
| SpringWorks Therapeutics, Inc.*,1 | 16,668 | 700,056 |
| Sutro Biopharma, Inc.*,1 | 8,054 | 62,499 |
| 7,613,263 | ||
| Electric — 0.75% | ||
| Vistra Energy Corp.1 | 42,301 | 787,645 |
| Healthcare - Products — 2.85% | ||
| Alphatec Holdings, Inc.*,1 | 57,772 | 271,528 |
| SeaSpine Holdings Corp.*,1 | 91,750 | 960,623 |
| Wright Medical Group NV (Netherlands)*,1,6 | 58,695 | 1,744,415 |
| 2,976,566 | ||
| Healthcare - Services — 1.77% | ||
| SI-BONE, Inc.*,1 | 62,555 | 997,127 |
| Vapotherm, Inc.*,1 | 20,809 | 852,961 |
| 1,850,088 | ||
| Holding Companies-Diversified — 6.00% | ||
| Flying Eagle Acquisition Corp. - A*,1 | 184,340 | 2,024,053 |
| Gores Holdings IV, Inc. - A*,1 | 109,100 | 1,101,910 |
| Landcadia Holdings II, Inc. - A*,1 | 56,450 | 922,958 |
| Longview Acquisition Corp.*,1 | 88,800 | 896,880 |
| Professional Holding Corp. - A*,1 | 22,875 | 317,505 |
| Sustainable Opportunities Acquisition Corp.*,1 | 100,200 | 1,012,020 |
| 6,275,326 | ||
| Lodging — 2.26% | ||
| Caesars Entertainment Corp.*,1 | 195,039 | 2,365,823 |
| Pharmaceuticals — 13.35% | ||
| AdaptHealth Corp.*,1 | 115,658 | 1,862,094 |
| Bioxcel Therapeutics, Inc.*,1 | 15,903 | 843,018 |
| Cytokinetics, Inc.*,1 | 171,126 | 4,033,440 |
| Ideaya Biosciences, Inc.*,1 | 84,997 | 1,207,807 |
| Merus NV (Netherlands)*,1,6 | 30,638 | 492,966 |
| MyoKardia, Inc.*,1 | 32,949 | 3,183,532 |
| Shares, Principal Amount, or Number of Contracts | Value | |
| Odonate Therapeutics, Inc.*,1 | $44,720 | $1,893,445 |
| scPharmaceuticals, Inc.*,1 | 59,940 | 441,158 |
| 13,957,460 | ||
| REITS — 2.31% | ||
| MGM Growth Properties LLC - A1 | 56,970 | 1,550,154 |
| Taubman Centers, Inc.1 | 22,845 | 862,627 |
| 2,412,781 | ||
| Retail — 1.13% | ||
| Tiffany & Co.1 | 9,682 | 1,180,623 |
| Savings & Loans — 1.46% | ||
| Waterstone Financial, Inc.1 | 102,884 | 1,525,770 |
| Telecommunications — 1.51% | ||
| Consolidated Communications Holdings, Inc.*,1 | 188,672 | 1,277,309 |
| HC2 Holdings, Inc.*,1 | 90,338 | 301,729 |
| 1,579,038 | ||
| Total COMMON STOCKS (Cost $37,627,637) | 43,923,411 | |
| PRIVATE INVESTMENT IN PUBLIC EQUITY (PIPES) — 1.91% | ||
| Healthcare - Services — 1.91% | ||
| Invitae Corp. *,^,1,7 | 1,994,066 | |
| CONVERTIBLE PREFERRED STOCKS — 0.00% | ||
| Auto Manufacturers — 0.00% | ||
| General Motors Corp. Senior Convertible Preferred Escrow - B*,^ | 25,000 | — |
| General Motors Corp. Senior Convertible Preferred Escrow - C*,^ | 162,750 | — |
| — | ||
| MASTER LIMITED PARTNERSHIPS — 0.44% | ||
| Trucking & Leasing — 0.44% | ||
| Fortress Transportation and Infrastructure Investors LLC1 | 35,650 | 463,093 |
| PREFERRED STOCKS — 1.88% | ||
| Banks — 1.88% | ||
| GMAC Capital Trust I 6.18%, (3-Month USD Libor + 579 basis points), 2/15/401,4 | 87,226 | 1,968,691 |
| PRIVATE PREFERRED STOCKS — 1.48% | ||
| Biotechnology — 1.48% | ||
| 14ner Oncology, Inc. Private Equity*,^,1 | 1,550,000 | 1,550,000 |
| WARRANTS — 0.54% | ||
| AdaptHealth Corp.*,1 | 69,352 | 337,050 |
| Flying Eagle Acquisition Corp. - A*,1 | 34,435 | 103,305 |
| Shares, Principal Amount, or Number of Contracts | Value | ||
| Gores Holdings IV, Inc. - A*,1 | 25,000 | $45,000 | |
| Healthcare Merger Corp.*,1 | 70,000 | 80,500 | |
| X4 Pharmaceuticals, Inc.*,^,1 | 5,547 | 3 | |
| Total WARRANTS (Cost $121,220) | 565,858 | ||
| SHORT TERM INVESTMENTS — 25.15% | |||
| Northern Institutional Treasury Portfolio (Premier Class), 0.10% | 26,294,391 | 26,294,391 | |
| TOTAL INVESTMENTS (Cost $89,836,816) | 94.58% | $98,904,284 | |
| Other Assets In Excess Liabilities | 5.42% | 5,666,212 | |
| Net Assets | 100.00% | $104,570,496 | |
| INVESTMENT SECURITIES SOLD SHORT—(11.46)% | |||
| CORPORATE BONDS — (1.10)% | |||
| Advertising — (0.91)% | |||
| Outfront Media Capital LLC / Outfront Media Capital Corp. 5.00%, 8/15/272 | $(1,056,000) | (950,400) | |
| REITS — (0.19)% | |||
| MGM Growth Properties Operating Partnership LP / MGP Finance Co-Issuer, Inc. 4.63%, 6/15/252 | (210,000) | (205,355) | |
| Total CORPORATE BONDS (Proceeds $1,210,478) | (1,155,755) | ||
| COMMON STOCKS — (0.60)% | |||
| Agriculture — (0.05)% | |||
| Vector Group Ltd. | (5,278) | (53,097) | |
| Diversified Financial Services — (0.07)% | |||
| AerCap Holdings NV (Ireland)*,6 | (2,277) | (70,132) | |
| Entertainment — (0.39)% | |||
| Eldorado Resorts, Inc.* | (10,258) | (410,935) | |
| Telecommunications — (0.09)% | |||
| Cincinnati Bell, Inc.* | (6,000) | (89,100) | |
| Total COMMON STOCKS (Proceeds $428,313) | (623,264) | ||
| EXCHANGE-TRADED FUNDS — (9.76)% | |||
| iShares Nasdaq Biotechnology ETF | (28,860) | (3,944,873) | |
| SPDR S&P Biotech ETF | (47,114) | (5,274,412) | |
| SPDR S&P Regional Banking ETF | (25,691) | (986,278) | |
| Total EXCHANGE-TRADED FUNDS (Proceeds $7,566,319) | (10,205,563) | ||
| Shares, Principal Amount, or Number of Contracts | Value | |
| TOTAL INVESTMENT SECURITIES SOLD SHORT (Proceeds $9,205,110) | (11.46)% | $(11,984,582) |
| ADR | American Depositary Receipt |
| PLC | Public Limited Company |
| * | Non-income producing security. |
| ^ | Security valued at fair value as determined in good faith by the Adviser, in accordance with procedures established by, and under the general supervision of, the Trust’s Board of Trustee. The security is valued using significant unobservable inputs. |
| 1 | All or a portion of this security is pledged as collateral for short sales or derivatives transactions. |
| 2 | Security is exempt from registration under Rule 144A of the Securities Act of 1933, as amended. Unless otherwise indicated, this security has been determined to be liquid under procedures established by Driehaus Mutual Funds’ Board of Trustees and may be resold in transactions exempt from registration, normally to qualified institutional buyers. The total value of these securities is $11,532,846, which represents 11% of Net Assets. |
| 3 | Perpetual security. Maturity date shown is the next call date or final legal maturity date, whichever comes first. |
| 4 | Variable rate security. Rates disclosed as of June 30, 2020. |
| 5 | The coupon rate equals 155 basis points plus the highest of the LIBOR 3 Month, the Constant Maturity Treasury 10 year rate, and the Constant Maturity Treasury 30 year rate, with a maximum of 12.95%. |
| 6 | Foreign security denominated in U.S. dollars and traded in the U.S. |
| 7 | The entire commitment to purchase 148,368 shares for $2,500,001 was unfunded as of June 30, 2020. |
| Security Type | Percent of Total Net Assets | |
| Convertible Bonds | 1.59% | |
| Corporate Bonds | 18.35% | |
| Common Stocks | 42.00% | |
| Convertible Preferred Stocks | 0.00% | |
| Foreign Issuer Bonds | 1.24% | |
| Master Limited Partnerships | 0.44% | |
| Preferred Stocks | 1.88% | |
| Private Investment in Public Equity | 4.30% | |
| Private Preferred Stocks | 1.48% | |
| Warrants | 0.54% | |
| Short Term Investments | 25.15% | |
| Total Investments | 96.97% | |
| Other Assets less Liabilities | 3.03% | |
| Total Net Assets | 100.00% |
| Average Annual Total Returns as of 6/30/20 | 1 Year | 3 Years | 5 Years | 10 Years |
| Driehaus Active Income Fund (LCMAX) | (4.50)% | (0.91)% | 0.19% | 1.25% |
| FTSE 3-Month T-Bill Index1 | 1.55% | 1.72% | 1.15% | 0.61% |
| Bloomberg Barclays U.S. Aggregate Bond Index2 | 8.74% | 5.32% | 4.30% | 3.82% |
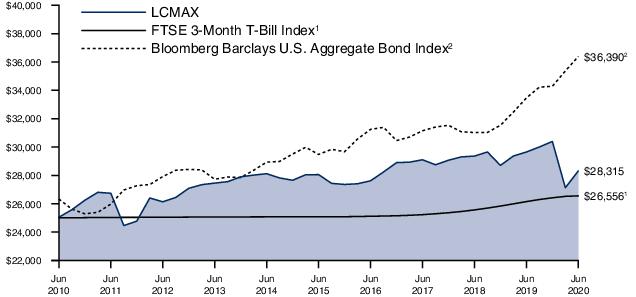
| 1 | The FTSE 3-Month T-Bill Index is designed to mirror the performance of the 3-month U.S. Treasury Bill. The FTSE 3-Month T-Bill Index is unmanaged and its returns reflect reinvestment of all distributions and changes in market prices. |
| 2 | The Bloomberg Barclays U.S. Aggregate Bond Index, an unmanaged index, represents securities that are SEC-registered, taxable and dollar denominated. This index covers the U.S. investment grade fixed rate bond market, with index components for government and corporate securities, mortgage pass-through securities and asset-backed securities. These major sectors are subdivided into more specific indices that are calculated and reported on a regular basis. |
| Shares, Principal Amount, or Number of Contracts | Value | |
| BANK LOANS — 8.55% | ||
| Computers — 2.44% | ||
| McAfee LLC, Initial Loan 9.50%, (1-Month USD Libor+850 basis points), 9/29/251,2 | $2,463,636 | $2,446,391 |
| Healthcare - Services — 0.27% | ||
| Heartland Dental LLC, Initial Term Loan 3.68%, (1-Month USD Libor+350 basis points), 4/30/251,2 | 303,244 | 269,002 |
| Investment Companies — 3.53% | ||
| Larchmont Resources LLC, Tranche A Term Loan 8.00%, (3-Month USD Libor+700 basis points), 8/7/20^,1,2 | 5,884,141 | 3,530,484 |
| Software — 2.31% | ||
| Blackboard Inc., Term B-5 Loan 7.00%, (3-Month USD Libor+500 basis points), 6/30/241,2 | 2,481,250 | 2,307,562 |
| Total BANK LOANS (Cost $10,935,586) | 8,553,439 | |
| CORPORATE BONDS — 58.58% | ||
| Agriculture — 1.26% | ||
| Vector Group Ltd. 6.13%, 2/1/253,4 | 1,310,000 | 1,257,600 |
| Auto Manufacturers — 1.07% | ||
| Navistar International Corp. 9.50%, 5/1/253 | 1,000,000 | 1,071,550 |
| Banks — 5.91% | ||
| JPMorgan Chase & Co. 4.23%, (3-Month USD Libor + 347 basis points), 10/30/204,5,6 | 2,915,000 | 2,653,525 |
| USB Realty Corp. 2.37%, (3-Month USD Libor + 115 basis points), 1/15/223,5,6 | 4,085,000 | 3,257,787 |
| 5,911,312 | ||
| Beverages — 1.26% | ||
| Cott Holdings, Inc. 5.50%, 4/1/253 | 1,250,000 | 1,256,362 |
| Commercial Services — 1.80% | ||
| Nielsen Finance LLC / Nielsen Finance Co. 5.00%, 4/15/223 | 1,809,000 | 1,802,596 |
| Computers — 2.39% | ||
| NCR Corp. 6.38%, 12/15/234 | 1,000,000 | 1,016,250 |
| Shares, Principal Amount, or Number of Contracts | Value | |
| NCR Corp. 8.12%, 4/15/253 | $1,300,000 | $1,378,000 |
| 2,394,250 | ||
| Cosmetics/Personal Care — 2.89% | ||
| Avon International Operations, Inc. 7.87%, 8/15/223,4 | 2,886,000 | 2,890,329 |
| Diversified Financial Services — 1.80% | ||
| ILFC E-Capital Trust I 3.02%, 12/21/653,6,7 | 1,906,000 | 936,818 |
| ILFC E-Capital Trust I 3.02%, 12/21/656,8 | 1,750,000 | 860,143 |
| 1,796,961 | ||
| Electrical Components & Equipments — 1.03% | ||
| Energizer Holdings, Inc. 6.38%, 7/15/263 | 1,000,000 | 1,033,960 |
| Entertainment — 2.02% | ||
| Lions Gate Capital Holdings LLC 6.38%, 2/1/243,4 | 2,070,000 | 2,018,250 |
| Food — 2.04% | ||
| Albertsons Cos., Inc. / Safeway, Inc. / New Albertsons LP / Albertsons LLC 5.75%, 3/15/25 | 2,000,000 | 2,043,760 |
| Insurance — 2.99% | ||
| Acrisure LLC / Acrisure Finance, Inc. 8.12%, 2/15/243,4 | 1,318,000 | 1,370,325 |
| Fidelity & Guaranty Life Holdings, Inc. 5.50%, 5/1/253 | 1,500,000 | 1,620,000 |
| 2,990,325 | ||
| Internet — 2.02% | ||
| Uber Technologies, Inc. 7.50%, 11/1/233 | 2,000,000 | 2,020,000 |
| Investment Companies — 2.88% | ||
| Compass Group Diversified Holdings LLC 8.00%, 5/1/263 | 1,118,000 | 1,136,928 |
| Icahn Enterprises LP / Icahn Enterprises Finance Corp. 4.75%, 9/15/24 | 1,851,000 | 1,740,310 |
| 2,877,238 | ||
| Iron/Steel — 1.69% | ||
| AK Steel Corp. 7.63%, 10/1/214 | 1,775,000 | 1,686,251 |
| Media — 4.37% | ||
| CCO Holdings LLC / CCO Holdings Capital Corp. 5.38%, 5/1/253 | 1,000,000 | 1,025,000 |
| GCI LLC 6.87%, 4/15/25 | 1,000,000 | 1,030,000 |
| Shares, Principal Amount, or Number of Contracts | Value | |
| Sirius XM Radio, Inc. 5.37%, 4/15/253 | $1,000,000 | $1,027,000 |
| Townsquare Media, Inc. 6.50%, 4/1/233 | 1,500,000 | 1,290,000 |
| 4,372,000 | ||
| Mining — 0.26% | ||
| Compass Minerals International, Inc. 6.75%, 12/1/273 | 250,000 | 262,500 |
| Oil & Gas Services — 2.46% | ||
| Archrock Partners LP / Archrock Partners Finance Corp. 6.87%, 4/1/273,4 | 2,372,000 | 2,234,424 |
| Archrock Partners LP / Archrock Partners Finance Corp. 6.25%, 4/1/283 | 250,000 | 227,500 |
| 2,461,924 | ||
| Pharmaceuticals — 2.76% | ||
| HLF Financing Sarl LLC / Herbalife International, Inc. 7.25%, 8/15/263,4 | 2,745,000 | 2,758,725 |
| Telecommunications — 9.70% | ||
| Cincinnati Bell, Inc. 7.00%, 7/15/243,4 | 3,000,000 | 3,060,000 |
| Consolidated Communications, Inc. 6.50%, 10/1/224 | 5,451,000 | 5,013,830 |
| HC2 Holdings, Inc. 11.50%, 12/1/213,4 | 634,000 | 603,885 |
| T-Mobile USA, Inc. 3.50%, 4/15/253 | 500,000 | 544,195 |
| Zayo Group Holdings, Inc. 4.00%, 3/1/273 | 250,000 | 237,890 |
| Zayo Group Holdings, Inc. 6.12%, 3/1/283 | 250,000 | 243,125 |
| 9,702,925 | ||
| Transportation — 3.03% | ||
| Cargo Aircraft Management, Inc. 4.75%, 2/1/283,4 | 2,000,000 | 1,982,500 |
| XPO Logistics, Inc. 6.25%, 5/1/253 | 1,000,000 | 1,047,500 |
| 3,030,000 | ||
| Trucking & Leasing — 2.95% | ||
| Fortress Transportation and Infrastructure Investors LLC 6.75%, 3/15/223,4 | 3,070,000 | 2,948,612 |
| Total CORPORATE BONDS (Cost $61,517,430) | 58,587,430 | |
| Shares, Principal Amount, or Number of Contracts | Value | ||
| FOREIGN ISSUER BONDS — 5.53% | |||
| Media — 2.81% | |||
| LCPR Senior Secured Financing DAC (Ireland) 6.75%, 10/15/273,9 | $2,750,000 | $2,805,000 | |
| Oil & Gas — 2.72% | |||
| Transocean Pontus Ltd. (Cayman Islands) 6.12%, 8/1/253,4,9 | 3,131,250 | 2,724,187 | |
| Total FOREIGN ISSUER BONDS (Cost $5,920,387) | 5,529,187 | ||
| COMMON STOCKS — 0.36% | |||
| Telecommunications — 0.36% | |||
| Consolidated Communications Holdings, Inc.* | 53,265 | 360,604 | |
| CONVERTIBLE PREFERRED STOCKS — 0.00% | |||
| Auto Manufacturers — 0.00% | |||
| General Motors Corp. Senior Convertible Preferred Escrow - B*,^ | 475,000 | 0 | |
| General Motors Corp. Senior Convertible Preferred Escrow - C*,^ | 11,790,650 | 0 | |
| 0 | |||
| PREFERRED STOCKS — 2.12% | |||
| Banks — 2.12% | |||
| GMAC Capital Trust I 6.18%, (3-Month USD Libor + 579 basis points), 2/15/404,6 | 93,866 | 2,118,556 | |
| PRIVATE STOCK — 0.12% | |||
| Investment Companies — 0.12% | |||
| Larchmont Resources LLC^ | 7,824 | 117,360 | |
| SHORT TERM INVESTMENTS — 22.15% | |||
| Northern Institutional Treasury Portfolio (Premier Class), 0.10% | 22,150,523 | 22,150,523 | |
| TOTAL INVESTMENTS (Cost $104,193,115) | 97.41% | $97,417,099 | |
| Other Assets In Excess Liabilities | 2.59% | 2,593,971 | |
| Net Assets | 100.00% | $100,011,070 | |
| INVESTMENT SECURITIES SOLD SHORT—(3.86)% | |||
| CORPORATE BONDS — (2.61)% | |||
| Advertising — (1.08)% | |||
| Outfront Media Capital LLC / Outfront Media Capital Corp. 5.00%, 8/15/273 | (1,200,000) | (1,080,000) | |
| Shares, Principal Amount, or Number of Contracts | Value | |
| Packaging & Container — (1.04)% | ||
| Owens-Brockway Glass Container, Inc. 6.63%, 5/13/273 | $(1,000,000) | $(1,040,000) |
| Software — (0.49)% | ||
| Blackboard, Inc. 10.37%, 11/15/243 | (500,000) | (487,500) |
| Total CORPORATE BONDS (Proceeds $2,623,565) | (2,607,500) | |
| MASTER LIMITED PARTNERSHIPS — (0.17)% | ||
| Investment Companies — (0.17)% | ||
| Compass Diversified Holdings 0.00%, | (10,000) | (172,400) |
| COMMON STOCKS — (1.08)% | ||
| Agriculture — (0.14)% | ||
| Vector Group Ltd. | (14,250) | (143,355) |
| Computers — (0.10)% | ||
| NCR Corp.* | (5,500) | (95,260) |
| Diversified Financial Services — (0.12)% | ||
| AerCap Holdings NV (Ireland)*,9 | (3,905) | (120,274) |
| Entertainment — (0.18)% | ||
| Lions Gate Entertainment Corp. - A* | (25,000) | (185,250) |
| Iron/Steel — (0.07)% | ||
| Cleveland-Cliffs, Inc. | (12,000) | (66,240) |
| Pharmaceuticals — (0.27)% | ||
| Herbalife Nutrition Ltd.* | (6,000) | (269,880) |
| Telecommunications — (0.20)% | ||
| Cincinnati Bell, Inc.* | (13,400) | (198,990) |
| Total COMMON STOCKS (Proceeds $1,095,370) | (1,079,249) | |
| TOTAL INVESTMENT SECURITIES SOLD SHORT (Proceeds $3,901,853) | (3.86)% | $(3,859,149) |
| ^ | Security valued at fair value as determined in good faith by the Adviser, in accordance with procedures established by, and under the general supervision of, the Trust’s Board of Trustee. The security is valued using significant unobservable inputs. |
| * | Non-income producing security. |
| 1 | Bank loans in which the Fund invests pay interest at rates which are periodically predetermined by reference to a base lending rate plus a premium. These base lending rates are generally (i) the lending rate offered by one or more major European banks, such as the London Inter-Bank Offered Rate (“LIBOR”), (ii) the prime rate offered by one or more United States banks or (iii) the certificate of deposit rate. Certain bank loans are subject to a LIBOR floor that establishes a minimum LIBOR rate. The interest rate shown reflects the rate in effect at June 30, 2020. Bank loans generally are subject to mandatory and/or optional repayment. As a result, the actual remaining maturity may be substantially less than the stated maturities shown. |
| 2 | Floating rate security. Rates disclosed as of June 30, 2020. |
| 3 | Security is exempt from registration under Rule 144A of the Securities Act of 1933, as amended. Unless otherwise indicated, this security has been determined to be liquid under procedures established by Driehaus Mutual Funds’ Board of Trustees and may be resold in transactions exempt from registration, normally to qualified institutional buyers. The total value of these securities is $45,465,048, which represents 45% of Net Assets. |
| 4 | All or a portion of this security is pledged as collateral for short sales or derivatives transactions. |
| 5 | Perpetual security. Maturity date shown is the next call date or final legal maturity date, whichever comes first. |
| 6 | Variable rate security. Rates disclosed as of June 30, 2020. |
| 7 | The coupon rate equals 155 basis points plus the highest of the LIBOR 3 Month, the Constant Maturity Treasury 10 year rate, and the Constant Maturity Treasury 30 year rate, with a maximum of 12.95%. |
| 8 | The coupon rate equals 155 basis points plus the highest of the LIBOR 3 Month, the Constant Maturity Treasury 10 year rate, and the Constant Maturity Treasury 30 year rate, with a maximum of 14.5%. |
| 9 | Foreign security denominated in U.S. dollars and traded in the U.S. |
| Security Type | Percent of Total Net Assets | |
| Bank Loans | 8.55% | |
| Corporate Bonds | 58.58% | |
| Common Stocks | 0.36% | |
| Convertible Preferred Stocks | 0.00% | |
| Foreign Issuer Bonds | 5.53% | |
| Preferred Stocks | 2.12% | |
| Private Stock | 0.12% | |
| Short Term Investments | 22.11% | |
| Total Investments | 97.37% | |
| Other Assets less Liabilities | 2.63% | |
| Total Net Assets | 100.00% |
| FUTURES CONTRACTS | ||||||||||||||
| Counterparty | Futures Contracts | Number of Contracts (Short) | Expiration Date | Notional Amount | Value at June 30, 2020 | Unrealized Appreciation/ (Depreciation) | ||||||||
| Goldman Sachs | E-Mini S&P 500 (United States Dollar) | (14) | September 18, 2020 | $(2,163,140) | $(2,154,205) | $8,935 | ||||||||
| Goldman Sachs | U.S. 5 Year Treasury Note | (15) | September 30, 2020 | (1,886,133) | (1,891,601) | (5,468) | ||||||||
| Goldman Sachs | U.S. 10 Year Treasury Note | (9) | September 21, 2020 | (1,252,547) | (1,256,995) | (4,448) | ||||||||
| Goldman Sachs | U.S. Treasury Long Bond | (2) | September 21, 2020 | (357,125) | (359,475) | (2,350) | ||||||||
| TOTAL FUTURES CONTRACTS | $(5,658,945) | $(5,662,276) | $(3,331) | |||||||||||
| Driehaus Emerging Markets Opportunities Fund | Driehaus Event Driven Fund | Driehaus Active Income Fund | |||
| ASSETS: | |||||
| Investments, at cost | $25,501,281 | $63,421,205 | $82,042,592 | ||
| Investments securities, at fair value | $32,289,148 | $72,044,035 | $75,266,576 | ||
| Short-term securities, at fair value (cost $1,672,200, $26,294,391 and $22,150,523, respectively) | $1,672,200 | $26,294,391 | $22,150,523 | ||
| Warrant securities, at fair value (cost $0, $121,220 and $0, respectively) | — | 565,858 | — | ||
| Foreign currency, at fair value (cost $35,855, $0 and $0, respectively) | 35,756 | — | — | ||
| Unrealized appreciation on forward foreign currency contracts | 20,464 | — | — | ||
| Collateral held at custodian for the benefit of brokers | 144,063 | 14,615,956 | 5,805,371 | ||
| Receivable for investment securities sold | 579,676 | 3,707,072 | — | ||
| Receivable for fund shares sold | — | 90,311 | 71 | ||
| Receivable for interest and dividends | 155,485 | 398,988 | 1,185,856 | ||
| Receivable for variation margin on futures contracts | — | — | 2,813 | ||
| Due from affiliates | 13,060 | — | — | ||
| Prepaid expenses | 28,280 | 48,168 | 22,178 | ||
| TOTAL ASSETS | 34,938,132 | 117,764,779 | 104,433,388 | ||
| LIABILITIES: | |||||
| Payable for investment securities sold short, cost | — | 9,205,110 | 3,901,853 | ||
| Payable for investment securities sold short, at fair value | — | 11,984,582 | 3,859,149 | ||
| Unrealized depreciation on forward foreign currency contracts | 38,920 | — | — | ||
| Payable for fund shares redeemed | — | 312,162 | 226,039 | ||
| Payable for investment securities purchased | 961,670 | 742,559 | — | ||
| Payable to affiliate | 24,234 | 83,573 | 47,491 | ||
| Payable for interest and dividends on securities sold short | — | 20,653 | 38,142 | ||
| Payable for variation margin on futures contracts | — | — | 29,750 | ||
| Accrued shareholder services plan fees | — | — | 28,038 | ||
| Accrued administration and accounting fees | 2,865 | 4,735 | 15,745 | ||
| Accrued expenses | 36,812 | 46,019 | 177,964 | ||
| TOTAL LIABILITIES | 1,064,501 | 13,194,283 | 4,422,318 | ||
| NET ASSETS | $33,873,631 | $104,570,496 | $100,011,070 | ||
| NET ASSETS CONSISTED OF THE FOLLOWING AT JUNE 30, 2020: | |||||
| Paid-in-capital | $27,791,629 | $99,392,900 | $624,066,292 | ||
| Total distributable earnings (deficit) | 6,082,002 | 5,177,596 | (524,055,222) | ||
| NET ASSETS | $33,873,631 | $104,570,496 | $100,011,070 | ||
| NET ASSETS | $33,873,631 | $104,570,496 | $100,011,070 | ||
| SHARES OUTSTANDING (Unlimited shares authorized, no par value) | 2,795,265 | 8,694,734 | 11,910,873 | ||
| NET ASSET VALUE | $12.12 | $12.03 | $8.40 | ||
| Driehaus Emerging Markets Opportunities Fund | Driehaus Event Driven Fund | Driehaus Active Income Fund | |||
| INVESTMENT INCOME: | |||||
| Interest income | $297,251 | $1,218,494 | $3,773,661 | ||
| Dividend income | 142,276 | 108,463 | 180,294 | ||
| Total investment income | 439,527 | 1,326,957 | 3,953,955 | ||
| Expenses: | |||||
| Investment advisory fees | 148,679 | 411,342 | 408,283 | ||
| Shareholder services fees | — | 7,847 | 1,539 | ||
| Administration fees | 33,705 | 38,290 | 57,474 | ||
| Transfer agent fees | 16,161 | 59,891 | 176,724 | ||
| Trustees fees | 5,467 | 9,856 | 43,508 | ||
| Custody fees | 21,325 | 16,988 | 11,162 | ||
| Reports to shareholders | 2,885 | 7,138 | 20,413 | ||
| Professional fees | 2,477 | 5,709 | 20,645 | ||
| Audit and tax fees | 24,238 | 25,170 | 23,847 | ||
| Federal and state registration fees | 10,401 | 10,872 | 13,833 | ||
| Chief compliance officer fees | 8,305 | 8,305 | 8,305 | ||
| Income on short positions | — | 53,466 | 118,739 | ||
| Interest expense | — | — | 7,753 | ||
| Miscellaneous | 21,032 | 16,240 | 43,808 | ||
| Total expenses | 294,675 | 671,114 | 956,033 | ||
| Fees paid indirectly | — | (7,585) | (210) | ||
| Fees waived by Adviser | (130,724) | — | — | ||
| Net expenses | 163,951 | 663,529 | 955,823 | ||
| Net investment income (loss) | 275,576 | 663,428 | 2,998,132 | ||
| NET REALIZED AND UNREALIZED GAIN (LOSS) ON INVESTMENT TRANSACTIONS: | |||||
| Net realized gain (loss) on transactions from: | |||||
| Investments | (443,762) | (1,020,877) | (7,024,449) | ||
| Purchased options contracts | — | — | (2,036) | ||
| Securities sold short | — | 695,799 | 405,937 | ||
| Futures contracts | — | — | (1,148,339) | ||
| Swaps contracts | 44,544 | — | — | ||
| Foreign currency | 3,055 | — | — | ||
| Net realized gain (loss) on investment transactions | (396,163) | (325,078) | (7,768,887) | ||
| Change in net unrealized appreciation (depreciation) on: | |||||
| Investments | 9,112 | 5,766,116 | (7,275,096) | ||
| Purchased options contracts | — | — | 28,995 | ||
| Warrants | — | 344,520 | — | ||
| Securities sold short | — | (304,928) | 438,302 | ||
| Futures contracts | — | — | (124,349) | ||
| Swap contracts | (26,132) | — | — | ||
| Forward foreign currency contracts | (18,456) | — | — | ||
| Foreign currency | (554) | — | — | ||
| Foreign currency translations | (2,637) | — | — | ||
| Net change in unrealized appreciation (depreciation) on investment transactions | (38,667) | 5,805,708 | (6,932,148) | ||
| Net realized and unrealized gain (loss) on investment transactions | (434,830) | 5,480,630 | (14,701,035) | ||
| NET INCREASE (DECREASE) IN NET ASSETS FROM OPERATIONS | $(159,254) | $6,144,058 | $(11,702,903) | ||
| Driehaus Emerging Markets Opportunities Fund | Driehaus Event Driven Fund | ||||||
| For the six months ended June 30, 2020 (unaudited) | For the year ended December 31, 2019 | For the six months ended June 30, 2020 (unaudited) | For the year ended December 31, 2019 | ||||
| INCREASE (DECREASE) IN NET ASSETS: | |||||||
| Operations: | |||||||
| Net investment income (loss) | $275,576 | $947,357 | $663,428 | $1,448,301 | |||
| Net realized gain (loss) on investment transactions | (396,163) | 333,334 | (325,078) | 4,699,382 | |||
| Net change in unrealized appreciation (depreciation) on investment transactions | (38,667) | 5,614,238 | 5,805,708 | 4,010,666 | |||
| Net increase (decrease) in net assets resulting from operations | (159,254) | 6,894,929 | 6,144,058 | 10,158,349 | |||
| Distributions from distributable earnings to shareholders | — | (443,723) | — | (2,262,269) | |||
| Capital share transactions: | |||||||
| Proceeds from shares sold | 1,351,498 | 10,925,869 | 43,189,813 | 36,050,717 | |||
| Reinvested distributions | — | 443,412 | 99,000 | 2,071,307 | |||
| Cost of shares redeemed | (6,361,670) | (10,414,503) | (14,317,404) | (28,238,483) | |||
| Net increase (decrease) from capital transactions | (5,010,172) | 954,778 | 28,971,409 | 9,883,541 | |||
| Total increase (decrease) in net assets | (5,169,426) | 7,405,984 | 35,115,467 | 17,779,621 | |||
| NET ASSETS: | |||||||
| Beginning of period | $39,043,057 | $31,637,073 | $69,455,029 | $51,675,408 | |||
| End of period | $33,873,631 | $39,043,057 | $104,570,496 | $69,455,029 | |||
| Driehaus Active Income Fund | ||
| For the six months ended June 30, 2020 (unaudited) | For the year ended December 31, 2019 | |
| $2,998,132 | $22,016,763 | |
| (7,768,887) | (31,100,746) | |
| (6,932,148) | 39,951,481 | |
| (11,702,903) | 30,867,498 | |
| (4,104,061) | (26,303,891) | |
| 13,632,043 | 79,909,192 | |
| 1,814,657 | 9,520,893 | |
| (139,312,376) | (649,333,198) | |
| (123,865,676) | (559,903,113) | |
| (139,672,640) | (555,339,506) | |
| $239,683,710 | $795,023,216 | |
| $100,011,070 | $239,683,710 | |
| For the six month period January 1, 2020 through June 30, 2020 (unaudited) | For the year ended December 31, 2019 | For the year ended December 31, 2018 | For the period April 10, 2017* through December 31, 2017 | ||||
| Net asset value, beginning of period | $ 11.94 | $ 9.93 | $ 11.54 | $ 10.00 | |||
| INCOME (LOSS) FROM INVESTMENT OPERATIONS: | |||||||
| Net investment income1 | 0.09 | 0.29 | 0.24 | 0.17 | |||
| Net realized and unrealized gain (loss) on investments | 0.09 | 1.86 | (1.77) | 1.94 | |||
| Total income (loss) from investment operations | 0.18 | 2.15 | (1.53) | 2.11 | |||
| LESS DISTRIBUTIONS: | |||||||
| Net investment income | — | (0.14) | — | (0.16) | |||
| Net realized gain | — | — | (0.08) | (0.41) | |||
| Total distributions | — | (0.14) | (0.08) | (0.57) | |||
| Redemption fees added to paid-in capital | 0.002 | — | — | 0.002 | |||
| Net asset value, end of period | $ 12.12 | $ 11.94 | $ 9.93 | $ 11.54 | |||
| Total Return | 1.51%3 | 21.64% | (13.22)% | 21.14%3 | |||
| RATIOS/SUPPLEMENTAL DATA: | |||||||
| Net assets, end of period (000’s) | $ 33,874 | $ 39,043 | $ 31,637 | $ 43,183 | |||
| Ratio of total expenses before reimbursements, waivers, recaptures and/or fees paid indirectly to average net assets | 1.78%4 | 1.89% | 2.05% | 2.04%4 | |||
| Ratio of total expenses net of reimbursements, waivers, recaptures and/or fees paid indirectly to average net assets5 | 0.99%4,6 | 1.23%6,7 | 1.75%6,7 | 1.75%4 | |||
| Ratio of net investment income (including dividends and interest on short positions and interest expense) net of reimbursements, waivers, recaptures and/or fees paid indirectly to average net assets5 | 1.66%4,6 | 2.67%7 | 2.19%7 | 2.12%4 | |||
| Portfolio turnover | 75%3 | 155% | 169% | 99%3 |
| * | Fund commenced operations on April 10, 2017. |
| 1 | Calculated using the average shares outstanding method. |
| 2 | Amount represents less than $0.01 per share. |
| 3 | Not annualized. |
| 4 | Annualized. |
| 5 | Effective May 1, 2019 the Adviser contractually agreed to waive its investment advisory fee or absorb other operating expenses to the extent necessary to ensure that total annual Fund operating expenses (other than interest, taxes, brokerage commissions, dividends and interest on short sales, other investment-related expenses, acquired fund fees and expenses, and extraordinary expenses such as litigation and other expenses not incurred in the ordinary course of the Fund’s business) would not exceed the Fund’s operating expense cap of 0.99% of average daily net assets until April 30, 2022. Prior to May 1, 2019. the annual operating expense limitation was 1.75%. |
| 6 | Such ratios are net of fees paid indirectly (see Note C in the Notes to Financial Statements). |
| 7 | The ratio for the fund includes the effect of fees paid indirectly which impacted the ratio by 0.00% for the years 2018 and 2019. |
| For the six month period January 1, 2020 through June 30, 2020 (unaudited) | For the year ended December 31, 2019 | For the year ended December 31, 2018 | For the year ended December 31, 2017 | For the year ended December 31, 2016 | For the year ended December 31, 2015 | ||||||
| Net asset value, beginning of period | $ 11.55 | $ 9.99 | $ 10.79 | $ 10.34 | $ 9.85 | $ 10.01 | |||||
| INCOME (LOSS) FROM INVESTMENT OPERATIONS: | |||||||||||
| Net investment income1 | 0.09 | 0.26 | 0.25 | 0.02 | 0.02 | 0.05 | |||||
| Net realized and unrealized gain (loss) on investments | 0.39 | 1.69 | (0.69) | 0.43 | 0.59 | (0.15) | |||||
| Total income (loss) from investment operations | 0.48 | 1.95 | (0.44) | 0.45 | 0.61 | (0.10) | |||||
| LESS DISTRIBUTIONS: | |||||||||||
| Net investment income | — | (0.39) | (0.36) | — | (0.09) | (0.06) | |||||
| Tax return of capital | — | — | — | — | (0.03) | — | |||||
| Total distributions | — | (0.39) | (0.36) | — | (0.12) | (0.06) | |||||
| Net asset value, end of period | $ 12.03 | $ 11.55 | $ 9.99 | $ 10.79 | $ 10.34 | $ 9.85 | |||||
| Total Return | 4.16%2 | 19.53% | (4.03)% | 4.35% | 6.25% | (1.08)% | |||||
| RATIOS/SUPPLEMENTAL DATA: | |||||||||||
| Net assets, end of period (000’s) | $ 104,570 | $ 69,455 | $ 51,675 | $ 165,648 | $ 256,482 | $ 232,456 | |||||
| Ratio of total expenses before reimbursements, waivers, recaptures and/or fees paid indirectly to average net assets | 1.63%3 | 1.93% | 1.90% | 1.77% | 2.03% | 1.86% | |||||
| Ratio of total expenses net of reimbursements, waivers, recaptures and/or fees paid indirectly to average net assets | 1.61%3,4,5,6 | 1.90%4,5,6 | 1.88%4,5,6 | 1.76%4,5,6 | 2.01%4,5,6 | 1.86% | |||||
| Ratio of net investment income (including dividends and interest on short positions and interest expense) net of reimbursements, waivers, recaptures and/or fees paid indirectly to average net assets | 1.61%3,5,6 | 2.33%5 | 2.25%5 | 0.17%5 | 0.19%5 | 0.45% | |||||
| Portfolio turnover | 83%2 | 111% | 101% | 198% | 246% | 400% |
| 1 | Calculated using the average shares outstanding method. |
| 2 | Not annualized. |
| 3 | Annualized. |
| 4 | The ratio for the fund includes the effect of income on short positions which increased the ratio by 0.43%, 0.59%, 0.31%, 0.31% and 0.30% for the years 2015, 2016, 2017, 2018 and 2019. For the six months ended June 30, 2020, the effect of income on short positions increased the ratio by 0.13%. |
| 5 | The ratio for the fund includes the effect of fees paid indirectly which impacted the ratio by 0.02%, 0.01%, 0.02%, 0.03% and 0.02% for the years 2016, 2017, 2018, 2019 and for the six months ended June 30, 2020. |
| 6 | Such ratios are net of fees paid indirectly (see Note C in the Notes to Financial Statements). |
| For the six month period January 1, 2020 through June 30, 2020 (unaudited) | For the year ended December 31, 2019 | For the year ended December 31, 2018 | For the year ended December 31, 2017 | For the year ended December 31, 2016 | For the year ended December 31, 2015 | ||||||
| Net asset value, beginning of period | $ 9.33 | $ 9.32 | $ 9.86 | $ 10.18 | $ 9.95 | $ 10.42 | |||||
| INCOME (LOSS) FROM INVESTMENT OPERATIONS: | |||||||||||
| Net investment income1 | 0.18 | 0.43 | 0.46 | 0.35 | 0.32 | 0.38 | |||||
| Net realized and unrealized gain (loss) on investments | (0.83) | 0.11 | (0.57) | (0.29) | 0.23 | (0.49) | |||||
| Total income (loss) from investment operations | (0.65) | 0.54 | (0.11) | 0.06 | 0.55 | (0.11) | |||||
| LESS DISTRIBUTIONS: | |||||||||||
| Net investment income | (0.28) | (0.53) | (0.43) | (0.38) | (0.32) | (0.36) | |||||
| Total distributions | (0.28) | (0.53) | (0.43) | (0.38) | (0.32) | (0.36) | |||||
| Net asset value, end of period | $ 8.40 | $ 9.33 | $ 9.32 | $ 9.86 | $ 10.18 | $ 9.95 | |||||
| Total Return | (6.84)%2 | 5.89% | (1.26)% | 0.59% | 5.63% | (1.07)% | |||||
| RATIOS/SUPPLEMENTAL DATA: | |||||||||||
| Net assets, end of period (000’s) | $ 100,011 | $ 239,684 | $ 795,023 | $ 1,534,270 | $ 2,274,827 | $ 2,875,993 | |||||
| Ratio of total expenses before reimbursements, waivers, recaptures and/or fees paid indirectly to average net assets | 1.27%3 | 1.40% | 1.10% | 1.18% | 1.38% | 1.05% | |||||
| Ratio of total expenses net of reimbursements, waivers, recaptures and/or fees paid indirectly to average net assets | 1.27%3,4,5,6 | 1.40%4,5,6 | 1.10%4,5,6 | 1.17%4,5,6 | 1.38%4,5,6 | 1.05% | |||||
| Ratio of net investment income (including dividends and interest on short positions and interest expense) net of reimbursements, waivers, recaptures and/or fees paid indirectly to average net assets | 4.00%3,5 | 4.55%5 | 4.70%5 | 3.53%5 | 3.20%5 | 3.69% | |||||
| Portfolio turnover | 28%2 | 84% | 74% | 89% | 115% | 76% |
| 1 | Calculated using the average shares outstanding method. |
| 2 | Not annualized. |
| 3 | Annualized. |
| 4 | The ratio for the fund includes the effect of income on short positions which decreased the ratio by 0.27%, 0.58%, 0.36%, 0.28% and 0.49% for the years 2015, 2016, 2017, 2018 and 2019. For the six months ended June 30, 2020, the effect of income on short positions decreased the ratio by 0.16%. |
| 5 | The ratio for the fund includes the effect of fees paid indirectly which decreased the ratio by 0.00%, 0.01%, 0.00%, 0.00% and 0.00% for the years 2016, 2017, 2018, 2019 and for the six months ended June 30, 2020. |
| 6 | Such ratios are net of fees paid indirectly (see Note C in the Notes to Financial Statements). |
| Fund | Commencement of Operations |
| Emerging Markets Opportunities Fund* | 04/10/17 |
| Event Driven Fund | 08/26/13 |
| Active Income Fund | 06/01/09 |
| * | Prior to January 29, 2020, the Emerging Markets Opportunities Fund was known as the Driehaus Multi-Asset Growth Economies Fund. |
| Assets | Total Value at June 30, 2020 | Level 1 Quoted Price | Level 2 Significant Observable Inputs | Level 3 Significant Unobservable Inputs | ||||
| Equity Securities | ||||||||
| Brazil | $1,471,903 | $1,471,903 | $— | $— | ||||
| Canada | 360,394 | 360,394 | — | — | ||||
| Chile | 327,152 | 327,152 | — | — | ||||
| China | 10,060,925 | 1,909,538 | 8,151,387 | — | ||||
| France | 442,808 | — | 442,808 | — | ||||
| Hong Kong | 1,348,703 | — | 1,348,703 | — | ||||
| India | 2,208,529 | 699,067 | 1,509,462 | — | ||||
| Indonesia | 335,032 | — | 335,032 | — | ||||
| Mexico | 155,568 | 155,568 | — | — | ||||
| Netherlands | 319,721 | — | 319,721 | — | ||||
| Poland | 534,494 | — | 534,494 | — | ||||
| Russia | 1,263,714 | 372,649 | 891,065 | — | ||||
| Singapore | 367,297 | 367,297 | — | — | ||||
| Slovenia | 193,379 | — | 193,379 | — | ||||
| South Africa | 372,404 | — | 372,404 | — | ||||
| South Korea | 2,487,137 | — | 2,487,137 | — | ||||
| Sweden | 327,385 | 327,385 | — | — | ||||
| Taiwan | 2,853,465 | — | 2,853,465 | — | ||||
| United Arab Emirates | 150,467 | — | 150,467 | — | ||||
| United States | 661,054 | 661,054 | — | — | ||||
| Short Term Investments | 1,672,200 | 1,672,200 | — | — |
| Assets | Total Value at June 30, 2020 | Level 1 Quoted Price | Level 2 Significant Observable Inputs | Level 3 Significant Unobservable Inputs | ||||
| Sovereign Bonds | $6,047,617 | $— | $6,047,617 | $— | ||||
| Total | $33,961,348 | $8,324,207 | $25,637,141 | $ — |
| Other Financial Instruments | ||||||||
| Forward Foreign Currency Contracts - Assets | $20,464 | $— | $20,464 | $— | ||||
| Forward Foreign Currency Contracts - Liabilities | (38,920) | — | (38,920) | — | ||||
| Total Other Financial Instruments | $(18,456) | $ — | $(18,456) | $ — |
| Assets | Total Value at June 30, 2020 | Level 1 Quoted Price | Level 2 Significant Observable Inputs | Level 3 Significant Unobservable Inputs | ||||
| Common Stocks | ||||||||
| Advertising | $274,011 | $274,011 | $— | $— | ||||
| Banks | 1,125,017 | 1,125,017 | — | — | ||||
| Biotechnology | 7,613,263 | 7,613,263 | — | — | ||||
| Electric | 787,645 | 787,645 | — | — | ||||
| Healthcare - Products | 2,976,566 | 2,976,566 | — | — | ||||
| Healthcare - Services | 1,850,088 | 1,850,088 | — | — | ||||
| Holding Companies-Diversified | 6,275,326 | 6,275,326 | — | — | ||||
| Lodging | 2,365,823 | 2,365,823 | — | — | ||||
| Pharmaceuticals | 13,957,460 | 13,957,460 | — | — | ||||
| REITS | 2,412,781 | 2,412,781 | — | — | ||||
| Retail | 1,180,623 | 1,180,623 | — | — | ||||
| Savings & Loans | 1,525,770 | 1,525,770 | — | — | ||||
| Telecommunications | 1,579,038 | 1,579,038 | — | — | ||||
| Convertible Bonds | 1,662,679 | — | 1,662,679 | — | ||||
| Convertible Preferred Stocks | 0 | — | — | 0 | ||||
| Corporate Bonds | 19,185,382 | — | 19,185,382 | — | ||||
| Foreign Issuer Bonds | 1,296,713 | — | 1,296,713 | — | ||||
| Master Limited Partnerships | 463,093 | 463,093 | — | — | ||||
| Preferred Stocks | 1,968,691 | — | 1,968,691 | — | ||||
| Private Investment in Public Equity | 1,994,066 | — | — | 1,994,066 | ||||
| Private Preferred Stocks | 1,550,000 | — | — | 1,550,000 | ||||
| Short Term Investments | 26,294,391 | 26,294,391 | — | — | ||||
| Warrants | 565,858 | 565,855 | 3 | — | ||||
| Total | $98,904,284 | $71,246,750 | $24,113,468 | $3,544,066 |
| Liabilities | ||||
| Common Stocks Sold Short | $(623,264) | $(623,264) | $— | $— |
| Corporate Bonds Sold Short | (1,155,755) | — | (1,155,755) | — |
| Liabilities | TotalValue at June 30, 2020 | Level 1Quoted Price | Level 2Significant Observable Inputs | Level 3Significant Unobservable Inputs | ||||
| Exchange-Traded Funds Sold Short | $(10,205,563) | $(10,205,563) | $— | $— | ||||
| Total | $(11,984,582) | $(10,828,827) | $(1,155,755) | $ — |
| Investments, at Value | |
| Balance as of December 31, 2019 | $412,500 |
| Realized gain (loss) | — |
| Change in net unrealized appreciation (depreciation) | 2,129,688 |
| Purchases | 1,001,878 |
| Sales | — |
| Transfers in and/or out of Level 3 | 0 |
| Balance as of June 30, 2020 | $3,544,066 |
| Financial Assets | Fair Value at June 30, 2020 | Valuation Technique(s) | Unobservable Inputs | Price/Range | ||||
| Convertible preferred stocks | $0 | Cash available in relation to claim | Estimated recovery | - | ||||
| Private Investment in Public Equity (PIPES) | $1,994,066 | Market approach | Probability of transaction close | 98.25% | ||||
| Private Preferred Stocks | $1,550,000 | Market approach | Transaction price | $1 |
| Assets | Total Value at June 30, 2020 | Level 1 Quoted Price | Level 2 Significant Observable Inputs | Level 3 Significant Unobservable Inputs | ||||
| Bank Loans | $8,553,439 | $— | $8,553,439 | $— |
| Assets | Total Value at June 30, 2020 | Level 1 Quoted Price | Level 2 Significant Observable Inputs | Level 3 Significant Unobservable Inputs | ||||
| Common Stocks | $360,604 | $360,604 | $— | $— | ||||
| Convertible Preferred Stocks | 0 | — | — | 0 | ||||
| Corporate Bonds | 58,587,430 | — | 58,587,430 | — | ||||
| Foreign Issuer Bonds | 5,529,187 | — | 5,529,187 | — | ||||
| Preferred Stocks | 2,118,556 | — | 2,118,556 | — | ||||
| Private Stock | 117,360 | — | — | 117,360 | ||||
| Short Term Investments | 22,150,523 | 22,150,523 | — | — | ||||
| Total | $97,417,099 | $22,511,127 | $74,788,612 | $117,360 |
| Liabilities | ||||||||
| Common Stocks Sold Short | $(1,079,249) | $(1,079,249) | $— | $— | ||||
| Corporate Bonds Sold Short | (2,607,500) | — | (2,607,500) | — | ||||
| Master Limited Partnership Sold Shorts | (172,400) | (172,400) | — | — | ||||
| Total | $(3,859,149) | $(1,251,649) | $(2,607,500) | $ — |
| Other Financial Instruments | ||||||||
| Futures Contracts - Assets | $8,935 | $8,935 | $— | $— | ||||
| Futures Contracts - Liabilities | (12,266) | (12,266) | — | — | ||||
| Total Other Financial Instruments | $(3,331) | $(3,331) | $ — | $ — |
| Investments, at Value | |
| Balance as of December 31, 2019 | $1,173,600 |
| Realized gain (loss) | — |
| Change in net unrealized appreciation (depreciation) | (1,056,240) |
| Purchases | — |
| Sales | — |
| Transfers in and/or out of Level 3 | — |
| Balance as of June 30, 2020 | $117,360 |
| Financial Assets | Fair Value at June 30, 2020 | Valuation Technique(s) | Unobservable Inputs | Price/Range | ||||
| Convertible preferred stocks | $0 | Cash available in relation to claim | Estimated recovery | - | ||||
| Private Stock | $117,360 | Recovery Analysis | N/A | N/A |
| Not Subject to Expiration | ||||
| Fund | Short-Term | Long-Term | ||
| Emerging Markets Opportunities Fund | $702,292 | $— | ||
| Event Driven Fund | 1,364,303 | — | ||
| Active Income Fund | 332,112,366 | 176,616,975 | ||
| Fund | Year | Ordinary Income | Long-Term Capital Gain | Return of Capital | Total Distribution | |||||
| Emerging Markets Opportunities Fund | 2019 | $443,723 | $— | $— | $443,723 | |||||
| 2018 | 233,414 | 29,970 | — | 263,384 | ||||||
| Event Driven Fund | 2019 | 2,262,269 | — | — | 2,262,269 | |||||
| 2018 | 1,805,482 | — | — | 1,805,482 | ||||||
| Active Income Fund | 2019 | 26,303,891 | — | — | 26,303,891 | |||||
| 2018 | 61,286,044 | — | — | 61,286,044 |
| Emerging Markets Opportunities Fund | Event Driven Fund | Active Income Fund | |||
| Undistributed ordinary income | $255,525 | $539,724 | $1,277,797 | ||
| Undistributed long-term capital gain | — | — | — | ||
| Accumulated earnings | 255,525 | 539,724 | 1,277,797 | ||
| Accumulated capital and other losses | (702,292) | (1,364,303) | (508,729,341) | ||
| Unrealized appreciation (depreciation) on currency and foreign currency translations | 2,880 | — | — | ||
| Unrealized appreciation (depreciation) on swap and swaptions contracts | 26,132 | — | — | ||
| Unrealized appreciation (depreciation) on investments, securities, sold short, options and futures contracts | 6,659,011 | (141,883) | (796,714) | ||
| Net assets | $6,241,256 | $(966,462) | $(508,248,258) |
| Fund | Basis | Gross Appreciation | Gross Depreciation | Net Appreciation/ Depreciation | ||||
| Emerging Markets Opportunities Fund | $27,293,329 | $7,243,973 | $(594,410) | $6,649,563 | ||||
| Event Driven Fund | 81,255,877 | 12,426,719 | (6,762,894) | 5,663,825 | ||||
| Active Income Fund | 101,162,463 | 697,405 | (8,305,249) | (7,607,844) |
| Asset derivatives | ||||
| Risk exposure category | Statements of Assets and Liabilities location | Fair Value | ||
| Currency contracts | Unrealized appreciation on forward foreign currency contracts | $20,464 | ||
| Total | $20,464 | |||
| Liabilities derivatives | ||||
| Risk exposure category | Statements of Assets and Liabilities location | Fair Value | ||
| Currency contracts | Unrealized depreciation on forward foreign currency contracts | $38,920 | ||
| Total | $38,920 | |||
| Asset derivatives | ||||
| Risk exposure category | Statements of Assets and Liabilities location | Fair Value | ||
| Equity contracts | Warrant securities, at fair value | $565,858 | ||
| Total | $565,858 | |||
| Asset derivatives | ||||
| Risk exposure category | Statements of Assets and Liabilities location | Fair Value | ||
| Equity contracts | N/A* | $8,935 | ||
| Total | $8,935 | |||
| * | Includes cumulative appreciation/depreciation of futures contracts as shown in the Schedule of Investments. Only current day’s variation margin is reported in the Statements of Assets and Liabilities. |
| Liabilities derivatives | ||||
| Risk exposure category | Statements of Assets and Liabilities location | Fair Value | ||
| Interest rate contracts | N/A* | $12,266 | ||
| Total | $12,266 | |||
| * | Includes cumulative appreciation/depreciation of futures contracts as shown in the Schedule of Investments. Only current day’s variation margin is reported in the Statements of Assets and Liabilities. |
| Amount of net realized gain (loss) on derivatives | ||||
| Risk exposure category | ||||
| Derivative | Interest rate contracts | Total | ||
| Swap contracts | $44,544 | $44,544 | ||
| Total | $44,544 | $44,544 | ||
| Amount of net realized gain (loss) on derivatives | ||||||
| Risk exposure category | ||||||
| Derivative | Equity contracts | Interest rate contracts | Total | |||
| Purchased options contracts | $(2,036) | $— | $(2,036) | |||
| Futures contracts | (227,730) | (920,610) | (1,148,339) | |||
| Total | $(229,766) | $(920,610) | $ (1,150,375) | |||
| Change in net unrealized appreciation (depreciation) on derivatives | ||||||
| Risk exposure category | ||||||
| Derivative | Currency contracts | Interest rate contracts | Total | |||
| Forward foreign currency contracts | $(18,456) | $— | $(18,456) | |||
| Swap contracts | — | (26,132) | (26,132) | |||
| Total | $(18,456) | $(26,132) | $(44,588) | |||
| Quarterly Derivative Averages | ||||
| Derivative | Quarterly Average | $ Amount/ Number | ||
| Swap contracts | gross notional amount | $18,215,035 | ||
| Forward foreign currency contracts - Long | gross notional amount | $1,221,073 | ||
| Forward foreign currency contracts - Short | gross notional amount | $1,227,225 | ||
| Change in net unrealized appreciation (depreciation) on derivatives | ||||
| Risk exposure category | ||||
| Derivative | Equity contracts | Total | ||
| Warrant contracts | $344,520 | $344,520 | ||
| Total | $344,520 | $344,520 | ||
| Quarterly Derivative Averages | ||||
| Derivative | Quarterly Average | $ Amount/ Number | ||
| Warrant contracts | number of contracts | 154,377 | ||
| Change in net unrealized appreciation (depreciation) on derivatives | ||||||
| Risk exposure category | ||||||
| Derivative | Equity contracts | Interest rate contracts | Total | |||
| Purchased options contracts | $28,995 | $— | $28,995 | |||
| Futures contracts | 8,935 | (133,284) | (124,349) | |||
| Total | $37,930 | $(133,284) | $(95,354) | |||
| Quarterly Derivative Averages | ||||
| Derivative | Quarterly Average | $ Amount/ Number | ||
| Purchased options contracts | number of contracts | 302 | ||
| Futures contracts - Short | number of contracts | (87) | ||
| Description | Gross Amounts Recognized in Statements of Assets and Liabilities | Derivatives Available for Offset | Collateral Received/ (Pledged) | Net Amount1 | ||||
| Unrealized appreciation on forward foreign currency contracts | $20,464 | $(20,464) | $— | $— |
| Description | Gross Amounts Recognized in Statements of Assets and Liabilities | Derivatives Available for Offset | Collateral Received/ (Pledged) | Net Amount2 | ||||
| Unrealized depreciation on forward foreign currency contracts | $(38,920) | $20,464 | $— | $(18,456) |
| 1 | Net amount represents the net amount receivable from the counterparty in the event of default. |
| 2 | Net amount represents the net amount payable to the counterparty in the event of default. |
| Year Ended December 31 | Emerging Markets Opportunities Fund | |
| 2021 | $119,889 | |
| 2022 | 234,125 | |
| 2023 | 130,724 | |
| Total | $484,738 |
| Fund | Purchases | Sales | Net Realized Gain (Loss) | |||
| Event Driven Fund | $1,079,445 | $— | $— | |||
| Active Income Fund | — | 5,350,225 | (109,648) |
| Fund | Shareholder services plan fees | Accrued shareholder services plan fees | ||
| Event Driven Fund | $ 7,847 | $— | ||
| Active Income Fund | 1,539 | 28,038 |
| Fund | Purchases | Sales | ||
| Emerging Markets Opportunities Fund | $23,421,552 | $26,588,352 | ||
| Event Driven Fund | 67,361,544 | 59,344,721 | ||
| Active Income Fund | 34,809,590 | 127,828,983 |
| Emerging Markets Opportunities Fund | Event Driven Fund | Active Income Fund | |||||||||
| 2020 | 2019 | 2020 | 2019 | 2020 | 2019 | ||||||
| Fund | |||||||||||
| Shares issued | 113,473 | 920,608 | 3,933,357 | 3,126,556 | 1,556,173 | 8,508,587 | |||||
| Shares reinvested | — | 37,514 | 8,594 | 181,217 | 223,196 | 1,024,936 | |||||
| Shares redeemed | (587,224) | (873,645) | (1,261,624) | (2,468,451) | (15,566,993) | (69,173,948) | |||||
| Net increase (decrease) | (473,751) | 84,477 | 2,680,327 | 839,322 | (13,787,624) | (59,640,425) | |||||
| Emerging Markets Opportunities Fund | ||||||
| Beginning Account Value January 1, 2020 | Ending Account Value June 30, 2020 | Expenses Paid During Six Months Ended June 30, 2020* | ||||
| Actual | $1,000.00 | $1,015.10 | $4.96 | |||
| Hypothetical Example, assuming a 5% return before expenses | $1,000.00 | $1,019.94 | $4.97 | |||
| Event Driven Fund | ||||||
| Beginning Account Value January 1, 2020 | Ending Account Value June 30, 2020 | Expenses Paid During Six Months Ended June 30, 2020* | ||||
| Actual | $1,000.00 | $1,041.60 | $7.51 | |||
| Hypothetical Example, assuming a 5% return before expenses | $1,000.00 | $1,017.50 | $7.42 | |||
| Active Income Fund | ||||||
| Beginning Account Value January 1, 2020 | Ending Account Value June 30, 2020 | Expenses Paid During Six Months Ended June 30, 2020* | ||||
| Actual | $1,000.00 | $931.60 | $5.33 | |||
| Hypothetical Example, assuming a 5% return before expenses | $1,000.00 | $1,019.34 | $5.57 | |||
| Emerging Markets Opportunities Fund | 0.99% |
| Event Driven Fund | 1.48% |
| Active Income Fund | 1.11% |
| • | the program supported each Fund’s ability to honor redemption requests timely; |
| • | the program supported the Adviser’s management of each Fund’s liquidity profile, including during periods of market volatility and net redemptions; |
| • | no material liquidity issues were identified during the period; |
| • | there were no material changes to the program during the period; |
| • | the implementation of the program was effective to manage each Fund’s liquidity risk; and |
| • | the program operated adequately during the period. |
Item 2. Code of Ethics.
Not applicable.
Item 3. Audit Committee Financial Expert.
Not applicable.
Item 4. Principal Accountant Fees and Services.
Not applicable.
Item 5. Audit Committee of Listed Registrants.
Not applicable.
Item 6. Investments.
| (a) | Schedule of Investments in securities of unaffiliated issuers as of the close of the reporting period is included as part of the report to shareholders filed under Item 1 of this form. |
| (b) | Not applicable. |
Item 7. Disclosure of Proxy Voting Policies and Procedures for Closed-End Management Investment Companies.
Not applicable.
Item 8. Portfolio Managers of Closed-End Management Investment Companies.
Not applicable.
Item 9. Purchases of Equity Securities by Closed-End Management Investment Companies and Affiliated Purchasers.
Not applicable.
Item 10. Submission of Matters to a Vote of Security Holders.
There have been no material changes to the procedures by which the shareholders may recommend nominees to the registrant’s board of directors, where those changes were implemented after the registrant last provided disclosure in response to the requirements of Item 407(c)(2)(iv) of Regulation S-K (17 CFR 229.407) (as required by Item 22(b)(15) of Schedule 14A (17 CFR 240.14a-101)), or this Item.
Item 11. Controls and Procedures.
| (a) | The registrant’s principal executive and principal financial officers, or persons performing similar functions, have concluded that the registrant’s disclosure controls and procedures (as defined in Rule 30a-3(c) under the Investment Company Act of 1940, as amended (the “1940 Act”) (17 CFR 270.30a-3(c))) are effective, as of a date within 90 days of the filing date of the report that includes the disclosure required by this paragraph, based on their evaluation of these controls and procedures required by Rule 30a-3(b) under the 1940 Act (17 CFR 270.30a-3(b)) and Rules 13a-15(b) or 15d-15(b) under the Securities Exchange Act of 1934, as amended (17 CFR 240.13a-15(b) or 240.15d-15(b)). |
| (b) | There were no changes in the registrant’s internal control over financial reporting (as defined in Rule 30a-3(d) under the 1940 Act (17 CFR 270.30a-3(d))) that occurred during the period covered by this report that has materially affected, or is reasonably likely to materially affect, the registrant’s internal control over financial reporting. |
Item 12. Disclosure of Securities Lending Activities for Closed-End Management Investment Companies.
Not applicable.
Item 13. Exhibits.
| (a)(1) | Not applicable. |
| (a)(2) | Certifications pursuant to Rule 30a-2(a) under the 1940 Act and Section 302 of the Sarbanes-Oxley Act of 2002 are attached hereto. |
| (a)(3) | Not applicable. |
| (a)(4) | Not applicable. |
| (b) | Certifications pursuant to Rule 30a-2(b) under the 1940 Act and Section 906 of the Sarbanes- Oxley Act of 2002 are attached hereto. |
SIGNATURES
Pursuant to the requirements of the Securities Exchange Act of 1934 and the Investment Company Act of 1940, the registrant has duly caused this report to be signed on its behalf by the undersigned, thereunto duly authorized.
| (Registrant) | Driehaus Mutual Funds | |
| By (Signature and Title)* | /s/ Stephen T. Weber | |
| Stephen T. Weber, President | ||
| (principal executive officer) | ||
| Date | September 2, 2020 |
Pursuant to the requirements of the Securities Exchange Act of 1934 and the Investment Company Act of 1940, this report has been signed below by the following persons on behalf of the registrant and in the capacities and on the dates indicated.
| By (Signature and Title)* | /s/ Stephen T. Weber | |
| Stephen T. Weber, President | ||
| (principal executive officer) | ||
| Date | September 2, 2020 | |
| By (Signature and Title)* | /s/ Robert M. Kurinsky | |
| Robert M. Kurinsky, Vice President and Treasurer | ||
| (principal financial officer) | ||
| Date | September 2, 2020 |
| * | Print the name and title of each signing officer under his or her signature. |