UNITED STATES
SECURITIES AND EXCHANGE COMMISSION
Washington, D.C. 20549
FORMN-CSR
CERTIFIED SHAREHOLDER REPORT OF REGISTERED
MANAGEMENT INVESTMENT COMPANIES
Investment Company Act file number 811-07655
Driehaus Mutual Funds
(Exact name of registrant as specified in charter)
25 East Erie Street
Chicago, IL 60611
(Address of principal executive offices) (Zip code)
Janet L. McWilliams
Driehaus Capital Management LLC
25 East Erie Street
Chicago, IL 60611
(Name and address of agent for service)
Registrant’s telephone number, including area code: 312-587-3800
Date of fiscal year end: December 31
Date of reporting period: June 30, 2019
FormN-CSR is to be used by management investment companies to file reports with the Commission not later than 10 days after the transmission to stockholders of any report that is required to be transmitted to stockholders under Rule30e-1 under the Investment Company Act of 1940 (17 CFR270.30e-1). The Commission may use the information provided on FormN-CSR in its regulatory, disclosure review, inspection, and policymaking roles.
A registrant is required to disclose the information specified by FormN-CSR, and the Commission will make this information public. A registrant is not required to respond to the collection of information contained in FormN-CSR unless the Form displays a currently valid Office of Management and Budget (“OMB”) control number. Please direct comments concerning the accuracy of the information collection burden estimate and any suggestions for reducing the burden to Secretary, Securities and Exchange Commission, 450 Fifth Street, NW, Washington, DC 20549-0609. The OMB has reviewed this collection of information under the clearance requirements of 44 U.S.C. § 3507.
| Item 1. | Reports to Stockholders. |
The Reports to Shareholders are attached herewith.
Driehaus Mutual Funds
Trustees & Officers
Theodore J. Beck
Trustee
Francis J. Harmon
Trustee
Christopher J. Towle
Trustee
Dawn M. Vroegop
Trustee
Daniel F. Zemanek
Chairman of the Board
Stephen J. Kneeley
President & Trustee
Robert M. Kurinsky
Vice President & Treasurer
Janet L. McWilliams
Chief Legal Officer &
Assistant Vice President
Anne S. Kochevar
Chief Compliance Officer &
Anti-Money Laundering
Compliance Officer
William H. Wallace, III
Secretary
Christina E.H. Jacobs
Assistant Secretary
Christine V. Mason
Assistant Secretary
Investment Adviser
Driehaus Capital Management LLC
25 East Erie Street
Chicago, IL 60611
Distributor
Driehaus Securities LLC
25 East Erie Street
Chicago, IL 60611
Administrator
The Bank of New York Mellon
4400 Computer Drive
Westborough, MA 01581
Transfer Agent
BNY Mellon Investment Servicing (US) Inc.
4400 Computer Drive
Westborough, MA 01581
Custodian
The Northern Trust Company
50 South LaSalle Street
Chicago, IL 60603
Semi-Annual Report to Shareholders
June 30, 2019
Driehaus Emerging Markets Growth Fund
Driehaus Emerging Markets Small Cap Growth Fund
Driehaus International Small Cap Growth Fund
Driehaus Micro Cap Growth Fund
Driehaus Small Cap Growth Fund
Beginning on May 1, 2021, as permitted by regulations adopted by the Securities and Exchange Commission, paper copies of shareholder reports will no longer be sent by mail, unless you specifically request paper copies of the reports. Instead, the reports will be made available on the Fund’s website (https://www.driehaus.com/fund-resources), and you will be notified by mail each time a report is posted and provided with a website link to access the report.
If you already elected to receive shareholder reports electronically, you will not be affected by this change and you need not take any action. You may elect to receive shareholder reports and other communications from a Fund electronically at any time by contacting your financial intermediary (such as a broker-dealer or bank) or, if you invest directly with a Fund, by calling 1-800-560-6111.
You may elect to receive all future reports in paper free of charge. If you invest through a financial intermediary, you can contact your financial intermediary to request that you continue to receive paper copies of your shareholder reports. If you invest directly with a Fund, you can call 1-800-560-6111 to inform the Fund that you wish to continue receiving paper copies of your shareholder reports. Your election to receive reports in paper will apply to all funds held in your account if you invest through a financial intermediary or all funds in the Driehaus Mutual Funds if you invest directly with a Fund.
Distributed by:
Driehaus Securities LLC
This report has been prepared for the shareholders of the Funds and is not an offer to sell or buy any Fund securities. Such offer is only made by the Funds’ prospectus.
Semi-Annual Report to Shareholders June 30, 2019
Investment Philosophy:
The Adviser seeks to achieve superior investment returns primarily by investing in global companies that are currently demonstrating rapid growth in their sales and earnings and which, in its judgment, have the ability to continue or accelerate their growth rates in the future. The Adviser manages the portfolios actively (above average turnover) to ensure that the Funds are fully invested, under appropriate market conditions, in companies that meet these criteria. Investors should note that investments in overseas markets can pose more risks than U.S. investments, and the international Funds’ share prices are expected to be more volatile than those of the U.S.-only Funds. In addition, the Funds’ returns will fluctuate with changes in stock market conditions, currency values, interest rates, government regulations, and economic and political conditions in countries in which the Funds invest. These risks are generally greater when investing in emerging markets.
Driehaus Emerging Markets Growth Fund
Driehaus Emerging Markets Small Cap Growth Fund
Driehaus International Small Cap Growth Fund
Driehaus Micro Cap Growth Fund
Driehaus Small Cap Growth Fund
Performance Overview and Schedule of Investments: | ||||
| 1 | ||||
| 6 | ||||
| 11 | ||||
| 16 | ||||
| 21 | ||||
| 26 | ||||
| 28 | ||||
| 30 | ||||
| 32 | ||||
| 39 | ||||
| 51 | ||||
PROXY VOTING POLICIES AND PROCEDURES AND PROXY VOTING RECORD
A description of the Funds’ policies and procedures with respect to the voting of proxies relating to the Funds’ portfolio securities is available without charge, upon request, by calling 1-800-560-6111. This information is also available on the Funds’ website at http://www.driehaus.com.
Information regarding how the Funds voted proxies related to portfolio securities during the 12-month period ended June 30, 2019 is available without charge, upon request, by calling 1-800-560-6111. This information is also available on the Securities and Exchange Commission’s (“SEC”) website at http://www.sec.gov.
HOW TO OBTAIN QUARTERLY PORTFOLIO HOLDINGS
Each Fund files a complete schedule of portfolio holdings with the SEC for the first and third quarters of each fiscal year on Form NPORT-EX. The Funds’ Form NPORT-EX is available electronically on the SEC’s website at http://www.sec.gov. Each Fund’s complete schedule of portfolio holdings is also available on the Fund’s website at http://www.driehaus.com.
Driehaus Emerging Markets Growth Fund
Performance Overview (unaudited)
The performance summarized below is historical and does not represent future results. Investment returns and principal value vary, and you may have a gain or loss when you sell shares. Performance data presented measures the change in the value of an investment in the Fund, assuming reinvestment of all dividends and capital gains. Average annual total return reflects annualized change.
The table does not reflect the deduction of taxes that a shareholder would pay on Fund distributions or the redemption of Fund shares. The graph compares the results of a $10,000 investment in the Fund over the last 10 fiscal year periods, with all dividends and capital gains reinvested, with the indicated indices (and dividends reinvested) for the same period.
| Average Annual Total Returns as of 6/30/19 | 1 Year | 3 Years | 5 Years | 10 Years | ||||||||||||
Driehaus Emerging Markets Growth Fund Investor Class (DREGX) | 2.42% | 11.08% | 3.36% | 8.25% | ||||||||||||
Driehaus Emerging Markets Growth Fund Institutional Class (DIEMX)1 | 2.62% | 11.21% | 3.43% | 8.29% | ||||||||||||
MSCI Emerging MarketsIndex-N2 | 1.21% | 10.66% | 2.49% | 5.81% | ||||||||||||
MSCI Emerging Markets GrowthIndex-N3 | –2.44% | 11.22% | 3.85% | 6.94% | ||||||||||||

| 1 | The returns for the periods prior to July 17, 2017 (institutional share class inception date) include the performance of the investor share class. |
| 2 | The Morgan Stanley Capital International Emerging Markets Index-Net (MSCI Emerging Markets Index-N) is a market capitalization-weighted index designed to measure equity market performance in emerging markets. Data is in U.S. dollars and is calculated with net dividend reinvestment. Source: Morgan Stanley Capital International Inc. |
| 3 | The Morgan Stanley Capital International Emerging Markets Growth Index-Net (MSCI Emerging Markets GrowthIndex-N) is a subset of the MSCI Emerging Markets Index and includes only the MSCI Emerging Markets Index stocks which are categorized as growth stocks. Data is in U.S. dollars and is calculated with net dividend reinvestment. Source: Morgan Stanley Capital International Inc. |
1
Driehaus Emerging Markets Growth Fund
Schedule of Investments
June 30, 2019 (unaudited)
| Number of Shares | Value (Note A) | |||||||
| EQUITY SECURITIES — 93.2% |
| |||||||
| FAR EAST — 60.4% |
| |||||||
China — 28.4% |
| |||||||
3SBio, Inc.1 | 3,914,206 | $ | 6,724,355 | |||||
AIA Group, Ltd. | 2,130,176 | 22,974,171 | ||||||
Alibaba Group Holding, Ltd. — SP ADR** | 359,290 | 60,881,691 | ||||||
Autohome, Inc. — ADR** | 46,938 | 4,018,831 | ||||||
China Mengniu Dairy Co., Ltd. | 4,261,447 | 16,502,013 | ||||||
China Merchants Bank Co., Ltd. — H | 1,259,146 | 6,278,241 | ||||||
China Tower Corp., Ltd. — H1 | 34,074,000 | 8,941,933 | ||||||
Country Garden Services Holdings Co., Ltd. | 6,402,890 | 14,802,949 | ||||||
Foshan Haitian Flavouring & Food Co., Ltd. — A | 1,213,415 | 18,550,234 | ||||||
GDS Holdings, Ltd. — ADR** | 188,093 | 7,066,654 | ||||||
Hong Kong Exchanges & Clearing, Ltd. | 288,727 | 10,193,800 | ||||||
Huazhu Group, Ltd. — ADR | 69,082 | 2,504,222 | ||||||
Industrial & Commercial Bank of China, Ltd. — H | 40,685,656 | 29,687,295 | ||||||
Inner Mongolia Yili Industrial Group Co., Ltd. — A | 1,398,700 | 6,803,804 | ||||||
Li Ning Co., Ltd. | 3,761,007 | 8,868,460 | ||||||
Meituan Dianping — B** | 1,468,781 | 12,879,591 | ||||||
New Oriental Education & Technology Group, Inc. — SP ADR** | 95,448 | 9,218,368 | ||||||
Ping An Insurance Group Co. of China, Ltd. — H | 3,470,212 | 41,669,020 | ||||||
Shanghai International Airport Co., Ltd. — A | 1,104,102 | 13,467,913 | ||||||
Shenzhou International Group Holdings, Ltd. | 1,641,889 | 22,573,688 | ||||||
TAL Education Group — ADR** | 326,897 | 12,454,776 | ||||||
Techtronic Industries Co., Ltd. | 2,886,829 | 22,099,207 | ||||||
Tencent Holdings, Ltd. | 1,500,022 | 67,707,126 | ||||||
Wuliangye Yibin Co., Ltd. — A | 1,407,471 | 24,170,640 | ||||||
Wuxi Biologics Cayman, Inc.1** | 1,066,612 | 9,578,303 | ||||||
Yum China Holdings, Inc. | 374,217 | 17,288,825 | ||||||
|
| |||||||
| 477,906,110 | ||||||||
|
| |||||||
| Number of Shares | Value (Note A) | |||||||
India — 11.3% |
| |||||||
HDFC Bank, Ltd. — ADR | 347,488 | $ | 45,187,340 | |||||
Housing Development Finance Corp., Ltd. | 465,386 | 14,779,221 | ||||||
ICICI Bank, Ltd. — SP ADR | 2,931,067 | 36,902,134 | ||||||
Kotak Mahindra Bank, Ltd. | 845,796 | 18,098,950 | ||||||
Nestle India, Ltd. | 42,058 | 7,258,268 | ||||||
Petronet LNG, Ltd. | 1,690,216 | 6,001,549 | ||||||
Pidilite Industries, Ltd. | 472,935 | 8,320,682 | ||||||
Reliance Industries, Ltd. | 856,686 | 15,551,964 | ||||||
Tata Consultancy Services, Ltd. | 712,126 | 22,977,031 | ||||||
Titan Co., Ltd. | 832,430 | 16,095,677 | ||||||
|
| |||||||
| 191,172,816 | ||||||||
|
| |||||||
South Korea — 6.4% |
| |||||||
Hyundai Motor Co. | 102,731 | 12,456,017 | ||||||
LG Household & Health Care, Ltd. | 17,338 | 19,715,753 | ||||||
Macquarie Korea Infrastructure Fund | 1,268,647 | 12,964,998 | ||||||
Samsung Electronics Co., Ltd. | 1,264,071 | 51,453,979 | ||||||
Samsung Fire & Marine Insurance Co., Ltd. | 44,950 | 10,433,118 | ||||||
|
| |||||||
| 107,023,865 | ||||||||
|
| |||||||
Taiwan — 6.2% |
| |||||||
Delta Electronics, Inc. | 1,979,598 | 10,038,368 | ||||||
Formosa Plastics Corp. | 2,890,424 | 10,655,469 | ||||||
Giant Manufacturing Co., Ltd. | 1,384,154 | 10,829,196 | ||||||
Taiwan Semiconductor Manufacturing Co., Ltd. — SP ADR | 1,845,301 | 72,280,440 | ||||||
|
| |||||||
| 103,803,473 | ||||||||
|
| |||||||
Thailand — 3.0% |
| |||||||
CP ALL PCL — NVDR | 10,760,516 | 30,175,410 | ||||||
Kasikornbank PCL — NVDR | 2,250,535 | 13,796,383 | ||||||
WHA Corp PCL — NVDR | 46,380,900 | 7,168,679 | ||||||
|
| |||||||
| 51,140,472 | ||||||||
|
| |||||||
Indonesia — 2.3% |
| |||||||
PT Bank Central Asia Tbk | 13,164,946 | 27,932,703 | ||||||
PT Telekomunikasi Indonesia Persero Tbk | 38,617,175 | 11,316,588 | ||||||
|
| |||||||
| 39,249,291 | ||||||||
|
| |||||||
Philippines — 1.6% |
| |||||||
BDO Unibank, Inc. | 6,730,957 | 18,392,388 | ||||||
SM Prime Holdings, Inc. | 12,002,722 | 8,691,343 | ||||||
|
| |||||||
| 27,083,731 | ||||||||
|
| |||||||
Notes to Financial Statements are an integral part of this Schedule.
2
Driehaus Emerging Markets Growth Fund
Schedule of Investments
June 30, 2019 (unaudited)
| Number of Shares | Value (Note A) | |||||||
Japan — 0.6% |
| |||||||
Keyence Corp. | 16,763 | $ | 10,281,846 | |||||
Singapore — 0.6% |
| |||||||
Sea, Ltd. — ADR** | 298,932 | 9,930,521 | ||||||
|
| |||||||
Total FAR EAST | 1,017,592,125 | |||||||
|
| |||||||
| EUROPE — 11.9% |
| |||||||
Russia — 4.4% |
| |||||||
Gazprom PJSC — SP ADR | 905,691 | 6,635,092 | ||||||
Lukoil PJSC — SP ADR | 195,329 | 16,489,674 | ||||||
Novatek PJSC — SP GDR | 127,932 | 27,121,584 | ||||||
Sberbank of Russia PJSC — SP ADR | 1,522,967 | 23,423,232 | ||||||
|
| |||||||
| 73,669,582 | ||||||||
|
| |||||||
Poland — 1.6% |
| |||||||
CD Projekt SA | 245,712 | 14,168,921 | ||||||
Powszechna Kasa Oszczednosci Bank Polski SA | 1,091,251 | 12,515,198 | ||||||
|
| |||||||
| 26,684,119 | ||||||||
|
| |||||||
Netherlands — 1.2% |
| |||||||
Heineken NV | 73,523 | 8,204,800 | ||||||
VEON, Ltd. | 4,535,127 | 12,698,356 | ||||||
|
| |||||||
| 20,903,156 | ||||||||
|
| |||||||
United Kingdom — 1.0% |
| |||||||
Diageo PLC | 408,094 | 17,537,941 | ||||||
Hungary — 1.0% |
| |||||||
OTP Bank PLC | 414,268 | 16,476,889 | ||||||
Switzerland — 0.8% |
| |||||||
Glencore PLC | 1,701,320 | 5,905,996 | ||||||
Roche Holding AG | 29,719 | 8,361,323 | ||||||
|
| |||||||
| 14,267,319 | ||||||||
|
| |||||||
France — 0.8% |
| |||||||
LVMH Moet Hennessy Louis Vuitton SE | 32,228 | 13,716,772 | ||||||
Greece — 0.6% |
| |||||||
Hellenic Telecommunications Organization SA | 638,543 | 9,439,136 | ||||||
Norway — 0.5% |
| |||||||
Yara International ASA | 173,113 | 8,397,465 | ||||||
|
| |||||||
Total EUROPE | 201,092,379 | |||||||
|
| |||||||
| SOUTH AMERICA — 10.9% |
| |||||||
Brazil — 7.8% |
| |||||||
B3 SA — Brasil Bolsa Balcao | 1,472,708 | 14,393,607 | ||||||
BK Brasil Operacao e Assessoria a Restaurantes SA | 1,140,674 | 6,579,755 | ||||||
Itau Unibanco Holding SA — SP PREF ADR | 727,127 | 6,849,536 | ||||||
Lojas Renner SA | 2,357,252 | 28,852,158 | ||||||
| Number of Shares | Value (Note A) | |||||||
Magazine Luiza SA | 255,019 | $ | 13,863,518 | |||||
Notre Dame Intermedica Participacoes SA | 1,668,583 | 17,385,645 | ||||||
Pagseguro Digital, Ltd. — A** | 214,024 | 8,340,515 | ||||||
Raia Drogasil SA | 874,073 | 17,456,649 | ||||||
Rumo SA** | 1,640,058 | 8,883,763 | ||||||
Transmissora Alianca de Energia Eletrica SA | 1,307,744 | 9,310,986 | ||||||
|
| |||||||
| 131,916,132 | ||||||||
|
| |||||||
Argentina — 1.6% |
| |||||||
Globant SA** | 78,982 | 7,981,131 | ||||||
MercadoLibre, Inc.** | 20,716 | 12,673,427 | ||||||
YPF SA — SP ADR | 302,840 | 5,514,716 | ||||||
|
| |||||||
| 26,169,274 | ||||||||
|
| |||||||
Peru — 1.2% |
| |||||||
Credicorp, Ltd. | 89,044 | 20,383,062 | ||||||
Chile — 0.3% |
| |||||||
Banco Santander Chile — ADR | 189,778 | 5,678,158 | ||||||
|
| |||||||
Total SOUTH AMERICA | 184,146,626 | |||||||
|
| |||||||
| NORTH AMERICA — 4.6% |
| |||||||
Mexico — 2.8% |
| |||||||
Grupo Aeroportuario del Centro Norte SAB de CV | 876,625 | 5,356,918 | ||||||
Grupo Financiero Banorte SAB de CV — O | 2,480,098 | 14,404,758 | ||||||
Wal-Mart de Mexico SAB de CV | 10,323,223 | 28,177,592 | ||||||
|
| |||||||
| 47,939,268 | ||||||||
|
| |||||||
United States — 1.1% |
| |||||||
Liberty Media Corp-Liberty Formula One — C** | 290,019 | 10,849,611 | ||||||
NIKE, Inc. — B | 100,270 | 8,417,666 | ||||||
|
| |||||||
| 19,267,277 | ||||||||
|
| |||||||
Canada — 0.7% |
| |||||||
Wheaton Precious Metals Corp. | 451,782 | 10,924,089 | ||||||
|
| |||||||
Total NORTH AMERICA | 78,130,634 | |||||||
|
| |||||||
| AFRICA — 4.5% |
| |||||||
South Africa — 3.7% |
| |||||||
Capitec Bank Holdings, Ltd. | 220,304 | 20,313,640 | ||||||
Clicks Group, Ltd. | 825,092 | 12,025,782 | ||||||
MTN Group, Ltd. | 1,667,973 | 12,641,542 | ||||||
Naspers, Ltd. — N | 69,648 | 16,908,962 | ||||||
|
| |||||||
| 61,889,926 | ||||||||
|
| |||||||
Egypt — 0.8% |
| |||||||
Commercial International Bank Egypt SAE | 3,078,017 | 13,604,485 | ||||||
|
| |||||||
Total AFRICA | 75,494,411 | |||||||
|
| |||||||
Notes to Financial Statements are an integral part of this Schedule.
3
Driehaus Emerging Markets Growth Fund
Schedule of Investments
June 30, 2019 (unaudited)
| Number of Shares | Value (Note A) | |||||||
| MIDDLE EAST — 0.9% |
| |||||||
Israel — 0.8% |
| |||||||
Nice, Ltd. — SP ADR** | 95,109 | $ | 13,029,933 | |||||
United Arab Emirates — 0.1% |
| |||||||
Network International Holdings PLC1** | 215,007 | 1,619,181 | ||||||
|
| |||||||
Total MIDDLE EAST | 14,649,114 | |||||||
|
| |||||||
Total EQUITY SECURITIES | 1,571,105,289 | |||||||
|
| |||||||
| ||||||||
TOTAL INVESTMENTS | 93.2 | % | $ | 1,571,105,289 | ||||
Other Assets In Excess Of Liabilities | 6.8 | % | 114,897,592 | |||||
|
|
|
| |||||
Net Assets | 100.0 | % | $ | 1,686,002,881 | ||||
| ||||||||
| 1 | 144A — This security was purchased pursuant to Rule 144A of the Securities Act of 1933 and may not be resold subject to that rule except to qualified institutional buyers. At June 30, 2019, these securities amounted to $26,863,772 or 1.6% of net assets. These 144A securities have not been deemed illiquid. |
| ** | Non-income producing security |
ADR — American Depository Receipt
NVDR —Non-Voting Depository Receipt
SP ADR — Sponsored American Depository Receipt
SP GDR — Sponsored Global Depository Receipt
SP PREF ADR — Sponsored Preferred American Depository Receipt
Regional Weightings*
Asia/Far EastEx-Japan | 59.8% | |||
South America | 10.9% | |||
Eastern Europe | 7.0% | |||
Western Europe | 4.9% | |||
North America | 4.6% | |||
Africa | 4.5% | |||
Middle East | 0.9% | |||
Japan | 0.6% |
Top Ten Holdings*
Taiwan Semiconductor Manufacturing Co., Ltd. — SP ADR | 4.3% | |||
Tencent Holdings, Ltd. | 4.0% | |||
Alibaba Group Holding, Ltd. — SP ADR | 3.6% | |||
Samsung Electronics Co., Ltd. | 3.1% | |||
HDFC Bank, Ltd. — ADR | 2.7% | |||
Ping An Insurance Group Co. of China, Ltd. — H | 2.5% | |||
ICICI Bank, Ltd. — SP ADR | 2.2% | |||
CP ALL PCL — NVDR | 1.8% | |||
Industrial & Commercial Bank of China, Ltd. — H | 1.8% | |||
Lojas Renner SA | 1.7% |
| * | All percentages are stated as a percent of net assets at June 30, 2019 |
Notes to Financial Statements are an integral part of this Schedule.
4
Driehaus Emerging Markets Growth Fund
Schedule of Investments
June 30, 2019 (unaudited)
Industry | Percent of Net Assets | |||
Automobiles | 0.7% | |||
Beverages | 3.0% | |||
Biotechnology | 0.4% | |||
Capital Markets | 2.2% | |||
Chemicals | 1.6% | |||
Commercial Banks | 19.6% | |||
Commercial Services & Supplies | 0.9% | |||
Computers & Peripherals | 3.0% | |||
Diversified Consumer Services | 1.3% | |||
Diversified Telecommunication Services | 1.8% | |||
Electric Utilities | 0.6% | |||
Electronic Equipment, Instruments & Components | 1.2% | |||
Entertainment | 2.1% | |||
Food & Staples Retailing | 5.2% | |||
Food Products | 2.9% | |||
Health Care Providers & Services | 1.0% | |||
Hotels, Restaurants & Leisure | 1.6% | |||
Information Technology Services | 2.4% | |||
Insurance | 4.5% | |||
Interactive Media & Services | 4.3% | |||
Industry | Percent of Net Assets | |||
Internet & Catalog Retail | 6.1% | |||
Leisure Equipment & Products | 0.6% | |||
Life Sciences Tools & Services | 0.6% | |||
Machinery | 1.3% | |||
Metals & Mining | 1.0% | |||
Multiline Retail | 2.5% | |||
Oil, Gas & Consumable Fuels | 4.6% | |||
Personal Products | 1.2% | |||
Pharmaceuticals | 0.5% | |||
Real Estate Management & Development | 0.9% | |||
Road & Rail | 0.5% | |||
Semiconductors & Semiconductor Equipment | 4.3% | |||
Software | 1.2% | |||
Textiles, Apparel & Luxury Goods | 4.1% | |||
Thrifts & Mortgage Finance | 0.9% | |||
Transportation Infrastructure | 1.1% | |||
Wireless Telecommunication Services | 1.5% | |||
Other Assets in Excess of Liabilities | 6.8% | |||
|
| |||
TOTAL | 100.0% | |||
|
| |||
Notes to Financial Statements are an integral part of this Schedule.
5
Driehaus Emerging Markets Small Cap Growth Fund
Performance Overview (unaudited)
The performance summarized below is historical and does not represent future results. Investment returns and principal value vary, and you may have a gain or loss when you sell shares. Performance data presented measures the change in the value of an investment in the Fund, assuming reinvestment of all dividends and capital gains. Average annual total return reflects annualized change.
The table does not reflect the deduction of taxes that a shareholder would pay on Fund distributions or the redemption of Fund shares. The graph compares the results of a $10,000 investment in the Fund since December 1, 2008 (the date of the Predecessor Limited Partnership’s inception), with all dividends and capital gains reinvested, with the indicated indices (and dividends reinvested) for the same period.
| Fund Only | Including Predecessor Limited Partnership | |||||||||||||||||||
| Average Annual Total Returns as of 6/30/19 | 1 Year | 3 Years | 5 Years | Since Inception (8/22/11 - 6/30/19) | 10 Years | |||||||||||||||
Driehaus Emerging Markets Small Cap Growth Fund (DRESX)1 | –2.11% | 4.00% | –0.81% | 3.63% | 7.10% | |||||||||||||||
MSCI Emerging Markets Small CapIndex-N2 | –5.12% | 5.46% | 0.53% | 2.25% | 5.86% | |||||||||||||||
MSCI Emerging Markets Small Cap GrowthIndex-N3 | –8.33% | 2.54% | –1.33% | 1.28% | 4.59% | |||||||||||||||
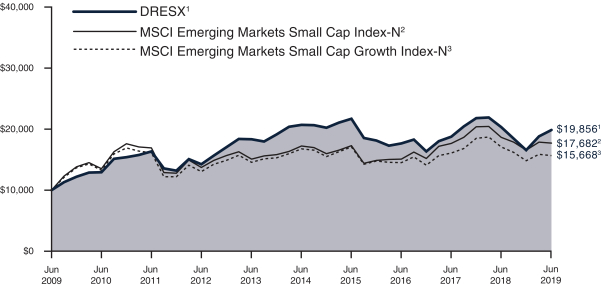
| 1 | The Driehaus Emerging Markets Small Cap Growth Fund (the “Fund”) performance shown above includes the performance of the Driehaus Emerging Markets Small Cap Growth Fund, L.P. (the “Predecessor Limited Partnership”), the Fund’s predecessor, for the periods before the Fund’s registration statement became effective. The Predecessor Limited Partnership, which was established on December 1, 2008, was managed with substantially the same investment objective, policies and philosophies as are followed by the Fund. The Fund succeeded to the Predecessor Limited Partnership’s assets on August 22, 2011. The Predecessor Limited Partnership was not registered under the Investment Company Act of 1940, as amended (“1940 Act”), and thus was not subject to certain investment and operational restrictions that are imposed by the 1940 Act. If the Predecessor Limited Partnership had been registered under the 1940 Act, its performance may have been adversely affected. The Predecessor Limited Partnership’s performance has been restated to reflect estimated expenses of the Fund. The returns for the periods presented above reflect fee waivers and/or reimbursements, if applicable, without which performance would have been lower. |
| 2 | The Morgan Stanley Capital International Emerging Markets Small Cap Index-Net (MSCI Emerging Markets Small Cap Index-N) is a market capitalization-weighted index designed to measure equity market performance of small cap stocks in global emerging markets. Data is in U.S. dollars and is calculated with net dividend reinvestment. Source: Morgan Stanley Capital International Inc. |
| 3 | The Morgan Stanley Capital International Emerging Markets Small Cap Growth Index-Net (MSCI Emerging Markets Small Cap Growth Index-N) is a subset of the MSCI Emerging Markets Small Cap Index and includes only the MSCI Emerging Markets Small Cap Index stocks which are categorized as growth stocks. Data is in U.S. dollars and is calculated with net dividend reinvestment. Source: Morgan Stanley Capital International Inc. |
6
Driehaus Emerging Markets Small Cap Growth Fund
Schedule of Investments
June 30, 2019 (unaudited)
| Number of Shares | Value (Note A) | |||||||
| EQUITY SECURITIES — 94.7% |
| |||||||
| FAR EAST — 64.0% |
| |||||||
China — 23.3% |
| |||||||
3SBio, Inc.1 | 166,000 | $ | 285,177 | |||||
Ausnutria Dairy Corp., Ltd. | 241,000 | 480,044 | ||||||
Baozun, Inc. — SP ADR** | 13,065 | 651,421 | ||||||
Bosideng International Holdings, Ltd. | 2,130,000 | 591,689 | ||||||
China Conch Venture Holdings, Ltd. | 256,000 | 904,490 | ||||||
China Resources Cement Holdings, Ltd. | 906,914 | 878,853 | ||||||
CIMC Enric Holdings, Ltd. | 764,000 | 616,153 | ||||||
Country Garden Services Holdings Co., Ltd. | 336,000 | 776,804 | ||||||
GDS Holdings, Ltd. — ADR** | 8,851 | 332,532 | ||||||
Hangzhou Tigermed Consulting Co., Ltd. — A | 30,632 | 343,859 | ||||||
Hua Hong Semiconductor, Ltd.1 | 291,000 | 563,248 | ||||||
Jiangsu Hengli Hydraulic Co., Ltd. — A | 169,320 | 773,592 | ||||||
Kingdee International Software Group Co., Ltd. | 507,966 | 549,472 | ||||||
Li Ning Co., Ltd. | 776,810 | 1,831,719 | ||||||
Midea Real Estate Holding, Ltd.1 | 224,400 | 574,523 | ||||||
Sany Heavy Equipment International Holdings Co., Ltd. | 1,180,725 | 426,238 | ||||||
Times China Holdings, Ltd. | 363,000 | 726,771 | ||||||
Toly Bread Co., Ltd. — A | 194,980 | 1,182,377 | ||||||
Yihai International Holding, Ltd. | 115,157 | 597,772 | ||||||
Zhejiang Supor Co., Ltd. — A | 40,390 | 445,929 | ||||||
Zoomlion Heavy Industry Science and Technology Co., Ltd. — H | 903,400 | 593,269 | ||||||
|
| |||||||
| 14,125,932 | ||||||||
|
| |||||||
India — 14.5% |
| |||||||
Aarti Industries | 27,048 | 696,718 | ||||||
ACC, Ltd. | 13,873 | 313,958 | ||||||
Cholamandalam Investment and Finance Co., Ltd. | 133,295 | 551,602 | ||||||
Godrej Properties, Ltd.** | 63,787 | 926,206 | ||||||
ICICI Lombard General Insurance Co., Ltd.1 | 40,481 | 652,452 | ||||||
Indraprastha Gas, Ltd. | 148,951 | 678,968 | ||||||
Info Edge India, Ltd. | 21,311 | 693,767 | ||||||
Ipca Laboratories, Ltd. | 22,959 | 305,250 | ||||||
L&T Technology Services, Ltd.1 | 26,477 | 669,582 | ||||||
Oberoi Realty, Ltd.** | 70,482 | 620,403 | ||||||
PI Industries, Ltd. | 38,082 | 647,219 | ||||||
RBL Bank, Ltd.1 | 32,808 | 303,543 | ||||||
| Number of Shares | Value (Note A) | |||||||
The Indian Hotels Co., Ltd. | 211,435 | $ | 482,584 | |||||
Voltas, Ltd. | 131,741 | 1,227,948 | ||||||
|
| |||||||
| 8,770,200 | ||||||||
|
| |||||||
Taiwan — 6.9% |
| |||||||
Accton Technology Corp. | 150,000 | 635,071 | ||||||
Chailease Holding Co., Ltd. | 157,000 | 649,544 | ||||||
Eclat Textile Co., Ltd. | 22,672 | 290,522 | ||||||
Parade Technologies, Ltd. | 36,584 | 621,915 | ||||||
Realtek Semiconductor Corp. | 81,000 | 595,905 | ||||||
Sunny Friend Environmental Technology Co., Ltd. | 89,000 | 792,302 | ||||||
TCI Co., Ltd. | 20,900 | 287,329 | ||||||
Voltronic Power Technology Corp. | 15,000 | 326,953 | ||||||
|
| |||||||
| 4,199,541 | ||||||||
|
| |||||||
Indonesia — 5.0% |
| |||||||
PT Ace Hardware Indonesia Tbk | 4,730,600 | 606,079 | ||||||
PT Bank Tabungan Pensiunan Nasional Syariah Tbk** | 4,583,100 | 1,119,214 | ||||||
PT Indocement Tunggal Prakarsa Tbk | 227,900 | 322,633 | ||||||
PT Pakuwon Jati Tbk | 11,810,200 | 610,260 | ||||||
PT Summarecon Agung Tbk | 4,081,500 | 352,464 | ||||||
|
| |||||||
| 3,010,650 | ||||||||
|
| |||||||
Thailand — 4.5% |
| |||||||
CPN Retail Growth Leasehold REIT | 610,600 | 607,265 | ||||||
Land & Houses PCL — NVDR | 2,084,200 | 754,369 | ||||||
Tisco Financial Group PCL — NVDR | 200,100 | 610,071 | ||||||
WHA Corp PCL — NVDR | 5,107,200 | 789,374 | ||||||
|
| |||||||
| 2,761,079 | ||||||||
|
| |||||||
Singapore — 2.8% |
| |||||||
Keppel DC REIT | 374,200 | 461,873 | ||||||
Sea, Ltd. — ADR** | 37,991 | 1,262,061 | ||||||
|
| |||||||
| 1,723,934 | ||||||||
|
| |||||||
Vietnam — 2.6% |
| |||||||
Bank for Foreign Trade of Vietnam JSC | 293,940 | 889,198 | ||||||
FPT Corp. | 311,608 | 699,630 | ||||||
|
| |||||||
| 1,588,828 | ||||||||
|
| |||||||
South Korea — 1.7% |
| |||||||
Fila Korea, Ltd. | 10,745 | 713,759 | ||||||
Koh Young Technology, Inc. | 4,234 | 304,720 | ||||||
|
| |||||||
| 1,018,479 | ||||||||
|
| |||||||
Notes to Financial Statements are an integral part of this Schedule.
7
Driehaus Emerging Markets Small Cap Growth Fund
Schedule of Investments
June 30, 2019 (unaudited)
| Number of Shares | Value (Note A) | |||||||
Philippines — 1.1% |
| |||||||
Megaworld Corp. | 5,479,900 | $ | 652,433 | |||||
Cambodia — 1.0% |
| |||||||
NagaCorp, Ltd. | 520,403 | 640,203 | ||||||
Bangladesh — 0.6% |
| |||||||
BRAC Bank, Ltd.** | 435,152 | 342,364 | ||||||
|
| |||||||
Total FAR EAST | 38,833,643 | |||||||
|
| |||||||
| SOUTH AMERICA — 9.9% |
| |||||||
Brazil — 8.8% |
| |||||||
Arco Platform, Ltd. — A** | 19,670 | 861,153 | ||||||
Azul SA — ADR** | 8,428 | 281,832 | ||||||
Banco Inter SA — Pref.1 | 19,100 | 304,062 | ||||||
BK Brasil Operacao e Assessoria a Restaurantes SA | 57,800 | 333,408 | ||||||
Construtora Tenda SA | 51,585 | 320,664 | ||||||
Energisa SA | 35,600 | 426,464 | ||||||
Linx SA | 39,600 | 365,377 | ||||||
Lojas Renner SA | 62,370 | 763,393 | ||||||
Metalurgica Gerdau SA — Pref. | 186,447 | 349,107 | ||||||
Notre Dame Intermedica Participacoes SA | 52,815 | 550,301 | ||||||
Odontoprev SA | 67,600 | 321,456 | ||||||
Rumo SA** | 78,800 | 426,839 | ||||||
|
| |||||||
| 5,304,056 | ||||||||
|
| |||||||
Argentina — 1.1% | ||||||||
Globant SA** | 6,661 | 673,094 | ||||||
|
| |||||||
Total SOUTH AMERICA | 5,977,150 | |||||||
|
| |||||||
| EUROPE — 9.4% | ||||||||
Poland — 3.1% | ||||||||
CD Projekt SA | 18,469 | 1,065,010 | ||||||
Dino Polska SA1** | 22,488 | 788,419 | ||||||
|
| |||||||
| 1,853,429 | ||||||||
|
| |||||||
Russia — 3.0% | ||||||||
Globaltrans Investment PLC — SP GDR | 33,288 | 309,578 | ||||||
TCS Group Holding PLC — GDR | 75,873 | 1,487,111 | ||||||
|
| |||||||
| 1,796,689 | ||||||||
|
| |||||||
United Kingdom — 1.3% | ||||||||
KAZ Minerals PLC | 101,826 | 780,800 | ||||||
Greece — 1.0% | ||||||||
JUMBO SA | 32,661 | 631,360 | ||||||
Czech Republic — 1.0% | ||||||||
Moneta Money Bank AS1 | 179,572 | 615,147 | ||||||
|
| |||||||
Total EUROPE | 5,677,425 | |||||||
|
| |||||||
| MIDDLE EAST — 4.0% | ||||||||
Saudi Arabia — 2.4% | ||||||||
Leejam Sports Co. JSC | 45,590 | 908,068 | ||||||
United International Transportation Co. | 61,077 | 538,242 | ||||||
|
| |||||||
| 1,446,310 | ||||||||
|
| |||||||
| Number of Shares | Value (Note A) | |||||||
United Arab Emirates — 1.6% | ||||||||
Network International Holdings PLC1** | 133,266 | $ | 1,003,603 | |||||
|
| |||||||
Total MIDDLE EAST | 2,449,913 | |||||||
|
| |||||||
| AFRICA — 3.4% | ||||||||
South Africa — 3.4% | ||||||||
Clicks Group, Ltd. | 85,254 | 1,242,584 | ||||||
Kumba Iron Ore, Ltd. | 14,604 | 517,781 | ||||||
The Foschini Group, Ltd. | 25,002 | 320,047 | ||||||
|
| |||||||
Total AFRICA | 2,080,412 | |||||||
|
| |||||||
| NORTH AMERICA — 2.5% | ||||||||
Canada — 1.6% | ||||||||
B2Gold Corp.** | 311,935 | 948,037 | ||||||
Mexico — 0.9% | ||||||||
Grupo Aeroportuario del Centro Norte SAB de CV — ADR | 11,755 | 574,584 | ||||||
|
| |||||||
Total NORTH AMERICA | 1,522,621 | |||||||
|
| |||||||
| CENTRAL AMERICA — 1.5% |
| |||||||
Panama — 1.5% | ||||||||
Copa Holdings SA — A | 9,213 | 898,912 | ||||||
|
| |||||||
Total CENTRAL AMERICA | 898,912 | |||||||
|
| |||||||
Total EQUITY SECURITIES | 57,440,076 | |||||||
|
| |||||||
| ||||||||
TOTAL INVESTMENTS | 94.7 | % | $ | 57,440,076 | ||||
Other Assets In Excess Of Liabilities | 5.3 | % | 3,208,801 | |||||
|
|
|
| |||||
Net Assets | 100.0 | % | $ | 60,648,877 | ||||
| ||||||||
| 1 | 144A — This security was purchased pursuant to Rule 144A of the Securities Act of 1933 and may not be resold subject to that rule except to qualified institutional buyers. At June 30, 2019, these securities amounted to $5,759,756 or 9.5% of net assets. These 144A securities have not been deemed illiquid, unless otherwise noted. |
| ** | Non-income producing security |
ADR — American Depository Receipt
GDR — Global Depository Receipt
NVDR —Non-Voting Depository Receipt
REIT — Real Estate Investment Trust
SP ADR — Sponsored American Depository Receipt
SP GDR — Sponsored Global Depository Receipt
Notes to Financial Statements are an integral part of this Schedule.
8
Driehaus Emerging Markets Small Cap Growth Fund
Schedule of Investments
June 30, 2019 (unaudited)
Regional Weightings*
Asia/Far EastEx-Japan | 64.0% | |||
South America | 9.9% | |||
Eastern Europe | 7.1% | |||
Middle East | 4.0% | |||
Africa | 3.4% | |||
North America | 2.5% | |||
Western Europe | 2.3% | |||
Central America | 1.5% |
Top Ten Holdings*
Li Ning Co., Ltd. | 3.0% | |||
TCS Group Holding PLC — GDR | 2.5% | |||
Sea, Ltd. — ADR | 2.1% | |||
Clicks Group, Ltd. | 2.0% | |||
Voltas, Ltd. | 2.0% | |||
Toly Bread Co., Ltd. — A | 2.0% | |||
PT Bank Tabungan Pensiunan Nasional Syariah Tbk | 1.8% | |||
CD Projekt SA | 1.8% | |||
Network International Holdings PLC | 1.7% | |||
B2Gold Corp. | 1.6% |
| * | All percentages are stated as a percent of net assets at June 30, 2019 |
Notes to Financial Statements are an integral part of this Schedule.
9
Driehaus Emerging Markets Small Cap Growth Fund
Schedule of Investments
June 30, 2019 (unaudited)
Industry | Percent of Net Assets | |||
Airlines | 1.5% | |||
Biotechnology | 0.5% | |||
Chemicals | 2.2% | |||
Commercial Banks | 9.3% | |||
Commercial Services & Supplies | 2.6% | |||
Communications Equipment | 1.0% | |||
Construction & Engineering | 2.0% | |||
Construction Materials | 2.5% | |||
Consumer Finance | 0.9% | |||
Diversified Consumer Services | 1.4% | |||
Diversified Financial Services | 1.1% | |||
Electric Utilities | 0.7% | |||
Electrical Equipment | 0.5% | |||
Electronic Equipment, Instruments & Components | 1.2% | |||
Entertainment | 3.8% | |||
Food & Staples Retailing | 3.3% | |||
Food Products | 3.7% | |||
Gas Utilities | 1.1% | |||
Health Care Providers & Services | 1.4% | |||
Hotels, Restaurants & Leisure | 3.9% | |||
Household Durables | 1.3% | |||
Information Technology Services | 2.2% | |||
Industry | Percent of Net Assets | |||
Insurance | 1.1% | |||
Interactive Media & Services | 1.1% | |||
Internet & Catalog Retail | 1.1% | |||
Life Sciences Tools & Services | 0.6% | |||
Machinery | 5.5% | |||
Media | 0.5% | |||
Metals & Mining | 4.3% | |||
Multiline Retail | 1.3% | |||
Personal Products | 0.5% | |||
Pharmaceuticals | 0.5% | |||
Professional Services | 1.1% | |||
Real Estate Investment Trust | 1.8% | |||
Real Estate Management & Development | 9.9% | |||
Road & Rail | 2.1% | |||
Semiconductors & Semiconductor Equipment | 3.4% | |||
Software | 2.6% | |||
Specialty Retail | 2.6% | |||
Textiles, Apparel & Luxury Goods | 5.7% | |||
Transportation Infrastructure | 0.9% | |||
Other Assets in Excess of Liabilities | 5.3% | |||
|
| |||
TOTAL | 100.0% | |||
|
| |||
Notes to Financial Statements are an integral part of this Schedule.
10
Driehaus International Small Cap Growth Fund
Performance Overview (unaudited)
The performance summarized below is historical and does not represent future results. Investment returns and principal value vary, and you may have a gain or loss when you sell shares. Performance data presented measures the change in the value of an investment in the Fund, assuming reinvestment of all dividends and capital gains. Average annual total return reflects annualized change.
The table does not reflect the deduction of taxes that a shareholder would pay on Fund distributions or the redemption of Fund shares. The graph compares the results of a $10,000 investment in the Fund over the last 10 fiscal year periods, with all dividends and capital gains reinvested, with the indicated index (and dividends reinvested) for the same period.
| Average Annual Total Returns as of 6/30/19 | 1 Year | 3 Years | 5 Years | 10 Years | ||||||||||||
Driehaus International Small Cap Growth Fund (DRIOX)1 | –5.11% | 9.59% | 5.61% | 11.37% | ||||||||||||
MSCI AC World ex USA Small Cap GrowthIndex-N2 | –6.37% | 7.63% | 3.53% | 8.79% | ||||||||||||
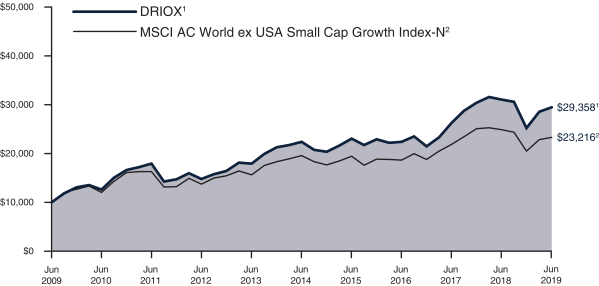
| 1 | The returns for the periods prior to January 1, 2010, reflect fee waivers and/or reimbursements without which performance would have been lower. |
| 2 | The Morgan Stanley Capital International All Country World ex USA Small Cap Growth Index-Net (MSCI AC World ex USA Small Cap Growth Index-N) is a market capitalization-weighted index designed to measure equity market performance in global developed markets and emerging markets, excluding the U.S., and is composed of stocks which are categorized as small capitalization growth stocks. Data is in U.S. dollars and is calculated with net dividend reinvestment. Source: Morgan Stanley Capital International Inc. |
11
Driehaus International Small Cap Growth Fund
Schedule of Investments
June 30, 2019 (unaudited)
| Number of Shares | Value (Note A) | |||||||
| EQUITY SECURITIES — 98.3% |
| |||||||
| EUROPE — 54.9% |
| |||||||
United Kingdom — 15.8% |
| |||||||
Ashmore Group PLC | 249,785 | $ | 1,616,213 | |||||
Aveva Group PLC | 73,952 | 3,796,071 | ||||||
Balfour Beatty PLC | 1,044,477 | 3,209,980 | ||||||
Clinigen Group PLC | 223,467 | 2,857,794 | ||||||
Croda International PLC | 59,322 | 3,857,214 | ||||||
Endava PLC — SP ADR** | 61,626 | 2,479,830 | ||||||
Greggs PLC | 49,630 | 1,448,379 | ||||||
Intermediate Capital Group PLC | 98,208 | 1,722,378 | ||||||
Oxford Biomedica PLC** | 123,540 | 1,084,111 | ||||||
Rentokil Initial PLC | 643,949 | 3,250,698 | ||||||
Serco Group PLC** | 1,719,547 | 3,144,594 | ||||||
Spirax-Sarco Engineering PLC | 25,116 | 2,929,663 | ||||||
Stock Spirits Group PLC | 484,052 | 1,355,466 | ||||||
Subsea 7 SA | 148,478 | 1,786,690 | ||||||
The Weir Group PLC | 200,428 | 3,936,374 | ||||||
Vesuvius PLC | 294,295 | 2,048,102 | ||||||
|
| |||||||
| 40,523,557 | ||||||||
|
| |||||||
Italy — 6.6% |
| |||||||
Amplifon SpA | 106,156 | 2,481,798 | ||||||
Autogrill SpA | 202,316 | 2,119,944 | ||||||
Davide Campari-Milano SpA | 252,887 | 2,477,311 | ||||||
DiaSorin SpA | 19,818 | 2,300,829 | ||||||
Leonardo SpA | 385,074 | 4,880,036 | ||||||
Piaggio & C SpA | 943,616 | 2,770,450 | ||||||
|
| |||||||
| 17,030,368 | ||||||||
|
| |||||||
Germany — 5.6% |
| |||||||
MTU Aero Engines AG | 5,607 | 1,335,713 | ||||||
Puma SE | 75,640 | 5,044,502 | ||||||
Rheinmetall AG | 10,531 | 1,289,087 | ||||||
Scout24 AG1 | 78,514 | 4,171,081 | ||||||
TAG Immobilien AG | 112,456 | 2,598,394 | ||||||
|
| |||||||
| 14,438,777 | ||||||||
|
| |||||||
Netherlands — 4.3% |
| |||||||
Argenx SE** | 22,164 | 3,104,971 | ||||||
BE Semiconductor Industries NV | 80,259 | 2,066,184 | ||||||
OCI NV** | 109,615 | 3,008,888 | ||||||
QIAGEN NV** | 69,986 | 2,840,249 | ||||||
|
| |||||||
| 11,020,292 | ||||||||
|
| |||||||
France — 4.2% |
| |||||||
Edenred | 56,058 | 2,859,536 | ||||||
JCDecaux SA | 61,743 | 1,870,340 | ||||||
Teleperformance | 13,878 | 2,780,555 | ||||||
Ubisoft Entertainment SA** | 20,085 | 1,572,213 | ||||||
Virbac SA** | 9,488 | 1,814,677 | ||||||
|
| |||||||
| 10,897,321 | ||||||||
|
| |||||||
| Number of Shares | Value (Note A) | |||||||
Denmark — 3.2% |
| |||||||
Ascendis Pharma AS — ADR** | 10,611 | $ | 1,221,857 | |||||
GN Store Nord AS | 51,916 | 2,422,533 | ||||||
Netcompany Group AS1** | 71,321 | 2,872,767 | ||||||
Royal Unibrew AS | 24,962 | 1,821,530 | ||||||
|
| |||||||
| 8,338,687 | ||||||||
|
| |||||||
Spain — 3.1% |
| |||||||
Cellnex Telecom SA1 | 118,212 | 4,373,991 | ||||||
Masmovil Ibercom SA** | 159,524 | 3,555,337 | ||||||
|
| |||||||
| 7,929,328 | ||||||||
|
| |||||||
Switzerland — 2.4% |
| |||||||
Galenica AG1 | 44,684 | 2,242,897 | ||||||
Tecan Group AG | 14,948 | 3,877,109 | ||||||
|
| |||||||
| 6,120,006 | ||||||||
|
| |||||||
Sweden — 2.1% |
| |||||||
Elekta AB — B | 190,540 | 2,763,873 | ||||||
Tele2 AB — B | 182,397 | 2,661,468 | ||||||
|
| |||||||
| 5,425,341 | ||||||||
|
| |||||||
Finland — 1.4% |
| |||||||
Huhtamaki OYJ | 84,778 | 3,485,863 | ||||||
Russia — 1.2% |
| |||||||
Globaltrans Investment PLC — SP GDR | 132,455 | 1,231,832 | ||||||
X5 Retail Group NV — GDR | 53,191 | 1,823,919 | ||||||
|
| |||||||
| 3,055,751 | ||||||||
|
| |||||||
Luxembourg — 1.1% |
| |||||||
B&M European Value Retail SA | 273,286 | 1,156,753 | ||||||
Befesa SA1 | 43,276 | 1,722,320 | ||||||
|
| |||||||
| 2,879,073 | ||||||||
|
| |||||||
Turkey — 1.1% |
| |||||||
Pegasus Hava Tasimaciligi AS** | 360,938 | 2,842,375 | ||||||
Belgium — 1.1% |
| |||||||
Barco NV | 13,339 | 2,809,073 | ||||||
Austria — 0.9% |
| |||||||
ams AG** | 56,307 | 2,207,405 | ||||||
Poland — 0.8% |
| |||||||
Dino Polska SA1** | 55,702 | 1,952,886 | ||||||
|
| |||||||
Total EUROPE | 140,956,103 | |||||||
|
| |||||||
| FAR EAST — 23.9% |
| |||||||
Japan — 16.5% |
| |||||||
Adastria Co., Ltd. | 57,159 | 1,223,605 | ||||||
Hitachi High-Technologies Corp. | 65,285 | 3,354,625 | ||||||
Kobe Bussan Co., Ltd. | 53,310 | 2,586,016 | ||||||
M&A Capital Partners Co., Ltd.** | 59,678 | 3,221,500 | ||||||
Minebea Mitsumi, Inc. | 120,554 | 2,040,635 | ||||||
NET One Systems Co., Ltd. | 132,452 | 3,642,538 | ||||||
Nichias Corp. | 68,730 | 1,234,801 | ||||||
Notes to Financial Statements are an integral part of this Schedule.
12
Driehaus International Small Cap Growth Fund
Schedule of Investments
June 30, 2019 (unaudited)
| Number of Shares | Value (Note A) | |||||||
Nihon Unisys, Ltd. | 67,318 | $ | 2,257,149 | |||||
PALTAC Corp. | 37,416 | 2,054,470 | ||||||
SCSK Corp. | 50,885 | 2,501,419 | ||||||
SG Holdings Co., Ltd. | 77,057 | 2,183,454 | ||||||
Shimadzu Corp. | 109,023 | 2,671,602 | ||||||
Sugi Holdings Co., Ltd. | 27,252 | 1,286,581 | ||||||
TechnoPro Holdings, Inc. | 63,311 | 3,358,892 | ||||||
THK Co., Ltd. | 49,100 | 1,172,680 | ||||||
Tokyo Tatemono Co., Ltd. | 267,941 | 2,974,775 | ||||||
United Arrows, Ltd. | 68,648 | 2,142,564 | ||||||
Yokogawa Electric Corp. | 119,249 | 2,335,982 | ||||||
|
| |||||||
| 42,243,288 | ||||||||
|
| |||||||
China — 2.8% | ||||||||
CIMC Enric Holdings, Ltd. | 1,846,969 | 1,489,548 | ||||||
Li Ning Co., Ltd. | 1,822,376 | 4,297,165 | ||||||
Zhuzhou CRRC Times Electric Co., Ltd. — H | 243,484 | 1,282,610 | ||||||
|
| |||||||
| 7,069,323 | ||||||||
|
| |||||||
Taiwan — 2.3% | ||||||||
Eclat Textile Co., Ltd. | 91,445 | 1,171,787 | ||||||
Giant Manufacturing Co., Ltd. | 456,004 | 3,567,635 | ||||||
Hiwin Technologies Corp. | �� | 150,818 | 1,262,502 | |||||
|
| |||||||
| 6,001,924 | ||||||||
|
| |||||||
Australia — 1.5% | ||||||||
Megaport, Ltd.** | 365,670 | 1,676,373 | ||||||
NEXTDC, Ltd.** | 480,852 | 2,190,908 | ||||||
|
| |||||||
| 3,867,281 | ||||||||
|
| |||||||
South Korea — 0.8% | ||||||||
Douzone Bizon Co., Ltd. | 29,892 | 1,610,256 | ||||||
Koh Young Technology, Inc. | 7,404 | 532,865 | ||||||
|
| |||||||
| 2,143,121 | ||||||||
|
| |||||||
Total FAR EAST | 61,324,937 | |||||||
|
| |||||||
| NORTH AMERICA — 10.4% | ||||||||
Canada — 10.0% | ||||||||
Aritzia, Inc.** | 124,970 | 1,601,311 | ||||||
CAE, Inc. | 95,549 | 2,569,035 | ||||||
CCL Industries, Inc. — B | 77,882 | 3,819,314 | ||||||
Empire Co., Ltd. — A | 153,668 | 3,870,009 | ||||||
Entertainment One, Ltd. | 264,307 | 1,332,561 | ||||||
Kinaxis, Inc.** | 60,383 | 3,765,782 | ||||||
Morneau Shepell, Inc. | 138,974 | 3,138,071 | ||||||
Parkland Fuel Corp. | 132,673 | 4,209,509 | ||||||
TFI International, Inc. | 42,855 | 1,296,891 | ||||||
|
| |||||||
| 25,602,483 | ||||||||
|
| |||||||
Mexico — 0.4% | ||||||||
Grupo Cementos de Chihuahua SAB de CV | 216,431 | 1,187,601 | ||||||
|
| |||||||
Total NORTH AMERICA | 26,790,084 | |||||||
|
| |||||||
| Number of Shares | Value (Note A) | |||||||
| SOUTH AMERICA — 3.2% | ||||||||
Brazil — 3.2% | ||||||||
BK Brasil Operacao e Assessoria a Restaurantes SA | 519,876 | $ | 2,998,803 | |||||
Rumo SA** | 372,372 | 2,017,041 | ||||||
Sul America SA | 331,993 | 3,247,349 | ||||||
|
| |||||||
Total SOUTH AMERICA | 8,263,193 | |||||||
|
| |||||||
| MIDDLE EAST — 3.1% | ||||||||
Israel — 2.3% | ||||||||
CyberArk Software, Ltd.** | 19,683 | 2,516,275 | ||||||
Nice, Ltd. — SP ADR** | 25,173 | 3,448,701 | ||||||
|
| |||||||
| 5,964,976 | ||||||||
|
| |||||||
United Arab Emirates — 0.8% | ||||||||
Network International Holdings PLC1** | 262,788 | 1,979,011 | ||||||
|
| |||||||
Total MIDDLE EAST | 7,943,987 | |||||||
|
| |||||||
| AFRICA — 1.6% | ||||||||
South Africa — 1.6% | ||||||||
Clicks Group, Ltd. | 156,191 | 2,276,496 | ||||||
Pick n Pay Stores, Ltd. | 369,698 | 1,811,087 | ||||||
|
| |||||||
Total AFRICA | 4,087,583 | |||||||
|
| |||||||
| CENTRAL AMERICA — 1.2% |
| |||||||
Panama — 1.2% | ||||||||
Copa Holdings SA — A | 31,850 | 3,107,605 | ||||||
|
| |||||||
Total CENTRAL AMERICA | 3,107,605 | |||||||
|
| |||||||
Total EQUITY SECURITIES | 252,473,492 | |||||||
|
| |||||||
| ||||||||
TOTAL INVESTMENTS | 98.3 | % | $ | 252,473,492 | ||||
Other Assets In Excess Of Liabilities | 1.7 | % | 4,454,620 | |||||
|
|
|
| |||||
Net Assets | 100.0 | % | $ | 256,928,112 | ||||
| ||||||||
| 1 | 144A — This security was purchased pursuant to Rule 144A of the Securities Act of 1933 and may not be resold subject to that rule except to qualified institutional buyers. At June 30, 2019, these securities amounted to $19,314,953 or 7.5% of net assets. These 144A securities have not been deemed illiquid. |
| ** | Non-income producing security |
ADR — American Depository Receipt
GDR — Global Depository Receipt
SP ADR — Sponsored American Depository Receipt
SP GDR — Sponsored Global Depository Receipt
Notes to Financial Statements are an integral part of this Schedule.
13
Driehaus International Small Cap Growth Fund
Schedule of Investments
June 30, 2019 (unaudited)
Regional Weightings*
Western Europe | 51.8% | |||
Japan | 16.5% | |||
North America | 10.4% | |||
Asia/Far EastEx-Japan | 7.4% | |||
South America | 3.2% | |||
Middle East | 3.1% | |||
Eastern Europe | 3.1% | |||
Africa | 1.6% | |||
Central America | 1.2% |
Top Ten Holdings*
Puma SE | 2.0% | |||
Leonardo SpA | 1.9% | |||
Cellnex Telecom SA | 1.7% | |||
Li Ning Co., Ltd. | 1.7% | |||
Parkland Fuel Corp. | 1.6% | |||
Scout24 AG | 1.6% | |||
The Weir Group PLC | 1.5% | |||
Tecan Group AG | 1.5% | |||
Empire Co., Ltd. — A | 1.5% | |||
Croda International PLC | 1.5% |
| * | All percentages are stated as a percent of net assets at June 30, 2019 |
Notes to Financial Statements are an integral part of this Schedule.
14
Driehaus International Small Cap Growth Fund
Schedule of Investments
June 30, 2019 (unaudited)
Industry | Percent of Net Assets | |||
Aerospace & Defense | 3.4% | |||
Air Freight & Logistics | 0.9% | |||
Airlines | 2.3% | |||
Automobiles | 1.1% | |||
Beverages | 2.2% | |||
Biotechnology | 2.1% | |||
Building Products | 0.5% | |||
Capital Markets | 2.6% | |||
Chemicals | 2.7% | |||
Commercial Services & Supplies | 4.3% | |||
Construction & Engineering | 1.2% | |||
Construction Materials | 0.5% | |||
Containers & Packaging | 2.8% | |||
Distributors | 0.8% | |||
Diversified Telecommunication Services | 3.1% | |||
Electrical Equipment | 0.5% | |||
Electronic Equipment, Instruments & Components | 4.3% | |||
Energy Equipment & Services | 0.7% | |||
Entertainment | 1.1% | |||
Food & Staples Retailing | 6.1% | |||
Health Care Equipment & Supplies | 2.9% | |||
Health Care Providers & Services | 1.8% | |||
Industry | Percent of Net Assets | |||
Hotels, Restaurants & Leisure | 2.6% | |||
Industrial Conglomerates | 0.5% | |||
Information Technology Services | 6.5% | |||
Insurance | 1.3% | |||
Interactive Media & Services | 1.6% | |||
Leisure Equipment & Products | 1.4% | |||
Life Sciences Tools & Services | 3.7% | |||
Machinery | 5.8% | |||
Media | 0.7% | |||
Multiline Retail | 0.5% | |||
Oil, Gas & Consumable Fuels | 1.6% | |||
Pharmaceuticals | 0.7% | |||
Professional Services | 3.6% | |||
Real Estate Management & Development | 2.2% | |||
Road & Rail | 1.8% | |||
Semiconductors & Semiconductor Equipment | 1.9% | |||
Software | 7.0% | |||
Specialty Retail | 1.3% | |||
Textiles, Apparel & Luxury Goods | 4.7% | |||
Wireless Telecommunication Services | 1.0% | |||
Other Assets in Excess of Liabilities | 1.7% | |||
|
| |||
TOTAL | 100.0% | |||
|
| |||
Notes to Financial Statements are an integral part of this Schedule.
15
Driehaus Micro Cap Growth Fund
Performance Overview (unaudited)
The performance summarized below is historical and does not represent future results. Investment returns and principal value vary, and you may have a gain or loss when you sell shares. Performance data presented measures the change in the value of an investment in the Fund, assuming reinvestment of all dividends and capital gains. Average annual total return reflects annualized change.
The table does not reflect the deduction of taxes that a shareholder would pay on Fund distributions or the redemption of Fund shares. The graph compares the results of a $10,000 investment in the Fund over the last 10 fiscal year periods (which includes performance of the Predecessor Limited Partnership), with all dividends and capital gains reinvested, with the indicated index (and dividends reinvested) for the same period.
| Fund Only | Including Predecessor Limited Partnership | |||||||||||||||||||
| Average Annual Total Returns as of 6/30/19 | 1 Year | 3 Years | 5 Years | Since Inception (11/18/13 - 6/30/19) | 10 Years | |||||||||||||||
Driehaus Micro Cap Growth Fund (DMCRX)1 | 8.93% | 26.35% | 16.28% | 15.56% | 18.35% | |||||||||||||||
Russell Microcap® Growth Index2 | –9.79% | 9.82% | 4.32% | 5.32% | 11.85% | |||||||||||||||
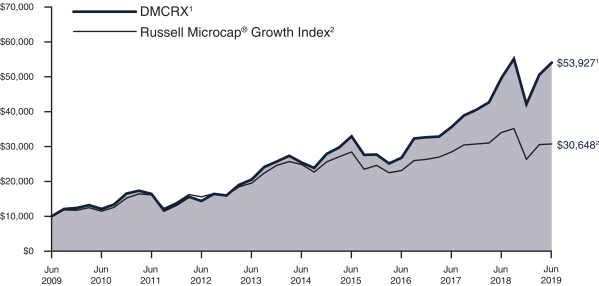
| 1 | The Driehaus Micro Cap Growth Fund (the “Fund”) performance shown above includes the performance of the Driehaus Micro Cap Fund, L.P. (the “Predecessor Limited Partnership”), one of the Fund’s predecessors, for the periods before the Fund’s registration statement became effective. The Predecessor Limited Partnership, which was established on July 1, 1996, was managed with substantially the same investment objective, policies and philosophies as are followed by the Fund. The Fund succeeded to the Predecessor Limited Partnership’s assets together with the assets of the Driehaus Institutional Micro Cap Fund, L.P. on November 18, 2013. The Predecessor Limited Partnership was not registered under the Investment Company Act of 1940, as amended (“1940 Act”), and thus was not subject to certain investment and operational restrictions that are imposed by the 1940 Act. If the Predecessor Limited Partnership had been registered under the 1940 Act, its performance may have been adversely affected. The Predecessor Limited Partnership’s performance has been restated to reflect estimated expenses of the Fund. The returns for the periods presented above reflect fee waivers and/or reimbursements, if applicable, without which performance would have been lower. |
| 2 | The Russell Microcap® Growth Index is constructed to provide a comprehensive and unbiased barometer of the micro cap growth market. Based on ongoing empirical research of investment manager behavior, the methodology used to determine growth probability approximates the aggregate microcap growth manager's opportunity set. |
16
Driehaus Micro Cap Growth Fund
Schedule of Investments
June 30, 2019 (unaudited)
| Number of Shares | Value (Note A) | |||||||
| EQUITY SECURITIES — 99.6% |
| |||||||
| HEALTH CARE — 34.7% |
| |||||||
Biotechnology — 16.2% |
| |||||||
Allakos, Inc.** | 39,828 | $ | 1,725,747 | |||||
Argenx SE — ADR** | 35,490 | 5,024,674 | ||||||
ArQule, Inc.** | 14,572 | 160,438 | ||||||
CareDx, Inc.** | 135,999 | 4,894,604 | ||||||
Coherus Biosciences, Inc.** | 99,650 | 2,202,265 | ||||||
Cytokinetics, Inc.** | 301,024 | 3,386,520 | ||||||
Global Blood Therapeutics, Inc.** | 38,656 | 2,033,306 | ||||||
Kura Oncology, Inc.** | 75,827 | 1,493,034 | ||||||
Mirati Therapeutics, Inc.** | 35,532 | 3,659,796 | ||||||
Natera, Inc.** | 126,289 | 3,483,051 | ||||||
Orchard Therapeutics PLC — ADR** | 144,663 | 2,023,835 | ||||||
Prevail Therapeutics, Inc.** | 61,005 | 805,266 | ||||||
Principia Biopharma, Inc.** | 39,404 | 1,307,819 | ||||||
Ra Pharmaceuticals, Inc.** | 54,562 | 1,640,679 | ||||||
Sutro Biopharma, Inc.** | 38,884 | 442,500 | ||||||
Turning Point Therapeutics, Inc.** | 36,075 | 1,468,252 | ||||||
Twist Bioscience Corp.** | 72,936 | 2,115,873 | ||||||
Veracyte, Inc.** | 52,542 | 1,497,972 | ||||||
Vericel Corp.** | 207,814 | 3,925,606 | ||||||
Y-mAbs Therapeutics, Inc.** | 41,635 | 952,192 | ||||||
|
| |||||||
| 44,243,429 | ||||||||
|
| |||||||
Health Care Equipment & Supplies — 6.7% |
| |||||||
BioLife Solutions, Inc.** | 102,903 | 1,744,206 | ||||||
iRhythm Technologies, Inc.** | 17,065 | 1,349,500 | ||||||
OrthoPediatrics Corp.** | 107,254 | 4,182,906 | ||||||
SI-BONE, Inc.** | 112,564 | 2,289,552 | ||||||
Tactile Systems Technology, Inc.** | 35,764 | 2,035,687 | ||||||
Tandem Diabetes Care, Inc.** | 82,747 | 5,338,836 | ||||||
Vapotherm, Inc.** | 58,675 | 1,349,525 | ||||||
|
| |||||||
| 18,290,212 | ||||||||
|
| |||||||
Pharmaceuticals — 4.7% |
| |||||||
MyoKardia, Inc.** | 64,534 | 3,235,735 | ||||||
Odonate Therapeutics, Inc.** | 79,655 | 2,922,542 | ||||||
Reata Pharmaceuticals, Inc. — A** | 39,753 | 3,750,696 | ||||||
Tricida, Inc.** | 73,447 | 2,898,219 | ||||||
|
| |||||||
| 12,807,192 | ||||||||
|
| |||||||
Life Sciences Tools & Services — 4.0% |
| |||||||
Codexis, Inc.** | 102,962 | 1,897,590 | ||||||
Fluidigm Corp.** | 301,490 | 3,714,357 | ||||||
NeoGenomics, Inc.** | 151,153 | 3,316,297 | ||||||
Personalis, Inc.** | 72,589 | 1,970,791 | ||||||
|
| |||||||
| 10,899,035 | ||||||||
|
| |||||||
| Number of Shares | Value (Note A) | |||||||
Health Care Technology — 2.0% |
| |||||||
Inspire Medical Systems, Inc.** | 88,967 | $ | 5,395,849 | |||||
Health Care Providers & Services — 1.1% |
| |||||||
PetIQ, Inc.** | 44,490 | 1,466,390 | ||||||
R1 RCM, Inc.** | 131,911 | 1,659,440 | ||||||
|
| |||||||
| 3,125,830 | ||||||||
|
| |||||||
Total HEALTH CARE | 94,761,547 | |||||||
|
| |||||||
| INFORMATION TECHNOLOGY — 19.3% |
| |||||||
Software — 12.6% |
| |||||||
Altair Engineering, Inc. — A** | 38,656 | 1,561,316 | ||||||
Alteryx, Inc. — A** | 34,106 | 3,721,647 | ||||||
Everbridge, Inc.** | 67,775 | 6,060,441 | ||||||
Five9, Inc.** | 40,962 | 2,100,941 | ||||||
Mimecast, Ltd.** | 30,017 | 1,402,094 | ||||||
PROS Holdings, Inc.** | 31,027 | 1,962,768 | ||||||
ShotSpotter, Inc.** | 37,472 | 1,656,262 | ||||||
Smartsheet, Inc. — A** | 88,144 | 4,266,170 | ||||||
Telaria, Inc.** | 406,889 | 3,059,805 | ||||||
Tufin Software Technologies, Ltd.** | 81,737 | 2,116,171 | ||||||
Upland Software, Inc.** | 97,930 | 4,458,753 | ||||||
Zscaler, Inc.** | 28,185 | 2,160,098 | ||||||
|
| |||||||
| 34,526,466 | ||||||||
|
| |||||||
Information Technology Services — 5.4% |
| |||||||
Endava PLC — SP ADR** | 127,722 | 5,139,533 | ||||||
Fastly, Inc.** | 89,875 | 1,822,665 | ||||||
I3 Verticals, Inc. — A** | 135,476 | 3,989,768 | ||||||
Paysign, Inc.** | 196,345 | 2,625,133 | ||||||
Virtusa Corp.** | 27,132 | 1,205,475 | ||||||
|
| |||||||
| 14,782,574 | ||||||||
|
| |||||||
Semiconductors & Semiconductor Equipment — 0.9% |
| |||||||
Inphi Corp.** | 46,353 | 2,322,285 | ||||||
Computers & Peripherals — 0.4% |
| |||||||
Sonim Technologies, Inc.** | 96,085 | 1,223,162 | ||||||
|
| |||||||
Total INFORMATION TECHNOLOGY | 52,854,487 | |||||||
|
| |||||||
| CONSUMER DISCRETIONARY — 16.1% |
| |||||||
Household Durables — 4.6% |
| |||||||
Century Communities, Inc.** | 41,534 | 1,103,974 | ||||||
Installed Building Products, Inc.** | 14,215 | 841,812 | ||||||
LGI Homes, Inc.** | 44,689 | 3,192,135 | ||||||
Skyline Champion Corp.** | 160,582 | 4,396,735 | ||||||
The Lovesac Co.** | 102,317 | 3,178,989 | ||||||
|
| |||||||
| 12,713,645 | ||||||||
|
| |||||||
Hotels, Restaurants & Leisure — 3.5% |
| |||||||
Century Casinos, Inc.** | 164,907 | 1,599,598 | ||||||
Everi Holdings, Inc.** | 175,004 | 2,087,798 | ||||||
Notes to Financial Statements are an integral part of this Schedule.
17
Driehaus Micro Cap Growth Fund
Schedule of Investments
June 30, 2019 (unaudited)
| Number of Shares | Value (Note A) | |||||||
Lindblad Expeditions Holdings, Inc.** | 130,128 | $ | 2,335,798 | |||||
Wingstop, Inc. | 36,150 | 3,425,213 | ||||||
|
| |||||||
| 9,448,407 | ||||||||
|
| |||||||
Specialty Retail — 2.0% |
| |||||||
Boot Barn Holdings, Inc.** | 121,452 | 4,328,549 | ||||||
Sonic Automotive, Inc. | 46,222 | 1,079,284 | ||||||
|
| |||||||
| 5,407,833 | ||||||||
|
| |||||||
Diversified Consumer Services — 1.8% |
| |||||||
Career Education Corp.** | 95,187 | 1,815,216 | ||||||
K12, Inc.** | 55,272 | 1,680,822 | ||||||
OneSpaWorld Holdings, Ltd.** | 100,360 | 1,555,580 | ||||||
|
| |||||||
| 5,051,618 | ||||||||
|
| |||||||
Distributors — 1.1% |
| |||||||
Funko, Inc. — A** | 119,368 | 2,891,093 | ||||||
Automobiles — 0.9% |
| |||||||
Winnebago Industries, Inc. | 62,116 | 2,400,783 | ||||||
Leisure Equipment & Products — 0.8% |
| |||||||
Malibu Boats, Inc. — A** | 32,411 | 1,259,167 | ||||||
MasterCraft Boat Holdings, Inc.** | 50,860 | 996,347 | ||||||
|
| |||||||
| 2,255,514 | ||||||||
|
| |||||||
Internet & Catalog Retail — 0.8% |
| |||||||
The Rubicon Project, Inc.** | 327,845 | 2,085,094 | ||||||
Auto Components — 0.6% |
| |||||||
Stoneridge, Inc.** | 54,450 | 1,717,897 | ||||||
|
| |||||||
Total CONSUMER DISCRETIONARY | 43,971,884 | |||||||
|
| |||||||
| INDUSTRIALS — 12.6% |
| |||||||
Machinery — 3.7% |
| |||||||
Columbus McKinnon Corp. | 39,491 | 1,657,437 | ||||||
Energy Recovery, Inc.** | 69,957 | 728,952 | ||||||
Harsco Corp.** | 100,498 | 2,757,665 | ||||||
Kornit Digital, Ltd.** | 74,759 | 2,366,870 | ||||||
LiqTech International, Inc.** | 142,482 | 1,411,997 | ||||||
Luxfer Holdings PLC | 45,512 | 1,115,954 | ||||||
|
| |||||||
| 10,038,875 | ||||||||
|
| |||||||
Aerospace & Defense — 2.4% |
| |||||||
Kratos Defense & Security Solutions, Inc.** | 124,980 | 2,860,792 | ||||||
Mercury Systems, Inc.** | 51,421 | 3,617,467 | ||||||
|
| |||||||
| 6,478,259 | ||||||||
|
| |||||||
Airlines — 1.4% |
| |||||||
Controladora Vuela Cia de Aviacion SAB de CV — ADR** | 254,123 | 2,383,674 | ||||||
Mesa Air Group, Inc.** | 171,664 | 1,569,009 | ||||||
|
| |||||||
| 3,952,683 | ||||||||
|
| |||||||
| Number of Shares | Value (Note A) | |||||||
Construction & Engineering — 1.4% |
| |||||||
Argan, Inc. | 46,422 | $ | 1,882,876 | |||||
Concrete Pumping Holdings, Inc.** | 118,622 | 607,345 | ||||||
NV5 Global, Inc.** | 15,707 | 1,278,550 | ||||||
|
| |||||||
| 3,768,771 | ||||||||
|
| |||||||
Commercial Services & Supplies — 1.1% |
| |||||||
Casella Waste Systems, Inc. — A** | 50,598 | 2,005,199 | ||||||
Knoll, Inc. | 43,768 | 1,005,789 | ||||||
|
| |||||||
| 3,010,988 | ||||||||
|
| |||||||
Professional Services — 1.0% |
| |||||||
ICF International, Inc. | 9,235 | 672,308 | ||||||
Willdan Group, Inc.** | 52,516 | 1,956,221 | ||||||
|
| |||||||
| 2,628,529 | ||||||||
|
| |||||||
Electrical Equipment — 0.6% |
| |||||||
Sunrun, Inc.** | 83,432 | 1,565,184 | ||||||
Air Freight & Logistics — 0.5% |
| |||||||
Air Transport Services Group, Inc.** | 61,268 | 1,494,939 | ||||||
Trading Companies & Distributors — 0.5% |
| |||||||
Titan Machinery, Inc.** | 68,679 | 1,413,414 | ||||||
|
| |||||||
Total INDUSTRIALS | 34,351,642 | |||||||
|
| |||||||
| FINANCIALS — 7.4% |
| |||||||
Insurance — 4.8% |
| |||||||
eHealth, Inc.** | 50,909 | 4,383,265 | ||||||
Goosehead Insurance, Inc. — A | 74,108 | 3,542,362 | ||||||
Kinsale Capital Group, Inc. | 38,145 | 3,489,505 | ||||||
Palomar Holdings, Inc.** | 64,385 | 1,547,815 | ||||||
|
| |||||||
| 12,962,947 | ||||||||
|
| |||||||
Thrifts & Mortgage Finance — 1.8% |
| |||||||
Meta Financial Group, Inc. | 75,953 | 2,130,482 | ||||||
NMI Holdings, Inc. — A** | 98,329 | 2,791,560 | ||||||
|
| |||||||
| 4,922,042 | ||||||||
|
| |||||||
Commercial Banks — 0.8% |
| |||||||
OFG Bancorp | 94,701 | 2,251,043 | ||||||
|
| |||||||
Total FINANCIALS | 20,136,032 | |||||||
|
| |||||||
| CONSUMER STAPLES — 3.5% |
| |||||||
Food Products — 1.7% |
| |||||||
Freshpet, Inc.** | 78,825 | 3,587,326 | ||||||
Village Farms International, Inc.** | 102,093 | 1,167,944 | ||||||
|
| |||||||
| 4,755,270 | ||||||||
|
| |||||||
Personal Products — 1.0% |
| |||||||
elf Beauty, Inc.** | 199,798 | 2,817,152 | ||||||
Tobacco — 0.8% |
| |||||||
Turning Point Brands, Inc. | 41,822 | 2,048,442 | ||||||
|
| |||||||
Total CONSUMER STAPLES | 9,620,864 | |||||||
|
| |||||||
Notes to Financial Statements are an integral part of this Schedule.
18
Driehaus Micro Cap Growth Fund
Schedule of Investments
June 30, 2019 (unaudited)
| Number of Shares | Value (Note A) | |||||||
| COMMUNICATION SERVICES — 3.2% |
| |||||||
Diversified Telecommunication Services — 1.4% |
| |||||||
Bandwidth, Inc. — A** | 50,204 | $ | 3,766,304 | |||||
Interactive Media & Services — 1.2% |
| |||||||
QuinStreet, Inc.** | 213,610 | 3,385,719 | ||||||
Media — 0.6% |
| |||||||
Cardlytics, Inc.** | 58,102 | 1,509,490 | ||||||
|
| |||||||
Total COMMUNICATION SERVICES | 8,661,513 | |||||||
|
| |||||||
| ENERGY — 1.6% |
| |||||||
Energy Equipment & Services — 1.2% |
| |||||||
Cactus, Inc. — A** | 28,135 | 931,831 | ||||||
DMC Global, Inc. | 21,341 | 1,351,952 | ||||||
Solaris Oilfield Infrastructure, Inc. — A | 77,947 | 1,167,646 | ||||||
|
| |||||||
| 3,451,429 | ||||||||
|
| |||||||
Oil, Gas & Consumable Fuels — 0.4% |
| |||||||
Brigham Minerals, Inc.** | 51,171 | 1,098,130 | ||||||
|
| |||||||
Total ENERGY | 4,549,559 | |||||||
|
| |||||||
| Number of Shares | Value (Note A) | |||||||
| MATERIALS — 1.2% |
| |||||||
Metals & Mining — 1.2% |
| |||||||
Materion Corp. | 32,510 | $ | 2,204,503 | |||||
Mayville Engineering Co, Inc.** | 71,316 | 984,161 | ||||||
|
| |||||||
Total MATERIALS | 3,188,664 | |||||||
|
| |||||||
Total EQUITY SECURITIES | 272,096,192 | |||||||
|
| |||||||
| ||||||||
TOTAL INVESTMENTS | 99.6 | % | $ | 272,096,192 | ||||
Other Assets In Excess Of Liabilities | 0.4 | % | 999,887 | |||||
|
|
|
| |||||
Net Assets | 100.0 | % | $ | 273,096,079 | ||||
| ||||||||
| ** | Non-income producing security |
ADR — American Depository Receipt
SP ADR — Sponsored American Depository Receipt
Top Ten Holdings*
Everbridge, Inc. | 2.2% | |||
Inspire Medical Systems, Inc. | 2.0% | |||
Tandem Diabetes Care, Inc. | 2.0% | |||
Endava PLC — SP ADR | 1.9% | |||
Argenx SE — ADR | 1.8% | |||
CareDx, Inc. | 1.8% | |||
Upland Software, Inc. | 1.6% | |||
Skyline Champion Corp. | 1.6% | |||
eHealth, Inc. | 1.6% | |||
Boot Barn Holdings, Inc. | 1.6% |
| * | All percentages are stated as a percent of net assets at June 30, 2019 |
Notes to Financial Statements are an integral part of this Schedule.
19
Driehaus Micro Cap Growth Fund
Schedule of Investments
June 30, 2019 (unaudited)
Industry | Percent of Net Assets | |||
Aerospace & Defense | 2.4% | |||
Air Freight & Logistics | 0.5% | |||
Airlines | 1.4% | |||
Auto Components | 0.6% | |||
Automobiles | 0.9% | |||
Biotechnology | 16.2% | |||
Commercial Banks | 0.8% | |||
Commercial Services & Supplies | 1.1% | |||
Computers & Peripherals | 0.4% | |||
Construction & Engineering | 1.4% | |||
Distributors | 1.1% | |||
Diversified Consumer Services | 1.8% | |||
Diversified Telecommunication Services | 1.4% | |||
Electrical Equipment | 0.6% | |||
Energy Equipment & Services | 1.2% | |||
Food Products | 1.7% | |||
Health Care Equipment & Supplies | 6.7% | |||
Health Care Providers & Services | 1.1% | |||
Health Care Technology | 2.0% | |||
Hotels, Restaurants & Leisure | 3.5% | |||
Household Durables | 4.6% | |||
Industry | Percent of Net Assets | |||
Information Technology Services | 5.4% | |||
Insurance | 4.8% | |||
Interactive Media & Services | 1.2% | |||
Internet & Catalog Retail | 0.8% | |||
Leisure Equipment & Products | 0.8% | |||
Life Sciences Tools & Services | 4.0% | |||
Machinery | 3.7% | |||
Media | 0.6% | |||
Metals & Mining | 1.2% | |||
Oil, Gas & Consumable Fuels | 0.4% | |||
Personal Products | 1.0% | |||
Pharmaceuticals | 4.7% | |||
Professional Services | 1.0% | |||
Semiconductors & Semiconductor Equipment | 0.9% | |||
Software | 12.6% | |||
Specialty Retail | 2.0% | |||
Thrifts & Mortgage Finance | 1.8% | |||
Tobacco | 0.8% | |||
Trading Companies & Distributors | 0.5% | |||
Other Assets in Excess of Liabilities | 0.4% | |||
|
| |||
TOTAL | 100.0% | |||
|
| |||
Notes to Financial Statements are an integral part of this Schedule.
20
Driehaus Small Cap Growth Fund
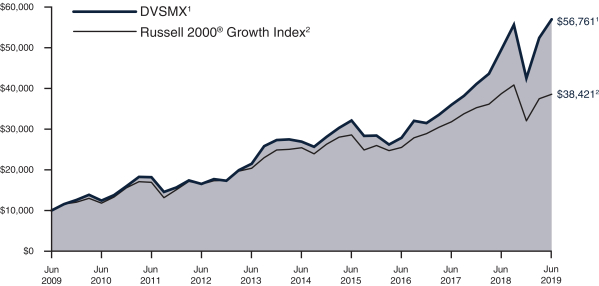
Performance Overview (unaudited)
The performance summarized below is historical and does not represent future results. Investment returns and principal value vary, and you may have a gain or loss when you sell shares. Performance data presented measures the change in the value of an investment in the Fund, assuming reinvestment of all dividends and capital gains. Average annual total return reflects annualized change.
The table does not reflect the deduction of taxes that a shareholder would pay on Fund distributions or the redemption of Fund shares. The graph compares the results of a $10,000 investment in the Fund over the last 10 fiscal year periods (which includes performance of the Predecessor Partnership), with all dividends and capital gains reinvested, with the indicated index (and dividends reinvested) for the same period.
| Fund Only | Including Predecessor Limited Partnership | |||||||||||||||||||
| Average Annual Total Returns as of 6/30/19) | 1 Year | Since Inception (8/21/17 - 6/30/19) | 3 Years | 5 Years | 10 Years | |||||||||||||||
Driehaus Small Cap Growth Fund Investor Class (DVSMX)1 | 14.89% | 30.33% | 26.84% | 16.12% | 18.96% | |||||||||||||||
Driehaus Small Cap Growth Fund Institutional Class (DNSMX)1 | 15.21% | 30.68% | 27.05% | 16.24% | 19.02% | |||||||||||||||
Russell 2000® Growth Index2 | –0.49% | 12.90% | 14.69% | 8.63% | 14.41% | |||||||||||||||
| 1 | The Driehaus Small Cap Growth Fund (“the Fund”) performance shown above includes the performance of the Driehaus Institutional Small Cap, L.P. (the “Predecessor Partnership”), one of the Fund’s predecessors, for the periods before the Fund’s registration statement became effective. The Predecessor Partnership was managed by the same investment team with substantially the same investment objective, policies and philosophies as are followed by the Fund. The Fund succeeded to the Predecessor Partnership’s assets together with the assets of the Driehaus Institutional Small Cap Recovery Fund, L.P., Driehaus Small Cap Recovery Fund, L.P. and Driehaus Small Cap Investors, L.P. (together, the “Limited Partnerships”) on August 21, 2017. The investment portfolios of the Limited Partnerships were identical and therefore had similar performance. The performance of the Predecessor Partnership is shown here because it has been in operation the longest. The Predecessor Partnership was not registered under the Investment Company Act of 1940, as amended (“1940 Act”), and thus was not subject to certain investment and operational restrictions that are imposed by the 1940 Act. If the Predecessor Partnership had been registered under the 1940 Act, its performance may have been adversely affected. The Predecessor Partnership’s performance has not been restated to reflect estimated expenses applicable to each class of shares of the Fund. The returns for the periods presented above reflect fee waivers and/or reimbursements, if applicable, without which performance would have been lower. |
| 2 | The Russell 2000® Growth Index measures the performance of those Russell 2000® companies with higherprice-to-book ratios and higher forecasted growth values. The performance data includes reinvested dividends. The Russell 2000® Index measures the performance of the 2,000 smallest companies in the Russell 3000® Index. |
21
Driehaus Small Cap Growth Fund
Schedule of Investments
June 30, 2019 (unaudited)
| Number of Shares | Value (Note A) | |||||||
| EQUITY SECURITIES — 99.8% |
| |||||||
| INFORMATION TECHNOLOGY — 28.0% |
| |||||||
Software — 17.1% |
| |||||||
Altair Engineering, Inc. — A** | 23,216 | $ | 937,694 | |||||
Alteryx, Inc. — A** | 33,523 | 3,658,030 | ||||||
Anaplan, Inc.** | 38,487 | 1,942,439 | ||||||
Coupa Software, Inc.** | 20,277 | 2,567,271 | ||||||
Crowdstrike Holdings, Inc. — A** | 16,797 | 1,147,067 | ||||||
Elastic NV** | 14,531 | 1,084,884 | ||||||
Everbridge, Inc.** | 40,714 | 3,640,646 | ||||||
Five9, Inc.** | 31,125 | 1,596,401 | ||||||
Globant SA** | 13,773 | 1,391,762 | ||||||
RingCentral, Inc. — A** | 13,403 | 1,540,273 | ||||||
Smartsheet, Inc. — A** | 57,017 | 2,759,623 | ||||||
The Trade Desk, Inc. — A** | 10,291 | 2,344,084 | ||||||
Zoom Video Communications, Inc. — A** | 11,685 | 1,037,511 | ||||||
Zscaler, Inc.** | 49,132 | 3,765,476 | ||||||
|
| |||||||
| 29,413,161 | ||||||||
|
| |||||||
Information Technology Services — 7.4% |
| |||||||
Endava PLC — SP ADR** | 76,966 | 3,097,112 | ||||||
EPAM Systems, Inc.** | 9,863 | 1,707,285 | ||||||
EVERTEC, Inc. | 25,402 | 830,645 | ||||||
Evo Payments, Inc. — A** | 26,484 | 835,040 | ||||||
KBR, Inc. | 70,220 | 1,751,287 | ||||||
MongoDB, Inc.** | 14,852 | 2,258,841 | ||||||
Twilio, Inc. — A** | 16,535 | 2,254,547 | ||||||
|
| |||||||
| 12,734,757 | ||||||||
|
| |||||||
Semiconductors & Semiconductor Equipment — 1.9% |
| |||||||
Inphi Corp.** | 29,867 | 1,496,337 | ||||||
SolarEdge Technologies, Inc.** | 29,044 | 1,814,088 | ||||||
|
| |||||||
| 3,310,425 | ||||||||
|
| |||||||
Electronic Equipment, Instruments & Components — 0.9% |
| |||||||
Itron, Inc.** | 25,591 | 1,601,229 | ||||||
Communications Equipment — 0.7% |
| |||||||
Acacia Communications, Inc.** | 24,982 | 1,178,151 | ||||||
|
| |||||||
Total INFORMATION TECHNOLOGY | 48,237,723 | |||||||
|
| |||||||
| HEALTH CARE — 24.8% |
| |||||||
Biotechnology — 12.3% |
| |||||||
Allakos, Inc.** | 25,039 | 1,084,940 | ||||||
Argenx SE — ADR** | 21,825 | 3,089,983 | ||||||
Ascendis Pharma AS — ADR** | 15,353 | 1,767,898 | ||||||
Blueprint Medicines Corp.** | 18,149 | 1,711,995 | ||||||
CareDx, Inc.** | 67,059 | 2,413,453 | ||||||
| Number of Shares | Value (Note A) | |||||||
Global Blood Therapeutics, Inc.** | 17,111 | $ | 900,039 | |||||
Insmed, Inc.** | 25,307 | 647,859 | ||||||
Mirati Therapeutics, Inc.** | 19,806 | 2,040,018 | ||||||
Orchard Therapeutics PLC — ADR** | 79,375 | 1,110,456 | ||||||
Repligen Corp.** | 12,551 | 1,078,758 | ||||||
Sarepta Therapeutics, Inc.** | 17,690 | 2,687,996 | ||||||
Turning Point Therapeutics, Inc.** | 22,459 | 914,081 | ||||||
Vericel Corp.** | 94,786 | 1,790,507 | ||||||
|
| |||||||
| 21,237,983 | ||||||||
|
| |||||||
Health Care Equipment & Supplies — 4.3% |
| |||||||
Glaukos Corp.** | 16,243 | 1,224,722 | ||||||
iRhythm Technologies, Inc.** | 10,143 | 802,108 | ||||||
SI-BONE, Inc.** | 78,095 | 1,588,452 | ||||||
Tactile Systems Technology, Inc.** | 16,803 | 956,427 | ||||||
Tandem Diabetes Care, Inc.** | 43,044 | 2,777,199 | ||||||
|
| |||||||
| 7,348,908 | ||||||||
|
| |||||||
Health Care Technology — 2.9% |
| |||||||
Inspire Medical Systems, Inc.** | 50,721 | 3,076,229 | ||||||
Omnicell, Inc.** | 23,211 | 1,996,842 | ||||||
|
| |||||||
| 5,073,071 | ||||||||
|
| |||||||
Pharmaceuticals — 2.6% |
| |||||||
MyoKardia, Inc.** | 40,863 | 2,048,871 | ||||||
Reata Pharmaceuticals, Inc. — A** | 19,758 | 1,864,167 | ||||||
Tricida, Inc.** | 12,016 | 474,151 | ||||||
|
| |||||||
| 4,387,189 | ||||||||
|
| |||||||
Life Sciences Tools & Services — 1.8% |
| |||||||
Adaptive Biotechnologies, Corp.** | 17,766 | 858,098 | ||||||
Fluidigm Corp.** | 121,036 | 1,491,164 | ||||||
NeoGenomics, Inc.** | 36,738 | 806,032 | ||||||
|
| |||||||
| 3,155,294 | ||||||||
|
| |||||||
Health Care Providers & Services — 0.9% |
| |||||||
Guardant Health, Inc.** | 18,002 | 1,554,113 | ||||||
|
| |||||||
Total HEALTH CARE | 42,756,558 | |||||||
|
| |||||||
| CONSUMER DISCRETIONARY — 20.1% |
| |||||||
Household Durables — 4.7% |
| |||||||
LGI Homes, Inc.** | 27,369 | 1,954,968 | ||||||
Roku, Inc.** | 21,991 | 1,991,945 | ||||||
Skyline Champion Corp.** | 57,633 | 1,577,992 | ||||||
Tempur Sealy International, Inc.** | 14,470 | 1,061,664 | ||||||
The Lovesac Co.** | 35,087 | 1,090,153 | ||||||
TopBuild Corp.** | 6,255 | 517,664 | ||||||
|
| |||||||
| 8,194,386 | ||||||||
|
| |||||||
Notes to Financial Statements are an integral part of this Schedule.
22
Driehaus Small Cap Growth Fund
Schedule of Investments
June 30, 2019 (unaudited)
| Number of Shares | Value (Note A) | |||||||
Specialty Retail — 3.8% |
| |||||||
Boot Barn Holdings, Inc.** | 52,621 | $ | 1,875,412 | |||||
Carvana Co.** | 16,749 | 1,048,320 | ||||||
Five Below, Inc.** | 6,817 | 818,176 | ||||||
Lithia Motors, Inc. | 12,114 | 1,438,901 | ||||||
Monro, Inc. | 17,014 | 1,451,294 | ||||||
|
| |||||||
| 6,632,103 | ||||||||
|
| |||||||
Diversified Consumer Services — 3.8% |
| |||||||
Bright Horizons Family Solutions, Inc.** | 6,829 | 1,030,291 | ||||||
Chegg, Inc.** | 40,784 | 1,573,855 | ||||||
Grand Canyon Education, Inc.** | 14,778 | 1,729,322 | ||||||
Strategic Education, Inc. | 12,028 | 2,140,984 | ||||||
|
| |||||||
| 6,474,452 | ||||||||
|
| |||||||
Hotels, Restaurants & Leisure — 3.7% |
| |||||||
Eldorado Resorts, Inc.** | 28,839 | 1,328,613 | ||||||
Planet Fitness, Inc. — A** | 29,258 | 2,119,450 | ||||||
SeaWorld Entertainment, Inc.** | 25,039 | 776,209 | ||||||
Wingstop, Inc. | 22,019 | 2,086,300 | ||||||
|
| |||||||
| 6,310,572 | ||||||||
|
| |||||||
Auto Components — 1.5% |
| |||||||
Fox Factory Holding Corp.** | 30,514 | 2,517,710 | ||||||
Internet & Catalog Retail — 0.8% |
| |||||||
Etsy, Inc.** | 22,372 | 1,372,970 | ||||||
Leisure Equipment & Products — 0.6% |
| |||||||
YETI Holdings, Inc.** | 36,689 | 1,062,147 | ||||||
Distributors — 0.6% | ||||||||
Pool Corp. | 5,298 | 1,011,918 | ||||||
Textiles, Apparel & Luxury Goods — 0.6% |
| |||||||
Deckers Outdoor Corp.** | 5,643 | 992,999 | ||||||
|
| |||||||
Total CONSUMER DISCRETIONARY | 34,569,257 | |||||||
|
| |||||||
| INDUSTRIALS — 16.5% |
| |||||||
Machinery — 4.1% |
| |||||||
Albany International, Corp. | 10,852 | 899,739 | ||||||
Chart Industries, Inc.** | 10,164 | 781,408 | ||||||
Harsco Corp.** | 61,131 | 1,677,435 | ||||||
John Bean Technologies Corp. | 19,894 | 2,409,760 | ||||||
Woodward, Inc. | 11,793 | 1,334,496 | ||||||
|
| |||||||
| 7,102,838 | ||||||||
|
| |||||||
Aerospace & Defense — 3.8% |
| |||||||
Axon Enterprise, Inc.** | 31,702 | 2,035,585 | ||||||
Kratos Defense & Security Solutions, Inc.** | 61,168 | 1,400,136 | ||||||
Mercury Systems, Inc.** | 30,477 | 2,144,057 | ||||||
Parsons Corp.** | 27,864 | 1,027,067 | ||||||
|
| |||||||
| 6,606,845 | ||||||||
|
| |||||||
Professional Services — 3.0% |
| |||||||
Exponent, Inc. | 19,803 | 1,159,268 | ||||||
FTI Consulting, Inc.** | 30,732 | 2,576,571 | ||||||
| Number of Shares | Value (Note A) | |||||||
TriNet Group, Inc.** | 20,833 | $ | 1,412,477 | |||||
|
| |||||||
| 5,148,316 | ||||||||
|
| |||||||
Commercial Services & Supplies — 2.6% |
| |||||||
Herman Miller, Inc. | 21,153 | 945,539 | ||||||
Tetra Tech, Inc. | 21,591 | 1,695,973 | ||||||
The Brink’s Co. | 22,685 | 1,841,568 | ||||||
|
| |||||||
| 4,483,080 | ||||||||
|
| |||||||
Construction & Engineering — 1.1% |
| |||||||
Arcosa, Inc. | 50,411 | 1,896,966 | ||||||
Building Products — 0.8% |
| |||||||
Armstrong World Industries, Inc. | 13,547 | 1,316,768 | ||||||
Airlines — 0.6% |
| |||||||
Copa Holdings SA — A | 10,567 | 1,031,022 | ||||||
Electrical Equipment — 0.5% |
| |||||||
Generac Holdings, Inc.** | 13,221 | 917,670 | ||||||
|
| |||||||
Total INDUSTRIALS | 28,503,505 | |||||||
|
| |||||||
| FINANCIALS — 4.8% |
| |||||||
Real Estate Investment Trust — 1.9% |
| |||||||
Americold Realty Trust | 58,118 | 1,884,186 | ||||||
Rexford Industrial Realty, Inc. | 35,392 | 1,428,775 | ||||||
|
| |||||||
| 3,312,961 | ||||||||
|
| |||||||
Insurance — 1.9% |
| |||||||
eHealth, Inc.** | 25,201 | 2,169,806 | ||||||
Kinsale Capital Group, Inc. | 10,908 | 997,864 | ||||||
|
| |||||||
| 3,167,670 | ||||||||
|
| |||||||
Commercial Banks — 0.5% |
| |||||||
First BanCorp | 83,154 | 918,020 | ||||||
Thrifts & Mortgage Finance — 0.5% |
| |||||||
LendingTree, Inc.** | 2,079 | 873,242 | ||||||
|
| |||||||
Total FINANCIALS | 8,271,893 | |||||||
|
| |||||||
| CONSUMER STAPLES — 2.7% |
| |||||||
Food Products — 2.2% | ||||||||
Freshpet, Inc.** | 43,674 | 1,987,604 | ||||||
The Simply Good Foods Co.** | 72,414 | 1,743,729 | ||||||
|
| |||||||
| 3,731,333 | ||||||||
|
| |||||||
Food & Staples Retailing — 0.5% |
| |||||||
Grocery Outlet Holding, Corp.** | 28,492 | 936,817 | ||||||
|
| |||||||
Total CONSUMER STAPLES | 4,668,150 | |||||||
|
| |||||||
| MATERIALS — 1.1% |
| |||||||
Chemicals — 1.1% |
| |||||||
Ingevity Corp.** | 18,812 | 1,978,458 | ||||||
|
| |||||||
Total MATERIALS | 1,978,458 | |||||||
|
| |||||||
Notes to Financial Statements are an integral part of this Schedule.
23
Driehaus Small Cap Growth Fund
Schedule of Investments
June 30, 2019 (unaudited)
| Number of Shares | Value (Note A) | |||||||
| ENERGY — 1.0% |
| |||||||
Oil, Gas & Consumable Fuels — 0.6% |
| |||||||
Scorpio Tankers, Inc. | 37,301 | $ | 1,101,126 | |||||
Energy Equipment & Services — 0.4% |
| |||||||
Cactus, Inc. — A** | 17,948 | 594,438 | ||||||
|
| |||||||
Total ENERGY | 1,695,564 | |||||||
|
| |||||||
| COMMUNICATION SERVICES — 0.8% |
| |||||||
Diversified Telecommunication Services — 0.8% |
| |||||||
Bandwidth, Inc. — A** | 18,441 | 1,383,444 | ||||||
|
| |||||||
Total COMMUNICATION SERVICES | 1,383,444 | |||||||
|
| |||||||
Total EQUITY SECURITIES | 172,064,552 | |||||||
|
| |||||||
| ||||||||
TOTAL INVESTMENTS | 99.8 | % | $ | 172,064,552 | ||||
Other Assets In Excess Of Liabilities | 0.2 | % | 354,911 | |||||
|
|
|
| |||||
Net Assets | 100.0 | % | $ | 172,419,463 | ||||
| ||||||||
| ** | Non-income producing security |
ADR — American Depository Receipt
SP ADR — Sponsored American Depository Receipt
Top Ten Holdings*
Zscaler, Inc. | 2.2% | |||
Alteryx, Inc. — A | 2.1% | |||
Everbridge, Inc. | 2.1% | |||
Endava PLC — SP ADR | 1.8% | |||
Argenx SE — ADR | 1.8% | |||
Inspire Medical Systems, Inc. | 1.8% | |||
Tandem Diabetes Care, Inc. | 1.6% | |||
Smartsheet, Inc. — A | 1.6% | |||
Sarepta Therapeutics, Inc. | 1.6% | |||
FTI Consulting, Inc. | 1.5% |
| * | All percentages are stated as a percent of net assets at June 30, 2019 |
Notes to Financial Statements are an integral part of this Schedule.
24
Driehaus Small Cap Growth Fund
Schedule of Investments
June 30, 2019 (unaudited)
Industry | Percent of Net Assets | |||
Aerospace & Defense | 3.8% | |||
Airlines | 0.6% | |||
Auto Components | 1.5% | |||
Biotechnology | 12.3% | |||
Building Products | 0.8% | |||
Chemicals | 1.1% | |||
Commercial Banks | 0.5% | |||
Commercial Services & Supplies | 2.6% | |||
Communications Equipment | 0.7% | |||
Construction & Engineering | 1.1% | |||
Distributors | 0.6% | |||
Diversified Consumer Services | 3.8% | |||
Diversified Telecommunication Services | 0.8% | |||
Electrical Equipment | 0.5% | |||
Electronic Equipment, Instruments & Components | 0.9% | |||
Energy Equipment & Services | 0.4% | |||
Food & Staples Retailing | 0.5% | |||
Food Products | 2.2% | |||
Health Care Equipment & Supplies | 4.3% | |||
Health Care Providers & Services | 0.9% | |||
Industry | Percent of Net Assets | |||
Health Care Technology | 2.9% | |||
Hotels, Restaurants & Leisure | 3.7% | |||
Household Durables | 4.7% | |||
Information Technology Services | 7.4% | |||
Insurance | 1.9% | |||
Internet & Catalog Retail | 0.8% | |||
Leisure Equipment & Products | 0.6% | |||
Life Sciences Tools & Services | 1.8% | |||
Machinery | 4.1% | |||
Oil, Gas & Consumable Fuels | 0.6% | |||
Pharmaceuticals | 2.6% | |||
Professional Services | 3.0% | |||
Real Estate Investment Trust | 1.9% | |||
Semiconductors & Semiconductor Equipment | 1.9% | |||
Software | 17.1% | |||
Specialty Retail | 3.8% | |||
Textiles, Apparel & Luxury Goods | 0.6% | |||
Thrifts & Mortgage Finance | 0.5% | |||
Other Assets in Excess of Liabilities | 0.2% | |||
|
| |||
TOTAL | 100.0% | |||
|
| |||
Notes to Financial Statements are an integral part of this Schedule.
25
Statements of Assets and Liabilities
June 30, 2019 (unaudited)
| Driehaus Emerging Markets Growth Fund | Driehaus Emerging Markets Small Cap Growth Fund | |||||||
ASSETS: | ||||||||
Investments, at cost | $ | 1,226,097,441 | $ | 48,371,656 | ||||
|
|
|
| |||||
Investments, at fair value | $ | 1,571,105,289 | $ | 57,440,076 | ||||
Foreign currency, at fair value* | 10,193,435 | 670,265 | ||||||
Cash and cash equivalents | 100,289,561 | 2,453,537 | ||||||
Receivables: | ||||||||
Dividends | 6,503,332 | 255,659 | ||||||
Investment securities sold | 18,753,458 | 863,776 | ||||||
Fund shares sold | 725,193 | 20,000 | ||||||
Foreign taxes | 650,044 | 664,813 | ||||||
Net unrealized appreciation on unsettled foreign currency transactions | — | 900 | ||||||
Prepaid expenses | 31,001 | 8,107 | ||||||
|
|
|
| |||||
| ||||||||
TOTAL ASSETS | 1,708,251,313 | 62,377,133 | ||||||
|
|
|
| |||||
| ||||||||
LIABILITIES: | ||||||||
Payables: | ||||||||
Investment securities purchased | 18,562,471 | 1,180,360 | ||||||
Fund shares redeemed | 2,042,346 | 367,063 | ||||||
Net unrealized depreciation on unsettled foreign currency transactions | 10,604 | — | ||||||
Foreign currency* | — | — | ||||||
Due to affiliates | 1,449,239 | 28,666 | ||||||
Audit and tax fees | 30,324 | 28,842 | ||||||
Accrued expenses | 153,448 | 123,325 | ||||||
|
|
|
| |||||
| ||||||||
TOTAL LIABILITIES | 22,248,432 | 1,728,256 | ||||||
|
|
|
| |||||
| ||||||||
NET ASSETS | $ | 1,686,002,881 | $ | 60,648,877 | ||||
|
|
|
| |||||
| ||||||||
NET ASSETS CONSISTED OF THE FOLLOWING AT JUNE 30, 2019: | ||||||||
Paid-in capital | $ | 1,373,310,603 | $ | 102,148,187 | ||||
Total distributable earnings (deficit) | 312,692,278 | (41,499,310 | ) | |||||
|
|
|
| |||||
NET ASSETS | $ | 1,686,002,881 | $ | 60,648,877 | ||||
|
|
|
| |||||
| ||||||||
NET ASSETS | — | $ | 60,648,877 | |||||
SHARES OUTSTANDING (Unlimited shares authorized, no par value) | — | 4,676,004 | ||||||
NET ASSET VALUE | — | $ | 12.97 | |||||
INVESTOR CLASS SHARES: | ||||||||
NET ASSETS | $ | 843,796,262 | — | |||||
SHARES OUTSTANDING (Unlimited shares authorized, no par value) | 23,059,083 | — | ||||||
NET ASSET VALUE | $ | 36.59 | — | |||||
INSTITUTIONAL CLASS SHARES: | ||||||||
NET ASSETS | $ | 842,206,619 | — | |||||
SHARES OUTSTANDING (Unlimited shares authorized, no par value) | 23,026,260 | — | ||||||
NET ASSET VALUE | $ | 36.58 | — | |||||
| * | The cost of foreign currency was $10,226,514, $669,586, ($54,861), $0 and $0, respectively. |
Notes to Financial Statements are an integral part of this Statement.
26
Statements of Assets and Liabilities
June 30, 2019 (unaudited)
| Driehaus International Small Cap Growth Fund | Driehaus Micro Cap Growth Fund | Driehaus Small Cap Growth Fund | ||||||||
| $ | 220,751,687 | $ | 189,674,180 | $ | 129,206,276 | |||||
|
|
|
|
|
| |||||
| $ | 252,473,492 | $ | 272,096,192 | $ | 172,064,552 | |||||
| — | — | — | ||||||||
| 8,365,810 | 379,658 | 1,937,165 | ||||||||
| 977,249 | 33,846 | 31,564 | ||||||||
| 2,502,669 | 5,243,784 | 1,685,187 | ||||||||
| 27,475 | 2,356 | 132,943 | ||||||||
| — | — | — | ||||||||
| 791 | — | — | ||||||||
| — | 10,640 | 28,552 | ||||||||
|
|
|
|
|
| |||||
|
| |||||||||
| 264,347,486 | 277,766,476 | 175,879,963 | ||||||||
|
|
|
|
|
| |||||
|
| |||||||||
| 3,955,339 | 3,866,434 | 2,741,596 | ||||||||
| 3,108,572 | 506,426 | 574,430 | ||||||||
| — | — | — | ||||||||
| 54,834 | — | — | ||||||||
| 209,781 | 271,511 | 80,442 | ||||||||
| 24,513 | 23,625 | 25,363 | ||||||||
| 66,335 | 2,401 | 38,669 | ||||||||
|
|
|
|
|
| |||||
|
| |||||||||
| 7,419,374 | 4,670,397 | 3,460,500 | ||||||||
|
|
|
|
|
| |||||
|
| |||||||||
| $ | 256,928,112 | $ | 273,096,079 | $ | 172,419,463 | |||||
|
|
|
|
|
| |||||
|
| |||||||||
| $ | 228,471,017 | $ | 171,476,486 | $ | 135,735,203 | |||||
| 28,457,095 | 101,619,593 | 36,684,260 | ||||||||
|
|
|
|
|
| |||||
| $ | 256,928,112 | $ | 273,096,079 | $ | 172,419,463 | |||||
|
|
|
|
|
| |||||
|
| |||||||||
| $ | 256,928,112 | $ | 273,096,079 | — | ||||||
| 27,072,017 | 19,173,566 | — | ||||||||
| $ | 9.49 | $ | 14.24 | — | ||||||
| — | — | $ | 10,600,419 | |||||||
| — | — | 678,153 | ||||||||
| — | — | $ | 15.63 | |||||||
| — | — | $ | 161,819,044 | |||||||
| — | — | 10,301,508 | ||||||||
| — | — | $ | 15.71 | |||||||
Notes to Financial Statements are an integral part of this Statement.
27
For the Six Months Ended June 30, 2019 (unaudited)
| Driehaus Emerging Markets Growth Fund | Driehaus Emerging Markets Small Cap Growth Fund | |||||||
INVESTMENT INCOME (LOSS): | ||||||||
Income: | ||||||||
Dividends* | $ | 16,406,068 | $ | 744,315 | ||||
|
|
|
| |||||
| ||||||||
Total income | 16,406,068 | 744,315 | ||||||
|
|
|
| |||||
| ||||||||
Expenses: | ||||||||
Investment advisory fee | 8,195,147 | 425,135 | ||||||
Administration fee | 419,987 | 71,637 | ||||||
Professional fees | 148,177 | 16,083 | ||||||
Audit and tax fees | 40,106 | 42,773 | ||||||
Federal and state registration fees | 49,289 | 11,797 | ||||||
Custodian fees | 182,548 | 35,403 | ||||||
Transfer agent fees | 203,104 | 31,666 | ||||||
Trustees’ fees | 95,728 | 24,263 | ||||||
Chief compliance officer fees | 9,947 | 9,947 | ||||||
Reports to shareholders | 63,367 | 14,670 | ||||||
Interest expense | — | 4,169 | ||||||
Shareholder services fees (Investor Class) | 764,784 | — | ||||||
Miscellaneous | 54,224 | 17,896 | ||||||
|
|
|
| |||||
Total expenses | 10,226,408 | 705,439 | ||||||
|
|
|
| |||||
| ||||||||
Investment advisory fees recaptured (waived) | — | (165,229 | ) | |||||
Transfer agent fees waived | — | — | ||||||
Fees paid indirectly | (53,690 | ) | (3,376 | ) | ||||
|
|
|
| |||||
Net expenses | 10,172,718 | 536,834 | ||||||
|
|
|
| |||||
| ||||||||
Net investment income (loss) | 6,233,350 | 207,481 | ||||||
|
|
|
| |||||
| ||||||||
| NET REALIZED AND UNREALIZED GAIN (LOSS) ON INVESTMENT TRANSACTIONS: | ||||||||
Net realized gain (loss) from security transactions | 36,410,509 | 4,780,011 | ||||||
Net realized foreign exchange gain (loss) | (536,747 | ) | (85,019 | ) | ||||
Net change in unrealized foreign exchange gain (loss) | 302 | (10,550 | ) | |||||
Net change in unrealized appreciation (depreciation) on investments | 178,892,164 | 9,313,366 | ||||||
|
|
|
| |||||
| ||||||||
Net realized and unrealized gain (loss) on investment transactions | 214,766,228 | 13,997,808 | ||||||
|
|
|
| |||||
| ||||||||
NET INCREASE (DECREASE) IN NET ASSETS RESULTING FROM OPERATIONS | $ | 220,999,578 | $ | 14,205,289 | ||||
|
|
|
| |||||
| ||||||||
| * | Dividends are net of $2,018,913, $74,224, $279,852, $663 and $0non-reclaimable foreign taxes withheld, respectively. |
Notes to Financial Statements are an integral part of this Statement.
28
Statements of Operations
For the Six Months Ended June 30, 2019 (unaudited)
| Driehaus International Small Cap Growth Fund | Driehaus Micro Cap Growth Fund | Driehaus Small Cap Growth Fund | ||||||||
| $ | 3,377,487 | $ | 163,161 | $ | 168,017 | |||||
|
|
|
|
|
| |||||
|
| |||||||||
| 3,377,487 | 163,161 | 168,017 | ||||||||
|
|
|
|
|
| |||||
|
| |||||||||
| 1,258,711 | 1,521,801 | 470,453 | ||||||||
| 129,255 | 113,528 | 84,869 | ||||||||
| 30,757 | 30,204 | 21,757 | ||||||||
| 29,645 | 23,739 | 23,408 | ||||||||
| 11,904 | 12,121 | 22,507 | ||||||||
| 23,734 | 20,029 | 11,849 | ||||||||
| 25,387 | 29,532 | 39,173 | ||||||||
| 30,892 | 30,864 | 24,913 | ||||||||
| 9,947 | 9,947 | 9,947 | ||||||||
| 9,322 | 14,464 | 7,152 | ||||||||
| — | — | — | ||||||||
| — | — | 6,075 | ||||||||
| 20,270 | 21,367 | 15,364 | ||||||||
|
|
|
|
|
| |||||
| 1,579,824 | 1,827,596 | 737,467 | ||||||||
|
|
|
|
|
| |||||
|
| |||||||||
| — | — | 28,671 | ||||||||
| — | — | (10,500 | ) | |||||||
| (7,818 | ) | (50,539 | ) | (21,537 | ) | |||||
|
|
|
|
|
| |||||
| 1,572,006 | 1,777,057 | 734,101 | ||||||||
|
|
|
|
|
| |||||
|
| |||||||||
| 1,805,481 | (1,613,896 | ) | (566,084 | ) | ||||||
|
|
|
|
|
| |||||
|
| |||||||||
| 2,109,670 | 32,958,460 | 5,016,161 | ||||||||
| (71,389 | ) | — | — | |||||||
| 8,360 | — | — | ||||||||
| | 33,916,801 | 29,229,340 | 39,880,249 | |||||||
|
|
|
|
|
| |||||
|
| |||||||||
| | 35,963,442 | 62,187,800 | 44,896,410 | |||||||
|
|
|
|
|
| |||||
|
| |||||||||
| $ | 37,768,923 | $ | 60,573,904 | $ | 44,330,326 | |||||
|
|
|
|
|
| |||||
|
| |||||||||
Notes to Financial Statements are an integral part of this Statement.
29
Statements of Changes in Net Assets
| Driehaus Emerging Markets Growth Fund | Driehaus Emerging Markets Small Cap Growth Fund | |||||||||||||||
| For the six month period January 1, 2019 through June 30, 2019 (unaudited) | For the year ended December 31, 2018 | For the six month period January 1, 2019 through June 30, 2019 (unaudited) | For the year ended December 31, 2018 | |||||||||||||
INCREASE (DECREASE) IN NET ASSETS: | ||||||||||||||||
Operations: | ||||||||||||||||
Net investment income (loss) | $ | 6,233,350 | $ | 13,091,970 | $ | 207,481 | $ | (651,909 | ) | |||||||
Net realized gain (loss) on investment transactions | 35,873,762 | (44,556,639 | ) | 4,694,992 | (7,135,511 | ) | ||||||||||
Net change in unrealized gain (loss) on investment transactions | 178,892,466 | (260,680,098 | ) | 9,302,816 | (45,204,627 | ) | ||||||||||
|
|
|
|
|
|
|
| |||||||||
| ||||||||||||||||
Net increase (decrease) in net assets resulting from operations | 220,999,578 | (292,144,767 | ) | 14,205,289 | (52,992,047 | ) | ||||||||||
|
|
|
|
|
|
|
| |||||||||
| ||||||||||||||||
Distributions from distributable earnings to shareholders: | ||||||||||||||||
Fund | — | — | — | — | ||||||||||||
Investor Class Shares | — | (33,373,513 | ) | — | — | |||||||||||
Institutional Class Shares | — | (29,571,288 | ) | — | — | |||||||||||
|
|
|
|
|
|
|
| |||||||||
Total distribution to shareholders | — | (62,944,801 | ) | — | — | |||||||||||
|
|
|
|
|
|
|
| |||||||||
| ||||||||||||||||
Capital share transactions: | ||||||||||||||||
Proceeds from shares sold: | ||||||||||||||||
Fund | — | — | 8,068,247 | 46,460,249 | ||||||||||||
Investor Class Shares | 56,385,115 | 248,502,111 | — | — | ||||||||||||
Institutional Class Shares | 136,828,563 | 435,408,153 | — | — | ||||||||||||
Reinvestment of distributions: | ||||||||||||||||
Fund | — | — | — | — | ||||||||||||
Investor Class Shares | — | 32,164,851 | — | — | ||||||||||||
Institutional Class Shares | — | 25,064,735 | — | — | ||||||||||||
Cost of shares redeemed: | ||||||||||||||||
Fund | — | — | (51,295,660 | ) | (174,964,581 | ) | ||||||||||
Investor Class Shares | (120,430,422 | ) | (560,155,804 | ) | — | — | ||||||||||
Institutional Class Shares | (53,967,608 | ) | (159,370,078 | ) | — | — | ||||||||||
Redemption fees: | ||||||||||||||||
Fund | — | — | 17,871 | 3,515 | ||||||||||||
Investor Class Shares | 46,642 | 47,011 | — | — | ||||||||||||
Institutional Class Shares | 39,808 | 29,188 | — | — | ||||||||||||
|
|
|
|
|
|
|
| |||||||||
Net increase (decrease) in net assets derived from capital share transactions | 18,902,098 | 21,690,167 | (43,209,542 | ) | (128,500,817 | ) | ||||||||||
|
|
|
|
|
|
|
| |||||||||
Total increase (decrease) in net assets | 239,901,676 | (333,399,401 | ) | (29,004,253 | ) | (181,492,864 | ) | |||||||||
|
|
|
|
|
|
|
| |||||||||
| ||||||||||||||||
NET ASSETS: | ||||||||||||||||
| ||||||||||||||||
Beginning of period | $ | 1,446,101,205 | $ | 1,779,500,606 | $ | 89,653,130 | $ | 271,145,994 | ||||||||
|
|
|
|
|
|
|
| |||||||||
End of period | $ | 1,686,002,881 | $ | 1,446,101,205 | $ | 60,648,877 | $ | 89,653,130 | ||||||||
|
|
|
|
|
|
|
| |||||||||
| ||||||||||||||||
Notes to Financial Statements are an integral part of this Statement.
30
Statements of Changes in Net Assets
| Driehaus International Small Cap Growth Fund | Driehaus Micro Cap Growth Fund | Driehaus Small Cap Growth Fund | ||||||||||||||||||||
| For the six month period January 1, 2019 through June 30, 2019 (unaudited) | For the year ended December 31, 2018 | For the six month period January 1, 2019 through June 30, 2019 (unaudited) | For the year ended December 31, 2018 | For the six month period January 1, 2019 through June 30, 2019 (unaudited) | For the year ended December 31, 2018 | |||||||||||||||||
| $ | 1,805,481 | $ | (647,474 | ) | $ | (1,613,896 | ) | $ | (4,596,602 | ) | $ | (566,084 | ) | $ | (600,193 | ) | ||||||
| | 2,038,281 | 14,971,674 | 32,958,460 | 57,475,280 | 5,016,161 | (9,010,176 | ) | |||||||||||||||
| | 33,925,161 | (62,120,561 | ) | 29,229,340 | (31,956,231 | ) | 39,880,249 | (6,057,156 | ) | |||||||||||||
|
|
|
|
|
|
|
|
|
|
|
| |||||||||||
|
| |||||||||||||||||||||
| | 37,768,923 | (47,796,361 | ) | 60,573,904 | 20,922,447 | 44,330,326 | (15,667,525 | ) | ||||||||||||||
|
|
|
|
|
|
|
|
|
|
|
| |||||||||||
|
| |||||||||||||||||||||
| — | (30,824,444 | ) | — | (72,862,388 | ) | — | — | |||||||||||||||
| — | — | — | — | — | (209,521 | ) | ||||||||||||||||
| — | — | — | — | — | (3,384,429 | ) | ||||||||||||||||
|
|
|
|
|
|
|
|
|
|
|
| |||||||||||
| | — | (30,824,444 | ) | — | (72,862,388 | ) | — | (3,593,950 | ) | |||||||||||||
|
|
|
|
|
|
|
|
|
|
|
| |||||||||||
|
| |||||||||||||||||||||
| 20,199,601 | 75,278,152 | 32,883,013 | 114,618,353 | — | — | |||||||||||||||||
| — | — | — | — | 4,061,498 | 11,673,140 | |||||||||||||||||
| — | — | — | — | 29,908,840 | 108,943,026 | |||||||||||||||||
| — | 28,587,722 | — | 65,764,404 | — | — | |||||||||||||||||
| — | — | — | — | — | 209,521 | |||||||||||||||||
| — | — | — | — | — | 3,384,429 | |||||||||||||||||
| (19,471,032 | ) | (132,180,063 | ) | (84,967,910 | ) | (186,474,543 | ) | — | — | |||||||||||||
| — | — | — | — | (3,331,549 | ) | (3,748,523 | ) | |||||||||||||||
| — | — | — | — | (33,492,411 | ) | (10,289,299 | ) | |||||||||||||||
| 133 | 4,036 | 227 | 105,720 | — | — | |||||||||||||||||
| — | — | — | — | 527 | 2,471 | |||||||||||||||||
| — | — | — | — | 9,035 | 44,745 | |||||||||||||||||
|
|
|
|
|
|
|
|
|
|
|
| |||||||||||
| | 728,702 | (28,310,153 | ) | (52,084,670 | ) | (5,986,066 | ) | (2,844,060 | ) | 110,219,510 | ||||||||||||
|
|
|
|
|
|
|
|
|
|
|
| |||||||||||
| | 38,497,625 | (106,930,958 | ) | 8,489,234 | (57,926,007 | ) | 41,486,266 | 90,958,035 | ||||||||||||||
|
|
|
|
|
|
|
|
|
|
|
| |||||||||||
|
| |||||||||||||||||||||
|
| |||||||||||||||||||||
| $ | 218,430,487 | $ | 325,361,445 | $ | 264,606,845 | $ | 322,532,852 | $ | 130,933,197 | $ | 39,975,162 | |||||||||||
|
|
|
|
|
|
|
|
|
|
|
| |||||||||||
| $ | 256,928,112 | $ | 218,430,487 | $ | 273,096,079 | $ | 264,606,845 | $ | 172,419,463 | $ | 130,933,197 | |||||||||||
|
|
|
|
|
|
|
|
|
|
|
| |||||||||||
|
| |||||||||||||||||||||
Notes to Financial Statements are an integral part of this Statement.
31
Driehaus Emerging Markets Growth Fund — Investor Class
Financial Highlights
| For the six month period January 1, 2019 through June 30, 2019 (unaudited) | For the year ended December 31, 2018 | For the year ended December 31, 2017 | For the year ended December 31, 2016 | For the year ended December 31, 2015 | For the year ended December 31, 2014 | |||||||||||||||||||
Net asset value, beginning of period | $ | 31.80 | $ | 39.64 | $ | 27.98 | $ | 26.52 | $ | 29.63 | $ | 32.53 | ||||||||||||
|
|
|
|
|
|
|
|
|
|
|
| |||||||||||||
INCOME (LOSS) FROM INVESTMENT OPERATIONS: | ||||||||||||||||||||||||
Net investment income (loss) | 0.12 | ^ | 0.26 | ^ | 0.11 | ^ | 0.03 | 0.06 | 0.04 | |||||||||||||||
Net realized and unrealized gain (loss) | 4.67 | (6.73 | ) | 11.78 | 1.54 | (3.17 | ) | (1.99 | ) | |||||||||||||||
|
|
|
|
|
|
|
|
|
|
|
| |||||||||||||
Total income (loss) from investment operations | 4.79 | (6.47 | ) | 11.89 | 1.57 | (3.11 | ) | (1.95 | ) | |||||||||||||||
|
|
|
|
|
|
|
|
|
|
|
| |||||||||||||
LESS DISTRIBUTIONS: | ||||||||||||||||||||||||
Dividends from net investment income | — | (0.16 | ) | (0.23 | ) | (0.11 | ) | — | — | |||||||||||||||
Distributions from capital gains | — | (1.21 | ) | — | — | — | (0.95 | ) | ||||||||||||||||
|
|
|
|
|
|
|
|
|
|
|
| |||||||||||||
Total distributions | — | (1.37 | ) | (0.23 | ) | (0.11 | ) | — | (0.95 | ) | ||||||||||||||
|
|
|
|
|
|
|
|
|
|
|
| |||||||||||||
Redemption fees added topaid-in capital | 0.00 | ~ | 0.00 | ~ | 0.00 | ~ | 0.00 | ~ | 0.00 | ~ | 0.00 | ~ | ||||||||||||
|
|
|
|
|
|
|
|
|
|
|
| |||||||||||||
Net asset value, end of period | $ | 36.59 | $ | 31.80 | $ | 39.64 | $ | 27.98 | $ | 26.52 | $ | 29.63 | ||||||||||||
|
|
|
|
|
|
|
|
|
|
|
| |||||||||||||
Total Return | 15.10 | %** | (16.26 | )% | 42.52 | % | 5.88 | % | (10.49 | )% | (5.96 | )% | ||||||||||||
RATIOS/SUPPLEMENTAL DATA | ||||||||||||||||||||||||
Net assets, end of period (in 000’s) | $ | 843,796 | $ | 791,656 | $ | 1,266,365 | $ | 1,335,873 | $ | 1,362,421 | $ | 1,701,219 | ||||||||||||
Ratio of expenses before reimbursements, waivers and fees paid indirectly to average net assets | 1.37 | %* | 1.38 | % | 1.54 | % | 1.65 | % | 1.65 | % | 1.65 | % | ||||||||||||
Ratio of net expenses to average net assets | 1.37 | %*# | 1.37 | %# | 1.53 | %# | 1.63 | %# | 1.64 | %# | 1.63 | %# | ||||||||||||
Ratio of net investment income (loss) to average net assets | 0.70 | %*# | 0.69 | %# | 0.33 | %# | 0.11 | %# | 0.22 | %# | 0.11 | %# | ||||||||||||
Portfolio turnover | 89 | %** | 218 | % | 176 | % | 232 | % | 257 | % | 289 | % | ||||||||||||
| * | Annualized |
| ** | Not Annualized |
| ^ | Net investment income (loss) per share has been calculated using the average shares method. |
| ~ | Amount represents less than $0.01 per share |
| # | Such ratios are net of fees paid indirectly (see Note B in the Notes to Financial Statements). |
Notes to Financial Statements are an integral part of this Schedule.
32
Driehaus Emerging Markets Growth Fund — Institutional Class
Financial Highlights
| For the six month period January 1, 2019 through June 30, 2019 (unaudited) | For the year ended December 31, 2018 | For the period July 17, 2017 through December 31, 2017 | ||||||||||
Net asset value, beginning of period | $ | 31.76 | $ | 39.61 | $ | 34.85 | ||||||
|
|
|
|
|
| |||||||
INCOME (LOSS) FROM INVESTMENT OPERATIONS: | ||||||||||||
Net investment income (loss) | 0.15 | 0.32 | 0.12 | ^ | ||||||||
Net realized and unrealized gain (loss) | 4.67 | (6.71 | ) | 4.92 | ||||||||
|
|
|
|
|
| |||||||
Total income (loss) from investment operations | 4.82 | (6.39 | ) | 5.04 | ||||||||
|
|
|
|
|
| |||||||
LESS DISTRIBUTIONS: | ||||||||||||
Dividends from net investment income | — | (0.25 | ) | (0.28 | ) | |||||||
Distributions from capital gains | — | (1.21 | ) | — | ||||||||
|
|
|
|
|
| |||||||
Total distributions | — | (1.46 | ) | (0.28 | ) | |||||||
|
|
|
|
|
| |||||||
Redemption fees added topaid-in capital | 0.00 | ~ | 0.00 | ~ | 0.00 | ~ | ||||||
|
|
|
|
|
| |||||||
Net asset value, end of period | $ | 36.58 | $ | 31.76 | $ | 39.61 | ||||||
|
|
|
|
|
| |||||||
Total Return | 15.18 | %** | (16.08 | )% | 14.47 | %** | ||||||
RATIOS/SUPPLEMENTAL DATA | ||||||||||||
Net assets, end of period (in 000’s) | $ | 842,207 | $ | 654,445 | $ | 513,135 | ||||||
Ratio of expenses before reimbursements, waivers and fees paid indirectly to average net assets | 1.19 | %* | 1.17 | % | 1.17 | %* | ||||||
Ratio of net expenses to average net assets | 1.18 | %*# | 1.16 | %# | 1.16 | %*# | ||||||
Ratio of net investment income (loss) to average net assets | 0.88 | %*# | 0.89 | %# | 0.71 | %*# | ||||||
Portfolio turnover | 89 | %** | 218 | % | 176 | %** | ||||||
| * | Annualized |
| ** | Not Annualized |
| ^ | Net investment income (loss) per share has been calculated using the average shares method. |
| ~ | Amount represents less than $0.01 per share |
| # | Such ratios are net of fees paid indirectly (see Note B in the Notes to Financial Statements). |
Notes to Financial Statements are an integral part of this Schedule.
33
Driehaus Emerging Markets Small Cap Growth Fund
Financial Highlights
| For the six month period January 1, 2019 through June 30, 2019 (unaudited) | For the year ended December 31, 2018 | For the year ended December 31, 2017 | For the year ended December 31, 2016 | For the year ended December 31, 2015 | For the year ended December 31, 2014 | |||||||||||||||||||
Net asset value, beginning of period | $ | 10.80 | $ | 14.21 | $ | 10.66 | $ | 11.85 | $ | 13.21 | $ | 12.49 | ||||||||||||
|
|
|
|
|
|
|
|
|
|
|
| |||||||||||||
INCOME (LOSS) FROM INVESTMENT OPERATIONS: | ||||||||||||||||||||||||
Net investment income (loss) | 0.03 | ^ | (0.04 | )^ | 0.02 | ^ | (0.03 | )^ | (0.05 | )^ | (0.02 | )^ | ||||||||||||
Net realized and unrealized gain (loss) | 2.14 | (3.37 | ) | 3.53 | (1.14 | ) | (1.31 | ) | 0.74 | |||||||||||||||
|
|
|
|
|
|
|
|
|
|
|
| |||||||||||||
Total income (loss) from investment operations | 2.17 | (3.41 | ) | 3.55 | (1.17 | ) | (1.36 | ) | 0.72 | |||||||||||||||
|
|
|
|
|
|
|
|
|
|
|
| |||||||||||||
LESS DISTRIBUTIONS: | ||||||||||||||||||||||||
Dividends from net investment income | — | — | — | (0.02 | ) | — | — | |||||||||||||||||
Distributions from capital gains | — | — | — | — | — | — | ||||||||||||||||||
|
|
|
|
|
|
|
|
|
|
|
| |||||||||||||
Total distributions | — | — | — | (0.02 | ) | — | — | |||||||||||||||||
|
|
|
|
|
|
|
|
|
|
|
| |||||||||||||
Redemption fees added topaid-in capital | 0.00 | ~ | 0.00 | ~ | 0.00 | ~ | 0.00 | ~ | 0.00 | ~ | 0.00 | ~ | ||||||||||||
|
|
|
|
|
|
|
|
|
|
|
| |||||||||||||
Net asset value, end of period | $ | 12.97 | $ | 10.80 | $ | 14.21 | $ | 10.66 | $ | 11.85 | $ | 13.21 | ||||||||||||
|
|
|
|
|
|
|
|
|
|
|
| |||||||||||||
Total Return | 20.09 | %** | (24.00 | )% | 33.30 | % | (9.97 | )% | (10.22 | )% | 5.77 | % | ||||||||||||
RATIOS/SUPPLEMENTAL DATA | ||||||||||||||||||||||||
Net assets, end of period (in 000’s) | $ | 60,649 | $ | 89,653 | $ | 271,146 | $ | 261,387 | $ | 432,718 | $ | 510,175 | ||||||||||||
Ratio of expenses before reimbursements, waivers and fees paid indirectly and recoupments, if any, to average net assets | 1.91 | %*¥ | 2.27 | %¥ | 1.82 | % | 1.75 | % | 1.69 | %¥ | 1.73 | % | ||||||||||||
Ratio of net expenses to average net assets | 1.45 | %*+#¥ | 2.26 | %#¥ | 1.80 | %# | 1.73 | %# | 1.68 | %#¥ | 1.71 | %+# | ||||||||||||
Ratio of net investment income (loss) to average net assets | 0.56 | %*+# | (0.30 | )%# | 0.15 | %# | (0.26 | )%# | (0.39 | )%# | (0.14 | )%+# | ||||||||||||
Portfolio turnover | 105 | %** | 207 | % | 243 | % | 240 | % | 306 | % | 265 | % | ||||||||||||
| * | Annualized |
| ** | Not annualized |
| ^ | Net investment income (loss) per share has been calculated using the average shares method. |
| ~ | Amount represents less than $0.01 per share |
| + | Such ratios are after administrative and transfer agent waivers and adviser expense reimbursements, when applicable. BNY Mellon Investment Servicing (US) Inc., the administrative agent and transfer agent, waived a portion of its fees beginning with the Fund’s commencement of operations, August 22, 2011. The Adviser contractually agreed to waive its investment advisory fee or absorb other operating expenses to the extent necessary to ensure that total annual Fund operating expenses (other than interest, taxes, brokerage commissions and other portfolio transaction expenses, capital expenditures, and extraordinary expenses) would not exceed the Fund’s operating expense cap of 2.00% of average daily net assets from August 22, 2011 to August 21, 2014 and the Fund’s operating expense cap of 1.45% of average daily net assets from November 1, 2018 until October 31, 2021. |
| # | Such ratios are net of fees paid indirectly (see Note B in the Notes to Financial Statements). |
| ¥ | Ratio of expenses to average net assets includes interest expense of 0.01% for the six months ended June 30, 2019, and less than 0.005% for the years ended December 31, 2018 and 2015. The interest expense is from utilizing the line of credit (see Note E in the Notes to Financial Statements). |
Notes to Financial Statements are an integral part of this Schedule.
34
Driehaus International Small Cap Growth Fund
Financial Highlights
| For the six month period January 1, 2019 through June 30, 2019 (unaudited) | For the year ended December 31, 2018 | For the year ended December 31, 2017 | For the year ended December 31, 2016 | For the year ended December 31, 2015 | For the year ended December 31, 2014 | |||||||||||||||||||
Net asset value, beginning of period | $ | 8.13 | $ | 11.39 | $ | 9.33 | $ | 10.08 | $ | 9.20 | $ | 10.84 | ||||||||||||
|
|
|
|
|
|
|
|
|
|
|
| |||||||||||||
INCOME (LOSS) FROM INVESTMENT OPERATIONS: | ||||||||||||||||||||||||
Net investment income (loss) | 0.06 | ^ | (0.02 | ) ^ | (0.04 | ) | (0.02 | ) | (0.02 | ) ^ | (0.04 | ) | ||||||||||||
Net realized and unrealized gain (loss) | 1.30 | (1.92 | ) | 3.88 | (0.61 | ) | 1.17 | (0.42 | ) | |||||||||||||||
|
|
|
|
|
|
|
|
|
|
|
| |||||||||||||
Total income (loss) from investment operations | 1.36 | (1.94 | ) | 3.84 | (0.63 | ) | 1.15 | (0.46 | ) | |||||||||||||||
|
|
|
|
|
|
|
|
|
|
|
| |||||||||||||
LESS DISTRIBUTIONS: | ||||||||||||||||||||||||
Dividends from net investment income | — | — | — | — | (0.03 | ) | (0.06 | ) | ||||||||||||||||
Distributions from capital gains | — | (1.32 | ) | (1.78 | ) | (0.12 | ) | (0.24 | ) | (1.12 | ) | |||||||||||||
|
|
|
|
|
|
|
|
|
|
|
| |||||||||||||
Total distributions | — | (1.32 | ) | (1.78 | ) | (0.12 | ) | (0.27 | ) | (1.18 | ) | |||||||||||||
|
|
|
|
|
|
|
|
|
|
|
| |||||||||||||
Redemption fees added topaid-in capital | 0.00 | ~ | 0.00 | ~ | 0.00 | ~ | 0.00 | ~ | 0.00 | ~ | 0.00 | ~ | ||||||||||||
|
|
|
|
|
|
|
|
|
|
|
| |||||||||||||
Net asset value, end of period | $ | 9.49 | $ | 8.13 | $ | 11.39 | $ | 9.33 | $ | 10.08 | $ | 9.20 | ||||||||||||
|
|
|
|
|
|
|
|
|
|
|
| |||||||||||||
Total Return | 16.73 | %** | (16.92 | )% | 41.44 | % | (6.22 | )% | 12.58 | % | (4.32 | )% | ||||||||||||
RATIOS/SUPPLEMENTAL DATA | ||||||||||||||||||||||||
Net assets, end of period (in 000’s) | $ | 256,928 | $ | 218,430 | $ | 325,361 | $ | 270,401 | $ | 341,249 | $ | 218,979 | ||||||||||||
Ratio of expenses before reimbursements, waivers and fees paid indirectly to average net assets | 1.26 | %* | 1.50 | % | 1.73 | % | 1.72 | % | 1.71 | % | 1.74 | % | ||||||||||||
Ratio of net expenses to average net assets | 1.25 | %*# | 1.49 | %# | 1.71 | %# | 1.70 | %# | 1.70 | %# | 1.72 | %# | ||||||||||||
Ratio of net investment income (loss) to average net assets | 1.43 | %*# | (0.21 | )%# | (0.44 | )%# | (0.15 | )%# | (0.19 | )%# | (0.40 | )%# | ||||||||||||
Portfolio turnover | 59 | %** | 118 | % | 143 | % | 151 | % | 251 | % | 277 | % | ||||||||||||
| * | Annualized |
| ** | Not annualized |
| ^ | Net investment income (loss) per share has been calculated using the average shares method. |
| ~ | Amount represents less than $0.01 per share |
| # | Such ratios are net of fees paid indirectly (see Note B in the Notes to Financial Statements). |
Notes to Financial Statements are an integral part of this Schedule.
35
Driehaus Micro Cap Growth Fund
Financial Highlights
| For the six month period January 1, 2019 through June 30, 2019 (unaudited) | For the year ended December 31, 2018 | For the year ended December 31, 2017 | For the year ended December 31, 2016 | For the year ended December 31, 2015 | For the year ended December 31, 2014 | |||||||||||||||||||
Net asset value, beginning of period | $ | 11.11 | $ | 14.44 | $ | 12.65 | $ | 10.74 | $ | 11.25 | $ | 10.74 | ||||||||||||
|
|
|
|
|
|
|
|
|
|
|
| |||||||||||||
INCOME (LOSS) FROM INVESTMENT OPERATIONS: | ||||||||||||||||||||||||
Net investment income (loss) | (0.08 | ) | (0.19 | ) | (0.18 | )^ | (0.11 | )^ | (0.14 | )^ | (0.14 | ) | ||||||||||||
Net realized and unrealized gain (loss) | 3.21 | 0.55 | 3.26 | 2.02 | 0.08 | 1.01 | ||||||||||||||||||
|
|
|
|
|
|
|
|
|
|
|
| |||||||||||||
Total income (loss) from investment operations | 3.13 | 0.36 | 3.08 | 1.91 | (0.06 | ) | 0.87 | |||||||||||||||||
|
|
|
|
|
|
|
|
|
|
|
| |||||||||||||
LESS DISTRIBUTIONS: | ||||||||||||||||||||||||
Dividends from net investment income | — | — | — | — | — | — | ||||||||||||||||||
Distributions from capital gains | — | (3.69 | ) | (1.29 | ) | — | (0.45 | ) | (0.36 | ) | ||||||||||||||
|
|
|
|
|
|
|
|
|
|
|
| |||||||||||||
Total distributions | — | (3.69 | ) | (1.29 | ) | — | (0.45 | ) | (0.36 | ) | ||||||||||||||
|
|
|
|
|
|
|
|
|
|
|
| |||||||||||||
Redemption fees added topaid-in capital | 0.00 | ~ | 0.00 | ~ | 0.00 | ~ | 0.00 | ~ | 0.00 | ~ | 0.00 | ~ | ||||||||||||
|
|
|
|
|
|
|
|
|
|
|
| |||||||||||||
Net asset value, end of period | $ | 14.24 | $ | 11.11 | $ | 14.44 | $ | 12.65 | $ | 10.74 | $ | 11.25 | ||||||||||||
|
|
|
|
|
|
|
|
|
|
|
| |||||||||||||
Total Return | 28.17 | %** | 3.88 | % | 24.30 | % | 17.78 | % | (0.55 | )% | 8.21 | % | ||||||||||||
RATIOS/SUPPLEMENTAL DATA | ||||||||||||||||||||||||
Net assets, end of period (in 000’s) | $ | 273,096 | $ | 264,607 | $ | 322,533 | $ | 396,590 | $ | 282,178 | $ | 111,846 | ||||||||||||
Ratio of expenses before reimbursements, waivers and fees paid indirectly and recoupments, if any, to average net assets | 1.50 | %* | 1.44 | %¥ | 1.45 | %¥ | 1.48 | % | 1.53 | % | 1.59 | % | ||||||||||||
Ratio of net expenses to average net assets | 1.46 | %*# | 1.42 | %#¥ | 1.43 | %#¥ | 1.44 | %+# | 1.52 | %+# | 1.60 | %+# | ||||||||||||
Ratio of net investment income (loss) to average net assets | (1.33 | )%*# | (1.19 | )%# | (1.33 | )%# | (1.00 | )%+# | (1.21 | )%+# | (1.39 | )%+# | ||||||||||||
Portfolio turnover | 78 | %** | 156 | % | 177 | % | 180 | % | 183 | % | 191 | % | ||||||||||||
| * | Annualized |
| ** | Not Annualized |
| ^ | Net investment income (loss) per share has been calculated using the average shares method. |
| ~ | Amount represents less than $0.01 per share |
| + | Such ratios are after administrative and transfer agent waivers and adviser expense reimbursements, when applicable. BNY Mellon Investment Servicing (US) Inc., the administrative agent and transfer agent, waived a portion of its fees beginning with the Fund’s commencement of operations, November 18, 2013. The Adviser contractually agreed to waive its investment advisory fee or absorb other operating expenses to the extent necessary to ensure that total annual Fund operating expenses (other than interest, taxes, brokerage commissions and other portfolio transaction expenses, capital expenditures, and extraordinary expenses) would not exceed the Fund’s operating expense cap of 1.70% of average daily net assets until November 17, 2016. |
| # | Such ratios are net of fees paid indirectly (see Note B in the Notes to Financial Statements). |
| ¥ | Ratio of expenses to average net assets includes interest expense of less than 0.005% for the years ended December 31, 2018 and 2017. The interest expense is from utilizing the line of credit (see Note E in the Notes to Financial Statements). |
Notes to Financial Statements are an integral part of this Schedule.
36
Driehaus Small Cap Growth Fund — Investor Class
Financial Highlights
| For the six month period January 1, 2019 through June 30, 2019 (unaudited) | For the year ended December 31, 2018 | For the period August 21, 2017 through December 31, 2017 | ||||||||||
Net asset value, beginning of period | $ | 11.66 | $ | 11.62 | $ | 10.00 | ||||||
|
|
|
|
|
| |||||||
INCOME (LOSS) FROM INVESTMENT OPERATIONS: | ||||||||||||
Net investment income (loss) | (0.06 | ) | (0.12 | )^ | (0.04 | )^ | ||||||
Net realized and unrealized gain (loss) | 4.03 | 0.48 | 1.86 | |||||||||
|
|
|
|
|
| |||||||
Total income (loss) from investment operations | 3.97 | 0.36 | 1.82 | |||||||||
|
|
|
|
|
| |||||||
LESS DISTRIBUTIONS: | ||||||||||||
Dividends from net investment income | — | — | — | |||||||||
Distributions from capital gains | — | (0.33 | ) | (0.20 | ) | |||||||
|
|
|
|
|
| |||||||
Total distributions | — | (0.33 | ) | (0.20 | ) | |||||||
|
|
|
|
|
| |||||||
Redemption fees added topaid-in capital | 0.00 | ~ | 0.01 | — | ||||||||
|
|
|
|
|
| |||||||
Net asset value, end of period | $ | 15.63 | $ | 11.66 | $ | 11.62 | ||||||
|
|
|
|
|
| |||||||
Total Return | 34.05 | %** | 3.33 | % | 18.18 | %** | ||||||
RATIOS/SUPPLEMENTAL DATA | ||||||||||||
Net assets, end of period (in 000’s) | $ | 10,600 | $ | 7,538 | $ | 1,344 | ||||||
Ratio of expenses before reimbursements, waivers and fees paid indirectly to average net assets | 1.60 | %* | 2.57 | % | 7.86 | %* | ||||||
Ratio of net expenses to average net assets | 1.17 | %*+# | 1.18 | %+# | 1.20 | %*+ | ||||||
Ratio of net investment income (loss) to average net assets | (0.96 | )%*+# | (0.87 | )%+# | (0.94 | )%*+ | ||||||
Portfolio turnover | 99 | %** | 193 | % | 66 | %** | ||||||
| * | Annualized |
| ** | Not Annualized |
| ^ | Net investment loss per share has been calculated using the average share method. |
| ~ | Amount represents less than $0.01 per share |
| + | Such ratios are after administrative and transfer agent waivers and adviser expense reimbursements, when applicable. BNY Mellon Investment Servicing (US) Inc., the administrative agent and transfer agent, waived a portion of its fees beginning with the Fund’s commencement of operations, August 21, 2017. The Adviser contractually agreed to waive its investment advisory fee or absorb other operating expenses to the extent necessary to ensure that total annual operating expenses for the Investor Class (other than interest, taxes, brokerage commissions and other portfolio transaction expenses, capital expenditures, and extraordinary expenses) would not exceed the Investor Class’s operating expense cap of 1.20% of average daily net assets until August 20, 2020. |
| # | Such ratios are net of fees paid indirectly (see Note B in the Notes to Financial Statements). |
Notes to Financial Statements are an integral part of this Schedule.
37
Driehaus Small Cap Growth Fund — Institutional Class
Financial Highlights
| For the six month period January 1, 2019 through June 30, 2019 (unaudited) | For the year ended December 31, 2018 | For the period August 21, 2017 through December 31, 2017 | ||||||||||
Net asset value, beginning of period | $ | 11.70 | $ | 11.63 | $ | 10.00 | ||||||
|
|
|
|
|
| |||||||
INCOME (LOSS) FROM INVESTMENT OPERATIONS: | ||||||||||||
Net investment income (loss) | (0.05 | ) | (0.08 | )^ | (0.03 | )^ | ||||||
Net realized and unrealized gain (loss) | 4.06 | 0.47 | 1.86 | |||||||||
|
|
|
|
|
| |||||||
Total income (loss) from investment operations | 4.01 | 0.39 | 1.83 | |||||||||
|
|
|
|
|
| |||||||
LESS DISTRIBUTIONS: | ||||||||||||
Dividends from net investment income | — | — | — | |||||||||
Distributions from capital gains | — | (0.33 | ) | (0.20 | ) | |||||||
|
|
|
|
|
| |||||||
Total distributions | — | (0.33 | ) | (0.20 | ) | |||||||
|
|
|
|
|
| |||||||
Redemption fees added topaid-in capital | 0.00 | ~ | 0.01 | — | ||||||||
|
|
|
|
|
| |||||||
Net asset value, end of period | $ | 15.71 | $ | 11.70 | $ | 11.63 | ||||||
|
|
|
|
|
| |||||||
Total Return | 34.27 | %** | 3.59 | % | 18.28 | %** | ||||||
RATIOS/SUPPLEMENTAL DATA | ||||||||||||
Net assets, end of period (in 000’s) | $ | 161,819 | $ | 123,395 | $ | 38,631 | ||||||
Ratio of expenses before reimbursements, waivers and fees paid indirectly and recoupments, if any, to average net assets | 0.90 | %* | 1.04 | % | 1.48 | %* | ||||||
Ratio of net expenses to average net assets | 0.92 | %*+# | 0.93 | %+# | 0.95 | %*+ | ||||||
Ratio of net investment income (loss) to average net assets | (0.71 | )%*+# | (0.62 | )%+# | (0.69 | )%*+ | ||||||
Portfolio turnover | 99 | %** | 193 | % | 66 | %** | ||||||
| * | Annualized |
| ** | Not Annualized |
| ^ | Net investment loss per share has been calculated using the average share method. |
| ~ | Amount represents less than $0.01 per share |
| + | Such ratios are after administrative and transfer agent waivers and adviser expense reimbursements, when applicable. BNY Mellon Investment Servicing (US) Inc., the administrative agent and transfer agent, waived a portion of its fees beginning with the Fund’s commencement of operations, August 21, 2017. The Adviser contractually agreed to waive its investment advisory fee or absorb other operating expenses to the extent necessary to ensure that total annual operating expenses for the Institutional Class (other than interest, taxes, brokerage commissions and other portfolio transaction expenses, capital expenditures, and extraordinary expenses) would not exceed the Institutional Class’s operating expense cap of 0.95% of average daily net assets until August 20, 2020. |
| # | Such ratios are net of fees paid indirectly (see Note B in the Notes to Financial Statements). |
Notes to Financial Statements are an integral part of this Schedule.
38
Notes to Financial Statements (unaudited)
A. SUMMARY OF SIGNIFICANT ACCOUNTING POLICIES
Organization
The Driehaus Mutual Funds(the “Trust”) is anopen-end registered management investment company under the Investment Company Act of 1940, as amended, organized as a Delaware statutory trust, with eight separate series currently in operation. The Trustwas organized under an Agreement and Declaration of Trust dated May 31, 1996, as subsequently amended and restated as of June 6, 2013, and amended as of June 4, 2015, and may issue an unlimited number of full and fractional units of beneficial interest (shares) without par value. The five series (“Funds” or each a “Fund”) included in this report are as follows:
| Fund | Commencement of Operations | |||
Driehaus Emerging Markets Growth Fund | 12/31/97 | |||
Driehaus Emerging Markets Small Cap Growth Fund | 08/22/11 | |||
Driehaus International Small Cap Growth Fund | 09/17/07 | |||
Driehaus Micro Cap Growth Fund* | 11/18/13 | |||
Driehaus Small Cap Growth Fund | 08/21/17 | |||
| * | On September 29, 2017, the Driehaus Micro Cap Growth Fund was closed to new investors. |
The Driehaus Emerging Markets Growth Fund and Driehaus Small Cap Growth Fund each offer two classes of shares, designated as Institutional Class and Investor Class. Each class of shares represents an interest in the same portfolio of investments of the respective Fund and voting privileges with respect to the Fund in general. Each class of shares has exclusive voting rights with respect to any matters involving only that class. The classes of each Fund pay pro rata the costs of management of that Fund’s portfolio, including the management fee. Each class of a Fund bears the cost of its own transfer agency and shareholder servicing arrangements, and any other class-specific expenses, which will result in differing expenses by class.
The investment objective of each Fundis to maximize capital appreciation.
Driehaus Emerging Markets Growth Fundseeks to achieve its objective by investing primarily in equity securities of emerging markets companies.
Driehaus Emerging Markets Small Cap Growth Fundseeks to achieve its objective by investing primarily in equity securities of small capitalization emerging markets companies.
Driehaus International Small Cap Growth Fundseeks to achieve its objective by investing primarily in equity securities of smaller capitalizationnon-U.S. companies exhibiting strong growth characteristics.
Driehaus Micro Cap Growth Fundseeks to achieve its objective by investing primarily in equity securities of micro capitalization U.S. companies exhibiting strong growth characteristics.
Driehaus Small Cap Growth Fundseeks to achieve its objective by investing primarily in equity securities of U.S. small capitalization companies.
The Funds, which are investment companies within the scope of Financial Accounting Standards Board (“FASB”) Accounting Standards Update2013-08, follow accounting and reporting guidance under FASB Accounting Standards Codification Topic 946,Financial Services-Investment Companies.
Cash is held at U.S. financial institutions, and at times, may exceed the amount insured by the U.S. Federal Deposit Insurance Corporation. The Funds consider highly liquid investments, with maturities of ninety days or less when purchased to be cash equivalents, and such investments may include money market mutual fund investments. All such investments are categorized in Level 1 of the fair value hierarchy.
Securities Valuation and Transactions
Equity securities and exchange-traded options are valued at the last sale price as of the close of the primary exchange or other designated time. Equity certificates are valued at the last sale price of the underlying security as of the close of the primary exchange. Investments initially valued in currencies other than the U.S. dollar are converted to the U.S. dollar using exchange rates obtained from an independent
39
Driehaus Mutual Funds
Notes to Financial Statements (unaudited) — (Continued)
pricing service. In addition, if quotations are not readily available, if the values have been materially affected by events occurring after the closing of a foreign market, or if there has been a movement in the U.S. market that exceeds a certain threshold, assets may be valued at fair value as determined in good faith by or under the direction of the Trust’sBoard of Trustees. Events that may materially affect asset values that could cause a fair value determination include, but are not limited to: corporate announcements relating to a specific security; natural and other disasters which may impact an entire market or region; and political and other events which may be global or impact a particular country or region. The frequency with which these procedures are used cannot be predicted and may be utilized to a significant extent. To the extent utilized, securities would be considered level 2 in the hierarchy described below.
Each Fund is subject to fair value accounting standards that define fair value, establish the framework for measuring fair value and provide a three-level hierarchy for fair valuation based upon the inputs to the valuation as of the measurement date. The three levels of the fair value hierarchy are as follows:
Level 1 — quoted prices in active markets for identical securities
Level 2 — significant observable inputs (including quoted prices for similar securities, interest rates, prepayment speeds, credit risk, etc.)
Level 3 — significant unobservable inputs (including the Funds’own assumptions in determining the fair value of investments)
The inputs or methodology used for valuing securities are not necessarily an indication of the risk associated with investing in those securities.
The summary of the Funds’ investments that are measured at fair value by level within the fair value hierarchy as of June 30, 2019 is as follows:
Fund | Total Value at June 30, 2019 | Level 1 Quoted Price | Level 2 Significant Observable Inputs | Level 3 Significant Unobservable Inputs | ||||||||||||
Driehaus Emerging Markets Growth Fund |
| |||||||||||||||
Investments in Securities* | $ | 1,571,105,289 | $ | 1,571,105,289 | $ | — | $ | — | ||||||||
|
|
|
|
|
|
|
| |||||||||
Driehaus Emerging Markets Small Cap Growth Fund | ||||||||||||||||
Equity Securities: | ||||||||||||||||
Africa | $ | 2,080,412 | $ | 2,080,412 | $ | — | $ | — | ||||||||
Central America | 898,912 | 898,912 | — | — | ||||||||||||
Europe | 5,677,425 | 5,677,425 | — | — | ||||||||||||
Far East | 38,833,643 | 38,134,013 | 699,630 | — | ||||||||||||
North America | 1,522,621 | 1,522,621 | — | — | ||||||||||||
South America | 5,977,150 | 5,977,150 | — | — | ||||||||||||
Middle East | 2,449,913 | 2,449,913 | — | — | ||||||||||||
|
|
|
|
|
|
|
| |||||||||
Total Investments | $ | 57,440,076 | $ | 56,740,446 | $ | 699,630 | $ | — | ||||||||
|
|
|
|
|
|
|
| |||||||||
Driehaus International Small Cap Growth Fund | ||||||||||||||||
Investments in Securities* | $ | 252,473,492 | $ | 252,473,492 | $ | — | $ | — | ||||||||
|
|
|
|
|
|
|
| |||||||||
Driehaus Micro Cap Growth Fund | ||||||||||||||||
Investments in Securities* | $ | 272,096,192 | $ | 272,096,192 | $ | — | $ | — | ||||||||
|
|
|
|
|
|
|
| |||||||||
40
Driehaus Mutual Funds
Notes to Financial Statements (unaudited) — (Continued)
Fund | Total Value at June 30, 2019 | Level 1 Quoted Price | Level 2 Significant Observable Inputs | Level 3 Significant Unobservable Inputs | ||||||||||||
Driehaus Small Cap Growth Fund | ||||||||||||||||
Investments in Securities* | $ | 172,064,552 | $ | 172,064,552 | $ | — | $ | — | ||||||||
|
|
|
|
|
|
|
| |||||||||
| * | See Schedule of Investments for industry and/or country breakout. |
The Funds used observable inputs in their valuation methodologies whenever they were available and deemed reliable.
When fair value pricing is employed, the prices of securities used by a Fund to calculate its net asset value may differ from closing prices for the same securities, which means that a Fund may value those securities higher or lower than another fund that does not employ fair value. In addition, the fair value price may differ materially from the value a Fund may ultimately realize.
Securities transactions are accounted for on trade date. The cost of investments sold is determined by the use of the specific identification method for both financial reporting and income tax purposes. Interest income is recorded on an accrual basis. Dividend income, net ofnon-reclaimable foreign taxes withheld, is recorded on theex-dividend date or as soon as the information is available. Income and expenses are accrued daily. The Funds’ investment income, expenses (other than class-specific expenses) and unrealized and realized gains and losses are allocated daily to each class of shares based upon the relative proportion of net assets of each class at the beginning of the day.
Options Contracts
The Funds are subject to equity and other risk exposures in the normal course of pursuing their investment objective. The Funds may use options contracts to hedge their portfolio or a portion thereof or speculatively for the purpose of profiting from a decline in the market value of a security. The Funds did notuse purchased or written options during the period January 1, 2019 through June 30, 2019.
The Funds may write covered call and put options on futures, securities or currencies the Funds own or in which they may invest. Writing put options tends to increase a Fund’s exposure to the underlying instrument. Writing call options tends to decrease a Fund’s exposure to the underlying instrument. When a Fund writes a call or put option, an amount equal to the premium received is recorded as a liability and subsequentlymarked-to-market to reflect the current value of the option written. These liabilities are reflected as written options outstanding in the Schedule of Investments. Payments received or made, if any, from writing options with premiums to be determined on a future date are reflected as such in the Schedule of Investments. Premiums received from writing options that expire are treated as realized gains. Premiums received from writing options that are exercised or closed are added to the proceeds or offset against amounts paid on the underlying future, security or currency transaction to determine the realized gain or loss. A Fund, as a writer of an option, has no control over whether the underlying future, security or currency may be sold (call) or purchased (put) and, as a result, bears the market risk of an unfavorable change in the price of the future, security or currency underlying the written option. The risk exists that a Fund may not be able to enter into a closing transaction because of an illiquid market.
The Funds may also purchase put and call options. Purchasing call options tends to increase a Fund’s exposure to the underlying instrument. Purchasing put options tends to decrease a Fund’s exposure to the underlying instrument. A Fund pays a premium which is included in its Schedule of Investments as an investment and subsequentlymarked-to-market to reflect the current value of the option. Premiums paid for purchasing options that expire are treated as realized losses. Premiums paid for purchasing options that are exercised or closed are added to the amounts paid or offset against the proceeds on the underlying future, security or currency transaction to determine the realized gain or loss. When entering into purchased option contracts, a Fund bears the risk of securities prices moving unexpectedly, in which case, a Fund may not achieve the anticipated benefits of the purchased option contracts; however, the risk of loss is limited to the premium paid. As of June 30, 2019, the Funds had no outstanding option contracts.
41
Driehaus Mutual Funds
Notes to Financial Statements (unaudited) — (Continued)
Swap Contracts
The Funds may engage in various swap transactions, including forward rate agreements and interest rate, primarily to manage risk, or as alternatives to direct investments. The Funds may also engage in credit default swaps, which involve the exchange of a periodic premium for protection against a defined credit event (such as payment default, refinancing or bankruptcy). The Funds did not engage in credit default swaps during the period January 1, 2019 through June 30, 2019.
Under the terms of a credit default swap contract, one party acts as a guarantor receiving a periodic payment that is a fixed percentage applied to a notional amount. In return, the party agrees to purchase the notional amount of the underlying instrument, at par, if a credit event occurs during the term of the contract. The Funds may enter into credit default swaps in which the Funds act as guarantor (a seller of protection), and may enter into credit default swaps in which the counterparty acts as guarantor (a buyer of protection). Premiums paid to or by the Funds are accrued daily and included in realized gain (loss) on swaps. The contracts aremarked-to-market daily using fair value estimates provided by an independent pricing service. Changes in value are recorded as net change in unrealized appreciation (depreciation) on the Statements of Operations. Unrealized gains are reported as an asset and unrealized losses are reported as a liability on the Statements of Assets and Liabilities. Gains or losses are realized upon termination of the contracts. The risk of loss under a swap contract may exceed the amount recorded as an asset or a liability. The notional amount of a swap contract is the reference amount pursuant to which the counterparties make payments. For swaps in which the referenced obligation is an index, in the event of default of any debt security included in the corresponding index, the Funds pay or receive the percentage of the corresponding index that the defaulted security comprises (1) multiplied by the notional value and (2) multiplied by the ratio of one minus the ratio of the fair value of the defaulted debt security to its par value. The maximum exposure to loss of the notional value as a seller of credit default swaps outstanding at June 30, 2019, for the Funds was $0.
Interest rate swaps are agreements between two parties to exchange cash flows based on a notional principal amount. The Funds may elect to pay a fixed rate and receive a floating rate or receive a fixed rate and pay a floating rate on a notional principal amount. The net interest received or paid on interest rate swap agreements is accrued daily as interest income/expense. Interest rate swaps aremarked-to-market daily using fair value estimates provided by an independent pricing service. Changes in value, including accrued interest, are recorded as net change in unrealized appreciation (depreciation) on the Statements of Operations. Unrealized gains are reported as an asset and unrealized losses are reported as a liability on the Statements of Assets and Liabilities. Gains or losses are realized upon termination of the contracts. The risk of loss under a swap contract may exceed the amount recorded as an asset or a liability.
Risks associated with swap contracts include changes in the returns of underlying instruments, failure of the counterparties to perform under the contracts’ terms and the possible lack of liquidity with respect to the contracts. Credit default swaps can involve greater risks than if an investor had invested in the reference obligation directly since, in addition to general market risks, credit default swaps are subject to counterparty credit risk, leverage risk, hedging risk, correlation risk and liquidity risk. The Funds disclose swap contracts on a gross basis, with no netting of contracts held with the same counterparty. As of June 30, 2019, the Funds had no outstanding swap contracts.
Forward Foreign Currency Contracts
The Funds may use forward foreign currency contracts to hedge foreign currency exposure in the portfolio. A forward foreign currency contract involves an obligation to purchase or sell a specific currency at a future date, which may be any fixed number of days from the date of the contract agreed upon by the parties, at a price set at the time of the contract. These contracts are principally traded in the inter-bank market conducted directly between currency traders (usually large commercial banks) and their customers.
The fair value of a forward foreign currency contract fluctuates with changes in currency exchange rates. Outstanding forward foreign currency contracts are valued daily at current market rates and the resulting change in fair value is recorded as net change in unrealized appreciation or depreciation on the Statements of Operations. When a forward foreign currency contract is settled, the Funds record a realized gain or loss equal to the difference between the value at the time the forward foreign currency contract was opened and the
42
Driehaus Mutual Funds
Notes to Financial Statements (unaudited) — (Continued)
value at the time it was settled. A forward foreign currency contract may involve market risk in excess of the unrealized gain or loss reflected on the Statements of Assets and Liabilities. In addition, the Funds could be exposed to credit risk if the counterparties are unable or unwilling to meet the terms of the contracts or market risk if the value of the foreign currency changes unfavorably. As of June 30, 2019, the Funds had no outstanding forward foreign currency contracts.
Foreign Currency Spot Contracts
The Fundsenter into foreign currency spot contracts to facilitate transactions in foreign currency denominated securities. These spot contracts are typically open for 2 to 5 days, depending on the settlement terms of the underlying security transaction. On June 30, 2019, the Fundshad foreign currency spot contracts outstanding under which they are obligated to exchange currencies at specified future dates. The net unrealized appreciation or depreciation on spot contracts is reflected as Net unrealized appreciation or depreciation on unsettled foreign currency transactions in the Statements of Assets and Liabilities.
Equity Certificates
The Funds may invest in equity certificates, which allow the Fundsto participate in the appreciation (depreciation) of the underlying security without actually owning the underlying security. These derivative instruments are purchased pursuant to an agreement with a financial institution and are valued at a calculated market price based on the value of the underlying security in accordance with the agreement. These equity certificates are subject to the credit risk of the issuing financial institution. There is nooff-balance sheet risk associated with equity certificates and the Funds’ potential loss is limited to the purchase price of the securities. The Funds are exposed to credit risk associated with the counterparty to the transaction, which is monitored by the Funds’ management on a periodic basis. A Fund’s equity certificates are not subject to any master netting agreement.
Federal Income Taxes
No provision is made for Federal income taxes since each Fundhas elected to be taxed as a “regulated investment company” under Subchapter M of the Internal Revenue Code (the “Code”) and has made and declared all the required distributions to its shareholders in amounts sufficient to relieve each Fundfrom all or substantially all Federal income and excise taxes under provisions of current Federal tax law.
Each Fund is subject to accounting standards that establish a minimum threshold for recognizing, and a system for measuring, the benefits of a tax position taken or expected to be taken in a tax return. Taxable years ending 2018, 2017, 2016 and 2015 remain open to Federal and state audit. As of June 30, 2019, management has evaluated the application of these standards to each Fund, and has determined that no provision for income tax is required in each Fund’s financial statements for uncertain tax provisions. The Funds recognize interest and penalties, if any, related to unrecognized tax benefits as income tax expense in the Statements of Operations. During the year, the Funds did not incur any interest or penalties. The Funds may be subject to foreign taxes on income, gains on investments or currency repatriation, a portion of which may be recoverable. Foreign taxes are provided for based on the Funds’ understanding of the tax rules and regulations that exist in the foreign markets in which they invest.
The amount of dividends and distributions from net investment income and net realized capital gains are determined in accordance with Federal income tax regulations, which may differ from United States Generally Accepted Accounting Principles (“U.S. GAAP”).
For the year ended December 31, 2018, reclassifications were recorded to distributable earnings (deficit) andpaid-in capital for any permanent tax differences. These reclassifications relate primarily to foreign currency losses, sales of passive foreign investment companies, net operating losses and foreign capital gain taxes paid. Results of operations and net assets were not affected by these reclassifications.
43
Driehaus Mutual Funds
Notes to Financial Statements (unaudited) — (Continued)
Accumulated capital losses represent net capital loss carryovers that may be available for an unlimited period to offset future realized capital gains and thereby reduce future capital gains distributions. Capital loss carryover retains the character of the original loss. The following table shows the amounts of capital loss carryover, if any, by each of the applicable Funds as of December 31, 2018:
| Unlimited Period of Net Capital Loss Carryover | ||||||||||||
| Fund | Short-Term | Long-Term | Accumulated Capital Loss Carryover | |||||||||
Driehaus Emerging Markets Small Cap Growth Fund | $ | 54,441,364 | $ | — | $ | 54,441,364 | ||||||
Pursuant to Federal income tax rules applicable to regulated investment companies, the Funds may elect to treat certain capital losses between November 1 and December 31 as occurring on the first day of the following tax year. For the year ended December 31, 2018, the following qualified late-year losses were deferred and recognized on January 1, 2019:
| Fund | Late-Year Ordinary Loss Deferral | Total Capital Loss Deferral | Total | |||||||||
Driehaus Emerging Markets Growth Fund | $ | — | $ | 57,688,347 | $ | 57,688,347 | ||||||
Driehaus Emerging Markets Small Cap Growth Fund | 149,500 | — | 149,500 | |||||||||
Driehaus International Small Cap Growth Fund | — | 6,704,891 | 6,704,891 | |||||||||
Driehaus Micro Cap Growth Fund | 11,898 | 8,462,610 | 8,474,508 | |||||||||
Driehaus Small Cap Growth Fund | — | 9,458,398 | 9,458,398 | |||||||||
Distributions to Shareholders
The Funds had no distributions during the six months ended June 30, 2019.
The tax character of distributions paid during the fiscal year ended December 31, 2018 was as follows:
Distributions paid from: | Driehaus Emerging Markets Growth Fund | Driehaus Emerging Markets Small Cap Growth Fund | Driehaus International Small Cap Growth Fund | Driehaus Micro Cap Growth Fund | Driehaus Small Cap Growth Fund | |||||||||||||||
Ordinary income . | $ | 8,970,853 | $ | — | $ | 5,657,722 | $ | 22,348,104 | $ | 1,454,358 | ||||||||||
Net long-term capital gain | 53,973,948 | — | 25,166,722 | 50,514,284 | 2,139,592 | |||||||||||||||
|
|
|
|
|
|
|
|
|
| |||||||||||
Total distributions paid | $ | 62,944,801 | $ | — | $ | 30,824,444 | $ | 72,862,388 | $ | 3,593,950 | ||||||||||
|
|
|
|
|
|
|
|
|
| |||||||||||
The tax character of distributions paid during the fiscal year ended December 31, 2017 was as follows:
Distributions paid from: | Driehaus Emerging Markets Growth Fund | Driehaus Emerging Markets Small Cap Growth Fund | Driehaus International Small Cap Growth Fund | Driehaus Micro Cap Growth Fund | Driehaus Small Cap Growth Fund | |||||||||||||||
Ordinary income . | $ | 11,017,755 | $ | — | $ | 21,815,148 | $ | — | $ | 222,898 | ||||||||||
Net long-term capital gain | — | — | 23,460,614 | 26,974,093 | 442,178 | |||||||||||||||
|
|
|
|
|
|
|
|
|
| |||||||||||
Total distributions paid | $ | 11,017,755 | $ | — | $ | 45,275,762 | $ | 26,974,093 | $ | 665,076 | ||||||||||
|
|
|
|
|
|
|
|
|
| |||||||||||
44
Driehaus Mutual Funds
Notes to Financial Statements (unaudited) — (Continued)
As of December 31, 2018, the components of net assets on a tax basis were as follows:
| Driehaus Emerging Markets Growth Fund | Driehaus Emerging Markets Small Cap Growth Fund | Driehaus International Small Cap Growth Fund | Driehaus Micro Cap Growth Fund | Driehaus Small Cap Growth Fund | ||||||||||||||||
Undistributed ordinary income | $ | — | $ | — | $ | — | $ | — | $ | — | ||||||||||
Undistributed long-term capital gain | — | — | 51,014 | — | 412,411 | |||||||||||||||
|
|
|
|
|
|
|
|
|
| |||||||||||
Accumulated earnings | $ | — | $ | — | $ | 51,014 | $ | — | $ | 412,411 | ||||||||||
Paid-in capital | 1,354,408,505 | 145,357,729 | 227,742,315 | 223,561,156 | 138,579,263 | |||||||||||||||
Accumulated capital and other losses | (57,688,347 | ) | (54,590,864 | ) | (6,704,891 | ) | (8,474,508 | ) | (9,458,398 | ) | ||||||||||
Unrealized appreciation (depreciation) on foreign currency | (60,409 | ) | (2,916 | ) | (3,316 | ) | — | — | ||||||||||||
Unrealized appreciation on investments | 149,441,456 | (1,110,819 | ) | (2,654,635 | ) | 49,520,197 | 1,399,921 | |||||||||||||
Other temporary differences | — | — | — | — | — | |||||||||||||||
|
|
|
|
|
|
|
|
|
| |||||||||||
Net assets | $ | 1,446,101,205 | $ | 89,653,130 | $ | 218,430,487 | $ | 264,606,845 | $ | 130,933,197 | ||||||||||
|
|
|
|
|
|
|
|
|
| |||||||||||
The differences between book-basis andtax-basis unrealized appreciation are attributable primarily to the tax deferral of losses on wash sales and passive foreign investment company (“PFIC”)mark-to-market.
The aggregate cost of investments and the composition of unrealized appreciation and depreciation on investments and net unrealized appreciation and/or depreciation on derivatives for Federal income tax purposes as of June 30, 2019, were as follows:
| Fund | Basis | Gross Appreciation | Gross Depreciation | Net Appreciation/ Depreciation | ||||||||||||
Driehaus Emerging Markets Growth Fund | $ | 1,242,771,669 | $ | 354,289,288 | $ | (25,955,668 | ) | $ | 328,333,620 | |||||||
Driehaus Emerging Markets Small Cap Growth Fund | $ | 49,237,529 | $ | 9,684,957 | $ | (1,482,410 | ) | $ | 8,202,547 | |||||||
Driehaus International Small Cap Growth Fund | $ | 221,211,326 | $ | 39,900,990 | $ | (8,638,824 | ) | $ | 31,262,166 | |||||||
Driehaus Micro Cap Growth Fund | $ | 193,346,655 | $ | 84,757,465 | $ | (6,007,928 | ) | $ | 78,749,537 | |||||||
Driehaus Small Cap Growth Fund | $ | 130,784,382 | $ | 43,052,271 | $ | (1,772,101 | ) | $ | 41,280,170 | |||||||
Foreign Currency Translation
Foreign currency and equity securities not denominated in U.S. dollars are translated into U.S. dollar values based upon the current rates of exchange on the date of the Funds’valuations.
Net realized foreign exchange gains or losses which are reported by the Fundsresult from currency gains and losses on transaction hedges arising from changes in exchange rates between the trade and settlement dates on spot contracts underlying securities transactions and the difference between the amounts accrued for dividends, interest, and foreign taxes and the amounts actually received or paid in U.S. dollars for these items. Net unrealized foreign exchange gains and losses result from changes in the U.S. dollar value of assets and liabilities (other than investments in securities), which are denominated in foreign currencies, as a result of changes in exchange rates.
The Fundsdo not isolate that portion of the results of operations which results from fluctuations in foreign exchange rates on investments. These fluctuations are included with the net realized gain (loss) from security transactions and the net change in unrealized appreciation (depreciation) of investments.
45
Driehaus Mutual Funds
Notes to Financial Statements (unaudited) — (Continued)
Use of Estimates
The preparation of financial statements, in conformity with U.S. GAAP, requires management to make estimates and assumptions that affect the reported amount of assets and liabilities and disclosure of contingent assets and liabilities at the date of the financial statements and the reported amounts of net increases or decreases in net assets from operations during the reporting period. Actual results could differ from those estimates.
Indemnifications
Under the Trust’s organizational documents, the officers and Trustees are indemnified against certain liabilities arising out of the performance of their duties to the Trust. In addition, in the normal course of business, the Trust enters into contracts that provide general indemnifications to other parties. The Funds’ maximum exposure under these agreements is unknown as this would involve future claims that may be made against the Funds that have not yet occurred. However, the Funds have not had prior claims or losses pursuant to these contracts and expect the risk of loss to be remote.
Recent Accounting Pronouncement
In August 2018, the Securities and Exchange Commission released its Final Rule on Disclosure Update and Simplification (the “Final Rule”) which is intended to simplify an issuer’s disclosure compliance efforts by removing redundant or outdated disclosure requirements without significantly altering the mix of information provided to investors. Effective with the reporting period ended December 31, 2018, the Fund adopted the Final Rule with the most notable impacts being that the Fund is no longer required to present the components of distributable earnings on the Statements of Assets and Liabilities or the sources of distributions to shareholders and the amount of undistributed net investment income on the Statements of Changes in Net Assets. The tax components of distributable earnings and distributions to shareholders continue to be disclosed within the Notes to Financial Statements.
In August 2018, the Financial Accounting Standards Board issued Accounting Standards Update (“ASU”) No. 2018-13 “Changes to the Disclosure Requirements for Fair Value Measurement” which modifies disclosure requirements for fair value measurements. The guidance is effective for fiscal years beginning after December 15, 2019 and for interim periods within those fiscal years. Management has evaluated the implications of certain provisions of ASUNo. 2018-13 and has determined to early adopt all aspects related to the removal and modification of certain fair value measurement disclosures under the ASU effective in the reporting period ended December 31, 2018.
B. INVESTMENT ADVISORY FEES, TRANSACTIONS WITH AFFILIATES, AND ADMINISTRATIVE FEES
Richard H. Driehaus is Chairman of Driehaus Capital Management LLC (“DCM” or the “Adviser”), a registered investment adviser, and of Driehaus Securities LLC (“DS LLC” or the “Distributor”), a registered broker-dealer.
DCM serves as the Funds’ investment adviser. In return for its services to the Funds, DCM receives monthly fees. Driehaus Micro Cap Growth Fund pays the Adviser a monthly fee computed and accrued daily at an annual rate of 1.25% of the Fund’s average daily net assets. Driehaus Small Cap Growth Fund pays the Adviser a monthly fee computed and accrued daily at an annual rate of 0.60% of the Fund’s average daily net assets. The Driehaus Emerging Markets Small Cap Growth Fund pays the Adviser a monthly fee computed and accrued daily at the annual rate of 1.15% of the Fund’s average daily net assets. Driehaus International Small Cap Growth Fund pays the Adviser a monthly fee computed and accrued daily at an annual rate of 1.00% of the Fund’s average daily net assets. The Driehaus Emerging Markets Growth Fund pays the Adviser a monthly fee computed and accrued daily at an annual rate of 1.05% on the first $1.5 billion and 0.75% in excess of $1.5 billion of the Fund’s average daily net assets.
DCM entered into a contractual agreement to cap Driehaus Emerging Markets Small Cap Growth Fund’s annual operating expenses (other than interest, taxes, brokerage commissions, dividends and interest on short sales and other portfolio transaction expenses and extraordinary expenses such as litigation and other expenses not incurred in the ordinary course of the Fund’s business) at 1.45% of average daily net assets until October 31, 2021. DCM is entitled to recoupment of previously waived fees and reimbursed expenses to the
46
Driehaus Mutual Funds
Notes to Financial Statements (unaudited) — (Continued)
extent that the Fund’s expense ratio remains below the operating expense cap in place at the time of the waiver and the current operating expense cap for a period not to exceed three years from the date on which the waiver or reimbursement was made. For the six months ended June 30, 2019, DCM waived fees for Driehaus Emerging Markets Small Cap Growth Fund totaling $165,229 under this agreement.
DCM has entered into a contractual agreement to cap Driehaus Small Cap Growth Fund’s annual operating expenses (other than interest, taxes, brokerage commissions, dividends and interest on short sales and other portfolio transaction expenses and extraordinary expenses such as litigation and other expenses not incurred in the ordinary course of the Fund’s business) at 1.20% of average daily net assets for the Investor Class and 0.95% of average daily net assets for the Institutional Class until August 20, 2020. For a period of three years subsequent to the Fund’s commencement of operations on August 21, 2017, DCM is entitled to recoupment of previously waived fees and reimbursed expenses to the extent that the expense ratio of each share class remains below the respective operating expense cap in place at the time of the waiver and the current operating expense cap for a period not to exceed three years from the date on which the waiver or reimbursement was made. For the six months ended June 30, 2019, DCM waived fees for the Investor Class shares of the Driehaus Small Cap Growth Fund totaling $11,970 and recouped fees for the Institutional Class shares of the Driehaus Small Cap Growth Fund totaling $40,641 under this agreement.
The table below indicates the amount of fees available for recoupment by DCM in future periods:
Year Ended December 31 | Driehaus Emerging Markets Small Cap Growth Fund | Driehaus Small Cap Growth Fund | ||||||
2020 | $ | — | $ | 26,532 | ||||
2021 | — | 80,104 | ||||||
2022 | 165,229 | 11,970 | ||||||
|
|
|
| |||||
Total | $ | 165,229 | $ | 118,606 | ||||
|
|
|
| |||||
The amounts incurred and payable to DCM during the six months ended June 30, 2019 are as follows:
| Fund | Advisory Fees | Advisory Fees Payable/(Receivable) (included in Due to affiliate/(Due from affiliate)) | ||||||
Driehaus Emerging Markets Growth Fund | $ | 8,195,147 | $ | 1,381,197 | ||||
Driehaus Emerging Markets Small Cap Growth Fund | 425,135 | 55,391 | ||||||
Driehaus International Small Cap Growth Fund | 1,258,711 | 209,781 | ||||||
Driehaus Micro Cap Growth Fund | 1,521,801 | 271,511 | ||||||
Driehaus Small Cap Growth Fund | 470,453 | 76,988 | ||||||
The Funds direct certain portfolio trades, subject to obtaining the best price and execution, to brokers who have agreed to pay a portion of the Funds’ operating expenses using part of the commissions generated. For the six months ended June 30, 2019, these arrangements reduced the expenses of Driehaus Emerging Markets Growth Fund, Driehaus Emerging Markets Small Cap Growth Fund, Driehaus International Small Cap Growth Fund, Driehaus Micro Cap Growth Fund and Driehaus Small Cap Growth Fund by $53,690 (0.5%), $3,376 (0.5%), $7,818 (0.5%), $50,539 (2.8%) and $21,537 (2.9%), respectively.
The Funds are permitted to purchase or sell securities from or to certain affiliated funds under specified conditions outlined in procedures adopted by the Board. The procedures have been designed to ensure that any purchase or sale of securities by the fund from or to another fund or portfolio that is or could be considered an affiliate by virtue of having a common investment adviser (or affiliated investment advisers), common trustees and/or common officers complies with Rule 17a-7 of the 1940 Act. Further, as defined under
47
Driehaus Mutual Funds
Notes to Financial Statements (unaudited) — (Continued)
these procedures, each transaction is effected at the current market price to minimize trading costs, where permissible. For the period ended June 30, 2019, the Funds engaged in purchases and sales of securities, pursuant to Rule 17a-7 of the 1940 Act, as follows:
| Fund | Purchases | Sales | Net Realized Gain (Loss) | |||||||||
Driehaus Micro Cap Growth Fund | $ | — | $ | 560,821 | $ | (54,736 | ) | |||||
Certain officers of the Trust are also officers of DCM and DS LLC. The Funds pay a portion of the Chief Compliance Officer’s salary and bonus. No other officers received compensation from the Funds. The Independent Trustees are compensated for their services to the Trust and such compensation is reflected as Trustees’ fees in the Statements of Operations.
BNY Mellon Investment Servicing (US) Inc. (“BNY Mellon”) serves as the Funds’ administrative and accounting agent. In compensation for these services, BNY Mellon earns the greater of a monthly minimum fee or a monthly fee based upon average daily net assets. BNY Mellon has agreed to waive a portion of its monthly fee for administrative services for the first two years of operations for Driehaus Small Cap Growth Fund. For the six months ended June 30, 2019, BNY Mellon waived $0 for Driehaus Small Cap Growth Fund. BNY Mellon also acts as the transfer agent and dividend disbursing agent for the Funds. For these services, BNY Mellon earns a monthly fee based on shareholder processing activity during the month. BNY Mellon has agreed to waive a portion of its monthly fee for transfer agent services for the first two years of operations for Driehaus Small Cap Growth Fund. For the six months ended June 30, 2019, BNY Mellon waived $10,500 for Driehaus Small Cap Growth Fund.
DS LLC is the Funds’ distributor. DS LLC does not earn any compensation from the Funds for these services. DS LLC has entered into a Fee Reimbursement Agreement (“Agreement”) with the Driehaus Emerging Markets Growth Fund and Driehaus Small Cap Growth Fund. Under these Agreements, the Funds reimburse DS LLC for certain fees paid by DS LLC to intermediaries who provide shareholder administrative and/orsub-transfer agency services to the Investor Class shares of the Driehaus Emerging Markets Growth Fund and Driehaus Small Cap Growth Fund. Currently, the amount to be reimbursed will not exceed 0.25% of the Investor Class’ average daily net assets held by such intermediaries.
The amounts incurred and payable to DS LLC during the six months ended June 30, 2019 are as follows:
| Fund | Shareholder Services Fees | Accrued Shareholder Services Fees (included in Due to affiliate) | ||||||
Driehaus Emerging Markets Growth Fund | $ | 764,784 | $ | 68,042 | ||||
Driehaus Small Cap Growth Fund | 6,075 | — | ||||||
C. INVESTMENT TRANSACTIONS
The aggregate purchases and sales of investment securities, other than short-term obligations and options, for the six months ended June 30, 2019 were as follows:
| Fund | Purchases | Sales | ||||||
Driehaus Emerging Markets Growth Fund | $ | 1,326,741,545 | $ | 1,309,466,653 | ||||
Driehaus Emerging Markets Small Cap Growth Fund | 73,812,266 | 116,093,071 | ||||||
Driehaus International Small Cap Growth Fund | 143,340,810 | 141,102,019 | ||||||
Driehaus Micro Cap Growth Fund | 191,613,046 | 244,733,666 | ||||||
Driehaus Small Cap Growth Fund | 153,019,778 | 153,732,000 | ||||||
48
Driehaus Mutual Funds
Notes to Financial Statements (unaudited) — (Continued)
D. CAPITAL SHARE TRANSACTIONS
For thesix-month period ended June 30, 2019, and the year ended December 31, 2018, transactions in capital shares (authorized shares unlimited) were as follows:
| Driehaus Emerging Markets Growth Fund | Driehaus Emerging Markets Small Cap Growth Fund | Driehaus International Small Cap Growth Fund | ||||||||||||||||||||||
| June 30, 2019 | December 31, 2018 | June 30, 2019 | December 31, 2018 | June 30, 2019 | December 31, 2018 | |||||||||||||||||||
Fund | ||||||||||||||||||||||||
Shares issued | — | — | 698,373 | 3,442,832 | 2,322,529 | 6,768,601 | ||||||||||||||||||
Shares reinvested | — | — | — | — | — | 3,560,115 | ||||||||||||||||||
Shares redeemed | — | — | (4,321,394 | ) | (14,229,116 | ) | (2,109,008 | ) | (12,040,667 | ) | ||||||||||||||
|
|
|
|
|
|
|
|
|
|
|
| |||||||||||||
Net increase (decrease) | — | — | (3,623,021 | ) | (10,786,284 | ) | 213,521 | (1,711,951 | ) | |||||||||||||||
|
|
|
|
|
|
|
|
|
|
|
| |||||||||||||
Investor Class | ||||||||||||||||||||||||
Shares issued | 1,632,903 | 6,511,231 | — | — | — | — | ||||||||||||||||||
Shares reinvested | — | 1,023,706 | — | — | — | — | ||||||||||||||||||
Shares redeemed | (3,466,702 | ) | (14,592,102 | ) | — | — | — | — | ||||||||||||||||
|
|
|
|
|
|
|
|
|
|
|
| |||||||||||||
Net increase (decrease) | (1,833,799 | ) | (7,057,165 | ) | — | — | — | — | ||||||||||||||||
|
|
|
|
|
|
|
|
|
|
|
| |||||||||||||
Institutional Class | ||||||||||||||||||||||||
Shares issued | 3,972,762 | 11,261,606 | — | — | — | — | ||||||||||||||||||
Shares reinvested | — | 798,753 | — | — | — | — | ||||||||||||||||||
Shares redeemed | (1,553,051 | ) | (4,408,218 | ) | — | — | — | — | ||||||||||||||||
|
|
|
|
|
|
|
|
|
|
|
| |||||||||||||
Net increase (decrease) | 2,419,711 | 7,652,141 | — | — | — | — | ||||||||||||||||||
|
|
|
|
|
|
|
|
|
|
|
| |||||||||||||
Total net increase (decrease) | 585,912 | 594,976 | — | — | — | — | ||||||||||||||||||
|
|
|
|
|
|
|
|
|
|
|
| |||||||||||||
| Driehaus Micro Cap Growth Fund | Driehaus Small Cap Growth Fund | |||||||||||||||||||||||
| June 30, 2019 | December 31, 2018 | June 30, 2019 | December 31, 2018 | |||||||||||||||||||||
Fund | ||||||||||||||||||||||||
Shares issued | 2,497,433 | 6,979,421 | — | — | ||||||||||||||||||||
Shares reinvested | — | 6,239,529 | — | — | ||||||||||||||||||||
Shares redeemed | (7,151,578 | ) | (11,725,708 | ) | — | — | ||||||||||||||||||
|
|
|
|
|
|
|
| |||||||||||||||||
Net increase (decrease) | (4,654,145 | ) | 1,493,242 | — | — | |||||||||||||||||||
|
|
|
|
|
|
|
| |||||||||||||||||
Investor Class | ||||||||||||||||||||||||
Shares issued | — | — | 289,613 | 802,721 | ||||||||||||||||||||
Shares reinvested | — | — | — | 18,657 | ||||||||||||||||||||
Shares redeemed | — | — | (257,810 | ) | (290,721 | ) | ||||||||||||||||||
|
|
|
|
|
|
|
| |||||||||||||||||
Net increase (decrease) | — | — | 31,803 | 530,657 | ||||||||||||||||||||
|
|
|
|
|
|
|
| |||||||||||||||||
Institutional Class | ||||||||||||||||||||||||
Shares issued | — | — | 2,212,496 | 7,683,576 | ||||||||||||||||||||
Shares reinvested | — | — | — | 300,304 | ||||||||||||||||||||
Shares redeemed | — | — | (2,454,247 | ) | (762,745 | ) | ||||||||||||||||||
|
|
|
|
|
|
|
| |||||||||||||||||
Net increase (decrease) | — | — | (241,751 | ) | 7,221,135 | |||||||||||||||||||
|
|
|
|
|
|
|
| |||||||||||||||||
Total net increase (decrease) | — | — | (209,948 | ) | 7,751,792 | |||||||||||||||||||
|
|
|
|
|
|
|
| |||||||||||||||||
49
Driehaus Mutual Funds
Notes to Financial Statements (unaudited) — (Continued)
E. LINE OF CREDIT
The Funds, together with other funds in the Trust, obtained a committed line of credit in the amount of $50,000,000. The line of credit is available primarily to meet large, unexpected shareholder redemptions subject to certain restrictions. Interest is charged at a rate per annum equal to the Federal Funds Rate in effect at the time of the borrowings plus 1.5%, or 1.75%, whichever is greater. There is a commitment fee of 0.10% of the excess of the $50,000,000 committed amount over the sum of the average daily balance of any loans, which is allocated amongst all funds that have access to the line. Driehaus Emerging Markets Small Cap Growth Fund utilized the line of credit during the periods January 1, 2019 to January 3, 2019 and February 25, 2019 to February 28, 2019. For the period January 1, 2019 to January 3, 2019, the average daily loan balance outstanding on days where borrowings existed was $5,000,000 and the weighted average interest rate was 4.00%. For the period February 25, 2019 to February 28, 2019, the average daily loan balance outstanding on days where borrowings existed was $6,000,000 and the weighted average interest rate was 4.00%. The interest expense, which is included on the Statements of Operations, was $4,169 for Driehaus Emerging Markets Small Cap Growth Fund.
F. FOREIGN INVESTMENT RISKS
To the extent a Fundinvests in foreign securities, it may entail risks due to the potential for political and economic instability in the countries where the issuers of these securities are located. In addition, foreign exchange fluctuations could affect the value of positions held. These risks are generally intensified in emerging markets.
G. REDEMPTION FEES
The Fundsmay charge a redemption fee of 2.00% of the redemption amount for shares redeemed within 60 days of purchase. The redemption fees are recorded inpaid-in capital and reflected in the Statements of Changes in Net Assets.
H. SUBSEQUENT EVENTS
Events or transactions that occurred after the date of this report through the date the report was issued have been evaluated for potential impact to the financial statements. There are no subsequent events that require recognition or disclosure in the financial statements.
50
Fund Expense Examples (unaudited)
As a mutual fund shareholder, you may incur two types of costs: (1) transaction costs, including sales charges; redemption fees; and exchange fees and (2) ongoing costs, including management fees; distribution(12b-1) fees; and other fund expenses. This example is intended to help you understand your ongoing costs (in dollars) of investing in each Fundand to compare these costs with the ongoing costs of investing in other mutual funds.
The example is based on an investment of $1,000 invested at the beginning of the period and held for the entire six months ended June 30, 2019.
Actual Expenses
The first line of the tables below (“Actual”) provides information about actual account values and actual expenses. You may use the information in this line, together with the amount you invested, to estimate the expenses that you paid over the period. Simply divide your account value by $1,000 (for example, an $8,600 account value divided by $1,000 = 8.6), then multiply the result by the number in the first line under the heading entitled “Expenses Paid During Period” to estimate the expenses you paid on your account during this period.
Hypothetical Example for Comparison Purposes
The second line of the tables below (“Hypothetical”) provides information about hypothetical account values and hypothetical expenses based on the Fund’sactual expense ratio and an assumed rate of return of 5% per year before expenses, which is not the Fund’sactual return. You may use this information to compare the ongoing costs of investing in the Fundsversus other funds. To do so, compare this 5% hypothetical example with the 5% hypothetical examples that appear in the shareholder reports of the other funds.
Please note that the expenses shown in the table are meant to highlight your ongoing costs only and do not reflect any transactional costs, such as sales charges, redemption fees or exchange fees. Therefore, the second line of the table is useful in comparing ongoing costs only, and will not help you determine the relative total costs of owning different funds. In addition, if these transactional costs were included, your costs would have been higher.
Driehaus Emerging Markets Growth Fund — Investor Class
| Beginning Account Value January 1, 2019 | Ending Account Value June 30, 2019 | Expenses Paid During Six Months Ended June 30, 2019* | ||||||||||
Actual | $ | 1,000 | $ | 1,151.00 | $ | 7.31 | ||||||
Hypothetical (5% return before expenses) | $ | 1,000 | $ | 1,018.00 | $ | 6.85 | ||||||
Driehaus Emerging Markets Growth Fund — Institutional Class
| Beginning Account Value January 1, 2019 | Ending Account Value June 30, 2019 | Expenses Paid During Period Ended June 30, 2019* | ||||||||||
Actual | $ | 1,000 | $ | 1,151.80 | $ | 6.35 | ||||||
Hypothetical (5% return before expenses) | $ | 1,000 | $ | 1,018.89 | $ | 5.96 | ||||||
51
Fund Expense Examples (unaudited) — (Continued)
Driehaus Emerging Markets Small Cap Growth Fund
| Beginning Account Value January 1, 2019 | Ending Account Value June 30, 2019 | Expenses Paid During Six Months Ended June 30, 2019* | ||||||||||
Actual | $ | 1,000 | $ | 1,200.90 | $ | 7.97 | ||||||
Hypothetical (5% return before expenses) | $ | 1,000 | $ | 1,017.55 | $ | 7.30 | ||||||
Driehaus International Small Cap Growth Fund
| Beginning Account Value January 1, 2019 | Ending Account Value June 30, 2019 | Expenses Paid During Six Months Ended June 30, 2019* | ||||||||||
Actual | $ | 1,000 | $ | 1,167.30 | $ | 6.77 | ||||||
Hypothetical (5% return before expenses) | $ | 1,000 | $ | 1,018.55 | $ | 6.31 | ||||||
Driehaus Micro Cap Growth Fund
| Beginning Account Value January 1, 2019 | Ending Account Value June 30, 2019 | Expenses Paid During Six Months Ended June 30, 2019* | ||||||||||
Actual | $ | 1,000 | $ | 1,281.70 | $ | 8.49 | ||||||
Hypothetical (5% return before expenses) | $ | 1,000 | $ | 1,017.36 | $ | 7.50 | ||||||
Driehaus Small Cap Growth Fund — Investor Class
| Beginning Account Value January 1, 2019 | Ending Account Value June 30, 2019 | Expenses Paid During Period Ended June 30, 2019* | ||||||||||
Actual | $ | 1,000 | $ | 1,340.50 | $ | 6.96 | ||||||
Hypothetical (5% return before expenses) | $ | 1,000 | $ | 1,018.84 | $ | 6.01 | ||||||
Driehaus Small Cap Growth Fund — Institutional Class
| Beginning Account Value January 1, 2019 | Ending Account Value June 30, 2019 | Expenses Paid During Period Ended June 30, 2019* | ||||||||||
Actual | $ | 1,000 | $ | 1,342.70 | $ | 5.52 | ||||||
Hypothetical (5% return before expenses) | $ | 1,000 | $ | 1,020.08 | $ | 4.76 | ||||||
| * | Expenses are equal to the Fund’s annualized expense ratios for thesix-month period in the table below multiplied by the average account value over the period, multiplied by the number of days in the most recent fiscal half-year (181), then divided by 365 to reflect the half-year period. These amounts exclude the reduction in expenses for fees paid indirectly and may differ from the Fund’s annualized expense ratio shown in the Financial Highlights. |
52
Fund Expense Examples (unaudited) — (Continued)
Driehaus Emerging Markets Growth Fund — Investor Class | 1.37% | |||
Driehaus Emerging Markets Growth Fund — Institutional Class | 1.19% | |||
Driehaus Emerging Markets Small Cap Growth Fund | 1.46% | |||
Driehaus International Small Cap Growth Fund | 1.26% | |||
Driehaus Micro Cap Growth Fund | 1.50% | |||
Driehaus Small Cap Growth Fund — Investor Class. | 1.20% | |||
Driehaus Small Cap Growth Fund — Institutional Class | 0.95% |
53
DRH-SAR2019
Item 1. Reports to Stockholders.
Driehaus Mutual Funds
Trustees & Officers
Theodore J. Beck
Trustee
Francis J. Harmon
Trustee
Christopher J. Towle
Trustee
Dawn M. Vroegop
Trustee
Daniel F. Zemanek
Chairman of the Board
Stephen J. Kneeley
President & Trustee
Robert M. Kurinsky
Vice President & Treasurer
Janet L. McWilliams
Chief Legal Officer &
Assistant Vice President
Anne S. Kochevar
Chief Compliance Officer &
Anti-Money Laundering
Compliance Officer
William H. Wallace, III
Secretary
Christina E.H. Jacobs
Assistant Secretary
Christine V. Mason
Assistant Secretary
Investment Adviser
Driehaus Capital Management LLC
25 East Erie Street
Chicago, IL 60611
Distributor
Driehaus Securities LLC
25 East Erie Street
Chicago, IL 60611
Administrator & Transfer Agent
UMB Fund Services, Inc.
235 W. Galena Street
Milwaukee, WI 53212
Custodian
The Northern Trust Company
50 South LaSalle Street
Chicago, IL 60603
Semi-Annual Report to Shareholders
June 30, 2019

Driehaus Active Income Fund
Driehaus Event Driven Fund
Driehaus Multi-Asset Growth Economies Fund
Beginning on May 1, 2021, as permitted by regulations adopted by the Securities and Exchange Commission, paper copies of shareholder reports will no longer be sent by mail, unless you specifically request paper copies of the reports. Instead, the reports will be made available on the Fund’s website (https://www.driehaus.com/fund-resources), and you will be notified by mail each time a report is posted and provided with a website link to access the report.
If you already elected to receive shareholder reports electronically, you will not be affected by this change and you need not take any action. You may elect to receive shareholder reports and other communications from a Fund electronically at any time by contacting your financial intermediary or, if you invest directly with a Fund, by calling1-877-779-0079.
You may elect to receive all future reports in paper free of charge. If you invest through a financial intermediary, you can contact your financial intermediary to request that you continue to receive paper copies of your shareholder reports. If you invest directly with a Fund, you can call1-877-779-0079 to inform the Fund that you wish to continue receiving paper copies of your shareholder reports. Your election to receive reports in paper will apply to all funds held in your account if you invest through a financial intermediary or all funds in the Driehaus Mutual Funds if you invest directly with a Fund.
Distributed by:
Driehaus Securities LLC
This report has been prepared for the shareholders of the Funds and is not an offer to sell or buy any Fund securities. Such offer is only made by the Funds’ prospectus.
Performance Overview and Schedule of Investments: | ||||
| 1 | ||||
| 7 | ||||
| 11 | ||||
| 16 | ||||
| 17 | ||||
| 18 | ||||
| 20 | ||||
| 23 | ||||
| 43 | ||||
| 45 | ||||
PROXY VOTING POLICIES AND PROCEDURES AND PROXY VOTING RECORD
A description of the Funds’ policies and procedures with respect to the voting of proxies relating to the Funds’ portfolio securities is available, without charge, upon request, by calling 1-877-779-0079. This information is also available on the Funds’ website at http://www.driehaus.com.
Information regarding how the Funds voted proxies related to portfolio securities during the 12-month period ended June 30, 2019 is available without charge, upon request, by calling 1-877-779-0079. This information is also available on the Securities and Exchange Commission’s (“SEC”) website at http://www.sec.gov.
HOW TO OBTAIN QUARTERLY PORTFOLIO HOLDINGS
Each Fund files a complete schedule of portfolio holdings with the SEC for the first and third quarters of each fiscal year on Form NPORT-EX. The Funds’ Form NPORT-EX is available electronically on the SEC’s website at http://www.sec.gov. Each Fund’s complete schedule of portfolio holdings is also available on the Funds’ website at http://www.driehaus.com.
Performance Overview (unaudited)
The performance summarized below is historical and does not represent future results. Investment returns and principal value vary, and you may have a gain or loss when you sell shares. Performance data presented measures the change in the value of an investment in the Fund, assuming reinvestment of all dividends and capital gains. Average annual total return reflects annualized change.
The table does not reflect the deduction of taxes that a shareholder would pay on Fund distributions or the redemption of Fund shares. The graph compares the results of a $25,000 investment (minimum investment) in the Fund over the last 10 fiscal year periods (which includes performance of the Predecessor Fund), with all dividends and capital gains reinvested, with the indicated indices (and dividends reinvested) for the same period.
| Average Annual Total Returns as of 6/30/19 | 1 Year | 3 Years | 5 Years | 10 Years | ||||||||||||
Driehaus Active Income Fund (LCMAX)1 | 0.98% | 2.39% | 1.07% | 2.55% | ||||||||||||
FTSE 3-Month T-Bill Index2 | 2.30% | 1.36% | 0.84% | 0.46% | ||||||||||||
Bloomberg Barclays U.S. Aggregate Bond Index3 | 7.87% | 2.31% | 2.95% | 3.90% | ||||||||||||
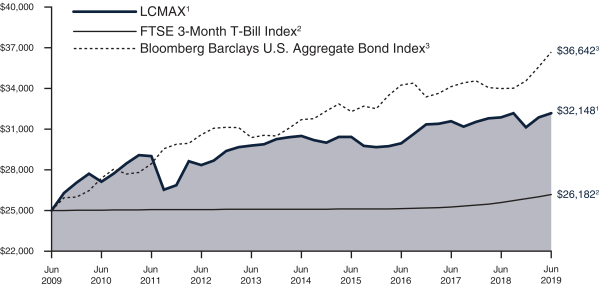
| 1 | The Driehaus Active Income Fund (the “Fund”) performance shown above includes the performance of the Lotsoff Capital Management Active Income Fund (the “Predecessor Fund”) for the periods before the Fund’s registration statement became effective. The Fund received the assets and liabilities of the Predecessor Fund on June 1, 2009 through a reorganization of the Predecessor Fund into the Fund. The Predecessor Fund was a nondiversified fund that was a series of another management investment company registered under the Investment Company Act of 1940, as amended. The Fund had no prior operating history prior to succeeding to the assets of the Predecessor Fund. The Fund has substantially similar investment objectives, strategies, and policies as the Predecessor Fund. Financial and performance information of the Fund includes the Predecessor Fund information. |
| 2 | The FTSE 3-Month T-Bill Index is designed to mirror the performance of the 3-month U.S. Treasury Bill. The FTSE3-Month T-Bill Index is unmanaged and its returns reflect reinvestment of all distributions and changes in market prices. |
| 3 | The Bloomberg Barclays U.S. Aggregate Bond Index, an unmanaged index, represents securities that are SEC-registered, taxable and dollar denominated. This index covers the U.S. investment grade fixed rate bond market, with index components for government and corporate securities, mortgage pass-through securities and asset-backed securities. These major sectors are subdivided into more specific indices that are calculated and reported on a regular basis. |
1
Driehaus Active Income Fund
Schedule of Investments
June 30, 2019 (unaudited)
| Shares, Principal Amount, or Number of Contracts | Value | |||||||
| BANK LOANS — 23.88% | ||||||||
Apparel — 1.30% | ||||||||
Boardriders, Inc. | $ | 6,438,174 | $ | 6,282,564 | ||||
Computers — 1.73% | ||||||||
McAfee LLC | 3,318,501 | 3,319,016 | ||||||
McAfee LLC | 4,963,636 | 5,039,133 | ||||||
|
| |||||||
| 8,358,149 | ||||||||
|
| |||||||
Distribution/Wholesale — 3.84% |
| |||||||
Fossil Group, Inc. | 18,566,509 | 18,605,127 | ||||||
Healthcare — Services — 1.25% |
| |||||||
Heartland Dental LLC | 299,581 | 284,603 | ||||||
Heartland Dental LLC | 6,721 | 6,385 | ||||||
Tivity Health, Inc. | 5,737,952 | 5,748,711 | ||||||
|
| |||||||
| 6,039,699 | ||||||||
|
| |||||||
Insurance — 4.55% |
| |||||||
Acrisure LLC | 4,260,741 | 4,249,215 | ||||||
Asurion LLC | 14,628,049 | 14,864,292 | ||||||
Genworth Holdings, Inc. | 2,905,575 | 2,936,462 | ||||||
|
| |||||||
| 22,049,969 | ||||||||
|
| |||||||
Internet — 0.07% |
| |||||||
Hoya Midco LLC | 345,674 | 342,938 | ||||||
Investment Companies — 3.40% |
| |||||||
Abe Investment Holdings, Inc. | 5,960,025 | 5,940,149 | ||||||
| Shares, Principal Amount, or Number of Contracts | Value | |||||||
Larchmont Resources LLC | $ | 5,884,140 | $ | 5,545,802 | ||||
UFC Holdings LLC | 5,000,000 | 4,996,875 | ||||||
|
| |||||||
| 16,482,826 | ||||||||
|
| |||||||
Media — 3.75% | ||||||||
Cumulus Media New Holdings, Inc. | 4,192,121 | 4,195,265 | ||||||
iHeartCommunications, Inc. | 7,500,000 | 7,518,187 | ||||||
NEP Group, Inc. | 6,500,000 | 6,467,500 | ||||||
|
| |||||||
| 18,180,952 | ||||||||
|
| |||||||
Real Estate Investment Trust — 1.11% |
| |||||||
Uniti Group LP | 5,485,934 | 5,359,949 | ||||||
Software — 1.86% | ||||||||
TIBCO Software, Inc. | 8,976,981 | 9,006,470 | ||||||
Telecommunications — 1.02% |
| |||||||
Intelsat Jackson Holdings S.A. (Luxembourg) | 5,000,000 | 4,955,475 | ||||||
|
| |||||||
Total BANK LOANS | 115,664,118 | |||||||
|
| |||||||
| CORPORATE BONDS — 59.49% |
| |||||||
Aerospace & Defense — 1.01% |
| |||||||
Bombardier, Inc. (Canada) | 4,500,000 | 4,905,000 | ||||||
Agriculture — 2.21% | ||||||||
Vector Group Ltd. | 11,560,000 | 10,713,577 | ||||||
Airlines — 1.24% | ||||||||
Virgin Australia Holdings Ltd. (Australia) | 5,956,000 | 6,027,472 | ||||||
Banks — 6.17% | ||||||||
JPMorgan Chase & Co. | 15,081,000 | 15,072,856 | ||||||
Notes to Financial Statements are an integral part of this Schedule.
2
Driehaus Active Income Fund
Schedule of Investments
June 30, 2019 (unaudited)
| Shares, Principal Amount, or Number of Contracts | Value | |||||||
USB Realty Corp. | $ | 17,435,000 | $ | 14,819,750 | ||||
|
| |||||||
| 29,892,606 | ||||||||
|
| |||||||
Beverages — 1.05% |
| |||||||
Cott Holdings, Inc. | 5,000,000 | 5,093,750 | ||||||
Commercial Services — 1.78% |
| |||||||
AMN Healthcare, Inc. | 3,000,000 | 3,060,510 | ||||||
Nielsen Finance LLC / Nielsen Finance Co. | 5,559,000 | 5,545,102 | ||||||
|
| |||||||
| 8,605,612 | ||||||||
|
| |||||||
Computers — 2.83% |
| |||||||
NCR Corp. | 8,000,000 | 8,250,000 | ||||||
Unisys Corp. | 4,960,000 | 5,474,600 | ||||||
|
| |||||||
| 13,724,600 | ||||||||
|
| |||||||
Cosmetics/Personal Care — 1.84% |
| |||||||
Avon International Capital PLC (United Kingdom) | 2,500,000 | 2,518,750 | ||||||
Avon International Operations, Inc. | 6,136,000 | 6,366,100 | ||||||
|
| |||||||
| 8,884,850 | ||||||||
|
| |||||||
Distribution/Wholesale — 1.37% |
| |||||||
Univar USA, Inc. | 6,500,000 | 6,621,875 | ||||||
Diversified Financial Services — 1.86% |
| |||||||
Curo Group Holdings Corp. | 4,900,000 | 4,067,000 | ||||||
ILFCE-Capital Trust I | 5,206,000 | 3,680,434 | ||||||
ILFCE-Capital Trust I | 1,750,000 | 1,237,180 | ||||||
|
| |||||||
| 8,984,614 | ||||||||
|
| |||||||
Energy-Alternate Sources — 1.29% |
| |||||||
Enviva Partners LP / Enviva Partners Finance Corp. | 6,000,000 | 6,240,000 | ||||||
Entertainment — 1.21% |
| |||||||
Lions Gate Capital Holdings LLC | 5,570,000 | 5,855,463 | ||||||
Home Builders — 0.43% |
| |||||||
Taylor Morrison Communities, Inc. / Taylor Morrison Holdings II, Inc. | 2,000,000 | 2,100,000 | ||||||
| Shares, Principal Amount, or Number of Contracts | Value | |||||||
Insurance — 3.20% |
| |||||||
Acrisure LLC / Acrisure Finance, Inc. | $ | 6,500,000 | $ | 6,711,250 | ||||
Genworth Holdings, Inc. | 8,764,000 | 8,785,910 | ||||||
|
| |||||||
| 15,497,160 | ||||||||
|
| |||||||
Internet — 3.30% |
| |||||||
EIG Investors Corp. | 13,060,000 | 13,843,600 | ||||||
Uber Technologies, Inc. | 2,000,000 | 2,120,000 | ||||||
|
| |||||||
| 15,963,600 | ||||||||
|
| |||||||
Investment Companies — 2.14% |
| |||||||
Compass Group Diversified Holdings LLC | 9,943,000 | 10,365,577 | ||||||
Iron/Steel — 1.22% |
| |||||||
AK Steel Corp. | 6,000,000 | 5,910,000 | ||||||
Leisure Time — 1.32% |
| |||||||
Vista Outdoor, Inc. | 6,550,000 | 6,389,001 | ||||||
Media — 5.85% |
| |||||||
Altice Luxembourg S.A. (Luxembourg) | 610,000 | 619,913 | ||||||
CSC Holdings LLC | 2,000,000 | 2,140,000 | ||||||
Cumulus Media New Holdings, Inc. | 1,000,000 | 997,300 | ||||||
GCI LLC | 500,000 | 523,900 | ||||||
GCI LLC | 6,000,000 | 6,255,000 | ||||||
iHeartCommunications, Inc. | 2,500,000 | 2,618,800 | ||||||
Lee Enterprises, Inc. | 5,475,000 | 5,570,812 | ||||||
Tribune Media Co. | 9,435,000 | 9,599,169 | ||||||
|
| |||||||
| 28,324,894 | ||||||||
|
| |||||||
Mining — 1.08% |
| |||||||
Mountain Province Diamonds, Inc. (Canada) | 5,260,000 | 5,233,700 | ||||||
Oil & Gas — 1.41% |
| |||||||
Transocean Pontus Ltd. (Cayman Islands) | 6,615,000 | 6,813,450 | ||||||
Packaging & Containers — 1.08% |
| |||||||
Ardagh Packaging Finance PLC / Ardagh Holdings USA, Inc. (Ireland) | 5,060,000 | 5,243,425 | ||||||
Notes to Financial Statements are an integral part of this Schedule.
3
Driehaus Active Income Fund
Schedule of Investments
June 30, 2019 (unaudited)
| Shares, Principal Amount, or Number of Contracts | Value | |||||||
Pharmaceuticals — 2.90% |
| |||||||
HLF Financing Sarl LLC / Herbalife International, Inc. | $ | 9,995,000 | $ | 10,044,975 | ||||
Horizon Pharma USA, Inc. | 3,902,000 | 4,019,060 | ||||||
|
| |||||||
| 14,064,035 | ||||||||
|
| |||||||
Retail — 3.13% |
| |||||||
CEC Entertainment, Inc. | 7,500,000 | 7,546,875 | ||||||
GameStop Corp. | 5,650,000 | 5,537,000 | ||||||
Men’s Wearhouse, Inc. | 2,167,000 | 2,085,737 | ||||||
|
| |||||||
| 15,169,612 | ||||||||
|
| |||||||
Software — 1.93% |
| |||||||
Donnelley Financial Solutions, Inc. | 5,215,000 | 5,397,525 | ||||||
j2 Cloud Services LLC / j2 Global Co.-Obligor, Inc. | 3,750,000 | 3,928,125 | ||||||
|
| |||||||
| 9,325,650 | ||||||||
|
| |||||||
Telecommunications — 3.88% |
| |||||||
Consolidated Communications, Inc. | 16,451,000 | 15,335,458 | ||||||
HC2 Holdings, Inc. | 3,922,000 | 3,451,360 | ||||||
|
| |||||||
| 18,786,818 | ||||||||
|
| |||||||
Transportation — 1.04% |
| |||||||
XPO CNW, Inc. | 5,482,000 | 5,043,440 | ||||||
Trucking & Leasing — 1.72% |
| |||||||
Fortress Transportation & Infrastructure Investors LLC | 8,000,000 | 8,310,000 | ||||||
|
| |||||||
Total CORPORATE BONDS | 288,089,781 | |||||||
|
| |||||||
| CONVERTIBLE CORPORATE BONDS — 1.01% |
| |||||||
Software — 1.01% |
| |||||||
Avaya Holdings Corp. 2.25%, 6/15/23 | 5,625,000 | 4,896,562 | ||||||
|
| |||||||
Total CONVERTIBLE CORPORATE BONDS | 4,896,562 | |||||||
|
| |||||||
| Shares, Principal Amount, or Number of Contracts | Value | |||||||
| COMMON STOCKS — 0.83% | ||||||||
Banks — 0.35% |
| |||||||
Kearny Financial Corp. | 127,756 | $ | 1,697,877 | |||||
Software — 0.36% |
| |||||||
Avaya Holdings Corp.* | 145,632 | 1,734,477 | ||||||
Telecommunications — 0.12% |
| |||||||
Consolidated Communications Holdings, Inc. | 121,265 | 597,837 | ||||||
|
| |||||||
Total COMMON STOCKS | 4,030,191 | |||||||
|
| |||||||
| CONVERTIBLE PREFERRED STOCKS — 0.00% |
| |||||||
Auto Manufacturers — 0.00% |
| |||||||
General Motors Corp. Senior Convertible Preferred Escrow — C 6.25%, 12/15/12*,10,11,12 | 11,790,650 | — | ||||||
General Motors Corp. Senior Convertible Preferred Escrow — B 5.25%, 3/6/34*,10,11,12 | 475,000 | — | ||||||
|
| |||||||
| — | ||||||||
|
| |||||||
Total CONVERTIBLE PREFERRED STOCKS | — | |||||||
|
| |||||||
| PREFERRED STOCKS — 2.89% |
| |||||||
Banks — 2.89% |
| |||||||
GMAC Capital Trust I | 534,658 | 13,970,614 | ||||||
|
| |||||||
Total PREFERRED STOCKS | 13,970,614 | |||||||
|
| |||||||
| PRIVATE STOCK — 0.40% |
| |||||||
Investment Companies — 0.40% |
| |||||||
Larchmont Resources LLC10 | 7,824 | 1,956,000 | ||||||
|
| |||||||
Total PRIVATE STOCK | 1,956,000 | |||||||
|
| |||||||
| ||||||||
TOTAL INVESTMENTS | 88.50 | % | $ | 428,607,266 | ||||
Other Assets less Liabilities | 11.50 | % | 55,674,805 | |||||
|
|
|
| |||||
Net Assets | 100.00 | % | $ | 484,282,071 | ||||
| ||||||||
Notes to Financial Statements are an integral part of this Schedule.
4
Driehaus Active Income Fund
Schedule of Investments
June 30, 2019 (unaudited)
| Shares, Principal Amount, or Number of Contracts | Value | |||||||
| INVESTMENT SECURITIES SOLD SHORT — (9.69)% |
| |||||||
| CORPORATE BONDS — (4.65)% |
| |||||||
Commercial Services — (0.42)% |
| |||||||
Avis Budget Car Rental LLC / Avis Budget Finance, Inc. | $ | (2,000,000 | ) | $ | (2,025,000 | ) | ||
Food — (1.24)% |
| |||||||
General Mills, Inc. | (2,000,000 | ) | (2,162,820 | ) | ||||
Kroger Co. | (4,000,000 | ) | (3,862,636 | ) | ||||
|
| |||||||
| (6,025,456 | ) | |||||||
|
| |||||||
Healthcare — Services — (1.64)% |
| |||||||
DaVita, Inc. | (2,000,000 | ) | (2,010,600 | ) | ||||
Hadrian Merger Sub, Inc. | (3,940,000 | ) | (3,743,000 | ) | ||||
HCA, Inc. | (2,000,000 | ) | (2,168,750 | ) | ||||
|
| |||||||
| (7,922,350 | ) | |||||||
|
| |||||||
Packaging & Containers — (0.49)% |
| |||||||
WRKCo, Inc. | (2,200,000 | ) | (2,396,801 | ) | ||||
Retail — (0.41)% |
| |||||||
Beacon Roofing Supply, Inc. | (2,000,000 | ) | (1,995,000 | ) | ||||
Telecommunications — (0.45)% |
| |||||||
T-Mobile USA, Inc. | (2,000,000 | ) | (2,172,120 | ) | ||||
|
| |||||||
Total CORPORATE BONDS | (22,536,727 | ) | ||||||
|
| |||||||
| COMMON STOCKS — (0.20)% |
| |||||||
Pharmaceuticals — (0.20)% |
| |||||||
Herbalife Nutrition Ltd.* | (22,000 | ) | (940,720 | ) | ||||
|
| |||||||
Total COMMON STOCKS | (940,720 | ) | ||||||
|
| |||||||
| EXCHANGE-TRADED FUNDS — (4.84)% |
| |||||||
Invesco Senior Loan ETF | (688,000 | ) | (15,590,080 | ) | ||||
iShares iBoxx High Yield Corporate Bond ETF | (90,000 | ) | (7,846,200 | ) | ||||
|
| |||||||
Total EXCHANGE-TRADED FUNDS | (23,436,280 | ) | ||||||
|
| |||||||
| ||||||||
TOTAL INVESTMENT SECURITIES SOLD SHORT | (9.69 | )% | $ | (46,913,727 | ) | |||
|
| |||||||
| ||||||||
LIBOR 3 Month — 3 Month U.S. Dollar London Interbank Offered Rate.
US LIBOR — U.S. Dollar London Interbank Offered Rate.
| * | Non-income producing security. |
| 1 | Bank loans in which the Fund invests pay interest at rates which are periodically predetermined by reference to a base lending rate plus a premium. These base lending rates are generally (i) the lending rate offered by one or more major European banks, such as the London Inter-Bank Offered Rate (“LIBOR”), (ii) the prime rate offered by one or more United States banks or (iii) the certificate of deposit rate. Certain bank loans are subject to a LIBOR floor that establishes a minimum LIBOR rate. The interest rate shown reflects the rate in effect at June 30, 2019. Bank loans generally are subject to mandatory and/or optional repayment. As a result, the actual remaining maturity may be substantially less than the stated maturities shown. |
| 2 | Floating rate security. Rates disclosed as of June 30, 2019. |
| 3 | Foreign security denominated in U.S. dollars and traded in the U.S. |
| 4 | Security is exempt from registration under Rule 144A of the Securities Act of 1933, as amended. Unless otherwise indicated, this security has been determined to be liquid under procedures established by Driehaus Mutual Funds’ (the “Trust”) Board of Trustees and may be resold in transactions exempt from registration, normally to qualified institutional buyers. |
| 5 | All or a portion of this security is pledged as collateral for short sales or derivatives transactions. |
| 6 | Perpetual security. Maturity date is not applicable. |
| 7 | Variable rate security. Rates disclosed as of June 30, 2019. |
| 8 | The coupon rate equals 155 basis points plus the highest of the LIBOR 3 Month, the Constant Maturity Treasury 10 year rate, and the Constant Maturity Treasury 30 year rate, with a maximum of 12.95%. |
| 9 | The coupon rate equals 155 basis points plus the highest of the LIBOR 3 Month, the Constant Maturity Treasury 10 year rate, and the Constant Maturity Treasury 30 year rate, with a maximum of 14.5%. |
| 10 | Pursuant to procedures adopted by the Trust’s Board of Trustees, this security has been determined to be illiquid by Driehaus Capital Management LLC (the “Adviser”), investment adviser to the Fund. |
| 11 | Security is in default. |
| 12 | Security valued at fair value as determined in good faith by the Adviser, in accordance with procedures established by, and under the general supervision of, the Trust’s Board of Trustees. |
Percentages are stated as a percent of net assets.
Notes to Financial Statements are an integral part of this Schedule.
5
Driehaus Active Income Fund
Schedule of Investments
June 30, 2019 (unaudited)
Security Type | Percent of Total Net Assets | |||
Bank Loans | 23.88 | % | ||
Corporate Bonds | 59.49 | % | ||
Convertible Corporate Bonds | 1.01 | % | ||
Common Stocks | 0.83 | % | ||
Convertible Preferred Stocks | 0.00 | % | ||
Preferred Stocks | 2.89 | % | ||
Private Stock | 0.40 | % | ||
|
| |||
Total Investments | 88.50 | % | ||
Other Assets less Liabilities | 11.50 | % | ||
|
| |||
Total Net Assets | 100.00 | % | ||
|
| |||
FUTURES CONTRACTS
| Counterparty | Futures Contracts | Number of Contracts (Short) | Expiration Date | Notional Amount | Value at June 30, 2019 | Unrealized Appreciation/ (Depreciation) | ||||||||||||||||
Goldman Sachs | U.S. 5 Year Treasury Note | (105 | ) | September 30, 2019 | $ | (12,253,582 | ) | $ | (12,406,411 | ) | $ | (152,829 | ) | |||||||||
Goldman Sachs | U.S. 10 Year Treasury Note | (65 | ) | September 19, 2019 | (8,172,077 | ) | (8,317,972 | ) | (145,895 | ) | ||||||||||||
Goldman Sachs | U.S. Treasury Long Bond | (15 | ) | September 19, 2019 | (2,271,059 | ) | (2,333,907 | ) | (62,848 | ) | ||||||||||||
|
|
|
|
|
| |||||||||||||||||
TOTAL FUTURES CONTRACTS |
| $ | (22,696,718 | ) | $ | (23,058,290 | ) | $ | (361,572 | ) | ||||||||||||
|
|
|
|
|
| |||||||||||||||||
Notes to Financial Statements are an integral part of this Schedule.
6
Performance Overview (unaudited)
The performance summarized below is historical and does not represent future results. Investment returns and principal value vary, and you may have a gain or loss when you sell shares. Performance data presented measures the change in the value of an investment in the Fund, assuming reinvestment of all dividends and capital gains.
The table does not reflect the deduction of taxes that a shareholder would pay on Fund distributions or the redemption of Fund shares. The graph compares the results of a $10,000 investment in the Fund since August 26, 2013 (the date of the Fund’s inception), with all dividends and capital gains reinvested, with the indicated indices (and dividends reinvested) for the same period.
| Cumulative Total Returns as of 6/30/19 | 1 Year | 3 Years | 5 Years | Since Inception (8/26/13 - 6/30/19 | ||||||||||||
Driehaus Event Driven Fund (DEVDX)1 | 9.65% | 7.93% | 2.35% | 4.26% | ||||||||||||
S&P 500 Index2 | 10.42% | 14.19% | 10.71% | 12.54% | ||||||||||||
FTSE3-MonthT-Bill Index3 | 2.30% | 1.36% | 0.84% | 0.73% | ||||||||||||

| 1 | The returns for the periods prior to March 1, 2014, reflect fee waivers and/or reimbursements without which performance would have been lower. |
| 2 | The S&P 500 Index consists of 500 stocks chosen for market size, liquidity and industry group. It is a market-weighted index, with each stock’s weight in the index proportionate to its market value. |
| 3 | The FTSE 3-Month T-Bill Index is designed to mirror the performance of the 3-month U.S. Treasury Bill. The FTSE3-Month T-Bill Index is unmanaged and its returns reflect reinvestment of all distributions and changes in market prices. |
7
Driehaus Event Driven Fund
Schedule of Investments
June 30, 2019 (unaudited)
| Shares, Principal Amount, or Number of Contracts | Value | |||||||
| BANK LOANS — 5.95% |
| |||||||
Distribution/Wholesale — 2.47% |
| |||||||
Fossil Group, Inc. | $ | 1,650,251 | $ | 1,653,684 | ||||
Insurance — 3.48% |
| |||||||
Asurion LLC | 2,300,000 | 2,337,145 | ||||||
|
| |||||||
Total BANK LOANS | 3,990,829 | |||||||
|
| |||||||
| CORPORATE BONDS — 26.50% |
| |||||||
Agriculture — 2.78% |
| |||||||
Vector Group Ltd. | 2,010,000 | 1,862,828 | ||||||
Banks — 4.66% |
| |||||||
State Street Corp. | 1,101,000 | 836,760 | ||||||
USB Realty Corp. | 2,698,000 | 2,293,300 | ||||||
|
| |||||||
| 3,130,060 | ||||||||
|
| |||||||
Diversified Financial Services — 5.47% |
| |||||||
Curo Group Holdings Corp. 8.25%, 9/1/253 | 1,524,800 | 1,265,584 | ||||||
ILFCE-Capital Trust I | 3,400,000 | 2,403,664 | ||||||
|
| |||||||
| 3,669,248 | ||||||||
|
| |||||||
Holding Companies-Diversified — 2.68% |
| |||||||
Arrow Bidco LLC | 1,785,000 | 1,796,156 | ||||||
Insurance — 2.60% |
| |||||||
Genworth Holdings, Inc. 7.70%, 6/15/20 | 1,739,000 | 1,743,347 | ||||||
Telecommunications — 8.31% |
| |||||||
Consolidated Communications, Inc. 6.50%, 10/1/225 | 3,377,000 | 3,148,006 | ||||||
HC2 Holdings, Inc. | 2,761,500 | 2,430,120 | ||||||
|
| |||||||
| 5,578,126 | ||||||||
|
| |||||||
Total CORPORATE BONDS | 17,779,765 | |||||||
|
| |||||||
| Shares, Principal Amount, or Number of Contracts | Value | |||||||
| CONVERTIBLE CORPORATE BONDS — 1.30% |
| |||||||
Software — 1.30% |
| |||||||
Avaya Holdings Corp. | $ | 1,000,000 | $ | 870,500 | ||||
|
| |||||||
Total CONVERTIBLE CORPORATE BONDS | 870,500 | |||||||
|
| |||||||
| COMMON STOCKS — 59.21% |
| |||||||
Banks — 2.01% |
| |||||||
Kearny Financial Corp. | 101,547 | 1,349,560 | ||||||
Biotechnology — 12.18% |
| |||||||
Argenx SE ADR (Netherlands)*5 | 19,901 | 2,817,584 | ||||||
Blueprint Medicines Corp.* | 10,803 | 1,019,047 | ||||||
Celgene Corp.* | 12,614 | 1,166,038 | ||||||
Ideaya Biosciences, Inc.*9 | 150,637 | 1,500,349 | ||||||
Orchard Therapeutics plc ADR (United Kingdom)* | 119,163 | 1,667,090 | ||||||
|
| |||||||
| 8,170,108 | ||||||||
|
| |||||||
Computers — 1.40% |
| |||||||
Perspecta, Inc | 40,192 | 940,895 | ||||||
Electronics — 2.08% |
| |||||||
Fluidigm Corp.*5 | 113,113 | 1,393,552 | ||||||
Entertainment — 0.76% |
| |||||||
Lions Gate Entertainment Corp., Class A | 41,428 | 507,493 | ||||||
Healthcare — Products — 3.22% |
| |||||||
Inspire Medical Systems, Inc.* | 13,451 | 815,803 | ||||||
SI-BONE, Inc.*5 | 66,292 | 1,348,379 | ||||||
|
| |||||||
| 2,164,182 | ||||||||
|
| |||||||
Healthcare — Services — 0.86% |
| |||||||
Vapotherm, Inc.* | 25,141 | 578,243 | ||||||
Holding Companies-Diversified — 1.75% |
| |||||||
Diamond Eagle Acquisition Corp.* | 117,000 | 1,177,020 | ||||||
Insurance — 4.85% |
| |||||||
FGL Holdings | 387,100 | 3,251,640 | ||||||
Oil & Gas — 2.99% |
| |||||||
Anadarko Petroleum Corp. | 28,475 | 2,009,196 | ||||||
Pharmaceuticals — 17.01% |
| |||||||
Array BioPharma, Inc.*5 | 87,425 | 4,050,400 | ||||||
Ascendis Pharma A/S ADR (Denmark)* | 9,659 | 1,112,234 | ||||||
Cytokinetics, Inc.* | 153,763 | 1,729,834 | ||||||
Mirati Therapeutics, Inc.* | 12,791 | 1,317,473 | ||||||
Notes to Financial Statements are an integral part of this Schedule.
8
Driehaus Event Driven Fund
Schedule of Investments
June 30, 2019 (unaudited)
| Shares, Principal Amount, or Number of Contracts | Value | |||||||
MyoKardia, Inc.* | 34,968 | $ | 1,753,296 | |||||
Odonate Therapeutics, Inc.* | 29,417 | 1,079,310 | ||||||
Sutro Biopharma, Inc.* | 16,946 | 192,845 | ||||||
Trevi Therapeutics, Inc.* | 23,962 | 179,715 | ||||||
|
| |||||||
| 11,415,107 | ||||||||
|
| |||||||
Savings & Loans — 3.54% |
| |||||||
OceanFirst Financial Corp.5 | 68,840 | 1,710,674 | ||||||
Waterstone Financial, Inc.5 | 38,838 | 662,576 | ||||||
|
| |||||||
| 2,373,250 | ||||||||
|
| |||||||
Software — 2.79% |
| |||||||
Avaya Holdings Corp.* | 43,666 | 520,062 | ||||||
Red Hat, Inc.* | 7,200 | 1,351,872 | ||||||
|
| |||||||
| 1,871,934 | ||||||||
|
| |||||||
Telecommunications — 3.77% |
| |||||||
Consolidated Communications Holdings, Inc. | 82,794 | 408,174 | ||||||
HC2 Holdings, Inc.* | 58,060 | 137,022 | ||||||
Zayo Group Holdings, Inc.* | 60,400 | 1,987,764 | ||||||
|
| |||||||
| 2,532,960 | ||||||||
|
| |||||||
Total COMMON STOCKS | 39,735,140 | |||||||
|
| |||||||
| CONVERTIBLE PREFERRED STOCKS — 0.00% |
| |||||||
Auto Manufacturers — 0.00% |
| |||||||
General Motors Corp. Senior Convertible Preferred Escrow — C 7.25%, 4/15/41*9,10,11 | 162,750 | — | ||||||
General Motors Corp. Senior Convertible Preferred Escrow — B 5.25%, 3/6/34*9,10,11 | 25,000 | — | ||||||
|
| |||||||
| — | ||||||||
|
| |||||||
Total CONVERTIBLE PREFERRED STOCKS | — | |||||||
|
| |||||||
| WARRANTS — 0.01% |
| |||||||
X4 Pharmaceuticals, Inc.*9 | 5,547 | 9,985 | ||||||
|
| |||||||
Total WARRANTS | 9,985 | |||||||
|
| |||||||
| ||||||||
TOTAL INVESTMENTS | 92.97 | % | $ | 62,386,219 | ||||
Other Assets less Liabilities | 7.03 | % | 4,717,166 | |||||
|
|
|
| |||||
Net Assets | 100.00 | % | $ | 67,103,385 | ||||
| ||||||||
| Shares, Principal Amount, or Number of Contracts | Value | |||||||
| INVESTMENT SECURITIES SOLD SHORT — (21.62)% |
| |||||||
| CORPORATE BONDS — (1.70)% |
| |||||||
Healthcare — Services — (1.70)% |
| |||||||
Hadrian Merger Sub, Inc. 8.50%, 5/1/263 | $ | (1,200,000 | ) | $ | (1,140,000 | ) | ||
|
| |||||||
Total CORPORATE BONDS | (1,140,000 | ) | ||||||
|
| |||||||
| COMMON STOCKS — (1.48)% |
| |||||||
Oil & Gas — (0.63)% |
| |||||||
Occidental Petroleum Corp. | (8,337 | ) | (419,184 | ) | ||||
Pharmaceuticals — (0.85)% |
| |||||||
Bristol-Myers | (12,614 | ) | (572,045 | ) | ||||
|
| |||||||
Total COMMON STOCKS (Proceeds $1,021,519) | (991,229 | ) | ||||||
|
| |||||||
| EXCHANGE-TRADED FUNDS — (18.44)% |
| |||||||
iShares Nasdaq Biotechnology ETF | (32,760 | ) | (3,574,116 | ) | ||||
SPDR S&P Biotech ETF | (74,260 | ) | (6,513,345 | ) | ||||
SPDR S&P Regional Banking ETF | (42,790 | ) | (2,286,270 | ) | ||||
|
| |||||||
Total EXCHANGE-TRADED FUNDS | (12,373,731 | ) | ||||||
|
| |||||||
| ||||||||
TOTAL INVESTMENT SECURITIES SOLD SHORT | (21.62 | )% | $ | (14,504,960 | ) | |||
|
| |||||||
| ||||||||
LIBOR 3 Month — 3 Month U.S. Dollar London Interbank Offered Rate.
US LIBOR — U.S. Dollar London Interbank Offered Rate.
| * | Non-income producing security. |
| 1 | Bank loans in which the Fund invests pay interest at rates which are periodically predetermined by reference to a base lending rate plus a premium. These base lending rates are generally (i) the lending rate offered by one or more major European banks, such as the London Inter-Bank Offered Rate (“LIBOR”), (ii) the prime rate offered by one or more United States banks or (iii) the certificate of deposit rate. Certain bank loans are subject to a LIBOR floor that establishes a minimum LIBOR rate. The interest rate shown reflects the rate in effect at June 30, 2019. Bank loans generally are subject to mandatory and/or optional repayment. As a result, the actual remaining maturity may be substantially less than the stated maturities shown. |
| 2 | Floating rate security. Rates disclosed as of June 30, 2019. |
| 3 | Security is exempt from registration under Rule 144A of the Securities Act of 1933, as amended. Unless otherwise |
Notes to Financial Statements are an integral part of this Schedule.
9
Driehaus Event Driven Fund
Schedule of Investments
June 30, 2019 (unaudited)
| indicated, this security has been determined to be liquid under procedures established by Driehaus Mutual Funds’ (the “Trust”) Board of Trustees and may be resold in transactions exempt from registration, normally to qualified institutional buyers. |
| 4 | Perpetual security. |
| 5 | All or a portion of this security is pledged as collateral for short sales or derivatives transactions. |
| 6 | Variable rate security. Rates disclosed as of June 30, 2019. |
| 7 | The coupon rate equals 155 basis points plus the highest of the LIBOR 3 Month, the Constant Maturity Treasury 10 year rate, and the Constant Maturity Treasury 30 year rate, with a maximum of 12.95%. |
| 8 | Convertible security. |
| 9 | Pursuant to procedures adopted by the Trust’s Board of Trustees, this security has been determined to be illiquid by Driehaus Capital Management LLC (the “Adviser”), investment adviser to the Fund. |
| 10 | Security is in default. |
| 11 | Security valued at fair value as determined in good faith by the Adviser, in accordance with procedures established by, and under the general supervision of, the Trust’s Board of Trustees. |
Percentages are stated as a percent of net assets.
Security Type | Percent of Total Net Assets | |||
Bank Loans | 5.95 | % | ||
Corporate Bonds | 26.50 | % | ||
Convertible Corporate Bonds | 1.30 | % | ||
Common Stocks | 59.21 | % | ||
Convertible Preferred Stocks | 0.00 | % | ||
Warrants | 0.01 | % | ||
|
| |||
Total Investments | 92.97 | % | ||
Other Assets less Liabilities | 7.03 | % | ||
|
| |||
Total Net Assets | 100.00 | % | ||
|
| |||
FORWARD FOREIGN CURRENCY CONTRACTS
| Counterparty | Currency Purchased | Currency Sold | Settlement Date | Unrealized Appreciation/ (Depreciation) | ||||||||||||||||||||
Goldman Sachs | EUR | 137,988 | USD | 154,975 | August 9, 2019 | $ | 2,479 | |||||||||||||||||
Goldman Sachs | USD | 155,621 | EUR | 137,988 | August 9, 2019 | (1,833 | ) | |||||||||||||||||
|
| |||||||||||||||||||||||
TOTAL FORWARD FOREIGN CURRENCY CONTRACTS |
| $ | 646 | |||||||||||||||||||||
|
| |||||||||||||||||||||||
EUR = Euro
USD = United States Dollar
Notes to Financial Statements are an integral part of this Schedule.
10
Driehaus Multi-Asset Growth Economies Fund
Performance Overview (unaudited)
The performance summarized below is historical and does not represent future results. Investment returns and principal value vary, and you may have a gain or loss when you sell shares. Performance data presented measures the change in the value of an investment in the Fund, assuming reinvestment of all dividends and capital gains.
The table does not reflect the deduction of taxes that a shareholder would pay on Fund distributions or the redemption of Fund shares. The graph compares the results of a $10,000 investment in the Fund since April 10, 2017 (the date of the Fund’s inception), with all dividends and capital gains reinvested, with the indicated indices (and dividends reinvested) for the same period.
| Cumulative Total Returns as of 6/30/19 | 1 Year | Since Inception (4/10/17 - 6/30/19) | ||||||
Driehaus Multi-Asset Growth Economies Fund (DMAGX)1 | 5.22% | 8.43% | ||||||
MSCI EM/JP Morgan GBI Blended Index2 | 5.20% | 5.91% | ||||||
MSCI Emerging MarketsIndex-N3 | 1.21% | 6.87% | ||||||
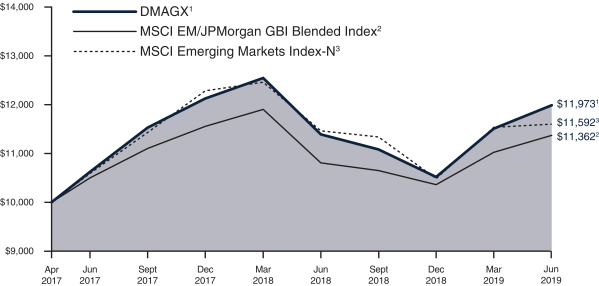
| 1 | The returns for the period reflect fee waivers and/or reimbursements without which performance would have been lower. |
| 2 | The MSCI EM/JPMorgan GBI Blended Index is an equally weighted benchmark comprised of 50 percent by the Morgan Stanley Capital International Emerging Markets Index-Net (MSCI EM) and 50 percent by the JPMorgan Global Bond Index Emerging Markets Global Diversified (JPMorgan GBI). The MSCI EM is a market capitalization-weighted index designed to measure equity market performance in emerging markets and the JPMorgan GBI tracks debt instruments in the emerging markets. Source: Morgan Stanley Capital International Inc. and JPMorgan. |
| 3 | The Morgan Stanley Capital International Emerging Markets Index-Net (MSCI Emerging Markets Index-N) is a market capitalization-weighted index designed to measure equity market performance in emerging markets. Data is in U.S. dollars and is calculated with net dividend reinvestment. Source: Morgan Stanley Capital International Inc. |
11
Driehaus Multi-Asset Growth Economies Fund
Schedule of Investments
June 30, 2019 (unaudited)
Shares, Principal | Value | |||||||
| SOVEREIGN BONDS — 31.61% |
| |||||||
Argentina — 3.65% | ||||||||
Argentina Treasury Bill | 22,000,000 | 2 | $ | 653,848 | ||||
Argentine Republic Government International Bond | $ | 770,000 | 675,675 | |||||
|
| |||||||
| 1,329,523 | ||||||||
|
| |||||||
Brazil — 2.85% | ||||||||
Brazil Notas do Tesouro Nacional | 1,000,000 | 2 | 303,696 | |||||
Brazilian Government International Bond | 700,000 | 734,300 | ||||||
|
| |||||||
| 1,037,996 | ||||||||
|
| |||||||
Colombia — 1.03% | ||||||||
Colombia Government International Bond | 340,000 | 375,190 | ||||||
Egypt — 5.10% | ||||||||
Egypt Treasury Bills | 33,000,000 | 2 | 1,857,328 | |||||
Indonesia — 3.79% | ||||||||
Indonesia Treasury Bond | 18,400,000,000 | 2 | 1,382,832 | |||||
Malaysia — 2.18% | ||||||||
Malaysia Government Bond | 3,000,000 | 2 | 793,902 | |||||
Mexico — 2.45% | ||||||||
Mexican Bonos | 100,000 | 2 | 532,104 | |||||
Mexican Bonos | 65,000 | 2 | 362,462 | |||||
|
| |||||||
| 894,566 | ||||||||
|
| |||||||
Nigeria — 2.00% | ||||||||
Nigeria OMO Bill | 140,000,000 | 2 | 357,419 | |||||
Nigeria Treasury Bill | 150,000,000 | 2 | 372,937 | |||||
|
| |||||||
| 730,356 | ||||||||
|
| |||||||
Peru — 4.10% | ||||||||
Peru Government Bond | 1,200,000 | 2 | 426,859 | |||||
Peruvian Government International Bond | 3,000,000 | 2 | 1,067,146 | |||||
|
| |||||||
| 1,494,005 | ||||||||
|
| |||||||
Shares, Principal | Value | |||||||
Poland — 1.51% | ||||||||
Republic of Poland Government Bond | 2,000,000 | 2 | $ | 551,999 | ||||
South Africa — 2.95% | ||||||||
Republic of South Africa Government Bond | 16,600,000 | 2 | 1,075,626 | |||||
|
| |||||||
Total SOVEREIGN BONDS | 11,523,323 | |||||||
|
| |||||||
| EQUITY SECURITIES — 63.37% |
| |||||||
Argentina — 1.11% | ||||||||
Globant SA*3,4 | 1,433 | 144,805 | ||||||
MercadoLibre, Inc.*4 | 424 | 259,391 | ||||||
|
| |||||||
| 404,196 | ||||||||
|
| |||||||
Brazil — 4.48% | ||||||||
Banco Bradesco SA — ADR3,4 | 30,743 | 301,896 | ||||||
Linx SA | 12,930 | 120,040 | ||||||
LOG Commercial Properties e Participacoes SA | 83,056 | 431,070 | ||||||
Magazine Luiza SA | 6,323 | 347,633 | ||||||
Pagseguro Digital, Ltd. — A*3,4 | 11,126 | 433,580 | ||||||
|
| |||||||
| 1,634,219 | ||||||||
|
| |||||||
China — 19.04% | ||||||||
3SBio, Inc.1 | 101,118 | 173,714 | ||||||
AIA Group Ltd | 40,720 | 439,170 | ||||||
Aier Eye Hospital Group Co., Ltd. — A | 59,604 | 268,760 | ||||||
Alibaba Group Holding, Ltd. — SP ADR*3,4 | 5,413 | 917,233 | ||||||
GDS Holdings Ltd. — ADR*3,4 | 4,698 | 176,504 | ||||||
HUYA, Inc. — ADR*3,4 | 14,142 | 349,449 | ||||||
Industrial & Commercial Bank of China, Ltd | 445,520 | 325,085 | ||||||
Inner Mongolia Yili Industrial Group Co., Ltd. — A | 88,075 | 428,430 | ||||||
JD.com, Inc. — ADR*3 | 10,879 | 329,525 | ||||||
Kingdee International Software Group Co., Ltd | 253,000 | 273,673 | ||||||
Meituan Dianping — B* | 48,586 | 426,046 | ||||||
MTR Corp. Ltd | 42,500 | 286,173 | ||||||
Ping An Healthcare and Technology Co., Ltd.*1 | 47,384 | 197,441 | ||||||
Ping An Insurance Group Co. of China, Ltd. — H | 52,461 | 629,932 | ||||||
Shanghai International Airport Co., Ltd. — A | 26,042 | 317,662 | ||||||
Notes to Financial Statements are an integral part of this Schedule.
12
Driehaus Multi-Asset Growth Economies Fund
Schedule of Investments
June 30, 2019 (unaudited)
Shares, Principal | Value | |||||||
Shenzhou International Group Holdings, Ltd | 30,168 | $ | 414,768 | |||||
Tencent Holdings, Ltd. | 21,906 | 988,780 | ||||||
|
| |||||||
| 6,942,345 | ||||||||
|
| |||||||
Cyprus — 0.91% | ||||||||
TCS Group Holding PLC GDR3 | 16,969 | 332,592 | ||||||
Czech Republic — 1.25% | ||||||||
Moneta Money Bank AS1 | 133,255 | 456,481 | ||||||
Egypt — 0.48% | ||||||||
Commercial International Bank Egypt SAE — GDR3 | 41,195 | 175,079 | ||||||
India — 7.47% | ||||||||
HDFC Bank Ltd. — ADR3,4 | 4,102 | 533,424 | ||||||
Hindustan Unilever, Ltd | 12,010 | 311,022 | ||||||
ICICI Bank Ltd. — SP ADR3,4 | 50,042 | 630,029 | ||||||
ICICI Lombard General Insurance Co., Ltd.1 | 15,288 | 246,404 | ||||||
Kotak Mahindra Bank Ltd. | 11,107 | 237,676 | ||||||
Reliance Industries Ltd. | 14,906 | 270,598 | ||||||
State Bank of India* | 49,344 | 258,238 | ||||||
Tata Consultancy Services, Ltd. | 7,332 | 236,570 | ||||||
|
| |||||||
| 2,723,961 | ||||||||
|
| |||||||
Indonesia — 1.87% | ||||||||
PT Bank Central Asia Tbk | 234,497 | 497,543 | ||||||
Telekomunikasi Indonesia Persero Tbk | 630,836 | 184,864 | ||||||
|
| |||||||
| 682,407 | ||||||||
|
| |||||||
Kuwait — 0.85% | ||||||||
National Bank of Kuwait SAKP . | 96,150 | 308,567 | ||||||
Mexico — 0.91% | ||||||||
Wal-Mart de Mexico SAB de CV | 121,179 | 330,824 | ||||||
Netherlands — 0.71% | ||||||||
Heineken NV | 2,319 | 258,798 | ||||||
Philippines — 1.18% | ||||||||
BDO Unibank, Inc | 157,185 | 429,509 | ||||||
Poland — 1.30% | ||||||||
CD Projekt SA | 4,243 | 244,668 | ||||||
Powszechna Kasa Oszczednosci Bank Polski SA | 20,118 | 230,724 | ||||||
|
| |||||||
| 475,392 | ||||||||
|
| |||||||
Russia — 3.48% | ||||||||
Gazprom PJSC — SP ADR3 | 26,770 | 196,117 | ||||||
MMC Norilsk Nickel PJSC — ADR3 | 12,966 | 294,458 | ||||||
Shares, Principal | Value | |||||||
Sberbank of Russia PJSC — SP ADR3 | 21,914 | $ | 337,037 | |||||
Tatneft PJSC — ADR3 | 2,657 | 196,087 | ||||||
Yandex NV — A*3,4 | 6,489 | 246,582 | ||||||
|
| |||||||
| 1,270,281 | ||||||||
|
| |||||||
Singapore — 0.85% | ||||||||
Sea Ltd. — ADR*3,4 | 9,360 | 310,939 | ||||||
South Africa — 3.50% | ||||||||
Capitec Bank Holdings Ltd. | 3,245 | 299,213 | ||||||
Clicks Group, Ltd. | 25,278 | 368,429 | ||||||
MTN Group, Ltd. | 48,724 | 369,278 | ||||||
Naspers Ltd. — N | 982 | 238,407 | ||||||
|
| |||||||
| 1,275,327 | ||||||||
|
| |||||||
South Korea — 5.09% | ||||||||
Fila Korea, Ltd. | 3,338 | 221,733 | ||||||
LG Chem, Ltd. | 457 | 140,308 | ||||||
Macquarie Korea Infrastructure Fund. | 28,231 | 288,508 | ||||||
NICE Information Service Co., Ltd. | 19,795 | 290,586 | ||||||
Samsung Electronics Co., Ltd. | 17,956 | 730,899 | ||||||
SK Hynix, Inc | 3,046 | 183,343 | ||||||
|
| |||||||
| 1,855,377 | ||||||||
|
| |||||||
Taiwan — 4.15% | ||||||||
Giant Manufacturing Co., Ltd. | 48,000 | 375,537 | ||||||
Hon Hai Precision Industry Co., Ltd. | 99,500 | 247,953 | ||||||
Taiwan Semiconductor Manufacturing Co., Ltd | 115,432 | 888,239 | ||||||
|
| |||||||
| 1,511,729 | ||||||||
|
| |||||||
Thailand — 2.67% | ||||||||
Charoen Pokphand Foods PCL — NVDR | 341,900 | 314,948 | ||||||
CP ALL PCL — NVDR | 132,613 | 371,883 | ||||||
Tisco Financial Group PCL — NVDR | 93,491 | 285,038 | ||||||
|
| |||||||
| 971,869 | ||||||||
|
| |||||||
United Arab Emirates — 0.06% |
| |||||||
Network International Holdings PLC*1 | 3,078 | 23,181 | ||||||
United States — 2.01% | ||||||||
Freeport-McMoRan, Inc.4 | 23,365 | 271,268 | ||||||
Liberty Media Corp. — Liberty Formula One — C*4 | 5,946 | 222,440 | ||||||
Xilinx, Inc.4 | 2,011 | 237,137 | ||||||
|
| |||||||
| 730,845 | ||||||||
|
| |||||||
Total EQUITY SECURITIES | 23,103,918 | |||||||
|
| |||||||
Notes to Financial Statements are an integral part of this Schedule.
13
Driehaus Multi-Asset Growth Economies Fund
Schedule of Investments
June 30, 2019 (unaudited)
Shares, Principal | Value | |||||||
| PURCHASED PUT OPTIONS — 0.00% |
| |||||||
OTC EUR vs USD Exercise Price: $1.10, Notional Amount: $110,000, Expiration Date: July 3, 2019 Counterparty: Goldman Sachs* | 10,000,000 | $ | 1 | |||||
|
| |||||||
Total PURCHASED PUT OPTIONS | 1 | |||||||
|
| |||||||
| ||||||||
TOTAL INVESTMENTS | 94.98 | % | $ | 34,627,242 | ||||
Other Assets less Liabilities | 5.02 | % | 1,830,111 | |||||
|
|
|
| |||||
Net Assets | 100.00 | % | $ | 36,457,353 | ||||
| ||||||||
ADR — American Depositary Receipt
GDR — Global Depositary Receipt
PCL — Public Company Limited
PJSC — Public Joint Stock Company
PLC — Public Limited Company
SP ADR — Sponsored American Depositary Receipt
| * | Non-income producing security. |
| 1 | Security is exempt from registration under Rule 144A of the Securities Act of 1933, as amended. Unless otherwise indicated, this security has been determined to be liquid under procedures established by Driehaus Mutual Funds’ (the “Trust”) Board of Trustees and may be resold in transactions exempt from registration, normally to qualified institutional buyers. |
| 2 | Foreign security, par value shown in local currency. |
| 3 | Foreign security denominated in U.S. dollars and traded on a U.S exchange. |
| 4 | All or a portion of this security is pledged as collateral for short sales or derivatives transactions. |
Percentages are stated as a percent of net assets.
Security Type/Sector | Percent of Total Net Assets | |||
Sovereign Bonds | 31.61 | % | ||
Equity Securities | 63.37 | % | ||
Purchased Put Options | 0.00 | % | ||
|
| |||
Total Investments | 94.98 | % | ||
Other Assets less Liabilities | 5.02 | % | ||
|
| |||
Total Net Assets | 100.00 | % | ||
|
| |||
Regional Weightings(a)
Asia/Far EastEx-Japan | 48.29% | |||
South America | 17.22% | |||
Africa | 14.03% | |||
Eastern Europe | 7.54% | |||
North America | 5.37% | |||
Middle East | 1.82% | |||
Western Europe | 0.71% |
| (a) | All percentages are stated as a percent of net assets at June 30, 2019. |
Notes to Financial Statements are an integral part of this Schedule.
14
Driehaus Multi-Asset Growth Economies Fund
Schedule of Investments
June 30, 2019 (unaudited)
INTEREST RATE SWAPS
Centrally Cleared Swap Contracts
| Clearing Exchange | Notional Amount | Fixed Rate | Floating Rate Index | Payment Frequency | Expiration Date | Value/ Unrealized Appreciation/ (Depreciation) | ||||||||||||||
LCH Clearnet Limited | USD 15,400,000 | 1.8987 | %1 | 3-Months USD US0003M1 | Quarterly | 6/5/2021 | $ | 17,706 | ||||||||||||
LCH Clearnet Limited | USD 3,300,000 | 2.0571 | %2 | 3-Months USD US0003M2 | Quarterly | 6/5/2029 | (29,585 | ) | ||||||||||||
LCH Clearnet Limited | ZAR 70,000,000 | 7.05 | %1 | 3-Months ZAR JIBAR Safex1 | Quarterly | 6/27/2024 | 3,123 | |||||||||||||
|
| |||||||||||||||||||
TOTAL CENTRALLY CLEARED SWAP CONTRACTS |
| (8,756 | ) | |||||||||||||||||
|
| |||||||||||||||||||
OTC SWAP CONTRACTS
| Counterparty | Notional Amount | Fixed Rate | Floating Rate Index | Payment Frequency | Expiration Date | Value/ Unrealized Appreciation/ (Depreciation) | ||||||||||||||||
Merrill Lynch | MYR 67,000,000 | 3.455 | %1 | 3-Months MYR KLIB3M | 1 | Quarterly | 4/5/2021 | $ | 24,823 | |||||||||||||
Merrill Lynch | MYR 26,500,000 | 3.485 | %2 | 3-Months MYR KLIB3M | 2 | Quarterly | 4/5/2024 | (32,470 | ) | |||||||||||||
|
| |||||||||||||||||||||
TOTAL OTC SWAP CONTRACTS |
| (7,647 | ) | |||||||||||||||||||
|
| |||||||||||||||||||||
TOTAL INTEREST RATE SWAPS |
| $ | (16,403 | ) | ||||||||||||||||||
|
| |||||||||||||||||||||
| 1 | Fund Pays the floating rate and receives the fixed rate. |
| 2 | Fund Pays the fixed rate and receives the floating rate. |
MYR — Malaysian Ringgit
ZAR — South African Rand
USD — United States Dollar
JIBA3M — SAFE South Africa Johannesburg Interbank Agreed Rate
KLIB3M — Bank Negara Malaysia Klibor Interbank
US0003M — ICE Libor USD3-month Rate
FORWARD FOREIGN CURRENCY CONTRACTS
| Counterparty | Currency Purchased | Currency Sold | Settlement Date | Unrealized Appreciation/ (Depreciation) | ||||||||||||||||||||
Goldman Sachs | CLP | 517,365,000 | USD | 750,000 | July 22, 2019 | $ | 13,791 | |||||||||||||||||
Goldman Sachs | USD | 1,000,000 | CNH | 6,941,000 | August 21, 2019 | (9,987 | ) | |||||||||||||||||
Goldman Sachs | HUF | 196,971,992 | USD | 686,181 | August 28, 2019 | 9,740 | ||||||||||||||||||
Goldman Sachs | USD | 674,922 | HUF | 196,971,992 | August 28, 2019 | (20,999 | ) | |||||||||||||||||
Goldman Sachs | IDR | 8,566,800,000 | USD | 604,445 | July 22, 2019 | 286 | ||||||||||||||||||
Goldman Sachs | USD | 600,000 | IDR | 8,566,800,000 | July 22, 2019 | (4,731 | ) | |||||||||||||||||
Goldman Sachs | TRY | 2,161,875 | USD | 366,826 | July 25, 2019 | 831 | ||||||||||||||||||
|
| |||||||||||||||||||||||
TOTAL FORWARD FOREIGN CURRENCY CONTRACTS |
| $ | (11,069 | ) | ||||||||||||||||||||
|
| |||||||||||||||||||||||
CLP = Chilean Peso
CNH = Chinese Yuan Renminbi
HUF = Hungarian Forint
IDR = Indonesian Rupiah
TRY = Turkish Lira
USD = United States Dollar
Notes to Financial Statements are an integral part of this Schedule.
15
Statements of Assets and Liabilities
June 30, 2019 (unaudited)
Driehaus Active Income Fund | Driehaus Event Driven Fund | Driehaus Multi-Asset Growth Economies Fund | ||||||||||
ASSETS: | ||||||||||||
Investment securities, at fair value (cost $435,146,430, $59,188,538 and $29,586,160, respectively) | $ | 428,607,266 | $ | 62,386,219 | $ | 34,627,241 | ||||||
Purchased options contracts, at fair value (premiums paid $0, $0 and $40,609, respectively) | — | — | 1 | |||||||||
Foreign currency, at fair value (cost $0, $0 and $38,198, respectively) | — | — | 38,775 | |||||||||
Unrealized appreciation on forward foreign currency contracts | — | 2,479 | 24,648 | |||||||||
Unrealized appreciation on open swap contracts | — | — | 24,823 | |||||||||
Cash and cash equivalents | 49,579,153 | 7,275,366 | 1,949,067 | |||||||||
Collateral held at custodian for the benefit of brokers | 47,289,093 | 15,192,307 | 665,584 | |||||||||
Receivable for investment securities sold | 6,239,983 | 576,119 | 20,890,620 | |||||||||
Receivable for fund shares sold | 162,941 | 55,580 | — | |||||||||
Receivable for interest and dividends | 6,171,587 | 315,770 | 253,518 | |||||||||
Prepaid expenses | 15,688 | 20,422 | 14,154 | |||||||||
|
|
|
|
|
| |||||||
| ||||||||||||
TOTAL ASSETS | 538,065,711 | 85,824,262 | 58,488,431 | |||||||||
|
|
|
|
|
| |||||||
| ||||||||||||
LIABILITIES: | ||||||||||||
Payable for investment securities sold short, at fair value (proceeds $45,056,757, $13,859,471 and $0, respectively) | 46,913,727 | 14,504,960 | — | |||||||||
Foreign currency due to custodian, at fair value (proceeds $0, $0 and $1,302, respectively) | — | — | 1,303 | |||||||||
Unrealized depreciation on open swap contracts | — | — | 32,470 | |||||||||
Unrealized depreciation on forward foreign currency contracts | — | 1,833 | 35,717 | |||||||||
Payable for fund shares redeemed | 3,479,467 | 908,481 | 306,705 | |||||||||
Payable for investment securities purchased | 2,528,611 | 3,131,832 | 21,554,431 | |||||||||
Payable for interest and dividends on securities sold short | 352,406 | 28,301 | — | |||||||||
Payable to affiliate | 224,960 | 54,523 | 3,471 | |||||||||
Payable for variation margin on futures contracts | 156 | — | — | |||||||||
Payable for variation margin on centrally cleared swaps | — | — | 20,551 | |||||||||
Accrued shareholder services plan fees | 75,796 | 5,553 | — | |||||||||
Accrued administration and accounting fees | 28,867 | 6,686 | 4,908 | |||||||||
Accrued foreign capital gains taxes | — | — | 19,473 | |||||||||
Accrued expenses | 179,650 | 78,708 | 52,049 | |||||||||
|
|
|
|
|
| |||||||
| ||||||||||||
TOTAL LIABILITIES | 53,783,640 | 18,720,877 | 22,031,078 | |||||||||
|
|
|
|
|
| |||||||
| ||||||||||||
NET ASSETS | $ | 484,282,071 | $ | 67,103,385 | $ | 36,457,353 | ||||||
|
|
|
|
|
| |||||||
SHARES OUTSTANDING (Unlimited shares authorized, no par value) | 52,204,262 | 5,725,672 | 3,220,409 | |||||||||
|
|
|
|
|
| |||||||
NET ASSET VALUE, OFFERING AND REDEMPTION PRICE PER SHARE | $ | 9.28 | $ | 11.72 | $ | 11.32 | ||||||
|
|
|
|
|
| |||||||
| ||||||||||||
NET ASSETS CONSISTED OF THE FOLLOWING AT JUNE 30, 2019: | ||||||||||||
Paid-in-capital | $ | 994,830,035 | $ | 67,085,127 | $ | 32,236,076 | ||||||
Total distributable earnings (deficit) | (510,547,964 | ) | 18,258 | 4,221,277 | ||||||||
|
|
|
|
|
| |||||||
NET ASSETS | $ | 484,282,071 | $ | 67,103,385 | $ | 36,457,353 | ||||||
|
|
|
|
|
| |||||||
| ||||||||||||
Notes to Financial Statements are an integral part of these Statements.
16
For the six months ended June 30, 2019 (unaudited)
| Driehaus Active Income Fund | Driehaus Event Driven Fund | Driehaus Multi-Asset Growth Economies Fund | ||||||||||
INVESTMENT INCOME (LOSS): | ||||||||||||
Interest income (net of $0, $0, and $6,712 ofnon-reclaimable foreign taxes withheld, respectively) | $ | 17,882,895 | $ | 1,209,036 | $ | 451,247 | ||||||
Dividend income (net of $0, $0, and $35,278 ofnon-reclaimable foreign taxes withheld, respectively) | 759,841 | 82,566 | 259,960 | |||||||||
|
|
|
|
|
| |||||||
| ||||||||||||
Total investment income | 18,642,736 | 1,291,602 | 711,207 | |||||||||
|
|
|
|
|
| |||||||
| ||||||||||||
Expenses: | ||||||||||||
Investment advisory fees | 1,631,003 | 284,053 | 165,674 | |||||||||
Shareholder services plan fees | 409,054 | 25,897 | — | |||||||||
Administration and fund accounting fees | 205,770 | 45,026 | 42,969 | |||||||||
Transfer agent fees and expenses | 120,392 | 29,591 | 16,363 | |||||||||
Trustees’ fees | 78,856 | 12,430 | 7,780 | |||||||||
Custody fees | 45,454 | 7,409 | 22,484 | |||||||||
Reports to shareholders | 36,904 | 7,451 | 1,427 | |||||||||
Legal fees | 36,437 | 21,462 | 8,189 | |||||||||
Audit and tax fees | 28,875 | 28,875 | 30,292 | |||||||||
Federal and state registration fees | 20,050 | 12,004 | 10,469 | |||||||||
Chief compliance officer fees | 10,626 | 10,626 | 10,625 | |||||||||
Dividends on short positions | 510,984 | 31,034 | — | |||||||||
Interest on short positions | 1,049,778 | 12,750 | — | |||||||||
Interest expense | 137,905 | 24,775 | — | |||||||||
Miscellaneous | 73,210 | 35,396 | 36,175 | |||||||||
|
|
|
|
|
| |||||||
Total expenses | 4,395,298 | 588,779 | 352,447 | |||||||||
Fees paid indirectly | (13,665 | ) | (6,060 | ) | (377 | ) | ||||||
Fees waived by Adviser | — | — | (96,591 | ) | ||||||||
|
|
|
|
|
| |||||||
Net expenses | 4,381,633 | 582,719 | 255,479 | |||||||||
|
|
|
|
|
| |||||||
| ||||||||||||
Net investment income (loss) | 14,261,103 | 708,883 | 455,728 | |||||||||
|
|
|
|
|
| |||||||
| ||||||||||||
NET REALIZED AND UNREALIZED GAIN (LOSS) ON INVESTMENTS: | ||||||||||||
Net realized gain (loss) on transactions from: | ||||||||||||
Investments | (17,211,805 | ) | 2,254,497 | 250,696 | ||||||||
Purchased options contracts | (173,713 | ) | (158,201 | ) | (43,680 | ) | ||||||
Securities sold short | (1,756,710 | ) | (11,365 | ) | — | |||||||
Futures contracts | (4,090,613 | ) | — | — | ||||||||
Swap contracts | — | — | 76,444 | |||||||||
Forward foreign currency contracts | — | 6,159 | (62,305 | ) | ||||||||
Foreign currency | (4 | ) | (389 | ) | (26,599 | ) | ||||||
|
|
|
|
|
| |||||||
| ||||||||||||
Net realized gain (loss) on investments | (23,232,845 | ) | 2,090,701 | 194,556 | ||||||||
|
|
|
|
|
| |||||||
| ||||||||||||
Change in net unrealized appreciation (depreciation) on: | ||||||||||||
Investments | 32,639,954 | 7,686,136 | 3,794,855 | |||||||||
Purchased options contracts | — | 158,041 | (27,349 | ) | ||||||||
Securities sold short | (3,132,328 | ) | (1,763,375 | ) | — | |||||||
Futures contracts | 1,490,644 | — | — | |||||||||
Swap contracts | — | — | (35,799 | ) | ||||||||
Forward foreign currency contracts | — | 414 | 47,714 | |||||||||
Foreign currency | — | — | 941 | |||||||||
Foreign currency translations | — | — | 581 | |||||||||
|
|
|
|
|
| |||||||
Net change in net unrealized appreciation (depreciation) on investments | 30,998,270 | 6,081,216 | 3,780,943 | |||||||||
|
|
|
|
|
| |||||||
| ||||||||||||
Net realized and unrealized gain (loss) on investments | 7,765,425 | 8,171,917 | 3,975,499 | |||||||||
|
|
|
|
|
| |||||||
| ||||||||||||
NET INCREASE (DECREASE) IN NET ASSETS RESULTING FROM OPERATIONS | $ | 22,026,528 | $ | 8,880,800 | $ | 4,431,227 | ||||||
|
|
|
|
|
| |||||||
| ||||||||||||
Notes to Financial Statements are an integral part of these Statements.
17
Statements of Changes in Net Assets
| Driehaus Active Income Fund | Driehaus Event Driven Fund | |||||||||||||||
| Six Months Ended June 30, 2019 (unaudited) | Year Ended December 31, 2018 | Six Months Ended June 30, 2019 (unaudited) | Year Ended December 31, 2018 | |||||||||||||
Operations: | ||||||||||||||||
Net investment income (loss) | $ | 14,261,103 | $ | 65,164,801 | $ | 708,883 | $ | 2,271,357 | ||||||||
Net realized gain (loss) on investments | (23,232,845 | ) | (13,038,583 | ) | 2,090,701 | 8,715,118 | ||||||||||
Net change in unrealized appreciation (depreciation) on investments | 30,998,270 | (54,923,960 | ) | 6,081,216 | (11,438,492 | ) | ||||||||||
|
|
|
|
|
|
|
| |||||||||
| ||||||||||||||||
Net increase (decrease) in net assets resulting from operations | 22,026,528 | (2,797,742 | ) | 8,880,800 | (452,017 | ) | ||||||||||
|
|
|
|
|
|
|
| |||||||||
| ||||||||||||||||
Distributions from distributable earnings to shareholders | (19,770,485 | ) | (61,286,044 | ) | — | (1,805,482 | ) | |||||||||
|
|
|
|
|
|
|
| |||||||||
| ||||||||||||||||
| Capital share transactions: | ||||||||||||||||
Proceeds from shares sold | 63,442,254 | 409,022,218 | 15,273,377 | 24,110,692 | ||||||||||||
Reinvested distributions | 7,294,327 | 30,925,792 | — | 1,595,256 | ||||||||||||
Cost of shares redeemed | (383,733,769 | ) | (1,115,111,267 | ) | (8,726,200 | ) | (137,420,790 | ) | ||||||||
|
|
|
|
|
|
|
| |||||||||
Net increase (decrease) from capital transactions | (312,997,188 | ) | (675,163,257 | ) | 6,547,177 | (111,714,842 | ) | |||||||||
|
|
|
|
|
|
|
| |||||||||
Total increase (decrease) in net assets | (310,741,145 | ) | (739,247,043 | ) | 15,427,977 | (113,972,341 | ) | |||||||||
|
|
|
|
|
|
|
| |||||||||
| ||||||||||||||||
NET ASSETS: | ||||||||||||||||
| ||||||||||||||||
Beginning of period | $ | 795,023,216 | $ | 1,534,270,259 | $ | 51,675,408 | $ | 165,647,749 | ||||||||
|
|
|
|
|
|
|
| |||||||||
End of period | $ | 484,282,071 | $ | 795,023,216 | $ | 67,103,385 | $ | 51,675,408 | ||||||||
|
|
|
|
|
|
|
| |||||||||
| ||||||||||||||||
Capital share transactions in shares: | ||||||||||||||||
Shares sold | 6,740,599 | 41,609,514 | 1,343,321 | 2,212,662 | ||||||||||||
Reinvested distributions | 785,156 | 3,181,505 | — | 163,616 | ||||||||||||
Shares redeemed | (40,660,415 | ) | (115,102,939 | ) | (792,734 | ) | (12,552,010 | ) | ||||||||
|
|
|
|
|
|
|
| |||||||||
Net increase (decrease) | (33,134,660 | ) | (70,311,920 | ) | 550,587 | (10,175,732 | ) | |||||||||
|
|
|
|
|
|
|
| |||||||||
| ||||||||||||||||
Notes to Financial Statements are an integral part of these Statements.
18
Statements of Changes in Net Assets
| Driehaus Multi-Asset Growth Economies Fund | ||||||
| Six Months Ended June 30, 2019 (unaudited) | Year Ended December 31, | |||||
| $ | 455,728 | $ | 890,806 | |||
| 194,556 | (2,333,064 | ) | ||||
| 3,780,943 |
| (4,311,453 | ) | ||
|
|
|
| |||
|
| |||||
| 4,431,227 |
| (5,753,711 | ) | ||
|
|
|
| |||
|
| |||||
| — |
| (263,384 | ) | ||
|
|
|
| |||
|
| |||||
| 853,687 | 1,507,595 | |||||
| — | 263,384 | |||||
| (464,634 | ) | (7,300,204 | ) | |||
|
|
|
| |||
| 389,053 |
| (5,529,225 | ) | ||
|
|
|
| |||
| 4,820,280 |
| (11,546,320 | ) | ||
|
|
|
| |||
|
| |||||
|
| |||||
| $ | 31,637,073 | $ | 43,183,393 | |||
|
|
|
| |||
| $ | 36,457,353 | $ | 31,637,073 | |||
|
|
|
| |||
|
| |||||
| 77,835 | 132,325 | |||||
| — | 26,740 | |||||
| (41,965 | ) | (718,082 | ) | |||
|
|
|
| |||
| 35,870 | (559,017 | ) | ||||
|
|
|
| |||
|
| |||||
Notes to Financial Statements are an integral part of these Statements.
19
Driehaus Active Income Fund
| For the six month period January 1, 2019 through June 30, 2019 (unaudited) | For the year ended December 31, 2018 | For the year ended December 31, 2017 | For the year ended December 31, 2016 | For the year ended December 31, 2015 | For the year ended December 31, 2014 | |||||||||||||||||||
Net asset value, beginning of period | $ | 9.32 | $ | 9.86 | $ | 10.18 | $ | 9.95 | $ | 10.42 | $ | 10.77 | ||||||||||||
|
|
|
|
|
|
|
|
|
|
|
| |||||||||||||
INCOME (LOSS) FROM INVESTMENT OPERATIONS: | ||||||||||||||||||||||||
Net investment income1 | 0.22 | 0.46 | 0.35 | 0.32 | 0.38 | 0.27 | ||||||||||||||||||
Net realized and unrealized gain (loss) on investments | 0.08 | (0.57 | ) | (0.29 | ) | 0.23 | (0.49 | ) | (0.36 | ) | ||||||||||||||
|
|
|
|
|
|
|
|
|
|
|
| |||||||||||||
Total from investment operations | 0.30 | (0.11 | ) | 0.06 | 0.55 | (0.11 | ) | (0.09 | ) | |||||||||||||||
|
|
|
|
|
|
|
|
|
|
|
| |||||||||||||
LESS DISTRIBUTIONS TO SHAREHOLDERS FROM: | ||||||||||||||||||||||||
Net investment income | (0.34 | ) | (0.43 | ) | (0.38 | ) | (0.32 | ) | (0.36 | ) | (0.26 | ) | ||||||||||||
Net realized gain | — | — | — | — | — | — | ||||||||||||||||||
|
|
|
|
|
|
|
|
|
|
|
| |||||||||||||
Total distributions | (0.34 | ) | (0.43 | ) | (0.38 | ) | (0.32 | ) | (0.36 | ) | (0.26 | ) | ||||||||||||
|
|
|
|
|
|
|
|
|
|
|
| |||||||||||||
Net asset value, end of period | $ | 9.28 | $ | 9.32 | $ | 9.86 | $ | 10.18 | $ | 9.95 | $ | 10.42 | ||||||||||||
|
|
|
|
|
|
|
|
|
|
|
| |||||||||||||
Total Return | 3.29 | %4 | (1.26 | )% | 0.59 | % | 5.63 | % | (1.07 | )% | (0.87 | )% | ||||||||||||
SUPPLEMENTAL DATA AND RATIOS: | ||||||||||||||||||||||||
Net assets, end of period (in 000’s) | $ | 484,282 | $ | 795,023 | $ | 1,534,270 | $ | 2,274,827 | $ | 2,875,993 | $ | 3,982,787 | ||||||||||||
Ratio of total expenses before reimbursements, waivers, recaptures and/or fees paid indirectly to average net assets | 1.48 | %3 | 1.10 | % | 1.18 | % | 1.38 | % | 1.05 | % | 1.05 | % | ||||||||||||
Ratio of total expenses net of reimbursements, waivers, recaptures and/or fees paid indirectly to average net assets | 1.48 | %2,3 | 1.10 | %2 | 1.17 | %2 | 1.38 | %2 | 1.05 | % | 1.05 | % | ||||||||||||
Ratio of expenses (excluding dividends and interest on short positions and interest expense) before reimbursements, waivers, recaptures and/or fees paid indirectly to average net assets | 0.91 | %3 | 0.82 | % | 0.81 | % | 0.80 | % | 0.78 | % | 0.77 | % | ||||||||||||
Ratio of expenses (excluding dividends and interest on short positions and interest expense) net of reimbursements, waivers, recaptures and/or fees paid indirectly to average net assets | 0.90 | %2,3 | 0.82 | %2 | 0.81 | %2 | 0.80 | %2 | 0.78 | % | 0.77 | % | ||||||||||||
Ratio of net investment income (including dividends and interest on short positions and interest expense) net of reimbursements, waivers, recaptures and/or fees paid indirectly to average net assets | 4.81 | %3 | 4.70 | % | 3.53 | % | 3.20 | % | 3.69 | % | 2.51 | % | ||||||||||||
Ratio of net investment income (excluding dividends and interest on short positions and interest expense) net of reimbursements, waivers, recaptures and/or fees paid indirectly to average net assets | 5.38 | %3 | 4.99 | % | 3.89 | % | 3.78 | % | 3.96 | % | 2.79 | % | ||||||||||||
Portfolio turnover rate | 54 | %4 | 74 | % | 89 | % | 115 | % | 76 | % | 43 | % | ||||||||||||
| 1 | Calculated based on average shares outstanding. |
| 2 | Such ratios are net of fees paid indirectly (see Note C in the Notes to Financial Statements). |
| 3 | Annualized. |
| 4 | Not annualized. |
Notes to Financial Statements are an integral part of this Schedule.
20
Driehaus Event Driven Fund
Financial Highlights
| For the six month period January 1, 2019 through June 30, 2019 (unaudited) | For the year ended December 31, 2018 | For the year ended December 31, 2017 | For the year ended December 31, 2016 | For the year ended December 31, 2015 | For the year ended December 31, 2014 | |||||||||||||||||||
Net asset value, beginning of period | $ | 9.99 | $ | 10.79 | $ | 10.34 | $ | 9.85 | $ | 10.01 | $ | 10.74 | ||||||||||||
|
|
|
|
|
|
|
|
|
|
|
| |||||||||||||
INCOME (LOSS) FROM INVESTMENT OPERATIONS: | ||||||||||||||||||||||||
Net investment income (loss)1 | 0.14 | 0.25 | 0.02 | 0.02 | 0.05 | (0.02 | ) | |||||||||||||||||
Net realized and unrealized gain (loss) on investments | 1.59 | (0.69 | ) | 0.43 | 0.59 | (0.15 | ) | (0.67 | ) | |||||||||||||||
|
|
|
|
|
|
|
|
|
|
|
| |||||||||||||
Total from investment operations | 1.73 | (0.44 | ) | 0.45 | 0.61 | (0.10 | ) | (0.69 | ) | |||||||||||||||
|
|
|
|
|
|
|
|
|
|
|
| |||||||||||||
LESS DISTRIBUTIONS TO SHAREHOLDERS FROM: | ||||||||||||||||||||||||
Net investment income | — | (0.36 | ) | — | (0.09 | ) | (0.06 | ) | — | |||||||||||||||
Net realized gain | — | — | — | — | — | (0.04 | ) | |||||||||||||||||
Tax return of capital | — | — | — | (0.03 | ) | — | — | |||||||||||||||||
|
|
|
|
|
|
|
|
|
|
|
| |||||||||||||
Total distributions | — | (0.36 | ) | — | (0.12 | ) | (0.06 | ) | (0.04 | ) | ||||||||||||||
|
|
|
|
|
|
|
|
|
|
|
| |||||||||||||
Net asset value, end of period | $ | 11.72 | $ | 9.99 | $ | 10.79 | $ | 10.34 | $ | 9.85 | $ | 10.01 | ||||||||||||
|
|
|
|
|
|
|
|
|
|
|
| |||||||||||||
Total Return | 17.32 | %3 | (4.03 | )% | 4.35 | % | 6.25 | % | (1.08 | )% | (6.35 | )% | ||||||||||||
SUPPLEMENTAL DATA AND RATIOS: | ||||||||||||||||||||||||
Net assets, end of period (in 000’s) | $ | 67,103 | $ | 51,675 | $ | 165,648 | $ | 256,482 | $ | 232,456 | $ | 166,300 | ||||||||||||
Ratio of total expenses before reimbursements, waivers, recaptures and/or fees paid indirectly to average net assets | 2.07 | %4 | 1.90 | % | 1.77 | % | 2.03 | % | 1.86 | % | 1.80 | % | ||||||||||||
Ratio of total expenses net of reimbursements, waivers, recaptures and/or fees paid indirectly to average net assets | 2.05 | ��%2,4 | 1.88 | %2 | 1.76 | %2 | 2.01 | %2 | 1.86 | % | 1.80 | % | ||||||||||||
Ratio of expenses (excluding dividends and interest on short positions and interest expense) before reimbursements, waivers, recaptures and/or fees paid indirectly to average net assets | 1.83 | %4 | 1.59 | % | 1.46 | % | 1.44 | % | 1.43 | % | 1.35 | % | ||||||||||||
Ratio of expenses (excluding dividends and interest on short positions and interest expense) net of reimbursements, waivers, recaptures and/or fees paid indirectly to average net assets | 1.81 | %2,4 | 1.57 | %2 | 1.45 | %2 | 1.42 | %2 | 1.43 | % | 1.35 | % | ||||||||||||
Ratio of net investment income (including dividends and interest on short positions and interest expense) net of reimbursements, waivers, recaptures and/or fees paid indirectly to average net assets | 2.50 | %4 | 2.25 | % | 0.17 | % | 0.19 | % | 0.45 | % | (0.17 | )% | ||||||||||||
Ratio of net investment income (excluding dividends and interest on short positions and interest expense) net of reimbursements, waivers, recaptures and/or fees paid indirectly to average net assets | 2.74 | %4 | 2.57 | % | 0.48 | % | 0.78 | % | 0.89 | % | 0.28 | % | ||||||||||||
Portfolio turnover rate | 58 | %3 | 101 | % | 198 | % | 246 | % | 400 | % | 315 | % | ||||||||||||
| 1 | Calculated based on average shares outstanding. |
| 2 | Such ratios are net of fees paid indirectly (see Note C in the Notes to Financial Statements). |
| 3 | Not annualized. |
| 4 | Annualized. |
Notes to Financial Statements are an integral part of this Schedule.
21
Driehaus Multi-Asset Growth Economies Fund
Financial Highlights
| For the six month period January 1, 2019 through June 30, 2019 (unaudited) | For the Year Ended December 31, 2018 | For the period April 10, 2017* through December 31, 2017 | ||||||||||
Net asset value, beginning of period | $ | 9.93 | $ | 11.54 | $ | 10.00 | ||||||
|
|
|
|
|
| |||||||
INCOME (LOSS) FROM INVESTMENT OPERATIONS: | ||||||||||||
Net investment income (loss)1 | 0.14 | 0.24 | 0.17 | |||||||||
Net realized and unrealized gain (loss) on investments | 1.25 | (1.77 | ) | 1.94 | ||||||||
|
|
|
|
|
| |||||||
Total from investment operations | 1.39 | (1.53 | ) | 2.11 | ||||||||
|
|
|
|
|
| |||||||
LESS DISTRIBUTIONS TO SHAREHOLDERS FROM: | ||||||||||||
Net investment income | — | — | (0.16 | ) | ||||||||
Net realized gain | — | (0.08 | ) | (0.41 | ) | |||||||
|
|
|
|
|
| |||||||
Total distributions | — | (0.08 | ) | (0.57 | ) | |||||||
|
|
|
|
|
| |||||||
Redemption fees added topaid-in capital | 0.00 | 0.00 | 0.00 | 4 | ||||||||
|
|
|
|
|
| |||||||
Net asset value, end of period | $ | 11.32 | $ | 9.93 | $ | 11.54 | ||||||
|
|
|
|
|
| |||||||
Total Return | 13.90 | %2 | (13.22 | )% | 21.14 | %2 | ||||||
SUPPLEMENTAL DATA AND RATIOS: | ||||||||||||
Net assets, end of period (in 000’s) | $ | 36,457 | $ | 31,637 | $ | 43,183 | ||||||
Ratio of total expenses before reimbursements, waivers, recaptures and/or fees paid indirectly to average net assets | 2.05 | % | 2.05 | % | 2.04 | %3 | ||||||
Ratio of total expenses net of reimbursements, waivers, recaptures and/or fees paid indirectly to average net assets | 1.49 | %3,5,6 | 1.75 | %5,6 | 1.75 | %3,5 | ||||||
Ratio of expenses (excluding dividends and interest on short positions and interest expense) before reimbursements, waivers, recaptures and/or fees paid indirectly to average net assets | 2.05 | % | 2.05 | % | 2.04 | %3 | ||||||
Ratio of expenses (excluding dividends and interest on short positions and interest expense) net of reimbursements, waivers, recaptures and/or fees paid indirectly to average net assets | 1.49 | %3.5,6 | 1.75 | %5,6 | 1.75 | %3,5 | ||||||
Ratio of net investment income (including dividends and interest on short positions and interest expense) net of reimbursements, waivers, recaptures and/or fees paid indirectly to average net assets | 2.66 | % | 2.19 | % | 2.12 | %3 | ||||||
Ratio of net investment income (excluding dividends and interest on short positions and interest expense) net of reimbursements, waivers, recaptures and/or fees paid indirectly to average net assets | 2.66 | %3,5 | 2.19 | %5 | 2.12 | %3,5 | ||||||
Portfolio turnover rate | 82 | %2 | 169 | % | 99 | %2 | ||||||
| * | Fund commenced operations on April 10, 2017. |
| 1 | Calculated based on average shares outstanding. |
| 2 | Not annualized. |
| 3 | Annualized. |
| 4 | Amount represents less than $0.01 per share. |
| 5 | Effective May 1, 2019 the Adviser contractually agreed to waive its investment advisory fee or absorb other operating expenses to the extent necessary to ensure that total annual Fund operating expenses (other than interest, taxes, brokerage commissions, dividends and interest on short sales, other investment-related expenses, acquired fund fees and expenses, and extraordinary expenses such as litigation and other expenses not incurred in the ordinary course of the Fund’s business) would not exceed the Fund’s operating expense cap of 0.99% of average daily net assets until April 30, 2022. Prior to May 1, 2019, the annual operating expense limitation was 1.75%. |
| 6 | Such ratios are net of fees paid indirectly (see Note C in the Notes to Financial Statements). |
Notes to Financial Statements are an integral part of this Schedule.
22
Driehaus Mutual Funds
Notes to Financial Statements (unaudited)
A. ORGANIZATION AND SUMMARY OF SIGNIFICANT ACCOUNTING POLICIES
Organization
The Driehaus Mutual Funds (the “Trust”) is anopen-end registered management investment company under the Investment Company Act of 1940, as amended, organized as a Delaware statutory trust, with eight separate series currently in operation. The Trust was organized under an Agreement and Declaration of Trust dated May 31, 1996, as subsequently amended and restated as of June 6, 2013 and amended as of June 4, 2015, and may issue an unlimited number of full and fractional units of beneficial interest (shares) without par value. The three series (“Funds” or each a “Fund”) included in this report are as follows: the Driehaus Active Income Fund (the “Active Income Fund”) commenced operations on June 1, 2009 following the receipt of the assets and liabilities of the Lotsoff Capital Management Active Income Fund (the “Acquired Fund”) pursuant to a plan of reorganization approved by the shareholders of the Acquired Fund. The reorganization was accomplished by atax-free exchange of Acquired Fund shares for an equal number of shares of the Active Income Fund as of June 1, 2009. The Active Income Fund seeks to provide current income and capital appreciation. The Driehaus Event Driven Fund (the “Event Driven Fund”) commenced operations on August 26, 2013, following atax-free exchange with the Driehaus Credit Opportunities Fund, L.P. The Event Driven Fund seeks to provide positive returns over full market cycles. The Driehaus Multi-Asset Growth Economies Fund (the “Multi-Asset Growth Economies Fund”) commenced operations on April 10, 2017, after succeeding to the assets of the Driehaus Emerging Markets Dividend Growth Fund, L.P. The transaction was structured to be atax-free exchange and the cost basis and holding period of the underlying securities were carried over to the Multi-Asset Growth Economies Fund. The Multi-Asset Growth Economies Fund seeks to maximize total return.
Significant Accounting Policies
The presentation of financial statements in conformity with U.S. generally accepted accounting principles (“U.S. GAAP”) requires management to make estimates and assumptions that affect the reported amounts of assets and liabilities at the date of the financial statements and the reported amounts of income and expenses. Actual results may differ from those estimates.
The Funds, which are investment companies within the scope of Financial Accounting Standards Board (“FASB”) Accounting Standards Update2013-08, follow accounting and reporting guidance under FASB Accounting Standards Codification Topic 946,Financial Services-Investment Companies.
Cash is held at U.S. financial institutions, and at times, may exceed the amount insured by the U.S. Federal Deposit Insurance Corporation. The Funds consider highly liquid investments, with maturities of ninety days or less when purchased to be cash equivalents, and such investments may include money market mutual fund investments. All such investments are categorized in Level 1 of the fair value hierarchy.
Securities Valuation
Investments in securities traded on a national securities exchange, including exchange-traded futures and options, are valued at the last reported sales or settlement price on the day of valuation and are generally classified as level 1. Exchange-traded securities for which no sale was reported are valued at the mean of the closing bid and ask prices from the exchange the security is primarily traded on and are generally classified as level 1. Equity certificates are valued at the last sale price of the underlying security as of the close of the primary exchange. Long-term fixed income securities are valued at the representative quoted bid price when held long or the representative quoted ask price if sold short or, if such prices are not available, at prices for securities of comparable maturity, quality and type or as determined by an independent pricing service. The pricing service provider may employ methodologies that utilize actual market transactions, broker-dealer supplied valuations or other techniques. Such techniques generally consider factors such as composite security prices, yields, maturities, call features, credit ratings and developments relating to specific securities, in arriving at valuations. Fixed income securities are generally classified as level 2. Short-term investments with remaining maturities of 60 days or less at the time of purchase are stated at amortized cost, which approximates fair value. If amortized cost does not approximate fair value, short-term securities are reported at fair value. These securities are generally classified as level 2. Swaps, forward foreign currency contracts and other financial derivatives are valued daily, primarily by an independent pricing service using pricing models and are
23
Driehaus Mutual Funds
Notes to Financial Statements (unaudited) — (Continued)
generally classified as level 2. The pricing models use inputs that are observed from actively quoted markets such as issuer details, indices, spreads, interest rates, yield curves, dividends and exchange rates. If valuations are not available from the independent pricing service or values received are deemed not representative of fair value, values will be obtained from a third party broker-dealer or counterparty. Investments initially valued in currencies other than the U.S. dollar are converted to the U.S. dollar using exchange rates obtained from an independent pricing service. In addition, for Multi-Asset Growth Economies Fund, if quotations are not readily available, if the values have been materially affected by events occurring after the closing of a foreign market, or if there has been a movement in the U.S. market that exceeds a certain threshold, assets may be valued at fair value as determined in good faith by or under the direction of the Trust’s Board of Trustees. Events that may materially affect asset values that could cause a fair value determination include, but are not limited to: corporate announcements relating to a specific security; natural and other disasters which may impact an entire market or region; and political and other events which may be global or impact a particular country or region. The frequency with which these procedures are used cannot be predicted and may be utilized to a significant extent. To the extent utilized, securities would be considered level 2 in the hierarchy described below. Securities for which market quotations are not readily available are valued at fair value as determined in good faith in accordance with procedures established by or under the direction of the Trust’s Board of Trustees and are generally classified as level 3. Under these procedures, the Funds primarily employ a market-based approach, which may use related or comparable assets or liabilities, recent transactions, market multiples, book values and other relevant information for the investment to determine the fair value of the investment. It is possible that the estimated values may differ significantly from the values that would have been used had a ready market existed for the investments, and such differences could be material.
Each Fund is subject to fair value accounting standards that define fair value, establish the framework for measuring fair value and provide a three-level hierarchy for fair valuation based upon the inputs to the valuation as of the measurement date. The three levels of the fair value hierarchy are as follows:
Level 1 — quoted prices for active markets for identical securities
Level 2 — significant observable inputs (including quoted prices for similar securities, interest rates, prepayment speeds, credit risk, etc.)
Level 3 — significant unobservable inputs (including the Fund’s own assumptions in determining the fair value of investments).
The inputs or methodology used for valuing securities are not necessarily an indication of the risk associated with investing in those securities. The following is a summary of the inputs used to value the Active Income Fund’s investments as of June 30, 2019:
Assets | Level 1 | Level 2 | Level 3 | Total | ||||||||||||
Bank Loans | $ | — | $ | 115,664,118 | $ | — | $ | 115,664,118 | ||||||||
Common Stocks | ||||||||||||||||
Banks | 1,697,877 | — | — | 1,697,877 | ||||||||||||
Software | 1,734,477 | — | — | 1,734,477 | ||||||||||||
Telecommunications | 597,837 | — | — | 597,837 | ||||||||||||
Convertible Corporate Bonds | — | 4,896,562 | — | 4,896,562 | ||||||||||||
Convertible Preferred Stocks | ||||||||||||||||
Auto Manufacturers | — | — | 0 | 0 | ||||||||||||
Corporate Bonds | — | 288,089,781 | — | 288,089,781 | ||||||||||||
Preferred Stock | ||||||||||||||||
Banks | 13,970,614 | — | — | 13,970,614 | ||||||||||||
Private Stock | ||||||||||||||||
Investment Companies | — | — | 1,956,000 | 1,956,000 | ||||||||||||
|
|
|
|
|
|
|
| |||||||||
Total | $ | 18,000,805 | $ | 408,650,461 | $ | 1,956,000 | $ | 428,607,266 | ||||||||
|
|
|
|
|
|
|
| |||||||||
24
Driehaus Mutual Funds
Notes to Financial Statements (unaudited) — (Continued)
Liabilities | Level 1 | Level 2 | Level 3 | Total | ||||||||||||
Common Stocks Sold Short | ||||||||||||||||
Pharmaceuticals | $ | (940,720 | ) | $ | — | $ | — | $ | (940,720 | ) | ||||||
Corporate Bonds Sold Short | — | (22,536,727 | ) | — | (22,536,727 | ) | ||||||||||
Exchange-Traded Funds Sold Short | (23,436,280 | ) | — | — | (23,436,280 | ) | ||||||||||
|
|
|
|
|
|
|
| |||||||||
Total | $ | (24,377,000 | ) | $ | (22,536,727 | ) | $ | — | $ | (46,913,727 | ) | |||||
|
|
|
|
|
|
|
| |||||||||
Other Financial Instruments* | ||||||||||||||||
Futures Contracts | $ | (361,572 | ) | $ | — | $ | — | $ | (361,572 | ) | ||||||
|
|
|
|
|
|
|
| |||||||||
Total Other Financial Instruments | $ | (361,572 | ) | $ | — | $ | — | $ | (361,572 | ) | ||||||
|
|
|
|
|
|
|
| |||||||||
| * | Other financial instruments are futures contracts, which are detailed in the Schedule of Investments. |
The following is a reconciliation of Level 3 assets for which significant unobservable inputs were used to determine fair value in the Active Income Fund:
| Investments, at Value | ||||
Balance as of December 31, 2018 | $ | 1,956,000 | ||
Realized gain (loss) | — | |||
Change in net unrealized appreciation (depreciation) | — | |||
Purchases | — | |||
Sales | — | |||
Transfers in and/or out of Level 3 | — | |||
|
| |||
Balance as of June 30, 2019 | $ | 1,956,000 | ||
|
| |||
As of June 30, 2019 and December 31, 2018, the Active Income Fund held Level 3 investments in General Motors Corp. senior convertible preferred stock and Larchmont Resources LLC private stock, valued at fair value as determined in good faith in accordance with procedures established by or under the direction of the Trust’s Board of Trustees. As a part of the ongoing restructuring of General Motors, any value previously ascribed to these holdings has been transferred to the General Motors Co. Motors Liquidation Co. GUC Trust common stock, which is freely and actively traded, and therefore the senior convertible preferred stock was fair valued at $0. The common stock investment in Larchmont Resources LLC has been valued using an unadjusted third-party pricing vendor quote. There were no transfers into or out of Level 3 during the six month period ended June 30, 2019. The following table summarizes the quantitative inputs and assumptions used for items categorized as Level 3 of the fair value hierarchy as of June 30, 2019:
Financial Assets | Fair Value at June 30, 2019 | Valuation | Unobservable | Price/Range | ||||||||
Convertible Preferred Stock | $ | — | Cash available in relation to claim | Estimated recovery | $ | — | ||||||
Private Stock | $ | 1,956,000 | Broker quote | N/A | N/A | |||||||
25
Driehaus Mutual Funds
Notes to Financial Statements (unaudited) — (Continued)
The following is a summary of the inputs used to value the Event Driven Fund’s investments as of June 30, 2019:
Assets | Level 1 | Level 2 | Level 3 | Total | ||||||||||||
Bank Loans | $ | — | $ | 3,990,829 | $ | — | $ | 3,990,829 | ||||||||
Common Stocks | ||||||||||||||||
Banks | 1,349,560 | — | — | 1,349,560 | ||||||||||||
Biotechnology | 8,170,108 | — | — | 8,170,108 | ||||||||||||
Computers | 940,895 | — | — | 940,895 | ||||||||||||
Electronics | 1,393,552 | — | — | 1,393,552 | ||||||||||||
Entertainment | 507,493 | — | — | 507,493 | ||||||||||||
Healthcare — Products | 2,164,182 | — | — | 2,164,182 | ||||||||||||
Healthcare — Services | 578,243 | — | — | 578,243 | ||||||||||||
Holding Companies — Diversified | 1,177,020 | — | — | 1,177,020 | ||||||||||||
Insurance | 3,251,640 | — | — | 3,251,640 | ||||||||||||
Oil & Gas | 2,009,196 | — | — | 2,009,196 | ||||||||||||
Pharmaceuticals | 11,415,107 | — | — | 11,415,107 | ||||||||||||
Savings & Loans | 2,373,250 | — | — | 2,373,250 | ||||||||||||
Software | 1,871,934 | — | — | 1,871,934 | ||||||||||||
Telecommunications | 2,532,960 | — | — | 2,532,960 | ||||||||||||
Convertible Corporate Bonds | — | 870,500 | — | 870,500 | ||||||||||||
Convertible Preferred Stocks | ||||||||||||||||
Auto Manufacturers | — | — | 0 | 0 | ||||||||||||
Corporate Bonds | — | 17,779,765 | — | 17,779,765 | ||||||||||||
Warrants | — | 9,985 | — | 9,985 | ||||||||||||
|
|
|
|
|
|
|
| |||||||||
Total | $ | 39,735,140 | $ | 22,651,079 | $ | 0 | $ | 62,386,219 | ||||||||
|
|
|
|
|
|
|
| |||||||||
Liabilities | ||||||||||||||||
Common Stocks Sold Short | ||||||||||||||||
Oil & Gas | $ | (419,184 | ) | $ | — | $ | — | $ | (419,184 | ) | ||||||
Pharmaceuticals | (572,045 | ) | — | — | (572,045 | ) | ||||||||||
Corporate Bonds Sold Short | — | (1,140,000 | ) | — | (1,140,000 | ) | ||||||||||
Exchange-Traded Funds Sold Short | (12,373,731 | ) | — | — | (12,373,731 | ) | ||||||||||
|
|
|
|
|
|
|
| |||||||||
Total | $ | (13,364,960 | ) | $ | (1,140,000 | ) | $ | — | $ | (14,504,960 | ) | |||||
|
|
|
|
|
|
|
| |||||||||
Other Financial Instruments* | ||||||||||||||||
Forward Foreign Currency Contracts — Assets | $ | — | $ | 2,479 | $ | — | $ | 2,479 | ||||||||
Forward Foreign Currency Contracts — Liabilities | — | (1,833 | ) | — | (1,833 | ) | ||||||||||
|
|
|
|
|
|
|
| |||||||||
Total Other Financial Instruments | $ | — | $ | 646 | $ | — | $ | 646 | ||||||||
|
|
|
|
|
|
|
| |||||||||
| * | Other financial instruments are forward foreign currency contracts, which are detailed in the Schedule of Investments. |
26
Driehaus Mutual Funds
Notes to Financial Statements (unaudited) — (Continued)
The following is a reconciliation of Level 3 assets for which significant unobservable inputs were used to determine fair value in the Event Driven Fund:
| Investments, at Value | ||||
Balance as of December 31, 2018 | $ | 830,745 | ||
Realized gain (loss) | — | |||
Change in net unrealized appreciation (depreciation) | — | |||
Purchases | — | |||
Sales | — | |||
Transfers in and/or out of Level 3 | (830,745 | ) | ||
|
| |||
Balance as of June 30, 2019 | $ | 0 | ||
|
| |||
As of June 30, 2019, the Event Driven Fund held Level 3 investments in General Motors Corp. senior convertible preferred stock. The General Motors Corp. senior convertible preferred stock was valued in the same manner described for the Active Income Fund. As of June 30, 2019, the Event Driven Fund’s investment in Ideaya Biosciences, Inc. transferred from Level 3 to Level 1. The following table summarizes the quantitative inputs and assumptions used for items categorized as Level 3 of the fair value hierarchy as of June 30, 2019:
Financial Assets | Fair Value at June 30, 2019 | Valuation | Unobservable | Price/Median | ||||||||
Convertible Preferred Stock | $ | — | Cash available in relation to claim | Estimated recovery | $ | — | ||||||
The following is a summary of the inputs used to value the Multi-Asset Growth Economies Fund’s investments as of June 30, 2019:
Assets | Level 1 | Level 2 | Level 3 | Total | ||||||||||||
Sovereign Bonds | ||||||||||||||||
Argentina | $ | — | $ | 1,329,523 | $ | — | $ | 1,329,523 | ||||||||
Brazil | — | 1,037,996 | — | 1,037,996 | ||||||||||||
Colombia | — | 375,190 | — | 375,190 | ||||||||||||
Egypt | — | 1,857,328 | — | 1,857,328 | ||||||||||||
Indonesia | — | 1,382,832 | — | 1,382,832 | ||||||||||||
Malaysia | — | 793,902 | — | 793,902 | ||||||||||||
Mexico | — | 894,566 | — | 894,566 | ||||||||||||
Nigeria | — | 730,356 | — | 730,356 | ||||||||||||
Peru | — | 1,494,005 | — | 1,494,005 | ||||||||||||
Poland | — | 551,999 | — | 551,999 | ||||||||||||
South Africa | — | 1,075,626 | — | 1,075,626 | ||||||||||||
Equity Securities | ||||||||||||||||
Argentina | 404,196 | — | — | 404,196 | ||||||||||||
Brazil | 1,634,219 | — | — | 1,634,219 | ||||||||||||
China | 6,942,345 | — | — | 6,942,345 | ||||||||||||
Cyprus | 332,592 | — | — | 332,592 | ||||||||||||
Czech Republic | 456,481 | — | — | 456,481 | ||||||||||||
Egypt | 175,079 | — | — | 175,079 | ||||||||||||
India | 2,723,961 | — | — | 2,723,961 | ||||||||||||
Indonesia | 682,407 | — | — | 682,407 | ||||||||||||
27
Driehaus Mutual Funds
Notes to Financial Statements (unaudited) — (Continued)
Assets (continued) | Level 1 | Level 2 | Level 3 | Total | ||||||||||||
Kuwait | $ | 308,567 | $ | — | $ | — | $ | 308,567 | ||||||||
Mexico | 330,824 | — | — | 330,824 | ||||||||||||
Netherlands | 258,798 | — | — | 258,798 | ||||||||||||
Philippines | 429,509 | — | — | 429,509 | ||||||||||||
Poland | 475,392 | — | — | 475,392 | ||||||||||||
Russia | 1,270,281 | — | — | 1,270,281 | ||||||||||||
Singapore | 310,939 | — | — | 310,939 | ||||||||||||
South Africa | 1,275,327 | — | — | 1,275,327 | ||||||||||||
South Korea | 1,855,377 | — | — | 1,855,377 | ||||||||||||
Taiwan | 1,511,729 | — | — | 1,511,729 | ||||||||||||
Thailand | 971,869 | — | — | 971,869 | ||||||||||||
United Arab Emirates | 23,181 | — | — | 23,181 | ||||||||||||
United States | 730,845 | — | — | 730,845 | ||||||||||||
Purchased Put Options | — | 1 | — | 1 | ||||||||||||
|
|
|
|
|
|
|
| |||||||||
Total | $ | 23,103,918 | $ | 11,523,324 | $ | — | $ | 34,627,242 | ||||||||
|
|
|
|
|
|
|
| |||||||||
Other Financial Instruments* | ||||||||||||||||
Interest Rate Swaps — Asset** | $ | — | $ | 20,829 | $ | — | $ | 20,829 | ||||||||
Interest Rate Swaps — Liabilities** | — | (29,585 | ) | — | (29,585 | ) | ||||||||||
OTC Interest Rate Swaps — Asset | — | 24,823 | — | 24,823 | ||||||||||||
OTC Interest Rate Swaps — Liabilities | — | (32,470 | ) | — | (32,470 | ) | ||||||||||
Forward Foreign Currency Contracts — Assets | — | 24,648 | — | 24,648 | ||||||||||||
Forward Foreign Currency Contracts — Liabilities | — | (35,717 | ) | — | (35,717 | ) | ||||||||||
|
|
|
|
|
|
|
| |||||||||
Total Other Financial Instruments | $ | — | $ | (27,472 | ) | $ | — | $ | (27,472 | ) | ||||||
|
|
|
|
|
|
|
| |||||||||
| * | Other financial instruments are swap and forward foreign currency contracts, which are detailed in the Schedule of Investments. |
| ** | Includes cumulative appreciation (depreciation) of centrally cleared swap contracts as shown in the Schedule of Investments. Only current day’s variation margin is reported in the Statements of Assets and Liabilities. |
Securities Sold Short
The Funds are engaged in selling securities short, which obligates them to replace a borrowed security by purchasing it at market price at the time of replacement. Each Fund incurs a loss if the price of the security increases between the date of the short sale and the date on which the Fund replaces the borrowed security. Each Fund realizes a gain if the price of the security declines between those dates. Gains are limited to the price at which the Fund sold the security short, while losses are potentially unlimited in size.
The Funds are required to establish a margin account with the broker lending the security sold short. While the short sale is outstanding, the broker retains the proceeds of the short sale and the Fund must maintain a deposit with the broker consisting of cash and securities having a value equal to a specified percentage of the value of the securities sold short. Such deposit is included in “Collateral held at custodian for the benefit of brokers” on the Statements of Assets and Liabilities. Each Fund is obligated to pay any dividends or interest due on securities sold short. Such dividends and interest are recorded as an expense to the Funds on the Statements of Operations.
28
Driehaus Mutual Funds
Notes to Financial Statements (unaudited) — (Continued)
Federal Income Taxes
The Funds’ policy is to comply with the requirements of Subchapter M of the Internal Revenue Code that are applicable to regulated investment companies and to distribute substantially all their taxable income to their shareholders. Therefore, no Federal income tax provision is required.
The FASB’s “Accounting for Uncertainty in Income Taxes” (“Tax Statement”) requires the evaluation of tax positions taken or expected to be taken in the course of preparing the Funds’tax returns to determine whether the tax positions are“more-likely-than-not” of being sustained by the applicable tax authority. Tax positions not deemed to meet themore-likely-than-not threshold would be recorded as a tax benefit or expense in the current year. Management has evaluated the implications of the Tax Statement and all of the uncertain tax positions and has determined that no liability is required to be recorded in the financial statements as of December 31, 2018. The Funds file tax returns with the U.S. Internal Revenue Service and various states. Taxable years ending 2018, 2017, 2016, and 2015 remain subject to examination by taxing authorities.
For Federal income tax purposes, capital loss carryforwards represent net capital losses of a fund that may be carried forward and applied against future net realized gains. On December 22, 2010, the Regulated Investment Company Modernization Act of 2010 was enacted to modernize several of the Federal income and excise tax provisions related to regulated investment companies. Underpre-enactment law, capital losses could be carried forward for up to eight years, and were required to be carried forward as short-term capital losses, irrespective of the character of the original loss. New net capital losses (those earned in taxable years beginning after December 22, 2010) may be carried forward indefinitely and must retain the character of the original loss.
At June 30, 2019, gross unrealized appreciation (depreciation) on investments, based on cost for Federal income tax purposes, were as follows:
| Active Income Fund | Event Driven Fund | Multi-Asset Growth Economies Fund | ||||||||||
Cost of investments | $ | 391,216,623 | $ | 45,679,044 | $ | 29,697,536 | ||||||
|
|
|
|
|
| |||||||
Gross unrealized appreciation | $ | 4,348,671 | $ | 6,510,875 | $ | 5,199,508 | ||||||
Gross unrealized depreciation | (13,871,755 | ) | (4,308,660 | ) | (269,802 | ) | ||||||
|
|
|
|
|
| |||||||
Net unrealized appreciation (depreciation) on investments | $ | (9,523,084 | ) | $ | 2,202,215 | $ | 4,929,706 | |||||
|
| �� |
|
|
| |||||||
The difference between cost amounts for financial statements and federal income tax purposes is due primarily to the tax deferral of losses on wash sales and timing differences in recognizing certain gains and losses on security transactions.
The amount of dividends and distributions from net investment income and net realized capital gains are determined in accordance with Federal income tax regulations, which may differ from U.S. GAAP.
The tax character of distributions paid were as follows:
Active Income Fund | ||||||||
Distributions paid from: | January 1, 2018 to December 31, 2018 | January 1, 2017 to December 31, 2017 | ||||||
Ordinary income | $ | 61,286,044 | $ | 74,683,208 | ||||
|
|
|
| |||||
Total distributions paid | $ | 61,286,044 | $ | 74,683,208 | ||||
|
|
|
| |||||
Event Driven Fund | ||||||||
Distributions paid from: | January 1, 2018 to December 31, 2018 | January 1, 2017 to December 31, 2017 | ||||||
Ordinary income | $ | 1,805,482 | $ | — | ||||
|
|
|
| |||||
Total distributions paid | $ | 1,805,482 | $ | — | ||||
|
|
|
| |||||
29
Driehaus Mutual Funds
Notes to Financial Statements (unaudited) — (Continued)
Multi-Asset Growth Economies Fund | ||||||||
Distributions paid from: | January 1, 2018 to December 31, 2018 | April 10, 2017* to December 31, 2017 | ||||||
Ordinary income | $ | 233,414 | $ | 1,804,830 | ||||
Long term capital gains distribution | 29,970 | 213,901 | ||||||
|
|
|
| |||||
Total distributions paid | $ | 263,384 | $ | 2,018,731 | ||||
|
|
|
| |||||
| * | The Fund commenced operations on April 10, 2017. |
As of December 31, 2018, the components of accumulated earnings (deficit) were as follows:
| Active Income Fund | Event Driven Fund | Multi-Asset Growth Economies Fund | ||||||||||
Undistributed ordinary income | $ | 4,870,359 | $ | 167,459 | $ | — | ||||||
Undistributed long-term capital gains | — | — | — | |||||||||
|
|
|
|
|
| |||||||
Accumulated earnings | 4,870,359 | 167,459 | — | |||||||||
Accumulated capital and other losses | (479,728,601 | ) | (5,099,213 | ) | (1,270,704 | ) | ||||||
Unrealized appreciation (depreciation) on currency and foreign currency translations | — | — | (51 | ) | ||||||||
Unrealized appreciation (depreciation) on swap and swaptions contracts | — | — | 19,396 | |||||||||
Unrealized appreciation (depreciation) on forward foreign currency contracts | — | — | (58,783 | ) | ||||||||
Unrealized appreciation (depreciation) on investments, securities sold short and futures contracts | (37,945,765 | ) | (3,930,788 | ) | 1,100,192 | |||||||
|
|
|
|
|
| |||||||
Total accumulated earnings (deficit) | $ | (512,804,007 | ) | $ | (8,862,542 | ) | $ | (209,950 | ) | |||
|
|
|
|
|
| |||||||
As of December 31, 2018, the Funds had net capital loss carryforwards to offset future net capital gains, if any, to the extent provided by Treasury regulations:
| Not Subject to Expiration | ||||||||
| Short-Term | Long-Term | |||||||
Active Income Fund | $ | 316,195,125 | $ | 163,533,476 | ||||
Event Driven Fund | 5,099,213 | — | ||||||
Multi-Asset Growth Economies Fund | 1,242,459 | — | ||||||
Post-October capital losses and late-year ordinary losses incurred after October 31 and within the taxable year are deemed to arise on the first business day of the Funds’ taxable year. As of December 31, 2018, the Funds had the following post-October capital losses and late-year ordinary losses:
| Post-October Capital Losses | Late-Year Ordinary Losses | |||||||
Active Income Fund | $ | — | $ | — | ||||
Event Driven Fund | — | — | ||||||
Multi-Asset Growth Economies Fund | — | 28,245 | ||||||
Foreign Currency Translation
The value of securities, currencies and other assets and liabilities not denominated in U.S. dollars are translated into U.S. dollar values based upon the current rates of exchange on the date of the Funds’valuations.
Net realized foreign exchange gains or losses which are reported by the Funds result from currency gains and losses on transaction hedges arising from changes in exchange rates between the trade and settlement dates on forward contract transactions, and the difference between the amounts accrued for dividends, interest, and foreign taxes and the amounts actually received or paid in U.S. dollars for these items. Net
30
Driehaus Mutual Funds
Notes to Financial Statements (unaudited) — (Continued)
unrealized foreign exchange gains and losses result from changes in the U.S. dollar value of assets and liabilities (other than investments in securities), which are denominated in foreign currencies, as a result of changes in exchange rates.
Net realized gain (loss) on foreign currency contracts on portfolio hedges result from the use of forward contracts to hedge portfolio positions denominated or quoted in a particular currency in order to reduce or limit exposure in that currency. The Event Driven Fund and Multi-Asset Growth Economies Fund held portfolio hedges as of June 30, 2019 as disclosed in the Schedule of Investments.
The Funds do not isolate that portion of the results of operations which results from fluctuations in foreign exchange rates on investments. These fluctuations are included with the net realized gain (loss) on investments and the net change in unrealized appreciation (depreciation) on investments.
Indemnifications
Under the Trust’s organizational documents, the officers and Trustees are indemnified against certain liabilities arising out of the performance of their duties to the Trust. In addition, in the normal course of business, the Trust enters into contracts that provide general indemnifications to other parties. A Fund’s maximum exposure under these agreements is unknown as this would involve future claims that may be made against a Fundthat have not yet occurred. However, the Fundshave not had prior claims or losses pursuant to these contracts and expect the risk of loss to be remote.
Recent Accounting Pronouncements
In August 2018, the Securities and Exchange Commission released its Final Rule on Disclosure Update and Simplification (the “Final Rule”) which is intended to simplify an issuer’s disclosure compliance efforts by removing redundant or outdated disclosure requirements without significantly altering the mix of information provided to investors. Effective with the reporting period ended December 31, 2018, the Funds adopted the Final Rule with the most notable impacts being that the Funds are no longer required to present the components of distributable earnings on the Statements of Assets and Liabilities or the sources of distributions to shareholders and the amount of undistributed net investment income on the Statements of Changes in Net Assets. The tax components of distributable earnings and distributions to shareholders continue to be disclosed within the Notes to Financial Statements.
In August 2018, the FASB issued Accounting Standards Update (“ASU”)No. 2018-13 “Changes to the Disclosure Requirements for Fair Value Measurement” which modifies disclosure requirements for fair value measurements. The guidance is effective for fiscal years beginning after December 15, 2019 and for interim periods within those fiscal years. Management has evaluated the implications of certain provisions of ASUNo. 2018-13 and has adopted all aspects related to the removal and modification of certain fair value measurement disclosures under the ASU effective for the reporting period ended December 31, 2018.
In March 2017, the FASB issued ASUNo. 2017-08 “Premium Amortization on Purchased Callable Debt Securities” which provides guidance related to the amortization period for certain purchased callable debt securities held at a premium. This ASU is effective for annual periods beginning after December 15, 2018, and interim periods within those annual periods, however, early adoption is permitted. The amendments in this ASU should be applied on a modified retrospective basis through a cumulative-effect adjustment directly to retained earnings as of the beginning of the period of adoption. Management has evaluated the implications of ASUNo. 2017-08 and has adopted all aspects related to the amortization period for purchased callable debt securities held at a premium starting in the reporting period ended June 30, 2019.
Securities Transactions and Income
The Trust records security transactions based on trade date. Dividend income is recognized on theex-dividend date, and interest income is recognized on an accrual basis. Discounts and premiums on securities purchased are accreted and amortized over the lives of the respective securities using the effective yield method. Withholding taxes on foreign dividends and interest have been provided for in accordance with the Trust’s understanding of the applicable country’s tax rules and rates.
31
Driehaus Mutual Funds
Notes to Financial Statements (unaudited) — (Continued)
Pursuant to the terms of certain of the senior unsecured loan agreements, the Funds may have unfunded loan commitments, which are callable on demand. Each Fund will have available with its custodian, cash and/or liquid securities having an aggregate value at least equal to the amount of the unfunded senior loan commitments. At June 30, 2019, the Funds had no unfunded senior loan commitments.
With respect to the senior loans held in each Fund’s portfolio, the Funds may: 1) invest in assignments; 2) act as a participant in primary lending syndicates; or 3) invest in participations. If a Fund purchases a participation of a senior loan interest, the Fund would typically enter into a contractual agreement with the lender or other third party selling the participation, rather than directly with the borrower. As such, the Fund not only assumes the credit risk of the borrower, but also that of the selling participant or other persons interpositioned between the Fund and the borrower. At June 30, 2019, the Funds had no such outstanding senior loan participation commitments.
B. INVESTMENTS IN DERIVATIVES
Each Fund uses derivative instruments such as swaps, futures, options, swaptions and forward foreign currency contracts in connection with their respective investment strategies. During the period January 1, 2019 through June 30, 2019, the Active Income Fund primarily utilized: 1) futures to hedge its interest rate and/or commodity risk and manage volatility; and 2) options to hedge downside risk and manage volatility. During the period January 1, 2019 through June 30, 2019, the Event Driven Fund primarily utilized: 1) options to both hedge exposure and provide exposure to certain market segments or specific securities; and 2) forward foreign currency contracts to manage currency risk in portfolio holdings. During the period January 1, 2019 through June 30, 2019, the Multi-Asset Growth Economies Fund primarily utilized: 1) interest rate swaps to hedge against interest rate fluctuation and enable the parties involved to exchange fixed and floating cash flows; 2) credit default swaps as alternatives to direct investments to manage exposure to specific sectors/markets/industries and/or credit events and manage volatility; 3) options to both hedge exposure and provide exposure to certain market segments or specific securities; and 4) forward foreign currency contracts to manage currency risk in portfolio holdings. Detail regarding each derivative type is included below.
Swap Contracts
The Funds are subject to credit risk, volatility risk and interest rate risk exposure in the normal course of pursuing their investment objectives. The Funds engage in various swap transactions, including forward rate agreements and interest rate, currency, volatility, index and total return swaps, primarily to manage duration and yield curve risk, or as alternatives to direct investments. Swaps that are centrally cleared are exposed to the creditworthiness of the clearing organizations (and, consequentially, that of their members — generally, banks and broker-dealers) involved in the transaction. Centrally cleared swaps are valued daily and unrealized gains or losses are recorded in a “variation margin” account. The Fund receives from or pays to the clearing organization a specified amount of cash based upon changes in the variation margin account. When a contract is closed, the Fund recognizes a realized gain or loss.
Interest rate swaps are agreements between two parties to exchange cash flows based on a notional principal amount. The Funds may elect to pay a fixed rate and receive a floating rate or receive a fixed rate and pay a floating rate on a notional principal amount. The net interest received or paid on interest rate swap agreements is accrued daily as interest income/expense. Interest rate swaps aremarked-to-market daily using fair value estimates provided by an independent pricing service. Changes in value, including accrued interest, are recorded as changes in net unrealized appreciation (depreciation) on the Statements of Operations. Unrealized appreciation is reported as an asset and unrealized depreciation is reported as a liability on the Statements of Assets and Liabilities. Gains or losses are realized upon termination of the contracts. The risk of loss under a swap contract may exceed the amount recorded as an asset or a liability.
Total return swap contracts are arrangements to exchange a market linked return for a periodic payment, both based on a notional principal amount, to hedge sector exposure and to manage exposure to specific sectors or industries and/or to gain exposure to specific markets/countries and to specific sectors/industries. To the extent that the total return of the security, index or other financial measure underlying the transaction exceeds or falls short of the offsetting interest rate obligation, the Fund will receive a payment from or make a
32
Driehaus Mutual Funds
Notes to Financial Statements (unaudited) — (Continued)
payment to the counterparty. Total return swap contracts are marked to market daily based upon quotations from market makers and the change, if any, is recorded as a change in net unrealized appreciation (depreciation) on the Statements of Operations. Unrealized appreciation is reported as an asset and unrealized depreciation is reported as a liability on the Statements of Assets and Liabilities. Payments received or made are recorded as realized gains or losses. Gains or losses are realized upon termination of the contracts. Each Fund’s maximum risk of loss from counterparty risk is the fair value of the contract.
Volatility swaps are forward contracts on the future realized volatility of an underlying instrument. Volatility swaps are generally used to speculate on future volatility levels, trade the spread between realized and implied volatility or hedge volatility exposure of other positions. Changes in value are recorded as changes in net unrealized appreciation (depreciation) on the Statements of Operations. Unrealized gains are reported as an asset and unrealized losses are reported as a liability on the Statements of Assets and Liabilities. Gains or losses are realized upon termination of the contracts. The risk of loss under a volatility swap contract is dependent upon the volatility of the underlying instrument.
Under the terms of a credit default swap contract, one party acts as a guarantor receiving a periodic payment that is a fixed percentage applied to a notional amount. In return, the party agrees to purchase the notional amount of the underlying instrument, at par, if a credit event occurs during the term of the contract. Each Fund may enter into credit default swaps in which the Fund acts as guarantor (a seller of protection), and may enter into credit default swaps in which the counterparty acts as guarantor (a buyer of protection). Premiums paid to or by the Funds are accrued daily and included in net realized gain (loss) on swap contracts. The contracts aremarked-to-market daily using fair value estimates provided by an independent pricing service. Changes in value are recorded as unrealized appreciation (depreciation) on the Statements of Operations. Unrealized gains are reported as an asset and unrealized losses are reported as a liability on the Statements of Assets and Liabilities. Gains or losses are realized upon termination of the contracts. The risk of loss under a swap contract may exceed the amount recorded as an asset or a liability. The notional amount of a swap contract is the reference amount pursuant to which the counterparties make payments. For swaps in which the referenced obligation is an index, in the event of default of any debt security included in the corresponding index, the Fund pays or receives the percentage of the corresponding index that the defaulted security comprises (1) multiplied by the notional value and (2) multiplied by the ratio of one minus the ratio of the market value of the defaulted debt security to its par value. The Funds held no credit default swaps at June 30, 2019.
Risks associated with swap contracts include changes in the returns of underlying instruments and/or interest rates, failure of the counterparties to perform under the contracts’ terms and the possible lack of liquidity with respect to the contracts. For centrally cleared swap contracts, counterparty risk is limited due to the role of the clearinghouse. Credit default swaps can involve greater risks than if an investor had invested in the reference obligation directly since, in addition to general market risks, credit default swaps are subject to counterparty credit risk, leverage risk, hedging risk, correlation risk and liquidity risk. The Funds disclose swap contracts on a gross basis, with no netting of contracts held with the same counterparty. As of June 30, 2019, the Multi-Asset Growth Economies Fund had outstanding swap contracts as listed on the Schedule of Investments and the required collateral is included in the Statements of Assets and Liabilities. The Active Income Fund and Event Driven Fund had no outstanding swap contracts at June 30, 2019.
Futures Contracts
The Funds may enter into futures contracts to produce incremental earnings, hedge existing positions or protect against market changes in the value of equities or interest rates. Upon entering into a futures contract with a broker, a Fund is required to deposit in a segregated account a specified amount of cash or U.S. government securities. Futures contracts are valued daily and unrealized gains or losses are recorded in a “variation margin” account. Daily, the Fund receives from or pays to the broker a specified amount of cash based upon changes in the variation margin account. When a contract is closed, the Fund recognizes a realized gain or loss. Futures contracts have market risks, including the risk that the change in the value of the contract may not correlate with changes in the value of the underlying securities. With futures contracts, there is minimal counterparty credit risk to the Funds since futures contracts are exchange-traded and the exchange’s clearinghouse, as counterparty to all exchange-traded futures contracts, guarantees the futures
33
Driehaus Mutual Funds
Notes to Financial Statements (unaudited) — (Continued)
contract against default. As of June 30, 2019, the Active Income Fund had outstanding futures contracts as listed in the Schedule of Investments and the required collateral is included in the Statements of Assets and Liabilities. The Event Driven Fund and Multi-Asset Growth Economies Fund had no outstanding futures contracts at June 30, 2019.
Options Contracts
The Funds may use options contracts to hedge downside risk, produce incremental earnings or protect against market changes in the value of equities or interest rates. The Funds may write covered call and put options on futures, swaps, securities or currencies the Funds own or in which they may invest. Writing put options tends to increase a Fund’s exposure to the underlying instrument. Writing call options tends to decrease a Fund’s exposure to the underlying instrument. When a Fund writes a call or put option, an amount equal to the premium received is recorded as a liability and subsequently marked to market to reflect the current value of the option written. These liabilities are reflected as written options outstanding in the Schedule of Investments. Premiums received from writing options that expire are treated as realized gains. Premiums received from writing options that are exercised or closed are added to the proceeds or offset against amounts paid on the underlying future, swap, security or currency transaction to determine the realized gain or loss. A Fund, as a writer of an option, has no control over whether the underlying future, swap, security or currency may be sold (call) or purchased (put) and, as a result, bears the market risk of an unfavorable change in the price of the future, swap, security or currency underlying the written option. The risk exists that a Fund may not be able to enter into a closing transaction because of an illiquid market. In addition, to the extent a Fund purchases anover-the-counter (“OTC”) option, it is subject to credit risk that the counterparty to the trade does not perform under the contract’s terms. The Funds are not subject to credit risk on OTC options written as the counterparty has already performed its obligation by paying the premium at the inception of the contract.
The Funds may also purchase put and call options. Purchasing call options tends to increase a Fund’s exposure to the underlying instrument. Purchasing put options tends to decrease a Fund’s exposure to the underlying instrument. A Fund pays a premium, which is included in its Schedule of Investments as an investment and subsequentlymarked-to-market to reflect the current value of the option. Premiums paid for purchasing options that expire are treated as realized losses. The risk associated with purchasing put and call options is limited to the premium paid. Premiums paid for purchasing options that are exercised or closed are added to the amounts paid or offset against the proceeds on the underlying future, swap, security or currency transaction to determine the realized gain or loss. When entering into purchased option contracts, a Fund bears the risk of securities prices moving unexpectedly, in which case, a Fund may not achieve the anticipated benefits of the purchased option contracts; however, the risk of loss is limited to the premium paid. As of June 30, 2019, the Multi-Asset Economies Fund had outstanding options as listed on the Schedule of Investments and the required collateral is included in the Statements of Assets and Liabilities. The Active Income Fund and Event Driven Fund had no outstanding options at June 30, 2019.
Swaptions
An option on a swap contract, also called a “swaption,” is an option that gives the buyer the right, but not the obligation, to enter into a swap on a future date in exchange for paying a market-based “premium.” A call or receiver swaption gives the owner the right to receive the total return of a specified asset, reference rate, or index swap. A put or payer swaption gives the owner the right to pay the total return of a specified asset, reference rate, or index swap. Swaptions also include options that allow an existing swap to be terminated or extended by one of the counterparties. The Funds had no outstanding swaptions at June 30, 2019.
Forward Foreign Currency Contracts
The Funds use forward foreign currency contracts to manage foreign currency, to produce incremental earnings or to hedge existing positions. A forward foreign currency contract involves an obligation to purchase or sell a specific currency at a future date, which may be any fixed number of days from the date of the contract agreed upon by the parties, at a price set at the time of the contract. These contracts are principally traded in the inter-bank market conducted directly between currency traders (usually large commercial banks) and their customers.
34
Driehaus Mutual Funds
Notes to Financial Statements (unaudited) — (Continued)
The market value of a forward foreign currency contract fluctuates with changes in currency exchange rates. Outstanding forward foreign currency contracts are valued daily at current market rates and the resulting change in market value is recorded as change in net unrealized appreciation or depreciation on the Statements of Operations. When a forward foreign currency contract is settled, the Fund records a realized gain or loss equal to the difference between the value at the time the forward foreign currency contract was opened and the value at the time it was settled. A forward foreign currency contract may involve market risk in excess of the unrealized appreciation (depreciation) reflected on the Statements of Assets and Liabilities. In addition, the Funds could be exposed to credit risk if the counterparties are unable or unwilling to meet the terms of the contracts or market risk if the value of the foreign currency changes unfavorably. As of June 30, 2019, the Event Driven Fund and Multi-Asset Economies Fund had forward foreign currency contracts as listed in the Schedule of Investments. The Active Income Fund had no outstanding forward foreign currency contracts at June 30, 2019.
Equity Certificates
The Funds may invest in equity certificates, which allow the Funds to participate in the appreciation (depreciation) of the underlying security without actually owning the underlying security. These derivative instruments are purchased pursuant to an agreement with a financial institution and are valued at a calculated market price based on the value of the underlying security in accordance with the agreement. These equity certificates are subject to the credit risk of the issuing financial institution. There is nooff-balance sheet risk associated with equity certificates and the Funds’ potential loss is limited to the purchase price of the securities. The Funds are exposed to credit risk associated with the counterparty to the transaction, which is monitored by the Funds’ management on a periodic basis. A Fund’s equity certificates are not subject to any master netting agreement. The Funds had no outstanding equity certificates at June 30, 2019.
Derivative Investment Holdings Categorized by Risk Exposure
Each Fund is subject to the FASB’s “Disclosures about Derivative Instruments and Hedging Activities” (the “Derivatives Statement”). The Derivatives Statement amends and expands disclosures about derivative instruments and hedging activities. The Derivatives Statement is intended to improve financial reporting about derivative instruments by requiring enhanced disclosures to enable investors to better understand how and why the Fund uses derivative instruments, how these derivative instruments are accounted for and their effects on the Funds’ financial position and results of operations.
The following table sets forth the fair value and the location in the Statements of Assets and Liabilities of the Active Income Fund’s derivative contracts by primary risk exposure as of June 30, 2019:
Liability derivatives | ||||||
Risk exposure category | Statements of Assets and Liabilities location | Fair Value | ||||
Interest rate contracts | N/A* | $ | 361,572 | |||
Total | $ | 361,572 | ||||
| * | Includes cumulative appreciation/depreciation of futures contracts as shown in the Schedule of Investments. Only current day’s variation margin is reported in the Statements of Assets and Liabilities. |
35
Driehaus Mutual Funds
Notes to Financial Statements (unaudited) — (Continued)
The following table sets forth the fair value and the location in the Statements of Assets and Liabilities of the Event Driven Fund’s derivative contracts by primary risk exposure as of June 30, 2019:
Asset derivatives | ||||||
Risk exposure category | Statements of Assets and Liabilities location | Fair Value | ||||
Currency contracts | Unrealized appreciation on forward foreign currency contracts | $ | 2,479 | |||
Warrants equity contracts | Investment securities, at fair value | 9,985 | ||||
Total | $ | 12,464 | ||||
Liability derivatives | ||||||
Risk exposure category | Statements of Assets and Liabilities location | Fair Value | ||||
Currency contracts | Unrealized depreciation on forward foreign currency contracts | $ | 1,833 | |||
Total | $ | 1,833 | ||||
The following table sets forth the fair value and the location in the Statements of Assets and Liabilities of the Multi-Asset Growth Economies Fund’s derivative contracts by primary risk exposure as of June 30, 2019:
Asset derivatives | ||||||
Risk exposure category | Statements of Assets and Liabilities location | Fair Value | ||||
Interest contracts | N/A* | $ | 20,829 | |||
Interest contracts | Unrealized appreciation on open OTC swap contracts | 24,823 | ||||
Currency contracts | Unrealized appreciation on forward foreign currency contracts | 24,648 | ||||
Currency contracts | Purchased options, at fair value | 1 | ||||
Total | $ | 70,301 | ||||
Liability derivatives | ||||||
Risk exposure category | Statements of Assets and Liabilities location | Fair Value | ||||
Interest contracts | N/A* | $ | 29,585 | |||
Interest contracts | Unrealized depreciation on open OTC swap contracts | 32,470 | ||||
Currency contracts | Unrealized depreciation on forward foreign currency contracts | 35,717 | ||||
Total | $ | 97,772 | ||||
| * | Includes cumulative appreciation (depreciation) of centrally cleared swaps as shown in the Schedule of Investments. Only current day’s variation margin is reported in the Statements of Assets and Liabilities. |
The following table sets forth the Active Income Fund’s net realized gain (loss) by primary risk exposure and by type of derivative contract for the period January 1, 2019 through June 30, 2019:
Amount of net realized gain (loss) on derivatives | ||||||||||||
| Risk exposure category | ||||||||||||
Derivative | Equity contracts | Interest rate contracts | Total | |||||||||
Purchased options contracts | $ | (173,713 | ) | $ | — | $ | (173,713 | ) | ||||
Futures contracts | — | (4,090,613 | ) | (4,090,613 | ) | |||||||
|
|
|
|
|
| |||||||
Total | $ | (173,713 | ) | $ | (4,090,613 | ) | $ | (4,264,326 | ) | |||
|
|
|
|
|
| |||||||
36
Driehaus Mutual Funds
Notes to Financial Statements (unaudited) — (Continued)
The following table sets forth the Event Driven Fund’s net realized gain (loss) by primary risk exposure and by type of derivative contract for the period January 1, 2019 through June 30, 2019:
Amount of net realized gain (loss) on derivatives | ||||||||||||
| Risk exposure category | ||||||||||||
Derivative | Currency contracts | Equity contracts | Total | |||||||||
Purchased options contracts | $ | — | $ | (158,201 | ) | $ | (158,201 | ) | ||||
Forward foreign currency contracts | 6,159 | — | 6,159 | |||||||||
|
|
|
|
|
| |||||||
Total | $ | 6,159 | $ | (158,201 | ) | $ | (152,042 | ) | ||||
|
|
|
|
|
| |||||||
The following table sets forth the Multi-Asset Growth Economies Fund’s net realized gain (loss) by primary risk exposure and by type of derivative contract for the period January 1, 2019 through June 30, 2019:
Amount of net realized gain (loss) on derivatives | ||||||||||||||||||||
| Risk exposure category | ||||||||||||||||||||
Derivative | Credit contracts | Currency contracts | Equity contracts | Interest rate contracts | Total | |||||||||||||||
Purchased options contracts | $ | — | $ | (43,680 | ) | $ | — | $ | — | $ | (43,680 | ) | ||||||||
Forward foreign currency contracts | — | (62,305 | ) | — | — | (62,305 | ) | |||||||||||||
Equity certificates* | — | — | (10,908 | ) | — | (10,908 | ) | |||||||||||||
Swap contracts | (106,001 | ) | — | — | 182,445 | 76,444 | ||||||||||||||
|
|
|
|
|
|
|
|
|
| |||||||||||
Total | $ | (106,001 | ) | $ | (105,985 | ) | $ | (10,908 | ) | $ | 182,445 | $ | (40,449 | ) | ||||||
|
|
|
|
|
|
|
|
|
| |||||||||||
| * | Included in change in net realized gain (loss) on investments in the Statements of Operations. |
The following table sets forth the Active Income Fund’s change in net unrealized appreciation (depreciation) by primary risk exposure and by type of derivative contract for the period January 1, 2019 through June 30, 2019:
Change in net unrealized appreciation (depreciation) on derivatives | ||||||||
| Risk exposure category | ||||||||
Derivative | Interest rate contracts | Total | ||||||
Futures contracts | $ | 1,490,644 | $ | 1,490,644 | ||||
|
|
|
| |||||
Total | $ | 1,490,644 | $ | 1,490,644 | ||||
|
|
|
| |||||
The gross notional amount and/or the number of contracts for the Active Income Fund as of June 30, 2019 are included on the Schedule of Investments. The quarterly average values of derivative investments for the period January 1, 2019 through June 30, 2019 is set forth in the table below:
Quarterly Derivative Averages | ||||||
Derivative | Quarterly Average | $ Amount / Number | ||||
Purchased options contracts | number of contracts | 8,366 | ||||
Written options contracts | number of contracts | (8,366 | ) | |||
Futures contracts — Short | number of contracts | (1,118 | ) | |||
Swap contracts | gross notional amount | 21,079,739 | ||||
Purchased swaptions contracts | gross notional amount | $ | 28,000,000 | |||
Forward foreign currency contracts — Long | fair value | $ | 3,132,732 | |||
Forward foreign currency contracts — Short | fair value | $ | (5,241,430 | ) | ||
37
Driehaus Mutual Funds
Notes to Financial Statements (unaudited) — (Continued)
The following table sets forth the Event Driven Fund’s change in net unrealized appreciation (depreciation) by primary risk exposure and by type of derivative contract for the period January 1, 2019 through June 30, 2019:
Change in net unrealized appreciation (depreciation) on derivatives | ||||||||||||
| Risk exposure category | ||||||||||||
Derivative | Equity contracts | Currency contracts | Total | |||||||||
Purchased options contracts | $ | 158,041 | $ | — | $ | 158,041 | ||||||
Forward foreign currency contracts | — | 414 | 414 | |||||||||
Purchased warrants contracts | 9,985 | — | 9,985 | |||||||||
|
|
|
|
|
| |||||||
Total | $ | 168,026 | $ | 414 | $ | 168,440 | ||||||
|
|
|
|
|
| |||||||
The gross notional amount and/or the number of contracts for the Event Driven Fund as of June 30, 2019 are included on the Schedule of Investments. The quarterly average values of derivative investments for the period January 1, 2019 through June 30, 2019 is set forth in the table below:
Quarterly Derivative Averages | ||||||||
Derivative | Quarterly Average | $ Amount / Number | ||||||
Purchased options contracts | number of contracts | 128 | ||||||
Forward foreign currency contracts — Long | fair value | $ | 285,706 | |||||
Forward foreign currency contracts — Short | fair value | $ | (487,696 | ) | ||||
Purchased warrants contracts | fair value | $ | 1,997 | |||||
The following table sets forth Multi-Asset Growth Economies Fund’s change in net unrealized appreciation (depreciation) by primary risk exposure and by type of derivative contract for the period January 1, 2019 through June 30, 2019:
Change in net unrealized appreciation (depreciation) on derivatives | ||||||||||||||||||||
| Risk exposure category | ||||||||||||||||||||
Derivative | Credit contracts | Equity contracts | Currency contracts | Interest rate contracts | Total | |||||||||||||||
Purchased options contracts | $ | — | $ | — | $ | (27,349 | ) | $ | — | $ | (27,349 | ) | ||||||||
Equity certificates* | — | 10,431 | — | — | 10,431 | |||||||||||||||
Forward foreign currency contracts | — | — | 47,714 | — | 47,714 | |||||||||||||||
Swap contracts | — | — | — | (35,799 | ) | (35,799 | ) | |||||||||||||
|
|
|
|
|
|
|
|
|
| |||||||||||
Total | $ | — | $ | 10,431 | $ | 20,365 | $ | (35,799 | ) | $ | (5,003 | ) | ||||||||
|
|
|
|
|
|
|
|
|
| |||||||||||
| * | Included in change in net unrealized appreciation (depreciation) on investments in the Statements of Operations. |
The gross notional amount and/or the number of contracts for the Multi-Asset Growth Economies Fund as of June 30, 2019 are included on the Schedule of Investments. The quarterly average values of derivative investments for the period January 1, 2019 through June 30, 2019 is set forth in the table below:
Quarterly Derivative Averages | ||||||
Derivative | Quarterly Average | $ Amount / Number | ||||
Purchased options contracts | number of contracts | 3,284,060 | ||||
Written options contracts | number of contracts | (60 | ) | |||
Swap contracts | gross notional amount | 31,726,854,354 | ||||
Forward foreign currency contracts — Long | fair value | $ | 2,653,482 | |||
Forward foreign currency contracts — Short | fair value | $ | (3,505,986 | ) | ||
38
Driehaus Mutual Funds
Notes to Financial Statements (unaudited) — (Continued)
Disclosures about Offsetting Assets and Liabilities
The Funds are party to various agreements, including International Swaps and Derivatives Association Agreements and related Credit Support Annexes (“Master Netting Agreements” or “MNA”), which govern the terms of certain transactions with select counterparties. MNAs are designed to reduce counterparty risk associated with the relevant transactions by establishing credit protection mechanisms and providing standardization as a means of improving legal certainty. As MNAs are specific to the unique operations of different asset types, they allow each Fund to close out and net its total exposure to a counterparty in the event of default with respect to all of the transactions governed under a single agreement with that counterparty. MNAs can also help reduce counterparty risk by specifying collateral posting requirements atpre-arranged exposure levels. Securities and cash pledged as collateral are reflected as assets in the Statements of Assets and Liabilities as either a component of Investment securities at fair value or Collateral held at custodian for the benefit of brokers.
The Funds’ derivative contracts held at June 30, 2019, are not accounted for as hedging instruments under U.S. GAAP. For financial reporting purposes, the Funds do not offset financial assets and financial liabilities that are subject to MNAs or similar arrangements on the Statements of Assets and Liabilities. The settlement of futures contracts and exchange-traded purchased options is guaranteed by the clearinghouse or exchange the instrument is traded on and is not subject to arrangements with particular counterparties. For that reason, these instruments are excluded from the below disclosure.
The following table presents the Event Driven Fund’s financial and derivative assets subject to Master Netting Agreements by type, net of amounts available for offset under a MNA and net of the related collateral received by the Event Driven Fund as of June 30, 2019:
Description | Gross Amounts Recognized in Statements of Assets and Liabilities | Derivatives Available for Offset | Collateral Pledged | Net Amount1 | ||||||||||||
Unrealized appreciation on forward foreign currency contracts | $ | 2,479 | $ | (1,833 | ) | $ | — | $ | 646 | |||||||
The following table presents the Event Driven Fund’s financial and derivative liabilities subject to Master Netting Agreements by type, net of amounts available for offset under a MNA and net of the related collateral received by the Event Driven Fund as of June 30, 2019:
Description | Gross Amounts Recognized in Statements of Assets and Liabilities | Derivatives Available for Offset | Collateral Pledged | Net Amount2 | ||||||||||||
Unrealized depreciation on forward foreign currency contracts | $ | 1,833 | $ | (1,833 | ) | $ | — | $ | — | |||||||
| 1 | Net amount represents the net amount receivable to the counterparty in the event of default. |
| 2 | Net amount represents the net amount payable to the counterparty in the event of default. |
The following table represents the Multi-Asset Growth Economies Fund’s financial and derivative assets subject to the Master Netting Agreements by type, net of amounts available for offset under a MNA and net of the related collateral received by the Multi-Asset Growth Economies Fund as of June 30, 2019:
Description | Gross Amounts Recognized in Statements of Assets and Liabilities | Derivatives Available for Offset | Collateral Received | Net Amount1 | ||||||||||||
Unrealized appreciation on open OTC swap contracts | $ | 24,823 | $ | (24,823 | ) | $ | — | $ | — | |||||||
Unrealized appreciation on forward foreign currency contracts | $ | 24,648 | $ | (24,648 | ) | $ | — | $ | — | |||||||
39
Driehaus Mutual Funds
Notes to Financial Statements (unaudited) — (Continued)
The following table presents the Multi-Asset Growth Economies Fund’s financial and derivative liabilities subject to Master Netting Agreements by type, net of amounts available for offset under a MNA and net of the related collateral pledged by the Multi-Asset Growth Economies Fund as of June 30, 2019:
Description | Gross Amounts Recognized in Statements of Assets and Liabilities | Derivatives Available for Offset | Collateral Pledged | Net Amount2 | ||||||||||||
Unrealized depreciation on open OTC swap contracts | $ | 32,470 | $ | (24,823 | ) | $ | — | $ | 7,647 | |||||||
Unrealized depreciation on forward foreign currency contracts | $ | 35,717 | $ | (24,648 | ) | $ | (11,069 | ) | $ | — | ||||||
| 1 | Net amount represents the net amount receivable from the counterparty in the event of default. |
| 2 | Net amount represents the net amount payable to the counterparty in the event of default. |
C. INVESTMENT ADVISORY FEES, TRANSACTIONS WITH AFFILIATES, AND ADMINISTRATIVE FEES
Richard H. Driehaus,is the Chairman of the Board of Driehaus Capital Management LLC (“DCM” or the “Adviser”), a registered investment adviser, and of Driehaus Securities LLC (“DS LLC” or the “Distributor”), a registered broker-dealer. As of June 30, 2019, Richard H. Driehaus controls the Driehaus Multi-Asset Growth Economies Fund due to his power to vote a majority of the shares of the Fund.
DCM serves as the Funds’investment adviser. In return for its services to the Funds, the Funds pay the Adviser an annual management fee on a monthly basis of 0.55%, for the Active Income Fund of average daily net assets and 1.00% for Event Driven Fund of average daily net assets. From January 1, 2019 to April 30, 2019, the Multi-Asset Growth Economies Fund paid the Adviser a management fee on a monthly basis of 1.00% of average daily net assets. Effective May 1, 2019, the Multi-Asset Growth Economies Fund pays the Adviser a management fee on a monthly basis of 0.90% of average daily net assets.
From January 1, 2019 to April 30, 2019, the Multi-Asset Growth Economies Fund annual operating expense limitation was 1.75%. Effective May 1, 2019, DCM entered into a written agreement to cap the Multi-Asset Growth Economies Fund’s annual ordinary operating expenses (other than interest, taxes, brokerage commissions, dividends and interest on short sales, other investment-related costs, acquired fund fees and expenses, and extraordinary expenses such as litigation and other expenses not incurred in the ordinary course of the Fund’s business) at 0.99% of average daily net assets until at least April 30, 2022. DCM is entitled to recoup previously waived fees and reimbursed expenses to the extent that the Multi-Asset Growth Economies Fund’s expense ratio remains below the operating expense cap in place at the time of the waiver and the current operating expense cap. The table below indicates the amount of fees available for recoupment by DCM in future periods:
Year Ended December 31 | Multi-Asset Growth Economies Fund | |||
2020 | $ | 58,341 | ||
2021 | 119,889 | |||
2022 | 96,591 | |||
|
| |||
Total | $ | 274,821 | ||
|
| |||
The Active Income Fund incurred $1,631,003 for investment advisory fees During the period January 1, 2019 through June 30, 2019, of which $224,960 was payable to DCM at June 30, 2019. The Event Driven Fund incurred $284,053 for investment advisory fees During the period January 1, 2019 through June 30, 2019, of which $54,523 was payable to DCM at June 30, 2019. The Multi-Asset Growth Economies Fund incurred $165,674 for investment advisory fees During the period January 1, 2019 through June 30, 2019, of which $3,471 was payable to DCM at June 30, 2019.
40
Driehaus Mutual Funds
Notes to Financial Statements (unaudited) — (Continued)
The Funds direct certain portfolio trades, subject to obtaining the best price and execution, to brokers who have agreed to pay a portion of the Funds’ operating expenses using part of the commissions generated. For the six ended June 30, 2019, these arrangements reduced the expenses of Driehaus Active Income Fund, Driehaus Event Driven Fund and Multi-Asset Growth Economies Fund by $13,665 (0.3%), $6,060 (1.0%) and $377 (0.1%), respectively.
The Funds are permitted to purchase or sell securities from or to certain affiliated funds under specified conditions outlined in procedures adopted by the Board. The procedures have been designed to ensure that any purchase or sale of securities by a Fund from or to another fund or portfolio that is or could be considered an affiliate by virtue of having a common investment adviser (or affiliated investment advisers), common trustees and/or common officers complies with Rule17a-7 of the 1940 Act. Further, as defined under these procedures, each transaction is effected at the current market price to minimize trading costs, where permissible. For the six months ended June 30, 2019, the Funds had no purchases and sales of securities, pursuant to Rule17a-7 of the 1940 Act.
DS LLC is the Funds’ distributor. DS LLC does not earn any compensation from the Funds for these services. DS LLC has entered into a Fee Reimbursement Agreement (“Agreement”) with the Active Income Fund and Event Driven Fund. Under these Agreements, the Funds reimburse DS LLC for certain fees paid by DS LLC to intermediaries who provide shareholder administrative and/orsub-transfer agency services to the Funds. Currently, the amount to be reimbursed will not exceed 0.25% of the average daily net assets held by such intermediaries. The amounts incurred and payable to DS LLC during the period January 1, 2019 through June 30, 2019 are as follows:
Fund | Shareholder services plan fees | Accrued shareholder services plan fees | ||||||
Active Income Fund | $ | 409,054 | $ | 75,796 | ||||
Event Driven Fund | 25,897 | 5,553 | ||||||
Certain officers of the Trust are also officers of DCM and DS LLC. The Funds pay a portion of the Chief Compliance Officer’s salary. No other officers received compensation from the Funds during the period January 1, 2019 through June 30, 2019. The Independent Trustees are compensated for their services to the Trust and such compensation is reflected as Trustees’ fees in the Statements of Operations.
UMB Fund Services, Inc. (“UMBFS”), an affiliate of UMB Financial Corporation, serves as the Funds’administrative and accounting agent. As compensation for these services, UMBFS earns the larger of a monthly minimum fee or a monthly fee based upon each Fund’s average daily net assets. UMBFS also acts as the transfer agent and dividend disbursing agent for the Funds. For these services, UMBFS earns a monthly fee based in part on shareholder processing activity during the month.
D. INVESTMENT TRANSACTIONS
Purchases and sales of investment securities (excluding swaps, options, futures, forwards, short-term securities and U.S. government obligations) for the Active Income Fund, Event Driven Fund and Multi-Asset Growth Economies Fund for the period January 1, 2019 through June 30, 2019 were as follows:
Active Income Fund | Event Driven Fund | Multi-Asset Growth Economies Fund | ||||||||||||||
| Purchases | $ | 289,510,085 | Purchases | $ | 34,336,970 | Purchases | $ | 24,021,292 | ||||||||
| Sales | $ | 569,553,335 | Sales | $ | 30,414,850 | Sales | $ | 24,145,560 | ||||||||
The Funds had no purchases and sales of U.S. government obligations for the period January 1, 2019 through June 30, 2019.
41
Driehaus Mutual Funds
Notes to Financial Statements (unaudited) — (Continued)
E. RESTRICTED SECURITIES
Restricted securities are securities that are not registered for sale under the Securities Act of 1933 or applicable foreign law and that may be resold only in transactions exempt from applicable registration. Restricted securities include Rule 144A securities which may be sold normally to qualified institutional buyers. At June 30, 2019, the Fundsheld restricted securities as denoted on the Schedule of Investments.
F. LINE OF CREDIT
The Funds, together with the other funds in the Trust, obtained a committed line of credit in the amount of $50,000,000. The line of credit is available primarily to meet large, unexpected shareholder redemptions subject to certain restrictions. Interest is charged at a rate per annum equal to the Federal Funds Rate in effect at the time of the borrowings plus 1.5%, or 1.75%, whichever is greater. There is a commitment fee of 0.10% of the excess of the $50,000,000 committed amount over the sum of the average daily balance of any loans, which is allocated amongst all funds that have access to the line. At June 30, 2019, the Funds had no outstanding borrowings under the line of credit.
G. REDEMPTION FEES
The Multi-Asset Growth Economies Fund may charge a redemption fee of 2.00% of the redemption amount for shares redeemed within 60 days of purchase. The redemption fees are recorded inpaid-in capital and reflected in the Statements of Changes in Net Assets.
H. SUBSEQUENT EVENTS
Events or transactions that occurred after the date of this report through the date the report was issued have been evaluated for potential impact to the financial statements. There are no subsequent events that require recognition or disclosure in the financial statements.
42
Fund Expense Examples (unaudited)
As a mutual fund shareholder, you may incur two types of costs: (1) transaction costs, including sales charges; redemption fees; and exchange fees and (2) ongoing costs, including management fees; distribution(12b-1) and/or service fees; and other fund expenses. This example is intended to help you understand your ongoing costs (in dollars) of investing in the Fundand to compare these costs with the ongoing costs of investing in other mutual funds.
The example is based on an investment of $1,000 invested at the beginning of the period and held for the entire six month period ended June 30, 2019.
Actual Expenses
The first line of the table below (“Actual”) provides information about actual account values and actual expenses. You may use the information in this line, together with the amount you invested, to estimate the expense that you paid over the period. Simply divide your account value by $1,000 (for example, an $8,600 account value divided by $1,000 = 8.6), then multiply the result by the number in the first line under the heading entitled “Expenses Paid During Period” to estimate the expenses you paid on your account during this period.
Hypothetical Example for Comparison Purposes
The second line of the tables below (“Hypothetical”) provides information about hypothetical account values and hypothetical expenses based on the Fund’sactual expense ratio and an assumed rate of return of 5% per year before expenses, which is not the Fund’sactual return. You may use this information to compare the ongoing costs of investing in the Fund versus other funds. To do so, compare this 5% hypothetical example with the 5% hypothetical examples that appear in the shareholder reports of the other funds.
Please note that the expenses shown in the table are meant to highlight your ongoing costs only and do not reflect any transactional costs, such as sales charges, redemption fees or exchange fees. Therefore, the second line of the table is useful in comparing ongoing costs only, and will not help you determine the relative total costs of owning different funds. In addition, if these transactional costs were included, your costs would have been higher.
Driehaus Active Income Fund
| Beginning Account Value January 1, 2019 | Ending Account Value June 30, 2019 | Expenses Paid During Six Months Ended June 30, 2019* | ||||||||||
Actual | $ | 1,000.00 | $ | 1,032.90 | $ | 7.46 | ||||||
Hypothetical Example, assuming a 5% return before expenses | $ | 1,000.00 | $ | 1,017.45 | $ | 7.40 | ||||||
Driehaus Event Driven Fund
| Beginning Account Value January 1, 2019 | Ending Account Value June 30, 2019 | Expenses Paid During Six Months Ended June 30, 2019* | ||||||||||
Actual | $ | 1,000.00 | $ | 1,173.20 | $ | 11.15 | ||||||
Hypothetical Example, assuming a 5% return before expenses | $ | 1,000.00 | $ | 1,014.52 | $ | 10.34 | ||||||
43
Fund Expense Examples (unaudited) — (Continued)
Driehaus Multi-Asset Growth Economies Fund
| Beginning Account Value January 1, 2019 | Ending Account Value June 30, 2019 | Expenses Paid During Six Months Ended June 30, 2019* | ||||||||||
Actual | $ | 1,000.00 | $ | 1,139.00 | $ | 7.90 | ||||||
Hypothetical Example, assuming a 5% return before expenses | $ | 1,000.00 | $ | 1,017.40 | $ | 7.45 | ||||||
| * | Expenses are equal to the Funds’ annualized expense ratios for thesix-month period in the table below multiplied by the average account value over the period, multiplied by the number of days in the most recent fiscal half-year (181), then divided by 365 to reflect the half-year period. These amounts exclude the reduction in expenses for fees paid indirectly and may differ from the Fund’s annualized ratio shown in the Financial Highlights. |
Driehaus Active Income Fund | 1.48% | |||
Driehaus Event Driven Fund | 2.07% | |||
Driehaus Multi-Asset Growth Economies Fund . | 1.49% |
44
Board Considerations in Connection with the Review of an Amendment to the
Investment Advisory Agreement for Driehaus Multi-Asset Growth Economies Fund
The Board of Trustees of Driehaus Mutual Funds (the “Trust”), including a majority of the Trustees who are not “interested persons” (as defined in the Investment Company Act of 1940, as amended) (the “Independent Trustees”), approved an amendment to the investment advisory agreement (the “Agreement”) with Driehaus Capital Management LLC (the “Adviser”) for the Driehaus Multi-Asset Growth Economies Fund (the “Fund”) on March 13, 2019. As part of its consideration, the Board reviewed materials received from the Adviser. The Board also considered materials previously provided by legal counsel, and the Independent Trustees met with their independent legal counsel to review the proposal presented and the materials provided. After their consideration of the information received, the Independent Trustees presented their findings and their recommendation to approve the Agreement to the full Board.
In connection with the review process, the Board considered that, at its September 2018 meeting, the Board considered information regarding, among other things, the nature, extent and quality of services provided by the Adviser and the advisory fee rates, operating expenses and total expense ratio of the Fund, along with performance information for the Fund. The Board also compared the advisory fee rate and expense ratio of the Fund to fees and expense ratios of a peer group of funds based on data compiled from Lipper Analytical Services, Inc., an independent provider of mutual fund data that is a service of Broadridge Financial Solutions (“Lipper”). The Board noted that, pursuant to the Agreement, the advisory fee schedule would be reduced. The Board also noted that the Fund’s advisory fee of 0.90% would be lower than the Lipper peer group median (primary share class only) as of December 31, 2018 (1st percentile would be the highest advisory fee). The Board considered that the Fund’s expense ratio would be in the 76th percentile (1st percentile being the highest expense ratio) based on information the Adviser obtained from Lipper. The Board further considered the Fund’s asset size and the Adviser’s representation that the change in fees would not diminish the quality or quantity of services the Adviser provides to the Fund.
Based on all of the information considered, in particular the information received and considered at its September 2018 meeting, as supplemented at the March 2019 meeting, the Board determined that the terms of the Agreement are fair and reasonable and that the approval of the Agreement is in the best interests of the Fund. No single factor was determinative in the Board’s analysis.
45
| Item 2. | Code of Ethics. |
Not applicable.
| Item 3. | Audit Committee Financial Expert. |
Not applicable.
| Item 4. | Principal Accountant Fees and Services. |
Not applicable.
| Item 5. | Audit Committee of Listed Registrants. |
Not applicable.
| Item 6. | Investments. |
| (a) | Schedule of Investments in securities of unaffiliated issuers as of the close of the reporting period is included as part of the report to shareholders filed under Item 1 of this form. |
| (b) | Not applicable. |
| Item 7. | Disclosure of Proxy Voting Policies and Procedures forClosed-End Management Investment Companies. |
Not applicable.
| Item 8. | Portfolio Managers ofClosed-End Management Investment Companies. |
Not applicable.
| Item 9. | Purchases of Equity Securities byClosed-End Management Investment Company and Affiliated Purchasers. |
Not applicable.
| Item 10. | Submission of Matters to a Vote of Security Holders. |
There have been no material changes to the procedures by which the shareholders may recommend nominees to the registrant’s board of directors, where those changes were implemented after the registrant last provided disclosure in response to the requirements of Item 407(c)(2)(iv) of RegulationS-K (17 CFR 229.407) (as required by Item 22(b)(15) of Schedule 14A (17 CFR240.14a-101)), or this Item.
| Item 11. | Controls and Procedures. |
| (a) | The registrant’s principal executive and principal financial officers, or persons performing similar functions, have concluded that the registrant’s disclosure controls and procedures (as defined in Rule30a-3(c) under the Investment Company Act of 1940, as amended (the “1940 Act”) (17 CFR270.30a-3(c))) are effective, as of a date within 90 days of the filing date of the report that includes the disclosure required by this paragraph, based on their evaluation of these controls and procedures required by Rule30a-3(b) under the 1940 Act (17 CFR270.30a-3(b)) and Rules13a-15(b) or15d-15(b) under the Securities Exchange Act of 1934, as amended (17 CFR240.13a-15(b) or240.15d-15(b)). |
| (b) | There were no changes in the registrant’s internal control over financial reporting (as defined in Rule30a-3(d) under the 1940 Act (17 CFR270.30a-3(d))) that occurred during the period covered by this report that has materially affected, or is reasonably likely to materially affect, the registrant’s internal control over financial reporting. |
| Item 12. | Disclosure of Securities Lending Activities forClosed-End Management Investment Companies. |
Not applicable.
| Item 13. | Exhibits. |
| (a)(1) | Not applicable. | |
| (a)(2) | Certifications pursuant to Rule30a-2(a) under the 1940 Act and Section 302 of the Sarbanes-Oxley Act of 2002 are attached hereto. | |
| (a)(3) | Not applicable. | |
| (a)(4) | Not applicable. | |
| (b) | Certifications pursuant to Rule30a-2(b) under the 1940 Act and Section 1350 of Chapter 63 of Title 18 of the United States Code (18 U.S.C. 1350) are attached hereto. | |
SIGNATURES
Pursuant to the requirements of the Securities Exchange Act of 1934 and the Investment Company Act of 1940, the registrant has duly caused this report to be signed on its behalf by the undersigned, thereunto duly authorized.
(Registrant) Driehaus Mutual Funds ��
By (Signature and Title)* /s/ Stephen J. Kneeley
Stephen J. Kneeley, President
(principal executive officer)
Date September 4, 2019
Pursuant to the requirements of the Securities Exchange Act of 1934 and the Investment Company Act of 1940, this report has been signed below by the following persons on behalf of the registrant and in the capacities and on the dates indicated.
By (Signature and Title)* /s/ Stephen J. Kneeley
Stephen J. Kneeley, President
(principal executive officer)
Date September 4, 2019
By (Signature and Title)* /s/ Robert M. Kurinsky
Robert M. Kurinsky, Vice President and Treasurer
(principal financial officer)
Date September 4, 2019
| * | Print the name and title of each signing officer under his or her signature. |