UNITED STATES
SECURITIES AND EXCHANGE COMMISSION
Washington, D.C. 20549
FORM N-CSR
CERTIFIED SHAREHOLDER REPORT OF REGISTERED
MANAGEMENT INVESTMENT COMPANIES
Investment Company Act file number | 811-7739 | |||||||
| ||||||||
Harding, Loevner Funds, Inc. | ||||||||
(Exact name of registrant as specified in charter) | ||||||||
| ||||||||
50 Division Street, Somerville, NJ |
| 08876 | ||||||
(Address of principal executive offices) |
| (Zip code) | ||||||
| ||||||||
David R. Loevner, President 50 Division Street, Somerville, NJ 08876 | ||||||||
(Name and address of agent for service) | ||||||||
| ||||||||
Registrant’s telephone number, including area code: | (877) 435-8105 |
| ||||||
| ||||||||
Date of fiscal year end: | 10/31/2009 |
| ||||||
| ||||||||
Date of reporting period: | 10/31/2009 |
| ||||||
Item 1. Reports to Stockholders
Annual Report |
| October 31, 2009 |

Mutual Funds for Individual Investors
· Emerging Markets Portfolio
· International Equity Portfolio
· International Small Companies Portfolio
· Global Equity Portfolio
State Street Bank and Trust Company
Attn: Harding, Loevner Funds, Inc.
200 Clarendon Street, 16th Floor, JHT 1651
Boston, MA 02116
(877) 435-8105 · www.hardingloevnerfunds.com
Harding, Loevner Funds, Inc.
Table of Contents
| Expense Example | 2 | ||||||
| Performance Information and Statements of Net Assets | |||||||
| Emerging Markets Portfolio | 3 | ||||||
| International Equity Portfolio | 10 | ||||||
| International Small Companies Portfolio | 17 | ||||||
| Global Equity Portfolio | 24 | ||||||
| Statements of Operations | 31 | ||||||
| Statements of Changes in Net Assets | 33 | ||||||
| Financial Highlights | 37 | ||||||
| Notes to Financial Statements | 41 | ||||||
| Report of Independent Registered Public Accounting Firm | 53 | ||||||
| Supplemental Tax Information | 54 | ||||||
| Directors and Principal Officers | 55 | ||||||
| Supplemental Information | 58 | ||||||
For use only when preceded or accompanied by a prospectus. Read the prospectus carefully before you invest or send money.
Harding, Loevner Funds, Inc.
Expense Example
October 31, 2009 (unaudited)
As a shareholder of a Harding Loevner Portfolio, you incur two types of costs: (1) transaction costs, including brokerage commissions on purchases and sales of fund shares; and (2) ongoing costs, including management fees and other fund expenses. The following example is intended to help you understand your ongoing costs (in dollars and cents) of investing in a Portfolio and to compare these costs with the ongoing costs of investing in other mutual funds.
The example is based on an investment of $1,000 invested on May 1, 2009 and held for the entire six month period from May 1, 2009 to October 31, 2009 for the Emerging Markets Portfolio, International Equity Portfolio—Investor Class, International Small Companies—Investor Class and Global Equity Portfolio.
Actual Expenses
The first line under each Portfolio in the table below provides information about actual account values and actual expenses. You may use the information in this line, together with the amount you invested, to estimate the expenses that you paid over the period. Simply divide your account value by $1,000 (for example, an $8,600 account value divided by $1,000 = 8.6), then multiply the result by the number in the first line for your Portfolio under the heading entitled "Expenses Paid During Period" to estimate the expenses you paid on your account during this period.
Hypothetical Example for Comparison Purposes
The second line under each Portfolio in the table below provides information about hypothetical account values and hypothetical expenses based on each Portfolio's actual expense ratio and an assumed rate of return of 5% per year before expenses, which is not the Portfolio's actual return. The hypothetical account values and expenses may not be used to estimate the actual ending account balance or expenses you paid for the period. You may use this information to compare the ongoing costs of investing in your Portfolio and other funds. To do so, compare this 5% hypothetical example with the 5% hypothetical examples that appear in the shareholder reports of the other funds.
Please note that the expenses shown in the table are meant to highlight your ongoing costs only and do not reflect any transactional costs, such as brokerage commissions paid on purchases and sales of fund shares. Therefore, the second line under each Portfolio in the table is useful in comparing ongoing costs only, and will not help you determine the relative total costs of owning different funds. In addition, if these transactional costs were included, your costs would have been higher.
| Beginning Account Value May 1, 2009 | Ending Account Value October 31, 2009 | Annualized Expense Ratio | Expenses Paid During Period* (May 1, 2009 to October 31, 2009) | ||||||||||||||||
| Emerging Markets Portfolio | |||||||||||||||||||
| Actual | $ | 1,000.00 | $ | 1,358.00 | 1.64 | % | $ | 9.75 | |||||||||||
| Hypothetical (5% annual return before expenses) | 1,000.00 | 1,016.90 | 1.64 | % | 8.34 | ||||||||||||||
| International Equity Portfolio—Investor Class | |||||||||||||||||||
| Actual | 1,000.00 | 1,319.40 | 1.25 | % | 7.31 | ||||||||||||||
| Hypothetical (5% annual return before expenses) | 1,000.00 | 1,018.90 | 1.25 | % | 6.36 | ||||||||||||||
| International Small Companies Portfolio— Investor Class | |||||||||||||||||||
| Actual | 1,000.00 | 1,535.30 | 1.75 | % | 11.18 | ||||||||||||||
| Hypothetical (5% annual return before expenses) | 1,000.00 | 1,016.40 | 1.75 | % | 8.89 | ||||||||||||||
| Global Equity Portfolio | |||||||||||||||||||
| Actual | 1,000.00 | 1,265.30 | 1.25 | % | 7.14 | ||||||||||||||
| Hypothetical (5% annual return before expenses) | 1,000.00 | 1,018.90 | 1.25 | % | 6.36 | ||||||||||||||
* Expenses are calculated using each Portfolio's annualized expense ratio (as disclosed in the table), multiplied by the average account value for the period, multiplied by number of days in the period (184 days), and divided by the number of days in the year (365 days).
Harding, Loevner Funds, Inc.
Emerging Markets Portfolio — Overview
(unaudited)
October 31, 2009
| Returns for the Year Ended October 31, 2009 | |||||||||||||||||||||||
| Cumulative Total Returns | Average Annualized Total Return | ||||||||||||||||||||||
| FUND NAME | Last 12 Months | 5 YR | 10 YR | 5 YR | 10 YR | ||||||||||||||||||
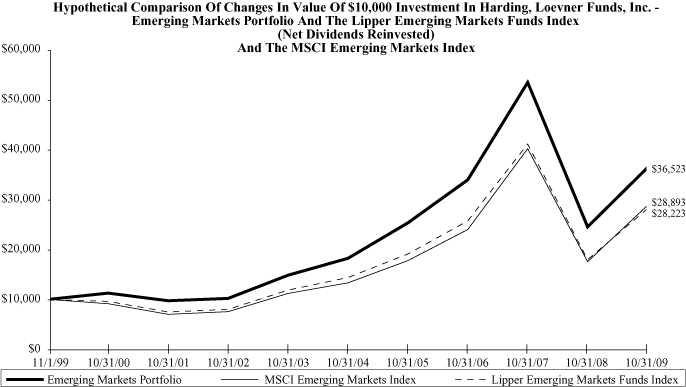
| Emerging Markets Portfolio (Inception date 11/9/98) | 48.44 | % | 99.83 | % | 265.23 | % | 14.85 | % | 13.83 | % | |||||||||||||
| MSCI Emerging Markets (Net dividend) | 64.11 | % | 117.14 | % | 188.93 | % | 16.77 | % | 11.19 | % | |||||||||||||
| Lipper Emerging Markets Funds Index | 56.90 | % | 96.12 | % | 182.23 | % | 14.42 | % | 10.93 | % | |||||||||||||
Performance data quoted represents past performance and does not guarantee future results. The investment return and principal value of an investment will fluctuate so that an investor's shares, when redeemed, may be worth more or less than their original cost. Performance current to the most recent month end may be lower or higher than the performance quoted and may be obtained by visiting the website at www.hardingloevnerfunds.com.
Investment return reflects voluntary fee waivers in effect. Absence such waivers, total return would be reduced. The performance provided does not reflect the deduction of taxes that a shareholder would pay on Portfolio distributions.
3
Harding, Loevner Funds, Inc.
Emerging Markets Portfolio (Individual) — Overview
October 31, 2009
The Emerging Markets Portfolio gained 48.44% for the fiscal year ending October 31, 2009, as compared to a gain of 64.11% for its benchmark, the MSCI Emerging Markets Index.
Consistent with its investment objectives and policies, the Portfolio was invested primarily in the securities of emerging markets companies that exhibit the fundamental characteristics of growth, financial strength, management quality, and durable competitive advantage.
The Portfolio's underperformance this period was the result primarily of unfavorable stock selection. Because we did not own some of the most distressed, cyclically-exposed companies in the Financials, Industrials, and Consumer Discretionary sectors that had previously declined the most in 2008, our companies did not benefit as much in the early stages of the rally that began in late February. Our overweight in the lagging Health Care sector and underweight in the booming Materials sector also detracted from relative returns.
Our holdings lagged the most in the Financials, Industrials, and Information Technology sectors, where the poor stocks included Samsung Fire & Marine, China Communications Construction, and Delta Electronics. Portfolio companies in Consumer Staples and Telecom Services outperformed overall. Strong stocks in these sectors included Hengan International, JBS, and Telekom Indonesia.
From a geographic perspective, the largest detractor from performance was our underweight and poor stock selection in Asia, including East Asia (China, Taiwan, and South Korea). Many listed companies in Asia are export-focused manufacturers, for whom we believe the potential for further expansion of excess capacity and margin-destroying competition presents risks for investors. In China, poor corporate governance and the lack of corporate capital allocation discipline remain obstacles to our finding attractive investments in this market.
Past performance does not guarantee future results.
The Portfolio invests in foreign securities, which will involve greater volatility and political, economic, and currency risks and differences in accounting methods. It also invests in emerging markets, which involve unique risks, such as exposure to economies less diverse and mature than the U.S. or other more established foreign markets. Economic and political instability may cause larger price changes in emerging markets securities than other foreign securities. Investments in debt securities typically decrease in value when interest rates rise. This risk is usually greater for longer-term debt securities. Investment by the Portfolio in lower-rated and non-rated securities presents a greater risk of loss to principal and interest than higher-rated securities.
The MSCI Emerging Markets Index is a free float-adjusted market capitalization index that is designed to measure equity market performance in the global emerging markets. The Index consists of 22 emerging market countries. The Index is net of foreign withholding taxes on dividends. You cannot invest directly in this Index.
It is not possible to invest directly in an index.
4
Harding, Loevner Funds, Inc.
Emerging Markets Portfolio
Statement of Net Assets
October 31, 2009
| Industry | Percentage of Net Assets | ||||||
| Airlines | 0.9 | % | |||||
| Banks | 18.2 | ||||||
| Beverages, Food & Tobacco | 4.5 | ||||||
| Building Materials | 2.0 | ||||||
| Chemicals | 2.7 | ||||||
| Commercial Services & Supplies | 3.8 | ||||||
| Communications | 8.5 | ||||||
| Computers & Information | 0.5 | ||||||
| Cosmetics & Personal Care | 1.0 | ||||||
| Electric Utilities | 1.2 | ||||||
| Electrical Equipment | 5.4 | ||||||
| Electronics | 1.7 | ||||||
| Engineering & Construction | 2.5 | ||||||
| Financial Services | 1.0 | ||||||
| Food | 1.1 | ||||||
| Food Retailers | 1.4 | ||||||
| Health Care Providers & Services | 2.6 | ||||||
| Home Construction, Furnishings & Appliances | 2.1 | ||||||
| Household Products | 1.1 | ||||||
| Insurance | 3.6 | ||||||
| Iron & Steel | 0.5 | ||||||
| Media | 1.4 | ||||||
| Medical Supplies | 0.7 | ||||||
| Metals & Mining | 3.9 | ||||||
| Oil & Gas | 12.0 | ||||||
| Pharmaceuticals | 3.3 | ||||||
| Real Estate | 1.4 | ||||||
| Retailers | 3.4 | ||||||
| Semiconductors | 5.3 | ||||||
| Total Investments | 97.7 | ||||||
| Other Assets Less Liabilities | 2.3 | * | |||||
| Net Assets | 100.0 | % | |||||
* Breakout of other assets and liabilities can be found on page 9.
See Notes to Financial Statements
5
Harding, Loevner Funds, Inc.
Emerging Markets Portfolio
Statement of Net Assets
October 31, 2009 (continued)
| Shares | Value (1) | ||||||||||
| Common Stocks - 96.1% | |||||||||||
| Brazil - 17.1% | |||||||||||
| Anhanguera Educacional Participacoes SA (Commercial Services & Supplies) | 1,663,882 | $ | 22,999,277 | ||||||||
| Banco Bradesco SA - ADR (Banks) | 1,688,200 | 33,257,540 | |||||||||
| Cia Brasileira de Distribuicao Grupo Pao de Acucar - Sponsored ADR (Food) | 289,200 | 17,493,708 | |||||||||
| Itau Unibanco Banco Multiplo SA - ADR (Banks) | 1,364,058 | 26,108,070 | |||||||||
| JBS SA (Beverages, Food & Tobacco) | 4,530,400 | 25,126,026 | |||||||||
| Natura Cosmeticos SA (Cosmetics & Personal Care) | 891,900 | 15,973,799 | |||||||||
| Petroleo Brasileiro SA - ADR (Oil & Gas) | 1,457,084 | 67,346,423 | |||||||||
| Usinas Siderurgicas de Minas Gerais SA (Iron & Steel) | 305,900 | 7,586,723 | |||||||||
| Vale SA - Sponsored ADR (Metals & Mining) | 1,866,200 | 47,569,438 | |||||||||
| 263,461,004 | |||||||||||
| Chile - 2.5% | |||||||||||
| Banco Santander - ADR (Banks) | 328,244 | 17,278,764 | |||||||||
| Sociedad Quimica y Minera de Chile SA - Sponsored ADR (Chemicals) | 576,500 | 21,186,375 | |||||||||
| 38,465,139 | |||||||||||
| China - 11.8% | |||||||||||
| Anhui Conch Cement Co., Ltd. (Building Materials) | 2,530,000 | 16,369,685 | |||||||||
| China Communications Construction Co., Ltd. - Class H (Engineering & Construction) | 18,090,000 | 19,521,536 | |||||||||
| China Insurance International Holdings Co., Ltd. (Insurance) | 6,411,600 | 22,421,416 | |||||||||
| China Mobile Ltd. - Sponsored ADR (Communications) | 346,061 | 16,171,430 | |||||||||
| China Overseas Land & Investment Ltd. (Real Estate) | 9,720,000 | 20,948,952 | |||||||||
| Hengan International Group Co., Ltd. (Health Care Providers & Services) | 6,241,000 | 40,009,646 | |||||||||
| Jiangsu Expressway Co., Ltd. - Class H (Commercial Services & Supplies) | 24,020,000 | 21,309,861 | |||||||||
| New Oriental Education & Technology Group - Sponsored ADR (Commercial Services & Supplies) | 203,500 | 14,212,440 | |||||||||
| Shandong Weigao Group Medical Polymer Co., Ltd. (Medical Supplies) | 3,196,000 | 11,146,921 | |||||||||
| 182,111,887 | |||||||||||
| Colombia - 1.1% | |||||||||||
| BanColombia SA - Sponsored ADR (Banks) | 436,300 | 17,268,754 | |||||||||
| Czech Republic - 0.9% | |||||||||||
| Central European Media Enterprises Ltd. (Media)* | 526,000 | 13,223,640 | |||||||||
| Egypt - 1.1% | |||||||||||
| Orascom Construction Industries - GDR, Reg. S (Engineering & Construction) | 338,200 | 16,341,977 | |||||||||
| Greece - 0.9% | |||||||||||
| Coca Cola Hellenic Bottling Co. SA (Beverages, Food & Tobacco)* | 535,200 | 13,946,578 | |||||||||
| Hungary - 0.5% | |||||||||||
| Richter Gedeon Nyrt (Pharmaceuticals) | 40,500 | 8,404,874 | |||||||||
| India - 5.2% | |||||||||||
| Axis Bank Ltd. (Banks) | 989,400 | 18,666,115 | |||||||||
| HDFC Bank Ltd. - ADR (Banks) | 238,497 | 26,380,153 | |||||||||
| Hindustan Unilever Ltd. (Household Products) | 2,713,700 | 16,218,916 | |||||||||
| NTPC Ltd. (Electric Utilities) | 4,065,900 | 18,139,733 | |||||||||
| 79,404,917 | |||||||||||
See Notes to Financial Statements
6
Harding, Loevner Funds, Inc.
Emerging Markets Portfolio
Statement of Net Assets
October 31, 2009 (continued)
| Shares | Value (1) | ||||||||||
| Indonesia - 2.4% | |||||||||||
| PT Bank Rakyat Indonesia (Banks) | 24,259,000 | $ | 17,708,576 | ||||||||
| PT Telekomunikasi Indonesia - Sponsored ADR (Communications) | 581,450 | 19,716,969 | |||||||||
| 37,425,545 | |||||||||||
| Israel - 3.0% | |||||||||||
| Israel Chemicals Ltd. (Chemicals) | 1,796,400 | 21,001,512 | |||||||||
| Teva Pharmaceutical Industries Ltd. - Sponsored ADR (Pharmaceuticals) | 485,300 | 24,497,944 | |||||||||
| 45,499,456 | |||||||||||
| Luxembourg - 1.1% | |||||||||||
| Millicom International Cellular SA (Communications) | 266,100 | 16,673,826 | |||||||||
| Malaysia - 1.2% | |||||||||||
| Public Bank Berhad (Banks) | 212,682 | 664,258 | |||||||||
| Public Bank Berhad (Banks) | 5,582,000 | 17,377,037 | |||||||||
| 18,041,295 | |||||||||||
| Mexico - 6.8% | |||||||||||
| America Movil SA de CV, Series L - ADR (Communications) | 664,600 | 29,328,798 | |||||||||
| Grupo Aeroportuario del Sureste SAB de CV, Series B - ADR (Engineering & Construction) | 71,598 | 2,913,323 | |||||||||
| Grupo Financiero Banorte SA de CV, Class O (Financial Services) | 4,701,840 | 15,422,640 | |||||||||
| Grupo Televisa SA - Sponsored ADR (Media) | 466,600 | 9,033,376 | |||||||||
| Telmex Internacional SAB de CV, Series L - ADR (Communications) | 913,800 | 12,299,748 | |||||||||
| Urbi Desarrollos Urbanos SA de CV (Home Construction, Furnishings & Appliances) | 6,278,500 | 12,363,230 | |||||||||
| Wal-Mart de Mexico SA de CV - Sponsored ADR (Retailers) | 690,707 | 24,043,511 | |||||||||
| 105,404,626 | |||||||||||
| Panama - 0.9% | |||||||||||
| Copa Holdings SA - Class A (Airlines) | 336,900 | 14,227,287 | |||||||||
| Peru - 1.1% | |||||||||||
| Credicorp Ltd. (Banks) | 247,500 | 17,084,925 | |||||||||
| Philippines - 0.4% | |||||||||||
| Philippine Long Distance Telephone Co. - Sponsored ADR (Communications) | 127,215 | 6,780,560 | |||||||||
| Poland - 1.9% | |||||||||||
| Bank Pekao SA (Banks) | 304,861 | 16,215,115 | |||||||||
| Central European Distribution Corp. (Beverages, Food & Tobacco) | 394,200 | 12,263,562 | |||||||||
| 28,478,677 | |||||||||||
| Russia - 6.0% | |||||||||||
| Lukoil - Sponsored ADR (Oil & Gas) | 574,894 | 33,573,809 | |||||||||
| OAO Gazprom - Sponsored ADR (Oil & Gas) | 1,550,285 | 37,016,842 | |||||||||
| X 5 Retail Group NV - GDR, Reg. S (Food Retailers) | 885,985 | 21,227,088 | |||||||||
| 91,817,739 | |||||||||||
| South Africa - 5.8% | |||||||||||
| Massmart Holdings Ltd. (Retailers) | 1,299,700 | 15,012,809 | |||||||||
| MTN Group Ltd. (Communications) | 2,002,700 | 30,061,582 | |||||||||
| Pretoria Portland Cement Co., Ltd. (Building Materials) | 3,309,000 | 13,810,207 | |||||||||
| SABMiller plc (Beverages, Food & Tobacco) | 650,600 | 17,382,162 | |||||||||
| Standard Bank Group Ltd. (Banks) | 1,021,316 | 12,776,510 | |||||||||
| 89,043,270 | |||||||||||
See Notes to Financial Statements
7
Harding, Loevner Funds, Inc.
Emerging Markets Portfolio
Statement of Net Assets
October 31, 2009 (continued)
| Shares | Value (1) | ||||||||||
| South Korea - 8.7% | |||||||||||
| KB Financial Group Inc. - ADR (Banks) | 459,337 | $ | 21,790,947 | ||||||||
| Samsung Electronics Co., Ltd., GDR, Reg S - GDR (Semiconductors) | 143,080 | 43,343,050 | |||||||||
| Samsung Electronics Co., Ltd., GDR, Reg S - GDR (Semiconductors) | 48,759 | 9,686,609 | |||||||||
| Samsung Fire & Marine Insurance Co., Ltd. (Insurance) | 182,400 | 33,438,270 | |||||||||
| Shinsegae Co., Ltd. (Retailers) | 31,500 | 13,680,197 | |||||||||
| Taewoong Co., Ltd. (Metals & Mining) | 189,000 | 12,693,767 | |||||||||
| 134,632,840 | |||||||||||
| Taiwan - 9.4% | |||||||||||
| Delta Electronics (Electrical Equipment) | 10,986,751 | 30,650,798 | |||||||||
| Hon Hai Precision Industry Co., Ltd. (Electrical Equipment) | 6,192,000 | 24,378,311 | |||||||||
| HTC Corp. (Computers & Information) | 774,650 | 7,745,302 | |||||||||
| MediaTek Inc. (Semiconductors) | 2,016,144 | 28,542,609 | |||||||||
| Synnex Technology International Corp. (Electronics) | 13,422,050 | 25,474,050 | |||||||||
| Taiwan Semiconductor Manufacturing Co. (Electrical Equipment) | 15,804,637 | 28,745,983 | |||||||||
| 145,537,053 | |||||||||||
| Thailand - 2.7% | |||||||||||
| PTT Exploration & Production plc (Oil & Gas) | 4,866,800 | 21,112,520 | |||||||||
| Siam Commercial Bank-Alien (Banks) | 8,863,300 | 20,484,366 | |||||||||
| 41,596,886 | |||||||||||
| Turkey - 2.4% | |||||||||||
| Arcelik (Home Construction, Furnishings & Appliances) | 6,289,700 | 20,465,602 | |||||||||
| Turkiye Garanti Bankasi AS (Banks) | 4,793,300 | 17,182,443 | |||||||||
| 37,648,045 | |||||||||||
| United Kingdom - 1.2% | |||||||||||
| Hikma Pharmaceuticals plc (Pharmaceuticals) | 2,349,000 | 18,145,625 | |||||||||
| Total Common Stocks (Cost $1,107,825,521) | 1,480,666,425 | ||||||||||
| Preferred Stocks - 1.7% | |||||||||||
| Brazil - 0.2% | |||||||||||
| Petroleo Brasileiro SA - Sponsored ADR (Oil & Gas) | 54,000 | 2,166,480 | |||||||||
| Russia - 1.5% | |||||||||||
| Oil & Gas - 1.5% | |||||||||||
| Transneft (Oil & Gas) | 26,900 | 23,403,000 | |||||||||
| Total Preferred Stocks (Cost $9,383,336) | 25,569,480 | ||||||||||
| Total Investments - 97.8% (Cost $1,117,208,857) | $ | 1,506,235,905 | |||||||||
See Notes to Financial Statements
8
Harding, Loevner Funds, Inc.
Emerging Markets Portfolio
Statement of Net Assets
October 31, 2009 (continued)
| Value (1) | |||||||
| Liabilities, Net of Other Assets - 2.2% | |||||||
| Cash | $ | 35,826,736 | |||||
| Dividends and interest receivable | 1,636,929 | ||||||
| Foreign currency (cost $696,586) | 690,157 | ||||||
| Receivable for Fund units sold | 2,688,326 | ||||||
| Tax reclaim receivable | 145,936 | ||||||
| Prepaid expenses | 1,284 | ||||||
| Payable to Investment Advisor | (1,410,034 | ) | |||||
| Payable for Fund units redeemed | (2,412,116 | ) | |||||
| Other liabilities | (2,581,376 | ) | |||||
| 34,585,842 | |||||||
| Net Assets - 100% | |||||||
| Applicable to 38,868,544 outstanding $.001 par value units (authorized 500,000,000 shares) | $ | 1,540,821,747 | |||||
| Net Asset Value, Offering Price and Redemption Price Per Unit | $ | 39.64 | |||||
| Components of Net Assets as of October 31, 2009 were as follows: | |||||||
| Paid-in capital | $ | 1,316,113,524 | |||||
| Accumulated undistributed net investment income | 4,594,502 | ||||||
| Accumulated net realized loss from investment transactions | (167,193,464 | ) | |||||
| Net unrealized appreciation on investments and on assets and liabilities denominated in foreign currencies | 387,307,185 | ||||||
| $ | 1,540,821,747 | ||||||
Summary of Abbreviations
ADR American Depository Receipt
GDR Global Depositary Receipt
Reg S Security sold outside United States without registration under the Securities Act of 1933.
(1) See Note 2 to Financial Statements.
* Non-income producing security.
See Notes to Financial Statements
9
Harding, Loevner Funds, Inc.
International Equity Portfolio — Overview
(unaudited)
October 31, 2009
| Returns for the Year Ended October 31, 2009 | |||||||||||||||||||||||
| Cumulative Total Returns | Average Annualized Total Return | ||||||||||||||||||||||
| FUND NAME | Last 12 Months | 5 YR | Inception | 5 YR | Inception | ||||||||||||||||||
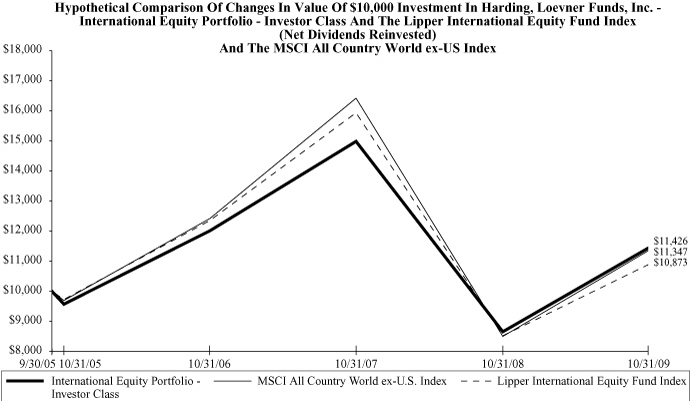
| International Equity Investor Class (Inception date 09/30/05) | 32.48 | % | N/A | 14.26 | % | N/A | 3.32 | % | |||||||||||||||
| MSCI All Country World ex-US (Net dividend) | 34.13 | % | N/A | 13.47 | % | N/A | 3.14 | % | |||||||||||||||
| Lipper International Fund Index | 28.17 | % | N/A | 8.73 | % | N/A | 2.07 | % | |||||||||||||||
Performance data quoted represents past performance and does not guarantee future results. The investment return and principal value of an investment will fluctuate so that an investor's shares, when redeemed, may be worth more or less than their original cost. Performance current to the most recent month end may be lower or higher than the performance quoted and may be obtained by visiting the website at www.hardingloevnerfunds.com.
Investment return reflects voluntary fee waivers in effect. Absence such waivers, total return would be reduced. The performance provided does not reflect the deduction of taxes that a shareholder would pay on Portfolio distributions.
10
Harding, Loevner Funds, Inc.
International Equity Portfolio (Investor Class) — Overview
October 31, 2009
The International Equity Portfolio gained 32.48% for the fiscal year ending October 31, 2009. In comparison, its benchmark, the MSCI All Country World ex-US Index, rose 34.13%.
Consistent with its investment objectives and policies, the Portfolio was invested primarily in the securities of non-US companies that exhibited the fundamental characteristics of growth, financial strength, management quality, and durable competitive advantage.
The portfolio's return was near the benchmark return. Good relative stock performance within sectors offset poor allocation between sectors. Heavy weightings in Health Care and Consumer Staples, along with light weightings in Materials and Financials hindered performance. The portfolio benefited from good stock selection in a number of industry groups, including consumer durables & apparel (LVMH), retailing (Li & Fung, China Resources Enterprise), food & staples retailing (Olam International), pharmaceuticals & biotech (Qiagen), capital goods (Atlas Copco, Schneider Electric), and telecom services (Telekom Indonesia). Positive stock selection was offset by a few holdings that lagged their industry groups, including companies in energy (Imperial Oil, Encana), diversified financials (Nomura Holdings), insurance (Swiss Reinsurance), health care equipment & services (Fresenius), technology hardware & equipment (Nokia), and materials (Air Liquide).
Viewed geographically, the portfolio enjoyed good stock selection in developed markets across Europe and Japan, but our holdings in emerging markets failed to keep up with the torrid pace of the emerging markets sub-index. Stock selection was particularly strong in the UK (Standard Chartered), France (LVMH, Schneider Electric), Germany (Allianz, Qiagen), Japan (Kubota, JSR), Hong Kong (Li & Fung) and Singapore (Olam International), along with Bermuda (Bunge). Emerging markets holdings that lagged included companies in Russia (Gazprom), South Africa (Sasol), Indonesia (Telekom Indonesia), and Taiwan (Taiwan Semiconductor).
Past performance does not guarantee future results.
The Portfolio invests in foreign securities, which will involve greater volatility and political, economic, and currency risks. It also invests in emerging markets, which involve unique risks, such as exposure to economies less diverse and mature than the U.S. or other more established foreign markets. Economic and political instability may cause larger price changes in emerging markets securities than other foreign securities. Investments in debt securities typically decrease in value when interest rates rise. This risk is usually greater for longer-term debt securities. Investment by the Portfolio in lower-rated and non-rated securities presents a greater risk of loss to principal and interest than higher-rated securities. The portfolio invests in smaller companies which involve additional risks such as limited liquidity and greater volatility.
The MSCI All Country World ex-US Index is a free float-adjusted market capitalization index that is designed to measure equity market performance in the global developed and emerging markets, excluding the US. The Index consists of 44 developed and emerging market countries. The Index is net of foreign withholding taxes on dividends. You cannot invest directly in this Index.
It is not possible to invest directly in an index.
11
Harding, Loevner Funds, Inc.
International Equity Portfolio
Statement of Net Assets
October 31, 2009
| Industry | Percentage of Net Assets | ||||||
| Banks | 7.6 | % | |||||
| Beverages, Food & Tobacco | 13.3 | ||||||
| Chemicals | 5.5 | ||||||
| Commercial Services & Supplies | 5.9 | ||||||
| Communications | 5.9 | ||||||
| Computer Software & Processing | 3.2 | ||||||
| Cosmetics & Personal Care | 2.2 | ||||||
| Electrical Equipment | 8.5 | ||||||
| Electronics | 2.0 | ||||||
| Financial Services | 3.5 | ||||||
| Health Care Providers & Services | 1.2 | ||||||
| Heavy Machinery | 2.4 | ||||||
| Holding Companies - Diversified | 2.2 | ||||||
| Insurance | 2.8 | ||||||
| Machinery - Diversified | 1.3 | ||||||
| Media | 5.0 | ||||||
| Medical Supplies | 5.4 | ||||||
| Oil & Gas | 9.9 | ||||||
| Oil & Gas Services | 1.7 | ||||||
| Pharmaceuticals | 2.1 | ||||||
| Real Estate | 1.3 | ||||||
| Retailers | 3.3 | ||||||
| Semiconductors | 2.0 | ||||||
| Total Investments | 98.2 | ||||||
| Other Assets Less Liabilities | 1.8 | * | |||||
| Net Assets | 100.0 | % | |||||
* Breakout of other assets and liabilities can be found on page 16.
See Notes to Financial Statements
12
Harding, Loevner Funds, Inc.
International Equity Portfolio
Statement of Net Assets
October 31, 2009 (continued)
| Shares | Value (1) | ||||||||||
| Common Stocks - 97.5% | |||||||||||
| Australia - 1.8% | |||||||||||
| Cochlear Ltd. (Medical Supplies) | 93,800 | $ | 5,375,496 | ||||||||
| Austria - 2.0% | |||||||||||
| Erste Bank der Oesterreichischen Sparkassen AG (Banks) | 149,220 | 5,995,923 | |||||||||
| Bermuda - 2.5% | |||||||||||
| Bunge Ltd. (Beverages, Food & Tobacco) | 129,280 | 7,376,717 | |||||||||
| Brazil - 0.8% | |||||||||||
| Petroleo Brasileiro SA - ADR (Oil & Gas) | 52,888 | 2,444,483 | |||||||||
| Canada - 3.2% | |||||||||||
| EnCana Corp. (Oil & Gas) | 79,882 | 4,424,664 | |||||||||
| Imperial Oil Ltd. (Oil & Gas) | 137,290 | 5,168,968 | |||||||||
| 9,593,632 | |||||||||||
| China - 2.7% | |||||||||||
| China Resources Enterprise (Financial Services) | 2,442,000 | 8,151,832 | |||||||||
| Finland - 2.0% | |||||||||||
| Nokia Oyj - Sponsored ADR (Communications) | 465,240 | 5,866,676 | |||||||||
| France - 15.1% | |||||||||||
| Air Liquide (Chemicals) | 94,402 | 10,194,126 | |||||||||
| Dassault Systemes SA (Computer Software & Processing) | 163,800 | 9,443,602 | |||||||||
| L'Oreal SA (Cosmetics & Personal Care) | 65,170 | 6,641,877 | |||||||||
| LVMH Moet Hennessy Louis Vuitton SA (Beverages, Food & Tobacco) | 64,430 | 6,684,127 | |||||||||
| Schlumberger Ltd. (Oil & Gas Services) | 83,400 | 5,187,480 | |||||||||
| Schneider Electric SA (Electrical Equipment) | 66,450 | 6,902,044 | |||||||||
| 45,053,256 | |||||||||||
| Germany - 5.8% | |||||||||||
| Allianz SE (Insurance) | 73,400 | 8,412,189 | |||||||||
| Fresenius AG (Health Care Providers & Services) | 73,368 | 3,649,800 | |||||||||
| Qiagen NV (Commercial Services & Supplies)* | 253,470 | 5,257,080 | |||||||||
| 17,319,069 | |||||||||||
| Hong Kong - 3.4% | |||||||||||
| Hutchison Whampoa Ltd. (Commercial Services & Supplies) | 531,000 | 3,717,414 | |||||||||
| Li & Fung Ltd. (Commercial Services & Supplies) | 1,550,200 | 6,419,433 | |||||||||
| 10,136,847 | |||||||||||
| Indonesia - 1.8% | |||||||||||
| PT Telekomunikasi Indonesia - Sponsored ADR (Communications) | 154,940 | 5,254,015 | |||||||||
| Israel - 0.8% | |||||||||||
| Teva Pharmaceutical Industries Ltd. - Sponsored ADR (Pharmaceuticals) | 44,160 | 2,229,197 | |||||||||
| Japan - 14.3% | |||||||||||
| Fanuc Ltd. (Electrical Equipment) | 65,400 | 5,493,297 | |||||||||
| Hoya Corp. (Electronics) | 267,300 | 5,854,040 | |||||||||
See Notes to Financial Statements
13
Harding, Loevner Funds, Inc.
International Equity Portfolio
Statement of Net Assets
October 31, 2009 (continued)
| Shares | Value (1) | ||||||||||
| Japan (continued) | |||||||||||
| JSR Corp. (Chemicals) | 323,900 | $ | 6,305,223 | ||||||||
| Jupiter Telecommunications Co., Ltd. (Media) | 6,085 | 5,589,849 | |||||||||
| Keyence Corp. (Electrical Equipment) | 34,765 | 6,897,888 | |||||||||
| Kubota Corp. (Machinery - Diversified) | 505,300 | 3,920,034 | |||||||||
| Nomura Holdings Inc. (Financial Services) | 335,200 | 2,345,623 | |||||||||
| So-net M3 Inc. (Commercial Services & Supplies) | 664 | 2,278,830 | |||||||||
| Sumitomo Realty & Development Co., Ltd. (Real Estate) | 199,000 | 3,739,343 | |||||||||
| 42,424,127 | |||||||||||
| Malaysia - 2.2% | |||||||||||
| Sime Darby Berhad (Holding Companies - Diversified) | 2,574,810 | 6,652,016 | |||||||||
| Mexico - 4.3% | |||||||||||
| America Movil SA de CV, Series L - ADR (Communications) | 144,000 | 6,354,720 | |||||||||
| Wal-Mart de Mexico SA de CV - Sponsored ADR (Retailers) | 184,620 | 6,426,622 | |||||||||
| 12,781,342 | |||||||||||
| Poland - 1.0% | |||||||||||
| Bank Pekao SA - GDR, Reg. S (Banks)#,* | 52,560 | 2,857,825 | |||||||||
| Russia - 2.3% | |||||||||||
| OAO Gazprom - Sponsored ADR (Oil & Gas) | 280,570 | 6,699,294 | |||||||||
| Singapore - 3.3% | |||||||||||
| DBS Group Holdings Ltd. (Banks) | 607,083 | 5,539,736 | |||||||||
| Olam International Ltd. (Beverages, Food & Tobacco) | 2,230,900 | 4,277,217 | |||||||||
| 9,816,953 | |||||||||||
| South Africa - 0.7% | |||||||||||
| Sasol Ltd. (Oil & Gas) | 55,641 | 2,084,364 | |||||||||
| South Korea - 2.0% | |||||||||||
| Samsung Electronics Co., Ltd., GDR, Reg S - GDR (Semiconductors) | 18,520 | 5,610,241 | |||||||||
| Samsung Electronics Co., Ltd., GDR, Reg S - GDR (Semiconductors) | 1,500 | 297,994 | |||||||||
| 5,908,235 | |||||||||||
| Sweden - 2.3% | |||||||||||
| Atlas Copco AB - Class A (Heavy Machinery) | 510,600 | 6,977,482 | |||||||||
| Switzerland - 9.5% | |||||||||||
| Alcon Inc. (Medical Supplies) | 49,370 | 7,049,542 | |||||||||
| Nestle SA - Sponsored ADR (Beverages, Food & Tobacco) | 220,350 | 10,250,682 | |||||||||
| Roche Holding AG - Genusschein (Pharmaceuticals) | 24,350 | 3,901,402 | |||||||||
| Swatch Group AG (Retailers) | 14,880 | 3,468,954 | |||||||||
| Synthes Inc. (Medical Supplies) | 29,320 | 3,479,419 | |||||||||
| 28,149,999 | |||||||||||
| Taiwan - 2.0% | |||||||||||
| Taiwan Semiconductor Manufacturing Co. (Electrical Equipment) | 3,330,125 | 6,056,939 | |||||||||
| United Kingdom - 11.7% | |||||||||||
| BG Group plc (Oil & Gas) | 372,680 | 6,424,711 | |||||||||
| Standard Chartered plc (Banks) | 338,010 | 8,300,246 | |||||||||
| Tesco plc (Beverages, Food & Tobacco) | 874,980 | 5,838,969 | |||||||||
See Notes to Financial Statements
14
Harding, Loevner Funds, Inc.
International Equity Portfolio
Statement of Net Assets
October 31, 2009 (continued)
| Shares | Value (1) | ||||||||||
| United Kingdom (continued) | |||||||||||
| Unilever plc (Beverages, Food & Tobacco) | 167,425 | $ | 5,011,364 | ||||||||
| WPP plc (Media) | 1,043,920 | 9,361,788 | |||||||||
| 34,937,078 | |||||||||||
| Total Common Stocks (Cost $230,874,100) | 290,142,797 | ||||||||||
| Preferred Stocks - 0.7% | |||||||||||
| Brazil - 0.7% | |||||||||||
| Petroleo Brasileiro SA - Sponsored ADR (Oil & Gas) | 55,400 | 2,222,648 | |||||||||
| Total Preferred Stocks (Cost $1,789,747) | 2,222,648 | ||||||||||
| Total Investments - 98.2% (Cost $232,663,847) | $ | 292,365,445 | |||||||||
See Notes to Financial Statements
15
Harding, Loevner Funds, Inc.
International Equity Portfolio
Statement of Net Assets
October 31, 2009 (continued)
| Value (1) | |||||||
| Liabilities, Net of Other Assets - 1.8% | |||||||
| Cash | $ | 4,718,958 | |||||
| Dividends and interest receivable | 415,158 | ||||||
| Foreign currency (cost $29,515) | 29,654 | ||||||
| Receivable for Fund units sold | 317,218 | ||||||
| Tax reclaim receivable | 84,743 | ||||||
| Prepaid expenses | 2,508 | ||||||
| Payable to Investment Advisor | (182,237 | ) | |||||
| Payable for Fund units redeemed | (54,407 | ) | |||||
| Payable for distribution fees | (15,865 | ) | |||||
| Other liabilities | (97,840 | ) | |||||
| 5,217,890 | |||||||
| Net Assets - 100% | |||||||
| Investor Class | |||||||
| Applicable to 3,173,243 outstanding $.001 par value units (authorized 250,000,000 shares) | $ | 38,133,502 | |||||
| Net Asset Value, Offering Price and Redemption Price Per Unit | $ | 12.02 | |||||
| Institutional Class | |||||||
| Applicable to 21,549,438 outstanding $.001 par value units (authorized 250,000,000 shares) | $ | 259,449,833 | |||||
| Net Asset Value, Offering Price and Redemption Price Per Unit | $ | 12.04 | |||||
| Components of Net Assets as of October 31, 2009 were as follows: | |||||||
| Paid-in capital | $ | 247,801,995 | |||||
| Accumulated undistributed net investment income | 2,365,492 | ||||||
| Accumulated net realized loss from investment transactions | (12,296,884 | ) | |||||
| Net unrealized appreciation on investments and on assets and liabilities denominated in foreign currencies | 59,712,732 | ||||||
| $ | 297,583,335 | ||||||
Summary of Abbreviations
ADR American Depository Receipt
GDR Global Depositary Receipt
Reg S Security sold outside United States without registration under the Securities Act of 1933.
(1) See Note 2 to Financial Statements.
* Non-income producing security.
# Security valued at fair value as determined in good faith under policies and procedures established by and under the supervision of the Portfolio's Board of Directors.
See Notes to Financial Statements
16
Harding, Loevner Funds, Inc.
International Small Companies Portfolio — Overview
(unaudited)
October 31, 2009
| Returns for the Year Ended October 31, 2009 | |||||||||||||||
| Cumulative Total Returns | Average Annualized Total Return | ||||||||||||||
| FUND NAME | Last 12 Months | Inception | Inception | ||||||||||||
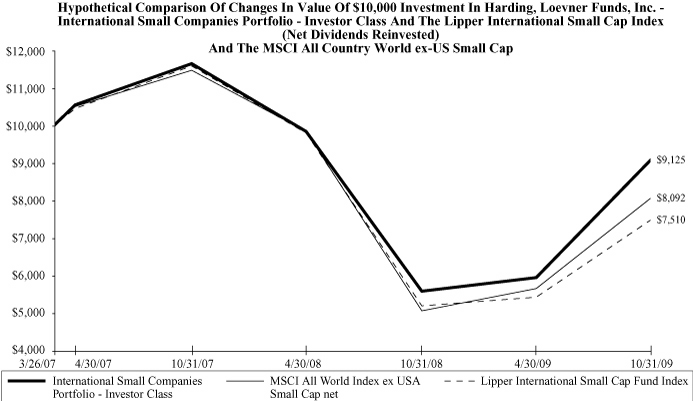
| International Small Companies Investor Class (Inception date 03/26/07) | 63.47 | % | (8.75 | )% | (3.46 | )% | |||||||||
| MSCI All Country World ex-US Small Cap | 60.12 | % | (19.08 | )% | (7.81 | )% | |||||||||
| Lipper International Small Cap Index | 44.85 | % | (24.90 | )% | (10.42 | )% | |||||||||
Performance data quoted represents past performance and does not guarantee future results. The investment return and principal value of an investment will fluctuate so that an investor's shares, when redeemed, may be worth more or less than their original cost. Performance current to the most recent month end may be lower or higher than the performance quoted and may be obtained by visiting the website at www.hardingloevnerfunds.com.
Investment return reflects voluntary fee waivers in effect. Absence such waivers, total return would be reduced. The performance provided does not reflect the deduction of taxes that a shareholder would pay on Portfolio distributions.
17
Harding, Loevner Funds, Inc.
International Small Companies (Individual) — Overview
October 31, 2009
The International Small Companies Portfolio rose 63.47% for the fiscal year ending October 31, 2009, while its benchmark, the MSCI All Country World ex-US Small Cap Index, rose 60.12%.
Consistent with its investment objectives and policies, the Portfolio was invested primarily in the securities of non-US smaller capitalization companies that exhibit the fundamental characteristics of growth, financial strength, management quality, and durable competitive advantage.
The Portfolio benefitted from strong stock selection in a wide range of sectors this period, particularly Consumer Discretionary, Health Care, Industrials, Materials, and Telecom Services. Notable stocks included Supermax Corporation (a Singapore-based maker of rubber and latex medical gloves) and Choong Ang Vaccine (a South Korean animal vaccine producer). Two Industrials companies, Canadian water treatment and paper equipment services company GLV and crane rental company Tat Hong of Singapore, were also strong performers this period. The Portfolio's underweight in Financials was beneficial as well.
Stock selection was weak in Financials, with the poor performance of Japanese cash-management services company Fidec and Irish insurance company FBD Holdings outweighing the positive contribution from Australia's Bank of Queensland. Our overweight in the underperforming Health Care sector was an additional detractor.
Past performance does not guarantee future results.
The Portfolio invests in foreign securities, which will involve greater volatility and political, economic, and currency risks. It also invests in emerging markets, which involve unique risks, such as exposure to economies less diverse and mature than the U.S. or other more established foreign markets. Economic and political instability may cause larger price changes in emerging markets securities than other foreign securities. The portfolio invests in smaller companies which involve additional risks such as limited liquidity and greater volatility.
The MSCI All Country World ex-US Small Cap Index is a free-float market capitalization index that is designed to measure small cap developed and emerging market equity performance. The Index consists of 44 developed and emerging markets countries and targeting companies market capitalization range of USD 170—4,200 million in terms of the company's full market capitalization. The Index is net of foreign withholding taxes on dividends. You cannot invest directly in this Index.
It is not possible to invest directly in an index.
18
Harding, Loevner Funds, Inc.
International Small Companies Portfolio
Statement of Net Assets
October 31, 2009
| Industry | Percentage of Net Assets | ||||||
| Agriculture | 1.3 | % | |||||
| Apparel | 0.6 | ||||||
| Automotive | 3.1 | ||||||
| Banks | 4.2 | ||||||
| Chemicals | 9.8 | ||||||
| Commercial Services & Supplies | 5.4 | ||||||
| Communications | 3.4 | ||||||
| Computers & Information | 1.3 | ||||||
| Cosmetics & Personal Care | 1.0 | ||||||
| Distribution/Wholesale | 2.6 | ||||||
| Electrical Equipment | 2.0 | ||||||
| Electronics | 4.1 | ||||||
| Engineering & Construction | 1.3 | ||||||
| Environmental Controls | 2.6 | ||||||
| Financial Services | 4.2 | ||||||
| Food | 6.4 | ||||||
| Gas | 1.5 | ||||||
| Gold and Silver Ores | 1.7 | ||||||
| Hand/Machine Tools | 2.4 | ||||||
| Health Care Providers & Services | 2.8 | ||||||
| Insurance | 2.1 | ||||||
| Leisure Time | 1.5 | ||||||
| Machinery - Diversified | 5.4 | ||||||
| Media | 1.3 | ||||||
| Medical Supplies | 4.1 | ||||||
| Miscellaneous Manufacturing | 7.6 | ||||||
| Oil & Gas Services | 1.2 | ||||||
| Packaging & Containers | 1.3 | ||||||
| Pharmaceuticals | 3.4 | ||||||
| Retailers | 3.6 | ||||||
| Semiconductors | 2.8 | ||||||
| Textiles & Apparel | 1.2 | ||||||
| Transportation | 1.1 | ||||||
| Trucking & Leasing | 1.6 | ||||||
| Total Investments | 99.9 | ||||||
| Other Assets Less Liabilities | 0.1 | * | |||||
| Net Assets | 100.0 | % | |||||
* Breakout of other assets and liabilities can be found on page 23.
See Notes to Financial Statements
19
Harding, Loevner Funds, Inc.
International Small Companies Portfolio
Statement of Net Assets
October 31, 2009 (continued)
| Shares | Value (1) | ||||||||||
| Common Stocks - 98.6% | |||||||||||
| Australia - 7.2% | |||||||||||
| Bank of Queensland Ltd. (Banks) | 8,794 | $ | 95,652 | ||||||||
| Bradken Ltd. (Engineering & Construction) | 14,800 | 81,596 | |||||||||
| Imdex Ltd. (Gold and Silver Ores) | 145,430 | 108,830 | |||||||||
| PIPE Networks Ltd. (Communications) | 14,132 | 76,294 | |||||||||
| SAI Global Ltd. (Media) | 26,800 | 82,394 | |||||||||
| 444,766 | |||||||||||
| Austria - 2.9% | |||||||||||
| BWT AG (Environmental Controls) | 3,286 | 84,206 | |||||||||
| Semperit AG Holding (Miscellaneous Manufacturing) | 2,730 | 96,005 | |||||||||
| 180,211 | |||||||||||
| Belgium - 1.2% | |||||||||||
| Sioen Industries NV (Textiles & Apparel) | 11,960 | 75,744 | |||||||||
| Canada - 2.8% | |||||||||||
| GLV, Inc. - Class A (Machinery - Diversified)* | 11,400 | 95,031 | |||||||||
| Laurentian Bank of Canada (Banks) | 2,100 | 76,718 | |||||||||
| 171,749 | |||||||||||
| China - 2.7% | |||||||||||
| Changmao Biochemical Engineering Co., Ltd. - Class H (Chemicals) | 456,000 | 72,906 | |||||||||
| Chen Hsong Holdings Ltd. (Machinery - Diversified) | 170,000 | 49,104 | |||||||||
| Dalian Refrigeration Co., Ltd. (Machinery - Diversified) | 76,000 | 48,220 | |||||||||
| 170,230 | |||||||||||
| Denmark - 2.7% | |||||||||||
| NKT Holding A/S (Miscellaneous Manufacturing)* | 1,450 | 82,388 | |||||||||
| Topsil Semiconductor Materials (Semiconductors)* | 560,000 | 85,146 | |||||||||
| 167,534 | |||||||||||
| Finland - 2.4% | |||||||||||
| Vacon Oyj (Hand/Machine Tools) | 2,377 | 84,428 | |||||||||
| Vaisala Oyj, Class A (Electronics) | 1,823 | 64,719 | |||||||||
| 149,147 | |||||||||||
| France - 3.9% | |||||||||||
| Boiron SA (Pharmaceuticals) | 2,073 | 85,332 | |||||||||
| Robertet SA (Food) | 550 | 66,249 | |||||||||
| Rubis (Gas) | 990 | 90,943 | |||||||||
| 242,524 | |||||||||||
| Germany - 6.3% | |||||||||||
| Bijou Brigitte Modische Accessoires AG (Retailers) | 482 | 78,023 | |||||||||
| Carl Zeiss Meditec AG (Medical Supplies) | 6,170 | 91,656 | |||||||||
| Drillisch AG (Communications)* | 21,510 | 136,887 | |||||||||
| Gerresheimer AG (Packaging & Containers) | 2,920 | 83,029 | |||||||||
| 389,595 | |||||||||||
| Hong Kong - 6.4% | |||||||||||
| Chong Hing Bank Ltd. (Banks) | 46,000 | 89,058 | |||||||||
| Pico Far East Holdings Ltd. (Commercial Services & Supplies) | 544,000 | 99,145 | |||||||||
| Top Form International Ltd. (Apparel)* | 540,000 | 39,834 | |||||||||
| Wasion Meters Group Ltd. (Electronics) | 86,000 | 71,518 | |||||||||
| Yip's Chemical Holdings Ltd. (Chemicals) | 140,000 | 97,351 | |||||||||
| 396,906 | |||||||||||
See Notes to Financial Statements
20
Harding, Loevner Funds, Inc.
International Small Companies Portfolio
Statement of Net Assets
October 31, 2009 (continued)
| Shares | Value (1) | ||||||||||
| Ireland - 2.4% | |||||||||||
| FBD Holdings plc (Insurance) | 6,730 | $ | 65,962 | ||||||||
| Grafton Group plc (Retailers)* | 17,000 | 83,779 | |||||||||
| 149,741 | |||||||||||
| Italy - 4.9% | |||||||||||
| Cembre S.p.A (Electrical Equipment) | 11,880 | 81,618 | |||||||||
| Marr S.p.A (Distribution/Wholesale) | 9,963 | 87,834 | |||||||||
| SABAF S.p.A (Electrical Equipment) | 1,966 | 44,814 | |||||||||
| Sol S.p.A (Chemicals) | 15,441 | 91,558 | |||||||||
| 305,824 | |||||||||||
| Japan - 15.7% | |||||||||||
| AISAN INDUSTRY Co., Ltd. (Automotive) | 5,400 | 39,753 | |||||||||
| Asahi Diamond Industrial Co., Ltd. (Hand/Machine Tools) | 9,000 | 63,026 | |||||||||
| ASKUL Corp. (Retailers) | 3,000 | 59,352 | |||||||||
| BML Inc. (Health Care Providers & Services) | 2,800 | 74,870 | |||||||||
| C. Uyemura & Co., Ltd. (Chemicals) | 1,300 | 54,142 | |||||||||
| LINTEC Corp. (Chemicals) | 4,100 | 73,002 | |||||||||
| MIURA Co., Ltd. (Machinery - Diversified) | 2,700 | 74,847 | |||||||||
| NAKANISHI Inc. (Pharmaceuticals) | 900 | 77,397 | |||||||||
| Pasona Inc. (Commercial Services & Supplies) | 85 | 66,058 | |||||||||
| PIGEON Corp. (Cosmetics & Personal Care) | 1,600 | 61,283 | |||||||||
| Stella Chemifa Corp. (Chemicals) | 2,800 | 152,645 | |||||||||
| TSUMURA & Co. (Pharmaceuticals) | 1,500 | 51,546 | |||||||||
| VIC TOKAI Corp. (Computers & Information) | 6,500 | 79,388 | |||||||||
| Yamatake Corp. (Electronics) | 2,200 | 46,763 | |||||||||
| 974,072 | |||||||||||
| Malaysia - 4.1% | |||||||||||
| MNRB Holdings Berhad (Insurance) | 70,600 | 64,117 | |||||||||
| Supermax Corp. Berhad (Miscellaneous Manufacturing) | 104,200 | 109,276 | |||||||||
| United Plantations Berhad (Agriculture) | 20,700 | 82,507 | |||||||||
| 255,900 | |||||||||||
| Netherlands - 2.8% | |||||||||||
| Brunel International (Commercial Services & Supplies) | 2,527 | 71,526 | |||||||||
| Kas Bank NV (Financial Services) | 4,938 | 101,563 | |||||||||
| 173,089 | |||||||||||
| New Zealand - 0.9% | |||||||||||
| Sanford Ltd. (Food) | 16,253 | 56,489 | |||||||||
| Singapore - 4.0% | |||||||||||
| Goodpack Ltd. (Trucking & Leasing) | 109,000 | 98,498 | |||||||||
| KS Energy Services Ltd. (Oil & Gas Services) | 98,000 | 77,239 | |||||||||
| Tat Hong Holdings Ltd. (Distribution/Wholesale) | 99,000 | 72,354 | |||||||||
| 248,091 | |||||||||||
| South Korea - 2.1% | |||||||||||
| Binggrae Co., Ltd. (Food) | 1,700 | 63,925 | |||||||||
| Han Kuk Carbon Co., Ltd. (Chemicals) | 13,100 | 67,917 | |||||||||
| 131,842 | |||||||||||
| Spain - 1.1% | |||||||||||
| Construcciones y Auxiliar de Ferrocarriles SA (Transportation) | 142 | 69,903 | |||||||||
See Notes to Financial Statements
21
Harding, Loevner Funds, Inc.
International Small Companies Portfolio
Statement of Net Assets
October 31, 2009 (continued)
| Shares | Value (1) | ||||||||||
| Sweden - 4.5% | |||||||||||
| KABE Husvagnar AB, Class B (Miscellaneous Manufacturing) | 9,600 | $ | 105,606 | ||||||||
| Mekonomen AB (Automotive) | 5,200 | 101,443 | |||||||||
| Studsvik AB (Environmental Controls) | 7,100 | 74,587 | |||||||||
| 281,636 | |||||||||||
| Switzerland - 1.1% | |||||||||||
| Lem Holding SA (Electronics) | 246 | 70,875 | |||||||||
| Taiwan - 4.9% | |||||||||||
| Merida Industry Co., Ltd. (Leisure Time) | 56,000 | 90,615 | |||||||||
| Nak Sealing Technologies Corp. (Automotive) | 56,000 | 49,359 | |||||||||
| Taiwan Paiho Ltd. (Miscellaneous Manufacturing) | 123,390 | 76,671 | |||||||||
| Youngtek Electronic Corp. (Semiconductors) | 39,642 | 86,232 | |||||||||
| 302,877 | |||||||||||
| Thailand - 1.2% | |||||||||||
| Khon Kaen Sugar Industry plc (Food) | 193,800 | 72,476 | |||||||||
| United Kingdom - 10.4% | |||||||||||
| Corin Group plc (Medical Supplies) | 72,577 | 83,973 | |||||||||
| Greggs plc (Food) | 10,700 | 75,588 | |||||||||
| Hamworthy KSE (Machinery - Diversified) | 15,852 | 66,137 | |||||||||
| PayPoint plc (Financial Services) | 9,097 | 66,821 | |||||||||
| Rathbone Brothers plc (Financial Services) | 6,130 | 92,807 | |||||||||
| Robert Wiseman Dairies plc (Food) | 9,051 | 65,951 | |||||||||
| RPS Group plc (Commercial Services & Supplies) | 28,526 | 97,882 | |||||||||
| Synergy Healthcare plc (Health Care Providers & Services) | 9,813 | 97,571 | |||||||||
| 646,730 | |||||||||||
| Total Common Stocks (Cost $6,372,605) | 6,127,951 | ||||||||||
| Preferred Stocks - 1.3% | |||||||||||
| Germany - 1.3% | |||||||||||
| Draegerwerk AG (Medical Supplies) | 2,182 | 78,178 | |||||||||
| Total Preferred Stocks (Cost $103,330) | 78,178 | ||||||||||
| Total Investments - 99.9% (Cost $6,475,935) | $ | 6,206,129 | |||||||||
See Notes to Financial Statements
22
Harding, Loevner Funds, Inc.
International Small Companies Portfolio
Statement of Net Assets
October 31, 2009 (continued)
| Value (1) | |||||||
| Liabilities, Net of Other Assets - 0.1% | |||||||
| Cash | $ | 23,288 | |||||
| Dividends and interest receivable | 7,516 | ||||||
| Foreign currency (cost $4,489) | 4,500 | ||||||
| Tax reclaim receivable | 4,613 | ||||||
| Prepaid expenses | 61 | ||||||
| Receivable from Investment Advisor | 12,565 | ||||||
| Payable for distribution fees | (12,847 | ) | |||||
| Other liabilities | (30,432 | ) | |||||
| 9,264 | |||||||
| Net Assets - 100% | |||||||
| Investor Class | |||||||
| Applicable to 696,734 outstanding $.001 par value units (authorized 250,000,000 shares) | $ | 6,215,393 | |||||
| Net Asset Value, Offering Price and Redemption Price Per Unit | $ | 8.92 | |||||
| Components of Net Assets as of October 31, 2009 were as follows: | |||||||
| Paid-in capital | $ | 6,792,548 | |||||
| Accumulated undistributed net investment income | 37,558 | ||||||
| Accumulated net realized loss from investment transactions | (340,563 | ) | |||||
| Net unrealized depreciation on investments and on assets and liabilities denominated in foreign currencies | (274,150 | ) | |||||
| $ | 6,215,393 | ||||||
Summary of Abbreviations
(1) See Note 2 to Financial Statements.
* Non-income producing security.
See Notes to Financial Statements
23
Harding, Loevner Funds, Inc.
Global Equity Portfolio — Overview
(unaudited)
October 31, 2009

| Returns for the Year Ended October 31, 2009 | |||||||||||||||||||||||
| Cumulative Total Returns | Average Annualized Total Return | ||||||||||||||||||||||
| FUND NAME | Last 12 Months | 5 YR | 10 YR | 5 YR | 10 YR | ||||||||||||||||||
| Global Equity Portfolio (Inception date 12/1/96) | 28.05 | % | 42.57 | % | 51.50 | % | 7.35 | % | 4.24 | % | |||||||||||||
| MSCI All Country World Index (Net dividend) | 22.66 | % | 20.04 | % | 10.00 | % | 3.72 | % | 0.96 | % | |||||||||||||
| Lipper Global Equity Fund Index | 19.51 | % | 20.14 | % | 23.09 | % | 3.74 | % | 2.10 | % | |||||||||||||
Performance data quoted represents past performance and does not guarantee future results. The investment return and principal value of an investment will fluctuate so that an investor's shares, when redeemed, may be worth more or less than their original cost. Performance current to the most recent month end may be lower or higher than the performance quoted and may be obtained by visiting the website at www.hardingloevnerfunds.com.
Investment return reflects voluntary fee waivers in effect. Absence such waivers, total return would be reduced. The performance provided does not reflect the deduction of taxes that a shareholder would pay on Portfolio distributions.
24
Harding, Loevner Funds, Inc.
Global Equity Portfolio — Overview
October 31, 2009
The Global Equity Portfolio gained 28.05% for the fiscal year ending October 31, 2009. In comparison, its benchmark, the MSCI All Country World Index, rose 22.66%.
Consistent with its investment objectives and policies, the Portfolio was invested primarily in the securities of global companies that exhibit the fundamental characteristics of growth, financial strength, management quality, and durable competitive advantage.
The Portfolio's outperformance was derived almost entirely from strong stock selection, especially in the Consumer Discretionary, Consumer Staples, and Health Care sectors, rather than from good allocation between sectors. Standout stocks in these sectors included Li & Fung (in the retailing industry group), Coach and Swatch (consumer durables and apparel), Olam International and Walgreen (food & staples retailing), and Medco Health Solutions and Sonova Holdings (health care equipment & services). These were partially offset by holdings in Energy, Financials, and Information Technology that lagged their industry groups, including Exxon Mobil (energy), Wells Fargo (banks), Schwab (diversified financials), Swiss Reinsurance (insurance), and Qualcomm and Keyence (technology & equipment).
Viewed geographically, stock selection in the US was especially strong, with our holdings in aggregate returning 25% versus the 10% return of the overall US market, led by eBay, Coach, Google, and Walgreen. Good stock selection also helped results in the UK (Standard Chartered) and Singapore (Olam International), partly offset by lagging results in Emerging Markets (China Merchants, Gazprom, Sasol, Telekom Indonesia, Teva Pharmaceuticals).
Past performance does not guarantee future results.
The Portfolio invests in foreign securities, which will involve greater volatility and political, economic, and currency risks and differences in accounting methods. It also invests in emerging markets, which involve unique risks, such as exposure to economies less diverse and mature than the U.S. or other more established foreign markets. Economic and political instability may cause larger price changes in emerging markets securities than other foreign securities. Investments in debt securities typically decrease in value when interest rates rise. This risk is usually greater for longer-term debt securities. Investment by the Portfolio in lower-rated and non-rated securities presents a greater risk of loss to principal and interest than higher-rated securities.
The MSCI All Country World Index is a free float-adjusted market capitalization index that is designed to measure equity market performance in the global developed and emerging markets. The Index consists of 45 developed and emerging market countries. The Index is net of foreign withholding taxes on dividends. You cannot invest directly in this Index.
It is not possible to invest directly in an index.
25
Harding, Loevner Funds, Inc.
Global Equity Portfolio
Statement of Net Assets
October 31, 2009
| Industry | Percentage of Net Assets | ||||||
| Apparel | 2.3 | % | |||||
| Banks | 5.1 | ||||||
| Beverages, Food & Tobacco | 7.8 | ||||||
| Biotechnology | 1.5 | ||||||
| Chemicals | 5.8 | ||||||
| Commercial Services & Supplies | 5.2 | ||||||
| Communications | 7.7 | ||||||
| Computer Software & Processing | 6.4 | ||||||
| Cosmetics & Personal Care | 6.0 | ||||||
| Electrical Equipment | 5.7 | ||||||
| Financial Services | 4.2 | ||||||
| Gold and Silver Ores | 1.6 | ||||||
| Health Care Providers & Services | 1.1 | ||||||
| Holding Companies - Diversified | 2.3 | ||||||
| Internet | 7.3 | ||||||
| Media | 1.1 | ||||||
| Medical Supplies | 3.5 | ||||||
| Miscellaneous Manufacturing | 2.1 | ||||||
| Office/Business Equip | 1.2 | ||||||
| Oil & Gas | 6.6 | ||||||
| Oil & Gas Services | 2.0 | ||||||
| Pharmaceuticals | 5.9 | ||||||
| Retailers | 6.5 | ||||||
| Toys/Games/Hobbies | 0.6 | ||||||
| Total Investments | 99.5 | ||||||
| Other Assets Less Liabilities | 0.5 | * | |||||
| Net Assets | 100.0 | % | |||||
* Breakout of other assets and liabilities can be found on page 30.
See Notes to Financial Statements
26
Harding, Loevner Funds, Inc.
Global Equity Portfolio
Statement of Net Assets
October 31, 2009 (continued)
| Shares | Value (1) | ||||||||||
| Common Stocks - 99.5% | |||||||||||
| Australia - 3.0% | |||||||||||
| Cochlear Ltd. (Medical Supplies) | 16,730 | $ | 958,764 | ||||||||
| Rio Tinto Ltd. (Gold and Silver Ores) | 19,113 | 1,061,382 | |||||||||
| 2,020,146 | |||||||||||
| Austria - 0.8% | |||||||||||
| Erste Bank der Oesterreichischen Sparkassen AG (Banks) | 13,600 | 546,472 | |||||||||
| Bermuda - 1.9% | |||||||||||
| Bunge Ltd. (Beverages, Food & Tobacco) | 21,870 | 1,247,902 | |||||||||
| Canada - 1.9% | |||||||||||
| EnCana Corp. (Oil & Gas) | 22,890 | 1,267,877 | |||||||||
| China - 1.0% | |||||||||||
| China Merchants Holdings International Co., Ltd. (Holding Companies - Diversified) | 214,000 | 683,376 | |||||||||
| Denmark - 1.0% | |||||||||||
| Novo Nordisk A/S, Series B (Pharmaceuticals) | 10,700 | 665,426 | |||||||||
| France - 8.4% | |||||||||||
| Air Liquide (Chemicals) | 9,529 | 1,029,002 | |||||||||
| Dassault Systemes SA (Computer Software & Processing) | 16,850 | 971,457 | |||||||||
| L'Oreal SA (Cosmetics & Personal Care) | 15,410 | 1,570,528 | |||||||||
| LVMH Moet Hennessy Louis Vuitton SA (Beverages, Food & Tobacco) | 6,784 | 703,789 | |||||||||
| Schlumberger Ltd. (Oil & Gas Services) | 21,790 | 1,355,338 | |||||||||
| 5,630,114 | |||||||||||
| Germany - 3.0% | |||||||||||
| Fresenius AG (Health Care Providers & Services) | 14,420 | 717,345 | |||||||||
| Qiagen NV (Commercial Services & Supplies)* | 30,678 | 636,275 | |||||||||
| SAP AG - Sponsored ADR (Computer Software & Processing) | 14,130 | 639,665 | |||||||||
| 1,993,285 | |||||||||||
| Hong Kong - 2.7% | |||||||||||
| Li & Fung Ltd. (Commercial Services & Supplies) | 429,800 | 1,779,817 | |||||||||
| Indonesia - 1.2% | |||||||||||
| PT Telekomunikasi Indonesia - Sponsored ADR (Communications) | 23,780 | 806,380 | |||||||||
| Israel - 1.1% | |||||||||||
| Teva Pharmaceutical Industries Ltd. - Sponsored ADR (Pharmaceuticals) | 15,000 | 757,200 | |||||||||
| Japan - 6.8% | |||||||||||
| Canon Inc. - Sponsored ADR (Office/Business Equip) | 22,000 | 828,520 | |||||||||
| Fanuc Ltd. (Electrical Equipment) | 6,800 | 571,169 | |||||||||
| JSR Corp. (Chemicals) | 39,200 | 763,090 | |||||||||
| Keyence Corp. (Electrical Equipment) | 7,060 | 1,400,808 | |||||||||
| Nintendo Co., Ltd. (Toys/Games/Hobbies) | 1,500 | 382,501 | |||||||||
| So-net M3 Inc. (Commercial Services & Supplies) | 166 | 569,707 | |||||||||
| 4,515,795 | |||||||||||
See Notes to Financial Statements
27
Harding, Loevner Funds, Inc.
Global Equity Portfolio
Statement of Net Assets
October 31, 2009 (continued)
| Shares | Value (1) | ||||||||||
| Malaysia - 1.2% | |||||||||||
| Sime Darby Berhad (Holding Companies - Diversified) | 319,157 | $ | 824,541 | ||||||||
| Mexico - 1.5% | |||||||||||
| America Movil SA de CV, Series L - ADR (Communications) | 22,700 | 1,001,751 | |||||||||
| Russia - 2.2% | |||||||||||
| OAO Gazprom - Sponsored ADR (Oil & Gas) | 61,900 | 1,478,014 | |||||||||
| Singapore - 3.8% | |||||||||||
| Olam International Ltd. (Beverages, Food & Tobacco) | 1,310,100 | 2,511,803 | |||||||||
| South Africa - 1.0% | |||||||||||
| Sasol Ltd. (Oil & Gas) | 17,730 | 664,182 | |||||||||
| Sweden - 1.0% | |||||||||||
| Telefonaktiebolaget LM Ericsson - Class B - Sponsored ADR (Communications) | 66,200 | 688,480 | |||||||||
| Switzerland - 5.6% | |||||||||||
| Nestle SA - Sponsored ADR (Beverages, Food & Tobacco) | 16,455 | 765,486 | |||||||||
| Novartis AG - Registered (Pharmaceuticals) | 15,020 | 783,492 | |||||||||
| Sonova Holding AG (Medical Supplies) | 8,780 | 903,472 | |||||||||
| Swatch Group AG (Retailers) | 3,650 | 850,919 | |||||||||
| Synthes Inc. (Medical Supplies) | 3,840 | 455,695 | |||||||||
| 3,759,064 | |||||||||||
| United Kingdom - 4.1% | |||||||||||
| RPS Group plc (Commercial Services & Supplies) | 146,300 | 502,003 | |||||||||
| Standard Chartered plc (Banks) | 60,800 | 1,493,018 | |||||||||
| WPP plc (Media) | 80,470 | 721,648 | |||||||||
| 2,716,669 | |||||||||||
| United States - 46.3% | |||||||||||
| 3M Co. (Miscellaneous Manufacturing) | 18,870 | 1,388,266 | |||||||||
| Abbott Laboratories (Pharmaceuticals) | 21,680 | 1,096,358 | |||||||||
| Adobe Systems Inc. (Computer Software & Processing)* | 44,890 | 1,478,677 | |||||||||
| Charles Schwab Corp. (Financial Services) | 46,900 | 813,246 | |||||||||
| Cisco Systems Inc. (Communications)* | 81,015 | 1,851,193 | |||||||||
| Coach Inc. (Apparel) | 46,900 | 1,546,293 | |||||||||
| Colgate-Palmolive Co. (Cosmetics & Personal Care) | 15,250 | 1,199,108 | |||||||||
| eBay Inc. (Internet)* | 83,200 | 1,852,864 | |||||||||
| Emerson Electric Co. (Electrical Equipment) | 49,570 | 1,871,267 | |||||||||
| Exxon Mobil Corp. (Oil & Gas) | 13,590 | 973,995 | |||||||||
| Genzyme Corp. (Biotechnology)* | 20,450 | 1,034,770 | |||||||||
| Google Inc. - Class A (Internet)* | 3,167 | 1,697,892 | |||||||||
| Greenhill & Co. Inc. (Financial Services) | 11,700 | 1,008,891 | |||||||||
| JPMorgan Chase & Co. (Financial Services) | 23,000 | 960,710 | |||||||||
| Medco Health Solutions Inc. (Pharmaceuticals)* | 11,868 | 666,032 | |||||||||
| Oracle Corp. (Computer Software & Processing) | 55,110 | 1,162,821 | |||||||||
| Praxair Inc. (Chemicals) | 10,120 | 803,933 | |||||||||
| Procter & Gamble Co. (Cosmetics & Personal Care) | 21,300 | 1,235,400 | |||||||||
| Qualcomm Inc. (Communications) | 18,520 | 766,913 | |||||||||
| Sigma-Aldrich Corp. (Chemicals) | 24,700 | 1,282,671 | |||||||||
See Notes to Financial Statements
28
Harding, Loevner Funds, Inc.
Global Equity Portfolio
Statement of Net Assets
October 31, 2009 (continued)
| Shares | Value (1) | ||||||||||
| United States (continued) | |||||||||||
| Staples Inc. (Retailers) | 69,310 | $ | 1,504,027 | ||||||||
| Walgreen Co. (Retailers) | 53,550 | 2,025,796 | |||||||||
| Wells Fargo & Co. (Banks) | 50,850 | 1,399,392 | |||||||||
| Yahoo! Inc. (Internet)* | 83,700 | 1,330,830 | |||||||||
| 30,951,345 | |||||||||||
| Total Common Stocks (Cost $51,329,641) | 66,509,639 | ||||||||||
| Total Investments - 99.5% (Cost $51,329,641) | $ | 66,509,639 | |||||||||
See Notes to Financial Statements
29
Harding, Loevner Funds, Inc.
Global Equity Portfolio
Statement of Net Assets
October 31, 2009 (continued)
| Value (1) | |||||||
| Liabilities, Net of Other Assets - 0.5% | |||||||
| Cash | $ | 476,149 | |||||
| Dividends and interest receivable | 59,828 | ||||||
| Foreign currency (cost $2,659) | 2,773 | ||||||
| Tax reclaim receivable | 13,321 | ||||||
| Prepaid expenses | 223 | ||||||
| Payable to Investment Advisor | (14,440 | ) | |||||
| Payable for Fund units redeemed | (192,231 | ) | |||||
| Other liabilities | (44,949 | ) | |||||
| 300,674 | |||||||
| Net Assets - 100% | |||||||
| Institutional Class Applicable to 3,295,642 outstanding $.001 par value units (authorized 500,000,000 shares) | $ | 66,810,313 | |||||
| Net Asset Value, Offering Price and Redemption Price Per Unit | $ | 20.27 | |||||
| Components of Net Assets as of October 31, 2009 were as follows: | |||||||
| Paid-in capital | $ | 53,105,959 | |||||
| Accumulated undistributed net investment income | 149,249 | ||||||
| Accumulated net realized loss from investment transactions | (1,626,235 | ) | |||||
| Net unrealized appreciation on investments and on assets and liabilities denominated in foreign currencies | 15,181,340 | ||||||
| $ | 66,810,313 | ||||||
Summary of Abbreviations
ADR American Depository Receipt
(1) See Note 2 to Financial Statements.
* Non-income producing security.
See Notes to Financial Statements
30
Harding, Loevner Funds, Inc.
Statements of Operations
Year Ended October 31, 2009
| Emerging Markets Portfolio | International Equity Portfolio | ||||||||||
| Investment Income | |||||||||||
| Interest | $ | 11,751 | $ | 1,688 | |||||||
| Dividends (net of foreign withholding taxes of $3,655,161 and $598,510, respectively) | 26,227,411 | 5,126,101 | |||||||||
| Total investment income | 26,239,162 | 5,127,789 | |||||||||
| Expenses | |||||||||||
| Investment advisory fees (Note 3) | 14,921,754 | 1,668,949 | |||||||||
| Administration fees (Note 3) | 758,546 | 148,573 | |||||||||
| Distribution fees, Investor Class | — | 51,886 | |||||||||
| Custodian and accounting fees (Note 3) | 1,117,792 | 145,302 | |||||||||
| Directors' fees and expenses (Note 3) | 180,998 | 35,488 | |||||||||
| Shareholder record keeping fees (Note 3) | 117,029 | 64,508 | |||||||||
| Printing and postage fees | 353,788 | 57,757 | |||||||||
| State registration filing fees | 24,000 | 31,066 | |||||||||
| Professional fees | 255,085 | 75,299 | |||||||||
| Sub Transfer Agent Fees | 1,611,789 | 50,383 | |||||||||
| Other fees and expenses | 249,844 | 49,612 | |||||||||
| Total expenses | 19,590,625 | 2,378,823 | |||||||||
| Less Waiver of investment advisory fee (Note 3) | — | (107,630 | ) | ||||||||
| Net expenses | 19,590,625 | 2,271,193 | |||||||||
| Net investment income | 6,648,537 | 2,856,596 | |||||||||
| Realized and Unrealized Gain (Loss) | |||||||||||
| Net realized gain (loss) — | |||||||||||
| Investment transactions | (142,828,259 | ) | (11,874,044 | ) | |||||||
| Foreign currency transactions | (1,263,805 | ) | (69,544 | ) | |||||||
| Net realized (loss) | (144,092,064 | ) | (11,943,588 | ) | |||||||
| Change in unrealized appreciation (depreciation) — | |||||||||||
| Investments | 633,935,416 | 76,755,156 | |||||||||
| Translation of assets and liabilities denominated in foreign currencies | (1,610,307 | ) | 4,152 | ||||||||
| Net change in unrealized appreciation | 632,325,109 | 76,759,308 | |||||||||
| Net realized and unrealized gain | 488,233,045 | 64,815,720 | |||||||||
| Net increase in net assets resulting from operations | $ | 494,881,582 | $ | 67,672,316 | |||||||
See Notes to Financial Statements
31
Harding, Loevner Funds, Inc.
Statements of Operations (continued)
Year Ended October 31, 2009
| International Small Companies Portfolio | Global Equity Portfolio | ||||||||||
| Investment Income | |||||||||||
| Interest | $ | 28 | $ | 211 | |||||||
| Dividends (net of foreign withholding taxes of $11,381 and $41,540, respectively) | 108,040 | 737,251 | |||||||||
| Total investment income | 108,068 | 737,462 | |||||||||
| Expenses | |||||||||||
| Investment advisory fees (Note 3) | 48,410 | 440,171 | |||||||||
| Administration fees (Note 3) | 6,671 | 32,870 | |||||||||
| Distribution fees, Investor Class | 9,682 | — | |||||||||
| Custodian and accounting fees (Note 3) | 49,921 | 64,716 | |||||||||
| Directors' fees and expenses (Note 3) | 666 | 7,476 | |||||||||
| Shareholder record keeping fees (Note 3) | 30,452 | 31,940 | |||||||||
| Printing and postage fees | 2,255 | 13,033 | |||||||||
| State registration filing fees | 14,016 | 17,127 | |||||||||
| Professional fees | 35,074 | 76,145 | |||||||||
| Sub Transfer Agent Fees | 2,287 | 22,034 | |||||||||
| Other fees and expenses | 2,352 | 9,958 | |||||||||
| Total expenses | 201,786 | 715,470 | |||||||||
| Less Waiver/Reimbursement of Fund expenses from Investment Advisor (Note 3) | (134,013 | ) | (165,256 | ) | |||||||
| Net expenses | 67,773 | 550,214 | |||||||||
| Net investment income | 40,295 | 187,248 | |||||||||
| Realized and Unrealized Gain (Loss) | |||||||||||
| Net realized gain (loss) — | |||||||||||
| Investment transactions | (275,832 | ) | (1,571,426 | ) | |||||||
| Foreign currency transactions | (472 | ) | (31,919 | ) | |||||||
| Net realized (loss) | (276,304 | ) | (1,603,345 | ) | |||||||
| Change in unrealized appreciation (depreciation) — | |||||||||||
| Investments | 2,412,025 | 16,794,484 | |||||||||
| Translation of assets and liabilities denominated in foreign currencies | (4,062 | ) | 851 | ||||||||
| Net change in unrealized appreciation | 2,407,963 | 16,795,335 | |||||||||
| Net realized and unrealized gain | 2,131,659 | 15,191,990 | |||||||||
| Net increase in net assets resulting from operations | $ | 2,171,954 | $ | 15,379,238 | |||||||
See Notes to Financial Statements
32
Harding, Loevner Funds, Inc.
Statements of Changes in Net Assets
| Emerging Markets Portfolio | |||||||||||
| Year Ended October 31, 2009 | Year Ended October 31, 2008 | ||||||||||
| Increase in Net Assets From Operations | |||||||||||
| Net investment income | $ | 6,648,537 | $ | 43,649,519 | |||||||
| Net realized loss on investments and foreign currency transactions | (144,092,064 | ) | (22,939,239 | ) | |||||||
| Net change in unrealized appreciation (depreciation) on investments and translation of assets and liabilities denominated in foreign currencies | 632,325,109 | (1,373,615,678 | ) | ||||||||
| Net increase (decrease) in net assets resulting from operations | 494,881,582 | (1,352,905,398 | ) | ||||||||
| Distributions to Shareholders from: | |||||||||||
| Net investment income | (36,974,029 | ) | (4,690,474 | ) | |||||||
| Net realized gain from investments and foreign-currency related transactions | — | (129,872,683 | ) | ||||||||
| Total distributions to shareholders | (36,974,029 | ) | (134,563,157 | ) | |||||||
| Transactions in units of Common Stock | |||||||||||
| Proceeds from sale of units | 522,043,263 | 597,246,046 | |||||||||
| Net Asset Value of shares issued to shareholders upon reinvestment of dividends | 30,745,773 | 120,546,841 | |||||||||
| Cost of shares units | (556,153,126 | ) | (707,556,978 | ) | |||||||
| Redemption fees | 154,275 | 399,319 | |||||||||
| Net increase (decrease) in net assets from Fund share transactions | (3,209,815 | ) | 10,635,228 | ||||||||
| Net increase (decrease) in net assets | 454,697,738 | (1,476,833,327 | ) | ||||||||
| Net Assets | |||||||||||
| At beginning of year | 1,086,124,009 | 2,562,957,336 | |||||||||
| At end of year | $ | 1,540,821,747 | $ | 1,086,124,009 | |||||||
| Accumulated undistributed net investment income included in net assets | $ | 4,594,502 | $ | 36,583,212 | |||||||
See Notes to Financial Statements
33
Harding, Loevner Funds, Inc.
Statements of Changes in Net Assets (continued)
| International Equity Portfolio | |||||||||||
| Year Ended October 31, 2009 | Year Ended October 31, 2008 | ||||||||||
| Increase in Net Assets From Operations | |||||||||||
| Net investment income | $ | 2,856,596 | $ | 3,314,737 | |||||||
| Net realized gain (loss) on investments and foreign currency transactions | (11,943,588 | ) | 40,264,254 | ||||||||
| Net change in unrealized appreciation (depreciation) on investments and translation of assets and liabilities denominated in foreign currencies | 76,759,308 | (197,938,277 | ) | ||||||||
| Net increase (decrease) in net assets resulting from operations | 67,672,316 | (154,359,286 | ) | ||||||||
| Distributions to Shareholders from: | |||||||||||
| Net investment income | |||||||||||
| Investor Class | (160,740 | ) | (85,868 | ) | |||||||
| Institutional Class | (3,101,928 | ) | (2,611,777 | ) | |||||||
| Net realized gain from investments and foreign-currency related transactions | |||||||||||
| Investor Class | (2,318,758 | ) | (1,359,303 | ) | |||||||
| Institutional Class | (36,230,389 | ) | (29,187,907 | ) | |||||||
| Total distributions to shareholders | (41,811,815 | ) | (33,244,855 | ) | |||||||
| Transactions in units of Common Stock | |||||||||||
| Proceeds from sale of units | |||||||||||
| Investor Class | 24,524,810 | 7,489,395 | |||||||||
| Institutional Class | 37,754,041 | 13,994,514 | |||||||||
| Net Asset Value of shares issued to shareholders upon reinvestment of dividends | |||||||||||
| Investor Class | 2,337,103 | 1,330,261 | |||||||||
| Institutional Class | 38,985,473 | 30,928,420 | |||||||||
| Cost of units redeemed | |||||||||||
| Investor Class | (5,664,340 | ) | (3,696,097 | ) | |||||||
| Institutional Class | (29,797,831 | ) | (66,170,127 | ) | |||||||
| Redemption fees | |||||||||||
| Investor Class | 2,232 | 481 | |||||||||
| Institutional Class | 9,202 | 3,098 | |||||||||
| Net increase (decrease) in net assets from Fund share transactions | 68,150,690 | (16,120,055 | ) | ||||||||
| Net increase (decrease) in net assets | 94,011,191 | (203,724,196 | ) | ||||||||
| Net Assets | |||||||||||
| At beginning of year | 203,572,144 | 407,296,340 | |||||||||
| At end of year | $ | 297,583,335 | $ | 203,572,144 | |||||||
| Accumulated undistributed net investment income included in net assets | $ | 2,365,492 | $ | 2,842,758 | |||||||
See Notes to Financial Statements
34
Harding, Loevner Funds, Inc.
Statements of Changes in Net Assets (continued)
| International Small Companies Portfolio | |||||||||||
| Year Ended October 31, 2009 | Year Ended October 31, 2008 | ||||||||||
| Increase in Net Assets From Operations | |||||||||||
| Net investment income | $ | 40,295 | $ | 58,463 | |||||||
| Net realized loss on investments and foreign currency transactions | (276,304 | ) | (76,901 | ) | |||||||
| Net change in unrealized appreciation (depreciation) on investments and translation of assets and liabilities denominated in foreign currencies | 2,407,963 | (3,040,639 | ) | ||||||||
| Net increase (decrease) in net assets resulting from operations | 2,171,954 | (3,059,077 | ) | ||||||||
| Distributions to Shareholders from: | |||||||||||
| Net investment income | |||||||||||
| Investor Class | (35,907 | ) | (15,014 | ) | |||||||
| Net realized gain from investments and foreign-currency related transactions | |||||||||||
| Investor Class | — | (39,692 | ) | ||||||||
| Total distributions to shareholders | (35,907 | ) | (54,706 | ) | |||||||
| Transactions in units of Common Stock | |||||||||||
| Proceeds from sale of units | |||||||||||
| Investor Class | 1,954,457 | 2,368,797 | |||||||||
| Net Asset Value of shares issued to shareholders upon reinvestment of dividends | |||||||||||
| Investor Class | 35,907 | 54,707 | |||||||||
| Cost of units redeemed | |||||||||||
| Investor Class | (687,371 | ) | (1,737,767 | ) | |||||||
| Net increase in net assets from Fund unit transactions | 1,302,993 | 685,737 | |||||||||
| Net increase (decrease) in net assets | 3,439,040 | (2,428,046 | ) | ||||||||
| Net Assets | |||||||||||
| At beginning of year | 2,776,353 | 5,204,399 | |||||||||
| At end of year | $ | 6,215,393 | $ | 2,776,353 | |||||||
| Accumulated undistributed net investment income included in net assets | $ | 37,558 | $ | 33,643 | |||||||
See Notes to Financial Statements
35
Harding, Loevner Funds, Inc.
Statements of Changes in Net Assets (continued)
| Global Equity Portfolio | |||||||||||
| Year Ended October 31, 2009 | Year Ended October 31, 2008 | ||||||||||
| Increase in Net Assets From Operations | |||||||||||
| Net investment income | $ | 187,248 | $ | 188,392 | |||||||
| Net realized loss on investments and foreign currency transactions | (1,603,345 | ) | (49,681 | ) | |||||||
| Net change in unrealized appreciation (depreciation) on investments and translation of assets and liabilities denominated in foreign currencies | 16,795,335 | (16,291,482 | ) | ||||||||
| Net increase (decrease) in net assets resulting from operations | 15,379,238 | (16,152,771 | ) | ||||||||
| Distributions to Shareholders from: | |||||||||||
| Net investment income | (140,635 | ) | (117,879 | ) | |||||||
| Net realized gain from investments and foreign-currency related transactions | — | (2,820,181 | ) | ||||||||
| Total distributions to shareholders | (140,635 | ) | (2,938,060 | ) | |||||||
| Transactions in units of Common Stock | |||||||||||
| Proceeds from sale of units | 29,033,478 | 6,806,873 | |||||||||
| Net Asset Value of shares issued to shareholders upon reinvestment of dividends | 76,577 | 2,881,495 | |||||||||
| Cost of units redeemed | (3,752,668 | ) | (4,193,388 | ) | |||||||
| Redemption fees | 6,503 | 1,820 | |||||||||
| Net increase in net assets from Fund unit transactions | 25,363,890 | 5,496,800 | |||||||||
| Net increase (decrease) in net assets | 40,602,493 | (13,594,031 | ) | ||||||||
| Net Assets | |||||||||||
| At beginning of year | 26,207,820 | 39,801,851 | |||||||||
| At end of year | $ | 66,810,313 | $ | 26,207,820 | |||||||
| Accumulated undistributed net investment income included in net assets | $ | 149,249 | $ | 140,612 | |||||||
See Notes to Financial Statements
36
Harding, Loevner Funds, Inc.
Financial Highlights
| Emerging Markets Portfolio | |||||||||||||||||||||||
| For the Year Ended Oct. 31, 2009 | For the Year Ended Oct. 31, 2008 | For the Year Ended Oct. 31, 2007 | For the Year Ended Oct. 31, 2006 | For the Year Ended Oct. 31, 2005 | |||||||||||||||||||
| Per Share Data | |||||||||||||||||||||||
| Net asset value, beginning of year | $ | 27.73 | $ | 64.07 | $ | 40.67 | $ | 30.41 | $ | 22.31 | |||||||||||||
| Increase (Decrease) in Net Assets from Operations | |||||||||||||||||||||||
| Net investment income | 0.26 | 1.12 | 0.16 | 0.22 | 0.11 | ||||||||||||||||||
| Net realized and unrealized gain (loss) on investments and foreign currency-related transactions | 12.68 | (34.06 | ) | 23.26 | 10.19 | 8.43 | |||||||||||||||||
| Net increase (decrease) from investment operations | 12.94 | (32.94 | ) | 23.42 | 10.41 | 8.54 | |||||||||||||||||
| Distributions to Shareholders from: | |||||||||||||||||||||||
| Net investment income | (1.03 | ) | (0.12 | ) | (0.02 | ) | (0.09 | ) | (0.02 | ) | |||||||||||||
| Net realized gain from investments and foreign currency-related transactions | — | (3.28 | ) | — | (0.06 | ) | (0.42 | ) | |||||||||||||||
| Total distributions | (1.03 | ) | (3.40 | ) | (0.02 | ) | (0.15 | ) | (0.44 | ) | |||||||||||||
| Net asset value, end of year | $ | 39.64 | $ | 27.73 | $ | 64.07 | $ | 40.67 | $ | 30.41 | |||||||||||||
| Total Return | 48.44 | % | (54.17 | )% | 57.62 | % | 34.29 | % | 38.76 | % | |||||||||||||
| Ratios/Supplemental Data: | |||||||||||||||||||||||
| Net assets, end of year (000's) | $ | 1,540,822 | $ | 1,086,124 | $ | 2,562,957 | $ | 1,452,468 | $ | 690,968 | |||||||||||||
| Net expenses to average net assets | 1.64 | % | 1.61 | % | 1.60 | % | 1.63 | % | 1.68 | % | |||||||||||||
| Net investment income to average net assets | 0.56 | % | 2.10 | % | 0.36 | % | 0.61 | % | 0.87 | % | |||||||||||||
| Portfolio turnover rate | 48 | % | 46 | % | 29 | % | 59 | % | 36 | % | |||||||||||||
See Notes to Financial Statements
37
Harding, Loevner Funds, Inc.
Financial Highlights (continued)
| International Equity Portfolio - Investor Class | |||||||||||||||||||||||
| For the Year Ended Oct. 31, 2009 | For the Year Ended Oct. 31, 2008 | For the Year Ended Oct. 31, 2007 | For the Year Ended Oct. 31, 2006 | For the Year Ended Oct. 31, 2005 (1) | |||||||||||||||||||
| Per Share Data | |||||||||||||||||||||||
| Net asset value, beginning of year | $ | 11.41 | $ | 21.66 | $ | 18.65 | $ | 14.91 | $ | 15.63 | |||||||||||||
| Increase (Decrease) in Net Assets from Operations | |||||||||||||||||||||||
| Net investment income | 0.13 | 0.13 | 0.09 | 0.11 | (2) | 0.00 | * | ||||||||||||||||
| Net realized and unrealized gain (loss) on investments and foreign currency-related transactions | 2.83 | (8.58 | ) | 4.32 | 3.71 | (0.72 | ) | ||||||||||||||||
| Net increase (decrease) from investment operations | 2.96 | (8.45 | ) | 4.41 | 3.82 | (0.72 | ) | ||||||||||||||||
| Distributions to Shareholders from: | |||||||||||||||||||||||
| Net investment income | (0.15 | ) | (0.11 | ) | (0.06 | ) | (0.07 | ) | — | ||||||||||||||
| Net realized gain from investments and foreign currency-related transactions | (2.20 | ) | (1.69 | ) | (1.34 | ) | (0.01 | ) | — | ||||||||||||||
| Total distributions | (2.35 | ) | (1.80 | ) | (1.40 | ) | (0.08 | ) | — | ||||||||||||||
| Net asset value, end of year | $ | 12.02 | $ | 11.41 | $ | 21.66 | $ | 18.65 | $ | 14.91 | |||||||||||||
| Total Return | 32.48 | % | (42.46 | )% | 24.95 | % | 25.74 | % | (4.61 | )%(B) | |||||||||||||
| Ratios/Supplemental Data: | |||||||||||||||||||||||
| Net assets, end of period (000's) | $ | 38,134 | $ | 12,122 | $ | 16,637 | $ | 9,884 | $ | 510 | |||||||||||||
| Net expenses to average net assets | 1.25 | % | 1.23 | % | 1.23 | % | 1.25 | % | 1.25 | %(A) | |||||||||||||
| Net investment income (loss) to average net assets | 1.03 | % | 0.81 | % | 0.48 | % | 0.61 | % | (1.25 | )%(A) | |||||||||||||
| Decrease reflected in above expense ratios due to expense reductions | 0.14 | % | — | 0.00 | % | 0.01 | % | 0.08 | %(A) | ||||||||||||||
| Portfolio turnover rate | 22 | % | 18 | % | 19 | % | 35 | % | 38 | %(B) | |||||||||||||
(1) For the period September 30, 2005 (commencement of operations) through October 31, 2005.
(2) Computed using average units outstanding throughout the year.
* Rounds to less than $(0.01).
(A) Annualized.
(B) Not Annualized.
See Notes to Financial Statements
38
Harding, Loevner Funds, Inc.
Financial Highlights (continued)
| International Small Companies Portfolio - Investor Class | |||||||||||||||
| For the Year Ended Oct. 31, 2009 | For the Year Ended Oct. 31, 2008 | For the Year Ended Oct. 31, 2007 (1) | |||||||||||||
| Per Share Data | |||||||||||||||
| Net asset value, beginning of year | $ | 5.53 | $ | 11.67 | $ | 10.00 | |||||||||
| Increase (Decrease) in Net Assets from Operations | |||||||||||||||
| Net investment income | 0.06 | 0.11 | 0.02 | ||||||||||||
| Net realized and unrealized gain (loss) on investments and foreign currency-related transactions | 3.40 | (6.15 | ) | 1.65 | |||||||||||
| Net increase (decrease) from investment operations | 3.46 | (6.04 | ) | 1.67 | |||||||||||
| Distributions to Shareholders from: | |||||||||||||||
| Net investment income | (0.07 | ) | (0.03 | ) | — | ||||||||||
| Net realized gain from investments and foreign currency-related transactions | — | (0.07 | ) | — | |||||||||||
| Total distributions | (0.07 | ) | (0.10 | ) | — | ||||||||||
| Net asset value, end of year | $ | 8.92 | $ | 5.53 | $ | 11.67 | |||||||||
| Total Return | 63.47 | % | (52.17 | )% | 16.70 | %(B) | |||||||||
| Ratios/Supplemental Data: | |||||||||||||||
| Net assets, end of period (000's) | $ | 6,215 | $ | 2,776 | $ | 5,204 | |||||||||
| Net expenses to average net assets | 1.75 | % | 1.75 | % | 1.75 | %(A) | |||||||||
| Net investment income to average net assets | 1.04 | % | 1.22 | % | 0.56 | %(A) | |||||||||
| Decrease reflected in above expense ratios due to expense reductions | 3.46 | % | 2.47 | % | 8.19 | %(A) | |||||||||
| Portfolio turnover rate | 24 | % | 26 | % | 12 | %(B) | |||||||||
(1) For the period from March 26, 2007 (commencement of operations) through October 31, 2007.
(A) Annualized.
(B) Not Annualized.
See Notes to Financial Statements
39
Harding, Loevner Funds, Inc.
Financial Highlights (continued)
| Global Equity Portfolio | |||||||||||||||||||||||
| For the Year Ended Oct. 31, 2009 | For the Year Ended Oct. 31, 2008 | For the Year Ended Oct. 31, 2007 | For the Year Ended Oct. 31, 2006 | For the Year Ended Oct. 31, 2005 | |||||||||||||||||||
| Per Share Data | |||||||||||||||||||||||
| Net asset value, beginning of year | $ | 15.92 | $ | 28.03 | $ | 24.04 | $ | 20.36 | $ | 17.17 | |||||||||||||
| Increase (Decrease) in Net Assets from Operations | |||||||||||||||||||||||
| Net investment income | 0.06 | 0.12 | 0.09 | 0.08 | 0.09 | ||||||||||||||||||
| Net realized and unrealized gain (loss) on investments and foreign currency-related transactions | 4.38 | (10.15 | ) | 5.78 | 4.14 | 3.12 | |||||||||||||||||
| Net increase (decrease) from investment operations | 4.44 | (10.03 | ) | 5.87 | 4.22 | 3.21 | |||||||||||||||||
| Distributions to Shareholders from: | |||||||||||||||||||||||
| Net investment income | (0.09 | ) | (0.08 | ) | (0.08 | ) | (0.06 | ) | (0.02 | ) | |||||||||||||
| Net realized gain from investments and foreign currency-related transactions | — | (2.00 | ) | (1.80 | ) | (0.48 | ) | — | |||||||||||||||
| Total distributions | (0.09 | ) | (2.08 | ) | (1.88 | ) | (0.54 | ) | (0.02 | ) | |||||||||||||
| Net asset value, end of year | $ | 20.27 | $ | 15.92 | $ | 28.03 | $ | 24.04 | $ | 20.36 | |||||||||||||
| Total Return | 28.05 | % | (38.54 | )% | 26.01 | % | 21.08 | % | 18.72 | % | |||||||||||||
| Ratios/Supplemental Data: | |||||||||||||||||||||||
| Net assets, end of period (000's) | $ | 66,810 | $ | 26,208 | $ | 39,802 | $ | 31,106 | $ | 25,317 | |||||||||||||
| Net expenses to average net assets | 1.25 | % | 1.25 | % | 1.25 | % | 1.25 | % | 1.25 | % | |||||||||||||
| Net investment income to average net assets | 0.43 | % | 0.51 | % | 0.34 | % | 0.37 | % | 0.44 | % | |||||||||||||
| Decrease reflected in above expense ratios due to expense reductions | 0.38 | % | 0.20 | % | 0.18 | % | 0.35 | % | 0.36 | % | |||||||||||||
| Portfolio turnover rate | 31 | % | 38 | % | 16 | % | 27 | % | 35 | % | |||||||||||||
See Notes to Financial Statements
40
Harding, Loevner Funds, Inc.
Notes to Financial Statements
October 31, 2009
1. Organization
Harding, Loevner Funds, Inc. (the "Fund") was organized as a Maryland corporation on July 31, 1996 and is registered under the Investment Company Act of 1940, as amended, ("1940 Act"), as an open-end diversified management investment company. The Fund currently has six Portfolios all of which were active as of October 31, 2009: International Equity Portfolio ("International Equity"); Global Equity Portfolio ("Global Equity"); Institutional Emerging Markets Portfolio, Emerging Markets Portfolio ("Emerging Markets"); International Small Companies Portfolio ("International Small Companies") and Frontier Emerging Markets Portfolio ("Frontier Emerging Markets"). Information presented in these financial statements pertains to Emerging Markets and Global Equity and Investor Class shares of International Equity and International Small Companies (individually, "Portfolio"; collectively, "Portfolios"). Information pertaining to Institutional Class sha res of International Equity Portfolio, Frontier Emerging Markets Portfolio and Institutional Emerging Markets Portfolio is presented in a separate report. The investment objective of each Portfolio is as follows: Emerging Markets—to seek long-term capital appreciation through investments in equity securities of companies based in emerging markets; International Equity—to seek long-term capital appreciation through investments in equity securities of companies based outside the United States; International Small Companies—to seek long-term capital appreciation through investments in equity securities of small companies based outside the United States; Global Equity—to seek long-term capital appreciation through investments in equity securities of companies based both inside and outside the United States.
Emerging Markets commenced operations on November 9, 1998. International Equity commenced operations on October 31, 1996 after acquiring the net assets of Harding Loevner LP's AMT Capital Fund, Inc. Effective August 5, 2005, International Equity Portfolio launched Investor Class Shares and converted existing shareholders to the Institutional Class. Investor Class of International Small Companies Portfolio commenced operations on March 26, 2007. Global Equity Portfolio commenced operations on December 1, 1996 following the acquisition of net assets of HLM Global Equity Limited Partnership, a limited partnership, in a tax-free reorganization. Effective November 3, 2009, Global Equity Portfolio launched Institutional Class shares and converted existing shareholders to the Advisor Class.
On August 26, 2009, Harding Loevner LLC, investment adviser to the Fund, its parent company, HLM Holdings, Inc., and certain shareholders of HLM Holdings consummated an agreement with Affiliated Managers Group, Inc. ("AMG") pursuant to which Harding Loevner LLC agreed to sell a majority interest in its business to AMG. AMG is a publicly traded Delaware corporation listed on the New York Stock Exchange. As part of the transaction, Harding Loevner LLC transferred its business to a new entity, Harding Loevner LP, and AMG acquired a majority interest in Harding Loevner LP.
The Fund is managed by Harding Loevner LP (the "Investment Advisor").
2. Summary of Significant Accounting Policies
The accounting policies of the Fund are in conformity with accounting principles generally accepted in the United States ("GAAP") for investment companies. The following is a summary of the Fund's significant accounting policies:
Indemnifications
Under the Fund's organizational document, its officers and Board are indemnified against certain liability arising out of the performance of their duties to the Portfolios. In the normal course of business, the Fund may enter into contracts that contain a variety of representations or that provide indemnification for certain liabilities. The Fund's maximum exposure under these arrangements is unknown, as this would involve future claims that may be made against the Fund that have not yet occurred. However, the Fund has not had prior claims or losses pursuant to these contracts and expects the risk of loss to be remote.
Estimates
The preparation of financial statements in accordance with GAAP requires management to make estimates and assumptions that affect the reported amounts and disclosures in the financial statements. Actual results could differ from those estimates.
Valuation
The Board has adopted procedures ("Procedures") to govern the valuation of the securities held by each Portfolio of the Fund in accordance with the 1940 Act. The Procedures incorporate principles set forth in relevant pronouncements of the Securities and Exchange Commission ("SEC") and its staff, including guidance on the obligations of the Portfolios and their Directors to determine, in good faith, the fair value of the Portfolios' securities when market quotations are not readily available.
41
Harding, Loevner Funds, Inc.
Notes to Financial Statements (continued)
October 31, 2009
2. Summary of Significant Accounting Policies (continued)
All investments in the Portfolios are valued daily at their market prices, which results in unrealized gains or losses. Securities traded on an exchange are valued at their last sales price on that exchange. Securities for which no sales are reported are valued at the latest bid price obtained from a quotation reporting system or from established market makers. Repurchase agreements are valued at their amortized cost plus accrued interest. Securities for which market quotations are not readily available are fair valued by the Board or its delegate in accordance with the Procedures, although the actual calculations may be done by others. Factors considered in making this determination may include, but are not limited to, information obtained by contacting the issuer, analysts, or the appropriate stock exchange (for exchange-traded securities), analysis of the issuer's financial statements or other available documents and, if necessary, availa ble information concerning other securities in similar circumstances. If a significant event occurs after the close of trading but before the calculation of the Portfolio's net asset value and such significant event has a material impact on the Portfolio's net asset value per share (i.e. more than $0.01 per share), then the security may be fair valued in accordance with the Procedures. As of October 31, 2009, there was one security in the International Equity Portfolio which required valuation by the Board or its delegate. The Fund has implemented additional fair value pricing on a daily basis for all foreign equity securities held by the Portfolios. The fair value pricing utilizes quantitative models developed by an independent pricing service unless the Fund determines that use of another additional fair valuation methodology is appropriate.
GAAP establishes a hierarchy for net asset value determination purposes in which various inputs are used in determining the value of each Portfolio's assets or liabilities. GAAP defines fair value as the price that the Portfolio would receive upon selling an investment in a timely transaction to an independent buyer in the principal or most advantageous market of the investment. GAAP established a three-tier hierarchy to maximize the use of observable market data and minimize the use of unobservable inputs and to establish classification of fair value measurements for disclosure purposes. Inputs may be observable or unobservable and refer broadly to the assumptions that market participants would use in pricing the asset or liability including assumptions about risk. Such risks include the inherent risk in a particular valuation technique which is used to measure fair value. This may include the pricing model and/or the inputs to the pricing model used in the valuation technique. Observable inputs are inputs that reflect the assumptions market participants would use in pricing the asset or liability developed based on market data obtained from sources independent of the reporting entity. Unobservable inputs are inputs that reflect the reporting entity's own assumptions about the assumptions market participants would use in pricing the asset or liability developed based on the best information available in the circumstances. The three-tier hierarchy of inputs is summarized in the three broad levels listed below.
Level 1—quoted prices in active markets for identical investments
Level 2—other significant observable inputs (including quoted prices for similar investments, interest rates, prepayment speeds, credit risk, etc.)
Level 3—significant unobservable inputs (including the Portfolio's own assumptions in determining the fair value of investments)
GAAP provides additional guidance for estimating fair value when the volume and level of activity for the asset or liability have significantly decreased as well as guidance on identifying circumstances that indicate a transaction is not orderly.
42
Harding, Loevner Funds, Inc.
Notes to Financial Statements (continued)
October 31, 2009
2. Summary of Significant Accounting Policies (continued)
The following is a summary of the inputs used as of October 31, 2009 in valuing the Portfolio's investments:
Emerging Markets
ASSETS VALUATION INPUT
| Description | Quoted Prices in Active Markets for Identical Assets (Level 1) | Significant Other Observable Inputs (Level 2) | Significant Unobservable Inputs (Level 3) | Total | |||||||||||||||
| Common Stocks | |||||||||||||||||||
| Brazil | $ | 263,461,004 | $ | — | $ | — | $ | 263,461,004 | |||||||||||
| Cayman Islands | 14,212,440 | — | — | 14,212,440 | |||||||||||||||
| Chile | 38,465,139 | — | — | 38,465,139 | |||||||||||||||
| China | 16,171,430 | 151,728,017 | — | 167,899,447 | |||||||||||||||
| Colombia | 17,268,754 | — | — | 17,268,754 | |||||||||||||||
| Czech Republic | 13,223,640 | — | — | 13,223,640 | |||||||||||||||
| Egypt | — | 16,341,977 | — | 16,341,977 | |||||||||||||||
| Greece | — | 13,946,578 | — | 13,946,578 | |||||||||||||||
| Hungary | — | 8,404,874 | — | 8,404,874 | |||||||||||||||
| India | 26,380,153 | 53,024,764 | — | 79,404,917 | |||||||||||||||
| Indonesia | 19,716,969 | 17,708,576 | — | 37,425,545 | |||||||||||||||
| Israel | 24,497,944 | 21,001,512 | — | 45,499,456 | |||||||||||||||
| Luxembourg | 16,673,826 | — | — | 16,673,826 | |||||||||||||||
| Malaysia | — | 18,041,295 | — | 18,041,295 | |||||||||||||||
| Mexico | 105,404,626 | — | — | 105,404,626 | |||||||||||||||
| Panama | 14,227,287 | — | — | 14,227,287 | |||||||||||||||
| Peru | 17,084,925 | — | — | 17,084,925 | |||||||||||||||
| Philippines | 6,780,560 | — | — | 6,780,560 | |||||||||||||||
| Poland | 12,263,562 | 16,215,115 | — | 28,478,677 | |||||||||||||||
| Russia | 33,573,809 | 58,243,930 | — | 91,817,739 | |||||||||||||||
| South Africa | — | 89,043,270 | — | 89,043,270 | |||||||||||||||
| South Korea | 21,790,947 | 112,841,893 | — | 134,632,840 | |||||||||||||||
| Taiwan | — | 145,537,053 | — | 145,537,053 | |||||||||||||||
| Thailand | 41,596,886 | — | — | 41,596,886 | |||||||||||||||
| Turkey | — | 37,648,045 | — | 37,648,045 | |||||||||||||||
| United Kingdom | — | 18,145,625 | — | 18,145,625 | |||||||||||||||
| Total Common Stocks | 702,793,901 | 777,872,524 | — | 1,480,666,425 | |||||||||||||||
| Preferred Stocks | |||||||||||||||||||
| Brazil | 2,166,480 | — | — | 2,166,480 | |||||||||||||||
| Russia | |||||||||||||||||||
| Oil & Gas | 23,403,000 | — | — | 23,403,000 | |||||||||||||||
| Total Preferred Stocks | 25,569,480 | — | — | 25,569,480 | |||||||||||||||
| Total Investments | 728,363,381 | 777,872,524 | — | 1,506,235,905 | |||||||||||||||
| Total | $ | 728,363,381 | $ | 777,872,524 | $ | — | $ | 1,506,235,905 | |||||||||||
43
Harding, Loevner Funds, Inc.
Notes to Financial Statements (continued)
October 31, 2009
2. Summary of Significant Accounting Policies (continued)
International Equity
ASSETS VALUATION INPUT
| Description | Quoted Prices in Active Markets for Identical Assets (Level 1) | Significant Other Observable Inputs (Level 2) | Significant Unobservable Inputs (Level 3) | Total | |||||||||||||||
| Common Stocks | |||||||||||||||||||
| Australia | $ | — | $ | 5,375,496 | $ | — | $ | 5,375,496 | |||||||||||
| Austria | — | 5,995,923 | — | 5,995,923 | |||||||||||||||
| Bermuda | 7,376,717 | — | — | 7,376,717 | |||||||||||||||
| Brazil | 2,444,483 | — | — | 2,444,483 | |||||||||||||||
| Canada | 9,593,632 | — | — | 9,593,632 | |||||||||||||||
| China | — | 8,151,832 | — | 8,151,832 | |||||||||||||||
| Finland | 5,866,676 | — | — | 5,866,676 | |||||||||||||||
| France | 5,187,480 | 39,865,776 | — | 45,053,256 | |||||||||||||||
| Germany | — | 17,319,069 | — | 17,319,069 | |||||||||||||||
| Hong Kong | — | 10,136,847 | — | 10,136,847 | |||||||||||||||
| Indonesia | 5,254,015 | — | — | 5,254,015 | |||||||||||||||
| Israel | 2,229,197 | — | — | 2,229,197 | |||||||||||||||
| Japan | — | 42,424,127 | — | 42,424,127 | |||||||||||||||
| Malaysia | — | 6,652,016 | — | 6,652,016 | |||||||||||||||
| Mexico | 12,781,342 | — | — | 12,781,342 | |||||||||||||||
| Poland | — | — | 2,857,825 | 2,857,825 | |||||||||||||||
| Russia | — | 6,699,294 | — | 6,699,294 | |||||||||||||||
| Singapore | — | 9,816,953 | — | 9,816,953 | |||||||||||||||
| South Africa | — | 2,084,364 | — | 2,084,364 | |||||||||||||||
| South Korea | — | 5,908,235 | — | 5,908,235 | |||||||||||||||
| Sweden | — | 6,977,482 | — | 6,977,482 | |||||||||||||||
| Switzerland | 17,300,224 | 10,849,775 | — | 28,149,999 | |||||||||||||||
| Taiwan | — | 6,056,939 | — | 6,056,939 | |||||||||||||||
| United Kingdom | — | 34,937,078 | — | 34,937,078 | |||||||||||||||
| Total Common Stocks | 68,033,766 | 219,251,206 | 2,857,825 | 290,142,797 | |||||||||||||||
| Preferred Stocks | |||||||||||||||||||
| Brazil | 2,222,648 | — | — | 2,222,648 | |||||||||||||||
| Total Preferred Stocks | 2,222,648 | — | — | 2,222,648 | |||||||||||||||
| Total Investments | 70,256,414 | 219,251,206 | 2,857,825 | 292,365,445 | |||||||||||||||
| Total | $ | 70,256,414 | $ | 219,251,206 | $ | 2,857,825 | $ | 292,365,445 | |||||||||||
44
Harding, Loevner Funds, Inc.
Notes to Financial Statements (continued)
October 31, 2009
2. Summary of Significant Accounting Policies (continued)
International Small Companies
ASSETS VALUATION INPUT
| Description | Quoted Prices in Active Markets for Identical Assets (Level 1) | Significant Other Observable Inputs (Level 2) | Significant Unobservable Inputs (Level 3) | Total | |||||||||||||||
| Common Stocks | |||||||||||||||||||
| Australia | $ | — | $ | 444,766 | $ | — | $ | 444,766 | |||||||||||
| Austria | — | 180,211 | — | 180,211 | |||||||||||||||
| Belgium | — | 75,744 | — | 75,744 | |||||||||||||||
| Canada | 171,749 | — | — | 171,749 | |||||||||||||||
| China | — | 259,288 | — | 259,288 | |||||||||||||||
| Denmark | — | 167,534 | — | 167,534 | |||||||||||||||
| Finland | — | 149,147 | — | 149,147 | |||||||||||||||
| France | — | 242,524 | — | 242,524 | |||||||||||||||
| Germany | — | 389,595 | — | 389,595 | |||||||||||||||
| Hong Kong | — | 307,848 | — | 307,848 | |||||||||||||||
| Ireland | 65,962 | 83,779 | — | 149,741 | |||||||||||||||
| Italy | — | 305,824 | — | 305,824 | |||||||||||||||
| Japan | — | 974,072 | — | 974,072 | |||||||||||||||
| Malaysia | — | 255,900 | — | 255,900 | |||||||||||||||
| Netherlands | — | 173,089 | — | 173,089 | |||||||||||||||
| New Zealand | — | 56,489 | — | 56,489 | |||||||||||||||
| Singapore | — | 248,091 | — | 248,091 | |||||||||||||||
| South Korea | — | 131,842 | — | 131,842 | |||||||||||||||
| Spain | — | 69,903 | — | 69,903 | |||||||||||||||
| Sweden | — | 281,636 | — | 281,636 | |||||||||||||||
| Switzerland | — | 70,875 | — | 70,875 | |||||||||||||||
| Taiwan | — | 302,877 | — | 302,877 | |||||||||||||||
| Thailand | 72,476 | — | — | 72,476 | |||||||||||||||
| United Kingdom | — | 646,730 | — | 646,730 | |||||||||||||||
| Total Common Stocks | 310,187 | 5,817,764 | — | 6,127,951 | |||||||||||||||
| Preferred Stocks | |||||||||||||||||||
| Germany | — | 78,178 | — | 78,178 | |||||||||||||||
| Total Preferred Stocks | — | 78,178 | — | 78,178 | |||||||||||||||
| Total Investments | 310,187 | 5,895,942 | — | 6,206,129 | |||||||||||||||
| Total | $ | 310,187 | $ | 5,895,942 | $ | — | $ | 6,206,129 | |||||||||||
45
Harding, Loevner Funds, Inc.
Notes to Financial Statements (continued)
October 31, 2009
2. Summary of Significant Accounting Policies (continued)
Global Equity
ASSETS VALUATION INPUT
| Description | Quoted Prices in Active Markets for Identical Assets (Level 1) | Significant Other Observable Inputs (Level 2) | Significant Unobservable Inputs (Level 3) | Total | |||||||||||||||
| Common Stocks | |||||||||||||||||||
| Australia | $ | — | $ | 2,020,146 | $ | — | $ | 2,020,146 | |||||||||||
| Austria | — | 546,472 | — | 546,472 | |||||||||||||||
| Bermuda | 1,247,902 | — | — | 1,247,902 | |||||||||||||||
| Canada | 1,267,877 | — | — | 1,267,877 | |||||||||||||||
| China | — | 683,376 | — | 683,376 | |||||||||||||||
| Denmark | — | 665,426 | — | 665,426 | |||||||||||||||
| France | 1,355,338 | 4,274,776 | — | 5,630,114 | |||||||||||||||
| Germany | 639,665 | 1,353,620 | — | 1,993,285 | |||||||||||||||
| Hong Kong | — | 1,779,817 | — | 1,779,817 | |||||||||||||||
| Indonesia | 806,380 | — | — | 806,380 | |||||||||||||||
| Israel | 757,200 | — | — | 757,200 | |||||||||||||||
| Japan | 828,520 | 3,687,275 | — | 4,515,795 | |||||||||||||||
| Malaysia | — | 824,541 | — | 824,541 | |||||||||||||||
| Mexico | 1,001,751 | — | — | 1,001,751 | |||||||||||||||
| Russia | — | 1,478,014 | — | 1,478,014 | |||||||||||||||
| Singapore | — | 2,511,803 | — | 2,511,803 | |||||||||||||||
| South Africa | — | 664,182 | — | 664,182 | |||||||||||||||
| Sweden | 688,480 | — | — | 688,480 | |||||||||||||||
| Switzerland | 765,486 | 2,993,578 | — | 3,759,064 | |||||||||||||||
| United Kingdom | — | 2,716,669 | — | 2,716,669 | |||||||||||||||
| United States | 30,951,345 | — | — | 30,951,345 | |||||||||||||||
| Total Common Stocks | 40,309,944 | 26,199,695 | — | 66,509,639 | |||||||||||||||
| Total Investments | 40,309,944 | 26,199,695 | — | 66,509,639 | |||||||||||||||
| Total | $ | 40,309,944 | $ | 26,199,695 | $ | — | $ | 66,509,639 | |||||||||||
Following is a reconciliation of investments for which significant unobservable inputs (Level 3) were used in determining value:
Asset Valuation Inputs
| Investments in Securities | |||||||||||||||||||||||||||||||||||||||||||
| International Equity | Balance as of October 31, 2008 | Accrued Discounts (Premiums) | Realized Gain (Loss) | Change in Unrealized Appreciation (Depreciation) | Net Purchases | Net Sales | Net Transfers in to Level 3 | Net Transfers out of Level 3 | Balance as of October 31, 2009 | Change in Unrealized Appreciation (Depreciation) from Investments Held at October 31, 2009 | |||||||||||||||||||||||||||||||||
| Common | |||||||||||||||||||||||||||||||||||||||||||
| Stocks | |||||||||||||||||||||||||||||||||||||||||||
| Poland | $ | 2,150,488 | $ | 0 | $ | 0 | $ | 456,787 | $ | 250,550 | $ | 0 | $ | 0 | $ | 0 | $ | 2,857,825 | $ | 456,787 | |||||||||||||||||||||||
| Total | $ | 2,150,488 | $ | 0 | $ | 0 | $ | 456,787 | $ | 250,550 | $ | 0 | $ | 0 | $ | 0 | $ | 2,857,825 | $ | 456,787 | |||||||||||||||||||||||
46
Harding, Loevner Funds, Inc.
Notes to Financial Statements (continued)
October 31, 2009
2. Summary of Significant Accounting Policies (continued)
Securities
All securities transactions are recorded on a trade date basis. Interest income and expenses are recorded on an accrual basis. Dividend income is recorded on the ex-dividend date (except for certain foreign dividends that may be recorded as soon as the Portfolio is informed of such dividends). The Portfolios accrete discount or amortize premium using the effective interest method on a daily basis as adjustments to interest income and the cost of investments. The Portfolios use the specific identification method for determining realized gains or losses from sales of securities.
Income Tax
It is the policy of each Portfolio of the Fund to qualify as a regulated investment company by complying with the applicable provisions of the Internal Revenue Code, and to make distributions of taxable income sufficient to relieve it from substantially all federal income and excise taxes.
Management has performed an analysis of each Portfolios' tax positions for the open tax years as of October 31, 2009 and has concluded that no provisions for income tax are required. The Portfolios' federal tax returns for the prior three fiscal years (open tax years: October 31, 2006; October 31, 2007; October 31, 2008; October 31, 2009) remain subject to examination by the Internal Revenue Service. Management is not aware of any events that are reasonably possible to occur in the next twelve months that would result in the amounts of any unrecognized tax benefits significantly increasing or decreasing for the Portfolios. However, management's conclusions regarding tax positions taken may be subject to review and adjustment at a later date based on factors including, but not limited to, new tax laws and accounting regulations and interpretations thereof.
Expenses
Expenses directly attributed to a specific Portfolio of the Fund are charged to that Portfolio's operations; expenses not directly attributable to a specific Portfolio are allocated among all the Portfolios of the Fund either equitably or based on their average daily net assets. As of July 1, 2009, pursuant to the Fund's multiple class expense allocation plan, certain expenses are allocated to particular classes of the International Equity Portfolio.
Dividends to Shareholders
It is the policy of the Portfolios to declare dividends from net investment income annually. Net short-term and long-term capital gains distributions for the Portfolios, if any, normally are distributed on an annual basis.
Dividends from net investment income and distributions from net realized gains from investment transactions have been determined in accordance with income tax regulations and may differ from net investment income and realized gains recorded by the Portfolios for financial reporting purposes. Differences result primarily from foreign currency transactions and timing differences related to recognition of income, and gains and losses from investment transactions. In general, to the extent that any differences which are permanent in nature result in over distributions to shareholders, the amount of the over distribution is reclassified within the capital accounts based on its federal tax basis treatment and may be reported as return of capital. Temporary differences do not require reclassification.
Currency Translation
Assets and liabilities denominated in foreign currencies and commitments under forward foreign currency exchange contracts are translated into U.S. dollars at the mean of the quoted bid and asked prices of such currencies against the U.S. dollar. Purchases and sales of the Portfolios' securities are translated at the rates of exchange prevailing when such securities were acquired or sold. Income and expenses are translated at exchange rates prevailing when accrued. The Portfolios do not isolate that portion of the results of operations resulting from changes in foreign exchange rates on investments from the fluctuations arising from changes in market prices of securities held. Such fluctuations are included with the net realized and unrealized gain or loss from investments.
Net realized gains and losses from foreign currency-related transactions arise from sales of foreign currency, currency gains or losses realized between the trade and settlement dates on securities transactions, and the difference between the amounts of dividends, interest, and foreign withholding taxes recorded on the Portfolios' books, and the U.S. dollar equivalent of the amounts actually received or paid. Net unrealized appreciation or depreciation on translation of assets and liabilities denominated in foreign currencies arise from changes in the value of assets and liabilities other than investments in securities at the period end, resulting from changes in the exchange rates.
Securities Lending
Each Portfolio is authorized to lend securities from its investment portfolio to banks, brokers and other financial institutions if it receives collateral in cash, U.S. Government securities or other liquid investments which will be maintained at all times in an amount equal to at least 102% of the current market value of loaned domestic securities (including ADRs) and 105% of loaned foreign securities. The loans
47
Harding, Loevner Funds, Inc.
Notes to Financial Statements (continued)
October 31, 2009
2. Summary of Significant Accounting Policies (continued)
will be terminable at any time by the Fund. During the period of such a loan, the Portfolio receives an agreed upon portion of the income on the loaned securities and/or a loan fee and may thereby increase its total return. A Portfolio continues to receive interest or dividends on the securities loaned and simultaneously earns either interest on the investment of the cash collateral or fee income if the loan is collateralized with securities rather than cash. However, the Portfolio normally pays lending fees and related expenses from the interest or dividends earned on invested collateral. Although the Fund is indemnified by the securities lending agent, should the borrower of the securities fail financially, there is a risk of delay in recovery of the securities or loss of rights in the collateral. However, loans are made only to borrowers deemed to be in good financial standing by the lending agent based on its ongoing review of such borro wers and are recommended to and approved by the Board. The Portfolios may invest cash collateral they receive in connection with a loan of securities in short-term money market instruments, securities of the U.S. Government and its agencies and other high quality short-term debt instruments. For purposes of complying with the Portfolios' investment policies and restrictions, collateral received in connection with securities loans will not be deemed an asset of the Portfolio unless otherwise required by law. The Board has appointed State Street Bank and Trust Company ("State Street Bank and Trust") as the lending agent for the Portfolios. However, the Portfolios are not currently lending securities. As of October 31, 2009, there were no securities on loan.
3. Significant Agreements and Transactions with Affiliates
The Board has approved investment an advisory agreement (the "Agreement") with the Investment Advisor. The advisory fees are computed daily at an annual rate of 1.25%, 0.75%, 1.25% and 1.00%, respectively, of the average daily net assets of Emerging Markets, International Equity, International Small Companies and Global Equity.
For the year ended October 31, 2009, the Investment Advisor has voluntarily agreed to reduce its fee to the extent that aggregate expenses exceed an annual rate of 1.75%, 1.25%, 1.75%, and 1.25%, respectively, of the average daily net assets of Emerging Markets, Investor Class shares of International Equity, Investor Class shares of International Small Companies and shares of Global Equity. For the year ended October 31, 2009, the Investment Advisor voluntarily waived and/or reimbursed $0, $107,630, $134,013 and $165,256 which came from investment advisory fees and other class-specific expenses from Emerging Markets, International Equity, International Small Companies and Global Equity, respectively.
In addition, the Fund has an administration agreement with State Street Bank and Trust, which provides certain accounting, clerical and bookkeeping services, corporate secretarial services, assistance in the preparation and filing of tax returns and reports to shareholders and the SEC, and the service of some State Street Bank and Trust employees as officers serving the Board of Directors. Under this agreement, Emerging Markets, International Equity, International Small Companies and Global Equity incurred $2,149,605, $388,387, $87,537 and $135,213 respectively, for the year ended October 31, 2009.
State Street Bank and Trust serves as transfer agent and chief compliance officer, dividend disbursing agent and agent in connection with any accumulation, open-account or similar plans provided to the shareholders of the Portfolios.
The Fund, on behalf of the Portfolios, has agreements with various financial intermediaries and "mutual fund supermarkets" under which customers of these intermediaries may purchase and hold Portfolio shares. These intermediaries assess fees in consideration for providing certain distribution, account maintenance, record keeping and transactional services. In recognition of the savings of expenses to the Portfolio arising from the intermediaries' assumption of functions that the Portflio would otherwise perform, such as providing sub-accounting and related shareholder services, each Portfolio or class is authorized, pursuant to a shareholder services plan, to pay to each intermediary up to 0.15% of its average daily net assets attributable to that intermediary (subject to the voluntary expense cap). The balance of the intermediaries' fees, after payments made pursuant to the plan of distribution adopted pursuant to Rule 12b-1 under the 1940 Act, if applicable, is paid by the Investment Advisor. Because of voluntary caps on the Portfolios' fees and expenses, the Investment Advisor paid a portion of the Portfolios' share of these fees during the year ended October 31, 2009.
4. Investment Transactions
Cost of purchases and proceeds from sales of investment securities, other than short-term investments, for the year ended October 31, 2009, were as follows for each Portfolio:
| Portfolio | Purchase Cost of Investment Securities | Proceeds from Sales of Investment Securities | |||||||||
| Emerging Markets | $ | 561,681,144 | $ | 724,325,525 | |||||||
| International Equity | 64,509,209 | 48,099,945 | |||||||||
| International Small Companies | 1,979,434 | 947,444 | |||||||||
| Global Equity | 37,156,219 | 13,345,160 | |||||||||
48
Harding, Loevner Funds, Inc.
Notes to Financial Statements (continued)
October 31, 2009
4. Investment Transactions (continued)
The Portfolios are permitted to purchase or sell securities from or to certain other Harding Loevner portfolios under specified conditions outlined in procedures adopted by the Board of Directors of the Fund. The procedures have been designed to ensure that any purchase or sale of securities by the Portfolios from or to another portfolio that is or could be considered an affiliate by virtue of having a common investment advisor complies with Rule 17a-7 of the 1940 Act. Further, as defined under the procedures, each transaction is effected at the current market price. Pursuant to these procedures, for the year ended October 31, 2009, Emerging Markets Portfolio engaged in securities purchases of $4,909,112.
The cost of investments for federal income tax purposes and the components of net unrealized appreciation on investments at October 31, 2009, for each of the Portfolios were as follows:
| Portfolio | Unrealized Appreciation | Unrealized Depreciation | Net | Cost | |||||||||||||||
| Emerging Markets | $ | 391,884,785 | $ | (21,320,079 | ) | $ | 370,564,706 | $ | 1,135,671,199 | ||||||||||
| International Equity | 74,040,383 | (14,931,993 | ) | 59,108,390 | 233,257,055 | ||||||||||||||
| International Small Companies | 655,350, | (950,042 | ) | (294,692 | ) | 6,500,821 | |||||||||||||
| Global Equity | 15,202,777 | (550,373 | ) | 14,652,404 | 51,857,235 | ||||||||||||||
The unrealized appreciation (depreciation) on foreign currency for Emerging Markets, International Equity, International Small Companies, and Global Equity was $(1,719,863), $11,134, $(4,344), and $1,342, respectively, for the year ended October 31, 2009.
5. Distributions to Shareholders
During the year ended October 31, 2009, the tax character of distributions paid from ordinary income was $36,974,029, $3,260,397, $35,907, and $140,635, respectively, for Emerging Markets, International Equity, International Small Companies, and Global Equity. The tax character of distributions paid from long-term capital gains was $38,551,418 for International Equity.
During the year ended October 31, 2008, the tax character of distributions paid from ordinary income was $27,907,253, $9,427,753, $66,872, and $216,645, respectively for Emerging Markets, International Equity, International Small Companies, and Global Equity. The tax character of distributions paid from long-term capital gains was $112,274,523, $26,554,287, and $2,754,682 for Emerging Markets, International Equity, and Global Equity.
As of the components of accumulated earnings/(deficit) on a tax basis were as follows:
| Portfolio | Undistributed Ordinary Income | Undistributed Long-Term Capital Gains | Accumulated Capital and Other Losses | Unrealized Appreciation (Depreciation)* | Total Accumulated Earnings/(Deficit) | ||||||||||||||||||
| Emerging Markets | $ | 4,594,502 | $ | — | $ | (148,731,122 | ) | $ | 368,844,843 | $ | 224,708,223 | ||||||||||||
| International Equity | 2,365,492 | — | (11,703,675 | ) | 59,119,523 | 49,781,340 | |||||||||||||||||
| International Small Companies | 37,560 | — | (315,679 | ) | (299,036 | ) | (577,155 | ) | |||||||||||||||
| Global Equity | 149,249 | — | (1,098,641 | ) | 14,653,746 | 13,704,354 | |||||||||||||||||
* The difference between book basis and tax basis net unrealized appreciation is attributable primarily to the tax deferral of losses on certain sales of securities.
At October 31, 2009 Emerging Markets, International Small Companies and Global Equity had $16,503,240, $64,733 and $20,904, respectively, available as capital loss carryforwards which expire in 2016. Emerging Markets, International Equity, International Small Companies and Global Equity had $132,227,882, $11,703,675, $250,946 and $1,077,737, respectively, available as capital loss carryforwards which expire in 2017.
Primarily as a result of differing book/tax treatment of foreign currency transactions and foreign capital gain tax expenses, the Fund made reclassifications among certain capital accounts. The reclassifications have no impact on the net assets of the Portfolio. As of October 31, 2009, the following reclassifications were made to the Statement of Net Assets.
49
Harding, Loevner Funds, Inc.
Notes to Financial Statements (continued)
October 31, 2009
5. Distributions to Shareholders (continued)
| Portfolio | Paid-in-Capital | Accumulated Undistributed Net Realized Gain/Loss on Investment & Foreign Currency Related Transactions | Accumulated Undistributed Net Investment Income | ||||||||||||
| Emerging Markets | $ | 395,008 | $ | 1,268,210 | $ | (1,663,218 | ) | ||||||||
| International Equity | — | 71,194 | (71,194 | ) | |||||||||||
| International Small Companies | — | 472 | (472 | ) | |||||||||||
| Global Equity | — | 37,976 | (37,976 | ) | |||||||||||
6. Foreign Exchange Contracts
The Portfolios, on occasion, enter into forward foreign exchange contracts in order to hedge their exposure to changes in foreign currency exchange rates on their foreign portfolio holdings. A forward foreign exchange contract is a commitment to purchase or sell a foreign currency at a future date at a negotiated forward rate. The gain or loss arising from the difference between the cost of the original contracts and the closing of such contracts is included in net realized gains or losses on foreign currency-related transactions. Fluctuations in the value of forward foreign exchange contracts are recorded for book purposes as unrealized appreciation or depreciation on assets and liabilities denominated in foreign currencies by the Portfolios. The Portfolios are also exposed to credit risk associated with counterparty nonperformance on these forward foreign exchange contracts which is typically limited to the unrealized gain on each open con tract.
The Portfolios enter into foreign currency transactions on the spot markets in order to pay for foreign investment purchases or to convert to dollars the proceeds from foreign investment sales or coupon interest receipts. The Portfolios held no open forward foreign currency exchange contracts on October 31, 2009.
7. Capital Share Transactions
Transactions in capital stock for Emerging Markets were as follows for the periods indicated:
| Year Ended October 31, 2009 | Year Ended October 31, 2008 | ||||||||||||||||||
| Shares | Amount | Shares | Amount | ||||||||||||||||
| Shares sold | 16,825,424 | $ | 522,043,263 | 12,410,621 | $ | 597,246,046 | |||||||||||||
| Shares issued upon reinvestment of dividends | 1,149,520 | 30,745,773 | 2,090,569 | 120,546,841 | |||||||||||||||
| 17,974,944 | 552,789,036 | 14,501,190 | 717,792,887 | ||||||||||||||||
| Shares redeemed | (18,269,280 | ) | (556,153,126 | ) | (15,340,254 | ) | (707,556,978 | ) | |||||||||||
| Net increase (decrease) | (294,336 | ) | $ | (3,364,090 | ) | (839,064 | ) | $ | (10,235,909 | ) | |||||||||
Transactions in capital stock for International Equity—Investor Class were as follows for the periods indicated:
| Year Ended October 31, 2009 | Year Ended October 31, 2008 | ||||||||||||||||||
| Shares | Amount | Shares | Amount | ||||||||||||||||
| Shares sold | 2,406,941 | $ | 24,524,810 | 440,350 | $ | 7,489,395 | |||||||||||||
| Shares issued upon reinvestment of dividends | 256,261 | 2,337,103 | 68,854 | 1,330,261 | |||||||||||||||
| 2,663,202 | 26,861,913 | 509,204 | 8,819,656 | ||||||||||||||||
| Shares redeemed | (551,993 | ) | (5,664,340 | ) | (215,285 | ) | (3,696,097 | ) | |||||||||||
| Net increase | 2,111,209 | $ | 21,197,573 | 293,919 | $ | 5,123,559 | |||||||||||||
50
Harding, Loevner Funds, Inc.
Notes to Financial Statements (continued)
October 31, 2009
7. Capital Share Transactions (continued)
Transactions in capital stock for International Equity—Institutional Class were as follows for the periods indicated:
| Year Ended October 31, 2009 | Year Ended October 31, 2008 | ||||||||||||||||||
| Shares | Amount | Shares | Amount | ||||||||||||||||
| Shares sold | 3,607,416 | $ | 37,754,041 | 814,257 | $ | 13,994,514 | |||||||||||||
| Shares issued upon reinvestment of dividends | 4,274,140 | 38,985,473 | 1,599,857 | 30,928,420 | |||||||||||||||
| 7,881,556 | 76,739,514 | 2,414,114 | 44,922,934 | ||||||||||||||||
| Shares redeemed | (3,062,169 | ) | (29,797,831 | ) | (3,678,345 | ) | (66,170,127 | ) | |||||||||||
| Net increase (decrease) | 4,819,387 | $ | 46,941,683 | (1,264,231 | ) | $ | (21,247,193 | ) | |||||||||||
Transactions in capital stock for International Small Companies—Investor Class were as follows for the periods indicated:
| Year Ended October 31, 2009 | Year Ended October 31, 2008 | ||||||||||||||||||
| Shares | Amount | Shares | Amount | ||||||||||||||||
| Shares sold | 287,938 | $ | 1,954,457 | 238,264 | $ | 2,368,797 | |||||||||||||
| Shares issued upon reinvestment of dividends | 6,686 | 35,907 | 5,151 | 54,707 | |||||||||||||||
| 294,624 | 1,990,364 | 243,415 | 2,423,504 | ||||||||||||||||
| Shares redeemed | (100,105 | ) | (687,371 | ) | (187,161 | ) | (1,737,767 | ) | |||||||||||
| Net increase | 194,519 | $ | 1,302,993 | 56,254 | $ | 685,737 | |||||||||||||
Transactions in capital stock for Global Equity were as follows for the periods indicated:
| Year Ended October 31, 2009 | Year Ended October 31, 2008 | ||||||||||||||||||
| Shares | Amount | Shares | Amount | ||||||||||||||||
| Shares sold | 1,872,104 | $ | 29,033,478 | 301,469 | $ | 6,806,873 | |||||||||||||
| Shares issued upon reinvestment of dividends | 5,005 | 76,577 | 113,938 | 2,881,495 | |||||||||||||||
| 1,877,109 | 29,110,055 | 415,407 | 9,688,368 | ||||||||||||||||
| Shares redeemed | (227,787 | ) | (3,752,668 | ) | (189,186 | ) | (4,193,388 | ) | |||||||||||
| Net increase | 1,649,322 | $ | 25,357,387 | 226,221 | $ | 5,494,980 | |||||||||||||
Redemptions made within 90 days of purchase may be subject to a redemption fee equal to 2% of the amount redeemed. For the year ended October 31, 2009, Emerging Markets, Investor Class of International Equity and Global Equity received $154,275, $2,232 and $6,503, respectively, in redemption fees related to transactions in shares of common stock as disclosed in the Portfolios' Statements of Changes in Net Assets. For the year ended October 31, 2009, International Small Companies Investor Class did not receive any redemption fees.
8. Concentration of Ownership
At October 31, 2009, the percentage of total shares outstanding held by record shareholders each owning 10% or greater of the aggregate total shares outstanding for each Portfolio or for the share classes listed of each Portfolio was as follows:
| No. of Shareholders | % Ownership | ||||||||||
| Emerging Markets | 2 | 74 | %* | ||||||||
| International Equity | 1 | 38 | %* | ||||||||
| International Small Companies | 3 | 66 | %* | ||||||||
| Global Equity | 3 | 58 | %* | ||||||||
* Represents omnibus position of broker-dealer representing numerous shareholder accounts.
Investment activities of these shareholders may have a material effect on the Portfolios.
51
Harding, Loevner Funds, Inc.
Notes to Financial Statements (continued)
October 31, 2009
9. Repurchase Agreements
Each Portfolio may enter into repurchase agreements under which a bank or securities firm that is a primary or reporting dealer in U.S. Government securities agrees, upon entering into a contract, to sell such securities to a Portfolio and repurchase such securities from such Portfolio at a mutually agreed upon price and date.
Each Portfolio may engage in repurchase transactions with parties selected on the basis of such party's creditworthiness. Securities purchased subject to repurchase agreements must have an aggregate market value greater than or equal to the repurchase price plus accrued interest at all times. If the value of the underlying securities falls below the value of the repurchase price plus accrued interest, the Portfolio will require the seller to deposit additional collateral by the next business day. If the request for additional collateral is not met, or the seller defaults on its repurchase obligation, the Portfolio maintains the right to sell the underlying securities at market value and may claim any resulting loss against the seller.
10. Concentration of Risk
Investing in securities of foreign issuers and currency transactions may involve certain considerations and risks not typically associated with investments in U.S. issuers. These risks include revaluation of currencies, adverse fluctuations in foreign currency values and possible adverse political, social and economic developments, including those particular to a specific industry, country or region, which could cause the securities and their markets to be less liquid and prices more volatile than those of comparable U.S. companies and U.S. government securities. These risks are greater with respect to securities of issuers located in emerging market countries in which Emerging Markets, International Equity, International Small Companies and Global Equity are authorized to invest.
11. Line of Credit
The Fund participates in a $50 million line of credit agreement with State Street Bank and Trust. Borrowings will be made solely to facilitate the handling of redemptions or unusual or unanticipated short-term cash requirements. Because several Portfolios participate there is no assurance that an individual Portfolio will have access to the entire $50 million at any particular time. Borrowings for International Equity and Global Equity are limited to the lesser of the remaining available credit or 25% of net assets. Borrowings for Emerging Markets and International Small Companies are limited to the lesser of the remaining available credit or 15% of net assets. Interest is charged to each Portfolio based on its borrowings at an amount above the Federal Funds rate. In addition, a commitment fee computed at an annual rate of 0.10% on the line of credit is allocated among the Portfolios. During the year ended October 31, 2009, Emerging Markets had borrowings on two days with a maximum balance of $36,268,115, at an average weighted interest rate of 1.35%; International Equity had borrowings on one day with a maximum balance of $66,185 at an average weighted interest rate of 0.85%; International Small Companies had borrowings on three days with a maximum balance of $85,819, at an average weighted interest rate of 0.99% and Global Equity had borrowings on one day with a maximum balance of $67,488, at an average weighted interest rate of 1.46%.
12. Subsequent Event
Global Equity launched Institutional Class shares on November 3, 2009. In accordance with the provisions set forth in FASB Accounting Standards Codification No. 855, "Subsequent Events," adopted by the Fund, Management has evaluated the possibility of additional subsequent events existing in the Portfolios' financial statements through December 21, 2009, the date the financial statements were issued. Management has determined that there are no additional subsequent events that would require disclosure in the Portfolios' financial statements through this date.
52
Harding, Loevner Funds, Inc.
Report of Independent Registered Public Accounting Firm
The Board of Directors and Shareholders
Harding, Loevner Funds, Inc.
We have audited the accompanying statements of net assets of the Harding, Loevner Funds, Inc. (comprising, the Emerging Markets Portfolio, Global Equity Portfolio, International Equity Portfolio, and International Small Companies Portfolio), (collectively the "Portfolios") as of October 31, 2009, and the related statements of operations for the year then ended, statements of changes in net assets for each of the years or periods in the two-year period then ended, and the financial highlights for each of the years or periods in the four-year period then ended. These financial statements and financial highlights are the responsibility of the Portfolios' management. Our responsibility is to express an opinion on these financial statements and financial highlights based on our audits. The financial highlights of the Portfolios for the year or period in the year ended October 31, 2005 were audited by other auditors whose report dated December 6, 2005, expressed an unqualified opinion on those financial highlights.
We conducted our audits in accordance with the standards of the Public Company Accounting Oversight Board (United States). Those standards require that we plan and perform the audits to obtain reasonable assurance about whether the financial statements and financial highlights are free of material misstatement. An audit includes examining, on a test basis, evidence supporting the amounts and disclosures in the financial statements. Our procedures included confirmation of securities owned as of October 31, 2009, by correspondence with the custodian and brokers or other appropriate auditing procedures. An audit also includes assessing the accounting principles used and significant estimates made by management, as well as evaluating the overall financial statement presentation. We believe that our audits provide a reasonable basis for our opinion.
In our opinion, the financial statements and financial highlights referred to above present fairly, in all material respects, the financial position of each of the aforementioned Portfolios of the Harding, Loevner Funds, Inc. as of October 31, 2009, the results of their operations for the year then ended, the changes in their net assets for each of the years in the two-year period then ended, and the financial highlights for each of the years or periods in the four-year period then ended, in conformity with U.S. generally accepted accounting principles.

Philadelphia, Pennsylvania
December 21, 2009
53
Harding, Loevner Funds, Inc.
Supplemental Tax Information
(unaudited)
During the year ended October 31, 2009, Global Equity designated 100% of distributions from net investment income as qualifying for the dividend received deduction for corporations.
Emerging Markets, International Equity, International Small Companies and Global Equity paid qualifying foreign taxes of $2,387,024, $456,565, $8,477 and $33,474, and earned $29,894,323, $5,726,299, $119,449 and $503,954 foreign source income during the year ended October 31, 2009, respectively. Pursuant to Section 853 of the Internal Revenue Code, Emerging Markets, International Equity, International Small Companies and Global Equity designated $0.0614, $0.0185, $0.0122 and $0.0102 per share as foreign taxes paid and $0.7691, $0.2316, $0.1714 and $0.1529 per share as income earned from foreign sources for the year ended October 31, 2009, respectively.
Emerging Markets, International Equity, International Small Companies and Global Equity had qualifying dividend income of $14,106,661 $4,355,260, $88,417 and $650,578 respectively, during the year ended October 31, 2009.
Pursuant to Section 852 of the Internal Revenue Code, International Equity designated $38,551,418 as long term capital gain dividends for the year ended October 31, 2009.
54
Harding, Loevner Funds, Inc.
Directors and Principal Officers of the Fund
(unaudited)
Disinterested Directors:
| Name, Address and Age | Position with the Fund | Term of Office and Length of Time Served* | Principal Occupation(s) During Past Five Years | Number of Portfolios in Fund Complex Overseen By Director | Other Directorships Held by Director | ||||||||||||||||||
| William E. Chapman, II c/o Harding Loevner LP 50 Division Street Fourth Floor Somerville, NJ 08876 Age, 68 | Director | Indefinite; Director since 2008 | Longboat Retirement Planning Solutions (Consulting Firm), President and Owner, 1998-present; Hewitt Associates, LLC (consulting firm), part-time provider of retirement and investment education seminars, 2000-present; Bowdoin College, Trustee, 2002-present. | 6 | Trustee, The Managers Funds, (9 portfolios); Trustee, Managers AMG Funds (6 portfolios), Managers Trust I (10 portfolios) and Managers Trust II (6 portfolios); Trustee, Third Avenue Trust (4 portfolios); Trustee, Third Avenue Variable Trust (1 portfolio). | ||||||||||||||||||
| R. Kelly Doherty c/o Harding Loevner LP 50 Division Street Fourth Floor Somerville, NJ 08876 Age, 51 | Director | Indefinite; Director since 2004 | Cayman Partners (private investment vehicles), Managing Partner, 1999-present. | 6 | L.P. Thebault & Co. (commercial printing); The Peck School | ||||||||||||||||||
| Charles Freeman c/o Harding Loevner LP 50 Division Street Fourth Floor Somerville, NJ 08876 Age, 45 | Director | Indefinite; Director since 2008 | Cayman Partners (private investment vehicles), Managing Partner, 1999-present. | 6 | National Committee for U.S. - China Relations. | ||||||||||||||||||
| Jane A. Freeman c/o Harding Loevner LP 50 Division Street Fourth Floor Somerville, NJ 08876 Age, 56 | Director | Indefinite; Director since 1996; Chairperson of Audit Committee 2005-2008; Lead Non-Interested Director since 2008 | Scientific Learning Corporation (Education Software), Executive Vice President and Chief Financial Officer, 2000-present; Finance & Business Development, Treasurer and Vice President, 1999-2000. | 6 | None | ||||||||||||||||||
| Samuel R. Karetsky c/o Harding Loevner LP 50 Division Street Fourth Floor Somerville, NJ 08876 Age, 64 | Director | Indefinite; Director since 1998 | The Karetsky Group, LLC (Advisory Firm), Managing Member, 2003-present; Wetherby Asset Management, Principal, 2004-present; European Investors Inc., Managing Director, 1998-2002 | 6 | None | ||||||||||||||||||
55
Harding, Loevner Funds, Inc.
Directors and Principal Officers of the Fund (continued)
(unaudited)
| Name, Address and Age | Position with the Fund | Term of Office and Length of Time Served* | Principal Occupation(s) During Past Five Years | Number of Portfolios in Fund Complex Overseen By Director | Other Directorships Held by Director | ||||||||||||||||||
| Eric Rakowski c/o Harding Loevner LP 50 Division Street Fourth Floor Somerville, NJ 08876 Age, 51 | Director | Indefinite; Director since 2008 | University of California at Berkeley School of Law, Professor, 1990-present. | 6 | Trustee, The Managers Funds, (9 portfolios); Trustee, Managers AMG Funds (6 portfolios), Managers Trust I (10 portfolios) and Managers Trust II (6 portfolios); Trustee, Third Avenue Trust (4 portfolios); Trustee, Third Avenue Variable Trust (1 portfolio). | ||||||||||||||||||
| Raymond J. Clark** c/o Harding Loevner LP 50 Division Street Fourth Floor Somerville, NJ 08876 Age, 73 | Director Emeritus | 1 year; Director Emeritus since 2009 | The Woodrow Wilson National Fellowship Foundation, Treasurer, 08/04-present; Wellesley College, Interim Vice President of Finance and Treasurer, 10/03-6/04; Princeton University, Treasurer, 1987-2001. | 6 | Princeton Healthcare System | ||||||||||||||||||
Interested Director:
| David R. Loevner*** Harding Loevner LP 50 Division Street, Fourth Floor Somerville, NJ 08876 Age, 55 | Director, President and Chairman of the Board | Indefinite; Director, President and Chairman of the Board since 1996 | Harding Loevner LP, President, 7/89-present; Parks Tennant Corporation (real estate), President, 1/01-present. | 6 | Director, Harding, Loevner Funds, plc (4 portfolios) | ||||||||||||||||||
| Jennifer M. Borggaard*** Affiliated Managers, Group, Inc. 600 Hale Street Prides Crossing, MA 01965 Age, 40 | Director | Indefinite; Director since 2008 | Affiliated Managers Group, Inc. ("AMG") (Asset Management Firm), Senior Vice President, 2007-present, Vice President, 2004-2007, Director and Senior Counsel, 2001-2004. | 6 | Director, DFD Fund of Funds, plc (4 portfolios) | ||||||||||||||||||
* Each director is elected to serve in accordance with the Articles of Incorporation and By-Laws of the Fund until his or her successor is duly elected and qualified.
** Effective September 9, 2009, Mr. Clark retired as a voting member of the Board and was elected to the position of "Director Emeritus" with a one-year term.
*** David R. Loevner is considered an "interested person" of the Fund as defined in the Investment Company Act of 1940, as amended, because he serves as President of Harding Loevner LP, the Fund's investment advisor. Jennifer M. Borggaard is an interested person of the Fund because she is an officer of AMG.
56
Harding, Loevner Funds, Inc.
Directors and Principal Officers of the Fund (continued)
(unaudited)
Principal Officers of the Fund
| Name, Address and Age | Position with the Fund | Term of Office and Length of Time Servedt | Principal Occupation (s) During Past Five Years | ||||||||||||
| Richard Reiter Harding Loevner LP 50 Division Street, Fourth Floor Somerville, NJ 08876 Age, 43 | Vice President | 1 year ; Vice President since 2007 | Harding Loevner LP, Chief Operating Officer 4/96-current. | ||||||||||||
| Puran Dulani Harding Loevner LP 50 Division Street, Fourth Floor Somerville, NJ 08876 Age, 51 | Chief Financial Officer and Treasurer | 1 year; Chief Financial Officer and Treasurer since 2007 | Harding Loevner LP, Chief of Operations and Accounting 3/02-present. | ||||||||||||
| Ellen Blanchard State Street Bank & Trust Company 200 Clarendon Street Boston, MA 02116 Age, 35 | Anti-Money Laundering Compliance Officer | 1 year; Anti-Money Laundering Compliance Officer since 2007 | State Street Bank & Trust Company (formerly, Investors Bank & Trust Company), Director and Senior Associate Counsel, 1/06-present; Senior Manager and Associate Counsel, 8/04-12/05; Manager and Associate Counsel 8/02-8/04; Product Manager, 8/99-8/02. | ||||||||||||
| Donna M. Rogers State Street Bank & Trust Company 200 Clarendon Street Boston, MA 02116 Age, 43 | Chief Compliance Officer of the Funds | 1 year; Chief Compliance Officer since 2007 | State Street Bank & Trust Company, (formerly, Investors Bank & Trust Company), Senior Director, 2002-present. | ||||||||||||
| Brendan J. O'Neill State Street Bank & Trust Company 200 Clarendon Street Boston, MA 02116 Age, 41 | Assistant Treasurer | 1 year; Assistant Treasurer since 2004 | State Street Bank & Trust Company (formerly, Investors Bank & Trust Company), Unit Director 11/07-present, Director 1/05-10/07; Senior Manager 11/02-12/04; Manager 7/00-10/02. | ||||||||||||
| Francine S. Hayes State Street Bank & Trust Company 200 Clarendon Street Boston, MA 02116 Age, 41 | Secretary | 1 year; Secretary since 2008 | State Street Bank & Trust Company (formerly, Investors Bank & Trust Company), Vice President and Senior Counsel, from 2004-present; and Assistant Vice President and Counsel, 2001-2004. | ||||||||||||
| Lori Renzulli Harding Loevner LP 50 Division Street Fourth Floor Somerville, NJ 08876 Age, 41 | Assistant Secretary | 1 year; Assistant Secretary since 2008 | Harding Loevner LP, Chief Counsel and Chief Compliance Officer, 6/06-present; Met Life, Director, Corporate Ethics and Compliance, 1/06-5/06; CitiStreet Retirement Services, Vice President and Counsel, 7/89-12/05. | ||||||||||||
| Brian C. Poole State Street Bank & Trust Company 200 Clarendon Street Boston, MA 02116 Age, 38 | Assistant Secretary | 1 year; Assistant Secretary since 2008 | State Street Bank & Trust Company (formerly, Investors Bank & Trust Company), Vice President and Counsel, 3/08-present and Associate Counsel, 7/04-9/07 | ||||||||||||
t Officers are elected to hold such office until their successor is elected and qualified to carry out the duties and responsibilities of their office, or until he or she resigns or is removed from office.
The Fund's Statement of Additional Information contains additional information about the Directors of the Fund and is available, without charge, upon request, by calling 1-877-435-8105.
57
Harding, Loevner Funds, Inc.
Supplemental Tax Information
(unaudited)
Quarterly Form N-Q Portfolio Schedule
Each Portfolio will file its complete schedule of investments with the SEC on Form N-Q at the end of the first and third fiscal quarters within 60 days of the end of the quarter to which it relates. The Portfolios' Form N-Q will be available on the SEC's website at www.sec.gov and may also be reviewed and copied at the SEC's Public Reference Room whose telephone number is 1-800-SEC-0330. Additionally, they are available upon request by calling 1-877-435-8105.
Proxy Voting Record
The Fund's proxy voting record relating to the Portfolios' securities during the most recent 12-month period ended June 30 is available on the Fund's website at www.hardingloevnerfunds.com and on the SEC's website at www.sec.gov, on Form N-PX.
Proxy Voting Policies and Procedures
A description of the Fund proxy voting policies and procedures are located in the Statement of Additional Information and is available without charge, upon request, by calling 1-877-435-8105 or on the SEC's website at www.sec.gov.
58
Harding, Loevner Funds, Inc.
Officers & Directors and Other Pertinent Information
OFFICERS AND DIRECTORS
David R. Loevner
Director, President and Chairman
of the Board of the Funds
Jennifer M. Borggaard
Director of the Funds
William E. Chapman II
Director of the Funds
R. Kelly Doherty
Director of the Funds
Charles Freeman
Director of the Funds
Jane A. Freeman
Director of the Funds
Samuel R. Karetsky
Director of the Funds
Eric Rakowski
Director of the Funds
Raymond J. Clark
Director Emeritus of the Funds
Donna Rogers
Chief Compliance Officer of the Funds
Ellen Blanchard
Anti-Money Laundering Compliance
Officer of the Funds
Puran Dulani
Chief Financial Officer and Treasurer
for the Funds
Richard Reiter
Vice President of the Funds
Brendan J. O'Neill
Assistant Treasurer of the Funds
Francine S. Hayes
Secretary of the Funds
Lori Renzulli
Assistant Secretary of the Funds
Brian C. Poole
Assistant Secretary of the Funds
59
HARDING, LOEVNER FUNDS, INC.
| DISTRIBUTOR | |
|
|
|
Harding Loevner LP |
| Quasar Distributors, LLC |
50 Division Street, Fourth Floor |
| 615 East Michigan Street |
Somerville, NJ 08876-2943 |
| Milwaukee, WI 53202-5210 |
|
|
|
ADMINISTRATOR, CUSTODIAN, FUND |
| INDEPENDENT REGISTERED PUBLIC |
ACCOUNTANT, TRANSFER AGENT AND |
| ACCOUNTING FIRM |
DIVIDEND DISBURSING AGENT |
|
|
|
| KPMG LLP |
State Street Bank and Trust Company |
| 1601 Market Street |
200 Clarendon Street, 16th Floor, JHT 1651 |
| Philadelphia, PA 19103-2499 |
Boston, MA 02116 |
|
|
|
|
|
LEGAL COUNSEL |
|
|
|
|
|
Dechert LLP |
|
|
1095 Avenue of the Americas |
|
|
New York, New York 10036-6797 |
|
|
This report is intended for shareholders of Harding, Loevner Funds, Inc. It may not be used as sales literature unless preceded or accompanied by the current Prospectus, which gives details about charges, expenses, investment objectives, risks and policies of the Portfolios.
HLFSANINV-G 12/09
Annual Report |
| October 31, 2009 |

Mutual Funds for Institutional Investors
· Institutional Emerging Markets Portfolio
· International Equity Portfolio
· Frontier Emerging Markets Portfolio
State Street Bank and Trust Company
Attn: Harding, Loevner Funds, Inc.
200 Clarendon Street, 16th Floor, JHT 1651
Boston, MA 02116
(877) 435-8105 · www.hardingloevnerfunds.com
Harding, Loevner Funds, Inc.
Table of Contents
| Expense Example | 3 | ||||||
| Performance Information and Statements of Net Assets | |||||||
| Institutional Emerging Markets Portfolio | 4 | ||||||
| International Equity Portfolio | 11 | ||||||
| Frontier Emerging Markets Portfolio | 18 | ||||||
| Statements of Operations | 26 | ||||||
| Statements of Changes in Net Assets | 28 | ||||||
| Financial Highlights | 31 | ||||||
| Notes to Financial Statements | 34 | ||||||
| Report of Independent Registered Public Accounting Firm | 45 | ||||||
| Supplemental Tax Information | 46 | ||||||
| Directors and Principal Officers | 47 | ||||||
| Supplemental Information | 51 | ||||||
For use only when preceded or accompanied by a prospectus. Read the prospectus carefully before you invest or send money.
This Page Intentionally Left Blank
Harding, Loevner Funds, Inc.
Expense Example
October 31, 2009 (unaudited)
As a shareholder of a Harding Loevner Portfolio, you incur two types of costs: (1) transaction costs, including brokerage commissions on purchases and sales of fund shares; and (2) ongoing costs, including management fees and other fund expenses. The following example is intended to help you understand your ongoing costs (in dollars and cents) of investing in the Portfolio and to compare these costs with the ongoing costs of investing in other mutual funds.
The example is based on an investment of $1,000 invested on May 1, 2009 and held for the entire six month period from May 1, 2009 to October 31, 2009 for the International Equity Portfolio—Institutional Class, Institutional Emerging Markets Portfolio, and Frontier Emerging Markets Portfolio—Institutional Class.
Actual Expenses
The first line under the Portfolio in the table below provides information about actual account values and actual expenses. You may use the information in this line, together with the amount you invested, to estimate the expenses that you paid over the period. Simply divide your account value by $1,000 (for example, an $8,600 account value divided by $1,000 = 8.6), then multiply the result by the number in the first line for the Portfolio under the heading entitled "Expenses Paid During Period" to estimate the expenses you paid on your account during this period.
Hypothetical Example for Comparison Purposes
The second line under each Portfolio in the table below provides information about hypothetical account values and hypothetical expenses based on the Portfolio's actual expense ratio and an assumed rate of return of 5% per year before expenses, which is not the Portfolio's actual return. The hypothetical account values and expenses may not be used to estimate the actual ending account balance or expenses you paid for the period. You may use this information to compare the ongoing costs of investing in the Portfolio and other funds. To do so, compare this 5% hypothetical example with the 5% hypothetical examples that appear in the shareholder reports of the other funds.
Please note that the expenses shown in the table are meant to highlight your ongoing costs only and do not reflect any transactional costs, such as brokerage commissions paid on purchases and sales of fund shares. Therefore, the second line under the Portfolio in the table is useful in comparing ongoing costs only, and will not help you determine the relative total costs of owning different funds. In addition, if these transactional costs were included, your costs would have been higher.
| Beginning Account Value May 1, 2009 | Ending Account Value October 31, 2009 | Annualized Expense Ratio | Expenses Paid During Period* (May 1, 2009 to October 31, 2009) | ||||||||||||||||
| Institutional Emerging Markets Portfolio | |||||||||||||||||||
| Actual | $ | 1,000.00 | $ | 1,364.50 | 1.30 | % | $ | 7.75 | |||||||||||
| Hypothetical (5% annual return before expenses) | 1,000.00 | 1,018.70 | 1.30 | % | 6.61 | ||||||||||||||
| International Equity Portfolio—Institutional Class | |||||||||||||||||||
| Actual | 1,000.00 | 1,321.60 | 0.99 | % | 5.79 | ||||||||||||||
| Hypothetical (5% annual return before expenses) | 1,000.00 | 1,020.20 | 0.99 | % | 5.04 | ||||||||||||||
| Frontier Emerging Markets Portfolio—Institutional Class | |||||||||||||||||||
| Actual | 1,000.00 | 1,413.50 | 2.00 | % | 12.17 | ||||||||||||||
| Hypothetical (5% annual return before expenses) | 1,000.00 | 1,015.10 | 2.00 | % | 10.16 | ||||||||||||||
* Expenses are calculated using each Portfolio's annualized expense ratio (as disclosed in the table), multiplied by the average account value for the period, multiplied by number of days in the period (184 days), and divided by the number of days in the year (365 days).
Harding, Loevner Funds, Inc.
Institutional Emerging Markets Portfolio — Overview
(unaudited)
October 31, 2009

| Returns for the Year Ended October 31, 2009 | |||||||||||||||||||||||
| Cumulative Total Returns | Average Annualized Total Return | ||||||||||||||||||||||
| FUND NAME | Last 12 Months | 5 YR | Inception | 5 YR | Inception | ||||||||||||||||||
| Institutional Emerging Markets Portfolio (Inception date 10/17/05) | 48.92 | % | N/A | 44.61 | % | N/A | 9.56 | % | |||||||||||||||
| MSCI Emerging Markets (Net dividend) | 64.11 | % | N/A | 61.27 | % | N/A | 12.55 | % | |||||||||||||||
| Lipper Emerging Markets Funds Index | 56.90 | % | N/A | 47.26 | % | N/A | 10.05 | % | |||||||||||||||
Performance data quoted represents past performance and does not guarantee future results. The investment return and principal value of an investment will fluctuate so that an investor's shares, when redeemed, may be worth more or less than their original cost. Performance current to the most recent month end may be lower or higher than the performance quoted and may be obtained by visiting the website at www.hardingloevnerfunds.com.
Investment return reflects voluntary fee waivers in effect. Absence such waivers, total return would be reduced. The performance provided does not reflect the deduction of taxes that a shareholder would pay on Portfolio distributions.
4
Harding, Loevner Funds, Inc.
Institutional Emerging Markets — Overview
October 31, 2009
The Institutional Emerging Markets Portfolio gained 48.92% for the fiscal year ending October 31, 2009, as compared to a gain of 64.11% for its benchmark, the MSCI Emerging Markets Index.
Consistent with its investment objectives and policies, the Portfolio was invested primarily in the securities of emerging markets companies that exhibit the fundamental characteristics of growth, financial strength, management quality, and durable competitive advantage.
The Portfolio's underperformance this period was the result primarily of unfavorable stock selection. Because we did not own some of the most distressed, cyclically-exposed companies in the Financials, Industrials, and Consumer Discretionary sectors that had previously declined the most in 2008, our companies did not benefit as much in the early stages of the rally that began in late February. Our overweight in the lagging Health Care sector and underweight in the booming Materials sector also detracted from relative returns.
Our holdings lagged the most in the Financials, Industrials, and Information Technology sectors, where the poor stocks included Samsung Fire & Marine, China Communications Construction, and Delta Electronics. Portfolio companies in Consumer Staples and Telecom Services outperformed overall. Strong stocks in these sectors included Hengan International, JBS, and Telekom Indonesia.
From a geographic perspective, the largest detractor from performance was our underweight and poor stock selection in Asia, including East Asia (China, Taiwan, and South Korea). Many listed companies in Asia are export-focused manufacturers, for whom we believe the potential for further expansion of excess capacity and margin-destroying competition presents risks for investors. In China, poor corporate governance and the lack of corporate capital allocation discipline remain obstacles to our finding attractive investments there.
Past performance does not guarantee future results.
The Portfolio invests in foreign securities, which will involve greater volatility and political, economic, and currency risks and differences in accounting methods. It also invests in emerging markets, which involve unique risks, such as exposure to economies less diverse and mature than the U.S. or other more established foreign markets. Economic and political instability may cause larger price changes in emerging markets securities than other foreign securities. Investments in debt securities typically decrease in value when interest rates rise. This risk is usually greater for longer-term debt securities. Investment by the Portfolio in lower-rated and non-rated securities presents a greater risk of loss to principal and interest than higher-rated securities.
The MSCI Emerging Markets Index is a free float-adjusted market capitalization index that is designed to measure equity market performance in the global emerging markets. The Index consists of 22 emerging market countries. The Index is net of foreign withholding taxes on dividends. You cannot invest directly in this Index.
It is not possible to invest directly in an index.
5
Harding, Loevner Funds, Inc.
Institutional Emerging Markets Portfolio
Statement of Net Assets
October 31, 2009
| Industry | Percentage of Net Assets | ||||||
| Airlines | 1.0 | % | |||||
| Banks | 18.2 | ||||||
| Beverages, Food & Tobacco | 4.6 | ||||||
| Building Materials | 2.0 | ||||||
| Chemicals | 2.8 | ||||||
| Commercial Services & Supplies | 3.8 | ||||||
| Communications | 8.5 | ||||||
| Computers & Information | 0.5 | ||||||
| Cosmetics & Personal Care | 1.1 | ||||||
| Electric Utilities | 1.1 | ||||||
| Electrical Equipment | 5.2 | ||||||
| Electronics | 1.7 | ||||||
| Engineering & Construction | 2.5 | ||||||
| Financial Services | 1.0 | ||||||
| Food | 1.1 | ||||||
| Food Retailers | 1.4 | ||||||
| Health Care Providers & Services | 2.6 | ||||||
| Home Construction, Furnishings & Appliances | 2.1 | ||||||
| Household Products | 1.0 | ||||||
| Insurance | 3.6 | ||||||
| Iron & Steel | 0.5 | ||||||
| Media | 1.5 | ||||||
| Medical Supplies | 0.7 | ||||||
| Metals & Mining | 3.7 | ||||||
| Oil & Gas | 12.1 | ||||||
| Pharmaceuticals | 3.3 | ||||||
| Real Estate | 1.4 | ||||||
| Retailers | 3.5 | ||||||
| Semiconductors | 5.5 | ||||||
| Total Investments | 98.0 | ||||||
| Other Assets Less Liabilities | 2.0 | * | |||||
| Net Assets | 100.0 | % | |||||
* Breakout of other assets and liabilities can be found on page 10.
See Notes to Financial Statements
6
Harding, Loevner Funds, Inc.
Institutional Emerging Markets Portfolio
Statement of Net Assets
October 31, 2009 (continued)
| Shares | Value (1) | ||||||||||
| Common Stocks - 96.4% | |||||||||||
| Brazil - 16.8% | |||||||||||
| Anhanguera Educacional Participacoes SA (Commercial Services & Supplies)* | 210,956 | $ | 2,915,973 | ||||||||
| Banco Bradesco SA - ADR (Banks) | 217,900 | 4,292,630 | |||||||||
| Cia Brasileira de Distribuicao Grupo Pao de Acucar - Sponsored ADR (Food) | 37,000 | 2,238,130 | |||||||||
| Itau Unibanco Banco Multiplo SA - ADR (Banks) | 174,696 | 3,343,681 | |||||||||
| JBS SA (Beverages, Food & Tobacco) | 584,900 | 3,243,911 | |||||||||
| Natura Cosmeticos SA (Cosmetics & Personal Care) | 120,900 | 2,165,301 | |||||||||
| Petroleo Brasileiro SA - ADR (Oil & Gas) | 195,646 | 9,042,758 | |||||||||
| Usinas Siderurgicas de Minas Gerais SA (Iron & Steel) | 41,500 | 1,029,255 | |||||||||
| Vale SA - Sponsored ADR (Metals & Mining) | 235,240 | 5,996,268 | |||||||||
| 34,267,907 | |||||||||||
| Chile - 2.5% | |||||||||||
| Banco Santander - ADR (Banks) | 41,836 | 2,202,247 | |||||||||
| Sociedad Quimica y Minera de Chile SA - Sponsored ADR (Chemicals) | 79,000 | 2,903,250 | |||||||||
| 5,105,497 | |||||||||||
| China - 11.9% | |||||||||||
| Anhui Conch Cement Co., Ltd. (Building Materials) | 340,000 | 2,199,879 | |||||||||
| China Communications Construction Co., Ltd. - Class H (Engineering & Construction) | 2,290,000 | 2,471,217 | |||||||||
| China Insurance International Holdings Co., Ltd. (Insurance)* | 814,000 | 2,846,565 | |||||||||
| China Mobile Ltd. - Sponsored ADR (Communications) | 45,189 | 2,111,682 | |||||||||
| China Overseas Land & Investment Ltd. (Real Estate) | 1,308,000 | 2,819,056 | |||||||||
| Hengan International Group Co., Ltd. (Health Care Providers & Services) | 839,000 | 5,378,640 | |||||||||
| Jiangsu Expressway Co., Ltd. - Class H (Commercial Services & Supplies) | 3,231,000 | 2,866,451 | |||||||||
| New Oriental Education & Technology Group - Sponsored ADR (Commercial Services & Supplies)* | 27,600 | 1,927,584 | |||||||||
| Shandong Weigao Group Medical Polymer Co., Ltd. (Medical Supplies) | 432,000 | 1,506,718 | |||||||||
| 24,127,792 | |||||||||||
| Colombia - 1.1% | |||||||||||
| BanColombia SA - Sponsored ADR (Banks) | 59,170 | 2,341,949 | |||||||||
| Czech Republic - 0.9% | |||||||||||
| Central European Media Enterprises Ltd. (Media)* | 70,930 | 1,783,180 | |||||||||
| Egypt - 1.1% | |||||||||||
| Orascom Construction Industries - GDR, Reg. S (Engineering & Construction) | 45,600 | 2,203,413 | |||||||||
| Greece - 1.0% | |||||||||||
| Coca Cola Hellenic Bottling Co. SA (Beverages, Food & Tobacco)* | 76,330 | 1,989,055 | |||||||||
| Hungary - 0.6% | |||||||||||
| Richter Gedeon Nyrt (Pharmaceuticals) | 5,450 | 1,131,026 | |||||||||
| India - 4.9% | |||||||||||
| Axis Bank Ltd. (Banks) | 126,900 | 2,394,107 | |||||||||
| HDFC Bank Ltd. - ADR (Banks) | 30,403 | 3,362,876 | |||||||||
| Hindustan Unilever Ltd. (Household Products) | 336,700 | 2,012,348 | |||||||||
| NTPC Ltd. (Electric Utilities) | 516,900 | 2,306,114 | |||||||||
| 10,075,445 | |||||||||||
See Notes to Financial Statements
7
Harding, Loevner Funds, Inc.
Institutional Emerging Markets Portfolio
Statement of Net Assets
October 31, 2009 (continued)
| Shares | Value (1) | ||||||||||
| Indonesia - 2.5% | |||||||||||
| PT Bank Rakyat Indonesia (Banks) | 3,316,000 | $ | 2,420,613 | ||||||||
| PT Telekomunikasi Indonesia - Sponsored ADR (Communications) | 79,230 | 2,686,689 | |||||||||
| 5,107,302 | |||||||||||
| Israel - 2.9% | |||||||||||
| Israel Chemicals Ltd. (Chemicals) | 245,130 | 2,865,788 | |||||||||
| Teva Pharmaceutical Industries Ltd. - Sponsored ADR (Pharmaceuticals) | 61,500 | 3,104,520 | |||||||||
| 5,970,308 | |||||||||||
| Luxembourg - 1.0% | |||||||||||
| Millicom International Cellular SA (Communications)* | 32,100 | 2,011,386 | |||||||||
| Malaysia - 1.3% | |||||||||||
| Public Bank Berhad (Banks) | 106,425 | 332,391 | |||||||||
| Public Bank Berhad (Banks) | 711,700 | 2,215,557 | |||||||||
| 2,547,948 | |||||||||||
| Mexico - 6.7% | |||||||||||
| America Movil SA de CV, Series L - ADR (Communications) | 82,550 | 3,642,932 | |||||||||
| Grupo Aeroportuario del Sureste SAB de CV, Series B - ADR (Engineering & Construction) | 10,305 | 419,310 | |||||||||
| Grupo Financiero Banorte SA de CV, Class O (Financial Services) | 630,180 | 2,067,072 | |||||||||
| Grupo Televisa SA - Sponsored ADR (Media) | 63,000 | 1,219,680 | |||||||||
| Telmex Internacional SAB de CV, Series L - ADR (Communications) | 123,800 | 1,666,348 | |||||||||
| Urbi Desarrollos Urbanos SA de CV (Home Construction, Furnishings & Appliances)* | 786,100 | 1,547,939 | |||||||||
| Wal-Mart de Mexico SA de CV - Sponsored ADR (Retailers) | 88,115 | 3,067,283 | |||||||||
| 13,630,564 | |||||||||||
| Panama - 1.0% | |||||||||||
| Copa Holdings SA - Class A (Airlines) | 46,000 | 1,942,580 | |||||||||
| Peru - 1.1% | |||||||||||
| Credicorp Ltd. (Banks) | 31,300 | 2,160,639 | |||||||||
| Philippines - 0.5% | |||||||||||
| Philippine Long Distance Telephone Co. - Sponsored ADR (Communications) | 17,555 | 935,682 | |||||||||
| Poland - 1.9% | |||||||||||
| Bank Pekao SA (Banks)* | 41,354 | 2,199,559 | |||||||||
| Central European Distribution Corp. (Beverages, Food & Tobacco)* | 53,250 | 1,656,608 | |||||||||
| 3,856,167 | |||||||||||
| Russia - 6.0% | |||||||||||
| Lukoil - Sponsored ADR (Oil & Gas) | 80,978 | 4,729,115 | |||||||||
| OAO Gazprom - Sponsored ADR (Oil & Gas) | 199,300 | 4,758,774 | |||||||||
| X 5 Retail Group NV - GDR, Reg. S (Food Retailers)* | 117,256 | 2,809,307 | |||||||||
| 12,297,196 | |||||||||||
| South Africa - 6.0% | |||||||||||
| Massmart Holdings Ltd. (Retailers) | 180,000 | 2,079,176 | |||||||||
| MTN Group Ltd. (Communications) | 282,050 | 4,233,719 | |||||||||
| Pretoria Portland Cement Co., Ltd. (Building Materials) | 454,000 | 1,894,782 | |||||||||
| SABMiller plc (Beverages, Food & Tobacco) | 88,200 | 2,356,451 | |||||||||
| Standard Bank Group Ltd. (Banks) | 137,768 | 1,723,457 | |||||||||
| 12,287,585 | |||||||||||
See Notes to Financial Statements
8
Harding, Loevner Funds, Inc.
Institutional Emerging Markets Portfolio
Statement of Net Assets
October 31, 2009 (continued)
| Shares | Value (1) | ||||||||||
| South Korea - 9.0% | |||||||||||
| KB Financial Group Inc. - ADR (Banks)* | 61,991 | $ | 2,940,853 | ||||||||
| Samsung Electronics Co., Ltd., GDR, Reg S - GDR (Semiconductors) | 20,030 | 6,067,663 | |||||||||
| Samsung Electronics Co., Ltd., GDR, Reg S - GDR (Semiconductors) | 6,691 | 1,329,254 | |||||||||
| Samsung Fire & Marine Insurance Co., Ltd. (Insurance) | 24,660 | 4,520,766 | |||||||||
| Shinsegae Co., Ltd. (Retailers) | 4,380 | 1,902,199 | |||||||||
| Taewoong Co., Ltd. (Metals & Mining) | 23,900 | 1,605,191 | |||||||||
| 18,365,926 | |||||||||||
| Taiwan - 9.3% | |||||||||||
| Delta Electronics (Electrical Equipment) | 1,387,189 | 3,869,975 | |||||||||
| Hon Hai Precision Industry Co., Ltd. (Electrical Equipment) | 782,000 | 3,078,785 | |||||||||
| HTC Corp. (Computers & Information) | 106,200 | 1,061,836 | |||||||||
| MediaTek Inc. (Semiconductors) | 273,816 | 3,876,421 | |||||||||
| Synnex Technology International Corp. (Electronics) | 1,802,530 | 3,421,068 | |||||||||
| Taiwan Semiconductor Manufacturing Co. (Electrical Equipment) | 2,015,577 | 3,665,996 | |||||||||
| 18,974,081 | |||||||||||
| Thailand - 2.7% | |||||||||||
| PTT Exploration & Production plc (Oil & Gas) | 641,000 | 2,780,703 | |||||||||
| Siam Commercial Bank-Alien (Banks) | 1,201,170 | 2,776,077 | |||||||||
| 5,556,780 | |||||||||||
| Turkey - 2.5% | |||||||||||
| Arcelik (Home Construction, Furnishings & Appliances)* | 853,000 | 2,775,515 | |||||||||
| Turkiye Garanti Bankasi AS (Banks) | 645,000 | 2,312,118 | |||||||||
| 5,087,633 | |||||||||||
| United Kingdom - 1.2% | |||||||||||
| Hikma Pharmaceuticals plc (Pharmaceuticals) | 320,920 | 2,479,052 | |||||||||
| Total Common Stocks (Cost $157,616,163) | 196,236,093 | ||||||||||
| Preferred Stocks - 1.6% | |||||||||||
| Russia - 1.6% | |||||||||||
| Transneft (Oil & Gas) | 3,729 | 3,244,230 | |||||||||
| Total Preferred Stocks (Cost $1,990,692) | 3,244,230 | ||||||||||
| Total Investments - 98.0% (Cost $159,606,855) | $ | 199,480,323 | |||||||||
See Notes to Financial Statements
9
Harding, Loevner Funds, Inc.
Institutional Emerging Markets Portfolio
Statement of Net Assets
October 31, 2009 (continued)
| Value (1) | |||||||
| Liabilities, Net of Other Assets - 2.0% | |||||||
| Cash | $ | 3,104,170 | |||||
| Dividends and interest receivable | 224,957 | ||||||
| Foreign currency (cost $604,176) | 599,322 | ||||||
| Receivable for Fund units sold | 599,975 | ||||||
| Tax reclaim receivable | 14,275 | ||||||
| Payable to Investment Advisor | (205,510 | ) | |||||
| Other liabilities | (269,555 | ) | |||||
| 4,067,634 | |||||||
| Net Assets - 100% | |||||||
| Applicable to 15,319,796 outstanding $.001 par value units (authorized 500,000,000 shares) | $ | 203,547,957 | |||||
| Net Asset Value, Offering Price and Redemption Price Per Unit | $ | 13.29 | |||||
| Components of Net Assets as of October 31, 2009 were as follows: | |||||||
| Paid-in capital | $ | 224,793,444 | |||||
| Accumulated undistributed net investment income | 1,100,413 | ||||||
| Accumulated net realized loss from investment transactions | (62,011,095 | ) | |||||
| Net unrealized appreciation on investments and on assets and liabilities denominated in foreign currencies | 39,665,195 | ||||||
| $ | 203,547,957 | ||||||
Summary of Abbreviations
ADR American Depository Receipt
GDR Global Depositary Receipt
Reg S Security sold outside United States without registration under the Securities Act of 1933.
(1) See Note 2 to Financial Statements.
* Non-income producing security.
See Notes to Financial Statements
10
Harding, Loevner Funds, Inc.
International Equity Portfolio — Overview
(unaudited)
October 31, 2009
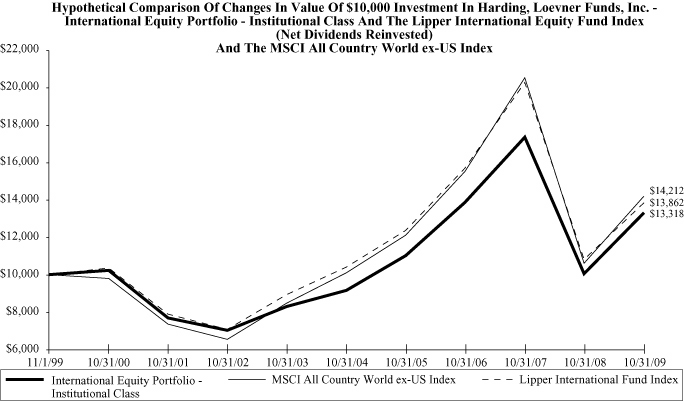
| Returns for the Year Ended October 31, 2009 | |||||||||||||||||||||||
| Cumulative Total Returns | Average Annualized Total Return | ||||||||||||||||||||||
| FUND NAME | Last 12 Months | 5 YR | 10 YR | 5 YR | 10 YR | ||||||||||||||||||
| International Equity Institutional Class (Inception date 11/1/94) | 32.77 | % | 45.76 | % | 33.18 | % | 7.83 | % | 2.91 | % | |||||||||||||
| MSCI All Country World ex-US (Net dividend) | 34.13 | % | 40.95 | % | 42.12 | % | 7.11 | % | 3.58 | % | |||||||||||||
| Lipper International Fund Index | 28.17 | % | 33.39 | % | 38.62 | % | 5.93 | % | 3.32 | % | |||||||||||||
Performance data quoted represents past performance and does not guarantee future results. The investment return and principal value of an investment will fluctuate so that an investor's shares, when redeemed, may be worth more or less than their original cost. Performance current to the most recent month end may be lower or higher than the performance quoted and may be obtained by visiting the website at www.hardingloevnerfunds.com.
Investment return reflects voluntary fee waivers in effect. Absence such waivers, total return would be reduced. The performance provided does not reflect the deduction of taxes that a shareholder would pay on Portfolio distributions.
11
Harding, Loevner Funds, Inc.
International Equity Portfolio — Overview
October 31, 2009
The International Equity Portfolio gained 32.77% for the fiscal year ending October 31, 2009. In comparison, its benchmark, the MSCI All Country World ex-US Index, rose 34.13%.
Consistent with its investment objectives and policies, the Portfolio was invested primarily in the securities of non-US companies that exhibited the fundamental characteristics of growth, financial strength, management quality, and durable competitive advantage.
The portfolio's return was near the benchmark return. Good relative stock performance within sectors offset poor allocation between sectors. Heavy weightings in Health Care and Consumer Staples, along with light weightings in Materials and Financials hindered performance. The portfolio benefited from good stock selection in a number of industry groups, including consumer durables & apparel (LVMH), retailing (Li & Fung, China Resources Enterprise), food & staples retailing (Olam International), pharmaceuticals & biotech (Qiagen), capital goods (Atlas Copco, Schneider Electric), and telecom services (Telekom Indonesia). Positive stock selection was offset by a few holdings that lagged their industry groups, including companies in energy (Imperial Oil, Encana), diversified financials (Nomura Holdings), insurance (Swiss Reinsurance), health care equipment & services (Fresenius), technology hardware & equipment (Nokia), and materials (Air Liquide).
Viewed geographically, the portfolio enjoyed good stock selection in developed markets across Europe and Japan, but our holdings in emerging markets failed to keep up with the torrid pace of the emerging markets sub-index. Stock selection was particularly strong in the UK (Standard Chartered), France (LVMH, Schneider Electric), Germany (Allianz, Qiagen), Japan (Kubota, JSR), Hong Kong (Li & Fung) and Singapore (Olam International), along with Bermuda (Bunge). Emerging markets holdings that lagged included companies in Russia (Gazprom), South Africa (Sasol), Indonesia (Telekom Indonesia), and Taiwan (Taiwan Semiconductor).
Past performance does not guarantee future results.
The Portfolio invests in foreign securities, which will involve greater volatility and political, economic, and currency risks. It also invests in emerging markets, which involve unique risks, such as exposure to economies less diverse and mature than the U.S. or other more established foreign markets. Economic and political instability may cause larger price changes in emerging markets securities than other foreign securities. Investments in debt securities typically decrease in value when interest rates rise. This risk is usually greater for longer-term debt securities. Investment by the Portfolio in lower-rated and non-rated securities presents a greater risk of loss to principal and interest than higher-rated securities. The portfolio invests in smaller companies which involve additional risk such as limited liquidity and greater volatility.
The MSCI All Country World ex-US Index is a free float-adjusted market capitalization index that is designed to measure equity market performance in the global developed and emerging markets, excluding the US. The Index consists of 44 developed and emerging market countries. The Index is net of foreign withholding taxes on dividends. You cannot invest directly in this Index.
It is not possible to invest directly in an index.
12
Harding, Loevner Funds, Inc.
International Equity Portfolio
Statement of Net Assets
October 31, 2009
| Industry | Percentage of Net Assets | ||||||
| Banks | 7.6 | % | |||||
| Beverages, Food & Tobacco | 13.3 | ||||||
| Chemicals | 5.5 | ||||||
| Commercial Services & Supplies | 5.9 | ||||||
| Communications | 5.9 | ||||||
| Computer Software & Processing | 3.2 | ||||||
| Cosmetics & Personal Care | 2.2 | ||||||
| Electrical Equipment | 8.5 | ||||||
| Electronics | 2.0 | ||||||
| Financial Services | 3.5 | ||||||
| Health Care Providers & Services | 1.2 | ||||||
| Heavy Machinery | 2.4 | ||||||
| Holding Companies-Diversified | 2.2 | ||||||
| Insurance | 2.8 | ||||||
| Machinery - Diversified | 1.3 | ||||||
| Media | 5.0 | ||||||
| Medical Supplies | 5.4 | ||||||
| Oil & Gas | 9.9 | ||||||
| Oil & Gas Services | 1.7 | ||||||
| Pharmaceuticals | 2.1 | ||||||
| Real Estate | 1.3 | ||||||
| Retailers | 3.3 | ||||||
| Semiconductors | 2.0 | ||||||
| Total Investments | 98.2 | ||||||
| Other Assets Less Liabilities | 1.8 | * | |||||
| Net Assets | 100.0 | % | |||||
* Breakout of other assets and liabilities can be found on page 17.
See Notes to Financial Statements
13
Harding, Loevner Funds, Inc.
International Equity Portfolio
Statement of Net Assets
October 31, 2009 (continued)
| Shares | Value (1) | ||||||||||
| Common Stocks - 97.5% | |||||||||||
| Australia - 1.8% | |||||||||||
| Cochlear Ltd. (Medical Supplies) | 93,800 | $ | 5,375,496 | ||||||||
| Austria - 2.0% | |||||||||||
| Erste Bank der Oesterreichischen Sparkassen AG (Banks) | 149,220 | 5,995,923 | |||||||||
| Bermuda - 2.5% | |||||||||||
| Bunge Ltd. (Beverages, Food & Tobacco) | 129,280 | 7,376,717 | |||||||||
| Brazil - 0.8% | |||||||||||
| Petroleo Brasileiro SA - ADR (Oil & Gas) | 52,888 | 2,444,483 | |||||||||
| Canada - 3.2% | |||||||||||
| EnCana Corp. (Oil & Gas) | 79,882 | 4,424,664 | |||||||||
| Imperial Oil Ltd. (Oil & Gas) | 137,290 | 5,168,968 | |||||||||
| 9,593,632 | |||||||||||
| China - 2.7% | |||||||||||
| China Resources Enterprise (Financial Services) | 2,442,000 | 8,151,832 | |||||||||
| Finland - 2.0% | |||||||||||
| Nokia Oyj - Sponsored ADR (Communications) | 465,240 | 5,866,676 | |||||||||
| France - 15.1% | |||||||||||
| Air Liquide (Chemicals) | 94,402 | 10,194,126 | |||||||||
| Dassault Systemes SA (Computer Software & Processing) | 163,800 | 9,443,602 | |||||||||
| L'Oreal SA (Cosmetics & Personal Care) | 65,170 | 6,641,877 | |||||||||
| LVMH Moet Hennessy Louis Vuitton SA (Beverages, Food & Tobacco) | 64,430 | 6,684,127 | |||||||||
| Schlumberger Ltd. (Oil & Gas Services) | 83,400 | 5,187,480 | |||||||||
| Schneider Electric SA (Electrical Equipment) | 66,450 | 6,902,044 | |||||||||
| 45,053,256 | |||||||||||
| Germany - 5.8% | |||||||||||
| Allianz SE (Insurance) | 73,400 | 8,412,189 | |||||||||
| Fresenius AG (Health Care Providers & Services) | 73,368 | 3,649,800 | |||||||||
| Qiagen NV (Commercial Services & Supplies)* | 253,470 | 5,257,080 | |||||||||
| 17,319,069 | |||||||||||
| Hong Kong - 3.4% | |||||||||||
| Hutchison Whampoa Ltd. (Commercial Services & Supplies) | 531,000 | 3,717,414 | |||||||||
| Li & Fung Ltd. (Commercial Services & Supplies) | 1,550,200 | 6,419,433 | |||||||||
| 10,136,847 | |||||||||||
| Indonesia - 1.8% | |||||||||||
| PT Telekomunikasi Indonesia - Sponsored ADR (Communications) | 154,940 | 5,254,015 | |||||||||
| Israel - 0.8% | |||||||||||
| Teva Pharmaceutical Industries Ltd. - Sponsored ADR (Pharmaceuticals) | 44,160 | 2,229,197 | |||||||||
See Notes to Financial Statements
14
Harding, Loevner Funds, Inc.
International Equity Portfolio
Statement of Net Assets
October 31, 2009 (continued)
| Shares | Value (1) | ||||||||||
| Japan - 14.3% | |||||||||||
| Fanuc Ltd. (Electrical Equipment) | 65,400 | $ | 5,493,297 | ||||||||
| Hoya Corp. (Electronics) | 267,300 | 5,854,040 | |||||||||
| JSR Corp. (Chemicals) | 323,900 | 6,305,223 | |||||||||
| Jupiter Telecommunications Co., Ltd. (Media) | 6,085 | 5,589,849 | |||||||||
| Keyence Corp. (Electrical Equipment) | 34,765 | 6,897,888 | |||||||||
| Kubota Corp. (Machinery - Diversified) | 505,300 | 3,920,034 | |||||||||
| Nomura Holdings Inc. (Financial Services) | 335,200 | 2,345,623 | |||||||||
| So-net M3 Inc. (Commercial Services & Supplies) | 664 | 2,278,830 | |||||||||
| Sumitomo Realty & Development Co., Ltd. (Real Estate) | 199,000 | 3,739,343 | |||||||||
| 42,424,127 | |||||||||||
| Malaysia - 2.2% | |||||||||||
| Sime Darby Berhad (Holding Companies-Diversified) | 2,574,810 | 6,652,016 | |||||||||
| Mexico - 4.3% | |||||||||||
| America Movil SA de CV, Series L - ADR (Communications) | 144,000 | 6,354,720 | |||||||||
| Wal-Mart de Mexico SA de CV - Sponsored ADR (Retailers) | 184,620 | 6,426,622 | |||||||||
| 12,781,342 | |||||||||||
| Poland - 1.0% | |||||||||||
| Bank Pekao SA - GDR, Reg. S (Banks)#,* | 52,560 | 2,857,825 | |||||||||
| Russia - 2.3% | |||||||||||
| OAO Gazprom - Sponsored ADR (Oil & Gas) | 280,570 | 6,699,294 | |||||||||
| Singapore - 3.3% | |||||||||||
| DBS Group Holdings Ltd. (Banks) | 607,083 | 5,539,736 | |||||||||
| Olam International Ltd. (Beverages, Food & Tobacco) | 2,230,900 | 4,277,217 | |||||||||
| 9,816,953 | |||||||||||
| South Africa - 0.7% | |||||||||||
| Sasol Ltd. (Oil & Gas) | 55,641 | 2,084,364 | |||||||||
| South Korea - 2.0% | |||||||||||
| Samsung Electronics Co., Ltd., GDR, Reg S - GDR (Semiconductors) | 18,520 | 5,610,241 | |||||||||
| Samsung Electronics Co., Ltd., GDR, Reg S - GDR (Semiconductors) | 1,500 | 297,994 | |||||||||
| 5,908,235 | |||||||||||
| Sweden - 2.3% | |||||||||||
| Atlas Copco AB - Class A (Heavy Machinery) | 510,600 | 6,977,482 | |||||||||
| Switzerland - 9.5% | |||||||||||
| Alcon Inc. (Medical Supplies) | 49,370 | 7,049,542 | |||||||||
| Nestle SA - Sponsored ADR (Beverages, Food & Tobacco) | 220,350 | 10,250,682 | |||||||||
| Roche Holding AG - Genusschein (Pharmaceuticals) | 24,350 | 3,901,402 | |||||||||
| Swatch Group AG (Retailers) | 14,880 | 3,468,954 | |||||||||
| Synthes Inc. (Medical Supplies) | 29,320 | 3,479,419 | |||||||||
| 28,149,999 | |||||||||||
| Taiwan - 2.0% | |||||||||||
| Taiwan Semiconductor Manufacturing Co. (Electrical Equipment) | 3,330,125 | 6,056,939 | |||||||||
See Notes to Financial Statements
15
Harding, Loevner Funds, Inc.
International Equity Portfolio
Statement of Net Assets
October 31, 2009 (continued)
| Shares | Value (1) | ||||||||||
| United Kingdom - 11.7% | |||||||||||
| BG Group plc (Oil & Gas) | 372,680 | $ | 6,424,711 | ||||||||
| Standard Chartered plc (Banks) | 338,010 | 8,300,246 | |||||||||
| Tesco plc (Beverages, Food & Tobacco) | 874,980 | 5,838,969 | |||||||||
| Unilever plc (Beverages, Food & Tobacco) | 167,425 | 5,011,364 | |||||||||
| WPP plc (Media) | 1,043,920 | 9,361,788 | |||||||||
| 34,937,078 | |||||||||||
| Total Common Stocks (Cost $230,874,100) | 290,142,797 | ||||||||||
| Preferred Stocks - 0.7% | |||||||||||
| Brazil - 0.7% | |||||||||||
| Petroleo Brasileiro SA - Sponsored ADR (Oil & Gas) | 55,400 | 2,222,648 | |||||||||
| Total Preferred Stocks (Cost $1,789,747) | 2,222,648 | ||||||||||
| Total Investments - 98.2% (Cost $232,663,847) | $ | 292,365,445 | |||||||||
See Notes to Financial Statements
16
Harding, Loevner Funds, Inc.
International Equity Portfolio
Statement of Net Assets
October 31, 2009 (continued)
| Value (1) | |||||||
| Liabilities, Net of Other Assets - 1.8% | |||||||
| Cash | $ | 4,718,958 | |||||
| Dividends and interest receivable | 415,158 | ||||||
| Foreign currency (cost $29,515) | 29,654 | ||||||
| Receivable for Fund units sold | 317,218 | ||||||
| Tax reclaim receivable | 84,743 | ||||||
| Prepaid expenses | 2,508 | ||||||
| Payable to Investment Advisor | (182,237 | ) | |||||
| Payable for Fund units redeemed | (54,407 | ) | |||||
| Payable for distribution fees | (15,865 | ) | |||||
| Other liabilities | (97,840 | ) | |||||
| 5,217,890 | |||||||
| Net Assets - 100% | |||||||
| Investor Class | |||||||
| Applicable to 3,173,243 outstanding $.001 par value units (authorized 250,000,000 shares) | $ | 38,133,502 | |||||
| Net Asset Value, Offering Price and Redemption Price Per Unit | $ | 12.02 | |||||
| Institutional Class | |||||||
| Applicable to 21,549,438 outstanding $.001 par value units (authorized 250,000,000 shares) | $ | 259,449,833 | |||||
| Net Asset Value, Offering Price and Redemption Price Per Unit | $ | 12.04 | |||||
| Components of Net Assets as of October 31, 2009 were as follows: | |||||||
| Paid-in capital | $ | 247,801,995 | |||||
| Accumulated undistributed net investment income | 2,365,492 | ||||||
| Accumulated net realized loss from investment transactions | (12,296,884 | ) | |||||
| Net unrealized appreciation on investments and on assets and liabilities denominated in foreign currencies | 59,712,732 | ||||||
| $ | 297,583,335 | ||||||
Summary of Abbreviations
ADR American Depository Receipt
GDR Global Depositary Receipt
Reg S Security sold outside United States without registration under the Securities Act of 1933.
(1) See Note 2 to Financial Statements.
* Non-income producing security.
# Security valued at fair value as determined in good faith under policies and procedures established by and under the supervision of the Portfolio's Board of Directors.
See Notes to Financial Statements
17
Harding, Loevner Funds, Inc.
Frontier Emerging Markets Portfolio — Overview
(unaudited)
October 31, 2009

| Returns for the Year Ended October 31, 2009 | |||||||||||||||
| Cumulative Total Returns | Average Annualized Total Return | ||||||||||||||
| FUND NAME | Last 12 Months | Inception | Inception | ||||||||||||
| Frontier Emerging Markets Portfolio - Institutional Class (Inception date 05/27/08) | 26.71 | % | (36.90 | )% | (27.48 | )% | |||||||||
| MSCI Frontier Emerging Markets Index (Net Dividends) | 12.09 | % | (40.96 | )% | (30.77 | )% | |||||||||
| S&P Frontier Broad Market Index | (6.16 | )% | (46.05 | )% | (34.99 | )% | |||||||||
Performance data quoted represents past performance and does not guarantee future results. The investment return and principal value of an investment will fluctuate so that an investor's shares, when redeemed, may be worth more or less than their original cost. Performance current to the most recent month end may be lower or higher than the performance quoted and may be obtained by visiting the website at www.hardingloevnerfunds.com.
Investment return reflects voluntary fee waivers in effect. Absence such waivers, total return would be reduced. The performance provided does not reflect the deduction of taxes that a shareholder would pay on Portfolio distributions.
18
Harding, Loevner Funds, Inc.
Frontier Emerging Markets Portfolio — Overview
October 31, 2009
The Frontier Emerging Markets Portfolio rose 26.71% for the fiscal year ending October 31, 2009, while its benchmark, the MSCI Frontier Emerging Markets Index rose 12.09%.
Consistent with its investment objectives and policies, the Portfolio was invested in the securities of companies with strong growth prospects located in frontier and smaller emerging markets countries that we regard as both economically stable and offering attractive long-term investment potential.
Strong stock selection in Europe, Asia, and the Gulf States was the main positive contributor to returns this period. Two Ukrainian food companies, Astarta Holding and Kernel Holding, along with Thailand's Home Products Center, a do-it-yourself retailer, were standouts. The Portfolio's large weighting in the outperforming Consumer Staples and Industrials sectors, and underweight the lagging Financials sector, were also beneficial.
Returns were hurt by the Portfolio's underweight and stock selection in Latin America, the strongest region in the Index this year. In Peru, for example, our holdings including domestic bank Credicorp performed well on an absolute basis, but still did not match the extraordinary rise of the country's overall market. The Portfolio's large exposure to Africa—particularly Nigeria where the market fell as political uncertainty in the Nigerian Delta oil region led to a decline in oil production—was another drag on performance. We continue to maintain a large weight in Africa, a reflection of our positive view of the long-term growth prospects for select companies in the region.
Past performance does not guarantee future results.
Foreign investments involve additional risks, including greater volatility and political, economic, and currency risks and differences in accounting methods. Emerging markets countries involve greater risks, such as immature economic structures, national policies restricting investments by foreigners, and different legal systems. Such risks may be magnified with respect to securities of issuers in frontier emerging markets. The Portfolio can have significant concentration in a single industry, and investment opportunities in frontier markets may be concentrated in the banking industry. The Portfolio will be vulnerable to factors affecting an industry in which it is concentrated. Investments in debt securities typically decrease in value when interest rates rise. This risk is usually greater for longer-term debt securities. Investment in lower-rated and non-rated securities presents a greater risk of loss of principal and interest than hig her-rated securities. Mutual fund investing involves risk. Principal loss is possible.
The MSCI Frontier Emerging Markets Index is a free float-adjusted market capitalization index designed to measure equity market performance in all countries from the MSCI Frontier Markets Index and the lower size spectrum of the MSCI Emerging Markets Index. The Index consists of 25 frontier markets and 5 emerging markets. The Index is net of foreign withholding taxes on dividends. You cannot invest directly in this Index.
It is not possible to invest directly in an index.
19
Harding, Loevner Funds, Inc.
Frontier Emerging Markets Portfolio
Statement of Net Assets
October 31, 2009
| Industry | Percentage of Net Assets | ||||||
| Agriculture | 1.9 | % | |||||
| Airlines | 0.6 | ||||||
| Banks | 21.8 | ||||||
| Beverages, Food & Tobacco | 8.0 | ||||||
| Building Materials | 5.9 | ||||||
| Chemicals | 2.9 | ||||||
| Commercial Services & Supplies | 2.6 | ||||||
| Communications | 9.6 | ||||||
| Electric Utilities | 2.1 | ||||||
| Electrical Equipment | 1.2 | ||||||
| Engineering & Construction | 6.5 | ||||||
| Financial Services | 5.0 | ||||||
| Food | 1.3 | ||||||
| Gold and Silver Ores | 1.3 | ||||||
| Heavy Machinery | 0.4 | ||||||
| Holding Companies-Diversified | 4.0 | ||||||
| Industrial - Diversified | 1.1 | ||||||
| Internet | 1.0 | ||||||
| Investment Companies | 1.6 | ||||||
| Iron & Steel | 0.2 | ||||||
| Lodging | 2.2 | ||||||
| Media | 1.8 | ||||||
| Metals & Mining | 2.0 | ||||||
| Oil & Gas | 4.9 | ||||||
| Pharmaceuticals | 4.4 | ||||||
| Real Estate | 0.8 | ||||||
| Textiles & Apparel | 1.1 | ||||||
| Transportation | 2.9 | ||||||
| Total Investments | 99.1 | ||||||
| Other Assets Less Liabilities | 0.9 | * | |||||
| Net Assets | 100.0 | % | |||||
* Breakout of other assets and liabilities can be found on page 25.
The staff of the Securities and Exchange Commission considers concentration of investments as the investment of more than 25% of the value of a fund's assets in the securities of companies in any one industry or group of industries. As of October 31, 2009, Frontier Emerging Markets Portfolio did not concentrate its investments in the securities of companies in any one industry or group of industries.
See Notes to Financial Statements
20
Harding, Loevner Funds, Inc.
Frontier Emerging Markets Portfolio
Statement of Net Assets
October 31, 2009 (continued)
| Shares | Value (1) | ||||||||||
| Common Stocks - 99.0% | |||||||||||
| Argentina - 1.4% | |||||||||||
| Molinos Rio De La Plata SA (Beverages, Food & Tobacco) | 41,398 | $ | 128,437 | ||||||||
| Bangladesh - 3.4% | |||||||||||
| Lafarge Surma Cement Ltd. (Building Materials)* | 10,100 | 70,753 | |||||||||
| Power Grid Co., Ltd. of Bangladesh (Electric Utilities) | 7,000 | 74,202 | |||||||||
| Square Pharmaceuticals Ltd. (Pharmaceuticals) | 4,235 | 165,816 | |||||||||
| 310,771 | |||||||||||
| Canada - 1.3% | |||||||||||
| Katanga Mining Ltd. (Gold and Silver Ores)* | 176,575 | 119,126 | |||||||||
| Colombia - 8.5% | |||||||||||
| BanColombia SA - Sponsored ADR (Banks) | 6,210 | 245,792 | |||||||||
| Cementos Argos SA - Sponsored ADR (Building Materials)# | 7,440 | 185,953 | |||||||||
| Ecopetrol SA - Sponsored ADR (Oil & Gas) | 3,200 | 82,528 | |||||||||
| Grupo de Inversiones Suramericana SA - ADR (Investment Companies)# | 6,300 | 141,715 | |||||||||
| Interconexion Electrica SA (Electric Utilities)# | 800 | 116,171 | |||||||||
| 772,159 | |||||||||||
| Croatia - 2.9% | |||||||||||
| Atlantic Grupa (Beverages, Food & Tobacco) | 1,230 | 168,862 | |||||||||
| Ericsson Nikola Tesla (Communications) | 361 | 98,594 | |||||||||
| 267,456 | |||||||||||
| Egypt - 6.3% | |||||||||||
| Elswedy Cables Holdings Co. (Electrical Equipment) | 8,393 | 112,311 | |||||||||
| Orascom Construction Industries - GDR, Reg. S (Engineering & Construction) | 4,030 | 194,732 | |||||||||
| Orascom Telecom Holding SAE - GDR (Communications) | 4,866 | 165,498 | |||||||||
| Oriental Weavers (Textiles & Apparel) | 16,000 | 97,538 | |||||||||
| 570,079 | |||||||||||
| Estonia - 1.1% | |||||||||||
| Tallink Group Ltd. (Transportation)* | 179,840 | 100,571 | |||||||||
| Ghana - 0.5% | |||||||||||
| Ghana Commercial Bank (Banks) | 68,600 | 43,152 | |||||||||
| Indonesia - 2.4% | |||||||||||
| PT Bank Rakyat Indonesia (Banks) | 293,000 | 213,884 | |||||||||
| Jordan - 2.8% | |||||||||||
| Arab Bank (Banks) | 10,500 | 199,085 | |||||||||
| Arab Potash Co. (Chemicals) | 1,193 | 50,901 | |||||||||
| 249,986 | |||||||||||
| Kazakhstan - 3.4% | |||||||||||
| Halyk Savings Bank of Kazakhstan JSC - GDR, Reg. S (Banks)* | 18,799 | 127,102 | |||||||||
| Kazakhstan Kagazy plc - GDR, Reg. S (Industrial - Diversified)* | 93,020 | 25,116 | |||||||||
| KazMunaiGas Exploration Production - GDR, Reg. S (Oil & Gas) | 5,150 | 121,543 | |||||||||
| Steppe Cement Ltd. (Building Materials)* | 31,250 | 32,654 | |||||||||
| 306,415 | |||||||||||
See Notes to Financial Statements
21
Harding, Loevner Funds, Inc.
Frontier Emerging Markets Portfolio
Statement of Net Assets
October 31, 2009 (continued)
| Shares | Value (1) | ||||||||||
| Kenya - 7.6% | |||||||||||
| Accesskenya (Internet) | 336,200 | $ | 89,885 | ||||||||
| East African Breweries Ltd. (Beverages, Food & Tobacco) | 62,300 | 119,642 | |||||||||
| Equity Bank Ltd. (Banks) | 380,000 | 73,730 | |||||||||
| Kenya Airways Ltd. (Airlines) | 172,500 | 56,347 | |||||||||
| Kenya Oil Co., Ltd. (Oil & Gas) | 67,900 | 41,824 | |||||||||
| Nation Media Group (Media) | 66,400 | 106,958 | |||||||||
| Safaricom Ltd. (Communications) | 3,726,400 | 201,179 | |||||||||
| 689,565 | |||||||||||
| Lebanon - 1.2% | |||||||||||
| Banque Audi sal- Audi Saradar Group - GDR, Reg. S (Banks) | 1,200 | 105,600 | |||||||||
| Lithuania - 1.2% | |||||||||||
| Teo Lt AB (Communications) | 131,040 | 107,662 | |||||||||
| Mauritius - 2.9% | |||||||||||
| Mauritius Commercial Bank (Banks) | 31,400 | 151,550 | |||||||||
| Sun Resorts Ltd. - Class A (Lodging) | 42,340 | 111,974 | |||||||||
| 263,524 | |||||||||||
| Morocco - 4.4% | |||||||||||
| Douja Prom Addoha (Real Estate) | 4,620 | 68,295 | |||||||||
| Managem (Metals & Mining)* | 1,522 | 52,659 | |||||||||
| Maroc Telecom (Communications) | 7,400 | 140,266 | |||||||||
| Ona SA (Holding Companies-Diversified) | 785 | 133,891 | |||||||||
| 395,111 | |||||||||||
| Nigeria - 4.7% | |||||||||||
| Dangote Sugar Refinery plc (Agriculture) | 844,530 | 84,061 | |||||||||
| Diamond Bank plc (Banks) | 2,122,578 | 106,762 | |||||||||
| First Bank of Nigeria plc (Banks) | 782,715 | 76,975 | |||||||||
| UAC of Nigeria plc (Holding Companies-Diversified) | 579,880 | 157,555 | |||||||||
| 425,353 | |||||||||||
| Pakistan - 1.1% | |||||||||||
| Engro Chemical Ltd. (Chemicals) | 7,560 | 15,049 | |||||||||
| MCB Bank Ltd. (Banks) | 12,650 | 32,304 | |||||||||
| Pakistan Petroleum Ltd. (Oil & Gas) | 27,060 | 56,487 | |||||||||
| 103,840 | |||||||||||
| Peru - 3.7% | |||||||||||
| Cementos Lima (Building Materials) | 7,612 | 83,735 | |||||||||
| Credicorp Ltd. (Financial Services) | 3,200 | 220,896 | |||||||||
| Ferreyros SA (Heavy Machinery) | 34,219 | 31,760 | |||||||||
| 336,391 | |||||||||||
| Philippines - 1.0% | |||||||||||
| International Container Term Services Inc. (Transportation) | 222,000 | 94,325 | |||||||||
| Poland - 0.1% | |||||||||||
| Ciech SA (Chemicals)* | 588 | 7,837 | |||||||||
| Qatar - 2.8% | |||||||||||
| Industries Qatar (Chemicals) | 6,150 | 186,985 | |||||||||
| Qatar Shipping Co. (Transportation) | 7,100 | 65,569 | |||||||||
| 252,554 | |||||||||||
See Notes to Financial Statements
22
Harding, Loevner Funds, Inc.
Frontier Emerging Markets Portfolio
Statement of Net Assets
October 31, 2009 (continued)
| Shares | Value (1) | ||||||||||
| Romania - 2.8% | |||||||||||
| Albalact SA (Beverages, Food & Tobacco)* | 636,200 | $ | 80,640 | ||||||||
| Banca Transilvania (Banks) | 217,790 | 130,315 | |||||||||
| SNP Petrom SA (Oil & Gas)* | 535,400 | 46,773 | |||||||||
| 257,728 | |||||||||||
| Senegal - 1.8% | |||||||||||
| Sonatel (Communications) | 595 | 160,187 | |||||||||
| Serbia - 0.8% | |||||||||||
| Energoprojekt Holding ad Beograd (Holding Companies-Diversified)* | 4,550 | 73,493 | |||||||||
| Sri Lanka - 2.6% | |||||||||||
| John Keells Holdings plc (Commercial Services & Supplies) | 190,000 | 234,445 | |||||||||
| Thailand - 7.6% | |||||||||||
| Home Product Center plc (Building Materials) | 1,042,910 | 130,422 | |||||||||
| Major Cineplex Group (Media) | 274,800 | 60,016 | |||||||||
| Minor International plc (Lodging) | 283,000 | 90,594 | |||||||||
| PTT Exploration & Production plc (Oil & Gas) | 22,400 | 97,173 | |||||||||
| Siam Commercial Bank-Alien (Banks) | 101,100 | 233,657 | |||||||||
| Thai Vegetable Oil plc (Beverages, Food & Tobacco) | 172,600 | 82,104 | |||||||||
| 693,966 | |||||||||||
| Trinidad And Tobago - 2.1% | |||||||||||
| Neal & Massy Holdings Ltd. (Industrial - Diversified)# | 9,900 | 76,719 | |||||||||
| Republic Bank Ltd. (Banks) | 6,250 | 83,030 | |||||||||
| Trinidad Cement Ltd. (Building Materials)* | 60,000 | 33,307 | |||||||||
| 193,056 | |||||||||||
| Turkey - 3.0% | |||||||||||
| BIM Birlesik Magazalar AS (Food) | 3,260 | 118,396 | |||||||||
| Turkiye Is Bankasi Series C (Banks) | 41,336 | 155,253 | |||||||||
| 273,649 | |||||||||||
| Ukraine - 2.7% | |||||||||||
| Astarta Holding N.V. (Beverages, Food & Tobacco)* | 11,660 | 137,715 | |||||||||
| Ferrexpo plc (Iron & Steel) | 8,320 | 20,161 | |||||||||
| Kernel Holding SA (Agriculture)* | 5,900 | 85,075 | |||||||||
| 242,951 | |||||||||||
| United Arab Emirates - 6.9% | |||||||||||
| Arabtec Holding Co. (Engineering & Construction)* | 452,000 | 393,972 | |||||||||
| Dubai Financial Market (Financial Services) | 370,000 | 233,037 | |||||||||
| 627,009 | |||||||||||
| United Kingdom - 4.0% | |||||||||||
| Hikma Pharmaceuticals plc (Pharmaceuticals) | 30,700 | 237,152 | |||||||||
| Kazakhmys plc (Metals & Mining)* | 7,300 | 129,260 | |||||||||
| 366,412 | |||||||||||
| Total Common Stocks (Cost $9,164,059) | 8,986,694 | ||||||||||
See Notes to Financial Statements
23
Harding, Loevner Funds, Inc.
Frontier Emerging Markets Portfolio
Statement of Net Assets
October 31, 2009 (continued)
| Shares | Value (1) | ||||||||||
| Warrant - 0.1% | |||||||||||
| Thailand - 0.1% | |||||||||||
| Thai Vegetable Oil., Issued by Thai Vegetable Oil., Expires 05/18/2012 (Beverages, Food & Tobacco)* | 34,520 | $ | 7,333 | ||||||||
| Total Investments - 99.1% (Cost $9,166,296) | $ | 8,994,027 | |||||||||
See Notes to Financial Statements
24
Harding, Loevner Funds, Inc.
Frontier Emerging Markets Portfolio
Statement of Net Assets
October 31, 2009 (continued)
| Value (1) | |||||||
| Liabilities, Net of Other Assets - 0.9% | |||||||
| Cash | $ | 91,610 | |||||
| Dividends and interest receivable | 16,453 | ||||||
| Foreign currency (cost $22,238) | 20,538 | ||||||
| Tax reclaim receivable | 910 | ||||||
| Receivable from Investment Advisor | 5,645 | ||||||
| Other liabilities | (57,880 | ) | |||||
| 77,276 | |||||||
| Net Assets - 100% | |||||||
| Applicable to 1,442,448 outstanding $.001 par value units (authorized 400,000,000 shares) | $ | 9,071,303 | |||||
| Net Asset Value, Offering Price and Redemption Price Per Unit | $ | 6.29 | |||||
| Components of Net Assets as of October 31, 2009 were as follows: | |||||||
| Paid-in capital | $ | 10,789,015 | |||||
| Accumulated undistributed net investment income | 67,258 | ||||||
| Accumulated net realized loss from investment transactions | (1,577,373 | ) | |||||
| Net unrealized depreciation on investments and on assets and liabilities denominated in foreign currencies | (207,597 | ) | |||||
| $ | 9,071,303 | ||||||
Summary of Abbreviations
ADR American Depository Receipt
GDR Global Depositary Receipt
Reg S Security sold outside United States without registration under the Securities Act of 1933.
(1) See Note 2 to Financial Statements.
# Security valued at fair value as determined in good faith under policies and procedures established by and under the supervision of the Portfolio's Board of Directors.
* Non-income producing security.
See Notes to Financial Statements
25
Harding, Loevner Funds, Inc.
Statements of Operations
Year Ended October 31, 2009
| Institutional Emerging Markets Portfolio | International Equity Portfolio | ||||||||||
| Investment Income | |||||||||||
| Interest | $ | 3,858 | $ | 1,688 | |||||||
| Dividends (net of foreign withholding taxes of $501,366 and $598,510, respectively) | 3,604,163 | 5,126,101 | |||||||||
| Total investment income | 3,608,021 | 5,127,789 | |||||||||
| Expenses | |||||||||||
| Investment advisory fees (Note 3) | 2,026,214 | 1,668,949 | |||||||||
| Administration fees (Note 3) | 107,697 | 148,573 | |||||||||
| Distribution fees, Investor Class | — | 51,886 | |||||||||
| Custodian and accounting fees (Note 3) | 195,371 | 145,302 | |||||||||
| Directors' fees and expenses (Note 3) | 28,804 | 35,488 | |||||||||
| Shareholder record keeping fees (Note 3) | 30,613 | 64,508 | |||||||||
| Printing and postage fees | 15,377 | 57,757 | |||||||||
| State registration filing fees | 9,224 | 31,066 | |||||||||
| Professional fees | 57,653 | 75,299 | |||||||||
| Sub Transfer Agent Fees | 451 | 50,383 | |||||||||
| Other fees and expenses | 34,629 | 49,612 | |||||||||
| Total Expenses | 2,506,033 | 2,378,823 | |||||||||
| Less Waiver of investment advisory fee (Note 3) | (398,771 | ) | (107,630 | ) | |||||||
| Net expenses | 2,107,262 | 2,271,193 | |||||||||
| Net investment income | 1,500,759 | 2,856,596 | |||||||||
| Realized and Unrealized Gain (Loss) | |||||||||||
| Net realized gain (loss) — | |||||||||||
| Investment transactions | (34,036,112 | ) | (11,874,044 | ) | |||||||
| Foreign currency transactions | (179,163 | ) | (69,544 | ) | |||||||
| Net realized (loss) | (34,215,275 | ) | (11,943,588 | ) | |||||||
| Change in unrealized appreciation (depreciation) — | |||||||||||
| Investments | 102,020,940 | 76,755,156 | |||||||||
| Translation of assets and liabilities denominated in foreign currencies | (184,442 | ) | 4,152 | ||||||||
| Net change in unrealized appreciation | 101,836,498 | 76,759,308 | |||||||||
| Net realized and unrealized gain | 67,621,223 | 64,815,720 | |||||||||
| Net increase in net assets resulting from operations | $ | 69,121,982 | $ | 67,672,316 | |||||||
See Notes to Financial Statements
26
Harding, Loevner Funds, Inc.
Statements of Operations (continued)
Period Ended October 31, 2009
| Frontier Emerging Markets Portfolio | |||||||
| Investment Income | |||||||
| Interest | $ | 205 | |||||
| Dividends (net of foreign withholding taxes of $16,542) | 215,640 | ||||||
| Total investment income | 215,845 | ||||||
| Expenses | |||||||
| Investment advisory fees (Note 3) | 95,437 | ||||||
| Administration fees (Note 3) | 9,135 | ||||||
| Custodian and accounting fees (Note 3) | 34,382 | ||||||
| Directors' fees and expenses (Note 3) | 1,116 | ||||||
| Shareholder record keeping fees (Note 3) | 27,705 | ||||||
| Printing and postage fees | 1,721 | ||||||
| State registration filing fees | 3,882 | ||||||
| Professional fees | 83,023 | ||||||
| Other fees and expenses | 3,374 | ||||||
| Total Expenses | 259,775 | ||||||
| Less Reimbursement of Fund expenses from Investment Advisor (Note 3) | (37,088 | ) | |||||
| Less Waiver of investment advisory fee (Note 3) | (95,437 | ) | |||||
| Net expenses | 127,250 | ||||||
| Net investment income | 88,595 | ||||||
| Realized and Unrealized Gain (Loss) | |||||||
| Net realized gain (loss) — | |||||||
| Investment transactions | (1,571,395 | ) | |||||
| Foreign currency transactions | (17,724 | ) | |||||
| Net realized (loss) | (1,589,119 | ) | |||||
| Change in unrealized appreciation (depreciation) — | |||||||
| Investments | 3,655,845 | ||||||
| Translation of assets and liabilities denominated in foreign currencies | (34,691 | ) | |||||
| Net change in unrealized appreciation | 3,621,154 | ||||||
| Net realized and unrealized gain | 2,032,035 | ||||||
| Net increase in net assets resulting from operations | $ | 2,120,630 | |||||
See Notes to Financial Statements
27
Harding, Loevner Funds, Inc.
Statements of Changes in Net Assets
| Institutional Emerging Markets Portfolio | |||||||||||
| Year Ended October 31, 2009 | Year Ended October 31, 2008 | ||||||||||
| Increase in Net Assets From Operations | |||||||||||
| Net investment income | $ | 1,500,759 | $ | 6,267,430 | |||||||
| Net realized loss on investments and foreign currency transactions | (34,215,275 | ) | (28,057,851 | ) | |||||||
| Net change in unrealized appreciation (depreciation) on investments and translation of assets and liabilities denominated in foreign currencies | 101,836,498 | (145,291,730 | ) | ||||||||
| Net increase (decrease) in net assets resulting from operations | 69,121,982 | (167,082,151 | ) | ||||||||
| Distributions to Shareholders from: | |||||||||||
| Net investment income | (5,277,778 | ) | (1,028,938 | ) | |||||||
| Net realized gain from investments and foreign-currency related transactions | — | (8,286,256 | ) | ||||||||
| Total distributions to shareholders | (5,277,778 | ) | (9,315,194 | ) | |||||||
| Transactions in units of Common Stock | |||||||||||
| Proceeds from sale of units | 45,649,131 | 86,978,082 | |||||||||
| Net Asset Value of shares issued to shareholders upon reinvestment of dividends | 4,205,119 | 8,746,852 | |||||||||
| Cost of shares units | (42,223,167 | ) | (32,362,942 | ) | |||||||
| Redemption fees | |||||||||||
| Institutional Class | 35,508 | 11,981 | |||||||||
| Net increase in net assets from fund unit transactions | 7,666,591 | 63,373,973 | |||||||||
| Net increase (decrease) in net assets | 71,510,795 | (113,023,372 | ) | ||||||||
| Net Assets | |||||||||||
| At beginning of year | 132,037,162 | 245,060,534 | |||||||||
| At end of year | $ | 203,547,957 | $ | 132,037,162 | |||||||
| Accumulated undistributed net investment income included in net assets | $ | 1,100,413 | $ | 5,094,625 | |||||||
See Notes to Financial Statements
28
Harding, Loevner Funds, Inc.
Statements of Changes in Net Assets (continued)
| International Equity Portfolio | |||||||||||
| Year Ended October 31, 2009 | Year Ended October 31, 2008 | ||||||||||
| Increase in Net Assets From Operations | |||||||||||
| Net investment income | $ | 2,856,596 | $ | 3,314,737 | |||||||
| Net realized gain (loss) on investments and foreign currency transactions | (11,943,588 | ) | 40,264,254 | ||||||||
| Net change in unrealized appreciation (depreciation) on investments and translation of assets and liabilities denominated in foreign currencies | 76,759,308 | (197,938,277 | ) | ||||||||
| Net increase (decrease) in net assets resulting from operations | 67,672,316 | (154,359,286 | ) | ||||||||
| Distributions to Shareholders from: | |||||||||||
| Net investment income | |||||||||||
| Investor Class | (160,740 | ) | (85,868 | ) | |||||||
| Institutional Class | (3,101,928 | ) | (2,611,777 | ) | |||||||
| Net realized gain from investments and foreign-currency related transactions | |||||||||||
| Investor Class | (2,318,758 | ) | (1,359,303 | ) | |||||||
| Institutional Class | (36,230,389 | ) | (29,187,907 | ) | |||||||
| Total distributions to shareholders | (41,811,815 | ) | (33,244,855 | ) | |||||||
| Transactions in units of Common Stock | |||||||||||
| Proceeds from sale of units | |||||||||||
| Investor Class | 24,524,810 | 7,489,395 | |||||||||
| Institutional Class | 37,754,041 | 13,994,514 | |||||||||
| Net Asset Value of shares issued to shareholders upon reinvestment of dividends | |||||||||||
| Investor Class | 2,337,103 | 1,330,261 | |||||||||
| Institutional Class | 38,985,473 | 30,928,420 | |||||||||
| Cost of units redeemed | |||||||||||
| Investor Class | (5,664,340 | ) | (3,696,097 | ) | |||||||
| Institutional Class | (29,797,831 | ) | (66,170,127 | ) | |||||||
| Redemption fees | |||||||||||
| Investor Class | 2,232 | 481 | |||||||||
| Institutional Class | 9,202 | 3,098 | |||||||||
| Net increase (decrease) in net assets from fund share transactions | 68,150,690 | (16,120,055 | ) | ||||||||
| Net increase (decrease) in net assets | 94,011,191 | (203,724,196 | ) | ||||||||
| Net Assets | |||||||||||
| At beginning of year | 203,572,144 | 407,296,340 | |||||||||
| At end of year | $ | 297,583,335 | $ | 203,572,144 | |||||||
| Accumulated undistributed net investment income included in net assets | $ | 2,365,492 | $ | 2,842,758 | |||||||
See Notes to Financial Statements
29
Harding, Loevner Funds, Inc.
Statements of Changes in Net Assets (continued)
| Frontier Emerging Markets Portfolio | |||||||||||
| Year Ended October 31, 2009 | Period Ended October 31, 2008 (A) | ||||||||||
| Increase in Net Assets From Operations | |||||||||||
| Net investment income | $ | 88,595 | $ | 8,230 | |||||||
| Net realized loss on investments and foreign currency transactions | (1,589,119 | ) | (2,562 | ) | |||||||
| Net change in unrealized appreciation (depreciation) on investments and translation of assets and liabilities denominated in foreign currencies | 3,621,154 | (3,828,751 | ) | ||||||||
| Net increase (decrease) in net assets resulting from operations | 2,120,630 | (3,823,083 | ) | ||||||||
| Distributions to Shareholders from: | |||||||||||
| Net investment income | |||||||||||
| Institutional Class | (15,259 | ) | — | ||||||||
| Total distributions to shareholders | (15,259 | ) | — | ||||||||
| Transactions in units of Common Stock | |||||||||||
| Proceeds from sale of units | |||||||||||
| Institutional Class | 2,540,000 | 8,698,504 | |||||||||
| Net Asset Value of shares issued to shareholders upon reinvestment of dividends | |||||||||||
| Institutional Class | 4,708 | — | |||||||||
| Cost of units redeemed | |||||||||||
| Institutional Class | (454,197 | ) | — | ||||||||
| Net increase in net assets from fund unit transactions | 2,090,511 | 8,698,504 | |||||||||
| Net increase in net assets | 4,195,882 | 4,875,421 | |||||||||
| Net Assets | |||||||||||
| At beginning of year | 4,875,421 | — | |||||||||
| At end of year | $ | 9,071,303 | $ | 4,875,421 | |||||||
| Accumulated undistributed net investment income included in net assets | $ | 67,258 | $ | 11,646 | |||||||
(A) The Institutional Class shares commenced operations on May 27, 2008.
See Notes to Financial Statements
30
Harding, Loevner Funds, Inc.
Financial Highlights
| Institutional Emerging Markets Portfolio | |||||||||||||||||||||||
| For the Year Ended Oct. 31, 2009 | For the Year Ended Oct. 31, 2008 | For the Year Ended Oct. 31, 2007 | For the Year Ended Oct. 31, 2006 | For the Year Ended Oct. 31, 2005 (1) | |||||||||||||||||||
| Per Share Data | |||||||||||||||||||||||
| Net asset value, beginning of year | $ | 9.29 | $ | 21.20 | $ | 13.42 | $ | 9.92 | $ | 10.00 | |||||||||||||
| Increase (Decrease) in Net Assets from Operations | |||||||||||||||||||||||
| Net investment income (loss) | 0.10 | 0.44 | 0.10 | 0.07 | (0.00 | )* | |||||||||||||||||
| Net realized and unrealized gain (loss) on investments and foreign currency-related transactions | 4.27 | (11.53 | ) | 7.70 | 3.45 | (0.08 | ) | ||||||||||||||||
| Net increase (decrease) from investment operations | 4.37 | (11.09 | ) | 7.80 | 3.52 | (0.08 | ) | ||||||||||||||||
| Distributions to Shareholders from: | |||||||||||||||||||||||
| Net investment income | (0.37 | ) | (0.09 | ) | (0.02 | ) | (0.02 | ) | — | ||||||||||||||
| Net realized gain from investments and foreign currency-related transactions | — | (0.73 | ) | — | — | — | |||||||||||||||||
| Total distributions | (0.37 | ) | (0.82 | ) | (0.02 | ) | (0.02 | ) | — | ||||||||||||||
| Net asset value, end of year | $ | 13.29 | $ | 9.29 | $ | 21.20 | $ | 13.42 | $ | 9.92 | |||||||||||||
| Total Return | 48.92 | % | (54.33 | )% | 58.18 | % | 35.38 | % | (0.70 | )%(B) | |||||||||||||
| Ratios/Supplemental Data: | |||||||||||||||||||||||
| Net assets, end of period (000's) | $ | 203,548 | $ | 132,037 | $ | 245,061 | $ | 85,930 | $ | 4,962 | |||||||||||||
| Net expenses to average net assets | 1.30 | % | 1.30 | % | 1.30 | % | 1.30 | % | 1.30 | %(A) | |||||||||||||
| Net investment income to average net assets | 0.93 | % | 2.56 | % | 0.72 | % | 0.88 | % | (0.19 | )%(A) | |||||||||||||
| Decrease reflected in above expense ratios due to expense reductions | 0.25 | % | 0.22 | % | 0.25 | % | 0.51 | % | 20.02 | %(A) | |||||||||||||
| Portfolio turnover rate | 57 | % | 51 | % | 32 | % | 38 | % | 1 | %(B) | |||||||||||||
(1) For the period from October 17, 2005 (commencement of operations) through October 31, 2005.
* Rounds to less than $(0.01).
(A) Annualized.
(B) Not Annualized.
See Notes to Financial Statements
31
Harding, Loevner Funds, Inc.
Financial Highlights (continued)
| International Equity Portfolio - Institutional Class | |||||||||||||||||||||||
| For the Year Ended Oct. 31, 2009 | For the Year Ended Oct. 31, 2008 | For the Year Ended Oct. 31, 2007 | For the Year Ended Oct. 31, 2006 | For the Year Ended Oct. 31, 2005 | |||||||||||||||||||
| Net asset value, beginning of year | $ | 11.44 | $ | 21.71 | $ | 18.68 | $ | 14.90 | $ | 12.41 | |||||||||||||
| Increase (Decrease) in Net Assets from Operations | |||||||||||||||||||||||
| Net investment income | 0.13 | 0.20 | 0.14 | 0.12 | (1) | 0.13 | |||||||||||||||||
| Net realized and unrealized gain (loss) on investments and foreign currency-related transactions | 2.86 | (8.63 | ) | 4.33 | 3.75 | 2.42 | |||||||||||||||||
| Net increase (decrease) from investment operations | 2.99 | (8.43 | ) | 4.47 | 3.87 | 2.55 | |||||||||||||||||
| Distributions to Shareholders from: | |||||||||||||||||||||||
| Net investment income | (0.19 | ) | (0.15 | ) | (0.10 | ) | (0.08 | ) | (0.06 | ) | |||||||||||||
| Net realized gain from investments and foreign currency-related transactions | (2.20 | ) | (1.69 | ) | (1.34 | ) | (0.01 | ) | — | ||||||||||||||
| Total distributions | (2.39 | ) | (1.84 | ) | (1.44 | ) | (0.09 | ) | (0.06 | ) | |||||||||||||
| Net asset value, end of year | $ | 12.04 | $ | 11.44 | $ | 21.71 | $ | 18.68 | $ | 14.90 | |||||||||||||
| Total Return | 32.77 | % | (42.33 | )% | 25.24 | % | 26.06 | % | 20.58 | % | |||||||||||||
| Ratios/Supplemental Data: | |||||||||||||||||||||||
| Net assets, end of year (000's) | $ | 259,450 | $ | 191,450 | $ | 390,659 | $ | 343,965 | $ | 300,227 | |||||||||||||
| Net expenses to average net assets | 1.00 | % | 0.98 | % | 0.98 | % | 1.00 | % | 1.00 | % | |||||||||||||
| Net investment income to average net assets | 1.31 | % | 1.05 | % | 0.70 | % | 0.69 | % | 0.77 | % | |||||||||||||
| Decrease reflected in above expense ratios due to expense reductions | 0.04 | % | — | — | 0.01 | % | 0.05 | % | |||||||||||||||
| Portfolio turnover rate | 22 | % | 18 | % | 19 | % | 35 | % | 38 | % | |||||||||||||
(1) Computed using average units outstanding throughout the year.
See Notes to Financial Statements
32
Harding, Loevner Funds, Inc.
Financial Highlights (continued)
| Frontier Emerging Markets Portfolio - Institutional Class | |||||||||||
| For the Year Ended Oct. 31, 2009 | For the Period Ended Oct. 31, 2008 (1) | ||||||||||
| Per Share Data | |||||||||||
| Net asset value, beginning of year | $ | 4.98 | $ | 10.00 | |||||||
| Increase (Decrease) in Net Assets from Operations | |||||||||||
| Net investment income | 0.07 | 0.01 | |||||||||
| Net realized and unrealized gain (loss) on investments and foreign currency-related transactions | 1.26 | (5.03 | ) | ||||||||
| Net increase (decrease) from investment operations | 1.33 | (5.02 | ) | ||||||||
| Distributions to Shareholders from: | |||||||||||
| Net investment income | (0.02 | ) | — | ||||||||
| Total distributions | (0.02 | ) | — | ||||||||
| Net asset value, end of year | $ | 6.29 | $ | 4.98 | |||||||
| Total Return | 26.71 | % | (50.20 | )%(B) | |||||||
| Ratios/Supplemental Data: | |||||||||||
| Net assets, end of period (000's) | $ | 9,071 | $ | 4,875 | |||||||
| Net expenses to average net assets | 2.00 | % | 2.00 | %(A) | |||||||
| Net investment income to average net assets | 1.39 | % | 0.42 | %(A) | |||||||
| Decrease reflected in above expense ratios due to expense reductions | 2.08 | % | 6.92 | %(A) | |||||||
| Portfolio turnover rate | 55 | % | 1 | %(B) | |||||||
(A) Annualized.
(B) Not Annualized.
(1) For the period from May 27, 2008 (commencement of operations) through October 31, 2008.
See Notes to Financial Statements
33
Harding, Loevner Funds, Inc.
Notes to Financial Statements
October 31, 2009
1. Organization
Harding, Loevner Funds, Inc. (the "Fund") was organized as a Maryland corporation on July 31, 1996 and is registered under the Investment Company Act of 1940, as amended ("the 1940 Act"), as an open-end diversified management investment company. The Fund currently has six Portfolios, all of which were active as of October 31, 2009: International Equity Portfolio ("International Equity"); Emerging Markets Portfolio ("Emerging Markets"); Institutional Emerging Markets Portfolio ("Institutional Emerging Markets"); Global Equity Portfolio ("Global Equity"); International Small Companies Portfolio ("International Small Companies") and Frontier Emerging Markets Portfolio ("Frontier Emerging Markets"). Information presented in these financial statements pertains to Institutional Emerging Markets, Institutional Class shares of International Equity and Frontier Emerging Markets (individually, "Portfolio"; collectively, "Portfolios"). Information pert aining to Investor Class shares of International Equity, Emerging Markets, Global Equity and Investor Class shares of International Small Companies Portfolios is presented in a separate report. The investment objective of each Portfolio is as follows: Institutional Emerging Markets—to seek long-term capital appreciation through investments in equity securities of companies based in emerging markets; International Equity—to seek long-term capital appreciation through investments in equity securities of companies based outside the United States; and Frontier Emerging Markets—to seek long-term capital appreciation through investments in securities of companies based in frontier and smaller emerging markets.
Institutional Emerging Markets Portfolio commenced operations on October 17, 2005. International Equity commenced operations on October 31, 1996 after acquiring the net assets of Harding Loevner LP's AMT Capital Fund, Inc. Effective August 5, 2005, International Equity launched Investor Class shares and converted existing shareholders to the Institutional Class. Institutional Class of Frontier Emerging Markets Portfolio commenced operations on May 27, 2008.
Effective April 29, 2009, shareholders of Frontier Emerging Markets approved a change in the Portfolio's fundamental investment policy regarding concentration which may, under certain conditions, permit the Portfolio to invest up to 35% of its net assets in companies in the same industry. During periods when the Portfolio makes use of its ability to so invest, it will operate as a concentrated portfolio and be subject to additional risks and greater volatility.
On August 26, 2009, Harding Loevner LLC, investment adviser to the Fund, its parent company, HLM Holdings, Inc., and certain shareholders of HLM Holdings consummated an agreement with Affiliated Managers Group, Inc. ("AMG") pursuant to which Harding Loevner LLC agreed to sell a majority interest in its business to AMG. AMG is a publicly traded Delaware corporation listed on the New York Stock Exchange. As part of the transaction, Harding Loevner LLC transferred its business to a new entity, Harding Loevner LP, and AMG acquired a majority interest in Harding Loevner LP.
The Fund is managed by Harding Loevner LP (the "Investment Advisor").
2. Summary of Significant Accounting Policies
The accounting policies of the Fund are in conformity with accounting principles generally accepted in the United States ("GAAP") for investment companies. The following is a summary of the Fund's significant accounting policies:
Indemnifications
Under the Fund's organizational document, its officers and Board are indemnified against certain liability arising out of the performance of their duties to the Portfolios. In the normal course of business, the Fund may enter into contracts that contain a variety of representations or that provide indemnification for certain liabilities. The Fund's maximum exposure under these arrangements is unknown, as this would involve future claims that may be made against the Fund that have not yet occurred. However, the Fund has not had prior claims or losses pursuant to these contracts and expects the risk of loss to be remote.
Estimates
The preparation of financial statements in accordance with GAAP requires management to make estimates and assumptions that affect the reported amounts and disclosures in the financial statements. Actual results could differ from those estimates.
Valuation
The Board has adopted procedures ("Procedures") to govern the valuation of the securities held by each Portfolio of the Fund in accordance with the 1940 Act. The Procedures incorporate principles set forth in relevant pronouncements of the Securities and Exchange Commission ("SEC") and its staff, including guidance on the obligations of the Portfolios and their Directors to determine, in good faith, the fair value of the Portfolios' securities when market quotations are not readily available.
34
Harding, Loevner Funds, Inc.
Notes to Financial Statements (continued)
October 31, 2009
2. Summary of Significant Accounting Policies (continued)
All investments in the Portfolios are valued daily at their market prices, which results in unrealized gains or losses. Securities traded on an exchange are valued at their last sales price on that exchange. Securities for which no sales are reported are valued at the latest bid price obtained from a quotation reporting system or from established market makers. Repurchase agreements are valued at their amortized cost plus accrued interest. Securities for which market quotations are not readily available are fair valued by the Board or its delegate in accordance with the Procedures, although the actual calculations may be done by others. Factors considered in making this determination may include, but are not limited to, information obtained by contacting the issuer, analysts, or the appropriate stock exchange (for exchange-traded securities), analysis of the issuer's financial statements or other available documents and, if necessary, availa ble information concerning other securities in similar circumstances. If a significant event occurs after the close of trading but before the calculation of the Portfolio's net asset value and such significant event has a material impact on the Portfolio's net asset value per share (i.e. more than $0.01 per share), then the security may be fair valued in accordance with the Procedures. As of October 31, 2009, there were five securities in the Portfolios which required valuation by the Board or its delegate. International Equity and Frontier Emerging Markets each held such securities. The Fund has implemented additional fair value pricing on a daily basis for all foreign equity securities held by the Portfolios. The fair value pricing utilizes quantitative models developed by an independent pricing service unless the Fund determines that use of another additional fair valuation methodology is appropriate.
GAAP establishes a hierarchy for net asset value determination purposes in which various inputs are used in determining the value of each Portfolio's assets or liabilities. GAAP defines fair value as the price that the Portfolio would receive upon selling an investment in a timely transaction to an independent buyer in the principal or most advantageous market of the investment. GAAP established a three-tier hierarchy to maximize the use of observable market data and minimize the use of unobservable inputs and to establish classification of fair value measurements for disclosure purposes. Inputs may be observable or unobservable and refer broadly to the assumptions that market participants would use in pricing the asset or liability including assumptions about risk. Such risks include the inherent risk in a particular valuation technique which is used to measure fair value. This may include the pricing model and/or the inputs to the pricing model used in the valuation technique. Observable inputs are inputs that reflect the assumptions market participants would use in pricing the asset or liability developed based on market data obtained from sources independent of the reporting entity. Unobservable inputs are inputs that reflect the reporting entity's own assumptions about the assumptions market participants would use in pricing the asset or liability developed based on the best information available in the circumstances. The three-tier hierarchy of inputs is summarized in the three broad levels listed below.
Level 1—quoted prices in active markets for identical investments
Level 2—other significant observable inputs (including quoted prices for similar investments, interest rates, prepayment speeds, credit risk, etc.)
Level 3—significant unobservable inputs (including the Portfolio's own assumptions in determining the fair value of investments)
GAAP provides additional guidance for estimating fair value when the volume and level of activity for the asset or liability have significantly decreased as well as guidance on identifying circumstances that indicate a transaction is not orderly.
35
Harding, Loevner Funds, Inc.
Notes to Financial Statements (continued)
October 31, 2009
2. Summary of Significant Accounting Policies (continued)
The following is a summary of the inputs used as of October 31, 2009 in valuing the Portfolio's investments:
Institutional Emerging Markets
ASSETS VALUATION INPUT
| Description | Quoted Prices in Active Markets for Identical Assets (Level 1) | Significant Other Observable Inputs (Level 2) | Significant Unobservable Inputs (Level 3) | Total | |||||||||||||||
| Common Stocks | |||||||||||||||||||
| Brazil | $ | 34,267,907 | $ | — | $ | — | $ | 34,267,907 | |||||||||||
| Cayman Islands | 1,927,584 | — | — | 1,927,584 | |||||||||||||||
| Chile | 5,105,497 | — | — | 5,105,497 | |||||||||||||||
| China | 2,111,682 | 20,088,526 | — | 22,200,208 | |||||||||||||||
| Colombia | 2,341,949 | — | — | 2,341,949 | |||||||||||||||
| Czech Republic | 1,783,180 | — | — | 1,783,180 | |||||||||||||||
| Egypt | — | 2,203,413 | — | 2,203,413 | |||||||||||||||
| Greece | — | 1,989,055 | — | 1,989,055 | |||||||||||||||
| Hungary | — | 1,131,026 | — | 1,131,026 | |||||||||||||||
| India | 3,362,876 | 6,712,569 | — | 10,075,445 | |||||||||||||||
| Indonesia | 2,686,689 | 2,420,613 | — | 5,107,302 | |||||||||||||||
| Israel | 3,104,520 | 2,865,788 | — | 5,970,308 | |||||||||||||||
| Luxembourg | 2,011,386 | — | — | 2,011,386 | |||||||||||||||
| Malaysia | — | 2,547,948 | — | 2,547,948 | |||||||||||||||
| Mexico | 13,630,564 | — | — | 13,630,564 | |||||||||||||||
| Panama | 1,942,580 | — | — | 1,942,580 | |||||||||||||||
| Peru | 2,160,639 | — | — | 2,160,639 | |||||||||||||||
| Philippines | 935,682 | — | — | 935,682 | |||||||||||||||
| Poland | 1,656,608 | 2,199,559 | — | 3,856,167 | |||||||||||||||
| Russia | 4,729,115 | 7,568,081 | — | 12,297,196 | |||||||||||||||
| South Africa | — | 12,287,585 | — | 12,287,585 | |||||||||||||||
| South Korea | 2,940,853 | 15,425,073 | — | 18,365,926 | |||||||||||||||
| Taiwan | — | 18,974,081 | — | 18,974,081 | |||||||||||||||
| Thailand | 5,556,780 | — | — | 5,556,780 | |||||||||||||||
| Turkey | — | 5,087,633 | — | 5,087,633 | |||||||||||||||
| United Kingdom | — | 2,479,052 | — | 2,479,052 | |||||||||||||||
| Total Common Stocks | 92,256,091 | 103,980,002 | — | 196,236,093 | |||||||||||||||
| Preferred Stocks | |||||||||||||||||||
| Russia | 3,244,230 | — | — | 3,244,230 | |||||||||||||||
| Total Preferred Stocks | 3,244,230 | — | — | 3,244,230 | |||||||||||||||
| Total Investments | 95,500,321 | 103,980,002 | — | 199,480,323 | |||||||||||||||
| Total | $ | 95,500,321 | $ | 103,980,002 | $ | — | $ | 199,480,323 | |||||||||||
36
Harding, Loevner Funds, Inc.
Notes to Financial Statements (continued)
October 31, 2009
2. Summary of Significant Accounting Policies (continued)
International Equity
ASSETS VALUATION INPUT
| Description | Quoted Prices in Active Markets for Identical Assets (Level 1) | Significant Other Observable Inputs (Level 2) | Significant Unobservable Inputs (Level 3) | Total | |||||||||||||||
| Common Stocks | |||||||||||||||||||
| Australia | $ | — | $ | 5,375,496 | $ | — | $ | 5,375,496 | |||||||||||
| Austria | — | 5,995,923 | — | 5,995,923 | |||||||||||||||
| Bermuda | 7,376,717 | — | — | 7,376,717 | |||||||||||||||
| Brazil | 2,444,483 | — | — | 2,444,483 | |||||||||||||||
| Canada | 9,593,632 | — | — | 9,593,632 | |||||||||||||||
| China | — | 8,151,832 | — | 8,151,832 | |||||||||||||||
| Finland | 5,866,676 | — | — | 5,866,676 | |||||||||||||||
| France | 5,187,480 | 39,865,776 | — | 45,053,256 | |||||||||||||||
| Germany | — | 17,319,069 | — | 17,319,069 | |||||||||||||||
| Hong Kong | — | 10,136,847 | — | 10,136,847 | |||||||||||||||
| Indonesia | 5,254,015 | — | — | 5,254,015 | |||||||||||||||
| Israel | 2,229,197 | — | — | 2,229,197 | |||||||||||||||
| Japan | — | 42,424,127 | — | 42,424,127 | |||||||||||||||
| Malaysia | — | 6,652,016 | — | 6,652,016 | |||||||||||||||
| Mexico | 12,781,342 | — | — | 12,781,342 | |||||||||||||||
| Poland | — | — | 2,857,825 | 2,857,825 | |||||||||||||||
| Russia | — | 6,699,294 | — | 6,699,294 | |||||||||||||||
| Singapore | — | 9,816,953 | — | 9,816,953 | |||||||||||||||
| South Africa | — | 2,084,364 | — | 2,084,364 | |||||||||||||||
| South Korea | — | 5,908,235 | — | 5,908,235 | |||||||||||||||
| Sweden | — | 6,977,482 | — | 6,977,482 | |||||||||||||||
| Switzerland | 17,300,224 | 10,849,775 | — | 28,149,999 | |||||||||||||||
| Taiwan | — | 6,056,939 | — | 6,056,939 | |||||||||||||||
| United Kingdom | — | 34,937,078 | — | 34,937,078 | |||||||||||||||
| Total Common Stocks | 68,033,766 | 219,251,206 | 2,857,825 | 290,142,797 | |||||||||||||||
| Preferred Stocks | |||||||||||||||||||
| Brazil | 2,222,648 | — | — | 2,222,648 | |||||||||||||||
| Total Preferred Stocks | 2,222,648 | — | — | 2,222,648 | |||||||||||||||
| Total Investments | 70,256,414 | 219,251,206 | 2,857,825 | 292,365,445 | |||||||||||||||
| Total | $ | 70,256,414 | $ | 219,251,206 | $ | 2,857,825 | $ | 292,365,445 | |||||||||||
37
Harding, Loevner Funds, Inc.
Notes to Financial Statements (continued)
October 31, 2009
2. Summary of Significant Accounting Policies (continued)
Frontier Emerging Markets
ASSETS VALUATION INPUT
| Description | Quoted Prices in Active Markets for Identical Assets (Level 1) | Significant Other Observable Inputs (Level 2) | Significant Unobservable Inputs (Level 3) | Total | |||||||||||||||
| Common Stocks | |||||||||||||||||||
| Argentina | $ | 128,437 | $ | — | $ | — | $ | 128,437 | |||||||||||
| Bangladesh | 310,771 | — | — | 310,771 | |||||||||||||||
| Canada | 119,126 | — | — | 119,126 | |||||||||||||||
| Colombia | 328,320 | — | 443,839 | 772,159 | |||||||||||||||
| Croatia | — | 267,456 | — | 267,456 | |||||||||||||||
| Egypt | — | 570,079 | — | 570,079 | |||||||||||||||
| Estonia | 100,571 | — | — | 100,571 | |||||||||||||||
| Ghana | 43,152 | — | — | 43,152 | |||||||||||||||
| Indonesia | — | 213,884 | — | 213,884 | |||||||||||||||
| Jordan | — | 249,986 | — | 249,986 | |||||||||||||||
| Kazakhstan | 60,590 | 245,825 | — | 306,415 | |||||||||||||||
| Kenya | — | 689,565 | — | 689,565 | |||||||||||||||
| Lebanon | 105,600 | — | — | 105,600 | |||||||||||||||
| Lithuania | — | 107,662 | — | 107,662 | |||||||||||||||
| Mauritius | 263,524 | — | — | 263,524 | |||||||||||||||
| Morocco | — | 395,111 | — | 395,111 | |||||||||||||||
| Nigeria | 425,353 | — | — | 425,353 | |||||||||||||||
| Pakistan | — | 103,840 | — | 103,840 | |||||||||||||||
| Peru | 336,391 | — | — | 336,391 | |||||||||||||||
| Philippines | — | 94,325 | — | 94,325 | |||||||||||||||
| Poland | — | 7,837 | — | 7,837 | |||||||||||||||
| Qatar | — | 252,554 | — | 252,554 | |||||||||||||||
| Romania | — | 257,728 | — | 257,728 | |||||||||||||||
| Senegal | 160,187 | — | — | 160,187 | |||||||||||||||
| Serbia | 73,493 | — | — | 73,493 | |||||||||||||||
| Sri Lanka | — | 234,445 | — | 234,445 | |||||||||||||||
| Thailand | 693,966 | — | — | 693,966 | |||||||||||||||
| Trinidad And Tobago | 116,337 | — | 76,719 | 193,056 | |||||||||||||||
| Turkey | — | 273,649 | — | 273,649 | |||||||||||||||
| Ukraine | — | 242,951 | — | 242,951 | |||||||||||||||
| United Arab Emirates | — | 627,009 | — | 627,009 | |||||||||||||||
| United Kingdom | — | 366,412 | — | 366,412 | |||||||||||||||
| Total Common Stocks | 3,265,818 | 5,200,318 | 520,558 | 8,986,694 | |||||||||||||||
| Warrant | |||||||||||||||||||
| Thailand | 7,333 | — | — | 7,333 | |||||||||||||||
| Total Investments | 3,273,151 | 5,200,318 | 520,558 | 8,994,027 | |||||||||||||||
| Total | $ | 3,273,151 | $ | 5,200,318 | $ | 520,558 | $ | 8,994,027 | |||||||||||
38
Harding, Loevner Funds, Inc.
Notes to Financial Statements (continued)
October 31, 2009
2. Summary of Significant Accounting Policies (continued)
Following is a reconciliation of investments for which significant unobservable inputs (Level 3) were used in determining value:
ASSET VALUATION INPUTS
| Investments in Securities | |||||||||||||||||||||||||||||||||||||||||||
| International Equity | Balance as of October 31, 2008 | Accrued Discounts (Premiums) | Realized Gain (Loss) | Change in Unrealized Appreciation (Depreciation) | Net Purchases | Net Sales | Net Transfers in to Level 3 | Net Transfers out of Level 3 | Balance as of October 31, 2009 | Change in Unrealized Appreciation (Depreciation) from Investments Held at October 31, 2009 | |||||||||||||||||||||||||||||||||
| Common Stocks | |||||||||||||||||||||||||||||||||||||||||||
| Poland | $ | 2,150,488 | $ | 0 | $ | 0 | $ | 456,787 | $ | 250,550 | $ | 0 | $ | 0 | $ | 0 | $ | 2,857,825 | $ | 456,787 | |||||||||||||||||||||||
| Total | $ | 2,150,488 | $ | 0 | $ | 0 | $ | 456,787 | $ | 250,550 | $ | 0 | $ | 0 | $ | 0 | $ | 2,857,825 | $ | 456,787 | |||||||||||||||||||||||
| Frontier Emerging Markets | |||||||||||||||||||||||||||||||||||||||||||
| Common Stocks | |||||||||||||||||||||||||||||||||||||||||||
| Colombia | $ | 0 | $ | 0 | $ | 0 | $ | 158,117 | $ | 285,722 | $ | 0 | $ | 0 | $ | 0 | $ | 443,839 | $ | 0 | |||||||||||||||||||||||
| Trinidad And Tobago | 0 | 0 | 0 | 0 | 0 | 0 | 76,719 | 0 | 76,719 | 0 | |||||||||||||||||||||||||||||||||
| Total | $ | 0 | $ | 0 | $ | 0 | $ | 158,117 | $ | 285,722 | $ | 0 | $ | 76,719 | $ | 0 | $ | 520,558 | $ | 0 | |||||||||||||||||||||||
Securities
All securities transactions are recorded on a trade date basis. Interest income and expenses are recorded on an accrual basis. Dividend income is recorded on the ex-dividend date (except for certain foreign dividends that may be recorded as soon as the Portfolio is informed of such dividends). The Portfolios accrete discount or amortize premium using the effective interest method on a daily basis as adjustments to interest income and the cost of investments. The Portfolios use the specific identification method for determining realized gains or losses from sales of securities.
Income Tax
It is the policy of each Portfolio of the Fund to qualify as a regulated investment company by complying with the applicable provisions of the Internal Revenue Code, and to make distributions of taxable income sufficient to relieve it from substantially all federal income and excise taxes.
Management has performed an analysis of each Portfolios' tax positions for the open tax years as of October 31, 2009 and has concluded that no provisions for income tax are required. The Portfolios' federal tax returns for the prior three fiscal years (open tax years: October 31, 2006; October 31, 2007; October 31, 2008; October 31, 2009) remain subject to examination by the Internal Revenue Service. Management is not aware of any events that are reasonably possible to occur in the next twelve months that would result in the amounts of any unrecognized tax benefits significantly increasing or decreasing for the Portfolios. However, management's conclusions regarding tax positions taken may be subject to review and adjustment at a later date based on factors including, but not limited to, new tax laws and accounting regulations and interpretations thereof.
Expenses
Expenses directly attributed to a specific Portfolio of the Fund are charged to that Portfolio's operations; expenses not directly attributable to a specific Portfolio are allocated among all the Portfolios of the Fund either equitably or based on their average daily net assets. As of
39
Harding, Loevner Funds, Inc.
Notes to Financial Statements (continued)
October 31, 2009
2. Summary of Significant Accounting Policies (continued)
July 1, 2009, pursuant to the Fund's multiple class expense allocation plan, certain expenses are allocated to particular classes of the International Equity Portfolio.
Dividends to Shareholders
It is the policy of the Portfolios to declare dividends from net investment income annually. Net short-term and long-term capital gains distributions for the Portfolios, if any, normally are distributed on an annual basis.
Dividends from net investment income and distributions from net realized gains from investment transactions have been determined in accordance with income tax regulations and may differ from net investment income and realized gains recorded by the Portfolios for financial reporting purposes. Differences result primarily from foreign currency transactions and timing differences related to recognition of income, and gains and losses from investment transactions. In general, to the extent that any differences which are permanent in nature result in over distributions to shareholders, the amount of the over distribution is reclassified within the capital accounts based on its federal tax basis treatment and may be reported as return of capital. Temporary differences do not require reclassification.
Currency Translation
Assets and liabilities denominated in foreign currencies and commitments under forward foreign currency exchange contracts are translated into U.S. dollars at the mean of the quoted bid and asked prices of such currencies against the U.S. dollar. Purchases and sales of the Portfolios' securities are translated at the rates of exchange prevailing when such securities were acquired or sold. Income and expenses are translated at exchange rates prevailing when accrued. The Portfolios do not isolate that portion of the results of operations resulting from changes in foreign exchange rates on investments from the fluctuations arising from changes in market prices of securities held. Such fluctuations are included with the net realized and unrealized gain or loss from investments.
Net realized gains and losses from foreign currency-related transactions arise from sales of foreign currency, currency gains or losses realized between the trade and settlement dates on securities transactions, and the difference between the amounts of dividends, interest, and foreign withholding taxes recorded on the Portfolios' books, and the U.S. dollar equivalent of the amounts actually received or paid. Net unrealized appreciation or depreciation on translation of assets and liabilities denominated in foreign currencies arise from changes in the value of assets and liabilities other than investments in securities at the period end, resulting from changes in the exchange rates.
Securities Lending
Each Portfolio is authorized to lend securities from its investment portfolio to banks, brokers and other financial institutions if it receives collateral in cash, U.S. Government securities or other liquid investments which will be maintained at all times in an amount equal to at least 102% of the current market value of loaned domestic securities (including ADRs) and 105% of loaned foreign securities. The loans will be terminable at any time by the Fund. During the period of such a loan, the Portfolio receives an agreed upon portion of the income on the loaned securities and/or a loan fee and may thereby increase its total return. A Portfolio continues to receive interest or dividends on the securities loaned and simultaneously earns either interest on the investment of the cash collateral or fee income if the loan is collateralized with securities rather than cash. However, the Portfolio normally pays lending fees and related expenses fro m the interest or dividends earned on invested collateral. Although the Fund is indemnified by the securities lending agent, should the borrower of the securities fail financially, there is a risk of delay in recovery of the securities or loss of rights in the collateral. However, loans are made only to borrowers deemed to be in good financial standing by the lending agent based on its ongoing review of such borrowers and are recommended to and approved by the Board. The Portfolios may invest cash collateral they receive in connection with a loan of securities in short-term money market instruments, securities of the U.S. Government and its agencies and other high quality short-term debt instruments. For purposes of complying with the Portfolios' investment policies and restrictions, collateral received in connection with securities loans will not be deemed an asset of the Portfolio unless otherwise required by law. The Board has appointed State Street Bank and Trust Company ("State Street Bank and Trust") a s the lending agent for the Portfolios. However, the Portfolios are not currently lending securities. As of October 31, 2009, there were no securities on loan.
3. Significant Agreements and Transactions with Affiliates
The Board has approved an investment advisory agreement (the "Agreement") with the Investment Advisor. The advisory fees are computed daily at an annual rate of 1.25%, 0.75%, and 1.50% of the average daily net assets of Institutional Emerging Markets, International Equity, and Frontier Emerging Markets, respectively.
40
Harding, Loevner Funds, Inc.
Notes to Financial Statements (continued)
October 31, 2009
3. Significant Agreements and Transactions with Affiliates (continued)
The Investment Advisor has voluntarily agreed to reduce its fee to the extent that aggregate expenses exceed an annual rate of 1.30%, 1.00%, and 2.00%, respectively, of the average daily net assets of Institutional Emerging Markets, Institutional Class shares of International Equity, and Institutional Class shares of Frontier Emerging Markets, respectively. For the year ended October 31, 2009, the Investment Advisor voluntarily waived and/or reimbursed $398,771, $107,630, and $132,525 respectively, in investment advisory fees from Institutional Emerging Markets, International Equity, and Frontier Emerging Markets, respectively.
In addition, the Fund has an administration agreement with State Street Bank and Trust, which provides certain accounting, clerical and bookkeeping services, corporate secretarial services, assistance in the preparation and filing of tax returns and reports to shareholders and the SEC, and the service of some State Street Bank and Trust employees as officers serving the Board of Directors. Under this agreement, Institutional Emerging Markets, International Equity, and Frontier Emerging Markets incurred $355,225, $388,387, and $72,070, respectively, for the year ended October 31, 2009.
State Street Bank and Trust serves as transfer agent and chief compliance officer, dividend disbursing agent and agent in connection with any accumulation, open-account or similar plans provided to the shareholders of the Portfolios.
The Fund, on behalf of the Portfolios, has agreements with various financial intermediaries and "mutual fund supermarkets", under which customers of these intermediaries may purchase and hold Portfolio shares. These intermediaries assess fees in consideration for providing certain distribution, account maintenance, record keeping and transactional services. In recognition of the savings of expenses to the Fund arising from the intermediaries' assumption of functions that the Fund would otherwise perform, such as providing sub-accounting and related shareholder services, each Portfolio or class is authorized, pursuant to a shareholder services plan, to pay to each intermediary up to 0.15% of its average daily net assets attributable to that intermediary (subject to the voluntary expense cap). The balance of the intermediaries' fees is paid by the Investment Advisor. Because of voluntary caps on the Portfolios' fees and expenses, the Investmen t Advisor paid a portion of the Portfolios' share of these fees during the year ended October 31, 2009.
4. Investment Transactions
Cost of purchases and proceeds from sales of investment securities, other than short-term investments, for the year ended October 31, 2009, were as follows for each Portfolio:
| Portfolio | Purchase Cost of Investment Securities | Proceeds from Sales of Investment Securities | |||||||||
| Institutional Emerging Markets | $ | 89,124,366 | $ | 118,082,399 | |||||||
| International Equity | 64,509,209 | 48,099,945 | |||||||||
| Frontier Emerging Markets | 4,112,665 | 3,450,053 | |||||||||
The Portfolios are permitted to purchase or sell securities from or to certain other Harding Loevner portfolios under specified conditions outlined in procedures adopted by the Board of Directors of the Fund. The procedures have been designed to ensure that any purchase or sale of securities by the Portfolios from or to another portfolio that is or could be considered an affiliate by virtue of having a common investment advisor complies with Rule 17a-7 of the 1940 Act. Further, as defined under the procedures, each transaction is effected at the current market price. Pursuant to these procedures, for the year ended October 31, 2009, Institutional Emerging Markets Portfolio engaged in securities sales of $4,909,112.
The cost of investments for federal income tax purposes and the components of net unrealized appreciation on investments at October 31, 2009, for each of the Portfolios were as follows:
| Portfolio | Unrealized Appreciation | Unrealized Depreciation | Net | Cost | |||||||||||||||
| Institutional Emerging Markets | $ | 25,884,945 | $ | (4,596,961 | ) | $ | 21,287,984 | $ | 178,192,339 | ||||||||||
| International Equity | 74,040,383 | (14,931,994 | ) | 59,108,389 | 233,257,056 | ||||||||||||||
| Frontier Emerging Markets | 1,647,998 | (1,880,845 | ) | (232,847 | ) | 9,226,874 | |||||||||||||
The unrealized appreciation (depreciation) on foreign currency for Institutional Emerging Markets, International Equity, and Frontier Emerging Markets was $(208,273), $11,134, and $(35,328), respectively, for the year ended October 31, 2009.
41
Harding, Loevner Funds, Inc.
Notes to Financial Statements (continued)
October 31, 2009
5. Distributions to Shareholders
During the year ended October 31, 2009, the tax character of distributions paid from ordinary income was $5,277,778, $3,260,397 and $15,259 for Institutional Emerging Markets, International Equity and Frontier Emerging Markets, respectively. The tax character of distributions paid from long term capital gains was $38,551,418 for International Equity.
During the year ended October 31, 2008, the tax character of distributions paid from ordinary income was $4,814,159 and $9,427,753 for Institutional Emerging Markets and International Equity, respectively. The tax character of distributions paid from long term capital gains was $4,958,355 and 26,554,287 for Institutional Emerging Markets and International Equity, respectively.
As of the components of accumulated earnings/(deficit) on a tax basis were as follows:
| Portfolio | Undistributed Ordinary Income | Undistributed Long-Term Capital Gains | Accumulated Capital and Other Losses | Unrealized Appreciation (Depreciation)* | Total Accumulated Earnings/(Deficit) | ||||||||||||||||||
| Institutional Emerging Markets | $ | 1,100,413 | $ | — | $ | (43,425,611 | ) | $ | 21,079,711 | $ | (21,245,487 | ) | |||||||||||
| International Equity | 2,365,492 | — | (11,703,675 | ) | 59,119,523 | 49,781,340 | |||||||||||||||||
| Frontier Emerging Markets | 127,836 | — | (1,577,373 | ) | (268,175 | ) | (1,717,712 | ) | |||||||||||||||
* The difference between book basis and tax basis net unrealized appreciation of investment is attributable primarily to the tax deferral of losses on certain sales of securities.
At October 31, 2009, Institutional Emerging Markets had $13,631,817 available as capital loss carryforwards which expire in 2016 and $29,793,794 available as capital loss carryforwards which expire in 2017. International Equity had $11,703,675 available as capital loss carryforwards which expire in 2017. Frontier Emerging Markets had $5,978 available as capital loss carryforwards which expire in 2016 and $1,571,395 available as capital loss carryforwards which expire in 2017.
Primarily as a result of differing book/tax treatment of foreign currency transactions and foreign capital gain tax expenses, the Fund made reclassifications among certain capital accounts. The reclassifications have no impact on the net assets of the Portfolios. As of October 31, 2009, the following reclassifications were made to the Statement of Net Assets.
| Portfolio | Paid-in-Capital | Accumulated Undistributed Net Realized Gain/Loss on Investment & Foreign Currency Related Transactions | Accumulated Undistributed Net Investment Income | ||||||||||||
| Institutional Emerging Markets | $ | — | $ | 217,193 | $ | (217,193 | ) | ||||||||
| International Equity | — | 71,194 | (71,194 | ) | |||||||||||
| Frontier Emerging Markets | — | 17,724 | (17,724 | ) | |||||||||||
6. Foreign Exchange Contracts
The Portfolios, on occasion, enter into forward foreign exchange contracts in order to hedge their exposure to changes in foreign currency exchange rates on their foreign portfolio holdings. A forward foreign exchange contract is a commitment to purchase or sell a foreign currency at a future date at a negotiated forward rate. The gain or loss arising from the difference between the cost of the original contracts and the closing of such contracts is included in net realized gains or losses on foreign currency-related transactions. Fluctuations in the value of forward foreign exchange contracts are recorded for book purposes as unrealized appreciation or depreciation on assets and liabilities denominated in foreign currencies by the Portfolios. The Portfolios are also exposed to credit risk associated with counterparty nonperformance on these forward foreign exchange contracts which is typically limited to the unrealized gain on each open con tract.
The Portfolios enter into foreign currency transactions on the spot markets in order to pay for foreign investment purchases or to convert to dollars the proceeds from foreign investment sales or coupon interest receipts. The Portfolios held no open forward foreign currency exchange contracts on October 31, 2009.
42
Harding, Loevner Funds, Inc.
Notes to Financial Statements (continued)
October 31, 2009
7. Capital Share Transactions
Transactions in capital stock for Institutional Emerging Markets were as follows for the periods indicated:
| Year Ended October 31, 2009 | Year Ended October 31, 2008 | ||||||||||||||||||
| Shares | Amount | Shares | Amount | ||||||||||||||||
| Shares sold | 4,770,185 | $ | 45,649,131 | 5,039,793 | $ | 86,978,082 | |||||||||||||
| Shares issued upon reinvestment of dividends | 471,426 | 4,205,119 | 448,651 | 8,746,852 | |||||||||||||||
| 5,241,611 | 49,854,250 | 5,488,444 | 95,724,934 | ||||||||||||||||
| Shares redeemed | (4,136,224 | ) | (42,223,167 | ) | (2,833,224 | ) | (32,362,942 | ) | |||||||||||
| Net increase | 1,105,387 | $ | 7,631,083 | 2,655,220 | $ | 63,361,992 | |||||||||||||
Transactions in capital stock for International Equity - Investor Class were as follows for the periods indicated:
| Year Ended October 31, 2009 | Year Ended October 31, 2008 | ||||||||||||||||||
| Shares | Amount | Shares | Amount | ||||||||||||||||
| Shares sold | 2,406,941 | $ | 24,524,810 | 440,350 | $ | 7,489,395 | |||||||||||||
| Shares issued upon reinvestment of dividends | 256,261 | 2,337,103 | 68,854 | 1,330,261 | |||||||||||||||
| 2,663,202 | 26,861,913 | 509,204 | 8,819,656 | ||||||||||||||||
| Shares redeemed | (551,993 | ) | (5,664,340 | ) | (215,285 | ) | (3,696,097 | ) | |||||||||||
| Net increase | 2,111,209 | $ | 21,197,573 | 293,919 | $ | 5,123,559 | |||||||||||||
Transactions in capital stock for International Equity - Institutional Class were as follows for the periods indicated:
| Year Ended October 31, 2009 | Year Ended October 31, 2008 | ||||||||||||||||||
| Shares | Amount | Shares | Amount | ||||||||||||||||
| Shares sold | 3,607,416 | $ | 37,754,041 | 814,257 | $ | 13,994,514 | |||||||||||||
| Shares issued upon reinvestment of dividends | 4,274,140 | 38,985,473 | 1,599,857 | 30,928,420 | |||||||||||||||
| 7,881,556 | 76,739,514 | 2,414,114 | 44,922,934 | ||||||||||||||||
| Shares redeemed | (3,062,169 | ) | (29,797,831 | ) | (3,678,345 | ) | (66,170,127 | ) | |||||||||||
| Net increase (decrease) | 4,819,387 | $ | 46,941,683 | (1,264,231 | ) | $ | (21,247,193 | ) | |||||||||||
Transactions in capital stock for Frontier Emerging Markets - Institutional Class were as follows for the periods indicated:
| Year Ended October 31, 2009 | Period From May 27, 2008 to October 31, 2008 (A) | ||||||||||||||||||
| Shares | Amount | Shares | Amount | ||||||||||||||||
| Shares sold | 553,912 | $ | 2,540,000 | 978,369 | $ | 8,698,504 | |||||||||||||
| Shares issued upon reinvestment of dividends | 1,017 | 4,708 | — | — | |||||||||||||||
| 554,929 | 2,544,708 | 978,369 | 8,698,504 | ||||||||||||||||
| Shares redeemed | (90,850 | ) | (454,197 | ) | — | — | |||||||||||||
| Net increase | 464,079 | $ | 2,090,511 | 978,369 | $ | 8,698,504 | |||||||||||||
(A) Institutional Class shares commenced operations on May 27, 2008.
Redemptions made within 90 days of purchase may be subject to a redemption fee equal to 2% of the amount redeemed. For the year ended October 31, 2009, Institutional Emerging Markets and International Equity - Institutional Class received $35,508 and $9,202, respectively, in redemption fees related to transactions in shares of common stock as disclosed in the Portfolios' Statements of Changes in Net Assets. For the year ended October 31, 2009, Frontier Emerging Markets did not receive any redemption fees.
43
Harding, Loevner Funds, Inc.
Notes to Financial Statements (continued)
October 31, 2009
8. Concentration of Ownership
At October 31, 2009, the percentage of total shares outstanding held by record shareholders each owning 10% or greater of the aggregate total shares outstanding for each Portfolio or for the share classes listed of each Portfolio was as follows:
| No. of Shareholders | % Ownership | ||||||||||
| Institutional Emerging Markets | 2 | 21 | % | ||||||||
| International Equity | 2 | 41 | % | ||||||||
| Frontier Emerging Markets | 3 | 94 | %* | ||||||||
* Represents omnibus position of broker-dealer representing numerous shareholder accounts.
Investment activities of these shareholders may have a material effect on the Portfolios.
9. Repurchase Agreements
Each Portfolio may enter into repurchase agreements under which a bank or securities firm that is a primary or reporting dealer in U.S. Government securities agrees, upon entering into a contract, to sell such securities to a Portfolio and repurchase such securities from such Portfolio at a mutually agreed upon price and date.
Each Portfolio may engage in repurchase transactions with parties selected on the basis of such party's creditworthiness. Securities purchased subject to repurchase agreements must have an aggregate market value greater than or equal to the repurchase price plus accrued interest at all times. If the value of the underlying securities falls below the value of the repurchase price plus accrued interest, the Portfolio will require the seller to deposit additional collateral by the next business day. If the request for additional collateral is not met, or the seller defaults on its repurchase obligation, the Portfolio maintains the right to sell the underlying securities at market value and may claim any resulting loss against the seller.
10. Concentration of Risk
Investing in securities of foreign issuers and currency transactions may involve certain considerations and risks not typically associated with investments in U.S. issuers. These risks include revaluation of currencies, adverse fluctuations in foreign currency values and possible adverse political, social and economic developments, including those particular to a specific industry, country or region, which could cause the securities and their markets to be less liquid and prices more volatile than those of comparable U.S. companies and U.S. government securities. These risks are greater with respect to securities of issuers located in emerging market countries in which Institutional Emerging Markets, International Equity, and Frontier Emerging Markets are authorized to invest.
11. Line of Credit
The Fund participates in a $50 million line of credit agreement with State Street Bank and Trust. Borrowings will be made solely to facilitate the handling of redemptions or unusual or unanticipated short-term cash requirements. Because several Portfolios participate there is no assurance that an individual Portfolio will have access to the entire $50 million at any particular time. Borrowings for International Equity are limited to the lesser of the remaining available credit or 25% of net assets. Borrowings for Institutional Emerging Markets and Frontier Emerging Markets are limited to the lesser of the remaining available credit or 15% of net assets. Interest is charged to each Portfolio based on its borrowings at an amount above the Federal Funds rate. In addition, a commitment fee computed at an annual rate of 0.10% on the line of credit is allocated among the Portfolios. During the year ended October 31, 2009, Institutional Emerging Ma rkets had borrowings on three days, the maximum balance being $4,034,152, at an average weighted interest rate of 1.20%; International Equity Portfolio had borrowings on one day, the maximum balance being $66,185, at an average weighted interest rate of 0.85%; and Frontier Emerging Markets had borrowings on two days, the maximum balance being $115,131, at an average weighted interest rate of 0.85%.
12. Subsequent Event
In accordance with the provisions set forth in FASB Accounting Standards Codification No. 855, "Subsequent Events," adopted by the Fund, Management has evaluated the possibility of subsequent events existing in the Portfolios' financial statements through December 21, 2009, the date the financial statements were issued. Management has determined that there are no subsequent events that would require disclosure in the Portfolios' financial statements through this date.
44
Harding, Loevner Funds, Inc.
Report of Independent Registered Public Accounting Firm
The Board of Directors and Shareholders
Harding, Loevner Funds, Inc.
We have audited the accompanying statements of net assets of the Harding, Loevner Funds, Inc. (comprising, the Frontier Emerging Markets Portfolio, International Equity Portfolio, and the Institutional Emerging Markets Portfolio), (collectively the "Portfolios") as of October 31, 2009, and the related statements of operations for the year then ended, statements of changes in net assets for each of the years or periods in the two-year period then ended, and the financial highlights for each of the years or periods in the four-year period then ended. These financial statements and financial highlights are the responsibility of the Portfolios' management. Our responsibility is to express an opinion on these financial statements and financial highlights based on our audits. The financial highlights of the Portfolios for the year or period in the year ended October 31, 2005 were audited by other auditors whose report dated December 6, 2005, expre ssed an unqualified opinion on those financial highlights.
We conducted our audits in accordance with the standards of the Public Company Accounting Oversight Board (United States). Those standards require that we plan and perform the audits to obtain reasonable assurance about whether the financial statements and financial highlights are free of material misstatement. An audit includes examining, on a test basis, evidence supporting the amounts and disclosures in the financial statements. Our procedures included confirmation of securities owned as of October 31, 2009, by correspondence with the custodian and brokers or other appropriate auditing procedures. An audit also includes assessing the accounting principles used and significant estimates made by management, as well as evaluating the overall financial statement presentation. We believe that our audits provide a reasonable basis for our opinion.
In our opinion, the financial statements and financial highlights referred to above present fairly, in all material respects, the financial position of each of the aforementioned Portfolios of the Harding, Loevner Funds, Inc. as of October 31, 2009, the results of their operations for the year then ended, the changes in their net assets for each of the years or periods in the two-year period then ended, and the financial highlights for each of the years or periods in the four-year period then ended, in conformity with U.S. generally accepted accounting principles.

Philadelphia, Pennsylvania
December 21, 2009
45
Harding, Loevner Funds, Inc.
Supplemental Tax Information
(unaudited)
During the year ended October 31, 2009, none of the Portfolios designated a percentage of distributions from net investment income as qualifying for the dividend received deduction for corporations.
Institutional Emerging Markets, International Equity, and Frontier Emerging Markets paid qualifying foreign taxes of $327,744, $456,565, and $16,215, and earned $4,105,529, $5,726,299 and $232,387 from foreign source income during the year ended October 31, 2009, respectively. Pursuant to Section 853 of the Internal Revenue Code, Institutional Emerging Markets, International Equity and Frontier Emerging Markets designated $0.0214, $0.0185 and $0.0112 per share as foreign taxes paid and $0.2680, $0.2316 and $0.1611 per share as income earned from foreign sources for the year ended October 31, 2009, respectively.
Institutional Emerging Markets, International Equity, and Frontier Emerging Markets had qualifying dividend income of $1,964,127, $3,262,669 and $109,313 respectively, during the year ended October 31, 2009.
Pursuant to Section 852 of the Internal Revenue Code, International Equity designated $38,551,418 as long term capital gain dividends for the year ended October 31, 2009.
46
Harding, Loevner Funds, Inc.
Directors and Principal Officers of the Fund
(unaudited)
Disinterested Directors:
| Name, Address and Age | Position with the Fund | Term of Office and Length of Time Served* | Principal Occupation(s) During Past Five Years | Number of Portfolios in Fund Complex Overseen By Director | Other Directorships Held by Director | ||||||||||||||||||
| William E. Chapman, II c/o Harding Loevner LP 50 Division Street Fourth Floor Somerville, NJ 08876 Age, 68 | Director | Indefinite; Director since 2008 | Longboat Retirement Planning Solutions (Consulting Firm), President and Owner, 1998-present; Hewitt Associates, LLC (consulting firm), part-time provider of retirement and investment education seminars, 2000-present; Bowdoin College, Trustee, 2002-present. | 6 | Trustee, The Managers Funds, (9 portfolios); Trustee, Managers AMG Funds (6 portfolios), Managers Trust I (10 portfolios) and Managers Trust II (6 portfolios); Trustee, Third Avenue Trust (4 portfolios); Trustee, Third Avenue Variable Trust (1 portfolio). | ||||||||||||||||||
| R. Kelly Doherty c/o Harding Loevner LP 50 Division Street Fourth Floor Somerville, NJ 08876 Age, 51 | Director | Indefinite; Director since 2004 | Cayman Partners (private investment vehicles), Managing Partner, 1999-present. | 6 | L.P. Thebault & Co. (commercial printing); The Peck School | ||||||||||||||||||
| Charles Freeman c/o Harding Loevner LP 50 Division Street Fourth Floor Somerville, NJ 08876 Age, 45 | Director | Indefinite; Director since 2008 | Cayman Partners (private investment vehicles), Managing Partner, 1999-present. | 6 | National Committee for U.S.-China Relations. | ||||||||||||||||||
| Jane A. Freeman c/o Harding Loevner LP 50 Division Street Fourth Floor Somerville, NJ 08876 Age, 56 | Director | Indefinite; Director since 1996; Chairperson of Audit Committee 2005-2008; Lead Non-Interested Director since 2008 | Scientific Learning Corporation (Education Software), Executive Vice President and Chief Financial Officer, 2000-present; Finance & Business Development, Treasurer and Vice President, 1999-2000. | 6 | None | ||||||||||||||||||
| Samuel R. Karetsky c/o Harding Loevner LP 50 Division Street Fourth Floor Somerville, NJ 08876 Age, 64 | Director | Indefinite; Director since 1998 | The Karetsky Group, LLC (Advisory Firm), Managing Member, 2003-present; Wetherby Asset Management, Principal, 2004-present; European Investors Inc., Managing Director, 1998-2002 | 6 | None | ||||||||||||||||||
47
Harding, Loevner Funds, Inc.
Directors and Principal Officers of the Fund (continued)
(unaudited)
| Name, Address and Age | Position with the Fund | Term of Office and Length of Time Served* | Principal Occupation(s) During Past Five Years | Number of Portfolios in Fund Complex Overseen By Director | Other Directorships Held by Director | ||||||||||||||||||
| Eric Rakowski c/o Harding Loevner LP 50 Division Street Fourth Floor Somerville, NJ 08876 Age, 51 | Director | Indefinite; Director since 2008 | University of California at Berkeley School of Law, Professor, 1990-present. | 6 | Trustee, The Managers Funds, (9 portfolios); Trustee, Managers AMG Funds (6 portfolios), Managers Trust I (10 portfolios) and Managers Trust II (6 portfolios); Trustee, Third Avenue Trust (4 portfolios); Trustee, Third Avenue Variable Trust (1 portfolio). | ||||||||||||||||||
| Raymond J. Clark** c/o Harding Loevner LP 50 Division Street Fourth Floor Somerville, NJ 08876 Age, 73 | Director Emeritus | 1 year; Director Emeritus since 2009 | The Woodrow Wilson National Fellowship Foundation, Treasurer, 08/04-present; Wellesley College, Interim Vice President of Finance and Treasurer, 10/03-6/04; Princeton University, Treasurer, 1987-2001. | 6 | Princeton Healthcare System | ||||||||||||||||||
Interested Director:
| David R. Loevner*** Harding Loevner LP 50 Division Street, Fourth Floor Somerville, NJ 08876 Age, 55 | Director, President and Chairman of the Board | Indefinite; Director, President and Chairman of the Board since 1996 | Harding Loevner LP, President, 7/89-present; Parks Tennant Corporation (real estate), President, 1/01-present. | 6 | Director, Harding, Loevner Funds, plc (4 portfolios) | ||||||||||||||||||
| Jennifer M. Borggaard*** Affiliated Managers, Group, Inc. 600 Hale Street Prides Crossing, MA 01965 Age, 40 | Director | Indefinite; Director since 2008 | Affiliated Managers Group, Inc. ("AMG") (Asset Management Firm), Senior Vice President, 2007-present, Vice President, 2004-2007, Director and Senior Counsel, 2001-2004. | 6 | Director, DFD Fund of Funds, plc (4 portfolios) | ||||||||||||||||||
* Each director is elected to serve in accordance with the Articles of Incorporation and By-Laws of the Fund until his or her successor is duly elected and qualified.
** Effective September 9, 2009, Mr. Clark retired as a voting member of the Board and was elected to the position of "Director Emeritus" with a one-year term.
*** David R. Loevner is considered an "interested person" of the Fund as defined in the Investment Company Act of 1940, as amended, because he serves as President of Harding Loevner LP, the Fund's investment advisor. Jennifer M. Borggaard is an interested person of the Fund because she is an officer of AMG.
48
Harding, Loevner Funds, Inc.
Directors and Principal Officers of the Fund (continued)
(unaudited)
Principal Officers of the Fund
| Name, Address and Age | Position with the Fund | Term of Office and Length of Time Servedt | Principal Occupation(s) During Past Five Years | ||||||||||||
| Richard Reiter Harding Loevner LP 50 Division Street, Fourth Floor Somerville, NJ 08876 Age, 43 | Vice President | 1 year ; Vice President since 2007 | Harding Loevner LP, Chief Operating Officer 4/96-current. | ||||||||||||
| Puran Dulani Harding Loevner LP 50 Division Street, Fourth Floor Somerville, NJ 08876 Age, 51 | Chief Financial Officer and Treasurer | 1 year; Chief Financial Officer and Treasurer since 2007 | Harding Loevner LP, Chief of Operations and Accounting 3/02-present. | ||||||||||||
| Ellen Blanchard State Street Bank & Trust Company 200 Clarendon Street Boston, MA 02116 Age, 35 | Anti-Money Laundering Compliance Officer | 1 year; Anti-Money Laundering Compliance Officer since 2007 | State Street Bank & Trust Company (formerly, Investors Bank & Trust Company), Director and Senior Associate Counsel, 1/06-present; Senior Manager and Associate Counsel, 8/04-12/05; Manager and Associate Counsel 8/02-8/04; Product Manager, 8/99-8/02. | ||||||||||||
| Donna M. Rogers State Street Bank & Trust Company 200 Clarendon Street Boston, MA 02116 Age, 43 | Chief Compliance Officer of the Funds | 1 year; Chief Compliance Officer since 2007 | State Street Bank & Trust Company, (formerly, Investors Bank & Trust Company), Senior Director, 2002-present. | ||||||||||||
| Brendan J. O'Neill State Street Bank & Trust Company 200 Clarendon Street Boston, MA 02116 Age, 41 | Assistant Treasurer | 1 year; Assistant Treasurer since 2004 | State Street Bank & Trust Company (formerly, Investors Bank & Trust Company), Unit Director 11/07-present, Director 1/05-10/07; Senior Manager 11/02-12/04; Manager 7/00-10/02. | ||||||||||||
| Francine S. Hayes State Street Bank & Trust Company 200 Clarendon Street Boston, MA 02116 Age, 41 | Secretary | 1 year; Secretary since 2008 | State Street Bank & Trust Company (formerly, Investors Bank & Trust Company), Vice President and Senior Counsel, from 2004-present; and Assistant Vice President and Counsel, 2001-2004. | ||||||||||||
| Lori Renzulli Harding Loevner LP 50 Division Street Fourth Floor Somerville, NJ 08876 Age, 41 | Assistant Secretary | 1 year; Assistant Secretary since 2008 | Harding Loevner LP, Chief Counsel and Chief Compliance Officer, 6/06-present; Met Life, Director, Corporate Ethics and Compliance, 1/06-5/06; CitiStreet Retirement Services, Vice President and Counsel, 7/89-12/05. | ||||||||||||
| Brian C. Poole State Street Bank & Trust Company 200 Clarendon Street Boston, MA 02116 Age, 38 | Assistant Secretary | 1 year; Assistant Secretary since 2008 | State Street Bank & Trust Company (formerly, Investors Bank & Trust Company), Vice President and Counsel, 3/08-present and Associate Counsel, 7/04-9/07 | ||||||||||||
t Officers are elected to hold such office until their successor is elected and qualified to carry out the duties and responsibilities of their office, or until he or she resigns or is removed from office.
The Fund's Statement of Additional Information contains additional information about the Directors of the Fund and is available, without charge, upon request, by calling 1-877-435-8105.
49
Harding, Loevner Funds, Inc.
Results of Written Consent of Shareholders of the Frontier Emerging Markets Portfolio
In April 2009, Harding, Loevner Funds, Inc. (the "Fund") sought approval via written consent from the shareholders of the Frontier Emerging Markets Portfolio (the "Portfolio") to (i) amend the Portfolio's fundamental investment limitation with respect to concentration of investments to permit the Portfolio to invest up to 35% of its assets in the securities of companies in any one industry, if, at the time of investment, that industry represents 20% or more of the Portfolio's benchmark index, currently the MSCI Frontier Markets Index and (ii) that if the Fund seeks the concurrence from the staff of the Division of Investment Management of the Securities and Exchange Commission (the "Staff") to further modify the fundamental investment restriction with respect to the Fund's concentration of investments, and the Staff concurs with the request, the fundamental investment restriction with respect to the Fund's concentration of investments will b e that the Fund may invest up to 50% of its total assets in the securities of companies in any one industry if, at the time of investment, that industry represents 20% or more of the Fund's benchmark index, currently the MSCI Frontier Emerging Markets Index.
Proposal 1
| 1,278,296.209 votes in favor 0 votes against 0 votes abstained | |||
Proposal 2
| 1,278,296.209 votes in favor 0 votes against 0 votes abstained | |||
50
Harding, Loevner Funds, Inc.
Supplemental Information
(unaudited)
Quarterly Form N-Q Portfolio Schedule
Each Portfolio will file its complete schedule of investments with the SEC on Form N-Q at the end of the first and third fiscal quarters within 60 days of the end of the quarter to which it relates. The Portfolios' Form N-Q will be available on the SEC's website at www.sec.gov and may also be reviewed and copied at the SEC's Public Reference Room whose telephone number is 1-800-SEC-0330. Additionally, they are available upon request by calling 1-877-435-8105.
Proxy Voting Record
The Fund's proxy voting record relating to the Portfolios' securities during the most recent 12-month period ended June 30 is available on the Fund's website at www.hardingloevnerfunds.com and on the SEC's website at www.sec.gov, on Form N-PX.
Proxy Voting Policies and Procedures
A description of the Fund proxy voting policies and procedures are located in the Statement of Additional Information and is available without charge, upon request, by calling 1-877-435-8105 or on the SEC's website at www.sec.gov.
51
Harding, Loevner Funds, Inc.
Officers & Directors and Other Pertinent Information
OFFICERS AND DIRECTORS
David R. Loevner
Director, President and Chairman of the
Board of the Funds
Jennifer M. Borggaard
Director of the Funds
William E. Chapman II
Director of the Funds
R. Kelly Doherty
Director of the Funds
Charles Freeman
Director of the Funds
Jane A. Freeman
Director of the Funds
Samuel R. Karetsky
Director of the Funds
Eric Rakowski
Director of the Funds
Raymond J. Clark
Director Emeritus of the Funds
Donna Rogers
Chief Compliance Officer of the Funds
Ellen Blanchard
Anti-Money Laundering Compliance
Officer of the Funds
Puran Dulani
Chief Financial Officer and Treasurer
for the Funds
Richard Reiter
Vice President of the Funds
Brendan J. O'Neill
Assistant Treasurer of the Funds
Francine S. Hayes
Secretary of the Funds
Lori Renzulli
Assistant Secretary of the Funds
Brian C. Poole
Assistant Secretary of the Funds
52
HARDING, LOEVNER FUNDS, INC.
INVESTMENT ADVISER |
| DISTRIBUTOR |
|
|
|
Harding Loevner LP |
| Quasar Distributors, LLC |
50 Division Street, Fourth Floor |
| 615 East Michigan Street |
Somerville, NJ 08876-2943 |
| Milwaukee, WI 53202-5210 |
|
|
|
ADMINISTRATOR, CUSTODIAN, FUND |
| INDEPENDENT REGISTERED PUBLIC |
ACCOUNTANT, TRANSFER AGENT AND |
| ACCOUNTING FIRM |
DIVIDEND DISBURSING AGENT |
|
|
|
| KPMG LLP |
State Street Bank and Trust Company |
| 1601 Market Street |
200 Clarendon Street, 16th Floor, JHT 1651 |
| Philadelphia, PA 19103-2499 |
Boston, MA 02116 |
|
|
|
|
|
LEGAL COUNSEL |
|
|
|
|
|
Dechert LLP |
|
|
1095 Avenue of the Americas |
|
|
New York, New York 10036-6797 |
|
|
This report is intended for shareholders of Harding, Loevner Funds, Inc. It may not be used as sales literature unless preceded or accompanied by the current Prospectus, which gives details about charges, expenses, investment objectives, risks and policies of the Portfolios.
HLFSANINST-G 12/09
Item 2. Code of Ethics.
As of October 31, 2009, the Registrant has adopted a code of ethics that applies to the Registrant’s President/Chief Executive Officer and Treasurer/Chief Financial Officer. For the year ended October 31, 2009, there were no amendments to a provision of its code of ethics, nor were there any waivers granted from a provision of the code of ethics. A copy of its code of ethics is filed with this Form N-CSR under Item 12(a)(1).
Item 3. Audit Committee Financial Expert.
The Registrant’s Board of Directors has determined that the Registrant has one audit committee financial expert serving on its audit committee. The audit committee financial expert serving on the Registrant’s audit committee is William Chapman, who is independent.
Item 4. Principal Accountant Fees and Services.
(a) AUDIT FEES: The aggregate fees billed for each of the last two fiscal years for professional services rendered by KPMG LLP for the audit of the registrant annual financial statements or services that are normally provided by the accountant in connection with statutory and regulatory filings or engagements for those fiscal years are $128,225 in 2009 and $124,500 in 2008.
(b) AUDIT-RELATED FEES: The aggregate fees billed in each of the last two fiscal years for assurance and related services by KPMG LLP that are reasonably related to the performance of the audit of the registrant financial statements and are not reported under paragraph (a) of this Item are NONE.
(c) TAX FEES: The aggregate fees billed in each of the last two fiscal years for professional services rendered by KPMG LLP for the review of domestic tax returns was $38,100 in 2009 and $25,500 in 2008. The aggregate fees billed for each of the last two fiscal years for preparation of Indian income-tax returns prepared by Ernst Young LLP was $18,158 in 2009 and 59,844 in 2008.
(d) ALL OTHER FEES: The aggregate fees billed in each of the last two fiscal years for products and services provided by KPMG LLP, other than the services reported in paragraphs (a) through (c) of this Item are NONE.
(e)(1) Disclose the audit committee pre-approval policies and procedures described in paragraph (c)(7) of Rule 2-01 of Regulation S-X.
A copy of the Audit Committee’s Pre-Approval Policies and Procedures is filed with this Form N-CSR under Item 12(c).
(e)(2) The percentage of services described in each of paragraphs (b) through (d) of this Item that were approved by the audit committee pursuant to paragraph (c)(7)(i)(C) of Rule 2-01 of Regulation S-X are as follows:
(b) Not applicable
(c) 100%
(d) Not applicable
(f) Not applicable.
(g) Not applicable.
(h) Not applicable.
Item 5. Audit Committee of Listed Registrants.
Not applicable.
Item 6. Schedule of Investments
(a) Included as Part of the Reports to Shareholders filed as Item 1 herewith.
(b) Not applicable.
Item 7. Disclosure of Proxy Voting Policies and Procedures for Closed-End Management Investment Companies.
Not applicable to this registrant.
Item 8. Portfolio Managers of Closed-end Management Investment Companies.
Not applicable to this registrant.
Item 9. Purchases of Equity Securities by Closed-End Management Investment Company and Affiliated Purchasers.
Not applicable to this registrant.
Item 10. Submission of Matters to a Vote of Security Holders.
Not applicable.
Item 11. Controls and Procedures.
(a) The Registrant’s Principal Executive Officer and Principal Financial Officer concluded that the Registrant’s disclosure controls and procedures (as defined in Rule 30a-3(c) under the Investment Company Act of 1940, as amended (the “1940 Act”)) were effective as of a date within 90 days prior to the filing date of this report, based on their evaluation of the effectiveness of the Registrant’s disclosure controls and procedures as of the Evaluation Date.
(b) There were no significant changes in the Registrant’s internal control over financial reporting (as defined in Rule 30a-3(d) under the 1940 Act) that occurred during the second fiscal quarter of the period covered by this report that has materially affected, or is reasonably likely to materially affect, the Registrant’s internal control over financial reporting.
Item 12. Exhibits.
(a)(1) SOX Code of Ethics is attached.
(a)(2) Section 302 Certification letters are attached.
(b) Section 906 Certifications are attached.
(c) Audit Committee Pre-Approval Policies and Procedures are attached.
SIGNATURES
Pursuant to the requirements of the Securities Exchange Act of 1934 and the Investment Company Act of 1940, the registrant has duly caused this report to be signed on its behalf by the undersigned, thereunto duly authorized.
Harding, Loevner Funds, Inc. |
| |
|
|
|
By: | /s/ David R. Loevner |
|
David R. Loevner, President |
| |
|
| |
Date: January 7, 2010 |
| |
Pursuant to the requirements of the Securities Exchange Act of 1934 and the Investment Company Act of 1940, this report has been signed below by the following persons on behalf of the registrant and in the capacities and on the dates indicated.
|
|
|
By: | /s/ David R. Loevner |
|
David R. Loevner, President |
| |
|
| |
Date: January 7, 2010 |
| |
|
| |
|
|
|
By: | /s/ Puran Dulani |
|
Puran Dulani, Treasurer and Chief Financial Officer |
| |
|
| |
Date: January 7, 2010 |
| |