Table of Contents
UNITED STATES
SECURITIES AND EXCHANGE COMMISSION
Washington, D.C. 20549
FORM N-CSR
CERTIFIED SHAREHOLDER REPORT OF REGISTERED
MANAGEMENT INVESTMENT COMPANIES
Investment Company Act file number 811-07739
Harding, Loevner Funds, Inc.
(Exact name of registrant as specified in charter)
400 Crossing Boulevard
Fourth Floor
Bridgewater, NJ 08807
(Address of principal executive offices) (Zip code)
Owen T. Meacham
The Northern Trust Company
50 South LaSalle Street
Chicago, IL 60603
With a copy to:
Stephen H. Bier, Esq.
Dechert LLP
1095 Avenue of the Americas
New York, NY 10036
(Name and address of agent for service)
Registrant’s telephone number, including area code: (877) 435-8105
Date of fiscal year end: 10/31
Date of reporting period: 10/31/2012
Table of Contents
Item 1. Reports to Stockholders.
Table of Contents
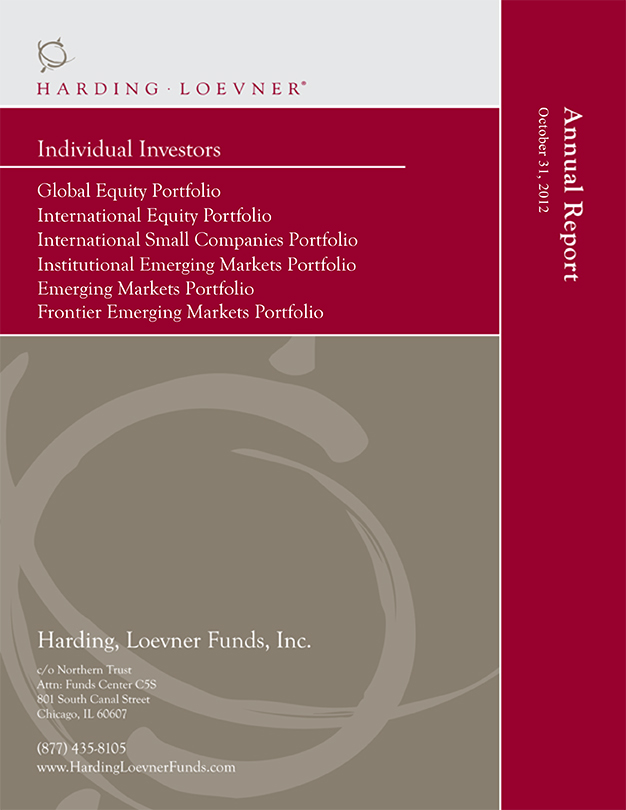
Table of Contents
Harding, Loevner Funds, Inc.
| 2 | ||||
| 3 | ||||
| 11 | ||||
| 19 | ||||
| 28 | ||||
| 37 | ||||
| 46 | ||||
| 56 | ||||
| 59 | ||||
| 65 | ||||
| 71 | ||||
| 81 | ||||
| 82 | ||||
| 83 | ||||
| 89 | ||||
| 90 | ||||
| 95 | ||||
For use only when proceeded or accompanied by a prospectus. Read the prospectus carefully before you invest or send money.
Table of Contents
Harding, Loevner Funds, Inc.
October 31, 2012 (unaudited)
As a shareholder of a Harding Loevner Portfolio, you incur ongoing costs, including management fees; to the extent applicable, distribution (12b-1) fees, and/or shareholder services fees and other fund expenses. The following example is intended to help you understand your ongoing costs (in dollars and cents) of investing in a Portfolio and to compare these costs with the ongoing costs of investing in other mutual funds.
The example is based on an investment of $1,000 invested on May 1, 2012 and held for the entire six month period from May 1, 2012 to October 31, 2012.
Actual Expenses
The first line under each Portfolio in the table below provides information about actual account values and actual expenses. You may use the information in this line, together with the amount you invested, to estimate the expenses that you paid over the period. Simply divide your account value by $1,000 (for example, an $8,600 account value divided by $1,000 = 8.6), then multiply the result by the number in the first line for your Portfolio under the heading entitled “Expenses Paid During Period” to estimate the expenses you paid on your account during this period.
Hypothetical Example for Comparison Purposes
The second line under each Portfolio in the table below provides information about hypothetical account values and hypothetical expenses based on the Portfolio’s actual expense ratio and an assumed rate of return of 5% per year before expenses, which is not the Portfolio’s actual return. The hypothetical account values and expenses may not be used to estimate the actual ending account balance or expenses you paid for the period. You may use this information to compare the ongoing costs of investing in your Portfolio and other funds. To do so, compare this 5% hypothetical example with the 5% hypothetical examples that appear in the shareholder reports of the other funds. Please note that the expenses shown in the table are meant to highlight your ongoing costs only. Therefore, the second line under each Portfolio in the table is useful in comparing ongoing costs only, and will not help you determine the relative total costs of owning different funds.
| Portfolio | Beginning Account Value May 1, 2012 | Ending Account Value October 31, 2012 | Annual Expense Ratio | Expenses Paid During Period* (May 1, 2012 to October 31, 2012) | ||||||||||||
Global Equity Portfolio—Institutional Class | ||||||||||||||||
Actual | $ | 1,000.00 | $ | 983.90 | 0.95 | % | $ | 4.74 | ||||||||
Hypothetical (5% annual return before expenses) | 1,000.00 | 1,020.36 | 0.95 | % | 4.82 | |||||||||||
Global Equity Portfolio—Advisor Class | ||||||||||||||||
Actual | 1,000.00 | 982.30 | 1.25 | % | 6.23 | |||||||||||
Hypothetical (5% annual return before expenses) | 1,000.00 | 1,018.85 | 1.25 | % | 6.34 | |||||||||||
International Equity Portfolio—Institutional Class | ||||||||||||||||
Actual | 1,000.00 | 1,027.10 | 0.89 | % | 4.53 | |||||||||||
Hypothetical (5% annual return before expenses) | 1,000.00 | 1,020.66 | 0.89 | % | 4.52 | |||||||||||
International Equity Portfolio—Investor Class | ||||||||||||||||
Actual | 1,000.00 | 1,025.10 | 1.23 | % | 6.26 | |||||||||||
Hypothetical (5% annual return before expenses) | 1,000.00 | 1,018.95 | 1.23 | % | 6.24 | |||||||||||
International Small Companies Portfolio—Institutional Class | ||||||||||||||||
Actual | 1,000.00 | 998.30 | 1.50 | % | 7.53 | |||||||||||
Hypothetical (5% annual return before expenses) | 1,000.00 | 1,017.60 | 1.50 | % | 7.61 | |||||||||||
International Small Companies Portfolio—Investor Class | ||||||||||||||||
Actual | 1,000.00 | 996.50 | 1.75 | % | 8.78 | |||||||||||
Hypothetical (5% annual return before expenses) | 1,000.00 | 1,016.34 | 1.75 | % | 8.87 | |||||||||||
Institutional Emerging Markets Portfolio | ||||||||||||||||
Actual | 1,000.00 | 1,022.90 | 1.30 | % | 6.61 | |||||||||||
Hypothetical (5% annual return before expenses) | 1,000.00 | 1,018.60 | 1.30 | % | 6.60 | |||||||||||
Emerging Markets Portfolio—Advisor Class | ||||||||||||||||
Actual | 1,000.00 | 1,023.40 | 1.46 | % | 7.43 | |||||||||||
Hypothetical (5% annual return before expenses) | 1,000.00 | 1,017.80 | 1.46 | % | 7.41 | |||||||||||
Frontier Emerging Markets Portfolio—Institutional Class | ||||||||||||||||
Actual | 1,000.00 | 1,040.90 | 1.97 | % | 10.11 | |||||||||||
Hypothetical (5% annual return before expenses) | 1,000.00 | 1,015.23 | 1.97 | % | 9.98 | |||||||||||
Frontier Emerging Markets Portfolio—Investor Class | ||||||||||||||||
Actual | 1,000.00 | 1,038.10 | 2.25 | % | 11.53 | |||||||||||
Hypothetical (5% annual return before expenses) | 1,000.00 | 1,013.83 | 2.25 | % | 11.39 | |||||||||||
* Expenses are calculated using each Portfolio’s annualized expense ratio (as disclosed in the table), multiplied by the average account value for the period, multiplied by the number of days in the period (184 days), and divided by the number of days in the year (366 days).
2
Table of Contents
Global Equity Portfolio (Institutional Class) — Overview
(unaudited)
October 31, 2012
Hypothetical Comparison Of Changes In Value Of $10,000 Investment In Harding, Loevner Funds, Inc. -
Global Equity Portfolio - Institutional Class And The MSCI All Country World Index
(Net Dividends Reinvested)
| Returns for the Year Ended October 31, 2012 | ||||||
| Cumulative Total Returns | Average Annualized Total Return | |||||
| FUND NAME | Last 12 Months | Inception | Inception | |||
Global Equity Portfolio— | 8.73% | 25.80% | 7.97% | |||
MSCI All Country World Index (Net Dividends) | 8.55% | 24.12% | 7.49% | |||
Performance data quoted represents past performance and does not guarantee future results. The investment return and principal value of an investment will fluctuate so that an investor’s shares, when redeemed, may be worth more or less than their original cost. Performance current to the most recent month end may be lower or higher than the performance quoted and may be obtained by visiting the website at www.hardingloevnerfunds.com.
Investment return reflects voluntary fee waivers in effect. Absent such waivers, total return would be reduced. The performance provided does not reflect the deduction of taxes that a shareholder would pay on Portfolio distributions.
3
Table of Contents
Harding, Loevner Funds, Inc.
Global Equity Portfolio (Advisor Class) — Overview
(unaudited)
October 31, 2012
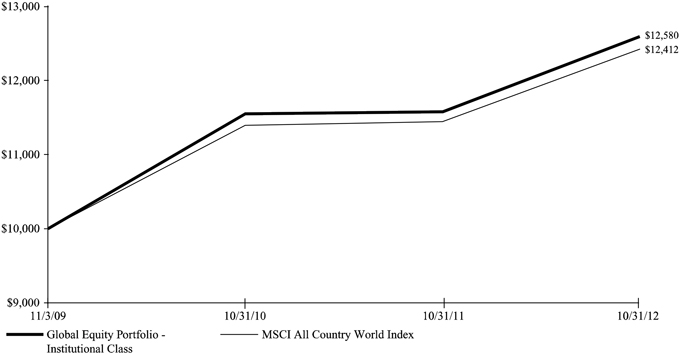
Hypothetical Comparison Of Changes In Value Of $10,000 Investment In Harding, Loevner Funds, Inc. -
Global Equity Portfolio - Advisor Class And The MSCI All Country World Index
(Net Dividends Reinvested)
| Returns for the Year Ended October 31, 2012 | ||||||||||
| Cumulative Total Returns | Average Annualized Total Return | |||||||||
| FUND NAME | Last 12 Months | 5 YR | 10 YR | 5 YR | 10 YR | |||||
Global Equity Portfolio— | 8.43% | -0.77% | 133.89% | -0.15% | 8.87% | |||||
MSCI All Country World Index (Net Dividends) | 8.55% | -13.93% | 111.27% | -2.96% | 7.77% | |||||
Performance data quoted represents past performance and does not guarantee future results. The investment return and principal value of an investment will fluctuate so that an investor’s shares, when redeemed, may be worth more or less than their original cost. Performance current to the most recent month end may be lower or higher than the performance quoted and may be obtained by visiting the website at www.hardingloevnerfunds.com.
Investment return reflects voluntary fee waivers in effect. Absent such waivers, total return would be reduced. The performance provided does not reflect the deduction of taxes that a shareholder would pay on Portfolio distributions.
4
Table of Contents
Harding, Loevner Funds, Inc.
Global Equity Portfolio - Overview
(unaudited)
October 31, 2012
The Global Equity Portfolio (the “Portfolio”) Investor Class gained 8.43% and the Institutional Class gained 8.73% (after all fees and expenses) for the fiscal year ended October 31, 2012. In comparison, the Portfolio’s benchmark, the MSCI All Country World Index (the “Index”) rose 8.55%, net of source taxes.
Consistent with its investment objectives and policies, the Portfolio was invested in the securities of global companies that exhibit the fundamental characteristics of durable growth, financial strength, management quality, and sustainable competitive advantage.
The Portfolio performance differed little from that of the Index in the fiscal year. Our stock selection in the Materials sector contributed most to performance. Seed maker Monsanto outperformed with double-digit year-over-year growth in sales and operating profits driven by strong sales in corn and bean seeds. The Consumer Discretionary sector detracted most from performance with Chinese footwear manufacturer Anta Sports Products underperforming as weak demand led to inventory buildups resulting in discounting and reduced profitability.
From a geographic perspective, the Portfolio benefited from positive stock selection in Japan and the European Monetary Union (EMU). In Japan, diaper maker Unicharm outperformed as the company continued to realize strong sales growth in China with consumers trading up from cloth to disposable diapers. In Europe, the Portfolio benefited from Spanish fast retailer Inditex, which grew profits by expanding out of its slowing domestic market into Asia and the Americas. The biggest detractor from performance was our stock selection in the United States. Data integration provider Informatica underperformed as weak European sales overwhelmed modest US and Asian operational improvements.
Past performance does not guarantee future results.
Fund holdings and sector allocations are subject to change and are not recommendations to buy or sell any security. Please see the Statement of Net Assets for a complete list of fund holdings.
The Portfolio invests in foreign securities, which will involve greater volatility and political, economic, and currency risks and differences in accounting methods. It also invests in emerging markets, which involve unique risks, such as exposure to economies less diverse and mature than the U.S. or other more established foreign markets. Economic and political instability may cause larger price changes in emerging markets securities than other foreign securities. Investments in debt securities typically decrease in value when interest rates rise. This risk is usually greater for longer-term debt securities. Investment by the Portfolio in lower rated and non-rated securities presents a greater risk of loss to principal and interest than higher-rated securities.
The MSCI All Country World Index is a free float-adjusted market capitalization index that is designed to measure equity market performance in the global developed and emerging markets. The Index consists of 45 developed and emerging market countries. The Index is net of foreign withholding taxes on dividends. You cannot invest directly in this Index.
5
Table of Contents
Harding, Loevner Funds, Inc.
Global Equity Portfolio
Statement of Net Assets
October 31, 2012
| Industry | Percentage of Net Assets | ||||
Automobiles & Components | 1.0 | % | |||
Banks | 12.9 | ||||
Capital Goods | 5.7 | ||||
Consumer Durables & Apparel | 5.9 | ||||
Consumer Services | 1.0 | ||||
Diversified Financials | 3.0 | ||||
Energy | 6.1 | ||||
Food, Beverage & Tobacco | 5.1 | ||||
Health Care Equipment & Services | 4.6 | ||||
Household & Personal Products | 6.8 | ||||
Insurance | 1.0 | ||||
Materials | 6.3 | ||||
Media | 1.2 | ||||
Mutual Funds | 2.5 | ||||
Pharmaceuticals, Biotechnology & Life Sciences | 4.1 | ||||
Retailing | 4.0 | ||||
Semiconductors & Semiconductor Equipment | 1.3 | ||||
Software & Services | 15.6 | ||||
Technology Hardware & Equipment | 6.7 | ||||
Telecommunication Services | 2.8 | ||||
Transportation | 1.9 | ||||
|
| ||||
Total Investments | 99.5 | ||||
Other Assets Less Liabilities | 0.5 | ||||
|
| ||||
Net Assets | 100.0 | % | |||
|
| ||||
See Notes to Financial Statements
6
Table of Contents
Harding, Loevner Funds, Inc.
Global Equity Portfolio
Statement of Net Assets
October 31, 2012 (continued)
| Shares | Value | |||||||
Common Stocks - 97.0% | ||||||||
Australia - 1.4% | ||||||||
Cochlear Ltd. (Health Care Equipment & Services)† | 55,778 | $ | 4,116,115 | |||||
|
| |||||||
China - 2.2% | ||||||||
Anta Sports Products Ltd. (Consumer Durables & Apparel)† | 1,388,000 | 1,180,236 | ||||||
China Merchants Holdings International Co., Ltd. (Transportation)† | 819,441 | 2,713,081 | ||||||
Shandong Weigao Group Medical Polymer Co., Ltd., Class H (Health Care Equipment & Services)† | 2,042,000 | 2,755,393 | ||||||
|
| |||||||
| 6,648,710 | ||||||||
|
| |||||||
France - 4.5% | ||||||||
Air Liquide SA (Materials)† | 36,380 | 4,294,664 | ||||||
Dassault Systemes SA (Software & Services)† | 56,650 | 5,970,215 | ||||||
L’Oreal SA (Household & Personal Products)† | 23,210 | 2,962,320 | ||||||
|
| |||||||
| 13,227,199 | ||||||||
|
| |||||||
Germany - 1.1% | ||||||||
Qiagen NV (Nasdaq Exchange) (Pharmaceuticals, Biotechnology & Life Sciences)* | 192,000 | 3,350,400 | ||||||
|
| |||||||
Hong Kong - 0.9% | ||||||||
AIA Group Ltd. (Insurance)† | 703,100 | 2,781,398 | ||||||
|
| |||||||
India - 2.5% | ||||||||
HDFC Bank Ltd. - ADR (Banks) | 96,000 | 3,589,440 | ||||||
ICICI Bank Ltd. - Sponsored ADR (Banks) | 94,000 | 3,689,500 | ||||||
|
| |||||||
| 7,278,940 | ||||||||
|
| |||||||
Indonesia - 1.0% | ||||||||
Bank Central Asia Tbk PT (Banks)† | 3,483,500 | 2,973,598 | ||||||
|
| |||||||
Japan - 9.3% | ||||||||
ABC-Mart Inc. (Retailing)† | 91,800 | 4,026,235 | ||||||
FANUC Corp. (Capital Goods)† | 44,100 | 7,071,818 | ||||||
Keyence Corp. (Technology Hardware & Equipment)† | 13,696 | 3,629,060 | ||||||
M3 Inc. (Health Care Equipment & Services)† | 1,920 | 3,685,403 | ||||||
Unicharm Corp. (Household & Personal Products)† | 165,000 | 8,930,311 | ||||||
|
| |||||||
| 27,342,827 | ||||||||
|
| |||||||
Mexico - 3.0% | ||||||||
America Movil SAB de CV, Series L - ADR (Telecommunication Services) | 230,500 | 5,829,345 | ||||||
Coca-Cola Femsa SAB de CV - Sponsored ADR (Food, Beverage & Tobacco) | 23,000 | 2,941,930 | ||||||
|
| |||||||
| 8,771,275 | ||||||||
|
| |||||||
Russia - 0.8% | ||||||||
Gazprom OAO - Sponsored ADR (Energy)† | 244,200 | 2,240,705 | ||||||
|
| |||||||
See Notes to Financial Statements
7
Table of Contents
Harding, Loevner Funds, Inc.
Global Equity Portfolio
Statement of Net Assets
October 31, 2012 (continued)
| Shares | Value | |||||||
South Africa - 1.3% | ||||||||
Sasol Ltd. (Energy)† | 91,400 | $ | 3,896,073 | |||||
|
| |||||||
Spain - 1.1% | ||||||||
Inditex SA (Retailing)† | 26,600 | 3,391,740 | ||||||
|
| |||||||
Sweden - 0.8% | ||||||||
Millicom International Cellular SA - SDR (Telecommunication Services)† | 28,775 | 2,485,752 | ||||||
|
| |||||||
Switzerland - 6.9% | ||||||||
Kuehne & Nagel International AG, Reg S (Transportation)† | 25,200 | 2,945,960 | ||||||
Lonza Group AG, Reg S (Pharmaceuticals, Biotechnology & Life Sciences)† | 49,300 | 2,499,260 | ||||||
Nestle SA - Sponsored ADR, Reg S (Food, Beverage & Tobacco) | 134,800 | 8,538,232 | ||||||
Sonova Holding AG, Reg S (Health Care Equipment & Services)† | 30,980 | 3,117,468 | ||||||
Swatch Group AG, Bearer (Consumer Durables & Apparel)† | 7,730 | 3,208,355 | ||||||
|
| |||||||
| 20,309,275 | ||||||||
|
| |||||||
Turkey - 1.5% | ||||||||
Turkiye Garanti Bankasi A/S - ADR (Banks) | 912,200 | 4,378,560 | ||||||
|
| |||||||
United Kingdom - 5.8% | ||||||||
ARM Holdings plc - Sponsored ADR (Semiconductors & Semiconductor Equipment) | 119,400 | 3,862,590 | ||||||
Shire plc (Pharmaceuticals, Biotechnology & Life Sciences)† | 105,600 | 2,969,749 | ||||||
Standard Chartered plc (Banks)† | 284,700 | 6,753,578 | ||||||
WPP plc (Media)† | 263,470 | 3,409,565 | ||||||
|
| |||||||
| 16,995,482 | ||||||||
|
| |||||||
United States - 52.9% | ||||||||
3M Co. (Capital Goods) | 35,500 | 3,109,800 | ||||||
Abbott Laboratories (Pharmaceuticals, Biotechnology & Life Sciences) | 50,200 | 3,289,104 | ||||||
Amazon.com Inc. (Retailing)* | 18,300 | 4,260,606 | ||||||
Apple Inc. (Technology Hardware & Equipment) | 10,100 | 6,010,510 | ||||||
BorgWarner Inc. (Automobiles & Components)* | 44,000 | 2,896,080 | ||||||
Bunge Ltd. (Food, Beverage & Tobacco) | 51,700 | 3,672,251 | ||||||
Citrix Systems Inc. (Software & Services)* | 79,000 | 4,882,990 | ||||||
Coach Inc. (Consumer Durables & Apparel) | 92,300 | 5,173,415 | ||||||
Cognizant Technology Solutions Corp., Class A (Software & Services)* | 43,200 | 2,879,280 | ||||||
Colgate-Palmolive Co. (Household & Personal Products) | 50,300 | 5,279,488 | ||||||
eBay Inc. (Software & Services)* | 221,000 | 10,672,090 | ||||||
EMC Corp. (Technology Hardware & Equipment)* | 136,100 | 3,323,562 | ||||||
Emerson Electric Co. (Capital Goods) | 136,400 | 6,605,852 | ||||||
Exxon Mobil Corp. (Energy) | 48,100 | 4,385,277 | ||||||
F5 Networks Inc. (Technology Hardware & Equipment)* | 45,700 | 3,769,336 | ||||||
First Republic Bank (Banks) | 95,000 | 3,263,250 | ||||||
Google Inc., Class A (Software & Services)* | 7,900 | 5,370,183 | ||||||
Informatica Corp. (Software & Services)* | 99,736 | 2,706,835 | ||||||
JPMorgan Chase & Co. (Diversified Financials) | 133,100 | 5,547,608 | ||||||
See Notes to Financial Statements
8
Table of Contents
Harding, Loevner Funds, Inc.
Global Equity Portfolio
Statement of Net Assets
October 31, 2012 (continued)
| Shares | Value | |||||||
United States - 52.9% - (continued) | ||||||||
Lazard Ltd., Class A (Diversified Financials) | 107,700 | $ | 3,172,842 | |||||
McDonald’s Corp. (Consumer Services) | 34,500 | 2,994,600 | ||||||
Microsoft Corp. (Software & Services) | 289,400 | 8,258,029 | ||||||
Monsanto Co. (Materials) | 52,400 | 4,510,068 | ||||||
NIKE Inc., Class B (Consumer Durables & Apparel) | 53,700 | 4,907,106 | ||||||
Praxair Inc. (Materials) | 35,500 | 3,770,455 | ||||||
Procter & Gamble Co. (Household & Personal Products) | 42,500 | 2,942,700 | ||||||
Ralph Lauren Corp. (Consumer Durables & Apparel) | 19,300 | 2,966,217 | ||||||
Schlumberger Ltd. (Energy) | 108,900 | 7,571,817 | ||||||
Sigma-Aldrich Corp. (Materials) | 86,600 | 6,074,124 | ||||||
SVB Financial Group (Banks)* | 48,100 | 2,721,979 | ||||||
Teradata Corp. (Software & Services)* | 77,200 | 5,273,532 | ||||||
Trimble Navigation Ltd. (Technology Hardware & Equipment)* | 66,600 | 3,142,188 | ||||||
Wells Fargo & Co. (Banks) | 315,900 | 10,642,671 | ||||||
|
| |||||||
| 156,045,845 | ||||||||
|
| |||||||
Total Common Stocks (Cost $240,846,535) | 286,233,894 | |||||||
|
| |||||||
Cash Equivalent - 2.5% | ||||||||
Northern Institutional Funds - | 7,467,446 | 7,467,446 | ||||||
|
| |||||||
Total Cash Equivalent (Cost $7,467,446) | 7,467,446 | |||||||
|
| |||||||
Total Investments — 99.5% (Cost $ 248,313,981) | $ | 293,701,340 | ||||||
|
| |||||||
Summary of Abbreviations
| ADR | American Depository Receipt |
| SDR | Swedish Depository Receipt |
| Reg S | Security sold outside United States without registration under the Securities Act of 1933. |
| * | Non-income producing security. |
| † | Investment categorized as level 2 security as disclosed in Note 2 of the Notes to Financial Statements. |
See Notes to Financial Statements
9
Table of Contents
Harding, Loevner Funds, Inc.
Global Equity Portfolio
Statement of Net Assets
October 31, 2012 (continued)
| Value | ||||
Other Assets, Net of Liabilities - 0.5% | ||||
Dividends and interest receivable | $ | 263,761 | ||
Foreign currency (cost $2,660) | 3,087 | |||
Receivable for Fund shares sold | 5,943,242 | |||
Tax reclaim receivable | 154,331 | |||
Prepaid expenses | 50,040 | |||
Payable to Investment Adviser | (236,469 | ) | ||
Payable for investments purchased | (4,357,380 | ) | ||
Payable for Fund shares redeemed | (170,989 | ) | ||
Other liabilities | (112,766 | ) | ||
|
| |||
| 1,536,857 | ||||
|
| |||
Net Assets - 100% | ||||
Institutional Class | ||||
Applicable to 9,041,108 outstanding $.001 par value shares (authorized 200,000,000 shares) | $ | 226,489,365 | ||
|
| |||
Net Asset Value, Offering Price and Redemption Price Per Share | $ | 25.05 | ||
|
| |||
Advisor Class | ||||
Applicable to 2,748,242 outstanding $.001 par value shares (authorized 200,000,000 shares) | $ | 68,748,832 | ||
|
| |||
Net Asset Value, Offering Price and Redemption Price Per Share | $ | 25.02 | ||
|
| |||
Components of Net Assets as of October 31, 2012 were as follows: | ||||
Paid-in capital | $ | 251,196,445 | ||
Accumulated undistributed net investment income | 1,540,991 | |||
Accumulated net realized loss from investment transactions | (2,887,087 | ) | ||
Net unrealized appreciation on investments and on assets and liabilities denominated in foreign currencies | 45,387,848 | |||
|
| |||
| $ | 295,238,197 | |||
|
| |||
See Notes to Financial Statements
10
Table of Contents
Harding, Loevner Funds, Inc.
International Equity Portfolio (Institutional Class) — Overview
(unaudited)
October 31, 2012
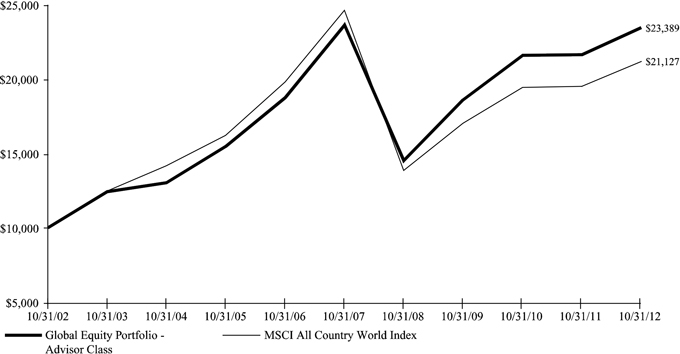
Hypothetical Comparison Of Changes In Value Of $10,000 Investment In Harding, Loevner Funds, Inc. -
International Equity Portfolio - Institutional Class And The MSCI All Country World ex-US Index
(Net Dividends Reinvested)
| Returns for the Year Ended October 31, 2012 | ||||||||||
| Cumulative Total Returns | Average Annualized Total Return | |||||||||
| FUND NAME | Last 12 Months | 5 YR | 10 YR | 5 YR | 10 YR | |||||
International Equity Portfolio— | 9.00% | -1.29% | 145.95% | -0.26% | 9.42% | |||||
MSCI All Country World ex-US Index (Net dividends) | 3.98% | -22.92% | 143.74% | -5.07% | 9.32% | |||||
Performance data quoted represents past performance and does not guarantee future results. The investment return and principal value of an investment will fluctuate so that an investor’s shares, when redeemed, may be worth more or less than their original cost. Performance current to the most recent month end may be lower or higher than the performance quoted and may be obtained by visiting the website at www.hardingloevnerfunds.com.
Investment return reflects voluntary fee waivers in effect. Absent such waivers, total return would be reduced. The performance provided does not reflect the deduction of taxes that a shareholder would pay on Portfolio distributions.
11
Table of Contents
Harding, Loevner Funds, Inc.
International Equity Portfolio (Investor Class) — Overview
(unaudited)
October 31, 2012
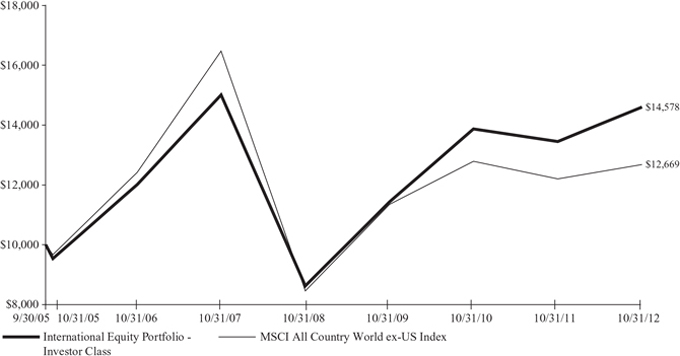
Hypothetical Comparison Of Changes In Value Of $10,000 Investment In Harding, Loevner Funds, Inc. -
International Equity Portfolio - Investor Class And The MSCI All Country World ex-US Index
(Net Dividends Reinvested)
| Returns for the Year Ended October 31, 2012 | ||||||||||
| Cumulative Total Returns | Average Annualized Total Return | |||||||||
| FUND NAME | Last 12 Months | 5 YR | Inception | 5 YR | Inception | |||||
International Equity Portfolio— | 8.51% | -2.74% | 45.78% | -0.55% | 5.46% | |||||
MSCI All Country World ex-US Index (Net dividends) | 3.98% | -22.92% | 26.69% | -5.07% | 3.39% | |||||
Performance data quoted represents past performance and does not guarantee future results. The investment return and principal value of an investment will fluctuate so that an investor’s shares, when redeemed, may be worth more or less than their original cost. Performance current to the most recent month end may be lower or higher than the performance quoted and may be obtained by visiting the website at www.hardingloevnerfunds.com.
Investment return reflects voluntary fee waivers in effect. Absent such waivers, total return would be reduced. The performance provided does not reflect the deduction of taxes that a shareholder would pay on Portfolio distributions.
12
Table of Contents
Harding, Loevner Funds, Inc.
International Equity Portfolio - Overview
(unaudited)
October 31, 2012
The International Equity Portfolio (the “Portfolio”) Investor Class gained 8.51% and the Institutional Class gained 9.00% (after all fees and expenses) for the fiscal year ended October 31, 2012. In comparison, the Portfolio’s benchmark, the MSCI All Country World ex-US Index (the “Index”) rose 3.98%, net of source taxes.
Consistent with its investment objectives and policies, the Portfolio was invested in the securities of non-US companies that exhibit the fundamental characteristics of durable growth, financial strength, management quality, and sustainable competitive advantage.
The Portfolio outperformed the Index in the fiscal year. Viewed by sector, the Portfolio benefited from good stock selection in Information Technology; here the Portfolio’s stocks returned 20% versus a 2% return for the Index. Six of our seven holdings in the sector were positive, the best performers being Samsung Electronics and Taiwan Semiconductor. Our overweight in Health Care was a big contributor; while our stock selection in the sector was roughly in-line with the Index. Energy and Financials detracted the most from performance. Poor stock selection was the cause of the Energy underperformance: Russian oil producer Gazprom underperformed as it experienced tax hikes and diminished prospects for its gas price formula, as did Petrobras, where shareholders have been subsidizing gasoline prices as the Brazilian government has been slow to boost domestic prices. The Portfolio’s underweight in the relatively strongly performing Financials sectors was the specific cause of that sector’s underperformance.
By geographical region, the Portfolio benefited mostly from strong stock selection, particularly in Japan and the European Monetary Union (EMU). In Japan, the Portfolio’s stocks were up 12%, while the Index was down 3%. Diaper maker Unicharm outperformed as the company continued to realize strong sales growth in China with consumers trading up from cloth to disposable diapers. In Europe EMU the Portfolio’s stocks were +14%, versus a return for the Index of 4%. Software designer Dassault Systemes outperformed as strong demand from existing customers for its V6 product line boosted sales. Europe ex-EMU detracted slightly from performance mostly because of poor stock selection in the United Kingdom, as BG Group and Tesco weighed upon returns.
Past performance does not guarantee future results.
Fund holdings and sector allocations are subject to change and are not recommendations to buy or sell any security. Please see the Statement of Net Assets for a complete list of fund holdings.
The Portfolio invests in foreign securities, which will involve greater volatility and political, economic, and currency risks. It also invests in emerging markets, which involve unique risks, such as exposure to economies less diverse and mature than the U.S. or other more established foreign markets. Economic and political instability may cause larger price changes in emerging markets securities than other foreign securities. Investments in debt securities typically decrease in value when interest rates rise. This risk is usually greater for longer-term debt securities. Investment by the Portfolio in lower-rated and non-rated securities presents a greater risk of loss to principal and interest than higher-rated securities. The portfolio invests in smaller companies which involve additional risks such as limited liquidity and greater volatility.
The MSCI All Country World ex-US Index is a free float-adjusted market capitalization index that is designed to measure equity market performance in the global developed and emerging markets, excluding the US. The Index consists of 44 developed and emerging market countries. The Index is net of foreign withholding taxes on dividends. You cannot invest directly in this Index.
13
Table of Contents
Harding, Loevner Funds, Inc.
International Equity Portfolio
Statement of Net Assets
October 31, 2012
| Industry | Percentage of Net Assets | ||||
Automobiles & Components | 2.4 | % | |||
Banks | 10.5 | ||||
Capital Goods | 8.9 | ||||
Consumer Durables & Apparel | 2.5 | ||||
Energy | 9.0 | ||||
Food & Staples Retailing | 1.2 | ||||
Food, Beverage & Tobacco | 8.3 | ||||
Health Care Equipment & Services | 8.5 | ||||
Household & Personal Products | 4.6 | ||||
Insurance | 4.9 | ||||
Materials | 4.5 | ||||
Media | 2.3 | ||||
Mutual Funds | 2.3 | ||||
Pharmaceuticals, Biotechnology & Life Sciences | 6.1 | ||||
Retailing | 2.7 | ||||
Semiconductors & Semiconductor Equipment | 7.0 | ||||
Software & Services | 6.8 | ||||
Technology Hardware & Equipment | 2.6 | ||||
Telecommunication Services | 2.8 | ||||
Transportation | 1.8 | ||||
|
| ||||
Total Investments | 99.7 | ||||
Other Assets Less Liabilities | 0.3 | ||||
|
| ||||
Net Assets | 100.0 | % | |||
|
| ||||
See Notes to Financial Statements
14
Table of Contents
Harding, Loevner Funds, Inc.
International Equity Portfolio
Statement of Net Assets
October 31, 2012 (continued)
| Shares | Value | |||||||
Common Stocks - 94.3% | ||||||||
Australia - 3.1% | ||||||||
Cochlear Ltd. (Health Care Equipment & Services)† | 438,011 | $ | 32,322,842 | |||||
CSL Ltd. (Pharmaceuticals, Biotechnology & Life Sciences)† | 665,500 | 32,708,176 | ||||||
|
| |||||||
| 65,031,018 | ||||||||
|
| |||||||
Belgium - 2.1% | ||||||||
Anheuser-Busch InBev NV - Sponsored ADR (Food, Beverage & Tobacco) | 524,000 | 43,911,200 | ||||||
|
| |||||||
Brazil - 1.1% | ||||||||
Petroleo Brasileiro SA - ADR (Energy) | 1,077,458 | 22,852,884 | ||||||
|
| |||||||
Canada - 4.8% | ||||||||
Canadian National Railway Co. (Transportation) | 428,000 | 36,970,640 | ||||||
Imperial Oil Ltd. (Energy) | 726,190 | 31,879,741 | ||||||
Potash Corp. of Saskatchewan Inc. (Materials) | 742,700 | 29,982,799 | ||||||
|
| |||||||
| 98,833,180 | ||||||||
|
| |||||||
Finland - 1.6% | ||||||||
Nokian Renkaat oyj (Automobiles & Components)† | 796,400 | 33,122,463 | ||||||
|
| |||||||
France - 11.9% | ||||||||
Air Liquide SA (Materials)† | 531,170 | 62,704,687 | ||||||
Dassault Systemes SA (Software & Services)† | 671,300 | 70,746,781 | ||||||
L’Oreal SA (Household & Personal Products)† | 354,670 | 45,266,962 | ||||||
LVMH Moet Hennessy Louis Vuitton SA (Consumer Durables & Apparel)† | 151,480 | 24,622,414 | ||||||
Schneider Electric SA (Capital Goods)† | 692,800 | 43,405,014 | ||||||
|
| |||||||
| 246,745,858 | ||||||||
|
| |||||||
Germany - 9.7% | ||||||||
Allianz SE, Reg S (Insurance)† | 385,600 | 47,809,517 | ||||||
Fresenius SE & Co. KGaA (Health Care Equipment & Services)† | 518,868 | 59,182,462 | ||||||
Qiagen NV (Nasdaq Exchange) (Pharmaceuticals, Biotechnology & Life Sciences)* | 1,333,670 | 23,272,542 | ||||||
SAP AG - Sponsored ADR (Software & Services) | 972,460 | 70,892,334 | ||||||
|
| |||||||
| 201,156,855 | ||||||||
|
| |||||||
Hong Kong - 6.0% | ||||||||
AIA Group Ltd. (Insurance)† | 13,384,800 | 52,949,019 | ||||||
Li & Fung Ltd. (Retailing)† | 33,849,400 | 56,527,363 | ||||||
Xinyi Glass Holdings Ltd. (Automobiles & Components)† | 28,334,000 | 15,824,226 | ||||||
|
| |||||||
| 125,300,608 | ||||||||
|
| |||||||
India - 1.6% | ||||||||
ICICI Bank Ltd. - Sponsored ADR (Banks) | 832,200 | 32,663,850 | ||||||
|
| |||||||
Japan - 12.8% | ||||||||
FANUC Corp. (Capital Goods)† | 355,100 | 56,943,368 | ||||||
See Notes to Financial Statements
15
Table of Contents
Harding, Loevner Funds, Inc.
International Equity Portfolio
Statement of Net Assets
October 31, 2012 (continued)
| Shares | Value | |||||||
Japan - 12.8% - (continued) | ||||||||
Hoya Corp. (Technology Hardware & Equipment)† | 1,388,500 | $ | 28,125,664 | |||||
JGC Corp. (Capital Goods)† | 827,000 | 28,457,021 | ||||||
Keyence Corp. (Technology Hardware & Equipment)† | 100,181 | 26,545,187 | ||||||
M3 Inc. (Health Care Equipment & Services)† | 13,893 | 26,667,345 | ||||||
MISUMI Group Inc. (Capital Goods)† | 944,100 | 23,181,313 | ||||||
Sysmex Corp. (Health Care Equipment & Services)† | 556,900 | 26,160,234 | ||||||
Unicharm Corp. (Household & Personal Products)† | 935,400 | 50,626,747 | ||||||
|
| |||||||
| 266,706,879 | ||||||||
|
| |||||||
Mexico - 1.9% | ||||||||
America Movil SAB de CV, Series L - ADR (Telecommunication Services) | 1,529,200 | 38,673,468 | ||||||
|
| |||||||
Poland - 1.1% | ||||||||
Bank Pekao SA - GDR, Reg S (Banks)#† | 496,550 | 23,842,593 | ||||||
|
| |||||||
Russia - 0.7% | ||||||||
Gazprom OAO - Sponsored ADR (Energy)† | 1,530,440 | 14,042,852 | ||||||
|
| |||||||
Singapore - 0.9% | ||||||||
DBS Group Holdings Ltd. (Banks)† | 1,600,083 | 18,265,973 | ||||||
|
| |||||||
South Africa - 2.0% | ||||||||
MTN Group Ltd. (Telecommunication Services)† | 1,103,300 | 19,878,128 | ||||||
Sasol Ltd. (Energy)† | 497,041 | 21,187,178 | ||||||
|
| |||||||
| 41,065,306 | ||||||||
|
| |||||||
South Korea - 1.3% | ||||||||
Samsung Electronics Co., Ltd. - GDR, Reg S (Semiconductors & Semiconductor Equipment)† | 43,590 | 26,391,854 | ||||||
|
| |||||||
Sweden - 1.6% | ||||||||
Atlas Copco AB, Class A (Capital Goods)† | 1,368,900 | 33,738,926 | ||||||
|
| |||||||
Switzerland - 9.7% | ||||||||
Lonza Group AG, Reg S (Pharmaceuticals, Biotechnology & Life Sciences)† | 364,700 | 18,488,443 | ||||||
Nestle SA - Sponsored ADR, Reg S (Food, Beverage & Tobacco) | 1,162,450 | 73,629,583 | ||||||
Roche Holding AG, Genusschein (Pharmaceuticals, Biotechnology & Life Sciences)† | 266,150 | 51,242,167 | ||||||
Sonova Holding AG, Reg S (Health Care Equipment & Services)† | 317,800 | 31,979,705 | ||||||
Swatch Group AG, Bearer (Consumer Durables & Apparel)† | 64,000 | 26,563,353 | ||||||
|
| |||||||
| 201,903,251 | ||||||||
|
| |||||||
Taiwan - 1.3% | ||||||||
Taiwan Semiconductor Manufacturing Co., Ltd. (Semiconductors & Semiconductor Equipment)† | 8,829,125 | 26,806,733 | ||||||
|
| |||||||
Turkey - 2.2% | ||||||||
Turkiye Garanti Bankasi A/S - ADR (Banks) | 9,437,300 | 45,299,040 | ||||||
|
| |||||||
See Notes to Financial Statements
16
Table of Contents
Harding, Loevner Funds, Inc.
International Equity Portfolio
Statement of Net Assets
October 31, 2012 (continued)
| Shares | Value | |||||||
United Kingdom - 12.5% | ||||||||
ARM Holdings plc (Semiconductors & Semiconductor Equipment)† | 6,432,800 | $ | 69,261,616 | |||||
BG Group plc (Energy)† | 1,944,180 | 36,071,561 | ||||||
Standard Chartered plc (Banks)† | 2,402,810 | 56,998,822 | ||||||
TESCO plc (Food & Staples Retailing)† | 4,671,610 | 24,152,208 | ||||||
Unilever plc (Food, Beverage & Tobacco)† | 652,525 | 24,335,791 | ||||||
WPP plc (Media)† | 3,722,020 | 48,166,649 | ||||||
|
| |||||||
| 258,986,647 | ||||||||
|
| |||||||
United States - 4.4% | ||||||||
Bunge Ltd. (Food, Beverage & Tobacco) | 417,080 | 29,625,192 | ||||||
Schlumberger Ltd. (Energy) | 881,800 | 61,311,554 | ||||||
|
| |||||||
| 90,936,746 | ||||||||
|
| |||||||
Total Common Stocks (Cost $1,732,541,490) | 1,956,278,184 | |||||||
|
| |||||||
Preferred Stocks - 3.1% | ||||||||
Brazil - 1.9% | ||||||||
Itau Unibanco Holding SA - ADR (Banks) | 2,736,900 | 39,904,002 | ||||||
|
| |||||||
South Korea - 1.2% | ||||||||
Samsung Electronics Co., Ltd. - GDR, Reg S (Semiconductors & Semiconductor Equipment)† | 64,310 | 23,655,200 | ||||||
|
| |||||||
Total Preferred Stocks (Cost $64,569,574) | 63,559,202 | |||||||
|
| |||||||
Cash Equivalent - 2.3% | ||||||||
Northern Institutional Funds - | 48,113,793 | 48,113,793 | ||||||
|
| |||||||
Total Cash Equivalent (Cost $48,113,793) | 48,113,793 | |||||||
|
| |||||||
Total Investments — 99.7% (Cost $ 1,845,224,857) | $ | 2,067,951,179 | ||||||
|
| |||||||
Summary of Abbreviations
| ADR | American Depository Receipt |
| GDR | Global Depository Receipt |
| Reg S | Security sold outside United States without registration under the Securities Act of 1933. |
| # | Security valued at fair value as determined in good faith under policies and procedures established by and under the supervision of the Portfolio’s Board of Directors. |
| * | Non-income producing security. |
| † | Investment categorized as level 2 security as disclosed in Note 2 of the Notes to Financial Statements. |
See Notes to Financial Statements
17
Table of Contents
Harding, Loevner Funds, Inc.
International Equity Portfolio
Statement of Net Assets
October 31, 2012 (continued)
| Value | ||||
Other Assets, Net of Liabilities - 0.3% | ||||
Dividends and interest receivable | $ | 2,323,698 | ||
Foreign currency (cost $19,349) | 19,760 | |||
Receivable for Fund shares sold | 11,627,330 | |||
Tax reclaim receivable | 2,071,822 | |||
Payable to Investment Adviser | (1,275,493 | ) | ||
Payable for securities purchased | (6,161,641 | ) | ||
Payable for Fund shares redeemed | (1,365,264 | ) | ||
Payable for distribution fees | (353,364 | ) | ||
Other liabilities | (430,076 | ) | ||
|
| |||
| 6,456,772 | ||||
|
| |||
Net Assets - 100% | ||||
Institutional Class | ||||
Applicable to 118,742,142 outstanding $.001 par value shares (authorized 200,000,000 shares) | $ | 1,798,940,312 | ||
|
| |||
Net Asset Value, Offering Price and Redemption Price Per Share | $ | 15.15 | ||
|
| |||
Investor Class | ||||
Applicable to 18,253,071 outstanding $.001 par value shares (authorized 200,000,000 shares) | $ | 275,467,639 | ||
|
| |||
Net Asset Value, Offering Price and Redemption Price Per Share | $ | 15.09 | ||
|
| |||
Components of Net Assets as of October 31, 2012 were as follows: | ||||
Paid-in-capital | $ | 1,857,838,405 | ||
Accumulated undistributed net investment income | �� | 18,521,821 | ||
Accumulated net realized loss from investment transactions | (24,620,899 | ) | ||
Net unrealized appreciation on investments and on assets and liabilities denominated in foreign currencies | 222,668,624 | |||
|
| |||
| $ | 2,074,407,951 | |||
|
| |||
See Notes to Financial Statements
18
Table of Contents
Harding, Loevner Funds, Inc.
International Small Companies Portfolio (Institutional Class) — Overview
(unaudited)
October 31, 2012
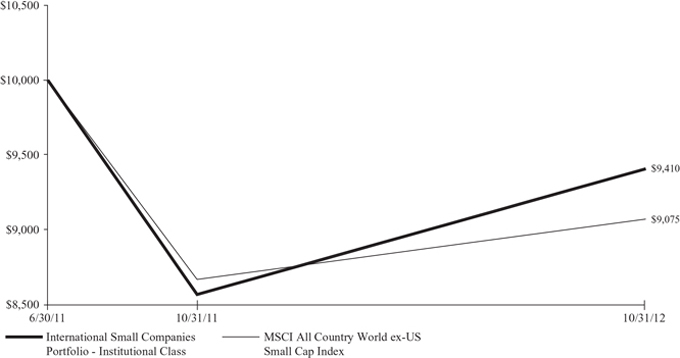
Hypothetical Comparison Of Changes In Value Of $10,000 Investment In Harding, Loevner Funds, Inc.-
International Small Companies Portfolio - Institutional Class And The MSCI All Country World ex-US Small Cap Index
(Net Dividends Reinvested)
| Returns for the Year Ended October 31, 2012 | ||||||
| Cumulative Total Returns | Average Annualized Total Return | |||||
| FUND NAME | Last 12 Months | Inception | Inception | |||
International Small Companies Portfolio— | 9.74% | -5.90% | -4.45% | |||
MSCI All Country World ex-US Small Cap Index | 4.63% | -9.25% | -7.00% | |||
Performance data quoted represents past performance and does not guarantee future results. The investment return and principal value of an investment will fluctuate so that an investor’s shares, when redeemed, may be worth more or less than their original cost. Performance current to the most recent month end may be lower or higher than the performance quoted and may be obtained by visiting the website at www.hardingloevnerfunds.com.
Investment return reflects voluntary fee waivers in effect. Absent such waivers, total return would be reduced. The performance provided does not reflect the deduction of taxes that a shareholder would pay on Portfolio distributions.
19
Table of Contents
Harding, Loevner Funds, Inc.
International Small Companies Portfolio (Investor Class) — Overview
(unaudited)
October 31, 2012
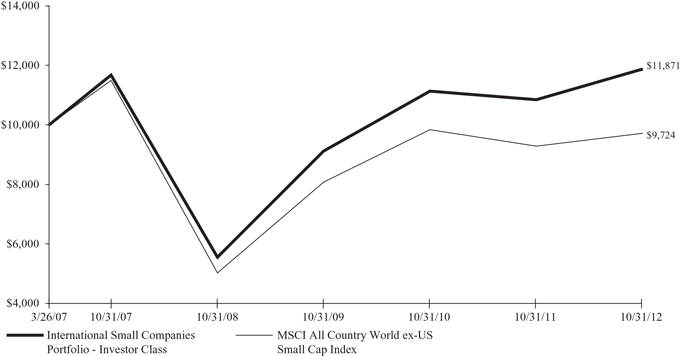
Hypothetical Comparison Of Changes In Value Of $10,000 Investment In Harding, Loevner Funds, Inc.-
International Small Companies Portfolio - Investor Class And The MSCI All Country World ex-US Small Cap Index
(Net Dividends Reinvested)
| Returns for the Year Ended October 31, 2012 | ||||||||||
| Cumulative Total Returns | Average Annualized Total Return | |||||||||
| FUND NAME | Last 12 Months | 5 YR | Inception | 5 YR | Inception | |||||
International Small Companies Portfolio— | 9.51% | 1.72% | 18.71% | 0.34% | 3.11% | |||||
MSCI All Country World ex-US Small Cap Index | 4.63% | -15.39% | -2.76% | -3.29% | -0.50% | |||||
Performance data quoted represents past performance and does not guarantee future results. The investment return and principal value of an investment will fluctuate so that an investor’s shares, when redeemed, may be worth more or less than their original cost. Performance current to the most recent month end may be lower or higher than the performance quoted and may be obtained by visiting the website at www.hardingloevnerfunds.com.
Investment return reflects voluntary fee waivers in effect. Absent such waivers, total return would be reduced. The performance provided does not reflect the deduction of taxes that a shareholder would pay on Portfolio distributions.
20
Table of Contents
Harding, Loevner Funds, Inc.
International Small Companies Portfolio - Overview
(unaudited)
October 31, 2012
The International Small Companies Portfolio (the “Portfolio”) Investor Class gained 9.51% and the Institutional Class gained 9.74% (after all fees and expenses) for the fiscal year ended October 31, 2012. In comparison, the Portfolio’s benchmark, the MSCI All Country World ex-US Small Cap Index (the “Index”) rose 4.63%, net of source taxes.
Consistent with its investment objectives and policies, the Portfolio was invested in the securities of non-US smaller capitalization companies that exhibit the fundamental characteristics of durable growth, financial strength, management quality, and sustainable competitive advantage.
The Portfolio outperformed the Index in the fiscal year. The Portfolio enjoyed positive relative performance in five of the nine economic sectors in which we were invested, led by Consumer Staples and Industrials. In Consumer Staples, Singapore-based packaged food maker Super Group benefited from growth in sales of its branded consumer goods in Thailand and the Philippines. In Industrials, specialty payments processor PayPoint outperformed on positive March fiscal-year results. The company reported strong transaction volumes with growth in all of its channels. Financials detracted most from performance due to both weak stock selection (Bank Bukopin in Indonesia) and the Portfolio’s underweight in this outperforming sector.
By region, Emerging Markets and Pacific ex-Japan were the largest contributors. Indonesian engineering group Wijaya Karya outperformed as the pace of infrastructure development in Indonesia remained strong. Super Group boosted performance in Singapore. Meanwhile, Europe ex-EMU detracted most from performance, with Swedish automobile parts supplier Mekonomen hurt by weak demand in the European automobile market.
Past performance does not guarantee future results.
Fund holdings and sector allocations are subject to change and are not recommendations to buy or sell any security. Please see the Statement of Net Assets for a complete list of fund holdings.
The Portfolio invests in foreign securities, which will involve greater volatility and political, economic, and currency risks. It also invests in emerging markets, which involve unique risks, such as exposure to economies less diverse and mature than the U.S. or other more established foreign markets. Economic and political instability may cause larger price changes in emerging markets securities than other foreign securities. The Portfolio invests in smaller companies which involve additional risks such as limited liquidity and greater volatility.
The MSCI All Country World ex-US Small Cap Index is a free-float market capitalization index that is designed to measure small cap developed and emerging market equity performance. The Index consists of 44 developed and emerging markets countries, targeting companies’ market capitalization range of USD 170-4,200 million in terms of the company’s full market capitalization. The Index is net of foreign withholding taxes on dividends. You cannot invest directly in this Index.
21
Table of Contents
Harding, Loevner Funds, Inc.
International Small Companies Portfolio
Statement of Net Assets
October 31, 2012
| Industry | Percentage of Net Assets | ||||
Banks | 5.6 | % | |||
Capital Goods | 17.0 | ||||
Commercial & Professional Services | 6.7 | ||||
Consumer Durables & Apparel | 1.7 | ||||
Diversified Financials | 2.6 | ||||
Food & Staples Retailing | 2.1 | ||||
Food, Beverage & Tobacco | 11.3 | ||||
Health Care Equipment & Services | 9.9 | ||||
Household & Personal Products | 3.3 | ||||
Insurance | 1.5 | ||||
Materials | 5.6 | ||||
Media | 3.2 | ||||
Mutual Funds | 3.5 | ||||
Pharmaceuticals, Biotechnology & Life Sciences | 5.2 | ||||
Retailing | 1.3 | ||||
Semiconductors & Semiconductor Equipment | 1.0 | ||||
Software & Services | 3.5 | ||||
Technology Hardware & Equipment | 6.8 | ||||
Telecommunication Services | 3.9 | ||||
Transportation | 2.6 | ||||
Utilities | 1.5 | ||||
|
| ||||
Total Investments | 99.8 | ||||
Other Assets Less Liabilities | 0.2 | ||||
|
| ||||
Net Assets | 100.0 | % | |||
|
| ||||
See Notes to Financial Statements
22
Table of Contents
Harding, Loevner Funds, Inc.
International Small Companies Portfolio
Statement of Net Assets
October 31, 2012 (continued)
| Shares | Value | |||||||
Common Stocks - 94.8% | ||||||||
Australia - 7.2% | ||||||||
Bank of Queensland Ltd. (Banks)† | 122,489 | $ | 960,682 | |||||
Bradken Ltd. (Capital Goods)† | 108,200 | 553,055 | ||||||
Imdex Ltd. (Materials)† | 641,333 | 887,900 | ||||||
SAI Global Ltd. (Commercial & Professional Services)† | 193,897 | 815,847 | ||||||
TPG Telecom Ltd. (Telecommunication Services)† | 587,100 | 1,452,253 | ||||||
|
| |||||||
| 4,669,737 | ||||||||
|
| |||||||
Austria - 1.5% | ||||||||
BWT AG (Commercial & Professional Services)† | 17,386 | 358,417 | ||||||
Semperit AG Holding (Capital Goods)† | 14,330 | 603,692 | ||||||
|
| |||||||
| 962,109 | ||||||||
|
| |||||||
Brazil - 1.1% | ||||||||
Fleury SA (Health Care Equipment & Services) | 58,200 | 684,571 | ||||||
|
| |||||||
Canada - 1.5% | ||||||||
Laurentian Bank of Canada (Banks) | 22,100 | 983,552 | ||||||
|
| |||||||
China - 4.2% | ||||||||
Dalian Refrigeration Co., Ltd., Class B (Capital Goods)† | 644,836 | 362,529 | ||||||
Vinda International Holdings Ltd. (Household & Personal Products)† | 694,000 | 965,658 | ||||||
Wasion Group Holdings Ltd. (Technology Hardware & Equipment)† | 1,366,000 | 500,544 | ||||||
Yip’s Chemical Holdings Ltd. (Materials)† | 1,294,000 | 872,081 | ||||||
|
| |||||||
| 2,700,812 | ||||||||
|
| |||||||
Denmark - 0.6% | ||||||||
NKT Holding A/S (Capital Goods)† | 11,350 | 379,910 | ||||||
|
| |||||||
Finland - 1.5% | ||||||||
Vacon plc (Capital Goods)† | 12,177 | 623,444 | ||||||
Vaisala oyj, Class A (Technology Hardware & Equipment)† | 18,233 | 378,133 | ||||||
|
| |||||||
| 1,001,577 | ||||||||
|
| |||||||
France - 5.7% | ||||||||
Ingenico (Technology Hardware & Equipment)† | 18,000 | 952,935 | ||||||
Rubis SCA (Utilities)† | 15,782 | 963,348 | ||||||
Touax SA (Transportation)† | 24,300 | 787,415 | ||||||
Virbac SA (Pharmaceuticals, Biotechnology & Life Sciences)† | 5,760 | 1,004,163 | ||||||
|
| |||||||
| 3,707,861 | ||||||||
|
| |||||||
Germany - 8.0% | ||||||||
Carl Zeiss Meditec AG - Bearer (Health Care Equipment & Services)† | 40,970 | 1,123,665 | ||||||
Drillisch AG (Telecommunication Services)† | 85,321 | 1,050,573 | ||||||
Gerresheimer AG (Pharmaceuticals, Biotechnology & Life Sciences)† | 15,620 | 775,009 | ||||||
KWS Saat AG (Food, Beverage & Tobacco)† | 5,145 | 1,477,298 | ||||||
See Notes to Financial Statements
23
Table of Contents
Harding, Loevner Funds, Inc.
International Small Companies Portfolio
Statement of Net Assets
October 31, 2012 (continued)
| Shares | Value | |||||||
Germany - 8.0% - (continued) | ||||||||
Pfeiffer Vacuum Technology AG (Capital Goods)† | 7,690 | $ | 784,888 | |||||
|
| |||||||
| 5,211,433 | ||||||||
|
| |||||||
Hong Kong - 3.8% | ||||||||
Chong Hing Bank Ltd. (Banks)† | 368,000 | 668,121 | ||||||
Pico Far East Holdings Ltd. (Media)† | 3,000,000 | 734,475 | ||||||
Vitasoy International Holdings Ltd. (Food, Beverage & Tobacco)† | 1,122,000 | 1,064,598 | ||||||
|
| |||||||
| 2,467,194 | ||||||||
|
| |||||||
Indonesia - 3.4% | ||||||||
Bank Bukopin Tbk PT (Banks)† | 15,705,166 | 1,046,349 | ||||||
Wijaya Karya Persero Tbk PT (Capital Goods)† | 8,000,000 | 1,140,940 | ||||||
|
| |||||||
| 2,187,289 | ||||||||
|
| |||||||
Ireland - 2.7% | ||||||||
FBD Holdings plc (Insurance)#† | 78,566 | 982,700 | ||||||
Grafton Group plc (Capital Goods)† | 168,000 | 748,270 | ||||||
|
| |||||||
| 1,730,970 | ||||||||
|
| |||||||
Italy - 1.9% | ||||||||
Cembre S.p.A. (Capital Goods)† | 68,617 | 546,524 | ||||||
MARR S.p.A. (Food & Staples Retailing)† | 72,063 | 679,239 | ||||||
|
| |||||||
| 1,225,763 | ||||||||
|
| |||||||
Japan - 11.5% | ||||||||
Asahi Diamond Industrial Co., Ltd. (Capital Goods)† | 42,900 | 378,771 | ||||||
BML Inc. (Health Care Equipment & Services)† | 21,600 | 543,315 | ||||||
C. Uyemura & Co., Ltd. (Materials)† | 11,600 | 382,033 | ||||||
GMO internet Inc. (Software & Services)† | 172,000 | 1,202,847 | ||||||
Lintec Corp. (Materials)† | 35,200 | 608,407 | ||||||
Message Co., Ltd. (Health Care Equipment & Services)† | 240 | 740,700 | ||||||
Nakanishi Inc. (Health Care Equipment & Services)† | 7,400 | 806,502 | ||||||
Pigeon Corp. (Household & Personal Products)† | 25,800 | 1,188,774 | ||||||
Rohto Pharmaceutical Co., Ltd. (Pharmaceuticals, Biotechnology & Life Sciences)† | 75,000 | 1,032,992 | ||||||
Tsumura & Co. (Pharmaceuticals, Biotechnology & Life Sciences)† | 18,400 | 586,962 | ||||||
|
| |||||||
| 7,471,303 | ||||||||
|
| |||||||
Malaysia - 3.7% | ||||||||
Coastal Contracts Bhd. (Capital Goods)† | 1,457,666 | 912,707 | ||||||
Supermax Corp. Bhd. (Health Care Equipment & Services)† | 1,007,000 | 667,265 | ||||||
United Plantations Bhd. (Food, Beverage & Tobacco)† | 95,200 | 786,072 | ||||||
|
| |||||||
| 2,366,044 | ||||||||
|
| |||||||
Netherlands - 2.5% | ||||||||
Brunel International NV (Commercial & Professional Services)† | 21,527 | 1,037,664 | ||||||
See Notes to Financial Statements
24
Table of Contents
Harding, Loevner Funds, Inc.
International Small Companies Portfolio
Statement of Net Assets
October 31, 2012 (continued)
| Shares | Value | |||||||
Netherlands - 2.5% - (continued) | ||||||||
KAS Bank NV - CVA (Diversified Financials)† | 59,438 | $ | 597,061 | |||||
|
| |||||||
| 1,634,725 | ||||||||
|
| |||||||
New Zealand - 0.8% | ||||||||
Sanford Ltd. (Food, Beverage & Tobacco)† | 143,153 | 512,093 | ||||||
|
| |||||||
Singapore - 5.7% | ||||||||
Goodpack Ltd. (Transportation)† | 574,000 | 911,584 | ||||||
Super Group Ltd. (Food, Beverage & Tobacco)† | 827,000 | 1,652,254 | ||||||
Tat Hong Holdings Ltd. (Capital Goods)† | 1,020,000 | 1,100,486 | ||||||
|
| |||||||
| 3,664,324 | ||||||||
|
| |||||||
South Korea - 4.0% | ||||||||
Cheil Worldwide Inc. (Media)† | 68,940 | 1,331,371 | ||||||
Han Kuk Carbon Co., Ltd. (Materials)† | 130,300 | 846,115 | ||||||
Samwha Capacitor Co., Ltd. (Technology Hardware & Equipment)† | 72,200 | 386,092 | ||||||
|
| |||||||
| 2,563,578 | ||||||||
|
| |||||||
Spain - 1.3% | ||||||||
Construcciones y Auxiliar de Ferrocarriles SA (Capital Goods)† | 1,722 | 819,145 | ||||||
|
| |||||||
Sweden - 3.7% | ||||||||
Industrial & Financial Systems, Class B (Software & Services)† | 67,636 | 1,043,610 | ||||||
Kabe Husvagnar AB, Class B (Consumer Durables & Apparel)† | 33,900 | 485,911 | ||||||
Mekonomen AB (Retailing)† | 30,300 | 848,320 | ||||||
|
| |||||||
| 2,377,841 | ||||||||
|
| |||||||
Switzerland - 2.5% | ||||||||
Huber & Suhner AG, Reg S (Capital Goods)† | 13,200 | 588,499 | ||||||
Huegli Holding AG - Bearer (Food, Beverage & Tobacco)† | 510 | 286,414 | ||||||
LEM Holding SA, Reg S (Technology Hardware & Equipment)† | 1,536 | 772,666 | ||||||
|
| |||||||
| 1,647,579 | ||||||||
|
| |||||||
Taiwan - 3.2% | ||||||||
Nak Sealing Technologies Corp. (Capital Goods)† | 535,000 | 863,249 | ||||||
Taiwan Paiho Ltd. (Consumer Durables & Apparel)† | 1,078,088 | 587,883 | ||||||
Youngtek Electronics Corp. (Semiconductors & Semiconductor Equipment)† | 313,973 | 643,929 | ||||||
|
| |||||||
| 2,095,061 | ||||||||
|
| |||||||
Thailand - 1.1% | ||||||||
Khon Kaen Sugar Industry pcl (Food, Beverage & Tobacco)† | 1,650,100 | 726,750 | ||||||
|
| |||||||
United Kingdom - 11.7% | ||||||||
Britvic plc (Food, Beverage & Tobacco)† | 142,500 | 827,751 | ||||||
Domino Printing Sciences plc (Technology Hardware & Equipment)† | 81,100 | 710,256 | ||||||
Gooch & Housego plc (Technology Hardware & Equipment)† | 106,600 | 736,430 | ||||||
See Notes to Financial Statements
25
Table of Contents
Harding, Loevner Funds, Inc.
International Small Companies Portfolio
Statement of Net Assets
October 31, 2012 (continued)
| Shares | Value | |||||||
United Kingdom - 11.7% - (continued) | ||||||||
Greggs plc (Food & Staples Retailing)† | 89,000 | $ | 673,884 | |||||
Morgan Crucible Co., plc (Capital Goods)† | 137,200 | 559,723 | ||||||
PayPoint plc (Commercial & Professional Services)† | 106,205 | 1,319,708 | ||||||
Rathbone Brothers plc (Diversified Financials)† | 51,830 | 1,083,956 | ||||||
RPS Group plc (Commercial & Professional Services)† | 215,860 | 815,640 | ||||||
Synergy Health plc (Health Care Equipment & Services)† | 56,013 | 840,360 | ||||||
|
| |||||||
| 7,567,708 | ||||||||
|
| |||||||
Total Common Stocks (Cost $58,259,645) | 61,358,929 | |||||||
|
| |||||||
Preferred Stocks - 1.5% | ||||||||
Germany - 1.5% | ||||||||
Draegerwerk AG & Co. KGaA (Health Care Equipment & Services)† | 10,117 | 989,914 | ||||||
|
| |||||||
Total Preferred Stocks (Cost $874,451) | 989,914 | |||||||
|
| |||||||
Warrants - 0.0% | ||||||||
Malaysia - 0.0% | ||||||||
Coastal Contracts Bhd., Expires 7/18/16 (Capital Goods)* | 115,333 | 12,494 | ||||||
|
| |||||||
Total Warrants (Cost $ — ) | 12,494 | |||||||
|
| |||||||
Cash Equivalent - 3.5% | ||||||||
Northern Institutional Funds - | 2,273,859 | 2,273,859 | ||||||
|
| |||||||
Total Cash Equivalent (Cost $2,273,859) | 2,273,859 | |||||||
|
| |||||||
Total Investments — 99.8% (Cost $ 61,407,955) | $ | 64,635,196 | ||||||
|
| |||||||
Summary of Abbreviations
Reg S Security sold outside United States without registration under the Securities Act of 1933.
| # | Security valued at fair value as determined in good faith under policies and procedures established by and under the supervision of the Portfolio’s Board of Directors. |
| * | Non-income producing security. |
| † | Investment categorized as level 2 security as disclosed in Note 2 of the Notes to Financial Statements. |
See Notes to Financial Statements
26
Table of Contents
Harding, Loevner Funds, Inc.
International Small Companies Portfolio
Statement of Net Assets
October 31, 2012 (continued)
| Value | ||||
Other Assets, Net of Liabilities - 0.2% | ||||
Dividends and interest receivable | $ | 63,730 | ||
Foreign currency (cost $6,791) | 6,891 | |||
Receivable for Fund shares sold | 154,785 | |||
Tax reclaim receivable | 69,238 | |||
Prepaid expenses | 8,957 | |||
Payable to Investment Adviser | (68,889 | ) | ||
Payable for Fund shares redeemed | (43,116 | ) | ||
Payable for distribution fees | (4,498 | ) | ||
Payable for capital gains tax | (3,667 | ) | ||
Other liabilities | (54,313 | ) | ||
|
| |||
| 129,118 | ||||
|
| |||
Net Assets - 100% | ||||
Institutional Class | ||||
Applicable to 2,927,496 outstanding $.001 par value shares (authorized 200,000,000 shares) | $ | 33,515,012 | ||
|
| |||
Net Asset Value, Offering Price and Redemption Price Per Share | $ | 11.45 | ||
|
| |||
Investor Class | ||||
Applicable to 2,734,349 outstanding $.001 par value shares (authorized 200,000,000 shares) | $ | 31,249,302 | ||
|
| |||
Net Asset Value, Offering Price and Redemption Price Per Share | $ | 11.43 | ||
|
| |||
Components of Net Assets as of October 31, 2012 were as follows: | ||||
Paid-in capital | $ | 61,727,707 | ||
Accumulated undistributed net investment income | 665,965 | |||
Accumulated net realized loss from investment transactions | (855,108 | ) | ||
Net unrealized appreciation on investments and on assets and liabilities denominated in foreign currencies | 3,225,750 | |||
|
| |||
| $ | 64,764,314 | |||
|
| |||
See Notes to Financial Statements
27
Table of Contents
Harding, Loevner Funds, Inc.
Institutional Emerging Markets Portfolio — Overview
(unaudited)
October 31, 2012
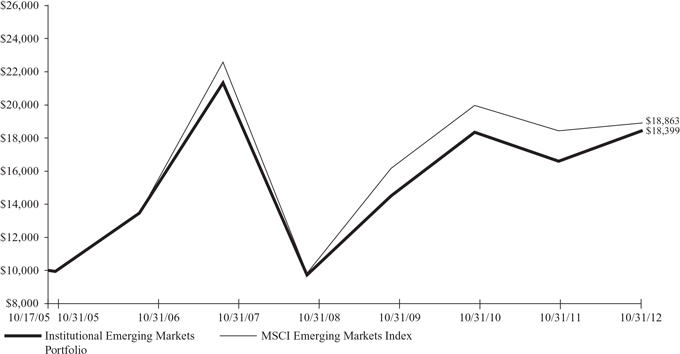
Hypothetical Comparison Of Changes In Value Of $10,000 Investment In Harding, Loevner Funds, Inc. -
Institutional Emerging Markets Portfolio And The MSCI Emerging Markets Index
(Net Dividends Reinvested)
| Returns for the Year Ended October 31, 2012 | ||||||||||
| Cumulative Total Returns | Average Annualized Total Return | |||||||||
| FUND NAME | Last 12 Months | 5 YR | Inception | 5 YR | Inception | |||||
Institutional Emerging Markets Portfolio— | 11.17% | -13.74% | 84.00% | -2.85% | 9.05% | |||||
MSCI Emerging Markets Index (Net dividend) | 2.63% | -16.20% | 88.63% | -3.47% | 9.43% | |||||
Performance data quoted represents past performance and does not guarantee future results. The investment return and principal value of an investment will fluctuate so that an investor’s shares, when redeemed, may be worth more or less than their original cost. Performance current to the most recent month end may be lower or higher than the performance quoted and may be obtained by visiting the website at www.hardingloevnerfunds.com.
Investment return reflects voluntary fee waivers in effect. Absent such waivers, total return would be reduced. The performance provided does not reflect the deduction of taxes that a shareholder would pay on Portfolio distributions.
28
Table of Contents
Harding, Loevner Funds, Inc.
Institutional Emerging Markets Portfolio - Overview
(unaudited)
October 31, 2012
The Institutional Emerging Markets Portfolio (the “Portfolio”) rose 11.17%, after all fees and expenses, for the fiscal year ended October 31, 2012. In comparison, the Portfolio’s benchmark, the MSCI Emerging Markets Index (the “Index”), rose 2.63%, net of source taxes.
Consistent with its investment objectives and policies, the Portfolio was invested in the securities of emerging markets companies that exhibit the fundamental characteristics of durable growth, financial strength, management quality, and sustainable competitive advantage.
The Portfolio performed well over the last 12 months, outpacing the Index by nearly nine percentage points. Our investments in Materials and Consumer Discretionary contributed most to performance, with the impact of the former split evenly between positive stock selection and a favorable underweight position, and the latter almost entirely due to good stock selection. In Materials, cement maker Semen Gresik outperformed as double-digit growth in Indonesia led to rising revenues for the company. In Consumer Discretionary, white goods manufacturer Arcelik of Turkey has been generating better-than-expected revenues.
Telecom Services detracted most from performance due to poor returns from Latin American cellular provider Millicom International. Stock selection was also weak in Consumer Staples, as Chinese supermarket operator Wumart reported slower-than-anticipated growth due to difficulties integrating the back office and procurement functions of its recently acquired Tianjin business with its core Beijing office.
By region, Latin America and Asia contributed most to performance. Good stock selection in Latin America included Brazilian beverage company Ambev as well as cosmetics manufacturer Natura Cosméticos. Within Asia, relative returns were especially strong in India due to good returns from Ambuja Cements and HDFC Bank. Nigeria’s Zenith Bank contributed markedly to the year’s outperformance as well.
The largest detractor in this period was Africa due to the Portfolio’s relatively light weighting in this region and weak stock selection. South African miner Impala Platinum and Egyptian contractor and cement manufacturer Orascom Construction both underperformed.
Past performance does not guarantee future results.
Fund holdings and sector allocations are subject to change and are not recommendations to buy or sell any security. Please see the Statement of Net Assets for a complete list of fund holdings.
The Portfolio invests in foreign securities, which will involve greater volatility and political, economic, and currency risks and differences in accounting methods. It also invests in emerging markets, which involve unique risks, such as exposure to economies less diverse and mature than the U.S. or other more established foreign markets. Economic and political instability may cause larger price changes in emerging markets securities than other foreign securities. Investments in debt securities typically decrease in value when interest rates rise. This risk is usually greater for longer-term debt securities. Investment by the Portfolio in lower-rated and non-rated securities presents a greater risk of loss to principal and interest than higher-rated securities.
The MSCI Emerging Markets Index is a free float-adjusted market capitalization index that is designed to measure equity market performance in the global emerging markets. The Index consists of 21 emerging market countries. The Index is net of foreign withholding taxes on dividends. You cannot invest directly in this Index.
29
Table of Contents
Harding, Loevner Funds, Inc.
Institutional Emerging Markets Portfolio
Statement of Net Assets
October 31, 2012
| Industry | Percentage of Net Assets | ||||
Automobiles & Components | 4.2 | % | |||
Banks | 19.5 | ||||
Capital Goods | 3.2 | ||||
Commercial & Professional Services | 1.5 | ||||
Consumer Durables & Apparel | 2.6 | ||||
Diversified Financials | 1.6 | ||||
Energy | 10.8 | ||||
Food & Staples Retailing | 0.5 | ||||
Food, Beverage & Tobacco | 7.1 | ||||
Health Care Equipment & Services | 1.6 | ||||
Household & Personal Products | 3.6 | ||||
Insurance | 2.8 | ||||
Materials | 8.1 | ||||
Mutual Funds | 2.6 | ||||
Pharmaceuticals, Biotechnology & Life Sciences | 3.2 | ||||
Semiconductors & Semiconductor Equipment | 10.0 | ||||
Software & Services | 3.5 | ||||
Technology Hardware & Equipment | 3.5 | ||||
Telecommunication Services | 4.8 | ||||
Transportation | 5.1 | ||||
|
| ||||
Total Investments | 99.8 | ||||
Other Assets Less Liabilities | 0.2 | ||||
|
| ||||
Net Assets | 100.0 | % | |||
|
| ||||
See Notes to Financial Statements
30
Table of Contents
Harding, Loevner Funds, Inc.
Institutional Emerging Markets Portfolio
Statement of Net Assets
October 31, 2012 (continued)
| Shares | Value | |||||||
Common Stocks - 83.9% | ||||||||
Brazil - 5.6% | ||||||||
Banco Bradesco SA - ADR (Banks) | 427,678 | $ | 6,697,437 | |||||
BM&FBovespa SA (Diversified Financials) | 1,124,600 | 7,198,149 | ||||||
Natura Cosmeticos SA (Household & Personal Products) | 114,300 | 3,047,362 | ||||||
Odontoprev SA (Health Care Equipment & Services) | 391,000 | 2,021,368 | ||||||
Petroleo Brasileiro SA - ADR (Energy) | 147,246 | 3,123,088 | ||||||
Vale SA - Sponsored ADR (Materials) | 220,000 | 4,030,400 | ||||||
|
| |||||||
| 26,117,804 | ||||||||
|
| |||||||
Chile - 2.3% | ||||||||
Banco Santander Chile - ADR (Banks) | 167,216 | 4,546,611 | ||||||
Sociedad Quimica y Minera de Chile SA - Sponsored ADR (Materials) | 106,500 | 6,161,025 | ||||||
|
| |||||||
| 10,707,636 | ||||||||
|
| |||||||
China - 12.5% | ||||||||
51job Inc. - ADR (Commercial & Professional Services)* | 49,500 | 2,327,985 | ||||||
Anhui Conch Cement Co., Ltd., Class H (Materials)† | 798,000 | 2,755,708 | ||||||
Baidu Inc. - Sponsored ADR (Software & Services)* | 61,300 | 6,535,806 | ||||||
China Merchants Holdings International Co., Ltd. (Transportation)† | 2,499,515 | 8,275,626 | ||||||
China Mobile Ltd. - Sponsored ADR (Telecommunication Services) | 120,600 | 6,680,034 | ||||||
CNOOC Ltd. - ADR (Energy) | 36,600 | 7,523,130 | ||||||
Hengan International Group Co., Ltd. (Household & Personal Products)† | 460,000 | 4,177,134 | ||||||
Jiangsu Expressway Co., Ltd., Class H (Transportation)† | 2,370,000 | 2,041,410 | ||||||
Shandong Weigao Group Medical Polymer Co., Ltd., Class H (Health Care Equipment & Services)† | 4,107,000 | 5,541,822 | ||||||
Tencent Holdings Ltd. (Software & Services)† | 271,100 | 9,573,750 | ||||||
Wumart Stores Inc., Class H (Food & Staples Retailing)† | 1,431,000 | 2,536,799 | ||||||
|
| |||||||
| 57,969,204 | ||||||||
|
| |||||||
Colombia - 2.4% | ||||||||
Bancolombia SA - Sponsored ADR (Banks) | 36,320 | 2,325,207 | ||||||
Cementos Argos SA - Sponsored ADR (Materials)#† | 61,390 | 1,467,921 | ||||||
Ecopetrol SA - Sponsored ADR (Energy) | 127,000 | 7,519,670 | ||||||
|
| |||||||
| 11,312,798 | ||||||||
|
| |||||||
Czech Republic - 1.1% | ||||||||
Komercni Banka A/S (Banks)† | 25,300 | 5,162,949 | ||||||
|
| |||||||
Egypt - 0.8% | ||||||||
Orascom Construction Industries - GDR (Capital Goods)*† | 87,670 | 3,590,587 | ||||||
|
| |||||||
Hong Kong - 2.8% | ||||||||
AIA Group Ltd. (Insurance)† | 1,910,000 | 7,555,782 | ||||||
ASM Pacific Technology Ltd. (Semiconductors & Semiconductor Equipment)† | 503,400 | 5,608,517 | ||||||
|
| |||||||
| 13,164,299 | ||||||||
|
| |||||||
See Notes to Financial Statements
31
Table of Contents
Harding, Loevner Funds, Inc.
Institutional Emerging Markets Portfolio
Statement of Net Assets
October 31, 2012 (continued)
| Shares | Value | |||||||
Hungary - 0.6% | ||||||||
Richter Gedeon Nyrt. (Pharmaceuticals, Biotechnology & Life Sciences)† | 14,000 | $ | 2,608,961 | |||||
|
| |||||||
India - 7.0% | ||||||||
Ambuja Cements Ltd. (Materials)† | 2,141,100 | 8,039,345 | ||||||
Axis Bank Ltd. (Banks)† | 274,600 | 5,995,621 | ||||||
Bajaj Auto Ltd. (Automobiles & Components)† | 118,500 | 3,987,699 | ||||||
Dabur India Ltd. (Household & Personal Products)† | 1,767,000 | 4,081,255 | ||||||
HDFC Bank Ltd. - ADR (Banks) | 132,800 | 4,965,392 | ||||||
Maruti Suzuki India Ltd. (Automobiles & Components)† | 207,000 | 5,507,347 | ||||||
|
| |||||||
| 32,576,659 | ||||||||
|
| |||||||
Indonesia - 5.0% | ||||||||
Astra International Tbk PT (Automobiles & Components)† | 8,088,000 | 6,777,888 | ||||||
Bank Rakyat Indonesia Persero Tbk PT (Banks)† | 8,778,000 | 6,762,134 | ||||||
Semen Gresik Persero Tbk PT (Materials)† | 4,403,100 | 6,797,438 | ||||||
United Tractors Tbk PT (Capital Goods)† | 1,214,500 | 2,647,809 | ||||||
|
| |||||||
| 22,985,269 | ||||||||
|
| |||||||
Italy - 1.2% | ||||||||
Tenaris SA - ADR (Energy) | 144,700 | 5,443,614 | ||||||
|
| |||||||
Malaysia - 1.1% | ||||||||
Axiata Group Bhd. (Telecommunication Services)† | 2,372,700 | 5,080,006 | ||||||
|
| |||||||
Mexico - 7.8% | ||||||||
America Movil SAB de CV, Series L - ADR (Telecommunication Services) | 417,654 | 10,562,470 | ||||||
Coca-Cola Femsa SAB de CV - Sponsored ADR (Food, Beverage & Tobacco) | 48,400 | 6,190,844 | ||||||
Fomento Economico Mexicano SAB de CV - Sponsored ADR (Food, Beverage & Tobacco) | 80,000 | 7,248,800 | ||||||
Grupo Aeroportuario del Sureste SAB de CV - ADR (Transportation) | 52,205 | 5,041,437 | ||||||
Grupo Financiero Banorte SAB de CV, Class O (Banks) | 1,315,880 | 7,310,444 | ||||||
|
| |||||||
| 36,353,995 | ||||||||
|
| |||||||
Nigeria - 1.6% | ||||||||
Zenith Bank plc (Banks) | 63,596,683 | 7,296,652 | ||||||
|
| |||||||
Panama - 1.7% | ||||||||
Copa Holdings SA, Class A (Transportation) | 85,000 | 7,889,700 | ||||||
|
| |||||||
Peru - 1.2% | ||||||||
Credicorp Ltd. (Banks) | 44,300 | 5,729,762 | ||||||
|
| |||||||
Poland - 1.4% | ||||||||
Bank Pekao SA (Banks)#† | 77,854 | 3,745,150 | ||||||
Kernel Holding SA (Food, Beverage & Tobacco)*† | 137,032 | 2,867,983 | ||||||
|
| |||||||
| 6,613,133 | ||||||||
|
| |||||||
See Notes to Financial Statements
32
Table of Contents
Harding, Loevner Funds, Inc.
Institutional Emerging Markets Portfolio
Statement of Net Assets
October 31, 2012 (continued)
| Shares | Value | |||||||
Russia - 4.2% | ||||||||
Gazprom OAO - Sponsored ADR (Energy)† | 205,000 | $ | 1,881,018 | |||||
Lukoil OAO - Sponsored ADR (Energy) | 143,900 | 8,662,780 | ||||||
Sberbank of Russia (Banks)#† | 624,100 | 1,826,990 | ||||||
Sberbank of Russia - Sponsored ADR (Banks)#† | 608,000 | 7,182,413 | ||||||
|
| |||||||
| 19,553,201 | ||||||||
|
| |||||||
South Africa - 2.5% | ||||||||
Aspen Pharmacare Holdings Ltd. (Pharmaceuticals, Biotechnology & Life Sciences)† | 303,900 | 5,536,308 | ||||||
Impala Platinum Holdings Ltd. (Materials)† | 156,200 | 2,807,125 | ||||||
Standard Bank Group Ltd. (Banks)† | 261,032 | 3,227,165 | ||||||
|
| |||||||
| 11,570,598 | ||||||||
|
| |||||||
South Korea - 4.4% | ||||||||
Amorepacific Corp. (Household & Personal Products)† | 4,680 | 5,318,335 | ||||||
Hankook Tire Co., Ltd. (Automobiles & Components)*† | 74,232 | 3,131,003 | ||||||
Hankook Tire Worldwide Co., Ltd. (Diversified Financials)† | 16,967 | 218,931 | ||||||
Samsung Electronics Co., Ltd. - GDR, Reg S (Semiconductors & Semiconductor Equipment)† | 9,880 | 5,981,912 | ||||||
Samsung Fire & Marine Insurance Co., Ltd. (Insurance)† | 25,960 | 5,671,357 | ||||||
|
| |||||||
| 20,321,538 | ||||||||
|
| |||||||
Taiwan - 7.7% | ||||||||
Advantech Co., Ltd. (Technology Hardware & Equipment)† | 716,000 | 2,472,664 | ||||||
Delta Electronics Inc. (Technology Hardware & Equipment)† | 1,086,189 | �� | 3,725,852 | |||||
Hiwin Technologies Corp. (Capital Goods)† | 392,700 | 2,521,802 | ||||||
Hon Hai Precision Industry Co., Ltd. (Technology Hardware & Equipment)† | 3,343,652 | 10,045,754 | ||||||
MediaTek Inc. (Semiconductors & Semiconductor Equipment)† | 510,000 | 5,656,340 | ||||||
Taiwan Semiconductor Manufacturing Co., Ltd. (Semiconductors & Semiconductor Equipment)† | 3,752,277 | 11,392,554 | ||||||
|
| |||||||
| 35,814,966 | ||||||||
|
| |||||||
Thailand - 1.6% | ||||||||
Siam Commercial Bank pcl (Banks)† | 1,389,070 | 7,296,107 | ||||||
|
| |||||||
Turkey - 3.5% | ||||||||
Arcelik A/S (Consumer Durables & Apparel)† | 1,821,660 | 12,038,187 | ||||||
Turkiye Garanti Bankasi A/S (Banks)† | 876,800 | 4,185,674 | ||||||
|
| |||||||
| 16,223,861 | ||||||||
|
| |||||||
United Arab Emirates - 1.0% | ||||||||
DP World Ltd. (Transportation)† | 41,300 | 499,857 | ||||||
Dragon Oil plc (Energy)† | 448,000 | 4,012,524 | ||||||
|
| |||||||
| 4,512,381 | ||||||||
|
| |||||||
See Notes to Financial Statements
33
Table of Contents
Harding, Loevner Funds, Inc.
Institutional Emerging Markets Portfolio
Statement of Net Assets
October 31, 2012 (continued)
| Shares | Value | |||||||
United Kingdom - 2.9% | ||||||||
Hikma Pharmaceuticals plc (Pharmaceuticals, Biotechnology & Life Sciences)† | 558,820 | $ | 6,668,759 | |||||
SABMiller plc (Food, Beverage & Tobacco)† | 154,800 | 6,611,884 | ||||||
|
| |||||||
| 13,280,643 | ||||||||
|
| |||||||
Total Common Stocks (Cost $309,626,337) | 389,176,323 | |||||||
|
| |||||||
Preferred Stocks - 10.1% | ||||||||
Brazil - 5.1% | ||||||||
Cia de Bebidas das Americas - ADR (Food, Beverage & Tobacco) | 241,000 | 9,830,390 | ||||||
Itau Unibanco Holding SA - ADR (Banks) | 157,196 | 2,291,918 | ||||||
Petroleo Brasileiro SA - Sponsored ADR (Energy) | 296,200 | 6,080,986 | ||||||
Vale SA - Sponsored ADR (Materials) | 308,600 | 5,489,994 | ||||||
|
| |||||||
| 23,693,288 | ||||||||
|
| |||||||
Russia - 1.2% | ||||||||
AK Transneft OAO (Energy)#† | 2,829 | 5,656,106 | ||||||
|
| |||||||
South Korea - 3.8% | ||||||||
Samsung Electronics Co., Ltd. - GDR, Reg S (Semiconductors & Semiconductor Equipment)† | 47,824 | 17,591,142 | ||||||
|
| |||||||
Total Preferred Stocks (Cost $40,291,993) | 46,940,536 | |||||||
|
| |||||||
Participation Notes - 3.2% | ||||||||
Qatar - 2.2% | ||||||||
Industries Qatar QSC, Issued by HSBC Bank plc, Maturity Date 2/23/15 (Capital Goods)#^† | 146,000 | 6,095,113 | ||||||
Qatar National Bank, Issued by HSBC Bank plc, Maturity Date 9/23/13 (Banks)#^† | 105,870 | 3,893,487 | ||||||
|
| |||||||
| 9,988,600 | ||||||||
|
| |||||||
Saudi Arabia - 1.0% | ||||||||
Jarir Marketing Co., Issued by HSBC Bank plc, Maturity Date 5/4/15 (Commercial & Professional Services)#^† | 109,200 | 4,571,596 | ||||||
|
| |||||||
Total Participation Notes (Cost $13,811,542) | 14,560,196 | |||||||
|
| |||||||
See Notes to Financial Statements
34
Table of Contents
Harding, Loevner Funds, Inc.
Institutional Emerging Markets Portfolio
Statement of Net Assets
October 31, 2012 (continued)
| Shares | Value | |||||||
Cash Equivalent - 2.6% | ||||||||
Northern Institutional Funds - | 12,085,038 | $ | 12,085,038 | |||||
|
| |||||||
Total Cash Equivalent (Cost $12,085,038) | 12,085,038 | |||||||
|
| |||||||
Total Investments — 99.8% (Cost $ 375,814,910) | $ | 462,762,093 | ||||||
|
| |||||||
Summary of Abbreviations
| ADR | American Depository Receipt |
| GDR | Global Depository Receipt |
| Reg S | Security traded outside United States without registration under the Securities Act of 1933. |
| # | Security valued at fair value as determined in good faith under policies and procedures established by and under the supervision of the Portfolio’s Board of Directors. |
| * | Non-income producing security. |
| ^ | Security exempt from registration pursuant to Rule 144A of the Securities Act of 1933. These securities, which represent 3.2% of net assets as of October 31, 2012, are considered liquid and may be resold in transactions exempt from registration, normally to qualified buyers. |
| † | Investment categorized as level 2 security as disclosed in Note 2 of the Notes to Financial Statements. |
See Notes to Financial Statements
35
Table of Contents
Harding, Loevner Funds, Inc.
Institutional Emerging Markets Portfolio
Statement of Net Assets
October 31, 2012 (continued)
| Value | ||||
Other Assets, Net of Liabilities - 0.2% | ||||
Dividends and interest receivable | $ | 597,144 | ||
Foreign currency (cost $12,173) | 12,267 | |||
Receivable for investments sold | 4,268,223 | |||
Receivable for Fund shares sold | 271,052 | |||
Tax reclaim receivable | 12,408 | |||
Prepaid expenses | 51,266 | |||
Payable to Investment Adviser | (456,066 | ) | ||
Payable for investments purchased | (2,313,033 | ) | ||
Payable for Fund shares redeemed | (760,647 | ) | ||
Payable for capital gains tax | (506,673 | ) | ||
Other liabilities | (146,912 | ) | ||
|
| |||
| 1,029,029 | ||||
|
| |||
Net Assets - 100% | ||||
Applicable to 28,003,301 outstanding $.001 par value shares (authorized 450,000,000 shares) | $ | 463,791,122 | ||
|
| |||
Net Asset Value, Offering Price and Redemption Price Per Share | $ | 16.56 | ||
|
| |||
Components of Net Assets as of October 31, 2012 were as follows: | ||||
Paid-in capital | $ | 430,972,709 | ||
Accumulated undistributed net investment income | 3,682,733 | |||
Accumulated net realized loss from investment transactions | (57,496,042 | ) | ||
Net unrealized appreciation on investments and on assets and liabilities denominated in foreign currencies | 86,631,722 | |||
|
| |||
| $ | 463,791,122 | |||
|
| |||
See Notes to Financial Statements
36
Table of Contents
Harding, Loevner Funds, Inc.
Emerging Markets Portfolio (Advisor Class) — Overview
(unaudited)
October 31, 2012
Hypothetical Comparison Of Changes In Value Of $10,000 Investment In Harding, Loevner Funds, Inc. -
Emerging Markets Portfolio – Advisor Class And The MSCI Emerging Markets Index
(Net Dividends Reinvested)
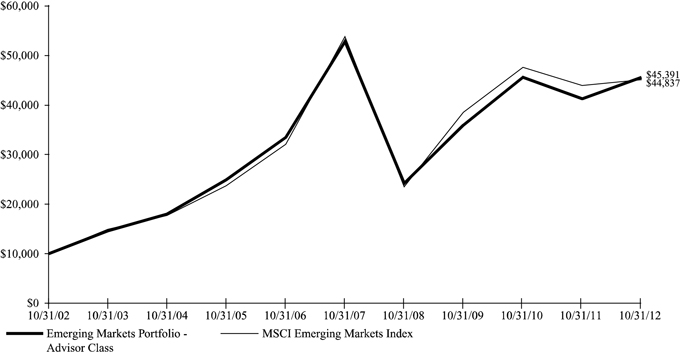
| Returns for the Year Ended October 31, 2012 | ||||||||||
| Cumulative Total Returns | Average Annualized Total Return | |||||||||
| FUND NAME | Last 12 Months | 5 YR | 10 YR | 5 YR | 10 YR | |||||
Emerging Markets Portfolio— | 10.60% | -13.65% | 353.91% | -2.89% | 16.33% | |||||
MSCI Emerging Markets Index (Net dividend) | 2.63% | -16.20% | 348.37% | -3.47% | 16.19% | |||||
Performance data quoted represents past performance and does not guarantee future results. The investment return and principal value of an investment will fluctuate so that an investor’s shares, when redeemed, may be worth more or less than their original cost. Performance current to the most recent month end may be lower or higher than the performance quoted and may be obtained by visiting the website at www.hardingloevnerfunds.com.
Investment return reflects voluntary fee waivers in effect. Absent such waivers, total return would be reduced. The performance provided does not reflect the deduction of taxes that a shareholder would pay on Portfolio distributions.
37
Table of Contents
Harding, Loevner Funds, Inc.
Emerging Markets Portfolio - Overview
(unaudited)
October 31, 2012
The Emerging Markets Portfolio (the “Portfolio”) Advisor Class rose 10.60%, after all fees and expenses, for the fiscal year ended October 31, 2012. In comparison, the Portfolio’s benchmark, the MSCI Emerging Markets Index (the “Index”), rose 2.63%, net of source taxes.
Consistent with its investment objectives and policies, the Portfolio was invested in the securities of emerging markets companies that exhibit the fundamental characteristics of durable growth, financial strength, management quality, and sustainable competitive advantage.
The Portfolio performed well over the last 12 months, outpacing the Index by about eight percentage points. Our investments in Materials and Energy contributed most to performance, with the impact of the former split evenly between positive stock selection and a favorable underweight position, and the latter almost entirely due to good stock selection. In Materials, cement maker Semen Gresik outperformed as double-digit growth in Indonesia led to rising revenues for the company. Russia’s Transneft and Colombia’s Ecopetrol boosted returns within the Energy sector.
Telecom Services detracted most from performance due to poor returns from Latin American cellular provider Millicom International. Stock selection was also weak in Consumer Staples, as Chinese supermarket operator Wumart reported slower-than-anticipated growth due to difficulties integrating the back office and procurement functions of its recently acquired Tianjin business with its core Beijing office.
By region, Latin America and Asia contributed most to performance. Good stock selection in Latin America included Brazilian beverage company Ambev as well as cosmetics manufacturer Natura Cosméticos. Within Asia, relative returns were especially strong in India due to good returns from Ambuja Cements and HDFC Bank. Nigeria’s Zenith Bank contributed markedly to the year’s outperformance as well.
The largest detractor was Africa due to the Portfolio’s relatively light weighting in this region and weak stock selection. South African miner Impala Platinum and Egyptian contractor and cement manufacturer Orascom Construction both underperformed in this period.
Past performance does not guarantee future results.
Fund holdings and sector allocations are subject to change and are not recommendations to buy or sell any security. Please see the Statement of Net Assets for a complete list of fund holdings.
The Portfolio invests in foreign securities, which will involve greater volatility and political, economic, and currency risks and differences in accounting methods. It also invests in emerging markets, which involve unique risks, such as exposure to economies less diverse and mature than the U.S. or other more established foreign markets. Economic and political instability may cause larger price changes in emerging markets securities than other foreign securities. Investments in debt securities typically decrease in value when interest rates rise. This risk is usually greater for longer-term debt securities. Investment by the Portfolio in lower-rated and non-rated securities presents a greater risk of loss to principal and interest than higher-rated securities.
The MSCI Emerging Markets Index is a free float-adjusted market capitalization index that is designed to measure equity market performance in the global emerging markets. The Index consists of 21 emerging market countries. The Index is net of foreign withholding taxes on dividends. You cannot invest directly in this Index.
38
Table of Contents
Harding, Loevner Funds, Inc.
Emerging Markets Portfolio
Statement of Net Assets
October 31, 2012
| Industry | Percentage of Net Assets | ||||
Automobiles & Components | 4.2 | % | |||
Banks | 19.5 | ||||
Capital Goods | 3.3 | ||||
Commercial & Professional Services | 1.5 | ||||
Consumer Durables & Apparel | 2.5 | ||||
Diversified Financials | 1.6 | ||||
Energy | 10.8 | ||||
Food & Staples Retailing | 0.6 | ||||
Food, Beverage & Tobacco | 7.1 | ||||
Health Care Equipment & Services | 1.6 | ||||
Household & Personal Products | 3.6 | ||||
Insurance | 2.8 | ||||
Materials | 8.1 | ||||
Mutual Funds | 2.3 | ||||
Pharmaceuticals, Biotechnology & Life Sciences | 3.2 | ||||
Semiconductors & Semiconductor Equipment | 10.1 | ||||
Software & Services | 3.4 | ||||
Technology Hardware & Equipment | 3.5 | ||||
Telecommunication Services | 4.8 | ||||
Transportation | 5.1 | ||||
|
| ||||
Total Investments | 99.6 | ||||
Other Assets Less Liabilities | 0.4 | ||||
|
| ||||
Net Assets | 100.0 | % | |||
|
| ||||
See Notes to Financial Statements
39
Table of Contents
Harding, Loevner Funds, Inc.
Emerging Markets Portfolio
Statement of Net Assets
October 31, 2012 (continued)
| Shares | Value | |||||||
Common Stocks - 85.5% | ||||||||
Brazil - 7.4% | ||||||||
Banco Bradesco SA - ADR (Banks) | 1,668,202 | $ | 26,124,043 | |||||
BM&FBovespa SA (Diversified Financials) | 4,203,000 | 26,901,849 | ||||||
Natura Cosmeticos SA (Household & Personal Products) | 407,400 | 10,861,727 | ||||||
Odontoprev SA (Health Care Equipment & Services) | 1,547,000 | 7,997,587 | ||||||
Petroleo Brasileiro SA - ADR (Energy) | �� | 1,337,584 | 28,370,157 | |||||
Vale SA - Sponsored ADR (Materials) | 1,464,000 | 26,820,480 | ||||||
|
| |||||||
| 127,075,843 | ||||||||
|
| |||||||
Chile - 2.3% | ||||||||
Banco Santander Chile - ADR (Banks) | 604,901 | 16,447,248 | ||||||
Sociedad Quimica y Minera de Chile SA - Sponsored ADR (Materials) | 396,300 | 22,925,955 | ||||||
|
| |||||||
| 39,373,203 | ||||||||
|
| |||||||
China - 12.3% | ||||||||
51job Inc. - ADR (Commercial & Professional Services)* | 191,671 | 9,014,287 | ||||||
Anhui Conch Cement Co., Ltd., Class H (Materials)† | 2,982,000 | 10,297,645 | ||||||
Baidu Inc. - Sponsored ADR (Software & Services)* | 218,500 | 23,296,470 | ||||||
China Merchants Holdings International Co., Ltd. (Transportation)† | 9,158,276 | 30,322,068 | ||||||
China Mobile Ltd. - Sponsored ADR (Telecommunication Services) | 441,100 | 24,432,529 | ||||||
CNOOC Ltd. - ADR (Energy) | 131,000 | 26,927,050 | ||||||
Hengan International Group Co., Ltd. (Household & Personal Products)† | 1,664,500 | 15,114,869 | ||||||
Jiangsu Expressway Co., Ltd., Class H (Transportation)† | 8,871,000 | 7,641,075 | ||||||
Shandong Weigao Group Medical Polymer Co., Ltd., Class H (Health Care Equipment & Services)† | 14,418,000 | 19,455,074 | ||||||
Tencent Holdings Ltd. (Software & Services)† | 986,000 | 34,820,058 | ||||||
Wumart Stores Inc., Class H (Food & Staples Retailing)† | 5,452,000 | 9,665,010 | ||||||
|
| |||||||
| 210,986,135 | ||||||||
|
| |||||||
Colombia - 2.5% | ||||||||
Bancolombia SA - Sponsored ADR (Banks) | 136,220 | 8,720,804 | ||||||
Cementos Argos SA - Sponsored ADR (Materials)#† | 230,700 | 5,516,360 | ||||||
Ecopetrol SA - Sponsored ADR (Energy) | 470,000 | 27,828,700 | ||||||
|
| |||||||
| 42,065,864 | ||||||||
|
| |||||||
Czech Republic - 1.1% | ||||||||
Komercni Banka A/S (Banks)† | 95,300 | 19,447,788 | ||||||
|
| |||||||
Egypt - 0.8% | ||||||||
Orascom Construction Industries - GDR (Capital Goods)*† | 328,400 | 13,449,854 | ||||||
|
| |||||||
Hong Kong - 2.8% | ||||||||
AIA Group Ltd. (Insurance)† | 7,090,000 | 28,047,378 | ||||||
ASM Pacific Technology Ltd. (Semiconductors & Semiconductor Equipment)† | 1,826,100 | 20,345,080 | ||||||
|
| |||||||
| 48,392,458 | ||||||||
|
| |||||||
See Notes to Financial Statements
40
Table of Contents
Harding, Loevner Funds, Inc.
Emerging Markets Portfolio
Statement of Net Assets
October 31, 2012 (continued)
| Shares | Value | |||||||
Hungary - 0.6% | ||||||||
Richter Gedeon Nyrt. (Pharmaceuticals, Biotechnology & Life Sciences)† | 52,300 | $ | 9,746,334 | |||||
|
| |||||||
India - 7.0% | ||||||||
Ambuja Cements Ltd. (Materials)† | 7,895,400 | 29,645,438 | ||||||
Axis Bank Ltd. (Banks)† | 1,006,400 | 21,973,756 | ||||||
Bajaj Auto Ltd. (Automobiles & Components)† | 453,500 | 15,260,940 | ||||||
Dabur India Ltd. (Household & Personal Products)† | 6,672,304 | 15,411,078 | ||||||
HDFC Bank Ltd. - ADR (Banks) | 499,185 | 18,664,527 | ||||||
Maruti Suzuki India Ltd. (Automobiles & Components)† | 750,000 | 19,954,157 | ||||||
|
| |||||||
| 120,909,896 | ||||||||
|
| |||||||
Indonesia - 5.0% | ||||||||
Astra International Tbk PT (Automobiles & Components)† | 30,340,000 | 25,425,458 | ||||||
Bank Rakyat Indonesia Persero Tbk PT (Banks)† | 32,362,000 | 24,930,072 | ||||||
Semen Gresik Persero Tbk PT (Materials)† | 16,290,600 | 25,149,178 | ||||||
United Tractors Tbk PT (Capital Goods)† | 4,593,000 | 10,013,493 | ||||||
|
| |||||||
| 85,518,201 | ||||||||
|
| |||||||
Italy - 1.1% | ||||||||
Tenaris SA - ADR (Energy) | 524,000 | 19,712,880 | ||||||
|
| |||||||
Malaysia - 1.1% | ||||||||
Axiata Group Bhd. (Telecommunication Services)† | 8,986,000 | 19,239,235 | ||||||
|
| |||||||
Mexico - 7.8% | ||||||||
America Movil SAB de CV, Series L - ADR (Telecommunication Services) | 1,528,594 | 38,658,142 | ||||||
Coca-Cola Femsa SAB de CV - Sponsored ADR (Food, Beverage & Tobacco) | 180,700 | 23,113,337 | ||||||
Fomento Economico Mexicano SAB de CV - Sponsored ADR (Food, Beverage & Tobacco) | 298,300 | 27,028,963 | ||||||
Grupo Aeroportuario del Sureste SAB de CV - ADR (Transportation) | 195,698 | 18,898,556 | ||||||
Grupo Financiero Banorte SAB de CV, Class O (Banks) | 4,798,840 | 26,660,222 | ||||||
|
| |||||||
| 134,359,220 | ||||||||
|
| |||||||
Nigeria - 1.6% | ||||||||
Zenith Bank plc (Banks) | 232,557,120 | 26,682,028 | ||||||
|
| |||||||
Panama - 1.7% | ||||||||
Copa Holdings SA, Class A (Transportation) | 306,100 | 28,412,202 | ||||||
|
| |||||||
Peru - 1.2% | ||||||||
Credicorp Ltd. (Banks) | 159,200 | 20,590,928 | ||||||
|
| |||||||
Poland - 1.5% | ||||||||
Bank Pekao SA (Banks)#† | 293,261 | 14,107,260 | ||||||
Kernel Holding SA (Food, Beverage & Tobacco)*† | 529,097 | 11,073,626 | ||||||
|
| |||||||
| 25,180,886 | ||||||||
|
| |||||||
See Notes to Financial Statements
41
Table of Contents
Harding, Loevner Funds, Inc.
Emerging Markets Portfolio
Statement of Net Assets
October 31, 2012 (continued)
| Shares | Value | |||||||
Russia - 4.3% | ||||||||
Gazprom OAO - Sponsored ADR (Energy)† | 807,570 | $ | 7,410,017 | |||||
Lukoil OAO - Sponsored ADR (Energy) | 532,794 | 32,074,199 | ||||||
Sberbank of Russia - Sponsored ADR (Banks)#† | 2,832,000 | 33,454,923 | ||||||
|
| |||||||
| �� | 72,939,139 | |||||||
|
| |||||||
South Africa - 2.5% | ||||||||
Aspen Pharmacare Holdings Ltd. (Pharmaceuticals, Biotechnology & Life Sciences)† | 1,125,500 | 20,503,832 | ||||||
Impala Platinum Holdings Ltd. (Materials)† | 582,800 | 10,473,704 | ||||||
Standard Bank Group Ltd. (Banks)† | 979,034 | 12,103,896 | ||||||
|
| |||||||
| 43,081,432 | ||||||||
|
| |||||||
South Korea - 4.3% | ||||||||
Amorepacific Corp. (Household & Personal Products)† | 17,200 | 19,546,019 | ||||||
Hankook Tire Co., Ltd. (Automobiles & Components)*† | 288,138 | 12,153,262 | ||||||
Hankook Tire Worldwide Co., Ltd. (Diversified Financials)† | 65,861 | 849,827 | ||||||
Samsung Electronics Co., Ltd. - GDR, Reg S (Semiconductors & Semiconductor Equipment)† | 34,680 | 20,997,236 | ||||||
Samsung Fire & Marine Insurance Co., Ltd. (Insurance)† | 94,200 | 20,579,423 | ||||||
|
| |||||||
| 74,125,767 | ||||||||
|
| |||||||
Taiwan - 7.7% | ||||||||
Advantech Co., Ltd. (Technology Hardware & Equipment)† | 2,570,000 | 8,875,344 | ||||||
Delta Electronics Inc. (Technology Hardware & Equipment)† | 3,951,751 | 13,555,319 | ||||||
Hiwin Technologies Corp. (Capital Goods)† | 1,488,900 | 9,561,270 | ||||||
Hon Hai Precision Industry Co., Ltd. (Technology Hardware & Equipment)† | 12,436,938 | 37,365,857 | ||||||
MediaTek Inc. (Semiconductors & Semiconductor Equipment)† | 1,864,000 | 20,673,368 | ||||||
Taiwan Semiconductor Manufacturing Co., Ltd. (Semiconductors & Semiconductor Equipment)† | 13,661,637 | 41,479,066 | ||||||
|
| |||||||
| 131,510,224 | ||||||||
|
| |||||||
Thailand - 1.5% | ||||||||
Siam Commercial Bank pcl (Banks)† | 4,955,300 | 26,027,773 | ||||||
|
| |||||||
Turkey - 3.5% | ||||||||
Arcelik A/S (Consumer Durables & Apparel)† | 6,611,712 | 43,692,586 | ||||||
Turkiye Garanti Bankasi A/S (Banks)† | 3,329,300 | 15,893,435 | ||||||
|
| |||||||
| 59,586,021 | ||||||||
|
| |||||||
United Arab Emirates - 1.0% | ||||||||
DP World Ltd. (Transportation)† | 186,400 | 2,256,016 | ||||||
Dragon Oil plc (Energy)† | 1,700,000 | 15,226,095 | ||||||
|
| |||||||
| 17,482,111 | ||||||||
|
| |||||||
United Kingdom - 2.9% | ||||||||
Hikma Pharmaceuticals plc (Pharmaceuticals, Biotechnology & Life Sciences)† | 2,112,353 | 25,208,069 | ||||||
SABMiller plc (Food, Beverage & Tobacco)† | 580,600 | 24,798,834 | ||||||
|
| |||||||
| 50,006,903 | ||||||||
|
| |||||||
See Notes to Financial Statements
42
Table of Contents
Harding, Loevner Funds, Inc.
Emerging Markets Portfolio
Statement of Net Assets
October 31, 2012 (continued)
| Shares | Value | |||||||
United Kingdom - 2.9% - (continued) | ||||||||
Total Common Stocks (Cost $1,037,580,737) | $ | 1,465,902,325 | ||||||
|
| |||||||
Preferred Stocks - 8.6% | ||||||||
Brazil - 3.4% | ||||||||
Cia de Bebidas das Americas - ADR (Food, Beverage & Tobacco) | 870,500 | 35,507,695 | ||||||
Itau Unibanco Holding SA - ADR (Banks) | 588,258 | 8,576,802 | ||||||
Petroleo Brasileiro SA - Sponsored ADR (Energy) | 284,400 | 5,838,732 | ||||||
Vale SA - Sponsored ADR (Materials) | 450,000 | 8,005,500 | ||||||
|
| |||||||
| 57,928,729 | ||||||||
|
| |||||||
Russia - 1.2% | ||||||||
AK Transneft OAO (Energy)#† | 10,600 | 21,192,903 | ||||||
|
| |||||||
South Korea - 4.0% | ||||||||
Samsung Electronics Co., Ltd. - GDR, Reg S (Semiconductors & Semiconductor Equipment)† | 187,759 | 69,063,548 | ||||||
|
| |||||||
Total Preferred Stocks (Cost $104,091,816) | 148,185,180 | |||||||
|
| |||||||
Participation Notes - 3.2% | ||||||||
Qatar - 2.2% | ||||||||
Industries Qatar QSC, Issued by HSBC Bank plc, Maturity Date 2/23/15 (Capital Goods)#^† | 546,000 | 22,794,051 | ||||||
Qatar National Bank, Issued by HSBC Bank plc, Maturity Date 9/23/13 (Banks)#^† | 403,200 | 14,828,130 | ||||||
|
| |||||||
| 37,622,181 | ||||||||
|
| |||||||
Saudi Arabia - 1.0% | ||||||||
Jarir Marketing Co., Issued by HSBC Bank plc, Maturity Date 5/4/15 (Commercial & Professional Services)#^† | 409,600 | 17,147,672 | ||||||
|
| |||||||
Total Participation Notes (Cost $51,863,269) | 54,769,853 | |||||||
|
| |||||||
Cash Equivalent - 2.3% | ||||||||
Northern Institutional Funds - Prime Obligations Portfolio, 0.12% (Mutual Funds) | 40,187,778 | 40,187,778 | ||||||
|
| |||||||
Total Cash Equivalent (Cost $40,187,778) | 40,187,778 | |||||||
|
| |||||||
Total Investments — 99.6% (Cost $ 1,233,723,600) | $ | 1,709,045,136 | ||||||
|
| |||||||
Summary of Abbreviations
| ADR | American Depository Receipt |
| GDR | Global Depository Receipt |
| Reg S | Security sold outside United States without registration under the Securities Act of 1933. |
See Notes to Financial Statements
43
Table of Contents
Harding, Loevner Funds, Inc.
Emerging Markets Portfolio
Statement of Net Assets
October 31, 2012 (continued)
| # | Security valued at fair value as determined in good faith under policies and procedures established by and under the supervision of the Portfolio’s Board of Directors. |
| * | Non-income producing security. |
| ^ | Security exempt from registration pursuant to Rule 144A of the Securities Act of 1933. These securities, which represent 3.2% of net assets as of October 31, 2012, are considered liquid and may be resold in transactions exempt from registration, normally to qualified buyers. |
| † | Investment categorized as level 2 security as disclosed in Note 2 of the Notes to Financial Statements. |
See Notes to Financial Statements
44
Table of Contents
Harding, Loevner Funds, Inc.
Emerging Markets Portfolio
Statement of Net Assets
October 31, 2012 (continued)
| Value | ||||
Other Assets, Net of Liabilities - 0.4% | ||||
Dividends and interest receivable | $ | 2,218,231 | ||
Foreign currency (cost $83,428) | 84,240 | |||
Receivable for investments sold | 15,407,672 | |||
Receivable for Fund shares sold | 2,248,597 | |||
Tax reclaim receivable | 71,640 | |||
Prepaid expenses | 19,020 | |||
Payable to Investment Adviser | (1,685,818 | ) | ||
Payable for investments purchased | (7,704,989 | ) | ||
Payable for Fund shares redeemed | (2,015,480 | ) | ||
Payable for capital gains tax | (1,536,920 | ) | ||
Other liabilities | (1,083,070 | ) | ||
|
| |||
| 6,023,123 | ||||
|
| |||
Net Assets - 100% | ||||
Advisor Class | ||||
Applicable to 34,622,755 outstanding $.001 par value shares (authorized 250,000,000 shares) | $ | 1,715,068,259 | ||
|
| |||
Net Asset Value, Offering Price and Redemption Price Per Share | $ | 49.54 | ||
|
| |||
Components of Net Assets as of October 31, 2012 were as follows: | ||||
Paid-in capital | $ | 1,131,091,030 | ||
Accumulated undistributed net investment income | 12,078,855 | |||
Accumulated net realized gain from investment transactions | 96,591,442 | |||
Net unrealized appreciation on investments and on assets and liabilities denominated in foreign currencies | 475,306,932 | |||
|
| |||
| $ | 1,715,068,259 | |||
|
| |||
See Notes to Financial Statements
45
Table of Contents
Harding, Loevner Funds, Inc.
Frontier Emerging Markets Portfolio (Institutional Class) — Overview
(unaudited)
October 31, 2012
Hypothetical Comparison Of Changes In Value Of $10,000 Investment In Harding, Loevner Funds, Inc. -
Frontier Emerging Markets Portfolio - Institutional Class And The MSCI Frontier Emerging Markets Index
(Net Dividends Reinvested)
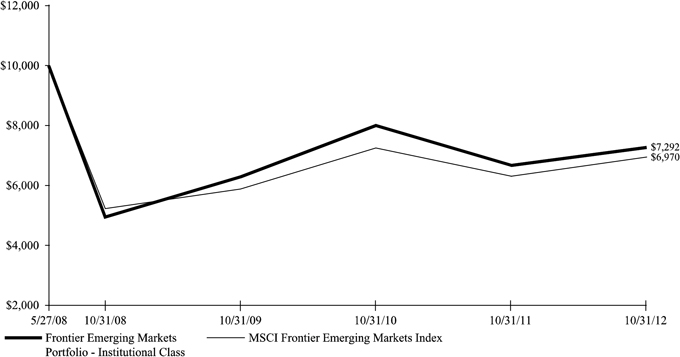
| Returns for the Year Ended October 31, 2012 | ||||||
| Cumulative Total Returns | Average Annualized Total Return | |||||
| FUND NAME | Last 12 Months | Inception | Inception | |||
Frontier Emerging Markets Portfolio— | 8.93% | -27.08% | -6.88% | |||
MSCI Frontier Emerging Markets Index (Net dividends) | 9.97% | -30.30% | -7.83% | |||
Performance data quoted represents past performance and does not guarantee future results. The investment return and principal value of an investment will fluctuate so that an investor’s shares, when redeemed, may be worth more or less than their original cost. Performance current to the most recent month end may be lower or higher than the performance quoted and may be obtained by visiting the website at www.hardingloevnerfunds.com.
Investment return reflects voluntary fee waivers in effect. Absent such waivers, total return would be reduced. The performance provided does not reflect the deduction of taxes that a shareholder would pay on Portfolio distributions.
46
Table of Contents
Harding, Loevner Funds, Inc.
Frontier Emerging Markets Portfolio (Investor Class)— Overview
(unaudited)
October 31, 2012
Hypothetical Comparison Of Changes In Value Of $10,000 Investment In Harding, Loevner Funds, Inc. -
Frontier Emerging Markets Portfolio - Investor Class And The MSCI Frontier Emerging Markets Index
(Net Dividends Reinvested)
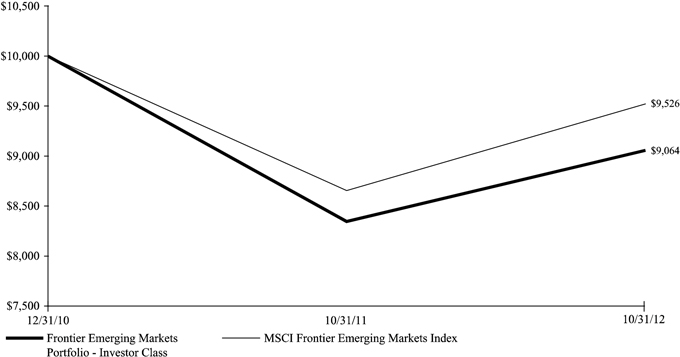
| Returns for the Year Ended October 31, 2012 | ||||||
| Cumulative Total Returns | Average Annualized Total Return | |||||
| FUND NAME | Last 12 Months | Inception | Inception | |||
Frontier Emerging Markets Portfolio— | 8.49% | -9.36% | -5.22% | |||
MSCI Frontier Emerging Markets Index (Net dividends) | 9.97% | -4.74% | -2.61% | |||
Performance data quoted represents past performance and does not guarantee future results. The investment return and principal value of an investment will fluctuate so that an investor’s shares, when redeemed, may be worth more or less than their original cost. Performance current to the most recent month end may be lower or higher than the performance quoted and may be obtained by visiting the website at www.hardingloevnerfunds.com.
Investment return reflects voluntary fee waivers in effect. Absent such waivers, total return would be reduced. The performance provided does not reflect the deduction of taxes that a shareholder would pay on Portfolio distributions.
47
Table of Contents
Harding, Loevner Funds, Inc.
Frontier Emerging Markets Portfolio - Overview
(unaudited)
October 31, 2012
The Frontier Emerging Markets Portfolio (the “Portfolio”) Investor Class rose 8.49%, and the Institutional Class rose 8.93% (after all fees and expenses) for the fiscal year ended October 31, 2012. In comparison, the Portfolio’s benchmark, the MSCI Frontier Emerging Markets Index (the “Index”), rose 9.97%, net of source taxes.
Consistent with its investment objectives and policies, the Portfolio was invested in the securities of companies with strong growth prospects in frontier and smaller emerging markets countries that we regard as both economically stable and as offering attractive long-term investment potential.
The Portfolio benefitted over the last 12 months from strong selection in Financials and Telecom Services. In Financials, both Access Bank Nigeria and First Bank of Nigeria have grown their loan books and their net interest margins remain high. In Telecom Services, Kenya’s Safaricom is enjoying reduced competitive pressures in its home market, allowing the company to raise prices. Meanwhile, Saudi Arabia’s Etihad Etisalat possesses a competitive industry position and strong telecom infrastructure. The company is at the end of its investment cycle and has the potential to generate significant free cash flow in the near future.
Weak stock selection in Consumer Staples and Energy detracted from relative performance. Argentinian branded-foods manufacturer Molinos Rio de La Plata and agricultural commodities company Cresud fell on concerns of increasing regulatory risk in the country. In Energy, Latin America’s Petrominerales had disappointing results from new well exploration activities this period.
Geographically, the Portfolio’s investments in the Gulf States helped relative returns, particularly the light exposure to Kuwait and good stock selection in Qatar. The Portfolio underperformed in Asia, where a small weighting in the outperforming Philippines was the primary detractor.
Past performance does not guarantee future results.
Fund holdings and sector allocations are subject to change and are not recommendations to buy or sell any security. Please see the Statement of Net Assets for a complete list of fund holdings.
Foreign investments involve additional risks, including greater volatility and political, economic, and currency risks and differences in accounting methods. Emerging markets countries involve greater risks, such as immature economic structures, national policies restricting investments by foreigners, and different legal systems. Such risks may be magnified with respect to securities of issuers in frontier emerging markets. The Portfolio can have significant concentration in a single industry, and investment opportunities in frontier markets may be concentrated in the banking industry. The Portfolio will be vulnerable to factors affecting an industry in which it is concentrated. Investments in debt securities typically decrease in value when interest rates rise. This risk is usually greater for longer-term debt securities. Investment in lower-rated and non-rated securities presents a greater risk of loss of principal and interest than higher-rated securities. Mutual fund investing involves risk. Principal loss is possible.
The MSCI Frontier Emerging Markets Index is a free float-adjusted market capitalization index designed to measure equity market performance in all countries from the MSCI Frontier Markets Index and the lower size spectrum of the MSCI Emerging Markets Index. The Index consists of 26 frontier markets and 5 emerging markets. The Index is net of foreign withholding taxes on dividends. You cannot invest directly in this Index.
Free cash flow is revenue less operating expenses including interest expense and maintenance capital spending. It is the discretionary cash that a company has after all expenses and is available for purposes such as dividend payments, investing back into the business or share repurchases.
48
Table of Contents
Harding, Loevner Funds, Inc.
Frontier Emerging Markets Portfolio
Statement of Net Assets
October 31, 2012
| Industry | Percentage of Net Assets | ||||
Automobiles & Components | 0.9 | % | |||
Banks | 32.3 | ||||
Capital Goods | 9.8 | ||||
Commercial & Professional Services | 3.1 | ||||
Consumer Durables & Apparel | 1.5 | ||||
Diversified Financials | 3.7 | ||||
Energy | 6.9 | ||||
Food, Beverage & Tobacco | 9.3 | ||||
Materials | 10.1 | ||||
Media | 1.5 | ||||
Mutual Funds | 3.4 | ||||
Pharmaceuticals, Biotechnology & Life Sciences | 4.1 | ||||
Real Estate | 1.9 | ||||
Retailing | 1.5 | ||||
Technology Hardware & Equipment | 0.6 | ||||
Telecommunication Services | 6.1 | ||||
Transportation | 1.5 | ||||
Utilities | 1.8 | ||||
|
| ||||
Total Investments | 100.0 | ||||
Other Assets Less Liabilities | 0.0 | ||||
|
| ||||
Net Assets | 100.0 | % | |||
|
| ||||
See Notes to Financial Statements
49
Table of Contents
Harding, Loevner Funds, Inc.
Frontier Emerging Markets Portfolio
Statement of Net Assets
October 31, 2012 (continued)
| Shares | Value | |||||||
Common Stocks - 87.6% | ||||||||
Argentina - 0.7% | ||||||||
Cresud SACIF y A - Sponsored ADR (Real Estate) | 77,100 | $ | 617,571 | |||||
|
| |||||||
Bangladesh - 2.7% | ||||||||
Lafarge Surma Cement Ltd. (Materials)* | 1,396,500 | 606,912 | ||||||
Power Grid Co. of Bangladesh Ltd. (Utilities) | 482,400 | 411,577 | ||||||
Square Pharmaceuticals Ltd. (Pharmaceuticals, Biotechnology & Life Sciences) | 595,818 | 1,313,771 | ||||||
|
| |||||||
| 2,332,260 | ||||||||
|
| |||||||
Canada - 0.8% | ||||||||
Katanga Mining Ltd. (Materials)* | 634,375 | 304,874 | ||||||
Petrominerales Ltd. (Energy) | 43,600 | 349,665 | ||||||
|
| |||||||
| 654,539 | ||||||||
|
| |||||||
Colombia - 11.1% | ||||||||
Bancolombia SA - Sponsored ADR (Banks) | 13,522 | 865,678 | ||||||
Cementos Argos SA - Sponsored ADR (Materials)#† | 121,840 | 2,913,365 | ||||||
Ecopetrol SA - Sponsored ADR (Energy) | 37,400 | 2,214,454 | ||||||
Grupo de Inversiones Suramericana SA - Sponsored ADR (Diversified Financials)#† | 43,900 | 1,714,045 | ||||||
Grupo Odinsa SA (Capital Goods) | 171,173 | 896,157 | ||||||
Interconexion Electrica SA ESP - ADR (Utilities)#† | 5,700 | 771,714 | ||||||
|
| |||||||
| 9,375,413 | ||||||||
|
| |||||||
Croatia - 0.5% | ||||||||
Ericsson Nikola Tesla (Technology Hardware & Equipment)† | 2,121 | 469,037 | ||||||
|
| |||||||
Egypt - 5.4% | ||||||||
Commercial International Bank Egypt SAE (Banks)† | 146,500 | 908,360 | ||||||
Ghabbour Auto (Automobiles & Components)† | 143,420 | 734,639 | ||||||
Orascom Construction Industries - GDR (Capital Goods)*† | 26,450 | 1,083,278 | ||||||
Orascom Telecom Holding SAE - GDR, Reg S (Telecommunication Services)*† | 186,069 | 559,683 | ||||||
Oriental Weavers (Consumer Durables & Apparel)† | 330,784 | 1,303,551 | ||||||
|
| |||||||
| 4,589,511 | ||||||||
|
| |||||||
Estonia - 0.5% | ||||||||
Tallink Group AS (Transportation)* | 519,120 | 456,201 | ||||||
|
| |||||||
Ghana - 0.9% | ||||||||
Ghana Commercial Bank Ltd. (Banks) | 746,149 | 809,187 | ||||||
|
| |||||||
Indonesia - 1.0% | ||||||||
Bank Rakyat Indonesia Persero Tbk PT (Banks)† | 1,084,980 | 835,815 | ||||||
|
| |||||||
Isle of Man - 0.9% | ||||||||
Zhaikmunai LP - GDR, Reg S (Energy)† | 72,800 | 781,225 | ||||||
|
| |||||||
See Notes to Financial Statements
50
Table of Contents
Harding, Loevner Funds, Inc.
Frontier Emerging Markets Portfolio
Statement of Net Assets
October 31, 2012 (continued)
| Shares | Value | |||||||
Jordan - 1.5% | ||||||||
Arab Bank plc (Banks)† | 73,050 | $ | 727,764 | |||||
Arab Potash Co. (Materials)† | 7,924 | 531,835 | ||||||
|
| |||||||
| 1,259,599 | ||||||||
|
| |||||||
Kazakhstan - 1.8% | ||||||||
Halyk Savings Bank of Kazakhstan JSC - GDR, Reg S (Banks)*† | 131,999 | 938,511 | ||||||
KazMunaiGas Exploration Production JSC - GDR, Reg S (Energy)† | 32,650 | 580,064 | ||||||
|
| |||||||
| 1,518,575 | ||||||||
|
| |||||||
Kenya - 4.5% | ||||||||
Equity Bank Ltd. (Banks)† | 4,156,200 | 1,184,573 | ||||||
Nation Media Group Ltd. (Media)† | 489,740 | 1,299,638 | ||||||
Safaricom Ltd. (Telecommunication Services)† | 24,881,400 | 1,286,469 | ||||||
|
| |||||||
| 3,770,680 | ||||||||
|
| |||||||
Lebanon - 0.6% | ||||||||
Banque Audi sal- Audi Saradar Group - GDR, Reg S (Banks)† | 82,890 | 505,629 | ||||||
|
| |||||||
Mauritius - 0.4% | ||||||||
Mauritius Commercial Bank (Banks) | 68,280 | 356,340 | ||||||
|
| |||||||
Morocco - 1.2% | ||||||||
Douja Promotion Groupe Addoha SA (Real Estate)† | 137,788 | 996,425 | ||||||
|
| |||||||
Nigeria - 12.0% | ||||||||
Access Bank plc (Banks) | 53,121,093 | 3,010,173 | ||||||
Dangote Cement plc (Materials) | 1,211,000 | 926,100 | ||||||
Diamond Bank plc (Banks)* | 38,889,692 | 1,007,774 | ||||||
First Bank of Nigeria plc (Banks) | 31,600,000 | 3,261,403 | ||||||
Lafarge Cement WAPCO Nigeria plc (Materials) | 1,680,474 | 599,176 | ||||||
UAC of Nigeria plc (Capital Goods) | 5,236,598 | 1,333,655 | ||||||
|
| |||||||
| 10,138,281 | ||||||||
|
| |||||||
Pakistan - 2.5% | ||||||||
Engro Corp., Ltd. (Materials)† | 489,692 | 471,150 | ||||||
MCB Bank Ltd. (Banks)† | 211,570 | 416,961 | ||||||
Pakistan Petroleum Ltd. (Energy)† | 668,298 | 1,205,844 | ||||||
|
| |||||||
| 2,093,955 | ||||||||
|
| |||||||
Peru - 7.9% | ||||||||
Alicorp SA (Food, Beverage & Tobacco) | 943,483 | 2,675,902 | ||||||
Credicorp Ltd. (Banks) | 21,800 | 2,819,612 | ||||||
Ferreycorp SAA (Capital Goods) | 386,533 | 320,682 | ||||||
Union Andina de Cementos SAA (Materials) | 698,880 | 833,316 | ||||||
|
| |||||||
| 6,649,512 | ||||||||
|
| |||||||
See Notes to Financial Statements
51
Table of Contents
Harding, Loevner Funds, Inc.
Frontier Emerging Markets Portfolio
Statement of Net Assets
October 31, 2012 (continued)
| Shares | Value | |||||||
Philippines - 6.8% | ||||||||
Bank of the Philippine Islands (Banks)† | 900,000 | $ | 1,768,839 | |||||
Philippine Long Distance Telephone Co. - Sponsored ADR (Telecommunication Services) | 21,660 | 1,376,060 | ||||||
Universal Robina Corp. (Food, Beverage & Tobacco)† | 1,500,000 | 2,615,316 | ||||||
|
| |||||||
| 5,760,215 | ||||||||
|
| |||||||
Poland - 0.4% | ||||||||
Kernel Holding SA (Food, Beverage & Tobacco)*† | 16,680 | 349,101 | ||||||
|
| |||||||
Qatar - 6.6% | ||||||||
Commercial Bank of Qatar QSC (Banks)† | 52,630 | 1,039,441 | ||||||
Industries Qatar QSC (Capital Goods)† | 52,000 | 2,170,981 | ||||||
Qatar Electricity & Water Co. (Utilities)† | 10,050 | 367,525 | ||||||
Qatar National Bank SAQ (Banks)† | 54,357 | 1,998,680 | ||||||
|
| |||||||
| 5,576,627 | ||||||||
|
| |||||||
Senegal - 1.1% | ||||||||
Sonatel (Telecommunication Services) | 3,795 | 899,856 | ||||||
|
| |||||||
Serbia - 0.2% | ||||||||
Energoprojekt Holding ad Beograd (Capital Goods)* | 23,677 | 149,180 | ||||||
|
| |||||||
Slovenia - 1.0% | ||||||||
Krka dd Novo mesto (Pharmaceuticals, Biotechnology & Life Sciences)† | 13,460 | 833,504 | ||||||
|
| |||||||
Sri Lanka - 2.1% | ||||||||
Commercial Bank of Ceylon plc (Banks)† | 980,000 | 789,362 | ||||||
John Keells Holdings plc (Capital Goods)† | 630,353 | 992,831 | ||||||
|
| |||||||
| 1,782,193 | ||||||||
|
| |||||||
Thailand - 3.8% | ||||||||
Home Product Center pcl (Retailing)† | 3,278,202 | 1,219,219 | ||||||
Siam Commercial Bank pcl (Banks)† | 186,300 | 978,543 | ||||||
Thai Vegetable Oil pcl (Food, Beverage & Tobacco)† | 1,276,600 | 1,024,545 | ||||||
|
| |||||||
| 3,222,307 | ||||||||
|
| |||||||
Trinidad & Tobago - 1.4% | ||||||||
Neal & Massy Holdings Ltd. (Capital Goods) | 65,422 | 492,767 | ||||||
Republic Bank Ltd. (Banks) | 37,452 | 641,967 | ||||||
Trinidad Cement Ltd. (Materials)* | 186,210 | 50,923 | ||||||
|
| |||||||
| 1,185,657 | ||||||||
|
| |||||||
Ukraine - 0.5% | ||||||||
Astarta Holding NV (Food, Beverage & Tobacco)*† | 20,720 | 415,358 | ||||||
|
| |||||||
See Notes to Financial Statements
52
Table of Contents
Harding, Loevner Funds, Inc.
Frontier Emerging Markets Portfolio
Statement of Net Assets
October 31, 2012 (continued)
| Shares | Value | |||||||
United Arab Emirates - 3.7% | ||||||||
Arabtec Holding Co. (Capital Goods)† | 1,231,091 | $ | 861,729 | |||||
DP World Ltd. (Transportation) | 70,000 | 830,200 | ||||||
Dragon Oil plc (Energy)† | 77,000 | 689,652 | ||||||
Dubai Financial Market (Diversified Financials)*† | 2,594,510 | 712,397 | ||||||
|
| |||||||
| 3,093,978 | ||||||||
|
| |||||||
United Kingdom - 2.2% | ||||||||
Ferrexpo plc (Materials)† | 54,630 | 184,804 | ||||||
Hikma Pharmaceuticals plc (Pharmaceuticals, Biotechnology & Life Sciences)† | 112,090 | 1,337,642 | ||||||
Kazakhmys plc (Materials)† | 29,520 | 339,229 | ||||||
|
| |||||||
| 1,861,675 | ||||||||
|
| |||||||
Vietnam - 0.9% | ||||||||
Petrovietnam Fertilizer & Chemical JSC (Materials)† | 452,000 | 778,265 | ||||||
|
| |||||||
Total Common Stocks (Cost $68,632,905) | 74,117,671 | |||||||
|
| |||||||
Participation Notes - 9.0% | ||||||||
Kuwait - 3.7% | ||||||||
Kuwait Projects Co. Holdings, Issued by HSBC Bank plc, Maturity Date 1/16/15 (Diversified Financials)#^† | 511,053 | 708,786 | ||||||
National Bank of Kuwait, Issued by Deutsche Bank AG, Maturity Date 3/28/18 (Banks)#^† | 709,900 | 2,423,556 | ||||||
|
| |||||||
| 3,132,342 | ||||||||
|
| |||||||
Saudi Arabia - 5.3% | ||||||||
Almarai Co., Ltd., Issued by HSBC Bank plc, Maturity Date 11/24/14 (Food, Beverage & Tobacco)#^† | 44,034 | 813,118 | �� | |||||
Etihad Etisalat Co., Issued by HSBC Bank plc, Maturity Date 12/5/14 (Telecommunication Services)#^† | 53,300 | 1,030,412 | ||||||
Jarir Marketing Co., Issued by HSBC Bank plc, Maturity Date 5/4/15 (Commercial & Professional Services)#^† | 62,615 | 2,621,341 | ||||||
|
| |||||||
| 4,464,871 | ||||||||
|
| |||||||
Total Participation Notes (Cost $7,575,855) | 7,597,213 | |||||||
|
| |||||||
See Notes to Financial Statements
53
Table of Contents
Harding, Loevner Funds, Inc.
Frontier Emerging Markets Portfolio
Statement of Net Assets
October 31, 2012 (continued)
| Shares | Value | |||||||
Cash Equivalent - 3.4% | ||||||||
Northern Institutional Funds - Prime Obligations Portfolio, 0.12% (Mutual Funds) | 2,848,121 | $ | 2,848,121 | |||||
|
| |||||||
Total Cash Equivalent (Cost $2,848,121) | 2,848,121 | |||||||
|
| |||||||
Total Investments — 100.0% (Cost $ 79,056,881) | $ | 84,563,005 | ||||||
|
| |||||||
Summary of Abbreviations
| ADR | American Depository Receipt |
| GDR | Global Depository Receipt |
| Reg S | Security sold outside United States without registration under the Securities Act of 1933. |
| # | Security valued at fair value as determined in good faith under policies and procedures established by and under the supervision of the Portfolio’s Board of Directors. |
| * | Non-income producing security. |
| ^ | Security exempt from registration pursuant to Rule 144A of the Securities Act of 1933. These securities, which represent 9.0% of net assets as of October 31, 2012, are considered liquid and may be resold in transactions exempt from registration, normally to qualified buyers. |
| † | Investment categorized as level 2 security as disclosed in Note 2 of the Notes to Financial Statements. |
See Notes to Financial Statements
54
Table of Contents
Harding, Loevner Funds, Inc.
Frontier Emerging Markets Portfolio
Statement of Net Assets
October 31, 2012 (continued)
| Value | ||||
Other Assets, Net of Liabilities - 0.0% | ||||
Dividends and interest receivable | $ | 125,177 | ||
Foreign currency (cost $53,880) | 53,474 | |||
Receivable for Fund shares sold | 50,122 | |||
Tax reclaim receivable | 3,800 | |||
Prepaid expenses | 3,216 | |||
Payable to Investment Adviser | (107,969 | ) | ||
Payable for Fund shares redeemed | (420 | ) | ||
Payable for distribution fees | (340 | ) | ||
Payable for capital gains tax | (33,769 | ) | ||
Other liabilities | (85,642 | ) | ||
|
| |||
| 7,649 | ||||
|
| |||
Net Assets - 100% | ||||
Institutional Class | ||||
Applicable to 11,460,766 outstanding $.001 par value shares (authorized 200,000,000 shares) | $ | 81,567,860 | ||
|
| |||
Net Asset Value, Offering Price and Redemption Price Per Share | $ | 7.12 | ||
|
| |||
Investor Class | ||||
Applicable to 423,905 outstanding $.001 par value shares (authorized 200,000,000 shares) | $ | 3,002,794 | ||
|
| |||
Net Asset Value, Offering Price and Redemption Price Per Share | $ | 7.08 | ||
|
| |||
Components of Net Assets as of October 31, 2012 were as follows: | ||||
Paid-in capital | $ | 93,723,431 | ||
Accumulated undistributed net investment income | 516,655 | |||
Accumulated net realized loss from investment transactions | (15,174,633 | ) | ||
Net unrealized appreciation on investments and on assets and liabilities denominated in foreign currencies | 5,505,201 | |||
|
| |||
| $ | 84,570,654 | |||
|
| |||
See Notes to Financial Statements
55
Table of Contents
Harding, Loevner Funds, Inc.
Year Ended October 31, 2012
| Global Equity Portfolio | International Equity Portfolio | |||||||
Investment Income | ||||||||
Interest | $ | 11 | $ | 110 | ||||
Dividends (net of foreign withholding taxes of $194,579 and $3,220,481, respectively) | 4,179,154 | 33,696,449 | ||||||
|
|
|
| |||||
Total investment income | 4,179,165 | 33,696,559 | ||||||
|
|
|
| |||||
Expenses | ||||||||
Investment advisory fees (Note 3) | 2,372,592 | 11,786,537 | ||||||
Administration fees (Note 3) | 99,003 | 472,408 | ||||||
Distribution fees, Investor Class | — | 582,041 | ||||||
Custody and accounting fees (Note 3) | 67,091 | 365,971 | ||||||
Directors’ fees and expenses (Note 3) | 23,182 | 146,653 | ||||||
Transfer agent fees and expenses (Note 3) | 46,617 | 193,025 | ||||||
Printing and postage fees | 28,168 | 199,872 | ||||||
State registration filing fees | 61,748 | 140,932 | ||||||
Professional fees | 54,649 | 181,011 | ||||||
Shareholder servicing fees (Note 3) | 142,884 | 451,882 | ||||||
Chief compliance and financial officers’ fees and expenses (Note 3) | 22,979 | 89,223 | ||||||
Other fees and expenses | 20,999 | 114,842 | ||||||
|
|
|
| |||||
Total Expenses | 2,939,912 | 14,724,397 | ||||||
|
|
|
| |||||
Less Waiver of investment advisory fee and/or reimbursement of other operating expenses (Note 3) | (390,287 | ) | — | |||||
|
|
|
| |||||
Net expenses | 2,549,625 | 14,724,397 | ||||||
|
|
|
| |||||
Net investment income | 1,629,540 | 18,972,162 | ||||||
|
|
|
| |||||
Realized and Unrealized Gain (Loss) | ||||||||
Net realized gain (loss) — | (780,028 | ) | (21,627,502 | ) | ||||
Foreign currency transactions | (29,413 | ) | (450,352 | ) | ||||
|
|
|
| |||||
Net realized loss | (809,441 | ) | (22,077,854 | ) | ||||
|
|
|
| |||||
Change in unrealized appreciation (depreciation) — | 19,722,947 | 152,184,129 | ||||||
Translation of assets and liabilities denominated in foreign currencies | (5,535 | ) | (53,617 | ) | ||||
|
|
|
| |||||
Net change in unrealized appreciation | 19,717,412 | 152,130,512 | ||||||
|
|
|
| |||||
Net realized and unrealized gain | 18,907,971 | 130,052,658 | ||||||
|
|
|
| |||||
Net increase in net assets resulting from operations | $ | 20,537,511 | $ | 149,024,820 | ||||
|
|
|
| |||||
See Notes to Financial Statements
56
Table of Contents
Harding, Loevner Funds, Inc.
Statements of Operations (continued)
Year Ended October 31, 2012
| International Small Companies Portfolio | Institutional Emerging Markets Portfolio | |||||||
Investment Income | ||||||||
Interest | $ | — | $ | 96 | ||||
Dividends (net of foreign withholding taxes of $172,239, and $854,340, respectively) | 1,594,610 | 8,860,295 | ||||||
|
|
|
| |||||
Total investment income | 1,594,610 | 8,860,391 | ||||||
|
|
|
| |||||
Expenses | ||||||||
Investment advisory fees (Note 3) | 688,165 | 4,502,436 | ||||||
Administration fees (Note 3) | 22,021 | 143,830 | ||||||
Distribution fees, Investor Class | 71,679 | — | ||||||
Custody and accounting fees (Note 3) | 28,165 | 191,311 | ||||||
Directors’ fees and expenses (Note 3) | 5,063 | 36,506 | ||||||
Transfer agent fees and expenses (Note 3) | 42,761 | 40,133 | ||||||
Printing and postage fees | 8,937 | 48,367 | ||||||
State registration filing fees | 44,691 | 28,299 | ||||||
Professional fees | 35,692 | 87,744 | ||||||
Shareholder servicing fees (Note 3) | 43,569 | 89,103 | ||||||
Chief compliance and financial officers’ fees and expenses (Note 3) | 13,236 | 29,689 | ||||||
Other fees and expenses | 8,251 | 30,623 | ||||||
|
|
|
| |||||
Total Expenses | 1,012,230 | 5,228,041 | ||||||
|
|
|
| |||||
Less Waiver of investment advisory fee and/or reimbursement of other operating expenses (Note 3) | (114,752 | ) | (225,402 | ) | ||||
|
|
|
| |||||
Net expenses | 897,478 | 5,002,639 | ||||||
|
|
|
| |||||
Net investment income | 697,132 | 3,857,752 | ||||||
|
|
|
| |||||
Realized and Unrealized Gain (Loss) | ||||||||
Net realized gain (loss) — | (654,220 | ) | (2,956,384 | ) | ||||
Foreign currency transactions | (22,073 | ) | (175,010 | ) | ||||
|
|
|
| |||||
Net realized loss | (676,293 | ) | (3,131,394 | ) | ||||
|
|
|
| |||||
Change in unrealized appreciation (depreciation) — | 5,309,003 | 42,306,727 | ||||||
Translation of assets and liabilities denominated in foreign currencies | (1,347 | ) | (4,709 | ) | ||||
|
|
|
| |||||
Net change in unrealized appreciation | 5,307,656 | 42,302,018 | ||||||
|
|
|
| |||||
Net realized and unrealized gain | 4,631,363 | 39,170,624 | ||||||
|
|
|
| |||||
Net increase in net assets resulting from operations | $ | 5,328,495 | $ | 43,028,376 | ||||
|
|
|
| |||||
See Notes to Financial Statements
57
Table of Contents
Harding, Loevner Funds, Inc.
Statements of Operations (continued)
Year Ended October 31, 2012
| Emerging Markets Portfolio | Frontier Emerging Markets Portfolio | |||||||
Investment Income | ||||||||
Interest | $ | 276 | $ | — | ||||
Dividends (net of foreign withholding taxes of $3,622,986, and $149,034, respectively) | 36,976,835 | 2,352,174 | ||||||
|
|
|
| |||||
Total investment income | 36,977,111 | 2,352,174 | ||||||
|
|
|
| |||||
Expenses | ||||||||
Investment advisory fees (Note 3) | 18,752,432 | 1,179,508 | ||||||
Administration fees (Note 3) | 481,734 | 31,454 | ||||||
Distribution fees, Investor Class | — | 4,673 | ||||||
Custody and accounting fees (Note 3) | 594,430 | 164,965 | ||||||
Directors’ fees and expenses (Note 3) | 151,912 | 7,441 | ||||||
Transfer agent fees and expenses (Note 3) | 118,826 | 42,603 | ||||||
Printing and postage fees | 331,014 | 13,243 | ||||||
State registration filing fees | 44,556 | 50,442 | ||||||
Professional fees | 221,010 | 48,948 | ||||||
Shareholder servicing fees (Note 3) | 3,185,485 | 11,971 | ||||||
Chief compliance and financial officers’ fees and expenses (Note 3) | 91,770 | 14,468 | ||||||
Other fees and expenses | 120,971 | 12,037 | ||||||
|
|
|
| |||||
Total Expenses | 24,094,140 | 1,581,753 | ||||||
|
|
|
| |||||
Less Waiver of investment advisory fee and/or reimbursement of other operating expenses (Note 3) | — | (45,880 | ) | |||||
|
|
|
| |||||
Net expenses | 24,094,140 | 1,535,873 | ||||||
|
|
|
| |||||
Net investment income | 12,882,971 | 816,301 | ||||||
|
|
|
| |||||
Realized and Unrealized Gain (Loss) | ||||||||
Net realized gain (loss) — | 116,161,792 | (8,692,956 | ) | |||||
Foreign currency transactions | (804,004 | ) | (126,134 | ) | ||||
|
|
|
| |||||
Net realized gain (loss) | 115,357,788 | (8,819,090 | ) | |||||
|
|
|
| |||||
Change in unrealized appreciation (depreciation) — | 29,598,061 | 13,935,106 | ||||||
Translation of assets and liabilities denominated in foreign currencies | (31,947 | ) | 5,809 | |||||
|
|
|
| |||||
Net change in unrealized appreciation | 29,566,114 | 13,940,915 | ||||||
|
|
|
| |||||
Net realized and unrealized gain | 144,923,902 | 5,121,825 | ||||||
|
|
|
| |||||
Net increase in net assets resulting from operations | $ | 157,806,873 | $ | 5,938,126 | ||||
|
|
|
| |||||
See Notes to Financial Statements
58
Table of Contents
Harding, Loevner Funds, Inc.
Statements of Changes in Net Assets
| Global Equity Portfolio | ||||||||
| Year Ended October 31, 2012 | Year Ended October 31, 2011 | |||||||
Increase (Decrease) in Net Assets from Operations | ||||||||
Net investment income | $ | 1,629,540 | $ | 777,945 | ||||
Net realized gain (loss) on investments and foreign currency transactions | (809,441 | ) | 1,157,896 | |||||
Net change in unrealized appreciation (depreciation) on investments and translation of assets and liabilities denominated in foreign currencies | 19,717,412 | (3,080,013 | ) | |||||
|
|
|
| |||||
Net increase (decrease) in net assets resulting from operations | 20,537,511 | (1,144,172 | ) | |||||
|
|
|
| |||||
Distributions to Shareholders from: | ||||||||
Net investment income | ||||||||
Institutional Class | (684,027 | ) | (276,121 | ) | ||||
Advisor Class | (113,542 | ) | (13,880 | ) | ||||
Net realized gain from investments and foreign-currency related transactions | ||||||||
Institutional Class | (1,537,528 | ) | (728,148 | ) | ||||
Advisor Class | (545,744 | ) | (323,990 | ) | ||||
|
|
|
| |||||
Total distributions to shareholders | (2,880,841 | ) | (1,342,139 | ) | ||||
|
|
|
| |||||
Transactions in Shares of Common Stock(1) | ||||||||
Proceeds from sale of shares | ||||||||
Institutional Class | 91,670,031 | 57,666,639 | ||||||
Advisor Class | 20,087,287 | 35,483,876 | ||||||
Net Asset Value of shares issued to shareholders upon reinvestment of dividends | ||||||||
Institutional Class | 1,833,323 | 757,810 | ||||||
Advisor Class | 642,691 | 319,667 | ||||||
Cost of shares redeemed | ||||||||
Institutional Class | (27,697,196 | ) | (14,433,357 | ) | ||||
Advisor Class | (14,405,854 | ) | (22,627,479 | ) | ||||
Redemption fees | ||||||||
Institutional Class | 18,098 | 1,922 | ||||||
Advisor Class | 4,602 | 20,283 | ||||||
|
|
|
| |||||
Net increase in net assets from portfolio share transactions | 72,152,982 | 57,189,361 | ||||||
|
|
|
| |||||
Net Increase in Net Assets | 89,809,652 | 54,703,050 | ||||||
Net Assets | ||||||||
At beginning of year | 205,428,545 | 150,725,495 | ||||||
|
|
|
| |||||
At end of year | $ | 295,238,197 | $ | 205,428,545 | ||||
|
|
|
| |||||
Accumulated Undistributed Net Investment Income Included in Net Assets | $ | 1,540,991 | $ | 738,434 | ||||
|
|
|
| |||||
(1) Capital Share Transactions: | ||||||||
Institutional Class: | ||||||||
Shares sold | 3,808,905 | 2,418,120 | ||||||
Shares issued upon reinvestment of dividends | 85,389 | 31,276 | ||||||
Shares redeemed | (1,144,945 | ) | (590,237 | ) | ||||
|
|
|
| |||||
Net increase | 2,749,349 | 1,859,159 | ||||||
|
|
|
| |||||
Advisor Class | ||||||||
Shares sold | 821,759 | 1,435,477 | ||||||
Shares issued upon reinvestment of dividends | 29,907 | 13,193 | ||||||
Shares redeemed | (599,801 | ) | (930,560 | ) | ||||
|
|
|
| |||||
Net increase | 251,865 | 518,110 | ||||||
|
|
|
| |||||
See Notes to Financial Statements
59
Table of Contents
Harding, Loevner Funds, Inc.
Statements of Changes in Net Assets (continued)
| International Equity Portfolio | ||||||||
| Year Ended October 31, 2012 | Year Ended October 31, 2011 | |||||||
Increase (Decrease) in Net Assets from Operations | ||||||||
Net investment income | $ | 18,972,162 | $ | 10,081,566 | ||||
Net realized gain (loss) on investments and foreign currency transactions | (22,077,854 | ) | 3,738,022 | |||||
Net change in unrealized appreciation (depreciation) on investments and translation of assets and liabilities denominated in foreign currencies | 152,130,512 | (67,252,727 | ) | |||||
|
|
|
| |||||
Net increase (decrease) in net assets resulting from operations | 149,024,820 | (53,433,139 | ) | |||||
|
|
|
| |||||
Distributions to Shareholders from: | ||||||||
Net investment income | ||||||||
Institutional Class | (8,435,017 | ) | (2,289,138 | ) | ||||
Investor Class | (893,072 | ) | (210,939 | ) | ||||
Net realized gain from investments and foreign-currency related transactions | ||||||||
Institutional Class | (2,613,516 | ) | — | |||||
Investor Class | (520,125 | ) | — | |||||
|
|
|
| |||||
Total distributions to shareholders | (12,461,730 | ) | (2,500,077 | ) | ||||
|
|
|
| |||||
Transactions in Shares of Common Stock(1) | ||||||||
Proceeds from sale of shares | ||||||||
Institutional Class | 939,709,934 | 599,634,622 | ||||||
Investor Class | 138,691,379 | 201,027,494 | ||||||
Net Asset Value of shares issued to shareholders upon reinvestment of dividends | ||||||||
Institutional Class | 9,656,302 | 1,793,340 | ||||||
Investor Class | 1,342,486 | 198,416 | ||||||
Cost of shares redeemed | ||||||||
Institutional Class | (240,252,076 | ) | (84,673,697 | ) | ||||
Investor Class | (118,142,336 | ) | (65,395,019 | ) | ||||
Redemption fees | ||||||||
Institutional Class | 152,620 | 109,344 | ||||||
Investor Class | 54,231 | 56,300 | ||||||
|
|
|
| |||||
Net increase in net assets from portfolio share transactions | 731,212,540 | 652,750,800 | ||||||
|
|
|
| |||||
Net Increase in Net Assets | 867,775,630 | 596,817,584 | ||||||
Net Assets | ||||||||
At beginning of year | 1,206,632,321 | 609,814,737 | ||||||
|
|
|
| |||||
At end of year | $ | 2,074,407,951 | $ | 1,206,632,321 | ||||
|
|
|
| |||||
Accumulated Undistributed Net Investment Income Included in Net Assets | $ | 18,521,821 | $ | 9,328,100 | ||||
|
|
|
| |||||
(1)Capital Share Transactions: | ||||||||
Institutional Class: | ||||||||
Shares sold | 65,948,571 | 40,523,413 | ||||||
Shares issued upon reinvestment of dividends | 756,763 | 121,911 | ||||||
Shares redeemed | (16,871,394 | ) | (5,748,378 | ) | ||||
|
|
|
| |||||
Net increase | 49,833,940 | 34,896,946 | ||||||
|
|
|
| |||||
Investor Class | ||||||||
Shares sold | 9,719,567 | 13,439,479 | ||||||
Shares issued upon reinvestment of dividends | 105,293 | 13,495 | ||||||
Shares redeemed | (8,527,692 | ) | (4,547,245 | ) | ||||
|
|
|
| |||||
Net increase | 1,297,168 | 8,905,729 | ||||||
|
|
|
| |||||
See Notes to Financial Statements
60
Table of Contents
Harding, Loevner Funds, Inc.
Statements of Changes in Net Assets (continued)
| International Small Companies Portfolio | ||||||||
| Year Ended October 31, 2012 | Year Ended October 31, 2011 | |||||||
Increase (Decrease) in Net Assets from Operations | ||||||||
Net investment income | $ | 697,132 | $ | 366,374 | ||||
Net realized gain (loss) on investments and foreign currency transactions | (676,293 | ) | 362,866 | |||||
Net change in unrealized appreciation (depreciation) on investments and translation of assets and liabilities denominated in foreign currencies | 5,307,656 | (4,168,855 | ) | |||||
|
|
|
| |||||
Net increase (decrease) in net assets resulting from operations | 5,328,495 | (3,439,615 | ) | |||||
|
|
|
| |||||
Distributions to Shareholders from: | ||||||||
Net investment income | ||||||||
Institutional Class | (161,662 | ) | — | |||||
Investor Class | (173,171 | ) | (47,000 | ) | ||||
|
|
|
| |||||
Total distributions to shareholders | (334,833 | ) | (47,000 | ) | ||||
|
|
|
| |||||
Transactions in Shares of Common Stock(1) | ||||||||
Proceeds from sale of shares | ||||||||
Institutional Class | 17,978,898 | 15,339,181 | (2) | |||||
Investor Class | 9,292,966 | 31,885,145 | ||||||
Net Asset Value of shares issued to shareholders upon reinvestment of dividends | ||||||||
Institutional Class | 130,766 | — | ||||||
Investor Class | 160,271 | 43,816 | ||||||
Cost of shares redeemed | ||||||||
Institutional Class | (1,391,951 | ) | (708,630 | )(2) | ||||
Investor Class | (10,558,037 | ) | (12,905,747 | ) | ||||
Redemption fees | ||||||||
Institutional Class | 14,028 | 1,933 | (2) | |||||
Investor Class | 2,439 | 7,507 | ||||||
|
|
|
| |||||
Net increase in net assets from portfolio share transactions | 15,629,380 | 33,663,205 | ||||||
|
|
|
| |||||
Net Increase in Net Assets | 20,623,042 | 30,176,590 | ||||||
Net Assets | ||||||||
At beginning of year | 44,141,272 | 13,964,682 | ||||||
|
|
|
| |||||
At end of year | $ | 64,764,314 | $ | 44,141,272 | ||||
|
|
|
| |||||
Accumulated Undistributed Net Investment Income Included in Net Assets | $ | 665,965 | $ | 325,737 | ||||
|
|
|
| |||||
(1) Capital Share Transactions: | ||||||||
Institutional Class: | ||||||||
Shares sold | 1,709,827 | 1,398,064 | (2) | |||||
Shares issued upon reinvestment of dividends | 13,956 | — | ||||||
Shares redeemed | (126,321 | ) | (68,030 | )(2) | ||||
|
|
|
| |||||
Net increase | 1,597,462 | 1,330,034 | ||||||
|
|
|
| |||||
Investor Class | ||||||||
Shares sold | 865,151 | 2,720,512 | ||||||
Shares issued upon reinvestment of dividends | 17,086 | 3,951 | ||||||
Shares redeemed | (1,014,994 | ) | (1,147,689 | ) | ||||
|
|
|
| |||||
Net increase (decrease) | (132,757 | ) | 1,576,774 | |||||
|
|
|
| |||||
| (2) | For the period from June 30, 2011 (commencement of class operations) through October 31, 2011. |
See Notes to Financial Statements
61
Table of Contents
Harding, Loevner Funds, Inc.
Statements of Changes in Net Assets (continued)
| Institutional Emerging Markets Portfolio | ||||||||
| Year Ended October 31, 2012 | Year Ended October 31, 2011 | |||||||
Increase (Decrease) in Net Assets from Operations | ||||||||
Net investment income | $ | 3,857,752 | $ | 4,056,302 | ||||
Net realized loss on investments and foreign currency transactions | (3,131,394 | ) | (2,109,246 | ) | ||||
Net change in unrealized appreciation (depreciation) on investments and translation of assets and liabilities denominated in foreign currencies | 42,302,018 | (48,022,367 | ) | |||||
|
|
|
| |||||
Net increase (decrease) in net assets resulting from operations | 43,028,376 | (46,075,311 | ) | |||||
|
|
|
| |||||
Distributions to Shareholders from: | ||||||||
Net investment income | (3,430,979 | ) | (1,078,916 | ) | ||||
|
|
|
| |||||
Total distributions to shareholders | (3,430,979 | ) | (1,078,916 | ) | ||||
|
|
|
| |||||
Transactions in Shares of Common Stock(1) | ||||||||
Proceeds from sale of shares | 207,655,743 | 171,526,601 | ||||||
Net Asset Value of shares issued to shareholders upon reinvestment of dividends | 2,570,787 | 870,785 | ||||||
Cost of shares redeemed | (114,789,511 | ) | (171,940,753 | ) | ||||
Redemption fees | 44,109 | 36,537 | ||||||
|
|
|
| |||||
Net increase in net assets from portfolio share transactions | 95,481,128 | 493,170 | ||||||
|
|
|
| |||||
Net Increase (Decrease) in Net Assets | 135,078,525 | (46,661,057 | ) | |||||
Net Assets | ||||||||
At beginning of year | 328,712,597 | 375,373,654 | ||||||
|
|
|
| |||||
At end of year | $ | 463,791,122 | $ | 328,712,597 | ||||
|
|
|
| |||||
Accumulated Undistributed Net Investment Income Included in Net Assets | $ | 3,682,733 | $ | 3,430,970 | ||||
|
|
|
| |||||
(1) Capital Share Transactions: | ||||||||
Institutional Class: | ||||||||
Shares sold | 13,500,583 | 10,378,951 | ||||||
Shares issued upon reinvestment of dividends | 187,375 | 51,925 | ||||||
Shares redeemed | (7,495,123 | ) | (11,094,796 | ) | ||||
|
|
|
| |||||
Net increase (decrease) | 6,192,835 | (663,920 | ) | |||||
|
|
|
| |||||
See Notes to Financial Statements
62
Table of Contents
Harding, Loevner Funds, Inc.
Statements of Changes in Net Assets (continued)
| Emerging Markets Portfolio | ||||||||
| Year Ended October 31, 2012 | Year Ended October 31, 2011 | |||||||
Increase (Decrease) in Net Assets from Operations | ||||||||
Net investment income | $ | 12,882,971 | $ | 12,592,512 | ||||
Net realized gain on investments and foreign currency transactions | 115,357,788 | 36,132,718 | ||||||
Net change in unrealized appreciation (depreciation) on investments and translation of assets and liabilities denominated in foreign currencies | 29,566,114 | (242,222,294 | ) | |||||
|
|
|
| |||||
Net increase (decrease) in net assets resulting from operations | 157,806,873 | (193,497,064 | ) | |||||
|
|
|
| |||||
Distributions to Shareholders from: | ||||||||
Net investment income | (12,198,687 | ) | (8,430,123 | ) | ||||
|
|
|
| |||||
Total distributions to shareholders | (12,198,687 | ) | (8,430,123 | ) | ||||
|
|
|
| |||||
Transactions in Shares of Common Stock(1) | ||||||||
Proceeds from sale of Advisor Class shares | 316,743,964 | 513,900,199 | ||||||
Net Asset Value of Advisor Class shares issued to shareholders upon reinvestment of dividends | 11,171,687 | 7,482,325 | ||||||
Cost of Advisor Class shares redeemed | (452,237,000 | ) | (688,295,547 | ) | ||||
Redemption fees | 130,937 | 236,079 | ||||||
|
|
|
| |||||
Net decrease in net assets from portfolio share transactions | (124,190,412 | ) | (166,676,944 | ) | ||||
|
|
|
| |||||
Net Increase (Decrease) in Net Assets | 21,417,774 | (368,604,131 | ) | |||||
Net Assets | ||||||||
At beginning of year | 1,693,650,485 | 2,062,254,616 | ||||||
|
|
|
| |||||
At end of year | $ | 1,715,068,259 | $ | 1,693,650,485 | ||||
|
|
|
| |||||
Accumulated Undistributed Net Investment Income Included in Net Assets | $ | 12,078,855 | $ | 12,198,578 | ||||
|
|
|
| |||||
(1) Capital Share Transactions: | ||||||||
Advisor Class: | ||||||||
Shares sold | 6,805,184 | 10,415,119 | ||||||
Shares issued upon reinvestment of dividends | 272,549 | 148,894 | ||||||
Shares redeemed | (9,945,806 | ) | (14,243,856 | ) | ||||
|
|
|
| |||||
Net decrease | (2,868,073 | ) | (3,679,843 | ) | ||||
|
|
|
| |||||
See Notes to Financial Statements
63
Table of Contents
Harding, Loevner Funds, Inc.
Statements of Changes in Net Assets (continued)
| Frontier Emerging Markets Portfolio | ||||||||
| Year Ended October 31, 2012 | Year Ended October 31, 2011 | |||||||
Increase (Decrease) in Net Assets from Operations | ||||||||
Net investment income | $ | 816,301 | $ | 960,775 | ||||
Net realized loss on investments and foreign currency transactions | (8,819,090 | ) | (5,439,936 | ) | ||||
Net change in unrealized appreciation (depreciation) on investments and translation of assets and liabilities denominated in foreign currencies | 13,940,915 | (15,959,551 | ) | |||||
|
|
|
| |||||
Net increase (decrease) in net assets resulting from operations | 5,938,126 | (20,438,712 | ) | |||||
|
|
|
| |||||
Distributions to Shareholders from: | ||||||||
Net investment income | ||||||||
Institutional Class | (485,460 | ) | (146,644 | ) | ||||
Investor Class | (4,494 | ) | — | |||||
|
|
|
| |||||
Total distributions to shareholders | (489,954 | ) | (146,644 | ) | ||||
|
|
|
| |||||
Transactions in Shares of Common Stock(1) | ||||||||
Proceeds from sale of shares | ||||||||
Institutional Class | 33,921,678 | 84,190,248 | ||||||
Investor Class | 2,377,451 | 1,441,038 | (2) | |||||
Net Asset Value of shares issued to shareholders upon reinvestment of dividends | ||||||||
Institutional Class | 413,499 | 113,054 | ||||||
Investor Class | 4,370 | — | ||||||
Cost of shares redeemed | ||||||||
Institutional Class | (59,804,613 | ) | (32,853,959 | ) | ||||
Investor Class | (757,747 | ) | (73,004 | )(2) | ||||
Redemption fees | ||||||||
Institutional Class | 76,924 | 13,350 | ||||||
Investor Class | 7 | 595 | (2) | |||||
|
|
|
| |||||
Net increase (decrease) in net assets from portfolio share transactions | (23,768,431 | ) | 52,831,322 | |||||
|
|
|
| |||||
Net Increase (Decrease) in Net Assets | (18,320,259 | ) | 32,245,966 | |||||
Net Assets | ||||||||
At beginning of year | 102,890,913 | 70,644,947 | ||||||
|
|
|
| |||||
At end of year | $ | 84,570,654 | $ | 102,890,913 | ||||
|
|
|
| |||||
Accumulated Undistributed Net Investment Income Included in Net Assets | $ | 516,655 | $ | 316,442 | ||||
|
|
|
| |||||
(1) Capital Share Transactions: | ||||||||
Institutional Class: | ||||||||
Shares sold | 5,166,058 | 11,007,881 | ||||||
Shares issued upon reinvestment of dividends | 67,787 | 14,576 | ||||||
Shares redeemed | (9,250,325 | ) | (4,506,525 | ) | ||||
|
|
|
| |||||
Net increase (decrease) | (4,016,480 | ) | 6,515,932 | |||||
|
|
|
| |||||
Investor Class | ||||||||
Shares sold | 353,056 | 197,456 | (2) | |||||
Shares issued upon reinvestment of dividends | 719 | — | ||||||
Shares redeemed | (116,978 | ) | (10,348 | )(2) | ||||
|
|
|
| |||||
Net increase | 236,797 | 187,108 | ||||||
|
|
|
| |||||
(2) For the period from December 31, 2010 (commencement of class operations) through October 31, 2011. |
| |||||||
See Notes to Financial Statements
64
Table of Contents
Harding, Loevner Funds, Inc.
| Global Equity Portfolio - Institutional Class | ||||||||||||
| For the Year Ended Oct. 31, 2012 | For the Year Ended Oct. 31, 2011 | For the Period Ended Oct. 31, 2010(1) | ||||||||||
Per Share Data | ||||||||||||
Net asset value, beginning of period | $ | 23.38 | $ | 23.52 | $ | 20.43 | ||||||
|
|
|
|
|
| |||||||
Increase in Net Assets from Operations | ||||||||||||
Net investment income | 0.18 | (2) | 0.12 | (2) | 0.10 | |||||||
Net realized and unrealized gain (loss) on investments and foreign currency-related transactions | 1.81 | (0.04 | ) | 3.04 | ||||||||
|
|
|
|
|
| |||||||
Net increase from investment operations | 1.99 | 0.08 | 3.14 | |||||||||
|
|
|
|
|
| |||||||
Distributions to Shareholders from: | ||||||||||||
Net investment income | (0.10 | ) | (0.06 | ) | (0.05 | ) | ||||||
Net realized gain from investments | (0.22 | ) | (0.16 | ) | — | |||||||
|
|
|
|
|
| |||||||
Total distributions | (0.32 | ) | (0.22 | ) | (0.05 | ) | ||||||
|
|
|
|
|
| |||||||
Net asset value, end of period | $ | 25.05 | $ | 23.38 | $ | 23.52 | ||||||
|
|
|
|
|
| |||||||
Total Return | 8.73 | % | 0.27 | % | 15.39 | %(A) | ||||||
Ratios/Supplemental Data: | ||||||||||||
Net assets, end of period (000’s) | $ | 226,489 | $ | 147,108 | $ | 104,276 | ||||||
Expenses to average net assets | 1.12 | % | 1.16 | % | 1.27 | %(B) | ||||||
Expenses to average net assets (net of fees waived/reimbursed) | 0.95 | % | 1.00 | % | 1.00 | %(B) | ||||||
Net investment income to average net assets | 0.72 | % | 0.48 | % | 0.43 | %(B) | ||||||
Portfolio turnover rate | 32 | % | 40 | % | 35 | %(A) | ||||||
| (1) | For the period from November 3, 2009 (commencement of class operations) through October 31, 2010. |
| (2) | Net investment income per share was calculated using the average shares outstanding method. |
| (A) | Not Annualized. |
| (B) | Annualized. |
| Global Equity Portfolio - Advisor Class | ||||||||||||||||||||
| For the Year Ended Oct. 31, 2012 | For the Year Ended Oct. 31, 2011 | For the Year Ended Oct. 31, 2010 | For the Year Ended Oct. 31, 2009 | For the Year Ended Oct. 31, 2008 | ||||||||||||||||
Per Share Data | ||||||||||||||||||||
Net asset value, beginning of year | $ | 23.36 | $ | 23.48 | $ | 20.27 | $ | 15.92 | $ | 28.03 | ||||||||||
|
|
|
|
|
|
|
|
|
| |||||||||||
Increase (Decrease) in Net Assets from Operations | ||||||||||||||||||||
Net investment income | 0.11 | (1) | 0.07 | (1) | 0.10 | 0.06 | 0.12 | |||||||||||||
Net realized and unrealized gain (loss) on investments and foreign currency-related transactions | 1.82 | (0.02 | ) | 3.15 | 4.38 | (10.15 | ) | |||||||||||||
|
|
|
|
|
|
|
|
|
| |||||||||||
Net increase (decrease) from investment operations | 1.93 | 0.05 | 3.25 | 4.44 | (10.03 | ) | ||||||||||||||
|
|
|
|
|
|
|
|
|
| |||||||||||
Distributions to Shareholders from: | ||||||||||||||||||||
Net investment income | (0.05 | ) | (0.01 | ) | (0.04 | ) | (0.09 | ) | (0.08 | ) | ||||||||||
Net realized gain from investments | (0.22 | ) | (0.16 | ) | — | — | (2.00 | ) | ||||||||||||
|
|
|
|
|
|
|
|
|
| |||||||||||
Total distributions | (0.27 | ) | (0.17 | ) | (0.04 | ) | (0.09 | ) | (2.08 | ) | ||||||||||
|
|
|
|
|
|
|
|
|
| |||||||||||
Net asset value, end of year | $ | 25.02 | $ | 23.36 | $ | 23.48 | $ | 20.27 | $ | 15.92 | ||||||||||
|
|
|
|
|
|
|
|
|
| |||||||||||
Total Return | 8.43 | % | 0.18 | % | 16.07 | % | 28.05 | % | (38.54 | )% | ||||||||||
Ratios/Supplemental Data: | ||||||||||||||||||||
Net assets, end of year (000’s) | $ | 68,749 | $ | 58,320 | $ | 46,450 | $ | 66,810 | $ | 26,208 | ||||||||||
Expenses to average net assets | 1.35 | % | 1.30 | % | 1.41 | % | 1.63 | % | 1.45 | % | ||||||||||
Expenses to average net assets (net of fees waived/reimbursed) | 1.23 | % | 1.18 | % | 1.17 | % | 1.25 | % | 1.25 | % | ||||||||||
Net investment income to average net assets | 0.45 | % | 0.31 | % | 0.31 | % | 0.43 | % | 0.51 | % | ||||||||||
Portfolio turnover rate | 32 | % | 40 | % | 35 | % | 31 | % | 38 | % | ||||||||||
(1) Net investment income per share was calculated using the average shares outstanding method.
See Notes to Financial Statements
65
Table of Contents
Harding, Loevner Funds, Inc.
Financial Highlights
(continued)
| International Equity Portfolio - Institutional Class | ||||||||||||||||||||
| For the Year Ended Oct. 31, 2012 | For the Year Ended Oct. 31, 2011 | For the Year Ended Oct. 31, 2010 | For the Year Ended Oct. 31, 2009 | For the Year Ended Oct. 31, 2008 | ||||||||||||||||
Per Share Data | ||||||||||||||||||||
Net asset value, beginning of year | $ | 14.06 | $ | 14.51 | $ | 12.04 | $ | 11.44 | $ | 21.71 | ||||||||||
|
|
|
|
|
|
|
|
|
| |||||||||||
Increase (Decrease) in Net Assets from Operations | ||||||||||||||||||||
Net investment income | 0.18 | (1) | 0.17 | (1) | 0.08 | 0.13 | 0.20 | |||||||||||||
Net realized and unrealized gain (loss) on investments and foreign currency-related transactions | 1.06 | (0.56 | ) | 2.49 | 2.86 | (8.63 | ) | |||||||||||||
|
|
|
|
|
|
|
|
|
| |||||||||||
Net increase (decrease) from investment operations | 1.24 | (0.39 | ) | 2.57 | 2.99 | (8.43 | ) | |||||||||||||
|
|
|
|
|
|
|
|
|
| |||||||||||
Distributions to Shareholders from: | ||||||||||||||||||||
Net investment income | (0.11 | ) | (0.06 | ) | (0.10 | ) | (0.19 | ) | (0.15 | ) | ||||||||||
Net realized gain from investments | (0.04 | ) | — | — | (2.20 | ) | (1.69 | ) | ||||||||||||
|
|
|
|
|
|
|
|
|
| |||||||||||
Total distributions | (0.15 | ) | (0.06 | ) | (0.10 | ) | (2.39 | ) | (1.84 | ) | ||||||||||
|
|
|
|
|
|
|
|
|
| |||||||||||
Net asset value, end of year | $ | 15.15 | $ | 14.06 | $ | 14.51 | $ | 12.04 | $ | 11.44 | ||||||||||
|
|
|
|
|
|
|
|
|
| |||||||||||
Total Return | 9.00 | % | (2.72 | )% | 21.50 | % | 32.77 | % | (42.33 | )% | ||||||||||
Ratios/Supplemental Data: | ||||||||||||||||||||
Net assets, end of year (000’s) | $ | 1,798,940 | $ | 969,139 | $ | 493,350 | $ | 259,450 | $ | 191,450 | ||||||||||
Expenses to average net assets | 0.87 | % | 0.86 | % | 0.93 | % | 1.04 | % | 0.98 | % | ||||||||||
Expenses to average net assets (net of fees waived/reimbursed) | 0.87 | % | 0.86 | % | 0.93 | % | 1.00 | % | 0.98 | % | ||||||||||
Net investment income to average net assets | 1.26 | % | 1.13 | % | 0.91 | % | 1.31 | % | 1.05 | % | ||||||||||
Portfolio turnover rate | 14 | % | 15 | % | 33 | % | 22 | % | 18 | % | ||||||||||
| (1) | Net investment income per share was calculated using the average shares outstanding method. |
| International Equity Portfolio - Investor Class | ||||||||||||||||||||
| For the Year Ended Oct. 31, 2012 | For the Year Ended Oct. 31, 2011 | For the Year Ended Oct. 31, 2010 | For the Year Ended Oct. 31, 2009 | For the Year Ended Oct. 31, 2008 | ||||||||||||||||
Per Share Data | ||||||||||||||||||||
Net asset value, beginning of year | $ | 14.01 | $ | 14.47 | $ | 12.02 | $ | 11.41 | $ | 21.66 | ||||||||||
|
|
|
|
|
|
|
|
|
| |||||||||||
Increase (Decrease) in Net Assets from Operations | ||||||||||||||||||||
Net investment income | 0.12 | (1) | 0.12 | (1) | 0.09 | 0.13 | 0.13 | |||||||||||||
Net realized and unrealized gain (loss) on investments and foreign currency-related transactions | 1.06 | (0.56 | ) | 2.44 | 2.83 | (8.58 | ) | |||||||||||||
|
|
|
|
|
|
|
|
|
| |||||||||||
Net increase (decrease) from investment operations | 1.18 | (0.44 | ) | 2.53 | 2.96 | (8.45 | ) | |||||||||||||
|
|
|
|
|
|
|
|
|
| |||||||||||
Distributions to Shareholders from: | ||||||||||||||||||||
Net investment income | (0.06 | ) | (0.02 | ) | (0.08 | ) | (0.15 | ) | (0.11 | ) | ||||||||||
Net realized gain from investments | (0.04 | ) | — | �� | — | (2.20 | ) | (1.69 | ) | |||||||||||
|
|
|
|
|
|
|
|
|
| |||||||||||
Total distributions | (0.10 | ) | (0.02 | ) | (0.08 | ) | (2.35 | ) | (1.80 | ) | ||||||||||
|
|
|
|
|
|
|
|
|
| |||||||||||
Net asset value, end of year | $ | 15.09 | $ | 14.01 | $ | 14.47 | $ | 12.02 | $ | 11.41 | ||||||||||
|
|
|
|
|
|
|
|
|
| |||||||||||
Total Return | 8.51 | % | (3.02 | )% | 21.18 | % | 32.48 | % | (42.46 | )% | ||||||||||
Ratios/Supplemental Data: | ||||||||||||||||||||
Net assets, end of year (000’s) | $ | 275,468 | $ | 237,494 | $ | 116,465 | $ | 38,134 | $ | 12,122 | ||||||||||
Expenses to average net assets | 1.24 | % | 1.26 | % | 1.32 | % | 1.39 | % | 1.23 | % | ||||||||||
Expenses to average net assets (net of fees waived/reimbursed) | 1.24 | % | 1.25 | % | 1.25 | % | 1.25 | % | 1.23 | % | ||||||||||
Net investment income to average net assets | 0.87 | % | 0.79 | % | 0.69 | % | 1.03 | % | 0.81 | % | ||||||||||
Portfolio turnover rate | 14 | % | 15 | % | 33 | % | 22 | % | 18 | % | ||||||||||
| (1) | Net investment income per share was calculated using the average shares outstanding method. |
See Notes to Financial Statements
66
Table of Contents
Harding, Loevner Funds, Inc.
Financial Highlights
(continued)
| International Small Companies Portfolio - Institutional Class | ||||||||
| For the Year Ended Oct. 31, 2012 | For the Period Ended Oct. 31, 2011(1) | |||||||
Per Share Data | ||||||||
Net asset value, beginning of period | $ | 10.53 | $ | 12.28 | ||||
|
|
|
| |||||
Increase (Decrease) in Net Assets from Operations | ||||||||
Net investment income | 0.16 | (2) | 0.03 | (2) | ||||
Net realized and unrealized gain (loss) on investments and foreign currency-related transactions | 0.85 | (1.78 | ) | |||||
|
|
|
| |||||
Net increase (decrease) from investment operations | 1.01 | (1.75 | ) | |||||
|
|
|
| |||||
Distributions to Shareholders from: | ||||||||
Net investment income | (0.09 | ) | — | |||||
|
|
|
| |||||
Total distributions | (0.09 | ) | — | |||||
|
|
|
| |||||
Net asset value, end of period | $ | 11.45 | $ | 10.53 | ||||
|
|
|
| |||||
Total Return | 9.74 | % | (14.25 | )%(A) | ||||
Ratios/Supplemental Data: | ||||||||
Net assets, end of period (000’s) | $ | 33,515 | $ | 14,000 | ||||
Expenses to average net assets | 1.64 | % | 2.70 | %(B) | ||||
Expenses to average net assets (net of fees waived/reimbursed) | 1.50 | % | 1.50 | %(B) | ||||
Net investment income to average net assets | 1.49 | % | 0.89 | %(B) | ||||
Portfolio turnover rate | 10 | % | 12 | %(A) | ||||
| (1) | For the period from June 30, 2011 (commencement of class operations) through October 31, 2011. |
| (2) | Net investment income per share was calculated using the average shares outstanding method. |
| (A) | Not Annualized. |
| (B) | Annualized. |
| International Small Companies Portfolio - Investor Class | ||||||||||||||||||||
| For the Year Ended Oct. 31, 2012 | For the Year Ended Oct. 31, 2011 | For the Year Ended Oct. 31, 2010 | For the Year Ended Oct. 31, 2009 | For the Year Ended Oct. 31, 2008 | ||||||||||||||||
Per Share Data | ||||||||||||||||||||
Net asset value, beginning of year | $ | 10.51 | $ | 10.82 | $ | 8.92 | $ | 5.53 | $ | 11.67 | ||||||||||
|
|
|
|
|
|
|
|
|
| |||||||||||
Increase (Decrease) in Net Assets from Operations | ||||||||||||||||||||
Net investment income | 0.11 | (1) | 0.15 | (1) | 0.05 | 0.06 | 0.11 | |||||||||||||
Net realized and unrealized gain (loss) on investments and foreign currency-related transactions | 0.88 | (0.43 | ) | 1.90 | 3.40 | (6.15 | ) | |||||||||||||
|
|
|
|
|
|
|
|
|
| |||||||||||
Net increase (decrease) from investment operations | 0.99 | (0.28 | ) | 1.95 | 3.46 | (6.04 | ) | |||||||||||||
|
|
|
|
|
|
|
|
|
| |||||||||||
Distributions to Shareholders from: | ||||||||||||||||||||
Net investment income | (0.07 | ) | (0.03 | ) | (0.05 | ) | (0.07 | ) | (0.03 | ) | ||||||||||
Net realized gain from investments | — | — | — | — | (0.07 | ) | ||||||||||||||
|
|
|
|
|
|
|
|
|
| |||||||||||
Total distributions | (0.07 | ) | (0.03 | ) | (0.05 | ) | (0.07 | ) | (0.10 | ) | ||||||||||
|
|
|
|
|
|
|
|
|
| |||||||||||
Net asset value, end of year | $ | 11.43 | $ | 10.51 | $ | 10.82 | $ | 8.92 | $ | 5.53 | ||||||||||
|
|
|
|
|
|
|
|
|
| |||||||||||
Total Return | 9.51 | % | (2.67 | )% | 21.93 | % | 63.47 | % | (52.17 | )% | ||||||||||
Ratios/Supplemental Data: | ||||||||||||||||||||
Net assets, end of year (000’s) | $ | 31,249 | $ | 30,142 | $ | 13,972 | $ | 6,215 | $ | 2,776 | ||||||||||
Expenses to average net assets | 2.02 | % | 2.15 | % | 3.14 | % | 5.21 | % | 4.22 | % | ||||||||||
Expenses to average net assets (net of fees waived/reimbursed) | 1.75 | % | 1.75 | % | 1.75 | % | 1.75 | % | 1.75 | % | ||||||||||
Net investment income to average net assets | 1.07 | % | 1.29 | % | 0.76 | % | 1.04 | % | 1.22 | % | ||||||||||
Portfolio turnover rate | 10 | % | 12 | % | 11 | % | 24 | % | 26 | % | ||||||||||
| (1) | Net investment income per share was calculated using the average shares outstanding method. |
See Notes to Financial Statements
67
Table of Contents
Harding, Loevner Funds, Inc.
Financial Highlights
(continued)
| Institutional Emerging Markets Portfolio | ||||||||||||||||||||
| For the Year Ended Oct. 31, 2012 | For the Year Ended Oct. 31, 2011 | For the Year Ended Oct. 31, 2010 | For the Year Ended Oct. 31, 2009 | For the Year Ended Oct. 31, 2008 | ||||||||||||||||
Per Share Data | ||||||||||||||||||||
Net asset value, beginning of year | $ | 15.07 | $ | 16.70 | $ | 13.29 | $ | 9.29 | $ | 21.20 | ||||||||||
|
|
|
|
|
|
|
|
|
| |||||||||||
Increase (Decrease) in Net Assets from Operations | ||||||||||||||||||||
Net investment income | 0.16 | (1) | 0.15 | (1) | 0.09 | 0.10 | 0.44 | |||||||||||||
Net realized and unrealized gain (loss) on investments and foreign currency-related transactions | 1.49 | (1.74 | ) | 3.41 | 4.27 | (11.53 | ) | |||||||||||||
|
|
|
|
|
|
|
|
|
| |||||||||||
Net increase (decrease) from investment operations | 1.65 | (1.59 | ) | 3.50 | 4.37 | (11.09 | ) | |||||||||||||
|
|
|
|
|
|
|
|
|
| |||||||||||
Distributions to Shareholders from: | ||||||||||||||||||||
Net investment income | (0.16 | ) | (0.04 | ) | (0.09 | ) | (0.37 | ) | (0.09 | ) | ||||||||||
Net realized gain from investments | — | — | — | — | (0.73 | ) | ||||||||||||||
|
|
|
|
|
|
|
|
|
| |||||||||||
Total distributions | (0.16 | ) | (0.04 | ) | (0.09 | ) | (0.37 | ) | (0.82 | ) | ||||||||||
|
|
|
|
|
|
|
|
|
| |||||||||||
Net asset value, end of year | $ | 16.56 | $ | 15.07 | $ | 16.70 | $ | 13.29 | $ | 9.29 | ||||||||||
|
|
|
|
|
|
|
|
|
| |||||||||||
Total Return | 11.17 | % | (9.58 | )% | 26.50 | % | 48.92 | % | (54.33 | )% | ||||||||||
Ratios/Supplemental Data: | ||||||||||||||||||||
Net assets, end of year (000’s) | $ | 463,791 | $ | 328,713 | $ | 375,374 | $ | 203,548 | $ | 132,037 | ||||||||||
Expenses to average net assets | 1.36 | % | 1.39 | % | 1.48 | % | 1.55 | % | 1.52 | % | ||||||||||
Expenses to average net assets (net of fees waived/reimbursed) | 1.30 | % | 1.30 | % | 1.30 | % | 1.30 | % | 1.30 | % | ||||||||||
Net investment income to average net assets | 1.00 | % | 0.93 | % | 0.74 | % | 0.93 | % | 2.56 | % | ||||||||||
Portfolio turnover rate | 42 | % | 53 | % | 34 | % | 57 | % | 51 | % | ||||||||||
| (1) | Net investment income per share was calculated using the average shares outstanding method. |
See Notes to Financial Statements
68
Table of Contents
Harding, Loevner Funds, Inc.
Financial Highlights
(continued)
| Emerging Markets Portfolio - Advisor Class | ||||||||||||||||||||
| For the Year Ended Oct. 31, 2012 | For the Year Ended Oct. 31, 2011 | For the Year Ended Oct. 31, 2010 | For the Year Ended Oct. 31, 2009 | For the Year Ended Oct. 31, 2008 | ||||||||||||||||
Per Share Data | ||||||||||||||||||||
Net asset value, beginning of year | $ | 45.18 | $ | 50.09 | $ | 39.64 | $ | 27.73 | $ | 64.07 | ||||||||||
|
|
|
|
|
|
|
|
|
| |||||||||||
Increase (Decrease) in Net Assets from Operations | ||||||||||||||||||||
Net investment income | 0.37 | (1) | 0.31 | (1) | 0.25 | 0.26 | 1.12 | |||||||||||||
Net realized and unrealized gain (loss) on investments and foreign currency-related transactions | 4.34 | (5.02 | ) | 10.33 | 12.68 | (34.06 | ) | |||||||||||||
|
|
|
|
|
|
|
|
|
| |||||||||||
Net increase (decrease) from investment operations | 4.71 | (4.71 | ) | 10.58 | 12.94 | (32.94 | ) | |||||||||||||
|
|
|
|
|
|
|
|
|
| |||||||||||
Distributions to Shareholders from: | ||||||||||||||||||||
Net investment income | (0.35 | ) | (0.20 | ) | (0.13 | ) | (1.03 | ) | (0.12 | ) | ||||||||||
Net realized gain from investments | — | — | — | — | (3.28 | ) | ||||||||||||||
|
|
|
|
|
|
|
|
|
| |||||||||||
Total distributions | (0.35 | ) | (0.20 | ) | (0.13 | ) | (1.03 | ) | (3.40 | ) | ||||||||||
|
|
|
|
|
|
|
|
|
| |||||||||||
Net asset value, end of year | $ | 49.54 | $ | 45.18 | $ | 50.09 | $ | 39.64 | $ | 27.73 | ||||||||||
|
|
|
|
|
|
|
|
|
| |||||||||||
Total Return | 10.60 | % | (9.48 | )% | 26.77 | % | 48.44 | % | (54.17 | )% | ||||||||||
Ratios/Supplemental Data: | ||||||||||||||||||||
Net assets, end of year (000’s) | $ | 1,715,068 | $ | 1,693,650 | $ | 2,062,255 | $ | 1,540,822 | $ | 1,086,124 | ||||||||||
Expenses to average net assets | 1.49 | % | 1.50 | % | 1.58 | % | 1.64 | % | 1.61 | % | ||||||||||
Net investment income to average net assets | 0.80 | % | 0.63 | % | 0.60 | % | 0.56 | % | 2.10 | % | ||||||||||
Portfolio turnover rate | 36 | % | 33 | % | 25 | % | 48 | % | 46 | % | ||||||||||
| (1) | Net investment income per share was calculated using the average shares outstanding method. |
See Notes to Financial Statements
69
Table of Contents
Harding, Loevner Funds, Inc.
Financial Highlights
(continued)
| Frontier Emerging Markets Portfolio - Institutional Class | ||||||||||||||||||||
| For the Year Ended Oct. 31, 2012 | For the Year Ended Oct. 31, 2011 | For the Year Ended Oct. 31, 2010 | For the Year Ended Oct. 31, 2009 | For the Period Ended Oct. 31, 2008 (1) | ||||||||||||||||
Per Share Data | ||||||||||||||||||||
Net asset value, beginning of period | $ | 6.57 | $ | 7.88 | $ | 6.29 | $ | 4.98 | $ | 10.00 | ||||||||||
|
|
|
|
|
|
|
|
|
| |||||||||||
Increase (Decrease) in Net Assets from Operations | ||||||||||||||||||||
Net investment income | 0.07 | (2) | 0.07 | (2) | 0.03 | 0.07 | 0.01 | |||||||||||||
Net realized and unrealized gain (loss) on investments and foreign currency-related transactions | 0.51 | (1.37 | ) | 1.65 | 1.26 | (5.03 | ) | |||||||||||||
|
|
|
|
|
|
|
|
|
| |||||||||||
Net increase (decrease) from investment operations | 0.58 | (1.30 | ) | 1.68 | 1.33 | (5.02 | ) | |||||||||||||
|
|
|
|
|
|
|
|
|
| |||||||||||
Distributions to Shareholders from: | ||||||||||||||||||||
Net investment income | (0.03 | ) | (0.01 | ) | (0.09 | ) | (0.02 | ) | — | |||||||||||
|
|
|
|
|
|
|
|
|
| |||||||||||
Total distributions | (0.03 | ) | (0.01 | ) | (0.09 | ) | (0.02 | ) | — | |||||||||||
|
|
|
|
|
|
|
|
|
| |||||||||||
Net asset value, end of period | $ | 7.12 | $ | 6.57 | $ | 7.88 | $ | 6.29 | $ | 4.98 | ||||||||||
|
|
|
|
|
|
|
|
|
| |||||||||||
Total Return | 8.93 | % | (16.49 | )% | 27.04 | % | 26.71 | % | (50.20 | )%(A) | ||||||||||
Ratios/Supplemental Data: | ||||||||||||||||||||
Net assets, end of period (000’s) | $ | 81,568 | $ | 101,666 | $ | 70,645 | $ | 9,071 | $ | 4,875 | ||||||||||
Expenses to average net assets | 1.95 | % | 1.87 | % | 2.37 | % | 4.08 | % | 8.92 | %(B) | ||||||||||
Expenses to average net assets (net of fees waived/reimbursed) | 1.95 | % | 1.87 | % | 2.00 | % | 2.00 | % | 2.00 | %(B) | ||||||||||
Net investment income to average net assets | 1.03 | % | 0.89 | % | (0.08 | )% | 1.39 | % | 0.42 | %(B) | ||||||||||
Portfolio turnover rate | 72 | % | 23 | % | 17 | % | 55 | % | 1 | %(A) | ||||||||||
| (1) | For the period from May 27, 2008 (commencement of class operations) through October 31, 2008. |
| (2) | Net investment income per share was calculated using the average shares outstanding method. |
| (A) | Not Annualized. |
| (B) | Annualized. |
| Frontier Emerging Markets Portfolio- Investor Class | ||||||||
| For the Year Ended Oct. 31, 2012 | For the Period Ended Oct. 31, 2011(1) | |||||||
Per Share Data | ||||||||
Net asset value, beginning of period | $ | 6.55 | $ | 7.84 | ||||
|
|
|
| |||||
Increase (Decrease) in Net Assets from Operations | ||||||||
Net investment income | 0.10 | (2) | 0.04 | (2) | ||||
Net realized and unrealized gain (loss) on investments and foreign currency-related transactions | 0.45 | (1.33 | ) | |||||
|
|
|
| |||||
Net increase (decrease) from investment operations | 0.55 | (1.29 | ) | |||||
|
|
|
| |||||
Distributions to Shareholders from: | ||||||||
Net investment income | (0.02 | ) | — | |||||
|
|
|
| |||||
Total Distributions | (0.02 | ) | — | |||||
|
|
|
| |||||
Net asset value, end of period | $ | 7.08 | $ | 6.55 | ||||
|
|
|
| |||||
Total Return | 8.49 | % | (16.45 | )%(A) | ||||
Ratios/Supplemental Data: | ||||||||
Net assets, end of period (000’s) | $ | 3,003 | $ | 1,225 | ||||
Expenses to average net assets | 4.71 | % | 9.06 | %(B) | ||||
Expenses to average net assets (net of fees waived/reimbursed) | 2.25 | % | 2.25 | %(B) | ||||
Net investment income to average net assets | 1.47 | % | 0.75 | %(B) | ||||
Portfolio turnover rate | 72 | % | 23 | %(A) | ||||
| (1) | For the period from December 31, 2010 (commencement of class operations) through October 31, 2011. |
| (2) | Net investment income per share was calculated using the average shares outstanding method. |
| (A) | Not Annualized. |
| (B) | Annualized. |
See Notes to Financial Statements
70
Table of Contents
Harding, Loevner Funds, Inc.
October 31, 2012
1. Organization
Harding, Loevner Funds, Inc. (the “Fund”) was organized as a Maryland corporation on July 31, 1996, and is registered under the Investment Company Act of 1940, as amended (the “1940 Act”), as an open-end diversified management investment company. The Fund currently has six Portfolios, all of which were active as of October 31, 2012 (individually, a “Portfolio”, collectively, the “Portfolios”). The Fund is managed by Harding Loevner LP (the “Investment Adviser”).
Portfolio | Inception Date | Investment Objective | ||
Global Equity Portfolio | Institutional Class: November 3, 2009 | to seek long-term capital appreciation | ||
(“Global Equity”) | Advisor Class: December 1, 1996 | through investments in equity securities | ||
| of companies based both inside and | ||||
| outside the United States | ||||
International Equity Portfolio | Institutional Class: May 11, 1994* | to seek long-term capital appreciation | ||
(“International Equity”) | Investor Class: September 30, 2005 | through investments in equity securities | ||
| of companies based outside the United | ||||
| States | ||||
International Small Companies Portfolio | Institutional Class: June 30, 2011 | to seek long-term capital appreciation | ||
(“International Small Companies”) | Investor Class: March 26, 2007 | through investments in equity securities | ||
| of small companies based outside the | ||||
| United States | ||||
Institutional Emerging Markets Portfolio | October 17, 2005 | to seek long-term capital appreciation | ||
(“Institutional Emerging Markets”) | through investments in equity securities | |||
| of companies based in emerging | ||||
| markets | ||||
Emerging Markets Portfolio | Advisor Class: November 9, 1998 | to seek long-term capital appreciation | ||
(“Emerging Markets”) | through investments in equity securities | |||
| of companies based in emerging | ||||
| markets | ||||
Frontier Emerging Markets Portfolio | Institutional Class: May 27, 2008 | to seek long-term capital appreciation | ||
(“Frontier Emerging Markets”) | Investor Class: December 31, 2010 | through investments in equity securities | ||
| of companies based in frontier and | ||||
| smaller emerging markets |
* International Equity is the successor to the HLM International Equity Portfolio of AMT Capital Fund, Inc., pursuant to a reorganization that took place on October 31, 1996. Information for periods prior to October 31, 1996 is historical information for the predecessor portfolio.
2. Summary of Significant Accounting Policies
The accounting policies of the Fund are in conformity with accounting principles generally accepted in the United States (“GAAP”) for investment companies. The following is a summary of the Fund’s significant accounting policies:
Indemnifications
Under the Fund’s organizational document, its officers and Board of Directors (“Board”) are indemnified against certain liability arising out of the performance of their duties to the Portfolios. In the normal course of business, the Fund may enter into contracts that contain a variety of representations or that provide indemnification for certain liabilities. The Fund’s maximum exposure under these arrangements is unknown, as this would involve future claims that may be made against the Fund that have not yet occurred. However, the Fund has not had prior claims or losses pursuant to these contracts and expects the risk of loss to be remote.
Estimates
The preparation of financial statements in accordance with GAAP requires management to make estimates and assumptions that affect the reported amounts and disclosures in the financial statements. Actual results could differ from those estimates.
71
Table of Contents
Harding, Loevner Funds, Inc.
Notes to Financial Statements
October 31, 2012
2. Summary of Significant Accounting Policies (continued)
Valuation
The Board has adopted procedures (“Procedures”) to govern the valuation of the securities held by each Portfolio of the Fund in accordance with the 1940 Act. The Procedures incorporate principles set forth in relevant pronouncements of the Securities and Exchange Commission (“SEC”) and its staff, including guidance on the obligations of the Portfolios and their Directors to determine, in good faith, the fair value of the Portfolios’ securities when market quotations are not readily available.
In determining a Portfolio’s net asset value (“NAV”), each equity security traded on a securities exchange, including the NASDAQ Stock Market, and over-the-counter securities, are first valued at the closing price on the exchange or market designated by the Fund’s accounting agent as the principal exchange (each, a “principal exchange”). The closing price provided by the Fund’s accounting agent for a principal exchange may differ from the price quoted elsewhere and may represent information such as last sales price, an official closing price, a closing auction price or other information, depending on exchange or market convention. Shares of open-end mutual funds are valued at NAV. Such securities are typically categorized as “Level 1” pursuant to the hierarchy described below.
Participation notes are valued based upon the closing or last traded price of their underlying local shares. Such securities are typically categorized as “Level 2” pursuant to the hierarchy described below.
Since trading in many foreign securities is normally completed before the time at which a Portfolio calculates its NAV, the effect on the value of such securities held by a Portfolio of events that occur between the close of trading in the security and the time at which the Portfolio prices its securities would not be reflected in the Portfolio’s calculation of its NAV if foreign securities were generally valued at their closing prices.
To address this issue, the Board has approved daily fair value pricing of certain foreign equity securities. The fair value pricing utilizes quantitative models developed by an independent pricing service, which may provide an adjustment to the closing prices described above. Use of fair value pricing could cause a Portfolio to value a security higher, lower or equal to its closing market price, which in turn could cause the Portfolio’s NAV per share to differ significantly from that which would have been calculated using closing market prices. The use of fair value pricing is also intended to decrease the opportunities for persons to engage in ‘‘time zone arbitrage,’’ i.e., trading intended to take advantage of stale closing prices in foreign markets that could affect the NAV of the Portfolios. Securities priced in this manner are not specifically designated on the Portfolios’ Statements of Net Assets as being “fair valued”; however, absent the use of significant unobservable inputs into their valuation, securities priced higher or lower than their closing market price would be categorized as “Level 2” pursuant to the hierarchy described below.
Any securities for which market quotations are not readily available or for which available prices are deemed unreliable are priced by the Investment Adviser at “fair value”, in accordance with the Procedures. Such securities are identified on the Portfolios’ Statements of Net Assets as securities valued at “fair value” and absent the use of significant unobservable inputs into their valuation, such securities would be categorized as “Level 2” pursuant to the hierarchy described below.
GAAP includes a topic which establishes a hierarchy for NAV determination purposes in which various inputs are used in determining the value of each Portfolio’s assets or liabilities. This topic defines fair value as the price that the Portfolio would receive upon selling an investment in a timely transaction to an independent buyer in the principal or most advantageous market of the investment. This topic establishes a three-tier hierarchy to maximize the use of observable market data and minimize the use of unobservable inputs and to establish classification of fair value measurements for disclosure purposes. Inputs may be observable or unobservable and refer broadly to the assumptions that market participants would use in pricing the asset or liability including assumptions about risk. Such risks include the inherent risk in a particular valuation technique which is used to measure fair value. This may include the pricing model and/or the inputs to the pricing model used in the valuation technique. Observable inputs are inputs that reflect the assumptions market participants would use in pricing the asset or liability developed based on market data obtained from sources independent of the reporting entity. Unobservable inputs are inputs that reflect the reporting entity’s own assumptions about the assumptions market participants would use in pricing the asset or liability developed based on the best information available in the circumstances. The three-tier hierarchy of inputs is summarized in the three broad levels listed below.
Level 1 | unadjusted quoted prices in active markets for identical investments | |
Level 2 | other significant observable inputs (including quoted prices for similar investments, interest rates, prepayment speeds, credit risk, etc.). | |
Level 3 | significant unobservable inputs (including the Portfolio’s own assumptions in determining the fair value of investments) |
72
Table of Contents
Harding, Loevner Funds, Inc.
Notes to Financial Statements
October 31, 2012
2. Summary of Significant Accounting Policies (continued)
The Portfolios disclose all transfers between levels based on valuations at the end of each reporting period. At October 31, 2012, Frontier Emerging Markets had transfers from Level 2 to Level 1 of $641,967 in Banking industry, $492,767 in Capital Goods industry, and $50,923 in Materials industry, based on Levels assigned to securities on October 31, 2011, due to the daily fair value pricing of certain foreign equity securities as described above. GAAP provides additional guidance for estimating fair value when the volume and level of activity for the asset or liability have significantly decreased as well as guidance on identifying circumstances that indicate when a transaction is not orderly.
The following is a summary of the inputs used as of October 31, 2012 in valuing the Portfolios’ investments. Please refer to each Portfolio’s Statement of Net Assets to view individual securities classified by industry type and country.
Global Equity | ||||||||||||||||
ASSET VALUATION INPUT | ||||||||||||||||
Description | | Unadjusted Quoted Prices in Active | |
| Other Significant Observable Inputs (Level 2) |
|
| Significant Unobservable Inputs (Level 3) |
| Total | ||||||
Common Stocks | $192,225,842 | $94,008,052 | $— | $286,233,894 | ||||||||||||
Cash Equivalents | 7,467,446 | — | — | 7,467,446 | ||||||||||||
|
|
|
|
|
|
|
| |||||||||
Total Investments | $199,693,288 | $94,008,052 | $— | $293,701,340 | ||||||||||||
|
|
|
|
|
|
|
| |||||||||
| International Equity | ||||||||||||||||
ASSET VALUATION INPUT | ||||||||||||||||
Description | | Unadjusted Quoted Prices in Active Markets for Identical Assets (Level 1) | | | Other Significant Observable Inputs (Level 2) | | | Significant Unobservable Inputs (Level 3) | | Total | ||||||
Common Stocks | $540,964,827 | $1,415,313,357 | $— | $1,956,278,184 | ||||||||||||
Preferred Stocks | 39,904,002 | 23,655,200 | — | 63,559,202 | ||||||||||||
Cash Equivalents | 48,113,793 | — | — | 48,113,793 | ||||||||||||
|
|
|
|
|
|
|
| |||||||||
Total Investments | $628,982,622 | $1,438,968,557 | $— | $2,067,951,179 | ||||||||||||
|
|
|
|
|
|
|
| |||||||||
International Small Companies | ||||||||||||||||
ASSET VALUATION INPUT | ||||||||||||||||
Description | | Unadjusted Quoted Prices in Active Markets for Identical Assets (Level 1) | | | Other Significant Observable Inputs (Level 2) | | | Significant Unobservable Inputs (Level 3) | | Total | ||||||
Common Stocks | $1,668,123 | $59,690,806 | $— | $61,358,929 | ||||||||||||
Preferred Stocks | — | 989,914 | — | 989,914 | ||||||||||||
Warrants | 12,494 | — | — | 12,494 | ||||||||||||
Cash Equivalents | 2,273,859 | — | — | 2,273,859 | ||||||||||||
|
|
|
|
|
|
|
| |||||||||
Total Investments | $3,954,476 | $60,680,720 | $— | $64,635,196 | ||||||||||||
|
|
|
|
|
|
|
| |||||||||
73
Table of Contents
Harding, Loevner Funds, Inc.
Notes to Financial Statements
October 31, 2012
2. Summary of Significant Accounting Policies (continued)
Institutional Emerging Markets | ||||||||||||||||
ASSET VALUATION INPUT | ||||||||||||||||
Description | | Unadjusted Quoted Prices in Active Markets for Identical Assets (Level 1) | |
| Other Significant Observable Inputs (Level 2) |
|
| Significant Unobservable Inputs (Level 3) |
| Total | ||||||
Common Stocks | $146,079,167 | $243,097,156 | $— | $389,176,323 | ||||||||||||
Preferred Stocks | 23,693,288 | 23,247,248 | — | 46,940,536 | ||||||||||||
Participation Notes | — | 14,560,196 | — | 14,560,196 | ||||||||||||
Cash Equivalents | 12,085,038 | — | — | 12,085,038 | ||||||||||||
|
|
|
|
|
|
|
| |||||||||
Total Investments | $181,857,493 | $280,904,600 | $— | $462,762,093 | ||||||||||||
|
|
|
|
|
|
|
| |||||||||
Emerging Markets | ||||||||||||||||
ASSET VALUATION INPUT | ||||||||||||||||
Description | | Unadjusted Quoted Prices in Active Markets for Identical Assets (Level 1) | |
| Other Significant Observable Inputs (Level 2) |
|
| Significant Unobservable Inputs (Level 3) |
| Total | ||||||
Common Stocks | $567,164,870 | $898,737,455 | $— | $1,465,902,325 | ||||||||||||
Preferred Stocks | 57,928,729 | 90,256,451 | — | 148,185,180 | ||||||||||||
Participation Notes | — | 54,769,853 | — | 54,769,853 | ||||||||||||
Cash Equivalents | 40,187,778 | — | — | 40,187,778 | ||||||||||||
|
|
|
|
|
|
|
| |||||||||
Total Investments | $665,281,377 | $1,043,763,759 | $— | $1,709,045,136 | ||||||||||||
|
|
|
|
|
|
|
| |||||||||
Frontier Emerging Markets ASSET VALUATION INPUT | ||||||||||||||||
Description | | Unadjusted Quoted Prices in Active Markets for Identical Assets (Level 1) | |
| Other Significant Observable Inputs (Level 2) |
|
| Significant Unobservable Inputs (Level 3) |
| Total | ||||||
Common Stocks | $30,431,133 | $43,686,538 | $— | $74,117,671 | ||||||||||||
Participation Notes | — | 7,597,213 | — | 7,597,213 | ||||||||||||
Cash Equivalents | 2,848,121 | — | — | 2,848,121 | ||||||||||||
|
|
|
|
|
|
|
| |||||||||
Total Investments | $33,279,254 | $51,283,751 | $— | $84,563,005 | ||||||||||||
|
|
|
|
|
|
|
| |||||||||
Securities
All securities transactions are recorded on a trade date basis. Interest income and expenses are recorded on an accrual basis. Dividend income is recorded on the ex-dividend date (except for certain foreign dividends that may be recorded as soon as the Portfolio is informed of such dividends). The Portfolios use the specific identification method for determining realized gains or losses from sales of securities.
Dividends to Shareholders
It is the policy of the Portfolios to declare dividends from net investment income annually. Net short-term and long-term capital gains distributions for the Portfolios, if any, normally are distributed on an annual basis.
Dividends from net investment income and distributions from net realized gains from investment transactions have been determined in accordance with income tax regulations and may differ from net investment income and realized gains recorded by the Portfolios for financial reporting purposes. Differences result primarily from foreign currency transactions and timing differences related to recognition of income, and gains and losses from investment transactions. In general, to the extent that any differences which are permanent in nature result in over distributions to shareholders, the amount of the over distribution is reclassified within the capital accounts based on its federal tax basis treatment and may be reported as return of capital. Temporary differences do not require reclassification.
74
Table of Contents
Harding, Loevner Funds, Inc.
Notes to Financial Statements
October 31, 2012
2. Summary of Significant Accounting Policies (continued)
Currency Translation
Assets and liabilities denominated in foreign currencies and commitments under forward foreign currency exchange contracts are translated into U.S. dollars at the mean of the quoted bid and asked prices of such currencies against the U.S. dollar. Purchases and sales of the Portfolios’ securities are translated at the rates of exchange prevailing when such securities were acquired or sold. Income and expenses are translated at exchange rates prevailing when accrued. The Portfolios do not isolate that portion of the results of operations resulting from changes in foreign exchange rates on investments from the fluctuations arising from changes in market prices of securities held. Such fluctuations are included with the net realized and unrealized gain or loss from investments.
Net realized gains and losses from foreign currency-related transactions arise from sales of foreign currency, currency gains or losses realized between the trade and settlement dates on securities transactions, and the difference between the amounts of dividends, interest, and foreign withholding taxes recorded on the Portfolios’ books, and the U.S. dollar equivalent of the amounts actually received or paid. Net unrealized appreciation or depreciation on translation of assets and liabilities denominated in foreign currencies arise from changes in the value of assets and liabilities other than investments in securities at the period end, resulting from changes in the exchange rates.
Redemption Fees
Redemptions made within 90 days of purchase may be subject to a redemption fee equal to 2% of the amount redeemed. For the years ended October 31, 2012 and October 31, 2011, the Portfolios received redemption fees related to transactions in shares of common stock as disclosed in the Portfolios’ Statements of Changes in Net Assets.
3. Significant Agreements and Transactions with Affiliates
The Board has approved an investment advisory agreement (the “Agreement”) with the Investment Adviser. Advisory fees are computed daily and paid monthly based on the average daily net assets of each Portfolio. The Investment Adviser has contractually agreed to reduce its fee and/or reimburse the Portfolios for other operating expenses to the extent that aggregate expenses, excluding certain non-operating expenses, exceed certain annual rates of the average daily net assets of each class.
Beginning November 1, 2011 and through December 31, 2012, the following annualized advisory fees and contractual expense limits are in effect:
Portfolio | Advisory Fees on assets up to $1 billion | Advisory Fees on assets over $1 billion | Contractual Expense Limit* | |||
Global Equity – Institutional Class | 0.95% | 0.93% | 0.95% | |||
Global Equity – Advisor Class | 0.95% | 0.93% | 1.25% | |||
International Equity – Institutional Class | 0.75% | 0.73% | 1.00% | |||
International Equity – Investor Class | 0.75% | 0.73% | 1.25% | |||
International Small Companies – Institutional Class | 1.25% | 1.23% | 1.50% | |||
International Small Companies – Investor Class | 1.25% | 1.23% | 1.75% | |||
Institutional Emerging Markets | 1.17% | 1.15% | 1.30% | |||
Emerging Markets – Advisor Class | 1.17% | 1.15% | 1.75% | |||
Frontier Emerging Markets – Institutional Class | 1.50% | 1.48% | 2.00% | |||
Frontier Emerging Markets – Investor Class | 1.50% | 1.48% | 2.25% |
* On December 18, 2012, the Board voted to extend the contractual expense limits listed above through February 28, 2014.
75
Table of Contents
Harding, Loevner Funds, Inc.
Notes to Financial Statements
October 31, 2012
3. Significant Agreements and Transactions with Affiliates (continued)
For the year ended October 31, 2012, the Investment Adviser waived and/or reimbursed the following amounts pursuant to the contractual expense limits described above:
Portfolio | Fees waived and/or reimbursed by the Investment Adviser | |
Global Equity – Institutional Class | $316,335 | |
Global Equity – Advisor Class | 73,952 | |
International Small Companies – Institutional Class | 38,220 | |
International Small Companies – Investor Class | 76,532 | |
Institutional Emerging Markets | 225,402 | |
Frontier Emerging Markets – Investor Class | 45,880 |
The Fund has an administration agreement with The Northern Trust Company (“Northern Trust”), which provides certain accounting, clerical and bookkeeping services, Blue Sky, corporate secretarial services and assistance in the preparation and filing of tax returns and reports to shareholders and the SEC.
Northern Trust also serves as custodian of each Portfolio’s securities and cash, transfer agent, dividend disbursing agent and agent in connection with any accumulation, open-account or similar plans provided to the shareholders of the Portfolios.
Foreside Compliance Services, LLC (“FCS”) provides an individual to serve as chief compliance officer of the Fund. Foreside Management Services, LLC (“FMS”) provides an individual to serve as chief financial officer and treasurer of the Fund. Fees paid to FCS and FMS are shown as “Chief compliance and financial officers’ fees and expenses” on the Statements of Operations.
The Fund has adopted an Amended Plan of Distribution pursuant to Rule 12b-1 under the 1940 Act (“Distribution Plan”). Under the Distribution Plan, the Investor Class of each of the International Equity, International Small Companies and Frontier Emerging Markets Portfolios may pay underwriters, distributors, dealers or brokers a fee at an annual rate of up to 0.25% of the average daily net assets of the Portfolio’s Investor Class shares for services or expenses arising in connection with activities primarily intended to result in the sale of Investor Class shares of the Portfolios.
The Fund, on behalf of the Portfolios, has agreements with various financial intermediaries and “mutual fund supermarkets”, under which customers of these intermediaries may purchase and hold Portfolio shares. These intermediaries assess fees in consideration for providing certain distribution, account maintenance, record keeping and transactional services. In recognition of the savings of expenses to the Fund arising from the intermediaries’ assumption of functions that the Fund would otherwise perform, such as providing sub-accounting and related shareholder services, each Portfolio or class is authorized, pursuant to a Shareholder Servicing Plan, to pay to each intermediary an annual rate of up to 0.25% of its average daily net assets attributable to that intermediary (subject to the contractual expense limits described above). With respect to Investor Class shares, the balance of the intermediaries’ fees, after payments made pursuant to the Distribution Plan, if applicable, is paid by the Investment Adviser. Because of the contractual expense limits on certain Portfolios’ fees and expenses, the Investment Adviser paid a portion of the Portfolios’ share of these fees during the year ended October 31, 2012.
4. Class Specific Expenses
Most expenses of the Fund can be directly attributed to a particular Portfolio. Expenses which cannot be directly attributed are apportioned among the Portfolios based upon relative net assets or other appropriate measures. If an expense is incurred at the Portfolio level, it is generally apportioned among the classes of that Portfolio based upon relative net assets of each respective class. Certain expenses are incurred at the class level and charged only to that particular class of shares. These expenses may be class specific (i.e., Distribution fees charged only to a particular share class) or they may be identifiable to a particular class (i.e., the costs related to printing and mailing shareholder reports to shareholders of a particular class). Class specific expenses for Portfolios with multiple active classes of shares are shown in the table below.
76
Table of Contents
Harding, Loevner Funds, Inc.
Notes to Financial Statements
October 31, 2012
4. Class Specific Expenses (continued)
| Portfolio | Distribution Fees | State Registration and Filing Fees | Printing and Postage Fees | Transfer Agent Fees and Expenses | Shareholder Servicing Fees | |||||||||||||||
Global Equity – Institutional Class | $ | - | $ | 39,396 | $ | 17,141 | $ | 22,302 | $ | 21,813 | ||||||||||
Global Equity – Advisor Class | - | 22,352 | 11,027 | 24,315 | 121,071 | |||||||||||||||
International Equity – Institutional Class | - | 100,967 | 128,925 | 109,081 | 272,341 | |||||||||||||||
International Equity – Investor Class | 582,041 | 39,965 | 70,947 | 83,944 | 179,541 | |||||||||||||||
International Small Companies – Institutional Class | - | 23,474 | 3,448 | 19,005 | 5,086 | |||||||||||||||
International Small Companies – Investor Class | 71,679 | 21,217 | 5,489 | 23,756 | 38,483 | |||||||||||||||
Frontier Emerging Markets – Institutional Class | - | 28,592 | 10,929 | 21,785 | 8,559 | |||||||||||||||
Frontier Emerging Markets – Investor Class | 4,673 | 21,850 | 2,314 | 20,818 | 3,412 | |||||||||||||||
5. Investment Transactions
Cost of purchases and proceeds from sales of investment securities, other than short-term investments, for the year ended October 31, 2012, were as follows for each Portfolio:
Portfolio | Purchase Cost of Investment Securities | Proceeds from Sales of Investment Securities | ||||||||||
Global Equity | $ | 148,322,824 | $ | 77,379,005 | ||||||||
International Equity | 927,442,702 | 217,930,144 | ||||||||||
International Small Companies | 20,154,206 | 5,245,464 | ||||||||||
Institutional Emerging Markets | 246,968,050 | 159,359,357 | ||||||||||
Emerging Markets | 566,134,810 | 694,156,248 | ||||||||||
Frontier Emerging Markets | 56,396,678 | 79,915,834 | ||||||||||
6. Income Tax
The cost of investments for federal income tax purposes and the components of net unrealized appreciation / (depreciation) on investments at October 31, 2012, for each of the Portfolios were as follows:
Portfolio | Gross Unrealized Appreciation | Gross Unrealized Depreciation | Net Unrealized Appreciation / (Depreciation) | Cost | ||||||||||||
Global Equity | $ | 48,246,822 | $ | (5,367,756 | ) | $ | 42,879,066 | $ | 250,822,274 | |||||||
International Equity | 266,782,229 | (49,229,922 | ) | 217,552,307 | 1,850,398,872 | |||||||||||
International Small Companies | 7,485,927 | (4,383,245 | ) | 3,102,682 | 61,532,514 | |||||||||||
Institutional Emerging Markets | 90,433,310 | (14,206,558 | ) | 76,226,752 | 386,535,341 | |||||||||||
Emerging Markets | 497,578,602 | (32,057,846 | ) | 465,520,756 | 1,243,524,380 | |||||||||||
Frontier Emerging Markets | 8,120,000 | (4,858,542 | ) | 3,261,458 | 81,301,547 | |||||||||||
The unrealized appreciation (depreciation) on foreign currency for Global Equity, International Equity, International Small Companies, Institutional Emerging Markets, Emerging Markets and Frontier Emerging Markets was $489, $(57,698), $(1,491), $4,183, $(14,604) and $(923), respectively, at October 31, 2012.
It is the policy of each Portfolio of the Fund to qualify as a regulated investment company by complying with the applicable provisions of the Internal Revenue Code, and to make distributions of taxable income sufficient to relieve it from substantially all federal income and excise taxes; therefore, no federal income tax provision is required.
77
Table of Contents
Harding, Loevner Funds, Inc.
Notes to Financial Statements
October 31, 2012
6. Income Tax (continued)
Management has performed an analysis of each Portfolio’s tax positions for the open tax years as of October 31, 2012 and has concluded that no provisions for income tax are required. The Portfolios’ federal tax returns for the prior three fiscal years (open tax years: October 31, 2009; October 31, 2010; October 31, 2011) remain subject to examination by the Portfolios’ major tax jurisdictions, which include the United States, the State of New Jersey and the State of Maryland. Management is not aware of any events that are reasonably possible to occur in the next twelve months that would result in the amounts of any unrecognized tax benefits significantly increasing or decreasing for the Portfolios. However, management’s conclusions regarding tax positions taken may be subject to review and adjustment at a later date based on factors including, but not limited to, new tax laws and accounting regulations and interpretations thereof.
During the year ended October 31, 2012, distributions paid from ordinary income on a tax basis were $797,569, $9,328,089, $334,833, $3,430,979, $12,198,687 and $489,954 for Global Equity, International Equity, International Small Companies, Institutional Emerging Markets, Emerging Markets, and Frontier Emerging Markets, respectively.
During the year ended October 31, 2011, distributions paid from ordinary income on a tax basis were $290,000, $2,500,077, $47,000, $1,078,916, $8,430,123 and $146,644 for Global Equity, International Equity, International Small Companies, Institutional Emerging Markets, Emerging Markets, and Frontier Emerging Markets, respectively.
During the year ended October 31, 2012, distributions paid from long-term capital gains on a tax basis were $2,083,272 and $3,133,641, for Global Equity and International Equity, respectively.
During the year ended October 31, 2011, distributions paid from long-term capital gains on a tax basis were $1,052,137, for Global Equity.
As of October 31, 2012, the components of accumulated earnings /(deficit) on a tax basis were as follows:
Portfolio | Undistributed Ordinary Income | Undistributed Long-Term Capital Gains | Accumulated Capital and Other Losses | Unrealized Appreciation (Depreciation)* | Total Accumulated Earnings/(Deficit) | |||||||||||||||
Global Equity | $ | 1,540,977 | $ | - | $ | (378,792 | ) | $ | 42,879,567 | $ | 44,041,752 | |||||||||
International Equity | 18,521,821 | - | (19,446,883 | ) | 217,494,608 | 216,569,546 | ||||||||||||||
International Small Companies | 665,965 | - | (730,550 | ) | 3,101,192 | 3,036,607 | ||||||||||||||
Institutional Emerging Markets | 3,683,658 | - | (46,776,141 | ) | 75,910,896 | 32,818,413 | ||||||||||||||
Emerging Markets | 12,078,855 | 106,392,227 | - | 465,506,147 | 583,977,229 | |||||||||||||||
Frontier Emerging Markets | 991,108 | - | (13,404,420 | ) | 3,260,535 | (9,152,777 | ) | |||||||||||||
* The difference between book basis and tax basis net unrealized appreciation is attributable primarily to the tax deferral of losses on certain sales of securities.
On December 22, 2010, the Regulated Investment Company Modernization Act of 2010 (the “Act”) was enacted, which changed various technical rules governing the tax treatment of regulated investment companies. The changes are generally effective for taxable years beginning after the date of enactment. One of the more prominent changes addresses capital loss carryforwards. Under the Act, each fund will be permitted to carry forward capital losses incurred in taxable years beginning after the date of enactment for an unlimited period. However, any losses incurred during those future taxable years will be required to be utilized prior to the losses incurred in pre-enactment taxable years, which carry an expiration date. As a result of this ordering rule, pre-enactment capital loss carryforwards may be more likely to expire unused. Additionally, post-enactment capital loss carryforwards will retain their character as either short-term or long-term capital losses rather than being considered all short-term as permitted under previous regulation.
Short-term capital losses incurred that will be carried forward under provisions of the Act are $378,792, $10,514,138, $293,995, $3,553,019, and $4,653,779 for Global Equity, International Equity, International Small Companies, Institutional Emerging Markets, and Frontier Emerging Markets, respectively. Long-term capital losses incurred that will be carried forward under provisions of the Act are $8,932,745, $239,458, $1,017,015, and $3,260,942 for International Equity, International Small Companies, Institutional Emerging Markets, and Frontier Emerging Markets, respectively.
At October 31, 2012, Institutional Emerging Markets had $8,577,340 available as pre-enactment capital loss carryforwards which expire in 2016. Institutional Emerging Markets and Frontier Emerging Markets had $29,793,794 and $1,252,470, respectively, available as pre-enactment capital loss carryforwards which expire in 2017. International Small Companies had $197,097 available as pre-enactment capital loss carryforwards which expire in 2018. Institutional Emerging Markets and Frontier Emerging Markets had $3,834,973 and $4,237,229, respectively, available as pre-enactment capital loss carryforwards which expire in 2019.
Primarily as a result of differing book/tax treatment of foreign currency transactions and foreign capital gain tax expenses, the Fund made reclassifications among certain capital accounts. The reclassifications have no impact on the net assets of the Portfolios. As of October 31, 2012, the following reclassifications were made to the Statement of Net Assets:
78
Table of Contents
Harding, Loevner Funds, Inc.
Notes to Financial Statements
October 31, 2012
6. Income Tax (continued)
Portfolio | Paid-in Capital | Accumulated Undistributed Net Realized Gain/Loss on Investment & Foreign Currency Related Transactions | Accumulated Undistributed Net Investment Income | |||||||||
Global Equity | $ | - | $ | 29,414 | $ | (29,414 | ) | |||||
International Equity | - | 450,352 | (450,352 | ) | ||||||||
International Small Companies | - | 22,071 | (22,071 | ) | ||||||||
Institutional Emerging Markets | - | 175,010 | (175,010 | ) | ||||||||
Emerging Markets | - | 804,007 | (804,007 | ) | ||||||||
Frontier Emerging Markets | - | 126,134 | (126,134 | ) | ||||||||
7. Foreign Exchange Contracts
The Portfolios, on occasion, enter into forward foreign exchange contracts in order to hedge their exposure to changes in foreign currency exchange rates on their foreign portfolio holdings. A forward foreign exchange contract is a commitment to purchase or sell a foreign currency at a future date at a negotiated forward rate. The gain or loss arising from the difference between the cost of the original contracts and the closing of such contracts is included in net realized gains or losses on foreign currency-related transactions. Fluctuations in the value of forward foreign exchange contracts are recorded for book purposes as unrealized appreciation or depreciation on assets and liabilities denominated in foreign currencies by the Portfolios. The Portfolios are also exposed to credit risk associated with counterparty nonperformance on these forward foreign exchange contracts which is typically limited to the unrealized gain on each open contract.
The Portfolios enter into foreign currency transactions on the spot markets in order to pay for foreign investment purchases or to convert to dollars the proceeds from foreign investment sales or coupon interest receipts. The Portfolios held no open forward foreign currency exchange contracts on October 31, 2012.
8. Participation Notes
Each Portfolio may invest in participation notes. Participation notes are promissory notes that are designed to offer a return linked to the performance of a particular underlying equity security or market. Participation notes are issued by banks or broker-dealers and allow a Portfolio to gain exposure to common stocks in markets where direct investment may not be allowed. Participation notes are generally traded over-the-counter and are subject to the risk that the broker-dealer or bank that issues them will not fulfill its contractual obligation to complete the transaction with a Portfolio. Participation notes constitute general unsecured contractual obligations of the banks or broker-dealers that issue them, and a Portfolio investing in participation notes would be relying on the creditworthiness of such banks or broker-dealers and would have no rights under a participation note against the issuer of the underlying assets. Participation notes may be more volatile and less liquid than other investments held by the Portfolios.
9. Concentration of Ownership
At October 31, 2012, the percentage of total shares outstanding held by record shareholders each owning 10% or greater of the aggregate shares outstanding of each Portfolio were as follows:
| No. of Shareholders | % Ownership | |||||||||||
Global Equity | 3 | 56.11 | %* | |||||||||
International Equity | 3 | 50.72 | %* | |||||||||
International Small Companies | 2 | 59.11 | %* | |||||||||
Institutional Emerging Markets | 2 | 52.96 | %* | |||||||||
Emerging Markets | 3 | 82.07 | %* | |||||||||
Frontier Emerging Markets | 3 | 58.90 | %* | |||||||||
* Includes omnibus positions of broker-dealers representing numerous shareholder accounts.
Investment activities of these shareholders may have a material effect on the Portfolios.
79
Table of Contents
Harding, Loevner Funds, Inc.
Notes to Financial Statements
October 31, 2012
10. Concentration of Risk
Investing in securities of foreign issuers and currency transactions may involve certain considerations and risks not typically associated with investments in U.S. issuers. These risks include revaluation of currencies, adverse fluctuations in foreign currency values and possible adverse political, social and economic developments, including those particular to a specific industry, country or region, which could cause the securities and their markets to be less liquid and prices more volatile than those of comparable U.S. companies and U.S. government securities. These risks are greater with respect to securities of issuers located in emerging market countries in which the Portfolios are authorized to invest.
Frontier Emerging Markets is permitted to invest up to 35% of its net assets in companies in the same industry, if, at the time of investment, that industry represents 20% or more of the Portfolio’s benchmark index. During periods when the Portfolio has invested more than 25% of its net assets in companies in the same industry, it will operate as a concentrated portfolio and be subject to additional risks and greater volatility. At October 31, 2012, the Portfolio’s investment in the Banking industry amounted to 32.3% of net assets.
11. Line of Credit
The Fund has a $100 million line of credit agreement with Northern Trust ($50 million prior to March 9, 2012). Borrowings would be made solely to facilitate the handling of redemptions or unusual or unanticipated short-term cash requirements. Because several Portfolios participate, and collateral requirements apply, there is no assurance that an individual Portfolio will have access to the entire $100 million at any particular time. Interest is charged to each Portfolio based on its borrowings at an amount above the Federal Funds rate, subject to a minimum rate. In addition, a facility fee is computed at an annual rate of 0.10% on the line of credit and is allocated among the Portfolios. For the year ended October 31, 2012, Institutional Emerging Markets Portfolio had an outstanding balance on four days with a maximum balance of $1,600,000 at an average weighted interest rate of 1.75%, Emerging Markets Portfolio had an outstanding balance on four days with a maximum balance of $2,500,000 at an average weighted interest rate of 1.75% and Frontier Emerging Markets Portfolio had an outstanding balance on twenty-six days with a maximum balance of $10,000,000 at an average weighted interest rate of 1.75%.
12. Recently Issued Accounting Pronouncements
In December 2011, Financial Accounting Standards Board (“FASB”) issued Accounting Standards Update (“ASU”) No. 2011-11, Disclosures about Offsetting Assets and Liabilities (“ASU 2011-11”). These disclosure requirements are intended to help investors and other financial statement users to better assess the effect or potential effect of offsetting arrangements on a company’s financial position. They also improve transparency in the reporting of how companies mitigate credit risk, including disclosure of related collateral pledged or received. In addition, ASU 2011-11 facilitates comparison between those reporting entities that prepare their financial statements on the basis of U.S. GAAP and those reporting entities that prepare their financial statements on the basis of International Financial Reporting Standards. Specifically, ASU 2011-11 requires reporting entities to disclose 1) both gross and net information about both instruments and transactions eligible for offset in the financial statements and 2) instruments and transactions subject to an agreement similar to a master netting arrangement. The effective date of ASU 2011-11 is for interim and annual periods beginning on or after January 1, 2013. At this time, management is evaluating the implications of this requirement and the impact it will have on the Fund’s financial statement disclosures.
13. Subsequent Events
Subsequent events occurring after the date of this report have been evaluated for potential impact, for purposes of recognition or disclosure in the financial statements, through the date the report was issued.
80
Table of Contents
Harding, Loevner Funds, Inc.
Report of Independent Registered Public Accounting Firm
The Shareholders and Board of Directors of Harding, Loevner Funds, Inc.:
We have audited the accompanying statements of net assets of the Harding, Loevner Funds, Inc. (comprising the Global Equity Portfolio, International Equity Portfolio, International Small Companies Portfolio, Institutional Emerging Markets Portfolio, Emerging Markets Portfolio, and Frontier Emerging Markets Portfolio) (collectively, the “Portfolios”) as of October 31, 2012, and the related statements of operations for the year then ended, statements of changes in net assets for each of the years in the two-year period then ended, and the financial highlights for each of the years or periods in the five-year period then ended. These financial statements and financial highlights are the responsibility of the Portfolios’ management. Our responsibility is to express an opinion on these financial statements and financial highlights based on our audits.
We conducted our audits in accordance with the standards of the Public Company Accounting Oversight Board (United States). Those standards require that we plan and perform the audits to obtain reasonable assurance about whether the financial statements and financial highlights are free of material misstatement. An audit includes examining, on a test basis, evidence supporting the amounts and disclosures in the financial statements. Our procedures included confirmation of securities owned as of October 31, 2012, by correspondence with the custodian and brokers or other appropriate auditing procedures. An audit also includes assessing the accounting principles used and significant estimates made by management, as well as evaluating the overall financial statement presentation. We believe that our audits provide a reasonable basis for our opinion.
In our opinion, the financial statements and financial highlights referred to above present fairly, in all material respects, the financial position of each of the aforementioned Portfolios of the Harding, Loevner Funds, Inc. as of October 31, 2012, the results of their operations for the year then ended, the changes in their net assets for each of the years in the two-year period then ended, and the financial highlights for each of the years or periods in the five-year period then ended, in conformity with U.S. generally accepted accounting principles.
| /s/ KPMG |
| Chicago, Illinois |
| December 18, 2012 |
81
Table of Contents
Harding, Loevner Funds, Inc.
(unaudited)
International Equity, International Small Companies, Institutional Emerging Markets, Emerging Markets, and Frontier Emerging Markets paid qualifying foreign taxes of $2,855,152, $141,292, $594,248, $2,491,605, and $103,258, and earned $22,000,274, $869,371, $4,573,832, $16,029,001, and $965,335 from foreign source income during the year ended October 31, 2012, respectively. Pursuant to Section 853 of the Internal Revenue Code, International Equity, International Small Companies, Institutional Emerging Markets, Emerging Markets, and Frontier Emerging Markets designated $0.0208, $0.0250, $0.0212, $0.0720, and $0.0087 per share as foreign taxes paid and $0.1606, $0.1535, $0.1633, $0.4630, and $0.0812 as income earned from foreign sources for the year ended October 31, 2012, respectively.
Global Equity, International Equity, International Small Companies, Institutional Emerging Markets, Emerging Markets, and Frontier Emerging Markets had qualifying dividend income of $3,863,261, $32,564,600, $1,335,778, $7,491,494, $31,792,533, and $1,298,690, respectively, during the year ended October 31, 2012.
During the year ended October 31, 2012, Global Equity designated 98% of the distributions from net investment income as qualifying for the 70% corporate dividend received deduction.
Pursuant to Section 852 of the Internal Revenue Code, Emerging Markets Portfolio designated $106,392,227 as a long term capital gain dividend for the year ended October 31, 2012.
82
Table of Contents
Harding, Loevner Funds, Inc.
Approval of Investment Advisory Agreement
(unaudited)
Approval of Investment Advisory Agreement
At an in-person meeting of the board of directors (the “Board”) of Harding, Loevner Funds, Inc. (the “Fund”) held on June 6, 2012 (the “June Meeting”), the Board, including a majority of those directors who are not “interested persons” of the Fund, as defined in the Investment Company Act of 1940, as amended (the “Independent Directors”), considered and approved the continuation of the investment advisory agreement (the “Advisory Agreement”) between the Fund on behalf of each of its series, the International Equity Portfolio, the Global Equity Portfolio, the Emerging Markets Portfolio, the Institutional Emerging Markets Portfolio, the International Small Companies Portfolio and the Frontier Emerging Markets Portfolio (each, a “Portfolio” and collectively, the “Portfolios”), and Harding Loevner LP (the “Adviser”).
Overview of the Review Process
Prior to the June Meeting, the Board requested, and the Adviser furnished, materials that the Board believed necessary to evaluate the terms of the Advisory Agreement, including information on, among other things: (i) the investment performance, expenses and advisory fees of each Portfolio relative to other mutual funds and benchmark indices, as set forth in reports prepared by Strategic Insight, a third party fund tracking organization engaged as part of the contract review process (the “Strategic Insight Reports”); (ii) the Adviser’s profitability and costs; (iii) the qualifications of the Adviser and portfolio management personnel with respect to services provided to the Portfolios; and (iv) the Adviser’s investment research capabilities and resources.
The Board established a sub-committee comprised of three Independent Directors (the “Committee”) to conduct a preliminary review of these materials, to assist the Board in its deliberations, and to liaise with the Adviser. The Committee reviewed the materials; discussed the materials during telephonic and in-person meetings with representatives of the Adviser; and requested and received supplemental information and analysis from the Adviser. Following the Committee’s review, the Adviser distributed revised and supplemental materials in final form to the full Board. The Board also received and considered a memorandum regarding the Board’s responsibilities in connection with renewal of the Advisory Agreement prepared by the legal counsel to the Independent Directors (“Independent Counsel”). Independent Counsel assisted the Independent Directors throughout the preparation, review and approval process.
At the June Meeting, the Board considered and discussed the materials and additional information presented by the Adviser. During the presentation, the Adviser expanded on those materials and responded to specific questions from the Board. Following the presentation, the Independent Directors met in executive session with Independent Counsel to further review and discuss the information presented during the meeting.
In its consideration of the continuance of the Advisory Agreement with respect to each Portfolio, the Board considered various factors discussed below. The following discussion is not intended to be all-inclusive, as the Board reviewed a variety of factors and considered a significant amount of information. The Board’s approval determinations were made on the basis of each director’s business judgment after consideration of all the information presented. Individual directors may have given different weights to certain factors and assigned various degrees of materiality to information received in connection with the approval process.
Nature, Extent and Quality of Services
The Board evaluated such information as it deemed necessary to assess the nature, extent and quality of investment advisory services provided to the Portfolios by the Adviser. The Board also considered the nature, extent and quality of certain non-advisory services provided to the Portfolios by the Adviser, including administrative, distribution, shareholder servicing, trading and the resources devoted to, and the record of compliance with, each Portfolio’s compliance policies and procedures. The Board noted that it received information at regular meetings throughout the year regarding the services rendered by the Adviser concerning the management of each Portfolio’s affairs and the Adviser’s role in coordinating providers of other services to the Portfolios. The Board’s evaluation of the services provided by the Adviser took into account the Board’s historical knowledge and familiarity with the scope and quality of the Adviser’s investment management and other capabilities and the quality of its administrative and other services.
The Adviser presented and discussed with the Board the qualifications, backgrounds and responsibilities of the Adviser’s management team and information regarding the portfolio managers for each Portfolio. The Board evaluated the ability of the Adviser to attract and retain qualified investment advisory and non-advisory personnel and engaged in a discussion with the Adviser regarding its recruitment, retention and professional development programs and strategies.
83
Table of Contents
Harding, Loevner Funds, Inc.
Approval of Investment Advisory Agreement (continued)
(unaudited)
Nature, Extent and Quality of Services (continued)
The Board also considered the adequacy of the financial and operational resources committed to each Portfolio by the Adviser, and how well the Adviser utilizes those resources to meet the Portfolio’s investment needs; to implement asset growth strategies; and to satisfy compliance requirements. Among other things, the Board recognized the technology enhancements implemented by the Adviser as of March 31, 2012 to improve operational efficiency and its capabilities in performance measurement, records management, proxy voting and trade cost management and additional enhancements scheduled for future implementation. The Board also recognized that the Adviser reports to the Board regularly and that at each regular meeting the Board receives a detailed report on each Portfolio’s performance, asset levels and asset flows. It was also noted that the Adviser had approximately $19.7 billion in assets under management as of March 31, 2012, and that it was an affiliate of Affiliated Managers Group, Inc., an established global asset management company.
The Board considered annual and periodic reports of the Chief Compliance Officer of the Fund (the “CCO”) with respect to the effectiveness and adequacy of the Adviser’s compliance program. The Board noted the CCO’s determination that the Adviser’s compliance program is reasonably designed to prevent violations of the federal securities laws. The Board also noted the actions taken by the Adviser in response to the CCO’s periodic recommendations for adding personnel, enhancing procedures and systems designed to ensure compliance with applicable laws and regulations.
Based on these considerations, the Board concluded that it was satisfied with the nature, extent and quality of services historically provided and to be provided to each Portfolio under the Advisory Agreement.
Performance of the Adviser
For each Portfolio, the Board considered, among other things, the historical performance year to date as of March 31, 2012 and for the one-year, three-year, five-year and ten-year periods (or shorter for newer Portfolios) included in the Strategic Insight Report, including comparisons against each Portfolio’s Morningstar Category and benchmark indices. In reviewing each Portfolio’s performance information, the Board took into consideration the extraordinary market volatility over the past several years, the effects of the volatility on each Portfolio’s performance, as well as the market conditions in which the Adviser’s investment strategies may underperform. The Board’s specific considerations with respect to each Portfolio’s performance are discussed under “Portfolio Specific Considerations” below.
In addition, the Board reviewed the Investment Adviser’s investment philosophy and its influence on the management of the Portfolios. The Board noted the Adviser’s bottom-up, business-focused approach based on a study of individual companies and the competitive dynamics of the global industries in which those companies participate. In evaluating the investment performance of the Portfolios, the Board acknowledged that the relatively longer holding periods associated with the Adviser’s investment style may result in underperformance during periods of short term volatility, but often produces outperformance over longer time periods.
Based on these considerations, the Board concluded that each Portfolio’s performance was reasonable.
Costs of the Services and Profitability of the Adviser
The Board considered information regarding the Adviser’s costs to provide investment management services to the Portfolios and the profitability to the Adviser from managing the Portfolios. In evaluating the Adviser’s profitability, the Board considered the Adviser’s profitability analysis for calendar years 2010 and 2011; each Portfolio’s expense ratio; and the Adviser’s contractual fee waivers and expense reimbursements with respect to each Portfolio. The Board also considered profitability on a Portfolio-by-Portfolio basis, focusing on the Adviser’s profit without taking into account those costs borne by the Adviser with respect to its efforts to expand the Portfolios’ shareholder base. The Board noted that the Adviser did not earn a profit on the International Small Companies Portfolio and Frontier Emerging Markets Portfolio for calendar year 2010 and did not earn a profit on the International Small Companies Portfolio for calendar year 2011. The Board considered the asset-based breakpoints adopted by the Fund beginning with fiscal 2012 and noted that the management fees for both Emerging Markets and Institutional Emerging Markets Portfolios were each reduced by 8 basis points, from 125 basis points to 117 basis points. The Board noted that the breakpoints offer actual savings for the Emerging Markets Portfolio and the International Equity Portfolio and meaningful potential savings for the Portfolios whose assets have not yet reached their first breakpoint level. The Board took note of the Adviser’s expectation that it would incur additional costs relating to current and planned increases in personnel and office space, and investment in new information systems intended to assure the continued delivery of high-quality services to its clients, including the Portfolios. The Board also noted that future profitability to the Adviser would depend on the growth of assets under management.
84
Table of Contents
Harding, Loevner Funds, Inc.
Approval of Investment Advisory Agreement (continued)
(unaudited)
Costs of the Services and Profitability of the Adviser (continued)
Based upon these considerations, the Board concluded that the profits historically realized by the Adviser and, that the profits the Adviser anticipates will be realized from its continued relationship with the Portfolios are not excessive in light of the nature, extent and quality of the services provided to the Portfolios.
Comparison of Fees and Services Provided by the Adviser
The Board considered the contractual advisory fees that are payable by the Portfolios to the Adviser. The Board also reviewed and considered actual investment advisory fees realized by the Adviser taking into account the fee waiver and/or expense reimbursement arrangements for each Portfolio. In addition, the Board considered the Strategic Insight Report, which included information comparing each Portfolio’s management fee and overall expenses with those of funds in a group of peer funds selected by Strategic Insight (the “Expense Group”).
The Board noted that, in general, the operating expenses of each Portfolio, with the exception of International Small Companies Portfolio, were below the median of their respective Expense Groups and Morningstar Category-derived universe (the “Expense Universe”). The Board also noted that each Portfolio’s total expense ratio, after waiver of advisory fees and reimbursement of expenses, was at or below its respective Expense Group median calculated by Strategic Insight, and each Portfolio’s advisory fees after waivers was within the range of those of the funds in its peer group, as calculated by Strategic Insight. A discussion of the Board’s considerations with respect to each Portfolio’s fees is set forth below under “Portfolio Specific Considerations”.
At the Board’s request, the Adviser also provided information on the fees charged and services provided to the Portfolios compared with private accounts with similar investment strategies managed by the Adviser. The Board took note of the fact that no current shareholder could achieve a lower net advisory fee if it opened a separate account with the Adviser. The Board noted that the Adviser’s private account clients require fewer services from the Adviser. The Board acknowledged that unlike the Portfolios, private account clients do not require the Adviser to participate in internal corporate governance matters, deliver services to potential end-clients, supervise third-party vendors, or devote its own resources toward expanding the shareholder base, nor do they require the same degree of compliance monitoring due to their differing regulatory framework. Further, the Board noted that the Adviser incurs no out-of-pocket expenses or business risk in connection with services provided to the private accounts, unlike the Portfolios. The Board additionally noted that institutional investors familiar with the competitive marketplace have invested in the Portfolios as a result of request-for-proposal processes and have by their investing in the Portfolios demonstrated that they perceive the advisory fees charged by the Adviser to be reasonable.
Based on these considerations, the Board concluded that each Portfolio’s expense ratio is reasonable.
Economies of Scale
The Board considered the extent to which economies of scale would be realized as the Portfolios’ assets grow; whether there is potential for realization of any further economies of scale for the Portfolios; and whether economies of scale are being passed along to the shareholders. The Board noted that to the extent a Portfolio’s assets have increased over time, it has realized economies of scale as certain expenses become a smaller percentage of overall assets. The Board also noted that, due to market weakness and asset outflows, the economies of scale realized by certain Portfolios had diminished since the prior year. The Board further noted that each Portfolio's contractual advisory fee contained breakpoints. The Board also noted that as of March 31, 2012, the asset levels of the Emerging Markets Portfolio and the International Equity Portfolio exceeded at least the first breakpoint. Accordingly, the Board determined that actual economies of scale existed for the Emerging Markets Portfolio and the International Equity Portfolio and potential economies of scale existed for those Portfolios whose assets had not yet reached their first breakpoint level.
The Board considered that other aspects of the Portfolios’ investment strategies may limit the realization of economies of scale, including a particular strategy’s universe of issuers, applicable trading volumes or markets, or the Adviser’s selection criteria. The Board also took note of the Adviser’s plans for marketing and distributing the various Portfolios and to pay for the associated expenses out of its own profits, through revenue sharing payments.
Based on these considerations, the Board concluded that it was satisfied with the extent to which economies of scale currently are and will be shared for the benefit of the Portfolios’ shareholders.
85
Table of Contents
Harding, Loevner Funds, Inc.
Approval of Investment Advisory Agreement (continued)
(unaudited)
Other Benefits
The Board considered other benefits derived or to be derived by the Adviser from the relationship with the Portfolios. In this regard, the Board considered that the Adviser may benefit from its relationship with the Portfolios in the following ways: (i) separately managed account clients may view the additional assets under management resulting from managing the Portfolios as a positive attribute; (ii) the Adviser may obtain increased reputational prestige from managing a nationally recognized mutual fund family that shares the Adviser’s name; and (iii) the Adviser’s ability to market to shareholders other financial products offered by the Adviser may be enhanced. The Board also considered that the Adviser benefits from the receipt of research services obtained through “soft dollars” in connection with Portfolio brokerage transactions. The Board also considered the extent to which the Adviser and its other clients, as well as the Portfolios, benefitted from receipt of these research products and services. In light of the costs of providing investment management, administrative and other services to the Portfolios and the Adviser’s ongoing commitment to the Portfolios, the profits and other ancillary benefits that the Adviser may receive were considered reasonable.
Portfolio Specific Considerations
In considering whether to approve the renewal of the Advisory Agreement for each Portfolio, the Board considered the following data included in the Strategic Insight Report.
Global Equity Portfolio
Portfolio Performance. The Global Equity Portfolio outperformed its MSCI All-Country World Index benchmark and Morningstar Category (World Stock) year–to-date, as of March 31, 2012, and for the three-, five- and ten-year periods. The Portfolio has performed in the first or second quartile of its Morningstar Category (World Stock) for the three-, five- and ten-year periods.
Management Fees and Expense Ratio. In considering the fees payable under the Advisory Agreement by the Portfolio, the Board took into account the factors described above and also considered the pricing structure (including the expense ratio to be borne by shareholders) of the Portfolio, as compared to its Expense Group, including that the net management fee is slightly above median of the Expense Group and slightly above median of the Expense Universe; and the net operating expenses are below median for both the Expense Group and Expense Universe. The Board noted that the contractual advisory fee to be paid by the Portfolio was reduced by five basis points beginning with the Portfolio’s 2012 fiscal year.
International Equity Portfolio
Portfolio Performance. The International Equity Portfolio outperformed its MSCI All-Country World ex-US benchmark year-to-date, as of March 31, 2012, and for the one-, three- and five-year periods. The Portfolio outperformed its Morningstar Category (Foreign Large Growth) for the one-, three-, five- and ten-year periods. The Portfolio has performed in the first or second quartile of its Morningstar Category (Foreign Large Growth) for the three-, five- and ten-year periods.
Management Fees and Expense Ratio. In considering the fees payable by the Portfolio under the Advisory Agreement, the Board took into account the factors described above and also considered the pricing structure (including the expense ratio to be borne by shareholders) of the Portfolio, as compared to its Expense Group, including that the net advisory fee and net operating expense are below median for both the Expense Group and Expense Universe. The Board noted that the Portfolio had reached its first asset-based breakpoint level resulting in a two basis point reduction in the contractual advisory fee beginning with the Portfolio’s 2012 fiscal year.
International Small Companies Portfolio
Portfolio Performance. The International Small Companies Portfolio outperformed its MSCI All-Country World ex-US Small Cap Index benchmark and its Morningstar Category year-to-date, as of March 31, 2012, and for the one-year, three-year and five-year periods. The Portfolio has performed in the first or second quartile of its Morningstar Category (Foreign Small/Mid Growth) for the three-year and five year periods. The Board noted that the Portfolio does not yet have a ten-year performance record.
86
Table of Contents
Harding, Loevner Funds, Inc.
Approval of Investment Advisory Agreement (continued)
(unaudited)
Portfolio Specific Considerations (continued)
Management Fees and Expense Ratio. In considering the fees payable by the Portfolio under the Advisory Agreement, the Board took into account the factors described above and also considered the pricing structure (including the expense ratio to be borne by shareholders) of the Portfolio, as compared to its Expense Group. The Board also considered that net operating expenses are above median for the Expense Group and the Expense Universe.
Emerging Markets Portfolio
Portfolio Performance. The Emerging Markets Portfolio has outperformed its MSCI Emerging Markets benchmark year-to-date, as of March 31, 2012, and for the one- and three-year periods. The Portfolio outperformed its Morningstar Category (Diversified Emerging Markets) year-to-date, as of March 31, 2012, and for the one-, three-, five-year and ten-year periods. The Board noted the Adviser’s statement that the Portfolio’s underperformance relative to its benchmark for the five- and ten-year periods was due to underperformance in 2009, which the Adviser appears to have addressed. The Portfolio has performed in the first or second quartile of its Morningstar Category (Diversified Emerging Markets) for the three-year period.
Management Fees and Expense Ratio. In considering the fees payable by the Portfolio under the Advisory Agreement, the Board took into account the factors described above and also considered the pricing structure (including the expense ratio to be borne by shareholders) of the Portfolio, as compared to its Expense Group, including that the Portfolio’s net advisory fee is above the median for the Expense Group, but below median for the Expense Universe; and that the net operating expenses for the Portfolio are well below median for the Expense Group and Expense Universe. The Board noted that the contractual advisory fee to be paid by the Portfolio was reduced by eight basis points beginning with the Portfolio’s 2012 fiscal year. The Board further noted that the Portfolio had reached its first asset-based breakpoint level resulting in a two basis point reduction in the contractual advisory fee beginning with the Portfolio’s 2012 fiscal year.
Institutional Emerging Markets Portfolio
Portfolio Performance. The Adviser advised the Board that the Institutional Emerging Markets Portfolio is managed to the same model as the Emerging Markets Portfolio and therefore its performance has tracked closely that of the Emerging Markets Portfolio. The Portfolio is measured against the same benchmark and Morningstar Category as the Emerging Markets Portfolio; however, the Portfolio does not yet have a ten-year performance record.
Management Fees and Expense Ratio. In considering the fees payable by the Portfolio under the Advisory Agreement, the Board took into account the factors described above and also considered the pricing structure (including the expense ratio to be borne by shareholders) of the Portfolio, as compared to its Expense Group, including that the net advisory fee is above the median for the Expense Group and Expense Universe, and that the net operating expenses are well below the median for the Expense Group and Expense Universe. The Board noted that the contractual advisory fee to be paid by the Portfolio was reduced by eight basis points beginning with the Portfolio’s 2012 fiscal year.
Frontier Emerging Markets Portfolio
Portfolio Performance. The Frontier Emerging Markets Portfolio underperformed its MSCI Frontier Markets benchmark year-to-date, as of March 31, 2012, and for the one-year period. The Board noted that the Portfolio does not yet have a five-year performance record. The Board further noted the Adviser’s statement that the Portfolio does not have a relevant peer group for performance comparison purposes because there is currently no Morningstar category of funds that invest primarily in frontier markets or the smallest emerging markets. The Board therefore took into account that the Strategic Insight Report was of limited utility for evaluating performance.
Management Fees and Expense Ratio. In considering the fees payable by the Portfolio under the Advisory Agreement, the Board took into account the factors described above and also considered the pricing structure (including the expense ratio to be borne by shareholders) of the Portfolio, as compared to its Expense Group, including that the Portfolio’s net advisory fee is above median for the Expense Group and Expense Universe, and that net operating expenses are also below median for the Expense Group. The Board noted that the above median ranking for the net advisory fee is due to the Portfolio’s small asset size and the substantial additional expenses associated with this type of specialty offering that are not common to emerging market funds generally. The Board further noted that the above median ranking for net total expense ratio was due, in part, to the Portfolio’s investment in a wider range of frontier stock markets than other funds.
87
Table of Contents
Harding, Loevner Funds, Inc.
Approval of Investment Advisory Agreement (continued)
(unaudited)
Conclusion
Following extensive discussion, both in general session and in executive session of the Independent Directors meeting alone with Independent Counsel, the Board determined that it had received sufficient information to take action on the proposed resolutions regarding continuance of the Advisory Agreement. The Board, including a majority of the Independent Directors, concluded with respect to each Portfolio that the fees to be paid by the Portfolio were reasonable in light of the nature, extent and quality of the services to be provided by the Adviser to each Portfolio, the Adviser’s costs, and each Portfolio’s current and reasonably foreseeable asset levels.
In light of all the foregoing, the Board, and separately, a majority of the Independent Directors, approved the continuance of the Advisory Agreement for each Portfolio. The Board’s decision was based on all of the above-mentioned factors and their related conclusions, with no single factor or conclusion being determinative and with each director not necessarily attributing the same weight to each factor.
88
Table of Contents
Harding, Loevner Funds, Inc.
(unaudited)
HARDING, LOEVNER FUNDS, INC. (THE “FUND”)
PRIVACY NOTICE
The Fund collects nonpublic personal information about you from the following sources:
| • | Information, such as your name, address, social security number, assets and income, submitted by you on applications, forms, or in other written or verbal customer communications. This information may also be provided by a consultant or intermediary acting on your behalf. |
| • | Information that results from any transaction performed by us for you. |
The Fund will not disclose any nonpublic personal information about you or its former customers to anyone except as permitted or required by law.
If you decide to close your account(s) or become an inactive customer, the Fund will adhere to the privacy policies and practices as described in this notice.
The Fund restricts access to your personal and account information to only those employees who need to know that information to provide products or services to you. The Fund maintains physical, administrative and technical safeguards to protect your nonpublic personal information.
89
Table of Contents
Harding, Loevner Funds, Inc.
Directors and Principal Officers
(unaudited)
Disinterested Directors:
Name, Address and Age | Position with the Fund | Term of Office and Length of Time Served* | Principal Occupation During Past Five Years | Number of Portfolios in Fund Complex Overseen By Director | Other Directorships | |||||
William E. Chapman, II c/o Harding Loevner LP 400 Crossing Boulevard Fourth Floor Bridgewater, NJ 08807 Age, 71 | Director | Indefinite; Director since 2008; Chairperson of the Audit Committee since 2009 | President and Owner, Longboat Retirement Planning Solutions (1998-present); Trustee of Bowdoin College (2002 – present); Hewitt Associates, LLC (part time) (provider of retirement and investment education seminars) (2000 – 2009). | 6 | Trustee of Third Avenue Trust (5 portfolios); Trustee of Third Avenue Variable Trust (1 portfolio); Trustee of Aston Funds (26 Portfolios); Trustee of The Managers Funds, Managers AMG Funds, Managers Trust I and Managers Trust II (33 portfolios); Director, Mutual Fund Directors Forum , Inc.; Director, Sarasota Memorial Healthcare Foundation, Inc. | |||||
R. Kelly Doherty c/o Harding Loevner LP 400 Crossing Boulevard Fourth Floor Bridgewater, NJ 08807 Age, 54 | Director | Indefinite; Director since 2004 | Cayman Partners (private investment vehicles), Managing Partner, 1999 – present. | 6 | Morristown Memorial Hospital; The Peck School | |||||
Charles Freeman c/o Harding Loevner LP 400 Crossing Boulevard Fourth Floor Bridgewater, NJ 08807 Age, 48 | Director | Indefinite; Director since 2008 | PepsiCo, Vice President Global Public Policy and Government Relations, 2011 - present; Center for Strategic and International Studies, Freeman Chair in China Studies, 2007 – 2011; China Alliance (legal and government relations group), Managing Director, 2005 – 2007. | 6 | None | |||||
Jane A. Freeman c/o Harding Loevner LP 400 Crossing Boulevard Fourth Floor Bridgewater, NJ 08807 Age, 59 | Director | Indefinite; Director since 1996; Lead Independent Director since 2008; Member of the Audit Committee since 2010 | Scientific Learning Corporation (Education Software), Chief Financial Officer, 2012 – present, Executive Vice President and Chief Financial Officer, 1999 – 2008; Consultant, 2008 – 2012. | 6 | Taproot Foundation (Non-Profit), Director, 2010-present | |||||
90
Table of Contents
Harding, Loevner Funds, Inc.
Directors and Principal Officers (continued)
(unaudited)
Disinterested Directors (continued):
Name, Address and Age | Position with the Fund | Term of Office and Length of Time Served* | Principal Occupation | Number of | Other Directorships | |||||
Samuel R. Karetsky c/o Harding Loevner LP 400 Crossing Boulevard Fourth Floor Bridgewater, NJ 08807 Age, 67 | Director | Indefinite; Director since 1998; Member of the Audit Committee since 1998 | The Karetsky Group LLC (Advisory Firm), Managing Member, 2003 - present; Wetherby Asset Management, Wealth Manager, 2004 – present; European Investors Inc., Managing Director, 1998 – 2002. | 6 | None | |||||
Eric Rakowski c/o Harding Loevner LP 400 Crossing Boulevard Fourth Floor Bridgewater, NJ 08807 Age, 54 | Director | Indefinite; Director since 2008 | University of California at Berkeley School of Law, Professor, 1990 – present. | 6 | Trustee of Third Avenue Trust (5 portfolios); Trustee of Third Avenue Variable Trust (1 portfolio); Trustee of The Managers Funds, Managers AMG Funds, Managers Trust I and Managers Trust II (33 portfolios) | |||||
91
Table of Contents
Harding, Loevner Funds, Inc.
Directors and Principal Officers (continued)
(unaudited)
Interested Directors:
Name, Address and Age | Position with | Term of | Principal Occupation During Past Five Years | Number of | Other Directorships | |||||
| David R. Loevner** Harding Loevner LP 400 Crossing Boulevard Fourth Floor Bridgewater, NJ 08807 Age, 58 | Director and Chairman of the Board of Directors | Indefinite; Director and Chairman of the Board since 1996 | Harding Loevner LP, President and Chief Executive Officer 1989 – present; Parks Tenn Corp. (real estate), President, 2001 - present. | 6 | Director, Harding, Loevner Funds, plc (4 portfolios) | |||||
| Jennifer M. Borggaard** Affiliated Managers Group, Inc. 600 Hale Street Prides Crossing, MA 01965 Age, 43 | Director | Indefinite; Director since 2008 | Affiliated Managers Group, Inc. (“AMG”) (asset management firm), Senior Vice President, 2007 – present, Vice President, 2004 – 2007, Director and Senior Counsel, 2001 – 2004. | 6 | Beautel, Goodman & Company LTD; Genesis Asset Managers, LLP- Member of the Governing Board; Montrusco Bolton Investments Inc.; Arrow Bidco Ltd.
| |||||
* Each director is elected to serve in accordance with the Articles of Incorporation and By-Laws of the Fund until his or her successor is duly elected and qualified.
**David R. Loevner is considered an “interested person” of the Fund as defined in the Investment Company Act of 1940, as amended, because he serves as President of Harding Loevner LP, the Fund’s investment advisor. Jennifer M. Borggaard is an interested person of the Fund because she is an officer of AMG.
The Funds’ Statement of Additional Information contains additional information about the Directors and is available upon request and without charge by calling (877) 435-8105.
92
Table of Contents
Harding, Loevner Funds, Inc.
Directors and Principal Officers (continued)
(unaudited)
Principal Officers of the Fund:
Name, Address and Age | Position with the Fund | Term of Office and Length of Time Served* | Principal Occupation During Past Five Years | |||
Richard Reiter Harding Loevner LP 400 Crossing Boulevard Fourth Floor Bridgewater, NJ 08807 Age, 46 | President | 1 year; since 2011 | Harding Loevner LP, Chief Operating Officer, 1996 – present. | |||
Susan Mosher Foreside Compliance Services, LLC Three Canal Plaza, Suite 100 Portland, ME 04101 Age, 57 | Chief Compliance Officer of the Funds | 1 year; since 2010 | Foreside Compliance Services, LLC, Head of Compliance Services, 2009 – present; Coast Asset Management, LLC, Chief Compliance Officer, 2007 – 2009; Harding, Loevner Funds, Inc., Anti-Money Laundering Officer, 2005 – 2007; Harding, Loevner Funds, Inc., Chief Compliance Officer, 2004 – 2007; Investors Bank & Trust Company, Senior Director and Chief Counsel/Director, 1995 – 2007. | |||
Charles S. Todd Foreside Management Services, LLC Three Canal Plaza, Suite 100 Portland, ME 04101 Age, 41 | Chief Financial Officer and Treasurer | 1 year; since 2010 | Foreside Management Services, LLC, Director/Treasurer and Principal Financial Officer, 2008 – Present; JPMorgan Investor Services Co., Vice President within the Fund Administration Department, formerly serving as Assistant Vice President, 2000 – 2008. | |||
Patrick Keniston Foreside Compliance Services, LLC Three Canal Plaza, Suite 100 Portland, ME 04101 Age, 48 | Anti-Money Laundering Compliance Officer | 1 year; since 2010 | Foreside Compliance Services, LLC, Director, 2008 – present; Citi Fund Services Ohio, Inc., Vice President, 2005 – 2008; Citigroup Global Transaction Services, Attorney, 2001 - 2005. | |||
Aaron Bellish Harding Loevner LP 400 Crossing Boulevard Fourth Floor Bridgewater, NJ 08807 Age, 33 | Assistant Treasurer | 1 year; since 2012 | Harding Loevner LP, Chief Financial Officer, 2012 – present; Mount Kellett Capital Management, Chief Financial Officer, formerly serving as Controller, 2008-2012; Lehman Brothers, Inc., Vice President, 2007-2008; PricewaterhouseCoopers LLP, Manager within Investment Management Group, 2002-2007; Arthur Andersen, LLP, Auditor, 2001-2002 | |||
Thomas A. Dula The Northern Trust Company 50 South LaSalle Street Chicago, IL 60603 Age, 38 | Assistant Treasurer | 1 year; since 2010 | The Northern Trust Company, Vice President and Client Service Delivery Manager, 2010 – present, Relationship Manager, 2009 – 2010, and Institutional Trust Account Administrator, 2004 - 2009. | |||
93
Table of Contents
Harding, Loevner Funds, Inc.
Directors and Principal Officers (continued)
(unaudited)
Principal Officers of the Fund (continued):
Name, Address and Age | Position with the Fund | Term of Office and Length of Time Served* | Principal Occupation During Past Five Years | |||
Owen T. Meacham The Northern Trust Company 50 South LaSalle Street Chicago, IL 60603 Age, 41 | Secretary | 1 year; since 2010 | The Northern Trust Company, Vice President and Senior Regulatory Administration Attorney, 2007 - present; ABN AMRO Asset Management, Product Strategy and Development Manager, 2005 – 2007. | |||
Lori M. Renzulli Harding Loevner LP 400 Crossing Boulevard Fourth Floor Bridgewater, NJ 08807 Age, 46 | Assistant Secretary | 1 year; since 2008 | Harding Loevner LP, Chief Counsel and Chief Compliance Officer, 2006 – present. | |||
Marcia Y. Lucas The Northern Trust Company 50 South LaSalle Street Chicago, IL 60603 Age, 45 | Assistant Secretary | 1 year; since 2011 | Vice President, The Northern Trust Company (2010-Present); Partner, Michael Best & Friedrich LLP (2005-2010). | |||
* Officers are elected to hold such office until their successor is elected and qualified to carry out the duties and responsibilities of their office, or until he or she resigns or is removed from office.
94
Table of Contents
Harding, Loevner Funds, Inc.
(unaudited)
Quarterly Form N-Q Portfolio Schedule
Each Portfolio will file its complete schedule of investments with the SEC on Form N-Q at the end of the first and third fiscal quarters within 60 days of the end of the quarter to which it relates. The Portfolios’ Form N-Q will be available on the SEC’s website at www.sec.gov and may also be reviewed and copied at the SEC’s Public Reference Room whose telephone number is (800) SEC-0330. Additionally, they are available upon request by calling (877) 435-8105.
Proxy Voting Record
The Fund’s proxy voting record relating to the Portfolios’ securities during the most recent 12-month period ended June 30 is available on the Fund’s website at www.hardingloevnerfunds.com and on the SEC’s website at www.sec.gov, on Form N-PX.
Proxy Voting Policies and Procedures
A description of the Fund proxy voting policies and procedures are located in the Statement of Additional Information and is available without charge, upon request, by calling (877) 435-8105 or on the SEC’s website at www.sec.gov.
Additional Information
The Adviser updates Fact Sheets for the Portfolios each calendar quarter, which are posted to the Fund’s website - www.hardingloevnerfunds.com. This information, along with the Adviser’s commentaries on its various strategies, is available without charge, upon request, by calling (877) 435-8105.
95
Table of Contents
Table of Contents

Table of Contents
Item 2. Code of Ethics.
As of October 31, 2012, the Registrant has adopted a code of ethics that applies to the Registrant’s President/Chief Executive Officer and Treasurer/Chief Financial Officer. For the fiscal year ended October 31, 2012, there were no amendments to a provision of its code of ethics, nor were there any waivers granted from a provision of the code of ethics. A copy of its code of ethics is filed with this Form N-CSR under Item 12(a)(1).
Item 3. Audit Committee Financial Expert.
The Registrant’s Board of Directors has determined that the following members of the Audit Committee are audit committee financial experts and independent: William Chapman and Jane Freeman.
Item 4. Principal Accountant Fees and Services.
(a) Audit Fees: The aggregate fees billed for each of the last two fiscal years for professional services rendered by KPMG LLP for the audit of the registrant annual financial statements or services that are normally provided by the accountant in connection with statutory and regulatory filings or engagements for those fiscal years are $138,770 in 2012 and $136,030 in 2011.
(b) Audit-Related Fees: The aggregate fees billed in each of the last two fiscal years for assurance and related services by KPMG LLP that are reasonably related to the performance of the audit of the registrant financial statements and are not reported under paragraph (a) of this Item are NONE.
(c) Tax Fees: The aggregate fees billed in each of the last two fiscal years for professional services rendered by KPMG LLP for the review of domestic tax returns were $43,200 in 2012 and $42,000 in 2011.
(d) All Other Fees: The aggregate fees billed in each of the last two fiscal years for products and services provided by KPMG LLP, other than the services reported in paragraphs (a) through (c) of this Item are NONE.
(e)(1) Disclose the audit committee pre-approval policies and procedures described in paragraph (c)(7) of Rule 2-01 of Regulation S-X.
A copy of the Audit Committee’s Pre-Approval Policies and Procedures is filed with this Form N-CSR under Item 12(c).
(e)(2) The percentage of services described in each of paragraphs (b) through (d) of this Item that were approved by the audit committee pursuant to paragraph (c)(7)(i)(C) of Rule 2-01 of Regulation S-X are as follows:
Paragraph (b) Audit-Related Fees: Not applicable
Paragraph (c) Tax Fees: 100%
Paragraph (d): All Other Fees: Not applicable
(f) Not applicable.
(g) Not applicable.
(h) Not applicable.
Table of Contents
Item 5. Audit Committee of Listed Registrants.
Not applicable.
Item 6. Investments.
| (a) | Schedule of Investments is included as part of the report to shareholders filed under Item 1 of this report on Form N-CSR. |
| (b) | Not applicable. |
Item 7. Disclosure of Proxy Voting Policies and Procedures for Closed-End Management Investment Companies.
Not applicable to this registrant.
Item 8. Portfolio Managers of Closed-End Management Investment Companies.
Not applicable to this registrant.
Item 9. Purchases of Equity Securities by Closed-End Management Investment Company and Affiliated Purchasers.
Not applicable to this registrant.
Item 10. Submission of Matters to a Vote of Security Holders.
Not applicable.
Item 11. Controls and Procedures.
| (a) | The Registrant’s Principal Executive Officer and Principal Financial Officer have concluded that the Registrant’s disclosure controls and procedures (as defined in Rule 30a-3(c) under the Investment Company Act of 1940, as amended (the “1940 Act”)) were effective as of a date within 90 days prior to the filing date of this report, based on their evaluation of the effectiveness of the Registrant’s disclosure controls and procedures as of the evaluation date. |
| (b) | There were no significant changes in the Registrant’s internal control over financial reporting (as defined in Rule 30a-3(d) under the 1940 Act) that occurred during the second fiscal quarter of the period covered by this report that have materially affected, or are reasonably likely to materially affect, the Registrant’s internal control over financial reporting. |
Item 12. Exhibits.
(a)(1) Code of Ethics for Senior Officers Pursuant to the Sarbanes-Oxley Act of 2002 is attached.
(a)(2) Section 302 Certifications are attached.
(b) Section 906 Certifications are attached.
(c) Audit Committee Pre-Approval Policies and Procedures are attached.
Table of Contents
SIGNATURES
Pursuant to the requirements of the Securities Exchange Act of 1934 and the Investment Company Act of 1940, the registrant has duly caused this report to be signed on its behalf by the undersigned, thereunto duly authorized.
| Harding, Loevner Funds, Inc. | ||||
| By | /s/ Richard T. Reiter | |||
| Richard T. Reiter, President | ||||
| Date: January 7, 2013 | ||||
| Pursuant to the requirements of the Securities Exchange Act of 1934 and the Investment Company Act of 1940, this report has been signed below by the following persons on behalf of the registrant and in the capacities and on the dates indicated. | ||||
| By | /s/ Richard T. Reiter | |||
| Richard T. Reiter, President | ||||
| Date: January 7, 2013 | ||||
| By | /s/ Charles S. Todd | |||
| Charles S. Todd, Treasurer and Chief Financial Officer | ||||
| Date: January 7, 2013 | ||||