UNITED STATES
SECURITIES AND EXCHANGE COMMISSION
Washington, D.C. 20549
FORM N-CSR
CERTIFIED SHAREHOLDER REPORT OF REGISTERED
MANAGEMENT INVESTMENT COMPANIES
Investment Company Act file number 811-07739
Harding, Loevner Funds, Inc.
(Exact name of registrant as specified in charter)
400 Crossing Boulevard
Fourth Floor
Bridgewater, NJ 08807
(Address of principal executive offices) (Zip code)
Owen T. Meacham
The Northern Trust Company
50 South LaSalle Street
Chicago, IL 60603
With a copy to:
Stephen H. Bier, Esq.
Dechert LLP
1095 Avenue of the Americas
New York, NY 10036
(Name and address of agent for service)
Registrant’s telephone number, including area code: (877) 435-8105
Date of fiscal year end: 10/31
Date of reporting period: 10/31/2013
Item 1. Reports to Stockholders.
About the Adviser
Harding Loevner Funds
Global equity investing for institutions is Harding Loevner’s exclusive focus. Through Harding Loevner Funds it offers five distinct global strategies based on its quality-and-growth investment philosophy. It seeks to purchase shares of growing, financially strong, well-managed companies at favorable prices. Harding Loevner manages each of the Funds’ Portfolios according to a disciplined, research-based investment process. It identifies companies with sustainable competitive advantages and assesses the durability of their earnings growth by conducting in-depth fundamental research into global industries. In constructing portfolios, Harding Loevner diversifies carefully to limit risk.
Receive Investor Materials Electronically
Shareholders may sign up for electronic delivery of investor materials. By doing so, you will receive the information faster and help us reduce the impact on the environment of providing these materials. To enroll in electronic delivery,
| | 1. | Go to http://www.icsdelivery.com |
| | 2. | Select the first letter of your brokerage firm’s name. |
| | 3. | From the list that follows, select your brokerage firm. If your brokerage firm is not listed, electronic delivery may not be available. Please contact your brokerage firm. |
| | 4. | Complete the information requested, including the e-mail address where you would like to receive notifications for electronic documents. |
Your information will be kept confidential and will not be used for any purpose other than electronic delivery. If you change your mind, you can cancel electronic delivery at any time and revert to physical delivery of your materials. Just go to http://www. icsdelivery.com, perform the first three steps above, and follow the instructions for cancelling electronic delivery. If you have any questions, please contact your brokerage firm.
Table of Contents
| | |
Harding, Loevner Funds, Inc. c/o Northern Trust Attn: Funds Center C5S 801 South Canal Street Chicago, IL 60607 | | |
Phone: (877) 435-8105 Fax: (312) 267-3657 www.HardingLoevnerFunds.com | | Must be preceded or accompanied by a current Prospectus. Quasar Distributors, LLC, Distributor |
Letter to Our Shareholders
| | |

| | from left: David R. Loevner, CFA Chairman of Harding, Loevner Funds, Inc. and CEO of the Adviser Simon Hallett, CFA CIO of the Adviser |
Each semester as we prepare to write to you, our shareholders, we consider how best to introduce the detailed discussions of our investment views, activities, and results that follow. This time we decided to invite our colleague Andrew West to use this space to share his observations on the place of our investment approach in the context of contemporary financial theory.
As Harding Loevner’s Manager of Investment Research, Andrew works closely with Simon on issues of portfolio construction and risk management, in addition to supporting the analysts at each stage of the investment process. Andrew joined Harding Loevner in 2006 as an analyst covering the automotive, transportation, and steel industries globally—duties that he still performs today.
We remain genuinely grateful to you for taking the time to read this report and, more importantly, for trusting us to invest on your behalf.
Sincerely,
| | |
 | |  |
| |
| David R. Loevner, CFA | | Simon Hallett, CFA |
Opinions expressed are those of Harding Loevner and are not intended to be forecasts of future events, a guarantee of future results, nor investment advice. Please read the separate disclosure page for important information, including the risks of investing in the Portfolios.
Past performance is not a guarantee of future results.
1
Risk, Return, and the Overthrow of the Capital Asset Pricing Model
Andrew West, CFA
Manager, Investment Research
| | |

| | Harding Loevner invests based on common-sense principles drawn from our founders’ experience: we stick to high-quality, growing companies that we can identify through fundamental research. This general philosophy flows naturally from our nature as cautious, patient people. It has been a constant throughout our firm’s existence since it was |
founded in 1989. In contrast to the boring continuity of thought in our little community, the prevailing wisdom in the larger world of academic investment theory has turned about completely over this same quarter century. Theories regarding market behavior and investment outcomes that were proclaimed as essential verities and celebrated with Nobel Prizes at the beginning of this period were subsequently overturned at the end. That academic battle is an engrossing tale that we have followed with interest. But, when it comes to our own story, we continue to invest in accordance with our beliefs that the steady-growth, high-quality segment of the global equity universe provides the best returns and risk experience over time.
In 1990 the Nobel Prizes for Economics were awarded to William Sharpe, Henry Markowitz, and Merton Miller, theorists who had been influential in the investment world for some time. Their work suggested an investment approach quite different from our own. In fact, it implied that if we thought we could achieve better returns through fundamental research—especially on less-risky, high-quality companies—we were destined to fail! The essence of the emergent consensus at the time Harding Loevner was founded was that the only future predictor of stock returns was “beta,” a measure of risk calculated by taking the slope of the regression of a stock’s past returns against the market. However, over the following two decades it became clear that the award-winning theories of 1990 failed to describe market behavior and, like the emperor who was seen to have no clothes, their authority declined. New Nobel Prize-winning theories validate the common-sense approach to which we have consistently adhered; namely, using fundamental research to identify growth opportunities, and seeking to reduce risk through quality and diversification.
To explain the overthrow of the old “1990 Consensus” and its replacement with a new set of investment prescriptions, it is helpful first to explain in more detail our investment process and its divergence from this consensus.
Harding Loevner’s primary assessment of risk and return is driven by judgments about unique and concrete company and industry fundamentals rather than calculations of historical stock return volatilities and co-movements. We marry both qualitative and quantitative analysis to identify strong and sustainable corporate business models. To assure that there is rigor in the qualitative aspects of our analysis, we require that every company in which we consider investing possess each of these
four criteria: Competitive Advantage, Sustainable Growth, Financial Strength, and Quality Management. These four criteria form the backbone of our investment process and imply that there are distinctions amongst equities that are identifiable and that may predict differences in future returns.
Competitive Advantage within a favorable industry structure is a prerequisite for durable profitability in a company. A company in an industry with unfavorable dynamics has a much steeper challenge than one well-positioned with few rivals. But, we also require that our companies possess competitive advantages that we think will allow them to sustain superior levels of return over time. Our analysts are primarily organized by industry rather than by geography as we believe that the understanding of industry structure and peer groups is key to identifying such investment opportunities.
Sustainable Growth allows cash flow and earnings to compound as a consequence of predictable long-term forces, like demographic trends, rising product penetration rates, and consumer substitution of higher-quality goods as incomes rise. Over time, these forces will mitigate the short-term impacts of unpredictable economic cycles. Sustainability also means that our companies are growing within the limits of their strategic and financial resources and are adding to the sum of human wealth.
When it comes to our own story, we continue to invest in accordance with our beliefs that the steady-growth, high-quality segment of the global equity universe provides the best returns and risk experience over time.
Financial Strength can help insulate equity investors from the risks of illiquidity or dilution. Not only can it can provide a buffer during difficult economic environments, it may protect our interests at other times as well, since, when a company’s debt becomes too large relative to its business or cash flows, management tends to sacrifice the long-term interests of equity investors to the immediate demands of creditors. Firms with strong balance sheets and sharp management teams can also act opportunistically to snap up attractive assets when weaker competitors cannot.
Quality Management is the least quantifiable of our four criteria, but aims to shield us from failures of strategy, execution, and intent. We have often seen companies with competitive advantages and growth potential fail to deliver due to incompetent
2
Letter to Our Shareholders
management. Strong corporate governance is another prerequisite in this category to assure that the resources of the firm are directed to shareholder wealth creation rather than management enrichment.
After determining that a potential investment meets our fundamental criteria, our analysts and portfolio managers convert their understanding of company and industry fundamentals into growth forecasts and estimates of fair value. We recognize that valuation is a difficult and imprecise art, but are committed to investing at valuations that appear reasonable based on past history and future prospects.
We recognize that valuation is a difficult and imprecise art, but are committed to investing at valuations that appear reasonable based on past history and future prospects.
So, that is what we do, and we have been steadfast in our adherence to this process throughout our history.
Let’s now review the theories honored by the 1990 Nobel Prizes and the bases for their conclusions that none of our four investment criteria (or any other fundamental research) could help investors predict risk or return.
Certainly, the most influential and widely promulgated theory to be recognized by a Nobel Prize was William Sharpe’s Capital Asset Pricing Model—CAPM—which stated that beta (the co-movement of stocks versus the index) is the only factor explaining expected stock and portfolio returns, and that the greater the beta (i.e., the higher the risk) the higher the expected returns. Sharpe’s CAPM was based on several important assumptions—namely that investors are perfectly rational; that they are perfectly informed about all security fundamentals; and that they all share the same view about the relationship between risk and return. In addition, the CAPM assumed that all investors create “optimal” portfolios through diversification, a tool for portfolio construction developed by Henry Markowitz and also awarded a Nobel Prize in 1990. Merton Miller’s theory that, in a perfect market, a company’s choice between debt and equity financing will not impact its value won the Nobel Prize in 1990 as well. In summary, the 1990 consensus proclaimed that business fundamentals don’t matter because markets are so efficient that all investors understand and price stocks perfectly and hold them in fully optimized portfolios. The only important factor was beta—with higher beta being the sole predictor of superior returns.
We beg to differ.
After twenty four years, have our efforts been a pointless waste of time, as would be indicated if returns are, indeed, determined by beta alone? The short answer is no. Years of data support different
conclusions: that within equity universes risk and return have not been positively correlated; that fundamental company characteristics matter (e.g. profitability, leverage, and valuation); and that investors and markets may not be as informed and rational as previously thought. Evidence has shown that, counter to the central CAPM tenet, low-beta equities have outperformed the market over decades and across geography.
Noting that the past twenty years of data were not supportive of the 1990 consensus, the academicians got to work to formulate theories with better explanatory power. This year the Nobel Committee awarded the supreme accolade to economists whose recent research validates the importance of company characteristics and valuation in determining equity returns. Eugene Fama was awarded the Prize based on his work on the Fama-French three-factor model, which adds size and value as additional factors in determining returns, noting the inadequacy of using beta alone. In November 2013, Fama published a new working paper that suggests company quality and investment behavior are also important and adds to the model profitability and investment measurements as the fourth and fifth factors, which “for applied purposes provide an acceptable description of average returns.”1 Robert Shiller, another Nobel recipient, was honored in part for his research into the long-run predictability of asset returns. This work suggests the importance of valuation, illustrating that stocks that are highly
We prefer our real-time experience and observations over academic studies of finance for many reasons.
priced relative to their dividends tend to generate lower long-run returns than higher-yielding equities.
Other recent research validates our long-held preference for companies with consistently higher profitability and lower indebtedness than the averages in their sectors by showing that such companies do, indeed, outperform their lower-quality peers.2 The issuance last year of new “Quality Indices” by MSCI is a further endorsement of the relevance of company quality. In backtests, MSCI found its World Quality Index, which represents developed markets, outperformed its standard World Index by 2.7% annually from November 1981 through November 2012. The Emerging Markets Quality Index outperformed the standard Emerging Markets Index by 2.8% annually from November 1998 through November 2012.
1 Eugene Fama and Kenneth French, “A Five-Factor Asset Pricing Model,” Draft Manuscript, Fama-Miller Working Paper Series, University of Chicago Booth School of Business, November 2013.
2 See, for example, Max Kozlov and Antti Petajisto, “Global Return Premiums on Earnings Quality, Value, and Size,” Blackrock, Inc., January 2013.
While we’re pleased to see theory moving in our direction, our track record over the last two decades is more compelling evidence to us than recent academic studies. We prefer our real-time experience and observations over academic studies of finance for many reasons. One major limitation of such studies is they can only rely upon what can be quantified, while our fundamental analysis incorporates more qualitative analysis of business models and industry characteristics whose uniqueness and specific applicability to the particular company and sector under examination make them less amenable to generalization or standardization. These characteristics are essential in informing analysts’ judgments, even though they are difficult to quantify and compare.
We don’t deny that qualitative investment research has its own weaknesses, including behavioral biases, subjectivity, and the difficulty of forecasting. Our process, favoring companies with high and steady profitability and growth, and strong balance sheets, was designed to help us overcome some common investor emotional biases, and reduce our dependence on forecasting unpredictable forces such as economic cycles (which we, like nearly all other investors and economists, do poorly). Over the years we have attempted to increase the objectivity of our company research, and created decision-making structures that reduce the impact of bias. We have also discovered that the higher confidence engendered by the quality and track records of our companies have made us less vulnerable to emotional, knee-jerk reactions.
We will continue to take an active interest in academic debates and disputes but, having no Nobel Prize winners among us, we are ill equipped to solve them! Rather, we have been gratified by the experience of actually applying our common-sense approach to the meaningful benefit of our clients. Our process of focusing on the long-term fundamentals of high-quality, value-creating companies around the world, and owning their stocks at prices we believe to be supportive of future positive returns, is a rational way to invest, and one that has the potential to produce above-average returns, while exposing our clients to below-average levels of risk.
We invite you to review the following commentaries to learn more about our investment process, our products, and results.
Global Equity Portfolio
Portfolio Managers
| | |

| | from left: |
| | Peter Baughan, CFA |
| | Co-Lead Portfolio Manager |
| | Ferrill Roll, CFA |
| | Co-Lead Portfolio Manager |
| | Alexander Walsh, CFA |
| | Portfolio Manager |
Performance Summary
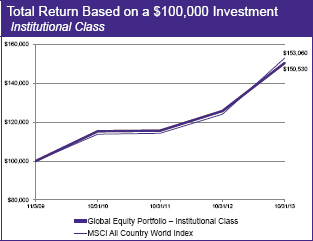
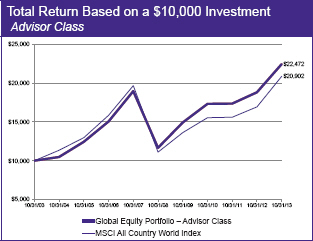
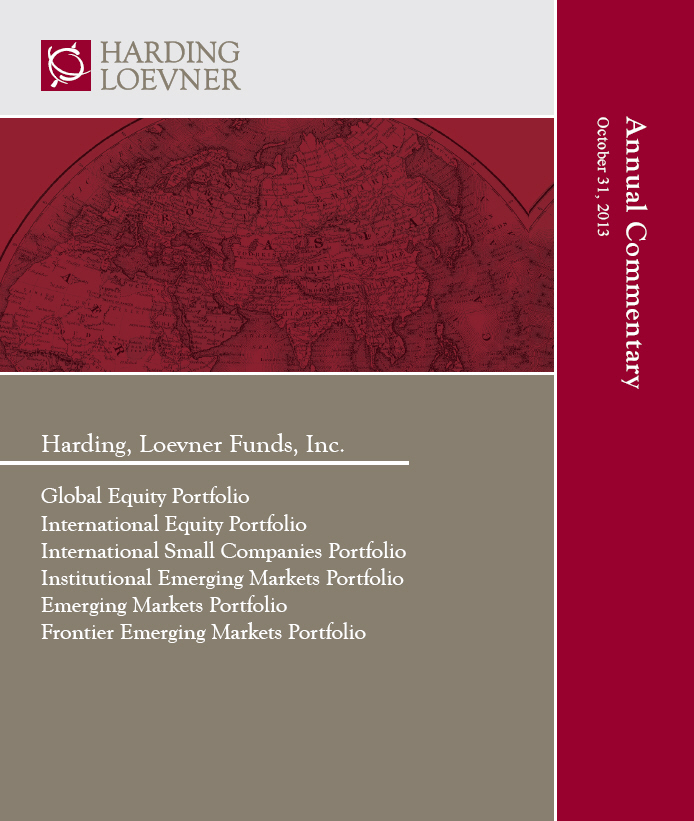
The Global Equity Portfolio – Institutional Class rose 19.66% and the Advisor Class gained 19.33% (net of fees and expenses) in the fiscal year ended October 31, 2013. The Portfolio’s benchmark, the MSCI All Country World Index (the Index), rose 23.32% (net of source taxes) in this period.
Market Review
Equity markets turned in surprisingly good results considering the challenges markets faced at the outset of this fiscal year: political dysfunction and fiscal cliff worries in the US; slowing growth, political change, and capital outflows in emerging markets (EMs); competitive devaluation in Japan; and fiscal retrenchment in Europe, where the European Central Bank (ECB) was resistant to adopting the US Federal Reserve brand of quantitative monetary stimulus.
But Japan’s grand experiment in reflating its economy and the ECB’s creative finesse of sovereign and banking system fault lines allowed stock markets in the two regions to lead the Index in overall returns, with Japanese and euro-zone stocks both rising by more than a third in the year. EMs lagged a long way behind, still plagued by falling exports, political fragility, and capital outflows—a situation that worsened considerably when the US Fed hinted in the spring that it might begin to “taper” its massive purchases of US Treasury debt.
Sector-wise, there was confusion between leaders and laggards from a cyclical point of view. Consumer Discretionary stocks performed the best, with cyclical groups such as automobiles & components and media leading the way. Industrials—particularly capital goods—did well too, but the sector was edged out by the usually non-cyclical Health Care. Adding to the disorder, Materials and Energy, often cyclically correlated, fell to the bottom of the heap along with Utilities.
Quality factors played a role in overall returns, with low quality companies racing ahead of the Index in the US, Japan, and euro zone.
Performance Attribution
The Portfolio lagged the Index in the fiscal year, with negative stock selection in seven of the nine sectors in which we were invested. Stocks in the Information Technology sector—where the Portfolio holds its largest overweight relative to the Index—detracted most from relative performance, primarily due to a handful of under-performing US companies, including Apple, Citrix Systems, and Teradata. Of course, had we owned less in this sector, the impact would have been lessened. Financials also detracted from performance, mainly because of our emphasis on EM-oriented banks,
| | | | |
Fund Facts at October 31, 2013 |
Total Net Assets | | | | $630.2 million |
Sales Charge | | | | None |
Number of Holdings | | | | 67 |
Turnover (5 Yr. Average) | | | | 30% |
Redemption Fee | | | | 2% first 90 days |
Dividend Policy | | | | Annual |
| | | Institutional Class | | Advisor Class |
Ticker | | HLMVX | | HLMGX |
CUSIP | | 412295602 | | 412295206 |
Inception Date | | 11/3/2009 | | 12/1/1996 |
Minimum Investment* | | $100,000 | | $5,000 |
Net Expense Ratio | | 0.95%† | | 1.24% |
Gross Expense Ratio | | 1.02% | | 1.25% |
*Lower minimums available through certain brokerage firms.†Harding Loevner has contractually agreed to Waive fees and/or reimburse expenses through February 28, 2014. The Net Expense Ratio is as of October 31, 2013. The Gross Expense Ratio is as of the Prospectus, February 28, 2013.
including India’s HDFC Bank and ICICI Bank, Turkey’s Garanti Bank, and Indonesia’s Bank Central Asia, as well as the UK’s Standard Chartered, which suffered inordinately in the EM carnage. Industrial stocks also fared badly, especially Fanuc, which saw demand for its robots fall afoul of Apple’s oversupply problems. Only our stocks within Energy and Materials served to add to relative performance, thanks to Schlumberger, and to our avoidance of mining and commodity-oriented businesses.
By region, our emphasis on holdings in the outperforming US market and our lack of holdings in resource-related markets, such as Canada and Brazil, helped performance but could not overcome poor stock selection within most regions. In addition to the clutch of US-based IT companies, we also suffered from Coach, the luxury handbag and accessory producer, which ceded US market share to competitors for the first time in many years, casting doubt on the continuance of its international expansion, which has been a key driver of its growth. Our EM holdings—again, focused on banks and Telecoms in a weak currency environment—lagged the poor performance of the regional index, more than offsetting the benefit of our below-benchmark allocation to the region. Our Japanese holdings lagged the Index, hurt by Fanuc and Unicharm. Strong performance in Europe ex-EMU partially cushioned the Portfolio’s overall underperformance because of outperformance from several UK holdings, including advertiser WPP, drug maker Shire Pharmaceutical, and semiconductor designer ARM Holdings.
Perspectives
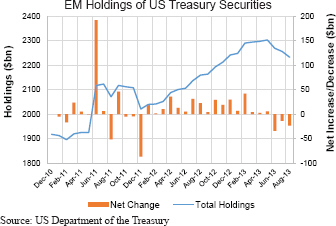
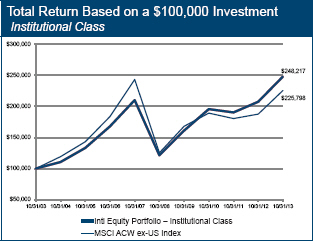
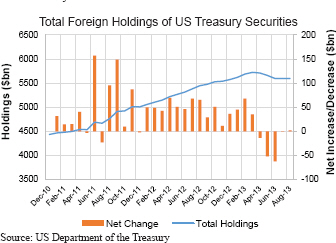
Market participants have focused on the volatility created by both the Fed’s notice of withdrawal of its extraordinary monetary stimulus (the tapering announcement in May) and then its subsequent about-face on ending Quantitative Easing while economic data remains anemic. But what has been much less appreciated, at least in the media and investment punditry that crosses our desks, is the fact that certain key long-term buyers of US Treasury securities have already been tapering their purchases for many months. That group is the collection of foreign central banks in developing countries that for years have been coping with sustained and large investment flows into their economies (both via public markets and by corporate direct investments) by standing in the middle of
Institutional Class HLMVX
Advisor Class HLMGX
| | | | | | | | | | | | | | | | | | | | | | | | | | | | | | | | | | | | | | | | | | | | |
Performance | |
Average Annualized Total Returns (%) | |
at September 30, 2013 | | | | | | | | | | | | | | | | | | | | | | | | | | | at October 31, 2013 | |
| | | | | | | | | | | | |
| | |
| Inception
Date |
| | | 1 year | | | | 3 years | | | | 5 years | | | | 10 years | | |
| Since
Inception |
* | | | 1 year | | | | 3 years | | | | 5 years | | | | 10 years | | |
| Since
Inception |
* |
Global Equity Portfolio – Inst. Class | | | 11/3/09 | | | | 13.37 | | | | 9.86 | | | | – | | | | – | | | | 10.26 | | | | 19.66 | | | | 9.27 | | | | – | | | | – | | | | 10.79 | |
| | | | | | | | | | | | |
Global Equity Portfolio – Advisor Class | | | 12/1/96 | | | | 13.06 | | | | 9.58 | | | | 8.80 | | | | 8.70 | | | | 6.42 | | | | 19.33 | | | | 9.03 | | | | 14.01 | | | | 8.43 | | | | 6.56 | |
| | | | | | | | | | | | |
MSCI All Country World Index | | | | | | | 17.76 | | | | 10.22 | | | | 7.72 | | | | 7.86 | | | | 5.71 | | | | 23.32 | | | | 10.36 | | | | 13.47 | | | | 7.65 | | | | 5.93 | |
*The inception returns of the Institutional Class are since 11/3/09; those of the Advisor Class and Index are since 12/1/96.
Performance data quoted represent past performance; past performance does not guarantee future results. The investment return and principal value of an investment will fluctuate so that an investor’s shares, when redeemed, may be worth more or less than their original cost. Current performance of the Portfolio may be lower or higher than the performance quoted. Performance data current to the most recent month end may be obtained by calling (877) 435-8105 or visiting www.hardingloevnerfunds.com. The Portfolio imposes a 2% redemption fee on shares held 90 days or less. Performance data does not reflect the redemption fee. If reflected, total returns would be reduced. The Gross Expense Ratios for the Institutional Class and Advisor Class are 1.02% and 1.25%, respectively.
The charts below illustrate the hypothetical return of an investment made in the corresponding share classes. Investment return reflects voluntary fee waivers in effect. Absent such waivers, total return would be reduced. The performance provided in the table above and charts below do not reflect the deduction of taxes that a shareholder would pay on Portfolio distributions or the redemption of Portfolio shares.
those transactions, building reserves of US dollars and other foreign currencies, and injecting the money flows into their economies without allowing their exchange rates to adjust fully to reflect the sustained demand for the currency. Those reserves were mostly invested in US Treasury notes. As those flows have waned, so have the central banks’ desire to hold such large reserves, and indeed, some of them are trying to smooth the downward pressure on their exchange rates by using those reserves to satisfy the demands for
capital repatriation rather than allowing the currency to bear the full brunt of the “rush for the exits” by developed world investors. The result, as the accompanying chart shows, is that EM holdings of US Treasuries have switched from substantial increases every quarter (net purchases) to modest decreases (net sales, as well as valuation declines). The amount is significant, and has exceeded the modest tapering amount (whether temporarily or inevitably) threatened by Mr. Bernanke.
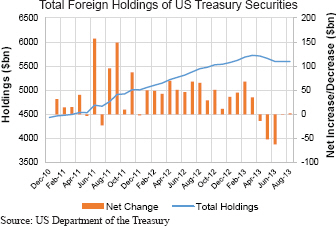
Global Equity Portfolio continued
It is not just EM central banks that have reduced their purchases of US Treasuries. Japan is another country with large foreign currency reserves, including large holdings of US Treasuries; as the country’s very large annual current account surplus has shrunk dramatically in recent quarters, so, as a result, has its monthly net purchases of additional Treasury securities. Other developed market holdings of Treasuries have also declined, which may be related to the declining fears of a European sovereign default and a break-up of the euro. The flip side of the recovery of the European bank sector from the brink of insolvency is that the flight of capital to US Treasuries—once considered the ultimate safe haven—may decline. So, it is less surprising than might otherwise be recognized that the bear market in the long end of the US Treasury bond market is already one of the worst on record. Nor should we puzzle that the Fed’s backward step from tapering of Quantitative Easing has itself allowed bond markets to recover their poise. The cumulative effect of these central bank reserve shifts is the evaporation of tens of billions of dollars’ worth of new investments in US government securities monthly. Large providers of capital to the gigantic flow of US borrowing needs have begun to find other uses of their capital—at home. Absent further curtailing of those borrowing needs—smaller budget deficits still, or greater domestic savings—the cost of capital for US borrowers is not likely to remain near zero, after inflation, for much longer.
We have viewed the meltdown in some of the EMs with mixed feelings. On the one hand, we were happy to have leaned against the earlier prevailing winds of enthusiasm for EMs by constraining ourselves to a significantly smaller emphasis on EM-domiciled companies than the Index, and have found more attractively priced EM businesses within the multinational companies listed in less favored developed stock markets. On the other hand, we were chagrined to have held steadfastly onto several financial companies based in rapidly growing economies such as India, Brazil, and Turkey—countries amongst the worst-hit of the various EMs because of the deterioration of their currencies as stock and bond investors withdrew their capital.
The tapering warning from the Fed—which was to have amounted to a reduction in its purchases by less than ten billion dollars per month—has merely been the catalyst that accelerated the rush for the exits from EM stock and bond markets by global investors. But when Quantitative Easing does end—and we believe it is in its
| | | | | | | | |
Geographical Weightings (%) at October 31, 2013 | |
Institutional and Advisor Classes | | | | | |
Country/Region | | | Portfolio | | | | Benchmark | 1 |
Canada | | | 0.0 | | | | 3.7 | |
Emerging Markets | | | 8.5 | | | | 11.2 | |
Europe EMU | | | 7.1 | | | | 11.3 | |
Europe ex-EMU | | | 14.5 | | | | 13.4 | |
Japan | | | 9.3 | | | | 7.8 | |
Middle East | | | 0.0 | | | | 0.2 | |
Pacific ex-Japan | | | 3.0 | | | | 4.8 | |
United States | | | 54.9 | | | | 47.6 | |
Frontier Markets2 | | | 0.0 | | | | – | |
Cash | | | 2.7 | | | | – | |
1MSCI All Country World Index; 2Includes countries with less-developed markets outside the Index.
| | | | | | | | |
Sector Weightings (%) at October 31, 2013 | |
Institutional and Advisor Classes | | | | | |
Sector | | | Portfolio | | | | Benchmark | 1 |
Consumer Discretionary | | | 14.2 | | | | 11.8 | |
Consumer Staples | | | 11.2 | | | | 10.0 | |
Energy | | | 6.1 | | | | 9.9 | |
Financials | | | 18.9 | | | | 21.7 | |
Health Care | | | 9.0 | | | | 10.1 | |
Industrials | | | 8.8 | | | | 10.7 | |
Information Technology | | | 21.4 | | | | 12.1 | |
Materials | | | 6.3 | | | | 6.2 | |
Telecom Services | | | 1.4 | | | | 4.2 | |
Utilities | | | 0.0 | | | | 3.3 | |
Cash | | | 2.7 | | | | – | |
1MSCI All Country World Index
twilight, not only for the Fed but for other Western central banks—there will follow a sustained adjustment period for many of these less-developed capital markets, and probably for the less-developed economies that they serve. Adjustment will come in the form of weakening currencies and rising capital costs for investment. It may also result in the demise of some investments made earlier that were dependent on low capital costs—and that may well mean loan losses for their lenders. The opacity of capital flows, and of mismatched funding of investments, means that we can have no strong sense of how dramatic this reckoning might be. If the adjustment is large and drawn out, then we cannot avoid seeing some of the banks’ pain spilling into the underlying economies and hurting as well the businesses of a number of our multinational companies that have been investing in these growth markets so assiduously for so many years.
Japan is marching to a different drummer than either the western developed economies or the emerging ones. Prime Minister Shinzo Abe has actually amplified its monetary and fiscal stimulus and has hopes of further spurring domestic demand through more fundamental reforms of its economy. But we expect resistance from within his own political party when Abe tries to push through some of his suggested changes, especially in light of the implementation of already scheduled consumption tax hikes. We also wonder how long it will be before the fruits of growth strategies, such as potential corporate tax cuts, are realized and how sustainable the growth will be. While we are skeptical of the future success of Abe’s reforms, we continue to not only look for disruptions and secular changes that Abenomics may create, but also continue to look for companies that can achieve sustainable growth regardless of what Abe may or may not do.
If uncertainty is the order of the day from our perspective in Japan and in EMs, one thing of which we are confident is a continued increase in the regulatory burden on banks in developed markets. Swedish banks, among the most resilient through the financial crisis in spite of their longstanding funding reliance on covered bonds (mortgage-backed securities), are bracing for changes to their overall leverage and liquid capital ratios. The two nationalized banks in the UK, Royal Bank of Scotland and Lloyds Bank, are hiving off parts of their branch networks to satisfy the UK competition authorities. Other banks, from the Netherlands to Germany
7
Institutional Class HLMVX
Advisor Class HLMGX
to Spain to Austria, are continuing to shrink their assets in order to meet the capital requirements laid out in Basel III. American banks are facing an energized panoply of regulators, illustrated by their joint victory over JPMorgan Chase, which agreed to the largest fine of a corporation in US history this November. At the same time that regulators are maintaining the pressure on management and on capital, bank customers are not lining up to do more business: demand for borrowing remains weak in all markets, as individuals and companies continue to seek ways to reduce their exposure to, or dependence on, financial leverage.
Portfolio Structure
Markets have seized on the incrementally positive economic data coming from European economies as a sign that the worst of the sovereign crisis that followed the 2008 financial crisis is over. Meanwhile, there has been increasingly apparent optimism, not least from Fed comments, that the US economy is gathering momentum. We have some sympathy for that point of view, but have not altered our portfolio stance nor increased our risk tolerance in cyclical companies significantly over the past twelve months. The reason for that is, of course, that we have held a balanced Portfolio of cyclical and non-cyclical companies for quite some time already, anticipating an eventual rebound in capital spending and consumer discretionary spending, the two segments of the developed economy that were worst hit by the crises.
In fact, our Portfolio turnover has been unusually low over the past several months, as our substantial holdings of IT companies—whose products and services form a large piece of capital investment spending—saw valuations compress through stock price underperformance even as earnings proved resilient according to consensus estimates. Rather than give up and rotate into other sectors, we hunkered down in the companies we already owned, convinced that their headwinds would be temporary, and that their virtues would ultimately be recognized by the market.
We have held onto leading providers of equipment and software that is enabling the massive shift of data storage and analysis to remote sites, including F5 Networks, Teradata, and EMC, along with the companies who are helping enterprises to build their internal infrastructure, linking the new technologies to their existing operations, such as Cognizant Technology and Informatica. We continue to hold companies leading the explosion of mobile computing, including ARM Holdings and Citrix Systems. And, we continue to identify attractive internet-based business models in non-IT industries, such as Amazon.com in retailing, eBay in auctions and online payments, and M3 in medical information. We also added two credit card servicers to the Portfolio in the fiscal year, American Express and MasterCard, attracted to their toll-taker positions in consumer expenditures in the US and increasingly in EMs.
Our exposure to capital goods and related companies outside of the IT sector remains strong, with a near-benchmark weight in Industrials, including several companies that should benefit from the upswing in US manufacturing that is following the surge of US domestic oil and gas production. Roper and Emerson Electric have a large US presence, as do our two industrial gas specialists (from the Materials sector), Praxair and Air Liquide, both of which expect large new opportunities from the spate of new US refinery projects announced recently.
| | | | | | |
Ten Largest Holdings at October 31, 2013 | |
Institutional and Advisor Classes | | | | |
Company | | Country | | | % | |
Wells Fargo | | United States | | | 3.8 | |
Google | | United States | | | 3.4 | |
Schlumberger | | United States | | | 2.9 | |
Nestlé | | Switzerland | | | 2.7 | |
eBay | | United States | | | 2.6 | |
Unicharm | | Japan | | | 2.5 | |
Nike | | United States | | | 2.3 | |
AIA Group | | Hong Kong | | | 2.2 | |
Sigma-Aldrich | | United States | | | 2.1 | |
Fanuc | | Japan | | | 2.1 | |
Our Financials holdings remain concentrated in two regions, the US and EMs. We have retained our holding in JPMorgan in the face of acrimonious criticism of its management and its governance, and despite the record-breaking settlement it reached with government agencies and regulators in November. In our view, the settlements are a final clearing of the debris of the financial crisis, and the scale of the payments themselves are more representative of regulatory shakedown and backward-looking revisionism than of egregious wrongdoing on the part of JPMorgan management and staff. The clearest evidence of this are the sums that relate to mortgage securitization actions of Bear Stearns and Washing-ton Mutual, companies that the very same government agencies begged JPMorgan to acquire without time for extensive due diligence during the worst moments of the 2008 crisis. But as one of the few entities to come out of the crisis stronger, JPMorgan stands a good chance to reap the rewards of a chastened, more concentrated global investment banking industry in an interconnected world that still requires the global money center expertise and services at which JPMorgan excels.
Within EM Financials, we have so far resisted the urge to respond to lower prices and cheaper currencies that beckon us to add to our holdings. We are not at all sure, as discussed earlier, whether we are near the end of a correction or the beginning of a major adjustment in many of the developing countries’ capital accounts and capital markets. We are watching and waiting, taking cold comfort from the history of capital adjustments and financial crises: they always last longer than you expect.
Please read the separate disclosure page for important information, including the risks of investing in the Portfolio.
International Equity Portfolio
Portfolio Managers
| | |

| | from left: Ferrill Roll, CFA Co-Lead Portfolio Manager Alexander Walsh, CFA Co-Lead Portfolio Manager Peter Baughan, CFA Portfolio Manager |
| | |

| | Institutional Class Best Fund in its Category for
5-Year Risk-Adjusted Performance for the period ended November 30, 2012. |
Performance Summary
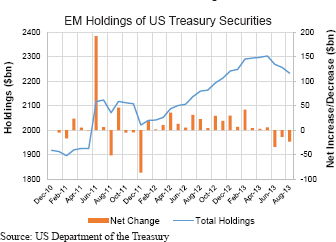
The International Equity Portfolio – Institutional Class rose 19.58% and the Investor Class gained 19.19% (net of fees and expenses) in the fiscal year ended October 31, 2013. The Portfolio’s benchmark, the MSCI All Country World ex-US Index (the Index), rose 20.31% (net of source taxes) in this period.
Market Review
Equity markets turned in surprisingly good results considering the challenges markets faced at the outset of this fiscal year: political dysfunction and fiscal cliff worries in the US; slowing growth, political change, and capital outflows in emerging markets (EMs); competitive devaluation in Japan; and fiscal retrenchment in Europe, where the European Central Bank (ECB) was resistant to adopting the US Federal Reserve brand of quantitative monetary stimulus.
But Japan’s grand experiment in reflating its economy and the ECB’s creative finesse of sovereign and banking system fault lines allowed stock markets in the two regions to lead the Index in overall returns, with Japanese and euro-zone stocks both rising by more than a third in the year. EMs were one of the worst performing regions in the Index, still plagued by falling exports, political fragility, and capital outflows—a situation that worsened considerably when the US Fed hinted in the spring that it might begin to “taper” its massive purchases of US Treasury debt.
Sector-wise, there was confusion between leaders and laggards from a cyclical point of view. Consumer Discretionary stocks performed the best, with cyclical groups such as automobiles & components and media leading the way. Industrials did well too, but the sector was edged out by the usually non-cyclical Health Care. Adding to the disorder, Energy and Materials, often cyclically correlated, fell to the bottom of the heap, with the latter being the only sector to experience negative returns in the fiscal year.
Quality factors did not play a clear-cut role in overall returns but were a significant factor on a regional basis, with low quality companies racing ahead of the Index in Japan and the European Monetary Union (EMU).
Performance Attribution
The Portfolio performed in-line with the Index in the fiscal year, with good sector allocations offset by poor stocks within several sectors. A heavy emphasis on Information Technology and Health Care companies proved beneficial, as did the Portfolio’s light
| | | | | | | | |
Fund Facts at October 31, 2013 | |
Total Net Assets | | | | | | | $3,877.5 million | |
Sales Charge | | | | | | | None | |
Number of Holdings | | | | | | | 53 | |
Turnover (5 Yr. Average) | | | | 20% | |
Redemption Fee | | | | | | | 2% first 90 days | |
Dividend Policy | | | | | | | Annual | |
| | | | Institutional Class | | | | Investor Class | |
Ticker | | | HLMIX | | | | HLMNX | |
CUSIP | | | 412295107 | | | | 412295503 | |
Inception Date | | | 5/11/1994 | | | | 9/30/2005 | |
Minimum Investment* | | | $100,000 | | | | $5,000 | |
Net Expense Ratio | | | 0.87% | | | | 1.20% | |
Gross Expense Ratio | | | 0.87% | | | | 1.24% | |
*Lower minimums available through certain brokerage firms. The Net Expense Ratio is as of October 31, 2013. The Gross Expense Ratio is as of the Prospectus, February 28, 2013.
allocation to Materials. However, our underweight to the strongly performing Financials sector diminished performance, and our focus on EM-oriented banks compounded the impact of our less-than-benchmark allocation. Garanti Bank was hit hard by political unrest in Turkey and suffered double-digit price declines. This came alongside poor performances from India’s ICICI Bank, Britain’s Standard Chartered, and, to a lesser extent, Brazil’s Itau Unibanco. We also suffered from poor stock selection within Industrials, where two Japanese companies, Fanuc and JGC Corp, under-performed. Fanuc saw demand for its robots fall afoul of Apple’s oversupply problems, while JGC suffered a highly publicized terrorist attack on one of its liquefied natural gas (LNG) projects in Algeria. While JGC’s share price mostly recovered in the months following the attack, Fanuc remained a significant laggard in the year. Notably, Schlumberger and Sasol drove good returns within Energy, but not enough to overcome the negative stock selection from other sectors.
Viewed regionally, the Portfolio experienced particularly strong performance in Europe ex-EMU, driven by our overweight to, and strongly performing holdings in, Switzerland (Roche Holding, Lonza Group, and Swatch Group), as well as good stocks within the UK (ARM Holdings and WPP). Our light holdings within EMs also helped performance, and, despite the emphasis on Financials, our EM stocks bettered the MSCI Emerging Markets Index—thanks in part to the very strong returns from Chinese internet search engine Baidu, a new holding this year. Stock selection in the euro zone detracted most from performance, primarily because of poor German holdings, including enterprise software giant SAP, and dialysis maker Fresenius Medical Care. The latter company’s shares reacted negatively to Medicare reimbursement rebasing proposals.
Perspectives
Market participants have focused on the volatility created by both the Fed’s notice of withdrawal of its extraordinary monetary stimulus (the tapering announcement in May) and then its subsequent about-face on ending Quantitative Easing while economic data remains anemic. But what has been much less appreciated, at least in the media and investment punditry that crosses our desks, is the fact that certain key long-term buyers of US Treasury securities have already been tapering their purchases for many months.
Institutional Class HLMIX
Investor Class HLMNX
| | | | | | | | | | | | | | | | | | | | | | | | | | | | | | | | | | | | | | | | | | | | |
Performance | |
Average Annualized Total Returns (%) | | | | | |
at September 30, 2013 | | | | | | | | | | | | | | | | | | | | | | | | | | | at October 31, 2013 | | | | | |
| | | | | | | | | | | | |
| | |
| Inception
Date |
| | | 1 year | | | | 3 years | | | | 5 years | | | | 10 years | | |
| Since
Inception* |
| | | 1 year | | | | 3 years | | | | 5 years | | | | 10 years | | |
| Since
Inception* |
|
Intl Equity Portfolio – Institutional Class | | | 5/11/94 | | | | 16.27 | | | | 8.17 | | | | 8.76 | | | | 9.67 | | | | 6.32 | | | | 19.58 | | | | 8.24 | | | | 15.39 | | | | 9.52 | | | | 6.47 | |
| | | | | | | | | | | | |
Intl Equity Portfolio – Investor Class | | | 9/30/05 | | | | 15.80 | | | | 7.78 | | | | 8.41 | | | | – | | | | 6.70 | | | | 19.19 | | | | 7.85 | | | | 15.03 | | | | – | | | | 7.07 | |
| | | | | | | | | | | | |
MSCI ACW ex-US Index | | | | | | | 16.50 | | | | 5.96 | | | | 6.27 | | | | 8.78 | | | | 5.59 | | | | 20.31 | | | | 6.05 | | | | 12.50 | | | | 8.49 | | | | 5.76 | |
*The inception returns of the Institutional Class and Index are since 5/11/94; those of the Investor Class are since 9/30/05.
Performance data quoted represent past performance; past performance does not guarantee future results. The investment return and principal value of an investment will fluctuate so that an investor’s shares, when redeemed, may be worth more or less than their original cost. Current performance of the Portfolio may be lower or higher than the performance quoted. Performance data current to the most recent month end may be obtained by calling (877) 435-8105 or visiting www.hardingloevnerfunds.com. The Portfolio imposes a 2% redemption fee on shares held 90 days or less. Performance data does not reflect the redemption fee. If reflected, total returns would be reduced. The Gross Expense Ratios for the Institutional Class and Investor Class are 0.87% and 1.24%, respectively.
The charts below illustrate the hypothetical return of an investment made in the corresponding share classes. Investment return reflects voluntary fee waivers in effect. Absent such waivers, total return would be reduced. The performance provided in the table above and charts below do not reflect the deduction of taxes that a shareholder would pay on Portfolio distributions or the redemption of Portfolio shares.
That group is the collection of foreign central banks in developing countries that for years have been coping with sustained and large investment flows into their economies (both via public markets and by corporate direct investments) by standing in the middle of those transactions, building reserves of US dollars and other foreign currencies, and injecting the money flows into their economies without allowing their exchange rates to adjust fully to reflect the sustained demand for the currency. Those reserves were mostly invested in US Treasury notes. As those flows have waned, so have the central banks’ desire to hold such large reserves, and indeed,
some of them are trying to smooth the downward pressure on their exchange rates by using those reserves to satisfy the demands for capital repatriation rather than allowing the currency to bear the full brunt of the “rush for the exits” by developed world investors. The result, as the accompanying chart shows, is that EM holdings of US Treasuries have switched from substantial increases every quarter (net purchases) to modest decreases (net sales, as well as valuation declines). The amount is significant, and has exceeded the modest tapering amount (whether temporarily or inevitably) threatened by Mr. Bernanke.
International Equity Portfolio continued
It is not just EM central banks that have reduced their purchases of US Treasuries. Japan is another country with large foreign currency reserves, including large holdings of US Treasuries; as the country’s very large annual current account surplus has shrunk dramatically in recent quarters, so, as a result, has its monthly net purchases of additional Treasury securities. Other developed market holdings of Treasuries have also declined, which may be related to the declining fears of a European sovereign default and a break-up of the euro. The flip side of the recovery of the Eu-ropean bank sector from the brink of insolvency is that the flight of capital to US Treasuries—once considered the ultimate safe haven—may decline. So, it is less surprising than might otherwise be recognized that the bear market in the long end of the US Treasury bond market is already one of the worst on record. Nor should we puzzle that the Fed’s backward step from tapering of Quantitative Easing has itself allowed bond markets to recover their poise. The cumulative effect of these central bank reserve shifts is the evaporation of tens of billions of dollars’ worth of new investments in US government securities monthly. Large providers of capital to the gigantic flow of US borrowing needs have begun to find other uses of their capital—at home. Absent further curtailing of those borrowing needs—smaller budget deficits still, or greater domestic savings—the cost of capital for US borrowers is not likely to remain near zero, after inflation, for much longer.
We have viewed the meltdown in some of the EMs with mixed feelings. On the one hand, we were happy to have leaned against the earlier prevailing winds of enthusiasm for EMs by constraining ourselves to a significantly smaller emphasis on EM-domiciled companies than the Index, and have found more attractively priced EM businesses within the multinational companies listed in less-favored developed stock markets. On the other hand, we were chagrined to have held steadfastly onto several financial companies based in rapidly growing economies such as India, Brazil, and Turkey—countries amongst the worst-hit of the various EMs because of the deterioration of their currencies as stock and bond investors withdrew their capital.
The tapering warning from the Fed—which was to have amounted to a reduction in its purchases by less than ten billion dollars per month—has merely been the catalyst that accelerated the rush for the exits from EM stock and bond markets by global investors. But
| | | | | | | | |
Geographical Weightings (%) at October 31, 2013 Institutional and Investor Classes | |
Country/Region | | | Portfolio | | | | Benchmark | 1 |
| | | |
Canada | | | 3.2 | | | | 7.2 | |
| | | |
Emerging Markets | | | 16.8 | | | | 21.3 | |
| | | |
Europe EMU | | | 28.6 | | | | 21.5 | |
| | | |
Europe ex-EMU | | | 20.6 | | | | 25.6 | |
| | | |
Japan | | | 14.6 | | | | 15.0 | |
| | | |
Middle East | | | 0.0 | | | | 0.3 | |
| | | |
Pacific ex-Japan | | | 8.3 | | | | 9.1 | |
| | | |
Frontier Markets2 | | | 0.0 | | | | – | |
| | | |
Other3 | | | 4.4 | | | | – | |
| | | |
Cash | | | 3.5 | | | | – | |
1MSCI All Country World ex-US Index; 2Includes countries with less-developed markets outside the Index; 3Includes countries with developed markets outside the Index where some holdings are incorporated.
| | | | | | | | |
Sector Weightings (%) at October 31, 2013 Institutional and Investor Classes | |
Sector | | | Portfolio | | | | Benchmark | 1 |
| | | |
Consumer Discretionary | | | 10.4 | | | | 10.6 | |
| | | |
Consumer Staples | | | 14.8 | | | | 10.1 | |
| | | |
Energy | | | 8.0 | | | | 9.3 | |
| | | |
Financials | | | 19.1 | | | | 27.0 | |
| | | |
Health Care | | | 12.3 | | | | 7.7 | |
| | | |
Industrials | | | 12.1 | | | | 11.0 | |
| | | |
Information Technology | | | 15.9 | | | | 6.4 | |
| | | |
Materials | | | 3.0 | | | | 8.7 | |
| | | |
Telecom Services | | | 0.9 | | | | 5.8 | |
| | | |
Utilities | | | 0.0 | | | | 3.4 | |
| | | |
Cash | | | 3.5 | | | | – | |
1MSCI All Country World ex-US Index
when Quantitative Easing does end—and surely it is in its twilight, not only for the Fed but for other Western central banks—there will follow a sustained adjustment period for many of these less-developed capital markets, and probably for the less-developed economies that they serve. Adjustment will come in the form of weakening currencies and rising capital costs for investment. It may also result in the demise of some investments made earlier that were dependent on low capital costs—and that may well mean loan losses for their lenders. The opacity of capital flows, and of mismatched funding of investments, means that we can have no strong sense of how dramatic this reckoning might be. If the adjustment is large and drawn out, then we cannot avoid seeing some of the banks’ pain spilling into the underlying economies and hurting as well the businesses of a number of our multinational companies that have been investing in these growth markets so assiduously for so many years.
Japan is marching to a different drummer than either the western developed economies or the emerging ones. Prime Minister Shinzo Abe has actually amplified its monetary and fiscal stimulus and has hopes of further spurring domestic demand through more fundamental reforms of its economy. But we expect resistance from within his own political party when Abe tries to push through some of his suggested changes, especially in light of the implementation of already scheduled consumption tax hikes. We also wonder how long it will be before the fruits of growth strategies, such as potential corporate tax cuts, are realized and how sustainable the growth will be. While we are skeptical of the future success of Abe’s reforms, we continue to not only look for disruptions and secular changes that Abenomics may create, but also continue to look for companies that can achieve sustainable growth regardless of what Abe may or may not do.
If uncertainty is the order of the day from our perspective in Japan and in EMs, one thing of which we are confident is a continued increase in the regulatory burden on banks in developed markets. Swedish banks, among the most resilient through the financial crisis in spite of their longstanding funding reliance on covered bonds (mortgage-backed securities), are bracing for changes to their overall leverage and liquid capital ratios. The two nationalized banks in the UK, Royal Bank of Scotland and Lloyds Bank, are hiving off parts of their branch networks to satisfy the UK competition authorities. Other banks, from the Netherlands to Germany
Institutional Class HLMIX
Investor Class HLMNX
to Spain to Austria, are continuing to shrink their assets in order to meet the capital requirements laid out in Basel III. American banks are facing an energized panoply of regulators, illustrated by their joint victory over JPMorgan Chase, which agreed to the largest fine of a corporation in US history this November. At the same time that regulators are maintaining the pressure on management and on capital, bank customers are not lining up to do more business: demand for borrowing remains weak in all markets, as individuals and companies continue to seek ways to reduce their exposure to, or dependence on, financial leverage.
Portfolio Structure
Markets have seized on the incrementally positive economic data coming from European economies as a sign that the worst of the sovereign crisis that followed the 2008 financial crisis is over. We have some sympathy for that point of view, and have incrementally increased our risk tolerance in European companies over the past twelve months. We have held onto global cyclical companies, including compressor specialist Atlas Copco and low-voltage electrical equipment supplier Schneider Electric—which, together with our large holdings in enterprise software giant SAP, semiconductor design specialist ARM Holdings, and 3-D software specialist Dassault Systemes—are all exposed to an upturn in corporate capital spending. Sales of advertising giant WPP, luxury watchmaker Swatch Group, and winter tire manufacturer Nokian Renkaat are all correlated to any surge in consumer spending, as is luxury carmaker BMW, which we purchased earlier this year. We also bought a new holding in BBVA in the year, the Spanish commercial bank with operations in Latin America and a stake in Turkey’s Garanti Bank.
In our opinion, our holdings in Japan remain of very high quality and are among the fastest-growing Japanese companies in the country. But as others have become attracted to their merits, their shares have become expensive, and indeed, our performance within Japan suffered relative to the Index over the first six months of Abe’s ascendancy. We are now casting our net slightly wider. If Abenomics succeeds in kindling some modest inflation as well as greater domestic investment demand, then we believe Tokyo office property will be in higher demand given the city’s central place in corporate Japan’s cultural hierarchy. With property values in Japan having suffered through a twenty-year bear market, and rents stable over the past decade, we believe that office rents in Japan have little downside, and potentially a lot of upside. We bought a new holding in Mitsubishi Estate, the quoted real-estate company with premier office property assets in prestigious Marunouchi, central Tokyo, which are partially financed by debt, a potent mixture for real profit creation if Mr. Abe succeeds.
Harding Loevner portfolios have long featured generous allocations to companies in the Consumer Staples and Health Care sectors, due to their consistent growth and persistent high quality—and we still hold more than a quarter of the Portfolio in those two sectors. Since purchasing a renewed holding in Novo Nor-disk in June, though, we sold our holding of Lonza Group, the Swiss-based bio-pharmaceutical and anti-microbial manufacturer, after shares rallied significantly on the installation of the new CEO and his embarkation on a substantial restructuring of the company’s various businesses. We also reduced our holding in Fresenius Medical Care, the global leader in kidney dialysis, because of the uncertainty over pricing for treatments in the US, which is under review by Medicare and Medicaid.
| | | | | | |
Ten Largest Holdings at October 31, 2013 | |
Institutional and Investor Classes | |
Company | | Country | | | % | |
| | | |
SAP | | Germany | | | 3.6 | |
| | | |
Nestlé | | Switzerland | | | 3.4 | |
| | | |
Dassault Systemes | | France | | | 3.4 | |
| | | |
WPP | | United Kingdom | | | 3.2 | |
| | | |
Roche Holding | | Switzerland | | | 3.0 | |
| | | |
Air Liquide | | France | | | 3.0 | |
| | | |
Allianz | | Germany | | | 3.0 | |
| | | |
Itau Unibanco | | Brazil | | | 2.9 | |
| | | |
AIA Group | | Hong Kong | | | 2.8 | |
| | | |
JGC Corp | | Japan | | | 2.5 | |
We have not gone whole hog in adding to companies domiciled in EMs. As mentioned, we bought a new holding in China’s largest internet search engine company, Baidu, which had underperformed along with most Chinese-related equities but appears to be grappling successfully with its biggest challenge: to adapt its revenue model from computer-based search to mobile search, where its business faces new competitors and new methods of information monetization. There are not yet many “internet-based” business models in non-US markets that meet our criteria for business quality and management consistency and also trade at remotely reasonable prices; in this case, we were able to exploit the market’s multiple fears over Baidu’s operations and home market to establish a position. We used the extended weakness in EM bank shares and currencies to add to holdings in India’s ICICI Bank and in Bra-zil’s Itau Unibanco. We also bought a new holding in Hong Kong Stock Exchange, which maintains our exposure to long-term trends in the financial integration of China to the world, but avoids significant credit risks. But we reduced our holding in Xinyi Glass, the Chinese producer of replacement glass for autos, after its share price recovered dramatically from China-related investor fears.
We also sold our holding in Potash, the Canadian producer of phosphates used in fertilizers, after the former Soviet bloc producers’ cartel broke ranks with each other and pricing discipline within the global potash industry fell apart.
The International Equity Portfolio, Institutional Class was ranked best out of 155 International Large-Cap Growth Funds for the 5-year period ended November 30, 2012. A Lipper Fund Award is awarded to one fund in each Lipper classification for achieving the strongest trend of consistent risk-adjusted performance against its classification peers over a three, five or ten-year period. Although Lipper makes reasonable efforts to ensure the accuracy and reliability of the data contained herein, the accuracy is not guaranteed by Lipper. Lipper Analytical Services, Inc. is an independent mutual fund research and rating service.© 2013, All Rights Reserved
Past performance does not guarantee future results.
Please read the separate disclosure page for important information, including the risks of investing in the Portfolio.
International Small Companies Portfolio
Portfolio Managers
| | |

| | from left: |
| | Josephine Lewis |
| | Co-Portfolio Manager |
| | Jafar Rizvi, CFA |
| | Co-Portfolio Manager |
Performance Summary
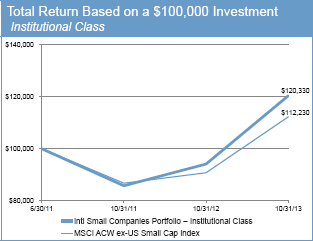
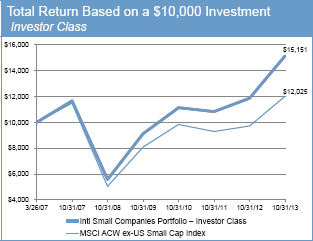
The International Small Companies Portfolio – Institutional Class rose 27.88% and the Investor Class gained 27.63% (net of fees and expenses) in the fiscal year ended October 31, 2013. The Portfolio’s benchmark, the MSCI All Country World ex-US Small Cap Index (the Index), rose 23.67% (net of source taxes) in this period.
Market Review
During the period, there were sharp divergences in performance for small company stocks among the Index’s different regions. From January to March 2013, euro-zone returns were dragged down by the news of a bank crisis and bailout in Cyprus, as government guarantees of bank deposits were cast aside as part of the European Monetary Union (EMU) bailout, giving depositors (and investors in EMU bank stocks) all over the continent reason to question the sanctity of their own nest eggs. However, incremental improvement of economic data toward the end of the fiscal year caused a slight positive change in growth prospects, which was enough to ignite investor optimism. Within the Index, small company stocks in Europe, both in the euro zone and outside of it, were up 47% and 37%, respectively, in the reporting period.
In contrast, shares of small companies in Emerging Markets (EMs) underperformed the Index by 14 percentage points. Currency depreciation among EM countries has been widespread, and markets of countries with especially large current account deficits, such as India and Indonesia, were especially punished. Concerns loom over how such countries will finance their deficits when the US Federal Reserve taps the brakes on its loose monetary policy of the last five years, by “tapering” its asset purchases. When implemented, this tightening will impact global liquidity and may cause further outflow of capital from EMs. However, the Fed’s retreat in September from plans to begin tapering helped EMs recover and post their largest two-month gain of the period.
Returns by sector did not show a clear pattern during the period, as the strongest returns in the Index came not only from cyclical sectors such as Information Technology and Consumer Discretionary, but also from the traditionally more defensive Telecom Services and Health Care sectors. The worst performing sectors in the Index were Energy and Materials, each underperforming the broader Index by more than 20 percentage points.
Small-cap stocks outperformed their large-cap counterparts (measured by the MSCI All Country World ex-US Index) by nearly four percentage points for the fiscal year ended October 31, 2013. This was partially due to the outperformance of small-
| | | | |
Fund Facts at October 31, 2013 |
Total Net Assets | | | | $79.1 million |
Sales Charge | | | | None |
Number of Holdings | | | | 105 |
Turnover (5 Yr. Average) | | | | 30% |
Redemption Fee | | | | 2% first 90 days |
Dividend Policy | | | | Annual |
| | | Institutional Class | | Investor Class |
Ticker | | HLMRX | | HLMSX |
CUSIP | | 412295875 | | 412295883 |
Inception Date | | 6/30/2011 | | 3/26/2007 |
Minimum Investment* | | $100,000 | | $5,000 |
Net Expense Ratio† | | 1.30% | | 1.55% |
Gross Expense Ratio | | 1.64% | | 2.02% |
*Lower minimums available through certain brokerage firms.†Harding Loevner has contractually agreed to waive fees and/or reimburse expenses through February 28, 2014. The Net Expense Ratio and the Gross Expense Ratio are as of the Prospectus, February 28, 2013.
cap European companies versus their large-cap counterparts. Returns by sector were similar to those of large-cap stocks, except in the case of Telecom Services and Information Technology, where small caps have trounced large caps in the period by approximately 12% in both sectors.
Performance Attribution
The Portfolio benefited from relative outperformance in seven of the ten economic sectors, led by stock selection in Consumer Staples. Pigeon, the Japanese provider of mother and baby care products, continues to expand into higher- margin, international markets such as China, which has helped operating results. The Portfolio’s longstanding underweights in Energy and Materials were a benefit this reporting period, as these were the weakest sectors in the Index. Conversely, our underweight to the strongly performing Consumer Discretionary sector detracted most from the Portfolio’s performance, though the companies we own fared modestly better than those in the Index. Stock selection in Industrials was weak, as Singapore-based crane maker Tat Hong Holdings underperformed due to weakness in Australian construction demand. We still believe in the company as it is a leading crane and heavy equipment operator in a fragmented industry, which allows it to benefit from its scale relative to small local operators. Further, the company derives nearly half of its revenues from South East Asia and should benefit from infrastructure development projects taking place there.
By geography, the largest contributor to the Portfolio’s outperformance was strong stock selection in Pacific ex-Japan, more than offsetting our overweight to the underperforming region. Australia’s TPG Telekom fared particularly well in an otherwise slowing Australian market as it leverages its low-cost provider status to syphon customers from more expensive competitors. Our positive stock selection in EMs, especially in China, also helped relative returns. Chinese company Haitian International, a producer of plastic injection molding machines, outperformed as the company launched a new product with capabilities superior to those of local Chinese competitors, and
Institutional Class HLMRX
Investor Class HLMSX
| | | | | | | | | | | | | | | | | | | | | | | | | | | | | | | | | | | | |
| Performance | |
Average Annualized Total Returns (%) | | | | | | | | | | | | | | | | | | | | | | | | | | | | |
at September 30, 2013 | | | | | | | | | | | | | | | | | | | | | | | at October 31, 2013 | | | | | |
| | | Inception
Date | | | 1 year | | | 3 years | | | 5 years | | | Since
Inception* | | | 1 year | | | 3 years | | | 5 years | | | Since
Inception* | |
Intl Small Companies Portfolio – Institutional Class | | | 6/30/11 | | | | 23.69 | | | | – | | | | – | | | | 7.22 | | | | 27.88 | | | | – | | | | – | | | | 8.24 | |
| | | | | | | | | | |
Intl Small Companies Portfolio – Investor Class | | | 3/26/07 | | | | 23.45 | | | | 11.51 | | | | 15.02 | | | | 6.13 | | | | 27.63 | | | | 10.80 | | | | 22.10 | | | | 6.50 | |
| | | | | | | | | | |
MSCI ACW ex-US Small Cap Index | | | | | | | 20.01 | | | | 7.26 | | | | 11.37 | | | | 2.39 | | | | 23.67 | | | | 6.90 | | | | 18.94 | | | | 2.83 | |
*The inception returns of the Institutional Class are since 6/30/11; those of the Investor Class and Index are since 3/26/07.
Performance data quoted represent past performance; past performance does not predict future results. The investment return and principal value of an investment will fluctuate so that an investor’s shares, when redeemed, may be worth more or less than their original cost. Current performance of the Portfolio may be lower or higher than the performance quoted. Performance data current to the most recent month end may be obtained by calling (877) 435-8105 or visiting www.hardingloevnerfunds.com. The Portfolio imposes a 2% redemption fee on shares held 90 days or less. Performance data does not reflect the redemption fee. If reflected, total returns would be reduced. The Gross Expense Ratio for the Institutional Class and Investor Class are 1.64% and 2.02%, respectively.
The charts below illustrate the hypothetical return of an investment made in the corresponding share classes. Investment return reflects voluntary fee waivers in effect. Absent such waivers, total return would be reduced. The performance provided in the table above and charts below do not reflect the deduction of taxes that a shareholder would pay on Portfolio distributions or the redemption of Portfolio shares.
comparable to machines produced by Japanese and German companies in its industry. The Portfolio’s underweight to the lagging, resource-heavy Canadian market also helped relative returns. However, our underweights in Europe ex-EMU and Japan hurt performance.
Investment Perspectives
A Quiet Year in M&A
We entered 2013 expecting it would be a good year for many of our companies to be acquired due to the continued pressure on larger companies to deliver revenue and earnings growth. The environment for M&A seemed particularly favorable given the combination of bleak economic prospects in many markets, easy-money monetary policies globally, and the strong competitive positioning of our Portfolio companies, which makes them attractive targets. Surprisingly, it has turned out to be a slow year for acquisitions with only one Portfolio company completely purchased year-to-date—a management buyout of Megane Top, a Japanese retailer of eyeglass lenses and frames. Management paid a price that was 40% below our estimate of fair value based on our forecasts for revenue and free cash flow growth. We were disappointed by the fact that the offer went through without granting shareholders an opportunity to dissent, particularly given the lack of any significant premium to the share price.
In August another Portfolio company, global provider of engineering and construction solutions Kentz, did receive acquisition offers from two rival companies, London-listed AMEC and German M+W Group. AMEC made the highest offer, which at Ł680 million represented a premium of about 20% over the previous day’s close. However, Kentz’s board unanimously rejected both bids on the grounds they undervalued the company. Based on our research, including interviews with the company, we concur that these offers did not reflect the fair value of the company. Kentz has an extensive addressable market and significant growth opportunities due to its wide range of capabilities across each segment of its end market: engineering, procurement, and construction. Taking these sources of future growth into account, our financial model confirms that AMEC’s higher offer still undervalued Kentz’s long-term free cash flows. While both buyout offers fell short, we were encouraged that two rival companies expressed interest in the business, confirming that Kentz’s competitive position is strong relative to its peers.
Two Portfolio companies initiated deals recently, demonstrating good discipline either in acquiring strategic assets or disposing non-
International Small Companies Portfolio continued
core businesses. Environmental, risk, and safety consultant RPS Group acquired three consultancy firms for a total cost of almost US$50 million. Ichron Limited, a UK-based geological and training services consultancy for the oil & gas sector, was acquired for US$20 million to further strengthen RPS’ position in Europe, Africa, and the Middle East. HMA Land Services, a Canadian consulting firm dedicated to infrastructure projects in North America, was also acquired for about US$20 million to help RPS enter the growing energy, pipeline, and utilities markets in North America. Finally, RPS acquired Asia-Pacific ASA Pty Ltd, an oceanographic consultancy whose specialties include coastal oil and gas exploration and marine emergency management, especially oil spills. The firm is based in Australia and was acquired for US$9 million. We liked these acquisitions for three reasons: they enhanced RPS’ core engineering consulting expertise in niche sectors and geographies; the amount paid was reasonable given the expertise acquired; and they provide RPS cross-sell opportunities to provide its consulting services to the clients of these three firms.
Although none of our Portfolio companies were acquired during the period, we think the deal environment remains favorable.
Meanwhile, Brazilian construction equipment rental company Mills decided to sell its industrial services business unit due to its relatively low profitability compared to the company’s other businesses. Mills had tried over the last few years to turn this business around, but return on invested capital (ROIC) remained only about 9% at the end of March 2013, while the company’s other business units had an average ROIC in the mid-to high-teens. In addition, the industrial services business had much higher volatility of ROIC, which increased risk and thus reduced the quality profile of the business. We think the sale was a good decision that not only enhanced Mills’ ROIC, but also improved the company’s risk profile. Although none of our Portfolio companies were acquired during
| | | | | | | | |
Geographical Weightings (%) at October 31, 2013 Institutional and Investor Classes | |
Country/Region | | | Portfolio | | | | Benchmark | 1 |
Canada | | | 1.0 | | | | 8.4 | |
Emerging Markets | | | 24.1 | | | | 20.7 | |
Europe EMU | | | 27.2 | | | | 17.3 | |
Europe ex-EMU | | | 21.4 | | | | 24.4 | |
Japan | | | 14.2 | | | | 19.1 | |
Middle East | | | 0.0 | | | | 0.8 | |
Pacific ex-Japan | | | 10.2 | | | | 9.3 | |
Frontier Markets2 | | | 0.0 | | | | – | |
Other3 | | | 0.6 | | | | – | |
Cash | | | 1.3 | | | | – | |
1MSCI All Country World ex-US Small Cap Index; 2Includes countries with less-developed markets outside the Index; 3Includes countries with developed markets outside the Index where some holdings are incorporated.
| | | | | | | | |
Sector Weightings (%) at October 31, 2013 Institutional and Investor Classes | |
Sector | | | Portfolio | | | | Benchmark | 1 |
Consumer Discretionary | | | 14.5 | | | | 18.4 | |
Consumer Staples | | | 13.0 | | | | 5.9 | |
Energy | | | 1.4 | | | | 5.5 | |
Financials | | | 8.9 | | | | 19.6 | |
Health Care | | | 12.0 | | | | 5.6 | |
Industrials | | | 28.3 | | | | 19.8 | |
Information Technology | | | 12.2 | | | | 10.4 | |
Materials | | | 4.1 | | | | 11.6 | |
Telecom Services | | | 3.2 | | | | 1.1 | |
Utilities | | | 1.1 | | | | 2.1 | |
Cash | | | 1.3 | | | | – | |
1MSCI All Country World ex-US Small Cap Index
the period, we think the deal environment remains favorable due to the reasons cited above. Nevertheless, our process doesn’t rely upon acquisitions to generate returns. We think the combination of strong competitive positions and sustainable growth prospects possessed by our companies will allow them to generate above-average risk-adjusted returns over the long term while continuing to operate independently.
Valuation Opportunities
Our Portfolio positioning by sector has remained largely unchanged over the last five years, with significant overweight positions in Industrials, Consumer Staples, and Health Care. We believe these sectors provide fertile hunting ground for high-quality, long-duration growth companies.
Toward the end of the period, the rally in Europe and continued underperformance in EMs did open the door for modest valuation-driven shifts in the Portfolio on a regional basis. As a bottom-up investment manager, we don’t have insights into when EMs will recover. We remain focused instead on analyzing companies’ underlying fundamentals and the competitive structure of industries, seeking to identify strong business models operating within attractive industries that can support long-term growth in cash flows. When broad-based market declines occur, we are then ready to add to our positions in companies with strong fundamentals at depressed share prices.
In France, we reduced our position in Ingenico, a specialist in point-of-sale systems. The company provides a range of secure transaction solutions—including hardware, software, and services—for payments at points of sale, over the Internet, or by mobile telephone. Ingenico continues to benefit from two tail-winds: (a) the global adoption of regulations requiring “Chip and PIN” technology and (b) missteps by its primary competitor, VeriFone. Chip and PIN is a system for enhancing the security of credit, debit, and ATM cards by embedding computer chips in the cards that are programmed to authorize payment only after a customer supplies a “personal identification number” (PIN). This
15
Institutional Class HLMRX
Investor Class HLMSX
technology is in widespread use in Europe and should eventually be adopted in the US and other regions. Ingenico has been successful in part by focusing on selling terminals and software that support Chip and PIN. VeriFone has lost market share to Ingenico by focusing on services, such as consulting, installation, and maintenance. While we continue to like Ingenico’s strong competitive position and growth prospects, we trimmed the Portfolio’s position slightly as the share price was beginning to reflect this strength based on our valuation analysis.
In contrast to France’s strong market, Indonesia fell more than 26% in US dollar terms from July through September 2013. We took advantage of this decline to increase our position in Indonesian holding AKR Corporindo. AKR is Indonesia’s largest private-sector company engaged in the distribution and trading of petroleum and chemical products. The company’s strong logistics capabilities provide it with a competitive advantage that is supported by a network of 12 sea ports, 6 inland ports, over 200 trucks, over 130 liquid tanks, and warehouses and barges across 18 cities. This footprint is not easily replicable, primarily due to the limited availability of land and port access on the sprawling Indonesian archipelago. Along with sending products to more places than most of its competitors, AKR can also transport them faster. This capability is especially valuable given that fuel oil prices in Indonesia are determined using the value of the Mean of Platts Singapore (MOPS), a fuel pricing index that changes every two weeks. Unlike its competitors, AKR can distribute its entire inventory within a two-week time period between each change in the MOPS, giving the company greater stability and visibility of its cash flows.
While returns for small-company stocks
showed wide regional variations in the
period, the small-cap market as a whole
has become increasingly expensive in the
last year as measured by trailing price-to-
earnings multiples.
In addition to AKR’s strong competitive position, we also like its future growth prospects. Not only does the company have a dominant position in delivering unsubsidized petroleum to industrial customers, but more recently it has become one of the only private companies sanctioned by the government to distribute a quota of subsidized petroleum to retail consumers. Part of the reason AKR was awarded this franchise was because its existing logistics infrastructure and advanced IT system allows for complete transparency of fuel distribution. We believe the quota of subsidized petroleum allocated to AKR for distribution will increase gradually, and that the company will grow as demand for petroleum in Indonesia expands.
| | | | | | |
Ten Largest Holdings at October 31, 2013 Institutional and Investor Classes | |
Company | | Country | | | % | |
Yoox | | Italy | | | 1.9 | |
Grafton Group | | Ireland | | | 1.8 | |
Super Group | | Singapore | | | 1.7 | |
Coastal Contracts | | Malaysia | | | 1.7 | |
RPC Group | | United Kingdom | | | 1.5 | |
Britvic | | United Kingdom | | | 1.5 | |
Industrial & Financial Systems | | Sweden | | | 1.5 | |
Bank of Georgia | | United Kingdom | | | 1.5 | |
AKR Corporindo | | Indonesia | | | 1.5 | |
BML | | Japan | | | 1.4 | |
While returns for small-company stocks showed wide regional variations in the period, the small-cap market as a whole has become increasingly expensive in the last year as measured by trailing price-to-earnings (P/E) multiples. The trailing twelvemonth P/E for the Index has risen sharply from 14x at the end of September 2012 to about 22x at the end of September 2013. The current multiple is roughly in line with its 10-year average, and well below the peak of 30–32x that was reached twice in the past 10 years.
The trailing P/E ratio is a useful indicator of the valuation level of individual companies and, in aggregate, of an equity asset class. However, the insights this metric can provide are limited—especially for a benchmark such as this Index that includes more than 4,000 companies—in part because it is an average based upon backward-looking data. In contrast, we consider for investment only companies that are higher-quality and faster-growing than the average Index company and analyze these businesses based on forward-looking, long-term estimates of operating fundamentals. For instance, our valuation process includes analyzing a company’s fair value based upon our forecasts for cash flows over a five- to ten-year horizon. While acknowledging the P/E expansion in the Index, our research continues to find what we believe to be attractive long-term investment opportunities within the international small company universe.
Please read the separate disclosure page for important information, including the risks of investing in the Portfolio.
Emerging Markets
| | |
Portfolio Managers | | |
| |

| | from left: G. Rusty Johnson, CFA Co-Lead Portfolio Manager Craig Shaw, CFA Co-Lead Portfolio Manager Richard Schmidt, CFA Portfolio Manager |
| |
| |
| |
| |
| | |
The Institutional Emerging Markets Portfolio and the Emerging Markets Portfolio – Advisor Class (collectively, the “Portfolios”) are both managed in strict accordance with the Emerging Markets Strategy Model Portfolio. The Portfolios, therefore, have highly similar holdings and characteristics. We have provided a single commentary to cover both Portfolios. The specific performance and characteristics of each are presented separately in the tables below.
Performance Summary
The Institutional Emerging Markets Portfolio rose 9.85% and the Emerging Markets Portfolio – Advisor Class gained 9.93% (net of fees and expenses) in the fiscal year ended October 31, 2013. The Portfolios’ benchmark, the MSCI Emerging Markets Index (the Index), rose 6.51% (net of source taxes) in this period.
Market Review
Concern over the health of emerging markets (EMs) escalated during much of the fiscal year, particularly over the summer, as many major EM currencies declined and several individual countries—formerly viewed as bastions of economic growth—displayed vulnerability to global macroeconomic and domestic political forces. The Index underperformed its developed market counterpart, the MSCI World Index, by approximately 19% during the period, but still ended in positive territory, reflecting the reality that the growth story for newly industrialized economies, while now less frothy than before, is not over, nor is the long-term outlook for EMs universally bleak.
EMs showed divergent trends through the year, both in geographic and sector performance. In the first calendar quarter of 2013, EMs’ underperformance relative to developed markets (DMs) was due mainly to weakness in Index heavyweights such as South Africa, China, South Korea, and Russia, while many smaller markets, including the Philippines, Indonesia, Turkey, and Thailand, did well. However, as the year progressed, several issues came to the fore that proved detrimental to a broader swath of EMs. These issues, which we discuss further in the following section, included worries over China’s future growth rate, internal political developments and economic health in many EM countries, and the prospective end of easy monetary policy in the US. EMs rebounded sharply however when these concerns abated in September, as confidence in China’s growth improved and as the US Federal Reserve signaled that major policy change was not imminent.
The EM Drag: Was it the Fed Tapering, or Was it Really… China?
History shows that after the Fed launched its Quantitative Easing (QE) program in 2009, EMs did well until early 2011, apparently benefitting from lower interest rates and increased global liquidity. More recently, when the Fed signaled a move toward tapering, the reverse occurred. While fluctuating QE has clearly been a factor in EM performance over the past year, we do not see Fed behavior as the sole determinant; it is but one of three key forces working
| | | | | | | | |
Portfolio Facts at October 31, 2013 | |
Sales Charge | | | | | | | None | |
| | | |
Number of Holdings | | | | | | | 80 | |
| | | |
Redemption Fee | | | | | |
| 2% first 90
days |
|
| | | |
Dividend Policy | | | | | | | Annual | |
| | | | Institutional Portfolio | | | | Advisor Class | |
| | | |
Ticker | | | HLMEX | | | | HLEMX | |
| | | |
CUSIP | | | 412295701 | | | | 412295305 | |
| | | |
Inception Date | | | 10/17/2005 | | | | 11/9/1998 | |
| | | |
Minimum Investment* | | | $500,000 | | | | $5,000 | |
| | | |
Portfolio Assets | | | $1,043.0 million | | |
| $2,112.5
million |
|
| | | |
Net Expense Ratio | | | 1.30% | † | | | 1.47% | |
| | | |
Gross Expense Ratio | | | 1.34% | | | | 1.47% | |
| | | |
Turnover (5 Yr. Average) | | | 42% | | | | 35% | |
*Lower minimums available through certain brokerage firms.†Harding Loevner through February has contractually 28, 2014. agreed The to Net waive Expense fees and/or Ratio is reimburse as of October expenses 31, 2013. The Gross Expense Ratio is as of the Prospectus, February 28, 2013.
together that jointly “explain the pain” in EMs: the trajectory of China’s economy; EM turmoil and domestic policies; and, last (and least?), the Fed.
The impact of economic policy initiatives in China has been broad and dramatic since the 2008-09 global financial crisis. The crisis prompted not only the US, but also China, to adopt highly stimulative policies, which were enacted in the US using monetary policy (i.e., QE), and in China through the massive fiscal stimulus of a US$586 billion investment binge in 2009-10. EM equity prices soared immediately after, especially those of countries and companies that supply raw materials to China. But when China, fearing the ill effects of too much investment and credit, began to cool its super-charged economy in 2011, EM equities, particularly those in the Materials sector, began to lag DMs. Our argument that China’s economic policy fluctuations have had a more powerful effect than global liquidity on EMs seems to be supported by the fact that EMs have underperformed DMs by nearly 15% from July 2011 until August 2013, during which time the Fed, in reality, remained accommodative. The weakness of the Materials and Energy sectors, down 9% and flat during the year, respectively, is more readily attributed to lower growth expectations for China than to any global liquidity shift. However, we note that many of China’s macroeconomic indicators appear to have bottomed and that leadership is attempting to enforce more responsible credit policies, partly influencing our decision to increase our effective weighting in China (which includes Hong Kong-listed Chinese companies) from significantly underweight to almost neutral relative to the Index.
The second force relates to the policies and economic health of individual emerging markets. When capital outflows from EMs accelerated this year, the markets punished, first and most severely, countries with large current account deficits and thus high dependence on external funding. Countries such as India and Turkey, for example, were pressured more than those that have little or no external dependency such as China and Taiwan.
We credit some of the weakness in EMs to individual country events. Political turmoil in several EM countries contributed to negative investor psychology; an example of such disruption was the public protest over Turkish Prime Minister Erdogan’s repression of peaceful demonstrations in the spring. Developments in Egypt have been more worrisome, as the newly-elected government exhibited a pro-
Institutional Emerging Markets Portfolio HLMEX
Emerging Markets Portfolio – Advisor Class HLEMX
| | | | | | | | | | | | | | | | | | | | | | | | | | | | | | | | | | | | | | | | | | | | |
| Performance | | | | | | | | | | | | | | | | | | | | | | | | | | | | | | | | | | | | | | | | | | | | |
Average Annualized Total Returns (%) | | | | | | | | | | | | | | | | | | | | | | | | | | | | | | | | | | | | | | | | | | | | |
at September 30, 2013 | | | | | | | | | | | | | | | | | | | | | | | | | | | at October 31, 2013 | |
| | | | Inception | | | | | | | | | | | | | | | | | | | | Since | | | | | | | | | | | | | | | | | | | | Since | |
| | | | Date | | | | 1 year | | | | 3 years | | | | 5 years | | | | 10 years | | | | Inception | * | | | 1 year | | | | 3 years | | | | 5 years | | | | 10 years | | | | Inception | * |
Institutional Emerging Markets Portfolio | | | 10/17/05 | | | | 5.79 | | | | 2.23 | | | | 7.48 | | | | – | | | | 8.55 | | | | 9.85 | | | | 3.36 | | | | 15.79 | | | | – | | | | 9.15 | |
Emerging Markets Portfolio – Advisor Class | | | 11/9/98 | | | | 5.90 | | | | 2.13 | | | | 7.50 | | | | 13.39 | | | | 13.54 | | | | 9.93 | | | | 3.25 | | | | 15.68 | | | | 13.12 | | | | 13.84 | |
MSCI Emerging Markets Index | | | | | | | 0.96 | | | | -0.34 | | | | 7.21 | | | | 12.79 | | | | 10.91 | | | | 6.51 | | | | 0.29 | | | | 15.38 | | | | 12.40 | | | | 11.20 | |
*The inception returns of the Institutional Emerging Markets Portfolio are since 10/17/05; those of the Emerging Markets Portfolio – Advisor Class and Index are since 11/9/98.
Performance data quoted represent past performance; past performance does not guarantee future results. The investment return and principal value of an investment will fluctuate so that an investor’s shares, when redeemed, may be worth more or less than their original cost. Current performance of each Portfolio may be lower or higher than the performance quoted. Performance data current to the most recent month end may be obtained by calling (877) 435-8105 or visiting www.hardingloevnerfunds.com. Each Portfolio imposes a 2% redemption fee on shares held 90 days or less. Performance data does not reflect the redemption fee. If reflected, total returns would be reduced. The Gross Expense Ratios for the Institutional Emerging Markers Portfolio and the Emerging Markets Portfolio – Advisor Class are 1.34% and 1.47%, respectively.
The charts below illustrate the hypothetical return of an investment made in the corresponding share classes. Investment return reflects voluntary fee waivers in effect. Absent such waivers, total return would be reduced. The performance provided in the table above and charts below do not reflect the deduction of taxes that a shareholder would pay on Portfolio distributions or the redemption of Portfolio shares.
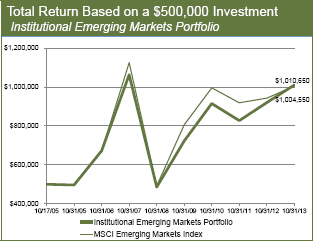
gressively more anti-business stance regarding taxation and other issues of commercial policy. And in Brazil and India, government initiatives have been clearly populist in character, as rising levels of social grants, imposition of fuel price controls, and enactment of labor laws onerous to business have been on the rise, pressuring margins and spurring doubts regarding the leaderships’ commitment to the development of free market economies.
Finally, the Fed has reduced real yields in the US to historic lows through aggressive bond purchases under the QE program over the past few years. Bond and equity capital sought the newly perceived safety and the far-higher yields of markets such as Brazil, Turkey, and South Africa. This inflow of capital had the pro-cyclical effect of pushing yields down, and currencies up. But by this spring, much of that reversed when the Fed suggested it would begin to taper its bond buying. While the Fed has actually not yet tapered its QE, the markets rapidly discounted tapering’s effect, sending EM interest rates higher and EM currencies lower, as capital flowed out.
Thus, we view the combination of economic policy and growth in China, individual country developments, and global capital flows as a perfect storm that swept across EMs and depressed their markets relative to DMs during the year.
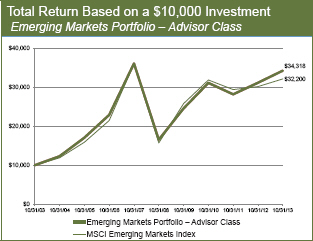
Have We Seen the Worst for EMs?
We think the answer is yes, probably. While the Fed reported that its actual bond-buying has remained unchanged, the effects of the projected tapering have been evident, as US long bond rates have increased to over 3%. Similarly, EMs have arguably discounted many of the ill effects of tapering well ahead of the reality. News in September that the Fed’s tapering initiative would remain on hold and that monetary hawk Lawrence Summers was not going to be the new Fed boss proved a catalyst for a strong relief-bounce in EM stocks and currencies, particularly in those countries that had been hardest hit.
We maintain that it is not all that bad in EMs. Key growth drivers such as underpenetrated markets in many industries including housing, auto, insurance, automation, and entertainment are still very evident and provide long-term growth and investment opportunities. While the current economic environment is less dynamic than in 2007 and 2010, we believe that the “new EM normal,” characterized by more modest growth, weaker currencies, and somewhat higher interest rates, augurs for a more sustainable economic path.
From the bottom up, we believe the opportunities appear larger than the risks. We are particularly encouraged by our conversations with banks, whose businesses can be especially sensitive to the macroeconomic environment vis-à-vis interest rate changes and
Emerging Markets continued
| | | | | | |
Ten Largest Holdings at October 31, 2013 Institutional Emerging Markets Portfolio HLMEX | |
Company | | Country | | | % | |
Samsung Electronics | | South Korea | | | 4.2 | |
Taiwan Semiconductor | | Taiwan | | | 2.9 | |
Baidu | | China | | | 2.8 | |
MediaTek | | Taiwan | | | 2.4 | |
Tencent | | China | | | 2.3 | |
AIA Group | | Hong Kong | | | 2.2 | |
Hikma Pharmaceuticals | | United Kingdom | | | 2.1 | |
Vale | | Brazil | | | 2.0 | |
Arcelik | | Turkey | | | 1.9 | |
Hankook Tire | | South Korea | | | 1.9 | |
| | | | | | |
Ten Largest Holdings at October 31, 2013 Emerging Markets Portfolio – Advisor Class HLEMX | |
Company | | Country | | | % | |
Samsung Electronics | | South Korea | | | 4.2 | |
Taiwan Semiconductor | | Taiwan | | | 2.9 | |
Baidu | | China | | | 2.8 | |
MediaTek | | Taiwan | | | 2.4 | |
Tencent | | China | | | 2.2 | |
AIA Group | | Hong Kong | | | 2.2 | |
Hikma Pharmaceuticals | | United Kingdom | | | 2.1 | |
Lukoil | | Russia | | | 2.0 | |
Arcelik | | Turkey | | | 1.9 | |
Hankook Tire | | South Korea | | | 1.9 | |
foreign exchange fluctuations. Below we present the views of our banks and insurance analyst, Bryan Lloyd, who had the opportunity to meet with a number of EM and Frontier banks in the third calendar quarter of 2013.
Performance Attribution
The Portfolios outperformed the Index primarily due to stock selection. In terms of sector, stock selection in Industrials and Information Technology had the largest positive impact on the Portfolios’ relative
performance. Within Industrials, electronics and book retailer Jarir Marketing saw strong demand for smart phones and IT products in Saudi Arabia that resulted in higher–than-expected profit growth. In Information Technology, Taiwan-based automation equipment maker Advantech enjoyed accelerating sales growth, notably in China, where rising labor costs have spurred increased automation. Telecom Services detracted most from the Portfolios’ performance, as regulatory reforms in Mexico negatively impacted América Móvil, which we ultimately sold from the Portfolios.
Bright Spots in Emerging and Frontier Financials
Bryan Lloyd, CFA
Emerging and frontier market financials cannot be easily grouped together. Rather, they behave as regional groups, each with their own themes and market conditions that are often independent of one another. In Central and Eastern Europe (CEE), our banks have navigated weak economic conditions reasonably well. Credit quality has been surprisingly resilient, despite the realities of weaker economic growth and higher unemployment. Rising regulatory pressure on fee income generation has put pressure on efficiency, and depressed near-term returns and growth. However, tougher conditions have disproportionately weakened the marginal players in these markets, and the new entrants from years ago are struggling to maintain relevance. Consolidation will continue to be a theme, although we believe it will mostly occur at the second and third tiers of the markets in places like Poland, the Czech Republic, and Hungary. Still, these underpenetrated economies are capable of generating mid-single digit loan growth even in near-recessionary conditions. After speaking with banks like Bank Pekao and Komerčni Banka, we are increasingly confident that macroeconomic conditions have bottomed or are at least improving, which implies additional upside for balance sheet growth.
Nigerian banks are experiencing a renaissance in lending growth, spurred in part by central bank efforts to drive greater bank activity toward the “real” economy and away from government securities holdings and municipal deposits. Unlike the period before the global financial crisis, loan growth is coupled with improved risk management practices and corporate governance principles, underwritten by a more prudent and proactive regulator. The structural changes taking shape in Nigeria are translating to large
syndicated loans for the Telecom Services sector as well as the oil and gas industry. The privatization of state electricity assets has generated significant new lending to the winning bidders, and new facilities for working capital and capital expenditure are yet to come. Competitive pressures appear to be relatively rational; in speaking with banks like Zenith Bank, it appears that there is more than enough lending opportunity to go around.
Insurance companies around the world have benefitted from the recent rise in interest rates. Although there are some negative short-term effects from these changes, the long-term health and value of insurers, especially those with strong life insurance franchises, is greatly enhanced as rates rise. The greatest opportunities appear to be in China and Southeast Asia, where the market is large and significantly underpenetrated and the gap between the need for insurance among the upper and middle classes and current coverage is wider than anywhere else in the world. The customer base relies on strong agency teams from companies like AIA Group who can educate the consumer about their life insurance needs. Growing a life insurance business in a large and diverse market like Asia is a very capital intensive proposition, and market leader AIA Group has the strongest capital base and balance sheet in the region. Similar dynamics exist in CEE countries, although on a smaller scale. We are currently investigating additional insurance opportunities in Latin America, which is another potentially large and profitable market. Discovery Holdings continues to be a disruptive force in its native South Africa and is working to successfully export its model to the UK, the US, China and, most recently, Singapore.
Institutional Emerging Markets Portfolio HLMEX
Emerging Markets Portfolio – Advisor Class HLEMX
Viewed geographically, our holdings in China and frontier markets (FMs), including those frontier companies listed on developed market exchanges, were the largest positive contributors to performance. Our top holdings in China were Baidu, a major search engine, and Tencent, a leading online social media and gaming platform. Within FMs, Panama-based regional airline Copa Holdings, a provider of air transport services in and around the Caribbean, outperformed due to margin growth from fuller planes and lower costs. Hikma Pharmaceuticals, a pharmaceutical company listed in London but with a focus on the Middle East and North Africa, was also a top contributor to performance. Latin America detracted most from performance, particularly due to our Brazilian holdings. Petrobras was negatively affected as government controls on fuel prices led to large refining losses that offset gains from the upstream oil division and materially reduced cashflows needed for large investment plans.
Portfolio Structure
Our historically large overweight in Consumer Staples has been steadily declining since its peak in the third quarter of 2010—when it stood at a 10% overweight relative to the Index—to today’s minor underweight of about 1% below the Index. In contrast, our overweight in Industrials is now roughly 4%, a substantial reversal from the 2.5% underweight we had in the third quarter of 2010. This shift in allocation has come about gradually as we have become less sanguine regarding the sustainability of growth in many Staples companies. We reduced our holdings in richly-valued names such as Coke Femsa and Ambev to fund the increased weighting in Industrials, as we observe that the EM consumer has become more cautious and less likely to purchase the premium products that have been driving improved profitability. We sold our holding in Chinese tissue and hygiene products producer Hengan International due to concerns of tissue overcapacity in China and the increased competition posed by multinationals entering this attractive market. We also exited our position in AmorePacific, a leading South Korean cosmetics company currently challenged by weakness in the door-to-door channel and the premium segment of the South Korean cosmetics market. While we acknowledge the strength of AmorePacific’s brands, we believe that near-term profitability may be reduced as management addresses these structural changes. As with the beverage stocks men-
| | | | | | | | | | | | |
Geographical Weightings (%) at October 31, 2013 | |
Country/Region | |
| Institutional
HLMEX |
| |
| Advisor
HLEMX |
| | | Benchmark | 1 |
Brazil | | | 8.8 | | | | 8.3 | | | | 11.7 | |
China | | | 13.0 | | | | 13.0 | | | | 18.9 | |
India | | | 6.2 | | | | 6.3 | | | | 6.2 | |
Mexico | | | 4.0 | | | | 4.0 | | | | 5.1 | |
Russia | | | 7.3 | | | | 7.8 | | | | 6.2 | |
South Africa | | | 4.9 | | | | 4.5 | | | | 7.5 | |
South Korea | | | 7.3 | | | | 7.3 | | | | 15.9 | |
Taiwan | | | 9.1 | | | | 9.1 | | | | 11.4 | |
Small Emerging Markets2 | | | 14.9 | | | | 15.3 | | | | 17.1 | |
Frontier Markets3 | | | 9.5 | | | | 9.5 | | | | – | |
Developed Market Listed4 | | | 13.3 | | | | 13.3 | | | | – | |
Cash | | | 1.7 | | | | 1.6 | | | | – | |
1MSCI Emerging Markets Index; 2Includes the remaining emerging markets which, individually, comprise less than 5% of the Index; 3Includes countries with less-developed markets outside the Index; 4Includes emerging markets or frontier markets companies listed in developed markets.
| | | | | | | | | | | | |
Sector Weightings (%) at October 31, 2013 | |
Sector | |
| Institutional
HLMEX |
| |
| Advisor
HLEMX |
| | | Benchmark | 1 |
Consumer Discretionary | | | 11.8 | | | | 12.1 | | | | 8.8 | |
Consumer Staples | | | 7.8 | | | | 7.8 | | | | 8.6 | |
Energy | | | 10.3 | | | | 10.2 | | | | 12.0 | |
Financials | | | 25.1 | | | | 25.3 | | | | 27.3 | |
Health Care | | | 4.5 | | | | 4.5 | | | | 1.5 | |
Industrials | | | 9.6 | | | | 9.3 | | | | 6.1 | |
Information Technology | | | 19.1 | | | | 19.2 | | | | 15.3 | |
Materials | | | 7.0 | | | | 6.8 | | | | 9.7 | |
Telecom Services | | | 3.1 | | | | 3.2 | | | | 7.4 | |
Utilities | | | 0.0 | | | | 0.0 | | | | 3.3 | |
Cash | | | 1.7 | | | | 1.6 | | | | – | |
1MSCI Emerging Markets Index
tioned above, we noted that valuations for both of these personal products companies also left no room for earnings disappointments.
An additional outcome related to our increasing Industrials overweight is our historically high weighting in Frontier Markets, where many of the Industrials companies in which we have invested are domiciled. Another geographical shift worth noting is the increase in our effective weighting in China. We’ve long been underweight this market, but, inclusive of Hong Kong-listed Chinese companies, we are now close to a neutral level relative to the Index. New positions such as Sands China, and Ctrip.com, as well as additions to existing holdings 51Job, Anhui Conch Cement, and Baidu, increased our exposure both to China’s Industrials and Consumer Discretionary sectors. Sands China is the operator of one of the biggest integrated resort casinos in Macau, modeled off of its parent’s Venetian Casino in Las Vegas. The industry structure is very favorable, as gaming is prohibited in China, except in Macau, where there are only six licensed operators, whose growth is restricted by the government to a rate of 3% a year until 2020. Thus, the supply side is constrained, while the demand side is robust, although challenging to accurately measure. Ctrip, a company we’ve owned previously, is China’s leading full-service travel agency, offering the widest available choice of air, rail, hotel, car rental, and tour packages. Ctrip continues to gain share in a rapidly growing sector, benefitting from the fact that many of the new entrants, often online service providers, are proving not only inferior but unreliable over time, thus pushing many more “serious” travelers toward Ctrip’s service platform.
Additionally, we reduced our largest holding, Samsung Electronics, from overweight to underweight as the challenge of building on their top global position in smartphones may prove hard to realize in future years.
Please read the separate disclosure page for important information, including the risks of investing in each Portfolio.
Frontier Emerging Markets Portfolio
| | |
| Portfolio Managers | | |
| |

| | from left: Pradipta Chakrabortty Co-Lead Portfolio Manager G. Rusty Johnson, CFA Co-Lead Portfolio Manager Richard Schmidt, CFA Portfolio Manager |
| | |
| |
| | |
Performance Summary
The Frontier Emerging Markets Portfolio – Institutional Class rose 20.20% and the Investor Class gained 19.83% (net of fees and expenses) in the fiscal year ended October 31, 2013. The Portfolio’s benchmark, the MSCI Frontier Emerging Markets Index (the Index), rose 11.17% (net of source taxes) in this period.
Market Review
The returns for frontier emerging markets (FEMs) in the Index were widely dispersed in the period, ranging from an 88% rise in Argen-tina to the 27% decline in Ukraine. The Gulf States region recorded the best Index performance, with particularly strong returns from the United Arab Emirates (UAE), which has benefitted from its safe-haven status in the Middle East, especially as other countries in the region have remained in crisis. One indication of the UAE’s growing popularity as a regional center for business was a report from Dubai’s land department that noted the value of property transactions surged 30% in the first half of calendar year 2013, inspiring a rally in the country’s real estate stocks.1 The other oil-rich countries in the Gulf region, with the exception of Bahrain, also recorded positive performance as the windfall from oil prices remaining above $100 a barrel continued to support government spending to foster growth.
Latin America was the worst-performing region this period owing to declining markets in Colombia (the Index’s largest market, representing 19% of total capitalization) and Peru. The Portfolio is underweight Colombia and at benchmark weight in Peru, a country we discuss further below. In sharp contrast to other countries in the region, Argentina enjoyed extraordinary returns this fiscal year. The country remains mired in a high degree of macroeconomic risk and harsh operating conditions for businesses, however, including widespread price controls and strict currency restrictions—the government, for example, has imposed price controls on roughly 500 basic supermarket goods in a bid to tame inflation.2 One reason for the strong returns is that late in the period investors cheered the electoral defeats suffered by President Cristina Fernandez’s Front for Victory party in congressional primary and mid-term elections, perhaps viewing them as a potential prelude to improvements in Argentina’s political and economic environment. For now, we think the risk-reward balance for Argentina remains unfavorable and we do not have investments in this market. Argentina continues to score poorly in our country risk-scoring model due to the weakness of the peso, our concerns over the government’s efforts to nationalize various industries, and its failure to address structural problems in the economy.
Viewing the Index by sector, Consumer stocks had the strongest performance while Energy and Materials fared the worst. Poor performance in these two sectors was centered in Latin America, particularly
1Lucy Barnard, “Property Transactions in Dubai Surge in First Half of 2013,” The National, July 18, 2013.
2Shane Romig, “Argentina’s Government Trims Price Controls to 500 Basic Goods,” The Wall Street Journal, May 29, 2013.
| | | | | | | | |
Fund Facts at October 31, 2013 | |
Total Net Assets | | | | | | | $293.5 million | |
| | | |
Sales Charge | | | | | | | None | |
| | | |
Number of Holdings | | | | | | | 78 | |
| | |
| Turnover (5 Yr. Average) | | | | 33% | |
| | | |
Redemption Fee | | | | | | | 2% first 90 days | |
| | | |
Dividend Policy | | | | | | | Annual | |
| | | |
| | | | Institutional Class | | | | Investor Class | |
| | | |
Ticker | | | HLFMX | | | | HLMOX | |
| | | |
CUSIP | | | 412295867 | | | | 412295859 | |
| | | |
Inception Date | | | 5/27/2008 | | | | 12/31/2010 | |
| | | |
Minimum Investment* | | | $100,000 | | | | $5,000 | |
| | | |
Net Expense Ratio | | | 1.80% | | | | 2.25%† | |
| | | |
Gross Expense Ratio | | | 1.95% | | | | 4.71% | |
*Lower minimums available through certain brokerage firms.†Harding Loevner has contractually agreed to waive fees and/or reimburse expenses through February 28, 2014. The Net Expense Ratio is as of October 31, 2013. The Gross Expense Ratio is as of the Prospectus, February 28, 2013.
Peru, where falling metal prices hurt mining companies, which dominate the country’s stock market.
Outlook
The long-term investment opportunity within many FEM countries reminds us of the progression we’ve seen in today’s larger emerging markets, which 25 years ago looked like the frontier and smaller emerging markets of today. Each country will follow its own, distinctive development path, but we’d like to highlight three trends that support the development of an expanding number of attractive investment opportunities in many FEM countries: promotion of business-friendly development policies; favorable demographics; and innovations in banking and credit that support broadening economic inclusion.
Governments in several frontier countries are promoting privatization and development policies that should improve the business environment by allowing the private sector to thrive and enhancing economic productivity. States have gradually reduced their involvement in direct economic management in favor of granting a greater role to the more-efficient private sector and reducing large government subsidies. Several privatization programs are underway in countries we focus on, including Nigeria’s planned privatization of the power sector and the “People’s IPO” in Kazakhstan, where the government has begun listing profitable state-owned companies on the local exchange. Governments are using the savings from these policies to fund massive physical and social infrastructure projects to improve economic productivity and diversify their economies. Examples include Peru’s five-year infrastructure investment plan discussed later; Saudi Arabia’s investments to lower its reliance on oil production; and Colombia’s and the Philippines’ ongoing infrastructure investment programs aimed at improving their countries’ transport infrastructures. In the coming years, we expect that governments in these countries and others will continue to build more roads, bridges, schools, hospitals, airports, and seaports to improve the business climate and lower the cost of doing business.
Many FEM countries have fast-growing and comparatively young populations, which put them in a demographic sweet spot for opportunities related to both global production and consumption growth. Annual population growth in these countries over the next 20 years is expected to be roughly 1.2%, which is twice that of
Institutional Class HLFMX
Investor Class HLMOX
| | | | | | | | | | | | | | | | | | | | | | | | | | | | | | | | | | | | |
| Performance | | | | | | | | | | | | | | | | | | | | | | | | | | | | | | | | | | | | |
Average Annualized Total Returns (%) | | | | | | | | | | | | | | | | | | | | | | | | | | | | | | | | | | | | |
at September 30, 2013 | | | | | | | | | | | | | | | | | | | | | | | at October 31, 2013 | |
| | | | Inception | | | | | | | | | | | | | | | | Since | | | | | | | | | | | | | | | | Since | |
| | | | Date | | | | 1 year | | | | 3 years | | | | 5 years | | | | Inception | * | | | 1 year | | | | 3 years | | | | 5 years | | | | Inception | * |
Frontier Emerging Markets Portfolio – Institutional Class | | | 5/27/08 | | | | 19.89 | | | | 3.44 | | | | 4.43 | | | | -2.87 | | | | 20.20 | | | | 3.02 | | | | 11.97 | | | | -2.40 | |
Frontier Emerging Markets Portfolio – Investor Class | | | 12/31/10 | | | | 19.34 | | | | – | | | | – | | | | 2.15 | | | | 19.83 | | | | – | | | | – | | | | 2.96 | |
MSCI Frontier Emerging Markets Index | | | | | | | 8.61 | | | | 2.66 | | | | 0.04 | | | | -5.27 | | | | 11.17 | | | | 2.13 | | | | 8.03 | | | | -4.59 | |
*The inception returns of the Institutional Class and Index are since 5/27/08; those of the Investor Class are since 12/31/10.
Performance data quoted represent past performance; past performance does not guarantee future results. The investment return and principal value of an investment will fluctuate so that an investor’s shares, when redeemed, may be worth more or less than their original cost. Current performance of the Portfolio may be lower or higher than the performance quoted. Performance data current to the most recent month end may be obtained by calling (877) 435-8105 or visiting www.hardingloevnerfunds.com. The Portfolio imposes a 2% redemption fee on shares held 90 days or less. Performance data does not reflect the redemption fee. If reflected, total returns would be reduced. The Gross Expense Ratios for the Institutional Class and Investor Class are 1.95% and 4.71%, respectively.
The charts below illustrate the hypothetical return of an investment made in the corresponding share classes. Investment return reflects voluntary fee waivers in effect. Absent such waivers, total return would be reduced. The performance provided in the table above and charts below do not reflect the deduction of taxes that a shareholder would pay on Portfolio distributions or the redemption of Portfolio shares.
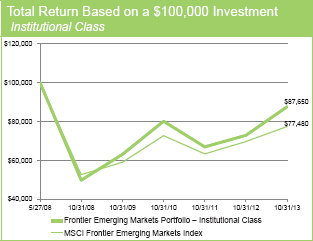
large emerging markets, and six times faster than developed markets.3 A few FEM countries, such as Pakistan, Nigeria, and Bangladesh, already have populations in excess of 150 million. These and other FEM countries have a significantly larger proportion of the population below the age of 15 than do developed and larger emerging countries (see chart at right). Many of these nations will thus possess large and productive working-age populations, available at globally competitive wages, well into the future. We have already seen indications of the possibilities for a gradual relocation of global production facilities to countries with such young populations. Samsung Electronics opened its largest mobile phone factory in the world in Vietnam earlier this year, for example. Additionally, a number of FEM countries have cultivated populations of workers who offer not only relatively low wages, but also specialized skills in particular industries. For instance, Bangladesh is gaining a growing share of the global ready-made garment manufacturing market from China. As the young people in these countries mature into the wage-earning workforce and per-capita income rises, we can expect to see broad growth in consumption and opportunities for many different types of companies to satisfy this growth.
Lastly, we expect growth and development in frontier economies may well be more broad-based and inclusive than in the emerging economies of a generation ago, in part because of their central banks’
3Citigroup, “Call of the Frontier Revisited: On the Right Track to Be Tomorrow’s Emerging Markets,” Citi GPS: Global Perspectives & Solutions (September 2013), p. 16.
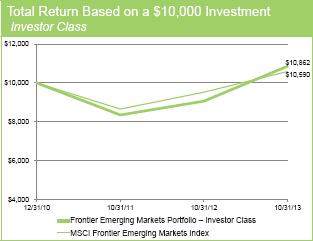
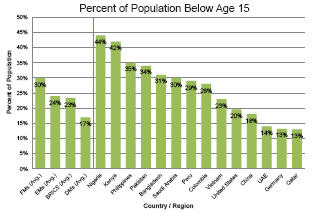
Source: United Nations Population Division’s World Population Prospects, “Population Ages—0-14 (% of total).” Run date: October 10, 2013. Data as of 2012.
promotion of financial inclusion, coupled with the availability of new technologies that expand low-cost access to banking and credit. Currently, frontier countries have significantly lower levels of credit penetration than emerging and developed countries. Private sector credit in frontier countries was about 60% of GDP at the end of 2011, compared to about 77% in emerging economies and around 160% in Organisation for Economic Co-operation and Development economies. To bring more people into the banking system, central banks
Frontier Emerging Markets Portfolio continued
in many newly emerging economies are supporting efforts to bypass traditional banking channels via agency and mobile banking. Kenya provides two examples of this trend. Equity Bank’s agency banking model, whereby the company contracts with third-party retail stores that act as agents to offer products and services on behalf of the bank, has successfully brought rural inhabitants into the modern financial system and provided Equity Bank access to cheap deposits for lending. Meanwhile, in 2007 Safaricom launched “M-Pesa,” a mobile banking platform that has grown to 17 million users with an annual transaction value equivalent to 30% of Kenya’s GDP.4 This mobile platform has helped extend basic banking services to rural Kenyans by allowing them to maintain deposit accounts without having to travel to bank branches in urban areas. As these types of initiatives are implemented across other frontier countries, we expect the banking population to grow and credit penetration to improve.
Performance Attribution
The portfolio outperformed the Index this fiscal year, with positive contribution from all ten sectors in which we held investments. Strong returns within Materials contributed most to relative performance, although our overweight to this underperforming sector was a detractor. The portfolio benefited especially from strong relative performance from several cement companies, including Dangote Cement and Union Andina De Cemento (UNACEM). These companies dominate local cement markets (Nigeria and Peru, respectively) with relatively stable product prices. They were therefore not as affected by the general malaise afflicting Materials companies that sell in global commodities markets, where prices were more volatile. Our holdings in Industrials also helped performance. Nigerian conglomerate UAC of Nigeria benefited from rising EBITDA margins because of changes in its restaurant segment from a self-managed to franchising model that returned the group to profitability. Financials contributed least to performance as our strong stock selection was partially offset by our underweight to this outperforming sector. Stock selection in Consumer Discretionary was also weak due largely to the lagging performance of Egypt’s Ghabbour Auto.
Viewed regionally, Africa contributed most to performance due in part to strong returns from Ghana Commercial Bank and Safaricom. Safaricom benefited from an improved competitive industry structure after one competitor, Essar, announced a desire to exit the market, and another competitor, Orange, found itself with financial difficulties. Investments in Latin America also positively contributed to performance because of good stock selection and our underweight to this poorly performing region. In Peru, packaged food company Alicorp’s dual strategy of growing in its domestic market
| | | | | | | | |
Geographical Weightings (%) at October 31, 2013 | |
Institutional and Investor Classes | |
Region | | | Portfolio | | | | Benchmark1 | |
Africa | | | 27.5 | | | | 15.3 | |
Asia | | | 25.2 | | | | 19.7 | |
Europe | | | 5.6 | | | | 4.5 | |
Gulf States | | | 17.5 | | | | 31.1 | |
Latin America | | | 16.4 | | | | 28.1 | |
Middle East | | | 1.2 | | | | 1.3 | |
Developed Market Listed2 | | | 2.8 | | | | – | |
Cash | | | 3.8 | | | | – | |
1MSCI Frontier Emerging Markers Index; 2Includes frontier marketsor emerging markets companies listed in developed markets.
| | | | | | | | |
Sector Weightings (%) at October 31, 2013 | |
Institutional and Investor Classes | |
Sector | | | Portfolio | | | | Benchmark1 | |
Consumer Discretionary | | | 4.4 | | | | 0.7 | |
Consumer Staples | | | 12.9 | | | | 7.5 | |
Energy | | | 5.1 | | | | 8.9 | |
Financials | | | 33.9 | | | | 49.9 | |
Health Care | | | 4.5 | | | | 1.1 | |
Industrials | | | 13.0 | | | | 9.5 | |
Information Technology | | | 0.5 | | | | 0.0 | |
Materials | | | 14.6 | | | | 8.5 | |
Telecom Services | | | 6.2 | | | | 10.8 | |
Utilities | | | 1.1 | | | | 3.1 | |
Cash | | | 3.8 | | | | – | |
1MSCI Frontier Emerging Markets Index
and expanding into other Latin American markets appears successful so far. The Portfolio’s strong stock selection in the Gulf States was neutralized by our underweight to this top-performing region.
Bangladesh
Political risk amidst economic progress
Bangladesh illustrates both the opportunities and risks associated with investing in frontier markets. The country’s economy continues to thrive and offers significant opportunities for companies and investors, while the political environment looks increasingly tense and uncertain, which is reflected in the heightened volatility of its equity market.
The Bangladeshi economy has been strong, with 6% real GDP growth in 2013 supported by upticks in export performance and public investment.5 Maintaining this growth in the future is predicated on Bangladesh’s fast-growing garment industry, which currently accounts for about 80% of the country’s exports and 10% of total output.6 The principal competitive advantage that Bangladesh enjoys in the global garment industry is abundant skilled, low-cost labor from a population of roughly 150 million, 95% percent of whom are below age 64. The tragic garment manufacturing building collapse this past April has heightened awareness of worker conditions in Bangladesh and forced garment companies to review safety guidelines. The benefits of this increased awareness remain to be seen, but beyond the potential for a positive impact on social welfare benefits could also include a more sustainable growth path for the industry.
The growth in garment exports along with strong remittance inflows from the large number of Bangladeshi workers abroad has enabled the country to build a strong current account surplus, putting it in a better position to withstand external shocks. The country has accumulated international reserves of over US$15 billion as of
4Safaricom, Full Year 2013 Results Presentation; Simone di Castri and Lara Gidvani, “The Kenyan Journey to Digital Financial Inclusion,” White African, July 2013.
5International Monetary Fund, “World Economic Outlook: Transitions and Tensions,” October 2013, p. 157.
6Bangladesh Garment Manufacturers & Export Association, Industry Strengths (accessed October 20, 2013). http://www.bgmea.com.bd/home/pages/Strengths#. Uma4c4zD-1s
Institutional Class HLFMX
Investor Class HLMOX
the end of June—sufficient to cover nearly 5 months of imports.7 Consequently, Bangladesh’s currency, the taka, has appreciated by roughly 5% against the US dollar in the past year and the currency’s outlook remains stable.8
Despite the economic progress achieved so far, Bangladesh recorded the worst performance among Asian markets in the Index this period as violent protests and nationwide strikes disrupted economic activity starting in February. Much of this turmoil was spurred by the trials involving several leaders of Bangladesh’s largest Islamist party, Ja-maat, for war crimes associated with the 1971 war of independence from Pakistan. Protestors have fought over how harsh the punishment handed down should be and over whether the Jamaat should be banned as a political party. The pro-Jamaat protesters have also been joined by the main opposition party, the Bangladesh Nationalist Party (BNP), which, in our opinion, has latched onto the situation to promote its own self-interest. The BNP is demanding a reinstatement of the previous system of a caretaker government to oversee the run up to national elections that are expected by early 2014.
Amidst this turmoil, we have kept our focus on identifying high-quality companies that have the managerial acumen and competitive advantages to ride out short-term upheavals and grow their businesses over the long term. In July 2013, for example, we purchased a new position in Olympic Industries Limited, the largest biscuit and confectionery manufacturer in Bangladesh with an estimated 35% share of the country’s biscuit market thanks to its quality brand and mass-market appeal. Olympic’s vast distribution network ensures that its products reach nearly Bangladesh’s entire population via over 550,000 “mom-and-pop” shops.9 This network is unrivalled and creates a barrier to new entrants in the country’s biscuit industry. Olympic’s management has demonstrated impressive execution capabilities and has maintained the company’s strong financial position, including robust cash flows, which allows Olympic to continue to invest in expanding production to cater to growing demand. In July, the company announced plans to add two new biscuit production lines to the existing five lines, which should increase production capacity by 60%. We believe that this expansion initiative, coupled with other plans to launch premium products, should provide for solid earnings growth going forward.
Peru
Rebalancing towards domestic demand
Over the last decade, Peru has emerged as one of the fastest-growing and most stable economies in Latin America. With sound fiscal policies, positive trade balance, and large foreign direct investment, the country achieved average annual real GDP growth of 6% and slashed its public debt by more than half, to only 19% of GDP. Meanwhile, according to the International Monetary Fund, inflation fell from 7% to an estimated 3% annual rate between 2008 and 2012.10 Peru’s long-term outlook remains favorable in our view.
The main risk to Peru’s economic progress comes from its heavy dependence on mining. Minerals—primarily copper and gold—account for 60% of its total exports.11 Similar to other Latin American commodity producers, Peru has in recent years rapidly increased the quantity of exports to China, which is now Peru’s largest market, accounting for 15% of total exports. The economy is therefore especially susceptible to fluctuating global demand for its commodity exports and especially to growth shocks emanating from China. Peru’s robust international reserves of US$64 billion should shield its balance of payments and currency from adverse near-term impacts.12 Nonetheless, the government is aware that the country’s dependence on metals is a weakness and is seeking to diversify the
| | | | |
Ten Largest Holdings at October 31, 2013 Institutional and Investor Classes |
Company | | Country | | % |
| | | |
| Jarir Marketing | | Saudi Arabia | | 4.0 |
| | | |
| Universal Robina | | Philippines | | 3.6 |
| | | |
| Cementos Argos | | Colombia | | 3.5 |
| | | |
| Bank of the Philippines | | Philippines | | 3.0 |
| | | |
| FBN Holdings | | Nigeria | | 2.8 |
| | | |
| Equity Bank | | Kenya | | 2.7 |
| | | |
| Engro | | Pakistan | | 2.6 |
| | | |
| Alicorp | | Peru | | 2.5 |
| | | |
| UAC of Nigeria | | Nigeria | | 2.5 |
| | | |
| Dangote Cement | | Nigeria | | 2.4 |
economy by applying Peru’s resource earnings towards supporting domestic demand and enhancing productivity. To help achieve these goals, the government is looking to spend boldly over the next five years to improve the quality of its infrastructure.
An important aspect of our investment process is identifying industries that have favorable competitive structures. We think Peru’s cement industry, which should benefit substantially from the large government-funded construction works unfolding across the country, presents one such attractive area for investment. A key determinant of the Peruvian cement industry’s structure is friction of distance, given the country’s mountainous topography, poor state of infrastructure, and the low value-to-weight ratio of the product. The market is segmented into three principal zones—the northern, central (including Lima’s metropolitan area), and southern regions—with a single company dominating each zone. Together these three main players account for nearly 100% of total cement shipments.13 Industry rivalry is almost nonexistent within each zone because high transportation costs make it uneconomical to ship excess bagged cement produced in one region to another. Consequently, each company has the power to increase its product prices in line with cost inflation. Cement manufacturers in Peru also enjoy strong bargaining power against cement buyers, because approximately 60% of total demand comes from a fragmented customer base that needs cement for construction of their own housing.
We are invested in Peru’s largest cement manufacturer, UNACEM, which we believe is well poised to benefit from projects in its home market—the central region—which is Peru’s most urbanized and populous area and where we expect most future infrastructure development in the medium term to be centered.
7Bangladesh Bank, “Monetary Policy Statement,” July–December 2013.
8Source: Bloomberg (accessed on 11/25/2013).
9Harding Loevner analyst phone call with Olympic Industries Limited Executive Director, 6/4/2013.
10International Monetary Fund, “Peru: 2012 Article IV Consultation,” IMF Country Report No.13/45, February 2013, p. 5, 6, 11, 33, & 50.
11Ibid, p. 25.
12Ibid, p. 40.
13Instituto Nacional de Estadistica e Informatica, “Local Sale of Cement per Company, by Department,” website accessed November 20, 2013. www.inei. gob.pe/estadisticas/indice-tematico/economia.
Please read the separate disclosure page for important information, including the risks of investing in the Portfolio.
Commentary Disclosures
The Portfolios invest in foreign securities, which will involve greater volatility and political, economic, and currency risks and differences in accounting methods. They also invest in emerging markets, which involve unique risks, such as exposure to economies less diverse and mature than the US or other more established foreign markets. Economic and political instability may cause larger price changes in emerging markets securities than other foreign securities.
The International Small Companies Portfolio invests in smaller companies which involve additional risks such as limited liquidity and greater volatility.
Diversification does not guarantee a profit or prevent a loss in a declining market.
Long-term earnings growth and earnings per share growth are not a forecast of the Portfolios’ future performance.
Bold type indicates companies held in the Portfolios during the fiscal year. Only the first reference to a particular holding appears in bold. The Portfolios are actively managed; therefore holdings shown may not be current. Portfolio holdings and sector and geographical allocations should not be considered recommendations to buy or sell any security. Please refer to the Portfolios of Investments in this report for complete Portfolio holdings. Current and future portfolio holdings are subject to risk.
While the Portfolios have no sales charge, management fees and other expenses still apply. Please see the Prospectus for further details.
Sector & Geographical Weightings data is sourced from: Wilshire Atlas, Harding Loevner Portfolios, and MSCI Barra. Differences may exist between this source data and similar information reported in the financial statements due to timing differences and/or adjustments required pursuant to Generally Accepted Accounting Principles (GAAP).
Five year average turnover data is calculated using a simple average of annual turnover figures for the past five fiscal years. These annual turnover figures utilize purchase, sales and market value data which is not reflective of adjustments required pursuant to Generally Accepted Accounting Principles (GAAP). Accordingly, differences may exist between this data and similar information reported in the financial statements.
The MSCI All Country World Index is a free float-adjusted market capitalization index that is designed to measure equity market performance in the global developed and emerging markets. The Index consists of 45 developed and emerging market countries. Net dividends reinvested.
The MSCI All Country World ex-US Index is a free float-adjusted market capitalization index that is designed to measure equity market performance in the global developed and emerging markets, excluding the US. The Index consists of 44 developed and emerging market countries. Net dividends reinvested.
The MSCI All Country World ex-US Small Cap Index is a free-float market capitalization index that is designed to measure small cap developed and emerging market equity performance. The Index consists of 44 developed and emerging markets countries and targets companies within a market capitalization range of USD 170–4,200 million in terms of the companies’ full market capitalization.
The MSCI All Country World ex-US Large Cap Index is a free float-adjusted market capitalization index that is designed to measure equity market performance in the global developed and emerging markets, excluding the US. The Index consists of 44 developed and emerging market countries. The Large Cap Indices target a coverage range of about 70% of the free float-adjusted market capitalization in each market. Net dividends reinvested.
The MSCI Emerging Markets Index is a free float-adjusted market capitalization index that is designed to measure equity market performance in the global emerging markets. The Index consists of 21 emerging market countries. Net dividends reinvested.
The MSCI Emerging Markets Quality Index is based on the MSCI Emerging Markets Index, its parent index. The Index aims to capture the performance of quality growth stocks by identifying stocks with high quality scores based on three main fundamental variables: high return on equity (ROE), stable year-over-year earnings growth and low financial leverage.
The MSCI Frontier Emerging Markets Index is a free float-adjusted market capitalization index designed to measure equity market performance in all countries from the MSCI Frontier Markets Index and the lower size spectrum of the MSCI Emerging Markets Index. The Index consists of 25 frontier markets and 5 emerging markets. Net dividends reinvested.
The MSCI World Index is a free float-adjusted market capitalization index that is designed to measure global developed market equity performance. The Index consists of 24 developed market countries. The MSCI World Quality Index is based on the MSCI World Index, its parent index. The Index aims to capture the performance of quality growth stocks by identifying stocks with high quality scores based on three main fundamental variables: high return on equity (ROE), stable year-over-year earnings growth and low financial leverage.
You cannot invest directly in these Indices.
Cash Flow measures the cash generating capability of a company by adding non-cash charges (e.g. depreciation) and interest expense to pretax income.
Debt/Equity Ratio is the total long-term debt divided by total shareholder’s equity.
Earnings Before Interest, Taxes, Depreciation and Amortization (EBITDA) is a measure of a company’s operating cash flow.
Earnings Per Share is the portion of a company’s profit allocated to each outstanding share of common stock.
Free Cash Flow is the measure of the financial performance calculated as operating cash flow minus capital expenditures.
Gross Domestic Product (GDP) is the monetary value of all finished goods and services produced within a country’s borders in a specific time period (usually calculated on an annual basis).
Price/Earnings (P/E) is the ratio of a firm’s closing stock price and its trailing 12 months’ earnings/share.
Return on Equity (ROE) is the net income divided by total common equity outstanding, expressed as a percent.
Return on Invested Capital is a calculation used to assess a company’s efficiency at allocating the capital under its control to profitable investments.
Revenue is the amount of money that a company actually receives during a specific period, including discounts and deductions for returned merchandise.
Turnover is calculated by dividing the lesser of Purchases or Sales by Average Capital.
Quasar Distributors, LLC, Distributor.

Annual Report
October 31, 2013
Global Equity Portfolio
International Equity Portfolio
International Small Companies Portfolio
Institutional Emerging Markets Portfolio
Emerging Markets Portfolio
Frontier Emerging Markets Portfolio
Harding, Loevner Funds, Inc.
c/o Northern Trust
Attn: Funds Center C5S
801 South Canal Street
Chicago, IL 60607
(877) 435-8105
www.HardingLoevnerFunds.com
Harding, Loevner Funds, Inc.
Table of Contents
For use only when proceeded or accompanied by a prospectus. Read the prospectus carefully before you invest or send money.
Harding, Loevner Funds, Inc.
Expense Example
October 31, 2013 (unaudited)
As a shareholder of a Harding Loevner Portfolio, you incur ongoing costs, including management fees; to the extent applicable, distribution (12b-1) fees, and/or shareholder services fees and other fund expenses. The following example is intended to help you understand your ongoing costs (in dollars and cents) of investing in a Portfolio and to compare these costs with the ongoing costs of investing in other mutual funds.
The example is based on an investment of $1,000 invested on May 1, 2013 and held for the entire six month period from May 1, 2013 to October 31, 2013.
Actual Expenses
The first line under each Portfolio in the table below provides information about actual account values and actual expenses. You may use the information in this line, together with the amount you invested, to estimate the expenses that you paid over the period. Simply divide your account value by $1,000 (for example, an $8,600 account value divided by $1,000 = 8.6), then multiply the result by the number in the first line for your Portfolio under the heading entitled “Expenses Paid During Period” to estimate the expenses you paid on your account during this period.
Hypothetical Example for Comparison Purposes
The second line under each Portfolio in the table below provides information about hypothetical account values and hypothetical expenses based on the Portfolio’s actual expense ratio and an assumed rate of return of 5% per year before expenses, which is not the Portfolio’s actual return. The hypothetical account values and expenses may not be used to estimate the actual ending account balance or expenses you paid for the period. You may use this information to compare the ongoing costs of investing in your Portfolio and other funds. To do so, compare this 5% hypothetical example with the 5% hypothetical examples that appear in the shareholder reports of the other funds. Please note that the expenses shown in the table are meant to highlight your ongoing costs only. Therefore, the second line under each Portfolio in the table is useful in comparing ongoing costs only, and will not help you determine the relative total costs of owning different funds.
| | | | | | | | | | | | | | | | |
| | | | | | | | | | | | | |
| Portfolio | | Beginning
Account Value
May 1, 2013 | | | Ending Account
Value
October 31, 2013 | | | Annualized Expense
Ratio | | | Expenses Paid
During Period*
(May 1, 2013 to
October 31, 2013) | |
Global Equity Portfolio—Institutional Class | | | | | | | | | | | | | | | | |
Actual | | $ | 1,000.00 | | | $ | 1,085.10 | | | | 0.95 | % | | $ | 4.99 | |
Hypothetical (5% annual return before expenses) | | | 1,000.00 | | | | 1,020.42 | | | | 0.95 | % | | | 4.84 | |
Global Equity Portfolio—Advisor Class | | | | | | | | | | | | | | | | |
Actual | | | 1,000.00 | | | | 1,083.70 | | | | 1.27 | % | | | 6.67 | |
Hypothetical (5% annual return before expenses) | | | 1,000.00 | | | | 1,018.80 | | | | 1.27 | % | | | 6.46 | |
International Equity Portfolio—Institutional Class | | | | | | | | | | | | | | | | |
Actual | | | 1,000.00 | | | | 1,071.60 | | | | 0.88 | % | | | 4.59 | |
Hypothetical (5% annual return before expenses) | | | 1,000.00 | | | | 1,020.77 | | | | 0.88 | % | | | 4.48 | |
International Equity Portfolio—Investor Class | | | | | | | | | | | | | | | | |
Actual | | | 1,000.00 | | | | 1,070.00 | | | | 1.22 | % | | | 6.37 | |
Hypothetical (5% annual return before expenses) | | | 1,000.00 | | | | 1,019.06 | | | | 1.22 | % | | | 6.21 | |
International Small Companies Portfolio—Institutional Class | | | | | | | | | | | | | | | | |
Actual | | | 1,000.00 | | | | 1,090.40 | | | | 1.30 | % | | | 6.85 | |
Hypothetical (5% annual return before expenses) | | | 1,000.00 | | | | 1,018.65 | | | | 1.30 | % | | | 6.61 | |
International Small Companies Portfolio—Investor Class | | | | | | | | | | | | | | | | |
Actual | | | 1,000.00 | | | | 1,089.80 | | | | 1.55 | % | | | 8.16 | |
Hypothetical (5% annual return before expenses) | | | 1,000.00 | | | | 1,017.39 | | | | 1.55 | % | | | 7.88 | |
Institutional Emerging Markets Portfolio | | | | | | | | | | | | | | | | |
Actual | | | 1,000.00 | | | | 1,030.80 | | | | 1.30 | % | | | 6.65 | |
Hypothetical (5% annual return before expenses) | | | 1,000.00 | | | | 1,018.65 | | | | 1.30 | % | | | 6.61 | |
Emerging Markets Portfolio—Advisor Class | | | | | | | | | | | | | | | | |
Actual | | | 1,000.00 | | | | 1,029.60 | | | | 1.48 | % | | | 7.57 | |
Hypothetical (5% annual return before expenses) | | | 1,000.00 | | | | 1,017.74 | | | | 1.48 | % | | | 7.53 | |
Frontier Emerging Markets Portfolio—Institutional Class | | | | | | | | | | | | | | | | |
Actual | | | 1,000.00 | | | | 1,049.60 | | | | 1.79 | % | | | 9.25 | |
Hypothetical (5% annual return before expenses) | | | 1,000.00 | | | | 1,016.18 | | | | 1.79 | % | | | 9.10 | |
Frontier Emerging Markets Portfolio—Investor Class | | | | | | | | | | | | | | | | |
Actual | | | 1,000.00 | | | | 1,047.40 | | | | 2.25 | % | | | 11.61 | |
Hypothetical (5% annual return before expenses) | | | 1,000.00 | | | | 1,013.86 | | | | 2.25 | % | | | 11.42 | |
* Expenses are calculated using each Portfolio’s annualized expense ratio (as disclosed in the table), multiplied by the average account value for the period, multiplied by the number of days in the period (184 days), and divided by the number of days in the year (365 days). Expense ratios for the most recent half year may differ from expense ratios based on one-year data in the Financial Highlights.
2
Harding, Loevner Funds, Inc.
Global Equity Portfolio
Portfolio of Investments
October 31, 2013
| | | | | | | | |
| | |
| | | Shares | | | Value | |
| COMMON STOCKS - 97.4% | | | | | | |
| | |
Australia - 0.8% | | | | | | | | |
| | |
Cochlear Ltd. (Health Care Equipment &
Services)† | | | 89,416 | | | | $4,975,907 | |
| | |
China - 0.4% | | | | | | | | |
| | |
China Merchants Holdings International Co., Ltd. (Transportation)† | | | 645,632 | | | | 2,287,854 | |
| | |
France - 4.6% | | | | | | | | |
| | |
Air Liquide SA (Materials)† | | | 67,030 | | | | 9,118,114 | |
| | |
Dassault Systemes SA (Software & Services)† | | | 103,528 | | | | 12,578,601 | |
| | |
L’Oreal SA (Household & Personal Products)† | | | 42,200 | | | | 7,222,024 | |
| | |
| | | | | | | 28,918,739 | |
| | |
Germany - 1.2% | | | | | | | | |
| | |
QIAGEN NV (Pharmaceuticals, Biotechnology & Life Sciences)* | | | 340,350 | | | | 7,882,506 | |
| | |
Hong Kong - 2.2% | | | | | | | | |
| | |
AIA Group Ltd. (Insurance)† | | | 2,706,600 | | | | 13,723,653 | |
| | |
India - 2.0% | | | | | | | | |
| | |
HDFC Bank Ltd. - ADR (Banks) | | | 171,200 | | | | 6,206,000 | |
| | |
ICICI Bank Ltd. - Sponsored ADR (Banks) | | | 166,700 | | | | 6,221,244 | |
| | |
| | | | | | | 12,427,244 | |
| | |
Indonesia - 0.9% | | | | | | | | |
| | |
Bank Central Asia Tbk PT (Banks)† | | | 6,290,924 | | | | 5,821,659 | |
| | |
Japan - 9.3% | | | | | | | | |
| | |
ABC-Mart Inc. (Retailing)† | | | 193,900 | | | | 9,702,864 | |
| | |
FANUC Corp. (Capital Goods)† | | | 80,600 | | | | 12,926,471 | |
| | |
Keyence Corp. (Technology Hardware & Equipment)† | | | 24,496 | | | | 10,492,234 | |
| | |
M3 Inc. (Health Care Equipment & Services)† | | | 2,590 | | | | 7,090,404 | |
| | |
MonotaRO Co. Ltd. (Capital Goods)† | | | 121,400 | | | | 2,852,706 | |
| | |
Unicharm Corp. (Household & Personal Products)† | | | 245,500 | | | | 15,757,730 | |
| | |
| | | | | | | 58,822,409 | |
| | |
Mexico - 2.2% | | | | | | | | |
| | |
America Movil SAB de CV, Series L - ADR (Telecommunication Services) | | | 408,500 | | | | 8,745,985 | |
| | | | | | | | |
| | |
| | | Shares | | | Value | |
| COMMON STOCKS - 97.4% (continued) | | | | | | |
| | |
Mexico - 2.2% (continued) | | | | | | | | |
| | |
Coca-Cola Femsa SAB de CV - Sponsored ADR (Food, Beverage & Tobacco) | | | 40,800 | | | | $4,958,832 | |
| | |
| | | | | | | 13,704,817 | |
| | |
Russia - 0.7% | | | | | | | | |
| | |
Gazprom OAO - Sponsored ADR (Energy)† | | | 459,800 | | | | 4,310,153 | |
| | |
South Africa - 1.3% | | | | | | | | |
| | |
Sasol Ltd. (Energy)† | | | 163,600 | | | | 8,360,058 | |
| | |
Spain - 1.3% | | | | | | | | |
| | |
Inditex SA (Retailing)† | | | 49,150 | | | | 8,070,383 | |
| | |
Switzerland - 7.4% | | | | | | | | |
| | |
Kuehne & Nagel International AG, Reg S (Transportation)† | | | 46,400 | | | | 5,857,537 | |
| | |
Lonza Group AG, Reg S (Pharmaceuticals, Biotechnology & Life Sciences)*† | | | 82,200 | | | | 7,328,000 | |
| | |
Nestle SA - Sponsored ADR, Reg S (Food, Beverage & Tobacco) | | | 239,000 | | | | 17,305,990 | |
| | |
Sonova Holding AG, Reg S (Health Care Equipment & Services)*† | | | 56,600 | | | | 7,354,623 | |
| | |
Swatch Group AG, Bearer (Consumer Durables & Apparel)† | | | 14,020 | | | | 8,980,627 | |
| | |
| | | | | | | 46,826,777 | |
| | |
Turkey - 1.1% | | | | | | | | |
| | |
Turkiye Garanti Bankasi AS - ADR (Banks) | | | 1,664,700 | | | | 6,742,035 | |
| | |
United Kingdom - 7.0% | | | | | | | | |
| | |
Aggreko plc (Commercial & Professional
Services)† | | | 127,000 | | | | 3,277,921 | |
| | |
ARM Holdings plc - Sponsored ADR (Semiconductors & Semiconductor Equipment) | | | 211,380 | | | | 9,975,022 | |
| | |
Shire plc (Pharmaceuticals, Biotechnology & Life Sciences)† | | | 190,670 | | | | 8,451,828 | |
| | |
Standard Chartered plc (Banks)† | | | 517,000 | | | | 12,425,462 | |
| | |
WPP plc (Media)† | | | 481,300 | | | | 10,260,867 | |
| | |
| | | | | | | 44,391,100 | |
| | |
United States - 55.0% | | | | | | | | |
| | |
3M Co. (Capital Goods) | | | 62,900 | | | | 7,915,965 | |
See Notes to Financial Statements
3
Harding, Loevner Funds, Inc.
Global Equity Portfolio
Portfolio of Investments
October 31, 2013 (continued)
| | | | | | | | |
| | |
| | | Shares | | | Value | |
| COMMON STOCKS - 97.4% (continued) | | | | | | |
| | |
United States - 55.0% (continued) | | | | | | | | |
| | |
Abbott Laboratories (Health Care Equipment & Services) | | | 171,900 | | | | $6,282,945 | |
| | |
Allergan, Inc. (Pharmaceuticals, Biotechnology & Life Sciences) | | | 83,500 | | | | 7,565,935 | |
| | |
Amazon.com Inc. (Retailing)* | | | 32,500 | | | | 11,830,975 | |
| | |
American Express Co. (Diversified Financials) | | | 93,200 | | | | 7,623,760 | |
| | |
BorgWarner Inc. (Automobiles & Components) | | | 77,900 | | | | 8,033,827 | |
| | |
Bunge Ltd. (Food, Beverage & Tobacco) | | | 91,600 | | | | 7,523,108 | |
| | |
Citrix Systems Inc. (Software & Services)* | | | 139,800 | | | | 7,937,844 | |
| | |
Coach Inc. (Consumer Durables & Apparel) | | | 251,500 | | | | 12,746,020 | |
| | |
Cognizant Technology Solutions Corp., Class A (Software & Services)* | | | 76,700 | | | | 6,667,531 | |
| | |
Colgate-Palmolive Co. (Household & Personal Products) | | | 178,000 | | | | 11,521,940 | |
| | |
eBay Inc. (Software & Services)* | | | 312,450 | | | | 16,469,240 | |
| | |
EMC Corp. (Technology Hardware & Equipment) | | | 241,400 | | | | 5,810,498 | |
| | |
Emerson Electric Co. (Capital Goods) | | | 149,124 | | | | 9,986,834 | |
| | |
Exxon Mobil Corp. (Energy) | | | 85,200 | | | | 7,635,624 | |
| | |
F5 Networks Inc. (Technology Hardware & Equipment)* | | | 81,050 | | | | 6,606,385 | |
| | |
First Republic Bank (Banks) | | | 168,500 | | | | 8,605,295 | |
| | |
Google Inc., Class A (Software & Services)* | | | 20,830 | | | | 21,466,981 | |
| | |
Informatica Corp. (Software & Services)* | | | 189,100 | | | | 7,299,260 | |
| | |
JPMorgan Chase & Co. (Diversified Financials) | | | 235,900 | | | | 12,158,286 | |
| | |
Lazard Ltd., Class A (Diversified Financials) | | | 191,000 | | | | 7,382,150 | |
| | |
MasterCard, Inc., Class A (Software & Services) | | | 9,430 | | | | 6,762,253 | |
| | |
Microsoft Corp. (Software & Services) | | | 335,300 | | | | 11,852,855 | |
| | |
Monsanto Co. (Materials) | | | 93,000 | | | | 9,753,840 | |
| | |
NIKE Inc., Class B (Consumer Durables & Apparel) | | | 190,300 | | | | 14,417,128 | |
| | |
Praxair Inc. (Materials) | | | 62,400 | | | | 7,781,904 | |
| | | | | | | | |
| | |
| | | Shares | | | Value | |
| COMMON STOCKS - 97.4% (continued) | | | | | | |
|
United States - 55.0% (continued) | |
| | |
Procter & Gamble Co. (Household & Personal Products) | | | 75,800 | | | | $6,120,850 | |
| | |
Ralph Lauren Corp. (Consumer Durables & Apparel) | | | 33,800 | | | | 5,598,632 | |
| | |
Roper Industries, Inc. (Capital Goods) | | | 84,550 | | | | 10,721,785 | |
| | |
Schlumberger Ltd. (Energy) | | | 193,050 | | | | 18,092,646 | |
| | |
Sigma-Aldrich Corp. (Materials) | | | 153,450 | | | | 13,262,684 | |
| | |
SVB Financial Group (Banks)* | | | 85,100 | | | | 8,150,878 | |
| | |
Teradata Corp. (Software & Services)* | | | 93,800 | | | | 4,133,766 | |
| | |
Trimble Navigation Ltd. (Technology Hardware & Equipment)* | | | 236,010 | | | | 6,742,806 | |
| | |
Wells Fargo & Co. (Banks) | | | 560,000 | | | | 23,906,400 | |
| | |
| | | | | | | | 346,368,830 | |
| |
Total Common Stocks (Cost $483,225,380) | | | | $613,634,124 | |
| | |
| | | | | | | | |
| CASH EQUIVALENT - 2.5% | | | | | | |
| | |
Northern Institutional Funds - Prime Obligations Portfolio, 0.01% (Money Market Fund) | | | 16,112,371 | | | | 16,112,371 | |
| |
Total Cash Equivalent (Cost $16,112,371) | | | | $16,112,371 | |
| | |
| | | | | | | | | |
| | |
Total Investments — 99.9% | | | | | | | | |
| | |
(Cost $499,337,751) | | | | | | | $629,746,495 | |
| |
Other Assets Less Liabilities - 0.1% | | | | 428,811 | |
| | |
Net Assets — 100.0% | | | | | | | $630,175,306 | |
Summary of Abbreviations
| ADR | American Depository Receipt. |
| Reg S | Security sold outside United States without registration under the Securities Act of 1933. |
| SDR | Swedish Depository Receipt. |
| * | Non-income producing security. |
| † | Investment categorized as level 2 security as disclosed in Note 2 of the Notes to Financial Statements. |
See Notes to Financial Statements
4
Harding, Loevner Funds, Inc.
Global Equity Portfolio
Portfolio of Investments
October 31, 2013 (continued)
| | | | | |
| Industry | | Percentage of
Net Assets |
| |
Automobiles & Components | | | | 1.3 | % |
| |
Banks | | | | 12.4 | |
| |
Capital Goods | | | | 7.1 | |
| |
Commercial & Professional Services | | | | 0.5 | |
| |
Consumer Durables & Apparel | | | | 6.6 | |
| |
Diversified Financials | | | | 4.3 | |
| |
Energy | | | | 6.1 | |
| |
Food, Beferage & Tobacco | | | | 4.7 | |
| |
Health Care Equipment & Services | | | | 4.1 | |
| |
Household & Personal Products | | | | 6.4 | |
| |
Insurance | | | | 2.2 | |
| |
Materials | | | | 6.3 | |
| |
Media | | | | 1.6 | |
| |
Money Market Fund | | | | 2.5 | |
| |
Pharmaceuticals, Biotechnology & Life Sciences | | | | 5.0 | |
| |
Retailing | | | | 4.7 | |
| |
Semiconductors & Semiconductor Equipment | | | | 1.6 | |
| |
Software & Services | | | | 15.1 | |
| |
Technology Hardware & Equipment | | | | 4.7 | |
| |
Telecommunication Services | | | | 1.4 | |
| |
Transportation | | | | 1.3 | |
| |
| | | | | | |
Total Investments | | | | 99.9 | |
Other Assets Less Liabilities | | | | 0.1 | |
Net Assets | | | | 100.0 | % |
See Notes to Financial Statements
5
Harding, Loevner Funds, Inc.
International Equity Portfolio
Portfolio of Investments
October 31, 2013
| | | | | | | | |
| | |
| | | Shares | | | Value | |
| COMMON STOCKS - 92.4% | | | | | | |
| | |
Australia - 2.6% | | | | | | | | |
| | |
Cochlear Ltd. (Health Care Equipment &
Services)† | | | 581,800 | | | | $32,376,565 | |
| | |
CSL Ltd. (Pharmaceuticals, Biotechnology & Life Sciences)† | | | 1,054,500 | | | | 69,235,985 | |
| | |
| | | | | | | 101,612,550 | |
| | |
Belgium - 2.2% | | | | | | | | |
| | |
Anheuser-Busch InBev NV - Sponsored ADR (Food, Beverage & Tobacco) | | | 821,700 | | | | 85,234,941 | |
| | |
Brazil - 0.8% | | | | | | | | |
| | |
Petroleo Brasileiro SA - ADR (Energy)* | | | 1,686,100 | | | | 29,388,723 | |
| | |
Canada - 3.2% | | | | | | | | |
| | |
Canadian National Railway Co. (Transportation) | | | 669,800 | | | | 73,631,114 | |
| | |
Imperial Oil Ltd. (Energy) | | | 1,149,600 | | | | 50,180,040 | |
| | |
| | | | | | | 123,811,154 | |
| | |
China - 1.5% | | | | | | | | |
| | |
Baidu Inc. - Sponsored ADR (Software & Services)* | | | 370,800 | | | | 59,661,720 | |
| | |
Denmark - 1.1% | | | | | | | | |
| | |
Novo Nordisk A/S, Class B (Pharmaceuticals, Biotechnology & Life Sciences)† | | | 259,700 | | | | 43,260,962 | |
| | |
Finland - 1.6% | | | | | | | | |
| | |
Nokian Renkaat oyj (Automobiles &
Components)† | | | 1,268,900 | | | | 64,112,340 | |
| | |
France - 12.4% | | | | | | | | |
| | |
Air Liquide SA (Materials)† | | | 844,200 | | | | 114,836,818 | |
| | |
Dassault Systemes SA (Software & Services)† | | | 1,072,174 | | | | 130,268,617 | |
| | |
L’Oreal SA (Household & Personal Products)† | | | 562,600 | | | | 96,282,239 | |
| | |
LVMH Moet Hennessy Louis Vuitton SA (Consumer Durables & Apparel)† | | | 240,900 | | | | 46,308,567 | |
| | |
Schneider Electric SA (Capital Goods)† | | | 1,100,200 | | | | 92,511,556 | |
| | |
| | | | | | | 480,207,797 | |
| | |
Germany - 10.7% | | | | | | | | |
| | |
Allianz SE, Reg S (Insurance)† | | | 682,500 | | | | 114,781,339 | |
| | |
Bayerische Motoren Werke AG (Automobiles & Components)† | | | 800,800 | | | | 90,814,813 | |
| | | | | | | | |
| | |
| | | Shares | | | Value | |
| COMMON STOCKS - 92.4% (continued) | |
| | |
Germany - 10.7% (continued) | | | | | | | | |
| | |
Fresenius Medical Care AG & Co. KGaA (Health Care Equipment & Services)† | | | 1,048,600 | | | | $69,398,074 | |
| | |
SAP AG - Sponsored ADR (Software & Services) | | | 1,767,000 | | | | 138,444,450 | |
| | |
| | | | | | | 413,438,676 | |
| | |
Hong Kong - 4.4% | | | | | | | | |
| | |
AIA Group Ltd. (Insurance)† | | | 21,116,000 | | | | 107,067,413 | |
| | |
Hong Kong Exchanges and Clearing Ltd. (Diversified Financials)† | | | 2,601,700 | | | | 41,820,616 | |
| | |
Xinyi Glass Holdings Ltd. (Automobiles & Components)† | | | 22,130,000 | | | | 21,903,105 | |
| | |
| | | | | | | 170,791,134 | |
| | |
India - 2.1% | | | | | | | | |
| | |
ICICI Bank Ltd. - Sponsored ADR (Banks) | | | 2,177,500 | | | | 81,264,300 | |
| | |
Japan - 14.6% | | | | | | | | |
| | |
FANUC Corp. (Capital Goods)† | | | 565,600 | | | | 90,709,826 | |
| | |
JGC Corp. (Capital Goods)† | | | 2,563,000 | | | | 98,032,791 | |
| | |
Keyence Corp. (Technology Hardware & Equipment)† | | | 159,381 | | | | 68,266,771 | |
| | |
M3 Inc. (Health Care Equipment & Services)† | | | 16,068 | | | | 43,987,881 | |
| | |
MISUMI Group Inc. (Capital Goods)† | | | 1,484,200 | | | | 43,497,380 | |
| | |
Mitsubishi Estate Co., Ltd. (Real Estate)† | | | 1,951,000 | | | | 55,717,632 | |
| | |
MonotaRO Co. Ltd. (Capital Goods)† | | | 516,600 | | | | 12,139,272 | |
| | |
Sysmex Corp. (Health Care Equipment & Services)† | | | 892,400 | | | | 58,977,190 | |
| | |
Unicharm Corp. (Household & Personal Products)† | | | 1,487,100 | | | | 95,451,408 | |
| | |
| | | | | | | 566,780,151 | |
| | |
Poland - 1.3% | | | | | | | | |
| | |
Bank Pekao SA - GDR, Reg S (Banks)#† | | | 789,100 | | | | 49,441,218 | |
| | |
Russia - 1.0% | | | | | | | | |
| | |
Gazprom OAO - Sponsored ADR (Energy)† | | | 4,152,300 | | | | 38,923,552 | |
| | |
Singapore - 1.3% | | | | | | | | |
| | |
DBS Group Holdings Ltd. (Banks)† | | | 3,626,083 | | | | 48,806,345 | |
See Notes to Financial Statements
6
Harding, Loevner Funds, Inc.
International Equity Portfolio
Portfolio of Investments
October 31, 2013 (continued)
| | | | | | | | |
| | |
| | | Shares | | | Value | |
| COMMON STOCKS - 92.4% (continued) | |
| | |
South Africa - 1.9% | | | | | | | | |
| | |
MTN Group Ltd. (Telecommunication
Services)† | | | 1,735,200 | | | | $34,497,463 | |
| | |
Sasol Ltd. (Energy)† | | | 781,300 | | | | 39,924,900 | |
| | |
| | | | | | | 74,422,363 | |
| | |
South Korea - 1.2% | | | | | | | | |
| | |
Samsung Electronics Co., Ltd. - GDR, Reg S (Semiconductors & Semiconductor Equipment)† | | | 69,200 | | | | 47,928,775 | |
| | |
Spain - 1.8% | | | | | | | | |
| | |
Banco Bilbao Vizcaya Argentaria SA (Banks)† | | | 5,864,400 | | | | 68,638,748 | |
| | |
Sweden - 1.5% | | | | | | | | |
| | |
Atlas Copco AB, Class A (Capital Goods)† | | | 2,157,700 | | | | 59,892,342 | |
| | |
Switzerland - 8.9% | | | | | | | | |
| | |
Nestle SA - Sponsored ADR, Reg S (Food, Beverage & Tobacco) | | | 1,820,300 | | | | 131,807,923 | |
| | |
Roche Holding AG, Genusschein (Pharmaceuticals, Biotechnology & Life Sciences)† | | | 420,300 | | | | 116,136,598 | |
| | |
Sonova Holding AG, Reg S (Health Care Equipment & Services)*† | | | 335,600 | | | | 43,607,974 | |
| | |
Swatch Group AG, Bearer (Consumer Durables & Apparel)† | | | 86,900 | | | | 55,664,512 | |
| | |
| | | | | | | 347,217,007 | |
| | |
Taiwan - 1.3% | | | | | | | | |
| | |
Taiwan Semiconductor Manufacturing Co., Ltd. (Semiconductors & Semiconductor Equipment)† | | | 11,038,125 | | | | 40,851,267 | |
| | |
Taiwan Semiconductor Manufacturing Co., Ltd. - Sponsored ADR (Semiconductors & Semiconductor Equipment) | | | 483,900 | | | | 8,908,599 | |
| | |
| | | | | | | 49,759,866 | |
| | |
Turkey - 1.6% | | | | | | | | |
| | |
Turkiye Garanti Bankasi AS (Banks)† | | | 345,100 | | | | 1,382,651 | |
| | |
Turkiye Garanti Bankasi AS - ADR (Banks) | | | 14,748,300 | | | | 59,730,615 | |
| | |
| | | | | | | 61,113,266 | |
| | | | | | | | |
| | |
| | | Shares | | | Value | |
| COMMON STOCKS - 92.4% (continued) | |
| | |
United Kingdom - 9.0% | | | | | | | | |
| | |
ARM Holdings plc (Semiconductors & Semiconductor Equipment)† | | | 4,774,100 | | | | $74,925,823 | |
| | |
BG Group plc (Energy)† | | | 3,099,900 | | | | 63,151,248 | |
| | |
Tesco plc (Food & Staples Retailing)† | | | 7,389,200 | | | | 43,056,556 | |
| | |
Unilever plc (Food, Beverage & Tobacco)† | | | 1,026,500 | | | | 41,580,627 | |
| | |
WPP plc (Media)† | | | 5,883,000 | | | | 125,420,076 | |
| | |
| | | | | | | 348,134,330 | |
| | |
United States - 4.4% | | | | | | | | |
| | |
Bunge Ltd. (Food, Beverage & Tobacco) | | | 1,002,500 | | | | 82,335,325 | |
| | |
Schlumberger Ltd. (Energy) | | | 941,200 | | | | 88,209,264 | |
| | |
| | | | | | | | 170,544,589 | |
| |
Total Common Stocks (Cost $2,853,444,029) | | | | $3,584,386,849 | |
| | |
| | | | | | | | | |
| PREFERRED STOCKS - 4.2% | | | | | | |
| | |
Brazil - 2.9% | | | | | | | | |
| | |
Itau Unibanco Holding SA - ADR (Banks) | | | 7,244,698 | | | | 111,640,796 | |
| | |
South Korea - 1.3% | | | | | | | | |
| | |
Samsung Electronics Co., Ltd. - GDR, Reg S (Semiconductors & Semiconductor Equipment)† | | | 102,400 | | | | 48,935,572 | |
| | |
| | | | | | | | | |
| |
Total Preferred Stocks (Cost $139,937,374) | | | | $160,576,368 | |
| | |
| | | | | | | | | |
| CASH EQUIVALENT - 4.3% | | | | | | |
| | |
Northern Institutional Funds - Prime Obligations Portfolio, 0.01% (Money Market Fund) | | | 168,028,389 | | | | 168,028,389 | |
| |
Total Cash Equivalent (Cost $168,028,389) | | | | $168,028,389 | |
| | |
| | | | | | | | | |
| | |
Total Investments — 100.9% | | | | | | | | |
| | |
(Cost $3,161,409,792) | | | | | | | $3,912,991,606 | |
| | |
Liabilities Less Other Assets - (0.9)% | | | | | | | (35,463,690 | ) |
| | |
Net Assets — 100.0% | | | | | | | $3,877,527,916 | |
See Notes to Financial Statements
7
Harding, Loevner Funds, Inc.
International Equity Portfolio
Portfolio of Investments
October 31, 2013 (continued)
Summary of Abbreviations
| ADR | American Depository Receipt. |
| GDR | Global Depository Receipt. |
| Reg S | Security sold outside United States without registration under the Securities Act of 1933. |
| # | Security valued at fair value as determined in good faith under policies and procedures established by and under the supervision of the Portfolio’s Board of Directors as disclosed in Note 2 of the Notes to Financial Statements. |
| * | Non-income producing security. |
| † | Investment categorized as level 2 security as disclosed in Note 2 of the Notes to Financial Statements. |
| | | | | |
| Industry | | Percentage of
Net Assets |
| |
Automobiles & Components | | | | 4.6 | % |
| |
Banks | | | | 10.9 | |
| |
Capital Goods | | | | 10.2 | |
| |
Consumer Durables & Apparel | | | | 2.6 | |
| |
Diversified Financials | | | | 1.1 | |
| |
Energy | | | | 8.0 | |
| |
Food & Staples Retailing | | | | 1.1 | |
| |
Food, Beverage & Tobacco | | | | 8.8 | |
| |
Health Care Equipment & Services | | | | 6.4 | |
| |
Household & Personal Products | | | | 4.9 | |
| |
Insurance | | | | 5.7 | |
| |
Materials | | | | 3.0 | |
| |
Media | | | | 3.2 | |
| |
Money Market Fund | | | | 4.3 | |
| |
Pharmaceuticals, Biotechnology & Life Sciences | | | | 5.9 | |
| |
Real Estate | | | | 1.4 | |
| |
Semiconductors & Semiconductor Equipment | | | | 5.7 | |
| |
Software & Services | | | | 8.5 | |
| |
Technology Hardware & Equipment | | | | 1.8 | |
| |
Telecommunication Services | | | | 0.9 | |
| |
Transportation | | | | 1.9 | |
| |
| | | | | |
Total Investments | | | | 100.9 | |
Liabilities Less Other Assets | | | | (0.9 | ) |
Net Assets | | | | 100.0 | % |
See Notes to Financial Statements
8
Harding, Loevner Funds, Inc.
International Small Companies Portfolio
Portfolio of Investments
October 31, 2013
| | | | | | | | |
| | |
| | | Shares | | | Value | |
| COMMON STOCKS - 98.3% | | | | | | |
| | |
Australia - 3.8% | | | | | | | | |
| | |
Cardno Ltd. (Capital Goods)† | | | 42,000 | | | | $280,920 | |
| | |
iiNET Ltd. (Telecommunication Services)† | | | 79,000 | | | | 485,110 | |
| | |
Imdex Ltd. (Materials)† | | | 577,200 | | | | 392,531 | |
| | |
SAI Global Ltd. (Commercial &
Professional Services)† | | | 208,497 | | | | 810,290 | |
| | |
TPG Telecom Ltd. (Telecommunication Services)† | | | 243,100 | | | | 1,070,758 | |
| | |
| | | | | | | 3,039,609 | |
| | |
Austria - 1.2% | | | | | | | | |
| | |
Semperit AG Holding (Capital Goods)† | | | 18,900 | | | | 925,509 | |
| | |
Brazil - 4.6% | | | | | | | | |
| | |
CETIP SA - Mercados Organizados
(Diversified Financials)*† | | | 90,900 | | | | 1,007,926 | |
| | |
Mills Estruturas e Servicos de Engenharia SA
(Capital Goods)*† | | | 68,700 | | | | 953,741 | |
| | |
SLC Agricola SA (Food, Beverage & Tobacco)† | | | 81,800 | | | | 763,155 | |
| | |
Valid Solucoes e Servicos de Seguranca em Meios de Pagamento e Identificacao SA (Commercial & Professional Services)† | | | 59,500 | | | | 917,918 | |
| | |
| | | | | | | 3,642,740 | |
| | |
Canada - 1.0% | | | | | | | | |
| | |
Laurentian Bank of Canada (Banks)† | | | 16,885 | | | | 753,845 | |
| | |
China - 1.4% | | | | | | | | |
| | |
Haitian International Holdings Ltd. (Capital Goods)† | | | 152,000 | | | | 367,124 | |
| | |
Yip’s Chemical Holdings Ltd. (Materials)† | | | 862,000 | | | | 725,512 | |
| | |
| | | | | | | 1,092,636 | |
| | |
Denmark - 0.6% | | | | | | | | |
| | |
Chr Hansen Holding A/S (Materials)† | | | 11,750 | | | | 435,173 | |
| | |
Finland - 2.0% | | | | | | | | |
| | |
PKC Group oyj (Capital Goods)† | | | 20,500 | | | | 669,872 | |
| | |
Vacon oyj (Capital Goods)† | | | 7,247 | | | | 539,086 | |
| | |
Vaisala oyj, Class A
(Technology Hardware & Equipment)*† | | | 15,180 | | | | 370,940 | |
| | |
| | | | | | | 1,579,898 | |
| | | | | | | | |
| | |
| | | Shares | | | Value | |
| COMMON STOCKS - 98.3% (continued) | | | | | | |
| | |
France - 5.1% | | | | | | | | |
| | |
Alten SA (Software & Services)† | | | 19,850 | | | | $898,858 | |
| | |
Ingenico (Technology Hardware & Equipment)† | | | 11,110 | | | | 835,990 | |
| | |
IPSOS (Media)† | | | 23,800 | | | | 1,003,472 | |
| | |
Rubis SCA (Utilities)† | | | 14,200 | | | | 887,060 | |
| | |
Virbac SA (Pharmaceuticals, Biotechnology &
Life Sciences)† | | | 2,000 | | | | 402,025 | |
| | |
| | | | | | | 4,027,405 | |
| | |
Germany - 9.2% | | | | | | | | |
| | |
Bechtle AG (Software & Services)† | | | 10,200 | | | | 654,511 | |
| | |
Bertrandt AG (Commercial & Professional Services)† | | | 3,620 | | | | 473,429 | |
| | |
Carl Zeiss Meditec AG - Bearer (Health Care Equipment & Services)† | | | 31,000 | | | | 979,517 | |
| | |
Gerresheimer AG (Pharmaceuticals, Biotechnology & Life Sciences)† | | | 16,400 | | | | 1,086,381 | |
| | |
Gerry Weber International AG (Consumer Durables & Apparel)† | | | 23,600 | | | | 979,076 | |
| | |
KWS Saat AG (Food, Beverage & Tobacco)† | | | 2,730 | | | | 975,238 | |
| | |
Leoni AG (Automobiles & Components)† | | | 6,800 | | | | 461,598 | |
| | |
Pfeiffer Vacuum Technology AG (Capital Goods)† | | | 6,750 | | | | 786,546 | |
| | |
Wirecard AG (Software & Services)† | | | 24,700 | | | | 899,615 | |
| | |
| | | | | | | 7,295,911 | |
| | |
Hong Kong - 2.4% | | | | | | | | |
| | |
Pico Far East Holdings Ltd. (Media)† | | | 2,485,000 | | | | 787,851 | |
| | |
SmarTone Telecommunications Holdings Ltd. (Telecommu-nication Services)† | | | 168,000 | | | | 221,806 | |
| | |
Vitasoy International Holdings Ltd.
(Food, Beverage & Tobacco)† | | | 668,000 | | | | 861,472 | |
| | |
| | | | | | | 1,871,129 | |
| | |
Indonesia - 3.4% | | | | | | | | |
| | |
AKR Corporindo Tbk PT (Capital Goods)† | | | 2,674,000 | | | | 1,148,654 | |
| | |
Bank Bukopin Tbk PT (Banks)† | | | 5,672,166 | | | | 325,612 | |
See Notes to Financial Statements
9
Harding, Loevner Funds, Inc.
International Small Companies Portfolio
Portfolio of Investments
October 31, 2013 (continued)
| | | | | | | | |
| | |
| | | Shares | | | Value | |
| COMMON STOCKS - 98.3% (continued) | | | | | | |
| | |
Indonesia - 3.4% (continued) | | | | | | | | |
| | |
Tower Bersama Infrastructure Tbk PT (Telecommunication Services)*† | | | 1,534,000 | | | | $774,768 | |
| | |
Wijaya Karya Persero Tbk PT (Capital Goods)† | | | 2,650,000 | | | | 450,247 | |
| | |
| | | | | | | 2,699,281 | |
| | |
Ireland - 1.8% | | | | | | | | |
| | |
Grafton Group plc (Capital Goods)† | | | 152,000 | | | | 1,449,690 | |
| | |
Italy - 3.4% | | | | | | | | |
| | |
Danieli & C Officine Meccaniche SpA
(Capital Goods)† | | | 25,000 | | | | 516,614 | |
| | |
DiaSorin SpA (Health Care Equipment & Services)† | | | 13,700 | | | | 648,334 | |
| | |
Yoox SpA (Retailing)*† | | | 42,500 | | | | 1,528,895 | |
| | |
| | | | | | | 2,693,843 | |
| | |
Japan - 14.2% | | | | | | | | |
| | |
ABC-Mart Inc. (Retailing)† | | | 6,900 | | | | 345,280 | |
| | |
Arcs Co., Ltd. (Food & Staples Retailing)† | | | 10,500 | | | | 196,801 | |
| | |
Asahi Diamond Industrial Co., Ltd. (Capital Goods)† | | | 19,600 | | | | 190,204 | |
| | |
Asics Corp. (Consumer Durables & Apparel)† | | | 43,500 | | | | 765,446 | |
| | |
BML Inc. (Health Care Equipment & Services)† | | | 33,500 | | | | 1,143,612 | |
| | |
Cosmos Pharmaceutical Corp. (Food &
Staples Retailing)† | | | 6,400 | | | | 780,343 | |
| | |
Hiday Hidaka Corp. (Consumer Services)† | | | 49,800 | | | | 1,064,287 | |
| | |
Lintec Corp. (Materials)† | | | 24,100 | | | | 499,280 | |
| | |
M3 Inc. (Health Care Equipment & Services)† | | | 342 | | | | 936,262 | |
| | |
Message Co., Ltd. (Health Care
Equipment & Services)† | | | 27,800 | | | | 783,958 | |
| | |
MISUMI Group Inc. (Capital Goods)† | | | 27,400 | | | | 803,011 | |
| | |
MonotaRO Co. Ltd. (Capital Goods)† | | | 40,500 | | | | 951,685 | |
| | |
Nakanishi Inc. (Health Care Equipment & Services)† | | | 3,500 | | | | 497,553 | |
| | |
Pigeon Corp. (Household & Personal Products)† | | | 17,100 | | | | 880,489 | |
| | |
Rohto Pharmaceutical Co., Ltd. (Pharmaceuticals, Biotechnology & Life Sciences)† | | | 23,000 | | | | 334,577 | |
| | | | | | | | |
| | |
| | | Shares | | | Value | |
| COMMON STOCKS - 98.3% (continued) | |
| | |
Japan - 14.2% (continued) | | | | | | | | |
| | |
Stanley Electric Co., Ltd.
(Automobiles & Components)† | | | 46,500 | | | | $1,079,749 | |
| | |
| | | | | | | 11,252,537 | |
| | |
Malaysia - 3.2% | | | | | | | | |
| | |
Coastal Contracts Bhd. (Capital Goods)† | | | 1,217,766 | | | | 1,355,387 | |
| | |
Dialog Group Bhd. (Capital Goods)† | | | 540,000 | | | | 470,279 | |
| | |
KPJ Healthcare Bhd. (Health Care
Equipment & Services)† | | | 375,000 | | | | 724,682 | |
| | |
| | | | | | | 2,550,348 | |
| | |
Mexico - 0.9% | | | | | | | | |
| | |
Grupo Herdez SAB de CV (Food,
Beverage & Tobacco)† | | | 214,000 | | | | 744,319 | |
| | |
Netherlands - 2.8% | | | | | | | | |
| | |
Arcadis NV (Capital Goods)† | | | 29,000 | | | | 909,409 | |
| | |
ASM International NV (Semiconductors & Semiconductor Equipment)*† | | | 11,920 | | | | 393,537 | |
| | |
Brunel International NV (Commercial & Professional Services)† | | | 15,100 | | | | 887,235 | |
| | |
| | | | | | | 2,190,181 | |
| | |
Norway - 0.5% | | | | | | | | |
| | |
Algeta ASA (Pharmaceuticals, Biotechnology & Life Sciences)*† | | | 9,600 | | | | 381,493 | |
| | |
Poland - 1.2% | | | | | | | | |
| | |
Eurocash SA (Food & Staples Retailing)† | | | 61,000 | | | | 934,792 | |
| | |
Singapore - 4.0% | | | | | | | | |
| | |
Ezion Holdings Ltd. (Energy)† | | | 592,000 | | | | 1,066,090 | |
| | |
Goodpack Ltd. (Transportation)† | | | 299,000 | | | | 460,987 | |
| | |
Super Group Ltd. (Food, Beverage & Tobacco)† | | | 406,000 | | | | 1,375,026 | |
| | |
Tat Hong Holdings Ltd. (Capital Goods)† | | | 377,000 | | | | 283,459 | |
| | |
| | | | | | | 3,185,562 | |
| | |
South Africa - 1.8% | | | | | | | | |
| | |
Clicks Group Ltd. (Food & Staples Retailing)† | | | 115,300 | | | | 717,890 | |
| | |
Discovery Ltd. (Insurance)† | | | 83,900 | | | | 709,412 | |
| | |
| | | | | | | 1,427,302 | |
See Notes to Financial Statements
10
Harding, Loevner Funds, Inc.
International Small Companies Portfolio
Portfolio of Investments
October 31, 2013 (continued)
| | | | | | | | |
| | |
| | | Shares | | | Value | |
| COMMON STOCKS - 98.3% (continued) | | | | | | |
| | |
South Korea - 3.6% | | | | | | | | |
| | |
Binggrae Co., Ltd. (Food, Beverage & Tobacco)† | | | 3,100 | | | | $261,868 | |
| | |
Cheil Worldwide Inc. (Media)*† | | | 44,990 | | | | 1,108,968 | |
| | |
Daou Technology Inc. (Software & Services)† | | | 26,200 | | | | 359,322 | |
| | |
Halla Visteon Climate Control Corp.
(Automobiles & Components)† | | | 29,100 | | | | 1,088,796 | |
| | |
| | | | | | | 2,818,954 | |
| | |
Spain - 1.3% | | | | | | | | |
| | |
Construcciones y Auxiliar de Ferrocarriles SA
(Capital Goods)† | | | 1,992 | | | | 1,035,357 | |
| | |
Sweden - 3.4% | | | | | | | | |
| | |
Avanza Bank Holding AB (Diversified Financials)† | | | 19,400 | | | | 624,565 | |
| | |
Industrial & Financial Systems, Class B
(Software & Services)† | | | 51,000 | | | | 1,166,171 | |
| | |
Mekonomen AB (Retailing)† | | | 26,840 | | | | 885,646 | |
| | |
| | | | | | | 2,676,382 | |
| | |
Switzerland - 1.3% | | | | | | | | |
| | |
LEM Holding SA, Reg S
(Technology Hardware & Equipment)† | | | 750 | | | | 553,470 | |
| | |
Temenos Group AG, Reg S (Software & Services)*† | | | 17,740 | | | | 450,653 | |
| | |
| | | | | | | 1,004,123 | |
| | |
Taiwan - 2.7% | | | | | | | | |
| | |
Advantech Co., Ltd.
(Technology Hardware & Equipment)† | | | 172,000 | | | | 1,103,584 | |
| | |
Chipbond Technology Corp. (Semiconductors & Semiconductor Equipment)† | | | 290,000 | | | | 585,661 | |
| | |
Youngtek Electronics Corp. (Semiconductors & Semiconductor Equipment)† | | | 213,042 | | | | 426,363 | |
| | |
| | | | | | | 2,115,608 | |
| | |
Thailand - 0.7% | | | | | | | | |
| | |
Khon Kaen Sugar Industry pcl (Food,
Beverage & Tobacco)† | | | 1,464,600 | | | | 592,898 | |
| | |
Turkey - 0.5% | | | | | | | | |
| | |
Arcelik A/S (Consumer Durables & Apparel)† | | | 63,000 | | | | 400,425 | |
| | | | | | | | |
| | |
| | | Shares | | | Value | |
| COMMON STOCKS - 98.3% (continued) | | | | | | |
| | |
United Kingdom - 15.7% | | | | | | | | |
| | |
Abcam plc (Pharmaceuticals, Biotechnology &
Life Sciences)† | | | 44,157 | | | | $356,768 | |
| | |
Bank of Georgia Holdings plc (Banks)† | | | 36,300 | | | | 1,151,315 | |
| | |
Britvic plc (Food, Beverage & Tobacco)† | | | 117,484 | | | | 1,177,160 | |
| | |
Domino Printing Sciences plc (Technology Hardware & Equipment)† | | | 83,100 | | | | 920,795 | |
| | |
Imagination Technologies Group plc (Semiconductors &
Semiconductor Equipment)*† | | | 7,320 | | | | 32,691 | |
| | |
Jardine Lloyd Thompson Group plc (Insurance)† | | | 30,900 | | | | 495,142 | |
| | |
Kentz Corp., Ltd. (Capital Goods)† | | | 119,400 | | | | 1,021,932 | |
| | |
Morgan Advanced Materials plc (Capital Goods)† | | | 145,000 | | | | 708,729 | |
| | |
PayPoint plc (Commercial & Professional Services)† | | | 60,500 | | | | 1,007,248 | |
| | |
Rathbone Brothers plc (Diversified Financials)† | | | 42,830 | | | | 1,120,285 | |
| | |
Rotork plc (Capital Goods)† | | | 18,100 | | | | 828,767 | |
| | |
RPC Group plc (Materials)† | | | 147,000 | | | | 1,204,347 | |
| | |
RPS Group plc (Commercial &
Professional Services)† | | | 242,000 | | | | 1,126,353 | |
| | |
St. James’s Place plc (Insurance)† | | | 36,400 | | | | 394,514 | |
| | |
Synergy Health plc (Health Care
Equipment & Services)† | | | 53,700 | | | | 892,837 | |
| | |
| | | | | | | 12,438,883 | |
| | |
United States - 0.6% | | | | | | | | |
| | |
First Cash Financial Services Inc.
(Diversified Financials)* | | | 7,800 | | | | 471,822 | |
| | |
Total Common Stocks (Cost $62,723,473) | | | | | | | $77,727,655 | |
| | |
| | | | | | | | |
| PREFERRED STOCKS - 0.4% | | | | | | |
| | |
Germany - 0.4% | | | | | | | | |
| | |
Draegerwerk AG & Co. KGaA (Health Care Equipment & Services)† | | | 2,857 | | | | 335,420 | |
| | |
Total Preferred Stocks (Cost $198,272) | | | | | | | $335,420 | |
See Notes to Financial Statements
11
Harding, Loevner Funds, Inc.
International Small Companies Portfolio
Portfolio of Investments
October 31, 2013 (continued)
| | | | | | | | |
| | |
| | | Shares | | | Value | |
| CASH EQUIVALENT - 2.5% | | | | | | |
| | |
Northern Institutional Funds - Prime Obligations Portfolio, 0.01% (Money Market Fund) | | | 1,981,924 | | | | $1,981,924 | |
| | |
Total Cash Equivalent (Cost $1,981,924) | | | | | | | $1,981,924 | |
| | |
| | | | | | | | | |
| | |
Total Investments — 101.2% | | | | | | | | |
| | |
(Cost $64,903,669) | | | | | | | $80,044,999 | |
| | |
Liabilities Less Other Assets - (1.2)% | | | | | | | (979,710 | ) |
| | |
Net Assets — 100.0% | | | | | | | $79,065,289 | |
Summary of Abbreviations
| Reg S | Security sold outside United States without registration under the Securities Act of 1933. |
| * | Non-income producing security. |
| † | Investment categorized as level 2 security as disclosed in Note 2 of the Notes to Financial Statements. |
| | | | | |
| Industry | | Percentage of
Net Assets |
| |
Automobiles & Components | | | | 3.3 | % |
| |
Banks | | | | 2.8 | |
| |
Capital Goods | | | | 21.1 | |
| |
Commercial & Professional Services | | | | 6.6 | |
| |
Consumer Durables & Apparel | | | | 2.7 | |
| |
Consumer Services | | | | 1.4 | |
| |
Diversified Financials | | | | 4.1 | |
| |
Energy | | | | 1.4 | |
| |
Food & Staples Retailing | | | | 3.3 | |
| |
Food, Beverage & Tobacco | | | | 8.5 | |
| |
Health Care Equipment & Services | | | | 8.8 | |
| |
Household & Personal Products | | | | 1.1 | |
| |
Insurance | | | | 2.0 | |
| |
Materials | | | | 4.1 | |
| |
Media | | | | 3.7 | |
| |
Money Market Fund | | | | 2.5 | |
| |
Pharmaceuticals, Biotechnology & Life
Sciences | | | | 3.2 | |
| |
Retailing | | | | 3.5 | |
| |
Semiconductors & Semiconductor Equipment | | | | 1.8 | |
| |
Software & Services | | | | 5.6 | |
| |
Technology Hardware & Equipment | | | | 4.8 | |
| |
Telecommunication Services | | | | 3.2 | |
| |
Transportation | | | | 0.6 | |
| |
Utilities | | | | 1.1 | |
| |
| | | | | | |
Total Investments | | | | 101.2 | |
Liabilities Less Other Assets | | | | (1.2 | ) |
Net Assets | | | | 100.0 | % |
See Notes to Financial Statements
12
Harding, Loevner Funds, Inc.
Institutional Emerging Markets Portfolio
Portfolio of Investments
October 31, 2013
| | | | | | | | |
| | |
| | | Shares | | | Value | |
| COMMON STOCKS - 85.4% | | | | | | |
| | |
Brazil - 5.8% | | | | | | | | |
| | |
Banco Bradesco SA - ADR (Banks)* | | | 1,190,000 | | | | $17,159,800 | |
| | |
BM&FBovespa SA (Diversified Financials)† | | | 2,289,400 | | | | 12,907,384 | |
| | |
Natura Cosmeticos SA (Household & Personal Products)† | | | 216,700 | | | | 4,333,613 | |
| | |
Petroleo Brasileiro SA - ADR (Energy)* | | | 552,800 | | | | 9,635,304 | |
| | |
Vale SA - Sponsored ADR (Materials) | | | 1,010,000 | | | | 16,170,100 | |
| | |
| | | | | | | 60,206,201 | |
| | |
Chile - 0.8% | | | | | | | | |
| | |
Banco Santander Chile - ADR (Banks) | | | 324,300 | | | | 7,964,808 | |
| | |
China - 13.0% | | | | | | | | |
| | |
51job Inc. - ADR (Commercial & Professional Services)* | | | 179,000 | | | | 13,711,400 | |
| | |
Anhui Conch Cement Co., Ltd., Class H (Materials)† | | | 2,444,000 | | | | 8,479,228 | |
| | |
Baidu Inc. - Sponsored ADR (Software & Services)* | | | 183,100 | | | | 29,460,790 | |
| | |
China Merchants Holdings International Co., Ltd. (Transportation)† | | | 4,949,063 | | | | 17,537,438 | |
| | |
China Mobile Ltd. - Sponsored ADR (Telecommunication Services) | | | 113,300 | | | | 5,893,866 | |
| | |
CNOOC Ltd. - ADR (Energy) | | | 83,800 | | | | 16,953,578 | |
| | |
Ctrip.com International Ltd. - ADR (Retailing)* | | | 101,000 | | | | 5,479,250 | |
| | |
Golden Eagle Retail Group Ltd. (Retailing)† | | | 3,093,000 | | | | 4,631,216 | |
| | |
Jiangsu Expressway Co., Ltd., Class H (Transportation)† | | | 4,830,000 | | | | 6,083,255 | |
| | |
Tencent Holdings Ltd. (Software & Services)† | | | 430,000 | | | | 23,451,996 | |
| | |
Wumart Stores Inc., Class H (Food & Staples Retailing)† | | | 2,290,876 | | | | 3,817,893 | |
| | |
| | | | | | | 135,499,910 | |
| | |
Colombia - 0.9% | | | | | | | | |
| | |
Ecopetrol SA - Sponsored ADR (Energy) | | | 190,800 | | | | 9,036,288 | |
| | |
Czech Republic - 1.2% | | | | | | | | |
| | |
Komercni Banka A/S (Banks)† | | | 52,000 | | | | 12,897,352 | |
| | | | | | | | |
| | |
| | | Shares | | | Value | |
| COMMON STOCKS - 85.4% (continued) | | | | | | |
| | |
Hong Kong - 6.7% | | | | | | | | |
| | |
AIA Group Ltd. (Insurance)† | | | 4,582,000 | | | | $23,232,756 | |
| | |
ASM Pacific Technology Ltd. (Semiconductors & Semiconductor Equipment)† | | | 1,468,000 | �� | | | 14,166,653 | |
| | |
Sands China Ltd. (Consumer Services)† | | | 2,417,200 | | | | 17,162,079 | |
| | |
Xinyi Glass Holdings Ltd. (Automobiles & Components)† | | | 15,147,000 | | | | 14,991,701 | |
| | |
| | | | | | | 69,553,189 | |
| | |
Hungary - 1.0% | | | | | | | | |
| | |
Richter Gedeon Nyrt (Pharmaceuticals, Biotechnology & Life Sciences)† | | | 525,000 | | | | 9,969,795 | |
| | |
India - 6.2% | | | | | | | | |
| | |
Ambuja Cements Ltd. (Materials)† | | | 5,050,000 | | | | 15,377,278 | |
| | |
Axis Bank Ltd. (Banks)† | | | 546,000 | | | | 10,770,574 | |
| | |
Bajaj Auto Ltd. (Automobiles & Components)† | | | 154,500 | | | | 5,358,830 | |
| | |
Dabur India Ltd. (Household & Personal Products)† | | | 3,602,000 | | | | 10,444,740 | |
| | |
ICICI Bank Ltd. (Banks)† | | | 482,000 | | | | 8,746,557 | |
| | |
Maruti Suzuki India Ltd. (Automobiles & Components)† | | | 544,700 | | | | 14,461,087 | |
| | |
| | | | | | | 65,159,066 | |
| | |
Indonesia - 3.3% | | | | | | | | |
| | |
Astra International Tbk PT (Automobiles & Components)† | | | 12,300,000 | | | | 7,240,757 | |
| | |
Bank Rakyat Indonesia Persero Tbk PT (Banks)† | | | 17,381,000 | | | | 12,153,811 | |
| | |
Semen Indonesia Persero Tbk PT (Materials)† | | | 8,679,100 | | | | 11,024,922 | |
| | |
United Tractors Tbk PT (Capital Goods)† | | | 2,414,000 | | | | 3,741,148 | |
| | |
| | | | | | | 34,160,638 | |
| | |
Italy - 1.3% | | | | | | | | |
| | |
Tenaris SA - ADR (Energy) | | | 285,000 | | | | 13,340,850 | |
| | |
Malaysia - 0.9% | | | | | | | | |
| | |
Axiata Group Bhd. (Telecommunication Services)† | | | 4,170,400 | | | | 9,079,946 | |
| | |
Mexico - 4.0% | | | | | | | | |
| | |
Coca-Cola Femsa SAB de CV - Sponsored ADR (Food, Beverage & Tobacco) | | | 59,200 | | | | 7,195,168 | |
See Notes to Financial Statements
13
Harding, Loevner Funds, Inc.
Institutional Emerging Markets Portfolio
Portfolio of Investments
October 31, 2013 (continued)
| | | | | | | | |
| | |
| | | Shares | | | Value | |
| COMMON STOCKS - 85.4% (continued) | | | | |
| | |
Mexico - 4.0% (continued) | | | | | | | | |
| | |
Fomento Economico Mexicano SAB de CV - Sponsored ADR (Food, Beverage & Tobacco) | | | 163,500 | | | | $15,254,550 | |
| | |
Grupo Aeroportuario del Sureste SAB de CV - ADR (Transportation) | | | 92,400 | | | | 10,996,524 | |
| | |
Grupo Financiero Banorte SAB de CV, Series O (Banks)† | | | 1,352,000 | | | | 8,629,754 | |
| | |
| | | | | | | 42,075,996 | |
| | |
Netherlands - 0.6% | | | | | | | | |
| | |
Zhaikmunai LP - GDR, Reg S (Energy)† | | | 486,800 | | | | 6,333,798 | |
| | |
Nigeria - 1.6% | | | | | | | | |
| | |
Zenith Bank plc (Banks) | | | 125,000,000 | | | | 16,955,290 | |
| | |
Panama - 1.7% | | | | | | | | |
| | |
Copa Holdings SA, Class A (Transportation) | | | 118,000 | | | | 17,645,720 | |
| | |
Peru - 1.3% | | | | | | | | |
| | |
Credicorp Ltd. (Banks) | | | 99,100 | | | | 13,537,060 | |
| | |
Poland - 0.9% | | | | | | | | |
| | |
Bank Pekao SA (Banks)† | | | 157,300 | | | | 9,831,391 | |
| | |
Russia - 5.9% | | | | | | | | |
| | |
Alrosa AO (Materials)#† | | | 4,721,260 | | | | 5,312,834 | |
| | |
Gazprom OAO - Sponsored ADR (Energy)† | | | 455,000 | | | | 4,265,158 | |
| | |
Lukoil OAO - Sponsored ADR (Energy) | | | 289,000 | | | | 18,920,830 | |
| | |
Moscow Exchange MICEX-RTS OAO (Diversified Financials)#† | | | 2,549,870 | | | | 4,869,742 | |
| | |
Novolipetsk Steel OJSC - GDR, Reg S (Materials)† | | | 494,000 | | | | 8,422,895 | |
| | |
Sberbank of Russia (Banks)#† | | | 624,100 | | | | 2,000,490 | |
| | |
Sberbank of Russia - Sponsored ADR (Banks)† | | | 1,381,400 | | | | 17,631,376 | |
| | |
| | | | | | | 61,423,325 | |
| | |
South Africa - 4.9% | | | | | | | | |
| | |
Aspen Pharmacare Holdings Ltd. (Pharmaceuticals, Biotechnology & Life Sciences)† | | | 531,000 | | | | 14,771,695 | |
| | |
Discovery Ltd. (Insurance)† | | | 1,390,000 | | | | 11,753,069 | |
| | |
Impala Platinum Holdings Ltd. (Materials)† | | | 316,300 | | | | 3,811,541 | |
| | |
Naspers Ltd., Class N (Media)† | | | 141,600 | | | | 13,231,287 | |
| | | | | | | | |
| | |
| | | Shares | | | Value | |
| COMMON STOCKS - 85.4% (continued) | | | | | | |
| | |
South Africa - 4.9% (continued) | | | | | | | | |
| | |
Standard Bank Group Ltd. (Banks)† | | | 555,000 | | | | $7,042,004 | |
| | |
| | | | | | | 50,609,596 | |
| | |
South Korea - 3.7% | | | | | | | | |
| | |
Hankook Tire Co., Ltd. (Automobiles & Components)† | | | 339,432 | | | | 19,932,679 | |
| | |
Samsung Electronics Co., Ltd. - GDR, Reg S (Semiconductors & Semiconductor
Equipment)† | | | 10,400 | | | | 7,203,169 | |
| | |
Samsung Fire & Marine Insurance Co., Ltd. (Insurance)† | | | 51,100 | | | | 11,937,425 | |
| | |
| | | | | | | 39,073,273 | |
| | |
Taiwan - 9.1% | | | | | | | | |
| | |
Advantech Co., Ltd. (Technology Hardware & Equipment)† | | | 2,025,000 | | | | 12,992,777 | |
| | |
Delta Electronics Inc. (Technology Hardware & Equipment)† | | | 2,109,189 | | | | 10,944,663 | |
| | |
Hiwin Technologies Corp. (Capital Goods)† | | | 820,391 | | | | 6,476,809 | |
| | |
Hon Hai Precision Industry Co., Ltd. (Technology Hardware & Equipment)† | | | 3,798,917 | | | | 9,625,528 | |
| | |
MediaTek Inc. (Semiconductors & Semiconductor Equipment)† | | | 1,810,000 | | | | 24,741,606 | |
| | |
Taiwan Semiconductor Manufacturing Co., Ltd. (Semiconductors & Semiconductor
Equipment)† | | | 8,201,277 | | | | 30,352,306 | |
| | |
| | | | | | | 95,133,689 | |
| | |
Thailand - 1.7% | | | | | | | | |
| | |
Siam Commercial Bank pcl (Banks)† | | | 3,327,970 | | | | 17,588,789 | |
| | |
Turkey - 3.0% | | | | | | | | |
| | |
Arcelik A/S (Consumer Durables & Apparel)† | | | 3,180,000 | | | | 20,211,933 | |
| | |
Turkiye Garanti Bankasi AS (Banks)† | | | 2,703,000 | | | | 10,829,634 | |
| | |
| | | | | | | 31,041,567 | |
| | |
Ukraine - 0.4% | | | | | | | | |
| | |
MHP SA - GDR, Reg S (Food, Beverage & Tobacco)† | | | 284,000 | | | | 4,502,463 | |
| | |
United Arab Emirates - 0.8% | | | | | | | | |
| | |
Dragon Oil plc (Energy)† | | | 911,300 | | | | 8,595,807 | |
See Notes to Financial Statements
14
Harding, Loevner Funds, Inc.
Institutional Emerging Markets Portfolio
Portfolio of Investments
October 31, 2013 (continued)
| | | | | | | | |
| | |
| | | Shares | | | Value | |
| COMMON STOCKS - 85.4% (continued) | | | | |
| | |
United Kingdom - 4.7% | | | | | | | | |
| | |
Bank of Georgia Holdings plc (Banks)† | | | 257,000 | | | | $8,151,183 | |
| | |
Hikma Pharmaceuticals plc (Pharmaceuticals, Biotechnology & Life Sciences)† | | | 1,143,000 | | | | 22,007,657 | |
| | |
SABMiller plc (Food, Beverage & Tobacco)† | | | 371,400 | | | | 19,277,331 | |
| | |
| | | | | | | | 49,436,171 | |
| | |
Total Common Stocks (Cost $760,906,516) | | | | | | | $890,651,978 | |
| | |
| | | | | | | | | |
| PREFERRED STOCKS - 8.0% | | | | | | |
| | |
Brazil - 3.1% | | | | | | | | |
| | |
Cia de Bebidas das Americas - ADR (Food, Beverage & Tobacco) | | | 445,000 | | | | 16,554,000 | |
| | |
Itau Unibanco Holding SA - ADR (Banks) | | | 354,720 | | | | 5,466,235 | |
| | |
Petroleo Brasileiro SA - Sponsored ADR
(Energy)* | | | 296,200 | | | | 5,378,992 | |
| | |
Vale SA - Sponsored ADR (Materials) | | | 308,600 | | | | 4,517,904 | |
| | |
| | | | | | | 31,917,131 | |
| | |
Russia - 1.4% | | | | | | | | |
| | |
AK Transneft OAO (Energy)#† | | | 5,760 | | | | 14,700,498 | |
| | |
South Korea - 3.5% | | | | | | | | |
| | |
Samsung Electronics Co., Ltd. - GDR, Reg S (Semiconductors & Semiconductor Equipment)† | | | 77,100 | | | | 36,845,045 | |
| | |
| | | | | | | | | |
| | |
Total Preferred Stocks (Cost $69,261,655) | | | | | | | $83,462,674 | |
| | |
| | | | | | | | | |
| PARTICIPATION NOTES - 5.0% | | | | | | |
| | |
Qatar - 1.9% | | | | | | | | |
| | |
Industries Qatar QSC, Issued by HSBC Bank plc, Maturity Date 2/23/15 (Capital
Goods)^† | | | 237,830 | | | | 10,421,397 | |
| | |
Qatar National Bank, Issued by HSBC Bank plc, Maturity Date 9/12/16 (Banks)^† | | | 207,500 | | | | 9,462,912 | |
| | |
| | | | | | | 19,884,309 | |
| | | | | | | | |
| | |
| | | Shares | | | Value | |
| PARTICIPATION NOTES - 5.0% (continued) | | | | |
| | |
Saudi Arabia - 3.1% | | | | | | | | |
| | |
Etihad Etisalat Co., Issued by HSBC Bank plc, Maturity Date 12/5/14 (Telecommunication Services)^† | | | 796,500 | | | | $17,892,791 | |
| | |
Jarir Marketing Co., Issued by HSBC Bank plc, Maturity Date 5/4/15 (Commercial & Professional Services)^† | | | 225,000 | | | | 14,023,504 | |
| | |
| | | | | | | | 31,916,295 | |
| | |
Total Participation Notes (Cost $45,261,489) | | | | | | | $51,800,604 | |
| | |
| | | | | | | | | |
| CASH EQUIVALENT - 1.3% | | | | | | |
| | |
Northern Institutional Funds - Prime Obligations Portfolio, 0.01% (Money Market Fund) | | | 13,626,202 | | | | 13,626,202 | |
| | |
Total Cash Equivalent (Cost $13,626,202) | | | | | | | $13,626,202 | |
| | |
| | | | | | | | | |
| | |
Total Investments — 99.7% | | | | | | | | |
| | |
(Cost $889,055,862) | | | | | | | $1,039,541,458 | |
| | |
Other Assets Less Liabilities - 0.3% | | | | | | | 3,499,865 | |
| | |
Net Assets — 100.0% | | | | | | | $1,043,041,323 | |
Summary of Abbreviations
| ADR | American Depository Receipt. |
| GDR | Global Depository Receipt. |
| Reg S | Security sold outside United States without registration under the Securities Act of 1933. |
| # | Security valued at fair value as determined in good faith under policies and procedures established by and under the supervision of the Portfolio’s Board of Directors as disclosed in Note 2 of the Notes to Financial Statements. |
| * | Non-income producing security. |
| ^ | Security exempt from registration pursuant to Rule 144A of the Securities Act of 1933. These securities, which represent 5.0% of net assets as of October 31, 2013, are considered liquid and may be resold in transactions exempt from registration, normally to qualified buyers. |
| † | Investment categorized as level 2 security as disclosed in Note 2 of the Notes to Financial Statements. |
See Notes to Financial Statements
15
Harding, Loevner Funds, Inc.
Institutional Emerging Markets Portfolio
Portfolio of Investments
October 31, 2013 (continued)
| | | | | |
| Industry | | Percentage of
Net Assets |
| |
Automobiles & Components | | | | 5.9 | % |
| |
Banks | | | | 18.9 | |
| |
Capital Goods | | | | 2.0 | |
| |
Commercial & Professional Services | | | | 2.7 | |
| |
Consumer Durables & Apparel | | | | 1.9 | |
| |
Consumer Services | | | | 1.6 | |
| |
Diversified Financials | | | | 1.7 | |
| |
Energy | | | | 10.3 | |
| |
Food & Staples Retailing | | | | 0.4 | |
| |
Food, Beverage & Tobacco | | | | 6.0 | |
| |
Household & Personal Products | | | | 1.4 | |
| |
Insurance | | | | 4.5 | |
| |
Materials | | | | 7.0 | |
| |
Media | | | | 1.3 | |
| |
Money Market Fund | | | | 1.3 | |
| |
Pharmaceuticals, Biotechnology & Life Sciences | | | | 4.5 | |
| |
Retailing | | | | 1.0 | |
| |
Semiconductors & Semiconductor Equipment | | | | 10.9 | |
| |
Software & Services | | | | 5.1 | |
| |
Technology Hardware & Equipment | | | | 3.2 | |
| |
Telecommunication Services | | | | 3.1 | |
| |
Transportation | | | | 5.0 | |
| |
| | | | | | |
Total Investments | | | | 99.7 | |
Other Assets Less Liabilities | | | | 0.3 | |
Net Assets | | | | 100.0 | % |
See Notes to Financial Statements
16
Harding, Loevner Funds, Inc.
Emerging Markets Portfolio
Portfolio of Investments
October 31, 2013
| | | | | | | | |
| | |
| | | Shares | | | Value | |
| COMMON STOCKS - 86.3% | | | | | | |
| | |
Brazil - 5.9% | | | | | | | | |
| | |
Banco Bradesco SA - ADR (Banks)* | | | 2,434,962 | | | | $35,112,152 | |
| | |
BM&FBovespa SA (Diversified Financials)† | | | 4,605,100 | | | | 25,963,045 | |
| | |
Natura Cosmeticos SA (Household & Personal Products)† | | | 447,400 | | | | 8,947,201 | |
| | |
Petroleo Brasileiro SA - ADR (Energy)* | | | 1,028,284 | | | | 17,922,990 | |
| | |
Vale SA - Sponsored ADR (Materials) | | | 2,330,083 | | | | 37,304,629 | |
| | |
| | | | | | | 125,250,017 | |
| | |
Chile - 0.8% | | | | | | | | |
| | |
Banco Santander Chile - ADR (Banks) | | | 664,700 | | | | 16,325,032 | |
| | |
China - 13.1% | | | | | | | | |
| | |
51job Inc. - ADR (Commercial & Professional Services)* | | | 364,271 | | | | 27,903,159 | |
| | |
Anhui Conch Cement Co., Ltd., Class H (Materials)† | | | 4,885,000 | | | | 16,948,048 | |
| | |
Baidu Inc. - Sponsored ADR (Software & Services)* | | | 370,300 | | | | 59,581,270 | |
| | |
China Merchants Holdings International Co., Ltd. (Transportation)† | | | 10,107,103 | | | | 35,815,405 | |
| | |
China Mobile Ltd. - Sponsored ADR (Telecommunication Services) | | | 244,800 | | | | 12,734,496 | |
| | |
CNOOC Ltd. - ADR (Energy) | | | 170,700 | | | | 34,534,317 | |
| | |
Ctrip.com International Ltd. - ADR (Retailing)* | | | 204,000 | | | | 11,067,000 | |
| | |
Golden Eagle Retail Group Ltd. (Retailing)† | | | 6,400,000 | | | | 9,582,859 | |
| | |
Jiangsu Expressway Co., Ltd., Class H (Transportation)† | | | 9,703,000 | | | | 12,220,667 | |
| | |
Tencent Holdings Ltd. (Software & Services)† | | | 867,700 | | | | 47,323,946 | |
| | |
Wumart Stores Inc., Class H (Food & Staples Retailing)† | | | 4,943,106 | | | | 8,238,005 | |
| | |
| | | | | | | 275,949,172 | |
| | |
Colombia - 1.2% | | | | | | | | |
| | |
Ecopetrol SA - Sponsored ADR (Energy) | | | 542,300 | | | | 25,683,328 | |
| | |
Czech Republic - 1.2% | | | | | | | | |
| | |
Komercni Banka A/S (Banks)† | | | 103,300 | | | | 25,621,086 | |
| | | | | | | | |
| | |
| | | Shares | | | Value | |
| COMMON STOCKS - 86.3% (continued) | |
| | |
Hong Kong - 6.7% | | | | | | | | |
| | |
AIA Group Ltd. (Insurance)† | | | 9,217,000 | | | | $46,734,246 | |
| | |
ASM Pacific Technology Ltd. (Semiconductors & Semiconductor Equipment)† | | | 3,005,000 | | | | 28,999,178 | |
| | |
Sands China Ltd. (Consumer Services)† | | | 4,894,000 | | | | 34,747,316 | |
| | |
Xinyi Glass Holdings Ltd. (Automobiles & Components)† | | | 30,650,000 | | | | 30,335,752 | |
| | |
| | | | | | | 140,816,492 | |
| | |
Hungary - 1.0% | | | | | | | | |
| | |
Richter Gedeon Nyrt (Pharmaceuticals, Biotechnology & Life Sciences)† | | | 1,068,000 | | | | 20,281,412 | |
| | |
India - 6.3% | | | | | | | | |
| | |
Ambuja Cements Ltd. (Materials)† | | | 10,116,000 | | | | 30,803,275 | |
| | |
Axis Bank Ltd. (Banks)† | | | 1,980,700 | | | | 39,071,934 | |
| | |
Bajaj Auto Ltd. (Automobiles & Components)† | | | 312,600 | | | | 10,842,525 | |
| | |
Dabur India Ltd. (Household & Personal Products)† | | | 7,359,504 | | | | 21,340,396 | |
| | |
ICICI Bank Ltd. (Banks)† | | | 50,000 | | | | 907,319 | |
| | |
Maruti Suzuki India Ltd. (Automobiles & Components)† | | | 1,103,800 | | | | 29,304,477 | |
| | |
| | | | | | | 132,269,926 | |
| | |
Indonesia - 3.3% | | | | | | | | |
| | |
Astra International Tbk PT (Automobiles & Components)† | | | 37,600,000 | | | | 22,134,346 | |
| | |
Bank Rakyat Indonesia Persero Tbk PT (Banks)† | | | 35,858,000 | | | | 25,074,009 | |
| | |
Semen Indonesia Persero Tbk PT (Materials)† | | | 17,850,600 | �� | | | 22,675,332 | |
| | |
United Tractors Tbk PT (Capital Goods)† | | | 303,000 | | | | 469,581 | |
| | |
| | | | | | | 70,353,268 | |
| | |
Italy - 1.3% | | | | | | | | |
| | |
Tenaris SA - ADR (Energy) | | | 576,100 | | | | 26,967,241 | |
| | |
Malaysia - 0.9% | | | | | | | | |
| | |
Axiata Group Bhd. (Telecommunication Services)† | | | 8,608,800 | | | | 18,743,392 | |
| | |
Mexico - 4.0% | | | | | | | | |
| | |
Coca-Cola Femsa SAB de CV - Sponsored ADR (Food, Beverage & Tobacco) | | | 119,200 | | | | 14,487,568 | |
See Notes to Financial Statements
17
Harding, Loevner Funds, Inc.
Emerging Markets Portfolio
Portfolio of Investments
October 31, 2013 (continued)
| | | | | | | | |
| | |
| | | Shares | | | Value | |
| COMMON STOCKS - 86.3% (continued) | | | | | | |
| | |
Mexico - 4.0% (continued) | | | | | | | | |
| | |
Fomento Economico Mexicano SAB de CV - Sponsored ADR (Food, Beverage & Tobacco) | | | 329,300 | | | | $30,723,690 | |
| | |
Grupo Aeroportuario del Sureste SAB de CV - ADR (Transportation) | | | 187,298 | | | | 22,290,335 | |
| | |
Grupo Financiero Banorte SAB de CV, Series O (Banks)† | | | 2,763,640 | | | | 17,640,188 | |
| | |
| | | | | | | 85,141,781 | |
| | |
Netherlands - 0.6% | | | | | | | | |
| | |
Zhaikmunai LP - GDR, Reg S (Energy)† | | | 1,004,000 | | | | 13,063,133 | |
| | |
Nigeria - 1.6% | | | | | | | | |
| | |
Zenith Bank plc (Banks) | | | 253,222,520 | | | | 34,347,689 | |
| | |
Panama - 1.7% | | | | | | | | |
| | |
Copa Holdings SA, Class A (Transportation) | | | 239,600 | | | | 35,829,784 | |
| | |
Peru - 1.3% | | | | | | | | |
| | |
Credicorp Ltd. (Banks) | | | 199,700 | | | | 27,279,020 | |
| | |
Poland - 1.0% | | | | | | | | |
| | |
Bank Pekao SA (Banks)† | | | 323,361 | | | | 20,210,353 | |
| | |
Russia - 6.4% | | | | | | | | |
| | |
Alrosa AO (Materials)#† | | | 9,610,770 | | | | 10,814,999 | |
| | |
Gazprom OAO - Sponsored ADR (Energy)† | | | 901,270 | | | | 8,448,482 | |
| | |
Lukoil OAO - Sponsored ADR (Energy) | | | 640,094 | | | | 41,906,954 | |
| | |
Moscow Exchange MICEX-RTS OAO (Diversified Financials)#† | | | 5,253,530 | | | | 10,033,192 | |
| | |
Novolipetsk Steel OJSC - GDR, Reg S (Materials)† | | | 1,443,000 | | | | 24,603,720 | |
| | |
Sberbank of Russia - Sponsored ADR (Banks)† | | | 3,114,400 | | | | 39,750,367 | |
| | |
| | | | | | | 135,557,714 | |
| | |
South Africa - 4.5% | | | | | | | | |
| | |
Aspen Pharmacare Holdings Ltd. (Pharmaceuticals, Biotechnology & Life Sciences)† | | | 1,076,100 | | | | 29,935,632 | |
| | |
Discovery Ltd. (Insurance)† | | | 2,805,000 | | | | 23,717,525 | |
| | |
Impala Platinum Holdings Ltd. (Materials)† | | | 50,000 | | | | 602,520 | |
| | |
Naspers Ltd., Class N (Media)† | | | 288,000 | | | | 26,911,092 | |
| | | | | | | | |
| | |
| | | Shares | | | Value | |
| COMMON STOCKS - 86.3% (continued) | |
| | |
South Africa - 4.5% (continued) | | | | | | | | |
| | |
Standard Bank Group Ltd. (Banks)† | | | 1,088,070 | | | | $13,805,754 | |
| | |
| | | | | | | 94,972,523 | |
| | |
South Korea - 3.7% | | | | | | | | |
| | |
Hankook Tire Co., Ltd. (Automobiles & Components)† | | | 694,138 | | | | 40,762,303 | |
| | |
Samsung Electronics Co., Ltd. - GDR, Reg S (Semiconductors & Semiconductor Equipment)† | | | 20,780 | | | | 14,392,485 | |
| | |
Samsung Fire & Marine Insurance Co., Ltd. (Insurance)† | | | 103,000 | | | | 24,061,738 | |
| | |
| | | | | | | 79,216,526 | |
| | |
Taiwan - 9.2% | | | | | | | | |
| | |
Advantech Co., Ltd. (Technology Hardware & Equipment)† | | | 4,056,000 | | | | 26,024,050 | |
| | |
Delta Electronics Inc. (Technology Hardware & Equipment)† | | | 4,348,751 | | | | 22,565,836 | |
| | |
Hiwin Technologies Corp. (Capital Goods)† | | | 1,686,097 | | | | 13,311,370 | |
| | |
Hon Hai Precision Industry Co., Ltd. (Technology Hardware & Equipment)† | | | 7,759,931 | | | | 19,661,769 | |
| | |
MediaTek Inc. (Semiconductors & Semiconductor Equipment)† | | | 3,661,000 | | | | 50,043,658 | |
| | |
Taiwan Semiconductor Manufacturing Co., Ltd. (Semiconductors & Semiconductor Equipment)† | | | 16,677,637 | | | | 61,722,675 | |
| | |
| | | | | | | 193,329,358 | |
| | |
Thailand - 1.7% | | | | | | | | |
| | |
Siam Commercial Bank pcl (Banks)† | | | 6,769,000 | | | | 35,775,116 | |
| | |
Turkey - 3.0% | | | | | | | | |
| | |
Arcelik A/S (Consumer Durables & Apparel)† | | | 6,431,012 | | | | 40,875,216 | |
| | |
Turkiye Garanti Bankasi AS (Banks)† | | | 5,550,700 | | | | 22,239,011 | |
| | |
| | | | | | | 63,114,227 | |
| | |
Ukraine - 0.4% | | | | | | | | |
| | |
MHP SA - GDR, Reg S (Food, Beverage & Tobacco)† | | | 582,400 | | | | 9,233,219 | |
| | |
United Arab Emirates - 0.8% | | | | | | | | |
| | |
Dragon Oil plc (Energy)† | | | 1,855,000 | | | | 17,497,227 | |
See Notes to Financial Statements
18
Harding, Loevner Funds, Inc.
Emerging Markets Portfolio
Portfolio of Investments
October 31, 2013 (continued)
| | | | | | | | |
| | |
| | | Shares | | | Value | |
| COMMON STOCKS - 86.3% (continued) | |
| | |
United Kingdom - 4.7% | | | | | | | | |
| | |
Bank of Georgia Holdings plc (Banks)† | | | 514,354 | | | | $16,313,594 | |
| | |
Hikma Pharmaceuticals plc (Pharmaceuticals, Biotechnology & Life Sciences)† | | | 2,313,053 | | | | 44,536,199 | |
| | |
SABMiller plc (Food, Beverage & Tobacco)† | | | 753,900 | | | | 39,130,802 | |
| | |
| | | | | | | | 99,980,595 | |
| |
Total Common Stocks (Cost $1,324,738,039) | | | | $1,822,808,631 | |
| | |
| | | | | | | | | |
| PREFERRED STOCKS - 7.3% | | | | | | |
| | |
Brazil - 2.4% | | | | | | | | |
| | |
Cia de Bebidas das Americas - ADR (Food, Beverage & Tobacco) | | | 894,200 | | | | 33,264,240 | |
| | |
Itau Unibanco Holding SA - ADR (Banks) | | | 1,011,883 | | | | 15,593,117 | |
| | |
Petroleo Brasileiro SA - Sponsored ADR (Energy)* | | | 28,000 | | | | 508,480 | |
| | |
Vale SA - Sponsored ADR (Materials) | | | 38,000 | | | | 556,320 | |
| | |
| | | | | | | 49,922,157 | |
| | |
Russia - 1.4% | | | | | | | | |
| | |
AK Transneft OAO (Energy)#† | | | 11,650 | | | | 29,732,778 | |
| | |
South Korea - 3.5% | | | | | | | | |
| | |
Samsung Electronics Co., Ltd. - GDR, Reg S (Semiconductors & Semiconductor Equipment)† | | | 156,959 | | | | 75,008,578 | |
| |
Total Preferred Stocks (Cost $81,688,725) | | | | $154,663,513 | |
| | |
| | | | | | | | | |
| PARTICIPATION NOTES - 4.9% | | | | | | |
| | |
Qatar - 1.9% | | | | | | | | |
| | |
Industries Qatar QSC, Issued by HSBC Bank plc, Maturity Date 2/23/15
(Capital Goods)^† | | | 471,110 | | | | 20,643,419 | |
| | |
Qatar National Bank, Issued by HSBC Bank plc, Maturity Date 9/12/16 (Banks)^† | | | 414,500 | | | | 18,903,022 | |
| | |
| | | | | | | 39,546,441 | |
| | | | | | | | |
| | |
| | | Shares | | | Value | |
| PARTICIPATION NOTES - 4.9% (continued) | | | | |
| | |
Saudi Arabia - 3.0% | | | | | | | | |
| | |
Etihad Etisalat Co., Issued by HSBC Bank plc, Maturity Date 12/5/14 (Telecommunication Services)^† | | | 1,586,300 | | | | $35,635,071 | |
| | |
Jarir Marketing Co., Issued by HSBC Bank plc, Maturity Date 5/4/15 (Commercial & Professional Services)^† | | | 451,900 | | | | 28,165,429 | |
| | |
| | | | | | | | 63,800,500 | |
| |
Total Participation Notes (Cost $88,007,562) | | | | $103,346,941 | |
| | |
| | | | | | | | | |
| CASH EQUIVALENT - 1.9% | | | | | | |
| | |
Northern Institutional Funds - Prime Obligations Portfolio, 0.01% (Money Market Fund) | | | 41,085,030 | | | | 41,085,030 | |
| |
Total Cash Equivalent (Cost $41,085,030) | | | | $41,085,030 | |
| | |
| | | | | | | | | |
| | |
Total Investments — 100.4% | | | | | | | | |
| | |
(Cost $1,535,519,356) | | | | | | | $2,121,904,115 | |
| |
Liabilities Less Other Assets - (0.4)% | | | | (9,357,766 | ) |
| | |
Net Assets — 100.0% | | | | | | | $2,112,546,349 | |
Summary of Abbreviations
| ADR | American Depository Receipt. |
| GDR | Global Depository Receipt. |
| Reg S | Security sold outside United States without registration under the Securities Act of 1933. |
| # | Security valued at fair value as determined in good faith under policies and procedures established by and under the supervision of the Portfolio’s Board of Directors as disclosed in Note 2 of the Notes to Financial Statements. |
| * | Non-income producing security. |
| ^ | Security exempt from registration pursuant to Rule 144A of the Securities Act of 1933. These securities, which represent 4.9% of net assets as of October 31, 2013, are considered liquid and may be resold in transactions exempt from registration, normally to qualified buyers. |
| † | Investment categorized as level 2 security as disclosed in Note 2 of the Notes to Financial Statements. |
See Notes to Financial Statements
19
Harding, Loevner Funds, Inc.
Emerging Markets Portfolio
Portfolio of Investments
October 31, 2013 (continued)
| | | | | |
| Industry | | Percentage of
Net Assets |
| |
Automobiles and Components | | | | 6.3 | % |
| |
Banks | | | | 19.1 | |
| |
Capital Goods | | | | 1.6 | |
| |
Commercial and Professional Services | | | | 2.7 | |
| |
Consumer Durables and Apparel | | | | 1.9 | |
| |
Consumer Services | | | | 1.6 | |
| |
Diversified Financials | | | | 1.7 | |
| |
Energy | | | | 10.2 | |
| |
Food and Staples Retailing | | | | 0.4 | |
| |
Food, Beverage and Tobacco | | | | 6.0 | |
| |
Household and Personal Porducts | | | | 1.4 | |
| |
Insurance | | | | 4.5 | |
| |
Materials | | | | 6.8 | |
| |
Media | | | | 1.4 | |
| |
Money Market Fund | | | | 1.9 | |
| |
Pharmaceuticals, Biotechnology and Life Sciences | | | | 4.5 | |
| |
Retailing | | | | 1.0 | |
| |
Semiconductors and Semiconductor Equipment | | | | 10.9 | |
| |
Software and Services | | | | 5.1 | |
| |
Technology Hardware and Equipment | | | | 3.2 | |
| |
Telecommunication Services | | | | 3.2 | |
| |
Transportation | | | | 5.0 | |
| |
| | | | | | |
Total Investments | | | | 100.4 | |
Liabilities Less Other Assets | | | | (0.4 | ) |
Net Assets | | | | 100.0 | % |
See Notes to Financial Statements
20
Harding, Loevner Funds, Inc.
Frontier Emerging Markets Portfolio
Portfolio of Investments
October 31, 2013
| | | | | | | | |
| | |
| | | Shares | | | Value | |
| COMMON STOCKS - 88.1% | | | | | | |
| | |
Bangladesh - 4.8% | | | | | | | | |
| | |
Lafarge Surma Cement Ltd. (Materials)*† | | | 3,600,000 | | | | $1,432,149 | |
| | |
Olympic Industries Ltd. (Food, Beverage & Tobacco)† | | | 2,201,500 | | | | 5,825,944 | |
| | |
Power Grid Co. of Bangladesh Ltd. (Utilities)† | | | 355,640 | | | | 239,412 | |
| | |
Square Pharmaceuticals Ltd. (Pharmaceuticals, Biotechnology & Life Sciences)† | | | 2,850,008 | | | | 6,598,236 | |
| | |
| | | | | | | 14,095,741 | |
| | |
Canada - 0.9% | | | | | | | | |
| | |
Katanga Mining Ltd. (Materials)*† | | | 1,945,875 | | | | 1,026,453 | |
| | |
Petrominerales Ltd. (Energy)† | | | 150,000 | | | | 1,724,932 | |
| | |
| | | | | | | 2,751,385 | |
| | |
Colombia - 8.2% | | | | | | | | |
| | |
Bancolombia SA - Sponsored ADR (Banks) | | | 33,000 | | | | 1,852,290 | |
| | |
Cementos Argos SA - Sponsored ADR
(Materials)#† | | | 390,000 | | | | 10,294,362 | |
| | |
Ecopetrol SA - Sponsored ADR (Energy) | | | 81,000 | | | | 3,836,160 | |
| | |
Grupo de Inversiones Suramericana SA - Sponsored ADR (Diversified Financials)#† | | | 111,000 | | | | 4,399,296 | |
| | |
Grupo Odinsa SA (Capital Goods)† | | | 476,000 | | | | 2,148,144 | |
| | |
Interconexion Electrica SA ESP - ADR
(Utilities)#† | | | 13,500 | | | | 1,669,353 | |
| | |
| | | | | | | 24,199,605 | |
| | |
Croatia - 0.5% | | | | | | | | |
| | |
Ericsson Nikola Tesla (Technology Hardware & Equipment)† | | | 6,221 | | | | 1,585,424 | |
| | |
Egypt - 3.5% | | | | | | | | |
| | |
Commercial International Bank Egypt SAE
(Banks)† | | | 410,000 | | | | 2,538,580 | |
| | |
Ghabbour Auto (Automobiles & Components)† | | | 394,000 | | | | 1,715,381 | |
| | |
Global Telecom Holding, GDR (Telecommunication Services)*† | | | 550,000 | | | | 1,858,588 | |
| | |
Oriental Weavers (Consumer Durables &
Apparel)† | | | 950,000 | | | | 4,137,451 | |
| | |
| | | | | | | 10,250,000 | |
| | | | | | | | |
| | |
| | | Shares | | | Value | |
| COMMON STOCKS - 88.1% (continued) | | | | | | |
| | |
Estonia - 1.2% | | | | | | | | |
| | |
Olympic Entertainment Group AS (Consumer Services) | | | 581,700 | | | | $1,516,422 | |
| | |
Tallink Group AS (Transportation) | | | 1,600,000 | | | | 2,092,021 | |
| | |
| | | | | | | 3,608,443 | |
| | |
Ghana - 1.6% | | | | | | | | |
| | |
Ghana Commercial Bank Ltd. (Banks) | | | 2,150,049 | | | | 4,842,453 | |
| | |
Indonesia - 0.7% | | | | | | | | |
| | |
Bank Rakyat Indonesia Persero Tbk PT (Banks)† | | | 2,999,980 | | | | 2,097,761 | |
| | |
Jordan - 0.7% | | | | | | | | |
| | |
Arab Bank plc (Banks)† | | | 182,250 | | | | 1,962,604 | |
| | |
Kazakhstan - 1.7% | | | | | | | | |
| | |
Halyk Savings Bank of Kazakhstan JSC - GDR, Reg S (Banks)† | | | 600,000 | | | | 4,919,272 | |
| | |
Kenya - 6.7% | | | | | | | | |
| | |
East African Breweries Ltd. (Food, Beverage & Tobacco)† | | | 1,025,000 | | | | 3,831,438 | |
| | |
Equity Bank Ltd. (Banks)† | | | 19,000,000 | | | | 7,857,068 | |
| | |
Nation Media Group Ltd. (Media)† | | | 723,040 | | | | 2,704,299 | |
| | |
Safaricom Ltd. (Telecommunication Services)† | | | 48,500,000 | | | | 5,370,409 | |
| | |
| | | | | | | 19,763,214 | |
| | |
Lebanon - 0.5% | | | | | | | | |
| | |
Banque Audi sal- Audi Saradar Group - GDR, Reg S (Banks)† | | | 210,000 | | | | 1,417,500 | |
| | |
Mauritius - 0.5% | | | | | | | | |
| | |
Mauritius Commercial Bank (Banks) | | | 197,280 | | | | 1,332,132 | |
| | |
Morocco - 1.0% | | | | | | | | |
| | |
Douja Promotion Groupe Addoha SA (Real Estate)† | | | 400,000 | | | | 2,846,113 | |
| | |
Netherlands - 0.9% | | | | | | | | |
| | |
Zhaikmunai LP - GDR, Reg S (Energy)† | | | 198,500 | | | | 2,582,701 | |
| | |
Nigeria - 12.9% | | | | | | | | |
| | |
Access Bank plc (Banks) | | | 37,000,000 | | | | 2,257,746 | |
| | |
Dangote Cement plc (Materials) | | | 5,950,000 | | | | 7,119,018 | |
| | |
Diamond Bank plc (Banks)* | | | 32,705,992 | | | | 1,369,615 | |
| | |
FBN Holdings plc (Banks) | | | 79,000,000 | | | | 8,059,194 | |
See Notes to Financial Statements
21
Harding, Loevner Funds, Inc.
Frontier Emerging Markets Portfolio
Portfolio of Investments
October 31, 2013 (continued)
| | | | | | | | |
| | |
| | | Shares | | | Value | |
| COMMON STOCKS - 88.1% (continued) | | | | | | |
| | |
Nigeria - 12.9% (continued) | | | | | | | | |
| | |
Guaranty Trust Bank plc (Banks) | | | 35,500,000 | | | | $5,655,856 | |
| | |
Intercontinental Wapic Insurance plc (Insurance)* | | | 7,895,516 | | | | 44,748 | |
| | |
Lafarge Cement WAPCO Nigeria plc (Materials) | | | 4,781,000 | | | | 3,071,221 | |
| | |
Nigerian Breweries plc (Food, Beverage & Tobacco) | | | 2,736,000 | | | | 3,015,113 | |
| | |
UAC of Nigeria plc (Capital Goods) | | | 17,300,000 | | | | 7,190,176 | |
| | |
| | | | | | | 37,782,687 | |
| | |
Pakistan - 4.2% | | | | | | | | |
| | |
Engro Corp., Ltd. (Materials)*† | | | 6,399,992 | | | | 7,594,857 | |
| | |
Pakistan Petroleum Ltd. (Energy)† | | | 2,399,997 | | | | 4,590,467 | |
| | |
| | | | | | | 12,185,324 | |
| | |
Peru - 7.0% | | | | | | | | |
| | |
Alicorp SAA, Class C (Food, Beverage & Tobacco)† | | | 2,355,000 | | | | 7,346,105 | |
| | |
Credicorp Ltd. (Banks) | | | 52,000 | | | | 7,103,200 | |
| | |
Ferreycorp SAA (Capital Goods)† | | | 1,182,011 | | | | 771,525 | |
| | |
Union Andina de Cementos SAA (Materials)† | | | 4,000,000 | | | | 5,221,781 | |
| | |
| | | | | | | 20,442,611 | |
| | |
Philippines - 9.0% | | | | | | | | |
| | |
Bank of the Philippine Islands (Banks)† | | | 3,750,000 | | | | 8,678,729 | |
| | |
International Container Terminal Services Inc. (Transportation)† | | | 1,375,000 | | | | 3,313,443 | |
| | |
Philippine Long Distance Telephone Co. - Sponsored ADR (Telecommunication Services) | | | 61,000 | | | | 4,035,150 | |
| | |
Universal Robina Corp. (Food, Beverage & Tobacco)† | | | 3,550,000 | | | | 10,510,694 | |
| | |
| | | | | | | 26,538,016 | |
| | |
Poland - 0.3% | | | | | | | | |
| | |
Kernel Holding SA (Food, Beverage &
Tobacco)*† | | | 60,000 | | | | 808,591 | |
| | |
Qatar - 5.3% | | | | | | | | |
| | |
Commercial Bank of Qatar QSC (Banks)† | | | 155,000 | | | | 2,822,088 | |
| | |
Industries Qatar QSC (Capital Goods)† | | | 99,500 | | | | 4,360,560 | |
| | |
Qatar Electricity & Water Co. (Utilities)† | | | 33,000 | | | | 1,441,642 | |
| | | | | | | | |
| | |
| | | Shares | | | Value | |
| COMMON STOCKS - 88.1% (continued) | | | | | | |
| | |
Qatar - 5.3% (continued) | | | | | | | | |
| | |
Qatar National Bank SAQ (Banks)† | | | 150,000 | | | | $6,842,903 | |
| | |
| | | | | | | 15,467,193 | |
| | |
Senegal - 1.3% | | | | | | | | |
| | |
Sonatel (Telecommunication Services) | | | 100,000 | | | | 3,853,075 | |
| | |
Slovenia - 1.5% | | | | | | | | |
| | |
Krka dd Novo mesto (Pharmaceuticals, Biotechnology & Life Sciences)† | | | 55,574 | | | | 4,294,523 | |
| | |
Sri Lanka - 2.3% | | | | | | | | |
| | |
Commercial Bank of Ceylon plc (Banks)† | | | 6,096,449 | | | | 5,505,622 | |
| | |
John Keells Holdings plc (Capital Goods)† | | | 784,615 | | | | 1,340,289 | |
| | |
| | | | | | | 6,845,911 | |
| | |
Thailand - 1.9% | | | | | | | | |
| | |
Home Product Center pcl (Retailing)† | | | 7,299,747 | | | | 2,720,549 | |
| | |
Siam Commercial Bank pcl (Banks)† | | | 550,000 | | | | 2,906,827 | |
| | |
| | | | | | | 5,627,376 | |
| | |
Trinidad & Tobago - 1.2% | | | | | | | | |
| | |
Neal & Massy Holdings Ltd. (Capital Goods) | | | 180,000 | | | | 1,615,794 | |
| | |
Republic Bank Ltd. (Banks) | | | 109,000 | | | | 1,907,840 | |
| | |
| | | | | | | 3,523,634 | |
| | |
Ukraine - 0.4% | | | | | | | | |
| | |
MHP SA - GDR, Reg S (Food, Beverage & Tobacco)† | | | 80,000 | | | | 1,268,299 | |
| | |
United Arab Emirates - 4.2% | | | | | | | | |
| | |
Agthia Group PJSC (Food, Beverage & Tobacco)† | | | 2,086,198 | | | | 2,316,027 | |
| | |
DP World Ltd. (Transportation) | | | 70,000 | | | | 1,183,000 | |
| | |
DP World Ltd. (London Stock Exchange) (Transportation)#† | | | 130,000 | | | | 2,197,000 | |
| | |
Dragon Oil plc (Energy)† | | | 225,000 | | | | 2,122,305 | |
| | |
Dubai Financial Market (Diversified Financials)*† | | | 6,900,000 | | | | 4,368,378 | |
| | |
| | | | | | | 12,186,710 | |
| | |
United Kingdom - 1.0% | | | | | | | | |
| | |
Ferrexpo plc (Materials)† | | | 200,000 | | | | 582,116 | |
See Notes to Financial Statements
22
Harding, Loevner Funds, Inc.
Frontier Emerging Markets Portfolio
Portfolio of Investments
October 31, 2013 (continued)
| | | | | | | | |
| | |
| | | Shares | | | Value | |
| COMMON STOCKS - 88.1% (continued) | | | | | | |
| | |
United Kingdom - 1.0% (continued) | | | | | | | | |
| | |
Hikma Pharmaceuticals plc (Pharmaceuticals, Biotechnology & Life Sciences)† | | | 114,000 | | | | $2,194,989 | |
| | |
Kazakhmys plc (Materials)† | | | 44,220 | | | | 186,328 | |
| | |
| | | | | | | 2,963,433 | |
| | |
Vietnam - 2.2% | | | | | | | | |
| | |
Hoa Phat Group JSC (Materials)† | | | 1,585,000 | | | | 2,798,454 | |
| | |
Petrovietnam Fertilizer & Chemical JSC (Materials)† | | | 1,900,000 | | | | 3,764,557 | |
| | |
| | | | | | | | 6,563,011 | |
| | |
Total Common Stocks (Cost $234,952,011) | | | | | | | $258,604,742 | |
| | |
| | | | | | | | |
| PARTICIPATION NOTES - 8.0% | | | | | | |
| | |
Kuwait - 1.9% | | | | | | | | |
| | |
Kuwait Projects Co. Holdings, Issued by HSBC Bank plc, Maturity Date 1/16/15 (Diversified Financials)^† | | | 1,349,655 | | | | 2,917,398 | |
| | |
National Bank of Kuwait, Issued by Deutsche Bank AG, Maturity Date 3/28/18 (Banks)^† | | | 839,345 | | | | 2,706,604 | |
| | |
| | | | | | | | 5,624,002 | |
| | |
Saudi Arabia - 6.1% | | | | | | | | |
| | |
Almarai Co., Ltd., Issued by HSBC Bank plc, Maturity Date 11/24/14 (Food, Beverage & Tobacco)^† | | | 197,000 | | | | 2,941,553 | |
| | |
Etihad Etisalat Co., Issued by HSBC Bank plc, Maturity Date 12/5/14 (Telecommunication Services)^† | | | 140,000 | | | | 3,144,998 | |
| | |
Jarir Marketing Co., Issued by HSBC Bank plc, Maturity Date 5/4/15 (Commercial & Professional Services)^† | | | 189,200 | | | | 11,792,209 | |
| | |
| | | | | | | | 17,878,760 | |
| | |
| | | | | | | | | |
| | |
Total Participation Notes (Cost $19,618,476) | | | | | | | $23,502,762 | |
| | | | | | | | |
| | |
| | | Number of Warrants | | | Value | |
| WARRANTS - 0.0% | | | | | | |
| | |
Sri Lanka - 0.0% | | | | | | | | |
| | |
John Keells Holdings plc, Expires 11/11/2016 (Capital Goods)*† | | | 34,871 | | | | $7,619 | |
| | |
John Keells Holdings plc, Expires 11/12/2015 (Capital Goods)*† | | | 34,871 | | | | 10,283 | |
| | |
| | | | | | | | 17,902 | |
| | |
Total Warrants (Cost $—) | | | | | | | 17,902 | |
| | |
| | | Shares | | | | |
| CASH EQUIVALENT - 4.3% | | | | | | |
| | |
Northern Institutional Funds - Prime Obligations Portfolio, 0.01% (Money Market Fund) | | | 12,518,155 | | | | $12,518,155 | |
| | |
Total Cash Equivalent (Cost $12,518,155) | | | | | | | $12,518,155 | |
| | |
| | | | | | | | | |
| | |
Total Investments — 100.4% | | | | | | | | |
| | |
(Cost $267,088,642) | | | | | | | $294,643,561 | |
| | |
Liabilities Less Other Assets - (0.4)% | | | | | | | (1,151,888 | ) |
| | |
Net Assets — 100.0% | | | | | | | $293,491,673 | |
Summary of Abbreviations
| ADR | American Depository Receipt. |
| GDR | Global Depository Receipt. |
| Reg S | Security sold outside United States without registration under the Securities Act of 1933. |
| # | Security valued at fair value as determined in good faith under policies and procedures established by and under the supervision of the Portfolio’s Board of Directors as disclosed in Note 2 of the Notes to Financial Statements. |
| * | Non-income producing security. |
| ^ | Security exempt from registration pursuant to Rule 144A of the Securities Act of 1933. These securities, which represent 8.0% of net assets as of October 31, 2013, are considered liquid and may be resold in transactions exempt from registration, normally to qualified buyers. |
| † | Investment categorized as level 2 security as disclosed in Note 2 of the Notes to Financial Statements. |
See Notes to Financial Statements
23
Harding, Loevner Funds, Inc.
Frontier Emerging Markets Portfolio
Portfolio of Investments
October 31, 2013 (continued)
| | | | | |
| Industry | | Percentage of
Net Assets |
| |
Automobiles and Components | | | | 0.6 | % |
| |
Banks | | | | 28.9 | |
| |
Capital Goods | | | | 5.9 | |
| |
Commercial and Professional Services | | | | 4.0 | |
| |
Consumer Durables and Apparel | | | | 1.4 | |
| |
Consumer Services | | | | 0.5 | |
| |
Diversified Financials | | | | 4.0 | |
| |
Energy | | | | 5.1 | |
| |
Food, Beverage and Tobacco | | | | 12.9 | |
| |
Insurance | | | | 0.0 | * |
| |
Materials | | | | 14.7 | |
| |
Media | | | | 0.9 | |
| |
Money Market Fund | | | | 4.3 | |
| |
Pharmaceuticals, Biotechnology and Life
Sciences | | | | 4.5 | |
| |
Real Estate | | | | 1.0 | |
| |
Retailing | | | | 0.9 | |
| |
Technology Hardware and Equipment | | | | 0.5 | |
| |
Telecommunication Services | | | | 6.2 | |
| |
Transportation | | | | 3.0 | |
| |
Utilities | | | | 1.1 | |
| |
| | | | | | |
Total Investments | | | | 100.4 | |
Liabilities Less Other Assets | | | | (0.4 | ) |
Net Assets | | | | 100.0 | % |
| * | Percentage of Net Assets rounds to less than 0.01. |
See Notes to Financial Statements
24
Harding, Loevner Funds, Inc.
Statements of Assets and Liabilities
October 31, 2013
| | | | | | | | | | | | |
| | | Global Equity Portfolio | | | International Equity Portfolio | | | International Small Companies Portfolio | |
ASSETS: | | | | | | | | | | | | |
Investments (cost $499,337,751, $3,161,409,792 and $64,903,669, respectively) | | | $629,746,495 | | | | $3,912,991,606 | | | | $80,044,999 | |
Dividends and interest receivable | | | 559,660 | | | | 2,776,901 | | | | 71,712 | |
Foreign currency (cost $2,660, $17,109 and $11,870, respectively) | | | 3,070 | | | | 17,533 | | | | 11,949 | |
Receivable for investments sold | | | 308,584 | | | | — | | | | — | |
Receivable for Fund shares sold | | | 37,421 | | | | 3,382,014 | | | | 81,502 | |
Tax reclaim receivable | | | 189,145 | | | | 3,536,751 | | | | 102,842 | |
Prepaid expenses | | | 13,479 | | | | 22,274 | | | | 25,083 | |
Total Assets | | | 630,857,854 | | | | 3,922,727,079 | | | | 80,338,087 | |
LIABILITIES: | | | | | | | | | | | | |
Payable to Investment Adviser | | | (443,497 | ) | | | (2,366,973 | ) | | | (81,806 | ) |
Payable for investments purchased | | | — | | | | (37,253,176 | ) | | | (1,052,566 | ) |
Payable for Fund shares redeemed | | | (43,153 | ) | | | (4,168,551 | ) | | | (51,637 | ) |
Payable for distribution fees | | | — | | | | (304,292 | ) | | | (11,283 | ) |
Other liabilities | | | (195,898 | ) | | | (1,106,171 | ) | | | (75,506 | ) |
Total Liabilities | | | (682,548 | ) | | | (45,199,163 | ) | | | (1,272,798 | ) |
Net Assets | | | $630,175,306 | | | | $3,877,527,916 | | | | $79,065,289 | |
ANALYSIS OF NET ASSETS: | | | | | | | | | | | | |
Paid in capital | | | $497,380,196 | | | | $3,128,638,003 | | | | $59,532,481 | |
Accumulated undistributed net investment income | | | 2,688,130 | | | | 29,706,785 | | | | 311,925 | |
Accumulated net realized gain (loss) from investment transactions | | | (311,338 | ) | | | (32,460,779 | ) | | | 4,077,446 | |
Net unrealized appreciation on investments and on assets and liabilities denominated in foreign currencies | | | 130,418,318 | | | | 751,643,907 | | | | 15,143,437 | |
Net Assets | | | $630,175,306 | | | | $3,877,527,916 | | | | $79,065,289 | |
Net Assets: | | | | | | | | | | | | |
Institutional Class | | | $543,292,873 | | | | $3,467,793,253 | | | | $26,235,560 | |
Investor Class | | | — | | | | 409,734,663 | | | | 52,829,729 | |
Advisor Class | | | 86,882,433 | | | | — | | | | — | |
Total Shares Outstanding: | | | | | | | | | | | | |
Institutional Class (200,000,000, 200,000,000 and 200,000,000, respectively, $.001 par value shares authorized) | | | 18,205,764 | | | | 192,983,288 | | | | 1,812,607 | |
Investor Class ( — , 200,000,000 and 200,000,000, respectively, $.001 par value shares authorized) | | | — | | | | 22,900,716 | | | | 3,656,644 | |
Advisor Class (200,000,000, — and — , respectively, $.001 par value shares authorized) | | | 2,915,788 | | | | — | | | | — | |
Net Asset Value, Offering Price and Redemption Price Per Share: | | | | | | | | | | | | |
Institutional Class | | | $29.84 | | | | $17.97 | | | | $14.47 | |
Investor Class | | | — | | | | 17.89 | | | | 14.45 | |
Advisor Class | | | 29.80 | | | | — | | | | — | |
See Notes to Financial Statements
25
Harding, Loevner Funds, Inc.
Statements of Assets and Liabilities (continued)
October 31, 2013
| | | | | | | | | | | | |
| | | Institutional Emerging Markets Portfolio | | | Emerging Markets Portfolio | | | Frontier Emerging Markets Portfolio | |
ASSETS: | | | | | | | | | | | | |
Investments (cost $889,055,862, $1,535,519,356 and $267,088,642, respectively) | | | $1,039,541,458 | | | | $2,121,904,115 | | | | $294,643,561 | |
Dividends and interest receivable | | | 1,168,482 | | | | 2,316,833 | | | | 377,833 | |
Foreign currency (cost $115,626, $1,040,272 and $375,411, respectively) | | | 116,137 | | | | 1,041,283 | | | | 374,854 | |
Receivable for investments sold | | | 232,911 | | | | 457,117 | | | | 413,268 | |
Receivable for Fund shares sold | | | 7,183,970 | | | | 1,880,777 | | | | 1,837,283 | |
Tax reclaim receivable | | | 148,817 | | | | 362,673 | | | | 8,439 | |
Prepaid expenses | | | 74,480 | | | | 13,177 | | | | 3,273 | |
Total Assets | | | 1,048,466,255 | | | | 2,127,975,975 | | | | 297,658,511 | |
LIABILITIES: | | | | | | | | | | | | |
Payable to Investment Adviser | | | (990,457 | ) | | | (2,013,205 | ) | | | (356,442 | ) |
Payable for investments purchased | | | (1,658,758 | ) | | | (10,997,377 | ) | | | (3,394,809 | ) |
Payable for Fund shares redeemed | | | (2,083,770 | ) | | | (1,131,283 | ) | | | (82,311 | ) |
Payable for distribution fees | | | — | | | | — | | | | (4,294 | ) |
Payable for capital gains tax | | | (346,694 | ) | | | — | | | | (177,212 | ) |
Other liabilities | | | (345,253 | ) | | | (1,287,761 | ) | | | (151,770 | ) |
Total Liabilities | | | (5,424,932 | ) | | | (15,429,626 | ) | | | (4,166,838 | ) |
Net Assets | | | $1,043,041,323 | | | | $2,112,546,349 | | | | $293,491,673 | |
ANALYSIS OF NET ASSETS: | | | | | | | | | | | | |
Paid in capital | | | $938,229,507 | | | | $1,466,579,979 | | | | $279,981,464 | |
Accumulated undistributed net investment income | | | 7,649,054 | | | | 14,910,876 | | | | 343,686 | |
Accumulated net realized gain (loss) from investment transactions | | | (52,981,366 | ) | | | 44,668,793 | | | | (14,210,944 | ) |
Net unrealized appreciation on investments and on assets and liabilities denominated in foreign currencies | | | 150,144,128 | | | | 586,386,701 | | | | 27,377,467 | |
Net Assets | | | $1,043,041,323 | | | | $2,112,546,349 | | | | $293,491,673 | |
Net Assets: | | | | | | | | | | | | |
Institutional Class | | | $1,043,041,323 | | | | $— | | | | $271,728,184 | |
Investor Class | | | — | | | | — | | | | 21,763,489 | |
Advisor Class | | | — | | | | 2,112,546,349 | | | | — | |
Total Shares Outstanding: | | | | | | | | | | | | |
Institutional Class (450,000,000, — and 200,000,000, respectively, $.001 par value shares authorized) | | | 57,723,178 | | | | — | | | | 32,132,466 | |
Investor Class ( — , — and 200,000,000, respectively, $.001 par value shares authorized) | | | — | | | | — | | | | 2,591,928 | |
Advisor Class ( — , 250,000,000 and — , respectively, $.001 par value shares authorized) | | | — | | | | 41,621,950 | | | | — | |
Net Asset Value, Offering Price and Redemption Price Per Share: | | | | | | | | | | | | |
Institutional Class | | | $18.07 | | | | $— | | | | $8.46 | |
Investor Class | | | — | | | | — | | | | 8.40 | |
Advisor Class | | | — | | | | 50.76 | | | | — | |
See Notes to Financial Statements
26
Harding, Loevner Funds, Inc.
Statements of Operations
For the Fiscal Year Ended October 31, 2013
| | | | | | | | | | | | |
| | | Global Equity Portfolio | | | International Equity Portfolio | | | International Small Companies Portfolio | |
INVESTMENT INCOME | | | | | | | | | | | | |
Dividends (net of foreign withholding taxes of $374,538, $6,641,847 and $125,420, respectively) | | | $7,932,349 | | | | $57,548,165 | | | | $1,412,865 | |
Total investment income | | | 7,932,349 | | | | 57,548,165 | | | | 1,412,865 | |
| | | | |
EXPENSES | | | | | | | | | | | | |
Investment advisory fees (Note 3) | | | 4,435,125 | | | | 21,935,944 | | | | 836,711 | |
Administration fees (Note 3) | | | 181,272 | | | | 788,622 | | | | 26,775 | |
Distribution fees, Investor Class | | | — | | | | 899,293 | | | | 107,256 | |
Custody and accounting fees (Note 3) | | | 112,795 | | | | 638,626 | | | | 58,575 | |
Directors’ fees and expenses (Note 3) | | | 32,329 | | | | 189,903 | | | | 4,365 | |
Transfer agent fees and expenses (Note 3) | | | 51,103 | | | | 444,715 | | | | 47,130 | |
Printing and postage fees | | | 34,757 | | | | 322,168 | | | | 13,122 | |
State registration filing fees | | | 57,118 | | | | 179,854 | | | | 42,700 | |
Professional fees | | | 62,235 | | | | 207,879 | | | | 33,841 | |
Shareholder servicing fees (Note 3) | | | 219,556 | | | | 1,332,854 | | | | 67,556 | |
Chief compliance and financial officers’ fees and expenses (Note 3) | | | 27,066 | | | | 108,063 | | | | 12,737 | |
Other fees and expenses | | | 23,557 | | | | 102,024 | | | | 7,899 | |
Total Expenses | | | 5,236,913 | | | | 27,149,945 | | | | 1,258,667 | |
Less Waiver of investment advisory fee and/or reimbursement of other operating expenses (Note 3) | | | (196,575 | ) | | | — | | | | (236,947 | ) |
Net expenses | | | 5,040,338 | | | | 27,149,945 | | | | 1,021,720 | |
Net investment income | | | 2,892,011 | | | | 30,398,220 | | | | 391,145 | |
REALIZED AND UNREALIZED GAIN (LOSS) | | | | | | | | | | | | |
Net realized gain (loss) | | | | | | | | | | | | |
Investment transactions | | | 2,575,749 | | | | (7,839,880 | ) | | | 4,932,554 | |
Foreign currency transactions | | | (22,542 | ) | | | (691,390 | ) | | | (5,183 | ) |
Net realized gain (loss) | | | 2,553,207 | | | | (8,531,270 | ) | | | 4,927,371 | |
Change in unrealized appreciation (depreciation) | | | | | | | | | | | | |
Investments | | | 85,021,385 | | | | 528,855,492 | | | | 11,914,089 | |
Translation of assets and liabilities denominated in foreign currencies | | | 9,085 | | | | 119,791 | | | | 3,598 | |
Net change in unrealized appreciation | | | 85,030,470 | | | | 528,975,283 | | | | 11,917,687 | |
Net realized and unrealized gain | | | 87,583,677 | | | | 520,444,013 | | | | 16,845,058 | |
| | | | |
NET INCREASE IN NET ASSETS RESULTING FROM OPERATIONS | | | $90,475,688 | | | | $550,842,233 | | | | $17,236,203 | |
See Notes to Financial Statements
27
Harding, Loevner Funds, Inc.
Statements of Operations (continued)
For the Fiscal Year Ended October 31, 2013
| | | | | | | | | | | | |
| | | Institutional Emerging Markets Portfolio | | | Emerging Markets Portfolio | | | Frontier Emerging Markets Portfolio | |
INVESTMENT INCOME | | | | | | | | | | | | |
Interest | | | $168 | | | | $— | | | | $— | |
Dividends (net of foreign withholding taxes of $1,678,633, $4,145,903 and $289,403, respectively) | | | 17,431,172 | | | | 42,709,319 | | | | 3,881,995 | |
Total investment income | | | 17,431,340 | | | | 42,709,319 | | | | 3,881,995 | |
| | | | |
EXPENSES | | | | | | | | | | | | |
Investment advisory fees (Note 3) | | | 8,521,418 | | | | 21,268,390 | | | | 2,117,192 | |
Administration fees (Note 3) | | | 246,482 | | | | 535,901 | | | | 56,252 | |
Distribution fees, Investor Class | | | — | | | | — | | | | 22,531 | |
Custody and accounting fees (Note 3) | | | 360,049 | | | | 792,460 | | | | 223,423 | |
Directors’ fees and expenses (Note 3) | | | 46,830 | | | | 120,219 | | | | 8,733 | |
Transfer agent fees and expenses (Note 3) | | | 62,227 | | | | 136,860 | | | | 46,101 | |
Printing and postage fees | | | 59,342 | | | | 294,379 | | | | 8,219 | |
State registration filing fees | | | 69,125 | | | | 50,396 | | | | 46,824 | |
Professional fees | | | 101,066 | | | | 170,849 | | | | 35,323 | |
Shareholder servicing fees (Note 3) | | | 315,213 | | | | 3,729,276 | | | | 30,323 | |
Chief compliance and financial officers’ fees and expenses (Note 3) | | | 34,404 | | | | 72,270 | | | | 14,891 | |
Other fees and expenses | | | 33,181 | | | | 82,909 | | | | 10,951 | |
Total Expenses | | | 9,849,337 | | | | 27,253,909 | | | | 2,620,763 | |
Less Waiver of investment advisory fee and/or reimbursement of other operating expenses (Note 3) | | | (257,255 | ) | | | — | | | | (34,840 | ) |
Net expenses | | | 9,592,082 | | | | 27,253,909 | | | | 2,585,923 | |
Net investment income | | | 7,839,258 | | | | 15,455,410 | | | | 1,296,072 | |
REALIZED AND UNREALIZED GAIN (LOSS) | | | | | | | | | | | | |
Net realized gain (loss) | | | | | | | | | | | | |
Investment transactions | | | 4,514,676 | | | | 54,469,578 | | | | 972,907 | |
Foreign currency transactions | | | (189,279 | ) | | | (544,534 | ) | | | (487,150 | ) |
Net realized gain | | | 4,325,397 | | | | 53,925,044 | | | | 485,757 | |
Change in unrealized appreciation (depreciation)
Investments (net of increase in deferred foreign taxes of $27,383, $ — and $183,779, respectively) | | | 63,511,030 | | | | 111,063,223 | | | | 21,865,016 | |
Translation of assets and liabilities denominated in foreign currencies | | | 1,376 | | | | 16,546 | | | | 7,250 | |
Net change in unrealized appreciation | | | 63,512,406 | | | | 111,079,769 | | | | 21,872,266 | |
Net realized and unrealized gain | | | 67,837,803 | | | | 165,004,813 | | | | 22,358,023 | |
| | | | |
NET INCREASE IN NET ASSETS RESULTING FROM OPERATIONS | | | $75,677,061 | | | | $180,460,223 | | | | $23,654,095 | |
See Notes to Financial Statements
28
Harding, Loevner Funds, Inc.
Statements of Changes in Net Assets
For the Fiscal Years Ended October 31,
| | | | | | | | | | | | | | | | |
| | | Global Equity Portfolio | | | International Equity Portfolio | |
| | | 2013 | | | 2012 | | | 2013 | | | 2012 | |
INCREASE (DECREASE) IN NET ASSETS FROM OPERATIONS | | | | | | | | | | | | | | | | |
Net investment income | | | $2,892,011 | | | | $1,629,540 | | | | $30,398,220 | | | | $18,972,162 | |
Net realized gain (loss) on investments and foreign currency transactions | | | 2,553,207 | | | | (809,441 | ) | | | (8,531,270 | ) | | | (22,077,854 | ) |
Net change in unrealized appreciation on investments and translation of assets and liabilities denominated in foreign currencies | | | 85,030,470 | | | | 19,717,412 | | | | 528,975,283 | | | | 152,130,512 | |
Net increase in net assets resulting from operations | | | 90,475,688 | | | | 20,537,511 | | | | 550,842,233 | | | | 149,024,820 | |
DISTRIBUTIONS TO SHAREHOLDERS FROM: | | | | | | | | | | | | | | | | |
Net investment income | | | | | | | | | | | | | | | | |
Institutional Class | | | (1,591,084 | ) | | | (684,027 | ) | | | (16,845,737 | ) | | | (8,435,017 | ) |
Investor Class | | | — | | | | — | | | | (1,676,084 | ) | | | (893,072 | ) |
Advisor Class | | | (131,246 | ) | | | (113,542 | ) | | | — | | | | — | |
Net realized gain from investments and foreign-currency related transactions | | | | | | | | | | | | | | | | |
Institutional Class | | | — | | | | (1,537,528 | ) | | | — | | | | (2,613,516 | ) |
Investor Class | | | — | | | | — | | | | — | | | | (520,125 | ) |
Advisor Class | | | — | | | | (545,744 | ) | | | — | | | | — | |
Total distributions to shareholders | | | (1,722,330 | ) | | | (2,880,841 | ) | | | (18,521,821 | ) | | | (12,461,730 | ) |
TRANSACTIONS IN SHARES OF COMMON STOCK(1) | | | | | | | | | | | | | | | | |
Proceeds from sale of shares | | | | | | | | | | | | | | | | |
Institutional Class | | | 316,739,231 | | | | 91,670,031 | | | | 1,562,569,374 | | | | 939,709,934 | |
Investor Class | | | — | | | | — | | | | 179,403,001 | | | | 138,691,379 | |
Advisor Class | | | 30,063,834 | | | | 20,087,287 | | | | — | | | | — | |
Net Asset Value of shares issued to shareholders upon reinvestment of dividends | | | | | | | | | | | | | | | | |
Institutional Class | | | 1,242,112 | | | | 1,833,323 | | | | 14,398,899 | | | | 9,656,302 | |
Investor Class | | | — | | | | — | | | | 1,574,749 | | | | 1,342,486 | |
Advisor Class | | | 127,851 | | | | 642,691 | | | | — | | | | — | |
Cost of shares redeemed | | | | | | | | | | | | | | | | |
Institutional Class | | | (76,276,493 | ) | | | (27,679,098 | ) | | | (380,238,872 | ) | | | (240,099,456 | ) |
Investor Class | | | — | | | | — | | | | (106,907,598 | ) | | | (118,088,105 | ) |
Advisor Class | | | (25,712,784 | ) | | | (14,401,252 | ) | | | — | | | | — | |
Net increase in net assets from portfolio share transactions | | | 246,183,751 | | | | 72,152,982 | | | | 1,270,799,553 | | | | 731,212,540 | |
NET INCREASE IN NET ASSETS | | | 334,937,109 | | | | 89,809,652 | | | | 1,803,119,965 | | | | 867,775,630 | |
NET ASSETS | | | | | | | | | | | | | | | | |
At beginning of year | | | 295,238,197 | | | | 205,428,545 | | | | 2,074,407,951 | | | | 1,206,632,321 | |
At end of year | | $ | 630,175,306 | | | $ | 295,238,197 | | | $ | 3,877,527,916 | | | $ | 2,074,407,951 | |
Accumulated Undistributed Net Investment Income Included in Net Assets | | | $2,688,130 | | | | $1,540,991 | | | | $29,706,785 | | | | $18,521,821 | |
| | | | |
(1) CAPITAL SHARE TRANSACTIONS: | | | | | | | | | | | | | | | | |
INSTITUTIONAL CLASS: | | | | | | | | | | | | | | | | |
Shares sold | | | 11,930,709 | | | | 3,808,905 | | | | 96,482,008 | | | | 65,948,571 | |
Shares issued upon reinvestment of dividends | | | 47,536 | | | | 85,389 | | | | 900,485 | | | | 756,763 | |
Shares redeemed | | | (2,813,589 | ) | | | (1,144,945 | ) | | | (23,141,347 | ) | | | (16,871,394 | ) |
Net increase | | | 9,164,656 | | | | 2,749,349 | | | | 74,241,146 | | | | 49,833,940 | |
INVESTOR CLASS: | | | | | | | | | | | | | | | | |
Shares sold | | | — | | | | — | | | | 11,060,209 | | | | 9,719,567 | |
Shares issued upon reinvestment of dividends | | | — | | | | — | | | | 98,609 | | | | 105,293 | |
Shares redeemed | | | — | | | | — | | | | (6,511,173 | ) | | | (8,527,692 | ) |
Net increase | | | — | | | | — | | | | 4,647,645 | | | | 1,297,168 | |
ADVISOR CLASS: | | | | | | | | | | | | | | | | |
Shares sold | | | 1,104,091 | | | | 821,759 | | | | — | | | | — | |
Shares issued upon reinvestment of dividends | | | 4,889 | | | | 29,907 | | | | — | | | | — | |
Shares redeemed | | | (941,434 | ) | | | (599,801 | ) | | | — | | | | — | |
Net increase | | | 167,546 | | | | 251,865 | | | | — | | | | — | |
See Notes to Financial Statements
29
Harding, Loevner Funds, Inc.
Statements of Changes in Net Assets (continued)
For the Fiscal Years Ended October 31,
| | | | | | | | | | | | | | | | |
| | | International Small Companies
Portfolio | | | Institutional Emerging Markets
Portfolio | |
| | | 2013 | | | 2012 | | | 2013 | | | 2012 | |
INCREASE (DECREASE) IN NET ASSETS FROM OPERATIONS | | | | | | | | | | | | | | | | |
Net investment income | | | $391,145 | | | | $697,132 | | | | $7,839,258 | | | | $3,857,752 | |
Net realized gain (loss) on investments and foreign currency transactions | | | 4,927,371 | | | | (676,293 | ) | | | 4,325,397 | | | | (3,131,394 | ) |
Net change in unrealized appreciation on investments and translation of assets and liabilities denominated in foreign currencies | | | 11,917,687 | | | | 5,307,656 | | | | 63,512,406 | | | | 42,302,018 | |
Net increase in net assets resulting from operations | | | 17,236,203 | | | | 5,328,495 | | | | 75,677,061 | | | | 43,028,376 | |
DISTRIBUTIONS TO SHAREHOLDERS FROM: | | | | | | | | | | | | | | | | |
Net investment income | | | | | | | | | | | | | | | | |
Institutional Class | | | (431,876 | ) | | | (161,662 | ) | | | (3,683,658 | ) | | | (3,430,979 | ) |
Investor Class | | | (308,126 | ) | | | (173,171 | ) | | | — | | | | — | |
Total distributions to shareholders | | | (740,002 | ) | | | (334,833 | ) | | | (3,683,658 | ) | | | (3,430,979 | ) |
TRANSACTIONS IN SHARES OF COMMON STOCK(1) | | | | | | | | | | | | | | | | |
Proceeds from sale of shares | | | | | | | | | | | | | | | | |
Institutional Class | | | 19,148,813 | | | | 17,978,898 | | | | 592,090,064 | | | | 207,655,743 | |
Investor Class | | | 28,307,070 | | | | 9,292,966 | | | | — | | | | — | |
Net Asset Value of shares issued to shareholders upon reinvestment of dividends | | | | | | | | | | | | | | | | |
Institutional Class | | | 365,536 | | | | 130,766 | | | | 2,741,282 | | | | 2,570,787 | |
Investor Class | | | 289,745 | | | | 160,271 | | | | — | | | | — | |
Cost of shares redeemed | | | | | | | | | | | | | | | | |
Institutional Class | | | (33,508,188 | ) | | | (1,377,923 | ) | | | (87,574,548 | ) | | | (114,745,402 | ) |
Investor Class | | | (16,798,202 | ) | | | (10,555,598 | ) | | | — | | | | — | |
Net Increase (Decrease) in Net Assets from Portfolio Share Transactions | | | (2,195,226 | ) | | | 15,629,380 | | | | 507,256,798 | | | | 95,481,128 | |
NET INCREASE IN NET ASSETS | | | 14,300,975 | | | | 20,623,042 | | | | 579,250,201 | | | | 135,078,525 | |
NET ASSETS | | | | | | | | | | | | | | | | |
At beginning of year | | | 64,764,314 | | | | 44,141,272 | | | | 463,791,122 | | | | 328,712,597 | |
At end of year | | $ | 79,065,289 | | | $ | 64,764,314 | | | $ | 1,043,041,323 | | | $ | 463,791,122 | |
Accumulated Undistributed Net Investment Income Included in Net Assets | | | $311,925 | | | | $665,965 | | | | $7,649,054 | | | | $3,682,733 | |
| | | | |
(1) CAPITAL SHARE TRANSACTIONS: | | | | | | | | | | | | | | | | |
INSTITUTIONAL CLASS: | | | | | | | | | | | | | | | | |
Shares sold | | | 1,481,881 | | | | 1,709,827 | | | | 34,724,731 | | | | 13,500,583 | |
Shares issued upon reinvestment of dividends | | | 30,847 | | | | 13,956 | | | | 160,028 | | | | 187,375 | |
Shares redeemed | | | (2,627,617 | ) | | | (126,321 | ) | | | (5,164,882 | ) | | | (7,495,123 | ) |
Net increase (decrease) | | | (1,114,889 | ) | | | 1,597,462 | | | | 29,719,877 | | | | 6,192,835 | |
INVESTOR CLASS: | | | | | | | | | | | | | | | | |
Shares sold | | | 2,186,667 | | | | 865,151 | | | | — | | | | — | |
Shares issued upon reinvestment of dividends | | | 24,430 | | | | 17,086 | | | | — | | | | — | |
Shares redeemed | | | (1,288,802 | ) | | | (1,014,994 | ) | | | — | | | | — | |
Net increase (decrease) | | | 922,295 | | | | (132,757 | ) | | | — | | | | — | |
See Notes to Financial Statements
30
Harding, Loevner Funds, Inc.
Statements of Changes in Net Assets (continued)
For the Fiscal Years Ended October 31,
| | | | | | | | | | | | | | | | |
| | | Emerging Markets
Portfolio | | | Frontier Emerging Markets
Portfolio | |
| | | 2013 | | | 2012 | | | 2013 | | | 2012 | |
INCREASE (DECREASE) IN NET ASSETS FROM OPERATIONS | | | | | | | | | | | | | | | | |
Net investment income | | | $15,455,410 | | | | $12,882,971 | | | | $1,296,072 | | | | $816,301 | |
Net realized gain (loss) on investments and foreign currency transactions | | | 53,925,044 | | | | 115,357,788 | | | | 485,757 | | | | (8,819,090 | ) |
Net change in unrealized appreciation on investments and translation of assets and liabilities denominated in foreign currencies | | | 111,079,769 | | | | 29,566,114 | | | | 21,872,266 | | | | 13,940,915 | |
Net increase in net assets resulting from operations | | | 180,460,223 | | | | 157,806,873 | | | | 23,654,095 | | | | 5,938,126 | |
DISTRIBUTIONS TO SHAREHOLDERS FROM: | | | | | | | | | | | | | | | | |
Net investment income | | | | | | | | | | | | | | | | |
Institutional Class | | | — | | | | — | | | | (962,492 | ) | | | (485,460 | ) |
Investor Class | | | — | �� | | | — | | | | (28,617 | ) | | | (4,494 | ) |
Advisor Class | | | (12,078,855 | ) | | | (12,198,687 | ) | | | — | | | | — | |
Net realized gain from investments and foreign-currency related transactions | | | | | | | | | | | | | | | | |
Advisor Class | | | (106,392,227 | ) | | | — | | | | — | | | | — | |
Total distributions to shareholders | | | (118,471,082 | ) | | | (12,198,687 | ) | | | (991,109 | ) | | | (489,954 | ) |
TRANSACTIONS IN SHARES OF COMMON STOCK(1) | | | | | | | | | | | | | | | | |
Proceeds from sale of shares | | | | | | | | | | | | | | | | |
Institutional Class | | | — | | | | — | | | | 181,207,514 | | | | 33,921,678 | |
Investor Class | | | — | | | | — | | | | 20,443,912 | | | | 2,377,451 | |
Advisor Class | | | 725,399,472 | | | | 316,743,964 | | | | — | | | | — | |
Net Asset Value of shares issued to shareholders upon reinvestment of dividends | | | | | | | | | | | | | | | | |
Institutional Class | | | — | | | | — | | | | 764,097 | | | | 413,499 | |
Investor Class | | | — | | | | — | | | | 27,866 | | | | 4,370 | |
Advisor Class | | | 108,806,723 | | | | 11,171,687 | | | | — | | | | — | |
Cost of shares redeemed | | | | | | | | | | | | | | | | |
Institutional Class | | | — | | | | — | | | | (13,347,232 | ) | | | (59,727,689 | ) |
Investor Class | | | — | | | | — | | | | (2,838,124 | ) | | | (757,740 | ) |
Advisor Class | | | (498,717,246 | ) | | | (452,106,063 | ) | | | — | | | | — | |
Net Increase (Decrease) in Net Assets from Portfolio Share Transactions | | | 335,488,949 | | | | (124,190,412 | ) | | | 186,258,033 | | | | (23,768,431 | ) |
NET INCREASE (DECREASE) IN NET ASSETS | | | 397,478,090 | | | | 21,417,774 | | | | 208,921,019 | | | | (18,320,259 | ) |
NET ASSETS | | | | | | | | | | | | | | | | |
At beginning of year | | | 1,715,068,259 | | | | 1,693,650,485 | | | | 84,570,654 | | | | 102,890,913 | |
At end of year | | $ | 2,112,546,349 | | | $ | 1,715,068,259 | | | $ | 293,491,673 | | | $ | 84,570,654 | |
Accumulated Undistributed Net Investment Income Included in Net Assets | | | $14,910,876 | | | | $12,078,855 | | | | $343,686 | | | | $516,655 | |
| | | | |
(1) CAPITAL SHARE TRANSACTIONS: | | | | | | | | | | | | | | | | |
INSTITUTIONAL CLASS: | | | | | | | | | | | | | | | | |
Shares sold | | | — | | | | — | | | | 22,269,797 | | | | 5,166,058 | |
Shares issued upon reinvestment of dividends | | | — | | | | — | | | | 104,958 | | | | 67,787 | |
Shares redeemed | | | — | | | | — | | | | (1,703,055 | ) | | | (9,250,325 | ) |
Net increase (decrease) | | | — | | | | — | | | | 20,671,700 | | | | (4,016,480 | ) |
INVESTOR CLASS: | | | | | | | | | | | | | | | | |
Shares sold | | | — | | | | — | | | | 2,531,639 | | | | 353,056 | |
Shares issued upon reinvestment of dividends | | | — | | | | — | | | | 3,843 | | | | 719 | |
Shares redeemed | | | — | | | | — | | | | (367,459 | ) | | | (116,978 | ) |
Net increase | | | — | | | | — | | | | 2,168,023 | | | | 236,797 | |
ADVISOR CLASS: | | | | | | | | | | | | | | | | |
Shares sold | | | 15,073,331 | | | | 6,805,184 | | | | — | | | | — | |
Shares issued upon reinvestment of dividends | | | 2,261,619 | | | | 272,549 | | | | — | | | | — | |
Shares redeemed | | | (10,335,755 | ) | | | (9,945,806 | ) | | | — | | | | — | |
Net increase (decrease) | | | 6,999,195 | | | | (2,868,073 | ) | | | — | | | | — | |
See Notes to Financial Statements
31
Harding, Loevner Funds, Inc.
Financial Highlights
| | | | | | | | | | | | | | | | |
| | | | |
| Global Equity Portfolio — Institutional Class | | | | | | | | | | | | |
| Per Share Data | | For the Year
Ended
Oct. 31, 2013 | | | For the Year
Ended
Oct. 31, 2012 | | | For the Year
Ended
Oct. 31, 2011 | | | For the Period Ended Oct. 31, 2010(1) | |
Net asset value, beginning of period | | | $25.05 | | | | $23.38 | | | | $23.52 | | | | $20.43 | |
INCREASE IN NET ASSETS FROM OPERATIONS: | | | | | | | | | | | | | | | | |
Net investment income | | | 0.17 | (2) | | | 0.18 | (2) | | | 0.12 | (2) | | | 0.10 | |
Net realized and unrealized gain (loss) on investments and foreign currency-related transactions | | | 4.74 | | | | 1.81 | | | | (0.04 | ) | | | 3.04 | |
Net increase from investment operations | | | 4.91 | | | | 1.99 | | | | 0.08 | | | | 3.14 | |
DISTRIBUTIONS TO SHAREHOLDERS FROM: | | | | | | | | | | | | | | | | |
Net investment income | | | (0.12 | ) | | | (0.10 | ) | | | (0.06 | ) | | | (0.05 | ) |
Net realized gain from investments | | | — | | | | (0.22 | ) | | | (0.16 | ) | | | — | |
Total distributions | | | (0.12 | ) | | | (0.32 | ) | | | (0.22 | ) | | | (0.05 | ) |
Net asset value, end of period | | | $29.84 | | | | $25.05 | | | | $23.38 | | | | $23.52 | |
Total Return | | | 19.66 | % | | | 8.73 | % | | | 0.27 | % | | | 15.39 | %(A) |
RATIOS/SUPPLEMENTAL DATA: | | | | | | | | | | | | | | | | |
Net assets, end of period (000’s) | | | $543,293 | | | | $226,489 | | | | $147,108 | | | | $104,276 | |
Expenses to average net assets | | | 0.99 | % | | | 1.12 | % | | | 1.16 | % | | | 1.27 | %(B) |
Expenses to average net assets (net of fees waived/reimbursed) | | | 0.95 | % | | | 0.95 | % | | | 1.00 | % | | | 1.00 | %(B) |
Net investment income to average net assets | | | 0.62 | % | | | 0.72 | % | | | 0.48 | % | | | 0.43 | %(B) |
Portfolio turnover rate | | | 13 | % | | | 32 | % | | | 40 | % | | | 35 | %(A) |
| (1) | For the period from November 3, 2009 (commencement of class operations) through October 31, 2010. |
| (2) | Net investment income per share was calculated using the average shares outstanding method. |
| | | | | | | | | | | | | | | | | | | | |
| | | | | |
| Global Equity Portfolio — Advisor Class | | | | | | | | | | | | | | | |
| Per Share Data | | For the Year
Ended
Oct. 31, 2013 | | | For the Year
Ended
Oct. 31, 2012 | | | For the Year
Ended
Oct. 31, 2011 | | | For the Year
Ended
Oct. 31, 2010 | | | For the Year
Ended
Oct. 31, 2009 | |
Net asset value, beginning of year | | | $25.02 | | | | $23.36 | | | | $23.48 | | | | $20.27 | | | | $15.92 | |
INCREASE IN NET ASSETS FROM OPERATIONS: | | | | | | | | | | | | | | | | | | | | |
Net investment income | | | 0.09 | (1) | | | 0.11 | (1) | | | 0.07 | (1) | | | 0.10 | | | | 0.06 | |
Net realized and unrealized gain (loss) on investments and foreign currency-related transactions | | | 4.74 | | | | 1.82 | | | | (0.02 | ) | | | 3.15 | | | | 4.38 | |
Net increase from investment operations | | | 4.83 | | | | 1.93 | | | | 0.05 | | | | 3.25 | | | | 4.44 | |
DISTRIBUTIONS TO SHAREHOLDERS FROM: | | | | | | | | | | | | | | | | | | | | |
Net investment income | | | (0.05 | ) | | | (0.05 | ) | | | (0.01 | ) | | | (0.04 | ) | | | (0.09 | ) |
Net realized gain from investments | | | — | | | | (0.22 | ) | | | (0.16 | ) | | | — | | | | — | |
Total distributions | | | (0.05 | ) | | | (0.27 | ) | | | (0.17 | ) | | | (0.04 | ) | | | (0.09 | ) |
Net asset value, end of year | | | $29.80 | | | | $25.02 | | | | $23.36 | | | | $23.48 | | | | $20.27 | |
Total Return | | | 19.33 | % | | | 8.43 | % | | | 0.18 | % | | | 16.07 | % | | | 28.05 | % |
RATIOS/SUPPLEMENTAL DATA: | | | | | | | | | | | | | | | | | | | | |
Net assets, end of year (000’s) | | | $86,882 | | | | $68,749 | | | | $58,320 | | | | $46,450 | | | | $66,810 | |
Expenses to average net assets | | | 1.25 | % | | | 1.35 | % | | | 1.30 | % | | | 1.41 | % | | | 1.63 | % |
Expenses to average net assets (net of fees waived/reimbursed) | | | 1.24 | % | | | 1.23 | % | | | 1.18 | % | | | 1.17 | % | | | 1.25 | % |
Net investment income to average net assets | | | 0.32 | % | | | 0.45 | % | | | 0.31 | % | | | 0.31 | % | | | 0.43 | % |
Portfolio turnover rate | | | 13 | % | | | 32 | % | | | 40 | % | | | 35 | % | | | 31 | % |
| (1) | Net investment income per share was calculated using the average shares outstanding method. |
See Notes to Financial Statements
32
Harding, Loevner Funds, Inc.
Financial Highlights (continued)
| | | | | | | | | | | | | | | | | | | | |
| | | | | |
| International Equity Portfolio — Institutional Class | | | | | | | | | | | | | | | |
| Per Share Data | | For the Year
Ended
Oct. 31, 2013 | | | For the Year
Ended
Oct. 31, 2012 | | | For the Year
Ended
Oct. 31, 2011 | | | For the Year
Ended
Oct. 31, 2010 | | | For the Year
Ended
Oct. 31, 2009 | |
Net asset value, beginning of year | | | $15.15 | | | | $14.06 | | | | $14.51 | | | | $12.04 | | | | $11.44 | |
INCREASE (DECREASE) IN NET ASSETS FROM OPERATIONS: | | | | | | | | | | | | | | | | | | | | |
Net investment income | | | 0.17 | (1) | | | 0.18 | (1) | | | 0.17 | (1) | | | 0.08 | | | | 0.13 | |
Net realized and unrealized gain (loss) on investments and foreign currency-related transactions | | | 2.78 | | | | 1.06 | | | | (0.56 | ) | | | 2.49 | | | | 2.86 | |
Net increase (decrease) from investment operations | | | 2.95 | | | | 1.24 | | | | (0.39 | ) | | | 2.57 | | | | 2.99 | |
DISTRIBUTIONS TO SHAREHOLDERS FROM: | | | | | | | | | | | | | | | | | | | | |
Net investment income | | | (0.13 | ) | | | (0.11 | ) | | | (0.06 | ) | | | (0.10 | ) | | | (0.19 | ) |
Net realized gain from investments | | | — | | | | (0.04 | ) | | | — | | | | — | | | | (2.20 | ) |
Total distributions | | | (0.13 | ) | | | (0.15 | ) | | | (0.06 | ) | | | (0.10 | ) | | | (2.39 | ) |
Net asset value, end of year | | | $17.97 | | | | $15.15 | | | | $14.06 | | | | $14.51 | | | | $12.04 | |
Total Return | | | 19.58 | % | | | 9.00 | % | | | (2.72 | )% | | | 21.50 | % | | | 32.77 | % |
RATIOS/SUPPLEMENTAL DATA: | | | | | | | | | | | | | | | | | | | | |
Net assets, end of year (000’s) | | | $3,467,793 | | | | $1,798,940 | | | | $969,139 | | | | $493,350 | | | | $259,450 | |
Expenses to average net assets | | | 0.87 | % | | | 0.87 | % | | | 0.86 | % | | | 0.93 | % | | | 1.04 | % |
Expenses to average net assets (net of fees waived/reimbursed) | | | 0.87 | % | | | 0.87 | % | | | 0.86 | % | | | 0.93 | % | | | 1.00 | % |
Net investment income to average net assets | | | 1.06 | % | | | 1.26 | % | | | 1.13 | % | | | 0.91 | % | | | 1.31 | % |
Portfolio turnover rate | | | 20 | % | | | 14 | % | | | 15 | % | | | 33 | % | | | 22 | % |
| (1) | Net investment income per share was calculated using the average shares outstanding method. |
| | | | | | | | | | | | | | | | | | | | |
| | | | | |
| International Equity Portfolio — Investor Class | | | | | | | | | | | | | | | |
| Per Share Data | | For the Year
Ended
Oct. 31, 2013 | | | For the Year
Ended
Oct. 31, 2012 | | | For the Year
Ended
Oct. 31, 2011 | | | For the Year
Ended
Oct. 31, 2010 | | | For the Year
Ended
Oct. 31, 2009 | |
Net asset value, beginning of year | | | $15.09 | | | | $14.01 | | | | $14.47 | | | | $12.02 | | | | $11.41 | |
INCREASE (DECREASE) IN NET ASSETS FROM OPERATIONS: | | | | | | | | | | | | | | | | | | | | |
Net investment income | | | 0.12 | (1) | | | 0.12 | (1) | | | 0.12 | (1) | | | 0.09 | | | | 0.13 | |
Net realized and unrealized gain (loss) on investments and foreign currency-related transactions | | | 2.77 | | | | 1.06 | | | | (0.56 | ) | | | 2.44 | | | | 2.83 | |
Net increase (decrease) from investment operations | | | 2.89 | | | | 1.18 | | | | (0.44 | ) | | | 2.53 | | | | 2.96 | |
DISTRIBUTIONS TO SHAREHOLDERS FROM: | | | | | | | | | | | | | | | | | | | | |
Net investment income | | | (0.09 | ) | | | (0.06 | ) | | | (0.02 | ) | | | (0.08 | ) | | | (0.15 | ) |
Net realized gain from investments | | | — | | | | (0.04 | ) | | | — | | | | — | | | | (2.20 | ) |
Total distributions | | | (0.09 | ) | | | (0.10 | ) | | | (0.02 | ) | | | (0.08 | ) | | | (2.35 | ) |
Net asset value, end of year | | | $17.89 | | | | $15.09 | | | | $14.01 | | | | $14.47 | | | | $12.02 | |
Total Return | | | 19.19 | % | | | 8.51 | % | | | (3.02 | )% | | | 21.18 | % | | | 32.48 | % |
RATIOS/SUPPLEMENTAL DATA: | | | | | | | | | | | | | | | | | | | | |
Net assets, end of year (000’s) | | | $409,735 | | | | $275,468 | | | | $237,494 | | | | $116,465 | | | | $38,134 | |
Expenses to average net assets | | | 1.20 | % | | | 1.24 | % | | | 1.26 | % | | | 1.32 | % | | | 1.39 | % |
Expenses to average net assets (net of fees waived/reimbursed) | | | 1.20 | % | | | 1.24 | % | | | 1.25 | % | | | 1.25 | % | | | 1.25 | % |
Net investment income to average net assets | | | 0.76 | % | | | 0.87 | % | | | 0.79 | % | | | 0.69 | % | | | 1.03 | % |
Portfolio turnover rate | | | 20 | % | | | 14 | % | | | 15 | % | | | 33 | % | | | 22 | % |
| (1) | Net investment income per share was calculated using the average shares outstanding method. |
See Notes to Financial Statements
33
Harding, Loevner Funds, Inc.
Financial Highlights (continued)
| | | | | | | | | | | | |
| | | |
| International Small Companies Portfolio — Institutional Class | | | | | | | | | |
| Per Share Data | | For the Year
Ended
Oct. 31, 2013 | | | For the Year
Ended
Oct. 31, 2012 | | | For the Period
Ended
Oct. 31, 2011(1) | |
Net asset value, beginning of period | | | $11.45 | | | | $10.53 | | | | $12.28 | |
INCREASE (DECREASE) IN NET ASSETS FROM OPERATIONS: | | | | | | | | | | | | |
Net investment income | | | 0.07 | (2) | | | 0.16 | (2) | | | 0.03 | (2) |
Net realized and unrealized gain (loss) on investments and foreign currency-related transactions | | | 3.09 | | | | 0.85 | | | | (1.78 | ) |
Net increase (decrease) from investment operations | | | 3.16 | | | | 1.01 | | | | (1.75 | ) |
DISTRIBUTIONS TO SHAREHOLDERS FROM: | | | | | | | | | | | | |
Net investment income | | | (0.14 | ) | | | (0.09 | ) | | | — | |
Total distributions | | | (0.14 | ) | | | (0.09 | ) | | | — | |
Net asset value, end of period | | | $14.47 | | | | $11.45 | | | | $10.53 | |
Total Return | | | 27.88 | % | | | 9.74 | % | | | (14.25 | )%(A) |
RATIOS/SUPPLEMENTAL DATA: | | | | | | | | | | | | |
Net assets, end of period (000’s) | | | $26,236 | | | | $33,515 | | | | $14,000 | |
Expenses to average net assets | | | 1.68 | % | | | 1.64 | % | | | 2.70 | %(B) |
Expenses to average net assets (net of fees waived/reimbursed) | | | 1.39 | % | | | 1.50 | % | | | 1.50 | %(B) |
Net investment income to average net assets | | | 0.57 | % | | | 1.49 | % | | | 0.89 | %(B) |
Portfolio turnover rate | | | 97 | % | | | 10 | % | | | 12 | %(A) |
| (1) | For the period from June 30, 2011 (commencement of class operations) through October 31, 2011. |
| (2) | Net investment income per share was calculated using the average shares outstanding method. |
| | | | | | | | | | | | | | | | | | | | |
| | | | | |
| International Small Companies Portfolio — Investor Class | | | | | | | | | | | | | | | |
| Per Share Data | | For the Year
Ended
Oct. 31, 2013 | | | For the Year
Ended
Oct. 31, 2012 | | | For the Year
Ended
Oct. 31, 2011 | | | For the Year
Ended
Oct. 31, 2010 | | | For the Year
Ended
Oct. 31, 2009 | |
Net asset value, beginning of year | | | $11.43 | | | | $10.51 | | | | $10.82 | | | | $8.92 | | | | $5.53 | |
INCREASE (DECREASE) IN NET ASSETS FROM | | | | | | | | | | | | | | | | | | | | |
OPERATIONS: | | | | | | | | | | | | | | | | | | | | |
Net investment income | | | 0.08 | (1) | | | 0.11 | (1) | | | 0.15 | (1) | | | 0.05 | | | | 0.06 | |
Net realized and unrealized gain (loss) on investments and foreign currency-related transactions | | | 3.05 | | | | 0.88 | | | | (0.43 | ) | | | 1.90 | | | | 3.40 | |
Net increase (decrease) from investment operations | | | 3.13 | | | | 0.99 | | | | (0.28 | ) | | | 1.95 | | | | 3.46 | |
DISTRIBUTIONS TO SHAREHOLDERS FROM: | | | | | | | | | | | | | | | | | | | | |
Net investment income | | | (0.11 | ) | | | (0.07 | ) | | | (0.03 | ) | | | (0.05 | ) | | | (0.07 | ) |
Total distributions | | | (0.11 | ) | | | (0.07 | ) | | | (0.03 | ) | | | (0.05 | ) | | | (0.07 | ) |
Net asset value, end of year | | | $14.45 | | | | $11.43 | | | | $10.51 | | | | $10.82 | | | | $8.92 | |
Total Return | | | 27.63 | % | | | 9.51 | % | | | (2.67 | )% | | | 21.93 | % | | | 63.47 | % |
RATIOS/SUPPLEMENTAL DATA: | | | | | | | | | | | | | | | | | | | | |
Net assets, end of year (000’s) | | | $52,830 | | | | $31,249 | | | | $30,142 | | | | $13,972 | | | | $6,215 | |
Expenses to average net assets | | | 1.99 | % | | | 2.02 | % | | | 2.15 | % | | | 3.14 | % | | | 5.21 | % |
Expenses to average net assets (net of fees waived/reimbursed) | | | 1.60 | % | | | 1.75 | % | | | 1.75 | % | | | 1.75 | % | | | 1.75 | % |
Net investment income to average net assets | | | 0.60 | % | | | 1.07 | % | | | 1.29 | % | | | 0.76 | % | | | 1.04 | % |
Portfolio turnover rate | | | 97 | % | | | 10 | % | | | 12 | % | | | 11 | % | | | 24 | % |
| (1) | Net investment income per share was calculated using the average shares outstanding method. |
See Notes to Financial Statements
34
Harding, Loevner Funds, Inc.
Financial Highlights (continued)
| | | | | | | | | | | | | | | | | | | | |
| | | | | |
| Institutional Emerging Markets Portfolio | | | | | | | | | | | | | | | |
| Per Share Data | | For the Year
Ended
Oct. 31, 2013 | | | For the Year
Ended
Oct. 31, 2012 | | | For the Year
Ended
Oct. 31, 2011 | | | For the Year
Ended
Oct. 31, 2010 | | | For the Year
Ended
Oct. 31, 2009 | |
Net asset value, beginning of year | | | $16.56 | | | | $15.07 | | | | $16.70 | | | | $13.29 | | | | $9.29 | |
INCREASE (DECREASE) IN NET ASSETS FROM | | | | | | | | | | | | | | | | | | | | |
OPERATIONS: | | | | | | | | | | | | | | | | | | | | |
Net investment income | | | 0.18 | (1) | | | 0.16 | (1) | | | 0.15 | (1) | | | 0.09 | | | | 0.10 | |
Net realized and unrealized gain (loss) on investments and foreign currency-related transactions | | | 1.45 | | | | 1.49 | | | | (1.74 | ) | | | 3.41 | | | | 4.27 | |
Net increase (decrease) from investment operations | | | 1.63 | | | | 1.65 | | | | (1.59 | ) | | | 3.50 | | | | 4.37 | |
DISTRIBUTIONS TO SHAREHOLDERS FROM: | | | | | | | | | | | | | | | | | | | | |
Net investment income | | | (0.12 | ) | | | (0.16 | ) | | | (0.04 | ) | | | (0.09 | ) | | | (0.37 | ) |
Total distributions | | | (0.12 | ) | | | (0.16 | ) | | | (0.04 | ) | | | (0.09 | ) | | | (0.37 | ) |
Net asset value, end of year | | | $18.07 | | | | $16.56 | | | | $15.07 | | | | $16.70 | | | | $13.29 | |
Total Return | | | 9.85 | % | | | 11.17 | % | | | (9.58 | )% | | | 26.50 | % | | | 48.92 | % |
RATIOS/SUPPLEMENTAL DATA: | | | | | | | | | | | | | | | | | | | | |
Net assets, end of year(000’s) | | | $1,043,041 | | | | $463,791 | | | | $328,713 | | | | $375,374 | | | | $203,548 | |
Expenses to average net assets | | | 1.33 | % | | | 1.36 | % | | | 1.39 | % | | | 1.48 | % | | | 1.55 | % |
Expenses to average net assets (net of fees waived/reimbursed) | | | 1.30 | % | | | 1.30 | % | | | 1.30 | % | | | 1.30 | % | | | 1.30 | % |
Net investment income to average net assets | | | 1.06 | % | | | 1.00 | % | | | 0.93 | % | | | 0.74 | % | | | 0.93 | % |
Portfolio turnover rate | | | 18 | % | | | 42 | % | | | 53 | % | | | 34 | % | | | 57 | % |
| (1) | Net investment income per share was calculated using the average shares outstanding method. |
| | | | | | | | | | | | | | | | | | | | |
| | | | | |
| Emerging Markets Portfolio — Advisor Class | | | | | | | | | | | | | | | |
| Per Share Data | | For the Year
Ended
Oct. 31, 2013 | | | For the Year
Ended
Oct. 31, 2012 | | | For the Year
Ended
Oct. 31, 2011 | | | For the Year
Ended
Oct. 31, 2010 | | | For the Year
Ended
Oct. 31, 2009 | |
Net asset value, beginning of year | | | $49.54 | | | | $45.18 | | | | $50.09 | | | | $39.64 | | | | $27.73 | |
INCREASE (DECREASE) IN NET ASSETS FROM | | | | | | | | | | | | | | | | | | | | |
OPERATIONS: | | | | | | | | | | | | | | | | | | | | |
Net investment income | | | 0.40 | (1) | | | 0.37 | (1) | | | 0.31 | (1) | | | 0.25 | | | | 0.26 | |
Net realized and unrealized gain (loss) on investments and foreign currency-related transactions | | | 4.33 | | | | 4.34 | | | | (5.02 | ) | | | 10.33 | | | | 12.68 | |
Net increase (decrease) from investment operations | | | 4.73 | | | | 4.71 | | | | (4.71 | ) | | | 10.58 | | | | 12.94 | |
DISTRIBUTIONS TO SHAREHOLDERS FROM: | | | | | | | | | | | | | | | | | | | | |
Net investment income | | | (0.36 | ) | | | (0.35 | ) | | | (0.20 | ) | | | (0.13 | ) | | | (1.03 | ) |
Net realized gain from investments | | | (3.15 | ) | | | — | | | | — | | | | — | | | | — | |
Total distributions | | | (3.51 | ) | | | (0.35 | ) | | | (0.20 | ) | | | (0.13 | ) | | | (1.03 | ) |
Net asset value, end of year | | | $50.76 | | | | $49.54 | | | | $45.18 | | | | $50.09 | | | | $39.64 | |
Total Return | | | 9.93 | % | | | 10.60 | % | | | (9.48 | )% | | | 26.77 | % | | | 48.44 | % |
RATIOS/SUPPLEMENTAL DATA: | | | | | | | | | | | | | | | | | | | | |
Net assets, end of year (000’s) | | | $2,112,546 | | | | $1,715,068 | | | | $1,693,650 | | | | $2,062,255 | | | | $1,540,822 | |
Expenses to average net assets | | | 1.47 | % | | | 1.49 | % | | | 1.50 | % | | | 1.58 | % | | | 1.64 | % |
Net investment income to average net assets | | | 0.83 | % | | | 0.80 | % | | | 0.63 | % | | | 0.60 | % | | | 0.56 | % |
Portfolio turnover rate | | | 26 | % | | | 36 | % | | | 33 | % | | | 25 | % | | | 48 | % |
| (1) | Net investment income per share was calculated using the average shares outstanding method. |
See Notes to Financial Statements
35
Harding, Loevner Funds, Inc.
Financial Highlights (continued)
| | | | | | | | | | | | | | | | | | | | |
| | | | | |
| Frontier Emerging Markets Portfolio — Institutional Class | | | | | | | | | | | | | | | |
| Per Share Data | | For the Year
Ended
Oct. 31, 2013 | | | For the Year
Ended
Oct. 31, 2012 | | | For the Year
Ended
Oct. 31, 2011 | | | For the Year
Ended
Oct. 31, 2010 | | | For the Year
Ended
Oct. 31, 2009 | |
Net asset value, beginning of year | | | $7.12 | | | | $6.57 | | | | $7.88 | | | | $6.29 | | | | $4.98 | |
INCREASE (DECREASE) IN NET ASSETS FROM | | | | | | | | | | | | | | | | | | | | |
OPERATIONS: | | | | | | | | | | | | | | | | | | | | |
Net investment income | | | 0.07 | (1) | | | 0.07 | (1) | | | 0.07 | (1) | | | 0.03 | | | | 0.07 | |
Net realized and unrealized gain (loss) on investments and foreign currency-related transactions | | | 1.35 | | | | 0.51 | | | | (1.37 | ) | | | 1.65 | | | | 1.26 | |
Net increase (decrease) from investment operations | | | 1.42 | | | | 0.58 | | | | (1.30 | ) | | | 1.68 | | | | 1.33 | |
DISTRIBUTIONS TO SHAREHOLDERS FROM: | | | | | | | | | | | | | | | | | | | | |
Net investment income | | | (0.08 | ) | | | (0.03 | ) | | | (0.01 | ) | | | (0.09 | ) | | | (0.02 | ) |
Total distributions | | | (0.08 | ) | | | (0.03 | ) | | | (0.01 | ) | | | (0.09 | ) | | | (0.02 | ) |
Net asset value, end of year | | | $8.46 | | | | $7.12 | | | | $6.57 | | | | $7.88 | | | | $6.29 | |
Total Return | | | 20.20 | % | | | 8.93 | % | | | (16.49 | )% | | | 27.04 | % | | | 26.71 | % |
RATIOS/SUPPLEMENTAL DATA: | | | | | | | | | | | | | | | | | | | | |
Net assets, end of year (000’s) | | | $271,728 | | | | $81,568 | | | | $101,666 | | | | $70,645 | | | | $9,071 | |
Expenses to average net assets | | | 1.80 | % | | | 1.95 | % | | | 1.87 | % | | | 2.37 | % | | | 4.08 | % |
Expenses to average net assets (net of fees waived/reimbursed) | | | 1.80 | % | | | 1.95 | % | | | 1.87 | % | | | 2.00 | % | | | 2.00 | % |
Net investment income (loss) to average net assets | | | 0.94 | % | | | 1.03 | % | | | 0.89 | % | | | (0.08 | %) | | | 1.39 | % |
Portfolio turnover rate | | | 24 | % | | | 72 | % | | | 23 | % | | | 17 | % | | | 55 | % |
| (1) | Net investment income per share was calculated using the average shares outstanding method. |
| | | | | | | | | | | | |
| | | |
| Frontier Emerging Markets Portfolio — Investor Class | | | | | | | | | |
| Per Share Data | | For the Year
Ended
Oct. 31, 2013 | | | For the Year
Ended
Oct. 31, 2012 | | | For the Period
Ended
Oct. 31, 2011(1) | |
Net asset value, beginning of period | | | $7.08 | | | | $6.55 | | | | $7.84 | |
INCREASE (DECREASE) IN NET ASSETS FROM OPERATIONS: | | | | | | | | | | | | |
Net investment income | | | 0.05 | (2) | | | 0.10 | (2) | | | 0.04 | (2) |
Net realized and unrealized gain (loss) on investments and foreign currency-related transactions | | | 1.34 | | | | 0.45 | | | | (1.33 | ) |
Net increase (decrease) from investment operations | | | 1.39 | | | | 0.55 | | | | (1.29 | ) |
DISTRIBUTIONS TO SHAREHOLDERS FROM: | | | | | | | | | | | | |
Net investment income | | | (0.07 | ) | | | (0.02 | ) | | | — | |
Total Distributions | | | (0.07 | ) | | | (0.02 | ) | | | — | |
Net asset value, end of period | | | $8.40 | | | | $7.08 | | | | $6.55 | |
Total Return | | | 19.83 | % | | | 8.49 | % | | | (16.45 | )%(A) |
RATIOS/SUPPLEMENTAL DATA: | | | | | | | | | | | | |
Net assets, end of period (000’s) | | | $21,763 | | | | $3,003 | | | | $1,225 | |
Expenses to average net assets | | | 2.64 | % | | | 4.71 | % | | | 9.06 | %(B) |
Expenses to average net assets (net of fees waived/reimbursed) | | | 2.25 | % | | | 2.25 | % | | | 2.25 | %(B) |
Net investment income to average net assets | | | 0.66 | % | | | 1.47 | % | | | 0.75 | %(B) |
Portfolio turnover rate | | | 24 | % | | | 72 | % | | | 23 | %(A) |
| (1) | For the period from December 31, 2010 (commencement of class operations) through October 31, 2011. |
| (2) | Net investment income per share was calculated using the average shares outstanding method. |
See Notes to Financial Statements
36
Harding, Loevner Funds, Inc.
Notes to Financial Statements
October 31, 2013
1. Organization
Harding, Loevner Funds, Inc. (the “Fund”) was organized as a Maryland corporation on July 31, 1996, and is registered under the Investment Company Act of 1940, as amended (the “1940 Act”), as an open-end diversified management investment company. The Fund currently has six Portfolios, all of which were active as of October 31, 2013 (individually, a “Portfolio”, collectively, the “Portfolios”). The Fund is managed by Harding Loevner LP (the “Investment Adviser”).
| | | | |
Portfolio | | Inception Date | | Investment Objective |
Global Equity Portfolio | | Institutional Class: November 3, 2009 | | to seek long-term capital appreciation |
(“Global Equity”) | | Advisor Class: December 1, 1996 | | through investments in equity securities |
| | | | | of companies based both inside and |
| | | | | outside the United States |
International Equity Portfolio | | Institutional Class: May 11, 1994* | | to seek long-term capital appreciation |
(“International Equity”) | | Investor Class: September 30, 2005 | | through investments in equity securities |
| | | | | of companies based outside the United |
| | | | | States |
International Small Companies Portfolio | | Institutional Class: June 30, 2011 | | to seek long-term capital appreciation |
(“International Small Companies”) | | Investor Class: March 26, 2007 | | through investments in equity securities |
| | | | | of small companies based outside the |
| | | | | United States |
Institutional Emerging Markets Portfolio | | October 17, 2005 | | to seek long-term capital appreciation |
(“Institutional Emerging Markets”) | | | | through investments in equity securities |
| | | | | of companies based in emerging |
| | | | | markets |
Emerging Markets Portfolio | | Advisor Class: November 9, 1998 | | to seek long-term capital appreciation |
(“Emerging Markets”) | | | | through investments in equity securities |
| | | | | of companies based in emerging |
| | | | | markets |
Frontier Emerging Markets Portfolio | | Institutional Class: May 27, 2008 | | to seek long-term capital appreciation |
(“Frontier Emerging Markets”) | | Investor Class: December 31, 2010 | | through investments in equity securities |
| | | | | of companies based in frontier and |
| | | | | smaller emerging markets |
* International Equity is the successor to the HLM International Equity Portfolio of AMT Capital Fund, Inc., pursuant to a reorganization that took place on October 31, 1996. Information for periods prior to October 31, 1996 is historical information for the predecessor portfolio.
2. Summary of Significant Accounting Policies
The accounting policies of the Fund are in conformity with accounting principles generally accepted in the United States (“GAAP”) for investment companies. The following is a summary of the Fund’s significant accounting policies:
Indemnifications
Under the Fund’s organizational document, its officers and Board of Directors (“Board”) are indemnified against certain liability arising out of the performance of their duties to the Portfolios. In the normal course of business, the Fund may enter into contracts that contain a variety of representations or that provide indemnification for certain liabilities. The Fund’s maximum exposure under these arrangements is unknown, as this would involve future claims that may be made against the Fund that have not yet occurred. However, the Fund has not had prior claims or losses pursuant to these contracts and expects the risk of loss to be remote.
Estimates
The preparation of financial statements in accordance with GAAP requires management to make estimates and assumptions that affect the reported amounts and disclosures in the financial statements. Actual results could differ from those estimates.
37
Harding, Loevner Funds, Inc.
Notes to Financial Statements
October 31, 2013
2. Summary of Significant Accounting Policies (continued)
Valuation
The Board has adopted procedures (“Procedures”) to govern the valuation of the securities held by each Portfolio of the Fund in accordance with the 1940 Act. The Procedures incorporate principles set forth in relevant pronouncements of the Securities and Exchange Commission (“SEC”) and its staff, including guidance on the obligations of the Portfolios and their Directors to determine, in good faith, the fair value of the Portfolios’ securities when market quotations are not readily available.
In determining a Portfolio’s net asset value (“NAV”), each equity security traded on a securities exchange, including the NASDAQ Stock Market, and over-the-counter securities, are first valued at the closing price on the exchange or market designated by the Fund’s accounting agent as the principal exchange (each, a “principal exchange”). The closing price provided by the Fund’s accounting agent for a principal exchange may differ from the price quoted elsewhere and may represent information such as last sales price, an official closing price, a closing auction price or other information, depending on exchange or market convention. Shares of open-end mutual funds including money market funds are valued at NAV. Such securities are typically categorized as “Level 1” pursuant to the hierarchy described below.
Participation notes are valued based upon the closing or last traded price of their underlying local shares. Such securities are typically categorized as “Level 2” pursuant to the hierarchy described below.
Since trading in many foreign securities is normally completed before the time at which a Portfolio calculates its NAV, the effect on the value of such securities held by a Portfolio of events that occur between the close of trading in the security and the time at which the Portfolio prices its securities would not be reflected in the Portfolio’s calculation of its NAV if foreign securities were generally valued at their closing prices.
To address this issue, the Board has approved the daily use of independently provided quantitative models that adjust the closing prices of certain foreign equity securities based on information after the foreign market closes. Use of these quantitative models could cause a Portfolio to value a security higher, lower or equal to its closing market price, which in turn could cause the Portfolio’s NAV per share to differ significantly from that which would have been calculated using closing market prices. The use of these quantitative models is also intended to decrease the opportunities for persons to engage in ‘‘time zone arbitrage,’’ i.e., trading intended to take advantage of stale closing prices in foreign markets that could affect the NAV of the Portfolios. Securities subjected to an adjustment to their closing prices due to these quantitative models are not specifically designated on the Portfolios’ Portfolio of Investments as being “fair valued”; however, absent the use of significant unobservable inputs into their valuation, securities priced higher or lower than their closing market price would be categorized as “Level 2” pursuant to the hierarchy described below.
Any securities for which market quotations are not readily available or for which available prices are deemed unreliable are priced by the Investment Adviser at “fair value in good faith”, in accordance with the Procedures. Such securities are identified on the Portfolios’ Portfolio of Investments as securities valued at “fair value in good faith” and absent the use of significant unobservable inputs into their valuation, such securities would be categorized as “Level 2” pursuant to the hierarchy described below.
GAAP includes a topic which establishes a hierarchy for NAV determination purposes in which various inputs are used in determining the value of each Portfolio’s assets or liabilities. This topic defines fair value as the price that the Portfolio would receive upon selling an investment in a timely transaction to an independent buyer in the principal or most advantageous market of the investment. This topic establishes a three-tier hierarchy to maximize the use of observable market data and minimize the use of unobservable inputs and to establish classification of fair value measurements for disclosure purposes. Inputs may be observable or unobservable and refer broadly to the assumptions that market participants would use in pricing the asset or liability including assumptions about risk. Such risks include the inherent risk in a particular valuation technique which is used to measure fair value. This may include the quantitative models and/or the inputs to the quantitative models used in the valuation technique. Observable inputs are inputs that reflect the assumptions market participants would use in pricing the asset or liability developed based on market data obtained from sources independent of the reporting entity. Unobservable inputs are inputs that reflect the reporting entity’s own assumptions about the assumptions market participants would use in pricing the asset or liability developed based on the best information available in the circumstances. The three-tier hierarchy of inputs is summarized in the three broad levels listed below.
| | |
| Level 1 | | unadjusted quoted prices in active markets for identical investments |
| Level 2 | | other significant observable inputs (including quoted prices for similar investments, interest rates, prepayment speeds, credit risk, etc.). |
| Level 3 | | significant unobservable inputs (including the Portfolio’s own assumptions in determining the fair value of investments) |
38
Harding, Loevner Funds, Inc.
Notes to Financial Statements
October 31, 2013
2. Summary of Significant Accounting Policies (continued)
The Portfolios disclose all transfers between levels based on valuations at the end of each reporting period. At October 31, 2013, the Portfolios below had transfers from Level 1 to Level 2, based on Levels assigned to securities on October 31, 2012, due to the daily use of quantitative models and the resulting closing price adjustments to certain foreign equity securities as described above as well as a pricing vendor providing a bid price only.
| | | | | | | | | | | | | | | | |
| | | International
Small Companies | | | Institutional
Emerging Markets | | | Emerging Markets | | | Frontier
Emerging Markets | |
Common Stock | | | | | | | | | | | | | | | | |
Banks | | | $753,845 | | | | $8,629,754 | | | | $17,640,188 | | | | $— | |
Capital Goods | | | — | | | | — | | | | — | | | | 2,919,669 | |
Diversified Financials | | | — | | | | 12,907,384 | | | | 25,963,045 | | | | — | |
Energy | | | — | | | | — | | | | — | | | | 1,724,932 | |
Food, Beverage & Tobacco | | | — | | | | — | | | | — | | | | 7,346,105 | |
Household & Personal Products | | | — | | | | 4,333,613 | | | | 8,947,201 | | | | — | |
Materials | | | — | | | | — | | | | — | | | | 7,680,384 | |
Pharmaceuticals, Biotechnology & Life Sciences | | | — | | | | — | | | | — | | | | 6,598,236 | |
Utilities | | | — | | | | — | | | | — | | | | 239,412 | |
| | | | | | | | | | | | | | | | |
Total | | | $753,845 | | | | $25,870,751 | | | | $52,550,434 | | | | $26,508,738 | |
| | | | | | | | | | | | | | | | |
GAAP provides additional guidance for estimating fair value when the volume and level of activity for the asset or liability have significantly decreased as well as guidance on identifying circumstances that indicate when a transaction is not orderly.
The following is a summary of the Portfolios’ investments classified by Level 1, Level 2 and Level 3 and security type as of October 31, 2013. Please refer to each Portfolio’s Portfolio of Investments to view individual securities classified by industry type and country.
| | | | | | | | | | | | | | | | | | | | | | | | | | | | | | | | |
| Portfolio | | Unadjusted Quoted Prices in Active Markets for Identical Assets (Level 1) | | | Other Significant Observable Inputs (Level 2) | | | Total | |
| | | Common
Stocks | | | Preferred
Stocks | | | Cash
Equivalents | | | Common
Stocks | | | Preferred
Stocks | | | Participation
Notes | | | Warrants | | | Investment
Securities | |
Global Equity | | | $414,406,444 | | | | $— | | | | $16,112,371 | | | | $199,227,680 | | | | $— | | | | $— | | | | $— | | | | $629,746,495 | |
International Equity | | | 888,797,014 | | | | 111,640,796 | | | | 168,028,389 | | | | 2,695,589,835 | | | | 48,935,572 | | | | — | | | | — | | | | 3,912,991,606 | |
International Small Companies | | | 471,822 | | | | — | | | | 1,981,924 | | | | 77,255,833 | | | | 335,420 | | | | — | | | | — | | | | 80,044,999 | |
Institutional Emerging Markets | | | 245,311,176 | | | | 31,917,131 | | | | 13,626,202 | | | | 645,340,802 | | | | 51,545,543 | | | | 51,800,604 | | | | — | | | | 1,039,541,458 | |
Emerging Markets | | | 512,000,654 | | | | 49,922,157 | | | | 41,085,030 | | | | 1,310,807,977 | | | | 104,741,356 | | | | 103,346,941 | | | | — | | | | 2,121,904,115 | |
Frontier Emerging Markets | | | 72,952,224 | | | | — | | | | 12,518,155 | | | | 185,652,518 | | | | — | | | | 23,502,762 | | | | 17,902 | | | | 294,643,561 | |
As of October 31, 2013, there were no Level 3 investments held within the Portfolios.
Securities
For financial reporting purposes, all securities transactions are recorded on a trade date basis, as of the last business day in the reporting period. Throughout the reporting period, securities transactions are typically accounted for on a trade date - plus one business day basis. Interest income and expenses are recorded on an accrual basis. Dividend income is recorded on the ex-dividend date (except for certain foreign dividends that may be recorded as soon as the Portfolio is informed of such dividends). The Portfolios use the specific identification method for determining realized gains or losses from sales of securities.
Dividends to Shareholders
It is the policy of the Portfolios to declare dividends from net investment income annually. Net short-term and long-term capital gains distributions for the Portfolios, if any, normally are distributed on an annual basis.
Dividends from net investment income and distributions from net realized gains from investment transactions have been determined in accordance with income tax regulations and may differ from net investment income and realized gains recorded by the Portfolios for financial reporting purposes. Differences result primarily from foreign currency transactions and timing differences related to recognition of income, and gains and losses from investment transactions. In general, to the extent that any differences which are permanent in nature result in over-distributions to shareholders, the amount of the over-distribution is reclassified within the capital accounts based on its federal tax basis treatment and may be reported as return of capital. Temporary differences do not require reclassification.
39
Harding, Loevner Funds, Inc.
Notes to Financial Statements
October 31, 2013
2. Summary of Significant Accounting Policies (continued)
Currency Translation
Assets and liabilities denominated in foreign currencies and commitments under forward foreign currency exchange contracts are translated into U.S. dollars at the mean of the quoted bid and asked prices of such currencies against the U.S. dollar. Purchases and sales of the Portfolios’ securities are translated at the rates of exchange prevailing when such securities were acquired or sold. Income and expenses are translated at exchange rates prevailing when accrued. The Portfolios do not isolate that portion of the results of operations resulting from changes in foreign exchange rates on investments from the fluctuations arising from changes in market prices of securities held. Such fluctuations are included with the Net realized gain (loss) from investments and Change in unrealized appreciation (depreciation) from investments on the Statements of Operations.
Net realized gains and losses from foreign currency-related transactions arise from sales of foreign currency, currency gains or losses realized between the trade and settlement dates on securities transactions, and the difference between the amounts of dividends, interest, and foreign withholding taxes recorded on the Portfolios’ books, and the U.S. dollar equivalent of the amounts actually received or paid. Net unrealized appreciation or depreciation on translation of assets and liabilities denominated in foreign currencies arise from changes in the value of assets and liabilities other than investments in securities at the period end, resulting from changes in the exchange rates.
Redemption Fees
Redemptions made within 90 days of purchase may be subject to a redemption fee equal to 2% of the amount redeemed. For the years ended October 31, 2013 and October 31, 2012, the Portfolios received the following redemption fees related to transactions in shares of common stock. These amounts are included as a component of “Cost of shares redeemed” in the Portfolios’ Statements of Changes in Net Assets.
| | | | | | | | | | | | | | | | | | | | | | | | |
| | | Institutional Class | | | Investor Class | | | Advisor Class | |
| Portfolio | | 2013 | | | 2012 | | | 2013 | | | 2012 | | | 2013 | | | 2012 | |
Global Equity | | $ | 741 | | | $ | 18,098 | | | $ | — | | | $ | — | | | $ | 13,746 | | | $ | 4,602 | |
International Equity | | | 234,492 | | | | 152,620 | | | | 70,744 | | | | 54,231 | | | | — | | | | — | |
International Small Companies | | | 67,590 | | | | 14,028 | | | | 6,416 | | | | 2,439 | | | | — | | | | — | |
Institutional Emerging Markets | | | 46,807 | | | | 44,109 | | | | — | | | | — | | | | — | | | | — | |
Emerging Markets | | | — | | | | — | | | | — | | | | — | | | | 231,312 | | | | 130,937 | |
Frontier Emerging Markets | | | 19,043 | | | | 76,924 | | | | 5,786 | | | | 7 | | | | — | | | | — | |
3. Significant Agreements and Transactions with Affiliates
The Board has approved an investment advisory agreement (the “Agreement”) with the Investment Adviser. Advisory fees are computed daily and paid monthly based on the average daily net assets of each Portfolio. The Investment Adviser has contractually agreed to reduce its fee and/or reimburse the Portfolios for other operating expenses to the extent that aggregate expenses, excluding certain non-operating expenses, exceed certain annual rates of the average daily net assets of each class.
The following annualized advisory fees and contractual expense limits became effective as of February 28, 2013.
| | | | | | |
Portfolio | | Advisory Fees on assets up to $1 billion | | Advisory Fees on assets over $1 billion | | Contractual Expense
Limit* |
Global Equity – Institutional Class | | 0.85% | | 0.83% | | 0.95% |
Global Equity – Advisor Class | | 0.85% | | 0.83% | | 1.25% |
International Equity – Institutional Class | | 0.75% | | 0.73% | | 1.00% |
International Equity – Investor Class | | 0.75% | | 0.73% | | 1.25% |
International Small Companies – Institutional Class | | 1.25% | | 1.23% | | 1.30% |
International Small Companies – Investor Class | | 1.25% | | 1.23% | | 1.55% |
Institutional Emerging Markets | | 1.15% | | 1.13% | | 1.30% |
Emerging Markets – Advisor Class | | 1.15% | | 1.13% | | 1.75% |
Frontier Emerging Markets – Institutional Class | | 1.50% | | 1.48% | | 2.00% |
Frontier Emerging Markets – Investor Class | | 1.50% | | 1.48% | | 2.25% |
* On December 20, 2013, the Board voted to extend the contractual expense limits listed above through February 28, 2015.
40
Harding, Loevner Funds, Inc.
Notes to Financial Statements
October 31, 2013
3. Significant Agreements and Transactions with Affiliates (continued)
For the period from November 1, 2012 through February 28, 2013, Global Equity’s advisory fees were 0.95% on assets up to $1 billion and 0.93% on assets over $1 billion; Institutional Emerging Markets’ and Emerging Markets’ advisory fees were 1.17% on assets up to $1 billion and 1.15% on assets over $1 billion; and International Small Companies’ contractual expense limit was 1.50% for Institutional Class and 1.75% for Investor Class.
For the year ended October 31, 2013, the Investment Adviser waived and/or reimbursed the following amounts pursuant to the contractual expense limits described above:
| | |
| Portfolio | | Fees waived and/or reimbursed by the Investment Adviser |
Global Equity – Institutional Class | | $187,282 |
Global Equity – Advisor Class | | 9,293 |
International Small Companies – Institutional Class | | 68,800 |
International Small Companies – Investor Class | | 168,147 |
Institutional Emerging Markets | | 257,255 |
Frontier Emerging Markets – Investor Class | | 34,840 |
The Fund has an administration agreement with The Northern Trust Company (“Northern Trust”), which provides certain accounting, clerical and bookkeeping services, Blue Sky, corporate secretarial services and assistance in the preparation and filing of tax returns and reports to shareholders and the SEC.
Northern Trust also serves as custodian of each Portfolio’s securities and cash, transfer agent, dividend disbursing agent and agent in connection with any accumulation, open-account or similar plans provided to the shareholders of the Portfolios.
Foreside Compliance Services, LLC (“FCS”) provides an individual to serve as chief compliance officer of the Fund. Foreside Management Services, LLC (“FMS”) provides an individual to serve as chief financial officer and treasurer of the Fund. Fees paid to FCS and FMS are shown as “Chief compliance and financial officers’ fees and expenses” on the Statements of Operations. Effective November 1, 2013, fees paid to FMS will be paid by the Investment Adviser rather than by the Fund.
The Fund has adopted an Amended Plan of Distribution pursuant to Rule 12b-1 under the 1940 Act (“Distribution Plan”). Under the Distribution Plan, the Investor Class of each of the International Equity, International Small Companies and Frontier Emerging Markets Portfolios may pay underwriters, distributors, dealers or brokers a fee at an annual rate of up to 0.25% of the average daily net assets of the Portfolio’s Investor Class for services or expenses arising in connection with activities primarily intended to result in the sale of Investor Class of the Portfolios.
The Fund, on behalf of the Portfolios, has agreements with various financial intermediaries and “mutual fund supermarkets”, under which customers of these intermediaries may purchase and hold Portfolio shares. These intermediaries assess fees in consideration for providing certain distribution, account maintenance, record keeping and transactional services. In recognition of the savings of expenses to the Fund arising from the intermediaries’ assumption of functions that the Fund would otherwise perform, such as providing sub-accounting and related shareholder services, each Portfolio or class is authorized, pursuant to a Shareholder Servicing Plan, to pay to each intermediary an annual rate of up to 0.25% of its average daily net assets attributable to that intermediary (subject to the contractual expense limits described above). Because of the contractual expense limits on certain Portfolios’ fees and expenses, the Investment Adviser paid a portion of the Portfolios’ share of these fees during the year ended October 31, 2013.
41
Harding, Loevner Funds, Inc.
Notes to Financial Statements
October 31, 2013
4. Class Specific Expenses
Most expenses of the Fund can be directly attributed to a particular Portfolio. Expenses which cannot be directly attributed are apportioned among the Portfolios based upon relative net assets or other appropriate measures. If an expense is incurred at the Portfolio level, it is generally apportioned among the classes of that Portfolio based upon relative net assets of each respective class. Certain expenses are incurred at the class level and charged only to that particular class. These expenses may be class specific (i.e., Distribution fees charged only to a particular class) or they may be identifiable to a particular class (i.e., the costs related to printing and mailing shareholder reports to shareholders of a particular class). Class specific expenses for Portfolios with multiple active classes are shown in the table below.
| | | | | | | | | | | | | | | | | | | | |
| Portfolio | | Distribution
Fees | | | State Registration
Filing Fees | | | Printing and
Postage Fees | | | Transfer Agent
Fees and Expenses | | | Shareholder
Servicing Fees | |
Global Equity – Institutional Class | | $ | — | | | $ | 34,344 | | | $ | 23,256 | | | $ | 24,113 | | | $ | 51,211 | |
Global Equity – Advisor Class | | | — | | | | 22,774 | | | | 11,501 | | | | 26,990 | | | | 168,345 | |
International Equity – Institutional Class | | | — | | | | 146,309 | | | | 231,288 | | | | 330,241 | | | | 1,031,716 | |
International Equity – Investor Class | | | 899,293 | | | | 33,545 | | | | 90,880 | | | | 114,474 | | | | 301,138 | |
International Small Companies – Institutional Class | | | — | | | | 19,289 | | | | 4,144 | | | | 20,945 | | | | 7,039 | |
International Small Companies – Investor Class | | | 107,256 | | | | 23,411 | | | | 8,978 | | | | 26,185 | | | | 60,517 | |
Frontier Emerging Markets – Institutional Class | | | — | | | | 24,031 | | | | 6,328 | | | | 24,668 | | | | 18,450 | |
Frontier Emerging Markets – Investor Class | | | 22,531 | | | | 22,793 | | | | 1,891 | | | | 21,433 | | | | 11,873 | |
5. Investment Transactions
Cost of purchases and proceeds from sales of investment securities, other than short-term investments, for the year ended October 31, 2013, were as follows for each Portfolio:
| | | | | | | | | | | | |
| Portfolio | | Purchase Cost of
Investment Securities | | | | | Proceeds from Sales of
Investment Securities | | | |
Global Equity | | $ | 306,059,973 | | | | | $ | 66,256,877 | | | |
International Equity | | | 1,779,207,294 | | | | | | 575,097,075 | | | |
International Small Companies | | | 62,632,614 | | | | | | 63,773,632 | | | |
Institutional Emerging Markets | | | 639,434,328 | | | | | | 132,043,881 | | | |
Emerging Markets | | | 722,255,530 | | | | | | 474,196,855 | | | |
Frontier Emerging Markets | | | 211,693,553 | | | | | | 34,272,486 | | | |
6. Income Tax
The cost of investments for federal income tax purposes and the components of net unrealized appreciation (depreciation) on investments at October 31, 2013, for each of the Portfolios were as follows:
| | | | | | | | | | | | | | | | |
| Portfolio | | Gross
Unrealized
Appreciation | | | Gross
Unrealized
Depreciation | | | Net
Unrealized
Appreciation
(Depreciation) | | | Cost | |
Global Equity | | $ | 134,235,518 | | | $ | (6,853,734 | ) | | $ | 127,381,784 | | | $ | 502,364,711 | |
International Equity | | | 775,918,383 | | | | (29,608,473 | ) | | | 746,309,910 | | | | 3,166,681,696 | |
International Small Companies | | | 15,675,048 | | | | (1,243,596 | ) | | | 14,431,452 | | | | 65,613,547 | |
Institutional Emerging Markets | | | 164,656,589 | | | | (24,268,478 | ) | | | 140,388,111 | | | | 899,153,347 | |
Emerging Markets | | | 589,653,885 | | | | (12,811,194 | ) | | | 576,842,691 | | | | 1,545,061,424 | |
Frontier Emerging Markets | | | 30,164,406 | | | | (4,155,725 | ) | | | 26,008,681 | | | | 268,634,880 | |
It is the policy of each Portfolio of the Fund to qualify as a regulated investment company by complying with the applicable provisions of the Internal Revenue Code, and to make distributions of taxable income sufficient to relieve it from substantially all federal income and excise taxes; therefore, no federal income tax provision is required.
42
Harding, Loevner Funds, Inc.
Notes to Financial Statements
October 31, 2013
6. Income Tax (continued)
Management has performed an analysis of each Portfolio’s tax positions for the open tax years as of October 31, 2013 and has concluded that no provisions for income tax are required. The Portfolios’ federal tax returns for the prior three fiscal years (open tax years: October 31, 2010; October 31, 2011; October 31, 2012) remain subject to examination by the Portfolios’ major tax jurisdictions, which include the United States, the State of New Jersey and the State of Maryland. Management is not aware of any events that are reasonably possible to occur in the next twelve months that would result in the amounts of any unrecognized tax benefits significantly increasing or decreasing for the Portfolios. However, management’s conclusions regarding tax positions taken may be subject to review and adjustment at a later date based on factors including, but not limited to, new tax laws and accounting regulations and interpretations thereof.
The tax character of distributions paid during the fiscal years ended October 31, 2013 and 2012 were as follows:
| | | | | | | | | | | | | | | | |
| | | Distributions From | |
| Portfolio | | Ordinary
Income
2013 | | | Long-Term
Capital Gains
2013 | | | Ordinary
Income
2012 | | | Long-Term
Capital Gains
2012 | |
Global Equity | | $ | 1,722,330 | | | $ | — | | | $ | 797,569 | | | $ | 2,083,272 | |
International Equity | | | 18,521,821 | | | | — | | | | 9,328,089 | | | | 3,133,641 | |
International Small Companies | | | 740,002 | | | | — | | | | 334,833 | | | | — | |
Institutional Emerging Markets | | | 3,683,658 | | | | — | | | | 3,430,979 | | | | — | |
Emerging Markets | | | 12,078,855 | | | | 106,392,227 | | | | 12,198,687 | | | | — | |
Frontier Emerging Markets | | | 991,109 | | | | — | | | | 489,954 | | | | — | |
As of October 31, 2013, the components of accumulated earnings/(deficit) on a tax basis were as follows:
| | | | | | | | | | | | | | | | | | | | |
| Portfolio | | Undistributed
Ordinary
Income | | | Undistributed
Long-Term
Capital Gains | | | Accumulated
Capital and
Other Losses | | | Unrealized
Appreciation
(Depreciation)* | | | Total
Accumulated
Earnings
(Deficit) | |
Global Equity | | $ | 2,737,929 | | | $ | 2,665,824 | | | $ | — | | | $ | 127,391,357 | | | $ | 132,795,110 | |
International Equity | | | 29,654,593 | | | | — | | | | (27,188,875 | ) | | | 746,424,195 | | | | 748,889,913 | |
International Small Companies | | | 1,780,822 | | | | 3,317,431 | | | | — | | | | 14,434,555 | | | | 19,532,808 | |
Institutional Emerging Markets | | | 7,649,054 | | | | — | | | | (42,883,881 | ) | | | 140,046,643 | | | | 104,811,816 | |
Emerging Markets | | | 14,910,876 | | | | 54,210,866 | | | | — | | | | 576,844,628 | | | | 645,966,370 | |
Frontier Emerging Markets | | | 805,774 | | | | — | | | | (13,129,939 | ) | | | 25,834,374 | | | | 13,510,209 | |
* The difference between book basis and tax basis net unrealized appreciation is attributable primarily to the tax deferral of losses on certain sale of securities. Unrealized Appreciation (Depreciation) includes amounts related to foreign currency and currency translations.
On December 22, 2010, the Regulated Investment Company Modernization Act of 2010 (the “Act”) was enacted, which changed various technical rules governing the tax treatment of regulated investment companies. The changes are generally effective for taxable years beginning after the date of enactment. One of the more prominent changes addresses capital loss carryforwards. Under the Act, each Portfolio will be permitted to carry forward capital losses incurred in taxable years beginning after the date of enactment for an unlimited period. However, any losses incurred during those future taxable years will be required to be utilized prior to the losses incurred in pre-enactment taxable years, which carry an expiration date. As a result of this ordering rule, pre-enactment capital loss carryforwards may be more likely to expire unused. Additionally, post-enactment capital loss carryforwards will retain their character as either short-term or long-term capital losses rather than being considered all short-term as permitted under previous regulation.
Capital losses incurred that will be carried forward indefinitely under provisions of the Act are as follows:
| | | | | | | | | | | | |
| Portfolio | | Short-Term
Capital Loss
Carryforward | | | | | Long-Term
Capital Loss
Carryforward | | | |
International Equity | | $ | 26,491,344 | | | | | $ | 697,531 | | | |
Institutional Emerging Markets | | | 677,774 | | | | | | — | | | |
Frontier Emerging Markets | | | 4,639,023 | | | | | | 3,001,217 | | | |
43
Harding, Loevner Funds, Inc.
Notes to Financial Statements
October 31, 2013
6. Income Tax (continued)
At October 31, 2013, the pre-enactment capital loss carryforwards and their respective years of expiration were as follows:
| | | | | | | | | | | | |
| Portfolio | | October 31,
2016 | | | October 31,
2017 | | | October 31,
2019 | |
Institutional Emerging Markets | | $ | 8,577,340 | | | $ | 29,793,794 | | | $ | 3,834,973 | |
Frontier Emerging Markets | | | — | | | | 1,252,470 | | | | 4,237,229 | |
Primarily as a result of differing book/tax treatment of foreign currency transactions and foreign capital gain tax expenses, the Portfolios made reclassifications among certain capital accounts. The reclassifications have no impact on the net assets of the Portfolios. As of October 31, 2013, the following reclassifications were made to the Statements of Assets and Liabilities:
| | | | | | | | | | | | |
| Portfolio | | Paid in Capital | | | Accumulated
Undistributed Net
Investment Income | | | Accumulated Net Realized
Gain (Loss) from
Investment Transactions | |
Global Equity | | $ | — | | | $ | (22,542 | ) | | $ | 22,542 | |
International Equity | | | 45 | | | | (691,435 | ) | | | 691,390 | |
International Small Companies | | | — | | | | (5,183 | ) | | | 5,183 | |
Institutional Emerging Markets | | | — | | | | (189,279 | ) | | | 189,279 | |
Emerging Markets | | | — | | | | (544,534 | ) | | | 544,534 | |
Frontier Emerging Markets | | | — | | | | (477,932 | ) | | | 477,932 | |
7. Foreign Exchange Contracts
The Portfolios, on occasion, may enter into forward foreign exchange contracts in order to hedge their exposure to changes in foreign currency exchange rates on their foreign portfolio holdings. A forward foreign exchange contract is a commitment to purchase or sell a foreign currency at a future date at a negotiated forward rate. The gain or loss arising from the difference between the cost of the original contracts and the closing of such contracts is included in Net realized gain (loss) on foreign currency-related transactions on the Statements of Operations. Fluctuations in the value of forward foreign exchange contracts are recorded for book purposes as unrealized appreciation or depreciation on assets and liabilities denominated in foreign currencies by the Portfolios. The Portfolios are also exposed to credit risk associated with counterparty nonperformance on these forward foreign exchange contracts which is typically limited to the unrealized gain on each open contract. The Portfolios held no open forward foreign currency exchange contracts on October 31, 2013.
The Portfolios also enter into foreign currency transactions on the spot markets in order to pay for foreign investment purchases or to convert to dollars the proceeds from foreign investment sales or coupon interest receipts. Unrealized appreciation (depreciation) on spot contracts is included in “Change in unrealized appreciation (depreciation) on Translation of assets and liabilities denominated in foreign currencies” on the Statements of Operations. Realized gains (losses) on spot contracts are included in “Net realized gain (loss) on Foreign currency transactions” on the Statements of Operations.
8. Participation Notes
Each Portfolio may invest in participation notes. Participation notes are promissory notes that are designed to offer a return linked to the performance of a particular underlying equity security or market. Participation notes are issued by banks or broker-dealers and allow a Portfolio to gain exposure to common stocks in markets where direct investment may not be allowed. Participation notes are generally traded over-the-counter and are subject to the risk that the bank or broker-dealer that issues them will not fulfill its contractual obligation to complete the transaction with a Portfolio. Participation notes constitute general unsecured contractual obligations of the banks or broker-dealers that issue them, and a Portfolio investing in participation notes would be relying on the creditworthiness of such banks or broker-dealers and would have no rights under a participation note against the issuer of the underlying assets. Participation notes may be more volatile and less liquid than other investments held by the Portfolios.
44
Harding, Loevner Funds, Inc.
Notes to Financial Statements
October 31, 2013
9. Concentration of Ownership
At October 31, 2013, the percentage of total shares outstanding held by record shareholders each owning 10% or greater of their respective class of each Portfolio were as follows:
| | | | | | | | | | | | |
| | | No. of
Shareholders | | | | | %
Ownership | | | |
Global Equity | | | 3 | | | | | | 56.04 | %* | | |
International Equity | | | 3 | | | | | | 44.73 | %* | | |
International Small Companies | | | 4 | | | | | | 70.44 | %* | | |
Institutional Emerging Markets | | | 2 | | | | | | 63.54 | %* | | |
Emerging Markets | | | 3 | | | | | | 78.46 | %* | | |
Frontier Emerging Markets | | | 4 | | | | | | 64.47 | %* | | |
* Includes omnibus positions of broker-dealers representing numerous shareholder accounts.
Investment activities of these shareholders may have a material effect on the Portfolios.
10. Concentration of Risk
Investing in securities of foreign issuers and currency transactions may involve certain considerations and risks not typically associated with investments in U.S. issuers. These risks include revaluation of currencies, adverse fluctuations in foreign currency values and possible adverse political, social and economic developments, including those particular to a specific industry, country or region, which could cause the securities and their markets to be less liquid and prices more volatile than those of comparable U.S. companies and U.S. government securities. These risks are greater with respect to securities of issuers located in emerging market countries in which the Portfolios are authorized to invest.
Frontier Emerging Markets is permitted to invest up to 35% of its total assets in companies in the same industry, if, at the time of investment, that industry represents 20% or more of the Portfolio’s benchmark index. During periods when the Portfolio has invested more than 25% of its total assets in companies in the same industry, it will operate as a concentrated portfolio and be subject to additional risks and greater volatility. At October 31, 2013, the Portfolio’s investment in the Banking industry amounted to 28.4% of its total assets.
11. Line of Credit
The Fund has a $100 million line of credit agreement with Northern Trust. Borrowings are made solely to facilitate the handling of redemptions or unusual or unanticipated short-term cash requirements. Because several Portfolios participate, and collateral requirements apply, there is no assurance that an individual Portfolio will have access to the entire $100 million at any particular time. Interest is charged to each Portfolio based on its borrowings at an amount above the Federal Funds rate, subject to a minimum rate. In addition, a facility fee is computed at an annual rate of 0.10% on the line of credit and is allocated among the Portfolios. For the year ended October 31, 2013, International Small Companies had an outstanding balance on five days with a maximum balance of $800,000 at an average weighted interest rate of 1.75%.
12. Recently Issued Accounting Pronouncements
In June 2013, the Financial Accounting Standards Board (“FASB”) issued Accounting Standards Update 2013-08, Amendments to the Scope, Measurement and Disclosure Requirements (“ASU 2013-08”), modifying Accounting Standards Codification 946 (“ASC 946”). The modifications were a result of a joint effort by the FASB and the International Accounting Standards Board to develop a consistent approach for determining whether an entity is an investment company for which fair value of investments is the most relevant measurement. ASU 2013-08 requires a reporting entity to disclose that it is an investment company and is applying the guidance as set forth in ASC 946, to disclose any changes in, and the reasons for, its status as an investment company and to disclose information related to whether it has provided or is contractually required to provide financial support to any of its investees. The effective date of ASU 2013-08 is for interim and annual periods beginning after December 15, 2013. At this time, management is evaluating the implications of this requirement and the impact it will have to the financial statement amounts and footnote disclosures, if any.
13. Subsequent Events
Subsequent events occurring after the date of this report have been evaluated for potential impact, for purposes of recognition or disclosure in the financial statements, through the date the report was issued.
45
Harding, Loevner Funds, Inc.
Report of Independent Registered Public Accounting Firm
The Shareholders and Board of Directors of Harding, Loevner Funds, Inc.:
We have audited the accompanying statements of assets and liabilities of the Harding, Loevner Funds, Inc. (comprising the Global Equity Portfolio, International Equity Portfolio, International Small Companies Portfolio, Institutional Emerging Markets Portfolio, Emerging Markets Portfolio, and Frontier Emerging Markets Portfolio) (collectively, the “Portfolios”) as of October 31, 2013, the portfolios of investments and the related statements of operations for the year then ended, statements of changes in net assets for each of the years in the two-year period then ended, and the financial highlights for each of the years or periods in the five-year period then ended. These financial statements and financial highlights are the responsibility of the Portfolios’ management. Our responsibility is to express an opinion on these financial statements and financial highlights based on our audits.
We conducted our audits in accordance with the standards of the Public Company Accounting Oversight Board (United States). Those standards require that we plan and perform the audits to obtain reasonable assurance about whether the financial statements and financial highlights are free of material misstatement. An audit includes examining, on a test basis, evidence supporting the amounts and disclosures in the financial statements. Our procedures included confirmation of securities owned as of October 31, 2013, by correspondence with the custodian and brokers or other appropriate auditing procedures. An audit also includes assessing the accounting principles used and significant estimates made by management, as well as evaluating the overall financial statement presentation. We believe that our audits provide a reasonable basis for our opinion.
In our opinion, the financial statements and financial highlights referred to above present fairly, in all material respects, the financial position of each of the aforementioned Portfolios of the Harding, Loevner Funds, Inc. as of October 31, 2013, the results of their operations for the year then ended, the changes in their net assets for each of the years in the two-year period then ended, and the financial highlights for each of the years or periods in the five-year period then ended, in conformity with U.S. generally accepted accounting principles.
/s/ KPMG
Chicago, Illinois
December 20, 2013
46
Harding, Loevner Funds, Inc.
Supplemental Tax Information
(unaudited)
International Equity, International Small Companies, Institutional Emerging Markets, Emerging Markets, and Frontier Emerging Markets paid qualifying foreign taxes of $1,410,183, $111,975, $1,173,371, $2,485,501, and $231,989, and earned $36,603,030, $516,566, $9,166,199, $18,939,454, and $1,585,474 from foreign source income during the year ended October 31, 2013, respectively. Pursuant to Section 853 of the Internal Revenue Code, International Equity, International Small Companies, Institutional Emerging Markets, Emerging Markets, and Frontier Emerging Markets designated $0.0065, $0.0205, $0.0203, $0.0597, and $0.0067 per share as foreign taxes paid and $0.1695, $0.0944, $0.1588, $0.4550, and $0.0457 as income earned from foreign sources for the year ended October 31, 2013, respectively.
Global Equity, International Equity, International Small Companies, Institutional Emerging Markets, Emerging Markets, and Frontier Emerging Markets had qualifying dividend income of $7,993,683, $58,831,991, $1,198,053, $14,346,811, $35,847,872, and $2,052,544, respectively, during the year ended October 31, 2013.
During the year ended October 31, 2013, Global Equity designated 100% of the distributions from net investment income as qualifying for the 70% corporate dividend received deduction.
Pursuant to Section 852 of the Internal Revenue Code, Emerging Markets Portfolio designated $54,210,866, as a long term capital gain dividend for the year ended October 31, 2013.
Pursuant to Section 852 of the Internal Revenue Code, Global Equity Portfolio designated $2,665,824 as a long term capital gain dividend for the year ended October 31, 2013.
Pursuant to Section 852 of the Internal Revenue Code, International Small Companies Portfolio designated $3,317,431 as a long term capital gain dividend for the year ended October 31, 2013.
47
Harding, Loevner Funds, Inc.
Approval of Investment Advisory Agreement
(unaudited)
Approval of Investment Advisory Agreement
At an in-person meeting of the board of directors (the “Board”) of Harding, Loevner Funds, Inc. (the “Fund”) held on June 7, 2013 (the “June Meeting”), the Board, including a majority of those directors who are not “interested persons” of the Fund, as defined in the Investment Company Act of 1940, as amended (the “Independent Directors”), considered and approved the continuation of the investment advisory agreement (the “Advisory Agreement”) between the Fund on behalf of each of its series, the Global Equity Portfolio, the International Equity Portfolio, the International Small Companies Portfolio, the Institutional Emerging Markets Portfolio, the Emerging Markets Portfolio, and the Frontier Emerging Markets Portfolio (each, a “Portfolio” and collectively, the “Portfolios”), and Harding Loevner LP (the “Adviser”).
Overview of the Review Process
Prior to the June Meeting, the Board requested, and the Adviser furnished, materials that the Board believed necessary to evaluate the terms of the Advisory Agreement, including information on, among other things: (i) the investment performance, expenses and advisory fees of each Portfolio relative to other mutual funds and benchmark indices, as set forth in reports prepared by Strategic Insight, a third party fund tracking organization engaged as part of the contract review process (the “Strategic Insight Reports”); (ii) the Adviser’s profitability and costs; (iii) the qualifications of the Adviser and portfolio management personnel with respect to services provided to the Portfolios; and (iv) the Adviser’s investment research capabilities and resources.
The Board established a sub-committee comprised of three Independent Directors (the “Committee”) to conduct a preliminary review of these materials, to assist the Board in its deliberations, and to liaise with the Adviser. The Committee reviewed the materials; discussed the materials during a telephonic meeting with representatives of the Adviser; and requested and received supplemental information and analysis from the Adviser. Following the Committee’s review, the Adviser distributed revised and supplemental materials in final form to the full Board. The Board also received and considered a memorandum regarding the Board’s responsibilities in connection with renewal of the Advisory Agreement prepared by the legal counsel to the Independent Directors (“Independent Counsel”). Independent Counsel assisted the Independent Directors throughout the preparation, review and approval process.
At the June Meeting, the Board considered and discussed the materials presented by the Adviser. During the presentation, the Adviser expanded on those materials and responded to specific questions from the Board. Following the presentation, the Independent Directors met in executive session with Independent Counsel to further review and discuss the information presented during the meeting.
In its consideration of the continuance of the Advisory Agreement with respect to each Portfolio, the Board considered various factors discussed below. The following discussion is not intended to be all-inclusive, as the Board reviewed a variety of factors and considered a significant amount of information. The Board’s approval determinations were made on the basis of each director’s business judgment after consideration of all the information presented. Individual directors may have given different weights to certain factors and assigned various degrees of materiality to information received in connection with the approval process.
Nature, Extent and Quality of Services
The Board evaluated such information as it deemed necessary to assess the nature, extent and quality of investment advisory services provided to the Portfolios by the Adviser. The Board also considered the nature, extent and quality of certain nonadvisory services provided to the Portfolios by the Adviser, including administrative, distribution, shareholder servicing, trading and the resources devoted to, and the record of compliance with, each Portfolio’s compliance policies and procedures. The Board noted that it received information at regular meetings throughout the year regarding the services rendered by the Adviser concerning the management of each Portfolio’s affairs and the Adviser’s role in coordinating providers of other services to the Portfolios. The Board’s evaluation of the services provided by the Adviser took into account the Board’s historical knowledge and familiarity with the scope and quality of the Adviser’s investment management and other capabilities and the quality of its administrative and other services.
48
Harding, Loevner Funds, Inc.
Approval of Investment Advisory Agreement (continued)
(unaudited)
The Adviser presented and discussed with the Board the qualifications, backgrounds and responsibilities of the Adviser’s management team and information regarding the portfolio managers for each Portfolio. The Board evaluated the ability of the Adviser to attract and retain qualified investment advisory and non-advisory personnel and engaged in a discussion with the Adviser regarding its recruitment, retention and professional development programs and strategies.
The Board also considered the adequacy of the financial and operational resources committed to each Portfolio by the Adviser, and how well the Adviser utilizes those resources to meet the Portfolio’s investment needs; to implement asset growth strategies; and to satisfy compliance requirements. Among other things, the Board recognized the technology enhancements implemented by the Adviser as of March 31, 2013 to improve operational efficiency and its capabilities in performance measurement, records management, proxy voting and trade cost management and additional enhancements scheduled for future implementation. The Board also recognized that the Adviser reports to the Board regularly and that at each regular meeting the Board receives a detailed report on each Portfolio’s performance, asset levels and asset flows. It was also noted that the Adviser had approximately $27.6 billion in assets under management as of March 31, 2013, and that it was an affiliate of Affiliated Managers Group, Inc., an established global asset management company.
The Board considered annual and periodic reports of the Chief Compliance Officer of the Fund (the “CCO”) with respect to the effectiveness and adequacy of the Adviser’s compliance program. The Board noted the CCO’s determination that the Adviser’s compliance program is reasonably designed to prevent violations of the federal securities laws. The Board also noted the actions taken by the Adviser in response to the CCO’s periodic recommendations for adding personnel, enhancing procedures and systems designed to ensure compliance with applicable laws and regulations.
Based on these considerations, the Board concluded that it was satisfied with the nature, extent and quality of services historically provided and to be provided to each Portfolio under the Advisory Agreement.
Performance of the Adviser
For each Portfolio, the Board considered, among other things, the historical performance year to date as of March 31, 2013 and for the one-year, three-year, five-year and ten-year periods (or shorter for newer Portfolios) included in the Strategic Insight Report, including comparisons against each Portfolio’s Morningstar Category and benchmark indices. The Board’s specific considerations with respect to each Portfolio’s performance are discussed under “Portfolio Specific Considerations” below.
In addition, the Board reviewed the Investment Adviser’s investment philosophy and its influence on the management of the Portfolios. The Board noted the Adviser’s bottom-up, business-focused approach based on a study of individual companies and the competitive dynamics of the global industries in which those companies participate. In evaluating the investment performance of the Portfolios, the Board acknowledged that the Adviser’s investment style may result in periods of underperformance, but has generally produced outperformance over longer time periods.
Based on these considerations, the Board concluded that each Portfolio’s performance was reasonable.
Costs of the Services and Profitability of the Adviser
The Board considered information regarding the Adviser’s costs to provide investment management services to the Portfolios and the profitability to the Adviser from managing the Portfolios. In evaluating the Adviser’s profitability, the Board considered the Adviser’s profitability analysis for calendar years 2011 and 2012; each Portfolio’s expense ratio; and the Adviser’s contractual fee waivers and expense reimbursements with respect to each Portfolio. The Board also considered profitability on a Portfolio-by-Portfolio basis, focusing on the Adviser’s profit without taking into account those costs borne by the Adviser with respect to its efforts to expand the Portfolios’ shareholder base. The Board noted that the Adviser did not earn a profit on the International Small Companies Portfolio and Frontier Emerging Markets Portfolio for calendar year 2012 and did not earn a profit on the International Small Companies Portfolio for calendar year 2011. The Board considered the asset-based breakpoints adopted by the Fund beginning with fiscal 2012 and noted that the management fees for both Emerging Markets and Institutional Emerging Markets Portfolios were each reduced by 8 basis points, from 125 basis points to 117 basis points. The Board noted that the breakpoints offer actual savings for the Emerging Markets Portfolio and the International Equity Portfolio and meaningful potential savings for the Portfolios whose assets have not yet reached their first breakpoint level.
49
Harding, Loevner Funds, Inc.
Approval of Investment Advisory Agreement (continued)
(unaudited)
The Board further considered steps taken by the Adviser beginning in March 2013 to reduce the total expense ratio of select Portfolios, including: (i) reducing the expense caps for the Institutional Class and Investor Class of the International Small Companies Portfolio by 20 basis points; (ii) reducing the contractual advisory fees for the Global Equity Portfolio by ten basis points; (iii) reducing the contractual advisory fees for the Institutional Emerging Markets Portfolio and Emerging Markets Portfolio by two basis points.
The Board took note of the Adviser’s expectation that it would incur additional costs relating to current and planned increases in personnel and office space, and investment in new information systems intended to assure the continued delivery of high-quality services to its clients, including the Portfolios. The Board also noted that future profitability to the Adviser from managing the Portfolios would depend on the level of assets in the Portfolios as well as the total assets under management of the Adviser.
Based upon these considerations, the Board concluded that the profits historically realized by the Adviser and, that the profits the Adviser anticipates will be realized from its continued relationship with the Portfolios are not excessive in light of the nature, extent and quality of the services provided to the Portfolios.
Comparison of Fees and Services Provided by the Adviser
The Board considered the contractual advisory fees that are payable by the Portfolios to the Adviser. The Board also reviewed and considered actual investment advisory fees realized by the Adviser taking into account the fee waiver and/or expense reimbursement arrangements for each Portfolio. In addition, the Board considered the Strategic Insight Report, which included information comparing each Portfolio’s management fee and overall expenses with those of funds in a group of peer funds selected by Strategic Insight (the “Expense Group”).
The Board noted that, in general, the operating expenses of each Portfolio, with the exception of the Institutional Class of the International Small Companies Portfolio and the Investor Class of the Frontier Emerging Markets Portfolio, were below the median of their respective Expense Groups and Morningstar Category-derived universe (the “Expense Universe”). The Board also noted that, with the exception of the International Small Companies Portfolio and the Frontier Emerging Markets Portfolio, which were above their respective Expense Group medians, each Portfolio’s total expense ratio, after waiver of advisory fees and reimbursement of expenses, was at or below its respective Expense Group median calculated by Strategic Insight, and each Portfolio’s advisory fees after waivers was within the range of those of the funds in its peer group, as calculated by Strategic Insight. A discussion of the Board’s considerations with respect to each Portfolio’s fees is set forth under “Portfolio Specific Considerations” below.
At the Board’s request, the Adviser also provided information on the fees charged and services provided to the Portfolios compared with separate accounts with similar investment strategies managed by the Adviser. The Board took note of the fact that no current shareholder could achieve a lower net advisory fee if it opened a separate account with the Adviser. The Board noted that the Adviser’s separate account clients require fewer services from the Adviser. The Board acknowledged that unlike the Portfolios, separate account clients do not require the Adviser to participate in internal corporate governance matters, deliver services to potential end-clients, supervise third-party vendors, or devote its own resources for expanding the shareholder base, nor do they require the same degree of compliance monitoring due to their differing regulatory framework. Further, the Board noted that the Adviser incurs no out-of-pocket expenses or business risk in connection with services provided to the separate accounts, unlike the Portfolios. The Board additionally noted that institutional investors familiar with the competitive marketplace have invested in the Portfolios as a result of request-for-proposal processes and have by their investing in the Portfolios demonstrated that they perceive the advisory fees charged by the Adviser to be reasonable.
Based on these considerations, the Board concluded that each Portfolio’s expense ratio is reasonable.
Economies of Scale
The Board considered the extent to which economies of scale would be realized as the Portfolios’ assets grow; whether there is potential for realization of any further economies of scale for the Portfolios; and whether economies of scale are being passed along to the shareholders. The Board noted that to the extent a Portfolio’s assets have increased over time, it has realized economies of scale as certain expenses become a smaller percentage of overall assets. The Board also noted that, due to market weakness and, in certain Portfolios, asset outflows, the economies of scale realized by certain Portfolios had diminished since the prior year. The Board further noted that each Portfolio’s contractual advisory fee contained breakpoints.
50
Harding, Loevner Funds, Inc.
Approval of Investment Advisory Agreement (continued)
(unaudited)
The Board also noted that as of March 31, 2013, the asset levels of the Emerging Markets Portfolio and the International Equity Portfolio exceeded at least the first breakpoint. Accordingly, the Board considered the economies of scale that had been realized by the Emerging Markets Portfolio and the International Equity Portfolio and potential economies of scale for those Portfolios whose assets had not yet reached their first breakpoint level.
The Board considered that other aspects of the Portfolios’ investment strategies may limit the realization of economies of scale, including a particular strategy’s universe of issuers, applicable trading volumes or markets, or the Adviser’s selection criteria. The Board also took note of the Adviser’s plans for marketing and distributing the various Portfolios and to pay for the associated expenses out of its own profits, through revenue sharing payments.
Based on these considerations, the Board concluded that it was satisfied with the extent to which economies of scale currently are and will be realized for the benefit of the Portfolios’ shareholders.
Other Benefits
The Board considered other benefits derived or to be derived by the Adviser from the relationship with the Portfolios. In this regard, the Board considered that the Adviser may benefit from its relationship with the Portfolios in the following ways: (i) separately managed account clients may view the additional assets under management resulting from managing the Portfolios as a positive attribute; (ii) the Adviser may obtain increased reputational prestige from managing a nationally recognized mutual fund family that shares the Adviser’s name; and (iii) the Adviser’s ability to market to shareholders other financial products offered by the Adviser may be enhanced. The Board also considered that the Adviser benefits from the receipt of research services obtained through “soft dollars” in connection with Portfolio brokerage transactions. The Board also considered the extent to which the Adviser and its other clients, as well as the Portfolios, benefitted from receipt of these research products and services. In light of the costs of providing investment management, administrative and other services to the Portfolios and the Adviser’s ongoing commitment to the Portfolios, the other ancillary benefits that the Adviser may receive were considered reasonable.
Portfolio Specific Considerations
In considering whether to approve the renewal of the Advisory Agreement for each Portfolio, the Board considered the following data included in the Strategic Insight Report.
Global Equity Portfolio
Portfolio Performance. The Advisor Class of the Global Equity Portfolio underperformed its MSCI All-Country World Index benchmark and Morningstar Category (World Stock) year-to-date, as of March 31, 2013, and for the one- and three-year periods, and it outperformed its benchmark and Morningstar Category (World Stock) for the five- and ten-year periods. The Advisor Class of the Portfolio has performed in the fourth quartile of its Morningstar Category (World Stock) for the one-year period, in the third quartile for the three-year period, and in the second quartile for the five- and ten-year periods.
The Institutional Class of the Global Equity Portfolio underperformed its MSCI All-Country World Index benchmark and Morningstar Category (World Stock) year-to-date, as of March 31, 2013, and for the one- and three-year periods. The Institutional Class of the Portfolio has performed in the fourth quartile of its Morningstar Category (World Stock) for the one-year period and in the third quartile for the three-year period.
Management Fees and Expense Ratio. In considering the fees payable under the Advisory Agreement by the Portfolio, the Board took into account the factors described above and also considered the pricing structure (including the expense ratio to be borne by shareholders) of the Portfolio, as compared to its Expense Group, including that the net management fee of the Advisor Class of the Portfolio is below median of the Expense Group and above median of the Expense Universe; and the net operating expenses are below median of the Expense Group and Expense Universe. With respect to the Institutional Class of the Portfolio, the Board noted that the net management fee of the Institutional Class of the Portfolio is below median of the Expense Group and above median of the Expense Universe; and the net operating expenses are below median for both the Expense Group and Expense Universe.
51
Harding, Loevner Funds, Inc.
Approval of Investment Advisory Agreement (continued)
(unaudited)
International Equity Portfolio
Portfolio Performance. The Institutional Class of the International Equity Portfolio underperformed its MSCI All- Country World ex-US Index benchmark and Morningstar Category (Foreign Large Growth) year-to-date, as of March 31, 2013, and it outperformed its benchmark and Morningstar Category (Foreign Large Growth) for the one-, three-, five- and ten-year periods. The Institutional Class of the Portfolio has performed in the second quartile of its Morningstar Category (Foreign Large Growth) for the one- and three-year periods, in the first quartile for the five-year period, and in the second quartile for the ten-year period.
The Investor Class of the International Equity Portfolio underperformed its MSCI All-Country World ex-US Index benchmark and Morningstar Category (Foreign Large Growth) year-to-date, as of March 31, 2013, and it outperformed its benchmark and Morningstar Category (Foreign Large Growth) for the one-, three- and five- year periods. The Investor Class of the Portfolio has performed in the second quartile of its Morningstar Category (Foreign Large Growth) for the one- and three-year periods and in the first quartile for the five-year period.
Management Fees and Expense Ratio. In considering the fees payable by the Portfolio under the Advisory Agreement, the Board took into account the factors described above and also considered the pricing structure (including the expense ratio to be borne by shareholders) of the Portfolio, as compared to its Expense Group, including that the net management fee of the Institutional Class of the Portfolio is below median for both the Expense Group and Expense Universe; and the net operating expenses are below median of the Expense Group and below median of the Expense Universe. With respect to the Investor Class of the Portfolio, the Board noted that the net management fee and net operating expenses are below median for both the Expense Group and Expense Universe. The Board noted that the International Equity Portfolio had reached its first asset-based breakpoint level resulting in a two basis point reduction in the contractual advisory fee.
International Small Companies Portfolio
Portfolio Performance. The Institutional Class of the International Small Companies Portfolio outperformed its MSCI All-Country World ex-US Small Cap benchmark and Morningstar Category (Foreign Small/Mid Blend) year-to-date, as of March 31, 2013, and for the one-year period. The Institutional Class of the Portfolio has performed in the first quartile of its Morningstar Category (Foreign Small/Mid Blend) for the one-year period.
The Investor Class of the International Small Companies Portfolio outperformed its MSCI All-Country World ex-US Small Cap benchmark and Morningstar Category (Foreign Small/Mid Blend) year-to-date, as of March 31, 2013, and for the one-, three- and five-year periods. The Investor Class of the Portfolio has performed in the first quartile of its Morningstar Category (Foreign Small/Mid Blend) for the one-, three- and five-year periods.
Management Fees and Expense Ratio. In considering the fees payable by the Portfolio under the Advisory Agreement, the Board took into account the factors described above, the Portfolio’s small asset size, and also considered the pricing structure (including the expense ratio to be borne by shareholders) of the Portfolio, as compared to its Expense Group, including that the net management fee and net operating expenses of the Institutional Class of the Portfolio are above median for both the Expense Group and Expense Universe. With respect to the Investor Class of the Portfolio, the net management fee is above median for both the Expense Group and Expense Universe; and the net operating expenses are below median for both the Expense Group and Expense Universe.
Emerging Markets Portfolio
Portfolio Performance. The Advisor Class of the Emerging Markets Portfolio outperformed its MSCI Emerging Markets Index benchmark and underperformed its Morningstar Category (Diversified Emerging Markets) year-to-date, as of March 31, 2013; outperformed its benchmark and Morningstar Category (Diversified Emerging Markets) for the one- and three-year periods; and underperformed its benchmark for the five- and ten-year periods and outperformed its Morningstar Category (Diversified Emerging Markets) for those periods. The Advisor Class of the Portfolio has performed in the second quartile of its Morningstar Category (Diversified Emerging Markets) for the one-, five- and ten-year periods, and in the first quartile for the three-year period.
52
Harding, Loevner Funds, Inc.
Approval of Investment Advisory Agreement (continued)
(unaudited)
Management Fees and Expense Ratio. In considering the fees payable by the Portfolio under the Advisory Agreement, the Board took into account the factors described above and also considered the pricing structure (including the expense ratio to be borne by shareholders) of the Portfolio, as compared to its Expense Group, including that the net management fee of the Advisor Class of the Portfolio is above the median for both the Expense Group and Expense Universe; and that the net operating expenses for the Advisor Class of the Portfolio are well below median for the Expense Group and Expense Universe. The Board noted that the Portfolio had reached its breakpoint level resulting in a two basis point reduction in the contractual advisory fee.
Institutional Emerging Markets Portfolio
Portfolio Performance. The Adviser advised the Board that the Institutional Emerging Markets Portfolio is managed to the same model as the Emerging Markets Portfolio and therefore its performance has tracked closely that of the Emerging Markets Portfolio. The Portfolio is measured against the same benchmark and Morningstar Category as the Emerging Markets Portfolio. The Institutional Emerging Markets Portfolio has outperformed its MSCI Emerging Markets Index benchmark and Morningstar Category (Diversified Emerging Markets) year-to-date, as of March 31, 2013, and for the one- and three-year periods. The Portfolio has performed in the second quartile of its Morningstar Category (Diversified Emerging Markets) for the one- and five-year periods, and in the first quartile for the three-year period.
Management Fees and Expense Ratio. In considering the fees payable by the Portfolio under the Advisory Agreement, the Board took into account the factors described above and also considered the pricing structure (including the expense ratio to be borne by shareholders) of the Portfolio, as compared to its Expense Group, including that the net management fee is above the median for both the Expense Group and Expense Universe, and that the net operating expenses are well below the median for the Expense Group and Expense Universe.
Frontier Emerging Markets Portfolio
Portfolio Performance. The Institutional Class of the Frontier Emerging Markets Portfolio outperformed its MSCI Frontier Emerging Markets Index benchmark and Morningstar Category (Diversified Emerging Markets) year-to-date, as of March 31, 2013, and for the one and three-year periods. The Institutional Class of the Portfolio has performed in the first quartile of its Morningstar Category (Diversified Emerging Markets) for the one-year period, and in the second quartile for the three-year period.
The Investor Class of the Frontier Emerging Markets Portfolio outperformed its MSCI Frontier Emerging Markets Index benchmark and Morningstar Category (Diversified Emerging Markets) year-to-date, as of March 31, 2013, and for the one-year period. The Investor Class of the Portfolio has performed in the first quartile of its Morningstar Category (Diversified Emerging Markets) for the one-year period. The Board further noted from the Adviser’s materials that the Portfolio does not have a relevant peer group for performance comparison purposes because there is currently no Morningstar category of funds that invest primarily in frontier markets or the smallest emerging markets. The Board therefore took into account that the Strategic Insight Report was of limited utility for evaluating performance.
Management Fees and Expense Ratio. In considering the fees payable by the Portfolio under the Advisory Agreement, the Board took into account the factors described above and also considered the pricing structure (including the expense ratio to be borne by shareholders) of the Portfolio, as compared to its Expense Group, including that the net management fee of the Institutional Class of the Portfolio is significantly above median for both the Expense Group and Expense Universe; and the net operating expenses are below median for the Expense Group and above median for the Expense Universe. With respect to the Investor Class of the Portfolio, the Board noted that the net management fee is significantly below median for both the Expense Group and Expense Universe, and the net operating expenses are significantly above median for both the Expense Group and Expense Universe. The Board noted that the above median ranking for the net advisory fee is due to the Portfolio’s small asset size and the substantial additional expenses associated with this type of specialty offering that are not common to emerging market funds generally. The Board further noted that the above median ranking for net total expense ratio was due, in part, to the lack of a Morningstar category of funds that invest primarily in frontier markets or the smallest emerging markets.
53
Harding, Loevner Funds, Inc.
Approval of Investment Advisory Agreement (continued)
(unaudited)
Conclusion
Following extensive discussion, both in general session and in executive session of the Independent Directors meeting alone with Independent Counsel, the Board determined that it had received sufficient information to take action on the proposed resolutions regarding continuance of the Advisory Agreement. The Board, including a majority of the Independent Directors, concluded with respect to each Portfolio that the fees to be paid by the Portfolio were reasonable in light of the nature, extent and quality of the services to be provided by the Adviser to each Portfolio, the Adviser’s costs, and each Portfolio’s current and reasonably foreseeable asset levels.
In light of all the foregoing, the Board, and separately, a majority of the Independent Directors, approved the continuance of the Advisory Agreement for each Portfolio. The Board’s decision was based on all of the above-mentioned factors and their related conclusions, with no single factor or conclusion being determinative and with each director not necessarily attributing the same weight to each factor.
54
Harding, Loevner Funds, Inc.
Privacy Notice
(unaudited)
HARDING, LOEVNER FUNDS, INC.
PRIVACY NOTICE
The Fund collects nonpublic personal information about you from the following sources:
| | • | | Information, such as your name, address, social security number, assets and income, submitted by you on applications, forms, or in other written or verbal customer communications. This information may also be provided by a consultant or intermediary acting on your behalf. |
| | • | | Information that results from any transaction performed by us for you. |
The Fund will not disclose any nonpublic personal information about you or its former customers to anyone except as permitted or required by law.
If you decide to close your account(s) or become an inactive customer, the Fund will adhere to the privacy policies and practices as described in this notice.
The Fund restricts access to your personal and account information to only those employees who need to know that information to provide products or services to you. The Fund maintains physical, administrative and technical safeguards to protect your nonpublic personal information.
55
Harding, Loevner Funds, Inc.
Directors and Principal Officers
(unaudited)
Disinterested Directors:
| | | | | | | | | | |
Name, Address and Age | | Position with
the Fund | | Term of
Office and
Length of
Time Served* | | Principal Occupation During Past Five Years | | Number of
Portfolios in
Fund Complex
Overseen By
Director | | Other Directorships |
William E. Chapman, II c/o Harding Loevner LP 400 Crossing Boulevard Fourth Floor Bridgewater, NJ 08807 Age, 72 | | Director | | Indefinite; Director since 2008; Chairperson of the Audit Committee since 2009 | | Longboat Retirement Planning Solutions, President and Owner, 1998 – present; Bowdoin College, Trustee 2002 – 2013; Mutual Fund Directors Forum, Inc., Director and Treasurer, 2010 – present; Sarasota Memorial Healthcare Foundation, Inc., Director, 2011 – present; Hewitt Associates, LLC (part-time employee) (provider of retirement and investment education seminars), 2000 – 2009. | | 6 | | Third Avenue Trust (5 portfolios); Third Avenue Variable Trust (1 portfolio); Aston Funds (23 Portfolios); The Managers Funds, Managers AMG Funds, Managers Trust I and Managers Trust II (40 portfolios). |
| | | | | |
R. Kelly Doherty c/o Harding Loevner LP 400 Crossing Boulevard Fourth Floor Bridgewater, NJ 08807 Age, 55 | | Director | | Indefinite; Director since 2004 | | Cayman Advisors (private investment vehicles), Managing Partner, 1999 – present. | | 6 | | None. |
| | | | | |
Charles Freeman c/o Harding Loevner LP 400 Crossing Boulevard Fourth Floor Bridgewater, NJ 08807 Age, 49 | | Director | | Indefinite; Director since 2008 | | Rock Creek Global Advisors, LLC, Vice President, 2013 – present; PepsiCo, Vice President Global Public Policy and Government Relations, 2011 – 2013; National Committee on US-China Relations (Non-Profit) 2007 – 2009 and 2010 – present; Center for Strategic and International Studies, Freeman Chair in China Studies, 2007 – 2011. | | 6 | | None. |
| | | | | |
Jane A. Freeman c/o Harding Loevner LP 400 Crossing Boulevard Fourth Floor Bridgewater, NJ 08807 Age, 60 | | Director | | Indefinite; Director since 1996; Lead Independent Director since 2008; Member of the Audit Committee since 2010 | | Scientific Learning Corporation (Education Software), Chief Financial Officer, 2012 – present; Taproot Foundation (Non-Profit), Director, 2010 – present; Russell Exchange Traded Funds Trust, Trustee and Chair of Audit Committee, 2011 – 2012; Consultant, 2008 – 2012. | | 6 | | None. |
56
Harding, Loevner Funds, Inc.
Directors and Principal Officers (continued)
(unaudited)
Disinterested Directors (continued):
| | | | | | | | | | |
Name, Address and Age | | Position with
the Fund | | Term of
Office and
Length of
Time Served* | | Principal Occupation During Past Five Years | | Number of
Portfolios in
Fund Complex
Overseen By
Director | | Other Directorships |
Samuel R. Karetsky c/o Harding Loevner LP 400 Crossing Boulevard Fourth Floor Bridgewater, NJ 08807 Age, 68 | | Director | | Indefinite; Director since 1998; Member of the Audit Committee since 1998 | | The Karetsky Group LLC (Advisory Firm), Managing Member, 2003 – present; Wetherby Asset Management, Wealth Manager, 2004 – present. | | 6 | | None. |
| | | | | |
Eric Rakowski c/o Harding Loevner LP 400 Crossing Boulevard Fourth Floor Bridgewater, NJ 08807 Age, 55 | | Director | | Indefinite; Director since 2008 | | University of California at Berkeley School of Law, Professor, 1990 – present. | | 6 | | Third Avenue Trust (5 portfolios); Third Avenue Variable Trust (1 portfolio); Aston Funds (23 Portfolios); The Managers Funds, Managers AMG Funds, Managers Trust I and Managers Trust II (40 portfolios). |
57
Harding, Loevner Funds, Inc.
Directors and Principal Officers
(unaudited)
Interested Directors:
| | | | | | | | | | |
Name, Address and Age | | Position with
the Fund | | Term of
Office and
Length of
Time Served* | | Principal Occupation During Past Five Years | | Number of
Portfolios in
Fund Complex
Overseen By
Director | | Other Directorships |
David R. Loevner** Harding Loevner LP 400 Crossing Boulevard Fourth Floor Bridgewater, NJ 08807 Age, 59 | | Director and Chairman of the Board of Directors | | Indefinite; Director and Chairman of the Board since 1996 | | Harding Loevner LP, President and Chief Executive Officer 1989 – present; Harding Loevner Funds, plc, Director, 2007 – present. | | 6 | | None. |
| | | | | |
Jennifer M. Borggaard** Affiliated Managers Group, Inc. 600 Hale Street Prides Crossing, MA 01965 Age, 44 | | Director | | Indefinite; Director since 2008 | | Affiliated Managers Group, Inc. (“AMG”) (asset management firm), Senior Vice President, 2007 – present; Friends of Marblehead Public Schools, 2011 – present, Board Member; Shore Country Day School, 2013 – present. | | 6 | | Beutel, Goodman & Company LTD; Genesis Asset Managers, LLP; Montrusco Bolton Investments Inc.; Arrow Bidco Ltd. |
* Each director is elected to serve in accordance with the Articles of Incorporation and By-Laws of the Fund until his or her successor is duly elected and qualified.
**David R. Loevner is considered an “interested person” of the Fund as defined in the Investment Company Act of 1940, as amended, because he serves as President of Harding Loevner LP, the Fund’s investment advisor. Jennifer M. Borggaard is an interested person of the Fund because she is an officer of AMG.
The Funds’ Statement of Additional Information contains additional information about the Directors and is available upon request and without charge by calling (877) 435-8105.
58
Harding, Loevner Funds, Inc.
Directors and Principal Officers (continued)
(unaudited)
Principal Officers of the Fund:
| | | | | | |
Name, Address and Age | | Position with the Fund | | Term of Office and Length of Time Served* | | Principal Occupation During Past Five Years |
Richard Reiter Harding Loevner LP 400 Crossing Boulevard Fourth Floor Bridgewater, NJ 08807 Age, 47 | | President | | 1 year; since 2011 | | Harding Loevner LP, Chief Operating Officer, 1996 – present. |
| | | |
Susan Mosher Foreside Compliance Services, LLC Three Canal Plaza, Suite 100 Portland, ME 04101 Age, 58 | | Chief Compliance Officer of the Funds | | 1 year; since 2010 | | Foreside Compliance Services, LLC, Managing Director – Compliance Services, July 2013 to present; Head of Compliance Services, 2009 – July 2013; Coast Asset Management, LLC, Chief Compliance Officer, 2007 – 2009. |
| | | |
Charles S. Todd Foreside Management Services, LLC Three Canal Plaza, Suite 100 Portland, ME 04101 Age, 42 | | Chief Financial Officer of the Funds | | 1 year; since 2010 | | Foreside Management Services, LLC, Business Head, Sarbanes-Oxley Services, 2012 – Present, Director, 2008 – 2012. |
| | | |
Patrick Keniston Foreside Compliance Services, LLC Three Canal Plaza, Suite 100 Portland, ME 04101 Age, 49 | | Anti-Money Laundering Compliance Officer | | 1 year; since 2012 | | Foreside Compliance Services, LLC, Director, 2008 – present. |
| | | |
Aaron Bellish Harding Loevner LP 400 Crossing Boulevard Fourth Floor Bridgewater, NJ 08807 Age, 34 | | Assistant Treasurer | | 1 year; since 2012 | | Harding Loevner LP, Chief Financial Officer, 2012 – present; Mount Kellett Capital Management, Chief Financial Officer, formerly serving as Controller, 2008 – 2012. |
| | | |
Thomas A. Dula The Northern Trust Company 50 South LaSalle Street Chicago, IL 60603 Age, 39 | | Assistant Treasurer | | 1 year; since 2010 | | The Northern Trust Company, Vice President and Client Service Delivery Manager, 2010 – present, Relationship Manager, 2009 – 2010, and Institutional Trust Account Administrator, 2004 – 2009. |
59
Harding, Loevner Funds, Inc.
Directors and Principal Officers (continued)
(unaudited)
Principal Officers of the Fund (continued):
| | | | | | |
Name, Address and Age | | Position with the Fund | | Term of Office and Length of Time Served* | | Principal Occupation During Past Five Years |
Owen T. Meacham The Northern Trust Company 50 South LaSalle Street Chicago, IL 60603 Age, 42 | | Secretary | | 1 year; since 2010 | | The Northern Trust Company, Senior Vice President and Managing Attorney,
2012 – present, Vice President and Senior Corporate Attorney, 2007 – 2012 |
| | | |
Lori M. Renzulli 400 Crossing Boulevard Fourth Floor Bridgewater, NJ 08807 Age, 47 | | Assistant Secretary | | 1 year; since 2008 | | Harding Loevner LP, Chief Counsel and Chief Compliance Officer, 2006 – present. |
| | | |
Marcia Y. Lucas The Northern Trust Company 50 South LaSalle Street Chicago, IL 60603 Age, 46 | | Assistant Secretary | | 1 year; since 2011 | | The Northern Trust Company, Vice President, 2011 – present, Second Vice President, 2010; Michael Best & Friedrich LLP, Partner, 2005 – 2010. |
* Officers are elected to hold such office until their successor is elected and qualified to carry out the duties and responsibilities of their office, or until he or she resigns or is removed from office.
60
Harding, Loevner Funds, Inc.
Supplemental Information
(unaudited)
Quarterly Form N-Q Portfolio Schedule
Each Portfolio will file its complete portfolio of investments with the SEC on Form N-Q at the end of the first and third fiscal quarters within 60 days of the end of the quarter to which it relates. The Portfolios’ Form N-Q will be available on the SEC’s website at www.sec.gov and may also be reviewed and copied at the SEC’s Public Reference Room whose telephone number is (800) SEC-0330. Additionally, they are available upon request by calling (877) 435-8105.
Proxy Voting Record
The Fund’s proxy voting record relating to the Portfolios’ securities during the most recent 12-month period ended June 30 is available on the Fund’s website at www.hardingloevnerfunds.com and on the SEC’s website at www.sec.gov, on Form N-PX.
Proxy Voting Policies and Procedures
A description of the Fund proxy voting policies and procedures are located in the Statement of Additional Information and is available without charge, upon request, by calling (877) 435-8105 or on the SEC’s website at www.sec.gov.
Additional Information
The Adviser updates Fact Sheets for the Portfolios each calendar quarter, which are posted to the Fund’s website – www.hardingloevnerfunds.com. This information, along with the Adviser’s commentaries on its various strategies, is available without charge, upon request, by calling (877) 435-8105.
61


Item 2. Code of Ethics.
| (a) | As of October 31, 2013, the Registrant has adopted a code of ethics that applies to the Registrant’s President/Chief Executive Officer and Treasurer/Chief Financial Officer (the “Code of Ethics”). |
| (c) | For the fiscal year ended October 31, 2013, there were no amendments to a provision of the Registrant’s Code of Ethics. |
| (d) | For the fiscal year ended October 31, 2013, there were no waivers granted from a provision of the Registrant’s Code of Ethics. |
Item 3. Audit Committee Financial Expert.
The Registrant’s Board of Directors has determined that the following members of the Audit Committee are audit committee financial experts and independent: William Chapman II and Jane Freeman.
Item 4. Principal Accountant Fees and Services.
(a) Audit Fees: The aggregate fees billed for each of the last two fiscal years for professional services rendered by KPMG LLP, the Registrant’s principal accountant, for the audit of the Registrant’s annual financial statements in connection with statutory and regulatory filings or engagements for those fiscal years are $143,000 in 2013 and $138,770 in 2012.
(b) Audit-Related Fees: The aggregate fees billed in each of the last two fiscal years for assurance and related services by KPMG LLP that are reasonably related to the performance of the audit of the Registrant financial statements and are not reported under paragraph (a) of this Item are NONE.
(c) Tax Fees: The aggregate fees billed in each of the last two fiscal years for professional services rendered by KPMG LLP for the review of domestic tax returns were $43,800 in 2013 and $43,200 in 2012.
(d) All Other Fees: The aggregate fees billed in each of the last two fiscal years for products and services provided by KPMG LLP, other than the services reported in paragraphs (a) through (c) of this Item are NONE.
(e)(1) Disclose the audit committee pre-approval policies and procedures described in paragraph (c)(7) of Rule 2-01 of Regulation S-X.
A copy of the Audit Committee’s Pre-Approval Policies and Procedures is filed with this Form N-CSR under Item 12(c).
(e)(2) The percentage of services described in each of paragraphs (b) through (d) of this Item that were approved by the audit committee pursuant to paragraph (c)(7)(i)(C) of Rule 2-01 of Regulation S-X are as follows:
Paragraph (b) Audit-Related Fees: Not applicable
Paragraph (c) Tax Fees: 100%
Paragraph (d): All Other Fees: Not applicable
(f) Not applicable.
(g) Not applicable.
(h) Not applicable.
Item 5. Audit Committee of Listed Registrants.
Not applicable.
Item 6. Investments.
| (a) | Schedule I is included as part of the report to shareholders filed under Item 1 of this report on Form N-CSR. |
Item 7. Disclosure of Proxy Voting Policies and Procedures for Closed-End Management Investment Companies.
Not applicable.
Item 8. Portfolio Managers of Closed-End Management Investment Companies.
Not applicable.
Item 9. Purchases of Equity Securities by Closed-End Management Investment Company and Affiliated Purchasers.
Not applicable.
Item 10. Submission of Matters to a Vote of Security Holders.
Not applicable.
Item 11. Controls and Procedures.
| (a) | The Registrant’s Principal Executive Officer and Principal Financial Officer, or persons performing similar functions, have concluded that the Registrant’s disclosure controls and procedures (as defined in Rule 30a-3(c) under the Investment Company Act of 1940, as amended (the “1940 Act”)) were effective as of a date within 90 days prior to the filing date of this report, based on their evaluation of the effectiveness of the Registrant’s disclosure controls and procedures as of the evaluation date. |
| (b) | There were no significant changes in the Registrant’s internal control over financial reporting (as defined in Rule 30a-3(d) under the 1940 Act) that occurred during the second fiscal quarter of the period covered by this report that have materially affected, or are reasonably likely to materially affect, the Registrant’s internal control over financial reporting. |
Item 12. Exhibits.
(a)(1) Exhibit 99.12.A: Incorporated by reference to Exhibit 12(a)(1) to the report filed on Form N-CSR on January 7, 2013 (Accession No. 0001193125-13-005151).
(a)(2) Exhibit 99.CERT: Certifications pursuant to Rule 30a-2(a) of the Act are attached.
(a)(3) Not applicable.
(b) Exhibit 99.906: Certifications pursuant to Rule 30a-2(b) of the Act are attached hereto.
(c) Exhibit 99.12.C: Incorporated by reference to Exhibit 12(c) of the report filed on Form N-CSR on January 7, 2013 (Accession No. 0001193125-13-005151).
SIGNATURES
Pursuant to the requirements of the Securities Exchange Act of 1934 and the Investment Company Act of 1940, the Registrant has duly caused this report to be signed on its behalf by the undersigned, thereunto duly authorized.
| | | | |
| Harding, Loevner Funds, Inc. | | |
| | |
| By | | /s/ Richard T. Reiter | | |
| | Richard T. Reiter | | |
| | (Principal Executive Officer) | | |
| |
| Date: January 6, 2014 | | |
|
| Pursuant to the requirements of the Securities Exchange Act of 1934 and the Investment Company Act of 1940, this report has been signed below by the following persons on behalf of the Registrant and in the capacities and on the dates indicated. |
| | |
| By | | /s/ Richard T. Reiter | | |
| | Richard T. Reiter | | |
| | (Principal Executive Officer) | | |
| |
| Date: January 6, 2014 | | |
| | |
| By | | /s/ Charles S. Todd | | |
| | Charles S. Todd | | |
| | (Principal Financial Officer) | | |
| |
| Date: January 6, 2014 | | |