Table of Contents
UNITED STATES
SECURITIES AND EXCHANGE COMMISSION
Washington, D.C. 20549
FORM N-CSR
CERTIFIED SHAREHOLDER REPORT OF REGISTERED
MANAGEMENT INVESTMENT COMPANIES
Investment Company Act file number 811-07739
Harding, Loevner Funds, Inc.
(Exact name of registrant as specified in charter)
400 Crossing Boulevard
Fourth Floor
Bridgewater, NJ 08807
(Address of principal executive offices) (Zip code)
Owen T. Meacham
The Northern Trust Company
50 South LaSalle Street
Chicago, IL 60603
With a copy to:
Stephen H. Bier, Esq.
Dechert LLP
1095 Avenue of the Americas
New York, NY 10036
(Name and address of agent for service)
Registrant’s telephone number, including area code: (877) 435-8105
Date of fiscal year end: 10/31
Date of reporting period: 10/31/2016
Table of Contents
Item 1. Reports to Stockholders.
Table of Contents
Table of Contents
 HARDING LOEVNER FUNDS
Global equity investing for institutions is Harding Loevner’s exclusive focus. Through Harding Loevner Funds it offers six distinct global strategies based on its quality-and-growth investment philosophy. It seeks to purchase shares of growing, financially strong, well-managed companies at favorable prices. Harding Loevner manages each of the Funds’ Portfolios according to a disciplined, research-based investment process. It identifies companies with sustainable competitive advantages and assesses the durability of their earnings growth by conducting in-depth fundamental research into global industries. In constructing portfolios, Harding Loevner diversifies carefully to limit risk.
RECEIVE INVESTOR MATERIALS ELECTRONICALLY
Shareholders may sign up for electronic delivery of investor materials. By doing so, you will receive the information faster and help us reduce the impact on the environment of providing these materials. To enroll in electronic delivery,
| 1. | Go to http://www.icsdelivery.com |
| 2. | Select the first letter of your brokerage firm’s name. |
| 3. | From the list that follows, select your brokerage firm. If your brokerage firm is not listed, electronic delivery may not be available. Please contact your brokerage firm. |
| 4. | Complete the information requested, including the e-mail address where you would like to receive notifications for electronic documents. |
Your information will be kept confidential and will not be used for any purpose other than electronic delivery. If you change your mind, you can cancel electronic delivery at any time and revert to physical delivery of your materials. Just go to http://www.icsdelivery.com, perform the first three steps above, and follow the instructions for cancelling electronic delivery. If you have any questions, please contact your brokerage firm.
Table of Contents
4 | Letter to Our Shareholders
10 | International Equity Portfolio
14 | International Equity Research Portfolio
18 | International Small Companies Portfolio
22 | Emerging Markets
26 | Frontier Emerging Markets Portfolio
CONTACT
Harding, Loevner Funds, Inc. c/o Northern Trust Attn: Funds Center C5S 801 South Canal Street Chicago, IL 60607
Phone: (877) 435-8105 Fax: (312) 267-3657 www.hardingloevnerfunds.com | Must be preceded or accompanied by a current Prospectus. Quasar Distributors, LLC, Distributor |
3
| ||||
Table of Contents

 | DAVID LOEVNER, CFA, CIC CHAIRMAN OF THE FUNDS AND CEO OF THE ADVISER
SIMON HALLETT, CFA CO-CIO OF THE ADVISER
FERRILL ROLL, CFA CO-CIO OF THE ADVISER |
At Harding Loevner we pursue continuous improvement of how we go about our job of investing. We have to keep getting better, because our goal of superior risk-adjusted returns, never easy to achieve, keeps getting harder! The “market” today is dominated by professional and institutional investors. As the average active investment manager gets better at every aspect of its game, the market becomes more efficient and thus harder for any one of them to beat. Competition among them and with passive investment products pushes weaker managers out. Recent low nominal returns especially have laid bare the value-for-money shortcomings of the many managers who failed to deliver the long-term performance they promised.
The survivors of this contest include many of the best active managers—and just a few of the luckiest. Because variations among them in investing skill are now smaller, their relative results on all but the longest time frames, paradoxically, come to be dominated by luck rather than skill. The paradox of skill is that it becomes hard on the basis of results alone to discern differences in skill among the most highly skilled. The consequence for investment managers is even more intense competition.
Adding to our competitive challenge, the return premium that has been available to investors (both passive and active, including ourselves) who favor fundamental business quality has been eroded in recent years by a rise in relative valuation of high-quality companies. Hence the need for us to redouble our efforts to improve our investment process yet further and to stiffen our resolve to stick to that process.
Michael Mauboussin, a deep thinker about the practice of investing, identifies four potential sources of competitive advantage for investors: Informational, Analytical, Behavioral, and Organizational. We find his taxonomy useful for organizing our thoughts about self-improvement.
Information—What Data is Useful?
We’ve never felt we had much in the way of information advantage over other investors. In our early years, when gathering data about the companies in our global investment universe was essentially a manual task of requesting printed materials by mail and of travelling far afield to meet with company managements, there were simply too few of us to outdo others! Later we defended our choice not to have multiple research outposts by pointing to the internet as a means for instantaneous distribution of financial
information and direct management contact. Nowadays, we face competitors who have torrents of incoming data and the computing capacity to crunch it, including a few who have turned to satellite or social media surveillance to detect changes in industrial, agricultural, and consumer activity in real time.
But Andrew West, our manager of research, points out that we have a different source of informational advantage: the advantage of looking for what few others care about, and finding it hidden in plain sight.
If the investment industry is increasingly focused on higher-frequency data, spending heavily to become the first to get, and to trade on, information, we are instead listening for longer-wavelength signals. While we may appear deaf to much of the high-frequency, big-data trends, we suspect these noisy signals are pulling investor attention away from more persistently meaningful information. We seek out only the kind of information that informs our understanding of medium- to long-term corporate value creation, rather than information that relates to any short-term “edge.”
Our research analysts are constantly searching for indicators of the presence (or absence) of our four key investment criteria: competitive advantage, quality management, financial strength, and sustainable growth. When weighing a company’s prospects, they are looking ahead five to ten years. Reading a quarterly report or meeting with management with an ear tuned for changes in competitive landscape and strategy leads to different observations compared with searching for information to refine an estimate of the next quarter’s earnings.
Information isn’t undifferentiated. Our research process provides both a filter for reducing noise and an amplifier for those signals that should be most important to our analysts. We may not know how many cars are in our companies’ parking lots or their latest Twitter trends, but we do have the information that should allow us to predict which companies will have fuller parking lots and be more liked by customers in the years ahead.
Analysis—Where Information Becomes Insight
This pursuit of longer-term phenomena ties directly to our analytical process and its advantages. We get our edge by focusing on the fundamental factors that matter most to long-run success in business, integrating these factors into a consistent, repeatable process, and executing that process skillfully.
We have adopted a common language in which to discuss the long-run drivers of business success such as industry competitive forces and trends, company strategy and growth opportunity, and management skill. Our analysts proceed to research a company in depth only after they can make a hypothesis that it meets each of our four quality-growth criteria. After making that hypothesis, they assess and score the company on ten distinct quality aspects, including each of Michael Porter’s five competitive forces*, as
4
|
Table of Contents
well as growth, financial strength, management quality, and ESG (Environmental, Social, and Governance) risks. We use checklists when practical, to ensure that we cover what should be covered and do so as objectively as possible.
This process is only as good as the discipline with which we follow it. No company can be held in our portfolios unless it has been through this process and continues to be covered by an analyst, with the analyst’s work subject to criticism from anyone and everyone in the research group. It is a painstaking process—this year our analysts each added just three new companies on average to our list of eligible investments. Analysts must regularly update companies’ operational mileposts and financial models, with all such updates and other company notes captured in our all-encompassing research database.
Behavior—Where Insights are Converted into Returns (Or Squandered!)
For years we have striven to raise our ability to identify and overcome our own biases as investors (by which we mean, our biases as humans, which carry over to our investing instincts). In searching for potential new investments our analysts use objective screens of fundamental data to avoid the high potential opportunity costs of analyzing companies that have low likelihood of ultimately meeting our stringent criteria. And we disaggregate our decision making into discrete components to avoid the halo effect, where attractive attributes from one facet are conflated with the assessment of another facet, rendering a higher overall assessment than is actually warranted.
One common bias is to only look for information that confirms your prior beliefs or hypothesis, known as confirmation bias. Confirmation bias is often compounded with groupthink, where a given hypothesis is arrived at by consensus, and no one has incentives to challenge it. We’ve tried hard to rid our process of consensus decision-making, while retaining, even emphasizing, the benefits of debate and challenge. Each investment decision is made by an individual, and the results of those decisions are measured, aggregated, and then fed through to that individual’s compensation, linking incentives and good decisions. By continuing to raise the bar in demanding feedback from colleagues, we raise the quality of the debate without raising the rancor.
Another inherent bias is that of overconfidence. We resist over-confidence in several ways. Our culture of debate inspires analysts regularly to reconsider their assumptions. Moreover, portfolio managers may hold (and act on) opinions that differ from those of the analyst. Our diversification rules also preclude over-concentration of our portfolios, while our preference runs to making individual stock picks over making big strategic bets. Growth investors
can compound overconfidence by extrapolating a rosy past into the future, which we resist by adopting into our valuation models the concept of fading returns.
Investors can also fall under the spell of the endowment effect, whereby they’re more comfortable keeping what they already own than switching to better-priced investments. We raise yellow flags to alert PMs to this bias risk.
Finally, we strive to communicate and capture as much of our reasoning as possible in writing (with over 100,000 analyst notes recorded in the past five years), which allows us to re-examine our prior decisions. The purpose of such self-criticism is to root out behavioral errors that bedevil all human decisions.
Organization & Culture—Where Incentives Reinforce Behavior
One of the hallmarks of the culture at Harding Loevner is the transparency that surrounds each decision. Analysts are solely responsible for choosing which companies they believe meet our criteria, but they have to lay out the rationale for their choices and invite input from colleagues. Every financial model they build to inform their buy/sell recommendations is open to all for scrutiny. But their recommendations are their own decisions. A PM can own only stocks that are rated by analysts, and thus is tied to the effectiveness of their combined efforts. But a PM’s decisions are independent of analysts’ decisions, since to be eligible for inclusion in the portfolio we require only that a company’s quality meet our threshold, not that its valuation or timeliness receive consensus approval. That each analyst and PM owns their own decisions engenders maximum accountability and minimum finger-pointing.
We aspire to provide the ideal organizational environment for making investment decisions under conditions of uncertainty. The firm’s compensation framework aligns employee interests with client aims, rewarding good decisions over diplomacy and salesmanship, and reserving our largest compensation for partners who have demonstrated a sustained ability to deliver good decisions tied to clients’ interests. That framework has fostered long-term employee loyalty, yet has proven flexible enough to accommodate the unpredictability of our trade. Our success at attracting a global clientele lends greater commercial diversification, and by extension, greater stability, to the organization. All this means our investment team can focus primarily on their job of delivering superior risk-adjusted returns for clients—even as others in the industry around them cope with turmoil.
In the years ahead, we’ll be looking for additional ways that we can improve the conversion of our insights into the portfolios we manage, and continue to justify the trust that you have placed in us as stewards of your capital.
Sincerely,
David R. Loevner, CFA |
Simon Hallett, CFA |
Ferrill D. Roll, CFA |


*Threat of Entry, Power of Suppliers, Power of Buyers, Threat of Substitutes, and Industry Rivalry. Michael Porter, “The Five Competitive Forces that Shape Strategy,” Harvard Business Review, January 2008, 78-93. Opinions expressed are those of Harding Loevner and are not intended to be forecasts of future events, a guarantee of future results, nor investment advice. Please read the separate disclosure page for important information, including the risks of investing in the Portfolios. Past performance is not a guarantee of future results.
5
|
Table of Contents

PORTFOLIO MANAGEMENT TEAM

PETER BAUGHAN, CFA CO-LEAD PORTFOLIO MANAGER
FERRILL ROLL, CFA CO-LEAD PORTFOLIO MANAGER
| CHRISTOPHER MACK, CFA PORTFOLIO MANAGER
RICHARD SCHMIDT, CFA PORTFOLIO MANAGER
ALEXANDER WALSH, CFA PORTFOLIO MANAGER |
 PERFORMANCE SUMMARY
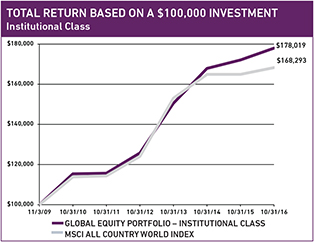
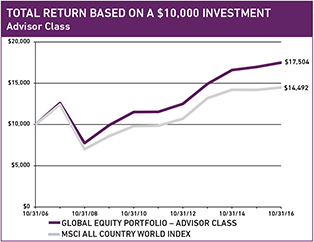
The Global Equity Portfolio – Institutional Class rose 3.43% and the Advisor Class gained 3.12% (net of fees and expenses) in the fiscal year ended October 31, 2016. The Portfolio’s benchmark, the MSCI All Country World Index, gained 2.05% (net of source taxes) in this period.
MARKET REVIEW
Markets turned in muted results in the fiscal year. Stocks recovered from a sell-off in late January as fears of a rapidly slowing Chinese economy ebbed after signs of improvement. This rebound was temporarily interrupted by the shocking “Leave” outcome of the EU referendum in the UK in late June. However, investors quickly turned their focus toward additional financial stimulus around the globe. The European Central Bank continued to ramp up its corporate bond-buying program, and the Bank of Japan adjusted its quantitative easing program. Meanwhile, Japanese Prime Minister Shinzō Abe launched a US$130 billion fiscal stimulus plan.
Stocks recovered from a sell-off in late
January as fears of a rapidly slowing Chinese
economy ebbed.
Materials and Information Technology (IT) were the best-performing sectors. Materials benefited from rising commodity prices, while IT stock returns reflected strong revenue growth and earnings results. Financials declined less than 2% for the year as a whole, masking a volatile period—sharp declines in early 2016 due to profitability worries as negative interest rates spread into more economies were followed by optimism that rates would increase. Health Care declined the most as high US drug prices attracted further political scrutiny, risking new regulatory moves in the main locus of multinational drug company profits.
FUND FACTS at October 31, 2016 | ||||||||
TOTAL NET ASSETS | $835.7M | |||||||
SALES CHARGE | NONE | |||||||
NUMBER OF HOLDINGS | 68 | |||||||
TURNOVER (5 YR. AVG.) | 29% | |||||||
REDEMPTION FEE | 2% FIRST 90 DAYS | |||||||
DIVIDEND POLICY | ANNUAL | |||||||
| INSTITUTIONAL CLASS | ADVISOR CLASS | |||||||
TICKER | HLMVX | HLMGX | ||||||
CUSIP | 412295602 | 412295206 | ||||||
INCEPTION DATE | 11/3/2009 | 12/1/1996 | ||||||
MINIMUM INVESTMENT1 | $100,000 | $5,000 | ||||||
EXPENSE RATIO | 0.92% | 1.18% | ||||||
1Lower minimums available through certain brokerage firms.
Viewed geographically, Pacific ex-Japan led returns, followed by emerging market (EM) stocks, which saw sharp recoveries in the year. Brazil was particularly strong due to a combination of strengthening commodity prices and the consummated impeachment of President Dilma Rousseff, which ushered in the prospect of a more business-friendly government. European stock markets were weak, due not only to worries over the trade implications of the UK referendum, but also to the potential for other disgruntled EU members to follow in the decision to leave the EU. Germany and France, key trading partners of the UK, declined over expected harm to exports. Spain and Italy fell even more as investors focused on the rising strength of their anti-Europe populist parties and the dependence of their teetering banks on continued access to eurozone financing.
Source: FactSet. Data as of October 31, 2016, MSCI Inc. and S&P.
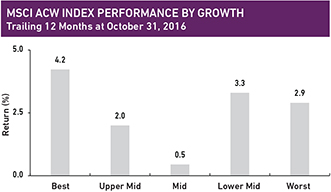
Harding Loevner growth rankings are proprietary measures determined using objective data that rank companies based on an assessment of historic growth of earnings, sales, and assets, as well as expected moves in earnings and profitability.
6
|
Table of Contents
PERFORMANCE (% TOTAL RETURN)
| for periods ending September 30, 2016 | for periods ending October 31, 2016 | |||||||||||||||||||||||||||||||||||||||||||||||||
| 1 YEAR | 3 YEARS | 5 YEARS | 10 YEARS | SINCE INCEPTION* | 1 YEAR | 3 YEARS | 5 YEARS | 10 YEARS | SINCE INCEPTION* | |||||||||||||||||||||||||||||||||||||||||
GLOBAL EQUITY PORTFOLIO - INSTITUTIONAL CLASS | 15.06 | 7.47 | 11.56 | – | 9.04 | – | 3.43 | 5.75 | 9.00 | – | 8.60 | – | ||||||||||||||||||||||||||||||||||||||
MSCI ALL COUNTRY WORLD INDEX | 11.96 | 5.18 | 10.64 | 4.34 | 8.10 | – | 2.05 | 3.21 | 8.04 | 3.78 | 7.73 | – | ||||||||||||||||||||||||||||||||||||||
GLOBAL EQUITY PORTFOLIO - ADVISOR CLASS | 14.74 | 7.20 | 11.26 | 6.31 | – | 6.54 | 3.12 | 5.47 | 8.70 | 5.76 | – | 6.40 | ||||||||||||||||||||||||||||||||||||||
Returns are annualized for periods greater than 1 year. *Inception of the Institutional Class, 11/3/09. Inception of the Advisor Class, 12/1/96. Index performance prior to 1/1/01 cannot be shown since it relies on back-filled data.
Performance data quoted represents past performance; past performance does not guarantee future results. The investment return and principal value of an investment will fluctuate so that an investor’s shares, when redeemed, may be worth more or less than their original cost. Current performance of the Portfolio may be lower or higher than the performance quoted. Performance data current to the most recent month end may be obtained by calling (877) 435-8105 or visiting www.hardingloevnerfunds.com. Performance data shown does not reflect the 2.00% redemption fee imposed on shares held 90 days or less; otherwise, total returns would be reduced.
The charts below illustrate the hypothetical return of an investment made in the corresponding share classes. Investment return reflects voluntary fee waivers in effect. Absent such waivers, total return would be reduced. The performance provided in the table above and charts below do not reflect the deduction of taxes that a shareholder would pay on Portfolio distributions or the redemption of Portfolio shares.
Style effects were mixed. The fastest-growing quintile of companies, led by many of the internet-based businesses in IT and Consumer Discretionary, performed far better than the other eighty percent. However, for the trailing year ended October 31, 2016, the MSCI US Value Index outperformed the US Growth Index.
PERFORMANCE ATTRIBUTION
The Global Equity Portfolio outperformed the benchmark thanks to stock selection. The Portfolio had substantial exposure to the fastest-growing companies, an important source of strong performers this year.
Viewed by sector, our Health Care holdings outpaced the lagging sector, led by online medical information platform M3 and biopharmaceuticals company Lonza Group. In IT, the takeover of ARM Holdings helped returns, alongside strong returns from network technology company F5 Networks, sensor and measurement equipment company Keyence, components manufacturer Cognex, telecom provider Tencent, Russian search engine Yandex, and Facebook. Strong stocks in Financials were another source of returns, thanks to Itau Unibanco, First Republic Bank, Bank Central Asia, and AIA Group. Poor stocks in Telecom Services and lack of Materials investments exposed to mining detracted the most from relative returns.
By region, strong stocks in Japan, led by M3, Keyence, and baby-care goods company Pigeon, contributed the most to performance. Strong stocks in Europe ex-EMU also contributed, due to the takeover of ARM Holdings and the strong stock performance from Lonza Group and Atlas Copco. Our stocks in EMs lagged, hurt by ICICI Bank, which revealed a surge in non-performing loans. In the US, Nike hurt returns as management cut earnings guidance for the company while it works through unsold inventories. Shares of Wells Fargo also fell as the unauthorized accounts scandal created a political firestorm. Strong IT stocks kept the return of US holdings not far behind the Index.
PERSPECTIVE AND OUTLOOK
The overall environment this fiscal year has been benign for investing, with rising markets punctuated by periodic conniptions. Most of the latter have had to do with investors trying to divine the intentions or next move of monetary authorities, and in 2016 those moves have included the shift from ZIRP to NIRP (zero interest rate policy to negative interest rate policy) and recently, some guesses about the US Federal Reserve heading the other way toward a first rate hike. But another source of seizure has been political events, such as the Brexit vote, the soap opera of Brazil’s presidential impeachment, and the attempted coup and
7
|
Table of Contents
subsequent crackdown in Turkey. The overall tone of stock markets has remained positive, but that trend is hard to disentangle from expectations of continued central bank liquidity injections into financial markets.
Over the past year, we have observed the increasingly high prices that high-quality and rapidly growing companies command in a low-growth, low-income world. We sense the emergence (in fits and starts) of a “value” style outperformance, which, if it persists, will be a headwind for our investment style. We felt it initially in the early 2016 rally in Energy and Materials. Another thread is the strong rally in EMs taken together as an asset class, recovering from three years of negative returns. Most recently, the phenomenon was visible in the rally in the share prices of Financials, particularly banks, and especially in Europe, where they’d previously been weakest. One might be tempted to see the return of merger and acquisition activity as another manifestation of that shift to a search for value. But so many of the targets of the announced transactions are high-quality companies that it feels less like a value-driven shift than just another facet of the ultra-low interest rates that have prevailed in the years since the financial crisis: earnings growth may be more easily purchased than achieved organically by companies with high-priced shares and access to cheap credit.
The overall tone of stock markets has remained
positive, but that trend is hard to disentangle
from expectations of continued central bank
liquidity injections into financial markets.
The value shift feels more advanced in the US, which fits with the general recovery from the crisis being further along or better established in that economy. There, the MSCI US Value Index has outperformed the US Growth Index by over 500 basis points in the fiscal year. But outside the US, the tailwind for value is, so far, less pronounced as value retreated heavily in the Brexit conniption—although it rebounded in the following months. In EMs, a resurgence in value stocks is even less visible, in part because
GEOGRAPHIC EXPOSURE (%) at October 31, 2016
| COUNTRY/REGION | PORTFOLIO | BENCHMARK1 | ||||||
CANADA | 0.0 | 3.2 | ||||||
EMERGING MARKETS | 11.6 | 11.2 | ||||||
EUROPE EMU | 10.1 | 10.1 | ||||||
EUROPE EX-EMU | 9.8 | 10.4 | ||||||
JAPAN | 11.9 | 8.2 | ||||||
MIDDLE EAST | 0.0 | 0.2 | ||||||
PACIFIC EX-JAPAN | 2.2 | 4.1 | ||||||
UNITED STATES | 49.1 | 52.6 | ||||||
FRONTIER MARKETS2 | 0.0 | – | ||||||
CASH | 5.3 | – | ||||||
1MSCI All Country World Index; 2Includes countries with less-developed markets outside the Index.
SECTOR EXPOSURE (%) at October 31, 2016
| SECTOR | PORTFOLIO | BENCHMARK1 | ||||||
CONSUMER DISCRETIONARY | 10.5 | 12.2 | ||||||
CONSUMER STAPLES | 5.8 | 10.1 | ||||||
ENERGY | 6.1 | 6.9 | ||||||
FINANCIALS | 16.2 | 17.6 | ||||||
HEALTH CARE | 16.9 | 11.1 | ||||||
INDUSTRIALS | 13.3 | 10.5 | ||||||
INFORMATION TECHNOLOGY | 23.2 | 16.1 | ||||||
MATERIALS | 2.7 | 5.2 | ||||||
REAL ESTATE | 0.0 | 3.2 | ||||||
TELECOM SERVICES | 0.0 | 3.7 | ||||||
UTILITIES | 0.0 | 3.4 | ||||||
CASH | 5.3 | – | ||||||
1MSCI All Country World Index.
the whole asset class is so beaten down that it almost all looks like value, and in part because the willingness of global investors to take EM cycle and governance risks is still restrained by recent memories of terrible performance.
Financials stocks, trading at low multiples of book value and earnings on average, would likely be particularly favored by a shift in the market toward greater focus on valuation, and also from a sustained rise in short-term interest rates. Given their hefty weight in the Index and our tendency to skew the Portfolio against Financials relative to the Index, this shift could pose a challenge for our strategy. In spite of the better performance from Financials in recent months, we are hard-pressed to get excited by its investment prospects.
Banks constitute more than half of the Index weight in Financials. We tend to prefer simple and transparent banks that are able to grow and generate strong returns without venturing far from the basic functions that banks perform in an economy, namely, taking deposits and making loans. Few banks are able to differentiate themselves, especially in developed economies. For the most part, the products and services that banks sell are almost identical, markets are saturated with branches, rivalry is fierce, and growth is scarce. Aside from logos and color schemes, a Chase bank branch does not look very different from a Barclays branch. The bargaining power of consumers is bolstered by broader availability of data that aids in comparison of product pricing, both on the lending and deposit-taking sides.
Faced with these challenges, banks sometimes adopt very risky tactics in order to win market share and generate growth. The credit crisis was precipitated by banks assuming nontraditional credit risks with increasing amounts of leverage. Wells Fargo, which was a rare big bank that avoided the credit pitfalls that ensnared its peers in the crisis, has lately provided an alternate example of bank managers pushing the edge of the envelope in order to grow. The high-pressure sales culture that its current managers nourished flowed directly from the sensible cross-selling strategy conceived by its long-serving and successful former CEO,
8
|
Table of Contents
Dick Kovacevich. The recent disclosures, regulatory penalties, and hearings on Wells Fargo’s case have thrown into question the company’s customer relationships and prospects for future growth, not to mention the judgment and efficacy of its management team, which took five years to address the underlying problem of pernicious incentives once they discovered bad behavior by thousands of employees.
In spite of the better performance
from Financials in recent months, we
are hard-pressed to get excited by its
investment prospects.
Furthermore, the threat from financial-technology companies offering new substitute services will further intensify the competitive forces in the industry, especially as those services are often supplied by technology rather than well-paid employees. And in the post-financial crisis world, regulators and central banks have only grown more intrusive. Their insistence on stronger capital ratios and greater asset liquidity constrains banks’ ability to deploy their capital toward profitable growth.
PORTFOLIO STRUCTURE
The most significant changes in Portfolio structure this year were a shift to an underweight position in the US for the first time in seven years and a further increase in our overweight position in Japan. We remain overweight in areas where we find the most attractive combination of business quality, growth, and valuation: IT, specifically software and services, and Health Care.
As Health Care stocks came under pressure, we added to existing holdings and bought new holdings in AmerisourceBergen, Regeneron, and Sysmex. We offset these purchases with sales of companies whose businesses faced risky challenges (Elekta, Davita HealthCare Partners, and IMS Health).
Due to MSCI’s recent decision to carve out Real Estate from Financials as a separate industrial sector, our Portfolio appears less skewed away from Financials than previously—the underweight having been transferred to the new sector, where we have no holdings. Within banks, we hold more in the US, EMs, and the eurozone than does the Index, but less in other regions. We hold a handful of smaller US banks that provide specialized offerings to niche customer segments, such as First Republic Bank, SVB Financial Group, and Signature Bank. We also hold a handful of highly profitable and growing banks in EMs that are leaders in their home countries, including Bank Central Asia in Indonesia, Itau Unibanco in Brazil, and Garanti Bank in Turkey. Our weight in Financials rose in the year as we added to both smaller US banks and EM banks.
TEN LARGEST HOLDINGS at October 31, 2016
| COMPANY | SECTOR | COUNTRY | % | |||||||||
ALPHABET | INFO TECHNOLOGY | UNITED STATES | 3.9 | |||||||||
M3 | HEALTH CARE | JAPAN | 3.2 | |||||||||
SCHLUMBERGER | ENERGY | UNITED STATES | 3.1 | |||||||||
SVB FINANCIAL GROUP | FINANCIALS | UNITED STATES | 3.0 | |||||||||
NIKE | CONS DISCRETIONARY | UNITED STATES | 2.9 | |||||||||
PRICELINE | CONS DISCRETIONARY | UNITED STATES | 2.5 | |||||||||
ROPER | INDUSTRIALS | UNITED STATES | 2.5 | |||||||||
PAYPAL | INFO TECHNOLOGY | UNITED STATES | 2.4 | |||||||||
FIRST REPUBLIC BANK | FINANCIALS | UNITED STATES | 2.3 | |||||||||
VERISK | INDUSTRIALS | UNITED STATES | 2.3 | |||||||||
Please read the separate disclosures page for important information, including the risks of investing in the Portfolio.
9
|
Table of Contents

PORTFOLIO MANAGEMENT TEAM

FERRILL ROLL, CFA CO-LEAD PORTFOLIO MANAGER
ALEXANDER WALSH, CFA CO-LEAD PORTFOLIO MANAGER | PETER BAUGHAN, CFA PORTFOLIO MANAGER
BRYAN LLOYD, CFA PORTFOLIO MANAGER
ANDREW WEST, CFA PORTFOLIO MANAGER |
 PERFORMANCE SUMMARY
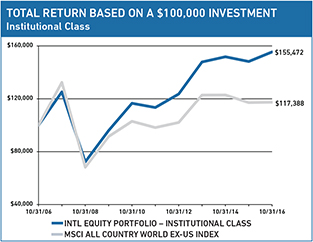
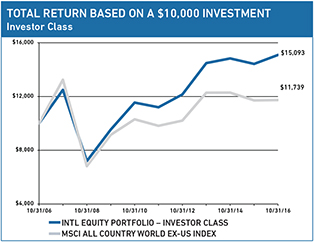
The International Equity Portfolio – Institutional Class rose 4.91% and the Investor Class gained 4.63% (net of fees and expenses) in the fiscal year ended October 31, 2016. The Portfolio’s benchmark, the MSCI All Country World ex-US Index, gained 0.23% (net of source taxes) in this period.
MARKET REVIEW
Markets turned in muted results in the fiscal year. Stocks recovered from a sell-off in late January as fears of a rapidly slowing Chinese economy ebbed after signs of improvement. This rebound was temporarily interrupted by the shocking “Leave” outcome of the EU referendum in the UK in late June. However, investors quickly turned their focus toward additional financial stimulus around the globe. The European Central Bank continued to ramp up its corporate bond-buying program, and the Bank of Japan adjusted its quantitative easing program. Meanwhile, Japanese Prime Minister Shinzō Abe launched a US$130 billion fiscal stimulus plan.
Materials, Information Technology (IT), and Energy were the best-performing sectors. Materials and Energy benefited from rising commodity prices, while IT stock returns reflected strong revenue growth and earnings results. Financials declined about 4% for the year as a whole, masking a volatile period—sharp declines in early 2016 due to profitability worries as negative interest rates spread into more economies were followed by optimism that rates would increase. Health Care declined the most as high US drug prices attracted further political scrutiny, risking new regulatory moves in the main locus of multinational drug company profits.
Viewed geographically, Pacific ex-Japan led returns, followed by emerging market (EM) stocks, which saw sharp recoveries in the year. Brazil was particularly strong due to a combination of strengthening commodity prices and the consummated
FUND FACTS at October 31, 2016 | ||||||||
TOTAL NET ASSETS | $6,788.6M | |||||||
SALES CHARGE | NONE | |||||||
NUMBER OF HOLDINGS | 52 | |||||||
TURNOVER (5 YR. AVG.) | 16% | |||||||
REDEMPTION FEE | 2% FIRST 90 DAYS | |||||||
DIVIDEND POLICY | ANNUAL | |||||||
| INSTITUTIONAL CLASS | INVESTOR CLASS | |||||||
TICKER | HLMIX | HLMNX | ||||||
CUSIP | 412295107 | 412295503 | ||||||
INCEPTION DATE | 5/11/1994 | 9/30/2005 | ||||||
MINIMUM INVESTMENT1 | $100,000 | $5,000 | ||||||
EXPENSE RATIO | 0.84% | 1.16% | ||||||
1Lower minimums available through certain brokerage firms.
impeachment of President Dilma Rousseff, which ushered in the prospect of a more business-friendly government. European stock markets were weak, due not only to worries over the trade implications of the UK referendum, but also to the potential for other disgruntled EU members to follow in the decision to leave the EU. Germany and France, key trading partners of the UK, declined over expected harm to exports. Spain and Italy fell even more as investors focused on the rising strength of their anti-Europe populist parties and the dependence of their teetering banks on continued access to eurozone financing.
Style effects were mixed. The fastest-growing quintile of companies, led by many of the internet-based businesses in IT and Consumer Discretionary, performed far better than the other eighty percent. However, for the trailing year ended October 31, 2016, the MSCI ACW ex-US Value Index slightly outperformed the ACW ex-US Growth Index.
PERFORMANCE ATTRIBUTION
The International Equity Portfolio outperformed the benchmark thanks to stock selection. Viewed by sector, our Health Care holdings outpaced the lagging sector, led by online medical information platform M3, blood plasma and recombinants company CSL Limited, and clinical testing equipment company Sysmex. In Financials, Brazil’s Itau Unibanco was propelled by rising commodity prices and the impeachment of President Dilma Rousseff. In IT, the take-over of ARM Holdings helped returns. Strong stocks in Industrials were another source of returns, thanks to Misumi Group and Kone. Poor stock selection in Materials and Consumer Staples, as well as our overweight in Health Care, detracted from relative returns.
By region, strong stocks in Japan, led by Keyence, M3, Sysmex, and Misumi Group contributed to relative performance. Strong stocks in Europe ex-EMU also contributed, due to the takeover of ARM
10
|
Table of Contents
PERFORMANCE (% TOTAL RETURN)
| for periods ending September 30, 2016 | for periods ending October 31, 2016 | |||||||||||||||||||||||||||||||||||||||||||||||||
| 1 YEAR | 3 YEARS | 5 YEARS | 10 YEARS | SINCE INCEPTION* | 1 YEAR | 3 YEARS | 5 YEARS | 10 YEARS | SINCE INCEPTION* | |||||||||||||||||||||||||||||||||||||||||
INTL EQUITY PORTFOLIO - INSTITUTIONAL CLASS | 17.62 | 3.74 | 9.19 | 5.17 | – | 5.97 | 4.91 | 1.69 | 6.51 | 4.51 | – | 5.82 | ||||||||||||||||||||||||||||||||||||||
MSCI ALL COUNTRY WORLD EX-US INDEX | 9.26 | 0.18 | 6.04 | 2.17 | 3.61 | – | 0.23 | -1.50 | 3.64 | 1.62 | 3.45 | – | ||||||||||||||||||||||||||||||||||||||
INTL EQUITY PORTFOLIO - INVESTOR CLASS | 17.27 | 3.44 | 8.84 | 4.87 | 5.80 | – | 4.63 | 1.38 | 6.15 | 4.20 | 5.50 | – | ||||||||||||||||||||||||||||||||||||||
Returns are annualized for periods greater than 1 year. *Inception of the Institutional Class, 5/11/94. Inception of the Investor Class, 9/30/05. Index performance prior to 1/1/01 cannot be shown since it relies on back-filled data.
Performance data quoted represents past performance; past performance does not guarantee future results. The investment return and principal value of an investment will fluctuate so that an investor’s shares, when redeemed, may be worth more or less than their original cost. Current performance of the Portfolio may be lower or higher than the performance quoted. Performance data current to the most recent month end may be obtained by calling (877) 435-8105 or visiting www.hardingloevnerfunds.com. Performance data shown does not reflect the 2.00% redemption fee imposed on shares held 90 days or less; otherwise, total returns would be reduced.
The charts below illustrate the hypothetical return of an investment made in the corresponding share classes. Investment return reflects voluntary fee waivers in effect. Absent such waivers, total return would be reduced. The performance provided in the table above and charts below do not reflect the deduction of taxes that a shareholder would pay on Portfolio distributions or the redemption of Portfolio shares.
Holdings in the UK and strong stock performance from the UK’s Royal Dutch Shell and Sweden’s Atlas Copco. Stock selection in Pacific ex-Japan and our underweight in EMs detracted.
PERSPECTIVE AND OUTLOOK
The overall environment this fiscal year has been benign for investing, with rising markets punctuated by periodic conniptions. Most of the latter have had to do with investors trying to divine the intentions or next move of monetary authorities, and in 2016 those moves have included the shift from ZIRP to NIRP (zero interest rate policy to negative interest rate policy) and recently, some guesses about the US Federal Reserve heading the other way toward a first rate hike. But another source of seizure has been political events, such as the Brexit vote, the soap opera of Brazil’s presidential impeachment, and the attempted coup and subsequent crackdown in Turkey. The overall tone of stock markets has remained positive, but that trend is hard to disentangle from expectations of continued central bank liquidity injections into financial markets.
Over the past year, we have observed the increasingly high prices that high-quality and rapidly growing companies command in a
low-growth, low-income world. We sense the emergence (in fits and starts) of a “value” style outperformance, which, if it persists, will be a headwind for our investment style. We felt it initially in the early 2016 rally in Energy and Materials. Another thread is the strong rally in EMs taken together as an asset class, recovering from three years of negative returns. Most recently, the phenomenon was visible in the rally in the share prices of Financials, particularly banks, and especially in Europe, where they’d previously been weakest. One might be tempted to see the return of merger and acquisition activity as another manifestation of that shift to a search for value. But so many of the targets of the announced transactions are high-quality companies that it feels less like a value-driven shift than just another facet of the ultra-low interest rates that have prevailed in the years since the financial crisis: earnings growth may be more easily purchased than achieved organically by companies with high-priced shares and access to cheap credit.
The value shift feels more advanced in the US, which fits with the general recovery from the crisis being further along or better established in that economy. There, the MSCI US Value Index has outperformed the US Growth Index by over 500 basis points in the fiscal year. But outside the US, the tailwind for value is, so
11
|
Table of Contents
far, less pronounced as value retreated heavily in the Brexit conniption—although it rebounded in the following months. In EMs, a resurgence in value stocks is even less visible, in part because the whole asset class is so beaten down that it almost all looks like value, and in part because the willingness of global investors to take EM cycle and governance risks is still restrained by recent memories of terrible performance.
In spite of the better performance from Financials in recent months, we are hard-pressed to get excited by its investment prospects. Without sustained improvements in that sector, it will be hard for a torrid value rally to take hold and persist. Bryan Lloyd, CFA, one of our analysts focusing on Financials, offers his take:
Financials: Cheap for a Reason?
Bryan Lloyd, CFA
Financials stocks, trading at low multiples of book value and earnings on average, would likely be particularly favored by a shift in the market toward greater focus on valuation, and also from a sustained rise in short-term interest rates. Given their hefty weight in the Index and our tendency to skew the Portfolio against Financials relative to the Index, this shift could pose a challenge for our strategy.
Banks constitute more than half of the Index weight in Financials. My preference in the banking world is for simple and transparent banks that are able to grow and generate strong returns without venturing far from the basic functions that banks perform in an economy, namely, taking deposits and making loans. Few banks are able to differentiate themselves, especially in developed economies. For the most part, the products and services that banks sell are almost identical, markets are saturated with branches, rivalry is fierce, and growth is scarce. Aside from logos and color schemes, a Chase bank branch does not look very different from a Barclays branch. The bargaining power of consumers is bolstered by broader availability of data that aids in comparison of product pricing, both on the lending and deposit-taking sides. Faced with these challenges, banks sometimes adopt very risky tactics
GEOGRAPHIC EXPOSURE (%) at October 31, 2016
| COUNTRY/REGION | PORTFOLIO | BENCHMARK1 | ||||||
CANADA | 2.0 | 6.8 | ||||||
EMERGING MARKETS | 16.7 | 23.6 | ||||||
EUROPE EMU | 29.6 | 21.3 | ||||||
EUROPE EX-EMU | 19.4 | 22.0 | ||||||
JAPAN | 17.2 | 17.2 | ||||||
MIDDLE EAST | 1.2 | 0.5 | ||||||
PACIFIC EX-JAPAN | 6.8 | 8.6 | ||||||
FRONTIER MARKETS2 | 0.0 | – | ||||||
OTHER3 | 4.1 | – | ||||||
CASH | 3.0 | – | ||||||
1MSCI All Country World ex-US Index; 2Includes countries with less-developed markets outside the Index; 3Includes companies classified in countries outside the Index.
SECTOR EXPOSURE (%) at October 31, 2016
| SECTOR | PORTFOLIO | BENCHMARK1 | ||||||
CONSUMER DISCRETIONARY | 9.2 | 11.5 | ||||||
CONSUMER STAPLES | 11.2 | 10.3 | ||||||
ENERGY | 7.3 | 6.8 | ||||||
FINANCIALS | 13.2 | 22.5 | ||||||
HEALTH CARE | 17.0 | 8.2 | ||||||
INDUSTRIALS | 14.6 | 11.7 | ||||||
INFORMATION TECHNOLOGY | 17.8 | 9.6 | ||||||
MATERIALS | 5.8 | 7.7 | ||||||
REAL ESTATE | 0.9 | 3.4 | ||||||
TELECOM SERVICES | 0.0 | 4.9 | ||||||
UTILITIES | 0.0 | 3.4 | ||||||
CASH | 3.0 | – | ||||||
1MSCI All Country World ex-US Index.
in order to win market share and generate growth. The credit crisis was precipitated by banks assuming nontraditional credit risks with increasing amounts of leverage.
Furthermore, the threat from financial-technology companies offering new substitute services will further intensify the competitive forces in the industry, especially as those services are often supplied by technology rather than well-paid employees. And in the post-financial crisis world, regulators and central banks have only grown more intrusive. Their insistence on stronger capital ratios and greater asset liquidity constrains banks’ ability to deploy their capital toward profitable growth.
In developed Europe, banks are further challenged by low or negative interest rates, which compress their net interest margins. Given the poor optics of charging depositors to hold their money in today’s backward NIRP/ZIRP world, banks have hit a lower bound and can no longer offset the effects of the declining lending rates of their loans and investment securities with lower funding costs. Mired in a highly competitive industry where local not-for-profit banks underprice their products, former German stalwarts Deutsche Bank and Commerzbank cannot earn their costs of capital, while tighter capital and liquidity requirements inhibit their ability to grow profitably. Without higher interest rates, consolidation and layoffs are among the few responses that European bank managements have, but few have pursued that sensible low-cost-producer strategy.
Insurance companies, which constitute roughly a quarter of the weight of Financials in the Index, are hardly on a solid footing, despite their lower financial leverage. Ultra-low bond yields reduce the investment income earned from the premiums they collect (often called “float”), which is a primary value driver for the group. In addition, in a rush to compete, many insurers long ago offered guaranteed returns to policyholders when yields were higher, failing to anticipate the current environment. The property and casualty insurance business is highly cyclical and has relatively low barriers to entry. Even when conditions in this industry are good (usually after large losses hit a number of companies at the same
12
|
Table of Contents
time) and pricing for new policies is rising, new entrants ranging from hedge funds to Bermuda-based startups find ways to enter the market quickly, and end up competing away the improving pricing conditions. Only the largest and most dominant players (e.g., Allianz) can maintain competitive advantages throughout the underwriting cycle. With top market shares in most of its key markets, Allianz readily uses its broader distribution and scale advantage to maintain healthy underwriting profits throughout the cycle. Life insurance, in contrast to property and casualty, is a business where persistent competitive advantages can be difficult or impossible to replicate. Portfolio holding AIA Group—which has competitive advantages such as proprietary data, high-quality agency-based distribution, and a legacy book of existing policies that produce recurring revenues and rising profits—is one exemplar.
While the investment prospects for Financials in developed markets appear dim, we have long argued that banks and insurers in emerging economies can offer long-term growth. The intense competitive environment described above is often absent in EMs, where in many economies there is low penetration of financial services. As these economies become more complex and their citizens accumulate wealth that they need to invest and protect, banks and insurance companies come to play more important roles. Few EM banks face the ultra-low NIRP/ZIRP interest margin problem faced by their counterparts in the developed world. We have been heartened to find some EM banks that possess transparent and high-quality balance sheets and seasoned management teams. With low levels of borrowing and financial intermediation, the best EM financials can introduce new products to grow volumes and revenues even with flat or narrowing interest margins.
PORTFOLIO STRUCTURE
Our actively managed Portfolio is quite different from its benchmark in terms of individual holdings, position sizes, geographical allocations, and sector allocations. We identify and examine these divergences to confirm they are consistent with our explicit views, and continually review and reassess our assumptions about businesses and their operating environments to ensure that the judgments that we have made about them in the past still hold.
Our investment in Financials makes up just over 13% of the Portfolio, only slightly more than half the Index weight, embedding a significant risk of not tracking the Index when Financials outperform, as occurred this July and August. This has been a consistent active risk in the Portfolio over the past twenty years, informed as it is by our jaundiced view of the business characteristics of the companies in the sector. Banks are inherently low-margin businesses, where high leverage can help deliver adequate returns at the best of times, but disaster at the worst.
Our investment principles dictate that we should invest only in companies that meet our quality and growth criteria: in short, businesses that can grow faster than the economies in which they operate, that possess demonstrated financial strength, and whose managements both are the authors of their historical record and have incentives that are properly aligned with shareholders’ interests.
TEN LARGEST HOLDINGS at October 31, 2016
| COMPANY | SECTOR | COUNTRY | % | |||||||||
SAMSUNG ELECTRONICS | INFO TECHNOLOGY | SOUTH KOREA | 4.0 | |||||||||
DASSAULT SYSTÈMES | INFO TECHNOLOGY | FRANCE | 3.9 | |||||||||
AIA GROUP | FINANCIALS | HONG KONG | 3.8 | |||||||||
NESTLÉ | CONS STAPLES | SWITZERLAND | 3.6 | |||||||||
ROCHE HOLDING | HEALTH CARE | SWITZERLAND | 3.1 | |||||||||
FANUC | INDUSTRIALS | JAPAN | 3.1 | |||||||||
WPP | CONS DISCRETIONARY | UNITED KINGDOM | 3.1 | |||||||||
ROYAL DUTCH SHELL | ENERGY | UNITED KINGDOM | 3.1 | |||||||||
M3 | HEALTH CARE | JAPAN | 2.7 | |||||||||
ALLIANZ | FINANCIALS | GERMANY | 2.6 | |||||||||
Finally, we want businesses with competitive advantages that will endure. High returns draw heightened competition, which equates to price erosion unless there is something about an offered product or service for which customers will pay a premium.
What could cause us to change our views on the sector? At some indeterminate point, interest rates will increase, which will be a positive for interest margins and likely lead to strong performance by bank shares, as we saw hinted recently. We are unable to predict this turning point, as we don’t even try to forecast interest rates. If, however, we could foresee sustained growth of economic activity leading to greater demand for credit, and it were accompanied by an expectation of consolidation in the industry and elimination or marginalization of the mutual and state-run institutions, allowing us to forecast greater sustainable profitability for the industry, it would be cause for reassessment of our long-held bias against Financials.
Looking at our Portfolio through a geographic lens reveals another source of active risk: EMs, which constitute 24% of the benchmark but just 17% of our Portfolio. Unlike our underweight in Financials, this stance is not one of sustained prejudice, to which our firm’s long history of investing in EMs, our two strategies devoted exclusively to investing in EMs, and the many EM companies in our coverage universe bear witness. Rather, the explanation lies in current valuation. While the MSCI EM Index overall is cheaper than its developed market counterpart on traditional valuation metrics, the EM Index is heavily laden with cheaply valued stocks of low-quality businesses—state-owned oil companies, basic materials producers, and Chinese banks—that do not meet our criteria and we would not own. Meanwhile, with the addition of a number of Chinese internet companies, IT has grown to rival Financials as the largest sector within the EM Index. While many of those large-cap IT stocks are in our opportunity set, they are among the most expensive. And shares of the highest-quality EM growth companies that have been highly prized by investors over recent years of economic retrenchment and poor EM returns remain too rich for our taste.
Please read the separate disclosures page for important information, including the risks of investing in the Portfolio.
13
|
Table of Contents

PORTFOLIO MANAGEMENT TEAM

ANDREW WEST, CFA PORTFOLIO MANAGER | MOON SURANA, CFA ASSOCIATE PORTFOLIO MANAGER |
 PERFORMANCE SUMMARY
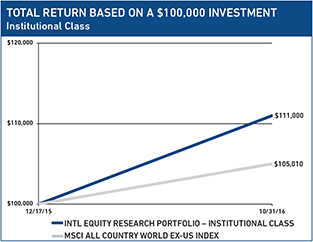
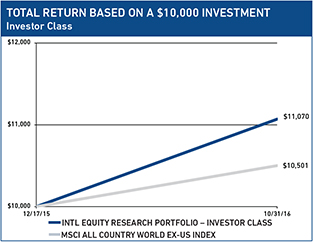
The International Equity Research Portfolio – Institutional Class, which launched December 17, 2015, rose 11.00% since inception through October 31, 2016, and the Investor Class rose 10.70% (net of fees and expenses). The Portfolio’s benchmark, the MSCI All Country World ex-US Index, rose 5.01% (net of source taxes) in this period.
MARKET REVIEW
Markets turned in muted results in the fiscal year. Stocks recovered from a sell-off in late January as fears of a rapidly slowing Chinese economy ebbed after signs of improvement. This rebound was temporarily interrupted by the shocking “Leave” outcome of the EU referendum in the UK in late June. However, investors quickly turned their focus toward additional financial stimulus around the globe. The European Central Bank continued to ramp up its corporate bond-buying program, and the Bank of Japan adjusted its quantitative easing program. Meanwhile, Japanese Prime Minister Shinzō Abe launched a US$130 billion fiscal stimulus plan.
Materials, Information Technology (IT), and Energy were the best-performing sectors. Materials and Energy benefited from rising commodity prices, while IT stock returns reflected strong revenue growth and earnings results. Financials declined about 4% for the year as a whole, masking a volatile period—sharp declines in early 2016 due to profitability worries as negative interest rates spread into more economies were followed by optimism that rates will increase. Health Care declined the most as high US drug prices attracted further political scrutiny, risking new regulatory moves in the main locus of multinational drug company profits.
Viewed geographically, Pacific ex-Japan led returns, followed by emerging market (EM) stocks, which saw sharp recoveries in the year. Brazil was particularly strong due to a combination of strengthening commodity prices and the consummated
FUND FACTS at October 31, 2016 | ||||||||
TOTAL NET ASSETS | $7.1M | |||||||
SALES CHARGE | NONE | |||||||
NUMBER OF HOLDINGS | 173 | |||||||
REDEMPTION FEE | 2% FIRST 90 DAYS | |||||||
DIVIDEND POLICY | ANNUAL | |||||||
| INSTITUTIONAL CLASS | INVESTOR CLASS | |||||||
| TICKER | HLIRX | HLINX | ||||||
CUSIP | 412295826 | 412295834 | ||||||
INCEPTION DATE | 12/17/2015 | 12/17/2015 | ||||||
MINIMUM INVESTMENT1 | $100,000 | $5,000 | ||||||
NET EXPENSE RATIO2 | 0.90% | 1.15% | ||||||
GROSS EXPENSE RATIO | 2.10% | 7.99% | ||||||
1Lower minimums available through certain brokerage firms; 2Shown net of Harding Loevner’s contractual agreement, through February 28, 2017, to waive its management fee to the extent necessary to cap the fund’s total operating expenses.
impeachment of President Dilma Rousseff, which ushered in the prospect of a more business-friendly government. European stock markets were weak, due not only to worries over the trade implications of the UK referendum, but also to the potential for other disgruntled EU members to follow in the decision to leave the EU. Germany and France, key trading partners of the UK, declined over expected harm to exports. Spain and Italy fell even more as investors focused on the rising strength of their anti-Europe populist parties and the dependence of their teetering banks on continued access to eurozone financing.
Style effects were mixed. The fastest-growing quintile of companies, led by many of the internet-based businesses in IT and Consumer Discretionary, performed far better than the other eighty percent. However, for the trailing year ended October 31, 2016, the MSCI ACW ex-US Value Index slightly outperformed the ACW ex-US Growth Index.
PERFORMANCE ATTRIBUTION
From inception through October 31, 2016, the International Equity Research Portfolio outperformed the benchmark thanks to stock selection. The Portfolio benefited from strong stock selection in Consumer Discretionary. One common factor among our major outperformers in the sector, up 20% or more, was improvement in consumer spending in Asia, which helped Indian automaker Maruti Suzuki, German sportswear maker Adidas, Chinese textile manufacturer Shenzhou International, Japanese fashion retailer Fast Retailing, and Macau-focused casino operator Sands China.
Materials was the biggest drag on relative performance as our stocks underperformed, rising 8% versus the sector benchmark’s 29% gain. Our Materials stocks comprise specialty chemicals and
14
|
Table of Contents
PERFORMANCE (% TOTAL RETURN)
| for periods ending September 30, 2016 | for periods ending October 31, 2016 | |||||||||
CUMULATIVE SINCE INCEPTION* | CUMULATIVE SINCE INCEPTION* | |||||||||
INTL EQUITY RESEARCH PORTFOLIO - INSTITUTIONAL CLASS | 13.10 | 11.00 | ||||||||
MSCI ALL COUNTRY WORLD EX-US INDEX | 6.55 | 5.01 | ||||||||
INTL EQUITY RESEARCH PORTFOLIO - INVESTOR CLASS | 12.90 | 10.70 | ||||||||
*Inception of the Institutional and Investor Class, 12/17/15.
Performance data quoted represents past performance; past performance does not guarantee future results. The investment return and principal value of an investment will fluctuate so that an investor’s shares, when redeemed, may be worth more or less than their original cost. Current performance of the Portfolio may be lower or higher than the performance quoted. Performance data current to the most recent month end may be obtained by calling (877) 435-8105 or visiting www.hardingloevnerfunds.com. Performance data shown does not reflect the 2.00% redemption fee imposed on shares held 90 days or less; otherwise, total returns would be reduced.
The charts below illustrate the hypothetical return of an investment made in the corresponding share classes. Investment return reflects voluntary fee waivers in effect. Absent such waivers, total return would be reduced. The performance provided in the table above and charts below do not reflect the deduction of taxes that a shareholder would pay on Portfolio distributions or the redemption of Portfolio shares.
cement companies that tend to have more modest cyclical swings, in contrast to the sharper ups and downs of the metals and mining companies that represent a large part of Materials in the Index. And we had one stock declining double-digits in the period: Danish specialty chemicals company and leading maker of industrial enzymes Novozymes, which lowered its growth outlook for the year in its 2016 first-half results.
Viewed by geography, stock selection was positive across all regions except Pacific ex-Japan. Stock selection was especially strong in Japan, including construction company of rental apartments Daito Trust, online retailer Start Today, cosmetics company Shiseido, and construction and mining machinery manufacturer Komatsu. Within Europe ex-EMU, ARM Holdings, which gained after a takeover by Japan’s SoftBank, was the biggest winner. We also benefited from a duo of German stocks: Adidas and detergent and shampoo maker Henkel. Stock selection was poor in Pacific ex-Japan, namely TPG Telecom in Australia. Our underweight in Canada also detracted, partly offset by good stock performance by Encana.
PERSPECTIVE AND OUTLOOK
The overall environment this fiscal year has been benign for investing, with rising markets punctuated by periodic conniptions. Most of the latter have had to do with investors trying to divine
the intentions or next move of monetary authorities, and in 2016 those moves have included the shift from ZIRP to NIRP (zero interest rate policy to negative interest rate policy) and recently, some guesses about the US Federal Reserve heading the other way toward a first rate hike. But another source of seizure has been political events, such as the Brexit vote, the soap opera of Brazil’s presidential impeachment, and the attempted coup and subsequent crackdown in Turkey. The overall tone of stock markets has remained positive, but that trend is hard to disentangle from expectations of continued central bank liquidity injections into financial markets.
Over the past year, we have observed the increasingly high prices that high-quality and rapidly growing companies command in a low-growth, low-income world. We sense the emergence (in fits and starts) of a “value” style outperformance, which, if it persists, will be a headwind for our investment style. We felt it initially in the early 2016 rally in Energy and Materials. Another thread is the strong rally in EMs taken together as an asset class, recovering from three years of negative returns. Most recently, the phenomenon was visible in the rally in the share prices of Financials, particularly banks, and especially in Europe, where they’d previously been weakest. One might be tempted to see the return of merger and acquisition activity as another manifestation of that shift to a search for value. But so many of the targets of the announced transactions are high-quality companies that it feels less like a
15
|
Table of Contents
value-driven shift than just another facet of the ultra-low interest rates that have prevailed in the years since the financial crisis: earnings growth may be more easily purchased than achieved organically by companies with high-priced shares and access to cheap credit.
The value shift feels more advanced in the US, which fits with the general recovery from the crisis being further along or better established in that economy. There, the MSCI US Value Index has outperformed the US Growth Index by over 500 basis points in the fiscal year. But outside the US, the tailwind for value is, so far, less pronounced as value retreated heavily in the Brexit conniption—although it rebounded in the following months. In EMs, a resurgence in value stocks is even less visible, in part because the whole asset class is so beaten down that it almost all looks like value, and in part because the willingness of global investors to take EM cycle and governance risks is still restrained by recent memories of terrible performance.
Banks constitute more than half of the Index weight in Financials. We tend to prefer simple and transparent banks that are able to grow and generate strong returns without venturing far from the basic functions that banks perform in an economy, namely, taking deposits and making loans. Few banks are able to differentiate themselves, especially in developed economies. For the most part, the products and services that banks sell are almost identical, markets are saturated with branches, rivalry is fierce, and growth is scarce. Aside from logos and color schemes, a Chase bank branch does not look very different from a Barclays branch. The bargaining power of consumers is bolstered by broader availability of data that aids in comparison of product pricing, both on the lending and deposit-taking sides.
Faced with these challenges, banks sometimes adopt very risky tactics in order to win market share and generate growth. The credit crisis was precipitated by banks assuming nontraditional credit risks with increasing amounts of leverage.
Furthermore, the threat from financial-technology companies offering new substitute services will further intensify the
GEOGRAPHIC EXPOSURE (%) at October 31, 2016
| COUNTRY/REGION | PORTFOLIO | BENCHMARK1 | ||||||
CANADA | 1.9 | 6.8 | ||||||
EMERGING MARKETS | 26.2 | 23.6 | ||||||
EUROPE EMU | 19.5 | 21.3 | ||||||
EUROPE EX-EMU | 20.3 | 22.0 | ||||||
JAPAN | 23.3 | 17.2 | ||||||
MIDDLE EAST | 1.1 | 0.5 | ||||||
PACIFIC EX-JAPAN | 5.4 | 8.6 | ||||||
FRONTIER MARKETS2 | 0.5 | – | ||||||
CASH | 1.8 | – | ||||||
1MSCI All Country World ex-US Index; 2Includes countries with less-developed markets outside the Index.
SECTOR EXPOSURE (%) at October 31, 2016
| SECTOR | PORTFOLIO | BENCHMARK1 | ||||||
CONSUMER DISCRETIONARY | 17.0 | 11.5 | ||||||
CONSUMER STAPLES | 8.5 | 10.3 | ||||||
ENERGY | 4.9 | 6.8 | ||||||
FINANCIALS | 19.8 | 22.5 | ||||||
HEALTH CARE | 10.6 | 8.2 | ||||||
INDUSTRIALS | 13.0 | 11.7 | ||||||
INFORMATION TECHNOLOGY | 12.7 | 9.6 | ||||||
MATERIALS | 7.5 | 7.7 | ||||||
REAL ESTATE | 2.1 | 3.4 | ||||||
TELECOM SERVICES | 1.9 | 4.9 | ||||||
UTILITIES | 0.2 | 3.4 | ||||||
CASH | 1.8 | – | ||||||
1MSCI All Country World ex-US Index.
competitive forces in the industry, especially as those services are often supplied by technology rather than well-paid employees. And in the post-financial crisis world, regulators and central banks have only grown more intrusive. Their insistence on stronger capital ratios and greater asset liquidity constrains banks’ ability to deploy their capital toward profitable growth.
PORTFOLIO STRUCTURE
Our actively managed Portfolio is quite different from its benchmark in terms of individual holdings, position sizes, geographical allocations, and sector allocations. These differences come from two sources: the insights that our team of analysts deliver to the portfolio via their buy and sell ratings, and the risk management process that the portfolio managers apply to weight the stocks our analysts recommend, directed toward the goals of outperforming the benchmark while achieving below-benchmark volatility of returns and limiting tracking error versus the asset class.
Our investment principles dictate that we should invest only in companies that meet our quality and growth criteria: in short, businesses that can grow faster than the economies in which they operate, that possess demonstrated financial strength, and whose managements both are the authors of their historical record and have incentives that are properly aligned with shareholders’ interests. Finally, we want businesses with competitive advantages that will endure. High returns draw heightened competition, which equates to price erosion unless there is something about an offered product or service for which customers will pay a premium.
By region we continue to be overweight in Japan and EMs, while we are underweight Canada, Europe, and the Pacific ex-Japan, especially Australia. By sector we are overweight Consumer Discretionary, IT, Health Care, and Industrials, and we are underweight Utilities, Telecom Services, Financials, Energy, Consumer Staples, and Real Estate.
16
|
Table of Contents
The explanation for our regional underweights in Canada and Australia is simple: our analysts haven’t found many stocks they like in these countries, whose indexes and economies tend to be oriented toward natural resources extraction—industries where consistently high-quality, growing companies are difficult to find. With Canada representing 7% of the benchmark and Australia 5%, our single-stock position limits and desire to diversify stock-specific risk naturally guide us to underweight these countries.
We have overweights in EMs and Japan because our analysts find a relatively large number of companies that meet our quality-growth criteria within these regions. In addition, our portfolio risk models suggest that owning positions in these stocks in greater amounts than the benchmark will bring beneficial diversification to an international portfolio, helping us reach our volatility and tracking error goals.
TEN LARGEST HOLDINGS at October 31, 2016
| COMPANY | SECTOR | COUNTRY | % | |||||||||
TAIWAN SEMICONDUCTOR | INFO TECHNOLOGY | TAIWAN | 1.4 | |||||||||
NIDEC | INDUSTRIALS | JAPAN | 1.3 | |||||||||
SHIMANO | CONS DISCRETIONARY | JAPAN | 1.2 | |||||||||
CHECK POINT | INFO TECHNOLOGY | ISRAEL | 1.1 | |||||||||
BANKINTER | FINANCIALS | SPAIN | 1.1 | |||||||||
HSBC | FINANCIALS | UNITED KINGDOM | 1.1 | |||||||||
HENKEL | CONS STAPLES | GERMANY | 1.1 | |||||||||
TENARIS | ENERGY | ITALY | 1.1 | |||||||||
SURUGA BANK | FINANCIALS | JAPAN | 1.1 | |||||||||
KUBOTA | INDUSTRIALS | JAPAN | 1.1 | |||||||||
As discussed in the 2016 Semi-Annual Report, the creation of the International Equity Research Portfolio was inspired by our confidence in the experience and skill of our analysts, the structure of our research process, and the incentives we have in place for our analysts to identify outperforming stocks of high-quality, growing companies. Importantly, despite varying views relevant to security performance, our research team is unified by a common approach to analyzing companies and stocks:
Stage One: Initial Qualification
Analysts identify companies that on a preliminary basis meet Harding Loevner’s quality-growth criteria and appear qualified for in-depth research. Companies are identified based on analysts’ broad research experience and evaluation of fundamental data.
Stage Two: In-Depth Research
Analysts study the qualified companies to gain a full understanding of their business models and to assess their growth potential and risks. Using Harding Loevner’s proprietary Quality Assessment Framework, each company is scored on ten specific factors related to business quality, growth potential, and industry structure. This common analytic framework facilitates collaboration and ensures the consistency of our approach across analysts, industries, and regions. It also serves as a tool for quantifying business risk.
Stage Three: Valuation & Rating
Analysts develop long-term earnings forecasts based upon their estimates of sales growth, margin expansion, capital expenditures, working capital needs, and cash reinvestment. They then estimate the fair value of a company based on their forecasts and create company mileposts to monitor future business results. Analysts assign buy, sell, or hold ratings to reflect potential return relative to their estimates of the shares’ fair values.
Stage Four: Portfolio Construction
The portfolio managers, Andrew West, CFA and Moon Surana, CFA, combine all buy- and best-buy-rated securities into a Portfolio that meets the strategy’s risk-control guidelines and objectives of below-market volatility and controlled tracking error over the long term. To achieve the goal of reducing Portfolio risks, the strategy’s portfolio managers employ a multifactor global risk model and an optimization algorithm to determine position sizes that fall within the Portfolio’s constraints. The risk model incorporates global company, market, industry, style, and statistical factor data going back many years. The portfolio managers review the position weights that the optimizer suggests; review the resulting impacts on risk constraints, other Portfolio characteristics, and trading costs; and may revise the optimization settings further. Thus the portfolio managers use the optimization output to place trades that they expect could provide favorable risk/return characteristics for the Portfolio.
Please read the separate disclosures page for important information, including the risks of investing in the Portfolio.
17
|
Table of Contents

PORTFOLIO MANAGEMENT

JAFAR RIZVI, CFA PORTFOLIO MANAGER |
 PERFORMANCE SUMMARY
The International Small Companies Portfolio – Institutional Class gained 4.15% and the Investor Class gained 3.92% (net of fees and expenses) in the fiscal year ended October 31, 2016. The Portfolio’s benchmark, the MSCI All Country World ex-US Small Cap Index, (the Index) rose 4.22% (net of sources taxes) in this period.
MARKET REVIEW
International small companies (as reflected by the MSCI All Country World ex-US Small Cap Index) closed the trailing twelve months up 4%.
Canadian small company stocks surged 15%, a reflection of the economy’s heavy exposure to commodity markets. Oil prices fell sharply at the beginning of the fiscal year, but beginning in January rebounded strongly for the rest of the period, improving prospects for the Canadian economy. The market in Japan was down 1% in local currency, but US investors saw a 13% return due to the strong appreciation of the yen in the period.
Europe (both inside and outside of the eurozone) was the worst-performing region in the fiscal year due mostly to poor returns in the first half of 2016. European stocks underperformed following the Brexit vote in June, reflecting diminished growth expectations at a time when Europe’s economy had barely recovered to its pre-financial crisis level (despite unprecedented levels of central bank support).
Emerging markets (EMs) performed in line with the overall Index, although Brazil, Russia, and India all surpassed the benchmark. In Brazil (up 65%), the economy remains in a precarious spot—GDP has shrunk in the last year—but the political situation became more stable starting in May when Michel Temer officially replaced Dilma Rousseff as president. Russia (81%) has shown signs of exiting its recession, aided by a depreciated and therefore more competitive currency and an elevated oil price compared to the beginning of the year. The International Monetary Fund and S&P released positive assessments of the Russian economy in September. India (16%) announced that its economy grew 7% in the second calendar quarter, making it the world’s fastest-growing economy.
FUND FACTS at October 31, 2016 | ||||||||
TOTAL NET ASSETS | $107.1M | |||||||
SALES CHARGE | NONE | |||||||
NUMBER OF HOLDINGS | 82 | |||||||
TURNOVER (5 YR. AVG.) | 46% | |||||||
REDEMPTION FEE | 2% FIRST 90 DAYS | |||||||
DIVIDEND POLICY | ANNUAL | |||||||
| INSTITUTIONAL CLASS | INVESTOR CLASS | |||||||
TICKER | HLMRX | HLMSX | ||||||
CUSIP | 412295875 | 412295883 | ||||||
INCEPTION DATE | 6/30/2011 | 3/26/2007 | ||||||
MINIMUM INVESTMENT1 | $100,000 | $5,000 | ||||||
NET EXPENSE RATIO2 | 1.25% | 1.50% | ||||||
GROSS EXPENSE RATIO | 1.64% | 1.93% | ||||||
1Lower minimums available through certain brokerage firms; 2Shown net of Harding Loevner’s contractual agreement, through February 28, 2017, to waive its management fee to the extent necessary to cap the fund’s total operating expenses.
By sector, Financials and Telecom Services performed worst in the Index. Materials, Consumer Staples, and Utilities posted the best returns.
PERFORMANCE ATTRIBUTION
The Portfolio’s underweight to the top-performing Materials sector detracted from relative performance. Stock selection in Industrials also detracted, due partially to Senior, a supplier of air-duct and fluid systems used in aerospace and commercial vehicles. The weak sales of commercial vehicles in North America—including in the mining and oil and gas industries—has continued to hurt demand for Senior’s components.
Offsetting some of the poor selection in Industrials were strong stock picks in Financials and Health Care. In April Cetip, Brazil’s central depository for financial products, benefited from an acquisition offer from BM&F Bovespa, the country’s clearing house and stock exchange. In Health Care, German ophthalmology-systems company Carl Zeiss Meditec reported strong growth in all of its business units, especially its refractive laser business. The company’s innovative new laser is used in the ReLEX SMILE vision-correction procedure, which has been taking significant market share from the more invasive LASIK procedure.
By region, the Portfolio’s underweight to strong-performing Japan detracted from relative performance, as did lack of exposure to top-performing Canada. Poor stock selection in EMs also hurt relative returns. In China, smart electricity meter manufacturer Wasion Group Holdings announced that one of its largest customers had slowed its investment in smart-grid technologies. This slowdown in investment, plus a concentrated effort to reign in payment terms that Wasion had previously extended to some
18
|
Table of Contents
PERFORMANCE (% TOTAL RETURN)
| for periods ending September 30, 2016 | for periods ending October 31, 2016 | |||||||||||||||||||||||||||||||||||||||||
| 1 YEAR | 3 YEARS | 5 YEARS | SINCE INCEPTION* | 1 YEAR | 3 YEARS | 5 YEARS | SINCE INCEPTION* | |||||||||||||||||||||||||||||||||||
INTL SMALL COMPANIES PORTFOLIO - INSTITUTIONAL CLASS | 11.42 | 3.47 | 10.43 | 5.06 | – | 4.15 | 1.79 | 8.16 | 4.57 | – | ||||||||||||||||||||||||||||||||
MSCI ALL COUNTRY WORLD EX-US SMALL CAP INDEX | 13.38 | 3.52 | 8.59 | 3.66 | – | 4.22 | 1.57 | 6.27 | 3.08 | – | ||||||||||||||||||||||||||||||||
INTL SMALL COMPANIES PORTFOLIO - INVESTOR CLASS | 11.13 | 3.19 | 10.14 | – | 5.19 | 3.92 | 1.51 | 7.89 | – | 4.91 | ||||||||||||||||||||||||||||||||
Returns are annualized for periods greater than 1 year. *Inception of the Institutional Class, 6/30/11. Inception of the Investor Class, 3/26/07. Index performance prior to 6/1/07 cannot be shown in the table above or in the charts below since it relies on back-filled data. Accordingly, the chart below for the Investor Class depicts a hypothetical investment in the Portfolio on inception date, while Index data begins on 6/1/07. For comparative purposes, the beginning value of the Index on that date was matched to the value of the hypothetical investment in the Portfolio.
Performance data quoted represents past performance; past performance does not guarantee future results. The investment return and principal value of an investment will fluctuate so that an investor’s shares, when redeemed, may be worth more or less than their original cost. Current performance of the Portfolio may be lower or higher than the performance quoted. Performance data current to the most recent month end may be obtained by calling (877) 435-8105 or visiting www.hardingloevnerfunds.com. Performance data shown does not reflect the 2.00% redemption fee imposed on shares held 90 days or less; otherwise, total returns would be reduced.
The charts below illustrate the hypothetical return of an investment made in the corresponding share classes. Investment return reflects voluntary fee waivers in effect. Absent such waivers, total return would be reduced. The performance provided in the table above and charts below do not reflect the deduction of taxes that a shareholder would pay on Portfolio distributions or the redemption of Portfolio shares.
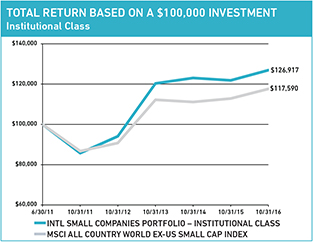
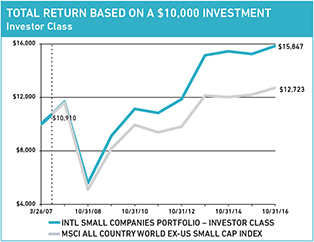
customers, contributed to a 13% decrease in earnings in calendar year 2015. However, we believe Wasion’s long-term prospects remain strong because China needs the company’s products to help ameliorate the country’s pollution crisis.
Good stock picking in the eurozone and Japan benefited the Portfolio’s relative performance. In the eurozone, Italian IT service provider Reply reported strong revenue and earnings growth for calendar year 2015. In Japan, Cosmos Pharmaceutical is a leader in the drug retail industry that has achieved significant growth in revenues and earnings over the last ten years through expanding its number of stores and improving margins. Looking ahead, the company forecasts growth in earnings of about 10% per year in the medium term.
INVESTMENT PERSPECTIVES
Mergers and Acquisition Activity
The recovery of the global economy has been slow since 2008, and the impact of this slow growth on both small and large companies has been visible in their declining sales growth (see the chart on the right).
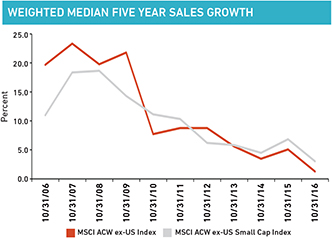
Source: FactSet (as of October 31, 2016).
Central banks in developed markets have aggressively lowered interest rates to spur growth, with Europe and Japan even taking the unprecedented step of pushing rates below zero. The current environment of low interest rates and anemic growth has been supportive of mergers and acquisitions (M&A). Companies pursue M&A for various strategic aims—to gain economies of scale, to improve their growth prospects by offering new products and
19
|
Table of Contents
services or entering into new markets, or to strengthen their managerial and technical talent, among other reasons. Low interest rates foster M&A because lower borrowing costs, all else being equal, mean deals are more likely to be earnings accretive. Also, in low-growth environments, management teams may be tempted to turn to acquisitions to grow faster, especially if their compensation is linked to growth.
M&A activity has picked up in the last couple of years to reach levels close to those of 2007, the previous peak year for deals (see the chart below). As the Financial Times wrote at the end of 2015, “[h]unger for growth in a weak economic environment, cheap financing, and continued pressure from activist shareholders to boost returns drove many companies to combine.“1 The availability of cheap financing was one of the factors that drove M&A in 2007, but the rate environment today is obviously more extreme—in 2007, zero was still considered the lower bound of interest rates!
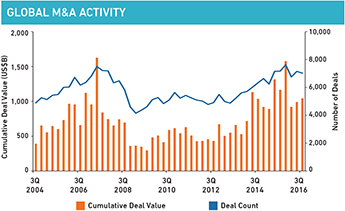
Source: Bloomberg.
We have seen a healthy level of M&A activity in the Portfolio, with our companies acting as targets or acquirers in 16 M&A deals of US$100 million or more in the past 18 months. Here we discuss four examples of this M&A activity.
GEOGRAPHIC EXPOSURE (%) at October 31, 2016
| COUNTRY/REGION | PORTFOLIO | BENCHMARK1 | ||||||
CANADA | 0.0 | 7.2 | ||||||
EMERGING MARKETS | 20.2 | 22.7 | ||||||
EUROPE EMU | 28.4 | 16.9 | ||||||
EUROPE EX-EMU | 18.6 | 20.6 | ||||||
JAPAN | 14.4 | 23.1 | ||||||
MIDDLE EAST | 0.0 | 1.0 | ||||||
PACIFIC EX-JAPAN | 4.6 | 8.5 | ||||||
FRONTIER MARKETS2 | 8.2 | – | ||||||
OTHER3 | 0.6 | – | ||||||
CASH | 5.0 | – | ||||||
1MSCI All Country World ex-US Small Cap Index; 2Includes countries with less-developed markets outside the Index; 3Includes companies classified in countries outside the Index.
SECTOR EXPOSURE (%) at October 31, 2016
| SECTOR | PORTFOLIO | BENCHMARK1 | ||||||
CONSUMER DISCRETIONARY | 7.7 | 15.9 | ||||||
CONSUMER STAPLES | 15.3 | 6.8 | ||||||
ENERGY | 0.0 | 3.7 | ||||||
FINANCIALS | 13.6 | 10.1 | ||||||
HEALTH CARE | 12.0 | 7.4 | ||||||
INDUSTRIALS | 23.2 | 19.6 | ||||||
INFORMATION TECHNOLOGY | 20.0 | 11.5 | ||||||
MATERIALS | 1.5 | 11.0 | ||||||
REAL ESTATE | 0.0 | 10.5 | ||||||
TELECOM SERVICES | 0.8 | 1.1 | ||||||
UTILITIES | 0.9 | 2.4 | ||||||
CASH | 5.0 | – | ||||||
1MSCI All Country World ex-US Small Cap Index.
In April, BM&F Bovespa, the Brazilian clearing house and stock exchange, made an offer for portfolio holding Cetip, the central depository for financial products in the country. In Brazil, as in the US, physical certificates are not exchanged when a financial asset is traded; rather, electronic records of all certificates and securities are tracked in a central location and are updated as ownership changes. Cetip serves as this central storage location, earning revenues primarily from the registration and custody of securities on behalf of banks, insurance companies, and other market participants. The company is a critical component of the market infrastructure in Brazil as it houses nearly all of the fixed-income securities in the country. The deal helps Bovespa grow its business and gives it access to the fixed-income market, one of the faster-growing segments of Brazil’s financial industry.
In the 2016 Semi-Annual Report, we noted that Max India had spun-off its insurance business to form a standalone company, Max Financial Services. We also described how Max Financial needed a deep-pocketed financial partner to provide capital in its early growth stage. In late June, such a partner arrived with Max Financial agreeing to merge with HDFC Life. Max Financial was one of HDFC Life’s few competitors, so the deal will significantly reduce industry rivalry. By combining both companies’ distribution channels and market reach in India, the merged company is expected to achieve faster sales growth with lower costs.
The Portfolio has benefitted from share-price appreciation for both Cetip and Max Financial since these two M&A deals were announced. But a concern we have in this environment of easy money is the potential for ill-advised acquisitions by the Portfolio’s companies. While managements always provide seemingly solid reasons for pursuing acquisitions, historical experience demands that we be skeptical that the ultimate outcome of M&A deals will resemble the original rosy rationale. Indeed, the empirical evidence suggests that, on average, M&A destroys value.
1James Fontanella-Khan, “Global Dealmaking Breaks 2007 Record,”Financial Times (December 21, 2015).
20
|
Table of Contents
In July 2015, we sold one of the Portfolio’s companies—Wirecard AG of Germany—because of discomfort with its M&A strategy. A leading company in the online- and mobile-payment processing industry, Wirecard had accelerated its acquisition activity in the prior year, particularly in Asia. By acquiring companies ostensibly to improve its growth in EMs, Wirecard increased the intangible assets on its balance sheet while its cash flows and returns on capital weakened. The company was also capitalizing costs aggressively and not providing enough details on changes in its working capital. We removed the company from the Portfolio and our research coverage when it could no longer meet our criteria for quality management and financial strength.
A more positive case of acquisition activity by a holding was TPG Telecom of Australia, which purchased another Australian tele-com business, iiNet (also a portfolio holding at the time), in September 2015. Both companies provided internet and telephone service, but in different regions and to different customer segments. TPG Telecom was dominant in the lower-priced market in large cities in New South Wales and Victoria, while iiNet was a leader in offering higher-end services in Western Australia, South Australia, and Queensland. When the deal was announced in early 2015, we thought it made genuine strategic sense. As we noted in the 2015 Semi-Annual Report, the two businesses complemented each other and the merger would create valuable economies of scale as network operations and data centers were consolidated.
PORTFOLIO HIGHLIGHTS
Over the trailing 12 months, the Portfolio increased its slight overweight in Industrials as our research identified a number of attractively priced, quality-growth small companies in this sector.
For example, Bossard is a Swiss distributor of industrial fasteners that serves mostly machine manufacturers. The company is distinctive among its peers in offering engineering services to help customers determine the technical requirements of new products during the design stage, which allows customers to focus more on their core businesses. Because Bossard is integral to its customers’ supply chains, it is costly for them to switch to a different distributor, which allows Bossard to reap economic returns well above those of a typical distributor of nuts and bolts.
Rational, a German manufacturer of industrial kitchen equipment, upholds its home country’s reputation for superior engineering and craftsmanship. The company’s primary product is the combi steamer, an oven used in professional catering and food service operations that can produce both dry (convection) and moist (steam) heat. Rational produces over 50% of the world’s combi steamers and its brand is the gold standard. Using sophisticated software and sensors, the company’s combi steamers can cook food to perfection at the press of a button. Rational has a long history of generating strong returns and growth; revenues and earnings have grown an average of 10% during each of the last five calendar years, while the company’s cash flow return on invested capital has been consistently above 20% in the same period.
TEN LARGEST HOLDINGS at October 31, 2016
| COMPANY | SECTOR | COUNTRY | % | |||||||||
BECHTLE | INFO TECHNOLOGY | GERMANY | 3.2 | |||||||||
ALTEN | INFO TECHNOLOGY | FRANCE | 2.8 | |||||||||
MAX FINANCIAL SERVICES | FINANCIALS | INDIA | 2.7 | |||||||||
GRUH FINANCE | FINANCIALS | INDIA | 2.6 | |||||||||
HIDAY HIDAKA | CONS DISCRETIONARY | JAPAN | 2.5 | |||||||||
VAISALA | INFO TECHNOLOGY | FINLAND | 2.5 | |||||||||
BOSSARD | INDUSTRIALS | SWITZERLAND | 2.3 | |||||||||
CARL ZEISS MEDITEC | HEALTH CARE | GERMANY | 2.1 | |||||||||
BML | HEALTH CARE | JAPAN | 2.1 | |||||||||
ABCAM | HEALTH CARE | UNITED KINGDOM | 2.1 | |||||||||
Another Industrials holding we purchased this period is China-based Haitian International Holdings, which makes plastic injection-molding machines (PIMM). Plastic injection molding is the most common method of producing the plastic components used in innumerable products such as automotive interior parts, medical equipment, toys, and milk caps. PIMMs are a critical piece of manufacturing equipment for Haitian’s customers, which gives the company favorable bargaining power over buyers. Haitian’s customers are also willing to pay a premium for the reliability, ease of maintenance, and energy efficiency of Haitian’s machines. While the company’s growth is more cyclical than that of most portfolio holdings, historically Haitian has generated a stable and high return on investment and we consider the valuation attractive for a business of its relative quality.
We also expanded the Portfolio’s underweight in Consumer Discretionary this fiscal year by selling several positions in that sector, including Leoni and Kolao Holdings.
We sold Leoni, a German supplier of wire harnesses to the auto industry. When first added to the Portfolio, the company had above-average returns and a cost advantage over its peers. However, we noted that the cost advantage appeared to be eroding. In 2015, Leoni underbid on several large contracts which it will have to carry for the next several years. Given the deterioration of its competitive advantage, we sold the position.
Lastly, we sold Kolao Holdings, a South Korea-listed car manufacturer and distributor that operates primarily in Laos. We believe the company continues to have good long-term growth prospects, although car sales have slowed over the past year due to Laos’ weak economy. Our main concern has been the deterioration of Kolao’s balance sheet. In an effort to boost sales, the company has been offering extensive dealer financing. The total amount of receivables from these car loans—about US$270 million as of June 30, 2016—are unacceptably high relative to the company’s annual sales of about US$358 million.
Please read the separate disclosures page for important information, including the risks of investing in the Portfolio.
21
|
Table of Contents

PORTFOLIO MANAGEMENT TEAM

| G. RUSTY JOHNSON, CFA | PRADIPTA CHAKRABORTTY | |
CO-LEAD PORTFOLIO MANAGER
| PORTFOLIO MANAGER
| |
| CRAIG SHAW, CFA | SCOTT CRAWSHAW | |
| CO-LEAD PORTFOLIO MANAGER | PORTFOLIO MANAGER
| |
| RICHARD SCHMIDT, CFA | ||
PORTFOLIO MANAGER |
The Institutional Emerging Markets Portfolio and the Emerging
Markets Portfolio are generally closed to new investors.
The Institutional Emerging Markets Portfolio – Class I and Class II – and the Emerging Markets Portfolio – Advisor Class (collectively, the “Portfolios”) are both managed in strict accordance with the Emerging Markets Equity strategy model portfolio. Therefore, the Portfolios have highly similar holdings and characteristics. We have provided a single commentary to cover both Portfolios. The specific performance and characteristics of each are presented separately in the tables that follow.
 PERFORMANCE SUMMARY
The Institutional Emerging Markets Portfolio – Class I rose 10.74%, the Institutional Emerging Markets Portfolio – Class II rose 11.06%, and the Emerging Markets Portfolio – Advisor Class rose 10.73% (all net of fees and expenses) in the fiscal year ended October 31, 2016. The Portfolios’ benchmark, the MSCI Emerging Markets Index rose 9.27% (net of source taxes) in this period.
MARKET REVIEW
The fiscal year began inauspiciously for emerging markets (EMs), which declined approximately 19% through late January amid concerns about the potential for tighter US monetary policy and concerns about China’s weakening currency and slowing economy. However, EMs enjoyed a mostly positive trend through the remainder of the year, with occasional short-term reversals as expectations surrounding US interest rates ebbed and flowed in response to economic data and geopolitical news.
One of those reversals occurred in June, when the British public’s surprise vote to leave the 28-state European Union (EU) caused period of market pandemonium. However, apart from its antic-ipated depressive effect on global trade, already tracking at subdued rates, the vote for Brexit is likely to have only minimal direct impact on the economies of EMs. The UK is the destination for
FUND FACTS at October 31, 2016 | ||||||||||
SALES CHARGE | NONE | |||||||||
NUMBER OF HOLDINGS | 78 | |||||||||
REDEMPTION FEE | 2% FIRST 90 DAYS | |||||||||
DIVIDEND POLICY | ANNUAL | |||||||||
| INSTITUTIONAL | ADVISOR | |||||||||
PORTFOLIO ASSETS | $3,432.5M | $2,998.5M | ||||||||
TURNOVER (5 YR AVG) | 26% | 29% | ||||||||
CLASS | CLASS I | CLASS II | ADVISOR | |||||||
TICKER | HLMEX | HLEEX | HLEMX | |||||||
CUSIP | 412295701 | 412295842 | 412295305 | |||||||
INCEPTION DATE | 10/17/2005 | 3/5/2014 | 11/9/1998 | |||||||
MINIMUM INVESTMENT1 | $500,000 | $25,000,000 | $5,000 | |||||||
NET EXPENSE RATIO | 1.30%2 | 1.14%2 | 1.45% | |||||||
GROSS EXPENSE RATIO | 1.31% | 1.27% | 1.45% | |||||||
1Lower minimums available through certain brokerage firms; 2Shown net of Harding Loevner’s contractual agreement, through February 28, 2017, to waive its management fee to the extent necessary to cap the fund’s total operating expenses.
only about 3% of exports on average from MSCI EM countries (representing approximately 1% of EMs’ GDP).1
The strength in EM returns after January was supported by firming commodity prices and a recovery in many EM currencies. The price of oil (measured by the Brent crude oil benchmark) weakened sharply in the first quarter of the fiscal year, from US$48 to about US$26 a barrel, but then rose to end the year near where it started. EM currencies contributed modestly to the overall Index return in US dollars, with help particularly from currencies of some commodity-producing countries that had weakened significantly in 2015. The Brazilian real was up 21% versus the US dollar this fiscal year, the Indonesian rupiah was up 5%, and the South African rand was up 3%.
Toward the end of the year a stream of other generally positive incremental inflections in fundamental indicators, including narrowing in current account deficits of those countries more reliant on external financing and positive inflation dynamics, contributed to improved investor sentiment and swelling portfolio flows into EM assets, both bonds and equities. Moreover, following a five-year period of declining corporate profit margins across many EM industries, earnings expectations looked set to improve.
Latin America offered the strongest returns—the only region to outperform the Index this fiscal year—led by Brazil, whose equity market and currency were propelled by the improved investor outlook following the impeachment of former President Dilma Rousseff. The new president, Michel Temer, has assembled a cab-
1Based on 2014 trade data sourced from “The Observatory of Economic Complexity,” http://atlas.media.mit.edu/en/.
22
|
Table of Contents
PERFORMANCE (% TOTAL RETURN)
| for periods ending September 30, 2016 | for periods ending October 31, 2016 | |||||||||||||||||||||||||||||||||||||||||||||||||||||||
| 1 YEAR | 3 YEARS | 5 YEARS | 10 YEARS | SINCE INCEPTION* | 1 YEAR | 3 YEARS | 5 YEARS | 10 YEARS | SINCE INCEPTION* | |||||||||||||||||||||||||||||||||||||||||||||||
INST. EMERGING MARKETS PORTFOLIO - CLASS I | 19.76 | 1.93 | 6.70 | 4.71 | – | 6.70 | – | 10.74 | -0.05 | 4.05 | 4.15 | – | 6.57 | – | ||||||||||||||||||||||||||||||||||||||||||
INST. EMERGING MARKETS PORTFOLIO - CLASS II | 20.05 | – | – | – | 1.58 | – | – | 11.06 | – | – | – | 1.23 | – | – | ||||||||||||||||||||||||||||||||||||||||||
MSCI EMERGING MARKETS INDEX | 16.79 | -0.56 | 3.03 | 3.94 | 0.27 | 5.95 | – | 9.27 | -2.04 | 0.54 | 3.48 | 0.35 | 5.93 | – | ||||||||||||||||||||||||||||||||||||||||||
EMERGING MARKETS PORTFOLIO - ADVISOR CLASS | 19.76 | 1.90 | 6.61 | 4.67 | – | – | 11.50 | 10.73 | -0.07 | 3.94 | 4.09 | – | – | 11.39 | ||||||||||||||||||||||||||||||||||||||||||
Returns are annualized for periods greater than 1 year. *Inception of Class I, 10/17/05. Inception of Class II, 3/5/14. Inception of the Advisor Class, 11/9/98. Index performance prior to 1/1/01 cannot be shown since it relies on back-filled data.
Performance data quoted represents past performance; past performance does not guarantee future results. The investment return and principal value of an investment will fluctuate so that an investor’s shares, when redeemed, may be worth more or less than their original cost. Current performance of the Portfolio may be lower or higher than the performance quoted. Performance data current to the most recent month end may be obtained by calling (877) 435-8105 or visiting www.hardingloevnerfunds.com. Performance data shown does not reflect the 2.00% redemption fee imposed on shares held 90 days or less; otherwise, total returns would be reduced.
inet conducive to implementing much-needed economic reforms. By contrast, Mexico’s stock market and currency suffered from the risk of a victory by Donald Trump in the US presidential election, with potentially negative implications for trade, investment, and remittances.
Emerging Europe lagged the Index, dragged down by market weakness in Poland and Turkey and despite strong returns registered in Russia. In Turkey, social order was restored fairly quickly following a failed coup attempt in early July; however, the subsequent concentration of power by President Recep Tayyip Erdoğan has been seen by many in the international community as a threat to Turkey’s long-term development. Meanwhile, Russia benefited from more-robust energy prices, which supported ruble appreciation, and from the realization that its economic downturn was less severe than anticipated.
Returns by sector in the 12-month period diverged widely, from declines of 5% for Health Care and 3% for Industrials to gains of 21% for Energy and 19% for Information Technology (IT). Energy and Materials (up 20%) were supported by rising commodity prices while IT was a rare bastion of growth in revenues and earnings in a world where growth continues to be scarce. The Financials sector performed in-line with the Index overall, but here again there was significant variation in returns, from the 3% decline in China to the 102% surge in Brazil.
PERFORMANCE ATTRIBUTION
The Portfolios benefited from strong stock selection in Financials and IT this fiscal year. Brazilian banks Itau Unibanco and Banco Bradesco were particularly large contributors to relative returns; both benefited from the rising optimism stoked by the political changes in Brazil. Russia’s Sberbank also rallied as it reported strong growth in net income and benefited from its home country’s improving economy. Strong earnings from Tencent, the Chinese social media and internet-gaming company, and Taiwan Semiconductor bolstered the Portfolios’ returns in IT.
The Portfolios’ performance lagged in Consumer Staples and Energy. Chinese food and beverage company Tingyi Holdings has had disappointing profit growth this year, and we sold the holding toward the end of the period as the stock still looked expensive
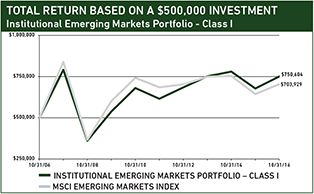
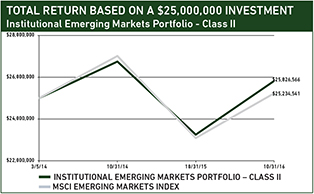
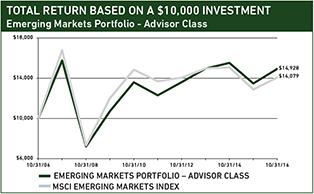
The charts above illustrate the hypothetical return of an investment made in the corresponding share classes. Investment return reflects voluntary fee waivers in effect. Absent such waivers, total return would be reduced. The performance provided in the table and charts above do not reflect the deduction of taxes that a shareholder would pay on Portfolio distributions or the redemption of Portfolio shares.
23
|
Table of Contents
against our reduced future growth expectations. Also, Nostrum Oil & Gas of Kazakhstan (listed in the Netherlands) under-performed the strong Energy sector as it announced in early 2016 a delay in the completion of its third gas-treatment facility as well as lower production targets for 2017.
Geographically, our holdings outpaced the Index in Asia and Eu-rope. In the former, Taiwan Semiconductor and cellphone camera lens manufacturer LARGAN Precision (also listed in Taiwan) boosted relative returns. Largan benefited from a positive outlook for the new iPhone 7 and the increasing adoption of dual cameras in leading smartphones.
From the perspective of the Portfolios’ structure (as always determined by our company-specific stock selection decisions), our underweight in Telecom Services helped, while our underweight in Materials detracted. Our underweight exposure to China (which represents roughly 25% of the Index) was also accretive, but partly offset by off-benchmark exposure to select frontier markets.
INVESTMENT PERSPECTIVES
Finding Growth in New Tech
In a world where growth has increasingly become a scarce commodity and as the nominal economic growth rates in EMs specifically have fallen significantly in recent years, investors are pursuing companies that they believe are able to achieve rapid growth. This craving for growth is, we believe, the key motivation behind IT’s leadership in recent quarters; the sector has contributed 40% of the Index’s total return in the last 12 months. In many cases, IT companies—including large-cap names—are posting the most rapid growth rates among EM companies.
GEOGRAPHIC EXPOSURE (%) at October 31, 2016
| COUNTRY/REGION | INSTITUTIONAL | ADVISOR | ||||||||
| HLMEX / HLEEX | HLEMX | BENCHMARK1 | ||||||||
BRAZIL | 7.5 | 7.5 | 8.3 | |||||||
CHINA + HONG KONG2 | 23.7 | 23.8 | 26.4 | |||||||
INDIA | 8.3 | 8.4 | 8.4 | |||||||
MEXICO | 5.7 | 5.7 | 3.8 | |||||||
RUSSIA | 5.1 | 5.2 | 3.7 | |||||||
SOUTH AFRICA | 5.3 | 5.3 | 7.1 | |||||||
SOUTH KOREA | 9.9 | 9.9 | 14.3 | |||||||
TAIWAN | 10.0 | 10.0 | 12.3 | |||||||
SMALL EMERGING MARKETS3 | 15.7 | 15.7 | 15.7 | |||||||
FRONTIER MARKETS4 | 1.3 | 1.3 | – | |||||||
DEVELOPED MARKET LISTED5 | 4.8 | 4.9 | – | |||||||
CASH | 2.7 | 2.3 | – | |||||||
1MSCI Emerging Markets Index; 2The Institutional Emerging Markets Portfolio’s end weight in China is 17.1% and Hong Kong is 6.6%. The Advisor Class’ end weight in China is 17.2% and Hong Kong is 6.6%. The Benchmark does not include Hong Kong; 3Includes the remaining emerging markets which, individually, comprise less than 5% of the Index; 4Includes countries with less-developed markets outside the Index; 5Includes emerging markets or frontier markets companies listed in developed markets.
SECTOR EXPOSURE (%) at October 31, 2016
| SECTOR | INSTITUTIONAL HLMEX / HLEEX | ADVISOR HLEMX | BENCHMARK1 | |||||||
CONSUMER DISCRETIONARY | 13.9 | 13.9 | 10.4 | |||||||
CONSUMER STAPLES | 8.0 | 8.1 | 7.7 | |||||||
ENERGY | 6.9 | 6.9 | 7.7 | |||||||
FINANCIALS | 29.7 | 29.9 | 24.1 | |||||||
HEALTH CARE | 3.6 | 3.6 | 2.5 | |||||||
INDUSTRIALS | 5.9 | 5.9 | 5.9 | |||||||
INFORMATION TECHNOLOGY | 23.0 | 23.0 | 23.6 | |||||||
MATERIALS | 0.8 | 0.8 | 6.6 | |||||||
REAL ESTATE | 0.5 | 0.5 | 2.6 | |||||||
TELECOM SERVICES | 3.8 | 3.9 | 6.0 | |||||||
UTILITIES | 1.2 | 1.2 | 2.9 | |||||||
CASH | 2.7 | 2.3 | – | |||||||
1MSCI Emerging Markets Index.
Among the fastest-growing companies in the EM tech landscape are what can be defined as new tech—companies that develop proprietary software and analyze “big data” to run new, disruptive businesses including e-commerce, online travel services, internet search, gaming, and social media. From our perspective, new tech primarily includes companies in three sub-industries: internet software and services and home entertainment software (both found within the IT sector), and internet and direct marketing retail (found within Consumer Discretionary).
The rise of new-tech companies during the last decade has significantly changed the profile of the EM tech landscape, as they now rival for dominance more traditional IT names long associated with EM Asia, such as manufacturers and assemblers of PCs, semiconductors, and IT hardware (i.e., old tech). The sales growth of the new-tech EM leaders dwarfs that of the old-tech leaders, as can be seen below for the 10 largest IT companies by weight in the Index (new-tech companies are shown in purple).
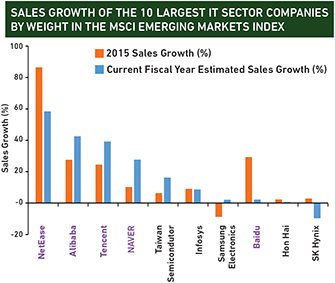
Source: MSCI Inc. and S&P, FactSet. Estimated sales growth in current fiscal year is based on consensus estimates obtained from FactSet. New-tech companies are shown in purple.
24
|
Table of Contents
Why are many new-tech businesses demonstrating robust growth trends even as EM economies have slowed overall? Because the services these companies provide are typically substitutes for existing economic output. Retailing is being shifted from traditional stores to online, cinemas are losing share to online video, and flight and hotel bookings are being made through mobile apps rather than local travel agents.
Rapid sales growth has supported rich valuations, such that the market capitalization of new tech is now approaching that of old tech. Since October 2009, the weight of new-tech companies in the Index has risen twelvefold from about 1% to 12% at the end of the fiscal year; in the same period, old tech has risen from about 12% to 15% of the Index.
Our holdings in new-tech businesses include 3 of the 10 largest IT companies in the Index: Tencent (China’s leading online social media and game platform), NAVER (South Korea’s leader in internet search), and Baidu (China’s internet search giant). The Portfolios also hold MercadoLibre, a NYSE-listed IT company that operates an e-commerce platform hosting over six-million sellers in 17 Latin American countries. We also hold a number of internet-focused companies classified in other sectors. Naspers, a South African publishing company that was an early-stage investor in Tencent and continues to own roughly one-third of the gaming giant, Ctrip.com, a Chinese online travel services company, and JD.com, a large Chinese e-commerce company, are all classified in Consumer Discretionary. 51Job Inc., an online job-search platform in China, is classified in Industrials.
PORTFOLIO HIGHLIGHTS
The Portfolios’ overall orientation tends to evolve incrementally, as we consider opportunities on a stock-by-stock relative basis and implement accordingly. Positioning relative to the benchmark also reflects the performance of the Portfolios’ individual holdings relative to their sector and market and changes decreed by MSCI in the Index’s composition. During the second half of the fiscal year, MSCI completed the staged entry of NYSE-listed Chinese internet stocks into the EM Index, which has raised the weight of IT to an all-time high of 24%, five percentage points higher than one year ago. Our relative positioning in IT has not changed significantly compared to one year ago, however, in part due to new investments over the year, including MercadoLibre.
Two other notable changes in the Portfolios’ relative positioning in this period were a shift from underweight to overweight Financials and a reduction in our overweight in Health Care. Within Financials, we responded to price moves by reducing positions in Brazil (BM&F Bovespa, Banco Bradesco) and Peru (Credicorp) that had rallied strongly in the first half of 2016, while adding to more attractively valued banks in Mexico (GF Banorte), India (Axis Bank), and Russia (Sberbank). However, the Portfolios’ relative weight in Financials increased primarily due to the strong relative performance of our holdings as well as the decision by MSCI to carve out real estate companies, effective September 1.
TEN LARGEST HOLDINGS at October 31, 2016
| COMPANY | SECTOR | COUNTRY | INSTITUTIONAL HLMEX / HLEEX | ADVISOR HLEMX | ||||||||||||||
SAMSUNG ELECTRONICS | INFO TECHNOLOGY | SOUTH KOREA | 5.5 | 5.5 | ||||||||||||||
TAIWAN SEMICONDUCTOR | INFO TECHNOLOGY | TAIWAN | 4.6 | 4.6 | ||||||||||||||
TENCENT | INFO TECHNOLOGY | CHINA | 4.0 | 4.0 | ||||||||||||||
SBERBANK | FINANCIALS | RUSSIA | 3.0 | 3.1 | ||||||||||||||
AIA GROUP | FINANCIALS | HONG KONG | 2.7 | 2.7 | ||||||||||||||
LARGAN PRECISION | INFO TECHNOLOGY | TAIWAN | 2.2 | 2.2 | ||||||||||||||
SANDS CHINA | CONS DISCRETIONARY | HONG KONG | 2.2 | 2.2 | ||||||||||||||
LUKOIL | ENERGY | RUSSIA | 2.2 | 2.2 | ||||||||||||||
CNOOC | ENERGY | CHINA | 2.0 | 2.0 | ||||||||||||||
GF BANORTE | FINANCIALS | MEXICO | 2.0 | 2.0 | ||||||||||||||
Coincidentally, we purchased Emaar Properties, a UAE-based real-estate developer of residential communities, shopping malls, and theme parks. Emaar is well positioned to take advantage of strong demand for new properties in Dubai, a regional hub for business and tourism that is considered a safe haven among the Gulf countries. Also, a significant portion of Emaar’s earnings comes from rental income generated by the hotels and malls it owns, which provide a dependable source of recurring cash flow, bolstering financial strength and reducing risk relative to this deeply cyclical industry.
Our Health Care exposure halved in the last twelve months as we have reacted to valuation and grown increasingly concerned about a deteriorating industry structure. Consolidation within US drug distributors has raised buyer power while increased US regulatory scrutiny on manufacturing assets and processes has led to rising costs. We also sold Jordan-based, UK-listed Hikma Pharmaceuticals after the company’s recent merger and acquisition activity in the US raised the percent of total revenues generated in developed markets to 70%, removing it from our EM universe.
We added new holdings in Consumer Staples by taking advantage of lower share prices for what we identified as high-quality, growing companies, including Kenya’s East African Breweries (which enjoys strong consumer loyalty locally for brands such as Tusker beer) and the Philippines’Universal Robina (a leading snack-food manufacturer in southeast Asia).
Geographically, we decreased our exposure to Turkey over the year to a clear underweight (from about 3% of each Portfolio to 1%) through reducing our position in Arcelik, the white-goods manufacturer, and Garanti Bank. We were concerned that both companies may be impacted as Turkey’s worsening political trends reduced the likelihood of much-needed structural reforms and improvements in the general business climate.
Lastly, we reduced our longstanding underweight in South Ko-rea by purchasing internet provider NAVER as well as two of the country’s leading cosmetics companies, LG Household & Health Care and AmorePacific.
Please read the separate disclosures page for important information, including the risks of investing in the Portfolios.
25
|
Table of Contents

PORTFOLIO MANAGEMENT TEAM

PRADIPTA CHAKRABORTTY CO-LEAD PORTFOLIO MANAGER
BABATUNDE OJO, CFA CO-LEAD PORTFOLIO MANAGER | G. RUSTY JOHNSON, CFA PORTFOLIO MANAGER
RICHARD SCHMIDT, CFA PORTFOLIO MANAGER |
 PERFORMANCE SUMMARY
The Frontier Emerging Markets Portfolio – Institutional Class declined 2.43% and the Investor Class declined 3.01% (net of fees and expenses) in the fiscal year ended October 31, 2016. The Portfolio’s benchmark, the MSCI Frontier Emerging Markets Index, rose 2.13% (net of source taxes).
MARKET REVIEW
Frontier emerging markets (FEMs) advanced in the fiscal year, with all regions except the Gulf States and Africa recording gains.
In Latin America, good returns were broadly based. Peru was the top-performing market as investors welcomed Pedro Pablo Kuczynski’s victory in the runoff presidential elections in June. Kuczynski, a former World Bank economist, is perceived as business friendly and committed to sound economic policies that should reinforce Peru’s economic recovery. Argentina also showed signs of recovery, which we discuss later in this report.
Asia posted a positive return despite uncertainty in the Philippines, the Index’s largest market, where investors have been rattled by the political spectacle of President Rodrigo Duterte since he was elected in May. The president’s violent “war on crime” policies, inflammatory rhetoric directed against the US, and insinuation of closer relations with China indicate a potential major shift in the Philippines’ foreign and economic policy.1 Such a development would adversely impact the Philippines’ relationship with the US, a top trading partner and its largest foreign investor.2
The Gulf States region was the poorest performer in the fiscal year, due largely to the National Bank of Kuwait (NBK), Ku-wait’s leading bank, which underperformed on the back of a slight downward revision in loan growth outlook and ongoing precautionary provision charges. Unlike in most countries, where the loan loss provisioning level is determined by bank management, Kuwait’s banking regulator takes an active role in setting what it
FUND FACTS at October 31, 2016 | ||||||||
TOTAL NET ASSETS | $374.9M | |||||||
SALES CHARGE | NONE | |||||||
NUMBER OF HOLDINGS | 70 | |||||||
TURNOVER (5 YR. AVG.) | 43% | |||||||
REDEMPTION FEE | 2% FIRST 90 DAYS | |||||||
DIVIDEND POLICY | ANNUAL | |||||||
| INSTITUTIONAL CLASS | INVESTOR CLASS | |||||||
TICKER | HLFMX | HLMOX | ||||||
CUSIP | 412295867 | 412295859 | ||||||
INCEPTION DATE | 5/27/2008 | 12/31/2010 | ||||||
MINIMUM INVESTMENT1 | $100,000 | $5,000 | ||||||
EXPENSE RATIO | 1.79% | 2.20% | ||||||
1Lower minimums available through certain brokerage firms.
deems an appropriate level of provisioning. The regulator is very conservative, so provisions mandated by the regulator continue to grow alongside loan growth, despite already substantial loan loss coverage ratios. Regardless, NBK’s core lending business remains stable, and the bank has recently raised additional equity capital to strengthen its balance sheet ahead of Basel III implementation.
Africa’s decline owed to the poor performance of Nigeria, which was beset by currency woes this year. In June, the Central Bank of Nigeria abandoned its earlier plan for a dual exchange rate regime and implemented a free-floating exchange rate mechanism.3 Investors applauded this long-overdue step required to address the scarcity of foreign exchange in the country. However, the positive local currency returns of Nigerian equities were counterbalanced by a sizeable naira devaluation; the naira depreciated nearly 37% against the US dollar during the fiscal year. Exacerbating these problems, inflation rose for the ninth consecutive month in Octo-ber and reached an eleven-year high of 18% (year-on-year), while crude oil production in the country dropped by one-third as a result of continued militant attacks on pipelines in the Niger Delta.4
Sector performance was mixed during the year, with Consumer Staples being the worst performer. Philippines-based food producer Universal Robina, which accounts for over 20% of the sector in the Index, declined following allegations of elevated lead content in its beverage products manufactured in Vietnam. Though the company’s products were subsequently cleared, the product recalls and audit by the Ministry of Health caused a loss
1Bryan Harris, “Philippines Pivots Away from the US,”Financial Times (September 14, 2016).
2“Philippines,”Office of the United States Trade Representative (May 2, 2014).
3Godwin I. Emefiele, “Re-Introducing and Operationalizing Nigeria’s Flexible Exchange Rate Market,”Central Bank of Nigeria (June 15, 2016).
4Tife Owolabi, “Nigerian Militant Group Claims Attack on Oil Pipeline Niger Delta,”Reuters (September 29, 2016).
26
|
Table of Contents
PERFORMANCE (% TOTAL RETURN)
| for periods ending September 30, 2016 | for periods ending October 31, 2016 | |||||||||||||||||||||||||||||||||||||||||||||
| 1 YEAR | 3 YEARS | 5 YEARS | SINCE INCEPTION* | 1 YEAR | 3 YEARS | 5 YEARS | SINCE INCEPTION* | |||||||||||||||||||||||||||||||||||||||
FRONTIER EMERGING MARKETS PORTFOLIO - INSTITUTIONAL CLASS | -1.77 | -2.52 | 4.48 | – | -2.75 | -2.43 | -3.56 | 3.27 | – | -2.81 | ||||||||||||||||||||||||||||||||||||
MSCI FRONTIER EMERGING MARKETS INDEX | 6.79 | -0.82 | 3.97 | -0.03 | – | 2.13 | -2.22 | 2.71 | -0.17 | – | ||||||||||||||||||||||||||||||||||||
FRONTIER EMERGING MARKETS PORTFOLIO - INVESTOR CLASS | -2.21 | -2.95 | 4.05 | -0.54 | – | -3.01 | -3.99 | 2.85 | -0.67 | – | ||||||||||||||||||||||||||||||||||||
Returns are annualized for periods greater than 1 year. *Inception of the Institutional Class, 5/27/08. Inception of the Investor Class, 12/31/10. Index performance prior to 12/2/08 cannot be shown in the table above or in the charts below since it relies on back-filled data. Accordingly, the chart below for the Institutional Class depicts a hypothetical investment in the Portfolio on inception date, while Index data begins on 12/2/08. For comparative purposes, the beginning value of the Index on that date was matched to the value of the hypothetical investment in the Portfolio.
Performance data quoted represents past performance; past performance does not guarantee future results. The investment return and principal value of an investment will fluctuate so that an investor’s shares, when redeemed, may be worth more or less than their original cost. Current performance of the Portfolio may be lower or higher than the performance quoted. Performance data current to the most recent month end may be obtained by calling (877) 435-8105 or visiting www.hardingloevnerfunds.com. Performance data shown does not reflect the 2.00% redemption fee imposed on shares held 90 days or less; otherwise, total returns would be reduced.
The charts below illustrate the hypothetical return of an investment made in the corresponding share classes. Investment return reflects voluntary fee waivers in effect. Absent such waivers, total return would be reduced. The performance provided in the table above and charts below do not reflect the deduction of taxes that a shareholder would pay on Portfolio distributions or the redemption of Portfolio shares.
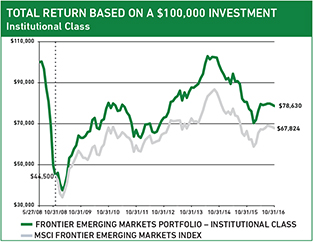
of sales in one of Universal Robina’s largest markets. Nigerian consumer companies also contributed to the poor performance of the Consumer Staples sector. These companies generate most of their revenue in the naira, so its depreciation led to reduced profitability as companies struggled to pass on higher costs to consumers without negatively impacting volume and revenue growth.
PERFORMANCE ATTRIBUTION
Stock selection in Consumer Discretionary and the Portfolio’s overweight in poorly performing Consumer Staples detracted most from sector performance relative to the benchmark. Worst among stocks in Consumer Discretionary was Saudi Arabian electronics retailer Jarir Marketing, which declined on lowered growth expectations due to the pressure of sustained low oil prices on consumer spending. The Portfolio benefited most from our Consumer Staples holdings, including Olympic Industries, a large biscuit and confectionary manufacturer in Bangladesh, which saw expanding margins mainly because of lower commodity prices and the company’s move toward premium products.
From a geographic perspective, our investments in the Gulf States detracted most from relative returns, especially our Saudi Arabian
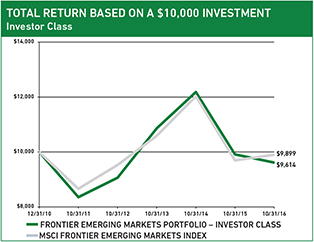
holdings such as Jarir Marketing and fast-food retailer Herfy Food Services. The United Arab Emirates (UAE) was impacted by poor performance from food and consumer-staples producer Agthia Group, which retrenched following changes in Abu Dhabi’s flour and animal feed subsidy policy, discussed later in this report. Our holdings in Latin America contributed most to relative performance, including Peruvian consumer goods company Alicorp and Colombian cement company Cementos Argos.
INVESTMENT PERSPECTIVES
Regulatory Risk in Frontier Markets
In recent years, we have seen many frontier nations choose democratic, rather than authoritarian, forms of government and adopt more orthodox policies to manage their economies. However, many nations still lack the solid legal and regulatory frameworks that characterize more developed markets. This is true even for market-oriented economies that have, for the most part, pursued sound regulation in the past, such as Kenya.
In August, Kenyan President Uhuru Kenyatta and the Kenyan Parliament enacted the Banking (Amendment) Bill 2015, which
27
|
Table of Contents
intends to regulate interest rates that are applicable to banks’ loans and deposits.5 The bill effectively caps the rate banks can charge on loans at a maximum of 4% above the monetary policy rate (MPR), set by the Central Bank of Kenya (currently at 10%), and sets a floor rate that banks must pay on the savings deposit accounts at 70% of MPR. The passage of this controversial legislation despite opposition from central-bank leadership is widely regarded as a populist measure designed to win votes ahead of Kenya’s parliamentary and presidential elections in August 2017.6
Beyond the negative impact on banks’ profitability, this abrupt regulatory change sharply raises systemic risk in the Kenyan banking system. Smaller banks in the country lack large branch networks and deposit-gathering capabilities and rely in part on interbank funding, the cost of which typically exceeds the lending rate cap mandated by the new legislation. Now these banks may be forced to curtail their lending, which would reduce the amount of credit available in the economy.
The legislation could also cause banks to shift their lending away from private-sector borrowers toward the government and ultimately lead to lower rates of economic growth in Kenya. As a result of this sudden regulatory decision and its threat to banks’ profitability, we sold our two Kenyan banks, KCB Group and Equity Bank, in September, although not before their shares fell sharply.
While we generally applaud actions aimed at curbing excessive spending and solidifying the foundation of long-term competitiveness, we acknowledge that such changes will bring volatility to a market and can negatively impact companies that previously benefited from government policies.
The interest rate cap in Kenya is a case of a regulatory overreach that distorts the normal functions of the market. Elsewhere in the frontier universe, we have seen governments adopt more market-oriented policies designed to limit their economic influence.
GEOGRAPHIC EXPOSURE (%) at October 31, 2016
| REGION | PORTFOLIO | BENCHMARK1 | ||||||
AFRICA | 18.9 | 16.8 | ||||||
ASIA | 37.4 | 38.6 | ||||||
EUROPE | 11.3 | 4.7 | ||||||
GULF STATES | 8.9 | 12.3 | ||||||
LATIN AMERICA | 18.6 | 25.1 | ||||||
MIDDLE EAST | 0.3 | 2.5 | ||||||
DEVELOPED MARKET LISTED2 | 3.1 | – | ||||||
CASH | 1.5 | – | ||||||
1MSCI Frontier Emerging Markets Index; 2Includes frontier or small emerging markets companies listed in developed markets.
SECTOR EXPOSURE (%) at October 31, 2016
| SECTOR | PORTFOLIO | BENCHMARK1 | ||||||
CONSUMER DISCRETIONARY | 7.7 | 1.7 | ||||||
CONSUMER STAPLES | 19.8 | 7.3 | ||||||
ENERGY | 5.8 | 5.5 | ||||||
FINANCIALS | 35.8 | 44.2 | ||||||
HEALTH CARE | 4.1 | 1.5 | ||||||
INDUSTRIALS | 2.8 | 8.5 | ||||||
INFORMATION TECHNOLOGY | 0.6 | 0.6 | ||||||
MATERIALS | 12.6 | 8.1 | ||||||
REAL ESTATE | 1.9 | 10.0 | ||||||
TELECOM SERVICES | 7.4 | 9.8 | ||||||
UTILITIES | 0.0 | 2.8 | ||||||
CASH | 1.5 | – | ||||||
1MSCI Frontier Emerging Markets Index.
While we generally applaud actions aimed at curbing excessive spending and solidifying the foundation of long-term competitiveness, we acknowledge that such changes will bring volatility to a market and can negatively impact companies that previously benefited from government policies. This has been the case with subsidy programs in several Gulf countries that have increasingly adopted austerity measures in response to low oil prices.
The government of Abu Dhabi (part of the UAE) has sponsored a subsidy program for flour and animal feed since 2007 to insulate the public from food price fluctuations. Under the program, our Consumer Staples holding Agthia Group sold its flagship products Grand Mills flour and Agrivita animal feed in Abu Dhabi at fixed prices significantly below those of its competitors, and was reimbursed for the difference by the government. This arrangement allowed the company to gain dominant market share in the emirate. But in early August, the government announced a plan to phase out the subsidy program over the next two years.7
Agthia is implementing several steps to counter the impact of subsidy cuts, including price increases, cost optimization, and a new range of value-priced products. Price increases, however, would negatively impact volumes, especially in the environment of overall slowdown in consumer spending in the UAE in the wake of lower oil prices. Moreover, competitors who were nearly absent from the Abu Dhabi market since 2007 given Agthia’s price advantage may respond with aggressive sales efforts, offering discounts and promotions in an effort to win market share. This would prompt Agthia to step up its own marketing and promotion activity, putting pressure on margins. In the long term, Agthia may be able to offset the impact on its flour and animal feed businesses
5“Statement by H.E. Uhuru Kenyatta, President of the Republic of Kenya and Commander-in-Chief of the Defence Forces, on the Banking (Amendment) Act 2015,” The Official Website of the President (August 24, 2016).
6John Aglionby, “Kenya to Cap Interest Rates on Bank Loans,” Financial Times (August 24, 2016).
7Agthia Group PJSC, Investor Presentation (September 2016).
28
|
Table of Contents
by growing other portions of its business portfolio and ramping up exports outside the UAE. For now, its growth and profitability outlook remain challenged.
Ever-changing regulation is a risk inherent to investing in frontier markets. Our adherence to strict diversification guidelines helps mitigate the idiosyncratic company-specific risks on a portfolio level.
Argentina
With a population of 43 million people, Argentina is the third-largest economy in Latin America and has the second-highest income per capita. The country boasts substantial oil and natural gas reserves, a host of mineral deposits, and an abundant water supply. Argentina is also one of the world’s leading food producers, ranking among the top-five producers of soybeans and beef. The country’s population is one of the most educated and urbanized in Latin America.8
Despite these advantages, Argentina has operated below its potential for the last 15 years due to the destructive policies of the Nestor and Cristina Kirchner governments. We have avoided investing in Argentina since 2012, deterred by unfriendly and unpredictable government policies toward business that posed substantial risks to companies operating in the country. Indeed, strict price controls in the high inflationary environment pressured corporate margins, capital movement restrictions meant that companies were unable to pay dividends, and oppressive regulations forced banks to lend at rates of interest below inflation.
The political direction of the country has changed radically since the December 2015 election of pro-business President Mauricio Macri. Upon taking office, the Macri administration swiftly undertook wide-ranging reforms designed to address the country’s longstanding economic imbalances. The first step in that direction was the abolition of foreign exchange controls, resulting in a substantial depreciation of the peso against the US dollar that largely eliminated the gap between the official and black market rates.9
In April 2016, Argentina finally settled a longstanding legal dispute from 2001’s sovereign default by making a repayment to holdout creditors. Subsequently, the country returned to the international capital markets with a US$16.5 billion bond issuance, the first such offering in more than a decade. Well-functioning capital markets and a fairly valued currency should stimulate a greater flow of foreign direct investment into Argentina. Since President
8Carlos G. Macedo, Marvelo Cintra, and Steven Goncalves, “Argentina: Banks,” Goldman Sachs Equity Research (April 26, 2016).
9Rodrigo Vergara, “International Monetary and Financial Committee Thirty-Third Meeting,”International Monetary Fund (April 16, 2016).
10Benedict Mander, “Results of Foreign Direct Investments in Argentina Remain Flat,”Financial Times (September 19, 2016).
11Taos Turner, “Argentina’s Central Bank to Take Aim at Inflation,” Wall Street Journal (April 28, 2016).
12“Argentina Financial Institutions: A Primer on the Card Industry,” Morgan Stanley Research (June 6, 2016).
TEN LARGEST HOLDINGS at October 31, 2016
| COMPANY | SECTOR | COUNTRY | % | |||||||||
SAFARICOM | TELECOM SERVICES | KENYA | 4.4 | |||||||||
HOA PHAT GROUP | MATERIALS | VIETNAM | 4.0 | |||||||||
SQUARE PHARMACEUTICALS | HEALTH CARE | BANGLADESH | 3.3 | |||||||||
BANCA TRANSILVANIA | FINANCIALS | ROMANIA | 3.3 | |||||||||
JOLLIBEE FOODS | CONS DISCRETIONARY | PHILIPPINES | 3.3 | |||||||||
COMMERCIAL INTL BANK | FINANCIALS | EGYPT | 3.1 | |||||||||
UNIVERSAL ROBINA | CONS STAPLES | PHILIPPINES | 3.0 | |||||||||
CEMENTOS ARGOS | MATERIALS | COLOMBIA | 2.9 | |||||||||
HALYK SAVINGS BANK | FINANCIALS | KAZAKHSTAN | 2.9 | |||||||||
OLYMPIC INDUSTRIES | CONS STAPLES | BANGLADESH | 2.9 | |||||||||
Macri’s election, a variety of multinational companies such as Toyota, Coca-Cola, Unilever, and Procter & Gamble have announced close to US$30 billion in new investments.10
Bringing down inflation is another key policy objective of President Macri. In April, the Central Bank of Argentina announced a target of lowering the annual inflation rate from over 35% to 5% by end of 2019.11 Lower inflation means lower interest rates, which in turn should bolster the recovery of economic activity.
We reentered Argentina this year by establishing positions in two Argentinian financial companies: Banco Macro, one of the largest banks in the country, and Grupo Financiero Galicia, a leading diversified financial services company. Both companies boast large branch networks, good positioning in the retail banking segment, and strong credit card operations. Credit card penetration in Ar-gentina is in-line with global averages (at an average of about two cards per capita), yet the ratio of credit card spending to total personal consumption expenditures is significantly below both global averages and averages of Argentina’s Latin American peers.12 These lower rates of spending can be traced back to the Kirchner regimes, during which bouts of inflation and devaluation inspired a general skepticism toward banks in many Argentines. As inflation normalizes under President Macri and interest rates decline, credit growth should accelerate and credit card spending should increase, benefiting Banco Macro and Grupo Financiero Galicia.
Please read the separate disclosures page for important information, including the risks of investing in the Portfolio.
29
|
Table of Contents
 DISCLOSURES
The Portfolios invest in foreign securities, which will involve greater volatility and political, economic, and currency risks and differences in accounting methods. They also invest in emerging markets, which involve unique risks, such as exposure to economies less diverse and mature than the US or other more established foreign markets. Economic and political instability may cause larger price changes in emerging markets securities than other foreign securities.
Investments in small- and mid-cap companies involve additional risks such as limited liquidity and greater volatility.
Diversification does not guarantee a profit or prevent a loss in a declining market.
Long-term earnings growth and earnings per share growth are not a forecast of the Portfolios’ future performance.
Companies held in the Portfolios during the fiscal year appear in bold type; only the first reference to a particular holding appears in bold. The Portfolios are actively managed; therefore holdings shown may not be current. Portfolio holdings and sector and geographic allocations should not be considered recommendations to buy or sell any security. Please refer to the Portfolios of Investments in this report for complete Portfolio holdings. Current and future Portfolio holdings are subject to risk.
While the Portfolios have no sales charge, management fees and other expenses still apply. Please see the Prospectus for further details.
Sector & Geographic Exposure data is sourced from: FactSet, Harding Loevner Funds Portfolios, and MSCI Barra. Differences may exist between this source data and similar information reported in the financial statements due to timing differences and/or adjustments required pursuant to Generally Accepted Accounting Principles (GAAP).
Five year average turnover data is calculated using a simple average of annual turnover figures for the past five fiscal years. These annual turnover figures utilize purchase, sales, and market value data which is not reflective of adjustments required pursuant to Generally Accepted Accounting Principles (GAAP). Accordingly, differences may exist between this data and similar information reported in the financial statements.
Quasar Distributors, LLC, Distributor.
INDEX DEFINITIONS
The MSCI All Country World Index is a free float-adjusted market capitalization index that is designed to measure equity market performance in the global developed and emerging markets. The Index consists of 46 developed and emerging market countries. Net dividends reinvested.
The MSCI All Country World ex-US Index is a free float-adjusted market capitalization index that is designed to measure equity market performance in the global developed and emerging markets, excluding the US. The Index consists of 45 developed and emerging market countries. Net dividends reinvested.
The MSCI All Country World ex-US Small Cap Index is a free- float market capitalization index that is designed to measure small cap developed and emerging market equity performance. The Index consists of 45 developed and emerging markets countries and targets companies within a market capitalization range of USD 8–6,660 million (as of October 31, 2016) in terms of the companies’ full market capitalization. Net dividends reinvested.
The MSCI Emerging Markets Index is a free float-adjusted market capitalization index that is designed to measure equity market performance in the global emerging markets. The Index consists of 23 emerging market countries. Net dividends reinvested.
The MSCI Frontier Emerging Markets Index is a free float-adjusted market capitalization index designed to measure equity market performance in all countries from the MSCI Frontier Markets Index and the lower size spectrum of the MSCI Emerging Markets Index. The Index consists of 23 frontier markets and 4 emerging markets. Net dividends reinvested.
The MSCI USA Growth Index captures large and mid cap US securities exhibiting overall growth style characteristics.
The MSCI USA Value Index captures large and mid cap US securities exhibiting overall value style characteristics.
You cannot invest directly in these Indices.
TERM DEFINITIONS
Basis Points are a common measurement used chiefly for interest rates and other percentages in finance. A basis point is one hundredth of one percent.
Cash Flow measures the cash generating capability of a company by adding non-cash charges (e.g. depreciation) and interest expense to pretax income.
Cash Flow Return on Invested Capital is a method of calculation that compares a company’s cash return to its equity.
Earnings Per Share is a proportionate saving in costs gained by an increased level of production.
Economies of scale is the cost advantage that arises with increased output of a product.
Gross Domestic Product (GDP) is the monetary value of all finished goods and services produced within a country’s borders in a specific time period (usually calculated on an annual basis).
Market Capitalization is the total dollar market value of all of a company’s outstanding shares.
Return on Capital (ROC) is a calculation used to assess a company’s efficiency at allocating the capital under its control to profitable investments.
Return on Equity (ROE) is the net income divided by total common equity outstanding, expressed as a percent.
Revenue is the amount of money that a company actually receives during a specific period, including discounts and deductions for returned merchandise.
Sales Growth is the amount by which the average sales volume of a company’s products or services has grown, typically from year to year.
Tracking Error is a measure of how closely a portfolio follows the index to which it is benchmarked.
Turnover is calculated by dividing the lesser of Purchases or Sales by Average Capital.
30
|
Table of Contents
Table of Contents
Harding, Loevner Funds, Inc.
| 2 | ||||
| 4 | ||||
| 7 | ||||
| 10 | ||||
| 16 | ||||
| 20 | ||||
| 24 | ||||
| 28 | ||||
| 32 | ||||
| 34 | ||||
| 36 | ||||
| 39 | ||||
| 46 | ||||
| 57 | ||||
| 58 | ||||
| 59 | ||||
| 64 | ||||
| 65 | ||||
| 70 | ||||
For use only when preceded or accompanied by a prospectus. Read the prospectus carefully before you invest or send money.
Table of Contents
Harding, Loevner Funds, Inc.
October 31, 2016 (unaudited)
As a shareholder of a Harding Loevner Portfolio, you incur ongoing costs, including management fees; and to the extent applicable, distribution (12b-1) fees, and/or shareholder services fees and other fund expenses. The following examples are intended to help you understand your ongoing costs (in dollars and cents) of investing in a Portfolio and to compare these costs with the ongoing costs of investing in other mutual funds.
The examples are based on an investment of $1,000 invested at the beginning of a six month period and held through the period ended October 31, 2016.
Actual Expenses
The first line under each Portfolio in the table below provides information about actual account values and actual expenses. You may use the information in this line, together with the amount you invested, to estimate the expenses that you paid over the period. Simply divide your account value by $1,000 (for example, an $8,600 account value divided by $1,000 = 8.6), then multiply the result by the number in the first line for your Portfolio under the heading entitled “Expenses Paid During Period” to estimate the expenses you paid on your account during this period.
Hypothetical Example for Comparison Purposes
The second line under each Portfolio in the table below provides information about hypothetical account values and hypothetical expenses based on the Portfolio’s actual expense ratio and an assumed rate of return of 5% per year before expenses, which is not the Portfolio’s actual return. The hypothetical account values and expenses may not be used to estimate the actual ending account balance or expenses you paid for the period. You may use this information to compare the ongoing costs of investing in your Portfolio and other funds. To do so, compare this 5% hypothetical example with the 5% hypothetical examples that appear in the shareholder reports of the other funds. Please note that the expenses shown in the table are meant to highlight your ongoing costs only. Therefore, the second line under each Portfolio in the table is useful in comparing ongoing costs only, and will not help you determine the relative total costs of owning different funds.
| Portfolio | Beginning Account Value May 1, 2016 | Ending Account Value October 31, 2016 | Annualized Expense Ratio | Expenses Paid During Period * (May 1, 2016 to October 31, 2016) | ||||||||||||||||
Global Equity Portfolio — Institutional Class | ||||||||||||||||||||
Actual | $ | 1,000.00 | $ | 1,042.00 | 0.92 | % | $ | 4.72 | ||||||||||||
Hypothetical (5% annual return before expenses) | 1,000.00 | 1,020.51 | 0.92 | % | 4.67 | |||||||||||||||
Global Equity Portfolio — Advisor Class | ||||||||||||||||||||
Actual | 1,000.00 | 1,040.70 | 1.15 | % | 5.90 | |||||||||||||||
Hypothetical (5% annual return before expenses) | 1,000.00 | 1,019.36 | 1.15 | % | 5.84 | |||||||||||||||
International Equity Portfolio — Institutional Class | ||||||||||||||||||||
Actual | 1,000.00 | 1,052.10 | 0.84 | % | 4.33 | |||||||||||||||
Hypothetical (5% annual return before expenses) | 1,000.00 | 1,020.91 | 0.84 | % | 4.27 | |||||||||||||||
International Equity Portfolio — Investor Class | ||||||||||||||||||||
Actual | 1,000.00 | 1,050.50 | 1.13 | % | 5.82 | |||||||||||||||
Hypothetical (5% annual return before expenses) | 1,000.00 | 1,019.46 | 1.13 | % | 5.74 | |||||||||||||||
International Equity Research Portfolio — Institutional Class | ||||||||||||||||||||
Actual | 1,000.00 | 1,056.10 | 0.90 | % | 4.65 | |||||||||||||||
Hypothetical (5% annual return before expenses) | 1,000.00 | 1,020.61 | 0.90 | % | 4.57 | |||||||||||||||
International Equity Research Portfolio — Investor Class | ||||||||||||||||||||
Actual | 1,000.00 | 1,054.30 | 1.15 | % | 5.94 | |||||||||||||||
Hypothetical (5% annual return before expenses) | 1,000.00 | 1,019.36 | 1.15 | % | 5.84 | |||||||||||||||
International Small Companies Portfolio — Institutional Class | ||||||||||||||||||||
Actual | 1,000.00 | 1,021.60 | 1.25 | % | 6.35 | |||||||||||||||
Hypothetical (5% annual return before expenses) | 1,000.00 | 1,018.85 | 1.25 | % | 6.34 | |||||||||||||||
International Small Companies Portfolio — Investor Class | ||||||||||||||||||||
Actual | 1,000.00 | 1,019.40 | 1.50 | % | 7.61 | |||||||||||||||
Hypothetical (5% annual return before expenses) | 1,000.00 | 1,017.60 | 1.50 | % | 7.61 | |||||||||||||||
* Expenses are calculated using each Portfolio’s annualized expense ratio (as disclosed in the table), multiplied by the average account value for the period, multiplied by the number of days in the period (184 days), and divided by the number of days in the year (366 days). Expense ratios for the most recent half year may differ from expense ratios based on one-year data in the Financial Highlights.
2
Table of Contents
Harding, Loevner Funds, Inc.
Expense Example (continued)
October 31, 2016 (unaudited)
| Portfolio | Beginning Account Value May 1, 2016 | Ending Account Value October 31, 2016 | Annualized Expense Ratio | Expenses Paid During Period * (May 1, 2016 to October 31, 2016) | ||||||||||||||||
Institutional Emerging Markets Portfolio — Class I | ||||||||||||||||||||
Actual | $ | 1,000.00 | $ | 1,094.90 | 1.28 | % | $ | 6.74 | ||||||||||||
Hypothetical (5% annual return before expenses) | 1,000.00 | 1,018.70 | 1.28 | % | 6.50 | |||||||||||||||
Institutional Emerging Markets Portfolio — Class II | ||||||||||||||||||||
Actual | 1,000.00 | 1,097.00 | 1.13 | % | 5.96 | |||||||||||||||
Hypothetical (5% annual return before expenses) | 1,000.00 | 1,019.46 | 1.13 | % | 5.74 | |||||||||||||||
Emerging Markets Portfolio — Advisor Class | ||||||||||||||||||||
Actual | 1,000.00 | 1,095.40 | 1.39 | % | 7.32 | |||||||||||||||
Hypothetical (5% annual return before expenses) | 1,000.00 | 1,018.15 | 1.39 | % | 7.05 | |||||||||||||||
Frontier Emerging Markets Portfolio — Institutional Class | ||||||||||||||||||||
Actual | 1,000.00 | 987.90 | 1.74 | % | 8.69 | |||||||||||||||
Hypothetical (5% annual return before expenses) | 1,000.00 | 1,016.39 | 1.74 | % | 8.82 | |||||||||||||||
Frontier Emerging Markets Portfolio — Investor Class | ||||||||||||||||||||
Actual | 1,000.00 | 985.10 | 2.21 | % | 11.03 | |||||||||||||||
Hypothetical (5% annual return before expenses) | 1,000.00 | 1,014.03 | 2.21 | % | 11.19 | |||||||||||||||
* Expenses are calculated using each Portfolio’s annualized expense ratio (as disclosed in the table), multiplied by the average account value for the period, multiplied by the number of days in the period (184 days), and divided by the number of days in the year (366 days). Expense ratios for the most recent half year may differ from expense ratios based on one-year data in the Financial Highlights.
3
Table of Contents
Portfolio of Investments
October 31, 2016
| Shares | Value | |||||||
| COMMON STOCKS - 93.3% | ||||||||
China - 3.7% | ||||||||
Baidu Inc. - Sponsored ADR (Software & Services)* | 56,100 | $9,921,846 | ||||||
Ctrip.com International Ltd. - ADR (Retailing)* | 220,000 | 9,713,000 | ||||||
Tencent Holdings Ltd. (Software & Services)† | 430,000 | 11,386,288 | ||||||
| 31,021,134 | ||||||||
Denmark - 0.1% | ||||||||
Novozymes A/S, Class B (Materials)† | 30,451 | 1,130,714 | ||||||
France - 4.0% | ||||||||
Air Liquide SA (Materials)† | 81,600 | 8,292,800 | ||||||
Dassault Systemes SA (Software & Services)† | 113,800 | 9,018,097 | ||||||
Essilor International SA (Health Care Equipment & Services)† | 70,800 | 7,945,428 | ||||||
L’Oreal SA (Household & Personal Products)† | 46,700 | 8,364,313 | ||||||
| 33,620,638 | ||||||||
Germany - 0.8% | ||||||||
Linde AG (Materials)† | 38,300 | 6,318,365 | ||||||
Hong Kong - 2.2% | ||||||||
AIA Group Ltd. (Insurance)† | 2,962,100 | 18,692,925 | ||||||
India - 1.7% | ||||||||
ICICI Bank Ltd. - Sponsored ADR (Banks) | 1,673,186 | 13,870,712 | ||||||
Indonesia - 1.3% | ||||||||
Bank Central Asia Tbk PT (Banks)† | 8,881,624 | 10,553,117 | ||||||
Italy - 2.3% | ||||||||
Luxottica Group SpA (Consumer Durables & Apparel)† | 218,900 | 10,849,781 | ||||||
Tenaris SA - ADR (Energy) | 288,250 | 8,128,650 | ||||||
| 18,978,431 | ||||||||
Japan - 11.9% | ||||||||
FANUC Corp. (Capital Goods)† | 45,400 | 8,506,421 | ||||||
Keyence Corp. (Technology Hardware & Equipment)† | 15,896 | 11,668,476 | ||||||
Kubota Corp. (Capital Goods)† | 1,101,900 | 17,761,987 | ||||||
M3 Inc. (Health Care Equipment & Services)† | 889,396 | 27,136,370 | ||||||
Makita Corp. (Capital Goods)† | 119,200 | 8,252,545 | ||||||
MonotaRO Co., Ltd. (Capital Goods)† | 327,200 | 7,980,899 | ||||||
| Shares | Value | |||||||
| COMMON STOCKS - 93.3% (continued) | ||||||||
Japan - 11.9% (continued) | ||||||||
Pigeon Corp. (Household & Personal Products)† | 348,648 | $9,827,954 | ||||||
Sysmex Corp. (Health Care Equipment & Services)† | 120,235 | 8,344,151 | ||||||
| 99,478,803 | ||||||||
Russia - 2.0% | ||||||||
Magnit PJSC - Sponsored GDR, Reg S (Food & Staples Retailing)† | 133,400 | 5,287,122 | ||||||
Yandex NV, Class A (Software & Services)* | 585,600 | 11,530,464 | ||||||
| 16,817,586 | ||||||||
South Africa - 0.9% | ||||||||
Sasol Ltd. (Energy)† | 271,730 | 7,505,473 | ||||||
Spain - 1.9% | ||||||||
Banco Bilbao Vizcaya Argentaria SA (Banks)† | 1,708,800 | 12,315,380 | ||||||
Grifols SA (Pharmaceuticals, Biotechnology & Life Sciences)† | 193,900 | 3,831,828 | ||||||
| 16,147,208 | ||||||||
Sweden - 1.1% | ||||||||
Atlas Copco AB, Class A (Capital Goods)† | 308,200 | 9,025,756 | ||||||
Switzerland - 5.0% | ||||||||
Lonza Group AG, Reg S (Pharmaceuticals, Biotechnology & Life Sciences)*† | 68,500 | 12,915,295 | ||||||
Nestle SA - Sponsored ADR (Food, Beverage & Tobacco) | 161,800 | 11,753,961 | ||||||
Roche Holding AG, Genusschein (Pharmaceuticals, Biotechnology & Life Sciences)† | 37,800 | 8,674,028 | ||||||
Sonova Holding AG, Reg S (Health Care Equipment & Services)† | 62,600 | 8,391,765 | ||||||
| 41,735,049 | ||||||||
Turkey - 0.8% | ||||||||
Turkiye Garanti Bankasi AS - ADR (Banks) | 2,465,400 | 6,792,177 | ||||||
United Kingdom - 3.8% | ||||||||
Abcam plc (Pharmaceuticals, Biotechnology & Life Sciences)† | 584,904 | 6,234,725 | ||||||
See Notes to Financial Statements
4
Table of Contents
Harding, Loevner Funds, Inc.
Global Equity Portfolio
Portfolio of Investments
October 31, 2016 (continued)
| Shares | Value | |||||||
| COMMON STOCKS - 93.3% (continued) | ||||||||
United Kingdom - 3.8% (continued) | ||||||||
Rotork plc (Capital Goods)† | 2,155,171 | $5,375,245 | ||||||
Shire plc (Pharmaceuticals, Biotechnology & Life Sciences)† | 156,500 | 8,837,503 | ||||||
WPP plc (Media)† | 527,100 | 11,453,143 | ||||||
| 31,900,616 | ||||||||
United States - 49.8% | ||||||||
3M Co. (Capital Goods) | 47,600 | 7,868,280 | ||||||
Abbott Laboratories (Health Care Equipment & Services) | 190,300 | 7,467,372 | ||||||
AbbVie Inc. (Pharmaceuticals, Biotechnology & Life Sciences) | 93,972 | 5,241,758 | ||||||
Alphabet Inc., Class A (Software & Services)* | 40,750 | 33,003,425 | ||||||
Amazon.com Inc. (Retailing)* | 14,575 | 11,511,627 | ||||||
AmerisourceBergen Corp. (Health Care Equipment & Services) | 130,600 | 9,183,792 | ||||||
Cognex Corp. (Technology Hardware & Equipment) | 219,300 | 11,315,880 | ||||||
Colgate-Palmolive Co. (Household & Personal Products) | 195,300 | 13,936,608 | ||||||
Exxon Mobil Corp. (Energy) | 124,900 | 10,406,668 | ||||||
F5 Networks Inc. (Technology Hardware & Equipment)* | 135,600 | 18,741,276 | ||||||
Facebook Inc., Class A (Software & Services)* | 101,300 | 13,269,287 | ||||||
First Republic Bank (Banks) | 264,400 | 19,679,292 | ||||||
IPG Photonics Corp. (Technology Hardware & Equipment)* | 120,300 | 11,670,303 | ||||||
Lazard Ltd., Class A (Diversified Financials) | 283,500 | 10,336,410 | ||||||
Mastercard Inc., Class A (Software & Services) | 101,200 | 10,830,424 | ||||||
Microsoft Corp. (Software & Services) | 111,200 | 6,663,104 | ||||||
Monsanto Co. (Materials) | 77,700 | 7,829,829 | ||||||
NIKE Inc., Class B (Consumer Durables & Apparel) | 486,900 | 24,432,642 | ||||||
PayPal Holdings Inc. (Software & Services)* | 478,000 | 19,913,480 | ||||||
Priceline Group Inc. (Retailing)* | 14,415 | 21,251,025 | ||||||
Red Hat Inc. (Software & Services)* | 106,800 | 8,271,660 | ||||||
| Shares | Value | |||||||
| COMMON STOCKS - 93.3% (continued) | ||||||||
United States - 49.8% (continued) | ||||||||
Regeneron Pharmaceuticals Inc (Pharmaceuticals, Biotechnology & Life Sciences)* | 23,100 | $7,969,962 | ||||||
Roper Technologies Inc. (Capital Goods) | 119,000 | 20,623,890 | ||||||
salesforce.com Inc. (Software & Services)* | 119,500 | 8,981,620 | ||||||
Schlumberger Ltd. (Energy) | 327,700 | 25,635,971 | ||||||
Signature Bank (Banks)* | 72,400 | 8,728,544 | ||||||
SVB Financial Group (Banks)* | 203,600 | 24,894,172 | ||||||
Verisk Analytics Inc. (Commercial & Professional Services)* | 235,600 | 19,213,180 | ||||||
WABCO Holdings Inc. (Capital Goods)* | 78,000 | 7,679,880 | ||||||
Waters Corp. (Pharmaceuticals, Biotechnology & Life Sciences)* | 71,600 | 9,962,424 | ||||||
| 416,513,785 | ||||||||
Total Common Stocks (Cost $595,541,247) | $780,102,489 | |||||||
| PREFERRED STOCKS - 2.6% | ||||||||
Brazil - 1.4% | ||||||||
Itau Unibanco Holding SA - Sponsored ADR (Banks) | 945,340 | 11,277,907 | ||||||
Spain - 1.2% | ||||||||
Grifols SA - ADR (Pharmaceuticals, Biotechnology & Life Sciences) | 713,000 | 10,188,770 | ||||||
Total Preferred Stocks (Cost $18,595,726) | $21,466,677 | |||||||
See Notes to Financial Statements
5
Table of Contents
Harding, Loevner Funds, Inc.
Global Equity Portfolio
Portfolio of Investments
October 31, 2016 (continued)
| Shares | Value | |||||||
| SHORT TERM INVESTMENTS - 3.8% | ||||||||
Northern Institutional Funds - Treasury Portfolio, 0.20% (Money Market Fund) | 31,613,440 | $31,613,440 | ||||||
Total Short Term Investments (Cost $31,613,440) |
| $31,613,440 | ||||||
Total Investments — 99.7% | ||||||||
(Cost $645,750,413) | $833,182,606 | |||||||
Other Assets Less Liabilities - 0.3% | 2,535,798 | |||||||
Net Assets — 100.0% | $835,718,404 | |||||||
Summary of Abbreviations
| ADR | American Depositary Receipt. |
| GDR | Global Depository Receipt. |
| Reg S | Security sold outside United States without registration under the Securities Act of 1933. |
| * | Non-income producing security. |
| † | Investment categorized as level 2 security as disclosed in Note 2 of the Notes to Financial Statements. |
| Industry | | Percentage of Net Assets | | ||
Banks | 12.9 | % | |||
Capital Goods | 11.2 | ||||
Commercial & Professional Services | 2.3 | ||||
Consumer Durables & Apparel | 4.2 | ||||
Diversified Financials | 1.2 | ||||
Energy | 6.2 | ||||
Food & Staples Retailing | 0.6 | ||||
Food, Beverage & Tobacco | 1.4 | ||||
Health Care Equipment & Services | 8.2 | ||||
Household & Personal Products | 3.9 | ||||
Insurance | 2.2 | ||||
Materials | 2.8 | ||||
Media | 1.4 | ||||
Money Market Fund | 3.8 | ||||
Pharmaceuticals, Biotechnology & Life Sciences | 8.8 | ||||
Retailing | 5.1 | ||||
Software & Services | 17.1 | ||||
Technology Hardware & Equipment | 6.4 | ||||
Total Investments | 99.7 | ||||
Other Assets Less Liabilities | 0.3 | ||||
Net Assets | 100.0 | % | |||
See Notes to Financial Statements
6
Table of Contents
Harding, Loevner Funds, Inc.
International Equity Portfolio
Portfolio of Investments
October 31, 2016
| Shares | Value | |||||||
| COMMON STOCKS - 92.5% | ||||||||
Australia - 1.4% | ||||||||
CSL Ltd. (Pharmaceuticals, Biotechnology & Life Sciences)† | 1,242,600 | $94,790,802 | ||||||
Belgium - 1.8% | ||||||||
Anheuser-Busch InBev SA/NV - Sponsored ADR (Food, Beverage & Tobacco) | 1,072,400 | 123,851,476 | ||||||
Canada - 2.0% | ||||||||
Canadian National Railway Co. (Transportation) | 2,196,900 | 138,119,103 | ||||||
China - 2.5% | ||||||||
Baidu Inc. - Sponsored ADR (Software & Services)* | 953,100 | 168,565,266 | ||||||
Denmark - 0.9% | ||||||||
Coloplast A/S, Class B (Health Care Equipment & Services)† | 853,400 | 59,484,903 | ||||||
France - 9.5% | ||||||||
Air Liquide SA (Materials)† | 1,437,580 | 146,097,597 | ||||||
Dassault Systemes SA (Software & Services)† | 3,350,118 | 265,480,571 | ||||||
L’Oreal SA (Household & Personal Products)† | 920,600 | 164,886,221 | ||||||
LVMH Moet Hennessy Louis Vuitton SE (Consumer Durables & Apparel)† | 392,800 | 71,449,491 | ||||||
| 647,913,880 | ||||||||
Germany - 13.3% | ||||||||
Allianz SE, Reg S (Insurance)† | 1,121,300 | 174,755,945 | ||||||
Bayer AG, Reg S (Pharmaceuticals, Biotechnology & Life Sciences)† | 1,629,800 | 161,539,170 | ||||||
Bayerische Motoren Werke AG (Automobiles & Components)† | 1,317,100 | 114,755,577 | ||||||
Fresenius Medical Care AG & Co. KGaA (Health Care Equipment & Services)† | 1,243,800 | 101,345,831 | ||||||
FUCHS PETROLUB SE (Materials)† | 497,340 | 19,655,396 | ||||||
Linde AG (Materials)† | 564,210 | 93,077,936 | ||||||
SAP SE - Sponsored ADR (Software & Services) | 1,736,380 | 152,523,619 | ||||||
Symrise AG (Materials)† | 1,281,400 | 87,992,023 | ||||||
| 905,645,497 | ||||||||
| Shares | Value | |||||||
| COMMON STOCKS - 92.5% (continued) | ||||||||
Hong Kong - 3.8% | ||||||||
AIA Group Ltd. (Insurance)† | 40,841,900 | $257,740,987 | ||||||
Israel - 1.3% | ||||||||
Check Point Software Technologies Ltd. (Software & Services)* | 1,000,300 | 84,585,368 | ||||||
Italy - 1.0% | ||||||||
Tenaris SA - ADR (Energy) | 2,489,200 | 70,195,440 | ||||||
Japan - 17.2% | ||||||||
FANUC Corp. (Capital Goods)† | 1,127,300 | 211,217,802 | ||||||
JGC Corp. (Capital Goods)† | 4,179,000 | 73,929,536 | ||||||
Keyence Corp. (Technology Hardware & Equipment)† | 166,181 | 121,985,339 | ||||||
Kubota Corp. (Capital Goods)† | 4,911,100 | 79,164,074 | ||||||
M3 Inc. (Health Care Equipment & Services)† | 6,015,600 | 183,542,031 | ||||||
MISUMI Group Inc. (Capital Goods)† | 7,354,700 | 134,201,071 | ||||||
Mitsubishi Estate Co., Ltd. (Real Estate)† | 3,184,000 | 63,110,358 | ||||||
MonotaRO Co., Ltd. (Capital Goods)† | 2,507,600 | 61,164,127 | ||||||
Park24 Co., Ltd. (Commercial & Professional Services)† | 2,809,600 | 86,863,672 | ||||||
Sysmex Corp. (Health Care Equipment & Services)† | 2,150,809 | 149,263,320 | ||||||
| 1,164,441,330 | ||||||||
Mexico - 0.8% | ||||||||
Grupo Televisa SAB - Sponsored ADR (Media) | 2,268,100 | 55,636,493 | ||||||
Singapore - 1.6% | ||||||||
DBS Group Holdings Ltd. (Banks)† | 10,017,383 | 107,718,890 | ||||||
South Africa - 4.4% | ||||||||
Aspen Pharmacare Holdings Ltd. (Pharmaceuticals, Biotechnology & Life Sciences)† | 2,979,769 | 64,908,495 | ||||||
Naspers Ltd., Class N (Media)† | 1,017,900 | 170,560,528 | ||||||
Sasol Ltd. (Energy)† | 2,239,700 | 61,862,906 | ||||||
| 297,331,929 | ||||||||
South Korea - 2.6% | ||||||||
Samsung Electronics Co., Ltd. - GDR (Technology Hardware & Equipment)† | 254,700 | 178,913,148 | ||||||
See Notes to Financial Statements
7
Table of Contents
Harding, Loevner Funds, Inc.
International Equity Portfolio
Portfolio of Investments
October 31, 2016 (continued)
| Shares | Value | |||||||
| COMMON STOCKS - 92.5% (continued) | ||||||||
Spain - 2.7% | ||||||||
Banco Bilbao Vizcaya Argentaria | 22,095,600 | $159,243,739 | ||||||
Grifols SA (Pharmaceuticals, Biotechnology & Life Sciences)† | 1,366,300 | 27,000,654 | ||||||
| 186,244,393 | ||||||||
Sweden - 2.5% | ||||||||
Alfa Laval AB (Capital Goods)† | 4,314,800 | 61,890,988 | ||||||
Atlas Copco AB, Class A (Capital Goods)† | 3,553,200 | 104,056,840 | ||||||
| 165,947,828 | ||||||||
Switzerland - 7.9% | ||||||||
Nestle SA - Sponsored ADR (Food, Beverage & Tobacco) | 3,395,800 | 246,687,891 | ||||||
Roche Holding AG, Genusschein (Pharmaceuticals, Biotechnology & Life Sciences)† | 930,200 | 213,454,523 | ||||||
Sonova Holding AG, Reg S (Health Care Equipment & Services)† | 545,400 | 73,112,917 | ||||||
| 533,255,331 | ||||||||
Taiwan - 2.0% | ||||||||
Taiwan Semiconductor Manufacturing Co., Ltd. (Semiconductors & Semiconductor Equipment)† | 10,837,125 | 64,684,862 | ||||||
Taiwan Semiconductor Manufacturing Co., Ltd. - Sponsored ADR (Semicon-ductors & Semiconductor Equipment) | 2,367,800 | 73,638,580 | ||||||
| 138,323,442 | ||||||||
Turkey - 1.0% | ||||||||
Turkiye Garanti Bankasi AS - ADR (Banks) | 24,508,300 | 67,520,366 | ||||||
United Kingdom - 8.2% | ||||||||
BBA Aviation plc (Transportation)† | 11,127,700 | 35,192,307 | ||||||
Royal Dutch Shell plc, Class B (Energy)† | 8,068,616 | 208,279,094 | ||||||
Unilever plc (Household & Personal | 2,459,600 | 102,860,790 | ||||||
WPP plc (Media)† | 9,667,300 | 210,056,858 | ||||||
| 556,389,049 | ||||||||
| Shares | Value | |||||||
| COMMON STOCKS -92.5% (continued) | ||||||||
United States - 4.1% | ||||||||
Bunge Ltd. (Food, Beverage & Tobacco) | 1,969,060 | $122,101,411 | ||||||
Schlumberger Ltd. (Energy) | 1,969,000 | 154,034,870 | ||||||
| 276,136,281 | ||||||||
Total Common Stocks (Cost $5,438,879,833) |
| $6,278,751,202 | ||||||
| PREFERRED STOCKS - 4.3% | ||||||||
Brazil - 1.8% | ||||||||
Itau Unibanco Holding SA - Sponsored ADR (Banks) | 10,510,580 | 125,391,224 | ||||||
Germany - 0.7% | ||||||||
FUCHS PETROLUB SE (Materials)† | 1,079,600 | 48,270,441 | ||||||
South Korea - 1.4% | ||||||||
Samsung Electronics Co., Ltd. - GDR, Reg S (Technology Hardware & Equipment)† | 167,000 | 94,596,917 | ||||||
Spain - 0.4% | ||||||||
Grifols SA - ADR (Pharmaceuticals, Biotechnology & Life Sciences) | 1,818,100 | 25,980,649 | ||||||
Total Preferred Stocks (Cost $225,366,716) |
| $294,239,231 | ||||||
| SHORT TERM INVESTMENTS - 3.4% | ||||||||
Northern Institutional Funds - Treasury Portfolio, 0.20% (Money Market Fund) | 229,967,183 | 229,967,183 | ||||||
Total Short Term Investments (Cost $229,967,183) |
| $229,967,183 | ||||||
Total Investments — 100.2% | ||||||||
(Cost $5,894,213,732) | $6,802,957,616 | |||||||
Liabilities Less Other Assets - (0.2)% | (14,383,034 | ) | ||||||
Net Assets — 100.0% | $6,788,574,582 | |||||||
See Notes to Financial Statements
8
Table of Contents
Harding, Loevner Funds, Inc.
International Equity Portfolio
Portfolio of Investments
October 31, 2016 (continued)
Summary of Abbreviations
| ADR | American Depositary Receipt. |
| GDR | Global Depository Receipt. |
| Reg S | Security sold outside United States without registration under the Securities Act of 1933. |
| * | Non-income producing security. |
| † | Investment categorized as level 2 security as disclosed in Note 2 of the Notes to Financial Statements. |
| Industry | | Percentage of Net Assets | | ||
Automobiles & Components | 1.7 | % | |||
Banks | 6.8 | ||||
Capital Goods | 10.7 | ||||
Commercial & Professional Services | 1.3 | ||||
Consumer Durables & Apparel | 1.0 | ||||
Energy | 7.3 | ||||
Food, Beverage & Tobacco | 7.3 | ||||
Health Care Equipment & Services | 8.3 | ||||
Household & Personal Products | 3.9 | ||||
Insurance | 6.4 | ||||
Materials | 5.8 | ||||
Media | 6.4 | ||||
Money Market Fund | 3.4 | ||||
Pharmaceuticals, Biotechnology & Life Sciences | 8.7 | ||||
Real Estate | 0.9 | ||||
Semiconductors & Semiconductor Equipment | 2.0 | ||||
Software & Services | 9.9 | ||||
Technology Hardware & Equipment | 5.8 | ||||
Transportation | 2.6 | ||||
Total Investments | 100.2 | ||||
Liabilities Less Other Assets | (0.2 | ) | |||
Net Assets | 100.0 | % | |||
See Notes to Financial Statements
9
Table of Contents
Harding, Loevner Funds, Inc.
International Equity Research Portfolio
Portfolio of Investments
October 31, 2016
| Shares | Value | |||||||
| COMMON STOCKS - 95.4% | ||||||||
Argentina - 0.5% | ||||||||
Banco Macro SA - ADR (Banks) | 240 | $18,295 | ||||||
Grupo Financiero Galicia SA - ADR (Banks) | 530 | 16,504 | ||||||
| 34,799 | ||||||||
Australia - 1.1% | ||||||||
DuluxGroup Ltd. (Materials)† | 7,000 | 34,222 | ||||||
TPG Telecom Ltd. (Telecommunication Services)† | 7,740 | 44,423 | ||||||
| 78,645 | ||||||||
Brazil - 0.3% | ||||||||
CETIP SA - Mercados Organizados (Diversified Financials) | 1,600 | 22,491 | ||||||
Canada - 1.9% | ||||||||
Cenovus Energy Inc. (Energy) | 2,900 | 41,836 | ||||||
Encana Corp. (Energy) | 5,150 | 49,131 | ||||||
Imperial Oil Ltd. (Energy) | 1,270 | 41,250 | ||||||
| 132,217 | ||||||||
China - 4.8% | ||||||||
51job Inc. - ADR (Commercial & Professional Services)* | 530 | 18,020 | ||||||
ANTA Sports Products Ltd. (Consumer Durables & Apparel)† | 22,600 | 65,263 | ||||||
China Merchants Port Holdings Co., Ltd. (Transportation)† | 5,000 | 12,942 | ||||||
China Mobile Ltd. - Sponsored ADR (Telecommunication Services) | 820 | 47,093 | ||||||
Ctrip.com International Ltd. - ADR (Retailing)* | 400 | 17,660 | ||||||
ENN Energy Holdings Ltd. (Utilities)† | 3,100 | 14,576 | ||||||
Fuyao Glass Industry Group Co., Ltd., Class H (Automobiles & Components)† | 5,600 | 16,258 | ||||||
Haitian International Holdings Ltd. (Capital Goods)† | 10,400 | 21,454 | ||||||
JD.com Inc. - ADR (Retailing)* | 680 | 17,646 | ||||||
Shenzhou International Group Holdings Ltd. (Consumer Durables & Apparel)† | 2,770 | 18,352 | ||||||
Sino Biopharmaceutical Ltd. (Pharmaceuticals, Biotechnology & Life Sciences)† | 80,000 | 55,938 | ||||||
| Shares | Value | |||||||
| COMMON STOCKS - 95.4% (continued) | ||||||||
China - 4.8% (continued) | ||||||||
Tencent Holdings Ltd. (Software & Services)† | 800 | $21,184 | ||||||
Tingyi Cayman Islands Holding Corp. (Food, Beverage & Tobacco)† | 11,150 | 12,010 | ||||||
| 338,396 | ||||||||
Colombia - 1.1% | ||||||||
Cementos Argos SA - Sponsored ADR (Materials)#† | 1,130 | 22,361 | ||||||
Cemex Latam Holdings SA (Materials)* | 5,430 | 20,190 | ||||||
Ecopetrol SA - Sponsored ADR (Energy)* | 1,800 | 15,642 | ||||||
Grupo Nutresa SA (Food, Beverage & Tobacco) | 2,430 | 20,350 | ||||||
| 78,543 | ||||||||
Denmark - 1.5% | ||||||||
Chr Hansen Holding A/S (Materials)† | 610 | 36,526 | ||||||
Coloplast A/S, Class B (Health Care Equipment & Services)† | 560 | 39,034 | ||||||
Novozymes A/S, Class B (Materials)† | 900 | 33,419 | ||||||
| 108,979 | ||||||||
Egypt - 0.3% | ||||||||
Commercial International Bank Egypt SAE - GDR, Reg S (Banks)† | 4,490 | 19,840 | ||||||
France - 1.7% | ||||||||
Air Liquide SA (Materials)† | 520 | 52,846 | ||||||
Dassault Systemes SA (Software & Services)† | 850 | 67,359 | ||||||
| 120,205 | ||||||||
Germany - 8.8% | ||||||||
adidas AG (Consumer Durables & Apparel)† | 420 | 68,881 | ||||||
Allianz SE, Reg S (Insurance)† | 390 | 60,782 | ||||||
Bayer AG, Reg S (Pharmaceuticals, Biotechnology & Life Sciences)† | 700 | 69,381 | ||||||
Bayerische Motoren Werke AG (Automobiles & Components)† | 780 | 67,959 | ||||||
Fresenius SE & Co. KGaA (Health Care Equipment & Services)† | 940 | 69,371 | ||||||
See Notes to Financial Statements
10
Table of Contents
Harding, Loevner Funds, Inc.
International Equity Research Portfolio
Portfolio of Investments
October 31, 2016 (continued)
| Shares | Value | |||||||
| COMMON STOCKS - 95.4% (continued) | ||||||||
Germany - 8.8% (continued) | ||||||||
Henkel AG & Co. KGaA (Household & Personal Products)† | 710 | $78,203 | ||||||
Linde AG (Materials)† | 420 | 69,288 | ||||||
SAP SE - Sponsored ADR (Software & Services) | 860 | 75,542 | ||||||
Symrise AG (Materials)† | 910 | 62,489 | ||||||
| 621,896 | ||||||||
Hong Kong - 3.5% | ||||||||
AIA Group Ltd. (Insurance)† | 11,600 | 73,204 | ||||||
ASM Pacific Technology Ltd. (Semiconductors & Semiconductor Equipment)† | 4,100 | 39,522 | ||||||
Hong Kong Exchanges & Clearing Ltd. (Diversified Financials)† | 2,700 | 71,366 | ||||||
Sands China Ltd. (Consumer Services)† | 14,800 | 64,230 | ||||||
| 248,322 | ||||||||
Hungary - 0.5% | ||||||||
Richter Gedeon Nyrt. (Pharmaceuticals, Biotechnology & Life Sciences)† | 1,670 | 35,877 | ||||||
India - 3.0% | ||||||||
Asian Paints Ltd. (Materials)† | 1,080 | 17,306 | ||||||
Axis Bank Ltd. (Banks)† | 2,460 | 17,944 | ||||||
Bharti Airtel Ltd. (Telecommunication Services)† | 3,300 | 15,758 | ||||||
Bharti Infratel Ltd. (Telecommunication Services)† | 2,620 | 13,520 | ||||||
Emami Ltd. (Household & Personal Products)† | 1,010 | 18,351 | ||||||
Godrej Consumer Products Ltd. (Household & Personal Products)† | 780 | 18,806 | ||||||
GRUH Finance Ltd. (Banks)† | 3,950 | 19,699 | ||||||
Housing Development Finance Corp., Ltd. (Banks)† | 850 | 17,751 | ||||||
ICICI Bank Ltd. - Sponsored ADR (Banks) | 1,508 | 12,501 | ||||||
ITC Ltd. (Food, Beverage & Tobacco)† | 4,740 | 17,274 | ||||||
Maruti Suzuki India Ltd. (Automobiles & | 280 | 24,644 | ||||||
| Shares | Value | |||||||
| COMMON STOCKS - 95.4% (continued) | ||||||||
India - 3.0% (continued) | ||||||||
Pidilite Industries Ltd. (Materials)† | 1,690 | $18,101 | ||||||
| 211,655 | ||||||||
Indonesia - 0.8% | ||||||||
Bank Central Asia Tbk PT (Banks)† | 15,500 | 18,417 | ||||||
Bank Rakyat Indonesia Persero Tbk PT (Banks)† | 20,000 | 18,660 | ||||||
Kalbe Farma Tbk PT (Pharmaceuticals, Biotechnology & Life Sciences)† | 173,800 | 23,132 | ||||||
| 60,209 | ||||||||
Ireland - 1.0% | ||||||||
Ryanair Holdings PLC - Sponsored ADR (Transportation)* | 970 | 72,837 | ||||||
Israel - 1.1% | ||||||||
Check Point Software Technologies Ltd. (Software & Services)* | 950 | 80,332 | ||||||
Italy - 1.1% | ||||||||
Tenaris SA - ADR (Energy) | 2,750 | 77,550 | ||||||
Japan - 23.5% | ||||||||
ABC-Mart Inc. (Retailing)† | 1,140 | 69,409 | ||||||
Daito Trust Construction Co., Ltd. (Real Estate)† | 400 | 66,997 | ||||||
Dentsu Inc. (Media)† | 1,220 | 60,842 | ||||||
Fast Retailing Co., Ltd. (Retailing)† | 180 | 60,732 | ||||||
Hakuhodo DY Holdings Inc. (Media)† | 5,590 | 67,244 | ||||||
JGC Corp. (Capital Goods)† | 3,000 | 53,072 | ||||||
Kakaku.com Inc. (Software & Services)† | 1,900 | 31,955 | ||||||
Keyence Corp. (Technology Hardware & | 100 | 73,405 | ||||||
Komatsu Ltd. (Capital Goods)† | 3,000 | 66,865 | ||||||
Kubota Corp. (Capital Goods)† | 4,800 | 77,373 | ||||||
Lawson Inc. (Food & Staples Retailing)† | 780 | 59,297 | ||||||
M3 Inc. (Health Care Equipment & Services)† | 1,200 | 36,613 | ||||||
Makita Corp. (Capital Goods)† | 900 | 62,309 | ||||||
MISUMI Group Inc. (Capital Goods)† | 2,300 | 41,968 | ||||||
See Notes to Financial Statements
11
Table of Contents
Harding, Loevner Funds, Inc.
International Equity Research Portfolio
Portfolio of Investments
October 31, 2016 (continued)
| Shares | Value | |||||||
| COMMON STOCKS - 95.4% (continued) | ||||||||
Japan - 23.5% (continued) | ||||||||
Mitsubishi Estate Co., Ltd. (Real Estate)† | 3,000 | $59,463 | ||||||
MonotaRO Co., Ltd. (Capital Goods)† | 1,400 | 34,148 | ||||||
NGK Insulators Ltd. (Capital Goods)† | 2,750 | 50,440 | ||||||
Nidec Corp. (Capital Goods)† | 920 | 89,192 | ||||||
Nomura Research Institute Ltd. (Software & Services)† | 1,620 | 56,216 | ||||||
Park24 Co., Ltd. (Commercial & Professional Services)† | 1,400 | 43,283 | ||||||
Pigeon Corp. (Household & Personal Products)† | 1,300 | 36,645 | ||||||
Rinnai Corp. (Consumer Durables & Apparel)† | 710 | 68,290 | ||||||
Shimano Inc. (Consumer Durables & Apparel)† | 500 | 85,596 | ||||||
SMC Corp. (Capital Goods)† | 235 | 68,148 | ||||||
Stanley Electric Co., Ltd. (Automobiles & Components)† | 1,400 | 38,533 | ||||||
Start Today Co., Ltd. (Retailing)† | 3,000 | 52,779 | ||||||
Sugi Holdings Co., Ltd. (Food & Staples Retailing)† | 570 | 30,577 | ||||||
Suruga Bank Ltd. (Banks)† | 3,170 | 77,384 | ||||||
Sysmex Corp. (Health Care Equipment & Services)† | 600 | 41,639 | ||||||
| 1,660,414 | ||||||||
Mexico - 0.8% | ||||||||
Coca-Cola Femsa SAB de CV - Sponsored ADR (Food, Beverage & Tobacco) | 210 | 15,752 | ||||||
Grupo Financiero Banorte SAB de CV, Series O (Banks) | 2,900 | 17,079 | ||||||
Grupo Televisa SAB - Sponsored ADR (Media) | 560 | 13,737 | ||||||
Wal-Mart de Mexico SAB de CV (Food & Staples Retailing) | 6,500 | 13,753 | ||||||
| 60,321 | ||||||||
Netherlands - 2.0% | ||||||||
ASML Holding NV, Reg S (Semiconductors & Semiconductor Equipment) | 720 | 76,046 | ||||||
Koninklijke Vopak NV (Energy)† | 1,320 | 66,609 | ||||||
| 142,655 | ||||||||
Peru - 1.2% | ||||||||
Alicorp SAA (Food, Beverage & Tobacco) | 17,290 | 40,096 | ||||||
| Shares | Value | |||||||
| COMMON STOCKS - 95.4% (continued) | ||||||||
Peru - 1.2% (continued) | ||||||||
Credicorp Ltd. (Banks) | 150 | $22,302 | ||||||
Union Andina de Cementos SAA (Materials) | 30,260 | 24,201 | ||||||
| 86,599 | ||||||||
Philippines - 1.5% | ||||||||
Bank of the Philippine Islands (Banks)† | 8,800 | 18,374 | ||||||
Jollibee Foods Corp. (Consumer Services)† | 10,350 | 50,870 | ||||||
Philippine Seven Corp. (Food & Staples Retailing)† | 6,170 | 20,082 | ||||||
Universal Robina Corp. (Food, Beverage & Tobacco)† | 4,090 | 15,405 | ||||||
| 104,731 | ||||||||
Qatar - 1.0% | ||||||||
Qatar National Bank SAQ (Banks)† | 1,656 | 72,759 | ||||||
Russia - 1.9% | ||||||||
LUKOIL PJSC - Sponsored ADR (Energy) | 440 | 21,388 | ||||||
Magnit PJSC - Sponsored GDR, Reg S (Food & Staples Retailing)† | 410 | 16,250 | ||||||
Moscow Exchange MICEX-RTS PJSC (Diversified Financials)† | 12,020 | 22,166 | ||||||
Novatek OJSC - Sponsored GDR, Reg S (Energy)† | 180 | 19,201 | ||||||
Sberbank of Russia PJSC - Sponsored ADR (Banks)† | 2,550 | 24,142 | ||||||
Yandex NV, Class A (Software & Services)* | 1,540 | 30,323 | ||||||
| 133,470 | ||||||||
Singapore - 0.8% | ||||||||
DBS Group Holdings Ltd. (Banks)† | 5,250 | 56,454 | ||||||
South Africa - 2.1% | ||||||||
Aspen Pharmacare Holdings Ltd. (Pharmaceuticals, Biotechnology & Life Sciences)† | 820 | 17,862 | ||||||
Discovery Ltd. (Insurance)† | 1,990 | 17,005 | ||||||
Life Healthcare Group Holdings Ltd. (Health Care Equipment & Services)† | 7,219 | 19,270 | ||||||
Massmart Holdings Ltd. (Food & Staples Retailing)† | 2,160 | 18,720 | ||||||
See Notes to Financial Statements
12
Table of Contents
Harding, Loevner Funds, Inc.
International Equity Research Portfolio
Portfolio of Investments
October 31, 2016 (continued)
| Shares | Value | |||||||
| COMMON STOCKS - 95.4% (continued) | ||||||||
South Africa - 2.1% (continued) | ||||||||
MTN Group Ltd. (Telecommunication Services)† | 1,790 | $15,447 | ||||||
Naspers Ltd., Class N (Media)† | 115 | 19,269 | ||||||
Sasol Ltd. (Energy)† | 610 | 16,849 | ||||||
Standard Bank Group Ltd. (Banks)† | 2,140 | 22,704 | ||||||
| 147,126 | ||||||||
South Korea - 1.1% | ||||||||
Coway Co., Ltd. (Consumer Durables & Apparel)† | 230 | 18,002 | ||||||
Hankook Tire Co., Ltd. (Automobiles & | 390 | 18,809 | ||||||
Hanssem Co., Ltd. (Consumer Durables & Apparel)† | 110 | 17,029 | ||||||
NAVER Corp. (Software & Services)† | 28 | 20,968 | ||||||
| 74,808 | ||||||||
Spain - 3.1% | ||||||||
Amadeus IT Group SA (Software & Services)† | 1,420 | 66,996 | ||||||
Banco Bilbao Vizcaya Argentaria SA (Banks)† | 4,883 | 35,192 | ||||||
Banco Santander SA (Banks)† | 7,150 | 35,026 | ||||||
Bankinter SA (Banks)† | 10,340 | 79,078 | ||||||
| 216,292 | ||||||||
Sweden - 2.6% | ||||||||
Alfa Laval AB (Capital Goods)† | 3,510 | 50,347 | ||||||
Skandinaviska Enskilda Banken AB, Class A | 6,230 | 62,770 | ||||||
Svenska Handelsbanken AB, Class A (Banks)† | 5,110 | 69,609 | ||||||
| 182,726 | ||||||||
Switzerland - 7.2% | ||||||||
Cie Financiere Richemont SA, Reg S (Consumer Durables & Apparel)† | 1,070 | 68,782 | ||||||
Givaudan SA, Reg S (Materials)† | 33 | 63,780 | ||||||
Lonza Group AG, Reg S (Pharmaceuticals, Biotechnology & Life Sciences)*† | 390 | 73,532 | ||||||
Nestle SA - Sponsored ADR (Food, Beverage & Tobacco) | 900 | 65,380 | ||||||
| Shares | Value | |||||||
| COMMON STOCKS - 95.4% (continued) | ||||||||
Switzerland - 7.2% (continued) |
| |||||||
Novartis AG - Sponsored ADR (Pharmaceuticals, Biotechnology & Life Sciences) | 980 | $69,600 | ||||||
Roche Holding AG, Genusschein (Pharmaceuticals, Biotechnology & Life Sciences)† | 280 | 64,252 | ||||||
SGS SA, Reg S (Commercial & Professional | 32 | 64,842 | ||||||
Temenos Group AG, Reg S (Software & Services)*† | 590 | 38,050 | ||||||
| 508,218 | ||||||||
Taiwan - 2.8% | ||||||||
Advantech Co., Ltd. (Technology Hardware & Equipment)† | 2,000 | 16,252 | ||||||
Airtac International Group (Capital Goods)† | 2,400 | 19,126 | ||||||
Delta Electronics Inc. (Technology Hardware & Equipment)† | 3,000 | 15,819 | ||||||
Eclat Textile Co., Ltd. (Consumer Durables & | 2,000 | 22,740 | ||||||
Largan Precision Co., Ltd. (Technology Hardware & Equipment)† | 230 | 27,121 | ||||||
Taiwan Semiconductor Manufacturing Co., Ltd. (Semiconductors & Semiconductor Equipment)† | 16,000 | 95,501 | ||||||
| 196,559 | ||||||||
Thailand - 0.3% | ||||||||
Siam Commercial Bank pcl, Reg S (Banks)† | 4,400 | 18,041 | ||||||
Turkey - 0.9% | ||||||||
Anadolu Hayat Emeklilik AS (Insurance)† | 17,273 | 27,530 | ||||||
BIM Birlesik Magazalar AS (Food & Staples | 980 | 15,925 | ||||||
Turkiye Garanti Bankasi AS - ADR (Banks) | 6,470 | 17,825 | ||||||
| 61,280 | ||||||||
United Arab Emirates - 0.5% | ||||||||
DP World Ltd. (Transportation)† | 820 | 14,716 | ||||||
Emaar Properties PJSC (Real Estate)† | 10,490 | 19,877 | ||||||
| 34,593 | ||||||||
See Notes to Financial Statements
13
Table of Contents
Harding, Loevner Funds, Inc.
International Equity Research Portfolio
Portfolio of Investments
October 31, 2016 (continued)
| Shares | Value | |||||||
| COMMON STOCKS - 95.4% (continued) | ||||||||
United Kingdom - 9.1% | ||||||||
Abcam plc (Pharmaceuticals, Biotechnology & Life Sciences)† | 3,320 | $35,389 | ||||||
Aberdeen Asset Management plc (Diversified Financials)† | 12,640 | 49,441 | ||||||
BBA Aviation plc (Transportation)† | 11,810 | 37,350 | ||||||
BGEO Group plc (Banks)† | 1,080 | 39,008 | ||||||
Burberry Group plc (Consumer Durables & Apparel)† | 3,760 | 67,867 | ||||||
Halma plc (Technology Hardware & Equipment)† | 3,120 | 39,934 | ||||||
Hikma Pharmaceuticals plc (Pharmaceuticals, Biotechnology & Life Sciences)† | 1,990 | 42,685 | ||||||
HSBC Holdings plc - Sponsored ADR (Banks) | 2,080 | 78,270 | ||||||
Jardine Lloyd Thompson Group plc (Insurance)† | 2,260 | 28,433 | ||||||
Rathbone Brothers plc (Diversified Financials)† | 900 | 19,625 | ||||||
Rotork plc (Capital Goods)† | 11,711 | 29,209 | ||||||
St James’s Place plc (Insurance)† | 4,350 | 50,201 | ||||||
Unilever plc (Household & Personal Products)† | 1,590 | 66,494 | ||||||
WPP plc (Media)† | 2,660 | 57,798 | ||||||
| 641,704 | ||||||||
Total Common Stocks (Cost $6,286,721) | $6,741,543 | |||||||
| PREFERRED STOCKS - 3.5% | ||||||||
Brazil - 0.8% | ||||||||
Banco Bradesco SA - ADR (Banks)* | 3,168 | 32,979 | ||||||
Itau Unibanco Holding SA - Sponsored ADR (Banks) | 2,310 | 27,558 | ||||||
| 60,537 | ||||||||
Germany - 1.1% | ||||||||
FUCHS PETROLUB SE (Materials)† | 1,730 | 77,351 | ||||||
South Korea - 0.8% | ||||||||
Amorepacific Corp. (Household & Personal Products)† | 80 | 13,967 | ||||||
LG Household & Health Care Ltd. (Household & Personal Products)† | 34 | 14,131 | ||||||
| Shares | Value | |||||||
| PREFERRED STOCKS - 3.5% (continued) | ||||||||
South Korea - 0.8% (continued) | ||||||||
Samsung Electronics Co., Ltd. - GDR, Reg S (Technology Hardware & Equipment)† | 48 | $27,189 | ||||||
| 55,287 | ||||||||
Spain - 0.8% | ||||||||
Grifols SA - ADR (Pharmaceuticals, Biotechnology & Life Sciences) | 4,000 | 57,160 | ||||||
Total Preferred Stocks (Cost $231,353) | $250,335 | |||||||
| SHORT TERM INVESTMENTS - 1.7% | ||||||||
Northern Institutional Funds - Treasury Portfolio, 0.20% (Money Market Fund) | 118,899 | 118,899 | ||||||
Total Short Term Investments (Cost $118,899) | $118,899 | |||||||
Total Investments — 100.6% | ||||||||
(Cost $6,636,973) | $7,110,777 | |||||||
Liabilities Less Other Assets - (0.6)% | (40,272 | ) | ||||||
Net Assets — 100.0% | $7,070,505 | |||||||
Summary of Abbreviations
| ADR | American Depositary Receipt. |
| GDR | Global Depository Receipt. |
| Reg S | Security sold outside United States without registration under the Securities Act of 1933. |
| # | Security valued at fair value as determined in good faith under policies and procedures established by and under the supervision of the Portfolio’s Board of Directors as disclosed in Note 2 of the Notes to Financial Statements. |
| * | Non-income producing security. |
| † | Investment categorized as level 2 security as disclosed in Note 2 of the Notes to Financial Statements. |
See Notes to Financial Statements
14
Table of Contents
Harding, Loevner Funds, Inc.
International Equity Research Portfolio
Portfolio of Investments
October 31, 2016 (continued)
| Industry | | Percentage of Net Assets | | ||
Automobiles & Components | 2.4 | % | |||
Banks | 13.7 | ||||
Capital Goods | 9.4 | ||||
Commercial & Professional Services | 1.8 | ||||
Consumer Durables & Apparel | 7.1 | ||||
Consumer Services | 1.6 | ||||
Diversified Financials | 2.6 | ||||
Energy | 4.9 | ||||
Food & Staples Retailing | 2.5 | ||||
Food, Beverage & Tobacco | 2.6 | ||||
Health Care Equipment & Services | 2.9 | ||||
Household & Personal Products | 3.5 | ||||
Insurance | 3.6 | ||||
Materials | 7.5 | ||||
Media | 3.1 | ||||
Money Market Fund | 1.7 | ||||
Pharmaceuticals, Biotechnology & Life Sciences | 7.7 | ||||
Real Estate | 2.1 | ||||
Retailing | 3.1 | ||||
Semiconductors & Semiconductor Equipment | 3.0 | ||||
Software & Services | 6.9 | ||||
Technology Hardware & Equipment | 2.8 | ||||
Telecommunication Services | 1.9 | ||||
Transportation | 2.0 | ||||
Utilities | 0.2 | ||||
Total Investments | 100.6 | ||||
Liabilities Less Other Assets | (0.6 | ) | |||
Net Assets | 100.0 | % | |||
See Notes to Financial Statements
15
Table of Contents
Harding, Loevner Funds, Inc.
International Small Companies Portfolio
Portfolio of Investments
October 31, 2016
| Shares | Value | |||||||
| COMMON STOCKS - 93.8% | ||||||||
Australia - 1.3% | ||||||||
SAI Global Ltd. (Commercial & | ||||||||
Professional Services)† | 303,765 | $1,080,019 | ||||||
TPG Telecom Ltd. (Telecommunication Services)† | 61,341 | 352,062 | ||||||
| 1,432,081 | ||||||||
Austria - 1.6% | ||||||||
Semperit AG Holding (Capital Goods)† | 62,540 | 1,695,263 | ||||||
Bangladesh - 2.3% | ||||||||
BRAC Bank Ltd. (Banks)† | 1,924,053 | 1,468,365 | ||||||
Square Pharmaceuticals Ltd. (Pharmaceuticals, Biotechnology & Life Sciences)*† | 302,600 | 1,032,192 | ||||||
| 2,500,557 | ||||||||
Brazil - 2.1% | ||||||||
CETIP SA - Mercados Organizados (Diversified Financials) | 81,027 | 1,138,998 | ||||||
Valid Solucoes e Servicos de Seguranca em Meios de Pagamento e Identificacao SA (Commercial & Professional Services) | 119,800 | 1,122,562 | ||||||
| 2,261,560 | ||||||||
China - 4.4% | ||||||||
Haitian International Holdings Ltd. (Capital Goods)† | 596,000 | 1,229,501 | ||||||
PAX Global Technology Ltd. (Technology Hardware & Equipment)† | 2,038,000 | 1,271,647 | ||||||
Shenzhou International Group Holdings Ltd. (Consumer Durables & Apparel)† | 106,000 | 702,295 | ||||||
Wasion Group Holdings Ltd. (Technology Hardware & Equipment)† | 2,574,000 | 1,514,218 | ||||||
| 4,717,661 | ||||||||
Colombia - 0.4% | ||||||||
Cemex Latam Holdings SA (Materials)* | 112,600 | 418,676 | ||||||
Denmark - 0.5% | ||||||||
Chr Hansen Holding A/S (Materials)† | 8,150 | 488,015 | ||||||
| Shares | Value | |||||||
| COMMON STOCKS - 93.8% (continued) | ||||||||
Egypt - 0.4% | ||||||||
Integrated Diagnostics Holdings plc (Health Care Equipment & Services)^† | 150,700 | $415,048 | ||||||
Finland - 2.5% | ||||||||
Vaisala OYJ, Class A (Technology Hardware & Equipment)† | 78,380 | 2,665,815 | ||||||
France - 6.8% | ||||||||
Alten SA (Software & Services)† | 41,920 | 2,996,619 | ||||||
IPSOS (Media)† | 42,000 | 1,372,858 | ||||||
LISI (Capital Goods)† | 64,400 | 1,906,423 | ||||||
Rubis SCA (Utilities)† | 10,824 | 986,704 | ||||||
| 7,262,604 | ||||||||
Germany - 10.9% | ||||||||
Bechtle AG (Software & Services)† | 32,500 | 3,416,532 | ||||||
Bertrandt AG (Commercial & Professional Services)† | 13,180 | 1,404,006 | ||||||
Carl Zeiss Meditec AG (Bearer) (Health Care Equipment & Services)† | 62,230 | 2,238,702 | ||||||
Gerresheimer AG (Pharmaceuticals, Biotechnology & Life Sciences)† | 21,850 | 1,649,118 | ||||||
KWS Saat SE (Food, Beverage & Tobacco)† | 4,370 | 1,429,230 | ||||||
Pfeiffer Vacuum Technology AG (Capital Goods)† | 11,100 | 1,007,258 | ||||||
Rational AG (Capital Goods)† | 950 | 493,152 | ||||||
| 11,637,998 | ||||||||
Hong Kong - 2.5% | ||||||||
Pico Far East Holdings Ltd. (Media)† | 2,929,000 | 890,914 | ||||||
Vitasoy International Holdings Ltd. (Food, Beverage & Tobacco)† | 832,900 | 1,740,002 | ||||||
| 2,630,916 | ||||||||
India - 5.2% | ||||||||
GRUH Finance Ltd. (Banks)† | 548,200 | 2,733,889 | ||||||
Max Financial Services Ltd. (Insurance)† | 342,200 | 2,886,235 | ||||||
| 5,620,124 | ||||||||
See Notes to Financial Statements
16
Table of Contents
Harding, Loevner Funds, Inc.
International Small Companies Portfolio
Portfolio of Investments
October 31, 2016 (continued)
| Shares | Value | |||||||
| COMMON STOCKS - 93.8% (continued) | ||||||||
Indonesia - 0.4% | ||||||||
Tower Bersama Infrastructure Tbk PT (Telecommunication Services)† | 985,500 | $451,254 | ||||||
Italy - 2.9% | ||||||||
Danieli & C Officine Meccaniche SpA (RSP) (Capital Goods)† | 60,600 | 812,686 | ||||||
DiaSorin SpA (Health Care Equipment & Services)† | 7,200 | 442,414 | ||||||
Reply SpA (Software & Services)† | 15,200 | 1,910,430 | ||||||
| 3,165,530 | ||||||||
Japan - 14.4% | ||||||||
ABC-Mart Inc. (Retailing)† | 7,700 | 468,814 | ||||||
Ariake Japan Co., Ltd. (Food, Beverage & Tobacco)† | 25,700 | 1,436,904 | ||||||
BML Inc. (Health Care Equipment & Services)† | 84,100 | 2,233,010 | ||||||
Cosmos Pharmaceutical Corp. (Food & Staples Retailing)† | 4,300 | 936,921 | ||||||
Hiday Hidaka Corp. (Consumer Services)† | 106,908 | 2,670,436 | ||||||
Infomart Corp. (Software & Services)† | 162,000 | 1,922,641 | ||||||
MISUMI Group Inc. (Capital Goods)† | 48,900 | 892,277 | ||||||
MonotaRO Co., Ltd. (Capital Goods)† | 15,700 | 382,947 | ||||||
Nakanishi Inc. (Health Care Equipment & Services)† | 40,700 | 1,456,913 | ||||||
Park24 Co., Ltd. (Commercial & Professional Services)† | 33,100 | 1,023,344 | ||||||
Pigeon Corp. (Household & Personal Products)† | 27,100 | 763,915 | ||||||
Rohto Pharmaceutical Co., Ltd. (Pharmaceuticals, Biotechnology & Life Sciences)† | 27,000 | 474,114 | ||||||
Sugi Holdings Co., Ltd. (Food & Staples Retailing)† | 14,300 | 767,100 | ||||||
| 15,429,336 | ||||||||
Kenya - 2.4% | ||||||||
East African Breweries Ltd. (Food, Beverage & Tobacco)† | 420,600 | 1,140,479 | ||||||
Equity Group Holdings Ltd. (Banks)† | 4,597,800 | 1,391,329 | ||||||
| 2,531,808 | ||||||||
| Shares | Value | |||||||
| COMMON STOCKS - 93.8% (continued) | ||||||||
Malaysia - 1.0% | ||||||||
Coastal Contracts Bhd. (Capital Goods)† | 1,506,466 | $548,967 | ||||||
Dialog Group Bhd. (Capital Goods)† | 1,436,840 | 530,701 | ||||||
| 1,079,668 | ||||||||
Mexico - 1.1% | ||||||||
Grupo Herdez SAB de CV (Food, Beverage & Tobacco) | 468,438 | 1,136,088 | ||||||
Netherlands - 3.7% | ||||||||
Arcadis NV (Capital Goods)† | 96,085 | 1,265,927 | ||||||
ASM International NV (Semiconductors & Semiconductor Equipment)† | 29,240 | 1,246,125 | ||||||
Brunel International NV (Commercial & Professional Services)† | 88,797 | 1,448,013 | ||||||
| 3,960,065 | ||||||||
Norway - 1.6% | ||||||||
Tomra Systems ASA (Commercial & Professional Services)† | 157,400 | 1,708,558 | ||||||
Peru - 0.5% | ||||||||
Alicorp SAA (Food, Beverage & Tobacco) | 251,100 | 582,304 | ||||||
Singapore - 0.8% | ||||||||
Super Group Ltd. (Food, Beverage & Tobacco)† | 1,211,000 | 843,005 | ||||||
South Africa - 1.3% | ||||||||
Clicks Group Ltd. (Food & Staples Retailing)† | 152,610 | 1,420,389 | ||||||
South Korea - 0.4% | ||||||||
Cheil Worldwide Inc. (Media)† | 25,870 | 382,523 | ||||||
Switzerland - 4.9% | ||||||||
Bossard Holding AG, Class A, Reg S (Capital Goods)*† | 17,100 | 2,436,080 | ||||||
LEM Holding SA, Reg S (Technology Hardware & Equipment)† | 1,980 | 2,211,989 | ||||||
Temenos Group AG, Reg S (Software & Services)*† | 9,320 | 601,059 | ||||||
| 5,249,128 | ||||||||
Taiwan - 1.5% | ||||||||
Advantech Co., Ltd. (Technology Hardware & Equipment)† | 73,383 | 596,307 | ||||||
See Notes to Financial Statements
17
Table of Contents
Harding, Loevner Funds, Inc.
International Small Companies Portfolio
Portfolio of Investments
October 31, 2016 (continued)
| Shares | Value | |||||||
| COMMON STOCKS - 93.8% (continued) | ||||||||
Taiwan - 1.5% (continued) | ||||||||
Chipbond Technology Corp. (Semiconductors & Semiconductor Equipment)† | 745,700 | $1,029,539 | ||||||
| 1,625,846 | ||||||||
Tanzania - 0.8% | ||||||||
Tanzania Breweries Ltd. (Food, Beverage & Tobacco) | 143,200 | 871,652 | ||||||
Turkey - 1.3% | ||||||||
Anadolu Hayat Emeklilik AS (Insurance)† | 896,206 | 1,428,385 | ||||||
Ukraine - 1.8% | ||||||||
Kernel Holding SA (Food, Beverage & Tobacco)† | 121,600 | 1,947,741 | ||||||
United Kingdom - 11.5% | ||||||||
Abcam plc (Pharmaceuticals, Biotechnology & Life Sciences)† | 208,627 | 2,223,838 | ||||||
BGEO Group plc (Banks)† | 37,120 | 1,340,707 | ||||||
Britvic plc (Food, Beverage & Tobacco)† | 97,331 | 660,999 | ||||||
Dignity plc (Consumer Services)† | 28,300 | 918,220 | ||||||
EMIS Group plc (Health Care Equipment & Services)† | 67,300 | 688,390 | ||||||
Grafton Group plc (Capital Goods)† | 125,140 | 760,439 | ||||||
Jardine Lloyd Thompson Group plc (Insurance)† | 40,002 | 503,257 | ||||||
Rathbone Brothers plc (Diversified Financials)† | 71,270 | 1,554,123 | ||||||
Rotork plc (Capital Goods)† | 188,746 | 470,754 | ||||||
RPC Group plc (Materials)† | 60,730 | 702,965 | ||||||
RPS Group plc (Commercial & Professional Services)† | 598,060 | 1,234,910 | ||||||
Senior plc (Capital Goods)† | 612,640 | 1,304,725 | ||||||
| 12,363,327 | ||||||||
United States - 0.6% | ||||||||
PriceSmart Inc. (Food & Staples Retailing) | 7,220 | 656,659 | ||||||
Total Common Stocks (Cost $88,762,803) | $100,579,584 | |||||||
| Shares | Value | |||||||
| PARTICIPATION NOTES - 0.8% | ||||||||
Saudi Arabia - 0.8% | ||||||||
Herfy Food Services Co., Issued by JP Morgan Structured Products, Maturity Date 1/7/19 (Consumer Services)^† | 47,300 | $841,071 | ||||||
Total Participation Notes (Cost $1,334,273) | $841,071 | |||||||
| SHORT TERM INVESTMENTS - 5.4% | ||||||||
Northern Institutional Funds - Treasury Portfolio, 0.20% (Money Market Fund) | 5,769,912 | 5,769,912 | ||||||
Total Short Term Investments (Cost $5,769,912) | $5,769,912 | |||||||
Total Investments — 100.0% | ||||||||
(Cost $95,866,988) | $107,190,567 | |||||||
Liabilities Less Other Assets - 0.0% | (41,826 | ) | ||||||
Net Assets — 100.0% | $107,148,741 | |||||||
Summary of Abbreviations
| Reg S | Security sold outside United States without registration under the Securities Act of 1933. |
| * | Non-income producing security. |
| ^ | Security exempt from registration pursuant to Rule 144A of the Securities Act of 1933. These securities, which represent 1.2% of net assets as of October 31, 2016, are considered liquid and may be resold in transactions exempt from registration, normally to qualified buyers. |
| † | Investment categorized as level 2 security as disclosed in Note 2 of the Notes to Financial Statements. |
See Notes to Financial Statements
18
Table of Contents
Harding, Loevner Funds, Inc.
International Small Companies Portfolio
Portfolio of Investments
October 31, 2016 (continued)
| Industry | | Percentage of Net Assets | | ||
Banks | 6.5 | % | |||
Capital Goods | 14.7 | ||||
Commercial & Professional Services | 8.4 | ||||
Consumer Durables & Apparel | 0.7 | ||||
Consumer Services | 4.1 | ||||
Diversified Financials | 2.5 | ||||
Food & Staples Retailing | 3.5 | ||||
Food, Beverage & Tobacco | 11.0 | ||||
Health Care Equipment & Services | 7.0 | ||||
Household & Personal Products | 0.7 | ||||
Insurance | 4.5 | ||||
Materials | 1.5 | ||||
Media | 2.5 | ||||
Money Market Fund | 5.4 | ||||
Pharmaceuticals, Biotechnology & Life | |||||
Sciences | 5.0 | ||||
Retailing | 0.4 | ||||
Semiconductors & Semiconductor Equipment | 2.1 | ||||
Software & Services | 10.1 | ||||
Technology Hardware & Equipment | 7.7 | ||||
Telecommunication Services | 0.8 | ||||
Utilities | 0.9 | ||||
Total Investments | 100.0 | ||||
Liabilities Less Other Assets | 0.0 | ||||
Net Assets | 100.0 | % | |||
See Notes to Financial Statements
19
Table of Contents
Harding, Loevner Funds, Inc.
Institutional Emerging Markets Portfolio
Portfolio of Investments
October 31, 2016
| Shares | Value | |||||||
| COMMON STOCKS - 90.4% | ||||||||
Brazil - 3.1% | ||||||||
Ambev SA - ADR (Food, Beverage & Tobacco) | 7,180,500 | $42,364,950 | ||||||
BM&FBovespa SA - Bolsa de Valores Mercadorias e Futuros (Diversified Financials)* | 5,311,400 | 31,282,682 | ||||||
Cielo SA (Software & Services) | 3,292,240 | 33,417,473 | ||||||
| 107,065,105 | ||||||||
Chile - 1.0% | ||||||||
Banco Santander Chile - ADR (Banks) | 1,569,800 | 35,869,930 | ||||||
China - 17.2% | ||||||||
51job Inc. - ADR (Commercial & Professional Services)* | 1,320,558 | 44,898,972 | ||||||
Baidu Inc. - Sponsored ADR (Software & Services)* | 169,700 | 30,013,142 | ||||||
China Merchants Port Holdings Co., Ltd. (Transportation)† | 14,615,488 | 37,829,456 | ||||||
China Mobile Ltd. - Sponsored ADR (Telecommunication Services) | 1,087,100 | 62,432,153 | ||||||
CNOOC Ltd. - Sponsored ADR (Energy) | 556,383 | 69,814,939 | ||||||
Ctrip.com International Ltd. - ADR (Retailing)* | 1,159,400 | 51,187,510 | ||||||
ENN Energy Holdings Ltd. (Utilities)† | 8,519,200 | 40,056,043 | ||||||
JD.com Inc. - ADR (Retailing)* | 1,257,200 | 32,624,340 | ||||||
Jiangsu Expressway Co., Ltd., Class H (Transportation)† | 15,257,000 | 20,773,206 | ||||||
Shenzhou International Group Holdings Ltd. (Consumer Durables & Apparel)† | 5,718,000 | 37,884,157 | ||||||
Sino Biopharmaceutical Ltd. (Pharmaceuticals, Biotechnology & Life Sciences)† | 36,642,505 | 25,621,287 | ||||||
Tencent Holdings Ltd. (Software & | 5,138,200 | 136,058,194 | ||||||
| 589,193,399 | ||||||||
Czech Republic - 1.3% | ||||||||
Komercni banka AS (Banks)† | 1,226,900 | 44,936,422 | ||||||
Egypt - 0.4% | ||||||||
Commercial International Bank Egypt SAE - GDR, Reg S (Banks)† | 2,987,875 | 13,202,801 | ||||||
Hong Kong - 6.6% | ||||||||
AIA Group Ltd. (Insurance)† | 14,740,015 | 93,019,816 | ||||||
| Shares | Value | |||||||
| COMMON STOCKS - 90.4% (continued) | ||||||||
Hong Kong - 6.6% (continued) | ||||||||
ASM Pacific Technology Ltd. (Semiconductors & Semiconductor Equipment)† | 3,262,069 | $31,444,539 | ||||||
Hong Kong Exchanges & Clearing Ltd. (Diversified Financials)† | 964,308 | 25,488,646 | ||||||
Sands China Ltd. (Consumer Services)† | 17,465,738 | 75,798,470 | ||||||
| 225,751,471 | ||||||||
Hungary - 1.4% | ||||||||
Richter Gedeon Nyrt. (Pharmaceuticals, Biotechnology & Life Sciences)† | 2,291,900 | 49,236,676 | ||||||
India - 8.3% | ||||||||
Ambuja Cements Ltd. (Materials)† | 7,876,550 | 28,530,055 | ||||||
Axis Bank Ltd. (Banks)† | 8,869,800 | 64,698,428 | ||||||
Bharti Airtel Ltd. (Telecommunication Services)† | 5,533,161 | 26,422,292 | ||||||
Bharti Infratel Ltd. (Telecommunication Services)† | 5,191,600 | 26,790,206 | ||||||
Dabur India Ltd. (Household & Personal Products)† | 6,128,800 | 26,758,348 | ||||||
Housing Development Finance Corp., Ltd. (Banks)† | 2,597,300 | 54,240,368 | ||||||
Maruti Suzuki India Ltd. (Automobiles & Components)† | 654,500 | 57,605,805 | ||||||
| 285,045,502 | ||||||||
Indonesia - 3.1% | ||||||||
Astra International Tbk PT (Automobiles & Components)† | 76,546,200 | 48,140,182 | ||||||
Bank Rakyat Indonesia Persero Tbk PT (Banks)† | 62,379,100 | 58,201,325 | ||||||
| 106,341,507 | ||||||||
Italy - 1.3% | ||||||||
Tenaris SA - ADR (Energy) | 1,548,300 | 43,662,060 | ||||||
Kenya - 0.9% | ||||||||
East African Breweries Ltd. (Food, Beverage & Tobacco)† | 5,037,565 | 13,659,623 | ||||||
Safaricom Ltd. (Telecommunication | 79,369,827 | 15,510,085 | ||||||
| 29,169,708 | ||||||||
See Notes to Financial Statements
20
Table of Contents
Harding, Loevner Funds, Inc.
Institutional Emerging Markets Portfolio
Portfolio of Investments
October 31, 2016 (continued)
| Shares | Value | |||||||
| COMMON STOCKS - 90.4% (continued) | ||||||||
Mexico - 5.7% | ||||||||
Fomento Economico Mexicano SAB de | 229,400 | $21,946,698 | ||||||
Grupo Aeroportuario del Sureste SAB de | 301,600 | 47,954,400 | ||||||
Grupo Financiero Banorte SAB de CV, | 11,405,900 | 67,170,559 | ||||||
Grupo Televisa SAB - Sponsored ADR (Media) | 2,327,200 | 57,086,216 | ||||||
| 194,157,873 | ||||||||
Peru - 1.0% | ||||||||
Credicorp Ltd. (Banks) | 240,500 | 35,757,540 | ||||||
Philippines - 0.6% | ||||||||
Universal Robina Corp. (Food, Beverage & Tobacco)† | 5,110,700 | 19,249,043 | ||||||
Poland - 1.4% | ||||||||
Bank Pekao SA (Banks)† | 1,520,800 | 46,914,593 | ||||||
Russia - 5.1% | ||||||||
LUKOIL PJSC - Sponsored ADR (Energy) | 1,520,500 | 73,911,505 | ||||||
Sberbank of Russia PJSC - Sponsored ADR (Banks)† | 10,794,000 | 102,193,825 | ||||||
| 176,105,330 | ||||||||
South Africa - 5.3% | ||||||||
Aspen Pharmacare Holdings Ltd. (Pharmaceuticals, Biotechnology & Life Sciences)† | 2,233,200 | 48,645,935 | ||||||
Discovery Ltd. (Insurance)† | 3,807,200 | 32,534,006 | ||||||
Massmart Holdings Ltd. (Food & Staples Retailing)† | 1,429,455 | 12,388,575 | ||||||
Naspers Ltd., Class N (Media)† | 167,600 | 28,083,254 | ||||||
Sasol Ltd. (Energy)† | 1,273,900 | 35,186,478 | ||||||
Standard Bank Group Ltd. (Banks)† | 2,501,800 | 26,542,079 | ||||||
| 183,380,327 | ||||||||
South Korea - 9.1% | ||||||||
Amorepacific Corp. (Household & Personal Products)† | 55,934 | 17,547,003 | ||||||
Hankook Tire Co., Ltd. (Automobiles & Components)† | 1,107,932 | 53,434,881 | ||||||
Hanssem Co., Ltd. (Consumer Durables & Apparel)† | 17,246 | 2,669,761 | ||||||
| Shares | Value | |||||||
| COMMON STOCKS - 90.4% (continued) | ||||||||
South Korea - 9.1% (continued) |
| |||||||
LG Household & Health Care Ltd. (Household & Personal Products)† | 51,400 | $36,829,598 | ||||||
NAVER Corp. (Software & Services)† | 56,470 | 42,286,917 | ||||||
Samsung Electronics Co., Ltd. - GDR (Technology Hardware & Equipment)† | 229,400 | 161,141,249 | ||||||
| 313,909,409 | ||||||||
Taiwan - 10.0% | ||||||||
Advantech Co., Ltd. (Technology Hardware & Equipment)† | 5,349,289 | 43,468,044 | ||||||
Airtac International Group (Capital Goods)† | 2,034,400 | 16,212,923 | ||||||
Eclat Textile Co., Ltd. (Consumer Durables & Apparel)† | 1,391,306 | 15,818,875 | ||||||
Hiwin Technologies Corp. (Capital Goods)† | 2,064,533 | 9,095,882 | ||||||
Hon Hai Precision Industry Co., Ltd. (Technology Hardware & Equipment)† | 8,233,158 | 22,215,546 | ||||||
Largan Precision Co., Ltd. (Technology Hardware & Equipment)† | 648,000 | 76,411,593 | ||||||
Taiwan Semiconductor Manufacturing Co., Ltd. (Semiconductors & Semiconductor Equipment)† | 26,635,277 | 158,981,207 | ||||||
| 342,204,070 | ||||||||
Thailand - 1.5% | ||||||||
Siam Commercial Bank pcl, Reg S (Banks)† | 12,829,170 | 52,603,354 | ||||||
Turkey - 0.9% | ||||||||
Arcelik AS (Consumer Durables & Apparel)† | 2,714,100 | 17,904,726 | ||||||
Turkiye Garanti Bankasi AS (Banks)† | 4,692,900 | 12,735,641 | ||||||
| 30,640,367 | ||||||||
Ukraine - 0.4% | ||||||||
MHP SA - GDR, Reg S (Food, Beverage & Tobacco)† | 1,523,200 | 14,399,753 | ||||||
United Arab Emirates - 1.2% | ||||||||
DP World Ltd. (Transportation)† | 1,399,700 | 25,119,766 | ||||||
Emaar Properties PJSC (Real Estate)† | 8,979,200 | 17,014,090 | ||||||
| 42,133,856 | ||||||||
See Notes to Financial Statements
21
Table of Contents
Harding, Loevner Funds, Inc.
Institutional Emerging Markets Portfolio
Portfolio of Investments
October 31, 2016 (continued)
| Shares | Value | |||||||
| COMMON STOCKS - 90.4% (continued) | ||||||||
United Kingdom - 2.8% | ||||||||
BGEO Group plc (Banks)† | 1,031,809 | $37,267,079 | ||||||
Coca-Cola HBC AG - CDI (Food, Beverage & Tobacco)*† | 1,996,700 | 43,114,944 | ||||||
Nostrum Oil & Gas plc (Energy)*† | 3,402,286 | 14,592,130 | ||||||
| 94,974,153 | ||||||||
United States - 0.8% | ||||||||
MercadoLibre Inc. (Software & Services) | 161,600 | 27,150,416 | ||||||
Total Common Stocks (Cost $2,849,817,279) |
| $3,103,054,665 | ||||||
| PREFERRED STOCKS - 6.3% | ||||||||
Brazil - 4.4% | ||||||||
Banco Bradesco SA - ADR (Banks)* | 5,354,250 | 55,737,743 | ||||||
Cia Brasileira de Distribuicao - Sponsored ADR (Food & Staples Retailing) | 1,487,400 | 28,334,970 | ||||||
Itau Unibanco Holding SA - Sponsored ADR (Banks) | 5,604,682 | 66,863,850 | ||||||
| 150,936,563 | ||||||||
Colombia - 1.1% | ||||||||
Bancolombia SA - Sponsored ADR (Banks) | 959,800 | 36,741,144 | ||||||
South Korea - 0.8% | ||||||||
Samsung Electronics Co., Ltd. - GDR, Reg S (Technology Hardware & Equipment)† | 51,244 | 29,027,092 | ||||||
Total Preferred Stocks (Cost $161,957,673) |
| $216,704,799 | ||||||
| PARTICIPATION NOTES - 0.8% | ||||||||
Qatar - 0.8% | ||||||||
Qatar National Bank, Issued by HSBC Bank plc, Maturity Date 9/9/19 (Banks)^† | 648,560 | 28,495,399 | ||||||
Total Participation Notes (Cost $27,969,069) |
| $28,495,399 | ||||||
| Shares | Value | |||||||
| SHORT TERM INVESTMENTS - 3.1% | ||||||||
Northern Institutional Funds - Treasury Portfolio, 0.20% (Money Market Fund) | 104,044,126 | $104,044,126 | ||||||
Total Short Term Investments (Cost $104,044,126) |
| $104,044,126 | ||||||
Total Investments — 100.6% | ||||||||
(Cost $3,143,788,147) | $3,452,298,989 | |||||||
Liabilities Less Other Assets - (0.6)% |
| (19,848,518 | ) | |||||
Net Assets — 100.0% | $3,432,450,471 | |||||||
Summary of Abbreviations
| ADR | American Depositary Receipt. |
| CDI | Chess Depository Interest. |
| GDR | Global Depository Receipt. |
| Reg S | Security sold outside United States without registration under the Securities Act of 1933. |
| * | Non-income producing security. |
| ^ | Security exempt from registration pursuant to Rule 144A of the Securities Act of 1933. These securities, which represent 0.8% of net assets as of October 31, 2016, are considered liquid and may be resold in transactions exempt from registration, normally to qualified buyers. |
| † | Investment categorized as level 2 security as disclosed in Note 2 of the Notes to Financial Statements. |
See Notes to Financial Statements
22
Table of Contents
Harding, Loevner Funds, Inc.
Institutional Emerging Markets Portfolio
Portfolio of Investments
October 31, 2016 (continued)
| Industry | | Percentage of Net Assets | | ||
Automobiles & Components | 4.6 | % | |||
Banks | 24.5 | ||||
Capital Goods | 0.7 | ||||
Commercial & Professional Services | 1.3 | ||||
Consumer Durables & Apparel | 2.2 | ||||
Consumer Services | 2.2 | ||||
Diversified Financials | 1.7 | ||||
Energy | 6.9 | ||||
Food & Staples Retailing | 1.2 | ||||
Food, Beverage & Tobacco | 4.5 | ||||
Household & Personal Products | 2.4 | ||||
Insurance | 3.7 | ||||
Materials | 0.8 | ||||
Media | 2.5 | ||||
Money Market Fund | 3.1 | ||||
Pharmaceuticals, Biotechnology & Life Sciences | 3.6 | ||||
Real Estate | 0.5 | ||||
Retailing | 2.4 | ||||
Semiconductors & Semiconductor Equipment | 5.5 | ||||
Software & Services | 7.8 | ||||
Technology Hardware & Equipment | 9.7 | ||||
Telecommunication Services | 3.8 | ||||
Transportation | 3.8 | ||||
Utilities | 1.2 | ||||
Total Investments | 100.6 | ||||
Liabilities Less Other Assets | (0.6 | ) | |||
Net Assets | 100.0 | % | |||
See Notes to Financial Statements
23
Table of Contents
Harding, Loevner Funds, Inc.
Portfolio of Investments
October 31, 2016
| Shares | Value | |||||||
| COMMON STOCKS - 90.9% | ||||||||
Brazil - 3.1% | ||||||||
Ambev SA - ADR (Food, Beverage & Tobacco) | 6,257,500 | $36,919,250 | ||||||
BM&FBovespa SA - Bolsa de Valores Mercadorias e Futuros (Diversified Financials)* | 4,613,400 | 27,171,654 | ||||||
Cielo SA (Software & Services) | 2,862,242 | 29,052,832 | ||||||
| 93,143,736 | ||||||||
Chile - 1.0% | ||||||||
Banco Santander Chile - ADR (Banks) | 1,364,900 | 31,187,965 | ||||||
China - 17.2% | ||||||||
51job Inc. - ADR (Commercial & Professional Services)* | 1,158,500 | 39,389,000 | ||||||
Baidu Inc. - Sponsored ADR (Software & Services)* | 145,200 | 25,680,072 | ||||||
China Merchants Port Holdings Co., Ltd. (Transportation)† | 12,720,541 | 32,924,740 | ||||||
China Mobile Ltd. - Sponsored ADR (Telecommunication Services) | 955,100 | 54,851,393 | ||||||
CNOOC Ltd. - Sponsored ADR (Energy) | 489,760 | 61,455,085 | ||||||
Ctrip.com International Ltd. - ADR (Retailing)* | 1,015,300 | 44,825,495 | ||||||
ENN Energy Holdings Ltd. (Utilities)† | 7,420,700 | 34,891,055 | ||||||
JD.com Inc. - ADR (Retailing)* | 1,090,500 | 28,298,475 | ||||||
Jiangsu Expressway Co., Ltd., Class H (Transportation)† | 13,619,000 | 18,542,983 | ||||||
Shenzhou International Group Holdings Ltd. (Consumer Durables & Apparel)† | 4,975,000 | 32,961,469 | ||||||
Sino Biopharmaceutical Ltd. (Pharmaceuticals, Biotechnology & Life Sciences)† | 32,705,192 | 22,868,227 | ||||||
Tencent Holdings Ltd. (Software & | 4,501,400 | 119,195,897 | ||||||
| 515,883,891 | ||||||||
Czech Republic - 1.3% | ||||||||
Komercni banka AS (Banks)† | 1,021,300 | 37,406,119 | ||||||
Egypt - 0.4% | ||||||||
Commercial International Bank Egypt SAE - GDR, Reg S (Banks)† | 2,666,950 | 11,784,700 | ||||||
Hong Kong - 6.6% | ||||||||
AIA Group Ltd. (Insurance)† | 12,899,600 | 81,405,508 | ||||||
| Shares | Value | |||||||
| COMMON STOCKS - 90.9% (continued) | ||||||||
Hong Kong - 6.6% (continued) | ||||||||
ASM Pacific Technology Ltd. (Semiconductors & Semiconductor Equipment)† | 2,831,723 | $27,296,242 | ||||||
Hong Kong Exchanges & Clearing Ltd. (Diversified Financials)† | 860,791 | 22,752,479 | ||||||
Sands China Ltd. (Consumer Services)† | 15,381,344 | 66,752,538 | ||||||
| 198,206,767 | ||||||||
Hungary - 1.4% | ||||||||
Richter Gedeon Nyrt. (Pharmaceuticals, Biotechnology & Life Sciences)† | 2,009,100 | 43,161,310 | ||||||
India - 8.4% | ||||||||
Ambuja Cements Ltd. (Materials)† | 6,924,990 | 25,083,361 | ||||||
Axis Bank Ltd. (Banks)† | 7,800,100 | 56,895,782 | ||||||
Bharti Airtel Ltd. (Telecommunication Services)† | 5,004,726 | 23,898,877 | ||||||
Bharti Infratel Ltd. (Telecommunication Services)† | 4,633,900 | 23,912,308 | ||||||
Dabur India Ltd. (Household & Personal Products)† | 5,480,900 | 23,929,616 | ||||||
Housing Development Finance Corp., Ltd. (Banks)† | 2,279,400 | 47,601,545 | ||||||
Maruti Suzuki India Ltd. (Automobiles & Components)† | 573,400 | 50,467,790 | ||||||
| 251,789,279 | ||||||||
Indonesia - 3.1% | ||||||||
Astra International Tbk PT (Automobiles & Components)† | 67,121,000 | 42,212,640 | ||||||
Bank Rakyat Indonesia Persero Tbk PT (Banks)† | 54,701,438 | 51,037,866 | ||||||
| 93,250,506 | ||||||||
Italy - 1.3% | ||||||||
Tenaris SA - ADR (Energy) | 1,349,200 | 38,047,440 | ||||||
Kenya - 0.9% | ||||||||
East African Breweries Ltd. (Food, Beverage & Tobacco)† | 4,427,150 | 12,004,451 | ||||||
Safaricom Ltd. (Telecommunication | 72,707,501 | 14,208,164 | ||||||
| 26,212,615 | ||||||||
See Notes to Financial Statements
24
Table of Contents
Harding, Loevner Funds, Inc.
Emerging Markets Portfolio
Portfolio of Investments
October 31, 2016 (continued)
| Shares | Value | |||||||
| COMMON STOCKS - 90.9% (continued) | ||||||||
Mexico - 5.7% | ||||||||
Fomento Economico Mexicano SAB de CV - Sponsored ADR (Food, Beverage & Tobacco) | 204,800 | $19,593,216 | ||||||
Grupo Aeroportuario del Sureste SAB de CV - ADR (Transportation) | 264,300 | 42,023,700 | ||||||
Grupo Financiero Banorte SAB de CV, Series O (Banks) | 10,020,540 | 59,012,026 | ||||||
Grupo Televisa SAB - Sponsored ADR (Media) | 2,041,400 | 50,075,542 | ||||||
| 170,704,484 | ||||||||
Peru - 1.0% | ||||||||
Credicorp Ltd. (Banks) | 209,300 | 31,118,724 | ||||||
Philippines - 0.6% | ||||||||
Universal Robina Corp. (Food, Beverage & Tobacco)† | 4,561,700 | 17,181,278 | ||||||
Poland - 1.3% | ||||||||
Bank Pekao SA (Banks)† | 1,270,200 | 39,183,927 | ||||||
Russia - 5.2% | ||||||||
LUKOIL PJSC - Sponsored ADR (Energy) | 1,331,593 | 64,728,736 | ||||||
Sberbank of Russia PJSC - Sponsored ADR (Banks)† | 9,761,100 | 92,414,688 | ||||||
| 157,143,424 | ||||||||
South Africa - 5.4% | ||||||||
Aspen Pharmacare Holdings Ltd. (Pharmaceuticals, Biotechnology & Life Sciences)† | 1,947,400 | 42,420,336 | ||||||
Discovery Ltd. (Insurance)† | 3,306,600 | 28,256,184 | ||||||
Massmart Holdings Ltd. (Food & Staples Retailing)† | 1,266,918 | 10,979,925 | ||||||
Naspers Ltd., Class N (Media)† | 145,400 | 24,363,396 | ||||||
Sasol Ltd. (Energy)† | 1,107,761 | 30,597,542 | ||||||
Standard Bank Group Ltd. (Banks)† | 2,233,000 | 23,690,327 | ||||||
| 160,307,710 | ||||||||
South Korea - 9.2% | ||||||||
Amorepacific Corp. (Household & Personal Products)† | 49,991 | 15,682,629 | ||||||
Hankook Tire Co., Ltd. (Automobiles & Components)† | 971,038 | 46,832,567 | ||||||
Hanssem Co., Ltd. (Consumer Durables & Apparel)† | 15,101 | 2,337,705 | ||||||
| Shares | Value | |||||||
| COMMON STOCKS - 90.9% (continued) | ||||||||
South Korea - 9.2% (continued) |
| |||||||
LG Household & Health Care Ltd. (Household & Personal Products)† | 44,800 | $32,100,506 | ||||||
NAVER Corp. (Software & Services)† | 49,428 | 37,013,596 | ||||||
Samsung Electronics Co., Ltd. - GDR (Technology Hardware & Equipment)† | 201,150 | 141,297,133 | ||||||
| 275,264,136 | ||||||||
Taiwan - 10.0% | ||||||||
Advantech Co., Ltd. (Technology Hardware & Equipment)† | 4,660,439 | 37,870,484 | ||||||
Airtac International Group (Capital Goods)† | 1,802,600 | 14,365,619 | ||||||
Eclat Textile Co., Ltd. (Consumer Durables & Apparel)† | 1,233,467 | 14,024,277 | ||||||
Hiwin Technologies Corp. (Capital Goods)† | 1,895,657 | 8,351,851 | ||||||
Hon Hai Precision Industry Co., Ltd. (Technology Hardware & Equipment)† | 7,297,171 | 19,689,971 | ||||||
Largan Precision Co., Ltd. (Technology Hardware & Equipment)† | 571,000 | 67,331,820 | ||||||
Taiwan Semiconductor Manufacturing Co., Ltd. (Semiconductors & Semiconductor Equipment)† | 23,341,637 | 139,322,059 | ||||||
| 300,956,081 | ||||||||
Thailand - 1.6% | ||||||||
Siam Commercial Bank pcl, Reg S (Banks)† | 11,269,400 | 46,207,841 | ||||||
Turkey - 0.9% | ||||||||
Arcelik AS (Consumer Durables & Apparel)† | 2,405,400 | 15,868,254 | ||||||
Turkiye Garanti Bankasi AS (Banks)† | 4,161,600 | 11,293,794 | ||||||
| 27,162,048 | ||||||||
Ukraine - 0.4% | ||||||||
MHP SA - GDR, Reg S (Food, Beverage & Tobacco)† | 1,359,525 | 12,852,431 | ||||||
United Arab Emirates - 1.3% | ||||||||
DP World Ltd. (Transportation)† | 1,249,300 | 22,420,608 | ||||||
Emaar Properties PJSC (Real Estate)† | 8,014,600 | 15,186,333 | ||||||
| 37,606,941 | ||||||||
See Notes to Financial Statements
25
Table of Contents
Harding, Loevner Funds, Inc.
Emerging Markets Portfolio
Portfolio of Investments
October 31, 2016 (continued)
| Shares | Value | |||||||
| COMMON STOCKS - 90.9% (continued) | ||||||||
United Kingdom - 2.8% | ||||||||
BGEO Group plc (Banks)† | 959,654 | $34,660,970 | ||||||
Coca-Cola HBC AG - CDI (Food, Beverage & Tobacco)*† | 1,739,900 | 37,569,836 | ||||||
Nostrum Oil & Gas plc (Energy)*† | 3,015,300 | 12,932,378 | ||||||
| 85,163,184 | ||||||||
United States - 0.8% | ||||||||
MercadoLibre Inc. (Software & Services) | 144,200 | 24,227,042 | ||||||
Total Common Stocks (Cost $2,280,093,621) |
| $2,725,153,579 | ||||||
| PREFERRED STOCKS - 6.3% | ||||||||
Brazil - 4.4% | ||||||||
Banco Bradesco SA - ADR (Banks)* | 4,700,646 | 48,933,725 | ||||||
Cia Brasileira de Distribuicao - Sponsored ADR (Food & Staples Retailing) | 1,330,200 | 25,340,310 | ||||||
Itau Unibanco Holding SA - Sponsored ADR (Banks) | 4,928,000 | 58,791,040 | ||||||
| 133,065,075 | ||||||||
Colombia - 1.1% | ||||||||
Bancolombia SA - Sponsored ADR (Banks) | 835,100 | 31,967,628 | ||||||
South Korea - 0.8% | ||||||||
Samsung Electronics Co., Ltd. - GDR, Reg S (Technology Hardware & Equipment)† | 44,082 | 24,970,187 | ||||||
Total Preferred Stocks (Cost $125,754,545) | $190,002,890 | |||||||
| PARTICIPATION NOTES - 0.8% | ||||||||
Qatar - 0.8% | ||||||||
Qatar National Bank, Issued by HSBC Bank plc, Maturity Date 9/9/19 (Banks)^† | 562,751 | 24,725,260 | ||||||
Total Participation Notes (Cost $24,249,053) |
| $24,725,260 | ||||||
| Shares | Value | |||||||
| SHORT TERM INVESTMENTS - 1.8% | ||||||||
Northern Institutional Funds - Treasury Portfolio, 0.20% (Money Market Fund) | 52,082,685 | $52,082,685 | ||||||
Total Short Term Investments (Cost $52,082,685) |
| $52,082,685 | ||||||
Total Investments — 99.8% | ||||||||
(Cost $2,482,179,904) | $2,991,964,414 | |||||||
Other Assets Less Liabilities - 0.2% | 6,519,564 | |||||||
Net Assets — 100.0% | $2,998,483,978 | |||||||
Summary of Abbreviations
| ADR | American Depositary Receipt. |
| CDI | Chess Depository Interest. |
| GDR | Global Depository Receipt. |
| Reg S | Security sold outside United States without registration under the Securities Act of 1933. |
| * | Non-income producing security. |
| ^ | Security exempt from registration pursuant to Rule 144A of the Securities Act of 1933. These securities, which represent 0.8% of net assets as of October 31, 2016, are considered liquid and may be resold in transactions exempt from registration, normally to qualified buyers. |
| † | Investment categorized as level 2 security as disclosed in Note 2 of the Notes to Financial Statements. |
See Notes to Financial Statements
26
Table of Contents
Harding, Loevner Funds, Inc.
Emerging Markets Portfolio
Portfolio of Investments
October 31, 2016 (continued)
| Industry | | Percentage of Net Assets | | ||
Automobiles & Components | 4.6 | % | |||
Banks | 24.6 | ||||
Capital Goods | 0.8 | ||||
Commercial & Professional Services | 1.3 | ||||
Consumer Durables & Apparel | 2.2 | ||||
Consumer Services | 2.2 | ||||
Diversified Financials | 1.7 | ||||
Energy | 6.9 | ||||
Food & Staples Retailing | 1.2 | ||||
Food, Beverage & Tobacco | 4.5 | ||||
Household & Personal Products | 2.4 | ||||
Insurance | 3.7 | ||||
Materials | 0.8 | ||||
Media | 2.5 | ||||
Money Market Fund | �� | 1.8 | |||
Pharmaceuticals, Biotechnology & Life Sciences | 3.6 | ||||
Real Estate | 0.5 | ||||
Retailing | 2.4 | ||||
Semiconductors & Semiconductor Equipment | 5.6 | ||||
Software & Services | 7.8 | ||||
Technology Hardware & Equipment | 9.7 | ||||
Telecommunication Services | 3.9 | ||||
Transportation | 3.9 | ||||
Utilities | 1.2 | ||||
Total Investments | 99.8 | ||||
Other Assets Less Liabilities | 0.2 | ||||
Net Assets | 100.0 | % | |||
See Notes to Financial Statements
27
Table of Contents
Harding, Loevner Funds, Inc.
Frontier Emerging Markets Portfolio
Portfolio of Investments
October 31, 2016
| Shares | Value | |||||||
| COMMON STOCKS - 93.7% | ||||||||
Argentina - 3.5% | ||||||||
Banco Macro SA - ADR (Banks) | 122,625 | $9,347,704 | ||||||
Grupo Financiero Galicia SA - ADR (Banks) | 122,700 | 3,820,878 | ||||||
| 13,168,582 | ||||||||
Bangladesh - 8.3% | ||||||||
BRAC Bank Ltd. (Banks)† | 4,253,500 | 3,246,111 | ||||||
GrameenPhone Ltd. (Telecommunication Services)† | 1,373,600 | 4,779,310 | ||||||
Olympic Industries Ltd. (Food, Beverage & Tobacco)† | 2,780,728 | 10,696,234 | ||||||
Square Pharmaceuticals Ltd. (Pharmaceuticals, Biotechnology & Life Sciences)*† | 3,660,530 | 12,486,354 | ||||||
| 31,208,009 | ||||||||
Colombia - 7.0% | ||||||||
Cementos Argos SA - Sponsored ADR (Materials)#† | 548,400 | 10,852,068 | ||||||
Cemex Latam Holdings SA (Materials)* | 1,898,100 | 7,057,636 | ||||||
Ecopetrol SA - Sponsored ADR (Energy)* | 667,800 | 5,803,182 | ||||||
Grupo Nutresa SA (Food, Beverage & Tobacco) | 312,300 | 2,615,327 | ||||||
| 26,328,213 | ||||||||
Croatia - 0.6% | ||||||||
Ericsson Nikola Tesla (Technology Hardware & Equipment)† | 13,950 | 2,353,365 | ||||||
Egypt - 4.3% | ||||||||
Commercial International Bank Egypt SAE - GDR, Reg S (Banks)† | 2,649,300 | 11,706,708 | ||||||
Oriental Weavers (Consumer Durables & Apparel) | 4,204,125 | 4,227,821 | ||||||
| 15,934,529 | ||||||||
Estonia - 1.6% | ||||||||
Olympic Entertainment Group AS (Consumer Services)† | 1,853,400 | 3,641,797 | ||||||
Tallink Grupp AS (Transportation)† | 2,466,600 | 2,453,199 | ||||||
| 6,094,996 | ||||||||
| Shares | Value | |||||||
| COMMON STOCKS - 93.7% (continued) | ||||||||
Kazakhstan - 2.9% | ||||||||
Halyk Savings Bank of Kazakhstan JSC - GDR, Reg S (Banks)*† | 1,630,496 | $10,800,652 | ||||||
Kenya - 6.9% | ||||||||
East African Breweries Ltd. (Food, Beverage & Tobacco)† | 3,430,400 | 9,301,711 | ||||||
Safaricom Ltd. (Telecommunication | 84,646,750 | 16,541,277 | ||||||
| 25,842,988 | ||||||||
Kuwait - 2.8% | ||||||||
Kuwait Projects Co. Holding KSCP (Diversified Financials)† | 2,690,600 | 4,393,209 | ||||||
Mabanee Co., SAK (Real Estate)† | 678,000 | 1,789,204 | ||||||
National Bank of Kuwait (Banks)† | 2,210,900 | 4,302,602 | ||||||
| 10,485,015 | ||||||||
Lebanon - 0.3% | ||||||||
Bank Audi SAL - GDR, Reg S (Banks) | 155,000 | 979,600 | ||||||
Morocco - 2.1% | ||||||||
Attijariwafa Bank (Banks)† | 115,900 | 4,786,149 | ||||||
Maroc Telecom (Telecommunication Services)† | 237,700 | 3,214,819 | ||||||
| 8,000,968 | ||||||||
Nigeria - 2.9% | ||||||||
Access Bank plc (Banks)† | 22,973,400 | 411,823 | ||||||
Dangote Cement plc (Materials)† | 3,493,700 | 1,939,553 | ||||||
Guaranty Trust Bank plc (Banks)† | 44,934,400 | 3,349,983 | ||||||
Lafarge Africa plc (Materials)† | 1,100,000 | 165,705 | ||||||
Nigerian Breweries plc (Food, Beverage & Tobacco)† | 3,894,100 | 1,802,983 | ||||||
Zenith Bank plc (Banks)† | 69,632,792 | 3,246,797 | ||||||
| 10,916,844 | ||||||||
Pakistan - 9.6% | ||||||||
Engro Corp., Ltd. (Materials)† | 1,652,792 | 4,403,002 | ||||||
Engro Fertilizers Ltd. (Materials)† | 6,456,499 | 3,910,927 | ||||||
Lucky Cement Ltd. (Materials)† | 711,900 | 4,561,298 | ||||||
MCB Bank Ltd. (Banks)† | 3,724,400 | 7,583,394 | ||||||
Oil & Gas Development Co., Ltd. (Energy)† | 2,314,900 | 3,096,042 | ||||||
See Notes to Financial Statements
28
Table of Contents
Harding, Loevner Funds, Inc.
Frontier Emerging Markets Portfolio
Portfolio of Investments
October 31, 2016 (continued)
| Shares | Value | |||||||
| COMMON STOCKS - 93.7% (continued) | ||||||||
Pakistan - 9.6% (continued) | ||||||||
Pakistan Petroleum Ltd. (Energy)† | 5,104,197 | $7,208,786 | ||||||
United Bank Ltd. (Banks)† | 2,598,700 | 4,993,967 | ||||||
| 35,757,416 | ||||||||
Peru - 6.0% | ||||||||
Alicorp SAA (Food, Beverage & Tobacco) | 4,475,600 | 10,378,974 | ||||||
Credicorp Ltd. (Banks) | 71,100 | 10,571,148 | ||||||
Ferreycorp SAA (Capital Goods) | 3,366,100 | 1,671,291 | ||||||
| 22,621,413 | ||||||||
Philippines - 13.0% | ||||||||
Bank of the Philippine Islands (Banks)† | 4,736,792 | 9,890,104 | ||||||
BDO Unibank Inc. (Banks)† | 1,637,900 | 3,815,710 | ||||||
International Container Terminal Services Inc. (Transportation)† | 2,723,520 | 4,376,542 | ||||||
Jollibee Foods Corp. (Consumer Services)† | 2,493,800 | 12,256,909 | ||||||
Robinsons Retail Holdings Inc. | ||||||||
(Food & Staples Retailing)† | 4,480,100 | 7,152,169 | ||||||
Universal Robina Corp. (Food, Beverage & Tobacco)† | 2,947,200 | 11,100,393 | ||||||
| 48,591,827 | ||||||||
Qatar - 0.5% | ||||||||
Qatar National Bank SAQ (Banks)† | 43,900 | 1,928,808 | ||||||
Romania - 3.3% | ||||||||
Banca Transilvania SA (Banks)† | 22,018,747 | 12,419,499 | ||||||
Senegal - 1.0% | ||||||||
Sonatel (Telecommunication Services) | 94,200 | 3,625,824 | ||||||
Slovenia - 0.8% | ||||||||
Krka dd Novo mesto (Pharmaceuticals, Biotechnology & Life Sciences)† | 45,024 | 2,889,735 | ||||||
Sri Lanka - 1.6% | ||||||||
Commercial Bank of Ceylon plc (Banks)† | 4,962,791 | 4,828,474 | ||||||
John Keells Holdings plc (Capital Goods)† | 1,257,142 | 1,266,544 | ||||||
| 6,095,018 | ||||||||
| Shares | Value | |||||||
| COMMON STOCKS - 93.7% (continued) | ||||||||
Tanzania - 1.9% | ||||||||
Tanzania Breweries Ltd. (Food, Beverage & Tobacco) | 1,136,670 | $6,918,861 | ||||||
Thailand - 0.9% | ||||||||
Home Product Center pcl, Reg S (Retailing)† | 6,507,594 | 1,878,040 | ||||||
Siam Commercial Bank pcl, Reg S (Banks)† | 393,600 | 1,613,875 | ||||||
| 3,491,915 | ||||||||
Turkey - 0.5% | ||||||||
Turkiye Garanti Bankasi AS (Banks)† | 674,500 | 1,830,465 | ||||||
Ukraine - 1.7% | ||||||||
Kernel Holding SA (Food, Beverage & Tobacco)† | 273,600 | 4,382,418 | ||||||
MHP SA - GDR, Reg S (Food, Beverage & Tobacco)† | 211,539 | 1,999,809 | ||||||
| 6,382,227 | ||||||||
United Arab Emirates - 2.1% | ||||||||
Agthia Group PJSC (Food, Beverage & Tobacco)† | 1,049,900 | 1,714,657 | ||||||
DP World Ltd. (Transportation)† | 47,500 | 852,461 | ||||||
Emaar Properties PJSC (Real Estate)† | 2,794,400 | 5,294,923 | ||||||
| 7,862,041 | ||||||||
United Kingdom - 1.4% | ||||||||
BGEO Group plc (Banks)† | 32,500 | 1,173,841 | ||||||
Nostrum Oil & Gas plc (Energy)*† | 950,200 | 4,075,331 | ||||||
| 5,249,172 | ||||||||
United States - 1.8% | ||||||||
PriceSmart Inc. (Food & Staples Retailing) | 74,000 | 6,730,300 | ||||||
Vietnam - 4.4% | ||||||||
Hoa Phat Group JSC (Materials)† | 8,123,935 | 14,827,713 | ||||||
PetroVietnam Drilling & Well Services JSC (Energy)*† | 1,637,003 | 1,760,646 | ||||||
| 16,588,359 | ||||||||
Total Common Stocks (Cost $331,127,557) |
| $351,096,641 | ||||||
See Notes to Financial Statements
29
Table of Contents
Harding, Loevner Funds, Inc.
Frontier Emerging Markets Portfolio
Portfolio of Investments
October 31, 2016 (continued)
| Shares | Value | |||||||
| PREFERRED STOCKS - 2.2% | ||||||||
Colombia - 2.2% | ||||||||
Bancolombia SA - Sponsored ADR (Banks) | 219,792 | $8,413,638 | ||||||
Total Preferred Stocks (Cost $8,745,040) | $8,413,638 | |||||||
| PARTICIPATION NOTES - 3.6% | ||||||||
Saudi Arabia - 3.6% | ||||||||
Al Rajhi Bank, Issued by JP Morgan Structured Products, Maturity Date 12/5/19 (Banks)^† | 181,800 | 2,741,758 | ||||||
Herfy Food Services Co., Issued by JP Morgan Structured Products, Maturity Date 1/7/19 (Consumer Services)^† | 142,800 | 2,539,217 | ||||||
Jarir Marketing Co., Issued by HSBC Bank plc, Maturity Date 1/22/18 (Retailing)^† | 198,800 | 4,833,305 | ||||||
Saudi British Bank, Issued by JP Morgan Structured Products, Maturity Date 12/2/19 (Banks)^† | 677,900 | 3,415,388 | ||||||
| 13,529,668 | ||||||||
Total Participation Notes (Cost $23,357,566) |
| $13,529,668 | ||||||
| Shares | Value | |||||||
| SHORT TERM INVESTMENTS - 1.0% | ||||||||
Northern Institutional Funds - Treasury Portfolio, 0.20% (Money Market Fund) | 3,714,727 | $3,714,727 | ||||||
Total Short Term Investments (Cost $3,714,727) |
| $3,714,727 | ||||||
Total Investments — 100.5% | ||||||||
(Cost $366,944,890) | $376,754,674 | |||||||
Liabilities Less Other Assets - (0.5)% | (1,870,366 | ) | ||||||
Net Assets — 100.0% | $374,884,308 | |||||||
Summary of Abbreviations
| ADR | American Depositary Receipt. |
| GDR | Global Depository Receipt. |
| Reg S | Security sold outside United States without registration under the Securities Act of 1933. |
| # | Security valued at fair value as determined in good faith under policies and procedures established by and under the supervision of the Portfolio’s Board of Directors as disclosed in Note 2 of the Notes to Financial Statements. |
| * | Non-income producing security. |
| ^ | Security exempt from registration pursuant to Rule 144A of the Securities Act of 1933. These securities, which represent 3.6% of net assets as of October 31, 2016, are considered liquid and may be resold in transactions exempt from registration, normally to qualified buyers. |
| † | Investment categorized as level 2 security as disclosed in Note 2 of the Notes to Financial Statements. |
See Notes to Financial Statements
30
Table of Contents
Harding, Loevner Funds, Inc.
Frontier Emerging Markets Portfolio
Portfolio of Investments
October 31, 2016 (continued)
| Industry | | Percentage of Net Assets | | ||
Banks | 35.0 | % | |||
Capital Goods | 0.8 | ||||
Consumer Durables & Apparel | 1.1 | ||||
Consumer Services | 4.9 | ||||
Diversified Financials | 1.2 | ||||
Energy | 5.9 | ||||
Food & Staples Retailing | 3.7 | ||||
Food, Beverage & Tobacco | 16.2 | ||||
Materials | 12.7 | ||||
Money Market Fund | 1.0 | ||||
Pharmaceuticals, Biotechnology & Life Sciences | 4.1 | ||||
Real Estate | 1.9 | ||||
Retailing | 1.8 | ||||
Technology Hardware & Equipment | 0.6 | ||||
Telecommunication Services | 7.5 | ||||
Transportation | 2.1 | ||||
Total Investments | 100.5 | ||||
Liabilities Less Other Assets | (0.5 | ) | |||
Net Assets | 100.0 | % | |||
See Notes to Financial Statements
31
Table of Contents
Harding, Loevner Funds, Inc.
Statements of Assets and Liabilities
October 31, 2016
| Global Equity Portfolio | International Equity Portfolio | International Equity Research Portfolio | International Small Companies Portfolio | |||||||||||||
ASSETS: | ||||||||||||||||
Investments (cost $645,750,413, $5,894,213,732, $6,636,973, and $95,866,988, respectively) | $833,182,606 | $6,802,957,616 | $7,110,777 | $107,190,567 | ||||||||||||
Dividends and interest receivable | 654,787 | 8,722,617 | 11,730 | 94,488 | ||||||||||||
Foreign currency (cost $0, $0, $54 and $185,698, respectively) | — | — | 54 | 185,833 | ||||||||||||
Receivable for investments sold | 7,982,436 | 135,475 | — | 2,637 | ||||||||||||
Receivable for Fund shares sold | 93,439 | 12,315,271 | — | 603,869 | ||||||||||||
Tax reclaim receivable | 769,042 | 10,777,954 | 3,569 | 166,195 | ||||||||||||
Prepaid expenses | 4,976 | 26,633 | 4,401 | 33,228 | ||||||||||||
Total Assets | 842,687,286 | 6,834,935,566 | 7,130,531 | 108,276,817 | ||||||||||||
LIABILITIES: | ||||||||||||||||
Payable to Investment Adviser | (581,475 | ) | (4,044,674 | ) | (9,392 | ) | (111,555 | ) | ||||||||
Payable for investments purchased | (3,964,961 | ) | (35,426,150 | ) | (13,283 | ) | (583,905 | ) | ||||||||
Payable for Fund shares redeemed | (2,194,365 | ) | (5,068,049 | ) | — | (221,696 | ) | |||||||||
Payable for distribution fees | — | (183,991 | ) | (1,393 | ) | (9,849 | ) | |||||||||
Deferred capital gains tax | — | — | (3,615 | ) | (130,684 | ) | ||||||||||
Other liabilities | (228,081 | ) | (1,638,120 | ) | (32,343 | ) | (70,387 | ) | ||||||||
Total Liabilities | (6,968,882 | ) | (46,360,984 | ) | (60,026 | ) | (1,128,076 | ) | ||||||||
Net Assets | $835,718,404 | $6,788,574,582 | $7,070,505 | $107,148,741 | ||||||||||||
ANALYSIS OF NET ASSETS: | ||||||||||||||||
Paid in capital | $636,678,872 | $5,849,006,505 | $6,360,184 | $92,450,779 | ||||||||||||
Accumulated undistributed net investment income | 3,727,557 | 62,986,475 | 108,064 | 1,209,255 | ||||||||||||
Accumulated net realized gain (loss) from investment transactions | 7,918,848 | (31,911,106 | ) | 132,467 | 2,315,172 | |||||||||||
Net unrealized appreciation on investments and on assets and liabilities denominated in foreign currencies | 187,393,127 | 908,492,708 | 469,790 | 11,173,535 | ||||||||||||
Net Assets | $835,718,404 | $6,788,574,582 | $7,070,505 | $107,148,741 | ||||||||||||
Net Assets: | ||||||||||||||||
Institutional Class | $779,020,183 | $6,354,809,589 | $6,244,110 | $62,785,381 | ||||||||||||
Investor Class | — | 433,764,993 | 826,395 | 44,363,360 | ||||||||||||
Advisor Class | 56,698,221 | — | — | — | ||||||||||||
Total Shares Outstanding: | ||||||||||||||||
Institutional Class (400,000,000, 400,000,000, 400,000,000, and 400,000,000, respectively, $.001 par value shares authorized) | 23,946,707 | 345,986,490 | 562,606 | 4,577,202 | ||||||||||||
Investor Class ( — , 400,000,000, 400,000,000, and 400,000,000, respectively, $.001 par value shares authorized) | — | 23,706,070 | 74,624 | 3,251,983 | ||||||||||||
Advisor Class (400,000,000, — , — , and — , respectively, $.001 par value shares authorized) | 1,746,173 | — | — | — | ||||||||||||
Net Asset Value, Offering Price and Redemption Price Per Share: | ||||||||||||||||
Institutional Class | $32.53 | $18.37 | $11.10 | $13.72 | ||||||||||||
Investor Class | — | 18.30 | 11.07 | 13.64 | ||||||||||||
Advisor Class | 32.47 | — | — | — | ||||||||||||
See Notes to Financial Statements
32
Table of Contents
Harding, Loevner Funds, Inc.
Statements of Assets and Liabilities (continued)
October 31, 2016
| Institutional Emerging Markets Portfolio | Emerging Markets | Frontier Emerging Markets Portfolio | ||||||||||
ASSETS: | ||||||||||||
Investments (cost $3,143,788,147, $2,482,179,904 and $366,944,890, respectively) | $3,452,298,989 | $2,991,964,414 | $376,754,674 | |||||||||
Dividends and interest receivable | 2,012,833 | 1,815,642 | 985,259 | |||||||||
Foreign currency (cost $6,860,336, $7,506,996 and $959,508,respectively) | 6,927,664 | 7,648,666 | 955,968 | |||||||||
Receivable for investments sold | 15,074,735 | 13,774,480 | 150,172 | |||||||||
Receivable for Fund shares sold | 5,807,096 | 3,339,657 | 209,275 | |||||||||
Tax reclaim receivable | 470,471 | 22,703 | — | |||||||||
Prepaid expenses | 46,183 | 15,154 | 2,956 | |||||||||
Total Assets | 3,482,637,971 | 3,018,580,716 | 379,058,304 | |||||||||
LIABILITIES: | ||||||||||||
Payable to Investment Adviser | (3,274,122 | ) | (2,909,631 | ) | (480,913 | ) | ||||||
Payable for investments purchased | (42,250,007 | ) | (12,637,151 | ) | (295,363 | ) | ||||||
Payable for Fund shares redeemed | (3,181,026 | ) | (3,165,811 | ) | (449,503 | ) | ||||||
Payable for distribution fees | — | — | (12,347 | ) | ||||||||
Deferred capital gains tax | (720,150 | ) | — | (2,744,941 | ) | |||||||
Other liabilities | (762,195 | ) | (1,384,145 | ) | (190,929 | ) | ||||||
Total Liabilities | (50,187,500 | ) | (20,096,738 | ) | (4,173,996 | ) | ||||||
Net Assets | $3,432,450,471 | $2,998,483,978 | $374,884,308 | |||||||||
ANALYSIS OF NET ASSETS: | ||||||||||||
Paid in capital | $3,272,321,030 | $2,561,637,361 | $468,428,692 | |||||||||
Accumulated undistributed net investment income | 22,439,907 | 17,368,088 | 3,677,573 | |||||||||
Accumulated net realized loss from investment transactions | (170,142,762 | ) | (90,438,976 | ) | (104,268,749 | ) | ||||||
Net unrealized appreciation on investments and on assets and liabilities denominated in foreign currencies | 307,832,296 | 509,917,505 | 7,046,792 | |||||||||
Net Assets | $3,432,450,471 | $2,998,483,978 | $374,884,308 | |||||||||
Net Assets: | ||||||||||||
Institutional Class | $— | $— | $342,113,551 | |||||||||
Class I | 3,051,419,053 | — | — | |||||||||
Class II | 381,031,418 | — | — | |||||||||
Investor Class | — | — | 32,770,757 | |||||||||
Advisor Class | — | 2,998,483,978 | — | |||||||||
Total Shares Outstanding: | ||||||||||||
Institutional Class ( — , — and 400,000,000, respectively, $.001 par value shares authorized) | — | — | 46,526,694 | |||||||||
Class I (500,000,000, — and — respectively, $.001 par value shares authorized) | 172,860,216 | — | — | |||||||||
Class II (400,000,000, — and — respectively, $.001 par value shares authorized) | 37,842,867 | — | — | |||||||||
Investor Class ( — , — and 400,000,000 , respectively, $.001 par value shares authorized) | — | — | 4,499,373 | |||||||||
Advisor Class ( — , 500,000,000 and — , respectively, $.001 par value shares authorized) | — | 64,808,267 | — | |||||||||
Net Asset Value, Offering Price and Redemption Price Per Share: | ||||||||||||
Institutional Class | $— | $— | $7.35 | |||||||||
Class I | 17.65 | — | — | |||||||||
Class II | 10.07 | — | — | |||||||||
Investor Class | — | — | 7.28 | |||||||||
Advisor Class | — | 46.27 | — | |||||||||
See Notes to Financial Statements
33
Table of Contents
Harding, Loevner Funds, Inc.
For the Fiscal Year Ended October 31, 2016
| Global Equity Portfolio | International Equity Portfolio | International Equity Research Portfolio(1) | International Small Companies Portfolio | |||||||||||||
INVESTMENT INCOME | ||||||||||||||||
Dividends (net of foreign withholding taxes of $605,040, $14,238,094, $13,503 and $171,869, respectively) | $11,035,397 | $116,405,869 | $136,443 | $2,576,952 | ||||||||||||
Total investment income | 11,035,397 | 116,405,869 | 136,443 | 2,576,952 | ||||||||||||
EXPENSES | ||||||||||||||||
Investment advisory fees (Note 3) | 6,586,625 | 40,179,337 | 42,558 | 1,183,304 | ||||||||||||
Administration fees (Note 3) | 270,192 | 1,400,980 | 2,270 | 37,866 | ||||||||||||
Distribution fees, Investor Class | — | 967,132 | 1,419 | 116,588 | ||||||||||||
Custody and accounting fees (Note 3) | 174,286 | 1,171,797 | 18,267 | 64,883 | ||||||||||||
Directors’ fees and expenses | 36,420 | 250,030 | 244 | 4,202 | ||||||||||||
Transfer agent fees and expenses (Note 3) | 48,869 | 215,448 | 35,200 | 43,378 | ||||||||||||
Printing and postage fees | 40,742 | 538,045 | 484 | 11,948 | ||||||||||||
State registration filing fees | 65,293 | 300,394 | 53,876 | 48,587 | ||||||||||||
Professional fees | 56,544 | 164,957 | 30,866 | 34,716 | ||||||||||||
Shareholder servicing fees (Note 3) | 420,379 | 3,804,253 | 1,020 | 93,728 | ||||||||||||
Compliance officers’ fees and expenses (Note 3) | 8,305 | 37,666 | 2,725 | 4,192 | ||||||||||||
Organization and offering fees | — | — | 42,971 | — | ||||||||||||
Other fees and expenses | 37,114 | 218,614 | 10,949 | 12,457 | ||||||||||||
Total Expenses | 7,744,769 | 49,248,653 | 242,849 | 1,655,849 | ||||||||||||
Less Waiver of investment advisory fee and/or reimbursement of other operating expenses (Note 3) | — | — | (190,352 | ) | (355,782 | ) | ||||||||||
Net expenses | 7,744,769 | 49,248,653 | 52,497 | 1,300,067 | ||||||||||||
Net investment income | 3,290,628 | 67,157,216 | 83,946 | 1,276,885 | ||||||||||||
REALIZED AND UNREALIZED GAIN (LOSS) | ||||||||||||||||
Net realized gain (loss) | ||||||||||||||||
Investment transactions | 11,517,590 | 31,513,121 | 129,499 | 3,066,588 | ||||||||||||
Foreign currency transactions | (59,166 | ) | (4,186,135 | ) | (2,869 | ) | (62,988 | ) | ||||||||
Net realized gain | 11,458,424 | 27,326,986 | 126,630 | 3,003,600 | ||||||||||||
Change in unrealized appreciation (depreciation) | ||||||||||||||||
Investments (net of increase (decrease) in deferred foreign taxes of $ -, $ -, $3,596 and $110,851, respectively) | 14,979,513 | 241,777,803 | 470,208 | (605,638 | ) | |||||||||||
Translation of assets and liabilities denominated in foreign currencies | 14,061 | (34,044 | ) | (418 | ) | (7,325 | ) | |||||||||
Net change in unrealized appreciation (depreciation) | 14,993,574 | 241,743,759 | 469,790 | (612,963 | ) | |||||||||||
Net realized and unrealized gain | 26,451,998 | 269,070,745 | 596,420 | 2,390,637 | ||||||||||||
NET INCREASE IN NET ASSETS RESULTING FROM OPERATIONS | $29,742,626 | $336,227,961 | $680,366 | $3,667,522 | ||||||||||||
| (1) | For the period from December 17, 2015 (commencement of class operations) through October 31, 2016. |
See Notes to Financial Statements
34
Table of Contents
Harding, Loevner Funds, Inc.
Statements of Operations (continued)
For the Fiscal Year Ended October 31, 2016
Institutional Emerging Markets Portfolio | Emerging Markets Portfolio | Frontier Emerging Markets Portfolio | ||||||||||
INVESTMENT INCOME | ||||||||||||
Interest | $2,766 | $1,018 | $23 | |||||||||
Dividends (net of foreign withholding taxes of $6,144,974, $6,037,934 and $1,122,357, respectively) | 56,315,645 | 53,709,969 | 12,170,884 | |||||||||
Total investment income | 56,318,411 | 53,710,987 | 12,170,907 | |||||||||
EXPENSES | ||||||||||||
Investment advisory fees (Note 3) | 29,464,926 | 28,475,499 | 5,712,045 | |||||||||
Administration fees (Note 3) | 704,280 | 683,903 | 142,522 | |||||||||
Distribution fees, Investor Class | — | — | 87,838 | |||||||||
Custody and accounting fees (Note 3) | 1,080,701 | 967,282 | 521,622 | |||||||||
Directors’ fees and expenses | 113,809 | 110,292 | 16,829 | |||||||||
Transfer agent fees and expenses (Note 3) | 76,937 | 209,421 | 60,109 | |||||||||
Printing and postage fees | 190,715 | 318,030 | 30,296 | |||||||||
State registration filing fees | 153,543 | 160,622 | 73,602 | |||||||||
Professional fees | 95,153 | 98,053 | 39,663 | |||||||||
Shareholder servicing fees (Note 3) | 1,403,838 | 4,542,133 | 247,185 | |||||||||
Compliance officers’ fees and expenses (Note 3) | 18,726 | 18,558 | 5,615 | |||||||||
Other fees and expenses | 105,532 | 95,512 | 21,541 | |||||||||
Total Expenses | 33,408,160 | 35,679,305 | 6,958,867 | |||||||||
Less Waiver of investment advisory fee and/or reimbursement of other operating expenses (Note 3) | (309,589 | ) | — | — | ||||||||
Net expenses | 33,098,571 | 35,679,305 | 6,958,867 | |||||||||
Net investment income | 23,219,840 | 18,031,682 | 5,212,040 | |||||||||
REALIZED AND UNREALIZED GAIN (LOSS) | ||||||||||||
Net realized gain (loss) | ||||||||||||
Investment transactions | (108,157,918 | ) | (74,762,915 | ) | (98,964,843 | ) | ||||||
Foreign currency transactions | (835,553 | ) | (753,705 | ) | (651,461 | ) | ||||||
Net realized loss | (108,993,471 | ) | (75,516,620 | ) | (99,616,304 | ) | ||||||
Change in unrealized appreciation (depreciation) | ||||||||||||
Investments (net of increase (decrease) in deferred foreign taxes of $714,187, $ - and $(6,042), respectively) | 417,311,109 | 336,878,393 | 72,732,464 | |||||||||
Translation of assets and liabilities denominated in foreign currencies | 57,235 | 152,357 | (29,818 | ) | ||||||||
Net change in unrealized appreciation | 417,368,344 | 337,030,750 | 72,702,646 | |||||||||
Net realized and unrealized gain (loss) | 308,374,873 | 261,514,130 | (26,913,658 | ) | ||||||||
NET INCREASE (DECREASE) IN NET ASSETS RESULTING FROM OPERATIONS | $331,594,713 | $279,545,812 | $(21,701,618 | ) | ||||||||
See Notes to Financial Statements
35
Table of Contents
Harding, Loevner Funds, Inc.
Statements of Changes in Net Assets
For the Fiscal Years Ended October 31
Global Equity Portfolio | International Equity Portfolio | International Equity Research Portfolio | ||||||||||||||||||
| 2016 | 2015 | 2016 | 2015 | 2016(1) | ||||||||||||||||
INCREASE (DECREASE) IN NET ASSETS FROM OPERATIONS | ||||||||||||||||||||
Net investment income | $3,290,628 | $3,263,770 | $67,157,216 | $50,697,563 | $83,946 | |||||||||||||||
Net realized gain (loss) on investments and foreign currency transactions | 11,458,424 | 21,375,197 | 27,326,986 | (23,827,343 | ) | 126,630 | ||||||||||||||
Net change in unrealized appreciation (depreciation) on investments and translation of assets and liabilities denominated in foreign currencies | 14,993,574 | (6,717,363 | ) | 241,743,759 | (163,155,496 | ) | 469,790 | |||||||||||||
Net increase (decrease) in net assets resulting from operations | 29,742,626 | 17,921,604 | 336,227,961 | (136,285,276 | ) | 680,366 | ||||||||||||||
DISTRIBUTIONS TO SHAREHOLDERS FROM: | ||||||||||||||||||||
Net investment income | ||||||||||||||||||||
Institutional Class | (2,860,663 | ) | (2,554,143 | ) | (45,476,713 | ) | (38,846,985 | ) | — | |||||||||||
Investor Class | — | — | (2,808,064 | ) | (2,382,379 | ) | — | |||||||||||||
Advisor Class | (54,968 | ) | (81,209 | ) | — | — | — | |||||||||||||
Net realized gain from investments and foreign-currency related transactions | ||||||||||||||||||||
Institutional Class | (20,000,354 | ) | (26,960,277 | ) | — | — | — | |||||||||||||
Advisor Class | (1,649,403 | ) | (3,050,849 | ) | — | — | — | |||||||||||||
Total distributions to shareholders | (24,565,388 | ) | (32,646,478 | ) | (48,284,777 | ) | (41,229,364 | ) | — | |||||||||||
TRANSACTIONS IN SHARES OF COMMON STOCK(2) | ||||||||||||||||||||
Proceeds from sale of shares | ||||||||||||||||||||
Institutional Class | 146,819,576 | 179,930,440 | 2,686,392,327 | 1,644,785,517 | 5,627,000 | |||||||||||||||
Investor Class | — | — | 157,141,271 | 181,756,485 | 763,139 | |||||||||||||||
Advisor Class | 6,080,000 | 8,977,263 | — | — | — | |||||||||||||||
Net Asset Value of shares issued to shareholders upon reinvestment of dividends | ||||||||||||||||||||
Institutional Class | 22,385,785 | 29,197,676 | 40,411,310 | 34,920,910 | — | |||||||||||||||
Investor Class | — | — | 2,570,728 | 2,200,814 | — | |||||||||||||||
Advisor Class | 1,636,088 | 3,034,341 | — | — | — | |||||||||||||||
Cost of shares redeemed | ||||||||||||||||||||
Institutional Class | (201,055,995 | ) | (122,660,318 | ) | (1,239,285,696 | ) | (746,791,832 | ) | — | |||||||||||
Investor Class | — | — | (143,501,075 | ) | (204,974,363 | ) | — | |||||||||||||
Advisor Class | (15,341,303 | ) | (27,141,183 | ) | — | — | — | |||||||||||||
Net increase (decrease) in net assets from portfolio share transactions | (39,475,849 | ) | 71,338,219 | 1,503,728,865 | 911,897,531 | 6,390,139 | ||||||||||||||
NET INCREASE (DECREASE) IN NET ASSETS | (34,298,611 | ) | 56,613,345 | 1,791,672,049 | 734,382,891 | 7,070,505 | ||||||||||||||
NET ASSETS | ||||||||||||||||||||
At beginning of year | 870,017,015 | 813,403,670 | 4,996,902,533 | 4,262,519,642 | — | |||||||||||||||
At end of year | $835,718,404 | $870,017,015 | $6,788,574,582 | $4,996,902,533 | $7,070,505 | |||||||||||||||
Accumulated Undistributed Net Investment Income Included in Net Assets | $3,727,557 | $3,486,856 | $62,986,475 | $48,300,171 | $108,064 | |||||||||||||||
(1) For the period from December 17, 2015 (commencement of class operations) through October 31, 2016. |
| |||||||||||||||||||
(2) CAPITAL SHARE TRANSACTIONS: | ||||||||||||||||||||
INSTITUTIONAL CLASS: | ||||||||||||||||||||
Shares sold | 4,743,905 | 5,552,736 | 155,282,178 | 90,620,921 | 562,606 | |||||||||||||||
Shares issued upon reinvestment of dividends | 735,407 | 927,499 | 2,391,202 | 1,969,594 | — | |||||||||||||||
Shares redeemed | (6,353,223 | ) | (3,848,567 | ) | (71,272,095 | ) | (41,691,570 | ) | — | |||||||||||
Net increase (decrease) | (873,911 | ) | 2,631,668 | 86,401,285 | 50,898,945 | 562,606 | ||||||||||||||
INVESTOR CLASS: | ||||||||||||||||||||
Shares sold | — | — | 8,952,504 | 9,933,245 | 74,624 | |||||||||||||||
Shares issued upon reinvestment of dividends | — | — | 152,294 | 124,129 | — | |||||||||||||||
Shares redeemed | — | — | (8,383,846 | ) | (11,368,105 | ) | — | |||||||||||||
Net increase (decrease) | — | — | 720,952 | (1,310,731 | ) | 74,624 | ||||||||||||||
ADVISOR CLASS: | ||||||||||||||||||||
Shares sold | 195,182 | 279,729 | — | — | — | |||||||||||||||
Shares issued upon reinvestment of dividends | 53,713 | 96,390 | — | — | — | |||||||||||||||
Shares redeemed | (501,701 | ) | (853,187 | ) | — | — | — | |||||||||||||
Net decrease | (252,806 | ) | (477,068 | ) | — | — | — | |||||||||||||
See Notes to Financial Statements
36
Table of Contents
Harding, Loevner Funds, Inc.
Statements of Changes in Net Assets (continued)
For the Fiscal Years Ended October 31
| International Small Companies Portfolio | Institutional Emerging Markets Portfolio | |||||||||||||||
| 2016 | 2015 | 2016 | 2015 | |||||||||||||
INCREASE (DECREASE) IN NET ASSETS FROM OPERATIONS | ||||||||||||||||
Net investment income | $1,276,885 | $629,869 | $23,219,840 | $15,570,984 | ||||||||||||
Net realized gain (loss) on investments and foreign currency transactions | 3,003,600 | 1,092,368 | (108,993,471 | ) | (21,501,107 | ) | ||||||||||
Net change in unrealized appreciation (depreciation) on investments and translation of assets and liabilities denominated in foreign currencies | (612,963 | ) | (2,817,067 | ) | 417,368,344 | (278,367,976 | ) | |||||||||
Net increase (decrease) in net assets resulting from operations | 3,667,522 | (1,094,830 | ) | 331,594,713 | (284,298,099 | ) | ||||||||||
DISTRIBUTIONS TO SHAREHOLDERS FROM: | ||||||||||||||||
Net investment income | ||||||||||||||||
Institutional Class | (312,564 | ) | (106,497 | ) | — | — | ||||||||||
Class I | — | — | (11,288,661 | ) | (11,022,311 | ) | ||||||||||
Class II | — | — | (2,859,722 | ) | (2,386,064 | ) | ||||||||||
Investor Class | (263,471 | ) | (121,488 | ) | — | — | ||||||||||
Net realized gain from investments and foreign-currency related transactions | ||||||||||||||||
Institutional Class | (448,708 | ) | (559,248 | ) | — | — | ||||||||||
Investor Class | (499,474 | ) | (1,082,713 | ) | — | — | ||||||||||
Total distributions to shareholders | (1,524,217 | ) | (1,869,946 | ) | (14,148,383 | ) | (13,408,375 | ) | ||||||||
TRANSACTIONS IN SHARES OF COMMON STOCK(1) | ||||||||||||||||
Proceeds from sale of shares | ||||||||||||||||
Institutional Class | 27,605,199 | 34,316,104 | — | — | ||||||||||||
Class I | — | — | 1,515,822,457 | 1,087,311,350 | ||||||||||||
Class II | — | — | 133,098,874 | 94,131,958 | ||||||||||||
Investor Class | 14,115,976 | 23,990,321 | — | — | ||||||||||||
Net Asset Value of shares issued to shareholders upon reinvestment of dividends | ||||||||||||||||
Institutional Class | 753,058 | 639,158 | — | — | ||||||||||||
Class I | — | — | 10,275,294 | 9,761,483 | ||||||||||||
Class II | — | — | 2,547,022 | 1,994,611 | ||||||||||||
Investor Class | 753,739 | 1,186,338 | — | — | ||||||||||||
Cost of shares redeemed | ||||||||||||||||
Institutional Class | (14,094,870 | ) | (14,712,427 | ) | — | — | ||||||||||
Class I | — | — | (636,759,011 | ) | (480,593,334 | ) | ||||||||||
Class II | — | — | (27,900,793 | ) | (12,650,000 | ) | ||||||||||
Investor Class | (21,567,425 | ) | (36,554,677 | ) | — | — | ||||||||||
Net increase in net assets from portfolio share transactions | 7,565,677 | 8,864,817 | 997,083,843 | 699,956,068 | ||||||||||||
NET INCREASE IN NET ASSETS | 9,708,982 | 5,900,041 | 1,314,530,173 | 402,249,594 | ||||||||||||
NET ASSETS | ||||||||||||||||
At beginning of year | 97,439,759 | 91,539,718 | 2,117,920,298 | 1,715,670,704 | ||||||||||||
At end of year | $107,148,741 | $97,439,759 | $3,432,450,471 | $2,117,920,298 | ||||||||||||
Accumulated Undistributed Net Investment Income Included in Net Assets | $1,209,255 | $576,624 | $22,439,907 | $14,198,100 | ||||||||||||
(1) CAPITAL SHARE TRANSACTIONS: | ||||||||||||||||
INSTITUTIONAL CLASS: | ||||||||||||||||
Shares sold | 2,053,936 | 2,501,397 | — | — | ||||||||||||
Shares issued upon reinvestment of dividends | 56,706 | 49,242 | — | — | ||||||||||||
Shares redeemed | (1,062,864 | ) | (1,094,841 | ) | — | — | ||||||||||
Net increase | 1,047,778 | 1,455,798 | — | — | ||||||||||||
CLASS I: | ||||||||||||||||
Shares sold | — | — | 96,092,162 | 63,747,416 | ||||||||||||
Shares issued upon reinvestment of dividends | — | — | 691,939 | 565,883 | ||||||||||||
Shares redeemed | — | — | (40,948,303 | ) | (29,078,697 | ) | ||||||||||
Net increase | — | — | 55,835,798 | 35,234,602 | ||||||||||||
CLASS II: | ||||||||||||||||
Shares sold | — | — | 14,188,787 | 9,176,034 | ||||||||||||
Shares issued upon reinvestment of dividends | — | — | 301,423 | 202,293 | ||||||||||||
Shares redeemed | — | — | (2,946,823 | ) | (1,260,322 | ) | ||||||||||
Net increase | — | — | 11,543,387 | 8,118,005 | ||||||||||||
INVESTOR CLASS: | ||||||||||||||||
Shares sold | 1,063,952 | 1,814,278 | — | — | ||||||||||||
Shares issued upon reinvestment of dividends | 56,972 | 91,609 | — | — | ||||||||||||
Shares redeemed | (1,631,129 | ) | (2,697,065 | ) | — | — | ||||||||||
Net decrease | (510,205 | ) | (791,178 | ) | — | — | ||||||||||
See Notes to Financial Statements
37
Table of Contents
Harding, Loevner Funds, Inc.
Statements of Changes in Net Assets (continued)
For the Fiscal Years Ended October 31
Emerging Markets Portfolio | Frontier Emerging Markets Portfolio | |||||||||||||||
| 2016 | 2015 | 2016 | 2015 | |||||||||||||
INCREASE (DECREASE) IN NET ASSETS FROM OPERATIONS | ||||||||||||||||
Net investment income | $18,031,682 | $14,248,662 | $5,212,040 | $6,842,933 | ||||||||||||
Net realized loss on investments and foreign currency transactions | (75,516,620 | ) | (13,368,536 | ) | (99,616,304 | ) | (6,368,968 | ) | ||||||||
Net change in unrealized appreciation (depreciation) on investments and translation of assets and liabilities denominated in foreign currencies | 337,030,750 | (373,414,947 | ) | 72,702,646 | (110,607,019 | ) | ||||||||||
Net increase (decrease) in net assets resulting from operations | 279,545,812 | (372,534,821 | ) | (21,701,618 | ) | (110,133,054 | ) | |||||||||
DISTRIBUTIONS TO SHAREHOLDERS FROM: | ||||||||||||||||
Net investment income | ||||||||||||||||
Institutional Class | — | — | (4,416,183 | ) | (2,796,658 | ) | ||||||||||
Investor Class | — | — | (210,680 | ) | (138,589 | ) | ||||||||||
Advisor Class | (12,240,604 | ) | (19,237,520 | ) | — | — | ||||||||||
Net realized gain from investments and foreign-currency related transactions | ||||||||||||||||
Institutional Class | — | — | — | (5,342,306 | ) | |||||||||||
Investor Class | — | — | — | (749,018 | ) | |||||||||||
Advisor Class | (56,015 | ) | (96,450,985 | ) | — | — | ||||||||||
Total distributions to shareholders | (12,296,619 | ) | (115,688,505 | ) | (4,626,863 | ) | (9,026,571 | ) | ||||||||
TRANSACTIONS IN SHARES OF COMMON STOCK(1) | ||||||||||||||||
Proceeds from sale of shares | ||||||||||||||||
Institutional Class | — | — | 172,581,972 | 284,093,970 | ||||||||||||
Investor Class | — | — | 8,706,008 | 31,005,270 | ||||||||||||
Advisor Class | 1,273,187,393 | 1,016,324,666 | — | — | ||||||||||||
Net Asset Value of shares issued to shareholders upon reinvestment of dividends | ||||||||||||||||
Institutional Class | — | — | 2,840,785 | 6,425,116 | ||||||||||||
Investor Class | — | — | 189,934 | 723,315 | ||||||||||||
Advisor Class | 11,423,918 | 107,333,549 | — | — | ||||||||||||
Cost of shares redeemed | ||||||||||||||||
Institutional Class | — | — | (260,477,237 | ) | (207,426,498 | ) | ||||||||||
Investor Class | — | — | (19,895,988 | ) | (51,944,631 | ) | ||||||||||
Advisor Class | (935,047,284 | ) | (799,281,192 | ) | — | — | ||||||||||
Net Increase (Decrease) in net assets from portfolio share transactions | 349,564,027 | 324,377,023 | (96,054,526 | ) | 62,876,542 | |||||||||||
NET INCREASE (DECREASE) IN NET ASSETS | 616,813,220 | (163,846,303 | ) | (122,383,007 | ) | (56,283,083 | ) | |||||||||
NET ASSETS | ||||||||||||||||
At beginning of year | 2,381,670,758 | 2,545,517,061 | 497,267,315 | 553,550,398 | ||||||||||||
At end of year | $2,998,483,978 | $2,381,670,758 | $374,884,308 | $497,267,315 | ||||||||||||
Accumulated Undistributed Net Investment Income Included in Net Assets | $17,368,088 | $12,479,573 | $3,677,573 | $4,338,521 | ||||||||||||
(1) CAPITAL SHARE TRANSACTIONS: | ||||||||||||||||
INSTITUTIONAL CLASS: | ||||||||||||||||
Shares sold | — | — | 23,810,559 | 32,984,178 | ||||||||||||
Shares issued upon reinvestment of dividends | — | — | 407,573 | 746,239 | ||||||||||||
Shares redeemed | — | — | (36,950,358 | ) | (24,456,897 | ) | ||||||||||
Net increase (decrease) | — | — | (12,732,226 | ) | 9,273,520 | |||||||||||
INVESTOR CLASS: | ||||||||||||||||
Shares sold | — | — | 1,222,170 | 3,626,234 | ||||||||||||
Shares issued upon reinvestment of dividends | — | — | 27,407 | 84,499 | ||||||||||||
Shares redeemed | — | — | (2,797,102 | ) | (6,029,863 | ) | ||||||||||
Net decrease | — | — | (1,547,525 | ) | (2,319,130 | ) | ||||||||||
ADVISOR CLASS: | ||||||||||||||||
Shares sold | 30,650,634 | 22,281,343 | — | — | ||||||||||||
Shares issued upon reinvestment of dividends | 293,448 | 2,374,111 | — | — | ||||||||||||
Shares redeemed | (22,813,733 | ) | (18,008,054 | ) | — | — | ||||||||||
Net increase | 8,130,349 | 6,647,400 | — | — | ||||||||||||
See Notes to Financial Statements
38
Table of Contents
Harding, Loevner Funds, Inc.
| Global Equity Portfolio — Institutional Class | ||||||||||||||||||||
| Per Share Data | For the Year Oct. 31, 2016 | For the Year Oct. 31, 2015 | For the Year Oct. 31, 2014 | For the Year Oct. 31, 2013 | For the Year Oct. 31, 2012 | |||||||||||||||
Net asset value, beginning of year | $32.44 | $32.98 | $29.84 | $25.05 | $23.38 | |||||||||||||||
INCREASE (DECREASE) IN NET ASSETS FROM OPERATIONS: | ||||||||||||||||||||
Net investment income(1) | 0.13 | 0.13 | 0.13 | 0.17 | 0.18 | |||||||||||||||
Net realized and unrealized gain (loss) on investments and foreign currency-related transactions | 0.92 | 0.68 | 3.27 | 4.74 | 1.81 | |||||||||||||||
Net increase from investment operations | 1.05 | 0.81 | 3.40 | 4.91 | 1.99 | |||||||||||||||
DISTRIBUTIONS TO SHAREHOLDERS FROM: | ||||||||||||||||||||
Net investment income | (0.12 | ) | (0.12 | ) | (0.13 | ) | (0.12 | ) | (0.10 | ) | ||||||||||
Net realized gain from investments | (0.84 | ) | (1.23 | ) | (0.13 | ) | — | (0.22 | ) | |||||||||||
Total distributions | (0.96 | ) | (1.35 | ) | (0.26 | ) | (0.12 | ) | (0.32 | ) | ||||||||||
Net asset value, end of year | $32.53 | $32.44 | $32.98 | $29.84 | $25.05 | |||||||||||||||
Total Return | 3.43 | % | 2.51 | % | 11.47 | % | 19.66 | % | 8.73 | % | ||||||||||
RATIOS/SUPPLEMENTAL DATA: | ||||||||||||||||||||
Net assets, end of year (000’s) | $779,020 | $805,291 | $731,897 | $543,293 | $226,489 | |||||||||||||||
Expenses to average net assets | 0.92 | % | 0.92 | % | 0.97 | % | 0.99 | % | 1.12 | % | ||||||||||
Expenses to average net assets (net of fees waived/reimbursed) | 0.92 | % | 0.92 | % | 0.95 | % | 0.95 | % | 0.95 | % | ||||||||||
Net investment income to average net assets | 0.42 | % | 0.41 | % | 0.43 | % | 0.62 | % | 0.72 | % | ||||||||||
Portfolio turnover rate | 24 | % | 45 | % | 30 | % | 13 | % | 32 | % | ||||||||||
| (1) | Net investment income per share was calculated using the average shares outstanding method. |
| Global Equity Portfolio — Advisor Class | ||||||||||||||||||||
| Per Share Data | For the Year Oct. 31, 2016 | For the Year Oct. 31, 2015 | For the Year Oct. 31, 2014 | For the Year Oct. 31, 2013 | For the Year Oct. 31, 2012 | |||||||||||||||
Net asset value, beginning of year | $32.38 | $32.92 | $29.80 | $25.02 | $23.36 | |||||||||||||||
INCREASE (DECREASE) IN NET ASSETS FROM OPERATIONS: | ||||||||||||||||||||
Net investment income(1) | 0.05 | 0.04 | 0.05 | 0.09 | 0.11 | |||||||||||||||
Net realized and unrealized gain (loss) on investments and foreign currency-related transactions | 0.91 | 0.68 | 3.27 | 4.74 | 1.82 | |||||||||||||||
Net increase from investment operations | 0.96 | 0.72 | 3.32 | 4.83 | 1.93 | |||||||||||||||
DISTRIBUTIONS TO SHAREHOLDERS FROM: | ||||||||||||||||||||
Net investment income | (0.03 | ) | (0.03 | ) | (0.07 | ) | (0.05 | ) | (0.05 | ) | ||||||||||
Net realized gain from investments | (0.84 | ) | (1.23 | ) | (0.13 | ) | — | (0.22 | ) | |||||||||||
Total distributions | (0.87 | ) | (1.26 | ) | (0.20 | ) | (0.05 | ) | (0.27 | ) | ||||||||||
Net asset value, end of year | $32.47 | $32.38 | $32.92 | $29.80 | $25.02 | |||||||||||||||
Total Return | 3.12 | % | 2.28 | % | 11.19 | % | 19.33 | % | 8.43 | % | ||||||||||
RATIOS/SUPPLEMENTAL DATA: | ||||||||||||||||||||
Net assets, end of year (000’s) | $56,698 | $64,726 | $81,507 | $86,882 | $68,749 | |||||||||||||||
Expenses to average net assets | 1.19 | % | 1.18 | % | 1.20 | % | 1.25 | % | 1.35 | % | ||||||||||
Expenses to average net assets (net of fees waived/reimbursed) | 1.19 | % | 1.18 | % | 1.20 | % | 1.24 | % | 1.23 | % | ||||||||||
Net investment income to average net assets | 0.15 | % | 0.13 | % | 0.16 | % | 0.32 | % | 0.45 | % | ||||||||||
Portfolio turnover rate | 24 | % | 45 | % | 30 | % | 13 | % | 32 | % | ||||||||||
| (1) | Net investment income per share was calculated using the average shares outstanding method. |
See Notes to Financial Statements
39
Table of Contents
Harding, Loevner Funds, Inc.
Financial Highlights (continued)
| International Equity Portfolio — Institutional Class | ||||||||||||||||||||
| Per Share Data | For the Year Oct. 31, 2016 | For the Year Oct. 31, 2015 | For the Year Oct. 31, 2014 | For the Year Oct. 31, 2013 | For the Year Oct. 31, 2012 | |||||||||||||||
Net asset value, beginning of year | $17.69 | $18.30 | $17.97 | $15.15 | $14.06 | |||||||||||||||
INCREASE (DECREASE) IN NET ASSETS FROM OPERATIONS: | ||||||||||||||||||||
Net investment income(1) | 0.21 | 0.20 | 0.18 | 0.17 | 0.18 | |||||||||||||||
Net realized and unrealized gain (loss) on investments and foreign currency-related transactions | 0.64 | (0.63 | ) | 0.29 | 2.78 | 1.06 | ||||||||||||||
Net increase (decrease) from investment operations | 0.85 | (0.43 | ) | 0.47 | 2.95 | 1.24 | ||||||||||||||
DISTRIBUTIONS TO SHAREHOLDERS FROM: | ||||||||||||||||||||
Net investment income | (0.17 | ) | (0.18 | ) | (0.14 | ) | (0.13 | ) | (0.11 | ) | ||||||||||
Net realized gain from investments | — | — | — | — | (0.04 | ) | ||||||||||||||
Total distributions | (0.17 | ) | (0.18 | ) | (0.14 | ) | (0.13 | ) | (0.15 | ) | ||||||||||
Net asset value, end of year | $18.37 | $17.69 | $18.30 | $17.97 | $15.15 | |||||||||||||||
Total Return | 4.91 | % | (2.40 | )% | 2.65 | % | 19.58 | % | 9.00 | % | ||||||||||
RATIOS/SUPPLEMENTAL DATA: | ||||||||||||||||||||
Net assets, end of year (000’s) | $6,354,810 | $4,591,802 | $3,819,491 | $3,467,793 | $1,798,940 | |||||||||||||||
Expenses to average net assets | 0.84 | % | 0.85 | % | 0.87 | % | 0.87 | % | 0.87 | % | ||||||||||
Net investment income to average net assets | 1.20 | % | 1.11 | % | 1.01 | % | 1.06 | % | 1.26 | % | ||||||||||
Portfolio turnover rate | 22 | % | 12 | % | 10 | % | 20 | % | 14 | % | ||||||||||
| (1) | Net investment income per share was calculated using the average shares outstanding method. |
| International Equity Portfolio — Investor Class | ||||||||||||||||||||
| Per Share Data | For the Year Oct. 31, 2016 | For the Year Oct. 31, 2015 | For the Year Oct. 31, 2014 | For the Year Oct. 31, 2013 | For the Year Oct. 31, 2012 | |||||||||||||||
Net asset value, beginning of year | $17.62 | $18.23 | $17.89 | $15.09 | $14.01 | |||||||||||||||
INCREASE (DECREASE) IN NET ASSETS FROM OPERATIONS: | ||||||||||||||||||||
Net investment income(1) | 0.14 | 0.15 | 0.13 | 0.12 | 0.12 | |||||||||||||||
Net realized and unrealized gain (loss) on investments and foreign currency-related transactions | 0.66 | (0.64 | ) | 0.29 | 2.77 | 1.06 | ||||||||||||||
Net increase (decrease) from investment operations | 0.80 | (0.49 | ) | 0.42 | 2.89 | 1.18 | ||||||||||||||
DISTRIBUTIONS TO SHAREHOLDERS FROM: | ||||||||||||||||||||
Net investment income | (0.12 | ) | (0.12 | ) | (0.08 | ) | (0.09 | ) | (0.06 | ) | ||||||||||
Net realized gain from investments | — | — | — | — | (0.04 | ) | ||||||||||||||
Total distributions | (0.12 | ) | (0.12 | ) | (0.08 | ) | (0.09 | ) | (0.10 | ) | ||||||||||
Net asset value, end of year | $18.30 | $17.62 | $18.23 | $17.89 | $15.09 | |||||||||||||||
Total Return | 4.63 | % | (2.76 | )% | 2.36 | % | 19.19 | % | 8.51 | % | ||||||||||
RATIOS/SUPPLEMENTAL DATA: | ||||||||||||||||||||
Net assets, end of year (000’s) | $433,765 | $405,101 | $443,029 | $409,735 | $275,468 | |||||||||||||||
Expenses to average net assets | 1.15 | % | 1.17 | % | 1.17 | % | 1.20 | % | 1.24 | % | ||||||||||
Net investment income to average net assets | 0.83 | % | 0.83 | % | 0.72 | % | 0.76 | % | 0.87 | % | ||||||||||
Portfolio turnover rate | 22 | % | 12 | % | 10 | % | 20 | % | 14 | % | ||||||||||
| (1) | Net investment income per share was calculated using the average shares outstanding method. |
See Notes to Financial Statements
40
Table of Contents
Harding, Loevner Funds, Inc.
Financial Highlights (continued)
| International Equity Research Portfolio — Institutional Class | ||||
| Per Share Data | For the Period Oct. 31, 2016(1) | |||
Net asset value, beginning of period | $10.00 | |||
INCREASE IN NET ASSETS FROM OPERATIONS: | ||||
Net investment income(2) | 0.14 | |||
Net realized and unrealized gain (loss) on investments and foreign currency-related transactions | 0.96 | |||
Net increase from investment operations | 1.10 | |||
Net asset value, end of period | $11.10 | |||
Total Return | 11.00 | %(A) | ||
RATIOS/SUPPLEMENTAL DATA: | ||||
Net assets, end of period (000’s) | $6,244 | |||
Expenses to average net assets | 3.54 | %(B) | ||
Expenses to average net assets (net of fees waived/reimbursed) | 0.90 | %(B) | ||
Net investment income to average net assets | 1.51 | %(B) | ||
Portfolio turnover rate | 33 | %(A) | ||
| (1) | For the period from December 17, 2015 (commencement of class operations) through October 31, 2016. |
| (2) | Net investment income per share was calculated using the average shares outstanding method. |
| (A) | Not Annualized. |
| (B) | Annualized. |
| International Equity Research Portfolio — Investor Class | ||||
| Per Share Data | For the Period Oct. 31, 2016(1) | |||
Net asset value, beginning of period | $10.00 | |||
INCREASE IN NET ASSETS FROM OPERATIONS: | ||||
Net investment income(2) | 0.11 | |||
Net realized and unrealized gain (loss) on investments and foreign currency-related transactions | 0.96 | |||
Net increase from investment operations | 1.07 | |||
Net asset value, end of period | $11.07 | |||
Total Return | 10.70 | %(A) | ||
RATIOS/SUPPLEMENTAL DATA: | ||||
Net assets, end of period (000’s) | $826 | |||
Expenses to average net assets | 10.91 | %(B) | ||
Expenses to average net assets (net of fees waived/reimbursed) | 1.15 | %(B) | ||
Net investment income to average net assets | 1.20 | %(B) | ||
Portfolio turnover rate | 33 | %(A) | ||
| (1) | For the period from December 17, 2015 (commencement of class operations) through October 31, 2016. |
| (2) | Net investment income per share was calculated using the average shares outstanding method. |
| (A) | Not Annualized. |
| (B) | Annualized. |
See Notes to Financial Statements
41
Table of Contents
Harding, Loevner Funds, Inc.
Financial Highlights (continued)
| International Small Companies Portfolio — Institutional Class | ||||||||||||||||||||
Per Share Data | For the Year Ended Oct 31, 2016 | For the Year Ended Oct 31, 2015 | For the Year Ended Oct 31, 2014 | For the Year Ended Oct 31, 2013 | For the Year Ended Oct 31, 2012 | |||||||||||||||
Net asset value, beginning of year | $13.40 | $13.85 | $14.47 | $11.45 | $10.53 | |||||||||||||||
INCREASE (DECREASE) IN NET ASSETS FROM | ||||||||||||||||||||
OPERATIONS: | ||||||||||||||||||||
Net investment income(1) | 0.20 | 0.11 | 0.08 | 0.07 | 0.16 | |||||||||||||||
Net realized and unrealized gain (loss) on investments and foreign currency-related transactions | 0.34 | (0.25 | ) | 0.23 | 3.09 | 0.85 | ||||||||||||||
Net increase (decrease) from investment operations | 0.54 | (0.14 | ) | 0.31 | 3.16 | 1.01 | ||||||||||||||
DISTRIBUTIONS TO SHAREHOLDERS FROM: | ||||||||||||||||||||
Net investment income | (0.09 | ) | (0.05 | ) | (0.06 | ) | (0.14 | ) | (0.09 | ) | ||||||||||
Net realized gain from investments | (0.13 | ) | (0.26 | ) | (0.87 | ) | — | — | ||||||||||||
Total distributions | (0.22 | ) | (0.31 | ) | (0.93 | ) | (0.14 | ) | (0.09 | ) | ||||||||||
Net asset value, end of year | $13.72 | $13.40 | $13.85 | $14.47 | $11.45 | |||||||||||||||
Total Return | 4.15 | % | (0.98 | )% | 2.28 | % | 27.88 | % | 9.74 | % | ||||||||||
RATIOS/SUPPLEMENTAL DATA: | ||||||||||||||||||||
Net assets, end of year (000’s) | $62,785 | $47,276 | $28,711 | $26,236 | $33,515 | |||||||||||||||
Expenses to average net assets | 1.60 | % | 1.64 | % | 1.59 | % | 1.68 | % | 1.64 | % | ||||||||||
Expenses to average net assets (net of fees waived/reimbursed) | 1.25 | % | 1.30 | % | 1.30 | % | 1.39 | % | 1.50 | % | ||||||||||
Net investment income to average net assets | 1.51 | % | 0.79 | % | 0.58 | % | 0.57 | % | 1.49 | % | ||||||||||
Portfolio turnover rate | 49 | % | 38 | % | 36 | % | 97 | % | 10 | % | ||||||||||
(1) Net investment income per share was calculated using the average shares outstanding method.
|
| |||||||||||||||||||
| International Small Companies Portfolio — Investor Class | ||||||||||||||||||||
Per Share Data | For the Year Ended Oct. 31, 2016 | For the Year Ended Oct. 31, 2015 | For the Year Ended Oct. 31, 2014 | For the Year Ended Oct. 31, 2013 | For the Year Ended Oct. 31, 2012 | |||||||||||||||
Net asset value, beginning of year | $13.33 | $13.80 | $14.45 | $11.43 | $10.51 | |||||||||||||||
INCREASE (DECREASE) IN NET ASSETS FROM | ||||||||||||||||||||
OPERATIONS: | ||||||||||||||||||||
Net investment income(1) | 0.16 | 0.08 | 0.05 | 0.08 | 0.11 | |||||||||||||||
Net realized and unrealized gain (loss) on investments and foreign currency-related transactions | 0.35 | (0.26 | ) | 0.22 | 3.05 | 0.88 | ||||||||||||||
Net increase (decrease) from investment operations | 0.51 | (0.18 | ) | 0.27 | 3.13 | 0.99 | ||||||||||||||
DISTRIBUTIONS TO SHAREHOLDERS FROM: | ||||||||||||||||||||
Net investment income | (0.07 | ) | (0.03 | ) | (0.05 | ) | (0.11 | ) | (0.07 | ) | ||||||||||
Net realized gain from investments | (0.13 | ) | (0.26 | ) | (0.87 | ) | — | — | ||||||||||||
Total distributions | (0.20 | ) | (0.29 | ) | (0.92 | ) | (0.11 | ) | (0.07 | ) | ||||||||||
Net asset value, end of year | $13.64 | $13.33 | $13.80 | $14.45 | $11.43 | |||||||||||||||
Total Return | 3.92 | % | (1.29 | )% | 1.97 | % | 27.63 | % | 9.51 | % | ||||||||||
RATIOS/SUPPLEMENTAL DATA: | ||||||||||||||||||||
Net assets, end of year (000’s) | $44,363 | $50,164 | $62,828 | $52,830 | $31,249 | |||||||||||||||
Expenses to average net assets | 1.90 | % | 1.93 | % | 1.88 | % | 1.99 | % | 2.02 | % | ||||||||||
Expenses to average net assets (net of fees waived/reimbursed) | 1.50 | % | 1.55 | % | 1.55 | % | 1.60 | % | 1.75 | % | ||||||||||
Net investment income to average net assets | 1.18 | % | 0.58 | % | 0.32 | % | 0.60 | % | 1.07 | % | ||||||||||
Portfolio turnover rate | 49 | % | 38 | % | 36 | % | 97 | % | 10 | % | ||||||||||
| (1) | Net investment income per share was calculated using the average shares outstanding method. |
See Notes to Financial Statements
42
Table of Contents
Harding, Loevner Funds, Inc.
Financial Highlights (continued)
| Institutional Emerging Markets Portfolio — Class I | ||||||||||||||||||||
Per Share Data | For the Year Ended Oct. 31, 2016 | For the Year Ended Oct. 31, 2015 | For the Year Ended Oct. 31, 2014 | For the Year Ended Oct. 31, 2013 | For the Year Ended Oct. 31, 2012 | |||||||||||||||
Net asset value, beginning of year | $16.04 | $18.60 | $18.07 | $16.56 | $15.07 | |||||||||||||||
INCREASE (DECREASE) IN NET ASSETS FROM | ||||||||||||||||||||
OPERATIONS: | ||||||||||||||||||||
Net investment income(1) | 0.14 | 0.13 | 0.20 | 0.18 | 0.16 | |||||||||||||||
Net realized and unrealized gain (loss) on investments and foreign currency-related transactions | 1.56 | (2.56 | ) | 0.48 | 1.45 | 1.49 | ||||||||||||||
Net increase (decrease) from investment operations | 1.70 | (2.43 | ) | 0.68 | 1.63 | 1.65 | ||||||||||||||
DISTRIBUTIONS TO SHAREHOLDERS FROM: | ||||||||||||||||||||
Net investment income | (0.09 | ) | (0.13 | ) | (0.15 | ) | (0.12 | ) | (0.16 | ) | ||||||||||
Total distributions | (0.09 | ) | (0.13 | ) | (0.15 | ) | (0.12 | ) | (0.16 | ) | ||||||||||
Net asset value, end of year | $17.65 | $16.04 | $18.60 | $18.07 | $16.56 | |||||||||||||||
Total Return | 10.74 | % | (13.14 | )% | 3.80 | % | 9.85 | % | 11.17 | % | ||||||||||
RATIOS/SUPPLEMENTAL DATA: | ||||||||||||||||||||
Net assets, end of year (000’s) | $3,051,419 | �� | $1,876,495 | $1,521,194 | $1,043,041 | $463,791 | ||||||||||||||
Expenses to average net assets | 1.29 | % | 1.31 | % | 1.31 | % | 1.33 | % | 1.36 | % | ||||||||||
Expenses to average net assets (net of fees waived/reimbursed) | 1.29 | % | 1.30 | % | 1.30 | % | 1.30 | % | 1.30 | % | ||||||||||
Net investment income to average net assets | 0.88 | % | 0.77 | % | 1.12 | % | 1.06 | % | 1.00 | % | ||||||||||
Portfolio turnover rate | 20 | % | 23 | % | 26 | % | 18 | % | 42 | % | ||||||||||
(1) Net investment income per share was calculated using the average shares outstanding method. |
| |||||||||||||||||||
| Institutional Emerging Markets Portfolio — Class II | ||||||||||||
Per Share Data | For the Year Ended Oct. 31, 2016 | For the Year Ended Oct. 31, 2015 | For the Period Ended Oct. 31, 2014(1) | |||||||||
Net asset value, beginning of period | $9.18 | $10.70 | $10.00 | |||||||||
INCREASE (DECREASE) IN NET ASSETS FROM OPERATIONS: | ||||||||||||
Net investment income(2) | 0.09 | 0.09 | 0.10 | |||||||||
Net realized and unrealized gain (loss) on investments and foreign currency-related transactions | 0.90 | (1.48 | ) | 0.60 | ||||||||
Net increase (decrease) from investment operations | 0.99 | (1.39 | ) | 0.70 | ||||||||
DISTRIBUTIONS TO SHAREHOLDERS FROM: | ||||||||||||
Net investment income | (0.10 | ) | (0.13 | ) | — | |||||||
Total distributions | (0.10 | ) | (0.13 | ) | — | |||||||
Net asset value, end of period | $10.07 | $9.18 | $10.70 | |||||||||
Total Return | 11.06 | % | (13.06 | )% | 7.00 | %(A) | ||||||
RATIOS/SUPPLEMENTAL DATA: | ||||||||||||
Net assets, end of period (000’s) | $381,031 | $241,425 | $194,477 | |||||||||
Expenses to average net assets | 1.24 | % | 1.27 | % | 1.30 | %(B) | ||||||
Expenses to average net assets (net of fees waived/reimbursed) | 1.13 | % | 1.14 | % | 1.14 | %(B) | ||||||
Net investment income to average net assets | 0.96 | % | 0.96 | % | 1.36 | %(B) | ||||||
Portfolio turnover rate | 20 | % | 23 | % | 26 | %(A) | ||||||
| (1) | For the period from March 5, 2014 (commencement of class operations) through October 31, 2014. |
| (2) | Net investment income per share was calculated using the average shares outstanding method. |
| (A) | Not Annualized. |
| (B) | Annualized. |
See Notes to Financial Statements
43
Table of Contents
Harding, Loevner Funds, Inc.
Financial Highlights (continued)
| Emerging Markets Portfolio — Advisor Class | ||||||||||||||||||||
Per Share Data | For the Year Ended Oct. 31, 2016 | For the Year Ended Oct. 31, 2015 | For the Year Ended Oct. 31, 2014 | For the Year Ended Oct. 31, 2013 | For the Year Ended Oct. 31, 2012 | |||||||||||||||
Net asset value, beginning of year | $42.02 | $50.88 | $50.76 | $49.54 | $45.18 | |||||||||||||||
INCREASE (DECREASE) IN NET ASSETS FROM | ||||||||||||||||||||
OPERATIONS: | �� | |||||||||||||||||||
Net investment income(1) | 0.30 | 0.26 | 0.49 | 0.40 | 0.37 | |||||||||||||||
Net realized and unrealized gain (loss) on investments and foreign currency-related transactions | 4.17 | (6.80 | ) | 1.32 | 4.33 | 4.34 | ||||||||||||||
Net increase (decrease) from investment operations | 4.47 | (6.54 | ) | 1.81 | 4.73 | 4.71 | ||||||||||||||
DISTRIBUTIONS TO SHAREHOLDERS FROM: | ||||||||||||||||||||
Net investment income | (0.22 | ) | (0.39 | ) | (0.40 | ) | (0.36 | ) | (0.35 | ) | ||||||||||
Net realized gain from investments | (— | )(2) | (1.93 | ) | (1.29 | ) | (3.15 | ) | — | |||||||||||
Total distributions | (0.22 | ) | (2.32 | ) | (1.69 | ) | (3.51 | ) | (0.35 | ) | ||||||||||
Net asset value, end of year | $46.27 | $42.02 | $50.88 | $50.76 | $49.54 | |||||||||||||||
Total Return | 10.73 | % | (13.17 | )% | 3.79 | % | 9.93 | % | 10.60 | % | ||||||||||
RATIOS/SUPPLEMENTAL DATA: | ||||||||||||||||||||
Net assets, end of year (000’s) | $2,998,484 | $2,381,671 | $2,545,517 | $2,112,546 | $1,715,068 | |||||||||||||||
Expenses to average net assets | 1.42 | % | 1.45 | % | 1.45 | % | 1.47 | % | 1.49 | % | ||||||||||
Net investment income to average net assets | 0.72 | % | 0.57 | % | 0.98 | % | 0.83 | % | 0.80 | % | ||||||||||
Portfolio turnover rate | 26 | % | 30 | % | 28 | % | 26 | % | 36 | % | ||||||||||
| (1) | Net investment income per share was calculated using the average shares outstanding method. |
| (2) | Amount was less than $0.005 per share. |
See Notes to Financial Statements
44
Table of Contents
Harding, Loevner Funds, Inc.
Financial Highlights (continued)
| Frontier Emerging Markets Portfolio — Institutional Class | ||||||||||||||||||||
Per Share Data | For the Year Ended Oct. 31, 2016 | For the Year Ended Oct. 31, 2015 | For the Year Ended Oct. 31, 2014 | For the Year Ended Oct. 31, 2013 | For the Year Ended Oct. 31, 2012 | |||||||||||||||
Net asset value, beginning of year | $7.62 | $9.50 | $8.46 | $7.12 | $6.57 | |||||||||||||||
INCREASE (DECREASE) IN NET ASSETS FROM | ||||||||||||||||||||
OPERATIONS: | ||||||||||||||||||||
Net investment income(1) | 0.10 | 0.11 | 0.09 | 0.07 | 0.07 | |||||||||||||||
Net realized and unrealized gain (loss) on investments and foreign currency-related transactions | (0.29 | ) | (1.84 | ) | 0.97 | 1.35 | 0.51 | |||||||||||||
Net increase (decrease) from investment operations | (0.19 | ) | (1.73 | ) | 1.06 | 1.42 | 0.58 | |||||||||||||
DISTRIBUTIONS TO SHAREHOLDERS FROM: | ||||||||||||||||||||
Net investment income | (0.08 | ) | (0.05 | ) | (0.02 | ) | (0.08 | ) | (0.03 | ) | ||||||||||
Net realized gain from investments | — | (0.10 | ) | — | — | — | ||||||||||||||
Total distributions | (0.08 | ) | (0.15 | ) | (0.02 | ) | (0.08 | ) | (0.03 | ) | ||||||||||
Net asset value, end of year | $7.35 | $7.62 | $9.50 | $8.46 | $7.12 | |||||||||||||||
Total Return | (2.43 | )% | (18.35 | )% | 12.60 | % | 20.20 | % | 8.93 | % | ||||||||||
RATIOS/SUPPLEMENTAL DATA: | ||||||||||||||||||||
Net assets, end of year (000’s) | $342,114 | $451,646 | $474,838 | $271,728 | $81,568 | |||||||||||||||
Expenses to average net assets | 1.79 | % | 1.79 | % | 1.77 | % | 1.80 | % | 1.95 | % | ||||||||||
Net investment income to average net assets | 1.41 | % | 1.29 | % | 1.01 | % | 0.94 | % | 1.03 | % | ||||||||||
Portfolio turnover rate | 47 | % | 38 | % | 37 | % | 24 | % | 72 | % | ||||||||||
| (1) | Net investment income per share was calculated using the average shares outstanding method. |
| Frontier Emerging Markets Portfolio — Investor Class | ||||||||||||||||||||
Per Share Data | For the Year Ended Oct. 31, 2016 | For the Year Ended Oct. 31, 2015 | For the Year Ended Oct. 31, 2014 | For the Year Ended Oct. 31, 2013 | For the Year Ended Oct. 31, 2012 | |||||||||||||||
Net asset value, beginning of year | $7.55 | $9.41 | $8.40 | $7.08 | $6.55 | |||||||||||||||
INCREASE (DECREASE) IN NET ASSETS FROM | ||||||||||||||||||||
OPERATIONS: | ||||||||||||||||||||
Net investment income(1) | 0.07 | 0.06 | 0.04 | 0.05 | 0.10 | |||||||||||||||
Net realized and unrealized gain (loss) on investments and foreign currency-related transactions | (0.30 | ) | (1.80 | ) | 0.98 | 1.34 | 0.45 | |||||||||||||
Net increase (decrease) from investment operations | (0.23 | ) | (1.74 | ) | 1.02 | 1.39 | 0.55 | |||||||||||||
DISTRIBUTIONS TO SHAREHOLDERS FROM: | ||||||||||||||||||||
Net investment income | (0.04 | ) | (0.02 | ) | (0.01 | ) | (0.07 | ) | (0.02 | ) | ||||||||||
Net realized gain from investments | — | (0.10 | ) | — | — | — | ||||||||||||||
Total Distributions | (0.04 | ) | (0.12 | ) | (0.01 | ) | (0.07 | ) | (0.02 | ) | ||||||||||
Net asset value, end of year | $7.28 | $7.55 | $9.41 | $8.40 | $7.08 | |||||||||||||||
Total Return | (3.01 | )% | (18.64 | )% | 12.15 | % | 19.83 | % | 8.49 | % | ||||||||||
RATIOS/SUPPLEMENTAL DATA: | ||||||||||||||||||||
Net assets, end of year (000’s) | $32,771 | $45,622 | $78,712 | $21,763 | $3,003 | |||||||||||||||
Expenses to average net assets | 2.23 | % | 2.20 | % | 2.22 | % | 2.64 | % | 4.71 | % | ||||||||||
Expenses to average net assets (net of fees waived/reimbursed) | 2.23 | % | 2.20 | % | 2.22 | % | 2.25 | % | 2.25 | % | ||||||||||
Net investment income to average net assets | 1.02 | % | 0.75 | % | 0.38 | % | 0.66 | % | 1.47 | % | ||||||||||
Portfolio turnover rate | 47 | % | 38 | % | 37 | % | 24 | % | 72 | % | ||||||||||
| (1) | Net investment income per share was calculated using the average shares outstanding method. |
See Notes to Financial Statements
45
Table of Contents
Harding, Loevner Funds, Inc.
October 31, 2016
1. Organization
Harding, Loevner Funds, Inc. (the “Fund”) was organized as a Maryland corporation on July 31, 1996, and is registered under the Investment Company Act of 1940, as amended (the “1940 Act”), as an open-end management investment company. The Fund currently has seven separate diversified Portfolios, all of which were active as of October 31, 2016 (individually, a “Portfolio”, collectively, the “Portfolios”). The Fund is managed by Harding Loevner LP (the “Investment Adviser”).
Portfolio | Inception Date | Investment Objective | ||
Global Equity Portfolio | Institutional Class: November 3, 2009 Advisor Class: December 1, 1996 | to seek long-term capital appreciation through investments in equity securities of companies based both inside and outside the United States | ||
International Equity Portfolio (“International Equity”) | Institutional Class: May 11, 1994* Investor Class: September 30, 2005 | to seek long-term capital appreciation through investments in equity securities of companies based outside the United States | ||
International Equity Research Portfolio (“International Equity Research”) | Institutional Class: December 17, 2015 Investor Class: December 17, 2015 | to seek long-term capital appreciation through investments in equity securities of companies based outside the United States | ||
International Small Companies Portfolio (“International Small Companies”) | Institutional Class: June 30, 2011 Investor Class: March 26, 2007 | to seek long-term capital appreciation through investments in equity securities of small companies based outside the United States | ||
Institutional Emerging Markets Portfolio** | Class I: October 17, 2005 Class II: March 5, 2014 | to seek long-term capital appreciation through investments in equity securities of companies based in emerging markets | ||
Emerging Markets Portfolio** | Advisor Class: November 9, 1998 | to seek long-term capital appreciation through investments in equity securities of companies based in emerging markets | ||
Frontier Emerging Markets Portfolio (“Frontier Emerging Markets”) | Institutional Class: May 27, 2008 Investor Class: December 31, 2010 | to seek long-term capital appreciation through investments in equity securities of companies based in frontier and smaller emerging markets |
* International Equity is the successor to the HLM International Equity Portfolio of AMT Capital Fund, Inc., pursuant to a reorganization that took place on October 31, 1996. Information for periods prior to October 31, 1996 is historical information for the predecessor portfolio.
** The Institutional Emerging Markets and Emerging Markets Portfolios are generally closed to new investors.
2. Summary of Significant Accounting Policies
The accounting policies of the Fund are in conformity with accounting principles generally accepted in the United States (“GAAP”) for investment companies. Accordingly, the Fund follows accounting and reporting guidance under FASB Accounting Standards Codification Topic 946, “Financial Services - Investment Companies”. The following is a summary of the Fund’s significant accounting policies:
Estimates
The preparation of financial statements in accordance with GAAP requires management to make estimates and assumptions that affect the reported amounts and disclosures in the financial statements. Actual results could differ from those estimates.
46
Table of Contents
Harding, Loevner Funds, Inc.
Notes to Financial Statements (continued)
October 31, 2016
2. Summary of Significant Accounting Policies (continued)
Valuation
The Board has adopted procedures (“Procedures”) to govern the valuation of the securities held by each Portfolio of the Fund in accordance with the 1940 Act. The Procedures incorporate principles set forth in relevant pronouncements of the Securities and Exchange Commission (“SEC”) and its staff, including guidance on the obligations of the Portfolios and their Directors to determine, in good faith, the fair value of the Portfolios’ securities when market quotations are not readily available.
In determining a Portfolio’s net asset value (“NAV”), each equity security traded on a securities exchange, including the NASDAQ Stock Market, and over-the-counter securities, are first valued at the closing price on the exchange or market designated by the Fund’s accounting agent as the principal exchange (each, a “principal exchange”). The closing price provided by the Fund’s accounting agent for a principal exchange may differ from the price quoted elsewhere and may represent information such as last sales price, an official closing price, a closing auction price or other information, depending on exchange or market convention. Shares of open-end mutual funds including money market funds are valued at NAV. Such securities are typically categorized as “Level 1” pursuant to the hierarchy described below.
Participation notes are valued based upon the closing or last traded price of their underlying local shares. Such securities are typically categorized as “Level 2” pursuant to the hierarchy described below.
Since trading in many foreign securities is normally completed before the time at which a Portfolio calculates its NAV, the effect on the value of such securities held by a Portfolio of events that occur between the close of trading in the security and the time at which the Portfolio prices its securities would not be reflected in the Portfolio’s calculation of its NAV if foreign securities were generally valued at their closing prices.
To address this issue, the Board has approved the daily use of independently provided quantitative models that may adjust the closing prices of certain foreign equity securities based on information that becomes available after the foreign market closes, through the application of an adjustment factor to such securities’ closing price. Adjustment factors may be greater than, less than, or equal to 1. Thus, use of these quantitative models could cause a Portfolio to value a security higher, lower or equal to its closing market price, which in turn could cause the Portfolio’s NAV per share to differ significantly from that which would have been calculated using closing market prices. The use of these quantitative models is also intended to decrease the opportunities for persons to engage in ‘‘time zone arbitrage,” i.e., trading intended to take advantage of stale closing prices in foreign markets that could affect the NAV of the Portfolios. Securities subjected to an adjustment factor due to the use of these quantitative models are not specifically designated on the Portfolios’ Portfolio of Investments as being “fair valued”. Securities with an adjustment factor greater than or less than 1, which are absent the use of significant unobservable inputs into their valuation, are categorized as “Level 2” and securities with an adjustment factor equal to 1, which are absent the use of significant unobservable inputs into their valuation, are categorized as “Level 1” pursuant to the hierarchy described below.
Any securities for which market quotations are not readily available or for which available prices are deemed unreliable are priced by the Investment Adviser at “fair value as determined in good faith”, in accordance with the Procedures. Such securities are identified on the Portfolios’ Portfolio of Investments as securities valued at “fair value as determined in good faith” and absent the use of significant unobservable inputs into their valuation, such securities would be categorized as “Level 2” pursuant to the hierarchy described below.
GAAP includes a topic which establishes a hierarchy for NAV determination purposes in which various inputs are used in determining the value of each Portfolio’s assets or liabilities. This topic defines fair value as the price that the Portfolio would receive upon selling an investment in a timely transaction to an independent buyer in the principal or most advantageous market of the investment. This topic establishes a three-tier hierarchy to maximize the use of observable market data and minimize the use of unobservable inputs and to establish classification of fair value measurements for disclosure purposes. Inputs may be observable or unobservable and refer broadly to the assumptions that market participants would use in pricing the asset or liability including assumptions about risk. Such risks include the inherent risk in a particular valuation technique which is used to measure fair value. This may include the quantitative models and/or the inputs to the quantitative models used in the valuation technique described above. Observable inputs are inputs that reflect the assumptions market participants would use in pricing the asset or liability developed based on market data obtained from sources independent of the reporting entity. Unobservable inputs are inputs that reflect the reporting entity’s own assumptions about the assumptions market participants would use in pricing the asset or liability developed based on the best information available in the circumstances. The three-tier hierarchy of inputs is summarized in the three broad levels listed below.
| Level 1 | unadjusted quoted prices in active markets for identical investments | |
| Level 2 | other significant observable inputs (including quoted prices for similar investments, interest rates, prepayment speeds, | |
| credit risk, etc.) | ||
| Level 3 | significant unobservable inputs (including the Portfolio’s own assumptions in determining the fair value of | |
| investments) |
47
Table of Contents
Harding, Loevner Funds, Inc.
Notes to Financial Statements (continued)
October 31, 2016
2. Summary of Significant Accounting Policies (continued)
The Portfolios disclose all transfers between levels based on valuations at the end of each reporting period. At October 31, 2016, there were no transfers between Level 1, Level 2 or Level 3 classifications based on levels assigned to the securities at October 31, 2015.
GAAP provides additional guidance for estimating fair value when the volume and level of activity for the asset or liability have significantly decreased as well as guidance on identifying circumstances that indicate when a transaction is not orderly.
The following is a summary of the Portfolios’ investments classified by Level 1, Level 2 and Level 3 and security type as of October 31, 2016. Please refer to each Portfolio’s Portfolio of Investments to view individual securities classified by industry type and country.
| Portfolio | Unadjusted Quoted Prices in Active Markets for Identical Assets (Level 1) | Other Significant Observable Inputs (Level 2) | Significant Unobservable Inputs | Total | ||||||||||||||||
Global Equity | ||||||||||||||||||||
Common Stocks | $ | 488,224,595 | $ | 291,877,894 | $ | — | $ | 780,102,489 | ||||||||||||
Preferred Stocks | 21,466,677 | — | — | 21,466,677 | ||||||||||||||||
Short-Term Investments | 31,613,440 | — | — | 31,613,440 | ||||||||||||||||
|
|
|
|
|
|
|
| |||||||||||||
Total Investments | $ | 541,304,712 | $ | 291,877,894 | $ | — | $ | 833,182,606 | ||||||||||||
|
|
|
|
|
|
|
| |||||||||||||
International Equity | ||||||||||||||||||||
Common Stocks | $ | 1,457,459,883 | $ | 4,821,291,319 | $ | — | $ | 6,278,751,202 | ||||||||||||
Preferred Stocks | 151,371,873 | 142,867,358 | — | 294,239,231 | ||||||||||||||||
Short-Term Investments | 229,967,183 | — | — | 229,967,183 | ||||||||||||||||
|
|
|
|
|
|
|
| |||||||||||||
Total Investments | $ | 1,838,798,939 | $ | 4,964,158,677 | $ | — | $ | 6,802,957,616 | ||||||||||||
|
|
|
|
|
|
|
| |||||||||||||
International Equity Research | ||||||||||||||||||||
Common Stocks | $ | 1,170,622 | $ | 5,570,921 | $ | — | $ | 6,741,543 | ||||||||||||
Preferred Stocks | 117,697 | 132,638 | — | 250,335 | ||||||||||||||||
Short-Term Investments | 118,899 | — | — | 118,899 | ||||||||||||||||
|
|
|
|
|
|
|
| |||||||||||||
Total Investments | $ | 1,407,218 | $ | 5,703,559 | $ | — | $ | 7,110,777 | ||||||||||||
|
|
|
|
|
|
|
| |||||||||||||
International Small Companies | ||||||||||||||||||||
Common Stocks | $ | 5,926,939 | $ | 94,652,645 | $ | — | $ | 100,579,584 | ||||||||||||
Participation Notes | — | 841,071 | — | 841,071 | ||||||||||||||||
Short-Term Investments | 5,769,912 | — | — | 5,769,912 | ||||||||||||||||
|
|
|
|
|
|
|
| |||||||||||||
Total Investments | $ | 11,696,851 | $ | 95,493,716 | $ | — | $ | 107,190,567 | ||||||||||||
|
|
|
|
|
|
|
| |||||||||||||
Institutional Emerging Markets | ||||||||||||||||||||
Common Stocks | $ | 808,545,485 | $ | 2,294,509,180 | $ | — | $ | 3,103,054,665 | ||||||||||||
Preferred Stocks | 187,677,707 | 29,027,092 | — | 216,704,799 | ||||||||||||||||
Participation Notes | — | 28,495,399 | — | 28,495,399 | ||||||||||||||||
Short-Term Investments | 104,044,126 | — | — | 104,044,126 | ||||||||||||||||
|
|
|
|
|
|
|
| |||||||||||||
Total Investments | $ | 1,100,267,318 | $ | 2,352,031,671 | $ | — | $ | 3,452,298,989 | ||||||||||||
|
|
|
|
|
|
|
| |||||||||||||
Emerging Markets | ||||||||||||||||||||
Common Stocks | $ | 707,657,647 | $ | 2,017,495,932 | $ | — | $ | 2,725,153,579 | ||||||||||||
Preferred Stocks | 165,032,703 | 24,970,187 | — | 190,002,890 | ||||||||||||||||
Participation Notes | — | 24,725,260 | — | 24,725,260 | ||||||||||||||||
Short-Term Investments | 52,082,685 | — | — | 52,082,685 | ||||||||||||||||
|
|
|
|
|
|
|
| |||||||||||||
Total Investments | $ | 924,773,035 | $ | 2,067,191,379 | $ | — | $ | 2,991,964,414 | ||||||||||||
|
|
|
|
|
|
|
| |||||||||||||
Frontier Emerging Markets | ||||||||||||||||||||
Common Stocks | $ | 73,748,546 | $ | 277,348,095 | $ | — | $ | 351,096,641 | ||||||||||||
Preferred Stocks | 8,413,638 | — | — | 8,413,638 | ||||||||||||||||
Participation Notes | — | 13,529,668 | — | 13,529,668 | ||||||||||||||||
Short-Term Investments | 3,714,727 | — | — | 3,714,727 | ||||||||||||||||
|
|
|
|
|
|
|
| |||||||||||||
Total Investments | $ | 85,876,911 | $ | 290,877,763 | $ | — | $ | 376,754,674 | ||||||||||||
|
|
|
|
|
|
|
| |||||||||||||
As of October 31, 2016, there were no Level 3 investments held within the Portfolios.
48
Table of Contents
Harding, Loevner Funds, Inc.
Notes to Financial Statements (continued)
October 31, 2016
2. Summary of Significant Accounting Policies (continued)
Securities
For financial reporting purposes, all securities transactions are recorded on a trade date basis, as of the last business day in the reporting period. Throughout the reporting period, securities transactions are typically accounted for on a trade date – plus one business day basis. Interest income and expenses are recorded on an accrual basis. Dividend income is recorded on the ex-dividend date (except for certain foreign dividends that may be recorded as soon as the Portfolio is informed of such dividends). The Portfolios use the specific identification method for determining realized gains or losses from sales of securities.
Dividends to Shareholders
It is the policy of the Portfolios to declare dividends from net investment income annually. Net short-term and long-term capital gains distributions for the Portfolios, if any, are also normally distributed on an annual basis.
Dividends from net investment income and distributions from net realized gains from investment transactions have been determined in accordance with income tax regulations and may differ from net investment income and realized gains recorded by the Portfolios for financial reporting purposes. Differences result primarily from foreign currency transactions and timing differences related to recognition of income, and gains and losses from investment transactions. In general, to the extent that any differences, which are permanent in nature, result in over distributions to shareholders, the amount of the over distribution is reclassified within the capital accounts based on its federal tax basis treatment and may be reported as return of capital. Temporary differences do not require reclassification.
Currency Translation
Assets and liabilities denominated in foreign currencies and commitments under forward foreign currency exchange contracts are translated into U.S. dollars at the mean of the quoted bid and asked prices of such currencies against the U.S. dollar. Purchases and sales of the Portfolios’ securities are translated at the rates of exchange prevailing when such securities were acquired or sold. Income and expenses are translated at exchange rates prevailing when accrued. The Portfolios do not isolate that portion of the results of operations resulting from changes in foreign exchange rates on investments from the fluctuations arising from changes in market prices of securities held. Such fluctuations are included with the Net realized gain (loss) from investments and Change in unrealized appreciation (depreciation) from investments on the Statements of Operations.
Net realized gains and losses from foreign currency-related transactions arise from sales of foreign currency, currency gains or losses realized between the trade and settlement dates on securities transactions, and the difference between the amounts of dividends, interest, and foreign withholding taxes recorded on the Portfolios’ books, and the U.S. dollar equivalent of the amounts actually received or paid. Net unrealized appreciation or depreciation on translation of assets and liabilities denominated in foreign currencies arise from changes in the value of assets and liabilities other than investments in securities at the period end, resulting from changes in the exchange rates.
Organization and Offering Fees
Costs incurred by the International Equity Research Portfolio in connection with the organization and offering of shares are deferred and amortized on a straight line basis over twelve-month period from the date of commencement of operations of the Portfolio.
Redemption Fees
The Fund uses fees on short-term redemptions to discourage frequent trading in Portfolio shares. Redemptions of Portfolio shares made within 90 days of purchase may be subject to a redemption fee equal to 2% of the amount redeemed. For the years ended October 31, 2016 and October 31, 2015, the Portfolios received the following redemption fees. These amounts are included as a component of “Cost of shares redeemed” in the Portfolios’ Statements of Changes in Net Assets.
49
Table of Contents
Harding, Loevner Funds, Inc.
Notes to Financial Statements (continued)
October 31, 2016
2. Summary of Significant Accounting Policies (continued)
| Institutional Class | Class I | Class II | ||||||||||||||||||||||||||||
| Portfolio | Year Ended October 31, 2016 | Year Ended October 31, 2015 | Year Ended October 31, 2016 | Year Ended October 31, 2015 | Year Ended October 31, 2016 | Year Ended October 31, 2015 | ||||||||||||||||||||||||
Global Equity | $ | 4,449 | $ | 3,177 | $ | — | $ | — | $ | — | $ | — | ||||||||||||||||||
International Equity | 380,046 | 546,500 | — | — | — | — | ||||||||||||||||||||||||
International Equity Research | — | — | — | — | — | — | ||||||||||||||||||||||||
International Small Companies | 3,331 | 893 | — | — | — | — | ||||||||||||||||||||||||
Institutional Emerging Markets | — | — | 230,759 | 283,979 | 7,953 | — | ||||||||||||||||||||||||
Emerging Markets | — | — | — | — | — | — | ||||||||||||||||||||||||
Frontier Emerging Markets | 103,983 | 93,406 | — | — | — | — | ||||||||||||||||||||||||
| Investor Class | Advisor Class | |||||||||||||||||||||||||||||
| Portfolio | Year Ended October 31, 2016 | Year Ended October 31, 2015 | Year Ended October 31, 2016 | Year Ended October 31, 2015 | ||||||||||||||||||||||||||
Global Equity | $ | — | $ | — | $ | 2,346 | $ | 5,378 | ||||||||||||||||||||||
International Equity | 57,813 | 41,860 | — | — | ||||||||||||||||||||||||||
International Equity Research | — | — | — | — | ||||||||||||||||||||||||||
International Small Companies | 1,331 | 1,806 | — | — | ||||||||||||||||||||||||||
Institutional Emerging Markets | — | — | — | — | ||||||||||||||||||||||||||
Emerging Markets | — | — | 255,545 | 381,385 | ||||||||||||||||||||||||||
Frontier Emerging Markets | 15,234 | 43,616 | — | — | ||||||||||||||||||||||||||
Indemnifications
Under the Fund’s organizational document, its officers and Board of Directors (“Board”) are indemnified against certain liability arising out of the performance of their duties to the Portfolios. In the normal course of business, the Fund may enter into contracts that contain a variety of representations or that provide indemnification for certain liabilities. The Fund’s maximum exposure under these arrangements is unknown, as this would involve future claims that may be made against the Fund that have not yet occurred. However, the Fund has not had prior claims or losses pursuant to these contracts and expects the risk of loss to be remote.
3. Significant Agreements and Transactions with Affiliates
The Board has approved investment advisory agreements with the Investment Adviser. Advisory fees are computed daily and paid monthly based on the average daily net assets of each Portfolio. The Investment Adviser has contractually agreed to reduce its fee and/or reimburse the Portfolios for other operating expenses to the extent that aggregate expenses, excluding certain non-operating expenses, exceed certain annual rates of the average daily net assets of each class.
The following annualized advisory fees and contractual expense limits were in effect for the year ended October 31, 2016. The advisory fees are charged at the Portfolio level as a whole and expense limitations are at the class specific level.
50
Table of Contents
Harding, Loevner Funds, Inc.
Notes to Financial Statements (continued)
October 31, 2016
3. Significant Agreements and Transactions with Affiliates (continued)
| Portfolio | First $1 billion of assets | Next $1 billion of assets | Next $1 billion of assets | Over $3 billion of assets | Over $4 billion of assets | Contractual Expense Limit | ||||||||||||||||||||||||
Global Equity – Institutional Class | 0.80% | 0.78% | 0.76% | 0.74% | 0.74% | 0.95% | ||||||||||||||||||||||||
Global Equity – Advisor Class | 0.80% | 0.78% | 0.76% | 0.74% | 0.74% | 1.25% | ||||||||||||||||||||||||
International Equity – Institutional Class | 0.75% | 0.73% | 0.71% | 0.69% | 0.67% | * | 1.00% | |||||||||||||||||||||||
International Equity – Investor Class | 0.75% | 0.73% | 0.71% | 0.69% | 0.67% | * | 1.25% | |||||||||||||||||||||||
International Equity Research – Institutional Class | 0.75% | 0.75% | 0.75% | 0.75% | 0.75% | 0.90% | ||||||||||||||||||||||||
International Equity Research – Investor Class | 0.75% | 0.75% | 0.75% | 0.75% | 0.75% | 1.15% | ||||||||||||||||||||||||
International Small Companies – Institutional Class** | 1.25% | 1.23% | 1.23% | 1.23% | 1.23% | 1.25% | ||||||||||||||||||||||||
International Small Companies – Investor Class** | 1.25% | 1.23% | 1.23% | 1.23% | 1.23% | 1.50% | ||||||||||||||||||||||||
Institutional Emerging Markets – Class I | 1.15% | 1.13% | 1.11% | 1.09% | 1.09% | 1.30% | ||||||||||||||||||||||||
Institutional Emerging Markets – Class II | 1.15% | 1.13% | 1.11% | 1.09% | 1.09% | 1.15% | ^ | |||||||||||||||||||||||
Emerging Markets – Advisor Class | 1.15% | 1.13% | 1.11% | 1.09% | 1.09% | 1.75% | ||||||||||||||||||||||||
Frontier Emerging Markets – Institutional Class + | 1.50% | 1.48% | 1.48% | 1.48% | 1.48% | 2.00% | ^^ | |||||||||||||||||||||||
Frontier Emerging Markets – Investor Class + | 1.50% | 1.48% | 1.48% | 1.48% | 1.48% | 2.25% | ^^ | |||||||||||||||||||||||
* Effective November 1, 2016, an additional advisory fee breakpoint was added to the International Equity Portfolio, providing a further 2 basis point reduction (to 0.65%) for assets over $5 billion.
**Effective November 1, 2016, a 10 basis point reduction in the advisory fee rate and the contractual expense limits for the International Small Companies Portfolio was implemented, whereby the advisory fee moved from 1.25% to 1.15% (at all asset levels), the contractual expense limit for the Institutional Class moved from 1.25% to 1.15%, and the contractual expense limit for the Investor Class moved from 1.50% to 1.40%.
^The Investment Adviser has contractually agreed to waive a portion of its management fee and/or reimburse the Portfolio’s Class II shares for their other operating expenses to the extent that the aggregate operating expenses of Class II exceed the applicable contractual management fee, currently 1.15% on the first $1 billion of average daily net assets, 1.13% on the next $1 billion, 1.11% on the next $1 billion and 1.09% for average daily net assets over $3 billion.
^^Effective November 1, 2016, a 25 basis point reduction in the contractual expense limits for the Frontier Emerging Markets Portfolio was implemented, whereby the contractual expense limit for the Institutional Class moved from 2.00% to 1.75%, and the contractual expense limit for the Investor Class moved from 2.25% to 2.00%.
+Effective March 1, 2017, a 15 basis point reduction in the advisory fee rate will be implemented, whereby the advisory fee will move from 1.50% to 1.35% (at all asset levels).
On December 14, 2016, the Board voted to extend the contractual expense limits listed above through February 28, 2018, inclusive of the changes to the International Equity, International Small Companies and Frontier Emerging Markets Portfolios described above.
For the year ended October 31, 2016, the Investment Adviser waived and/or reimbursed the following amounts pursuant to the contractual expense limits described above:
| Portfolio | Fees waived and/or reimbursed by the Investment Adviser | ||||
International Equity Research – Institutional Class | $134,955 | ||||
International Equity Research – Investor Class | 55,397 | ||||
International Small Companies – Institutional Class | 168,176 | ||||
International Small Companies – Investor Class | 187,606 | ||||
Institutional Emerging Markets – Class II | 309,589 | ||||
The Fund has an administration agreement with The Northern Trust Company (“Northern Trust”), which provides certain accounting, clerical and bookkeeping services, Blue Sky, corporate secretarial services and assistance in the preparation and filing of tax returns and reports to shareholders and the SEC.
51
Table of Contents
Harding, Loevner Funds, Inc.
Notes to Financial Statements (continued)
October 31, 2016
3. Significant Agreements and Transactions with Affiliates (continued)
Northern Trust also serves as custodian of each Portfolio’s securities and cash, transfer agent, dividend disbursing agent and agent in connection with any accumulation, open-account or similar plans provided to the shareholders of the Portfolios.
Through December 31, 2015, Alaric Compliance Services, LLC (“ACS”) provided an individual to serve as chief compliance and anti-money laundering compliance officer of the Fund. Effective January 1, 2016, ACS provides compliance support to the Fund’s Chief Compliance Officer. Fees paid to ACS are shown as “Compliance officers’ fees and expenses” on the Statements of Operations.
The Fund has adopted an Amended Plan of Distribution pursuant to Rule 12b-1 under the 1940 Act (“Distribution Plan”). Under the Distribution Plan, the Investor Class of each of the International Equity, International Equity Research, International Small Companies and Frontier Emerging Markets Portfolios may pay underwriters, distributors, dealers or brokers a fee at an annual rate of up to 0.25% of the average daily net assets of the Portfolio’s Investor Class shares for services or expenses arising in connection with activities primarily intended to result in the sale of Investor Class shares of the Portfolios or for Shareholder Services (defined below) consistent with those described under the Shareholder Servicing Plan.
The Fund, on behalf of the Portfolios, has agreements with various financial intermediaries and “mutual fund supermarkets”, under which customers of these intermediaries may purchase and hold Portfolio shares. These intermediaries assess fees in consideration for providing certain account maintenance, record keeping and transactional and other shareholder services (collectively, “Shareholder Services”). Each Portfolio or class is authorized, pursuant to a Shareholder Servicing Plan, to pay to each intermediary an annual rate of up to 0.25% of its average daily net assets attributable to that intermediary (subject to the contractual expense limits described above) for such Shareholder Services. Because of the contractual expense limits on certain Portfolios’ fees and expenses, the Investment Adviser paid a portion of the Portfolios’ share of these fees during the year ended October 31, 2016. Such payments, if any, are included in the table above under the caption “Fees waived and/or reimbursed by the Investment Adviser”.
A Portfolio may purchase securities from, or sell securities to, an affiliated fund provided the affiliation is due solely to having a common investment adviser, common officers, or common Trustees. For the year ended October 31, 2016, the following Portfolios engaged in purchases and/or sales of securities from an affiliated portfolio in compliance with Rule 17a-7 of the 1940 Act:
| Portfolio | Purchases | Sales* | ||||||||
Emerging Markets | $ | — | $ | 22,386,513 | ||||||
Institutional Emerging Markets | 22,386,513 | — | ||||||||
* For the year ended October 31, 2016, the realized gain loss associated with these transactions is $9,718,014.
4. Class Specific Expenses
Most expenses of the Fund can be directly attributed to a particular Portfolio. Expenses which cannot be directly attributed are apportioned among the Portfolios based upon relative net assets or other appropriate measures. If an expense is incurred at the Portfolio level, it is generally apportioned among the classes of that Portfolio based upon relative net assets of each respective class. Certain expenses are incurred at the class level and charged only to that particular class. These expenses may be class specific (i.e., Distribution fees charged only to a particular class) or they may be identifiable to a particular class (i.e., the costs related to mailing shareholder reports to shareholders of a particular class). Class level expenses for Portfolios with multiple active classes are shown in the table below.
52
Table of Contents
Harding, Loevner Funds, Inc.
Notes to Financial Statements (continued)
October 31, 2016
4. Class Specific Expenses (continued)
The class level expenses for the year ended October 31, 2016, were as follows for each Portfolio:
| Portfolio | Distribution Fees | State Registration Filing Fees | Printing and Postage Fees | Transfer Agent Fees and Expenses | Shareholder Servicing Fees | ||||||||||||||||||||
Global Equity – Institutional Class | $ | — | $ | 41,510 | $ | 34,775 | $ | 24,644 | $ | 291,558 | |||||||||||||||
Global Equity – Advisor Class | — | 23,783 | 5,967 | 24,225 | 128,821 | ||||||||||||||||||||
International Equity – Institutional Class | — | 254,141 | 481,230 | 126,418 | 3,448,668 | ||||||||||||||||||||
International Equity – Investor Class | 967,132 | 46,253 | 56,815 | 89,030 | 355,585 | ||||||||||||||||||||
International Equity Research – Institutional Class | — | 26,938 | 328 | 17,633 | — | ||||||||||||||||||||
International Equity Research – Investor Class | 1,419 | 26,938 | 156 | 17,567 | 1,020 | ||||||||||||||||||||
International Small Companies – Institutional Class | — | 24,388 | 4,881 | 21,305 | 36,567 | ||||||||||||||||||||
International Small Companies – Investor Class | 116,588 | 24,199 | 7,067 | 22,073 | 57,161 | ||||||||||||||||||||
Institutional Emerging Markets – Class I | — | 122,092 | 176,370 | 48,073 | — | ||||||||||||||||||||
Institutional Emerging Markets – Class II | — | 31,451 | 14,345 | 28,864 | 1,403,838 | ||||||||||||||||||||
Frontier Emerging Markets – Institutional Class | — | 47,319 | 24,148 | 34,936 | 204,810 | ||||||||||||||||||||
Frontier Emerging Markets – Investor Class | 87,838 | 26,283 | 6,148 | 25,173 | 42,375 | ||||||||||||||||||||
5. Investment Transactions
Cost of purchases and proceeds from sales of investment securities, other than short-term investments, for the year ended October 31, 2016, were as follows for each Portfolio:
| Portfolio | Purchase Cost of Investment Securities | Proceeds from Sales of Investment Securities | ||||||||
Global Equity | $ | 194,844,916 | $ | 287,124,790 | ||||||
International Equity | 2,744,642,867 | 1,213,684,744 | ||||||||
International Equity Research | 8,475,990 | 2,094,482 | ||||||||
International Small Companies | 47,767,844 | 44,643,676 | ||||||||
Institutional Emerging Markets | 1,491,940,296 | 507,643,160 | ||||||||
Emerging Markets | 986,646,297 | 651,906,346 | ||||||||
Frontier Emerging Markets | 179,137,297 | 280,694,295 | ||||||||
6. Income Tax
The cost of investments for federal income tax purposes and the components of net unrealized appreciation (depreciation) on investments at October 31, 2016, for each of the Portfolios were as follows:
| Portfolio | Gross Unrealized Appreciation | Gross Unrealized Depreciation | Net Unrealized Appreciation / (Depreciation) | Cost | ||||||||||||||||
Global Equity | $ | 205,311,803 | $ | (19,610,467 | ) | $ | 185,701,336 | $ | 647,481,270 | |||||||||||
International Equity | 1,077,342,751 | (177,285,096 | ) | 900,057,655 | 5,902,899,961 | |||||||||||||||
International Equity Research | 750,849 | (280,769 | ) | 470,080 | 6,640,697 | |||||||||||||||
International Small Companies | 18,392,135 | (8,054,116 | ) | 10,338,019 | 96,852,548 | |||||||||||||||
Institutional Emerging Markets | 421,992,425 | (143,462,527 | ) | 278,529,898 | 3,173,769,091 | |||||||||||||||
Emerging Markets | 608,717,103 | (131,479,191 | ) | 477,237,912 | 2,514,726,502 | |||||||||||||||
Frontier Emerging Markets | 50,830,553 | (47,320,333 | ) | 3,510,220 | 373,244,454 | |||||||||||||||
It is the policy of each Portfolio of the Fund to qualify as a regulated investment company by complying with the applicable provisions of the Internal Revenue Code, and to make distributions of taxable income sufficient to relieve it from substantially all federal income and excise taxes; therefore, no federal income tax provision is required.
53
Table of Contents
Harding, Loevner Funds, Inc.
Notes to Financial Statements (continued)
October 31, 2016
6. Income Tax (continued)
The Portfolios may be subject to taxes imposed by countries in which they invest. Such taxes are generally based on income and/or capital gains earned. Taxes are accrued based on net investment income, net realized gains and net unrealized appreciation as such income and/or gains are recorded. Taxes accrued on unrealized gains are reflected as a liability on the Statements of Assets and Liabilities under the caption “Deferred capital gains tax” and as a reduction in “Net unrealized appreciation on investments and on assets and liabilities denominated in foreign currencies”. When assets subject to capital gains tax are sold, accrued taxes are relieved, and the actual amount of the taxes paid is reflected on the Statements of Operations as a reduction in “Net realized gain (loss) on Investment Transactions”.
Management has performed an analysis of each Portfolio’s tax positions for the open tax years as of October 31, 2016 and has concluded that no provisions for income tax are required. The Portfolios’ federal tax returns for the prior three fiscal years (open tax years: October 31, 2013; October 31, 2014; October 31, 2015) remain subject to examination by the Portfolios’ major tax jurisdictions, which include the United States, the State of New Jersey and the State of Maryland. Management is not aware of any events that are reasonably possible to occur in the next twelve months that would result in the amounts of any unrecognized tax benefits significantly increasing or decreasing for the Portfolios. However, management’s conclusions regarding tax positions taken may be subject to review and adjustment at a later date based on factors including, but not limited to, new tax laws and accounting regulations and interpretations thereof.
The tax character of distributions paid during the fiscal years ended October 31, 2016 and 2015 were as follows:
| Distributions From | ||||||||||||||||||||
| Portfolio | Ordinary Income 2016 | Long-Term Capital Gains 2016 | Ordinary Income 2015 | Long-Term Capital Gains 2015 | ||||||||||||||||
Global Equity | $ | 2,915,631 | $ | 21,649,757 | $ | 2,635,352 | $ | 30,011,126 | ||||||||||||
International Equity | 48,284,777 | — | 41,229,364 | — | ||||||||||||||||
International Equity Research | — | — | — | — | ||||||||||||||||
International Small Companies | 576,035 | 948,182 | 532,201 | 1,337,745 | ||||||||||||||||
Institutional Emerging Markets | 14,148,383 | — | 13,408,375 | — | ||||||||||||||||
Emerging Markets | 12,240,604 | 56,015 | 19,237,520 | 96,450,985 | ||||||||||||||||
Frontier Emerging Markets | 4,626,863 | — | 2,935,247 | 6,091,324 | ||||||||||||||||
As of October 31, 2016, the components of accumulated earnings/ (deficit) on a tax basis were as follows:
| Portfolio | Undistributed Ordinary Income | Undistributed Long-Term Capital Gains | Accumulated Capital and Other Losses | Unrealized Appreciation (Depreciation)* | Total Accumulated Earnings/(Deficit) | ||||||||||||||||||||
Global Equity | $ | 3,264,567 | $ | 10,109,118 | $ | — | $ | 185,665,847 | $ | 199,039,532 | |||||||||||||||
International Equity | 63,054,355 | — | (23,224,877 | ) | 899,738,599 | 939,568,077 | |||||||||||||||||||
International Equity Research | 251,889 | — | (7,634 | ) | 466,066 | 710,321 | |||||||||||||||||||
International Small Companies | 1,214,050 | 3,298,574 | — | 10,185,338 | 14,697,962 | ||||||||||||||||||||
Institutional Emerging Markets | 22,513,197 | — | (140,146,253 | ) | 277,762,497 | 160,129,441 | |||||||||||||||||||
Emerging Markets | 17,343,320 | — | (57,867,610 | ) | 477,370,907 | 436,846,617 | |||||||||||||||||||
Frontier Emerging Markets | 3,677,573 | — | (97,969,185 | ) | 747,228 | (93,544,384 | ) | ||||||||||||||||||
* The difference between book basis and tax basis net unrealized appreciation is attributable primarily to the tax deferral of losses on certain sale of securities. Unrealized Appreciation (Depreciation) includes amounts related to foreign currency and currency translations.
The Regulated Investment Company Modernization Act of 2010 (the “Act”) changed various technical rules governing the tax treatment of regulated investment companies and became effective for the Portfolios for the fiscal year ended October 31, 2012. Under the Act, each Portfolio is permitted to carry forward capital losses incurred in taxable years beginning after the date of enactment for an unlimited period. However, any losses incurred during post-enactment years are required to be utilized prior to the losses incurred in pre-enactment taxable years, which carry an expiration date. As a result of this ordering rule, pre-enactment capital loss carryforwards may be more likely to expire unused. Additionally, post-enactment capital loss carryforwards will retain their character as either short-term or long-term capital losses rather than being considered all short-term as permitted under previous regulation.
54
Table of Contents
Harding, Loevner Funds, Inc.
Notes to Financial Statements (continued)
October 31, 2016
6. Income Tax (continued)
At October 31, 2016, capital losses incurred that will be carried forward indefinitely under provisions of the Act are as follows:
| Portfolio | Short-Term Capital Loss Carryforward | Long-Term Capital Loss Carryforward | ||||||||
International Equity | $ | 23,224,877 | $ | — | ||||||
Institutional Emerging Markets | 22,278,520 | 85,365,104 | ||||||||
Emerging Markets | 26,826,433 | 31,041,177 | ||||||||
Frontier Emerging Markets | 17,016,311 | 80,952,874 | ||||||||
At October 31, 2016, the pre-enactment capital loss carryforwards and their respective years of expiration were as follows:
| Portfolio | October 31, 2017 | October 31, 2019 | ||||||||
Institutional Emerging Markets | $ | 28,667,656 | $ | 3,834,973 | ||||||
Primarily as a result of differing book/tax treatment of foreign currency transactions and foreign capital gain tax expenses, the Portfolios made reclassifications among certain capital accounts. The reclassifications have no impact on the net assets of the Portfolios. As of October 31, 2016, the following reclassifications were made to the Statements of Assets and Liabilities:
| Portfolio | Paid-in Capital | Accumulated Undistributed Net Investment Income | Accumulated Net Realized Gain (Loss) from Investment Transactions | ||||||||||||
Global Equity | $ | — | $ | (134,296 | ) | $ | 134,296 | ||||||||
International Equity | — | (4,186,135 | ) | 4,186,135 | |||||||||||
International Equity Research | (29,955 | ) | 24,118 | 5,837 | |||||||||||
International Small Companies | — | (68,219 | ) | 68,219 | |||||||||||
Institutional Emerging Markets | (5,903 | ) | (829,650 | ) | 835,553 | ||||||||||
Emerging Markets | — | (902,563 | ) | 902,563 | |||||||||||
Frontier Emerging Markets | — | (1,246,125 | ) | 1,246,125 | |||||||||||
7. Foreign Exchange Contracts
The Portfolios do not generally hedge foreign currency exposure, however, the Portfolios may enter into forward foreign exchange contracts in order to hedge their exposure to changes in foreign currency exchange rates on their foreign portfolio holdings. Each Portfolio will conduct its currency transactions either on a spot (cash) basis at the rate prevailing in the currency exchange market, or by entering into forward contracts to purchase or sell currency. Foreign currency transactions entered into on the spot markets serve to pay for foreign investment purchases or to convert to dollars, the proceeds from foreign investment sales or dividend and interest receipts. The Portfolios will disclose open forward currency contracts, if any, on the Portfolios of Investments. The Portfolios do not separately disclose open spot market transactions on the Portfolios of Investments. Such realized gain (loss) and unrealized appreciation (depreciation) on spot market transactions is included in “net realized gain (loss) on foreign currency transactions” and “change in unrealized appreciation (depreciation) on translation of assets and liabilities denominated in foreign currencies”, respectively, on the Portfolios’ Statements of Operations. The Portfolios held no open forward currency contracts as of or during the fiscal year ended October 31, 2016.
8. Participation Notes
Each Portfolio may invest in participation notes. Participation notes are promissory notes that are designed to replicate the return of a particular underlying equity or debt security, currency or market. Participation notes are issued by banks or broker-dealers or their affiliates and allow a Portfolio to gain exposure to common stocks in markets where direct investment may not be allowed. Participation notes are generally traded over-the-counter. In addition to carrying the same risks associated with a direct investment in the underlying security, participation notes are subject to the risk that the broker-dealer or bank that issues them will not fulfill its contractual obligation to complete the transaction with a Portfolio. Participation notes constitute general unsecured contractual obligations of the banks or broker-dealers that issue them, and a Portfolio would be relying on the creditworthiness of such banks or broker-dealers and would have no rights under a participation note against the issuer(s) of the underlying security(ies). Participation notes may be more volatile and less liquid than other investments held by the Portfolios.
55
Table of Contents
Harding, Loevner Funds, Inc.
Notes to Financial Statements (continued)
October 31, 2016
9. Concentration of Ownership
At October 31, 2016, the percentage of total shares outstanding held by record shareholders each owning 10% or greater of the aggregate shares outstanding of each Portfolio were as follows:
| No. of Shareholders | % Ownership | |||||||||
Global Equity | 3 | 48.84 | %* | |||||||
International Equity | 3 | 62.41 | %* | |||||||
International Equity Research | 2 | 78.46 | % | |||||||
International Small Companies | 3 | 69.12 | %* | |||||||
Institutional Emerging Markets | 2 | 50.10 | %* | |||||||
Emerging Markets | 3 | 72.30 | %* | |||||||
Frontier Emerging Markets | 3 | 59.83 | %* | |||||||
* Includes omnibus positions of broker-dealers representing numerous shareholder accounts.
Investment activities of these shareholders may have a material effect on the Portfolios.
10. Concentration of Risk
Investing in securities of foreign issuers and currency transactions may involve certain considerations and risks not typically associated with investments in U.S. issuers. These risks include revaluation of currencies, adverse fluctuations in foreign currency values and possible adverse political, social and economic developments, including those particular to a specific industry, country or region, which could cause the securities and their markets to be less liquid and prices more volatile than those of comparable U.S. companies and U.S. government securities. These risks are greater with respect to securities of issuers located in emerging market countries in which the Portfolios are authorized to invest.
Frontier Emerging Markets is permitted to invest up to 35% of its total assets in companies in the same industry, if, at the time of investment, that industry represents 20% or more of the Portfolio’s benchmark index. During periods when the Portfolio has invested more than 25% of its total assets in companies in the same industry, it will operate as a concentrated portfolio and be subject to additional risks and greater volatility. At October 31, 2016, the Portfolio’s investment in the Banking industry amounted to 34.62% of its total assets.
11. Line of Credit
The Fund has a $150 million line of credit agreement ($100 million prior to April 1, 2016) with Northern Trust. Borrowings are made solely to facilitate the handling of redemptions or unusual or unanticipated short-term cash requirements. Because several Portfolios participate and collateral requirements apply, there is no assurance that an individual Portfolio will have access to the entire $150 million at any particular time. Interest is charged to each Portfolio based on its borrowings at an amount above the Federal Funds rate, subject to a minimum rate. In addition, a facility fee is computed at an annual rate of 0.15% (0.10% prior to April 1, 2016) on the line of credit and is allocated among the Portfolios.
For the year ended October 31, 2016, Frontier Emerging Markets had an outstanding balance for two days with a maximum balance of $200,000 at an average weighted interest rate of 1.75%.
12. Subsequent Events
Subsequent events occurring after the date of this report have been evaluated for potential impact, for purposes of recognition or disclosure in the financial statements, through the date the report was issued and it has been determined that no other adjustments or disclosures are required beyond what is already included in the financial statements and accompanying footnotes.
56
Table of Contents
Harding, Loevner Funds, Inc.
Report of Independent Registered Public Accounting Firm
The Shareholders and Board of Directors
Harding, Loevner Funds, Inc.:
We have audited the accompanying statements of assets and liabilities of Harding, Loevner Funds, Inc. (comprising the Global Equity Portfolio, International Equity Portfolio, International Equity Research Portfolio, International Small Companies Portfolio, Institutional Emerging Markets Portfolio, Emerging Markets Portfolio, and Frontier Emerging Markets Portfolio) (collectively, the Portfolios) including the portfolios of investments, as of October 31, 2016, and the related statements of operations for the year or period then ended, the statements of changes in net assets for each of the years or periods in the two-year period then ended, and the financial highlights for each of the years or periods in the five-year period then ended. These financial statements and financial highlights are the responsibility of the Portfolios’ management. Our responsibility is to express an opinion on these financial statements and financial highlights based on our audits.
We conducted our audits in accordance with the standards of the Public Company Accounting Oversight Board (United States). Those standards require that we plan and perform the audit to obtain reasonable assurance about whether the financial statements and financial highlights are free of material misstatement. An audit includes examining, on a test basis, evidence supporting the amounts and disclosures in the financial statements. Our procedures included confirmation of securities owned as of October 31, 2016, by correspondence with the custodian and brokers or other appropriate auditing procedures. An audit also includes assessing the accounting principles used and significant estimates made by management, as well as evaluating the overall financial statement presentation. We believe that our audits provide a reasonable basis for our opinion.
In our opinion, the financial statements and financial highlights referred to above present fairly, in all material respects, the financial position of the aforementioned Portfolios of Harding, Loevner Funds, Inc. as of October 31, 2016, and the results of their operations for the year or period then ended, the changes in their net assets for each of the years or periods in the two-year period then ended, and the financial highlights for each of the years or periods in the five-year period then ended, in conformity with U.S. generally accepted accounting principles.
/s/ KPMG LLP
Chicago, Illinois
December 16, 2016
57
Table of Contents
Harding, Loevner Funds, Inc.
(unaudited)
Global Equity, International Equity, International Equity Research, International Small Companies, Institutional Emerging Markets, Emerging Markets, and Frontier Emerging Markets paid qualifying foreign taxes of $575,749, $12,787,444, $14,181, $194,739, $5,173,139, $5,072,767, and $1,878,760 and earned $2,733,652, $81,034,135, $97,252, $1,438,756, $29,209,780, $23,960,270, and $6,301,797 from foreign source income during the fiscal year ended October 31, 2016, respectively. Pursuant to Section 853 of the Internal Revenue Code, Global Equity, International Equity, International Equity Research, International Small Companies, Institutional Emerging Markets, Emerging Markets, and Frontier Emerging Markets designated $0.0224, $0.0346, $0.0223, $0.0249, $0.0246, $0.0783 and $0.0368 per share as foreign taxes paid and $0.1064, $0.2192, $0.1526, $0.1838, $0.1386, $0.3697, and $0.1235 as income earned from foreign sources for the fiscal year ended October 31, 2016, respectively.
Global Equity, International Equity, International Equity Research, International Small Companies, Institutional Emerging Markets, Emerging Markets, and Frontier Emerging Markets had qualifying dividend income of $10,844,542, $113,455,620, $123,224, $1,578,312, $41,447,720, $39,853,496, and $6,417,023, respectively, during the fiscal year ended October 31, 2016.
For the fiscal year ended October 31, 2016, Global Equity designated 100% of the distributions from net investment income as qualifying for the 70% corporate dividend received deduction
For the fiscal year ended October 31, 2016, International Small Companies designated 0.40% of the distributions from net investment income as qualifying for the 70% corporate dividend received deduction.
For the fiscal year ended October 31, 2016, Institutional Emerging Markets designated 0.11% of the distributions from net investment income as qualifying for the 70% corporate dividend received deduction.
For the fiscal year ended October 31, 2016, Emerging Markets designated 0.13% of the distributions from net investment income as qualifying for the 70% corporate dividend received deduction.
For the fiscal year ended October 31, 2016, Frontier Emerging Markets designated 1.09% of the distributions from net investment income as qualifying for the 70% corporate dividend received deduction.
Pursuant to Section 852 of the Internal Revenue Code, Global Equity designated $10,109,118 as a long term capital gain dividend for the fiscal year ended October 31, 2016.
Pursuant to Section 852 of the Internal Revenue Code, International Small Companies designated $3,298,574 as a long term capital gain dividend for the fiscal year ended October 31, 2016.
58
Table of Contents
Harding, Loevner Funds, Inc.
Approval of Investment Advisory Agreement
(unaudited)
Approval of Investment Advisory Agreement
At an in-person meeting of the board of directors (the “Board”) of Harding, Loevner Funds, Inc. (the “Fund”) held on June 10, 2016 (the “June Meeting”), the Board, including a majority of those directors who are not “interested persons” of the Fund, as defined in the Investment Company Act of 1940, as amended (the “Independent Directors”), considered and approved the continuation of the investment advisory agreement (the “Advisory Agreement”) between the Fund on behalf of the following series of the Fund: the Global Equity Portfolio, the International Equity Portfolio, the International Small Companies Portfolio, the Institutional Emerging Markets Portfolio, the Emerging Markets Portfolio, and the Frontier Emerging Markets Portfolio (each, a “Portfolio” and, collectively, the “Portfolios”), and Harding Loevner LP (“Adviser”).
Overview of the Review Process
Prior to the June Meeting, the Board requested, and the Adviser furnished, materials that the Board believed necessary to evaluate the terms of the Advisory Agreement, including information on, among other things: (i) the investment performance, expenses and advisory fees of each Portfolio relative to other mutual funds and benchmark indices, as set forth in reports prepared by Strategic Insight, a third party fund analytics provider engaged as part of the Advisory Agreement review process (the “Strategic Insight Reports”); (ii) the Adviser’s profitability and costs arising from services provided to the Fund; (iii) the qualifications of the Adviser and portfolio management personnel with respect to services provided to the Portfolios; and (iv) the Adviser’s investment research capabilities and resources.
The Board established a subcommittee comprised of three Independent Directors (the “Subcommittee”) to conduct a preliminary review of these materials, to assist the Board in its deliberations, and to liaise with the Adviser. The Subcommittee reviewed the materials and discussed the materials during a telephonic meeting with representatives of the Adviser. Following the Subcommittee’s review, the Adviser distributed revised and supplemental materials in final form to the full Board. The Board also received and considered a memorandum regarding the Board’s responsibilities in connection with renewal of the Advisory Agreement prepared by the legal counsel to the Independent Directors (“Independent Counsel”). Independent Counsel assisted the Independent Directors throughout the preparation, review and approval process.
At the June Meeting, the Board considered and discussed the materials presented by the Adviser. During the presentation, the Adviser expanded on those materials and responded to specific questions from the Board. Among other things, the Adviser focused on the long-term performance records of the Portfolios and the competitiveness of the Portfolio’s total expense ratios. The Adviser also focused on its management of Fund expenses; reinvestment from revenues in personnel and technology systems that service the Fund; and the Adviser’s efforts to share the benefits of economies of scale with fund shareholders, noting the addition of breakpoints and management fee reductions and waivers over the past three years. Following the presentation, the Independent Directors met in executive session with Independent Counsel to review and discuss further the information presented during the meeting.
In evaluating continuance of the Advisory Agreement with respect to each Portfolio, among other things, the Board considered the various factors and information discussed below. The following discussion is not intended to be all-inclusive, as the Board reviewed a variety of factors and considered a significant amount of information. The Board’s approval determinations were made on the basis of each director’s business judgment after consideration of all the information presented. No single factor was determinative. Individual directors may have given different weights to certain factors and assigned various degrees of materiality to information received in connection with the approval process.
Nature, Extent and Quality of Services
The Board evaluated the information it deemed necessary to assess the nature, extent and quality of investment advisory services provided to the Portfolios by the Adviser. The Board also considered the nature, extent and quality of certain non-advisory services provided to the Portfolios by the Adviser, including portfolio trading; the resources devoted to, and the record of compliance with, each Portfolio’s compliance policies and procedures; and the quality and quantity of administrative, distribution and shareholder servicing. The Board noted that it received information in connection with quarterly board and committee meetings throughout the year regarding the services rendered by the Adviser concerning the management of each Portfolio’s affairs and the Adviser’s role in coordinating providers of other services to the Portfolios.
59
Table of Contents
Harding, Loevner Funds, Inc.
Approval of Investment Advisory Agreement (continued)
(unaudited)
The Adviser presented and discussed with the Board the qualifications, backgrounds and responsibilities of the Adviser’s management team and information regarding the members of the portfolio management team for each Portfolio. The Board evaluated the ability of the Adviser to attract and retain qualified investment advisory and non-advisory personnel and engaged in a discussion with the Adviser regarding its recruitment, retention and professional development programs and strategies.
The Board also considered the adequacy of the financial and operational resources committed to each Portfolio by the Adviser, and how well the Adviser utilizes those resources to meet the Portfolio’s investment needs, to implement asset growth strategies and to satisfy compliance requirements.
The Board further noted that, as of March 31, 2016, the Adviser had approximately $39.78 billion in assets under management; and that the Fund was the Adviser’s largest client, with assets of approximately $11.3 billion. The Board took into account the benefits realized by the Portfolios from the Adviser affiliation with Affiliated Managers Group, Inc., an established global asset management company.
The Board considered annual and periodic reports of the Chief Compliance Officer of the Fund (the “CCO”) with respect to the effectiveness and adequacy of the Adviser’s compliance program, including program enhancements related to information security and financial intermediary oversight. The Board noted the CCO’s determination that the Adviser’s compliance program is reasonably designed to prevent violations of the federal securities laws. The Board also noted the actions taken by the Adviser in response to the CCO’s periodic recommendations designed to ensure continued compliance with applicable laws and regulations.
Based on these considerations, the Board concluded that it was satisfied with the nature, extent and quality of services historically provided and to be provided to each Portfolio under the Advisory Agreement.
Performance of the Adviser
For each Portfolio, the Board considered, among other things, the historical performance for multiple time periods ended as of March 31, 2016, including the one-year, three-year, five-year and ten-year periods (or shorter for newer Portfolios) included in the Strategic Insight Reports, compared against each Portfolio’s Morningstar Category and benchmark index. The Board considered the Portfolios’ risk adjusted performance and the high active share (i.e., low overlap with benchmark indices) inherent in the Adviser’s investment process.
With respect to the recent performance of the Portfolios, the Board noted that for the one-year period ended March 31, 2016, each share class of the Global Equity Portfolio, Emerging Markets Portfolio and Institutional Emerging Markets Portfolio outperformed its respective Morningstar Category and benchmark index; that each share class of the International Small Companies Portfolio and Frontier Emerging Markets Portfolio underperformed compared to its respective Morningstar Category and benchmark index; and that each share class of the International Equity Portfolio outperformed its respective benchmark index while underperforming compared to its respective Morningstar Category.
In assessing longer term performance by the Portfolios, for the five-year period ended March 31, 2016, the Board noted that each share class of all Portfolios with at least five years of operations outperformed its respective Morningstar Category and benchmark index, with the exception of the International Equity Portfolio (Investor Class) and the International Small Companies Portfolio (Investor Class), which underperformed compared to its respective Morningstar Category while outperforming its respective benchmark index, and each share class of the Frontier Emerging Markets Portfolio, which outperformed its respective Morningstar Category while underperforming compared to its respective benchmark index. For the ten-year period ended March 31, 2016, the Board noted that each share class of all Portfolios with at least ten years of operations outperformed its respective Morningstar Category and benchmark index.
60
Table of Contents
Harding, Loevner Funds, Inc.
Approval of Investment Advisory Agreement (continued)
(unaudited)
In addition, the Board reviewed the Adviser’s investment philosophy and its influence on the management of the Portfolios, as well as the effectiveness of the Adviser’s use of portfolio management teams for the day-to-day management of Portfolios. The Board noted the Adviser’s bottom-up, business-focused approach based on a study of individual companies and the competitive dynamics of the global industries in which those companies participate. The Board considered the Adviser’s disciplined adherence to its investment philosophy and process as well as the evolutionary enhancements to the methodology used in its implementation.
In evaluating the investment performance of the Portfolios, the Board acknowledged that the Adviser’s investment style may result in periods of underperformance, but has generally produced outperformance over longer time periods. The Board also considered the Adviser’s ongoing efforts to identify the causes of any underperformance and the effectiveness of the Adviser’s efforts to address underperformance. Finally, the Board considered that the Morningstar Category performance data provided within the Strategic Insight Reports was less useful with respect to the Frontier Emerging Markets Portfolio, as Morningstar did not have a Frontier category at March 31, 2016 and instead compared the Portfolio to the Diversified Emerging Markets category.
Based on these considerations, the Board concluded that each Portfolio’s performance was reasonable.
Costs of the Services and Profitability of the Adviser
The Board considered information regarding the Adviser’s costs to provide investment management services to the Portfolios and the profitability to the Adviser from managing the Portfolios. In evaluating the Adviser’s profitability, the Board considered the Adviser’s profitability analysis for calendar years 2014 and 2015, including profitability adjusted, on a pro forma basis, for estimated provisions for federal and state corporate income taxes; each Portfolio’s expense ratio; the allocation methodology used by the Adviser to compute such profitability; and the Adviser’s contractual fee waivers and expense reimbursements with respect to the applicable Portfolios. The Board also considered profitability on a Portfolio-by-Portfolio basis, focusing on the Adviser’s profit both with and without taking into account those costs borne by the Adviser with respect to its efforts to expand the Portfolios’ shareholder base. The Board considered the fact that the Adviser’s overall profitability decreased slightly from 2014 to 2015. In addition, the Board considered the Adviser’s proposal to further reduce the total expense ratio of select Portfolios, beginning in November 1, 2016, including: (i) adding a breakpoint level that would reduce the contractual advisory fee by two basis points for assets over $5 billion for the International Equity Portfolio; (ii) reducing the expense cap for the Institutional and Investor Classes of the Frontier Emerging Markets Portfolio by twenty five basis points, to 175 basis points and 200 basis points, respectively; and (iii) reducing the expense cap for the Institutional and Investor Classes of the International Small Companies Portfolio by ten basis points, to 115 basis points and 140 basis points, respectively.
The Board took note of the costs the Adviser has incurred that are intended to assure the continued delivery of high-quality services to its clients, including the Portfolios, and the costs the Adviser plans to incur with maintaining and enhancing those investments. The Board also noted that future profitability to the Adviser from managing the Portfolios would depend on the level of assets in the Portfolios and investment returns, as well as the Adviser’s total assets under management.
Based upon these considerations, the Board concluded that the profits historically realized by the Adviser and, and the profits the Adviser anticipates will be realized from its continued relationship with the Portfolios, are not excessive in light of the nature, extent and quality of the services provided to the Portfolios.
Comparison of Fees and Services Provided by the Adviser
The Board reviewed the contractual advisory fees that are payable by the Portfolios to the Adviser and the actual investment advisory fees realized by the Adviser taking into account the fee waiver and/or expense reimbursement arrangements for certain of the Portfolios. The Board considered the fact that the Adviser’s waiver/expense reimbursement arrangements are not subject to recapture and that the proposed fee reductions and breakpoints were contractual in nature, noting that in
61
Table of Contents
Harding, Loevner Funds, Inc.
Approval of Investment Advisory Agreement (continued)
(unaudited)
fiscal-year 2015 the Adviser waived a portion of its advisory fees for the Institutional Emerging Markets (both Class I and Class II) and International Small Companies Portfolios (both Institutional Class and Investor Class). In addition, the Board compared the Adviser’s separate account fee schedule with the advisory fees payable by the Portfolios to the Adviser. Finally, the Board considered the Strategic Insight Reports, which included information comparing each Portfolio’s management fee and overall expenses with those of funds in a group of peer funds selected by Strategic Insight (the “Expense Group”).
The Board noted that the net operating expenses of each Portfolio were at or below the median of their respective Expense Groups and of their respective Morningstar Category-derived universe (the “Expense Universe”), with the exception of the Frontier Emerging Markets Portfolio, as Morningstar did not have a Frontier category as of March 31, 2016, and of the International Small Companies Portfolio (Institutional Class), which was slightly above median for its Expense Universe. The Board also observed that, except as noted below, the total expense ratio of each class of each Portfolio, after any applicable waiver of advisory fees and reimbursement of expenses, was below its respective Expense Group and Expense Universe medians calculated by Strategic Insight. Exceptions included Institutional Emerging Markets Portfolio (Class I), which had a total expense ratio equal to the Expense Group median and slightly above the median of its respective Expense Universe, and Frontier Emerging Markets Portfolio (both Institutional and Investor Class) which had total expense ratios above the median of its respective Expense Group and Expense Universe, and International Small Companies Portfolio (both Institutional and Investor Class) which had total expense ratios above the median of its respective Expense Group and Expense Universe, which differences the Board did not consider to be material. The Board further considered the small size of the Expense Group for the Frontier Emerging Markets Portfolio and the unique nature of its asset class in arriving at that conclusion.
The Board noted that the net management fee for each class of each Portfolio was at or below the median of its Expense Group, except for the Global Equity Portfolio (Institutional Class), the Emerging Markets Portfolio (Advisor Class) and the Frontier Emerging Markets Portfolio (both Institutional and Investor Class), which were above the median for their respective Expense Groups. The Board also noted that for each Portfolio with an Expense Universe, the net management fee was above the median of its Expense Universe, except for the International Equity Portfolio (both Institutional and Advisor Class) and International Small Companies Portfolio (Investor), which were below the median for its Expense Universe. In its consideration of the reasonableness of each Portfolio’s net management fee, the Board considered the extensive scope of non-advisory services provided by the Adviser (including but not limited to executive and administrative support, supervision of vendors, distribution support, shareholder servicing, trading), which it performs without additional compensation, and that such additional services contribute directly to below-median net operating expenses because the Adviser is absorbing a portion of the Portfolios’ operating expenses.
The Board recognized that the Adviser’s separate account and collective trust clients require fewer services from the Adviser. The Board additionally recognized the Adviser’s efforts to increase institutional account minimums and direct more institutional investors into pooled vehicles, including the Portfolios. Further, the Board took note that many sophisticated institutional investors, after reviewing similar investment vehicles with the assistance of their consultants, had determined to invest in the Portfolios, which further supported the reasonableness of the advisory fees charged by the Adviser.
Based on these considerations, the Board concluded that each Portfolio’s fee was not so disproportionately large that it could not have been the result of an arm’s-length negotiation.
Economies of Scale
The Board considered the extent to which economies of scale have been realized as the Portfolios’ assets grew, whether there is potential for realization of further economies of scale for the Portfolios, and whether material economies of scale are being shared with shareholders. The Board also considered that the Portfolios have benefitted both from asset growth in the Portfolios and even more from asset growth in the Adviser’s other accounts, each of which have resulted in certain expenses becoming a smaller percentage of overall assets.
62
Table of Contents
Harding, Loevner Funds, Inc.
Approval of Investment Advisory Agreement (continued)
(unaudited)
The Board acknowledged that other aspects of the Portfolios’ investment strategies may limit the realization of economies of scale, including a particular strategy’s universe of issuers, applicable trading volumes or markets, or the Adviser’s selection criteria. The Board also acknowledged the Adviser’s considerable and continued reinvestment in its business and its plans for marketing and distributing the various Portfolios and paying for the associated expenses out of its own profits, through revenue sharing payments.
Based on these considerations, the Board concluded that it was satisfied with the extent to which economies of scale currently are and will be realized for the benefit of the Portfolios’ shareholders, and recognized its obligation to consider the same annually based on changing circumstances.
Other Benefits
The Board considered other benefits derived or to be derived by the Adviser from the relationship with the Portfolios. In this regard, the Board noted that the only tangible material indirect benefit from the Adviser’s relationship with the Portfolios is from the receipt of research products and services obtained through “soft dollars” in connection with Portfolio brokerage transactions. The Board also considered the extent to which the Adviser and its other clients, including the Portfolios, benefitted from receipt of these research products and services. In light of the costs of providing investment management, administrative and other services to the Portfolios and the Adviser’s ongoing commitment to the Portfolios, the other ancillary benefits that the Adviser may receive were considered reasonable.
Conclusion
Following extensive discussion, both in general session and in executive session of the Independent Directors meeting alone with Independent Counsel, the Board determined that it had received sufficient information to take action on the proposed resolutions regarding continuance of the Advisory Agreement. The Board, including a majority of the Independent Directors, concluded with respect to each Portfolio that its investment advisory fees were sufficiently supported by their review of the factors described above.
In light of all the foregoing, the Board, and separately, a majority of the Independent Directors, approved the continuance of the Advisory Agreement for each Portfolio. The Board’s decision was based on all of the above-mentioned factors and their related conclusions, with no single factor or conclusion being determinative and with each director not necessarily attributing the same weight to each factor.
63
Table of Contents
Harding, Loevner Funds, Inc.
(unaudited)
HARDING, LOEVNER FUNDS, INC.
PRIVACY NOTICE
The Fund collects nonpublic personal information about you from the following sources:
| • | Information, such as your name, address, social security number, assets and income, submitted by you on applications, forms, or in other written or verbal customer communications. This information may also be provided by a consultant or intermediary acting on your behalf. |
| • | Information that results from any transaction performed by us for you. |
The Fund will not disclose any nonpublic personal information about you or its former customers to anyone except as permitted or required by law.
If you decide to close your account(s) or become an inactive customer, the Fund will adhere to the privacy policies and practices as described in this notice.
The Fund restricts access to your personal and account information to only those employees who need to know that information to provide products or services to you. The Fund maintains physical, administrative and technical safeguards to protect your nonpublic personal information.
64
Table of Contents
Harding, Loevner Funds, Inc.
Directors and Principal Officers
(unaudited)
Disinterested Directors:
Name, Address and Age | Position with | Term of Office | Principal Occupation | Number of Portfolios in Fund Complex Overseen By Director | Other Directorships | |||||
William E. Chapman, II c/o Harding Loevner LP 400 Crossing Boulevard Fourth Floor Bridgewater, NJ 08807 Age, 75 | Director | Indefinite; Director since 2008; Chairperson of the Audit Committee since 2009 | Longboat Retirement Planning Solutions, President and Owner, 1998 – present; Bowdoin College, Trustee, 2002 – 2013; Mutual Fund Directors Forum, Inc., Director and Treasurer, 2010 – present; Sarasota Memorial Healthcare Foundation, Inc., Director and Secretary, 2011 – present. | 7 | Third Avenue Trust (5 portfolios); Third Avenue Variable Trust (1 portfolio); AMG Funds, (66 portfolios). | |||||
Carolyn Ainslie c/o Harding Loevner LP 400 Crossing Boulevard Fourth Floor Bridgewater, NJ 08807 Age, 58 | Director | Indefinite; Director since 2015; Member of the Audit Committee since 2015 | Princeton University, Vice President for Finance and Treasurer, 2008 – present. | 7 | None. | |||||
R. Kelly Doherty c/o Harding Loevner LP 400 Crossing Boulevard Fourth Floor Bridgewater, NJ 08807 Age, 58 | Director | Indefinite; Director since 2004; Lead Independent Director since 2014 | Caymen Partners (private investment vehicles), Managing Partner, 1998 – present. | 7 | Selective Insurance Group, Inc.(SIGI). | |||||
Charles Freeman, III c/o Harding Loevner LP 400 Crossing Boulevard Fourth Floor Bridgewater, NJ 08807 Age, 52 | Director | Indefinite; Director since 2008 | Forbes-Tate, LLC, International Principal, 2014 – present; Rock Creek Global Advisors, LLC, Vice President, 2013 – 2014; PepsiCo, Vice President Global Public Policy and Government Relations, 2011 – 2013; National Committee on US-China Relations (non-profit), Board Member, 2007 – 2009 and 2010 – present; Center for Strategic and International Studies, Freeman Chair in China Studies, 2007 – 2011. | 7 | None. | |||||
65
Table of Contents
Harding, Loevner Funds, Inc.
Directors and Principal Officers
(unaudited)
Disinterested Directors (continued):
Name, Address and Age | Position with | Term of Office | Principal Occupation | Number of Portfolios in Fund Complex Overseen By Director | Other Directorships | |||||
Samuel R. Karetsky c/o Harding Loevner LP 400 Crossing Boulevard Fourth Floor Bridgewater, NJ 08807 Age, 71 | Director | Indefinite; Director since 1998; Member of the Audit Committee since 1998 | The Karetsky Group LLC (advisory firm), Managing Member, 2003 – present; Wetherby Asset Management, Wealth Manager, 2004 – present. | 7 | None. | |||||
Eric Rakowski c/o Harding Loevner LP 400 Crossing Boulevard Fourth Floor Bridgewater, NJ 08807 Age, 58 | Director | Indefinite; Director since 2008 | University of California at Berkeley School of Law, Professor, 1990 – present. | 7 | Third Avenue Trust (5 portfolios); Third Avenue Variable Trust (1 portfolio); AMG Funds (66 portfolios); AMG Pantheon Private Equity Fund (1 portfolio); AMG Pantheon Private Equity Master Fund (1 portfolio). | |||||
66
Table of Contents
Harding, Loevner Funds, Inc.
Directors and Principal Officers
(unaudited)
Interested Directors:
Name, Address and Age | Position with | Term of Office | Principal Occupation | Number of Portfolios in Fund Complex Overseen By Director | Other Directorships | |||||
David R. Loevner** Harding Loevner LP Fish Creek Center 1230 Ida Dr. Ste. 3 1⁄2 PO Box 383 Wilson, WY 83014 Age, 62 | Director and Chairman of the Board of Directors | Indefinite; Director and Chairman of the Board since 1996 | Harding Loevner LP, President and Chief Executive Officer, 1989 – present; Harding Loevner Funds, plc, Director, 2007 – present. | 7 | None. | |||||
Jennifer M. Borggaard** Affiliated Managers Group, Inc. 600 Hale Street Prides Crossing, MA 01965 Age, 47 | Director | Indefinite; Director since 2008 | Affiliated Managers Group, Inc. (“AMG”) (asset management firm), Senior Vice President, 2007 – present;Shore Country Day School, Board Member, 2013 – present, President of Board, 2015 – present. | 7 | Genesis Asset Managers, LLP; Arrow Bidco Ltd. | |||||
* Each director is elected to serve in accordance with the Articles of Incorporation and By-Laws of the Fund until his or her successor is duly elected and qualified.
** David R. Loevner is considered an “interested person” of the Fund as defined in the Investment Company Act of 1940, as amended, because he serves as President of Harding Loevner LP, the Fund’s investment advisor. Jennifer M. Borggaard is an interested person of the Fund as a result of her affiliation with AMG, a control person of Harding Loevner.
The Funds’ Statement of Additional Information contains additional information about the Directors and is available upon request and without charge by calling (877) 435-8105.
67
Table of Contents
Harding, Loevner Funds, Inc.
Directors and Principal Officers
(unaudited)
Principal Officers of the Fund:
Name, Address and Age | Position(s) with the Fund | Term of Office | Principal Occupation During Past Five Years | |||
Richard Reiter Harding Loevner LP 400 Crossing Boulevard Fourth Floor Bridgewater, NJ 08807 Age, 50 | President | 1 year; since 2011 | Harding Loevner LP, Chief Operating Officer, 1996 – present. | |||
Charles S. Todd Foreside Management Services, LLC Three Canal Plaza, Suite 100 Portland, ME 04101 Age, 45 | Chief Financial Officer and Treasurer | 1 year; since 2010 | Foreside, Business Head, Fund Officer & Compliance Services, 2015 – present; Foreside Management Services, LLC, Business Head, Treasurer Services, 2012 – 2015, Director, 2008 – 2012. | |||
Aaron Bellish Harding Loevner LP 400 Crossing Boulevard Fourth Floor Bridgewater, NJ 08807 Age, 37 | Assistant Treasurer | 1 year; since 2012 | Harding Loevner LP, Chief Financial Officer, 2012 – present; Mount Kellett Capital Management, Chief Financial Officer, formerly serving as Controller, 2008-2012. | |||
Derek Jewusiak The Northern Trust Company 50 South LaSalle Street Chicago, IL 60603 Age, 45 | Assistant Treasurer | 1 year; since December 2013 | The Northern Trust Company, Vice President, 2012 – present, Second Vice President, 2008 – 2012. | |||
68
Table of Contents
Harding, Loevner Funds, Inc.
Directors and Principal Officers
(unaudited)
Principal Officers of the Fund (continued):
Name, Address and Age | Position(s) with the Fund | Term of Office | Principal Occupation During Past Five Years | |||
Owen T. Meacham The Northern Trust Company 50 South LaSalle Street Chicago, IL 60603 Age, 46 | Secretary | 1 year; since 2010 | The Northern Trust Company, Senior Vice President and Assistant General Counsel, 2015 – present, Senior Vice President and Managing Attorney, 2012 – 2015, Senior Vice President and Senior Corporate Attorney, 2011 – 2012, Vice President and Senior Corporate Attorney, 2007 – 2012. | |||
Lori M. Renzulli Harding Loevner LP 400 Crossing Boulevard Fourth Floor Bridgewater, NJ 08807 Age, 50 | Assistant Secretary | 1 year; since 2008 | Harding Loevner LP, Chief Counsel and Chief Compliance Officer, 2006 – present. | |||
Brian Simon Harding Loevner LP 400 Crossing Boulevard Fourth Floor Bridgewater, NJ 08807 Age, 54 | Chief Compliance Officer and Anti-Money Laundering Compliance Officer and Assistant Secretary | 1 year, since 2016, 2016 and 2015 respectively | Harding Loevner LP, General Counsel, 2014 – present; Lazard Asset Management LLC, Director of Legal Affairs and Chief Compliance Officer, 2002 – 2014. | |||
Marcia Y. Lucas The Northern Trust Company 50 South LaSalle Street Chicago, IL 60603 Age, 49 | Assistant Secretary | 1 year; since 2011 | The Northern Trust Company, Senior Vice President, 2015 – present; Vice President, 2011 – present, Second Vice President, 2010; Michael Best & Friedrich LLP, partner, 2005 – 2010. | |||
* Officers are elected to hold such office until their successor is elected and qualified to carry out the duties and responsibilities of their office, or until he or she resigns or is removed from office.
69
Table of Contents
Harding, Loevner Funds, Inc.
(unaudited)
Quarterly Form N-Q Portfolio Schedule
Each Portfolio will file its complete portfolio of investments with the SEC on Form N-Q at the end of the first and third fiscal quarters within 60 days of the end of the quarter to which it relates. The Portfolios’ Form N-Q will be available on the SEC’s website at www.sec.gov and may also be reviewed and copied at the SEC’s Public Reference Room whose telephone number is (800) SEC-0330. Additionally, they are available upon request by calling (877) 435-8105.
Proxy Voting Record
The Fund’s proxy voting record relating to the Portfolios’ securities during the most recent 12-month period ended June 30 is available on the Fund’s website at www.hardingloevnerfunds.com and on the SEC’s website at www.sec.gov, on Form N-PX.
Proxy Voting Policies and Procedures
The Fund’s proxy voting policies and procedures are included in Appendix B to Statement of Additional Information and is available without charge, upon request, by calling (877) 435-8105 or on the SEC’s website at www.sec.gov.
Additional Information
The Adviser updates Fact Sheets for the Portfolios each calendar quarter, which are posted to the Fund’s website at www.hardingloevnerfunds.com. This information, along with the Adviser’s commentaries on its various strategies, is available without charge, upon request, by calling (877) 435-8105.
70
Table of Contents
This report is intended for shareholders of Harding, Loevner Funds, Inc. It may not be used as sales literature unless preceded or accompanied by the current Prospectus, which gives details about charges, expenses, investment objectives, risks and policies of the Portfolios.
Table of Contents

Table of Contents
Item 2. Code of Ethics.
| (a) | As of October 31, 2016, the Registrant has adopted a code of ethics that applies to the Registrant’s President/Chief Executive Officer and Treasurer/Chief Financial Officer (the “Code of Ethics”). |
| (c) | For the fiscal year ended October 31, 2016, there were no amendments to a provision of the Registrant’s Code of Ethics. |
| (d) | For the fiscal year ended October 31, 2016, there were no waivers granted from a provision of the Registrant’s Code of Ethics. |
Item 3. Audit Committee Financial Expert.
The Registrant’s Board of Directors has determined that the following members of the Audit Committee are audit committee financial experts and independent: Carolyn Ainslie, William Chapman, II and Samuel Karetsky.
Item 4. Principal Accountant Fees and Services.
(a) Audit Fees: The aggregate fees billed for each of the last two fiscal years for professional services rendered by KPMG LLP, the Registrant’s principal accountant, for the audit of the Registrant’s annual financial statements in connection with statutory and regulatory filings or engagements for those fiscal years are $173,300 in 2016 and $150,300 in 2015.
(b) Audit-Related Fees: The aggregate fees billed in each of the last two fiscal years for assurance and related services by KPMG LLP that are reasonably related to the performance of the audit of the Registrant financial statements and are not reported under paragraph (a) of this Item are None.
(c) Tax Fees: The aggregate fees billed in each of the last two fiscal years for professional services rendered by KPMG LLP for the review of domestic tax returns were $57,525 in 2016 and $47,400 in 2015.
(d) All Other Fees: The aggregate fees billed in each of the last two fiscal years for products and services provided by KPMG LLP, other than the services reported in paragraphs (a) through (c) of this Item are None.
(e)(1) Disclose the audit committee pre-approval policies and procedures described in paragraph (c)(7) of Rule 2-01 of Regulation S-X.
A copy of the Audit Committee’s Pre-Approval Policies and Procedures is filed with this Form N-CSR under Item 12(c).
(e)(2) The percentage of services described in each of paragraphs (b) through (d) of this Item that were approved by the audit committee pursuant to paragraph (c)(7)(i)(C) of Rule 2-01 of Regulation S-X are as follows:
Paragraph (b) Audit-Related Fees: Not applicable
Paragraph (c) Tax Fees: 100%
Paragraph (d): All Other Fees: Not applicable
(f) Not applicable.
(g) Not applicable.
(h) Not applicable.
Table of Contents
Item 5. Audit Committee of Listed Registrants.
Not applicable.
Item 6. Investments.
| (a) | Schedule I is included as part of the report to shareholders filed under Item 1 of this report on Form N-CSR. |
| (b) | Not applicable. |
Item 7. Disclosure of Proxy Voting Policies and Procedures for Closed-End Management Investment Companies.
Not applicable.
Item 8. Portfolio Managers of Closed-End Management Investment Companies.
Not applicable.
Item 9. Purchases of Equity Securities by Closed-End Management Investment Company and Affiliated Purchasers.
Not applicable.
Item 10. Submission of Matters to a Vote of Security Holders.
Not applicable.
Item 11. Controls and Procedures.
| (a) | The Registrant’s Principal Executive Officer and Principal Financial Officer, or persons performing similar functions, have concluded that the Registrant’s disclosure controls and procedures (as defined in Rule 30a-3(c) under the Investment Company Act of 1940, as amended (the “1940 Act”)) were effective as of a date within 90 days prior to the filing date of this report, based on their evaluation of the effectiveness of the Registrant’s disclosure controls and procedures as of the evaluation date. |
| (b) | There were no significant changes in the Registrant’s internal control over financial reporting (as defined in Rule 30a-3(d) under the 1940 Act) that occurred during the second fiscal quarter of the period covered by this report that have materially affected, or are reasonably likely to materially affect, the Registrant’s internal control over financial reporting. |
Item 12. Exhibits.
| (a)(1) | Exhibit 99.12.A: Incorporated by reference to Exhibit 12(a)(1) to the report filed on Form N-CSR on January 7, 2013 (Accession No. 0001193125-13-005151). |
| (a)(2) | Exhibit 99.CERT: Certifications pursuant to Rule 30a-2(a) of the Act are attached. |
| (a)(3) | Not applicable. |
| (b) | Exhibit 99.906: Certifications pursuant to Rule 30a-2(b) of the Act are attached hereto. |
| (c) | Incorporated by reference to Exhibit 12(c) to the report filed on Form N-CSR on January 1, 2015 (Accession No. 0001193125-16-422394). |
Table of Contents
SIGNATURES
Pursuant to the requirements of the Securities Exchange Act of 1934 and the Investment Company Act of 1940, the Registrant has duly caused this report to be signed on its behalf by the undersigned, thereunto duly authorized.
Harding, Loevner Funds, Inc. | ||||
By | /s/ Richard T. Reiter | |||
Richard T. Reiter (Principal Executive Officer) | ||||
Date: January 9, 2017 | ||||
Pursuant to the requirements of the Securities Exchange Act of 1934 and the Investment Company Act of 1940, this report has been signed below by the following persons on behalf of the Registrant and in the capacities and on the dates indicated. | ||||
By | /s/ Richard T. Reiter | |||
Richard T. Reiter (Principal Executive Officer) | ||||
Date: January 9, 2017 | ||||
By | /s/ Charles S. Todd | |||
Charles S. Todd (Principal Financial Officer) | ||||
Date: January 9, 2017 | ||||