Table of Contents
UNITED STATES
SECURITIES AND EXCHANGE COMMISSION
Washington, D.C. 20549
FORMN-CSR
CERTIFIED SHAREHOLDER REPORT OF REGISTERED
MANAGEMENT INVESTMENT COMPANIES
Investment Company Act file number 811-07739
Harding, Loevner Funds, Inc.
(Exact name of registrant as specified in charter)
400 Crossing Boulevard
Fourth Floor
Bridgewater, NJ 08807
(Address of principal executive offices) (Zip code)
Marcia Y. Lucas
The Northern Trust Company
50 South LaSalle Street
Chicago, IL 60603
With a copy to:
Stephen H. Bier, Esq.
Dechert LLP
1095 Avenue of the Americas
New York, NY 10036
(Name and address of agent for service)
Registrant’s telephone number, including area code:(877)435-8105
Date of fiscal year end:10/31
Date of reporting period:10/31/2019
Table of Contents
Item 1. Reports to Stockholders.
| (a) | The following is a copy of the report transmitted to shareholders pursuant to Rule30e-1 under the Investment Company Act of 1940 (17 CFR270.30e-1) |
Table of Contents
Harding, Loevner Funds, Inc. HARDING LOEVNER Fundamental. Thinking. Worldwide. Annual Commentary October 31, 2019 Global Equity Portfolio International Equity Portfolio International Small Companies Portfolio Institutional Emerging Markets Portfolio Emerging Markets Portfolio Frontier Emerging Markets Portfolio Global Equity Research Portfolio International Equity Research Portfolio Emerging Markets Research Portfolio Beginning on January 1, 2021, as permitted by regulations adopted by the Securities and Exchange Commission, paper copies of the Fund’s shareholder reports will no longer be sent by mail, unless you specifically request paper copies of the reports from the Fund or from your financial intermediary, such as a broker-dealer or bank. Instead, the reports will be made available on a website, and you will be notified by mail each time a report is posted and provided with a website link to access the report. If you already elected to receive shareholder reports electronically, you will not be affected by this change and you need not take any action. You may elect to receive shareholder reports and other communications from the Fund electronically by contacting your financial intermediary. You may elect to receive all future reports in paper free of charge. You can inform the Fund that you wish to continue receiving paper copies of your shareholder reports by calling (877) 435-8105 or by sending an email request to hardingloevnerfunds@ntrs.com. If your account is held through a financial intermediary, you can contact your financial intermediary to make your election. Your election to receive reports in paper will apply to all Funds held with the Fund complex/your financial intermediary. The Prospectus, SAI, and the Fund’s annual and semi-annual reports are also available free of charge on Harding Loevner’s website at hardingloevnerfunds.com. Reports and other information about the Fund are also available on the EDGAR database on the Commission’s Internet site at SEC.gov or by electronic request at the following e-mail address: publicinfo@sec.gov. A duplication fee will be applied to written requests and needs to be paid at the time your request is submitted.
As with all mutual funds, the Securities and Exchange Commission has not approved or disapproved these securities or determined if this prospectus is truthful or complete. Any representation to the contrary is a criminal offense.
Table of Contents
 HARDING LOEVNER FUNDS
Global equity investing for institutions is Harding Loevner’s exclusive focus. Through Harding Loevner Funds it offers distinct global strategies based on itsquality-and-growth investment philosophy. It seeks to purchase shares of growing, financially strong, well-managed companies at favorable prices. Harding Loevner manages each of the Funds’ Portfolios according to a disciplined, research-based investment process. It identifies companies with sustainable competitive advantages and assesses the durability of their earnings growth by conductingin-depth fundamental research into global industries. In constructing portfolios, Harding Loevner diversifies carefully to limit risk.
RECEIVE INVESTOR MATERIALS ELECTRONICALLY
Shareholders may sign up for electronic delivery of investor materials. By doing so, you will receive the information faster and help us reduce the impact on the environment of providing these materials. To enroll in electronic delivery,
| 1. | Go to http://www.icsdelivery.com |
| 2. | Select the first letter of your brokerage firm’s name. |
| 3. | From the list that follows, select your brokerage firm. If your brokerage firm is not listed, electronic delivery may not be available. Please contact your brokerage firm. |
| 4. | Complete the information requested, including thee-mail address where you would like to receive notifications for electronic documents. |
Your information will be kept confidential and will not be used for any purpose other than electronic delivery. If you change your mind, you can cancel electronic delivery at any time and revert to physical delivery of your materials. Just go to http://www.icsdelivery.com, perform the first three steps above, and follow the instructions for cancelling electronic delivery. If you have any questions, please contact your brokerage firm.
2
|
Table of Contents


Contact
Harding, Loevner Funds, Inc. c/o Northern Trust Attn: Funds Center C5S 801 South Canal Street Chicago, IL 60607
Phone: (877)435-8105 Fax: (312)267-3657 www.hardingloevnerfunds.com | Must be preceded or accompanied by a current Prospectus. Quasar Distributors, LLC, Distributor |
3
| ||||
Table of Contents

 | DAVID LOEVNER, CFA, CIC CHAIRMAN OF THE FUNDS AND CEO OF THE ADVISER
SIMON HALLETT, CFA CO-CIO OF THE ADVISER
FERRILL ROLL, CFA CO-CIO OF THE ADVISER |
Unfortunately, when it comes to investing, we are our own worst enemy. Our reflexes and impulses, molded by millennia spent confronting a never-ending series of existential threats, have bequeathed us a nervous system uniquely unsuited to the perils of investing in marketable assets. Our instinctive behaviors—to hang with the herd, mimic our neighbors, and fight or take flight at the first sign of danger—are at odds with the composure, patience, and independence of thought and action essential for success in that activity.
With the threats of predation and deprivation waning, our antiquated nervous systems are particularly maladapted to today’s challenges. We are subjected to a continual stream of information, not all of it truthful, delivered by methods diabolically designed to devour our limited attention and incite us to immediate action. What remains of our attention is left to contend with an overabundance of investment choices offering dizzying arrays of exposures and risk profiles. Amid this overload, it is no wonder so many savers give up and opt for a passive approach that, for all its flaws, at least may provide an average return.
As active investors bent on achieving above-average returns, the question we keep returning to, like a fool to his folly, is how best to continue to overcome the long odds. Each time, we reaffirm our bedrock principles: a consistency of investment philosophy; a focus on process rather than outcomes; a disciplined approach to fundamental research; and a deliberate structuring of decision making to mitigate our behavioral shortcomings. What links each of these elements is an unflinching focus on the long term. While we’ve frequently laid out the ins and outs of how we invest, we’ve not previously delved into the importance of a long horizon. In the balance of this letter we will explain specifically why a long-term perspective is critical to our success, the internal structures we have created to foster it, and why none of it would matter were it not for clients who share our far sightedness.
Forecasting short-term stock price movements is notoriously difficult, but that does not prevent many from trying. Difficult, however, does not mean impossible and on this thin reed of possibility are pinned the hopes of a disproportionate share of investors. Most will fail. Because short-term swings are dominated by noise and randomness, even those who find their hopes realized,
at least at first, will owe a debt to providence for an unknown share of theirnew-found prosperity. In our experience, maintaining a lengthy horizon is a powerful antidote to the siren song of swift profits, and it is also essential if you hope to disentangle skill from luck.
Over short horizons, even the sharpest of insights translates into an investment edge that is vanishingly small, barely distinguishable from chance. A negligible edge may be useless at a daily frequency but adds up over time. For instance, you can forecast a slight decline in temperatures of aboutone-third of a degree each day in New York’s Central Park between September and December. This prediction is worthless if you want to know the variation inday-to-day temperatures. Best to look out the window if you are planning a fall picnic. But over the entire season, this ostensibly useless projection will track almost the entire drop in temperature—a source of edge in timing the purchase of a winter coat.
Over short horizons, even the sharpest of insights translates into an investment edge that is vanishingly small, barely distinguishable from chance.
Long-term thinking promotes a long investment horizon. It encourages you to look through short-term dislocations and view a price decline as an opportunity rather than a cause for despair. This is especially relevant for fundamental investors who expect to be rewarded for bearing the intrinsic business risks of the companies they own. Virtually all the value (i.e., discounted cash flow) of a long-lived asset lies not over the next year but far out into the future with minor quarterly variations in operating performance, or stock price, having almost no bearing on the underlying value of a business.
Long-term thinking is of little use if it’s not matched with long-term behavior. There is no point in declaring you have a long horizon if the next minute you are riveted byminute-by-minute price changes and assiduously following every twist and turn in the market. Keep that up and you will soon find that your horizon has become much shorter than you intended. We are hardwired to fear losses far more than we enjoy the prospect of gains. It’s easy to see how investors get swept up in the modern world’s flow of news and data, especially given our species’ tendency to overweight recent information. To avoid this fate, every opportunity to beat back your behavioral shortcomings must be seized with alacrity.
Harding Loevner’s investment philosophy is predicated on the idea that building a diversified portfolio of the finest companies in the world while paying careful attention to the price we were paying for their shares had the best chance of de-
4
|
Table of Contents
livering superior long-term returns. Despite being armed with knowledge of our value-destroying instincts, it still took painful trial and error to feel our way toward erecting the structures that allow us to evade them. Our Quality Assessment framework is central to our effort to maintain a focus on long-term company fundamentals rather than short-term stock-price movements. In this framework we look through Michael Porter’s competitive strategy lens to see the threats and opportunities that shape each industry and examine their effect on its constituent companies. This approach is a far cry from standard financial practice that equates investment risk with observed share price volatility. We are convinced that, for an unleveraged long-term investor, an understanding of competitive dynamics leads to a more accurate assessment of long-term risks of an investment in a company’s stock than do measures of short-term price dispersion.
We also encourage long-term thinking in how we task our analysts with assessing the long-term prospects of the companies in their respective sectors. They typically look ahead seven to ten years, and in some cases as long as twenty years, when forecasting a company’s earnings and cash flows. Businesses where analysts have made a case for protracted periods of rapid growth include not only Consumer Staples companies such as cosmetics makers, but also some singularly cyclical industrial and transportation businesses.
Another reflection of our emphasis on long-term thinking is our indifference to quarterly earnings estimates. We neither require nor expect our analysts to produce them. While we have a regard for fundamental research put out by a small number of brokerage house and independent analysts, we put no store in their projections for a single quarter. We are happy to let others obsess over whether a company can “beat the number.” Our analysts are naturally concerned with quarterly earnings reports to ascertain whether businesses are meeting the targets we’ve set for them. But fixation on the unexpected difference in financial results over anyninety-day period brings Macbeth’s mournful take on existence to mind: “A tale told by an idiot, full of sound and fury, signifying nothing.”
We are happy to let others obsess over whether a company can “beat the number.”
Finally, given ourdrawn-out investment horizon, for us to be successful we need clients who share our long-term perspective. Periods of underperformance are inevitable for every truly active manager, no matter how sensible its investment philosophy or disciplined its implementation. We are grateful to every client who accepts this prolonged and occasionally taxing tradeoff and is willing to bear the risk alongside us.
Sincerely,
David R. Loevner, CFA, CIC |
Simon Hallett, CFA |
Ferrill D. Roll, CFA |


Opinions expressed are those of Harding Loevner and are not intended to be forecasts of future events, a guarantee of future results, nor investment advice. Please read the separate disclosure page for important information, including the risks of investing in the Portfolios. Past performance is not a guarantee of future results.
5
|
Table of Contents

PORTFOLIO MANAGEMENT TEAM
| PETER BAUGHAN, CFA CO-LEAD PORTFOLIO MANAGER
FERRILL ROLL, CFA CO-LEAD PORTFOLIO MANAGER
SCOTT CRAWSHAW PORTFOLIO MANAGER
JINGYI LI PORTFOLIO MANAGER
CHRISTOPHER MACK, CFA PORTFOLIO MANAGER
RICHARD SCHMIDT, CFA PORTFOLIO MANAGER |

 PERFORMANCE SUMMARY
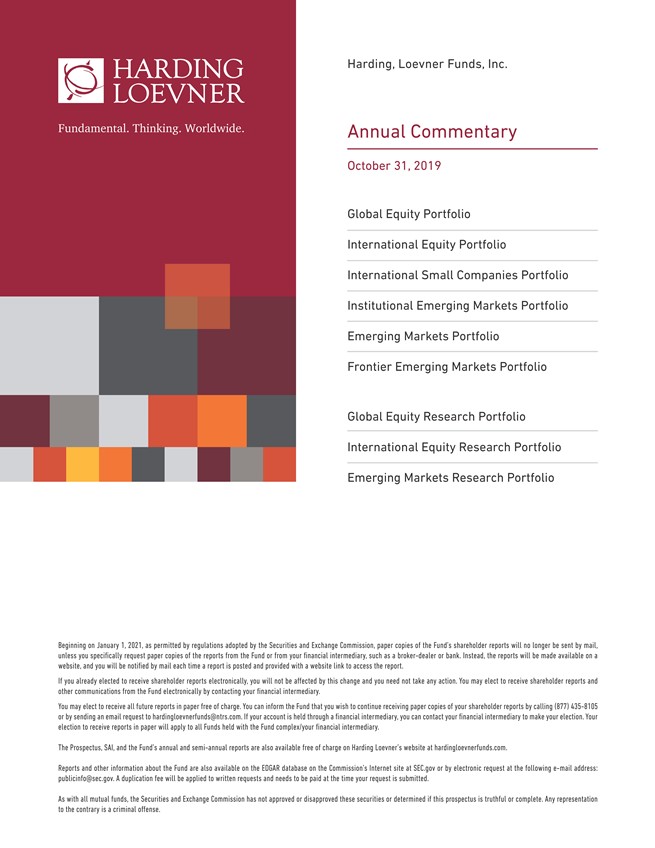
For the Global Equity Portfolio, the Institutional Class rose 11.86%, the Institutional Class Z rose 11.89%, and the Advisor Class rose 11.60% (net of fees and expenses) in the fiscal year ended October 31, 2019. The Portfolio’s benchmark, the MSCI All Country World Index, rose 12.59% (net of source taxes).
MARKET REVIEW
Global stock markets had a volatile fiscal year. After declining sharply toward the end of 2018 amid risingUS-China trade tensions and worries that the US Federal Reserve’s interest rate hikes might trigger a global recession, markets recovered strongly in 2019 to end the trailing twelve months with double-digit gains.
TheUS-China trade drama featured whiplash-inducing developments as optimism about talks turned sour, only to be followed by another apparently positive turn, before again dissolving into recriminations. The year ended at a positive point, with US and Chinese officials beginning a new round of trade negotiations, China offering to increase its purchases of US agricultural goods, and President Donald Trump indicating a willingness to accede to a “phase one” agreement.
As the year progressed, there were increasing signs that the trade war was weighing on global economic growth. Official GDP growth forecasts were revised downward in both the US and in Europe. In China, retail sales and manufacturing activity fell amid a sharp decline in bank lending. Germany’s manufacturing sector abruptly contracted in 2019, and the country’s export sales and orders declined at the fastest rate since the financial crisis in 2008. In September, the Organization for Economic Cooperation and Development (OECD) cut its 2019 forecast for global economic growth to the slowest rate in a decade, citing the impact of theUS-China tariff
FUND FACTS at October 31, 2019 | ||||||||||||
TOTAL NET ASSETS | $962.3M | |||||||||||
SALES CHARGE | NONE | |||||||||||
NUMBER OF HOLDINGS | 69 | |||||||||||
TURNOVER (5 YR. AVG.) | 37% | |||||||||||
REDEMPTION FEE | 2% FIRST 90 DAYS | |||||||||||
DIVIDEND POLICY | ANNUAL | |||||||||||
INSTITUTIONAL INVESTORS | INDIVIDUAL INVESTORS | |||||||||||
| INST CLASS | INST CLASS Z | ADVISOR CLASS | ||||||||||
TICKER | HLMVX | HLGZX | HLMGX | |||||||||
CUSIP | 412295602 | 412295727 | 412295206 | |||||||||
INCEPTION DATE | 11/3/2009 | 8/1/2017 | 12/1/1996 | |||||||||
MINIMUM INVESTMENT1 | $100,000 | $10,000,000 | $5,000 | |||||||||
NET EXPENSE RATIO2 | 0.93% | 0.88% | 1.12% | |||||||||
GROSS EXPENSE RATIO | 0.94% | 0.91% | 1.14% | |||||||||
1Lower minimums available through certain brokerage firms;2The net expense ratio is as of October 31, 2019 as the Portfolio is operating below the contractual agreement, which is in effect until February 28, 2020.
All Expense Ratios are as of the Prospectus dated February 28, 2019 unless otherwise noted.
wars on global trade and capital investment. It also reduced its GDP growth estimates for next year for 18 of the G20 economies.
Confronted with anemic economic growth and still no inflationary impulse from ten years of easy money, central banks responded with additional stimulus. The Federal Reserve cut interest rates in July for the first time since the global financial crisis, and cut them again in late September. The European Central Bank renewed its quantitative easing program and pushed short-term interest rates deeper into negative territory. China lowered its reserve requirement for banks. Central banks in other countries also moved to cut rates or otherwise create monetary stimulus.
Information Technology (IT), led by the traditionally cyclical semiconductor group, was one of the strongest sectors, alongside Real Estate and Utilities (normally considered “defensive” sectors). Energy and Materials were the weakest-performing sectors amid declines in the prices of oil and other commodities.
PERFORMANCE ATTRIBUTION
Poor performance from our IT holdings detracted in the fiscal year, notablyUS-based graphics chipmakerNVIDIA, which suffered from the theUS-China technology dispute. Stocks in Energy also detracted, especially oilfield services companySchlumberger, although this was offset by our underweight in the poorly performing sector.
6
|
Table of Contents
PERFORMANCE (% TOTAL RETURN)
| for periods ended September 30, 2019 | for periods ended October 31, 2019 | |||||||||||||||||||||||||||||||||||||||||||||||||||||||||
1 YEAR | 3 YEARS | 5 YEARS | 10 YEARS | SINCE INCEPTION* Nov-09 Aug-17 Dec-96 | 1 YEAR | 3 YEARS | 5 YEARS | 10 YEARS | SINCE INCEPTION* Nov-09 Aug-17 Dec-96 | |||||||||||||||||||||||||||||||||||||||||||||||||
GLOBAL EQUITY PORTFOLIO – INST CLASS | -1.83 | 10.64 | 8.44 | — | 9.52 | 11.86 | 12.46 | 8.56 | – | 9.74 | ||||||||||||||||||||||||||||||||||||||||||||||||
GLOBAL EQUITY PORTFOLIO – INST CLASS Z | -1.75 | – | – | – | 5.66 | 11.89 | – | – | – | 6.76 | ||||||||||||||||||||||||||||||||||||||||||||||||
GLOBAL EQUITY PORTFOLIO – ADVISOR CLASS | -2.08 | 10.37 | 8.17 | 9.13 | 7.04 | 11.60 | 12.20 | 8.30 | 9.56 | 7.14 | ||||||||||||||||||||||||||||||||||||||||||||||||
MSCI ALL COUNTRY WORLD INDEX | 1.38 | 9.71 | 6.65 | 8.35 | 8.63 | 5.97 | – | 12.59 | 11.33 | 7.08 | 8.81 | 8.85 | 7.01 | – | ||||||||||||||||||||||||||||||||||||||||||||
Returns are annualized for periods greater than 1 year. *Inception of the Institutional Class, November 3, 2009. Inception of the Institutional Class Z, August 1, 2017. Inception of the Advisor Class, December 1, 1996. Index performance prior to January 1, 2001 cannot be shown since it relies on back-filled data.
Performance data quoted represents past performance; past performance does not guarantee future results. The investment return and principal value of an investment will fluctuate so that an investor’s shares, when redeemed, may be worth more or less than their original cost. Current performance of the Portfolio may be lower or higher than the performance quoted. Performance data current to the most recent month end may be obtained by calling (877)435-8105 or visiting www.hardingloevnerfunds.com. Performance data shown does not reflect the 2.00% redemption fee imposed on shares held 90 days or less; otherwise, total returns would be reduced.
Offsetting this, good stocks within Financials contributed positively to relative performance. Shares ofAIA Group, a Hong Kong-based insurer, announced in February that the company had received approval from Chinese regulators to expand operations to additional provinces. Indian financialsHDFC Bank andICICI Bank rebounded from prior weakness, later aided by the country’s September corporate tax cut. Strong returns from the Portfolio’s Health Care and Industrials stocks also contributed.
From a geographic perspective, stocks in the US detracted significantly from relative performance, especially Schlumberger andWalgreens Boots Alliance. Shares of pharmaceutical manufacturerRegeneron were weaker on continued concerns that drug price reforms would impact revenues, particularly if US proposals to benchmark drug prices to lower-priced international equivalents were enacted.
The Portfolio benefited from strong stocks in Japan, where shares of medical information services companyM3 rose sharply after the announcement that it would be added to the Nikkei 225 Index. Optical sensor manufacturerKeyence also gained. Pacificex-Japan was another contributor, thanks to Hong Kong-based AIA.
The Portfolio’s performance in emerging markets was mixed. While returns from stocks in India (HDFC Bank and ICICI Bank) and Indonesia (Bank Central Asia) were positive in the fiscal year, they only partially offset the poor performance of our Chinese holdings. Shares ofBaidu,AAC Technologies, andCtrip.com were all sharply negative.
PERSPECTIVE AND OUTLOOK
We have been concerned about President Trump’s approach to trade policy from the outset of his administration. A day after his election in 2016, we predicted “beneficiaries of trade and globalization stand to lose” if consensus assumptions about his future policies proved correct. By the fourth quarter of last year, new tariffs had been imposed, and their impact was beginning to be felt. We revealed our fear of an emergent trade war becoming “an attack on the bounty of globalization: the efficiencies of
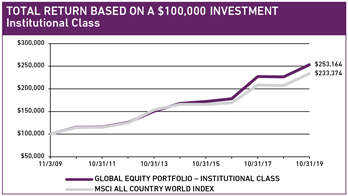
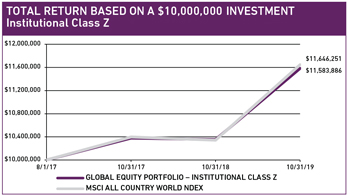
The charts above illustrate the hypothetical return of an investment made in the corresponding share classes. Investment return reflects voluntary fee waivers in effect. Absent such waivers, total return would be reduced. The performance provided in the table and charts above do not reflect the deduction of taxes that a shareholder would pay on Portfolio distributions or the redemption of Portfolio shares.
7
|
Table of Contents
global supply chains that have benefited consumers everywhere while bolstering the profits of those companies most adept at exploiting them.”
We are no longer thinking about the possibility of a hot trade war but rather grappling with the reality of one. As it has escalated, companies have canceled investment plans, shifted their supply chains out of China, and been forced to choose between accepting lower margins or lower sales. The impact of tariffs is now showing up in economic data. In August, the US Purchasing Managers Index sank to a10-year low, while Germany’s Business Climate Index dropped to a nearly7-year low. The World Trade Organization (WTO) halved its estimate of growth in world trade in merchandise this year to just 1.2%, the slowest since 2009.
Due to the nature of today’s global trading system the negative effects of the trade war will be further-reaching than its proponents represented. According to a new WTO report, today more thantwo-thirds of global trade flows through global value chains (GVCs), with the remainder reflecting the traditional cross-border exchange of finished products. In “simple” GVCs, companies supply intermediate goods for use in finished production in other countries, for example, Brazilian iron ore exported to China to be made into steel for use in its skyscrapers. In “complex” GVCs, components cross andre-cross borders in intermediate production before being assembled as a final product. The iPhone is the classic example of such a “made in the world” product of a complex GVC. Gorilla Glass from Corning factories in Kentucky, semiconductors from Texas Instruments, batteries from Korea, DRAM from Taiwan, and other parts from 40 additional countries are assembled in China and shipped as a finished smartphone to consumers around the globe. The automobile and aircraft industries exhibit a similarly complex organization of production.
Determining the impact of tariffs on participants in GVCs is a near-impossible task. The WTO report notes: “One important policy implication is that changes in trade policy can have broad and unanticipated effects. The unilateral imposition of trade protection on exports from a partner country can have a significant impact on third countries when trade is carried out through GVCs, particularly complex GVCs. Indeed, as many products today are
GEOGRAPHIC EXPOSURE (%) at October 31, 2019
| COUNTRY/REGION | PORTFOLIO | BENCHMARK1 | ||||||
CANADA | 0.0 | 3.0 | ||||||
EMERGING MARKETS | 14.5 | 11.7 | ||||||
EUROPE EMU | 8.0 | 9.5 | ||||||
EUROPEEX-EMU | 9.2 | 9.1 | ||||||
FRONTIER MARKETS2 | 0.0 | – | ||||||
JAPAN | 11.5 | 7.4 | ||||||
MIDDLE EAST | 0.0 | 0.2 | ||||||
PACIFICEX-JAPAN | 2.8 | 3.6 | ||||||
UNITED STATES | 51.0 | 55.5 | ||||||
CASH | 3.0 | – | ||||||
1MSCI All Country World Index;2Includes countries with less-developed markets outside the Index.
SECTOR EXPOSURE (%) at October 31, 2019
| SECTOR | PORTFOLIO | BENCHMARK1 | ||||||
COMMUNICATION SERVICES | 8.9 | 8.8 | ||||||
CONSUMER DISCRETIONARY | 12.1 | 10.8 | ||||||
CONSUMER STAPLES | 5.5 | 8.4 | ||||||
ENERGY | 2.3 | 5.3 | ||||||
FINANCIALS | 14.2 | 16.7 | ||||||
HEALTH CARE | 17.9 | 11.6 | ||||||
INDUSTRIALS | 12.1 | 10.5 | ||||||
INFORMATION TECHNOLOGY | 18.3 | 16.5 | ||||||
MATERIALS | 5.7 | 4.7 | ||||||
REAL ESTATE | 0.0 | 3.3 | ||||||
UTILITIES | 0.0 | 3.4 | ||||||
CASH | 3.0 | – | ||||||
1MSCI All Country World Index.
already ‘made in the world,’ increasing import protection can even harm exports from the home country.”
So great has been the bounty of the global trading system over our investing careers, it’s certainly the case that we have developed a bias in favor of businesses that are deeply embedded in complex GVCs. We have found that they tend to have lower and more flexible costs, making them more competitive. They are able to achieve higher and more geographically diversified revenues, and higher and more stable profit margins, potentially resulting in higher returns on capital. It is for these reasons that our research process leads us to them. If the global trading system is under rising threat from political interference, discount rates will rise for the shares of those companies most exposed.
Every quarter, we provide a breakdown of the portfolio’s regional and sector exposures as an exhibit of the diversification of our holdings, and, by implication, of the risks in the portfolio. Internally, we also compute the regional sources of revenues for each portfolio company. Thus, we put at the disposal of the portfolio managers the aggregate regional revenue breakdown of the companies in their portfolios, as a guide to risks of growth interruption or exposure to long-term trends in the various countries or regions.
We’ve adopted and streamlined the WTO’s taxonomy of enterprises to create a classification by which we can (crudely) estimate the portfolio’s aggregate exposure to global value chains. Accordingly, we classify our companies as follows:
| • | Adomestic business is one whose operations are limited to one country. An example is HDFC Bank, which does almost all its business in its home market of India. |
| • | Amulti-domestic business is similar to what is commonly known as a multinational corporation (MNC), but with what we think is a needed twist. An example is the Swiss-based consumer products giantNestlé. The company is commonly viewed as an MNC since it sells its products in 190 countries. |
8
|
Table of Contents
While Nestlé uses raw materials from around the world and there is some trade in Nestlé’s end products, the vast majority of its products are manufactured in the same place they are sold: in the 80 countries where it has factories. To us, this means Nestlé’s GVC exposure is lower as it is effectively a set of domestic business in multiple countries. |
| • | Across-border business not only has sales in multiple countries but also a complex production chain that sources components from many countries, assembles in others, and then transports the final product to countries around the world. Examples here include Adidas andApple. |
Distinguishing our companies in this way yields a picture of our aggregate exposure to each of the three business models. As can be seen in the table below, our portfolio’s exposure to cross-border businesses is sizable, with nearly 60% by portfolio weight so classified.
MODEL GLOBAL EQUITY PORTFOLIO END WEIGHT BY GLOBAL VALUE CHAIN CLASSIFICATION | ||||||||
CROSS-BORDER | 59 | % | ||||||
MULTI-DOMESTIC | 19 | % | ||||||
| DOMESTIC | 22 | % | ||||||
Source: Harding Loevner Global Equity Model as of October 31, 2019.
If theUS-instigated tariff threats have increased the risks of employing complex supply chains, then discount rates will have also risen for the companies whose businesses depend on them. While each analyst will be making judgments about whether such risks for any one company are adequately (or excessively) discounted in its share price, portfolio managers need to consider just how many of such judgments, that is, how many cross-border businesses, they are willing to back in their portfolio.
Over the last twelve months, the share prices of companies that we have categorized as cross-border have performed worse than the rest of the portfolio. This effect was particularly pronounced in the fourth quarter of 2018. Unfortunately, without a similar classification for all stocks in the index, we have no means to quantify the effect on relative performance of this “cross border” factor apart from other factors.
The effect of tariffs on participants in GVCs is but one, albeit a very important, example of how political intrusion in the economic sphere impacts our companies. It is clear that we must constantly monitor on many fronts the threats of government intervention. These threats are rising, not only in the form of tariffs, but also as additional restrictions on technology transfer (e.g., the US ban on sales of certain computer chips to certain Chinese entities), capital restrictions (US threats to restrict investment in Chinese equities, or force Chinese companies to move their listings from US stock exchanges), or even putative presidential “orders” that US companies abandon the business relationships they have built up in China. Our analysts must grasp how each company manages its supply chain and make a judgment about whether or not such risks are appropriately discounted in its share price.
TEN LARGEST HOLDINGS at October 31, 2019
| COMPANY | SECTOR | COUNTRY | % | |||||||||
PAYPAL | INFO TECHNOLOGY | US | 4.2 | |||||||||
BOOKING HOLDINGS | CONS DISCRETIONARY | US | 2.9 | |||||||||
ALPHABET | COMM SERVICES | US | 2.9 | |||||||||
VERTEX PHARMA | HEALTH CARE | US | 2.8 | |||||||||
AIA GROUP | FINANCIALS | HONG KONG | 2.8 | |||||||||
ROPER | INDUSTRIALS | US | 2.7 | |||||||||
FIRST REPUBLIC BANK | FINANCIALS | US | 2.7 | |||||||||
M3 | HEALTH CARE | JAPAN | 2.4 | |||||||||
LONZA | HEALTH CARE | SWITZERLAND | 2.4 | |||||||||
VERISK ANALYTICS | INDUSTRIALS | US | 2.4 | |||||||||
PORTFOLIO HIGHLIGHTS
We tend to favorEM-oriented financial companies because we think that economies where the penetration of financial services is low, the ratio of debt to GDP is modest, and the need for retirement savings and other protection is only beginning to be recognized offer banks and insurers more opportunities for growth. That preference exposes the portfolio not only to more growth opportunity but also to more market volatility, and results in this period illustrated thattrade-off. Two of our holdings—AIA andStandard Chartered—have significant operations in Hong Kong and China. While their shares have performed poorly recently as unrest in Hong Kong has escalated, we like their long-term prospects.
AIA, apan-Asian insurer, boasts Hong Kong as its largest and most profitable market. The company has increasingly prospered by writing policies in Hong Kong for Chinese nationals willing and able to travel there. This business is sure to have been affected by the unrest that has, at times, shuttered the city’s airport and subways. AIA has long been investing to expand its operations on the mainland, already an important source of growth and significant share of revenues. In our view, AIA remains one of the most respected brands in all of Asia and in China, preferred by consumers for its multinational pedigree and financial strength, advantages that will outlast the current turmoil in Hong Kong.
Standard Chartered, aUK-domiciled bank with a large presence across Asia, including Hong Kong, also saw its shares dip. In addition to its Hong Kong operations, the bank is exposed to the disruption of the complex global supply chains of its clients. It books roughlytwo-thirds of its corporate banking revenues in a country different from the home country of the client. We have been positively surprised by the resilience of the business (and its shares) given the headwinds from these two sources. In August, the stock rebounded after first-half results showed that the bank’s business is slowly returning to growth after several years of retrenchment under the new management team led by CEO Bill Winters. We’re attracted to the modestly valued shares, which discount high market skepticism that the bank can regain the double-digit return on equity that it targets.
Please read the separate disclosures page for important information, including the risks of investing in the Portfolio.
9
|
Table of Contents

PORTFOLIO MANAGEMENT TEAM
|
FERRILL ROLL, CFA CO-LEAD PORTFOLIO MANAGER
ANDREW WEST, CFA CO-LEAD PORTFOLIO MANAGER
SCOTT CRAWSHAW PORTFOLIO MANAGER
BRYAN LLOYD, CFA PORTFOLIO MANAGER
PATRICK TODD, CFA PORTFOLIO MANAGER
ALEXANDER WALSH, CFA PORTFOLIO MANAGER |

 PERFORMANCE SUMMARY
For the International Equity Portfolio, the Institutional Class rose 11.19%, the Institutional Class Z rose 11.29%, and the Investor Class rose 10.79% (net of fees and expenses) in the fiscal year ended October 31, 2019. The Portfolio’s benchmark, the MSCI All Country Worldex-US Index, rose 11.27% (net of source taxes).
MARKET REVIEW
International stock markets had a volatile fiscal year. After falling sharply toward the end of 2018 amid risingUS-China trade tensions and worries that the US Federal Reserve’s interest rate hikes might trigger a global recession, markets recovered strongly in 2019 to end the trailing twelve months with double-digit gains.
TheUS-China trade drama featured whiplash-inducing developments as optimism about talks turned sour, only to be followed by another apparently positive turn, before again dissolving into recriminations. The year ended at a positive point, with US and Chinese officials beginning a new round of trade negotiations, China offering to increase its purchases of US agricultural goods, and President Donald Trump indicating a willingness to accede to a “phase one” agreement.
As the year progressed, there were increasing signs that the trade war was weighing on global economic growth. Official GDP growth forecasts were revised downward in both the US and in Europe. In China, retail sales and manufacturing activity fell amid a sharp decline in bank lending. Germany’s manufacturing sector abruptly contracted in 2019, and the country’s export sales and orders declined at the fastest rate since the financial crisis in 2008. In September, the OECD cut its 2019 forecast for global economic growth to the slowest rate in a decade, citing the impact of the
FUND FACTS at October 31, 2019 | ||||||||||||
TOTAL NET ASSETS | $16,101.0M | |||||||||||
SALES CHARGE | NONE | |||||||||||
NUMBER OF HOLDINGS | 60 | |||||||||||
TURNOVER (5 YR. AVG.) | 17% | |||||||||||
REDEMPTION FEE | 2% FIRST 90 DAYS | |||||||||||
DIVIDEND POLICY | ANNUAL | |||||||||||
INSTITUTIONAL INVESTORS | INDIVIDUAL INVESTORS | |||||||||||
| INST CLASS | INST CLASS Z | INVESTOR CLASS | ||||||||||
TICKER | HLMIX | HLIZX | HLMNX | |||||||||
CUSIP | 412295107 | 412295719 | 412295503 | |||||||||
INCEPTION DATE | 5/11/1994 | 7/17/2017 | 9/30/2005 | |||||||||
MINIMUM INVESTMENT1 | $100,000 | $10,000,000 | $5,000 | |||||||||
NET EXPENSE RATIO | 0.81% | 0.74% | 1.13% | 2 | ||||||||
GROSS EXPENSE RATIO | 0.81% | 0.74% | 1.14% | |||||||||
1Lower minimums available through certain brokerage firms;2The net expense ratio is as of October 31, 2019 as the Portfolio is operating below the contractual agreement, which is in effect until February 28, 2020.
All Expense Ratios are as of the Prospectus dated February 28, 2019 unless otherwise noted.
US-China tariff wars on global trade and capital investment. It also reduced its GDP growth estimates for next year for 18 of the G20 economies.
Confronted with anemic economic growth and still no inflationary impulse from ten years of easy money, central banks responded with additional stimulus. The Federal Reserve cut interest rates in July for the first time since the global financial crisis, and cut them again in late September. The European Central Bank renewed its quantitative easing program and pushed short-term interest rates deeper into negative territory. China lowered its reserve requirement for banks. Central banks in other countries also moved to cut rates or otherwise create monetary stimulus.
Information Technology, led by the traditionally cyclical semiconductor group, was the strongest sector, followed by Utilities (normally considered a “defensive” sector). Energy and Materials were the weakest-performing sectors amid declines in the prices of oil and other commodities.
PERFORMANCE ATTRIBUTION
Good stock performance within Financials was the largest contributor to relative returns in the year. Shares ofAIA Group, a Hong Kong-based insurer, rose after the company announced in February that it had received approval from Chinese regulators
10
|
Table of Contents
PERFORMANCE (% TOTAL RETURN)
| for periods ended September 30, 2019 | for periods ended October 31, 2019 | |||||||||||||||||||||||||||||||||||||||||||||||||||||||||
| 1 | 3 | 5 | 10 | SINCE INCEPTION* | 1 | 3 | 5 | 10 | SINCE INCEPTION* | |||||||||||||||||||||||||||||||||||||||||||||||||
| YEAR | YEARS | YEARS | YEARS | May-94 | Jul-17 | Sep-05 | YEAR | YEARS | YEARS | YEARS | May-94 | Jul-17 | Sep-05 | |||||||||||||||||||||||||||||||||||||||||||||
INTL EQUITY PORTFOLIO – INST CLASS | -3.34 | 6.68 | 5.37 | 7.19 | 6.05 | 11.19 | 8.83 | 5.71 | 7.64 | 6.17 | ||||||||||||||||||||||||||||||||||||||||||||||||
INTL EQUITY PORTFOLIO – INST CLASS Z | -3.25 | – | – | – | 2.82 | 11.29 | – | – | – | 4.23 | ||||||||||||||||||||||||||||||||||||||||||||||||
INTL EQUITY PORTFOLIO – INVESTOR CLASS | -3.65 | 6.31 | 5.03 | 6.84 | 5.91 | 10.79 | 8.46 | 5.36 | 7.29 | 6.12 | ||||||||||||||||||||||||||||||||||||||||||||||||
MSCI ALL COUNTRY WORLDEX-US INDEX | -1.23 | 6.33 | 2.90 | 4.46 | – | 1.79 | 4.19 | 11.27 | 8.07 | 3.82 | 4.94 | – | 3.25 | 4.42 | ||||||||||||||||||||||||||||||||||||||||||||
Returns are annualized for periods greater than 1 year. *Inception of the Institutional Class, May 11, 1994. Inception of the Institutional Class Z, July 17, 2017. Inception of the Investor Class, September 30, 2005. Index performance prior to January 1, 2001 cannot be shown since it relies on back-filled data.
Performance data quoted represents past performance; past performance does not guarantee future results. The investment return and principal value of an investment will fluctuate so that an investor’s shares, when redeemed, may be worth more or less than their original cost. Current performance of the Portfolio may be lower or higher than the performance quoted. Performance data current to the most recent month end may be obtained by calling (877)435-8105 or visiting www.hardingloevnerfunds.com. Performance data shown does not reflect the 2.00% redemption fee imposed on shares held 90 days or less; otherwise, total returns would be reduced.
to expand operations to additional provinces. Indian financialsHDFC Bank and ICICI Bank rebounded from prior weakness, later aided by the country’s September corporate tax cut. Strong returns from Consumer Staples stocks also contributed, especially French cosmetics manufacturerL’Oréaland Swiss branded-food giantNestlé.
Poor performance from our Communication Services holdings detracted in the period, especially telecom services providerChina Mobile and Chinese internet search engineBaidu. China’s government eliminated data-roaming charges, decreasing China Mobile’s average revenue per user. Baidu is facing increased rivalry in online advertising amid China’s slowing economy.
From a geographic perspective, the Portfolio benefited from strong stock selection in Europe outside the eurozone. In Switzerland, Nestlé, pharmaceutical giantRoche, and hearing-aid manufacturerSonova Holdings led performance. In Sweden, industrial equipment manufacturerAtlas Copco boosted relative returns. But that good performance was offset by poor stocks from emerging markets, especially from Chinese holdings. Baidu, China Mobile, and online social media, payments, and games companyTencent all detracted.
PERSPECTIVE AND OUTLOOK
We have been concerned about President Trump’s approach to trade policy from the outset of his administration. A day after his election in 2016, we predicted “beneficiaries of trade and globalization stand to lose” if consensus assumptions about his future policies proved correct. By the fourth quarter of last year, new tariffs had been imposed, and their impact was beginning to be felt. We revealed our fear of an emergent trade war becoming “an attack on the bounty of globalization: the efficiencies of global supply chains that have benefited consumers everywhere while bolstering the profits of those companies most adept at exploiting them.”
We are no longer thinking about the possibility of a hot trade war but rather grappling with the reality of one. As it has escalated, companies have canceled investment plans, shifted their supply
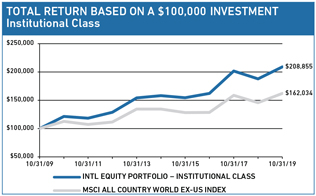
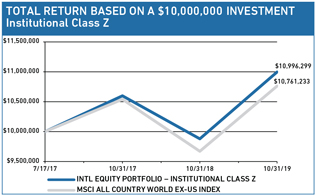
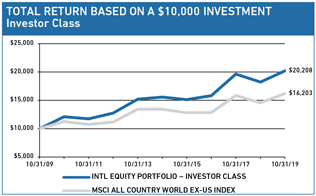
The charts above illustrate the hypothetical return of an investment made in the corresponding share classes. Investment return reflects voluntary fee waivers in effect. Absent such waivers, total return would be reduced. The performance provided in the table and charts above do not reflect the deduction of taxes that a shareholder would pay on Portfolio distributions or the redemption of Portfolio shares.
11
|
Table of Contents
chains out of China, and been forced to choose between accepting lower margins or lower sales. The impact of tariffs is now showing up in economic data. In August, the US Purchasing Managers Index sank to a10-year low, while Germany’s Business Climate Index dropped to a nearly7-year low. The World Trade Organization (WTO) halved its estimate of growth in world trade in merchandise this year to just 1.2%, the slowest since 2009.
Due to the nature of today’s global trading system the negative effects of the trade war will be further-reaching than its proponents represented. According to a new WTO report, today more thantwo-thirds of global trade flows through global value chains (GVCs), with the remainder reflecting the traditional cross-border exchange of finished products. In “simple” GVCs, companies supply intermediate goods for use in finished production in other countries, for example, Brazilian iron ore exported to China to be made into steel for use in its skyscrapers. In “complex” GVCs, components cross andre-cross borders in intermediate production before being assembled as a final product. The iPhone is the classic example of such a “made in the world” product of a complex GVC. Gorilla Glass from Corning factories in Kentucky, semiconductors from Texas Instruments, batteries from Korea, DRAM from Taiwan, and other parts from 40 additional countries are assembled in China and shipped as a finished smartphone to consumers around the globe. The automobile and aircraft industries exhibit a similarly complex organization of production.
Determining the impact of tariffs on participants in GVCs is a near-impossible task. The WTO report notes: “One important policy implication is that changes in trade policy can have broad and unanticipated effects. The unilateral imposition of trade protection on exports from a partner country can have a significant impact on third countries when trade is carried out through GVCs, particularly complex GVCs. Indeed, as many products today are already ‘made in the world,’ increasing import protection can even harm exports from the home country.”
GEOGRAPHIC EXPOSURE (%) at October 31, 2019
| COUNTRY/REGION | PORTFOLIO | BENCHMARK1 | ||||||
CANADA | 2.9 | 6.7 | ||||||
EMERGING MARKETS | 22.0 | 26.2 | ||||||
EUROPE EMU | 23.2 | 21.5 | ||||||
EUROPEEX-EMU | 25.3 | 20.4 | ||||||
FRONTIER MARKETS2 | 0.0 | – | ||||||
JAPAN | 11.4 | 16.7 | ||||||
MIDDLE EAST | 2.6 | 0.4 | ||||||
PACIFICEX-JAPAN | 6.0 | 8.1 | ||||||
OTHER3 | 3.1 | – | ||||||
CASH | 3.5 | – | ||||||
1MSCI All Country Worldex-US Index;2Includes countries with less-developed markets outside the Index;3Includes companies classified in countries outside the Index.
SECTOR EXPOSURE (%) at October 31, 2019
| SECTOR | PORTFOLIO | BENCHMARK1 | ||||||
COMM SERVICES | 5.5 | 6.7 | ||||||
CONSUMER DISCRETIONARY | 2.1 | 11.6 | ||||||
CONSUMER STAPLES | 15.4 | 9.8 | ||||||
ENERGY | 4.3 | 6.6 | ||||||
FINANCIALS | 18.8 | 21.6 | ||||||
HEALTH CARE | 10.8 | 8.7 | ||||||
INDUSTRIALS | 12.8 | 12.1 | ||||||
INFORMATION TECHNOLOGY | 19.7 | 9.0 | ||||||
MATERIALS | 7.1 | 7.3 | ||||||
REAL ESTATE | 0.0 | 3.2 | ||||||
UTILITIES | 0.0 | 3.4 | ||||||
CASH | 3.5 | – | ||||||
1MSCI All Country World ex-USIndex.
So great has been the bounty of the global trading system over our investing careers, it’s certainly the case that we have developed a bias in favor of businesses that are deeply embedded in complex GVCs. We have found that they tend to have lower and more flexible costs, making them more competitive. They are able to achieve higher and more geographically diversified revenues, and higher and more stable profit margins, potentially resulting in higher returns on capital. It is for these reasons that our research process leads us to them. If the global trading system is under rising threat from political interference, discount rates will rise for the shares of those companies most exposed.
Every quarter, we provide a breakdown of the portfolio’s regional and sector exposures as an exhibit of the diversification of our holdings, and, by implication, of the risks in the portfolio. Internally, we also compute the regional sources of revenues for each portfolio company. Thus, we put at the disposal of the portfolio managers the aggregate regional revenue breakdown of the companies in their portfolios, as a guide to risks of growth interruption or exposure to long-term trends in the various countries or regions.
We’ve adopted and streamlined the WTO’s taxonomy of enterprises to create a classification by which we can (crudely) estimate the portfolio’s aggregate exposure to global value chains. Accordingly, we classify our companies as follows:
| • | Adomestic business is one whose operations are limited to one country. An example is HDFCBank, which does almost all its business in its home market of India. |
| • | Amulti-domestic business is similar to what is commonly known as a multinational corporation (MNC), but with what we think is a needed twist. An example is the Swiss-based consumer products giant Nestlé. The company is commonly viewed as an MNC since it sells its products in 190 countries. While Nestlé uses raw materials from around the world and there is some trade in Nestlé’s end products, the vast majority of its products are manufac- |
12
|
Table of Contents
tured in the same place they are sold: in the 80 countries where it has factories. To us, this means Nestlé’s GVC exposure is lower as it is effectively a set of domestic business in multiple countries. |
| • | Across-border business not only has sales in multiple countries but also a complex production chain that sources components from many countries, assembles in others, and then transports the final product to countries around the world. Examples here includeAdidas and Apple. |
Distinguishing our companies in this way yields a picture of our exposure to each business model. As can be seen in the table below, our portfolio’s exposure to cross-border businesses is sizable, with more than 50% by portfolio weight so classified.
| MODEL INTERNATIONAL EQUITY PORTFOLIO END WEIGHT BY GLOBAL VALUE CHAIN CLASSIFICATION | |||||||||
CROSS-BORDER | 58 | % | |||||||
MULTI-DOMESTIC | 32 | % | |||||||
DOMESTIC | 10 | % | |||||||
Source: Harding Loevner International Equity Model as of October 31, 2019.
If theUS-instigated tariff threats have increased the risks of employing complex supply chains, then discount rates will have also risen for the companies whose businesses depend on them. While each analyst will be making judgments about whether such risks for any one company are adequately (or excessively) discounted in its share price, portfolio managers need to consider just how many of such judgments, that is, how many cross-border businesses, they are willing to back in their portfolio.
Over the last twelve months, the share prices of companies that we have categorized as cross-border have performed worse than those classified as multi-domestic, although the small handful of domestic companies in the portfolio did even worse (dominated by terrible performance from Chinese internet search provider Baidu). Unfortunately, without a similar classification for all stocks in the index, we have no means to quantify the effect on relative performance of this “cross-border” factor apart from other factors.
The effect of tariffs on participants in GVCs is but one, albeit a very important, example of how political intrusion in the economic sphere impacts our companies. It is clear that we must constantly monitor on many fronts the threats of government intervention. These threats are rising, not only in the form of tariffs, but also as additional restrictions on technology transfer (e.g., the US ban on sales of certain computer chips to certain Chinese entities), capital restrictions (US threats to restrict investment in Chinese equities, or force Chinese companies to move their listings from US stock exchanges), or even putative presidential “orders” that US companies abandon the business relationships they have built up in China. Our analysts must grasp how each company manages its supply chain and make a judgment about whether or not such risks are appropriately discounted in its share price.
TEN LARGEST HOLDINGS at October 31, 2019
| COMPANY | SECTOR | COUNTRY | % | ||||||||||
NESTLÉ | CONS STAPLES | SWITZERLAND | 3.8 | ||||||||||
ROCHE | HEALTH CARE | SWITZERLAND | 3.8 | ||||||||||
TSMC | INFO TECHNOLOGY | TAIWAN | 3.8 | ||||||||||
AIA GROUP | FINANCIALS | HONG KONG | 3.3 | ||||||||||
ALLIANZ | FINANCIALS | GERMANY | 3.2 | ||||||||||
SAP | INFO TECHNOLOGY | GERMANY | 3.2 | ||||||||||
L’OREAL | CONS STAPLES | FRANCE | 3.1 | ||||||||||
SAMSUNG ELECTRONICS | INFO TECHNOLOGY | SOUTH KOREA | 2.9 | ||||||||||
ATLAS COPCO | INDUSTRIALS | SWEDEN | 2.8 | ||||||||||
DBS GROUP | FINANCIALS | SINGAPORE | 2.7 | ||||||||||
PORTFOLIO HIGHLIGHTS
The International Equity Portfolio has long included large allocations to Health Care companies, due to their consistent growth and high-quality. Though the Portfolio remains overweight in Health Care relative to the index, we have reduced the Portfolio’s allocation to the sector by a third over the last 12 months. We shifted this allocation mainly into Consumer Staples, purchasing Canadian roadside retailerAlimentation Couche-Tardand Mexican convenience stores operator and Coca-Coa bottlerFEMSA.
We exited our position in German kidney dialysis companyFresenius Medical Care after its shares had rebounded following the defeat in November 2018 of the California ballot proposal that would have set controls on the profits of dialysis providers. However, regulatory threats in the US remain. We are also concerned about how the company’s earnings depend on customers who pay through commercial insurers. There is a high risk that insurers may start increasing pricing pressure on dialysis providers.
We were reluctant sellers ofBayer, which we owned into its merger with Monsanto, anticipating synergies between their crop science businesses. Over the past year, however, Bayer’s future has been clouded by adverse jury verdicts finding Monsanto’s Roundup to blame for some users’ blood cancers. The distraction of the lawsuits to follow will make it difficult for management to deliver upon our prior growth expectations. Moreover, the company now faces a large and indeterminate legal liability, in the estimation of which we do not have a particular edge.
Portfolio Management Team Update
As previously announced, Andrew West, a portfolio manager of the International Equity strategy since 2014, became aco-lead portfolio manager of the strategy on January 2, 2019, replacing Alec Walsh. Ferrill Roll continues as the strategy’s otherco-lead portfolio manager.
Please read the separate disclosures page for important information, including the risks of investing in the Portfolio.
13
|
Table of Contents

PORTFOLIO MANAGEMENT

JAFAR RIZVI, CFA CO-LEAD PORTFOLIO MANAGER
ANIX VYAS, CFA CO-LEAD PORTFOLIO MANAGER |
 PERFORMANCE SUMMARY
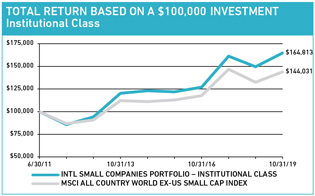
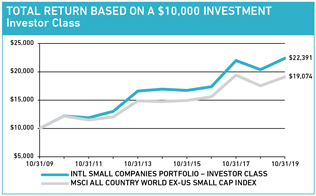
For the International Small Companies Portfolio, the Institutional Class gained 10.14% and the Investor Class rose 9.82% (net of fees and expenses) in the fiscal year ended October 31, 2019. The Portfolio’s benchmark, the MSCI All Country Worldex-US Small Cap Index, rose 8.77% (net of source taxes).
MARKET REVIEW
Stocks of international small companies ended 2018 with their steepest decline since the recession as the opening salvos of theUS-China trade war led to the imposition of new tariffs, the US yield curve flattened after the Federal Reserve indicated additional short-term rate hikes, and reports of slowing growth in China and Germany sparked a flight to safety. However, stocks recouped much of their earlier losses by the end of March asUS-China tensions (temporarily) cooled and central banks reversed course; the Fed announced a pause to future rate hikes and the unwinding of its balance sheet, while the European and Chinese central banks took steps to lower borrowing costs and encourage loan growth. This momentum continued into July, as the Fed cut rates for the first time since the financial crisis and the European Central Bank pushed rates further into negative territory.
This shift in policy was largely precipitated by the slowing global economy. In September, the OECD cut its 2019 forecast for global economic growth to the slowest rate in a decade, blaming the impact of theUS-China trade war on global trade and capital investment. It also reduced its GDP growth estimates for next year for 18 of the G20 economies. Purchasing manager indexes, including those for the US and Germany, indicated the sharpest contraction in manufacturing in close to a decade. In Emerging Markets (EMs), China reported in September that its economy grew 6% in the second quarter of 2019, the lowest rate in nearly three decades.
Coupled with slowing growth, geopolitical concerns also weighed on markets. Independent of theUS-China trade war, a separate trade dispute broke out between Japan and South Korea over World War II reparations. In Europe, the UK’s Brexit fiasco dragged on, as the country continued to extend its deadline to
FUND FACTS at October 31, 2019 | ||||||||
TOTAL NET ASSETS | $329.3M | |||||||
SALES CHARGE | NONE | |||||||
NUMBER OF HOLDINGS | 93 | |||||||
TURNOVER (5 YR. AVG.) | 39% | |||||||
REDEMPTION FEE | 2% FIRST 90 DAYS | |||||||
DIVIDEND POLICY | ANNUAL | |||||||
INSTITUTIONAL INVESTORS | INDIVIDUAL INVESTORS | |||||||
| INSTITUTIONAL CLASS | INVESTOR CLASS | |||||||
TICKER | HLMRX | HLMSX | ||||||
CUSIP | 412295875 | 412295883 | ||||||
INCEPTION DATE | 6/30/2011 | 3/26/2007 | ||||||
MINIMUM INVESTMENT1 | $100,000 | $5,000 | ||||||
NET EXPENSE RATIO2 | 1.15% | 1.40% | ||||||
GROSS EXPENSE RATIO | 1.39% | 1.75% | ||||||
1Lower minimums available through certain brokerage firms;2Shown net of Harding Loevner’s contractual agreement through February 28, 2020.
All Expense Ratios are as of the Prospectus dated February 28, 2019 unless otherwise noted.
leave the EU. In the Middle East, a drone attack on Saudi Arabia’s largest oil production facility disrupted nearly half of the kingdom’s oil output, causing a brief spike in oil prices. In Hong Kong, political protests have at times grounded the city to a halt.
Information Technology (IT) was the best-performing sector, rising approximately 25% during the period. The sector saw an improving outlook for semiconductor and hardware companies as strong demand was anticipated for new devices utilizing the next generation of cellular network technology, 5G. On the other hand, Energy stocks were by far the worst performing, falling 19%.
By region, the Middle East (Israel), Pacificex-Japan, and EMs all performed strongly. Frontier Markets performed the worst, falling nearly 3% as countries such as Saudi Arabia and Argentina weighed on performance.
PERFORMANCE ATTRIBUTION
Strong stock selection in Industrials contributed to the Portfolio’s outperformance over the trailing 12 months. Philippines-based container terminal operatorICTSI rose after its operating margins improved due to increased volumes and efficiencies at its Argentinian, Columbian, and Australian ports. Our stock selection in IT and our overweight to the sector also contributed. In particular, shares of Argentinian IT services firmGlobant were strong as the company’slow-cost base (a majority of its revenue is in USD, while a majority of its costs are in Argentinian pesos), differentiated service offering, and unique operating model continued to drive revenue and profit growth. Israeli information security com-
14
|
Table of Contents
PERFORMANCE (% TOTAL RETURN)
| for periods ended September 30, 2019 | for periods ended October 31, 2019 | |||||||||||||||||||||||||||||||||||||||||||||||||
| 1 | 3 | 5 | 10 | SINCE INCEPTION* | 1 | 3 | 5 | 10 | SINCE INCEPTION* | |||||||||||||||||||||||||||||||||||||||||
| YEAR | YEARS | YEARS | YEARS | Jun-11 | Mar-07 | YEAR | YEARS | YEARS | YEARS | Jun-11 | Mar-07 | |||||||||||||||||||||||||||||||||||||||
INTL SMALL COMPANIES PORTFOLIO – INST CLASS | -4.16 | 7.20 | 5.24 | – | 5.83 | 10.14 | 9.10 | 6.02 | – | 6.18 | ||||||||||||||||||||||||||||||||||||||||
INTL SMALL COMPANIES PORTFOLIO – INVESTOR CLASS | -4.37 | 6.95 | 4.97 | 8.10 | 5.61 | 9.82 | 8.84 | 5.75 | 8.39 | 5.83 | ||||||||||||||||||||||||||||||||||||||||
MSCI ALL COUNTRY WORLDEX-US SMALL CAP INDEX | -5.63 | 4.64 | 3.98 | 6.13 | 4.02 | – | 8.77 | 6.98 | 5.31 | 6.67 | 4.47 | – | ||||||||||||||||||||||||||||||||||||||
Returns are annualized for periods greater than 1 year. *Inception of the Institutional Class, June 30, 2011. Inception of the Investor Class, March 26, 2007. Index performance prior to June 1, 2007 cannot be shown since it relies on back-filled data.
Performance data quoted represents past performance; past performance does not guarantee future results. The investment return and principal value of an investment will fluctuate so that an investor’s shares, when redeemed, may be worth more or less than their original cost. Current performance of the Portfolio may be lower or higher than the performance quoted. Performance data current to the most recent month end may be obtained by calling (877)435-8105 or visiting www.hardingloevnerfunds.com. Performance data shown does not reflect the 2.00% redemption fee imposed on shares held 90 days or less; otherwise, total returns would be reduced.
The charts below illustrate the hypothetical return of an investment made in the corresponding share classes. Investment return reflects voluntary fee waivers in effect. Absent such waivers, total return would be reduced. The performance provided in the table and charts above do not reflect the deduction of taxes that a shareholder would pay on Portfolio distributions or the redemption of Portfolio shares.
panyCyberArk Softwarealso contributed as strong sales of its security software led to rising revenue, earnings, and profit margins.
Poor selection in Materials hurt relative returns. Shares of Vietnamese steel producerHoa Phat Group declined as the company faced declining margins due to rising costs for imported iron ore. The portfolio’s underweight to strongly-performing Real Estate, and overweight to poorly-performing Consumer Staples, also detracted.
Our stock selection in the eurozone contributed more to our relative returns than any other region, thanks to Germany-based ophthalmic equipment manufacturerCarl Zeiss Meditec, whose shares gained as the company improved margins and grew sales of its laser eye surgery platform, RelexSMILE. Finland-based atmospheric devices manufacturerVaisala also contributed as the company raised its revenue guidance during the period and acquired a liquid measurement business that should provide new avenues for growth. Our stocks in emerging markets also helped, especially ICTSI.
Our poor stock selection in Europe outside the eurozone, particularly the UK and Sweden, detracted from relative returns. In the UK,Senior, a manufacturer of components for jetliners, trucks, and power plants, continued to suffer from the extended grounding of the Boeing 737 Max, which uses a number of Senior’s parts. Investors are concerned that Boeing will further reduce production
of the plane, hurting Senior’s sales. Kazakhstan-basedNostrum Oil & Gas (which trades on the London Stock Exchange) was another detractor. We exited our position in the company as management has repeatedly guided down production targets and delayed the commissioning of a gas treatment unit that was expected to double production volumes.
INVESTMENT PERSPECTIVES
Corporate managers recognized as early as the 1960s how computers and software could boost productivity and reduce costs. They also realized that the design, implementation, and management of increasingly sophisticated and constantly evolving systems required expertise that most companies could not readily sustain internally, so they turned to specialist companies for help. The IT services industry took off, its growth occurring in waves that mirrored technological advances. At first, companies sought services to set up hardware (e.g., mainframes, minicomputers, PCs, and servers), customizeoff-the-shelf software, and install corporate networks. Later, growth was propelled by the emergence of the internet and more advanced software for enterprise and supply-chain management. While IT leaders like IBM and Electronic Data Systems captured most of the early growth, later phases offered opportunities for smaller companies to carve out places for themselves.
15
|
Table of Contents
Advances in artificial intelligence, cloud computing, and Big Data analytics are driving the latest wave of growth for IT services companies. Corporate managers who believe these tools will transform their businesses are spending heavily in hopes that the technologies will allow them to capture new growth opportunities, fend off rivals, and improve their returns on capital. Once again, they’re seeking outside help. The total addressable market for the “digital” services, within the broader US$1 trillion IT Services and Consulting industry, is estimated to be as much as US$300 billion, and it’s growing about 20% a year, significantly higher than the industry’s overall growth of about 5% a year. But the IT services giants that benefited most from the earlier growth are not in the best position to capture this new opportunity. Large incumbents like TCS in India, IBM in the US, and Capgemini in France are saddled with high revenue exposure to older technologies. Smaller IT services companies, on the other hand, have little to no exposure to legacy technologies and have smaller, nimbler, and more focused teams of engineers who specialize only in the cutting-edge technologies most in demand today.
The strong growth and potentially high profits of digital IT services have attracted numerous companies to the industry. Barriers to entry are low: engineers with expertise in the right niche can easily set up their own companies and attract customers. However, the transition from a single entrepreneur to a growing company (and a potential long-term investment opportunity) requires more than just the specialized knowledge of an individual engineer. Management ability and organizational structure are the defining characteristics between a small IT shop and large organization with more sustainable growth. As a company executes on projects, management must develop repeatable methodologies and processes, as well as document mistakes and how they were fixed. Companies that do this well tend to be more successful at accumulating and applying these skills across multiple clients.
Italy-basedReplyis an IT services company that has developed areas of expertise and an organizational structure conducive to long-term growth. It was founded in 1996 by Mario Rizzante, who left his position at the systems integrator Atos because he saw the potential of the internet to reshape the ways businesses operated internally and how they interacted with customers externally. At the time, many of the largest IT services companies were not focused on the internet. Rizzante filled the void. He realized that Reply would need to build a nimble organization that could adapt to new technological trends more quickly than larger companies. Reply was structured differently than most IT services companies, relying on small teams that operated as independent companies. The parent company incentivized these subsidiary companies appropriately, paying their managers bonuses for growing earnings. Each developed a particular technological or business focus, and, due to their small size, they stayed nimble over a period marked by technological advancement.
Today, Reply’s 7,600 employees still operate in small business units; the company now has a network of over 80 subsidiaries, each focused on a specific technology or industry. An executive board oversees all the offerings and coordinates collaboration among the teams. The autonomous nature of the subsidiaries allows
SECTOR EXPOSURE (%) at October 31, 2019
| SECTOR | PORTFOLIO | BENCHMARK1 | ||||||
COMMUNICATION SERVICES | 7.2 | 4.7 | ||||||
CONSUMER DISCRETIONARY | 6.0 | 12.4 | ||||||
CONSUMER STAPLES | 10.7 | 6.1 | ||||||
ENERGY | 3.6 | 3.1 | ||||||
FINANCIALS | 5.1 | 10.2 | ||||||
HEALTH CARE | 14.8 | 7.3 | ||||||
INDUSTRIALS | 21.1 | 19.4 | ||||||
INFORMATION TECHNOLOGY | 20.2 | 10.7 | ||||||
MATERIALS | 3.8 | 10.0 | ||||||
REAL ESTATE | 0.6 | 12.7 | ||||||
UTILITIES | 2.2 | 3.4 | ||||||
CASH | 4.7 | – | ||||||
1MSCI All Country Worldex-US Small Cap Index.
GEOGRAPHIC EXPOSURE (%) at October 31, 2019
| COUNTRY/REGION | PORTFOLIO | BENCHMARK1 | ||||||
CANADA | 1.4 | 6.8 | ||||||
EMERGING MARKETS | 22.8 | 20.7 | ||||||
EUROPE EMU | 23.6 | 16.4 | ||||||
EUROPEEX-EMU | 21.7 | 23.1 | ||||||
FRONTIER MARKETS2 | 4.4 | – | ||||||
JAPAN | 15.6 | 23.0 | ||||||
MIDDLE EAST | 1.7 | 1.3 | ||||||
PACIFICEX-JAPAN | 1.8 | 8.7 | ||||||
OTHER3 | 2.3 | – | ||||||
CASH | 4.7 | – | ||||||
1MSCI All Country Worldex-US Small Cap Index;2Includes countries with less-developed markets outside the Index;3Includes companies classified in countries outside the Index.
the company as a whole to be extremely adaptable. At the same time, their aggregate knowledge can be applied to multiple customers. Its “Data Reply” subsidiary, for example, specializes in providing customers with applications for acquiring, analyzing, and interpreting Big Data. Recently, the company was hired by a large energy supplier to apply machine learning tools to sensor data collected at a wind farm to help better predict when its turbines might fail. By doing so, the energy company could undertake maintenance work more efficiently and reduce costly downtime.
With its network of small businesses, Reply has been quicker to offer solutions for cutting-edge technology than most other IT services companies. Its selling point is knowledge of the newest technology, not low cost. Customers do not mind: over the past five years, Reply’s revenues and operating profits have risen at a compounded rate of 10% and 15%, respectively, per year—a growth rate we expect to continue.
16
|
Table of Contents
Argentina-based Globant is another, more recent example of a small IT services firm that has developed sustainable competitive advantages. The company was founded in 2003 by four engineers who foresaw a fundamental shift in how software services and products could be delivered thanks to the ubiquitous availability of high-speed internet and its ability to transmit live data, images, and video. Rather than follow the “we work while you sleep” model of Indian IT services providers, they envisioned a company that could help clients during their workdays, regardless of location. Argentina’s economy and perennially weak currency also helped in that engineers were paid in pesos while clients outside Argentina paid their bills in stronger currencies. Globant’s early focus was on software development, infrastructure management, and globalization/localization, which entailed developing programs for different languages. One of its first clients was Google, which hired the young company to help build its AdWords online-advertising system. The success of that project led to additional work on Google’s onlinee-commerce engine and the social media capabilities of a subsequent acquisition—YouTube.
The early work led to a specialization in numerous areas of interest to future clients: social media integration, data security, and designing software for mobile devices. Over time, it gained more business from Google and added many other blue-chip clients, including Disney, Ubisoft, and American Express. Unlike larger rivals that have more bureaucratic management structures, Globant organizes its people into small cross-functional teams. It now has over 9,200 employees, many of whom are located in Argentina and elsewhere in Latin America.
Globant’slow-cost base, differentiated service offering, and unique operating model have helped drive nearly 30% compound annual revenue growth and approximately 80% operating profit growth over the last five years. We think the company can continue to grow revenues and profits at a rate much higher than the IT services industry as a whole due to its unique services offering, providing opportunities for further penetration at existing customers and the addition of new clients.
PORTFOLIO HIGHLIGHTS
During the past 12 months, our highest-quality and fastest-growing companies have generally become more expensive, and are also larger contributors to portfolio risk in terms of volatility, beta, and tracking error. Our preference for these companies presents us with a dilemma: should we continue to emphasize the highest-quality and fastest-growing companies, tolerating their prices and heightened risk, or should we gravitate incrementally to businesses that may be slightly less robust, but whose stock prices are cheaper and less volatile? It’s largely been a balancing act between these two approaches, though recently we have slightly favored the latter—choosing to trim strong performers that have led to sector overweights.
In the period, we maintained our significant overweight to the IT sector, which represents about 20% of the portfolio. During reviews of our portfolio’s risk profile, we noticed that these holdings
TEN LARGEST HOLDINGS at October 31, 2019
| COMPANY | SECTOR | COUNTRY | % | |||||||||
ARIAKE | CONS STAPLES | JAPAN | 2.8 | |||||||||
CARL ZEISS MEDITEC | HEALTH CARE | GERMANY | 2.6 | |||||||||
ALTEN | INFO TECHNOLOGY | FRANCE | 2.4 | |||||||||
RUBIS | UTILITIES | FRANCE | 2.2 | |||||||||
BECHTLE | INFO TECHNOLOGY | GERMANY | 2.2 | |||||||||
REPLY | INFO TECHNOLOGY | ITALY | 2.2 | |||||||||
ABCAM | HEALTH CARE | UK | 2.1 | |||||||||
VAISALA | INFO TECHNOLOGY | FINLAND | 2.0 | |||||||||
CORE LABORATORIES | ENERGY | US | 2.0 | |||||||||
NAKANISHI | HEALTH CARE | JAPAN | 1.9 | |||||||||
had elevated the portfolio’s risk, specifically in terms of volatility, beta, and tracking error. In response, we trimmed several of our IT holdings: Globant, CyberArk, andInfomart. The actions had their desired effect, reducing the portfolio’s overall risk profile, though the continued rise in these companies’ share prices has exacted an opportunity cost.
We continued this approach into August with Carl Zeiss Meditec. Though it continues to execute exceptionally well, we trimmed our exposure due to its increasing contribution to our portfolio’s volatility. We have little doubt that the company’s margins can expand further, but think this is already reflected in its stock, which has been trading at or near itsall-time high. We also trimmed several other holdings, including ICTSI,Integrated Diagnostics,Nakanishi, andBechtle, all in the effort to temper our exposure to expensive valuations and volatility. We also sold two companies specifically on account of their high valuations:Britvic, a UK beverage maker, andBrunel International, a Netherlands-based specialty employment company.
On an absolute basis, our exposure to Japan increased during the period, though we are still underweight relative to the benchmark. We established a position inRohto Pharmaceutical, a maker of health and beauty products, and purchased additional shares of Nakanishi, a manufacturer of equipment for dentists.
Geopolitical uncertainty has also created opportunities for us to add to our positions in several high-quality, growing companies. Amid slumping global auto sales, we added to our positions in South Korea’sHankook Tire and lubricant makerFuchs Petrolubof Germany. We also purchased Turkey’s largest confectionary companyÜlker, whose economies of scale provide a cost advantage in manufacturing.
Please read the separate disclosures page for important information, including the risks of investing in the Portfolio.
17
|
Table of Contents

PORTFOLIO MANAGEMENT TEAM

| SCOTT CRAWSHAW | PRADIPTA CHAKRABORTTY | |
CO-LEAD PORTFOLIO MANAGER
| PORTFOLIO MANAGER
| |
| CRAIG SHAW, CFA | G. RUSTY JOHNSON, CFA | |
| CO-LEAD PORTFOLIO MANAGER | PORTFOLIO MANAGER
| |
| RICHARD SCHMIDT, CFA | ||
| PORTFOLIO MANAGER |
The Institutional Emerging Markets Portfolio (Institutional Class and Institutional Class Z) and the Emerging Markets Portfolio (Advisor Class)—collectively, the “Portfolios”—are both managed in strict accordance with Harding Loevner’s Emerging Markets Equity strategy model portfolio. Therefore, the Portfolios have highly similar holdings and characteristics. We have provided a single commentary to cover both Portfolios. The specific performance and characteristics of each are presented separately in the tables that follow.
 PERFORMANCE SUMMARY
The Institutional Emerging Markets Portfolio – Institutional Class rose 16.43%, the Institutional Emerging Markets Portfolio – Institutional Class Z rose 16.61%, and the Emerging Markets Portfolio – Advisor Class rose 16.46% (all net of fees and expenses) in the fiscal year ended October 31, 2019. The Portfolios’ benchmark, the MSCI Emerging Markets Index, rose 11.86% (net of source taxes) in the fiscal year.
MARKET REVIEW
EMs posted strong returns in a fiscal year marked by the twists and tweets in theUS-China trade dispute, weakening global economic data, and central bank actions in response to the cloudy economic outlook. TheUS-China trade drama featured whiplash-inducing developments as optimism about talks turned sour, only to be followed by another apparently positive turn, before again dissolving into recriminations. The year ended at a positive point, with US and Chinese officials beginning a new round of trade negotiations, China offering to increase its purchases of US agricultural goods, and President Donald Trump indicating a willingness to accede to a “phase one” agreement.
As the year progressed, there were increasing signs that the trade war was weighing on global economic growth. China’s economy grew at a rate of only 6% in the second quarter of 2019, the slowest rate in nearly three decades. In September, the OECD cut its 2019 forecast for global economic growth to the slowest rate in a decade, citing the impact of theUS-China dispute on global trade and capital investment. Central banks responded with a newly dovish policy stance.
FUND FACTS at October 31, 2019 | ||||||||||||
SALES CHARGE | NONE | |||||||||||
NUMBER OF HOLDINGS | 74 | |||||||||||
REDEMPTION FEE | 2% FIRST 90 DAYS | |||||||||||
DIVIDEND POLICY | ANNUAL | |||||||||||
INSTITUTIONAL INVESTORS | INDIVIDUAL INVESTORS | |||||||||||
PORTFOLIO ASSETS | $5,422.6M | $4,274.3M | ||||||||||
TURNOVER (5 YR. AVG.) | 20% | 24% | ||||||||||
CLASS | INST CLASS | INST CLASS Z | ADVISOR | |||||||||
TICKER | HLMEX | HLEZX | HLEMX | |||||||||
CUSIP | 412295701 | 412295693 | 412295305 | |||||||||
INCEPTION DATE | 10/17/2005 | 3/5/2014 | 11/9/1998 | |||||||||
MINIMUM INVESTMENT1 | $500,000 | $10,000,000 | $5,000 | |||||||||
NET EXPENSE RATIO | 1.27% | 1.11%2 | 1.37% | 3 | ||||||||
GROSS EXPENSE RATIO | 1.27% | 1.20% | 1.40% | |||||||||
1Lower minimums available through certain brokerage firms;2Shown net of Harding Loevner’s contractual agreement through February 28, 2020.3The net expense ratio is as of October 31, 2019 as the Portfolio is operating below the contractual agreement, which is in effect until February 28, 2020.
All Expense Ratios are as of the Prospectus dated February 28, 2019 unless otherwise noted.
As growth in China and other key EMs decelerated, business results among Information Technology (IT) companies proved resilient, with the sector up 23%. Consumer Discretionary and Staples also outperformed the index but saw a wide divergence in returns across countries.
Materials was the worst-performing sector, falling 5%, with weak performance from steel producers and petrochemical companies due to dimming global growth prospects. Health Care was also weak as political pressures continued to mount worldwide over the rising cost burden of health care, particularly in the US, an important market for manyEM-based generic drug manufacturers.
Emerging Europe was the strongest region, thanks to a sizeable contribution from Russia. In a global environment of rising risks from conflicts over trade and technology, as well as lower sovereign bond yields, investors were attracted by Russia’s relative isolation from dislocations in global trade and the high dividend yields offered by Russia’s blue-chip stocks, such asSberbank andLukoil.
In Asia, IT heavyweight Taiwan was the best-performing market. Returns were also strong in India, where Prime Minister Narendra Modi won a second five-year term with a strong majority of the vote that ensures policy continuity. Modi’sre-election coincided with tightening credit conditions and weakening consumer and corporate confidence, however. His government responded by announcing a series of stimulative policies, including a significant corporate tax cut. In Latin America, investors in Brazil were cheered by the Senate’s passage of a landmark social security reform bill that is forecast to save the government nearly US$200 billion over the next ten years.
18
|
Table of Contents
PERFORMANCE (% TOTAL RETURN)
| for periods ended September 30, 2019 | for periods ended October 31, 2019 | |||||||||||||||||||||||||||||||||||||||||||||||||||||||||||||||||||||||
| 1 | 3 | 5 | 10 | SINCE INCEPTION* | 1 | 3 | 5 | 10 | SINCE INCEPTION* | |||||||||||||||||||||||||||||||||||||||||||||||||||||||||||||||
| YEAR | YEARS | YEARS | YEARS | Oct-05 | Mar-14 | Nov-98 | YEAR | YEARS | YEARS | YEARS | Oct-05 | Mar-14 | Nov-98 | |||||||||||||||||||||||||||||||||||||||||||||||||||||||||||
INST. EMERGING MARKETS PORTFOLIO – INST. CLASS | 0.78 | 5.56 | 3.06 | 4.95 | 6.45 | 16.43 | 7.23 | 3.47 | 5.58 | 6.71 | ||||||||||||||||||||||||||||||||||||||||||||||||||||||||||||||
INST. EMERGING MARKETS PORTFOLIO – CLASS Z | 0.90 | 5.74 | 3.25 | – | 3.80 | 16.61 | 7.44 | 3.67 | – | 4.48 | ||||||||||||||||||||||||||||||||||||||||||||||||||||||||||||||
EMERGING MARKETS PORTFOLIO – ADVISOR CLASS | 0.74 | 5.45 | 3.00 | 4.90 | 10.61 | 16.46 | 7.14 | 3.41 | 5.52 | 10.77 | ||||||||||||||||||||||||||||||||||||||||||||||||||||||||||||||
MSCI EMERGING MARKETS INDEX | -2.01 | 5.97 | 2.33 | 3.37 | 5.96 | 3.30 | – | 11.86 | 7.36 | 2.93 | 3.78 | 6.24 | 4.01 | – | ||||||||||||||||||||||||||||||||||||||||||||||||||||||||||
Returns are annualized for periods greater than 1 year. *Inception of Institutional Class, 10/17/05. Inception of Class Z, 3/5/14. Inception of the Advisor Class, 11/9/98. Index performance prior to 1/1/01 cannot be shown since it relies on back-filled data.
Performance data quoted represents past performance; past performance does not guarantee future results. The investment return and principal value of an investment will fluctuate so that an investor’s shares, when redeemed, may be worth more or less than their original cost. Current performance of the Portfolio may be lower or higher than the performance quoted. Performance data current to the most recent month end may be obtained by calling (877)435-8105 or visiting www.hardingloevnerfunds.com. Performance data shown does not reflect the 2.00% redemption fee imposed on shares held 90 days or less; otherwise, total returns would be reduced.
PERFORMANCE ATTRIBUTION
The Portfolios’ outperformance was a result of generally favorable sector allocations and good stock selection. Our underweight to Materials and overweights to IT and Consumer Discretionary were all helpful. Good stock picks in Financials and IT offset weaker ones in Materials, Real Estate, and Consumer Staples.
In Financials, our investments in an array of growing banks and insurance companies across Russia, Brazil, India, South Africa, Mexico, Indonesia, and China/Hong Kong produced strong returns. Sberbank of Russia andBank Rakyatof Indonesia were large contributors. Shares of Hong Kong-listed AIA Group also rose in anticipation of the Chinese government’s plan to accelerate the removal of restrictions on foreign insurance companies.
In IT, shares of smartphone camera-equipment manufacturers, especially China’sSunny Optical, rose in response to rising demand from makers of premium smartphones. The increase was partly spurred by the launches of new phones, including Apple’s iPhone 11 Pro, which incorporate advanced cameras requiring high-specification lens sets.
Poor stock selection in Materials was due toSasol, a South African energy and specialty-chemicals company, which disappointed shareholders with the delays and excess costs associated with ramping up its new Louisiana chemical plant. In Consumer Staples,Jiangsu Yanghe, China’s third-largest distiller of baijiu (“white spirits”), reported slowing sales in its stronghold territory.
By region, our relative performance was boosted mainly by strong stocks in Asia including Sunny Optical and natural gas distributorENN Energy in China and semiconductor manufacturerTSMC in Taiwan. We underperformed in South Africa mainly due toSasol and the insurerDiscovery Holdings. Discovery’s shares sold off after the government announced a preliminary seven-year plan to develop a universal health insurance program that could restrict the services that private medical schemes like those administered by Discovery can provide. We think the impact on Discovery’s business will be less than initially feared, because the government’s fiscal position is challenged and the basic public plan it can afford won’t satisfy the growing demand for quality health care.
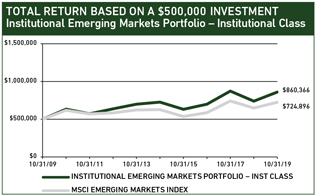
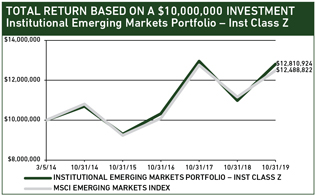
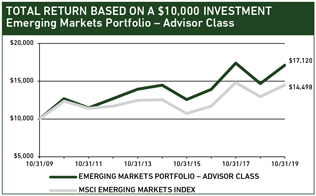
The charts above illustrate the hypothetical return of an investment made in the corresponding share classes. Investment return reflects voluntary fee waivers in effect. Absent such waivers, total return would be reduced. The performance provided in the table and charts above do not reflect the deduction of taxes that a shareholder would pay on Portfolio distributions or the redemption of Portfolio shares.
19
|
Table of Contents
PERSPECTIVE AND OUTLOOK
When we first wrote about theUS-China trade dispute in April 2018, we stated that we would make no changes to our portfolio based on tweets, headlines, and geopolitical predictions, reminding readers that our investment decisions remain anchored in analysis of industry and company fundamentals. With respect to potential changes in global trade, we seek answers to two primary questions: Would the competitive position of a company be affected? If so, what are the implications for its long-term growth and profit margins?
To illustrate how we analyze the implications of the trade dispute and incorporate them into our investment decisions, we discuss two holdings especially exposed.
Techtronic Industries (TTI), the manufacturer of Milwaukee, Ryobi, and Homelite cordless tools, appears to be caught right in the middle of the conflict. Though headquartered in Hong Kong, the company’s factories are concentrated in China and the majority of its revenue is generated in the US. In the weeks following the Trump administration’s September 2018 announcement of tariffs on US$200 billion in Chinese goods, TTI’s shares fell 28%.
In our opinion, this was an overreaction. For one reason, the tariff list often targets components rather than whole products.“Lithium-ion battery-operated cordless tools”—TTI’s fastest-growing product line—are not on the list.Lithium-ion batteries are on the list, but TTI sources the majority of its batteries from Japan and South Korea and so avoids the levies. Corded tools are also on the list. TTI’s key competitors in the US market, such as Stanley Black & Decker, also manufacture primarily in China but they are more exposed to tariffs because a higher percentage of their sales comes from corded tools. Some also source theirLi-ion batteries from China.
GEOGRAPHIC EXPOSURE (%) at October 31, 2019
| COUNTRY/REGION | INSTITUTIONAL | ADVISOR | ||||||||
| HLMEX / HLEZX | HLEMX | BENCHMARK1 | ||||||||
BRAZIL | 7.6 | 7.6 | 7.7 | |||||||
CHINA + HONG KONG2 | 32.4 | 32.5 | 31.8 | |||||||
INDIA | 6.6 | 6.6 | 8.9 | |||||||
MEXICO | 4.6 | 4.6 | 2.5 | |||||||
RUSSIA | 8.7 | 8.8 | 4.1 | |||||||
SOUTH AFRICA | 2.9 | 2.9 | 4.7 | |||||||
SOUTH KOREA | 9.1 | 9.2 | 12.2 | |||||||
TAIWAN | 8.3 | 8.3 | 11.9 | |||||||
SMALL EMERGING MARKETS3 | 9.9 | 9.9 | 16.2 | |||||||
FRONTIER MARKETS4 | 2.3 | 2.3 | — | |||||||
DEVELOPED MARKET LISTED5 | 4.3 | 4.3 | — | |||||||
CASH | 3.3 | 3.0 | — | |||||||
1MSCI Emerging Markets Index;2The Harding Loevner Funds Institutional Emerging Markets Portfolio’s end weight in China is 25.7% and Hong Kong is 6.6%. The Harding Loevner Funds Emerging Markets Portfolio’s end weight in China is 25.8% and Hong Kong is 6.7%. The Benchmark does not include Hong Kong;3Includes the remaining emerging markets which, individually, comprise less than 5% of the Index;4Includes countries with less-developed markets outside the Index;5Includes emerging markets or frontier markets companies listed in developed markets, excluding Hong Kong.
SECTOR EXPOSURE (%) at October 31, 2019
| SECTOR | INSTITUTIONAL HLMEX / HLEZX | ADVISOR HLEMX | BENCHMARK1 | |||||||
COMMUNICATION SERVICES | 7.4 | 7.4 | 11.1 | |||||||
CONSUMER DISCRETIONARY | 15.3 | 15.4 | 13.3 | |||||||
CONSUMER STAPLES | 9.0 | 9.0 | 6.7 | |||||||
ENERGY | 7.8 | 7.8 | 7.8 | |||||||
FINANCIALS | 27.1 | 27.2 | 24.7 | |||||||
HEALTH CARE | 1.4 | 1.4 | 2.8 | |||||||
INDUSTRIALS | 7.1 | 7.2 | 5.3 | |||||||
INFORMATION TECHNOLOGY | 18.7 | 18.7 | 15.5 | |||||||
MATERIALS | 0.6 | 0.6 | 7.1 | |||||||
REAL ESTATE | 0.0 | 0.0 | 2.9 | |||||||
UTILITIES | 2.3 | 2.3 | 2.8 | |||||||
CASH | 3.3 | 3.0 | — | |||||||
1MSCI Emerging Markets Index.
Another reason is that even if the tariffs were extended to cover cordless tools we would expect TTI to continue to grow, albeit with some margin impact that TTI can offset by moving production outside of China or introducing new products at higher prices.Do-it-yourselfers have already largely transitioned from corded to cordless tools, but professionals have held back due to concerns about cordless tools’ inferior power and reliability. Thanks to recent advances in battery technology, cordless tools now meet the demanding requirements of construction and industrial jobs, and professionals are responding accordingly.
Our analyst expects the cordless power-tool market to grow at a compound annual rate of 6% over the next 10 years, with TTI’s sales growing at 10% thanks to market-share gain on the strength of its superior technology, and its first mover advantage and brand loyalty among professionals. The impact of tariffs to growth is negligible in his model, though he does account for a potential impact to TTI’s margins if the company relocates some production outside of China. Based on that outlook, we established a position in TTI at the beginning of 2019 and added to it in recent months.
While the key issue for TTI is how tariffs could raise the price and depress the sales of its products, the concern forHangzhou Hikvisionis not nearly as straightforward. Its global business success has put the company in the crosshairs of the Trump administration as it combats what it perceives as China’s military and technological threat to the US. The company is the global leader in developing and manufacturing video surveillance equipment, including systems that incorporate artificial intelligence (AI) andbig-data analysis to improve the efficacy and expand the applications of its cameras. Hikvision’s high-quality,low-cost products have enabled it to dominate the vast Chinese market, and it is rapidly capturing market share elsewhere.
The US government has targeted Hikvision’s products purportedly for national security reasons, despite that its products have been certified by US governmental and international agencies to comply with the highest cybersecurity standards. In October, the US added Hikvision to the Treasury Department’s Entity List, which restricts the company’s ability to purchase certain advanced US technology. The US
20
|
Table of Contents
market as a whole accounts for only 5% of its US$7 billion in annual sales. Under any scenario, its most important market will continue to be China, which accounts for more than 70% of sales. The threat of loss of access to US semiconductors would not have a material financial impact on the company in the near term. In recent years, Hikvision has significantly diversified its sources of semiconductors and produces most of its products usingnon-US chips.
Surveillance is a vast and growing global business. According to BIS Research, the surveillance market is expected to grow 16% a year to over US$77 billion by 2023. The growth is being propelled by the replacement of simple analog video cameras with advanced digital technology that offers more increasingly advanced analytical capabilities.
Hikvision appears poised to capture much of the industry’s growth. The company’s key competitive advantages are its heavy investment in R&D and the large number of engineers it has hired from China’s highly skilled and affordable labor pool. In 2018, the company spent 4.5 billion renminbi (US$655 million) on R&D (a 40% increase over the previous year) and employed over 16,000 engineers, who account for nearly half of its total workforce. No other surveillance company comes close to Hikvision’s scale.
We recognize that there are social risks associated with selling surveillance equipment, which can be used for socially oppressive as well as socially beneficial purposes. As an integral part of our fundamental research, we explore environmental, social, or governance (ESG) issues that may pose a risk to the sustainability of a company’s business. Our ESG analysis culminates in assigning a score to each of these three areas for a company. The ESG scores are measures of the risk to the sustainability of a company’s growth and impact our estimate of a company’s fair value. Late last year, news reports emerged that Hikvision’s technology was being used to support government surveillance in Xinjiang province, where for years Uighurs and other Muslims have been detained inre-education camps for the ostensible purpose of countering extremism and terrorism. The reports detailed, for the first time, the role that advanced surveillance systems played in the government’s crackdown in the province, including in the camps.
In meetings with Hikvision’s management in China, we discussed the Xinjiang issue. They claimed that the company had been unaware of the purposes of the government contracts at issue, as the projects’ specifications were very similar to the typical surveillance system used for security at many large school campuses in China or abroad, that the company was not involved in the operations at its clients’ sites, and that the data collected in Xinjiang was not accessible by Hikvision. Though it is impossible for us to confirm what the company knew about the camps before last year’s reports, we were encouraged by the actions it has taken in the aftermath. Hikvision immediately made changes to reduce its social risk exposure, including ending its participation in such projects in Xinjiang and revising its screening procedures to comply with international human rights standards. Nonetheless, we assign the company a high social risk score to reflect the heightened concerns surrounding the potential for employment of its products in human rights abuses, and to reflect the additional, related risk factor that its largest shareholder remains a Chinese state entity.
TEN LARGEST HOLDINGS at October 31, 2019
| COMPANY | SECTOR | COUNTRY | INSTITUTIONAL HLMEX / HLEZX | ADVISOR HLEMX | |||||||||||||||||
TSMC | INFO TECHNOLOGY | TAIWAN | 5.5 | 5.5 | |||||||||||||||||
SAMSUNG ELECTRONICS | INFO TECHNOLOGY | SOUTH KOREA | 4.7 | 4.7 | |||||||||||||||||
ALIBABA | CONS DISCRETIONARY | CHINA | 4.3 | 4.3 | |||||||||||||||||
TENCENT | COMM SERVICES | CHINA | 4.0 | 4.0 | |||||||||||||||||
LUKOIL | ENERGY | RUSSIA | 2.9 | 2.9 | |||||||||||||||||
NOVATEK | ENERGY | RUSSIA | 2.7 | 2.7 | |||||||||||||||||
AIA GROUP | FINANCIALS | HONG KONG | 2.7 | 2.7 | |||||||||||||||||
SBERBANK | FINANCIALS | RUSSIA | 2.6 | 2.6 | |||||||||||||||||
HDFC CORP | FINANCIALS | INDIA | 2.5 | 2.5 | |||||||||||||||||
ENN ENERGY | UTILITIES | CHINA | 2.3 | 2.3 | |||||||||||||||||
PORTFOLIO HIGHLIGHTS
We seek businesses with enduring competitive advantages within industries with favorable characteristics. Our new purchases this year involved attractively priced companies that are executing their corporate strategies well, including two new investments in companies connected to the automotive industry.Autohome is China’s leading online platform where automotive buyers can browse for comprehensive information about cars and driving. Data gathered from the platform’s roughly 90 million users is valuable to automakers and car dealers. In fact, online advertising and lead-generation data are Autohome’s key revenue streams. As Brazil’s largest car rental company,Localiza has the scale to source vehicles more cheaply than competitors and provide retail and fleet customers with better quality and choice.
We also added to our position inCoca-Cola HBC, a multi-national Coca-Cola bottler that generates a majority of revenues from emerging Europe and Nigeria. The company has continued to improve profit margins by achieving economies of scale and using enhanced data analytics to engage more effectively with retailers on product placement and pricing.
Our sales this year includedRaia Drogasil, the leading Brazilian drugstore operator. In late 2018, the company lowered generic drug prices to capture a bigger share of the prescription market, igniting sales growth. Same-store sales and operating leverage also improved, allowing margins to recover. Raia Drogasil’s shares rallied strongly since the early 2019, taking their price well beyond our estimate of fair value.
We also sold Chinese laser-tools manufacturerHan’s Laser for failing to live up to our demands for high-quality corporate governance. In early July, reports surfaced in the media of the company’s spending on a European “R&D center,” which turned out to be more of a five star R&R resort. In a conference call, executives denied misleading investors, even though there was no hint of the project’s true nature in the company’s financial disclosures. Disappointed by their lack of transparency and dissembling, we felt we could no longer trust management to look after the interests of shareholders.
Please read the separate disclosures page for important information, including the risks of investing in the Portfolios.
21
|
Table of Contents

PORTFOLIO MANAGEMENT TEAM

PRADIPTA CHAKRABORTTY CO-LEAD PORTFOLIO MANAGER
BABATUNDE OJO, CFA CO-LEAD PORTFOLIO MANAGER |
 PERFORMANCE SUMMARY
For the Frontier Emerging Markets Portfolio, the Institutional Class I rose 3.59%, the Institutional Class II rose 4.01%, and the Investor Class rose 3.24% (net of fees and expenses) in the fiscal year ended October 31, 2019. The Portfolio’s benchmark, the MSCI Frontier Emerging Markets Index, rose 9.70% (net of source taxes).
MARKET REVIEW
Stocks in Frontier Emerging Markets (FEMs) sold off toward the end of 2018 and then bounced back in early 2019. In August, returns again fell sharply as politics roiled the equity markets of Argentina and Peru. For the fiscal year ended October 31, FEMs posted solid gains.
By region, the Gulf States performed the best, primarily due to Kuwait, which accounts for 80% of the region’s index weight. Investors anticipated index provider MSCI’s announcement of the country’s reclassification from frontier to emerging market (EM) status. On June 25, the MSCI confirmed its plan, which could be implemented as early as May 2020.
Europe also recorded strong performance, lifted by Romania. Its market rose after the government lowered its proposed taxes on banks, and was also helped by the country’s improving political environment. In August, the liberal party ALDE broke out of the ruling coalition that was responsible for several anti-business proposals. The exit likely limits the ability of the coalition to impose new regulations harmful to companies.
Argentina’s market plunged 48% inUS-dollar terms in one day after President Mauricio Macri unexpectedly lost a primary election in August. In October, the business-friendly former president was voted out of office in the general election and replaced by Alberto Fernández of the Frente de Todos party, a coalition of leftist politicians. With former President Christina Kirchner as the vice-presidential candidate of the opposition party, investors fear the country’s return to populist economic policies that included
FUND FACTS at October 31, 2019 | ||||||||||||
TOTAL NET ASSETS | $294.0M | |||||||||||
SALES CHARGE | NONE | |||||||||||
NUMBER OF HOLDINGS | 65 | |||||||||||
TURNOVER (5 YR. AVG.) | 33% | |||||||||||
REDEMPTION FEE | 2% FIRST 90 DAYS | |||||||||||
DIVIDEND POLICY | ANNUAL | |||||||||||
INSTITUTIONAL INVESTORS | INDIVIDUAL INVESTORS | |||||||||||
| INST CLASS I | INST CLASS II | INVESTOR CLASS | ||||||||||
TICKER | HLFMX | HLFFX | HLMOX | |||||||||
CUSIP | 412295867 | 412295735 | 412295859 | |||||||||
INCEPTION DATE | 5/27/2008 | 3/1/2017 | 12/31/2010 | |||||||||
MINIMUM INVESTMENT1 | $100,000 | $10,000,000 | $5,000 | |||||||||
NET EXPENSE RATIO | 1.62% | 1.35%2 | 2.00%2 | |||||||||
GROSS EXPENSE RATIO | 1.62% | 1.56% | 2.06% | |||||||||
1Lower minimums available through certain brokerage firms;2Shown net of Harding Loevner’s contractual agreement through February 28, 2020.
All Expense Ratios are as of the Prospectus dated February 28, 2019 unless otherwise noted.
large fiscal deficits, price and capital controls, and the nationalization of some private companies.
A 25% fall in the Argentine peso following Macri’s primary loss essentially guaranteed that inflation would rise. It led Macri’s government to impose a temporary freeze on fuel prices, and to reinstate capital controls to preserve the country’s rapidly dwindling foreign exchange reserves. The government also announced a voluntary plan for debt renegotiation to push out repayments, including of debt owed to the IMF. Ratings agencies deemed the move a technical default; against the background of the country’s recurring history of default, this created further panic and further declines in the country’s equity and bond markets.
Elsewhere in Latin America, politics weighed on Peru’s market, too. In July, President Martín Vizcarra, in a bid to oust opponents who have blocked his anti-corruption reforms, announced his intention to dissolve Congress and seek elections in 2020, a year earlier than scheduled. Congress has resisted the move, and investors fear the impasse will make it even harder for the executive and legislative branches to work together to approve investment projects needed to boost the Peruvian economy.
The Middle East, which accounts for just 2% of the index, also fell in the period as investors continued to worry that Lebanon may default on its debt after the country failed to form a government that could pass much-needed fiscal reforms.
By sector, Information Technology (IT) performed the best, mainly due to an 81% rise in the share price ofGlobant, an
22
|
Table of Contents
PERFORMANCE (% TOTAL RETURN)
| for periods ended September 30, 2019 | for periods ended October 31, 2019 | |||||||||||||||||||||||||||||||||||||||||||||||||||||||||
1 YEAR | 3 YEARS | 5 YEARS | 10 YEARS | SINCE INCEPTION* | 1 YEAR | 3 YEARS | 5 YEARS | 10 YEARS | SINCE INCEPTION* | |||||||||||||||||||||||||||||||||||||||||||||||||
| May-08 | Mar-17 | Dec-10 | May-08 | Mar-17 | Dec-10 | |||||||||||||||||||||||||||||||||||||||||||||||||||||
FRONTIER EM PORTFOLIO – INST CLASS I | -2.61 | 2.52 | -3.53 | 2.90 | -1.38 | 3.59 | 3.47 | -2.47 | 3.28 | -1.20 | ||||||||||||||||||||||||||||||||||||||||||||||||
FRONTIER EM PORTFOLIO – INST CLASS II | -2.34 | – | – | – | 2.65 | 4.01 | – | – | – | 3.32 | ||||||||||||||||||||||||||||||||||||||||||||||||
FRONTIER EM PORTFOLIO – INVESTOR CLASS | -2.98 | 2.22 | -3.89 | – | 0.40 | 3.24 | 3.12 | -2.85 | – | 0.60 | ||||||||||||||||||||||||||||||||||||||||||||||||
MSCI FRONTIER EM INDEX | 2.63 | 3.47 | -2.32 | 2.93 | – | 3.67 | 1.16 | 9.70 | 4.67 | -1.15 | 3.47 | – | 4.55 | 1.44 | ||||||||||||||||||||||||||||||||||||||||||||
Returns are annualized for periods greater than 1 year. *Inception of the Institutional Class I, May 27, 2008. Inception of the Institutional Class II, March 1, 2017. Inception of the Investor Class, December 31, 2010. Index performance prior to December 2, 2008 cannot be shown since it relies on back-filled data.
The one year total return above will differ from the total return in the Financial Highlights. The Financial Highlights’ total return has been adjusted to reflect performance in conformity with US GAAP principles. Performance data quoted represents past performance; past performance does not guarantee future results. The investment return and principal value of an investment will fluctuate so that an investor’s shares, when redeemed, may be worth more or less than their original cost. Current performance of the Portfolio may be lower or higher than the performance quoted. Performance data current to the most recent month end may be obtained by calling (877)435-8105 or visiting www.hardingloevnerfunds.com. Performance data shown does not reflect the 2.00% redemption fee imposed on shares held 90 days or less; otherwise, total returns would be reduced.
The charts below illustrate the hypothetical return of an investment made in the corresponding share classes. Investment return reflects voluntary fee waivers in effect. Absent such waivers, total return would be reduced. The performance provided in the table and charts above do not reflect the deduction of taxes that a shareholder would pay on Portfolio distributions or the redemption of Portfolio shares.
Argentine IT services provider. The company reported healthy organic sales growth, including strong demand from its leading customer Disney. Real Estate also outperformed, boosted by Vietnam’s real estate companies, which are seeing increased demand from manufacturers looking to relocate factories from China. Energy declined the most, partly due to falling oil prices, but amplified by thesell-off of Argentine energy companies YPF and Transportadora de Gas del Sur.
Consumer Discretionary also posted declines because of an 11% fall inJollibee Foods, a Philippines-based quick-service restaurant operator. Investors fled after the company announced the acquisition of The Coffee Bean & Tea Leaf, a loss-making US coffee shop chain. It followed closely on an earlier US acquisition, Smashburger, which continues to drag on Jollibee’s profits.
PERFORMANCE ATTRIBUTION
Viewed by sector, our weak stocks in Materials detracted the most from relative returns in the fiscal year. Vietnamese steel producerHoa Phat Group faced rising costs for imported iron ore, which contributed to ayear-on-year margin decline. Our weak stocks in Financials also detracted significantly. Argentine banksBanco Macro andGrupo Financiero Galicia plummeted on the turn of events. Our stock selection in Consumer Discretionary contributed; however, this was offset by our overwieght to the sector, including Jollibee Foods. Our overweight to Globant helped returns.
By region, our stocks in Asia detracted the most, particularly Vietnam (Hoa Phat Group) and the Philippines (Jollibee Foods). Despite the collapse of Argentine stocks, we had good stock selection in the country due to Globant.
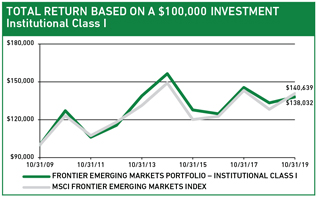
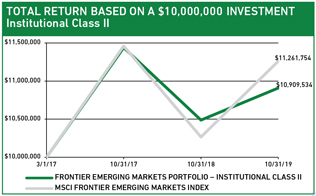
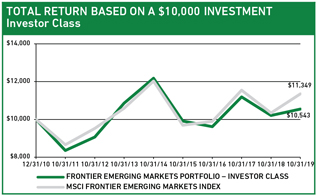
23
|
Table of Contents
PERSPECTIVE AND OUTLOOK
Deepening financial inclusion in Kenya
For developing economies to grow, businesses and individuals need access to bank accounts and loans. We estimate that only about half of adults in FEM countries have access to financial services, compared with 94% in developed countries. Low financial inclusion is particularly striking insub-Saharan Africa (SSA). According to the World Bank, 57% of people in the region are unbanked. The majority of people can ill afford to travel to a distant bank branch to access or deposit cash and pay bills and, even if physical branches were more accessible, banking services are prohibitively expensive for many.
The emergence of digital technology and the proliferation of mobile phones have created an unprecedented opportunity to improve financial inclusion around the world.Two-thirds of unbanked adults in the world have a mobile phone. In SSA, Kenya stands out as a success story, largely thanks to the digital financial platform operated bySafaricom, the country’s largest mobile operator. Safaricom’s innovation in mobile technology has allowed Kenyans to leapfrog the need for traditional branches and ATMs in remote locations where setting them up can be uneconomical. As a result, the value of mobile money transactions leaped from zero in 2007 to about half of Kenya’s GDP in 2018, and the percentage of adults in Kenya with an account almost doubled from 42% in 2011 to 82% in 2017.
The impact of mobile financial services has been transformational for Kenyans. It has improved the way they pay for goods and services, transfer money, save, and borrow. In a country where many people receive remittances from a relative or friend living in another part of the country or abroad, mobile technology has delivered substantial savings of fees. Mobile platforms are also facilitating trade, as unbanked farmers in rural areas of Kenya now benefit from the security and convenience of digital payments for their agricultural sales. Overall, the improved financial access in Kenya has helped stimulate consumption, increase access to credit for small business owners, boost employment, reduce poverty, and set the stage for broad-based economic growth.
GEOGRAPHIC EXPOSURE (%) at October 31, 2019
| REGION | PORTFOLIO | BENCHMARK1 | ||||||
AFRICA | 18.0 | 15.5 | ||||||
ASIA | 33.6 | 37.4 | ||||||
EUROPE | 9.2 | 5.1 | ||||||
GULF STATES | 14.7 | 16.9 | ||||||
LATIN AMERICA | 21.5 | 23.6 | ||||||
MIDDLE EAST | 0.0 | 1.5 | ||||||
DEVELOPED MRKTS LISTED2 | 1.8 | – | ||||||
CASH | 1.2 | – | ||||||
1MSCI Frontier Emerging Markets Index;2Includes frontier or small emerging markets companies listed in developed markets.
SECTOR EXPOSURE (%) at October 31, 2019
| SECTOR | PORTFOLIO | BENCHMARK1 | ||||||
COMMUNICATION SERVICES | 6.3 | 8.1 | ||||||
CONSUMER DISCRETIONARY | 3.8 | 0.9 | ||||||
CONSUMER STAPLES | 16.4 | 5.5 | ||||||
ENERGY | 6.0 | 4.7 | ||||||
FINANCIALS | 33.6 | 44.0 | ||||||
HEALTH CARE | 4.7 | 1.4 | ||||||
INDUSTRIALS | 4.9 | 12.0 | ||||||
INFORMATION TECHNOLOGY | 7.5 | 1.4 | ||||||
MATERIALS | 5.5 | 6.3 | ||||||
REAL ESTATE | 10.1 | 12.4 | ||||||
UTILITIES | 0.0 | 3.3 | ||||||
CASH | 1.2 | – | ||||||
1MSCI Frontier Emerging Markets Index.
Safaricom was formed in 1997 by the government of Kenya, with Vodafone acquiring a 40% stake in May 2000 as part of a privatization process. In March 2007, the company launched its pioneering mobile payments system, M-Pesa, the Swahili word for money. From their mobile phones, M-Pesa account holders can send money to each other almost instantaneously and inexpensively, using an extensive network of retail agents, typically located in shops. To deposit or remit cash, customers exchange real-world money with a Safaricom agent for“e-float” that is credited or debited to their mobile-money account; recipients visit another agent to collect the cash. In Kenya, Safaricom has established a network of over 176,000 M-Pesa agents, which dwarfs competitors Telkom’s 28,000 and Airtel’s 20,000 mobile money agents. Today, Safaricom dominates the Kenyan market with a 90% share of mobile financial services.
Safaricom has significantly broadened the scope of its services to include savings and loan products offered through local banks. There is ample room for continued growth in electronic payments as eight out of ten domestic transactions are still settled in cash. The company is taking initiatives to capitalize on M-Pesa’s huge customer base, encompasses 27 million active users. Among the more promising is MaSoko, ane-commerce platform that enables small businesses to sell their products and get paid through M-Pesa. Another service helps farmers obtain higher prices by connecting them directly to markets, bypassing middlemen. The company is also rolling out a health care application called M-Tiba, which is a mobile health insurance scheme that guides people to high-quality primary care centers. This wave of innovation has helped Safaricom grow M-Pesa revenues at aten-year cumulative annual growth rate of 38%, and it now contributes about a third of the company’s revenue. We believe M-Pesa has a long runway for growth as Safaricom continues to eat into the share of cash transactions and increase the use of M-Pesa beyond Kenya’s borders.
Through the widespread usage of its M-Pesa product, Safaricom has cultivated tremendous customer loyalty to build a strong retail brand. In a 2009 survey, 84% of users claimed that losing
24
|
Table of Contents
the service of M-Pesa would have a significant, negative effect on their lives. The pricing power this gives the company over its customers lets it consistently pass on increased costs to consumers.
When Safaricom launched M-Pesa with the approval of the Kenyan Central Bank, few regulations governed its activities. In recent years, however, there have been several attempts to pass legislation in the Kenyan Parliament aimed at breaking up telecommunication service providers, with the goal to loosen Safaricom’s grip on the market. The breakup efforts have failed primarily because of Safaricom’s crucial role in the growth of the Kenyan economy; the company accounts for 6% of Kenya’s GDP, more than 40% of the Nairobi Securities Exchange capitalization, and creates about one million direct and indirect jobs for Kenyans. The government benefits in other ways from digital payments: they are easier to monitor for anticorruption and taxation purposes, and they reduce thenot-insignificant cost of printing and distributing paper currency.
PORTFOLIO HIGHLIGHTS
We conceived our FEM strategy as a means to provide access to both frontier and small EMs that live in the shadow of larger EMs like Brazil, Russia, India, and China. We define small EMs as those with weights of less than 5% in the MSCI EM Index. All of the countries in our portfolio—regardless of how they are classified by the index provider—share similar risk characteristics and high potential growth: they are in the early stages of a journey previously taken by the developed economies that the larger EM economies have largely completed.
To assure our clients that the new strategy would maintain substantial exposure to frontier markets, at launch we adopted an internal guideline that limited its exposure to small EMs to a maximum of 50% of the portfolio. At the time, we did not foresee the frequency with which MSCI would reclassify countries from frontier to emerging markets (and sometimes back again) or the magnitude of such reclassifications. In 2014, the UAE and Qatar were both reclassified from FM to EM. They were followed by the upgrade of Pakistan in 2017. More recently, Argentina (a country that was downgraded from EM to FM in 2009) and Saudi Arabia were upgraded in May 2019. The five newly promoted countries represent, in aggregate, less than 4% of the MSCI EM index.
The May reclassifications of Saudi Arabia and Argentina resulted in a passive breach of our 50%small-EM ceiling. At the recommendation of the strategy’s portfolio managers and with the approval of ourco-chief investment officers, we decided to eliminate thesmall-EM ceiling because we wanted to avoid forced transactions that would incur unnecessary trading costs for our clients. We also no longer regard the guideline as helpful or relevant to maintaining a portfolio that reflects the frontier and small EM quality-growth opportunity sets and is complementary (rather than duplicative) to a traditional EM portfolio.
Unrelated to Argentina’s reclassification but in the wake of its April rally, we trimmed our five holdings there. Inmid-August,
TEN LARGEST HOLDINGS at October 31, 2019
| COMPANY | SECTOR | COUNTRY | % | |||||||||
MABANEE | REAL ESTATE | KUWAIT | 4.7 | |||||||||
SAFARICOM | COMM SERVICES | KENYA | 4.7 | |||||||||
ECOPETROL | ENERGY | COLOMBIA | 4.6 | |||||||||
NATIONAL BANK OF KUWAIT | FINANCIALS | KUWAIT | 4.6 | |||||||||
SM PRIME HOLDINGS | REAL ESTATE | PHILIPPINES | 4.5 | |||||||||
CREDICORP | FINANCIALS | PERU | 4.5 | |||||||||
BANCOLOMBIA | FINANCIALS | COLOMBIA | 4.2 | |||||||||
GLOBANT | INFO TECHNOLOGY | ARGENTINA | 3.7 | |||||||||
COMMERCIAL INTERNATIONAL BANK | FINANCIALS | EGYPT | 3.6 | |||||||||
HOA PHAT GROUP | MATERIALS | VIETNAM | 3.3 | |||||||||
Macri unexpectedly lost an election and the Argentine stock market fell by half inUS-dollar terms. We assessed our exposure to the country in light of the sharp fall in the Argentine peso and rapid drawdown of foreign reserves. We exited our positions inLoma Negra, a leading cement company, andTelecom Argentina, which both have high levels of debt denominated in foreign currencies. We were doubtful of the companies’ ability to pass on to consumers who are struggling with high inflation and recession the sharply higher cost in pesos of servicing these debts. Concerned about a potential run on the banks as Argentines started withdrawing their deposits, we also exited our two financial holdings, Banco Macro and Grupo Financiero Galicia.
Our only remaining Argentine holding is Globant, whose exposure to the domestic economy is limited. It derives over 90% of its revenue from clients in the US and Europe, whom it bills in US dollars and euros. The company repatriates to Argentina only enough dollars to cover the operating costs of its local subsidiary, which accounts for less than a quarter of the consolidated company’s operating costs. Globant keeps the majority of its cash outside of Argentina in dollars, shielding it from capital controls.
In addition to companies in sectors traditionally associated with FEM countries, such as banking, cement, and consumer staples, we are increasingly finding high-quality, growing companies in “new economy” industries like software and digital payments. One example isUAE-basedNetwork International, which we bought this year. The company enables over 65,000 merchants in the region, including Etihad Airways, Four Seasons, Zara, and many smaller merchants, to accept digital (electronic) payments in stores and online. It works with over 220 regional banks, including Abu Dhabi Commercial Bank, Standard Bank, and Zenith Bank, to manage card issuance and process transactions on their behalf. The company has become the largest independent merchant acquirer and payment processor in the Middle East & Africa (MEA). Its market shares in merchant acquiring and outsourced card issuance stand at 19% and 24%, respectively—more than twice those of its next largest competitor.
Please read the separate disclosures page for important information, including the risks of investing in the Portfolio.
25
|
Table of Contents

PORTFOLIO MANAGEMENT TEAM

MOON SURANA, CFA PORTFOLIO MANAGER
ANDREW WEST, CFA PORTFOLIO MANAGER |
PERFORMANCE SUMMARY
For the Global Equity Research Portfolio, the Institutional Class rose 14.36% (net of fees and expenses) in the fiscal year ended October 31, 2019. The Portfolio’s benchmark, the MSCI All Country World Index, rose 12.59% (net of source taxes).
MARKET REVIEW
Global stock markets had a volatile fiscal year. After falling sharply toward the end of 2018 amid risingUS-China trade tensions and worries that the US Federal Reserve’s interest rate hikes might trigger a global recession, markets recovered strongly in 2019 to end the trailing twelve months with double-digit gains.
TheUS-China trade drama featured whiplash-inducing developments as optimism about talks turned sour, only to be followed by another apparently positive turn, before again dissolving into recriminations. The year ended at a positive point, with US and Chinese officials beginning a new round of trade negotiations, China offering to increase its purchases of US agricultural goods, and President Donald Trump indicating a willingness to accede to a “phase one” agreement.
In September, the OECD cut its 2019 forecast for global economic growth to the slowest rate in a decade, citing the impact of theUS-China tariff wars on global trade and capital investment.
As the year progressed, there were increasing signs that the trade war was weighing on global economic growth. Official GDP growth forecasts were revised downward in both the US and in Europe. In China, retail sales and manufacturing activity fell amid a sharp decline in bank lending. Germany’s manufacturing sector abruptly contracted in 2019, and the country’s export sales and orders declined at the fastest rate since the financial crisis in 2008. In September, the OECD cut its 2019 forecast for global economic growth to the slowest rate in a decade, citing the impact of theUS-China tariff wars on
FUND FACTS at October 31, 2019 | ||||||
TOTAL NET ASSETS | $6.9M | |||||
SALES CHARGE | NONE | |||||
NUMBER OF HOLDINGS | 259 | |||||
TURNOVER (5 YR. AVG.) | – | |||||
REDEMPTION FEE | 2% FIRST 90 DAYS | |||||
DIVIDEND POLICY | ANNUAL | |||||
INSTITUTIONAL INVESTORS | ||||||
| INSTITUTIONAL CLASS | ||||||
TICKER | HLRGX | |||||
CUSIP | 412295792 | |||||
INCEPTION DATE | 12/19/2016 | |||||
MINIMUM INVESTMENT1 | $100,000 | |||||
NET EXPENSE RATIO2 | 0.80% | |||||
GROSS EXPENSE RATIO | 2.54% | |||||
1Lower minimums available through certain brokerage firms;2Shown net of Harding Loevner’s contractual agreement through February 28, 2020.
All Expense Ratios are as of the Prospectus dated February 28, 2019 unless otherwise noted.
global trade and capital investment. It also reduced its GDP growth estimates for next year for 18 of the G20 economies.
Confronted with anemic economic growth and still no inflationary impulse from ten years of easy money, central banks responded with additional stimulus. The Federal Reserve cut interest rates in July for the first time since the global financial crisis, and cut them again in late September. The European Central Bank renewed its quantitative easing program and pushed short-term interest rates deeper into negative territory. China lowered its reserve requirement for banks. Central banks in other countries also moved to cut rates or otherwise create monetary stimulus.
Information Technology (IT), led by the traditionally cyclical semiconductor group, was one of the strongest sectors, alongside Real Estate and Utilities (normally considered “defensive” sectors). Energy and Materials were the weakest-performing sectors amid declines in the prices of oil and other commodities.
PERFORMANCE ATTRIBUTION
Our strong stock selection in the US contributed to relative returns, especially financial services technology providerFiserv and chip-design software providerSynopsys. Good performance from the Portfolio’s emerging markets holdings also helped. In China, private education providerNew Oriental Education & Technology Groupreported higher-than-expected sales and strong enrollment growth for its tutoring programs. In Taiwan,Advantech
26
|
Table of Contents
PERFORMANCE (% TOTAL RETURN)
| for periods ended September 30, 2019 | for periods ended October 31, 2019 | |||||||||||||||||||||||||
| CALENDAR YTD | 1 YEAR | SINCE INCEPTION* | CALENDAR YTD | 1 YEAR | SINCE INCEPTION* | |||||||||||||||||||||
GLOBAL EQUITY RESEARCH PORTFOLIO – INSTITUTIONAL CLASS | 16.33 | 2.99 | 12.87 | 19.37 | 14.36 | 13.48 | ||||||||||||||||||||
MSCI ALL COUNTRY WORLD INDEX | 16.20 | 1.38 | 9.97 | 19.38 | 12.59 | 10.70 | ||||||||||||||||||||
Returns are annualized for periods greater than 1 year. *Inception date: December 19, 2016.
Performance data quoted represents past performance; past performance does not guarantee future results. The investment return and principal value of an investment will fluctuate so that an investor’s shares, when redeemed, may be worth more or less than their original cost. Current performance of the Portfolio may be lower or higher than the performance quoted. Performance data current to the most recent month end may be obtained by calling (877)435-8105 or visiting www.hardingloevnerfunds.com. Performance data shown does not reflect the 2.00% redemption fee imposed on shares held 90 days or less; otherwise, total returns would be reduced.
The chart below illustrates the hypothetical return of an investment made in the corresponding share classes. Investment return reflects voluntary fee waivers in effect. Absent such waivers, total return would be reduced. The performance provided in the table and charts above do not reflect the deduction of taxes that a shareholder would pay on Portfolio distributions or the redemption of Portfolio shares.
announced a five-year plan to raise margins and reported solid revenue growth coupled with surprisingly good cost control.
Our stocks in the eurozone and Canada modestly detracted. Spanish bankBankinter and Italian steel-pipe manufacturerTenaris both declined in the year. The latter has been unable to grow its volumes independent of rising energy prices. Canadian oil producerEncana declined significantly in the period.
By sector, stocks in Health Care, Financials, and Materials boosted returns.US-based sleep-disorder breathing equipment manufacturerResMed was the best performer within Health Care as it continues to gain share in the breathing mask market. Indonesia’sBank Central Asia stood out in Financials. The strong performance ofUS-based global industrial gas companyAir Products & Chemicals lifted the Portfolio’s returns in Materials.
Poor stock selection in Communication Services was the main detractor in the year, dragged down by Indian tower operatorBharti Infratel, which fell amid the country’s economic weakness. The Japanese advertising agencyDentsu faced strong headwinds and detracted from our relative returns. As consumers continue to shift their attention to online media, clients expect their ad agencies to provide new means to command the audience’s attention. Dentsu has proven to clients that it can deliver on its promises, improving return on investment in marketing efforts. Over the past five years, it has won more new contracts than it has lost. Weak stocks in Energy also detracted, namely Tenaris, Encana, andPakistan Petroleum; this was offset by the Portfolio’s underweight in the poor-performing sector.
PERSPECTIVE AND OUTLOOK
We have been concerned about President Trump’s approach to trade policy from the outset of his administration. A day after his election in 2016, we predicted “beneficiaries of trade and globalization stand to lose” if consensus assumptions about his future policies proved correct. By the fourth quarter of 2018, new tariffs had been imposed, and their impact was beginning to be felt. We revealed our fear of an emergent trade war becoming “an attack
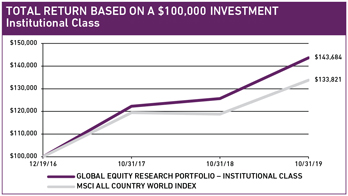
on the bounty of globalization: the efficiencies of global supply chains that have benefited consumers everywhere while bolstering the profits of those companies most adept at exploiting them.”
We are no longer thinking about the possibility of a hot trade war but rather grappling with the reality of one. As it has escalated, companies have canceled investment plans, shifted their supply chains out of China, and been forced to choose between accepting lower margins or lower sales. The impact of tariffs is now showing up in economic data. In August, the US Purchasing Managers Index sank to a10-year low, while Germany’s Business Climate Index dropped to a nearly7-year low. The World Trade Organization (WTO) halved its estimate of growth in world trade in merchandise this year to just 1.2%, the slowest since 2009.
Due to the nature of today’s global trading system the negative effects of the trade war will be further-reaching than its proponents represented. According to a new WTO report, today more thantwo-thirds of global trade flows through global value chains (GVCs), with the remainder reflecting the traditional cross-border exchange of finished products. In “simple” GVCs, companies supply intermediate goods for use in finished production in other countries, for example, Brazilian iron ore exported to China to be made into steel for use in its skyscrapers. In “complex” GVCs, components cross andre-cross borders in intermediate production before being assembled as a final product. The iPhone is the classic example of such a “made in the world” product of a com-
27
|
Table of Contents
plex GVC. Gorilla Glass from Corning factories in Kentucky, semiconductors from Texas Instruments, batteries from Korea, DRAM from Taiwan, and other parts from 40 additional countries are assembled in China and shipped as a finished smartphone to consumers around the globe. The automobile and aircraft industries exhibit a similarly complex organization of production.
Determining the impact of tariffs on participants in GVCs is a near-impossible task. The WTO report notes: “One important policy implication is that changes in trade policy can have broad and unanticipated effects. The unilateral imposition of trade protection on exports from a partner country can have a significant impact on third countries when trade is carried out through GVCs, particularly complex GVCs. Indeed, as many products today are already ‘made in the world,’ increasing import protection can even harm exports from the home country.”
It’s certainly the case that we have developed a bias in favor of businesses that are deeply embedded in complex GVCs.
So great has been the bounty of the global trading system over our investing careers, it’s certainly the case that we have developed a bias in favor of businesses that are deeply embedded in complex GVCs. We have found that they tend to have lower and more flexible costs, making them more competitive. They are able to achieve higher and more geographically diversified revenues, and higher and more stable profit margins, potentially resulting in higher returns on capital. It is for these reasons that our research process leads us to them. If the global trading system is under rising threat from political interference, discount rates will rise for the shares of those companies most exposed.
We’ve adopted and streamlined the WTO’s taxonomy of enterprises to create a classification by which we can (crudely) estimate the portfolio’s aggregate exposure to global value chains. Accordingly, we classify our companies as follows:
GEOGRAPHIC EXPOSURE (%) at October 31, 2019
| COUNTRY/REGION | PORTFOLIO | BENCHMARK1 | ||||||
CANADA | 1.9 | 3.0 | ||||||
EMERGING MARKETS | 21.7 | 11.7 | ||||||
EUROPE EMU | 9.2 | 9.5 | ||||||
EUROPEEX-EMU | 13.0 | 9.1 | ||||||
FRONTIER MARKETS2 | 0.0 | – | ||||||
JAPAN | 11.8 | 7.4 | ||||||
MIDDLE EAST | 0.0 | 0.2 | ||||||
PACIFICEX-JAPAN | 3.0 | 3.6 | ||||||
UNITED STATES | 38.3 | 55.5 | ||||||
CASH | 1.1 | – | ||||||
1MSCI All Country World Index;2Includes countries with less-developed markets outside the Index.
SECTOR EXPOSURE (%) at October 31, 2019
| SECTOR | PORTFOLIO | BENCHMARK1 | ||||||
COMMUNICATION SERVICES | 5.3 | 8.8 | ||||||
CONSUMER DISCRETIONARY | 12.9 | 10.8 | ||||||
CONSUMER STAPLES | 14.4 | 8.4 | ||||||
ENERGY | 3.0 | 5.3 | ||||||
FINANCIALS | 15.6 | 16.7 | ||||||
HEALTH CARE | 12.2 | 11.6 | ||||||
INDUSTRIALS | 13.7 | 10.5 | ||||||
INFORMATION TECHNOLOGY | 15.2 | 16.5 | ||||||
MATERIALS | 5.6 | 4.7 | ||||||
REAL ESTATE | 0.5 | 3.3 | ||||||
UTILITIES | 0.5 | 3.4 | ||||||
CASH | 1.1 | – | ||||||
1MSCI All Country World Index.
| • | Adomestic business is one whose operations are limited to one country. An example isHDFC Bank, which does almost all its business in its home market of India. |
| • | Amulti-domestic business is similar to what is commonly known as a multinational corporation (MNC), but with what we think is a needed twist. An example is the Swiss-based consumer products giantNestlé. The company is commonly viewed as an MNC since it sells its products in 190 countries. While Nestlé uses raw materials from around the world and there is some trade in Nestlé’s end products, the vast majority of its products are manufactured in the same place they are sold: in the 80 countries where it has factories. To us, this means Nestlé’s GVC exposure is lower as it is effectively a set of domestic business in multiple countries. |
| • | Across-border business not only has sales in multiple countries but also a complex production chain that sources components from many countries, assembles in others, and then transports the final product to countries around the world. Examples here includeAdidas andApple. |
Distinguishing our companies in this way yields a picture of our aggregate exposure to each of the three business models. As can be seen in the table below, our portfolio’s exposure to cross-border businesses is sizable, with nearly 50% by portfolio weight so classified.
| MODEL GLOBAL EQUITY RESEARCH PORTFOLIO END WEIGHT BY GLOBAL VALUE CHAIN CLASSIFICATION | ||||||
CROSS-BORDER | 49% | |||||
MULTI-DOMESTIC | 26% | |||||
DOMESTIC | 25% | |||||
Source: Harding Loevner Global Equity Research Model as of October 31, 2019.
28
|
Table of Contents
In periods of heightened investor anxiety about trade tensions, the share prices of companies that we have categorized as cross-border have performed worse than the rest of the portfolio—notably at the end of 2018. Unfortunately, without a similar classification for all stocks in the index, we have no means to quantify the effect on relative performance of this “cross border” factor apart from other factors.
The effect of tariffs on participants in GVCs is but one, albeit a very important, example of how political intrusion in the economic sphere impacts our companies. It is clear that we must constantly monitor on many fronts the threats of government intervention. These threats are rising, not only in the form of tariffs, but also as additional restrictions on technology transfer (e.g., the US ban on sales of certain computer chips to certain Chinese entities), capital restrictions (US threats to restrict investment in Chinese equities, or force Chinese companies to move their listings from US stock exchanges), or even putative presidential “orders” that US companies abandon the business relationships they have built up in China. Our analysts must grasp how each company manages its supply chain and make a judgment about whether or not such risks are appropriately discounted in its share price.
PORTFOLIO HIGHLIGHTS
The Global Equity Research Portfolio’s holdings are directly determined by analysts’ recommendations among Harding Loevner’s collection of researched companies. In addition to responding to changes in analysts’ ratings, we also adjust individual position weights to maintain our desired risk profile (moderately lower expected volatility compared with the benchmark and constrained tracking error).
New analyst recommendations (both upgrades and downgrades) resulted in a modest increase in the Portfolio’s allocation to Consumer Staples and a reduction in our IT and Health Care investments compared with end of the last fiscal year.
New purchases in Consumer Staples included two Japanese companies, baby care goods manufacturerPigeon and cosmetics companyShiseido. The latter is in the midst of a corporate rejuvenation that we believe has good potential to support long-term earnings growth beyond the expectations reflected in its current valuation. We also added Philippines-based branded consumer foods makerUniversal Robina, which has continued to gain market share and grow revenue in the domestic coffee business. Our other Consumer Staples purchases included South Korean cosmetics manufacturerAmorepacific, Turkish retailerBIM Birlesik, andUS-based drugstore operatorWalgreens Boots Alliance.
The Portfolio’s allocation to IT fell in the year as a result of analyst downratings. We sold Israel-based cybersecurity software developerCheck Point. The enterprise security industry has become increasingly fragmented, resulting in increased threats of substitution and new entrants. The increasingly less-favorable industry structure requires Check Point to invest more aggresively in new products and marketing, threatening the company’s earnings growth potential. We sold several other IT holdings due to valuation, includingUS-based
TEN LARGEST HOLDINGS at October 31, 2019
| COMPANY | SECTOR | COUNTRY | % | |||||||||
ALLEGION | INDUSTRIALS | US | 1.2 | |||||||||
JPMORGAN CHASE | FINANCIALS | US | 1.2 | |||||||||
ECOLAB | MATERIALS | US | 1.1 | |||||||||
MERCK | HEALTH CARE | US | 1.1 | |||||||||
TIFFANY & CO | CONS DISCRETIONARY | US | 1.1 | |||||||||
PROCTER & GAMBLE | CONS STAPLES | US | 1.1 | |||||||||
RESMED INC | HEALTH CARE | US | 1.1 | |||||||||
AMPHENOL | INFO TECHNOLOGY | US | 1.0 | |||||||||
FIRST REPUBLIC BANK | FINANCIALS | US | 1.0 | |||||||||
ROPER | INDUSTRIALS | US | 1.0 | |||||||||
market-research services providerGartner,US-based financial technology services providerJack Henry & Associates, and Indian technology companyTata Consultancy Services.
In Health Care, we soldAmerisourceBergen, a US drug wholesaler, whose growth prospects are dimmed by reforms in pharmacy rebate practices and the backlash against widespread opioid prescription abuses. We also exited our position in US pharmaceutical manufacturerRegeneron, which the analyst downgraded due to concerns that earnings growth may be dampened in the near future by high R&D expenses at a time when the company’s production pipeline is not especially strong.
By geography, our exposure to the eurozone increased. We added to our positions inFuchs Petrolub,Henkel, andBanco Santander. We also purchased French biopharma-equipment supplierSartorius Stedim Biotech. The Portfolio’s allocation to the US decreased. We sold our positions in IT consultantAccenture, Gartner, and retail farm chain storeTractor Supply Co.
Please read the separate disclosures page for important information, including the risks of investing in the Portfolio.
29
|
Table of Contents

PORTFOLIO MANAGEMENT TEAM

MOON SURANA, CFA PORTFOLIO MANAGER
ANDREW WEST, CFA PORTFOLIO MANAGER |
PERFORMANCE SUMMARY
For the International Equity Research Portfolio, the Institutional Class rose 12.93% (net of fees and expenses) in the fiscal year ended October 31, 2019. The Portfolio’s benchmark, the MSCI All Country Worldex-US Index, rose 11.27% (net of source taxes).
MARKET REVIEW
International stock markets had a volatile fiscal year. After declining sharply toward the end of 2018 amid risingUS-China trade tensions and worries that the US Federal Reserve’s interest rate hikes might trigger a global recession, markets recovered strongly in 2019 to end the trailing twelve months with double-digit gains.
TheUS-China trade drama featured whiplash-inducing developments as optimism about talks turned sour, only to be followed by another apparently positive turn, before again dissolving into recriminations. The year ended at a positive point, with US and Chinese officials beginning a new round of trade negotiations, China offering to increase its purchases of US agricultural goods, and President Donald Trump indicating a willingness to accede to a “phase one” agreement.
As the year progressed, there were increasing signs that the trade war was weighing on global economic growth. Official GDP growth forecasts were revised downward in both the US and in Europe. In China, retail sales and manufacturing activity fell amid a sharp decline in bank lending. Germany’s manufacturing sector abruptly contracted in 2019, and the country’s export sales and orders declined at the fastest rate since the financial crisis in 2008. In September, the OECD cut its 2019 forecast for global economic growth to the slowest rate in a decade, citing the impact of theUS-China tariff wars on global trade and capital investment. It also reduced its GDP growth estimates for next year for 18 of the G20 economies.
FUND FACTS at October 31, 2019 | ||||||||||||
TOTAL NET ASSETS | $19.5M | |||||||||||
SALES CHARGE | NONE | |||||||||||
NUMBER OF HOLDINGS | 191 | |||||||||||
TURNOVER (5 YR. AVG.) | – | |||||||||||
REDEMPTION FEE | 2% FIRST 90 DAYS | |||||||||||
DIVIDEND POLICY | ANNUAL | |||||||||||
INSTITUTIONAL INVESTORS | ||||||||||||
| INST CLASS | INST CLASS Z | |||||||||||
TICKER | HLIRX | HLMZX | ||||||||||
CUSIP | 412295826 | 412295743 | ||||||||||
INCEPTION DATE | 12/17/2015 | – | ||||||||||
MINIMUM INVESTMENT1 | $100,000 | $10,000,000 | ||||||||||
NET EXPENSE RATIO2 | 0.75% | 0.75% | ||||||||||
GROSS EXPENSE RATIO | 1.73% | 1.83% | ||||||||||
1Lower minimums available through certain brokerage firms;2Shown net of Harding Loevner’s contractual agreement through February 28, 2020.
All Expense Ratios are as of the Prospectus dated February 28, 2019 unless otherwise noted.
Confronted with anemic economic growth and still no inflationary impulse from ten years of easy money, central banks responded with additional stimulus. The Federal Reserve cut interest rates in July for the first time since the global financial crisis, and cut them again in late September. The European Central Bank renewed its quantitative easing program and pushed short-term interest rates deeper into negative territory. China lowered its reserve requirement for banks. Central banks in other countries also moved to cut rates or otherwise create monetary stimulus.
Information Technology (IT), led by the traditionally cyclical semiconductor group, was the strongest sector, followed by Utilities (normally considered a “defensive” sector). Energy and Materials were the weakest-performing sectors amid declines in the prices of oil and other commodities.
PERFORMANCE ATTRIBUTION
Our strong stock selection in Japan contributed to relative returns. Shares ofNomura Research Institute, an IT systems integrator for financial companies, rose after the company reported improved margins after a large brokerage firm signed up for its cloud-based accounting system. Shares ofNITORI, Japan’s largest home-furnishing retailer, jumped after the company reported an increase in same-store sales in the first quarter.
30
|
Table of Contents
PERFORMANCE (% TOTAL RETURN)
| for periods ended September 30, 2019 | for periods ended October 31, 2019 | |||||||||||||||||||||||||
1 YEAR | 3 YEARS | SINCE INCEPTION* | 1 YEAR | 3 YEARS | SINCE INCEPTION* | |||||||||||||||||||||
INTL EQUITY RESEARCH PORTFOLIO - INSTITUTITONAL CLASS | -0.67 | 7.08 | 9.05 | 12.93 | 8.91 | 9.75 | ||||||||||||||||||||
MSCI ALL COUNTRY WORLDEX-US INDEX | -1.23 | 6.33 | 6.75 | 11.27 | 8.07 | 7.55 | ||||||||||||||||||||
Returns are annualized for periods greater than 1 year. *Inception date: December 17, 2015.
Performance data quoted represents past performance; past performance does not guarantee future results. The investment return and principal value of an investment will fluctuate so that an investor’s shares, when redeemed, may be worth more or less than their original cost. Current performance of the Portfolio may be lower or higher than the performance quoted. Performance data current to the most recent month end may be obtained by calling (877)435-8105 or visiting www.hardingloevnerfunds.com. Performance data shown does not reflect the 2.00% redemption fee imposed on shares held 90 days or less; otherwise, total returns would be reduced.
The chart below illustrates the hypothetical return of an investment made in the corresponding share classes. Investment return reflects voluntary fee waivers in effect. Absent such waivers, total return would be reduced. The performance provided in the table and charts above do not reflect the deduction of taxes that a shareholder would pay on Portfolio distributions or the redemption of Portfolio shares.
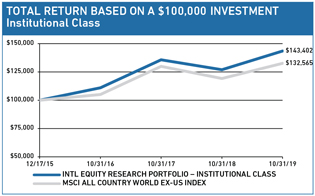
Stocks in Pacificex-Japan also helped relative returns. Hong Kong-based semiconductor equipment makerASM Pacific Technology rose after chip foundryTSMC issued stronger-than-anticipated guidance for the second half of the year. Innovative cord-less-tool makerTechtronic Industries, headquartered in Hong Kong but whose factories are concentrated in China, also rose.
Our stock selection was also strong in EMs. Philippines-based container terminal operatorICTSI rose after its operating margins improved due to increased volumes and efficiencies at its Argentinian, Columbian, and Australian ports. In China, private education providerNew Oriental Education reported better-than-expected sales and enrollment growth for its tutoring programs.
Our stock selection in Canada detracted from relative returns. Oil producerEnCana declined significantly in the period, offsetting the gains of roadside retailerAlimentation Couche-Tard.
By sector, stocks in Financials, Industrials, and IT helped relative returns. Indonesia’sBank Central Asia stood out in Financials, while ICTSI led Industrials stocks. In IT, Nomura Research Institute and Argentina’sGlobant rose in the fiscal year, as did stocks of semiconductor companies ASM Pacific Technology andASML.
Our stocks in Communication Services detracted however, dragged down by Indonesian tower operatorBharti Infratel, which fell amid the country’s economic weakness. The Japanese
advertising agencyDentsu faced strong headwinds and detracted from our relative returns. As consumers continue to shift their attention to online media, Clients expect their ad agencies to provide new means to command the audience’s attention. Dentsu has proven to clients that it can deliver on its promises, improving return on investment in marketing efforts. Over the past five years, it has won more new contracts than it has lost.
PERSPECTIVE AND OUTLOOK
We have been concerned about President Trump’s approach to trade policy from the outset of his administration. A day after his election in 2016, we predicted “beneficiaries of trade and globalization stand to lose” if consensus assumptions about his future policies proved correct. By the fourth quarter of 2018, new tariffs had been imposed, and their impact was beginning to be felt. We revealed our fear of an emergent trade war becoming “an attack on the bounty of globalization: the efficiencies of global supply chains that have benefited consumers everywhere while bolstering the profits of those companies most adept at exploiting them.”
We are no longer thinking about the possibility of a hot trade war but rather grappling with the reality of one. As it has escalated, companies have canceled investment plans, shifted their supply chains out of China, and been forced to choose between accepting lower margins or lower sales. The impact of tariffs is now showing up in economic data. In August, the US Purchasing Managers Index sank to a10-year low, while Germany’s Business Climate Index dropped to a nearly7-year low. The World Trade Organization (WTO) halved its estimate of growth in world trade in merchandise this year to just 1.2%, the slowest since 2009.
Due to the nature of today’s global trading system the negative effects of the trade war will be further-reaching than its proponents represented. According to a new WTO report, today more thantwo-thirds of global trade flows through global value chains (GVCs), with the remainder reflecting the traditional cross-border exchange of finished products. In “simple” GVCs, companies supply intermediate goods for use in finished production in other
31
|
Table of Contents
countries, for example, Brazilian iron ore exported to China to be made into steel for use in its skyscrapers. In “complex” GVCs, components cross andre-cross borders in intermediate production before being assembled as a final product. The iPhone is the classic example of such a “made in the world” product of a complex GVC. Gorilla Glass from Corning factories in Kentucky, semiconductors from Texas Instruments, batteries from Korea, DRAM from Taiwan, and other parts from 40 additional countries are assembled in China and shipped as a finished smartphone to consumers around the globe. The automobile and aircraft industries exhibit a similarly complex organization of production.
Determining the impact of tariffs on participants in GVCs is a near-impossible task. The WTO report notes: “One important policy implication is that changes in trade policy can have broad and unanticipated effects. The unilateral imposition of trade protection on exports from a partner country can have a significant impact on third countries when trade is carried out through GVCs, particularly complex GVCs. Indeed, as many products today are already ‘made in the world,’ increasing import protection can even harm exports from the home country.”
So great has been the bounty of the global trading system over our investing careers, it’s certainly the case that we have developed a bias in favor of businesses that are deeply embedded in complex GVCs. We have found that they tend to have lower and more flexible costs, making them more competitive. They are able to achieve higher and more geographically diversified revenues, and higher and more stable profit margins, potentially resulting in higher returns on capital. It is for these reasons that our research process leads us to them. If the global trading system is under rising threat from political interference, discount rates will rise for the shares of those companies most exposed.
We’ve adopted and streamlined the WTO’s taxonomy of enterprises to create a classification by which we can (crudely) estimate the portfolio’s aggregate exposure to global value chains. Accordingly, we classify our companies as follows:
GEOGRAPHIC EXPOSURE (%) at October 31, 2019
| COUNTRY/REGION | PORTFOLIO | BENCHMARK1 | ||||||
CANADA | 2.4 | 6.7 | ||||||
EMERGING MARKETS | 31.4 | 26.2 | ||||||
EUROPE EMU | 16.4 | 21.5 | ||||||
EUROPEEX-EMU | 22.3 | 20.4 | ||||||
FRONTIER MARKETS2 | 0.0 | – | ||||||
JAPAN | 19.5 | 16.7 | ||||||
MIDDLE EAST | 0.0 | 0.4 | ||||||
PACIFICEX-JAPAN | 5.5 | 8.1 | ||||||
CASH | 2.5 | – | ||||||
1MSCI All Country Worldex-US Index;2Includes countries with less-developed markets outside the Index.
SECTOR EXPOSURE (%) at October 31, 2019
| SECTOR | PORTFOLIO | BENCHMARK1 | ||||||
COMMUNICATION SERVICES | 5.0 | 6.7 | ||||||
CONSUMER DISCRETIONARY | 14.6 | 11.6 | ||||||
CONSUMER STAPLES | 14.6 | 9.8 | ||||||
ENERGY | 3.9 | 6.6 | ||||||
FINANCIALS | 17.6 | 21.6 | ||||||
HEALTH CARE | 7.9 | 8.7 | ||||||
INDUSTRIALS | 14.8 | 12.1 | ||||||
INFORMATION TECHNOLOGY | 9.1 | 9.0 | ||||||
MATERIALS | 6.7 | 7.3 | ||||||
REAL ESTATE | 1.9 | 3.2 | ||||||
UTILITIES | 1.4 | 3.4 | ||||||
CASH | 2.5 | – | ||||||
1MSCI All Country Worldex-US Index.
| • | Adomestic business is one whose operations are limited to one country. An example isHDFC Bank, which does almost all its business in its home market of India. |
| • | Amulti-domestic business is similar to what is commonly known as a multinational corporation (MNC), but with what we think is a needed twist. An example is the Swiss-based consumer products giantNestlé. The company is commonly viewed as an MNC since it sells its products in 190 countries. While Nestlé uses raw materials from around the world and there is some trade in Nestlé’s end products, the vast majority of its products are manufactured in the same place they are sold: in the 80 countries where it has factories. To us, this means Nestlé’s GVC exposure is lower as it is effectively a set of domestic business in multiple countries. |
| • | Across-border business not only has sales in multiple countries but also a complex production chain that sources components from many countries, assembles in others, and then transports the final product to countries around the world. Examples here includeAdidas and Apple. |
Distinguishing our companies in this way yields a picture of our aggregate exposure to each of the three business models. As can be seen in the table below, our Portfolio’s exposure to cross-border businesses is sizable, with nearly 50% by portfolio weight so classified.
| MODEL INTL EQUITY RESEARCH PORTFOLIO END WEIGHT BY GLOBAL VALUE CHAIN CLASSIFICATION | ||||||
CROSS-BORDER | 49% | |||||
MULTI-DOMESTIC | 24% | |||||
DOMESTIC | 27% | |||||
Source: Harding Loevner International Equity Research Model as of October 31, 2019.
32
|
Table of Contents
In periods of heightened investor anxiety about trade tensions, the share prices of companies that we have categorized as cross-border have performed worse than the rest of the portfolio—notably at the end of 2018. Unfortunately, without a similar classification for all stocks in the index, we have no means to quantify the effect on relative performance of this “cross border” factor apart from other factors.
The effect of tariffs on participants in GVCs is but one, albeit a very important, example of how political intrusion in the economic sphere impacts our companies. It is clear that we must constantly monitor on many fronts the threats of government intervention. These threats are rising, not only in the form of tariffs, but also as additional restrictions on technology transfer (e.g., the US ban on sales of certain computer chips to certain Chinese entities), capital restrictions (US threats to restrict investment in Chinese equities, or force Chinese companies to move their listings from US stock exchanges), or even putative presidential “orders” that US companies abandon the business relationships they have built up in China. Our analysts must grasp how each company manages its supply chain and make a judgment about whether or not such risks are appropriately discounted in its share price.
PORTFOLIO HIGHLIGHTS
The International Equity Research portfolio’s holdings are directly determined by analysts’ recommendations among Harding Loevner’s collection of researched companies. In addition to responding to changes in analysts’ ratings, we also adjust individual position weights to maintain our desired risk profile (moderately lower expected volatility compared with the benchmark and constrained tracking error).
New analyst recommendations (both upgrades and downgrades) resulted in a modest increase in the Portfolio’s allocation to Consumer Discretionary and a reduction in our Industrials and Financials investments compared with end of the last fiscal year.
New purchases in Consumer Discretionary included leading Philippine home-improvement retailerWilcon Depot and Japanese furniture retailer NITORI. Over more than 40 years, Wilcon has grown from a single shop in Manila selling building materials to become the leading “big box” home-improvement retailer with 52 stores throughout the country. Wilcon’s strong brand, extensive store footprint, and wide assortment of leading local and international brands make it the top destination for the Philippines’ rising middle class. The company enjoys long-standing relationships with over 400 domestic and foreign suppliers. Its size enables it to source products at lower prices than regional chains and “mom and pop” stores. Wilcon’sin-house brands, making up 49% of its sales, set it apart from other home-improvement retailers and carry higher margins.
NITORI continues to grow even as demand for furniture shrinks amid Japan’s aging population. The company continues to add to its industry-leading 12% market share by offering high-quality andlow-cost products. It is vertically integrated: NITORI designs
TEN LARGEST HOLDINGS at October 31, 2019
| COMPANY | SECTOR | COUNTRY | % | |||||||||
NITORI HOLDINGS | CONS DISCRETIONARY | JAPAN | 1.2 | |||||||||
ROCHE | HEALTH CARE | SWITZERLAND | 1.1 | |||||||||
ALLIANZ | FINANCIALS | GERMANY | 1.1 | |||||||||
COMPASS GROUP | CONS DISCRETIONARY | UK | 1.1 | |||||||||
UNICHARM | CONS STAPLES | JAPAN | 1.1 | |||||||||
KUEHNE + NAGEL | INDUSTRIALS | SWITZERLAND | 1.1 | |||||||||
ESSILORLUXOTTICA | CONS DISCRETIONARY | FRANCE | 1.0 | |||||||||
SHIONOGI | HEALTH CARE | JAPAN | 1.0 | |||||||||
ABC-MART | CONS DISCRETIONARY | JAPAN | 1.0 | |||||||||
HOMESERVE | INDUSTRIALS | UK | 1.0 | |||||||||
and builds its furniture, operates retail stores, and delivers merchandise to customers’ homes. Its extensive transportation network can reach 98% of Japan’s population.
In Industrials, our weight in the sector decreased after we trimmed two relatively volatile stocks, Sweden’sAtlas Copco and Japan’sKomatsu. We also sold refrigeration-equipment manufacturerHoshizaki. After it missed a deadline for filing its third-quarter results and delayed its quarterly financial report our analyst determined that the company no longer meets our corporate-governance standards.
By region, our exposure to Europeex-EMU decreased. We exited two positions due to high valuations:Assa Abloy, a Swedish security-equipment manufacturer, andRightmove, aUK-based online real estate marketplace. Also in the UK, we sold financial company St. James’s Place due to concerns over regulatory and competitive pressures.
Our exposure to Japan and the Eurozone increased. In Japan, we shifted from a slight underweight to an overweight relative to the index. In the eurozone, we added to our positions inAB InBev,Fuchs Petrolub,Henkel, andBanco Santander. We also purchased French biopharma-equipment supplierSartorius Stedim Biotech.
Please read the separate disclosures page for important information, including the risks of investing in the Portfolio.
33
|
Table of Contents

PORTFOLIO MANAGEMENT TEAM

MOON SURANA, CFA PORTFOLIO MANAGER
ANDREW WEST, CFA PORTFOLIO MANAGER |
PERFORMANCE SUMMARY
The Emerging Markets Research Portfolio – Institutional Class rose 15.05% (net of fees and expenses) in the fiscal year ended October 31, 2019. The Portfolio’s benchmark, the MSCI Emerging+ Frontier Markets Index, rose 11.85% (net of source taxes) in the fiscal year.
MARKET REVIEW
Emerging Markets (EMs) posted strong returns in a fiscal year marked by the twists and tweets in theUS-China trade dispute, weakening global economic data, and central bank actions in response to the cloudy economic outlook. TheUS-China trade drama featured whiplash-inducing developments as optimism about talks turned sour, only to be followed by another apparently positive turn, before again dissolving into recriminations. The year ended at a positive point, with US and Chinese officials beginning a new round of trade negotiations, China offering to increase its purchases of US agricultural goods, and President Donald Trump indicating a willingness to accede to a “phase one” agreement.
As the year progressed, there were increasing signs that the trade war was weighing on global economic growth. China’s economy, for example, grew at a rate of only 6% in the second quarter of 2019, the slowest rate in nearly three decades. In September, the OECD cut its 2019 forecast for global economic growth to the slowest rate in a decade, citing the impact of theUS-China dispute on global trade and capital investment. Central banks responded with a newly dovish policy stance.
As growth in China and other key EMs decelerated, business results among Information Technology (IT) companies proved resilient, with the sector up 23%. Consumer Discretionary and Staples also outperformed the index but saw a wide divergence in returns across countries.
FUND FACTS at October 31, 2019 | ||||||
TOTAL NET ASSETS | $7.2M | |||||
SALES CHARGE | NONE | |||||
NUMBER OF HOLDINGS | 111 | |||||
TURNOVER (5 YR. AVG.) | – | |||||
REDEMPTION FEE | 2% FIRST 90 DAYS | |||||
DIVIDEND POLICY | ANNUAL | |||||
INSTITUTIONAL INVESTORS | ||||||
| INSTITUTIONAL CLASS | ||||||
TICKER | HLREX | |||||
CUSIP | 412295776 | |||||
INCEPTION DATE | 12/19/2016 | |||||
MINIMUM INVESTMENT1 | $100,000 | |||||
NET EXPENSE RATIO2 | 1.15% | |||||
GROSS EXPENSE RATIO | 2.75% | |||||
1Lower minimums available through certain brokerage firms;2Shown net of Harding Loevner’s contractual agreement through February 28, 2020.
All Expense Ratios are as of the Prospectus dated February 28, 2019 unless otherwise noted.
Materials was the worst-performing sector, falling 5%, with weak performance from steel producers and petrochemical companies due to dimming global growth prospects. Health Care was also weak as political pressures continued to mount worldwide over the rising cost burden of health care, particularly in the US, an important market for manyEM-based generic drug manufacturers.
Emerging Europe was the strongest region, delivering double-digit returns thanks to a sizeable contribution from Russia. In a global environment of rising risks from conflicts over trade and technology, as well as lower sovereign bond yields, investors were attracted by Russia’s relative isolation from dislocations in global trade and the high dividend yields offered by Russia’s blue-chip stocks, such asSberbank andLukoil.
In Asia, IT heavyweight Taiwan was the best-performing market. Returns were also strong in India, where Prime Minister Narendra Modi won a second five-year term with a strong majority of the vote that ensures policy continuity. Modi’sre-election coincided with tightening credit conditions and weakening consumer and corporate confidence, however. His government responded by announcing a series of stimulative policies, including a significant corporate tax cut. In Latin America, investors in Brazil were cheered by the Senate’s passage of a landmark social security reform bill that is forecast to save the government nearly US$200 billion over the next ten years.
34
|
Table of Contents
PERFORMANCE (% TOTAL RETURN)
| for periods ended September 30, 2019 | for periods ended October 31, 2019 | |||||||||||||||||||||||||
| CALENDAR YTD | 1 YEAR | SINCE INCEPTION* | CALENDAR YTD | 1 YEAR | SINCE INCEPTION* | |||||||||||||||||||||
EMERGING MARKETS RESEARCH PORTFOLIO – INSTL CLASS | 11.02 | 3.41 | 10.00 | 14.43 | 15.05 | 10.85 | ||||||||||||||||||||
MSCI EMERGING + FRONTIER MARKETS INDEX | 6.00 | -1.84 | 8.69 | 10.41 | 11.85 | �� | 9.97 | |||||||||||||||||||
Returns are annualized for periods greater than 1 year. *Inception date: December 19, 2016.
Performance data quoted represents past performance; past performance does not guarantee future results. The investment return and principal value of an investment will fluctuate so that an investor’s shares, when redeemed, may be worth more or less than their original cost. Current performance of the Portfolio may be lower or higher than the performance quoted. Performance data current to the most recent month end may be obtained by calling (877)435-8105 or visiting www.hardingloevnerfunds.com. Performance data shown does not reflect the 2.00% redemption fee imposed on shares held 90 days or less; otherwise, total returns would be reduced.
The chart below illustrates the hypothetical return of an investment made in the share class. Investment return reflects voluntary fee waivers in effect. Absent such waivers, total return would be reduced. The performance provided in the table and charts above do not reflect the deduction of taxes that a shareholder would pay on Portfolio distributions or the redemption of Portfolio shares.
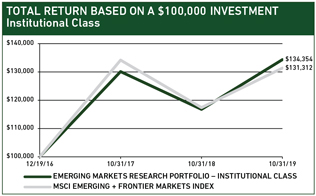
PERFORMANCE ATTRIBUTION
The Portfolio outperformed the index in the fiscal year primarily due to strong stock selection in the Financials, Industrials, and Materials sectors. Our underweight in Materials was also helpful. In Financials, Indonesia’sBank Central Asia and Indian holdingsKotak Mahindra Bank and mortgage lenderHDFC Corp were key contributors. The latter announced solid results including strong growth in loans and profits year over year.Shanghai International Airport and Brazilian industrial-motor manufacturerWEG led in Industrials. WEG has seen improving demand from the mining andpulp-and-paper industries. In Materials, Indian adhesives manufacturerPidilite Industries reported double-digit revenue and profit growth, helped by lower commodity prices.
Stocks in Consumer Staples and Communication Services detracted in the year. Shares ofBrazil-based brewerAmbev sold off in the latter half of the fiscal year due to economic deterioration in Argentina, a significant market for the company. Our analyst believes that Argentine beer consumption will be steady even if the economy continues to contract. He also has an increasingly positive view of the beer industry’s competitive dynamics in Brazil, where a distribution agreement between Heineken andCoca Cola Femsa is likely to be terminated.China Mobile detracted in Communication Services. China’s government eliminated data-roaming charges, reducing China Mobile’s average revenue per user.
By region, holdings in Asia provided the bulk of outperformance. In China, private education providerNew Oriental Education& Technology Group reported higher-than-expected sales and strong enrollment growth for its tutoring programs.Gree Electric Appliances andPing An Insurance also boosted relative returns.In South Korea, cosmetics companyAmorePacific and social media companyNAVER were the main contributors. Shares of Tai-wanese industrial PC manufacturerAdvantech also rose as the company announced a five-year plan to raise margins and reported solid revenue growth coupled with surprisingly good cost control.
Holdings in Africa modestly detracted. Shares of South African insurance companyDiscovery Holdings sold off after the government announced a preliminary plan to develop a universal health insurance program over the course of the next seven years. Under the program, private medical schemes like those administered by Discovery would be limited to covering services not provided by the public system. We think the impact on Discovery’s business will be less than initially feared, because the government’s fiscal position is challenged and the basic public plan it can afford won’t satisfy the growing demand for quality health care. The Portfolio’s underweight in China, small exposure to Pakistan, and overweight in Frontier Markets also dragged on relative returns.
PERSPECTIVE AND OUTLOOK
When we first wrote about theUS-China trade dispute in April 2018, we stated that we would make no changes to our portfolio based on tweets, headlines, and geopolitical predictions, reminding readers that our investment decisions remain anchored in analysis of industry and company fundamentals. With respect to potential changes in global trade, we seek answers to two primary questions: Would the competitive position of a company be affected? If so, what are the implications for its long-term growth and profit margins?
To illustrate how we analyze the implications of the trade dispute and incorporate them into our investment decisions, we discuss one holding especially exposed.
35
|
Table of Contents
Hangzhou Hikvision, a new addition to the Portfolio this year, is the global leader in developing and manufacturing video surveillance equipment, including systems that incorporate artificial intelligence (AI) andbig-data analysis to improve the efficacy and expand the applications of its cameras. Surveillance is a vast and growing global business. According to BIS Research, the surveillance market is expected to grow 16% a year to over US$77 billion by 2023. The growth is being propelled by the replacement of simple analog video cameras with advanced digital technology that offers more increasingly advanced analytical capabilities for a variety of purposes that include monitoring parking lots, alerting authorities when drivers violate traffic laws, and counting inventory and sending a notice when stock is running low.
Hikvision appears poised to capture much of the industry’s growth. Its high-quality,low-cost products have enabled it to dominate the vast Chinese market, and it is rapidly capturing market share elsewhere. The company’s key competitive advantages are its heavy investment in R&D and the large number of engineers it has hired from China’s highly skilled and affordable labor pool. In 2018, the company spent 4.5 billion renminbi (US$655 million) on R&D (a 40% increase over the previous year) and employed over 16,000 engineers, who account for nearly half of its total workforce. No other surveillance company comes close to Hikvision’s scale.
The global business success of Hikvision has put the company in the crosshairs of the Trump administration as it combats what it perceives as China’s military and technological threat to the US. The US has targeted Hikvision’s products purportedly for national security reasons, despite that its products have been certified by US governmental and international agencies to comply with the highest cybersecurity standards. In October, the US government added Hikvision was added to the Treasury Department’s Entity
GEOGRAPHIC EXPOSURE (%) at October 31, 2019
| COUNTRY/REGION | PORTFOLIO | BENCHMARK1 | ||||||
BRAZIL | 6.6 | 7.5 | ||||||
CHINA + HONG KONG2 | 27.5 | 31.3 | ||||||
INDIA | 10.3 | 8.8 | ||||||
MEXICO | 6.6 | 2.4 | ||||||
RUSSIA | 4.9 | 4.0 | ||||||
SOUTH AFRICA | 1.4 | 4.6 | ||||||
SOUTH KOREA | 6.5 | 12.0 | ||||||
TAIWAN | 6.8 | 11.7 | ||||||
SMALL EMERGING MARKETS3 | 21.8 | 15.9 | ||||||
FRONTIER MARKETS | 6.2 | 1.8 | ||||||
DEVELOPED MARKET LISTED4 | 0.3 | – | ||||||
CASH | 1.1 | – | ||||||
1MSCI Emerging + Frontier Markets Index;2The Emerging Markets Research Portfolio’s end weight in China as of October 31, 2019 is 27.5% and Hong Kong is 0.0%. The Benchmark does not include Hong Kong;3Includes the remaining emerging markets which, individually, comprise less than 5% of the Index;4Includes emerging markets or frontier markets companies listed in developed markets.
SECTOR EXPOSURE (%) at October 31, 2019
| SECTOR | PORTFOLIO | BENCHMARK1 | ||||||
COMMUNICATION SERVICES | 8.2 | 11.1 | ||||||
CONSUMER DISCRETIONARY | 13.5 | 13.0 | ||||||
CONSUMER STAPLES | 17.4 | 6.8 | ||||||
ENERGY | 7.9 | 7.8 | ||||||
FINANCIALS | 25.9 | 25.1 | ||||||
HEALTH CARE | 3.0 | 2.8 | ||||||
INDUSTRIALS | 5.6 | 5.3 | ||||||
INFORMATION TECHNOLOGY | 11.0 | 15.2 | ||||||
MATERIALS | 3.3 | 7.1 | ||||||
REAL ESTATE | 1.7 | 3.0 | ||||||
UTILITIES | 1.4 | 2.8 | ||||||
CASH | 1.1 | – | ||||||
1MSCI Emerging + Frontier Markets Index.
List, which restricts the company’s ability to purchase certain advanced US technology.
The US market as a whole accounts for only 5% of its US$7 billion in annual sales. Under any scenario, its most important market will continue to be China, which accounts for more than 70% of sales. The threat of loss of access to US semiconductors raises the political drama, but would not have a material financial impact on the company in the near term. In recent years, Hikvision has significantly diversified its sources of semiconductors and produces most of its products usingnon-US chips.
We recognize that there are social risks associated with selling surveillance equipment, which can be used for socially oppressive as well as socially beneficial purposes. As an integral part of our fundamental research, we explore environmental, social, or governance (ESG) issues that may pose a risk to the sustainability of a company’s business. Our ESG analysis culminates in assigning a score to each of these three areas for a company. The ESG scores are measures of the risk to the sustainability of a company’s growth and impact our estimate of a company’s fair value. Late last year, news reports emerged that Hikvision’s technology was being used to support government surveillance in Xinjiang province, where for years Uighurs and other Muslims have been detained inre-education camps for the ostensible purpose of countering extremism and terrorism. The reports detailed, for the first time, the role that advanced surveillance systems played in the government’s crackdown in the province, including in the camps.
In meetings with Hikvision’s management in China, we discussed the Xinjiang issue. They claimed that the company had been unaware of the purposes of the government contracts at issue, as the projects’ specifications were very similar to the typical surveillance system used for security at many large school campuses in China or abroad, that the company was not involved in the operations at its clients’ sites, and that the data collected in Xinjiang was not accessible by Hikvision. Though it is impossible for us to confirm
36
|
Table of Contents
what the company knew about the camps before last year’s reports, we were encouraged by the actions it has taken in the aftermath. Hikvision immediately made changes to reduce its social risk exposure, including ending its participation in such projects in Xinjiang and revising its screening procedures to comply with international human rights standards. Nonetheless, we assign the company a high social risk score to reflect the heightened concerns surrounding the potential for employment of its products in human rights abuses, and to reflect the additional, related risk factor that its largest shareholder remains a Chinese state entity.
PORTFOLIO HIGHLIGHTS
The Emerging Markets Equity Research Portfolio’s holdings are directly determined by analysts’ recommendations among Harding Loevner’s collection of researched companies. In addition to responding to changes in analysts’ ratings, we also adjust individual position weights to maintain our desired risk profile (moderately lower expected volatility compared with the benchmark and constrained tracking error).
New analyst recommendations (both upgrades and downgrades) resulted in a significant increase in the Portfolio’s allocation to IT and a reduction in our Consumer Discretionary and Financials investments compared with end of the last fiscal year.
New purchases in IT includedHon Hai Precision, a Taiwan-based company specializing in electronic manufacturing services. The company manufactures, tests, distributes, and provides return/repair services for electronic components and assemblies on behalf of original equipment manufacturers (OEMs). The company’s vertical integration approach to sourcing components in its manufacturing process allows Hon Hai to produce electronic devices at a lower cost than OEMs as well as competitors. We also purchasedTata Consultancy (TCS), an Indian technology company that enjoys a strong reputation for its ability to execute large-scale IT projects, and its workforce of over 400,000 people provides it with scale advantages unmatched by most peers. As businesses worldwide in all industries initiate large and complex digital initiatives, demand for TCS’s services should continue to grow. We also added toLargan Precision, the Taiwanese manufacturer of plastic lens sets for smartphones, whose stock had fallen (excessively in the analyst’s view) on trade war fears.
The Portfolio’s weight in Consumer Discretionary declined in part due to our sales of three Chinese companies on valuation concerns: sportswear companyANTA Sports,e-commerce giantJD.com, and appliance manufacturerMidea Group. We also sold Indian motorcycle manufacturerHero Motocorp, which the analyst expected will face margin pressures due to the cost of meeting India’s tightening emissions standards.
Looking at the Portfolio geographically, this year we made numerous purchases and sales in China, but the overall impact was an increase in our exposure to this large market. New holdings includeFuyao. Fuyao is a leading producer of automobile glass, with 65% market share in China and about 30% market share
TEN LARGEST HOLDINGS at October 31, 2019
| COMPANY | SECTOR | COUNTRY | % | ||||||||||
HDFC BANK ADR | FINANCIALS | INDIA | 2.1 | ||||||||||
LUKOIL | ENERGY | RUSSIA | 2.1 | ||||||||||
SAMSUNG ELECTRONICS | INFO TECHNOLOGY | SOUTH KOREA | 2.1 | ||||||||||
TSMC | INFO TECHNOLOGY | TAIWAN | 2.0 | ||||||||||
HON HAI PRECISION | INFO TECHNOLOGY | TAIWAN | 2.0 | ||||||||||
CNOOC | ENERGY | CHINA | 1.9 | ||||||||||
PING AN INSURANCE | FINANCIALS | CHINA | 1.9 | ||||||||||
ALIBABA GROUP HOLDING | CONS DISCRETIONARY | CHINA | 1.9 | ||||||||||
WEG | INDUSTRIALS | BRAZIL | 1.9 | ||||||||||
JARIR MARKETING | CONS DISCRETIONARY | SAUDI ARABIA | 1.9 | ||||||||||
in North America. China’s weak auto market had caused Fuyao’s shares to fall to a level that in the analyst’s view no longer reflected the company’s solid growth prospects, which are supported by its constant focus on upgrading technology and controlling costs. We also repurchased internet game giantTencent, which we had sold in January. Tencent received new government approvals to start monetizing certain popular (but formerly free) games. The analyst expected these games to contribute significantly to the company’s revenues and earnings.
We reduced our holdings in South Africa through the sale ofTiger Brands, a consumer-products company that the analyst believes no longer has significant growth potential, andStandard Bank, on concerns about the country’s deteriorating economic and fiscal outlook.
We also reduced our weight in frontier markets. Our sales included two Argentina-based companies, global IT services consultantGlobant andTelecom Argentina. The latter has been unable to raise prices fast enough to keep pace with inflation, pressuring margins. We also sold Vietnamese consumer products manufacturerMasan, whose animal feed business has slowed due to China’s 2018 decision to stop importing Vietnamese pigs and the African Swine Flu pandemic.
Please read the separate disclosures page for important information, including the risks of investing in the Portfolio.
37
|
Table of Contents
 DISCLOSURES
The Portfolios invest in foreign securities, which will involve greater volatility and political, economic, and currency risks and differences in accounting methods. They also invest in emerging markets, which involve unique risks, such as exposure to economies less diverse and mature than the US or other more established foreign markets. Economic and political instability may cause larger price changes in emerging markets securities than other foreign securities.
Investments in small- andmid-cap companies involve additional risks such as limited liquidity and greater volatility.
Diversification does not guarantee a profit or prevent a loss in a declining market.
Long-term earnings growth and earnings per share growth are not a forecast of the Portfolios’ future performance.
Companies held in the Portfolios during the first half of the fiscal year appear in bold type; only the first reference to a particular holding appears in bold. The Portfolios are actively managed; therefore holdings shown may not be current. Portfolio holdings and sector and geographic allocations should not be considered recommendations to buy or sell any security. Please refer to the Portfolios of Investments in this report for complete Portfolio holdings. Current and future Portfolio holdings are subject to risk.
While the Portfolios have no sales charge, management fees and other expenses still apply. Please see the Prospectus for further details.
Sector & Geographic Exposure data is sourced from: Northern Trust, Harding Loevner Funds Portfolios, and MSCI Barra.
Expense Ratios: Differences may exist between the commentary data and similar information reported in the financial statements due to timing differences. Unless otherwise stated, the expense ratios presented are shown as of the most recent Prospectus date, February 28, 2019.
Five year average turnover data is calculated using a simple average of annual turnover figures for the past five fiscal years. These annual turnover figures utilize purchase, sales, and market value data which is not reflective of adjustments required pursuant to Generally Accepted Accounting Principles (GAAP). Accordingly, differences may exist between this data and similar information reported in the financial statements.
Quasar Distributors, LLC, Distributor.
INDEX DEFINITIONS
The Germany’s Business Climate Index is a key monthly survey that measures the business climate in Germany.
The MSCI All Country World Index is a freefloat-adjusted market capitalization index that is designed to measure equity market performance in the global developed and emerging markets. The Index consists of 47 developed and emerging market countries. Net dividends reinvested.
The MSCI All Country Worldex-US Index is a freefloat-adjusted market capitalization index that is designed to measure equity market performance in the global developed and emerging markets, excluding the US. The Index consists of 48 developed and emerging market countries. Net dividends reinvested.
The MSCI All Country Worldex-US Small Cap Index is a free-float market capitalization index that is designed to measure small cap developed and emerging market equity performance. The Index consists of 48 developed and emerging markets countries and targets companies within a market capitalization range of USD 87–12,489 million (as of March 31, 2019) in terms of the companies’ full market capitalization. Net dividends reinvested.
The MSCI Emerging Markets Index is a freefloat-adjusted market capitalization index that is designed to measure equity market performance in the global emerging markets. The Index consists of 26 emerging market countries. Net dividends reinvested.
The MSCI Emerging + Frontier Markets Index is a freefloat-adjusted market capitalization index that is designed to measure equity market performance in the global emerging markets and frontier markets. The Index consists of 26 emerging markets countries and 28 frontier markets countries. Net dividends reinvested.
The MSCI Frontier Emerging Markets Index is a freefloat-adjusted market capitalization index designed to measure equity market performance in all countries from the MSCI Frontier Markets Index and the lower size spectrum of the MSCI Emerging Markets Index. The Index consists of 28 frontier markets and 6 emerging markets. Net dividends reinvested.
The Nikkei 225 is a stock market index for the Tokyo Stock Exchange (TSE).
You cannot invest directly in these Indexes.
TERM DEFINITIONS
Beta measures the portfolio’s sensitivity to the market.
Discounted cash flow is a method of estimating the value of an investment based on its future cash flows.
Dividend yield is the annual dividends per share divided by current price per share, expressed as a percent.
Economies of scale is the cost advantage that arises with increased output of a product.
Gross Domestic Product (GDP) is the monetary value of all finished goods and services produced within a country’s borders in a specific time period (usually calculated on an annual basis).
Market Capitalization is the total dollar market value of all of a company’s outstanding shares.
The Purchasing Managers Index (PMI) is an indicator of the economic health of the manufacturing sector. The index is based on five major indicators: new orders, inventory levels, production, supplier deliveries, and the employment environment.
Return on Capital (ROC) is a calculation used to assess a company’s efficiency at allocating the capital under its control to profitable investments.
Tracking Error is a measure of how closely a portfolio follows the index to which it is benchmarked.
Turnover is calculated by dividing the lesser of Purchases or Sales by Average Capital.
38
|
Table of Contents
Table of Contents
Harding, Loevner Funds, Inc.
| 2 | ||||
| 4 | ||||
| 4 | ||||
| 7 | ||||
| 10 | ||||
| 14 | ||||
| 17 | ||||
| 20 | ||||
| 23 | ||||
| 30 | ||||
| 36 | ||||
| 40 | ||||
| 43 | ||||
| 45 | ||||
| 48 | ||||
| 51 | ||||
| 66 | ||||
| 67 | ||||
| 68 | ||||
| 73 | ||||
| 74 | ||||
| 79 | ||||
For use only when preceded or accompanied by a prospectus. Read the prospectus carefully before you invest or send money.
Table of Contents
Harding, Loevner Funds, Inc.
October 31, 2019(unaudited)
As a shareholder of a Harding Loevner Portfolio, you incur ongoing costs, including management fees; to the extent applicable, distribution(12b-1) fees and/or shareholder services fees; and other fund expenses. The following examples are intended to help you understand your ongoing costs (in dollars and cents) of investing in a Portfolio and to compare these costs with the ongoing costs of investing in other mutual funds.
The examples are based on an investment of $1,000 invested at the beginning of a six month period and held through the period ended October 31, 2019.
Actual Expenses
The first line under each Portfolio in the table below provides information about actual account values and actual expenses. You may use the information in this line, together with the amount you invested, to estimate the expenses that you paid over the period. Simply divide your account value by $1,000 (for example, an $8,600 account value divided by $1,000 = 8.6), then multiply the result by the number in the first line for your Portfolio under the heading entitled “Expenses Paid During Period” to estimate the expenses you paid on your account during this period.
Hypothetical Example for Comparison Purposes
The second line under each Portfolio in the table below provides information about hypothetical account values and hypothetical expenses based on the Portfolio’s actual expense ratio and an assumed rate of return of 5% per year before expenses, which is not the Portfolio’s actual return. The hypothetical account values and expenses may not be used to estimate the actual ending account balance or expenses you paid for the period. You may use this information to compare the ongoing costs of investing in your Portfolio and other funds. To do so, compare this 5% hypothetical example with the 5% hypothetical examples that appear in the shareholder reports of the other funds. Please note that the expenses shown in the table are meant to highlight your ongoing costs only. Therefore, the second line under each Portfolio in the table is useful in comparing ongoing costs only, and will not help you determine the relative total costs of owning different funds.
| Portfolio | Beginning Account Value May 1, 2019 | Ending Account Value | Annualized Expense Ratio | Expenses Paid During Period* (May 1, 2019 to October 31, 2019) | ||||||||||||||||
Global Equity Portfolio — Institutional Class | ||||||||||||||||||||
Actual | $ | 1,000.00 | $ | 1,017.80 | 0.94 | % | $ | 4.78 | ||||||||||||
Hypothetical (5% annual return before expenses) | 1,000.00 | 1,020.47 | 0.94 | 4.79 | ||||||||||||||||
Global Equity Portfolio — Institutional Class Z | ||||||||||||||||||||
Actual | 1,000.00 | 1,018.20 | 0.87 | 4.43 | ||||||||||||||||
Hypothetical (5% annual return before expenses) | 1,000.00 | 1,020.82 | 0.87 | 4.43 | ||||||||||||||||
Global Equity Portfolio — Advisor Class | ||||||||||||||||||||
Actual | 1,000.00 | 1,016.70 | 1.10 | 5.59 | ||||||||||||||||
Hypothetical (5% annual return before expenses) | 1,000.00 | 1,019.66 | 1.10 | 5.60 | ||||||||||||||||
International Equity Portfolio — Institutional Class | ||||||||||||||||||||
Actual | 1,000.00 | 1,016.60 | 0.81 | 4.12 | ||||||||||||||||
Hypothetical (5% annual return before expenses) | 1,000.00 | 1,021.12 | 0.81 | 4.13 | ||||||||||||||||
International Equity Portfolio — Institutional Class Z | ||||||||||||||||||||
Actual | 1,000.00 | 1,017.00 | 0.75 | 3.81 | ||||||||||||||||
Hypothetical (5% annual return before expenses) | 1,000.00 | 1,021.42 | 0.75 | 3.82 | ||||||||||||||||
International Equity Portfolio — Investor Class | ||||||||||||||||||||
Actual | 1,000.00 | 1,015.20 | 1.12 | 5.69 | ||||||||||||||||
Hypothetical (5% annual return before expenses) | 1,000.00 | 1,019.56 | 1.12 | 5.70 | ||||||||||||||||
International Small Companies Portfolio — Institutional Class | ||||||||||||||||||||
Actual | 1,000.00 | 1,004.50 | 1.15 | 5.81 | ||||||||||||||||
Hypothetical (5% annual return before expenses) | 1,000.00 | 1,019.41 | 1.15 | 5.85 | ||||||||||||||||
* Expenses are calculated using each Portfolio’s annualized expense ratio (as disclosed in the table), multiplied by the average account value for the period, multiplied by the number of days in the period (184 days), and divided by the number of days in the year (365 days).
2
Table of Contents
Harding, Loevner Funds, Inc.
Expense Example (continued)
October 31, 2019(unaudited)
| Portfolio | Beginning Account Value May 1, 2019 | Ending Account Value October 31, 2019 | Annualized Expense Ratio | Expenses Paid During Period* (May 1, 2019 to October 31, 2019) | ||||||||||||||||
International Small Companies Portfolio — Investor Class | ||||||||||||||||||||
Actual | $ | 1,000.00 | $ | 1,003.20 | 1.41 | % | $ | 7.12 | ||||||||||||
Hypothetical (5% annual return before expenses) | 1,000.00 | 1,018.10 | 1.41 | 7.17 | ||||||||||||||||
Institutional Emerging Markets Portfolio — Institutional Class | ||||||||||||||||||||
Actual | 1,000.00 | 982.00 | 1.27 | 6.34 | ||||||||||||||||
Hypothetical (5% annual return before expenses) | 1,000.00 | 1,018.80 | 1.27 | 6.46 | ||||||||||||||||
Institutional Emerging Markets Portfolio — Institutional Class Z | ||||||||||||||||||||
Actual | 1,000.00 | 982.90 | 1.11 | 5.55 | ||||||||||||||||
Hypothetical (5% annual return before expenses) | 1,000.00 | 1,019.61 | 1.11 | 5.65 | ||||||||||||||||
Emerging Markets Portfolio — Advisor Class | ||||||||||||||||||||
Actual | 1,000.00 | 981.70 | 1.36 | 6.79 | ||||||||||||||||
Hypothetical (5% annual return before expenses) | 1,000.00 | 1,018.35 | 1.36 | 6.92 | ||||||||||||||||
Frontier Emerging Markets Portfolio — Institutional Class I | ||||||||||||||||||||
Actual | 1,000.00 | 950.10 | 1.61 | 7.91 | ||||||||||||||||
Hypothetical (5% annual return before expenses) | 1,000.00 | 1,017.09 | 1.61 | 8.19 | ||||||||||||||||
Frontier Emerging Markets Portfolio — Institutional Class II | ||||||||||||||||||||
Actual | 1,000.00 | 951.30 | 1.35 | 6.64 | ||||||||||||||||
Hypothetical (5% annual return before expenses) | 1,000.00 | 1,018.40 | 1.35 | 6.87 | ||||||||||||||||
Frontier Emerging Markets Portfolio — Investor Class | ||||||||||||||||||||
Actual | 1,000.00 | 948.60 | 2.00 | 9.82 | ||||||||||||||||
Hypothetical (5% annual return before expenses) | 1,000.00 | 1,015.12 | 2.00 | 10.16 | ||||||||||||||||
Global Equity Research Portfolio — Institutional Class | ||||||||||||||||||||
Actual | 1,000.00 | 1,018.60 | 0.80 | 4.07 | ||||||||||||||||
Hypothetical (5% annual return before expenses) | 1,000.00 | 1,021.17 | 0.80 | 4.08 | ||||||||||||||||
International Equity Research Portfolio — Institutional Class | ||||||||||||||||||||
Actual | 1,000.00 | 1,014.30 | 0.75 | 3.81 | ||||||||||||||||
Hypothetical (5% annual return before expenses) | 1,000.00 | 1,021.42 | 0.75 | 3.82 | ||||||||||||||||
Emerging Markets Research Portfolio — Institutional Class | ||||||||||||||||||||
Actual | 1,000.00 | 989.60 | 1.15 | 5.77 | ||||||||||||||||
Hypothetical (5% annual return before expenses) | 1,000.00 | 1,019.41 | 1.15 | 5.85 | ||||||||||||||||
* Expenses are calculated using each Portfolio’s annualized expense ratio (as disclosed in the table), multiplied by the average account value for the period, multiplied by the number of days in the period (184 days), and divided by the number of days in the year (365 days).
3
Table of Contents
Harding, Loevner Funds, Inc.
October 31, 2019
| Shares | Value | |||||||
| COMMON STOCKS - 95.9% | ||||||||
China - 6.4% | ||||||||
AAC Technologies Holdings Inc. (Technology Hardware & Equipment)† | 1,312,500 | $8,409,893 | ||||||
Alibaba Group Holding Ltd. - Sponsored ADR (Retailing)* | 92,815 | 16,397,626 | ||||||
Baidu Inc. - Sponsored ADR (Media & Entertainment)* | 133,558 | 13,602,882 | ||||||
Ctrip.com International Ltd. - ADR (Retailing)* | 400,342 | 13,207,283 | ||||||
NetEase Inc. - ADR (Media & Entertainment) | 34,805 | 9,949,357 | ||||||
| 61,567,041 | ||||||||
Denmark - 0.7% | ||||||||
Chr Hansen Holding A/S (Materials)† | 82,678 | 6,346,149 | ||||||
Finland - 1.1% | ||||||||
Kone OYJ, Class B (Capital Goods)† | 158,867 | 10,108,689 | ||||||
France - 3.8% | ||||||||
Air Liquide SA (Materials)† | 78,673 | 10,455,651 | ||||||
EssilorLuxottica SA (Consumer Durables & Apparel)† | 101,899 | 15,552,716 | ||||||
L’Oreal SA (Household & Personal Products)† | 37,261 | 10,883,764 | ||||||
| 36,892,131 | ||||||||
Germany - 2.2% | ||||||||
Symrise AG (Materials)† | 221,262 | 21,291,513 | ||||||
Hong Kong - 2.8% | ||||||||
AIA Group Ltd. (Insurance)† | 2,681,205 | 26,604,140 | ||||||
India - 2.9% | ||||||||
HDFC Bank Ltd. - ADR (Banks) | 179,410 | 10,960,157 | ||||||
ICICI Bank Ltd. - Sponsored ADR (Banks) | 1,332,117 | 17,357,484 | ||||||
| 28,317,641 | ||||||||
Indonesia - 1.7% | ||||||||
Bank Central Asia Tbk PT (Banks)† | 7,177,554 | 16,047,977 | ||||||
Japan - 11.6% | ||||||||
FANUC Corp. (Capital Goods)† | 36,245 | 7,154,954 | ||||||
Keyence Corp. (Technology Hardware & Equipment)† | 25,602 | 16,165,292 | ||||||
Kubota Corp. (Capital Goods)† | 647,835 | 10,280,033 | ||||||
M3 Inc. (Health Care Equipment & Services)† | 974,790 | 23,316,956 | ||||||
Makita Corp. (Capital Goods)† | 262,663 | 8,838,439 | ||||||
MonotaRO Co., Ltd. (Capital Goods)† | 473,060 | 14,309,823 | ||||||
Nidec Corp. (Capital Goods)† | 71,500 | 10,514,269 | ||||||
Shiseido Co., Ltd. (Household & | 112,800 | 9,342,790 | ||||||
| Shares | Value | |||||||
| COMMON STOCKS - 95.9% (continued) | ||||||||
Japan - 11.6% (continued) | ||||||||
Sysmex Corp. (Health Care Equipment & Services)† | 172,465 | $11,230,447 | ||||||
| 111,153,003 | ||||||||
Netherlands - 0.1% | ||||||||
Prosus NV (Retailing)* | 16,568 | 1,142,513 | ||||||
Russia - 1.2% | ||||||||
Yandex NV, Class A (Media & Entertainment)* | 354,366 | 11,832,281 | ||||||
South Africa - 0.2% | ||||||||
Naspers Ltd., Class N (Retailing)† | 12,973 | 1,843,503 | ||||||
South Korea - 1.0% | ||||||||
Samsung Electronics Co., Ltd. - GDR, Reg S (Technology Hardware & Equipment)† | 8,944 | 9,558,668 | ||||||
Spain - 0.7% | ||||||||
Banco Bilbao Vizcaya Argentaria SA (Banks)† | 1,369,836 | 7,182,403 | ||||||
Switzerland - 6.0% | ||||||||
Alcon Inc. (Health Care Equipment & Services)* | 158,443 | 9,390,916 | ||||||
Lonza Group AG, Reg S (Pharmaceuticals, Biotechnology & Life Sciences)*† | 63,941 | 23,020,201 | ||||||
Nestle SA - Sponsored ADR (Food Beverage & Tobacco) | 128,037 | 13,720,445 | ||||||
Sonova Holding AG, Reg S | ||||||||
(Health Care Equipment & Services)† | 49,904 | 11,435,103 | ||||||
| 57,566,665 | ||||||||
United Kingdom - 2.5% | ||||||||
Abcam plc (Pharmaceuticals, Biotechnology & Life Sciences)† | 800,745 | 12,112,953 | ||||||
Standard Chartered plc (Banks)† | 1,337,093 | 12,154,615 | ||||||
| 24,267,568 | ||||||||
United States - 51.0% | ||||||||
3M Co. (Capital Goods) | 38,413 | 6,337,761 | ||||||
Abbott Laboratories (Health Care Equipment & Services) | 150,444 | 12,578,623 | ||||||
Alphabet Inc., Class A (Media & Entertainment)* | 22,237 | 27,991,936 | ||||||
Amazon.com Inc. (Retailing)* | 8,224 | 14,611,252 | ||||||
Apple Inc. (Technology Hardware & Equipment) | 78,487 | 19,524,426 | ||||||
Booking Holdings Inc. (Retailing)* | 13,808 | 28,289,416 | ||||||
Cognex Corp. (Technology Hardware & Equipment) | 146,407 | 7,538,496 | ||||||
Cognizant Technology Solutions Corp., Class A (Software & Services) | 125,790 | 7,665,643 | ||||||
See Notes to Financial Statements
4
Table of Contents
Harding, Loevner Funds, Inc.
Global Equity Portfolio
Portfolio of Investments
October 31, 2019 (continued)
| Shares | Value | |||||||
| COMMON STOCKS - 95.9% (continued) | ||||||||
United States - 51.0% (continued) | ||||||||
Colgate-Palmolive Co. (Household & Personal Products) | 156,988 | $10,769,377 | ||||||
Core Laboratories NV (Energy) | 251,187 | 11,062,275 | ||||||
eBay Inc. (Retailing) | 232,389 | 8,191,712 | ||||||
Exxon Mobil Corp. (Energy) | 159,049 | 10,746,941 | ||||||
Facebook Inc., Class A (Media & Entertainment)* | 59,454 | 11,394,359 | ||||||
First Republic Bank (Banks) | 243,028 | 25,848,458 | ||||||
Illumina Inc. (Pharmaceuticals, Biotechnology & Life Sciences)* | 29,196 | 8,628,002 | ||||||
IPG Photonics Corp. (Technology Hardware & Equipment)* | 57,483 | 7,718,817 | ||||||
Linde plc (Materials)† | 82,193 | 16,244,778 | ||||||
Mastercard Inc., Class A (Software & Services) | 80,301 | 22,228,120 | ||||||
Microsoft Corp. (Software & Services) | 89,742 | 12,866,311 | ||||||
NIKE Inc., Class B (Consumer Durables & Apparel) | 193,864 | 17,360,521 | ||||||
NVIDIA Corp. (Semiconductors & Semiconductor Equipment) | 73,648 | 14,804,721 | ||||||
PayPal Holdings Inc. (Software & Services)* | 384,226 | 39,997,927 | ||||||
Regeneron Pharmaceuticals Inc. (Pharmaceuticals, Biotechnology & Life Sciences)* | 41,051 | 12,573,100 | ||||||
Roper Technologies Inc. (Capital Goods) | 78,049 | 26,299,391 | ||||||
salesforce.com Inc. (Software & Services)* | 63,703 | 9,968,882 | ||||||
SVB Financial Group (Banks)* | 46,720 | 10,347,546 | ||||||
UnitedHealth Group Inc. (Health Care Equipment & Services) | 32,289 | 8,159,430 | ||||||
Verisk Analytics Inc. (Commercial & Professional Services) | 158,143 | 22,883,292 | ||||||
Vertex Pharmaceuticals Inc. (Pharmaceuticals, Biotechnology & Life Sciences)* | 138,957 | 27,163,314 | ||||||
Walgreens Boots Alliance Inc. (Food & Staples Retailing) | 143,526 | 7,862,354 | ||||||
Walt Disney Co. (Media & Entertainment) | 85,315 | 11,084,125 | ||||||
Waters Corp. (Pharmaceuticals, Biotechnology & Life Sciences)* | 56,639 | 11,985,945 | ||||||
| 490,727,251 | ||||||||
Total Common Stocks (Cost $605,168,141) |
| $922,449,136 | ||||||
| Shares | Value | |||||||
| PREFERRED STOCKS - 1.1% | ||||||||
Brazil - 1.0% | ||||||||
Itau Unibanco Holding SA - Sponsored ADR, 0.48% (Banks)+ | 1,129,929 | $10,203,259 | ||||||
Spain - 0.1% | ||||||||
Grifols SA - ADR, 1.59% (Pharmaceuticals, Biotechnology & Life Sciences)+ | 32,756 | 717,684 | ||||||
Total Preferred Stocks (Cost $6,198,023) |
| $10,920,943 | ||||||
| SHORT TERM INVESTMENTS - 2.7% | ||||||||
Northern Institutional Funds - Prime Obligations Portfolio (Shares), 1.91% (Money Market Funds) | 8,101,519 | 8,103,139 | ||||||
Northern Institutional Funds - Treasury Portfolio (Premier Shares), 1.72% (Money Market Funds) | 18,221,992 | 18,221,992 | ||||||
Total Short Term Investments (Cost $26,324,321) |
| $26,325,131 | ||||||
Total Investments - 99.7% | ||||||||
(Cost $637,690,485) | $959,695,210 | |||||||
Other Assets Less Liabilities - 0.3% | 2,604,784 | |||||||
Net Assets - 100.0% | $962,299,994 | |||||||
Summary of Abbreviations
| ADR | American Depositary Receipt. |
| GDR | Global Depositary Receipt. |
| Reg S | Security sold outside United States without registration under the Securities Act of 1933. |
| † | Investment categorized as level 2 security as disclosed in Note 2 of the Notes to Financial Statements. |
| * | Non-income producing security. |
| + | Current yield is disclosed. Dividends are calculated based on a percentage of the issuer’s net income. |
See Notes to Financial Statements
5
Table of Contents
Harding, Loevner Funds, Inc.
Global Equity Portfolio
Portfolio of Investments
October 31, 2019 (continued)
| Industry | | Percentage of Net Assets |
| ||
Banks | 11.4 | % | |||
Capital Goods | 9.8 | ||||
Commercial & Professional Services | 2.4 | ||||
Consumer Durables & Apparel | 3.4 | ||||
Energy | 2.3 | ||||
Food & Staples Retailing | 0.8 | ||||
Food Beverage & Tobacco | 1.4 | ||||
Health Care Equipment & Services | 8.0 | ||||
Household & Personal Products | 3.2 | ||||
Insurance | 2.8 | ||||
Materials | 5.7 | ||||
Media & Entertainment | 8.9 | ||||
Pharmaceuticals, Biotechnology & Life Sciences | 9.9 | ||||
Retailing | 8.7 | ||||
Semiconductors & Semiconductor Equipment | 1.5 | ||||
Software & Services | 9.6 | ||||
Technology Hardware & Equipment | 7.2 | ||||
Money Market Funds | 2.7 | ||||
Total Investments | 99.7 | ||||
Other Assets Less Liabilities | 0.3 | ||||
Net Assets | 100.0 | % | |||
See Notes to Financial Statements
6
Table of Contents
Harding, Loevner Funds, Inc.
International Equity Portfolio
Portfolio of Investments
October 31, 2019
| Shares | Value | |||||||
| COMMON STOCKS - 93.3% | ||||||||
Brazil- 1.5% | ||||||||
Ambev SA - ADR (Food Beverage & | 55,125,983 | $237,592,987 | ||||||
Canada - 2.9% | ||||||||
Alimentation Couche-Tard Inc., Class B (Food & Staples Retailing) | 5,905,400 | 177,103,713 | ||||||
Canadian National Railway Co. (Transportation) | 3,292,005 | 294,206,487 | ||||||
| 471,310,200 | ||||||||
China - 5.4% | ||||||||
Baidu Inc. - Sponsored ADR (Media & Entertainment)* | 1,790,722 | 182,385,036 | ||||||
China Mobile Ltd. - Sponsored ADR (Telecommunication Services) | 5,459,277 | 220,445,605 | ||||||
Ping An Insurance Group Co. of China Ltd., Class H (Insurance)† | 26,575,500 | 304,566,145 | ||||||
Tencent Holdings Ltd. (Media & | 3,781,000 | 154,180,106 | ||||||
| 861,576,892 | ||||||||
Denmark - 0.9% | ||||||||
Novozymes A/S, Class B (Materials)† | 2,945,663 | 138,793,319 | ||||||
France - 6.8% | ||||||||
Air Liquide SA (Materials)† | 1,199,341 | 159,392,555 | ||||||
Dassault Systemes SE (Software & Services)† | 1,578,561 | 240,126,405 | ||||||
L’Oreal SA (Household & Personal Products)† | 1,695,179 | 495,153,887 | ||||||
Schneider Electric SE (Capital Goods)† | 2,212,225 | 206,092,948 | ||||||
| 1,100,765,795 | ||||||||
Germany - 12.2% | ||||||||
adidas AG (Consumer Durables & Apparel)† | 941,376 | 290,353,772 | ||||||
Allianz SE, Reg S (Insurance)† | 2,088,590 | 509,736,074 | ||||||
Infineon Technologies AG (Semiconductors & Semiconductor Equipment)† | 21,697,307 | 423,166,239 | ||||||
SAP SE - Sponsored ADR (Software & Services) | 3,826,622 | 507,333,545 | ||||||
Symrise AG (Materials)† | 2,351,332 | 226,263,053 | ||||||
| 1,956,852,683 | ||||||||
Hong Kong - 3.3% | ||||||||
AIA Group Ltd. (Insurance)† | 53,739,274 | 533,225,612 | ||||||
India - 3.0% | ||||||||
HDFC Bank Ltd. - ADR (Banks) | 3,764,098 | 229,948,747 | ||||||
ICICI Bank Ltd. - Sponsored ADR (Banks) | 18,996,823 | 247,528,604 | ||||||
| 477,477,351 | ||||||||
| Shares | Value | |||||||
| COMMON STOCKS - 93.3% (continued) | ||||||||
Israel - 2.6% | ||||||||
Check Point Software Technologies Ltd. (Software & Services)* | 3,738,807 | $420,279,295 | ||||||
Japan - 11.4% | ||||||||
Chugai Pharmaceutical Co., Ltd. (Pharmaceuticals, Biotechnology & Life Sciences)† | 3,429,000 | 288,780,767 | ||||||
Dentsu Inc. (Media & Entertainment)† | 4,527,700 | 161,658,618 | ||||||
FANUC Corp. (Capital Goods)† | 852,200 | 168,228,778 | ||||||
Keyence Corp. (Technology Hardware & Equipment)† | 444,027 | 280,361,937 | ||||||
Komatsu Ltd. (Capital Goods)† | 6,223,600 | 145,852,008 | ||||||
Kubota Corp. (Capital Goods)† | 16,343,400 | 259,341,798 | ||||||
M3 Inc. (Health Care Equipment & Services)† | 3,971,859 | 95,006,784 | ||||||
Sysmex Corp. (Health Care Equipment & Services)† | 2,992,707 | 194,876,854 | ||||||
Unicharm Corp. (Household & | 6,936,131 | 235,466,989 | ||||||
| 1,829,574,533 | ||||||||
Mexico - 0.9% | ||||||||
Fomento Economico Mexicano SAB de CV - Sponsored ADR (Food Beverage & Tobacco) | 1,627,737 | 144,901,148 | ||||||
Netherlands - 0.1% | ||||||||
Prosus NV (Retailing)* | 248,351 | 17,126,037 | ||||||
Russia - 2.7% | ||||||||
LUKOIL PJSC - Sponsored ADR (Energy) | 3,013,808 | 277,451,164 | ||||||
Yandex NV, Class A (Media & Entertainment)* | 4,874,781 | 162,768,938 | ||||||
| 440,220,102 | ||||||||
Singapore - 2.7% | ||||||||
DBS Group Holdings Ltd. (Banks)† | 22,688,583 | 432,657,077 | ||||||
South Africa - 0.6% | ||||||||
Naspers Ltd., Class N (Retailing)† | 194,443 | 27,630,939 | ||||||
Sasol Ltd. (Materials)† | 4,110,440 | 74,609,902 | ||||||
| 102,240,841 | ||||||||
South Korea - 1.4% | ||||||||
Samsung Electronics Co., Ltd. - GDR, Reg S (Technology Hardware & Equipment)† | 217,781 | 232,747,804 | ||||||
Spain - 3.5% | ||||||||
Amadeus IT Group SA (Software & Services)† | 3,002,567 | 222,275,356 | ||||||
See Notes to Financial Statements
7
Table of Contents
Harding, Loevner Funds, Inc.
International Equity Portfolio
Portfolio of Investments
October 31, 2019 (continued)
| Shares | Value | |||||||
| COMMON STOCKS - 93.3% (continued) | ||||||||
Spain - 3.5% (continued) | ||||||||
Banco Bilbao Vizcaya Argentaria SA (Banks)† | 65,262,633 | $342,188,798 | ||||||
| 564,464,154 | ||||||||
Sweden - 5.1% | ||||||||
Alfa Laval AB (Capital Goods)† | 9,469,959 | 218,918,417 | ||||||
Atlas Copco AB, Class A (Capital Goods)† | 12,532,241 | 442,979,593 | ||||||
Epiroc AB, Class A (Capital Goods)† | 14,548,471 | 163,952,534 | ||||||
| 825,850,544 | ||||||||
Switzerland - 12.0% | ||||||||
Lonza Group AG, Reg S (Pharmaceuticals, Biotechnology & Life Sciences)*† | 841,618 | 303,001,449 | ||||||
Nestle SA - Sponsored ADR (Food Beverage & Tobacco) | 5,765,575 | 617,839,017 | ||||||
Roche Holding AG, Genusschein (Pharmaceuticals, Biotechnology & Life Sciences)† | 2,047,899 | 617,667,177 | ||||||
SGS SA, Reg S (Commercial & Professional Services)† | 62,524 | 163,262,453 | ||||||
Sonova Holding AG, Reg S (Health Care Equipment & Services)† | 1,001,090 | 229,391,772 | ||||||
| 1,931,161,868 | ||||||||
Taiwan - 3.8% | ||||||||
Taiwan Semiconductor Manufacturing Co., Ltd. (Semiconductors & Semiconductor Equipment)† | 10,837,125 | 105,285,703 | ||||||
Taiwan Semiconductor Manufacturing Co., Ltd. - Sponsored ADR (Semiconductors & Semiconductor Equipment) | 9,914,253 | 511,872,883 | ||||||
| 617,158,586 | ||||||||
United Kingdom - 7.4% | ||||||||
Diageo plc (Food Beverage & Tobacco)† | 7,418,603 | 303,716,620 | ||||||
HSBC Holdings plc (Banks)† | 20,513,562 | 155,117,880 | ||||||
Rio Tinto plc (Materials)† | 2,758,793 | 143,331,662 | ||||||
Royal Dutch Shell plc, Class B (Energy)† | 7,894,209 | 227,353,824 | ||||||
Standard Chartered plc (Banks)† | 9,231,500 | 83,917,369 | ||||||
Unilever plc (Household & Personal Products)† | 4,513,686 | 270,825,779 | ||||||
| 1,184,263,134 | ||||||||
United States - 3.1% | ||||||||
Linde plc (Materials)† | 1,594,016 | 315,044,290 | ||||||
| Shares | Value | |||||||
| COMMON STOCKS - 93.3% (continued) | ||||||||
United States - 3.1% (continued) |
| |||||||
Schlumberger Ltd. (Energy) | 5,768,386 | $188,568,539 | ||||||
| 503,612,829 | ||||||||
Total Common Stocks (Cost $12,231,338,118) |
| $15,023,852,791 | ||||||
| PREFERRED STOCKS - 3.2% | ||||||||
Brazil - 1.2% | ||||||||
Itau Unibanco Holding SA - Sponsored ADR, 0.48% (Banks)+ | 20,410,994 | 184,311,276 | ||||||
Germany - 0.5% | ||||||||
FUCHS PETROLUB SE, 2.45% | 1,981,104 | 84,967,166 | ||||||
South Korea - 1.5% | ||||||||
Samsung Electronics Co., Ltd. - GDR, Reg S, 3.24% (Technology Hardware & Equipment)+† | 271,875 | 235,361,423 | ||||||
Spain - 0.0% | ||||||||
Grifols SA - ADR, 1.59% (Pharmaceuticals, Biotechnology & Life Sciences)+ | 186,782 | 4,092,394 | ||||||
Total Preferred Stocks (Cost $361,317,426) |
| $508,732,259 | ||||||
| SHORT TERM INVESTMENTS - 3.4% | ||||||||
Northern Institutional Funds - Prime Obligations Portfolio (Shares), 1.91% (Money Market Funds) | 330,127,339 | 330,193,364 | ||||||
Northern Institutional Funds - Treasury Portfolio (Premier Shares), 1.72% (Money Market Funds) | 219,706,297 | 219,706,298 | ||||||
Total Short Term Investments (Cost $549,833,636) |
| $549,899,662 | ||||||
Total Investments - 99.9% | ||||||||
(Cost $13,142,489,180) | $16,082,484,712 | |||||||
Other Assets Less Liabilities - 0.1% | 18,493,778 | |||||||
Net Assets - 100.0% | $16,100,978,490 | |||||||
See Notes to Financial Statements
8
Table of Contents
Harding, Loevner Funds, Inc.
International Equity Portfolio
Portfolio of Investments
October 31, 2019 (continued)
Summary of Abbreviations
| ADR | American Depositary Receipt. |
| GDR | Global Depositary Receipt. |
| Reg S | Security sold outside United States without registration under the Securities Act of 1933. |
| * | Non-income producing security. |
| † | Investment categorized as level 2 security as disclosed in Note 2 of the Notes to Financial Statements. |
| + | Current yield is disclosed. Dividends are calculated based on a percentage of the issuer’s net income. |
| Industry | | Percentage of Net Assets |
| ||
Banks | 10.5 | % | |||
Capital Goods | 10.0 | ||||
Commercial & Professional Services | 1.0 | ||||
Consumer Durables & Apparel | 1.8 | ||||
Energy | 4.3 | ||||
Food & Staples Retailing | 1.1 | ||||
Food Beverage & Tobacco | 8.2 | ||||
Health Care Equipment & Services | 3.2 | ||||
Household & Personal Products | 6.2 | ||||
Insurance | 8.4 | ||||
Materials | 7.0 | ||||
Media & Entertainment | 4.1 | ||||
Pharmaceuticals, Biotechnology & Life Sciences | 7.5 | ||||
Retailing | 0.3 | ||||
Semiconductors & Semiconductor Equipment | 6.4 | ||||
Software & Services | 8.7 | ||||
Technology Hardware & Equipment | 4.6 | ||||
Telecommunication Services | 1.4 | ||||
Transportation | 1.8 | ||||
Money Market Funds | 3.4 | ||||
Total Investments | 99.9 | ||||
Other Assets Less Liabilities | 0.1 | ||||
Net Assets | 100.0 | % | |||
See Notes to Financial Statements
9
Table of Contents
Harding, Loevner Funds, Inc.
International Small Companies Portfolio
Portfolio of Investments
October 31, 2019
| Shares | Value | |||||||
| COMMON STOCKS - 94.2% | ||||||||
Argentina - 1.0% | ||||||||
Globant SA (Software & Services)* | 34,258 | $3,194,901 | ||||||
Bangladesh - 0.4% | ||||||||
Square Pharmaceuticals Ltd. (Pharmaceuticals, Biotechnology & Life Sciences)† | 434,545 | 1,203,205 | ||||||
Canada - 1.4% | ||||||||
Kinaxis Inc. (Software & Services)* | 72,300 | 4,617,078 | ||||||
China - 1.9% | ||||||||
51job Inc. - ADR (Commercial & Professional Services)* | 26,731 | 2,105,601 | ||||||
Haitian International Holdings Ltd. (Capital Goods)† | 1,751,000 | 4,102,716 | ||||||
| 6,208,317 | ||||||||
Egypt - 0.9% | ||||||||
Integrated Diagnostics Holdings plc (Health Care Equipment & Services)† | 642,760 | 3,036,072 | ||||||
Finland - 2.0% | ||||||||
Vaisala OYJ, Class A (Technology Hardware & Equipment)† | 221,882 | 6,644,695 | ||||||
France - 6.7% | ||||||||
Alten SA (Software & Services)† | 72,366 | 7,948,240 | ||||||
Chargeurs SA (Consumer Durables & Apparel)† | 97,296 | 1,652,358 | ||||||
IPSOS (Media & Entertainment)† | 49,201 | 1,481,863 | ||||||
LISI (Capital Goods)† | 106,312 | 3,735,941 | ||||||
Rubis SCA (Utilities)† | 126,800 | 7,356,330 | ||||||
| 22,174,732 | ||||||||
Germany - 10.8% | ||||||||
Bechtle AG (Software & Services)† | 65,644 | 7,111,915 | ||||||
Bertrandt AG (Commercial & Professional | 23,488 | 1,171,829 | ||||||
Carl Zeiss Meditec AG (Bearer) (Health Care Equipment & Services)† | 77,326 | 8,420,279 | ||||||
FUCHS PETROLUB SE (Materials)† | 135,393 | 5,482,594 | ||||||
KWS Saat SE & Co. KGaA (Food Beverage & Tobacco)† | 71,856 | 4,829,057 | ||||||
Pfeiffer Vacuum Technology AG (Capital Goods)† | 18,585 | 2,908,737 | ||||||
Rational AG (Capital Goods)† | 1,148 | 873,838 | ||||||
STRATEC SE (Health Care Equipment & | 64,069 | 4,836,087 | ||||||
| 35,634,336 | ||||||||
| Shares | Value | |||||||
| COMMON STOCKS - 94.2% (continued) | ||||||||
Hong Kong - 1.8% | ||||||||
ASM Pacific Technology Ltd. (Semiconductors & Semiconductor Equipment)† | 202,000 | $2,805,849 | ||||||
Pico Far East Holdings Ltd. (Media & Entertainment)† | 9,291,000 | 3,164,175 | ||||||
| 5,970,024 | ||||||||
India - 2.8% | ||||||||
Bharti Infratel Ltd. (Telecommunication Services)† | 480,954 | 1,285,471 | ||||||
Max Financial Services Ltd. (Insurance)*† | 924,907 | 5,294,060 | ||||||
SH Kelkar & Co., Ltd. (Materials)*† | 1,499,535 | 2,622,806 | ||||||
| 9,202,337 | ||||||||
Indonesia - 2.3% | ||||||||
Sarana Menara Nusantara Tbk PT (Telecommunication Services)† | 65,062,100 | 3,059,275 | ||||||
Tower Bersama Infrastructure Tbk PT (Telecommunication Services)† | 9,789,800 | 4,401,498 | ||||||
| 7,460,773 | ||||||||
Israel - 1.7% | ||||||||
CyberArk Software Ltd. (Software & Services)* | 54,163 | 5,501,878 | ||||||
Italy - 3.0% | ||||||||
Danieli & C Officine Meccaniche SpA (RSP) (Capital Goods)† | 71,186 | 782,210 | ||||||
DiaSorin SpA (Health Care Equipment & Services)† | 18,189 | 2,054,452 | ||||||
Reply SpA (Software & Services)† | 108,743 | 7,098,765 | ||||||
| 9,935,427 | ||||||||
Japan - 15.6% | ||||||||
ABC-Mart Inc. (Retailing)† | 8,800 | 603,425 | ||||||
Ariake Japan Co., Ltd. (Food Beverage & Tobacco)† | 119,300 | 9,291,183 | ||||||
BML Inc. (Health Care Equipment & Services)† | 98,400 | 2,888,064 | ||||||
Cosmos Pharmaceutical Corp. (Food & Staples Retailing)† | 19,100 | 3,945,313 | ||||||
FINDEX Inc. (Health Care Equipment & Services)† | 109,400 | 1,021,543 | ||||||
Infomart Corp. (Software & Services)† | 319,100 | 4,797,959 | ||||||
MISUMI Group Inc. (Capital Goods)† | 58,400 | 1,464,403 | ||||||
MonotaRO Co., Ltd. (Capital Goods)† | 37,800 | 1,143,430 | ||||||
Nakanishi Inc. (Health Care Equipment & Services)† | 376,000 | 6,252,566 | ||||||
See Notes to Financial Statements
10
Table of Contents
Harding, Loevner Funds, Inc.
International Small Companies Portfolio
Portfolio of Investments
October 31, 2019 (continued)
| Shares | Value | |||||||
| COMMON STOCKS - 94.2% (continued) | ||||||||
Japan - 15.6% (continued) | ||||||||
Nihon M&A Center Inc. (Commercial & Professional Services)† | 123,500 | $3,772,761 | ||||||
Pigeon Corp. (Household & Personal Products)† | 28,900 | 1,420,547 | ||||||
Rinnai Corp. (Consumer Durables & Apparel)† | 12,800 | 937,947 | ||||||
Rohto Pharmaceutical Co., Ltd. (Pharmaceuticals, Biotechnology & Life Sciences)† | 86,500 | 2,593,281 | ||||||
SMS Co., Ltd. (Commercial & Professional Services)† | 247,000 | 6,066,897 | ||||||
Stanley Electric Co., Ltd. (Automobiles & Components)† | 187,000 | 5,174,704 | ||||||
| 51,374,023 | ||||||||
Kenya - 0.3% | ||||||||
East African Breweries Ltd. (Food Beverage & Tobacco)† | 504,400 | 980,966 | ||||||
Kuwait- 0.6% | ||||||||
Mabanee Co. SAK (Real Estate)† | 821,463 | 2,090,343 | ||||||
Malaysia - 1.1% | ||||||||
Dialog Group Bhd. (Energy)† | 4,471,240 | 3,719,119 | ||||||
Mexico - 1.9% | ||||||||
Grupo Herdez SAB de CV (Food Beverage & Tobacco) | 1,568,638 | 3,197,375 | ||||||
Megacable Holdings SAB de CV (Media & Entertainment) | 708,200 | 2,909,523 | ||||||
| 6,106,898 | ||||||||
Netherlands - 1.0% | ||||||||
ASM International NV (Semiconductors & Semiconductor Equipment)† | 33,604 | 3,377,900 | ||||||
Nigeria - 0.4% | ||||||||
Nestle Nigeria plc (Food Beverage & Tobacco) | 421,264 | 1,418,750 | ||||||
Norway - 1.5% | ||||||||
Tomra Systems ASA (Commercial & Professional Services) | 182,002 | 4,900,278 | ||||||
Peru - 0.3% | ||||||||
Alicorp SAA (Food Beverage & Tobacco) | 303,910 | �� | 833,215 | |||||
Philippines - 0.9% | ||||||||
International Container Terminal Services Inc. (Transportation)† | 809,390 | 1,886,021 | ||||||
Security Bank Corp. (Banks)† | 287,480 | 1,127,387 | ||||||
| 3,013,408 | ||||||||
| Shares | Value | |||||||
| COMMON STOCKS - 94.2% (continued) | ||||||||
Romania - 0.5% | ||||||||
Societatea Nationala de Gaze Naturale ROMGAZ SA (Energy)† | 194,905 | $1,678,950 | ||||||
South Africa - 1.1% | ||||||||
Clicks Group Ltd. (Food & Staples Retailing)† | 73,185 | 1,191,957 | ||||||
Discovery Ltd. (Insurance)† | 301,485 | 2,398,892 | ||||||
| 3,590,849 | ||||||||
South Korea - 1.9% | ||||||||
Cheil Worldwide Inc. (Media & Entertainment)† | 55,849 | 1,187,528 | ||||||
Hankook Tire & Technology Co., Ltd. (Automobiles & Components)† | 127,223 | 3,390,944 | ||||||
Woongjin Coway Co., Ltd. (Consumer Durables & Apparel)† | 20,894 | 1,640,532 | ||||||
| 6,219,004 | ||||||||
Sweden - 3.5% | ||||||||
Alfa Laval AB (Capital Goods)† | 132,935 | 3,073,078 | ||||||
Intrum AB (Commercial & Professional Services)† | 177,616 | 4,782,990 | ||||||
Paradox Interactive AB (Media & Entertainment)† | 198,106 | 2,700,126 | ||||||
Thule Group AB (Consumer Durables & Apparel)† | 55,126 | 1,122,466 | ||||||
| 11,678,660 | ||||||||
Switzerland - 2.9% | ||||||||
Bossard Holding AG, Class A, Reg S | 24,518 | 3,890,078 | ||||||
LEM Holding SA, Reg S (Technology Hardware & Equipment)† | 2,902 | 3,433,018 | ||||||
VAT Group AG (Capital Goods)*† | 15,805 | 2,318,724 | ||||||
| 9,641,820 | ||||||||
Taiwan - 2.4% | ||||||||
Advantech Co., Ltd. (Technology Hardware & Equipment)† | 101,517 | 998,853 | ||||||
Chipbond Technology Corp. (Semiconductors & Semiconductor Equipment)† | 1,582,700 | 3,123,003 | ||||||
Eclat Textile Co., Ltd. (Consumer Durables & Apparel)† | 124,909 | 1,677,298 | ||||||
Silergy Corp. (Semiconductors & Semiconductor Equipment)† | 75,000 | 2,096,970 | ||||||
| 7,896,124 | ||||||||
Turkey - 1.4% | ||||||||
Anadolu Hayat Emeklilik AS (Insurance)† | 1,951,939 | 1,889,735 | ||||||
See Notes to Financial Statements
11
Table of Contents
Harding, Loevner Funds, Inc.
International Small Companies Portfolio
Portfolio of Investments
October 31, 2019 (continued)
| Shares | Value | |||||||
| COMMON STOCKS - 94.2% (continued) | ||||||||
Turkey - 1.4% (continued) | ||||||||
Ulker Biskuvi Sanayi AS (Food Beverage & Tobacco)† | 873,744 | $2,809,940 | ||||||
| 4,699,675 | ||||||||
Ukraine- 0.9% | ||||||||
Kernel Holding SA (Food Beverage & Tobacco)† | 261,103 | 2,905,452 | ||||||
United Arab Emirates - 1.9% | ||||||||
Agthia Group PJSC (Food Beverage & Tobacco)† | 2,477,285 | 2,480,535 | ||||||
Network International Holdings plc (Software & Services)*† | 524,726 | 3,676,543 | ||||||
| 6,157,078 | ||||||||
United Kingdom - 13.8% | ||||||||
Abcam plc (Pharmaceuticals, Biotechnology & Life Sciences)† | 452,699 | 6,848,025 | ||||||
Bank of Georgia Group plc (Banks)† | 146,923 | 2,475,440 | ||||||
BBA Aviation plc (Transportation)† | 1,150,423 | 4,531,510 | ||||||
Clarkson plc (Transportation)† | 124,395 | 4,546,140 | ||||||
Dechra Pharmaceuticals plc (Pharmaceuticals, Biotechnology & Life Sciences)† | 176,359 | 6,009,853 | ||||||
Diploma plc (Capital Goods)† | 225,703 | 4,676,463 | ||||||
EMIS Group plc (Health Care Equipment & Services)† | 261,458 | 3,644,204 | ||||||
Rathbone Brothers plc (Diversified Financials)† | 130,154 | 3,504,619 | ||||||
Rightmove plc (Media & Entertainment)† | 432,227 | 3,356,279 | ||||||
Senior plc (Capital Goods)† | 2,400,009 | 5,741,975 | ||||||
| 45,334,508 | ||||||||
United States - 2.3% | ||||||||
Core Laboratories NV (Energy) | 145,958 | 6,427,990 | ||||||
Sensata Technologies Holding plc | 20,341 | 1,041,256 | ||||||
| 7,469,246 | ||||||||
Vietnam - 1.3% | ||||||||
Hoa Phat Group JSC (Materials)*† | 4,639,253 | 4,350,126 | ||||||
Total Common Stocks (Cost $271,659,953) |
| $310,220,167 | ||||||
| Shares | Value | |||||||
| PARTICIPATION NOTES - 1.1% | ||||||||
Saudi Arabia - 1.1% | ||||||||
Jarir Marketing Co., Issued by HSBC BANK PLC, Maturity Date 1/19/21 (Retailing)^† | 86,360 | $3,647,132 | ||||||
Total Participation Notes (Cost $3,330,555) | $3,647,132 | |||||||
| SHORT TERM INVESTMENTS - 4.6% | ||||||||
Northern Institutional Funds - Treasury Portfolio (Premier Shares), 1.72% (Money Market Funds) | 15,272,520 | 15,272,520 | ||||||
Total Short Term Investments (Cost $15,272,520) |
| $15,272,520 | ||||||
Total Investments - 99.9% | ||||||||
(Cost $290,263,028) | $329,139,819 | |||||||
Other Assets Less Liabilities - 0.1% | 206,638 | |||||||
Net Assets - 100.0% | $329,346,457 | |||||||
Summary of Abbreviations
| ADR | American Depositary Receipt. |
| Reg S | Security sold outside United States without registration under the Securities Act of 1933. |
| * | Non-income producing security. |
| † | Investment categorized as level 2 security as disclosed in Note 2 of the Notes to Financial Statements. |
| ^ | Security exempt from registration pursuant to Rule 144A of the Securities Act of 1933. These securities, which represent 1.1% of net assets as of October 31, 2019, are considered liquid and may be resold in transactions exempt from registration, normally to qualified buyers. |
See Notes to Financial Statements
12
Table of Contents
Harding, Loevner Funds, Inc.
International Small Companies Portfolio
Portfolio of Investments
October 31, 2019 (continued)
| Industry | | Percentage of Net Assets | | ||
Automobiles & Components | 2.6 | % | |||
Banks | 1.1 | ||||
Capital Goods | 10.8 | ||||
Commercial & Professional Services | 6.8 | ||||
Consumer Durables & Apparel | 2.1 | ||||
Diversified Financials | 1.1 | ||||
Energy | 3.6 | ||||
Food & Staples Retailing | 1.6 | ||||
Food Beverage & Tobacco | 8.8 | ||||
Health Care Equipment & Services | 9.7 | ||||
Household & Personal Products | 0.4 | ||||
Insurance | 2.9 | ||||
Materials | 3.8 | ||||
Media & Entertainment | 4.6 | ||||
Pharmaceuticals, Biotechnology & Life Sciences | 5.1 | ||||
Real Estate | 0.6 | ||||
Retailing | 1.3 | ||||
Semiconductors & Semiconductor Equipment | 3.4 | ||||
Software & Services | 13.4 | ||||
Technology Hardware & Equipment | 3.3 | ||||
Telecommunication Services | 2.7 | ||||
Transportation | 3.4 | ||||
Utilities | 2.2 | ||||
Money Market Fund | 4.6 | ||||
Total Investments | 99.9 | ||||
Other Assets Less Liabilities | 0.1 | ||||
Net Assets | 100.0 | % | |||
See Notes to Financial Statements
13
Table of Contents
Harding, Loevner Funds, Inc.
Institutional Emerging Markets Portfolio
Portfolio of Investments
October 31, 2019
| Shares | Value | |||||||
| COMMON STOCKS - 90.8% | ||||||||
Brazil- 3.9% | ||||||||
Ambev SA - ADR (Food Beverage & Tobacco)* | 15,367,653 | $66,234,584 | ||||||
B3 SA - Brasil Bolsa Balcao (Diversified Financials) | 3,697,100 | 44,599,351 | ||||||
Localiza Rent a Car SA (Transportation) | 3,609,400 | 38,861,462 | ||||||
WEG SA (Capital Goods) | 9,319,070 | 59,253,531 | ||||||
| 208,948,928 | ||||||||
Chile - 0.4% | ||||||||
Banco Santander Chile - ADR (Banks) | 840,778 | 20,372,051 | ||||||
China - 25.7% | ||||||||
51job Inc. - ADR (Commercial & Professional Services)* | 879,460 | 69,275,064 | ||||||
AAC Technologies Holdings Inc. (Technology Hardware & Equipment)† | 4,339,000 | 27,802,305 | ||||||
Alibaba Group Holding Ltd. - Sponsored ADR (Retailing)* | 1,317,508 | 232,764,138 | ||||||
Autohome Inc. - ADR (Media & Entertainment)* | 517,740 | 43,780,094 | ||||||
Baidu Inc. - Sponsored ADR (Media & Entertainment)* | 332,520 | 33,867,162 | ||||||
CNOOC Ltd. - Sponsored ADR (Energy) | 474,531 | 70,486,835 | ||||||
CSPC Pharmaceutical Group Ltd. (Pharmaceuticals, Biotechnology & Life Sciences)† | 20,320,000 | 51,692,095 | ||||||
Ctrip.com International Ltd. - ADR (Retailing)* | 793,558 | 26,179,478 | ||||||
ENN Energy Holdings Ltd. (Utilities)† | 11,117,200 | 126,830,581 | ||||||
Hangzhou Hikvision Digital Technology Co., Ltd., Class A (Technology Hardware & Equipment)† | 14,953,670 | 67,781,592 | ||||||
JD.com Inc. - ADR (Retailing)* | 723,828 | 22,547,242 | ||||||
Jiangsu Yanghe Brewery Joint-Stock Co., Ltd., Class A (Food Beverage & Tobacco)† | 3,298,900 | 47,092,563 | ||||||
Midea Group Co., Ltd., Class A (Consumer Durables & Apparel)† | 10,117,813 | 78,953,153 | ||||||
Ping An Insurance Group Co. of China Ltd., Class H (Insurance)† | 8,538,500 | 97,854,717 | ||||||
SF Holding Co., Ltd., Class A (Transportation)† | 642,756 | 3,592,245 | ||||||
Shenzhou International Group Holdings Ltd. (Consumer Durables & Apparel)† | 4,220,000 | 57,793,587 | ||||||
Sino Biopharmaceutical Ltd. (Pharmaceuticals, Biotechnology & Life Sciences)† | 16,472,757 | 24,368,059 | ||||||
| Shares | Value | |||||||
| COMMON STOCKS - 90.8% (continued) | ||||||||
China - 25.7% (continued) | ||||||||
Sunny Optical Technology Group Co., Ltd. (Technology Hardware & Equipment)† | 4,789,800 | $75,977,255 | ||||||
Tencent Holdings Ltd. (Media & Entertainment)† | 5,273,500 | 215,040,675 | ||||||
Weibo Corp. - Sponsored ADR (Media & Entertainment)* | 440,506 | 21,668,490 | ||||||
| 1,395,347,330 | ||||||||
Czech Republic - 0.8% | ||||||||
Komercni banka AS (Banks) | 1,319,966 | 44,617,903 | ||||||
Egypt - 0.9% | ||||||||
Commercial International Bank Egypt SAE - GDR, Reg S (Banks)† | 9,408,593 | 46,441,360 | ||||||
Hong Kong - 6.6% | ||||||||
AIA Group Ltd. (Insurance)† | 14,576,615 | 144,635,829 | ||||||
ASM Pacific Technology Ltd. (Semiconductors & Semiconductor Equipment)† | 3,325,069 | 46,186,339 | ||||||
Sands China Ltd. (Consumer Services)† | 21,344,538 | 104,394,916 | ||||||
Techtronic Industries Co., Ltd. | 8,279,801 | 64,063,242 | ||||||
| 359,280,326 | ||||||||
India - 6.6% | ||||||||
Housing Development Finance Corp., Ltd. (Banks)† | 4,555,132 | 136,841,511 | ||||||
Kotak Mahindra Bank Ltd. (Banks)† | 3,722,504 | 82,633,796 | ||||||
Maruti Suzuki India Ltd. (Automobiles & Components)† | 668,069 | 71,195,131 | ||||||
Tata Consultancy Services Ltd. (Software & Services)† | 2,111,196 | 67,576,725 | ||||||
| 358,247,163 | ||||||||
Indonesia - 3.3% | ||||||||
Astra International Tbk PT (Automobiles & Components)† | 83,294,200 | 41,051,746 | ||||||
Bank Central Asia Tbk PT (Banks)† | 26,664,433 | 59,617,831 | ||||||
Bank Rakyat Indonesia Persero Tbk PT (Banks)† | 267,767,100 | 80,083,317 | ||||||
| 180,752,894 | ||||||||
Italy - 0.9% | ||||||||
Tenaris SA - ADR (Energy) | 2,446,007 | 49,653,942 | ||||||
Kenya - 1.3% | ||||||||
East African Breweries Ltd. (Food Beverage & Tobacco)† | 6,379,865 | 12,407,676 | ||||||
Safaricom plc (Telecommunication Services)† | 201,753,527 | 58,039,042 | ||||||
| 70,446,718 | ||||||||
See Notes to Financial Statements
14
Table of Contents
Harding, Loevner Funds, Inc.
Institutional Emerging Markets Portfolio
Portfolio of Investments
October 31, 2019 (continued)
| Shares | Value | |||||||
| COMMON STOCKS - 90.8% (continued) | ||||||||
Mexico - 4.6% | ||||||||
Fomento Economico Mexicano SAB de CV - Sponsored ADR (Food Beverage & Tobacco) | 575,828 | $51,260,208 | ||||||
Grupo Aeroportuario del Sureste SAB de CV - ADR (Transportation) | 350,437 | 57,384,059 | ||||||
Grupo Financiero Banorte SAB de CV, Series O (Banks) | 13,042,200 | 71,189,198 | ||||||
Wal-Mart de Mexico SAB de CV (Food & Staples Retailing) | 23,058,900 | 69,201,273 | ||||||
| 249,034,738 | ||||||||
Netherlands - 0.2% | ||||||||
Prosus NV (Retailing)* | 135,834 | 9,366,977 | ||||||
Panama - 1.0% | ||||||||
Copa Holdings SA, Class A (Transportation) | 547,366 | 55,689,017 | ||||||
Peru - 1.2% | ||||||||
Credicorp Ltd. (Banks) | 307,384 | 65,792,471 | ||||||
Russia - 8.7% | ||||||||
LUKOIL PJSC - Sponsored ADR (Energy) | 1,681,557 | 154,804,137 | ||||||
Novatek PJSC - Sponsored GDR, Reg S (Energy)† | 685,404 | 146,806,705 | ||||||
Sberbank of Russia PJSC - Sponsored ADR (Banks)† | 9,609,635 | 141,336,786 | ||||||
Yandex NV, Class A (Media & Entertainment)* | 915,296 | 30,561,733 | ||||||
| 473,509,361 | ||||||||
South Africa - 2.9% | ||||||||
Discovery Ltd. (Insurance)† | 5,474,051 | 43,556,594 | ||||||
Naspers Ltd., Class N (Retailing)† | 118,249 | 16,803,541 | ||||||
Sasol Ltd. (Materials)† | 1,754,910 | 31,853,929 | ||||||
Standard Bank Group Ltd. (Banks)† | 5,536,795 | 63,546,923 | ||||||
| 155,760,987 | ||||||||
South Korea - 8.3% | ||||||||
Amorepacific Corp. (Household & Personal Products)† | 218,507 | 35,954,461 | ||||||
Hankook Tire & Technology Co., Ltd. (Automobiles & Components)† | 1,737,574 | 46,312,511 | ||||||
LG Household & Health Care Ltd. (Household & Personal Products)† | 94,958 | 102,508,633 | ||||||
Samsung Electronics Co., Ltd. - GDR, Reg S (Technology Hardware & Equipment)† | 194,476 | 207,841,189 | ||||||
Woongjin Coway Co., Ltd. (Consumer Durables & Apparel)† | 699,635 | 54,933,152 | ||||||
| 447,549,946 | ||||||||
| Shares | Value | |||||||
| COMMON STOCKS - 90.8% (continued) | ||||||||
Taiwan - 8.3% | ||||||||
Eclat Textile Co., Ltd. (Consumer Durables & Apparel)† | 5,062,031 | $67,973,783 | ||||||
Hon Hai Precision Industry Co., Ltd. (Technology Hardware & Equipment)† | 9,624,031 | 25,326,725 | ||||||
Largan Precision Co., Ltd. (Technology Hardware & Equipment)† | 401,000 | 58,643,603 | ||||||
Taiwan Semiconductor Manufacturing Co., Ltd. (Semiconductors & Semiconductor Equipment)† | 30,854,277 | 299,757,939 | ||||||
| 451,702,050 | ||||||||
Thailand - 1.3% | ||||||||
Siam Commercial Bank pcl, Reg S (Banks)† | 19,265,070 | 71,458,448 | ||||||
United Arab Emirates - 0.7% | ||||||||
DP World plc (Transportation)† | 2,862,062 | 38,035,245 | ||||||
United Kingdom - 1.6% | ||||||||
Bank of Georgia Group plc (Banks)† | 729,779 | 12,295,722 | ||||||
Coca-Cola HBC AG - CDI (Food Beverage & Tobacco)*† | 2,439,926 | 74,286,711 | ||||||
| 86,582,433 | ||||||||
United States - 1.6% | ||||||||
EPAM Systems Inc. (Software & Services)* | 498,076 | 87,641,453 | ||||||
Total Common Stocks (Cost $3,958,351,368) |
| $4,926,231,741 | ||||||
| PREFERRED STOCKS - 5.8% | ||||||||
Brazil - 3.7% | ||||||||
Banco Bradesco SA - ADR, 6.01% (Banks)+ | 10,554,556 | 92,457,910 | ||||||
Cia Brasileira de Distribuicao - Sponsored ADR (Food & Staples Retailing)* | 1,330,834 | 27,441,797 | ||||||
Itau Unibanco Holding SA - Sponsored ADR, 0.48% (Banks)+ | 8,926,688 | 80,607,993 | ||||||
| 200,507,700 | ||||||||
Colombia - 1.2% | ||||||||
Bancolombia SA - Sponsored ADR, 2.17% (Banks)+ | 1,299,397 | 67,412,716 | ||||||
See Notes to Financial Statements
15
Table of Contents
Harding, Loevner Funds, Inc.
Institutional Emerging Markets Portfolio
Portfolio of Investments
October 31, 2019 (continued)
| Shares | Value | |||||||
| PREFERRED STOCKS - 5.8% (continued) | ||||||||
South Korea - 0.9% | ||||||||
Samsung Electronics Co., Ltd. - GDR, Reg S, 3.24% (Technology Hardware & | 55,330 | $47,899,026 | ||||||
Total Preferred Stocks (Cost $207,869,705) |
| $315,819,442 | ||||||
| SHORT TERM INVESTMENTS - 3.3% | ||||||||
Northern Institutional Funds - Prime Obligations Portfolio (Shares), 1.91% (Money Market Funds) | 89,900,989 | 89,918,969 | ||||||
Northern Institutional Funds - Treasury Portfolio (Premier Shares), 1.72% (Money Market Funds) | 86,683,361 | 86,683,361 | ||||||
Total Short Term Investments | $176,602,330 | |||||||
Total Investments - 99.9% | ||||||||
(Cost $4,342,807,223) | $5,418,653,513 | |||||||
Other Assets Less Liabilities - 0.1% | 3,972,921 | |||||||
Net Assets - 100.0% | $5,422,626,434 | |||||||
Summary of Abbreviations
| ADR | American Depositary Receipt. |
| CDI | Chess Depositary Interest. |
| GDR | Global Depositary Receipt. |
| Reg S | Security sold outside United States without registration under the Securities Act of 1933. |
| * | Non-income producing security. |
| † | Investment categorized as level 2 security as disclosed in Note 2 of the Notes to Financial Statements. |
| + | Current yield is disclosed. Dividends are calculated based on a percentage of the issuer’s net income. |
| Industry | | Percentage of Net Assets | | ||
Automobiles & Components | 2.9 | % | |||
Banks | 20.9 | ||||
Capital Goods | 2.3 | ||||
Commercial & Professional Services | 1.3 | ||||
Consumer Durables & Apparel | 4.8 | ||||
Consumer Services | 1.9 | ||||
Diversified Financials | 0.9 | ||||
Energy | 7.7 | ||||
Food & Staples Retailing | 1.8 | ||||
Food Beverage & Tobacco | 4.6 | ||||
Household & Personal Products | 2.6 | ||||
Insurance | 5.3 | ||||
Materials | 0.6 | ||||
Media & Entertainment | 6.4 | ||||
Pharmaceuticals, Biotechnology & Life Sciences | 1.3 | ||||
Retailing | 5.7 | ||||
Semiconductors & Semiconductor Equipment | 6.3 | ||||
Software & Services | 2.9 | ||||
Technology Hardware & Equipment | 9.4 | ||||
Telecommunication Services | 1.1 | ||||
Transportation | 3.6 | ||||
Utilities | 2.3 | ||||
Money Market Funds | 3.3 | ||||
Total Investments | 99.9 | ||||
Other Assets Less Liabilities | 0.1 | ||||
Net Assets | 100.0 | % | |||
See Notes to Financial Statements
16
Table of Contents
Harding, Loevner Funds, Inc.
Portfolio of Investments
October 31, 2019
| Shares | Value | |||||||
| COMMON STOCKS - 91.2% | ||||||||
Brazil- 3.9% | ||||||||
Ambev SA - ADR (Food Beverage & Tobacco)* | 12,244,556 | $52,774,037 | ||||||
B3 SA - Brasil Bolsa Balcao (Diversified Financials) | 2,923,200 | 35,263,537 | ||||||
Localiza Rent a Car SA (Transportation) | 2,853,800 | 30,726,115 | ||||||
WEG SA (Capital Goods) | 7,368,230 | 46,849,486 | ||||||
| 165,613,175 | ||||||||
Chile - 0.4% | ||||||||
Banco Santander Chile - ADR (Banks) | 664,768 | 16,107,329 | ||||||
China - 25.8% | ||||||||
51job Inc. - ADR (Commercial & Professional Services)* | 695,352 | 54,772,877 | ||||||
AAC Technologies Holdings Inc. (Technology Hardware & Equipment)† | 3,430,500 | 21,981,057 | ||||||
Alibaba Group Holding Ltd. - Sponsored ADR (Retailing)* | 1,041,698 | 184,036,786 | ||||||
Autohome Inc. - ADR (Media & Entertainment)* | 409,355 | 34,615,059 | ||||||
Baidu Inc. - Sponsored ADR (Media & Entertainment)* | 262,456 | 26,731,143 | ||||||
CNOOC Ltd. - Sponsored ADR (Energy) | 375,191 | 55,730,871 | ||||||
CSPC Pharmaceutical Group Ltd. (Pharmaceuticals, Biotechnology & Life Sciences)† | 16,066,000 | 40,870,334 | ||||||
Ctrip.com International Ltd. - ADR (Retailing)* | 627,433 | 20,699,015 | ||||||
ENN Energy Holdings Ltd. (Utilities)† | 8,789,700 | 100,277,296 | ||||||
Hangzhou Hikvision Digital Technology Co., Ltd., Class A (Technology Hardware & Equipment)† | 11,823,257 | 53,592,141 | ||||||
JD.com Inc. - ADR (Retailing)* | 568,264 | 17,701,423 | ||||||
Jiangsu Yanghe Brewery Joint-Stock Co., Ltd., Class A (Food Beverage & Tobacco)† | 2,608,300 | 37,234,088 | ||||||
Midea Group Co., Ltd., Class A (Consumer Durables & Apparel)† | 7,999,738 | 62,425,006 | ||||||
Ping An Insurance Group Co. of China Ltd., Class H (Insurance)† | 6,751,000 | 77,369,233 | ||||||
SF Holding Co., Ltd., Class A (Transportation)† | 508,321 | 2,840,912 | ||||||
Shenzhou International Group Holdings Ltd. (Consumer Durables & Apparel)† | 3,336,000 | 45,687,063 | ||||||
Sino Biopharmaceutical Ltd. (Pharmaceuticals, Biotechnology & Life Sciences)† | 13,024,788 | 19,267,497 | ||||||
| Shares | Value | |||||||
| COMMON STOCKS - 91.2% (continued) | ||||||||
China - 25.8% (continued) | ||||||||
Sunny Optical Technology Group Co., Ltd. (Technology Hardware & Equipment)† | 3,787,100 | $60,072,125 | ||||||
Tencent Holdings Ltd. (Media & Entertainment)† | 4,169,600 | 170,026,282 | ||||||
Weibo Corp. - Sponsored ADR (Media & Entertainment)* | 348,290 | 17,132,385 | ||||||
| 1,103,062,593 | ||||||||
Czech Republic - 0.8% | ||||||||
Komercni banka AS (Banks) | 1,043,641 | 35,277,479 | ||||||
Egypt - 0.9% | ||||||||
Commercial International Bank Egypt SAE - GDR, Reg S (Banks)† | 7,438,974 | 36,719,206 | ||||||
Hong Kong - 6.7% | ||||||||
AIA Group Ltd. (Insurance)† | 11,524,989 | 114,356,203 | ||||||
ASM Pacific Technology Ltd. (Semiconductors & Semiconductor Equipment)† | 2,629,023 | 36,518,024 | ||||||
Sands China Ltd. (Consumer Services)† | 16,876,144 | 82,540,256 | ||||||
Techtronic Industries Co., Ltd. | 6,597,000 | 51,042,918 | ||||||
| 284,457,401 | ||||||||
India - 6.6% | ||||||||
Housing Development Finance Corp., Ltd. (Banks)† | 3,618,838 | 108,714,140 | ||||||
Kotak Mahindra Bank Ltd. (Banks)† | 2,943,226 | 65,335,037 | ||||||
Maruti Suzuki India Ltd. (Automobiles & Components)† | 530,749 | 56,561,140 | ||||||
Tata Consultancy Services Ltd. (Software & Services)† | 1,677,246 | 53,686,533 | ||||||
| 284,296,850 | ||||||||
Indonesia - 3.3% | ||||||||
Astra International Tbk PT (Automobiles & Components)† | 65,857,200 | 32,457,878 | ||||||
Bank Central Asia Tbk PT (Banks)† | 21,082,410 | 47,137,232 | ||||||
Bank Rakyat Indonesia Persero Tbk PT (Banks)† | 211,712,090 | 63,318,483 | ||||||
| 142,913,593 | ||||||||
Italy - 0.9% | ||||||||
Tenaris SA - ADR (Energy) | 1,933,953 | 39,259,246 | ||||||
Kenya - 1.3% | ||||||||
East African Breweries Ltd. (Food Beverage & Tobacco)† | 5,007,350 | 9,738,384 | ||||||
Safaricom plc (Telecommunication Services)† | 159,517,901 | 45,888,993 | ||||||
| 55,627,377 | ||||||||
See Notes to Financial Statements
17
Table of Contents
Harding, Loevner Funds, Inc.
Emerging Markets Portfolio
Portfolio of Investments
October 31, 2019 (continued)
| Shares | Value | |||||||
| COMMON STOCKS - 91.2% (continued) | ||||||||
Mexico - 4.6% | ||||||||
Fomento Economico Mexicano SAB de CV - Sponsored ADR (Food Beverage & Tobacco) | 455,282 | $40,529,204 | ||||||
Grupo Aeroportuario del Sureste SAB de CV -ADR (Transportation) | 281,178 | 46,042,897 | ||||||
Grupo Financiero Banorte SAB de CV, Series O (Banks) | 10,311,940 | 56,286,419 | ||||||
Wal-Mart de Mexico SAB de CV (Food & Staples Retailing) | 18,231,700 | 54,714,529 | ||||||
| 197,573,049 | ||||||||
Netherlands - 0.2% | ||||||||
Prosus NV (Retailing)* | 106,377 | 7,335,652 | ||||||
Panama - 1.0% | ||||||||
Copa Holdings SA, Class A (Transportation) | 432,779 | 44,030,935 | ||||||
Peru - 1.2% | ||||||||
Credicorp Ltd. (Banks) | 243,036 | 52,019,425 | ||||||
Russia - 8.8% | ||||||||
LUKOIL PJSC - Sponsored ADR (Energy) | 1,329,535 | 122,396,992 | ||||||
Novatek PJSC - Sponsored GDR, Reg S (Energy)† | 541,920 | 116,073,862 | ||||||
Sberbank of Russia PJSC - Sponsored ADR (Banks)† | 7,597,929 | 111,748,975 | ||||||
Yandex NV, Class A (Media & Entertainment)* | 723,685 | 24,163,843 | ||||||
| 374,383,672 | ||||||||
South Africa - 2.9% | ||||||||
Discovery Ltd. (Insurance)† | 4,328,098 | 34,438,336 | ||||||
Naspers Ltd., Class N (Retailing)† | 93,493 | 13,285,639 | ||||||
Sasol Ltd. (Materials)† | 1,387,532 | 25,185,534 | ||||||
Standard Bank Group Ltd. (Banks)† | 4,377,708 | 50,243,846 | ||||||
| 123,153,355 | ||||||||
South Korea - 8.3% | ||||||||
Amorepacific Corp. (Household & Personal Products)† | 172,047 | 28,309,652 | ||||||
Hankook Tire & Technology Co., Ltd. (Automobiles & Components)† | 1,373,826 | 36,617,336 | ||||||
LG Household & Health Care Ltd. (Household & Personal Products)† | 75,079 | 81,048,944 | ||||||
Samsung Electronics Co., Ltd. - GDR, Reg S (Technology Hardware & Equipment)† | 153,739 | 164,304,575 | ||||||
Woongjin Coway Co., Ltd. (Consumer Durables & Apparel)† | 553,172 | 43,433,336 | ||||||
| 353,713,843 | ||||||||
| Shares | Value | |||||||
| COMMON STOCKS - 91.2% (continued) | ||||||||
Taiwan - 8.4% | ||||||||
Eclat Textile Co., Ltd. (Consumer Durables & Apparel)† | 4,002,216 | $53,742,414 | ||||||
Hon Hai Precision Industry Co., Ltd. (Technology Hardware & Equipment)† | 7,609,136 | 20,024,301 | ||||||
Largan Precision Co., Ltd. (Technology Hardware & Equipment)† | 317,001 | 46,359,303 | ||||||
Taiwan Semiconductor Manufacturing Co., Ltd. (Semiconductors & Semiconductor Equipment)† | 24,395,637 | 237,010,443 | ||||||
| 357,136,461 | ||||||||
Thailand - 1.3% | ||||||||
Siam Commercial Bank pcl, Reg S (Banks)† | 15,232,100 | 56,499,261 | ||||||
United Arab Emirates - 0.7% | ||||||||
DP World plc (Transportation)† | 2,262,910 | 30,072,841 | ||||||
United Kingdom - 1.6% | ||||||||
Bank of Georgia Group plc (Banks)† | 575,296 | 9,692,907 | ||||||
Coca-Cola HBC AG - CDI (Food Beverage & Tobacco)*† | 1,944,116 | 59,191,132 | ||||||
| 68,884,039 | ||||||||
United States - 1.6% | ||||||||
EPAM Systems Inc. (Software & Services)* | 393,808 | 69,294,456 | ||||||
Total Common Stocks (Cost $2,958,110,930) |
| $3,897,431,238 | ||||||
| PREFERRED STOCKS - 5.8% | ||||||||
Brazil - 3.7% | ||||||||
Banco Bradesco SA - ADR, 6.01% (Banks)+ | 8,345,038 | 73,102,533 | ||||||
Cia Brasileira de Distribuicao - Sponsored ADR (Food & Staples Retailing)* | 1,047,641 | 21,602,357 | ||||||
Itau Unibanco Holding SA - Sponsored ADR, 0.48% (Banks)+ | 7,057,952 | 63,733,307 | ||||||
| 158,438,197 | ||||||||
Colombia - 1.2% | ||||||||
Bancolombia SA - Sponsored ADR, 2.17% (Banks)+ | 1,027,377 | 53,300,319 | ||||||
See Notes to Financial Statements
18
Table of Contents
Harding, Loevner Funds, Inc.
Emerging Markets Portfolio
Portfolio of Investments
October 31, 2019 (continued)
| Shares | Value | |||||||
| PREFERRED STOCKS - 5.8% (continued) | ||||||||
South Korea - 0.9% | ||||||||
Samsung Electronics Co., Ltd. - GDR, Reg S, 3.24% (Technology Hardware & | 43,779 | $37,899,357 | ||||||
Total Preferred Stocks (Cost $145,566,572) |
| $249,637,873 | ||||||
| SHORT TERM INVESTMENTS - 2.9% | ||||||||
Northern Institutional Funds - Prime Obligations Portfolio (Shares), 1.91% (Money Market Funds) | 52,805,269 | 52,815,830 | ||||||
Northern Institutional Funds - Treasury Portfolio (Premier Shares), 1.72% (Money Market Funds) | 70,710,431 | 70,710,431 | ||||||
Total Short Term Investments | $123,526,261 | |||||||
Total Investments - 99.9% | ||||||||
(Cost $3,227,195,902) | $4,270,595,372 | |||||||
Other Assets Less Liabilities - 0.1% | 3,718,429 | |||||||
Net Assets - 100.0% | $4,274,313,801 | |||||||
Summary of Abbreviations
| ADR | American Depositary Receipt. |
| CDI | Chess Depositary Interest. |
| GDR | Global Depositary Receipt. |
| Reg S | Security sold outside United States without registration under the Securities Act of 1933. |
| * | Non-income producing security. |
| † | Investment categorized as level 2 security as disclosed in Note 2 of the Notes to Financial Statements. |
| + | Current yield is disclosed. Dividends are calculated based on a percentage of the issuer’s net income. |
| Industry | | Percentage of Net Assets | | ||
Automobiles & Components | 2.9 | % | |||
Banks | 20.9 | ||||
Capital Goods | 2.3 | ||||
Commercial & Professional Services | 1.3 | ||||
Consumer Durables & Apparel | 4.9 | ||||
Consumer Services | 1.9 | ||||
Diversified Financials | 0.8 | ||||
Energy | 7.8 | ||||
Food & Staples Retailing | 1.8 | ||||
Food Beverage & Tobacco | 4.7 | ||||
Household & Personal Products | 2.6 | ||||
Insurance | 5.3 | ||||
Materials | 0.6 | ||||
Media & Entertainment | 6.4 | ||||
Pharmaceuticals, Biotechnology & Life Sciences | 1.4 | ||||
Retailing | 5.7 | ||||
Semiconductors & Semiconductor Equipment | 6.4 | ||||
Software & Services | 2.9 | ||||
Technology Hardware & Equipment | 9.4 | ||||
Telecommunication Services | 1.1 | ||||
Transportation | 3.6 | ||||
Utilities | 2.3 | ||||
Money Market Funds | 2.9 | ||||
Total Investments | 99.9 | ||||
Other Assets Less Liabilities | 0.1 | ||||
Net Assets | 100.0 | % | |||
See Notes to Financial Statements
19
Table of Contents
Harding, Loevner Funds, Inc.
Frontier Emerging Markets Portfolio
Portfolio of Investments
October 31, 2019
| Shares | Value | |||||||
| COMMON STOCKS - 93.1% | ||||||||
Argentina - 3.7% | ||||||||
Globant SA (Software & Services)* | 116,473 | $10,862,272 | ||||||
Bangladesh - 3.3% | ||||||||
BRAC Bank Ltd. (Banks)*† | 2,170,366 | 1,296,635 | ||||||
GrameenPhone Ltd. (Telecommunication Services)† | 254,236 | 952,116 | ||||||
Square Pharmaceuticals Ltd. (Pharmaceuticals, Biotechnology & Life Sciences)† | 2,658,273 | 7,360,454 | ||||||
| 9,609,205 | ||||||||
Colombia - 5.4% | ||||||||
Cementos Argos SA - Sponsored ADR (Materials)#† | 63,279 | 714,230 | ||||||
Ecopetrol SA - Sponsored ADR (Energy) | 743,040 | 13,560,480 | ||||||
Grupo Nutresa SA (Food Beverage & Tobacco) | 211,292 | 1,602,819 | ||||||
| 15,877,529 | ||||||||
Croatia - 0.6% | ||||||||
Ericsson Nikola Tesla (Technology Hardware & Equipment)† | 9,514 | 1,801,046 | ||||||
Egypt - 5.7% | ||||||||
Commercial International Bank Egypt SAE - GDR, Reg S (Banks)† | 2,166,238 | 10,692,676 | ||||||
Edita Food Industries SAE (Food Beverage & Tobacco) | 1,827,011 | 1,754,565 | ||||||
Integrated Diagnostics Holdings plc (Health Care Equipment & Services)† | 903,889 | 4,269,513 | ||||||
| 16,716,754 | ||||||||
Estonia - 0.6% | ||||||||
Tallink Grupp AS (Transportation)† | 1,719,609 | 1,798,979 | ||||||
Georgia - 0.6% | ||||||||
TBC Bank Group PLC (Banks)† | 96,800 | 1,604,936 | ||||||
Kazakhstan - 2.3% | ||||||||
Halyk Savings Bank of Kazakhstan JSC - GDR, Reg S (Banks)† | 506,568 | 6,761,790 | ||||||
Kenya - 5.4% | ||||||||
East African Breweries Ltd. (Food Beverage & Tobacco)† | 1,074,500 | 2,089,707 | ||||||
Equity Group Holdings Ltd. (Banks)† | 160,500 | 72,259 | ||||||
Safaricom plc (Telecommunication Services)† | 48,081,050 | 13,831,620 | ||||||
| 15,993,586 | ||||||||
| Shares | Value | |||||||||
| COMMON STOCKS - 93.1% (continued) | ||||||||||
Kuwait- 9.3% | ||||||||||
Mabanee Co. SAK (Real Estate)† | 5,460,480 | $ | 13,895,057 | |||||||
National Bank of Kuwait SAKP (Banks)† | 4,370,574 | 13,555,040 | ||||||||
| 27,450,097 | ||||||||||
Morocco - 2.2% | ||||||||||
Maroc Telecom (Telecommunication Services)† | 258,336 | 3,856,712 | ||||||||
Societe d’Exploitation des Ports (Transportation)† | 146,364 | 2,703,081 | ||||||||
| 6,559,793 | ||||||||||
Nigeria - 4.7% | ||||||||||
Dangote Cement plc (Materials) | 4,750,711 | 1,959,299 | ||||||||
Guaranty Trust Bank plc (Banks)† | 64,489,698 | 4,432,828 | ||||||||
Lafarge Africa plc (Materials)* | 743,285 | 27,290 | ||||||||
Nestle Nigeria plc (Food Beverage & Tobacco) | 834,885 | 2,811,759 | ||||||||
Nigerian Breweries plc (Food Beverage & Tobacco) | 1,270,573 | 175,372 | ||||||||
Zenith Bank plc (Banks)† | 94,148,094 | 4,418,246 | ||||||||
| 13,824,794 | ||||||||||
Pakistan - 0.5% | ||||||||||
Engro Corp., Ltd. (Materials)† | 175,391 | 333,937 | ||||||||
MCB Bank Ltd. (Banks)† | 440,600 | 489,152 | ||||||||
Oil & Gas Development Co., Ltd. (Energy)† | 818,100 | 678,458 | ||||||||
| 1,501,547 | ||||||||||
Peru - 8.2% | ||||||||||
Alicorp SAA (Food Beverage & Tobacco) | 1,261,918 | 3,459,739 | ||||||||
Cementos Pacasmayo SAA, Class C (Materials) | 1,681,864 | 3,399,229 | ||||||||
Credicorp Ltd. (Banks) | 62,229 | 13,319,495 | ||||||||
Ferreycorp SAA (Capital Goods) | 6,099,575 | 3,957,329 | ||||||||
| 24,135,792 | ||||||||||
Philippines - 19.8% | ||||||||||
Bank of the Philippine Islands (Banks)† | 3,038,484 | 5,792,814 | ||||||||
BDO Unibank Inc. (Banks)† | 2,008,088 | 6,109,673 | ||||||||
International Container Terminal Services Inc. (Transportation)† | 1,558,610 | 3,631,836 | ||||||||
Jollibee Foods Corp. (Consumer Services)† | 493,950 | 2,255,823 | ||||||||
Robinsons Retail Holdings Inc. (Food & Staples Retailing)† | 5,738,380 | 8,563,442 | ||||||||
Security Bank Corp. (Banks)† | 2,100,220 | 8,236,264 | ||||||||
SM Prime Holdings Inc. (Real Estate)† | 17,401,700 | 13,358,539 | ||||||||
Universal Robina Corp. (Food Beverage & Tobacco)† | 2,385,150 | 7,092,689 | ||||||||
See Notes to Financial Statements
20
Table of Contents
Harding, Loevner Funds, Inc.
Frontier Emerging Markets Portfolio
Portfolio of Investments
October 31, 2019 (continued)
| Shares | Value | |||||||
| COMMON STOCKS - 93.1% (continued) | ||||||||
Philippines - 19.8% (continued) | ||||||||
Wilcon Depot Inc. (Retailing)† | 9,840,200 | $3,198,939 | ||||||
| 58,240,019 | ||||||||
Romania - 3.5% | ||||||||
Banca Transilvania SA (Banks)† | 12,531,791 | 7,000,083 | ||||||
Societatea Nationala de Gaze Naturale ROMGAZ SA (Energy)† | 390,332 | 3,362,396 | ||||||
| 10,362,479 | ||||||||
Slovenia - 0.7% | ||||||||
Krka dd Novo mesto (Pharmaceuticals, Biotechnology & Life Sciences)† | 30,791 | 2,177,555 | ||||||
Sri Lanka - 0.4% | ||||||||
Commercial Bank of Ceylon plc (Banks)† | 477,863 | 255,128 | ||||||
John Keells Holdings plc (Capital Goods)† | 897,375 | 775,456 | ||||||
| 1,030,584 | ||||||||
Thailand - 0.9% | ||||||||
Home Product Center pcl, Reg S (Retailing) | 4,399,994 | 2,506,372 | ||||||
Ukraine- 0.9% | ||||||||
Kernel Holding SA (Food Beverage & Tobacco)† | 143,362 | 1,595,277 | ||||||
MHP SE - GDR (Food Beverage & Tobacco)† | 105,693 | 894,194 | ||||||
| 2,489,471 | ||||||||
United Arab Emirates - 3.8% | ||||||||
Agthia Group PJSC (Food Beverage & Tobacco)† | 3,489,410 | 3,493,988 | ||||||
Emaar Properties PJSC (Real Estate)† | 2,243,049 | 2,607,008 | ||||||
Network International Holdings plc (Software & Services)*† | 723,827 | 5,071,563 | ||||||
| 11,172,559 | ||||||||
United Kingdom - 0.4% | ||||||||
Bank of Georgia Group plc (Banks)† | 66,788 | 1,125,281 | ||||||
United States - 1.4% | ||||||||
EPAM Systems Inc. (Software & Services)* | 24,109 | 4,242,220 | ||||||
Vietnam - 8.8% | ||||||||
Hoa Phat Group JSC (Materials)*† | 10,344,649 | 9,699,951 | ||||||
Masan Group Corp. (Food Beverage & Tobacco)*† | 742,650 | 2,368,599 | ||||||
Sai Gon Cargo Service Corp. (Transportation)† | 217,160 | 1,432,307 | ||||||
Saigon Beer Alcohol Beverage Corp. (Food Beverage & Tobacco)† | 298,990 | 3,357,844 | ||||||
| Shares | Value | |||||||
| COMMON STOCKS - 93.1% (continued) | ||||||||
Vietnam - 8.8% (continued) | ||||||||
Vietnam Dairy Products JSC (Food Beverage & Tobacco)† | 1,611,870 | $9,006,605 | ||||||
| 25,865,306 | ||||||||
Total Common Stocks (Cost $222,879,443) |
| $273,709,966 | ||||||
| PREFERRED STOCKS - 4.2% | ||||||||
Colombia - 4.2% | ||||||||
Bancolombia SA - Sponsored ADR, 2.17% (Banks)+ | 237,514 | 12,322,226 | ||||||
Total Preferred Stocks (Cost $8,975,169) |
| $12,322,226 | ||||||
| PARTICIPATION NOTES - 1.6% | ||||||||
Saudi Arabia - 1.6% | ||||||||
Al Rajhi Bank, Issued by JP Morgan Structured Products, Maturity Date 12/5/19 (Banks)^† | 78,921 | 1,270,849 | ||||||
Herfy Food Services Co., Issued by JP Morgan Structured Products, Maturity Date 1/14/19 (Consumer Services)^† | 58,791 | 761,619 | ||||||
Jarir Marketing Co., Issued by HSBC BANK PLC, Maturity Date 1/19/21 (Retailing)^† | 60,974 | 2,575,037 | ||||||
| 4,607,505 | ||||||||
Total Participation Notes (Cost $3,486,745) |
| $4,607,505 | ||||||
| SHORT TERM INVESTMENTS - 1.2% | ||||||||
Northern Institutional Funds - Treasury Portfolio (Premier Shares), 1.72% (Money Market Funds) | 3,717,275 | 3,717,275 | ||||||
Total Short Term Investments (Cost $3,717,275) |
| $3,717,275 | ||||||
Total Investments - 100.1% | ||||||||
(Cost $239,058,632) | $294,356,972 | |||||||
Liabilities Less Other Assets - (0.1)% | (312,577 | ) | ||||||
Net Assets - 100.0% | $294,044,395 | |||||||
See Notes to Financial Statements
21
Table of Contents
Harding, Loevner Funds, Inc.
Frontier Emerging Markets Portfolio
Portfolio of Investments
October 31, 2019 (continued)
Summary of Abbreviations
| ADR | American Depositary Receipt. |
| GDR | Global Depositary Receipt. |
| Reg S | Security sold outside United States without registration under the Securities Act of 1933. |
| * | Non-income producing security. |
| † | Investment categorized as level 2 security as disclosed in Note 2 of the Notes to Financial Statements. |
| # | Security valued at fair value as determined in good faith under policies and procedures established by and under the supervision of the Portfolio’s Board of Directors as disclosed in Note 2 of the Notes to Financial Statements. |
| + | Current yield is disclosed. Dividends are calculated based on a percentage of the issuer’s net income. |
| ^ | Security exempt from registration pursuant to Rule 144A of the Securities Act of 1933. These securities, which represent 1.6% of net assets as of October 31, 2019, are considered liquid and may be resold in transactions exempt from registration, normally to qualified buyers. |
| Industry | | Percentage of Net Assets | | ||
Banks | 33.7 | % | |||
Capital Goods | 1.6 | ||||
Consumer Services | 1.1 | ||||
Energy | 5.9 | ||||
Food & Staples Retailing | 2.9 | ||||
Food Beverage & Tobacco | 13.6 | ||||
Health Care Equipment & Services | 1.5 | ||||
Materials | 5.5 | ||||
Pharmaceuticals, Biotechnology & Life Sciences | 3.2 | ||||
Real Estate | 10.1 | ||||
Retailing | 2.9 | ||||
Software & Services | 6.8 | ||||
Technology Hardware & Equipment | 0.6 | ||||
Telecommunication Services | 6.3 | ||||
Transportation | 3.2 | ||||
Money Market Fund | 1.2 | ||||
Total Investments | 100.1 | ||||
Liabilities Less Other Assets | (0.1 | ) | |||
Net Assets | 100.0 | % | |||
See Notes to Financial Statements
22
Table of Contents
Harding, Loevner Funds, Inc.
Global Equity Research Portfolio
Portfolio of Investments
October 31, 2019
| Shares | Value | |||||||
| COMMON STOCKS - 98.3% | ||||||||
Australia - 0.9% | ||||||||
BHP Group Ltd. (Materials)† | 1,977 | $48,345 | ||||||
Cochlear Ltd. (Health Care Equipment & Services)† | 83 | 12,077 | ||||||
| 60,422 | ||||||||
Belgium - 0.5% | ||||||||
Anheuser-Busch InBev SA, NV (Food Beverage & Tobacco)† | 463 | 37,396 | ||||||
Brazil- 0.5% | ||||||||
Ambev SA - ADR (Food Beverage & Tobacco)* | 2,877 | 12,400 | ||||||
Ultrapar Participacoes SA - Sponsored ADR (Energy) | 1,872 | 8,742 | ||||||
WEG SA (Capital Goods) | 1,900 | 12,081 | ||||||
| 33,223 | ||||||||
Canada - 1.9% | ||||||||
Alimentation Couche-Tard Inc. (Food & Staples Retailing) | 1,600 | 48,178 | ||||||
Canadian National Railway Co. (Transportation) | 600 | 53,622 | ||||||
Cenovus Energy Inc. (Energy) | 1,500 | 12,778 | ||||||
Encana Corp. (Energy) | 3,462 | 13,606 | ||||||
| 128,184 | ||||||||
China - 5.0% | ||||||||
AAC Technologies Holdings Inc. (Technology Hardware & Equipment)† | 1,670 | 10,701 | ||||||
Alibaba Group Holding Ltd. - Sponsored ADR (Retailing)* | 55 | 9,717 | ||||||
Autohome Inc. - ADR (Media & Entertainment)* | 92 | 7,780 | ||||||
China International Travel Service Corp., Ltd., Class A (Consumer Services)† | 800 | 10,238 | ||||||
China Tower Corp., Ltd., Class H (Telecommunication Services)† | 38,000 | 8,314 | ||||||
CNOOC Ltd. - Sponsored ADR (Energy) | 119 | 17,676 | ||||||
CSPC Pharmaceutical Group Ltd. (Pharmaceuticals, Biotechnology & Life Sciences)† | 8,000 | 20,351 | ||||||
Ctrip.com International Ltd. - ADR (Retailing)* | 270 | 8,907 | ||||||
ENN Energy Holdings Ltd. (Utilities)† | 2,000 | 22,817 | ||||||
Fuyao Glass Industry Group Co., Ltd., Class A (Automobiles & Components)† | 2,600 | 7,797 | ||||||
Glodon Co., Ltd., Class A (Software & Services)† | 2,000 | 8,996 | ||||||
Gree Electric Appliances Inc. of Zhuhai, Class A (Consumer Durables & Apparel)† | 1,700 | 14,043 | ||||||
| Shares | Value | |||||||
| COMMON STOCKS - 98.3% (continued) | ||||||||
China - 5.0% (continued) | ||||||||
Haitian International Holdings Ltd. (Capital Goods)† | 4,000 | $9,372 | ||||||
Hangzhou Hikvision Digital Technology Co., Ltd., Class A (Technology Hardware & Equipment)† | 2,700 | 12,238 | ||||||
Inner Mongolia Yili Industrial Group Co., Ltd., Class A (Food Beverage & Tobacco)† | 2,200 | 8,979 | ||||||
Jiangsu Yanghe Brewery Joint-Stock Co., Ltd., Class A (Food Beverage & Tobacco)† | 600 | 8,565 | ||||||
NetEase Inc. - ADR (Media & Entertainment) | 41 | 11,720 | ||||||
New Oriental Education & Technology Group Inc. - Sponsored ADR (Consumer Services)* | 110 | 13,427 | ||||||
Ping An Insurance Group Co. of China Ltd., Class A (Insurance)† | 1,100 | 13,646 | ||||||
SF Holding Co., Ltd., Class A (Transportation)† | 1,900 | 10,619 | ||||||
Shenzhen Inovance Technology Co., Ltd., Class A (Capital Goods)† | 2,900 | 10,200 | ||||||
Shenzhou International Group Holdings Ltd. (Consumer Durables & Apparel)† | 1,000 | 13,695 | ||||||
Sino Biopharmaceutical Ltd. (Pharmaceuticals, Biotechnology & Life Sciences)† | 9,000 | 13,314 | ||||||
Songcheng Performance Development Co., Ltd., Class A (Consumer Services)† | 2,900 | 12,123 | ||||||
Sunny Optical Technology Group Co., Ltd. (Technology Hardware & Equipment)† | 900 | 14,276 | ||||||
Tencent Holdings Ltd. (Media & Entertainment)† | 200 | 8,155 | ||||||
Weibo Corp. - Sponsored ADR (Media & Entertainment)* | 235 | 11,560 | ||||||
WuXi AppTec Co., Ltd., Class A (Pharmaceuticals, Biotechnology & Life Sciences)† | 980 | 13,071 | ||||||
Wuxi Biologics Cayman Inc. (Pharmaceuticals, Biotechnology & Life Sciences)*† | 1,000 | 11,764 | ||||||
| 344,061 | ||||||||
Colombia - 0.4% | ||||||||
Ecopetrol SA - Sponsored ADR (Energy) | 800 | 14,600 | ||||||
See Notes to Financial Statements
23
Table of Contents
Harding, Loevner Funds, Inc.
Global Equity Research Portfolio
Portfolio of Investments
October 31, 2019 (continued)
| Shares | Value | |||||||
| COMMON STOCKS - 98.3% (continued) | ||||||||
Colombia - 0.4% (continued) | ||||||||
Grupo Nutresa SA (Food Beverage & Tobacco) | 1,370 | $10,393 | ||||||
| 24,993 | ||||||||
Denmark - 0.4% | ||||||||
Chr Hansen Holding A/S (Materials)† | 150 | 11,514 | ||||||
Novozymes A/S, Class B (Materials)† | 290 | 13,664 | ||||||
| 25,178 | ||||||||
Egypt - 0.6% | ||||||||
Commercial International Bank Egypt SAE - GDR, Reg S (Banks)† | 7,736 | 38,185 | ||||||
France - 2.5% | ||||||||
Air Liquide SA (Materials)† | 330 | 43,857 | ||||||
Dassault Systemes SE (Software & Services)† | 130 | 19,775 | ||||||
EssilorLuxottica SA (Consumer Durables & Apparel)† | 320 | 48,841 | ||||||
Kering SA (Consumer Durables & Apparel)† | 26 | 14,808 | ||||||
Rubis SCA (Utilities)† | 241 | 13,982 | ||||||
Sartorius Stedim Biotech (Pharmaceuticals, Biotechnology & Life Sciences)† | 109 | 16,322 | ||||||
Schneider Electric SE (Capital Goods)† | 159 | 14,812 | ||||||
| 172,397 | ||||||||
Germany - 3.4% | ||||||||
adidas AG (Consumer Durables & Apparel)† | 60 | 18,506 | ||||||
Allianz SE, Reg S (Insurance)† | 230 | 56,133 | ||||||
Bayer AG, Reg S (Pharmaceuticals, Biotechnology & Life Sciences)† | 196 | 15,207 | ||||||
Bayerische Motoren Werke AG (Automobiles & Components)† | 350 | 26,823 | ||||||
FUCHS PETROLUB SE (Materials)† | 375 | 15,185 | ||||||
Henkel AG & Co. KGaA (Household & | 549 | 52,761 | ||||||
Infineon Technologies AG (Semiconductors & Semiconductor Equipment)† | 1,190 | 23,209 | ||||||
SAP SE - Sponsored ADR (Software & Services) | 110 | 14,584 | ||||||
Symrise AG (Materials)† | 160 | 15,396 | ||||||
| 237,804 | ||||||||
Hong Kong - 1.2% | ||||||||
AIA Group Ltd. (Insurance)† | 1,600 | 15,876 | ||||||
| Shares | Value | |||||||
| COMMON STOCKS - 98.3% (continued) | ||||||||
Hong Kong - 1.2% (continued) | ||||||||
ASM Pacific Technology Ltd. (Semiconductors & Semiconductor Equipment)† | 1,000 | $13,891 | ||||||
Sands China Ltd. (Consumer Services)† | 6,400 | 31,302 | ||||||
Techtronic Industries Co., Ltd. (Capital Goods)† | 2,500 | 19,343 | ||||||
| 80,412 | ||||||||
India - 3.0% | ||||||||
Asian Paints Ltd. (Materials)† | 460 | 11,736 | ||||||
Bharti Infratel Ltd. (Telecommunication Services)† | 15,217 | 40,671 | ||||||
HDFC Bank Ltd. - ADR (Banks) | 235 | 14,356 | ||||||
Housing Development Finance Corp., Ltd. (Banks)† | 340 | 10,214 | ||||||
ICICI Bank Ltd. - Sponsored ADR (Banks) | 1,034 | 13,473 | ||||||
ITC Ltd. (Food Beverage & Tobacco)† | 16,136 | 58,634 | ||||||
Kotak Mahindra Bank Ltd. (Banks)† | 1,206 | 26,771 | ||||||
Max Financial Services Ltd. (Insurance)*† | 1,630 | 9,330 | ||||||
Pidilite Industries Ltd. (Materials)† | 1,120 | 22,131 | ||||||
| 207,316 | ||||||||
Indonesia - 0.8% | ||||||||
Astra International Tbk PT (Automobiles & Components)† | 16,000 | 7,886 | ||||||
Bank Rakyat Indonesia Persero Tbk PT (Banks)† | 34,200 | 10,229 | ||||||
Unilever Indonesia Tbk PT (Household & Personal Products)† | 11,200 | 34,761 | ||||||
| 52,876 | ||||||||
Japan - 11.8% | ||||||||
ABC-Mart Inc. (Retailing)† | 700 | 48,000 | ||||||
Chugai Pharmaceutical Co., Ltd. (Pharmaceuticals, Biotechnology & Life Sciences)† | 300 | 25,265 | ||||||
Daito Trust Construction Co., Ltd. (Real Estate)† | 100 | 13,235 | ||||||
Dentsu Inc. (Media & Entertainment)† | 500 | 17,852 | ||||||
FANUC Corp. (Capital Goods)† | 100 | 19,740 | ||||||
Fast Retailing Co., Ltd. (Retailing)† | 60 | 37,000 | ||||||
Hakuhodo DY Holdings Inc. (Media & Entertainment)† | 3,100 | 46,184 | ||||||
Infomart Corp. (Software & Services)† | 1,200 | 18,043 | ||||||
See Notes to Financial Statements
24
Table of Contents
Harding, Loevner Funds, Inc.
Global Equity Research Portfolio
Portfolio of Investments
October 31, 2019 (continued)
| Shares | Value | |||||||
| COMMON STOCKS - 98.3% (continued) | ||||||||
Japan - 11.8% (continued) | ||||||||
Kakaku.com Inc. (Media & Entertainment)† | 600 | $13,988 | ||||||
Kao Corp. (Household & Personal Products)† | 700 | 56,309 | ||||||
Keyence Corp. (Technology Hardware & Equipment)† | 23 | 14,522 | ||||||
Komatsu Ltd. (Capital Goods)† | 900 | 21,092 | ||||||
Kubota Corp. (Capital Goods)† | 1,600 | 25,389 | ||||||
Makita Corp. (Capital Goods)† | 1,200 | 40,379 | ||||||
MISUMI Group Inc. (Capital Goods)† | 700 | 17,553 | ||||||
MonotaRO Co., Ltd. (Capital Goods)† | 500 | 15,125 | ||||||
Nidec Corp. (Capital Goods)† | 100 | 14,705 | ||||||
Nitori Holdings Co., Ltd. (Retailing)† | 400 | 61,077 | ||||||
Nomura Research Institute Ltd. (Software & Services)† | 990 | 21,041 | ||||||
Pigeon Corp. (Household & Personal Products)† | 400 | 19,661 | ||||||
Rinnai Corp. (Consumer Durables & Apparel)† | 540 | 39,570 | ||||||
Shimano Inc. (Consumer Durables & Apparel)† | 400 | 66,566 | ||||||
Shionogi & Co., Ltd. (Pharmaceuticals, Biotechnology & Life Sciences)† | 600 | 35,909 | ||||||
Shiseido Co., Ltd. (Household & Personal Products)† | 200 | 16,565 | ||||||
SMC Corp. (Capital Goods)† | 40 | 17,268 | ||||||
Stanley Electric Co., Ltd. (Automobiles & Components)† | 500 | 13,836 | ||||||
Sugi Holdings Co., Ltd. (Food & Staples Retailing)† | 500 | 27,773 | ||||||
Sysmex Corp. (Health Care Equipment & Services)† | 300 | 19,535 | ||||||
Unicharm Corp. (Household & Personal Products)† | 1,000 | 33,948 | ||||||
| 817,130 | ||||||||
Malaysia - 0.5% | ||||||||
Dialog Group Bhd. (Energy)† | 40,300 | 33,521 | ||||||
Mexico - 2.0% | ||||||||
Coca-Cola Femsa SAB de CV - Sponsored ADR (Food Beverage & Tobacco) | 565 | 31,063 | ||||||
Fomento Economico Mexicano SAB de CV - Sponsored ADR (Food Beverage & Tobacco) | 90 | 8,012 | ||||||
Grupo Aeroportuario del Sureste SAB de CV - ADR (Transportation) | 69 | 11,299 | ||||||
| Shares | Value | |||||||
| COMMON STOCKS - 98.3% (continued) | ||||||||
Mexico - 2.0% (continued) | ||||||||
Grupo Bimbo SAB de CV, Series A (Food Beverage & Tobacco) | 12,200 | $22,667 | ||||||
Grupo Financiero Banorte SAB de CV, Series O (Banks) | 1,400 | 7,642 | ||||||
Wal-Mart de Mexico SAB de CV (Food & Staples Retailing) | 18,700 | 56,120 | ||||||
| 136,803 | ||||||||
Netherlands - 0.7% | ||||||||
Adyen NV (Software & Services)*† | 18 | 12,641 | ||||||
ASML Holding NV, Reg S (Semiconductors & Semiconductor Equipment) | 90 | 23,578 | ||||||
Prosus NV (Retailing)* | 166 | 11,447 | ||||||
| 47,666 | ||||||||
Pakistan - 0.5% | ||||||||
Engro Corp., Ltd. (Materials)† | 7,680 | 14,622 | ||||||
MCB Bank Ltd. (Banks)† | 10,800 | 11,990 | ||||||
Oil & Gas Development Co., Ltd. (Energy)† | 13,400 | 11,113 | ||||||
| 37,725 | ||||||||
Peru - 0.5% | ||||||||
Alicorp SAA (Food Beverage & Tobacco) | 9,290 | 25,470 | ||||||
Credicorp Ltd. (Banks) | 50 | 10,702 | ||||||
| 36,172 | ||||||||
Philippines - 1.8% | ||||||||
Bank of the Philippine Islands (Banks)† | 30,030 | 57,251 | ||||||
BDO Unibank Inc. (Banks)† | 3,320 | 10,101 | ||||||
Robinsons Retail Holdings Inc. (Food & | 10,510 | 15,684 | ||||||
Security Bank Corp. (Banks)† | 3,360 | 13,177 | ||||||
SM Prime Holdings Inc. (Real Estate)† | 12,800 | 9,826 | ||||||
Universal Robina Corp. (Food Beverage & Tobacco)† | 3,090 | 9,189 | ||||||
Wilcon Depot Inc. (Retailing)† | 32,600 | 10,598 | ||||||
| 125,826 | ||||||||
Poland - 0.1% | ||||||||
ING Bank Slaski SA (Banks)† | 198 | 10,060 | ||||||
Qatar - 0.8% | ||||||||
Qatar National Bank QPSC (Banks)† | 10,949 | 57,733 | ||||||
Russia - 0.6% | ||||||||
LUKOIL PJSC - Sponsored ADR (Energy) | 130 | 11,968 | ||||||
Novatek PJSC - Sponsored GDR, Reg S (Energy)† | 50 | 10,709 | ||||||
Sberbank of Russia PJSC - Sponsored ADR (Banks)† | 620 | 9,119 | ||||||
See Notes to Financial Statements
25
Table of Contents
Harding, Loevner Funds, Inc.
Global Equity Research Portfolio
Portfolio of Investments
October 31, 2019 (continued)
| Shares | Value | |||||||
| COMMON STOCKS - 98.3% (continued) | ||||||||
Russia - 0.6% (continued) | ||||||||
Yandex NV, Class A (Media & Entertainment)* | 274 | $9,149 | ||||||
| 40,945 | ||||||||
Singapore - 1.0% | ||||||||
DBS Group Holdings Ltd. (Banks)† | 2,400 | 45,767 | ||||||
Oversea-Chinese Banking Corp. Ltd. (Banks)† | 2,703 | 21,639 | ||||||
| 67,406 | ||||||||
South Africa - 0.4% | ||||||||
Clicks Group Ltd. (Food & | ||||||||
Staples Retailing)† | 851 | 13,860 | ||||||
Discovery Ltd. (Insurance)† | 1,831 | 14,569 | ||||||
| 28,429 | ||||||||
South Korea - 1.0% | ||||||||
Amorepacific Corp. (Household & Personal Products)† | 85 | 13,986 | ||||||
Hankook Tire & Technology Co., Ltd. (Automobiles & Components)† | 447 | 11,914 | ||||||
LG Household & Health Care Ltd. (Household & Personal Products)† | 9 | 9,716 | ||||||
NAVER Corp. (Media & Entertainment)† | 125 | 17,596 | ||||||
Woongjin Coway Co., Ltd. (Consumer Durables & Apparel)† | 184 | 14,447 | ||||||
| 67,659 | ||||||||
Spain - 2.0% | ||||||||
Amadeus IT Group SA (Software & Services)† | 450 | 33,313 | ||||||
Banco Bilbao Vizcaya Argentaria SA (Banks)† | 3,607 | 18,912 | ||||||
Banco Santander SA - Sponsored ADR (Banks) | 13,924 | 55,139 | ||||||
Bankinter SA (Banks)† | 4,810 | 33,316 | ||||||
| 140,680 | ||||||||
Sweden - 2.0% | ||||||||
Alfa Laval AB (Capital Goods)† | 887 | 20,505 | ||||||
Atlas Copco AB, Class A (Capital Goods)† | 544 | 19,229 | ||||||
Epiroc AB, Class A (Capital Goods)† | 1,467 | 16,532 | ||||||
Hexagon AB, Class B (Technology Hardware & Equipment)† | 270 | 13,790 | ||||||
Intrum AB (Commercial & Professional Services)† | 539 | 14,515 | ||||||
Skandinaviska Enskilda Banken AB, Class A (Banks)† | 5,250 | 50,323 | ||||||
| 134,894 | ||||||||
| Shares | Value | |||||||
| COMMON STOCKS - 98.3% (continued) | ||||||||
Switzerland - 4.5% | ||||||||
Alcon Inc. (Health Care Equipment & Services)* | 912 | $54,054 | ||||||
Cie Financiere Richemont SA, Reg S (Consumer Durables & Apparel)† | 140 | 11,022 | ||||||
Kuehne + Nagel International AG, Reg S (Transportation)† | 285 | 46,053 | ||||||
Lonza Group AG, Reg S (Pharmaceuticals, Biotechnology & Life Sciences)*† | 60 | 21,601 | ||||||
Nestle SA - Sponsored ADR (Food Beverage & Tobacco) | 540 | 57,866 | ||||||
Roche Holding AG, Genusschein (Pharmaceuticals, Biotechnology & Life Sciences)† | 225 | 67,862 | ||||||
SGS SA, Reg S (Commercial & Professional Services)† | 8 | 20,890 | ||||||
Temenos AG, Reg S (Software & Services)*† | 98 | 13,994 | ||||||
Vifor Pharma AG (Pharmaceuticals, Biotechnology & Life Sciences)† | 91 | 14,333 | ||||||
| 307,675 | ||||||||
Taiwan - 1.6% | ||||||||
Advantech Co., Ltd. (Technology Hardware & Equipment)† | 4,000 | 39,357 | ||||||
Eclat Textile Co., Ltd. (Consumer Durables & Apparel)† | 714 | 9,588 | ||||||
Hon Hai Precision Industry Co., Ltd. (Technology Hardware & Equipment)† | 4,000 | 10,526 | ||||||
Largan Precision Co., Ltd. (Technology Hardware & Equipment)† | 70 | 10,237 | ||||||
Taiwan Semiconductor Manufacturing Co., Ltd. (Semiconductors & Semiconductor Equipment)† | 4,000 | 38,861 | ||||||
| 108,569 | ||||||||
Thailand - 0.3% | ||||||||
Siam Commercial Bank pcl, Reg S (Banks)† | 6,200 | 22,997 | ||||||
Turkey - 0.1% | ||||||||
BIM Birlesik Magazalar AS (Food & Staples Retailing)† | 1,226 | 10,144 | ||||||
United Arab Emirates - 0.5% | ||||||||
DP World plc (Transportation)† | 745 | 9,901 | ||||||
Emaar Properties PJSC (Real Estate)† | 9,900 | 11,506 | ||||||
See Notes to Financial Statements
26
Table of Contents
Harding, Loevner Funds, Inc.
Global Equity Research Portfolio
Portfolio of Investments
October 31, 2019 (continued)
| Shares | Value | |||||||||
| COMMON STOCKS - 98.3% (continued) | ||||||||||
United Arab Emirates - 0.5% (continued) | ||||||||||
Network International Holdings plc | 1,425 | $9,984 | ||||||||
| 31,391 | ||||||||||
United Kingdom - 6.2% | ||||||||||
Abcam plc (Pharmaceuticals, Biotechnology & Life Sciences)† | 970 | 14,673 | ||||||||
Bank of Georgia Group plc (Banks)† | 637 | 10,733 | ||||||||
BBA Aviation plc (Transportation)† | 5,148 | 20,278 | ||||||||
Compass Group plc (Consumer Services)† | 2,255 | 60,108 | ||||||||
Dechra Pharmaceuticals plc (Pharmaceuticals, Biotechnology & Life Sciences)† | 780 | 26,580 | ||||||||
Diageo plc (Food Beverage & Tobacco)† | 817 | 33,448 | ||||||||
Diploma plc (Capital Goods)† | 1,486 | 30,789 | ||||||||
HomeServe plc (Commercial & Professional Services)† | 977 | 14,670 | ||||||||
HSBC Holdings plc - Sponsored ADR (Banks) | 920 | 34,767 | ||||||||
Rathbone Brothers plc (Diversified Financials)† | 762 | 20,518 | ||||||||
Rio Tinto plc (Materials)† | 225 | 11,690 | ||||||||
Rotork plc (Capital Goods)† | 3,615 | 14,120 | ||||||||
Royal Dutch Shell plc, Class B - Sponsored ADR (Energy) | 790 | 46,049 | ||||||||
Spirax-Sarco Engineering plc (Capital Goods)† | 154 | 15,832 | ||||||||
Standard Chartered plc (Banks)† | 2,119 | 19,262 | ||||||||
Unilever plc (Household & Personal Products)† | 898 | 53,881 | ||||||||
| 427,398 | ||||||||||
United States - 38.3% | ||||||||||
Abbott Laboratories (Health Care Equipment & Services) | 390 | 32,608 | ||||||||
Adobe Inc. (Software & Services)* | 90 | 25,014 | ||||||||
Air Products & Chemicals Inc. (Materials) | 320 | 68,243 | ||||||||
Allegion plc (Capital Goods) | 721 | 83,665 | ||||||||
Alphabet Inc., Class A (Media & Entertainment)* | 45 | 56,646 | ||||||||
Altair Engineering Inc., Class A (Software & Services)* | 403 | 14,859 | ||||||||
Amazon.com Inc. (Retailing)* | 20 | 35,533 | ||||||||
Amphenol Corp., Class A (Technology Hardware & Equipment) | 700 | 70,231 | ||||||||
ANSYS Inc. (Software & Services)* | 78 | 17,172 | ||||||||
| Shares | Value | |||||||||
| COMMON STOCKS - 98.3% (continued) | ||||||||||
United States - 38.3% (continued) | ||||||||||
Apple Inc. (Technology Hardware & Equipment) | 65 | $ | 16,169 | |||||||
Automatic Data Processing Inc. (Software & Services) | 418 | 67,812 | ||||||||
Booking Holdings Inc. (Retailing)* | 7 | 14,341 | ||||||||
BorgWarner Inc. (Automobiles & Components) | 407 | 16,964 | ||||||||
Cisco Systems Inc. (Technology Hardware & Equipment) | 845 | 40,146 | ||||||||
Cognex Corp. (Technology Hardware & Equipment) | 270 | 13,902 | ||||||||
Cognizant Technology Solutions Corp., Class A (Software & Services) | 686 | 41,805 | ||||||||
Colgate-Palmolive Co. (Household & Personal Products) | 950 | 65,170 | ||||||||
Danaher Corp. (Health Care Equipment & Services) | 327 | 45,067 | ||||||||
Deere & Co. (Capital Goods) | 200 | 34,828 | ||||||||
eBay Inc. (Retailing) | 1,070 | 37,718 | ||||||||
Ecolab Inc. (Materials) | 400 | 76,828 | ||||||||
Emerson Electric Co. (Capital Goods) | 185 | 12,978 | ||||||||
EnerSys (Capital Goods) | 200 | 13,372 | ||||||||
Facebook Inc., Class A (Media & Entertainment)* | 270 | 51,746 | ||||||||
First Republic Bank (Banks) | 660 | 70,198 | ||||||||
Fiserv Inc. (Software & Services)* | 626 | 66,444 | ||||||||
Guidewire Software Inc. (Software & Services)* | 152 | 17,136 | ||||||||
Healthcare Services Group Inc. (Commercial & Professional Services) | 622 | 15,152 | ||||||||
HEICO Corp. (Capital Goods) | 212 | 26,148 | ||||||||
Helmerich & Payne Inc. (Energy) | 327 | 12,263 | ||||||||
IDEXX Laboratories Inc. (Health Care Equipment & Services)* | 70 | 19,951 | ||||||||
Illumina Inc. (Pharmaceuticals, Biotechnology & Life Sciences)* | 60 | 17,731 | ||||||||
IQVIA Holdings Inc. (Pharmaceuticals, Biotechnology & Life Sciences)* | 100 | 14,442 | ||||||||
JPMorgan Chase & Co. (Banks) | 641 | 80,074 | ||||||||
Kansas City Southern (Transportation) | 302 | 42,516 | ||||||||
Linde plc (Materials)† | 169 | 33,401 | ||||||||
Mastercard Inc., Class A (Software & Services) | 141 | 39,030 | ||||||||
McDonald’s Corp. (Consumer Services) | 313 | 61,567 | ||||||||
See Notes to Financial Statements
27
Table of Contents
Harding, Loevner Funds, Inc.
Global Equity Research Portfolio
Portfolio of Investments
October 31, 2019 (continued)
| Shares | Value | |||||||||
| COMMON STOCKS - 98.3% (continued) | ||||||||||
United States - 38.3% (continued) | ||||||||||
Merck & Co., Inc. (Pharmaceuticals, Biotechnology & Life Sciences) | 880 | $ | 76,261 | |||||||
Mettler-Toledo International Inc. (Pharmaceuticals, Biotechnology & Life Sciences)* | 19 | 13,394 | ||||||||
Microsoft Corp. (Software & Services) | 400 | 57,348 | ||||||||
NIKE Inc., Class B (Consumer Durables & Apparel) | 156 | 13,970 | ||||||||
NVIDIA Corp. (Semiconductors & Semiconductor Equipment) | 107 | 21,509 | ||||||||
PayPal Holdings Inc. (Software & Services)* | 240 | 24,984 | ||||||||
Procter & Gamble Co. (Household & Personal Products) | 606 | 75,453 | ||||||||
Proto Labs Inc. (Capital Goods)* | 133 | 12,897 | ||||||||
Prudential Financial Inc. (Insurance) | 460 | 41,924 | ||||||||
Reinsurance Group of America Inc. (Insurance) | 380 | 61,739 | ||||||||
Repligen Corp. (Pharmaceuticals, Biotechnology & Life Sciences)* | 146 | 11,606 | ||||||||
ResMed Inc. (Health Care Equipment & Services) | 510 | 75,439 | ||||||||
Rollins Inc. (Commercial & Professional Services) | 600 | 22,866 | ||||||||
Roper Technologies Inc. (Capital Goods) | 208 | 70,088 | ||||||||
salesforce.com Inc. (Software & Services)* | 130 | 20,344 | ||||||||
Schlumberger Ltd. (Energy) | 518 | 16,933 | ||||||||
Sensata Technologies Holding plc (Capital Goods)* | 328 | 16,790 | ||||||||
ServiceNow Inc. (Software & Services)* | 54 | 13,352 | ||||||||
Signature Bank (Banks) | 473 | 55,965 | ||||||||
Synopsys Inc. (Software & Services)* | 511 | 69,368 | ||||||||
Thermo Fisher Scientific Inc. (Pharmaceuticals, Biotechnology & Life Sciences) | 60 | 18,119 | ||||||||
Tiffany & Co. (Retailing) | 608 | 75,702 | ||||||||
UnitedHealth Group Inc. (Health Care Equipment & Services) | 230 | 58,121 | ||||||||
Verisk Analytics Inc. (Commercial & Professional Services) | 249 | 36,030 | ||||||||
| Shares | Value | |||||||||
| COMMON STOCKS - 98.3% (continued) | ||||||||||
United States - 38.3% (continued) |
| |||||||||
Vertex Pharmaceuticals Inc. (Pharmaceuticals, Biotechnology & Life Sciences)* | 69 | $ | 13,488 | |||||||
Walgreens Boots Alliance Inc. (Food & Staples Retailing) | 941 | 51,548 | ||||||||
Walt Disney Co. (Media & Entertainment) | 471 | 61,192 | ||||||||
Waters Corp. (Pharmaceuticals, Biotechnology & Life Sciences)* | 149 | 31,531 | ||||||||
Workday Inc., Class A (Software & Services)* | 140 | 22,702 | ||||||||
Zoetis Inc. (Pharmaceuticals, Biotechnology & Life Sciences) | 261 | 33,387 | ||||||||
| 2,642,920 | ||||||||||
Total Common Stocks (Cost $5,770,894) |
| $ | 6,776,190 | |||||||
| PREFERRED STOCKS - 0.6% | ||||||||||
Brazil - 0.3% | ||||||||||
Banco Bradesco SA - ADR, 6.01% (Banks)+ | 1,262 | 11,055 | ||||||||
Cia Brasileira de Distribuicao - Sponsored ADR (Food & Staples Retailing)* | 510 | 10,516 | ||||||||
| 21,571 | ||||||||||
Colombia - 0.1% | ||||||||||
Bancolombia SA - Sponsored ADR, 2.17% (Banks)+ | 187 | 9,702 | ||||||||
South Korea - 0.2% | ||||||||||
Samsung Electronics Co., Ltd. - GDR, Reg S, 3.24% (Technology Hardware & Equipment)+† | 17 | 14,717 | ||||||||
Total Preferred Stocks (Cost $41,163) |
| $45,990 | ||||||||
| SHORT TERM INVESTMENTS - 1.1% | ||||||||||
Northern Institutional Funds - Treasury Portfolio (Premier Shares), 1.72% (Money Market Funds) | 73,599 | 73,599 | ||||||||
Total Short Term Investments (Cost $73,599) |
| $73,599 | ||||||||
Total Investments - 100.0% | ||||||||||
(Cost $5,885,656) | $ | 6,895,779 | ||||||||
Liabilities Less Other Assets - (0.0)% | (880 | ) | ||||||||
Net Assets - 100.0% | $ | 6,894,899 | ||||||||
See Notes to Financial Statements
28
Table of Contents
Harding, Loevner Funds, Inc.
Global Equity Research Portfolio
Portfolio of Investments
October 31, 2019 (continued)
Summary of Abbreviations
| ADR | American Depositary Receipt. |
| GDR | Global Depositary Receipt. |
| Reg S | Security sold outside United States without registration under the Securities Act of 1933. |
| † | Investment categorized as level 2 security as disclosed in Note 2 of the Notes to Financial Statements. |
| * | Non-income producing security. |
| + | Current yield is disclosed. Dividends are calculated based on a percentage of the issuer’s net income. |
| Industry | | Percentage of Net Assets | | ||
Automobiles & Components | 1.2 | % | |||
Banks | 12.0 | ||||
Capital Goods | 8.9 | ||||
Commercial & Professional Services | 1.7 | ||||
Consumer Durables & Apparel | 3.9 | ||||
Consumer Services | 2.9 | ||||
Diversified Financials | 0.3 | ||||
Energy | 3.1 | ||||
Food & Staples Retailing | 3.2 | ||||
Food Beverage & Tobacco | 4.7 | ||||
Health Care Equipment & Services | 4.7 | ||||
Household & Personal Products | 6.2 | ||||
Insurance | 3.0 | ||||
Materials | 5.6 | ||||
Media & Entertainment | 4.6 | ||||
Pharmaceuticals, Biotechnology & Life Sciences | 7.9 | ||||
Real Estate | 0.5 | ||||
Retailing | 5.0 | ||||
Semiconductors & Semiconductor Equipment | 1.7 | ||||
Software & Services | 9.6 | ||||
Technology Hardware & Equipment | 4.1 | ||||
Telecommunication Services | 0.7 | ||||
Transportation | 2.9 | ||||
Utilities | 0.5 | ||||
Money Market Fund | 1.1 | ||||
Total Investments | 100.0 | ||||
Liabilities Less Other Assets | (0.0 | ) | |||
Net Assets | 100.0 | % | |||
See Notes to Financial Statements
29
Table of Contents
Harding, Loevner Funds, Inc.
International Equity Research Portfolio
Portfolio of Investments
October 31, 2019
| Shares | Value | |||||||
| COMMON STOCKS - 96.3% | ||||||||
Australia - 1.4% | ||||||||
BHP Group Ltd. (Materials)† | 7,016 | $171,568 | ||||||
Cochlear Ltd. (Health Care Equipment & Services)† | 709 | 103,160 | ||||||
| 274,728 | ||||||||
Belgium - 0.9% | ||||||||
Anheuser-Busch InBev SA, NV (Food Beverage & Tobacco)† | 2,061 | 166,465 | ||||||
Brazil- 0.8% | ||||||||
Ambev SA - ADR (Food Beverage & Tobacco)* | 9,987 | 43,044 | ||||||
Ultrapar Participacoes SA - Sponsored ADR (Energy) | 9,877 | 46,125 | ||||||
WEG SA (Capital Goods) | 9,700 | 61,676 | ||||||
| 150,845 | ||||||||
Canada - 2.4% | ||||||||
Alimentation Couche-Tard Inc. (Food & Staples Retailing) | 6,000 | 180,670 | ||||||
Canadian National Railway Co. (Transportation) | 2,155 | 192,592 | ||||||
Cenovus Energy Inc. (Energy) | 6,200 | 52,816 | ||||||
Encana Corp. (Energy) | 10,759 | 42,283 | ||||||
| 468,361 | ||||||||
China - 7.9% | ||||||||
AAC Technologies Holdings Inc. (Technology Hardware & Equipment)† | 7,500 | 48,057 | ||||||
Alibaba Group Holding Ltd. - Sponsored ADR (Retailing)* | 265 | 46,818 | ||||||
Autohome Inc. - ADR (Media & Entertainment)* | 664 | 56,148 | ||||||
China International Travel Service Corp., Ltd., Class A (Consumer Services)† | 3,700 | 47,349 | ||||||
China Tower Corp., Ltd., Class H (Telecommunication Services)† | 178,000 | 38,943 | ||||||
CNOOC Ltd. - Sponsored ADR (Energy) | 375 | 55,702 | ||||||
CSPC Pharmaceutical Group Ltd. (Pharmaceuticals, Biotechnology & Life Sciences)† | 20,000 | 50,878 | ||||||
Ctrip.com International Ltd. - ADR (Retailing)* | 1,249 | 41,204 | ||||||
ENN Energy Holdings Ltd. (Utilities)† | 7,000 | 79,859 | ||||||
Fuyao Glass Industry Group Co., Ltd., Class A (Automobiles & Components)† | 18,400 | 55,182 | ||||||
Glodon Co., Ltd., Class A (Software & Services)† | 8,680 | 39,043 | ||||||
Gree Electric Appliances Inc. of Zhuhai, Class A (Consumer Durables & Apparel)† | 5,300 | 43,781 | ||||||
| Shares | Value | |||||||
| COMMON STOCKS - 96.3% (continued) | ||||||||
China - 7.9% (continued) | ||||||||
Haitian International Holdings Ltd. (Capital Goods)† | 22,400 | $52,485 | ||||||
Hangzhou Hikvision Digital Technology Co., Ltd., Class A (Technology Hardware & Equipment)† | 12,500 | 56,660 | ||||||
Inner Mongolia Yili Industrial Group Co., Ltd., Class A (Food Beverage & Tobacco)† | 11,400 | 46,526 | ||||||
Jiangsu Yanghe Brewery Joint-Stock Co., Ltd., Class A (Food Beverage & Tobacco)† | 2,900 | 41,398 | ||||||
NetEase Inc. - ADR (Media & Entertainment) | 192 | 54,885 | ||||||
New Oriental Education & Technology Group Inc. - Sponsored ADR (Consumer Services)* | 393 | 47,970 | ||||||
Ping An Insurance Group Co. of China Ltd., Class A (Insurance)† | 5,200 | 64,510 | ||||||
SF Holding Co., Ltd., Class A (Transportation)† | 8,700 | 48,623 | ||||||
Shenzhen Inovance Technology Co., Ltd., Class A (Capital Goods)† | 13,100 | 46,074 | ||||||
Shenzhou International Group Holdings Ltd. (Consumer Durables & Apparel)† | 5,770 | 79,021 | ||||||
Sino Biopharmaceutical Ltd. (Pharmaceuticals, Biotechnology & Life Sciences)† | 39,000 | 57,692 | ||||||
Songcheng Performance Development Co., Ltd., Class A (Consumer Services)† | 13,400 | 56,017 | ||||||
Sunny Optical Technology Group Co., Ltd. (Technology Hardware & Equipment)† | 4,100 | 65,035 | ||||||
Tencent Holdings Ltd. (Media & Entertainment)† | 900 | 36,700 | ||||||
Weibo Corp. - Sponsored ADR (Media & Entertainment)* | 1,103 | 54,257 | ||||||
WuXi AppTec Co., Ltd., Class A (Pharmaceuticals, Biotechnology & Life Sciences)† | 4,780 | 63,753 | ||||||
Wuxi Biologics Cayman Inc. (Pharmaceuticals, Biotechnology & Life Sciences)*† | 4,500 | 52,939 | ||||||
| 1,527,509 | ||||||||
Colombia - 0.8% | ||||||||
Ecopetrol SA - Sponsored ADR (Energy) | 3,904 | 71,248 | ||||||
See Notes to Financial Statements
30
Table of Contents
Harding, Loevner Funds, Inc.
International Equity Research Portfolio
Portfolio of Investments
October 31, 2019 (continued)
| Shares | Value | |||||||
| COMMON STOCKS - 96.3% (continued) | ||||||||
Colombia - 0.8% (continued) | ||||||||
Grupo Nutresa SA (Food Beverage & Tobacco) | 11,532 | $87,479 | ||||||
| 158,727 | ||||||||
Denmark - 1.3% | ||||||||
Chr Hansen Holding A/S (Materials)† | 994 | 76,297 | ||||||
Novozymes A/S, Class B (Materials)† | 3,764 | 177,351 | ||||||
| 253,648 | ||||||||
Egypt - 0.6% | ||||||||
Commercial International Bank Egypt SAE - GDR, | 23,275 | 114,887 | ||||||
France - 4.0% | ||||||||
Air Liquide SA (Materials)† | 1,365 | 181,409 | ||||||
Dassault Systemes SE (Software & Services)† | 307 | 46,700 | ||||||
EssilorLuxottica SA (Consumer Durables & Apparel)† | 1,338 | 204,217 | ||||||
Kering SA (Consumer Durables & Apparel)† | 91 | 51,827 | ||||||
Rubis SCA (Utilities)† | 3,337 | 193,597 | ||||||
Sartorius Stedim Biotech (Pharmaceuticals, Biotechnology & Life Sciences)† | 297 | 44,473 | ||||||
Schneider Electric SE (Capital Goods)† | 596 | 55,524 | ||||||
| 777,747 | ||||||||
Germany - 7.0% | ||||||||
adidas AG (Consumer Durables & Apparel)† | 564 | 173,958 | ||||||
Allianz SE, Reg S (Insurance)† | 882 | 215,259 | ||||||
Bayer AG, Reg S (Pharmaceuticals, Biotechnology & Life Sciences)† | 685 | 53,145 | ||||||
Bayerische Motoren Werke AG (Automobiles & Components)† | 1,932 | 148,063 | ||||||
FUCHS PETROLUB SE (Materials)† | 4,120 | 166,835 | ||||||
Henkel AG & Co. KGaA (Household & Personal Products)† | 1,948 | 187,209 | ||||||
Infineon Technologies AG (Semiconductors & Semiconductor Equipment)† | 3,022 | 58,939 | ||||||
SAP SE - Sponsored ADR (Software & Services) | 1,385 | 183,623 | ||||||
Symrise AG (Materials)† | 1,725 | 165,993 | ||||||
| 1,353,024 | ||||||||
Hong Kong - 2.3% | ||||||||
AIA Group Ltd. (Insurance)† | 18,800 | 186,542 | ||||||
| Shares | Value | |||||||
| COMMON STOCKS - 96.3% (continued) | ||||||||
Hong Kong - 2.3% (continued) | ||||||||
ASM Pacific Technology Ltd. (Semiconductors & Semiconductor Equipment)† | 3,500 | $48,616 | ||||||
Sands China Ltd. (Consumer Services)† | 9,200 | 44,997 | ||||||
Techtronic Industries Co., Ltd. (Capital Goods)† | 20,500 | 158,615 | ||||||
| 438,770 | ||||||||
India - 3.9% | ||||||||
Asian Paints Ltd. (Materials)† | 2,389 | 60,949 | ||||||
Bharti Infratel Ltd. (Telecommunication Services)† | 53,053 | 141,798 | ||||||
HDFC Bank Ltd. - ADR (Banks) | 1,314 | 80,272 | ||||||
Housing Development Finance Corp., Ltd. (Banks)† | 3,774 | 113,375 | ||||||
ICICI Bank Ltd. - Sponsored ADR (Banks) | 4,955 | 64,564 | ||||||
ITC Ltd. (Food Beverage & Tobacco)† | 26,778 | 97,304 | ||||||
Kotak Mahindra Bank Ltd. (Banks)† | 2,910 | 64,597 | ||||||
Max Financial Services Ltd. (Insurance)*† | 13,094 | 74,949 | ||||||
Pidilite Industries Ltd. (Materials)† | 3,542 | 69,988 | ||||||
| 767,796 | ||||||||
Indonesia - 1.1% | ||||||||
Astra International Tbk PT (Automobiles & Components)† | 126,100 | 62,149 | ||||||
Bank Rakyat Indonesia Persero Tbk PT (Banks)† | 160,800 | 48,092 | ||||||
Unilever Indonesia Tbk PT (Household & Personal Products)† | 35,700 | 110,802 | ||||||
| 221,043 | ||||||||
Japan - 19.4% | ||||||||
ABC-Mart Inc. (Retailing)† | 2,940 | 201,599 | ||||||
Chugai Pharmaceutical Co., Ltd. (Pharmaceuticals, Biotechnology & Life Sciences)† | 1,600 | 134,747 | ||||||
Daito Trust Construction Co., Ltd. (Real Estate)† | 1,300 | 172,054 | ||||||
Dentsu Inc. (Media & Entertainment)† | 5,420 | 193,518 | ||||||
FANUC Corp. (Capital Goods)† | 500 | 98,703 | ||||||
Fast Retailing Co., Ltd. (Retailing)† | 220 | 135,666 | ||||||
Hakuhodo DY Holdings Inc. (Media & Entertainment)† | 10,190 | 151,811 | ||||||
Infomart Corp. (Software & Services)† | 4,200 | 63,151 | ||||||
See Notes to Financial Statements
31
Table of Contents
Harding, Loevner Funds, Inc.
International Equity Research Portfolio
Portfolio of Investments
October 31, 2019 (continued)
| Shares | Value | |||||||
| COMMON STOCKS - 96.3% (continued) | ||||||||
Japan - 19.4% (continued) | ||||||||
Kakaku.com Inc. (Media & Entertainment)† | 6,000 | $139,877 | ||||||
Kao Corp. (Household & Personal Products)† | 2,500 | 201,103 | ||||||
Keyence Corp. (Technology Hardware & Equipment)† | 90 | 56,827 | ||||||
Komatsu Ltd. (Capital Goods)† | 1,840 | 43,121 | ||||||
Kubota Corp. (Capital Goods)† | 9,700 | 153,922 | ||||||
Makita Corp. (Capital Goods)† | 3,800 | 127,867 | ||||||
MISUMI Group Inc. (Capital Goods)† | 3,400 | 85,256 | ||||||
MonotaRO Co., Ltd. (Capital Goods)† | 1,800 | 54,449 | ||||||
Nidec Corp. (Capital Goods)† | 300 | 44,116 | ||||||
Nitori Holdings Co., Ltd. (Retailing)† | 1,500 | 229,039 | ||||||
Nomura Research Institute Ltd. (Software & Services)† | 7,106 | 151,025 | ||||||
Pigeon Corp. (Household & Personal Products)† | 2,700 | 132,715 | ||||||
Rinnai Corp. (Consumer Durables & Apparel)† | 1,900 | 139,227 | ||||||
Shimano Inc. (Consumer Durables & Apparel)† | 1,200 | 199,697 | ||||||
Shionogi & Co., Ltd. (Pharmaceuticals, Biotechnology & Life Sciences)† | 3,400 | 203,483 | ||||||
Shiseido Co., Ltd. (Household & Personal Products)† | 600 | 49,696 | ||||||
SMC Corp. (Capital Goods)† | 260 | 112,242 | ||||||
Stanley Electric Co., Ltd. (Automobiles & | 6,115 | 169,216 | ||||||
Sugi Holdings Co., Ltd. (Food & Staples Retailing)† | 1,455 | 80,820 | ||||||
Sysmex Corp. (Health Care Equipment & Services)† | 800 | 52,094 | ||||||
Unicharm Corp. (Household & Personal Products)† | 6,100 | 207,082 | ||||||
| 3,784,123 | ||||||||
Malaysia - 0.6% | ||||||||
Dialog Group Bhd. (Energy)† | 133,900 | 111,376 | ||||||
Mexico - 1.8% | ||||||||
Coca-Cola Femsa SAB de CV - Sponsored ADR (Food Beverage & Tobacco) | 818 | 44,974 | ||||||
Fomento Economico Mexicano SAB de CV - Sponsored ADR (Food Beverage & Tobacco) | 454 | 40,415 | ||||||
Grupo Aeroportuario del Sureste SAB de CV - ADR (Transportation) | 317 | 51,909 | ||||||
| Shares | Value | |||||||
| COMMON STOCKS - 96.3% (continued) | ||||||||
Mexico - 1.8% (continued) | ||||||||
Grupo Bimbo SAB de CV, Series A (Food Beverage & Tobacco) | 21,800 | $40,503 | ||||||
Grupo Financiero Banorte SAB de CV, Series O (Banks) | 9,600 | 52,400 | ||||||
Wal-Mart de Mexico SAB de CV (Food & Staples Retailing) | 41,800 | 125,444 | ||||||
| 355,645 | ||||||||
Netherlands - 1.4% | ||||||||
Adyen NV (Software & Services)*† | 63 | 44,244 | ||||||
ASML Holding NV, Reg S (Semiconductors & Semiconductor Equipment) | 742 | 194,382 | ||||||
Prosus NV (Retailing)* | 578 | 39,858 | ||||||
| 278,484 | ||||||||
Pakistan - 0.7% | ||||||||
Engro Corp., Ltd. (Materials)† | 23,710 | 45,143 | ||||||
MCB Bank Ltd. (Banks)† | 50,600 | 56,176 | ||||||
Oil & Gas Development Co., Ltd. (Energy)† | 47,500 | 39,392 | ||||||
| 140,711 | ||||||||
Peru - 0.6% | ||||||||
Alicorp SAA (Food Beverage & Tobacco) | 18,253 | 50,044 | ||||||
Credicorp Ltd. (Banks) | 331 | 70,847 | ||||||
| 120,891 | ||||||||
Philippines - 2.9% | ||||||||
Bank of the Philippine Islands (Banks)† | 43,180 | 82,322 | ||||||
BDO Unibank Inc. (Banks)† | 29,700 | 90,363 | ||||||
Robinsons Retail Holdings Inc. (Food & | 62,440 | 93,180 | ||||||
Security Bank Corp. (Banks)† | 25,310 | 99,256 | ||||||
SM Prime Holdings Inc. (Real Estate)† | 131,100 | 100,640 | ||||||
Universal Robina Corp. (Food Beverage & Tobacco)† | 14,230 | 42,315 | ||||||
Wilcon Depot Inc. (Retailing)† | 149,900 | 48,731 | ||||||
| 556,807 | ||||||||
Poland - 0.2% | ||||||||
ING Bank Slaski SA (Banks)† | 909 | 46,187 | ||||||
Qatar - 1.0% | ||||||||
Qatar National Bank QPSC (Banks)† | 37,073 | 195,484 | ||||||
Russia - 1.4% | ||||||||
LUKOIL PJSC - Sponsored ADR (Energy) | 949 | 87,365 | ||||||
Novatek PJSC - Sponsored GDR, Reg S (Energy)† | 396 | 84,819 | ||||||
Sberbank of Russia PJSC - Sponsored ADR (Banks)† | 3,385 | 49,786 | ||||||
See Notes to Financial Statements
32
Table of Contents
Harding, Loevner Funds, Inc.
International Equity Research Portfolio
Portfolio of Investments
October 31, 2019 (continued)
| Shares | Value | |||||||
| COMMON STOCKS - 96.3% (continued) | ||||||||
Russia - 1.4% (continued) | ||||||||
Yandex NV, Class A (Media & Entertainment)* | 1,402 | $46,813 | ||||||
| 268,783 | ||||||||
Singapore - 1.9% | ||||||||
DBS Group Holdings Ltd. (Banks)† | 9,370 | 178,680 | ||||||
Oversea-Chinese Banking Corp. Ltd. (Banks)† | 22,784 | 182,399 | ||||||
| 361,079 | ||||||||
South Africa - 0.6% | ||||||||
Clicks Group Ltd. (Food & Staples Retailing)† | 4,068 | 66,255 | ||||||
Discovery Ltd. (Insurance)† | 6,527 | 51,935 | ||||||
| 118,190 | ||||||||
South Korea - 1.7% | ||||||||
Amorepacific Corp. (Household & Personal Products)† | 394 | 64,831 | ||||||
Hankook Tire & Technology Co., Ltd. (Automobiles & Components)† | 2,855 | 76,096 | ||||||
LG Household & Health Care Ltd. (Household & Personal Products)† | 45 | 48,578 | ||||||
NAVER Corp. (Media & Entertainment)† | 391 | 55,038 | ||||||
Woongjin Coway Co., Ltd. (Consumer Durables & Apparel)† | 1,100 | 86,369 | ||||||
| 330,912 | ||||||||
Spain - 3.1% | ||||||||
Amadeus IT Group SA (Software & Services)† | 2,425 | 179,519 | ||||||
Banco Bilbao Vizcaya Argentaria SA (Banks)† | 10,787 | 56,559 | ||||||
Banco Santander SA - Sponsored ADR (Banks) | 48,359 | 191,502 | ||||||
Bankinter SA (Banks)† | 26,327 | 182,350 | ||||||
| 609,930 | ||||||||
Sweden - 3.7% | ||||||||
Alfa Laval AB (Capital Goods)† | 2,963 | 68,496 | ||||||
Atlas Copco AB, Class A (Capital Goods)† | 1,570 | 55,495 | ||||||
Epiroc AB, Class A (Capital Goods)† | 15,452 | 174,135 | ||||||
Hexagon AB, Class B (Technology Hardware & Equipment)† | 2,545 | 129,980 | ||||||
Intrum AB (Commercial & Professional Services)† | 3,759 | 101,225 | ||||||
Skandinaviska Enskilda Banken AB, Class A (Banks)† | 19,933 | 191,066 | ||||||
| 720,397 | ||||||||
| Shares | Value | |||||||
| COMMON STOCKS - 96.3% (continued) | ||||||||
Switzerland - 6.7% | ||||||||
Alcon Inc. (Health Care | ||||||||
Equipment & Services)* | 3,158 | $187,175 | ||||||
Cie Financiere Richemont SA, Reg S (Consumer Durables & Apparel)† | 2,114 | 166,429 | ||||||
Kuehne + Nagel International AG, Reg S | 1,269 | 205,055 | ||||||
Lonza Group AG, Reg S (Pharmaceuticals, Biotechnology & Life Sciences)*† | 194 | 69,844 | ||||||
Nestle SA - Sponsored ADR (Food Beverage & Tobacco) | 1,647 | 176,492 | ||||||
Roche Holding AG, Genusschein (Pharmaceuticals, Biotechnology & Life Sciences)† | 739 | 222,890 | ||||||
SGS SA, Reg S (Commercial & Professional Services)† | 69 | 180,173 | ||||||
Temenos AG, Reg S (Software & Services)*† | 264 | 37,698 | ||||||
Vifor Pharma AG (Pharmaceuticals, Biotechnology & Life Sciences)† | 317 | 49,928 | ||||||
| 1,295,684 | ||||||||
Taiwan - 1.6% | ||||||||
Advantech Co., Ltd. (Technology Hardware & | 10,000 | 98,393 | ||||||
Eclat Textile Co., Ltd. (Consumer Durables & Apparel)† | 3,040 | 40,821 | ||||||
Hon Hai Precision Industry Co., Ltd. (Technology Hardware & Equipment)† | 19,000 | 50,001 | ||||||
Largan Precision Co., Ltd. (Technology Hardware & Equipment)† | 420 | 61,422 | ||||||
Taiwan Semiconductor Manufacturing Co., Ltd. (Semiconductors & Semiconductor Equipment)† | 6,000 | 58,292 | ||||||
| 308,929 | ||||||||
Thailand - 0.7% | ||||||||
Siam Commercial Bank pcl, Reg S (Banks)† | 39,300 | 145,772 | ||||||
Turkey - 0.3% | ||||||||
BIM Birlesik Magazalar AS (Food & Staples Retailing)† | 6,927 | 57,316 | ||||||
United Arab Emirates - 1.0% | ||||||||
DP World plc (Transportation)† | 3,997 | 53,118 | ||||||
Emaar Properties PJSC (Real Estate)† | 78,581 | 91,331 | ||||||
See Notes to Financial Statements
33
Table of Contents
Harding, Loevner Funds, Inc.
International Equity Research Portfolio
Portfolio of Investments
October 31, 2019 (continued)
| Shares | Value | |||||||
| COMMON STOCKS - 96.3% (continued) | ||||||||
United Arab Emirates - 1.0% (continued) | ||||||||
Network International Holdings plc (Software & Services)*† | 6,329 | $44,345 | ||||||
| 188,794 | ||||||||
United Kingdom - 10.6% | ||||||||
Abcam plc (Pharmaceuticals, Biotechnology & Life Sciences)† | 5,806 | 87,828 | ||||||
Bank of Georgia Group plc (Banks)† | 2,342 | 39,459 | ||||||
BBA Aviation plc (Transportation)† | 43,347 | 170,744 | ||||||
Compass Group plc (Consumer Services)† | 7,804 | 208,018 | ||||||
Dechra Pharmaceuticals plc (Pharmaceuticals, Biotechnology & Life Sciences)† | 3,147 | 107,241 | ||||||
Diageo plc (Food Beverage & Tobacco)† | 2,907 | 119,012 | ||||||
Diploma plc (Capital Goods)† | 5,153 | 106,768 | ||||||
HomeServe plc (Commercial & Professional Services)† | 13,422 | 201,538 | ||||||
HSBC Holdings plc - Sponsored ADR (Banks) | 3,626 | 137,027 | ||||||
Rathbone Brothers plc (Diversified Financials)† | 2,799 | 75,368 | ||||||
Rio Tinto plc (Materials)† | 3,730 | 193,790 | ||||||
Rotork plc (Capital Goods)† | 12,541 | 48,985 | ||||||
Royal Dutch Shell plc, Class B - Sponsored ADR (Energy) | 2,806 | 163,562 | ||||||
Spirax-Sarco Engineering plc (Capital Goods)† | 1,168 | 120,075 | ||||||
Standard Chartered plc (Banks)† | 11,000 | 99,994 | ||||||
Unilever plc (Household & Personal Products)† | 3,129 | 187,743 | ||||||
| 2,067,152 | ||||||||
Total Common Stocks (Cost $17,187,383) | $18,736,196 | |||||||
| PREFERRED STOCKS - 1.2% | ||||||||
Brazil- 0.6% | ||||||||
Banco Bradesco SA - ADR, 6.01% (Banks)+ | 8,058 | 70,588 | ||||||
Cia Brasileira de Distribuicao - Sponsored ADR (Food & Staples Retailing)* | 2,381 | 49,096 | ||||||
| 119,684 | ||||||||
Colombia - 0.3% | ||||||||
Bancolombia SA - Sponsored ADR, 2.17% (Banks)+ | 930 | 48,249 | ||||||
| Shares | Value | |||||||
| PREFERRED STOCKS - 1.2% (continued) | ||||||||
South Korea - 0.3% | ||||||||
Samsung Electronics Co., Ltd. - GDR, Reg S, 3.24% (Technology Hardware & Equipment)+† | 67 | $58,002 | ||||||
Total Preferred Stocks (Cost $194,143) | $225,935 | |||||||
| SHORT TERM INVESTMENTS - 2.4% | ||||||||
Northern Institutional Funds - Treasury Portfolio (Premier Shares), 1.72% (Money Market Funds) | 476,501 | 476,501 | ||||||
Total Short Term Investments (Cost $476,501) |
| $476,501 | ||||||
Total Investments - 99.9% | ||||||||
(Cost $17,858,027) | $19,438,632 | |||||||
Other Assets Less Liabilities - 0.1% | 18,952 | |||||||
Net Assets - 100.0% | $19,457,584 | |||||||
Summary of Abbreviations
| ADR | American Depositary Receipt. |
| GDR | Global Depositary Receipt. |
| Reg S | Security sold outside United States without registration under the Securities Act of 1933. |
| † | Investment categorized as level 2 security as disclosed in Note 2 of the Notes to Financial Statements. |
| * | Non-income producing security. |
| + | Current yield is disclosed. Dividends are calculated based on a percentage of the issuer’s net income. |
See Notes to Financial Statements
34
Table of Contents
Harding, Loevner Funds, Inc.
International Equity Research Portfolio
Portfolio of Investments
October 31, 2019 (continued)
| Industry | | Percentage of Net Assets | | ||
Automobiles & Components | 2.7 | % | |||
Banks | 14.2 | ||||
Capital Goods | 8.5 | ||||
Commercial & Professional Services | 2.4 | ||||
Consumer Durables & Apparel | 6.1 | ||||
Consumer Services | 2.1 | ||||
Diversified Financials | 0.4 | ||||
Energy | 4.0 | ||||
Food & Staples Retailing | 3.2 | ||||
Food Beverage & Tobacco | 4.9 | ||||
Health Care Equipment & Services | 1.8 | ||||
Household & Personal Products | 6.2 | ||||
Insurance | 3.1 | ||||
Materials | 6.7 | ||||
Media & Entertainment | 4.1 | ||||
Pharmaceuticals, Biotechnology & Life Sciences | 6.2 | ||||
Real Estate | 1.9 | ||||
Retailing | 3.8 | ||||
Semiconductors & Semiconductor Equipment | 1.9 | ||||
Software & Services | 3.9 | ||||
Technology Hardware & Equipment | 3.3 | ||||
Telecommunication Services | 0.9 | ||||
Transportation | 3.8 | ||||
Utilities | 1.4 | ||||
Money Market Fund | 2.4 | ||||
Total Investments | 99.9 | ||||
Other Assets Less Liabilities | 0.1 | ||||
Net Assets | 100.0 | % | |||
See Notes to Financial Statements
35
Table of Contents
Harding, Loevner Funds, Inc.
Emerging Markets Research Portfolio
Portfolio of Investments
October 31, 2019
| Shares | Value | |||||||
| COMMON STOCKS - 91.1% | ||||||||
Bangladesh - 0.5% | ||||||||
GrameenPhone Ltd. (Telecommunication Services)† | 5,493 | $20,571 | ||||||
Square Pharmaceuticals Ltd. (Pharmaceuticals, Biotechnology & Life Sciences)† | 4,543 | 12,579 | ||||||
| 33,150 | ||||||||
Brazil- 3.8% | ||||||||
Ambev SA - ADR (Food Beverage & Tobacco)* | 20,505 | 88,377 | ||||||
Ultrapar Participacoes SA - Sponsored ADR (Energy) | 11,420 | 53,331 | ||||||
WEG SA (Capital Goods) | 21,200 | 134,796 | ||||||
| 276,504 | ||||||||
China - 27.5% | ||||||||
AAC Technologies Holdings Inc. (Technology Hardware & Equipment)† | 7,000 | 44,853 | ||||||
Alibaba Group Holding Ltd. - Sponsored ADR (Retailing)* | 773 | 136,566 | ||||||
Autohome Inc. - ADR (Media & Entertainment)* | 442 | 37,376 | ||||||
China International Travel Service Corp., Ltd., Class A (Consumer Services)† | 2,800 | 35,832 | ||||||
China Tower Corp., Ltd., Class H (Telecommunication Services)† | 444,000 | 97,139 | ||||||
CNOOC Ltd. - Sponsored ADR (Energy) | 933 | 138,588 | ||||||
CSPC Pharmaceutical Group Ltd. (Pharmaceuticals, Biotechnology & Life Sciences)† | 24,000 | 61,054 | ||||||
Ctrip.com International Ltd. - ADR (Retailing)* | 950 | 31,340 | ||||||
ENN Energy Holdings Ltd. (Utilities)† | 9,000 | 102,676 | ||||||
Fuyao Glass Industry Group Co., Ltd., Class A (Automobiles & Components)† | 37,300 | 111,863 | ||||||
Glodon Co., Ltd., Class A (Software & Services)† | 6,800 | 30,587 | ||||||
Gree Electric Appliances Inc. of Zhuhai, Class A (Consumer Durables & Apparel)† | 4,300 | 35,521 | ||||||
Haitian International Holdings Ltd. (Capital Goods)† | 15,000 | 35,146 | ||||||
Hangzhou Hikvision Digital Technology Co., Ltd., Class A (Technology Hardware & Equipment)† | 10,500 | 47,594 | ||||||
Inner Mongolia Yili Industrial Group Co., Ltd., Class A (Food Beverage & Tobacco)† | 17,400 | 71,013 | ||||||
| Shares | Value | |||||||
| COMMON STOCKS - 91.1% (continued) | ||||||||
China - 27.5% (continued) | ||||||||
Jiangsu Yanghe Brewery Joint-Stock Co., Ltd., Class A (Food Beverage & Tobacco)† | 3,800 | $54,246 | ||||||
NetEase Inc. - ADR (Media & Entertainment) | 279 | 79,755 | ||||||
New Oriental Education & Technology Group Inc. - Sponsored ADR (Consumer Services)* | 558 | 68,109 | ||||||
Ping An Insurance Group Co. of China Ltd., Class A (Insurance)† | 11,100 | 137,704 | ||||||
SF Holding Co., Ltd., Class A (Transportation)† | 13,000 | 72,655 | ||||||
Shenzhen Inovance Technology Co., Ltd., Class A (Capital Goods)† | 17,000 | 59,790 | ||||||
Shenzhou International Group Holdings Ltd. (Consumer Durables & Apparel)† | 6,000 | 82,171 | ||||||
Sino Biopharmaceutical Ltd. (Pharmaceuticals, Biotechnology & Life Sciences)† | 30,000 | 44,379 | ||||||
Songcheng Performance Development Co., Ltd., Class A (Consumer Services)† | 10,100 | 42,221 | ||||||
Sunny Optical Technology Group Co., Ltd. (Technology Hardware & Equipment)† | 3,100 | 49,173 | ||||||
Tencent Holdings Ltd. (Media & Entertainment)† | 3,300 | 134,566 | ||||||
Weibo Corp. - Sponsored ADR (Media & Entertainment)* | 837 | 41,172 | ||||||
WuXi AppTec Co., Ltd., Class A (Pharmaceuticals, Biotechnology & Life Sciences)† | 3,640 | 48,548 | ||||||
Wuxi Biologics Cayman Inc. (Pharmaceuticals, Biotechnology & Life Sciences)*† | 4,000 | 47,057 | ||||||
| 1,978,694 | ||||||||
Colombia - 0.7% | ||||||||
Ecopetrol SA - Sponsored ADR (Energy) | 1,683 | 30,715 | ||||||
Grupo Nutresa SA (Food Beverage & Tobacco) | 2,477 | 18,790 | ||||||
| 49,505 | ||||||||
Egypt - 0.9% | ||||||||
Commercial International Bank Egypt SAE - GDR, Reg S (Banks)† | 13,500 | 66,637 | ||||||
India - 10.3% | ||||||||
Asian Paints Ltd. (Materials)† | 2,810 | 71,690 | ||||||
See Notes to Financial Statements
36
Table of Contents
Harding, Loevner Funds, Inc.
Emerging Markets Research Portfolio
Portfolio of Investments
October 31, 2019 (continued)
| Shares | Value | |||||||
| COMMON STOCKS - 91.1% (continued) | ||||||||
India - 10.3% (continued) | ||||||||
Bharti Infratel Ltd. (Telecommunication Services)† | 14,487 | $38,720 | ||||||
HDFC Bank Ltd. - ADR (Banks) | 2,433 | 148,632 | ||||||
Housing Development Finance Corp., Ltd. (Banks)† | 2,360 | 70,897 | ||||||
ICICI Bank Ltd. - Sponsored ADR (Banks) | 4,150 | 54,074 | ||||||
ITC Ltd. (Food Beverage & Tobacco)† | 35,757 | 129,932 | ||||||
Kotak Mahindra Bank Ltd. (Banks)† | 4,364 | 96,874 | ||||||
Max Financial Services Ltd. (Insurance)*† | 9,910 | 56,724 | ||||||
Pidilite Industries Ltd. (Materials)† | 3,601 | 71,153 | ||||||
| 738,696 | ||||||||
Indonesia - 3.5% | ||||||||
Astra International Tbk PT (Automobiles & | 226,200 | 111,483 | ||||||
Bank Rakyat Indonesia Persero Tbk PT (Banks)† | 284,800 | 85,177 | ||||||
Unilever Indonesia Tbk PT (Household & Personal Products)† | 17,700 | 54,936 | ||||||
| 251,596 | ||||||||
Kazakhstan - 0.3% | ||||||||
Halyk Savings Bank of Kazakhstan JSC - GDR, Reg S (Banks)† | 1,610 | 21,491 | ||||||
Kenya - 0.2% | ||||||||
Safaricom plc (Telecommunication Services)† | 62,300 | 17,922 | ||||||
Kuwait- 1.2% | ||||||||
Mabanee Co. SAK (Real Estate)† | 8,845 | 22,507 | ||||||
National Bank of Kuwait SAKP (Banks)† | 20,523 | 63,651 | ||||||
| 86,158 | ||||||||
Malaysia - 0.7% | ||||||||
Dialog Group Bhd. (Energy)† | 63,800 | 53,068 | ||||||
Mexico - 6.6% | ||||||||
Coca-Cola Femsa SAB de CV - Sponsored ADR (Food Beverage & Tobacco) | 868 | 47,723 | ||||||
Fomento Economico Mexicano SAB de CV - Sponsored ADR (Food Beverage & Tobacco) | 1,393 | 124,005 | ||||||
Grupo Aeroportuario del Sureste SAB de CV - ADR (Transportation) | 448 | 73,360 | ||||||
| Shares | Value | |||||||
| COMMON STOCKS - 91.1% (continued) | ||||||||
Mexico - 6.6% (continued) | ||||||||
Grupo Bimbo SAB de CV, Series A (Food Beverage & Tobacco) | 24,900 | $46,262 | ||||||
Grupo Financiero Banorte SAB de CV, Series O (Banks) | 11,500 | 62,771 | ||||||
Wal-Mart de Mexico SAB de CV (Food & Staples Retailing) | 40,300 | 120,943 | ||||||
| 475,064 | ||||||||
Morocco - 1.0% | ||||||||
Attijariwafa Bank (Banks)† | 1,198 | 58,575 | ||||||
Maroc Telecom (Telecommunication Services)† | 900 | 13,436 | ||||||
| 72,011 | ||||||||
Nigeria - 0.9% | ||||||||
Dangote Cement plc (Materials) | 44,096 | 18,186 | ||||||
Guaranty Trust Bank plc (Banks)† | 261,863 | 18,000 | ||||||
Nestle Nigeria plc (Food Beverage & Tobacco) | 5,120 | 17,243 | ||||||
Zenith Bank plc (Banks)† | 260,470 | 12,224 | ||||||
| 65,653 | ||||||||
Pakistan - 0.9% | ||||||||
Engro Corp., Ltd. (Materials)† | 11,490 | 21,877 | ||||||
MCB Bank Ltd. (Banks)† | 17,600 | 19,539 | ||||||
Oil & Gas Development Co., Ltd. (Energy)† | 27,700 | 22,972 | ||||||
| 64,388 | ||||||||
Peru - 2.1% | ||||||||
Alicorp SAA (Food Beverage & Tobacco) | 6,050 | 16,588 | ||||||
Credicorp Ltd. (Banks) | 617 | 132,063 | ||||||
| 148,651 | ||||||||
Philippines - 3.7% | ||||||||
Bank of the Philippine Islands (Banks)† | 26,900 | 51,284 | ||||||
BDO Unibank Inc. (Banks)† | 12,990 | 39,522 | ||||||
Robinsons Retail Holdings Inc. (Food & | 10,620 | 15,848 | ||||||
Security Bank Corp. (Banks)† | 9,060 | 35,530 | ||||||
SM Prime Holdings Inc. (Real Estate)† | 72,700 | 55,809 | ||||||
Universal Robina Corp. (Food Beverage & Tobacco)† | 15,950 | 47,430 | ||||||
Wilcon Depot Inc. (Retailing)† | 56,500 | 18,368 | ||||||
| 263,791 | ||||||||
Poland - 0.2% | ||||||||
ING Bank Slaski SA (Banks)† | 342 | 17,377 | ||||||
Qatar - 1.8% | ||||||||
Qatar National Bank QPSC (Banks)† | 24,574 | 129,577 | ||||||
See Notes to Financial Statements
37
Table of Contents
Harding, Loevner Funds, Inc.
Emerging Markets Research Portfolio
Portfolio of Investments
October 31, 2019 (continued)
| Shares | Value | |||||||
| COMMON STOCKS - 91.1% (continued) | ||||||||
Romania - 0.5% | ||||||||
Banca Transilvania SA (Banks)† | 32,012 | $17,882 | ||||||
Societatea Nationala de Gaze Naturale ROMGAZ SA (Energy)† | 2,060 | 17,745 | ||||||
| 35,627 | ||||||||
Russia - 4.9% | ||||||||
LUKOIL PJSC - Sponsored ADR (Energy) | 1,614 | 148,585 | ||||||
Novatek PJSC - Sponsored GDR, Reg S (Energy)† | 467 | 100,027 | ||||||
Sberbank of Russia PJSC - Sponsored ADR (Banks)† | 4,750 | 69,862 | ||||||
Yandex NV, Class A (Media & Entertainment)* | 1,073 | 35,827 | ||||||
| 354,301 | ||||||||
South Africa - 1.4% | ||||||||
Clicks Group Ltd. (Food & Staples Retailing)† | 2,632 | 42,867 | ||||||
Discovery Ltd. (Insurance)† | 7,600 | 60,473 | ||||||
| 103,340 | ||||||||
South Korea - 4.4% | ||||||||
Amorepacific Corp. (Household & Personal Products)† | 353 | 58,085 | ||||||
Hankook Tire & Technology Co., Ltd. (Automobiles & Components)† | 2,101 | 55,999 | ||||||
LG Household & Health Care Ltd. (Household & Personal Products)† | 70 | 75,566 | ||||||
NAVER Corp. (Media & Entertainment)† | 545 | 76,716 | ||||||
Woongjin Coway Co., Ltd. (Consumer Durables & Apparel)† | 650 | 51,036 | ||||||
| 317,402 | ||||||||
Taiwan - 6.8% | ||||||||
Advantech Co., Ltd. (Technology Hardware & Equipment)† | 8,000 | 78,714 | ||||||
Eclat Textile Co., Ltd. (Consumer Durables & Apparel)† | 4,080 | 54,787 | ||||||
Hon Hai Precision Industry Co., Ltd. (Technology Hardware & Equipment)† | 54,000 | 142,107 | ||||||
Largan Precision Co., Ltd. (Technology Hardware & Equipment)† | 470 | 68,735 | ||||||
Taiwan Semiconductor Manufacturing Co., Ltd. (Semiconductors & Semiconductor Equipment)† | 15,000 | 145,729 | ||||||
| 490,072 | ||||||||
Thailand - 1.7% | ||||||||
Siam Commercial Bank pcl, Reg S (Banks)† | 32,000 | 118,695 | ||||||
| Shares | Value | |||||||
| COMMON STOCKS - 91.1% (continued) | ||||||||
Turkey - 1.3% | ||||||||
BIM Birlesik Magazalar AS (Food & | 11,148 | $92,242 | ||||||
United Arab Emirates - 1.4% | ||||||||
DP World plc (Transportation)† | 1,960 | 26,047 | ||||||
Emaar Properties PJSC (Real Estate)† | 36,745 | 42,707 | ||||||
Network International Holdings plc (Software & Services)*† | 4,958 | 34,739 | ||||||
| 103,493 | ||||||||
United Kingdom - 0.3% | ||||||||
Bank of Georgia Group plc (Banks)† | 1,170 | 19,713 | ||||||
Vietnam - 1.6% | ||||||||
Hoa Phat Group JSC (Materials)*† | 61,760 | 57,911 | ||||||
Vietnam Dairy Products JSC (Food Beverage & Tobacco)† | 9,842 | 54,994 | ||||||
| 112,905 | ||||||||
Total Common Stocks (Cost $6,126,697) |
| $6,557,723 | ||||||
| PREFERRED STOCKS - 5.9% | ||||||||
Brazil - 2.8% | ||||||||
Banco Bradesco SA - ADR, 6.01% (Banks)+ | 14,632 | 128,176 | ||||||
Cia Brasileira de Distribuicao - Sponsored ADR (Food & Staples Retailing)* | 3,548 | 73,160 | ||||||
| 201,336 | ||||||||
Colombia - 1.0% | ||||||||
Bancolombia SA - Sponsored ADR, 2.17% (Banks)+ | 1,420 | 73,670 | ||||||
South Korea - 2.1% | ||||||||
Samsung Electronics Co., Ltd. - GDR, Reg S, 3.24% (Technology Hardware & Equipment)+† | 171 | 148,034 | ||||||
Total Preferred Stocks (Cost $399,704) | $423,040 | |||||||
| PARTICIPATION NOTES - 1.8% | ||||||||
Saudi Arabia - 1.8% | ||||||||
Jarir Marketing Co., Issued by HSBC BANK PLC, Maturity Date 1/19/21 (Retailing)^† | 3,187 | 134,592 | ||||||
Total Participation Notes (Cost $128,369) | $134,592 | |||||||
See Notes to Financial Statements
38
Table of Contents
Harding, Loevner Funds, Inc.
Emerging Markets Research Portfolio
Portfolio of Investments
October 31, 2019 (continued)
| Shares | Value | |||||||
| SHORT TERM INVESTMENTS - 1.2% | ||||||||
Northern Institutional Funds - Treasury Portfolio (Premier Shares), 1.72% (Money Market Funds) | 85,633 | $85,633 | ||||||
Total Short Term Investments (Cost $85,633) |
| $85,633 | ||||||
Total Investments - 100.0% | ||||||||
(Cost $6,740,403) | $7,200,988 | |||||||
Liabilities Less Other Assets - (0.0)% | (3,299 | ) | ||||||
Net Assets - 100.0% | $7,197,689 | |||||||
Summary of Abbreviations
| ADR | American Depositary Receipt. |
| GDR | Global Depositary Receipt. |
| Reg S | Security sold outside United States without registration under the Securities Act of 1933. |
| † | Investment categorized as level 2 security as disclosed in Note 2 of the Notes to Financial Statements. |
| * | Non-income producing security. |
| + | Current yield is disclosed. Dividends are calculated based on a percentage of the issuer’s net income. |
| ^ | Security exempt from registration pursuant to Rule 144A of the Securities Act of 1933. These securities, which represent 1.8% of net assets as of October 31, 2019, are considered liquid and may be resold in transactions exempt from registration, normally to qualified buyers. |
| Industry | | Percentage of Net Assets | | ||
Automobiles & Components | 3.9 | % | |||
Banks | 22.6 | ||||
Capital Goods | 3.2 | ||||
Consumer Durables & Apparel | 3.1 | ||||
Consumer Services | 2.0 | ||||
Energy | 7.6 | ||||
Food & Staples Retailing | 4.8 | ||||
Food Beverage & Tobacco | 10.0 | ||||
Household & Personal Products | 2.6 | ||||
Insurance | 3.5 | ||||
Materials | 3.4 | ||||
Media & Entertainment | 5.7 | ||||
Pharmaceuticals, Biotechnology & Life Sciences | 3.0 | ||||
Real Estate | 1.7 | ||||
Retailing | 4.4 | ||||
Semiconductors & Semiconductor Equipment | 2.0 | ||||
Software & Services | 0.9 | ||||
Technology Hardware & Equipment | 8.1 | ||||
Telecommunication Services | 2.6 | ||||
Transportation | 2.3 | ||||
Utilities | 1.4 | ||||
Money Market Fund | 1.2 | ||||
Total Investments | 100.0 | ||||
Liabilities Less Other Assets | (0.0 | ) | |||
Net Assets | 100.0 | % | |||
See Notes to Financial Statements
39
Table of Contents
Harding, Loevner Funds, Inc.
Statements of Assets and Liabilities
October 31, 2019
Global Equity Portfolio | International Equity Portfolio | International Small Companies Portfolio | ||||||||||
ASSETS: | ||||||||||||
Investments (cost $637,690,485, $13,142,489,180 and $290,263,028, respectively) | $959,695,210 | $16,082,484,712 | $329,139,819 | |||||||||
Dividends and interest receivable | 533,021 | 14,756,291 | 434,254 | |||||||||
Foreign currency (cost $0, $0 and $21,418, respectively) | — | — | 21,395 | |||||||||
Receivable for investments sold | 3,080,348 | 33,510,047 | — | |||||||||
Receivable for Fund shares sold | 226,030 | 10,056,618 | 94,220 | |||||||||
Tax reclaims receivable | 276,634 | 18,792,873 | 197,943 | |||||||||
Prepaid expenses | 27,480 | 114,736 | 75,642 | |||||||||
Total Assets: | 963,838,723 | 16,159,715,277 | 329,963,273 | |||||||||
LIABILITIES: | ||||||||||||
Payable to Investment Adviser | (640,358 | ) | (8,908,877 | ) | (311,598 | ) | ||||||
Payable for investments purchased | (4,708 | ) | (34,816,228 | ) | (32,038 | ) | ||||||
Payable for Fund shares redeemed | (641,213 | ) | (10,577,915 | ) | (117,358 | ) | ||||||
Payable for directors’ fees and expenses | (6,513 | ) | (104,162 | ) | (1,876 | ) | ||||||
Payable for distribution fees | — | (268,180 | ) | (37,586 | ) | |||||||
Deferred capital gains tax | — | — | (8,451 | ) | ||||||||
Other liabilities | (245,937 | ) | (4,061,425 | ) | (107,909 | ) | ||||||
Total Liabilities | (1,538,729 | ) | (58,736,787 | ) | (616,816 | ) | ||||||
Net Assets | $962,299,994 | $16,100,978,490 | $329,346,457 | |||||||||
ANALYSIS OF NET ASSETS: | ||||||||||||
Paid in capital | $648,338,225 | $13,101,861,657 | $295,565,473 | |||||||||
Distributable earnings | 313,961,769 | 2,999,116,833 | 33,780,984 | |||||||||
Net Assets | $962,299,994 | $16,100,978,490 | $329,346,457 | |||||||||
Net Assets: | ||||||||||||
Institutional Class | $684,763,943 | $13,766,876,290 | $272,251,858 | |||||||||
Institutional Class Z | 229,355,424 | 1,938,763,497 | — | |||||||||
Investor Class | — | 395,338,703 | 57,094,599 | |||||||||
Advisor Class | 48,180,627 | — | — | |||||||||
Total Shares Outstanding: | ||||||||||||
Institutional Class (400,000,000, 500,000,000 and 400,000,000, respectively, $.001 par value shares authorized) | 19,356,148 | 605,823,985 | 17,404,697 | |||||||||
Institutional Class Z (200,000,000, 200,000,000 and — , respectively, $.001 par value shares authorized) | 6,486,096 | 85,324,443 | — | |||||||||
Investor Class (— , 400,000,000 and 400,000,000, respectively, $.001 par value shares authorized) | — | 17,444,050 | 3,687,495 | |||||||||
Advisor Class (400,000,000, — and — , respectively, $.001 par value shares authorized) | 1,364,767 | — | — | |||||||||
Net Asset Value, Offering Price and Redemption Price Per Share: | ||||||||||||
Institutional Class | $35.38 | $22.72 | $15.64 | |||||||||
Institutional Class Z | 35.36 | 22.72 | — | |||||||||
Investor Class | — | 22.66 | 15.48 | |||||||||
Advisor Class | 35.30 | — | — | |||||||||
See Notes to Financial Statements
40
Table of Contents
Harding, Loevner Funds, Inc.
Statements of Assets and Liabilities (continued)
October 31, 2019
Institutional Emerging Markets Portfolio | Emerging Markets Portfolio | Frontier Emerging Markets Portfolio | ||||||||||
ASSETS: | ||||||||||||
Investments (cost $4,342,807,223, $3,227,195,902 and $239,058,632, respectively) | $5,418,653,513 | $4,270,595,372 | $294,356,972 | |||||||||
Dividends and interest receivable | 4,569,447 | 3,611,650 | 387,435 | |||||||||
Foreign currency (cost $285,848, $227,474 and $108,592, respectively) | 285,644 | 227,312 | 109,163 | |||||||||
Receivable for investments sold | 16,555,981 | 13,063,664 | 931,938 | |||||||||
Receivable for Fund shares sold | 5,580,088 | 2,734,667 | 37,179 | |||||||||
Tax reclaims receivable | 162,610 | 118,532 | 42,024 | |||||||||
Prepaid expenses | 64,149 | 29,405 | 24,956 | |||||||||
Total Assets: | 5,445,871,432 | 4,290,380,602 | 295,889,667 | |||||||||
LIABILITIES: | ||||||||||||
Payable to Investment Adviser | (5,006,941 | ) | (3,979,335 | ) | (339,936 | ) | ||||||
Payable for investments purchased | (8,675,679 | ) | (6,811,102 | ) | (74,395 | ) | ||||||
Payable for Fund shares redeemed | (6,292,506 | ) | (2,339,265 | ) | (529,875 | ) | ||||||
Payable for directors’ fees and expenses | (35,090 | ) | (28,112 | ) | (1,919 | ) | ||||||
Payable for distribution fees | — | — | (17,972 | ) | ||||||||
Deferred capital gains tax | (1,714,822 | ) | (942,996 | ) | (720,919 | ) | ||||||
Other liabilities | (1,519,960 | ) | (1,965,991 | ) | (160,256 | ) | ||||||
Total Liabilities | (23,244,998 | ) | (16,066,801 | ) | (1,845,272 | ) | ||||||
Net Assets | $5,422,626,434 | $4,274,313,801 | $294,044,395 | |||||||||
ANALYSIS OF NET ASSETS: | ||||||||||||
Paid in capital | $4,487,982,987 | $3,226,800,222 | $362,641,806 | |||||||||
Distributable earnings | 934,643,447 | 1,047,513,579 | (68,597,411 | ) | ||||||||
Net Assets | $5,422,626,434 | $4,274,313,801 | $294,044,395 | |||||||||
Net Assets: | ||||||||||||
Institutional Class | $4,864,702,108 | $— | $— | |||||||||
Institutional Class I | — | — | 144,742,361 | |||||||||
Institutional Class II | — | — | 128,741,987 | |||||||||
Institutional Class Z | 557,924,326 | — | — | |||||||||
Investor Class | — | — | 20,560,047 | |||||||||
Advisor Class | — | 4,274,313,801 | — | |||||||||
Total Shares Outstanding: | ||||||||||||
Institutional Class (500,000,000, — and — , respectively, $.001 par value shares authorized) | 228,946,652 | — | — | |||||||||
Institutional Class I (— , — and 400,000,000, respectively, $.001 par value shares authorized) | — | — | 18,554,761 | |||||||||
Institutional Class II (— , — and 200,000,000, respectively, $.001 par value shares authorized) | — | — | 16,465,956 | |||||||||
Institutional Class Z (400,000,000, — and — , respectively, $.001 par value shares authorized) | 26,221,682 | — | — | |||||||||
Investor Class (— , — and 400,000,000, respectively, $.001 par value shares authorized) | — | — | 2,652,911 | |||||||||
Advisor Class (— , 500,000,000 and — , respectively, $.001 par value shares authorized) | — | 76,800,257 | — | |||||||||
Net Asset Value, Offering Price and Redemption Price Per Share: | ||||||||||||
Institutional Class | $21.25 | $— | $— | |||||||||
Institutional Class I | — | — | 7.80 | |||||||||
Institutional Class II | — | — | 7.82 | |||||||||
Institutional Class Z | 21.28 | — | — | |||||||||
Investor Class | — | — | 7.75 | |||||||||
Advisor Class | — | 55.65 | — | |||||||||
See Notes to Financial Statements
41
Table of Contents
Harding, Loevner Funds, Inc.
Statements of Assets and Liabilities (continued)
October 31, 2019
Global Equity Research Portfolio | International Equity Research Portfolio | Emerging Markets Research Portfolio | ||||||||||
ASSETS: | ||||||||||||
Investments (cost $5,885,656, $17,858,027 and $6,740,403, respectively) | $6,895,779 | $19,438,632 | $7,200,988 | |||||||||
Dividends and interest receivable | 9,138 | 27,518 | 6,266 | |||||||||
Foreign currency (cost $206, $710 and $781, respectively) | 206 | 710 | 781 | |||||||||
Receivable for Fund shares sold | — | 3,180 | — | |||||||||
Tax reclaims receivable | 2,180 | 11,812 | — | |||||||||
Capital gain tax refund receivable | 214 | 683 | — | |||||||||
Prepaid expenses | 24,060 | 21,421 | 26,896 | |||||||||
Total Assets: | 6,931,577 | 19,503,956 | 7,234,931 | |||||||||
LIABILITIES: | ||||||||||||
Payable to Investment Adviser | (3,998 | ) | (10,330 | ) | (5,992 | ) | ||||||
Payable for Fund shares redeemed | — | (2,706 | ) | — | ||||||||
Payable for directors’ fees and expenses | (45 | ) | (80 | ) | (46 | ) | ||||||
Deferred capital gains tax | — | — | (389 | ) | ||||||||
Other liabilities | (32,635 | ) | (33,256 | ) | (30,815 | ) | ||||||
Total Liabilities | (36,678 | ) | (46,372 | ) | (37,242 | ) | ||||||
Net Assets | $6,894,899 | $19,457,584 | $7,197,689 | |||||||||
ANALYSIS OF NET ASSETS: | ||||||||||||
Paid in capital | $5,516,958 | $17,562,071 | $6,455,319 | |||||||||
Distributable earnings | 1,377,941 | 1,895,513 | 742,370 | |||||||||
Net Assets | $6,894,899 | $19,457,584 | $7,197,689 | |||||||||
Net Assets: | ||||||||||||
Institutional Class | $6,894,899 | $19,457,584 | $7,197,689 | |||||||||
Total Shares Outstanding: | ||||||||||||
Institutional Class (300,000,000, 300,000,000 and 300,000,000, respectively, $.001 par value shares authorized) | 548,352 | 1,617,638 | 630,509 | |||||||||
Net Asset Value, Offering Price and Redemption Price Per Share: | ||||||||||||
Institutional Class | $12.57 | $12.03 | $11.42 | |||||||||
See Notes to Financial Statements
42
Table of Contents
Harding, Loevner Funds, Inc.
For the Fiscal Year Ended October 31, 2019
Global Equity Portfolio | International Equity Portfolio | International Small Companies Portfolio | Institutional Emerging Markets Portfolio | Emerging Markets | ||||||||||||||||
INVESTMENT INCOME | ||||||||||||||||||||
Dividends (net of foreign withholding taxes of $767,781, $35,472,356, $406,433, $12,485,147 and $10,122,406, respectively) | $11,097,750 | $322,021,929 | $4,470,639 | $121,667,395 | $96,821,924 | |||||||||||||||
Total investment income | 11,097,750 | 322,021,929 | 4,470,639 | 121,667,395 | 96,821,924 | |||||||||||||||
EXPENSES | ||||||||||||||||||||
Investment advisory fees (Note 3) | 7,329,143 | 99,837,059 | 2,628,637 | 55,130,081 | 43,901,002 | |||||||||||||||
Administration fees | 302,340 | 4,764,347 | 82,928 | 1,588,942 | 1,260,114 | |||||||||||||||
Distribution fees, Investor Class | — | 1,045,472 | 143,005 | — | — | |||||||||||||||
Custody and accounting fees (Note 3) | 116,444 | 1,823,599 | 138,725 | 1,523,220 | 1,201,586 | |||||||||||||||
Directors’ fees and expenses | 25,793 | 416,559 | 6,318 | 139,285 | 110,490 | |||||||||||||||
Transfer agent fees and expenses (Note 3) | 12,781 | 530,097 | 5,395 | 50,720 | 518,626 | |||||||||||||||
Printing and postage fees | 35,194 | 1,024,679 | 19,682 | 271,871 | 350,089 | |||||||||||||||
State registration filing fees | 49,071 | 548,548 | 42,340 | 109,466 | 61,526 | |||||||||||||||
Professional fees | 50,322 | 284,960 | 55,996 | 136,198 | 125,061 | |||||||||||||||
Shareholder servicing fees (Note 3) | 637,925 | 10,246,325 | 188,589 | 3,572,003 | 6,079,073 | |||||||||||||||
Compliance officers’ fees and expenses (Note 3) | 2,930 | 47,322 | 718 | 15,750 | 12,444 | |||||||||||||||
Other fees and expenses | 38,102 | 396,730 | 20,056 | 136,260 | 113,580 | |||||||||||||||
Total Expenses | 8,600,045 | 120,965,697 | 3,332,389 | 62,673,796 | 53,733,591 | |||||||||||||||
Less Waiver of investment advisory fee and/or reimbursement of other operating expenses (Note 3) | — | — | (560,742 | ) | (380,017 | ) | — | |||||||||||||
Net expenses | 8,600,045 | 120,965,697 | 2,771,647 | 62,293,779 | 53,733,591 | |||||||||||||||
Net investment income | 2,497,705 | 201,056,232 | 1,698,992 | 59,373,616 | 43,088,333 | |||||||||||||||
REALIZED AND UNREALIZED GAIN (LOSS) | ||||||||||||||||||||
Net realized gain (loss) | ||||||||||||||||||||
Investment transactions | (6,306,831 | ) | (31,535,956 | ) | (5,567,841 | ) | (12,160,990 | ) | 5,393,149 | |||||||||||
Foreign currency transactions | (68,866 | ) | (2,076,702 | ) | (129,774 | ) | (1,165,884 | ) | (707,969 | ) | ||||||||||
Net realized gain (loss) | (6,375,697 | ) | (33,612,658 | ) | (5,697,615 | ) | (13,326,874 | ) | 4,685,180 | |||||||||||
Change in unrealized appreciation (depreciation) | ||||||||||||||||||||
Investments (net of increase (decrease) in deferred foreign taxes of $—, $—, $(96,680), $1,713,830 and $942,836, respectively) | 107,258,721 | 1,424,675,842 | 26,174,433 | 673,734,392 | 498,988,195 | |||||||||||||||
Translation of assets and liabilities denominated in foreign currencies | 14,953 | 717,397 | 14,336 | 4,605 | (11,394 | ) | ||||||||||||||
Net change in unrealized appreciation | 107,273,674 | 1,425,393,239 | 26,188,769 | 673,738,997 | 498,976,801 | |||||||||||||||
Net realized and unrealized gain | 100,897,977 | 1,391,780,581 | 20,491,154 | 660,412,123 | 503,661,981 | |||||||||||||||
NET INCREASE IN NET ASSETS RESULTING FROM OPERATIONS | $103,395,682 | $1,592,836,813 | $22,190,146 | $719,785,739 | $546,750,314 | |||||||||||||||
See Notes to Financial Statements
43
Table of Contents
Harding, Loevner Funds, Inc.
Statements of Operations (continued)
For the Fiscal Year Ended October 31, 2019
Frontier Emerging Markets Portfolio | Global Equity Research Portfolio | International Equity Research Portfolio | Emerging Markets Research Portfolio | |||||||||||||
INVESTMENT INCOME | ||||||||||||||||
Dividends (net of foreign withholding taxes of $908,224, $10,249, $28,088 and $18,168, respectively) | $12,074,127 | $128,474 | $282,664 | $172,115 | ||||||||||||
Total investment income | 12,074,127 | 128,474 | 282,664 | 172,115 | ||||||||||||
EXPENSES | ||||||||||||||||
Investment advisory fees (Note 3) | 4,739,547 | 47,125 | 85,316 | 71,871 | ||||||||||||
Administration fees (Note 3) | 122,085 | 12,042 | 13,800 | 12,175 | ||||||||||||
Distribution fees, Investor Class | 58,139 | 465 | 882 | 472 | ||||||||||||
Custody and accounting fees (Note 3) | 449,780 | 9,339 | 13,012 | 13,459 | ||||||||||||
Directors’ fees and expenses | 9,937 | 212 | 337 | 213 | ||||||||||||
Transfer agent fees and expenses (Note 3) | 4,088 | — | — | — | ||||||||||||
Printing and postage fees | 21,053 | 209 | 536 | — | ||||||||||||
State registration filing fees | 36,018 | 32,229 | 28,372 | 32,312 | ||||||||||||
Professional fees | 54,481 | 43,858 | 42,857 | 45,345 | ||||||||||||
Shareholder servicing fees (Note 3) | 160,353 | — | 2,042 | — | ||||||||||||
Compliance officers’ fees and expenses (Note 3) | 1,119 | 24 | 38 | 24 | ||||||||||||
Other fees and expenses | 22,532 | 1,933 | 2,118 | 2,172 | ||||||||||||
Total Expenses | 5,679,132 | 147,436 | 189,310 | 178,043 | ||||||||||||
Less Waiver of investment advisory fee and/or reimbursement of other operating expenses (Note 3) | (323,388 | ) | (93,411 | ) | (93,671 | ) | (95,421 | ) | ||||||||
Net expenses | 5,355,744 | 54,025 | 95,639 | 82,622 | ||||||||||||
Net investment income | 6,718,383 | 74,449 | 187,025 | 89,493 | ||||||||||||
REALIZED AND UNREALIZED GAIN (LOSS) | ||||||||||||||||
Net realized gain (loss) | ||||||||||||||||
Investment transactions | (25,420,243 | ) | 295,774 | 144,849 | 209,375 | |||||||||||
Foreign currency transactions | (383,055 | ) | 118 | (1,445 | ) | (2,316 | ) | |||||||||
Net realized gain (loss) | (25,803,298 | ) | 295,892 | 143,404 | 207,059 | |||||||||||
Change in unrealized appreciation (depreciation) | 36,014,892 | 494,165 | 1,381,161 | 638,100 | ||||||||||||
Translation of assets and liabilities denominated in foreign currencies | (7,202 | ) | 5 | 335 | (70 | ) | ||||||||||
Net change in unrealized appreciation | 36,007,690 | 494,170 | 1,381,496 | 638,030 | ||||||||||||
Net realized and unrealized gain | 10,204,392 | 790,062 | 1,524,900 | 845,089 | ||||||||||||
NET INCREASE IN NET ASSETS RESULTING FROM OPERATIONS | $16,922,775 | $864,511 | $1,711,925 | $934,582 | ||||||||||||
See Notes to Financial Statements
44
Table of Contents
Harding, Loevner Funds, Inc.
Statements of Changes in Net Assets
For the Fiscal Years Ended October 31
Global Equity Portfolio | International Equity Portfolio | International Small Companies Portfolio | ||||||||||||||||||||||
| 2019 | 2018 | 2019 | 2018 | 2019 | 2018 | |||||||||||||||||||
INCREASE (DECREASE) IN NET ASSETS FROM OPERATIONS | ||||||||||||||||||||||||
Net investment income | $2,497,705 | $2,880,013 | $201,056,232 | $188,111,334 | $1,698,992 | $1,684,619 | ||||||||||||||||||
Net realized gain (loss) on investments and foreign currency transactions | (6,375,697 | ) | 84,065,593 | (33,612,658 | ) | (99,614,726 | ) | (5,697,615 | ) | 9,819,784 | ||||||||||||||
Net change in unrealized appreciation (depreciation) on investments and translation of assets and liabilities denominated in foreign currencies | 107,273,674 | (94,344,043 | ) | 1,425,393,239 | (1,198,264,762 | ) | 26,188,769 | (29,991,836 | ) | |||||||||||||||
Net increase (decrease) in net assets resulting from operations | 103,395,682 | (7,398,437 | ) | 1,592,836,813 | (1,109,768,154 | ) | 22,190,146 | (18,487,433 | ) | |||||||||||||||
DISTRIBUTIONS TO SHAREHOLDERS: | ||||||||||||||||||||||||
Institutional Class | (64,234,872 | ) | (75,945,675 | ) | (167,443,933 | ) | (187,967,105 | ) | (8,346,534 | ) | (2,045,986 | ) | ||||||||||||
Institutional Class Z | (15,391,303 | ) | (16,353,510 | ) | (20,898,599 | ) | (3,458,977 | ) | — | — | ||||||||||||||
Investor Class | — | — | (3,656,420 | ) | (7,760,428 | ) | (3,593,042 | ) | (557,242 | ) | ||||||||||||||
Advisor Class | (9,454,857 | ) | (9,422,593 | ) | — | — | — | — | ||||||||||||||||
Total distributions to shareholders | (89,081,032 | ) | (101,721,778 | ) | (191,998,952 | ) | (199,186,510 | ) | (11,939,576 | ) | (2,603,228 | ) | ||||||||||||
TRANSACTIONS IN SHARES OF COMMON STOCK | ||||||||||||||||||||||||
Institutional Class | 57,694,848 | (93,043,196 | ) | 566,865,141 | 1,969,136,424 | 112,439,750 | 21,866,504 | |||||||||||||||||
Institutional Class Z | 82,448,223 | 112,530,952 | 437,598,452 | 1,369,945,673 | — | — | ||||||||||||||||||
Investor Class | — | — | (54,430,541 | ) | (198,921,542 | ) | (2,538,877 | ) | 13,956,662 | |||||||||||||||
Advisor Class | (42,431,140 | ) | 28,071,937 | — | — | — | — | |||||||||||||||||
Net Increase in net assets from portfolio share transactions | 97,711,931 | 47,559,693 | 950,033,052 | 3,140,160,555 | 109,900,873 | 35,823,166 | ||||||||||||||||||
NET INCREASE (DECREASE) IN NET ASSETS | 112,026,581 | (61,560,522 | ) | 2,350,870,913 | 1,831,205,891 | 120,151,443 | 14,732,505 | |||||||||||||||||
NET ASSETS | ||||||||||||||||||||||||
At beginning of year | 850,273,413 | 911,833,935 | 13,750,107,577 | 11,918,901,686 | 209,195,014 | 194,462,509 | ||||||||||||||||||
At end of year | $962,299,994 | $850,273,413 | $16,100,978,490 | $13,750,107,577 | $329,346,457 | $209,195,014 | ||||||||||||||||||
See Notes to Financial Statements
45
Table of Contents
Harding, Loevner Funds, Inc.
Statements of Changes in Net Assets (continued)
For the Fiscal Years Ended October 31
| Institutional Emerging Markets Portfolio | Emerging Markets Portfolio | Frontier Emerging Markets Portfolio | ||||||||||||||||||||||
| 2019 | 2018 | 2019 | 2018 | 2019 | 2018 | |||||||||||||||||||
INCREASE (DECREASE) IN NET ASSETS FROM OPERATIONS | ||||||||||||||||||||||||
Net investment income | $59,373,616 | $43,560,880 | $43,088,333 | $30,475,892 | $6,718,383 | $6,303,168 | ||||||||||||||||||
Net realized gain (loss) on investments and foreign currency transactions | (13,326,874 | ) | (67,093,355 | ) | 4,685,180 | (11,468,128 | ) | (25,803,298 | ) | 9,478,438 | ||||||||||||||
Net change in unrealized appreciation (depreciation) on investments and translation of assets and liabilities denominated in foreign currencies | 673,738,997 | (776,222,456 | ) | 498,976,801 | (665,366,341 | ) | 36,007,690 | (55,969,791 | ) | |||||||||||||||
Net increase (decrease) in net assets resulting from operations | 719,785,739 | (799,754,931 | ) | 546,750,314 | (646,358,577 | ) | 16,922,775 | (40,188,185 | ) | |||||||||||||||
DISTRIBUTIONS TO SHAREHOLDERS: | ||||||||||||||||||||||||
Institutional Class | (37,840,245 | ) | (34,875,251 | )* | — | — | — | — | ||||||||||||||||
Institutional Class I | — | — | — | — | (2,317,415 | ) | (5,147,342 | ) | ||||||||||||||||
Institutional Class II | — | — | — | — | (2,370,233 | ) | (3,499,694 | ) | ||||||||||||||||
Institutional Class Z | (4,685,232 | ) | (3,886,186 | )** | — | — | — | — | ||||||||||||||||
Investor Class | — | — | — | — | (193,925 | ) | (491,328 | ) | ||||||||||||||||
Advisor Class | — | — | (29,768,361 | ) | (30,340,225 | ) | — | — | ||||||||||||||||
Total distributions to shareholders | (42,525,477 | ) | (38,761,437 | ) | (29,768,361 | ) | (30,340,225 | ) | (4,881,573 | ) | (9,138,364 | ) | ||||||||||||
TRANSACTIONS IN SHARES OF COMMON STOCK | ||||||||||||||||||||||||
Institutional Class | 273,614,078 | 355,101,774 | * | — | — | — | — | |||||||||||||||||
Institutional Class I | — | — | — | — | (79,791,087 | ) | (19,849,297 | ) | ||||||||||||||||
Institutional Class II | — | — | — | — | (42,137,950 | ) | 16,504,134 | |||||||||||||||||
Institutional Class Z | 101,847,677 | 8,520,318 | ** | — | — | — | — | |||||||||||||||||
Investor Class | — | — | — | — | (5,615,597 | ) | (2,303,970 | ) | ||||||||||||||||
Advisor Class | — | — | 298,174,837 | 120,879,281 | — | — | ||||||||||||||||||
Net Increase (Decrease) in net assets from portfolio share transactions | 375,461,755 | 363,622,092 | 298,174,837 | 120,879,281 | (127,544,634 | ) | (5,649,133 | ) | ||||||||||||||||
NET INCREASE (DECREASE) IN NET ASSETS | 1,052,722,017 | (474,894,276 | ) | 815,156,790 | (555,819,521 | ) | (115,503,432 | ) | (54,975,682 | ) | ||||||||||||||
NET ASSETS | ||||||||||||||||||||||||
At beginning of year | 4,369,904,417 | 4,844,798,693 | 3,459,157,011 | 4,014,976,532 | 409,547,827 | 464,523,509 | ||||||||||||||||||
At end of year | $5,422,626,434 | $4,369,904,417 | $4,274,313,801 | $3,459,157,011 | $294,044,395 | $409,547,827 | ||||||||||||||||||
| * | Formerly Class I |
| ** | Formerly Class II |
See Notes to Financial Statements
46
Table of Contents
Harding, Loevner Funds, Inc.
Statements of Changes in Net Assets (continued)
For the Fiscal Years Ended October 31
| Global Equity Research Portfolio | International Equity Research Portfolio | Emerging Markets Research Portfolio | ||||||||||||||||||||||
| 2019 | 2018 | 2019 | 2018 | 2019 | 2018 | |||||||||||||||||||
INCREASE (DECREASE) IN NET ASSETS FROM OPERATIONS | ||||||||||||||||||||||||
Net investment income | $74,449 | $45,926 | $187,025 | $116,795 | $89,493 | $63,243 | ||||||||||||||||||
Net realized gain on investments and foreign currency transactions | 295,892 | 468,654 | 143,404 | 693,010 | 207,059 | 449,129 | ||||||||||||||||||
Net change in unrealized appreciation (depreciation) on investments and translation of assets and liabilities denominated in foreign currencies | 494,170 | (356,645 | ) | 1,381,496 | (1,542,490 | ) | 638,030 | (1,254,653 | ) | |||||||||||||||
Net increase (decrease) in net assets resulting from operations | 864,511 | 157,935 | 1,711,925 | (732,685 | ) | 934,582 | (742,281 | ) | ||||||||||||||||
DISTRIBUTIONS TO SHAREHOLDERS: | ||||||||||||||||||||||||
Institutional Class | (466,964 | ) | (219,334 | ) | (728,939 | ) | (531,221 | ) | (473,739 | ) | (435,447 | ) | ||||||||||||
Investor Class* | (48,022 | ) | (22,701 | ) | (85,106 | ) | (63,122 | ) | (45,468 | ) | (45,523 | ) | ||||||||||||
Total distributions to shareholders | (514,986 | ) | (242,035 | ) | (814,045 | ) | (594,343 | ) | (519,207 | ) | (480,970 | ) | ||||||||||||
TRANSACTIONS IN SHARES OF COMMON STOCK | ||||||||||||||||||||||||
Institutional Class | 1,078,763 | 219,158 | 9,225,741 | 1,018,199 | 1,090,834 | 935,446 | ||||||||||||||||||
Investor Class* | (547,730 | ) | 22,877 | (1,044,838 | ) | 84,604 | (560,346 | ) | 45,523 | |||||||||||||||
Net Increase in net assets from portfolio share transactions | 531,033 | 242,035 | 8,180,903 | 1,102,803 | 530,488 | 980,969 | ||||||||||||||||||
NET INCREASE (DECREASE) IN NET ASSETS | 880,558 | 157,935 | 9,078,783 | (224,225 | ) | 945,863 | (242,282 | ) | ||||||||||||||||
NET ASSETS | ||||||||||||||||||||||||
At beginning of year | 6,014,341 | 5,856,406 | 10,378,801 | 10,603,026 | 6,251,826 | 6,494,108 | ||||||||||||||||||
At end of year | $6,894,899 | $6,014,341 | $19,457,584 | $10,378,801 | $7,197,689 | $6,251,826 | ||||||||||||||||||
| * | Effective March 1, 2019, the Investor Class shares of the Global Equity Research, International Equity Research and Emerging Markets Research Portfolios were closed and their balances were transferred to the Institutional Class (See Note 6). |
See Notes to Financial Statements
47
Table of Contents
Harding, Loevner Funds, Inc.
For the Fiscal Year Ended October 31
INCREASE (DECREASE) IN NET ASSETS FROM OPERATIONS: | DISTRIBUTIONS TO SHAREHOLDERS FROM: | RATIOS/SUPPLEMENTAL DATA: | ||||||||||||||||||||||||||||||||||||||||||||||||||||||
Net asset value, beginning of year | Net investment income (loss)(1) | Net realized and unrealized gain (loss) on investments and foreign currency- related transactions | Net increase (decrease) from investment operations | Net investment income | Net realized gain from | Total distributions | Net asset value, end of | Total Return | Net assets, end of year (000’s) | Expenses to average net assets | Expenses to average net assets (net of fees waived/ reimbursed) | Net investment income to average net assets | Portfolio turnover rate | |||||||||||||||||||||||||||||||||||||||||||
Global Equity Portfolio–Institutional Class |
| |||||||||||||||||||||||||||||||||||||||||||||||||||||||
10/31/19 | $35.68 | $ 0.09 | $ 3.45 | $ 3.54 | $(0.12 | ) | $(3.72 | ) | $(3.84 | ) | $35.38 | 11.86 | % | $ 684,764 | 0.93 | % | 0.93 | % | 0.28 | % | 39 | % | ||||||||||||||||||||||||||||||||||
10/31/18 | 40.84 | 0.13 | (0.13 | ) | — | (0.14 | ) | (5.02 | ) | (5.16 | ) | 35.68 | (0.35 | ) | 619,347 | 0.94 | 0.94 | 0.34 | 42 | |||||||||||||||||||||||||||||||||||||
10/31/17 | 32.53 | 0.09 | 8.74 | 8.83 | (0.13 | ) | (0.39 | ) | (0.52 | ) | 40.84 | 27.58 | 790,097 | 0.93 | 0.93 | 0.25 | 33 | |||||||||||||||||||||||||||||||||||||||
10/31/16 | 32.44 | 0.13 | 0.92 | 1.05 | (0.12 | ) | (0.84 | ) | (0.96 | ) | 32.53 | 3.43 | 779,020 | 0.92 | 0.92 | 0.42 | 24 | |||||||||||||||||||||||||||||||||||||||
10/31/15 | 32.98 | 0.13 | 0.68 | 0.81 | (0.12 | ) | (1.23 | ) | (1.35 | ) | 32.44 | 2.51 | 805,291 | 0.92 | 0.92 | 0.41 | 45 | |||||||||||||||||||||||||||||||||||||||
Global Equity Portfolio–Institutional Class Z |
| |||||||||||||||||||||||||||||||||||||||||||||||||||||||
10/31/19 | 35.67 | 0.11 | 3.44 | 3.55 | (0.14 | ) | (3.72 | ) | (3.86 | ) | 35.36 | 11.89 | 229,355 | 0.88 | 0.88 | 0.32 | 39 | |||||||||||||||||||||||||||||||||||||||
10/31/18 | 40.84 | 0.17 | (0.15 | ) | 0.02 | (0.17 | ) | (5.02 | ) | (5.19 | ) | 35.67 | (0.26 | ) | 140,359 | 0.91 | 0.90 | 0.43 | 42 | |||||||||||||||||||||||||||||||||||||
10/31/17(2)(3) | 39.33 | (0.01 | ) | 1.52 | 1.51 | — | — | — | 40.84 | 3.80 | (A) | 46,493 | 1.21 | (B) | 0.90 | (B) | (0.05 | )(B) | 33 | (A) | ||||||||||||||||||||||||||||||||||||
Global Equity Portfolio–Advisor Class |
| |||||||||||||||||||||||||||||||||||||||||||||||||||||||
10/31/19 | 35.60 | 0.03 | 3.43 | 3.46 | (0.04 | ) | (3.72 | ) | (3.76 | ) | 35.30 | 11.60 | 48,181 | 1.12 | 1.12 | 0.09 | 39 | |||||||||||||||||||||||||||||||||||||||
10/31/18 | 40.78 | 0.07 | (0.15 | ) | (0.08 | ) | (0.08 | ) | (5.02 | ) | (5.10 | ) | 35.60 | (0.57 | ) | 90,567 | 1.14 | 1.14 | 0.18 | 42 | ||||||||||||||||||||||||||||||||||||
10/31/17 | 32.47 | 0.01 | 8.73 | 8.74 | (0.04 | ) | (0.39 | ) | (0.43 | ) | 40.78 | 27.28 | 75,244 | 1.14 | 1.14 | 0.02 | 33 | |||||||||||||||||||||||||||||||||||||||
10/31/16 | 32.38 | 0.05 | 0.91 | 0.96 | (0.03 | ) | (0.84 | ) | (0.87 | ) | 32.47 | 3.12 | 56,698 | 1.19 | 1.19 | 0.15 | 24 | |||||||||||||||||||||||||||||||||||||||
10/31/15 | 32.92 | 0.04 | 0.68 | 0.72 | (0.03 | ) | (1.23 | ) | (1.26 | ) | 32.38 | 2.28 | 64,726 | 1.18 | 1.18 | 0.13 | 45 | |||||||||||||||||||||||||||||||||||||||
International Equity Portfolio–Institutional Class |
| |||||||||||||||||||||||||||||||||||||||||||||||||||||||
10/31/19 | 20.74 | 0.29 | 1.98 | 2.27 | (0.29 | ) | — | (0.29 | ) | 22.72 | 11.19 | 13,766,876 | 0.81 | 0.81 | 1.35 | 30 | ||||||||||||||||||||||||||||||||||||||||
10/31/18 | 22.64 | 0.31 | (1.83 | ) | (1.52 | ) | (0.20 | ) | (0.18 | ) | (0.38 | ) | 20.74 | (6.86 | ) | 11,995,592 | 0.81 | 0.81 | 1.34 | 10 | ||||||||||||||||||||||||||||||||||||
10/31/17 | 18.37 | 0.23 | 4.22 | 4.45 | (0.18 | ) | — | (0.18 | ) | 22.64 | 24.47 | 11,107,736 | 0.82 | 0.82 | 1.22 | 12 | ||||||||||||||||||||||||||||||||||||||||
10/31/16 | 17.69 | 0.21 | 0.64 | 0.85 | (0.17 | ) | — | (0.17 | ) | 18.37 | 4.91 | 6,354,810 | 0.84 | 0.84 | 1.20 | 22 | ||||||||||||||||||||||||||||||||||||||||
10/31/15 | 18.30 | 0.20 | (0.63 | ) | (0.43 | ) | (0.18 | ) | — | (0.18 | ) | 17.69 | (2.40 | ) | 4,591,802 | 0.85 | 0.85 | 1.11 | 12 | |||||||||||||||||||||||||||||||||||||
International Equity Portfolio–Institutional Class Z |
| |||||||||||||||||||||||||||||||||||||||||||||||||||||||
10/31/19 | 20.75 | 0.30 | 1.98 | 2.28 | (0.31 | ) | �� | (0.31 | ) | 22.72 | 11.29 | 1,938,763 | 0.75 | 0.75 | 1.42 | 30 | ||||||||||||||||||||||||||||||||||||||||
10/31/18 | 22.64 | 0.40 | (1.90 | ) | (1.50 | ) | (0.21 | ) | (0.18 | ) | (0.39 | ) | 20.75 | (6.79 | ) | 1,342,804 | 0.74 | 0.74 | 1.77 | 10 | ||||||||||||||||||||||||||||||||||||
10/31/17(3)(4) | 21.35 | 0.02 | 1.27 | 1.29 | — | — | — | 22.64 | 6.00 | (A) | 166,923 | 0.99 | (B) | 0.80 | (B) | 0.33 | (B) | 12 | (A) | |||||||||||||||||||||||||||||||||||||
International Equity Portfolio–Investor Class |
| |||||||||||||||||||||||||||||||||||||||||||||||||||||||
10/31/19 | 20.65 | 0.22 | 1.98 | 2.20 | (0.19 | ) | — | (0.19 | ) | 22.66 | 10.79 | 395,339 | 1.13 | 1.13 | 1.03 | 30 | ||||||||||||||||||||||||||||||||||||||||
10/31/18 | 22.55 | 0.21 | (1.80 | ) | (1.59 | ) | (0.13 | ) | (0.18 | ) | (0.31 | ) | 20.65 | (7.16 | ) | 411,712 | 1.14 | 1.14 | 0.92 | 10 | ||||||||||||||||||||||||||||||||||||
10/31/17 | 18.30 | 0.19 | 4.18 | 4.37 | (0.12 | ) | — | (0.12 | ) | 22.55 | 24.04 | 644,243 | 1.14 | 1.14 | 0.95 | 12 | ||||||||||||||||||||||||||||||||||||||||
10/31/16 | 17.62 | 0.14 | 0.66 | 0.80 | (0.12 | ) | — | (0.12 | ) | 18.30 | 4.63 | 433,765 | 1.15 | 1.15 | 0.83 | 22 | ||||||||||||||||||||||||||||||||||||||||
10/31/15 | 18.23 | 0.15 | (0.64 | ) | (0.49 | ) | (0.12 | ) | — | (0.12 | ) | 17.62 | (2.76 | ) | 405,101 | 1.17 | 1.17 | 0.83 | 12 | |||||||||||||||||||||||||||||||||||||
International Small Companies Portfolio–Institutional Class |
| |||||||||||||||||||||||||||||||||||||||||||||||||||||||
10/31/19 | 15.29 | 0.12 | 1.24 | 1.36 | (0.13 | ) | (0.88 | ) | (1.01 | ) | 15.64 | 10.14 | 272,252 | 1.38 | 1.15 | 0.78 | 37 | |||||||||||||||||||||||||||||||||||||||
10/31/18 | 16.67 | 0.13 | (1.30 | ) | (1.17 | ) | (0.06 | ) | (0.15 | ) | (0.21 | ) | 15.29 | (7.15 | ) | 151,283 | 1.39 | 1.15 | 0.75 | 52 | ||||||||||||||||||||||||||||||||||||
10/31/17 | 13.72 | 0.11 | 3.41 | 3.52 | (0.16 | ) | (0.41 | ) | (0.57 | ) | 16.67 | 26.98 | 144,170 | 1.41 | 1.15 | 0.72 | 19 | |||||||||||||||||||||||||||||||||||||||
10/31/16 | 13.40 | 0.20 | 0.34 | 0.54 | (0.09 | ) | (0.13 | ) | (0.22 | ) | 13.72 | 4.15 | 62,785 | 1.60 | 1.25 | 1.51 | 49 | |||||||||||||||||||||||||||||||||||||||
10/31/15 | 13.85 | 0.11 | (0.25 | ) | (0.14 | ) | (0.05 | ) | (0.26 | ) | (0.31 | ) | 13.40 | (0.98 | ) | 47,276 | 1.64 | 1.30 | 0.79 | 38 | ||||||||||||||||||||||||||||||||||||
| (A) | Not Annualized. |
| (B) | Annualized. |
| (1) | Net investment income per share was calculated using the average shares outstanding method. |
| (2) | For the period from August 1, 2017 (commencement of class operations) through October 31, 2017. |
| (3) | All per share amounts and net asset values have been adjusted as a result of the reverse share split effected after the close of business on December 1, 2017. (See Note 1). |
| (4) | For the period from July 17, 2017 (commencement of class operations) through October 31, 2017. |
See Notes to Financial Statements
48
Table of Contents
Harding, Loevner Funds, Inc.
Financial Highlights (continued)
For the Fiscal Year Ended October 31
INCREASE (DECREASE) IN NET ASSETS FROM OPERATIONS: | DISTRIBUTIONS TO SHAREHOLDERS FROM: | RATIOS/SUPPLEMENTAL DATA: | ||||||||||||||||||||||||||||||||||||||||||||||||||||||
Net asset value, beginning of year | Net investment income (loss)(1) | Net realized and unrealized gain (loss) on investments and foreign currency- related transactions | Net increase (decrease) from investment operations | Net investment income | Net realized gain from investments | Total distributions | Net asset value, end of year | Total Return | Net assets, end of year (000’s) | Expenses to average net assets | Expenses to average net assets (net of fees waived/ reimbursed) | Net investment income to average net assets | Portfolio turnover rate | |||||||||||||||||||||||||||||||||||||||||||
| International Small Companies Portfolio–Investor Class | ||||||||||||||||||||||||||||||||||||||||||||||||||||||||
10/31/19 | $15.16 | $ 0.09 | $ 1.21 | $ 1.30 | $(0.10 | ) | $(0.88 | ) | $(0.98 | ) | $15.48 | 9.82 | % | $57,095 | 1.70 | % | 1.40 | % | 0.63 | % | 37 | % | ||||||||||||||||||||||||||||||||||
10/31/18 | 16.55 | 0.10 | (1.29 | ) | (1.19 | ) | (0.05 | ) | (0.15 | ) | (0.20 | ) | 15.16 | (7.35 | ) | 57,912 | 1.75 | 1.40 | 0.58 | 52 | ||||||||||||||||||||||||||||||||||||
10/31/17 | 13.64 | 0.05 | 3.42 | 3.47 | (0.15 | ) | (0.41 | ) | (0.56 | ) | 16.55 | 26.71 | 50,292 | 1.80 | 1.40 | 0.37 | 19 | |||||||||||||||||||||||||||||||||||||||
10/31/16 | 13.33 | 0.16 | 0.35 | 0.51 | (0.07 | ) | (0.13 | ) | (0.20 | ) | 13.64 | 3.92 | 44,363 | 1.90 | 1.50 | 1.18 | 49 | |||||||||||||||||||||||||||||||||||||||
10/31/15 | 13.80 | 0.08 | (0.26 | ) | (0.18 | ) | (0.03 | ) | (0.26 | ) | (0.29 | ) | 13.33 | (1.29 | ) | 50,164 | 1.93 | 1.55 | 0.58 | 38 | ||||||||||||||||||||||||||||||||||||
| Institutional Emerging Markets Portfolio–Institutional Class (Formerly Class I) | ||||||||||||||||||||||||||||||||||||||||||||||||||||||||
10/31/19 | 18.43 | 0.24 | 2.76 | 3.00 | (0.18 | ) | — | (0.18 | ) | 21.25 | 16.43 | 4,864,702 | 1.27 | 1.27 | 1.18 | 17 | ||||||||||||||||||||||||||||||||||||||||
10/31/18 | 21.94 | 0.19 | (3.53 | ) | (3.34 | ) | (0.17 | ) | — | (0.17 | ) | 18.43 | (15.33 | ) | 3,978,321 | 1.27 | 1.27 | 0.84 | 24 | |||||||||||||||||||||||||||||||||||||
10/31/17 | 17.65 | 0.19 | 4.20 | 4.39 | (0.10 | ) | — | (0.10 | ) | 21.94 | 25.08 | 4,386,511 | 1.28 | 1.28 | 0.97 | 17 | ||||||||||||||||||||||||||||||||||||||||
10/31/16 | 16.04 | 0.14 | 1.56 | 1.70 | (0.09 | ) | — | (0.09 | ) | 17.65 | 10.74 | 3,051,419 | 1.29 | 1.29 | 0.88 | 20 | ||||||||||||||||||||||||||||||||||||||||
10/31/15 | 18.60 | 0.13 | (2.56 | ) | (2.43 | ) | (0.13 | ) | — | (0.13 | ) | 16.04 | (13.14 | ) | 1,876,495 | 1.31 | 1.30 | 0.77 | 23 | |||||||||||||||||||||||||||||||||||||
| Institutional Emerging Markets Portfolio–Institutional Class Z (Formerly Class II) | ||||||||||||||||||||||||||||||||||||||||||||||||||||||||
10/31/19 | 18.45 | 0.27 | 2.76 | 3.03 | (0.20 | ) | — | (0.20 | ) | 21.28 | 16.61 | 557,924 | 1.19 | 1.11 | 1.34 | 17 | ||||||||||||||||||||||||||||||||||||||||
10/31/18 | 21.94 | 0.22 | (3.52 | ) | (3.30 | ) | (0.19 | ) | — | (0.19 | ) | 18.45 | (15.21 | ) | 391,583 | 1.20 | 1.11 | 1.00 | 24 | |||||||||||||||||||||||||||||||||||||
10/31/17(2) | 17.71 | 0.22 | 4.21 | 4.43 | (0.20 | ) | — | (0.20 | ) | 21.94 | 25.43 | 458,288 | 1.23 | 1.12 | 1.12 | 17 | ||||||||||||||||||||||||||||||||||||||||
10/31/16(2) | 16.14 | 0.16 | 1.59 | 1.75 | (0.18 | ) | — | (0.18 | ) | 17.71 | 11.06 | 381,031 | 1.24 | 1.13 | 0.96 | 20 | ||||||||||||||||||||||||||||||||||||||||
10/31/15(2) | 18.81 | 0.16 | (2.60 | ) | (2.44 | ) | (0.23 | ) | — | (0.23 | ) | 16.14 | (13.06 | ) | 241,425 | 1.27 | 1.14 | 0.96 | 23 | |||||||||||||||||||||||||||||||||||||
| Emerging Markets Portfolio–Advisor Class | ||||||||||||||||||||||||||||||||||||||||||||||||||||||||
10/31/19 | 48.21 | 0.58 | 7.28 | 7.86 | (0.42 | ) | — | (0.42 | ) | 55.65 | 16.46 | 4,274,314 | 1.37 | 1.37 | 1.10 | 19 | ||||||||||||||||||||||||||||||||||||||||
10/31/18 | 57.46 | 0.42 | (9.24 | ) | (8.82 | ) | (0.40 | ) | (0.03 | ) | (0.43 | ) | 48.21 | (15.47 | ) | 3,459,157 | 1.40 | 1.40 | 0.73 | 24 | ||||||||||||||||||||||||||||||||||||
10/31/17 | 46.27 | 0.43 | 11.02 | 11.45 | (0.26 | ) | — | (0.26 | ) | 57.46 | 24.93 | 4,014,977 | 1.42 | 1.42 | 0.84 | 17 | ||||||||||||||||||||||||||||||||||||||||
10/31/16 | 42.02 | 0.30 | 4.17 | 4.47 | (0.22 | ) | — | (3) | (0.22 | ) | 46.27 | 10.73 | 2,998,484 | 1.42 | 1.42 | 0.72 | 26 | |||||||||||||||||||||||||||||||||||||||
10/31/15 | 50.88 | 0.26 | (6.80 | ) | (6.54 | ) | (0.39 | ) | (1.93 | ) | (2.32 | ) | 42.02 | (13.17 | ) | 2,381,671 | 1.45 | 1.45 | 0.57 | 30 | ||||||||||||||||||||||||||||||||||||
| Frontier Emerging Markets Portfolio–Institutional Class I | ||||||||||||||||||||||||||||||||||||||||||||||||||||||||
10/31/19 | 7.62 | 0.14 | 0.14 | 0.28 | (0.10 | ) | — | (0.10 | ) | 7.80 | 3.73 | 144,742 | 1.63 | 1.63 | 1.72 | 31 | ||||||||||||||||||||||||||||||||||||||||
10/31/18 | 8.50 | 0.11 | (0.82 | ) | (0.71 | ) | (0.17 | ) | — | (0.17 | ) | 7.62 | (8.47 | ) | 220,367 | 1.62 | 1.62 | 1.24 | 20 | |||||||||||||||||||||||||||||||||||||
10/31/17 | 7.35 | 0.05 | 1.17 | 1.22 | (0.07 | ) | — | (0.07 | ) | 8.50 | 16.82 | 266,844 | 1.71 | 1.71 | 0.69 | 28 | ||||||||||||||||||||||||||||||||||||||||
10/31/16 | 7.62 | 0.10 | (0.29 | ) | (0.19 | ) | (0.08 | ) | — | (0.08 | ) | 7.35 | (2.43 | ) | 342,114 | 1.79 | 1.79 | 1.41 | 47 | |||||||||||||||||||||||||||||||||||||
10/31/15 | 9.50 | 0.11 | (1.84 | ) | (1.73 | ) | (0.05 | ) | (0.10 | ) | (0.15 | ) | 7.62 | (18.35 | ) | 451,646 | 1.79 | 1.79 | 1.29 | 38 | ||||||||||||||||||||||||||||||||||||
| (1) | Net investment income per share was calculated using the average shares outstanding method. |
| (2) | All per share amounts and net asset values have been adjusted as a result of the reverse share split effected after the close of business on December 1, 2017. (See Note 1). |
| (3) | Amount was less than $0.005 per share. |
See Notes to Financial Statements
49
Table of Contents
Harding, Loevner Funds, Inc.
Financial Highlights (continued)
For the Fiscal Year Ended October 31
INCREASE (DECREASE) IN NET ASSETS FROM OPERATIONS: | DISTRIBUTIONS TO SHAREHOLDERS FROM: | RATIOS/SUPPLEMENTAL DATA: | ||||||||||||||||||||||||||||||||||||||||||||||||||||||
Net asset value, beginning of year | Net investment income (loss)(1) | Net realized and unrealized gain (loss) on investments and foreign currency- related transactions | Net increase (decrease) from investment operations | Net investment income | Net realized gain from investments | Total distributions | Net asset value, end of year | Total Return | Net assets, end of year (000’s) | Expenses to average net assets | Expenses to average net assets (net of fees waived/ reimbursed) | Net investment income to average net assets | Portfolio turnover rate | |||||||||||||||||||||||||||||||||||||||||||
| Frontier Emerging Markets Portfolio–Institutional Class II | ||||||||||||||||||||||||||||||||||||||||||||||||||||||||
10/31/19 | $ 7.63 | $ 0.17 | $ 0.13 | $ 0.30 | $(0.11 | ) | $ — | $(0.11 | ) | $ 7.82 | 4.01 | % | $ 128,742 | 1.55 | % | 1.35 | % | 2.19 | % | 31 | % | |||||||||||||||||||||||||||||||||||
10/31/18 | 8.50 | 0.14 | (0.83 | ) | (0.69 | ) | (0.18 | ) | — | (0.18 | ) | 7.63 | (8.31 | ) | 163,794 | 1.56 | 1.35 | 1.51 | 20 | |||||||||||||||||||||||||||||||||||||
10/31/17(2)(3) | 7.43 | 0.08 | 0.99 | 1.07 | — | — | — | 8.50 | 14.40 | (A) | 166,698 | 1.58 | (B) | 1.35 | (B) | 1.47 | (B) | 28 | (A) | |||||||||||||||||||||||||||||||||||||
| Frontier Emerging Markets Portfolio–Investor Class | ||||||||||||||||||||||||||||||||||||||||||||||||||||||||
10/31/19 | 7.57 | 0.11 | 0.13 | 0.24 | (0.06 | ) | — | (0.06 | ) | 7.75 | 3.24 | 20,560 | 2.00 | 2.00 | 1.38 | 31 | ||||||||||||||||||||||||||||||||||||||||
10/31/18 | 8.43 | 0.07 | (0.79 | ) | (0.72 | ) | (0.14 | ) | — | (0.14 | ) | 7.57 | (8.75 | ) | 25,388 | 2.06 | 2.00 | 0.87 | 20 | |||||||||||||||||||||||||||||||||||||
10/31/17 | 7.28 | 0.04 | 1.15 | 1.19 | (0.04 | ) | — | (0.04 | ) | 8.43 | 16.40 | 30,981 | 2.13 | 2.00 | 0.48 | 28 | ||||||||||||||||||||||||||||||||||||||||
10/31/16 | 7.55 | 0.07 | (0.30 | ) | (0.23 | ) | (0.04 | ) | — | (0.04 | ) | 7.28 | (3.01 | ) | 32,771 | 2.23 | 2.23 | 1.02 | 47 | |||||||||||||||||||||||||||||||||||||
10/31/15 | 9.41 | 0.06 | (1.80 | ) | (1.74 | ) | (0.02 | ) | (0.10 | ) | (0.12 | ) | 7.55 | (18.64 | ) | 45,622 | 2.20 | 2.20 | 0.75 | 38 | ||||||||||||||||||||||||||||||||||||
| Global Equity Research Portfolio–Institutional Class | ||||||||||||||||||||||||||||||||||||||||||||||||||||||||
10/31/19 | 12.06 | 0.14 | 1.40 | 1.54 | (0.09 | ) | (0.94 | ) | (1.03 | ) | 12.57 | 14.36 | 6,895 | 1.96 | 0.83 | 1.18 | 44 | |||||||||||||||||||||||||||||||||||||||
10/31/18 | 12.23 | 0.10 | 0.23 | 0.33 | (0.18 | ) | (0.32 | ) | (0.50 | ) | 12.06 | 2.74 | 5,452 | 2.64 | 0.90 | 0.76 | 45 | |||||||||||||||||||||||||||||||||||||||
10/31/17(4) | 10.00 | 0.08 | 2.15 | 2.23 | — | — | — | 12.23 | 22.30 | (A) | 5,308 | 3.49 | (B) | 0.90 | (B) | 0.80 | (B) | 36 | (A) | |||||||||||||||||||||||||||||||||||||
| International Equity Research Portfolio–Institutional Class | ||||||||||||||||||||||||||||||||||||||||||||||||||||||||
10/31/19 | 11.59 | 0.18 | 1.17 | 1.35 | (0.13 | ) | (0.78 | ) | (0.91 | ) | 12.03 | 12.93 | 19,458 | 1.42 | 0.79 | 1.62 | 44 | |||||||||||||||||||||||||||||||||||||||
10/31/18 | 13.11 | 0.14 | (0.93 | ) | (0.79 | ) | (0.14 | ) | (0.59 | ) | (0.73 | ) | 11.59 | (6.43 | ) | 9,305 | 1.78 | 0.90 | 1.07 | 43 | ||||||||||||||||||||||||||||||||||||
10/31/17 | 11.10 | 0.12 | 2.26 | 2.38 | (0.17 | ) | (0.20 | ) | (0.37 | ) | 13.11 | 22.26 | 9,479 | 2.26 | 0.90 | 0.99 | 55 | |||||||||||||||||||||||||||||||||||||||
10/31/16(5) | 10.00 | 0.14 | 0.96 | 1.10 | — | — | — | 11.10 | 11.00 | (A) | 6,244 | 3.54 | (B) | 0.90 | (B) | 1.51 | (B) | 33 | (A) | |||||||||||||||||||||||||||||||||||||
| Emerging Markets Research Portfolio–Institutional Class | ||||||||||||||||||||||||||||||||||||||||||||||||||||||||
10/31/19 | 10.82 | 0.15 | 1.35 | 1.50 | (0.09 | ) | (0.81 | ) | (0.90 | ) | 11.42 | 15.05 | 7,198 | 2.29 | 1.19 | 1.35 | 58 | |||||||||||||||||||||||||||||||||||||||
10/31/18 | 13.01 | 0.12 | (1.34 | ) | (1.22 | ) | (0.23 | ) | (0.74 | ) | (0.97 | ) | 10.82 | (10.24 | ) | 5,702 | 2.90 | 1.30 | 0.93 | 55 | ||||||||||||||||||||||||||||||||||||
10/31/17(4) | 10.00 | 0.10 | 2.91 | 3.01 | — | — | — | 13.01 | 30.10 | (A) | 5,880 | 3.72 | (B) | 1.30 | (B) | 1.04 | (B) | 46 | (A) | |||||||||||||||||||||||||||||||||||||
| (A) | Not Annualized. |
| (B) | Annualized. |
| (1) | Net investment income per share was calculated using the average shares outstanding method. |
| (2) | For the period from March 1, 2017 (commencement of class operations) through October 31, 2017. |
| (3) | All per share amounts and net asset values have been adjusted as a result of the share dividend effected after the close of business on December 1, 2017. (See Note 1). |
| (4) | For the period from December 19, 2016 (commencement of class operations) through October 31, 2017. |
| (5) | For the period from December 17, 2015 (commencement of class operations) through October 31, 2016. |
See Notes to Financial Statements
50
Table of Contents
Harding, Loevner Funds, Inc.
October 31, 2019
1. Organization
Harding, Loevner Funds, Inc. (the “Fund”) was organized as a Maryland corporation on July 31, 1996, and is registered under the Investment Company Act of 1940, as amended (the “1940 Act”), as anopen-end management investment company. The Fund currently has nine separate diversified Portfolios, all of which were active as of October 31, 2019 (individually, a “Portfolio”, collectively, the “Portfolios”). The Fund is managed by Harding Loevner LP (the “Investment Adviser”).
Portfolio | Inception Date | Investment Objective | ||
Global Equity Portfolio (“Global Equity”) | Institutional Class: November 3, 2009 Institutional Class Z: August 1, 2017 Advisor Class: December 1, 1996 | to seek long-term capital appreciation through investments in equity securities of companies based both inside and outside the United States | ||
International Equity Portfolio (“International Equity”) | Institutional Class: May 11, 1994* Institutional Class Z: July 17, 2017 Investor Class: September 30, 2005 | to seek long-term capital appreciation through investments in equity securities of companies based outside the United States | ||
International Small Companies Portfolio (“International Small Companies”) | Institutional Class: June 30, 2011 Investor Class: March 26, 2007 | to seek long-term capital appreciation through investments in equity securities of small companies based outside the United States | ||
Institutional Emerging Markets Portfolio** (“Institutional Emerging Markets”) | Institutional Class (Formerly Class I): October 17, 2005 Institutional Class Z (Formerly Class II): March 5, 2014 | to seek long-term capital appreciation through investments in equity securities of companies based in emerging markets | ||
Emerging Markets Portfolio** (“Emerging Markets”) | Advisor Class: November 9, 1998 | to seek long-term capital appreciation through investments in equity securities of companies based in emerging markets | ||
Frontier Emerging Markets Portfolio (“Frontier Emerging Markets”) | Institutional Class I: May 27, 2008 Institutional Class II: March 1, 2017 Investor Class: December 31, 2010 | to seek long-term capital appreciation through investments in equity securities of companies based in frontier and smaller emerging markets | ||
Global Equity Research Portfolio (“Global Equity Research”) | Institutional Class***: December 19, 2016 | to seek long-term capital appreciation through investments in equity securities of companies based both inside and outside the United States | ||
International Equity Research Portfolio (“International Equity Research”) | Institutional Class***: December 17, 2015 | to seek long-term capital appreciation through investments in equity securities of companies based outside the United States | ||
Emerging Markets Research Portfolio (“Emerging Markets Research”) | Institutional Class***: December 19, 2016 | to seek long-term capital appreciation through investments in equity securities of companies based in emerging markets |
* The International Equity Portfolio is the successor to the HLM International Equity Portfolio of AMT Capital Fund, Inc., pursuant to a reorganization that took place on October 31, 1996. Information for periods prior to October 31, 1996, is historical information for the predecessor portfolio.
** Effective March 1, 2019, the Institutional Emerging Markets and Emerging Markets Portfolios’ shares are generally available for purchase by new and existing shareholders, subject to certain limitations that may apply at the Fund’s discretion.
*** Effective March 1, 2019, the Investor Class shares of the Global Equity Research, International Equity Research and Emerging Markets Research Portfolios were closed and their balances were transferred to the Institutional Class (See Note 7) .
51
Table of Contents
Harding, Loevner Funds, Inc.
Notes to Financial Statements (continued)
October 31, 2019
1. Organization (continued)
On November 24, 2017, the Board of Directors (the “Board”) of the Fund approved reverse share splits (the “Reverse Splits”) of the outstanding Institutional Class Z shares of the Global Equity Portfolio, Institutional Class Z shares of the International Equity Portfolio, and Class II shares of the Institutional Emerging Markets Portfolio (each, a “Split Impacted Portfolio”) at the ratios indicated below.
| Portfolio | Reverse Share Split Ratio | ||||
Global Equity Portfolio – Institutional Class Z | 1 for 3.933146 | ||||
International Equity Portfolio – Institutional Class Z | 1 for 2.135356 | ||||
Institutional Emerging Markets Portfolio – Class II | 1 for 1.758429 | ||||
The Reverse Splits were effected after the close of business on December 1, 2017. Institutional Class Z shares and Class II shares of the Split Impacted Portfolios began trading on a split-adjusted basis on December 4, 2017.
The total dollar value of each shareholder’s investment in a Split Impacted Portfolio remained unchanged by the Reverse Splits. While the Reverse Splits reduced the number of outstanding Institutional Class Z or Class II shares of the Split Impacted Portfolios, they proportionately increased the net asset value (“NAV”) per share of Institutional Class Z shares and Class II shares of the Split Impacted Portfolio such that the aggregate market value of each Split Impacted Portfolio’s Institutional Class Z shares or Class II shares, as applicable, remained the same. The Reverse Splits did not affect the voting rights of a shareholder’s investment in a Split Impacted Portfolio, and was not a taxable event for the Split Impacted Portfolio’s shareholders.
On November 24, 2017, the Board also declared a share dividend (the “Share Dividend”) with respect to the Institutional Class II shares of the Frontier Emerging Markets Portfolio equal to 0.346467 shares on each outstanding Institutional Class II share. The Share Dividend was paid to the Portfolio’s Institutional Class II shareholders of record as of the close of business on December 1, 2017. The total dollar value of each shareholder’s investment in the Portfolio remained unchanged by the Share Dividend. While the Share Dividend increased the number of outstanding Institutional Class II shares of the Portfolio, it proportionately decreased the NAV per share of Institutional Class II shares of the Portfolio such that the aggregate market value of the Portfolio’s Institutional Class II shares remained the same. The Share Dividend did not affect the voting rights of a shareholder’s investment in the Portfolio, and was not a taxable event for the Portfolio’s shareholders.
The Board approved the Reverse Splits in order to bring the NAV per share of the Institutional Class Z shares of the Global Equity Portfolio and International Equity Portfolio and Class II shares of the Institutional Emerging Markets Portfolio into line with the NAV per share of the other share classes of the Split Impacted Portfolios. The Board also declared the Share Dividend in order to bring the NAV per share of the Institutional Class II shares of the Frontier Emerging Markets Portfolio into line with the NAV per share of the other share classes of the Portfolio. The Reverse Splits and the Share Dividend are intended to create a general level of parity of required distributions across the Fund’s share classes by increasing the NAV per share and reducing the number of outstanding shares of the share classes subject to the Reverse Splits and decreasing the NAV per share and increasing the number of outstanding shares of the Institutional Class II shares of the Frontier Emerging Markets Portfolio through the Share Dividend.
Per share data, including the proportionate impact to NAV, in the Financial Highlights and Capital Share activity presented in the Capital Share Transactions disclosure (see Note 7) have been restated to reflect the Reverse Splits and the Share Dividend, respectively.
2. Summary of Significant Accounting Policies
The accounting policies of the Fund are in conformity with accounting principles generally accepted in the United States (“GAAP”) for investment companies. Accordingly, the Fund follows accounting and reporting guidance under FASB Accounting Standards Codification Topic 946, “Financial Services – Investment Companies”. The following is a summary of the Fund’s significant accounting policies:
Estimates
The preparation of financial statements in accordance with GAAP requires management to make estimates and assumptions that affect the reported amounts and disclosures in the financial statements. Actual results could differ from those estimates.
52
Table of Contents
Harding, Loevner Funds, Inc.
Notes to Financial Statements (continued)
October 31, 2019
2. Summary of Significant Accounting Policies (continued)
Valuation
The Board has adopted procedures (“Procedures”) to govern the valuation of the securities held by each Portfolio of the Fund in accordance with the 1940 Act. The Procedures incorporate principles set forth in relevant pronouncements of the Securities and Exchange Commission (“SEC”) and its staff, including guidance on the obligations of the Portfolios and their Directors to determine, in good faith, the fair value of the Portfolios’ securities when market quotations are not readily available.
In determining a Portfolio’s NAV, each equity security traded on a securities exchange, including the NASDAQ Stock Market, andover-the-counter securities, are first valued at the closing price on the exchange or market designated by the Fund’s accounting agent as the principal exchange (each, a “principal exchange”). The closing price provided by the Fund’s accounting agent for a principal exchange may differ from the price quoted elsewhere and may represent information such as last sales price, an official closing price, a closing auction price or other information, depending on exchange or market convention. Shares ofopen-end mutual funds including money market funds are valued at NAV. Such securities are typically categorized as “Level 1” pursuant to the hierarchy described below.
Participation notes are valued based upon the closing or last traded price of their underlying local shares. Such securities are typically categorized as “Level 2” pursuant to the hierarchy described below.
Since trading in many foreign securities is normally completed before the time at which a Portfolio calculates its NAV, the effect on the value of such securities held by a Portfolio of events that occur between the close of trading in the security and the time at which the Portfolio prices its securities would not be reflected in the Portfolio’s calculation of its NAV if foreign securities were generally valued at their closing prices. To address this issue, the Board has approved the daily use of independently provided quantitative models that may adjust the closing prices of certain foreign equity securities based on information that becomes available after the foreign market closes, through the application of an adjustment factor to such securities’ closing price. Adjustment factors may be greater than, less than, or equal to 1. Thus, use of these quantitative models could cause a Portfolio to value a security higher, lower or equal to its closing market price, which in turn could cause the Portfolio’s NAV per share to differ significantly from that which would have been calculated using closing market prices. The use of these quantitative models is also intended to decrease the opportunities for persons to engage in ‘‘time zone arbitrage,’’ i.e., trading intended to take advantage of stale closing prices in foreign markets that could affect the NAV of the Portfolios. Securities subjected to an adjustment factor due to the use of these quantitative models are not specifically designated on the Portfolios’ Portfolio of Investments as being “fair valued”. Securities with an adjustment factor greater than or less than 1, which are absent the use of significant unobservable inputs into their valuation, are categorized as “Level 2” and securities with an adjustment factor equal to 1, which are absent the use of significant unobservable inputs into their valuation, are categorized as “Level 1” pursuant to the hierarchy described below.
Any securities for which market quotations are not readily available or for which available prices are deemed unreliable are priced by the Investment Adviser at “fair value as determined in good faith”, in accordance with the Procedures. Such securities are identified on the Portfolios’ Portfolio of Investments as securities valued at “fair value as determined in good faith” and absent the use of significant unobservable inputs into their valuation, such securities would be categorized as “Level 2” pursuant to the hierarchy described below.
GAAP has established a hierarchy for NAV determination purposes in which various inputs are used in determining the value of each Portfolio’s assets or liabilities. GAAP defines fair value as the price that the Portfolio would receive upon selling an investment in a timely transaction to an independent buyer in the principal or most advantageous market of the investment. GAAP establishes a three-tier hierarchy to maximize the use of observable market data and minimize the use of unobservable inputs and to establish classification of fair value measurements for disclosure purposes. Inputs may be observable or unobservable and refer broadly to the assumptions that market participants would use in pricing the asset or liability including assumptions about risk. Such risks include the inherent risk in a particular valuation technique which is used to measure fair value. This may include the quantitative models and/or the inputs to the quantitative models used in the valuation technique described above. Observable inputs are inputs that reflect the assumptions market participants would use in pricing the asset or liability developed based on market data obtained from sources independent of the reporting entity. Unobservable inputs are inputs that reflect the reporting entity’s own assumptions about the assumptions market participants would use in pricing the asset or liability developed based on the best information available in the circumstances. The three-tier hierarchy of inputs is summarized in the three broad levels listed below.
| Level 1 | unadjusted quoted prices in active markets for identical assets | |
| Level 2 | other significant observable inputs (including quoted prices for similar investments, interest rates, prepayment speeds, credit risk, etc.) | |
| Level 3 | significant unobservable inputs (including the Portfolio’s own assumptions in determining the fair value of investments) |
53
Table of Contents
Harding, Loevner Funds, Inc.
Notes to Financial Statements (continued)
October 31, 2019
2. Summary of Significant Accounting Policies (continued)
GAAP provides additional guidance for estimating fair value when the volume and level of activity for the asset or liability have significantly decreased as well as guidance on identifying circumstances that indicate when a transaction is not orderly.
The following is a summary of the Portfolios’ investments classified by Level 1, Level 2 and Level 3 and security type as of October 31, 2019. Please refer to each Portfolio’s Portfolio of Investments to view individual securities classified by industry type and country.
| Portfolio | Unadjusted Quoted Prices in Active Markets for Identical Assets (Level 1) | Other Significant Observable Inputs (Level 2) | Significant Unobservable Inputs (Level 3) | Total | ||||||||||||
Global Equity | ||||||||||||||||
Common Stocks | $ | 592,043,417 | $ | 330,405,719 | $ | — | $ | 922,449,136 | ||||||||
Preferred Stocks | 10,920,943 | — | — | 10,920,943 | ||||||||||||
Short Term Investments | 26,325,131 | — | — | 26,325,131 | ||||||||||||
Total Investments | $ | 629,289,491 | $ | 330,405,719 | $ | — | $ | 959,695,210 | ||||||||
International Equity | ||||||||||||||||
Common Stocks | $ | 4,437,351,745 | $ | 10,586,501,046 | $ | — | $ | 15,023,852,791 | ||||||||
Preferred Stocks | 188,403,670 | 320,328,589 | — | 508,732,259 | ||||||||||||
Short Term Investments | 549,899,662 | — | — | 549,899,662 | ||||||||||||
Total Investments | $ | 5,175,655,077 | $ | 10,906,829,635 | $ | — | $ | 16,082,484,712 | ||||||||
International Small Companies | ||||||||||||||||
Common Stocks | $ | 36,147,845 | $ | 274,072,322 | $ | — | $ | 310,220,167 | ||||||||
Participation Notes | — | 3,647,132 | — | 3,647,132 | ||||||||||||
Short Term Investments | 15,272,520 | — | — | 15,272,520 | ||||||||||||
Total Investments | $ | 51,420,365 | $ | 277,719,454 | $ | — | $ | 329,139,819 | ||||||||
Institutional Emerging Markets | ||||||||||||||||
Common Stocks | $ | 1,497,051,853 | $ | 3,429,179,888 | $ | — | $ | 4,926,231,741 | ||||||||
Preferred Stocks | 267,920,416 | 47,899,026 | — | 315,819,442 | ||||||||||||
Short Term Investments | 176,602,330 | — | — | 176,602,330 | ||||||||||||
Total Investments | $ | 1,941,574,599 | $ | 3,477,078,914 | $ | — | $ | 5,418,653,513 | ||||||||
Emerging Markets | ||||||||||||||||
Common Stocks | $ | 1,184,491,140 | $ | 2,712,940,098 | $ | — | $ | 3,897,431,238 | ||||||||
Preferred Stocks | 211,738,516 | 37,899,357 | — | 249,637,873 | ||||||||||||
Short Term Investments | 123,526,261 | — | — | 123,526,261 | ||||||||||||
Total Investments | $ | 1,519,755,917 | $ | 2,750,839,455 | $ | — | $ | 4,270,595,372 | ||||||||
Frontier Emerging Markets | ||||||||||||||||
Common Stocks | $ | 63,638,240 | $ | 210,071,726 | $ | — | $ | 273,709,966 | ||||||||
Preferred Stocks | 12,322,226 | — | — | 12,322,226 | ||||||||||||
Participation Notes | — | 4,607,505 | — | 4,607,505 | ||||||||||||
Short Term Investments | 3,717,275 | — | — | 3,717,275 | ||||||||||||
Total Investments | $ | 79,677,741 | $ | 214,679,231 | $ | — | $ | 294,356,972 | ||||||||
Global Equity Research | ||||||||||||||||
Common Stocks | $ | 3,396,111 | $ | 3,380,079 | $ | — | $ | 6,776,190 | ||||||||
Preferred Stocks | 31,273 | 14,717 | — | 45,990 | ||||||||||||
Short Term Investments | 73,599 | — | — | 73,599 | ||||||||||||
Total Investments | $ | 3,500,983 | $ | 3,394,796 | $ | — | $ | 6,895,779 | ||||||||
54
Table of Contents
Harding, Loevner Funds, Inc.
Notes to Financial Statements (continued)
October 31, 2019
2. Summary of Significant Accounting Policies (continued)
| Portfolio | Unadjusted Quoted Prices in Active Markets for Identical Assets (Level 1) | Other Significant Observable Inputs (Level 2) | Significant Unobservable Inputs (Level 3) | Total | ||||||||||||
International Equity Research | ||||||||||||||||
Common Stocks | $ | 3,164,088 | $ | 15,572,108 | $ | — | $ | 18,736,196 | ||||||||
Preferred Stocks | 167,933 | 58,002 | — | 225,935 | ||||||||||||
Short Term Investments | 476,501 | — | — | 476,501 | ||||||||||||
Total Investments | $ | 3,808,522 | $ | 15,630,110 | $ | — | $ | 19,438,632 | ||||||||
Emerging Markets Research | ||||||||||||||||
Common Stocks | $ | 1,905,177 | $ | 4,652,546 | $ | — | $ | 6,557,723 | ||||||||
Preferred Stocks | 275,006 | 148,034 | — | 423,040 | ||||||||||||
Participation Notes | — | 134,592 | — | 134,592 | ||||||||||||
Short Term Investments | 85,633 | — | — | 85,633 | ||||||||||||
Total Investments | $ | 2,265,816 | $ | 4,935,172 | $ | — | $ | 7,200,988 | ||||||||
As of October 31, 2019, there were no Level 3 investments held within the Portfolios.
Securities
For financial reporting purposes, all securities transactions are recorded on a trade date basis, as of the last business day in the reporting period. Throughout the reporting period, securities transactions are typically accounted for on a trade date – plus one business day basis. Interest income and expenses are recorded on an accrual basis. Dividend income is recorded on theex-dividend date (except for certain foreign dividends that may be recorded as soon as the Portfolio is informed of such dividends). The Portfolios use the specific identification method for determining realized gains or losses from sales of securities.
Dividends to Shareholders
It is the policy of the Portfolios to declare dividends from net investment income annually. Net short-term and long-term capital gains distributions for the Portfolios, if any, are also normally distributed on an annual basis.
Dividends from net investment income and distributions from net realized gains from investment transactions have been determined in accordance with income tax regulations and may differ from net investment income and realized gains recorded by the Portfolios for financial reporting purposes. Differences result primarily from foreign currency transactions and timing differences related to recognition of income, and gains and losses from investment transactions. In general, to the extent that any differences, which are permanent in nature, result in over distributions to shareholders, the amount of the over distribution is reclassified within the capital accounts based on its federal tax basis treatment and may be reported as return of capital. Temporary differences do not require reclassification.
Currency Translation
Assets and liabilities denominated in foreign currencies and commitments under forward foreign currency exchange contracts are translated into U.S. dollars at the mean of the quoted bid and asked prices of such currencies against the U.S. dollar. Purchases and sales of the Portfolios’ securities are translated at the rates of exchange prevailing when such securities were acquired or sold. Income and expenses are translated at exchange rates prevailing when accrued. The Portfolios do not isolate that portion of the results of operations resulting from changes in foreign exchange rates on investments from the fluctuations arising from changes in market prices of securities held. Such fluctuations are included with the “Net realized gain (loss) on investment transactions” and “Change in unrealized appreciation (depreciation) on investments” on the Statements of Operations.
55
Table of Contents
Harding, Loevner Funds, Inc.
Notes to Financial Statements (continued)
October 31, 2019
2. Summary of Significant Accounting Policies (continued)
Net realized gains and losses from foreign currency-related transactions arise from sales of foreign currency, currency gains or losses realized between the trade and settlement dates on securities transactions, and the difference between the amounts of dividends, interest, and foreign withholding taxes recorded on the Portfolios’ books, and the U.S. dollar equivalent of the amounts actually received or paid. Net unrealized appreciation or depreciation on translation of assets and liabilities denominated in foreign currencies arise from changes in the value of assets and liabilities other than investments in securities at the period end, resulting from changes in the exchange rates.
Expenses
Most expenses of the Fund can be directly attributed to a particular Portfolio. Expenses which cannot be directly attributed are apportioned among the Portfolios based upon relative net assets or other appropriate measures. If an expense is incurred at the Portfolio level, it is generally apportioned among the classes of that Portfolio based upon relative net assets of each respective class. Certain expenses are incurred at the class level and charged only to that particular class. These expenses may be class specific (i.e., Distribution fees charged only to a particular class) or they may be identifiable to a particular class (i.e., the costs related to mailing shareholder reports to shareholders of a particular class).
Redemption Fees
The Fund has established fees on short-term redemptions to discourage frequent trading in Portfolio shares. Redemptions of Portfolio shares made within 90 days of purchase may be subject to a redemption fee equal to 2% of the amount redeemed. For the years ended October 31, 2019 and October 31, 2018, the Portfolios received the following redemption fees. These amounts are netted against “Payments for Shares Redeemed” in Note 7 – Capital Share Transactions.
| Institutional Class | Institutional Class I | Institutional Class II | ||||||||||||||||||||||||||||
| Portfolio | Year Ended October 31, 2019 | Year Ended October 31, 2018 | Year Ended October 31, 2019 | Year Ended October 31, 2018 | Year Ended October 31, 2019 | Year Ended October 31, 2018 | ||||||||||||||||||||||||
Global Equity | $ | 79,336 | $ | 14,174 | $ | — | $ | — | $ | — | $ | — | ||||||||||||||||||
International Equity | 905,862 | 465,416 | — | — | — | — | ||||||||||||||||||||||||
International Small Companies | 7,219 | 5,178 | — | — | — | — | ||||||||||||||||||||||||
Institutional Emerging Markets | 182,069 | * | 98,733 | * | — | — | — | — | ||||||||||||||||||||||
Emerging Markets | — | — | — | — | — | — | ||||||||||||||||||||||||
Frontier Emerging Markets | — | — | 12,856 | 15,128 | — | — | ||||||||||||||||||||||||
Global Equity Research | — | — | — | — | — | — | ||||||||||||||||||||||||
International Equity Research | — | — | — | — | — | — | ||||||||||||||||||||||||
Emerging Markets Research | — | — | — | — | — | — | ||||||||||||||||||||||||
* Formerly Class I | ||||||||||||||||||||||||||||||
| Investor Class | Advisor Class | Institutional Class Z | ||||||||||||||||||||||||||||
| Portfolio | Year Ended October 31, 2019 | Year Ended October 31, 2018 | Year Ended October 31, 2019 | Year Ended October 31, 2018 | Year Ended October 31, 2019 | Year Ended October 31, 2018 | ||||||||||||||||||||||||
Global Equity | $ | — | $ | — | $ | 7,472 | $ | 14,265 | $ | 9,100 | $ | — | ||||||||||||||||||
International Equity | 31,086 | 58,517 | — | — | 12,652 | 119 | ||||||||||||||||||||||||
International Small Companies | 2,312 | 5,609 | — | — | — | — | ||||||||||||||||||||||||
Institutional Emerging Markets | — | — | — | — | — | — | ||||||||||||||||||||||||
Emerging Markets | — | — | 79,727 | 98,576 | — | — | ||||||||||||||||||||||||
Frontier Emerging Markets | 4,961 | 2,538 | — | — | — | — | ||||||||||||||||||||||||
Global Equity Research | — | — | — | — | — | — | ||||||||||||||||||||||||
International Equity Research | — | 2 | — | — | — | — | ||||||||||||||||||||||||
Emerging Markets Research | — | — | — | — | — | — | ||||||||||||||||||||||||
56
Table of Contents
Harding, Loevner Funds, Inc.
Notes to Financial Statements (continued)
October 31, 2019
2. Summary of Significant Accounting Policies (continued)
Indemnifications
Under the Fund’s organizational document, its officers and Board are indemnified against certain liability arising out of the performance of their duties to the Portfolios. In the normal course of business, the Fund may enter into contracts that contain a variety of representations or that provide indemnification for certain liabilities. The Fund’s maximum exposure under these arrangements is unknown, as this would involve future claims that may be made against the Fund that have not yet occurred. However, the Fund has not had prior claims or losses pursuant to these contracts and expects the risk of loss to be remote.
3. Transactions with Affiliates and Significant Agreements
The Board has approved investment advisory agreements with Harding Loevner LP (the “Investment Adviser”). Advisory fees are computed daily and paid monthly based on the average daily net assets of each Portfolio. The Investment Adviser has contractually agreed to reduce its fee and/or reimburse the Portfolios for other operating expenses to the extent that aggregate expenses, excluding certainnon-operating expenses, exceed certain annual rates of the average daily net assets of each class.
The following annualized advisory fees and contractual expense limits were in effect for the year ended October 31, 2019. The advisory fees are charged at the Portfolio level as a whole and expense limitations are at the class specific level.
| Portfolio | First $1 billion of assets | Next $1 billion of assets | Next $1 billion of assets | Over $3 billion of assets | Over $4 billion of assets | Over $5 billion of assets | Contractual Expense Limit* | ||||||||||||||||||||||||||||
Global Equity – Institutional Class | 0.80% | 0.78% | 0.76% | 0.74% | 0.74% | 0.74% | 0.95% | ||||||||||||||||||||||||||||
Global Equity – Institutional Class Z | 0.80% | 0.78% | 0.76% | 0.74% | 0.74% | 0.74% | 0.90% | ||||||||||||||||||||||||||||
Global Equity – Advisor Class | 0.80% | 0.78% | 0.76% | 0.74% | 0.74% | 0.74% | 1.25% | ||||||||||||||||||||||||||||
International Equity – Institutional Class | 0.75% | 0.73% | 0.71% | 0.69% | 0.67% | 0.65% | 1.00% | ||||||||||||||||||||||||||||
International Equity – Institutional Class Z | 0.75% | 0.73% | 0.71% | 0.69% | 0.67% | 0.65% | 0.80% | ||||||||||||||||||||||||||||
International Equity – Investor Class | 0.75% | 0.73% | 0.71% | 0.69% | 0.67% | 0.65% | 1.25% | ||||||||||||||||||||||||||||
International Small Companies – Institutional Class | 1.15% | 1.15% | 1.15% | 1.15% | 1.15% | 1.15% | 1.15% | ||||||||||||||||||||||||||||
International Small Companies – Investor Class | 1.15% | 1.15% | 1.15% | 1.15% | 1.15% | 1.15% | 1.40% | ||||||||||||||||||||||||||||
Institutional Emerging Markets – Institutional Class | 1.15% | 1.13% | 1.11% | 1.09% | 1.09% | 1.09% | 1.30% | ||||||||||||||||||||||||||||
Institutional Emerging Markets – Institutional Class Z | 1.15% | 1.13% | 1.11% | 1.09% | 1.09% | 1.09% | 1.15% | ** | |||||||||||||||||||||||||||
Emerging Markets – Advisor Class | 1.15% | 1.13% | 1.11% | 1.09% | 1.09% | 1.09% | 1.75% | ||||||||||||||||||||||||||||
Frontier Emerging Markets – Institutional Class I | 1.35% | 1.35% | 1.35% | 1.35% | 1.35% | 1.35% | 1.75% | ||||||||||||||||||||||||||||
Frontier Emerging Markets – Institutional Class II | 1.35% | 1.35% | 1.35% | 1.35% | 1.35% | 1.35% | 1.35% | ||||||||||||||||||||||||||||
Frontier Emerging Markets – Investor Class | 1.35% | 1.35% | 1.35% | 1.35% | 1.35% | 1.35% | 2.00% | ||||||||||||||||||||||||||||
Global Equity Research – Institutional Class1 | 0.70% | 0.70% | 0.70% | 0.70% | 0.70% | 0.70% | 0.80% | ||||||||||||||||||||||||||||
International Equity Research – Institutional Class2 | 0.70% | 0.70% | 0.70% | 0.70% | 0.70% | 0.70% | 0.75% | ||||||||||||||||||||||||||||
Emerging Markets Research – Institutional Class3 | 1.00% | 1.00% | 1.00% | 1.00% | 1.00% | 1.00% | 1.15% | ||||||||||||||||||||||||||||
| * | Effective through February 28, 2020. |
| ** | The Investment Adviser has contractually agreed to waive a portion of its management fee and/or reimburse the Portfolio’s Institutional Class Z shares for their other operating expenses to the extent that the aggregate operating expenses of Institutional Class Z exceed the applicable contractual management fee, currently 1.15% on the first $1 billion of average daily net assets, 1.13% on the next $1 billion, 1.11% on the next $1 billion and 1.09% for average daily net assets over $3 billion. |
| 1 | Prior to March 1, 2019, the Global Equity Research Portfolio’s advisory fees were 0.80% of the Portfolio’s average daily net assets and the contractual expense limit for the Institutional Class was 0.90% of the Class’s average daily net assets. |
| 2 | Prior to March 1, 2019, the International Equity Research Portfolio’s advisory fees were 0.75% of the Portfolio’s average daily net assets and the contractual expense limit for the Institutional Class was 0.90% of the Class’s average daily net assets. |
| 3 | Prior to March 1, 2019, the Emerging Markets Research Portfolio’s advisory fees were 1.15% of the Portfolio’s average daily net assets and the contractual expense limit for the Institutional Class was 1.30% of the Class’s average daily net assets. |
57
Table of Contents
Harding, Loevner Funds, Inc.
Notes to Financial Statements (continued)
October 31, 2019
3. Transactions with Affiliates and Significant Agreements (continued)
For the year ended October 31, 2019, the Investment Adviser waived and/or reimbursed the following amounts pursuant to the contractual expense limits described above:
| Portfolio | Fees waived and/or reimbursed by the Investment Adviser | ||||
International Small Companies – Institutional Class | $ | 387,102 | |||
International Small Companies – Investor Class | 173,640 | ||||
Institutional Emerging Markets – Institutional Class Z | 380,017 | ||||
Frontier Emerging Markets – Institutional Class II | 323,388 | ||||
Global Equity Research – Institutional Class | 71,050 | ||||
Global Equity Research – Investor Class | 22,361 | ||||
International Equity Research – Institutional Class | 72,414 | ||||
International Equity Research – Investor Class | 21,257 | ||||
Emerging Markets Research – Institutional Class | 73,301 | ||||
Emerging Markets Research – Investor Class | 22,120 | ||||
The Fund has an administration agreement with The Northern Trust Company (“Northern Trust”), which provides certain accounting, clerical and bookkeeping services, Blue Sky, corporate secretarial services and assistance in the preparation and filing of tax returns and reports to shareholders and the SEC.
Northern Trust also serves as custodian of each Portfolio’s securities and cash, transfer agent, dividend disbursing agent and agent in connection with any accumulation, open-account or similar plans provided to the shareholders of the Portfolios.
Foreside Fund Officer Services, LLC provides compliance support to the Fund’s Chief Compliance Officer. Fees paid pursuant to these services are shown as “Compliance officers’ fees and expenses” on the Statements of Operations.
The Fund has adopted an Amended Plan of Distribution pursuant to Rule12b-1 under the 1940 Act (“Distribution Plan”). Under the Distribution Plan, the Investor Class of each of the International Equity, International Small Companies and Frontier Emerging Markets Portfolios may pay underwriters, distributors, dealers or brokers a fee at an annual rate of up to 0.25% of the average daily net assets of the Portfolio’s Investor Class shares for services or expenses arising in connection with activities primarily intended to result in the sale of Investor Class shares of the Portfolios or for Shareholder Services (defined below) consistent with those described under the Shareholder Servicing Plan.
The Fund, on behalf of the Portfolios, has agreements with various financial intermediaries and “mutual fund supermarkets”, under which customers of these intermediaries may purchase and hold Portfolio shares. These intermediaries assess fees in consideration for providing certain account maintenance, record keeping and transactional and other shareholder services (collectively, “Shareholder Services”). With the exception of Institutional Class Z, each Portfolio or class is authorized, pursuant to a Shareholder Servicing Plan, to pay to each intermediary an annual rate of up to 0.25% of its average daily net assets attributable to that intermediary (subject to the contractual expense limits described above) for such Shareholder Services. Because of the contractual expense limits on certain Portfolios’ fees and expenses, the Investment Adviser paid a portion of the Portfolios’ share of these fees during the year ended October 31, 2019. Such payments, if any, are included in the table above under the caption “Fees waived and/or reimbursed by the Investment Adviser”.
A Portfolio may purchase securities from, or sell securities to, an affiliated fund provided the affiliation is due solely to having a common investment adviser, common officers, or common Directors. For the year ended October 31, 2019, no Portfolios engaged in purchases and/or sales of securities from an affiliated portfolio in compliance with Rule17a-7 of the 1940 Act.
4. Class Specific Expenses
The class level expenses for the year ended October 31, 2019, were as follows for each Portfolio:
| Portfolio | Distribution Fees | State Registration Filing Fees | Printing and Postage Fees | Transfer Agent Fees and Expenses | Shareholder Servicing Fees | ||||||||||||||||||||
Global Equity – Institutional Class | $ | — | $ | 10,923 | $ | 22,843 | $ | 7,152 | $ | 460,362 | |||||||||||||||
Global Equity – Institutional Class Z | — | 26,338 | 5,876 | 3,664 | — | ||||||||||||||||||||
Global Equity – Advisor Class | — | 11,810 | 6,475 | 1,965 | 177,563 | ||||||||||||||||||||
International Equity – Institutional Class | — | 335,604 | 804,457 | 475,052 | 9,663,666 | ||||||||||||||||||||
58
Table of Contents
Harding, Loevner Funds, Inc.
Notes to Financial Statements (continued)
October 31, 2019
4. Class Specific Expenses (continued)
| Portfolio | Distribution Fees | State Registration Filing Fees | Printing and Postage Fees | Transfer Agent Fees and Expenses | Shareholder Servicing Fees | |||||||||||||||
International Equity – Institutional Class Z | $ | — | $ | 187,269 | $ | 179,993 | $ | 30,415 | $ | — | ||||||||||
International Equity – Investor Class | 1,045,472 | 25,675 | 40,229 | 24,630 | 582,659 | |||||||||||||||
International Small Companies – Institutional Class | — | 22,529 | 13,115 | 3,936 | 120,430 | |||||||||||||||
International Small Companies – Investor Class | 143,005 | 19,811 | 6,567 | 1,459 | 68,159 | |||||||||||||||
Institutional Emerging Markets – Institutional Class | — | 90,878 | 258,911 | 42,694 | 3,572,003 | |||||||||||||||
Institutional Emerging Markets – Institutional Class Z | — | 18,588 | 12,960 | 8,026 | — | |||||||||||||||
Frontier Emerging Markets – Institutional Class I | — | 8,961 | 13,363 | 3,744 | 129,100 | |||||||||||||||
Frontier Emerging Markets – Institutional Class II | — | 13,586 | 4,291 | — | — | |||||||||||||||
Frontier Emerging Markets – Investor Class | 58,139 | 13,471 | 3,399 | 344 | 31,253 | |||||||||||||||
Global Equity Research – Institutional Class | — | 20,888 | 183 | — | — | |||||||||||||||
Global Equity Research – Investor Class | 465 | 11,341 | 26 | — | — | |||||||||||||||
International Equity Research – Institutional Class | — | 18,157 | 482 | — | 1,948 | |||||||||||||||
International Equity Research – Investor Class | 882 | 10,215 | 54 | — | 94 | |||||||||||||||
Emerging Markets Research – Institutional Class | — | 20,971 | — | — | — | |||||||||||||||
Emerging Markets Research – Investor Class | 472 | 11,341 | — | — | — | |||||||||||||||
5. Investment Transactions
Cost of purchases and proceeds from sales of investment securities, other than short-term investments, for the year ended October 31, 2019, were as follows for each Portfolio:
| Portfolio | Purchase Cost of Investment Securities | Proceeds from Sales of Investment Securities | ||||||||
Global Equity | $ | 366,470,140 | $ | 348,871,175 | ||||||
International Equity | 5,083,349,202 | 4,239,455,774 | ||||||||
International Small Companies | 170,799,900 | 82,516,439 | ||||||||
Institutional Emerging Markets | 1,158,380,721 | 829,343,678 | ||||||||
Emerging Markets | 968,770,454 | 714,533,137 | ||||||||
Frontier Emerging Markets | 106,039,645 | 236,158,007 | ||||||||
Global Equity Research | 2,885,875 | 2,778,950 | ||||||||
International Equity Research | 12,348,036 | 5,164,191 | ||||||||
Emerging Markets Research | 3,983,574 | 3,904,113 | ||||||||
6.In-Kind Redemptions
During the year ended October 31, 2018, the International Equity Portfolio delivered portfolio securities rather than cash in exchange for the redemption of shares for certain investors(in-kind redemptions). These investors received readily marketable securities that were valued on the redemption date using the same method employed in calculating the Portfolio’s NAV per share. The International Equity Portfolio hadin-kind redemptions of approximately $61,058,983. The redemption amounts are included in “Net increase (decrease) in net assets from portfolio share transactions” on the Statements of Changes in Net Assets. Net loss of approximately $(10,565,679) on the securities resulting from suchin-kind redemptions are included in “Net realized gain (loss) on investments and foreign currency transactions” in the Statements of Changes in Net Assets. For financial reporting purposes, these transactions are treated as sales of securities and the resulting gains and losses are recognized based on the market value of the securities on the date of the redemption. For tax purposes, no gains or losses are recognized. During the year ended October 31, 2019 there were noin-kind redemptions.
59
Table of Contents
Harding, Loevner Funds, Inc.
Notes to Financial Statements (continued)
October 31, 2019
7. Capital Share Transactions
Transactions in capital shares for the year ended October 31, 2019, were as follows for each Portfolio:
| Shares Sold | Proceeds From Shares Sold | Shares From Reinvested Dividends | Reinvestment of Dividends | Shares Redeemed | Payments for Shares Redeemed | Net Increase in Shares | Net Increase in Net Assets | |||||||||||||||||||||||||||||||||
Global Equity | ||||||||||||||||||||||||||||||||||||||||
Institutional Class | 6,480,898 | $ | 214,724,441 | 1,984,043 | $ | 59,461,782 | (6,465,537 | ) | $ | (216,491,375 | ) | 1,999,404 | $ | 57,694,848 | ||||||||||||||||||||||||||
Institutional Class Z | 2,700,167 | 89,388,860 | 514,072 | 15,391,303 | (663,559 | ) | (22,331,940 | ) | 2,550,680 | 82,448,223 | ||||||||||||||||||||||||||||||
Advisor Class | 693,636 | 21,687,688 | 310,232 | 9,294,552 | (2,183,139 | ) | (73,413,380 | ) | (1,179,271 | ) | (42,431,140 | ) | ||||||||||||||||||||||||||||
International Equity |
| |||||||||||||||||||||||||||||||||||||||
Institutional Class | 220,376,972 | 4,642,294,048 | 6,889,755 | 133,385,649 | (199,780,919 | ) | (4,208,814,556 | ) | 27,485,808 | 566,865,141 | ||||||||||||||||||||||||||||||
Institutional Class Z | 30,574,387 | 653,016,988 | 1,030,494 | 19,929,755 | (11,009,003 | ) | (235,348,291 | ) | 20,595,878 | 437,598,452 | ||||||||||||||||||||||||||||||
Investor Class | 7,439,378 | 157,313,694 | 185,567 | 3,594,437 | (10,116,759 | ) | (215,338,672 | ) | (2,491,814 | ) | (54,430,541 | ) | ||||||||||||||||||||||||||||
International Small Companies |
| |||||||||||||||||||||||||||||||||||||||
Institutional Class | 11,740,090 | 174,939,842 | 483,963 | 6,368,951 | (4,710,546 | ) | (68,869,043 | ) | 7,513,507 | 112,439,750 | ||||||||||||||||||||||||||||||
Investor Class | 942,433 | 13,279,661 | 271,646 | 3,544,980 | (1,346,337 | ) | (19,363,518 | ) | (132,258 | ) | (2,538,877 | ) | ||||||||||||||||||||||||||||
Institutional Emerging Markets |
| |||||||||||||||||||||||||||||||||||||||
Institutional Class* | 68,282,636 | 1,374,367,156 | 1,735,602 | 31,674,733 | (56,911,201 | ) | (1,132,427,811 | ) | 13,107,037 | 273,614,078 | ||||||||||||||||||||||||||||||
Institutional Class Z** | 7,607,526 | 154,213,357 | 223,763 | 4,083,688 | (2,833,432 | ) | (56,449,368 | ) | 4,997,857 | 101,847,677 | ||||||||||||||||||||||||||||||
Emerging Markets |
| |||||||||||||||||||||||||||||||||||||||
Advisor Class | 23,245,944 | 1,254,356,568 | 546,892 | 26,141,428 | (18,740,314 | ) | (982,323,159 | ) | 5,052,522 | 298,174,837 | ||||||||||||||||||||||||||||||
Frontier Emerging Markets |
| |||||||||||||||||||||||||||||||||||||||
Institutional Class I | 3,651,239 | 28,143,602 | 243,399 | 1,798,720 | (14,243,297 | ) | (109,733,409 | ) | (10,348,659 | ) | (79,791,087 | ) | ||||||||||||||||||||||||||||
Institutional Class II | 196,850 | 1,500,000 | 320,735 | 2,370,233 | (5,514,982 | ) | (46,008,183 | ) | (4,997,397 | ) | (42,137,950 | ) | ||||||||||||||||||||||||||||
Investor Class | 836,407 | 6,382,046 | 25,247 | 186,071 | (1,564,483 | ) | (12,183,714 | ) | (702,829 | ) | (5,615,597 | ) | ||||||||||||||||||||||||||||
Global Equity Research |
| |||||||||||||||||||||||||||||||||||||||
Institutional Class | 52,369 | *** | 612,560 | *** | 43,929 | 466,964 | (45 | ) | (761 | ) | 96,253 | 1,078,763 | ||||||||||||||||||||||||||||
Investor Class | — | — | 4,535 | 48,021 | (51,332 | ) | (595,751 | ) | (46,797 | ) | (547,730 | ) | ||||||||||||||||||||||||||||
International Equity Research |
| |||||||||||||||||||||||||||||||||||||||
Institutional Class | 758,015 | *** | 8,659,313 | *** | 70,702 | 728,938 | (14,045 | ) | (162,510 | ) | 814,672 | 9,225,741 | ||||||||||||||||||||||||||||
Investor Class | 1,057 | 12,337 | 8,319 | 85,106 | (102,743 | ) | (1,142,281 | ) | (93,367 | ) | (1,044,838 | ) | ||||||||||||||||||||||||||||
Emerging Markets Research |
| |||||||||||||||||||||||||||||||||||||||
Institutional Class | 56,179 | *** | 617,645 | *** | 47,469 | 473,739 | (48 | ) | (550 | ) | 103,600 | 1,090,834 | ||||||||||||||||||||||||||||
Investor Class | — | — | 4,579 | 45,469 | (55,566 | ) | (605,815 | ) | (50,987 | ) | (560,346 | ) | ||||||||||||||||||||||||||||
| * | Formerly Class I |
| ** | Formerly Class II |
| *** | Includes shares of 51,332, 99,550, 55,566 and proceeds of $595,962, $1,109,987, $605,671 for the Global Equity Research Portfolio, International Equity Research Portfolio and Emerging Markets Research Portfolio, respectively, which were transferred due to the liquidation of the Investor Class. The transfer was completed on March 1, 2019. |
Transactions in capital shares for the year ended October 31, 2018, were as follows for each Portfolio:
| Shares Sold | Proceeds From Shares Sold | Shares From Reinvested Dividends | Reinvestment of Dividends | Shares Redeemed | Payments for Shares Redeemed | Net Increase (Decrease) in Shares | Net Increase (Decrease) in Net Assets | |||||||||||||||||||||||||||||||||
Global Equity | ||||||||||||||||||||||||||||||||||||||||
Institutional Class | 4,222,061 | $ 163,660,655 | 1,985,000 | $72,809,813 | (8,196,322 | ) | $(329,513,664 | ) | (1,989,261 | ) | $(93,043,196 | ) | ||||||||||||||||||||||||||||
Institutional Class Z* | 3,022,161 | 122,288,781 | 446,208 | 16,353,512 | (671,382 | ) | (26,111,341 | ) | 2,796,987 | 112,530,952 | ||||||||||||||||||||||||||||||
Advisor Class | 1,328,597 | 51,385,900 | 246,019 | 9,021,500 | (875,815 | ) | (32,335,463 | ) | 698,801 | 28,071,937 | ||||||||||||||||||||||||||||||
International Equity |
| |||||||||||||||||||||||||||||||||||||||
Institutional Class | 232,296,256 | 5,334,395,433 | 7,307,212 | 163,096,976 | (151,929,905 | ) | (3,528,355,985 | ) | 87,673,563 | 1,969,136,424 | ||||||||||||||||||||||||||||||
60
Table of Contents
Harding, Loevner Funds, Inc.
Notes to Financial Statements (continued)
October 31, 2019
7. Capital Share Transactions (continued)
| Shares Sold | Proceeds From Shares Sold | Shares From Reinvested Dividends | Reinvestment of Dividends | Shares Redeemed | Payments for Shares Redeemed | Net Increase (Decrease) in Shares | Net Increase (Decrease) in Net Assets | |||||||||||||||||||||||||||||||||
Institutional Class Z* | 63,032,179 | $ | 1,500,188,135 | 155,042 | $ | 3,458,969 | (5,832,124 | ) | $ | (133,701,431 | ) | 57,355,097 | $ | 1,369,945,673 | ||||||||||||||||||||||||||
Investor Class | 8,607,082 | 196,360,751 | 300,709 | 6,702,815 | (17,543,028 | ) | (401,985,108 | ) | (8,635,237 | ) | (198,921,542 | ) | ||||||||||||||||||||||||||||
International Small Companies |
| |||||||||||||||||||||||||||||||||||||||
Institutional Class | 4,414,710 | 75,558,465 | 101,227 | 1,699,608 | (3,275,521 | ) | (55,391,569 | ) | 1,240,416 | 21,866,504 | ||||||||||||||||||||||||||||||
Investor Class | 2,098,944 | 36,291,266 | 32,401 | 540,442 | (1,350,567 | ) | (22,875,046 | ) | 780,778 | 13,956,662 | ||||||||||||||||||||||||||||||
Institutional Emerging Markets |
| |||||||||||||||||||||||||||||||||||||||
Class I | 50,336,127 | 1,108,172,151 | 1,419,754 | 31,021,590 | (35,863,143 | ) | (784,091,967 | ) | 15,892,738 | 355,101,774 | ||||||||||||||||||||||||||||||
Class II* | 5,107,867 | 111,057,625 | 148,910 | 3,252,204 | (4,923,508 | ) | (105,789,511 | ) | 333,269 | 8,520,318 | ||||||||||||||||||||||||||||||
Emerging Markets |
| |||||||||||||||||||||||||||||||||||||||
Advisor Class | 15,590,502 | 898,061,610 | 491,096 | 28,100,532 | (14,208,794 | ) | (805,282,861 | ) | 1,872,804 | 120,879,281 | ||||||||||||||||||||||||||||||
Frontier Emerging Markets |
| |||||||||||||||||||||||||||||||||||||||
Institutional Class I | 5,301,424 | 46,483,198 | 494,375 | 4,202,186 | (8,293,448 | ) | (70,534,681 | ) | (2,497,649 | ) | (19,849,297 | ) | ||||||||||||||||||||||||||||
Institutional Class II** | 1,432,965 | 13,004,440 | 411,729 | 3,499,694 | — | — | 1,844,694 | 16,504,134 | ||||||||||||||||||||||||||||||||
Investor Class | 1,021,089 | 8,777,456 | 52,964 | 448,605 | (1,391,249 | ) | (11,530,031 | ) | (317,196 | ) | (2,303,970 | ) | ||||||||||||||||||||||||||||
Global Equity Research |
| |||||||||||||||||||||||||||||||||||||||
Institutional Class | — | — | 18,157 | 219,334 | — | (176 | ) | 18,157 | 219,158 | |||||||||||||||||||||||||||||||
Investor Class | — | 176 | 1,884 | 22,701 | — | — | 1,884 | 22,877 | ||||||||||||||||||||||||||||||||
International Equity Research |
| |||||||||||||||||||||||||||||||||||||||
Institutional Class | 50,153 | 653,962 | 42,396 | 531,220 | (12,791 | ) | (166,983 | ) | 79,758 | 1,018,199 | ||||||||||||||||||||||||||||||
Investor Class | 12,181 | 153,036 | 5,062 | 63,122 | (10,025 | ) | (131,554 | ) | 7,218 | 84,604 | ||||||||||||||||||||||||||||||
Emerging Markets Research |
| |||||||||||||||||||||||||||||||||||||||
Institutional Class | 39,249 | 500,000 | 35,810 | 435,446 | — | — | 75,059 | 935,446 | ||||||||||||||||||||||||||||||||
Investor Class | — | — | 3,750 | 45,523 | — | — | 3,750 | 45,523 | ||||||||||||||||||||||||||||||||
| * | Share amounts have been adjusted as a result of the reverse share split effected after the close of business on December 1, 2017. (See Note 1). |
| ** | Share amounts have been adjusted as a result of the share dividend effected after the close of business on December 1, 2017. (See Note 1). |
8. Income Tax
The cost of investments for federal income tax purposes and the components of net unrealized appreciation (depreciation) on investments at October 31, 2019, for each of the Portfolios were as follows:
| Portfolio | Gross Unrealized Appreciation | Gross Unrealized Depreciation | Net Unrealized Appreciation / (Depreciation) | Cost | ||||||||||||||||
Global Equity | $ | 330,893,339 | $ | (21,011,314 | ) | $ | 309,882,025 | $ | 649,813,185 | |||||||||||
International Equity | 3,600,513,493 | (711,291,877 | ) | 2,889,221,616 | 13,193,263,096 | |||||||||||||||
International Small Companies | 50,043,208 | (13,789,993 | ) | 36,253,215 | 292,886,604 | |||||||||||||||
Institutional Emerging Markets | 1,306,590,591 | (289,223,027 | ) | 1,017,367,564 | 4,401,285,949 | |||||||||||||||
Emerging Markets | 1,201,106,779 | (196,712,199 | ) | 1,004,394,580 | 3,266,200,792 | |||||||||||||||
Frontier Emerging Markets | 67,345,702 | (16,815,643 | ) | 50,530,059 | 243,826,913 | |||||||||||||||
Global Equity Research | 1,263,361 | (254,112 | ) | 1,009,249 | 5,886,530 | |||||||||||||||
International Equity Research | 2,070,551 | (492,144 | ) | 1,578,407 | 17,860,225 | |||||||||||||||
Emerging Markets Research | 989,808 | (536,135 | ) | 453,673 | 6,747,315 | |||||||||||||||
It is the policy of each Portfolio of the Fund to qualify as a regulated investment company by complying with the applicable provisions of the Internal Revenue Code, and to make distributions of taxable income sufficient to relieve it from substantially all federal income and excise taxes; therefore, no federal income tax provision is required.
61
Table of Contents
Harding, Loevner Funds, Inc.
Notes to Financial Statements (continued)
October 31, 2019
8. Income Tax (continued)
The Portfolios may be subject to taxes imposed by countries in which they invest. Such taxes are generally based on income and/or capital gains earned. Taxes are accrued based on net investment income, net realized gains and net unrealized appreciation as such income and/or gains are recorded. Taxes accrued on unrealized gains are reflected as a liability on the Statements of Assets and Liabilities under the caption “Deferred capital gains tax” and as a reduction in “Distributable earnings”. When assets subject to capital gains tax are sold, accrued taxes are relieved, and the actual amount of the taxes paid is reflected on the Statements of Operations as a reduction in “Net realized gain (loss) on Investment Transactions”. The Portfolios seek to recover a portion of foreign withholding taxes applied to income earned in jurisdictions where favorable treaty rates for US investors are available. The portion of such taxes believed to be recoverable is reflected as an asset on the Statements of Assets and Liabilities under the caption “Tax reclaims receivable”.
Management has performed an analysis of each Portfolio’s tax positions for the open tax years as of October 31, 2019, and has concluded that no provisions for income tax are required. The Portfolios’ federal tax returns for the prior three fiscal years (open tax years: October 31, 2016; October 31, 2017; October 31, 2018) remain subject to examination by the Portfolios’ major tax jurisdictions, which include the United States, the State of New Jersey and the State of Maryland. Management is not aware of any events that are reasonably possible to occur in the next twelve months that would result in the amounts of any unrecognized tax benefits significantly increasing or decreasing for the Portfolios. However, management’s conclusions regarding tax positions taken may be subject to review and adjustment at a later date based on factors including, but not limited to, new tax laws and accounting regulations and interpretations thereof.
The tax character of distributions paid during the fiscal years ended October 31, 2019 and 2018 were as follows:
Distributions From | ||||||||||||||||||||
| Portfolio | Ordinary Income 2019 | Long-Term Capital Gains 2019 | Ordinary Income 2018 | Long-Term Capital Gains 2018 | ||||||||||||||||
Global Equity | $ | 5,039,201 | $ | 84,041,831 | $ | 12,438,660 | $ | 89,283,118 | ||||||||||||
International Equity | 191,998,952 | — | 109,614,020 | 89,572,490 | ||||||||||||||||
International Small Companies | 1,400,782 | 10,538,794 | 1,712,845 | 890,383 | ||||||||||||||||
Institutional Emerging Markets | 42,525,477 | — | 38,761,437 | — | ||||||||||||||||
Emerging Markets | 29,768,361 | — | 28,497,360 | 1,842,865 | ||||||||||||||||
Frontier Emerging Markets | 4,881,573 | — | 9,138,364 | — | ||||||||||||||||
Global Equity Research | 231,465 | 283,521 | 242,035 | — | ||||||||||||||||
International Equity Research | 306,053 | 507,992 | 345,365 | 248,978 | ||||||||||||||||
Emerging Markets Research | 175,404 | 343,803 | 480,970 | — | ||||||||||||||||
As of October 31, 2019, the components of distributable earnings/ (deficit) on a tax basis were as follows:
| Portfolio | Undistributed Ordinary Income | Undistributed Long-Term Capital Gains | Accumulated Capital and Other Losses | Unrealized Appreciation (Depreciation)* | Total Accumulated Earnings/(Deficit) | ||||||||||||||||||||
Global Equity | $ | 5,797,294 | $ | — | $ | (1,713,943 | ) | $ | 309,878,418 | $ | 313,961,769 | ||||||||||||||
International Equity | 242,519,092 | — | (132,716,245 | ) | 2,889,313,986 | 2,999,116,833 | |||||||||||||||||||
International Small Companies | 1,323,056 | — | (3,791,115 | ) | 36,249,043 | 33,780,984 | |||||||||||||||||||
Institutional Emerging Markets | 77,683,984 | — | (158,699,491 | ) | 1,015,658,954 | 934,643,447 | |||||||||||||||||||
Emerging Markets | 58,253,618 | — | (14,198,703 | ) | 1,003,458,664 | 1,047,513,579 | |||||||||||||||||||
Frontier Emerging Markets | 5,812,512 | — | (124,209,713 | ) | 49,799,790 | (68,597,411 | ) | ||||||||||||||||||
Global Equity Research | 72,644 | 296,142 | — | 1,009,155 | 1,377,941 | ||||||||||||||||||||
International Equity Research | 180,758 | 142,337 | (6,014 | ) | 1,578,432 | 1,895,513 | |||||||||||||||||||
Emerging Markets Research | 135,255 | 154,592 | — | 452,523 | 742,370 | ||||||||||||||||||||
* The difference between book basis and tax basis net unrealized appreciation is attributable primarily to the tax deferral of losses on certain sale of securities. Unrealized Appreciation (Depreciation) includes amounts related to foreign currency and currency translations.
The Regulated Investment Company Modernization Act of 2010 (the “Act”) changed various technical rules governing the tax treatment of regulated investment companies and became effective for the Portfolios for the fiscal year ended October 31, 2012. Under the Act, each Portfolio is permitted to carry forward capital losses incurred in taxable years beginning after the date of enactment for an unlimited period. However, any losses incurred during post-enactment years are required to be utilized prior to the losses incurred inpre-enactment taxable years, which carry
62
Table of Contents
Harding, Loevner Funds, Inc.
Notes to Financial Statements (continued)
October 31, 2019
8. Income Tax (continued)
an expiration date. As a result of this ordering rule,pre-enactment capital loss carryforwards may be more likely to expire unused. Additionally, post-enactment capital loss carryforwards will retain their character as either short-term or long-term capital losses rather than being considered all short-term as permitted under previous regulation.
At October 31, 2019, capital losses incurred that will be carried forward indefinitely under provisions of the Act are as follows:
| Portfolio | Short-Term Capital Loss Carryforward | Long-Term Capital Loss Carryforward | ||||||||
Global Equity | $ | — | $ | (1,713,943 | ) | |||||
International Equity | (132,716,245 | ) | — | |||||||
International Small Companies | (3,791,115 | ) | — | |||||||
Institutional Emerging Markets | (45,085,901 | ) | (113,613,590 | ) | ||||||
Emerging Markets | (14,198,703 | ) | — | |||||||
Frontier Emerging Markets | (16,639,343 | ) | (107,570,370 | ) | ||||||
At October 31, 2019, Institutional Emerging Markets had $3,834,973 ofpre-enactment capital loss carryforwards expire unused.
Primarily as a result of differing book/tax treatment of foreign currency transactions and foreign capital gain tax expenses, the Portfolios made reclassifications among certain capital accounts. The reclassifications have no impact on the net assets of the Portfolios. As of October 31, 2019, the following reclassifications were made to the Statements of Assets and Liabilities:
| Portfolio | Paid-in Capital | Distributable earnings | ||||||
International Equity | $ | (19,041 | ) | $ | 19,041 | |||
Institutional Emerging Markets | (3,834,973 | ) | 3,834,973 | |||||
9. Foreign Exchange Contracts
The Portfolios do not generally hedge foreign currency exposure, however, the Portfolios may enter into forward foreign exchange contracts in order to hedge their exposure to changes in foreign currency exchange rates on their foreign portfolio holdings. Each Portfolio will conduct its currency transactions either on a spot (cash) basis at the rate prevailing in the currency exchange market, or by entering into forward contracts to purchase or sell currency. Foreign currency transactions entered into on the spot markets serve to pay for foreign investment purchases or to convert to dollars, the proceeds from foreign investment sales or dividend and interest receipts. The Portfolios will disclose open forward currency contracts, if any, on the Portfolios of Investments. The Portfolios do not separately disclose open spot market transactions on the Portfolios of Investments. Such realized gain (loss) and unrealized appreciation (depreciation) on spot market transactions is included in “Net realized gain (loss) on foreign currency transactions” and “Change in unrealized appreciation (depreciation) on translation of assets and liabilities denominated in foreign currencies”, respectively, on the Portfolios’ Statements of Operations. The Portfolios held no open forward currency contracts as of or during the fiscal year ended October 31, 2019.
10. Participation Notes
Each Portfolio may invest in participation notes. Participation notes are promissory notes that are designed to replicate the return of a particular underlying equity or debt security, currency or market. Participation notes are issued by banks or broker-dealers or their affiliates and allow a Portfolio to gain exposure to common stocks in markets where direct investment may not be allowed. Participation notes are generally tradedover-the-counter. In addition to carrying the same risks associated with a direct investment in the underlying security, participation notes are subject to the risk that the broker-dealer or bank that issues them will not fulfill its contractual obligation to complete the transaction with a Portfolio. Participation notes constitute general unsecured contractual obligations of the banks or broker-dealers that issue them, and a Portfolio would be relying on the creditworthiness of such banks or broker-dealers and would have no rights under a participation note against the issuer(s) of the underlying security(ies). Participation notes may be more volatile and less liquid than other investments held by the Portfolios.
63
Table of Contents
Harding, Loevner Funds, Inc.
Notes to Financial Statements (continued)
October 31, 2019
11. Concentration of Ownership
At October 31, 2019, the percentage of total shares outstanding held by record shareholders each owning 10% or greater of the aggregate shares outstanding of each Portfolio were as follows:
| No. of Shareholders | % Ownership | |||||||||
Global Equity | 3 | 44.83 | %* | |||||||
International Equity | 3 | 50.66 | %* | |||||||
International Small Companies | 3 | 56.00 | %* | |||||||
Institutional Emerging Markets | 2 | 55.77 | %* | |||||||
Emerging Markets | 3 | 63.68 | %* | |||||||
Frontier Emerging Markets | 3 | 50.84 | %* | |||||||
Global Equity Research | 2 | 83.35 | % | |||||||
International Equity Research | 3 | 72.78 | %* | |||||||
Emerging Markets Research | 2 | 74.59 | % | |||||||
| * | Includes omnibus positions of broker-dealers representing numerous shareholder accounts. |
Investment activities of these shareholders may have a material effect on the Portfolios.
12. Concentration of Risk
Investing in securities of foreign issuers and currency transactions may involve certain considerations and risks not typically associated with investments in U.S. issuers. These risks include revaluation of currencies, adverse fluctuations in foreign currency values and possible adverse political, social and economic developments, including those particular to a specific industry, country or region, which could cause the securities and their markets to be less liquid and prices more volatile than those of comparable U.S. companies and U.S. government securities. These risks are greater with respect to securities of issuers located in emerging market countries in which the Portfolios are authorized to invest.
Frontier Emerging Markets is permitted to invest up to 35% of its total assets in companies in the same industry, if, at the time of investment, that industry represents 20% or more of the Portfolio’s benchmark index. During periods when the Portfolio has invested more than 25% of its total assets in companies in the same industry, it will operate as a concentrated portfolio and be subject to additional risks and greater volatility. Such additional risks include increased competition within the industry, or changes in legislation, or government regulations affecting the industry. The value of the Portfolio’s shares may be particularly vulnerable to factors affecting the banking industry, such as the availability and cost of capital funds, changes in interest rates, the rate of corporate and consumer debt defaults, extensive government regulation, and price competition. Such risks may be magnified with respect to securities of issuers in Frontier Emerging Markets. At October 31, 2019, the Portfolio’s investment in the Banking industry amounted to 33.38% of its total assets.
13. Line of Credit
The Fund has a $150 million line of credit agreement with Northern Trust. Borrowings are made solely to facilitate the handling of redemptions or unusual or unanticipated short-term cash requirements. Because several Portfolios participate and collateral requirements apply, there is no assurance that an individual Portfolio will have access to the entire $150 million at any particular time. Interest is charged to each Portfolio based on its borrowings at an amount above the Federal Funds rate, subject to a minimum rate. In addition, a facility fee is computed at an annual rate of 0.15% on the line of credit and is allocated among the Portfolios.
For the year ended October 31, 2019, International Small Companies had an outstanding balance for ten days with a maximum balance of $10,700,000 at an average weighted interest rate of 3.51%. For the year ended October 31, 2019, Frontier Emerging Markets had an outstanding balance for seven days with a maximum balance of $1,000,000 at an average weighted interest rate of 3.60%. For the year ended October 31, 2019, Emerging Markets Research had an outstanding balance for four days with a maximum balance of $100,000 at an average weighted interest rate of 3.65%.
14. Subsequent Events
Subsequent events occurring after the date of this report have been evaluated for potential impact, for purposes of recognition or disclosure in the financial statements, through the date the report was issued.
64
Table of Contents
Harding, Loevner Funds, Inc.
Notes to Financial Statements (continued)
October 31, 2019
14. Subsequent Events (continued)
On November 25, 2019, U.S. Bancorp, the parent company of Quasar Distributors, LLC, the Fund’s distributor, announced that it had signed a purchase agreement to sell Quasar to Foreside Financial Group, LLC such that Quasar will become a wholly-owned broker-dealer subsidiary of Foreside. The transaction is expected to close by the end of March 2020. Quasar will remain the Fund’s distributor at the close of the transaction, subject to Board approval.
65
Table of Contents
| ||
KPMG LLP | ||
Aon Center | ||
Suite 5500 | ||
200 E. Randolph Street | ||
Chicago, IL 60601-6436 |

Report of Independent Registered Public Accounting Firm
To the Shareholders and Board of Directors
Harding, Loevner Funds, Inc.:
Opinion on the Financial Statements
We have audited the accompanying statements of assets and liabilities of Global Equity Portfolio, International Equity Portfolio, International Small Companies Portfolio, Institutional Emerging Markets Portfolio, Emerging Markets Portfolio, Frontier Emerging Markets Portfolio, Global Equity Research Portfolio, International Equity Research Portfolio, and Emerging Markets Research Portfolio (each a portfolio of the Harding, Loevner Funds, Inc.) (the Portfolios), including the portfolios of investments, as of October 31, 2019, the related statements of operations for the year then ended, the statements of changes in net assets for each of the years in thetwo-year period then ended, and the related notes (collectively, the financial statements) and the financial highlights for each of the years or periods presented therein in the five-year period then ended. In our opinion, the financial statements and financial highlights present fairly, in all material respects, the financial position of the Portfolios as of October 31, 2019, the results of their operations for the year then ended, the changes in their net assets for each of the years in thetwo-year period then ended, and the financial highlights for each of the years or periods in the five-year period then ended, in conformity with U.S. generally accepted accounting principles.
Basis for Opinion
These financial statements and financial highlights are the responsibility of the Portfolios’ management. Our responsibility is to express an opinion on these financial statements and financial highlights based on our audits. We are a public accounting firm registered with the Public Company Accounting Oversight Board (United States) (PCAOB) and are required to be independent with respect to the Portfolios in accordance with the U.S. federal securities laws and the applicable rules and regulations of the Securities and Exchange Commission and the PCAOB.
We conducted our audits in accordance with the standards of the PCAOB. Those standards require that we plan and perform the audit to obtain reasonable assurance about whether the financial statements and financial highlights are free of material misstatement, whether due to error or fraud. Our audits included performing procedures to assess the risks of material misstatement of the financial statements and financial highlights, whether due to error or fraud, and performing procedures that respond to those risks. Such procedures included examining, on a test basis, evidence regarding the amounts and disclosures in the financial statements and financial highlights. Such procedures also included confirmation of securities owned as of October 31, 2019, by correspondence with custodians and brokers. Our audits also included evaluating the accounting principles used and significant estimates made by management, as well as evaluating the overall presentation of the financial statements and financial highlights. We believe that our audits provide a reasonable basis for our opinion.

We have served as the auditor of Harding, Loevner Funds, Inc. Portfolios since 2006.
Chicago, Illinois
December 13, 2019
KPMG LLP is a Delaware limited liability partnership and the U.S. member
firm of the KPMG network of independent member firms affiliated with
KPMG International Cooperative (“KPMG International”), a Swiss entity.
Table of Contents
Harding, Loevner Funds, Inc.
(unaudited)
Global Equity, International Equity, International Small Companies, Institutional Emerging Markets, Emerging Markets, Frontier Emerging Markets, Global Equity Research, International Equity Research, and Emerging Markets Research paid qualifying foreign taxes of $0, $31,979,822, $422,668, $10,068,804, $8,020,769, $1,180,231, $8,877, $25,219, and $16,179 and earned $0, $277,029,376, $2,055,932, $89,883,839, $67,849,254, $7,576,258, $63,573, $210,616, and $106,520 from foreign source income during the fiscal year ended October 31, 2019, respectively. Pursuant to Section 853 of the Internal Revenue Code, Global Equity, International Equity, International Small Companies, Institutional Emerging Markets, Emerging Markets, Frontier Emerging Markets, Global Equity Research, International Equity Research, and Emerging Markets Research designated $0.0000, $0.0451, $0.0200, $0.0440, $0.1044, $0.0636, $0.0162, $0.0156, and $0.0257 per share as foreign taxes paid and $0.0000, $0.3910, $0.0975, $0.3926, $0.8835, $0.4083, $0.1159, $0.1302, and $0.1689 as income earned from foreign sources for the fiscal year ended October 31, 2019, respectively.
Global Equity, International Equity, International Small Companies, Institutional Emerging Markets, Emerging Markets, Frontier Emerging Markets, Global Equity Research, International Equity Research, and Emerging Markets Research had qualifying dividend income of $9,894,762, $304,561,423, $3,902,024, $89,194,669, $70,841,689, $7,326,584, $120,728, $254,971, and $134,853, respectively, during the fiscal year ended October 31, 2019.
For the fiscal year ended October 31, 2019, Global Equity designated 62.60% of the distributions from net investment income as qualifying for the 70% corporate dividend received deduction.
For the fiscal year ended October 31, 2019, International Equity designated 3.26% of the distributions from net investment income as qualifying for the 70% corporate dividend received deduction.
For the fiscal year ended October 31, 2019, International Small Companies designated 8.26% of the distributions from net investment income as qualifying for the 70% corporate dividend received deduction.
For the fiscal year ended October 31, 2019, Global Equity Research designated 45.43% of the distributions from net investment income as qualifying for the 70% corporate dividend received deduction.
Pursuant to Section 852 of the Internal Revenue Code, Global Equity Research designated $296,142 as a long term capital gain dividend for the fiscal year ended October 31, 2019.
Pursuant to Section 852 of the Internal Revenue Code, International Equity Research designated $142,337 as a long term capital gain dividend for the fiscal year ended October 31, 2019.
Pursuant to Section 852 of the Internal Revenue Code, Emerging Markets Research designated $154,592 as a long term capital gain dividend for the fiscal year ended October 31, 2019.
67
Table of Contents
Harding, Loevner Funds, Inc.
Approval of Investment Advisory Agreement
(unaudited)
Approval of Investment Advisory Agreements
At anin-person meeting of the board of directors (the “Board”) of Harding, Loevner Funds, Inc. (the “Fund”) held on June 14, 2019 (the “June Meeting”), the Board, including a majority of those directors who are not “interested persons” of the Fund, as defined in the Investment Company Act of 1940, as amended (the “Independent Directors”), considered and approved the continuation of three investment advisory agreements (the “Advisory Agreements”): the first, between Harding Loevner LP (“Harding Loevner” or the “Adviser”) and the Fund on behalf of the Global Equity Portfolio, the International Equity Portfolio, the International Small Companies Portfolio, the Institutional Emerging Markets Portfolio, the Emerging Markets Portfolio, and the Frontier Emerging Markets Portfolio (collectively, the “Traditional Portfolios”); the second between the Adviser and the Fund on behalf of the International Equity Research Portfolio (the “IER Portfolio”); and the third between the Adviser and the Fund on behalf of the Global Equity Research Portfolio (the “GER Portfolio”) and Emerging Markets Research Portfolio (the “EMR Portfolio” and together with the IER Portfolio and GER Portfolio, the “Research Portfolios”, and together with the Traditional Portfolios, each a “Portfolio” and together the “Portfolios”).
Overview of the Review Process
Prior to the June Meeting, the Board established a subcommittee of the Governance Committee of the Board (the “Governance Committee”) comprised of three Independent Directors (the “Subcommittee”) to conduct a preliminary review of the materials provided to the Board by the Adviser in connection with consideration of the Advisory Agreements, to assist the Board in its deliberations, and to liaise with the Adviser. In addition, legal counsel to the Independent Directors (“Independent Counsel”), on behalf of the Independent Directors, delivered to the Adviser a written request for information that the Board believed necessary to evaluate the terms of the Advisory Agreements. In response, the Adviser furnished materials to facilitate the Board’s evaluation the terms of the Advisory Agreements (the “Renewal Materials”), including information on, among other things: (i) the investment performance, expenses and advisory fees of each Portfolio relative to other mutual funds and benchmark indices, as set forth in reports prepared by Strategic Insight (the “Strategic Insight Reports”), a third party fund analytics provider engaged as part of the Advisory Agreement review process; (ii) the Adviser’s profitability and costs arising from services provided to the Fund; (iii) the qualifications of the Adviser and portfolio management personnel with respect to services provided to the Portfolios; and (iv) the Adviser’s investment research capabilities and resources.
In preparation for the June Meeting, the Adviser provided the Subcommittee a preliminary version of the Renewal Materials for review and comment. The Subcommittee and representatives of the Adviser discussed the preliminary Renewal Materials during a telephonic meeting on May 21, 2019. Following this meeting, the Adviser revised the Renewal Material in response to the Subcommittee’s comments and distributed the Renewal Materials in final form to the full Board. The Board also received and considered a memorandum regarding the Board’s responsibilities in connection with renewal of the Advisory Agreements prepared by Independent Counsel and Independent Counsel assisted the Independent Directors throughout the process.
At the June Meeting, both in general and executive sessions, the Board considered and discussed the materials presented by the Adviser. During the presentations, the Adviser expanded on those materials and responded to specific questions from the Board. Among other things, the Adviser focused on the long-term performance records of the Portfolios and the competitiveness of the Portfolios’ advisory fees and total expense ratios. The Adviser also focused on the quality of the services provided to the Portfolios and its continued investment in personnel, technology and other investment management products that service the Fund. The Independent Directors met in executive session with Independent Counsel prior to the commencement of the June Meeting to discuss the materials provided by the Adviser and met in executive session again following the Adviser’s presentation on the Advisory Agreements and further discussed the information presented during the meeting.
In evaluating continuance of the Advisory Agreements with respect to each Portfolio, among other things, the Board considered the various factors and information discussed below. The following discussion is not intended to beall-inclusive, as the Board reviewed a variety of factors and considered a significant amount of information.
Nature, Extent and Quality of Services
The Board evaluated the information it deemed necessary to assess the nature, extent and quality of investment advisory services provided to the Portfolios by the Adviser. The Board also considered the nature, extent and quality of the extensivenon-advisory services provided to the Portfolios by the Adviser, including portfolio trading; the resources devoted to, and the record of compliance with, each Portfolio’s compliance policies and procedures; the resources devoted to the supervision of third-party service providers; and the quality and quantity of administrative and shareholder servicing. The Board noted that it received information in connection with quarterly Board and committee meetings throughout the year regarding the services rendered by the Adviser concerning the management of each Portfolio’s affairs and the Adviser’s role in coordinating providers of other services to the Portfolios.
68
Table of Contents
Harding, Loevner Funds, Inc.
Approval of Investment Advisory Agreement (continued)
(unaudited)
The Adviser presented and discussed with the Board the qualifications, backgrounds and responsibilities of the Adviser’s management team and information regarding the members of each Portfolio’s portfolio management team. The Board evaluated the Adviser’s ability to attract and retain qualified investment advisory andnon-advisory personnel and engaged in a discussion with the Adviser regarding its recruitment, retention and professional development programs and strategies.
The Board also considered the adequacy of the Adviser’s financial and operational resources committed to each Portfolio, and how well the Adviser utilizes those resources to meet the Portfolio’s investment needs, to overseenon-investment services and to satisfy compliance requirements.
The Board further noted that, as of March 31, 2019, the Adviser had approximately $66.03 billion in assets under management and that the Fund was the Adviser’s largest client, with assets of approximately $25.41 billion. The Board took into account the benefits realized by the Portfolios from the Adviser’s affiliation with Affiliated Managers Group, Inc., an established global asset management company.
The Board considered annual and periodic reports of the Fund’s Chief Compliance Officer (the “CCO”) with respect to the effectiveness and adequacy of the Fund’s and the Adviser’s compliance programs, including program enhancements related to information security and financial intermediary oversight and noted the additional compliance services that are provided, including liquidity risk management. The Board noted the CCO’s determination that the Adviser’s compliance program is reasonably designed to prevent violations of the federal securities laws.
Based on these considerations, the Board concluded that it was satisfied with the nature, extent and quality of services historically provided and to be provided to each Portfolio under its Advisory Agreements.
Performance of the Adviser
For each Portfolio, the Board considered, among other things, the historical performance for multiple time periods ended as of March 31, 2019, including theone-year, three-year, five-year andten-year periods (or shorter for newer Portfolios) included in the Strategic Insight Reports, compared against each Portfolio’s Morningstar Category and benchmark index. The Board considered the Portfolios’ risk-adjusted performance and the high active share (i.e., low overlap with benchmark indices) inherent in the Adviser’s investment process.
With respect to the recent performance of the Portfolios, the Board noted that for theone-year period ended March 31, 2019: each share class of the International Small Companies Portfolio, Global Equity Research Portfolio and Emerging Markets Research Portfolio outperformed the Portfolio’s respective Morningstar Category and benchmark index; each share class of the Global Equity Portfolio, International Equity Portfolio, Emerging Markets Portfolio, Institutional Emerging Markets Portfolio, Frontier Emerging Markets Portfolio and International Equity Research Portfolio underperformed compared to the Portfolios’ respective Morningstar Category and benchmark index.
In assessing longer term performance by the Portfolios, for the five-year period ended March 31, 2019, the Board noted that each share class of all Portfolios, except the share classes of the Frontier Emerging Markets Portfolio and the International Small Companies Portfolio, with at least five years of operations, outperformed its respective Morningstar Category and benchmark index. Each share class of the International Small Companies Portfolio outperformed the Portfolio’s benchmark index, but underperformed its respective Morningstar Category.
For theten-year period ended March 31, 2019, the Board noted that each share class of all Portfolios with at least ten years of operations outperformed its respective Morningstar Category and benchmark index, except for the share classes of the Frontier Emerging Markets Portfolio, which outperformed the Portfolio’s benchmark index, but underperformed its respective Morningstar Category.
In addition, the Board reviewed the Adviser’s investment philosophy used to manage the Portfolios, as well as the effectiveness of the Adviser’s use of portfolio management teams for theday-to-day management of Portfolios. The Board noted the Adviser’sbottom-up, business-focused approach based on a study of individual companies and the competitive dynamics of the global industries in which those companies participate. The Board considered the Adviser’s disciplined adherence to its investment philosophy and process as well as the evolutionary enhancements to the methodology used in its implementation.
In evaluating the investment performance of the Portfolios, the Board acknowledged that the Adviser’s investment style may result in periods of underperformance, but has generally produced outperformance over longer time periods and that the Portfolios generally performed well relative to their respective benchmark index. The Board also considered the Adviser’s ongoing efforts to identify the causes of any underperformance and the effectiveness of the Adviser’s efforts to address underperformance. Finally, the Board considered that the Morningstar Category performance data provided within the Strategic Insight Reports was less useful with respect to the Frontier Emerging Markets Portfolio, as Morningstar did not have a Frontier category at March 31, 2019 and instead compared the Portfolio to the Diversified Emerging Markets category.
69
Table of Contents
Harding, Loevner Funds, Inc.
Approval of Investment Advisory Agreement (continued)
(unaudited)
Based on these considerations, the Board concluded that each Portfolio’s performance was consistent with the Adviser’s investment discipline.
Costs of the Services and Profitability of the Adviser
The Board considered information regarding the Adviser’s costs to provide investment management services to the Portfolios and the profitability to the Adviser from managing the Portfolios. In evaluating the Adviser’s profitability, the Board considered the Adviser’s profitability analyses for calendar years 2017 and 2018, noting that the Adviser’s profitability in relation to its management of the Portfolios was slightly lower in 2018 than the prior year. The Board also considered profitability adjusted, on a pro forma basis, for estimated provisions for federal and state corporate income taxes; each Portfolio’s expense ratio; the allocation methodology used by the Adviser to compute such profitability; and the Adviser’s contractual fee waivers and expense reimbursements with respect to the applicable Portfolios. The Board further considered profitability on aPortfolio-by-Portfolio basis, focusing on the Adviser’s profit both with and without taking into account those costs borne by the Adviser with respect to its efforts to expand the Portfolios’ shareholder base.
The Adviser also presented its profitability analyses for calendar years 2017 and 2018 on an adjusted basis to reflect the equity-related compensation received by certain senior personnel of the Adviser who are limited partners of the Adviser. In the adjusted profitability analyses, the Adviser stated that it had adjusted the Adviser’s personnel expenses to an amount that more closely resembled the compensation paid to similarly situated personnel at peer firms, noting that the salaries and bonuses paid to the Adviser’s limited partners are lower than the compensation paid at peer firms because the limited partners also receive equity-related compensation. The Board noted that this adjusted profitability information was useful in its consideration and assessment of the Adviser’s profitability.
The Board took note of the costs the Adviser has incurred that are intended to assure the continued delivery of high-quality services to its clients, including the Portfolios, and the future costs the Adviser plans to incur, including hiring additional qualified personnel and further investing in technology, including with respect to cybersecurity as well as enhancing its operational infrastructure. The Board considered the Adviser’s need to accommodate changing regulatory requirements and to adapt to structural changes in the mutual fund marketplace. The Board also noted that future profitability to the Adviser from managing the Portfolios would depend on the level of assets in the Portfolios and investment returns, as well as the Adviser’s total assets under management, and may be limited as certain Portfolios’ investment strategies encounter their capacity limitations. In assessing profitability, the Board considered each Portfolio’s profitability in the context of the services provided, the reasonableness of the fees charged for those services and the continued growth of assets through new investments.
Based upon these considerations, the Board concluded that the profits historically realized by the Adviser, and the profits the Adviser anticipates will be realized from its continued relationship with the Portfolios, are not excessive in light of the nature, extent and quality of the services provided to the Portfolios.
Comparison of Fees and Services Provided by the Adviser
The Board reviewed the contractual advisory fees that are payable by the Portfolios to the Adviser and the actual investment advisory fees realized by the Adviser taking into account the fee waiver and/or expense reimbursement arrangements for certain of the Portfolios. The Board considered the fact that the Adviser’s waiver/expense reimbursement arrangements are not subject to recapture and that the proposed fee reductions and breakpoints were contractual in nature, noting that in fiscal-year 2018 the Adviser waived a portion of its advisory fees for the following Portfolios: Global Equity Portfolio (Institutional Class Z), Institutional Emerging Markets Portfolio (Institutional Class Z), Frontier Emerging Markets Portfolio (Investor and Institutional Class II), International Small Companies Portfolio, International Equity Research Portfolio, Global Equity Research Portfolio and Emerging Markets Research Portfolio. In addition, the Board compared the Adviser’s separate account fee schedule with the advisory fees payable by the Portfolios to the Adviser. Finally, the Board considered the Strategic Insight Reports, which included information comparing each Portfolio’s management fee and overall expenses with those of funds in a group of peer funds selected by Strategic Insight (the “Expense Group”).
The Board noted that the net operating expenses of each Portfolio (expenses other than the fees pursuant to the Advisory Agreements and distribution and service fees) were at or below the median of their respective Expense Groups and of their respective Morningstar Category-derived universe (the “Expense Universe”), with the exception of the Global Equity Research Portfolio, International Equity Research Portfolio, and Emerging Markets Research Portfolio, which had net operating expenses above their respective Expense Group and Expense Universe medians due to the small asset size of the Portfolios, although this was partially offset by the voluntary subsidy of the Portfolios by the Adviser. The Board also observed that, except as noted below, the total expense ratio of each class of each Portfolio, after any applicable waiver of advisory fees and reimbursement of expenses, was below its respective Expense Group and Expense Universe medians. Exceptions included the Institutional Class of the Institutional Emerging Markets Portfolio, which had a total expense ratio above the median for both its Expense Group and Expense Universe and the Institutional Class of the International Small Companies Portfolio, which had a total expense ratio above the median for its Expense Universe. The Board did not consider any of these differences to be material.
70
Table of Contents
Harding, Loevner Funds, Inc.
Approval of Investment Advisory Agreement (continued)
(unaudited)
The Board noted that the net management fee for each class of each Portfolio was at or below the median of its Expense Group, except for the Advisor Class of the Global Equity Portfolio, Emerging Markets Portfolio (Advisor Class), both classes of the Institutional Emerging Markets Portfolio and all classes of the Frontier Emerging Markets Portfolio, which were above the median for their respective Expense Groups. The Board also noted that, for each Portfolio with an Expense Universe, the net management fee was at or below the median of its Expense Universe, except for the Global Equity Portfolio (all classes), International Small Companies Portfolio (Institutional Class), Emerging Markets Portfolio (Advisor Class) and both classes of the Institutional Emerging Markets Portfolio, which were above the median for their respective Expense Universes. In its consideration of each Portfolio’s net management fee, the Board considered each Portfolio’s performance record and the extensive scope ofnon-advisory services provided by the Adviser, which it performs without additional compensation.
The Board recognized that the Adviser’s separate account and collective trust clients require fewer services from the Adviser than the Fund. The Board additionally recognized the Adviser’s efforts to increase institutional account minimums and direct more institutional investors into pooled vehicles, including the Portfolios. Further, the Board took note that many sophisticated institutional investors, after reviewing similar investment vehicles with the assistance of their consultants, had determined and continue to invest in the Portfolios, which further supported the reasonableness of the advisory fees charged by the Adviser. The Board also noted the Adviser’s commitment to periodically review the fees charged to the Portfolio and propose management fee reductions, if appropriate, as it has done in the past, to ensure that the fees remain competitive.
Based on these considerations, the Board concluded that each Portfolio’s fee, in light of the services provided by the Adviser, was reasonable.
Economies of Scale
The Board considered the extent to which economies of scale have been realized as the Portfolios’ assets grew, whether there is potential for realization of further economies of scale for the Portfolios, and whether material economies of scale are being shared with shareholders. The Board also considered that the Portfolios have benefitted both from asset growth in the Portfolios and even more from asset growth in the Adviser’s other accounts, each of which have resulted in certain expenses becoming a smaller percentage of overall assets.
The Board acknowledged that other aspects of the Portfolios’ investment strategies may limit the realization of economies of scale, including a particular strategy’s capacity limitations. The Board noted that, as of March 1, 2019, the Emerging Markets Portfolio and Institutional Emerging Markets Portfolio are open to new investors subject to certain limitations at the Fund’s discretion. Further, the Board recognized that access to the International Equity Portfolio is limited and may not be available to all investors. The Board also acknowledged the Adviser’s considerable and continued reinvestment in its business and its business plans for the Research Portfolios and paying for the associated expenses out of its own profits, including through revenue sharing payments.
The Board considered that the Adviser assumes substantial business risk each time it sponsors a new Portfolio and that the fee waivers in place for the three Research Portfolios currently exceed the Adviser’s advisory fee. The Board also noted that the Adviser provides the same high quality services to the International Small Companies Portfolio and Research Portfolios that have not yet achieved profitability due to their smaller level of assets.
Based on these considerations, the Board concluded that it was satisfied with the extent to which economies of scale currently are and will be realized for the benefit of the Portfolios’ shareholders, and recognized its obligation to consider the same annually based on changing circumstances.
Other Benefits
The Board considered other benefits derived or to be derived by the Adviser from the relationship with the Portfolios as part of its consideration of continuance of the Advisory Agreements. In this regard, the Board noted that the only tangible material indirect benefit from the Adviser’s relationship with the Portfolios is from the receipt of research products and services obtained through soft dollars in connection with Portfolio brokerage transactions. The Board also considered the extent to which the Adviser and its clients, including the Portfolios, benefitted from receipt of these research products and services.
The Board also considered the benefits that the Portfolios derived from their association with the Adviser. In this regard, the Board considered the competitive nature of the mutual fund marketplace and that many of the Portfolios’ shareholders invested in the Portfolios because of the Fund’s relationship with the Investment Adviser.
71
Table of Contents
Harding, Loevner Funds, Inc.
Approval of Investment Advisory Agreement (continued)
(unaudited)
Conclusion
Following extensive discussion, both in general session and in executive sessions of the Independent Directors meeting alone with Independent Counsel, the Board determined that it had received sufficient information to take action on the proposed resolutions regarding continuance of the Advisory Agreements and that all of its questions had been addressed to its satisfaction. The Board, including a majority of the Independent Directors, concluded with respect to each Portfolio that its investment advisory fees were sufficiently supported by their review of the factors described above.
In light of all the foregoing, the Board, and separately, a majority of the Independent Directors, approved the continuance of each Advisory Agreement on behalf of the respective Portfolio(s). The Board’s approval determinations were made on the basis of each director’s business judgment after consideration of all the information presented. The Board’s decision was based on all of the above-mentioned factors and their related conclusions, with no single factor or conclusion being determinative and with each director not necessarily attributing the same weight to each factor.
72
Table of Contents
Harding, Loevner Funds, Inc.
(unaudited)
HARDING, LOEVNER FUNDS, INC.
PRIVACY NOTICE
The Fund collects nonpublic personal information about you from the following sources:
| • | Information, such as your name, address, social security number, assets and income, submitted by you on applications, forms, or in other written or verbal customer communications. This information may also be provided by a consultant or intermediary acting on your behalf. |
| • | Information that results from any transaction performed by us for you. |
The Fund will not disclose any nonpublic personal information about you or its former customers to anyone except as permitted or required by law.
If you decide to close your account(s) or become an inactive customer, the Fund will adhere to the privacy policies and practices as described in this notice.
The Fund restricts access to your personal and account information to only those employees who need to know that information to provide products or services to you. The Fund maintains physical, administrative and technical safeguards to protect your nonpublic personal information.
73
Table of Contents
Harding, Loevner Funds, Inc.
Directors and Principal Officers
(unaudited)
Independent Directors:
Name, Address and Age | Position with the Fund | Term of Office | Principal Occupation During Past Five Years | Number of Portfolios in Fund Complex Overseen By Director | Other Directorships | |||||
Carolyn N. Ainslie c/o Harding Loevner LP 400 Crossing Boulevard Fourth Floor Bridgewater, NJ 08807 Age, 61 | Director | Indefinite; Director since 2014; Member of the Audit Committee since 2015 – Present and Co – Chairperson June – December, 2017 and Chairperson since 2018; Member of the Governance Committee since March 2018 | Bill & Melinda Gates Foundation, Chief Financial Officer, 2018-present; Princeton University, Vice President for Finance and Treasurer, 2008 – 2018. | 9 | None. | |||||
Jill R. Cuniff c/o Harding Loevner LP 400 Crossing Boulevard Fourth Floor Bridgewater, NJ 08807 Age, 55 | Director | Indefinite; since 2018; Member of the Audit Committee since 2018; Member of the Governance Committee since March 2018 | Edge Asset Management, President and Director, 2009 – 2016. | 9 | None. | |||||
R. Kelly Doherty c/o Harding Loevner LP 400 Crossing Boulevard Fourth Floor Bridgewater, NJ 08807 Age, 61 | Director | Indefinite; Director since 2004; Lead Independent Director since 2014; Member of the Governance Committee since March 2018 | Caymen Partners (private investment vehicles), Managing Partner, 1998 – present. | 9 | Selective Insurance Group, Inc. (SIGI). | |||||
74
Table of Contents
Harding, Loevner Funds, Inc.
Directors and Principal Officers
(unaudited)
Independent Directors (continued):
Name, Address and Age | Position with | Term of Office | Principal Occupation During Past Five Years | Number of Portfolios in Fund Complex Overseen By Director | Other Directorships | |||||
Charles W. Freeman, III c/o Harding Loevner LP 400 Crossing Boulevard Fourth Floor Bridgewater, NJ 08807 Age, 55 | Director | Indefinite; Director since 2008; Member of the Governance Committee since March 2018 | U.S. Chamber of Commerce, Senior Vice President for Asia, 2018 – present; Bower Group Asia, Managing Director, China, December 2016 – 2017; Forbes-Tate, LLC, International Principal, 2014 – 2016; Rock Creek Global Advisors, LLC, Vice President, 2013 – 2014; PepsiCo, Vice President Global Public Policy and Government Relations, 2011 – 2013; National Committee onUS-China Relations(non-profit), Board Member, 2007 – 2009 and 2010 – present. | 9 | None. | |||||
Samuel R. Karetsky c/o Harding Loevner LP 400 Crossing Boulevard Fourth Floor Bridgewater, NJ 08807 Age, 74 | Director | Indefinite; Director since 1998; Member of the Audit Committee since 1998; Member of the Governance Committee since March 2018 | The Karetsky Group LLC (advisory firm), Managing Member, 2003 – present; Wetherby Asset Management, Wealth Manager, 2004 – present. | 9 | None. | |||||
Eric Rakowski c/o Harding Loevner LP 400 Crossing Boulevard Fourth Floor Bridgewater, NJ 08807 Age, 61 | Director | Indefinite; Director since 2008; Chairman of the Governance Committee since March 2018 | University of California at Berkeley School of Law, Professor, 1990 – present. | 9 | Third Avenue Trust (3 portfolios); Third Avenue Variable Trust (1 portfolio); AMG Funds (57 portfolios); AMG Pantheon Private Equity Fund (1 portfolio); AMG Pantheon Private Equity Master Fund (1 portfolio); AMG Pantheon Subsidiary Fund, LLC (1 portfolio). | |||||
75
Table of Contents
Harding, Loevner Funds, Inc.
Directors and Principal Officers
(unaudited)
Interested Directors:
Name, Address and Age | Position with | Term of Office | Principal Occupation | Number of Portfolios in Fund Complex Overseen By Director | Other Directorships | |||||
| David R. Loevner** Harding Loevner LP Fish Creek Center 1230 Ida Dr. Ste. 31⁄2 PO Box 383 Wilson, WY 83014 Age, 65 | Director and Chairman of the Board of Directors | Indefinite; Director and Chairman of the Board since 1996 | Harding Loevner LP, Chairman and Chief Executive Officer, 1989 – present; Harding Loevner Funds, plc, Director, 2007 – present. | 9 | None. | |||||
| Christine C. Carsman***Affiliated Managers Group, Inc. 777 South Flager Drive West Palm Beach, FL 33477 Age, 67 | Director | Indefinite; Director beginning 2017 | Affiliated Managers Group, Inc., Senior Policy Advisor, 2019 – present; Executive Vice President, Deputy General Counsel and Chief Regulatory Counsel 2017 – 2018; Senior Vice President and Deputy General Counsel 2011 – 2016; AMG Funds plc. Chair of the Board of Directors, 2015 – present; Director, 2010 – 2018. | 9 | AMG Funds (75 portfolios); AMG Pantheon Funds (3 portfolios). | |||||
* Each of Mr. Loevner and Ms. Carsman is elected to serve in accordance with the Articles of Incorporation andBy-Laws of the Fund until their respective successor is duly elected and qualified.
** Mr. Loevner is considered an “interested person” of the Fund as defined in the 1940 Act, because he serves as President of Harding Loevner LP, the Fund’s investment advisor.
*** Ms. Carsman is considered an “interested person” of the Fund as defined in the 1940 Act, as a result of her position with, and interest in securities of, AMG, a control person of Harding Loevner.
The Funds’ Statement of Additional Information contains additional information about the Directors and is available upon request and without charge by calling (877)435-8105.
76
Table of Contents
Harding, Loevner Funds, Inc.
Directors and Principal Officers
(unaudited)
Principal Officers of the Fund:
Name, Address and Age | Position(s) with the Fund | Term of Office | Principal Occupation During Past Five Years | |||
Richard T. Reiter Harding Loevner LP 400 Crossing Boulevard Fourth Floor Bridgewater, NJ 08807 Age, 53 | President | 1 year; since 2011 | Harding Loevner LP, President and Chief Operating Officer, 1996 – present. | |||
Tracy L. Dotolo Foreside Management Services, LLC Three Canal Plaza, Suite 100 Portland, ME 04101 Age, 43 | Chief Financial Officer and Treasurer | 1 year; since 2019 | Fund Principal Financial Officer at Foreside, Inc. 2016 – present; Vice President – Global Fund Services at JPMorgan Chase 2009-2016. | |||
Aaron J. Bellish Harding Loevner LP 400 Crossing Boulevard Fourth Floor Bridgewater, NJ 08807 Age, 40 | Assistant Treasurer | 1 year; since 2012 | Harding Loevner LP, Chief Financial Officer, 2012 – present. | |||
Derek A. Jewusiak The Northern Trust Company 50 South LaSalle Street Chicago, IL 60603 Age, 48 | Assistant Treasurer | 1 year; since 2013 | The Northern Trust Company, Vice President, 2012 – present. | |||
Ryan Bowles Harding Loevner LP 400 Crossing Boulevard Fourth Floor Bridgewater, NJ 08807 Age, 31 | Assistant Treasurer | 1 year; since 2019 | Harding Loevner LP, Product Manager, 2010 – present. | |||
Lisa R. Price Harding Loevner LP 400 Crossing Boulevard Fourth Floor Bridgewater, NJ 08807 Age, 40 | Assistant Secretary | 1 year; since 2019 | Harding Loevner LP, Counsel, 2019 – present; Oak Hill Advisors, LP, Principal, Associate General Counsel and Chief Compliance Officer (OHAI), January 2019 – August 2019, Vice President, Associate General Counsel and Chief Compliance Officer (OHAI), 2015 – 2018; Associate, Dechert LLP, 2005 – 2015. | |||
Brian D. Simon Harding Loevner LP 400 Crossing Boulevard Fourth Floor Bridgewater, NJ 08807 Age, 57 | Chief Compliance Officer, Anti-Money Laundering Compliance Officer and Assistant Secretary | 1 year, since 2016, 2016 and 2015 respectively | Harding Loevner LP, General Counsel, 2014 – present; Lazard Asset Management LLC, Director of Legal Affairs and Chief Compliance Officer, 2002 – 2014. | |||
77
Table of Contents
Harding, Loevner Funds, Inc.
Directors and Principal Officers
(unaudited)
Principal Officers of the Fund (continued):
Name, Address and Age | Position(s) with the Fund | Term of Office and Length of Time Served* | Principal Occupation During Past Five Years | |||
Marcia Y. Lucas The Northern Trust Company 50 South LaSalle Street Chicago, IL 60603 Age, 52 | Secretary, December 2018 – Present; Assistant Secretary, 2011 – November 2018 | 1 year; since 2011 | The Northern Trust Company, Senior Vice President, 2015 – present; Vice President, 2011 – 2014. |
* Officers are elected to hold such office until their successor is elected and qualified to carry out the duties and responsibilities of their office, or until he or she resigns or is removed from office.
There is no family relationship among any of the Directors or officers listed above.
78
Table of Contents
Harding, Loevner Funds, Inc.
(unaudited)
Quarterly FormN-PORT
Each Portfolio files its complete portfolio of investments with the SEC for the first and third quarters of each fiscal year as an exhibit to its reports on FormN-PORT. Previously, the Portfolios filed complete portfolios of investment with the SEC for the first and third quarters of each fiscal year on FormN-Q. The Portfolios’ FormsN-PORT andN-Q are available on the SEC’s website at www.sec.gov. Additionally, they are available upon request by calling (877)435-8105.
Proxy Voting Record
The Fund’s proxy voting record relating to the Portfolios’ securities during the most recent12-month period ended June 30 is available on the Fund’s website at www.hardingloevnerfunds.com and on the SEC’s website at www.sec.gov, on FormN-PX.
Proxy Voting Policies and Procedures
The Fund’s proxy voting policies and procedures are included in Appendix B to Statement of Additional Information and is available without charge, upon request, by calling (877)435-8105 or on the SEC’s website at www.sec.gov.
Additional Information
The Adviser updates Fact Sheets for the Portfolios each calendar quarter, which are posted to the Fund’s website at www.hardingloevnerfunds.com. This information, along with the Adviser’s commentaries on its various strategies, is available without charge, upon request, by calling (877)435-8105.
79
Table of Contents
This report is intended for shareholders of Harding, Loevner Funds, Inc. It may not be used as sales literature unless preceded or accompanied by the current Prospectus, which gives details about charges, expenses, investment objectives, risks and policies of the Portfolios.
Table of Contents

Table of Contents
Item 1. Reports to Stockholders (cont.).
| (b) | Not applicable. |
Item 2. Code of Ethics.
| (a) | As of October 31, 2019, the Registrant has adopted a code of ethics that applies to the Registrant’s President/Chief Executive Officer and Treasurer/Chief Financial Officer (the “Code of Ethics”). |
| (c) | For the fiscal year ended October 31, 2019, there were no amendments to a provision of the Registrant’s Code of Ethics. |
| (d) | For the fiscal year ended October 31, 2019, there were no waivers granted from a provision of the Registrant’s Code of Ethics. |
Item 3. Audit Committee Financial Expert.
As of October 31, 2019, the Registrant’s Board of Directors has determined that the following members of the Audit Committee are audit committee financial experts and independent: Carolyn N. Ainslie and Jill R. Cuniff.
Item 4. Principal Accountant Fees and Services.
(a) Audit Fees: The aggregate fees billed for each of the last two fiscal years for professional services rendered by KPMG LLP, the Registrant’s principal accountant, for the audit of the Registrant’s annual financial statements in connection with statutory and regulatory filings or engagements for those fiscal years are $222,050 in 2019 and $217,700 in 2018.
(b) Audit-Related Fees: The aggregate fees billed in each of the last two fiscal years for assurance and related services by KPMG LLP that are reasonably related to the performance of the audit of the Registrant financial statements and are not reported under paragraph (a) of this Item are None.
(c) Tax Fees: The aggregate fees billed in each of the last two fiscal years for professional services rendered by KPMG LLP for the review of domestic tax returns were $75,060 in 2019 and $74,115 in 2018.
(d) All Other Fees: The aggregate fees billed in each of the last two fiscal years for products and services provided by KPMG LLP, other than the services reported in paragraphs (a) through (c) of this Item are $1,800 in 2019 and $1,500 in 2018, related to research, preparation and filing of tax returns in certain foreign jurisdictions.
(e)(1) Disclose the audit committeepre-approval policies and procedures described in paragraph (c)(7) of Rule2-01 of RegulationS-X.
A copy of the Audit Committee’sPre-Approval Policies and Procedures is filed with this FormN-CSR under Item 13(c).
(e)(2) There were no amounts that werepre-approved by the Audit Committee pursuant to paragraph (c)(7)(i)(C) of Rule2-01 of RegulationS-X.
(f) Not applicable.
(g) Not applicable.
(h) Not applicable.
Table of Contents
Item 5. Audit Committee of Listed Registrants.
Not applicable.
Item 6. Investments.
| (a) | Schedule I is included as part of the report to shareholders filed under Item 1 of this report on FormN-CSR. |
| (b) | Not applicable. |
Item 7. Disclosure of Proxy Voting Policies and Procedures forClosed-End Management Investment Companies.
Not applicable.
Item 8. Portfolio Managers ofClosed-End Management Investment Companies.
Not applicable.
Item 9. Purchases of Equity Securities byClosed-End Management Investment Company and Affiliated Purchasers.
Not applicable.
Item 10. Submission of Matters to a Vote of Security Holders.
Not applicable.
Item 11. Controls and Procedures.
| (a) | The Registrant’s Principal Executive Officer and Principal Financial Officer, or persons performing similar functions, have concluded that the Registrant’s disclosure controls and procedures (as defined in Rule30a-3(c) under the Investment Company Act of 1940, as amended (the “1940 Act”)) were effective as of a date within 90 days prior to the filing date of this report, based on their evaluation of the effectiveness of the Registrant’s disclosure controls and procedures as of the evaluation date. |
| (b) | There were no significant changes in the Registrant’s internal control over financial reporting (as defined in Rule30a-3(d) under the 1940 Act) that occurred during the period covered by this report that have materially affected, or are reasonably likely to materially affect, the Registrant’s internal control over financial reporting. |
Item 12. Disclosure of Securities Lending Activities forClosed-End Management Investment Companies.
Not applicable.
Table of Contents
Item 13. Exhibits.
| (a)(1) | Exhibit 99.12.A: Incorporated by reference to Exhibit 12(a)(1) to the report filed on FormN-CSR on January 7, 2013 (AccessionNo. 0001193125-13-005151). |
| (a)(2) | Exhibit 99.CERT: Certifications pursuant to Rule30a-2(a) of the Investment Company Act of 1940, as amended, are attached. |
| (a)(3) | Not applicable. |
| (a)(4) | Not applicable. |
| (b) | Exhibit 99.906: Certifications pursuant toRule 30a-2(b) of the Investment Company Act of 1940, as amended, are attached hereto. |
| (c) | Incorporated by reference to Exhibit 12(c) to the report filed on FormN-CSR on January 6, 2016 (AccessionNo. 0001193125-16-422394). |
Table of Contents
SIGNATURES
Pursuant to the requirements of the Securities Exchange Act of 1934 and the Investment Company Act of 1940, the Registrant has duly caused this report to be signed on its behalf by the undersigned, thereunto duly authorized.
Harding, Loevner Funds, Inc. | ||||
By | /s/ Richard T. Reiter | |||
Richard T. Reiter (Principal Executive Officer) | ||||
Date: January 2, 2020 | ||||
Pursuant to the requirements of the Securities Exchange Act of 1934 and the Investment Company Act of 1940, this report has been signed below by the following persons on behalf of the Registrant and in the capacities and on the dates indicated. | ||||
By | /s/ Richard T. Reiter | |||
Richard T. Reiter (Principal Executive Officer) | ||||
Date: January 2, 2020 | ||||
By | /s/ Tracy L. Dotolo | |||
Tracy L. Dotolo (Principal Financial Officer) | ||||
Date: January 2, 2020 | ||||