Table of Contents
UNITED STATES
SECURITIES AND EXCHANGE COMMISSION
Washington, D.C. 20549
FORM N-CSR
CERTIFIED SHAREHOLDER REPORT OF REGISTERED
MANAGEMENT INVESTMENT COMPANIES
Investment Company Act file number 811-07739
Harding, Loevner Funds, Inc.
(Exact name of registrant as specified in charter)
400 Crossing Boulevard
Fourth Floor
Bridgewater, NJ 08807
(Address of principal executive offices) (Zip code)
Marcia Y. Lucas
The Northern Trust Company
333 South Wabash Avenue
Chicago, IL 60604
With a copy to:
Stephen H. Bier, Esq.
Dechert LLP
1095 Avenue of the Americas
New York, NY 10036
(Name and address of agent for service)
Registrant’s telephone number, including area code: (877) 435-8105
Date of fiscal year end: 10/31
Date of reporting period: 10/31/2020
Table of Contents
Item 1. Reports to Stockholders.
| (a) | The following is a copy of the report transmitted to shareholders pursuant to Rule 30e-1 under the Investment Company Act of 1940 (17 CFR 270.30e-1) |
Table of Contents
HARDING
LOEVNER
Fundamental. Thinking. Worldwide.
Annual Commentary
October 31, 2020
Harding, Loevner Funds, Inc.
Global Equity Portfolio
International Equity Portfolio
International Small Companies Portfolio
Institutional Emerging Markets Portfolio
Emerging Markets Portfolio
Frontier Emerging Markets Portfolio
Global Equity Research Portfolio
International Equity Research Portfolio
Emerging Markets Research Portfolio
Beginning on January 1, 2021, as permitted by regulations adopted by the Securities and Exchange Commission, paper copies of the Fund’s shareholder reports will no longer be sent by mail, unless you specifically request paper copies of the reports from the Fund or from your financial intermediary, such as a broker-dealer or bank. Instead, the reports will be made available on a website, and you will be notified by mail each time a report is posted and provided with a website link to access the report.
If you already elected to receive shareholder reports electronically, you will not be affected by this change and you need not take any action. You may elect to receive shareholder reports and other communications from the Fund electronically by contacting your financial intermediary.
You may elect to receive all future reports in paper free of charge. You can inform the Fund that you wish to continue receiving paper copies of your shareholder reports by calling (877) 435-8105 or by sending an email request to hardingloevnerfunds@ntrs.com. If your account is held through a financial intermediary, you can contact your financial intermediary to make your election. Your election to receive reports in paper will apply to all Funds held with the Fund complex/your financial intermediary.
The Prospectus, SAI, and the Fund’s annual and semi-annual reports are also available free of charge on Harding Loevner’s website at hardingloevnerfunds.com.
Reports and other information about the Fund are also available on the EDGAR database on the Commission’s Internet site at SEC.gov or by electronic request at the following e-mail address: publicinfo@sec.gov. A duplication fee will be applied to written requests and needs to be paid at the time your request is submitted.
As with all mutual funds, the Securities and Exchange Commission has not approved or disapproved these securities or determined if this prospectus is truthful or complete. Any representation to the contrary is a criminal offense.
Table of Contents
 HARDING LOEVNER FUNDS
Global equity investing for institutions is Harding Loevner’s exclusive focus. Through Harding Loevner Funds it offers distinct global strategies based on its quality-and-growth investment philosophy. It seeks to purchase shares of growing, financially strong, well-managed companies at favorable prices. Harding Loevner manages each of the Funds’ Portfolios according to a disciplined, research-based investment process. It identifies companies with sustainable competitive advantages and assesses the durability of their earnings growth by conducting in-depth fundamental research into global industries. In constructing portfolios, Harding Loevner diversifies carefully to limit risk.
RECEIVE INVESTOR MATERIALS ELECTRONICALLY
Shareholders may sign up for electronic delivery of investor materials. By doing so, you will receive the information faster and help us reduce the impact on the environment of providing these materials. To enroll in electronic delivery,
| 1. | Go to http://www.icsdelivery.com |
| 2. | Select the first letter of your brokerage firm’s name. |
| 3. | From the list that follows, select your brokerage firm. If your brokerage firm is not listed, electronic delivery may not be available. Please contact your brokerage firm. |
| 4. | Complete the information requested, including the e-mail address where you would like to receive notifications for electronic documents. |
Your information will be kept confidential and will not be used for any purpose other than electronic delivery. If you change your mind, you can cancel electronic delivery at any time and revert to physical delivery of your materials. Just go to http://www.icsdeliv-ery.com, perform the first three steps above, and follow the instructions for cancelling electronic delivery. If you have any questions, please contact your brokerage firm.
2
|
Table of Contents


Contact
Harding, Loevner Funds, Inc. c/o Northern Trust Attn: Funds Center, Floor 38 333 South Wabash Avenue Chicago, IL 60604
Phone: (877) 435-8105 Fax: (312) 267-3657 www.hardingloevnerfunds.com | Must be preceded or accompanied by a current Prospectus. Quasar Distributors, LLC, Distributor |
3
| ||||
Table of Contents

 | DAVID LOEVNER, CFA, CIC CHAIRMAN AND CHIEF EXECUTIVE OFFICER
SIMON HALLETT, CFA CO-CHIEF INVESTMENT OFFICER
FERRILL D. ROLL, CFA CO-CHIEF INVESTMENT OFFICER |
Value investing, the notion of excluding all but the most unloved stocks from portfolios, is dead. Following value’s decade of underperformance of the broad market, the coup de grâce was delivered by the pandemic. Then again, value investing has been readied for a spot in the ground before, only later to leap back to life.
The Wall Street Journal in its October 23rd edition wrote about one high-profile casualty of value’s latest demise: systematic value investor Ted Aronson, who’s thrown in the towel by deciding to dissolve his longstanding investment fund. Aronson, who was highly successful throughout most of his long career, said of his—or any—particular investment approach: “It can all work for years, for decades, until or except when the not-so-invisible hand comes down and slaps you and says, ‘That’s what worked in the past, but it’s not going to work now, nope, not anymore.’” A useful reminder that, in investing as in life, nothing works always or forever.
The efficacy of investment styles tends to ebb and flow, and on these cycles float the fortunes of investors. An earlier generation of value managers suffered a similar fate to Ted Aronson at the peak of the technology-media-telecom (“TMT”) bubble twenty years ago. In the space of three months in early 2000, Gary Brin-son, founder of Brinson Partners, Julian Robertson of Tiger Management, Tony Dye of Phillips and Drew, and George Vander-heiden of Fidelity, all storied value investors with once-enviable track records, decided to call it quits after a run of disappointing returns. The Nasdaq index, a useful proxy for growth stocks, saluted their departure by peaking on March 10, 2000, at 5,132, at a price to trailing earnings multiple of 72. “Value managers are fast becoming a rare species” quipped Jeremy Grantham, one of value’s handful of survivors, in his first quarter letter of 2000.
Growth investors for their part took to explaining why their approach must out of necessity win always, from that point onwards and into eternity and, as a corollary, why value investing was destined to fail. Heedless, value stocks commenced outperforming growth stocks and continued to do so over the next five years. Now, twenty years on, growth at any price rules the
roost once again. Earnings, profits, and cash flows, the building blocks at the foundation of any sensible fundamental investment approach, have been cast aside in favor of revenue growth rate and the potential size of the addressable market. The latter term is a conveniently malleable notion that admits any number of self-contradictory futures featuring incompatible outcomes. An electric car in every driveway? Sure. And a swarm of on-demand self-driving taxis, too? Why not!
We are suspicious of value calculations that project galloping growth out beyond the horizon. No tree grows to the sky. Most phenomena are cyclical, even within secular trends. Investors are apt to make their biggest blunders when they forget this and extrapolate current trends ad infinitum. Every valuation model embeds opinions about the future, but without evidence opinion morphs into conjecture, making it indistinguishable from hearsay. And as the rationale for high valuations drifts further away from actual observable cash flows and profits the greater is the risk that stocks slip their valuation anchor entirely. Unmoored from any rational basis, stock prices become ever more sensitive to fickle changes in mood, in either direction.
Many analysts who’d started their careers in the late ’90s appeared to be mentally stunted by the bursting of the TMT bubble in 2000, left wondering why what had worked in their formative years and filled their playbook no longer held.
The last few years have been brutal for any investor seeking a margin of safety, that is, a discount to fair value intended to insure against unforeseen risks. It may yet get more merciless. A person forming their view of markets could easily be convinced that valuation no longer matters, that price can safely be ignored. We believe they do so at their peril. Many analysts who’d started their careers in the late ’90s appeared to be mentally stunted by the bursting of the TMT bubble in 2000, left wondering why what had worked in their formative years and filled their playbook no longer held. Growth is ascendant again but it’s a different generation of analysts leading the charge—a generation comprised of many who have yet to experience their investment style fall out of favor.
Even the most sensible investment policies will get you into trouble sometimes. Because markets are the collected actions of individual human beings, they don’t follow fixed rules.
4
|
Table of Contents
Previously reliable relationships can evaporate without warning and, although conditions may be similar, they are never the same. Every investor is faced with the same dilemma: how to be consistent and yet still be sufficiently flexible to adapt and evolve.
Our response to this dilemma is threefold: avoid slavish devotion to any single market factor (such as quality, value, or growth), disaggregate our investment decisions and distribute them among our numerous analysts and portfolio managers, and erect strong guardrails around our investment process. Sovereign about which companies they cover and which they recommend, our analysts are free to judge the merits of different businesses, but they must follow a fixed set of research protocols. Managers are not free to add just any company to their portfolios but, rather, must choose from among those covered by our analysts; they are, however, free to disagree with an analyst by owning it over objections as to the current price. Likewise, the resulting portfolio can range widely but must obey rules that enforce diversification.
These guardrails are sometimes a source of tension and abiding by them probably means we miss out occasionally, but on balance this is more than made up by some fatal crashes we have avoided. We do not favor a single factor because we don’t believe any factor is permanently endowed with alpha creation. Even combinations of factors guarantee success only in hindsight. We train our sights on quality, growth, and val-
ue because each helps us to view different constellations of stocks. Quality is the closest thing we have to a lodestar since in our experience it narrows the range of potential bad outcomes. But value and growth are at opposite celestial poles, each with opportunities and traps; you cannot afford to focus on one at the expense of the other.
Our guardrails are sometimes a source of tension and abiding by them probably means we miss out occasionally, but on balance this is more than made up by some fatal crashes we have avoided.
Aronson, Brinson, Robertson and the rest are all smart fellows. We don’t believe for a minute that we are any smarter. As we have seen, what befell their value-oriented approach can befall a growth-oriented approach like ours. For the time being, the global policy direction continues to smile upon growth while frowning upon value. But change may be afoot—the underpinnings don’t seem very stable to us.
As always, we are honored by your continued trust in us.
Sincerely,
David R. Loevner, CFA, CIC |
Simon Hallett, CFA |
Ferrill D. Roll, CFA |


Opinions expressed are those of Harding Loevner and are not intended to be forecasts of future events, a guarantee of future results, nor investment advice. Please read the separate disclosure page for important information, including the risks of investing in the Portfolios. Past performance is not a guarantee of future results.
5
|
Table of Contents

PORTFOLIO MANAGEMENT TEAM
| PETER BAUGHAN, CFA CO-LEAD PORTFOLIO MANAGER
FERRILL ROLL, CFA CO-LEAD PORTFOLIO MANAGER
SCOTT CRAWSHAW PORTFOLIO MANAGER
JINGYI LI PORTFOLIO MANAGER
CHRISTOPHER MACK, CFA PORTFOLIO MANAGER
RICHARD SCHMIDT, CFA PORTFOLIO MANAGER |

 PERFORMANCE SUMMARY
For the Global Equity Portfolio, the Institutional Class rose 20.63%, the Institutional Class Z rose 20.76%, and the Advisor Class rose 20.47% (net of fees and expenses) in the fiscal year ended October 31, 2020. The Portfolio’s benchmark, the MSCI All Country World Index, rose 4.89% (net of source taxes).
MARKET REVIEW
Global stock markets have experienced an extraordinarily volatile twelve months, reacting to the COVID-19 pandemic and to the varying ways in which different countries around the world adapted (or failed to adapt) to its challenges.
Renewed optimism marked the final months of 2019, as central bank largesse and a de-escalation of US-China trade frictions had alleviated fears that had persisted through most of the year. However, the good vibes were short-lived as the COVID-19 outbreak that began in December rapidly engulfed the globe in the early months of the new year, with governments struggling to contain both the disease and its economic fallout. The size and speed of the equity market decline were unprecedented, with measures of volatility reaching levels not seen since the global financial crisis, which unfolded much more slowly. The ensuing forced business closures, restricted travel, and home confinements brought economic activity around the world to a shuddering stop; in turn, prompting an unprecedented monetary and fiscal response. On the monetary front, central bankers cut reserve requirements, lowered interest rates, and unveiled aggressive plans to keep credit flowing. On the fiscal side, governments implemented massive spending programs, dwarfing the rescue plans from the global financial crisis. Exacerbating market turmoil, an oil price war erupted between Saudi Arabia and Russia
FUND FACTS at October 31, 2020 | ||||||||||||
TOTAL NET ASSETS | $1,387.1M | |||||||||||
SALES CHARGE | NONE | |||||||||||
NUMBER OF HOLDINGS | 67 | |||||||||||
TURNOVER (5 YR. AVG.) | 41% | |||||||||||
DIVIDEND POLICY | ANNUAL | |||||||||||
INSTITUTIONAL INVESTORS | | INDIVIDUAL INVESTORS |
| |||||||||
| INST CLASS | INST CLASS Z | ADVISOR CLASS | ||||||||||
TICKER | HLMVX | HLGZX | HLMGX | |||||||||
CUSIP | 412295602 | 412295727 | 412295206 | |||||||||
INCEPTION DATE | 11/3/2009 | 8/1/2017 | 12/1/1996 | |||||||||
MINIMUM INVESTMENT1 | $100,000 | $10,000,000 | $5,000 | |||||||||
NET EXPENSE RATIO | 0.88%2 | 0.80%3 | 1.07% | 2 | ||||||||
GROSS EXPENSE RATIO | 0.88%2 | 0.83%3 | 1.07% | 2 | ||||||||
1Lower minimums available through certain brokerage fi rms; 2The Expense Ratio is as of the most recent Prospectus and is based on expenses for the most recent fi scal year end. The gross expense ratio is applicable to investors. 3The Expense Ratio is as of the most recent Prospectus and is based on expenses for the most recent fi scal year end. The net expense ratio is shown net of Harding Loevner’s contractual agreement through February 28, 2022. The Net Expense Ratio is applicable to investors.
amid a collapse in oil demand, the combination of which pushed down oil prices to an 18-year low.
During the latter half of 2020, conditions started to improve as countries began to emerge from lockdowns and new economic data showed signs of a fledgling recovery. Business activity remained weak, but many indicators—unemployment, consumer spending, and service and manufacturing surveys—rebounded from the troughs witnessed in April. Financial conditions remain highly accommodative in most economies; central banks have kept short-term interest rates hovering near-zero in every major developed economy, underscoring their proclivity to provide ongoing support for battered economies. More recently, sentiment was boosted by rising hopes for a successful vaccine, as multiple drug candidates entered the third and final stages of testing.
Information Technology (IT) and Consumer Discretionary (which contains many e-commerce businesses) were the strongest sectors as shares of the “COVID-19 winners,” companies that are either insulated or directly benefit from the pandemic, continued to rise. Conversely, Financials and Energy lagged as both were weighed down by lower interest rates, rising loan loss provisions, and the collapsed oil price.
6
|
Table of Contents
PERFORMANCE (% TOTAL RETURN)
| for periods ended September 30, 2020 | for periods ended October 31, 2020 | |||||||||||||||||||||||||||||||||||||||||||||||||||||||||
1 YEAR | 3 YEARS | 5 YEARS | 10 YEARS | SINCE INCEPTION* Nov-09 Aug-17 Dec-96 | 1 YEAR | 3 YEARS | 5 YEARS | 10 YEARS | SINCE INCEPTION* Nov-09 Aug-17 Dec-96 | |||||||||||||||||||||||||||||||||||||||||||||||||
GLOBAL EQUITY PORTFOLIO – INST CLASS | 26.72 | 12.16 | 14.58 | 10.95 | 11.00 | 20.63 | 10.37 | 12.15 | 10.22 | 10.69 | ||||||||||||||||||||||||||||||||||||||||||||||||
GLOBAL EQUITY PORTFOLIO – INST CLASS Z | 26.82 | 12.22 | – | – | 11.94 | 20.76 | 10.45 | – | – | 10.88 | ||||||||||||||||||||||||||||||||||||||||||||||||
GLOBAL EQUITY PORTFOLIO – ADVISOR CLASS | 26.56 | 11.95 | 14.32 | 10.68 | 7.79 | 20.47 | 10.16 | 11.90 | 9.97 | 7.67 | ||||||||||||||||||||||||||||||||||||||||||||||||
MSCI ALL COUNTRY WORLD INDEX | 10.44 | 7.12 | 10.30 | 8.55 | 8.80 | 7.36 | – | 4.89 | 5.52 | 8.11 | 7.90 | 8.48 | 6.35 | – | ||||||||||||||||||||||||||||||||||||||||||||
Returns are annualized for periods greater than 1 year. *Inception of the Institutional Class, November 3, 2009. Inception of the Institutional Class Z, August 1, 2017. Inception of the Advisor Class, December 1, 1996. Index performance prior to January 1, 2001 cannot be shown since it relies on back-filled data.
Performance data quoted represents past performance; past performance does not guarantee future results. The investment return and principal value of an investment will fluctuate so that an investor’s shares, when redeemed, may be worth more or less than their original cost. Current performance of the Portfolio may be lower or higher than the performance quoted. Performance data current to the most recent month end may be obtained by calling (877) 435-8105 or visiting www. hardingloevnerfunds.com.
PERFORMANCE ATTRIBUTION
Strong performance from our Health Care holdings contributed in the fiscal year, notably Swiss contract drug manufacturer Lonza. The company enjoyed increased demand for its anti-microbial chemicals used to sanitize surfaces, in addition to continued optimism surrounding a potential COVID-19 vaccine from its strategic partner Moderna. Stocks in Information Technology were also helpful, particularly US-based online electronic payments provider PayPal, which benefited from the lockdown-induced acceleration in e-commerce transactions as well as a heightened aversion to handling cash (or even physical credit cards), resulting in strong growth in PayPal’s “card not present” transactions. Additionally, it gained new users as people discovered they could receive government aid payments via its app rather than waiting for a check in the mail.
Offsetting this strong performance, weak stocks within Consumer Discretionary detracted from relative performance. Shares of Booking Holdings, a US-based online travel agency, fell sharply in anticipation of dramatic revenue and profit declines as a result of the cessation of global travel. Energy stocks also detracted, particularly US-based oilfield services provider Schlumberger. Shares declined significantly as its customers rushed to cut expenditures for exploration and production in the face of declining oil prices.
From a geographic perspective, the Portfolio benefitted from positive stock selection in every major world region. Stocks in the US contributed the most to relative performance, especially PayPal and semiconductor chip manufacturer NVIDIA. Shares of the latter were boosted by strong financial results as well as the announcement of an agreement to buy Arm Holdings, a provider of software for designing mobile device chips. The Portfolio also benefitted from strong stocks in Europe (epically Lonza) and Japan, where optical sensors specialist Keyence was helped by signs of order recovery in the factory automation industry. The Portfolio’s overweight in Japan and Europe outside the eurozone detracted.
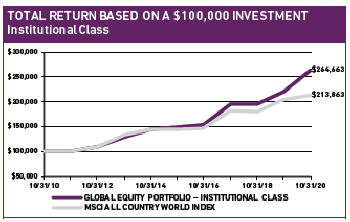
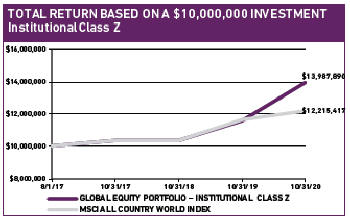
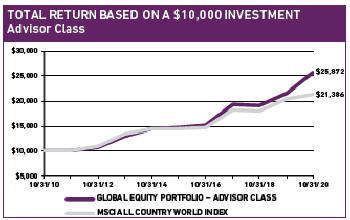
The charts above illustrate the hypothetical return of an investment made in the corresponding share classes. Investment return reflects voluntary fee waivers in effect. Absent such waivers, total return would be reduced. The performance provided in the table and charts above do not reflect the deduction of taxes that a shareholder would pay on Portfolio distributions or the redemption of Portfolio shares.
7
|
Table of Contents
PERSPECTIVE AND OUTLOOK
We’ve been harping on about the stretched valuations of high-quality growth companies for so long that we would forgive you for tuning us out. But as valuations continue to march higher, so too do our concerns—which is where we might have left it were it not for the evidence of a ramp-up in speculative behavior. The large number of highly valued, but (historically) weakly profitable companies with negative market-implied discount rates (MIDRs) causes us more worry over other signs of market excess.
By one of our estimates, nearly 20% of global stocks are priced to seriously disappoint based on our analysis of MIDRs for cohorts of global stocks in HOLT, a database of company accounts. A MIDR is an aggregation of company-level discount rates, each derived by comparing a forecast of the company’s future cashflows with its current market value. If expected future cash flows are low (or far off) while the company’s current market value is high, the discount rate that equates them must be low. But there’s low, and then there’s what we observe in today’s most expensively priced stocks. Out of the approximately 7,200 global stocks with market capitalizations above US$1 billion (totaling US$83 trillion in capitalization), nearly 900 companies (amounting to US$17 trillion) currently show up having negative implied discount rates, a higher percentage than at any time since just before the bursting of the tech bubble. Put a different way, these stocks are priced to deliver negative real returns even if HOLT’s formulaic and consensus-based assumptions about future cash flow growth are met. Among these 900 richly valued companies, 275, with US$2.6 trillion market capitalization, were loss-making throughout 2019. Our view is that, when dealing with a large group of companies, you are betting against the weight of historical evidence if you assume that so many can beat the odds by outstripping current growth expectations to deliver positive returns.
Throughout the year, companies that score highest along the growth dimension have leapt ahead of the pack. Not much of a surprise perhaps, since the value of long-duration growth has risen as interest rates have declined. But what is a surprise, to us at least, is the apparent willingness to bid up all growth stocks
GEOGRAPHIC EXPOSURE (%) at October 31, 2020
| COUNTRY/REGION | PORTFOLIO | BENCHMARK1 | ||||||
CANADA | 0.0 | 2.7 | ||||||
EMERGING MARKETS | 14.6 | 13.0 | ||||||
EUROPE EMU | 6.6 | 8.2 | ||||||
EUROPE EX-EMU | 10.2 | 7.8 | ||||||
FRONTIER MARKETS2 | 0.0 | – | ||||||
JAPAN | 7.1 | 6.9 | ||||||
MIDDLE EAST | 0.0 | 0.2 | ||||||
PACIFIC EX-JAPAN | 1.4 | 3.1 | ||||||
UNITED STATES | 56.5 | 58.1 | ||||||
CASH | 3.6 | – | ||||||
1MSCI All Country World Index; 2Includes countries with less-developed markets outside the Index.
SECTOR EXPOSURE (%) at October 31, 2020
| SECTOR | PORTFOLIO | BENCHMARK1 | ||||||
COMM SERVICES | 12.1 | 9.7 | ||||||
CONSUMER DISCRETIONARY | 9.9 | 13.1 | ||||||
CONSUMER STAPLES | 4.4 | 7.9 | ||||||
ENERGY | 1.1 | 2.8 | ||||||
FINANCIALS | 14.8 | 12.7 | ||||||
HEALTH CARE | 18.3 | 12.3 | ||||||
INDUSTRIALS | 10.9 | 9.6 | ||||||
INFORMATION TECHNOLOGY | 20.3 | 21.2 | ||||||
MATERIALS | 4.6 | 4.8 | ||||||
REAL ESTATE | 0.0 | 2.7 | ||||||
UTILITIES | 0.0 | 3.2 | ||||||
1MSCI All Country World Index.
without regard for the quality of that prospective growth. There are two kinds of growth companies that we try to keep out of our portfolio. The first type are companies that meet our quality criteria but whose share prices are unreasonably high relative to our future growth expectations. The second type are companies that fail to meet our investment criteria for business quality; they are rejected, summarily or sometimes after lengthy debate, by our analysts.
In cases of both types, there are “many a slip ’twixt the [growth] cup and the [quality] lip.” In the lifecycle of the typical successful firm, growth precedes profitability, which makes quality assessment fraught in the early, rapid growth phase. The archetype for the firm with rapidly growing sales but only modest profitability was Amazon.com. Early in our investment coverage we debated its business quality at length, holding back from introducing it into our qualified (i.e., investible) universe until 2009, when it met our quality criteria more clearly. Currently, a growing number of investors appear willing to take a leap of faith much earlier over the fortunes of hitherto profitless companies. A poster child for exuberance over profitless growth is Shopify, a Canadian IT services company whose sales have grown rapidly to US$2 billion annually, but which has yet to turn a profit since going public in 2015. Our analyst, upon meeting with the company several years ago, noted its impressive sales growth but was put off by its high client turnover. This year, a different analyst, lured by dazzling revenue growth and a potential boost from COVID-19, re-examined the company. But whereas we expected—perhaps even hoped—to find a clear path for it to eventual profitability, instead we found a company busily undermining its long-term profit prospects by pursuing low margin businesses to maintain its sales growth at any cost.
Fortunately, even within the IT sector there are still opportunities to be uncovered if you are willing to do the legwork. We have been drawn to the payments industry for more than a decade, as we recognized the orders-of-magnitude better margins of transferring money online as compared to the rusty pipes of the traditional banking system. We also continue to find attractive investments in Software and Internet Services. Among these companies, we tend
8
|
Table of Contents
to see high returns on invested capital, low capital investment requirements, and high rates of sales and profit growth—all achieved with low sensitivity to the business cycle. Our analysts favor business process facilitators such as salesforce.com and cloud computing providers like Microsoft, whose Azure has quietly emerged as a major player to rival the cloud services from fellow Global Portfolio holdings Amazon.com, Tencent, and Alibaba.
PORTFOLIO HIGHLIGHTS
Financials have been the MSCI All Country World Index’s second-worst performing market sector over the last one, three and five years (Energy has been the worst) and the third-worst performing sector, behind Energy and Materials, over the last 10 years. The reasons are not hard to fathom: a decade of low or even negative interest rates, rising capital requirements alongside new regulations coming out of the financial crisis, and sweeping technological changes enabling the emergence of new players and substitute products. Yet, despite these headwinds, our own investments in Financials have been a consistent source of outperformance. In fact, over the same periods Financials have been among the largest sources of positive attribution, generally trailing only Health Care and IT. While our longstanding underweight in Financials contributed to outperformance, positive stock selection within the sector was the primary driver.
We have selected our current bank holdings from among banks with established brands that command strong positions in their markets and have stable liability structures and adequate capital. These banks can be further separated into two buckets according to quality and growth fundamentals: those with sustained quality and growth characteristics over the past decade or longer (which are, unfortunately, generally priced accordingly), and those that are in the process of recovering from deep credit cycles in their home markets. Banks in the latter bucket are currently less profitable and slower growing, but their shares are priced as if their weakness will persist indefinitely.
First Republic Bank (FRB) is an interesting case of a growing, high-quality bank operating in the first bucket. FRB has consistently generated double-digit growth in tangible book value per share with virtually no credit losses: net write-offs have averaged a minuscule five basis points of average loans outstanding, per year, over the last 20 years. The bank’s core competency involves collecting stable deposits and extending (primarily secured) loans to wealthy customers in California and New York. A key to FRB’s history of profitable growth is low customer acquisition costs thanks to superior client service; according to the bank, nearly 60% of new loans originate from existing customers, and almost another 30% come from customer referrals.
In the second bucket, the knock-on effects of the pandemic have contributed to anticipated loan losses for our more cyclically exposed banks, such as BBVA, which has reeled from its economic impact on both its home market of Spain and in Mexico. However, its Mexican business appears already to have turned the corner thanks to generous loss provisions front-loaded into the first and second quarter’s accounts, as well as recovering transaction
TEN LARGEST HOLDINGS at October 31, 2020
| COMPANY | SECTOR | COUNTRY | % | |||||||
| PAYPAL | INFO TECHNOLOGY | US | 4.5 | |||||||
| ALPHABET | COMM SERVICES | US | 3.1 | |||||||
| APPLE | INFO TECHNOLOGY | US | 2.9 | |||||||
COMM SERVICES | US | 2.8 | ||||||||
| TENCENT | COMM SERVICES | CHINA | 2.7 | |||||||
| FIRST REPUBLIC BANK | FINANCIALS | US | 2.6 | |||||||
| ILLUMINA | HEALTH CARE | US | 2.5 | |||||||
| VERTEX PHARMACEUTICALS | HEALTH CARE | US | 2.5 | |||||||
| ALIBABA | CONS DISCRETIONARY | CHINA | 2.1 | |||||||
| SYMRISE | MATERIALS | GERMANY | 2.1 | |||||||
and lending activity (with new loans now rising above the pre-COVID-19 levels of February). Managements of all our banks stress the importance of a culture of disciplined credit underwriting that long predates the pandemic as the basis for optimism about the health of their loan books. Due to their positive profit leverage to higher interest rates, we continue to believe that our exposure to quality banks acts as a counterweight to the price risks entailed in the highly priced, long-duration growth stocks we own in other sectors, which could react badly should inflation and interest rates reverse their downward course.
The Portfolio has benefited from its “marketplace” investments in Alibaba, Amazon.com and eBay, among the COVID-19 winners we alluded to above. We conjecture that, as investors are forced to pay more attention to risk management, market-places that facilitate risk transfers may also see accelerated growth. Recently, we added an investment in a financial company that has operated marketplaces for well over 100 years. Today, CME Group is the world’s leading and most diverse derivatives marketplace, and operates four exchanges: Chicago Mercantile Exchange, Chicago Board of Trade, New York Mercantile Exchange and The Commodity Exchange. Each provides deep liquidity and high price transparency with minimal counter party risk. Unlike some exchanges whose services have become commoditized, CME has integrated trading with higher-margin settlement functions. CME’s revenues are diversified: approximately a third come from interest rates, a third from commodities (energy, metals, and agriculture), a quarter from equities and foreign exchange, and the balance from data services, and it generates a third of its revenues internationally. In sum, CME is a highly profitable toll taker on risk management transactions.
Please read the separate disclosures page for important information, including the risks of investing in the Portfolio.
9
|
Table of Contents

PORTFOLIO MANAGEMENT TEAM
 |
FERRILL ROLL, CFA CO-LEAD PORTFOLIO MANAGER
ANDREW WEST, CFA CO-LEAD PORTFOLIO MANAGER
BRYAN LLOYD, CFA PORTFOLIO MANAGER
PATRICK TODD, CFA PORTFOLIO MANAGER |
 PERFORMANCE SUMMARY
For the International Equity Portfolio, the Institutional Class rose 6.25%, the Institutional Class Z rose 6.32%, and the Investor Class rose 5.91% (net of fees and expenses) in the fiscal year ended October 31, 2020. The Portfolio’s benchmark, the MSCI All Country World ex-US Index, fell 2.61% (net of source taxes).
MARKET REVIEW
Global stock markets have experienced an extraordinarily volatile twelve months, reacting to the COVID-19 pandemic and to the varying ways in which different countries around the world adapted (or failed to adapt) to its challenges.
Renewed optimism marked the final months of 2019, as central bank largesse and a de-escalation of US-China trade frictions had alleviated fears that had persisted through most of the year. However, the good vibes were short-lived as the COVID-19 outbreak that began in December rapidly engulfed the globe in the early months of the new year, with governments struggling to contain both the disease and its economic fallout. The size and speed of the equity market decline were unprecedented, with measures of volatility reaching levels not seen since the global financial crisis, which unfolded much more slowly. The ensuing forced business closures, restricted travel, and home confinements brought economic activity around the world to a shuddering stop; in turn, prompting an unprecedented monetary and fiscal response. On the monetary front, central bankers cut reserve requirements, lowered interest rates, and unveiled aggressive plans to keep credit flowing. On the fiscal side, governments implemented massive spending programs, dwarfing the rescue plans from the global financial crisis. Exacerbating market turmoil, an oil price war erupted between Saudi Arabia and Russia amid a collapse in
FUND FACTS at October 31, 2020 | ||||||||||
TOTAL NET ASSETS | $16,073.6M | |||||||||
SALES CHARGE | NONE | |||||||||
NUMBER OF HOLDINGS | 55 | |||||||||
TURNOVER (5 YR. AVG.) | 18% | |||||||||
DIVIDEND POLICY | ANNUAL | |||||||||
INSTITUTIONAL INVESTORS | INDIVIDUAL INVESTORS | |||||||||
| INST CLASS | INST CLASS Z | INVESTOR CLASS | ||||||||
TICKER | HLMIX | HLIZX | HLMNX | |||||||
CUSIP | 412295107 | 412295719 | 412295503 | |||||||
INCEPTION DATE | 5/11/1994 | 7/17/2017 | 9/30/2005 | |||||||
MINIMUM INVESTMENT1 | $100,000 | $10,000,000 | $5,000 | |||||||
GROSS EXPENSE RATIO | 0.81%2 | 0.75%1 | 1.13%1 | |||||||
1Lower minimums available through certain brokerage firms; 2The Expense Ratio is as of the most recent Prospectus and is based on expenses for the most recent fiscal year end. The gross expense ratio is applicable to investors.
oil demand, the combination of which pushed down oil prices to an 18-year low.
During the latter half of 2020, conditions started to improve as countries began to emerge from lockdowns and new economic data showed signs of a fledgling recovery. Business activity remained weak, but many indicators—unemployment, consumer spending, and service and manufacturing surveys—rebounded from the troughs witnessed in April. Financial conditions remain highly accommodative in most economies; central banks have kept short-term interest rates hovering near-zero in every major developed economy, underscoring their proclivity to provide ongoing support for battered economies. More recently, sentiment was boosted by rising hopes for a successful vaccine, as multiple drug candidates entered the third and final stages of testing.
Information Technology (IT), Communication Services, and Consumer Discretionary (which contains many e-commerce businesses)
were the strongest sectors as shares of the “COVID-19 winners,” companies that are either insulated or directly benefit from the pandemic, continued to rise. Conversely, Financials and Energy lagged as both were weighed down by lower interest rates, rising loan loss provisions, and the collapsed oil price.
PERFORMANCE ATTRIBUTION
Strong performance from our Industrials holdings contributed in the fiscal year, notably Swiss compressor maker Atlas Copco. The company benefitted from strong order growth for industrial compressors and vacuum technology products throughout the period.
10
|
Table of Contents
PERFORMANCE (% TOTAL RETURN)
| for periods ended September 30, 2020 | for periods ended October 31, 2020 | |||||||||||||||||||||||||||||||||||||||||||||||||||||
| 1 | 3 | 5 | 10 | SINCE INCEPTION* | 1 | 3 | 5 | 10 | SINCE INCEPTION* | |||||||||||||||||||||||||||||||||||||||||||||
| YEAR | YEARS | YEARS | YEARS | May-94 | Jul-17 | Sep-05 | YEAR | YEARS | YEARS | YEARS | May-94 | Jul-17 | Sep-05 | |||||||||||||||||||||||||||||||||||||||||
| INTL EQUITY PORTFOLIO – INST CLASS | 14.05 | 5.28 | 10.24 | 6.94 | 6.34 | 6.25 | 3.24 | 7.52 | 6.21 | 6.17 | ||||||||||||||||||||||||||||||||||||||||||||
| INTL EQUITY PORTFOLIO – INST CLASS Z | 14.11 | 5.34 | — | — | 6.22 | 6.32 | 6.32 | — | — | 4.86 | ||||||||||||||||||||||||||||||||||||||||||||
| INTL EQUITY PORTFOLIO – INVESTOR CLASS | 13.69 | 4.93 | 9.88 | 6.59 | 6.41 | 5.91 | 2.90 | 7.17 | 5.85 | 6.11 | ||||||||||||||||||||||||||||||||||||||||||||
| MSCI ALL COUNTRY WORLD EX-US INDEX | 3.00 | 1.16 | 6.23 | 4.00 | — | 2.16 | �� | .11 | -2.61 | -0.19 | 4.26 | 3.43 | — | 1.44 | 3.94 | |||||||||||||||||||||||||||||||||||||||
Returns are annualized for periods greater than 1 year. *Inception of the Institutional Class, May 11, 1994. Inception of the Institutional Class Z, July 17, 2017. Inception of the Investor Class, September 30, 2005. Index performance prior to January 1, 2001 cannot be shown since it relies on back-filled data.
Performance data quoted represents past performance; past performance does not guarantee future results. The investment return and principal value of an investment will fluctuate so that an investor’s shares, when redeemed, may be worth more or less than their original cost. Current performance of the Portfolio may be lower or higher than the performance quoted. Performance data current to the most recent month end may be obtained by calling (877) 435-8105 or visiting www.hardingloevnerfunds.com.
Stocks in Health Care were also helpful, especially Swiss contract drug manufacturer Lonza. The company enjoyed increased demand for its anti-microbial chemicals used to sanitize surfaces, in addition to continued optimism surrounding a potential COVID-19 vaccine from its strategic partner Moderna. The Portfolio’s overweight in Information Technology was also helpful.
Offsetting this strong performance, weak stocks within Energy detracted from relative performance. Shares of US-based oilfield services provider Schlumberger declined significantly as its customers rushed to cut expenditures for exploration and production in the face of declining oil prices. Financials stocks also detracted, particularly Spanish bank BBVA. The company was negatively impacted by low interest rates and concerns over the potential for loan losses in Mexico and Spain.
From a geographic perspective, European stocks contributed the most to relative performance, especially Lonza and Infineon Technologies, a Germany-based maker of semiconductors chiefly used in cars. Shares surged amid evidence that automobile production was pulling out of its pandemic-induced swoon and by continued excitement about its April acquisition of Cypress Semiconductor, which will expand Infineon’s share in industrial applications. Stocks in Emerging Markets detracted from performance, particularly Brazilian brewer Ambev. Shares declined as COVID-related lockdowns continued to hurt patronage of bars and restaurants, where the majority of beer in Brazil is sold.
PERSPECTIVE AND OUTLOOK
We’ve been harping on about the stretched valuations of high-quality growth companies for so long that we would forgive you for tuning us out. But as valuations continue to march higher, so too do our concerns—which is where we might have left it were it not for the evidence of a ramp-up in speculative behavior. The large number of highly valued, but (historically) weakly profitable companies with negative market-implied discount rates (MIDRs) causes us more worry over other signs of market excess.
By one of our estimates, 15% of international stocks (by capitalization) are priced to seriously disappoint based on our analysis
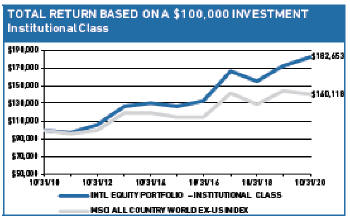
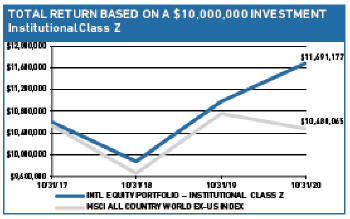
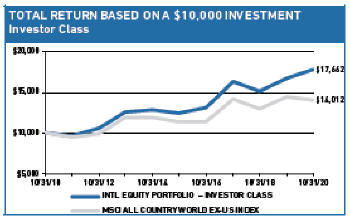
The charts above illustrate the hypothetical return of an investment made in the corresponding share classes. Investment return reflects voluntary fee waivers in effect. Absent such waivers, total return would be reduced. The performance provided in the table and charts above do not reflect the deduction of taxes that a shareholder would pay on Portfolio distributions or the redemption of Portfolio shares.
11
|
Table of Contents
of MIDRs for cohorts of global stocks in HOLT, a database of company accounts. A MIDR is an aggregation of company-level discount rates, each derived by comparing a forecast of the company’s future cashflows with its current market value. If expected future cash flows are low, or far off, while the company’s current market value is high, the discount rate that equates them must be low. But there’s low, and then there’s what we observe in today’s most expensively priced stocks. Out of the approximately 5,000 international stocks with market capitalizations above US$1 billion (totaling US$46.3 trillion in capitalization), nearly 600 companies (amounting to US$7.8 trillion) currently show up having negative implied discount rates, a higher percentage than at any time since just before the bursting of the tech bubble. Put a different way, these stocks are priced to deliver negative real returns even if HOLT’s formulaic and consensus-based assumptions about future cash flow growth are met. Among these 600 richly valued companies, 371, with US$1.9 trillion market capitalization, were loss-making throughout 2019. Our view is that, when dealing with a large group of companies, you are betting against the weight of historical evidence if you assume that so many can beat the odds by outstripping current growth expectations to deliver positive returns.
Throughout the year, companies that score highest along the growth dimension have leapt ahead of the pack. Not much of a surprise perhaps, since the value of long-duration growth has risen as interest rates have declined. But what is a surprise, to us at least, is the apparent willingness to bid up all growth stocks without regard for the quality of that prospective growth. There are two kinds of growth companies that we try to keep out of our portfolio. The first type are companies that meet our quality criteria but whose share prices are unreasonably high relative to our future growth expectations. The second type are companies that fail to meet our investment criteria for business quality; they are rejected, summarily or sometimes after lengthy debate, by our analysts.
GEOGRAPHIC EXPOSURE (%) at October 31, 2020
| COUNTRY/REGION | PORTFOLIO | BENCHMARK1 | ||||||
| CANADA | 2.1 | 6.4 | ||||||
| EMERGING MARKETS | 22.7 | 31.0 | ||||||
| EUROPE EMU | 24.0 | 19.7 | ||||||
| EUROPE EX-EMU | 24.9 | 18.6 | ||||||
| FRONTIER MARKETS2 | 0.0 | — | ||||||
| JAPAN | 14.7 | 16.6 | ||||||
| MIDDLE EAST | 1.5 | 0.4 | ||||||
| PACIFIC EX-JAPAN | 4.9 | 7.3 | ||||||
| OTHER3 | 1.5 | — | ||||||
| CASH | 3.7 | — | ||||||
1MSCI All Country World ex-US Index; 2Includes countries with less-developed markets outside the Index; 3Includes companies classified in countries outside the Index.
SECTOR EXPOSURE (%) at October 31, 2020
| SECTOR | PORTFOLIO | BENCHMARK1 | ||||||
| COMM SERVICES | 5.0 | 7.9 | ||||||
| CONSUMER DISCRETIONARY | 4.8 | 14.3 | ||||||
| CONSUMER STAPLES | 13.9 | 9.5 | ||||||
| ENERGY | 1.8 | 4.0 | ||||||
| FINANCIALS | 14.1 | 17.1 | ||||||
| HEALTH CARE | 13.1 | 10.0 | ||||||
| INDUSTRIALS | 14.1 | 11.6 | ||||||
| INFORMATION TECHNOLOGY | 21.7 | 11.7 | ||||||
| MATERIALS | 7.8 | 7.8 | ||||||
| REAL ESTATE | 0.0 | 2.7 | ||||||
| UTILITIES | 0.0 | 3.4 | ||||||
| CASH | 3.7 | — | ||||||
1MSCI All Country World ex-US Index.
In cases of both types, there are “many a slip ’twixt the [growth] cup and the [quality] lip.” In the lifecycle of the typical successful firm, growth precedes profitability, which makes quality assessment fraught in the early, rapid growth phase. The archetype for the firm with rapidly growing sales but only modest profitability was Amazon.com. Early in our investment coverage we debated its business quality at length, holding back from introducing it into our qualified (i.e., investible) universe until 2009, when it met our quality criteria more clearly and we added it to our Global Equity strategy. Currently, a growing number of investors appear willing to take a leap of faith much earlier over the fortunes of hitherto profitless companies. A poster child for exuberance over profitless growth is Shopify, a Canadian IT services company, whose sales have grown rapidly to US$2 billion annually, but which has yet to turn a profit since going public in 2015. Our analyst, upon meeting with the company several years ago, noted its impressive sales growth but was put off by its high client turnover. This year, a different analyst, lured by dazzling revenue growth and a potential boost from COVID-19, re-examined the company. But whereas we expected—perhaps even hoped—to find a clear path for it to eventual profitability, instead we found a company busily undermining its long-term profit prospects by pursuing low margin businesses to maintain its sales growth at any cost.
Fortunately, even within the IT sector there are still opportunities to be uncovered if you are willing to do the legwork. Semiconductor manufacturers have a long track record of sustained growth and profitability yet still appear reasonably priced. While their shares have been historically volatile (given the cyclical nature of the industry), we see semiconductor demand continuing to grow for the foreseeable future—fueled by mobile services, high performance (cloud) computing, and smarter connected devices in the home, industry, and transportation. At the same time, as we have predicted, the industry has consolidated; there are barely a handful of companies who are masters of the ever-increasing challenge of manufacturing ever-smaller and more sophisticated chips. This quarter’s announcement by US chipmaker Intel that it has been struggling to manufacture the next generation of smaller, faster,
12
|
Table of Contents
and more efficient chips gave our thesis a shot in the arm. We expect top chipmakers, particularly TSMC and South Korea-based Samsung Electronics, to enjoy a widening competitive advantage and improving industry structure in the years ahead.
Beyond semiconductors, we also continue to find attractive investments in Software and Internet Services. Among these companies, we tend to see high returns on invested capital, low capital investment requirements, and high rates of sales and profit growth—all achieved with low sensitivity to the business cycle. Our analysts favor business process facilitators such as SAP and Dassault Systémes in Europe, as well as financial technology leaders such as Adyen.
PORTFOLIO HIGHLIGHTS
We have been drawn to the payments industry for more than a decade, as we recognized the orders-of-magnitude better margins of transferring money online as compared to the rusty pipes of the traditional banking system. However, the companies best positioned to benefit were either located in the US or trapped inside other businesses, such as the AliPay subsidiary of Chinese ecommerce behemoth Alibaba. We thus found few counterparts internationally to PayPal or Mastercard (both held in our Global strategy), until the listing in 2018 of Adyen—a Dutch payments software company whose platform enables merchants to transact with their customers seamlessly across both online and offline distribution channels—caught the eye of our analysts. Ebay has chosen Adyen to supplant PayPal as the default payment processor on its global online marketplace, as have a growing number of other multinational companies attracted to Adyen’s multi-currency, multi-channel capabilities, and the richness of the customer information it can provide from the transactions. When the shares dipped slightly in the first quarter market dive, we pounced, trusting the growth estimates of our own modeling, which gauged the shares to be attractively priced despite a price-to-earnings ratio (merely a snapshot, after all, of today’s earnings) at eye-watering levels. That confidence was not misplaced, as the company has won a slew of new mandates through the pandemic from businesses rushing to adapt or die in an economy whose shift from brick-and-mortar to online commerce has accelerated dramatically.
Technology and online businesses have attracted lots of attention during this pandemic, as have biotech and diagnostic companies tasked with battling the virus itself. Most of our health care holdings remain slightly out of the limelight, which suits us just fine. Roche, for instance, sells one of the leading test kits for COVID-19, but remains primarily focused on its many promising (and potentially lucrative) therapies for cancer and other diseases now making their way through clinical trials. Meanwhile, Sonova Holding, a hearing aid manufacturer whose products and upgrades fell squarely into the “non-urgent” category in the first months of the pandemic, announced recently that its sales were rebounding as it worked through a backlog of deferred maintenance and new device orders. Unlike some treatments that require hospital stays, the majority of Sonova’s products are
TEN LARGEST HOLDINGS at October 31, 2020
| COMPANY | SECTOR | COUNTRY | % | |||||||||
TSMC | INFO TECHNOLOGY | TAIWAN | 4.3 | |||||||||
INFINEON TECHNOLOGIES | INFO TECHNOLOGY | GERMANY | 3.5 | |||||||||
SAMSUNG ELECTRONICS | INFO TECHNOLOGY | SOUTH KOREA | 3.4 | |||||||||
ATLAS COPCO | INDUSTRIALS | SWEDEN | 3.2 | |||||||||
L’OREAL | CONS STAPLES | FRANCE | 3.2 | |||||||||
TENCENT | COMM SERVICES | CHINA | 3.1 | |||||||||
ROCHE | HEALTH CARE | SWITZERLAND | 3.0 | |||||||||
LONZA | HEALTH CARE | SWITZERLAND | 3.0 | |||||||||
AIA GROUP | FINANCIALS | HONG KONG | 2.9 | |||||||||
UNICHARM | CONS STAPLES | JAPAN | 2.7 | |||||||||
delivered in small clinics or stores, which are transitioning more easily to a gradual re-opening for elective business.
The Portfolio’s bias towards EM banks and insurers has been detrimental to returns this year, as currency depreciation and sharper economic declines in those markets have hit bank share prices especially hard. Our three insurance holdings, AIA Group in Hong Kong, Ping An Insurance in China, and Allianz in Germany, have held up much better—both because their businesses are normally less cyclically exposed and because the strong performance of their bond portfolios has enabled them to maintain their profits and dividends. More negatively, consequences of governmental mismanagement of the coronavirus and its knock-on economic effects have amplified expected loan losses for Brazil’s Itaú Unibanco, India’s ICICI Bank, and Spain’s BBVA. The latter, with its most profitable subsidiary BBVA Bancomer in Mexico, has reeled from the economic effects of the pandemic. But its Mexican business appears to have already turned the corner thanks to generous loss provisions front-loaded into first and second quarters, and to recovering transaction and lending activity with new loans now rising above the pre-COVID-19 levels of February. Managements of all our banks stress the importance of having established a culture of disciplined credit underwriting, long prior to the pandemic, as the basis for optimism about the health of their loan books. For the time being, we continue to believe that maintaining a holding in banks acts as a counterweight to the price risks entailed in the rapidly growing, highly priced companies we own in other sectors. A return to normal economic output and demand levels could spark a rise in bond yields that would hurt the valuations of most growth stocks, but swell the earnings of banks, whose net interest earnings have heretofore been squeezed by the plentiful monetary stimulus pumped out by central banks around the world.
Please read the separate disclosures page for important information, including the risks of investing in the Portfolio.
13
|
Table of Contents

PORTFOLIO MANAGEMENT

JAFAR RIZVI, CFA CO-LEAD PORTFOLIO MANAGER
ANIX VYAS, CFA CO-LEAD PORTFOLIO MANAGER |
 PERFORMANCE SUMMARY
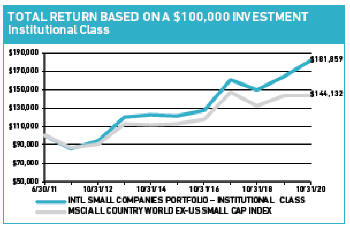
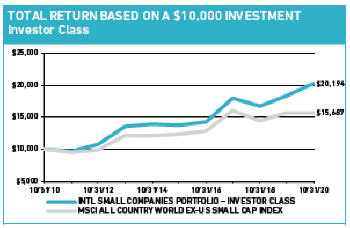
For the International Small Companies Portfolio, the Institutional Class gained 10.34% and the Investor Class rose 10.07% (net of fees and expenses) in the fiscal year ended October 31, 2020. The Portfolio’s benchmark, the MSCI All Country World ex-US Small Cap Index, rose 0.07% (net of source taxes).
MARKET REVIEW
Stocks of international small companies rose at the start of the fiscal year amid easing US-China trade tensions, with the two parties agreeing to a limited pull-back from their entrenched positions. The market also benefited from the overwhelming election victory of the Conservative Party in the UK, as the likelihood of an orderly Brexit increased. From January through April, however, markets fell sharply as the COVID-19 pandemic engulfed the planet. The size and speed of equity market declines were unprecedented, with volatility reaching levels not seen since the global financial crisis. Although the respiratory disease spread first in Asia, the epicenter shifted rapidly to Europe and the US. By April 30, the infection had spread to over 180 countries, and governments everywhere were struggling to contain the disease and its fallout. The ensuing travel restrictions, business closures, and home confinements brought economic activity to a shuddering stop. Small caps with low leverage did particularly well during the fallout, helping performance during the worst part of the market decline in March.
As the health crisis morphed into a full-blown economic crisis, policymakers grappled with how to respond. On the monetary front, central bankers pulled out all the stops. The Bank of England pledged unlimited support to large company financings and the European Central Bank expanded its asset purchase program, relaxing its asset eligibility requirements for both sovereign and corporate issuers. The People’s Bank of China cut its reserve requirement ratio—twice—hoping to spur bank lending. The US Federal Reserve lowered short-term rates to near-zero and unveiled aggressive actions to keep credit flowing, even committing to low interest rates through 2023. Central bankers remained highly accommodative across the world, with short-
FUND FACTS at October 31, 2019 | ||||||||
TOTAL NET ASSETS | $329.3M | |||||||
SALES CHARGE | NONE | |||||||
NUMBER OF HOLDINGS | 81 | |||||||
TURNOVER (5 YR. AVG.) | 38% | |||||||
DIVIDEND POLICY | ANNUAL | |||||||
INSTITUTIONAL INVESTORS | INDIVIDUAL INVESTORS | |||||||
| INSTITUTIONAL CLASS | INVESTOR CLASS | |||||||
TICKER | HLMRX | HLMSX | ||||||
CUSIP | 412295875 | 412295883 | ||||||
INCEPTION DATE | 6/30/2011 | 3/26/2007 | ||||||
MINIMUM INVESTMENT1 | $100,000 | $5,000 | ||||||
NET EXPENSE RATIO2 | 1.15% | 1.40% | ||||||
GROSS EXPENSE RATIO | 1.23% | 1.55% | ||||||
1Lower minimums available through certain brokerage firms; 2The Expense Ratio is as of the most recent Prospectus and is based on expenses for the most recent fiscal year end. The net expense ratio is shown net of Harding Loevner’s contractual agreement through February 28, 2021. The Net Expense Ratio is applicable to investors.
term interest rates hovering near-zero in every major economy, and guidance for more of the same for many months to come.
Bolstered by the massive stimulus, markets rebounded from the end of March through the rest of the fiscal year. While business activity remained weak, economic data signaled a nascent recovery as countries around the world started to reopen. Several indicators, including unemployment, consumer spending, and service and manufacturing surveys, reflected notable improvements from trough levels seen in April. Progress toward a vaccine also boosted sentiment, despite rising cases of the novel coronavirus in many countries including the United States and much of Latin America.
By sector, Health Care and Information Technology (IT) performed best. Health Care performance was largely driven by pharmaceutical and life sciences companies engaged in trying to find effective treatments for COVID-19. IT performed well as increased adoption of cloud-based applications and rising levels of investment in next-generation mobile technology extended demand for semiconductors, hardware, and software-as-a-service (SaaS) companies.
Viewed by region, Canada, Pacific ex-Japan, and Emerging Markets performed best. South Korea was among the leaders in EM, having set the standard for containment, contact tracing, and testing programs after emerging as an early coronavirus hotspot. Somewhat counterintuitively given the failure of the country’s containment efforts, small caps in India also outperformed, receiving a lift from a new policy by the Indian Securities and Exchange Board mandating that domestic multi-capitalization
14
|
Table of Contents
PERFORMANCE (% TOTAL RETURN)
| for periods ended September 30, 2020 | for periods ended October 31, 2020 | |||||||||||||||||||||||||||||||||||||||||||||||||
| 1 | 3 | 5 | 10 | SINCE INCEPTION* | 1 | 3 | 5 | 10 | SINCE INCEPTION* | |||||||||||||||||||||||||||||||||||||||||
| YEAR | YEARS | YEARS | YEARS | Jun-11 | Mar-07 | YEAR | YEARS | YEARS | YEARS | Jun-11 | Mar-07 | |||||||||||||||||||||||||||||||||||||||
INTL SMALL COMPANIES PORTFOLIO – INST CLASS | 15.84 | 4.99 | 9.72 | — | 6.87 | 10.34 | 4.11 | 8.34 | — | 6.61 | ||||||||||||||||||||||||||||||||||||||||
INTL SMALL COMPANIES PORTFOLIO – INVESTOR CLASS | 15.54 | 4.73 | 9.45 | 7.97 | 6.31 | 10.07 | 3.85 | 8.08 | 7.28 | 6.14 | ||||||||||||||||||||||||||||||||||||||||
MSCI ALL COUNTRY WORLD EX-US SMALL CAP INDEX | 6.97 | 0.93 | 6.80 | 5.31 | 4.33 | — | 0.07 | -0.58 | 5.01 | 4.61 | 3.99 | — | ||||||||||||||||||||||||||||||||||||||
Returns are annualized for periods greater than 1 year. *Inception of the Institutional Class, June 30, 2011. Inception of the Investor Class, March 26, 2007. Index performance prior to June 1, 2007 cannot be shown since it relies on back-filled data.
Performance data quoted represents past performance; past performance does not guarantee future results. The investment return and principal value of an investment will fluctuate so that an investor’s shares, when redeemed, may be worth more or less than their original cost. Current performance of the Portfolio may be lower or higher than the performance quoted. Performance data current to the most recent month end may be obtained by calling (877) 435-8105 or visiting www. hardingloevnerfunds.com.
The charts below illustrate the hypothetical return of an investment made in the corresponding share classes. Investment return reflects voluntary fee waivers in effect. Absent such waivers, total return would be reduced. The performance provided in the table and charts above do not reflect the deduction of taxes that a shareholder would pay on Portfolio distributions or the redemption of Portfolio shares.
funds invest a minimum of 25% in small caps. The Middle East and Eurozone lagged during the period.
PERFORMANCE ATTRIBUTION
By sector, the Portfolio’s longstanding overweight to IT again pos itively contributed to our relative performance. Shares of Kinaxis a Canadian-based provider of supply-chain management software, continued to outperform as companies assess global supply resilience in the face of COVID-19 disruptions. Italy-based Reply, digital-media-focused IT services provider, was another large con tributor after an earnings report that showed resiliency in the of marketing tech budgets having been slashed, a credit to its relationships with BMW and Volkswagen among other longtime customers. Poor stock selection in Consumer Staples was the detractor from relative returns over the fiscal year.
Viewed geographically, almost all regions ended the year with pos itive returns. Holdings in the Eurozone led the way, with Germany companies STRATEC and Bechtle contributing most. STRATEC, maker of equipment and consumables for diagnostic companies, experienced expanding margins due to a combination of surging
demand for COVID-19 tests and an improving product mix. In early February, Bechtle said its fourth-quarter revenue grew 18%, well above investor’s expectations and an acceleration from the year prior. Poor stock selection in Pacific ex-Japan and the Portfolio’s US holdings were the largest detractors from relative returns.
INVESTMENT PERSPECTIVES
After Wirecard admitted to accounting fraud involving fictitious cash and profits and declared bankruptcy in June, The Financial Times ran an article looking back at third-party assessments of the company’s environmental, social, and governance (ESG) practices.1 Before its collapse, Wirecard had earned median-grade ESG ratings from MSCI and Sustainalytics, the two most prominent and widely used ratings services, and fell in similar mid-tier or neutral ESG categories in rankings from other services. As a middle-of-the-pack company in ESG terms, Wirecard was held in some ESG-focused passively managed exchange traded funds, including big funds managed by Blackrock and Vanguard.
1“Anatomy of a Scandal: Wirecard Tests ESG,” Financial Times Moral Money (July 1, 2020).
15
|
Table of Contents
As the article noted, there were a few prescient outliers that had deliberately avoided Wirecard on governance grounds. At Harding Loevner, though we don’t put our strategies forward as “ESG focused,” we integrate ESG factors into our fundamental assessment and valuation of every company that we consider for investment. It’s notable that we covered Wirecard until 2016, when we expelled it from our pool of companies qualified for investment because it no longer met our “management quality,” i.e., governance, criteria. The analyst who made the judgement to remove it cited his growing unease regarding the company’s financial disclosure (including the opacity around its cash flow accounting), its failure to explain clearly the logic of a series of acquisitions, and prior (unproven) public accusations of fraud. Each of these concerns were surfaced in our checklist for identifying corporate governance weaknesses that our analysts complete for each of their covered companies.
As a cautionary tale about the limitations of ESG ratings, the surprising downfall of this once-$13 billion market cap company is arguably even more relevant to investors in companies with smaller capitalizations. With thousands of companies under coverage, ratings providers like MSCI are inherently limited in how deeply they can assess ESG risks of firms. MSCI relies on a combination of company reporting, macro-level data, other publicly available information, and (as it acknowledges in its ratings disclosures) uneven levels of engagement between its analysts and company managements. Because small companies tend to be more resource-constrained than large companies, their reporting tends to be more limited and their one-on-one engagement with ESG ratings providers can be more infrequent. These companies are also less well-covered by brokers’ research departments and the media, further restricting the amount of publicly available information on them.
As fundamental, bottom up investors, we have never outsourced judgement on risks, ESG or otherwise. While we use data from MSCI and other external providers to inform our decision-making, we do our own scoring. Each analyst is responsible for identifying and assessing the material ESG-related risks or opportunities facing each of the companies that they cover. Companies are assessed across three dozen criteria, including impact from environmental regulation, water consumption that could face scarcity costs, human capital management, and supply chains. Analysts incorporate these factors into the assumptions of their financial models for companies, including cash flow projections.
The long investment horizon over which we assess our companies means we are focused on all risks to the sustainability of the comparative advantages that allow them to achieve high profitability and long-term growth, which include risks stemming from environmental, social, and governance factors. In the process of identifying the merits of a business, our analysts weed out companies that have elevated ESG-related risks, and they flag the material ESG-related risks of companies that do meet our investment criteria to ensure we monitor them closely.
We are not trying to build portfolios with superior third-party ESG ratings. Rather, we are trying to build portfolios with favor-
SECTOR EXPOSURE (%) at October 31, 2020
| SECTOR | PORTFOLIO | BENCHMARK1 | ||||
COMMUNICATION SERVICES | 9.8 | 4.5 | ||||
CONSUMER DISCRETIONARY | 5.3 | 12.5 | ||||
CONSUMER STAPLES | 11.0 | 6.2 | ||||
ENERGY | 1.7 | 2.0 | ||||
FINANCIALS | 4.7 | 9.6 | ||||
HEALTH CARE | 11.0 | 7.9 | ||||
INDUSTRIALS | 17.6 | 19.9 | ||||
INFORMATION TECHNOLOGY | 25.8 | 12.5 | ||||
MATERIALS | 6.7 | 10.4 | ||||
REAL ESTATE | 0.9 | 11.2 | ||||
UTILITIES | 1.2 | 3.3 | ||||
CASH | 4.3 | — | ||||
1MSCI All Country World ex-US Small Cap Index.
GEOGRAPHIC EXPOSURE (%) at October 31, 2020
| COUNTRY/REGION | PORTFOLIO | BENCHMARK1 | ||||
CANADA | 3.0 | 6.6 | ||||
EMERGING MARKETS | 20.5 | 22.0 | ||||
EUROPE EMU | 20.2 | 13.9 | ||||
EUROPE EX-EMU | 27.7 | 23.8 | ||||
FRONTIER MARKETS2 | 6.0 | — | ||||
JAPAN | 15.6 | 22.3 | ||||
MIDDLE EAST | 1.5 | 1.5 | ||||
PACIFIC EX-JAPAN | 0.6 | 9.9 | ||||
OTHER3 | 0.6 | — | ||||
CASH | 4.3 | — | ||||
1MSCI All Country World ex-US Small Cap Index; 2Includes countries with less-developed markets outside the Index; 3Includes companies classified in countries outside the Index.
able risk and return characteristics. To that end our analysts and portfolio managers pay close attention to ESG risks because these factors can contribute profoundly to the success or failure of our investments. External ESG ratings are for us an input, a useful reference point. An external rating that differs from our own may signal an asymmetry between our deep fundamental knowledge of the company and the rater’s unavoidably superficial and possibly distorted knowledge. Such asymmetries can be important contributors to our opportunity to generate alpha in small caps. To the extent that poorly- or non-MSCI-rated firms slip under the radar of ESG-focused funds, our ability to uncover high-quality growing companies with low ESG risks before they are endorsed by the ratings providers is potentially a way, then, for us to purchase them at a better price.
An example of a high-ESG-scoring company on our radar is Vaisala, based in Finland. The company was founded 84 years ago by Professor Vilho Vaisala, among the first developers of the radiosonde, a package of sensors sent aloft, typically by balloon, to measure pressure, temperature, wind, humidity, and other at-
16
|
Table of Contents
mospheric variables. While routine weather forecasting remains an important part of its business, the company has leveraged its monitoring capabilities to expand into more specialized, and more profitable, applications such as supporting renewable energy producers, who need accurate wind and solar radiation data to forecast their power production. Assessing air quality, especially in large emerging markets like China and India, is another growing market. With these environmentally related areas of emphasis, Vaisala is clearly aligned with trends likely to persist for some time. Vaisala has no ESG rating from MSCI (unsurprisingly, since it’s not even in the MSCI Small Cap Index), but our view is that this is a highly sustainable business. We are more than happy to see its earnings, and our reasonably-valued investment in them, compound until such time as the market comes around to our view.
PORTFOLIO HIGHLIGHTS
We made only slight changes to the Portfolio in reaction to the spreading pandemic as we responded to shifting valuations and revisions to our outlook for companies. Our Portfolio’s sectoral profile was essentially unchanged: we retained our longstanding overweight to IT, Health Care, and Consumer Staples and underweight to Financials, Consumer Discretionary, and Real Estate.
We sold Ülker, Turkey’s largest confectionary company, primarily due to a breakdown in our fundamental business thesis, specifically regarding governance. While the business continues to thrive, rising levels of cash on the balance sheet have magnified pre-existing governance risks. When we evaluate companies, we flag and monitor material risks. In the case of Ülker, governance risks were always on our radar for a couple of reasons: the company is controlled by a large holding company, and it did not have enough independent board members. Our decision to invest despite these risks was based on the expectation that governance would eventually improve under pressure from shareholders. While this may yet occur, the risk that the company could use its swelling cash for related-party M&A has increased.
We sold three companies that had grown too large to remain in our small cap Portfolio. Italian-based diagnostic company Diasorin was the most extreme example. Its shares have performed very well on a relative basis as the company has been inundated with demand for COVID-19 testing in a country that saw heartbreaking levels of illness earlier this spring. While the company continues to meet our quality and growth criteria, at a now-$10 billion market cap, it has simply outgrown the Portfolio. Alfa Laval, a Swedish manufacturer of heat exchangers, and MonotaRO, a Japanese wholesaler of maintenance, repair, and operations supplies, were the other two size-driven sales during the year.
We also sold Nakanishi, a Japan-based leading provider of high-quality handheld dental equipment. The company manufacturers many of its own components, making for an especially powerful, lightweight, and smoothly operating set of tools. We anticipated these advantages would help it gain share in the US, to reach the high levels it enjoys in Asia and Europe, but the
TEN LARGEST HOLDINGS at October 31, 2020
| COMPANY | SECTOR | COUNTRY | % | |||||||||
STRATEC | HEALTH CARE | GERMANY | 3.3 | |||||||||
KINAXIS | INFO TECHNOLOGY | CANADA | 3.0 | |||||||||
BECHTLE | INFO TECHNOLOGY | GERMANY | 2.9 | |||||||||
REPLY | INFO TECHNOLOGY | ITALY | 2.9 | |||||||||
HOA PHAT GROUP | MATERIALS | VIETNAM | 2.8 | |||||||||
PARADOX INTERACTIVE | COMM SERVICES | SWEDEN | 2.7 | |||||||||
ABCAM | HEALTH CARE | UK | 2.5 | |||||||||
FUCHS PETROLUB | MATERIALS | GERMANY | 2.3 | |||||||||
DECHRA PHARMACEUTICALS | HEALTH CARE | UK | 2.2 | |||||||||
ARIAKE | CONS STAPLES | JAPAN | 2.1 | |||||||||
company has struggled with US distribution resulting in a persistent failure to meet its targets. Management has now turned its sights to gaining share in China instead, which will require significant additional investment in distribution. Lacking confidence in their ability to execute this plan, we sold.
Proceeds from these sales were reallocated to more attractively priced existing positions and a new holding in Siauliu Bankas, the fastest growing and most profitable bank in Lithuania’s concentrated banking market. The bank has benefitted from having not only the country’s largest branch network, but also the highest customer satisfaction rating. While it caters to small businesses, which have been heavily impacted by the pandemic, we think the company’s scale and reputation will enable it to resume growing its loan book, which should ultimately yield a significantly higher return on equity. We also added to two other existing companies that are suffering from what we consider transient effects of the pandemic. Both UK-based aerospace supplier Senior and Network International are exposed to the airline industry: Senior, as a supplier of components used in the manufacturing of commercial aircraft, and Network, as a supplier of processing services to airlines. We view both companies as having durable competitive advantages and long-term growth opportunities.
Please read the separate disclosures page for important information, including the risks of investing in the Portfolio.
17
|
Table of Contents

PORTFOLIO MANAGEMENT TEAM

| SCOTT CRAWSHAW | PRADIPTA CHAKRABORTTY | |
CO-LEAD PORTFOLIO MANAGER
| PORTFOLIO MANAGER
| |
| CRAIG SHAW, CFA | RICHARD SCHMIDT, CFA | |
| CO-LEAD PORTFOLIO MANAGER | PORTFOLIO MANAGER
|
The Institutional Emerging Markets Portfolio (Institutional Class and Institutional Class Z) and the Emerging Markets Portfolio (Advisor Class)—collectively, the “Portfolios”—are both managed in strict accordance with Harding Loevner’s Emerging Markets Equity strategy model portfolio. Therefore, the Portfolios have highly similar holdings and characteristics. We have provided a single commentary to cover both Portfolios. The specific performance and characteristics of each are presented separately in the tables that follow.
 PERFORMANCE SUMMARY
For the Institutional Emerging Markets Portfolio, the Institutional Class rose 1.38% and the Class Z rose 1.55% (net of fees and expenses). For the Emerging Markets Portfolio, the Advisor Class rose 1.11% (net of fees and expenses) in the fiscal year ended October 31, 2020. The Portfolios’ benchmark, the MSCI Emerging Markets Index, rose 8.25% (net of source taxes) in the fiscal year.
MARKET REVIEW
Emerging Markets (EMs) enjoyed a strong start to the fiscal year, with rising expectations for earnings growth amid the efforts of governments and central banks to stimulate their economies and signs of a de-escalation in US-China trade tensions. But in January optimism evaporated when the COVID-19 outbreak in the Chinese city of Wuhan rapidly spread to become a planet-engulfing pandemic. EMs plummeted nearly 34% from early January through late-March. The size and speed of the equity market decline were unprecedented. Volatility reached levels not seen since the global financial crisis.
The virus presented a complex mix of countervailing developments across the EM landscape as the year progressed. Among the best-performing regions, China has been notable for the speed and strength of its economic recovery. By March 2020, the country had controlled the domestic spread of the virus and started relaxing its lockdowns, and by the end of the fiscal year the economy has already returned to posting year-over-year growth.
FUND FACTS at October 31, 2020 |
| |||||||||||
SALES CHARGE | NONE | |||||||||||
NUMBER OF HOLDINGS | 77 | |||||||||||
DIVIDEND POLICY | ANNUAL | |||||||||||
INSTITUTIONAL INVESTORS | INDIVIDUAL INVESTORS | |||||||||||
PORTFOLIO ASSETS | $5,477.0M | $3,743.3M | ||||||||||
TURNOVER (5 YR. AVG.) | 20% | 21% | ||||||||||
CLASS | INST CLASS | INST CLASS Z | ADVISOR | |||||||||
TICKER | HLMEX | HLEZX | HLEMX | |||||||||
CUSIP | 412295701 | 412295693 | 412295305 | |||||||||
INCEPTION DATE | 10/17/2005 | 3/5/2014 | 11/9/1998 | |||||||||
MINIMUM INVESTMENT1 | $500,000 | $10,000,000 | $5,000 | |||||||||
NET EXPENSE RATIO | 1.17%2 | 1.11%2 | 1.32% | 2 | ||||||||
GROSS EXPENSE RATIO | 1.27%2 | 1.19%2 | 1.37% | 2 | ||||||||
1Lower minimums available through certain brokerage firms; 2The Expense Ratio is as of the most recent Prospectus and is based on expenses for the most recent fiscal year end. The net expense ratio is shown net of Harding Loevner’s contractual agreement through February 28, 2022. The Net Expense Ratio is applicable to investors.
Relative to China’s experience, the economic damage wrought by the pandemic in most other EMs has been significantly greater and their recoveries more halting. Still, the massive scale and pace of monetary and fiscal stimulus by global central banks in response to the economic damage of the pandemic helped stoke a recovery in EM shares prices that started in March and continued, mostly unabated, through the end of the fiscal year. Moreover, companies that benefit from the transformation in consumer habits shaped by lockdowns and social distancing, such as e-commerce and online services businesses, saw significant acceleration of demand. Investors clamoring for exposure to this select group of EM winners continued to fuel momentum in their shares, akin to the FAANG concentration effect we have witnessed in the US stock market.
The strongest performing sectors were Consumer Discretionary and Information Technology (IT), followed by Communication Services and Health Care. Consumer Discretionary was led partly by Chinese e-commerce and online education companies. These internet businesses reported increased usage and gained market share from offline competitors amid COVID-19-related shutdowns. Information Technology (IT) stocks were relatively resilient amid the pandemic. Hardware and semiconductor companies enjoyed growth in demand from the rollout of 5G wireless networks and increased usage of cloud computing services.
Energy stocks suffered the most amid the collapse in oil prices. Financials, especially banks in oil- and commodity-producing countries like Russia, Mexico, Brazil, and Colombia, were also weak. Expectations for loan growth have fallen with weaker economic activity, and inves-
18
|
Table of Contents
PERFORMANCE (% TOTAL RETURN)
| for periods ended September 30, 2020 | for periods ended October 31, 2020 | |||||||||||||||||||||||||||||||||||||||||||||||||||||||||||||||||||||||
| 1 | 3 | 5 | 10 | SINCE INCEPTION* | 1 | 3 | 5 | 10 | SINCE INCEPTION* | |||||||||||||||||||||||||||||||||||||||||||||||||||||||||||||||
| YEAR | YEARS | YEARS | YEARS | Oct-05 | Mar-14 | Nov-98 | YEAR | YEARS | YEARS | YEARS | Oct-05 | Mar-14 | Nov-98 | |||||||||||||||||||||||||||||||||||||||||||||||||||||||||||
INST. EMERGING MARKETS PORTFOLIO – INST. CLASS | 4.11 | 0.14 | 7.96 | 3.32 | 6.29 | 1.38 | -0.02 | 6.72 | 3.26 | 6.35 | ||||||||||||||||||||||||||||||||||||||||||||||||||||||||||||||
INST. EMERGING MARKETS PORTFOLIO –CLASS Z | 4.34 | 0.33 | 8.17 | — | 3.88 | 1.55 | 0.14 | 6.94 | — | 4.03 | ||||||||||||||||||||||||||||||||||||||||||||||||||||||||||||||
EMERGING MARKETS PORTFOLIO – ADVISOR CLASS | 3.81 | -0.01 | 7.83 | 3.21 | 10.29 | 1.11 | -0.16 | 6.61 | 3.16 | 10.32 | ||||||||||||||||||||||||||||||||||||||||||||||||||||||||||||||
MSCI EMERGING MARKETS INDEX | 10.54 | 2.42 | 8.97 | 2.50 | 6.26 | 4.37 | — | 8.25 | 1.94 | 7.92 | 2.42 | 6.37 | 4.63 | — | ||||||||||||||||||||||||||||||||||||||||||||||||||||||||||
Returns are annualized for periods greater than 1 year. *Inception of Institutional Class, 10/17/05. Inception of Class Z, 3/5/14. Inception of the Advisor Class, 11/9/98. Index performance prior to 1/1/01 cannot be shown since it relies on back-filled data.
Performance data quoted represents past performance; past performance does not guarantee future results. The investment return and principal value of an investment will fluctuate so that an investor’s shares, when redeemed, may be worth more or less than their original cost. Current performance of the Portfolio may be lower or higher than the performance quoted. Performance data current to the most recent month end may be obtained by calling (877) 435-8105 or visiting www. hardingloevnerfunds.com.
tors have been concerned about a rise in credit losses due to virus-related business disruption and unemployment.
Asia was the only EM region with positive performance, with returns in China, Taiwan, and South Korea enhanced by these markets’ heavy weights in Consumer Discretionary and IT stocks. The weakest region was Latin America; Brazil, its largest market, struggled to regain its footing as investors remained concerned about the economic impact of the pandemic and the government’s chaotic response.
Across EMs on average, stocks of companies that score highest on Growth and Quality measures significantly outperformed the broad index.
PERFORMANCE ATTRIBUTION
Our stocks in the Consumer Discretionary, Financials, and Consumer Staples sectors were the main detractors from relative performance this year. In Consumer Discretionary, Macao casino operator Sands China dragged on performance, despite the company being among the best positioned to emerge healthy once the chill on travel due to the pandemic has passed. We also had poor stock selection in the automobile industry. Indonesia’s Astra International temporarily closed its auto manufacturing and sales operations late in the fiscal year due to the country’s re-imposition of social-distancing measures. The sharp share-price declines for many of our Financials holdings, especially bank stocks, during the initial shock of the COVID-19 pandemic, also weighed heavily on relative returns.
We outperformed in Industrials, led by strong performance in power tools manufacturer Techtronic Industries, which witnessed resurgent demand, especially in cordless DIY power equipment and floor-care products, and rapid growth of its e-commerce business.
By geography, unfavorable allocations were key causes of underperformance. Our pursuit of diversification and commitment to investing in high-quality, growing, and reasonably priced companies put us at odds with the huge concentration of returns from the biggest “COVID winners” in China. Our overweight to Latin America (where our bank holdings especially hurt) and emerging Europe also hurt relative returns. Shares of Russian Energy companies Novatek and Lukoil fell sharply amid the decline in oil and gas prices amid the global economic slowdown.
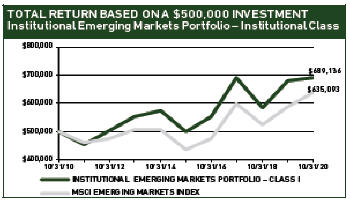
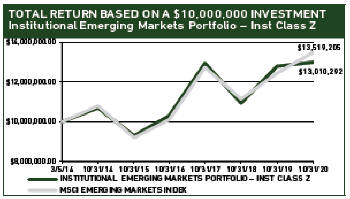
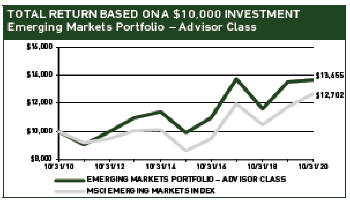
The charts above illustrate the hypothetical return of an investment made in the corresponding share classes. Investment return reflects voluntary fee waivers in effect. Absent such waivers, total return would be reduced. The performance provided in the table and charts above do not reflect the deduction of taxes that a shareholder would pay on Portfolio distributions or the redemption of Portfolio shares.
19
|
Table of Contents
A number of our diverse holdings in China beyond internet-related enterprises were helpful this year. Midea Group, a leading manufacturer of household appliances, was a key contributor. After manufacturing shutdowns were lifted, the company quickly ramped up air conditioner production and hit a record in April. Shares of delivery business SF Express were also quite strong as e-commerce shipments during the pandemic boosted demand for its services.
PERSPECTIVE AND OUTLOOK
Viewed superficially, that the EM Index rose 8% in the fiscal year might suggest that the effects of the pandemic are now behind the EMs and their commercial life is back to normal. Unfortunately, nothing could be further from the truth. To see how much has changed, look below the surface of the EM Index at the colossal divergence of sectors and regions within. While the IT and Consumer Discretionary sectors rose 35% and 48%, respectively, for the year-to-date, Financials fell 20% and Energy was down 30%. Country performance has been similarly disparate. The year-to-date spread, for example, between China (up 35%) and Brazil (down 38%) is an eye-watering 73%.
The difference between China and Brazil owes in part to their respective gearing to global growth and their opposite roles in the global commodity trade, and in part to how effectively each country has handled the pandemic. Once it recognized the seriousness of the initial outbreak of the disease, Chinese authorities were relatively quick to impose severe and widescale lockdowns, along with instituting comprehensive tracing and testing. By contrast, Brazil’s President Jair Bolsonaro has consistently dismissed the seriousness of the virus, and his administration’s uneven approach to containing it has left nearly 6 million reportedly infected and 160,000 dead, second to the US, whose population is considerably larger.
GEOGRAPHIC EXPOSURE (%) at October 31, 2020
| COUNTRY/REGION | INSTITUTIONAL | ADVISOR | BENCHMARK1 | |||
| HLMEX / HLEZX | HLEMX | |||||
BRAZIL | 6.8 | 6.8 | 4.4 | |||
CHINA + HONG KONG2 | 34.9 | 35.0 | 43.2 | |||
INDIA | 8.3 | 8.3 | 8.1 | |||
MEXICO | 4.6 | 4.6 | 1.6 | |||
RUSSIA | 6.6 | 6.6 | 2.7 | |||
SOUTH AFRICA | 1.4 | 1.4 | 3.5 | |||
SOUTH KOREA | 10.0 | 10.0 | 11.9 | |||
TAIWAN | 11.3 | 11.3 | 12.7 | |||
SMALL EMERGING MARKETS3 | 6.5 | 6.5 | 11.9 | |||
FRONTIER MARKETS4 | 1.9 | 1.9 | — | |||
DEVELOPED MARKET LISTED5 | 5.9 | 5.9 | — | |||
CASH | 1.8 | 1.7 | — | |||
1MSCI Emerging Markets Index; 2The Benchmark does not include Hong Kong; 3Includes the remaining emerging markets which, individually, comprise less than 5% of the Index; 4Includes countries with less-developed markets outside the Index; 5Includes emerging markets or frontier markets companies listed in developed markets, excluding Hong Kong.
SECTOR EXPOSURE (%) at October 31, 2020
| SECTOR | INSTITUTIONAL HLMEX / HLEZX | ADVISOR HLEMX | BENCHMARK1 | |||
COMM SERVICES | 10.2 | 10.2 | 13.2 | |||
CONSUMER DISCRETIONARY | 16.7 | 16.8 | 20.9 | |||
CONSUMER STAPLES | 9.3 | 9.3 | 5.9 | |||
ENERGY | 4.3 | 4.3 | 4.9 | |||
FINANCIALS | 22.1 | 22.1 | 17.1 | |||
HEALTH CARE | 2.2 | 2.2 | 4.2 | |||
INDUSTRIALS | 8.4 | 8.4 | 4.3 | |||
INFORMATION TECHNOLOGY | 23.6 | 23.6 | 18.4 | |||
MATERIALS | 0.0 | 0.0 | 6.9 | |||
REAL ESTATE | 0.0 | 0.0 | 2.3 | |||
UTILITIES | 1.4 | 1.4 | 1.9 | |||
CASH | 1.8 | 1.7 | — | |||
1MSCI Emerging Markets Index.
But the disparity in their stock markets’ performance ultimately also comes down to the relative makeup, in terms of company membership, of each countries’ sleeve of the EM Index. China has an especially large weighting in technology-related companies that in many cases have directly benefitted from the pandemic. Some of these are great companies whose long-term growth prospects have been pulled forward as changes in consumer habits accelerated over the past several months, but some, like many in a recent rash of IPOs to hit the market, are considerably more speculative. Brazil’s stock market, by comparison, tends to represent a more diversified mix of sectors that retains the profile of a traditional developing market, with larger market weights in Financials, Materials, and Energy, one-tenth the weight of China in Communications Services, and almost no weight in IT.
Pursuing growth opportunities among banking, Industrials, oil and gas, and the like may not be as exciting as the latest pure technology sensation such as NIO, a Chinese EV producer, valued at about 20 times estimated 2020 sales. While the company has tremendous growth potential, it also has a short history, significant operating losses, and is not expected to break even until 2022. Examples of such growing, expensive, but profitless companies currently abound in EMs. We are attracted to what may appear more boring: well-established companies with technological and other competitive advantages that offer consistent profitability, strong management, and sound finances, along with prospects for above average, if not always rocketing, growth.
Our Brazilian holdings, which range across the Financials, Consumer, Energy, and Industrials sectors, illustrate our ability to uncover growth in diverse industries. A great example of skillful management and growth in a prosaic industry is Localiza, the country’s largest rental car company. It was the first rental car company in Brazil to adopt dynamic pricing, adjusting the price based on short-term supply and demand, an innovation that was only possible after digitizing core processes. Localiza has been working on improving customer satisfaction and stickiness with new digital interfaces including a WhatsApp-based booking and customer assistance service-bot and the first rental solution in Brazil that is 100% mobile and eliminates
20
|
Table of Contents
human interaction through the entire rental experience. Localiza’s business of renting fleets offers a strong long-term growth opportunity as less than a tenth of corporate fleets are outsourced currently. To take advantage of rising demand for private transport as a substitute for mass transit when the pandemic recedes, Localiza has begun to offer flexible long-term subscriptions to individuals as well.
Another Brazilian company leading its industry in technological investment and innovation is the electric motors, generator, and transformer manufacturer WEG. The company is one of Brazil’s most successful industrial exporters, generating about 60% of revenues from outside its home market. This year WEG continued to enjoy solid growth in both domestic and foreign revenues despite a tough economic backdrop. Some of the growth has come from growing sales to wind and solar energy producers, as demand for energy from green sources has bucked the overall energy downturn. Looking forward, an even bigger area of opportunity relates to its integration of smart technology across its installed base of energy and other industrial equipment. Before and throughout the pandemic, WEG’s management has pursued a strategy to enhance its digital and automation capabilities to enable the company to serve customers better.
Perhaps nowhere has management skill in navigating the pandemic come more into play than in Brazil’s banking industry. Conservative bankers at well-capitalized banks have taken provisions for loan losses aggressively to ensure they can withstand worst-case scenarios. Generally, such provisioning, whether undertaken in an abundance of caution or fully warranted, heightened investors’ concerns about asset quality and led to indiscriminate pressure on bank shares. We hold two Brazilian banks, Banco Bradesco and Itaú Unibanco. Itaú’s second quarter results were dragged down by its provisions. However, compared to competitors, the percentage of its loans covered by the moratoriums represents but a small fraction of its total loan book, and a majority of those loans are fully collateralized. The risk of actual losses arising from the repayment deferral, in other words, is far lower than that which appears priced into its shares.
Itaú’s management is committed to improving efficiencies and customer satisfaction through investment in financial technology. To attract and retain younger customers, Itaú released a mobile app and digital wallet called Iti that works well on cheaper smart phones. Management plans to add more functionality to Iti over time, with the goal of making it a multipurpose platform, like the “super apps” prevalent in China. More broadly, the bank has been aggressive in growing its online banking channel to reduce reliance on physical branches where the cost of servicing customers is higher. The company’s deep experience in credit underwriting and debt collection is a competitive advantage that has helped it survive through many previous credit cycles, emerging stronger each time.
PORTFOLIO HIGHLIGHTS
Across the entire EM universe, we continued to seek compelling opportunities in high-quality, growing businesses while avoiding what we considered unsustainable share prices. Our belief in the benefits
TEN LARGEST HOLDINGS at October 31, 2020
| COMPANY | SECTOR | COUNTRY | INSTITUTIONAL HLMEX / HLEZX | ADVISOR HLEMX | |||||||||||
TSMC | SECTOR | TAIWAN | 5.8 | 5.8 | |||||||||||
TENCENT | INFO TECHNOLOGY | CHINA | 5.8 | 5.8 | |||||||||||
ALIBABA | COMM SERVICES | CHINA | 5.7 | 5.7 | |||||||||||
SAMSUNG ELECTRONICS | CONS DISCRETIONARY | SOUTH KOREA | 5.6 | 5.6 | |||||||||||
EPAM SYSTEMS | INFO TECHNOLOGY | US | 3.3 | 3.3 | |||||||||||
LG HOUSEHOLD & HEALTH CARE | INFO TECHNOLOGY | SOUTH KOREA | 2.9 | 2.9 | |||||||||||
AIA GROUP | CONS STAPLES | HONG KONG | 2.5 | 2.5 | |||||||||||
TATA CONSULTANCY SERVICES | FINANCIALS | INDIA | 2.4 | 2.4 | |||||||||||
HDFC CORP | INFO TECHNOLOGY | INDIA | 2.2 | 2.2 | |||||||||||
MIDEA GROUP | FINANCIALS | CHINA | 2.0 | 2.1 | |||||||||||
of diversification meant we also kept within reasonable bounds the Portfolio’s exposure to China’s large opportunity set.
Holding roughly one-sixth of the Portfolio (by weight) in banks has not been good for returns this fiscal year, but we saw no reason to shrink from our bank investments. Flailing share prices are not necessarily a signal of weak businesses. While ongoing economic impact of the pandemic undeniably heightens the uncertainty surrounding banks, we see encouraging signs across our high-quality bank holdings. Itaú Unibanco is hardly the only one of our banks whose asset quality has held up better than its share price. Moreover, India’s HDFC Bank and Indonesia’s Bank Central Asia have continued to achieve good growth in new business via their digital channels.
We increased our Consumer Discretionary exposure with the purchase of New Oriental (EDU), a Chinese private education provider focusing on foreign language training, after-school K-12 tutoring, and test preparation. The company is a good example of the kind of durable growth found in China outside the altitudinous valuations of its e-commerce segment.
In Communication Services, we purchased CD Projekt, an intensely creative and entrepreneurial Poland-based video game company, with a strong balance sheet and net cash position to boot. It is a leader in an industry that is producing ever more immersive games, which, through digital distribution, have become accessible to millions of gamers worldwide who spend increasing amounts of time playing them. The company’s competitive advantage, beside a focused line of hugely popular and visually stunning games, is its low-cost locale, where game developer talent is on par with that of competitors in the US, western Europe, and Japan but wages are significantly lower.
Our sales this year included Chinese smartphone-component manufacturer AAC Technologies due to concerns that its core business making speakers and microphones faces rising competition that may compress margins. Moreover, AAC’s newer business lines in handset lenses and camera modules face competition from well-entrenched established producers, so its growing capacity in these areas could lead to price wars.
Please read the separate disclosures page for important information, including the risks of investing in the Portfolios.
21
|
Table of Contents

PORTFOLIO MANAGEMENT TEAM


PRADIPTA CHAKRABORTTY
CO-LEAD PORTFOLIO MANAGER
BABATUNDE OJO, CFA
CO-LEAD PORTFOLIO MANAGER
PERFORMANCE SUMMARY
For the Frontier Emerging Markets Portfolio, the Institutional Class I fell 9.50%, the Institutional Class II fell 9.26%, and the Investor Class fell 9.70% (net of fees and expenses) in the fiscal year ended October 31, 2020. The Portfolio’s benchmark, the MSCI Frontier Emerging Markets Index, fell 11.89% (net of source taxes).
FUND FACTS at October 31, 2020
| ||||||||||||
TOTAL NET ASSETS | $200.6M | |||||||||||
SALES CHARGE | NONE | |||||||||||
NUMBER OF HOLDINGS | 58 | |||||||||||
TURNOVER (5 YR. AVG.) | 29% | |||||||||||
DIVIDEND POLICY | ANNUAL | |||||||||||
INSTITUTIONAL INVESTORS
|
| INDIVIDUAL INVESTORS
|
| |||||||||
| INST CLASS I | INST CLASS II | INVESTOR CLASS | ||||||||||
TICKER | HLFMX | HLFFX | HLMOX | |||||||||
CUSIP | 412295867 | 412295735 | 412295859 | |||||||||
INCEPTION DATE | 5/27/2008 | 3/1/2017 | 12/31/2010 | |||||||||
MINIMUM INVESTMENT1 | $100,000 | $10,000,000 | $5,000 | |||||||||
NET EXPENSE RATIO | 1.63%2 | 1.35%3 | 2.00% | 2 | ||||||||
GROSS EXPENSE RATIO | 1.63%2 | 1.55%3 | 2.00% | 2 | ||||||||
1Lower minimums available through certain brokerage firms; 2The Expense Ratio is as of the most recent Prospectus and is based on expenses for the most recent fi scal year end. The gross expense ratio is applicable to investors. 3The Expense Ratio is as of the most recent Prospectus and is based on expenses for the most recent fi scal year end. The net expense ratio is shown net of Harding Loevner’s contractual agreement through February 28, 2021. The Net Expense Ratio is applicable to investors.
MARKET REVIEW
The year began with rising expectations for earnings growth amid de-escalating US-China trade tensions, but in January, however, a new coronavirus claimed its first victims in China and spread from its origin in Wuhan to other parts of the country. Although the disease spread first in Asia, the epicenter shifted rapidly to Europe and the US. By April 30, the infection had spread to over 180 countries, and governments everywhere were struggling to contain the disease. The ensuing travel restrictions, business closures, and home confinements brought economic activity to a shuddering stop. Though the number of confirmed COVID-19 cases in Frontier Emerging Markets (FEM) countries remained low relative to developed countries, many of their economies—especially those reliant on China’s consumers and supply chains—were hit hard by China’s containment measures. The size and speed of equity market declines were unprecedented, with volatility reaching levels not seen since the global financial crisis. In Vietnam, for example, some factories shut down due to shortages of raw materials from China, while demand for their finished products plummeted. Many countries followed China’s lead, imposing travel bans, border closures, and, in some cases, complete shutdowns of non-essential businesses to slow the virus’s spread. Countries reliant on commodities exports for private and public income suffered from reduced demand and falling prices.
Towards the middle of the fiscal year, FEMs began to recover from the COVID-induced market declines. Visible progress on a vaccine boosted sentiment despite record coronavirus cases in many countries including the United States and much of Latin America.
Governments in most FEM countries, following the example of the US and Europe, started a gradual reopening of their economies, relaxing social distancing and restrictions on movement. Investors, with renewed hope that people and businesses would soon be back to their old routines, piled into stocks that were cheap after the broad sell-off from market declines in the first quarter.
Unprecedented fiscal and monetary stimulus enacted by governments aiming to cushion the pandemic’s impact on households and businesses supported the stock markets. A sharp recovery in the price of oil off its April low also helped boost the currencies and stock markets of oil-dependent countries such as Colombia, Kazakhstan, and Kuwait. The price rise was partly a response to Saudi Arabia and Russia finally reaching a deal to cut oil production for two months by about 10 million barrels a day, and partly reflective of improving demand outlook as business activity and travel gradually resumed around the world. This positive momentum continued through the end of the fiscal year, as most countries continued to re-open their economies despite the prevalence of the coronavirus. Market sentiment also further improved as multiple vaccine candidates entered the third and final stage of testing.
Returns in all regions were negative for the year. Latin America performed the worst (down 26%), due in no small part to Colombian bank Bancolombia, whose near-term growth and asset quality deteriorated on the back of the oil-price collapse during the year. The Gulf States performed the best (down
22
|
Table of Contents
PERFORMANCE (% TOTAL RETURN)
| for periods ended September 30, 2020 | for periods ended October 31, 2020 | |||||||||||||||||||||||||||||||||||||||||||||||||||||||||||||||||||||||
1 YEAR | 3 YEARS | 5 YEARS | 10 YEARS | SINCE INCEPTION* | 1 YEAR | 3 YEARS | 5 YEARS | 10 YEARS | SINCE INCEPTION* | |||||||||||||||||||||||||||||||||||||||||||||||||||||||||||||||
| May-08 | Mar-17 | Dec-10 | May-08 | Mar-17 | Dec-10 | |||||||||||||||||||||||||||||||||||||||||||||||||||||||||||||||||||
FRONTIER EM PORTFOLIO – INST CLASS I | -7.85 | -5.16 | -0.50 | 0.18 | -1.92 | -9.50 | -4.97 | -0.44 | -0.17 | -1.90 | ||||||||||||||||||||||||||||||||||||||||||||||||||||||||||||||
FRONTIER EM PORTFOLIO – INST CLASS II | -7.62 | -4.92 | — | — | -0.32 | -9.26 | -4.71 | — | — | -0.27 | ||||||||||||||||||||||||||||||||||||||||||||||||||||||||||||||
FRONTIER EM PORTFOLIO – INVESTOR CLASS | -8.18 | -5.48 | -0.83 | — | -0.52 | -9.70 | -5.25 | -0.80 | — | -0.50 | ||||||||||||||||||||||||||||||||||||||||||||||||||||||||||||||
MSCI FRONTIER EM INDEX | -11.52 | -5.33 | 0.92 | 0.34 | — | -0.81 | -0.22 | -11.89 | -4.69 | 0.63 | 0.06 | –– | -0.21 | 0.00 | ||||||||||||||||||||||||||||||||||||||||||||||||||||||||||
Returns are annualized for periods greater than 1 year. *Inception of the Institutional Class I, May 27, 2008. Inception of the Institutional Class II, March 1, 2017. Inception of the Investor Class, December 31, 2010. Index performance prior to December 2, 2008 cannot be shown since it relies on back-filled data.
Performance data quoted represents past performance; past performance does not guarantee future results. The investment return and principal value of an investment will fluctuate so that an investor’s shares, when redeemed, may be worth more or less than their original cost. Current performance of the Portfolio may be lower or higher than the performance quoted. Performance data current to the most recent month end may be obtained by calling (877) 435-8105 or visiting www. hardingloevnerfunds.com.
only 0.1%), driven by index heavyweight Kuwait and the price momentum related to its impending reclassification by the MSCI as an Emerging Market. By sector, pandemic beneficiary Information Technology (IT) performed best. Globant, a global software developer with its roots in Argentina and the sole IT company in the FEM Index, especially outperformed. Energy sector not surprisingly was the worst-performing sector.
⬛ PERFORMANCE ATTRIBUTION
Viewed by sector, our large overweight in Information Technology (IT) was a top contributor. One notable performer was EPAM, an IT servicer. Ongoing mass political unrest in the company’s home market of Belarus was not enough to overshadow robust global demand for corporate digital transformations. However, stock selection overall was poor, due to Dubai-based Network International, the leading merchant acquirer and payment processor in the Middle East and North Africa. The stock plummeted following its equity-financed acquisition of African payments company DPO. The move was viewed especially dimly in the wake of the revelation of massive fraud at German payments processor Wirecard involving third-party contractors. We have engaged with the company about its internal controls, confirming that it does not outsource processing to third parties.
By region, the Portfolio benefited most from strong stock selection in Latin America and Asia. Globant, an Argentina-based global software developer, was a notable contributor. Its largest customer, Disney, experienced accelerating growth of its new Disney+ content distribution platform. Its top travel industry customers, including Southwest airlines, did pare back but were offset by rapidly growing sales to consumer product, retail, and manufacturing customers.
In Asia, Vietnamese steel producer Hoa Phat Group contributed most. Growth in its construction steel sales reached 65% year-over-year in August, and billet sales were strong due to powerfully recovering levels of exports to China and other Asian markets after the initial waves of pandemic closures had passed. Vietnam Dairy Products also surged despite Vietnam’s experiencing a second wave of the virus, which led to a shutdown around the Da
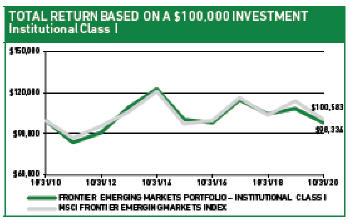
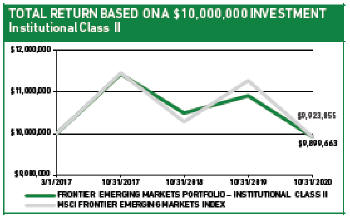
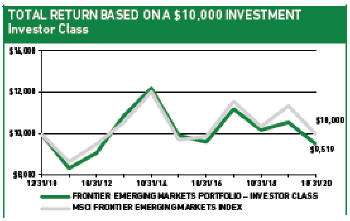
The charts above illustrate the hypothetical return of an investment made in the corresponding share classes. Investment return reflects voluntary fee waivers in effect. Absent such waivers, total return would be reduced. The performance provided in the table and charts above do not reflect the deduction of taxes that a shareholder would pay on Portfolio distributions or the redemption of Portfolio shares.
23
|
Table of Contents
Nang region. Last year the company won contracts in 22 provinces and cities to supply milk to schools and now enjoys exclusivity for many school districts.
The Portfolio’s underweight in the Gulf States detracted from relative returns over the fiscal year.
⬛ PERSPECTIVE AND OUTLOOK
Economic crises are especially bad for banks because their exposure to the downward trajectory of the larger economy through their lending to various sectors is magnified by the high degree of financial leverage that they employ. Loans are made on the back of deposits that ultimately need to be paid back regardless of whether borrowers run into difficulty or not. The peculiar nature of this crisis, with shutdowns of entire industries, meant that banks immediately fell victim to the disappearance of their borrowers’ revenues, often the companies’ only means to stay current on loans. In many instances, the full scope of the devastation has yet to come into focus for their lenders.
The pandemic is impacting banks through pressures on both their revenue and their balance sheets. From a revenue perspective, as central banks have cut interest rates to stimulate their economies, banks’ net interest margins, or the difference between what they pay to depositors and receive from borrowers, has contracted. Even more so than in more developed markets, in FEM the vast percentage of deposits are held in current accounts that pay little or no interest. Though the market rates that banks can charge on variable-interest loans have come down, the rate they pay depositors are already close to their lower bound of zero. Worse than that, many governments have guaranteed new loans to businesses impacted by COVID-19. Those loans are offered through banks at even lower spreads than on banks’ existing loans. In addition to the cratering of interest income, fee income has also fallen, due to lower volumes of transactions and fewer cross-selling opportunities to customers struggling to keep their businesses afloat. Some banks have exploited the openness of consumers to change their habits during the crisis as an opportunity to promote banking online, as a means of trimming their long-term costs. However,
GEOGRAPHIC EXPOSURE (%) at October 31, 2020
| REGION | PORTFOLIO | BENCHMARK1 | ||||||
AFRICA | 20.1 | 14.9 | ||||||
ASIA | 37.8 | 37.7 | ||||||
EUROPE | 8.8 | 6.0 | ||||||
GULF STATES | 11.3 | 23.2 | ||||||
LATIN AMERICA | 14.8 | 16.7 | ||||||
MIDDLE EAST | 0.0 | 1.5 | ||||||
DEVELOPED MRKTS LISTED2 | 6.2 | — | ||||||
CASH | 1.0 | — | ||||||
1 MSCI Frontier Emerging Markets Index; 2 Includes frontier or small emerging markets companies listed in developed markets.
SECTOR EXPOSURE (%) at October 31, 2020
| SECTOR | PORTFOLIO | BENCHMARK1 | ||||||
COMMUNICATION SERVICES | 5.8 | 9.4 | ||||||
CONSUMER DISCRETIONARY | 4.4 | 0.9 | ||||||
CONSUMER STAPLES | 17.8 | 6.7 | ||||||
ENERGY | 3.6 | 3.2 | ||||||
FINANCIALS | 33.3 | 41.0 | ||||||
HEALTH CARE | 4.6 | 1.7 | ||||||
INDUSTRIALS | 4.9 | 11.6 | ||||||
INFORMATION TECHNOLOGY | 10.3 | 3.4 | ||||||
MATERIALS | 5.1 | 6.2 | ||||||
REAL ESTATE | 9.2 | 12.8 | ||||||
UTILITIES | 0.0 | 3.1 | ||||||
1MSCI Frontier Emerging Markets Index.
this has meant a short-term sacrificing of income, as transaction fees have been typically waived on digital transactions to induce customers to make the switch.
We expect even bigger impacts on FEM banks’ profitability from losses on outstanding loans. Pressures on borrowers in some industries, such as hospitality, tourism, restaurants, aviation, and real estate, show few signs of abating. In many countries, banks in conjunction with regulators have extended debt repayment moratoriums for up to a year. These have helped customers avoid defaulting on their loans, but it has also obscured the depth and extent of the borrowers’ distress. While they hope for their customers’ rapid recovery, the truth is that most banks don’t know which of their customers in the hard-hit sectors will ever be able to repay their loans, and they probably won’t know until the moratoriums expire. The stronger and better-run banks have significantly increased their provisions for bad loans. To absorb the impact, many banks have suspended their dividends and some regulators have offered forbearance on capital requirements. Even so, we expect the combination of these forces to dent profitability substantially and cause even otherwise-healthy banks to log losses headed into next year.
We have seen this movie before, in previous crises. We expect there will be a shakeout after the debt service moratoriums expire, as the lagged effect of the crisis hits ill-prepared institutions. The highest-quality banks should emerge as winners. We believe our focus on quality and balance sheet strength leads us to invest in only the most profitable, best-capitalized banks, whose risk management practices and underwriting standards should do much to protect them in this crisis. An example is Commercial International Bank (CIB), Egypt’s leading private bank in terms of profit, deposits, and asset base. Its skilled management has maintained prudent credit and risk management policies over many years. While the Bank has consistently increased market share, management’s incentive structure is such that growth has never come at the expense of lending to borrowers with questionable capacity to repay. Of CIB’s loan book, 78% is to businesses, most of which are subsidiaries of multinational
24
|
Table of Contents
companies that are domestic leaders in their sectors and unlikely to default. CIB’s exposure to tourism and hospitality is low, only 5% of its portfolio, and consists mainly of loans to five-star hotel chains, which remain on stable financial footing. The remaining 22% of loans are to individual borrowers, the majority of whom have salaried government positions—as close to a layoff-proof job as there is in Egypt. Further, during good times management has been prudent, preparing the bank for even worst-case scenarios by taking loan-loss provisions approximately 2.5 times the amount of its bad loans. Importantly, CIB has a large capital base that can absorb losses, if needed, eliminating the need to raise new capital from shareholders. Its capital adequacy ratio stood at 30% at the end of June, far above the minimum requirement of 13%. Given this, we expect it to emerge from the crisis less damaged than competitors with smaller capital bases and more exposure to vulnerable sectors and companies, positioned to grow market share once again.
⬛ PORTFOLIO HIGHLIGHTS
We seized opportunities offered up by the pandemic to buy stocks that we believe have meaningful upside to current share prices based on our estimates of their fair values. We particularly saw opportunities in the banking sector, as the relative values for some high-quality banks improved more than for companies in other sectors.
In the latter half of the fiscal year we established two new positions in bank holdings: Vietnam-based Vietcombank (VCB) and Bank Central Asia (BCA). We view VCB as the highest quality bank in its market. It enjoys the lowest funding costs, having garnered cheap current and low-interest savings deposits through its extensive network of 522 branches, 2,600 ATMs, and 60,600 point-of-sale terminals throughout the country. The bank also has strong institutional relationships with top corporations and government agencies in Vietnam. It is the leader in trade financing and the designated clearing center for foreign currencies in Vietnam. BCA is a high-quality Indonesian bank that we have monitored for a while, and now find to be priced attractively. We regard the bank’s management team and its risk management practices highly. The bank’s loan losses have been consistently lower than peers’. More importantly, asset quality looks good, with no exposure to airlines and a combined exposure of less than 2.5% to other heavily impacted sectors like hotels, travel, and restaurants.
We also added selectively to our existing bank holdings, including Egypt’s Commercial International Bank, MCB Bank in Pakistan, Bank of Philippines Islands (BPI), Bank of Georgia, Banca Transilvania in Romania, and Security Bank in the Philippines, all attractively priced. While we agree with the consensus that the quality of banks’ assets is at risk of further deterioration, we don’t always agree with the market’s pricing of that risk. We have extensive experience investing in FEM banks, and understand well the robustness of the risk management policies and practices, balance sheet strength, and management capabilities of those banks we have identified as meeting our high-quality standards.
TEN LARGEST HOLDINGS at October 31, 2020
| COMPANY | SECTOR | COUNTRY | % | |||||||||
HOA PHAT GROUP | MATERIALS | VIETNAM | 4.8 | |||||||||
VIETNAM DAIRY PRODUCTS | CONS STAPLES | VIETNAM | 4.7 | |||||||||
SM PRIME HOLDINGS | REAL ESTATE | PHILIPPINES | 4.5 | |||||||||
GLOBANT | INFO TECHNOLOGY | ARGENTINA | 4.4 | |||||||||
NATIONAL BANK OF KUWAIT | FINANCIALS | KUWAIT | 4.1 | |||||||||
MABANEE | REAL ESTATE | KUWAIT | 4.1 | |||||||||
EPAM SYSTEMS | INFO TECHNOLOGY | US | 4.1 | |||||||||
SAFARICOM | COMM SERVICES | KENYA | 3.9 | |||||||||
COMMERCIAL INTERNATIONAL BANK | FINANCIALS | EGYPT | 3.3 | |||||||||
BANCA TRANSILVANIA | FINANCIALS | ROMANIA | 3.3 | |||||||||
We confidently expect our high-quality banks to weather the COVID-19 crisis better than their industry counterparts, yet in many cases the market is pricing in loan losses far higher than our analysts’ central expectations, and often higher than their very pessimistic scenarios.
We sold our position in Masan Group, a Vietnamese packaged food company, after it made a large acquisition of a loss-making retail supermarket chain, which we think will be detrimental to future profitability. Management has no experience in running supermarkets, which in our view implies substantial operational risk ahead. Further, as the acquisition was funded with debt, the company’s financial risk has increased significantly, its net debt ratio tripling from two to six times EBITDA. As such, we believe it no longer meets our financial quality standard. That, together with the other factors, led to our sale.
Please read the separate disclosures page for important information, including the risks of investing in the Portfolio.
25
|
Table of Contents

PORTFOLIO MANAGEMENT TEAM


MOON SURANA, CFA PORTFOLIO MANAGER
ANDREW WEST, CFA PORTFOLIO MANAGER |
PERFORMANCE SUMMARY
For the Global Equity Research Portfolio, the Institutional Class rose 7.15% (net of fees and expenses) in the fiscal year ended October 31, 2020. The Portfolio’s benchmark, the MSCI All Country World Index, rose 4.89% (net of source taxes).
MARKET REVIEW
Global stock markets had yet another volatile fiscal year, defined largely by the COVID-19 pandemic and the ways in which governments and countries around the world adapted (or failed to adapt) to its challenges.
The fiscal year began with renewed optimism as central bank largesse and a de-escalation of US-China trade frictions alleviated fears that had persisted through most of 2019. However, the jubilation was short-lived as the COVID-19 outbreak that began in December rapidly engulfed the planet, with governments struggling to contain both the disease and its fallout. The size and speed of the equity market decline were unprecedented, with volatility reaching levels not seen since the global financial crisis. The ensuing forced business closures, restricted travel, and home confinements brought economic activity around the world to a shuddering stop, which, in turn, prompted an unprecedented monetary and fiscal response. On the monetary front, central bankers cut reserve requirements, lowered interest rates, and unveiled aggressive plans to keep credit flowing. On the fiscal side, governments implemented massive spending programs, dwarfing the rescue plans from the global financial crisis. Exacerbating market turmoil, an oil price war erupted between Saudi Arabia and Russia amid a collapse in oil demand, the combination of which pushed down oil prices to an 18-year low.
During the latter half of 2020, conditions started to improve as countries began to emerge from lockdowns and new economic data showed signs of a fledgling recovery. Business activity remained weak, but many indicators—unemployment, consumer spending, and service and manufacturing surveys—rebounded from the troughs witnessed in April. Financial conditions continued to remain highly accommodative across the world; central banks have kept
FUND FACTS at October 31, 2020 | ||||||
| TOTAL NET ASSETS | $7.4M | |||||
| SALES CHARGE | NONE | |||||
| NUMBER OF HOLDINGS | 288 | |||||
| TURNOVER (5 YR. AVG.) | — | |||||
| DIVIDEND POLICY | ANNUAL | |||||
INSTITUTIONAL INVESTORS | ||||||
| INSTITUTIONAL CLASS | ||||||
| TICKER | HLRGX | |||||
| CUSIP | 412295792 | |||||
| INCEPTION DATE | 12/19/2016 | |||||
| MINIMUM INVESTMENT1 | $100,000 | |||||
| NET EXPENSE RATIO2 | 0.80% | |||||
| GROSS EXPENSE RATIO2 | 1.96% | |||||
1Lower minimums available through certain brokerage firms; 2The Expense Ratio is as of the most recent Prospectus and is based on expenses for the most recent fiscal year end. The net expense ratio is shown net of Harding Loevner’s contractual agreement through February 28, 2021. The net expense ratio is applicable to investors.
short-term interest rates hovering near-zero in every major economy, underscoring their proclivity to provide ongoing support for battered economies. Additionally, sentiment was further boosted by rising hopes for a successful vaccine, as multiple drug candidates entered the third and final stages of testing.
Information Technology (IT), Communication Services, and Consumer Discretionary (which contains many e-commerce businesses) were the strongest sectors as shares of the “COVID-19 winners,” companies that are either insulated or directly benefit from the pandemic, continued to rise. Conversely, Financials and Energy lagged as both were weighed down by lower interest rates, rising loan loss provisions, and a languishing oil price.
PERFORMANCE ATTRIBUTION
Strong performance from our Industrials holdings contributed in the fiscal year, notably Hong Kong-based power tools manufacturer Techtronic Industries. The company maintained earnings guidance for the year after the reopening of its main manufacturing facilities in China during the second quarter of 2020. It also saw a surge in demand for DIY tools and outdoor products, growing usage of its e-commerce channel, and the launch of several new products. Strong stock selection in Health Care also boosted performance, especially Japanese pharmaceutical manufacturer Chugai Pharmaceutical. Chugai initially benefited from news of the potential use of the company’s rheumatoid arthritis drug Actemra to treat COVID-19 symptoms. Despite later test results that showed less promise, the company has several key propri-
26
|
Table of Contents
PERFORMANCE (% TOTAL RETURN)
| for periods ended September 30, 2020 | for periods ended October 31, 2020 | |||||||||||||||||||||||
| 1 YEAR | 3 YEARS | SINCE INCEPTION* | 1 YEAR | 3 YEARS | SINCE INCEPTION* | |||||||||||||||||||
GLOBAL EQUITY RESEARCH PORTFOLIO – INSTITUTIONAL CLASS | 11.59 | 9.41 | 12.53 | 7.15 | 7.98 | 11.81 | ||||||||||||||||||
MSCI ALL COUNTRY WORLD INDEX | 10.44 | 7.12 | 10.10 | 4.89 | 5.52 | 9.17 | ||||||||||||||||||
Returns are annualized for periods greater than 1 year. *Inception date: December 19,2016.
Performance data quoted represents past performance; past performance does not guarantee future results. The investment return and principal value of an investment will fluctuate so that an investor’s shares, when redeemed, may be worth more or less than their original cost. Current performance of the Portfolio may be lower or higher than the performance quoted. Performance data current to the most recent month end may be obtained by calling (877) 435-8105 or visiting www. hardingloevnerfunds.com.
The chart below illustrates the hypothetical return of an investment made in the corresponding share classes. Investment return reflects voluntary fee waivers in effect. Absent such waivers, total return would be reduced. The performance provided in the table and charts above do not reflect the deduction of taxes that a shareholder would pay on Portfolio distributions or the redemption of Portfolio shares.
etary drug products that treat a range of diseases, which, when coupled with its strong R&D platform and alliance with Swiss pharmaceutical giant Roche, should help drive long term growth. The Portfolio’s underweights in Financials and Energy, the two worst performing sectors for the year, were also helpful.
Offsetting this strong performance, our underweight to Information Technology, the best performing sector for the year, dragged on returns. Poor stock selection within the sector also detracted from relative performance, particularly our holding of Amadeus, a transaction-processing solutions provider for the travel and tourism industry. While the travel situation has improved gradually over the past few months and there is hope for a vaccine in the near future, the industry remains weak and net profits are still in negative territory.
From a geographic perspective, Japanese stocks contributed the most to relative performance, especially Chugai and Unicharm, a maker of diapers and other disposable hygiene products that was helped by demand for its infection-prevention products such as masks and sanitizing wipes. European stocks both inside and outside the eurozone also positively contributed, especially Sartorius Stedim Biotech, a France-based pharmaceutical and laboratory supplier. Our underweight in the United States and in several strong performers like Apple, Microsoft, and Amazon.com dragged on performance.
PERSPECTIVE AND OUTLOOK
We’ve been harping on about the stretched valuations of high-quality growth companies for so long that we would forgive you, our dear reader, for tuning us out. But as valuations continue to march higher, so too do our concerns—which is where we might have left it were it not for the evidence of a ramp-up in speculative behavior. The large number of highly valued, but (historically) weakly profitable companies with negative market-implied discount rates (MIDRs) causes us more worry over other signs of market excess.
By one of our estimates, nearly 20% of global stocks are priced to seriously disappoint based on our analysis of MIDRs for cohorts of
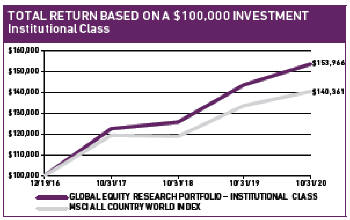
global stocks in HOLT, a database of company accounts. An MIDR is an aggregation of company-level discount rates, each derived by comparing a forecast of the company’s future cashflows with its current market value. If expected future cash flows are low (or far off) while the company’s current market value is high, the discount rate that equates them must be low. But there’s low, and then there’s what we observe in today’s most expensively priced stocks. Out of the approximately 7,200 global stocks with market capitalizations above US$1 billion (totaling US$83 trillion in capitalization), nearly 900 companies (amounting to US$17 trillion) currently show up as having negative implied discount rates, a higher percentage than at any time since just before the bursting of the tech bubble. Put a different way, these stocks are priced to deliver negative real returns even if HOLT’s formulaic and consensus-based assumptions about future cash flow growth are met. Among these 900 richly valued companies, 275, with US$2.6 trillion market capitalization, were loss-making throughout 2019. Our view is that, when dealing with a large group of companies, you are betting against the weight of historical evidence if you assume that so many can beat the odds by outstripping current growth expectations to deliver positive returns.
Throughout the year, companies that score highest along the growth dimension have leapt ahead of the pack. Not much of a surprise perhaps, since the value of long-duration growth has risen as interest rates have declined. But what is a surprise, to us
27
|
Table of Contents
at least, is the apparent willingness to bid up all growth stocks without regard for the quality of that prospective growth. There are two kinds of growth companies that we try to keep out of our portfolios. The first type are companies that meet our quality criteria but whose share prices are unreasonably high relative to our future growth expectations. The second type are companies that fail to meet our investment criteria for business quality; they are rejected, summarily or sometimes after lengthy debate, by our analysts.
In cases of both types, there are “many a slip ’twixt the [growth] cup and the [quality] lip.” In the lifecycle of the typical successful firm, growth precedes profitability, which makes quality assessment fraught in the early, rapid growth phase. The archetype for the firm with rapidly growing sales but only modest profitability was Amazon.com. Currently, a growing number of investors appear willing to take a leap of faith much earlier over the fortunes of hitherto profitless companies. A poster child for exuberance over profitless growth is Shopify, a Canadian IT services company, whose sales have grown rapidly to US$2 billion annually, but which has yet to turn a profit since going public in 2015. Our analyst, upon meeting with the company several years ago, noted its impressive sales growth but was put off by its high client turnover. This year, a different analyst, lured by dazzling revenue growth and a potential boost from COVID-19, re-examined the company. But whereas we expected—perhaps even hoped—to find a clear path for it to eventual profitability, instead we found a company busily undermining its long-term profit prospects by pursuing low margin businesses to maintain its sales growth at any cost.
Fortunately, even within the IT sector there are still opportunities to be uncovered if you are willing to do the legwork. Semiconductor manufacturers have a long track record of sustained growth and profitability yet still appear reasonably priced. While their shares have been historically volatile (given the cyclical nature of the industry), we see semiconductor demand continuing to grow for the foreseeable future—fueled by mobile services, high performance (cloud) computing, and smarter connected devices in the home, industry, and transportation. At the same time, as we have
GEOGRAPHIC EXPOSURE (%) at October 31, 2020
COUNTRY/REGION | PORTFOLIO | BENCHMARK1 | |||||||||
CANADA | 0.9 | 2.7 | |||||||||
EMERGING MARKETS | 22.6 | 13.0 | |||||||||
EUROPE EMU | 9.4 | 8.2 | |||||||||
EUROPE EX-EMU | 10.1 | 7.8 | |||||||||
FRONTIER MARKETS2 | 0.3 | — | |||||||||
JAPAN | 9.6 | 6.9 | |||||||||
MIDDLE EAST | 0.0 | 0.2 | |||||||||
PACIFIC EX-JAPAN | 2.3 | 3.1 | |||||||||
UNITED STATES | 43.3 | 58.1 | |||||||||
CASH | 1.5 | — | |||||||||
1MSCI All Country World Index; 2Includes countries with less-developed markets outside the Index.
SECTOR EXPOSURE (%) at October 31, 2020
| SECTOR | PORTFOLIO | BENCHMARK1 | ||||||
COMM SERVICES | 4.6 | 9.7 | ||||||
CONSUMER DISCRETIONARY | 12.2 | 13.1 | ||||||
CONSUMER STAPLES | 10.4 | 7.9 | ||||||
ENERGY | 2.4 | 2.8 | ||||||
FINANCIALS | 11.4 | 12.7 | ||||||
HEALTH CARE | 15.9 | 12.3 | ||||||
INDUSTRIALS | 18.2 | 9.6 | ||||||
INFORMATION TECHNOLOGY | 17.8 | 21.2 | ||||||
MATERIALS | 5.0 | 4.8 | ||||||
REAL ESTATE | 0.3 | 2.7 | ||||||
UTILITIES | 0.3 | 3.2 | ||||||
CASH | 1.5 | — | ||||||
1MSCI All Country World Index.
predicted, the industry has consolidated; there are barely a handful of companies who are masters of the ever-increasing challenge of manufacturing ever-smaller and more sophisticated chips. This quarter’s announcement by US chipmaker Intel that it has been struggling to manufacture the next generation of smaller, faster, and more efficient chips gave our thesis a shot in the arm. We expect top chipmakers, particularly TSMC and South Korea-based Samsung Electronics, to enjoy a widening competitive advantage and improving industry structure in the years ahead.
Beyond semiconductors, we also continue to find attractive investments in Software and Internet Services. Among these companies, we tend to see high returns on invested capital, low capital investment requirements, and high rates of sales and profit growth—all achieved with low sensitivity to the business cycle. Our analysts favor business process facilitators such as SAP and Dassault Systémes in Europe, as well as financial technology leaders such as Adyen.
PORTFOLIO HIGHLIGHTS
The Global Equity Research Portfolio’s holdings are directly determined by analysts’ recommendations among Harding Loevner’s collection of researched companies. In addition to responding to changes in analysts’ ratings, we also adjust individual position weights to maintain our desired risk profile (moderately lower expected volatility compared with the benchmark and constrained tracking error). During the fiscal year, our analysts recommended buying 114 companies and selling 83 holdings. We had the highest number of net downgrades in Consumer Discretionary during the fiscal year and most net upgrades in Information Technology. We ended the period with 288 holdings in the Portfolio.
By sector, our absolute exposure in Financials came down over 400 bps over the year; however, our relative exposure remains mostly the same as the sector has underperformed for the period. Our active exposure in Industrials rose, making it our biggest sector overweight,
28
|
Table of Contents
followed by Health Care. Communication Services remains our biggest underweight in the Portfolio.
By region, our absolute exposure in the US rose 500 bps over the year; however, it still remains the largest regional underweight for now. Emerging Markets remains our largest overweight, though our active exposure has not changed much, as it has become a larger weight in the benchmark.
In Financials, we added several holdings as our analysts upgraded banks and other Financials stocks during the year as valuations in the sector looked increasingly attractive. In Energy, we bought Finland’s Neste, a refiner and fuel retailer that evolved relatively early to become the global leader in the fast-growing market for renewable diesel and jet fuels. We also purchased Canadian Integrated oil and gas company Imperial Oil and Netherlands-based liquid bulk storage provider Vopak as two companies that were well positioned to weather the energy market downturn.
In Industrials, there were many analyst upgrades and subsequent Portfolio purchases, including French aerospace company Safran. The company (through its joint venture with GE) produces the engines used on three quarters of the world’s single-aisle commercial airplanes. Although COVID-19 has had a devastating impact on aerospace companies, our analyst saw it as an opportunity to initiate a position in a company with sufficient financial strength to survive a lengthy business downturn and be relatively well positioned to prosper in a rebound.
In Consumer Staples our analysts downgraded, and we thus sold, many stocks due to concerns around valuation, including German chemical and consumer goods company Henkel, Chinese alcoholic beverage, food, and packing material maker Kweichow Moutai, and Hong Kong-based Budweiser APAC.
We made several new purchases and additions in the US that increased the Portfolio’s allocation to this region. Purchases included the e-commerce company Etsy. As the world’s largest marketplace for hand-crafted goods, the company provides a comprehensive selling platform including order tracking, payments, and advertising so sellers can focus on what they do best—crafting. It offers over 66 million items in various retail categories to buyers, and our analyst believes it is well positioned with a strong brand that will continue to grow.
Our exposure to Emerging Markets was bolstered by several new purchases, including Bupa Arabia, a health care insurer in Saudi Arabia, where our analyst believes the company’s leading market share and strong reputation should help it achieve stable growth and profitability. We also purchased JD.com, one of the two (with Alibaba) massive online retailers in China. The purchase was a byproduct of sweeping changes in Chinese shopping behavior since the pandemic which our analyst believes could turbocharge growth at the company for years to come.
In Japan, we sold furniture and home accessories maker NITORI and ophthalmic equipment manufacturer Nidec after strong appreciation. Our sales in Europe outside the eurozone included Swiss
TEN LARGEST HOLDINGS at October 31, 2020
| COMPANY | SECTOR | COUNTRY | % | ||||||||||
FIRST REPUBLIC BANK | FINANCIALS | US | 1.1 | ||||||||||
DANAHER | HEALTH CARE | US | 1.0 | ||||||||||
MICROSOFT | INFO TECHNOLOGY | US | 1.0 | ||||||||||
PROCTER & GAMBLE | CONS STAPLES | US | 1.0 | ||||||||||
ALPHABET | COMM SERVICES | US | 1.0 | ||||||||||
HONEYWELL | INDUSTRIALS | US | 1.0 | ||||||||||
COMM SERVICES | US | 1.0 | |||||||||||
AIR PRODUCTS | MATERIALS | US | 0.9 | ||||||||||
CHURCH & DWIGHT | CONS STAPLES | US | 0.9 | ||||||||||
ROCKWELL AUTOMATION | INDUSTRIALS | US | 0.9 | ||||||||||
foods manufacturer Nestlé and two UK-based businesses, food and consumer products manufacturer Unilever and spirits maker Diageo.
Please read the separate disclosures page for important information, including the risks of investing in the Portfolio.
29
|
Table of Contents

PORTFOLIO MANAGEMENT TEAM


MOON SURANA, CFA
PORTFOLIO MANAGER
ANDREW WEST, CFA
PORTFOLIO MANAGER
PERFORMANCE SUMMARY
For the International Equity Research Portfolio, the Institutional Class rose 1.73% (net of fees and expenses) in the fiscal year ended October 31, 2020. The Portfolio’s benchmark, the MSCI All Country World ex-US Index, fell 2.61% (net of source taxes).
MARKET REVIEW
Global stock markets have experienced an extraordinarily volatile twelve months, reacting to the COVID-19 pandemic and to the varying ways in which different countries around the world adapted (or failed to adapt) to its challenges.
Renewed optimism marked the final months of 2019, as central bank largesse and a de-escalation of US-China trade frictions had alleviated fears that had persisted through most of the year. However, the good vibes were short-lived as the COVID-19 outbreak that began in December rapidly engulfed the globe in the early months of the new year, with governments struggling to contain both the disease and its economic fallout. The size and speed of the equity market decline were unprecedented, with measures of volatility reaching levels not seen since the global financial crisis, which unfolded much more slowly. The ensuing forced business closures, restricted travel, and home confinements brought economic activity around the world to a shuddering stop; in turn, prompting an unprecedented monetary and fiscal response. On the monetary front, central bankers cut reserve requirements, lowered interest rates, and unveiled aggressive plans to keep credit flowing. On the fiscal side, governments implemented massive spending programs, dwarfing the rescue plans from the global financial crisis. Exacerbating market turmoil, an oil price war erupted between Saudi Arabia and Russia amid a collapse in oil demand, the combination of which pushed down oil prices to an 18-year low.
FUND FACTS at October 31, 2020 | ||||||||
TOTAL NET ASSETS | $12.5M | |||||||
SALES CHARGE | NONE | |||||||
NUMBER OF HOLDINGS | 207 | |||||||
TURNOVER (5 YR. AVG.) | — | |||||||
DIVIDEND POLICY | ANNUAL | |||||||
| INSTITUTIONAL INVESTORS | ||||||||
INST CLASS | INST CLASS Z | |||||||
TICKER | HLIRX | HLMZX | ||||||
CUSIP | 412295826 | 412295743 | ||||||
INCEPTION DATE | 12/17/2015 | — | ||||||
MINIMUM INVESTMENT1 | $100,000 | $10,000,000 | ||||||
NET EXPENSE RATIO | 0.75%2 | 0.75%2 | ||||||
GROSS EXPENSE RATIO | 1.42%2 | 1.83%2 | ||||||
1Lower minimums available through certain brokerage firms; 2The Expense Ratio is as of the most recent Prospectus and is based on expenses for the most recent fiscal year end. The net expense ratio is shown net of Harding Loevner’s contractual agreement through February 28, 2021. The Net Expense Ratio is applicable to investors.
During the latter half of 2020, conditions started to improve as countries began to emerge from lockdowns and new economic data showed signs of a fledgling recovery. Business activity remained weak, but many indicators—unemployment, consumer spending, and service and manufacturing surveys—rebounded from the troughs witnessed in April. Financial conditions remain highly accommodative in most economies; central banks have kept short-term interest rates hovering near-zero in every major developed economy, underscoring their proclivity to provide ongoing support for battered economies. More recently, sentiment was boosted by rising hopes for a successful vaccine, as multiple drug candidates entered the third and final stages of testing.
Information Technology (IT), Communication Services, and Consumer Discretionary (which contains many e-commerce businesses) were the strongest sectors as shares of the “COVID-19 winners,” companies that are either insulated or directly benefit from the pandemic, continued to rise Conversely, Financials and Energy lagged as both were weighed down by lower interest rates, rising loan loss provisions, and the collapsed oil price.
PERFORMANCE ATTRIBUTION
Strong performance from our Industrials holdings contributed in the fiscal year, notably Hong Kong-based power tools manufacturer Techtronic Industries. Techtronic maintained earnings guidance for the year after the reopening of its main manufacturing facilities in China during 2Q20. The company also saw a
30
|
Table of Contents
PERFORMANCE (% TOTAL RETURN)
| for periods ended September 30, 2020 | for periods ended October 31, 2020 | ||||||||||||||||||||||||||||||||||||
| 1 YEAR | 3 YEARS | SINCE INCEPTION* | 1 YEAR | 3 YEARS | SINCE INCEPTION* | ||||||||||||||||||||||||||||||||
INTL EQUITY RESEARCH PORTFOLIO –INSTITUTITONAL CLASS | 6.79 | 3.77 | 8.58 | 1.73 | 2.44 | 8.06 | |||||||||||||||||||||||||||||||
MSCI ALL COUNTRY WORLD EX-US INDEX | 3.00 | 1.16 | 5.96 | -2.61 | -0.19 | 5.38 | |||||||||||||||||||||||||||||||
Returns are annualized for periods greater than 1 year. *Inception date: December 17,2015.
Performance data quoted represents past performance; past performance does not guarantee future results. The investment return and principal value of an investment will fluctuate so that an investor’s shares, when redeemed, may be worth more or less than their original cost. Current performance of the Portfolio may be lower or higher than the performance quoted. Performance data current to the most recent month end may be obtained by calling (877) 435-8105 or visiting www. hardingloevnerfunds.com.
The chart below illustrates the hypothetical return of an investment made in the corresponding share classes. Investment return reflects voluntary fee waivers in effect. Absent such waivers, total return would be reduced. The performance provided in the table and charts above do not reflect the deduction of taxes that a shareholder would pay on Portfolio distributions or the redemption of Portfolio shares.
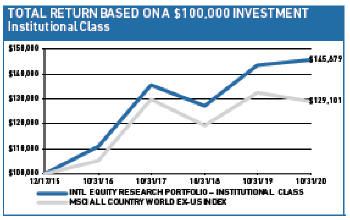
surge in demand for DIY tools and outdoor products, growing usage of its e-commerce channel, and the launch of several new products. Stocks in Health Care were also helpful, especially Japanese pharmaceutical manufacturer Chugai Pharmaceutical. Chugai benefited from news of the potential use of the company’s co-promoted drug Actemra to treat COVID-19 symptoms. Despite later test results that showed less promise, the company has several key proprietary drug products that treat a range of diseases, which, when coupled with its strong R&D platform and alliance with Roche, should help drive long term growth. The Portfolio’s underweights in Financials and Energy were also helpful.
Offsetting this strong performance, weak stocks within Information Technology detracted from relative performance. Shares of Network International, a UK-listed but Middle East- and Africa-focused credit card merchant acquirer, suffered a significant decline in merchant transaction processing revenues because Dubai, its biggest market, was depressed due to travel restrictions. Shares also fell following the loss of a large strategic customer and renewed questions about how it accounts for net debt. We believe its investors are (over)reacting to the recent collapse of Wirecard, a German electronic payment provider revealed over the summer as a fraud. Consumer Discretionary stocks also detracted; largely due to our underweight in strongly performing Chinese e-commerce company Alibaba.
From a geographic perspective, Japanese stocks contributed the most to relative performance, especially Chugai and Unicharm, a maker of diapers and feminine hygiene products. Shares were helped by viral demand for its disposable hygiene products such as masks, cleaning sheets, and wet tissues. European stocks both inside and outside the eurozone also contributed, especially Sartorius, a France-based pharmaceutical and laboratory supplier. Shares benefited from the vast mobilization of labs searching for a vaccine and new antivirals that could prove effective in battling the coronavirus. Stocks in Emerging Markets detracted from performance; our underweights in strongly performing Alibaba, Chinese internet game giant Tencent, and Taiwanese semiconductor manufacturer TSMC were the main detractors.
PERSPECTIVE AND OUTLOOK
We’ve been harping on about the stretched valuations of high-quality growth companies for so long that we would forgive you for tuning us out. But as valuations continue to march higher, so too do our concerns—which is where we might have left it were it not for the evidence of a ramp-up in speculative behavior. The large number of highly valued, but (historically) weakly profitable companies with negative market-implied discount rates (MIDRs) causes us more worry over other signs of market excess.
By one of our estimates, 15% of international stocks (by capitalization) are priced to seriously disappoint based on our analysis of MIDRs for cohorts of global stocks in HOLT, a database of company accounts. A MIDR is an aggregation of company-level discount rates, each derived by comparing a forecast of the company’s future cashflows with its current market value. If expected future cash flows are low, or far off, while the company’s current market value is high, the discount rate that equates them must be low. But there’s low, and then there’s what we observe in today’s most expensively priced stocks. Out of the approximately 5,000 international stocks with market capitalizations above US$1 billion (totaling US$46.3 trillion in capitalization), nearly 600 companies (amounting to US$7.8 trillion) currently show up having negative implied discount rates, a higher percentage than at any time since just before the bursting of the tech bubble. Put a
31
|
Table of Contents
different way, these stocks are priced to deliver negative real returns even if HOLT’s formulaic and consensus-based assumptions about future cash flow growth are met. Among these 600 richly valued companies, 371, with US$1.9 trillion market capitalization, were loss-making throughout 2019. Our view is that, when dealing with a large group of companies, you are betting against the weight of historical evidence if you assume that so many can beat the odds by outstripping current growth expectations to deliver positive returns.
Throughout the year, companies that score highest along the growth dimension have leapt ahead of the pack. Not much of a surprise perhaps, since the value of long-duration growth has risen as interest rates have declined. But what is a surprise, to us at least, is the apparent willingness to bid up all growth stocks without regard for the quality of that prospective growth. There are two kinds of growth companies that we try to keep out of our portfolio. The first type are companies that meet our quality criteria but whose share prices are unreasonably high relative to our future growth expectations. The second type are companies that fail to meet our investment criteria for business quality; they are rejected, summarily or sometimes after lengthy debate, by our analysts.
In cases of both types, there are “many a slip ’twixt the [growth] cup and the [quality] lip.” In the lifecycle of the typical successful firm, growth precedes profitability, which makes quality assessment fraught in the early, rapid growth phase. The archetype for the firm with rapidly growing sales but only modest profitability was Amazon.com. Currently, a growing number of investors appear willing to take a leap of faith much earlier over the fortunes of hitherto profitless companies. A poster child for exuberance over profitless growth is Shopify, a Canadian IT services company, whose sales have grown rap-idly to US$2 billion annually, but which has yet to turn a profit since going public in 2015. Our analyst, upon meeting with the company several years ago, noted its impressive sales growth but was put off by its high client turnover. This year, a different analyst, lured by dazzling revenue growth and a potential boost from COVID-19, re-examined
GEOGRAPHIC EXPOSURE (%) at October 31, 2020
| COUNTRY/REGION | PORTFOLIO | BENCHMARK1 | ||||||
CANADA | 1.4 | 6.4 | ||||||
EMERGING MARKETS | 33.3 | 31.0 | ||||||
EUROPE EMU | 19.8 | 19.7 | ||||||
EUROPE EX-EMU | 19.4 | 18.6 | ||||||
FRONTIER MARKETS2 | 0.5 | — | ||||||
JAPAN | 18.2 | 16.6 | ||||||
MIDDLE EAST | 0.0 | 0.4 | ||||||
PACIFIC EX-JAPAN | 5.4 | 7.3 | ||||||
CASH | 2.0 | — | ||||||
1 MSCI All Country World ex-US Index; 2 Includes countries with less-developed markets outside the Index.
SECTOR EXPOSURE (%) at October 31, 2020
| SECTOR | PORTFOLIO | BENCHMARK1 | ||||||
COMMUNICATION SERVICES | 4.0 | 7.9 | ||||||
CONSUMER DISCRETIONARY | 13.6 | 14.3 | ||||||
CONSUMER STAPLES | 13.6 | 9.5 | ||||||
ENERGY | 4.0 | 4.0 | ||||||
FINANCIALS | 13.8 | 17.1 | ||||||
HEALTH CARE | 11.5 | 10.0 | ||||||
INDUSTRIALS | 18.3 | 11.6 | ||||||
INFORMATION TECHNOLOGY | 11.4 | 11.7 | ||||||
MATERIALS | 6.7 | 7.8 | ||||||
REAL ESTATE | 0.7 | 2.7 | ||||||
UTILITIES | 0.4 | 3.4 | ||||||
CASH
| 2.0 | — | ||||||
1MSCI All Country World ex-US Index.
the company. But whereas we expected—perhaps even hoped—to find a clear path for it to eventual profitability, instead we found a company busily undermining its long-term profit prospects by pursuing low margin businesses to maintain its sales growth at any cost.
Fortunately, even within the IT sector there are still opportunities to be uncovered if you are willing to do the legwork. Semiconductor manufacturers have a long track record of sustained growth and profitability yet still appear reasonably priced. While their shares have been historically volatile (given the cyclical nature of the industry), we see semiconductor demand continuing to grow for the foreseeable future—fueled by mobile services, high performance (cloud) computing, and smarter connected devices in the home, industry, and transportation. At the same time, as we have predicted, the industry has consolidated; there are barely a handful of companies who are masters of the ever-increasing challenge of manufacturing ever-smaller and more sophisticated chips. This quarter’s announcement by US chipmaker Intel that it has been struggling to manufacture the next generation of smaller, faster, and more efficient chips gave our thesis a shot in the arm. We expect top chipmakers, particularly TSMC and South Korea-based Samsung Electronics, to enjoy a widening competitive advantage and improving industry structure in the years ahead.
Beyond semiconductors, we also continue to find attractive investments in Software and Internet Services. Among these companies, we tend to see high returns on invested capital, low capital investment requirements, and high rates of sales and profit growth—all achieved with low sensitivity to the business cycle. Our analysts favor business process facilitators such as SAP and Dassault Systémes in Europe, as well as financial technology leaders such as Adyen.
⬛ PORTFOLIO HIGHLIGHTS
The International Equity Research Portfolio’s holdings are directly determined by analysts’ recommendations among Harding
32
|
Table of Contents
Loevner’s collection of researched companies. In addition to responding to changes in analysts’ ratings, we also adjust individual position weights to maintain our desired risk profile (moderately lower expected volatility compared with the benchmark and constrained tracking error). During the fiscal year, our analysts recommended buying 84 companies and selling 68 holdings. We had the highest number of net downgrades in Communication Services during the fiscal year and most net upgrades in Health Care. We ended the period with 207 holdings in the Portfolio.
By sector, the Portfolio’s allocation in Energy, Information Technology, and Health Care increased while its allocations in Consumer Discretionary and Communication Services decreased. Overall, the Portfolio’s largest overweights relative to the benchmark are in Industrials and Consumer Staples and its largest underweights are in Communication Services and Financials.
By region, the Portfolio’s allocations in the eurozone and Emerging Markets increased while its allocations in Japan and Europe outside the eurozone decreased. Overall, the Portfolio’s largest overweights relative to the benchmark are in Emerging Markets and Japan and its largest underweights are in Canada and Pacific ex-Japan.
In Energy, we bought Finland’s Neste, a refiner and fuel retailer that evolved relatively early to become the global leader in the fast-growing market for renewable diesel and jet fuels. Large economies of scale, a deep network of renewable feedstock suppliers, established customer relationships, and important technological advantages give Neste a crucial lead in tackling the complex logistical and technical challenges of converting food-related waste and residues into a viable global alternative fuel supply. We also purchased Canadian Integrated oil and gas company Imperial Oil and Netherlands-based liquid bulk storage provider Vopak. We established positions in several new Health Care companies, including Hangzhou Tigermed Consulting which provides clinical research services to both domestic Chinese and foreign companies for the development of pharmaceuticals and other healthcare products. It is well positioned to benefit from China’s rapidly expanding patentable drug pipeline. We also established positions in Swiss hearing-aid manufacturer Sonova Holding, Denmark-based medical device maker Coloplast, and Jiangsu Hengrui Medicine, a Chinese pharmaceutical company.
In Consumer Discretionary, we sold South Korea’s Hankook Tire after prosecutors charged its CEO with taking bribes and embezzling corporate funds. Our analyst immediately “unrated” (disqualified for investment) the company for violating our corporate governance standards. In Communication Services, we sold Jap-anese marketing and advertising agency Dentsu and Indian tele-com tower provider Bharti Infratel, both due to growth concerns.
Our exposure to the eurozone was bolstered by several new purchases, including French aerospace company Safran. Safran (through its joint venture with GE) produces the engines used on three quarters of the world’s single-aisle commercial airplanes. Although COVID-19 has had a devastating impact on aerospace companies, our analyst saw it as an opportunity to initiate a position in
TEN LARGEST HOLDINGS at October 31, 2020
| COMPANY | SECTOR | COUNTRY | % | |||||||||
KOMATSU | INDUSTRIALS | JAPAN | 1.1 | |||||||||
GRIFOLS | HEALTH CARE | SPAIN | 1.1 | |||||||||
NOMURA RESEARCH INSTITUTE | INFO TECHNOLOGY | JAPAN | 1.1 | |||||||||
UNICHARM | CONS STAPLES | JAPAN | 1.0 | |||||||||
HAKUHODO | COMM SERVICES | JAPAN | 1.0 | |||||||||
KOBAYASHI | CONS STAPLES | JAPAN | 1.0 | |||||||||
FAST RETAILING | CONS DISCRETIONARY | JAPAN | 1.0 | |||||||||
FINECO | FINANCIALS | ITALY | 1.0 | |||||||||
SYMRISE | MATERIALS | GERMANY | 1.0 | |||||||||
REPLY | INFO TECHNOLOGY | ITALY | 1.0 | |||||||||
a company with sufficient financial strength to survive a lengthy business downturn and be relatively well positioned to prosper in a rebound. We also we purchased Spanish pharmaceutical and chemicals maker Grifols, and two German companies, optical manufacturer Carl Zeiss Meditec and in-vitro diagnostics systems provider STRATEC. Our Emerging Markets purchases included Bupa Arabia, a health care insurer in Saudi Arabia. Our analyst believes the company’s leading market share and strong reputation should help it achieve stable growth and profitability. We also purchased China Duty Free (formerly China International Travel Service), for whom a near-term decline in airport-based sales has been offset by an expansion in its addressable market as the government lowered quotas on duty-free purchases brought back to the mainland from the island shopping destination of Hainan.
In Japan, we sold furniture and home accessories maker NITORI and ophthalmic equipment manufacturer Nidec after strong appreciation and trimmed comparison shopping website Kakaku. Our sales in Europe outside the eurozone included UK-based food and consumer products manufacturer Unilever, Swiss foods manufacturer Nestlé, and UK-based alcoholic beverages manufacturer Diageo. We also reduced our positions in a pair of Danish companies after strong stock price performance caused the holdings to bump up against our maximum position size limits. One was the probiotics maker Chr. Hansen; the other, bio-tech firm Novozymes.
Please read the separate disclosures page for important information, including the risks of investing in the Portfolio.
33
|
Table of Contents

PORTFOLIO MANAGEMENT TEAM

MOON SURANA, CFA PORTFOLIO MANAGER
ANDREW WEST, CFA PORTFOLIO MANAGER |
⬛ PERFORMANCE SUMMARY
For the Emerging Markets Equity Research Portfolio, the Institutional Class rose 2.19% (net of fees and expenses) in the fiscal year ended October 31, 2020. The Portfolio’s benchmark, the MSCI Emerging + Frontier Markets Index, rose 8.05% (net of source taxes) in this period.
⬛ MARKET REVIEW
Emerging Markets (EMs) enjoyed a strong start to the fiscal year, with rising expectations for earnings growth amid the efforts of governments and central banks to stimulate their economies and signs of a de-escalation in US-China trade tensions. But in January optimism evaporated when the COVID-19 outbreak in the Chinese city of Wuhan rapidly spread to become a planet-engulfing pandemic. EMs plummeted nearly 34% from early January through late-March. The size and speed of the equity market decline were unprecedented. Volatility reached levels not seen since the global financial crisis.
The virus presented a complex mix of countervailing developments across the EM landscape as the year progressed. Among the best-performing regions, China has been notable for the speed and strength of its economic recovery. By March 2020, the country had controlled the domestic spread of the virus and started relaxing its lockdowns, and by the end of the fiscal year the economy has already returned to posting year-over-year growth.
Relative to China’s experience, the economic damage wrought by the pandemic in most other EMs has been significantly greater and their recoveries more halting. Still, the massive scale and pace of monetary and fiscal stimulus by global central banks in response to the economic damage of the pandemic helped stoke a recovery in EM shares prices that started in March and continued, mostly unabated, through the end of the fiscal year. Moreover, companies that benefit from the transformation in consumer habits shaped by lockdowns and social distancing, such as e-commerce and online
FUND FACTS at October 31, 2020 | |||||||||
TOTAL NET ASSETS | $7.4M | ||||||||
SALES CHARGE | NONE | ||||||||
NUMBER OF HOLDINGS | 123 | ||||||||
TURNOVER (5 YR. AVG.) | - | ||||||||
DIVIDEND POLICY | ANNUAL | ||||||||
INSTITUTIONAL INVESTORS | |||||||||
| INSTITUTIONAL CLASS | |||||||||
TICKER | HLREX | ||||||||
CUSIP | 412295776 | ||||||||
INCEPTION DATE | 12/19/2016 | ||||||||
MINIMUM INVESTMENT1 | $100,000 | ||||||||
NET EXPENSE RATIO2 | 1.15% | ||||||||
GROSS EXPENSE RATIO2 | 2.29% | ||||||||
1Lower minimums available through certain brokerage fi rms; 2The Expense Ratio is as of the most recent Prospectus and is based on expenses for the most recent fi scal year end. The net expense ratio is shown net of Harding Loevner’s contractual agreement through February 28, 2021 .. The Net Expense Ratio is applicable to investors.
services businesses, saw significant acceleration of demand. Investors clamoring for exposure to this select group of EM winners continued to fuel momentum in their shares, akin to the FAANG concentration effect we have witnessed in the US stock market.
The strongest performing sectors were Consumer Discretionary and Information Technology (IT), followed by Communication Services and Health Care. Consumer Discretionary was led partly by Chi-nese e-commerce and online education companies. These internet businesses reported increased usage and gained market share from offline competitors amid COVID-19-related shutdowns. Information Technology (IT) stocks were relatively resilient amid the pandemic. Hardware and semiconductor companies enjoyed growth in demand from the rollout of 5G wireless networks and increased usage of cloud computing services.
Energy stocks suffered the most amid the collapse in oil prices. Financials, especially banks in oil- and commodity-producing countries like Russia, Mexico, Brazil, and Colombia, were also weak. Expectations for loan growth have fallen with weaker economic activity, and investors have been concerned about a rise in credit losses due to virus-related business disruption and unemployment.
Asia was the only EM region with positive performance, with returns in China, Taiwan, and South Korea enhanced by these markets’ heavy weights in Consumer Discretionary and IT stocks. The weakest region was Latin America; Brazil, its largest market, struggled to regain its footing as investors remained concerned about the economic impact of the pandemic and the government’s chaotic response.
34
|
Table of Contents
PERFORMANCE (% TOTAL RETURN)
| for periods ended September 30, 2020 | for periods ended October 31, 2020 | |||||||||||||||||||||||||||||
| 1 YEAR | 3 YEARS | SINCE INCEPTION* | 1 YEAR | 3 YEARS | SINCE INCEPTION* | |||||||||||||||||||||||||
EMERGING MARKETS RESEARCH PORTFOLIO – INSTL CLASS | 4.01 | 1.86 | 8.38 | 2.19 | 1.81 | 8.55 | ||||||||||||||||||||||||
MSCI EMERGING + FRONTIER MARKETS INDEX | 10.29 | 2.35 | 9.11 | 8.05 | 1.88 | 9.47 | ||||||||||||||||||||||||
Returns are annualized for periods greater than 1 year. *Inception date: December 19, 2016.
Performance data quoted represents past performance; past performance does not guarantee future results. The investment return and principal value of an investment will fluctuate so that an investor’s shares, when redeemed, may be worth more or less than their original cost. Current performance of the Portfolio may be lower or higher than the performance quoted. Performance data current to the most recent month end may be obtained by calling (877) 435-8105 or visiting www.hardingloevnerfunds.com.
The chart below illustrates the hypothetical return of an investment made in the corresponding share classes. Investment return reflects voluntary fee waivers in effect. Absent such waivers, total return would be reduced. The performance provided in the table and charts above do not reflect the deduction of taxes that a shareholder would pay on Portfolio distributions or the redemption of Portfolio shares.
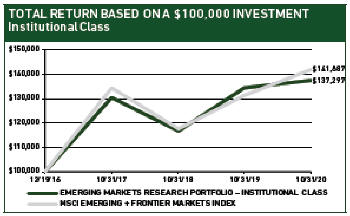
⬛ PERFORMANCE ATTRIBUTION
Our stocks in the Consumer Discretionary, IT, and Consumer Staples sectors were the main detractors from relative performance this year. We lagged in Consumer Discretionary primarily because our risk management practices led us to have a lower exposure versus the index to top-performing Chinese online retailing and marketing companies, such as Alibaba and Meituan Dianping. Meituan is a leading online marketplace for local lifestyle services, such as food delivery and travel reservations, which we purchased at the end of the fiscal year. In Consumer Staples, FEMSA, Mexico’s largest convenience store operator and controlling stakeholder in one of the world’s largest Coca-Cola bottlers, has been hurt by pandemic-related business interruptions. However, the company has been recovering with an increasing number of stores now operating under normal hours. The portfolio’s overweight in Consumer Staples also weighed on relative returns.
We outperformed in Industrials, where a significant contributor was WEG, a Brazilian manufacturer of electric motors, generators, and transformers. The company, an emerging leader in internet-connected industrial equipment, posted strong earnings throughout the fiscal year. Another contributor in Industrials was Chinese delivery company SF Express, which saw a boost in demand for its services as a result of the pandemic.
By geography, unfavorable allocations were key causes of under-performance. Our pursuit of diversification and commitment to investing in high-quality, growing, and reasonably priced companies put us at odds with the huge concentration of returns from the biggest “COVID winners” in China. We either avoided members of this cohort due to valuation concerns and lack of profitability, or we held higher-quality winners, such as e-commerce giant Alibaba and online game leader Tencent, but had a lower exposure than the index. Our overweight to Latin America (particularly Mexico) was another significant detractor.
Our stock selection was notably strong in India and South Korea. In India, Hero MotoCorp shares were buoyed by signs of recovery in automobile demand following a prolonged downcycle. South Korean social media company Naver has generated strong earnings during the pandemic thanks in part to strong demand for its Naver Pay and cloud services offerings as well as solid demand from advertisers.
⬛ PERSPECTIVE AND OUTLOOK
Viewed superficially, that the MSCI Emerging + Frontier Markets Index rose 8% in the fiscal year might suggest that the effects of the pandemic are now behind developing economies and their commercial life is back to normal. Unfortunately, nothing could be further from the truth. To see how much has changed, look below the surface of the Index at the colossal divergence of sectors and regions within. While the IT and Consumer Discretionary sectors rose 35% and 48%, respectively, for the year-to-date, Financials fell 20% and Energy was down 30%. Country performance has been similarly disparate. The year-to-date spread, for example, between China (up 35%) and Brazil (down 38%) is an eye-watering 73%.
The difference between China and Brazil owes in part to their respective gearing to global growth and their opposite roles in the global commodity trade, and in part to how effectively each country has handled the pandemic. Once it recognized the seriousness of the initial outbreak of the disease, Chinese authorities were relatively quick to impose severe and widescale lockdowns, along with instituting comprehensive tracing and testing. By contrast, Brazil’s President Jair Bolsonaro has consistently dismissed the seriousness
35
|
Table of Contents
of the virus, and his administration’s uneven approach to containing it has left nearly 6 million reportedly infected and 160,000 dead, second to the US, whose population is considerably larger.
But the disparity in their stock markets’ performance ultimately also comes down to the relative makeup, in terms of company membership, of each countries’ sleeve of the EM Index. China has an especially large weighting in technology-related companies that in many cases have directly benefitted from the pandemic. Some of these are great companies whose long-term growth prospects have been pulled forward as changes in consumer habits accelerated over the past several months, but some, like many in a recent rash of IPOs to hit the market, are considerably more speculative. Braz-il’s stock market, by comparison, tends to represent a more diversified mix of sectors that retains the profile of a traditional developing market, with larger market weights in Financials, Materials, and Energy, one-tenth the weight of China in Communication Services, and almost no weight in IT.
Pursuing growth opportunities among banking, Industrials, oil and gas, and the like may not be as exciting as the latest pure technology sensation such as NIO, a Chinese electric vehicle producer, valued at about 20 times estimated 2020 sales. While the company has tremendous growth potential, it also has a short history, significant operating losses, and is not expected to break even until 2022. Examples of such growing, expensive, but profitless companies currently abound in EMs. We are attracted to what may appear more boring: well-established companies with technological and other competitive advantages that offer consistent profitability, strong management, and sound finances, along with prospects for above average, if not always rocketing, growth.
GEOGRAPHIC EXPOSURE (%) at October 31, 2020
| COUNTRY/REGION | PORTFOLIO | BENCHMARK | 1 | |||||||
BRAZIL | 5.1 | 4.3 | ||||||||
CHINA + HONG KONG2 | 33.4 | 42.6 | ||||||||
INDIA | 9.8 | 8.0 | ||||||||
MEXICO | 5.2 | 1.6 | ||||||||
RUSSIA | 2.9 | 2.6 | ||||||||
SOUTH AFRICA | 2.2 | 3.4 | ||||||||
SOUTH KOREA | 9.3 | 11.7 | ||||||||
TAIWAN | 8.5 | 12.5 | ||||||||
SMALL EMERGING MARKETS3 | 15.3 | 11.7 | ||||||||
FRONTIER MARKETS | 7.0 | 1.6 | ||||||||
.DEVELOPED MARKET LISTED4 | 0.2 | — | ||||||||
CASH | 1.1 | — | ||||||||
1MSCI Emerging + Frontier Markets Index; 2The Emerging Markets Research Portfolio’s end weight in China at October 31, 2020 is 33.4% and Hong Kong is 0.0%. The Benchmark does not include Hong Kong; 3Includes the remaining emerging markets which, individually, comprise less than 5% of the Index; 4Includes emerging markets or frontier markets companies listed in developed markets.
SECTOR EXPOSURE (%) at October 31, 2020
| SECTOR | PORTFOLIO | BENCHMARK1 | ||||||
COMMUNICATION SERVICES | 9.0 | 13.3 | ||||||
CONSUMER DISCRETIONARY | 16.0 | 20.6 | ||||||
CONSUMER STAPLES | 19.3 | 5.9 | ||||||
ENERGY | 3.8 | 4.9 | ||||||
FINANCIALS | 21.2 | 17.6 | ||||||
HEALTH CARE | 5.2 | 4.2 | ||||||
INDUSTRIALS | 5.8 | 4.3 | ||||||
INFORMATION TECHNOLOGY | 13.1 | 18.1 | ||||||
MATERIALS | 2.5 | 6.8 | ||||||
REAL ESTATE | 1.5 | 2.4 | ||||||
UTILITIES | 1.5 | 1.9 | ||||||
CASH | 1.1 | — | ||||||
1MSCI Emerging + Frontier Markets Index.
Our Brazilian holdings, which range across the Financials, Consumer, Energy, and Industrials sectors, illustrate our ability to uncover growth in diverse industries. One Brazilian company leading its industry in technological investment and innovation is WEG. The company is one of Brazil’s most successful industrial exporters, generating about 60% of revenues from outside its home market. This year WEG continued to enjoy solid growth in both domestic and foreign revenues despite a tough economic backdrop. Some of the growth has come from growing sales to wind and solar energy producers, as demand for energy from green sources has bucked the overall energy downturn. Looking forward, an even bigger area of opportunity relates to WEG’s integration of smart technology across its installed base of energy and other industrial equipment to help enable the company to serve customers better.
Perhaps nowhere has management skill in navigating the pandemic come more into play than in Brazil’s banking industry. Conservative bankers at well-capitalized banks have taken provisions for loan losses aggressively to ensure they can withstand worst-case scenarios. Generally, such provisioning, whether undertaken in an abundance of caution or fully warranted, heightened investors’ concerns about asset quality and led to indiscriminate pressure on bank shares. We hold two Brazilian banks, Banco Bradesco and Itaú Unibanco. Itaú’s second quarter results were dragged down by its provisions. However, compared to competitors, the percentage of its loans covered by the moratoriums represents but a small fraction of its total loan book, and a majority of those loans are fully collateralized. The risk of actual losses arising from the repayment deferral, in other words, is far lower than that which appears priced into its shares.
Itaú’s management is committed to improving efficiencies and customer satisfaction through investment in financial technology. To attract and retain younger customers, Itaú released a mobile app and digital wallet called Iti that works well on cheaper smart phones. Management plans to add more functionality to Iti over time, with the goal of making it a multipurpose platform, like the “super apps” prevalent in China. More broadly, the bank has been aggressive in growing its online banking channel to reduce reli-
36
|
Table of Contents
ance on physical branches where the cost of servicing customers is higher. The company’s deep experience in credit underwriting and debt collection is a competitive advantage that has helped it survive through many previous credit cycles, emerging stronger each time.
PORTFOLIO HIGHLIGHTS
The Emerging Markets Equity Research portfolio’s holdings are directly determined by analysts’ recommendations among Harding Loevner’s collection of researched companies. In addition to responding to changes in analysts’ ratings, we also adjust individual position weights to maintain our desired risk profile (moderately lower expected volatility compared with the benchmark and constrained tracking error). During the fiscal year, our analysts recommended buying 58 EM companies and selling 46 holdings. We had the highest number of net upgrades in Financials and Health Care and most net downgrades in Materials. We ended the period with 123 holdings in the portfolio.
By sector, we increased the Portfolio’s allocations to Consumer Staples, Financials, and Health Care, and reduced our allocations to Industrials and Energy. Overall, the Portfolio’s largest overweights relative to the benchmark are in Consumer Staples and Financials and its largest underweights are in IT and Consumer Discretionary.
By geography, we increased the Portfolio’s allocations to South Ko-rea, Brazil, and Chile and trimmed our allocations to China, Qatar, and Indonesia. The Portfolio’s largest overweights relative to the benchmark are in Latin America (particularly Mexico) and Frontier Markets (notably Vietnam) and its largest underweights are in Asia, especially China and Taiwan.
Our purchases in Consumer Stapes included Raia Drogasil, the leading Brazilian drugstore operator. The company’s neighborhood locations in particular have seen a boost to growth as people working from home increasingly rely upon them for daily consumer items. We also bought Godrej, a large Indian consumer goods company with a “3X3” strategy: focus on three continents (Asia, Africa, and Latin America) and three product categories (personal washing, hair care, and home care). The share price, which fell partly due to concerns about falling consumption during the pandemic, looked attractive to our analyst given Godrej’s long-term growth potential. The company recently launched several promising household insecticide products, for example. Furthermore, we purchased Wuliangye, a leading brand in the Chinese premium liquor (baijiu) industry. Wuliangye has been growing alongside the rise of Chinese household wealth as consumers have upgraded their liquor consumption.
In IT, our additions to the portfolio included Silergy, a Taiwan-listed semiconductor equipment company that designs and sells power-management integrated circuits. In China, we purchased TravelSky, the country’s dominant provider of global distribution systems used in air traffic control. The company also supplies IT solutions for airports and is positioned to grow alongside China’s growth in air travel.
TEN LARGEST HOLDINGS at October 31, 2020 | |||||||||||||||
| COMPANY | SECTOR | COUNTRY | % | ||||||
| ALIBABA | CONS DISCRETIONARY | CHINA | 2.1 | ||||||
| TSMC | INFO TECHNOLOGY | TAIWAN | 2.0 | ||||||
| SAMSUNG ELECTRONICS | INFO TECHNOLOGY | SOUTH KOREA | 2.0 | ||||||
| AMOREPACIFIC | CONS STAPLES | SOUTH KOREA | 2.0 | ||||||
| ECLAT | CONS DISCRETIONARY | TAIWAN | 2.0 | ||||||
| TENCENT | COMM SERVICES | CHINA | 2.0 | ||||||
| FEMSA | CONS STAPLES | MEXICO | 2.0 | ||||||
| TATA CONSULTANCY SERVICES | INFO TECHNOLOGY | INDIA | 1.9 | ||||||
| NAVER | COMM SERVICES | SOUTH KOREA | 1.9 | ||||||
| HDFC BANK | FINANCIALS | INDIA | 1.9 | ||||||
Our weight in Financials fell in large part due to the decline in bank shares this year, reflecting investors’ concerns about how the economic slowdown caused by the pandemic may hurt banks’ businesses. Our analysts responded by recommending the purchase of a number of banks where the stock price did not properly discount their long-term growth potential. Our bank holdings operate across the EM universe, including Brazil (as noted above), Chile (Banco Santander Chile), China (China Merchants Bank), Egypt (Commercial International Bank), Czech Republic (Komercni Banka), Colombia (Bancolombia), and Vietnam (Bank for Foreign Trade of Vietnam). Commercial International Bank, for example, is Egypt’s leading private bank in terms of profit, deposits, and asset base. While the bank has consistently increased market share, management’s prudent credit and risk management policies have meant this growth has never come at the expense of lending to borrowers with questionable capacity to repay.
By geography, alongside purchasing the new Chinese holdings mentioned above, we also responded to our analysts’ valuation concerns for some businesses. Our holdings in delivery companies ZTO Express and SF Express have done particularly well as demand for their services rose amid the need for social distancing. We sold the former and trimmed our position in the latter. We also sold Sunny Optical, a maker of camera equipment for smartphones, and Baidu, the large internet search business. While Baidu’s core internet search business remains solid, other companies appear better positioned to capture growth in online advertising. Baidu also faces intensifying rivalry in other potential growth areas like its news-feed and short-video offerings.
Elsewhere in Asia, we purchased Thailand’s Bumrungrad Hospital (BH), which operates a high-end private hospital in Bangkok. The company’s competitive advantages include a strong reputation for meeting the highest global standards for care. BH’s growth should be supported by Thailand’s aging population, Thailand’s doctor shortage (which limits the number of new hospitals) and comparatively low-quality of the public hospital system, as well the increase in health care spending as incomes in the country rise.
Please read the separate disclosures page for important information, including the risks of investing in the Portfolio.
37
|
Table of Contents
 DISCLOSURES
The Portfolios invest in foreign securities, which will involve greater volatility and political, economic, and currency risks and differences in accounting methods. They also invest in emerging markets, which involve unique risks, such as exposure to economies less diverse and mature than the US or other more established foreign markets. Economic and political instability may cause larger price changes in emerging markets securities than other foreign securities.
Investments in small- and mid-cap companies involve additional risks such as limited liquidity and greater volatility.
Diversification does not guarantee a profit or prevent a loss in a declining market.
Long-term earnings growth and earnings per share growth are not a forecast of the Portfolios’ future performance.
Companies held in the Portfolios during the fiscal year appear in bold type; only the first reference to a particular holding appears in bold. The Portfolios are actively managed; therefore holdings shown may not be current. Portfolio holdings and sector and geographic allocations should not be considered recommendations to buy or sell any security. Please refer to the Portfolios of Investments in this report for complete Portfolio holdings. Current and future Portfolio holdings are subject to risk.
While the Portfolios have no sales charge, management fees and other expenses still apply. Please see the Prospectus for further details.
Sector & Geographic Exposure data is sourced from: Northern Trust, Harding Loevner Funds Portfolios, and MSCI Barra.
Expense Ratios: Differences may exist between the commentary data and similar information reported in the financial statements due to timing differences. Unless otherwise stated, the expense ratios presented are shown as of the most recent Prospectus date, February 28, 2020.
Five year average turnover data is calculated using a simple average of annual turnover figures for the past five fiscal years. These annual turnover figures utilize purchase, sales, and market value data which is not reflective of adjustments required pursuant to Generally Accepted Accounting Principles (GAAP). Accordingly, differences may exist between this data and similar information reported in the financial statements.
Quasar Distributors, LLC, Distributor.
INDEX DEFINITIONS
The MSCI All Country World Index is a free float-adjusted market capitalization index that is designed to measure equity market performance in the global developed and emerging markets. The Index consists of 49 developed and emerging market countries. Net dividends reinvested.
The MSCI All Country World ex-US Index is a free float-adjusted market capitalization index that is designed to measure equity market performance in the global developed and emerging markets, excluding the US. The Index consists of 48 developed and emerging market countries. Net dividends reinvested.
The MSCI All Country World ex-US Small Cap Index is a free-float market capitalization index that is designed to measure small cap developed and emerging market equity performance. The Index consists of 48 developed and emerging markets countries and targets companies within a market capitalization range of USD 32–10,202 million (as of September 30, 2020). in terms of the companies’ full market capitalization. Net dividends reinvested.
The MSCI Emerging Markets Index is a free float-adjusted market capitalization index that is designed to measure equity market performance in the global emerging markets. The Index consists of 26 emerging market countries. Net dividends reinvested.
The MSCI Emerging + Frontier Markets Index is a free float-adjusted market capitalization index that is designed to measure equity market performance in the global emerging markets and frontier markets. The Index consists of 26 emerging markets countries and 28 frontier markets countries. Net dividends reinvested.
The MSCI Frontier Emerging Markets Index is a free float-adjusted market capitalization index designed to measure equity market performance in all countries from the MSCI Frontier Markets
Index and the lower size spectrum of the MSCI Emerging Markets Index. The Index consists of 28 frontier markets and 6 emerging markets. Net dividends reinvested.
You cannot invest directly in these Indexes.
TERM DEFINITIONS
Alpha measures risk-adjusted return.
Basis Points (bps) are a common measurement used chiefly for interest rates and other percentages in finance. A basis point is one hundredth of one percent.
Beta measures the portfolio’s sensitivity to the market.
Discounted cash flow is a method of estimating the value of an investment based on its future cash flows.
Dividend yield is the annual dividends per share divided by current price per share, expressed as a percent.
Economies of scale is the cost advantage that arises with increased output of a product.
FAANG is an acronym referring to the stocks of the five most popular and best-performing American technology companies: Facebook, Amazon, Apple, Netflix and Alphabet (formerly known as Google).
Gross Domestic Product (GDP) is the monetary value of all finished goods and services produced within a country’s borders in a specific time period (usually calculated on an annual basis).
Market Capitalization is the total dollar market value of all of a company’s outstanding shares.
Price/Earnings is the ratio of a firm’s closing stock price & its trailing 12 months’ earnings/share.
The Purchasing Managers Index (PMI) is an indicator of the economic health of the manufacturing sector. The index is based on five major indicators: new orders, inventory levels, production, supplier deliveries, and the employment environment.
Return on Capital (ROC) is a calculation used to assess a company’s efficiency at allocating the capital under its control to profitable investments.
Return on Equity is the net income divided by total common equity outstanding, expressed as a percent.
Tangible book value is the book value of a company less than the value of any tangible assets, such as goodwill.
Tracking Error is a measure of how closely a portfolio follows the index to which it is benchmarked.
Turnover is calculated by dividing the lesser of Purchases or Sales by Average Capital.
38
|
Table of Contents
HARDING
LOEVNER
Fundamental. Thinking. Worldwide.
Annual Report
October 31, 2020
Harding, Loevner Funds, Inc.
Global Equity Portfolio
International Equity Portfolio
International Small Companies Portfolio
Institutional Emerging Markets Portfolio
Emerging Markets Portfolio
Frontier Emerging Markets Portfolio
Global Equity Research Portfolio
International Equity Research Portfolio
Emerging Markets Research Portfolio
Table of Contents
This page intentionally left blank.
Table of Contents
Harding, Loevner Funds, Inc.
| 2 | ||||
Portfolio of Investments | 4 | |||
| 4 | ||||
| 7 | ||||
| 10 | ||||
| 13 | ||||
| 16 | ||||
| 19 | ||||
| 22 | ||||
| 30 | ||||
| 36 | ||||
| 40 | ||||
| 43 | ||||
| 45 | ||||
| 48 | ||||
| 51 | ||||
| 64 | ||||
| 65 | ||||
| 66 | ||||
| 71 | ||||
| 72 | ||||
| 77 | ||||
For use only when preceded or accompanied by a prospectus. Read the prospectus carefully before you invest or send money.
Table of Contents
Harding, Loevner Funds, Inc.
October 31, 2020 (unaudited)
As a shareholder of a Harding Loevner Portfolio, you incur ongoing costs, including management fees; to the extent applicable, distribution (12b-1) fees and/or shareholder services fees; and other fund expenses. The following examples are intended to help you understand your ongoing costs (in dollars and cents) of investing in a Portfolio and to compare these costs with the ongoing costs of investing in other mutual funds.
The examples are based on an investment of $1,000 invested at the beginning of a six month period and held through the period ended October 31, 2020.
Actual Expenses
The first line under each Portfolio in the table below provides information about actual account values and actual expenses. You may use the information in this line, together with the amount you invested, to estimate the expenses that you paid over the period. Simply divide your account value by $1,000 (for example, an $8,600 account value divided by $1,000 = 8.6), then multiply the result by the number in the first line for your Portfolio under the heading entitled “Expenses Paid During Period” to estimate the expenses you paid on your account during this period.
Hypothetical Example for Comparison Purposes
The second line under each Portfolio in the table below provides information about hypothetical account values and hypothetical expenses based on the Portfolio’s actual expense ratio and an assumed rate of return of 5% per year before expenses, which is not the Portfolio’s actual return. The hypothetical account values and expenses may not be used to estimate the actual ending account balance or expenses you paid for the period. You may use this information to compare the ongoing costs of investing in your Portfolio and other funds. To do so, compare this 5% hypothetical example with the 5% hypothetical examples that appear in the shareholder reports of the other funds. Please note that the expenses shown in the table are meant to highlight your ongoing costs only. Therefore, the second line under each Portfolio in the table is useful in comparing ongoing costs only, and will not help you determine the relative total costs of owning different funds.
| Portfolio | Beginning Account Value May 1, 2020 | Ending Account Value October 31, 2020 | Annualized Expense Ratio | Expenses Paid During Period* (May 1, 2020 to October 31, 2020) | ||||||||||||
Global Equity Portfolio — Institutional Class | ||||||||||||||||
Actual | $ | 1,000.00 | $ | 1,212.10 | 0.90 | % | $ | 5.00 | ||||||||
Hypothetical (5% annual return before expenses) | 1,000.00 | 1,020.61 | 0.90 | 4.57 | ||||||||||||
Global Equity Portfolio — Institutional Class Z | ||||||||||||||||
Actual | 1,000.00 | 1,212.80 | 0.82 | 4.56 | ||||||||||||
Hypothetical (5% annual return before expenses) | 1,000.00 | 1,021.01 | 0.82 | 4.17 | ||||||||||||
Global Equity Portfolio — Advisor Class | ||||||||||||||||
Actual | 1,000.00 | 1,211.40 | 1.03 | 5.73 | ||||||||||||
Hypothetical (5% annual return before expenses) | 1,000.00 | 1,019.96 | 1.03 | 5.23 | ||||||||||||
International Equity Portfolio — Institutional Class | ||||||||||||||||
Actual | 1,000.00 | 1,172.20 | 0.81 | 4.42 | ||||||||||||
Hypothetical (5% annual return before expenses) | 1,000.00 | 1,021.06 | 0.81 | 4.12 | ||||||||||||
International Equity Portfolio — Institutional Class Z | ||||||||||||||||
Actual | 1,000.00 | 1,172.70 | 0.73 | 3.99 | ||||||||||||
Hypothetical (5% annual return before expenses) | 1,000.00 | 1,021.47 | 0.73 | 3.71 | ||||||||||||
International Equity Portfolio — Investor Class | ||||||||||||||||
Actual | 1,000.00 | 1,170.40 | 1.11 | 6.06 | ||||||||||||
Hypothetical (5% annual return before expenses) | 1,000.00 | 1,019.56 | 1.11 | 5.63 | ||||||||||||
International Small Companies Portfolio — Institutional Class | ||||||||||||||||
Actual | 1,000.00 | 1,233.80 | 1.15 | 6.46 | ||||||||||||
Hypothetical (5% annual return before expenses) | 1,000.00 | 1,019.36 | 1.15 | 5.84 | ||||||||||||
* Expenses are calculated using each Portfolio’s annualized expense ratio (as disclosed in the table), multiplied by the average account value for the period, multiplied by the number of days in the period (184 days), and divided by the number of days in the year (366 days).
2
Table of Contents
Harding, Loevner Funds, Inc.
Expense Example (continued)
October 31, 2020 (unaudited)
Portfolio | Beginning Account Value May 1, 2020 | Ending Account Value October 31, 2020 | Annualized Expense Ratio | Expenses Paid During Period* (May 1, 2020 to October 31, 2020) | ||||||||||||
International Small Companies Portfolio — Investor Class | ||||||||||||||||
Actual | $ | 1,000.00 | $ | 1,231.80 | 1.40 | % | $ | 7.85 | ||||||||
Hypothetical (5% annual return before expenses) | 1,000.00 | 1,018.10 | 1.40 | 7.10 | ||||||||||||
Institutional Emerging Markets Portfolio — Institutional Class | ||||||||||||||||
Actual | 1,000.00 | 1,196.70 | 1.28 | 7.07 | ||||||||||||
Hypothetical (5% annual return before expenses) | 1,000.00 | 1,018.70 | 1.28 | 6.50 | ||||||||||||
Institutional Emerging Markets Portfolio — Institutional Class Z | ||||||||||||||||
Actual | 1,000.00 | 1,198.20 | 1.11 | 6.13 | ||||||||||||
Hypothetical (5% annual return before expenses) | 1,000.00 | 1,019.56 | 1.11 | 5.63 | ||||||||||||
Emerging Markets Portfolio — Advisor Class | ||||||||||||||||
Actual | 1,000.00 | 1,197.30 | 1.35 | 7.46 | ||||||||||||
Hypothetical (5% annual return before expenses) | 1,000.00 | 1,018.35 | 1.35 | 6.85 | ||||||||||||
Frontier Emerging Markets Portfolio — Institutional Class I | ||||||||||||||||
Actual | 1,000.00 | 1,159.10 | 1.68 | 9.12 | ||||||||||||
Hypothetical (5% annual return before expenses) | 1,000.00 | 1,016.69 | 1.68 | 8.52 | ||||||||||||
Frontier Emerging Markets Portfolio — Institutional Class II | ||||||||||||||||
Actual | 1,000.00 | 1,162.20 | 1.35 | 7.34 | ||||||||||||
Hypothetical (5% annual return before expenses) | 1,000.00 | 1,018.35 | 1.35 | 6.85 | ||||||||||||
Frontier Emerging Markets Portfolio — Investor Class | ||||||||||||||||
Actual | 1,000.00 | 1,159.90 | 2.00 | 10.86 | ||||||||||||
Hypothetical (5% annual return before expenses) | 1,000.00 | 1,015.08 | 2.00 | 10.13 | ||||||||||||
Global Equity Research Portfolio — Institutional Class | ||||||||||||||||
Actual | 1,000.00 | 1,164.20 | 0.80 | 4.35 | ||||||||||||
Hypothetical (5% annual return before expenses) | 1,000.00 | 1,021.11 | 0.80 | 4.06 | ||||||||||||
International Equity Research Portfolio — Institutional Class | ||||||||||||||||
Actual | 1,000.00 | 1,170.60 | 0.75 | 4.09 | ||||||||||||
Hypothetical (5% annual return before expenses) | 1,000.00 | 1,021.37 | 0.75 | 3.81 | ||||||||||||
Emerging Markets Research Portfolio — Institutional Class | ||||||||||||||||
Actual | 1,000.00 | 1,195.10 | 1.15 | 6.35 | ||||||||||||
Hypothetical (5% annual return before expenses) | 1,000.00 | 1,019.36 | 1.15 | 5.84 | ||||||||||||
* Expenses are calculated using each Portfolio’s annualized expense ratio (as disclosed in the table), multiplied by the average account value for the period, multiplied by the number of days in the period (184 days), and divided by the number of days in the year (366 days).
3
Table of Contents
Global Equity Portfolio
Portfolio of Investments
October 31, 2020
| Shares | Value | |||||||
| COMMON STOCKS - 94.5% | ||||||||
China - 6.7% | ||||||||
Alibaba Group Holding Ltd. | 777,920 | $29,614,599 | ||||||
NetEase Inc. (Media & | 689,000 | 12,047,098 | ||||||
Tencent Holdings Ltd. (Media & Entertainment)† | 497,600 | 38,169,117 | ||||||
Trip.com Group Ltd. - ADR | 471,314 | 13,554,991 | ||||||
| 93,385,805 | ||||||||
Denmark - 0.9% | ||||||||
Genmab A/S (Pharmaceuticals, Biotechnology & Life Sciences)*† | 37,912 | 12,643,750 | ||||||
Finland - 1.1% | ||||||||
Kone OYJ, Class B (Capital | 187,063 | 14,893,622 | ||||||
France - 3.0% | ||||||||
Air Liquide SA (Materials)† | 92,603 | 13,554,596 | ||||||
L’Oreal SA (Household & | 43,859 | 14,204,145 | ||||||
Schneider Electric SE (Capital | 119,235 | 14,490,899 | ||||||
| 42,249,640 | ||||||||
Germany - 2.1% | ||||||||
Symrise AG (Materials)† | 235,941 | 29,167,390 | ||||||
Hong Kong - 1.4% | ||||||||
AIA Group Ltd. (Insurance)† | 2,072,605 | 19,547,387 | ||||||
India - 3.1% | ||||||||
HDFC Bank Ltd. - ADR | 453,663 | 26,058,403 | ||||||
ICICI Bank Ltd. - Sponsored | 1,577,576 | 16,643,427 | ||||||
| 42,701,830 | ||||||||
Indonesia - 1.2% | ||||||||
Bank Central Asia Tbk PT | 8,451,354 | 16,615,604 | ||||||
Japan - 7.1% | ||||||||
FANUC Corp. (Capital Goods)† | 42,645 | 9,064,223 | ||||||
Keyence Corp. (Technology | 60,404 | 27,391,594 | ||||||
Kubota Corp. (Capital Goods)† | 762,835 | 13,288,813 | ||||||
Makita Corp. (Capital Goods)† | 309,363 | 13,675,253 | ||||||
MISUMI Group Inc. (Capital | 57,600 | 1,712,543 | ||||||
Shiseido Co., Ltd. (Household & | 232,900 | 14,417,523 | ||||||
Sysmex Corp. (Health Care | 203,065 | 19,110,704 | ||||||
| 98,660,653 | ||||||||
Poland - 0.9% | ||||||||
CD Projekt SA (Media & | 145,152 | 12,309,289 | ||||||
| Shares | Value | |||||||
| COMMON STOCKS - 94.5% (continued) | ||||||||
Russia - 0.9% | ||||||||
Yandex NV, Class A (Media & Entertainment)* | 216,765 | $12,479,161 | ||||||
Spain - 0.3% | ||||||||
Banco Bilbao Vizcaya | 1,612,396 | 4,642,465 | ||||||
Switzerland - 6.7% | ||||||||
Alcon Inc. (Health Care | 269,528 | 15,319,971 | ||||||
Lonza Group AG, Reg S | 43,387 | 26,240,596 | ||||||
Nestle SA - Sponsored ADR | 151,792 | 17,041,688 | ||||||
Roche Holding AG, Genusschein (Pharmaceuticals, | 61,125 | 19,622,084 | ||||||
Sonova Holding AG, Reg S | 59,118 | 13,993,924 | ||||||
| 92,218,263 | ||||||||
United Kingdom - 2.6% | ||||||||
Abcam plc (Pharmaceuticals, | 993,433 | 18,984,641 | ||||||
Network International Holdings | 1,670,572 | 4,823,607 | ||||||
Standard Chartered plc | 2,778,362 | 12,716,368 | ||||||
| 36,524,616 | ||||||||
United States - 56.5% | ||||||||
Align Technology Inc. (Health | 52,156 | 22,222,628 | ||||||
Alphabet Inc., Class A (Media & | 26,274 | 42,461,674 | ||||||
Amazon.com Inc. (Retailing)* | 7,747 | 23,521,054 | ||||||
Apple Inc. (Technology | 371,698 | 40,463,044 | ||||||
CME Group Inc. (Diversified | 123,483 | 18,611,358 | ||||||
Cognizant Technology Solutions | 148,115 | 10,578,373 | ||||||
Deere & Co. (Capital Goods) | 89,176 | 20,145,750 | ||||||
eBay Inc. (Retailing) | 273,633 | 13,033,140 | ||||||
EPAM Systems Inc. (Software & | 57,868 | 17,878,319 | ||||||
Estee Lauder Cos., Inc., Class A | 66,163 | 14,533,365 | ||||||
Etsy Inc. (Retailing)* | 142,689 | 17,349,556 | ||||||
Exxon Mobil Corp. (Energy) | 450,847 | 14,706,629 | ||||||
See Notes to Financial Statements
4
Table of Contents
Harding, Loevner Funds, Inc.
Global Equity Portfolio
Portfolio of Investments (continued)
October 31, 2020
| Shares | Value | |||||||
| COMMON STOCKS - 94.5% (continued) | ||||||||
United States - 56.5% (continued) | ||||||||
Facebook Inc., Class A (Media & | 145,581 | $38,303,817 | ||||||
First Republic Bank (Banks) | 287,342 | 36,245,320 | ||||||
Illumina Inc. (Pharmaceuticals, | 118,414 | 34,659,778 | ||||||
Intuitive Surgical Inc. (Health | 20,279 | 13,527,715 | ||||||
Linde plc (Materials)† | 96,780 | 21,300,817 | ||||||
Mastercard Inc., Class A | 94,959 | 27,408,966 | ||||||
Microsoft Corp. (Software & | 105,669 | 21,394,802 | ||||||
NIKE Inc., Class B (Consumer | 229,545 | 27,563,764 | ||||||
NVIDIA Corp. (Semiconductors | 36,163 | 18,130,682 | ||||||
PayPal Holdings Inc. (Software | 333,072 | 61,994,691 | ||||||
Proto Labs Inc. (Capital Goods)* | 123,947 | 14,635,662 | ||||||
Roper Technologies Inc. (Capital | 65,463 | 24,309,030 | ||||||
salesforce.com Inc. (Software & | 75,432 | 17,520,591 | ||||||
SVB Financial Group (Banks)* | 55,012 | 15,991,988 | ||||||
Synopsys Inc. (Software & | 85,535 | 18,292,515 | ||||||
Thermo Fisher Scientific Inc. | 49,372 | 23,358,881 | ||||||
Tradeweb Markets Inc., Class A | 250,107 | 13,625,829 | ||||||
Verisk Analytics Inc. | 142,299 | 25,324,953 | ||||||
Vertex Pharmaceuticals Inc. | 164,251 | 34,223,338 | ||||||
VF Corp. (Consumer Durables & | 186,670 | 12,544,224 | ||||||
Walt Disney Co. (Media & | 100,457 | 12,180,411 | ||||||
Workday Inc., Class A (Software | 70,149 | 14,739,708 | ||||||
| 782,782,372 | ||||||||
Total Common Stocks (Cost $916,573,902) |
| $1,310,821,847 | ||||||
| Shares | Value | |||||||
| PREFERRED STOCKS - 1.8% | ||||||||
Brazil - 1.8% | ||||||||
Itau Unibanco Holding SA - | 6,096,572 | $24,934,979 | ||||||
Total Preferred Stocks (Cost $24,288,726) |
| $24,934,979 | ||||||
| SHORT TERM INVESTMENTS—3.4% | ||||||||
Northern Institutional Funds - | 46,680,288 | 46,680,288 | ||||||
Total Short Term Investments (Cost $46,680,288) |
| $46,680,288 | ||||||
Total Investments — 99.7% | ||||||||
(Cost $987,542,916) | $1,382,437,114 | |||||||
Other Assets Less Liabilities - 0.3% | 3,736,267 | |||||||
Net Assets — 100.0% | $1,386,173,381 | |||||||
Summary of Abbreviations
| ADR | American Depositary Receipt | |
| Reg S | Security sold outside United States without registration under the Securities Act of 1933. | |
| * | Non-income producing security. | |
| † | Investment categorized as level 2 security as disclosed in Note 2 of the Notes to Financial Statements. | |
| ^ | Security exempt from registration pursuant to Rule 144A of the Securities Act of 1933. These securities, which represent 0.3% of net assets as of October 31, 2020, are considered liquid and may be resold in transactions exempt from registration, normally to qualified buyers. | |
| + | Current yield is disclosed. Dividends are calculated based on a percentage of the issuer’s net income. | |
See Notes to Financial Statements
5
Table of Contents
Harding, Loevner Funds, Inc.
Global Equity Portfolio
Portfolio of Investments (continued)
October 31, 2020
| Industry | | Percentage of Net Assets | | ||
Banks | 11.1 | % | |||
Capital Goods | 9.1 | ||||
Commercial & Professional Services | 1.8 | ||||
Consumer Durables & Apparel | 2.9 | ||||
Diversified Financials | 2.3 | ||||
Energy | 1.1 | ||||
Food Beverage & Tobacco | 1.2 | ||||
Health Care Equipment & Services | 6.1 | ||||
Household & Personal Products | 3.1 | ||||
Insurance | 1.4 | ||||
Materials | 4.6 | ||||
Media & Entertainment | 12.1 | ||||
Pharmaceuticals, Biotechnology & Life Sciences | 12.3 | ||||
Retailing | 7.0 | ||||
Semiconductors & Semiconductor Equipment | 1.3 | ||||
Software & Services | 14.0 | ||||
Technology Hardware & Equipment | 4.9 | ||||
Money Market Fund | 3.4 | ||||
Total Investments | 99.7 | ||||
Other Assets Less Liabilities | 0.3 | ||||
Net Assets | 100.0 | % | |||
See Notes to Financial Statements
6
Table of Contents
International Equity Portfolio
Portfolio of Investments
October 31, 2020
| Shares | Value | |||||||
| COMMON STOCKS - 92.6% | ||||||||
Brazil - 1.0% | ||||||||
Ambev SA - ADR (Food | 74,026,025 | $158,415,694 | ||||||
Canada - 2.2% | ||||||||
Alimentation Couche - Tard Inc., | 5,530,400 | 170,316,229 | ||||||
Canadian National Railway Co. | 1,777,014 | 176,724,042 | ||||||
| 347,040,271 | ||||||||
China - 7.6% | ||||||||
Alibaba Group Holding Ltd. - | 979,628 | 298,482,855 | ||||||
China Mobile Ltd. - Sponsored | 5,112,616 | 157,110,690 | ||||||
Ping An Insurance Group Co. of | 24,888,000 | 255,497,095 | ||||||
Tencent Holdings Ltd. (Media & | 6,583,700 | 505,012,094 | ||||||
| 1,216,102,734 | ||||||||
Denmark - 1.0% | ||||||||
Novozymes A/S, Class B | 2,758,615 | 165,974,919 | ||||||
France - 8.2% | ||||||||
Air Liquide SA (Materials)† | 1,123,052 | 164,384,696 | ||||||
Dassault Systemes SE (Software | 1,478,323 | 252,727,889 | ||||||
L’Oreal SA (Household & | 1,587,536 | 514,138,298 | ||||||
Schneider Electric SE (Capital | 3,253,363 | 395,388,565 | ||||||
| 1,326,639,448 | ||||||||
Germany - 11.4% | ||||||||
adidas AG (Consumer Durables | 881,599 | 261,959,028 | ||||||
Allianz SE, Reg S (Insurance)† | 1,955,966 | 344,297,062 | ||||||
Infineon Technologies AG | 20,319,541 | 569,029,813 | ||||||
SAP SE - Sponsored ADR | 3,583,634 | 382,839,620 | ||||||
Symrise AG (Materials)† | 2,202,024 | 272,217,599 | ||||||
| 1,830,343,122 | ||||||||
Hong Kong - 2.9% | ||||||||
AIA Group Ltd. (Insurance)† | 50,326,874 | 474,648,516 | ||||||
India - 2.4% | ||||||||
HDFC Bank Ltd. - ADR | 3,525,080 | 202,480,595 | ||||||
ICICI Bank Ltd. - Sponsored | 17,790,536 | 187,690,155 | ||||||
| 390,170,750 | ||||||||
| Shares | Value | |||||||||
| COMMON STOCKS - 92.6% (continued) | ||||||||||
Israel - 1.5% | ||||||||||
Check Point Software | 2,080,968 | $ | 236,314,726 | |||||||
Japan - 14.7% | ||||||||||
Chugai Pharmaceutical Co., Ltd. (Pharmaceuticals, | 7,910,700 | 305,243,540 | ||||||||
FANUC Corp. (Capital Goods)† | 798,000 | 169,615,434 | ||||||||
Keyence Corp. (Technology | 831,554 | 377,087,438 | ||||||||
Komatsu Ltd. (Capital Goods)† | 9,710,100 | 217,941,253 | ||||||||
Kubota Corp. (Capital Goods)† | 15,305,600 | 266,628,104 | ||||||||
Nitori Holdings Co., Ltd. | 993,400 | 204,998,900 | ||||||||
Shionogi & Co., Ltd. | 2,723,700 | 128,585,010 | ||||||||
Sysmex Corp. (Health Care | 2,802,707 | 263,766,299 | ||||||||
Unicharm Corp. (Household & | 9,291,000 | 431,370,590 | ||||||||
| 2,365,236,568 | ||||||||||
Mexico - 0.9% | ||||||||||
Fomento Economico Mexicano | �� | 2,704,009 | 145,394,564 | |||||||
Netherlands - 2.7% | ||||||||||
Adyen NV (Software & | 253,953 | 428,537,970 | ||||||||
Russia - 1.8% | ||||||||||
LUKOIL PJSC - Sponsored | 2,822,433 | 144,198,102 | ||||||||
Yandex NV, Class A (Media & | 2,509,512 | 144,472,606 | ||||||||
| 288,670,708 | ||||||||||
Singapore - 2.0% | ||||||||||
DBS Group Holdings Ltd. | 21,247,883 | 316,493,595 | ||||||||
South Korea - 1.6% | ||||||||||
Samsung Electronics Co., Ltd. - | 203,953 | 257,793,819 | ||||||||
Spain - 1.1% | ||||||||||
Banco Bilbao Vizcaya | 61,118,494 | 175,974,425 | ||||||||
Sweden - 5.6% | ||||||||||
Alfa Laval AB (Capital | 8,868,623 | 180,018,496 | ||||||||
Atlas Copco AB, Class A | 11,736,451 | 518,353,308 | ||||||||
See Notes to Financial Statements
7
Table of Contents
Harding, Loevner Funds, Inc.
International Equity Portfolio
Portfolio of Investments (continued)
October 31, 2020
| Shares | Value | |||||||
| COMMON STOCKS - 92.6% (continued) | ||||||||
Sweden - 5.6% (continued) | ||||||||
Epiroc AB, Class A (Capital Goods)† | 13,624,652 | $203,681,281 | ||||||
| 902,053,085 | ||||||||
Switzerland - 11.9% | ||||||||
Alcon Inc. (Health Care Equipment & Services)* | 3,872,456 | 220,110,399 | ||||||
Lonza Group AG, Reg S (Pharmaceuticals, Biotechnology & Life Sciences)† | 788,176 | 476,691,363 | ||||||
Nestle SA - Sponsored ADR (Food Beverage & Tobacco) | 3,202,046 | 359,493,704 | ||||||
Roche Holding AG, Genusschein (Pharmaceuticals, Biotechnology & Life Sciences)† | 1,529,640 | 491,038,428 | ||||||
SGS SA, Reg S (Commercial & Professional Services)† | 58,554 | 146,135,099 | ||||||
Sonova Holding AG, Reg S (Health Care Equipment & Services)*† | 943,442 | 223,323,787 | ||||||
| 1,916,792,780 | ||||||||
Taiwan - 4.3% | ||||||||
Taiwan Semiconductor Manufacturing Co., Ltd. (Semiconductors & Semiconductor Equipment)† | 5,272,125 | 79,566,945 | ||||||
Taiwan Semiconductor Manufacturing Co., Ltd. - Sponsored ADR (Semiconductors & Semiconductor Equipment) | 7,348,069 | 616,282,547 | ||||||
| 695,849,492 | ||||||||
United Kingdom - 6.3% | ||||||||
Diageo plc (Food Beverage & Tobacco)† | 6,947,526 | 224,733,845 | ||||||
Rio Tinto plc (Materials)† | 5,420,518 | 307,175,161 | ||||||
Royal Dutch Shell plc, Class B (Energy)† | 12,509,495 | 150,876,255 | ||||||
Standard Chartered plc (Banks)*† | 21,060,347 | 96,391,729 | ||||||
Unilever plc (Household & Personal Products)† | 4,227,070 | 241,027,730 | ||||||
| 1,020,204,720 | ||||||||
United States - 1.5% | ||||||||
Linde plc (Materials)† | 1,115,815 | 245,585,566 | ||||||
Total Common Stocks (Cost $10,993,094,297) |
| $14,904,237,472 | ||||||
| PREFERRED STOCKS - 3.7% | ||||||||
Brazil - 1.3% | ||||||||
Itau Unibanco Holding SA - Sponsored ADR, 0.78% (Banks)+ | 51,341,298 | 209,985,909 | ||||||
| Shares | Value | |||||||
| PREFERRED STOCKS - 3.7% (continued) | ||||||||
Germany - 0.6% | ||||||||
FUCHS PETROLUB SE, 2.19% | 1,855,305 | $95,820,056 | ||||||
South Korea - 1.8% | ||||||||
Samsung Electronics Co., Ltd. - GDR, Reg S, 2.63% (Technology Hardware & Equipment)+† | 254,610 | 286,383,112 | ||||||
Total Preferred Stocks (Cost $446,618,153) |
| $592,189,077 | ||||||
| SHORT TERM INVESTMENTS - 3.5% | ||||||||
Northern Institutional Funds - Treasury Portfolio (Premier Shares), 0.00% (Money Market Funds) | 564,535,699 | 564,535,699 | ||||||
Total Short Term Investments (Cost $564,535,699) | $564,535,699 | |||||||
Total Investments — 99.8% | ||||||||
(Cost $12,004,248,149) | $16,060,962,248 | |||||||
Other Assets Less Liabilities - 0.2% | 38,628,761 | |||||||
Net Assets — 100.0% | $16,099,591,009 | |||||||
Summary of Abbreviations
| ADR | American Depositary Receipt |
| GDR | Global Depositary Receipt |
| Reg S | Security sold outside United States without registration under the Securities Act of 1933. |
| * | Non-income producing security. |
| † | Investment categorized as level 2 security as disclosed in Note 2 of the Notes to Financial Statements. |
| ^ | Security exempt from registration pursuant to Rule 144A of the Securities Act of 1933. These securities, which represent 2.7% of net assets as of October 31, 2020, are considered liquid and may be resold in transactions exempt from registration, normally to qualified buyers. |
| + | Current yield is disclosed. Dividends are calculated based on a percentage of the issuer’s net income. |
See Notes to Financial Statements
8
Table of Contents
Harding, Loevner Funds, Inc.
International Equity Portfolio
Portfolio of Investments (continued)
October 31, 2020
| Industry | | Percentage of Net Assets | | ||
Banks | 7.4 | % | |||
Capital Goods | 12.1 | ||||
Commercial & Professional Services | 0.9 | ||||
Consumer Durables & Apparel | 1.6 | ||||
Energy | 1.8 | ||||
Food & Staples Retailing | 1.1 | ||||
Food Beverage & Tobacco | 5.5 | ||||
Health Care Equipment & Services | 4.4 | ||||
Household & Personal Products | 7.4 | ||||
Insurance | 6.7 | ||||
Materials | 7.8 | ||||
Media & Entertainment | 4.0 | ||||
Pharmaceuticals, Biotechnology & Life Sciences | 8.7 | ||||
Retailing | 3.1 | ||||
Semiconductors & Semiconductor Equipment | 7.9 | ||||
Software & Services | 8.1 | ||||
Technology Hardware & Equipment | 5.7 | ||||
Telecommunication Services | 1.0 | ||||
Transportation | 1.1 | ||||
Money Market Fund | 3.5 | ||||
Total Investments | 99.8 | ||||
Other Assets Less Liabilities | 0.2 | ||||
Net Assets | 100.0 | % | |||
See Notes to Financial Statements
9
Table of Contents
International Small Companies Portfolio
Portfolio of Investments
October 31, 2020
| Shares | Value | |||||||
| COMMON STOCKS - 95.7% | ||||||||
Argentina - 1.7% | ||||||||
Globant SA (Software & Services)* | 35,770 | $6,460,420 | ||||||
Bangladesh - 0.3% | ||||||||
Square Pharmaceuticals Ltd. (Pharmaceuticals, Biotechnology & Life Sciences)† | 478,190 | 1,119,792 | ||||||
Canada - 3.0% | ||||||||
Kinaxis Inc. (Software & Services)* | 74,900 | 11,433,733 | ||||||
China - 1.2% | ||||||||
Haitian International Holdings Ltd. (Capital Goods)† | 1,820,000 | 4,511,222 | ||||||
Denmark - 0.7% | ||||||||
SimCorp A/S (Software & Services)† | 23,477 | 2,806,587 | ||||||
Egypt - 1.9% | ||||||||
Edita Food Industries SAE (Food Beverage & Tobacco)† | 8,193,318 | 4,712,557 | ||||||
Integrated Diagnostics Holdings plc (Health Care Equipment & Services)^† | 666,601 | 2,340,738 | ||||||
| 7,053,295 | ||||||||
Finland - 2.6% | ||||||||
Nokian Renkaat OYJ (Automobiles & Components)† | 71,830 | 2,210,242 | ||||||
Vaisala OYJ, Class A (Technology Hardware & Equipment)† | 185,254 | 7,714,954 | ||||||
| 9,925,196 | ||||||||
France - 3.3% | ||||||||
Alten SA (Software & Services)*† | 75,165 | 6,015,418 | ||||||
LISI (Capital Goods)*† | 107,888 | 1,746,178 | ||||||
Rubis SCA (Utilities)† | 138,765 | 4,559,450 | ||||||
| 12,321,046 | ||||||||
Germany - 10.9% | ||||||||
Bechtle AG (Software & Services)† | 63,134 | 10,878,675 | ||||||
FUCHS PETROLUB SE (Materials)† | 221,224 | 8,506,060 | ||||||
KWS Saat SE & Co. KGaA (Food Beverage & Tobacco)† | 74,995 | 5,520,272 | ||||||
Pfeiffer Vacuum Technology AG (Capital Goods)† | 19,293 | 3,517,176 | ||||||
STRATEC SE (Health Care Equipment & Services)† | 85,637 | 12,562,305 | ||||||
| 40,984,488 | ||||||||
Hong Kong - 0.6% | ||||||||
ASM Pacific Technology Ltd. (Semiconductors & Semiconductor Equipment)† | 209,500 | 2,109,012 | ||||||
| Shares | Value | |||||||
| COMMON STOCKS - 95.7% (continued) | ||||||||
India - 2.5% | ||||||||
Max Financial Services Ltd. (Insurance)*† | 963,157 | $7,677,099 | ||||||
SH Kelkar & Co., Ltd. (Materials)^† | 1,568,501 | 1,807,856 | ||||||
| 9,484,955 | ||||||||
Indonesia - 2.5% | ||||||||
Sarana Menara Nusantara Tbk PT (Telecommunication Services)† | 66,007,400 | 4,431,970 | ||||||
Tower Bersama Infrastructure Tbk PT (Telecommunication Services)† | 49,990,600 | 5,104,245 | ||||||
| 9,536,215 | ||||||||
Israel - 1.5% | ||||||||
CyberArk Software Ltd. (Software & Services)* | 56,328 | 5,584,921 | ||||||
Italy - 2.9% | ||||||||
Reply SpA (Software & Services)† | 101,030 | 10,863,994 | ||||||
Japan - 15.6% | ||||||||
ABC-Mart Inc. (Retailing)† | 25,200 | 1,277,304 | ||||||
Ariake Japan Co., Ltd. (Food Beverage & Tobacco)† | 124,100 | 7,965,377 | ||||||
BML Inc. (Health Care Equipment & Services)† | 103,600 | 2,914,824 | ||||||
Cosmos Pharmaceutical Corp. (Food & Staples | 39,600 | 6,734,255 | ||||||
Infomart Corp. (Software & Services)† | 668,400 | 5,534,059 | ||||||
JCU Corp. (Materials)† | 146,300 | 4,613,381 | ||||||
MISUMI Group Inc. (Capital Goods)† | 60,000 | 1,783,899 | ||||||
Nihon M&A Center Inc. (Commercial & Professional Services)† | 128,100 | 7,495,413 | ||||||
Pigeon Corp. (Household & Personal Products)† | 30,000 | 1,381,743 | ||||||
Rinnai Corp. (Consumer Durables & Apparel)† | 13,500 | 1,333,475 | ||||||
Rohto Pharmaceutical Co., Ltd. (Household & Personal Products)† | 89,100 | 2,789,303 | ||||||
SMS Co., Ltd. (Commercial & Professional Services)† | 257,200 | 7,587,499 | ||||||
Stanley Electric Co., Ltd. (Automobiles & Components)† | 257,400 | 7,333,498 | ||||||
| 58,744,030 | ||||||||
Kuwait - 0.9% | ||||||||
Mabanee Co. SAK (Real Estate)† | 1,563,493 | 3,312,704 | ||||||
Lithuania - 1.0% | ||||||||
Siauliu Bankas AB (Banks)*† | 7,812,456 | 3,867,758 | ||||||
See Notes to Financial Statements
10
Table of Contents
Harding, Loevner Funds, Inc.
International Small Companies Portfolio
Portfolio of Investments (continued)
October 31, 2020
| Shares | Value | |||||||
| COMMON STOCKS - 95.7% (continued) | ||||||||
Malaysia - 1.8% | ||||||||
Dialog Group Bhd. (Energy)† | 4,619,340 | $4,115,380 | ||||||
TIME dotCom Bhd. | 910,000 | 2,822,746 | ||||||
| 6,938,126 | ||||||||
Mexico - 2.0% | ||||||||
Grupo Herdez SAB de CV (Food Beverage & Tobacco) | 2,273,322 | 4,028,672 | ||||||
Megacable Holdings SAB de CV (Media & Entertainment) | 1,151,100 | 3,651,676 | ||||||
| 7,680,348 | ||||||||
Netherlands - 0.6% | ||||||||
ASM International NV | 14,980 | 2,143,623 | ||||||
Norway - 2.0% | ||||||||
Tomra Systems ASA | 189,526 | 7,645,062 | ||||||
Peru - 1.3% | ||||||||
Alicorp SAA (Food Beverage & | 1,007,126 | 1,949,905 | ||||||
Ferreycorp SAA (Capital Goods) | 6,014,213 | 2,911,042 | ||||||
| 4,860,947 | ||||||||
Philippines - 0.2% | ||||||||
Security Bank Corp. (Banks)† | 303,040 | 603,670 | ||||||
Romania - 0.3% | ||||||||
Societatea Nationala de Gaze | 200,626 | 1,239,216 | ||||||
Saudi Arabia - 1.1% | ||||||||
Jarir Marketing Co. (Retailing)† | 87,234 | 4,028,379 | ||||||
South Africa - 0.6% | ||||||||
Clicks Group Ltd. | 76,263 | 1,106,721 | ||||||
Discovery Ltd. (Insurance)† | 176,455 | 1,160,425 | ||||||
| 2,267,146 | ||||||||
South Korea - 0.3% | ||||||||
Cheil Worldwide Inc. | 58,334 | 1,075,613 | ||||||
Sweden - 4.4% | ||||||||
Intrum AB (Commercial & | 184,267 | 4,505,822 | ||||||
Paradox Interactive AB | 332,763 | 10,288,078 | ||||||
Thule Group AB (Consumer Durables & Apparel)*^† | 60,480 | 1,974,472 | ||||||
| 16,768,372 | ||||||||
Switzerland - 3.7% | ||||||||
Bossard Holding AG, Class A, | 25,612 | 4,162,552 | ||||||
| Shares | Value | |||||||
| COMMON STOCKS - 95.7% (continued) | ||||||||
Switzerland - 3.7% (continued) | ||||||||
LEM Holding SA, Reg S | 3,740 | $6,779,977 | ||||||
VAT Group AG (Capital | 16,391 | 3,072,800 | ||||||
| 14,015,329 | ||||||||
Taiwan - 2.7% | ||||||||
Advantech Co., Ltd. (Technology | 197,645 | 2,000,366 | ||||||
Chipbond Technology Corp. | 1,665,700 | 3,648,135 | ||||||
Eclat Textile Co., Ltd. | 128,909 | 1,708,924 | ||||||
Silergy Corp. (Semiconductors & | 45,000 | 2,778,146 | ||||||
| 10,135,571 | ||||||||
Ukraine - 0.7% | ||||||||
Kernel Holding SA | 264,198 | 2,570,872 | ||||||
United Arab Emirates - 0.8% | ||||||||
Agthia Group PJSC (Food | 2,504,211 | 2,836,900 | ||||||
United Kingdom - 16.7% | ||||||||
Abcam plc (Pharmaceuticals, | 484,344 | 9,255,881 | ||||||
Bank of Georgia Group plc | 147,048 | 1,709,770 | ||||||
Clarkson plc (Transportation)† | 126,367 | 3,291,241 | ||||||
Dechra Pharmaceuticals plc | 182,252 | 8,247,998 | ||||||
Diploma plc (Capital Goods)† | 235,075 | 6,781,948 | ||||||
EMIS Group plc (Health Care | 373,100 | 4,821,543 | ||||||
Keywords Studios plc (Software | 252,151 | 6,915,941 | ||||||
Network International Holdings | 1,187,048 | 3,427,480 | ||||||
Rathbone Brothers plc | 139,075 | 2,621,860 | ||||||
Rightmove plc (Media & | 445,811 | 3,572,157 | ||||||
Senior plc (Capital Goods)† | 5,046,175 | 3,592,335 | ||||||
Signature Aviation plc | 939,915 | 2,886,038 | ||||||
YouGov plc (Media & Entertainment)† | 475,897 | 5,949,403 | ||||||
| 63,073,595 | ||||||||
United States - 0.6% | ||||||||
Core Laboratories NV (Energy) | 85,427 | 1,234,420 | ||||||
See Notes to Financial Statements
11
Table of Contents
Harding, Loevner Funds, Inc.
International Small Companies Portfolio
Portfolio of Investments (continued)
October 31, 2020
| Shares | Value | |||||||
| COMMON STOCKS - 95.7% (continued) | ||||||||
United States - 0.6% (continued) | ||||||||
Sensata Technologies Holding plc | 21,265 | $929,493 | ||||||
| 2,163,913 | ||||||||
Vietnam - 2.8% | ||||||||
Hoa Phat Group JSC (Materials)† | 7,943,481 | 10,471,492 | ||||||
Total Common Stocks (Cost $286,319,105) |
| $360,637,542 | ||||||
| SHORT TERM INVESTMENTS - 4.7% | ||||||||
Northern Institutional Funds - Treasury Portfolio (Premier Shares), 0.00% (Money | 17,897,933 | 17,897,933 | ||||||
Total Short Term Investments (Cost $17,897,933) |
| $17,897,933 | ||||||
Total Investments — 100.4% | ||||||||
(Cost $304,217,038) | $378,535,475 | |||||||
Liabilities Less Other Assets - (0.4)% | (1,673,062 | ) | ||||||
Net Assets — 100.0% | $376,862,413 | |||||||
Summary of Abbreviations
| Reg S | Security sold outside United States without registration under the Securities Act of 1933. |
| * | Non-income producing security. |
| † | Investment categorized as level 2 security as disclosed in Note 2 of the Notes to Financial Statements. |
| ^ | Security exempt from registration pursuant to Rule 144A of the Securities Act of 1933. These securities, which represent 3.3% of net assets as of October 31, 2020, are considered liquid and may be resold in transactions exempt from registration, normally to qualified buyers. |
| Industry | Percentage of Net Assets | |||
Automobiles & Components | 2.5 | % | ||
Banks | 1.7 | |||
Capital Goods | 8.8 | |||
Commercial & Professional Services | 7.2 | |||
Consumer Durables & Apparel | 1.3 | |||
Diversified Financials | 0.7 | |||
Energy | 1.8 | |||
Food & Staples Retailing | 2.1 | |||
Food Beverage & Tobacco | 7.9 | |||
Health Care Equipment & Services | 6.0 | |||
Household & Personal Products | 1.1 | |||
Insurance | 2.3 | |||
Materials | 6.7 | |||
Media & Entertainment | 6.5 | |||
Pharmaceuticals, Biotechnology & Life Sciences | 4.9 | |||
Real Estate | 0.9 | |||
Retailing | 1.4 | |||
Semiconductors & Semiconductor Equipment | 2.8 | |||
Software & Services | 18.6 | |||
Technology Hardware & Equipment | 4.4 | |||
Telecommunication Services | 3.3 | |||
Transportation | 1.6 | |||
Utilities | 1.2 | |||
Money Market Fund | 4.7 | |||
Total Investments | 100.4 | |||
Liabilities Less Other Assets | (0.4 | ) | ||
Net Assets | 100.0 | % | ||
See Notes to Financial Statements
12
Table of Contents
Institutional Emerging Markets Portfolio
Portfolio of Investments
October 31, 2020
| Shares | Value | |||||||||
| COMMON STOCKS - 94.4% | ||||||||||
Brazil - 4.7% | ||||||||||
Ambev SA - ADR (Food Beverage & Tobacco)* | 22,297,568 | $47,716,796 | ||||||||
B3 SA - Brasil Bolsa Balcao (Diversified Financials) | 5,287,700 | 47,044,168 | ||||||||
Cia Brasileira de Distribuicao - ADR (Food & Staples Retailing) | 1,330,667 | 14,317,977 | ||||||||
Localiza Rent a Car SA (Transportation)* | 5,755,570 | 60,866,335 | ||||||||
Lojas Renner SA (Retailing) | 3,880,600 | 25,327,594 | ||||||||
Ultrapar Participacoes SA | 6,778,178 | 19,349,516 | ||||||||
WEG SA (Capital Goods) | 3,310,346 | 43,747,948 | ||||||||
| 258,370,334 | ||||||||||
Chile - 0.2% | ||||||||||
Banco Santander Chile - ADR | 840,673 | 11,668,541 | ||||||||
China - 28.4% | ||||||||||
51job Inc. - ADR (Commercial | 614,174 | 43,053,597 | ||||||||
Alibaba Group Holding Ltd. | 4,501,516 | 171,367,996 | ||||||||
Alibaba Group Holding Ltd. - | 466,375 | 142,099,799 | ||||||||
Autohome Inc. - ADR | 258,708 | 24,719,549 | ||||||||
Baidu Inc. - Sponsored ADR | 341,754 | 45,470,370 | ||||||||
CNOOC Ltd. - Sponsored ADR | 167,384 | 15,419,414 | ||||||||
CSPC Pharmaceutical Group | 60,864,080 | 64,167,614 | ||||||||
ENN Energy Holdings Ltd. | 6,200,200 | 78,571,486 | ||||||||
Fuyao Glass Industry Group Co., | 6,002,991 | 33,731,966 | ||||||||
Fuyao Glass Industry Group Co., | 5,113,600 | 21,758,367 | ||||||||
Hangzhou Hikvision Digital | 11,769,638 | 79,065,264 | ||||||||
Jiangsu Hengrui Medicine Co., | 2,129,900 | 28,358,478 | ||||||||
Jiangsu Yanghe Brewery | 874,800 | 22,017,102 | ||||||||
Midea Group Co., Ltd., Class A | 9,610,264 | 112,102,213 | ||||||||
| Shares | Value | |||||||||
| COMMON STOCKS - 94.4% (continued) | ||||||||||
China - 28.4% (continued) | ||||||||||
New Oriental Education & | 255,604 | $40,993,769 | ||||||||
Ping An Insurance Group Co. of | 8,861,000 | 90,965,918 | ||||||||
SF Holding Co., Ltd., Class A | 3,155,800 | 39,134,378 | ||||||||
Shenzhou International Group | 3,961,000 | 68,450,938 | ||||||||
Sino Biopharmaceutical Ltd. | 24,707,135 | 24,934,444 | ||||||||
Sunny Optical Technology | 3,405,100 | 56,635,428 | ||||||||
Tencent Holdings Ltd. (Media & | 4,124,800 | 316,398,664 | ||||||||
Trip.com Group Ltd. - ADR | 713,294 | 20,514,335 | ||||||||
ZTO Express Cayman Inc. - | 433,078 | 12,550,600 | ||||||||
| 1,552,481,689 | ||||||||||
Czech Republic - 0.5% | ||||||||||
Komercni banka AS (Banks)*† | 1,319,801 | 26,761,868 | ||||||||
Egypt - 0.7% | ||||||||||
Commercial International Bank | 9,407,417 | 36,374,101 | ||||||||
Hong Kong - 6.5% | ||||||||||
AIA Group Ltd. (Insurance)† | 14,574,815 | 137,459,646 | ||||||||
ASM Pacific Technology Ltd. | 3,324,669 | 33,469,060 | ||||||||
Sands China Ltd. (Consumer | 21,704,138 | 76,070,253 | ||||||||
Techtronic Industries Co., Ltd. | 8,278,801 | 111,357,955 | ||||||||
| 358,356,914 | ||||||||||
India - 8.3% | ||||||||||
HDFC Bank Ltd. - ADR | 1,068,337 | 61,365,277 | ||||||||
Housing Development Finance | 4,554,563 | 118,137,515 | ||||||||
Kotak Mahindra Bank Ltd. | 3,722,039 | 77,682,358 | ||||||||
Maruti Suzuki India Ltd. | 667,985 | 62,957,646 | ||||||||
Tata Consultancy Services Ltd. | 3,666,287 | 131,764,546 | ||||||||
| 451,907,342 | ||||||||||
See Notes to Financial Statements
13
Table of Contents
Harding, Loevner Funds, Inc.
Institutional Emerging Markets Portfolio
Portfolio of Investments (continued)
October 31, 2020
| Shares | Value | |||||||||
| COMMON STOCKS - 94.4% (continued) | ||||||||||
Indonesia - 2.6% | ||||||||||
Astra International Tbk PT | 83,283,800 | $30,780,052 | ||||||||
Bank Central Asia Tbk PT | 26,661,033 | 52,416,354 | ||||||||
Bank Rakyat Indonesia Persero | 267,733,700 | 60,657,141 | ||||||||
| 143,853,547 | ||||||||||
Italy - 0.4% | ||||||||||
Tenaris SA - ADR (Energy) | 2,445,701 | 23,380,902 | ||||||||
Kenya - 1.2% | ||||||||||
East African Breweries Ltd. | 6,334,865 | 8,717,421 | ||||||||
Safaricom plc | 201,728,327 | 57,185,723 | ||||||||
| 65,903,144 | ||||||||||
Mexico - 4.6% | ||||||||||
Fomento Economico Mexicano | 1,056,177 | 56,790,637 | ||||||||
Grupo Aeroportuario del Sureste | 352,749 | 40,689,597 | ||||||||
Grupo Financiero Banorte SAB | 17,412,800 | 77,576,296 | ||||||||
Wal-Mart de Mexico SAB de CV | 31,114,700 | 75,177,540 | ||||||||
| 250,234,070 | ||||||||||
Panama - 0.7% | ||||||||||
Copa Holdings SA, Class A | 796,563 | 39,254,625 | ||||||||
Peru - 0.8% | ||||||||||
Credicorp Ltd. | 357,923 | 41,046,610 | ||||||||
Poland - 0.4% | ||||||||||
CD Projekt SA (Media & | 265,306 | 22,498,679 | ||||||||
Russia - 6.6% | ||||||||||
LUKOIL PJSC - Sponsored | 1,681,347 | 85,900,018 | ||||||||
Novatek PJSC - Sponsored GDR, | 758,921 | 91,485,555 | ||||||||
Sberbank of Russia PJSC - | 9,608,434 | 97,096,714 | ||||||||
Yandex NV, Class A (Media & | 1,549,923 | 89,229,067 | ||||||||
| 363,711,354 | ||||||||||
South Africa - 1.4% | ||||||||||
Discovery Ltd. (Insurance)† | 6,411,055 | 42,161,154 | ||||||||
| Shares | Value | |||||||||
| COMMON STOCKS - 94.4% (continued) | ||||||||||
South Africa - 1.4% (continued) | ||||||||||
Standard Bank Group Ltd. | 5,536,103 | $36,159,564 | ||||||||
| 78,320,718 | ||||||||||
South Korea - 8.9% | ||||||||||
Amorepacific Corp. (Household | 284,709 | 39,805,884 | ||||||||
Coway Co., Ltd. (Consumer | 699,548 | 42,964,619 | ||||||||
LG Household & Health Care | 119,394 | 156,745,898 | ||||||||
Samsung Electronics Co., Ltd. - | 194,419 | 245,742,972 | ||||||||
| 485,259,373 | ||||||||||
Taiwan - 11.3% | ||||||||||
Airtac International Group | 2,587,000 | 69,649,732 | ||||||||
Eclat Textile Co., Ltd. | 5,061,031 | 67,093,189 | ||||||||
Hon Hai Precision Industry Co., | 27,344,031 | 74,180,130 | ||||||||
Largan Precision Co., Ltd. | 569,000 | 60,492,573 | ||||||||
Silergy Corp. (Semiconductors & | 418,122 | 25,813,417 | ||||||||
Taiwan Semiconductor | 21,116,277 | 318,686,990 | ||||||||
| 615,916,031 | ||||||||||
Thailand - 0.7% | ||||||||||
Siam Commercial Bank pcl, Reg | 19,262,670 | 40,172,409 | ||||||||
United Kingdom - 2.2% | ||||||||||
Bank of Georgia Group plc | 724,621 | 8,425,382 | ||||||||
Coca-Cola HBC AG - CDI (Food | 3,950,608 | 89,861,097 | ||||||||
Network International Holdings | 6,921,616 | 19,985,462 | ||||||||
| 118,271,941 | ||||||||||
United States - 3.3% | ||||||||||
EPAM Systems Inc. (Software & | 588,821 | 181,916,248 | ||||||||
Total Common Stocks (Cost $3,962,966,593) |
| $ | 5,165,660,440 | |||||||
See Notes to Financial Statements
14
Table of Contents
Harding, Loevner Funds, Inc.
Institutional Emerging Markets Portfolio
Portfolio of Investments (continued)
October 31, 2020
| Shares | Value | |||||||||||
| PREFERRED STOCKS - 3.8% | ||||||||||||
Brazil - 2.1% |
| |||||||||||
Banco Bradesco SA - ADR, |
| 16,456,965 | $57,599,378 | |||||||||
Itau Unibanco Holding SA - |
| 13,349,876 | 54,600,993 | |||||||||
| 112,200,371 | ||||||||||||
Colombia - 0.6% |
| |||||||||||
Bancolombia SA - Sponsored |
| 1,309,841 | 33,387,847 | |||||||||
South Korea - 1.1% |
| |||||||||||
Samsung Electronics Co., Ltd. - |
| 55,364 | 62,272,945 | |||||||||
Total Preferred Stocks (Cost $222,750,405) |
| $207,861,163 | ||||||||||
| SHORT TERM INVESTMENTS - 1.3% | ||||||||||||
Northern Institutional Funds - |
| 73,992,957 | 73,992,957 | |||||||||
Total Short Term Investments (Cost $73,992,957) |
| $73,992,957 | ||||||||||
Total Investments — 99.5% |
| |||||||||||
(Cost $4,259,709,955) |
| $5,447,514,560 | ||||||||||
Other Assets Less Liabilities - 0.5% |
| 26,824,458 | ||||||||||
Net Assets — 100.0% |
| $5,474,339,018 | ||||||||||
| Summary | of Abbreviations |
| ADR | American Depositary Receipt |
| CDI | Chess Depositary Interest |
| GDR | Global Depositary Receipt |
| Reg S | Security sold outside United States without registration under the Securities Act of 1933. |
| * | Non-income producing security. |
| † | Investment categorized as level 2 security as disclosed in Note 2 of the Notes to Financial Statements. |
| ^ | Security exempt from registration pursuant to Rule 144A of the Securities Act of 1933. These securities, which represent 0.8% of net assets as of October 31, 2020, are considered liquid and may be resold in transactions exempt from registration, normally to qualified buyers. |
| + | Current yield is disclosed. Dividends are calculated based on a percentage of the issuer’s net income. |
| Industry | Percentage of Net Assets | ||||
Automobiles & Components | 2.7 | % | |||
Banks | 16.3 | ||||
Capital Goods | 4.1 | ||||
Commercial & Professional Services | 0.8 | ||||
Consumer Durables & Apparel | 5.3 | ||||
Consumer Services | 2.1 | ||||
Diversified Financials | 0.9 | ||||
Energy | 4.3 | ||||
Food & Staples Retailing | 1.6 | ||||
Food Beverage & Tobacco | 4.1 | ||||
Household & Personal Products | 3.6 | ||||
Insurance | 4.9 | ||||
Media & Entertainment | 9.1 | ||||
Pharmaceuticals, Biotechnology & Life Sciences | 2.3 | ||||
Retailing | 6.6 | ||||
Semiconductors & Semiconductor Equipment | 6.9 | ||||
Software & Services | 6.1 | ||||
Technology Hardware & Equipment | 10.6 | ||||
Telecommunication Services | 1.0 | ||||
Transportation | 3.5 | ||||
Utilities | 1.5 | ||||
Money Market Fund | 1.3 | ||||
Total Investments | 99.5 | ||||
Other Assets Less Liabilities | 0.5 | ||||
Net Assets | 100.0 | % | |||
See Notes to Financial Statements
15
Table of Contents
Emerging Markets Portfolio
Portfolio of Investments
October 31, 2020
| Shares | Value | |||||||||
| COMMON STOCKS - 94.5% | ||||||||||
Brazil - 4.7% | ||||||||||
Ambev SA - ADR (Food | 15,333,271 | $32,813,200 | ||||||||
B3 SA - Brasil Bolsa Balcao | 3,591,300 | 31,951,457 | ||||||||
Cia Brasileira de Distribuicao - | 917,244 | 9,869,545 | ||||||||
Localiza Rent a Car SA | 3,933,055 | 41,592,865 | ||||||||
Lojas Renner SA (Retailing) | 2,666,900 | 17,406,113 | ||||||||
Ultrapar Participacoes SA | 4,632,300 | 13,223,725 | ||||||||
WEG SA (Capital Goods) | 2,262,030 | 29,893,906 | ||||||||
| 176,750,811 | ||||||||||
Chile - 0.2% | ||||||||||
Banco Santander Chile - ADR (Banks) | 579,486 | 8,043,266 | ||||||||
China - 28.4% | ||||||||||
51job Inc. - ADR (Commercial | 423,126 | 29,661,133 | ||||||||
Alibaba Group Holding Ltd. | 3,076,064 | 117,102,532 | ||||||||
Alibaba Group Holding Ltd. - | 318,923 | 97,172,649 | ||||||||
Autohome Inc. - ADR (Media & | 176,396 | 16,854,638 | ||||||||
Baidu Inc. - Sponsored ADR | 232,771 | 30,970,181 | ||||||||
CNOOC Ltd. - Sponsored ADR | 115,380 | 10,628,806 | ||||||||
CSPC Pharmaceutical Group | 41,954,560 | 44,231,738 | ||||||||
ENN Energy Holdings Ltd. | 4,236,700 | 53,689,206 | ||||||||
Fuyao Glass Industry Group Co., | 4,054,725 | 22,784,283 | ||||||||
Fuyao Glass Industry Group Co., | 3,573,200 | 15,203,965 | ||||||||
Hangzhou Hikvision Digital | 8,042,657 | 54,028,407 | ||||||||
Jiangsu Hengrui Medicine Co., | 1,455,500 | 19,379,203 | ||||||||
Jiangsu Yanghe Brewery | 598,200 | 15,055,590 | ||||||||
Midea Group Co., Ltd., Class A | 6,612,468 | 77,133,395 | ||||||||
| Shares | Value | |||||||||
| COMMON STOCKS - 94.5% (continued) | ||||||||||
China - 28.4% (continued) | ||||||||||
New Oriental Education & | 175,662 | $28,172,672 | ||||||||
Ping An Insurance Group Co. of | 6,055,000 | 62,159,873 | ||||||||
SF Holding Co., Ltd., Class A | 2,157,900 | 26,759,641 | ||||||||
Shenzhou International Group | 2,706,000 | 46,762,999 | ||||||||
Sino Biopharmaceutical Ltd. | 16,883,182 | 17,038,509 | ||||||||
Sunny Optical Technology | 2,326,900 | 38,702,234 | ||||||||
Tencent Holdings Ltd. (Media & | 2,820,500 | 216,350,473 | ||||||||
Trip.com Group Ltd. - ADR | 486,496 | 13,991,625 | ||||||||
ZTO Express Cayman Inc. - | 294,892 | 8,545,970 | ||||||||
| 1,062,379,722 | ||||||||||
Czech Republic - 0.5% | ||||||||||
Komercni banka AS (Banks)*† | 901,874 | 18,287,479 | ||||||||
Egypt - 0.7% | ||||||||||
Commercial International Bank | 6,459,897 | 24,977,414 | ||||||||
Hong Kong - 6.5% | ||||||||||
AIA Group Ltd. (Insurance)† | 9,959,589 | 93,932,004 | ||||||||
ASM Pacific Technology Ltd. | 2,271,923 | 22,871,187 | ||||||||
Sands China Ltd. (Consumer | 14,831,344 | 51,981,981 | ||||||||
Techtronic Industries Co., Ltd. | 5,657,000 | 76,092,173 | ||||||||
| 244,877,345 | ||||||||||
India - 8.3% | ||||||||||
HDFC Bank Ltd. - ADR | 726,123 | 41,708,505 | ||||||||
Housing Development Finance | 3,112,318 | 80,728,165 | ||||||||
Kotak Mahindra Bank Ltd. | 2,543,421 | 53,083,522 | ||||||||
Maruti Suzuki India Ltd. | 459,068 | 43,267,200 | ||||||||
Tata Consultancy Services Ltd. | 2,505,323 | 90,040,073 | ||||||||
| 308,827,465 | ||||||||||
See Notes to Financial Statements
16
Table of Contents
Harding, Loevner Funds, Inc.
Emerging Markets Portfolio
Portfolio of Investments (continued)
October 31, 2020
| Shares | Value | |||||||||
| COMMON STOCKS - 94.5% (continued) | ||||||||||
Indonesia - 2.6% | ||||||||||
Astra International Tbk PT | 57,236,300 | $21,153,409 | ||||||||
Bank Central Asia Tbk PT | 18,220,510 | 35,822,045 | ||||||||
Bank Rakyat Indonesia Persero | 182,972,190 | 41,453,765 | ||||||||
| 98,429,219 | ||||||||||
Italy - 0.4% | ||||||||||
Tenaris SA - ADR (Energy) | 1,685,849 | 16,116,716 | ||||||||
Kenya - 1.2% | ||||||||||
East African Breweries Ltd. | 4,397,150 | 6,050,927 | ||||||||
Safaricom plc | 137,849,201 | 39,077,339 | ||||||||
| 45,128,266 | ||||||||||
Mexico - 4.6% | ||||||||||
Fomento Economico Mexicano | 725,196 | 38,993,789 | ||||||||
Grupo Aeroportuario del Sureste | 240,999 | 27,799,235 | ||||||||
Grupo Financiero Banorte SAB | 11,918,640 | 53,099,096 | ||||||||
Wal-Mart de Mexico SAB de CV | 21,121,300 | 51,032,064 | ||||||||
| 170,924,184 | ||||||||||
Panama - 0.7% | ||||||||||
Copa Holdings SA, Class A | 549,080 | 27,058,662 | ||||||||
Peru - 0.8% | ||||||||||
Credicorp Ltd. (Banks) | 245,259 | 28,126,302 | ||||||||
Poland - 0.4% | ||||||||||
CD Projekt SA (Media & | 181,294 | 15,374,231 | ||||||||
Russia - 6.7% | ||||||||||
LUKOIL PJSC - Sponsored | 1,145,905 | 58,544,287 | ||||||||
Novatek PJSC - Sponsored GDR, | 518,655 | 62,522,239 | ||||||||
Sberbank of Russia PJSC - | 6,565,834 | 66,350,137 | ||||||||
Yandex NV, Class A (Media & | 1,066,212 | 61,381,825 | ||||||||
| 248,798,488 | ||||||||||
South Africa - 1.4% | ||||||||||
Discovery Ltd. (Insurance)† | 4,381,388 | 28,813,413 | ||||||||
| Shares | Value | |||||||||
| COMMON STOCKS - 94.5% (continued) | ||||||||||
South Africa - 1.4% (continued) | ||||||||||
Standard Bank Group Ltd. | 3,783,435 | $24,711,852 | ||||||||
| 53,525,265 | ||||||||||
South Korea - 8.9% | ||||||||||
Amorepacific Corp. (Household | 194,553 | 27,200,946 | ||||||||
Coway Co., Ltd. (Consumer | 478,029 | 29,359,434 | ||||||||
LG Household & Health Care | 81,587 | 107,111,141 | ||||||||
Samsung Electronics Co., Ltd. - | 132,855 | 167,926,914 | ||||||||
| 331,598,435 | ||||||||||
Taiwan - 11.3% | ||||||||||
Airtac International Group | 1,768,000 | 47,599,817 | ||||||||
Eclat Textile Co., Ltd. | 3,458,216 | 45,844,955 | ||||||||
Hon Hai Precision Industry Co., Ltd. | 18,685,136 | 50,689,886 | ||||||||
Largan Precision Co., Ltd. | 389,001 | 41,356,188 | ||||||||
Silergy Corp. (Semiconductors & | 287,000 | 17,718,395 | ||||||||
Taiwan Semiconductor | 14,429,637 | 217,772,176 | ||||||||
| 420,981,417 | ||||||||||
Thailand - 0.7% | ||||||||||
Siam Commercial Bank pcl, Reg | 13,164,300 | 27,454,223 | ||||||||
United Kingdom - 2.2% | ||||||||||
Bank of Georgia Group plc | 502,982 | 5,848,320 | ||||||||
Coca-Cola HBC AG - CDI (Food | 2,703,106 | 61,485,238 | ||||||||
Network International Holdings | 4,772,780 | 13,780,916 | ||||||||
| 81,114,474 | ||||||||||
United States - 3.3% | ||||||||||
EPAM Systems Inc. (Software & | 403,715 | 124,727,749 | ||||||||
Total Common Stocks (Cost $2,484,401,963) |
| $ | 3,533,501,133 | |||||||
See Notes to Financial Statements
17
Table of Contents
Harding, Loevner Funds, Inc.
Emerging Markets Portfolio
Portfolio of Investments (continued)
October 31, 2020
| Shares | Value | |||||||
| PREFERRED STOCKS - 3.8% | ||||||||
Brazil - 2.1% | ||||||||
Banco Bradesco SA - ADR, 5.13% (Banks)+ | 11,231,320 | $39,309,620 | ||||||
Itau Unibanco Holding SA - Sponsored ADR, 0.78% (Banks)+ | 9,101,231 | 37,224,035 | ||||||
| 76,533,655 | ||||||||
Colombia - 0.6% | ||||||||
Bancolombia SA - Sponsored ADR, 4.18% (Banks)+ | 892,706 | 22,755,076 | ||||||
South Korea - 1.1% | ||||||||
Samsung Electronics Co., Ltd. - GDR, Reg S, 2.63% (Technology Hardware & Equipment)+† | 37,832 | 42,553,104 | ||||||
Total Preferred Stocks (Cost $124,848,655) |
| $141,841,835 | ||||||
| SHORT TERM INVESTMENTS - 1.3% | ||||||||
Northern Institutional Funds - Treasury Portfolio (Premier Shares), 0.00% (Money Market Funds) | 48,020,945 | 48,020,945 | ||||||
Total Short Term Investments (Cost $48,020,945) |
| $48,020,945 | ||||||
Total Investments — 99.6% | ||||||||
(Cost $2,657,271,563) | $3,723,363,913 | |||||||
Other Assets Less Liabilities - 0.4% | 15,845,322 | |||||||
Net Assets — 100.0% | $3,739,209,235 | |||||||
Summary of Abbreviations
| ADR | American Depositary |
| CDI | Chess Depositary Interest |
| GDR | Global Depositary Receipt |
| Reg S | Security sold outside United States without registration under the Securities Act of 1933. |
| * | Non-income producing security. |
| † | Investment categorized as level 2 security as disclosed in Note 2 of the Notes to Financial Statements. |
| ^ | Security exempt from registration pursuant to Rule 144A of the Securities Act of 1933. These securities, which represent 0.8% of net assets as of October 31, 2020, are considered liquid and may be resold in transactions exempt from registration, normally to qualified buyers. |
| + | Current yield is disclosed. Dividends are calculated based on a percentage of the issuer’s net income. |
| Industry | | Percentage of Net Assets | | ||
Automobiles & Components | 2.7 | % | |||
Banks | 16.3 | ||||
Capital Goods | 4.1 | ||||
Commercial & Professional Services | 0.8 | ||||
Consumer Durables & Apparel | 5.3 | ||||
Consumer Services | 2.1 | ||||
Diversified Financials | 0.9 | ||||
Energy | 4.3 | ||||
Food & Staples Retailing | 1.6 | ||||
Food Beverage & Tobacco | 4.1 | ||||
Household & Personal Products | 3.6 | ||||
Insurance | 5.0 | ||||
Media & Entertainment | 9.1 | ||||
Pharmaceuticals, Biotechnology & Life Sciences | 2.2 | ||||
Retailing | 6.6 | ||||
Semiconductors & Semiconductor Equipment | 6.9 | ||||
Software & Services | 6.1 | ||||
Technology Hardware & Equipment | 10.6 | ||||
Telecommunication Services | 1.1 | ||||
Transportation | 3.5 | ||||
Utilities | 1.4 | ||||
Money Market Fund | 1.3 | ||||
Total Investments | 99.6 | ||||
Other Assets Less Liabilities | 0.4 | ||||
Net Assets | 100.0 | % | |||
See Notes to Financial Statements
18
Table of Contents
Frontier Emerging Markets Portfolio
Portfolio of Investments
October 31, 2020
| Shares | Value | |||||||
| COMMON STOCKS - 96.4% | ||||||||
Argentina - 4.4% | ||||||||
Globant SA (Software & Services)* | 49,116 | $8,870,841 | ||||||
Bangladesh - 2.8% | ||||||||
GrameenPhone Ltd. (Telecommunication | 187,524 | 729,794 | ||||||
Square Pharmaceuticals Ltd. (Pharmaceuticals, Biotechnology & Life Sciences)† | 2,099,384 | 4,916,193 | ||||||
| 5,645,987 | ||||||||
Colombia - 3.1% | ||||||||
Cementos Argos SA - Sponsored ADR | 45,446 | 267,427 | ||||||
Ecopetrol SA - Sponsored ADR (Energy) | 551,077 | 5,097,462 | ||||||
Grupo Nutresa SA (Food Beverage & Tobacco) | 149,622 | 824,973 | ||||||
| 6,189,862 | ||||||||
Croatia - 0.2% | ||||||||
Ericsson Nikola Tesla (Technology Hardware & Equipment)*† | 2,209 | 479,139 | ||||||
Egypt - 5.3% | ||||||||
Commercial International Bank Egypt SAE - GDR, Reg S (Banks)† | 1,721,960 | 6,658,018 | ||||||
Edita Food Industries SAE (Food Beverage & Tobacco)† | 2,774,933 | 1,596,060 | ||||||
Integrated Diagnostics Holdings plc (Health Care Equipment & Services)^† | 666,629 | 2,340,837 | ||||||
| 10,594,915 | ||||||||
Georgia - 0.4% | ||||||||
TBC Bank Group plc (Banks)*† | 69,760 | 831,099 | ||||||
Iceland - 1.1% | ||||||||
Marel HF (Capital Goods)^† | 453,128 | 2,189,818 | ||||||
Indonesia - 0.5% | ||||||||
Bank Central Asia Tbk PT (Banks)† | 514,900 | 1,012,308 | ||||||
Kazakhstan - 1.9% | ||||||||
Halyk Savings Bank of Kazakhstan JSC - GDR, Reg S(Banks)† | 378,186 | 3,774,545 | ||||||
Kenya - 5.3% | ||||||||
East African Breweries Ltd. (Food Beverage & Tobacco)† | 821,800 | 1,130,881 | ||||||
Equity Group Holdings plc (Banks)*† | 5,148,400 | 1,601,578 | ||||||
| Shares | Value | |||||||
| COMMON STOCKS - 96.4% (continued) | ||||||||
Kenya - 5.3% (continued) | ||||||||
Safaricom plc (Telecommunication Services)† | 27,958,650 | $7,925,687 | ||||||
| 10,658,146 | ||||||||
Kuwait - 8.2% | ||||||||
Mabanee Co. SAK (Real Estate)† | 3,882,212 | 8,225,569 | ||||||
National Bank of Kuwait SAKP (Banks)† | 2,981,375 | 8,233,455 | ||||||
| 16,459,024 | ||||||||
Morocco - 2.6% | ||||||||
Maroc Telecom (Telecommunication Services)† | 192,570 | 2,951,132 | ||||||
Societe d’Exploitation des Ports (Transportation)† | 108,510 | 2,220,762 | ||||||
| 5,171,894 | ||||||||
Nigeria - 7.0% | ||||||||
Guaranty Trust Bank plc (Banks)† | 51,111,047 | 4,299,793 | ||||||
Nestle Nigeria plc (Food Beverage & Tobacco) | 1,394,492 | 5,131,751 | ||||||
Nigerian Breweries plc (Food Beverage & Tobacco) | 1,270,573 | 171,019 | ||||||
Zenith Bank plc (Banks)† | 75,801,615 | 4,336,312 | ||||||
| 13,938,875 | ||||||||
Pakistan - 0.9% | ||||||||
MCB Bank Ltd. (Banks)† | 1,454,400 | 1,509,277 | ||||||
Oil & Gas Development Co., Ltd. (Energy)† | 607,900 | 354,289 | ||||||
| 1,863,566 | ||||||||
Peru - 4.7% | ||||||||
Alicorp SAA (Food Beverage & Tobacco) | 929,633 | 1,799,870 | ||||||
Cementos Pacasmayo SAA, Class C (Materials) | 261,456 | 390,503 | ||||||
Credicorp Ltd. (Banks) | 48,997 | 5,618,976 | ||||||
Ferreycorp SAA (Capital Goods) | 3,421,598 | 1,656,146 | ||||||
| 9,465,495 | ||||||||
Philippines - 19.1% | ||||||||
Bank of the Philippine Islands (Banks)† | 3,078,284 | 4,678,296 | ||||||
BDO Unibank Inc. (Banks)† | 1,481,928 | 2,721,873 | ||||||
International Container Terminal Services Inc. (Transportation)† | 1,008,340 | 2,395,852 | ||||||
Jollibee Foods Corp. (Consumer Services)† | 354,230 | 1,244,275 | ||||||
Robinsons Retail Holdings Inc. (Food & Staples Retailing)† | 2,154,830 | 2,849,259 | ||||||
Security Bank Corp. (Banks)† | 2,380,190 | 4,741,449 | ||||||
SM Prime Holdings Inc. (Real Estate)† | 12,885,700 | 8,973,073 | ||||||
See Notes to Financial Statements
19
Table of Contents
Harding, Loevner Funds, Inc.
Frontier Emerging Markets Portfolio
Portfolio of Investments (continued)
October 31, 2020
| Shares | Value | |||||||
| COMMON STOCKS - 96.4% (continued) | ||||||||
Philippines - 19.1% (continued) | ||||||||
Universal Robina Corp. (Food Beverage & Tobacco)† | 2,296,560 | $6,533,690 | ||||||
Wilcon Depot Inc. (Retailing)† | 13,819,900 | 4,083,687 | ||||||
| 38,221,454 | ||||||||
Romania - 4.2% | ||||||||
Banca Transilvania SA (Banks)† | 14,502,447 | 6,567,541 | ||||||
Societatea Nationala de Gaze Naturale ROMGAZ SA (Energy)† | 282,706 | 1,746,204 | ||||||
| 8,313,745 | ||||||||
Saudi Arabia - 1.0% | ||||||||
Jarir Marketing Co. (Retailing)† | 44,988 | 2,077,501 | ||||||
Slovenia - 1.0% | ||||||||
Krka dd Novo mesto (Pharmaceuticals, Biotechnology & Life Sciences)† | 22,453 | 2,013,934 | ||||||
Sri Lanka - 0.3% | ||||||||
Commercial Bank of Ceylon plc (Banks)† | 333,738 | 134,661 | ||||||
John Keells Holdings plc (Capital Goods)† | 628,372 | 446,491 | ||||||
| 581,152 | ||||||||
Thailand - 0.7% | ||||||||
Home Product Center pcl, Reg S (Retailing)† | 3,264,994 | 1,466,589 | ||||||
United Arab Emirates - 2.0% | ||||||||
Agthia Group PJSC (Food Beverage & Tobacco)† | 2,554,440 | 2,893,802 | ||||||
Emaar Properties PJSC (Real Estate)*† | 1,650,176 | 1,195,327 | ||||||
| 4,089,129 | ||||||||
United Kingdom - 2.1% | ||||||||
Bank of Georgia Group plc (Banks)*† | 85,075 | 989,192 | ||||||
Network International Holdings plc (Software & Services)*^† | 1,117,426 | 3,226,454 | ||||||
| 4,215,646 | ||||||||
United States - 4.1% | ||||||||
EPAM Systems Inc. (Software & Services)* | 26,523 | 8,194,281 | ||||||
Vietnam - 13.5% | ||||||||
Bank for Foreign Trade of Vietnam JSC (Banks)† | 1,113,110 | 3,987,369 | ||||||
Hoa Phat Group JSC (Materials)† | 7,259,566 | 9,569,922 | ||||||
Sai Gon Cargo Service Corp. (Transportation)† | 168,050 | 830,565 | ||||||
Saigon Beer Alcohol Beverage Corp. (Food Beverage & Tobacco)† | 414,720 | 3,297,839 | ||||||
| Shares | Value | |||||||
| COMMON STOCKS - 96.4% (continued) | ||||||||
Vietnam - 13.5% (continued) | ||||||||
Vietnam Dairy Products JSC (Food Beverage & Tobacco)† | 2,016,664 | $9,413,504 | ||||||
| 27,099,199 | ||||||||
Total Common Stocks (Cost $170,671,698) | $193,418,144 | |||||||
| PREFERRED STOCKS - 2.6% | ||||||||
Colombia - 2.6% | ||||||||
Bancolombia SA - Sponsored ADR, 4.18% (Banks)+ | 204,530 | 5,213,470 | ||||||
Total Preferred Stocks (Cost $6,369,901) | $5,213,470 | |||||||
| SHORT TERM INVESTMENTS - 1.3% | ||||||||
Northern Institutional Funds - Treasury Portfolio (Premier Shares), 0.00% (Money Market Funds) | 2,648,061 | 2,648,061 | ||||||
Total Short Term Investments (Cost $2,648,061) | $2,648,061 | |||||||
Total Investments — 100.3% | ||||||||
(Cost $179,689,660) | $201,279,675 | |||||||
Liabilities Less Other Assets - (0.3)% | (665,321 | ) | ||||||
Net Assets — 100.0% | $200,614,354 | |||||||
Summary of Abbreviations
| ADR | American Depositary |
| GDR | Global Depositary Receipt |
| Reg S | Security sold outside United States without registration under the Securities Act of 1933. |
| * | Non-income producing security. |
| † | Investment categorized as level 2 security as disclosed in Note 2 of the Notes to Financial Statements. |
| # | Security valued at fair value as determined in good faith under policies and procedures established by and under the supervision of the Portfolio’s Board of Directors as disclosed in Note 2 of the Notes to Financial Statements. |
| ^ | Security exempt from registration pursuant to Rule 144A of the Securities Act of 1933. These securities, which represent 3.9% of net assets as of October 31, 2020, are considered liquid and may be resold in transactions exempt from registration, normally to qualified buyers. |
| + | Current yield is disclosed. Dividends are calculated based on a percentage of the issuer’s net income. |
See Notes to Financial Statements
20
Table of Contents
Harding, Loevner Funds, Inc.
Frontier Emerging Markets Portfolio
Portfolio of Investments (continued)
October 31, 2020
| Industry | | Percentage of Net Assets |
| ||
Banks | 33.4 | % | |||
Capital Goods | 2.1 | ||||
Consumer Services | 0.6 | ||||
Energy | 3.6 | ||||
Food & Staples Retailing | 1.4 | ||||
Food Beverage & Tobacco | 16.3 | ||||
Health Care Equipment & Services | 1.2 | ||||
Materials | 5.1 | ||||
Pharmaceuticals, Biotechnology & Life Sciences | 3.5 | ||||
Real Estate | 9.2 | ||||
Retailing | 3.8 | ||||
Software & Services | 10.1 | ||||
Technology Hardware & Equipment | 0.2 | ||||
Telecommunication Services | 5.8 | ||||
Transportation | 2.7 | ||||
Money Market Fund | 1.3 | ||||
Total Investments | 100.3 | ||||
Liabilities Less Other Assets | (0.3 | ) | |||
Net Assets | 100.0 | % | |||
See Notes to Financial Statements
21
Table of Contents
Global Equity Research Portfolio
Portfolio of Investments
October 31, 2020
| Shares | Value | |||||||
| COMMON STOCKS - 97.6% | ||||||||
Australia - 0.4% | ||||||||
BHP Group Ltd. (Materials)† | 676 | $16,255 | ||||||
Cochlear Ltd. (Health Care Equipment & Services)† | 83 | 12,434 | ||||||
| 28,689 | ||||||||
Brazil - 1.1% | ||||||||
Ambev SA - ADR (Food Beverage & Tobacco)* | 7,484 | 16,016 | ||||||
B3 SA - Brasil Bolsa Balcao (Diversified Financials) | 1,000 | 8,897 | ||||||
Cia Brasileira de Distribuicao - ADR (Food & Staples Retailing) | 1,123 | 12,083 | ||||||
Raia Drogasil SA (Food & Staples Retailing) | 2,500 | 10,483 | ||||||
Ultrapar Participacoes SA - Sponsored ADR (Energy) | 2,681 | 7,614 | ||||||
WEG SA (Capital Goods) | 1,900 | 25,109 | ||||||
| 80,202 | ||||||||
Canada - 0.9% | ||||||||
Alimentation Couche-Tard Inc. (Food & Staples Retailing) | 1,600 | 49,538 | ||||||
Imperial Oil Ltd. (Energy) | 1,500 | 19,951 | ||||||
| 69,489 | ||||||||
Chile - 0.2% | ||||||||
Banco Santander Chile - ADR (Banks) | 1,149 | 15,948 | ||||||
China - 9.2% | ||||||||
51job Inc. - ADR (Commercial & Professional Services)* | 150 | 10,515 | ||||||
AAC Technologies Holdings Inc. (Technology Hardware & Equipment)† | 1,670 | 8,777 | ||||||
Alibaba Group Holding Ltd. - Sponsored ADR (Retailing)* | 55 | 16,758 | ||||||
Autohome Inc. - ADR (Media & Entertainment) | 143 | 13,664 | ||||||
China Merchants Bank Co., Ltd., Class A (Banks)† | 1,900 | 11,321 | ||||||
China Mobile Ltd. - Sponsored ADR (Telecommunication Services) | 1,689 | 51,903 | ||||||
China Tourism Group Duty Free Corp., Ltd., Class A (Retailing)† | 500 | 14,829 | ||||||
China Tower Corp., Ltd., Class H (Telecommunication Services)^† | 80,000 | 12,492 | ||||||
CSPC Pharmaceutical Group Ltd. (Pharmaceuticals, Biotechnology & Life Sciences)† | 15,360 | 16,194 | ||||||
ENN Energy Holdings Ltd. (Utilities)† | 2,000 | 25,345 | ||||||
| Shares | Value | |||||||||
| COMMON STOCKS - 97.6% (continued) | ||||||||||
China - 9.2% (continued) | ||||||||||
Fuyao Glass Industry Group Co., Ltd., Class H (Automobiles & Components)^† | 3,600 | $ | 15,318 | |||||||
Glodon Co., Ltd., Class A (Software & Services)† | 2,000 | 21,280 | ||||||||
Gree Electric Appliances Inc. of Zhuhai, Class A (Consumer Durables & Apparel)† | 1,200 | 10,519 | ||||||||
Haitian International Holdings Ltd. (Capital Goods)† | 4,000 | 9,915 | ||||||||
Hangzhou Hikvision Digital Technology Co., Ltd., Class A (Technology Hardware & Equipment)† | 2,700 | 18,138 | ||||||||
Hangzhou Tigermed Consulting Co., Ltd., Class A (Pharmaceuticals, Biotechnology & Life Sciences)† | 700 | 13,018 | ||||||||
Inner Mongolia Yili Industrial Group Co., Ltd., Class A (Food Beverage & Tobacco)† | 2,600 | 15,547 | ||||||||
JD.com Inc. - ADR (Retailing)* | 207 | 16,875 | ||||||||
Jiangsu Expressway Co., Ltd., Class H (Transportation)† | 56,000 | 55,900 | ||||||||
Jiangsu Hengrui Medicine Co., Ltd., Class A (Pharmaceuticals, Biotechnology & Life Sciences)† | 840 | 11,184 | ||||||||
Jiangsu Yanghe Brewery Joint-Stock Co., Ltd., Class A (Food Beverage & Tobacco)† | 600 | 15,101 | ||||||||
Meituan, Class B (Retailing)*† | 300 | 11,222 | ||||||||
Midea Group Co., Ltd., Class A (Consumer Durables & Apparel)† | 1,200 | 13,998 | ||||||||
NetEase Inc. - ADR (Media & Entertainment) | 205 | 17,792 | ||||||||
New Oriental Education & Technology Group Inc. - Sponsored ADR (Consumer Services)* | 110 | 17,642 | ||||||||
Ping An Insurance Group Co. of China Ltd., Class A (Insurance)† | 1,100 | 12,842 | ||||||||
SF Holding Co., Ltd., Class A (Transportation)† | 1,900 | 23,561 | ||||||||
Shanghai International Airport Co., Ltd., Class A (Transportation)† | 1,000 | 9,895 | ||||||||
Shenzhen Inovance Technology Co., Ltd., Class A (Capital Goods)† | 2,900 | 27,817 | ||||||||
Shenzhou International Group Holdings Ltd. (Consumer Durables & Apparel)† | 1,000 | 17,281 | ||||||||
See Notes to Financial Statements
22
Table of Contents
Harding, Loevner Funds, Inc.
Global Equity Research Portfolio
Portfolio of Investments (continued)
October 31, 2020
| Shares | Value | |||||||
| COMMON STOCKS - 97.6% (continued) | ||||||||
China - 9.2% (continued) | ||||||||
Sino Biopharmaceutical Ltd. (Pharmaceuticals, Biotechnology & Life Sciences)† | 13,500 | $13,624 | ||||||
Suofeiya Home Collection Co., Ltd., Class A (Consumer Durables & Apparel)† | 4,000 | 16,933 | ||||||
Tencent Holdings Ltd. (Media & Entertainment)† | 200 | 15,341 | ||||||
TravelSky Technology Ltd., Class H (Software & Services)† | 5,000 | 10,525 | ||||||
Trip.com Group Ltd. - ADR (Retailing)* | 514 | 14,783 | ||||||
Wuliangye Yibin Co., Ltd., Class A (Food Beverage & Tobacco)† | 500 | 18,303 | ||||||
WuXi AppTec Co., Ltd., Class A (Pharmaceuticals, Biotechnology & Life Sciences)† | 1,372 | 23,193 | ||||||
Wuxi Biologics Cayman Inc. (Pharmaceuticals, Biotechnology & Life Sciences)*^† | 1,000 | 28,097 | ||||||
| 677,442 | ||||||||
Colombia - 0.3% | ||||||||
Ecopetrol SA - Sponsored ADR (Energy) | 800 | 7,400 | ||||||
Grupo Nutresa SA (Food Beverage & Tobacco) | 2,782 | 15,339 | ||||||
| 22,739 | ||||||||
Czech Republic - 0.1% | ||||||||
Komercni banka AS (Banks)*† | 493 | 9,997 | ||||||
Denmark - 1.3% | ||||||||
Chr Hansen Holding A/S (Materials)† | 129 | 12,996 | ||||||
Coloplast A/S, Class B (Health Care Equipment & Services)† | 193 | 28,180 | ||||||
Genmab A/S (Pharmaceuticals, Biotechnology & Life Sciences)*† | 39 | 13,007 | ||||||
Novozymes A/S, Class B (Materials)† | 732 | 44,041 | ||||||
| 98,224 | ||||||||
Egypt - 0.1% | ||||||||
Commercial International Bank Egypt SAE - GDR, Reg S (Banks)† | 2,264 | 8,754 | ||||||
Finland - 0.4% | ||||||||
Kone OYJ, Class B (Capital Goods)† | 211 | 16,800 | ||||||
Neste OYJ (Energy)† | 314 | 16,401 | ||||||
| 33,201 | ||||||||
| Shares | Value | |||||||
| COMMON STOCKS - 97.6% (continued) | ||||||||
France - 2.9% | ||||||||
Air Liquide SA (Materials)† | 330 | $48,303 | ||||||
Dassault Systemes SE (Software & Services)† | 130 | 22,224 | ||||||
EssilorLuxottica SA (Consumer Durables & Apparel)*† | 109 | 13,504 | ||||||
Kering SA (Consumer Durables & Apparel)† | 26 | 15,730 | ||||||
L’Oreal SA (Household & Personal Products)† | 49 | 15,869 | ||||||
Safran SA (Capital Goods)*† | 327 | 34,750 | ||||||
Sartorius Stedim Biotech (Pharmaceuticals, Biotechnology & Life Sciences)† | 109 | 41,486 | ||||||
Schneider Electric SE (Capital Goods)† | 159 | 19,324 | ||||||
| 211,190 | ||||||||
Germany - 3.2% | ||||||||
adidas AG (Consumer Durables & Apparel)*† | 60 | 17,828 | ||||||
Allianz SE, Reg S (Insurance)† | 230 | 40,486 | ||||||
Bayerische Motoren Werke AG (Automobiles & Components)† | �� | 350 | 23,921 | |||||
Brenntag AG (Capital Goods)† | 257 | 16,429 | ||||||
Carl Zeiss Meditec AG (Bearer) (Health Care Equipment & Services)† | 134 | 17,383 | ||||||
FUCHS PETROLUB SE (Materials)† | 375 | 14,419 | ||||||
Infineon Technologies AG (Semiconductors & Semiconductor Equipment)† | 502 | 14,058 | ||||||
KWS Saat SE & Co. KGaA (Food Beverage & Tobacco)† | 393 | 28,928 | ||||||
SAP SE - Sponsored ADR (Software & Services) | 110 | 11,751 | ||||||
STRATEC SE (Health Care Equipment & Services)† | 221 | 32,419 | ||||||
Symrise AG (Materials)† | 160 | 19,779 | ||||||
| 237,401 | ||||||||
Hong Kong - 1.2% | ||||||||
AIA Group Ltd. (Insurance)† | 1,600 | 15,090 | ||||||
ASM Pacific Technology Ltd. (Semiconductors & Semiconductor Equipment)† | 1,800 | 18,120 | ||||||
Sands China Ltd. (Consumer Services)† | 6,400 | 22,431 | ||||||
Techtronic Industries Co., Ltd. (Capital Goods)† | 2,500 | 33,628 | ||||||
| 89,269 | ||||||||
India - 2.2% | ||||||||
Asian Paints Ltd. (Materials)† | 460 | 13,747 | ||||||
See Notes to Financial Statements
23
Table of Contents
Harding, Loevner Funds, Inc.
Global Equity Research Portfolio
Portfolio of Investments (continued)
October 31, 2020
| Shares | Value | |||||||
| COMMON STOCKS - 97.6% (continued) | ||||||||
India - 2.2% (continued) | ||||||||
Godrej Consumer Products Ltd. (Household & Personal Products)† | 1,225 | $10,985 | ||||||
HDFC Bank Ltd. - ADR (Banks)* | 235 | 13,498 | ||||||
Hero MotoCorp Ltd. (Automobiles & Components)† | 419 | 15,823 | ||||||
Housing Development Finance Corp., Ltd. (Banks)† | 918 | 23,811 | ||||||
ICICI Bank Ltd. - Sponsored ADR (Banks)* | 1,034 | 10,909 | ||||||
Kotak Mahindra Bank Ltd. (Banks)*† | 608 | 12,690 | ||||||
Max Financial Services Ltd. (Insurance)*† | 1,630 | 12,992 | ||||||
Pidilite Industries Ltd. (Materials)† | 1,120 | 23,754 | ||||||
Tata Consultancy Services Ltd. (Software & Services)† | 741 | 26,631 | ||||||
| 164,840 | ||||||||
Indonesia - 0.4% | ||||||||
Astra International Tbk PT (Automobiles & | 33,400 | 12,344 | ||||||
Bank Rakyat Indonesia Persero Tbk PT (Banks)† | 46,900 | 10,626 | ||||||
Unilever Indonesia Tbk PT (Household & Personal Products)† | 17,000 | 9,051 | ||||||
| 32,021 | ||||||||
Italy - 0.4% | ||||||||
FinecoBank Banca Fineco SpA (Banks)*† | 1,194 | 16,351 | ||||||
Reply SpA (Software & Services)† | 131 | 14,087 | ||||||
| 30,438 | ||||||||
Japan - 9.6% | ||||||||
ABC-Mart Inc. (Retailing)† | 700 | 35,481 | ||||||
Benefit One Inc. (Commercial & Professional Services)† | 1,000 | 24,986 | ||||||
Chugai Pharmaceutical Co., Ltd. (Pharmaceuticals, Biotechnology & Life Sciences)† | 600 | 23,152 | ||||||
FANUC Corp. (Capital Goods)† | 100 | 21,255 | ||||||
Fast Retailing Co., Ltd. (Retailing)† | 60 | 41,960 | ||||||
Hakuhodo DY Holdings Inc. (Media & Entertainment)† | 3,100 | 39,625 | ||||||
Infomart Corp. (Software & Services)† | 2,300 | 19,043 | ||||||
Kakaku.com Inc. (Media & Entertainment)† | 500 | 13,293 | ||||||
| Shares | Value | |||||||
| COMMON STOCKS - 97.6% (continued) | ||||||||
Japan - 9.6% (continued) | ||||||||
Kao Corp. (Household & Personal Products)† | 600 | $42,659 | ||||||
Keyence Corp. (Technology Hardware & Equipment)† | 46 | 20,860 | ||||||
Kobayashi Pharmaceutical Co., Ltd. (Household & Personal Products)† | 150 | 14,590 | ||||||
Komatsu Ltd. (Capital Goods)† | 900 | 20,200 | ||||||
Kubota Corp. (Capital Goods)† | 2,600 | 45,293 | ||||||
Makita Corp. (Capital Goods)† | 1,200 | 53,046 | ||||||
MISUMI Group Inc. (Capital Goods)† | 700 | 20,812 | ||||||
MonotaRO Co., Ltd. (Capital Goods)† | 500 | 27,916 | ||||||
Nomura Research Institute Ltd. (Software & Services)† | 890 | 26,191 | ||||||
Pigeon Corp. (Household & Personal Products)† | 400 | 18,423 | ||||||
Rinnai Corp. (Consumer Durables & Apparel)† | 540 | 53,339 | ||||||
Shiseido Co., Ltd. (Household & Personal Products)† | 300 | 18,571 | ||||||
SMC Corp. (Capital Goods)† | 40 | 21,120 | ||||||
Stanley Electric Co., Ltd. (Automobiles & Components)† | 500 | 14,245 | ||||||
Sugi Holdings Co., Ltd. (Food & Staples Retailing)† | 500 | 33,185 | ||||||
Sysmex Corp. (Health Care Equipment & Services)† | 200 | 18,822 | ||||||
Unicharm Corp. (Household & Personal Products)† | 900 | 41,786 | ||||||
| 709,853 | ||||||||
Malaysia - 0.2% | ||||||||
Dialog Group Bhd. (Energy)† | 16,000 | 14,254 | ||||||
Mexico - 1.2% | ||||||||
Fomento Economico Mexicano SAB de CV - Sponsored ADR (Food Beverage & Tobacco) | 192 | 10,324 | ||||||
Grupo Aeroportuario del Sureste SAB de CV - ADR (Transportation)* | 134 | 15,457 | ||||||
Grupo Financiero Banorte SAB de CV, Series O (Banks)* | 3,300 | 14,702 | ||||||
Wal-Mart de Mexico SAB de CV (Food & Staples Retailing) | 18,700 | 45,182 | ||||||
| 85,665 | ||||||||
Netherlands - 1.2% | ||||||||
Adyen NV (Software & Services)*^† | 18 | 30,374 | ||||||
ASML Holding NV, Reg S (Semiconductors & Semiconductor Equipment) | 90 | 32,509 | ||||||
See Notes to Financial Statements
24
Table of Contents
Harding, Loevner Funds, Inc.
Global Equity Research Portfolio
Portfolio of Investments (continued)
October 31, 2020
| Shares | Value | |||||||||
| COMMON STOCKS - 97.6% (continued) | ||||||||||
Netherlands - 1.2% (continued) | ||||||||||
Koninklijke Vopak NV (Energy)† | 243 | $ | 12,633 | |||||||
Prosus NV (Retailing)*† | 166 | 16,593 | ||||||||
| 92,109 | ||||||||||
Pakistan - 0.3% | ||||||||||
MCB Bank Ltd. (Banks)† | 10,800 | 11,207 | ||||||||
Oil & Gas Development Co., Ltd. (Energy)† | 13,400 | 7,810 | ||||||||
| 19,017 | ||||||||||
Panama - 0.3% | ||||||||||
Copa Holdings SA, Class A (Transportation) | 376 | 18,529 | ||||||||
Peru - 0.4% | ||||||||||
Alicorp SAA (Food Beverage & Tobacco) | 9,290 | 17,986 | ||||||||
Credicorp Ltd. (Banks) | 94 | 10,780 | ||||||||
| 28,766 | ||||||||||
Philippines - 1.2% | ||||||||||
Bank of the Philippine Islands (Banks)† | 12,490 | 18,982 | ||||||||
BDO Unibank Inc. (Banks)† | 10,070 | 18,496 | ||||||||
Robinsons Retail Holdings Inc. (Food & Staples Retailing)† | 10,510 | 13,897 | ||||||||
Security Bank Corp. (Banks)† | 4,340 | 8,646 | ||||||||
SM Prime Holdings Inc. (Real Estate)† | 12,800 | 8,913 | ||||||||
Universal Robina Corp. (Food Beverage & Tobacco)† | 3,090 | 8,791 | ||||||||
Wilcon Depot Inc. (Retailing)† | 32,600 | 9,633 | ||||||||
| 87,358 | ||||||||||
Poland - 0.2% | ||||||||||
ING Bank Slaski SA (Banks)*† | 426 | 11,044 | ||||||||
Russia - 0.5% | ||||||||||
LUKOIL PJSC - Sponsored ADR (Energy) | 278 | 14,203 | ||||||||
Novatek PJSC - Sponsored GDR, Reg S (Energy)† | 89 | 10,729 | ||||||||
Sberbank of Russia PJSC - Sponsored ADR (Banks)† | 1,278 | 12,914 | ||||||||
| 37,846 | ||||||||||
Saudi Arabia - 0.3% | ||||||||||
Bupa Arabia for Cooperative Insurance Co. (Insurance)*† | 397 | 12,133 | ||||||||
Jarir Marketing Co. (Retailing)† | 252 | 11,637 | ||||||||
| 23,770 | ||||||||||
Singapore - 0.7% | ||||||||||
DBS Group Holdings Ltd. (Banks)† | 2,400 | 35,749 | ||||||||
Oversea-Chinese Banking Corp., Ltd. (Banks)† | 2,703 | 16,659 | ||||||||
| 52,408 | ||||||||||
| Shares | Value | |||||||||
| COMMON STOCKS - 97.6% (continued) | ||||||||||
South Africa - 0.3% | ||||||||||
Clicks Group Ltd. (Food & Staples Retailing)† | 851 | $ | 12,350 | |||||||
Discovery Ltd. (Insurance)† | 1,831 | 12,041 | ||||||||
| 24,391 | ||||||||||
South Korea - 0.9% | ||||||||||
Amorepacific Corp. (Household & Personal Products)† | 79 | 11,045 | ||||||||
Coway Co., Ltd. (Consumer Durables & Apparel)*† | 184 | 11,301 | ||||||||
LG Household & Health Care Ltd. (Household & Personal Products)† | 9 | 11,816 | ||||||||
NAVER Corp. (Media & Entertainment)† | 125 | 32,223 | ||||||||
| 66,385 | ||||||||||
Spain - 1.0% | ||||||||||
Banco Bilbao Vizcaya Argentaria SA (Banks)† | 6,148 | 17,702 | ||||||||
Banco Santander SA - Sponsored ADR (Banks)* | 13,924 | 27,987 | ||||||||
Bankinter SA (Banks)† | 8,132 | 30,579 | ||||||||
| 76,268 | ||||||||||
Sweden - 1.9% | ||||||||||
Alfa Laval AB (Capital Goods)*† | 887 | 18,005 | ||||||||
Assa Abloy AB, Class B (Capital Goods)† | 664 | 14,259 | ||||||||
Atlas Copco AB, Class A (Capital Goods)† | 544 | 24,026 | ||||||||
Epiroc AB, Class A (Capital Goods)† | 1,467 | 21,931 | ||||||||
Hexagon AB, Class B (Technology Hardware & Equipment)*† | 270 | 19,718 | ||||||||
Intrum AB (Commercial & Professional Services)† | 1,097 | 26,824 | ||||||||
Skandinaviska Enskilda Banken AB, Class A (Banks)*† | 1,670 | 14,353 | ||||||||
| 139,116 | ||||||||||
Switzerland - 3.2% | ||||||||||
Alcon Inc. (Health Care Equipment & Services)* | 661 | 37,571 | ||||||||
Cie Financiere Richemont SA, Class A, Reg S (Consumer Durables & Apparel)† | 244 | 15,284 | ||||||||
Lonza Group AG, Reg S (Pharmaceuticals, Biotechnology & Life Sciences)† | 60 | 36,288 | ||||||||
Roche Holding AG, Genusschein (Pharmaceuticals, Biotechnology & Life Sciences)† | 143 | 45,905 | ||||||||
SGS SA, Reg S (Commercial & Professional Services)† | 8 | 19,966 | ||||||||
See Notes to Financial Statements
25
Table of Contents
Harding, Loevner Funds, Inc.
Global Equity Research Portfolio
Portfolio of Investments (continued)
October 31, 2020
| Shares | Value | |||||||
| COMMON STOCKS - 97.6% (continued) | ||||||||
Switzerland - 3.2% (continued) | ||||||||
Sonova Holding AG, Reg S (Health Care Equipment & Services)*† | 170 | $40,241 | ||||||
Temenos AG, Reg S (Software & Services)† | 98 | 10,505 | ||||||
VAT Group AG (Capital Goods)^† | 96 | 17,997 | ||||||
Vifor Pharma AG (Pharmaceuticals, Biotechnology & Life Sciences)† | 91 | 10,217 | ||||||
| 233,974 | ||||||||
Taiwan - 2.1% | ||||||||
Advantech Co., Ltd. (Technology Hardware & Equipment)† | 4,399 | 44,522 | ||||||
Eclat Textile Co., Ltd. (Consumer Durables & Apparel)† | 1,000 | 13,257 | ||||||
Hon Hai Precision Industry Co., Ltd. (Technology Hardware & Equipment)† | 4,000 | 10,852 | ||||||
Largan Precision Co., Ltd. (Technology Hardware & Equipment)† | 100 | 10,631 | ||||||
Silergy Corp. (Semiconductors & Semiconductor Equipment)† | 200 | 12,347 | ||||||
Taiwan Semiconductor Manufacturing Co., Ltd. (Semiconductors & Semiconductor Equipment)† | 4,000 | 60,368 | ||||||
| 151,977 | ||||||||
Thailand - 0.5% | ||||||||
Bumrungrad Hospital pcl, Reg S (Health Care Equipment & Services)† | 7,000 | 20,438 | ||||||
Siam Commercial Bank pcl, Reg S(Banks)† | 6,200 | 12,930 | ||||||
| 33,368 | ||||||||
Turkey - 0.1% | ||||||||
BIM Birlesik Magazalar AS (Food & Staples Retailing)† | 1,226 | 9,782 | ||||||
United Arab Emirates - 0.2% | ||||||||
Emaar Properties PJSC (Real Estate)*† | 18,834 | 13,643 | ||||||
United Kingdom - 3.7% | ||||||||
Abcam plc (Pharmaceuticals, Biotechnology & Life Sciences)† | 970 | 18,537 | ||||||
Coca-Cola HBC AG - CDI (Food Beverage & | 751 | 17,082 | ||||||
Compass Group plc (Consumer Services)† | 967 | 13,227 | ||||||
| Shares | Value | |||||||||
| COMMON STOCKS - 97.6% (continued) | ||||||||||
United Kingdom - 3.7% (continued) | ||||||||||
Dechra Pharmaceuticals plc (Pharmaceuticals, Biotechnology & Life Sciences)† | 780 | $35,300 | ||||||||
Diploma plc (Capital Goods)† | 671 | 19,358 | ||||||||
Halma plc (Technology Hardware & Equipment)† | 511 | 15,687 | ||||||||
HomeServe plc (Commercial & Professional Services)† | 977 | 13,989 | ||||||||
Network International Holdings plc (Software & Services)*^† | 2,567 | 7,412 | ||||||||
Rathbone Brothers plc (Diversified Financials)† | 762 | 14,365 | ||||||||
Reckitt Benckiser Group plc (Household & Personal Products)† | 152 | 13,393 | ||||||||
Rio Tinto plc (Materials)† | 225 | 12,751 | ||||||||
Rotork plc (Capital Goods)† | 3,615 | 13,173 | ||||||||
Royal Dutch Shell plc, Class B - Sponsored ADR (Energy) | 790 | 19,079 | ||||||||
Signature Aviation plc (Transportation)† | 7,104 | 21,813 | ||||||||
Spirax-Sarco Engineering plc (Capital Goods)† | 154 | 22,519 | ||||||||
Standard Chartered plc (Banks)*† | 3,634 | 16,633 | ||||||||
| 274,318 | ||||||||||
United States - 43.3% | ||||||||||
Abbott Laboratories (Health Care Equipment & Services) | 390 | 40,993 | ||||||||
AbbVie Inc. (Pharmaceuticals, Biotechnology & Life Sciences) | 332 | 28,253 | ||||||||
Accenture plc, Class A (Software & Services) | 70 | 15,184 | ||||||||
Adobe Inc. (Software & Services)* | 90 | 40,239 | ||||||||
Air Products and Chemicals Inc. (Materials) | 253 | 69,889 | ||||||||
Allegion plc (Capital Goods) | 570 | 56,145 | ||||||||
Alphabet Inc., Class A (Media & Entertainment)* | 45 | 72,725 | ||||||||
Altair Engineering Inc., Class A (Software & Services)* | 403 | 17,341 | ||||||||
Amazon.com Inc. (Retailing)* | 14 | 42,506 | ||||||||
AMETEK Inc. (Capital Goods) | 147 | 14,435 | ||||||||
Amphenol Corp., Class A (Technology Hardware & Equipment) | 144 | 16,249 | ||||||||
ANSYS Inc. (Software & Services)* | 78 | 23,741 | ||||||||
Apple Inc. (Technology Hardware & Equipment) | 260 | 28,304 | ||||||||
Atlassian Corp. plc, Class A (Software & Services)* | 117 | 22,420 | ||||||||
See Notes to Financial Statements
26
Table of Contents
Harding, Loevner Funds, Inc.
Global Equity Research Portfolio
Portfolio of Investments (continued)
October 31, 2020
| Shares | Value | |||||||||
| COMMON STOCKS - 97.6% (continued) | ||||||||||
United States - 43.3% (continued) | ||||||||||
Automatic Data Processing Inc. (Software & Services) | 418 | $66,027 | ||||||||
Booking Holdings Inc. (Retailing)* | 9 | 14,603 | ||||||||
BorgWarner Inc. (Automobiles & Components) | 919 | 32,147 | ||||||||
Church & Dwight Co., Inc. (Household & Personal Products) | 787 | 69,563 | ||||||||
Cisco Systems Inc. (Technology Hardware & Equipment) | 845 | 30,335 | ||||||||
CME Group Inc. (Diversified Financials) | 88 | 13,263 | ||||||||
Cognex Corp. (Technology Hardware & Equipment) | 585 | 38,551 | ||||||||
Cognizant Technology Solutions Corp., Class A (Software & Services) | 686 | 48,994 | ||||||||
Colgate-Palmolive Co. (Household & Personal Products) | 825 | 65,084 | ||||||||
Danaher Corp. (Health Care Equipment & Services) | 327 | 75,060 | ||||||||
Deere & Co. (Capital Goods) | 200 | 45,182 | ||||||||
Domino’s Pizza Inc. (Consumer Services) | 137 | 51,830 | ||||||||
eBay Inc. (Retailing) | 1,273 | 60,633 | ||||||||
Ecolab Inc. (Materials) | 322 | 59,116 | ||||||||
Edwards Lifesciences Corp. (Health Care Equipment & Services)* | 846 | 60,650 | ||||||||
Emerson Electric Co. (Capital Goods) | 666 | 43,150 | ||||||||
EnerSys (Capital Goods) | 200 | 14,320 | ||||||||
EPAM Systems Inc. (Software & Services)* | 59 | 18,228 | ||||||||
Etsy Inc. (Retailing)* | 183 | 22,251 | ||||||||
Exxon Mobil Corp. (Energy) | 1,474 | 48,082 | ||||||||
Facebook Inc., Class A (Media & Entertainment)* | 270 | 71,040 | ||||||||
First Republic Bank (Banks) | 660 | 83,252 | ||||||||
Gartner Inc. (Software & Services)* | 461 | 55,366 | ||||||||
Guidewire Software Inc. (Software & Services)* | 152 | 14,609 | ||||||||
Healthcare Services Group Inc. (Commercial & Professional Services) | 622 | 14,231 | ||||||||
HEICO Corp. (Capital Goods) | 290 | 30,464 | ||||||||
Honeywell International Inc. (Capital Goods) | 432 | 71,258 | ||||||||
IDEXX Laboratories Inc. (Health Care Equipment & Services)* | 70 | 29,737 | ||||||||
Illumina Inc. (Pharmaceuticals, Biotechnology & Life Sciences)* | 60 | 17,562 | ||||||||
| Shares | Value | |||||||||
| COMMON STOCKS - 97.6% (continued) | ||||||||||
United States - 43.3% (continued) | ||||||||||
Intuitive Surgical Inc. (Health Care Equipment & Services)* | 21 | $14,009 | ||||||||
IPG Photonics Corp. (Technology Hardware & Equipment)* | 95 | 17,666 | ||||||||
IQVIA Holdings Inc. (Pharmaceuticals, Biotechnology & Life Sciences)* | 100 | 15,399 | ||||||||
Johnson & Johnson (Pharmaceuticals, Biotechnology & Life Sciences) | 501 | 68,692 | ||||||||
JPMorgan Chase & Co. (Banks) | 641 | 62,844 | ||||||||
Kansas City Southern (Transportation) | 101 | 17,790 | ||||||||
Linde plc (Materials)† | 169 | 37,196 | ||||||||
Mastercard Inc., Class A (Software & Services) | 230 | 66,387 | ||||||||
McDonald’s Corp. (Consumer Services) | 313 | 66,669 | ||||||||
Merck & Co., Inc. (Pharmaceuticals, Biotechnology & Life Sciences) | 734 | 55,204 | ||||||||
Mettler-Toledo International Inc. (Pharmaceuticals, Biotechnology & Life Sciences)* | 19 | 18,960 | ||||||||
Microsoft Corp. (Software & Services) | 363 | 73,497 | ||||||||
Neurocrine Biosciences Inc. (Pharmaceuticals, Biotechnology & Life Sciences)* | 445 | 43,908 | ||||||||
NIKE Inc., Class B (Consumer Durables & Apparel) | 156 | 18,732 | ||||||||
PayPal Holdings Inc. (Software & Services)* | 240 | 44,671 | ||||||||
Procter & Gamble Co. (Household & Personal Products) | �� | 532 | 72,937 | |||||||
Proto Labs Inc. (Capital Goods)* | 133 | 15,705 | ||||||||
Reinsurance Group of America Inc. (Insurance) | 380 | 38,388 | ||||||||
ResMed Inc. (Health Care Equipment & Services) | 81 | 15,547 | ||||||||
Rockwell Automation Inc. (Capital Goods) | 293 | 69,476 | ||||||||
Rollins Inc. (Commercial & Professional Services) | 755 | 43,677 | ||||||||
Roper Technologies Inc. (Capital Goods) | 178 | 66,099 | ||||||||
salesforce.com Inc. (Software & Services)* | 130 | 30,195 | ||||||||
Sensata Technologies Holding plc (Capital Goods)* | 328 | 14,337 | ||||||||
See Notes to Financial Statements
27
Table of Contents
Harding, Loevner Funds, Inc.
Global Equity Research Portfolio
Portfolio of Investments (continued)
October 31, 2020
| Shares | Value | |||||||
| COMMON STOCKS - 97.6% (continued) | ||||||||
United States - 43.3% (continued) | ||||||||
ServiceNow Inc. (Software & Services)* | 54 | $26,869 | ||||||
Signature Bank (Banks) | 473 | 38,190 | ||||||
Starbucks Corp. (Consumer Services) | 578 | 50,263 | ||||||
SVB Financial Group (Banks)* | 102 | 29,651 | ||||||
Synopsys Inc. (Software & Services)* | 269 | 57,528 | ||||||
Texas Instruments Inc. (Semiconductors & Semiconductor Equipment) | 115 | 16,628 | ||||||
Thermo Fisher Scientific Inc. (Pharmaceuticals, Biotechnology & Life Sciences) | 60 | 28,387 | ||||||
Tiffany & Co. (Retailing) | 106 | 13,869 | ||||||
UnitedHealth Group Inc. (Health Care Equipment & Services) | 109 | 33,260 | ||||||
Verisk Analytics Inc. (Commercial & Professional Services) | 249 | 44,315 | ||||||
Vertex Pharmaceuticals Inc. (Pharmaceuticals, Biotechnology & Life Sciences)* | 158 | 32,921 | ||||||
Visa Inc., Class A (Software & Services) | 76 | 13,810 | ||||||
Workday Inc., Class A (Software & Services)* | 140 | 29,417 | ||||||
Zoetis Inc. (Pharmaceuticals, Biotechnology & Life Sciences) | 261 | 41,382 | ||||||
| 3,197,487 | ||||||||
Total Common Stocks (Cost $5,922,610) | $7,211,172 | |||||||
| PREFERRED STOCKS - 1.0% | ||||||||
Brazil - 0.3% | ||||||||
Banco Bradesco SA - ADR, 5.13% (Banks)+ | 2,857 | 9,999 | ||||||
Itau Unibanco Holding SA - Sponsored ADR, 0.78% (Banks)+ | 3,374 | 13,800 | ||||||
| 23,799 | ||||||||
Colombia - 0.2% | ||||||||
Bancolombia SA - Sponsored ADR, 4.18% (Banks)+ | 360 | 9,176 | ||||||
South Korea - 0.3% | ||||||||
Samsung Electronics Co., Ltd. - GDR, Reg S, 2.63% (Technology Hardware & Equipment)+† | 17 | 19,122 | ||||||
| Shares | Value | |||||||
| PREFERRED STOCKS - 1.0% (continued) | ||||||||
Spain - 0.2% | ||||||||
Grifols SA - ADR, 1.17% (Pharmaceuticals, Biotechnology & Life Sciences)+ | 942 | $15,995 | ||||||
Total Preferred Stocks (Cost $69,985) | $68,092 | |||||||
| SHORT TERM INVESTMENTS - 1.6% | ||||||||
Northern Institutional Funds - Treasury Portfolio (Premier Shares), 0.00% (Money Market Funds) | 119,647 | 119,647 | ||||||
Total Short Term Investments (Cost $119,647) | $119,647 | |||||||
Total Investments - 100.2% | ||||||||
(Cost $6,112,242) | $7,398,911 | |||||||
Liabilities Less Other Assets - (0.2)% | (11,895 | ) | ||||||
Net Assets - 100.0% | $7,387,016 | |||||||
Summary of Abbreviations
| ADR | American Depositary Receipt |
| CDI | Chess Depositary Interest |
| GDR | Global Depositary Receipt |
| Reg S | Security sold outside United States without registration under the Securities Act of 1933. |
| † | Investment categorized as level 2 security as disclosed in Note 2 of the Notes to Financial Statements. |
| * | Non-income producing security. |
| ^ | Security exempt from registration pursuant to Rule 144A of the Securities Act of 1933. These securities, which represent 1.5% of net assets as of October 31, 2020, are considered liquid and may be resold in transactions exempt from registration, normally to qualified buyers. |
| + | Current yield is disclosed. Dividends are calculated based on a percentage of the issuer’s net income. |
See Notes to Financial Statements
28
Table of Contents
Harding, Loevner Funds, Inc.
Global Equity Research Portfolio
Portfolio of Investments (continued)
October 31, 2020
| Industry | | Percentage of Net Assets |
| ||
Automobiles & Components | 1.5 | % | |||
Banks | 8.9 | ||||
Capital Goods | 13.3 | ||||
Commercial & Professional Services | 2.7 | ||||
Consumer Durables & Apparel | 3.0 | ||||
Consumer Services | 3.0 | ||||
Diversified Financials | 0.5 | ||||
Energy | 2.4 | ||||
Food & Staples Retailing | 2.5 | ||||
Food Beverage & Tobacco | 2.2 | ||||
Health Care Equipment & Services | 6.5 | ||||
Household & Personal Products | 5.6 | ||||
Insurance | 2.0 | ||||
Materials | 5.0 | ||||
Media & Entertainment | 3.7 | ||||
Pharmaceuticals, Biotechnology & Life Sciences | 9.4 | ||||
Real Estate | 0.3 | ||||
Retailing | 4.7 | ||||
Semiconductors & Semiconductor Equipment | 2.1 | ||||
Software & Services | 11.7 | ||||
Technology Hardware & Equipment | 4.1 | ||||
Telecommunication Services | 0.9 | ||||
Transportation | 2.2 | ||||
Utilities | 0.4 | ||||
Money Market Fund | 1.6 | ||||
Total Investments | 100.2 | ||||
Liabilities Less Other Assets | (0.2 | ) | |||
Net Assets | 100.0 | % | |||
See Notes to Financial Statements
29
Table of Contents
International Equity Research Portfolio
Portfolio of Investments
October 31, 2020
| Shares | Value | |||||||
| COMMON STOCKS - 95.8% | ||||||||
Australia - 1.4% | ||||||||
BHP Group Ltd. (Materials)† | 4,296 | $103,301 | ||||||
Cochlear Ltd. (Health Care Equipment & Services)† | 451 | 67,565 | ||||||
| 170,866 | ||||||||
Brazil - 1.5% | ||||||||
Ambev SA - ADR (Food Beverage & Tobacco)* | 13,956 | 29,866 | ||||||
B3 SA - Brasil Bolsa Balcao (Diversified Financials) | 2,900 | 25,801 | ||||||
Cia Brasileira de Distribuicao - ADR (Food & Staples Retailing) | 2,444 | 26,297 | ||||||
Raia Drogasil SA (Food & Staples Retailing) | 7,000 | 29,352 | ||||||
Ultrapar Participacoes SA - Sponsored ADR (Energy) | 10,307 | 29,272 | ||||||
WEG SA (Capital Goods) | 3,100 | 40,968 | ||||||
| 181,556 | ||||||||
Canada - 1.4% | ||||||||
Alimentation Couche-Tard Inc. (Food & Staples Retailing) | 3,800 | 117,654 | ||||||
Imperial Oil Ltd. (Energy) | 4,200 | 55,861 | ||||||
| 173,515 | ||||||||
Chile - 0.3% | ||||||||
Banco Santander Chile - ADR (Banks) | 2,474 | 34,339 | ||||||
China - 13.3% | ||||||||
51job Inc. - ADR (Commercial & Professional Services)* | 452 | 31,685 | ||||||
AAC Technologies Holdings Inc. (Technology Hardware & Equipment)† | 5,000 | 26,279 | ||||||
Alibaba Group Holding Ltd. - Sponsored ADR (Retailing)* | 168 | 51,188 | ||||||
Autohome Inc. - ADR (Media & Entertainment) | 422 | 40,322 | ||||||
China Merchants Bank Co., Ltd., Class A (Banks)† | 5,300 | 31,581 | ||||||
China Mobile Ltd. - Sponsored ADR (Telecommunication Services) | 2,118 | 65,086 | ||||||
China Tourism Group Duty Free Corp., Ltd., Class A (Retailing)† | 1,700 | 50,418 | ||||||
China Tower Corp., Ltd., Class H (Telecommunication Services)^† | 170,000 | 26,546 | ||||||
CSPC Pharmaceutical Group Ltd. (Pharmaceuticals, Biotechnology & Life Sciences)† | 25,600 | 26,990 | ||||||
ENN Energy Holdings Ltd. (Utilities)† | 4,300 | 54,491 | ||||||
| Shares | Value | |||||||
| COMMON STOCKS - 95.8% (continued) | ||||||||
China - 13.3% (continued) | ||||||||
Fuyao Glass Industry Group Co., Ltd., Class H (Automobiles & Components)^† | 10,000 | $42,550 | ||||||
Glodon Co., Ltd., Class A (Software & Services)† | 5,580 | 59,370 | ||||||
Gree Electric Appliances Inc. of Zhuhai, Class A (Consumer Durables & Apparel)† | 3,300 | 28,927 | ||||||
Haitian International Holdings Ltd. (Capital Goods)† | 14,400 | 35,693 | ||||||
Hangzhou Hikvision Digital Technology Co., Ltd., Class A (Technology Hardware & Equipment)† | 7,900 | 53,070 | ||||||
Hangzhou Tigermed Consulting Co., Ltd., Class A (Pharmaceuticals, Biotechnology & Life Sciences)† | 2,200 | 40,914 | ||||||
Inner Mongolia Yili Industrial Group Co., Ltd., Class A (Food Beverage & Tobacco)† | 10,700 | 63,981 | ||||||
JD.com Inc. - ADR (Retailing)* | 588 | 47,934 | ||||||
Jiangsu Expressway Co., Ltd., Class H (Transportation)† | 32,000 | 31,943 | ||||||
Jiangsu Hengrui Medicine Co., Ltd., Class A (Pharmaceuticals, Biotechnology & Life Sciences)† | 2,720 | 36,215 | ||||||
Jiangsu Yanghe Brewery Joint-Stock Co., Ltd., Class A (Food Beverage & Tobacco)† | 1,800 | 45,303 | ||||||
Meituan, Class B (Retailing)*† | 900 | 33,666 | ||||||
Midea Group Co., Ltd., Class A (Consumer Durables & Apparel)† | 3,400 | 39,660 | ||||||
NetEase Inc. - ADR (Media & Entertainment) | 610 | 52,942 | ||||||
New Oriental Education & Technology Group Inc. - Sponsored ADR (Consumer Services)* | 249 | 39,935 | ||||||
Ping An Insurance Group Co. of China Ltd., Class A (Insurance)† | 3,300 | 38,525 | ||||||
SF Holding Co., Ltd., Class A (Transportation)† | 5,500 | 68,204 | ||||||
Shanghai International Airport Co., Ltd., Class A (Transportation)† | 2,900 | 28,697 | ||||||
Shenzhen Inovance Technology Co., Ltd., Class A (Capital Goods)† | 8,300 | 79,615 | ||||||
Shenzhou International Group Holdings Ltd. (Consumer Durables & Apparel)† | 3,770 | 65,150 | ||||||
See Notes to Financial Statements
30
Table of Contents
Harding, Loevner Funds, Inc.
International Equity Research Portfolio
Portfolio of Investments (continued)
October 31, 2020
| Shares | Value | |||||||
| COMMON STOCKS - 95.8% (continued) | ||||||||
China - 13.3% (continued) | ||||||||
Sino Biopharmaceutical Ltd. (Pharmaceuticals, Biotechnology & Life Sciences)† | 36,500 | $36,836 | ||||||
Suofeiya Home Collection Co., Ltd., Class A (Consumer Durables & Apparel)† | 11,600 | 49,106 | ||||||
Tencent Holdings Ltd. (Media & Entertainment)† | 600 | 46,024 | ||||||
TravelSky Technology Ltd., Class H (Software & Services)† | 14,000 | 29,470 | ||||||
Trip.com Group Ltd. - ADR (Retailing)* | 1,251 | 35,979 | ||||||
Wuliangye Yibin Co., Ltd., Class A (Food Beverage & Tobacco)† | 1,300 | 47,588 | ||||||
WuXi AppTec Co., Ltd., Class A (Pharmaceuticals, Biotechnology & Life Sciences)† | 2,492 | 42,126 | ||||||
Wuxi Biologics Cayman Inc. (Pharmaceuticals, Biotechnology & Life Sciences)*^† | 1,500 | 42,145 | ||||||
| 1,666,154 | ||||||||
Colombia - 0.6% | ||||||||
Ecopetrol SA - Sponsored ADR (Energy) | 3,713 | 34,345 | ||||||
Grupo Nutresa SA (Food Beverage & Tobacco) | 7,328 | 40,405 | ||||||
| 74,750 | ||||||||
Czech Republic - 0.2% | ||||||||
Komercni banka AS (Banks)*† | 1,394 | 28,266 | ||||||
Denmark - 2.4% | ||||||||
Chr Hansen Holding A/S (Materials)† | 741 | 74,651 | ||||||
Coloplast A/S, Class B (Health Care Equipment & Services)† | 399 | 58,258 | ||||||
Genmab A/S (Pharmaceuticals, Biotechnology & Life Sciences)*† | 133 | 44,356 | ||||||
Novozymes A/S, Class B (Materials)† | 1,933 | 116,301 | ||||||
| 293,566 | ||||||||
Egypt - 0.2% | ||||||||
Commercial International Bank Egypt SAE - GDR, Reg S (Banks)† | 6,379 | 24,665 | ||||||
Finland - 0.7% | ||||||||
Kone OYJ, Class B (Capital Goods)† | 601 | 47,850 | ||||||
Neste OYJ (Energy)† | 665 | 34,735 | ||||||
| 82,585 | ||||||||
| Shares | Value | |||||||
| COMMON STOCKS - 95.8% (continued) | ||||||||
France - 5.7% | ||||||||
Air Liquide SA (Materials)† | 763 | $111,683 | ||||||
Dassault Systemes SE (Software & Services)† | 195 | 33,336 | ||||||
EssilorLuxottica SA (Consumer Durables & Apparel)*† | 850 | 105,308 | ||||||
Kering SA (Consumer Durables & Apparel)† | 111 | 67,155 | ||||||
L’Oreal SA (Household & Personal Products)† | 350 | 113,351 | ||||||
Safran SA (Capital Goods)*† | 1,113 | 118,276 | ||||||
Sartorius Stedim Biotech (Pharmaceuticals, Biotechnology & Life Sciences)† | 188 | 71,554 | ||||||
Schneider Electric SE (Capital Goods)† | 778 | 94,552 | ||||||
| 715,215 | ||||||||
Germany - 6.5% | ||||||||
adidas AG (Consumer Durables & Apparel)*† | 99 | 29,417 | ||||||
Allianz SE, Reg S (Insurance)† | 560 | 98,573 | ||||||
Bayerische Motoren Werke AG (Automobiles & Components)† | 1,228 | 83,927 | ||||||
Brenntag AG (Capital Goods)† | 540 | 34,520 | ||||||
Carl Zeiss Meditec AG (Bearer) (Health Care Equipment & Services)† | 740 | 95,996 | ||||||
FUCHS PETROLUB SE (Materials)† | 2,618 | 100,662 | ||||||
Infineon Technologies AG (Semiconductors & Semiconductor Equipment)† | 1,060 | 29,684 | ||||||
KWS Saat SE & Co. KGaA (Food Beverage & Tobacco)† | 828 | 60,948 | ||||||
SAP SE - Sponsored ADR (Software & Services) | 757 | 80,870 | ||||||
STRATEC SE (Health Care Equipment & Services)† | 535 | 78,481 | ||||||
Symrise AG (Materials)† | 987 | 122,014 | ||||||
| 815,092 | ||||||||
Hong Kong - 2.6% | ||||||||
AIA Group Ltd. (Insurance)† | 9,200 | 86,768 | ||||||
ASM Pacific Technology Ltd. (Semiconductors & Semiconductor Equipment)† | 10,100 | 101,676 | ||||||
Sands China Ltd. (Consumer Services)† | 8,800 | 30,843 | ||||||
Techtronic Industries Co., Ltd. (Capital Goods)† | 7,500 | 100,882 | ||||||
| 320,169 | ||||||||
India - 3.4% | ||||||||
Asian Paints Ltd. (Materials)† | 1,518 | 45,365 | ||||||
See Notes to Financial Statements
31
Table of Contents
Harding, Loevner Funds, Inc.
International Equity Research Portfolio
Portfolio of Investments (continued)
October 31, 2020
| Shares | Value | |||||||
| COMMON STOCKS - 95.8% (continued) | ||||||||
India - 3.4% (continued) | ||||||||
Godrej Consumer Products Ltd. (Household & Personal Products)† | 6,966 | $62,466 | ||||||
HDFC Bank Ltd. - ADR (Banks)* | 835 | 47,962 | ||||||
Hero MotoCorp Ltd. (Automobiles & Components)† | 1,194 | 45,089 | ||||||
Housing Development Finance Corp., Ltd. (Banks)† | 1,554 | 40,308 | ||||||
ICICI Bank Ltd. - Sponsored ADR (Banks)* | 3,149 | 33,222 | ||||||
Kotak Mahindra Bank Ltd. (Banks)*† | 1,697 | 35,418 | ||||||
Max Financial Services Ltd. (Insurance)*† | 4,078 | 32,505 | ||||||
Pidilite Industries Ltd. (Materials)† | 2,251 | 47,741 | ||||||
Tata Consultancy Services Ltd. (Software & Services)† | 1,001 | 35,975 | ||||||
| 426,051 | ||||||||
Indonesia - 0.8% | ||||||||
Astra International Tbk PT (Automobiles & | 122,700 | 45,348 | ||||||
Bank Rakyat Indonesia Persero Tbk PT (Banks)† | 133,500 | 30,245 | ||||||
Unilever Indonesia Tbk PT (Household & Personal Products)† | 53,600 | 28,539 | ||||||
| 104,132 | ||||||||
Italy - 2.0% | ||||||||
FinecoBank Banca Fineco SpA (Banks)*† | 9,136 | 125,115 | ||||||
Reply SpA (Software & Services)† | 1,107 | 119,039 | ||||||
| 244,154 | ||||||||
Japan - 18.2% | ||||||||
ABC-Mart Inc. (Retailing)† | 1,840 | 93,263 | ||||||
Benefit One Inc. (Commercial & Professional Services)† | 2,200 | 54,970 | ||||||
Chugai Pharmaceutical Co., Ltd. (Pharmaceuticals, Biotechnology & Life Sciences)† | 2,600 | 100,324 | ||||||
FANUC Corp. (Capital Goods)† | 350 | 74,393 | ||||||
Fast Retailing Co., Ltd. (Retailing)† | 180 | 125,880 | ||||||
Hakuhodo DY Holdings Inc. (Media & Entertainment)† | 9,990 | 127,694 | ||||||
Infomart Corp. (Software & Services)† | 5,100 | 42,226 | ||||||
Kakaku.com Inc. (Media & Entertainment)† | 2,900 | 77,098 | ||||||
| Shares | Value | |||||||
| COMMON STOCKS - 95.8% (continued) | ||||||||
Japan - 18.2% (continued) | ||||||||
Kao Corp. (Household & Personal Products)† | 1,300 | $92,427 | ||||||
Keyence Corp. (Technology Hardware & Equipment)† | 100 | 45,347 | ||||||
Kobayashi Pharmaceutical Co., Ltd. (Household & Personal Products)† | 1,300 | 126,448 | ||||||
Komatsu Ltd. (Capital Goods)† | 6,040 | 135,566 | ||||||
Kubota Corp. (Capital Goods)† | 4,800 | 83,617 | ||||||
Makita Corp. (Capital Goods)† | 2,400 | 106,091 | ||||||
MISUMI Group Inc. (Capital Goods)† | 2,200 | 65,410 | ||||||
MonotaRO Co., Ltd. (Capital Goods)† | 1,100 | 61,414 | ||||||
Nomura Research Institute Ltd. (Software & Services)† | 4,506 | 132,605 | ||||||
Pigeon Corp. (Household & Personal Products)† | 1,700 | 78,299 | ||||||
Rinnai Corp. (Consumer Durables & Apparel)† | 1,200 | 118,531 | ||||||
Shiseido Co., Ltd. (Household & Personal Products)† | 600 | 37,143 | ||||||
SMC Corp. (Capital Goods)† | 160 | 84,480 | ||||||
Stanley Electric Co., Ltd. (Automobiles & Components)† | 3,915 | 111,541 | ||||||
Sugi Holdings Co., Ltd. (Food & Staples Retailing)† | 1,755 | 116,479 | ||||||
Sysmex Corp. (Health Care Equipment & Services)† | 500 | 47,056 | ||||||
Unicharm Corp. (Household & Personal Products)† | 2,800 | 130,001 | ||||||
| 2,268,303 | ||||||||
Malaysia - 0.6% | ||||||||
Dialog Group Bhd. (Energy)† | 85,100 | 75,816 | ||||||
Mexico - 1.4% | ||||||||
Fomento Economico Mexicano SAB de CV - Sponsored ADR (Food Beverage & Tobacco) | 692 | 37,209 | ||||||
Grupo Aeroportuario del Sureste SAB de CV - ADR (Transportation)* | 310 | 35,759 | ||||||
Grupo Financiero Banorte SAB de CV, Series O (Banks)* | 9,600 | 42,769 | ||||||
Wal-Mart de Mexico SAB de CV (Food & Staples Retailing) | 26,600 | 64,269 | ||||||
| 180,006 | ||||||||
Netherlands - 2.5% | ||||||||
Adyen NV (Software & Services)*^† | 40 | 67,499 | ||||||
ASML Holding NV, Reg S (Semiconductors & Semiconductor Equipment) | 212 | 76,576 | ||||||
See Notes to Financial Statements
32
Table of Contents
Harding, Loevner Funds, Inc.
International Equity Research Portfolio
Portfolio of Investments (continued)
October 31, 2020
| Shares | Value | |||||||
| COMMON STOCKS - 95.8% (continued) | ||||||||
Netherlands - 2.5% (continued) | ||||||||
Koninklijke Vopak NV (Energy)† | 1,727 | $89,780 | ||||||
Prosus NV (Retailing)*† | 757 | 75,666 | ||||||
| 309,521 | ||||||||
Pakistan - 0.5% | ||||||||
MCB Bank Ltd. (Banks)† | 32,100 | 33,311 | ||||||
Oil & Gas Development Co., Ltd. (Energy)† | 47,100 | 27,450 | ||||||
| 60,761 | ||||||||
Panama - 0.5% | ||||||||
Copa Holdings SA, Class A (Transportation) | 1,359 | 66,972 | ||||||
Peru - 0.6% | ||||||||
Alicorp SAA (Food Beverage & Tobacco) | 17,978 | 34,807 | ||||||
Credicorp Ltd. (Banks) | 323 | 37,042 | ||||||
| 71,849 | ||||||||
Philippines - 2.2% | ||||||||
Bank of the Philippine Islands (Banks)† | 27,440 | 41,703 | ||||||
BDO Unibank Inc. (Banks)† | 18,870 | 34,659 | ||||||
Robinsons Retail Holdings Inc. (Food & Staples Retailing)† | 39,680 | 52,467 | ||||||
Security Bank Corp. (Banks)† | 19,210 | 38,267 | ||||||
SM Prime Holdings Inc. (Real Estate)† | 83,300 | 58,007 | ||||||
Universal Robina Corp. (Food Beverage & Tobacco)† | 9,040 | 25,719 | ||||||
Wilcon Depot Inc. (Retailing)† | 95,300 | 28,160 | ||||||
| 278,982 | ||||||||
Poland - 0.2% | ||||||||
ING Bank Slaski SA (Banks)*† | 980 | 25,406 | ||||||
Russia - 0.7% | ||||||||
LUKOIL PJSC - Sponsored ADR (Energy) | 603 | 30,807 | ||||||
Novatek PJSC - Sponsored GDR, Reg S (Energy)† | 190 | 22,904 | ||||||
Sberbank of Russia PJSC - Sponsored ADR (Banks)† | 3,389 | 34,247 | ||||||
| 87,958 | ||||||||
Saudi Arabia - 0.5% | ||||||||
Bupa Arabia for Cooperative Insurance Co. (Insurance)*† | 1,141 | 34,869 | ||||||
Jarir Marketing Co. (Retailing)† | 724 | 33,434 | ||||||
| 68,303 | ||||||||
Singapore - 1.4% | ||||||||
DBS Group Holdings Ltd. (Banks)† | 5,970 | 88,925 | ||||||
Oversea-Chinese Banking Corp., Ltd. (Banks)† | 14,484 | 89,269 | ||||||
| 178,194 | ||||||||
| Shares | Value | |||||||
| COMMON STOCKS - 95.8% (continued) | ||||||||
South Africa - 0.5% | ||||||||
Clicks Group Ltd. (Food & Staples Retailing)† | 2,585 | $37,513 | ||||||
Discovery Ltd. (Insurance)† | 4,148 | 27,279 | ||||||
| 64,792 | ||||||||
South Korea - 1.3% | ||||||||
Amorepacific Corp. (Household & Personal Products)† | 223 | 31,178 | ||||||
Coway Co., Ltd. (Consumer Durables & Apparel)*† | 524 | 32,183 | ||||||
LG Household & Health Care Ltd. (Household & Personal Products)† | 29 | 38,073 | ||||||
NAVER Corp. (Media & Entertainment)† | 249 | 64,188 | ||||||
| 165,622 | ||||||||
Spain - 1.4% | ||||||||
Banco Bilbao Vizcaya Argentaria SA (Banks)† | 18,242 | 52,523 | ||||||
Banco Santander SA - Sponsored ADR (Banks)* | 30,731 | 61,770 | ||||||
Bankinter SA (Banks)† | 16,713 | 62,847 | ||||||
| 177,140 | ||||||||
Sweden - 4.2% | ||||||||
Alfa Laval AB (Capital Goods)*† | 1,883 | 38,222 | ||||||
Assa Abloy AB, Class B (Capital Goods)† | 5,185 | 111,344 | ||||||
Atlas Copco AB, Class A (Capital Goods)† | 998 | 44,078 | ||||||
Epiroc AB, Class A (Capital Goods)† | 5,368 | 80,249 | ||||||
Hexagon AB, Class B (Technology Hardware & Equipment)*† | 1,069 | 78,068 | ||||||
Intrum AB (Commercial & Professional Services)† | 2,391 | 58,466 | ||||||
Skandinaviska Enskilda Banken AB, Class A (Banks)*† | 12,667 | 108,867 | ||||||
| 519,294 | ||||||||
Switzerland - 5.0% | ||||||||
Alcon Inc. (Health Care Equipment & Services)* | 1,961 | 111,463 | ||||||
Cie Financiere Richemont SA, Class A, Reg S (Consumer Durables & Apparel)† | 1,343 | 84,122 | ||||||
Lonza Group AG, Reg S (Pharmaceuticals, Biotechnology & Life Sciences)† | 123 | 74,391 | ||||||
Roche Holding AG, Genusschein (Pharmaceuticals, Biotechnology & Life Sciences)† | 362 | 116,208 | ||||||
SGS SA, Reg S (Commercial & Professional Services)† | 44 | 109,812 | ||||||
See Notes to Financial Statements
33
Table of Contents
Harding, Loevner Funds, Inc.
International Equity Research Portfolio
Portfolio of Investments (continued)
October 31, 2020
| Shares | Value | |||||||
| COMMON STOCKS - 95.8% (continued) | ||||||||
Switzerland - 5.0% (continued) | ||||||||
Sonova Holding AG, Reg S (Health Care Equipment & Services)*† | 140 | $33,140 | ||||||
Temenos AG, Reg S (Software & Services)† | 306 | 32,802 | ||||||
VAT Group AG (Capital Goods)^† | 207 | 38,806 | ||||||
Vifor Pharma AG (Pharmaceuticals, Biotechnology & Life Sciences)† | 201 | 22,566 | ||||||
| 623,310 | ||||||||
Taiwan - 2.1% | ||||||||
Advantech Co., Ltd. (Technology Hardware & Equipment)† | 6,998 | 70,827 | ||||||
Eclat Textile Co., Ltd. (Consumer Durables & Apparel)† | 2,700 | 35,794 | ||||||
Hon Hai Precision Industry Co., Ltd. (Technology Hardware & Equipment)† | 12,000 | 32,554 | ||||||
Largan Precision Co., Ltd. (Technology Hardware & Equipment)† | 300 | 31,894 | ||||||
Silergy Corp. (Semiconductors & Semiconductor Equipment)† | 500 | 30,868 | ||||||
Taiwan Semiconductor Manufacturing Co., Ltd. (Semiconductors & Semiconductor Equipment)† | 4,000 | 60,368 | ||||||
| 262,305 | ||||||||
Thailand - 0.5% | ||||||||
Bumrungrad Hospital pcl, Reg S (Health Care Equipment & Services)† | 9,100 | 26,569 | ||||||
Siam Commercial Bank pcl, Reg S (Banks)† | 16,000 | 33,368 | ||||||
| 59,937 | ||||||||
Turkey - 0.3% | ||||||||
BIM Birlesik Magazalar AS (Food & Staples Retailing)† | 4,402 | 35,123 | ||||||
United Arab Emirates - 0.3% | ||||||||
Emaar Properties PJSC (Real Estate)*† | 49,936 | 36,172 | ||||||
United Kingdom - 7.9% | ||||||||
Abcam plc (Pharmaceuticals, Biotechnology & Life Sciences)† | 1,734 | 33,137 | ||||||
Coca-Cola HBC AG - CDI (Food Beverage & Tobacco)*† | 1,189 | 27,045 | ||||||
Compass Group plc (Consumer Services)† | 4,959 | 67,833 | ||||||
| Shares | Value | |||||||
| COMMON STOCKS - 95.8% (continued) | ||||||||
United Kingdom - 7.9% (continued) | ||||||||
Dechra Pharmaceuticals plc (Pharmaceuticals, Biotechnology & Life Sciences)† | 2,000 | $90,512 | ||||||
Diploma plc (Capital Goods)† | 3,275 | 94,484 | ||||||
Halma plc (Technology Hardware & Equipment)† | 2,597 | 79,722 | ||||||
HomeServe plc (Commercial & Professional Services)† | 4,536 | 64,949 | ||||||
Network International Holdings plc (Software & Services)*^† | 7,598 | 21,939 | ||||||
Rathbone Brothers plc (Diversified Financials)† | 1,779 | 33,538 | ||||||
Reckitt Benckiser Group plc (Household & Personal Products)† | 777 | 68,465 | ||||||
Rio Tinto plc (Materials)† | 1,986 | 112,545 | ||||||
Rotork plc (Capital Goods)† | 7,970 | 29,043 | ||||||
Royal Dutch Shell plc, Class B - Sponsored ADR (Energy) | 4,189 | 101,164 | ||||||
Signature Aviation plc (Transportation)† | 9,155 | 28,111 | ||||||
Spirax-Sarco Engineering plc (Capital Goods)† | 742 | 108,502 | ||||||
Standard Chartered plc (Banks)*† | 6,991 | 31,997 | ||||||
| 992,986 | ||||||||
Total Common Stocks (Cost $10,217,212) | $11,963,827 | |||||||
| PREFERRED STOCKS - 2.2% | ||||||||
Brazil - 0.5% | ||||||||
Banco Bradesco SA - ADR, 5.13% (Banks)+ | 8,564 | 29,974 | ||||||
Itau Unibanco Holding SA - Sponsored ADR, 0.78% (Banks)+ | 7,362 | 30,111 | ||||||
| 60,085 | ||||||||
Colombia - 0.3% | ||||||||
Bancolombia SA - Sponsored ADR, 4.18% (Banks)+ | 1,501 | 38,260 | ||||||
South Korea - 0.3% | ||||||||
Samsung Electronics Co., Ltd. - GDR, Reg S, 2.63% (Technology Hardware & Equipment)+† | 42 | 47,241 | ||||||
Spain - 1.1% | ||||||||
Grifols SA - ADR, 1.17% (Pharmaceuticals, Biotechnology & Life Sciences)+ | 7,968 | 135,297 | ||||||
Total Preferred Stocks (Cost $273,864) | $280,883 | |||||||
See Notes to Financial Statements
34
Table of Contents
Harding, Loevner Funds, Inc.
International Equity Research Portfolio
Portfolio of Investments (continued)
October 31, 2020
| Shares | Value | |||||||
| SHORT TERM INVESTMENTS - 2.0% | ||||||||
Northern Institutional Funds - Treasury Portfolio (Premier Shares), 0.00% (Money Market Funds) | 251,379 | $251,379 | ||||||
Total Short Term Investments (Cost $251,379) |
| $251,379 | ||||||
Total Investments — 100.0% | ||||||||
(Cost $10,742,455) | $12,496,089 | |||||||
Liabilities Less Other Assets - (0.0)% | (2,087 | ) | ||||||
Net Assets — 100.0% | $12,494,002 | |||||||
Summary of Abbreviations
| ADR | American Depositary Receipt |
| CDI | Chess Depositary Interest |
| GDR | Global Depositary Receipt |
| Reg S | Security sold outside United States without registration under the Securities Act of 1933. |
| † | Investment categorized as level 2 security as disclosed in Note 2 of the Notes to Financial Statements. |
| * | Non-income producing security. |
| ^ | Security exempt from registration pursuant to Rule 144A of the Securities Act of 1933. These securities, which represent 1.9% of net assets as of October 31, 2020, are considered liquid and may be resold in transactions exempt from registration, normally to qualified buyers. |
| + | Current yield is disclosed. Dividends are calculated based on a percentage of the issuer’s net income. |
| Industry | | Percentage of Net Assets | | ||
Automobiles & Components | 2.6 | % | |||
Banks | 10.8 | ||||
Capital Goods | 13.7 | ||||
Commercial & Professional Services | 2.6 | ||||
Consumer Durables & Apparel | 5.2 | ||||
Consumer Services | 1.1 | ||||
Diversified Financials | 0.5 | ||||
Energy | 4.0 | ||||
Food & Staples Retailing | 3.8 | ||||
Food Beverage & Tobacco | 3.3 | ||||
Health Care Equipment & Services | 4.2 | ||||
Household & Personal Products | 6.5 | ||||
Insurance | 2.5 | ||||
Materials | 6.7 | ||||
Media & Entertainment | 3.3 | ||||
Pharmaceuticals, Biotechnology & Life Sciences | 7.3 | ||||
Real Estate | 0.8 | ||||
Retailing | 4.6 | ||||
Semiconductors & Semiconductor Equipment | 2.4 | ||||
Software & Services | 5.2 | ||||
Technology Hardware & Equipment | 3.7 | ||||
Telecommunication Services | 0.7 | ||||
Transportation | 2.1 | ||||
Utilities | 0.4 | ||||
Money Market Fund | 2.0 | ||||
Total Investments | 100.0 | ||||
Liabilities Less Other Assets | (0.0 | ) | |||
Net Assets | 100.0 | % | |||
See Notes to Financial Statements
35
Table of Contents
Emerging Markets Research Portfolio
Portfolio of Investments
October 31, 2020
| Shares | Value | |||||||
| COMMON STOCKS - 95.1% | ||||||||
Bangladesh - 0.6% | ||||||||
GrameenPhone Ltd. (Telecommunication Services)† | 5,493 | $21,377 | ||||||
Square Pharmaceuticals Ltd. (Pharmaceuticals, Biotechnology & Life Sciences)† | 10,331 | 24,193 | ||||||
| 45,570 | ||||||||
Brazil - 3.7% | ||||||||
Ambev SA - ADR (Food Beverage & Tobacco)* | 20,505 | 43,881 | ||||||
B3 SA - Brasil Bolsa Balcao (Diversified Financials) | 3,300 | 29,360 | ||||||
Cia Brasileira de Distribuicao - ADR (Food & Staples Retailing) | 8,181 | 88,027 | ||||||
Raia Drogasil SA (Food & Staples Retailing) | 8,000 | 33,545 | ||||||
Ultrapar Participacoes SA - Sponsored ADR (Energy) | 11,420 | 32,433 | ||||||
WEG SA (Capital Goods) | 3,600 | 47,576 | ||||||
| 274,822 | ||||||||
Chile - 0.8% | ||||||||
Banco Santander Chile - ADR (Banks) | 4,331 | 60,114 | ||||||
China - 33.4% | ||||||||
51job Inc. - ADR (Commercial & Professional Services)* | 249 | 17,455 | ||||||
AAC Technologies Holdings Inc. (Technology Hardware & Equipment)† | 7,000 | 36,790 | ||||||
Alibaba Group Holding Ltd. - Sponsored ADR (Retailing)* | 502 | 152,954 | ||||||
Autohome Inc. - ADR (Media & Entertainment) | 442 | 42,233 | ||||||
China Merchants Bank Co., Ltd., Class A (Banks)† | 12,200 | 72,696 | ||||||
China Mobile Ltd. - Sponsored ADR (Telecommunication Services) | 2,034 | 62,505 | ||||||
China Tourism Group Duty Free Corp., Ltd., Class A (Retailing)† | 1,700 | 50,418 | ||||||
China Tower Corp., Ltd., Class H (Telecommunication Services)^† | 444,000 | 69,331 | ||||||
CSPC Pharmaceutical Group Ltd. (Pharmaceuticals, Biotechnology & Life Sciences)† | 46,080 | 48,581 | ||||||
ENN Energy Holdings Ltd. (Utilities)† | 9,000 | 114,052 | ||||||
Fuyao Glass Industry Group Co., Ltd., Class H (Automobiles & Components)^† | 11,600 | 49,358 | ||||||
| Shares | Value | |||||||
| COMMON STOCKS - 95.1% (continued) | ||||||||
China - 33.4% (continued) | ||||||||
Glodon Co., Ltd., Class A (Software & Services)† | 3,400 | $36,175 | ||||||
Gree Electric Appliances Inc. of Zhuhai, Class A (Consumer Durables & Apparel)† | 4,700 | 41,200 | ||||||
Haitian International Holdings Ltd. (Capital Goods)† | 15,000 | 37,180 | ||||||
Hangzhou Hikvision Digital Technology Co., Ltd., Class A (Technology Hardware & Equipment)† | 10,500 | 70,536 | ||||||
Hangzhou Tigermed Consulting Co., Ltd., Class A (Pharmaceuticals, Biotechnology & Life Sciences)† | 2,300 | 42,774 | ||||||
Inner Mongolia Yili Industrial Group Co., Ltd., Class A (Food Beverage & Tobacco)† | 11,300 | 67,568 | ||||||
JD.com Inc. - ADR (Retailing)* | 1,651 | 134,590 | ||||||
Jiangsu Expressway Co., Ltd., Class H (Transportation)† | 50,000 | 49,911 | ||||||
Jiangsu Hengrui Medicine Co., Ltd., Class A (Pharmaceuticals, Biotechnology & Life Sciences)† | 5,400 | 71,898 | ||||||
Jiangsu Yanghe Brewery Joint-Stock Co., Ltd., Class A (Food Beverage & Tobacco)† | 2,200 | 55,370 | ||||||
Meituan, Class B (Retailing)*† | 2,200 | 82,295 | ||||||
Midea Group Co., Ltd., Class A (Consumer Durables & Apparel)† | 4,000 | 46,659 | ||||||
NetEase Inc. - ADR (Media & Entertainment) | 1,395 | 121,072 | ||||||
New Oriental Education & Technology Group Inc. - Sponsored ADR (Consumer Services)* | 261 | 41,859 | ||||||
Ping An Insurance Group Co. of China Ltd., Class A (Insurance)† | 11,100 | 129,584 | ||||||
SF Holding Co., Ltd., Class A (Transportation)† | 5,900 | 73,165 | ||||||
Shanghai International Airport Co., Ltd., Class A (Transportation)† | 3,600 | 35,624 | ||||||
Shenzhen Inovance Technology Co., Ltd., Class A (Capital Goods)† | 7,600 | 72,901 | ||||||
Shenzhou International Group Holdings Ltd. (Consumer Durables & Apparel)† | 3,000 | 51,844 | ||||||
Sino Biopharmaceutical Ltd. (Pharmaceuticals, Biotechnology & Life Sciences)† | 45,000 | 45,414 | ||||||
See Notes to Financial Statements
36
Table of Contents
Harding, Loevner Funds, Inc.
Emerging Markets Research Portfolio
Portfolio of Investments (continued)
October 31, 2020
| Shares | Value | |||||||
| COMMON STOCKS - 95.1% (continued) | ||||||||
China - 33.4% (continued) | ||||||||
Suofeiya Home Collection Co., Ltd., Class A (Consumer Durables & Apparel)† | 13,700 | $57,996 | ||||||
Tencent Holdings Ltd. (Media & Entertainment)† | 1,900 | 145,742 | ||||||
TravelSky Technology Ltd., Class H (Software & Services)† | 23,000 | 48,415 | ||||||
Trip.com Group Ltd. - ADR (Retailing)* | 1,311 | 37,704 | ||||||
Wuliangye Yibin Co., Ltd., Class A (Food Beverage & Tobacco)† | 1,100 | 40,267 | ||||||
WuXi AppTec Co., Ltd., Class A (Pharmaceuticals, Biotechnology & Life Sciences)† | 2,856 | 48,279 | ||||||
Wuxi Biologics Cayman Inc. (Pharmaceuticals, Biotechnology & Life Sciences)*^† | 2,000 | 56,194 | ||||||
| 2,458,589 | ||||||||
Colombia - 0.6% | ||||||||
Ecopetrol SA - Sponsored ADR (Energy) | 2,874 | 26,584 | ||||||
Grupo Nutresa SA (Food Beverage & Tobacco) | 3,657 | 20,164 | ||||||
| 46,748 | ||||||||
Czech Republic - 0.7% | ||||||||
Komercni banka AS (Banks)*† | 2,407 | 48,807 | ||||||
Egypt - 0.6% | ||||||||
Commercial International Bank Egypt SAE - GDR, Reg S (Banks)† | 11,703 | 45,250 | ||||||
India - 9.8% | ||||||||
Asian Paints Ltd. (Materials)† | 2,810 | 83,976 | ||||||
Godrej Consumer Products Ltd. (Household & Personal Products)† | 7,970 | 71,469 | ||||||
HDFC Bank Ltd. - ADR (Banks)* | 2,433 | 139,752 | ||||||
Hero MotoCorp Ltd. (Automobiles & Components)† | 2,039 | 76,998 | ||||||
Housing Development Finance Corp., Ltd. (Banks)† | 1,478 | 38,337 | ||||||
ICICI Bank Ltd. - Sponsored ADR (Banks)* | 4,150 | 43,782 | ||||||
Kotak Mahindra Bank Ltd. (Banks)*† | 1,950 | 40,698 | ||||||
Max Financial Services Ltd. (Insurance)*† | 5,458 | 43,504 | ||||||
Pidilite Industries Ltd. (Materials)† | 2,034 | 43,139 | ||||||
| Shares | Value | |||||||
| COMMON STOCKS - 95.1% (continued) | ||||||||
India - 9.8% (continued) | ||||||||
Tata Consultancy Services Ltd. (Software & Services)† | 3,947 | $141,853 | ||||||
| 723,508 | ||||||||
Indonesia - 1.5% | ||||||||
Astra International Tbk PT (Automobiles & Components)† | 59,300 | 21,916 | ||||||
Bank Rakyat Indonesia Persero Tbk PT (Banks)† | 152,000 | 34,437 | ||||||
Unilever Indonesia Tbk PT (Household & Personal Products)† | 105,000 | 55,906 | ||||||
| 112,259 | ||||||||
Kazakhstan - 0.2% | ||||||||
Halyk Savings Bank of Kazakhstan JSC - GDR, Reg S (Banks)† | 1,610 | 16,069 | ||||||
Kenya - 0.2% | ||||||||
Safaricom plc (Telecommunication Services)† | 62,300 | 17,661 | ||||||
Kuwait - 0.3% | ||||||||
Mabanee Co. SAK (Real Estate)† | 9,375 | 19,864 | ||||||
Malaysia - 0.8% | ||||||||
Dialog Group Bhd. (Energy)† | 63,800 | 56,839 | ||||||
Mexico - 5.2% | ||||||||
Fomento Economico Mexicano SAB de CV - Sponsored ADR (Food Beverage & Tobacco) | 2,705 | 145,448 | ||||||
Grupo Aeroportuario del Sureste SAB de CV - ADR (Transportation)* | 448 | 51,677 | ||||||
Grupo Financiero Banorte SAB de CV, Series O | 11,500 | 51,234 | ||||||
Wal-Mart de Mexico SAB de CV (Food & Staples Retailing) | 57,000 | 137,720 | ||||||
| 386,079 | ||||||||
Morocco - 1.1% | ||||||||
Attijariwafa Bank (Banks)*† | 1,345 | 55,080 | ||||||
Maroc Telecom (Telecommunication Services)† | 1,491 | 22,849 | ||||||
| 77,929 | ||||||||
Nigeria - 0.9% | ||||||||
Guaranty Trust Bank plc (Banks)† | 261,863 | 22,029 | ||||||
Nestle Nigeria plc (Food Beverage & Tobacco) | 5,120 | 18,842 | ||||||
Zenith Bank plc (Banks)† | 414,394 | 23,706 | ||||||
| 64,577 | ||||||||
See Notes to Financial Statements
37
Table of Contents
Harding, Loevner Funds, Inc.
Emerging Markets Research Portfolio
Portfolio of Investments (continued)
October 31, 2020
| Shares | Value | |||||||
| COMMON STOCKS - 95.1% (continued) | ||||||||
Pakistan - 0.5% | ||||||||
MCB Bank Ltd. (Banks)† | 17,600 | $18,264 | ||||||
Oil & Gas Development Co., Ltd. (Energy)† | 27,700 | 16,144 | ||||||
| 34,408 | ||||||||
Panama - 0.6% | ||||||||
Copa Holdings SA, Class A (Transportation) | 840 | 41,395 | ||||||
Peru - 1.2% | ||||||||
Alicorp SAA (Food Beverage & Tobacco) | 9,214 | 17,839 | ||||||
Credicorp Ltd. (Banks) | 617 | 70,758 | ||||||
| 88,597 | ||||||||
Philippines - 3.4% | ||||||||
Bank of the Philippine Islands (Banks)† | 26,900 | 40,882 | ||||||
BDO Unibank Inc. (Banks)† | 30,810 | 56,589 | ||||||
Robinsons Retail Holdings Inc. (Food & Staples Retailing)† | 15,670 | 20,720 | ||||||
Security Bank Corp. (Banks)† | 10,700 | 21,315 | ||||||
SM Prime Holdings Inc. (Real Estate)† | 72,700 | 50,625 | ||||||
Universal Robina Corp. (Food Beverage & Tobacco)† | 15,950 | 45,378 | ||||||
Wilcon Depot Inc. (Retailing)† | 56,500 | 16,695 | ||||||
| 252,204 | ||||||||
Poland - 0.2% | ||||||||
ING Bank Slaski SA (Banks)*† | 505 | 13,092 | ||||||
Romania - 0.4% | ||||||||
Banca Transilvania SA (Banks)† | 35,213 | 15,947 | ||||||
Societatea Nationala de Gaze Naturale ROMGAZ SA (Energy)† | 2,060 | 12,724 | ||||||
| 28,671 | ||||||||
Russia - 2.9% | ||||||||
LUKOIL PJSC - Sponsored ADR (Energy) | 1,444 | 73,774 | ||||||
Novatek PJSC - Sponsored GDR, Reg S (Energy)† | 501 | 60,394 | ||||||
Sberbank of Russia PJSC - Sponsored ADR (Banks)† | 7,465 | 75,436 | ||||||
| 209,604 | ||||||||
Saudi Arabia - 1.5% | ||||||||
Bupa Arabia for Cooperative Insurance Co. (Insurance)*† | 1,690 | 51,647 | ||||||
Jarir Marketing Co. (Retailing)† | 1,292 | 59,663 | ||||||
| 111,310 | ||||||||
Slovenia - 0.2% | ||||||||
Krka dd Novo mesto (Pharmaceuticals, Biotechnology & Life Sciences)† | 174 | 15,607 | ||||||
| Shares | Value | |||||||
| COMMON STOCKS - 95.1% (continued) | ||||||||
South Africa - 2.2% | ||||||||
Clicks Group Ltd. (Food & Staples Retailing)† | 7,577 | $109,957 | ||||||
Discovery Ltd. (Insurance)† | 7,600 | 49,980 | ||||||
| 159,937 | ||||||||
South Korea - 7.3% | ||||||||
Amorepacific Corp. (Household & Personal Products)† | 1,048 | 146,523 | ||||||
Coway Co., Ltd. (Consumer Durables & Apparel)*† | 1,760 | 108,095 | ||||||
LG Household & Health Care Ltd. (Household & Personal Products)† | 106 | 139,162 | ||||||
NAVER Corp. (Media & Entertainment)† | 546 | 140,750 | ||||||
| 534,530 | ||||||||
Taiwan - 8.5% | ||||||||
Advantech Co., Ltd. (Technology Hardware & Equipment)† | 5,499 | 55,655 | ||||||
Eclat Textile Co., Ltd. (Consumer Durables & Apparel)† | 11,000 | 145,825 | ||||||
Hon Hai Precision Industry Co., Ltd. (Technology Hardware & Equipment)† | 49,000 | 132,930 | ||||||
Largan Precision Co., Ltd. (Technology Hardware & Equipment)† | 700 | 74,420 | ||||||
Silergy Corp. (Semiconductors & Semiconductor Equipment)† | 1,100 | 67,910 | ||||||
Taiwan Semiconductor Manufacturing Co., Ltd. (Semiconductors & Semiconductor Equipment)† | 10,000 | 150,920 | ||||||
| 627,660 | ||||||||
Thailand - 1.3% | ||||||||
Bumrungrad Hospital pcl, Reg S (Health Care Equipment & Services)† | 10,600 | 30,949 | ||||||
Siam Commercial Bank pcl, Reg S (Banks)† | 32,000 | 66,736 | ||||||
| 97,685 | ||||||||
Turkey - 1.2% | ||||||||
BIM Birlesik Magazalar AS (Food & Staples Retailing)† | 11,148 | 88,949 | ||||||
United Arab Emirates - 0.5% | ||||||||
Emaar Properties PJSC (Real Estate)*† | 53,031 | 38,414 | ||||||
United Kingdom - 0.2% | ||||||||
Helios Towers plc (Telecommunication Services)*† | 8,087 | 16,899 | ||||||
Vietnam - 2.6% | ||||||||
Bank for Foreign Trade of Vietnam JSC (Banks)† | 15,240 | 54,592 | ||||||
See Notes to Financial Statements
38
Table of Contents
Harding, Loevner Funds, Inc.
Emerging Markets Research Portfolio
Portfolio of Investments
October 31, 2020
| Shares | Value | |||||||
| COMMON STOCKS - 95.1% (continued) | ||||||||
Vietnam - 2.6% (continued) | ||||||||
Hoa Phat Group JSC (Materials)† | 46,716 | $61,583 | ||||||
Saigon Beer Alcohol Beverage Corp. (Food Beverage & Tobacco)† | 2,320 | 18,449 | ||||||
Vietnam Dairy Products JSC (Food Beverage & Tobacco)† | 11,811 | 55,129 | ||||||
| 189,753 | ||||||||
Total Common Stocks (Cost $6,448,978) | $7,003,400 | |||||||
| PREFERRED STOCKS - 3.8% | ||||||||
Brazil - 1.4% | ||||||||
Banco Bradesco SA - ADR, 5.13% (Banks)+ | 19,936 | 69,776 | ||||||
Itau Unibanco Holding SA - Sponsored ADR, 0.78% (Banks)+ | 8,370 | 34,234 | ||||||
| 104,010 | ||||||||
Colombia - 0.4% | ||||||||
Bancolombia SA - Sponsored ADR, 4.18% (Banks)+ | 1,139 | 29,033 | ||||||
South Korea - 2.0% | ||||||||
Samsung Electronics Co., Ltd. - GDR, Reg S, 2.63% (Technology Hardware & Equipment)+† | 133 | 149,597 | ||||||
Total Preferred Stocks (Cost $307,825) | $282,640 | |||||||
| SHORT TERM INVESTMENTS - 1.0% | ||||||||
Northern Institutional Funds - Treasury Portfolio (Premier Shares), 0.00% (Money Market Funds) | 72,705 | 72,705 | ||||||
Total Short Term Investments (Cost $72,705) |
| $72,705 | ||||||
Total Investments — 99.9% | ||||||||
(Cost $6,829,508) | $7,358,745 | |||||||
Other Assets Less Liabilities – 0.1% | 8,227 | |||||||
Net Assets — 100.0% | $7,366,972 | |||||||
Summary of Abbreviations
| ADR | American Depositary Receipt |
| GDR | Global Depositary Receipt |
| Reg | Security sold outside United States without registration under the Securities Act of 1933. |
| † | Investment categorized as level 2 security as disclosed in Note 2 of the Notes to Financial Statements. |
| * | Non-income producing security. |
| ^ | Securities Act of 1933. These securities, which represent 2.4% of net assets as of October 31, 2020, are considered liquid and may be resold in transactions exempt from registration, normally to qualified buyers. |
| + | Current yield is disclosed. Dividends are calculated based on a percentage of the issuer’s net income. |
| Industry | | Percentge of Net Assets | | ||
Automobiles & Components | 2.0 | % | |||
Banks | 17.1 | ||||
Capital Goods | 2.1 | ||||
Commercial & Professional Services | 0.2 | ||||
Consumer Durables & Apparel | 6.1 | ||||
Consumer Services | 0.6 | ||||
Diversified Financials | 0.4 | ||||
Energy | 3.8 | ||||
Food & Staples Retailing | 6.5 | ||||
Food Beverage & Tobacco | 7.2 | ||||
Health Care Equipment & Services | 0.4 | ||||
Household & Personal Products | 5.6 | ||||
Insurance | 3.7 | ||||
Materials | 2.6 | ||||
Media & Entertainment | 6.1 | ||||
Pharmaceuticals, Biotechnology & Life Sciences | 4.8 | ||||
Real Estate | 1.5 | ||||
Retailing | 7.2 | ||||
Semiconductors & Semiconductor Equipment | 3.0 | ||||
Software & Services | 3.1 | ||||
Technology Hardware & Equipment | 7.1 | ||||
Telecommunication Services | 2.9 | ||||
Transportation | 3.4 | ||||
Utilities | 1.5 | ||||
Money Market Fund | 1.0 | ||||
Total Investments | 99.9 | ||||
Other Assets Less Liabilities | 0.1 | ||||
Net Assets | 100.0 | % | |||
See Notes to Financial Statements
39
Table of Contents
Harding, Loevner Funds, Inc.
Statements of Assets and Liabilities
October 31, 2020
Global Equity Portfolio | International Equity Portfolio | International Small Companies Portfolio | ||||||||||
ASSETS: | ||||||||||||
Investments (cost $987,542,916, $12,004,248,149 and $304,217,038, respectively) | $1,382,437,114 | $16,060,962,248 | $378,535,475 | |||||||||
Dividends and interest receivable | 299,854 | 8,415,274 | 303,326 | |||||||||
Foreign currency (cost $0, $0 and $186,254, respectively) | — | — | 186,162 | |||||||||
Receivable for investments sold | 5,554,755 | — | — | |||||||||
Receivable for Fund shares sold | 426,958 | 43,505,891 | 266,968 | |||||||||
Tax reclaims receivable | 277,185 | 17,105,023 | 167,839 | |||||||||
Prepaid expenses | 42,377 | 97,597 | 85,121 | |||||||||
Total Assets: | 1,389,038,243 | 16,130,086,033 | 379,544,891 | |||||||||
LIABILITIES: | ||||||||||||
Payable to Investment Adviser | (910,739 | ) | (9,588,882 | ) | (375,750 | ) | ||||||
Payable for investments purchased | (401,102 | ) | — | (1,991,992 | ) | |||||||
Payable for Fund shares redeemed | (1,269,256 | ) | (16,503,927 | ) | (125,722 | ) | ||||||
Payable for directors’ fees and expenses | (8,131 | ) | (130,210 | ) | (2,851 | ) | ||||||
Payable for distribution fees | — | (222,515 | ) | (46,683 | ) | |||||||
Deferred capital gains tax | — | — | (1,489 | ) | ||||||||
Other liabilities | (275,634 | ) | (4,049,490 | ) | (137,991 | ) | ||||||
Total Liabilities | (2,864,862 | ) | (30,495,024 | ) | (2,682,478 | ) | ||||||
Net Assets | $1,386,173,381 | $16,099,591,009 | $376,862,413 | |||||||||
ANALYSIS OF NET ASSETS: | ||||||||||||
Paid in capital | $911,617,440 | $12,536,236,277 | $312,258,907 | |||||||||
Distributable earnings | 474,555,941 | 3,563,354,732 | 64,603,506 | |||||||||
Net Assets | $1,386,173,381 | $16,099,591,009 | $376,862,413 | |||||||||
Net Assets: | ||||||||||||
Institutional Class | $1,043,741,621 | $13,596,899,875 | $337,166,554 | |||||||||
Institutional Class Z | 289,319,816 | 2,165,342,760 | — | |||||||||
Investor Class | — | 337,348,374 | 39,695,859 | |||||||||
Advisor Class | 53,111,944 | — | — | |||||||||
Total Shares Outstanding: | ||||||||||||
Institutional Class (500,000,000, 700,000,000(1) and 500,000,000, respectively, $.001 par value shares authorized) | 24,610,044 | 572,318,462 | 19,665,624 | |||||||||
Institutional Class Z (200,000,000, 300,000,000(1) and —, respectively, $.001 par value shares authorized) | 6,824,475 | 91,137,361 | — | |||||||||
Investor Class (—, 100,000,000 (1) and 100,000,000(1), respectively, $.001 par value shares authorized) | — | 14,232,172 | 2,342,665 | |||||||||
Advisor Class (400,000,000, — and —, respectively, $.001 par value shares authorized) | 1,252,396 | — | — | |||||||||
Net Asset Value, Offering Price and Redemption Price Per Share: | ||||||||||||
Institutional Class | $42.41 | $23.76 | $17.14 | |||||||||
Institutional Class Z | 42.39 | 23.76 | — | |||||||||
Investor Class | — | 23.70 | 16.94 | |||||||||
Advisor Class | 42.41 | — | — | |||||||||
| (1) | As amended by Articles Supplementary filed on December 10, 2020. |
See Notes to Financial Statements
40
Table of Contents
Harding, Loevner Funds, Inc.
Statements of Assets and Liabilities (continued)
October 31, 2020
Institutional Emerging Markets Portfolio | Emerging Markets Portfolio | Frontier Emerging Markets Portfolio | ||||||||||
ASSETS: | ||||||||||||
Investments (cost $4,259,709,955, $2,657,271,563 and $179,689,660, respectively) | $5,447,514,560 | $3,723,363,913 | $201,279,675 | |||||||||
Dividends and interest receivable | 11,185,092 | 7,922,433 | 48,132 | |||||||||
Foreign currency (cost $4,750,893, $3,129,781 and $232,860, respectively) | 4,748,134 | 3,127,967 | 233,929 | |||||||||
Receivable for investments sold | 40,376,731 | 27,351,842 | — | |||||||||
Receivable for Fund shares sold | 3,778,489 | 2,130,020 | 40,717 | |||||||||
Tax reclaims receivable | 59,920 | — | — | |||||||||
Prepaid expenses | 72,204 | 29,497 | 35,865 | |||||||||
Total Assets: | 5,507,735,130 | 3,763,925,672 | 201,638,318 | |||||||||
LIABILITIES: | ||||||||||||
Payable to Investment Adviser | (5,247,427 | ) | (3,655,630 | ) | (234,317 | ) | ||||||
Payable for investments purchased | (17,189,692 | ) | (11,533,104 | ) | — | |||||||
Payable for Fund shares redeemed | (6,202,929 | ) | (6,092,271 | ) | (94,243 | ) | ||||||
Payable for directors’ fees and expenses | (43,533 | ) | (29,489 | ) | (1,569 | ) | ||||||
Payable for distribution fees | — | — | (15,787 | ) | ||||||||
Deferred capital gains tax | (3,176,493 | ) | (1,710,473 | ) | (508,047 | ) | ||||||
Other liabilities | (1,536,038 | ) | (1,695,470 | ) | (170,001 | ) | ||||||
Total Liabilities | (33,396,112 | ) | (24,716,437 | ) | (1,023,964 | ) | ||||||
Net Assets | $5,474,339,018 | $3,739,209,235 | $200,614,354 | |||||||||
ANALYSIS OF NET ASSETS: | ||||||||||||
Paid in capital | $4,555,654,572 | $2,754,354,325 | $305,480,839 | |||||||||
Distributable earnings | 918,684,446 | 984,854,910 | (104,866,485 | ) | ||||||||
Net Assets | $5,474,339,018 | $3,739,209,235 | $200,614,354 | |||||||||
Net Assets: | ||||||||||||
Institutional Class | $4,847,707,340 | $— | $— | |||||||||
Institutional Class I | — | — | 73,376,038 | |||||||||
Institutional Class II | — | — | 116,911,018 | |||||||||
Institutional Class Z | 626,631,678 | — | — | |||||||||
Investor Class | — | — | 10,327,298 | |||||||||
Advisor Class | — | 3,739,209,235 | — | |||||||||
Total Shares Outstanding: | ||||||||||||
Institutional Class (500,000,000, — and —, respectively, $.001 par value shares authorized) | 228,363,447 | — | — | |||||||||
Institutional Class I (—, — and 400,000,000, respectively, $.001 par value shares authorized) | — | — | 10,601,637 | |||||||||
Institutional Class II (—, — and 200,000,000, respectively, $.001 par value shares authorized) | — | — | 16,812,144 | |||||||||
Institutional Class Z (500,000,000, — and —, respectively, $.001 par value shares authorized) | 29,451,889 | — | — | |||||||||
Investor Class (—, — and 400,000,000, respectively, $.001 par value shares authorized) | — | — | 1,500,007 | |||||||||
Advisor Class (—, 500,000,000 and —, respectively, $.001 par value shares authorized) | — | 67,402,587 | — | |||||||||
Net Asset Value, Offering Price and Redemption Price Per Share: | ||||||||||||
Institutional Class | $21.23 | $— | $— | |||||||||
Institutional Class I | — | — | 6.92 | |||||||||
Institutional Class II | — | — | 6.95 | |||||||||
Institutional Class Z | 21.28 | — | — | |||||||||
Investor Class | — | — | 6.88 | |||||||||
Advisor Class | — | 55.48 | — | |||||||||
See Notes to Financial Statements
41
Table of Contents
Harding, Loevner Funds, Inc.
Statements of Assets and Liabilities (continued)
October 31, 2020
Global Equity Research Portfolio | International Equity Research Portfolio | Emerging Markets Research Portfolio | ||||||||||
ASSETS: | ||||||||||||
Investments (cost $6,112,242, $10,742,455 and $6,829,508, respectively) | $7,398,911 | $12,496,089 | $7,358,745 | |||||||||
Dividends and interest receivable | 5,934 | 13,435 | 8,702 | |||||||||
Foreign currency (cost $52, $193 and $18,149, respectively) | 52 | 193 | 18,160 | |||||||||
Receivable for Fund shares sold | — | 2,329 | — | |||||||||
Tax reclaims receivable | 1,734 | 9,906 | — | |||||||||
Capital gain tax refund receivable | — | 204 | 107 | |||||||||
Prepaid expenses | 27,804 | 33,071 | 28,112 | |||||||||
Total Assets: | 7,434,435 | 12,555,227 | 7,413,826 | |||||||||
LIABILITIES: | ||||||||||||
Payable to Investment Adviser | (4,537 | ) | (7,655 | ) | (6,326 | ) | ||||||
Payable for directors’ fees and expenses | (58 | ) | (99 | ) | (57 | ) | ||||||
Deferred capital gains tax | (3,096 | ) | (9,607 | ) | (10,824 | ) | ||||||
Other liabilities | (39,728 | ) | (43,864 | ) | (29,647 | ) | ||||||
Total Liabilities | (47,419 | ) | (61,225 | ) | (46,854 | ) | ||||||
Net Assets | $7,387,016 | $12,494,002 | $7,366,972 | |||||||||
ANALYSIS OF NET ASSETS: | ||||||||||||
Paid in capital | $5,896,839 | $10,396,382 | $6,761,037 | |||||||||
Distributable earnings | 1,490,177 | 2,097,620 | 605,935 | |||||||||
Net Assets | $7,387,016 | $12,494,002 | $7,366,972 | |||||||||
Net Assets: | ||||||||||||
Institutional Class | $7,387,016 | $12,494,002 | $7,366,972 | |||||||||
Total Shares Outstanding: | ||||||||||||
Institutional Class (400,000,000, 400,000,000 and 400,000,000, respectively, $.001 par value shares authorized) | 578,840 | 1,040,222 | 657,051 | |||||||||
Net Asset Value, Offering Price and Redemption Price Per Share: | ||||||||||||
Institutional Class | $12.76 | $12.01 | $11.21 | |||||||||
See Notes to Financial Statements
42
Table of Contents
Harding, Loevner Funds, Inc.
For the Fiscal Year Ended October 31, 2020
Global Equity Portfolio | International Equity Portfolio | International Small Companies Portfolio | Institutional Emerging Markets Portfolio | Emerging Markets Portfolio | ||||||||||||||||
INVESTMENT INCOME | ||||||||||||||||||||
Dividends (net of foreign withholding taxes of $410,681, $34,116,036, $473,404, $12,908,581 and $9,341,348, respectively) | $7,897,449 | $287,667,288 | $5,553,232 | $100,076,269 | $72,524,473 | |||||||||||||||
Total investment income | 7,897,449 | 287,667,288 | 5,553,232 | 100,076,269 | 72,524,473 | |||||||||||||||
EXPENSES | ||||||||||||||||||||
Investment advisory fees (Note 3) | 7,922,301 | 106,143,812 | 3,869,166 | 59,705,673 | 43,910,461 | |||||||||||||||
Administration fees (Note 3) | 329,339 | 4,995,349 | 115,727 | 1,696,562 | 1,240,629 | |||||||||||||||
Distribution fees, Investor Class | — | 903,367 | 124,745 | — | — | |||||||||||||||
Custody and accounting fees (Note 3) | 107,433 | 1,557,071 | 143,252 | 1,460,370 | 1,108,844 | |||||||||||||||
Directors’ fees and expenses | 30,749 | 501,545 | 10,716 | 169,425 | 123,018 | |||||||||||||||
Transfer agent fees and expenses (Note 3) | 10,509 | 546,110 | 7,421 | 58,425 | 585,138 | |||||||||||||||
Printing and postage fees | 34,704 | 977,937 | 22,231 | 375,046 | 394,270 | |||||||||||||||
State registration filing fees | 70,642 | 356,876 | 53,854 | 126,276 | 100,128 | |||||||||||||||
Professional fees | 53,102 | 318,614 | 58,516 | 142,157 | 125,640 | |||||||||||||||
Shareholder servicing fees (Note 3) | 660,453 | 10,903,524 | 239,235 | 4,169,315 | 5,633,807 | |||||||||||||||
Compliance officers’ fees and expenses (Note 3) | 2,788 | 45,335 | 963 | 15,333 | 11,148 | |||||||||||||||
Other fees and expenses | 40,805 | 462,895 | 16,594 | 156,533 | 117,048 | |||||||||||||||
Total Expenses | 9,262,825 | 127,712,435 | 4,662,420 | 68,075,115 | 53,350,131 | |||||||||||||||
Less Waiver of investment advisory fee and/or reimbursement of other operating expenses | (12,588 | ) | — | (668,582 | ) | (485,350 | ) | — | ||||||||||||
Net expenses | 9,250,237 | 127,712,435 | 3,993,838 | 67,589,765 | 53,350,131 | |||||||||||||||
Net investment income (loss) | (1,352,788 | ) | 159,954,853 | 1,559,394 | 32,486,504 | 19,174,342 | ||||||||||||||
REALIZED AND UNREALIZED GAIN (LOSS) | ||||||||||||||||||||
Net realized gain (loss) | ||||||||||||||||||||
Investment transactions | 111,015,898 | (442,417,223 | ) | (3,930,378 | ) | (72,429,784 | ) | (39,130,088 | ) | |||||||||||
Foreign currency transactions | (59,325 | ) | (1,229,663 | ) | (136,751 | ) | (1,196,905 | ) | (1,201,688 | ) | ||||||||||
Net realized gain (loss) | 110,956,573 | (443,646,886 | ) | (4,067,129 | ) | (73,626,689 | ) | (40,331,776 | ) | |||||||||||
Change in unrealized appreciation (depreciation) | ||||||||||||||||||||
Investments (net of increase (decrease) in deferred foreign taxes of $—, $—, $7,381, $(1,498,721) and $(786,006), respectively) | 72,889,473 | 1,116,718,567 | 35,449,027 | 110,459,595 | 21,906,874 | |||||||||||||||
Translation of assets and liabilities denominated in foreign currencies | 13,629 | 747,761 | 3,912 | 9,076 | (1,248 | ) | ||||||||||||||
Net change in unrealized appreciation | 72,903,102 | 1,117,466,328 | 35,452,939 | 110,468,671 | 21,905,626 | |||||||||||||||
Net realized and unrealized gain (loss) | 183,859,675 | 673,819,442 | 31,385,810 | 36,841,982 | (18,426,150 | ) | ||||||||||||||
NET INCREASE IN NET ASSETS RESULTING FROM OPERATIONS | $182,506,887 | $833,774,295 | $32,945,204 | $69,328,486 | $748,192 | |||||||||||||||
See Notes to Financial Statements
43
Table of Contents
Harding, Loevner Funds, Inc.
Statements of Operations (continued)
For the Fiscal Year Ended October 31, 2020
Frontier Emerging Markets Portfolio | Global Equity Research Portfolio | International Equity Research Portfolio | Emerging Markets Research Portfolio | |||||||||||||
INVESTMENT INCOME | ||||||||||||||||
Dividends (net of foreign withholding taxes of $751,420, $8,397, $33,173 and $17,407, respectively) | $7,398,806 | $111,651 | $348,033 | $138,685 | ||||||||||||
Total investment income | 7,398,806 | 111,651 | 348,033 | 138,685 | ||||||||||||
EXPENSES | ||||||||||||||||
Investment advisory fees (Note 3) | 3,108,656 | 48,932 | 125,016 | 70,114 | ||||||||||||
Administration fees (Note 3) | 82,267 | 12,197 | 15,617 | 12,203 | ||||||||||||
Distribution fees, Investor Class | 33,949 | — | — | — | ||||||||||||
Custody and accounting fees (Note 3) | 371,139 | 10,947 | 27,552 | 15,008 | ||||||||||||
Directors’ fees and expenses | 7,330 | 235 | 547 | 252 | ||||||||||||
Transfer agent fees and expenses (Note 3) | 6,029 | 487 | 637 | 507 | ||||||||||||
Printing and postage fees | 12,601 | 227 | 520 | 229 | ||||||||||||
State registration filing fees | 47,745 | 21,532 | 17,729 | 21,794 | ||||||||||||
Professional fees | 45,518 | 40,450 | 39,731 | 41,095 | ||||||||||||
Shareholder servicing fees (Note 3) | 88,754 | — | 18,400 | — | ||||||||||||
Compliance officers’ fees and expenses (Note 3) | 666 | 23 | 52 | 23 | ||||||||||||
Other fees and expenses | 22,433 | 7,445 | 4,627 | 7,077 | ||||||||||||
Total Expenses | 3,827,087 | 142,475 | 250,428 | 168,302 | ||||||||||||
Less Waiver of investment advisory fee and/or reimbursement of other operating expenses (Note 3) | (306,864 | ) | (86,553 | ) | (116,489 | ) | (87,673 | ) | ||||||||
Net expenses | 3,520,223 | 55,922 | 133,939 | 80,629 | ||||||||||||
Net investment income | 3,878,583 | 55,729 | 214,094 | 58,056 | ||||||||||||
REALIZED AND UNREALIZED GAIN (LOSS) | ||||||||||||||||
Net realized gain (loss) | ||||||||||||||||
Investment transactions | (619,752 | ) | 164,503 | 205,229 | 50,972 | |||||||||||
Foreign currency transactions | (211,294 | ) | (1,662 | ) | (6,589 | ) | (4,713 | ) | ||||||||
Net realized gain (loss) | (831,046 | ) | 162,841 | 198,640 | 46,259 | |||||||||||
Change in unrealized appreciation (depreciation) | ||||||||||||||||
Investments (net of increase (decrease) in deferred foreign taxes of $212,536, $(3,121), $(9,463) and $(9,680), respectively) | (33,495,789 | ) | 273,425 | 163,565 | 58,971 | |||||||||||
Translation of assets and liabilities denominated in foreign currencies | 2,240 | 122 | 408 | (4 | ) | |||||||||||
Net change in unrealized appreciation (depreciation) | (33,493,549 | ) | 273,547 | 163,973 | 58,967 | |||||||||||
Net realized and unrealized gain (loss) | (34,324,595 | ) | 436,388 | 362,613 | 105,226 | |||||||||||
NET INCREASE (DECREASE) IN NET ASSETS RESULTING FROM OPERATIONS | $(30,446,012 | ) | $492,117 | $576,707 | $163,282 | |||||||||||
See Notes to Financial Statements
44
Table of Contents
Harding, Loevner Funds, Inc.
Statements of Changes in Net Assets
For the Fiscal Years Ended October 31
Global Equity Portfolio | International Equity Portfolio | International Small Companies Portfolio | ||||||||||||||||||||||
| 2020 | 2019 | 2020 | 2019 | 2020 | 2019 | |||||||||||||||||||
INCREASE (DECREASE) IN NET ASSETS FROM OPERATIONS | ||||||||||||||||||||||||
Net investment income (loss) | $(1,352,788 | ) | $2,497,705 | $159,954,853 | $201,056,232 | $1,559,394 | $1,698,992 | |||||||||||||||||
Net realized gain (loss) on investments and foreign currency transactions | 110,956,573 | (6,375,697 | ) | (443,646,886 | ) | (33,612,658 | ) | (4,067,129 | ) | (5,697,615 | ) | |||||||||||||
Net change in unrealized appreciation on investments and translation of assets and liabilities denominated in foreign currencies | 72,903,102 | 107,273,674 | 1,117,466,328 | 1,425,393,239 | 35,452,939 | 26,188,769 | ||||||||||||||||||
Net increase in net assets resulting from operations | 182,506,887 | 103,395,682 | 833,774,295 | 1,592,836,813 | 32,945,204 | 22,190,146 | ||||||||||||||||||
DISTRIBUTIONS TO SHAREHOLDERS: | ||||||||||||||||||||||||
Institutional Class | (4,316,797 | ) | (64,234,872 | ) | (230,105,321 | ) | (167,443,933 | ) | (1,807,612 | ) | (8,346,534 | ) | ||||||||||||
Institutional Class Z | (1,747,501 | ) | (15,391,303 | ) | (34,291,239 | ) | (20,898,599 | ) | — | — | ||||||||||||||
Investor Class | — | — | (5,139,836 | ) | (3,656,420 | ) | (315,070 | ) | (3,593,042 | ) | ||||||||||||||
Advisor Class | (135,973 | ) | (9,454,857 | ) | — | — | — | — | ||||||||||||||||
Total distributions to shareholders | (6,200,271 | ) | (89,081,032 | ) | (269,536,396 | ) | (191,998,952 | ) | (2,122,682 | ) | (11,939,576 | ) | ||||||||||||
TRANSACTIONS IN SHARES OF COMMON STOCK | ||||||||||||||||||||||||
Institutional Class | 243,439,192 | 57,694,848 | (630,807,060 | ) | 566,865,141 | 36,814,201 | 112,439,750 | |||||||||||||||||
Institutional Class Z | 7,571,877 | 82,448,223 | 135,625,446 | 437,598,452 | — | — | ||||||||||||||||||
Investor Class | — | — | (70,443,766 | ) | (54,430,541 | ) | (20,120,767 | ) | (2,538,877 | ) | ||||||||||||||
Advisor Class | (3,444,298 | ) | (42,431,140 | ) | — | — | — | — | ||||||||||||||||
Net Increase (Decrease) in net assets from portfolio share transactions | 247,566,771 | 97,711,931 | (565,625,380 | ) | 950,033,052 | 16,693,434 | 109,900,873 | |||||||||||||||||
NET INCREASE (DECREASE) IN NET ASSETS | 423,873,387 | 112,026,581 | (1,387,481 | ) | 2,350,870,913 | 47,515,956 | 120,151,443 | |||||||||||||||||
NET ASSETS | ||||||||||||||||||||||||
At beginning of year | 962,299,994 | 850,273,413 | 16,100,978,490 | 13,750,107,577 | 329,346,457 | 209,195,014 | ||||||||||||||||||
At end of year | $1,386,173,381 | $962,299,994 | $16,099,591,009 | $16,100,978,490 | $376,862,413 | $329,346,457 | ||||||||||||||||||
See Notes to Financial Statements
45
Table of Contents
Harding, Loevner Funds, Inc.
Statements of Changes in Net Assets (continued)
For the Fiscal Years Ended October 31
Institutional Emerging Markets Portfolio | Emerging Markets Portfolio | Frontier Emerging Markets Portfolio | ||||||||||||||||||||||
| 2020 | 2019 | 2020 | 2019 | 2020 | 2019 | |||||||||||||||||||
INCREASE (DECREASE) IN NET ASSETS FROM OPERATIONS | ||||||||||||||||||||||||
Net investment income | $32,486,504 | $59,373,616 | $19,174,342 | $43,088,333 | $3,878,583 | $6,718,383 | ||||||||||||||||||
Net realized gain (loss) on investments and foreign currency transactions | (73,626,689 | ) | (13,326,874 | ) | (40,331,776 | ) | 4,685,180 | (831,046 | ) | (25,803,298 | ) | |||||||||||||
Net change in unrealized appreciation | ||||||||||||||||||||||||
(depreciation) on investments and translation of assets and liabilities denominated in foreign currencies | 110,468,671 | 673,738,997 | 21,905,626 | 498,976,801 | (33,493,549 | ) | 36,007,690 | |||||||||||||||||
Net increase (decrease) in net assets resulting from operations | 69,328,486 | 719,785,739 | 748,192 | 546,750,314 | (30,446,012 | ) | 16,922,775 | |||||||||||||||||
DISTRIBUTIONS TO SHAREHOLDERS: | ||||||||||||||||||||||||
Institutional Class | (76,149,087 | ) | (37,840,245 | ) | — | — | — | — | ||||||||||||||||
Institutional Class I | — | — | — | — | (2,815,425 | ) | (2,317,415 | ) | ||||||||||||||||
Institutional Class II | — | — | — | — | (2,717,575 | ) | (2,370,233 | ) | ||||||||||||||||
Institutional Class Z | (9,138,400 | ) | (4,685,232 | ) | — | — | — | — | ||||||||||||||||
Investor Class | — | — | — | — | (292,150 | ) | (193,925 | ) | ||||||||||||||||
Advisor Class | — | — | (63,406,861 | ) | (29,768,361 | ) | — | — | ||||||||||||||||
Total distributions to shareholders | (85,287,487 | ) | (42,525,477 | ) | (63,406,861 | ) | (29,768,361 | ) | (5,825,150 | ) | (4,881,573 | ) | ||||||||||||
TRANSACTIONS IN SHARES OF COMMON STOCK | ||||||||||||||||||||||||
Institutional Class | (12,857,492 | ) | 273,614,078 | — | — | — | — | |||||||||||||||||
Institutional Class I | — | — | — | — | (51,623,798 | ) | (79,791,087 | ) | ||||||||||||||||
Institutional Class II | — | — | — | — | 2,717,575 | (42,137,950 | ) | |||||||||||||||||
Institutional Class Z | 80,529,077 | 101,847,677 | — | — | — | — | ||||||||||||||||||
Investor Class | — | — | — | — | (8,252,656 | ) | (5,615,597 | ) | ||||||||||||||||
Advisor Class | — | — | (472,445,897 | ) | 298,174,837 | — | — | |||||||||||||||||
Net Increase (Decrease) in net assets from portfolio share transactions | 67,671,585 | 375,461,755 | (472,445,897 | ) | 298,174,837 | (57,158,879 | ) | (127,544,634 | ) | |||||||||||||||
NET INCREASE (DECREASE) IN NET ASSETS | 51,712,584 | 1,052,722,017 | (535,104,566 | ) | 815,156,790 | (93,430,041 | ) | (115,503,432 | ) | |||||||||||||||
NET ASSETS | ||||||||||||||||||||||||
At beginning of year | 5,422,626,434 | 4,369,904,417 | 4,274,313,801 | 3,459,157,011 | 294,044,395 | 409,547,827 | ||||||||||||||||||
At end of year | $5,474,339,018 | $5,422,626,434 | $3,739,209,235 | $4,274,313,801 | $200,614,354 | $294,044,395 | ||||||||||||||||||
See Notes to Financial Statements
46
Table of Contents
Harding, Loevner Funds, Inc.
Statements of Changes in Net Assets (continued)
For the Fiscal Years Ended October 31
Global Equity Research Portfolio | International Equity Research Portfolio | Emerging Markets Research Portfolio | ||||||||||||||||||||||
| 2020 | 2019 | 2020 | 2019 | 2020 | 2019 | |||||||||||||||||||
INCREASE (DECREASE) IN NET ASSETS FROM OPERATIONS | ||||||||||||||||||||||||
Net investment income | $55,729 | $74,449 | $214,094 | $187,025 | $58,056 | $89,493 | ||||||||||||||||||
Net realized gain on investments and foreign currency transactions | 162,841 | 295,892 | 198,640 | 143,404 | 46,259 | 207,059 | ||||||||||||||||||
Net change in unrealized appreciation on investments and translation of assets and liabilities denominated in foreign currencies | 273,547 | 494,170 | 163,973 | 1,381,496 | 58,967 | 638,030 | ||||||||||||||||||
Net increase in net assets resulting from operations | 492,117 | 864,511 | 576,707 | 1,711,925 | 163,282 | 934,582 | ||||||||||||||||||
DISTRIBUTIONS TO SHAREHOLDERS: | ||||||||||||||||||||||||
Institutional Class | (379,881 | ) | (466,964 | ) | (374,600 | ) | (728,939 | ) | (299,717 | ) | (473,739 | ) | ||||||||||||
Investor Class* | — | (48,022 | ) | — | (85,106 | ) | — | (45,468 | ) | |||||||||||||||
Total distributions to shareholders | (379,881 | ) | (514,986 | ) | (374,600 | ) | (814,045 | ) | (299,717 | ) | (519,207 | ) | ||||||||||||
TRANSACTIONS IN SHARES OF COMMON STOCK | ||||||||||||||||||||||||
Institutional Class | 379,881 | 1,078,763 | (7,165,689 | ) | 9,225,741 | 305,718 | 1,090,834 | |||||||||||||||||
Investor Class* | — | (547,730 | ) | — | (1,044,838 | ) | — | (560,346 | ) | |||||||||||||||
Net Increase (Decrease) in net assets from portfolio share transactions | 379,881 | 531,033 | (7,165,689 | ) | 8,180,903 | 305,718 | 530,488 | |||||||||||||||||
NET INCREASE (DECREASE) IN NET ASSETS | 492,117 | 880,558 | (6,963,582 | ) | 9,078,783 | 169,283 | 945,863 | |||||||||||||||||
NET ASSETS | ||||||||||||||||||||||||
At beginning of year | 6,894,899 | 6,014,341 | 19,457,584 | 10,378,801 | 7,197,689 | 6,251,826 | ||||||||||||||||||
At end of year | $7,387,016 | $6,894,899 | $12,494,002 | $19,457,584 | $7,366,972 | $7,197,689 | ||||||||||||||||||
| * | Effective March 1, 2019, the Investor Class shares of the Global Equity Research, International Equity Research and Emerging Markets Research Portfolios were closed and their balances were transferred to the Institutional Class (See Note 7). |
See Notes to Financial Statements
47
Table of Contents
Harding, Loevner Funds, Inc.
For the Fiscal Year Ended October 31
| INCREASE (DECREASE) IN NET ASSETS FROM OPERATIONS: | DISTRIBUTIONS TO SHAREHOLDERS FROM: | RATIOS/SUPPLEMENTAL DATA: | ||||||||||||||||||||||||||||||||||||||||||||||||||||||
Net asset value, beginning of year | Net investment income (loss)(1) | Net realized and unrealized gain (loss) on investments and foreign currency- related transactions | Net increase (decrease) from investment operations | Net investment income | Net realized gain from investment | Total distribution | Net asset value, end of year | Total Return | Net assets, end of year (000’s) | Expenses to average net assets | Expenses to average net assets (net of fees waived/ reimbursed) | Net investment income to average | Portfolio turnover rate | |||||||||||||||||||||||||||||||||||||||||||
| Global Equity Portfolio–Institutional Class |
| |||||||||||||||||||||||||||||||||||||||||||||||||||||||
10/31/20 | $ | 35.38 | $ | (0.06 | ) | $ | 7.33 | $ | 7.27 | $ | (0.24 | ) | $ | — | $ | (0.24 | ) | $ | 42.41 | 20.63 | % | $ | 1,043,741 | 0.92 | % | 0.92 | % | (0.15 | )% | 63 | % | |||||||||||||||||||||||||
10/31/19 | 35.68 | 0.09 | 3.45 | 3.54 | (0.12 | ) | (3.72 | ) | (3.84 | ) | 35.38 | 11.86 | 684,764 | 0.93 | 0.93 | 0.28 | 39 | |||||||||||||||||||||||||||||||||||||||
10/31/18 | 40.84 | 0.13 | (0.13 | ) | — | (0.14 | ) | (5.02 | ) | (5.16 | ) | 35.68 | (0.35 | ) | 619,347 | 0.94 | 0.94 | 0.34 | 42 | |||||||||||||||||||||||||||||||||||||
10/31/17 | 32.53 | 0.09 | 8.74 | 8.83 | (0.13 | ) | (0.39 | ) | (0.52 | ) | 40.84 | 27.58 | 790,097 | 0.93 | 0.93 | 0.25 | 33 | |||||||||||||||||||||||||||||||||||||||
10/31/16 | 32.44 | 0.13 | 0.92 | 1.05 | (0.12 | ) | (0.84 | ) | (0.96 | ) | 32.53 | 3.43 | 779,020 | 0.92 | 0.92 | 0.42 | 24 | |||||||||||||||||||||||||||||||||||||||
| Global Equity Portfolio–Institutional Class Z |
| |||||||||||||||||||||||||||||||||||||||||||||||||||||||
10/31/20 | 35.36 | (0.02 | ) | 7.31 | 7.29 | (0.26 | ) | — | (0.26 | ) | 42.39 | 20.76 | 289,320 | 0.85 | 0.84 | (0.05 | ) | 63 | ||||||||||||||||||||||||||||||||||||||
10/31/19 | 35.67 | 0.11 | 3.44 | 3.55 | (0.14 | ) | (3.72 | ) | (3.86 | ) | 35.36 | 11.89 | 229,355 | 0.88 | 0.88 | 0.32 | 39 | |||||||||||||||||||||||||||||||||||||||
10/31/18 | 40.84 | 0.17 | (0.15 | ) | 0.02 | (0.17 | ) | (5.02 | ) | (5.19 | ) | 35.67 | (0.26 | ) | 140,359 | 0.91 | 0.90 | 0.43 | 42 | |||||||||||||||||||||||||||||||||||||
10/31/17(2)(3) | 39.33 | (0.01 | ) | 1.52 | 1.51 | — | — | — | 40.84 | 3.80 | (A) | 46,493 | 1.21 | (B) | 0.90 | (B) | (0.05 | )(B) | 33 | (A) | ||||||||||||||||||||||||||||||||||||
| Global Equity Portfolio–Advisor Class |
| |||||||||||||||||||||||||||||||||||||||||||||||||||||||
10/31/20 | 35.30 | (0.12 | ) | 7.33 | 7.21 | (0.10 | ) | — | (0.10 | ) | 42.41 | 20.47 | 53,112 | 1.11 | 1.11 | (0.32 | ) | 63 | ||||||||||||||||||||||||||||||||||||||
10/31/19 | 35.60 | 0.03 | 3.43 | 3.46 | (0.04 | ) | (3.72 | ) | (3.76 | ) | 35.30 | 11.60 | 48,181 | 1.12 | 1.12 | 0.09 | 39 | |||||||||||||||||||||||||||||||||||||||
10/31/18 | 40.78 | 0.07 | (0.15 | ) | (0.08 | ) | (0.08 | ) | (5.02 | ) | (5.10 | ) | 35.60 | (0.57 | ) | 90,567 | 1.14 | 1.14 | 0.18 | 42 | ||||||||||||||||||||||||||||||||||||
10/31/17 | 32.47 | 0.01 | 8.73 | 8.74 | (0.04 | ) | (0.39 | ) | (0.43 | ) | 40.78 | 27.28 | 75,244 | 1.14 | 1.14 | 0.02 | 33 | |||||||||||||||||||||||||||||||||||||||
10/31/16 | 32.38 | 0.05 | 0.91 | 0.96 | (0.03 | ) | (0.84 | ) | (0.87 | ) | 32.47 | 3.12 | 56,698 | 1.19 | 1.19 | 0.15 | 24 | |||||||||||||||||||||||||||||||||||||||
| International Equity Portfolio–Institutional Class |
| |||||||||||||||||||||||||||||||||||||||||||||||||||||||
10/31/20 | 22.72 | 0.23 | 1.19 | 1.42 | (0.38 | ) | — | (0.38 | ) | 23.76 | 6.25 | 13,596,900 | 0.81 | 0.81 | 1.01 | 17 | ||||||||||||||||||||||||||||||||||||||||
10/31/19 | 20.74 | 0.29 | 1.98 | 2.27 | (0.29 | ) | — | (0.29 | ) | 22.72 | 11.19 | 13,766,876 | 0.81 | 0.81 | 1.35 | 30 | ||||||||||||||||||||||||||||||||||||||||
10/31/18 | 22.64 | 0.31 | (1.83 | ) | (1.52 | ) | (0.20 | ) | (0.18 | ) | (0.38 | ) | 20.74 | (6.86 | ) | 11,995,592 | 0.81 | 0.81 | 1.34 | 10 | ||||||||||||||||||||||||||||||||||||
10/31/17 | 18.37 | 0.23 | 4.22 | 4.45 | (0.18 | ) | — | (0.18 | ) | 22.64 | 24.47 | 11,107,736 | 0.82 | 0.82 | 1.22 | 12 | ||||||||||||||||||||||||||||||||||||||||
10/31/16 | 17.69 | 0.21 | 0.64 | 0.85 | (0.17 | ) | — | (0.17 | ) | 18.37 | 4.91 | 6,354,810 | 0.84 | 0.84 | 1.20 | 22 | ||||||||||||||||||||||||||||||||||||||||
| International Equity Portfolio–Institutional Class Z |
| |||||||||||||||||||||||||||||||||||||||||||||||||||||||
10/31/20 | 22.72 | 0.25 | 1.18 | 1.43 | (0.39 | ) | — | (0.39 | ) | 23.76 | 6.32 | 2,165,343 | 0.73 | 0.73 | 1.08 | 17 | ||||||||||||||||||||||||||||||||||||||||
10/31/19 | 20.75 | 0.30 | 1.98 | 2.28 | (0.31 | ) | — | (0.31 | ) | 22.72 | 11.29 | 1,938,763 | 0.75 | 0.75 | 1.42 | 30 | ||||||||||||||||||||||||||||||||||||||||
10/31/18 | 22.64 | 0.40 | (1.90 | ) | (1.50 | ) | (0.21 | ) | (0.18 | ) | (0.39 | ) | 20.75 | (6.79 | ) | 1,342,804 | 0.74 | 0.74 | 1.77 | 10 | ||||||||||||||||||||||||||||||||||||
10/31/17(3)(4) | 21.35 | 0.02 | 1.27 | 1.29 | — | — | — | 22.64 | 6.00 | (A) | 166,923 | 0.99 | (B) | 0.80 | (B) | 0.33 | (B) | 12 | (A) | |||||||||||||||||||||||||||||||||||||
| International Equity Portfolio–Investor Class |
| |||||||||||||||||||||||||||||||||||||||||||||||||||||||
10/31/20 | 22.66 | 0.16 | 1.18 | 1.34 | (0.30 | ) | — | (0.30 | ) | 23.70 | 5.91 | 337,348 | 1.13 | 1.13 | 0.69 | 17 | ||||||||||||||||||||||||||||||||||||||||
10/31/19 | 20.65 | 0.22 | 1.98 | 2.20 | (0.19 | ) | — | (0.19 | ) | 22.66 | 10.79 | 395,339 | 1.13 | 1.13 | 1.03 | 30 | ||||||||||||||||||||||||||||||||||||||||
10/31/18 | 22.55 | 0.21 | (1.80 | ) | (1.59 | ) | (0.13 | ) | (0.18 | ) | (0.31 | ) | 20.65 | (7.16 | ) | 411,712 | 1.14 | 1.14 | 0.92 | 10 | ||||||||||||||||||||||||||||||||||||
10/31/17 | 18.30 | 0.19 | 4.18 | 4.37 | (0.12 | ) | — | (0.12 | ) | 22.55 | 24.04 | 644,243 | 1.14 | 1.14 | 0.95 | 12 | ||||||||||||||||||||||||||||||||||||||||
10/31/16 | 17.62 | 0.14 | 0.66 | 0.80 | (0.12 | ) | — | (0.12 | ) | 18.30 | 4.63 | 433,765 | 1.15 | 1.15 | 0.83 | 22 | ||||||||||||||||||||||||||||||||||||||||
| International Small Companies Portfolio–Institutional Class |
| |||||||||||||||||||||||||||||||||||||||||||||||||||||||
10/31/20 | 15.64 | 0.08 | 1.53 | 1.61 | (0.11 | ) | — | (0.11 | ) | 17.14 | 10.34 | 337,166 | 1.34 | 1.15 | 0.50 | 30 | ||||||||||||||||||||||||||||||||||||||||
10/31/19 | 15.29 | 0.12 | 1.24 | 1.36 | (0.13 | ) | (0.88 | ) | (1.01 | ) | 15.64 | 10.14 | 272,252 | 1.38 | 1.15 | 0.78 | 37 | |||||||||||||||||||||||||||||||||||||||
10/31/18 | 16.67 | 0.13 | (1.30 | ) | (1.17 | ) | (0.06 | ) | (0.15 | ) | (0.21 | ) | 15.29 | (7.15 | ) | 151,283 | 1.39 | 1.15 | 0.75 | 52 | ||||||||||||||||||||||||||||||||||||
10/31/17 | 13.72 | 0.11 | 3.41 | 3.52 | (0.16 | ) | (0.41 | ) | (0.57 | ) | 16.67 | 26.98 | 144,170 | 1.41 | 1.15 | 0.72 | 19 | |||||||||||||||||||||||||||||||||||||||
10/31/16 | 13.40 | 0.20 | 0.34 | 0.54 | (0.09 | ) | (0.13 | ) | (0.22 | ) | 13.72 | 4.15 | 62,785 | 1.60 | 1.25 | 1.51 | 49 | |||||||||||||||||||||||||||||||||||||||
| (A) | Not Annualized. |
| (B) | Annualized. |
| (1) | Net investment income per share was calculated using the average shares outstanding method. |
| (2) | For the period from August 1, 2017 (commencement of class operations) through October 31, 2017. |
| (3) | All per share amounts and net asset values have been adjusted as a result of the reverse share split effected after the close of business on December 1, 2017. |
| (4) | For the period from July 17, 2017 (commencement of class operations) through October 31, 2017. |
See Notes to Financial Statements
48
Table of Contents
Harding, Loevner Funds, Inc.
Financial Highlights (continued)
For the Fiscal Year Ended October 31
INCREASE (DECREASE) IN NET ASSETS FROM OPERATIONS: | DISTRIBUTIONS TO SHAREHOLDERS FROM: | RATIOS/SUPPLEMENTAL DATA: | ||||||||||||||||||||||||||||||||||||||||||||||||||||||
Net asset value, beginning | Net investment income (loss)(1) | Net realized and unrealized gain (loss) on investments and foreign currency- related transactions | Net increase (decrease) from investment operations | Net investment income | Net realized gain from investments | Total distributions | Net asset value, end of year | Total Return | Net assets, end of year (000’s) | Expenses to average net assets | Expenses to average net assets (net of fees waived/ reimbursed) | Net investment income to average net assets | Portfolio turnover rate | |||||||||||||||||||||||||||||||||||||||||||
| International Small Companies Portfolio–Investor Class | ||||||||||||||||||||||||||||||||||||||||||||||||||||||||
| 10/31/20 | $15.48 | $0.04 | $1.51 | $1.55 | $(0.09 | ) | $ — | $(0.09 | ) | $16.94 | 10.07 | % | $39,696 | 1.67 | % | 1.40 | % | 0.28 | % | 30 | % | |||||||||||||||||||||||||||||||||||
| 10/31/19 | 15.16 | 0.09 | 1.21 | 1.30 | (0.10 | ) | (0.88 | ) | (0.98 | ) | 15.48 | 9.82 | 57,095 | 1.70 | 1.40 | 0.63 | 37 | |||||||||||||||||||||||||||||||||||||||
| 10/31/18 | 16.55 | 0.10 | (1.29 | ) | (1.19 | ) | (0.05 | ) | (0.15 | ) | (0.20 | ) | 15.16 | (7.35 | ) | 57,912 | 1.75 | 1.40 | 0.58 | 52 | ||||||||||||||||||||||||||||||||||||
| 10/31/17 | 13.64 | 0.05 | 3.42 | 3.47 | (0.15 | ) | (0.41 | ) | (0.56 | ) | 16.55 | 26.71 | 50,292 | 1.80 | 1.40 | 0.37 | 19 | |||||||||||||||||||||||||||||||||||||||
| 10/31/16 | 13.33 | 0.16 | 0.35 | 0.51 | (0.07 | ) | (0.13 | ) | (0.20 | ) | 13.64 | 3.92 | 44,363 | 1.90 | 1.50 | 1.18 | 49 | |||||||||||||||||||||||||||||||||||||||
| Institutional Emerging Markets Portfolio–Institutional Class (Formerly Class I) | ||||||||||||||||||||||||||||||||||||||||||||||||||||||||
| 10/31/20 | 21.25 | 0.12 | 0.19 | 0.31 | (0.33 | ) | — | (0.33 | ) | 21.23 | 1.38 | 4,847,707 | 1.28 | 1.28 | 0.59 | 23 | ||||||||||||||||||||||||||||||||||||||||
| 10/31/19 | 18.43 | 0.24 | 2.76 | 3.00 | (0.18 | ) | — | (0.18 | ) | 21.25 | 16.43 | 4,864,702 | 1.27 | 1.27 | 1.18 | 17 | ||||||||||||||||||||||||||||||||||||||||
| 10/31/18 | 21.94 | 0.19 | (3.53 | ) | (3.34 | ) | (0.17 | ) | — | (0.17 | ) | 18.43 | (15.33 | ) | 3,978,321 | 1.27 | 1.27 | 0.84 | 24 | |||||||||||||||||||||||||||||||||||||
| 10/31/17 | 17.65 | 0.19 | 4.20 | 4.39 | (0.10 | ) | — | (0.10 | ) | 21.94 | 25.08 | 4,386,511 | 1.28 | 1.28 | 0.97 | 17 | ||||||||||||||||||||||||||||||||||||||||
| 10/31/16 | 16.04 | 0.14 | 1.56 | 1.70 | (0.09 | ) | — | (0.09 | ) | 17.65 | 10.74 | 3,051,419 | 1.29 | 1.29 | 0.88 | 20 | ||||||||||||||||||||||||||||||||||||||||
| Institutional Emerging Markets Portfolio–Institutional Class Z (Formerly Class II) | ||||||||||||||||||||||||||||||||||||||||||||||||||||||||
| 10/31/20 | 21.28 | 0.15 | 0.20 | 0.35 | (0.35 | ) | — | (0.35 | ) | 21.28 | 1.55 | 626,632 | 1.19 | 1.11 | 0.76 | 23 | ||||||||||||||||||||||||||||||||||||||||
| 10/31/19 | 18.45 | 0.27 | 2.76 | 3.03 | (0.20 | ) | — | (0.20 | ) | 21.28 | 16.61 | 557,924 | 1.19 | 1.11 | 1.34 | 17 | ||||||||||||||||||||||||||||||||||||||||
| 10/31/18 | 21.94 | 0.22 | (3.52 | ) | (3.30 | ) | (0.19 | ) | — | (0.19 | ) | 18.45 | (15.21 | ) | 391,583 | 1.20 | 1.11 | 1.00 | 24 | |||||||||||||||||||||||||||||||||||||
| 10/31/17(2) | 17.71 | 0.22 | 4.21 | 4.43 | (0.20 | ) | — | (0.20 | ) | 21.94 | 25.43 | 458,288 | 1.23 | 1.12 | 1.12 | 17 | ||||||||||||||||||||||||||||||||||||||||
| 10/31/16(2) | 16.14 | 0.16 | 1.59 | 1.75 | (0.18 | ) | — | (0.18 | ) | 17.71 | 11.06 | 381,031 | 1.24 | 1.13 | 0.96 | 20 | ||||||||||||||||||||||||||||||||||||||||
| Emerging Markets Portfolio–Advisor Class | ||||||||||||||||||||||||||||||||||||||||||||||||||||||||
| 10/31/20 | 55.65 | 0.26 | 0.40 | 0.66 | (0.83 | ) | — | (0.83 | ) | 55.48 | 1.11 | 3,739,209 | 1.36 | 1.36 | 0.49 | 18 | ||||||||||||||||||||||||||||||||||||||||
| 10/31/19 | 48.21 | 0.58 | 7.28 | 7.86 | (0.42 | ) | — | (0.42 | ) | 55.65 | 16.46 | 4,274,314 | 1.37 | 1.37 | 1.10 | 19 | ||||||||||||||||||||||||||||||||||||||||
| 10/31/18 | 57.46 | 0.42 | (9.24 | ) | (8.82 | ) | (0.40 | ) | (0.03 | ) | (0.43 | ) | 48.21 | (15.47 | ) | 3,459,157 | 1.40 | 1.40 | 0.73 | 24 | ||||||||||||||||||||||||||||||||||||
| 10/31/17 | 46.27 | 0.43 | 11.02 | 11.45 | (0.26 | ) | — | (0.26 | ) | 57.46 | 24.93 | 4,014,977 | 1.42 | 1.42 | 0.84 | 17 | ||||||||||||||||||||||||||||||||||||||||
| 10/31/16 | 42.02 | 0.30 | 4.17 | 4.47 | (0.22 | ) | — | (3) | (0.22 | ) | 46.27 | 10.73 | 2,998,484 | 1.42 | 1.42 | 0.72 | 26 | |||||||||||||||||||||||||||||||||||||||
| Frontier Emerging Markets Portfolio–Institutional Class I | ||||||||||||||||||||||||||||||||||||||||||||||||||||||||
| 10/31/20 | 7.80 | 0.10 | (0.82 | ) | (0.72 | ) | (0.16 | ) | — | (0.16 | ) | 6.92 | (9.50 | ) | 73,376 | 1.68 | 1.68 | 1.44 | 21 | |||||||||||||||||||||||||||||||||||||
| 10/31/19 | 7.62 | 0.14 | 0.14 | 0.28 | (0.10 | ) | — | (0.10 | ) | 7.80 | 3.59 | 144,742 | 1.63 | 1.63 | 1.72 | 31 | ||||||||||||||||||||||||||||||||||||||||
| 10/31/18 | 8.50 | 0.11 | (0.82 | ) | (0.71 | ) | (0.17 | ) | — | (0.17 | ) | 7.62 | (8.47 | ) | 220,367 | 1.62 | 1.62 | 1.24 | 20 | |||||||||||||||||||||||||||||||||||||
| 10/31/17 | 7.35 | 0.05 | 1.17 | 1.22 | (0.07 | ) | — | (0.07 | ) | 8.50 | 16.82 | 266,844 | 1.71 | 1.71 | 0.69 | 28 | ||||||||||||||||||||||||||||||||||||||||
| 10/31/16 | 7.62 | 0.10 | (0.29 | ) | (0.19 | ) | (0.08 | ) | — | (0.08 | ) | 7.35 | (2.43 | ) | 342,114 | 1.79 | 1.79 | 1.41 | 47 | |||||||||||||||||||||||||||||||||||||
| Frontier Emerging Markets Portfolio–Institutional Class II | ||||||||||||||||||||||||||||||||||||||||||||||||||||||||
| 10/31/20 | 7.82 | 0.14 | (0.84 | ) | (0.70 | ) | (0.17 | ) | — | (0.17 | ) | 6.95 | (9.26 | ) | 116,911 | 1.60 | 1.35 | 1.95 | 21 | |||||||||||||||||||||||||||||||||||||
| 10/31/19 | 7.63 | 0.17 | 0.13 | 0.30 | (0.11 | ) | — | (0.11 | ) | 7.82 | 4.01 | 128,742 | 1.55 | 1.35 | 2.19 | 31 | ||||||||||||||||||||||||||||||||||||||||
| 10/31/18 | 8.50 | 0.14 | (0.83 | ) | (0.69 | ) | (0.18 | ) | — | (0.18 | ) | 7.63 | (8.31 | ) | 163,794 | 1.56 | 1.35 | 1.51 | 20 | |||||||||||||||||||||||||||||||||||||
| 10/31/17(4)(5) | 7.43 | 0.08 | 0.99 | 1.07 | — | — | — | 8.50 | 14.40 | (A) | 166,698 | 1.58 | (B) | 1.35 | (B) | 1.47 | (B) | 28 | (A) | |||||||||||||||||||||||||||||||||||||
| (A) | Not Annualized. |
| (B) | Annualized. |
| (1) | Net investment income per share was calculated using the average shares outstanding method. |
| (2) | All per share amounts and net asset values have been adjusted as a result of the reverse share split effected after the close of business on December 1, 2017. |
| (3) | Amount was less than $0.005 per share. |
| (4) | For the period from March 1, 2017 (commencement of class operations) through October 31, 2017. |
| (5) | All per share amounts and net asset values have been adjusted as a result of the share dividend effected after the close of business on December 1, 2017. |
See Notes to Financial Statements
49
Table of Contents
Harding, Loevner Funds, Inc.
Financial Highlights (continued)
For the Fiscal Year Ended October 31
INCREASE (DECREASE) IN NET ASSETS FROM OPERATIONS: | DISTRIBUTIONS TO SHAREHOLDERS FROM: | RATIOS/SUPPLEMENTAL DATA: | ||||||||||||||||||||||||||||||||||||||||||||||||||||||
| Net asset value, beginning of year | Net investment income (loss)(1) | Net realized foreign transactions | Net investment | Net investments income | Net from | Total distributions | Net asset value, end of year | Total Return | Net assets, end of year (000’s) | Expenses to average net assets | Expenses to average | Net investment income to average net assets | Portfolio turnover | |||||||||||||||||||||||||||||||||||||||||||
| Frontier Emerging Markets Portfolio–Investor Class | ||||||||||||||||||||||||||||||||||||||||||||||||||||||||
10/31/20 | $ 7.75 | $ 0.08 | $ (0.83 | ) | $ (0.75 | ) | $ (0.12 | ) | $ — | $(0.12 | ) | $ 6.88 | (9.70 | )% | $ 10,327 | 2.12 | % | 2.00 | % | 1.17 | % | 21 | % | |||||||||||||||||||||||||||||||||
10/31/19 | 7.57 | 0.11 | 0.13 | 0.24 | (0.06 | ) | — | (0.06 | ) | 7.75 | 3.24 | 20,560 | 2.00 | 2.00 | 1.38 | 31 | ||||||||||||||||||||||||||||||||||||||||
10/31/18 | 8.43 | 0.07 | (0.79 | ) | (0.72 | ) | (0.14 | ) | — | (0.14 | ) | 7.57 | (8.75 | ) | 25,388 | 2.06 | 2.00 | 0.87 | 20 | |||||||||||||||||||||||||||||||||||||
10/31/17 | 7.28 | 0.04 | 1.15 | 1.19 | (0.04 | ) | — | (0.04 | ) | 8.43 | 16.40 | 30,981 | 2.13 | 2.00 | 0.48 | 28 | ||||||||||||||||||||||||||||||||||||||||
10/31/16 | 7.55 | 0.07 | (0.30 | ) | (0.23 | ) | (0.04 | ) | — | (0.04 | ) | 7.28 | (3.01 | ) | 32,771 | 2.23 | 2.23 | 1.02 | 47 | |||||||||||||||||||||||||||||||||||||
| Global Equity Research Portfolio–Institutional Class | ||||||||||||||||||||||||||||||||||||||||||||||||||||||||
10/31/20 | 12.57 | 0.10 | 0.78 | 0.88 | (0.15 | ) | (0.54 | ) | (0.69 | ) | 12.76 | 7.15 | 7,387 | 2.04 | 0.80 | 0.80 | 44 | |||||||||||||||||||||||||||||||||||||||
10/31/19 | 12.06 | 0.14 | 1.40 | 1.54 | (0.09 | ) | (0.94 | ) | (1.03 | ) | 12.57 | 14.36 | 6,895 | 1.96 | 0.83 | 1.18 | 44 | |||||||||||||||||||||||||||||||||||||||
10/31/18 | 12.23 | 0.10 | 0.23 | 0.33 | (0.18 | ) | (0.32 | ) | (0.50 | ) | 12.06 | 2.74 | 5,452 | 2.64 | 0.90 | 0.76 | 45 | |||||||||||||||||||||||||||||||||||||||
10/31/17(2) | 10.00 | 0.08 | 2.15 | 2.23 | — | — | — | 12.23 | 22.30 | (A) | 5,308 | 3.49 | (B) | 0.90 | (B) | 0.80 | (B) | 36 | (A) | |||||||||||||||||||||||||||||||||||||
| International Equity Research Portfolio–Institutional Class | ||||||||||||||||||||||||||||||||||||||||||||||||||||||||
10/31/20 | 12.03 | 0.14 | 0.07 | 0.21 | (0.14 | ) | (0.09 | ) | (0.23 | ) | 12.01 | 1.73 | 12,494 | 1.40 | 0.75 | 1.20 | 51 | |||||||||||||||||||||||||||||||||||||||
10/31/19 | 11.59 | 0.18 | 1.17 | 1.35 | (0.13 | ) | (0.78 | ) | (0.91 | ) | 12.03 | 12.93 | 19,458 | 1.42 | 0.79 | 1.62 | 44 | |||||||||||||||||||||||||||||||||||||||
10/31/18 | 13.11 | 0.14 | (0.93 | ) | (0.79 | ) | (0.14 | ) | (0.59 | ) | (0.73 | ) | 11.59 | (6.43 | ) | 9,305 | 1.78 | 0.90 | 1.07 | 43 | ||||||||||||||||||||||||||||||||||||
10/31/17 | 11.10 | 0.12 | 2.26 | 2.38 | (0.17 | ) | (0.20 | ) | (0.37 | ) | 13.11 | 22.26 | 9,479 | 2.26 | 0.90 | 0.99 | 55 | |||||||||||||||||||||||||||||||||||||||
10/31/16(3) | 10.00 | 0.14 | 0.96 | 1.10 | — | — | — | 11.10 | 11.00 | (A) | 6,244 | 3.54 | (B) | 0.90 | (B) | 1.51 | (B) | 33 | (A) | |||||||||||||||||||||||||||||||||||||
| Emerging Markets Research Portfolio–Institutional Class | ||||||||||||||||||||||||||||||||||||||||||||||||||||||||
10/31/20 | 11.42 | 0.09 | 0.17 | 0.26 | (0.14 | ) | (0.33 | ) | (0.47 | ) | 11.21 | 2.19 | 7,367 | 2.40 | 1.15 | 0.83 | 67 | |||||||||||||||||||||||||||||||||||||||
10/31/19 | 10.82 | 0.15 | 1.35 | 1.50 | (0.09 | ) | (0.81 | ) | (0.90 | ) | 11.42 | 15.05 | 7,198 | 2.29 | 1.19 | 1.35 | 58 | |||||||||||||||||||||||||||||||||||||||
10/31/18 | 13.01 | 0.12 | (1.34 | ) | (1.22 | ) | (0.23 | ) | (0.74 | ) | (0.97 | ) | 10.82 | (10.24 | ) | 5,702 | 2.90 | 1.30 | 0.93 | 55 | ||||||||||||||||||||||||||||||||||||
10/31/17(2) | 10.00 | 0.10 | 2.91 | 3.01 | — | — | — | 13.01 | 30.10 | (A) | 5,880 | 3.72 | (B) | 1.30 | (B) | 1.04 | (B) | 46 | (A) | |||||||||||||||||||||||||||||||||||||
(A) Not Annualized.
(B) Annualized.
(1) Net investment income per share was calculated using the average shares outstanding method.
(2) For the period from December 19, 2016 (commencement of class operations) through October 31, 2017.
(3) For the period from December 17, 2015 (commencement of class operations) through October 31, 2016.
See Notes to Financial Statements
50
Table of Contents
Harding, Loevner Funds, Inc.
October 31, 2020
1. Organization
Harding, Loevner Funds, Inc. (the “Fund”) was organized as a Maryland corporation on July 31, 1996, and is registered under the Investment Company Act of 1940, as amended (the “1940 Act”), as an open-end management investment company. The Fund currently has nine separate diversified Portfolios, all of which were active as of October 31, 2020 (individually, a “Portfolio”, collectively, the “Portfolios”). The Fund is managed by Harding Loevner LP (the “Investment Adviser”).
Portfolio | Inception Date | Investment Objective | ||
Global Equity Portfolio (“Global Equity”) | Institutional Class: November 3, 2009 Institutional Class Z: August 1, 2017 Advisor Class: December 1, 1996 | to seek long-term capital appreciation through investments in equity securities of companies based both inside and outside the United States | ||
International Equity Portfolio (“International Equity”) | Institutional Class: May 11, 1994* Institutional Class Z: July 17, 2017 Investor Class: September 30, 2005 | to seek long-term capital appreciation through investments in equity securities of companies based outside the United States | ||
International Small Companies Portfolio (“International Small Companies”) | Institutional Class: June 30, 2011 Investor Class: March 26, 2007 | to seek long-term capital appreciation through investments in equity securities of small companies based outside the United States | ||
Institutional Emerging Markets Portfolio** (“Institutional Emerging Markets”) | Institutional Class (Formerly Class I): October 17, 2005 Institutional Class Z (Formerly Class II): March 5, 2014 | to seek long-term capital appreciation through investments in equity securities of companies based in emerging markets | ||
Emerging Markets Portfolio** (“Emerging Markets”) | Advisor Class: November 9, 1998 | to seek long-term capital appreciation through investments in equity securities of companies based in emerging markets | ||
Frontier Emerging Markets Portfolio (“Frontier Emerging Markets”) | Institutional Class I: May 27, 2008 Institutional Class II: March 1, 2017 Investor Class: December 31, 2010 | to seek long-term capital appreciation through investments in equity securities of companies based in frontier and smaller emerging markets | ||
Global Equity Research Portfolio (“Global Equity Research”) | Institutional Class***: December 19, 2016 | to seek long-term capital appreciation through investments in equity securities of companies based both inside and outside the United States | ||
International Equity Research Portfolio (“International Equity Research”) | Institutional Class***: December 17, 2015 | to seek long-term capital appreciation through investments in equity securities of companies based outside the United States | ||
Emerging Markets Research Portfolio (“Emerging Markets Research”) | Institutional Class***: December 19, 2016 | to seek long-term capital appreciation through investments in equity securities of companies based in emerging markets |
** Effective March 1, 2019, the Institutional Emerging Markets and Emerging Markets Portfolios’ shares are generally available for purchase by new and existing shareholders, subject to certain limitations that may apply at the Fund’s discretion.
*** Effective March 1, 2019, the Investor Class shares of the Global Equity Research, International Equity Research and Emerging Markets Research Portfolios were closed and their balances were transferred to the Institutional Class (See Note 7) .
2. Summary of Significant Accounting Policies
The accounting policies of the Fund are in conformity with accounting principles generally accepted in the United States (“GAAP”) for investment companies. Accordingly, the Fund follows accounting and reporting guidance under Financial Accounting Standards Board (“FASB”) Accounting Standards Codification Topic 946, “Financial Services - Investment Companies”. The following is a summary of the Fund’s significant accounting policies:
51
Table of Contents
Harding, Loevner Funds, Inc.
Notes to Financial Statements (continued)
October 31, 2020
2. Summary of Significant Accounting Policies (continued)
Estimates
The preparation of financial statements in accordance with GAAP requires management to make estimates and assumptions that affect the reported amounts and disclosures in the financial statements. Actual results could differ from those estimates.
Valuation
The Board of Directors of the Fund (the “Board” or the “Directors”) has adopted procedures (“Procedures”) to govern the valuation of the securities held by each Portfolio of the Fund in accordance with the 1940 Act. The Procedures incorporate principles set forth in relevant pronouncements of the Securities and Exchange Commission (“SEC”) and its staff, including guidance on the obligations of the Portfolios and their Directors to determine, in good faith, the fair value of the Portfolios’ securities when market quotations are not readily available.
In determining a Portfolio’s net asset value per share (“NAV”), each equity security traded on a securities exchange, including the NASDAQ Stock Market, and over-the-counter securities, are first valued at the closing price on the exchange or market designated by the Fund’s accounting agent as the principal exchange (each, a “principal exchange”). The closing price provided by the Fund’s accounting agent for a principal exchange may differ from the price quoted elsewhere and may represent information such as last sales price, an official closing price, a closing auction price or other information, depending on exchange or market convention. Shares of open-end mutual funds including money market funds are valued at NAV. Such securities are typically categorized as “Level 1” pursuant to the hierarchy described below.
Participation notes are valued based upon the closing or last traded price of their underlying local shares. Such securities are typically categorized as “Level 2” pursuant to the hierarchy described below.
Since trading in many foreign securities is normally completed before the time at which a Portfolio calculates its NAV, the effect on the value of such securities held by a Portfolio of events that occur between the close of trading in the security and the time at which the Portfolio prices its securities would not be reflected in the Portfolio’s calculation of its NAV if foreign securities were generally valued at their closing prices. To address this issue, the Board has approved the daily use of independently provided quantitative models that may adjust the closing prices of certain foreign equity securities based on information that becomes available after the foreign market closes, through the application of an adjustment factor to such securities’ closing price. Adjustment factors may be greater than, less than, or equal to 1. Thus, use of these quantitative models could cause a Portfolio to value a security higher, lower or equal to its closing market price, which in turn could cause the Portfolio’s NAV per share to differ significantly from that which would have been calculated using closing market prices. The use of these quantitative models is also intended to decrease the opportunities for persons to engage in ‘‘time zone arbitrage,’’ i.e., trading intended to take advantage of stale closing prices in foreign markets that could affect the NAV of the Portfolios. Securities subjected to an adjustment factor due to the use of these quantitative models are not specifically designated on the Portfolios’ Portfolio of Investments as being “fair valued”. Securities with an adjustment factor greater than or less than 1, which are absent the use of significant unobservable inputs into their valuation, are categorized as “Level 2” and securities with an adjustment factor equal to 1, which are absent the use of significant unobservable inputs into their valuation, are categorized as “Level 1” pursuant to the hierarchy described below.
Any securities for which market quotations are not readily available or for which available prices are deemed unreliable are priced by the Investment Adviser at “fair value as determined in good faith”, in accordance with the Procedures. Such securities are identified on the Portfolios’ Portfolio of Investments as securities valued at “fair value as determined in good faith” and absent the use of significant unobservable inputs into their valuation, such securities would be categorized as “Level 2” pursuant to the hierarchy described below.
GAAP has established a hierarchy for NAV determination purposes in which various inputs are used in determining the value of each Portfolio’s assets or liabilities. GAAP defines fair value as the price that the Portfolio would receive upon selling an investment in a timely transaction to an independent buyer in the principal or most advantageous market of the investment. GAAP establishes a three-tier hierarchy to maximize the use of observable market data and minimize the use of unobservable inputs and to establish classification of fair value measurements for disclosure purposes. Inputs may be observable or unobservable and refer broadly to the assumptions that market participants would use in pricing the asset or liability including assumptions about risk. Such risks include the inherent risk in a particular valuation technique which is used to measure fair value. This may include the quantitative models and/or the inputs to the quantitative models used in the valuation technique described above. Observable inputs are inputs that reflect the assumptions market participants would use in pricing the asset or liability developed based on market data obtained from sources independent of the reporting entity. Unobservable inputs are inputs that reflect the reporting entity’s own assumptions about the assumptions market participants would use in pricing the asset or liability developed based on the best information available in the circumstances. The three-tier hierarchy of inputs is summarized in the three broad levels listed below.
52
Table of Contents
Harding, Loevner Funds, Inc.
Notes to Financial Statements (continued)
October 31, 2020
2. Summary of Significant Accounting Policies (continued)
| Level 1 | unadjusted quoted prices in active markets for identical assets | |
| Level 2 | other significant observable inputs (including quoted prices for similar investments, interest rates, prepayment speeds, credit risk, etc.) | |
| Level 3 | significant unobservable inputs (including the Portfolio’s own assumptions in determining the fair value of investments) |
GAAP provides additional guidance for estimating fair value when the volume and level of activity for the asset or liability have significantly decreased as well as guidance on identifying circumstances that indicate when a transaction is not orderly.
The following is a summary of the Portfolios’ investments classified by Level 1, Level 2 and Level 3 and security type as of October 31, 2020. Please refer to each Portfolio’s Portfolio of Investments to view individual securities classified by industry type and country.
| Portfolio | Unadjusted Quoted Prices in Active Markets for Identical Assets (Level 1) | Other Significant Observable Inputs (Level 2) | Significant Unobservable Inputs (Level 3) | Total | ||||||||||||
Global Equity | ||||||||||||||||
Common Stocks | $ | 862,579,196 | $ | 448,242,651 | $ | — | $ | 1,310,821,847 | ||||||||
Preferred Stocks | 24,934,979 | — | — | 24,934,979 | ||||||||||||
Short Term Investments | 46,680,288 | — | — | 46,680,288 | ||||||||||||
Total Investments | $ | 934,194,463 | $ | 448,242,651 | $ | — | $ | 1,382,437,114 | ||||||||
International Equity | ||||||||||||||||
Common Stocks | $ | 3,600,326,528 | $ | 11,303,910,944 | $ | — | $ | 14,904,237,472 | ||||||||
Preferred Stocks | 209,985,909 | 382,203,168 | — | 592,189,077 | ||||||||||||
Short Term Investments | 564,535,699 | — | — | 564,535,699 | ||||||||||||
Total Investments | $ | 4,374,848,136 | $ | 11,686,114,112 | $ | — | $ | 16,060,962,248 | ||||||||
International Small Companies | ||||||||||||||||
Common Stocks | $ | 38,184,282 | $ | 322,453,260 | $ | — | $ | 360,637,542 | ||||||||
Short Term Investments | 17,897,933 | — | — | 17,897,933 | ||||||||||||
Total Investments | $ | 56,082,215 | $ | 322,453,260 | $ | — | $ | 378,535,475 | ||||||||
Institutional Emerging Markets | ||||||||||||||||
Common Stocks | $ | 1,387,187,125 | $ | 3,778,473,315 | $ | — | $ | 5,165,660,440 | ||||||||
Preferred Stocks | 145,588,218 | 62,272,945 | — | 207,861,163 | ||||||||||||
Short Term Investments | 73,992,957 | — | — | 73,992,957 | ||||||||||||
Total Investments | $ | 1,606,768,300 | $ | 3,840,746,260 | $ | — | $ | 5,447,514,560 | ||||||||
Emerging Markets | ||||||||||||||||
Common Stocks | $ | 949,379,981 | $ | 2,584,121,152 | $ | — | $ | 3,533,501,133 | ||||||||
Preferred Stocks | 99,288,731 | 42,553,104 | — | 141,841,835 | ||||||||||||
Short Term Investments | 48,020,945 | — | — | 48,020,945 | ||||||||||||
Total Investments | $ | 1,096,689,657 | $ | 2,626,674,256 | $ | — | $ | 3,723,363,913 | ||||||||
Frontier Emerging Markets | ||||||||||||||||
Common Stocks | $ | 37,755,822 | $ | 155,662,322 | $ | — | $ | 193,418,144 | ||||||||
Preferred Stocks | 5,213,470 | — | — | 5,213,470 | ||||||||||||
Short Term Investments | 2,648,061 | — | — | 2,648,061 | ||||||||||||
Total Investments | $ | 45,617,353 | $ | 155,662,322 | $ | — | $ | 201,279,675 | ||||||||
Global Equity Research | ||||||||||||||||
Common Stocks | $ | 3,809,068 | $ | 3,402,104 | $ | — | $ | 7,211,172 | ||||||||
Preferred Stocks | 48,970 | 19,122 | — | 68,092 | ||||||||||||
Short Term Investments | 119,647 | — | — | 119,647 | ||||||||||||
Total Investments | $ | 3,977,685 | $ | 3,421,226 | $ | — | $ | 7,398,911 | ||||||||
53
Table of Contents
Harding, Loevner Funds, Inc.
Notes to Financial Statements (continued)
October 31, 2020
2. Summary of Significant Accounting Policies (continued)
| Portfolio | Unadjusted Quoted Prices in Active Markets for Identical Assets (Level 1) | Other Significant Observable Inputs | Significant Unobservable Inputs (Level 3) | Total | ||||||||||||
International Equity Research | ||||||||||||||||
Common Stocks | $ | 1,691,892 | $ | 10,271,935 | $ | — | $ | 11,963,827 | ||||||||
Preferred Stocks | 233,642 | 47,241 | — | 280,883 | ||||||||||||
Short Term Investments | 251,379 | — | — | 251,379 | ||||||||||||
Total Investments | $ | 2,176,913 | $ | 10,319,176 | $ | — | $ | 12,496,089 | ||||||||
Emerging Markets Research | ||||||||||||||||
Common Stocks | $ | 1,784,277 | $ | 5,219,123 | $ | — | $ | 7,003,400 | ||||||||
Preferred Stocks | 133,043 | 149,597 | — | 282,640 | ||||||||||||
Short Term Investments | 72,705 | — | — | 72,705 | ||||||||||||
Total Investments | $ | 1,990,025 | $ | 5,368,720 | $ | — | $ | 7,358,745 | ||||||||
As of October 31, 2020, there were no Level 3 investments held within the Portfolios.
Securities
For financial reporting purposes, all securities transactions are recorded on a trade date basis, as of the last business day in the reporting period. Throughout the reporting period, securities transactions are typically accounted for on a trade date – plus one business day basis. Interest income and expenses are recorded on an accrual basis. Dividend income is recorded on the ex-dividend date (except for certain foreign dividends that may be recorded as soon as the Portfolio is informed of such dividends). The Portfolios use the specific identification method for determining realized gains or losses from sales of securities.
Dividends to Shareholders
It is the policy of the Portfolios to declare dividends from net investment income annually. Net short-term and long-term capital gains distributions for the Portfolios, if any, are also normally distributed on an annual basis.
Dividends from net investment income and distributions from net realized gains from investment transactions have been determined in accordance with income tax regulations and may differ from net investment income and realized gains recorded by the Portfolios for financial reporting purposes. Differences result primarily from foreign currency transactions and timing differences related to recognition of income, and gains and losses from investment transactions. In general, to the extent that any differences, which are permanent in nature, result in over distributions to shareholders, the amount of the over distribution is reclassified within the capital accounts based on its federal tax basis treatment and may be reported as return of capital. Temporary differences do not require reclassification.
Currency Translation
Assets and liabilities denominated in foreign currencies and commitments under forward foreign currency exchange contracts are translated into U.S. dollars at the mean of the quoted bid and asked prices of such currencies against the U.S. dollar. Purchases and sales of the Portfolios’ securities are translated at the rates of exchange prevailing when such securities were acquired or sold. Income and expenses are translated at exchange rates prevailing when accrued. The Portfolios do not isolate that portion of the results of operations resulting from changes in foreign exchange rates on investments from the fluctuations arising from changes in market prices of securities held. Such fluctuations are included with the “Net realized gain (loss) on investment transactions” and “Change in unrealized appreciation (depreciation) on investments” on the Statements of Operations.
Net realized gains and losses from foreign currency-related transactions arise from sales of foreign currency, currency gains or losses realized between the trade and settlement dates on securities transactions, and the difference between the amounts of dividends, interest, and foreign withholding taxes recorded on the Portfolios’ books, and the U.S. dollar equivalent of the amounts actually received or paid. Net unrealized appreciation or depreciation on translation of assets and liabilities denominated in foreign currencies arise from changes in the value of assets and liabilities other than investments in securities at the period end, resulting from changes in the exchange rates.
54
Table of Contents
Harding, Loevner Funds, Inc.
Notes to Financial Statements (continued)
October 31, 2020
2. Summary of Significant Accounting Policies (continued)
Expenses
Most expenses of the Fund can be directly attributed to a particular Portfolio. Expenses which cannot be directly attributed are apportioned among the Portfolios based upon relative net assets or other appropriate measures. If an expense is incurred at the Portfolio level, it is generally apportioned among the classes of that Portfolio based upon relative net assets of each respective class. Certain expenses are incurred at the class level and charged only to that particular class. These expenses may be class specific (i.e., distribution fees charged only to a particular class) or they may be identifiable to a particular class (i.e., the costs related to mailing shareholder reports to shareholders of a particular class).
Redemption Fees
Prior to February 28, 2020, the Fund had established fees on short-term redemptions to discourage frequent trading in Portfolio shares. Redemptions of Portfolio shares made within 90 days of purchase may have been subject to a redemption fee equal to 2% of the amount redeemed. For the years ended October 31, 2020 and October 31, 2019, the Portfolios received the following redemption fees. These amounts are netted against “Payments for Shares Redeemed” in Note7 - CapitalShare Transactions.
| Institutional Class | Institutional Class I | Institutional Class II | ||||||||||||||||||||||||||||
| Portfolio | Year Ended October 31, 2020 | Year Ended October 31, 2019 | Year Ended October 31, 2020 | Year Ended October 31, 2019 | Year Ended October 31, 2020 | Year Ended October 31, 2019 | ||||||||||||||||||||||||
Global Equity | $ | 18,908 | $ | 79,336 | $ | — | $ | — | $ | — | $ | — | ||||||||||||||||||
International Equity | 132,379 | 905,862 | — | — | — | — | ||||||||||||||||||||||||
International Small Companies | 974 | 7,219 | — | — | — | — | ||||||||||||||||||||||||
Institutional Emerging Markets | 27,951 | * | 182,069 | * | — | — | — | — | ||||||||||||||||||||||
Emerging Markets | — | — | — | — | — | — | ||||||||||||||||||||||||
Frontier Emerging Markets | — | — | 1,471 | 12,856 | — | — | ||||||||||||||||||||||||
Global Equity Research | — | — | — | — | — | — | ||||||||||||||||||||||||
International Equity Research | — | — | — | — | — | — | ||||||||||||||||||||||||
Emerging Markets Research | — | — | — | — | — | — | ||||||||||||||||||||||||
* Formerly Class I | ||||||||||||||||||||||||||||||
| Investor Class | Advisor Class | Institutional Class Z | ||||||||||||||||||||||||||||
| Portfolio | Year Ended October 31, 2020 | Year Ended October 31, 2019 | Year Ended October 31, 2020 | Year Ended October 31, 2019 | Year Ended October 31, 2020 | Year Ended October 31, 2019 | ||||||||||||||||||||||||
Global Equity | $ | — | $ | — | $ | 1,561 | $ | 7,472 | $ | — | $ | 9,100 | ||||||||||||||||||
International Equity | 4,924 | 31,086 | — | — | 26 | 12,652 | ||||||||||||||||||||||||
International Small Companies | 1,582 | 2,312 | — | — | — | — | ||||||||||||||||||||||||
Institutional Emerging Markets | — | — | — | — | — | — | ||||||||||||||||||||||||
Emerging Markets | — | — | 36,279 | 79,727 | — | — | ||||||||||||||||||||||||
Frontier Emerging Markets | 1,292 | 4,961 | — | — | — | — | ||||||||||||||||||||||||
Global Equity Research | — | — | — | — | — | — | ||||||||||||||||||||||||
International Equity Research | — | — | — | — | — | — | ||||||||||||||||||||||||
Emerging Markets Research | — | — | — | — | — | — | ||||||||||||||||||||||||
Indemnifications
Under the Fund’s organizational document, its officers and Board are indemnified against certain liability arising out of the performance of their duties to the Portfolios. In the normal course of business, the Fund may enter into contracts that contain a variety of representations or that provide indemnification for certain liabilities. The Fund’s maximum exposure under these arrangements is unknown, as this would involve future claims that may be made against the Fund that have not yet occurred. However, the Fund has not had prior claims or losses pursuant to these contracts and expects the risk of loss to be remote.
55
Table of Contents
Harding, Loevner Funds, Inc.
Notes to Financial Statements (continued)
October 31, 2020
3. Transactions with Affiliates and Significant Agreements
The Board has approved investment advisory agreements with The Investment Adviser. Advisory fees are computed daily and paid monthly based on the average daily net assets of each Portfolio. The Investment Adviser has contractually agreed to reduce its fee and/or reimburse the Portfolios for other operating expenses to the extent that aggregate expenses, excluding certain non-operating expenses, exceed certain annual rates of the average daily net assets of each class.
The following annualized advisory fees and contractual expense limits were in effect for the year ended October 31, 2020. The advisory fees are charged at the Portfolio level as a whole and expense limitations are at the class specific level.
| Portfolio | First $1 billion of assets | Next $1 billion of assets | Next $1 billion of assets | Over $3 billion of assets | Over $4 billion of assets | Over $5 billion of assets | Contractual Expense Limit* | ||||||||||||||||||||||||||||
Global Equity–Institutional Class*** | 0.75% | 0.73% | 0.71% | 0.69% | 0.69% | 0.69% | 0.90% | 1 | |||||||||||||||||||||||||||
Global Equity–Institutional Class Z*** | 0.75% | 0.73% | 0.71% | 0.69% | 0.69% | 0.69% | 0.80% | 1 | |||||||||||||||||||||||||||
Global Equity–Advisor Class*** | 0.75% | 0.73% | 0.71% | 0.69% | 0.69% | 0.69% | 1.20% | 1 | |||||||||||||||||||||||||||
International Equity–Institutional Class | 0.75% | 0.73% | 0.71% | 0.69% | 0.67% | 0.65% | 1.00% | ||||||||||||||||||||||||||||
International Equity–Institutional Class Z | 0.75% | 0.73% | 0.71% | 0.69% | 0.67% | 0.65% | 0.80% | ||||||||||||||||||||||||||||
International Equity–Investor Class | 0.75% | 0.73% | 0.71% | 0.69% | 0.67% | 0.65% | 1.25% | ||||||||||||||||||||||||||||
International Small Companies–Institutional Class**** | 1.15% | 1.15% | 1.15% | 1.15% | 1.15% | 1.15% | 1.15% | ||||||||||||||||||||||||||||
International Small Companies–Investor Class**** | 1.15% | 1.15% | 1.15% | 1.15% | 1.15% | 1.15% | 1.40% | ||||||||||||||||||||||||||||
Institutional Emerging Markets–Institutional Class | 1.15% | 1.13% | 1.11% | 1.09% | 1.09% | 1.09% | 1.30% | 2 | |||||||||||||||||||||||||||
Institutional Emerging Markets–Institutional Class Z | 1.15% | 1.13% | 1.11% | 1.09% | 1.09% | 1.09% | 1.15% | ** | |||||||||||||||||||||||||||
Emerging Markets–Advisor Class | 1.15% | 1.13% | 1.11% | 1.09% | 1.09% | 1.09% | 1.75% | 3 | |||||||||||||||||||||||||||
Frontier Emerging Markets–Institutional Class I | 1.35% | 1.35% | 1.35% | 1.35% | 1.35% | 1.35% | 1.75% | ||||||||||||||||||||||||||||
Frontier Emerging Markets–Institutional Class II | 1.35% | 1.35% | 1.35% | 1.35% | 1.35% | 1.35% | 1.35% | ||||||||||||||||||||||||||||
Frontier Emerging Markets–Investor Class | 1.35% | 1.35% | 1.35% | 1.35% | 1.35% | 1.35% | 2.00% | ||||||||||||||||||||||||||||
Global Equity Research–Institutional Class | 0.70% | 0.70% | 0.70% | 0.70% | 0.70% | 0.70% | 0.80% | ||||||||||||||||||||||||||||
International Equity Research–Institutional Class | 0.70% | 0.70% | 0.70% | 0.70% | 0.70% | 0.70% | 0.75% | ||||||||||||||||||||||||||||
Emerging Markets Research–Institutional Class | 1.00% | 1.00% | 1.00% | 1.00% | 1.00% | 1.00% | 1.15% | ||||||||||||||||||||||||||||
| * | Effective through February 28, 2021 for each Portfolio except the Global Equity Portfolio, Institutional Emerging Markets Portfolio, and Emerging Markets Portfolio. |
| ** | The Investment Adviser has agreed to maintain the current expense cap for the Institutional Emerging Markets Portfolio’s Institutional Class Z until February 28, 2022. |
| *** | Prior to July 1, 2020, Global Equity Portfolio had a contractual management fee of 0.80% on the first $1 billion of average net assets, 0.78% on the next $1 billion of average net assets, 0.76% on the next $1 billion of average net assets, and 0.74% for the average daily net assets over $3 billion. |
| **** | Effective November 1, 2020, International Small Companies Contractual management fee will be 1.00% of the portfolios average daily net assets. |
| 1 | Prior to July 2, 2020, the Global Equity Portfolio’s contractual expense limit for the Institutional Class, Institutional Class Z and Advisor Class was 0.95%, 0.90% and 1.25%, respectively, of the Classes’ average daily net assets. Expense cap change effective until February 28, 2022. |
| 2 | Effective November 1, 2020, the Investment Adviser has contractually agreed to lower the expense cap for the Institutional Emerging Markets Portfolio’s Institutional Class to 1.17%. Expense cap change effective through February 28, 2022. |
| 3 | Effective November 1, 2020, the Investment Adviser has contractually agreed to lower the expense cap for the Emerging Markets Portfolio’s Advisor Class to 1.32%. Expense cap change effective through February 28, 2022. |
56
Table of Contents
Harding, Loevner Funds, Inc.
Notes to Financial Statements (continued)
October 31, 2020
3. Transactions with Affiliates and Significant Agreements (continued)
| Portfolio | Fees waived and/or reimbursed by the Investment Advisor | ||||
Global Equity–Institutional Class Z | $ | 12,588 | |||
International Small Companies–Institutional Class | 536,652 | ||||
International Small Companies–Investor Class | 131,930 | ||||
Institutional Emerging Markets–Institutional Class Z | 485,350 | ||||
Frontier Emerging Markets–Institutional Class II | 290,442 | ||||
Frontier Emerging Markets–Investor Class | 16,422 | ||||
Global Equity Research–Institutional Class | 86,553 | ||||
International Equity Research–Institutional Class | 116,489 | ||||
Emerging Markets Research–Institutional Class | 87,673 | ||||
The Fund has an administration agreement with The Northern Trust Company (“Northern Trust”), which provides certain accounting, clerical and bookkeeping services, Blue Sky, corporate secretarial services and assistance in the preparation and filing of tax returns and reports to shareholders and the SEC.
Northern Trust also serves as custodian of each Portfolio’s securities and cash, transfer agent, dividend disbursing agent and agent in connection with any accumulation, open-account or similar plans provided to the shareholders of the Portfolios.
Foreside Management Services, LLC provides compliance support to the Fund’s Chief Compliance Officer. Fees paid pursuant to these services are shown as “Compliance officers’ fees and expenses” on the Statements of Operations.
The Fund has adopted an Amended Plan of Distribution pursuant to Rule 12b-1 under the 1940 Act (“Distribution Plan”). Under the Distribution Plan, the Investor Class of each of the International Equity, International Small Companies and Frontier Emerging Markets Portfolios may pay underwriters, distributors, dealers or brokers a fee at an annual rate of up to 0.25% of the average daily net assets of the Portfolio’s Investor Class shares for services or expenses arising in connection with activities primarily intended to result in the sale of Investor Class shares of the Portfolios or for Shareholder Services (defined below) consistent with those described under the Shareholder Servicing Plan.
The Fund, on behalf of the Portfolios, has agreements with various financial intermediaries and “mutual fund supermarkets”, under which customers of these intermediaries may purchase and hold Portfolio shares. These intermediaries assess fees in consideration for providing certain account maintenance, recordkeeping and transactional and other shareholder services (collectively, “Shareholder Services”). With the exception of Institutional Class Z, each Portfolio or class is authorized, pursuant to a Shareholder Servicing Plan, to pay to each intermediary an annual rate of up to 0.25% of its average daily net assets attributable to that intermediary (subject to the contractual expense limits described above) for such Shareholder Services. Because of the contractual expense limits on certain Portfolios’ fees and expenses, the Investment Adviser paid a portion of the Portfolios’ share of these fees during the year ended October 31, 2020. Such payments, if any, are included in the table above under the caption “Fees waived and/or reimbursed by the Investment Adviser”.
A Portfolio may purchase securities from, or sell securities to, an affiliated fund provided the affiliation is due solely to having a common investment adviser, common officers, or common Directors. For the year ended October 31, 2020, no Portfolios engaged in purchases and/or sales of securities from an affiliated portfolio in compliance with Rule 17a-7 of the 1940 Act.
4. Class Specific Expenses
| Portfolio | Distribution Fees | State Registration Filing Fees | Printing and Postage Fees | Transfer Agent Fees and Expenses | Shareholder Servicing Fees | |||||||||||||||
Global Equity–Institutional Class | $ | — | $ | 30,638 | $ | 24,058 | $ | 6,004 | $ | 548,095 | ||||||||||
Global Equity–Institutional Class Z | — | 25,611 | 4,782 | 1,422 | — | |||||||||||||||
Global Equity–Advisor Class | — | 14,393 | 5,864 | 3,083 | 112,358 | |||||||||||||||
International Equity–Institutional Class | — | 234,029 | 799,942 | 497,330 | 10,433,546 | |||||||||||||||
International Equity–Institutional Class Z | — | 86,627 | 130,095 | 22,481 | — | |||||||||||||||
57
Table of Contents
Harding, Loevner Funds, Inc.
Notes to Financial Statements (continued)
October 31, 2020
4. Class Specific Expenses (continued)
| Portfolio | Distribution Fees | State Registration Filing Fees | Printing and Postage Fees | Transfer Agent Fees and Expenses | Shareholder Servicing Fees | |||||||||||||||
International Equity–Investor Class | $ | 903,367 | $ | 36,220 | $ | 47,900 | $ | 26,299 | $ | 469,978 | ||||||||||
International Small Companies–Institutional Class | — | 37,175 | 15,692 | 3,943 | 185,216 | |||||||||||||||
International Small Companies–Investor Class | 124,745 | 16,679 | 6,539 | 3,478 | 54,019 | |||||||||||||||
Institutional Emerging Markets–Institutional Class | — | 92,513 | 347,959 | 47,938 | 4,169,315 | |||||||||||||||
Institutional Emerging Markets–Institutional Class Z | — | 33,763 | 27,087 | 10,487 | — | |||||||||||||||
Frontier Emerging Markets–Institutional Class I | — | 16,477 | 7,438 | 4,274 | 68,858 | |||||||||||||||
Frontier Emerging Markets–Institutional Class II | — | 15,600 | 2,373 | 405 | — | |||||||||||||||
Frontier Emerging Markets–Investor Class | 33,949 | 15,668 | 2,790 | 1,350 | 19,896 | |||||||||||||||
5. Investment Transactions
| Portfolio | Purchase Cost of Investment Securities | Proceeds from Sales of Investment Securities | ||||||
Global Equity | $ | 857,001,900 | $ 638,488,932 | |||||
International Equity | 2,644,681,905 | 3,355,065,496 | ||||||
International Small Companies | 113,362,010 | 98,105,063 | ||||||
Institutional Emerging Markets | 1,258,488,077 | 1,166,207,676 | ||||||
Emerging Markets | 755,980,343 | 1,210,940,710 | ||||||
Frontier Emerging Markets | 48,023,458 | 105,723,313 | ||||||
Global Equity Research | 3,057,605 | 3,041,861 | ||||||
International Equity Research | 8,725,920 | 15,824,862 | ||||||
Emerging Markets Research | 4,635,566 | 4,584,638 | ||||||
6. In-Kind Redemptions
7. Capital Share Transactions
| Shares Sold | Proceeds Shares Sold | Shares From Reinvested Dividends | Reinvestment Dividends | Shares Redeemed | Payments for Shares | Net Increase (Decrease) in Shares | Net Increase in Net Assets | |||||||||||||||||||||||||||||||||
Global Equity | ||||||||||||||||||||||||||||||||||||||||
Institutional Class | 12,675,160 | $ | 516,679,441 | 99,937 | $ | 3,750,633 | (7,521,201 | ) | $ | (276,990,882 | ) | 5,253,896 | $ | 243,439,192 | ||||||||||||||||||||||||||
Institutional Class Z | 1,214,016 | 46,104,062 | 34,033 | 1,275,910 | (909,670 | ) | (39,808,095 | ) | 338,379 | 7,571,877 | ||||||||||||||||||||||||||||||
Advisor Class | 324,320 | 12,635,875 | 3,494 | 131,272 | (440,185 | ) | (16,211,445 | ) | (112,371 | ) | (3,444,298 | ) | ||||||||||||||||||||||||||||
International Equity | ||||||||||||||||||||||||||||||||||||||||
Institutional Class | 186,458,188 | 4,129,832,968 | 7,739,005 | 182,950,087 | (227,702,716 | ) | (4,943,590,115 | ) | (33,505,523 | ) | (630,807,060 | ) | ||||||||||||||||||||||||||||
Institutional Class Z | 27,006,575 | 623,067,400 | 1,367,636 | 32,317,240 | (22,561,293 | ) | (519,759,194 | ) | 5,812,918 | 135,625,446 | ||||||||||||||||||||||||||||||
58
Table of Contents
Harding, Loevner Funds, Inc.
Notes to Financial Statements (continued)
October 31, 2020
7. Capital Share Transactions (continued)
Shares Sold | Proceeds Shares Sold | Shares From Reinvested Dividends | Reinvestment Dividends | Shares Redeemed | Payments for Shares | Net Increase (Decrease) in Shares | Net Increase in Net Assets | |||||||||||||||||||||||||
Investor Class | 4,328,969 | $ | 95,529,374 | 213,471 | $ | 5,048,578 | (7,754,318 | ) | $ | (171,021,718 | ) | (3,211,878 | ) | $ (70,443,766) | ||||||||||||||||||
International Small Companies | ||||||||||||||||||||||||||||||||
Institutional Class | 7,221,258 | 109,689,074 | 98,894 | 1,656,470 | (5,059,225 | ) | (74,531,343 | ) | 2,260,927 | 36,814,201 | ||||||||||||||||||||||
Investor Class | 609,402 | 9,503,676 | 18,570 | 308,083 | (1,972,802 | ) | (29,932,526 | ) | (1,344,830 | ) | (20,120,767 | ) | ||||||||||||||||||||
Institutional Emerging Markets |
| |||||||||||||||||||||||||||||||
Institutional Class | 80,055,144 | 1,550,781,076 | 2,860,129 | 63,923,895 | (83,498,478 | ) | (1,627,562,463 | ) | (583,205 | ) | (12,857,492) | |||||||||||||||||||||
Institutional Class Z | 7,951,385 | 170,473,905 | 364,763 | 8,156,096 | (5,085,941 | ) | (98,100,924 | ) | 3,230,207 | 80,529,077 | ||||||||||||||||||||||
Emerging Markets | ||||||||||||||||||||||||||||||||
Advisor Class | 16,535,208 | 833,799,789 | 963,746 | 56,465,950 | (26,896,624 | ) | (1,362,711,636 | ) | (9,397,670 | ) | (472,445,897) | |||||||||||||||||||||
Frontier Emerging Markets | ||||||||||||||||||||||||||||||||
Institutional Class I | 4,237,438 | 28,199,937 | 272,401 | 2,132,906 | (12,462,963 | ) | (81,956,641 | ) | (7,953,124 | ) | (51,623,798) | |||||||||||||||||||||
Institutional Class II | — | — | 346,188 | 2,717,575 | — | — | 346,188 | 2,717,575 | ||||||||||||||||||||||||
Investor Class | 573,612 | 3,560,115 | 35,821 | 279,761 | (1,762,337 | ) | (12,092,532 | ) | (1,152,904 | ) | (8,252,656 | ) | ||||||||||||||||||||
Global Equity Research | ||||||||||||||||||||||||||||||||
Institutional Class | — | — | 30,488 | 379,881 | — | — | 30,488 | 379,881 | ||||||||||||||||||||||||
International Equity Research | ||||||||||||||||||||||||||||||||
Institutional Class | 152,365 | 1,688,521 | 30,406 | 374,600 | (760,187 | ) | (9,228,810 | ) | (577,416 | ) | (7,165,689 | ) | ||||||||||||||||||||
Emerging Markets Research | ||||||||||||||||||||||||||||||||
Institutional Class | 660 | 6,001 | 25,882 | 299,717 | — | — | 26,542 | 305,718 | ||||||||||||||||||||||||
Transactions in capital shares for the year ended October 31, 2019, were as follows for each Portfolio:
Shares Sold | Proceeds From Shares Sold | Shares From Reinvested Dividends | Reinvestment of Dividends | Shares Redeemed | Payments for Shares Redeemed | Net Increase (Decrease) in Shares | Net Increase (Decrease) in Net Assets | |||||||||||||||||||||||||
Global Equity | ||||||||||||||||||||||||||||||||
Institutional Class | 6,480,898 | $ | 214,724,441 | 1,984,043 | $ | 59,461,782 | (6,465,537 | ) | $ | (216,491,375 | ) | 1,999,404 | $ 57,694,848 | |||||||||||||||||||
Institutional Class Z | 2,700,167 | 89,388,860 | 514,072 | 15,391,303 | (663,559 | ) | (22,331,940 | ) | 2,550,680 | 82,448,223 | ||||||||||||||||||||||
Advisor Class | 693,636 | 21,687,688 | 310,232 | 9,294,552 | (2,183,139 | ) | (73,413,380 | ) | (1,179,271 | ) | (42,431,140 | ) | ||||||||||||||||||||
International Equity | ||||||||||||||||||||||||||||||||
Institutional Class | 220,376,972 | 4,642,294,048 | 6,889,755 | 133,385,649 | (199,780,919 | ) | (4,208,814,556 | ) | 27,485,808 | 566,865,141 | ||||||||||||||||||||||
Institutional Class Z | 30,574,387 | 653,016,988 | 1,030,494 | 19,929,755 | (11,009,003 | ) | (235,348,291 | ) | 20,595,878 | 437,598,452 | ||||||||||||||||||||||
Investor Class | 7,439,378 | 157,313,694 | 185,567 | 3,594,437 | (10,116,759 | ) | (215,338,672 | ) | (2,491,814 | ) | (54,430,541) | |||||||||||||||||||||
International Small Companies |
| |||||||||||||||||||||||||||||||
Institutional Class | 11,740,090 | 174,939,842 | 483,963 | 6,368,951 | (4,710,546 | ) | (68,869,043 | ) | 7,513,507 | 112,439,750 | ||||||||||||||||||||||
Investor Class | 942,433 | 13,279,661 | 271,646 | 3,544,980 | (1,346,337 | ) | (19,363,518 | ) | (132,258 | ) | (2,538,877 | ) | ||||||||||||||||||||
Institutional Emerging Markets |
| |||||||||||||||||||||||||||||||
Institutional Class* | 68,282,636 | 1,374,367,156 | 1,735,602 | 31,674,733 | (56,911,201 | ) | (1,132,427,811 | ) | 13,107,037 | 273,614,078 | ||||||||||||||||||||||
Institutional | ||||||||||||||||||||||||||||||||
Class Z** | 7,607,526 | 154,213,357 | 223,763 | 4,083,688 | (2,833,432 | ) | (56,449,368 | ) | 4,997,857 | 101,847,677 | ||||||||||||||||||||||
Emerging Markets | ||||||||||||||||||||||||||||||||
Advisor Class | 23,245,944 | 1,254,356,568 | 546,892 | 26,141,428 | (18,740,314 | ) | (982,323,159 | ) | 5,052,522 | 298,174,837 | ||||||||||||||||||||||
Frontier Emerging Markets |
| |||||||||||||||||||||||||||||||
Institutional Class I | 3,651,239 | 28,143,602 | 243,399 | 1,798,720 | (14,243,297 | ) | (109,733,409 | ) | (10,348,659 | ) | (79,791,087) | |||||||||||||||||||||
Institutional Class II | 196,850 | 1,500,000 | 320,735 | 2,370,233 | (5,514,982 | ) | (46,008,183 | ) | (4,997,397 | ) | (42,137,950 | ) | ||||||||||||||||||||
Investor Class | 836,407 | 6,382,046 | 25,247 | 186,071 | (1,564,483 | ) | (12,183,714 | ) | (702,829 | ) | (5,615,597 | ) | ||||||||||||||||||||
Global Equity Research | ||||||||||||||||||||||||||||||||
Institutional Class | 52,369*** | 612,560*** | 43,929 | 466,964 | (45 | ) | (761 | ) | 96,253 | 1,078,763 | ||||||||||||||||||||||
Investor Class | — | — | 4,535 | 48,021 | (51,332 | ) | (595,751 | ) | (46,797 | ) | (547,730 | ) | ||||||||||||||||||||
International Equity Research |
| |||||||||||||||||||||||||||||||
Institutional Class | 758,015*** | 8,659,313*** | 70,702 | 728,938 | (14,045 | ) | (162,510 | ) | 814,672 | 9,225,741 | ||||||||||||||||||||||
59
Table of Contents
Harding, Loevner Funds, Inc.
Notes to Financial Statements (continued)
October 31, 2020
7. Capital Share Transactions (continued)
Shares Sold | Proceeds From Shares Sold | Shares From Reinvested Dividends | Reinvestment of Dividends | Shares Redeemed | Payments for Shares Redeemed | Net Increase (Decrease) in Shares | Net Increase (Decrease) in Net Assets | |||||||||||||||||||||||||
Investor Class | 1,057 | $12,337 | 8,319 | $ | 85,106 | (102,743 | ) | $(1,142,281) | (93,367 | ) | $ (1,044,838) | |||||||||||||||||||||
Emerging Markets Research | ||||||||||||||||||||||||||||||||
Institutional Class | 56,179*** | 617,645*** | 47,469 | 473,739 | (48 | ) | (550) | 103,600 | 1,090,834 | |||||||||||||||||||||||
Investor Class | — | — | 4,579 | 45,469 | (55,566 | ) | (605,815) | (50,987 | ) | (560,346) | ||||||||||||||||||||||
| * | Formerly Class I |
| ** | Formerly Class II |
| *** | Includes shares of 51,332, 99,550, 55,566 and proceeds of $595,962, $1,109,987, $605,671 for the Global Equity Research Portfolio, International Equity Research Portfolio and Emerging Markets Research Portfolio, respectively, which were transferred due to the liquidation of the Investor Class. The transfer was completed on March 1, 2019. |
8. Income Tax
The cost of investments for federal income tax purposes and the components of net unrealized appreciation (depreciation) on investments at October 31, 2020, for each of the Portfolios were as follows:
| Portfolio | Gross Unrealized Appreciation | Gross Unrealized Depreciation | Net Unrealized Appreciation / (Depreciation) | Cost | ||||||||||||||||
Global Equity | $ | 406,134,128 | $ | (18,082,374 | ) | $ | 388,051,754 | $ | 994,385,360 | |||||||||||
International Equity | 4,890,870,896 | (907,799,644 | ) | 3,983,071,252 | 12,077,890,996 | |||||||||||||||
International Small Companies | 96,693,816 | (28,008,132 | ) | 68,685,684 | 309,849,791 | |||||||||||||||
Institutional Emerging Markets | 1,583,890,845 | (482,153,730 | ) | 1,101,737,115 | 4,345,777,445 | |||||||||||||||
Emerging Markets | 1,269,771,771 | (261,045,780 | ) | 1,008,725,991 | 2,714,637,922 | |||||||||||||||
Frontier Emerging Markets | 37,905,285 | (22,912,836 | ) | 14,992,449 | 186,287,226 | |||||||||||||||
Global Equity Research | 1,774,388 | (492,651 | ) | 1,281,737 | 6,117,174 | |||||||||||||||
International Equity Research | 2,350,631 | (721,443 | ) | 1,629,188 | 10,866,901 | |||||||||||||||
Emerging Markets Research | 1,359,757 | (870,772 | ) | 488,985 | 6,869,760 | |||||||||||||||
It is the policy of each Portfolio of the Fund to qualify as a regulated investment company by complying with the applicable provisions of the Internal Revenue Code, and to make distributions of taxable income sufficient to relieve it from substantially all federal income and excise taxes; therefore, no federal income tax provision is required.
The Portfolios may be subject to taxes imposed by countries in which they invest. Such taxes are generally based on income and/or capital gains earned. Taxes are accrued based on net investment income, net realized gains and net unrealized appreciation as such income and/or gains are recorded. Taxes accrued on unrealized gains are reflected as a liability on the Statements of Assets and Liabilities under the caption “Deferred capital gains tax” and as a reduction in “Distributable earnings”. When assets subject to capital gains tax are sold, accrued taxes are relieved, and the actual amount of the taxes paid is reflected on the Statements of Operations as a reduction in “Net realized gain (loss) on Investment Transactions”. The Portfolios seek to recover a portion of foreign withholding taxes applied to income earned in jurisdictions where favorable treaty rates for US investors are available. The portion of such taxes believed to be recoverable is reflected as an asset on the Statements of Assets and Liabilities under the caption “Tax reclaims receivable”.
Management has performed an analysis of each Portfolio’s tax positions for the open tax years as of October 31, 2020, and has concluded that no provisions for income tax are required. The Portfolios’ federal tax returns for the prior three fiscal years (open tax years: October 31, 2017; October 31, 2018; October 31, 2019) remain subject to examination by the Portfolios’ major tax jurisdictions, which include the United States, the State of New Jersey and the State of Maryland. Management is not aware of any events that are reasonably possible to occur in the next twelve
60
Table of Contents
Harding, Loevner Funds, Inc.
Notes to Financial Statements (continued)
October 31, 2020
8. Income Tax (continued)
months that would result in the amounts of any unrecognized tax benefits significantly increasing or decreasing for the Portfolios. However, management’s conclusions regarding tax positions taken may be subject to review and adjustment at a later date based on factors including, but not limited to, new tax laws and accounting regulations and interpretations thereof.
The tax character of distributions paid during the fiscal years ended October 31, 2020 and 2019 were as follows:
| Distributions From | ||||||||||||||||||||
| Portfolio | Ordinary Income 2020 | Long-Term Capital Gains 2020 | Ordinary Income 2019 | Long-Term Capital Gains 2019 | ||||||||||||||||
Global Equity | $ | 6,200,271 | $ | — | $ | 5,039,201 | $ | 84,041,831 | ||||||||||||
International Equity | 269,536,396 | — | 191,998,952 | — | ||||||||||||||||
International Small Companies | 2,122,682 | — | 1,400,782 | 10,538,794 | ||||||||||||||||
Institutional Emerging Markets | 85,287,487 | — | 42,525,477 | — | ||||||||||||||||
Emerging Markets | 63,406,861 | — | 29,768,361 | — | ||||||||||||||||
Frontier Emerging Markets | 5,825,150 | — | 4,881,573 | — | ||||||||||||||||
Global Equity Research | 83,862 | 296,019 | 231,465 | 283,521 | ||||||||||||||||
International Equity Research | 232,264 | 142,336 | 306,053 | 507,992 | ||||||||||||||||
Emerging Markets Research | 145,125 | 154,592 | 175,404 | 343,803 | ||||||||||||||||
| Portfolio | Undistributed Ordinary Income | Undistributed Long-Term Capital Gains | Accumulated Capital and Other Losses | Unrealized Appreciation (Depreciation) * | Total Accumulated Earnings/ (Deficit) | ||||||||||||||||||||
Global Equity | $ | 10,667,801 | $ | 75,826,970 | $ | — | $ | 388,061,170 | $ | 474,555,941 | |||||||||||||||
International Equity | 135,575,106 | — | (556,130,928 | ) | 3,983,910,554 | 3,563,354,732 | |||||||||||||||||||
International Small Companies | 622,603 | — | (4,712,315 | ) | 68,693,218 | 64,603,506 | |||||||||||||||||||
Institutional Emerging Markets | 25,996,001 | — | (205,849,543 | ) | 1,098,537,988 | 918,684,446 | |||||||||||||||||||
Emerging Markets | 14,604,730 | — | (36,752,112 | ) | 1,007,002,292 | 984,854,910 | |||||||||||||||||||
Frontier Emerging Markets | 3,637,669 | — | (122,981,109 | ) | 14,476,955 | (104,866,485 | ) | ||||||||||||||||||
Global Equity Research | 184,365 | 27,046 | — | 1,278,766 | 1,490,177 | ||||||||||||||||||||
International Equity Research | 482,937 | — | (5,474 | ) | 1,620,157 | 2,097,620 | |||||||||||||||||||
Emerging Markets Research | 60,373 | 67,410 | — | 478,152 | 605,935 | ||||||||||||||||||||
* The difference between book basis and tax basis net unrealized appreciation is attributable primarily to the tax deferral of losses on certain sale of securities.
Unrealized Appreciation (Depreciation) includes amounts related to foreign currency and currency translations.
Under the Regulated Investment Company Modernization Act of 2010 (the “Act”), each Portfolio is permitted to carry forward capital losses incurred in taxable years beginning after the date of enactment for an unlimited period. Additionally, post-enactment capital loss carryforwards will retain their character as either short-term or long-term capital losses.
At October 31, 2020, capital losses incurred that will be carried forward indefinitely under provisions of the Act were as follows:
| Portfolio | Short-Term Capital Loss Carryforward | Long-Term Capital Loss Carryforward | ||||||||
International Equity | $ (324,240,954 | ) | $ (231,889,974 | ) | ||||||
International Small Companies | (4,091,913 | ) | (620,403 | ) | ||||||
Institutional Emerging Markets | (47,899,513 | ) | (157,950,030 | ) | ||||||
Emerging Markets | (34,585,281 | ) | (2,166,831 | ) | ||||||
Frontier Emerging Markets | (20,318,737 | ) | (102,662,372 | ) | ||||||
61
Table of Contents
Harding, Loevner Funds, Inc.
Notes to Financial Statements (continued)
October 31, 2020
8. Income Tax (continued)
Primarily as a result of differing book/tax treatment of foreign currency transactions and foreign capital gain tax expenses, the Portfolios made reclassifications among certain capital accounts. The reclassifications have no impact on the net assets of the Portfolios. As of October 31, 2020, the following reclassifications were made to the Statements of Assets and Liabilities:
| Portfolio | Paid-in Capital | Distributable earnings | ||||||||
Global Equity | $ | 15,712,444 | $ (15,712,444) | |||||||
Frontier Emerging Markets | (2,088 | ) | 2,088 | |||||||
During the fiscal year ended October 31, 2020, the Global Equity and Frontier Emerging Markets Portfolios utilized $1,903,096 and $1,228,604, respectively, in capital loss carryforwards.
9. Foreign Exchange Contracts
The Portfolios do not generally hedge foreign currency exposure, however, the Portfolios may enter into forward foreign exchange contracts in order to hedge their exposure to changes in foreign currency exchange rates on their foreign portfolio holdings. Each Portfolio will conduct its currency transactions either on a spot (cash) basis at the rate prevailing in the currency exchange market, or by entering into forward contracts to purchase or sell currency. Foreign currency transactions entered into on the spot markets serve to pay for foreign investment purchases or to convert to dollars, the proceeds from foreign investment sales or dividend and interest receipts. The Portfolios will disclose open forward currency contracts, if any, on the Portfolios of Investments. The Portfolios do not separately disclose open spot market transactions on the Portfolios of Investments. Such realized gain (loss) and unrealized appreciation (depreciation) on spot market transactions is included in “Net realized gain (loss) on foreign currency transactions” and “Change in unrealized appreciation (depreciation) on translation of assets and liabilities denominated in foreign currencies”, respectively, on the Portfolios’ Statements of Operations. The Portfolios held no open forward currency contracts as of or during the fiscal year ended October 31, 2020.
10. Participation Notes
Each Portfolio may invest in participation notes. Participation notes are promissory notes that are designed to replicate the return of a particular underlying equity or debt security, currency or market. Participation notes are issued by banks or broker-dealers or their affiliates and allow a Portfolio to gain exposure to common stocks in markets where direct investment may not be allowed. Participation notes are generally traded over-the-counter. In addition to carrying the same risks associated with a direct investment in the underlying security, participation notes are subject to the risk that the broker-dealer or bank that issues them will not fulfill its contractual obligation to complete the transaction with a Portfolio. Participation notes constitute general unsecured contractual obligations of the banks or broker-dealers that issue them, and a Portfolio would be relying on the creditworthiness of such banks or broker-dealers and would have no rights under a participation note against the issuer(s) of the underlying security(ies). Participation notes may be more volatile and less liquid than other investments held by the Portfolios.
11. Concentration of Ownership
At October 31, 2020, the percentage of total shares outstanding held by record shareholders each owning 10% or greater of the aggregate shares outstanding of each Portfolio were as follows:
No. of Shareholders | % Ownership | |||||||||||
Global Equity | 2 | 31.18 | %* | |||||||||
International Equity | 2 | 27.54 | %* | |||||||||
International Small Companies | 3 | 45.71 | %* | |||||||||
Institutional Emerging Markets | 2 | 56.39 | %* | |||||||||
Emerging Markets | 3 | 61.75 | %* | |||||||||
Frontier Emerging Markets | 3 | 39.18 | %* | |||||||||
Global Equity Research | 2 | 83.35 | % | |||||||||
International Equity Research | 3 | 70.47 | %* | |||||||||
Emerging Markets Research | 2 | 74.52 | % | |||||||||
| * | Includes omnibus positions of broker-dealers representing numerous shareholder accounts. |
Investment activities of these shareholders may have a material effect on the Portfolios.
62
Table of Contents
Harding, Loevner Funds, Inc.
Notes to Financial Statements (continued)
October 31, 2020
12. Concentration of Risk
Investing in securities of foreign issuers and currency transactions may involve certain considerations and risks not typically associated with investments in U.S. issuers. These risks include revaluation of currencies, adverse fluctuations in foreign currency values and possible adverse political, social and economic developments, including those particular to a specific industry, country or region, which could cause the securities and their markets to be less liquid and prices more volatile than those of comparable U.S. companies and U.S. government securities. These risks are greater with respect to securities of issuers located in emerging market countries in which the Portfolios are authorized to invest.
Frontier Emerging Markets is permitted to invest up to 35% of its total assets in companies in the same industry, if, at the time of investment, that industry represents 20% or more of the Portfolio’s benchmark index. During periods when the Portfolio has invested more than 25% of its total assets in companies in the same industry, it will operate as a concentrated portfolio and be subject to additional risks and greater volatility. Such additional risks include increased competition within the industry, or changes in legislation, or government regulations affecting the industry. The value of the Portfolio’s shares may be particularly vulnerable to factors affecting the banking industry, such as the availability and cost of capital funds, changes in interest rates, the rate of corporate and consumer debt defaults, extensive government regulation, and price competition. Such risks may be magnified with respect to securities of issuers in Frontier Emerging Markets. At October 31, 2020, the Portfolio’s investment in the Banking industry amounted to 33.18% of its total assets.
13. Pandemic Risk
The outbreak of the novel coronavirus (“COVID-19”) and subsequent global pandemic began significantly impacting the U.S. and global financial markets and economies during the calendar quarter ended 31 March, 2020. The worldwide spread of COVID-19 has created significant uncertainty in the global economy. The duration and extent of COVID-19 over the long-term cannot be reasonably estimated at this time. The ultimate impact of COVID-19 and the extent to which COVID-19 impacts the Funds’ normal course of business, results of operations, investments, and cash flows will depend on future developments, which are highly uncertain and difficult to predict. Management continues to monitor and evaluate this situation.
14. Line of Credit
The Fund has a $150 million line of credit agreement with Northern Trust. Borrowings are made solely to facilitate the handling of redemptions or unusual or unanticipated short-term cash requirements. Because several Portfolios participate and collateral requirements apply, there is no assurance that an individual Portfolio will have access to the entire $150 million at any particular time. Interest is charged to each Portfolio based on its borrowings at an amount above the Federal Funds rate, subject to a minimum rate. In addition, a facility fee is computed at an annual rate of 0.15% on the line of credit and is allocated among the Portfolios.
For the year ended October 31, 2020, Frontier Emerging Markets had an outstanding balance for twenty four days with a maximum balance of $3,500,000 at an average weighted interest rate of 1.84%. Institutional Emerging Markets had an outstanding balance for one day with a maximum balance of $2,300,000 at an average weighted interest rate of 1.75%. International Equity Research had an outstanding balance for three days with a maximum balance of $1,500,000 at an average weighted interest rate of 1.75%. International Equity Portfolio had an outstanding balance for three days with a maximum balance of $111,800,000 at an average weighted interest rate of 1.30%.
15. Subsequent Events
Subsequent events occurring after the date of this report have been evaluated for potential impact, for purposes of recognition or disclosure in the financial statements, through the date the report was issued.
63
Table of Contents
| ||
KPMG LLP | ||
Aon Center | ||
Suite 5500 | ||
200 E. Randolph Street | ||
Chicago, IL 60601-6436 |

Report of Independent Registered Public Accounting Firm
To the Shareholders and Board of Directors
Harding, Loevner Funds, Inc.:
Opinion on the Financial Statements
We have audited the accompanying statements of assets and liabilities of Global Equity Portfolio, International Equity Portfolio, International Small Companies Portfolio, Institutional Emerging Markets Portfolio, Emerging Markets Portfolio, Frontier Emerging Markets Portfolio, Global Equity Research Portfolio, International Equity Research Portfolio, and Emerging Markets Research Portfolio (each a portfolio of the Harding, Loevner Funds, Inc.) (the Portfolios), including the portfolios of investments, as of October 31, 2020, the related statements of operations for the year then ended, the statements of changes in net assets for each of the years in the two-year period then ended, and the related notes (collectively, the financial statements) and the financial highlights for each of the years or periods presented therein for the five-year period ended. In our opinion, the financial statements and financial highlights present fairly, in all material respects, the financial position of the Portfolios as of October 31, 2020, the results of their operations for the year then ended, the changes in their net assets for each of the years in the two-year period then ended, and the financial highlights for each of the years or periods in the five-year period then ended, in conformity with U.S. generally accepted accounting principles.
Basis for Opinion
These financial statements and financial highlights are the responsibility of the Portfolios’ management. Our responsibility is to express an opinion on these financial statements and financial highlights based on our audits. We are a public accounting firm registered with the Public Company Accounting Oversight Board (United States) (PCAOB) and are required to be independent with respect to the Portfolios in accordance with the U.S. federal securities laws and the applicable rules and regulations of the Securities and Exchange Commission and the PCAOB.
We conducted our audits in accordance with the standards of the PCAOB. Those standards require that we plan and perform the audit to obtain reasonable assurance about whether the financial statements and financial highlights are free of material misstatement, whether due to error or fraud. Our audits included performing procedures to assess the risks of material misstatement of the financial statements and financial highlights, whether due to error or fraud, and performing procedures that respond to those risks. Such procedures included examining, on a test basis, evidence regarding the amounts and disclosures in the financial statements and financial highlights. Such procedures also included confirmation of securities owned as of October 31, 2020, by correspondence with custodians and brokers. Our audits also included evaluating the accounting principles used and significant estimates made by management, as well as evaluating the overall presentation of the financial statements and financial highlights. We believe that our audits provide a reasonable basis for our opinion.

We have served as the auditor of Harding, Loevner Funds, Inc. Portfolios since 2006.
Chicago, Illinois
December 18, 2020
KPMG LLP, a Delaware limited liability partnership and a member firm of
the KPMG global organization of independent member firms affiliated with
KPMG International Limited, a private English company limited by guarantee.
64
Table of Contents
Harding, Loevner Funds, Inc.
(unaudited)
International Equity, International Small Companies, Institutional Emerging Markets, Emerging Markets, Frontier Emerging Markets, Global Equity Research, International Equity Research, and Emerging Markets Research paid qualifying foreign taxes of $29,937,579, $448,490, $9,721,165, $7,051,535, $527,353, $6,604, $29,752, and $13,154 and earned $191,825,729, $2,009,372, $44,602,003, $28,079,154, $4,624,415, $44,899, $245,951, and $75,229 from foreign source income during the fiscal year ended October 31, 2020, respectively. Pursuant to Section 853 of the Internal Revenue Code, International Equity, International Small Companies, Institutional Emerging Markets, Emerging Markets, Frontier Emerging Markets, Global Equity Research, International Equity Research, and Emerging Markets Research designated $0.0442, $0.0204, $0.0377, $0.1046, $0.0182, $0.0114, $0.0286, and $0.0200 per share as foreign taxes paid and $0.2831, $0.0913, $0.1730, $0.4166, $0.1599, $0.0776, $0.2364, and $0.1145 as income earned from foreign sources for the fiscal year ended October 31, 2020, respectively.
Global Equity, International Equity, International Small Companies, Institutional Emerging Markets, Emerging Markets, Frontier Emerging Markets, Global Equity Research, International Equity Research, and Emerging Markets Research had qualifying dividend income of $7,283,333, $283,457,068, $4,499,976, $74,272,226, $53,987,776, $4,006,388, $103,619, $316,039, and $104,773, respectively, during the fiscal year ended October 31, 2020.
For the fiscal year ended October 31, 2020, Global Equity designated 32.78% of the distributions from net investment income as qualifying for the 70% corporate dividend received deduction.
For the fiscal year ended October 31, 2020, Global Equity Research designated 17.99% of the distributions from net investment income as qualifying for the 70% corporate dividend received deduction.
Pursuant to Section 852 of the Internal Revenue Code, Global Equity designated $75,826,970 as a long term capital gain dividend for the fiscal year ended October 31, 2020.
Pursuant to Section 852 of the Internal Revenue Code, Global Equity Research designated $27,046 as a long term capital gain dividend for the fiscal year ended October 31, 2020.
Pursuant to Section 852 of the Internal Revenue Code, Emerging Markets Research designated $67,411 as a long term capital gain dividend for the fiscal year ended October 31, 2020.
65
Table of Contents
Harding, Loevner Funds, Inc.
Approval of Investment Advisory Agreement
(unaudited)
Approval of Investment Advisory Agreements
Overview of the Review Process
Prior to the Meeting, the Board established a subcommittee of the Governance Committee of the Board (the “Governance Committee”) comprised of three Independent Directors (the “Subcommittee”) to conduct a preliminary review of the materials provided to the Board by the Adviser in connection with consideration of the Advisory Agreements, to assist the Board in its deliberations, and to liaise with the Adviser. In addition, legal counsel to the Independent Directors (“Independent Counsel”), on behalf of the Independent Directors, delivered to the Adviser a written request for information that the Board believed necessary to evaluate the terms of the Advisory Agreements. In response, the Adviser furnished materials to facilitate the Board’s evaluation of the terms of the Advisory Agreements (the “Renewal Materials”), including information on, among other things: (i) the investment performance, expenses and advisory fees of each Portfolio relative to other mutual funds and benchmark indices, as set forth in reports prepared by Institutional Shareholder Services (the “ISS Reports”), a third-party fund analytics provider engaged as part of the Advisory Agreement review process (The Board took note that ISS had acquired Strategic Insight, the third-party fund analytics provider previously engaged to provide such reports, but that the methodology used to prepare the reports was materially unchanged); (ii) the Adviser’s profitability and costs arising from services provided to the Fund; (iii) the qualifications of the Adviser and portfolio management personnel with respect to services provided to the Portfolios; and (iv) the Adviser’s investment research capabilities and resources. The Adviser also sought to provide the foregoing information in the context of the unprecedented circumstances faced by the industry as a whole given the reality of the continuing COVID-19 pandemic.
In preparation for the Meeting, the Adviser provided the Subcommittee with a preliminary version of the Renewal Materials for review and comment. The Subcommittee and representatives of the Adviser discussed the preliminary Renewal Materials during a telephonic meeting on May 21, 2020. Following this meeting, the Adviser revised the Renewal Materials in response to the Subcommittee’s comments and distributed the Renewal Materials in final form to the full Board. The Board also received and considered a memorandum regarding the Board’s responsibilities in connection with renewal of the Advisory Agreements prepared by Independent Counsel and Independent Counsel assisted the Independent Directors throughout the process.
At the Meeting, both in general and executive sessions, the Board considered and discussed the materials presented by the Adviser. During the presentations, the Adviser expanded on those materials and responded to specific questions from the Board. Among other things, the Adviser focused on the long-term performance records of the Portfolios and the competitiveness of the Portfolios’ advisory fees and total expense ratios. The Adviser also focused on the quality of the services provided to the Portfolios and its continued investment in personnel, technology and other resources that service the Fund. The Independent Directors met in executive session with Independent Counsel prior to the commencement of the Meeting to discuss the materials provided by the Adviser.
In evaluating continuance of the Advisory Agreements with respect to each Portfolio, among other things, the Board considered the various factors and information discussed below. The following discussion is not intended to be all-inclusive, as the Board reviewed a variety of factors and considered a significant amount of information.
Nature, Extent and Quality of Services
The Board evaluated the information it deemed necessary to assess the nature, extent and quality of investment advisory services provided to the Portfolios by the Adviser. The Board also considered the nature, extent and quality of the extensive non-advisory services provided to the Portfolios by the Adviser, including portfolio trading; the resources devoted to, and the record of compliance with, each Portfolio’s compliance policies and procedures; the resources devoted to the supervision of third-party service providers; and the quality and quantity of administrative
66
Table of Contents
Harding, Loevner Funds, Inc.
Approval of Investment Advisory Agreement (continued)
(unaudited)
and shareholder servicing. The Board noted that it received information in connection with quarterly Board and committee meetings throughout the year regarding the services rendered by the Adviser concerning the management of each Portfolio’s affairs and the Adviser’s role in coordinating providers of other services to the Portfolios.
The Adviser presented and discussed with the Board the qualifications, backgrounds and responsibilities of the Adviser’s management team and information regarding the members of each Portfolio’s portfolio management team. The Board evaluated the Adviser’s ability to attract and retain qualified investment advisory and non-advisory personnel and engaged in a discussion with the Adviser regarding its recruitment, retention and professional development programs and strategies.
The Board also considered the adequacy of the Adviser’s financial and operational resources committed to each Portfolio, and how well the Adviser utilized those resources to meet the Portfolio’s investment needs, to oversee non-investment services and to satisfy compliance requirements. The Board also considered the nature and extent of the steps taken by the Adviser to deliver the same quality of service to its clients, including the Fund, under the remote work conditions brought about by the COVID-19 pandemic and the Adviser’s operation of its business continuity plan and cybersecurity policies during this remote work environment.
The Board further noted that, as of March 31, 2020, the Adviser had approximately $57.42 billion in assets under management and that the Fund was the Adviser’s largest client, with assets of approximately $22.4 billion. The Board took into account the benefits realized by the Portfolios from the Adviser’s affiliation with Affiliated Managers Group, Inc., an established global asset management company.
The Board considered annual and periodic reports of the Fund’s Chief Compliance Officer (the “CCO”) with respect to the effectiveness and adequacy of the Fund’s and the Adviser’s compliance programs, including program enhancements related to information security and financial intermediary oversight and noted the additional compliance services that are provided, including liquidity risk management. The Board noted the CCO’s determination that the Adviser’s compliance program is reasonably designed to prevent violations of the federal securities laws.
Based on these considerations, the Board concluded that it was satisfied with the nature, extent and quality of services historically provided and to be provided to each Portfolio under its Advisory Agreements.
Performance of the Adviser
For each Portfolio, the Board considered, among other things, the historical performance for multiple time periods ended as of March 31, 2020, including the one-year, three-year, five-year and ten-year periods (or shorter for newer Portfolios) included in the ISS Reports, compared against each Portfolio’s Morningstar Category and benchmark index. The Board considered the Portfolios’ risk-adjusted performance and the high active share (i.e., low overlap with benchmark indices) inherent in the Adviser’s investment process.
With respect to the recent performance of the Portfolios, the Board noted that for the one-year period ended March 31, 2020: each class of the Global Equity Portfolio, International Equity Portfolio, International Small Companies Portfolio and International Equity Research Portfolio outperformed its respective benchmark index; each class of the Emerging Markets Portfolio, Institutional Emerging Markets Portfolio, Frontier Emerging Markets Portfolio, Global Equity Research Portfolio and Emerging Markets Research Portfolio underperformed its respective benchmark index; and all Portfolios, except the Global Equity Portfolio, performed below the median of their respective Morningstar Category.
In assessing longer term performance by the Portfolios, for the five-year period ended March 31, 2020, the Board noted that each class of the Global Equity Portfolio, International Equity Portfolio and International Small Companies Portfolio, with at least five years of operations, outperformed its respective benchmark index; and each class of the Global Equity Portfolio, International Equity Portfolio, Emerging Markets Portfolio and Institutional Emerging Markets Portfolio, with at least five years of operations, was at, or above, the median of its respective Morningstar Category. Each class of the Emerging Markets Portfolio, Institutional Emerging Markets Portfolio and Frontier Emerging Markets Portfolio, with at least five years of operations, underperformed its respective benchmark index; and each class of the Frontier Emerging Markets Portfolio and International Small Companies Portfolio, with at least five years of operations, was below the median of its respective Morningstar Category. The Board noted in their review that the Research Portfolios had not yet completed five years of operations.
For the ten-year period ended March 31, 2020, the Board noted that each class of all Portfolios with at least ten years of operations had performance above the median of its respective Morningstar Category and outperformed its benchmark index, except all classes of the International Small Companies Portfolio, which outperformed its benchmark index but performed below the median of its Morningstar Category, and all classes of the Frontier Emerging Markets Portfolio, which underperformed the Portfolio’s benchmark index and was below the median of its respective Morningstar Category.
67
Table of Contents
Harding, Loevner Funds, Inc.
Approval of Investment Advisory Agreement (continued)
(unaudited)
In addition, the Board reviewed the Adviser’s investment philosophy used to manage the Portfolios, as well as the effectiveness of the Adviser’s use of portfolio management teams for the day-to-day management of Portfolios. The Board noted the Adviser’s bottom-up, business-focused approach based on the study of individual companies and the competitive dynamics of the global industries in which those companies participate. The Board considered the Adviser’s disciplined adherence to its investment philosophy and process as well as the evolutionary enhancements to the methodology used in its implementation.
In evaluating the investment performance of the Portfolios, the Board acknowledged that the Adviser’s investment style may result in periods of underperformance, but has generally produced outperformance over longer time periods and that the Portfolios generally performed well relative to their respective benchmark indices. The Board also considered the Adviser’s ongoing efforts to identify the causes of any underperformance and the effectiveness of these efforts. Finally, the Board considered that the Morningstar Category performance data provided within the ISS Reports was less useful with respect to the Frontier Emerging Markets Portfolio, as Morningstar did not have a Frontier Markets category at March 31, 2020 and instead compared the Portfolio to the Diversified Emerging Markets category.
Based on these considerations, the Board concluded that each Portfolio’s performance was consistent with the Adviser’s investment discipline.
Costs of the Services and Profitability of the Adviser
The Board considered information regarding the Adviser’s costs to provide investment management services to the Portfolios and the profitability to the Adviser from managing the Portfolios. In evaluating the Adviser’s profitability, the Board considered the Adviser’s profitability analyses for calendar years 2018 and 2019, noting that the Adviser’s profitability in relation to its management of the Portfolios was slightly higher in 2019 than the prior year. The Board also considered profitability adjusted, on a pro forma basis, for estimated provisions for federal and state corporate income taxes; each Portfolio’s expense ratio; the allocation methodology used by the Adviser to compute such profitability; and the Adviser’s contractual fee waivers and expense reimbursements with respect to the applicable Portfolios. The Board further considered profitability on a Portfolio-by-Portfolio basis, focusing on the Adviser’s profit both with and without taking into account those costs borne by the Adviser with respect to its efforts to expand the Portfolios’ shareholder base.
The Adviser also presented its profitability analyses for calendar years 2018 and 2019 on an adjusted basis to reflect the equity-related compensation received by certain senior personnel of the Adviser who are limited partners of the Adviser. In the adjusted profitability analyses, the Adviser stated that it had adjusted the Adviser’s personnel expenses to an amount that more closely resembled the compensation paid to similarly situated personnel at peer firms, noting that the salaries and bonuses paid to the Adviser’s limited partners are lower than the compensation paid at peer firms because the limited partners also receive equity-related compensation. The Board noted that this adjusted profitability information was useful in its consideration and assessment of the Adviser’s profitability.
The Board took note of the costs the Adviser has incurred that are intended to assure the continued delivery of high-quality services to its clients, including the Portfolios, and the future costs the Adviser plans to incur, including hiring additional qualified personnel and further investing in technology, including with respect to cybersecurity as well as enhancing its operational infrastructure. The Board considered the Adviser’s need to accommodate changing regulatory requirements and to adapt to structural changes in the mutual fund marketplace. The Board also noted that future profitability to the Adviser from managing the Portfolios would depend on the level of assets in the Portfolios and investment returns, as well as the Adviser’s total assets under management, and may be limited as certain Portfolios’ investment strategies encounter their capacity limitations. In assessing profitability, the Board considered each Portfolio’s profitability in the context of the services provided, the reasonableness of the fees charged for those services and the continued growth of assets through new investments.
Based upon these considerations, the Board concluded that the profits historically realized by the Adviser, and the profits the Adviser anticipates will be realized from its continued relationship with the Portfolios, are not excessive in light of the nature, extent and quality of the services provided to the Portfolios.
Comparison of Fees and Services Provided by the Adviser
The Board reviewed the contractual advisory fees that are payable by the Portfolios to the Adviser and the actual investment advisory fees realized by the Adviser taking into account the fee waiver and/or expense reimbursement arrangements for certain of the Portfolios. The Board considered the fact that the Adviser’s waiver/expense reimbursement arrangements are not subject to recapture and that the proposed fee reductions and breakpoints were contractual in nature, noting that in fiscal year 2019, the Adviser waived a portion of its advisory fees for the following Portfolios: the Institutional Class Z of the Institutional Emerging Markets Portfolio, the Institutional Class II of the Frontier Emerging Markets Portfolio, the International Small Companies Portfolio, the International Equity Research Portfolio, the Global Equity Research Portfolio and the Emerging Markets Research Portfolio. In addition, the Board compared the Adviser’s separate account fee schedule with the
68
Table of Contents
Harding, Loevner Funds, Inc.
Approval of Investment Advisory Agreement (continued)
(unaudited)
advisory fees payable by the Portfolios to the Adviser. Finally, the Board considered the ISS Reports, which included information comparing each Portfolio’s management fee and overall expenses with those of funds in a group of peer funds selected by Institutional Shareholder Services (the “Expense Group”).
The Board noted that the net operating expenses of each Portfolio (expenses other than the fees pursuant to the Advisory Agreements and distribution and service fees) were at or below the median of their respective Expense Groups and of their respective Morningstar Category-derived universe (the “Expense Universe”), with the exception of the Research Portfolios, which had net operating expenses above their respective Expense Universe medians due to the small asset size of these Portfolios, although this was partially offset by the voluntary subsidy of those Portfolios by the Adviser. The Board also observed that, except as noted below, the total expense ratio of each class of each Portfolio, after any applicable waiver of advisory fees and reimbursement of expenses, was below its respective Expense Group and Expense Universe medians. Exceptions included: the Institutional Class of the Institutional Emerging Markets Portfolio, which had a total expense ratio above the median for its Expense Group and Expense Universe; the Investor Class of the Frontier Emerging Markets Portfolio, which had a total expense ratio above the median for its Expense Group; and the Institutional Class of the International Small Companies Portfolio, the Institutional Class of the Institutional Emerging Markets Portfolio and the Emerging Markets Research Portfolio, each of which had a total expense ratio above the median for its Expense Universe. The Board did not consider any of these differences to be material.
The Board noted that the net management fee for each class of each Portfolio was at or below the median of its Expense Group, except the Advisor Class of the Emerging Markets Portfolio; both classes of the Institutional Emerging Markets Portfolio and International Small Companies Portfolio; the Global Equity Research Portfolio; the Emerging Markets Research Portfolio; and all classes of the Frontier Emerging Markets Portfolio, each of which were above the median for their respective Expense Groups. The Board also noted that, for each Portfolio with an Expense Universe, the net management fee was at or below the median of its Expense Universe, except all classes of the Global Equity Portfolio, International Equity Portfolio and International Small Companies Portfolio; the Advisor Class of the Emerging Markets Portfolio; and both classes of the Institutional Emerging Markets Portfolio, each of which were above the median for their respective Expense Universes. The Board noted that there is no Expense Universe for the Frontier Emerging Markets Portfolio, as there is no comparative Morningstar Category. In its consideration of each Portfolio’s net management fee, the Board considered each Portfolio’s performance record and the extensive scope of non-advisory services provided by the Adviser, which it performs without additional compensation.
The Board recognized that the Adviser’s separate account and collective trust clients require fewer services from the Adviser than the Fund. The Board additionally recognized the Adviser’s efforts to increase institutional account minimums and direct more institutional investors into pooled vehicles, including the Portfolios. Further, the Board took note that many sophisticated institutional investors, after reviewing similar investment vehicles with the assistance of their consultants, had determined and continue to, invest in the Portfolios, which further supported the reasonableness of the advisory fees charged by the Adviser.
The Board also noted the Adviser’s commitment to review periodically the fees charged to the Portfolios and the proposed management fee reductions for the Global Equity Portfolio and the International Small Companies Portfolio as part of the 2020 Advisory Agreements renewal process, to ensure that the fees remain competitive.
Based on these considerations, the Board concluded that each Portfolio’s fee, in light of the services provided by the Adviser, was reasonable.
Economies of Scale
The Board considered the extent to which economies of scale have been realized as the Portfolios’ assets grew, whether there is potential for realization of further economies of scale for the Portfolios, and whether material economies of scale are being shared with shareholders. The Board also considered that the Portfolios have benefitted both from asset growth in the Portfolios and even more from asset growth in the Adviser’s other accounts, each of which have resulted in certain expenses becoming a smaller percentage of overall assets.
The Board acknowledged that other aspects of the Portfolios’ investment strategies may limit the realization of economies of scale, including a particular strategy’s capacity limitations. The Board noted the strategies utilized by the Adviser to manage the high level of capacity utilization in the International Equity Portfolio, Emerging Markets Portfolio and Institutional Emerging Markets Portfolio and that those Portfolios have been open to new investors subject to certain limitations at the Fund’s discretion since March 1, 2019. The Board also acknowledged the Adviser’s considerable and continued reinvestment in its business and its business plans for the Research Portfolios and paying for the associated expenses out of its own profits, including through revenue sharing payments.
69
Table of Contents
Harding, Loevner Funds, Inc.
Approval of Investment Advisory Agreement (continued)
(unaudited)
The Board considered that the Adviser assumes substantial business risk each time it sponsors a new Portfolio and that the fee waivers in place for the Global Equity Research and the Emerging Markets Research Portfolios currently exceed the Adviser’s advisory fee. The Board also noted that the Adviser provides the same high-quality services to the International Small Companies Portfolio and Research Portfolios that have not yet achieved profitability due to their smaller level of assets.
Based on these considerations, the Board concluded that it was satisfied with the extent to which any economies of scale currently are and will be realized for the benefit of the Portfolios’ shareholders, and recognized its obligation to consider the same annually based on changing circumstances.
Other Benefits
The Board also considered the benefits that the Portfolios derived from their association with the Adviser. In this regard, the Board considered the competitive nature of the mutual fund marketplace and that the Portfolios’ shareholders invested in the Portfolios because of the Fund’s relationship with the Investment Adviser.
Conclusion
Following extensive discussion, both in general session and in an executive session of the Independent Directors meeting alone with Independent Counsel, the Board determined that it had received sufficient information to take action on the proposed resolutions regarding continuance of the Advisory Agreements and that all of its questions had been addressed to its satisfaction. The Board, including a majority of the Independent Directors, concluded with respect to each Portfolio that its investment advisory fees were sufficiently supported by their review of the factors described above.
In light of all the foregoing, the Board, and separately, a majority of the Independent Directors, approved the continuance of each Advisory Agreement on behalf of the respective Portfolio(s). The Board’s approval determinations were made on the basis of each Director’s business judgment after consideration of all the information presented. The Board’s decision was based on all of the above-mentioned factors and their related conclusions, with no single factor or conclusion being determinative and with each Director not necessarily attributing the same weight to each factor.
70
Table of Contents
Harding, Loevner Funds, Inc.
(unaudited)
HARDING, LOEVNER FUNDS, INC.
PRIVACY NOTICE
The Fund collects nonpublic personal information about you from the following sources:
| • | Information, such as your name, address, social security number, assets and income, submitted by you on applications, forms, or in other written or verbal customer communications. This information may also be provided by a consultant or intermediary acting on your behalf. |
| • | Information that results from any transaction performed by us for you. |
The Fund will not disclose any nonpublic personal information about you or its former customers to anyone except as permitted or required by law.
If you decide to close your account(s) or become an inactive customer, the Fund will adhere to the privacy policies and practices as described in this notice.
The Fund restricts access to your personal and account information to only those employees who need to know that information to provide products or services to you. The Fund maintains physical, administrative and technical safeguards to protect your nonpublic personal information.
71
Table of Contents
Harding, Loevner Funds, Inc.
Directors and Principal Officers
(unaudited)
Independent Directors:
Name, Address and Age | Position with the Fund | Term of Office and Length of Time Served* | Principal Occupation During Past Five Years | Number of Portfolios in Fund Complex Overseen By Director | Other Directorships | |||||
Carolyn N. Ainslie c/o Harding Loevner LP 400 Crossing Boulevard Fourth Floor Bridgewater, NJ 08807 Age, 62 | Director | Indefinite; Director since 2014; Member of the Audit Committee since 2015 - Present and Co - Chairperson June - December, 2017 and Chairperson since 2018; Member of the Governance Committee since March 2018 | Bill & Melinda Gates Foundation, Chief Financial Officer, 2018-present; Princeton University, Vice President for Finance and Treasurer, 2008 – 2018. | 9 | None. | |||||
Jill R. Cuniff c/o Harding Loevner LP 400 Crossing Boulevard Fourth Floor Bridgewater, NJ 08807 Age, 56 | Director | Indefinite; since 2018; Member of the Audit Committee since 2018; Member of the Governance Committee since March 2018 | Edge Asset Management, President and Director, 2009—2016. | 9 | None. | |||||
R. Kelly Doherty c/o Harding Loevner LP 400 Crossing Boulevard Fourth Floor Bridgewater, NJ 08807 Age, 62 | Director | Indefinite; Director since 2004; Lead Independent Director since 2014; Member of the Governance Committee since March 2018 | Caymen Partners (private investment vehicles), Managing Partner, 1999 – present. | 9 | Selective Insurance Group, Inc. (SIGI). | |||||
Charles W. Freeman, III c/o Harding Loevner LP 400 Crossing Boulevard Fourth Floor Bridgewater, NJ 08807 Age, 56 | Director | Indefinite; Director since 2008; Member of the Governance Committee since March 2018 | U.S. Chamber of Commerce, Senior Vice President for Asia, 2018 - present; Bower Group Asia, Managing Director, China, December 2016 – 2017; Forbes-Tate, LLC, International Principal, 2014 – 2016. | 9 | None. | |||||
72
Table of Contents
Harding, Loevner Funds, Inc.
Directors and Principal Officers
(unaudited)
Independent Directors (continued):
Name, Address and Age | Position with the Fund | Term of Office and Length of Time Served* | Principal Occupation During Past Five Years | Number of Portfolios in Fund Complex Overseen By Director | Other Directorships | |||||
Samuel R. Karetsky c/o Harding LoevnerLP 400 Crossing Boulevard Fourth Floor Bridgewater, NJ 08807 Age, 75 | Director | Indefinite; Director since 1998; Member of the Audit Committee since 1998; Member of the Governance Committee since March 2018 | The Karetsky Group LLC (advisory firm), Managing Member, 2003 – present; Wetherby Asset Management, Wealth Manager, 2004 – present. | 9 | None. | |||||
Eric Rakowski c/o Harding Loevner LP 400 Crossing Boulevard | Director | Indefinite; Director since 2008; Chairman of the Governance Committee since March 2018 | University of California at Berkeley School of Law, Professor, 1990 – present. | 9 | AMG Funds (46 portfolios); AMG Pantheon Private Equity Fund (1 portfolio); AMG Pantheon Private Equity Master Fund (1 portfolio); AMG Pantheon Subsidiary Fund, LLC (1 portfolio). | |||||
73
Table of Contents
Harding, Loevner Funds, Inc.
Directors and Principal Officers
(unaudited)
Interested Directors:
Name, Address and Age | Position with the Fund | Term of Office and Length of Time Served* | Principal Occupation During Past Five Years | Number of Portfolios in Fund Complex Overseen By Director | Other Directorships | |||||
David R. Loevner** Harding Loevner LP Fish Creek Center 1230 Ida Dr. Ste. 31⁄2 PO Box 383 Wilson, WY 83014 Age, 66 | Director and Chairman of the Board of Directors | Indefinite; Director and Chairman of the Board since 1996 | Harding Loevner LP, Chairman and Chief Executive Officer, 1989 – present; Harding Loevner Funds, plc, Director, 2007—present. | 9 | None. | |||||
Christine C. Carsman*** Affiliated Managers Group, Inc. 777 South Flager Drive West Palm Beach, FL 33477 Age, 68 | Director | Indefinite; Director beginning 2017 | Affiliated Managers Group, Inc., Senior Policy Advisor, 2019-present; Executive Vice President, Deputy General Counsel and Chief Regulatory Counsel 2017-2018; Senior Vice President and Deputy General Counsel 2011-2016; AMG Funds plc. Chair of the Board of Directors, 2015-2018; Director, 2010-2018. | 9 | AMG Funds (46 portfolios); AMG Pantheon Private Equity Fund (1 portfolio); AMG Pantheon Private Equity Master Fund (1 portfolio); AMG Pantheon Subsidiary Fund, LLC (1 portfolio). | |||||
** Mr. Loevner is considered an “interested person” of the Fund as defined in the 1940 Act, because he serves as President of Harding Loevner LP, the Fund’s investment advisor.
*** Ms. Carsman is considered an “interested person” of the Fund as defined in the 1940 Act, as a result of her position with, and interest in securities of, AMG, a control person of Harding Loevner.
The Funds’ Statement of Additional Information contains additional information about the Directors and is available upon request and without charge by calling (877) 435-8105.
74
Table of Contents
Harding, Loevner Funds, Inc.
Directors and Principal Officers
(unaudited)
Principal Officers of the Fund:
Name, Address and Age | Position(s) with the Fund | Term of Office and Length of Time Served* | Principal Occupation During Past Five Years | |||
Richard T. Reiter Harding Loevner LP 400 Crossing Boulevard Fourth Floor Bridgewater, NJ 08807 Age, 54 | President | 1 year; since 2011 | Harding Loevner LP, President and Chief Operating Officer, 1996—present. | |||
Tracy L. Dotolo Foreside Management Services, LLC 10 High Street, Suite 302 Boston, MA 02110 Age, 44 | Chief Financial Officer and Treasurer | 1 year; since 2019 | Director at Foreside, Inc. 2016 – present; Vice President – Global Fund Services at JPMorgan Chase 2009 – 2016. | |||
Aaron J. Bellish Harding Loevner LP 400 Crossing Boulevard Fourth Floor Bridgewater, NJ 08807 Age, 41 | Assistant Treasurer | 1 year; since 2012 | Harding Loevner LP, Chief Financial Officer, 2012-present. | |||
Derek A. Jewusiak The Northern Trust Company 333 South Wabash Chicago, IL 60604 Age, 49 | Assistant Treasurer | 1 year; since 2013 | The Northern Trust Company, Vice President, 2012 – present. | |||
Ryan Bowles Harding Loevner LP 400 Crossing Boulevard Fourth Floor Bridgewater, NJ 08807 Age, 32 | Assistant Treasurer | 1 year; since 2019 | Harding Loevner LP, Product Manager, 2010 – present. | |||
Lisa R. Price Harding Loevner LP 400 Crossing Boulevard Fourth Floor Bridgewater, NJ 08807 Age, 41 | Assistant Secretary | 1 year; since 2019 | Harding Loevner LP, Counsel, 2019 – present; Oak Hill Advisors, LP, Principal, Associate General Counsel and Chief Compliance Officer (OHAI), January 2019 – August 2019, Vice President, Associate General Counsel and Chief Compliance Officer (OHAI), 2015 – 2018; Associate, Dechert LLP, 2005 – 2015. | |||
Brian D. Simon Harding Loevner LP 400 Crossing Boulevard Fourth Floor Bridgewater, NJ 08807 Age, 58 | Chief Compliance Officer, Anti-Money Laundering Compliance Officer and Assistant Secretary | 1 year, since 2016, 2016 and 2015 respectively | Harding Loevner LP, General Counsel, 2014 – present. | |||
75
Table of Contents
Harding, Loevner Funds, Inc.
Directors and Principal Officers
(unaudited)
Principal Officers of the Fund (continued):
Name, Address and Age | Position(s) with the Fund | Term of Office and Length of Time Served* | Principal Occupation During Past Five Years | |||
Marcia Y. Lucas The Northern Trust Company 333 South Wabash Avenue Chicago, IL 60604 Age, 53 | Secretary, December 2018— Present; Assistant Secretary, 2011-November 2018 | 1 year; since 2011 | The Northern Trust Company, Senior Vice President, 2015 – present. | |||
There is no family relationship among any of the Directors or officers listed above.
76
Table of Contents
Harding, Loevner Funds, Inc.
(unaudited)
Quarterly Portfolio Schedules of Investments
Each Portfolio files its complete portfolio of investments with the SEC for the first and third quarters of each fiscal year as an exhibit to its reports on Form N-PORT. Previously, the Portfolios filed complete portfolios of investment with the SEC for the first and third quarters of each fiscal year on Form N-Q. The Portfolios’ Forms N-PORT and N-Q are available on the SEC’s website at www.sec.gov. Additionally, they are available upon request by calling (877) 435-8105.
Proxy Voting Record
The Fund’s proxy voting record relating to the Portfolios’ securities during the most recent 12-month period ended June 30 is available on the Fund’s website at www.hardingloevnerfunds.com and on the SEC’s website at www.sec.gov, on Form N-PX.
Proxy Voting Policies and Procedures
The Fund’s proxy voting policies and procedures are included in Appendix B to the Fund’s Statement of Additional Information and is available without charge, upon request, by calling (877) 435-8105 or on the SEC’s website at www.sec.gov.
Additional Information
The Adviser updates Fact Sheets for the Portfolios each calendar quarter that are posted to the Fund’s website at www.hardingloevnerfunds.com. This information, along with the Adviser’s commentaries on its various strategies, is available without charge, upon request, by calling (877) 435-8105.
77
Table of Contents
This page intentionally left blank.
78
Table of Contents
This report is intended for shareholders of Harding, Loevner Funds, Inc. It may not be used as sales literature unless preceded or accompanied by the current Prospectus, which gives details about charges, expenses, investment objectives, risks and policies of the Portfolios.
Table of Contents

Client Name
Address Line 1
Address Line 2
City, State Zip
(877) 435-8105
www.hardingloevnerfunds.com
Table of Contents
Item 1. Reports to Stockholders (cont.).
| (b) | Not applicable. |
Item 2. Code of Ethics.
| (a) | As of October 31, 2020, the Registrant has adopted a code of ethics that applies to the Registrant’s President/Chief Executive Officer and Treasurer/Chief Financial Officer (the “Code of Ethics”). |
| (c) | For the fiscal year ended October 31, 2020, there were no amendments to a provision of the Registrant’s Code of Ethics. |
| (d) | For the fiscal year ended October 31, 2020, there were no waivers granted from a provision of the Registrant’s Code of Ethics. |
Item 3. Audit Committee Financial Expert.
As of October 31, 2020, the Registrant’s Board of Directors has determined that the following members of the Audit Committee are audit committee financial experts and independent: Carolyn N. Ainslie and Jill R. Cuniff.
Item 4. Principal Accountant Fees and Services.
(a) Audit Fees: The aggregate fees billed for each of the last two fiscal years for professional services rendered by KPMG LLP, the Registrant’s principal accountant, for the audit of the Registrant’s annual financial statements in connection with statutory and regulatory filings or engagements for those fiscal years are $226,820 in 2020 and $222,050 in 2019.
(b) Audit-Related Fees: The aggregate fees billed in each of the last two fiscal years for assurance and related services by KPMG LLP that are reasonably related to the performance of the audit of the Registrant financial statements and are not reported under paragraph (a) of this Item are None.
(c) Tax Fees: The aggregate fees billed in each of the last two fiscal years for professional services rendered by KPMG LLP for the review of domestic tax returns were $92,090 in 2020 and $75,060 in 2019.
(d) All Other Fees: The aggregate fees billed in each of the last two fiscal years for products and services provided by KPMG LLP, other than the services reported in paragraphs (a) through (c) of this Item are $0 in 2020 and $1,800 in 2019, related to research, preparation and filing of tax returns in certain foreign jurisdictions.
(e)(1) Disclose the audit committee pre-approval policies and procedures described in paragraph (c)(7) of Rule 2-01 of Regulation S-X.
A copy of the Audit Committee’s Pre-Approval Policies and Procedures is filed with this Form N-CSR under Item 13(c).
(e)(2) There were no amounts that were pre-approved by the Audit Committee pursuant to paragraph (c)(7)(i)(C) of Rule 2-01 of Regulation S-X.
(f) Not applicable.
2
Table of Contents
(g) Not applicable.
(h) Not applicable.
Item 5. Audit Committee of Listed Registrants.
Not applicable.
Item 6. Investments.
| (a) | Schedule I is included as part of the report to shareholders filed under Item 1 of this report on Form N-CSR. |
| (b) | Not applicable. |
Item 7. Disclosure of Proxy Voting Policies and Procedures for Closed-End Management Investment Companies.
Not applicable.
Item 8. Portfolio Managers of Closed-End Management Investment Companies.
Not applicable.
Item 9. Purchases of Equity Securities by Closed-End Management Investment Company and Affiliated Purchasers.
Not applicable.
Item 10. Submission of Matters to a Vote of Security Holders.
Not applicable.
Item 11. Controls and Procedures.
| (a) | The Registrant’s Principal Executive Officer and Principal Financial Officer, or persons performing similar functions, have concluded that the Registrant’s disclosure controls and procedures (as defined in Rule 30a-3(c) under the Investment Company Act of 1940, as amended (the “1940 Act”)) were effective as of a date within 90 days prior to the filing date of this report, based on their evaluation of the effectiveness of the Registrant’s disclosure controls and procedures as of the evaluation date. |
| (b) | There were no significant changes in the Registrant’s internal control over financial reporting (as defined in Rule 30a-3(d) under the 1940 Act) that occurred during the period covered by this report that have materially affected, or are reasonably likely to materially affect, the Registrant’s internal control over financial reporting. |
Item 12. Disclosure of Securities Lending Activities for Closed-End Management Investment Companies.
Not applicable.
Item 13. Exhibits.
(a)(1) |
3
Table of Contents
(a)(2) | ||
(a)(3) | Not applicable. | |
(a)(4) | Not applicable. | |
(c) | ||
4
Table of Contents
SIGNATURES
Pursuant to the requirements of the Securities Exchange Act of 1934 and the Investment Company Act of 1940, the Registrant has duly caused this report to be signed on its behalf by the undersigned, thereunto duly authorized.
Harding, Loevner Funds, Inc. | ||
By | /s/ Richard T. Reiter | |
Richard T. Reiter | ||
(Principal Executive Officer) | ||
Date: January 4, 2021
Pursuant to the requirements of the Securities Exchange Act of 1934 and the Investment Company Act of 1940, this report has been signed below by the following persons on behalf of the Registrant and in the capacities and on the dates indicated.
By | /s/ Richard T. Reiter | |
Richard T. Reiter | ||
(Principal Executive Officer) |
Date: January 4, 2021
By | /s/ Tracy L. Dotolo | |
Tracy L. Dotolo | ||
(Principal Financial Officer) |
Date: January 4, 2021
5