Table of Contents
UNITED STATES
SECURITIES AND EXCHANGE COMMISSION
Washington, D.C. 20549
FORM N-CSR
CERTIFIED SHAREHOLDER REPORT OF REGISTERED
MANAGEMENT INVESTMENT COMPANIES
Investment Company Act file number 811-07739
Harding, Loevner Funds, Inc.
(Exact name of registrant as specified in charter)
400 Crossing Boulevard
Fourth Floor
Bridgewater, NJ 08807
(Address of principal executive offices) (Zip code)
Owen T. Meacham
The Northern Trust Company
50 South LaSalle Street
Chicago, IL 60603
With a copy to:
Stephen H. Bier, Esq.
Dechert LLP
1095 Avenue of the Americas
New York, NY 10036
(Name and address of agent for service)
Registrant’s telephone number, including area code: (877) 435-8105
Date of fiscal year end: 10/31
Date of reporting period: 10/31/2017
Table of Contents
Item 1. Reports to Stockholders.
Table of Contents
HARDING, LOEVNER FUNDS, INC. Annual Commentary Global Equity Portfolio International Equity Portfolio International Small Companies Portfolio Institutional Emerging Markets Portfolio Emerging Markets Portfolio Frontier Emerging Markets Portfolio Global Equity Research Portfolio International Equity Research Portfolio Emerging Markets Research Portfolio October 31, 2017 Fundamental. Thinking. Worldwide.
Table of Contents
 HARDING LOEVNER FUNDS
Global equity investing for institutions is Harding Loevner’s exclusive focus. Through Harding Loevner Funds it offers distinct global strategies based on its quality-and-growth investment philosophy. It seeks to purchase shares of growing, financially strong, well-managed companies at favorable prices. Harding Loevner manages each of the Funds’ Portfolios according to a disciplined, research-based investment process. It identifies companies with sustainable competitive advantages and assesses the durability of their earnings growth by conducting in-depth fundamental research into global industries. In constructing portfolios, Harding Loevner diversifies carefully to limit risk.
RECEIVE INVESTOR MATERIALS ELECTRONICALLY
Shareholders may sign up for electronic delivery of investor materials. By doing so, you will receive the information faster and help us reduce the impact on the environment of providing these materials. To enroll in electronic delivery,
| 1. | Go to http://www.icsdelivery.com |
| 2. | Select the first letter of your brokerage firm’s name. |
| 3. | From the list that follows, select your brokerage firm. If your brokerage firm is not listed, electronic delivery may not be available. Please contact your brokerage firm. |
| 4. | Complete the information requested, including the e-mail address where you would like to receive notifications for electronic documents. |
Your information will be kept confidential and will not be used for any purpose other than electronic delivery. If you change your mind, you can cancel electronic delivery at any time and revert to physical delivery of your materials. Just go to http://www.icsdelivery.com, perform the first three steps above, and follow the instructions for cancelling electronic delivery. If you have any questions, please contact your brokerage firm.
Table of Contents
4 | Letter to Our Shareholders
10 | International Equity Portfolio
14 | International Small Companies Portfolio
18 | Emerging Markets
22 | Frontier Emerging Markets Portfolio
26 | Global Equity Research Portfolio
30 | International Equity Research Portfolio
34 | Emerging Markets Research Portfolio
CONTACT
Harding, Loevner Funds, Inc. c/o Northern Trust Attn: Funds Center C5S 801 South Canal Street Chicago, IL 60607
Phone: (877) 435-8105 Fax: (312) 267-3657 www.hardingloevnerfunds.com | Must be preceded or accompanied by a current Prospectus. Quasar Distributors, LLC, Distributor |
3
| ||||
Table of Contents

 | DAVID LOEVNER, CFA, CIC CHAIRMAN OF THE FUNDS AND CEO OF THE ADVISER
SIMON HALLETT, CFA CO-CIO OF THE ADVISER
FERRILL ROLL, CFA CO-CIO OF THE ADVISER |
Don’t Count Out Active Management
In 1974, the American Express Asset Management Company proposed a novel investment product that would hold shares of every company in the S&P 500 Index. The “Index Fund of America” promised to avoid the decisions and some of the costs associated with researching and selecting individual securities.1 While this fund never got off the ground, the passive approach to investing eventually proved wildly popular as investors flocked to inexpensive funds that tracked rising markets. Today thousands of passive funds follow a bewildering variety of indexes—of which there are now over a million!2 Cheerleading for the passive approach has been led by investment theorists who characterize the stock market as a zero-sum game in which every active investor’s gain is offset by another’s loss.3 After active managers’ fees are taken into account, the theorists argue, active managers on the whole are predestined to fail to beat their benchmarks. Investors are increasingly buying this argument: over the last decade, equity mutual fund investors in the US have poured an estimated US$750 billion into passive funds even as they pulled about US$1 trillion from actively managed funds.4
Investors are in a difficult place. In choosing passive management, they minimize costs and the risk of underperformance while giving up any chance of outperformance. If they opt for active management, they have the opportunity to beat a benchmark index but also face a strong likelihood of underperformance, especially after fees. Investment theory offers little help. The zero-sum game arithmetic cited by supporters of the passive approach, for example, applies only to active managers as a group. Though the argument speaks volumes to the likelihood of a randomly selected manager beating its benchmark, it says little about the ability of a carefully selected manager to do so. In fact, while many managers do not outperform, some do. Our view is that active management can work for the benefit of investors. Making it work is our mission. The challenge for investors who seek to benefit from active management is to identify markets where stock picking is potentially effective, to select managers who show signs of skill, and then to stick with their approach long term.
Stacking the Odds in Your Favor
The pursuit of skilled managers begins by understanding where active managers have demonstrated the most and the least success. In practice, not all indexes are equally difficult to outperform. Most studies favoring passive investing have been based on
analysis of large-cap US stock funds due to the US market’s long unbroken history and the availability of stock, fund, and index return data. They have shown that the available quantity of information and the human energy devoted to researching US large-cap companies make the market in their stocks relatively efficient, so that few active managers are able to beat the S&P 500.
In contrast, active managers have experienced more success when not confined to large-cap US stocks. Investment universes that stretch across borders and include less prominent companies provide greater opportunities to take advantage of market inefficiencies. A recent study of global equity portfolios from 2002–2012 found that active managers on average outperformed their benchmarks by 1.2–1.4% a year before fees.5 Other research found that the majority of institutional portfolios of non-US equities generated excess return, net of fees, versus their indexes for the 15-year period ending March 31, 2017.6
Identifying Skill Not Luck
Even in markets where the average active manager adds value over an index after fees, choosing a manager who produces average results would hardly count as a big success. An investor must identify those who will outperform in the future and by a significant margin.
A manager’s success at picking investments is always a combination of luck and skill. Luck waxes and wanes, but skill can lead to long-term outperformance. The challenge is distinguishing between the two. It becomes harder as unskilled managers are squeezed out of the industry, shrinking the variations of skill among the remaining managers, and leading luck, paradoxically, to play a greater role in their relative results. Countless studies have proved what the advertisements warn: past performance is no guarantee of future results. In fact it’s worse—past performance alone has little to no predictive power. Rather than trying to divine differences in skill from results, an investor’s time is better spent studying the differences in a manager’s approach to discern the existence and sources of competitive edge.
The most obvious requirement for outperformance is high active share, which measures a manager’s willingness to invest differently than the benchmark index.7 Also important is the discipline to stick with decisions even in the face of short-term setbacks. Martijn Cremers of the University of Notre Dame explored these characteristics in his recent article, “Active Share and the Three Pillars of Active Management: Skill, Conviction, and Opportunity.” His analysis of US long-only retail mutual funds from 1990 to 2015 found that, on average, funds with high active share and long holding duration outperformed their benchmarks. The average fund in the top quintile of both active share and holding duration beat its benchmark by 188 basis points annually and beat its counterpart in the corresponding bottom quintiles by 311 basis points.8 High active share and patience are apparently among the ingredients required to outperform, but they are by no means sufficient.
4
|
Table of Contents
To reap excess returns a manager must have a competitive edge at developing insights and converting them into profitable investments.9 At Harding Loevner, our edge is based on an investment process that reflects our understanding of human decision-making. We look for and try to overcome biases that might hinder our investment decisions. One example is confirmation bias, which behavioral psychologists define as the tendency to look only for information that reinforces what one already knows or believes. Because this bias is often compounded in groups, we have created a process where every investment choice is made by a single individual who is held accountable for the decision and its consequences. We also strive to retain the benefits of group collaboration by encouraging our research team to question and challenge ideas. Our culture—which we call collaboration without consensus—is at the heart of our edge. It leads us to build portfolios significantly different from their respective indexes, while conviction in our process gives us the courage to maintain our long-term perspective when our approach inevitably will be out of favor.
After investors have identified a skilled manager, they must stay the course to realize the benefits. But it’s not easy. The difference between a portfolio and its benchmark index not only provides the opportunity to outperform, but also opens the door to underperformance.
Successful managers, regardless of their skill, will underperform their benchmarks for significant periods. In an analysis of the top quartile of active international equity managers for the decade ended September 30, 2017, every manager spent at least one three-year period below the benchmark.10 Many investors cannot stomach a year’s underperformance, much less three years. In fact, there is evidence that underperformance may lead investors to abandon skilled managers at inopportune times. As a result, they miss out on positive returns they would have received had they stayed put.11
We Believe in Active Management
Investors can benefit from both passive and active management: passive funds provide access to markets at low cost, and some active managers can identify mispriced securities to generate excess returns. At Harding Loevner, we invest actively across global, developed, and emerging markets, where there has been ample scope for successful active investing. We are relentless in trying to improve our competitive edge, which has delivered superior long-term results to our clients.
To see how our active approach translates to investment insights and actions, we invite you to read the commentaries that follow.
We thank you for your support and your trust.
Sincerely,
David R. Loevner, CFA, CIC |
Simon Hallett, CFA |
Ferrill D. Roll, CFA |


1“Marketplace: Fund to Invest in S. & P. 500,” The New York Times, February 23, 1974. In this year, a few other firms were also working to develop index funds. However, the first did not launch until 1976, when Vanguard introduced the First Index Investment Trust based on the S&P 500.
2“Financial-Market Index-Makers are Growing in Power,” Economist, August 24, 2017.
3The zero-sum game assumes that active and passive investors are working in the same closed system of securities. In reality, markets and the indexes that track them are not static. New listings, bankruptcies, and mergers regularly are sources of change. Index designers also make changes of their own volition. In addition, most active managers are under no obligation to invest in solely index-constituent stocks.
4Morningstar. Estimated net asset flows of US mutual funds for 10 years through September 30, 2017.
5David Gallagher et al., “Global Equity Fund Performance: an Attribution Approach,” Financial Analysts Journal 73, no. 1 (2017): 56–71.
6Ruchir Sharma, “What They Don’t Tell You About Passive Investing,” Morgan Stanley Investment Insight (2017).
7Active share is equal to the proportion of portfolio assets that is invested differently from the benchmark.
8Martijn Cremers, “Active Share and the Three Pillars of Active Management: Skill, Conviction, and Opportunity,” Financial Analysts Journal 73, no. 2 (2017): 61–79.
9Different skilled managers may have different competitive advantages, but they ultimately boil down to four key sources of edge: informational, analytical, behavioral, and organizational. For further discussion of how these sources of edge pertain to our investment process, please see our October 2016 letter available on Harding Loevner’s website.
10 eVestment. Based on net of fees performance for managers in eVestment’s ACWI ex-US Large Cap universe relative to the MSCI ACWI ex-US Index for 10 years through September 30, 2017.
11Russel Kinnel, “Mind the Gap: Global Investor Returns Show the Costs of Bad Timing Around the World,” Morningstar Manager Research, May 30, 2017.
Opinions expressed are those of Harding Loevner and are not intended to be forecasts of future events, a guarantee of future results, nor investment advice. Please read the separate disclosure page for important information, including the risks of investing in the Portfolios. Past performance is not a guarantee of future results.
5
|
Table of Contents

PORTFOLIO MANAGEMENT TEAM
| ||
PETER BAUGHAN, CFA CO-LEAD PORTFOLIO MANAGER
FERRILL ROLL, CFA CO-LEAD PORTFOLIO MANAGER | CHRISTOPHER MACK, CFA PORTFOLIO MANAGER
RICHARD SCHMIDT, CFA PORTFOLIO MANAGER | |

 PERFORMANCE SUMMARY
The Global Equity Portfolio – Institutional Class gained 27.58% and the Advisor Class gained 27.28% (net of fees and expenses) in the fiscal year ended October 31, 2017. The Portfolio’s benchmark, the MSCI All Country World Index, rose 23.19% (net of source taxes) in this period.
MARKET REVIEW
Markets had modest gains in the last two months of 2016, in US dollar terms, as investors reacted to the astonishing outcome of the US presidential election, but accelerated in 2017 as investor optimism returned amid improving economic data in most regions. The Index ended the fiscal year with a robust increase. Through October, the Index posted 12 consecutive positive monthly returns, the longest such stretch for the Index since the bear market recovery of 2003–04. Although the gains came 7 years since the last recession, investors cheered positive economic data as it suggested synchronized growth across all major regions, while inflation remained muted. Meanwhile, investors largely rationalized the threat to stability from the US Federal Reserve’s staggered exit from extremely loose monetary policy as being about normalization rather than inflation taming. Markets also mostly ignored escalating tensions between North Korea and the US, illustrated by the half-percent rise in the Japanese stock market on the day the latest intercontinental ballistic missile (ICBM) flew through its airspace in late August.
Information Technology (IT) stocks returned almost double the return of the Index in the trailing year. IT companies reported strong sales and earnings growth, with the biggest positive surprises coming from a handful of big Chinese internet companies.
The eurozone and Emerging Markets (EMs) led regional returns. Better economic growth data across Europe, along with relief over the defeat in the French general elections of the anti-EU far-right, allowed investors to view the future more optimistically. They favored stocks of more-cyclical businesses, especially energy, autos, and banks. The euro gained 6% against the US dollar, bolstering
FUND FACTS at October 31, 2017 | ||||||||||||
TOTAL NET ASSETS | $911.8M | |||||||||||
SALES CHARGE | NONE | |||||||||||
NUMBER OF HOLDINGS | 74 | |||||||||||
TURNOVER (5 YR. AVG.) | 30% | |||||||||||
REDEMPTION FEE | 2% FIRST 90 DAYS | |||||||||||
DIVIDEND POLICY | ANNUAL | |||||||||||
INSTITUTIONAL INVESTORS | INDIVIDUAL INVESTORS | |||||||||||
| INSTL CLASS | INSTL CLASS Z | ADVISOR CLASS | ||||||||||
TICKER | HLMVX | HLGZX | HLMGX | |||||||||
CUSIP | 412295602 | 412295727 | 412295206 | |||||||||
INCEPTION DATE | 11/3/2009 | 8/1/2017 | 12/1/1996 | |||||||||
MINIMUM INVESTMENT1 | $100,000 | $10,000,000 | $5,000 | |||||||||
NET EXPENSE RATIO | 0.92% | 0.90%2 | 1.19% | |||||||||
GROSS EXPENSE RATIO | 0.92% | 1.53% | 1.19% | |||||||||
1Lower minimums available through certain brokerage firms; 2Shown net of Harding Loevner’s contractual agreement through February 28, 2018.
European Monetary Union (EMU) stock returns to US investors. The strong performance of IT stocks, especially Chinese internet stocks, was important to EM gains.
The US stock market trailed the overall Index slightly, as accelerating economic growth and good earnings in IT and other cyclical sectors were offset by growth concerns in Consumer Staples and Health Care, and where optimism about government infrastructure spending or tax reform faded after other aims of the administration foundered in Congress in spite of the Republican majorities.
In addition to the US election, the end of 2016 was marked by a persistent value rally in which the least-expensive quintile of stocks outperformed the most-expensive quintile in every major region and in nearly every sector. And, because there is a high degree of overlap between low-quality or slow-growing businesses and companies with lowly priced stocks, the shares of the lowest-quality and slowest-growth businesses also performed better on average than shares of those with superior quality and growth records. This rally was reversed in the first six months of 2017, as style trends in the market favored stocks whose businesses demonstrated strong growth characteristics, while there was little differentiation in returns according to valuation. But then, from July to October, only the most-expensive quintile of stocks showed significant outperformance. Quality showed no pattern of effect on returns. Within developed markets, the growth preference waned late in September as US bond yields rose from the lowest levels of the year after Congress revealed plans for a large tax cut, and the Fed reiterated its intention to continue tightening monetary policy. Growth in EMs was strong throughout 2017.
6
|
Table of Contents
PERFORMANCE (% TOTAL RETURN)
| for periods ended September 30, 2017 | for periods ended October 31, 2017 | |||||||||||||||||||||||||||||||||||||||||||||||||||||||||
| 1 YEAR | 3 YEARS | 5 YEARS | 10 YEARS | SINCE INCEPTION* | 1 YEAR | 3 YEARS | 5 YEARS | 10 YEARS | SINCE INCEPTION* | |||||||||||||||||||||||||||||||||||||||||||||||||
GLOBAL EQUITY PORTFOLIO - INSTL CLASS | 21.63 | 10.42 | 11.35 | – | – | 10.56 | – | 27.58 | 10.59 | 12.54 | – | – | 10.81 | – | ||||||||||||||||||||||||||||||||||||||||||||
GLOBAL EQUITY PORTFOLIO - INSTL CLASS Z | – | – | – | – | 1.10 | – | – | – | – | 3.80 | ||||||||||||||||||||||||||||||||||||||||||||||||
MSCI ALL COUNTRY WORLD INDEX | 18.63 | 7.43 | 10.20 | 3.88 | 1.86 | 9.37 | – | 23.19 | 7.92 | 10.81 | 3.70 | 3.98 | 9.55 | – | ||||||||||||||||||||||||||||||||||||||||||||
GLOBAL EQUITY PORTFOLIO - ADVISOR CLASS | 21.30 | 10.13 | 11.06 | 5.81 | – | – | 7.20 | 27.28 | 10.31 | 12.25 | 5.86 | – | – | 7.31 | ||||||||||||||||||||||||||||||||||||||||||||
Returns are annualized for periods greater than 1 year. *Inception of the Institutional Class, 11/3/09. Inception of the Institutional Class Z, 8/1/17. Inception of the Advisor Class, 12/1/96. Index performance prior to 1/1/01 cannot be shown since it relies on back-filled data.
Performance data quoted represents past performance; past performance does not guarantee future results. The investment return and principal value of an investment will fluctuate so that an investor’s shares, when redeemed, may be worth more or less than their original cost. Current performance of the Portfolio may be lower or higher than the performance quoted. Performance data current to the most recent month end may be obtained by calling (877) 435-8105 or visiting www.hardingloevnerfunds.com. Performance data shown does not reflect the 2.00% redemption fee imposed on shares held 90 days or less; otherwise, total returns would be reduced.
PERFORMANCE ATTRIBUTION
The Portfolio outperformed in five of the eight sectors in which we have holdings and benefited from holding no Telecom Services, Real Estate, or Utilities stocks. Our large holding of IT stocks contributed the most to performance over the year, driven in part by Chinese internet businesses Weibo and Tencent, each of which reported accelerating earnings growth as internet users consumed more advertisements, games, and other services than the market had anticipated. Additionally, PayPal reported robust sales and earnings growth, as mobile-payment transactions processed through its platform surpassed the market, while Cognex captured investors’ imaginations with broader applications for its machine-vision software and optical sensors.
We had good stocks in Financials as well, led by US-based commercial bank SVB Financial Group. Energy, especially Schlum-berger, was a detractor, as was our modest allocation to cash in a strong period for equity returns.
Stocks in Consumer Discretionary also detracted from relative performance. Nike reported disappointing earnings, negatively impacted by retail-store closings as distribution shifts toward internet-based sales. UK-based advertising agency WPP reported weak earnings, and management lowered its full-year guidance due to weaker ad spending by its customers.
Viewed geographically, our outperformance stemmed largely from good stock selection in the US, including SVB Financial Group, PayPal, Cognex, and IPG Photonics. Stocks in EMs were beneficial to relative returns as well, led by internet businesses in China as well as Yandex in Russia. Eurozone holdings trailed the Index, the worst being well-pipe supplier Tenaris.
PERSPECTIVE AND OUTLOOK
The investment environment has become increasingly challenging for investors concerned with the quality, growth, and price tripod that forms the foundation of Harding Loevner’s investment philosophy. Quality as a standalone factor has become expensive in stock-price terms, in spite of the surge in value stocks at the end of 2016. We have noted the investment industry’s
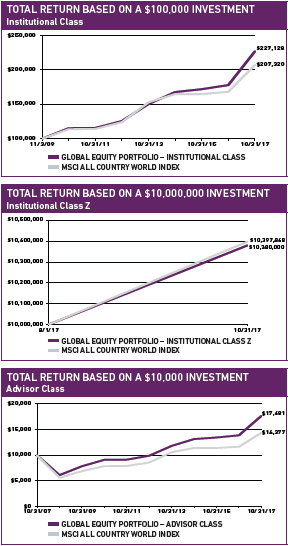
The charts above illustrate the hypothetical return of an investment made in the corresponding share classes. Investment return reflects voluntary fee waivers in effect. Absent such waivers, total return would be reduced. The performance provided in the table and charts above do not reflect the deduction of taxes that a shareholder would pay on Portfolio distributions or the redemption of Portfolio shares.
7
|
Table of Contents
efforts to reverse-engineer the successful performance that high-quality portfolios have enjoyed over the past decade by constructing “smart beta” portfolios that use quantitative tools to identify companies with similar high-quality attributes. These approaches implicitly promise future outperformance similar to that observed in the past. Smart beta approaches overlap with other managers employing optimization software to create “low volatility” portfolios that appeal to investors fearful of the inherent ups and downs of stock market investing, overlapping simply because the stocks of high-quality companies have traded with much more restrained gyrations than the average stock in past market tempests. The broader emphasis on quality, enshrined in the documenting by academics of a quality factor effect, and commercialized through the creation of “quality indexes” as benchmarks for passive money, has meant increasingly persistent and decreasingly price-sensitive demand for the stocks of high-quality companies.
Our Portfolio response has been to redouble our attention to the other two legs of our philosophical stool: growth and price. If quality is fashionable, based on either a blind embrace of its prior success or a backward-looking fear of another financial crisis, then the fruitful way forward must be one that remains discerning yet is courageously forward-looking. In the past 12 months, this route has involved an emphasis on price, encompassing the strong value rally capped by the “Trump bump,” but it has also, in recent months, coalesced around companies achieving faster growth. This latter focus on growth is the topic of this piece.
We have had a longstanding focus on growth companies in the IT sector, where the Portfolio has held an overweight position for over a decade. Our holdings have emphasized the emerging winners and beneficiaries of the promise now being realized by “Internet 2.0” and “Big Data.” Fifteen years after the tech bubble (wrongly) priced the first advent of internet-based business (“Internet 1.0”), we are witnessing the emergence in a number of industry segments of dominant or even winner-take-all internet-based businesses skillfully exploiting the “network effect” to secure their supremacy. While investors are clearly paying high prices for these businesses, their surge in the current year can
GEOGRAPHIC EXPOSURE (%) at October 31, 2017
| COUNTRY/REGION | PORTFOLIO | BENCHMARK1 | ||||||
CANADA | 0.0 | 3.1 | ||||||
EMERGING MARKETS | 14.0 | 11.7 | ||||||
EUROPE EMU | 14.0 | 10.9 | ||||||
EUROPE EX-EMU | 12.5 | 10.3 | ||||||
JAPAN | 9.8 | 7.9 | ||||||
MIDDLE EAST | 1.1 | 0.1 | ||||||
PACIFIC EX-JAPAN | 2.4 | 3.9 | ||||||
UNITED STATES | 43.7 | 52.1 | ||||||
FRONTIER MARKETS2 | 0.0 | – | ||||||
CASH | 2.5 | – | ||||||
1MSCI All Country World Index; 2Includes countries with less-developed markets outside the Index.
SECTOR EXPOSURE (%) at October 31, 2017
| SECTOR | PORTFOLIO | BENCHMARK1 | ||||||
CONSUMER DISCRETIONARY | 11.7 | 11.9 | ||||||
CONSUMER STAPLES | 5.6 | 8.6 | ||||||
ENERGY | 3.7 | 6.3 | ||||||
FINANCIALS | 13.8 | 18.6 | ||||||
HEALTH CARE | 16.6 | 10.8 | ||||||
INDUSTRIALS | 14.7 | 10.8 | ||||||
INFORMATION TECHNOLOGY | 22.4 | 18.4 | ||||||
MATERIALS | 9.0 | 5.4 | ||||||
REAL ESTATE | 0.0 | 3.1 | ||||||
TELECOM SERVICES | 0.0 | 3.0 | ||||||
UTILITIES | 0.0 | 3.1 | ||||||
CASH | 2.5 | – | ||||||
1MSCI All Country World Index.
mostly be explained by stronger-than-expected reported earnings rather than a re-estimation of their future growth rate.
We have been fortunate to own a number of internet businesses that have continued to generate strong results. We are aware of the great promise—and considerable hype—around emergent technologies such as artificial intelligence (AI), machine learning, and Big Data analytics of all types. For example, Facebook’s intimate personal profiles on hundreds of millions of consumers across the Western world (echoed in Tencent’s data on consumer behavior across China) have vast monetization potential. It is possible, however, that current valuations reflect peak optimism for the monetization of consumer data. Certainly, there is insufficient appreciation by investors of the rising risk that the collection and sale of consumer-behavior and other personal data will face more stringent regulation. At some point, Facebook’s ability to deliver yet another highly customized mobile advertisement or Amazon. com’s disruption of yet another consumer category will face diminishing marginal returns, but the share prices of these companies don’t discount that happening for many years.
The technologies that have catalyzed a global boom across online media, enterprise software, and e-commerce have applications in other industries that perhaps are less than fully discounted in stock prices. Our research efforts extend to companies in health care and life sciences that can use similar technology toolkits as Facebook or Amazon but whose products and penetration of end markets have yet to be fully realized. For example, there is now an extensive amount of human genetic data that is ripe for analysis by Health Care companies capable of exploiting advances in AI. By combining gene-sequencing data with other large data sets such as anonymized patient health records and diagnostic test results, Big Data can help make drug development faster and more precise. Portfolio holding Regeneron, a leading biotechnology company, is using Big Data today at its Regeneron Genetics Center to identify genomic biomarkers for new drug therapies and other applications at the intersection of pharmacology and genomics (“pharmacogenomics”). Regeneron is also an early investor in rapidly emerging gene-editing technologies, which have the potential to transform drug-discovery productivity and economics.
8
|
Table of Contents
Advancements in gene sequencing could also present opportunities for industrial application. Novozymes, the global leader in industrial enzymes, uses Big Data analytics to alter microbe DNA to create new enzymes that can replace polluting chemicals in consumer products such as detergents, as well as in agricultural fertilizers, an application it is currently pursuing through an alliance with Monsanto. Chr. Hansen, the global leader in bacterial cultures for food, is similarly using Big Data analytics to develop bacteria strains for promising new markets in bio-protection, animal health, and human health.
PORTFOLIO HIGHLIGHTS
We have aimed to curb any increase in the forecast volatility of the Portfolio relative to the Index as we have made transactions over the last fiscal year. With few exceptions, our new purchases have been of stocks exhibiting lower volatility, including Chr. Hansen, Symrise, Check Point Software Technologies, Reckitt Benckiser, and HDFC Bank, while the reductions and sales we have made have been of holdings exhibiting higher-than-average volatility.
Within IT, we are concerned that investors have become too focused on the rewards Facebook and Google derive from their growing dominance of digital advertising in the West, and not enough on the risks that dominance creates. Their business models are inherently attractive: consumers willingly give large amounts of personal data to Google and Facebook, who analyze it for clues to buying preferences and sell their conclusions to the highest bidder, to be used in targeted advertising. Consumers thus see ads or news tailored to them, while advertisers don’t waste money marketing to disinterested targets. In practice, however, there is clear potential for abuse, including disregard of privacy rights and in the dissemination of false or misleading information. Critics assert that the power of the big social media companies has become too large. That is, can these companies’ demonstrated ability to influence behavior be allowed to roll on unrestrained, or at least without a political backlash?
For the moment, we have taken a different view of the two companies’ potential challenges, avoiding a rush to undifferentiated judgment. The abuse of Facebook’s platform and algorithms does not immediately indict the company, in our view, but the abusers. Facebook has seen its targeting tools used in ways it never imagined (e.g., targeting racist messages to organize and incite violence). The company has responded with a public expression of horror and has made changes to its filtering technologies. That said, the company’s response to the purchase of ads by Russian front companies has been considerably slower in coming. While retaining our Facebook holding, we are wary, wondering if we’ve seen peak margins, as structural costs of doing business rise in a more censorious environment—be it self-imposed or regulated by government agents. If so, we may also be witnessing peak valuation.
TEN LARGEST HOLDINGS at October 31, 2017
| COMPANY | SECTOR | COUNTRY | % | |||||||||
PAYPAL | INFO TECHNOLOGY | UNITED STATES | 3.3 | |||||||||
NIKE | CONS DISCRETIONARY | UNITED STATES | 3.1 | |||||||||
ROPER INDUSTRIES | INDUSTRIALS | UNITED STATES | 2.9 | |||||||||
PRICELINE GROUP | CONS DISCRETIONARY | UNITED STATES | 2.6 | |||||||||
SVB FINANCIAL GROUP | FINANCIALS | UNITED STATES | 2.4 | |||||||||
SYSMEX | HEALTH CARE | JAPAN | 2.4 | |||||||||
SYMRISE | MATERIALS | GERMANY | 2.4 | |||||||||
AIA GROUP | FINANCIALS | HONG KONG | 2.3 | |||||||||
SCHLUMBERGER | ENERGY | UNITED STATES | 2.0 | |||||||||
KUBOTA | INDUSTRIALS | JAPAN | 1.9 | |||||||||
On the other hand, Alphabet’s troubles with the European Commission are of a different character. There, the charge is not inadvertent abuse of the company’s powerful platform by malicious actors, but rather a violation of antitrust regulation through management’s conscious decision to favor its own products in its search rankings. We sold our large, longstanding holding in Alphabet in August 2017. We will revisit the company after the impact of still-to-come EU remedies can be assessed, or if its share price becomes meaningfully more attractive. We would also like to see less opacity and cash burn across Alphabet’s many “moon shot” ventures.
We redeployed Alphabet proceeds into two new holdings in Apple and Cognizant. We see Apple as being attractively priced in a world of very high valuations and believe the company probably to be least at risk among US large-cap techs from data-privacy concerns. Indeed, Apple has been vocal about its concerns of potential abuse of consumer data by the search and social media companies. We are also mightily impressed by Apple’s ability to deliver unprecedented performance—with design elegance—in its latest hardware products and suspect that the growth potential of its evolving software and services business is being underestimated. We also bought Cognizant, the IT consulting firm whose shares have underperformed the IT sector over the past two years, and whose management is focusing more on free cash flow generation than on growing at breakneck rates.
Please read the separate disclosures page for important information, including the risks of investing in the Portfolio.
9
|
Table of Contents

PORTFOLIO MANAGEMENT TEAM

FERRILL ROLL, CFA CO-LEAD PORTFOLIO MANAGER
ALEXANDER WALSH, CFA CO-LEAD PORTFOLIO MANAGER
| BRYAN LLOYD, CFA PORTFOLIO MANAGER
PATRICK TODD, CFA PORTFOLIO MANAGER
ANDREW WEST, CFA PORTFOLIO MANAGER |
 PERFORMANCE SUMMARY
The International Equity Portfolio – Institutional Class gained 24.47% and the Investor Class gained 24.04% (net of fees and expenses) in the fiscal year ended October 31, 2017. The Portfolio’s benchmark, the MSCI All Country World ex-US Index (the Index), rose 23.65% (net of source taxes) in this period.
MARKET REVIEW
Non-US markets faced declines in the last two months of 2016 as investors reacted to the astonishing outcome of the US presidential election, but reversed course in 2017 as investor optimism returned amid improving economic data in most regions. The Index ended the fiscal year with a robust increase. Through October, the Index posted 11 consecutive positive monthly returns, the longest such stretch for the Index in the past 10 years. Although the gains came 7 years on since the last recession, investors cheered positive economic data as it suggested synchronized growth across all major regions, while inflation remained muted. Meanwhile, investors largely rationalized the threat to stability from the US Federal Reserve’s staggered exit from extremely loose monetary policy as being about normalization rather than inflation taming. Markets also mostly ignored escalating tensions between North Korea and the US, illustrated by the half-percent rise in the Japanese stock market on the day the latest ICBM flew through its airspace in late August.
Information Technology (IT) stocks returned roughly double the return of the Index in the trailing year. IT companies reported strong sales and earnings growth, with the biggest positive surprises coming from a handful of big Chinese internet companies.
The eurozone and Emerging Markets (EMs) led regional returns. Better economic growth data across Europe, along with relief over the defeat in the French general elections of the anti-EU far-right, allowed investors to view the future more optimistically. They favored stocks of more-cyclical businesses, especially energy, autos,
FUND FACTS at October 31, 2017 | ||||||||||||
TOTAL NET ASSETS | $11,918.9M | |||||||||||
SALES CHARGE | NONE | |||||||||||
NUMBER OF HOLDINGS | 55 | |||||||||||
TURNOVER (5 YR. AVG.) | 15% | |||||||||||
REDEMPTION FEE | 2% FIRST 90 DAYS | |||||||||||
DIVIDEND POLICY | ANNUAL | |||||||||||
INSTITUTIONAL INVESTORS | INDIVIDUAL INVESTORS | |||||||||||
| INSTL CLASS | INSTL CLASS Z | INVESTOR CLASS | ||||||||||
TICKER | HLMIX | HLIZX | HLMNX | |||||||||
CUSIP | 412295107 | 412295719 | 412295503 | |||||||||
INCEPTION DATE | 5/11/1994 | 7/17/2017 | 9/30/2005 | |||||||||
MINIMUM INVESTMENT1 | $100,000 | $10,000,000 | $5,000 | |||||||||
NET EXPENSE RATIO | 0.83% | 0.80%2 | 1.14% | |||||||||
GROSS EXPENSE RATIO | 0.83% | 1.43% | 1.14% | |||||||||
1Lower minimums available through certain brokerage firms; 2Shown net of Harding Loevner’s contractual agreement through February 28, 2018.
and banks. The euro gained 6% against the US dollar, bolstering European Monetary Union (EMU) stock returns to US investors. The strong performance of IT stocks, especially Chinese internet stocks, was important to EM gains.
In addition to the US election, the end of 2016 was marked by a sharp value rally in which the least-expensive quintile of stocks outperformed the most-expensive quintile in every major region and in nearly every sector. And, because there is a high degree of overlap between low-quality or slow-growing businesses and companies with lowly priced stocks, the shares of the lowest-quality and slowest-growth businesses also performed better on average than shares of those with superior quality and growth records. This value rally was reversed in the first six months of 2017, as style trends in the market favored stocks whose businesses demonstrated strong growth characteristics, while there was little differentiation in returns according to valuation. But then, from July to October, only the most-expensive quintile of stocks showed significant outperformance, while quality showed no pattern of effect on returns. Within developed markets, the growth preference waned late in September as US bond yields rose from the lowest levels of the year after Congress revealed plans for a large tax cut, and the Fed reiterated its intention to continue tightening monetary policy. Growth in EMs was strong throughout 2017.
 PERFORMANCE ATTRIBUTION
Our large holding of IT stocks added to performance over the year. We also benefited from good stock selection within Consumer Staples, especially soybean processor Bunge. We had good stocks in Financials as well, especially German insurer Allianz and
10
|
Table of Contents
PERFORMANCE (% TOTAL RETURN)
| for periods ended September 30, 2017 | for periods ended October 31, 2017 | |||||||||||||||||||||||||||||||||||||||||||||||||||||||||
1 YEAR | 3 YEARS | 5 YEARS | 10 YEARS | SINCE | 1 YEAR | 3 YEARS | 5 YEARS | 10 YEARS | SINCE | |||||||||||||||||||||||||||||||||||||||||||||||||
INTL EQUITY PORTFOLIO - INSTITUTIONAL CLASS | 18.66 | 8.28 | 9.02 | 4.83 | – | – | 6.48 | 24.47 | 8.42 | 9.38 | 4.45 | – | – | 6.55 | ||||||||||||||||||||||||||||||||||||||||||||
INTL EQUITY PORTFOLIO - INSTITUTIONAL CLASS Z | – | – | – | – | 3.80 | – | – | – | – | – | – | 6.00 | – | – | ||||||||||||||||||||||||||||||||||||||||||||
MSCI ALL COUNTRY WORLD EX-US INDEX | 19.62 | 4.70 | 6.98 | 1.28 | 3.45 | 4.86 | – | 23.65 | 5.71 | 7.29 | 0.92 | 5.40 | 4.99 | – | ||||||||||||||||||||||||||||||||||||||||||||
INTL EQUITY PORTFOLIO - INVESTOR CLASS | 18.23 | 7.94 | 8.67 | 4.51 | – | 6.79 | – | 24.04 | 8.07 | 9.03 | 4.13 | – | 6.92 | – | ||||||||||||||||||||||||||||||||||||||||||||
Returns are annualized for periods greater than 1 year. *Inception of the Institutional Class, 5/11/94. Inception of the Institutional Class Z, 7/17/17. Inception of the Investor Class, 9/30/05. Index performance prior to 1/1/01 cannot be shown since it relies on back-filled data.
Performance data quoted represents past performance; past performance does not guarantee future results. The investment return and principal value of an investment will fluctuate so that an investor’s shares, when redeemed, may be worth more or less than their original cost. Current performance of the Portfolio may be lower or higher than the performance quoted. Performance data current to the most recent month end may be obtained by calling (877) 435-8105 or visiting www.hardingloevnerfunds.com. Performance data shown does not reflect the 2.00% redemption fee imposed on shares held 90 days or less; otherwise, total returns would be reduced.
Singapore bank DBS Group. Our significant overweight to Health Care was a detractor from relative returns, as was our modest allocation to cash in a strong period for equity returns.
Viewed geographically, we benefited from good stock selection in EMs, Pacific Ex-Japan, the Middle East, the eurozone, and Canada. EM holdings bettered the Index due to Naspers and IT heavyweights Samsung Electronics and Taiwan Semiconductor. Our stock selection in Japan detracted from relative returns, due to declines in shares of M3, Park24, and Sysmex.
PERSPECTIVE AND OUTLOOK
The investment environment has become increasingly challenging for investors concerned with the quality, growth, and price tripod that forms the foundation of Harding Loevner’s investment philosophy. Quality as a standalone factor has become expensive in stock-price terms, in spite of the surge in value stocks at the end of 2016. We have noted the investment industry’s efforts to reverse-engineer the successful performance that high-quality portfolios have enjoyed over the past decade by constructing “smart beta” portfolios that use quantitative tools to identify companies with similar high-quality attributes. These approaches implicitly promise future outperformance similar to that observed in the past. Smart beta approaches overlap with other managers employing optimization software to create “low volatility” portfolios that appeal to investors fearful of the inherent ups and downs of stock market investing, overlapping simply because the stocks of high-quality companies have traded with much more restrained gyrations than the average stock in past market tempests. The broader emphasis on quality, enshrined in the documenting by academics of a quality factor effect, and commercialized through the creation of “quality indexes” as benchmarks for passive money, has meant increasingly persistent and decreasingly price-sensitive demand for the stocks of high-quality companies.
Our Portfolio response has been to redouble our attention to the other two legs of our philosophical stool: growth and price. If quality is fashionable, based on either a blind embrace of its prior success or a backward-looking fear of another financial crisis, then the fruitful way forward must be one that remains discerning
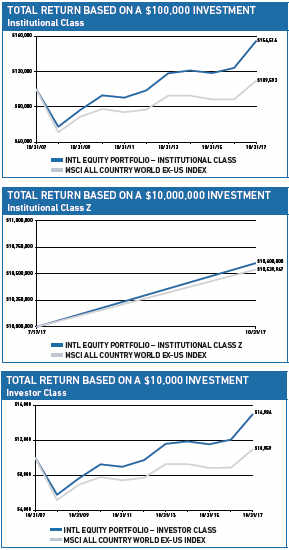
The charts above illustrate the hypothetical return of an investment made in the corresponding share classes. Investment return reflects voluntary fee waivers in effect. Absent such waivers, total return would be reduced. The performance provided in the table and charts above do not reflect the deduction of taxes that a shareholder would pay on Portfolio distributions or the redemption of Portfolio shares.
11
|
Table of Contents
yet is courageously forward-looking. In the past 12 months, this route has involved an emphasis on price, encompassing the strong value rally capped by the “Trump bump,” but it has also, in recent months, coalesced around companies achieving faster growth.
Faster economic growth has long been associated with rising labor productivity. Traditionally, labor productivity and wage growth were joined at the hip: as productivity grew, both companies and workers shared the benefits. However, the relationship between wage growth and productivity has steadily separated since the late 1970s, pressuring labor’s share of profits.
The fall of trade barriers over decades has dramatically increased consumer choices and lowered prices for those goods, while the outsourcing of manufacturing jobs from the developed world to the developing world enabled staggering gains in employment, and therefore per capita income, in developing countries. That weakened the bargaining position of less-skilled workers in the US and other developed economies. That labor arbitrage is essentially complete. Now, instead of low-skilled workers being replaced by cheaper labor abroad, their manufacturing jobs risk substitution by the application of industrial automation, robotics, and computing power. That substitution results in a similar dampening of wage growth. Furthermore, the service sector is no longer immune from the threat of technology. For example, in financial services the use of algorithmic trading and robo-advisors has begun eliminating high-paying jobs, while mobile phone apps have replaced human brokers.
Contrary to populist rhetoric, this is not solely an American or even a developed-world phenomenon. In their global company research travels, our analysts have seen the same application of industrial automation and robotics in Guangdong Province, China or Hwaseong, South Korea as they have in Peoria or Columbus. Wenting Shen, CFA, one of our China analysts, spent a month in the country this summer and noted as much: “Standing in the middle of China’s largest furniture factory last month, one can only hear the rhythms of machines, but hardly see any workers around… As frequently reported, China’s blue-collar wages have
GEOGRAPHIC EXPOSURE (%) at October 31, 2017
| COUNTRY/REGION | PORTFOLIO | BENCHMARK1 | ||||||
CANADA | 2.1 | 6.5 | ||||||
EMERGING MARKETS | 21.0 | 24.5 | ||||||
EUROPE EMU | 31.0 | 22.8 | ||||||
EUROPE EX-EMU | 19.2 | 21.4 | ||||||
JAPAN | 12.8 | 16.4 | ||||||
MIDDLE EAST | 2.2 | 0.3 | ||||||
PACIFIC EX-JAPAN | 6.4 | 8.1 | ||||||
FRONTIER MARKETS2 | 0.0 | – | ||||||
OTHER3 | 1.5 | – | ||||||
CASH | 3.8 | – | ||||||
1MSCI All Country World ex-US Index; 2Includes countries with less-developed markets outside the Index; 3Includes companies classified in countries outside the Index.
SECTOR EXPOSURE (%) at October 31, 2017
| SECTOR | PORTFOLIO | BENCHMARK1 | ||||||
CONSUMER DISCRETIONARY | 7.2 | 11.3 | ||||||
CONSUMER STAPLES | 7.5 | 9.5 | ||||||
ENERGY | 5.2 | 6.7 | ||||||
FINANCIALS | 18.8 | 23.0 | ||||||
HEALTH CARE | 16.5 | 7.6 | ||||||
INDUSTRIALS | 12.5 | 11.9 | ||||||
INFORMATION TECHNOLOGY | 21.0 | 11.7 | ||||||
MATERIALS | 6.8 | 7.9 | ||||||
REAL ESTATE | 0.7 | 3.2 | ||||||
TELECOM SERVICES | 0.0 | 4.1 | ||||||
UTILITIES | 0.0 | 3.1 | ||||||
CASH | 3.8 | – | ||||||
1MSCI All Country World ex-US Index.
been soaring, [while] automation equipment has become cheaper because of localized production of global brands as well as the improvement of substitute local brands.”
Companies that can facilitate faster, more efficient manufacturing (i.e., enable productivity gains) have enjoyed sustained and profitable growth, and many of them find a place in our Portfolio. Increasingly, their devices—such as Fanuc’s industrial robots, Keyence’s optical sensors, and Schlumberger’s downhole oil-well test tools—are integrated more fully with software and embedded with more semiconductor chips to gather information and precisely measure output, flows, temperatures, and tolerances. The prospect of machine learning has driven the capture of even more data, which will allow computers to use algorithms increasingly to make decisions independently.
PORTFOLIO HIGHLIGHTS
In our investment process, we first populate our stable of investment candidates with businesses that we believe meet our quality and growth criteria and then follow with valuation work to determine what we think a business is worth. Focusing first on the business and only later on the attractiveness of its shares means that if its shares are not attractively priced, we can monitor the progress and valuation of the business while waiting for a dislocation in the share price to provide an opening for a purchase. The market’s recent low volatility has been accompanied by high correlation among stock prices, so that there just have not been many relative price dislocations that afford us compelling opportunities to buy.
Activity in the Portfolio has been muted in recent months. Over the fiscal year, we have made thirty-two Portfolio transactions—including additions and reductions to existing positions as well as new purchases or dispositions. Nearly one-third of these transactions took place in November and December of 2016 alone, mainly reacting to large relative price changes that presented themselves in the more volatile and heterogeneous markets in the wake of the US election.
12
|
Table of Contents
One needs to look back over the past fiscal year to have a true sense of how incremental changes to the Portfolio have cumulated to substantial shifts in sectoral weights. We have reduced our holdings in Consumer Staples by about 370 basis points, largely on the sales of Bunge and Anheuser-Busch InBev (AB InBev). Owned in our Portfolio since 2012, AB InBev had been a successful investment. 3G Capital, the private equity group managing the business since its hostile takeover in late 2008, followed its cost-cutting template, wrenching down costs and boosting margins, but since AB InBev’s acquisition of another multinational beer giant, SABMiller, antitrust considerations likely rule out any further acquisitions of inefficient competitors to which to apply those methods next. Now, 3G faces the task of growing the business organically, despite slow growth in beer consumption globally and the constant challenge from the growing craft segment. Slower sales, coupled with fewer cost-cutting levers, meant to us that the company’s prospects were fully priced in its shares. Bunge, by comparison, had been a less profitable investment over our 12 years as owners. The weather-related vicissitudes of being an agriculture company, coupled with a significant exposure to recession-weary Brazilian consumers through its forward integration into cooking oils in that market, as well as long-term threats to government subsidies for its ethanol business were such that, after a bumper crop of three consecutive positive quarterly earnings surprises, we decided to exit, unconvinced that the inherently cyclical nature of the business had changed. To this point, the sale appears to have been well timed.
While our Consumer Staples holdings shrank, our Financials holdings grew. We made three new investments in EM banks in the fiscal year: India’s HDFC Bank and ICICI Bank and Mexico’s GF Banorte. All three investments were made after the Trump victory, when US dollar strength afforded the opportunity to buy EM securities more cheaply. This was especially the case with Banorte, whose share price was also depressed by Trump’s border-wall rhetoric and his threats to repeal NAFTA. We also bought a new holding in the UK-listed HSBC, believing that the regulatory environment for banks is poised to become easier, after seven years of capital, liquidity, and compliance directives following the global financial crisis. We added to our holding in BBVA, which has operations in both the US and in EMs. We believed that political consensus was building to stimulate US economic activity via government infrastructure spending, which would lead to higher interest rates and thus to higher net interest margins for the banks. Both those expectations have been dashed, with interest rates and spreads now back near pre-election levels. Nevertheless, given the outperformance of Financials against the overall market over the last year, the increased weight to Financials and our good stock selection have benefited the Portfolio by neutralizing an underweight stance that would have been costly. Today, Financials represents just under 20% of the Portfolio versus 23% for the Index.
TEN LARGEST HOLDINGS at October 31, 2017
| COMPANY | SECTOR | COUNTRY | % | |||||||||
SAMSUNG ELECTRONICS | INFO TECHNOLOGY | SOUTH KOREA | 3.7 | |||||||||
ALLIANZ | FINANCIALS | GERMANY | 3.6 | |||||||||
BAYER | HEALTH CARE | GERMANY | 3.5 | |||||||||
AIA GROUP | FINANCIALS | HONG KONG | 3.4 | |||||||||
DASSAULT SYSTÈMES | INFO TECHNOLOGY | FRANCE | 3.4 | |||||||||
NESTLE | CONS STAPLES | SWITZERLAND | 3.4 | |||||||||
FANUC | INDUSTRIALS | JAPAN | 3.2 | |||||||||
ROYAL DUTCH SHELL | ENERGY | UNITED KINGDOM | 3.1 | |||||||||
NASPERS | CONS DISCRETIONARY | SOUTH AFRICA | 3.0 | |||||||||
BAIDU | INFO TECHNOLOGY | CHINA | 2.8 | |||||||||
Please read the separate disclosures page for important information, including the risks of investing in the Portfolio.
13
|
Table of Contents

PORTFOLIO MANAGEMENT

JAFAR RIZVI, CFA PORTFOLIO MANAGER |
 PERFORMANCE SUMMARY
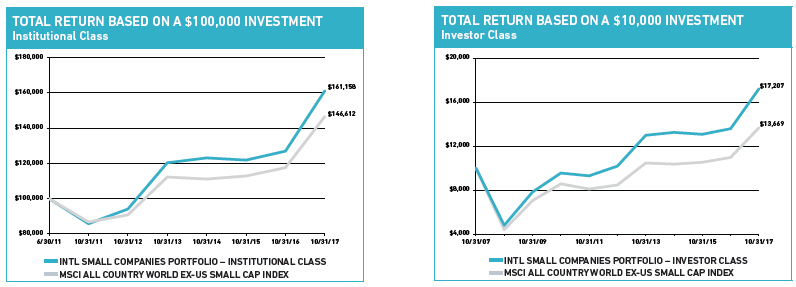
The International Small Companies Portfolio – Institutional Class gained 26.98% and the Investor Class gained 26.71% (net of fees and expenses) in the fiscal year ended October 31, 2017. The Portfolio’s benchmark, the MSCI All Country World ex-US Small Cap Index (the Index), rose 24.68% (net of source taxes) in this period.
MARKET REVIEW
The MSCI All Country World ex-US Small Cap Index rose 25% in the trailing 12 months, extending its string of monthly gains to eleven, the longest since 2012. Accelerating global economic growth has been an important factor underpinning investor optimism. The International Monetary Fund in July projected global economic growth of 3.5% for 2017, an improvement over 3.1% in 2016. Central banks in the US, Europe, and Japan have echoed this forecast. From our perspective deep within the company research trench, smaller companies continue to meet or exceed their growth expectations.
In contrast with the stock market’s sanguinity, political risks have been rising. Tensions between the US and North Korea heightened after North Korea launched several intercontinental ballistic missiles, two of which flew over Japanese territory. Although Angela Merkel won the election in Germany, the extreme right Alternative for Germany (AfD) party gained a foothold in the German parliament. The party draws those skeptical of the European Union; it has opposed German-backed bailouts of struggling members such as Greece and its manifesto calls for the dissolution of the euro.
The US dollar weakened as the Federal Reserve hesitated to raise rates and investors’ confidence in the administration’s ability to deliver on business-friendly tax policy changes waned. With the exception of the Swiss franc, all currencies in Europe—both inside and outside the eurozone—appreciated against the dollar, helping these two regions perform strongly in dollar terms.
Emerging Markets (EMs) also rose strongly, led by Peru. Many EM countries benefitted from rising commodity prices lifted by sustained global growth.
FUND FACTS at October 31, 2017 | ||||||||
TOTAL NET ASSETS | $194.5M | |||||||
SALES CHARGE | NONE | |||||||
NUMBER OF HOLDINGS | 87 | |||||||
TURNOVER (5 YR. AVG.) | 48% | |||||||
REDEMPTION FEE | 2% FIRST 90 DAYS | |||||||
DIVIDEND POLICY | ANNUAL | |||||||
INSTITUTIONAL INVESTORS | INDIVIDUAL INVESTORS | |||||||
| INSTITUTIONAL CLASS | INVESTOR CLASS | |||||||
TICKER | HLMRX | HLMSX | ||||||
CUSIP | 412295875 | 412295883 | ||||||
INCEPTION DATE | 6/30/2011 | 3/26/2007 | ||||||
MINIMUM INVESTMENT1 | $100,000 | $5,000 | ||||||
NET EXPENSE RATIO2 | 1.15% | 1.40% | ||||||
GROSS EXPENSE RATIO | 1.50% | 1.80% | ||||||
1Lower minimums available through certain brokerage firms; 2Shown net of Harding Loevner’s contractual agreement through February 28, 2018.
By sector, Information Technology (IT) rose the most, with companies in that sector reporting good earnings and providing strong guidance for the rest of 2017. Industrials and Financials also bettered the Index. In May, OPEC extended its crude oil production cuts by nine months, but the stubbornly slow declines in global crude oil inventories thus far this year—along with concerns about rising oil production in the US, Nigeria, and Libya as well as the lack of further OPEC actions to support oil prices—put pressure on oil prices in the period, impacting Energy sector performance.
PERFORMANCE ATTRIBUTION
Viewed by sector, our stock selection in Industrials and Financials contributed the most to relative returns. In Industrials, RPS Group, Bossard, Senior, and Arcadis had strong returns. BRAC Bank, GRUH Finance, and Rathbone Brothers led the way in Financials.
Our stock selection in IT, in particular Chinese PAX Global and Hong Kong-based Wasion Group Holdings, detracted significantly. PAX, a manufacturer of electronic payment terminals, reported a 15% fall in net income year-over-year for the first half of 2017 due to increased spending on sales, marketing, and technology. These investments are aimed at enhancing PAX’s distribution capabilities outside of China and at developing more software to enhance the company’s hardware products, pursuits that we believe will lead to future growth. However, our overweight to the IT sector in the period was a strong contributor.
Viewed by region, the Portfolio had the greatest success in the European Monetary Union (EMU), due to both our large overweight compared to the Index and strong stock selection. Approximately 30% of our Portfolio is invested in Europe EMU, compared to just
14
|
Table of Contents
PERFORMANCE (% TOTAL RETURN)
| for periods ended September 30, 2017 | for periods ended October 31, 2017 | |||||||||||||||||||||||||||||||||||||||||||||||||
| 1 YEAR | 3 YEARS | 5 YEARS | 10 YEARS | SINCE INCEPTION* | 1 YEAR | 3 YEARS | 5 YEARS | 10 YEARS | SINCE INCEPTION* | |||||||||||||||||||||||||||||||||||||||||
INTL SMALL COMPANIES PORTFOLIO - INSTITUTIONAL CLASS | 23.31 | 8.91 | 11.06 | – | 7.79 | – | 26.98 | 9.40 | 11.36 | – | 7.82 | – | ||||||||||||||||||||||||||||||||||||||
MSCI ALL COUNTRY WORLD EX-US SMALL CAP INDEX | 19.17 | 8.14 | 9.67 | 3.57 | 6.00 | – | 24.68 | 9.68 | 10.07 | 3.17 | 6.22 | – | ||||||||||||||||||||||||||||||||||||||
INTL SMALL COMPANIES PORTFOLIO - INVESTOR CLASS | 23.03 | 8.62 | 10.78 | 5.81 | – | 6.77 | 26.71 | 9.13 | 11.09 | 5.58 | – | 6.80 | ||||||||||||||||||||||||||||||||||||||
Returns are annualized for periods greater than 1 year. *Inception of the Institutional Class, 6/30/11. Inception of the Investor Class, 3/26/07. Index performance prior to 6/1/07 cannot be shown in the table above since it relies on back-filled data.
Performance data quoted represents past performance; past performance does not guarantee future results. The investment return and principal value of an investment will fluctuate so that an investor’s shares, when redeemed, may be worth more or less than their original cost. Current performance of the Portfolio may be lower or higher than the performance quoted. Performance data current to the most recent month end may be obtained by calling (877) 435-8105 or visiting www.hardinglo-evnerfunds.com. Performance data shown does not reflect the 2.00% redemption fee imposed on shares held 90 days or less; otherwise, total returns would be reduced.
The charts below illustrate the hypothetical return of an investment made in the corresponding share classes. Investment return reflects voluntary fee waivers in effect. Absent such waivers, total return would be reduced. The performance provided in the table above and charts below do not reflect the deduction of taxes that a shareholder would pay on Portfolio distributions or the redemption of Portfolio shares.
18% of the Index. France, Germany, and the Netherlands are the main sources of the overweight. In terms of stock selection, Finland-based Vaisala was a top contributor. The company manufactures microscopic mechanical sensors primarily used in weather equipment. In April, the company disclosed that its first-quarter new-order growth increased by 26% year-over-year. Stock selection in France and Germany detracted, however.
Stock selection in Europe ex-EMU was strong thanks to UK-based industrials (RPS Group and Senior) and Switzerland-based Bossard, a supplier of specialized fasteners, which reported strong earnings. Bossard continued to exhibit robust growth in the US, where sales increased by 32%, largely due to revenue earned from Tesla.
Our modest cash position detracted from relative performance in a strong period for equity returns.
INVESTMENT PERSPECTIVES
The automotive trend toward electric and hybrid vehicles will provide a significant impetus to several of our holdings. Electric Vehicles (EVs) make up slightly less than 1% of all vehicles on the road
today. Hybrid vehicles1 constitute another 3%. Forecasts vary, but some middle-of-the-road forecasts suggest the proportion of EV’s and hybrids could rise to 11% by 2025, and 18% by 2030.
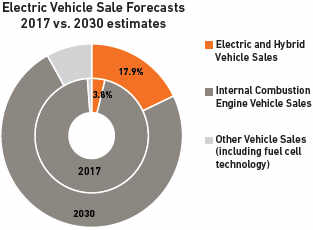
Source: Bank of America Merrill Lynch Global Research estimates, LMC Automotive, IHS Markit.
1Vehicles with an internal combustion engine and an electric motor.
15
|
Table of Contents
Investment in engineering and design for new EV and hybrid models means rising demand for Bertrandt, a provider of design and engineering services to German automakers. Special considerations pertaining to electrification include exterior and interior design, use of newer and lighter materials, noise reduction techniques, battery testing, and powertrain design.2 Given the extent of design and engineering services required, we estimate that at least a quarter of Bertrandt’s new business will relate to EVs and hybrids.
Companies that produce EV components will also benefit directly from the increased number of EVs and wider range of models. For example, LEM Holdings makes transducers that measure and control current and voltage. The company designs the chips that are used in its transducers, called application specific integrated circuits (ASICS), giving LEM a significant competitive advantage relative to competitors who rely on undifferentiated off-the-shelf chips. EVs use ten times as many transducers as internal combustion engine (ICE)-based cars. In the first quarter of 2017, the company increased sales of transducers for EVs and hybrids by 44%, and we estimate that they now represent 8% of its total sales. Bossard, the industrial fastener distributor, is also supplying the growing EV market. Tesla, one of Bossard’s largest clients, plans to produce 500,000 electric cars per year by 2018, five times its current rate. Bossard will be supplying parts for Tesla’s Model 3, which went into production in July, and its products will likely be chosen for new models that Tesla will introduce in the next few years. We estimate about 10% of Bossard’s total sales come from EVs currently. Other EV-oriented clients of Bossard include Proterra (electric buses), Gogoro (electric scooters), Alta Motors (electric motocross bikes), and Lucid Motors (electric cars). Sensata Technologies, which makes sensors for the automotive market, was recently added to the Portfolio and is discussed in the Portfolio Highlights section.
Though these companies may see sales related to traditional ICE cars decline, we expect their EV-related products to grow at a faster rate, offsetting the loss in sales to traditional business. Many automakers are setting targets that support these expectations. For instance, BMW aims for 15–25% of total sales to be from EVs by 2025.
GEOGRAPHIC EXPOSURE (%) at October 31, 2017
| COUNTRY/REGION | PORTFOLIO | BENCHMARK1 | ||||||
CANADA | 0.0 | 6.6 | ||||||
EMERGING MARKETS | 16.5 | 22.1 | ||||||
EUROPE EMU | 29.3 | 18.4 | ||||||
EUROPE EX-EMU | 23.6 | 22.5 | ||||||
JAPAN | 13.8 | 21.5 | ||||||
MIDDLE EAST | 0.6 | 1.1 | ||||||
PACIFIC EX-JAPAN | 4.0 | 7.8 | ||||||
FRONTIER MARKETS2 | 6.8 | – | ||||||
OTHER3 | 1.1 | – | ||||||
CASH | 4.3 | – | ||||||
1MSCI All Country World ex-US Small Cap Index; 2Includes countries with less- developed markets outside the Index; 3Includes companies classified in coun-tries outside the Index.
SECTOR EXPOSURE (%) at October 31, 2017
| SECTOR | PORTFOLIO | BENCHMARK1 | ||||||
CONSUMER DISCRETIONARY | 7.5 | 15.6 | ||||||
CONSUMER STAPLES | 11.5 | 6.4 | ||||||
ENERGY | 1.6 | 3.2 | ||||||
FINANCIALS | 12.5 | 10.5 | ||||||
HEALTH CARE | 13.2 | 6.7 | ||||||
INDUSTRIALS | 22.5 | 20.1 | ||||||
INFORMATION TECHNOLOGY | 22.4 | 12.8 | ||||||
MATERIALS | 2.9 | 11.0 | ||||||
REAL ESTATE | 0.0 | 9.8 | ||||||
TELECOM SERVICES | 0.6 | 1.1 | ||||||
UTILITIES | 1.0 | 2.8 | ||||||
CASH | 4.3 | – | ||||||
1MSCI All Country World ex-US Small Cap Index.
Other Portfolio companies don’t sell directly to the EV and hybrid car manufactures, but are still beneficiaries from the increasing demand in semiconductors for these cars. One of the main parts of a car, the powertrain, is expected to have 6 to 10 times more semiconductors by value for an EV than for a traditional ICE-based car. For example, analysts at UBS found US$580 worth of semiconductors in the powertrain of a Chevy Bolt, as opposed to US$60–90 in a traditional engine.3
In addition, EVs use advanced driver assistance systems, which include many safety features such as automatic braking, lane departure warning, and adaptive cruise control. These features require functionality provided by semiconductors including LiDAR (light detection and ranging), radar, sensors, and image processing.
Manufacturing of all of these semiconductors requires “clean rooms”—spaces that are cleansed of all particles by vacuum pumps. Pfeiffer Vacuum Technology is a German manufacturer of technologically-advanced pumps that can create near-perfect vacuums. Pfeiffer’s pumps are used in plants that operate at the nanometer scale and demand precision. About 38% of Pfeiffer’s sales are to manufacturers of semiconductors.
To pack more and more functionality onto the surface of a semiconductor, the integrated circuits must be made increasingly small. Deposition, which involves exposing silicon wafers to different chemicals to deposit thin films onto which the integrated circuits are etched, is the key process to create circuits on the molecular or even atomic scale. ASM International is the market leader in atomic layer deposition technology, and is benefitting from increased adoption of advanced semiconductors in EVs, which we estimate are the source of about 10–12% of ASM’s sales.
2The powertrain includes the main power-generating components of a vehicle: the engine, differentials, drive shafts, transfer case, and transmission.
3UBS Global Research, Q-Series: UBS Evidence Lab Electric Car Teardown. (May 18, 2017).
16
|
Table of Contents
The shift toward EVs will not be without negative impacts on some companies, however. Those with exposure to traditional fossil fuels, for instance, will face headwinds long term. Although we continue to hold a significant underweight in Energy relative to the Index, two companies in the Portfolio—Dialog Group Berhad and Nostrum Oil & Gas—are classified under the Energy sector. Dialog provides both upstream and downstream technical and engineering services including logistics, plant maintenance, fabrication, engineering, and construction. Nostrum Oil & Gas is a UK-listed oil and gas exploration and development company with fields in Kazakhstan.
We think the impact of EV penetration on oil and gas prices will be very gradual. Currently, the installed base of traditional ICE-based vehicles is so large that even a faster-than-expected adoption of hybrid and electric alternatives would not be an immediate threat to the future of these oil and gas companies. With over 1.2 billion traditional cars on the road, there is certainly a sizable market for oil and gas in the near term. That said, we do think sustained EV adoption poses a risk to energy suppliers, and we are closely monitoring the fundamentals of both businesses relative to their share prices.
PORTFOLIO HIGHLIGHTS
In the trailing 12 months, we continued to redeploy capital away from our most-expensive holdings in favor of relatively cheaper alternatives that nonetheless offer quality and growth characteristics.
For example, we sold Japan’s Sugi Holdings—as we considered it significantly overvalued—and Saudi Arabia’s Herfy Food Services—out of concern about intensifying competition from McDonald’s and Burger King. We also sold Coastal Contracts of Malaysia as its core business of building, selling, and chartering of offshore vehicles remains weak and could weaken further as low oil prices continue to impact demand for offshore exploration and production ships. In addition, the company is now venturing outside its main business to pursue offshore gas-treatment projects, detracting focus from its core business. Hong Kong-based electric-meter company Wasion Group Holdings was sold as we observed a significant slowdown in growth for Waison’s smart meters now that the penetration of these products in China has increased significantly. Competition has also increased, mainly from local companies.
We used the cash raised from these sales to establish positions in new high quality-growth companies whose stocks appeared more attractive on our financial models.
One new purchase was Emami Limited, an Indian company that manufactures personal care and medicinal products, such as skin cream, hair oils, pain-relief creams, and digestion aids. Emami’s products are mostly herbal based, which Indian consumers perceive as safer and more effective than chemical-based products.
TEN LARGEST HOLDINGS at October 31, 2017
| COMPANY | SECTOR | COUNTRY | % | |||||||||
VAISALA | INFO TECHNOLOGY | FINLAND | 3.1 | |||||||||
HIDAY HIDAKA | CONS DISCRETIONARY | JAPAN | 2.8 | |||||||||
ALTEN | INFO TECHNOLOGY | FRANCE | 2.7 | |||||||||
BECHTLE | INFO TECHNOLOGY | GERMANY | 2.7 | |||||||||
REPLY | INFO TECHNOLOGY | ITALY | 2.4 | |||||||||
LISI | INDUSTRIALS | FRANCE | 2.2 | |||||||||
BOSSARD | INDUSTRIALS | SWITZERLAND | 2.1 | |||||||||
ABCAM | HEALTH CARE | UNITED KINGDOM | 2.1 | |||||||||
BRAC BANK | FINANCIALS | BANGLADESH | 2.0 | |||||||||
CARL ZEISS MEDITEC | HEALTH CARE | GERMANY | 1.9 | |||||||||
Over its 43-year history, Emami has built up a distribution network of 4.6 million retail locations in India that sell its products. Through its 16 brands Emami controls approximately two-thirds of the Indian herbal-products market, a share we think it can maintain due to the nationwide reach of its distribution and customer loyalty to its brands. It would be very difficult and expensive for a competitor to build an equivalent network. Thanks to these competitive advantages, Emami grew its earnings 27% per annum over the last ten years and routinely generates a return on capital of over 20%. The negative impact of India’s 2016 currency demonetization on consumer spending is now largely behind the company. We expect it to resume growing its earnings rapidly, as consumers’ rising disposable income enables them to spend more on brand-name products.
We also purchased Sensata Technologies, which makes sensors and controls that measure physical phenomenon such as pressure, speed, and temperature. Its primary end markets are the industrial and automotive industries, both of which are increasingly adopting Sensata’s products—ranging from tire pressure monitoring systems to sensors that monitor the performance of energy-conserving industrial refrigerators—to enhance safety and efficiency. Sensata is a low-cost leader, with strong positions in both the sensor and control markets thanks to an ability to deliver high-quality, customized products. The company has consistently generated strong free cash flow and double-digit returns on invested capital and returns on equity.
Other high-quality companies added to the Portfolio in the past 12 months include five other Industrials companies, an Energy company, two Financials companies, two Health Care companies, and three IT companies.
Please read the separate disclosures page for important information, including the risks of investing in the Portfolio.
17
|
Table of Contents

| PORTFOLIO MANAGEMENT TEAM | ||
 |
| G. RUSTY JOHNSON, CFA | PRADIPTA CHAKRABORTTY | |
CO-LEAD PORTFOLIO MANAGER
| PORTFOLIO MANAGER
| |
| CRAIG SHAW, CFA | SCOTT CRAWSHAW | |
| CO-LEAD PORTFOLIO MANAGER | PORTFOLIO MANAGER
| |
| RICHARD SCHMIDT, CFA | ||
PORTFOLIO MANAGER |
The Institutional Emerging Markets Portfolio and the Emerging Markets Portfolio are generally closed to new investors.
The Institutional Emerging Markets Portfolio – Class I and Class II – and the Emerging Markets Portfolio – Advisor Class (collectively, the “Portfolios”) are both managed in strict accordance with the Emerging Markets Equity strategy model portfolio. Therefore, the Portfolios have highly similar holdings and characteristics. We have provided a single commentary to cover both Portfolios. The specific performance and characteristics of each are presented separately in the tables that follow.
 PERFORMANCE SUMMARY
The Institutional Emerging Markets Portfolio – Class I rose 25.08%, the Institutional Emerging Markets Portfolio – Class II rose 25.43%, and the Emerging Markets Portfolio – Advisor Class rose 24.93% (all net of fees and expenses) in the fiscal year ended October 31, 2017. The Portfolios’ benchmark, the MSCI Emerging Markets Index rose 26.45% (net of source taxes) in this period.
MARKET REVIEW
The fiscal year ending October 31, 2017 began inauspiciously for Emerging Markets (EMs), which declined sharply in November as the surprise election of Donald Trump sparked concern among investors about the potential impact of his protectionist agenda on global trade and EM companies. Inflation expectations and bond yields also quickly rose, hurting the value of EM currencies versus the US dollar. But EMs recovered in January and enjoyed positive momentum for the rest of the fiscal year, propelled by a supportive combination of robust global economic growth, declining inflation expectations, and strong results in the Information Technology (IT) sector.
Investors were also heartened by China’s strong economic growth, the stabilization of its currency, and moderation of capital outflows. Rising corporate profits have eased fears about the corporate sector’s ability to service its high level of debt—which has been a key risk facing the Chinese economy. As corporate liabilities fell,
FUND FACTS at October 31, 2017 | ||||||||||||
SALES CHARGE | NONE | |||||||||||
NUMBER OF HOLDINGS | 78 | |||||||||||
REDEMPTION FEE | 2% FIRST 90 DAYS | |||||||||||
DIVIDEND POLICY | ANNUAL | |||||||||||
INSTITUTIONAL INVESTORS | INDIVIDUAL INVESTORS | |||||||||||
PORTFOLIO ASSETS | $4,844.8M | $4,015.0M | ||||||||||
TURNOVER (5 YR AVG) | 21% | 29% | ||||||||||
CLASS | CLASS I | CLASS II | ADVISOR | |||||||||
TICKER | HLMEX | HLEEX | HLEMX | |||||||||
CUSIP | 412295701 | 412295693 | 412295305 | |||||||||
INCEPTION DATE | 10/17/2005 | 3/5/2014 | 11/9/1998 | |||||||||
MINIMUM INVESTMENT1 | $500,000 | $25,000,000 | $5,000 | |||||||||
NET EXPENSE RATIO | 1.29% | 1.12%2 | 1.42% | |||||||||
GROSS EXPENSE RATIO | 1.29% | 1.24%3 | 1.42% | |||||||||
1Lower minimums available through certain brokerage firms;
2The Net Expense Ratio is as of October 31, 2017 as the Portfolio is operating below the contractual agreement, which is in effect until February 28, 2018;
3The Gross Expense Ratio is as of the Prospectus dated February 28, 2017.
China’s ratio of overall debt to GDP declined in September 2017 for the first time in nearly six years.1 Other positive news included the boosting of domestic confidence by a stronger property market. China’s Real Estate sector, another source of systemic risk, appeared to find a more sustainable path as recent financial reforms, notably the development of the domestic bond market, helped shift funding for real estate projects out of the shadow banking system.
Companies reporting demonstrable growth in revenues and profits had the strongest share-price performance, particularly the stocks of the “New” (technology-oriented) EM companies in both IT and Consumer Discretionary. Real Estate outperformed as well, led by China’s large listed developers. Yet “Old” (commodity-oriented) EM companies in the Materials sector also soared, aided by a roughly 30% rise in industrial metals prices in the trailing 12 months. The more-defensive Consumer Staples, Health Care, and Telecom Services sectors, while all positive, lagged the benchmark significantly.
From a regional perspective, Asia was the best performer, with the IT-heavy Chinese and South Korean markets leading the way. In China, leading internet platforms such as Tencent, which focuses on social media and gaming, and Alibaba, the largest e-commerce platform, posted a strong acceleration in revenue growth which boosted share prices. Another Index heavyweight, Samsung Electronics, as well as other technology companies benefitted from strong global demand for high-powered memory products. South Korea also elected a new president, Moon Jae-in, who seeks progressive economic reforms and aims to secure healthier relations with China.
1Gabriel Wildau, “Beijing effort and inflation push China debt load down,” Financial Times (September 24, 2017).
18
|
Table of Contents
PERFORMANCE (% TOTAL RETURN)
| for periods ended September 30, 2017 | for periods ended October 31, 2017 | |||||||||||||||||||||||||||||||||||||||||||||||||||||||
| 1 YEAR | 3 YEARS | 5 YEARS | 10 YEARS | SINCE INCEPTION* | 1 YEAR | 3 YEARS | 5 YEARS | 10 YEARS | SINCE INCEPTION* | |||||||||||||||||||||||||||||||||||||||||||||||
INST. EMERGING MARKETS PORTFOLIO - CLASS I | 21.95 | 6.43 | 6.44 | 2.62 | – | 7.90 | – | 25.08 | 6.36 | 6.53 | 1.73 | – | 8.00 | – | ||||||||||||||||||||||||||||||||||||||||||
INST. EMERGING MARKETS PORTFOLIO - CLASS II | 22.14 | 6.63 | – | – | 6.96 | – | – | 25.43 | 6.59 | – | – | 7.34 | – | – | ||||||||||||||||||||||||||||||||||||||||||
MSCI EMERGING MARKETS INDEX | 22.46 | 4.91 | 3.98 | 1.31 | 6.04 | 7.24 | – | 26.45 | 5.70 | 4.83 | 0.59 | 6.90 | 7.50 | – | ||||||||||||||||||||||||||||||||||||||||||
EMERGING MARKETS PORTFOLIO - ADVISOR CLASS | 21.73 | 6.37 | 6.41 | 2.58 | – | – | 12.02 | 24.93 | 6.30 | 6.50 | 1.70 | – | – | 12.07 | ||||||||||||||||||||||||||||||||||||||||||
Returns are annualized for periods greater than 1 year. *Inception of Class I, 10/17/05. Inception of Class II, 3/5/14. Inception of the Advisor Class, 11/9/98. Index performance prior to 1/1/01 cannot be shown since it relies on back-filled data.
Performance data quoted represents past performance; past performance does not guarantee future results. The investment return and principal value of an investment will fluctuate so that an investor’s shares, when redeemed, may be worth more or less than their original cost. Current performance of the Portfolio may be lower or higher than the performance quoted. Performance data current to the most recent month end may be obtained by calling (877) 435-8105 or visiting www.hardingloevnerfunds.com. Performance data shown does not reflect the 2.00% redemption fee imposed on shares held 90 days or less; otherwise, total returns would be reduced.
Emerging Europe also posted good returns, although the region modestly lagged the Index. Robust economic performance and moderating political risk strongly supported stock markets in Hungary and Poland. Emmanuel Macron’s victory in the French presidential election provided a measure of optimism about the future of the European Union.
The large markets of Latin America faced headwinds from the burden of rising political risks. In Brazil, popular support for Brazil’s President Michel Temer continued to fade due to allegations that he helped direct payment of bribes for political favors. The legislature’s commitment to his reform program remains strong, however, as seen in the Senate’s approval of new labor laws in July allowing for flexible work hours and more direct negotiations between employers and their workers. Returns in Mexico were hurt by concerns about the sustainability of the NAFTA trade agreement (the abolition of which was a feature of President Trump’s agenda) and political uncertainties as the country moves toward an election year in 2018.
The only region to decline this period was the Middle East, despite the support of more robust energy prices. (Brent crude reached around US$60 by the end of the fiscal year, the highest since summer 2015.) No solution has been forthcoming for the diplomatic stand-off that erupted in June 2017 between Index-constituent Qatar and a coalition of its neighbors, led by Saudi Arabia, which has accused Qatar of funding terrorist groups. The coalition members have cut off relations with Qatar and blockaded the country.
PERFORMANCE ATTRIBUTION
The Portfolios underperformed this year as overall positive stock selection was overcome by unfavorable sector and geographic allocations. We especially were hurt by being underweight in IT (including Chinese e-commerce giant Alibaba) and by our small allocation to cash in a period of strong Index returns.
Stocks in Industrials and Utilities were key positive contributors. In the former, Chinese online job search and human resource-services business 51Job Inc. reported strong growth in revenues in part due to the success of its cross-selling initiatives. The Portfolios’ only Utilities holding, Chinese natural-gas distributor ENN Energy, has enjoyed significant volume growth in 2017 aided by energy development
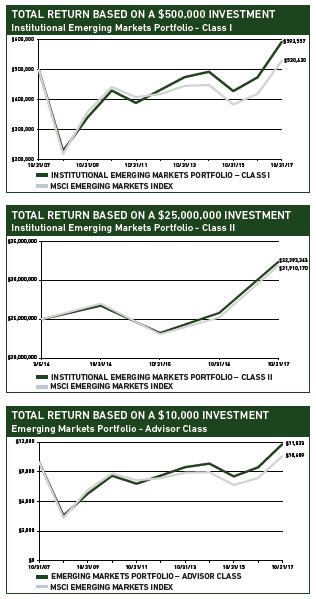
The charts above illustrate the hypothetical return of an investment made in the corresponding share classes. Investment return reflects voluntary fee waivers in effect. Absent such waivers, total return would be reduced. The performance provided in the table and charts above do not reflect the deduction of taxes that a shareholder would pay on Portfolio distributions or the redemption of Portfolio shares.
19
|
Table of Contents
projects in China. Stock selection was poor in Consumer Discretionary, as Mexican media company Televisa suffered from a decline in television advertising, and IT, where the profit margins of South Korea-based search and social platform NAVER felt the cost of artificial intelligence-related investments. The Taiwanese industrial PC maker Advantech also had weak returns as growth in its US business slowed. From a regional perspective, allocation effects were negative given our underweight exposure to the surging markets of China and South Korea. This detractor was partially offset by positive stock selection in Asia, including Taiwanese pneumatic equipment maker AirTAC and Chinese social media platform Weibo, both of which enjoyed robust earnings growth. Taiwan’s Largan Precision was also a significant contributor as high-end smartphone makers accelerated their roll-out of camera features that incorporate its specialized miniature lenses.
INVESTMENT PERSPECTIVES
EM technology continues to roar ahead
The stand-out performance by IT sector stocks together with those of internet-based businesses classified in other sectors was an astonishing feature of the fiscal year. The IT sector index rose 52% in the fiscal year. Contrary to the established view that EMs are engaged primarily in resource extraction and basic manufacturing, the Index is dominated today by IT and internet-related companies. The IT sector alone comprises almost 30% of the EM Index, more than double its weight just five years ago.
The outperformance of the EM IT sector is not a new phenomenon—the sector consistently outpaced the broad Index over the past five years. While the total earnings base of the EM Index was essentially flat for the period 2012–2016, the companies in the IT sector generated superior financial results, which has underpinned their share-price appreciation. IT’s sales growth has
GEOGRAPHIC EXPOSURE (%) at October 31, 2017
| COUNTRY/REGION | INSTITUTIONAL | ADVISOR | ||||||||
| HLMEX / HLEEX | HLEMX | BENCHMARK1 | ||||||||
BRAZIL | 7.0 | 7.0 | 7.1 | |||||||
CHINA + HONG KONG2 | 28.9 | 28.9 | 29.7 | |||||||
INDIA | 5.1 | 5.1 | 8.7 | |||||||
MEXICO | 4.4 | 4.4 | 3.1 | |||||||
RUSSIA | 5.7 | 5.7 | 3.2 | |||||||
SOUTH AFRICA | 5.4 | 5.4 | 6.3 | |||||||
SOUTH KOREA | 10.5 | 10.6 | 15.7 | |||||||
TAIWAN | 10.8 | 10.8 | 11.8 | |||||||
SMALL EMERGING MARKETS3 | 15.3 | 15.3 | 14.4 | |||||||
FRONTIER MARKETS4 | 1.1 | 1.1 | – | |||||||
DEVELOPED MARKET LISTED5 | 3.7 | 3.7 | – | |||||||
CASH | 2.1 | 2.0 | – | |||||||
1MSCI Emerging Markets Index; 2The Harding Loevner Funds Emerging Markets Portfolios’ end weight in China is 22.9% and Hong Kong is 6.0%. The Benchmark does not include Hong Kong; 3Includes the remaining emerging markets which, individually, comprise less than 5% of the Index; 4Includes countries with less- developed markets outside the Index; 5Includes emerging markets or frontier markets companies listed in developed markets.
SECTOR EXPOSURE (%) at October 31, 2017
| SECTOR | INSTITUTIONAL HLMEX / HLEEX | ADVISOR HLEMX | BENCHMARK1 | |||||||
CONSUMER DISCRETIONARY | 13.9 | 13.9 | 10.2 | |||||||
CONSUMER STAPLES | 6.9 | 6.9 | 6.2 | |||||||
ENERGY | 5.8 | 5.8 | 6.9 | |||||||
FINANCIALS | 26.9 | 26.9 | 23.0 | |||||||
HEALTH CARE | 4.4 | 4.5 | 2.3 | |||||||
INDUSTRIALS | 7.2 | 7.2 | 5.5 | |||||||
INFORMATION TECHNOLOGY | 25.3 | 25.3 | 28.5 | |||||||
MATERIALS | 0.9 | 0.9 | 7.2 | |||||||
REAL ESTATE | 1.3 | 1.3 | 2.8 | |||||||
TELECOM SERVICES | 3.4 | 3.4 | 4.9 | |||||||
UTILITIES | 1.9 | 1.9 | 2.5 | |||||||
CASH | 2.1 | 2.0 | – | |||||||
1MSCI Emerging Markets Index.
outpaced other sectors, while its return on capital has been high and increasingly stable. The strong fundamentals of today’s EM technology companies (both within and outside the IT sector) are why, as investors focused on quality and growth, we continue to find new opportunities in this area.
The current universe of IT and internet-focused EM businesses includes traditional manufacturers that have moved beyond their origins as low-cost producers of commodity electronics goods. Among this group are holdings Samsung Electronics and Taiwan Semiconductor, which have reinvested their prodigious cash flows into research to develop their own cutting-edge technologies.
The universe also includes internet-based enterprises that have leveraged technology produced by others to leapfrog to the forefront of their industries. China has been at the center of this trend, with the country’s economic transformation facilitated by deep in-ternet and smartphone penetration and the eagerness of the growing middle class to spend their time—and money—online in the digital domain. The ability of Chinese businesses to create services and experiences for the growing number of users of online and mobile platforms is a demonstration of EM companies’ capacity for innovation and technological leadership. Among the great successes that have emerged from China’s transformation are Ten-cent, the online gaming and social media business, and Weibo, the leading open social media platform in China with roughly 340 million active users of its platform. China has also provided a platform for growth for other internet-based businesses held in the Portfolios, spanning e-retailing (JD.com), travel (Ctrip.com), and recruiting (51Job Inc.).
The leading internet-based companies in China have dominant market shares in their niche areas and thus benefit from scale and network-effect advantages. They also benefit from a colossal domestic market with few foreign competitors, which in some cases are effectively barred from operating in China’s protected technology industries. All of this helps make these companies highly profitable and cash generative, allowing them to invest in improving the quality of their products and the customer experience, which, in turn, helps to sustain their growth and to deepen the moat that secures their competitive positions.
20
|
Table of Contents
As we search for new tech opportunities, we are also prompted to take pause. Experience tells us to be wary when high investor confidence in an industry prevails and markets are pricing in a bright future of extended growth. The technology companies held in the Portfolios have established advantages of scale and high barriers to entry that are undoubtedly difficult to surmount. Yet, because of their size, their growth must slow from current rates at some point to converge with the pace of broader economic development; that is, these platforms, as they grow, eventually become the economy. As their growth slows, competitive pressures for these companies will tend to rise. Furthermore, where companies’ fates rely upon the sharp end of technological advancement, the threat to incumbents of disruption from the next new-new thing is ever present. We navigate these risks by focusing on a diverse group of businesses that we consider to have durable competitive advantages and long-term growth opportunities, while remaining careful about price when selecting holdings and determining their weights in the model portfolio.
PORTFOLIO HIGHLIGHTS
The Portfolios’ sector orientation changed only modestly during the trailing 12 months. Two of the more-significant changes were increases in our absolute weights in Industrials and IT, although in the latter our underweight relative to the Index widened. While we added to a number of existing Financials holdings, including South Africa’s Standard Bank, Brazil’s Itau Unibanco, and Hong Kong Exchanges, we also sold two banks (India’s Axis Bank and Qatar National Bank). We also moved from having an overweight to an underweight in India (including selling Ambuja Cement on valuation grounds). In addition, we purchased seven new Chinese holdings and sold one, bringing the combined weight in China and Hong Kong in the Portfolios to 29%. This is the largest absolute level in the strategy’s history, but still just below China’s 30% weight in the Index.
Until recently, foreign investors seeking to invest in the diversity of Chinese companies contributing to China’s economic transformation had limited access to the large number of locally listed stocks known as A-shares. However, the establishment of the mutual market access trading facility known as Shanghai-Hong Kong Connect in November 2014 and the follow-on Shenzhen-Hong Kong Connect in December 2016 has made approximately 1,200 Chinese companies investable only through A-shares readily available to foreign institutional investors. We have been preparing for the A-share opportunity for several years, including expanding our research resources dedicated to China and completing the administrative and operational processes necessary to invest via both Shanghai Connect and Shenzhen Connect for the Harding Loevner Funds.
We now hold three investments in A-share companies for the strategy, including video-surveillance-equipment maker Hangzhou
TEN LARGEST HOLDINGS at October 31, 2017
| COMPANY | SECTOR | COUNTRY | INSTITUTIONAL HLMEX / HLEEX | ADVISOR HLEMX | ||||||||||||||
SAMSUNG ELECTRONICS | INFO TECHNOLOGY | SOUTH KOREA | 5.5 | 5.5 | ||||||||||||||
TAIWAN SEMICONDUCTOR | INFO TECHNOLOGY | TAIWAN | 5.0 | 5.0 | ||||||||||||||
TENCENT | INFO TECHNOLOGY | CHINA | 4.0 | 4.0 | ||||||||||||||
SBERBANK | FINANCIALS | RUSSIA | 2.7 | 2.7 | ||||||||||||||
AIA GROUP | FINANCIALS | HONG KONG | 2.6 | 2.6 | ||||||||||||||
ITAU UNIBANCO | FINANCIALS | BRAZIL | 2.0 | 2.0 | ||||||||||||||
MARUTI SUZUKI | CONS DISCRETIONARY | INDIA | 1.9 | 1.9 | ||||||||||||||
ENN ENERGY | UTILITIES | CHINA | 1.9 | 1.9 | ||||||||||||||
LARGAN PRECISION | INFO TECHNOLOGY | TAIWAN | 1.8 | 1.8 | ||||||||||||||
CNOOC | ENERGY | CHINA | 1.8 | 1.8 | ||||||||||||||
Hikvision, leading domestic drug manufacturer Jiangsu Hen-grui Medicine, and home-appliance manufacturer Midea Group. Jiangsu Hengrui, for example, specializes in surgical anesthetics, contrast reagents for radiology, and oncology drugs. Its niche treatments are often complex to manufacture and are important for critical care, which makes them less-susceptible to regulatory price pressures than many generic drugs. The company’s products command strong margins, generating significant cash flows that are reinvested back into the business.
In Brazil, we purchased WEG, a Brazilian industrial company founded in 1961 by German immigrants. The company began as a manufacturer of electric motors used in a broad array of industrial applications, a business that still accounts for the majority of revenues and where it enjoys about 80% market share in Brazil. WEG also serves the power sector, producing transformers, control panels and automation systems for hydro-, thermo-, and wind-power stations. Its competitive strategy in both the industrial-motor and power businesses has been to operate a vertically integrated production model and differentiate itself through the quality and customized nature of its products as well as the strength of its after-sales service. WEG is pursuing the same strategy worldwide.
Our sales in the latter half of the fiscal year included Latin Ameri-can e-commerce company MercadoLibre (Meli), after it changed its business strategy radically by offering free delivery in Mex-ico (representing 10% of sales) and Brazil (60% of sales). The costs of promoting the new offering and absorbing shipping costs caused the company’s margins to contract significantly. Management indicated one goal of the strategy change was to increase the “economic moat” (i.e., barrier to entry) to make it less appealing for Amazon or Alibaba to enter in its markets. But given the essentially limitless resources of Amazon and Alibaba, our view is they were unlikely to be dissuaded. Our estimates indicated Meli’s shares appeared overvalued when taking into account the company’s lower future margins. We will continue to monitor the company’s strategy as it unfolds, watching for signs of a recovery in margins or a notable acceleration of revenue growth that could offset the margin compression.
Please read the separate disclosures page for important information, including the risks of investing in the Portfolios.
21
|
Table of Contents

PORTFOLIO MANAGEMENT TEAM

PRADIPTA CHAKRABORTTY CO-LEAD PORTFOLIO MANAGER
BABATUNDE OJO, CFA CO-LEAD PORTFOLIO MANAGER | RICHARD SCHMIDT, CFA PORTFOLIO MANAGER |
 PERFORMANCE SUMMARY
The Frontier Emerging Markets Portfolio – Institutional Class I gained 16.82% and the Investor Class gained 16.40% (net of fees and expenses) in the fiscal year ended October 31, 2017. The Portfolio’s benchmark, the MSCI Frontier Emerging Markets Index, gained 16.68% (net of source taxes).
MARKET REVIEW
Every region except the Middle East and every sector except Information Technology advanced in the last fiscal year. Latin America, led by Argentina, was the best-performing region. Investors in Argentina applauded the results of August primary elections in which President Mauricio Macri’s Cambiemos (“Let’s Change”) coalition garnered 36% of the nationwide vote, winning several important districts, while populist former President Cristina Fernández de Kirchner who ran in the Buenos Aires province fared poorly. The solid showing for Cambiemos in the subsequent elections in October allayed fears that Macri’s pro-business reform agenda could be derailed by the return of a populist government.
Africa rose, due largely to Nigeria. The market was buoyed by generally improving corporate earnings and by the Central Bank of Nigeria’s partial liberalization of its exchange-rate regime. In April, the NAFEX1 benchmark rate for foreign-exchange transactions was created to boost dollar liquidity. Nigeria has suffered from a shortage of dollars since the price of oil, its key export, plunged in 2014, and Nigerian authorities had continued to manage the local currency’s exchange rate even after it was devalued in June 2016. The NAFEX provides a window for foreign investors to conduct currency transactions without restriction or delay, and its inception brought strong capital inflows into the country. We began using the NAFEX rate, which is lower than the interbank rate used by pricing services such as index provider MSCI, to value our Portfolio’s Nigerian holdings in June 2017 because we believe it reflects most closely the rate readily available to foreign investors in open market transactions.
1NAFEX stands for Nigerian Autonomous Foreign Exchange Rate Fixing. The rate is computed based on the survey of ten Nigerian banks conducting currency operations involving purchases and sales of currency on behalf of their clients.
FUND FACTS at October 31, 2017 | ||||||||||||
TOTAL NET ASSETS | $464.5M | |||||||||||
SALES CHARGE | NONE | |||||||||||
NUMBER OF HOLDINGS | 77 | |||||||||||
TURNOVER (5 YR. AVG.) | 35% | |||||||||||
REDEMPTION FEE | 2% FIRST 90 DAYS | |||||||||||
DIVIDEND POLICY | ANNUAL | |||||||||||
INSTITUTIONAL INVESTORS | INDIVIDUAL INVESTORS | |||||||||||
| INSTL CLASS I | INSTL CLASS II | INVESTOR CLASS | ||||||||||
TICKER | HLFMX | HLFFX | HLMOX | |||||||||
CUSIP | 412295867 | 412295735 | 412295859 | |||||||||
INCEPTION DATE | 5/27/2008 | 3/1/2017 | 12/31/2010 | |||||||||
MINIMUM INVESTMENT1 | $100,000 | $10,000,000 | $5,000 | |||||||||
NET EXPENSE RATIO | 1.64% | 1.35%2 | 2.00% | 2 | ||||||||
EXPENSE RATIO | 1.64% | 1.75% | 2.08% | |||||||||
1Lower minimums available through certain brokerage firms; 2Shown net of Harding Loevner’s contractual agreement through February 28, 2018.
Bangladesh and Vietnam were Asia’s top performers. Bangladesh was bolstered by advances in the shares of Grameenphone—the country’s largest mobile telecom company. Grameenphone emerged as the leader in terms of market share, revenue, and network coverage following last year’s government-mandated user-registration program, aimed at verifying subscribers’ identities. The program, which eliminated unverified subscribers across the telecom market, effectively boosted Grameenphone’s market share as the company had fewer unverified subscribers relative to its competitors. Grameenphone’s growth outlook remains strong, supported by the low mobile penetration in Bangladesh and increasing smartphone adoption that is driving data usage.
Amidst the otherwise strong performance of the Asia region in the fiscal year, Pakistan was the worst-performing market. Shares of Habib Bank suffered heavy losses when the New York Department of Financial Services imposed a multi-million dollar fine and ordered the bank to close its US branch after investigations revealed serious deficiencies in its anti-money laundering compliance. We discuss Habib further in this report.
Energy was the top-performing sector in the fiscal year. The price of oil rose as global oil inventories were drawn down. Supply decreased due to production cutbacks, mostly by OPEC countries. At the same time, global oil consumption surpassed expectations, prompting OPEC to increase its global demand forecasts for the next two years.
Financials was boosted by Kuwaiti banks in anticipation of Kuwait’s upgrade to Emerging Market (EM) status by index-provider FTSE Russell. Argentina’s Banco Macro and Grupo Financiero Galicia also rose strongly. The country’s improving economy and declining inflation should stimulate credit demand from local businesses previously unable to afford long-term financing.
22
|
Table of Contents
PERFORMANCE (% TOTAL RETURN)
| for periods ended September 30, 2017 | for periods ended October 31, 2017 | |||||||||||||||||||||||||||||||||||||||||||||||||
| 1 YEAR | 3 YEARS | 5 YEARS | SINCE INCEPTION* | 1 YEAR | 3 YEARS | 5 YEARS | SINCE INCEPTION* | |||||||||||||||||||||||||||||||||||||||||||
FRONTIER EMERGING MARKETS PORTFOLIO - INST. CLASS I | 16.42 | -3.35 | 5.27 | – | – | -0.85 | 16.82 | -2.37 | 4.73 | – | – | -0.90 | ||||||||||||||||||||||||||||||||||||||
FRONTIER EMERGING MARKETS PORTFOLIO - INST. CLASS II | – | – | – | 15.00 | – | – | – | – | – | 14.40 | – | – | ||||||||||||||||||||||||||||||||||||||
MSCI FRONTIER EMERGING MARKETS INDEX | 15.53 | -2.48 | 4.13 | 14.48 | 2.14 | – | 16.68 | -1.34 | 3.93 | 14.63 | 2.13 | – | ||||||||||||||||||||||||||||||||||||||
FRONTIER EMERGING MARKETS PORTFOLIO - INVESTOR CLASS | 16.14 | -3.74 | 4.85 | – | 1.77 | – | 16.40 | -2.79 | 4.30 | – | 1.66 | – | ||||||||||||||||||||||||||||||||||||||
Returns are annualized for periods greater than 1 year. *Inception of the Institutional Class I, 5/27/08. Inception of the Investor Class, 12/31/10. Inception of the Institutional Class II, 3/1/17. Index performance prior to 12/2/08 cannot be shown in the table above or in the charts below since it relies on back-filled data. Accordingly, the chart below for Institutional Class I depicts a hypothetical investment in the Portfolio on inception date, while Index data begins on 12/2/08. For comparative purposes, the beginning value of the Index on that date was matched to the value of the hypothetical investment in the Portfolio.
Performance data quoted represents past performance; past performance does not guarantee future results. The investment return and principal value of an investment will fluctuate so that an investor’s shares, when redeemed, may be worth more or less than their original cost. Current performance of the Portfolio may be lower or higher than the performance quoted. Performance data current to the most recent month end may be obtained by calling (877) 435-8105 or visiting www.hardingloevnerfunds.com. Performance data shown does not reflect the 2.00% redemption fee imposed on shares held 90 days or less; otherwise, total returns would be reduced.
PERFORMANCE ATTRIBUTION
By sector, stock selection was strongest in Financials, led by Banco Macro and Grupo Financiero Galicia. Halyk Savings Bank of Kazakhstan contributed as well. The bank benefited from favorable terms in its merger with rival Kazkommertsbank in March, a move supported by the Kazakh government. Stock selection in Telecom Services was also strong, due largely to Grameenphone and Safaricom. The latter had positive net-subscriber growth coupled with declining capital-expenditure intensity, leading to strongly rising free cash flow generation.
Materials was led by Vietnamese steel producer Hoa Phat Group (HPG), the largest producer of construction steel in the country. Its vertical integration gives HPG a cost advantage that helped it gain market share from smaller producers. HPG has experienced strong volume growth and favorable domestic pricing due to “anti-dumping” tariffs on imports. Within Materials, we prefer to focus on producers of cement, construction steel, or other products employed domestically, such as HPG, who can achieve significant competitive advantages in their home market.
Poor stock selection in Energy detracted. Kazakhstan’s Nostrum Oil & Gas fell following an English court’s ruling allowing Claremont, an entity controlled by former Nostrum Executive Chairman Frank Monstrey, to dispose of its large shareholding.
Viewed by region, stock selection in the Asian markets contributed most to our relative performance. In Bangladesh, Grameenphone shares were boosted in July by strong operating results as the company reported sustained subscriber growth and its ninth consecutive quarter of revenue growth. We also benefited from stock selection in Pakistan, upon which the Habib Bank scandal weighed heavily. When we previously examined Habib, we observed that it trailed behind its top peers on profitability and efficiency metrics. Despite being the largest bank in Pakistan with the widest branch footprint, its proportion of low-cost current and savings accounts deposits was lower than that of its main competitors. Moreover, the bank’s management pursued lending to the agricultural sector, seemingly prioritizing social objectives ahead of profitability. We ultimately decided to invest in United Bank Pakistan and MCB Bank instead. Management quality and foresight is one of
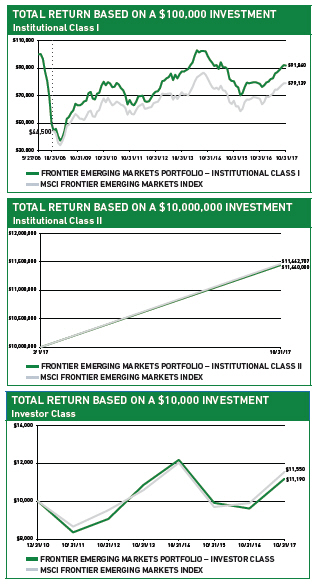
The charts above illustrate the hypothetical return of an investment made in the corresponding share classes. Investment return reflects voluntary fee waivers in effect. Absent such waivers, total return would be reduced. The performance provided in the table and charts above do not reflect the deduction of taxes that a shareholder would pay on Portfolio distributions or the redemption of Portfolio shares.
23
|
Table of Contents
the key pillars of our investment process; while we could not have foreseen Habib’s falling out with the US regulator, paying close attention to management’s track record served us well.
Stocks in the Gulf States region detracted from our relative returns, especially our underweight to the Kuwaiti market, which makes up nearly three-quarters of the region. Index-inclusion announcements typically trigger a flurry of activity by certain market participants attempting to front run expected capital flows by passive and other benchmark-driven investors. Such thinking has no bearing on our portfolio construction; rather than speculating on short-term movements, we confine ourselves to seeking financially strong, high-quality, long-duration growth businesses that are run by experienced managers whose interests are aligned with their shareholders. Since we have thus far found few such Kuwaiti companies, we remain underweight in that market.
INVESTMENT PERSPECTIVES
Four Secular Trends and Investment Opportunities in Frontier Emerging Markets
Several trends in frontier economies are strengthening the foundation for growth and expanding the universe of investment opportunities.
1. Investment in Education
Fast population growth in many frontier nations translates into high proportions of young workers. But an abundant labor force must be educated in order to compete effectively in the global economy. Some frontier countries are making substantial progress in this regard. Vietnam’s sizable investment in education, equal to 4.5% of its GDP (ahead of the regional average of 3.0%), has borne fruit: youth illiteracy has been virtually eliminated, and Vietnam now ranks well above most developed countries in science, mathematics, and reading. Educational initiatives aimed at skills development have helped to cement Vietnam’s position as one of the top foreign direct investment (FDI) destinations among frontier emerging markets (FEMs). The country has attracted multi-billion dollar investments from Korea’s Samsung and Taiwan’s Hon Hai Precision, which operate technology-manufacturing and assembly plants in Vietnam.
GEOGRAPHIC EXPOSURE (%) at October 31, 2017
| REGION | PORTFOLIO | BENCHMARK1 | ||||||
AFRICA | 17.9 | 15.6 | ||||||
ASIA | 34.3 | 34.4 | ||||||
EUROPE | 8.0 | 4.8 | ||||||
GULF STATES | 11.4 | 13.2 | ||||||
LATIN AMERICA | 24.3 | 30.0 | ||||||
MIDDLE EAST | 0.0 | 2.0 | ||||||
DEVELOPED MARKET LISTED2 | 3.1 | – | ||||||
CASH | 1.0 | – | ||||||
1MSCI Frontier Emerging Markets Index; 2Includes frontier or small emerging markets companies listed in developed markets.
SECTOR EXPOSURE (%) at October 31, 2017
| SECTOR | PORTFOLIO | BENCHMARK1 | ||||||
CONSUMER DISCRETIONARY | 9.0 | 1.4 | ||||||
CONSUMER STAPLES | 16.3 | 6.5 | ||||||
ENERGY | 5.6 | 5.9 | ||||||
FINANCIALS | 34.6 | 46.8 | ||||||
HEALTH CARE | 4.8 | 1.5 | ||||||
INDUSTRIALS | 4.0 | 8.8 | ||||||
INFORMATION TECHNOLOGY | 2.4 | 0.5 | ||||||
MATERIALS | 9.0 | 6.9 | ||||||
REAL ESTATE | 5.5 | 9.2 | ||||||
TELECOM SERVICES | 7.8 | 9.1 | ||||||
UTILITIES | 0.0 | 3.4 | ||||||
CASH | 1.0 | – | ||||||
1MSCI Frontier Emerging Markets Index.
The higher incomes of skilled laborers support consumption and growth in many frontier nations. The Philippines’ robust business process outsourcing (BPO) industry employs 1.4 million people and accounts for 9% of the country’s GDP. Workers in the BPO industry earn higher wages than the average Filipino, allowing them to spend a larger share of their incomes on discretionary goods. Robinsons Retail is poised to benefit from the increased purchasing power and changing lifestyles of urban middle-class Filipinos and from the ongoing formalization of the retail sector in the Philippines. The second-largest multi-format retail group in the Philippines, Robinsons has over 1,500 stores throughout the country, including both staples (supermarkets and pharmacies) and discretionary (department, hardware, and drug stores) formats.
2. Investment in Infrastructure
Lack of physical infrastructure is a significant barrier to economic growth for many frontier countries. By easing logistical bottlenecks and increasing efficiency, the modernization of infrastructure creates opportunities for FEMs to integrate their economies more closely in global manufacturing and supply chains.
Pakistan has long suffered from inadequate roads and an unreliable power supply. Beginning in 2013, the Pakistani government partnered with China to promote FDI via the China-Pakistan Economic Corridor (CPEC), a more than US$50 billion initiative consisting of large-scale construction and infrastructure projects to improve transportation links between China and Pakistan and upgrade the latter’s power sector. Lucky Cement—the largest cement manufacturer in Pakistan with approximately 18% market share—has benefited from the demand for cement underpinned by CPEC. Lucky is the industry’s lowest-cost producer due to the proximity of its Karachi plant to Pakistan’s main port, its own captive power plants, and its nationwide distribution network.
FEMs are typically unencumbered by the legacy infrastructure that exists in developed countries, which allows them to leapfrog directly into some of today’s newest technologies. Telephony is an example: most frontier countries have bypassed landline telephone networks altogether in favor of wireless connectivity. Despite being
24
|
Table of Contents
a late adopter of 3G technology, Bangladesh has experienced a rapid increase in mobile telephony that has more than tripled smartphone penetration between 2013 and 2016. Local telecom carriers are able to offer Bangladeshi consumers access to data services on par with those in emerging and developed markets. Grameenphone has the widest 3G network footprint in Bangladesh, enabling it to add data subscribers rapidly, which now account for over 40% of the total subscriber base. Additional revenue generated from data permits the company to reinvest in spectrum and network buildout, further extending its distribution reach.
3. Government Promotion of Business-Friendly Policies
Many frontier governments are increasingly supporting privatization and other reforms to ease regulatory burdens and encourage FDI. Such initiatives are key to fostering a business-friendly climate conducive to growth. Argentina is undergoing a profound pro-business shift, as the Macri administration embarks on a series of wide-ranging reforms designed to address impediments to economic growth dating to the Nestor and Cristina Kirchner administrations. Initial steps included abolishing foreign-exchange controls and reducing or removing export taxes on grain, beef, and soybeans. More recently, Macri has implemented energy reforms, reducing heavy consumer subsidies for electricity in order to curb the budget deficit and incent power companies to upgrade their ancient infrastructures.
The Macri administration has also undertaken reforms in the banking sector, abolishing restrictions on minimum deposit rates and fees, relaxing mandatory lending to certain sectors, and eliminating license requirements for opening branches. Macri’s reforms, combined with declining inflation, are stimulating lending by Argentine banks, such as Banco Macro and Grupo Financiero Galicia, primarily to local small- and mid-size enterprises. Credit in Argentina is growing at an approximately 15% rate when adjusted for inflation, much faster than in other Latin American countries.
4. Innovations in Banking and Credit
Today, frontier nations have considerably lower levels of credit penetration than countries in the emerging and developed world. At just 38%, the private sector credit-to-GDP ratio for frontier countries is less than half of EM levels. The promotion of financial inclusion by governments of many FEMs combined with new technologies that expand low-cost access to banking and credit should sustain secular growth in their financial sectors.
The success of “mobile money” in Kenya demonstrates how technological innovation can overcome the lack of a traditional banking infrastructure. M-Pesa, a mobile money-transfer and payment platform launched by Safaricom in 2007, currently counts 19 million active users, with an annual transaction value equal to approximately half of Kenya’s GDP. The value of transactions carried out through M-Pesa, which accounts for over 80% of all mobile money transactions in Kenya, has grown at 27% per year on average since 2013. By giving them access to mobile money accounts, M-Pesa has brought millions of people and small businesses—including those in rural areas where bank branches are sparse—into the modern banking system. It has also facilitated the creation of an electronic payment ecosystem encompassing payment processing,
TEN LARGEST HOLDINGS at October 31, 2017
| COMPANY | SECTOR | COUNTRY | % | |||||||||
HOA PHAT GROUP | MATERIALS | VIETNAM | 4.7 | |||||||||
SAFARICOM | TELECOM SERVICES | KENYA | 4.4 | |||||||||
CREDICORP | FINANCIALS | PERU | 3.6 | |||||||||
BANCO MACRO | FINANCIALS | ARGENTINA | 3.4 | |||||||||
ALICORP | CONS STAPLES | PERU | 3.1 | |||||||||
SQUARE PHARMACEUTICALS | HEALTH CARE | BANGLADESH | 3.0 | |||||||||
EMAAR PROPERTIES | REAL ESTATE | UAE | 2.8 | |||||||||
GRUPO FINANCIERO GALICIA | FINANCIALS | ARGENTINA | 2.8 | |||||||||
JOLLIBEE FOODS | CONS DISCRETIONARY | PHILIPPINES | 2.7 | |||||||||
SECURITY BANK | FINANCIALS | PHILIPPINES | 2.6 | |||||||||
savings, lending, and, eventually, e-commerce, in a country underpenetrated by branch banking.
These four broad trends should sustain the growth of frontier economies well into the future. They act as tailwinds to current holdings and create fertile environments for the emergence of the next generation of high-quality, long-duration growth businesses.
Like Safaricom, companies meeting our investment criteria often make a substantial impact on their local economies that goes far beyond generating shareholder profits. For example, Vietnam Dairy Products has been instrumental in developing and growing a domestic dairy industry in Vietnam over the past forty years. In addition to directly employing more than 10,000 workers in its factories and processing facilities, the company procures fresh milk from a vast network of dairy farmers, supporting nearly 7,700 farming households across the country.
The impact of leading frontier companies like Vietnam Dairy and Safaricom is not lost on politicians; it can help shield such companies from political meddling or regulatory overreach. The high-quality companies we own in the Portfolio thus tend to demonstrate greater resilience against the political upheavals inherent in frontier markets and, in fact, can serve as “safe havens” in times of elevated geopolitical risk.
Each country in the frontier universe follows its own unique development path. The underlying economic and political diversity of FEMs coupled with the lower level of global investor engagement in frontier equities—which are generally overlooked and under-owned—contributes to their lower correlations with both emerging and developed markets. Thus FEMs can be powerful diversifiers of global investment portfolios, reducing their overall risk while providing the opportunity to potentially benefit from frontier markets’ potential long-term growth.
Please read the separate disclosures page for important information, including the risks of investing in the Portfolio.
25
|
Table of Contents

PORTFOLIO MANAGEMENT TEAM

ANDREW WEST, CFA PORTFOLIO MANAGER
MOON SURANA, CFA PORTFOLIO MANAGER |
PERFORMANCE SUMMARY
The Global Equity Research Portfolio – Institutional Class gained 22.30% and the Investor Class rose 22.10% (net of fees and expenses) from its inception date of December 19, 2016 through October 31, 2017. The Portfolio’s benchmark, the MSCI All Country World Index, gained 19.47% during that period (net of source taxes).
MARKET REVIEW
Markets had modest gains in the last two months of 2016, in US dollar terms, as investors reacted to the astonishing outcome of the US presidential election, but accelerated in 2017 as investor optimism returned amid improving economic data in most regions. The Index ended the fiscal year with a robust increase. Through October, the Index posted 12 consecutive positive monthly returns, the longest such stretch for the Index since the bear market recovery of 2003–04. Although the gains came 7 years since the last recession, investors cheered positive economic data as it suggested synchronized growth across all major regions, while inflation remained muted. Meanwhile, investors largely rationalized the threat to stability from the US Federal Reserve’s staggered exit from extremely loose monetary policy as being about normalization rather than inflation taming. Markets also mostly ignored escalating tensions between North Korea and the US, illustrated by the half-percent rise in the Japanese stock market on the day the latest ICBM flew through its airspace in late August.
Information Technology (IT) stocks returned almost double the return of the Index in the trailing year. IT companies reported strong sales and earnings growth, with the biggest positive surprises coming from a handful of big Chinese internet companies.
The eurozone and Emerging Markets (EMs) led regional returns. Better economic growth data across Europe, along with relief over the defeat in the French general elections of the anti-EU far-right, allowed investors to view the future more optimistically. They favored stocks of more-cyclical businesses, especially energy, autos, and banks. The euro gained 6% against the US dollar, bolstering European Monetary Union (EMU) stock returns to US investors. The
FUND FACTS at October 31, 2017 | ||||||||
TOTAL NET ASSETS | $5.9M | |||||||
SALES CHARGE | NONE | |||||||
NUMBER OF HOLDINGS | 250 | |||||||
TURNOVER (5 YR. AVG.) | – | |||||||
REDEMPTION FEE | 2% FIRST 90 DAYS | |||||||
DIVIDEND POLICY | ANNUAL | |||||||
INSTITUTIONAL INVESTORS | INDIVIDUAL INVESTORS | |||||||
| INSTITUTIONAL CLASS | INVESTOR CLASS | |||||||
TICKER | HLRGX | HLGNX | ||||||
CUSIP | 412295792 | 412295818 | ||||||
INCEPTION DATE | 12/19/2016 | 12/19/2016 | ||||||
MINIMUM INVESTMENT1 | $100,000 | $5,000 | ||||||
NET EXPENSE RATIO2 | 0.90% | 1.15% | ||||||
GROSS EXPENSE RATIO | 2.96% | 8.86% | ||||||
1Lower minimums available through certain brokerage firms; 2Shown net of Harding Loevner’s contractual agreement through February 28, 2018.
strong performance of IT stocks, especially Chinese internet stocks, was important to EM gains.
The US stock market trailed the overall Index slightly, as accelerating economic growth and good earnings in IT and other cyclical sectors were offset by growth concerns in Consumer Staples and Health Care, and where optimism about government infrastructure spending or tax reform faded after other aims of the administration foundered in Congress in spite of the Republican majorities.
In addition to the US election, the end of 2016 was marked by a persistent value rally in which the least-expensive quintile of stocks outperformed the most-expensive quintile in every major region and in nearly every sector. And, because there is a high degree of overlap between low-quality or slow-growing businesses and companies with lowly priced stocks, the shares of the lowest-quality and slowest-growth businesses also performed better on average than shares of those with superior quality and growth records. This rally was reversed in the first six months of 2017, as style trends in the market favored stocks whose businesses demonstrated strong growth characteristics, while there was little differentiation in returns according to valuation. But then, from July to October, only the most-expensive quintile of stocks showed significant outperformance. Quality showed no pattern of effect on returns. Within developed markets, the growth preference waned late in September as US bond yields rose from the lowest levels of the year after Congress revealed plans for a large tax cut, and the Fed reiterated its intention to continue tightening monetary policy. Growth in EMs was strong throughout 2017.
PERFORMANCE ATTRIBUTION
The Global Equity Research Portfolio was launched on December 19, 2016. In the 10-month period from inception to October 31,
26
|
Table of Contents
PERFORMANCE (% TOTAL RETURNS)
| for periods ended September 30, 2017 | for periods ended October 31, 2017 | |||||||||||||||||||||||||
| CALENDAR YTD | 1 YEAR | SINCE INCEPTION* | CALENDAR YTD | 1 YEAR | SINCE INCEPTION* | |||||||||||||||||||||
GLOBAL EQUITY RESEARCH PORTFOLIO - INSTITUTIONAL CLASS | 19.78 | – | 19.30 | 22.79 | – | 22.30 | ||||||||||||||||||||
MSCI ALL COUNTRY WORLD INDEX | 17.24 | – | 17.03 | 19.68 | – | 19.47 | ||||||||||||||||||||
GLOBAL EQUITY RESEARCH PORTFOLIO - INVESTOR CLASS | 19.58 | – | 19.10 | 22.59 | – | 22.10 | ||||||||||||||||||||
*Inception of the Institutional and Investor Class, 12/19/16.
Performance data quoted represents past performance; past performance does not guarantee future results. The investment return and principal value of an investment will fluctuate so that an investor’s shares, when redeemed, may be worth more or less than their original cost. Current performance of the Portfolio may be lower or higher than the performance quoted. Performance data current to the most recent month end may be obtained by calling (877) 435-8105 or visiting www.hardingloevnerfunds.com. Performance data shown does not reflect the 2.00% redemption fee imposed on shares held 90 days or less; otherwise, total returns would be reduced.
The charts below illustrate the hypothetical return of an investment made in the corresponding share classes. Investment return reflects voluntary fee waivers in effect. Absent such waivers, total return would be reduced. The performance provided in the table above and charts below do not reflect the deduction of taxes that a shareholder would pay on Portfolio distributions or the redemption of Portfolio shares.
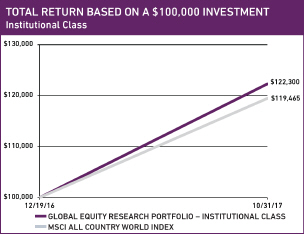
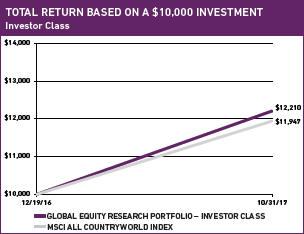
2017, the Portfolio benefited from our stock selection in Industrials, with strong returns by Japan’s MISUMI Group and Nidec as well as China’s 51Job Inc., an online job search and human resource-services business, which reported strong growth in revenues in part due to the success of its cross-selling initiatives.
Stocks in Financials, Consumer Staples, and Health Care, as well as our underweight to Energy and overweight to IT, also contributed to relative returns. Our stock selection in IT detracted from performance however, due to US-based companies F5 Networks, Cisco, and Qualcomm. Stocks in Energy also dragged on relative returns.
Viewed by geography, our stock selection in the US combined with our underweight there contributed the most to relative returns. Apple, Estée Lauder, and Roper stood out the most. Stocks in Japan (especially MISUMI, Nidec, Keyence, and Komatsu) and Europe ex-EMU (UK’s Rathbone Brothers and Swiss Lonza Group) also contributed to relative returns. Our overweight to EMs was also beneficial. Stock selection was weak in Canada (Cenovus Energy) and EMs, where India’s Sun Pharmaceuticals was a notable detractor.
Our modest cash position detracted from relative performance in a strong period for equity returns.
PERSPECTIVE AND OUTLOOK
The investment environment has become increasingly challenging for investors concerned with the quality, growth, and price tripod that forms the foundation of Harding Loevner’s investment philosophy. Quality as a standalone factor has become expensive in stock-price terms, in spite of the surge in value stocks at the end of 2016. We have noted the investment industry’s efforts to reverse-engineer the successful performance that high-quality portfolios have enjoyed over the past decade by constructing “smart beta” portfolios that use quantitative tools to identify companies with similar high-quality attributes. These approaches implicitly promise future outperformance similar to that observed in the past. Smart beta approaches overlap with other managers employing optimization software to create “low volatility” portfolios that appeal to investors fearful of the inherent ups and downs of stock market investing, overlapping simply because the stocks of high-quality companies have traded with much more restrained gyrations than the average stock in past market tempests. The broader emphasis on quality, enshrined in the documenting by academics of a quality factor effect, and commercialized through the creation of “quality indexes” as benchmarks for passive money, has meant increasingly persistent and decreasingly price-sensitive demand for the stocks of high-quality companies.
27
|
Table of Contents
Our investment team’s response has been to redouble our attention to the other two legs of our philosophical stool: growth and price. If quality is fashionable, based on either a blind embrace of its prior success or a backward-looking fear of another financial crisis, then the fruitful way forward must be one that remains discerning yet is courageously forward-looking. In the past 12 months, this route has involved an emphasis on price, encompassing the strong value rally capped by the “Trump bump,” but it has also, in recent months, coalesced around companies achieving faster growth. This latter focus on growth is the topic of this piece.
Our holdings have emphasized the emerging winners and beneficiaries of the promise now being realized by “Internet 2.0” and “Big Data.” Fifteen years after the tech bubble (wrongly) priced the first advent of internet-based business (“Internet 1.0”), we are witnessing the emergence in a number of industry segments of dominant or even winner-take-all internet-based businesses skillfully exploiting the “network effect” to secure their supremacy. While investors are clearly paying high prices for these businesses, their surge in the current year can mostly be explained by stronger-than-expected reported earnings rather than a re-estimation of their future growth rate.
We have been fortunate to own a number of internet businesses that have continued to generate strong results. We are aware of the great promise—and considerable hype—around emergent technologies such as artificial intelligence (AI), machine learning, and Big Data analytics of all types. For example, Facebook’s intimate personal profiles on hundreds of millions of consumers across the Western world (echoed in Tencent’s data on consumer behavior across China) have vast monetization potential. It is possible, however, that current valuations reflect peak optimism for the monetization of consumer data. Certainly, there is insufficient appreciation by investors of the rising risk that the collection and sale of consumer-behavior and other personal data will face more stringent regulation. At some point, Facebook’s ability to deliver yet another highly customized mobile advertisement or Amazon. com’s disruption of yet another consumer category will face diminishing marginal returns, but the share prices of these companies don’t discount that happening for many years.
GEOGRAPHIC EXPOSURE (%) at October 31, 2017
| COUNTRY/REGION | PORTFOLIO | BENCHMARK1 | ||||||
CANADA | 1.3 | 3.1 | ||||||
EMERGING MARKETS | 20.9 | 11.7 | ||||||
EUROPE EMU | 6.6 | 10.9 | ||||||
EUROPE EX-EMU | 8.4 | 10.3 | ||||||
JAPAN | 11.2 | 7.9 | ||||||
MIDDLE EAST | 0.9 | 0.1 | ||||||
PACIFIC EX-JAPAN | 3.8 | 3.9 | ||||||
UNITED STATES | 43.4 | 52.1 | ||||||
FRONTIER MARKETS2 | 1.3 | – | ||||||
CASH | 2.2 | – | ||||||
1MSCI All Country World Index; 2Includes countries with less-developed markets outside the Index.
SECTOR EXPOSURE (%) at October 31, 2017
| SECTOR | PORTFOLIO | BENCHMARK1 | ||||||
CONSUMER DISCRETIONARY | 12.1 | 11.9 | ||||||
CONSUMER STAPLES | 12.3 | 8.6 | ||||||
ENERGY | 3.2 | 6.3 | ||||||
FINANCIALS | 17.0 | 18.6 | ||||||
HEALTH CARE | 9.9 | 10.8 | ||||||
INDUSTRIALS | 15.2 | 10.8 | ||||||
INFORMATION TECHNOLOGY | 21.4 | 18.4 | ||||||
MATERIALS | 4.0 | 5.4 | ||||||
REAL ESTATE | 1.7 | 3.1 | ||||||
TELECOM SERVICES | 0.7 | 3.0 | ||||||
UTILITIES | 0.3 | 3.1 | ||||||
CASH | 2.2 | – | ||||||
1MSCI All Country World Index.
The technologies that have catalyzed a global boom across online media, enterprise software, and e-commerce have applications in other industries that perhaps are less than fully discounted in stock prices. Our research efforts extend to companies in health care and life sciences that can use similar technology toolkits as Facebook or Amazon but whose products and penetration of end markets have yet to be fully realized. For example, there is now an extensive amount of human genetic data that is ripe for analysis by Health Care companies capable of exploiting advances in AI. By combining gene-sequencing data with other large data sets such as anonymized patient health records and diagnostic test results, Big Data can help make drug development faster and more precise. Portfolio holding Regeneron, a leading bio-technology company, is using Big Data today at its Regeneron Genetics Center to identify genomic biomarkers for new drug therapies and other applications at the intersection of pharmacology and genomics (“pharmacogenomics”). Regeneron is also an early investor in rapidly emerging gene-editing technologies, which have the potential to transform drug-discovery productivity and economics.
Advancements in gene sequencing could also present opportunities for industrial application. Novozymes, the global leader in industrial enzymes, uses Big Data analytics to alter microbe DNA to create new enzymes that can replace polluting chemicals in consumer products such as detergents, as well as in agricultural fertilizers, an application it is currently pursuing through an alliance with Monsanto.
PORTFOLIO HIGHLIGHTS
In the Global Equity Research Portfolio, we seek to own all of the stocks recommended by our analysts that are appropriate for a strategy benchmarked to the MSCI All Country World Index. The Portfolio therefore reflects all of our analysts’ individual perspectives and outlooks about their areas of expertise, rather than having one or two portfolio managers attempt to filter those insights into a more concentrated Portfolio. Importantly, despite varying views relevant to security performance, our research team is unified by a common approach to analyzing companies and stocks.
28
|
Table of Contents
The Portfolio’s holdings are therefore directly determined by analysts’ recommendations among Harding Loevner’s collection of researched companies.
Industrials is the Portfolio’s largest sector overweight as of October 31, 2017. Recent new purchases in this sector included Australian online job site SEEK and Canadian National Railway. We also purchased two Japanese companies: SMC, a manufacturer of pneumatic equipment, and Fanuc, one of the world’s leading producers of industrial automation equipment, including computer numerical controls and servo motors used in machine tools and robots. Roughly half of Fanuc’s customers are automakers and their suppliers, but it has also been gaining new customers in other industries such as food production. The analyst thought the share price, which had been mostly flat year-to-date, had become attractive relative to other Japanese stocks, particularly following Fanuc’s reports of a recent strong uptick in orders.
Our next largest overweight is to Consumer Staples, where our largest holdings include US businesses Estée Lauder and Church & Dwight Co. (whose many products include Arm & Hammer baking soda). The Portfolio’s overweight persists despite the sale of some holdings at the end of the fiscal period on analyst concerns about unjustifiably high valuations, such as Indian personal products makers Godrej and Hindustan Unilever as well as Japanese cosmetics maker Shiseido.
Our major underweights relative to the Index include Energy, Utilities, Telecom Services, and Financials, as we find a limited number of companies that possess high-quality, durable-growth characteristics in these sectors, relative to the weight of these sectors within the benchmark.
Viewed by region, the Portfolio’s largest overweight is to EMs. Nearly a fourth of this weight is held in Chinese companies. Until recently, foreign investors seeking to invest in the diversity of Chinese companies contributing to China’s economic transformation had limited access to the large number of locally listed stocks known as A-shares. However, the establishment of the mutual market access trading facility known as Shanghai-Hong Kong Connect in November 2014 and the follow-on Shenzhen-Hong Kong Connect in December 2016 has made approximately 1,200 Chinese companies investable only through A-shares readily available to foreign institutional investors. We have been preparing for the A-share opportunity for several years, including expanding our research resources dedicated to China and completing the administrative and operational processes necessary to invest via both Shanghai Connect and Shenzhen Connect for the Harding, Loevner Funds.
We now hold six investments in A-share companies for the strategy, including air-conditioner manufacturer Gree Electric, video-surveillance-equipment maker Hangzhou Hikvision, dairy goods producer Inner Mongolia Yili Industrial, leading domestic drug manufacturer Jiangsu Hengrui Medicine, home-appliance
TEN LARGEST HOLDINGS at October 31, 2017
| COMPANY | SECTOR | COUNTRY | % | |||||||||
APPLE | INFO TECHNOLOGY | UNITED STATES | 1.2 | |||||||||
ESTEE LAUDER | CONS STAPLES | UNITED STATES | 1.2 | |||||||||
ROPER | INDUSTRIALS | UNITED STATES | 1.1 | |||||||||
MCDONALD’S | CONS DISCRETIONARY | UNITED STATES | 1.1 | |||||||||
DEERE | INDUSTRIALS | UNITED STATES | 1.1 | |||||||||
TECHNIPFMC | ENERGY | UNITED STATES | 1.1 | |||||||||
AMPHENOL | INFO TECHNOLOGY | UNITED STATES | 1.0 | |||||||||
IBM | INFO TECHNOLOGY | UNITED STATES | 1.0 | |||||||||
T.ROWE PRICE | FINANCIALS | UNITED STATES | 1.0 | |||||||||
FISERV | INFO TECHNOLOGY | UNITED STATES | 1.0 | |||||||||
manufacturer Midea Group, and kitchen furniture maker Suofeiya Home Collection Co. Jiangsu Hengrui, for example, specializes in three areas, surgical anesthetics, contrast reagents for radiology, and oncology drugs. Its niche treatments are often complex to manufacture and are important for critical care, which makes them less-susceptible to regulatory price pressures than many generic drugs. The company’s products command strong margins, generating significant cash flows that are reinvested back into the business.
Our next largest overweight is to Japan, where our 24 holdings include Nidec. The company manufacturers motors for a wide range of applications, such as hard-disk drives, home appliances, and automobiles. The Portfolio’s largest underweight by region remains the US.
PM TEAM UPDATE
Moon Surana has been promoted from Associate Portfolio Manager to Portfolio Manager of the Global Equity Research strategy. Andrew West continues to lead the strategy’s portfolio management team of two.
Please read the separate disclosures page for important information, including the risks of investing in the Portfolio.
29
|
Table of Contents

PORTFOLIO MANAGEMENT TEAM

ANDREW WEST, CFA PORTFOLIO MANAGER
MOON SURANA, CFA PORTFOLIO MANAGER |
PERFORMANCE SUMMARY
The International Equity Research Portfolio – Institutional Class gained 22.26% and the Investor Class rose 22.05% (net of fees and expenses) in the fiscal year ended October 31, 2017. The Portfolio’s benchmark, the MSCI All Country World (ACW) ex-US Index, gained 23.65% (net of source taxes).
MARKET REVIEW
Non-US markets declined in the first two months of the fiscal year as investors reacted to the astonishing outcome of the US presidential election, but reversed course in 2017 as investor optimism returned amid improving economic data in most regions. Through October, the Index posted 11 consecutive positive monthly returns, the longest such stretch in the past 10 years. Although the gains came seven years since the last recession, investors cheered positive economic data as it suggested synchronized growth across all major regions, while inflation remained muted. Meanwhile, investors largely rationalized the threat to stability from the US Federal Reserve’s staggered exit from extremely loose monetary policy as being about normalization rather than inflation taming. Markets also mostly ignored escalating tensions between North Korea and the US, illustrated by the half-percent rise in the Japanese stock market on the day the latest ICBM flew through its airspace in late August.
Information Technology (IT) stocks returned roughly double the return of the Index in the trailing year. IT companies reported strong sales and earnings growth, with the biggest positive surprises coming from a handful of big Chinese internet companies.
The eurozone and Emerging Markets (EMs) led regional returns. Better economic growth data across Europe, along with relief over the defeat in the French general elections of the anti-EU far-right, allowed investors to view the future more optimistically. They favored stocks of more-cyclical businesses, especially energy, autos, and banks. The euro gained 6% against the US dollar, bolstering European Monetary Union (EMU)
FUND FACTS at October 31, 2017 | ||||||||||||
TOTAL NET ASSETS | $10.6M | |||||||||||
SALES CHARGE | NONE | |||||||||||
NUMBER OF HOLDINGS | 192 | |||||||||||
TURNOVER (5 YR. AVG.) | – | |||||||||||
REDEMPTION FEE | 2% FIRST 90 DAYS | |||||||||||
DIVIDEND POLICY | ANNUAL | |||||||||||
INSTITUTIONAL INVESTORS | INDIVIDUAL INVESTORS | |||||||||||
| INSTL CLASS | INSTL CLASS Z | INVESTOR CLASS | ||||||||||
TICKER | HLIRX | HLMZX | HLINX | |||||||||
CUSIP | 412295826 | 412295743 | 412295834 | |||||||||
INCEPTION DATE | 12/17/2015 | – | 12/17/2015 | |||||||||
MINIMUM INVESTMENT1 | $100,000 | $10,000,000 | $5,000 | |||||||||
NET EXPENSE RATIO2 | 0.90% | 0.90% | 1.15% | |||||||||
GROSS EXPENSE RATIO | 3.54% | 1.88% | 10.91% | |||||||||
1Lower minimums available through certain brokerage firms; 2Shown net of Harding Loevner’s contractual agreement through February 28, 2018.
stock returns to US investors. The strong performance of IT stocks, especially Chinese internet stocks, was important to EM gains.
In addition to the US election, the end of 2016 was marked by a sharp value rally in which the least-expensive quintile of stocks outperformed the most-expensive quintile in every major region and in nearly every sector. And, because there is a high degree of overlap between low-quality or slow-growing businesses and companies with lowly priced stocks, the shares of the lowest-quality and slowest-growth businesses also performed better on average than shares of those with superior quality and growth records. This rally was reversed in the first six months of 2017, as style trends in the market favored stocks whose businesses demonstrated strong growth characteristics, while there was little differentiation in returns according to valuation. From July to October, only the most-expensive quintile of stocks showed significant outperformance, while quality showed no pattern of effect on returns. Within developed markets, the growth preference waned late in September as US bond yields rose from the lowest levels of the year after Congress revealed plans for a large tax cut, and the Fed reiterated its intention to continue tightening monetary policy. For EMs, growth was strong throughout 2017.
PERFORMANCE ATTRIBUTION
Viewed by sector, our stock selection in the Materials and Energy sectors detracted as both sectors benefited from rebounds in energy and metals prices in the final third of the fiscal year, but the rallying shares of mining and steel companies were completely absent from the Portfolio. Other drags on relative returns were from stock selection in IT, Financials, and Real Estate. Within IT, our software and services companies such as Kakaku.com and Infosys
30
|
Table of Contents
PERFORMANCE (% TOTAL RETURNS)
| for periods ended September 30, 2017 | for periods ended October 31, 2017 | |||||||||||||||||
1 YEAR | SINCE INCEPTION* | 1 YEAR | SINCE INCEPTION* | |||||||||||||||
INTL EQUITY RESEARCH PORTFOLIO - INSTITUTIONAL CLASS | 17.34 | 17.14 | 22.26 | 17.70 | ||||||||||||||
MSCI ALL COUNTRY WORLD EX-US INDEX | 19.62 | 14.52 | 23.65 | 14.96 | ||||||||||||||
INTL EQUITY RESEARCH PORTFOLIO - INVESTOR CLASS | 17.01 | 16.84 | 22.05 | 17.42 | ||||||||||||||
*Inception of the Institutional and Investor Class, 12/17/15.
Performance data quoted represents past performance; past performance does not guarantee future results. The investment return and principal value of an investment will fluctuate so that an investor’s shares, when redeemed, may be worth more or less than their original cost. Current performance of the Portfolio may be lower or higher than the performance quoted. Performance data current to the most recent month end may be obtained by calling (877) 435-8105 or visiting www.hardingloevnerfunds.com. Performance data shown does not reflect the 2.00% redemption fee imposed on shares held 90 days or less; otherwise, total returns would be reduced.
The charts below illustrate the hypothetical return of an investment made in the corresponding share classes. Investment return reflects voluntary fee waivers in effect. Absent such waivers, total return would be reduced. The performance provided in the table above and charts below do not reflect the deduction of taxes that a shareholder would pay on Portfolio distributions or the redemption of Portfolio shares.
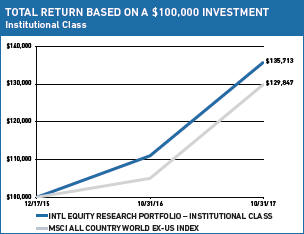
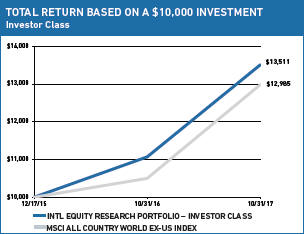
detracted the most, slightly offset by our technology hardware and equipment companies including Sunny Optical.
Our overweight to the strongly performing IT sector, however, was beneficial to relative returns. Our underweight to the lagging Telecom Services sector also contributed. We had positive stock selection in Industrials, with strong returns by Japan’s MISUMI Group as well as China’s 51Job Inc., an online job search and human resource-services business, which reported strong growth in revenues in part due to the success of its cross-selling initiatives.
Viewed by region, our stocks in Japan and overweight to this region detracted the most from relative returns, hurt by declines in ABC-MART, Dentsu, Rinnai, and Park24. Stock selection in EMs was also negative, particularly in South Korea (Hankook Tire and NAVER) and India (Infosys). In contrast, our stock picks in Europe ex-EMU were strong, especially Temenos and Richemont. We also enjoyed positive stock selection from Europe EMU and our relatively small investment in the Middle East, where we hold only the Israeli IT company Check Point Software Technologies.
Our modest cash position detracted from relative performance in a strong period for equity returns.
PERSPECTIVE AND OUTLOOK
The investment environment has become increasingly challenging for investors concerned with the quality, growth, and price tripod that forms the foundation of Harding Loevner’s investment philosophy. Quality as a standalone factor has become expensive in stock-price terms, in spite of the surge in value stocks at the end of 2016. We have noted the investment industry’s efforts to reverse-engineer the successful performance that high-quality portfolios have enjoyed over the past decade by constructing “smart beta” portfolios that use quantitative tools to identify companies with similar high-quality attributes. These approaches implicitly promise future outperformance similar to that observed in the past. Smart beta approaches overlap with other managers employing optimization software to create “low volatility” portfolios that appeal to investors fearful of the inherent ups and downs of stock market investing, overlapping simply because the stocks of high-quality companies have traded with much more restrained gyrations than the average stock in past market tempests. The broader emphasis on quality, enshrined in the documenting by academics of a quality factor effect, and commercialized through the creation of “quality indexes” as benchmarks for passive money, has meant increasingly persistent and decreasingly price-sensitive demand for the stocks of high-quality companies.
31
|
Table of Contents
Our investment team’s response has been to redouble our attention to the other two legs of our philosophical stool: growth and price. If quality is fashionable, based on either a blind embrace of its prior success or a backward-looking fear of another financial crisis, then the fruitful way forward must be one that remains discerning yet is courageously forward-looking. In the past 12 months, this route has involved an emphasis on price, encompassing the strong value rally capped by the “Trump bump,” but it has also, in recent months, coalesced around companies achieving faster growth.
Faster economic growth has long been associated with rising labor productivity. Traditionally, labor productivity and wage growth were joined at the hip: as productivity grew, both companies and workers shared the benefits. However, the relationship between wage growth and productivity has steadily separated since the late 1970s, pressuring labor’s share of profits.
The fall of trade barriers over decades has dramatically increased consumer choices and lowered prices for those goods, while the outsourcing of manufacturing jobs from the developed world to the developing world enabled staggering gains in employment, and therefore per capita income, in developing countries. That weakened the bargaining position of less-skilled workers in the US and other developed economies. That labor arbitrage is essentially complete. Now, instead of low-skilled workers being replaced by cheaper labor abroad, their manufacturing jobs risk substitution by the application of industrial automation, robotics, and computing power. That substitution results in a similar dampening of wage growth. Furthermore, the service sector is no longer immune from the threat of technology. For example, in financial services the use of algorithmic trading and robo-advisors has begun eliminating high-paying jobs, while mobile phone apps have replaced human brokers.
Contrary to populist rhetoric, this is not solely an American or even a developed-world phenomenon. In their global company research travels, our analysts have seen the same application of industrial automation and robotics in Guangdong Province, China or Hwaseong, South Korea as they have in Peoria or Columbus.
GEOGRAPHIC EXPOSURE (%) at October 31, 2017
| COUNTRY/REGION | PORTFOLIO | BENCHMARK1 | ||||||
CANADA | 3.0 | 6.5 | ||||||
EMERGING MARKETS | 29.5 | 24.5 | ||||||
EUROPE EMU | 15.4 | 22.8 | ||||||
EUROPE EX-EMU | 20.2 | 21.4 | ||||||
JAPAN | 18.9 | 16.4 | ||||||
MIDDLE EAST | 1.0 | 0.3 | ||||||
PACIFIC EX-JAPAN | 7.1 | 8.1 | ||||||
FRONTIER MARKETS2 | 2.0 | – | ||||||
CASH | 2.9 | – | ||||||
1MSCI All Country World ex-US Index; 2Includes countries with less-developed markets outside the Index.
SECTOR EXPOSURE (%) at October 31, 2017
| SECTOR | PORTFOLIO | BENCHMARK1 | ||||||
CONSUMER DISCRETIONARY | 13.7 | 11.3 | ||||||
CONSUMER STAPLES | 10.8 | 9.5 | ||||||
ENERGY | 3.7 | 6.7 | ||||||
FINANCIALS | 17.5 | 23.0 | ||||||
HEALTH CARE | 9.0 | 7.6 | ||||||
INDUSTRIALS | 17.8 | 11.9 | ||||||
INFORMATION TECHNOLOGY | 14.8 | 11.7 | ||||||
MATERIALS | 4.6 | 7.9 | ||||||
REAL ESTATE | 3.0 | 3.2 | ||||||
TELECOM SERVICES | 1.6 | 4.1 | ||||||
UTILITIES | 0.6 | 3.1 | ||||||
CASH | 2.9 | – | ||||||
1MSCI All Country World ex-US Index.
Wenting Shen, CFA, one of our China analysts, spent a month in the country during the summer and noted as much: “Standing in the middle of China’s largest furniture factory last month, one can only hear the rhythms of machines, but hardly see any workers around…As frequently reported, China’s blue-collar wages have been soaring, [while] automation equipment has become cheaper because of localized production of global brands as well as the improvement of substitute local brands.”
Companies that can facilitate faster, more efficient manufacturing (i.e., enable productivity gains) have enjoyed sustained and profitable growth, and many of them find a place in our Portfolio. Increasingly, their devices—such as Fanuc’s industrial robots and Keyence’s optical sensors—are integrated more fully with software and embedded with more semiconductor chips to gather information and precisely measure output, flows, temperatures, and tolerances. The prospect of machine learning has driven the capture of even more data, which will allow computers to use algorithms increasingly to make decisions independently.
PORTFOLIO HIGHLIGHTS
In the International Equity Research Portfolio, we seek to own all of the stocks recommended by our analysts that are appropriate for a MSCI ACW ex-US Index-benchmarked strategy. The Portfolio therefore reflects all of our analysts’ individual perspectives and outlooks about their areas of expertise, rather than having one or two portfolio managers attempt to filter those insights into a more concentrated Portfolio. Importantly, despite varying views relevant to security performance, our research team is unified by a common approach to analyzing companies and stocks.
The Portfolio’s holdings are therefore directly determined by analysts’ recommendations among Harding Loevner’s collection of researched companies. During the trailing 12 months, analysts’ rating upgrades led us to increase the Portfolio’s sector weights in Industrials, Consumer Staples, IT, Real Estate, and Utilities, while downgrades led us to decrease our exposure to Consumer Discretionary, Materials, Financials, Health Care, Energy, and Telecomm Services.
32
|
Table of Contents
Industrials became the Portfolio’s largest sector overweight as of October 31, displacing Consumer Discretionary from the top spot. Our new purchases in this sector included Australian online job site SEEK and Canadian National Railway. We also purchased two Japanese companies: SMC, a manufacturer of pneumatic equipment, and Fanuc, one of the world’s leading producers of industrial automation equipment, including computer numerical controls and servo motors used in machine tools and robots. Roughly half of Fanuc’s customers are automakers and their suppliers, but it has also been gaining new customers in other industries such as food production. The analyst thought the share price, which had been mostly flat year-to-date, had become attractive relative to other Japanese stocks, particularly following Fanuc’s reports of a recent strong uptick in orders. We also sold Japanese parking lot operator Park24.
Our major underweights relative to the Index include Financials, Energy, and Materials, as we find a more limited number of companies with high quality-growth characteristics in these sectors.
The Portfolio’s new holdings in IT include UK online real-estate service provider Rightmove and Alibaba, China’s online marketplace juggernaut. The company’s unique vision, championed by Chairman Jack Ma, is to empower small enterprises through its e-commerce platform in China and ultimately globally. It has roughly 500 million (and growing) users of its online marketplace.
Viewed by region, the most notable change to our Portfolio in the year was an increase in its exposure to EMs, which overtook Japan as the Portfolio’s largest regional overweight. Our increased weight in EMs came partly from adding several new Pakistani companies recommended by our analysts after the decision in September by Index provider MSCI to re-classify Pakistan from a Frontier Market to an EM. We bought Engro, Pakistan’s largest conglomerate with interests in fertilizer, dairy, power generation and petrochemicals, as well as two banks (United Bank of Pakistan and MCB Bank) and two Energy companies (Oil & Gas Development Company of Pakistan and Pakistan Petroleum). In December 2016, Pakistan Petroleum entered an agreement with the Pakistani government to extend the lease on its Sui gas field, one of the largest natural gas fields in Pakistan, on terms favorable to the company. The agreement also includes a large contractual price increase for gas, enhancing the company’s profitability.
Further adding to our EM weight, we increased our positions in some Chinese holdings and purchased some new holdings, including Alibaba and oil company CNOOC. We also added some companies that are only available via locally listed stocks known as A-shares. Until recently, foreign investors seeking to invest in the diversity of Chinese companies contributing to China’s economic transformation had limited access to A-shares. However, the establishment of the mutual market access trading facility known as Shanghai-Hong Kong Connect in November 2014 and the follow-on Shenzhen-Hong Kong Connect in December 2016 has made approximately 1,200 Chinese companies investable only
TEN LARGEST HOLDINGS at October 31, 2017
| COMPANY | SECTOR | COUNTRY | % | |||||||||
NIDEC | INDUSTRIALS | JAPAN | 1.3 | |||||||||
AMADEUS | INFO TECHNOLOGY | SPAIN | 1.2 | |||||||||
NOVOZYMES | MATERIALS | DENMARK | 1.1 | |||||||||
STANLEY ELECTRIC | CONS DISCRETIONARY | JAPAN | 1.1 | |||||||||
ATLAS COPCO | INDUSTRIALS | SWEDEN | 1.1 | |||||||||
ALLIANZ | FINANCIALS | GERMANY | 1.1 | |||||||||
KOMATSU | INDUSTRIALS | JAPAN | 1.1 | |||||||||
OCBC | FINANCIALS | SINGAPORE | 1.1 | |||||||||
GRIFOLS | HEALTH CARE | SPAIN | 1.1 | |||||||||
SAP | INFO TECHNOLOGY | GERMANY | 1.1 | |||||||||
through A-shares readily available to foreign institutional investors. We had been preparing for the A-share opportunity for several years, including expanding our research resources dedicated to China and completing the administrative and operational processes necessary to invest via both Shanghai Connect and Shenzhen Connect for the Harding, Loevner Funds.
We now hold six investments in A-share companies for the strategy, including air-conditioner manufacturer Gree Electric, video-surveillance-equipment maker Hangzhou Hikvision, dairy goods producer Inner Mongolia Yili Industrial, leading domestic drug manufacturer Jiangsu Hengrui Medicine, home-appliance manufacturer Midea Group, and kitchen furniture maker Suofeiya Home Collection Co. Jiangsu Hengrui, for example, specializes in three areas, surgical anesthetics, contrast reagents for radiology, and oncology drugs. Its niche treatments are often complex to manufacture and are important for critical care, which makes them less-susceptible to regulatory price pressures than many generic drugs. The company’s products command strong margins, generating significant cash flows that are reinvested back into the business.
Within developed markets, we decreased our Japanese weight in response to information from our risk models. We will consider making this type of weighting adjustment whenever the models indicate they will help achieve our goal of maintaining moderately lower expected volatility in comparison to the Index and restrained tracking error.
PM TEAM UPDATE
Moon Surana has been promoted from Associate Portfolio Manager to Portfolio Manager of the International Equity Research strategy. Andrew West continues to lead the strategy’s portfolio management team of two.
Please read the separate disclosures page for important information, including the risks of investing in the Portfolio.
33
|
Table of Contents

PORTFOLIO MANAGEMENT TEAM
ANDREW WEST, CFA PORTFOLIO MANAGER
MOON SURANA, CFA PORTFOLIO MANAGER |
PERFORMANCE SUMMARY
The Emerging Markets Research Portfolio was launched on December 19, 2016. From inception to October 31, 2017, the Institutional Class gained 30.10% and the Investor Class rose 29.90% (net of fees and expenses). The Portfolio’s benchmark, the MSCI Emerging + Frontier Markets Index, gained 34.16% (net of source taxes) in this period.
MARKET REVIEW
The fiscal year ending October 31, 2017 began inauspiciously for Emerging Markets (EMs), which declined sharply in November as the surprise election of Donald Trump sparked concern among investors about the potential impact of his protectionist agenda on global trade and EM companies. Inflation expectations and bond yields also quickly rose, hurting the value of EM currencies versus the US dollar. But EMs recovered in January and enjoyed positive momentum for the rest of the fiscal year, propelled by a supportive combination of robust global economic growth, declining inflation expectations, and strong results in the Information Technology (IT) sector.
Investors were also heartened by China’s strong economic growth, the stabilization of its currency, and moderation of capital outflows. Rising corporate profits have eased fears about the corporate sector’s ability to service its high level of debt—which has been a key risk facing the Chinese economy. As corporate liabilities fell, China’s ratio of overall debt to GDP declined in September 2017 for the first time in nearly six years.1 Other positive news included the boosting of domestic confidence by a stronger property market. China’s Real Estate sector, another source of systemic risk, appeared to find a more sustainable path as recent financial reforms, notably the development of the domestic bond market, helped shift funding for real estate projects out of the shadow banking system.
Companies reporting demonstrable growth in revenues and profits had the strongest share-price performance, particularly the stocks of the “New” (technology-oriented) EM companies in both IT and Consumer Discretionary. Real Estate outperformed as well, led by China’s large listed developers. Yet “Old” (commodity-oriented) EM
FUND FACTS at October 31, 2017 | ||||||||
TOTAL NET ASSETS | $6.5M | |||||||
SALES CHARGE | NONE | |||||||
NUMBER OF HOLDINGS | 129 | |||||||
TURNOVER (5 YR. AVG.) | – | |||||||
REDEMPTION FEE | 2% FIRST 90 DAYS | |||||||
DIVIDEND POLICY | ANNUAL | |||||||
INSTITUTIONAL INVESTORS | INDIVIDUAL INVESTORS | |||||||
| INSTITUTIONAL CLASS | INVESTOR CLASS | |||||||
TICKER | HLREX | HLENX | ||||||
CUSIP | 412295776 | 412295784 | ||||||
INCEPTION DATE | 12/19/2016 | 12/19/2016 | ||||||
MINIMUM INVESTMENT1 | $100,000 | $5,000 | ||||||
NET EXPENSE RATIO2 | 1.30% | 1.55% | ||||||
GROSS EXPENSE RATIO | 3.57% | 9.26% | ||||||
1Lower minimums available through certain brokerage firms; 2Shown net of Harding Loevner’s contractual agreement through February 28, 2018.
companies in the Materials sector also soared, aided by a roughly 30% rise in industrial metals prices in the trailing 12 months. The more-defensive Consumer Staples, Health Care, and Telecom Services sectors, while all positive, lagged the benchmark significantly.
From a regional perspective, Asia was the best performer, with the IT-heavy Chinese and South Korean markets leading the way. In China, leading internet platforms such as Tencent, which focuses on social media and gaming, and Alibaba, the largest e-commerce platform, posted a strong acceleration in revenue growth which boosted share prices. Another Index heavyweight Samsung Electronics and other technology companies benefitted from strong global demand for high-powered memory products. South Korea also elected a new president, Moon Jae-in, who campaigned on progressive economic policies and aims to secure healthier relations with China.
Emerging Europe also posted good returns, although the region modestly lagged the Index. Robust economic performance and moderating political risk strongly supported stock markets in Hungary and Poland. Emmanuel Macron’s victory in the French presidential election provided a measure of optimism about the future of the European Union.
The large markets of Latin America faced headwinds from the burden of rising political risks. In Brazil, popular support for Brazil’s President Michel Temer continued to fade due to allegations that he helped direct payment of bribes for political favors. The legislature’s commitment to his reform program remains strong, however, as seen in the Senate’s approval of new labor laws in July allowing for flexible work hours and more direct negotiations between
1Gabriel Wildau, “Beijing effort and inflation push China debt load down,” Financial Times (September 24, 2017).
34
|
Table of Contents
PERFORMANCE (% TOTAL RETURNS)
| for periods ended September 30, 2017 | for periods ended October 31, 2017 | |||||||||||||||||||||||||
| CALENDAR YTD | 1 YEAR | SINCE INCEPTION* | CALENDAR YTD | 1 YEAR | SINCE INCEPTION* | |||||||||||||||||||||
EMERGING MARKETS RESEARCH PORTFOLIO - INSTL CLASS | 27.03 | – | 28.30 | 28.81 | – | 30.10 | ||||||||||||||||||||
MSCI EMERGING + FRONTIER MARKETS INDEX | 27.69 | – | 29.69 | 32.10 | – | 34.16 | ||||||||||||||||||||
EMERGING MARKETS RESEARCH PORTFOLIO - INVESTOR CLASS | 26.83 | – | 28.10 | 28.61 | – | 29.90 | ||||||||||||||||||||
*Inception of the Institutional and Investor Class, 12/19/16.
Performance data quoted represents past performance; past performance does not guarantee future results. The investment return and principal value of an investment will fluctuate so that an investor’s shares, when redeemed, may be worth more or less than their original cost. Current performance of the Portfolio may be lower or higher than the performance quoted. Performance data current to the most recent month end may be obtained by calling (877) 435-8105 or visiting www.hardingloevnerfunds.com. Performance data shown does not reflect the 2.00% redemption fee imposed on shares held 90 days or less; otherwise, total returns would be reduced.
The charts below illustrate the hypothetical return of an investment made in the corresponding share classes. Investment return reflects voluntary fee waivers in effect. Absent such waivers, total return would be reduced. The performance provided in the table above and charts below do not reflect the deduction of taxes that a shareholder would pay on Portfolio distributions or the redemption of Portfolio shares.
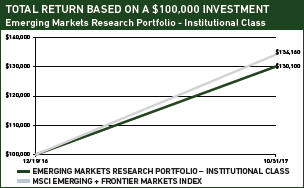
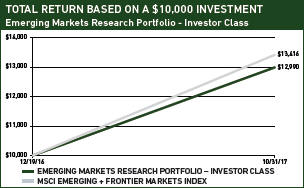
employers and their workers. Returns in Mexico were hurt by concerns about the sustainability of the NAFTA trade agreement (the abolition of which was a feature of President Trump’s agenda) and political uncertainties as the country moves toward an election year in 2018.
The only region to decline this period was the Middle East, despite the support of more robust energy prices. (Brent crude reached around US$60 by the end of the fiscal year, the highest since summer 2015.) No solution has been forthcoming for the diplomatic stand-off that erupted in June 2017 between Index-constituent Qatar and a coalition of its neighbors, led by Saudi Arabia, which has accused Qatar of funding terrorist groups. The coalition members have cut off relations with Qatar and blockaded the country.
PERFORMANCE ATTRIBUTION
The Portfolio underperformed in the 10 months since inception as overall positive stock selection was overcome by unfavorable sector and geographic allocations. We especially were hurt by being underweight in IT (including Chinese e-commerce giant Alibaba) and by our small allocation to cash in a period of strong Index returns. Stock selection in IT also detracted, especially laggards such as Delta Electronics and software and services companies NetEase and Infosys.
Stocks in Industrials, Financials, and Health Care were key positive contributors. In Industrials, Chinese online job search and human resource-services business 51Job Inc. reported strong growth in revenues in part due to the success of its cross-selling initiatives. In Financials, Grupo Financiero Galicia and Banco Macro benefited
from the resumption of growth in the Argentinian economy and an uptick in spending on financial services. In Health Care, Shanghai-listed domestic drug manufacturer Jiangsu Hengrui Medicine led returns. This company specializes in three areas: surgical anesthetics, contrast reagents for radiology, and oncology drugs. The company’s products command strong margins, generating significant cash flows that are reinvested back into the business.
From a regional perspective, allocation effects were negative given our underweight exposure to the surging markets of China and South Korea. The latter market was a detractor as none of our diversified positions kept up with the high-returning Samsung Electronics, which we were underweight relative to the Index. Our overweights to the Middle East and Pakistan also detracted from relative returns. This was partially offset by positive stock selection in Asia, including Taiwanese pneumatic equipment maker AirTAC, Indonesia’s Bank Central Asia, and Chinese social media platform Weibo. Taiwan’s Largan Precision was also a significant contributor as high-end smartphone makers accelerated their roll-out of camera features that incorporate its specialized miniature lenses. Our holdings in Frontier Market companies contributed to relative returns as well, especially Argentine banks discussed above.
PERSPECTIVE AND OUTLOOK
EM technology continues to roar ahead
The stand-out performance by IT sector stocks together with those of internet-based businesses classified in other sectors was an
35
|
Table of Contents
astonishing feature of the fiscal year. The IT sector index rose 52% in the fiscal year. Contrary to the established view that EMs are engaged primarily in resource extraction and basic manufacturing, the Index is dominated today by IT and internet-related companies. The IT sector alone comprises almost 28% of the Index, more than double its weight just five years ago.
In the period 2012–2016, many companies in the IT sector generated superior financial results, including high and increasingly stable returns on capital, which has underpinned their share-price appreciation. The strong fundamentals of today’s EM technology companies (both within and outside the IT sector) are why, as investors focused on quality and growth, we continue to find new opportunities in this area.
The current universe of IT and internet-focused EM businesses includes traditional manufacturers that have moved beyond their origins as low-cost producers of commodity electronics goods. Among this group are holdings Samsung Electronics and Taiwan Semiconductor, which have reinvested their prodigious cash flows into research to develop their own cutting-edge technologies.
The universe also includes internet-based enterprises that have leveraged technology produced by others to leapfrog to the forefront of their industries. China has been at the center of this trend, with the country’s economic transformation facilitated by deep internet and smartphone penetration and the eagerness of the growing middle class to spend their time—and money—online in the digital domain. The ability of Chinese businesses to create distinctive services and experiences for users of online and mobile platforms is a demonstration of EM companies’ capacity for innovation and technological leadership. Among the great successes that have emerged from China’s transformation are Tencent, the online gaming and social media business, and Weibo, the leading open social media platform in China with roughly 340 million active users of its platform. (It was a holding much of the past 10 months until the analyst rated the stock sell due to valuation
GEOGRAPHIC EXPOSURE (%) at October 31, 2017
| COUNTRY/REGION | PORTFOLIO | BENCHMARK1 | ||||||
BRAZIL | 7.3 | 6.9 | ||||||
CHINA | 28.0 | 29.0 | ||||||
INDIA | 7.6 | 8.5 | ||||||
MEXICO | 5.6 | 3.0 | ||||||
RUSSIA | 4.6 | 3.1 | ||||||
SOUTH AFRICA | 4.0 | 6.2 | ||||||
SOUTH KOREA | 4.1 | 15.3 | ||||||
TAIWAN | 7.3 | 11.6 | ||||||
SMALL EMERGING MARKETS2 | 17.7 | 14.1 | ||||||
FRONTIER MARKETS | 10.1 | 2.3 | ||||||
DEVELOPED MARKET LISTED3 | 1.7 | – | ||||||
CASH | 2.0 | – | ||||||
1MSCI Emerging + Frontier Markets Index; 2Includes the remaining emerging markets which, individually, comprise less than 5% of the Index; 3Includes emerging markets or frontier markets companies listed in developed markets.
SECTOR EXPOSURE (%) at October 31, 2017
| SECTOR | PORTFOLIO | BENCHMARK1 | ||||||
CONSUMER DISCRETIONARY | 14.6 | 10.0 | ||||||
CONSUMER STAPLES | 15.7 | 6.3 | ||||||
ENERGY | 5.5 | 6.9 | ||||||
FINANCIALS | 26.6 | 23.5 | ||||||
HEALTH CARE | 4.9 | 2.4 | ||||||
INDUSTRIALS | 7.5 | 5.4 | ||||||
INFORMATION TECHNOLOGY | 13.3 | 27.8 | ||||||
MATERIALS | 2.8 | 7.1 | ||||||
REAL ESTATE | 2.7 | 2.9 | ||||||
TELECOM SERVICES | 3.4 | 5.1 | ||||||
UTILITIES | 1.0 | 2.6 | ||||||
CASH | 2.0 | – | ||||||
1MSCI Emerging + Frontier Markets Index.
concerns.) China has also provided a platform for growth for other internet-based businesses held in the Portfolio, such as e-retailing (JD.com) and recruiting (51Job Inc.).
The leading internet-based companies in China have dominant market shares in their niche areas and thus benefit from scale and network-effect advantages. They also benefit from a colossal domestic market with few foreign competitors, which in some cases are effectively barred from operating in China’s protected technology industries. All of this helps make most of these companies highly profitable and cash generative, allowing them to invest in improving the quality of their products and the customer experience, which, in turn, helps to sustain their growth and to deepen the moat that secures their competitive positions.
As we search for new tech opportunities, we are also prompted to take pause. Experience tells us to be wary when high investor confidence in an industry prevails and markets are pricing in a bright future of extended growth. The technology companies held in the Portfolio have established advantages of scale and high barriers to entry that are undoubtedly difficult to surmount. Yet, because of their size, their growth must slow from current rates at some point to converge with the pace of broader economic development; that is, these platforms, as they grow, eventually become the economy. As their growth slows, competitive pressures for these companies will tend to rise. Furthermore, where companies’ fates rely upon the sharp end of technological advancement, the threat to incumbents of disruption from the next new-new thing is ever present. We navigate these risks by focusing on a diverse group of businesses that we consider to have durable competitive advantages and long-term growth opportunities, while remaining careful about price when selecting holdings and determining their weights in the model portfolio.
PORTFOLIO HIGHLIGHTS
In the Emerging Markets Research Portfolio, we seek to own all of the stocks recommended by our analysts that are listed in either EMs or frontier markets. The benchmark for the Portfolio is
36
|
Table of Contents
the MSCI Emerging + Frontier Markets (EFM) Index to reflect the large number of companies from both emerging and frontier markets included in the opportunity set. The Portfolio therefore reflects all of our analysts’ individual perspectives and outlooks about their areas of expertise, rather than having one or two portfolio managers attempt to filter those insights into a more concentrated Portfolio. Importantly, despite varying views relevant to security performance, our research team is unified by a common approach to analyzing companies and stocks.
At the sector level, the Portfolio’s largest overweights versus the Index are Consumer Staples and Consumer Discretionary. These sectors tend to have an abundance of faster-growing, higher-quality EM companies operating in industries with favorable competitive environments. Stocks that our analysts favor in Consumer Staples include South Korean cosmetics producer LG Household & Heath Care and PriceSmart, which is based in the US but operates a large network of membership warehouse clubs in Central and South America and the Caribbean. Analyst-recommended Consumer Discretionary stocks include South Korean home-furnishings company Hanssem, Chinese sportswear brand Anta Sports, and the Philippines’ Jollibee Foods, a popular quick-service restaurant.
The Portfolio’s largest sector underweights are IT and Materials. We have 11 holdings in the IT sector as of the end of the fiscal year, all of which are based in Asia and about half of which are Chinese companies, including Tencent (the gaming giant), AAC Technologies (manufacturer of smartphone acoustic components), and Sunny Optical (a maker of camera modules for smartphones). The primary cause of our underweight is our insistence on company-level diversification, leading us to avoid undue concentration in individual companies. We note that weights within the IT sector index have become more concentrated, with weights of 3% or higher in Samsung Electronics, Taiwan Semiconductor, Alibaba, and Tencent. We hold eight companies in Materials, where we recently added some positions as declining share prices increased the number of analyst recommendations in the sector, including cement companies Cemex Latam of Colombia and Lucky Cement of Pakistan, as well as Indian paint manufacturer Asian Paints. We are also underweight Telecom Services and Utilities as our analysts have determined that few companies within these sectors meet our four key criteria required for investment. Telecom Services broadly faces slower growth, rising competition, and margin pressure, and Utilities is limited by heavy regulation.
By region, our largest country weight on an absolute basis is China, with 26 companies comprising 28% of the Portfolio (just below the benchmark’s 29% China weight). Since inception we have increased our positions in some Chinese holdings and purchased some new holdings, including Alibaba and oil company CNOOC.
We also added some Chinese companies that are only available via locally listed stocks known as A-shares. Until recently, foreign investors seeking to invest in the diversity of Chinese companies contributing to China’s economic transformation had limited access to A-shares. However, the establishment of the mutual market access trading facility known as Shanghai-Hong Kong Connect in November 2014 and the follow-on Shenzhen-Hong Kong Connect
TEN LARGEST HOLDINGS at October 31, 2017
| COMPANY | SECTOR | COUNTRY | % | |||||||||
BANK CENTRAL ASIA | FINANCIALS | INDONESIA | 2.2 | |||||||||
TAIWAN SEMICONDUCTOR | INFO TECHNOLOGY | TAIWAN | 2.1 | |||||||||
B3 | FINANCIALS | BRAZIL | 2.0 | |||||||||
LARGAN PRECISION | INFO TECHNOLOGY | TAIWAN | 2.0 | |||||||||
HDFC CORP | FINANCIALS | INDIA | 1.9 | |||||||||
FUYAO GLASS | CONS DISCRETIONARY | CHINA | 1.9 | |||||||||
AMBEV | CONS STAPLES | BRAZIL | 1.9 | |||||||||
EMAAR PROPERTIES | REAL ESTATE | UAE | 1.7 | |||||||||
SHENZHOU INTERNATIONAL | CONS DISCRETIONARY | CHINA | 1.7 | |||||||||
NETEASE | INFO TECHNOLOGY | CHINA | 1.7 | |||||||||
in December 2016 has made approximately 1,200 Chinese companies investable only through A-shares readily available to foreign institutional investors. We had been preparing for the A-share opportunity for several years, including expanding our research resources dedicated to China and completing the administrative and operational processes necessary to invest via both Shanghai Connect and Shenzhen Connect for the Harding, Loevner Funds.
We now hold six investments in A-share companies for the strategy, including air-conditioner manufacturer Gree Electronic Appliances, video-surveillance-equipment maker Hangzhou Hikvision, dairy goods producer Inner Mongolia Yili Industrial, leading domestic drug manufacturer Jiangsu Hengrui Medicine, home-appliance manufacturer Midea Group, and kitchen furniture maker Suofeiya Home Collection Co. Hangzhou Hikvision, for example, is a leading manufacturer of video surveillance equipment and related systems that dedicates significant resources to research and development. The company’s distinctive product line includes advanced software that uses artificial intelligence to analyze video data and perform automated image identification. We expect the company, which currently enjoys a 19% market share globally, to continue to grow as it adds to its global roster of customers that has included the Beijing Olympic Stadium, Brazil’s World Cup Stadium, and the Minnesota Public Schools.
We hold only about one-third of the benchmark weight in South Korea, our largest country underweight versus the Index. Our analysts cover a number of high-quality companies listed in Frontier Markets, leading us to have a much higher weight in these markets than the Index (10% versus 2%). These companies include Grupo Financiero Galicia of Argentina, Grameenphone of Bangladesh, and Vietnam Dairy Products of Vietnam.
PM TEAM UPDATE
Moon Surana has been promoted from Associate Portfolio Manager to Portfolio Manager of the Emerging Markets Equity Research strategy. Andrew West continues to lead the strategy’s portfolio management team of two.
Please read the separate disclosures page for important information, including the risks of investing in the Portfolio.
37
|
Table of Contents
 DISCLOSURES
The Portfolios invest in foreign securities, which will involve greater volatility and political, economic, and currency risks and differences in accounting methods. They also invest in emerging markets, which involve unique risks, such as exposure to economies less diverse and mature than the US or other more established foreign markets. Economic and political instability may cause larger price changes in emerging markets securities than other foreign securities.
Investments in small- and mid-cap companies involve additional risks such as limited liquidity and greater volatility.
Diversification does not guarantee a profit or prevent a loss in a declining market.
Long-term earnings growth and earnings per share growth are not a forecast of the Portfolios’ future performance.
Companies held in the Portfolios during the fiscal year appear in bold type; only the first reference to a particular holding appears in bold. The Portfolios are actively managed; therefore holdings shown may not be current. Portfolio holdings and sector and geographic allocations should not be considered recommendations to buy or sell any security. Please refer to the Portfolios of Investments in this report for complete Portfolio holdings. Current and future Portfolio holdings are subject to risk.
While the Portfolios have no sales charge, management fees and other expenses still apply. Please see the Prospectus for further details.
Sector & Geographic Exposure data is sourced from: FactSet, Harding Loevner Funds Portfolios, and MSCI Barra. Differences may exist between this source data and similar information reported in the financial statements due to timing differences and/or adjustments required pursuant to Generally Accepted Accounting Principles (GAAP).
Expense Ratios: Differences may exist between the commentary data and similar information reported in the financial statements due to timing differences. The expense ratios presented are shown as of the most recent Prospectus date, February 28, 2017.
Five year average turnover data is calculated using a simple average of annual turnover figures for the past five fiscal years. These annual turnover figures utilize purchase, sales, and market value data which is not reflective of adjustments required pursuant to Generally Accepted Accounting Principles (GAAP). Accordingly, differences may exist between this data and similar information reported in the financial statements.
Quasar Distributors, LLC, Distributor.
INDEX DEFINITIONS
The MSCI All Country World Index is a free float-adjusted market capitalization index that is designed to measure equity market performance in the global developed and emerging markets. The Index consists of 47 developed and emerging market countries. Net dividends reinvested.
The MSCI All Country World ex-US Index is a free float-adjusted market capitalization index that is designed to measure equity market performance in the global developed and emerging markets, excluding the US. The Index consists of 46 developed and emerging market countries. Net dividends reinvested.
The MSCI All Country World ex-US Small Cap Index is a free-float market capitalization index that is designed to measure small cap developed and emerging market equity performance. The Index consists of 46 developed and emerging markets countries and targets companies within a market capitalization range of USD 44–12,400 million (as of September 30, 2017) in terms of the companies’ full market capitalization. Net dividends reinvested.
The MSCI Emerging Markets Index is a free float-adjusted market capitalization index that is designed to measure equity market performance in the global emerging markets. The Index consists of 24 emerging market countries. Net dividends reinvested.
The MSCI Emerging + Frontier Markets Index is a free float-adjusted market capitalization index that is designed to measure equity market performance in the global emerging markets and frontier markets. The Index consists of 24 emerging markets countries and 29 frontier markets countries. Net dividends reinvested.
The MSCI Frontier Emerging Markets Index is a free float-adjusted market capitalization index designed to measure equity market performance in all countries from the MSCI Frontier Markets Index and the lower size spectrum of the MSCI Emerging Markets Index. The Index consists of 29 frontier markets and 5 emerging markets. Net dividends reinvested.
The MSCI USA Growth Index captures large and mid cap US securities exhibiting overall growth style characteristics.
The MSCI USA Value Index captures large and mid cap US securities exhibiting overall value style characteristics.
The S&P 500 Index is an unmanaged index commonly used to measure performance of US stocks.
You cannot invest directly in these Indexes.
TERM DEFINITIONS
Basis Points are a common measurement used chiefly for interest rates and other percentages in finance. A basis point is one hundredth of one percent.
Cash Flow measures the cash generating capability of a company by adding non-cash charges (e.g. depreciation) and interest expense to pretax income.
Correlation is the extent to which the values of different types of investments move in tandem with one another in response to changing economic and market conditions.
Duration is a measure of the sensitivity of the price–the value of principal–of a fixed-income investment to a change in interest rates.
Earnings Per Share is the portion of a company’s profit allocated to each outstanding share of common stock.
Free cash flow is a measure of a company’s financial performance, calculated as operating cash flow minus capital expenditures.
Gross Domestic Product (GDP) is the monetary value of all finished goods and services produced within a country’s borders in a specific time period (usually calculated on an annual basis).
Market Capitalization is the total dollar market value of all of a company’s outstanding shares.
Return on Capital (ROC) is a calculation used to assess a company’s efficiency at allocating the capital under its control to profitable investments.
Tracking Error is a measure of how closely a portfolio follows the index to which it is benchmarked.
Turnover is calculated by dividing the lesser of Purchases or Sales by Average Capital.
38
|
Table of Contents
Table of Contents
Harding, Loevner Funds, Inc.
| 2 | ||||
| 4 | ||||
| 4 | ||||
| 7 | ||||
| 10 | ||||
| 13 | ||||
| 16 | ||||
| 19 | ||||
| 22 | ||||
| 29 | ||||
| 35 | ||||
| 40 | ||||
| 43 | ||||
| 45 | ||||
| 48 | ||||
| 51 | ||||
| 66 | ||||
| 67 | ||||
| 68 | ||||
| 72 | ||||
| 73 | ||||
| 77 | ||||
For use only when preceded or accompanied by a prospectus. Read the prospectus carefully before you invest or send money.
Table of Contents
Expense Example
October 31, 2017 (unaudited)
As a shareholder of a Harding Loevner Portfolio, you incur ongoing costs, including management fees; and to the extent applicable, distribution (12b-1) fees, and/or shareholder services fees and other fund expenses. The following examples are intended to help you understand your ongoing costs (in dollars and cents) of investing in a Portfolio and to compare these costs with the ongoing costs of investing in other mutual funds.
The examples are based on an investment of $1,000 invested at the beginning of a six month period and held through the period ended October 31, 2017.
Actual Expenses
The first line under each Portfolio in the table below provides information about actual account values and actual expenses. You may use the information in this line, together with the amount you invested, to estimate the expenses that you paid over the period. Simply divide your account value by $1,000 (for example, an $8,600 account value divided by $1,000 = 8.6), then multiply the result by the number in the first line for your Portfolio under the heading entitled “Expenses Paid During Period” to estimate the expenses you paid on your account during this period.
Hypothetical Example for Comparison Purposes
The second line under each Portfolio in the table below provides information about hypothetical account values and hypothetical expenses based on the Portfolio’s actual expense ratio and an assumed rate of return of 5% per year before expenses, which is not the Portfolio’s actual return. The hypothetical account values and expenses may not be used to estimate the actual ending account balance or expenses you paid for the period. You may use this information to compare the ongoing costs of investing in your Portfolio and other funds. To do so, compare this 5% hypothetical example with the 5% hypothetical examples that appear in the shareholder reports of the other funds. Please note that the expenses shown in the table are meant to highlight your ongoing costs only. Therefore, the second line under each Portfolio in the table is useful in comparing ongoing costs only, and will not help you determine the relative total costs of owning different funds.
| Portfolio | Beginning Account Value May 1, 2017 | Ending Account Value October 31, 2017 | Annualized Expense Ratio | Expenses Paid During Period * (May 1, 2017 to October 31, 2017) | ||||||||||||
Global Equity Portfolio — Institutional Class | ||||||||||||||||
Actual | $1,000.00 | $1,127.90 | 0.93% | $4.99 | ||||||||||||
Hypothetical (5% annual return before expenses) | 1,000.00 | 1,020.52 | 0.93 | 4.74 | ||||||||||||
Global Equity Portfolio — Institutional Class Z** | ||||||||||||||||
Actual | 1,000.00 | 1,038.00 | 0.90 | 2.29 | ||||||||||||
Hypothetical (5% annual return before expenses) | 1,000.00 | 1,020.67 | 0.90 | 4.58 | ||||||||||||
Global Equity Portfolio — Advisor Class | ||||||||||||||||
Actual | 1,000.00 | 1,126.80 | 1.13 | 6.06 | ||||||||||||
Hypothetical (5% annual return before expenses) | 1,000.00 | 1,019.51 | 1.13 | 5.75 | ||||||||||||
International Equity Portfolio — Institutional Class | ||||||||||||||||
Actual | 1,000.00 | 1,120.20 | 0.83 | 4.44 | ||||||||||||
Hypothetical (5% annual return before expenses) | 1,000.00 | 1,021.02 | 0.83 | 4.23 | ||||||||||||
International Equity Portfolio — Institutional Class Z*** | ||||||||||||||||
Actual | 1,000.00 | 1,060.00 | 0.80 | 2.39 | ||||||||||||
Hypothetical (5% annual return before expenses) | 1,000.00 | 1,021.18 | 0.80 | 4.06 | ||||||||||||
* Expenses are calculated using each Portfolio’s annualized expense ratio (as disclosed in the table), multiplied by the average account value for the period, multiplied by the number of days in the period (184 days), and divided by the number of days in the year (365 days). Expense ratios for the most recent half year may differ from expense ratios based on one-year data in the Financial Highlights.
** Global Equity Portfolio — Institutional Class Z commenced operations on August 1, 2017 and the Actual example reflects the period from August 1, 2017 to October 31, 2017 (91 days). However, for purposes of comparability, the Hypothetical example assumes that the class was operational for the full six month period.
*** International Equity Portfolio — Institutional Class Z commenced operations on July 17, 2017 and the Actual example reflects the period from July 17, 2017 to October 31, 2017 (106 days). However, for purposes of comparability, the Hypothetical example assumes that the class was operational for the full six month period.
2
Table of Contents
Harding, Loevner Funds, Inc.
Expense Example (continued)
October 31, 2017 (unaudited)
| Portfolio | Beginning Account Value May 1, 2017 | Ending Account Value October 31, 2017 | Annualized Expense Ratio | Expenses Paid During Period * (May 1, 2017 to October 31, 2017) | ||||||||||||
International Equity Portfolio — Investor Class | ||||||||||||||||
Actual | $1,000.00 | $1,118.00 | 1.15% | $6.14 | ||||||||||||
Hypothetical (5% annual return before expenses) | 1,000.00 | 1,019.41 | 1.15 | 5.85 | ||||||||||||
International Small Companies Portfolio — Institutional Class | ||||||||||||||||
Actual | 1,000.00 | 1,134.80 | 1.15 | 6.19 | ||||||||||||
Hypothetical (5% annual return before expenses) | 1,000.00 | 1,019.41 | 1.15 | 5.85 | ||||||||||||
International Small Companies Portfolio — Investor Class | ||||||||||||||||
Actual | 1,000.00 | 1,133.60 | 1.40 | 7.53 | ||||||||||||
Hypothetical (5% annual return before expenses) | 1,000.00 | 1,018.15 | 1.40 | 7.12 | ||||||||||||
Institutional Emerging Markets Portfolio — Class I | ||||||||||||||||
Actual | 1,000.00 | 1,132.70 | 1.29 | 6.93 | ||||||||||||
Hypothetical (5% annual return before expenses) | 1,000.00 | 1,018.70 | 1.29 | 6.56 | ||||||||||||
Institutional Emerging Markets Portfolio — Class II | ||||||||||||||||
Actual | 1,000.00 | 1,134.50 | 1.12 | 6.03 | ||||||||||||
Hypothetical (5% annual return before expenses) | 1,000.00 | 1,019.56 | 1.12 | 5.70 | ||||||||||||
Emerging Markets Portfolio — Advisor Class | ||||||||||||||||
Actual | 1,000.00 | 1,132.20 | 1.43 | 7.69 | ||||||||||||
Hypothetical (5% annual return before expenses) | 1,000.00 | 1,018.00 | 1.43 | 7.27 | ||||||||||||
Frontier Emerging Markets Portfolio — Institutional Class I | ||||||||||||||||
Actual | 1,000.00 | 1,111.10 | 1.67 | 8.89 | ||||||||||||
Hypothetical (5% annual return before expenses) | 1,000.00 | 1,016.79 | 1.67 | 8.49 | ||||||||||||
Frontier Emerging Markets Portfolio — Institutional Class II | ||||||||||||||||
Actual | 1,000.00 | 1,112.80 | 1.35 | 7.19 | ||||||||||||
Hypothetical (5% annual return before expenses) | 1,000.00 | 1,018.40 | 1.35 | 6.87 | ||||||||||||
Frontier Emerging Markets Portfolio — Investor Class | ||||||||||||||||
Actual | 1,000.00 | 1,109.20 | 2.00 | 10.62 | ||||||||||||
Hypothetical (5% annual return before expenses) | 1,000.00 | 1,015.14 | 2.00 | 10.14 | ||||||||||||
Global Equity Research Portfolio — Institutional Class | ||||||||||||||||
Actual | 1,000.00 | 1,116.90 | 0.90 | 4.80 | ||||||||||||
Hypothetical (5% annual return before expenses) | 1,000.00 | 1,020.67 | 0.90 | 4.58 | ||||||||||||
Global Equity Research Portfolio — Investor Class | ||||||||||||||||
Actual | 1,000.00 | 1,116.10 | 1.15 | 6.13 | ||||||||||||
Hypothetical (5% annual return before expenses) | 1,000.00 | 1,019.41 | 1.15 | 5.85 | ||||||||||||
International Equity Research Portfolio — Institutional Class | ||||||||||||||||
Actual | 1,000.00 | 1,112.90 | 0.90 | 4.79 | ||||||||||||
Hypothetical (5% annual return before expenses) | 1,000.00 | 1,020.67 | 0.90 | 4.58 | ||||||||||||
International Equity Research Portfolio — Investor Class | ||||||||||||||||
Actual | 1,000.00 | 1,111.60 | 1.15 | 6.12 | ||||||||||||
Hypothetical (5% annual return before expenses) | 1,000.00 | 1,019.41 | 1.15 | 5.85 | ||||||||||||
Emerging Markets Research Portfolio — Institutional Class | ||||||||||||||||
Actual | 1,000.00 | 1,134.30 | 1.30 | 6.99 | ||||||||||||
Hypothetical (5% annual return before expenses) | 1,000.00 | 1,018.65 | 1.30 | 6.61 | ||||||||||||
Emerging Markets Research Portfolio — Investor Class | ||||||||||||||||
Actual | 1,000.00 | 1,133.50 | 1.55 | 8.34 | ||||||||||||
Hypothetical (5% annual return before expenses) | 1,000.00 | 1,017.39 | 1.55 | 7.88 | ||||||||||||
* Expenses are calculated using each Portfolio’s annualized expense ratio (as disclosed in the table), multiplied by the average account value for the period, multiplied by the number of days in the period (184 days), and divided by the number of days in the year (365 days). Expense ratios for the most recent half year may differ from expense ratios based on one-year data in the Financial Highlights.
3
Table of Contents
Portfolio of Investments
October 31, 2017
| Shares | Value | |||||||
| COMMON STOCKS - 94.9% | ||||||||
China - 5.7% | ||||||||
Alibaba Group Holding Ltd. - Sponsored ADR (Software & Services)* | 51,274 | $9,480,050 | ||||||
Baidu Inc. - Sponsored ADR | 47,445 | 11,573,733 | ||||||
Sino Biopharmaceutical Ltd. (Pharmaceuticals, Biotechnology & Life Sciences)† | 5,801,269 | 6,775,852 | ||||||
Tencent Holdings Ltd. (Software & Services)† | 218,980 | 9,863,314 | ||||||
Weibo Corp. - Sponsored ADR (Software & Services)* | 140,361 | 13,004,447 | ||||||
Wuxi Biologics Cayman Inc. (Pharmaceuticals, Biotechnology & Life Sciences)*† | 150,760 | 854,730 | ||||||
| 51,552,126 | ||||||||
Denmark - 2.6% | ||||||||
Chr Hansen Holding A/S (Materials)† | 138,560 | 12,125,738 | ||||||
Novozymes A/S, Class B (Materials)† | 202,815 | 11,201,984 | ||||||
| 23,327,722 | ||||||||
Finland - 1.0% | ||||||||
Kone OYJ, Class B (Capital Goods)† | 165,220 | 8,946,826 | ||||||
France - 3.3% | ||||||||
Air Liquide SA (Materials)† | 75,902 | 9,667,468 | ||||||
Essilor International SA (Health Care Equipment & Services)† | 90,775 | 11,497,892 | ||||||
L’Oreal SA (Household & Personal Products)† | 39,590 | 8,813,703 | ||||||
| 29,979,063 | ||||||||
Germany - 4.8% | ||||||||
Bayerische Motoren Werke AG (Automobiles & Components)† | 96,435 | 9,829,185 | ||||||
Linde AG (Materials)*† | 59,350 | 12,744,417 | ||||||
Symrise AG (Materials)† | 276,495 | 21,530,282 | ||||||
| 44,103,884 | ||||||||
Hong Kong - 2.4% | ||||||||
AIA Group Ltd. (Insurance)† | 2,846,605 | 21,423,502 | ||||||
India - 2.3% | ||||||||
HDFC Bank Ltd. - ADR (Banks) | 89,980 | 8,305,154 | ||||||
ICICI Bank Ltd. - Sponsored ADR (Banks) | 1,422,455 | 13,015,463 | ||||||
| 21,320,617 | ||||||||
Indonesia - 1.3% | ||||||||
Bank Central Asia Tbk PT (Banks)† | 7,620,654 | 11,771,776 | ||||||
| Shares | Value | |||||||
| COMMON STOCKS - 94.9% (continued) | ||||||||
Israel - 1.1% | ||||||||
Check Point Software Technologies Ltd. (Software & Services)* | 83,340 | $9,809,951 | ||||||
Italy - 1.9% | ||||||||
Luxottica Group SpA (Consumer Durables & Apparel)† | 185,360 | 10,622,590 | ||||||
Tenaris SA - ADR (Energy) | 243,900 | 6,646,275 | ||||||
| 17,268,865 | ||||||||
Japan - 9.9% | ||||||||
FANUC Corp. (Capital Goods)† | 38,445 | 9,013,166 | ||||||
Keyence Corp. (Technology Hardware & Equipment)† | 27,202 | 15,049,820 | ||||||
Kubota Corp. (Capital Goods)† | 941,735 | 17,752,561 | ||||||
M3 Inc. (Health Care Equipment & Services)† | 348,845 | 10,451,919 | ||||||
Makita Corp. (Capital Goods)† | 204,035 | 8,587,893 | ||||||
MonotaRO Co., Ltd. (Capital Goods)† | 276,880 | 7,574,812 | ||||||
Sysmex Corp. (Health Care | 319,165 | 21,880,665 | ||||||
| 90,310,836 | ||||||||
Mexico - 0.9% | ||||||||
Grupo Televisa SAB - Sponsored ADR (Media) | 354,110 | 7,751,468 | ||||||
Russia - 1.4% | ||||||||
Yandex NV, Class A (Software & Services)* | 378,970 | 12,820,555 | ||||||
South Africa - 0.7% | ||||||||
Sasol Ltd. (Materials)† | 231,720 | 6,811,042 | ||||||
Spain - 1.4% | ||||||||
Banco Bilbao Vizcaya Argentaria SA (Banks)† | 1,454,440 | 12,723,314 | ||||||
Sweden - 2.2% | ||||||||
Atlas Copco AB, Class A (Capital Goods)† | 260,720 | 11,405,811 | ||||||
Intrum Justitia AB (Commercial & Professional Services)† | 256,890 | 8,984,838 | ||||||
| 20,390,649 | ||||||||
Switzerland - 4.0% | ||||||||
Lonza Group AG, Reg S (Pharmaceuticals, Biotechnology & Life Sciences)† | 58,740 | 15,618,400 | ||||||
Nestle SA - Sponsored ADR (Food Beverage & Tobacco) | 136,865 | 11,528,139 | ||||||
Sonova Holding AG, Reg S (Health Care Equipment & Services)† | 53,020 | 9,579,301 | ||||||
| 36,725,840 | ||||||||
Turkey - 0.6% | ||||||||
Turkiye Garanti Bankasi AS - ADR (Banks) | 2,113,205 | 5,747,918 | ||||||
See Notes to Financial Statements
4
Table of Contents
Harding, Loevner Funds, Inc.
Global Equity Portfolio
Portfolio of Investments
October 31, 2017 (continued)
| Shares | Value | |||||||
| COMMON STOCKS - 94.9% (continued) | ||||||||
United Kingdom - 3.7% | ||||||||
Abcam plc (Pharmaceuticals, Biotechnology & Life Sciences)† | 556,109 | $7,349,231 | ||||||
Reckitt Benckiser Group plc (Household & Personal Products)† | 132,705 | 11,869,003 | ||||||
Shire plc (Pharmaceuticals, Biotechnology & Life Sciences)† | 132,385 | 6,515,802 | ||||||
WPP plc (Media)† | 450,705 | 7,965,555 | ||||||
| 33,699,591 | ||||||||
United States - 43.7% | ||||||||
3M Co. (Capital Goods) | 40,780 | 9,387,148 | ||||||
Abbott Laboratories (Health Care Equipment & Services) | 160,940 | 8,727,776 | ||||||
Amazon.com Inc. (Retailing)* | 8,775 | 9,698,832 | ||||||
AmerisourceBergen Corp. (Health Care Equipment & Services) | 111,970 | 8,616,092 | ||||||
Apple Inc. (Technology Hardware & Equipment) | 83,815 | 14,168,088 | ||||||
Cognex Corp. (Technology Hardware & Equipment) | 84,325 | 10,384,624 | ||||||
Cognizant Technology Solutions Corp., Class A (Software & Services) | 133,570 | 10,107,242 | ||||||
Colgate-Palmolive Co. (Household & Personal Products) | 166,680 | 11,742,606 | ||||||
eBay Inc. (Software & Services)* | 246,758 | 9,287,971 | ||||||
Exxon Mobil Corp. (Energy) | 106,520 | 8,878,442 | ||||||
Facebook Inc., Class A (Software & Services)* | 86,785 | 15,626,507 | ||||||
First Republic Bank (Banks) | 143,245 | 13,952,063 | ||||||
IPG Photonics Corp. (Technology Hardware & Equipment)* | 61,065 | 13,001,349 | ||||||
Mastercard Inc., Class A (Software & Services) | 85,625 | 12,738,431 | ||||||
Microsoft Corp. (Software & Services) | 95,290 | 7,926,222 | ||||||
Monsanto Co. (Materials) | 65,780 | 7,965,958 | ||||||
NIKE Inc., Class B (Consumer Durables & Apparel) | 512,300 | 28,171,377 | ||||||
PayPal Holdings Inc. (Software & Services)* | 408,890 | 29,669,058 | ||||||
Priceline Group Inc. (Retailing)* | 12,315 | 23,545,787 | ||||||
Regeneron Pharmaceuticals Inc. (Pharmaceuticals, Biotechnology & Life Sciences)* | 43,577 | 17,544,972 | ||||||
Roper Technologies Inc. (Capital Goods) | 101,575 | 26,223,618 | ||||||
Schlumberger Ltd. (Energy) | 278,900 | 17,849,600 | ||||||
Signature Bank (Banks)* | 49,265 | 6,404,943 | ||||||
| Shares | Value | |||||||
| COMMON STOCKS - 94.9% (continued) | ||||||||
United States - 43.7% (continued) | ||||||||
Starbucks Corp. (Consumer Services) | 163,625 | $8,973,195 | ||||||
SVB Financial Group (Banks)* | 101,585 | 22,275,559 | ||||||
Verisk Analytics Inc. (Commercial & Professional Services)* | 201,150 | 17,107,807 | ||||||
WABCO Holdings Inc. (Capital Goods)* | 65,610 | 9,682,068 | ||||||
Walgreens Boots Alliance Inc. (Food & Staples Retailing) | 102,835 | 6,814,875 | ||||||
Waters Corp. (Pharmaceuticals, Biotechnology & Life Sciences)* | 60,580 | 11,876,709 | ||||||
| 398,348,919 | ||||||||
Total Common Stocks (Cost $564,636,893) |
| $864,834,464 | ||||||
| PREFERRED STOCKS - 2.7% | ||||||||
Brazil - 1.1% | ||||||||
Itau Unibanco Holding SA - Sponsored ADR, 0.45% (Banks) | 799,780 | 10,245,182 | ||||||
Spain - 1.6% | ||||||||
Grifols SA - ADR, 1.42% (Pharmaceuticals, Biotechnology & Life Sciences) | 605,690 | 14,324,569 | ||||||
Total Preferred Stocks (Cost $15,700,399) | $24,569,751 | |||||||
| SHORT TERM INVESTMENTS - 0.9% | ||||||||
Northern Institutional Funds - Treasury Portfolio, 0.88% (Money Market Fund) | 8,589,264 | 8,589,264 | ||||||
Total Short Term Investments (Cost $8,589,264) |
| $8,589,264 | ||||||
Total Investments — 98.5% | ||||||||
(Cost $588,926,556) | $897,993,479 | |||||||
Other Assets Less Liabilities - 1.5% | 13,840,456 | |||||||
Net Assets — 100.0% | $911,833,935 | |||||||
Summary of Abbreviations
| ADR | American Depositary Receipt. |
| Reg S | Security sold outside United States without registration under the Securities Act of 1933. |
| * | Non-income producing security. |
| † | Investment categorized as level 2 security as disclosed in Note 2 of the Notes to Financial Statements. |
See Notes to Financial Statements
5
Table of Contents
Harding, Loevner Funds, Inc.
Global Equity Portfolio
Portfolio of Investments
October 31, 2017 (continued)
| Industry | | Percentage of Net Assets | | ||
Automobiles & Components | 1.1 | % | |||
Banks | 11.4 | ||||
Capital Goods | 11.9 | ||||
Commercial & Professional Services | 2.9 | ||||
Consumer Durables & Apparel | 4.2 | ||||
Consumer Services | 1.0 | ||||
Energy | 3.7 | ||||
Food & Staples Retailing | 0.7 | ||||
Food Beverage & Tobacco | 1.3 | ||||
Health Care Equipment & Services | 7.8 | ||||
Household & Personal Products | 3.6 | ||||
Insurance | 2.3 | ||||
Materials | 9.0 | ||||
Media | 1.7 | ||||
Pharmaceuticals, Biotechnology & Life Sciences | 8.9 | ||||
Retailing | 3.6 | ||||
Software & Services | 16.7 | ||||
Technology Hardware & Equipment | 5.8 | ||||
Money Market Fund | 0.9 | ||||
Total Investments | 98.5 | ||||
Other Assets Less Liabilities | 1.5 | ||||
Net Assets | 100.0 | % | |||
See Notes to Financial Statements
6
Table of Contents
International Equity Portfolio
Portfolio of Investments
October 31, 2017
| Shares | Value | |||||||
| COMMON STOCKS - 91.1% | ||||||||
Australia - 0.9% | ||||||||
CSL Ltd. (Pharmaceuticals, Biotechnology & Life Sciences)† | 1,050,900 | $112,081,749 | ||||||
Canada - 2.1% | ||||||||
Canadian National Railway Co. (Transportation) | 3,096,200 | 249,213,138 | ||||||
China - 3.7% | ||||||||
Baidu Inc. - Sponsored ADR (Software & Services)* | 1,374,300 | 335,246,742 | ||||||
Weibo Corp. - Sponsored ADR (Software & Services)* | 1,187,310 | 110,004,272 | ||||||
| 445,251,014 | ||||||||
France - 9.6% | ||||||||
Air Liquide SA (Materials)† | 2,228,688 | 283,862,997 | ||||||
Dassault Systemes SE (Software & Services)† | 3,811,219 | 404,836,098 | ||||||
L’Oreal SA (Household & Personal Products)† | 1,297,500 | 288,855,271 | ||||||
LVMH Moet Hennessy Louis Vuitton SE (Consumer Durables & Apparel)† | 553,700 | 165,246,778 | ||||||
| 1,142,801,144 | ||||||||
Germany - 16.1% | ||||||||
Allianz SE, Reg S (Insurance)† | 1,865,800 | 433,264,899 | ||||||
Bayer AG, Reg S (Pharmaceuticals, Biotechnology & Life Sciences)† | 3,145,300 | 410,810,903 | ||||||
Bayerische Motoren Werke AG (Automobiles & Components)† | 1,420,000 | 144,734,206 | ||||||
Fresenius Medical Care AG & Co. KGaA (Health Care Equipment & Services)† | 1,753,000 | 169,529,589 | ||||||
FUCHS PETROLUB SE (Materials)† | 701,240 | 34,928,649 | ||||||
Infineon Technologies AG (Semiconductors & Semiconductor Equipment)† | 5,107,600 | 139,841,565 | ||||||
Linde AG (Materials)† | 3,400 | 734,290 | ||||||
Linde AG (Materials)†* | 791,810 | 170,027,919 | ||||||
SAP SE - Sponsored ADR (Software & Services) | 2,447,180 | 279,467,956 | ||||||
Symrise AG (Materials)† | 1,805,996 | 140,630,399 | ||||||
| 1,923,970,375 | ||||||||
Hong Kong - 3.4% | ||||||||
AIA Group Ltd. (Insurance)† | 53,922,900 | 405,822,858 | ||||||
India - 2.1% | ||||||||
HDFC Bank Ltd. - ADR (Banks) | 1,221,900 | 112,781,370 | ||||||
ICICI Bank Ltd. - Sponsored ADR (Banks) | 14,590,900 | 133,506,735 | ||||||
| 246,288,105 | ||||||||
| Shares | Value | |||||||
| COMMON STOCKS - 91.1% (continued) | ||||||||
Israel - 2.2% | ||||||||
Check Point Software Technologies Ltd. (Software & Services)* | 2,227,000 | $262,140,170 | ||||||
Italy - 0.6% | ||||||||
Tenaris SA - ADR (Energy) | 2,820,200 | 76,850,450 | ||||||
Japan - 12.9% | ||||||||
FANUC Corp. (Capital Goods)† | 1,604,700 | 376,210,860 | ||||||
JGC Corp. (Capital Goods)† | 6,232,000 | 104,357,476 | ||||||
Keyence Corp. (Technology Hardware & Equipment)† | 340,927 | 188,621,788 | ||||||
Kubota Corp. (Capital Goods)† | 7,217,900 | 136,063,980 | ||||||
M3 Inc. (Health Care Equipment & Services)† | 8,478,100 | 254,016,585 | ||||||
Mitsubishi Estate Co., Ltd. (Real Estate)† | 4,487,000 | 81,374,318 | ||||||
MonotaRO Co., Ltd. (Capital Goods)† | 3,151,400 | 86,215,192 | ||||||
Park24 Co., Ltd. (Commercial & Professional Services)† | 4,195,900 | 96,700,074 | ||||||
Sysmex Corp. (Health Care Equipment & Services)† | 3,031,307 | 207,814,181 | ||||||
| 1,531,374,454 | ||||||||
Mexico - 1.7% | ||||||||
Grupo Financiero Banorte SAB de CV, Series O (Banks) | 23,637,300 | 140,282,029 | ||||||
Grupo Televisa SAB - Sponsored ADR (Media) | 3,031,619 | 66,362,140 | ||||||
| 206,644,169 | ||||||||
Singapore - 2.0% | ||||||||
DBS Group Holdings Ltd. (Banks)† | 14,118,383 | 235,962,800 | ||||||
South Africa - 4.6% | ||||||||
Aspen Pharmacare Holdings Ltd. (Pharmaceuticals, Biotechnology & Life Sciences)† | 4,199,569 | 94,886,972 | ||||||
Naspers Ltd., Class N (Media)† | 1,434,600 | 354,446,976 | ||||||
Sasol Ltd. (Materials)† | 3,156,600 | 92,783,247 | ||||||
| 542,117,195 | ||||||||
South Korea - 1.7% | ||||||||
Samsung Electronics Co., Ltd. - GDR (Technology Hardware & Equipment)† | 168,200 | 207,753,119 | ||||||
Spain - 3.3% | ||||||||
Banco Bilbao Vizcaya Argentaria SA (Banks)† | 38,113,000 | 333,409,203 | ||||||
Grifols SA (Pharmaceuticals, Biotechnology & Life Sciences)† | 1,925,600 | 60,297,906 | ||||||
| 393,707,109 | ||||||||
Sweden - 3.1% | ||||||||
Alfa Laval AB (Capital Goods)† | 6,081,200 | 153,743,350 | ||||||
See Notes to Financial Statements
7
Table of Contents
Harding, Loevner Funds, Inc.
International Equity Portfolio
Portfolio of Investments
October 31, 2017 (continued)
| Shares | Value | |||||||
| COMMON STOCKS - 91.1% (continued) | ||||||||
Sweden - 3.1% (continued) | ||||||||
Atlas Copco AB, Class A | 5,007,700 | $219,073,645 | ||||||
| 372,816,995 | ||||||||
Switzerland - 6.7% | ||||||||
Nestle SA - Sponsored ADR (Food Beverage & Tobacco) | 4,785,900 | 403,116,357 | ||||||
Roche Holding AG, Genusschein (Pharmaceuticals, Biotechnology & Life Sciences)† | 1,096,600 | 253,533,479 | ||||||
Sonova Holding AG, Reg S (Health Care Equipment & Services)† | 768,700 | 138,883,601 | ||||||
| 795,533,437 | ||||||||
Taiwan - 2.8% | ||||||||
Taiwan Semiconductor Manufacturing Co., Ltd. (Semiconductors & Semiconductor Equipment)† | 10,837,125 | 87,533,374 | ||||||
Taiwan Semiconductor Manufacturing Co., Ltd. - Sponsored ADR (Semiconductors & Semiconductor Equipment) | 5,731,400 | 242,610,162 | ||||||
| 330,143,536 | ||||||||
Turkey - 0.8% | ||||||||
Turkiye Garanti Bankasi AS - ADR (Banks) | 34,541,100 | 93,951,792 | ||||||
United Kingdom - 9.3% | ||||||||
BBA Aviation plc (Transportation)† | 15,682,900 | 66,319,541 | ||||||
HSBC Holdings plc (Banks)† | 15,939,700 | 155,432,309 | ||||||
Royal Dutch Shell plc, Class B (Energy)† | 11,371,616 | 365,997,840 | ||||||
Shire plc (Pharmaceuticals, Biotechnology & Life Sciences)† | 4,017,200 | 197,720,875 | ||||||
Unilever plc (Household & Personal Products)† | 3,466,400 | 196,603,967 | ||||||
WPP plc (Media)† | 7,260,200 | 128,313,479 | ||||||
| 1,110,388,011 | ||||||||
United States - 1.5% | ||||||||
Schlumberger Ltd. (Energy) | 2,775,000 | 177,600,000 | ||||||
Total Common Stocks (Cost $8,355,996,802) |
| $10,862,411,620 | ||||||
| PREFERRED STOCKS - 4.8% | ||||||||
Brazil - 1.6% | ||||||||
Itau Unibanco Holding SA - Sponsored ADR, 0.45% (Banks) | 14,813,280 | 189,758,117 | ||||||
| Shares | Value | |||||||
| PREFERRED STOCKS - 4.8% (continued) | ||||||||
Germany - 0.7% | ||||||||
FUCHS PETROLUB SE, 1.83% (Materials)† | 1,521,300 | $85,399,124 | ||||||
South Korea - 2.0% | ||||||||
Samsung Electronics Co., Ltd. - GDR, Reg S, 1.19% (Technology Hardware & Equipment)† | 235,346 | 237,731,074 | ||||||
Spain - 0.5% | ||||||||
Grifols SA - ADR, 1.42% (Pharmaceuticals, Biotechnology & Life Sciences) | 2,562,300 | 60,598,395 | ||||||
Total Preferred Stocks (Cost $367,170,107) |
| $573,486,710 | ||||||
| SHORT TERM INVESTMENTS - 3.8% | ||||||||
Northern Institutional Funds - Prime Obligations Portfolio, 1.19% (Money Market Fund) | 241,851,630 | 241,900,000 | ||||||
Northern Institutional Funds - Treasury Portfolio, 0.88% (Money Market Fund) | 210,740,895 | 210,740,895 | ||||||
Total Short Term Investments (Cost $452,640,895) |
| $452,640,895 | ||||||
Total Investments — 99.7% | ||||||||
(Cost $9,175,807,804) | $11,888,539,225 | |||||||
Other Assets Less Liabilities - 0.3% | 30,362,461 | |||||||
Net Assets — 100.0% | $11,918,901,686 | |||||||
Summary of Abbreviations
| ADR | American Depositary Receipt. |
| GDR | Global Depository Receipt. |
| Reg S | Security sold outside United States without registration under the Securities Act of 1933. |
| * | Non-income producing security. |
| † | Investment categorized as level 2 security as disclosed in Note 2 of the Notes to Financial Statements. |
See Notes to Financial Statements
8
Table of Contents
Harding, Loevner Funds, Inc.
International Equity Portfolio
Portfolio of Investments
October 31, 2017 (continued)
| Industry | | Percentage of Net Assets | | |
Automobiles & Components | 1.2 | % | ||
Banks | 11.7 | |||
Capital Goods | 9.0 | |||
Commercial & Professional Services | 0.8 | |||
Consumer Durables & Apparel | 1.4 | |||
Energy | 5.2 | |||
Food Beverage & Tobacco | 3.4 | |||
Health Care Equipment & Services | 6.5 | |||
Household & Personal Products | 4.1 | |||
Insurance | 7.0 | |||
Materials | 6.8 | |||
Media | 4.6 | |||
Pharmaceuticals, Biotechnology & Life Sciences | 10.0 | |||
Real Estate | 0.7 | |||
Semiconductors & Semiconductor Equipment | 3.9 | |||
Software & Services | 11.7 | |||
Technology Hardware & Equipment | 5.3 | |||
Transportation | 2.6 | |||
Money Market Fund | 3.8 | |||
Total Investments | 99.7 | |||
Other Assets Less Liabilities | 0.3 | |||
Net Assets | 100.0 | % | ||
See Notes to Financial Statements
9
Table of Contents
International Small Companies Portfolio
Portfolio of Investments
October 31, 2017
| Shares | Value | |||||||
| COMMON STOCKS - 95.9% | ||||||||
Argentina - 0.9% | ||||||||
Globant SA (Software & Services)* | 43,700 | $1,648,364 | ||||||
Australia - 0.9% | ||||||||
DuluxGroup Ltd. (Materials)† | 249,000 | 1,409,817 | ||||||
TPG Telecom Ltd. (Telecommunication Services)† | 86,841 | 359,121 | ||||||
| 1,768,938 | ||||||||
Bangladesh - 2.9% | ||||||||
BRAC Bank Ltd. (Banks)† | 3,232,263 | 3,925,393 | ||||||
Square Pharmaceuticals Ltd. (Pharmaceuticals, Biotechnology & Life Sciences)† | 473,460 | 1,697,461 | ||||||
| 5,622,854 | ||||||||
China - 3.1% | ||||||||
Haitian International Holdings Ltd. | 840,000 | 2,539,738 | ||||||
PAX Global Technology Ltd. (Technology Hardware & Equipment)† | 4,069,000 | 2,069,380 | ||||||
Shenzhou International Group Holdings Ltd. (Consumer Durables & Apparel)† | 155,000 | 1,324,088 | ||||||
| 5,933,206 | ||||||||
Colombia - 0.3% | ||||||||
Cemex Latam Holdings SA (Materials)* | 165,400 | 586,122 | ||||||
Denmark - 0.5% | ||||||||
Chr Hansen Holding A/S (Materials)† | 11,750 | 1,028,272 | ||||||
Egypt - 1.2% | ||||||||
Integrated Diagnostics Holdings plc (Health Care Equipment & Services)† | 614,000 | 2,395,366 | ||||||
Finland - 3.1% | ||||||||
Vaisala OYJ, Class A (Technology Hardware & Equipment)† | 110,980 | 6,022,650 | ||||||
France - 7.0% | ||||||||
Alten SA (Software & Services)† | 60,320 | 5,281,884 | ||||||
IPSOS (Media)† | 60,700 | 2,244,308 | ||||||
LISI (Capital Goods)† | 91,600 | 4,204,171 | ||||||
Rubis SCA (Utilities)† | 30,248 | 1,898,774 | ||||||
| 13,629,137 | ||||||||
Germany - 11.4% | ||||||||
Bechtle AG (Software & Services)† | 65,800 | 5,260,630 | ||||||
Bertrandt AG (Commercial & Professional Services)† | 29,080 | 2,727,708 | ||||||
| Shares | Value | |||||||
| COMMON STOCKS - 95.9% (continued) | ||||||||
Germany - 11.4% (continued) | ||||||||
Carl Zeiss Meditec AG (Bearer) (Health Care Equipment & Services)† | 70,830 | $3,775,512 | ||||||
Gerresheimer AG (Pharmaceuticals, Biotechnology & Life Sciences)† | 30,950 | 2,461,335 | ||||||
KWS Saat SE (Food Beverage & Tobacco)† | 6,320 | 2,672,336 | ||||||
Pfeiffer Vacuum Technology AG (Capital Goods)† | 9,700 | 1,558,509 | ||||||
Rational AG (Capital Goods)† | 1,410 | 926,367 | ||||||
STRATEC Biomedical AG (Health Care Equipment & Services)† | 39,100 | 2,842,065 | ||||||
| 22,224,462 | ||||||||
Hong Kong - 3.1% | ||||||||
Pico Far East Holdings Ltd. (Media)† | 7,639,000 | 3,241,088 | ||||||
Vitasoy International Holdings Ltd. (Food Beverage & Tobacco)† | 1,216,900 | 2,823,275 | ||||||
| 6,064,363 | ||||||||
India - 4.3% | ||||||||
Emami Ltd. (Household & Personal Products)† | 77,800 | 1,514,539 | ||||||
GRUH Finance Ltd. (Banks) | 239,700 | 1,843,142 | ||||||
Max Financial Services Ltd. (Insurance)* | 395,500 | 3,584,283 | ||||||
SH Kelkar & Co., Ltd. (Materials)† | 358,300 | 1,500,416 | ||||||
| 8,442,380 | ||||||||
Indonesia - 0.4% | ||||||||
Tower Bersama Infrastructure Tbk PT (Telecommunication Services)† | 1,484,000 | 746,244 | ||||||
Israel - 0.6% | ||||||||
CyberArk Software Ltd. (Software & Services)* | 28,000 | 1,186,360 | ||||||
Italy - 3.6% | ||||||||
Danieli & C Officine Meccaniche SpA (RSP) (Capital Goods)† | 89,000 | 1,480,436 | ||||||
DiaSorin SpA (Health Care Equipment & Services)† | 10,300 | 937,024 | ||||||
Reply SpA (Software & Services)† | 86,200 | 4,583,018 | ||||||
| 7,000,478 | ||||||||
Japan - 13.9% | ||||||||
ABC-Mart Inc. (Retailing)† | 10,700 | 538,682 | ||||||
Ariake Japan Co., Ltd. (Food Beverage & Tobacco)† | 36,600 | 2,792,849 | ||||||
BML Inc. (Health Care Equipment & Services)† | 120,000 | 2,656,809 | ||||||
See Notes to Financial Statements
10
Table of Contents
Harding, Loevner Funds, Inc.
International Small Companies Portfolio
Portfolio of Investments
October 31, 2017 (continued)
| Shares | Value | |||||||
| COMMON STOCKS - 95.9% (continued) | ||||||||
Japan - 13.9% (continued) | ||||||||
Cosmos Pharmaceutical Corp. (Food & Staples Retailing)† | 6,200 | $1,287,265 | ||||||
FINDEX Inc. (Health Care Equipment & | 137,100 | 968,735 | ||||||
GMO Payment Gateway Inc. (Software & | 20,600 | 1,509,687 | ||||||
Hiday Hidaka Corp. (Consumer Services)† | 184,669 | 5,418,707 | ||||||
Infomart Corp. (Software & Services)† | 458,800 | 3,443,760 | ||||||
MISUMI Group Inc. (Capital Goods)† | 79,500 | 2,184,749 | ||||||
MonotaRO Co., Ltd. (Capital Goods)† | 20,900 | 571,777 | ||||||
Nakanishi Inc. (Health Care Equipment & | 59,500 | 2,695,304 | ||||||
SMS Co., Ltd. (Software & Services)† | 45,000 | 1,361,070 | ||||||
Suruga Bank Ltd. (Banks)† | 68,700 | 1,553,694 | ||||||
| 26,983,088 | ||||||||
Kenya - 1.2% | ||||||||
East African Breweries Ltd. (Food Beverage & Tobacco)† | 632,200 | 1,489,569 | ||||||
Equity Group Holdings Ltd. (Banks)† | 2,437,900 | 892,823 | ||||||
| 2,382,392 | ||||||||
Malaysia - 0.6% | ||||||||
Dialog Group Bhd. (Energy)† | 1,997,440 | 1,066,331 | ||||||
Mexico - 0.7% | ||||||||
Grupo Herdez SAB de CV (Food Beverage & Tobacco) | 654,738 | 1,400,882 | ||||||
Netherlands - 4.2% | ||||||||
Arcadis NV (Capital Goods)† | 140,385 | 3,245,498 | ||||||
ASM International NV (Semiconductors & Semiconductor Equipment)† | 41,040 | 2,750,877 | ||||||
Brunel International NV (Commercial & Professional Services)† | 127,897 | 2,173,260 | ||||||
| 8,169,635 | ||||||||
Norway - 1.6% | ||||||||
Tomra Systems ASA (Commercial & Professional Services)† | 226,500 | 3,161,245 | ||||||
Peru - 0.6% | ||||||||
Alicorp SAA (Food Beverage & Tobacco) | 378,200 | 1,180,966 | ||||||
Russia - 1.6% | ||||||||
Moscow Exchange MICEX-RTS PJSC (Diversified Financials)† | 1,500,000 | 3,034,158 | ||||||
| Shares | Value | |||||||
| COMMON STOCKS - 95.9% (continued) | ||||||||
South Africa - 0.7% | ||||||||
Clicks Group Ltd. (Food & Staples Retailing)† | 125,110 | $1,408,357 | ||||||
South Korea - 0.4% | ||||||||
Cheil Worldwide Inc. (Media)† | 36,770 | 682,326 | ||||||
Sweden - 1.6% | ||||||||
Alfa Laval AB (Capital Goods)† | 60,600 | 1,532,074 | ||||||
Intrum Justitia AB (Commercial & Professional Services)† | 43,200 | 1,510,938 | ||||||
| 3,043,012 | ||||||||
Switzerland - 4.1% | ||||||||
Bossard Holding AG, Class A, Reg S (Capital Goods)† | 17,450 | 4,127,444 | ||||||
LEM Holding SA, Reg S (Technology Hardware & Equipment)† | 1,795 | 2,348,986 | ||||||
Temenos Group AG, Reg S (Software & Services)*† | 13,520 | 1,561,728 | ||||||
| 8,038,158 | ||||||||
Taiwan - 1.5% | ||||||||
Advantech Co., Ltd. (Technology Hardware & Equipment)† | 124,517 | 851,290 | ||||||
Chipbond Technology Corp. (Semiconductors & Semiconductor Equipment)† | 1,077,700 | 2,107,754 | ||||||
| 2,959,044 | ||||||||
Tanzania - 0.6% | ||||||||
Tanzania Breweries Ltd. (Food Beverage & Tobacco) | 205,100 | 1,204,056 | ||||||
Turkey - 1.2% | ||||||||
Anadolu Hayat Emeklilik AS (Insurance)† | 1,257,206 | 2,237,232 | ||||||
Ukraine - 1.2% | ||||||||
Kernel Holding SA (Food Beverage & Tobacco)† | 172,400 | 2,316,852 | ||||||
United Kingdom - 15.8% | ||||||||
Abcam plc (Pharmaceuticals, Biotechnology & Life Sciences)† | 303,127 | 4,005,960 | ||||||
BBA Aviation plc (Transportation)† | 335,300 | 1,417,910 | ||||||
BGEO Group plc (Banks)† | 62,120 | 2,935,663 | ||||||
Britvic plc (Food Beverage & Tobacco)† | 139,131 | 1,399,257 | ||||||
Clarkson plc (Transportation)† | 37,800 | 1,473,113 | ||||||
Dignity plc (Consumer Services)† | 40,100 | 1,290,847 | ||||||
EMIS Group plc (Health Care Equipment & Services)† | 99,300 | 1,268,676 | ||||||
Halma plc (Technology Hardware & Equipment)† | 100,800 | 1,581,575 | ||||||
Jardine Lloyd Thompson Group plc (Insurance)† | 59,302 | 1,025,956 | ||||||
See Notes to Financial Statements
11
Table of Contents
Harding, Loevner Funds, Inc.
International Small Companies Portfolio
Portfolio of Investments
October 31, 2017 (continued)
| Shares | Value | |||||||
| COMMON STOCKS - 95.9% (continued) | ||||||||
United Kingdom - 15.8% (continued) | ||||||||
Nostrum Oil & Gas plc (Energy)*† | 419,700 | $2,097,798 | ||||||
Rathbone Brothers plc (Diversified Financials)† | 100,170 | 3,406,268 | ||||||
Rotork plc (Capital Goods)† | 277,146 | 966,773 | ||||||
RPC Group plc (Materials)† | 87,930 | 1,100,363 | ||||||
RPS Group plc (Commercial & Professional Services)† | 875,160 | 3,418,733 | ||||||
Senior plc (Capital Goods)† | 863,240 | 3,305,035 | ||||||
| 30,693,927 | ||||||||
United States - 1.1% | ||||||||
PriceSmart Inc. (Food & Staples Retailing) | 11,020 | 923,476 | ||||||
Sensata Technologies Holding NV (Capital Goods)* | 25,400 | 1,242,314 | ||||||
| 2,165,790 | ||||||||
Total Common Stocks (Cost $143,350,684) | $186,426,647 | |||||||
| SHORT TERM INVESTMENTS - 4.4% | ||||||||
Northern Institutional Funds - Treasury Portfolio, 0.88% (Money Market Fund) | 8,652,238 | 8,652,238 | ||||||
Total Short Term Investments (Cost $8,652,238) |
| $8,652,238 | ||||||
Total Investments — 100.3% | ||||||||
(Cost $152,002,922) | $195,078,885 | |||||||
Liabilities Less Other Assets - (0.3)% | (616,376 | ) | ||||||
Net Assets — 100.0% | $194,462,509 | |||||||
Summary of Abbreviations
| Reg S | Security sold outside United States without registration under the Securities Act of 1933. |
| * | Non-income producing security. |
| † | Investment categorized as level 2 security as disclosed in Note 2 of the Notes to Financial Statements. |
| Industry | | Percentage of Net Assets | | ||
Banks | 5.7 | % | |||
Capital Goods | 14.3 | ||||
Commercial & Professional Services | 6.7 | ||||
Consumer Durables & Apparel | 0.7 | ||||
Consumer Services | 3.4 | ||||
Diversified Financials | 3.3 | ||||
Energy | 1.6 | ||||
Food & Staples Retailing | 1.9 | ||||
Food Beverage & Tobacco | 8.9 | ||||
Health Care Equipment & Services | 9.0 | ||||
Household & Personal Products | 0.8 | ||||
Insurance | 3.5 | ||||
Materials | 2.9 | ||||
Media | 3.2 | ||||
Pharmaceuticals, Biotechnology & Life Sciences | 4.2 | ||||
Retailing | 0.3 | ||||
Semiconductors & Semiconductor Equipment | 2.5 | ||||
Software & Services | 13.3 | ||||
Technology Hardware & Equipment | 6.6 | ||||
Telecommunication Services | 0.6 | ||||
Transportation | 1.5 | ||||
Utilities | 1.0 | ||||
Money Market Fund | 4.4 | ||||
Total Investments | 100.3 | ||||
Liabilities Less Other Assets | (0.3 | ) | |||
Net Assets | 100.0 | % | |||
See Notes to Financial Statements
12
Table of Contents
Institutional Emerging Markets Portfolio
Portfolio of Investments
October 31, 2017
| Shares | Value | |||||||
| COMMON STOCKS - 91.8% | ||||||||
Brazil - 2.7% | ||||||||
Ambev SA - ADR (Food Beverage & Tobacco) | 7,981,800 | $50,524,794 | ||||||
B3 SA - Brasil Bolsa Balcao (Diversified Financials)* | 5,884,700 | 42,993,406 | ||||||
WEG SA (Capital Goods) | 5,514,400 | 35,871,498 | ||||||
| 129,389,698 | ||||||||
Chile - 1.1% | ||||||||
Banco Santander Chile - ADR (Banks) | 1,741,000 | 54,458,480 | ||||||
China - 22.9% | ||||||||
51job Inc. - ADR (Commercial & Professional Services)* | 1,375,410 | 85,137,879 | ||||||
AAC Technologies Holdings Inc. (Technology Hardware & Equipment)† | 3,473,500 | 63,608,778 | ||||||
Alibaba Group Holding Ltd. - Sponsored ADR (Software & Services)* | 204,600 | 37,828,494 | ||||||
China Merchants Port Holdings Co., Ltd. (Transportation)† | 16,225,488 | 50,799,411 | ||||||
China Mobile Ltd. - Sponsored ADR (Telecommunication Services) | 882,000 | 44,496,900 | ||||||
CNOOC Ltd. - Sponsored ADR (Energy) | 624,683 | 85,394,166 | ||||||
Ctrip.com International Ltd. - ADR | 660,200 | 31,616,978 | ||||||
ENN Energy Holdings Ltd. (Utilities)† | 12,247,200 | 89,919,165 | ||||||
Hangzhou Hikvision Digital Technology Co., Ltd., Class A (Technology Hardware & Equipment)† | 9,188,618 | 54,471,813 | ||||||
JD.com Inc. - ADR (Retailing)* | 1,754,300 | 65,821,336 | ||||||
Jiangsu Expressway Co., Ltd., Class H (Transportation)† | 17,371,000 | 26,690,592 | ||||||
Jiangsu Hengrui Medicine Co., Ltd., Class A (Pharmaceuticals, Biotechnology & Life Sciences)† | 3,649,540 | 37,001,726 | ||||||
Midea Group Co., Ltd., Class A (Consumer Durables & Apparel)† | 6,326,854 | 48,724,713 | ||||||
NetEase Inc. - ADR (Software & Services) | 68,241 | 19,238,503 | ||||||
Shenzhou International Group Holdings Ltd. (Consumer Durables & Apparel)† | 8,805,000 | 75,216,747 | ||||||
Sino Biopharmaceutical Ltd. (Pharmaceuticals, Biotechnology & Life Sciences)† | 41,718,505 | 48,726,999 | ||||||
Tencent Holdings Ltd. (Software & Services)† | 4,323,500 | 194,739,409 | ||||||
| Shares | Value | |||||||
| COMMON STOCKS - 91.8% (continued) | ||||||||
China - 22.9% (continued) | ||||||||
Weibo Corp. - Sponsored ADR (Software & Services)* | 527,300 | $48,854,345 | ||||||
| 1,108,287,954 | ||||||||
Czech Republic - 1.1% | ||||||||
Komercni banka AS (Banks)† | 1,300,400 | 55,891,312 | ||||||
Egypt - 0.6% | ||||||||
Commercial International Bank Egypt SAE - GDR, Reg S (Banks)† | 5,982,715 | 27,310,795 | ||||||
Hong Kong - 6.0% | ||||||||
AIA Group Ltd. (Insurance)† | 16,454,415 | 123,835,657 | ||||||
ASM Pacific Technology Ltd. (Semiconductors & Semiconductor Equipment)† | 3,612,169 | 52,765,620 | ||||||
Hong Kong Exchanges & Clearing Ltd. (Diversified Financials)† | 2,033,147 | 56,622,768 | ||||||
Sands China Ltd. (Consumer Services)† | 12,416,138 | 58,549,149 | ||||||
| 291,773,194 | ||||||||
Hungary - 1.3% | ||||||||
Richter Gedeon Nyrt. (Pharmaceuticals, Biotechnology & Life Sciences)† | 2,562,700 | 63,754,888 | ||||||
India - 5.1% | ||||||||
Bharti Airtel Ltd. (Telecommunication Services) | 4,880,100 | 37,460,844 | ||||||
Bharti Infratel Ltd. (Telecommunication | 5,910,800 | 40,435,546 | ||||||
Housing Development Finance Corp., Ltd. (Banks)† | 2,907,600 | 76,672,809 | ||||||
Maruti Suzuki India Ltd. (Automobiles & Components) | 731,400 | 92,721,821 | ||||||
| 247,291,020 | ||||||||
Indonesia - 2.7% | ||||||||
Astra International Tbk PT (Automobiles & Components)† | 85,617,700 | 50,504,879 | ||||||
Bank Rakyat Indonesia Persero Tbk PT | 69,775,600 | 80,410,187 | ||||||
| 130,915,066 | ||||||||
Italy - 1.0% | ||||||||
Tenaris SA - ADR (Energy) | 1,721,000 | 46,897,250 | ||||||
Kenya - 1.1% | ||||||||
East African Breweries Ltd. (Food Beverage & Tobacco)† | 5,735,465 | 13,513,716 | ||||||
See Notes to Financial Statements
13
Table of Contents
Harding, Loevner Funds, Inc.
Institutional Emerging Markets Portfolio
Portfolio of Investments
October 31, 2017 (continued)
| Shares | Value | |||||||
| COMMON STOCKS - 91.8% (continued) | ||||||||
Kenya - 1.1% (continued) | ||||||||
Safaricom Ltd. | 165,865,527 | $40,726,794 | ||||||
| 54,240,510 | ||||||||
Mexico - 4.4% | ||||||||
Fomento Economico Mexicano SAB de CV - Sponsored ADR (Food Beverage & Tobacco) | 261,200 | 22,920,300 | ||||||
Grupo Aeroportuario del Sureste SAB de CV - ADR (Transportation) | 337,200 | 60,287,988 | ||||||
Grupo Financiero Banorte SAB de CV, Series O (Banks) | 12,781,900 | 75,857,685 | ||||||
Grupo Televisa SAB - Sponsored ADR (Media) | 2,469,603 | 54,059,610 | ||||||
| 213,125,583 | ||||||||
Peru - 1.2% | ||||||||
Credicorp Ltd. (Banks) | 266,900 | 55,899,536 | ||||||
Philippines - 0.2% | ||||||||
Universal Robina Corp. (Food Beverage & Tobacco)† | 3,685,850 | 10,212,196 | ||||||
Poland - 1.1% | ||||||||
Bank Pekao SA (Banks)† | 1,617,300 | 52,886,356 | ||||||
Russia - 5.7% | ||||||||
Lukoil PJSC - Sponsored ADR (Energy) | 1,566,100 | 83,050,283 | ||||||
Magnit PJSC (Food & Staples Retailing) | 128,654 | 16,963,308 | ||||||
Novatek PJSC - Sponsored GDR, Reg S (Energy)† | 419,155 | 47,845,194 | ||||||
Sberbank of Russia PJSC - Sponsored ADR (Banks)† | 8,946,100 | 128,351,244 | ||||||
| 276,210,029 | ||||||||
South Africa - 5.4% | ||||||||
Aspen Pharmacare Holdings Ltd. (Pharmaceuticals, Biotechnology & Life Sciences)† | 2,904,200 | 65,618,815 | ||||||
Discovery Ltd. (Insurance)† | 4,836,700 | 50,213,745 | ||||||
Naspers Ltd., Class N (Media)† | 185,500 | 45,831,531 | ||||||
Sasol Ltd. (Materials)† | 1,413,100 | 41,535,832 | ||||||
Standard Bank Group Ltd. (Banks)† | 5,088,300 | 59,022,160 | ||||||
| 262,222,083 | ||||||||
South Korea - 9.6% | ||||||||
Amorepacific Corp. (Household & Personal Products)† | 134,564 | 37,772,952 | ||||||
Hankook Tire Co., Ltd. (Automobiles & Components)† | 1,238,632 | 59,680,922 | ||||||
Hanssem Co., Ltd. (Consumer Durables & Apparel)† | 125,764 | 19,191,191 | ||||||
| Shares | Value | |||||||
| COMMON STOCKS - 91.8% (continued) | ||||||||
South Korea - 9.6% (continued) | ||||||||
LG Household & Health Care Ltd. (Household & Personal Products)† | 70,600 | $74,147,087 | ||||||
NAVER Corp. (Software & Services)† | 64,500 | 51,664,216 | ||||||
Samsung Electronics Co., Ltd. - GDR (Technology Hardware & Equipment)† | 180,009 | 222,339,067 | ||||||
| 464,795,435 | ||||||||
Taiwan - 10.8% | ||||||||
Advantech Co., Ltd. (Technology Hardware & Equipment)† | 6,185,201 | 42,286,559 | ||||||
Airtac International Group (Capital Goods)† | 2,419,515 | 39,246,511 | ||||||
Eclat Textile Co., Ltd. (Consumer Durables & Apparel)† | 3,921,752 | 46,921,596 | ||||||
Hon Hai Precision Industry Co., Ltd. (Technology Hardware & Equipment)† | 18,531,539 | 69,131,101 | ||||||
Largan Precision Co., Ltd. (Technology Hardware & Equipment)† | 448,000 | 85,484,271 | ||||||
Taiwan Semiconductor Manufacturing Co., Ltd. (Semiconductors & Semiconductor Equipment)† | 29,773,277 | 240,484,020 | ||||||
| 523,554,058 | ||||||||
Thailand - 1.3% | ||||||||
Siam Commercial Bank pcl, Reg S (Banks)† | 14,374,970 | 63,393,531 | ||||||
Turkey - 1.5% | ||||||||
Arcelik AS (Consumer Durables & Apparel)† | 4,677,900 | 25,549,365 | ||||||
Turkiye Garanti Bankasi AS (Banks)† | 16,576,400 | 45,569,743 | ||||||
| 71,119,108 | ||||||||
United Arab Emirates - 2.3% | ||||||||
DP World Ltd. (Transportation)† | 2,178,600 | 51,741,647 | ||||||
Emaar Properties PJSC (Real Estate)† | 27,206,881 | 61,579,299 | ||||||
| 113,320,946 | ||||||||
United Kingdom - 2.7% | ||||||||
BGEO Group plc (Banks)† | 981,009 | 46,360,457 | ||||||
Coca-Cola HBC AG - CDI (Food Beverage & Tobacco)*† | 1,984,900 | 67,065,932 | ||||||
Nostrum Oil & Gas plc (Energy)*† | 3,873,686 | 19,361,947 | ||||||
| 132,788,336 | ||||||||
Total Common Stocks (Cost $3,365,026,637) |
| $4,449,737,364 | ||||||
See Notes to Financial Statements
14
Table of Contents
Harding, Loevner Funds, Inc.
Institutional Emerging Markets Portfolio
Portfolio of Investments
October 31, 2017 (continued)
| Shares | Value | |||||||
| PREFERRED STOCKS - 6.0% | ||||||||
Brazil - 4.3% | ||||||||
Banco Bradesco SA - ADR (Banks)* | 6,595,535 | $69,714,805 | ||||||
Cia Brasileira de Distribuicao - Sponsored ADR (Food & Staples Retailing)* | 1,693,700 | 39,344,651 | ||||||
Itau Unibanco Holding SA - Sponsored ADR, 0.45% (Banks) | 7,572,881 | 97,008,606 | ||||||
| 206,068,062 | ||||||||
Colombia - 0.8% | ||||||||
Bancolombia SA - Sponsored ADR, 3.41% (Banks) | 1,065,200 | 40,211,300 | ||||||
South Korea - 0.9% | ||||||||
Samsung Electronics Co., Ltd. - GDR, Reg S, 1.19% (Technology Hardware & Equipment)† | 44,844 | 45,298,464 | ||||||
Total Preferred Stocks (Cost $199,703,291) |
| $291,577,826 | ||||||
| SHORT TERM INVESTMENTS - 2.1% | ||||||||
Northern Institutional Funds - Prime Obligations Portfolio, 1.19% (Money Market Fund) | 39,192,162 | 39,200,000 | ||||||
Northern Institutional Funds - Treasury Portfolio, 0.88% (Money Market Fund) | 60,529,549 | 60,529,549 | ||||||
Total Short Term Investments (Cost $99,729,549) |
| $99,729,549 | ||||||
Total Investments — 99.9% | ||||||||
(Cost $3,664,459,477) | $4,841,044,739 | |||||||
Other Assets Less Liabilities - 0.1% | 3,753,954 | |||||||
Net Assets — 100.0% | $4,844,798,693 | |||||||
Summary of Abbreviations
| ADR | American Depositary Receipt. |
| CDI | Chess Depository Interest. |
| GDR | Global Depository Receipt. |
| Reg S | Security sold outside United States without registration under the Securities Act of 1933. |
| * | Non-income producing security. |
| † | Investment categorized as level 2 security as disclosed in Note 2 of the Notes to Financial Statements. |
| Industry | | Percentage of Net Assets | | ||
Automobiles & Components | 4.2 | % | |||
Banks | 21.2 | ||||
Capital Goods | 1.5 | ||||
Commercial & Professional Services | 1.8 | ||||
Consumer Durables & Apparel | 4.4 | ||||
Consumer Services | 1.2 | ||||
Diversified Financials | 2.1 | ||||
Energy | 5.8 | ||||
Food & Staples Retailing | 1.2 | ||||
Food Beverage & Tobacco | 3.4 | ||||
Household & Personal Products | 2.3 | ||||
Insurance | 3.6 | ||||
Materials | 0.9 | ||||
Media | 2.1 | ||||
Pharmaceuticals, Biotechnology & Life Sciences | 4.4 | ||||
Real Estate | 1.3 | ||||
Retailing | 2.0 | ||||
Semiconductors & Semiconductor Equipment | 6.0 | ||||
Software & Services | 7.3 | ||||
Technology Hardware & Equipment | 12.0 | ||||
Telecommunication Services | 3.4 | ||||
Transportation | 3.9 | ||||
Utilities | 1.8 | ||||
Money Market Fund | 2.1 | ||||
Total Investments | 99.9 | ||||
Other Assets Less Liabilities | 0.1 | ||||
Net Assets | 100.0 | % | |||
See Notes to Financial Statements
15
Table of Contents
Emerging Markets Portfolio
Portfolio of Investments
October 31, 2017
| Shares | Value | |||||||
| COMMON STOCKS - 91.9% | ||||||||
Brazil - 2.7% | ||||||||
Ambev SA - ADR (Food Beverage & Tobacco) | 6,621,300 | $41,912,829 | ||||||
B3 SA - Brasil Bolsa Balcao (Diversified Financials)* | 4,881,600 | 35,664,794 | ||||||
WEG SA (Capital Goods) | 4,574,400 | 29,756,743 | ||||||
| 107,334,366 | ||||||||
Chile - 1.1% | ||||||||
Banco Santander Chile - ADR (Banks) | 1,444,300 | 45,177,704 | ||||||
China - 22.9% | ||||||||
51job Inc. - ADR (Commercial & Professional Services)* | 1,141,200 | 70,640,280 | ||||||
AAC Technologies Holdings Inc. (Technology Hardware & Equipment)† | 2,881,500 | 52,767,725 | ||||||
Alibaba Group Holding Ltd. - Sponsored ADR (Software & Services)* | 169,700 | 31,375,833 | ||||||
China Merchants Port Holdings Co., Ltd. (Transportation)† | 13,460,541 | 42,142,803 | ||||||
China Mobile Ltd. - Sponsored ADR (Telecommunication Services) | 731,700 | 36,914,265 | ||||||
CNOOC Ltd. - Sponsored ADR (Energy) | 518,160 | 70,832,472 | ||||||
Ctrip.com International Ltd. - ADR (Retailing)* | 546,900 | 26,191,041 | ||||||
ENN Energy Holdings Ltd. (Utilities)† | 10,158,700 | 74,585,361 | ||||||
Hangzhou Hikvision Digital Technology Co., Ltd., Class A (Technology Hardware & Equipment)† | 7,631,400 | 45,240,339 | ||||||
JD.com Inc. - ADR (Retailing)* | 1,455,300 | 54,602,856 | ||||||
Jiangsu Expressway Co., Ltd., Class H (Transportation)† | 14,409,000 | 22,139,471 | ||||||
Jiangsu Hengrui Medicine Co., Ltd., Class A (Pharmaceuticals, Biotechnology & Life Sciences)† | 3,025,350 | 30,673,228 | ||||||
Midea Group Co., Ltd., Class A (Consumer Durables & Apparel)† | 5,248,400 | 40,419,264 | ||||||
NetEase Inc. - ADR (Software & Services) | 56,631 | 15,965,411 | ||||||
Shenzhou International Group Holdings Ltd. (Consumer Durables & Apparel)† | 7,305,000 | 62,402,991 | ||||||
Sino Biopharmaceutical Ltd. (Pharmaceuticals, Biotechnology & Life Sciences)† | 34,609,192 | 40,423,358 | ||||||
Tencent Holdings Ltd. (Software & Services)† | 3,590,700 | 161,732,577 | ||||||
| Shares | Value | |||||||
| COMMON STOCKS - 91.9% (continued) | ||||||||
China - 22.9% (continued) | ||||||||
Weibo Corp. - Sponsored ADR (Software & Services)* | 437,400 | $40,525,110 | ||||||
| 919,574,385 | ||||||||
Czech Republic - 1.2% | ||||||||
Komercni banka AS (Banks)† | 1,078,700 | 46,362,626 | ||||||
Egypt - 0.6% | ||||||||
Commercial International Bank Egypt SAE - GDR, Reg S (Banks)† | 4,957,331 | 22,629,968 | ||||||
Hong Kong - 6.0% | ||||||||
AIA Group Ltd. (Insurance)† | 13,649,600 | 102,726,665 | ||||||
ASM Pacific Technology Ltd. (Semiconductors & Semiconductor Equipment)† | 2,996,423 | 43,770,963 | ||||||
Hong Kong Exchanges & Clearing Ltd. (Diversified Financials)† | 1,686,065 | 46,956,599 | ||||||
Sands China Ltd. (Consumer Services)† | 10,299,744 | 48,569,148 | ||||||
| 242,023,375 | ||||||||
Hungary - 1.3% | ||||||||
Richter Gedeon Nyrt. (Pharmaceuticals, Biotechnology & Life Sciences)† | 2,125,900 | 52,888,171 | ||||||
India - 5.1% | ||||||||
Bharti Airtel Ltd. (Telecommunication Services) | 4,048,200 | 31,074,976 | ||||||
Bharti Infratel Ltd. (Telecommunication | 4,903,300 | 33,543,279 | ||||||
Housing Development Finance Corp., Ltd. | 2,412,000 | 63,603,939 | ||||||
Maruti Suzuki India Ltd. (Automobiles & Components) | 606,800 | 76,925,897 | ||||||
| 205,148,091 | ||||||||
Indonesia - 2.7% | ||||||||
Astra International Tbk PT (Automobiles & Components)† | 71,024,000 | 41,896,226 | ||||||
Bank Rakyat Indonesia Persero Tbk PT (Banks)† | 57,881,938 | 66,703,797 | ||||||
| 108,600,023 | ||||||||
Italy - 1.0% | ||||||||
Tenaris SA - ADR (Energy) | 1,427,700 | 38,904,825 | ||||||
Kenya - 1.1% | ||||||||
East African Breweries Ltd. (Food Beverage & Tobacco)† | 4,757,850 | 11,210,291 | ||||||
See Notes to Financial Statements
16
Table of Contents
Harding, Loevner Funds, Inc.
Emerging Markets Portfolio
Portfolio of Investments
October 31, 2017 (continued)
| Shares | Value | |||||||
| COMMON STOCKS - 91.9% (continued) | ||||||||
Kenya - 1.1% (continued) | ||||||||
Safaricom Ltd. (Telecommunication | 138,989,351 | $34,127,590 | ||||||
| 45,337,881 | ||||||||
Mexico - 4.4% | ||||||||
Fomento Economico Mexicano SAB de | 216,000 | 18,954,000 | ||||||
Grupo Aeroportuario del Sureste SAB de | 279,700 | 50,007,563 | ||||||
Grupo Financiero Banorte SAB de CV, | 10,603,140 | 62,927,238 | ||||||
Grupo Televisa SAB - Sponsored ADR (Media) | 2,048,710 | 44,846,262 | ||||||
| 176,735,063 | ||||||||
Peru - 1.2% | ||||||||
Credicorp Ltd. (Banks) | 221,400 | 46,370,016 | ||||||
Philippines - 0.2% | ||||||||
Universal Robina Corp. (Food Beverage & Tobacco)† | 3,080,840 | 8,535,926 | ||||||
Poland - 1.1% | ||||||||
Bank Pekao SA (Banks)† | 1,341,600 | 43,870,856 | ||||||
Russia - 5.7% | ||||||||
Lukoil PJSC - Sponsored ADR (Energy) | 1,299,193 | 68,896,205 | ||||||
Magnit PJSC (Food & Staples Retailing) | 106,707 | 14,069,548 | ||||||
Novatek PJSC - Sponsored GDR, Reg S (Energy)† | 347,746 | 39,694,087 | ||||||
Sberbank of Russia PJSC - Sponsored ADR (Banks)† | 7,421,200 | 106,473,240 | ||||||
| 229,133,080 | ||||||||
South Africa - 5.4% | ||||||||
Aspen Pharmacare Holdings Ltd. (Pharmaceuticals, Biotechnology & Life Sciences)† | 2,409,200 | 54,434,560 | ||||||
Discovery Ltd. (Insurance)† | 4,012,300 | 41,654,973 | ||||||
Naspers Ltd., Class N (Media)† | 153,900 | 38,024,111 | ||||||
Sasol Ltd. (Materials)† | 1,172,261 | 34,456,752 | ||||||
Standard Bank Group Ltd. (Banks)† | 4,221,000 | 48,961,841 | ||||||
| 217,532,237 | ||||||||
South Korea - 9.6% | ||||||||
Amorepacific Corp. (Household & Personal Products)† | 111,577 | 31,320,358 | ||||||
Hankook Tire Co., Ltd. (Automobiles & Components)† | 1,027,538 | 49,509,794 | ||||||
Hanssem Co., Ltd. (Consumer Durables & Apparel)† | 104,267 | 15,910,816 | ||||||
| Shares | Value | |||||||
| COMMON STOCKS - 91.9% (continued) | ||||||||
South Korea - 9.6% (continued) | ||||||||
LG Household & Health Care Ltd. (Household & Personal Products)† | 58,600 | $61,544,183 | ||||||
NAVER Corp. (Software & Services)† | 53,400 | 42,773,164 | ||||||
Samsung Electronics Co., Ltd. - GDR (Technology Hardware & Equipment)† | 149,262 | 184,361,748 | ||||||
| 385,420,063 | ||||||||
Taiwan - 10.8% | ||||||||
Advantech Co., Ltd. (Technology Hardware & Equipment)† | 5,130,462 | 35,075,591 | ||||||
Airtac International Group (Capital Goods)† | 2,007,397 | 32,561,620 | ||||||
Eclat Textile Co., Ltd. (Consumer Durables & Apparel)† | 3,253,216 | 38,922,932 | ||||||
Hon Hai Precision Industry Co., Ltd. (Technology Hardware & Equipment)† | 15,373,171 | 57,348,946 | ||||||
Largan Precision Co., Ltd. (Technology Hardware & Equipment)† | 372,001 | 70,982,666 | ||||||
Taiwan Semiconductor Manufacturing Co., Ltd. (Semiconductors & Semiconductor Equipment)† | 24,698,637 | 199,495,257 | ||||||
| 434,387,012 | ||||||||
Thailand - 1.3% | ||||||||
Siam Commercial Bank pcl, Reg S (Banks)† | 11,924,700 | 52,587,855 | ||||||
Turkey - 1.5% | ||||||||
Arcelik AS (Consumer Durables & Apparel)† | 3,880,600 | 21,194,738 | ||||||
Turkiye Garanti Bankasi AS (Banks)† | 13,750,900 | 37,802,236 | ||||||
| 58,996,974 | ||||||||
United Arab Emirates - 2.3% | ||||||||
DP World Ltd. (Transportation)† | 1,807,200 | 42,920,915 | ||||||
Emaar Properties PJSC (Real Estate)† | 22,569,366 | 51,082,876 | ||||||
| 94,003,791 | ||||||||
United Kingdom - 2.7% | ||||||||
BGEO Group plc (Banks)† | 813,754 | 38,456,331 | ||||||
Coca-Cola HBC AG - CDI (Food Beverage & Tobacco)*† | 1,646,600 | 55,635,429 | ||||||
Nostrum Oil & Gas plc (Energy)*† | 3,212,300 | 16,056,125 | ||||||
| 110,147,885 | ||||||||
Total Common Stocks (Cost $2,578,172,830) | $3,691,702,173 | |||||||
See Notes to Financial Statements
17
Table of Contents
Harding, Loevner Funds, Inc.
Emerging Markets Portfolio
Portfolio of Investments
October 31, 2017 (continued)
| Shares | Value | |||||||
| PREFERRED STOCKS - 6.0% | ||||||||
Brazil - 4.3% | ||||||||
Banco Bradesco SA - ADR (Banks)* | 5,471,300 | $57,831,641 | ||||||
Cia Brasileira de Distribuicao - Sponsored ADR (Food & Staples Retailing)* | 1,405,000 | 32,638,150 | ||||||
Itau Unibanco Holding SA - Sponsored ADR, 0.45% (Banks) | 6,282,100 | 80,473,701 | ||||||
| 170,943,492 | ||||||||
Colombia - 0.8% | ||||||||
Bancolombia SA - Sponsored ADR, 3.41% (Banks) | 883,600 | 33,355,900 | ||||||
South Korea - 0.9% | ||||||||
Samsung Electronics Co., Ltd. - GDR, Reg S, 1.19% (Technology Hardware & Equipment)† | 37,182 | 37,558,815 | ||||||
Total Preferred Stocks (Cost $146,536,546) |
| $241,858,207 | ||||||
| SHORT TERM INVESTMENTS - 1.9% | ||||||||
Northern Institutional Funds - Prime Obligations Portfolio, 1.19% (Money Market Fund) | 32,293,541 | 32,300,000 | ||||||
Northern Institutional Funds - Treasury Portfolio, 0.88% (Money Market Fund) | 42,891,356 | 42,891,356 | ||||||
Total Short Term Investments (Cost $75,191,356) |
| $75,191,356 | ||||||
Total Investments — 99.8% | ||||||||
(Cost $2,799,900,732) | $4,008,751,736 | |||||||
Other Assets Less Liabilities - 0.2% | 6,224,796 | |||||||
Net Assets — 100.0% | $4,014,976,532 | |||||||
Summary of Abbreviations
| ADR | American Depositary Receipt. |
| CDI | Chess Depository Interest. |
| GDR | Global Depository Receipt. |
| Reg S | Security sold outside United States without registration under the Securities Act of 1933. |
| * | Non-income producing security. |
| † | Investment categorized as level 2 security as disclosed in Note 2 of the Notes to Financial Statements. |
| Industry | | Percentage of Net Assets | | ||
Automobiles & Components | 4.2 | % | |||
Banks | 21.3 | ||||
Capital Goods | 1.5 | ||||
Commercial & Professional Services | 1.8 | ||||
Consumer Durables & Apparel | 4.4 | ||||
Consumer Services | 1.2 | ||||
Diversified Financials | 2.0 | ||||
Energy | 5.8 | ||||
Food & Staples Retailing | 1.2 | ||||
Food Beverage & Tobacco | 3.4 | ||||
Household & Personal Products | 2.3 | ||||
Insurance | 3.6 | ||||
Materials | 0.9 | ||||
Media | 2.1 | ||||
Pharmaceuticals, Biotechnology & Life Sciences | 4.4 | ||||
Real Estate | 1.3 | ||||
Retailing | 2.0 | ||||
Semiconductors & Semiconductor Equipment | 6.1 | ||||
Software & Services | 7.3 | ||||
Technology Hardware & Equipment | 12.0 | ||||
Telecommunication Services | 3.4 | ||||
Transportation | 3.9 | ||||
Utilities | 1.8 | ||||
Money Market Fund | 1.9 | ||||
Total Investments | 99.8 | ||||
Other Assets Less Liabilities | 0.2 | ||||
Net Assets | 100.0 | % | |||
See Notes to Financial Statements
18
Table of Contents
Frontier Emerging Markets Portfolio
Portfolio of Investments
October 31, 2017
| Shares | Value | |||||||
| COMMON STOCKS - 93.3% | ||||||||
Argentina - 9.5% | ||||||||
Banco Macro SA - ADR (Banks) | 127,092 | $16,003,425 | ||||||
Cablevision Holding SA - Sponsored GDR | 269,626 | 6,210,215 | ||||||
Globant SA (Software & Services)* | 229,000 | 8,637,880 | ||||||
Grupo Clarin SA, Class B - GDR Reg S | 79,686 | 483,327 | ||||||
Grupo Financiero Galicia SA - ADR (Banks) | 233,700 | 12,830,130 | ||||||
| 44,164,977 | ||||||||
Bangladesh - 6.3% | ||||||||
BRAC Bank Ltd. (Banks)† | 724,200 | 879,498 | ||||||
GrameenPhone Ltd. (Telecommunication | 1,562,200 | 8,252,840 | ||||||
Olympic Industries Ltd. (Food Beverage & Tobacco)† | 1,928,489 | 5,957,187 | ||||||
Square Pharmaceuticals Ltd. (Pharmaceuticals, Biotechnology & Life Sciences)† | 3,899,183 | 13,979,456 | ||||||
| 29,068,981 | ||||||||
Colombia - 5.8% | ||||||||
Cementos Argos SA - Sponsored ADR | 510,900 | 9,321,013 | ||||||
Cemex Latam Holdings SA (Materials)* | 980,500 | 3,474,562 | ||||||
Ecopetrol SA - Sponsored ADR (Energy) | 1,042,900 | 11,565,761 | ||||||
Grupo Nutresa SA (Food Beverage & Tobacco) | 312,300 | 2,773,901 | ||||||
| 27,135,237 | ||||||||
Croatia - 0.5% | ||||||||
Ericsson Nikola Tesla (Technology Hardware & Equipment)† | 13,950 | 2,494,371 | ||||||
Egypt - 4.5% | ||||||||
Commercial International Bank Egypt SAE - GDR, Reg S (Banks)† | 2,557,300 | 11,673,947 | ||||||
Integrated Diagnostics Holdings plc (Health Care Equipment & Services)† | 1,385,100 | 5,403,619 | ||||||
Oriental Weavers (Consumer Durables & | 3,490,125 | 3,601,946 | ||||||
| 20,679,512 | ||||||||
Estonia - 1.4% | ||||||||
Olympic Entertainment Group AS (Consumer Services)† | 1,473,000 | 3,191,014 | ||||||
Tallink Grupp AS (Transportation)† | 2,640,800 | 3,260,972 | ||||||
| 6,451,986 | ||||||||
| Shares | Value | |||||||
| COMMON STOCKS - 93.3% (continued) | ||||||||
Kazakhstan - 1.9% | ||||||||
Halyk Savings Bank of Kazakhstan JSC - GDR, Reg S (Banks)*† | 925,530 | $9,021,445 | ||||||
Kenya - 4.9% | ||||||||
East African Breweries Ltd. (Food Beverage & Tobacco)† | 935,700 | 2,204,666 | ||||||
Safaricom Ltd. (Telecommunication Services)† | 83,896,450 | 20,600,022 | ||||||
| 22,804,688 | ||||||||
Kuwait - 1.9% | ||||||||
Kuwait Projects Co. Holding KSCP (Diversified Financials)† | 678,200 | 759,950 | ||||||
Mabanee Co. SAK (Real Estate)† | 711,900 | 1,846,192 | ||||||
National Bank of Kuwait SAKP (Banks) | 2,472,675 | 6,267,488 | ||||||
| 8,873,630 | ||||||||
Morocco - 2.1% | ||||||||
Attijariwafa Bank (Banks)† | 122,900 | 6,125,334 | ||||||
Maroc Telecom (Telecommunication Services)† | 250,300 | 3,565,328 | ||||||
| 9,690,662 | ||||||||
Nigeria - 5.4% | ||||||||
Access Bank plc (Banks)† | 121,738,600 | 3,311,808 | ||||||
Dangote Cement plc (Materials)† | 7,077,500 | 4,406,605 | ||||||
Guaranty Trust Bank plc (Banks)† | 57,497,800 | 6,709,029 | ||||||
Lafarge Africa plc (Materials)† | 1,100,000 | 152,660 | ||||||
Nestle Nigeria plc (Food Beverage & Tobacco)† | 551,600 | 1,918,572 | ||||||
Nigerian Breweries plc (Food Beverage & Tobacco)† | 3,894,100 | 1,625,581 | ||||||
Zenith Bank plc (Banks)† | 100,704,392 | 7,137,974 | ||||||
| 25,262,229 | ||||||||
Pakistan - 2.7% | ||||||||
Engro Corp., Ltd. (Materials)† | 532,092 | 1,404,857 | ||||||
Lucky Cement Ltd. (Materials)† | 114,500 | 529,202 | ||||||
Maple Leaf Cement Factory Ltd. (Materials)† | 1,624,000 | 1,040,261 | ||||||
MCB Bank Ltd. (Banks)† | 1,393,700 | 2,633,241 | ||||||
Oil & Gas Development Co., Ltd. (Energy)† | 1,173,400 | 1,599,612 | ||||||
Pakistan Petroleum Ltd. (Energy)† | 2,236,597 | 3,819,707 | ||||||
United Bank Ltd. (Banks)† | 849,000 | 1,444,122 | ||||||
| 12,471,002 | ||||||||
Peru - 7.3% | ||||||||
Alicorp SAA (Food Beverage & Tobacco) | 4,663,746 | 14,562,997 | ||||||
Credicorp Ltd. (Banks) | 79,616 | 16,674,775 | ||||||
See Notes to Financial Statements
19
Table of Contents
Harding, Loevner Funds, Inc.
Frontier Emerging Markets Portfolio
Portfolio of Investments
October 31, 2017 (continued)
| Shares | Value | |||||||
| COMMON STOCKS - 93.3% (continued) | ||||||||
Peru - 7.3% (continued) | ||||||||
Ferreycorp SAA (Capital Goods) | 3,366,100 | $2,630,332 | ||||||
| 33,868,104 | ||||||||
Philippines - 16.1% | ||||||||
Bank of the Philippine Islands (Banks)† | 4,936,592 | 9,377,998 | ||||||
BDO Unibank Inc. (Banks)† | 2,089,368 | 5,555,131 | ||||||
International Container Terminal Services Inc. (Transportation)† | 2,847,620 | 5,827,394 | ||||||
Jollibee Foods Corp. (Consumer Services)† | 2,596,900 | 12,525,747 | ||||||
Robinsons Retail Holdings Inc. (Food & Staples Retailing)† | 5,340,100 | 10,030,408 | ||||||
Security Bank Corp. (Banks)† | 2,497,400 | 11,892,661 | ||||||
SM Prime Holdings Inc. (Real Estate)† | 15,515,200 | 11,132,051 | ||||||
Universal Robina Corp. (Food Beverage & Tobacco)† | 3,121,300 | 8,648,026 | ||||||
| 74,989,416 | ||||||||
Romania - 1.8% | ||||||||
Banca Transilvania SA (Banks)† | 15,426,163 | 8,588,005 | ||||||
Senegal - 0.9% | ||||||||
Sonatel (Telecommunication Services) | 98,400 | 4,018,996 | ||||||
Slovenia - 0.6% | ||||||||
Krka dd Novo mesto (Pharmaceuticals, Biotechnology & Life Sciences)† | 46,124 | 2,949,645 | ||||||
Sri Lanka - 0.5% | ||||||||
Commercial Bank of Ceylon plc (Banks)† | 1,255,532 | 1,223,469 | ||||||
John Keells Holdings plc (Capital Goods)† | 1,257,142 | 1,306,048 | ||||||
| 2,529,517 | ||||||||
Tanzania - 0.3% | ||||||||
Tanzania Breweries Ltd. (Food Beverage & Tobacco) | 208,066 | 1,221,468 | ||||||
Thailand - 1.3% | ||||||||
Home Product Center pcl, Reg S (Retailing)† | 11,062,794 | 4,262,606 | ||||||
Siam Commercial Bank pcl, Reg S (Banks)† | 393,600 | 1,735,773 | ||||||
| 5,998,379 | ||||||||
Turkey - 0.4% | ||||||||
Turkiye Garanti Bankasi AS (Banks)† | 674,500 | 1,854,250 | ||||||
Ukraine - 1.4% | ||||||||
Kernel Holding SA (Food Beverage & Tobacco)† | 286,400 | 3,848,878 | ||||||
| Shares | Value | |||||||
| COMMON STOCKS - 93.3% (continued) | ||||||||
Ukraine - 1.4% (continued) | ||||||||
MHP SE - GDR (Food Beverage & Tobacco)† | 222,939 | $2,497,798 | ||||||
| 6,346,676 | ||||||||
United Arab Emirates - 5.0% | ||||||||
Agthia Group PJSC (Food Beverage & Tobacco)† | 2,931,716 | 4,158,452 | ||||||
DP World Ltd. (Transportation)† | 247,800 | 5,885,238 | ||||||
Emaar Properties PJSC (Real Estate)† | 5,786,500 | 13,097,004 | ||||||
| 23,140,694 | ||||||||
United Kingdom - 2.4% | ||||||||
BGEO Group plc (Banks)† | 37,900 | 1,791,076 | ||||||
Nostrum Oil & Gas plc (Energy)*† | 1,836,000 | 9,176,927 | ||||||
| 10,968,003 | ||||||||
United States - 0.8% | ||||||||
PriceSmart Inc. (Food & Staples Retailing) | 42,277 | 3,542,813 | ||||||
Vietnam - 7.6% | ||||||||
Hoa Phat Group JSC (Materials)*† | 13,337,302 | 21,751,346 | ||||||
Masan Group Corp. (Food Beverage & Tobacco)† | 1,543,350 | 4,045,370 | ||||||
Vietnam Dairy Products JSC (Food Beverage & Tobacco)† | 1,410,100 | 9,375,276 | ||||||
| 35,171,992 | ||||||||
Total Common Stocks (Cost $352,437,396) | $433,306,678 | |||||||
| PREFERRED STOCKS - 1.8% | ||||||||
Colombia - 1.8% | ||||||||
Bancolombia SA - Sponsored ADR, 3.41% (Banks) | 228,768 | 8,635,992 | ||||||
Total Preferred Stocks (Cost $8,411,607) | $8,635,992 | |||||||
| PARTICIPATION NOTES - 4.6% | ||||||||
Saudi Arabia - 4.6% | ||||||||
Al Rajhi Bank, Issued by JP Morgan Structured Products, Maturity Date 12/5/19 (Banks)†^ | 454,400 | 7,795,889 | ||||||
Herfy Food Services Co., Issued by JP Morgan Structured Products, Maturity Date 1/14/19 (Consumer Services)†^ | 104,620 | 1,324,050 | ||||||
Jarir Marketing Co., Issued by HSBC BANK PLC, Maturity Date 1/22/18 (Retailing)†^ | 276,700 | 10,397,314 | ||||||
See Notes to Financial Statements
20
Table of Contents
Harding, Loevner Funds, Inc.
Frontier Emerging Markets Portfolio
Portfolio of Investments
October 31, 2017 (continued)
| Shares | Value | |||||||
| PARTICIPATION NOTES - 4.6% (continued) | ||||||||
Saudi Arabia - 4.6% (continued) | ||||||||
Saudi British Bank, Issued by JP Morgan Structured Products, Maturity Date 12/9/19 (Banks)†^ | 277,400 | $1,825,485 | ||||||
| 21,342,738 | ||||||||
Total Participation Notes (Cost $24,890,137) | $21,342,738 | |||||||
| SHORT TERM INVESTMENTS - 0.8% | ||||||||
Northern Institutional Funds - Treasury Portfolio, 0.88% (Money Market Fund) | 3,733,709 | 3,733,709 | ||||||
Total Short Term Investments (Cost $3,733,709) |
| $3,733,709 | ||||||
Total Investments — 100.5% | ||||||||
(Cost $389,472,849) | $467,019,117 | |||||||
Liabilities Less Other Assets - (0.5)% | (2,495,608 | ) | ||||||
Net Assets — 100.0% | $464,523,509 | |||||||
Summary of Abbreviations
| ADR | American Depositary Receipt. |
| GDR | Global Depository Receipt. |
| Reg S | Security sold outside United States without registration under the Securities Act of 1933. |
| # | Security valued at fair value as determined in good faith under policies and procedures established by and under the supervision of the Portfolio’s Board of Directors as disclosed in Note 2 of the Notes to Financial Statements. |
| * | Non-income producing security. |
| ^ | Security exempt from registration pursuant to Rule 144A of the Securities Act of 1933. These securities, which represent 4.6% of net assets as of October 31, 2017, are considered liquid and may be resold in transactions exempt from registration, normally to qualified buyers. |
| † | Investment categorized as level 2 security as disclosed in Note 2 of the Notes to Financial Statements. |
| Industry | | Percentage of Net Assets | | ||
Banks | 34.7 | % | |||
Capital Goods | 0.8 | ||||
Consumer Durables & Apparel | 0.8 | ||||
Consumer Services | 3.7 | ||||
Diversified Financials | 0.2 | ||||
Energy | 5.6 | ||||
Food & Staples Retailing | 2.9 | ||||
Food Beverage & Tobacco | 13.5 | ||||
Health Care Equipment & Services | 1.2 | ||||
Materials | 9.1 | ||||
Media | 1.4 | ||||
Pharmaceuticals, Biotechnology & Life Sciences | 3.6 | ||||
Real Estate | 5.6 | ||||
Retailing | 3.2 | ||||
Software & Services | 1.9 | ||||
Technology Hardware & Equipment | 0.5 | ||||
Telecommunication Services | 7.8 | ||||
Transportation | 3.2 | ||||
Money Market Fund | 0.8 | ||||
Total Investments | 100.5 | ||||
Liabilities Less Other Assets | (0.5 | ) | |||
Net Assets | 100.0 | % | |||
See Notes to Financial Statements
21
Table of Contents
Global Equity Research Portfolio
Portfolio of Investments
October 31, 2017
| Shares | Value | |||||||
| COMMON STOCKS - 97.4% | ||||||||
Argentina - 1.1% | ||||||||
Banco Macro SA - ADR (Banks) | 250 | $31,480 | ||||||
Cablevision Holding SA - Sponsored GDR (Media)#*† | 314 | 7,232 | ||||||
Globant SA (Software & Services)* | 290 | 10,939 | ||||||
Grupo Financiero Galicia SA - ADR (Banks) | 310 | 17,019 | ||||||
| 66,670 | ||||||||
Australia - 1.4% | ||||||||
CSL Ltd. (Pharmaceuticals, Biotechnology & Life Sciences)† | 180 | 19,198 | ||||||
DuluxGroup Ltd. (Materials)† | 4,340 | 24,573 | ||||||
SEEK Ltd. (Commercial & Professional Services)† | 2,150 | 30,252 | ||||||
TPG Telecom Ltd. (Telecommunication Services)† | 1,810 | 7,485 | ||||||
| 81,508 | ||||||||
Brazil - 0.6% | ||||||||
Ambev SA - ADR (Food Beverage & Tobacco) | 1,430 | 9,052 | ||||||
B3 SA - Brasil Bolsa Balcao (Diversified Financials)* | 1,200 | 8,767 | ||||||
Ultrapar Participacoes SA - Sponsored ADR (Energy) | 340 | 8,123 | ||||||
WEG SA (Capital Goods) | 1,400 | 9,107 | ||||||
| 35,049 | ||||||||
Canada - 1.3% | ||||||||
Alimentation Couche-Tard Inc. (Food & Staples Retailing) | 800 | 37,827 | ||||||
Canadian National Railway Co. (Transportation) | 150 | 12,073 | ||||||
Cenovus Energy Inc. (Energy) | 1,500 | 14,557 | ||||||
Encana Corp. (Energy) | 1,110 | 12,987 | ||||||
| 77,444 | ||||||||
China - 5.8% | ||||||||
51job Inc. - ADR (Commercial & Professional | 320 | 19,808 | ||||||
AAC Technologies Holdings Inc. (Technology Hardware & Equipment)† | 670 | 12,269 | ||||||
Alibaba Group Holding Ltd. - Sponsored ADR (Software & Services)* | 55 | 10,169 | ||||||
ANTA Sports Products Ltd. (Consumer Durables & Apparel)† | 3,000 | 13,493 | ||||||
China Merchants Port Holdings Co., Ltd. (Transportation)† | 2,000 | 6,262 | ||||||
China Mobile Ltd. - Sponsored ADR (Telecommunication Services) | 130 | 6,559 | ||||||
CNOOC Ltd. - Sponsored ADR (Energy) | 119 | 16,267 | ||||||
| Shares | Value | |||||||
| COMMON STOCKS - 97.4% (continued) | ||||||||
China - 5.8% (continued) | ||||||||
ENN Energy Holdings Ltd. (Utilities)† | 2,000 | $14,684 | ||||||
Fuyao Glass Industry Group Co., Ltd., Class H (Automobiles & Components)† | 5,200 | 19,857 | ||||||
Gree Electric Appliances Inc. of Zhuhai, Class A (Consumer Durables & Apparel)† | 1,700 | 10,911 | ||||||
Haitian International Holdings Ltd. (Capital Goods)† | 4,000 | 12,094 | ||||||
Hangzhou Hikvision Digital Technology Co., Ltd., Class A (Technology Hardware & Equipment)† | 2,250 | 13,338 | ||||||
Inner Mongolia Yili Industrial Group Co., Ltd., Class A (Food Beverage & Tobacco)† | 8,300 | 36,996 | ||||||
JD.com Inc. - ADR (Retailing)* | 270 | 10,130 | ||||||
Jiangsu Expressway Co., Ltd., Class H (Transportation)† | 6,000 | 9,219 | ||||||
Jiangsu Hengrui Medicine Co., Ltd., Class A (Pharmaceuticals, Biotechnology & Life Sciences)† | 3,000 | 30,441 | ||||||
Midea Group Co., Ltd., Class A (Consumer Durables & Apparel)† | 1,500 | 11,552 | ||||||
NetEase Inc. - ADR (Software & Services) | 27 | 7,612 | ||||||
Shenzhou International Group Holdings Ltd. (Consumer Durables & Apparel)† | 1,000 | 8,543 | ||||||
Sino Biopharmaceutical Ltd. (Pharmaceuticals, Biotechnology & Life Sciences)† | 12,000 | 14,016 | ||||||
Sun Art Retail Group Ltd. (Food & Staples Retailing)† | 8,000 | 8,081 | ||||||
Sunny Optical Technology Group Co. Ltd. (Technology Hardware & Equipment)† | 1,000 | 14,680 | ||||||
Suofeiya Home Collection Co., Ltd., Class A (Consumer Durables & Apparel)† | 1,600 | 9,386 | ||||||
Tencent Holdings Ltd. (Software & Services)† | 300 | 13,513 | ||||||
Tingyi Cayman Islands Holding Corp. (Food Beverage & Tobacco)† | 6,000 | 9,479 | ||||||
| 339,359 | ||||||||
Colombia - 0.6% | ||||||||
Cementos Argos SA - Sponsored ADR (Materials)#† | 370 | 6,750 | ||||||
Cemex Latam Holdings SA (Materials)* | 2,090 | 7,406 | ||||||
See Notes to Financial Statements
22
Table of Contents
Harding, Loevner Funds, Inc.
Global Equity Research Portfolio
Portfolio of Investments
October 31, 2017 (continued)
| Shares | Value | |||||||
| COMMON STOCKS - 97.4% (continued) | ||||||||
Colombia - 0.6% (continued) | ||||||||
Ecopetrol SA - Sponsored ADR (Energy) | 800 | $8,872 | ||||||
Grupo Nutresa SA (Food Beverage & Tobacco) | 1,370 | 12,169 | ||||||
| 35,197 | ||||||||
Denmark - 0.5% | ||||||||
Coloplast A/S, Class B (Health Care Equipment & Services)† | 150 | 13,190 | ||||||
Novozymes A/S, Class B (Materials)† | 290 | 16,017 | ||||||
| 29,207 | ||||||||
Egypt - 0.8% | ||||||||
Commercial International Bank Egypt SAE - GDR, Reg S (Banks)† | 10,240 | 46,745 | ||||||
France - 0.9% | ||||||||
Dassault Systemes SE (Software & Services)† | 130 | 13,809 | ||||||
Essilor International SA (Health Care Equipment & Services)† | 320 | 40,532 | ||||||
| 54,341 | ||||||||
Germany - 3.4% | ||||||||
adidas AG (Consumer Durables & Apparel)† | 60 | 13,352 | ||||||
Allianz SE, Reg S (Insurance)† | 60 | 13,933 | ||||||
Bayer AG, Reg S (Pharmaceuticals, Biotechnology & Life Sciences)† | 100 | 13,061 | ||||||
Bayerische Motoren Werke AG (Automobiles & Components)† | 350 | 35,674 | ||||||
FUCHS PETROLUB SE (Materials)† | 220 | 10,958 | ||||||
Gerresheimer AG (Pharmaceuticals, Biotechnology & Life Sciences)† | 260 | 20,677 | ||||||
Henkel AG & Co. KGaA (Household & Personal | 90 | 11,333 | ||||||
Infineon Technologies AG (Semiconductors & Semiconductor Equipment)† | 1,190 | 32,581 | ||||||
Linde AG (Materials)*† | 110 | 23,621 | ||||||
SAP SE - Sponsored ADR (Software & Services) | 110 | 12,562 | ||||||
Symrise AG (Materials)† | 160 | 12,459 | ||||||
| 200,211 | ||||||||
Hong Kong - 0.6% | ||||||||
AIA Group Ltd. (Insurance)† | 1,600 | 12,041 | ||||||
| Shares | Value | |||||||
| COMMON STOCKS - 97.4% (continued) | ||||||||
Hong Kong - 0.6% (continued) | ||||||||
ASM Pacific Technology Ltd. (Semiconductors & Semiconductor Equipment)† | 1,000 | $14,608 | ||||||
Hong Kong Exchanges & Clearing Ltd. (Diversified Financials)† | 400 | 11,140 | ||||||
| 37,789 | ||||||||
Hungary - 0.4% | ||||||||
Richter Gedeon Nyrt. (Pharmaceuticals, Biotechnology & Life Sciences)† | 930 | 23,137 | ||||||
India - 3.5% | ||||||||
Asian Paints Ltd. (Materials)† | 460 | 8,392 | ||||||
Bharti Infratel Ltd. (Telecommunication Services)† | 4,020 | 27,501 | ||||||
Dabur India Ltd. (Household & Personal Products)† | 1,710 | 8,801 | ||||||
Emami Ltd. (Household & Personal Products)† | 450 | 8,760 | ||||||
HDFC Bank Ltd. - ADR (Banks) | 250 | 23,075 | ||||||
Housing Development Finance Corp., Ltd. (Banks)† | 390 | 10,284 | ||||||
ICICI Bank Ltd. - Sponsored ADR (Banks) | 1,034 | 9,461 | ||||||
Infosys Ltd. - Sponsored ADR (Software & Services) | 3,310 | 49,153 | ||||||
ITC Ltd. (Food Beverage & Tobacco)† | 2,090 | 8,597 | ||||||
Kotak Mahindra Bank Ltd. (Banks) | 590 | 9,337 | ||||||
Max Financial Services Ltd. (Insurance)* | 1,630 | 14,772 | ||||||
Pidilite Industries Ltd. (Materials) | 1,120 | 13,519 | ||||||
United Spirits Ltd. (Food Beverage & Tobacco)*† | 220 | 10,366 | ||||||
| 202,018 | ||||||||
Indonesia - 1.2% | ||||||||
Bank Central Asia Tbk PT (Banks)† | 34,500 | 53,293 | ||||||
Bank Rakyat Indonesia Persero Tbk PT (Banks)† | 8,500 | 9,796 | ||||||
Kalbe Farma Tbk PT (Pharmaceuticals, Biotechnology & Life Sciences)† | 62,500 | 7,377 | ||||||
| 70,466 | ||||||||
Israel - 0.9% | ||||||||
Check Point Software Technologies Ltd. (Software & Services)* | 450 | 52,969 | ||||||
Italy - 0.3% | ||||||||
Tenaris SA - ADR (Energy) | 720 | 19,620 | ||||||
See Notes to Financial Statements
23
Table of Contents
Harding, Loevner Funds, Inc.
Global Equity Research Portfolio
Portfolio of Investments
October 31, 2017 (continued)
| Shares | Value | |||||||
| COMMON STOCKS - 97.4% (continued) | ||||||||
Japan - 11.3% | ||||||||
ABC-Mart Inc. (Retailing)† | 200 | $10,069 | ||||||
Asics Corp. (Consumer Durables & Apparel)† | 600 | 9,124 | ||||||
Daito Trust Construction Co., Ltd. (Real Estate)† | 128 | 22,343 | ||||||
Dentsu Inc. (Media)† | 500 | 21,343 | ||||||
FANUC Corp. (Capital Goods)† | 200 | 46,889 | ||||||
Fast Retailing Co., Ltd. (Retailing)† | 100 | 33,441 | ||||||
Hakuhodo DY Holdings Inc. (Media)† | 3,100 | 42,930 | ||||||
JGC Corp. (Capital Goods)† | 1,300 | 21,769 | ||||||
Kakaku.com Inc. (Software & Services)† | 600 | 8,248 | ||||||
Kao Corp. (Household & Personal Products)† | 600 | 36,279 | ||||||
Komatsu Ltd. (Capital Goods)† | 1,600 | 52,657 | ||||||
Kubota Corp. (Capital Goods)† | 1,600 | 30,161 | ||||||
M3 Inc. (Health Care Equipment & Services)† | 400 | 11,985 | ||||||
Makita Corp. (Capital Goods)† | 1,200 | 50,508 | ||||||
MISUMI Group Inc. (Capital Goods)† | 1,600 | 43,970 | ||||||
Mitsubishi Estate Co., Ltd. (Real Estate)† | 2,500 | 45,339 | ||||||
NGK Insulators Ltd. (Capital Goods)† | 700 | 13,813 | ||||||
Nidec Corp. (Capital Goods)† | 400 | 52,947 | ||||||
Nomura Research Institute Ltd. (Software & Services)† | 330 | 14,044 | ||||||
Rinnai Corp. (Consumer Durables & Apparel)† | 120 | 10,234 | ||||||
SMC Corp. (Capital Goods)† | 40 | 15,348 | ||||||
Stanley Electric Co., Ltd. (Automobiles & Components)† | 500 | 18,464 | ||||||
Suruga Bank Ltd. (Banks)† | 1,600 | 36,185 | ||||||
Sysmex Corp. (Health Care Equipment & Services)† | 200 | 13,711 | ||||||
| 661,801 | ||||||||
Mexico - 1.1% | ||||||||
Coca-Cola Femsa SAB de CV - Sponsored ADR (Food Beverage & Tobacco) | 110 | 7,528 | ||||||
El Puerto de Liverpool SAB de CV, Series C1 (Retailing) | 1,100 | 7,493 | ||||||
Fomento Economico Mexicano SAB de CV - Sponsored ADR (Food Beverage & Tobacco) | 90 | 7,897 | ||||||
Grupo Financiero Banorte SAB de CV, Series O (Banks) | 1,400 | 8,309 | ||||||
Grupo Financiero Santander Mexico SAB de CV, Series B - ADR (Banks) | 1,000 | 8,420 | ||||||
| Shares | Value | |||||||
| COMMON STOCKS - 97.4% (continued) | ||||||||
Mexico - 1.1% (continued) | ||||||||
Grupo Televisa SAB - Sponsored ADR (Media) | 350 | $7,662 | ||||||
Kimberly-Clark de Mexico SAB de CV, Series A (Household & Personal Products) | 3,900 | 6,715 | ||||||
Wal-Mart de Mexico SAB de CV (Food & Staples Retailing) | 3,700 | 8,268 | ||||||
| 62,292 | ||||||||
Netherlands - 0.3% | ||||||||
ASML Holding NV, Reg S (Semiconductors & Semiconductor Equipment) | 90 | 16,268 | ||||||
Panama - 0.1% | ||||||||
Copa Holdings SA, Class A (Transportation) | 70 | 8,623 | ||||||
Peru - 0.7% | ||||||||
Alicorp SAA (Food Beverage & Tobacco) | 9,290 | 29,009 | ||||||
Credicorp Ltd. (Banks) | 50 | 10,472 | ||||||
| 39,481 | ||||||||
Philippines - 1.7% | ||||||||
Bank of the Philippine Islands (Banks)† | 21,510 | 40,862 | ||||||
Jollibee Foods Corp. (Consumer Services)† | 1,710 | 8,248 | ||||||
Robinsons Retail Holdings Inc. (Food & Staples Retailing)† | 10,510 | 19,741 | ||||||
Security Bank Corp. (Banks)† | 3,360 | 16,000 | ||||||
SM Prime Holdings Inc. (Real Estate)† | 12,800 | 9,184 | ||||||
Universal Robina Corp. (Food Beverage & Tobacco)† | 2,230 | 6,179 | ||||||
| 100,214 | ||||||||
Qatar - 0.1% | ||||||||
Qatar Electricity & Water Co. QSC (Utilities)† | 120 | 6,036 | ||||||
Russia - 0.6% | ||||||||
Lukoil PJSC - Sponsored ADR (Energy) | 130 | 6,894 | ||||||
Magnit PJSC - Sponsored GDR, Reg S (Food & Staples Retailing)† | 300 | 8,494 | ||||||
Moscow Exchange MICEX-RTS PJSC (Diversified Financials)† | 3,590 | 7,262 | ||||||
Novatek PJSC - Sponsored GDR, Reg S (Energy)† | 50 | 5,707 | ||||||
Sberbank of Russia PJSC - Sponsored ADR (Banks)† | 620 | 8,895 | ||||||
| 37,252 | ||||||||
Singapore - 1.8% | ||||||||
DBS Group Holdings Ltd. (Banks)† | 3,000 | 50,139 | ||||||
See Notes to Financial Statements
24
Table of Contents
Harding, Loevner Funds, Inc.
Global Equity Research Portfolio
Portfolio of Investments
October 31, 2017 (continued)
| Shares | Value | |||||||
| COMMON STOCKS - 97.4% (continued) | ||||||||
Singapore - 1.8% (continued) | ||||||||
Oversea-Chinese Banking Corp. Ltd. (Banks)† | 6,000 | $52,384 | ||||||
| 102,523 | ||||||||
South Africa - 0.8% | ||||||||
Aspen Pharmacare Holdings Ltd. (Pharmaceuticals, Biotechnology & Life Sciences)† | 360 | 8,134 | ||||||
Discovery Ltd. (Insurance)† | 850 | 8,825 | ||||||
Naspers Ltd., Class N (Media)† | 50 | 12,353 | ||||||
Sasol Ltd. (Materials)† | 250 | 7,348 | ||||||
Standard Bank Group Ltd. (Banks)† | 640 | 7,424 | ||||||
| 44,084 | ||||||||
South Korea - 0.4% | ||||||||
Hankook Tire Co., Ltd. (Automobiles & Components)† | 150 | 7,227 | ||||||
Hanssem Co., Ltd. (Consumer Durables & Apparel)† | 50 | 7,630 | ||||||
NAVER Corp. (Software & Services)† | 10 | 8,010 | ||||||
| 22,867 | ||||||||
Spain - 1.4% | ||||||||
Amadeus IT Group SA (Software & Services)† | 210 | 14,246 | ||||||
Banco Bilbao Vizcaya Argentaria SA (Banks)† | 1,436 | 12,562 | ||||||
Banco Santander SA (Banks)† | 1,840 | 12,487 | ||||||
Bankinter SA (Banks)† | 4,810 | 45,419 | ||||||
| 84,714 | ||||||||
Sweden - 1.3% | ||||||||
Assa Abloy AB, Class B (Capital Goods)† | 1,220 | 25,718 | ||||||
Atlas Copco AB, Class A (Capital Goods)† | 290 | 12,687 | ||||||
Hexagon AB, Class B (Technology Hardware & Equipment)† | 270 | 13,852 | ||||||
Intrum Justitia AB (Commercial & Professional | 290 | 10,143 | ||||||
Skandinaviska Enskilda Banken AB, Class A (Banks)† | 900 | 11,076 | ||||||
| 73,476 | ||||||||
Switzerland - 2.6% | ||||||||
Cie Financiere Richemont SA, Reg S (Consumer Durables & Apparel)† | 140 | 12,922 | ||||||
Lonza Group AG, Reg S (Pharmaceuticals, Biotechnology & Life Sciences)† | 60 | 15,954 | ||||||
Nestle SA - Sponsored ADR (Food Beverage & Tobacco) | 540 | 45,484 | ||||||
| Shares | Value | |||||||
| COMMON STOCKS - 97.4% (continued) | ||||||||
Switzerland - 2.6% (continued) | ||||||||
Novartis AG - Sponsored ADR (Pharmaceuticals, Biotechnology & Life Sciences) | 540 | $44,593 | ||||||
SGS SA, Reg S (Commercial & Professional Services)† | 8 | 19,755 | ||||||
Temenos Group AG, Reg S (Software & Services)*† | 140 | 16,172 | ||||||
| 154,880 | ||||||||
Taiwan - 1.3% | ||||||||
Airtac International Group (Capital Goods)† | 1,044 | 16,934 | ||||||
Delta Electronics Inc. (Technology Hardware & Equipment)† | 1,000 | 4,822 | ||||||
Eclat Textile Co., Ltd. (Consumer Durables & Apparel)† | 714 | 8,543 | ||||||
Largan Precision Co., Ltd. (Technology Hardware & Equipment)† | 60 | 11,449 | ||||||
Taiwan Semiconductor Manufacturing Co., Ltd. (Semiconductors & Semiconductor Equipment)† | 4,000 | 32,309 | ||||||
| 74,057 | ||||||||
Thailand - 0.1% | ||||||||
Siam Commercial Bank pcl, Reg S (Banks)† | 1,800 | 7,938 | ||||||
Turkey - 0.2% | ||||||||
Turkiye Garanti Bankasi AS - ADR (Banks) | 3,380 | 9,194 | ||||||
United Arab Emirates - 0.7% | ||||||||
DP World Ltd. (Transportation)† | 720 | 17,100 | ||||||
Emaar Properties PJSC (Real Estate)† | 9,900 | 22,407 | ||||||
| 39,507 | ||||||||
United Kingdom - 4.0% | ||||||||
Abcam plc (Pharmaceuticals, Biotechnology & Life Sciences)† | 970 | 12,819 | ||||||
BBA Aviation plc (Transportation)† | 2,830 | 11,967 | ||||||
BGEO Group plc (Banks)† | 320 | 15,123 | ||||||
Burberry Group plc (Consumer Durables & Apparel)† | 520 | 13,133 | ||||||
Diageo plc (Food Beverage & Tobacco)† | 1,040 | 35,504 | ||||||
Halma plc (Technology Hardware & Equipment)† | 820 | 12,866 | ||||||
HSBC Holdings plc - Sponsored ADR (Banks) | 920 | 44,868 | ||||||
Nostrum Oil & Gas plc (Energy)*† | 1,490 | 7,448 | ||||||
See Notes to Financial Statements
25
Table of Contents
Harding, Loevner Funds, Inc.
Global Equity Research Portfolio
Portfolio of Investments
October 31, 2017 (continued)
| Shares | Value | |||||||||
| COMMON STOCKS - 97.4% (continued) | ||||||||||
United Kingdom - 4.0% (continued) | ||||||||||
Reckitt Benckiser Group plc (Household & Personal Products)† | 110 | $9,838 | ||||||||
Rightmove plc (Software & Services)† | 200 | 11,031 | ||||||||
Rotork plc (Capital Goods)† | 3,050 | 10,639 | ||||||||
Shire plc (Pharmaceuticals, Biotechnology & Life Sciences)† | 790 | 38,883 | ||||||||
St James’s Place plc (Diversified Financials)† | 750 | 11,722 | ||||||||
| 235,841 | ||||||||||
United States - 43.6% | ||||||||||
Accenture plc, Class A (Software & Services) | 380 | 54,097 | ||||||||
Adobe Systems Inc. (Software & Services)* | 90 | 15,764 | ||||||||
Air Products & Chemicals Inc. (Materials) | 320 | 51,018 | ||||||||
Allegion plc (Capital Goods) | 450 | 37,525 | ||||||||
Alphabet Inc., Class A (Software & Services)* | 45 | 46,487 | ||||||||
Amazon.com Inc. (Retailing)* | 30 | 33,158 | ||||||||
Amphenol Corp., Class A (Technology Hardware & Equipment) | 700 | 60,900 | ||||||||
Apple Inc. (Technology Hardware & Equipment) | 420 | 70,997 | ||||||||
Church & Dwight Co., Inc. (Household & Personal Products) | 1,080 | 48,784 | ||||||||
Cisco Systems Inc. (Technology Hardware & Equipment) | 1,560 | 53,274 | ||||||||
Cognizant Technology Solutions Corp., Class A (Software & Services) | 170 | 12,864 | ||||||||
Colgate-Palmolive Co. (Household & Personal Products) | 710 | 50,019 | ||||||||
Costco Wholesale Corp. (Food & Staples Retailing) | 355 | 57,183 | ||||||||
Deere & Co. (Capital Goods) | 480 | 63,782 | ||||||||
eBay Inc. (Software & Services)* | 1,070 | 40,275 | ||||||||
Ecolab Inc. (Materials) | 400 | 52,264 | ||||||||
EPAM Systems Inc. (Software & Services)* | 150 | 13,673 | ||||||||
Equifax Inc. (Commercial & Professional Services) | 80 | 8,682 | ||||||||
Estee Lauder Cos., Inc., Class A (Household & Personal Products) | 610 | 68,204 | ||||||||
Facebook Inc., Class A (Software & Services)* | 270 | 48,616 | ||||||||
Fiserv Inc. (Software & Services)* | 450 | 58,243 | ||||||||
| Shares | Value | |||||||||
| COMMON STOCKS - 97.4% (continued) | ||||||||||
United States - 43.6% (continued) | ||||||||||
Flowserve Corp. (Capital Goods) | 530 | $ | 23,357 | |||||||
Gartner Inc. (Software & Services)* | 450 | 56,389 | ||||||||
Healthcare Services Group Inc. (Commercial & Professional Services) | 220 | 11,636 | ||||||||
Helmerich & Payne Inc. (Energy) | 180 | 9,776 | ||||||||
Henry Schein Inc. (Health Care Equipment & Services)* | 620 | 48,732 | ||||||||
IDEXX Laboratories Inc. (Health Care Equipment & Services)* | 70 | 11,632 | ||||||||
International Business Machines Corp. (Software & Services) | 380 | 58,543 | ||||||||
IPG Photonics Corp. (Technology Hardware & Equipment)* | 100 | 21,291 | ||||||||
JPMorgan Chase & Co. (Banks) | 570 | 57,348 | ||||||||
Lazard Ltd., Class A (Diversified Financials) | 240 | 11,410 | ||||||||
Lululemon Athletica Inc. (Consumer Durables & Apparel)* | 290 | 17,838 | ||||||||
Mastercard Inc., Class A (Software & Services) | 290 | 43,143 | ||||||||
McDonald’s Corp. (Consumer Services) | 390 | 65,095 | ||||||||
Mettler-Toledo International Inc. (Pharmaceuticals, Biotechnology & Life Sciences)* | 30 | 20,479 | ||||||||
Microsoft Corp. (Software & Services) | 670 | 55,731 | ||||||||
NIKE Inc., Class B (Consumer Durables & Apparel) | 1,010 | 55,540 | ||||||||
PayPal Holdings Inc. (Software & Services)* | 240 | 17,414 | ||||||||
Priceline Group Inc. (Retailing)* | 7 | 13,384 | ||||||||
PriceSmart Inc. (Food & Staples Retailing) | 230 | 19,274 | ||||||||
Procter & Gamble Co. (Household & Personal Products) | 560 | 48,350 | ||||||||
Prudential Financial Inc. (Insurance) | 460 | 50,812 | ||||||||
Red Hat Inc. (Software & Services)* | 120 | 14,500 | ||||||||
Regeneron Pharmaceuticals Inc. (Pharmaceuticals, Biotechnology & Life Sciences)* | 82 | 33,015 | ||||||||
Reinsurance Group of America Inc. (Insurance) | 380 | 56,764 | ||||||||
Rockwell Automation Inc. (Capital Goods) | 170 | 34,139 | ||||||||
See Notes to Financial Statements
26
Table of Contents
Harding, Loevner Funds, Inc.
Global Equity Research Portfolio
Portfolio of Investments
October 31, 2017 (continued)
| Shares | Value | |||||||
| COMMON STOCKS - 97.4% (continued) | ||||||||
United States - 43.6% (continued) | ||||||||
Rollins Inc. (Commercial & Professional Services) | 650 | $28,542 | ||||||
Roper Technologies Inc. (Capital Goods) | 260 | 67,124 | ||||||
salesforce.com Inc. (Software & Services)* | 130 | 13,304 | ||||||
Schlumberger Ltd. (Energy) | 280 | 17,920 | ||||||
Sensata Technologies Holding NV (Capital Goods)* | 240 | 11,738 | ||||||
Signature Bank (Banks)* | 320 | 41,603 | ||||||
Starbucks Corp. (Consumer Services) | 1,036 | 56,814 | ||||||
T Rowe Price Group Inc. (Diversified Financials) | 630 | 58,527 | ||||||
TechnipFMC plc (Energy)* | 2,290 | 62,723 | ||||||
Texas Instruments Inc. (Semiconductors & Semiconductor Equipment) | 390 | 37,709 | ||||||
Thermo Fisher Scientific Inc. (Pharmaceuticals, Biotechnology & Life Sciences) | 60 | 11,630 | ||||||
TJX Cos Inc. (Retailing) | 820 | 57,236 | ||||||
UnitedHealth Group Inc. (Health Care Equipment & Services) | 230 | 48,351 | ||||||
Verisk Analytics Inc. (Commercial & Professional Services)* | 350 | 29,767 | ||||||
Visa Inc., Class A (Software & Services) | 260 | 28,595 | ||||||
WABCO Holdings Inc. (Capital Goods)* | 140 | 20,660 | ||||||
Walgreens Boots Alliance Inc. (Food & Staples Retailing) | 550 | 36,448 | ||||||
Walt Disney Co. (Media) | 460 | 44,993 | ||||||
Waters Corp. (Pharmaceuticals, Biotechnology & Life Sciences)* | 200 | 39,210 | ||||||
Workday Inc., Class A (Software & Services)* | 140 | 15,539 | ||||||
Zoetis Inc. (Pharmaceuticals, Biotechnology & Life Sciences) | 380 | 24,252 | ||||||
| 2,554,086 | ||||||||
Total Common Stocks (Cost $4,844,507) |
| $5,706,864 | ||||||
| PREFERRED STOCKS - 0.9% | ||||||||
Brazil - 0.3% | ||||||||
Banco Bradesco SA - ADR (Banks)* | 957 | 10,116 | ||||||
Itau Unibanco Holding SA - Sponsored ADR, 0.45% (Banks) | 730 | 9,351 | ||||||
| 19,467 | ||||||||
| Shares | Value | |||||||
| PREFERRED STOCKS - 0.9% (continued) | ||||||||
Colombia - 0.1% | ||||||||
Bancolombia SA - Sponsored ADR, 3.41% (Banks) | 187 | $7,059 | ||||||
South Korea - 0.2% | ||||||||
LG Household & Health Care Ltd., 1.15% (Household & Personal Products)† | 20 | 11,697 | ||||||
Spain - 0.3% | ||||||||
Grifols SA - ADR, 1.42% (Pharmaceuticals, Biotechnology & Life Sciences) | 660 | 15,609 | ||||||
Total Preferred Stocks (Cost $40,817) | $53,832 | |||||||
| SHORT TERM INVESTMENTS - 2.7% | ||||||||
Northern Institutional Funds - Treasury Portfolio, 0.88% (Money Market Fund) | 155,263 | 155,263 | ||||||
Total Short Term Investments (Cost $155,263) |
| $155,263 | ||||||
Total Investments — 101.0% | ||||||||
(Cost $5,040,587) | $5,915,959 | |||||||
Liabilities Less Other Assets - (1.0)% | (59,553 | ) | ||||||
Net Assets — 100.0% | $5,856,406 | |||||||
Summary of Abbreviations
| ADR | American Depositary Receipt. |
| GDR | Global Depository Receipt. |
| Reg S | Security sold outside United States without registration under the Securities Act of 1933. |
| # | Security valued at fair value as determined in good faith under policies and procedures established by and under the supervision of the Portfolio’s Board of Directors as disclosed in Note 2 of the Notes to Financial Statements. |
| * | Non-income producing security. |
| † | Investment categorized as level 2 security as disclosed in Note 2 of the Notes to Financial Statements. |
See Notes to Financial Statements
27
Table of Contents
Harding, Loevner Funds, Inc.
Global Equity Research Portfolio
Portfolio of Investments
October 31, 2017 (continued)
| Industry | | Percentage of Net Assets | | ||
Automobiles & Components | 1.4 | % | |||
Banks | 12.5 | ||||
Capital Goods | 11.5 | ||||
Commercial & Professional Services | 2.7 | ||||
Consumer Durables & Apparel | 3.5 | ||||
Consumer Services | 2.2 | ||||
Diversified Financials | 1.9 | ||||
Energy | 3.3 | ||||
Food & Staples Retailing | 3.3 | ||||
Food Beverage & Tobacco | 3.7 | ||||
Health Care Equipment & Services | 3.2 | ||||
Household & Personal Products | 5.3 | ||||
Insurance | 2.7 | ||||
Materials | 4.0 | ||||
Media | 2.3 | ||||
Pharmaceuticals, Biotechnology & Life Sciences | 6.7 | ||||
Real Estate | 1.7 | ||||
Retailing | 2.8 | ||||
Semiconductors & Semiconductor Equipment | 2.3 | ||||
Software & Services | 14.3 | ||||
Technology Hardware & Equipment | 4.9 | ||||
Telecommunication Services | 0.7 | ||||
Transportation | 1.1 | ||||
Utilities | 0.3 | ||||
Money Market Fund | 2.7 | ||||
Total Investments | 101.0 | ||||
Liabilities Less Other Assets | (1.0 | ) | |||
Net Assets | 100.0 | % | |||
See Notes to Financial Statements
28
Table of Contents
Harding, Loevner Funds, Inc.
International Equity Research Portfolio
Portfolio of Investments
October 31, 2017
| Shares | Value | |||||||
| COMMON STOCKS - 95.4% | ||||||||
Argentina - 1.6% | ||||||||
Banco Macro SA - ADR (Banks) | 350 | $44,072 | ||||||
Cablevision Holding SA - Sponsored GDR (Media)#*† | 1,709 | 39,363 | ||||||
Globant SA (Software & Services)* | 1,246 | 46,999 | ||||||
Grupo Financiero Galicia SA - ADR (Banks) | 640 | 35,136 | ||||||
| 165,570 | ||||||||
Australia - 2.2% | ||||||||
CSL Ltd. (Pharmaceuticals, Biotechnology & Life Sciences)† | 580 | 61,859 | ||||||
DuluxGroup Ltd. (Materials)† | 9,240 | 52,316 | ||||||
SEEK Ltd. (Commercial & Professional Services)† | 4,580 | 64,445 | ||||||
TPG Telecom Ltd. (Telecommunication Services)† | 13,430 | 55,538 | ||||||
| 234,158 | ||||||||
Brazil - 1.0% | ||||||||
Ambev SA - ADR (Food Beverage & Tobacco) | 4,310 | 27,283 | ||||||
B3 SA - Brasil Bolsa Balcao (Diversified Financials)* | 3,900 | 28,493 | ||||||
Ultrapar Participacoes SA - Sponsored ADR (Energy) | 990 | 23,651 | ||||||
WEG SA (Capital Goods) | 4,200 | 27,321 | ||||||
| 106,748 | ||||||||
Canada - 3.0% | ||||||||
Alimentation Couche-Tard Inc. (Food & Staples Retailing) | 2,100 | 99,295 | ||||||
Canadian National Railway Co. (Transportation) | 1,230 | 99,003 | ||||||
Cenovus Energy Inc. (Energy) | 6,900 | 66,962 | ||||||
Encana Corp. (Energy) | 4,560 | 53,352 | ||||||
| 318,612 | ||||||||
China - 9.5% | ||||||||
51job Inc. - ADR (Commercial & Professional Services)* | 670 | 41,473 | ||||||
AAC Technologies Holdings Inc. (Technology Hardware & Equipment)† | 2,000 | 36,625 | ||||||
Alibaba Group Holding Ltd. - Sponsored ADR (Software & Services)* | 160 | 29,582 | ||||||
ANTA Sports Products Ltd. (Consumer Durables & Apparel)† | 7,600 | 34,183 | ||||||
China Merchants Port Holdings Co., Ltd. (Transportation)† | 9,000 | 28,178 | ||||||
China Mobile Ltd. - Sponsored ADR (Telecommunication Services) | 410 | 20,684 | ||||||
CNOOC Ltd. - Sponsored ADR (Energy) | 220 | 30,074 | ||||||
| Shares | Value | |||||||
| COMMON STOCKS - 95.4% (continued) | ||||||||
China - 9.5% (continued) | ||||||||
ENN Energy Holdings Ltd. (Utilities)† | 3,100 | $22,760 | ||||||
Fuyao Glass Industry Group Co., Ltd., Class H (Automobiles & Components)† | 7,200 | 27,494 | ||||||
Gree Electric Appliances Inc. of Zhuhai, Class A (Consumer Durables & Apparel)† | 4,900 | 31,450 | ||||||
Haitian International Holdings Ltd. (Capital Goods)† | 12,400 | 37,491 | ||||||
Hangzhou Hikvision Digital Technology Co., Ltd., Class A (Technology Hardware & Equipment)† | 6,900 | 40,904 | ||||||
Inner Mongolia Yili Industrial Group Co., Ltd., Class A (Food Beverage & Tobacco)† | 21,400 | 95,387 | ||||||
JD.com Inc. - ADR (Retailing)* | 830 | 31,142 | ||||||
Jiangsu Expressway Co., Ltd., Class H (Transportation)† | 72,000 | 110,628 | ||||||
Jiangsu Hengrui Medicine Co., Ltd., Class A (Pharmaceuticals, Biotechnology & Life Sciences)† | 3,480 | 35,283 | ||||||
Midea Group Co., Ltd., Class A (Consumer Durables & Apparel)† | 4,700 | 36,196 | ||||||
NetEase Inc. - ADR (Software & Services) | 80 | 22,554 | ||||||
Shenzhou International Group Holdings Ltd. (Consumer Durables & Apparel)† | 3,770 | 32,205 | ||||||
Sino Biopharmaceutical Ltd. (Pharmaceuticals, Biotechnology & Life Sciences)† | 24,000 | 28,032 | ||||||
Sun Art Retail Group Ltd. (Food & Staples Retailing)† | 66,000 | 66,666 | ||||||
Sunny Optical Technology Group Co. Ltd. (Technology Hardware & Equipment)† | 3,000 | 44,041 | ||||||
Suofeiya Home Collection Co., Ltd., Class A (Consumer Durables & Apparel)† | 4,800 | 28,159 | ||||||
Tencent Holdings Ltd. (Software & Services)† | 1,000 | 45,042 | ||||||
Tingyi Cayman Islands Holding Corp. (Food Beverage & Tobacco)† | 21,150 | 33,412 | ||||||
Wuxi Biologics Cayman Inc. (Pharmaceuticals, Biotechnology & Life Sciences)*† | 2,750 | 15,591 | ||||||
| 1,005,236 | ||||||||
Colombia - 0.9% | ||||||||
Cementos Argos SA - Sponsored ADR (Materials)#† | 1,390 | 25,360 | ||||||
See Notes to Financial Statements
29
Table of Contents
Harding, Loevner Funds, Inc.
International Equity Research Portfolio
Portfolio of Investments
October 31, 2017 (continued)
| Shares | Value | |||||||
| COMMON STOCKS - 95.4% (continued) | ||||||||
Colombia - 0.9% (continued) | ||||||||
Cemex Latam Holdings SA (Materials)* | 6,320 | $22,396 | ||||||
Ecopetrol SA - Sponsored ADR (Energy) | 2,280 | 25,285 | ||||||
Grupo Nutresa SA (Food Beverage & Tobacco) | 2,920 | 25,936 | ||||||
| 98,977 | ||||||||
Denmark - 1.7% | ||||||||
Coloplast A/S, Class B (Health Care Equipment & Services)† | 630 | 55,398 | ||||||
Novozymes A/S, Class B (Materials)† | 2,180 | 120,407 | ||||||
| 175,805 | ||||||||
Egypt - 0.2% | ||||||||
Commercial International Bank Egypt SAE - GDR, Reg S (Banks)† | 5,810 | 26,522 | ||||||
France - 2.0% | ||||||||
Dassault Systemes SE (Software & Services)† | 1,050 | 111,533 | ||||||
Essilor International SA (Health Care Equipment & Services)† | 780 | 98,798 | ||||||
| 210,331 | ||||||||
Germany - 8.2% | ||||||||
adidas AG (Consumer Durables & Apparel)† | 320 | 71,212 | ||||||
Allianz SE, Reg S (Insurance)† | 505 | 117,268 | ||||||
Bayer AG, Reg S (Pharmaceuticals, Biotechnology & Life Sciences)† | 840 | 109,713 | ||||||
Bayerische Motoren Werke AG (Automobiles & Components)† | 1,114 | 113,545 | ||||||
FUCHS PETROLUB SE (Materials)† | 510 | 25,403 | ||||||
Gerresheimer AG (Pharmaceuticals, Biotechnology & Life Sciences)† | 560 | 44,535 | ||||||
Henkel AG & Co. KGaA (Household & Personal Products)† | 810 | 101,994 | ||||||
Infineon Technologies AG (Semiconductors & Semiconductor Equipment)† | 1,150 | 31,486 | ||||||
Linde AG (Materials)*† | 510 | 109,514 | ||||||
SAP SE - Sponsored ADR (Software & Services) | 1,000 | 114,200 | ||||||
Symrise AG (Materials)† | 350 | 27,254 | ||||||
| 866,124 | ||||||||
Hong Kong - 2.8% | ||||||||
AIA Group Ltd. (Insurance)† | 13,200 | 99,343 | ||||||
| Shares | Value | |||||||
| COMMON STOCKS - 95.4% (continued) | ||||||||
Hong Kong - 2.8% (continued) | ||||||||
ASM Pacific Technology Ltd. (Semiconductors & Semiconductor Equipment)† | 6,400 | $93,490 | ||||||
Hong Kong Exchanges & Clearing Ltd. (Diversified Financials)† | 3,700 | 103,044 | ||||||
| 295,877 | ||||||||
Hungary - 0.2% | ||||||||
Richter Gedeon Nyrt. (Pharmaceuticals, Biotechnology & Life Sciences)† | 940 | 23,385 | ||||||
India - 4.1% | ||||||||
Asian Paints Ltd. (Materials)† | 1,380 | 25,176 | ||||||
Bharti Infratel Ltd. (Telecommunication Services)† | 13,880 | 94,953 | ||||||
Dabur India Ltd. (Household & Personal Products)† | 5,390 | 27,740 | ||||||
Emami Ltd. (Household & Personal Products)† | 1,420 | 27,643 | ||||||
HDFC Bank Ltd. - ADR (Banks) | 282 | 26,029 | ||||||
Housing Development Finance Corp., Ltd. (Banks)† | 1,080 | 28,479 | ||||||
ICICI Bank Ltd. - Sponsored ADR (Banks) | 2,849 | 26,068 | ||||||
Infosys Ltd. - Sponsored ADR (Software & Services) | 3,240 | 48,114 | ||||||
ITC Ltd. (Food Beverage & Tobacco)† | 6,040 | 24,845 | ||||||
Kotak Mahindra Bank Ltd. (Banks) | 1,770 | 28,011 | ||||||
Max Financial Services Ltd. (Insurance)* | 2,340 | 21,207 | ||||||
Pidilite Industries Ltd. (Materials) | 2,100 | 25,347 | ||||||
United Spirits Ltd. (Food Beverage & Tobacco)*† | 640 | 30,157 | ||||||
| 433,769 | ||||||||
Indonesia - 0.8% | ||||||||
Bank Central Asia Tbk PT (Banks)† | 21,000 | 32,439 | ||||||
Bank Rakyat Indonesia Persero Tbk PT (Banks)† | 25,500 | 29,386 | ||||||
Kalbe Farma Tbk PT (Pharmaceuticals, Biotechnology & Life Sciences)† | 162,000 | 19,122 | ||||||
| 80,947 | ||||||||
Israel - 1.0% | ||||||||
Check Point Software Technologies Ltd. (Software & Services)* | 900 | 105,939 | ||||||
Italy - 0.4% | ||||||||
Tenaris SA - ADR (Energy) | 1,620 | 44,145 | ||||||
See Notes to Financial Statements
30
Table of Contents
Harding, Loevner Funds, Inc.
International Equity Research Portfolio
Portfolio of Investments
October 31, 2017 (continued)
| Shares | Value | |||||||
| COMMON STOCKS - 95.4% (continued) | ||||||||
Japan - 19.1% | ||||||||
ABC-Mart Inc. (Retailing)† | 1,640 | $82,564 | ||||||
Asics Corp. (Consumer Durables & Apparel)† | 3,100 | 47,142 | ||||||
Daito Trust Construction Co., Ltd. (Real Estate)† | 572 | 99,845 | ||||||
Dentsu Inc. (Media)† | 1,820 | 77,687 | ||||||
FANUC Corp. (Capital Goods)† | 300 | 70,333 | ||||||
Fast Retailing Co., Ltd. (Retailing)† | 300 | 100,324 | ||||||
Hakuhodo DY Holdings Inc. (Media)† | 6,790 | 94,030 | ||||||
JGC Corp. (Capital Goods)† | 4,000 | 66,982 | ||||||
Kakaku.com Inc. (Software & Services)† | 3,500 | 48,114 | ||||||
Kao Corp. (Household & Personal Products)† | 1,000 | 60,466 | ||||||
Komatsu Ltd. (Capital Goods)† | 3,500 | 115,186 | ||||||
Kubota Corp. (Capital Goods)† | 5,400 | 101,795 | ||||||
M3 Inc. (Health Care Equipment & Services)† | 900 | 26,965 | ||||||
Makita Corp. (Capital Goods)† | 2,600 | 109,435 | ||||||
MISUMI Group Inc. (Capital Goods)† | 3,900 | 107,176 | ||||||
Mitsubishi Estate Co., Ltd. (Real Estate)† | 5,000 | 90,678 | ||||||
MonotaRO Co., Ltd. (Capital Goods)† | 700 | 19,150 | ||||||
NGK Insulators Ltd. (Capital Goods)† | 4,150 | 81,890 | ||||||
Nidec Corp. (Capital Goods)† | 1,020 | 135,016 | ||||||
Nomura Research Institute Ltd. (Software & Services)† | 2,602 | 110,734 | ||||||
Rinnai Corp. (Consumer Durables & Apparel)† | 1,100 | 93,811 | ||||||
SMC Corp. (Capital Goods)† | 160 | 61,394 | ||||||
Stanley Electric Co., Ltd. (Automobiles & Components)† | 3,200 | 118,168 | ||||||
Suruga Bank Ltd. (Banks)† | 3,370 | 76,215 | ||||||
Sysmex Corp. (Health Care Equipment & Services)† | 400 | 27,422 | ||||||
| 2,022,522 | ||||||||
Mexico - 1.7% | ||||||||
Coca-Cola Femsa SAB de CV - Sponsored ADR (Food Beverage & Tobacco) | 292 | 19,984 | ||||||
El Puerto de Liverpool SAB de CV, Series C1 (Retailing) | 3,000 | 20,436 | ||||||
Fomento Economico Mexicano SAB de CV - Sponsored ADR (Food Beverage & Tobacco) | 280 | 24,570 | ||||||
Grupo Financiero Banorte SAB de CV, Series O (Banks) | 3,700 | 21,959 | ||||||
| Shares | Value | |||||||
| COMMON STOCKS - 95.4% (continued) | ||||||||
Mexico - 1.7% (continued) | ||||||||
Grupo Financiero Santander Mexico SAB de CV, Series B - ADR (Banks) | 2,830 | $23,829 | ||||||
Grupo Televisa SAB - Sponsored ADR (Media) | 990 | 21,671 | ||||||
Kimberly-Clark de Mexico SAB de CV, Series A (Household & Personal Products) | 11,500 | 19,801 | ||||||
Wal-Mart de Mexico SAB de CV (Food & Staples Retailing) | 14,400 | 32,177 | ||||||
| 184,427 | ||||||||
Netherlands - 0.8% | ||||||||
ASML Holding NV, Reg S (Semiconductors & Semiconductor Equipment) | 450 | 81,337 | ||||||
Pakistan - 1.2% | ||||||||
Engro Corp., Ltd. (Materials)† | 8,100 | 21,386 | ||||||
Lucky Cement Ltd. (Materials)† | 3,100 | 14,328 | ||||||
MCB Bank Ltd. (Banks)† | 12,600 | 23,806 | ||||||
Oil & Gas Development Co., Ltd. (Energy)† | 17,700 | 24,129 | ||||||
Pakistan Petroleum Ltd. (Energy)† | 15,500 | 26,471 | ||||||
United Bank Ltd. (Banks)† | 12,200 | 20,752 | ||||||
| 130,872 | ||||||||
Panama - 0.5% | ||||||||
Copa Holdings SA, Class A (Transportation) | 394 | 48,537 | ||||||
Peru - 0.7% | ||||||||
Alicorp SAA (Food Beverage & Tobacco) | 10,540 | 32,912 | ||||||
Credicorp Ltd. (Banks) | 180 | 37,699 | ||||||
| 70,611 | ||||||||
Philippines - 1.4% | ||||||||
Bank of the Philippine Islands (Banks)† | 11,760 | 22,340 | ||||||
Jollibee Foods Corp. (Consumer Services)† | 5,870 | 28,313 | ||||||
Robinsons Retail Holdings Inc. (Food & Staples Retailing)† | 14,760 | 27,724 | ||||||
Security Bank Corp. (Banks)† | 4,950 | 23,572 | ||||||
SM Prime Holdings Inc. (Real Estate)† | 38,900 | 27,911 | ||||||
Universal Robina Corp. (Food Beverage & Tobacco)† | 8,560 | 23,717 | ||||||
| 153,577 | ||||||||
Qatar - 0.4% | ||||||||
Qatar Electricity & Water Co. QSC (Utilities)† | 820 | 41,244 | ||||||
Russia - 1.3% | ||||||||
Lukoil PJSC - Sponsored ADR (Energy) | 530 | 28,106 | ||||||
See Notes to Financial Statements
31
Table of Contents
Harding, Loevner Funds, Inc.
International Equity Research Portfolio
Portfolio of Investments
October 31, 2017 (continued)
| Shares | Value | |||||||
| COMMON STOCKS - 95.4% (continued) | ||||||||
Russia - 1.3% (continued) | ||||||||
Magnit PJSC - Sponsored GDR, Reg S (Food & Staples Retailing)† | 790 | $22,366 | ||||||
Moscow Exchange MICEX-RTS PJSC (Diversified Financials)† | 14,560 | 29,452 | ||||||
Novatek PJSC - Sponsored GDR, Reg S (Energy)† | 220 | 25,112 | ||||||
Sberbank of Russia PJSC - Sponsored ADR (Banks)† | 2,020 | 28,981 | ||||||
| 134,017 | ||||||||
Singapore - 2.1% | ||||||||
DBS Group Holdings Ltd. (Banks)† | 6,250 | 104,457 | ||||||
Oversea-Chinese Banking Corp. | ||||||||
Ltd. (Banks)† | 13,100 | 114,371 | ||||||
| 218,828 | ||||||||
South Africa - 1.3% | ||||||||
Aspen Pharmacare Holdings Ltd. (Pharmaceuticals, Biotechnology & Life Sciences)† | 1,040 | 23,498 | ||||||
Discovery Ltd. (Insurance)† | 2,580 | 26,785 | ||||||
Naspers Ltd., Class N (Media)† | 150 | 37,061 | ||||||
Sasol Ltd. (Materials)† | 780 | 22,927 | ||||||
Standard Bank Group Ltd. (Banks)† | 2,670 | 30,971 | ||||||
| 141,242 | ||||||||
South Korea - 0.7% | ||||||||
Hankook Tire Co., Ltd. (Automobiles & Components)† | 490 | 23,610 | ||||||
Hanssem Co., Ltd. (Consumer Durables & Apparel)† | 150 | 22,889 | ||||||
NAVER Corp. (Software & Services)† | 38 | 30,438 | ||||||
| 76,937 | ||||||||
Spain - 3.0% | ||||||||
Amadeus IT Group SA (Software & Services)† | 1,800 | 122,111 | ||||||
Banco Bilbao Vizcaya Argentaria SA (Banks)† | 6,144 | 53,747 | ||||||
Banco Santander SA (Banks)† | 5,980 | 40,583 | ||||||
Bankinter SA (Banks)† | 11,130 | 105,094 | ||||||
| 321,535 | ||||||||
Sweden - 4.0% | ||||||||
Assa Abloy AB, Class B (Capital Goods)† | 2,270 | 47,853 | ||||||
Atlas Copco AB, Class A (Capital Goods)† | 2,690 | 117,680 | ||||||
Hexagon AB, Class B (Technology Hardware & Equipment)† | 1,450 | 74,391 | ||||||
| Shares | Value | |||||||
| COMMON STOCKS - 95.4% (continued) | ||||||||
Sweden - 4.0% (continued) | ||||||||
Intrum Justitia AB (Commercial & Professional Services)† | 2,520 | $88,138 | ||||||
Skandinaviska Enskilda Banken AB, Class A (Banks)† | 7,530 | 92,666 | ||||||
| 420,728 | ||||||||
Switzerland - 4.9% | ||||||||
Cie Financiere Richemont SA, Reg S (Consumer Durables & Apparel)† | 1,180 | 108,917 | ||||||
Lonza Group AG, Reg S (Pharmaceuticals, Biotechnology & Life Sciences)† | 110 | 29,248 | ||||||
Nestle SA - Sponsored ADR (Food Beverage & Tobacco) | 1,010 | 85,072 | ||||||
Novartis AG - Sponsored ADR (Pharmaceuticals, Biotechnology & Life Sciences) | 1,210 | 99,922 | ||||||
SGS SA, Reg S (Commercial & Professional Services)† | 37 | 91,366 | ||||||
Temenos Group AG, Reg S (Software & Services)*† | 920 | 106,271 | ||||||
| 520,796 | ||||||||
Taiwan - 1.3% | ||||||||
Airtac International Group (Capital Goods)† | 2,507 | 40,665 | ||||||
Delta Electronics Inc. (Technology Hardware & Equipment)† | 3,000 | 14,468 | ||||||
Eclat Textile Co., Ltd. (Consumer Durables & Apparel)† | 2,040 | 24,407 | ||||||
Largan Precision Co., Ltd. (Technology Hardware & Equipment)† | 130 | 24,806 | ||||||
Taiwan Semiconductor Manufacturing Co., Ltd. (Semiconductors & Semiconductor Equipment)† | 4,000 | 32,309 | ||||||
| 136,655 | ||||||||
Thailand - 0.2% | ||||||||
Siam Commercial Bank pcl, Reg S (Banks)† | 5,700 | 25,137 | ||||||
Turkey - 0.2% | ||||||||
Turkiye Garanti Bankasi AS - ADR (Banks) | 8,480 | 23,066 | ||||||
United Arab Emirates - 1.3% | ||||||||
Agthia Group PJSC (Food Beverage & Tobacco)† | 10,250 | 14,539 | ||||||
DP World Ltd. (Transportation)† | 1,070 | 25,412 | ||||||
Emaar Properties PJSC (Real Estate)† | 45,410 | 102,780 | ||||||
| 142,731 | ||||||||
See Notes to Financial Statements
32
Table of Contents
Harding, Loevner Funds, Inc.
International Equity Research Portfolio
Portfolio of Investments
October 31, 2017 (continued)
| Shares | Value | |||||||
| COMMON STOCKS - 95.4% (continued) | ||||||||
United Kingdom - 9.7% | ||||||||
Abcam plc (Pharmaceuticals, Biotechnology & Life Sciences)† | 4,030 | $53,258 | ||||||
BBA Aviation plc (Transportation)† | 25,050 | 105,931 | ||||||
BGEO Group plc (Banks)† | 1,330 | 62,853 | ||||||
Burberry Group plc (Consumer Durables & Apparel)† | 4,290 | 108,347 | ||||||
Diageo plc (Food Beverage & Tobacco)† | 3,180 | 108,561 | ||||||
Halma plc (Technology Hardware & Equipment)† | 6,140 | 96,338 | ||||||
HSBC Holdings plc - Sponsored ADR (Banks) | 2,120 | 103,393 | ||||||
Nostrum Oil & Gas plc (Energy)*† | 8,290 | 41,436 | ||||||
Reckitt Benckiser Group plc (Household & Personal Products)† | 1,020 | 91,228 | ||||||
Rightmove plc (Software & Services)† | 1,090 | 60,116 | ||||||
Rotork plc (Capital Goods)† | 15,621 | 54,491 | ||||||
Shire plc (Pharmaceuticals, Biotechnology & Life Sciences)† | 1,791 | 88,151 | ||||||
St James’s Place plc (Insurance)† | 3,490 | 54,548 | ||||||
| 1,028,651 | ||||||||
Total Common Stocks (Cost $8,431,087) | $10,115,595 | |||||||
| PREFERRED STOCKS - 2.0% | ||||||||
Brazil - 0.5% | ||||||||
Banco Bradesco SA - ADR (Banks)* | 2,450 | 25,897 | ||||||
Itau Unibanco Holding SA - Sponsored ADR, 0.45% (Banks) | 1,940 | 24,851 | ||||||
| 50,748 | ||||||||
Colombia - 0.2% | ||||||||
Bancolombia SA - Sponsored ADR, 3.41% (Banks) | 560 | 21,140 | ||||||
South Korea - 0.2% | ||||||||
LG Household & Health Care Ltd., 1.15% (Household & Personal Products)† | 44 | 25,734 | ||||||
Spain - 1.1% | ||||||||
Grifols SA - ADR, 1.42% (Pharmaceuticals, Biotechnology & Life Sciences) | 4,830 | 114,229 | ||||||
Total Preferred Stocks (Cost $150,966) | $211,851 | |||||||
| Shares | Value | |||||||
| SHORT TERM INVESTMENTS - 2.7% | ||||||||
Northern Institutional Funds - Treasury Portfolio, 0.88% (Money Market Fund) | 287,703 | $287,703 | ||||||
Total Short Term Investments (Cost $287,703) |
| $287,703 | ||||||
Total Investments — 100.1% | ||||||||
(Cost $8,869,756) | $10,615,149 | |||||||
Liabilities Less Other Assets - (0.1)% | (12,123 | ) | ||||||
Net Assets — 100.0% | $10,603,026 | |||||||
Summary of Abbreviations
| ADR | American Depositary Receipt. |
| GDR | Global Depository Receipt. |
| Reg S | Security sold outside United States without registration under the Securities Act of 1933. |
| # | Security valued at fair value as determined in good faith under policies and procedures established by and under the supervision of the Portfolio’s Board of Directors as disclosed in Note 2 of the Notes to Financial Statements. |
| * | Non-income producing security. |
| † | Investment categorized as level 2 security as disclosed in Note 2 of the Notes to Financial Statements. |
See Notes to Financial Statements
33
Table of Contents
Harding, Loevner Funds, Inc.
International Equity Research Portfolio
Portfolio of Investments
October 31, 2017 (continued)
| Industry | | Percentage of Net Assets |
| ||
Automobiles & Components | 2.7 | % | |||
Banks | 13.1 | ||||
Capital Goods | 11.3 | ||||
Commercial & Professional Services | 2.7 | ||||
Consumer Durables & Apparel | 6.0 | ||||
Consumer Services | 0.3 | ||||
Diversified Financials | 1.5 | ||||
Energy | 3.7 | ||||
Food & Staples Retailing | 2.3 | ||||
Food Beverage & Tobacco | 5.2 | ||||
Health Care Equipment & Services | 2.0 | ||||
Household & Personal Products | 3.3 | ||||
Insurance | 3.0 | ||||
Materials | 4.6 | ||||
Media | 2.5 | ||||
Pharmaceuticals, Biotechnology & Life Sciences | 7.0 | ||||
Real Estate | 3.0 | ||||
Retailing | 2.2 | ||||
Semiconductors & Semiconductor Equipment | 2.3 | ||||
Software & Services | 9.5 | ||||
Technology Hardware & Equipment | 3.1 | ||||
Telecommunication Services | 1.6 | ||||
Transportation | 3.9 | ||||
Utilities | 0.6 | ||||
Money Market Fund | 2.7 | ||||
Total Investments | 100.1 | ||||
Liabilities Less Other Assets | (0.1 | ) | |||
Net Assets | 100.0 | % | |||
See Notes to Financial Statements
34
Table of Contents
Harding, Loevner Funds, Inc.
Emerging Markets Research Portfolio
Portfolio of Investments
October 31, 2017
| Shares | Value | |||||||
| COMMON STOCKS - 93.9% | ||||||||
Argentina - 2.5% | ||||||||
Banco Macro SA - ADR (Banks) | 510 | $64,219 | ||||||
Cablevision Holding SA - Sponsored GDR (Media)#*† | 653 | 15,041 | ||||||
Grupo Financiero Galicia SA - ADR (Banks) | 1,470 | 80,703 | ||||||
| 159,963 | ||||||||
Bangladesh - 0.5% | ||||||||
GrameenPhone Ltd. (Telecommunication Services)† | 3,400 | 17,961 | ||||||
Square Pharmaceuticals Ltd. (Pharmaceuticals, Biotechnology & Life Sciences)† | 3,950 | 14,162 | ||||||
| 32,123 | ||||||||
Brazil - 5.4% | ||||||||
Ambev SA - ADR (Food Beverage & Tobacco) | 19,220 | 121,662 | ||||||
B3 SA - Brasil Bolsa Balcao (Diversified Financials)* | 17,900 | 130,777 | ||||||
Ultrapar Participacoes SA - Sponsored ADR (Energy) | 1,290 | 30,818 | ||||||
WEG SA (Capital Goods) | 10,200 | 66,352 | ||||||
| 349,609 | ||||||||
China - 27.7% | ||||||||
51job Inc. - ADR (Commercial & Professional Services)* | 1,130 | 69,947 | ||||||
AAC Technologies Holdings Inc. (Technology Hardware & Equipment)† | 2,500 | 45,782 | ||||||
Alibaba Group Holding Ltd. - Sponsored ADR (Software & Services)* | 380 | 70,258 | ||||||
ANTA Sports Products Ltd. (Consumer Durables & Apparel)† | 18,000 | 80,959 | ||||||
China Merchants Port Holdings Co., Ltd. (Transportation)† | 20,000 | 62,617 | ||||||
China Mobile Ltd. - Sponsored ADR (Telecommunication Services) | 1,890 | 95,351 | ||||||
CNOOC Ltd. - Sponsored ADR (Energy) | 543 | 74,228 | ||||||
ENN Energy Holdings Ltd. (Utilities)† | 8,000 | 58,736 | ||||||
Fuyao Glass Industry Group Co., Ltd., Class H (Automobiles & Components)† | 32,400 | 123,722 | ||||||
Gree Electric Appliances Inc. of Zhuhai, Class A (Consumer Durables & Apparel)† | 6,100 | 39,152 | ||||||
Haitian International Holdings Ltd. (Capital Goods)† | 13,000 | 39,306 | ||||||
| Shares | Value | |||||||
| COMMON STOCKS - 93.9% (continued) | ||||||||
China - 27.7% (continued) | ||||||||
Hangzhou Hikvision Digital Technology Co., Ltd., Class A (Technology Hardware & Equipment)† | 7,650 | $45,351 | ||||||
Inner Mongolia Yili Industrial Group Co., Ltd., Class A (Food Beverage & Tobacco)† | 18,163 | 80,959 | ||||||
JD.com Inc. - ADR (Retailing)* | 1,410 | 52,903 | ||||||
Jiangsu Expressway Co., Ltd., Class H (Transportation)† | 30,000 | 46,095 | ||||||
Jiangsu Hengrui Medicine Co., Ltd., Class A (Pharmaceuticals, Biotechnology & Life Sciences)† | 9,180 | 93,151 | ||||||
Midea Group Co., Ltd., Class A (Consumer Durables & Apparel)† | 9,900 | 76,242 | ||||||
NetEase Inc. - ADR (Software & Services) | 384 | 108,257 | ||||||
Shenzhou International Group Holdings Ltd. (Consumer Durables & Apparel)† | 13,000 | 111,053 | ||||||
Sino Biopharmaceutical Ltd. (Pharmaceuticals, Biotechnology & Life Sciences)† | 76,000 | 88,768 | ||||||
Sun Art Retail Group Ltd. (Food & Staples Retailing)† | 49,500 | 49,999 | ||||||
Sunny Optical Technology Group Co. Ltd. (Technology Hardware & Equipment)† | 4,000 | 58,721 | ||||||
Suofeiya Home Collection Co., Ltd., Class A (Consumer Durables & Apparel)† | 11,300 | 66,290 | ||||||
Tencent Holdings Ltd. (Software & Services)† | 1,500 | 67,563 | ||||||
Tingyi Cayman Islands Holding Corp. (Food Beverage & Tobacco)† | 40,000 | 63,190 | ||||||
Wuxi Biologics Cayman Inc. (Pharmaceuticals, Biotechnology & Life Sciences)*† | 5,000 | 28,347 | ||||||
| 1,796,947 | ||||||||
Colombia - 1.2% | ||||||||
Cementos Argos SA - Sponsored ADR (Materials)#† | 650 | 11,859 | ||||||
Cemex Latam Holdings SA (Materials)* | 3,780 | 13,395 | ||||||
Ecopetrol SA - Sponsored ADR (Energy) | 3,450 | 38,260 | ||||||
Grupo Nutresa SA (Food Beverage & Tobacco) | 1,530 | 13,590 | ||||||
| 77,104 | ||||||||
See Notes to Financial Statements
35
Table of Contents
Harding, Loevner Funds, Inc.
Emerging Markets Research Portfolio
Portfolio of Investments
October 31, 2017 (continued)
| Shares | Value | |||||||
| COMMON STOCKS - 93.9% (continued) | ||||||||
Egypt - 0.7% | ||||||||
Commercial International Bank Egypt SAE - GDR, Reg S (Banks)† | 9,600 | $43,824 | ||||||
Hungary - 0.7% | ||||||||
Richter Gedeon Nyrt. (Pharmaceuticals, Biotechnology & Life Sciences)† | 1,690 | 42,044 | ||||||
India - 8.2% | ||||||||
Asian Paints Ltd. (Materials)† | 830 | 15,142 | ||||||
Bharti Infratel Ltd. (Telecommunication Services)† | 4,820 | 32,973 | ||||||
Dabur India Ltd. (Household & Personal Products)† | 9,630 | 49,562 | ||||||
Emami Ltd. (Household & Personal Products)† | 830 | 16,158 | ||||||
HDFC Bank Ltd. - ADR (Banks) | 338 | 31,197 | ||||||
Housing Development Finance Corp., Ltd. (Banks)† | 4,700 | 123,938 | ||||||
ICICI Bank Ltd. - Sponsored ADR (Banks) | 3,920 | 35,868 | ||||||
Infosys Ltd. - Sponsored ADR (Software & Services) | 3,100 | 46,035 | ||||||
ITC Ltd. (Food Beverage & Tobacco)† | 12,650 | 52,034 | ||||||
Kotak Mahindra Bank Ltd. (Banks) | 2,200 | 34,817 | ||||||
Max Financial Services Ltd. (Insurance)* | 3,040 | 27,550 | ||||||
Pidilite Industries Ltd. (Materials) | 4,150 | �� | 50,091 | |||||
United Spirits Ltd. (Food Beverage & Tobacco)*† | 400 | 18,848 | ||||||
| 534,213 | ||||||||
Indonesia - 3.3% | ||||||||
Bank Central Asia Tbk PT (Banks)† | 90,500 | 139,797 | ||||||
Bank Rakyat Indonesia Persero Tbk PT (Banks)† | 55,500 | 63,959 | ||||||
Kalbe Farma Tbk PT (Pharmaceuticals, Biotechnology & Life Sciences)† | 109,400 | 12,913 | ||||||
| 216,669 | ||||||||
Kazakhstan - 0.2% | ||||||||
Halyk Savings Bank of Kazakhstan JSC - GDR, Reg S (Banks)*† | 1,610 | 15,693 | ||||||
Kenya - 0.8% | ||||||||
Safaricom Ltd. (Telecommunication Services)† | 203,700 | 50,017 | ||||||
| Shares | Value | |||||||
| COMMON STOCKS - 93.9% (continued) | ||||||||
Kuwait - 1.1% | ||||||||
Kuwait Projects Co. Holding KSCP (Diversified Financials)† | 7,680 | $8,605 | ||||||
Mabanee Co. SAK (Real Estate)† | 4,798 | 12,443 | ||||||
National Bank of Kuwait SAKP (Banks) | 18,616 | 47,186 | ||||||
| 68,234 | ||||||||
Lebanon - 0.2% | ||||||||
Bank Audi SAL - GDR, Reg S (Banks) | 2,600 | 15,600 | ||||||
Mexico - 5.6% | ||||||||
Coca-Cola Femsa SAB de CV - Sponsored ADR (Food Beverage & Tobacco) | 820 | 56,121 | ||||||
El Puerto de Liverpool SAB de CV, Series C1 (Retailing) | 2,000 | 13,624 | ||||||
Fomento Economico Mexicano SAB de CV - Sponsored ADR (Food Beverage & Tobacco) | 1,020 | 89,505 | ||||||
Grupo Financiero Banorte SAB de CV, Series O (Banks) | 5,000 | 29,674 | ||||||
Grupo Financiero Santander Mexico SAB de CV, Series B - ADR (Banks) | 1,800 | 15,156 | ||||||
Grupo Televisa SAB - Sponsored ADR (Media) | 2,150 | 47,064 | ||||||
Kimberly-Clark de Mexico SAB de CV, Series A (Household & Personal Products) | 17,100 | 29,443 | ||||||
Wal-Mart de Mexico SAB de CV (Food & Staples Retailing) | 37,100 | 82,901 | ||||||
| 363,488 | ||||||||
Morocco - 0.4% | ||||||||
Attijariwafa Bank (Banks)† | 320 | 15,949 | ||||||
Maroc Telecom (Telecommunication Services)† | 900 | 12,820 | ||||||
| 28,769 | ||||||||
Nigeria - 0.9% | ||||||||
Dangote Cement plc (Materials)† | 26,700 | 16,624 | ||||||
Nestle Nigeria plc (Food Beverage & Tobacco)† | 6,250 | 21,739 | ||||||
Zenith Bank plc (Banks)† | 260,470 | 18,462 | ||||||
| 56,825 | ||||||||
Pakistan - 1.3% | ||||||||
Engro Corp., Ltd. (Materials)† | 4,900 | 12,937 | ||||||
Lucky Cement Ltd. (Materials)† | 1,900 | 8,782 | ||||||
MCB Bank Ltd. (Banks)† | 5,500 | 10,392 | ||||||
Oil & Gas Development Co., Ltd. (Energy)† | 23,700 | 32,308 | ||||||
Pakistan Petroleum Ltd. (Energy)† | 7,100 | 12,126 | ||||||
See Notes to Financial Statements
36
Table of Contents
Harding, Loevner Funds, Inc.
Emerging Markets Research Portfolio
Portfolio of Investments
October 31, 2017 (continued)
| Shares | Value | |||||||
| COMMON STOCKS - 93.9% (continued) | ||||||||
Pakistan - 1.3% (continued) | ||||||||
United Bank Ltd. (Banks)† | 5,700 | $9,695 | ||||||
| 86,240 | ||||||||
Panama - 0.7% | ||||||||
Copa Holdings SA, Class A (Transportation) | 390 | 48,044 | ||||||
Peru - 1.3% | ||||||||
Alicorp SAA (Food Beverage & Tobacco) | 6,050 | 18,891 | ||||||
Credicorp Ltd. (Banks) | 320 | 67,021 | ||||||
| 85,912 | ||||||||
Philippines - 3.5% | ||||||||
Bank of the Philippine Islands (Banks)† | 20,920 | 39,742 | ||||||
Jollibee Foods Corp. (Consumer Services)† | 9,090 | 43,844 | ||||||
Robinsons Retail Holdings Inc. (Food & Staples Retailing)† | 8,430 | 15,834 | ||||||
Security Bank Corp. (Banks)† | 8,470 | 40,334 | ||||||
SM Prime Holdings Inc. (Real Estate)† | 72,700 | 52,162 | ||||||
Universal Robina Corp. (Food Beverage & Tobacco)† | 11,760 | 32,583 | ||||||
| 224,499 | ||||||||
Qatar - 0.2% | ||||||||
Qatar Electricity & Water Co. QSC (Utilities)† | 210 | 10,562 | ||||||
Romania - 0.2% | ||||||||
Banca Transilvania SA (Banks)† | 26,660 | 14,842 | ||||||
Russia - 4.6% | ||||||||
Lukoil PJSC - Sponsored ADR (Energy) | 1,520 | 80,605 | ||||||
Magnit PJSC - Sponsored GDR, Reg S (Food & Staples Retailing)† | 720 | 20,384 | ||||||
Moscow Exchange MICEX-RTS PJSC (Diversified Financials)† | 28,840 | 58,337 | ||||||
Novatek PJSC - Sponsored GDR, Reg S (Energy)† | 690 | 78,761 | ||||||
Sberbank of Russia PJSC - Sponsored ADR (Banks)† | 4,380 | 62,841 | ||||||
| 300,928 | ||||||||
Senegal - 0.2% | ||||||||
Sonatel (Telecommunication Services) | 360 | 14,704 | ||||||
South Africa - 4.0% | ||||||||
Aspen Pharmacare Holdings Ltd. (Pharmaceuticals, Biotechnology & Life Sciences)† | 1,760 | 39,766 | ||||||
Discovery Ltd. (Insurance)† | 3,620 | 37,582 | ||||||
Naspers Ltd., Class N (Media)† | 220 | 54,356 | ||||||
| Shares | Value | |||||||
| COMMON STOCKS - 93.9% (continued) | ||||||||
South Africa - 4.0% (continued) | ||||||||
Sasol Ltd. (Materials)† | 1,840 | $54,084 | ||||||
Standard Bank Group Ltd. (Banks)† | 6,320 | 73,309 | ||||||
| 259,097 | ||||||||
South Korea - 3.1% | ||||||||
Hankook Tire Co., Ltd. (Automobiles & Components)† | 1,430 | 68,901 | ||||||
Hanssem Co., Ltd. (Consumer Durables & Apparel)† | 446 | 68,058 | ||||||
NAVER Corp. (Software & Services)† | 80 | 64,080 | ||||||
| 201,039 | ||||||||
Taiwan - 7.4% | ||||||||
Airtac International Group (Capital Goods)† | 4,178 | 67,770 | ||||||
Delta Electronics Inc. (Technology Hardware & Equipment)† | 20,000 | 96,451 | ||||||
Eclat Textile Co., Ltd. (Consumer Durables & Apparel)† | 4,080 | 48,815 | ||||||
Largan Precision Co., Ltd. (Technology Hardware & Equipment)† | 680 | 129,753 | ||||||
Taiwan Semiconductor Manufacturing Co., Ltd. (Semiconductors & Semiconductor Equipment)† | 17,000 | 137,312 | ||||||
| 480,101 | ||||||||
Thailand - 1.1% | ||||||||
Siam Commercial Bank pcl, Reg S (Banks)† | 16,100 | 71,001 | ||||||
Turkey - 1.0% | ||||||||
Turkiye Garanti Bankasi AS - ADR (Banks) | 23,330 | 63,458 | ||||||
United Arab Emirates - 3.2% | ||||||||
Agthia Group PJSC (Food Beverage & Tobacco)† | 6,740 | 9,560 | ||||||
DP World Ltd. (Transportation)† | 3,730 | 88,587 | ||||||
Emaar Properties PJSC (Real Estate)† | 49,480 | 111,992 | ||||||
| 210,139 | ||||||||
United Kingdom - 0.9% | ||||||||
BGEO Group plc (Banks)† | 1,040 | 49,148 | ||||||
Nostrum Oil & Gas plc (Energy)*† | 2,220 | 11,097 | ||||||
| 60,245 | ||||||||
United States - 0.8% | ||||||||
PriceSmart Inc. (Food & Staples Retailing) | 625 | 52,375 | ||||||
See Notes to Financial Statements
37
Table of Contents
Harding, Loevner Funds, Inc.
Emerging Markets Research Portfolio
Portfolio of Investments
October 31, 2017 (continued)
| Shares | Value | |||||||
| COMMON STOCKS - 93.9% (continued) | ||||||||
Vietnam - 1.0% | ||||||||
Masan Group Corp. (Food Beverage & Tobacco)† | 7,960 | $20,865 | ||||||
Vietnam Dairy Products JSC (Food Beverage & Tobacco)† | 6,520 | 43,349 | ||||||
| 64,214 | ||||||||
Total Common Stocks (Cost $5,063,518) | $6,098,522 | |||||||
| PREFERRED STOCKS - 3.4% | ||||||||
Brazil - 1.9% | ||||||||
Banco Bradesco SA - ADR (Banks)* | 6,182 | 65,344 | ||||||
Itau Unibanco Holding SA - Sponsored ADR, 0.45% (Banks) | 4,720 | 60,463 | ||||||
| 125,807 | ||||||||
Colombia - 0.4% | ||||||||
Bancolombia SA - Sponsored ADR, 3.41% (Banks) | 670 | 25,292 | ||||||
South Korea - 1.1% | ||||||||
LG Household & Health Care Ltd., 1.15% (Household & Personal Products)† | 120 | 70,183 | ||||||
Total Preferred Stocks (Cost $176,378) | $221,282 | |||||||
| PARTICIPATION NOTES - 1.4% | ||||||||
Saudi Arabia - 1.4% | ||||||||
Al Rajhi Bank, Issued by JP Morgan Structured Products, Maturity Date 12/5/19 (Banks)†^ | 1,870 | 32,083 | ||||||
Jarir Marketing Co., Issued by HSBC BANK PLC, Maturity Date 1/22/18 (Retailing)†^ | 1,210 | 45,467 | ||||||
Saudi British Bank, Issued by JP Morgan Structured Products, Maturity Date 12/9/19 (Banks)†^ | 1,870 | 12,306 | ||||||
| 89,856 | ||||||||
Total Participation Notes (Cost $81,324) | $89,856 | |||||||
| SHORT TERM INVESTMENTS - 1.8% | ||||||||
Northern Institutional Funds - Treasury Portfolio, 0.88% (Money Market Fund) | 116,760 | 116,760 | ||||||
| Shares | Value | |||||||||||
| SHORT TERM INVESTMENTS - 1.8% (continued) | ||||||||||||
Total Short Term Investments (Cost $116,760) |
| $116,760 | ||||||||||
Total Investments — 100.5% | ||||||||||||
(Cost $5,437,980) | $6,526,420 | |||||||||||
Liabilities Less Other Assets — (0.5)% | (32,312 | ) | ||||||||||
Net Assets — 100.0% | $6,494,108 | |||||||||||
Summary of Abbreviations
| ADR | American Depositary Receipt. |
| GDR | Global Depository Receipt. |
| Reg S | Security sold outside United States without registration under the Securities Act of 1933. |
| # | Security valued at fair value as determined in good faith under policies and procedures established by and under the supervision of the Portfolio’s Board of Directors as disclosed in Note 2 of the Notes to Financial Statements. |
| * | Non-income producing security. |
| ^ | Security exempt from registration pursuant to Rule 144A of the Securities Act of 1933. These securities, which represent 1.4% of net assets as of October 31, 2017, are considered liquid and may be resold in transactions exempt from registration, normally to qualified buyers. |
| † | Investment categorized as level 2 security as disclosed in Note 2 of the Notes to Financial Statements. |
See Notes to Financial Statements
38
Table of Contents
Harding, Loevner Funds, Inc.
Emerging Markets Research Portfolio
Portfolio of Investments
October 31, 2017 (continued)
| Industry | | Percentage of Net Assets | | ||
Automobiles & Components | 3.0 | % | |||
Banks | 22.7 | ||||
Capital Goods | 2.7 | ||||
Commercial & Professional Services | 1.1 | ||||
Consumer Durables & Apparel | 7.6 | ||||
Consumer Services | 0.7 | ||||
Diversified Financials | 3.0 | ||||
Energy | 5.5 | ||||
Food & Staples Retailing | 3.4 | ||||
Food Beverage & Tobacco | 9.9 | ||||
Household & Personal Products | 2.5 | ||||
Insurance | 1.0 | ||||
Materials | 2.8 | ||||
Media | 1.8 | ||||
Pharmaceuticals, Biotechnology & Life Sciences | 4.9 | ||||
Real Estate | 2.7 | ||||
Retailing | 1.7 | ||||
Semiconductors & Semiconductor Equipment | 2.1 | ||||
Software & Services | 5.5 | ||||
Technology Hardware & Equipment | 5.8 | ||||
Telecommunication Services | 3.4 | ||||
Transportation | 3.8 | ||||
Utilities | 1.1 | ||||
Money Market Fund | 1.8 | ||||
Total Investments | 100.5 | ||||
Liabilities Less Other Assets | (0.5 | ) | |||
Net Assets | 100.0 | % | |||
See Notes to Financial Statements
39
Table of Contents
Statements of Assets and Liabilities
October 31, 2017
| Global Equity Portfolio | International Equity Portfolio | International Small Companies Portfolio | ||||||||||
ASSETS: | ||||||||||||
Investments (cost $588,926,556, $9,175,807,804 and $152,002,922, respectively) | $897,993,479 | $11,888,539,225 | $195,078,885 | |||||||||
Dividends and interest receivable | 620,507 | 14,359,174 | 153,442 | |||||||||
Foreign currency (cost $0, $0 and $114,352, respectively) | — | — | 114,342 | |||||||||
Receivable for investments sold | 14,355,153 | 3,634,187 | — | |||||||||
Receivable for Fund shares sold | 9,851,087 | 23,932,206 | 81,197 | |||||||||
Tax reclaim receivable | 605,364 | 13,371,145 | 168,325 | |||||||||
Prepaid expenses | 15,637 | 40,386 | 55,537 | |||||||||
Total Assets: | 923,441,227 | 11,943,876,323 | 195,651,728 | |||||||||
LIABILITIES: | ||||||||||||
Payable to Investment Adviser | (641,138 | ) | (6,755,259 | ) | (186,842 | ) | ||||||
Payable for investments purchased | — | (8,804,668 | ) | (434,674 | ) | |||||||
Payable for Fund shares redeemed | (10,702,478 | ) | (6,304,229 | ) | (66,452 | ) | ||||||
Payable for distribution fees | — | (348,553 | ) | (15,392 | ) | |||||||
Deferred capital gains tax | — | — | (397,357 | ) | ||||||||
Other liabilities | (263,676 | ) | (2,761,928 | ) | (88,502 | ) | ||||||
Total Liabilities | (11,607,292 | ) | (24,974,637 | ) | (1,189,219 | ) | ||||||
Net Assets | $911,833,935 | $11,918,901,686 | $194,462,509 | |||||||||
ANALYSIS OF NET ASSETS: | ||||||||||||
Paid in capital | $503,066,601 | $9,022,252,770 | $149,841,434 | |||||||||
Accumulated undistributed net investment income | 2,699,422 | 104,884,439 | 705,573 | |||||||||
Accumulated net realized gain from investment transactions | 96,997,380 | 78,805,881 | 1,239,816 | |||||||||
Net unrealized appreciation on investments and on assets and liabilities denominated in foreign currencies | 309,070,532 | 2,712,958,596 | 42,675,686 | |||||||||
Net Assets | $911,833,935 | $11,918,901,686 | $194,462,509 | |||||||||
Net Assets: | ||||||||||||
Institutional Class | $790,096,966 | $11,107,736,189 | $144,170,263 | |||||||||
Institutional Class Z | 46,492,656 | 166,922,506 | — | |||||||||
Investor Class | — | 644,242,991 | 50,292,246 | |||||||||
Advisor Class | 75,244,313 | — | — | |||||||||
Total Shares Outstanding: | ||||||||||||
Institutional Class (400,000,000, 500,000,000 and 400,000,000, respectively, $.001 par value shares authorized) | 19,346,005 | 490,664,614 | 8,650,774 | |||||||||
Institutional Class Z (200,000,000, 200,000,000 and —, respectively, $.001 par value shares authorized) | 1,138,429(1 | ) | 7,373,468(1 | ) | — | |||||||
Investor Class (—, 400,000,000 and 400,000,000, respectively, $.001 par value shares authorized) | — | 28,571,101 | 3,038,975 | |||||||||
Advisor Class (400,000,000, — and —, respectively, $.001 par value shares authorized) | 1,845,237 | — | — | |||||||||
Net Asset Value, Offering Price and Redemption Price Per Share: | ||||||||||||
Institutional Class | $40.84 | $22.64 | $16.67 | |||||||||
Institutional Class Z | 40.84(1 | ) | 22.64(1 | ) | — | |||||||
Investor Class | — | 22.55 | 16.55 | |||||||||
Advisor Class | 40.78 | — | — | |||||||||
| (1) | All share amounts and net asset values have been adjusted as a result of the reverse share split effected after the close of business on December 1, 2017. (See Note 1). |
See Notes to Financial Statements
40
Table of Contents
Harding, Loevner Funds, Inc.
Statements of Assets and Liabilities (continued)
October 31, 2017
Institutional Emerging Markets Portfolio | Emerging Markets Portfolio | Frontier Emerging Markets Portfolio | ||||||||||
ASSETS: | ||||||||||||
Investments (cost $3,664,459,477, $2,799,900,732 and $389,472,849, respectively) | $4,841,044,739 | $4,008,751,736 | $467,019,117 | |||||||||
Dividends and interest receivable | 4,654,265 | 3,877,087 | 332,031 | |||||||||
Foreign currency (cost $2,799,696, $7,908,903 and $1,112,839, respectively) | 2,819,288 | 7,925,410 | 1,114,223 | |||||||||
Receivable for investments sold | 10,270,023 | 8,525,513 | — | |||||||||
Receivable for Fund shares sold | 8,090,622 | 4,215,696 | 294,957 | |||||||||
Tax reclaim receivable | 784,975 | 229,801 | — | |||||||||
Prepaid expenses | 69,149 | 15,775 | 14,300 | |||||||||
Total Assets: | 4,867,733,061 | 4,033,541,018 | 468,774,628 | |||||||||
LIABILITIES: | ||||||||||||
Payable to Investment Adviser | (4,564,771 | ) | (3,797,422 | ) | (538,679 | ) | ||||||
Payable for investments purchased | (12,775,017 | ) | (10,675,216 | ) | — | |||||||
Payable for Fund shares redeemed | (4,325,948 | ) | (2,147,799 | ) | (467,319 | ) | ||||||
Payable for distribution fees | — | — | (15,681 | ) | ||||||||
Deferred capital gains tax | — | — | (3,008,936 | ) | ||||||||
Other liabilities | (1,268,632 | ) | (1,944,049 | ) | (220,504 | ) | ||||||
Total Liabilities | (22,934,368 | ) | (18,564,486 | ) | (4,251,119 | ) | ||||||
Net Assets | $4,844,798,693 | $4,014,976,532 | $464,523,509 | |||||||||
ANALYSIS OF NET ASSETS: | ||||||||||||
Paid in capital | $3,752,734,113 | $2,807,746,104 | $495,835,573 | |||||||||
Accumulated undistributed net investment income | 38,774,466 | 28,518,437 | 3,585,808 | |||||||||
Accumulated net realized loss from investment transactions | (123,330,153 | ) | (30,140,573 | ) | (109,428,045 | ) | ||||||
Net unrealized appreciation on investments and on assets and liabilities denominated in foreign currencies | 1,176,620,267 | 1,208,852,564 | 74,530,173 | |||||||||
Net Assets | $4,844,798,693 | $4,014,976,532 | $464,523,509 | |||||||||
Net Assets: | ||||||||||||
Institutional Class I | $— | $— | $266,844,308 | |||||||||
Institutional Class II | — | — | 166,698,320 | |||||||||
Class I | 4,386,510,718 | — | — | |||||||||
Class II | 458,287,975 | — | — | |||||||||
Investor Class | — | — | 30,980,881 | |||||||||
Advisor Class | — | 4,014,976,532 | — | |||||||||
Total Shares Outstanding: | ||||||||||||
Institutional Class I (— , — and 400,000,000, respectively, $.001 par value shares authorized) | — | — | 31,401,069 | |||||||||
Institutional Class II (— , — and 200,000,000, respectively, $.001 par value shares authorized) | — | — | 19,618,659(1 | ) | ||||||||
Class I (500,000,000, — and — , respectively, $.001 par value shares authorized) | 199,946,877 | — | — | |||||||||
Class II (400,000,000, — and — , respectively, $.001 par value shares authorized) | 20,890,556(2 | ) | — | — | ||||||||
Investor Class (— , — and 400,000,000, respectively, $.001 par value shares authorized) | — | — | 3,672,936 | |||||||||
Advisor Class (— , 500,000,000 and — , respectively, $.001 par value shares authorized) | — | 69,874,931 | — | |||||||||
Net Asset Value, Offering Price and Redemption Price Per Share: | ||||||||||||
Institutional Class I | $— | $— | $8.50 | |||||||||
Institutional Class II | — | — | 8.50(1 | ) | ||||||||
Class I | 21.94 | — | — | |||||||||
Class II | 21.94(2 | ) | — | — | ||||||||
Investor Class | — | — | 8.43 | |||||||||
Advisor Class | — | 57.46 | — | |||||||||
| (1) | All share amounts and net asset values have been adjusted as a result of the share dividend effected after the close of business on December 1, 2017. (See Note 1). |
| (2) | All share amounts and net asset values have been adjusted as a result of the reverse share split effected after the close of business on December 1, 2017. (See Note 1). |
See Notes to Financial Statements
41
Table of Contents
Harding, Loevner Funds, Inc.
Statements of Assets and Liabilities (continued)
October 31, 2017
Global Equity Research Portfolio | International Equity Research Portfolio | Emerging Markets Research Portfolio | ||||||||||
ASSETS: | ||||||||||||
Investments (cost $5,040,587, $8,869,756 and $5,437,980, respectively) | $5,915,959 | $10,615,149 | $6,526,420 | |||||||||
Dividends and interest receivable | 6,318 | 17,133 | 6,894 | |||||||||
Receivable for investments sold | 27,885 | — | — | |||||||||
Receivable for Fund shares sold | — | 2,727 | — | |||||||||
Tax reclaim receivable | 1,117 | 8,390 | 399 | |||||||||
Prepaid Offering fees | 2,775 | — | 2,775 | |||||||||
Prepaid expenses | 11,678 | 12,004 | 11,661 | |||||||||
Total Assets: | 5,965,732 | 10,655,403 | 6,548,149 | |||||||||
LIABILITIES: | ||||||||||||
Payable to Investment Adviser | (3,945 | ) | (6,719 | ) | (6,337 | ) | ||||||
Payable for investments purchased | (68,185 | ) | — | — | ||||||||
Payable for distribution fees | (1,076 | ) | (3,264 | ) | (1,192 | ) | ||||||
Deferred capital gains tax | (2,731 | ) | (3,803 | ) | (12,352 | ) | ||||||
Other liabilities | (33,389 | ) | (38,591 | ) | (34,160 | ) | ||||||
Total Liabilities | (109,326 | ) | (52,377 | ) | (54,041 | ) | ||||||
Net Assets | $5,856,406 | $10,603,026 | $6,494,108 | |||||||||
ANALYSIS OF NET ASSETS: | ||||||||||||
Paid in capital | $4,743,890 | $8,278,365 | $4,943,862 | |||||||||
Accumulated undistributed net investment income | 86,427 | 107,310 | 107,347 | |||||||||
Accumulated net realized gain from investment transactions | 153,462 | 475,727 | 366,841 | |||||||||
Net unrealized appreciation on investments and on assets and liabilities denominated in foreign currencies | 872,627 | 1,741,624 | 1,076,058 | |||||||||
Net Assets | $5,856,406 | $10,603,026 | $6,494,108 | |||||||||
Net Assets: | ||||||||||||
Institutional Class | $5,308,016 | $9,478,824 | $5,880,459 | |||||||||
Investor Class | 548,390 | 1,124,202 | 613,649 | |||||||||
Total Shares Outstanding: | ||||||||||||
Institutional Class (300,000,000, 300,000,000 and 300,000,000, respectively, $.001 par value shares authorized) | 433,942 | 723,208 | 451,850 | |||||||||
Investor Class (200,000,000, 300,000,000 and 200,000,000, respectively, $.001 par value shares authorized) | 44,913 | 86,149 | 47,237 | |||||||||
Net Asset Value, Offering Price and Redemption Price Per Share: | ||||||||||||
Institutional Class | $12.23 | $13.11 | $13.01 | |||||||||
Investor Class | 12.21 | 13.05 | 12.99 | |||||||||
See Notes to Financial Statements
42
Table of Contents
Statements of Operations
For the Fiscal Year Ended October 31, 2017
| Global Equity Portfolio | International Equity Portfolio | International Small Companies Portfolio | Institutional Emerging | Emerging Markets Portfolio | ||||||||||||||||
INVESTMENT INCOME | ||||||||||||||||||||
Interest | $— | $2,074 | $— | $3,180 | $2,105 | |||||||||||||||
Dividends (net of foreign withholding taxes of $773,489, $19,361,317, $279,902, $9,858,427 and $7,801,434, respectively) | 10,642,992 | 183,799,532 | 2,608,511 | 91,038,820 | 78,338,799 | |||||||||||||||
Total investment income | 10,642,992 | 183,801,606 | 2,608,511 | 91,042,000 | 78,340,904 | |||||||||||||||
EXPENSES | ||||||||||||||||||||
Investment advisory fees (Note 3) | 7,286,517 | 61,400,782 | 1,628,608 | 45,255,823 | 38,899,243 | |||||||||||||||
Administration fees (Note 3) | 294,204 | 2,140,228 | 56,648 | 1,028,087 | 896,941 | |||||||||||||||
Distribution fees, Investor Class | — | 1,361,777 | 107,591 | — | — | |||||||||||||||
Custody and accounting fees (Note 3) | 210,232 | 1,938,428 | 92,128 | 2,081,066 | 1,778,213 | |||||||||||||||
Directors’ fees and expenses | 27,464 | 267,491 | 4,186 | 120,247 | 102,713 | |||||||||||||||
Transfer agent fees and expenses (Note 3) | 54,785 | 314,590 | 43,456 | 92,247 | 524,456 | |||||||||||||||
Printing and postage fees | 42,450 | 740,403 | 17,956 | 253,621 | 381,883 | |||||||||||||||
State registration filing fees | 72,433 | 445,004 | 48,514 | 183,819 | 101,077 | |||||||||||||||
Professional fees | 57,772 | 250,090 | 39,623 | 147,098 | 161,550 | |||||||||||||||
Shareholder servicing fees (Note 3) | 510,109 | 6,375,087 | 118,523 | 2,401,769 | 6,199,625 | |||||||||||||||
Compliance officers’ fees and expenses (Note 3) | 4,470 | 33,863 | 1,228 | 15,855 | 13,665 | |||||||||||||||
Other fees and expenses | 37,569 | 282,854 | 10,999 | 125,380 | 100,376 | |||||||||||||||
Total Expenses | 8,598,005 | 75,550,597 | 2,169,460 | 51,705,012 | 49,159,742 | |||||||||||||||
Less Waiver of investment advisory fee and/or reimbursement of other operating expenses (Note 3) | (21,683 | ) | (17,070 | ) | (433,215 | ) | (447,297 | ) | — | |||||||||||
Less waiver of transfer agent fee and expenses (Note 3) | (6,170 | ) | (11,459 | ) | — | — | — | |||||||||||||
Net expenses | 8,570,152 | 75,522,068 | 1,736,245 | 51,257,715 | 49,159,742 | |||||||||||||||
Net investment income | 2,072,840 | 108,279,538 | 872,266 | 39,784,285 | 29,181,162 | |||||||||||||||
REALIZED AND UNREALIZED GAIN (LOSS) | ||||||||||||||||||||
Net realized gain (loss) | ||||||||||||||||||||
Investment transactions | 99,357,621 | 110,716,987 | 2,170,001 | 18,142,495 | 60,294,719 | |||||||||||||||
Foreign currency transactions | (6,378 | ) | (1,594,220 | ) | (108,680 | ) | (942,355 | ) | (683,601 | ) | ||||||||||
Net realized gain | 99,351,243 | 109,122,767 | 2,061,321 | 17,200,140 | 59,611,118 | |||||||||||||||
Change in unrealized appreciation (depreciation) | ||||||||||||||||||||
Investments (net of increase (decrease) in deferred foreign taxes of $—, $—, $270,849, $(714,186) and $—, respectively) | 121,634,730 | 1,803,987,537 | 31,481,535 | 868,788,606 | 699,066,494 | |||||||||||||||
Translation of assets and liabilities denominated in foreign currencies | 42,675 | 478,351 | 20,616 | (635 | ) | (131,435 | ) | |||||||||||||
Net change in unrealized appreciation | 121,677,405 | 1,804,465,888 | 31,502,151 | 868,787,971 | 698,935,059 | |||||||||||||||
Net realized and unrealized gain | 221,028,648 | 1,913,588,655 | 33,563,472 | 885,988,111 | 758,546,177 | |||||||||||||||
NET INCREASE IN NET ASSETS RESULTING FROM OPERATIONS | $223,101,488 | $2,021,868,193 | $34,435,738 | $925,772,396 | $787,727,339 | |||||||||||||||
See Notes to Financial Statements
43
Table of Contents
Harding, Loevner Funds, Inc.
Statements of Operations (continued)
For the Fiscal Year Ended October 31, 2017
Frontier Emerging Markets Portfolio | Global Equity Research Portfolio(1) | International Equity Research Portfolio | Emerging Markets Research Portfolio(1) | |||||||||||||
INVESTMENT INCOME | ||||||||||||||||
Dividends (net of foreign withholding taxes of $1,014,723, $5,244, $18,282 and $12,423, respectively) | $10,438,465 | $78,093 | $171,516 | $117,995 | ||||||||||||
Total investment income | 10,438,465 | 78,093 | 171,516 | 117,995 | ||||||||||||
EXPENSES | ||||||||||||||||
Investment advisory fees (Note 3) | 5,820,360 | 36,839 | 68,053 | 58,154 | ||||||||||||
Administration fees (Note 3) | 154,328 | 1,842 | 3,630 | 2,023 | ||||||||||||
Distribution fees, Investor Class | 77,496 | 1,076 | 2,453 | 1,192 | ||||||||||||
Custody and accounting fees (Note 3) | 586,993 | 18,435 | 28,863 | 21,275 | ||||||||||||
Directors’ fees and expenses | 12,473 | 157 | 263 | 175 | ||||||||||||
Transfer agent fees and expenses (Note 3) | 64,874 | 37,252 | 40,908 | 37,189 | ||||||||||||
Printing and postage fees | 33,415 | 2,254 | 971 | 2,254 | ||||||||||||
State registration filing fees | 86,344 | 52,400 | 46,854 | 52,400 | ||||||||||||
Professional fees | 44,536 | 31,156 | 41,215 | 34,509 | ||||||||||||
Shareholder servicing fees (Note 3) | 252,659 | — | 637 | — | ||||||||||||
Compliance officers’ fees and expenses | 2,674 | 207 | 711 | 208 | ||||||||||||
Organization fees | — | 2,173 | — | 2,026 | ||||||||||||
Offering fees | — | 17,892 | 4,401 | 17,892 | ||||||||||||
Other fees and expenses | 18,934 | 1,567 | 7,275 | 1,594 | ||||||||||||
Total Expenses | 7,155,086 | 203,250 | 246,234 | 230,891 | ||||||||||||
Less Waiver of investment advisory fee and/or reimbursement of other operating expenses (Note 3) | (263,655 | ) | (160,732 | ) | (162,131 | ) | (163,960 | ) | ||||||||
Less waiver of transfer agent fee and expenses (Note 3) | — | — | — | — | ||||||||||||
Net expenses | 6,891,431 | 42,518 | 84,103 | 66,931 | ||||||||||||
Net investment income | 3,547,034 | 35,575 | 87,413 | 51,064 | ||||||||||||
REALIZED AND UNREALIZED GAIN (LOSS) | ||||||||||||||||
Net realized gain (loss) | ||||||||||||||||
Investment transactions | (6,030,201 | ) | 157,274 | 513,096 | 371,911 | |||||||||||
Foreign currency transactions | 909,680 | (470 | ) | (3,092 | ) | 3,575 | ||||||||||
Net realized gain (loss) | (5,120,521 | ) | 156,804 | 510,004 | 375,486 | |||||||||||
Change in unrealized appreciation (depreciation) | 67,344,532 | 872,658 | 1,271,451 | 1,076,280 | ||||||||||||
Translation of assets and liabilities denominated in foreign currencies | 138,849 | (31 | ) | 383 | (222 | ) | ||||||||||
Net change in unrealized appreciation | 67,483,381 | 872,627 | 1,271,834 | 1,076,058 | ||||||||||||
Net realized and unrealized gain | 62,362,860 | 1,029,431 | 1,781,838 | 1,451,544 | ||||||||||||
NET INCREASE IN NET ASSETS RESULTING FROM OPERATIONS | $65,909,894 | $1,065,006 | $1,869,251 | $1,502,608 | ||||||||||||
| (1) | For the period from December 19, 2016 (commencement of class operations) through October 31, 2017. |
See Notes to Financial Statements
44
Table of Contents
Harding, Loevner Funds, Inc.
Statements of Changes in Net Assets
For the Fiscal Years Ended October 31
Global Equity Portfolio | International Equity Portfolio | International Small Companies Portfolio | ||||||||||||||||||||||
| 2017 | 2016 | 2017 | 2016 | 2017 | 2016 | |||||||||||||||||||
INCREASE (DECREASE) IN NET ASSETS FROM OPERATIONS | ||||||||||||||||||||||||
Net investment income | $2,072,840 | $3,290,628 | $108,279,538 | $67,157,216 | $872,266 | $1,276,885 | ||||||||||||||||||
Net realized gain on investments and foreign currency transactions | 99,351,243 | 11,458,424 | 109,122,767 | 27,326,986 | 2,061,321 | 3,003,600 | ||||||||||||||||||
Net change in unrealized appreciation (depreciation) on investments and translation of assets and liabilities denominated in foreign currencies | 121,677,405 | 14,993,574 | 1,804,465,888 | 241,743,759 | 31,502,151 | (612,963 | ) | |||||||||||||||||
Net increase in net assets resulting from operations | 223,101,488 | 29,742,626 | 2,021,868,193 | 336,227,961 | 34,435,738 | 3,667,522 | ||||||||||||||||||
DISTRIBUTIONS TO SHAREHOLDERS FROM: | ||||||||||||||||||||||||
Net investment income | (3,192,599 | ) | (2,860,663 | ) | (61,948,722 | ) | (45,476,713 | ) | (758,218 | ) | (312,564 | ) | ||||||||||||
Investor Class | — | — | (2,877,064 | ) | (2,808,064 | ) | (455,833 | ) | (263,471 | ) | ||||||||||||||
Advisor Class | (71,969 | ) | (54,968 | ) | — | — | — | — | ||||||||||||||||
Net realized gain from investments and foreign-currency related transactions | (9,438,405 | ) | (20,000,354 | ) | — | — | (1,995,191 | ) | (448,708 | ) | ||||||||||||||
Investor Class | — | — | — | — | (1,303,383 | ) | (499,474 | ) | ||||||||||||||||
Advisor Class | (670,713 | ) | (1,649,403 | ) | — | — | — | — | ||||||||||||||||
Total distributions to shareholders | (13,373,686 | ) | (24,565,388 | ) | (64,825,786 | ) | (48,284,777 | ) | (4,512,625 | ) | (1,524,217 | ) | ||||||||||||
TRANSACTIONS IN SHARES OF COMMON STOCK | ||||||||||||||||||||||||
Institutional Class | (182,801,422 | ) | (31,850,634 | ) | 2,919,220,272 | 1,487,517,941 | 59,600,587 | 14,263,387 | ||||||||||||||||
Institutional Class Z | 45,129,498 | — | 163,450,051 | — | — | — | ||||||||||||||||||
Investor Class | — | — | 90,614,374 | 16,210,924 | (2,209,932 | ) | (6,697,710 | ) | ||||||||||||||||
Advisor Class | 4,059,653 | (7,625,215 | ) | — | — | — | — | |||||||||||||||||
Net Increase (Decrease) in net assets from portfolio share transactions | (133,612,271 | ) | (39,475,849 | ) | 3,173,284,697 | 1,503,728,865 | 57,390,655 | 7,565,677 | ||||||||||||||||
NET INCREASE (DECREASE) IN | ||||||||||||||||||||||||
NET ASSETS | 76,115,531 | (34,298,611 | ) | 5,130,327,104 | 1,791,672,049 | 87,313,768 | 9,708,982 | |||||||||||||||||
NET ASSETS | ||||||||||||||||||||||||
At beginning of year | 835,718,404 | 870,017,015 | 6,788,574,582 | 4,996,902,533 | 107,148,741 | 97,439,759 | ||||||||||||||||||
At end of year | $911,833,935 | $835,718,404 | $11,918,901,686 | $6,788,574,582 | $194,462,509 | $107,148,741 | ||||||||||||||||||
Accumulated Undistributed Net Investment Income Included In Net Assets | $2,699,422 | $3,727,557 | $104,884,439 | $62,986,475 | $705,573 | $1,209,255 | ||||||||||||||||||
See Notes to Financial Statements
45
Table of Contents
Harding, Loevner Funds, Inc.
Statements of Changes in Net Assets (continued)
For the Fiscal Years Ended October 31
| Institutional Emerging Markets Portfolio | Emerging Markets Portfolio | Frontier Emerging Markets Portfolio | ||||||||||||||||||||||
| 2017 | 2016 | 2017 | 2016 | 2017 | 2016 | |||||||||||||||||||
INCREASE (DECREASE) IN NET ASSETS FROM OPERATIONS | ||||||||||||||||||||||||
Net investment income | $39,784,285 | $23,219,840 | $29,181,162 | $18,031,682 | $3,547,034 | $5,212,040 | ||||||||||||||||||
Net realized gain (loss) on investments and foreign currency transactions | 17,200,140 | (108,993,471 | ) | 59,611,118 | (75,516,620 | ) | (5,120,521 | ) | (99,616,304 | ) | ||||||||||||||
Net change in unrealized appreciation on investments and translation of assets and liabilities denominated in foreign currencies | 868,787,971 | 417,368,344 | 698,935,059 | 337,030,750 | 67,483,381 | 72,702,646 | ||||||||||||||||||
Net increase (decrease) in net assets resulting from operations | 925,772,396 | 331,594,713 | 787,727,339 | 279,545,812 | 65,909,894 | (21,701,618 | ) | |||||||||||||||||
DISTRIBUTIONS TO SHAREHOLDERS FROM: | ||||||||||||||||||||||||
Net investment income | — | — | — | — | (3,512,132 | ) | (4,416,183 | ) | ||||||||||||||||
Class I | (18,225,386 | ) | (11,288,661 | ) | — | — | — | — | ||||||||||||||||
Class II | (4,287,811 | ) | (2,859,722 | ) | — | — | — | �� | — | |||||||||||||||
Investor Class | — | — | — | — | (165,442 | ) | (210,680 | ) | ||||||||||||||||
Advisor Class | — | — | (17,343,528 | ) | (12,240,604 | ) | — | — | ||||||||||||||||
Net realized gain from investments and foreign-currency related transactions | — | — | — | (56,015 | ) | — | — | |||||||||||||||||
Total distributions to shareholders | (22,513,197 | ) | (14,148,383 | ) | (17,343,528 | ) | (12,296,619 | ) | (3,677,574 | ) | (4,626,863 | ) | ||||||||||||
TRANSACTIONS IN SHARES OF COMMON STOCK | ||||||||||||||||||||||||
Institutional Class I | — | — | — | — | (113,854,561 | ) | (85,054,480 | ) | ||||||||||||||||
Institutional Class II | — | — | — | — | 147,539,455 | — | ||||||||||||||||||
Class I | 521,998,725 | 889,338,740 | — | — | — | — | ||||||||||||||||||
Class II | (12,909,702 | ) | 107,745,103 | — | — | — | — | |||||||||||||||||
Investor Class | — | — | — | — | (6,278,013 | ) | (11,000,046 | ) | ||||||||||||||||
Advisor Class | — | — | 246,108,743 | 349,564,027 | — | — | ||||||||||||||||||
Net Increase (Decrease) in net assets from portfolio share transactions | 509,089,023 | 997,083,843 | 246,108,743 | 349,564,027 | 27,406,881 | (96,054,526 | ) | |||||||||||||||||
NET INCREASE (DECREASE) IN | ||||||||||||||||||||||||
NET ASSETS | 1,412,348,222 | 1,314,530,173 | 1,016,492,554 | 616,813,220 | 89,639,201 | (122,383,007 | ) | |||||||||||||||||
NET ASSETS | ||||||||||||||||||||||||
At beginning of year | 3,432,450,471 | 2,117,920,298 | 2,998,483,978 | 2,381,670,758 | 374,884,308 | 497,267,315 | ||||||||||||||||||
At end of year | $4,844,798,693 | $3,432,450,471 | $4,014,976,532 | $2,998,483,978 | $464,523,509 | $374,884,308 | ||||||||||||||||||
Accumulated Undistributed Net Investment Income Included In Net Assets | $38,774,466 | $22,439,907 | $28,518,437 | $17,368,088 | $3,585,808 | $3,677,573 | ||||||||||||||||||
See Notes to Financial Statements
46
Table of Contents
Harding, Loevner Funds, Inc.
Statements of Changes in Net Assets (continued)
For the Fiscal Years Ended October 31
Global Equity Research Portfolio | International Equity Research Portfolio | Emerging Markets Research Portfolio | ||||||||||||||
| 2017(1) | 2017 | 2016(2) | 2017(1) | |||||||||||||
INCREASE (DECREASE) IN NET ASSETS FROM OPERATIONS | ||||||||||||||||
Net investment income | $35,575 | $87,413 | $83,946 | $51,064 | ||||||||||||
Net realized gain on investments and foreign currency transactions | 156,804 | 510,004 | 126,630 | 375,486 | ||||||||||||
Net change in unrealized appreciation on investments and translation of assets and liabilities denominated in foreign currencies | 872,627 | 1,271,834 | 469,790 | 1,076,058 | ||||||||||||
Net increase in net assets resulting from operations | 1,065,006 | 1,869,251 | 680,366 | 1,502,608 | ||||||||||||
DISTRIBUTIONS TO SHAREHOLDERS FROM: | ||||||||||||||||
Net investment income | ||||||||||||||||
Institutional Class | — | (106,029 | ) | — | — | |||||||||||
Investor Class | — | (12,691 | ) | — | — | |||||||||||
Net realized gain from investments and foreign-currency related transactions | ||||||||||||||||
Institutional Class | — | (121,633 | ) | — | — | |||||||||||
Investor Class | — | (14,558 | ) | — | — | |||||||||||
Total distributions to shareholders | — | (254,911 | ) | — | — | |||||||||||
TRANSACTIONS IN SHARES OF COMMON STOCK | ||||||||||||||||
Institutional Class | 4,341,525 | 1,790,387 | 5,627,000 | 4,518,305 | ||||||||||||
Investor Class | 449,875 | 127,794 | 763,139 | 473,195 | ||||||||||||
Net Increase in net assets from portfolio share transactions | 4,791,400 | 1,918,181 | 6,390,139 | 4,991,500 | ||||||||||||
NET INCREASE IN NET ASSETS | 5,856,406 | 3,532,521 | 7,070,505 | 6,494,108 | ||||||||||||
NET ASSETS | ||||||||||||||||
At beginning of year | — | 7,070,505 | — | — | ||||||||||||
At end of year | $5,856,406 | $10,603,026 | $7,070,505 | $6,494,108 | ||||||||||||
Accumulated Undistributed Net Investment Income Included In Net Assets | $86,427 | $107,310 | $108,064 | $107,347 | ||||||||||||
| (1) | For the period from December 19, 2016 (commencement of class operations) through October 31, 2017. |
| (2) | For the period from December 17, 2015 (commencement of class operations) through October 31, 2016. |
See Notes to Financial Statements
47
Table of Contents
Financial Highlights
For the Fiscal Years Ended October 31
INCREASE (DECREASE) IN NET ASSETS FROM OPERATIONS: | DISTRIBUTIONS TO SHAREHOLDERS FROM: | RATIOS/SUPPLEMENTAL DATA: | ||||||||||||||||||||||||||||||||||||||||||||||||||||||
| Net asset value, beginning of year | Net investment income (loss)(1) | Net realized and unrealized gain (loss) on investments and foreign currency- related transactions | Net increase (decrease) from investment operations | Net investment income | Net from | Total distributions | Net of | Total Return | Net assets, end of year (000’s) | Expenses to average net assets | Expenses to average | Net investment income to average net assets | Portfolio turnover rate | |||||||||||||||||||||||||||||||||||||||||||
Global Equity Portfolio–Institutional Class |
| |||||||||||||||||||||||||||||||||||||||||||||||||||||||
Year Ended 10/31/17 | $32.53 | $0.09 | $8.74 | $8.83 | $(0.13 | ) | $(0.39 | ) | $(0.52 | ) | $40.84 | 27.58 | % | $790,097 | 0.93 | % | 0.93 | % | 0.25 | % | 33 | % | ||||||||||||||||||||||||||||||||||
Year Ended 10/31/16 | 32.44 | 0.13 | 0.92 | 1.05 | (0.12 | ) | (0.84 | ) | (0.96 | ) | 32.53 | 3.43 | 779,020 | 0.92 | 0.92 | 0.42 | 24 | |||||||||||||||||||||||||||||||||||||||
Year Ended 10/31/15 | 32.98 | 0.13 | 0.68 | 0.81 | (0.12 | ) | (1.23 | ) | (1.35 | ) | 32.44 | 2.51 | 805,291 | 0.92 | 0.92 | 0.41 | 45 | |||||||||||||||||||||||||||||||||||||||
Year Ended 10/31/14 | 29.84 | 0.13 | 3.27 | 3.40 | (0.13 | ) | (0.13 | ) | (0.26 | ) | 32.98 | 11.47 | 731,897 | 0.97 | 0.95 | 0.43 | 30 | |||||||||||||||||||||||||||||||||||||||
Year Ended 10/31/13 | 25.05 | 0.17 | 4.74 | 4.91 | (0.12 | ) | — | (0.12 | ) | 29.84 | 19.66 | 543,293 | 0.99 | 0.95 | 0.62 | 13 | ||||||||||||||||||||||||||||||||||||||||
Global Equity Portfolio–Institutional Class Z |
| |||||||||||||||||||||||||||||||||||||||||||||||||||||||
Period Ended 10/31/17(2)(3) | 39.33 | (0.01 | ) | 1.52 | 1.51 | — | — | — | 40.84 | 3.80 | (A) | 46,493 | 1.21 | (B) | 0.90 | (B) | (0.05 | )(B) | 33 | (A) | ||||||||||||||||||||||||||||||||||||
Global Equity Portfolio–Advisor Class |
| |||||||||||||||||||||||||||||||||||||||||||||||||||||||
Year Ended 10/31/17 | 32.47 | 0.01 | 8.73 | 8.74 | (0.04 | ) | (0.39 | ) | (0.43 | ) | 40.78 | 27.28 | 75,244 | 1.14 | 1.14 | 0.02 | 33 | |||||||||||||||||||||||||||||||||||||||
Year Ended 10/31/16 | 32.38 | 0.05 | 0.91 | 0.96 | (0.03 | ) | (0.84 | ) | (0.87 | ) | 32.47 | 3.12 | 56,698 | 1.19 | 1.19 | 0.15 | 24 | |||||||||||||||||||||||||||||||||||||||
Year Ended 10/31/15 | 32.92 | 0.04 | 0.68 | 0.72 | (0.03 | ) | (1.23 | ) | (1.26 | ) | 32.38 | 2.28 | 64,726 | 1.18 | 1.18 | 0.13 | 45 | |||||||||||||||||||||||||||||||||||||||
Year Ended 10/31/14 | 29.80 | 0.05 | 3.27 | 3.32 | (0.07 | ) | (0.13 | ) | (0.20 | ) | 32.92 | 11.19 | 81,507 | 1.20 | 1.20 | 0.16 | 30 | |||||||||||||||||||||||||||||||||||||||
Year Ended 10/31/13 | 25.02 | 0.09 | 4.74 | 4.83 | (0.05 | ) | — | (0.05 | ) | 29.80 | 19.33 | 86,882 | 1.25 | 1.24 | 0.32 | 13 | ||||||||||||||||||||||||||||||||||||||||
International Equity Portfolio–Institutional Class |
| |||||||||||||||||||||||||||||||||||||||||||||||||||||||
Year Ended 10/31/17 | 18.37 | 0.23 | 4.22 | 4.45 | (0.18 | ) | — | (0.18 | ) | 22.64 | 24.47 | 11,107,736 | 0.82 | 0.82 | 1.22 | 12 | ||||||||||||||||||||||||||||||||||||||||
Year Ended 10/31/16 | 17.69 | 0.21 | 0.64 | 0.85 | (0.17 | ) | — | (0.17 | ) | 18.37 | 4.91 | 6,354,810 | 0.84 | 0.84 | 1.20 | 22 | ||||||||||||||||||||||||||||||||||||||||
Year Ended 10/31/15 | 18.30 | 0.20 | (0.63 | ) | (0.43 | ) | (0.18 | ) | — | (0.18 | ) | 17.69 | (2.40 | ) | 4,591,802 | 0.85 | 0.85 | 1.11 | 12 | |||||||||||||||||||||||||||||||||||||
Year Ended 10/31/14 | 17.97 | 0.18 | 0.29 | 0.47 | (0.14 | ) | — | (0.14 | ) | 18.30 | 2.65 | 3,819,491 | 0.87 | 0.87 | 1.01 | 10 | ||||||||||||||||||||||||||||||||||||||||
Year Ended 10/31/13 | 15.15 | 0.17 | 2.78 | 2.95 | (0.13 | ) | — | (0.13 | ) | 17.97 | 19.58 | 3,467,793 | 0.87 | 0.87 | 1.06 | 20 | ||||||||||||||||||||||||||||||||||||||||
International Equity Portfolio–Institutional Class Z |
| |||||||||||||||||||||||||||||||||||||||||||||||||||||||
Period Ended 10/31/17(2)(4) | 21.35 | 0.02 | 1.27 | 1.29 | — | — | — | 22.64 | 6.00 | (A) | 166,923 | 0.99 | (B) | 0.80 | (B) | 0.33 | (B) | 12 | (A) | |||||||||||||||||||||||||||||||||||||
International Equity Portfolio–Investor Class |
| |||||||||||||||||||||||||||||||||||||||||||||||||||||||
Year Ended 10/31/17 | 18.30 | 0.19 | 4.18 | 4.37 | (0.12 | ) | — | (0.12 | ) | 22.55 | 24.04 | 644,243 | 1.14 | 1.14 | 0.95 | 12 | ||||||||||||||||||||||||||||||||||||||||
Year Ended 10/31/16 | 17.62 | 0.14 | 0.66 | 0.80 | (0.12 | ) | — | (0.12 | ) | 18.30 | 4.63 | 433,765 | 1.15 | 1.15 | 0.83 | 22 | ||||||||||||||||||||||||||||||||||||||||
Year Ended 10/31/15 | 18.23 | 0.15 | (0.64 | ) | (0.49 | ) | (0.12 | ) | — | (0.12 | ) | 17.62 | (2.76 | ) | 405,101 | 1.17 | 1.17 | 0.83 | 12 | |||||||||||||||||||||||||||||||||||||
Year Ended 10/31/14 | 17.89 | 0.13 | 0.29 | 0.42 | (0.08 | ) | — | (0.08 | ) | 18.23 | 2.36 | 443,029 | 1.17 | 1.17 | 0.72 | 10 | ||||||||||||||||||||||||||||||||||||||||
Year Ended 10/31/13 | 15.09 | 0.12 | 2.77 | 2.89 | (0.09 | ) | — | (0.09 | ) | 17.89 | 19.19 | 409,735 | 1.20 | 1.20 | 0.76 | 20 | ||||||||||||||||||||||||||||||||||||||||
International Small Companies Portfolio–Institutional Class |
| |||||||||||||||||||||||||||||||||||||||||||||||||||||||
Year Ended 10/31/17 | 13.72 | 0.11 | 3.41 | 3.52 | (0.16 | ) | (0.41 | ) | (0.57 | ) | 16.67 | 26.98 | 144,170 | 1.41 | 1.15 | 0.72 | 19 | |||||||||||||||||||||||||||||||||||||||
Year Ended 10/31/16 | 13.40 | 0.20 | 0.34 | 0.54 | (0.09 | ) | (0.13 | ) | (0.22 | ) | 13.72 | 4.15 | 62,785 | 1.60 | 1.25 | 1.51 | 49 | |||||||||||||||||||||||||||||||||||||||
Year Ended 10/31/15 | 13.85 | 0.11 | (0.25 | ) | (0.14 | ) | (0.05 | ) | (0.26 | ) | (0.31 | ) | 13.40 | (0.98 | ) | 47,276 | 1.64 | 1.30 | 0.79 | 38 | ||||||||||||||||||||||||||||||||||||
Year Ended 10/31/14 | 14.47 | 0.08 | 0.23 | 0.31 | (0.06 | ) | (0.87 | ) | (0.93 | ) | 13.85 | 2.28 | 28,711 | 1.59 | 1.30 | 0.58 | 36 | |||||||||||||||||||||||||||||||||||||||
Year Ended 10/31/13 | 11.45 | 0.07 | 3.09 | 3.16 | (0.14 | ) | — | (0.14 | ) | 14.47 | 27.88 | 26,236 | 1.68 | 1.39 | 0.57 | 97 | ||||||||||||||||||||||||||||||||||||||||
| (A) | Not Annualized. |
| (B) | Annualized. |
| (1) | Net investment income per share was calculated using the average shares outstanding method. |
| (2) | All per share amounts and net asset values have been adjusted as a result of the reverse share split effected after the close of business on December 1, 2017. (See Note 1). |
| (3) | For the period from August 1, 2017 (commencement of class operations) through October 31, 2017. |
| (4) | For the period from July 17, 2017 (commencement of class operations) through October 31, 2017. |
See Notes to Financial Statements
48
Table of Contents
Harding, Loevner Funds, Inc.
Financial Highlights (continued)
For the Fiscal Years Ended October 31
INCREASE (DECREASE) IN NET ASSETS FROM OPERATIONS: | DISTRIBUTIONS TO SHAREHOLDERS FROM: | RATIOS/SUPPLEMENTAL DATA: | ||||||||||||||||||||||||||||||||||||||||||||||||||||||
| Net asset value, beginning of year | Net investment income (loss)(1) | Net realized and unrealized gain (loss) on investments and foreign currency- related transactions | Net increase (decrease) from investment operations | Net investment income | Net from | Total distributions | Net of year | Total Return | Net assets, end of year (000’s) | Expenses to average | Expenses to average | Net investment income to average net assets | Portfolio turnover rate | |||||||||||||||||||||||||||||||||||||||||||
| International Small Companies Portfolio–Investor Class | ||||||||||||||||||||||||||||||||||||||||||||||||||||||||
Year Ended 10/31/17 | $13.64 | $0.05 | $3.42 | $3.47 | $(0.15 | ) | $(0.41 | ) | $(0.56 | ) | $16.55 | 26.71 | % | $50,292 | 1.80 | % | 1.40 | % | 0.37 | % | 19 | % | ||||||||||||||||||||||||||||||||||
Year Ended 10/31/16 | 13.33 | 0.16 | 0.35 | 0.51 | (0.07 | ) | (0.13 | ) | (0.20 | ) | 13.64 | 3.92 | 44,363 | 1.90 | 1.50 | 1.18 | 49 | |||||||||||||||||||||||||||||||||||||||
Year Ended 10/31/15 | 13.80 | 0.08 | (0.26 | ) | (0.18 | ) | (0.03 | ) | (0.26 | ) | (0.29 | ) | 13.33 | (1.29 | ) | 50,164 | 1.93 | 1.55 | 0.58 | 38 | ||||||||||||||||||||||||||||||||||||
Year Ended 10/31/14 | 14.45 | 0.05 | 0.22 | 0.27 | (0.05 | ) | (0.87 | ) | (0.92 | ) | 13.80 | 1.97 | 62,828 | 1.88 | 1.55 | 0.32 | 36 | |||||||||||||||||||||||||||||||||||||||
Year Ended 10/31/13 | 11.43 | 0.08 | 3.05 | 3.13 | (0.11 | ) | — | (0.11 | ) | 14.45 | 27.63 | 52,830 | 1.99 | 1.60 | 0.60 | 97 | ||||||||||||||||||||||||||||||||||||||||
| Institutional Emerging Markets Portfolio–Class I | ||||||||||||||||||||||||||||||||||||||||||||||||||||||||
Year Ended 10/31/17 | 17.65 | 0.19 | 4.20 | 4.39 | (0.10 | ) | — | (0.10 | ) | 21.94 | 25.08 | 4,386,511 | 1.28 | 1.28 | 0.97 | 17 | ||||||||||||||||||||||||||||||||||||||||
Year Ended 10/31/16 | 16.04 | 0.14 | 1.56 | 1.70 | (0.09 | ) | — | (0.09 | ) | 17.65 | 10.74 | 3,051,419 | 1.29 | 1.29 | 0.88 | 20 | ||||||||||||||||||||||||||||||||||||||||
Year Ended 10/31/15 | 18.60 | 0.13 | (2.56 | ) | (2.43 | ) | (0.13 | ) | — | (0.13 | ) | 16.04 | (13.14 | ) | 1,876,495 | 1.31 | 1.30 | 0.77 | 23 | |||||||||||||||||||||||||||||||||||||
Year Ended 10/31/14 | 18.07 | 0.20 | 0.48 | 0.68 | (0.15 | ) | — | (0.15 | ) | 18.60 | 3.80 | 1,521,194 | 1.31 | 1.30 | 1.12 | 26 | ||||||||||||||||||||||||||||||||||||||||
Year Ended 10/31/13 | 16.56 | 0.18 | 1.45 | 1.63 | (0.12 | ) | — | (0.12 | ) | 18.07 | 9.85 | 1,043,041 | 1.33 | 1.30 | 1.06 | 18 | ||||||||||||||||||||||||||||||||||||||||
| Institutional Emerging Markets Portfolio–Class II | ||||||||||||||||||||||||||||||||||||||||||||||||||||||||
Year Ended 10/31/17(2) | 17.71 | 0.22 | 4.21 | 4.43 | (0.20 | ) | — | (0.20 | ) | 21.94 | 25.43 | 458,288 | 1.23 | 1.12 | 1.12 | 17 | ||||||||||||||||||||||||||||||||||||||||
Year Ended 10/31/16(2) | 16.14 | 0.16 | 1.59 | 1.75 | (0.18 | ) | — | (0.18 | ) | 17.71 | 11.06 | 381,031 | 1.24 | 1.13 | 0.96 | 20 | ||||||||||||||||||||||||||||||||||||||||
Year Ended 10/31/15(2) | 18.81 | 0.16 | (2.60 | ) | (2.44 | ) | (0.23 | ) | — | (0.23 | ) | 16.14 | (13.06 | ) | 241,425 | 1.27 | 1.14 | 0.96 | 23 | |||||||||||||||||||||||||||||||||||||
Period Ended 10/31/14(2)(3) | 17.58 | 0.17 | 1.06 | 1.23 | — | — | — | 18.81 | 7.00 | (A) | 194,477 | 1.30 | (B) | 1.14 | (B) | 1.36 | (B) | 26 | (A) | |||||||||||||||||||||||||||||||||||||
| Emerging Markets Portfolio–Advisor Class | ||||||||||||||||||||||||||||||||||||||||||||||||||||||||
Year Ended 10/31/17 | 46.27 | 0.43 | 11.02 | 11.45 | (0.26 | ) | — | (0.26 | ) | 57.46 | 24.93 | 4,014,977 | 1.42 | 1.42 | 0.84 | 17 | ||||||||||||||||||||||||||||||||||||||||
Year Ended 10/31/16 | 42.02 | 0.30 | 4.17 | 4.47 | (0.22 | ) | — | (4) | (0.22 | ) | 46.27 | 10.73 | 2,998,484 | 1.42 | 1.42 | 0.72 | 26 | |||||||||||||||||||||||||||||||||||||||
Year Ended 10/31/15 | 50.88 | 0.26 | (6.80 | ) | (6.54 | ) | (0.39 | ) | (1.93 | ) | (2.32 | ) | 42.02 | (13.17 | ) | 2,381,671 | 1.45 | 1.45 | 0.57 | 30 | ||||||||||||||||||||||||||||||||||||
Year Ended 10/31/14 | 50.76 | 0.49 | 1.32 | 1.81 | (0.40 | ) | (1.29 | ) | (1.69 | ) | 50.88 | 3.79 | 2,545,517 | 1.45 | 1.45 | 0.98 | 28 | |||||||||||||||||||||||||||||||||||||||
Year Ended 10/31/13 | 49.54 | 0.40 | 4.33 | 4.73 | (0.36 | ) | (3.15 | ) | (3.51 | ) | 50.76 | 9.93 | 2,112,546 | 1.47 | 1.47 | 0.83 | 26 | |||||||||||||||||||||||||||||||||||||||
| Frontier Emerging Markets Portfolio–Institutional Class I | ||||||||||||||||||||||||||||||||||||||||||||||||||||||||
Year Ended 10/31/17 | 7.35 | 0.05 | 1.17 | 1.22 | (0.07 | ) | — | (0.07 | ) | 8.50 | 16.82 | 266,844 | 1.71 | 1.71 | 0.69 | 28 | ||||||||||||||||||||||||||||||||||||||||
Year Ended 10/31/16 | 7.62 | 0.10 | (0.29 | ) | (0.19 | ) | (0.08 | ) | — | (0.08 | ) | 7.35 | (2.43 | ) | 342,114 | 1.79 | 1.79 | 1.41 | 47 | |||||||||||||||||||||||||||||||||||||
Year Ended 10/31/15 | 9.50 | 0.11 | (1.84 | ) | (1.73 | ) | (0.05 | ) | (0.10 | ) | (0.15 | ) | 7.62 | (18.35 | ) | 451,646 | 1.79 | 1.79 | 1.29 | 38 | ||||||||||||||||||||||||||||||||||||
Year Ended 10/31/14 | 8.46 | 0.09 | 0.97 | 1.06 | (0.02 | ) | — | (0.02 | ) | 9.50 | 12.60 | 474,838 | 1.77 | 1.77 | 1.01 | 37 | ||||||||||||||||||||||||||||||||||||||||
Year Ended 10/31/13 | 7.12 | 0.07 | 1.35 | 1.42 | (0.08 | ) | — | (0.08 | ) | 8.46 | 20.20 | 271,728 | 1.80 | 1.80 | 0.94 | 24 | ||||||||||||||||||||||||||||||||||||||||
| Frontier Emerging Markets Portfolio–Institutional Class II | ||||||||||||||||||||||||||||||||||||||||||||||||||||||||
Period Ended 10/31/17(5)(6) | 7.43 | 0.08 | 0.99 | 1.07 | — | — | — | 8.50 | 14.40 | (A) | 166,698 | 1.58 | (B) | 1.35 | (B) | 1.47 | (B) | 28 | (A) | |||||||||||||||||||||||||||||||||||||
| (A) | Not Annualized. |
| (B) | Annualized. |
| (1) | Net investment income per share was calculated using the average shares outstanding method. |
| (2) | All per share amounts and net asset values have been adjusted as a result of the reverse share split effected after the close of business on December 1, 2017. (See Note 1). |
| (3) | For the period from March 5, 2014 (commencement of class operations) through October 31, 2014. |
| (4) | Amount was less than $0.005 per share. |
| (5) | For the period from March 1, 2017 (commencement of class operations) through October 31, 2017. |
| (6) | All per share amounts and net asset values have been adjusted as a result of the share dividend effected after the close of business on December 1, 2017. (See Note 1). |
See Notes to Financial Statements
49
Table of Contents
Harding, Loevner Funds, Inc.
Financial Highlights (continued)
For the Fiscal Years Ended October 31
INCREASE (DECREASE) IN NET ASSETS FROM OPERATIONS: | DISTRIBUTIONS TO SHAREHOLDERS FROM: | RATIOS/SUPPLEMENTAL DATA: | ||||||||||||||||||||||||||||||||||||||||||||||||||||||
| Net asset value, beginning of year | Net investment income (loss)(1) | Net realized and unrealized gain (loss) on investments and foreign | Net increase (decrease) from investment operations | Net investment income | Net from | Total distributions | Net of | Total Return | Net assets, end of year (000’s) | Expenses to average net assets | Expenses to average | Net investment income to average net assets | Portfolio turnover rate | |||||||||||||||||||||||||||||||||||||||||||
| Frontier Emerging Markets Portfolio–Investor Class | ||||||||||||||||||||||||||||||||||||||||||||||||||||||||
Year Ended 10/31/17 | $7.28 | $0.04 | $1.15 | $1.19 | $(0.04 | ) | $— | $(0.04 | ) | $8.43 | 16.40 | % | $30,981 | 2.13 | % | 2.00 | % | 0.48 | % | 28 | % | |||||||||||||||||||||||||||||||||||
Year Ended 10/31/16 | 7.55 | 0.07 | (0.30 | ) | (0.23 | ) | (0.04 | ) | — | (0.04 | ) | 7.28 | (3.01 | ) | 32,771 | 2.23 | 2.23 | 1.02 | 47 | |||||||||||||||||||||||||||||||||||||
Year Ended 10/31/15 | 9.41 | 0.06 | (1.80 | ) | (1.74 | ) | (0.02 | ) | (0.10 | ) | (0.12 | ) | 7.55 | (18.64 | ) | 45,622 | 2.20 | 2.20 | 0.75 | 38 | ||||||||||||||||||||||||||||||||||||
Year Ended 10/31/14 | 8.40 | 0.04 | 0.98 | 1.02 | (0.01 | ) | — | (0.01 | ) | 9.41 | 12.15 | 78,712 | 2.22 | 2.22 | 0.38 | 37 | ||||||||||||||||||||||||||||||||||||||||
Year Ended 10/31/13 | 7.08 | 0.05 | 1.34 | 1.39 | (0.07 | ) | — | (0.07 | ) | 8.40 | 19.83 | 21,763 | 2.64 | 2.25 | 0.66 | 24 | ||||||||||||||||||||||||||||||||||||||||
| Global Equity Research Portfolio–Institutional Class | ||||||||||||||||||||||||||||||||||||||||||||||||||||||||
Period Ended 10/31/17(2) | 10.00 | 0.08 | 2.15 | 2.23 | — | — | — | 12.23 | 22.30 | (A) | 5,308 | 3.49 | (B) | 0.90 | (B) | 0.80 | (B) | 36 | (A) | |||||||||||||||||||||||||||||||||||||
| Global Equity Research Portfolio–Investor Class | ||||||||||||||||||||||||||||||||||||||||||||||||||||||||
Period Ended 10/31/17(2) | 10.00 | 0.05 | 2.16 | 2.21 | — | — | — | 12.21 | 22.10 | (A) | 548 | 13.36 | (B) | 1.15 | (B) | 0.55 | (B) | 36 | (A) | |||||||||||||||||||||||||||||||||||||
| International Equity Research Portfolio–Institutional Class | ||||||||||||||||||||||||||||||||||||||||||||||||||||||||
Year Ended 10/31/17 | 11.10 | 0.12 | 2.26 | 2.38 | (0.17 | ) | (0.20 | ) | (0.37 | ) | 13.11 | 22.26 | 9,479 | 2.26 | 0.90 | 0.99 | 55 | |||||||||||||||||||||||||||||||||||||||
Period Ended 10/31/16(3) | 10.00 | 0.14 | 0.96 | 1.10 | — | — | — | 11.10 | 11.00 | (A) | 6,244 | 3.54 | (B) | 0.90 | (B) | 1.51 | (B) | 33 | (A) | |||||||||||||||||||||||||||||||||||||
| International Equity Research Portfolio–Investor Class | ||||||||||||||||||||||||||||||||||||||||||||||||||||||||
Year Ended 10/31/17 | 11.07 | 0.08 | 2.27 | 2.35 | (0.17 | ) | (0.20 | ) | (0.37 | ) | 13.05 | 22.05 | 1,124 | 6.49 | 1.15 | 0.71 | 55 | |||||||||||||||||||||||||||||||||||||||
Period Ended 10/31/16(3) | 10.00 | 0.11 | 0.96 | 1.07 | — | — | — | 11.07 | 10.70 | (A) | 826 | 10.91 | (B) | 1.15 | (B) | 1.20 | (B) | 33 | (A) | |||||||||||||||||||||||||||||||||||||
| Emerging Markets Research Portfolio–Institutional Class | ||||||||||||||||||||||||||||||||||||||||||||||||||||||||
Period Ended 10/31/17(2) | 10.00 | 0.10 | 2.91 | 3.01 | — | — | — | 13.01 | 30.10 | (A) | 5,880 | 3.72 | (B) | 1.30 | (B) | 1.04 | (B) | 46 | (A) | |||||||||||||||||||||||||||||||||||||
| Emerging Markets Research Portfolio–Investor Class | ||||||||||||||||||||||||||||||||||||||||||||||||||||||||
Period Ended 10/31/17(2) | 10.00 | 0.08 | 2.91 | 2.99 | — | — | — | 12.99 | 29.90 | (A) | 614 | 12.64 | (B) | 1.55 | (B) | 0.78 | (B) | 46 | (A) | |||||||||||||||||||||||||||||||||||||
| (A) | Not Annualized. |
| (B) | Annualized. |
| (1) | Net investment income per share was calculated using the average shares outstanding method. |
| (2) | For the period from December 19, 2016 (commencement of class operations) through October 31, 2017. |
| (3) | For the period from December 17, 2015 (commencement of class operations) through October 31, 2016. |
See Notes to Financial Statements
50
Table of Contents
Notes to Financial Statements
October 31, 2017
1. Organization
Harding, Loevner Funds, Inc. (the “Fund”) was organized as a Maryland corporation on July 31, 1996, and is registered under the Investment Company Act of 1940, as amended (the “1940 Act”), as an open-end management investment company. The Fund currently has nine separate diversified Portfolios, all of which were active as of October 31, 2017 (individually, a “Portfolio”, collectively, the “Portfolios”). The Fund is managed by Harding Loevner LP (the “Investment Adviser”).
Portfolio | Inception Date | Investment Objective | ||
Global Equity Portfolio | Institutional Class: November 3, 2009 Institutional Class Z: August 1, 2017 Advisor Class: December 1, 1996 | to seek long-term capital appreciation through investments in equity securities of companies based both inside and outside the United States | ||
International Equity Portfolio | Institutional Class: May 11, 1994* Institutional Class Z: July 17, 2017 Investor Class: September 30, 2005 | to seek long-term capital appreciation through investments in equity securities of companies based outside the United States | ||
International Small Companies Portfolio (“International Small Companies”) | Institutional Class: June 30, 2011 Investor Class: March 26, 2007 | to seek long-term capital appreciation through investments in equity securities of small companies based outside the United States | ||
Institutional Emerging Markets Portfolio** | Class I: October 17, 2005 Class II: March 5, 2014 | to seek long-term capital appreciation through investments in equity securities of companies based in emerging markets | ||
Emerging Markets Portfolio** | Advisor Class: November 9, 1998 | to seek long-term capital appreciation through investments in equity securities of companies based in emerging markets | ||
Frontier Emerging Markets Portfolio (“Frontier Emerging Markets”) | Institutional Class I (formerly, the Institutional Class): May 27, 2008 Institutional Class II: March 1, 2017 Investor Class: December 31, 2010 | to seek long-term capital appreciation through investments in equity securities of companies based in frontier and smaller emerging markets | ||
Global Equity Research Portfolio | Institutional Class: December 19, 2016 Investor Class: December 19, 2016 | to seek long-term capital appreciation through investments in equity securities of companies based both inside and outside the United States | ||
International Equity Research Portfolio (“International Equity Research”) | Institutional Class: December 17, 2015 Investor Class: December 17, 2015 | to seek long-term capital appreciation through investments in equity securities of companies based outside the United States | ||
Emerging Markets Research Portfolio (“Emerging Markets Research”) | Institutional Class: December 19, 2016 Investor Class: December 19, 2016 | to seek long-term capital appreciation through investments in equity securities of companies based in emerging markets |
* International Equity is the successor to the HLM International Equity Portfolio of AMT Capital Fund, Inc., pursuant to a reorganization that took place on October 31, 1996. Information for periods prior to October 31, 1996 is historical information for the predecessor portfolio.
** The Institutional Emerging Markets and Emerging Markets Portfolios are generally closed to new investors.
On November 24, 2017, the Board of Directors (the “Board”) of the Fund approved reverse share splits (the “Reverse Splits”) of the outstanding Institutional Class Z shares of the Global Equity Portfolio, Institutional Class Z shares of the International Equity Portfolio, and Class II shares of the Institutional Emerging Markets Portfolio (each, a “Split Impacted Portfolio”) at the ratios indicated below.
| Portfolio | Reverse Share Split Ratio | ||||
Global Equity Portfolio – Institutional Class Z | 1 for 3.933146 | ||||
International Equity Portfolio – Institutional Class Z | 1 for 2.135356 | ||||
Institutional Emerging Markets Portfolio – Class II | 1 for 1.758429 | ||||
The Reverse Splits were effected after the close of business on December 1, 2017. Institutional Class Z shares and Class II shares of the Split Impacted Portfolios began trading on a split-adjusted basis on December 4, 2017.
51
Table of Contents
Harding, Loevner Funds, Inc.
Notes to Financial Statements (continued)
October 31, 2017
1. Organization (continued)
The total dollar value of each shareholder’s investment in a Split Impacted Portfolio will remain unchanged. While the Reverse Splits will reduce the number of outstanding Institutional Class Z or Class II shares of the Split Impacted Portfolios, they proportionately will increase the net asset value (“NAV”) per share of Institutional Class Z shares and Class II shares of the Split Impacted Portfolio such that the aggregate market value of each Split Impacted Portfolio’s Institutional Class Z shares or Class II shares, as applicable, will remain the same. The Reverse Splits will not affect the voting rights of a shareholder’s investment in a Split Impacted Portfolio, and will not be a taxable event for the Split Impacted Portfolio’s shareholders.
On November 24, 2017, the Board also declared a share dividend (the “Share Dividend”) with respect to the Institutional Class II shares of the Frontier Emerging Markets Portfolio equal to 0.346467 shares on each outstanding Institutional Class II share. The Share Dividend was paid to the Portfolio’s Institutional Class II shareholders of record as of the close of business on December 1, 2017. The total dollar value of each shareholder’s investment in the Portfolio will remain unchanged. While the Share Dividend will increase the number of outstanding Institutional Class II shares of the Portfolio, it proportionately will decrease the NAV per share of Institutional Class II shares of the Portfolio such that the aggregate market value of the Portfolio’s Institutional Class II shares will remain the same. The Share Dividend will not affect the voting rights of a shareholder’s investment in the Portfolio, and will not be a taxable event for the Portfolio’s shareholders.
The Board approved the Reverse Splits in order to bring the NAV per share of the Institutional Class Z shares of the Global Equity Portfolio and International Equity Portfolio and Class II shares of the Institutional Emerging Markets Portfolio into line with the NAV per share of the other share classes of the Split Impacted Portfolios. The Board also declared the Share Dividend in order to bring the NAV per share of the Institutional Class II shares of the Frontier Emerging Markets Portfolio into line with the NAV per share of the other share classes of the Portfolio. The Reverse Splits and the Share Dividend are intended to create a general level of parity of required distributions across the Fund’s share classes by increasing the NAV per share and reducing the number of outstanding shares of the share classes subject to the Reverse Splits and decreasing the NAV per share and increasing the number of outstanding shares of the Institutional Class II shares of the Frontier Emerging Markets Portfolio through the Share Dividend.
Per share data, including the proportionate impact to NAV, in the Financial Highlights and Capital share activity presented in the Capital Share Transactions disclosure (see Note 6) have been restated to reflect the Reverse Splits and the Share Dividend, respectively.
2. Summary of Significant Accounting Policies
The accounting policies of the Fund are in conformity with accounting principles generally accepted in the United States (“GAAP”) for investment companies. Accordingly, the Fund follows accounting and reporting guidance under FASB Accounting Standards Codification Topic 946, “Financial Services - Investment Companies”. The following is a summary of the Fund’s significant accounting policies:
Estimates
The preparation of financial statements in accordance with GAAP requires management to make estimates and assumptions that affect the reported amounts and disclosures in the financial statements. Actual results could differ from those estimates.
Valuation
The Board has adopted procedures (“Procedures”) to govern the valuation of the securities held by each Portfolio of the Fund in accordance with the 1940 Act. The Procedures incorporate principles set forth in relevant pronouncements of the Securities and Exchange Commission (“SEC”) and its staff, including guidance on the obligations of the Portfolios and their Directors to determine, in good faith, the fair value of the Portfolios’ securities when market quotations are not readily available.
In determining a Portfolio’s net asset value (“NAV”), each equity security traded on a securities exchange, including the NASDAQ Stock Market, and over-the-counter securities, are first valued at the closing price on the exchange or market designated by the Fund’s accounting agent as the principal exchange (each, a “principal exchange”). The closing price provided by the Fund’s accounting agent for a principal exchange may differ from the price quoted elsewhere and may represent information such as last sales price, an official closing price, a closing auction price or other information, depending on exchange or market convention. Shares of open-end mutual funds including money market funds are valued at NAV. Such securities are typically categorized as “Level 1” pursuant to the hierarchy described below.
Participation notes are valued based upon the closing or last traded price of their underlying local shares. Such securities are typically categorized as “Level 2” pursuant to the hierarchy described below.
52
Table of Contents
Harding, Loevner Funds, Inc.
Notes to Financial Statements (continued)
October 31, 2017
2. Summary of Significant Accounting Policies (continued)
Since trading in many foreign securities is normally completed before the time at which a Portfolio calculates its NAV, the effect on the value of such securities held by a Portfolio of events that occur between the close of trading in the security and the time at which the Portfolio prices its securities would not be reflected in the Portfolio’s calculation of its NAV if foreign securities were generally valued at their closing prices.
To address this issue, the Board has approved the daily use of independently provided quantitative models that may adjust the closing prices of certain foreign equity securities based on information that becomes available after the foreign market closes, through the application of an adjustment factor to such securities’ closing price. Adjustment factors may be greater than, less than, or equal to 1. Thus, use of these quantitative models could cause a Portfolio to value a security higher, lower or equal to its closing market price, which in turn could cause the Portfolio’s NAV per share to differ significantly from that which would have been calculated using closing market prices. The use of these quantitative models is also intended to decrease the opportunities for persons to engage in ‘‘time zone arbitrage,’’ i.e., trading intended to take advantage of stale closing prices in foreign markets that could affect the NAV of the Portfolios. Securities subjected to an adjustment factor due to the use of these quantitative models are not specifically designated on the Portfolios’ Portfolio of Investments as being “fair valued”. Securities with an adjustment factor greater than or less than 1, which are absent the use of significant unobservable inputs into their valuation, are categorized as “Level 2” and securities with an adjustment factor equal to 1, which are absent the use of significant unobservable inputs into their valuation, are categorized as “Level 1” pursuant to the hierarchy described below.
Any securities for which market quotations are not readily available or for which available prices are deemed unreliable are priced by the Investment Adviser at “fair value as determined in good faith”, in accordance with the Procedures. Such securities are identified on the Portfolios’ Portfolio of Investments as securities valued at “fair value as determined in good faith” and absent the use of significant unobservable inputs into their valuation, such securities would be categorized as “Level 2” pursuant to the hierarchy described below.
GAAP includes a topic which establishes a hierarchy for NAV determination purposes in which various inputs are used in determining the value of each Portfolio’s assets or liabilities. This topic defines fair value as the price that the Portfolio would receive upon selling an investment in a timely transaction to an independent buyer in the principal or most advantageous market of the investment. This topic establishes a three-tier hierarchy to maximize the use of observable market data and minimize the use of unobservable inputs and to establish classification of fair value measurements for disclosure purposes. Inputs may be observable or unobservable and refer broadly to the assumptions that market participants would use in pricing the asset or liability including assumptions about risk. Such risks include the inherent risk in a particular valuation technique which is used to measure fair value. This may include the quantitative models and/or the inputs to the quantitative models used in the valuation technique described above. Observable inputs are inputs that reflect the assumptions market participants would use in pricing the asset or liability developed based on market data obtained from sources independent of the reporting entity. Unobservable inputs are inputs that reflect the reporting entity’s own assumptions about the assumptions market participants would use in pricing the asset or liability developed based on the best information available in the circumstances. The three-tier hierarchy of inputs is summarized in the three broad levels listed below.
| Level 1 | unadjusted quoted prices in active markets for identical investments | |
| Level 2 | other significant observable inputs (including quoted prices for similar investments, interest rates, prepayment speeds, credit risk, etc.) | |
| Level 3 | significant unobservable inputs (including the Portfolio’s own assumptions in determining the fair value of investments) |
The Portfolios disclose all transfers between levels based on valuations at the end of each reporting period.
At October 31, 2017, the Portfolios below had transfers from Level 1 to Level 2, based on levels assigned to the securities on October 31, 2016, due to the use of an adjustment factor other than 1 as an input to the valuation.
Frontier Emerging Markets | |||||
Common Stock | |||||
Consumer Durables & Apparel | $ | 3,601,946 | |||
|
| ||||
Total | $ | 3,601,946 | |||
|
| ||||
53
Table of Contents
Harding, Loevner Funds, Inc.
Notes to Financial Statements (continued)
October 31, 2017
2. Summary of Significant Accounting Policies (continued)
At October 31, 2017, the Portfolios below had transfers from Level 2 to Level 1, based on levels assigned to the securities on October 31, 2016, due to the use of an adjustment factor of 1 as inputs to the valuations.
| International Small Companies | Institutional Emerging Markets | Emerging Markets | Frontier Emerging Markets | International Equity Research | |||||||||||||||||||||
Common Stock | |||||||||||||||||||||||||
Automobiles & Components | $ | — | $ | 92,721,821 | $ | 76,925,897 | $ | — | $ | — | |||||||||||||||
Banks | 1,843,142 | — | — | 6,267,488 | — | ||||||||||||||||||||
Insurance | 3,584,283 | — | — | — | — | ||||||||||||||||||||
Materials | — | — | — | — | 25,347 | ||||||||||||||||||||
Telecommunication Services | — | 37,460,844 | 31,074,976 | — | — | ||||||||||||||||||||
|
|
|
|
|
|
|
|
|
| ||||||||||||||||
Total | $ | 5,427,425 | $ | 130,182,665 | $ | 108,000,873 | $ | 6,267,488 | $ | 25,347 | |||||||||||||||
|
|
|
|
|
|
|
|
|
| ||||||||||||||||
GAAP provides additional guidance for estimating fair value when the volume and level of activity for the asset or liability have significantly decreased as well as guidance on identifying circumstances that indicate when a transaction is not orderly.
The following is a summary of the Portfolios’ investments classified by Level 1, Level 2 and Level 3 and security type as of October 31, 2017. Please refer to each Portfolio’s Portfolio of Investments to view individual securities classified by industry type and country.
| Portfolio | Unadjusted Quoted Prices in Active Markets for Identical Assets (Level 1) | Other Significant Observable Inputs (Level 2) | Significant Unobservable Inputs (Level 3) | Total | ||||||||||||||||
Global Equity | ||||||||||||||||||||
Common stocks | $ | 508,032,072 | $ | 356,802,392 | $ | — | $ | 864,834,464 | ||||||||||||
Preferred stocks | 24,569,751 | — | — | 24,569,751 | ||||||||||||||||
Short Term Investments | 8,589,264 | — | — | 8,589,264 | ||||||||||||||||
|
|
|
|
|
|
|
| |||||||||||||
Total Investments | $ | 541,191,087 | $ | 356,802,392 | $ | — | $ | 897,993,479 | ||||||||||||
|
|
|
|
|
|
|
| |||||||||||||
International Equity | ||||||||||||||||||||
Common stocks | $ | 2,683,133,313 | $ | 8,179,278,307 | $ | — | $ | 10,862,411,620 | ||||||||||||
Preferred stocks | 250,356,512 | 323,130,198 | — | 573,486,710 | ||||||||||||||||
Short Term Investments | 452,640,895 | — | — | 452,640,895 | ||||||||||||||||
|
|
|
|
|
|
|
| |||||||||||||
Total Investments | $ | 3,386,130,720 | $ | 8,502,408,505 | $ | — | $ | 11,888,539,225 | ||||||||||||
|
|
|
|
|
|
|
| |||||||||||||
International Small Companies | ||||||||||||||||||||
Common stocks | $ | 14,799,965 | $ | 171,626,682 | $ | — | $ | 186,426,647 | ||||||||||||
Short Term Investments | 8,652,238 | — | — | 8,652,238 | ||||||||||||||||
|
|
|
|
|
|
|
| |||||||||||||
Total Investments | $ | 23,452,203 | $ | 171,626,682 | $ | — | $ | 195,078,885 | ||||||||||||
|
|
|
|
|
|
|
| |||||||||||||
Institutional Emerging Markets | ||||||||||||||||||||
Common stocks | $ | 1,148,355,404 | $ | 3,301,381,960 | $ | — | $ | 4,449,737,364 | ||||||||||||
Preferred stocks | 246,279,362 | 45,298,464 | — | 291,577,826 | ||||||||||||||||
Short Term Investments | 99,729,549 | — | — | 99,729,549 | ||||||||||||||||
|
|
|
|
|
|
|
| |||||||||||||
Total Investments | $ | 1,494,364,315 | $ | 3,346,680,424 | $ | — | $ | 4,841,044,739 | ||||||||||||
|
|
|
|
|
|
|
| |||||||||||||
Emerging Markets | ||||||||||||||||||||
Common stocks | $ | 952,535,868 | $ | 2,739,166,305 | $ | — | $ | 3,691,702,173 | ||||||||||||
Preferred stocks | 204,299,392 | 37,558,815 | — | 241,858,207 | ||||||||||||||||
Short Term Investments | 75,191,356 | — | — | 75,191,356 | ||||||||||||||||
|
|
|
|
|
|
|
| |||||||||||||
Total Investments | $ | 1,232,026,616 | $ | 2,776,725,120 | $ | — | $ | 4,008,751,736 | ||||||||||||
|
|
|
|
|
|
|
| |||||||||||||
54
Table of Contents
Harding, Loevner Funds, Inc.
Notes to Financial Statements (continued)
October 31, 2017
2. Summary of Significant Accounting Policies (continued)
| Portfolio | Unadjusted Quoted Prices in Active Markets for Identical Assets (Level 1) | Other Significant Observable Inputs (Level 2) | Significant Unobservable Inputs (Level 3) | Total | ||||||||||||||||
Frontier Emerging Markets | ||||||||||||||||||||
Common stocks | $ | 104,204,528 | $ | 329,102,150 | $ | — | $ | 433,306,678 | ||||||||||||
Preferred stocks | 8,635,992 | — | — | 8,635,992 | ||||||||||||||||
Participation Notes | — | 21,342,738 | — | 21,342,738 | ||||||||||||||||
Short Term Investments | 3,733,709 | — | — | 3,733,709 | ||||||||||||||||
|
|
|
|
|
|
|
| |||||||||||||
Total Investments | $ | 116,574,229 | $ | 350,444,888 | $ | — | $ | 467,019,117 | ||||||||||||
|
|
|
|
|
|
|
| |||||||||||||
Global Equity Research | ||||||||||||||||||||
Common stocks | $ | 3,307,174 | $ | 2,399,690 | $ | — | $ | 5,706,864 | ||||||||||||
Preferred stocks | 42,135 | 11,697 | — | 53,832 | ||||||||||||||||
Short Term Investments | 155,263 | — | — | 155,263 | ||||||||||||||||
|
|
|
|
|
|
|
| |||||||||||||
Total Investments | $ | 3,504,572 | $ | 2,411,387 | $ | — | $ | 5,915,959 | ||||||||||||
|
|
|
|
|
|
|
| |||||||||||||
International Equity Research | ||||||||||||||||||||
Common stocks | $ | 1,964,224 | $ | 8,151,371 | $ | — | $ | 10,115,595 | ||||||||||||
Preferred stocks | 186,117 | 25,734 | — | 211,851 | ||||||||||||||||
Short Term Investments | 287,703 | — | — | 287,703 | ||||||||||||||||
|
|
|
|
|
|
|
| |||||||||||||
Total Investments | $ | 2,438,044 | $ | 8,177,105 | $ | — | $ | 10,615,149 | ||||||||||||
|
|
|
|
|
|
|
| |||||||||||||
Emerging Markets Research | ||||||||||||||||||||
Common stocks | $ | 2,027,650 | $ | 4,070,872 | $ | — | $ | 6,098,522 | ||||||||||||
Preferred stocks | 151,099 | 70,183 | — | 221,282 | ||||||||||||||||
Participation Notes | — | 89,856 | — | 89,856 | ||||||||||||||||
Short Term Investments | 116,760 | — | — | 116,760 | ||||||||||||||||
|
|
|
|
|
|
|
| |||||||||||||
Total Investments | $ | 2,295,509 | $ | 4,230,911 | $ | — | $ | 6,526,420 | ||||||||||||
|
|
|
|
|
|
|
| |||||||||||||
As of October 31, 2017, there were no Level 3 investments held within the Portfolios.
Securities
For financial reporting purposes, all securities transactions are recorded on a trade date basis, as of the last business day in the reporting period. Throughout the reporting period, securities transactions are typically accounted for on a trade date – plus one business day basis. Interest income and expenses are recorded on an accrual basis. Dividend income is recorded on the ex-dividend date (except for certain foreign dividends that may be recorded as soon as the Portfolio is informed of such dividends). The Portfolios use the specific identification method for determining realized gains or losses from sales of securities.
Dividends to Shareholders
It is the policy of the Portfolios to declare dividends from net investment income annually. Net short-term and long-term capital gains distributions for the Portfolios, if any, are also normally distributed on an annual basis.
Dividends from net investment income and distributions from net realized gains from investment transactions have been determined in accordance with income tax regulations and may differ from net investment income and realized gains recorded by the Portfolios for financial reporting purposes. Differences result primarily from foreign currency transactions and timing differences related to recognition of income, and gains and losses from investment transactions. In general, to the extent that any differences, which are permanent in nature, result in over distributions to shareholders, the amount of the over distribution is reclassified within the capital accounts based on its federal tax basis treatment and may be reported as return of capital. Temporary differences do not require reclassification.
55
Table of Contents
Harding, Loevner Funds, Inc.
Notes to Financial Statements (continued)
October 31, 2017
2. Summary of Significant Accounting Policies (continued)
Currency Translation
Assets and liabilities denominated in foreign currencies and commitments under forward foreign currency exchange contracts are translated into U.S. dollars at the mean of the quoted bid and asked prices of such currencies against the U.S. dollar. Purchases and sales of the Portfolios’ securities are translated at the rates of exchange prevailing when such securities were acquired or sold. Income and expenses are translated at exchange rates prevailing when accrued. The Portfolios do not isolate that portion of the results of operations resulting from changes in foreign exchange rates on investments from the fluctuations arising from changes in market prices of securities held. Such fluctuations are included with the Net realized gain (loss) from investments and Change in unrealized appreciation (depreciation) from investments on the Statements of Operations.
Net realized gains and losses from foreign currency-related transactions arise from sales of foreign currency, currency gains or losses realized between the trade and settlement dates on securities transactions, and the difference between the amounts of dividends, interest, and foreign withholding taxes recorded on the Portfolios’ books, and the U.S. dollar equivalent of the amounts actually received or paid. Net unrealized appreciation or depreciation on translation of assets and liabilities denominated in foreign currencies arise from changes in the value of assets and liabilities other than investments in securities at the period end, resulting from changes in the exchange rates.
Organization and Offering Fees
Costs incurred by the Global Equity Research Portfolio and the Emerging Markets Research Portfolio in connection with their organization were expensed as they were incurred. Costs related to the offering of shares were deferred and amortized on a straight line basis over the twelve-month period from the date of commencement of operations of the Portfolios.
Redemption Fees
The Fund uses fees on short-term redemptions to discourage frequent trading in Portfolio shares. Redemptions of Portfolio shares made within 90 days of purchase may be subject to a redemption fee equal to 2% of the amount redeemed. For the years ended October 31, 2017 and October 31, 2016, the Portfolios received the following redemption fees. These amounts are included as a component of “Payments for Shares Redeemed” in Note 6 - Capital Share Transactions.
| Institutional Class | Institutional Class I | Institutional Class II | Class I | ||||||||||||||||||||||||||||||||
| Portfolio | Year Ended October 31, 2017 | Year Ended October 31, 2016 | Year Ended October 31, 2017 | Year Ended October 31, 2016 | Year Ended October 31, 2017 | Year Ended October 31, 2017 | Year Ended 2016 | ||||||||||||||||||||||||||||
Global Equity | $ | 1,918 | $ | 4,449 | $ | — | $ | — | $ | — | $ | — | $ | — | |||||||||||||||||||||
International Equity | 658,145 | 380,046 | — | — | — | — | — | ||||||||||||||||||||||||||||
International Small Companies | 20,596 | 3,331 | — | — | — | — | — | ||||||||||||||||||||||||||||
Institutional Emerging Markets | — | — | — | — | — | 102,466 | 230,759 | ||||||||||||||||||||||||||||
Emerging Markets | — | — | — | — | — | — | — | ||||||||||||||||||||||||||||
Frontier Emerging Markets | — | — | 11,410 | 103,983 | — | — | — | ||||||||||||||||||||||||||||
Global Equity Research | — | — | — | — | — | — | — | ||||||||||||||||||||||||||||
International Equity Research | — | — | — | — | — | — | — | ||||||||||||||||||||||||||||
Emerging Markets Research | — | — | — | — | — | — | — | ||||||||||||||||||||||||||||
| Class II | Investor Class | Advisor Class | Institutional Class Z | ||||||||||||||||||||||||||||||||
| Portfolio | Year Ended October 31, 2017 | Year Ended October 31, 2016 | Year Ended October 31, 2017 | Year Ended October 31, 2016 | Year Ended October 31, 2017 | Year Ended October 31, 2016 | Year Ended 2017 | ||||||||||||||||||||||||||||
Global Equity | $ | — | $ | — | $ | — | $ | — | $ | 4,375 | $ | 2,346 | $ | — | |||||||||||||||||||||
International Equity | — | — | 42,489 | 57,813 | — | — | — | ||||||||||||||||||||||||||||
International Small Companies | — | — | 4,790 | 1,331 | — | — | — | ||||||||||||||||||||||||||||
Institutional Emerging Markets | — | 7,953 | — | — | — | — | — | ||||||||||||||||||||||||||||
Emerging Markets | — | — | — | — | 166,320 | 255,545 | — | ||||||||||||||||||||||||||||
Frontier Emerging Markets | — | — | 4,709 | 15,234 | — | — | — | ||||||||||||||||||||||||||||
56
Table of Contents
Harding, Loevner Funds, Inc.
Notes to Financial Statements (continued)
October 31, 2017
2. Summary of Significant Accounting Policies (continued)
| Class II | Investor Class | Advisor Class | Institutional Class Z | ||||||||||||||||||||||||||||||||
| Portfolio | Year Ended October 31, 2017 | Year Ended October 31, 2016 | Year Ended October 31, 2017 | Year Ended October 31, 2016 | Year Ended October 31, 2017 | Year Ended October 31, 2016 | Year Ended October 31, 2017 | ||||||||||||||||||||||||||||
Global Equity Research | $ | — | $ | — | $ | — | $ | — | $ | — | $ | — | $ | — | |||||||||||||||||||||
International Equity Research | — | — | —8 | — | — | — | — | ||||||||||||||||||||||||||||
Emerging Markets Research | — | — | — | — | — | — | — | ||||||||||||||||||||||||||||
Indemnifications
Under the Fund’s organizational document, its officers and Board are indemnified against certain liability arising out of the performance of their duties to the Portfolios. In the normal course of business, the Fund may enter into contracts that contain a variety of representations or that provide indemnification for certain liabilities. The Fund’s maximum exposure under these arrangements is unknown, as this would involve future claims that may be made against the Fund that have not yet occurred. However, the Fund has not had prior claims or losses pursuant to these contracts and expects the risk of loss to be remote.
3. Transactions with Affiliates and Significant Agreements
The Board has approved investment advisory agreements with the Investment Adviser. Advisory fees are computed daily and paid monthly based on the average daily net assets of each Portfolio. The Investment Adviser has contractually agreed to reduce its fee and/or reimburse the Portfolios for other operating expenses to the extent that aggregate expenses, excluding certain non-operating expenses, exceed certain annual rates of the average daily net assets of each class.
57
Table of Contents
Harding, Loevner Funds, Inc.
Notes to Financial Statements (continued)
October 31, 2017
3. Transactions with Affiliates and Significant Agreements (continued)
The following annualized advisory fees and contractual expense limits were in effect for the year ended October 31, 2017. The advisory fees are charged at the Portfolio level as a whole and expense limitations are at the class specific level.
| Portfolio | First $1 billion of assets | Next $1 billion of assets | Next $1 billion of assets | Over $3 billion of assets | Over $4 billion of assets | Over $5 billion of assets | Contractual Expense Limit* | ||||||||||||||||||||||||||||
Global Equity–Institutional Class | 0.80% | 0.78% | 0.76% | 0.74% | 0.74% | 0.74% | 0.95% | ||||||||||||||||||||||||||||
Global Equity–Institutional Class Z | 0.80% | 0.78% | 0.76% | 0.74% | 0.74% | 0.74% | 0.90% | ||||||||||||||||||||||||||||
Global Equity–Advisor Class | 0.80% | 0.78% | 0.76% | 0.74% | 0.74% | 0.74% | 1.25% | ||||||||||||||||||||||||||||
International Equity–Institutional Class | 0.75% | 0.73% | 0.71% | 0.69% | 0.67% | 0.65% | 1.00% | ||||||||||||||||||||||||||||
International Equity–Institutional Class Z | 0.75% | 0.73% | 0.71% | 0.69% | 0.67% | 0.65% | 0.80% | ||||||||||||||||||||||||||||
International Equity–Investor Class | 0.75% | 0.73% | 0.71% | 0.69% | 0.67% | 0.65% | 1.25% | ||||||||||||||||||||||||||||
International Small Companies–Institutional Class | 1.15% | 1.15% | 1.15% | 1.15% | 1.15% | 1.15% | 1.15% | ||||||||||||||||||||||||||||
International Small Companies–Investor Class | 1.15% | 1.15% | 1.15% | 1.15% | 1.15% | 1.15% | 1.40% | ||||||||||||||||||||||||||||
Institutional Emerging Markets–Class I | 1.15% | 1.13% | 1.11% | 1.09% | 1.09% | 1.09% | 1.30% | ||||||||||||||||||||||||||||
Institutional Emerging Markets–Class II | 1.15% | 1.13% | 1.11% | 1.09% | 1.09% | 1.09% | 1.15% | ** | |||||||||||||||||||||||||||
Emerging Markets–Advisor Class | 1.15% | 1.13% | 1.11% | 1.09% | 1.09% | 1.09% | 1.75% | ||||||||||||||||||||||||||||
Frontier Emerging Markets–Institutional Class I*** | 1.35% | 1.35% | 1.35% | 1.35% | 1.35% | 1.35% | 1.75% | ||||||||||||||||||||||||||||
Frontier Emerging Markets–Institutional Class II | 1.35% | 1.35% | 1.35% | 1.35% | 1.35% | 1.35% | 1.35% | ||||||||||||||||||||||||||||
Frontier Emerging Markets–Investor Class*** | 1.35% | 1.35% | 1.35% | 1.35% | 1.35% | 1.35% | 2.00% | ||||||||||||||||||||||||||||
Global Equity Research–Institutional Class | 0.80% | 0.80% | 0.80% | 0.80% | 0.80% | 0.80% | 0.90% | ||||||||||||||||||||||||||||
Global Equity Research–Investor Class | 0.80% | 0.80% | 0.80% | 0.80% | 0.80% | 0.80% | 1.15% | ||||||||||||||||||||||||||||
International Equity Research–Institutional Class | 0.75% | 0.75% | 0.75% | 0.75% | 0.75% | 0.75% | 0.90% | ||||||||||||||||||||||||||||
International Equity Research–Investor Class | 0.75% | 0.75% | 0.75% | 0.75% | 0.75% | 0.75% | 1.15% | ||||||||||||||||||||||||||||
Emerging Markets Research–Institutional Class | 1.15% | 1.15% | 1.15% | 1.15% | 1.15% | 1.15% | 1.30% | ||||||||||||||||||||||||||||
Emerging Markets Research–Investor Class | 1.15% | 1.15% | 1.15% | 1.15% | 1.15% | 1.15% | 1.55% | ||||||||||||||||||||||||||||
* Effective through February 28, 2019.
** The Investment Adviser has contractually agreed to waive a portion of its management fee and/or reimburse the Portfolio’s Class II shares for their other operating expenses to the extent that the aggregate operating expenses of Class II exceed the applicable contractual management fee, currently 1.15% on the first $1 billion of average daily net assets, 1.13% on the next $1 billion, 1.11% on the next $1 billion and 1.09% for average daily net assets over $3 billion.
*** Prior to March 1, 2017, Frontier Emerging Markets – Institutional Class I and Frontier Emerging Markets – Investor Class had a contractual management fee of 1.50% on the first $1 billion of average net assets and 1.48% for the average daily net assets over $1 billion.
For the year ended October 31, 2017, the Investment Adviser waived and/or reimbursed the following amounts pursuant to the contractual expense limits described above:
| Portfolio | Fees waived and/or reimbursed by the Investment Adviser | ||||
Global Equity–Institutional Class Z | $ | 21,683 | |||
International Equity–Institutional Class Z | 17,070 | ||||
International Small Companies–Institutional Class | 259,892 | ||||
International Small Companies–Investor Class | 173,323 | ||||
Institutional Emerging Markets–Class II | 447,297 | ||||
Frontier Emerging Markets–Institutional Class II | 221,478 | ||||
Frontier Emerging Markets–Investor Class | 42,177 | ||||
Global Equity Research–Institutional Class | 108,191 | ||||
Global Equity Research–Investor Class | 52,541 | ||||
International Equity Research–Institutional Class | 109,759 | ||||
International Equity Research–Investor Class | 52,372 | ||||
Emerging Markets Research–Institutional Class | 111,054 | ||||
Emerging Markets Research–Investor Class | 52,906 | ||||
58
Table of Contents
Harding, Loevner Funds, Inc.
Notes to Financial Statements (continued)
October 31, 2017
3. Transactions with Affiliates and Significant Agreements (continued)
The Fund has an administration agreement with The Northern Trust Company (“Northern Trust”), which provides certain accounting, clerical and bookkeeping services, Blue Sky, corporate secretarial services and assistance in the preparation and filing of tax returns and reports to shareholders and the SEC.
Northern Trust also serves as custodian of each Portfolio’s securities and cash, transfer agent, dividend disbursing agent and agent in connection with any accumulation, open-account or similar plans provided to the shareholders of the Portfolios. Northern Trust has agreed to waive certain transfer agent fees and expenses for Institutional Class Z of the Global Equity and International Equity Portfolios for a period of six months from the commencement of each class (through January 31, 2018 and January 16, 2018, respectively). The amounts waived are captioned as “Less Waiver of transfer agent fees and expenses” on the Statements of Operations.
Alaric Compliance Services, LLC (“ACS”) provides compliance support to the Fund’s Chief Compliance Officer. Fees paid to ACS are shown as “Compliance officers’ fees and expenses” on the Statements of Operations.
The Fund has adopted an Amended Plan of Distribution pursuant to Rule 12b-1 under the 1940 Act (“Distribution Plan”). Under the Distribution Plan, the Investor Class of each of the International Equity, International Small Companies, Frontier Emerging Markets, Global Equity Research, International Equity Research and Emerging Markets Research Portfolios may pay underwriters, distributors, dealers or brokers a fee at an annual rate of up to 0.25% of the average daily net assets of the Portfolio’s Investor Class shares for services or expenses arising in connection with activities primarily intended to result in the sale of Investor Class shares of the Portfolios or for Shareholder Services (defined below) consistent with those described under the Shareholder Servicing Plan.
The Fund, on behalf of the Portfolios, has agreements with various financial intermediaries and “mutual fund supermarkets”, under which customers of these intermediaries may purchase and hold Portfolio shares. These intermediaries assess fees in consideration for providing certain account maintenance, record keeping and transactional and other shareholder services (collectively, “Shareholder Services”). With the exception of Institutional Class Z, each Portfolio or class is authorized, pursuant to a Shareholder Servicing Plan, to pay to each intermediary an annual rate of up to 0.25% of its average daily net assets attributable to that intermediary (subject to the contractual expense limits described above) for such Shareholder Services. Because of the contractual expense limits on certain Portfolios’ fees and expenses, the Investment Adviser paid a portion of the Portfolios’ share of these fees during the year ended October 31, 2017. Such payments, if any, are included in the table above under the caption “Fees waived and/or reimbursed by the Investment Adviser”.
A Portfolio may purchase securities from, or sell securities to, an affiliated fund provided the affiliation is due solely to having a common investment adviser, common officers, or common Trustees. For the year ended October 31, 2017, no Portfolios engaged in purchases and/or sales of securities from an affiliated portfolio in compliance with Rule 17a-7 of the 1940 Act.
4. Class Specific Expenses
Most expenses of the Fund can be directly attributed to a particular Portfolio. Expenses which cannot be directly attributed are apportioned among the Portfolios based upon relative net assets or other appropriate measures. If an expense is incurred at the Portfolio level, it is generally apportioned among the classes of that Portfolio based upon relative net assets of each respective class. Certain expenses are incurred at the class level and charged only to that particular class. These expenses may be class specific (i.e., Distribution fees charged only to a particular class) or they may be identifiable to a particular class (i.e., the costs related to mailing shareholder reports to shareholders of a particular class). Class level expenses for Portfolios with multiple active classes are shown in the table below.
The class level expenses for the year ended October 31, 2017, were as follows for each Portfolio:
| Portfolio | Distribution Fees | State Registration Filing Fees | Printing and Postage Fees | Transfer Agent Fees and Expenses | Shareholder Servicing Fees | ||||||||||||||||||||
Global Equity–Institutional Class | $ | — | $ | 29,571 | $ | 32,906 | $ | 24,455 | $ | 390,545 | |||||||||||||||
Global Equity–Institutional Class Z | — | 20,690 | 3,532 | 6,170 | — | ||||||||||||||||||||
Global Equity–Advisor Class | — | 22,172 | 6,012 | 24,160 | 119,564 | ||||||||||||||||||||
International Equity–Institutional Class | — | 381,883 | 662,203 | 207,597 | 5,756,714 | ||||||||||||||||||||
International Equity–Institutional Class Z | — | �� | 20,270 | 3,532 | 11,459 | — | |||||||||||||||||||
International Equity–Investor Class | 1,361,777 | 42,851 | 74,668 | 95,534 | 618,373 | ||||||||||||||||||||
International Small Companies–Institutional Class | — | 25,043 | 6,959 | 21,373 | 64,002 | ||||||||||||||||||||
International Small Companies–Investor Class | 107,591 | 23,471 | 10,997 | 22,083 | 54,521 | ||||||||||||||||||||
59
Table of Contents
Harding, Loevner Funds, Inc.
Notes to Financial Statements (continued)
October 31, 2017
4. Class Specific Expenses (continued)
| Portfolio | Distribution Fees | State Registration Filing Fees | Printing and Postage Fees | Transfer Agent Fees and Expenses | Shareholder Servicing Fees | ||||||||||||||||||||
Institutional Emerging Markets–Class I | $ | — | $ | 146,494 | $ | 233,004 | $ | 60,998 | $ | 2,401,769 | |||||||||||||||
Institutional Emerging Markets–Class II | — | 37,325 | 20,617 | 31,249 | — | ||||||||||||||||||||
Frontier Emerging Markets–Institutional Class I | — | 42,053 | 21,612 | 27,960 | 217,288 | ||||||||||||||||||||
Frontier Emerging Markets–Institutional Class II | — | 21,019 | 6,436 | 12,183 | — | ||||||||||||||||||||
Frontier Emerging Markets–Investor Class | 77,496 | 23,272 | 5,367 | 24,731 | 35,371 | ||||||||||||||||||||
Global Equity Research–Institutional Class | — | 26,000 | 1,154 | 18,646 | — | ||||||||||||||||||||
Global Equity Research–Investor Class | 1,076 | 26,400 | 1,100 | 18,606 | — | ||||||||||||||||||||
International Equity Research–Institutional Class | — | 23,695 | 626 | 20,521 | 59 | ||||||||||||||||||||
International Equity Research–Investor Class | 2,453 | 23,159 | 345 | 20,387 | 578 | ||||||||||||||||||||
Emerging Markets Research–Institutional Class | — | 26,000 | 1,154 | 18,582 | — | ||||||||||||||||||||
Emerging Markets Research–Investor Class | 1,192 | 26,400 | 1,100 | 18,607 | — | ||||||||||||||||||||
5. Investment Transactions
Cost of purchases and proceeds from sales of investment securities, other than short-term investments, for the year ended October 31, 2017, were as follows for each Portfolio:
| Portfolio | Purchase Cost of Investment Securities | Proceeds from Sales of Investment Securities | ||||||||
Global Equity | $ | 293,142,078 | $ | 426,297,631 | ||||||
International Equity | 3,989,491,577 | 1,041,381,674 | ||||||||
International Small Companies | 77,501,960 | 26,471,603 | ||||||||
Institutional Emerging Markets | 1,173,911,482 | 667,124,321 | ||||||||
Emerging Markets | 799,446,197 | 565,212,208 | ||||||||
Frontier Emerging Markets | 149,080,135 | 115,872,542 | ||||||||
Global Equity Research | 6,612,898 | 1,881,721 | ||||||||
International Equity Research | 6,436,181 | 4,852,961 | ||||||||
Emerging Markets Research | 7,566,343 | 2,612,609 | ||||||||
6. Capital Share Transactions
Transactions in capital shares for the year ended October 31, 2017, were as follows for each Portfolio:
Shares Sold | Proceeds From Shares Sold | Shares From Reinvested Dividends | Reinvestment of Dividends | Shares Redeemed | Payments for Shares | Net Increase in Shares | Net Increase in Net Assets | |||||||||||||||||||||||||||||||||
Global Equity | ||||||||||||||||||||||||||||||||||||||||
Institutional Class | 3,557,207 | $ | 126,591,078 | 380,579 | $ | 12,167,114 | (8,538,488 | ) | $ | (321,559,614 | ) | (4,600,702 | ) | $ | (182,801,422 | ) | ||||||||||||||||||||||||
Institutional | ||||||||||||||||||||||||||||||||||||||||
Class Z* | 1,138,429 | 45,129,498 | — | — | — | — | 1,138,429 | 45,129,498 | ||||||||||||||||||||||||||||||||
Advisor Class | 591,509 | 21,937,118 | 22,083 | 706,436 | (514,528 | ) | (18,583,901 | ) | 99,064 | 4,059,653 | ||||||||||||||||||||||||||||||
International Equity | ||||||||||||||||||||||||||||||||||||||||
Institutional Class | 212,768,400 | 4,289,975,391 | 3,099,381 | 54,673,082 | (71,189,657 | ) | (1,425,428,201 | ) | 144,678,124 | 2,919,220,272 | ||||||||||||||||||||||||||||||
Institutional | ||||||||||||||||||||||||||||||||||||||||
Class Z* | 7,386,891 | 163,751,319 | — | — | (13,423 | ) | (301,268 | ) | 7,373,468 | 163,450,051 | ||||||||||||||||||||||||||||||
Investor Class | 16,523,590 | 330,104,697 | 142,696 | 2,514,304 | (11,801,255 | ) | (242,004,627 | ) | 4,865,031 | 90,614,374 | ||||||||||||||||||||||||||||||
International Small Companies |
| |||||||||||||||||||||||||||||||||||||||
Institutional Class | 4,711,720 | 69,203,857 | 198,337 | 2,518,889 | (836,485 | ) | (12,122,159 | ) | 4,073,572 | 59,600,587 | ||||||||||||||||||||||||||||||
Investor Class | 738,353 | 11,215,961 | 136,919 | 1,729,291 | (1,088,280 | ) | (15,155,184 | ) | (213,008 | ) | (2,209,932 | ) | ||||||||||||||||||||||||||||
Institutional Emerging Markets |
| |||||||||||||||||||||||||||||||||||||||
Class I | 54,560,688 | 1,038,641,937 | 980,891 | 16,341,647 | (28,454,918 | ) | (532,984,859 | ) | 27,086,661 | 521,998,725 | ||||||||||||||||||||||||||||||
60
Table of Contents
Harding, Loevner Funds, Inc.
Notes to Financial Statements (continued)
October 31, 2017
6. Capital Share Transactions (continued)
Shares Sold | Proceeds From Shares Sold | Shares From Reinvested Dividends | Reinvestment Dividends | Shares Redeemed | Payments for Shares | Net Increase in Shares | Net Increase in Net Assets | |||||||||||||||||||||||||||||||||
Class II* | 1,043,057 | $ | 20,705,438 | 214,790 | $ | 3,569,199 | (1,888,130 | ) | $ | (37,184,339 | ) | (630,283 | ) | $ | (12,909,702 | ) | ||||||||||||||||||||||||
Emerging Markets | ||||||||||||||||||||||||||||||||||||||||
Advisor Class | 19,627,835 | 977,092,988 | 367,978 | 16,069,613 | (14,929,149 | ) | (747,053,858 | ) | 5,066,664 | 246,108,743 | ||||||||||||||||||||||||||||||
Frontier Emerging Markets | ||||||||||||||||||||||||||||||||||||||||
Institutional Class I | 10,785,448 | 81,054,731 | 416,181 | 2,975,698 | (26,327,254 | ) | (197,884,990 | ) | (15,125,625 | ) | (113,854,561 | ) | ||||||||||||||||||||||||||||
Institutional Class II** | 19,618,659 | 147,539,455 | — | — | — | — | 19,618,659 | 147,539,455 | ||||||||||||||||||||||||||||||||
Investor Class | 1,172,765 | 8,931,159 | 21,332 | 151,672 | (2,020,534 | ) | (15,360,844 | ) | (826,437 | ) | (6,278,013 | ) | ||||||||||||||||||||||||||||
Global Equity Research | ||||||||||||||||||||||||||||||||||||||||
Institutional Class | 433,942 | 4,341,525 | — | — | — | — | 433,942 | 4,341,525 | ||||||||||||||||||||||||||||||||
Investor Class | 44,913 | 449,875 | — | — | — | — | 44,913 | 449,875 | ||||||||||||||||||||||||||||||||
International Equity Research | ||||||||||||||||||||||||||||||||||||||||
Institutional Class | 206,473 | 2,385,238 | 21,912 | 227,662 | (67,783 | ) | (822,513 | ) | 160,602 | 1,790,387 | ||||||||||||||||||||||||||||||
Investor Class | 27,569 | 319,632 | 2,630 | 27,249 | (18,674 | ) | (219,087 | ) | 11,525 | 127,794 | ||||||||||||||||||||||||||||||
Emerging Markets Research | ||||||||||||||||||||||||||||||||||||||||
Institutional Class | 451,850 | 4,518,305 | — | — | — | — | 451,850 | 4,518,305 | ||||||||||||||||||||||||||||||||
Investor Class | 47,237 | 473,195 | — | — | — | — | 47,237 | 473,195 | ||||||||||||||||||||||||||||||||
* All share amounts have been adjusted as a result of the reverse share split effected after the close of business on December 1, 2017. (See Note 1).
** All share amounts have been adjusted as a result of the share dividend effected after the close of business on December 1, 2017. (See Note 1).
Transactions in capital shares for the year ended October 31, 2016, were as follows for each Portfolio:
Shares Sold | Proceeds From Shares Sold | Shares From Reinvested Dividends | Reinvestment Dividends | Shares Redeemed | Payments for Shares | Net Increase in Shares | Net Increase in Net Assets | |||||||||||||||||||||||||||||||||
Global Equity |
| |||||||||||||||||||||||||||||||||||||||
Institutional Class | 4,743,905 | $ | 146,819,576 | 735,407 | $ | 22,385,785 | (6,353,223 | ) | $ | (201,055,995 | ) | (873,911 | ) | $ | (31,850,634 | ) | ||||||||||||||||||||||||
Advisor Class | 195,182 | 6,080,000 | 53,713 | 1,636,088 | (501,701 | ) | (15,341,303 | ) | (252,806 | ) | (7,625,215 | ) | ||||||||||||||||||||||||||||
International Equity |
| |||||||||||||||||||||||||||||||||||||||
Institutional Class | 155,282,178 | 2,686,392,327 | 2,391,202 | 40,411,310 | (71,272,095 | ) | (1,239,285,696 | ) | 86,401,285 | 1,487,517,941 | ||||||||||||||||||||||||||||||
Investor Class | 8,952,504 | 157,141,271 | 152,294 | 2,570,728 | (8,383,846 | ) | (143,501,075 | ) | 720,952 | 16,210,924 | ||||||||||||||||||||||||||||||
International Small Companies |
| |||||||||||||||||||||||||||||||||||||||
Institutional Class | 2,053,936 | 27,605,199 | 56,706 | 753,058 | (1,062,864 | ) | (14,094,870 | ) | 1,047,778 | 14,263,387 | ||||||||||||||||||||||||||||||
Investor Class | 1,063,952 | 14,115,976 | 56,972 | 753,739 | (1,631,129 | ) | (21,567,425 | ) | (510,205 | ) | (6,697,710 | ) | ||||||||||||||||||||||||||||
Institutional Emerging Markets |
| |||||||||||||||||||||||||||||||||||||||
Class I | 96,092,162 | 1,515,822,457 | 691,939 | 10,275,294 | (40,948,303 | ) | (636,759,011 | ) | 55,835,798 | 889,338,740 | ||||||||||||||||||||||||||||||
Class II* | 8,069,013 | 133,098,874 | 171,416 | 2,547,022 | (1,675,827 | ) | (27,900,793 | ) | 6,564,602 | 107,745,103 | ||||||||||||||||||||||||||||||
Emerging Markets |
| |||||||||||||||||||||||||||||||||||||||
Advisor Class | 30,650,634 | 1,273,187,393 | 293,448 | 11,423,918 | (22,813,733 | ) | (935,047,284 | ) | 8,130,349 | 349,564,027 | ||||||||||||||||||||||||||||||
Frontier Emerging Markets |
| |||||||||||||||||||||||||||||||||||||||
Institutional Class I | 23,810,559 | 172,581,972 | 407,573 | 2,840,785 | (36,950,358 | ) | (260,477,237 | ) | (12,732,226 | ) | (85,054,480 | ) | ||||||||||||||||||||||||||||
Investor Class | 1,222,170 | 8,706,008 | 27,407 | 189,934 | (2,797,102 | ) | (19,895,988 | ) | (1,547,525 | ) | (11,000,046 | ) | ||||||||||||||||||||||||||||
International Equity Research |
| |||||||||||||||||||||||||||||||||||||||
Institutional Class | 562,606 | 5,627,000 | — | — | — | — | 562,606 | 5,627,000 | ||||||||||||||||||||||||||||||||
Investor Class | 74,624 | 763,139 | — | — | — | — | 74,624 | 763,139 | ||||||||||||||||||||||||||||||||
* All share amounts have been adjusted as a result of the reverse share split effected after the close of business on December 1, 2017. (See Note 1).
61
Table of Contents
Harding, Loevner Funds, Inc.
Notes to Financial Statements (continued)
October 31, 2017
7. Income Tax
The cost of investments for federal income tax purposes and the components of net unrealized appreciation (depreciation) on investments at October 31, 2017, for each of the Portfolios were as follows:
| Portfolio | Gross Unrealized | Gross Unrealized Depreciation | Net Unrealized Appreciation / (Depreciation) | Cost | ||||||||||||||||
Global Equity | $ | 316,018,905 | $ | (8,973,963 | ) | $ | 307,044,942 | $ | 590,948,537 | |||||||||||
International Equity | 2,895,069,825 | (197,834,661 | ) | 2,697,235,164 | 9,191,304,061 | |||||||||||||||
International Small Companies | 45,949,689 | (3,531,563 | ) | 42,418,126 | 152,660,759 | |||||||||||||||
Institutional Emerging Markets | 1,238,371,029 | (93,160,904 | ) | 1,145,210,125 | 3,695,834,614 | |||||||||||||||
Emerging Markets | 1,261,423,340 | (84,534,687 | ) | 1,176,888,653 | 2,831,863,082 | |||||||||||||||
Frontier Emerging Markets | 96,502,249 | (32,831,473 | ) | 63,670,776 | 403,348,341 | |||||||||||||||
Global Equity Research | 970,909 | (94,797 | ) | 876,112 | 5,039,847 | |||||||||||||||
International Equity Research | 1,957,647 | (216,466 | ) | 1,741,181 | 8,873,968 | |||||||||||||||
Emerging Markets Research | 1,178,043 | (93,101 | ) | 1,084,942 | 5,441,478 | |||||||||||||||
It is the policy of each Portfolio of the Fund to qualify as a regulated investment company by complying with the applicable provisions of the Internal Revenue Code, and to make distributions of taxable income sufficient to relieve it from substantially all federal income and excise taxes; therefore, no federal income tax provision is required.
The Portfolios may be subject to taxes imposed by countries in which they invest. Such taxes are generally based on income and/or capital gains earned. Taxes are accrued based on net investment income, net realized gains and net unrealized appreciation as such income and/or gains are recorded. Taxes accrued on unrealized gains are reflected as a liability on the Statements of Assets and Liabilities under the caption “Deferred capital gains tax” and as a reduction in “Net unrealized appreciation on investments and on assets and liabilities denominated in foreign currencies”. When assets subject to capital gains tax are sold, accrued taxes are relieved, and the actual amount of the taxes paid is reflected on the Statements of Operations as a reduction in “Net realized gain (loss) on Investment Transactions”. The Portfolios seek to recover a portion of foreign withholding taxes applied to income earned in jurisdictions where favorable treaty rates for US investors are available. The portion of such taxes believed to be recoverable is reflected as an asset on the Statements of Assets and Liabilities under the caption “Tax reclaim receivable”.
Management has performed an analysis of each Portfolio’s tax positions for the open tax years as of October 31, 2017 and has concluded that no provisions for income tax are required. The Portfolios’ federal tax returns for the prior three fiscal years (open tax years: October 31, 2014; October 31, 2015; October 31, 2016) remain subject to examination by the Portfolios’ major tax jurisdictions, which include the United States, the State of New Jersey and the State of Maryland. Management is not aware of any events that are reasonably possible to occur in the next twelve months that would result in the amounts of any unrecognized tax benefits significantly increasing or decreasing for the Portfolios. However, management’s conclusions regarding tax positions taken may be subject to review and adjustment at a later date based on factors including, but not limited to, new tax laws and accounting regulations and interpretations thereof.
The tax character of distributions paid during the fiscal years ended October 31, 2017 and 2016 were as follows:
| Distributions From | ||||||||||||||||||||
| Portfolio | Ordinary 2017 | Long-Term Capital Gains 2017 | Ordinary 2016 | Long-Term Capital Gains 2016 | ||||||||||||||||
Global Equity | $ | 3,264,568 | $ | 10,109,118 | $ | 2,915,631 | $ | 21,649,757 | ||||||||||||
International Equity | 64,825,786 | — | 48,284,777 | — | ||||||||||||||||
International Small Companies | 1,214,051 | 3,298,574 | 576,035 | 948,182 | ||||||||||||||||
Institutional Emerging Markets | 22,513,197 | — | 14,148,383 | — | ||||||||||||||||
Emerging Markets | 17,343,528 | — | 12,240,604 | 56,015 | ||||||||||||||||
Frontier Emerging Markets | 3,677,574 | — | 4,626,863 | — | ||||||||||||||||
Global Equity Research | — | — | — | — | ||||||||||||||||
International Equity Research | 254,911 | — | — | — | ||||||||||||||||
62
Table of Contents
Harding, Loevner Funds, Inc.
Notes to Financial Statements (continued)
October 31, 2017
7. Income Tax (continued)
| Distributions From | ||||||||||||||||||||
| Portfolio | Ordinary 2017 | Long-Term Capital Gains 2017 | Ordinary Income 2016 | Long-Term Capital Gains 2016 | ||||||||||||||||
Emerging Markets Research | $ | — | $ | — | $ | — | $ | — | ||||||||||||
As of October 31, 2017, the components of accumulated earnings/ (deficit) on a tax basis were as follows:
| Portfolio | Undistributed Ordinary | Undistributed Long-Term | Accumulated Capital and | Unrealized Appreciation | Total Accumulated Earnings/(Deficit) | ||||||||||||||||||||
Global Equity | $ | 12,438,664 | $ | 89,283,117 | $ | — | $ | 307,045,553 | $ | 408,767,334 | |||||||||||||||
International Equity | 109,614,087 | 89,572,490 | — | 2,697,462,339 | 2,896,648,916 | ||||||||||||||||||||
International Small Companies | 1,712,842 | 890,383 | — | 42,017,850 | 44,621,075 | ||||||||||||||||||||
Institutional Emerging Markets | 38,761,359 | — | (91,941,908 | ) | 1,145,245,129 | 1,092,064,580 | |||||||||||||||||||
Emerging Markets | 28,497,353 | 1,842,865 | — | 1,176,890,210 | 1,207,230,428 | ||||||||||||||||||||
Frontier Emerging Markets | 9,099,379 | — | (101,066,124 | ) | 60,654,681 | (31,312,064 | ) | ||||||||||||||||||
Global Equity Research | 239,149 | — | — | 873,367 | 1,112,516 | ||||||||||||||||||||
International Equity Research | 345,365 | 248,978 | (7,094 | ) | 1,737,412 | 2,324,661 | |||||||||||||||||||
Emerging Markets Research | 477,685 | — | — | 1,072,561 | 1,550,246 | ||||||||||||||||||||
* The difference between book basis and tax basis net unrealized appreciation is attributable primarily to the tax deferral of losses on certain sale of securities. Unrealized Appreciation (Depreciation) includes amounts related to foreign currency and currency translations.
The Regulated Investment Company Modernization Act of 2010 (the “Act”) changed various technical rules governing the tax treatment of regulated investment companies and became effective for the Portfolios for the fiscal year ended October 31, 2012. Under the Act, each Portfolio is permitted to carry forward capital losses incurred in taxable years beginning after the date of enactment for an unlimited period. However, any losses incurred during post-enactment years are required to be utilized prior to the losses incurred in pre-enactment taxable years, which carry an expiration date. As a result of this ordering rule, pre-enactment capital loss carryforwards may be more likely to expire unused. Additionally, post-enactment capital loss carryforwards will retain their character as either short-term or long-term capital losses rather than being considered all short-term as permitted under previous regulation.
At October 31, 2017, capital losses incurred that will be carried forward indefinitely under provisions of the Act are as follows:
| Portfolio | Short-Term Capital Loss Carryforward | Long-Term Capital Loss Carryforward | ||||||||
Institutional Emerging Markets | $ | (11,160,327 | ) | $ | (76,946,608 | ) | ||||
Frontier Emerging Markets | (17,019,306 | ) | (84,046,818 | ) | ||||||
At October 31, 2017, the pre-enactment capital loss carryforwards and their respective years of expiration were as follows:
| Portfolio | October 31, 2019 | ||||
Institutional Emerging Markets | $ | (3,834,973 | ) | ||
The Institutional Emerging Markets Portfolio had $28,667,656 in capital loss carryover expire at October 31, 2017.
Primarily as a result of differing book/tax treatment of foreign currency transactions and foreign capital gain tax expenses, the Portfolios made reclassifications among certain capital accounts. The reclassifications have no impact on the net assets of the Portfolios. As of October 31, 2017, the following reclassifications were made to the Statements of Assets and Liabilities:
| Portfolio | Paid-in Capital | Accumulated Undistributed Net Investment Income | Accumulated Net Realized Gain (Loss) from Investment Transactions | ||||||||||||
Global Equity | $ | — | $ | 163,593 | $ | (163,593 | ) | ||||||||
63
Table of Contents
Harding, Loevner Funds, Inc.
Notes to Financial Statements (continued)
October 31, 2017
7. Income Tax (continued)
| Portfolio | Paid-in Capital | Accumulated Undistributed Net Investment Income | Accumulated Net Realized Gain (Loss) from Investment Transactions | ||||||||||||
International Equity | $ | (38,432 | ) | $ | (1,555,788 | ) | $ | 1,594,220 | |||||||
International Small Companies | — | (161,897 | ) | 161,897 | |||||||||||
Institutional Emerging Markets | (28,675,940 | ) | (936,529 | ) | 29,612,469 | ||||||||||
Emerging Markets | — | (687,285 | ) | 687,285 | |||||||||||
Frontier Emerging Markets | — | 38,775 | (38,775 | ) | |||||||||||
Global Equity Research | (47,510 | ) | 50,852 | (3,342 | ) | ||||||||||
International Equity Research | — | 30,553 | (30,553 | ) | |||||||||||
Emerging Markets Research | (47,638 | ) | 56,283 | (8,645 | ) | ||||||||||
8. Foreign Exchange Contracts
The Portfolios do not generally hedge foreign currency exposure, however, the Portfolios may enter into forward foreign exchange contracts in order to hedge their exposure to changes in foreign currency exchange rates on their foreign portfolio holdings. Each Portfolio will conduct its currency transactions either on a spot (cash) basis at the rate prevailing in the currency exchange market, or by entering into forward contracts to purchase or sell currency. Foreign currency transactions entered into on the spot markets serve to pay for foreign investment purchases or to convert to dollars, the proceeds from foreign investment sales or dividend and interest receipts. The Portfolios will disclose open forward currency contracts, if any, on the Portfolios of Investments. The Portfolios do not separately disclose open spot market transactions on the Portfolios of Investments. Such realized gain (loss) and unrealized appreciation (depreciation) on spot market transactions is included in “net realized gain (loss) on foreign currency transactions” and “change in unrealized appreciation (depreciation) on translation of assets and liabilities denominated in foreign currencies”, respectively, on the Portfolios’ Statements of Operations. The Portfolios held no open forward currency contracts as of or during the fiscal year ended October 31, 2017.
9. Participation Notes
Each Portfolio may invest in participation notes. Participation notes are promissory notes that are designed to replicate the return of a particular underlying equity or debt security, currency or market. Participation notes are issued by banks or broker-dealers or their affiliates and allow a Portfolio to gain exposure to common stocks in markets where direct investment may not be allowed. Participation notes are generally traded over-the-counter. In addition to carrying the same risks associated with a direct investment in the underlying security, participation notes are subject to the risk that the broker-dealer or bank that issues them will not fulfill its contractual obligation to complete the transaction with a Portfolio. Participation notes constitute general unsecured contractual obligations of the banks or broker-dealers that issue them, and a Portfolio would be relying on the creditworthiness of such banks or broker-dealers and would have no rights under a participation note against the issuer(s) of the underlying security(ies). Participation notes may be more volatile and less liquid than other investments held by the Portfolios.
10. Concentration of Ownership
At October 31, 2017, the percentage of total shares outstanding (adjusted for the Reverse Splits and Share Dividend previously disclosed in Note 1) held by record shareholders each owning 10% or greater of the aggregate shares outstanding of each Portfolio were as follows:
| No. of Shareholders | % Ownership | |||||||||
Global Equity | 4 | 69.66 | %* | |||||||
International Equity | 3 | 60.71 | %* | |||||||
International Small Companies | 3 | 74.87 | %* | |||||||
Institutional Emerging Markets | 2 | 55.77 | %* | |||||||
Emerging Markets | 3 | 69.70 | %* | |||||||
Frontier Emerging Markets | 2 | 48.18 | %* | |||||||
Global Equity Research | 2 | 83.53 | % | |||||||
International Equity Research | 2 | 63.95 | % | |||||||
Emerging Markets Research | 2 | 80.15 | % | |||||||
* Includes omnibus positions of broker-dealers representing numerous shareholder accounts.
64
Table of Contents
Harding, Loevner Funds, Inc.
Notes to Financial Statements (continued)
October 31, 2017
10. Concentration of Ownership (continued)
Investment activities of these shareholders may have a material effect on the Portfolios.
11. Concentration of Risk
Investing in securities of foreign issuers and currency transactions may involve certain considerations and risks not typically associated with investments in U.S. issuers. These risks include revaluation of currencies, adverse fluctuations in foreign currency values and possible adverse political, social and economic developments, including those particular to a specific industry, country or region, which could cause the securities and their markets to be less liquid and prices more volatile than those of comparable U.S. companies and U.S. government securities. These risks are greater with respect to securities of issuers located in emerging market countries in which the Portfolios are authorized to invest.
Frontier Emerging Markets is permitted to invest up to 35% of its total assets in companies in the same industry, if, at the time of investment, that industry represents 20% or more of the Portfolio’s benchmark index. During periods when the Portfolio has invested more than 25% of its total assets in companies in the same industry, it will operate as a concentrated portfolio and be subject to additional risks and greater volatility. At October 31, 2017, the Portfolio’s investment in the Banking industry amounted to 34.34% of its total assets.
12. Line of Credit
The Fund has a $150 million line of credit agreement with Northern Trust. Borrowings are made solely to facilitate the handling of redemptions or unusual or unanticipated short-term cash requirements. Because several Portfolios participate and collateral requirements apply, there is no assurance that an individual Portfolio will have access to the entire $150 million at any particular time. Interest is charged to each Portfolio based on its borrowings at an amount above the Federal Funds rate, subject to a minimum rate. In addition, a facility fee is computed at an annual rate of 0.15% on the line of credit and is allocated among the Portfolios.
For the year ended October 31, 2017, Global Equity had an outstanding balance for one day of $22,300,000 at an average weighted interest rate of 1.75%.
13. New Accounting Pronouncements
Amendments to Regulation S-X
In October 2016, the SEC adopted new rules and amended existing rules (together, the “final rules”) intended to modernize the reporting and disclosure of information by registered investment companies. In part, the final rules amend Regulation S-X and require standardized, enhanced disclosure about derivatives in investment company financial statements, as well as other amendments. The compliance date of the amendments to Regulation S-X was August 1, 2017. However, adoption of the standards did not have any impact.
14. Subsequent Events
Subsequent events occurring after the date of this report have been evaluated for potential impact, for purposes of recognition or disclosure in the financial statements, through the date the report was issued and it has been determined that no other adjustments or disclosures are required beyond what is already included in the financial statements and accompanying footnotes.
65
Table of Contents
Harding, Loevner Funds, Inc.
Report of Independent Registered Public Accounting Firm
To the Shareholders and Board of Directors of
Harding, Loevner Funds, Inc.:
We have audited the accompanying statements of assets and liabilities, including the portfolios of investments, of Global Equity Portfolio, International Equity Portfolio, International Small Companies Portfolio, Institutional Emerging Markets Portfolio, Emerging Markets Portfolio, Frontier Emerging Markets Portfolio, Global Equity Research Portfolio, International Equity Research Portfolio, and Emerging Markets Research Portfolio (the “Portfolios”) as of October 31, 2017, and the related statements of operations for the year or period then ended, the statements of changes in net assets for each of the years or periods in the two-year period then ended, and the financial highlights for each of the years or periods in the five-year period then ended. These financial statements and financial highlights are the responsibility of the Portfolios’ management. Our responsibility is to express an opinion on these financial statements and financial highlights based on our audits.
We conducted our audits in accordance with the standards of the Public Company Accounting Oversight Board (United States). Those standards require that we plan and perform the audit to obtain reasonable assurance about whether the financial statements and financial highlights are free of material misstatement. An audit includes examining, on a test basis, evidence supporting the amounts and disclosures in the financial statements. Our procedures included confirmation of securities owned as of October 31, 2017, by correspondence with the custodian and brokers or other appropriate auditing procedures. An audit also includes assessing the accounting principles used and significant estimates made by management, as well as evaluating the overall financial statement presentation. We believe that our audits provide a reasonable basis for our opinion.
In our opinion, the financial statements and financial highlights referred to above present fairly, in all material respects, the financial position of the Portfolios as of October 31, 2017, and the results of their operations for the year or period then ended, the changes in their net assets for each of the years or periods in the two-year period then ended, and the financial highlights for each of the years or periods in the five-year period then ended, in conformity with U.S. generally accepted accounting principles.
/s/ KPMG LLP
Chicago, Illinois
December 15, 2017
66
Table of Contents
Harding, Loevner Funds, Inc.
(unaudited)
Global Equity, International Equity, International Small Companies, Institutional Emerging Markets, Emerging Markets, Frontier Emerging Markets, Global Equity Research, International Equity Research, and Emerging Markets Research paid qualifying foreign taxes of $647,710, $17,012,568, $286,217, $7,608,854, $6,128,425, $1,791,297, $5,120, $17,512, and $14,015 and earned $2,165,459, $126,150,728, $1,133,034, $151,002,545, $36,742,074, $10,035,311, $95,056, $139,851, and $209,869 from foreign source income during the fiscal year ended October 31, 2017, respectively. Pursuant to Section 853 of the Internal Revenue Code, Global Equity, International Equity, International Small Companies, Institutional Emerging Markets, Emerging Markets, Frontier Emerging Markets, Global Equity Research, International Equity Research, and Emerging Markets Research designated $0.0290, $0.0323, $0.0245, $0.0345, $0.0877, $0.0328, $0.0107, $0.0216, and $0.0281 per share as foreign taxes paid and $0.0970, $0.2396, $0.0969, $0.6838, $0.5258, $0.1835, $0.1985, $0.1728, and $0.4205 as income earned from foreign sources for the fiscal year ended October 31, 2017, respectively.
Global Equity, International Equity, International Small Companies, Institutional Emerging Markets, Emerging Markets, Frontier Emerging Markets, Global Equity Research, International Equity Research, and Emerging Markets Research had qualifying dividend income of $9,688,416, $174,407,857, $2,035,145, $65,371,220, $55,877,326, $12,370,459, $75,433, $193,931, and $101,952, respectively, during the fiscal year ended October 31, 2017.
For the fiscal year ended October 31, 2017, Global Equity designated 100% of the distributions from net investment income as qualifying for the 70% corporate dividend received deduction.
For the fiscal year ended October 31, 2017, Global Equity Research designated 69.72% of the distributions from net investment income as qualifying for the 70% corporate dividend received deduction.
Pursuant to Section 852 of the Internal Revenue Code, Global Equity designated $89,283,117 as a long term capital gain dividend for the fiscal year ended October 31, 2017.
Pursuant to Section 852 of the Internal Revenue Code, International Equity designated $89,572,490 as a long term capital gain dividend for the fiscal year ended October 31, 2017.
Pursuant to Section 852 of the Internal Revenue Code, International Small Companies designated $890,383 as a long term capital gain dividend for the fiscal year ended October 31, 2017.
Pursuant to Section 852 of the Internal Revenue Code, Emerging Markets designated $1,842,865 as a long term capital gain dividend for the fiscal year ended October 31, 2017.
Pursuant to Section 852 of the Internal Revenue Code, International Equity Research designated $248,978 as a long term capital gain dividend for the fiscal year ended October 31, 2017.
67
Table of Contents
Harding, Loevner Funds, Inc.
Approval of Investment Advisory Agreement
(unaudited)
Approval of Investment Advisory Agreements
At an in-person meeting of the board of directors (the “Board”) of Harding, Loevner Funds, Inc. (the “Fund”) held on June 15, 2017 (the “June Meeting”), the Board, including a majority of those directors who are not “interested persons” of the Fund, as defined in the Investment Company Act of 1940, as amended (the “Independent Directors”), considered and approved the continuation of two investment advisory agreements (the “Advisory Agreements”): the first, between Harding Loevner LP (“Harding Loevner” or the “Adviser”) and the Fund on behalf of the Global Equity Portfolio, the International Equity Portfolio, the International Small Companies Portfolio, the Institutional Emerging Markets Portfolio, the Emerging Markets Portfolio, and the Frontier Emerging Markets Portfolio (collectively, the “Legacy Portfolios”); and the second between the Adviser and the Fund on behalf of the International Equity Research Portfolio (the “Research Portfolio” and together with the Legacy Portfolios, each a “Portfolio” and together the “Portfolios”).
Overview of the Review Process
Prior to the June Meeting, the Board established a subcommittee comprised of three Independent Directors (the “Subcommittee”) to conduct a preliminary review of the materials provided to the Board by the Adviser in connection with consideration of the Advisory Agreements, to assist the Board in its deliberations, and to liaise with the Adviser. In addition, the Board requested, and the Adviser furnished, materials that the Board believed necessary to evaluate the terms of the Advisory Agreements, including information on, among other things: (i) the investment performance, expenses and advisory fees of each Portfolio relative to other mutual funds and benchmark indices, as set forth in reports prepared by Strategic Insight, a third party fund analytics provider engaged as part of the Advisory Agreement review process (the “Strategic Insight Reports”); (ii) the Adviser’s profitability and costs arising from services provided to the Fund; (iii) the qualifications of the Adviser and portfolio management personnel with respect to services provided to the Portfolios; and (iv) the Adviser’s investment research capabilities and resources.
The Subcommittee reviewed the materials and discussed the materials during a telephonic meeting with representatives of the Adviser on May 19, 2017. Following the Subcommittee’s review, the Adviser distributed revised and supplemental materials in final form to the full Board. The Board also received and considered a memorandum regarding the Board’s responsibilities in connection with renewal of the Advisory Agreements prepared by the legal counsel to the Independent Directors (“Independent Counsel”). Independent Counsel assisted the Independent Directors throughout the process.
At the June Meeting, the Board considered and discussed the materials presented by the Adviser. During the presentation, the Adviser expanded on those materials and responded to specific questions from the Board. Among other things, the Adviser focused on the long-term performance records of the Portfolios and the competitiveness of the Portfolio’s total expense ratios. The Adviser also focused on its management of Fund expenses; reinvestment from revenues in personnel and technology that service the Fund; and the Adviser’s efforts to share the benefits of economies of scale with Fund shareholders, noting the addition of breakpoints and management fee reductions and waivers in three out of the four most recent years. The Independent Directors met in executive session with Independent Counsel prior to the commencement of the June Meeting to discuss the materials provided by the Adviser and met in executive session again following the Adviser’s presentation on the Advisory Agreements and further discussed the information presented during the meeting.
In evaluating continuance of the Advisory Agreements with respect to each Portfolio, among other things, the Board considered the various factors and information discussed below. The following discussion is not intended to be all-inclusive, as the Board reviewed a variety of factors and considered a significant amount of information.
Nature, Extent and Quality of Services
The Board evaluated the information it deemed necessary to assess the nature, extent and quality of investment advisory services provided to the Portfolios by the Adviser. The Board also considered the nature, extent and quality of certain non-advisory services provided to the Portfolios by the Adviser, including portfolio trading; the resources devoted to, and the record of compliance with, each Portfolio’s compliance policies and procedures; and the quality and quantity of administrative and shareholder servicing. The Board noted that it received information in connection with quarterly Board and committee meetings throughout the year regarding the services rendered by the Adviser concerning the management of each Portfolio’s affairs and the Adviser’s role in coordinating providers of other services to the Portfolios.
The Adviser presented and discussed with the Board the qualifications, backgrounds and responsibilities of the Adviser’s management team and information regarding the members of each Portfolio’s portfolio management team. The Board evaluated the Adviser’s ability to attract and retain qualified investment advisory and non-advisory personnel and engaged in a discussion with the Adviser regarding its recruitment, retention and professional development programs and strategies.
68
Table of Contents
Harding, Loevner Funds, Inc.
Approval of Investment Advisory Agreement
(unaudited)
The Board also considered the adequacy of the Adviser’s financial and operational resources committed to each Portfolio, and how well the Adviser utilizes those resources to meet the Portfolio’s investment needs, to oversee non-investment services and to satisfy compliance requirements.
The Board further noted that, as of March 31, 2017, the Adviser had approximately $49.73 billion in assets under management and that the Fund was the Adviser’s largest client, with assets of approximately $17.06 billion. The Board took into account the benefits realized by the Portfolios from the Adviser’s affiliation with Affiliated Managers Group, Inc., an established global asset management company.
The Board considered annual and periodic reports of the Fund’s Chief Compliance Officer (the “CCO”) with respect to the effectiveness and adequacy of the Adviser’s compliance program, including program enhancements related to information security and financial intermediary oversight. The Board noted the CCO’s determination that the Adviser’s compliance program is reasonably designed to prevent violations of the federal securities laws.
Based on these considerations, the Board concluded that it was satisfied with the nature, extent and quality of services historically provided and to be provided to each Portfolio under its Advisory Agreement.
Performance of the Adviser
For each Portfolio, the Board considered, among other things, the historical performance for multiple time periods ended as of March 31, 2017, including the one-year, three-year, five-year and ten-year periods (or shorter for newer Portfolios) included in the Strategic Insight Reports, compared against each Portfolio’s Morningstar Category and benchmark index. The Board considered the Portfolios’ risk adjusted performance and the high active share (i.e., low overlap with benchmark indices) inherent in the Adviser’s investment process.
With respect to the recent performance of the Portfolios, the Board noted that for the one-year period ended March 31, 2017: each share class of the Global Equity Portfolio, International Equity Portfolio, Institutional Emerging Markets Portfolio, Emerging Markets Portfolio and International Equity Research Portfolio outperformed its respective Morningstar Category and benchmark index; each share class of the International Small Companies Portfolio outperformed its respective Morningstar Category while underperforming compared to its benchmark index; and the Frontier Emerging Markets Portfolio (Investor Class) underperformed compared to its Morningstar Category and benchmark index and the Frontier Emerging Markets Portfolio (Institutional Class) underperformed compared to its Morningstar category while outperforming its benchmark index.
In assessing longer term performance by the Portfolios, for the five-year period ended March 31, 2017, the Board noted that each share class of all Portfolios, except the Investor Class of the International Small Companies Portfolio, with at least five years of operations, outperformed its respective Morningstar Category and benchmark index.
For the ten-year period ended March 31, 2017, the Board noted that each share class of all Portfolios with at least ten years of operations outperformed its respective Morningstar Category and benchmark index.
In addition, the Board reviewed the Adviser’s investment philosophy and its influence on the management of the Portfolios, as well as the effectiveness of the Adviser’s use of portfolio management teams for the day-to-day management of Portfolios. The Board noted the Adviser’s bottom-up, business-focused approach based on a study of individual companies and the competitive dynamics of the global industries in which those companies participate. The Board considered the Adviser’s disciplined adherence to its investment philosophy and process as well as the evolutionary enhancements to the methodology used in its implementation.
In evaluating the investment performance of the Portfolios, the Board acknowledged that the Adviser’s investment style may result in periods of underperformance, but has generally produced outperformance over longer time periods. The Board also considered the Adviser’s ongoing efforts to identify the causes of any underperformance and the effectiveness of the Adviser’s efforts to address underperformance. Finally, the Board considered that the Morningstar Category performance data provided within the Strategic Insight Reports was less useful with respect to the Frontier Emerging Markets Portfolio, as Morningstar did not have a Frontier category at March 31, 2017 and instead compared the Portfolio to the Diversified Emerging Markets category.
Based on these considerations, the Board concluded that each Portfolio’s performance was consistent with the Adviser’s investment discipline.
69
Table of Contents
Harding, Loevner Funds, Inc.
Approval of Investment Advisory Agreement
(unaudited)
Costs of the Services and Profitability of the Adviser
The Board considered information regarding the Adviser’s costs to provide investment management services to the Portfolios and the profitability to the Adviser from managing the Portfolios. In evaluating the Adviser’s profitability, the Board considered the Adviser’s profitability analysis for calendar years 2015 and 2016, including profitability adjusted, on a pro forma basis, for estimated provisions for federal and state corporate income taxes; each Portfolio’s expense ratio; the allocation methodology used by the Adviser to compute such profitability; and the Adviser’s contractual fee waivers and expense reimbursements with respect to the applicable Portfolios. The Board also considered profitability on a Portfolio-by-Portfolio basis, focusing on the Adviser’s profit both with and without taking into account those costs borne by the Adviser with respect to its efforts to expand the Portfolios’ shareholder base.
The Board took note of the costs the Adviser has incurred that are intended to assure the continued delivery of high-quality services to its clients, including the Portfolios, and the future costs the Adviser plans to incur. The Board also noted that future profitability to the Adviser from managing the Portfolios would depend on the level of assets in the Portfolios and investment returns, as well as the Adviser’s total assets under management.
Based upon these considerations, the Board concluded that the profits historically realized by the Adviser , and the profits the Adviser anticipates will be realized from its continued relationship with the Portfolios, are not excessive in light of the nature, extent and quality of the services provided to the Portfolios.
Comparison of Fees and Services Provided by the Adviser
The Board reviewed the contractual advisory fees that are payable by the Portfolios to the Adviser and the actual investment advisory fees realized by the Adviser taking into account the fee waiver and/or expense reimbursement arrangements for certain of the Portfolios. The Board considered the fact that the Adviser’s waiver/expense reimbursement arrangements are not subject to recapture and that the proposed fee reductions and breakpoints were contractual in nature, noting that in fiscal-year 2016 the Adviser waived a portion of its advisory fees for Class II of the Institutional Emerging Markets and the Institutional Class and Investor Class of the Frontier Emerging Markets Portfolio, International Small Companies Portfolios and International Equity Research Portfolio. In addition, the Board compared the Adviser’s separate account fee schedule with the advisory fees payable by the Portfolios to the Adviser. Finally, the Board considered the Strategic Insight Reports, which included information comparing each Portfolio’s management fee and overall expenses with those of funds in a group of peer funds selected by Strategic Insight (the “Expense Group”).
The Board noted that the net operating expenses of each Portfolio (expenses other than the fees pursuant to the Advisory Agreements and distribution and service fees) were at or below the median of their respective Expense Groups and of their respective Morningstar Category-derived universe (the “Expense Universe”), with the exception of the International Small Companies Portfolio (Institutional Class), which had net operating expenses slightly above the median for its Expense Group and Expense Universe, and both classes of the International Equity Research Portfolio, which had net operating expenses above their respective Expense Group and Expense Universe medians. The Board also observed that, except as noted below, the total expense ratio of each class of each Portfolio, after any applicable waiver of advisory fees and reimbursement of expenses, was below its respective Expense Group and Expense Universe medians. Exceptions included the Institutional Emerging Markets Portfolio (Class I), which had a total expense ratio above both its Expense Group median and its Expense Universe median; the Frontier Emerging Markets Portfolio (Investor Class) which had a total expense ratio above the median of its Expense Group; and both classes of the International Small Companies Portfolio, which had total expense ratios at the median of their respective Expense Groups and above the median of their respective Expense Universes. The Board did not consider any of these differences to be material.
The Board noted that the net management fee for each class of each Portfolio was at or below the median of its Expense Group, except for the Emerging Markets Portfolio (Advisor Class), and both classes of the Institutional Emerging Markets Portfolio and the Frontier Emerging Markets Portfolio, which were above the median for their respective Expense Groups. The Board also noted that, for each Portfolio with an Expense Universe, the net management fee was above the median of its Expense Universe, except for both classes of the International Equity Research Portfolio and the International Equity Portfolio, and the International Small Companies Portfolio (Investor Class), which were below the median for their respective Expense Universes. In its consideration of each Portfolio’s net management fee, the Board considered the extensive scope of non-advisory services provided by the Adviser (including but not limited to executive and administrative support, supervision of vendors, , shareholder servicing, and trading), which it performs without additional compensation, and that such additional services contribute directly to below-median net operating expenses because the Adviser is effectively absorbing a portion of the Portfolios’ operating expenses.
The Board recognized that the Adviser’s separate account and collective trust clients require fewer services from the Adviser. The Board additionally recognized the Adviser’s efforts to increase institutional account minimums and direct more institutional investors into pooled vehicles, including the Portfolios. Further, the Board took note that many sophisticated institutional investors, after reviewing similar investment vehicles with the assistance of their consultants, had determined to invest in the Portfolios, which further supported the reasonableness of the advisory fees charged by the Adviser.
70
Table of Contents
Harding, Loevner Funds, Inc.
Approval of Investment Advisory Agreement
(unaudited)
Based on these considerations, the Board concluded that each Portfolio’s fee was reasonable.
Economies of Scale
The Board considered the extent to which economies of scale have been realized as the Portfolios’ assets grew, whether there is potential for realization of further economies of scale for the Portfolios, and whether material economies of scale are being shared with shareholders. The Board also considered that the Portfolios have benefitted both from asset growth in the Portfolios and even more from asset growth in the Adviser’s other accounts, each of which have resulted in certain expenses becoming a smaller percentage of overall assets.
The Board acknowledged that other aspects of the Portfolios’ investment strategies may limit the realization of economies of scale, including a particular strategy’s universe of issuers, applicable trading volumes or markets, or the Adviser’s selection criteria. The Board also acknowledged the Adviser’s considerable and continued reinvestment in its business and its business plans for the various Portfolios and paying for the associated expenses out of its own profits, including through revenue sharing payments.
Based on these considerations, the Board concluded that it was satisfied with the extent to which economies of scale currently are and will be realized for the benefit of the Portfolios’ shareholders, and recognized its obligation to consider the same annually based on changing circumstances.
Other Benefits
The Board considered other benefits derived or to be derived by the Adviser from the relationship with the Portfolios as part of its consideration of continuance of the Advisory Agreements. In this regard, the Board noted that the only tangible material indirect benefit from the Adviser’s relationship with the Portfolios is from the receipt of research products and services obtained through soft dollars in connection with Portfolio brokerage transactions. The Board also considered the extent to which the Adviser and its clients, including the Portfolios, benefitted from receipt of these research products and services.
Conclusion
Following extensive discussion, both in general session and in executive sessions of the Independent Directors meeting alone with Independent Counsel, the Board determined that it had received sufficient information to take action on the proposed resolutions regarding continuance of the Advisory Agreements. The Board, including a majority of the Independent Directors, concluded with respect to each Portfolio that its investment advisory fees were sufficiently supported by their review of the factors described above.
In light of all the foregoing, the Board, and separately, a majority of the Independent Directors, approved the continuance of each Advisory Agreement on behalf of the respective Portfolio(s). The Board’s approval determinations were made on the basis of each director’s business judgment after consideration of all the information presented. The Board’s decision was based on all of the above-mentioned factors and their related conclusions, with no single factor or conclusion being determinative and with each director not necessarily attributing the same weight to each factor.
71
Table of Contents
Harding, Loevner Funds, Inc.
(unaudited)
HARDING, LOEVNER FUNDS, INC.
PRIVACY NOTICE
The Fund collects nonpublic personal information about you from the following sources:
| • | Information, such as your name, address, social security number, assets and income, submitted by you on applications, forms, or in other written or verbal customer communications. This information may also be provided by a consultant or intermediary acting on your behalf. |
| • | Information that results from any transaction performed by us for you. |
The Fund will not disclose any nonpublic personal information about you or its former customers to anyone except as permitted or required by law.
If you decide to close your account(s) or become an inactive customer, the Fund will adhere to the privacy policies and practices as described in this notice.
The Fund restricts access to your personal and account information to only those employees who need to know that information to provide products or services to you. The Fund maintains physical, administrative and technical safeguards to protect your nonpublic personal information.
72
Table of Contents
Harding, Loevner Funds, Inc.
Directors and Principal Officers
(unaudited)
Disinterested Directors:
Name, Address and Age | Position with | Term of Office | Principal Occupation | Number of Portfolios in Fund Complex Overseen By Director | Other Directorships | |||||
William E. Chapman, II**** c/o Harding Loevner LP 400 Crossing Boulevard Fourth Floor Bridgewater, NJ 08807 Age, 76 | Director | Indefinite; Director since 2008; Chairperson of the Audit Committee since 2009 | Longboat Retirement Planning Solutions, President and Owner, 1998 – present; Bowdoin College, Trustee, 2002 – 2013; Mutual Fund Directors Forum, Inc., Director and Treasurer, 2010 – present; Sarasota Memorial Healthcare Foundation, Inc., Director and Secretary, 2011 – present. | 9 | Third Avenue Trust (5 portfolios); Third Avenue Variable Trust (1 portfolio); AMG Funds, (66 portfolios). | |||||
Carolyn Ainslie c/o Harding Loevner LP 400 Crossing Boulevard Fourth Floor Bridgewater, NJ 08807 Age, 59 | Director | Indefinite; Director since 2014; Member of the Audit Committee since 2015 – Present and Co – Chairperson June – December, 2017 and Chairperson since 2018 | Princeton University, Vice President for Finance and Treasurer, 2008 – present. | 9 | None. | |||||
Jill R. Cuniff***** c/o Harding Loevner LP 400 Crossing Boulevard Fourth Floor Bridgewater, NJ 08807 Age, 53 | Director | Indefinite; since 2018 | Edge Asset Management, President and Director, 2009-2016. | 9 | None. | |||||
R. Kelly Doherty c/o Harding Loevner LP 400 Crossing Boulevard Fourth Floor Bridgewater, NJ 08807 Age, 59 | Director | Indefinite; Director since 2004; Lead Independent Director since 2014 | Caymen Partners (private investment vehicles), Managing Partner, 1998 – present. | 9 | Selective Insurance Group, Inc.(SIGI). | |||||
73
Table of Contents
Harding, Loevner Funds, Inc.
Directors and Principal Officers
(unaudited)
Disinterested Directors (continued):
Name, Address and Age | Position with | Term of Office | Principal Occupation | Number of Portfolios in Fund Complex Overseen By Director | Other Directorships | |||||
Charles Freeman, III c/o Harding Loevner LP 400 Crossing Boulevard Fourth Floor Bridgewater, NJ 08807 Age, 54 | Director | Indefinite; Director since 2008 | Bower Group Asia, Managing Director, China, December 2016 to present; Forbes-Tate, LLC, International Principal, 2014 – 2016; Rock Creek Global Advisors, LLC, Vice President, 2013 – 2014; PepsiCo, Vice President Global Public Policy and Government Relations, 2011 – 2013; National Committee on US-China Relations (non-profit), Board Member, 2007 – 2009 and 2010 – present; Center for Strategic and International Studies, Freeman Chair in China Studies, 2007 – 2011. | 9 | None. | |||||
Samuel R. Karetsky c/o Harding Loevner LP 400 Crossing Boulevard Fourth Floor Bridgewater, NJ 08807 Age, 72 | Director | Indefinite; Director since 1998; Member of the Audit Committee since 1998 | The Karetsky Group LLC (advisory firm), Managing Member, 2003 – present; Wetherby Asset Management, Wealth Manager, 2004 – present. | 9 | None. | |||||
Eric Rakowski c/o Harding Loevner LP 400 Crossing Boulevard Fourth Floor Bridgewater, NJ 08807 Age, 59 | Director | Indefinite; Director since 2008 | University of California at Berkeley School of Law, Professor, 1990 – present. | 9 | Third Avenue Trust (5 portfolios); Third Avenue Variable Trust (1 portfolio); AMG Funds (66 portfolios); AMG Pantheon Private Equity Fund (1 portfolio); AMG Pantheon Private Equity Master Fund (1 portfolio). | |||||
74
Table of Contents
Harding, Loevner Funds, Inc.
Directors and Principal Officers
(unaudited)
Interested Directors:
Name, Address and Age | Position with | Term of Office | Principal Occupation | Number of Portfolios in Fund Complex Overseen By Director | Other Directorships | |||||
David R. Loevner** Harding Loevner LP Fish Creek Center 1230 Ida Dr. Ste. 3 1⁄2 PO Box 383 Wilson, WY 83014 Age, 63 | Director and Chairman of the Board of Directors | Indefinite; Director and Chairman of the Board since 1996 | Harding Loevner LP, Chairman and Chief Executive Officer, 1989 – present; Harding Loevner Funds, plc, Director, 2007 – present. | 9 | None. | |||||
Christine Carsman*** Affiliated Managers Group, Inc. 600 Hale Street Prides Crossing, MA 01965 Age, 64 | Director | Indefinite; Director beginning 2017 | Affiliated Managers Group, Inc., Executive Vice President, Deputy General Counsel and Chief Regulatory Counsel 2017 – present; Senior Vice President and Deputy General Counsel 2011 – 2016; Senior Vice President and Chief Regulatory Counsel 2007 – 2011; Vice President and Chief Regulatory Counsel 2004 – 2007; AMG Funds plc. Chair of the Board of Directors, 2015 – present; Director, 2010 – present; Secretary and Chief Legal Officer, AMG Funds, AMG Funds I, AMG Funds II and AMG Funds III 2004 – 2011; Wellington Management Company, LLP, Senior Counsel, Vice President and Director of Operational Risk Management and Compliance 1995 – 2004. | 9 | AMG Funds (69 portfolios). | |||||
* Each of Mr. Loevner and Ms. Carsman is elected to serve in accordance with the Articles of Incorporation and By-Laws of the Fund until their respective successor is duly elected and qualified.
** Mr. Loevner is considered an “interested person” of the Fund as defined in the Investment Company Act of 1940, as amended, because he serves as Chairman and Chief Executive Officer of Harding Loevner LP, the Fund’s investment advisor.
*** Ms. Carsman is considered an interested person of the Fund as a result of her position with, and interest in securities of, AMG, a control person of Harding Loevner. Ms. Carsman became a Director of the Fund effective March 3, 2017.
**** William E. Chapman, II is retiring as a Board director effective December 31, 2017.
***** Jill R. Cuniff has been elected to the Board effective January 1, 2018.
The Funds’ Statement of Additional Information contains additional information about the Directors and is available upon request and without charge by calling (877) 435-8105.
75
Table of Contents
Harding, Loevner Funds, Inc.
Directors and Principal Officers
(unaudited)
Principal Officers of the Fund:
Name, Address and Age | Position(s) with the Fund | Term of Office | Principal Occupation During Past Five Years | |||
Richard Reiter Harding Loevner LP 400 Crossing Boulevard Fourth Floor Bridgewater, NJ 08807 Age, 51 | President | 1 year; since 2011 | Harding Loevner LP, President, since October 2017; Chief Operating Officer, 1996 – present. | |||
Charles S. Todd Foreside Management Services, LLC Three Canal Plaza, Suite 100 Portland, ME 04101 Age, 46 | Chief Financial Officer and Treasurer | 1 year; since 2010 | Foreside, Senior Managing Director, Fund and Advisor Compliance, 2017 – present; Business Head, Fund Officer and Compliance Services, 2015 – 2017; Foreside, Business Head, Treasurer Services, 2012 – 2015. | |||
Aaron Bellish Harding Loevner LP 400 Crossing Boulevard Fourth Floor Bridgewater, NJ 08807 Age, 39 | Assistant Treasurer | 1 year; since 2012 | Harding Loevner LP, Chief Financial Officer, 2012 – present; Mount Kellett Capital Management, Chief Financial Officer, formerly serving as Controller, 2008-2012. | |||
Derek Jewusiak The Northern Trust Company 50 South LaSalle Street Chicago, IL 60603 Age, 47 | Assistant Treasurer | 1 year; since December 2013 | The Northern Trust Company, Vice President, 2012 – present, Second Vice President, 2008 – 2012. | |||
Owen T. Meacham The Northern Trust Company 50 South LaSalle Street Chicago, IL 60603 Age, 47 | Secretary | 1 year; since 2010 | The Northern Trust Company, Senior Vice President and Assistant General Counsel, 2015 – present, Senior Vice President and Managing Attorney, 2012 – 2015, Senior Vice President and Senior Corporate Attorney, 2011 – 2012. | |||
Lori M.Renzulli Harding Loevner LP 400 Crossing Boulevard Fourth Floor Bridgewater, NJ 08807 Age, 52 | Assistant Secretary | 1 year; since 2008 | Harding Loevner LP, Chief Counsel and Chief Compliance Officer, 2006 – present. | |||
Brian Simon Harding Loevner LP 400 Crossing Boulevard Fourth Floor Bridgewater, NJ 08807 Age, 55 | Chief Compliance Officer and Anti-Money Laundering Compliance Officer and Assistant Secretary | 1 year, since 2016, 2016 and 2015 respectively | Harding Loevner LP, General Counsel, 2014 – present; Lazard Asset Management LLC, Director of Legal Affairs and Chief Compliance Officer, 2002 – 2014. | |||
Marcia Y. Lucas The Northern Trust Company 50 South LaSalle Street Chicago, IL 60603 Age, 50 | Assistant Secretary | 1 year; since 2011 | The Northern Trust Company, Senior Vice President, 2015 – present; Vice President, 2011 – present, Second Vice President, 2010; Michael Best & Friedrich LLP, partner, 2005 – 2010. | |||
* Officers are elected to hold such office until their successor is elected and qualified to carry out the duties and responsibilities of their office, or until he or she resigns or is removed from office.
76
Table of Contents
Harding, Loevner Funds, Inc.
(unaudited)
Quarterly Form N-Q Portfolio Schedule
Each Portfolio will file its complete portfolio of investments with the SEC on Form N-Q at the end of the first and third fiscal quarters within 60 days of the end of the quarter to which it relates. The Portfolios’ Form N-Q will be available on the SEC’s website at www.sec.gov and may also be reviewed and copied at the SEC’s Public Reference Room whose telephone number is (800) SEC-0330. Additionally, they are available upon request by calling (877) 435-8105.
Proxy Voting Record
The Fund’s proxy voting record relating to the Portfolios’ securities during the most recent 12-month period ended June 30 is available on the Fund’s website at www.hardingloevnerfunds.com and on the SEC’s website at www.sec.gov, on Form N-PX.
Proxy Voting Policies and Procedures
The Fund’s proxy voting policies and procedures are included in Appendix B to Statement of Additional Information and is available without charge, upon request, by calling (877) 435-8105 or on the SEC’s website at www.sec.gov.
Additional Information
The Adviser updates Fact Sheets for the Portfolios each calendar quarter, which are posted to the Fund’s website at www.hardingloevnerfunds.com. This information, along with the Adviser’s commentaries on its various strategies, is available without charge, upon request, by calling (877) 435-8105.
77
Table of Contents
This report is intended for shareholders of Harding, Loevner Funds, Inc. It may not be used as sales literature unless preceded or accompanied by the current Prospectus, which gives details about charges, expenses, investment objectives, risks and policies of the Portfolios.
Table of Contents

Table of Contents
Item 2. Code of Ethics.
| (a) | As of October 31, 2017, the Registrant has adopted a code of ethics that applies to the Registrant’s President/Chief Executive Officer and Treasurer/Chief Financial Officer (the “Code of Ethics”). |
| (c) | For the fiscal year ended October 31, 2017, there were no amendments to a provision of the Registrant’s Code of Ethics. |
| (d) | For the fiscal year ended October 31, 2017, there were no waivers granted from a provision of the Registrant’s Code of Ethics. |
Item 3. Audit Committee Financial Expert.
As of October 31, 2017, the Registrant’s Board of Directors has determined that the following members of the Audit Committee are audit committee financial experts and independent: Carolyn Ainslie, William Chapman, II and Samuel Karetsky. Mr. Chapman is retiring from the Registrant’s Board of Directors effective December 31, 2017.
Item 4. Principal Accountant Fees and Services.
(a) Audit Fees: The aggregate fees billed for each of the last two fiscal years for professional services rendered by KPMG LLP, the Registrant’s principal accountant, for the audit of the Registrant’s annual financial statements in connection with statutory and regulatory filings or engagements for those fiscal years are $213,300 in 2017 and $173,300 in 2016.
(b) Audit-Related Fees: The aggregate fees billed in each of the last two fiscal years for assurance and related services by KPMG LLP that are reasonably related to the performance of the audit of the Registrant financial statements and are not reported under paragraph (a) of this Item are None.
(c) Tax Fees: The aggregate fees billed in each of the last two fiscal years for professional services rendered by KPMG LLP for the review of domestic tax returns were $74,675 in 2017 and $57,525 in 2016.
(d) All Other Fees: The aggregate fees billed in each of the last two fiscal years for products and services provided by KPMG LLP, other than the services reported in paragraphs (a) through (c) of this Item are $18,450 in 2017, related to research, preparation and filing of tax returns in certain foreign jurisdictions; and $0 in 2016.
(e)(1) Disclose the audit committee pre-approval policies and procedures described in paragraph (c)(7) of Rule 2-01 of Regulation S-X.
A copy of the Audit Committee’s Pre-Approval Policies and Procedures is filed with this Form N-CSR under Item 12(c).
(e)(2) The percentage of services described in each of paragraphs (b) through (d) of this Item that were approved by the audit committee pursuant to paragraph (c)(7)(i)(C) of Rule 2-01 of Regulation S-X are as follows:
Paragraph (b) Audit-Related Fees: Not applicable
Paragraph (c) Tax Fees: 100%
Paragraph (d): All Other Fees: 100%
(f) Not applicable.
(g) Not applicable.
Table of Contents
(h) Not applicable.
Item 5. Audit Committee of Listed Registrants.
Not applicable.
Item 6. Investments.
| (a) | Schedule I is included as part of the report to shareholders filed under Item 1 of this report on Form N-CSR. |
| (b) | Not applicable. |
Item 7. Disclosure of Proxy Voting Policies and Procedures for Closed-End Management Investment Companies.
Not applicable.
Item 8. Portfolio Managers of Closed-End Management Investment Companies.
Not applicable.
Item 9. Purchases of Equity Securities by Closed-End Management Investment Company and Affiliated Purchasers.
Not applicable.
Item 10. Submission of Matters to a Vote of Security Holders.
Not applicable.
Item 11. Controls and Procedures.
| (a) | The Registrant’s Principal Executive Officer and Principal Financial Officer, or persons performing similar functions, have concluded that the Registrant’s disclosure controls and procedures (as defined in Rule 30a-3(c) under the Investment Company Act of 1940, as amended (the “1940 Act”)) were effective as of a date within 90 days prior to the filing date of this report, based on their evaluation of the effectiveness of the Registrant’s disclosure controls and procedures as of the evaluation date. |
| (b) | There were no significant changes in the Registrant’s internal control over financial reporting (as defined in Rule 30a-3(d) under the 1940 Act) that occurred during the second fiscal quarter of the period covered by this report that have materially affected, or are reasonably likely to materially affect, the Registrant’s internal control over financial reporting. |
Item 12. Disclosure of Securities Lending Activities for Closed-End Management Investment Companies.
Not applicable.
Item 13. Exhibits.
| (a)(1) | Exhibit 99.12.A: Incorporated by reference to Exhibit 12(a)(1) to the report filed on Form N-CSR on January 7, 2013 (Accession No. 0001193125-13-005151). |
| (a)(2) | Exhibit 99.CERT: Certifications pursuant to Rule 30a-2(a) of the Act are attached. |
| (a)(3) | Not applicable. |
| (a)(4) | Not applicable. |
| (b) | Exhibit 99.906: Certifications pursuant to Rule 30a-2(b) of the Act are attached hereto. |
| (c) | Incorporated by reference to Exhibit 12(c) to the report filed on Form N-CSR on January 1, 2015 (Accession No. 0001193125-16-422394). |
Table of Contents
SIGNATURES
Pursuant to the requirements of the Securities Exchange Act of 1934 and the Investment Company Act of 1940, the Registrant has duly caused this report to be signed on its behalf by the undersigned, thereunto duly authorized.
Harding, Loevner Funds, Inc. | ||||
By | /s/ Richard T. Reiter | |||
Richard T. Reiter (Principal Executive Officer) | ||||
Date: January 5, 2018 | ||||
Pursuant to the requirements of the Securities Exchange Act of 1934 and the Investment Company Act of 1940, this report has been signed below by the following persons on behalf of the Registrant and in the capacities and on the dates indicated.
By | /s/ Richard T. Reiter | |||
Richard T. Reiter (Principal Executive Officer) | ||||
Date: January 5, 2018 | ||||
By | /s/ Charles S. Todd | |||
Charles S. Todd (Principal Financial Officer) | ||||
Date: January 5, 2018 | ||||