UNITED STATES
SECURITIES AND EXCHANGE COMMISSION
Washington, D.C. 20549
FORM N-CSR
CERTIFIED SHAREHOLDER REPORT OF REGISTERED
MANAGEMENT INVESTMENT COMPANIES
Investment Company Act file number 811-07739
Harding, Loevner Funds, Inc.
(Exact name of registrant as specified in charter)
400 Crossing Boulevard
Fourth Floor
Bridgewater, NJ 08807
(Address of principal executive offices) (Zip code)
Marcia Y. Lucas
The Northern Trust Company
50 South LaSalle Street
Chicago, IL 60603
With a copy to:
Stephen H. Bier, Esq.
Dechert LLP
1095 Avenue of the Americas
New York, NY 10036
(Name and address of agent for service)
Registrant’s telephone number, including area code: (877) 435-8105
Date of fiscal year end: 10/31
Date of reporting period: 10/31/2018
Item 1. Reports to Stockholders.
 HARDING LOEVNER FUNDS
Global equity investing for institutions is Harding Loevner’s exclusive focus. Through Harding Loevner Funds it offers distinct global strategies based on its quality-and-growth investment philosophy. It seeks to purchase shares of growing, financially strong, well-managed companies at favorable prices. Harding Loevner manages each of the Funds’ Portfolios according to a disciplined, research-based investment process. It identifies companies with sustainable competitive advantages and assesses the durability of their earnings growth by conducting in-depth fundamental research into global industries. In constructing portfolios, Harding Loevner diversifies carefully to limit risk.
RECEIVE INVESTOR MATERIALS ELECTRONICALLY
Shareholders may sign up for electronic delivery of investor materials. By doing so, you will receive the information faster and help us reduce the impact on the environment of providing these materials. To enroll in electronic delivery,
| | 1. | Go to http://www.icsdelivery.com |
| | 2. | Select the first letter of your brokerage firm’s name. |
| | 3. | From the list that follows, select your brokerage firm. If your brokerage firm is not listed, electronic delivery may not be available. Please contact your brokerage firm. |
| | 4. | Complete the information requested, including the e-mail address where you would like to receive notifications for electronic documents. |
Your information will be kept confidential and will not be used for any purpose other than electronic delivery. If you change your mind, you can cancel electronic delivery at any time and revert to physical delivery of your materials. Just go to http://www.icsdelivery.com, perform the first three steps above, and follow the instructions for cancelling electronic delivery. If you have any questions, please contact your brokerage firm.
Table of Contents
5 Letter to Our Shareholders
6 Global Equity Portfolio
10 International Equity Portfolio
14 International Small Companies Portfolio
18 Emerging Markets portfolios
22 Frontier Emerging Markets Portfolio
26 Global Equity Research Portfolio
30 International Equity Research Portfolio
34 Emerging Markets Research Portfolio
Contact
| | |
Harding, Loevner Funds, Inc. c/o Northern Trust Attn: Funds Center C5S 801 South Canal Street Chicago, IL 60607 Phone: (877) 435-8105 Fax: (312) 267-3657 www.hardingloevnerfunds.com | | Must be preceded or accompanied by a current Prospectus. Quasar Distributors, LLC, Distributor |
This page intentionally left blank.

| | |
 | | DAVID LOEVNER, CFA, CIC CHAIRMAN OF THE FUNDS AND CEO OF THE ADVISER SIMON HALLETT, CFA CO-CIO OF THE ADVISER FERRILL ROLL, CFA CO-CIO OF THE ADVISER |
The decade since the global financial crisis has seen a very long run of generally rising share prices. But as we write this for our annual report to you for the period ended October 31, on the eve of its publication in December, share prices are falling hard—especially those of the highest growth companies, including the masters of the online economy. This development raises the question of why investor sentiment has soured. You probably can list the suspected causes as well as we: most prominently, the tariff wars instigated by the Trump administration, the eight hikes in short-term interest rates by the US Federal Reserve and the prospect for more as the labor market tightens, and the rising number of democratic countries in which unorthodox populist leaders from the right or the left are displacing or undermining the effectiveness of centrist governments or political voices.
We cannot predict whether the shift in sentiment will prove to be merely a corrective pause in an even more elongated bull market, or instead marks the beginning of a new, generally downward trend, a “secular” bear market. Those who have read or heard us over the years know that we are consistent in disclaiming any clairvoyance about the duration of economic or market cycles.
Our investment philosophy emerged from the premise that we cannot forecast the market’s future, but that we can identify companies that have navigated shifting tides well in the past, and—due to strong competitive advantages or benign competitive environments, along with sound finances and capable managements,—can be reasonably expected to weather capricious government policies or unforeseen economic downturns better than the average company in the future as well. Further that, so long as we don’t pay too much for the privilege of owning shares in such companies, we believe our investments in them will, on average, produce better-than-average returns for our Portfolios.
When asked about how much conviction we have in the prospects for the coming year of our current holdings, our resounding answer is, “Zero!” We recognize, for one thing, that if we discount our ability to forecast the market’s future, we equally cannot be confident in any near-term view of market-relative performance of individual stocks, since that, too, requires an ability to predict other investors’ behavior that we decidedly lack. Further, we recognize that, over our own long careers at Harding Loevner and prior, the future returns of individual holdings or, for that matter, of geographical or sectoral emphases, have never reliably shown a positive correlation with the respective degrees of our confidence in them ex ante.
Instead, and as we wrote in our Semi-Annual Commentary in 2017, we place our conviction, not in individual bets, but in the efficacy of our investment process, properly executed. That process helps us to avoid focusing on the ephemeral aspects of stocks and markets that we have little hope of getting consistently right, and instead maximize our efforts analyzing the more durable aspects of companies as potential investments: their ability to compete, the sustainability of their cash flows, and appropriate assumptions on which to make estimates of what those cash flows ought to be worth to an owner. That process, buttressed by findings from behavioral finance, prompts us to shift our clients’ capital incrementally away from the priciest of the best companies to their brethren that, while also growing and of high-quality, are, due to market fashion or investors’ shortsightedness in viewing temporary setbacks, currently less demanded.
Prosaic though it may be, that process, executed doggedly in strong markets and in weak ones, has helped us deliver good results over time. It is not a recipe for outperforming in every season, nor does it signal when periods of better or worse relative performance will arise. That uncertainty is the source of the challenge, both for us and for our clients: to retain conviction in the process and remain committed to its disciplined execution, because it has proven sound and we know no better alternative.
As ever, we are deeply grateful to you, our shareholders, for sharing our conviction.
Sincerely,
| | | | |

David R. Loevner, CFA, CIC | | 
Simon Hallett, CFA | | 
Ferrill D. Roll, CFA |
Opinions expressed are those of Harding Loevner and are not intended to be forecasts of future events, a guarantee of future results, nor investment advice. Please read the separate disclosure page for important information, including the risks of investing in the Portfolios. Past performance is not a guarantee of future results.

PORTFOLIO MANAGEMENT TEAM
| | |

|
PETER BAUGHAN, CFA CO-LEAD PORTFOLIO MANAGER FERRILL ROLL, CFA CO-LEAD PORTFOLIO MANAGER | | SCOTT CRAWSHAW PORTFOLIO MANAGER CHRISTOPHER MACK, CFA PORTFOLIO MANAGER RICHARD SCHMIDT, CFA PORTFOLIO MANAGER |
 PERFORMANCE SUMMARY
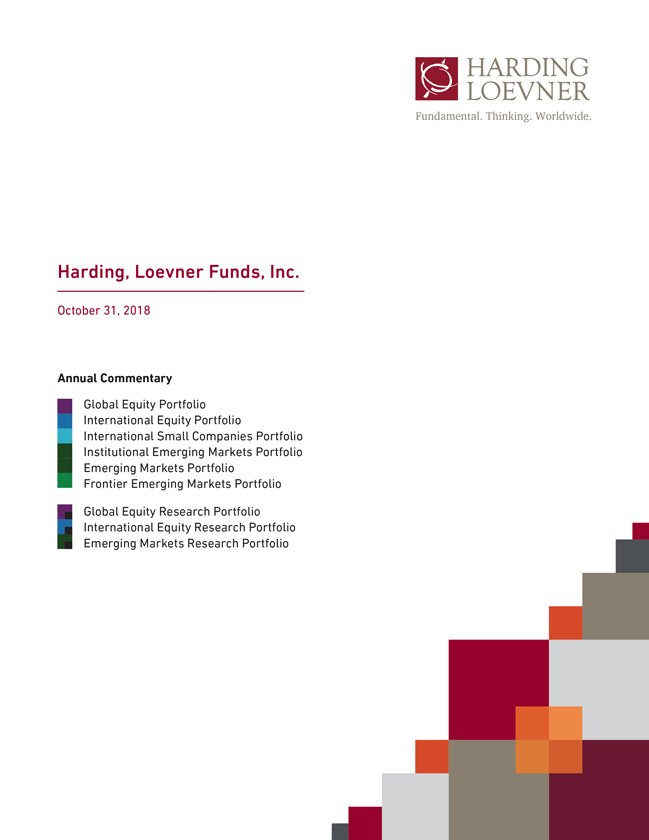
For the Global Equity Portfolio, the Institutional Class declined 0.35%, the Institutional Class Z declined 0.26%, and the Advisor Class declined 0.57% (net of fees and expenses) in the fiscal year ended October 31, 2018. The Portfolio’s benchmark, the MSCI All Country World Index (ACWI), declined 0.52% (net of source taxes).
MARKET REVIEW
Global stock markets had a volatile fiscal year. In 2017, synchronized global economic growth helped send stock markets soaring, but declines in January and February ended the MSCI ACWI’s 15-month streak of positive monthly returns. Emerging Markets (EMs) were hit particularly hard, weighed down by weakness in China and worries that rising US interest rates and trade frictions will combine to derail growth and investment in developing economies. Markets ended the fiscal year with a sharp sell-off in late September through October, led by Information Technology (IT) stocks.
Due to the substantial tax cuts enacted in November 2017, estimates of 2018’s earnings for US companies are indicating nearly twice as much profit growth as in the rest of the world. These estimates helped propel a broad-based US market rally, with most sectors in the US finishing the fiscal year in positive territory. IT, traditionally a high-beta sector, outperformed the US index. But, unusually for a non-cyclical sector, Health Care was also strong as investor worries about government intervention in drug pricing abated, boosting large-cap pharmaceutical stocks.
The Federal Reserve hiked overnight interest rates in late September, the eighth increase since late 2015. Short-term interest rates remain below the current inflation rate, doing little to dampen growth in the US economy or in US corporate earnings. These “normalizing” rate hikes have yet to deter investors in US equities more than temporarily so far; the same cannot be said of investors in US bonds or EM equities.
| | | | | | | | | | | | |
| | | |
| | FUND FACTS at October 31, 2018 | | | | | | |
| | | |
| | TOTAL NET ASSETS | | | $850.3M | | | |
| | | |
| | SALES CHARGE | | | NONE | | | |
| | | |
| | NUMBER OF HOLDINGS | | | 73 | | | |
| | | |
| | TURNOVER (5 YR. AVG.) | | | 36% | | | |
| | | |
| | REDEMPTION FEE | | | 2% FIRST 90 DAYS | | | |
| | | |
| | | DIVIDEND POLICY | | | ANNUAL | | | |
| | | | |
| | | | INSTITUTIONAL INVESTORS | | | INDIVIDUAL INVESTORS | | | |
| | | | | |
| | | | INSTL CLASS | | INSTL CLASS Z | | | ADVISOR CLASS | | | |
| | | | | |
| | TICKER | | HLMVX | | HLGZX | | | HLMGX | | | |
| | | | | |
| | CUSIP | | 412295602 | | 412295727 | | | 412295206 | | | |
| | | | | |
| | INCEPTION DATE | | 11/3/2009 | | 8/1/2017 | | | 12/1/1996 | | | |
| | | | | |
| | MINIMUM INVESTMENT1 | | $100,000 | | $10,000,000 | | | $5,000 | | | |
| | | | | |
| | NET EXPENSE RATIO | | 0.93% | | 0.90%2 | | | 1.14% | | | |
| | | | | |
| | GROSS EXPENSE RATIO | | 0.93% | | 1.21% | | | 1.14% | | | |
1Lower minimums available through certain brokerage firms; 2Shown net of Harding Loevner’s contractual agreement through February 28, 2019.
All Expense Ratios are as of the Prospectus dated February 28, 2018 unless otherwise noted.
EMs performed the worst in the year. Higher US short-term interest rates have been accompanied—led, even—by higher long-term rates (and lower bond prices). As these higher reference yields rippled through global markets, investors have punished markets in some of the developing economies most dependent on foreign capital, as borrowing costs and refinancing risks became more daunting. Severe economic crises in Turkey and Argentina raised the specter of EM contagion, the risk that investors retreat en masse from EMs.
The troubles that beset EM index heavyweight China this year were primarily domestic in origin. Government efforts to reduce leverage throughout the economy and bring transparency to the country’s unregulated lending (“shadow banking”) have, inevitably if unintentionally, slowed GDP growth. Chinese health care companies were hurt by a vaccine scandal and greater regulatory focus on decreasing the price of drugs. The escalating trade war with the US is beginning to have significant effects, as Chinese firms postpone capital investments to improve productivity or expand capacity in the face of uncertainty. Some of the biggest share price declines, not only in EMs, but also globally, were of Chinese internet search, e-commerce, and social media companies, predominantly domestic consumer businesses that rank among the world’s most valuable companies.
Elsewhere in the world, developed markets were mixed as investors continued to struggle with familiar problems. In Europe, investors are contemplating a worst-case “no-deal” Brexit, with negotiations between the UK and Europe still inconclusive as the deadline approaches. In Japan, US-instigated trade friction dampened Chinese demand for Japanese machine tools and led to lower manufacturing output. However, strong corporate profits,
PERFORMANCE (% TOTAL RETURN)
| | | | | | | | | | | | | | | | | | | | | | | | | | | | | | | | | | | | | | | | | | | | | | | | | | | | | | | | | | |
| | | |
| | | | | for periods ended September 30, 2018 | | | for periods ended October 31, 2018 | |
| | | | | | | | | | | |
| | | | | 1
YEAR | | | 3
YEARS | | | 5
YEARS | | | 10
YEARS | | | SINCE
INCEPTION* Nov-09 Aug-17 Dec-96 | | | 1
YEAR | | | 3
YEARS | | | 5
YEARS | | | 10
YEARS | | | SINCE
INCEPTION* Nov-09 Aug-17 Dec-96 | |
| | | | | | | | | | | | | | | |
| | GLOBAL EQUITY PORTFOLIO – INST CLASS | | | 13.42 | | | | 16.65 | | | | 11.36 | | | | – | | | | 10.88 | | | | | | | | | | | | -0.35 | | | | 9.56 | | | | 8.50 | | | | – | | | | 9.51 | | | | | | | | | |
| | | | | | | | | | | | | | | |
| | GLOBAL EQUITY PORTFOLIO – INST CLASS Z | | | 13.43 | | | | – | | | | – | | | | – | | | | | | | | 12.48 | | | | | | | | -0.26 | | | | – | | | | – | | | | – | | | | | | | | 2.81 | | | | | |
| | | | | | | | | | | | | | | |
| | GLOBAL EQUITY PORTFOLIO - ADVISOR CLASS | | | 13.21 | | | | 16.36 | | | | 11.09 | | | | 9.94 | | | | | | | | | | | | 7.47 | | | | -0.57 | | | | 9.28 | | | | 8.22 | | | | 11.08 | | | | | | | | | | | | 6.94 | |
| | | | | | | | | | | | | | | |
| | MSCI ALL COUNTRY WORLD INDEX | | | 9.77 | | | | 13.40 | | | | 8.67 | | | | 8.19 | | | | 9.48 | | | | 10.07 | | | | – | | | | -0.52 | | | | 7.74 | | | | 6.15 | | | | 9.75 | | | | 8.44 | | | | 2.74 | | | | – | |
Returns are annualized for periods greater than 1 year. *Inception of the Institutional Class, November 3, 2009. Inception of the Institutional Class Z, August 1, 2017. Inception of the Advisor Class, December 1, 1996. Index performance prior to January 1, 2001 cannot be shown since it relies on back-filled data.
Performance data quoted represents past performance; past performance does not guarantee future results. The investment return and principal value of an investment will fluctuate so that an investor’s shares, when redeemed, may be worth more or less than their original cost. Current performance of the Portfolio may be lower or higher than the performance quoted. Performance data current to the most recent month end may be obtained by calling (877) 435-8105 or visiting www.hardingloevnerfunds.com. Performance data shown does not reflect the 2.00% redemption fee imposed on shares held 90 days or less; otherwise, total returns would be reduced.
along with the export-enhancing effects of a weaker yen and the continued strength of the Japanese labor market, and thus domestic spending, kept Japanese stocks relatively firm.
Style effects, once again, favored higher-quality, higher-growth, and more-expensive stocks. These effects were pronounced in the US, but not clear cut for non-US stocks. However, the preference for higher-growth (and more-expensive) stocks reversed sharply in October, both in and out of the US.
PERFORMANCE ATTRIBUTION
Stock selection was the most significant contributor to the Portfolio’s relative performance in the trailing 12 months. Our stocks and overweight in the top-performing Health Care sector were especially beneficial. Outsourced drug manufacturers Lonza Group (based in Switzerland) and Wuxi Biologics (based in China) both announced plans to expand capacity to meet burgeoning demand for biologic drugs. Japanese clinical-testing-equipment manufacturer Sysmex, Chinese drug manufacturer Sino Biopharmaceu-tical, and UK-based pharmaceutical company Shire also outperformed in the period.
Poor stocks within IT were the largest drag on relative returns. Shares of IPG Photonics, a US-based producer of industrial lasers, fell sharply after it reported a slowdown in orders. The company said Chinese manufacturers are reducing capital expenditures due to uncertainty over US tariffs. China-based AAC Technologies, already suffering from the poor uptake of Apple’s last iPhone models, raised concerns that its components for consumer electronics products would suffer from escalating trade measures even though, in September, Apple secured an exemption for its products from the US tariffs on Chinese goods.
Viewed geographically, stock selection in the eurozone contributed the most to our relative performance. German industrial-gas producer Linde rose as its planned merger with US industrial-gas producer Praxair won antitrust clearance in the US, and German flavors-and-fragrance maker Symrise forecasted continued steady growth in its second quarter results. Factory-materials supplier MonotaRO and Sysmex led stocks in Japan.
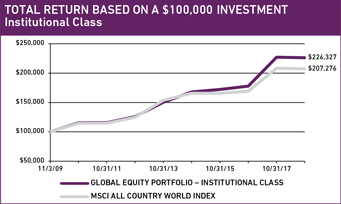
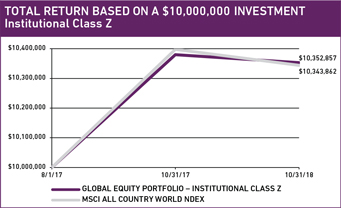
The charts above illustrate the hypothetical return of an investment made in the corresponding share classes. Investment return reflects voluntary fee waivers in effect. Absent such waivers, total return would be reduced. The performance provided in the table and charts above do not reflect the deduction of taxes that a shareholder would pay on Portfolio distributions or the redemption of Portfolio shares.
In the US, we were hurt by both poor stocks and the portfolio’s underweight in the strong US market. IPG Photonics was the biggest detractor, followed by biotech company Regeneron, oilfield services company Schlumberger, and Signature Bank.
PERSPECTIVE AND OUTLOOK
Among the biggest contributors to China’s decline this year has been the fall in the shares of its internet giants—online retailer Alibaba, search engine Baidu, and social media and gaming company Tencent. The reasons for their decline are not so obvious. They serve domestic rather than foreign customers, so they have little direct exposure to the ongoing trade war. They have no need to borrow, generating very strong free cash flow, as do the largest US internet companies. Yet this year, the share prices of the counterparts have diverged, the Chinese IT sector falling sharply and US IT continuing upward. The share price divergence appears to be greater than warranted by the relative deterioration evident in the Chinese companies’ competitive situation.
Indeed, the business models of the largest internet companies in China and the US are remarkably similar, as are the competitive structures of their industries in their respective home markets. They have also achieved similar growth over the last decade. Their profitability arises from having achieved dominance with their core platforms, building on the network effects that accelerate once they reach a critical mass of users. Search results on either Google or Baidu are superior to less-used rivals because more user searches can be analyzed to improve the efficacy of the search engine. Socializing on Facebook or Tencent’s WeChat platforms becomes more appealing as more friends use the platforms. Once that self-reinforcing process is in place, the businesses can increase customer stickiness and bolster profits by pursuing additional value enhancements, such as reinvesting profits in service improvements created using machine learning to analyze users’ experience across billions of interactions. Other competitive strategies can include seeking to achieve economies of scale rapidly (i.e., spreading fixed costs over a larger revenue base) and employing product bundling strategies that increase customer loyalty, reflected in the manifold benefits of membership in Amazon.com’s Prime or Alibaba’s 88 VIP programs.
GEOGRAPHIC EXPOSURE (%) at October 31, 2018
| | | | | | | | |
| | | | |
| | | COUNTRY/REGION | | PORTFOLIO | | BENCHMARK1 | | |
| | | | |
| | CANADA | | 0.0 | | 3.0 | | |
| | | | |
| | EMERGING MARKETS | | 15.4 | | 10.9 | | |
| | | | |
| | EUROPE EMU | | 12.3 | | 9.7 | | |
| | | | |
| | EUROPE EX-EMU | | 13.6 | | 9.6 | | |
| | | | |
| | FRONTIER MARKETS2 | | 0.0 | | – | | |
| | | | |
| | JAPAN | | 8.6 | | 7.5 | | |
| | | | |
| | MIDDLE EAST | | 1.0 | | 0.2 | | |
| | | | |
| | PACIFIC EX-JAPAN | | 2.3 | | 3.6 | | |
| | | | |
| | UNITED STATES | | 42.8 | | 55.5 | | |
| | | | |
| | CASH | | 4.0 | | – | | |
1MSCI All Country World Index; 2Includes countries with less-developed markets outside the Index.
SECTOR EXPOSURE (%) at October 31, 2018
| | | | | | | | |
| | | | |
| | | SECTOR | | PORTFOLIO | | BENCHMARK1 | | |
| | | | |
| | CONSUMER DISCRETIONARY | | 12.0 | | 12.0 | | |
| | | | |
| | CONSUMER STAPLES | | 5.8 | | 8.4 | | |
| | | | |
| | ENERGY | | 3.2 | | 6.6 | | |
| | | | |
| | FINANCIALS | | 13.0 | | 17.4 | | |
| | | | |
| | HEALTH CARE | | 16.7 | | 12.0 | | |
| | | | |
| | INDUSTRIALS | | 15.5 | | 10.4 | | |
| | | | |
| | INFORMATION TECHNOLOGY | | 21.4 | | 19.6 | | |
| | | | |
| | MATERIALS | | 8.4 | | 4.7 | | |
| | | | |
| | REAL ESTATE | | 0.0 | | 2.9 | | |
| | | | |
| | TELECOM SERVICES | | 0.0 | | 2.9 | | |
| | | | |
| | UTILITIES | | 0.0 | | 3.1 | | |
| | | | |
| | CASH | | 4.0 | | – | | |
1MSCI All Country WorldIndex.
The US and Chinese internet companies also face similar challenges from increased scrutiny by regulators. The challenge, however, has been greater in China, where the government and Communist Party impose requirements to support their policies and restrict any material that may undercut their legitimacy. In August, for example, the General Administration of Press and Publication suspended approvals of new video games amid public officials’ concern about game addiction and eyesight impairment in young people. With games accounting for 35–40% of its revenues and an even larger percentage of profits, Tencent would be hurt if the license approval process becomes permanently contentious, curtailing its ability to keep its core constituency engaged with new products. This kind of regulatory intervention in China, which occurs without warning and for which there is no legal recourse, is more arbitrary and potentially more damaging than the fines levied on Google by the European Union, or the expensive content monitoring efforts that Facebook has been forced to adopt after public shaming.
Along with more-damaging regulatory actions, we have witnessed an intensification of rivalry among internet companies in China that has not been, so far, nearly as virulent in the US. We suspect (without hard evidence) that there is greater propensity among Chinese internet users to switch platforms to the “new, new thing” than in the US. (After all, half of the 800 million mobile internet users in China are under the age of 30.) This willingness to switch enables new entrants, making profitability hard to sustain. Weibo (a social network) and Tencent both have lost some user attention to an emergent short-video platform, Douyin, whose active users has swelled fourfold just since last December, to 225 million.
Another factor intensifying the rivalry among China’s online leaders is that after many years of rapid internet adoption, growth in new users is harder to come by, prompting greater competition for the attention of existing users. As a result, China’s internet companies have increased spending on new services that they
bundle with their existing products at no extra cost to users. They have also stepped up investments in additional areas of commerce, hoping not only to defend their existing market dominance but also to achieve new network effects. Alibaba, for example, has steadily invested in logistics and delivery, bringing its e-commerce services closer to the offline last mile in an effort to keep its customers happily tied to its platform by increasing convenience. Tencent, having declared 2018 a “year of investment,” has invested in major new games for its core platform, short-video and newsfeed platforms, expanded cloud services, its WeChat Pay mobile payment platform, and various e-commerce businesses that compete directly with Alibaba. These company strategies appear to be designed specifically to attract and lock in consumers through the convenience and economy of bundled services.
Offsetting this more-intense competition between the leading online players in China is an important difference that they enjoy relative to their US peers. The existing brick-and-mortar incumbents in China’s retailing, entertainment/media, and information/publishing industries are far less powerful than the incumbents in the US. Amazon must do battle with Walmart, whose revenues are three times as large and whose balance sheet resources match Amazon’s; Alibaba’s revenues are more than double those of its nearest offline competitor, while its operating cash flow is at least 10 times larger, generated from 17 times the gross merchandise value. Facebook and Netflix face off against Disney, Comcast, and Viacom, which have powerful content franchises. In China, these legacy industries were far more fragmented, if they even existed at all in private-sector form, as the mobile internet took hold over the past decade. Thus, the leading Chinese companies face a much smaller or weaker set of potential substitutes, leaving them greater firepower to direct at their online rivals or the ability to conform to government directives without irretrievably dashing profitability.
We have reduced our earnings and growth estimates for Alibaba, Tencent, and Baidu. Each of their share prices has fallen by 25% or more from its January highs. We have stuck with our investments in China’s internet businesses, pending any further developments. In contrast, we are viewing the US companies with even greater suspicion.
PORTFOLIO HIGHLIGHTS
Many of our purchases this year, including three in the IT sector that we discuss below, were of stocks that experienced significant declines due to disappointing business results that we do not expect to persist. In each case, we are attempting to take advantage of the market’s myopia.
Shares of AAC Technologies suffered this year due to weaker-than-expected sales of Apple’s iPhone X. While other investors sold their shares, we did the opposite. Demand is rising for internet-connected devices that rely on voice commands to interact with users. AAC’s expertise in developing quality speakers and microphones in ever-smaller packages is unlikely to be matched by competitors anytime soon.
TEN LARGEST HOLDINGS at October 31, 2018
| | | | | | | | | | | | |
| | | | | |
| | | COMPANY | | SECTOR | | COUNTRY | | % | | | |
| | | | | |
| | PAYPAL | | INFO TECHNOLOGY | | US | | | 3.7 | | | |
| | | | | |
| | LONZA GROUP | | HEALTH CARE | | SWITZERLAND | | | 3.3 | | | |
| | | | | |
| | ROPER | | INDUSTRIALS | | US | | | 3.1 | | | |
| | | | | |
| | VERISK | | INDUSTRIALS | | US | | | 2.6 | | | |
| | | | | |
| | FIRST REPUBLIC BANK | | FINANCIALS | | US | | | 2.6 | | | |
| | | | | |
| | BOOKING HOLDINGS | | CONS DISCRETIONARY | | US | | | 2.5 | | | |
| | | | | |
| | SYMRISE | | MATERIALS | | GERMANY | | | 2.4 | | | |
| | | | | |
| | AIA GROUP | | FINANCIALS | | HONG KONG | | | 2.4 | | | |
| | | | | |
| | NASPERS | | CONS DISCRETIONARY | | SOUTH AFRICA | | | 2.0 | | | |
| | | | | |
| | APPLE | | INFO TECHNOLOGY | | US | | | 2.0 | | | |
Samsung Electronics, a leading South Korean manufacturer of computer memory chips, saw its share price drop significantly this year as investors worried about the potential impact of tariffs on goods made in EMs. Samsung’s customers are investing in artificial intelligence (AI) applications that require faster, more-expensive memory to run sophisticated algorithms. We do not know how the trade disputes will play out, but we are confident that AI is a long-term structural growth opportunity regardless.
We also purchased Cognex, a US-based provider of machine-vision software and equipment, which we had sold from the portfolio last year after its shares rose on a spike in iPhone X-related orders. Given the lumpiness of product orders, we felt the price didn’t adequately discount the risk of growth disappointment. As it turned out, investors quickly lost their enthusiasm for the stock. In April, we repurchased the shares, regarding that, at their lower price, short-term risk from order volatility was outweighed by the potential from rising long-term demand for industrial automation equipment.
In Financials, we sold Turkey’s Garanti Bank in April, ending an unsuccessful investment that saw a strong banking franchise deliver poor returns to foreign investors due to chronic currency weakness. Nevertheless, we avoided additional losses amid the distress that shook EMs later in the year. We re-established a position in UK-based Standard Chartered, a bank we held from 2003–15 and sold due to concerns with weak management and undisciplined investments. We believe Standard Chartered’s new management team, installed in 2015, has put the bank on a path back to healthy, sustainable returns on capital.
We made few new purchases or complete sales toward the end of the fiscal year. Our inactivity reflects a high degree of uncertainty about the potential outcomes of unfolding trade tensions and their impact on valuations. Our inability to forecast any outcome makes us leery of jettisoning investments in the strong businesses we hold whose share prices have underperformed—especially given our expectation that they have some ability to navigate successfully upcoming changes in the global trade order.
Please read the separate disclosures page for important information, including the risks of investing in the Portfolio.

PORTFOLIO MANAGEMENT TEAM
| | | | |
| | 
| | FERRILL ROLL, CFA CO-LEAD PORTFOLIO MANAGER ALEXANDER WALSH, CFA CO-LEAD PORTFOLIO MANAGER SCOTT CRAWSHAW PORTFOLIO MANAGER BRYAN LLOYD, CFA PORTFOLIO MANAGER PATRICK TODD, CFA PORTFOLIO MANAGER ANDREW WEST, CFA PORTFOLIO MANAGER |
 PERFORMANCE SUMMARY
For the International Equity Portfolio, the Institutional Class declined 6.86%, the Institutional Class Z declined 6.79%, and the Investor Class declined 7.16% (net of fees and expenses) in the fiscal year ended October 31, 2018. The Portfolio’s benchmark, the MSCI All Country World (ACW) ex-US Index, declined 8.24% (net of source taxes).
MARKET REVIEW
International stock markets faced a volatile fiscal year. In 2017, synchronized global economic growth helped send stock markets soaring, but declines in January and February ended the MSCI ACW ex-US Index’s 14-month streak of positive monthly returns. Emerging Markets (EMs) were hit particularly hard, weighed down by weakness in China and worries that rising US interest rates and trade frictions will combine to derail growth and investment in developing economies. Markets ended the fiscal year with a sharp sell-off in late September through October, led by Information Technology (IT) stocks.
The Federal Reserve hiked overnight interest rates in late September, the eighth increase since late 2015. Short-term interest rates remain below the current inflation rate, doing little to dampen growth in the US economy or in US corporate earnings. These “normalizing” rate hikes have yet to deter investors in US equities more than temporarily so far; the same cannot be said of investors in US bonds or EM equities.
EMs performed the worst in the year. Higher US short-term interest rates have been accompanied—led, even—by higher long-term rates (and lower bond prices). As these higher reference yields rippled through global markets, investors have punished markets in some of the developing economies most dependent on
| | | | | | | | | | | | |
| | | |
| | FUND FACTS at October 31, 2018 | | | | | | |
| | | |
| | TOTAL NET ASSETS | | | $13,750.1M | | | |
| | | |
| | SALES CHARGE | | | NONE | | | |
| | | |
| | NUMBER OF HOLDINGS | | | 58 | | | |
| | | |
| | TURNOVER (5 YR. AVG.) | | | 14% | | | |
| | | |
| | REDEMPTION FEE | | | 2% FIRST 90 DAYS | | | |
| | | |
| | | DIVIDEND POLICY | | | ANNUAL | | | |
| | | | |
| | | | INSTITUTIONAL INVESTORS | | | INDIVIDUAL INVESTORS | | | |
| | | | | |
| | | | INSTL CLASS | | INSTL CLASS Z | | | INVESTOR CLASS | | | |
| | | | | |
| | TICKER | | HLMIX | | HLIZX | | | HLMNX | | | |
| | | | | |
| | CUSIP | | 412295107 | | 412295719 | | | 412295503 | | | |
| | | | | |
| | INCEPTION DATE | | 5/11/1994 | | 7/17/2017 | | | 9/30/2005 | | | |
| | | | | |
| | MINIMUM INVESTMENT1 | | $100,000 | | $10,000,000 | | | $5,000 | | | |
| | | | | |
| | NET EXPENSE RATIO | | 0.82% | | 0.74%2 | | | 1.14% | | | |
| | | | | |
| | GROSS EXPENSE RATIO | | 0.82% | | 0.99% | | | 1.14% | | | |
1Lower minimums available through certain brokerage firms; 2The Net Expense Ratio is as of October 31, 2018 as the Portfolio is operating below the contractual agreement, which is in effect until February 28, 2019.
All Expense Ratios are as of the Prospectus dated February 28, 2018 unless otherwise noted.
foreign capital, as borrowing costs and refinancing risks became more daunting. Severe economic crises in Turkey and Argentina raised the specter of EM contagion, the risk that investors retreat en masse from EMs.
The troubles that beset EM index heavyweight China this year were primarily domestic in origin. Government efforts to reduce leverage throughout the economy and bring transparency to the country’s unregulated lending (“shadow banking”) have, inevitably if unintentionally, slowed GDP growth. Chinese health care companies were hurt by a vaccine scandal and greater regulatory focus on decreasing the price of drugs. The escalating trade war with the US is beginning to have significant effects, as Chinese firms postpone capital investments to improve productivity or expand capacity in the face of uncertainty. Some of the biggest share price declines, not only in EMs, but also globally, were of Chinese internet search, e-commerce, and social media companies, predominantly domestic consumer businesses that rank among the world’s most valuable companies.
Elsewhere in the world, developed markets were mixed as investors continued to struggle with familiar problems. In Europe, investors are contemplating a worst-case “no-deal” Brexit, with negotiations between the UK and Europe still inconclusive as the deadline approaches. US-instigated trade friction dampened Chinese demand for Japanese machine tools and led to lower manufacturing output in Japan. However, strong corporate profits, along with the export-enhancing effects of a weaker yen and the continued strength of the Japanese labor market, and thus domestic spending, kept Japanese stocks relatively firm.
PERFORMANCE (% TOTAL RETURN)
| | | | | | | | | | | | | | | | | | | | | | | | | | | | | | | | | | | | | | | | | | | | | | | | | | | | | | | | | | |
| | | |
| | | | | for periods ended September 30, 2018 | | | for periods ended October 31, 2018 | |
| | | | | | | | | | | |
| | | | | 1 | | | 3 | | | 5 | | | 10 | | | SINCE INCEPTION* | | | 1 | | | 3 | | | 5 | | | 10 | | | SINCE INCEPTION* | |
| | | | | YEAR | | | YEARS | | | YEARS | | | YEARS | | | May-94 | | | Jul-17 | | | Sep-05 | | | YEAR | | | YEARS | | | YEARS | | | YEARS | | | May-94 | | | Jul-17 | | | Sep-05 | |
| | | | | | | | | | | | | | | |
| | INTL EQUITY PORTFOLIO – INST CLASS | | | 5.85 | | | | 13.89 | | | | 7.00 | | | | 7.88 | | | | 6.45 | | | | | | | | | | | | -6.86 | | | | 6.74 | | | | 4.04 | | | | 9.57 | | | | 5.97 | | | | | | | | | |
| | | | | | | | | | | | | | | |
| | INTL EQUITY PORTFOLIO – INST CLASS Z | | | 5.88 | | | | – | | | | – | | | | – | | | | | | | | 8.15 | | | | | | | | -6.79 | | | | – | | | | – | | | | – | | | | | | | | -0.93 | | | | | |
| | | | | | | | | | | | | | | |
| | INTL EQUITY PORTFOLIO – INVESTOR CLASS | | | 5.48 | | | | 13.50 | | | | 6.66 | | | | 7.53 | | | | | | | | | | | | 6.68 | | | | -7.16 | | | | 6.41 | | | | 3.71 | | | | 9.22 | | | | | | | | | | | | 5.77 | |
| | | | | | | | | | | | | | | |
| | MSCI ALL COUNTRY WORLD EX-US INDEX | | | 1.76 | | | | 9.97 | | | | 4.12 | | | | 5.18 | | | | – | | | | 4.36 | | | | 4.62 | | | | -8.24 | | | | 4.37 | | | | 1.63 | | | | 6.92 | | | | – | | | | -2.56 | | | | 3.91 | |
Returns are annualized for periods greater than 1 year. *Inception of the Institutional Class, May 11, 1994. Inception of the Institutional Class Z, July 17, 2017. Inception of the Investor Class, September 30, 2005. Index performance prior to January 1, 2001 cannot be shown since it relies on back-filled data.
Performance data quoted represents past performance; past performance does not guarantee future results. The investment return and principal value of an investment will fluctuate so that an investor’s shares, when redeemed, may be worth more or less than their original cost. Current performance of the Portfolio may be lower or higher than the performance quoted. Performance data current to the most recent month end may be obtained by calling (877) 435-8105 or visiting www.hardingloevnerfunds.com. Performance data shown does not reflect the 2.00% redemption fee imposed on shares held 90 days or less; otherwise, total returns would be reduced.
Style effects showed significant outperformance from high-growth stocks until late summer, but that effect reversed viciously in the final three months of the fiscal year. The most-expensive stocks also outperformed strongly, with a similar reversal. The highest-quality cohort performed the best, but there was not a clear preference for higher quality across the market.
PERFORMANCE ATTRIBUTION
The Portfolio’s relative outperformance in the trailing 12 months derived primarily from good stock selection. In IT, French software designer Dassault Systèmes rose alongside demand for its newest 3D-design products. Financials was boosted by Singapore commercial bank DBS Group, Hong Kong-based insurer AIA Group, and Brazil’s Itaú Unibanco. German industrial-gas producer Linde led Materials, as its planned merger with US industrial-gas producer Praxair won antitrust clearance in the US.
Our stocks in Health Care detracted the most from relative outperformance. In August, shares of German life-sciences firm Bayer declined after a California jury awarded US$290 million to a man who claimed his cancer was caused by glyphosate, an herbicide found in Monsanto’s Roundup weed killer. Bayer, which acquired Monsanto in June, is appealing the verdict. Shares of South Africa’s Aspen Pharmacare declined after the company provided weak revenue guidance for 2019. Our overweight relative the index in Health Care, the second-best-performing sector, however, was helpful.
Viewed geographically, the strongest relative returns were contributed by Europe (both within and outside of the eurozone) and Pacific ex-Japan. Leading stocks in Europe included Dassault, UK-based Royal Dutch Shell, Swiss pharmaceutical outsourcing company Lonza Group, and Nestlé.
In addition to Aspen Pharmacare, EM returns were hampered by South African media conglomerate Naspers, whose shares fell in tandem with its largest investment, China gaming and social media giant Tencent, as Chinese regulators halted approval of new video games in the country. Tencent’s profit margins also deteriorated in the latest quarter due to rising expenses associated with its many new digital ventures. Weibo and Baidu, a Chinese social media platform and search engine respectively, also declined.
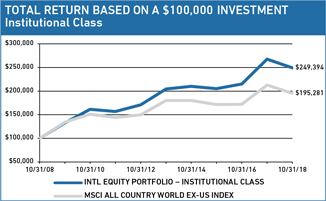
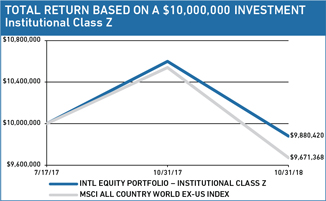
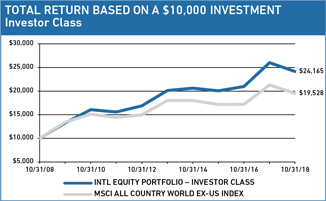
The charts above illustrate the hypothetical return of an investment made in the corresponding share classes. Investment return reflects voluntary fee waivers in effect. Absent such waivers, total return would be reduced. The performance provided in the table and charts above do not reflect the deduction of taxes that a shareholder would pay on Portfolio distributions or the redemption of Portfolio shares.
PERSPECTIVE AND OUTLOOK
Among the biggest contributors to China’s decline this year has been the fall in the shares of its internet giants—Alibaba, Baidu, and Tencent. The reasons for their decline are not so obvious. They serve domestic rather than foreign customers, so they have little direct exposure to the ongoing trade war. They have no need to borrow, generating very strong free cash flow, as do the largest US internet companies. Yet this year, the share prices of the counterparts have diverged, the Chinese IT sector falling sharply and US IT continuing upward. The share price divergence appears to be greater than warranted by the relative deterioration evident in the Chinese companies’ competitive situation.
Indeed, the business models of the largest internet companies in China and the US are remarkably similar, as are the competitive structures of their industries in their respective home markets. They have also achieved similar growth over the last decade. Their profitability arises from having achieved dominance with their core platforms, building on the network effects that accelerate once they reach a critical mass of users. Search results on either Google or Baidu are superior to less-used rivals because more user searches can be analyzed to improve the efficacy of the search engine. Socializing on Facebook or Tencent’s WeChat platforms becomes more appealing as more friends use the platform. Likewise, Instagram or Weibo becomes more attractive to users as more opinion leaders choose it to establish their presence, and more valuable to advertisers as more followers join the audience. Once that self-reinforcing process is in place, the businesses can increase customer stickiness and bolster profits by pursuing additional value enhancements, such as reinvesting profits in service improvements created using machine learning to analyze users’ experience across billions of interactions. Other competitive strategies can include seeking to achieve economies of scale rapidly (i.e., spreading fixed costs over a larger revenue base) and employing product bundling strategies that increase customer loyalty, reflected in the manifold benefits of membership in Amazon’s Prime or Alibaba’s 88 VIP programs.
GEOGRAPHIC EXPOSURE (%) at October 31, 2018
| | | | | | | | |
| | | | |
| | | COUNTRY/REGION | | PORTFOLIO | | BENCHMARK1 | | |
| | | | |
| | CANADA | | 2.4 | | 6.7 | | |
| | | | |
| | EMERGING MARKETS | | 19.5 | | 24.6 | | |
| | | | |
| | EUROPE EMU | | 27.5 | | 21.8 | | |
| | | | |
| | EUROPE EX-EMU | | 20.9 | | 21.6 | | |
| | | | |
| | FRONTIER MARKETS2 | | 0.0 | | – | | |
| | | | |
| | JAPAN | | 12.8 | | 16.9 | | |
| | | | |
| | MIDDLE EAST | | 2.8 | | 0.4 | | |
| | | | |
| | PACIFIC EX-JAPAN | | 7.9 | | 8.0 | | |
| | | | |
| | OTHER3 | | 3.1 | | – | | |
| | | | |
| | CASH | | 3.1 | | – | | |
1MSCI All Country World ex-US Index; 2Includes countries with less-developed markets outside the Index; 3Includes companies classified in countries outside the Index.
SECTOR EXPOSURE (%) at October 31, 2018
| | | | | | | | |
| | | | |
| | | SECTOR | | PORTFOLIO | | BENCHMARK1
| | |
| | | | |
| | CONSUMER DISCRETIONARY | | 5.6 | | 10.7 | | |
| | | | |
| | CONSUMER STAPLES | | 8.9 | | 9.8 | | |
| | | | |
| | ENERGY | | 5.4 | | 7.8 | | |
| | | | |
| | FINANCIALS | | 18.1 | | 22.3 | | |
| | | | |
| | HEALTH CARE | | 15.6 | | 8.6 | | |
| | | | |
| | INDUSTRIALS | | 13.5 | | 11.8 | | |
| | | | |
| | INFORMATION TECHNOLOGY | | 21.4 | | 11.1 | | |
| | | | |
| | MATERIALS | | 8.4 | | 7.8 | | |
| | | | |
| | REAL ESTATE | | 0.0 | | 3.1 | | |
| | | | |
| | TELECOM SERVICES | | 0.0 | | 3.9 | | |
| | | | |
| | UTILITIES | | 0.0 | | 3.1 | | |
| | | | |
| | CASH | | 3.1 | | - | | |
1MSCI All Country World ex-US Index.
The US and Chinese internet companies also face similar challenges from regulators. The challenge, however, has been greater in China, where the government and Communist Party impose requirements to support their policies and restrict any material that may undercut their legitimacy. In August, for example, the General Administration of Press and Publication suspended approvals of new video games amid public officials’ concern about game addiction and eyesight impairment in young people. With games accounting for 35–40% of its revenues and an even larger percentage of profits, Tencent would be hurt if the license approval process becomes permanently contentious, curtailing its ability to keep its core constituency engaged with new products. The effect of such state intrusion may be to suppress content production and dull user engagement, degrading the platform’s vitality and its attractiveness to advertisers. This kind of regulatory intervention in China, which occurs without warning and for which there is no legal recourse, is more arbitrary and potentially more damaging than the fines levied on Google by the European Union, or the expensive content monitoring efforts that Facebook has been forced to adopt after public shaming.
Along with more-damaging regulatory actions, we have witnessed an intensification of rivalry among internet companies in China that has not been, so far, nearly as virulent in the US. We suspect (without hard evidence) that there is greater propensity among Chinese internet users to switch platforms to the “new, new thing” than in the US. (After all, half of the 800 million mobile internet users in China are under the age of 30.) This willingness to switch enables new entrants, making profitability hard to sustain. Weibo and Tencent both have lost some user attention to an emergent short video platform, Douyin, whose active users has swelled fourfold just since last December, to 225 million.
Another factor intensifying the rivalry among China’s online leaders is that after many years of rapid internet adoption, growth in new users is harder to come by, prompting greater competition for the attention of the existing users. As a result, China’s internet companies have increased spending on new services that they bundle with their existing products at no extra cost to users.
They have also stepped up investments in additional areas of commerce, hoping not only to defend their existing market dominance but also to achieve new network effects. Alibaba, for example, has steadily invested in logistics and delivery, bringing its e-commerce closer to the offline last mile, trying to keep its customers happily tied to its platform by increasing convenience. Tencent, having declared 2018 a “year of investment,” has invested in major new games for its core platform, short-video and newsfeed platforms, expanding cloud services, its WeChat Pay mobile payment platform, and in various e-commerce businesses that compete directly with Alibaba. These company strategies appear to be designed specifically to attract and lock in consumers through the convenience and economy of bundled services.
Offsetting this more-intense competition between the leading online players in China is an important difference that they enjoy relative to their US peers. The existing brick-and-mortar incumbents in China’s retailing, entertainment/media, and information/ publishing industries are far less powerful than the incumbents in the US. Amazon must do battle with Walmart, whose revenues are three times as large and whose balance sheet resources match Amazon’s; Alibaba’s revenues are more than double those of its nearest offline competitor, while its operating cash flow is at least 10 times larger, generated from 17 times the gross merchandise value. Facebook and Netflix face off against Disney, Comcast, and Viacom, which have powerful content franchises. In China, these legacy industries were far more fragmented, if they even existed at all in private-sector form, as the mobile internet took hold over the past decade. Thus, the leading Chinese companies face a much smaller or weaker set of potential substitutes, leaving them greater firepower to direct at their online rivals or the ability to conform to government directives without irretrievably dashing profitability.
We have reduced our earnings and growth estimates for Alibaba, Tencent, and Baidu. Each of their share prices has fallen by 25% or more from its January highs. We are sticking for now with our investments in these companies (Tencent through Naspers) as we watch business developments closely.
PORTFOLIO HIGHLIGHTS
The lower prices of many EM stocks this year caused us to scrabble through the companies we follow, with an eye for bargains. In August, we purchased Brazil’s Ambev, one of the country’s largest brewers and the largest PepsiCo bottler outside the US. Brazil’s economy, hurt by falling commodities prices, has stagnated, and its unemployment rate has hovered at 12–14% since 2017. Still, Ambev’s revenues and earnings have continued to grow. After a sharp decline in its dollar-denominated stock, we took advantage of the opportunity to tap the company’s steady stream of profits at a reasonable price.
We also added a new holding in Health Care. Swiss pharmaceutical-outsourcing company Lonza Group is the premier contract manufacturer of biologics, enjoying long-standing relationships with customers like Bristol-Myers Squibb and Roche. Lonza recently opened the world’s largest development and manufacturing site for treatments involving gene editing and cell engineering.
TEN LARGEST HOLDINGS at October 31, 2018
| | | | | | | | | | | | | |
| | | | | |
| | | COMPANY | | SECTOR | | COUNTRY | | % | | |
| | | | | |
| | AIA GROUP | | FINANCIALS | | HONG KONG | | | | 4.0 | | | |
| | | | | |
| | NESTLÉ | | CONS STAPLES | | SWITZERLAND | | | | 3.6 | | | |
| | | | | |
| | ALLIANZ | | FINANCIALS | | GERMANY | | | | 3.5 | | | |
| | | | | |
| | ROYAL DUTCH SHELL | | ENERGY | | UNITED KINGDOM | | | | 3.3 | | | |
| | | | | |
| | SAMSUNG ELECTRONICS | | INFO TECHNOLOGY | | SOUTH KOREA | | | | 3.1 | | | |
| | | | | |
| | CHECK POINT | | INFO TECHNOLOGY | | ISRAEL | | | | 2.8 | | | |
| | | | | |
| | BAYER | | HEALTH CARE | | GERMANY | | | | 2.7 | | | |
| | | | | |
| | TSMC | | INFO TECHNOLOGY | | TAIWAN | | | | 2.7 | | | |
| | | | | |
| | DBS GROUP | | FINANCIALS | | SINGAPORE | | | | 2.7 | | | |
| | | | | |
| | FANUC | | INDUSTRIALS | | JAPAN | | | | 2.7 | | | |
The FDA approved the first of these types of therapies only in 2017, and we anticipate an accelerating pace of approvals in the coming years, which should underpin growth in demand for Lonza’s services.
In IT, we added to our position in Weibo, whose shares have fallen more than 50% since January. We are resisting the urge to conflate a weak share price with a weak business franchise. We expect Weibo’s revenues will continue to grow for the next several years even if online advertising spending growth slows, as the company now expects. Although we have lowered our growth expectations, we believe that Weibo’s system for cultivating key opinion leaders, who provide the content that Weibo’s users consume, remains a durable advantage.
Our complete sales in the fiscal year included UK-based pharmaceutical Shire, which received an acquisition offer from Japan’s Takeda Pharmaceutical, and Turkey’s Garanti Bank, a strong banking franchise that delivered poor returns to foreign investors due to chronic currency weakness.
Portfolio Management Team Update
Andrew West, portfolio manager on the International Equity strategy, will become a co-lead portfolio manager on January 2, 2019, replacing Alec Walsh. Ferrill Roll will continue as the other co-lead portfolio manager. Alec will remain on the International Equity strategy as a supporting member of the portfolio management team, along with Portfolio Managers Scott Crawshaw, Bryan Lloyd, and Patrick Todd. The assignment changes are being made in anticipation of Alec’s retirement, which is expected after the end of 2019.
Please read the separate disclosures page for important information, including the risks of investing in the Portfolio.

PORTFOLIO MANAGEMENT

| | |
JAFAR RIZVI, CFA CO-LEAD PORTFOLIO MANAGER ANIX VYAS, CFA CO-LEAD PORTFOLIO MANAGER | | |
 PERFORMANCE SUMMARY
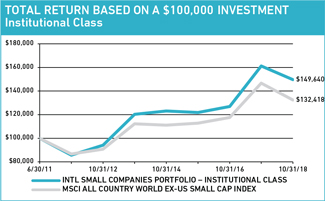
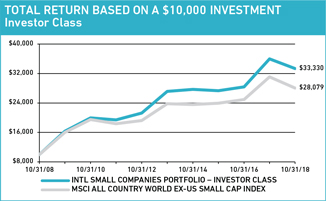
For the International Small Companies Portfolio, the Institutional Class declined 7.15% and the Investor Class declined 7.35% (net of fees and expenses) in the fiscal year ended October 31, 2018. The Portfolio’s benchmark, the MSCI All Country World ex-US Small Cap Index, declined 9.73% (net of source taxes).
MARKET REVIEW
This fiscal year, we have witnessed a return of market volatility. Following the sharp two week decline from late January to early February, the markets remained mostly flat until June, when volatility spiked again. Non-US stocks were dragged down by rising US interest rates, dollar strength, and an escalating trade war between the US and China.
The US economy is firing on all cylinders. In the second quarter, it grew at a 4.2% annual rate, the fastest in four years. Unemployment fell to 3.7%, the lowest since 1969, and inflation remains moderate. The Federal Reserve raised interest rates in September for the third time in 2018. The move contributed to dollar strength against most major currencies and detracted from international returns for US dollar-based investors.
The picture is less rosy outside the US. Small companies in Emerging Markets (EMs) fared worst. Escalating trade tensions between the US and China weighed on Taiwan, South Korea, Malaysia, and other developing countries that export to China. A prolonged trade war could further weaken China’s economy and demand for those countries’ products. Higher US interest rates and the strong dollar also took a toll on developing countries. Capital flowed to the US in pursuit of higher rates, while the strong dollar increased the cost of US-dollar denominated debt, which has risen to 16% of GDP in EMs, a level not reached since the late 1990s.1 The price of oil rose 21% in the fiscal year, further pressuring the economies of India, China, and other countries reliant on imported petroleum. India also faced a liquidity crunch after IL&FS, one of the country’s largest infrastructure lenders,
1BCA Research. Daily Insights. October 1, 2018.
| | | | | | | | |
| | |
| | FUND FACTS at October 31, 2018 | | |
| | | | |
| | TOTAL NET ASSETS | | | | $209.3M | | |
| | | | |
| | SALES CHARGE | | | | NONE | | |
| | | | |
| | NUMBER OF HOLDINGS | | | | 100 | | |
| | | | |
| | TURNOVER (5 YR. AVG.) | | | | 39% | | |
| | | | |
| | REDEMPTION FEE | | | | 2% FIRST 90 DAYS | | |
| | | | |
| | DIVIDEND POLICY | | | | ANNUAL | | |
| | | |
| | INSTITUTIONAL INVESTORS | | INDIVIDUAL INVESTORS | | |
| | | | |
| | | | INSTITUTIONAL CLASS | | INVESTOR CLASS | | |
| | | | |
| | TICKER | | HLMRX | | HLMSX | | |
| | | | |
| | CUSIP | | 412295875 | | 412295883 | | |
| | | | |
| | INCEPTION DATE | | 6/30/2011 | | 3/26/2007 | | |
| | | | |
| | MINIMUM INVESTMENT1 | | $100,000 | | $5,000 | | |
| | | | |
| | NET EXPENSE RATIO2 | | 1.15% | | 1.40% | | |
| | | | |
| | GROSS EXPENSE RATIO | | 1.41% | | 1.80% | | |
1Lower minimums available through certain brokerage firms; 2Shown net of Harding Loevner’s contractual agreement through February 28, 2019.
All Expense Ratios are as of the Prospectus dated February 28, 2018 unless otherwise noted.
defaulted on US$13 billion of debt, sending tremors through the Indian financial markets.
In Europe ex-European Monetary Union (EMU), small-cap stocks performed roughly in line with the index. In the UK, shares fell 9% as the March 29 deadline for its exit from the European Union (EU) nears. The “hard” Brexit scenario—one where the UK leaves the EU without retaining privileged access to its single market—appears increasingly likely. In late September, Prime Minister Theresa May said negotiations with the EU had stalled and her government was prepared to leave the EU without a deal.
Viewed by sector, Health Care—typically viewed as a “safe” sector—was the only sector to register a positive return. Energy was the next best, declining only slightly, as tightening global inventories and the pending US sanctions against Iran buoyed oil prices. Materials, Financials, and Information Technology (IT) performed the worst. The semiconductors and semiconductor equipment industry group fell 32% as reported book-to-bill ratios indicated orders may have peaked. Prices for memory chips and other semiconductors have begun to decline.
PERFORMANCE ATTRIBUTION
Our strong stock selection in IT contributed to the Portfolio’s outperformance over the trailing 12 months, especially within the software and services industry group. Shares of Infomart, a Japanese e-commerce company, were strong. The company reported a 13% increase in sales as more businesses eliminated paper invoices by adopting Infomart’s digital system. Shares of Bechtle, a German technology consultant, surged in August after the company reported a 17% increase in sales, in part due
PERFORMANCE (% TOTAL RETURN)
| | | | | | | | | | | | | | | | | | | | | | | | | | | | | | | | | | | | | | | | | | | | | | | | | | |
| | | |
| | | | | for periods ended September 30, 2018 | | | for periods ended October 31, 2018 | |
| | | | | | | | | | | |
| | | | | 1 | | | 3 | | | 5 | | | 10 | | | SINCE INCEPTION* | | | 1 | | | 3 | | | 5 | | | 10 | | | SINCE INCEPTION* | |
| | | | | YEAR | | | YEARS | | | YEARS | | | YEARS | | | Jun-11 | | | Mar-07 | | | YEAR | | | YEARS | | | YEARS | | | YEARS | | | Jun-11 | | | Mar-07 | |
| | | | | | | | | | | | | |
| | INTL SMALL COMPANIES PORTFOLIO – INST CLASS | | | 4.23 | | | | 12.72 | | | | 7.32 | | | | – | | | | 7.29 | | | | | | | | -7.15 | | | | 7.08 | | | | 4.46 | | | | – | | | | 5.65 | | | | | |
| | | | | | | | | | | | | |
| | INTL SMALL COMPANIES PORTFOLIO – INVESTOR CLASS | | | 3.98 | | | | 12.44 | | | | 7.04 | | | | 10.96 | | | | | | | | 6.52 | | | | -7.35 | | | | 6.85 | | | | 4.19 | | | | 12.79 | | | | | | | | 5.50 | |
| | | | | | | | | | | | | |
| | MSCI ALL COUNTRY WORLD EX-US SMALL CAP INDEX | | | 1.86 | | | | 11.24 | | | | 6.14 | | | | 8.73 | | | | 5.42 | | | | – | | | | -9.73 | | | | 5.47 | | | | 3.36 | | | | 10.88 | | | | 3.90 | | | | – | |
Returns are annualized for periods greater than 1 year. *Inception of the Institutional Class, June 30, 2011. Inception of the Investor Class, March 26, 2007. Index performance prior to June 1, 2007 cannot be shown since it relies on back-filled data.
Performance data quoted represents past performance; past performance does not guarantee future results. The investment return and principal value of an investment will fluctuate so that an investor’s shares, when redeemed, may be worth more or less than their original cost. Current performance of the Portfolio may be lower or higher than the performance quoted. Performance data current to the most recent month end may be obtained by calling (877) 435-8105 or visiting www.hardingloevnerfunds.com. Performance data shown does not reflect the 2.00% redemption fee imposed on shares held 90 days or less; otherwise, total returns would be reduced.
The charts below illustrate the hypothetical return of an investment made in the corresponding share classes. Investment return reflects voluntary fee waivers in effect. Absent such waivers, total return would be reduced. The performance provided in the table and charts above do not reflect the deduction of taxes that a shareholder would pay on Portfolio distributions or the redemption of Portfolio shares.
to its successful expansion in Austria and Switzerland. Bechtle also revised upward its revenue and earnings estimates for the remainder of 2018.
Our stock selection in Health Care and our overweight to the sector also contributed. Dentistry tool manufacturer Nakanishi was a strong contributor. Japan’s Ministry of Health and Labor enacted stricter regulations requiring more frequent sterilization—in lieu of just cleaning—of dental equipment. Because sterilization takes more time, dentists bought additional instruments to use while others are sanitized. Nakanishi’s dental equipment sales in Japan surged 77% in the third quarter of 2018.
Poor selection in Financials hurt relative returns. Life insurance company Max Financial, which is discussed later in this report, detracted. Anadolu Hayat Emeklilik, Turkey’s oldest life insurer and our only holding in the country, also detracted. Investors expect that public participants will contribute less to government-subsidized savings plans as Turkey’s economy deteriorates. Returns for US dollar-based investors were also hurt by the lira’s decline against the greenback.
Our stock selection in Japan contributed more to our relative returns than in any other region, thanks to Nakanishi and Infomart. Our stocks in the eurozone also helped, especially medical technology provider Carl Zeiss and Bechtle in Germany. Italian IT consultant Reply also contributed.
Our poor stock selection in EMs, particularly India and China, detracted from our relative returns. In India, Max Financial and fragrance and flavors company SH Kelkar detracted. In China, shares of plastic injection-molding machines manufacturer Haitian fell, facing some investor concerns about trade wars. Chinese furniture company Suofeiya also declined after reporting slow second-quarter growth.
INVESTMENT PERSPECTIVES
When supported by pro-growth public policies and political stability, emerging and frontier economies are capable of rapid expansion; the rise of China is the most salient example of this phenomenon. Investing in this growth, however, requires fortitude as developing countries—especially those dependent on external financing to fund their capital formation—are vulnerable to internal and external shocks that raise the cost of borrowing or undermine the confidence of foreign lenders. This year, many emerging and frontier markets (EMs and FMs) sold off as US interest rates rose, the dollar strengthened, and trade disputes escalated.
As small-cap investors, we are finding opportunities to invest in companies that are introducing the necessities and luxuries of modern life, from urban apartments to financial services, to millions of newly minted middle class consumers. Whereas our small developed market companies tend to be niche businesses serving
narrowly targeted customers, in EMs and FMs our small caps often are not limited to niche products and therefore enjoy greater potential. In these markets, industries that matured long ago in developed economies still offer growth opportunities.
One such example is the steel industry, where large caps tend to dominate. In developed countries, the steel industry has been contracting for decades. In Vietnam, it is booming. The country’s rapidly rising need for industrial plants, infrastructure, and urban residential construction creates enormous demand for the material. The country’s market leader is Hoa Phat Group, an integrated steel producer with the lowest production costs—a competitive advantage that will improve next year as the company increases its scale when a new plant with four million tons of additional capacity comes online.
In a small market like Peru, a small-cap company can operate nationwide. Alicorp makes a broad range of consumer packaged goods including pasta, cooking oil, flour, detergent, and soap. The Peruvian economy is strong, with low public debt, a stable currency, and accelerating growth. From 2001 to 2016, the percentage of Peruvians in poverty fell from 55% to 21%, lifting demand for Alicorp’s products. Alicorp tailors its goods to local tastes, unlike the multinationals that compete with it, including Unilever, Nestlé, and Kraft. The company has high brand recognition and one of Peru’s largest distribution networks, covering every major town in the country. The company has little debt and its management team has a good track record of capital allocation.
Urbanization and the other structural changes that accompany modernization disrupt traditional social networks and safety nets, creating demand for a more modern form of financial security. India’s Max Financial is a small company selling into a nascent market for life insurance. The Indian life insurance market was only privatized in 2001. Premium per capita lags significantly behind not only developed markets but also other EMs, pointing to a long runway for growth. Max has been growing quickly due to its strong agent network and its distribution partnership with Axis Bank. The recent troubles in the Indian banking sector are not expected to disrupt Max’s growth significantly, and the company is expanding its own agent network to hedge the risk that Axis does not renew the distribution partnership in 2021. The costs of this expansion will reduce Max’s margins in the short term, but ensure Max’s long-term growth prospects and strengthen its negotiating position vis-à-vis its partner. It is representative of the strategic foresight Max has demonstrated as it expanded its market share over the last decade.
For the reasons described, we are overweight in developing regions, when emerging and frontier markets are combined. Because our view of the long-term prospects for each of these high-quality, growing businesses has not changed, we see the recent sell-off in EMs and FMs as an opportunity to add to several existing holdings at more attractive prices, and to make new investments in emerging countries, such as Argentina and South Africa. Warren Buffett once said, “You pay a very high price in the stock market for a cheery consensus.” We think the inverse is true in emerging and frontier markets today: the overwhelmingly
SECTOR EXPOSURE (%) at October 31, 2018
| | | | | | | | |
| | | | |
| | | SECTOR | | PORTFOLIO | | BENCHMARK1 | | |
| | | | |
| | CONSUMER DISCRETIONARY | | 7.8 | | 14.8 | | |
| | | | |
| | CONSUMER STAPLES | | 10.5 | | 6.7 | | |
| | | | |
| | ENERGY | | 4.3 | | 4.0 | | |
| | | | |
| | FINANCIALS | | 6.7 | | 11.1 | | |
| | | | |
| | HEALTH CARE | | 16.1 | | 7.6 | | |
| | | | |
| | INDUSTRIALS | | 20.6 | | 19.5 | | |
| | | | |
| | INFORMATION TECHNOLOGY | | 20.8 | | 11.3 | | |
| | | | |
| | MATERIALS | | 8.0 | | 10.2 | | |
| | | | |
| | REAL ESTATE | | 0.5 | | 10.6 | | |
| | | | |
| | TELECOM SERVICES | | 1.2 | | 1.3 | | |
| | | | |
| | UTILITIES | | 1.4 | | 2.9 | | |
| | | | |
| | CASH | | 2.1 | | – | | |
1MSCI All Country World ex-US Small Cap Index.
GEOGRAPHIC EXPOSURE (%) at October 31, 2018
| | | | | | | | |
| | | | |
| | | COUNTRY/REGION | | PORTFOLIO | | BENCHMARK1 | | |
| | | | |
| | CANADA | | 1.2 | | 7.2 | | |
| | | | |
| | EMERGING MARKETS | | 17.6 | | 19.0 | | |
| | | | |
| | EUROPE EMU | | 24.6 | | 17.3 | | |
| | | | |
| | EUROPE EX-EMU | | 24.9 | | 23.5 | | |
| | | | |
| | FRONTIER MARKETS2 | | 10.6 | | – | | |
| | | | |
| | JAPAN | | 13.6 | | 23.1 | | |
| | | | |
| | MIDDLE EAST | | 1.4 | | 1.5 | | |
| | | | |
| | PACIFIC EX-JAPAN | | 3.2 | | 8.4 | | |
| | | | |
| | OTHER3 | | 0.8 | | – | | |
| | | | |
| | CASH | | 2.1 | | – | | |
1MSCI All Country World ex-US Small Cap Index; 2Includes countries with less-developed markets outside the Index; 3Includes countries classified in countries outside the Index.
gloomy consensus offers the potential to acquire strong long-term growth at reasonable prices.
PORTFOLIO HIGHLIGHTS
The addition of Anix Vyas, CFA as a co-lead portfolio manager on April 2 led to above-average activity in early 2018 as the Portfolio was adjusted to incorporate the investment decisions of each of the portfolio managers, taken independently. The number of holdings increased from 87 on October 31, 2017 to 100 on October 31, 2018.
Over the past 12 months, we added to several existing EM and FM holdings (including Hoa Phat, Moscow Exchange, Kernel, and Tower Bersama). We also initiated positions in Loma Negra, Argentina’s largest cement producer, Tiger Brands, South Africa’s dominant packaged goods company, Mabanee, Kuwait’s real estate developer, and Bharti Infratel, India’s largest wireless tower operator.
Stocks in Argentina were especially hard hit amid the country’s escalating currency crisis. The government responded by hiking interest rates to 60% (the world’s highest) and accelerating its plan to reduce the country’s fiscal deficit. Latin America’s third-largest economy will likely shrink this year and next. Construction activity and cement demand will decline. At the time of our purchase, Loma Negra’s shares had fallen 60% from their peak in January, and we believed its poor near-term outlook was more than fully reflected in its share price.
The Argentine cement industry has grown over the long term, despite the country’s frequent economic crises. In its 92 years in business, Loma has accumulated competitive advantages that should help it withstand the current crisis and eventually return to growth. Through one of its subsidiaries, Loma has indirect control of Ferrosur Roca, which operates a rail network that connects five of Loma’s eight factories to distribution centers. This enables Loma to move its cement faster and more cheaply than its competitors, and to shift production among factories based on regional demand. With its logistical advantages and lower production costs, Loma could comfortably match its rivals on price—but it doesn’t. On the strength of the company’s brand, it prices its cement at a 3% premium to peers. A new plant in Buenos Aires province, scheduled to be operational in 2020, will expand the company’s production capacity by 30% and produce at lower costs than existing plants, cementing Loma’s structural advantages over the competition.
In South Africa, shares of consumer-products maker Tiger Brands have fallen sharply this year due to a recession and a listeriosis outbreak traced to its meat-processing facilities. More than 200 people died and a thousand sickened this spring after eating polony sausage and other chilled meats. Scientists tied the outbreak to a strain of listeria that existing government and industry tests did not detect. Tiger recalled the tainted products and closed several factories, and is now leading efforts to improve national food-testing standards.
When we initiated our position in August, Tiger shares had fallen 25% from their highs reached before the listeria tragedy. Though it faces headwinds from South African economic weakness and litigation in the short term, the company’s competitive advantages remain strong. Most of Tiger’s food and personal-care brands lead the market in their categories. To capture share, Tiger packages its products in a variety of sizes and price points. The company, which primarily targets South Africa’s growing middle class, enjoys one of the largest distribution networks in Africa. At home, its distribution system extends across modern and traditional retail outlets, such as “spaza” shops (convenience stores run out of homes). About 10% of Tiger’s sales are in other African countries, including Nigeria, Kenya, and Cameroon.
We have difficulty identifying high-quality real estate businesses, but we found an exception in Kuwaiti developer Mabanee. The company owns and manages The Avenues, Kuwait’s largest shopping mall. The Avenues, which already accounts for more than 30% of the country’s total retail space, is undergoing an expansion project, which should provide a boost to Mabanee’s revenue and
TEN LARGEST HOLDINGS at October 31, 2018
| | | | | | | | | | | | |
| | | | | |
| | | COMPANY | | SECTOR | | COUNTRY | | % | | | |
| | | | | |
| | CARL ZEISS MEDITEC | | HEALTH CARE | | GERMANY | | | 3.2 | | | |
| | | | | |
| | NAKANISHI | | HEALTH CARE | | JAPAN | | | 2.9 | | | |
| | | | | |
| | ARIAKE | | CONS STAPLES | | JAPAN | | | 2.4 | | | |
| | | | | |
| | ABCAM | | HEALTH CARE | | UK | | | 2.4 | | | |
| | | | | |
| | BECHTLE | | INFO TECHNOLOGY | | GERMANY | | | 2.4 | | | |
| | | | | |
| | ALTEN | | INFO TECHNOLOGY | | FRANCE | | | 2.3 | | | |
| | | | | |
| | SENIOR | | INDUSTRIALS | | UK | | | 2.2 | | | |
| | | | | |
| | HOA PHAT GROUP | | MATERIALS | | VIETNAM | | | 2.1 | | | |
| | | | | |
| | REPLY | | INFO TECHNOLOGY | | ITALY | | | 2.0 | | | |
| | | | | |
| | DECHRA PHARMACEUTICALS | | HEALTH CARE | | UK | | | 1.7 | | | |
profits over the next three years. In a country with few large malls, Mabanee’s competitive advantage lies in the exclusive franchise agreement that its majority shareholder, Alshaya Group, has with nearly 90 international retail brands in Kuwait, which will also help it grow.
We also purchased India’s largest wireless tower operator, Bharti Infratel. In India, smartphone adoption lags much of the world, but that is changing rapidly as inexpensive models become available. With the number of smartphone users expected to double to 650 million in the next four years, more cell towers will be needed to meet burgeoning data demands. Infratel owns 92,000 towers across all of India’s 29 states and leases space for antennas and electronics to telecom operators, including Bharti Airtel, Vodafone Idea, and Jio Communications. Infratel’s 40% market share of towers is over twice as high as its closest competitor. Its scale allows it to negotiate lower prices than its rivals for steel, concrete, air conditioners, batteries, and other materials.
The recent merger of two of its customers, Vodafone and Idea, resulted in a consolidation of the antennas and wireless equipment on Infratel’s towers and, consequently, a decline in leases in the third quarter. We saw a sharp fall in its share price as an opportunity to establish a position at an attractive price because we think the set back is only short term. We expect Infratel to recover quickly as telecom operators lease more tower space to meet the demands of serving new smartphone users and implementing faster data networks. In fact, another 100,000 towers are needed just to meet current demand properly, according to the Tower and Infrastructure Providers Association of India.
Please read the separate disclosures page for important information, including the risks of investing in the Portfolio.

| | |
| PORTFOLIO MANAGEMENT TEAM |

|
| SCOTT CRAWSHAW | | PRADIPTA CHAKRABORTTY |
CO-LEAD PORTFOLIO MANAGER | | PORTFOLIO MANAGER |
| CRAIG SHAW, CFA | | G. RUSTY JOHNSON, CFA |
| CO-LEAD PORTFOLIO MANAGER | | PORTFOLIO MANAGER |
| | RICHARD SCHMIDT, CFA |
| | PORTFOLIO MANAGER |
The Institutional Emerging Markets Portfolio and the Emerging Markets Portfolio are generally closed to new investors.
The Institutional Emerging Markets Portfolio – Class I and Class II – and the Emerging Markets Portfolio – Advisor Class (collectively, the “Portfolios”) are both managed in strict accordance with Harding Loevner’s Emerging Markets Equity strategy model portfolio. Therefore, the Portfolios have highly similar holdings and characteristics. We have provided a single commentary to cover both Portfolios. The specific performance and characteristics of each are presented separately in the tables that follow.
 PERFORMANCE SUMMARY
The Institutional Emerging Markets Portfolio – Class I fell 15.33%, the Institutional Emerging Markets Portfolio – Class II fell 15.21%, and the Emerging Markets Portfolio – Advisor Class fell 15.47% (all net of fees and expenses) in the fiscal year ended October 31, 2018. The Portfolios’ benchmark, the MSCI Emerging Markets Index, fell 12.52% (net of source taxes) in the fiscal year.
MARKET REVIEW
The fiscal year began positively, with emerging markets (EMs) up about 14% through the end of January. But EMs fell nearly 25% during the rest of the period as global trade tensions escalated, US interest rates rose, the dollar strengthened, and investors grew concerned about the prospects for continued growth, notably in China. In the end, every sector except Energy fell, and over two-thirds of the markets in the index posted losses.
The Chinese market—the largest in the index—fell over 30% from its January high. China’s economic momentum slowed as a side effect of the government’s efforts to reduce its reliance on borrowed money and to clamp down especially on unregulated “shadow” lending. An escalating trade war with the US started to have an impact, too, as Chinese firms, facing uncertainty, postponed new capital investments. Arguably the most critical factor was a tightening of regulations impacting businesses in key industries such as health care, online games, and social media—home to some of China’s fastest-growing businesses. The sharp reduction in growth expectations
| | | | | | | | | | | | |
| | | |
| | FUND FACTS at October 31, 2018 | | | | | | |
| | | | |
| | SALES CHARGE | | | | | NONE | | | |
| | | | |
| | NUMBER OF HOLDINGS | | | | | 75 | | | |
| | | | |
| | REDEMPTION FEE | | | | | 2% FIRST 90 DAYS | | | |
| | | | |
| | DIVIDEND POLICY | | | | | ANNUAL | | | |
| | | |
| | INSTITUTIONAL INVESTORS | | | INDIVIDUAL INVESTORS | | | |
| | | | |
| | PORTFOLIO ASSETS | | $4,369.9M | | | $3,459.1M | | | |
| | | | |
| | TURNOVER (5 YR. AVG.) | | 22% | | | 25% | | | |
| | | | | |
| | CLASS | | CLASS I | | CLASS II | | | ADVISOR | | | |
| | | | | |
| | TICKER | | HLMEX | | HLMEX | | | HLEMX | | | |
| | | | | |
| | CUSIP | | 412295701 | | 412295693 | | | 412295305 | | | |
| | | | | |
| | INCEPTION DATE | | 10/17/2005 | | 3/5/2014 | | | 11/9/1998 | | | |
| | | | | |
| | MINIMUM INVESTMENT1 | | $500,000 | | $25,000,000 | | | $5,000 | | | |
| | | | | |
| | NET EXPENSE RATIO | | 1.28% | | 1.12%2 | | | 1.42% | | | |
| | | | | |
| | GROSS EXPENSE RATIO | | 1.28% | | 1.23% | |
| 1.42%
|
| | |
1Lower minimums available through certain brokerage firms; 2The Net Expense Ratio is as of October 31, 2018 as the Portfolio is operating below the contractual agreement, which is in effect until February 28, 2019.
All Expense Ratios are as of the Prospectus dated February 28, 2018 unless otherwise noted. and shares prices for large and growing Chinese companies also dampened confidence in EMs more broadly.
and shares prices for large and growing Chinese companies also dampened confidence in EMs more broadly.
In Europe, Turkey’s financial stresses erupted into a full-blown crisis. The lira fell just over 30% in the fiscal year as lenders and equity investors were repulsed by the erratic, unorthodox policies of the increasingly authoritarian president, Recep Tayyip Erdoğan, whose expressed economic views include that higher interest rates cause inflation. In Russia, rising oil prices helped buoy the economy and the equity market, and offset the negative impact on shares of the sanctions imposed on Russia by the US and Europe.
Latin America, the best-performing major region, was led by Peru and Brazil. At the end of the fiscal year, investors welcomed the election of Jair Bolsonaro to Brazil’s presidency, hoping his hardline approach will reduce crime and corruption and that he will cut the fiscal deficit by reducing social spending.
Higher oil prices were not a positive for India, which began to feel the burden of more costly energy imports. The rising cost of diesel exacerbated a farming crisis started by high fertilizer prices and low crop prices. India’s banking system was also shaken when IL&FS, a large infrastructure lender, defaulted on US$13 billion of debt in September.
By sector, Energy was the only source of positive returns in this period supported by higher oil prices. The Materials sector, while negative, outperformed the index, led by iron and steel companies in Brazil and chemical companies in Asia. Financials also outperformed, with strong share prices for banks in Brazil and Taiwan.
Consumer Discretionary declined the most in the fiscal year partly due to weakness in China’s automotive and e-commerce stocks,
PERFORMANCE (% TOTAL RETURN)
| | | | | | | | | | | | | | | | | | | | | | | | | | | | | | | | | | | | | | | | | | | | | | | | | | | | | | | | | | | | | | | | | | | | | | | | |
| | | | | for periods ended September 30, 2018 | | for periods ended October 31, 2018 |
| | | | | | | | | | | |
| | | | | 1 | | 3 | | 5 | | 10 | | SINCE INCEPTION* | | 1 | | 3 | | 5 | | 10 | | SINCE INCEPTION* |
| | | | | YEAR | | YEARS | | YEARS | | YEARS | | Oct-05 | | Mar-14 | | Nov-98 | | YEAR | | YEARS | | YEARS | | YEARS | | Oct-05 | | Mar-14 | | Nov-98 |
| | | | | | | | | | | | | | | |
| | INST. EMERGING MARKETS PORTFOLIO – CLASS I | | | | -4.30 | | | | | 11.80 | | | | | 4.33 | | | | | 5.89 | | | | | | | | | | 6.90 | | | | | | | | | | -15.33 | | | | | 5.46 | | | | | 1.12 | | | | | 8.21 | | | | | | | | | | 6.00 | | | | | | |
| | | | | | | | | | | | | | | |
| | INST. EMERGING MARKETS PORTFOLIO – CLASS II | | | | -4.07 | | | | | 12.05 | | | | | – | | | | | – | | | | | 4.45 | | | | | | | | | | | | | | | -15.21 | | | | | 5.70 | | | | | – | | | | | – | | | | | 2.04 | | | | | | | | | | | |
| | | | | | | | | | | | | | | |
| | EMERGING MARKETS PORTFOLIO – ADVISOR CLASS | | | | -4.39 | | | | | 11.71 | | | | | 4.25 | | | | | 5.86 | | | | | | | | | | | | | | | 11.13 | | | | | -15.47 | | | | | 5.35 | | | | | 1.05 | | | | | 8.12 | | | | | | | | | | | | | | | 10.50 | |
| | | | | | | | | | | | | | | |
| | MSCI EMERGING MARKETS INDEX | | | | -0.81 | | | | | 12.36 | | | | | 3.61 | | | | | 5.40 | | | | | 4.50 | | | | | 6.61 | | | | | – | | | | | -12.52 | | | | | 6.52 | | | | | 0.78 | | | | | 7.84 | | | | | 2.39 | | | | | 5.82 | | | | | – | |
Returns are annualized for periods greater than 1 year. *Inception of Class I, October 17, 2005. Inception of Class II, March 5, 2014. Inception of the Advisor Class, November 9, 1998. Index performance prior to January 1, 2001 cannot be shown since it relies on back-filled data.
Performance data quoted represents past performance; past performance does not guarantee future results. The investment return and principal value of an investment will fluctuate so that an investor’s shares, when redeemed, may be worth more or less than their original cost. Current performance of the Portfolio may be lower or higher than the performance quoted. Performance data current to the most recent month end may be obtained by calling (877) 435-8105 or visiting www.hardingloevnerfunds.com. Performance data shown does not reflect the 2.00% redemption fee imposed on shares held 90 days or less; otherwise, total returns would be reduced.
as well as South Africa’s Naspers, a major shareholder of Chinese online-game giant Tencent. Information Technology (IT) was also weak, with declines in Chinese internet and hardware stocks. Furthermore, Industrials lagged the index as confidence in the outlook for global EM growth waned.
PERFORMANCE ATTRIBUTION
The Portfolios underperformed this year as poor stocks outweighed modestly positive contributions from our sector and geographic allocations. Relative returns were especially hurt by lagging holdings in the IT and Consumer Staples sectors. In IT, two suppliers of specialty components to smartphone manufacturers—China’s AAC Technologies (acoustic components) and Taiwan’s Largan Precision (plastic lenses)—suffered on concerns over weaker demand for their products, in part due to soft iPhone sales. In Consumer Staples, South Korean cosmetics manufacturer Amorepacific reported weaker-than-expected sales as its “masstige” brands seemed to lose traction in the key growth market of China, where the company has faced rising competition both from local brands and larger multinational cosmetics companies. Brazilian beer giant Ambev’s stock fell on concerns about declining revenue growth.
The Portfolios outperformed in Consumer Discretionary, helped especially by Chinese textile manufacturer Shenzhou International. The company’s investments to expand and further automate its production facilities are expected to strengthen Shenzhou’s competitive position by accelerating the development and delivery of products to key global clients such as Nike. Russian energy producers Lukoil and Novatek helped relative returns in Energy. Novatek’s new Siberian liquefied natural gas (LNG) project came online and investors began to appreciate the magnitude of the growth prospects for its LNG exports. Our overweight in Financials and small allocation to cash (less than 3%) were also helpful.
From a geographic perspective, we lagged the most in Asia, with poor returns in South Korea, Taiwan, and India. The main culprits in each market included the aforementioned Amorepacific and Largan Precision, as well as Indian automobile manufacturer Maruti Suzuki. The latter was hit by two issues that raised concerns about future demand for cars: higher oil prices and worries about the rising cost of financing, which supports an estimated 70% of Maruti’s new-car sales. Our relatively good returns in Europe were helped by Russia’s Lukoil and Novatek.
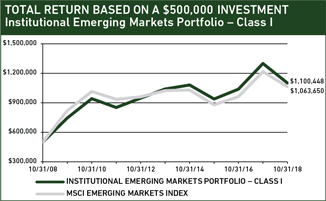
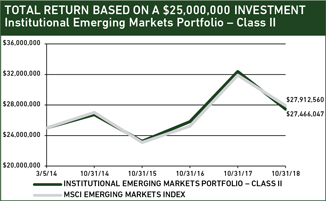

The charts above illustrate the hypothetical return of an investment made in the corresponding share classes. Investment return reflects voluntary fee waivers in effect. Absent such waivers, total return would be reduced. The performance provided in the table and charts above do not reflect the deduction of taxes that a shareholder would pay on Portfolio distributions or the redemption of Portfolio shares.
The Portfolios’ underweights in China and South Korea were helpful this year, while our small (less than 3%) off-benchmark allocation to Frontier Markets hurt. Argentina’s Banco Macro fell sharply as the peso plummeted due to fears of runaway inflation.
INVESTMENT PERSPECTIVES
At the start of 2018, investors cheered the return of synchronized global growth: in 2017, all 45 Organization for Economic Cooperation and Development (OECD) economies expanded simultaneously for the first time since the global financial crisis. As of the end of October, the mood has darkened, with much of the concern focused on China. Risks to growth in the world’s second-largest economy appear to be rising amid the escalating trade war and the Chinese government’s policies to reduce the country’s reliance on debt. If China stumbles, other EMs that have benefited from the country’s demand may follow. Global economic growth will become increasingly dependent on growth in the US, where the Federal Reserve is raising interest rates.
Economic expansion, of course, helps businesses’ revenues and profits. But it isn’t the only source of a company’s potential growth. Some industries expand faster than others, and some businesses grow faster than the rest of their industry. Companies that have competitive advantages like strong bargaining power over suppliers, differentiated products with pricing power over customers, and strong management teams tend to sustain faster growth. Some companies are innovative, deploying technology creatively to take advantage of changes in their industries—or even to refashion those industries. These competitive qualities do not immunize companies from the ill effects of economic malaise, but they do help them to withstand it and better to position themselves to resume fast growth in a more favorable environment in the future.
GEOGRAPHIC EXPOSURE (%) at October 31, 2018
| | | | | | | | | | |
| | | | | |
| | | COUNTRY/REGION | | INSTITUTIONAL
| | ADVISOR
| | | | |
| | | | | HLMEX / HLEEX | | HLEMX | | BENCHMARK1 | | |
| | | | | |
| | BRAZIL | | 8.2 | | 8.3 | | 8.0 | | |
| | | | | |
| | CHINA + HONG KONG2 | | 29.9 | | 30.1 | | 30.0 | | |
| | | | | |
| | INDIA | | 4.2 | | 4.2 | | 8.7 | | |
| | | | | |
| | MEXICO | | 4.5 | | 4.5 | | 2.9 | | |
| | | | | |
| | RUSSIA | | 8.2 | | 8.2 | | 3.9 | | |
| | | | | |
| | SOUTH AFRICA | | 6.0 | | 6.0 | | 5.9 | | |
| | | | | |
| | SOUTH KOREA | | 9.3 | | 9.4 | | 14.0 | | |
| | | | | |
| | TAIWAN | | 8.2 | | 8.2 | | 11.8 | | |
| | | | | |
| | SMALL EMERGING MARKETS3 | | 12.1 | | 12.1 | | 14.8 | | |
| | | | | |
| | FRONTIER MARKETS4 | | 2.4 | | 2.4 | | — | | |
| | | | | |
| | DEVELOPED MARKET LISTED5 | | 4.5 | | 4.5 | | — | | |
| | | | | |
| | CASH | | 2.5 | | 2.1 | | — | | |
1MSCI Emerging Markets Index; 2The Institutional Emerging Markets Portfolio’s end weight in China is 24.0% and Hong Kong is 5.9%. The Advisor Class’ end weight in China is 24.2% and Hong Kong is 5.9%. The Benchmark does not include Hong Kong; 3Includes the remaining emerging markets which, individually, comprise less than 5% of the Index; 4Includes countries with less-developed markets outside the Index; 5Includes emerging markets or frontier markets companies listed in developed markets.
SECTOR EXPOSURE (%) at October 31, 2018
| | | | | | | | | | |
| | | | | |
| | | SECTOR | | INSTITUTIONAL
HLMEX / HLEEX | | ADVISOR
HLEMX | | BENCHMARK1
| | |
| | | | | |
| | CONSUMER DISCRETIONARY | | 12.5 | | 12.5 | | 8.7 | | |
| | | | | |
| | CONSUMER STAPLES | | 7.9 | | 8.0 | | 6.5 | | |
| | | | | |
| | ENERGY | | 8.5 | | 8.5 | | 8.7 | | |
| | | | | |
| | FINANCIALS | | 29.6 | | 29.7 | | 24.5 | | |
| | | | | |
| | HEALTH CARE | | 3.3 | | 3.3 | | 2.9 | | |
| | | | | |
| | INDUSTRIALS | | 7.0 | | 7.0 | | 5.4 | | |
| | | | | |
| | INFORMATION TECHNOLOGY | | 23.6 | | 23.7 | | 25.4 | | |
| | | | | |
| | MATERIALS | | 1.2 | | 1.3 | | 7.8 | | |
| | | | | |
| | REAL ESTATE | | 0.9 | | 0.9 | | 2.8 | | |
| | | | | |
| | TELECOM SERVICES | | 1.0 | | 1.0 | | 4.7 | | |
| | | | | |
| | UTILITIES | | 2.0 | | 2.0 | | 2.6 | | |
| | | | | |
| | CASH | | 2.5 | | 2.1 | | — | | |
1MSCI Emerging Markets Index.
Ultimately, a company’s ability to generate free cash flow over time is what matters for long-term returns to owners of its equity. Our research process is designed to uncover resilient companies that can sustain cash-flow growth in a variety of environments. For example, we have found durable growth in industries and geographies as diverse and challenging as retailing in Mexico and telecommunications in Kenya.
Walmart de México (Walmex) is using technology and management lessons from its US parent Walmart to reshape retailing in Mexico. The company has been consistently growing faster than its peers; in first quarter 2018 Walmex’s same-store sales growth was 10%, beating its peers overall by five percentage points.
Like its parent, Walmex keeps prices low by finding efficiencies and maximizing returns from every inch of its store space. In 2016, the company announced it would spend US$1.3 billion on logistics over three years to increase further the automation of its stores and warehouses. Proprietary mobile apps help managers train new workers, monitor product sales, and improve store operations. When scoping out locations for a new store, district managers use in-house software that estimates the competition it would face and how much of it would cannibalize Walmex’s existing stores’ business. In addition, Walmex is deploying free Wi-Fi, product-information kiosks, and self-service checkouts to enhance shoppers’ experiences.
E-commerce currently makes up only 3% of retail sales in Mexico, but the percentage is rising. Walmex’s management is aware of the potential opportunity—and the potential to be disrupted by Amazon.com and other online platforms. Walmex initially has focused on building out the infrastructure for its online grocery business, which it hopes will get its customers accustomed to shopping online. Paradoxically, one of Walmex’s biggest advantages in e-commerce may well be its 2,390 physical stores. Because of the difficulties of last-mile package delivery in Mexico, e-commerce cannot succeed (as Amazon itself realizes) without physical infrastructure, which Walmex holds in abundance.
Growth investors are rarely attracted to the wireless communications industry, for good reason. The companies must spend heavily
to build, maintain, and upgrade their vast networks, but due to intense competition, the rates they can charge for voice and data are in near-constant decline. Safaricom, Kenya’s largest mobile telecom operator, has figured out how to escape the doldrums: by leveraging its underlying technology to move beyond mobile telephony to offer services typically provided by firms in other sectors.
In 2007, Safaricom launched M-Pesa, a data platform that supports person-to-person money transfer services via cell phones. M-Pesa was designed to solve the problem of how to transfer cash easily and cheaply across long distances in a country where cash dominates daily transactions and millions of consumers lack bank accounts or, in rural areas, even access to bank branches. The company has since extended this business with other services—such as business-to-business and person-to-business money transfers—
and finding other ways to capitalize on M-Pesa’s huge customer base, which now encompasses 27 million registered users. Among the more promising is MaSoko, an e-commerce platform launched at the end of 2017 where small businesses can sell their products and get paid through M-Pesa.
While Safaricom’s voice business has matured, its overall revenue and profits should grow at double-digit rates in coming years thanks to its mobile data business, M-Pesa, and related products. The company has nearly completed building out its network, allowing free cash flow to grow even as Safaricom continues to invest in new businesses. In 2017, Kenya’s GDP grew by 4.9%, well below the previous year’s rate of 5.9%, as the economy was affected by a disputed presidential election, tight credit, and a prolonged drought. Despite these headwinds, Safaricom’s free cash flow rose 27% for its fiscal year ended March 31, 2018.
PORTFOLIO HIGHLIGHTS
Our new purchases this year included three Financials companies. India’s Kotak Mahindra Bank and Indonesia’s Bank Central Asia (BCA) share a number of positive characteristics that underpin their competitive advantages and durable growth opportunities. Both operate in countries with a large pool of potential customers who, as they climb the income ladder, are increasingly turning to banks for their financial needs. To capture those new customers, Kotak and BCA have invested heavily in technology infrastructure. Both now have market-leading online banking services that are attractive to the rising number of smartphone users in Southeast Asia. We also bought Ping An Insurance, a leading Chinese insurance company. Ping An has invested heavily to be at the forefront among Chinese insurers in deploying technology, including artificial intelligence. Its AI-powered tools help the company’s more than one million agents sell products tailored to specific types of customers. China’s rising household wealth, and consequent rising demand for insurance products, provide Ping An significant long-term growth opportunities.
In IT, we established a position in EPAM, a technology-services provider headquartered in Pennsylvania but with much of its staff based in Eastern Europe, China, and India. The company’s software developers serve the needs of global clients in a wide variety of in-
TEN LARGEST HOLDINGS at October 31, 2018
| | | | | | | | | | | | | | | | | | | | | |
| | | | | | |
| | | COMPANY | | SECTOR | | COUNTRY | | INSTITUTIONAL
HLMEX /
HLEEX | | ADVISOR
HLEMX | | |
| | | | | | |
| | SAMSUNG ELECTRONICS | | INFO TECHNOLOGY | | SOUTH KOREA | | | | 4.7 | | | | | 4.7 | | | | | | |
| | | | | | |
| | TSMC | | INFO TECHNOLOGY | | TAIWAN | | | | 4.7 | | | | | 4.7 | | | | | | |
| | | | | | |
| | TENCENT | | INFO TECHNOLOGY | | CHINA | | | | 3.2 | | | | | 3.2 | | | | | | |
| | | | | | |
| | ALIBABA | | INFO TECHNOLOGY | | CHINA | | | | 2.9 | | | | | 3.0 | | | | | | |
| | | | | | |
| | LUKOIL | | ENERGY | | RUSSIA | | | | 2.7 | | | | | 2.7 | | | | | | |
| | | | | | |
| | NOVATEK | | ENERGY | | RUSSIA | | | | 2.5 | | | | | 2.5 | | | | | | |
| | | | | | |
| | SBERBANK | | FINANCIALS | | RUSSIA | | | | 2.4 | | | | | 2.4 | | | | | | |
| | | | | | |
| | AIA GROUP | | FINANCIALS | | HONG KONG | | | | 2.3 | | | | | 2.4 | | | | | | |
| | | | | | |
| | ITAÚ UNIBANCO | | FINANCIALS | | BRAZIL | | | | 2.3 | | | | | 2.3 | | | | | | |
| | | | | | |
| | HDFC CORP | | FINANCIALS | | INDIA | | | | 2.1 | | | | | 2.1 | | | | | | |
dustries, including finance, media, and life sciences. EPAM has consistently grown revenues by over 20% per year since 2010, and the company is poised to expand its services into new areas, such as health care and tourism.
Our sales this year included Hanssem, a South Korean home-furnishings retailer. Our analyst believed its management lacked adequate foresight to anticipate and respond to industry changes—or keep up with IKEA, Williams Sonoma, and other competitors. We also sold China Mobile to make room for investments in more-appealing Chinese companies. We believe China Mobile’s growth prospects are constrained by its high subscriber penetration rate and pricing pressure on data and voice services.
Lastly, in July we sold our two holdings in Turkey because we were concerned that economic mismanagement by President Erdoğan will hurt the country’s businesses for the foreseeable future. A power-hungry leader who rejects economic orthodoxy and is unchecked by any form of accountability strikes us as very bad for business. The companies we sold—white-goods manufacturer Arçelik and Garanti Bank—are both well managed. However, Arçelik’s margins are under pressure as its costs for raw materials are denominated in US dollars. Turkish banks including Garanti rely upon external funding; further erosion of the country’s creditworthiness would impact banks’ liquidity and potentially precipitate a banking crisis. Regardless, it is difficult for banks to operate profitably in an environment of rising inflation.
Portfolio Management Team Update
Scott Crawshaw, portfolio manager on the Emerging Markets Equity strategy since 2014, became a co-lead portfolio manager on July 1, 2018, replacing Rusty Johnson. Craig Shaw continues as the other co-lead portfolio manager. Rusty remains on the EM strategy as a portfolio manager, along with Portfolio Managers Pradipta Chakrabortty and Rick Schmidt. Rusty also continues to support the strategy as an analyst of emerging markets companies. The assignment changes were made to provide Rusty with added flexibility to address a health issue.
Please read the separate disclosures page for important information, including the risks of investing in the Portfolios.

PORTFOLIO MANAGEMENT TEAM

|
PRADIPTA CHAKRABORTTY CO-LEAD PORTFOLIO MANAGER BABATUNDE OJO, CFA CO-LEAD PORTFOLIO MANAGER |
 PERFORMANCE SUMMARY
For the Frontier Emerging Markets Portfolio, the Institutional Class I fell 8.47%, the Institutional Class II fell 8.31%, and the Investor Class fell 8.75% (net of fees and expenses) in the fiscal year ended October 31, 2018. The Portfolio’s benchmark, the MSCI Frontier Emerging Markets Index, declined 10.43% (net of source taxes).
MARKET REVIEW
Stocks in frontier emerging markets (FEMs) fell in the fiscal year. Investors worried about the economic impact on FEMs of a strengthening US dollar, rising US interest rates, escalating trade tensions, and a slowdown in China. All regions except Frontier Europe and the Gulf States declined, with Latin America and Asia falling the most.
Argentina, one of the largest components of the FEM Index, was by far the worst-performing market in the fiscal year. Persistently high inflation, a currency crisis, and rising US interest rates weighed heavily on stock prices. Investors lost confidence in President Mauricio Macri’s gradual approach to economic reform, which became markedly less gradual after his government missed inflation targets and imposed an ill-considered tax on bond capital gains. Amid a less accommodative global liquidity environment, the value of the Argentine peso spiraled downward, losing 50% against the US dollar during the period. The central bank hiked interest rates significantly, while Macri cut government spending in an effort to reduce Argentina’s budget deficit. He also turned to the IMF for assistance, ultimately securing a US$50 billion aid package. Argentina suffered a worsening of its economic crisis in August following President Macri’s unexpected request to the IMF to accelerate disbursements on the US$50 billion line of credit granted in June. A precipitous sell-off of the peso ensued. Subsequently the IMF agreed to increase its support by US$7 billion and front-load payments to shore up the country’s budget in 2018 and 2019, provided Argentina caps its money supply growth and further scales back fiscal spending, with a goal of balancing the primary budget (i.e., excluding interest payments) next year. This medicine should
| | | | | | | | | | | | |
| | | |
| | FUND FACTS at October 31, 2018 | | | | | | |
| | | |
| | TOTAL NET ASSETS | | | $409.5M | | | |
| | | |
| | SALES CHARGE | | | NONE | | | |
| | | |
| | NUMBER OF HOLDINGS | | | 71 | | | |
| | | |
| | TURNOVER (5 YR. AVG.) | | | 34% | | | |
| | | |
| | REDEMPTION FEE | | | 2% FIRST 90 DAYS | | | |
| | | |
| | | DIVIDEND POLICY | | | ANNUAL | | | |
| | | | |
| | | | INSTITUTIONAL INVESTORS | | | INDIVIDUAL INVESTORS | | | |
| | | | | |
| | | | INSTL CLASS I | | INSTL CLASS II | | | INVESTOR CLASS | | | |
| | | | | |
| | TICKER | | HLFMX | | HLFFX | | | HLMOX | | | |
| | | | | |
| | CUSIP | | 412295867 | | 412295735 | | | 412295859 | | | |
| | | | | |
| | INCEPTION DATE | | 5/27/2008 | | 3/1/2017 | | | 12/31/2010 | | | |
| | | | | |
| | MINIMUM INVESTMENT1 | | $100,000 | | $10,000,000 | | | $5,000 | | | |
| | | | | |
| | NET EXPENSE RATIO | | 1.66% | | 1.35%2 | | | 2.00%2 | | | |
| | | | | |
| | GROSS EXPENSE RATIO | | 1.66% | | 1.58% | | | 2.08% | | | |
1Lower minimums available through certain brokerage firms; 2Shown net of Harding Loevner’s contractual agreement through February 28, 2019.
All Expense Ratios are as of the Prospectus dated February 28, 2018 unless otherwise noted.
achieve the desired result of quelling high inflation, but will not prevent the legacy of excessive spending and indebtedness from exacting a heavy toll on the economy, which is expected to slip into recession this year.
Europe was the best-performing region, led by Kazakhstan. Halyk Savings Bank reported accelerating loan demand, mainly from its corporate customers, and profit growth fueled by its takeover of competitor Kazkommertsbank in 2017. The Gulf States benefited from rising oil prices.
Asia declined, largely due to Pakistan and the Philippines. In Pakistan, rapidly dwindling dollar reserves prompted authorities to devalue the rupee by approximately 5% in June—the third such move since December. The weak currency and rising inflation prompted the government to hike interest rates, which is expected to slow economic growth. MCB Bank and United Bank Limited, however, stand to profit from higher interest rates as they re-price variable-interest loans; a significant proportion of their deposits do not pay interest to savers. Philippine markets fell in response to accelerating inflation and a widening trade deficit, the latter largely due to imports of machinery for President Rodrigo Duterte’s infrastructure projects.
All sectors except Information Technology (IT) and Energy fell in the fiscal year. Globant, an Argentinian technology consulting firm that designs websites and mobile apps for other companies, is thriving, despite the country’s economic crisis. Globant earns 85% of its revenues in US dollars and incurs two-thirds of its costs in pesos or other Latin American currencies. Energy performed well, as crude oil prices climbed about 21% for the
PERFORMANCE (% TOTAL RETURN)
| | | | | | | | | | | | | | | | | | | | | | | | | | | | | | | | | | | | | | | | | | | | | | | | | | | | | | | | | | |
| | | |
| | | | | for periods ended 09/30/2018 | | | for periods ended 10/31/2018 | |
| | | | | | | | | | | |
| | | | | 1
YEAR | | | 3
YEARS | | | 5
YEARS | | | 10
YEARS | | | SINCE INCEPTION* | | | 1
YEAR | | | 3
YEARS | | | 5
YEARS | | | 10
YEARS | | | SINCE INCEPTION* | |
| | May-08 | | | Mar-17 | | | Dec-10 | | | May-08 | | | Mar-17 | | | Dec-10 | |
| | | | | | | | | | | | | | | |
| | FRONTIER EM PORTFOLIO - INST CLASS I | | | -4.95 | | | | 2.82 | | | | 0.49 | | | | 2.44 | | | | -1.26 | | | | | | | | | | | | -8.47 | | | | 1.42 | | | | -0.83 | | | | 5.38 | | | | -1.65 | | | | | | | | | |
| | | | | | | | | | | | | | | |
| | FRONTIER EM PORTFOLIO - INST CLASS II | | | -4.73 | | | | – | | | | – | | | | – | | | | | | | | 5.94 | | | | | | | | -8.31 | | | | – | | | | – | | | | – | | | | | | | | 2.90 | | | | | |
| | | | | | | | | | | | | | | |
| | FRONTIER EM PORTFOLIO - INVESTOR CLASS | | | -5.21 | | | | 2.49 | | | | 0.13 | | | | – | | | | | | | | | | | | 0.84 | | | | -8.75 | | | | 1.00 | | | | -1.23 | | | | – | | | | | | | | | | | | 0.27 | |
| | | | | | | | | | | | | | | |
| | MSCI FRONTIER EM INDEX | | | -6.57 | | | | 4.86 | | | | 1.04 | | | | 0.54 | | | | – | | | | 4.33 | | | | 0.97 | | | | -10.43 | | | | 2.20 | | | | -0.46 | | | | 3.69 | | | | – | | | | 1.59 | | | | 0.43 | |
Returns are annualized for periods greater than 1 year. *Inception of the Institutional Class I, May 27, 2008. Inception of the Investor Class, December 31, 2010. Inception of the Institutional Class II, March 1, 2017. Index performance prior to December 2, 2008 cannot be shown since it relies on back-filled data.
Performance data quoted represents past performance; past performance does not guarantee future results. The investment return and principal value of an investment will fluctuate so that an investor’s shares, when redeemed, may be worth more or less than their original cost. Current performance of the Portfolio may be lower or higher than the performance quoted. Performance data current to the most recent month end may be obtained by calling (877) 435-8105 or visiting www.hardinglo-evnerfunds.com. Performance data shown does not reflect the 2.00% redemption fee imposed on shares held 90 days or less; otherwise, total returns would be reduced.
period, and global oil producers, led by Saudi Arabia and Russia, extended last year’s deal to cut oil production to the end of 2018.
In Materials, falling copper prices hurt shares of Peruvian mining companies. Investors are concerned that escalating trade tensions and slower-than-expected growth in China are sapping demand for the metal. In Colombia, Cementos Argos fell due to the continued softness of cement demand, which declined by 1.4% in the first half of 2018, according to the National Department of Statistics.
PERFORMANCE ATTRIBUTION
The Portfolio’s outperformance in the trailing twelve months was helped by good stock selection, especially in Consumer Discretionary, Materials, and Energy. In Consumer Discretionary, Saudi Arabian electronic retailer Jarir Marketing contributed to relative returns as it opened new stores and reduced costs by renegotiating supplier contracts. In Materials, we benefited most from construction steel producer Hoa Phat, which continues to gain market share and benefit from Vietnam’s strong economic growth. Energy returns were led by Colombian oil exploration and production company Ecopetrol. Increased oil production and rising oil prices boosted Ecopetrol’s revenue while a cost savings program and lower debt improved its profitability. Our poor stock selection in Financials detracted most from relative performance. Shares of Philippines-based Security Bank dropped after the commercial bank reported weak second-quarter 2018 results as loan growth slowed due to the delayed booking of certain infrastructure loans.
By geography, our holdings in Asia were the main source of our outperformance, with Hoa Phat and several companies in the Philippines providing strong relative returns. Stocks in Latin America—especially Ecopetrol and Globant—also contributed, as did stocks in Africa. The Portfolio’s overweight in Europe contributed in the fiscal year, while its allocation to frontier companies listed in developed markets detracted.
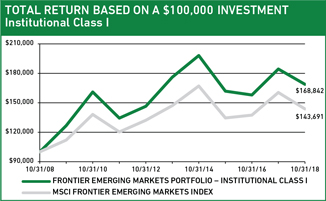
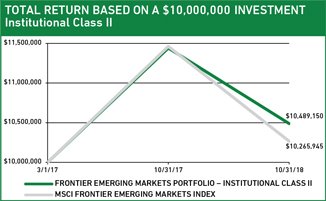
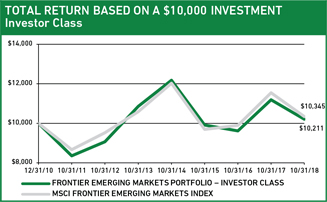
The charts above illustrate the hypothetical return of an investment made in the corresponding share classes. Investment return reflects voluntary fee waivers in effect. Absent such waivers, total return would be reduced. The performance provided in the table and charts above do not reflect the deduction of taxes that a shareholder would pay on Portfolio distributions or the redemption of Portfolio shares.
PERSPECTIVE AND OUTLOOK
Investors become nervous about frontier and emerging economies when US interest rates rise and the dollar strengthens against their currencies. Central to their concerns are how much these countries must borrow externally each year to fund their current accounts, how much they already owe to foreigners, and how much more they will have to spend to service that foreign-currency-denominated debt. Weaker currencies can also profoundly affect economies and companies. Consumers’ purchasing power declines as imports become expensive. Companies’ profit margins compress as input costs rise for raw materials and components sourced from abroad.
For investors, volatile currencies in emerging and frontier markets are a fact of life. Developing economies that are investing for growth often import more than they export, run fiscal deficits, and have significant public and private debt loads and thus have high financing and refinancing needs. Countries with high fiscal and trade deficits and significant dependence on foreign capital flows to fund them are often vulnerable to sell-offs triggered by adverse developments in local economies and financial markets or higher levels of US interest rates. Often the resulting bout of risk aversion becomes widespread and spares virtually no country. It happened in 1997–98, when an abrupt devaluation of the Thai baht led to cascading declines in currencies across Asia and later in Russia and Brazil. Five years ago, the Federal Reserve hinted that it would begin tapering bond purchases, triggering another sell-off. The story played out yet again, in the fiscal year, amid higher US rates and a strengthening greenback.
We do not know if the current situation will be contained or escalate further; yet we believe developing economies are better prepared to weather a storm. Some larger FEM countries such as the Philippines and Vietnam have bolstered their fiscal accounts, and many have built up sizable hard-currency buffers. Policy responses to crises have generally been getting better as well. For example, Egypt and Argentina, which in the past relied on administrative controls, have, with the help of the IMF, embraced market-based approaches that include controlling their fiscal spending and allowing their currencies to float freely. While
GEOGRAPHIC EXPOSURE (%) at October 31, 2018
| | | | | | | | |
| | | | |
| | | REGION | | PORTFOLIO | | BENCHMARK1 | | |
| | | | |
| | AFRICA | | 17.2 | | 15.2 | | |
| | | | |
| | ASIA | | 32.0 | | 35.2 | | |
| | | | |
| | EUROPE | | 8.1 | | 5.0 | | |
| | | | |
| | GULF STATES | | 15.8 | | 14.6 | | |
| | | | |
| | LATIN AMERICA | | 25.0 | | 28.3 | | |
| | | | |
| | MIDDLE EAST | | 0.0 | | 1.7 | | |
| | | | |
| | DEVELOPED MARKET LISTED2 | | 1.5 | | – | | |
| | | | |
| | CASH | | 0.4 | | – | | |
1MSCI Frontier Emerging Markets Index; 2Includes frontier or small emerging markets companies listed in developed markets.
SECTOR EXPOSURE (%) at October 31, 2018
| | | | | | | | |
| | | | |
| | | SECTOR | | PORTFOLIO | | BENCHMARK1 | | |
| | | | |
| | CONSUMER DISCRETIONARY | | 10.7 | | 1.4 | | |
| | | | |
| | CONSUMER STAPLES | | 13.6 | | 6.2 | | |
| | | | |
| | ENERGY | | 7.7 | | 6.3 | | |
| | | | |
| | FINANCIALS | | 34.6 | | 45.9 | | |
| | | | |
| | HEALTH CARE | | 4.6 | | 1.6 | | |
| | | | |
| | INDUSTRIALS | | 4.5 | | 7.8 | | |
| | | | |
| | INFORMATION TECHNOLOGY | | 3.3 | | 0.8 | | |
| | | | |
| | MATERIALS | | 8.0 | | 6.7 | | |
| | | | |
| | REAL ESTATE | | 5.8 | | 11.0 | | |
| | | | |
| | TELECOM SERVICES | | 6.8 | | 8.3 | | |
| | | | |
| | UTILITIES | | 0.0 | | 4.0 | | |
| | | | |
| | CASH | | 0.4 | | – | | |
1MSCI Frontier Emerging Markets Index.
FEMs are not insulated from future upheavals that are beyond their control, we believe they should be in a better position to manage them.
We do not attempt to forecast currency movements, but we monitor them closely to assess their impact on our Portfolio companies. We seek to manage currency risk by ensuring that the Portfolio we build is diversified across countries and currencies. We invest in companies with strong finances and competitive positions. While our holdings can be adversely affected by currency devaluations, because they have staying power and the pricing power that comes from bargaining power over customers, they are generally able to recover their margins over time. In most cases, they will come out of the economic crises significantly strengthened relative to their industry rivals. We illustrate this with the example of Nigeria’s Dangote Cement.
We seek to manage currency risk by ensuring that the Portfolio we build is diversified across countries and currencies. We invest in companies with strong finances and competitive positions.
Dangote Cement is Africa’s largest cement producer with 46 million tons of installed cement production capacity across 10 countries. Nigeria, Dangote’s largest and most profitable market, accounts for two-thirds of its total capacity. The majority of the company’s revenue is in naira, while approximately 60% of its costs are dollar-linked: Dangote imports machinery and spare parts from abroad, and the gas that powers its kilns is priced in US dollars. In June 2016, the naira lost 30% of its value against the dollar after Nigeria’s central bank began to liberalize its foreign exchange rate regime. Dangote’s operating costs soared, crushing its operating margin, which declined by over 20 percentage points from 2015 to the third quarter of 2016.
The Nigerian cement industry is highly consolidated with only three players, of which Dangote is by far the largest with 65% market share. As the market leader with the widest distribution reach across the country, Dangote is able to set cement prices in the market. The company used its pricing power to its advantage: starting in the second half of 2016, Dangote implemented several price increases to protect its profitability in the face of the naira’s devaluation. Dangote’s hard currency revenues generated in other African countries provided the dollars needed to fund growth outside of Nigeria. As Dangote experienced difficulty in sourcing dollars in Nigeria, where the foreign currency market was not fully liberalized until April 2017, the company ramped up production in existing markets like Tanzania and Senegal and launched new operations in Congo and Sierra Leone. The company also moved aggressively to control its costs, particularly in energy, the largest expense in cement production. By the end of 2017, Dangote converted its plants to operate on multiple fuel sources, enabling it to increase the use of locally sourced coal and reduce the use of gas and fuel oil, which are paid for in dollars and are significantly more expensive than coal.
These initiatives helped restore Dangote’s operating margins to pre-devaluation levels and positioned the company for future growth. Africa’s urban population is projected to quadruple to over 1.4 billion people by 2050, which will require more spending on housing and infrastructure—and cement.
Sharp currency swings are disruptive in the short-term to companies, including the high-quality businesses in our Portfolio, but their competitive strength, financial wherewithal, and managerial acumen should better enable them to ride out short-term turmoil and eventually return to growing their businesses.
PORTFOLIO HIGHLIGHTS
Our sector exposures—and our underweights and overweights relative to the index—are the result of our bottom-up analysis of individual companies and their competitive advantages within their industries, as well as valuation considerations. Despite the market volatility of 2018, our Portfolio’s structure has changed very little this year. Stocks in the Health Care and Consumer sectors together still account for more than a quarter of the Portfolio. In these sectors, we continue to find many high-quality, growing businesses with strong, well-established brands and superior distribution capabilities. In contrast, the paucity of our holdings in Real Estate reflects the cyclical nature of companies in the sector and their volatile cash flows. We also hold no Utilities because they lack pricing power due to the substantial influence wielded over them by regulators.
Our overall geographic weights may look similar to those of the index, but the makeup of holdings within each region is quite different. For example, stocks of Asian companies account for about a third of the Portfolio, slightly below the benchmark. Yet our holdings are substantially more diversified than the index. Because our self-imposed risk guidelines preclude us from investing more than 20% in any single market, we are underweight in
TEN LARGEST HOLDINGS at October 31, 2018
| | | | | | | | | | | | |
| | | | | |
| | | COMPANY | | SECTOR | | COUNTRY | | % | | | |
| | | | | |
| | HOA PHAT GROUP | | MATERIALS | | VIETNAM | | | 4.9 | | | |
| | | | | |
| | JOLLIBEE FOODS | | CONS DISCRETIONARY | | PHILIPPINES | | | 4.5 | | | |
| | | | | |
| | ECOPETROL | | ENERGY | | COLOMBIA | | | 4.3 | | | |
| | | | | |
| | CREDICORP | | FINANCIALS | | PERU | | | 4.3 | | | |
| | | | | |
| | JARIR MARKETING | | CONS DISCRETIONARY | | SAUDI ARABIA | | | 4.2 | | | |
| | | | | |
| | SAFARICOM | | TELECOM SERVICES | | KENYA | | | 3.9 | | | |
| | | | | |
| | AL RAJHI BANK | | FINANCIALS | | SAUDI ARABIA | | | 3.2 | | | |
| | | | | |
| | ALICORP | | CONS STAPLES | | PERU | | | 3.1 | | | |
| | | | | |
| | SM PRIME HOLDINGS | | REAL ESTATE | | PHILIPPINES | | | 3.0 | | | |
| | | | | |
| | NATIONAL BANK OF KUWAIT | | FINANCIALS | | KUWAIT | | | 2.8 | | | |
the Philippines, which constitutes 23% of the index. Instead, we are overweight in Bangladesh, Pakistan, and Thailand.
Another example of difference can be found in the Gulf States region, where our Portfolio’s weight at 15.8% is only slightly above that of the benchmark, but its composition by country and sector differs significantly. We are substantially underweight Ku-wait (another benchmark heavyweight at 11%) as we struggle to find quality companies with durable prospects for growth. The number of vibrant private-sector companies has been limited by the country’s historical dependence on hydrocarbons, its lack of economic diversity beyond the oil-and-gas industry, and the state’s significant regulation of the economy.
An exception is the National Bank of Kuwait (NBK), a Portfolio holding since 2011, to which we added during the year. NBK is Kuwait’s largest bank with roughly 30% market share. NBK’s competitive advantages include its longstanding relationships with Kuwait’s corporate sector and strong branch network throughout the Gulf States, which facilitates cross-border transactions. In addition, NBK’s solid balance sheet and investment-grade credit rating help it raise funds at a lower cost than its smaller competitors. Indeed, non-interest-bearing demand deposits comprise a substantial portion of NBK’s deposit base. As a result, NBK is expected to benefit from higher interest rates as the Central Bank of Kuwait follows the US Fed’s rate increases. In addition, the Kuwaiti government’s spending plans, which include large infrastructure projects, should support loan growth.
Please read the separate disclosures page for important information, including the risks of investing in the Portfolio.

PORTFOLIO MANAGEMENT TEAM

| | |
MOON SURANA, CFA PORTFOLIO MANAGER ANDREW WEST, CFA PORTFOLIO MANAGER | | |
PERFORMANCE SUMMARY
For the Global Equity Research Portfolio, the Institutional Class rose 2.74% and the Investor Class rose 2.49% (net of fees and expenses) in the fiscal year ended October 31, 2018. The Portfolio’s benchmark, the MSCI All Country World Index (ACWI), declined 0.52% (net of source taxes).
MARKET REVIEW
Global stock markets had a volatile fiscal year. In 2017, synchronized global economic growth helped send stock markets soaring, but declines in January and February ended the MSCI ACWI’s 15-month streak of positive monthly returns. Emerging Markets (EMs) were hit particularly hard, weighed down by weakness in China and worries that rising US interest rates and trade frictions will combine to derail growth and investment in developing economies. Markets ended the fiscal year with a sharp sell-off in late September through October, led by Information Technology (IT) stocks.
Due to the substantial tax cuts enacted in November 2017, estimates of 2018’s earnings for US companies are indicating nearly twice as much profit growth as in the rest of the world. These estimates helped propel a broad-based US market rally, with most sectors in the US finishing the fiscal year in positive territory. IT, traditionally a high-beta sector, outperformed the US index. But, unusually for a non-cyclical sector, Health Care was also strong as investor worries about government intervention in drug pricing abated, boosting large-cap pharmaceutical stocks.
The Federal Reserve hiked overnight interest rates in late September, the eighth increase since late 2015. Short-term interest rates remained below the current inflation rate, doing little to dampen growth in the US economy or in US corporate earnings. These “normalizing” rate hikes have yet to deter investors in US equities more than temporarily so far; the same cannot be said of investors in US bonds or EM equities.
EMs performed the worst in the year. Higher US short-term interest rates have been accompanied—led, even—by higher long-term rates
| | | | | | | | |
| | |
| | FUND FACTS at October 31, 2018 | | |
| | | |
| | TOTAL NET ASSETS | | $6.0M | | |
| | | | |
| | SALES CHARGE | | | | NONE | | |
| | | |
| | NUMBER OF HOLDINGS | | 261 | | |
| | | |
| | TURNOVER (5 YR. AVG.) | | – | | |
| | | |
| | REDEMPTION FEE | | 2% FIRST 90 DAYS | | |
| | | |
| | DIVIDEND POLICY | | ANNUAL | | |
| | | | |
| | | | INSTITUTIONAL INVESTORS | | INDIVIDUAL INVESTORS | | |
| | | | |
| | | | INSTITUTIONAL CLASS | | INVESTOR CLASS | | |
| | | | |
| | TICKER | | HLRGX | | HLGNX | | |
| | | | |
| | CUSIP | | 412295792 | | 412295818 | | |
| | | | |
| | INCEPTION DATE | | 12/19/2016 | | 12/19/2016 | | |
| | | | |
| | MINIMUM INVESTMENT1 | | $100,000 | | $5,000 | | |
| | | | |
| | NET EXPENSE RATIO2 | | 0.90% | | 1.15% | | |
| | | | |
| | GROSS EXPENSE RATIO | | 3.49% | | 13.36% | | |
1Lower minimums available through certain brokerage firms; 2Shown net of Harding Loevner’s contractual agreement through February 28, 2019.
All Expense Ratios are as of the Prospectus dated February 28, 2018 unless otherwise noted.
(and lower bond prices). As these higher reference yields rippled through global markets, investors punished markets in some of the developing economies most dependent on foreign capital, as borrowing costs and refinancing risks became more daunting. Severe economic crises in Turkey and Argentina raised the specter of EM contagion, the risk that investors retreat en masse from EMs.
The troubles that beset EM index heavyweight China this year were primarily domestic in origin. Government efforts to reduce leverage throughout the economy and bring transparency to the country’s unregulated lending (“shadow banking”) have, inevitably if unintentionally, slowed GDP growth. Chinese health care companies were hurt by a vaccine scandal and greater regulatory focus on decreasing the price of drugs. The escalating trade war with the US began to have significant effects, as Chinese firms postponed capital investments to improve productivity or expand capacity in the face of uncertainty. Some of the biggest share price declines, not only in EMs, but also globally, were of Chinese internet search, e-commerce, and social media businesses, predominantly domestic consumer businesses that rank among the world’s most valuable companies.
Elsewhere in the world, developed markets were mixed as investors continued to struggle with familiar problems. In Europe, investors have been contemplating a worst-case “no-deal” Brexit, with negotiations between the UK and Europe still inconclusive as the deadline approaches. In Japan, US-instigated trade friction dampened Chinese demand for Japanese machine tools and led to lower manufacturing output. However, strong corporate profits, along with the export-enhancing effects of a weaker yen and the continued strength of the Japanese labor market—and thus domestic spending—kept Japanese stocks relatively firm.
PERFORMANCE (% TOTAL RETURN)
| | | | | | | | | | | | | | | | | | | | | | | | | | |
| | | |
| | | | | for periods ended September 30, 2018 | | | for periods ended October 31, 2018 | |
| | | | | | | |
| | | | | 1
YEAR | | | 3
YEAR | | | SINCE
INCEPTION* | | | 1
YEAR | | | 3
YEAR | | | SINCE
INCEPTION* | |
| | | | | | | |
| | GLOBAL EQUITY RESEARCH PORTFOLIO - INSTITUTIONAL CLASS | | | 13.97 | | | | – | | | | 18.83 | | | | 2.74 | | | | – | | | | 13.02 | |
| | | | | | | |
| | GLOBAL EQUITY RESEARCH PORTFOLIO - INVESTOR CLASS | | | 13.64 | | | | – | | | | 18.53 | | | | 2.49 | | | | – | | | | 12.77 | |
| | | | | | | |
| | MSCI ALL COUNTRY WORLD INDEX | | | 9.77 | | | | – | | | | 15.11 | | | | -0.52 | | | | – | | | | 9.70 | |
Returns are annualized for periods greater than 1 year. *Inception of the Institutional and Investor Class, December 19, 2016.
Performance data quoted represents past performance; past performance does not guarantee future results. The investment return and principal value of an investment will fluctuate so that an investor’s shares, when redeemed, may be worth more or less than their original cost. Current performance of the Portfolio may be lower or higher than the performance quoted. Performance data current to the most recent month end may be obtained by calling (877) 435-8105 or visiting www.hardingloevnerfunds.com. Performance data shown does not reflect the 2.00% redemption fee imposed on shares held 90 days or less; otherwise, total returns would be reduced.
The charts below illustrate the hypothetical return of an investment made in the corresponding share classes. Investment return reflects voluntary fee waivers in effect. Absent such waivers, total return would be reduced. The performance provided in the table and charts above do not reflect the deduction of taxes that a shareholder would pay on Portfolio distributions or the redemption of Portfolio shares.
Style effects, once again, favored higher-quality, higher-growth, and more-expensive stocks. These effects were pronounced in the US, but not clear cut for non-US stocks. However, the preference for higher-growth (and more-expensive) stocks reversed sharply in October, both in and out of the US.
PERFORMANCE ATTRIBUTION
Stock selection, dictated as always by our analysts’ recommendations, was the primary cause of our outperformance in the quarter. Strong holdings in Industrials, IT, and Consumer Discretionary were the main contributors to relative returns. In Industrials, risk-analytics company Verisk, Chinese job-search platform 51job Inc., and engineering firm JGC Corp, stood out. In IT, we saw good performance in the software and services industry, particularly US provider of human resources software Automatic Data Processing, Indian technology consultant Infosys, and US financial services technology provider Fiserv.
In Consumer Discretionary, our strongest contributors were US companies Tractor Supply, Lululemon Athletica, and TJX. Our stocks in Real Estate (Emaar Properties) and Telecom Services (Bharti Infratel and Telecom Argentina) detracted from relative returns.
By region, our US stocks contributed the most to relative returns. EM stocks were also helpful, though our overweight to this under-performing region detracted. Our EM outperformance was thanks to several strong stocks in China, including 51job Inc. and the state oil company CNOOC. We also had good stocks in Europe ex-European Monetary Union (EMU), especially in the UK. Our single holding in the Middle East, Israeli security-software company Check Point, detracted from performance.
PERSPECTIVE AND OUTLOOK
Among the biggest contributors to China’s decline this year has been the fall in the shares of its internet giants—online retailer Alibaba, search engine Baidu, and social media and gaming
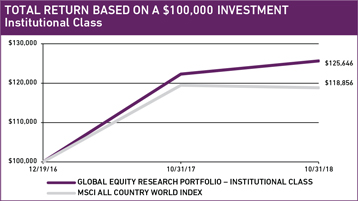
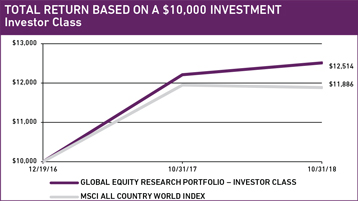
company Tencent. The reasons for their decline are not so obvious. They serve domestic rather than foreign customers, so they have little direct exposure to the ongoing trade war. They have no need to borrow, generating very strong free cash flow, as do the largest US internet companies. Yet this year, the share prices of the counterparts have diverged, the Chinese IT sector falling sharply and US IT continuing upward. The share price divergence appears to be greater than warranted by the relative deterioration evident in the Chinese companies’ competitive situation.
Indeed, the business models of the largest internet companies in China and the US are remarkably similar, as are the competitive structures of their industries in their respective home markets. They have also achieved similar growth over the last decade.
Their profitability arises from having achieved dominance with their core platforms, building on the network effects that accelerate once they reach a critical mass of users. Search results on either Google or Baidu are superior to less-used rivals because more user searches can be analyzed to improve the efficacy of the search engine. Socializing on Facebook or Tencent’s WeChat platforms becomes more appealing as more friends use the platforms. Once that self-reinforcing process is in place, the businesses can increase customer stickiness and bolster profits by pursuing additional value enhancements, such as reinvesting profits in service improvements created using machine learning to analyze users’ experience across billions of interactions. Other competitive strategies can include seeking to achieve economies of scale rapidly (i.e., spreading fixed costs over a larger revenue base) and employing product bundling strategies that increase customer loyalty, reflected in the manifold benefits of membership in Amazon. com’s Prime or Alibaba’s 88 VIP programs.
The US and Chinese internet companies also face similar challenges from increased scrutiny by regulators. The challenge, however, has been greater in China, where the government and Communist Party impose requirements to support their policies and restrict any material that may undercut their legitimacy. In August, for example, the General Administration of Press and Publication suspended approvals of new video games amid public officials’ concern about game addiction and eyesight impairment in young people. With games accounting for 35–40% of its revenues and an even larger percentage of profits, Tencent would be hurt if the license approval process becomes permanently contentious, curtailing its ability to keep its core constituency engaged with new products. This kind of regulatory intervention in China, which occurs without warning and for which there is no legal recourse, is more arbitrary and potentially more damaging than the fines the European Union levied on Google (Alphabet’s largest subsidiary), or the expensive content monitoring efforts that Face-book has been forced to adopt after public shaming.
Along with more-damaging regulatory actions, we have witnessed an intensification of rivalry among internet companies in China that has not been, so far, nearly as virulent in the US. We suspect
GEOGRAPHIC EXPOSURE (%) at October 31, 2018
| | | | | | | | |
| | | | |
| | | COUNTRY/REGION | | PORTFOLIO | | BENCHMARK1 | | |
| | | | |
| | CANADA | | 1.9 | | 3.0 | | |
| | | | |
| | EMERGING MARKETS | | 19.8 | | 10.9 | | |
| | | | |
| | EUROPE EMU | | 7.0 | | 9.7 | | |
| | | | |
| | EUROPE EX-EMU | | 13.4 | | 9.6 | | |
| | | | |
| | FRONTIER MARKETS2 | | 1.0 | | – | | |
| | | | |
| | JAPAN | | 9.4 | | 7.5 | | |
| | | | |
| | MIDDLE EAST | | 0.8 | | 0.2 | | |
| | | | |
| | PACIFIC EX-JAPAN | | 2.7 | | 3.6 | | |
| | | | |
| | UNITED STATES | | 42.4 | | 55.5 | | |
| | | | |
| | CASH | | 1.6 | | – | | |
1MSCI All Country World Index; 2Includes countries with less-developed markets outside the Index.
SECTOR EXPOSURE (%) at October 31, 2018
| | | | | | | | |
| | | | |
| | | SECTOR | | PORTFOLIO | | BENCHMARK1 | | |
| | | | |
| | CONSUMER DISCRETIONARY | | 14.1 | | 12.0 | | |
| | | | |
| | CONSUMER STAPLES | | 12.5 | | 8.4 | | |
| | | | |
| | ENERGY | | 2.8 | | 6.6 | | |
| | | | |
| | FINANCIALS | | 14.5 | | 17.4 | | |
| | | | |
| | HEALTH CARE | | 13.8 | | 12.0 | | |
| | | | |
| | INDUSTRIALS | | 13.3 | | 10.4 | | |
| | | | |
| | INFORMATION TECHNOLOGY | | 20.4 | | 19.6 | | |
| | | | |
| | MATERIALS | | 4.8 | | 4.7 | | |
| | | | |
| | REAL ESTATE | | 0.4 | | 2.9 | | |
| | | | |
| | TELECOM SERVICES | | 1.3 | | 2.9 | | |
| | | | |
| | UTILITIES | | 0.5 | | 3.1 | | |
| | | | |
| | CASH | | 1.6 | | – | | |
1MSCI All Country WorldIndex.
(without hard evidence) that there is greater propensity among Chinese internet users to switch platforms to the “new, new thing” than in the US. (After all, half of the 800 million mobile internet users in China are under the age of 30.) This willingness to switch enables new entrants, making profitability hard to sustain. Weibo (a social network) and Tencent both have lost some user attention to an emergent short-video platform, Douyin, whose active users has swelled fourfold just since last December, to 225 million.
China’s internet companies have increased spending on new services that they bundle with their existing products at no extra cost to users. They have also stepped up investments in additional areas of commerce, hoping not only to defend their existing market dominance but also to achieve new network effects.
Another factor intensifying the rivalry among China’s online leaders is that after many years of rapid internet adoption, growth in new users is harder to come by, prompting greater competition for the attention of existing users. As a result, China’s internet companies have increased spending on new services that they bundle with their existing products at no extra cost to users. They have also stepped up investments in additional areas of commerce, hoping not only to defend their existing market dominance but also to achieve new network effects. Alibaba, for example, has steadily invested in logistics and delivery, bringing its e-commerce services closer to the offline last mile in an effort to keep its customers happily tied to its platform by increasing convenience. Tencent, having declared 2018 a “year of investment,” has invested in major new games for its core platform, short-video and newsfeed platforms, expanded cloud services, its WeChat Pay mobile payment platform, and various e-commerce businesses that compete directly with Alibaba. These company strategies appear to be de-signed specifically to attract and lock in consumers through the convenience and economy of bundled services.
Offsetting this more-intense competition between the leading online players in China is an important difference that they enjoy relative to their US peers. The existing brick-and-mortar incumbents in China’s retailing, entertainment/media, and information/publishing industries are far less powerful than the incumbents in the US. Amazon must do battle with Walmart, whose revenues are three times as large and whose balance sheet resources match Amazon’s; Alibaba’s revenues are more than double those of its nearest offline competitor, while its operating cash flow is at least 10 times larger, generated from 17 times the gross merchandise value. Facebook and Netflix face off against Disney, Comcast, and Viacom, which have powerful content franchises. In China, these legacy industries were far more fragmented, if they even existed at all in private-sector form, as the mobile internet took hold over the past decade. Thus, the leading Chinese companies face a much smaller or weaker set of potential substitutes, leaving them greater firepower to direct at their online rivals or the ability to conform to government directives without irretrievably dashing profitability.
PORTFOLIO HIGHLIGHTS
The Global Equity Research Portfolio’s holdings are directly determined by analysts’ recommendations among Harding Loevner’s collection of companies under active research coverage. As we executed Portfolio changes in response to analyst ratings, we continued to adjust individual position weights to maintain our desired risk profile (moderately lower volatility compared with the benchmark and restrained tracking error). Our exposure to certain sectors and regions shifted but remained well within our self-imposed risk limits.
The existing brick-and-mortar incumbents in China’s retailing, entertainment/media, and information/publishing industries are far less powerful than the incumbents in the US.
The most significant change occurred in Health Care, where we moved from an underweight to an overweight position relative to the benchmark. Turnover was high in the sector with 18 sales on downgrades and 19 purchases on upgrades. We sold Japanese clinical laboratory equipment manufacturer Sysmex, following recent stock outperformance. We also sold Shire, a UK-based biopharmaceutical manufacturer, after Japan’s Takeda Pharmaceutical made a formal bid for the company, sending Shire’s shares to our analyst’s estimate of their fair value. Among our Health Care purchases were Japan’s Chugai Pharmaceutical, German dialysis company Fresenius Medical Care, and two manufacturers of equipment for the hearing impaired: Australia’s Cochlear (a specialist in cochlear implants) and Switzerland’s Sonova Holding (a producer of hearing aids).
In IT, our overweight position significantly decreased. Our analysts recommended selling several Chinese technology companies
TEN LARGEST HOLDINGS at October 31, 2018
| | | | | | | | | | | | |
| | | | | |
| | | COMPANY | | SECTOR | | COUNTRY | | % | | | |
| | | | | |
| | AUTOMATIC DATA PROCESSING | | INFO TECHNOLOGY | | US | | | 1.3 | | | |
| | | | | |
| | APPLE | | INFO TECHNOLOGY | | US | | | 1.3 | | | |
| | | | | |
| | FISERV | | INFO TECHNOLOGY | | US | | | 1.2 | | | |
| | | | | |
| | IQVIA | | HEALTH CARE | | US | | | 1.2 | | | |
| | | | | |
| | MCDONALD’S | | CONS DISCRETIONARY | | US | | | 1.1 | | | |
| | | | | |
| | PROCTER & GAMBLE | | CONS STAPLES | | US | | | 1.1 | | | |
| | | | | |
| | TRACTOR SUPPLY | | CONS DISCRETIONARY | | US | | | 1.1 | | | |
| | | | | |
| | GARTNER | | INFO TECHNOLOGY | | US | | | 1.1 | | | |
| | | | | |
| | MERCK | | HEALTH CARE | | US | | | 1.1 | | | |
| | | | | |
| | CHURCH & DWIGHT | | CONS STAPLES | | US | | | 1.1 | | | |
due to China’s slowing economy and escalating trade war with the US, including NetEase, an online gaming company, and Hang-zhou Hikvision, a manufacturer of video-surveillance equipment. We also decreased our exposure to Financials by about 200 basis points. Our sales included Japan’s Suruga Bank, which admitted that its employees fabricated loan documents in a failed real estate investment scheme.
We sold Japanese clinical laboratory equipment manufacturer Sysmex, following recent stock outperformance.
Another notable change was the 200 basis point increase of our weight in Consumer Discretionary. Our purchases in this sector included UK online retailer ASOS, Japanese bicycle-components manufacturer Shimano, and Mexican media company Televisa.
Viewed by region, our most significant change was an over 500 basis point increase in our weight in Europe Ex-EMU. New purchases in this region included Switzerland’s Temenos Group, which specializes in banking software that helps financial institutions automate processes and provide online services to their customers. In February, our analyst downgraded the shares after Temenos made an expensive bid for a UK financial-software company. When the deal fell through in April, the analyst upgraded the stock.
Please read the separate disclosures page for important information, including the risks of investing in the Portfolio.

PORTFOLIO MANAGEMENT TEAM
| | |
MOON SURANA, CFA PORTFOLIO MANAGER ANDREW WEST, CFA PORTFOLIO MANAGER | | |
PERFORMANCE SUMMARY
For the International Equity Research Portfolio, the Institutional Class declined 6.43% and the Investor Class declined 6.63% (net of fees and expenses) in the fiscal year ended October 31, 2018. The Portfolio’s benchmark, the MSCI All Country World (ACW) ex-US Index, declined 8.24% (net of source taxes).
MARKET REVIEW
International stock markets faced a volatile fiscal year. In 2017, synchronized global economic growth helped send stock markets soaring, but declines in January and February ended the MSCI ACW ex-US Index’s 14-month streak of positive monthly returns. Emerging Markets (EMs) were hit particularly hard, weighed down by weakness in China and worries that rising US interest rates and trade frictions will combine to derail growth and investment in developing economies. Markets ended the fiscal year with a sharp sell-off in late September through October, led by Information Technology (IT) stocks.
The Federal Reserve hiked overnight interest rates in late September, the eighth increase since late 2015. Short-term interest rates remain below the current inflation rate, doing little to dampen growth in the US economy or in US corporate earnings. These “normalizing” rate hikes have yet to deter investors in US equities more than temporarily so far; the same cannot be said of investors in US bonds or EM equities.
EMs performed the worst in the year. Higher US short-term interest rates have been accompanied—led, even—by higher long-term rates (and lower bond prices). As these higher reference yields rippled through global markets, investors have punished markets in some of the developing economies most dependent on foreign capital, as borrowing costs and refinancing risks became more daunting. Severe economic crises in Turkey and Argentina raised the specter of EM contagion, the risk that investors retreat en masse from EMs.
| | | | | | | | | | | | |
| | | |
| | FUND FACTS at October 31, 2018 | | | | | | |
| | | |
| | TOTAL NET ASSETS | | | $10.4M | | | |
| | | |
| | SALES CHARGE | | | NONE | | | |
| | | |
| | NUMBER OF HOLDINGS | | | 193 | | | |
| | | |
| | TURNOVER (5 YR. AVG.) | | | – | | | |
| | | |
| | REDEMPTION FEE | | | 2% FIRST 90 DAYS | | | |
| | | |
| | | DIVIDEND POLICY | | | ANNUAL | | | |
| | | | |
| | | | INSTITUTIONAL INVESTORS | | | INDIVIDUAL INVESTORS | | | |
| | | | | |
| | | | INSTL CLASS | | INSTL CLASS Z | | | INVESTOR CLASS | | | |
| | | | | |
| | TICKER | | HLIRX | | HLMZX | | | HLINX | | | |
| | | | | |
| | CUSIP | | 412295826 | | 412295743 | | | 412295834 | | | |
| | | | | |
| | INCEPTION DATE | | 12/17/2015 | | – | | | 12/17/2015 | | | |
| | | | | |
| | MINIMUM INVESTMENT1 | | $100,000 | | $10,000,000 | | | $5,000 | | | |
| | | | | |
| | NET EXPENSE RATIO2 | | 0.90% | | 0.90% | | | 1.15% | | | |
| | | | | |
| | GROSS EXPENSE RATIO | | 2.26% | | 1.88% | | | 6.49% | | | |
1Lower minimums available through certain brokerage firms; 2Shown net of Harding Loevner’s contractual agreement through February 28, 2019.
All Expense Ratios are as of the Prospectus dated February 28, 2018 unless otherwise noted.
The troubles that beset EM index heavyweight China this year were primarily domestic in origin. Government efforts to reduce leverage throughout the economy and bring transparency to the country’s unregulated lending (“shadow banking”) have, inevitably if unintentionally, slowed GDP growth. Chinese health care companies were hurt by a vaccine scandal and greater regulatory focus on decreasing the price of drugs. The escalating trade war with the US is beginning to have significant effects, as Chinese firms postpone capital investments to improve productivity or expand capacity in the face of uncertainty. Some of the biggest share price declines, not only in EMs, but also globally, were of Chinese internet search, e-commerce, and social media companies, predominantly domestic consumer businesses that rank among the world’s most valuable companies.
Elsewhere in the world, developed markets were mixed as investors continued to struggle with familiar problems. In Europe, investors are contemplating a worst-case “no-deal” Brexit, with negotiations between the UK and Europe still inconclusive as the deadline approaches. However, the UK market experienced only a relatively modest decline this year, supported by the performance of its important multinational pharmaceutical companies, which rallied alongside their American counterparts. US-instigated trade friction dampened Chinese demand for Japanese machine tools and led to lower manufacturing output in Japan. However, strong corporate profits, along with the export-enhancing effects of a weaker yen and the continued strength of the Japanese labor market, and thus domestic spending, kept Japanese stocks relatively firm.
Style effects showed significant outperformance from high-growth stocks until late summer, but that effect reversed viciously
PERFORMANCE (% TOTAL RETURN)
| | | | | | | | | | | | | | | | | | | | | | | | | | |
| | | |
| | | | | for periods ended September 30, 2018 | | | for periods ended October 31, 2018 | |
| | | | | | | |
| | | | | 1 YEAR | | | 3 YEARS | | | SINCE
INCEPTION* | | | 1
YEAR | | | 3
YEARS | | | SINCE
INCEPTION* | |
| | | | | | | |
| | INTL EQUITY RESEARCH PORTFOLIO - INSTITUTITONAL CLASS | | | 5.35 | | | | – | | | | 12.77 | | | | -6.43 | | | | – | | | | 8.67 | |
| | | | | | | |
| | INTL EQUITY RESEARCH PORTFOLIO - INVESTOR CLASS | | | 5.12 | | | | – | | | | 12.49 | | | | -6.63 | | | | – | | | | 8.42 | |
| | | | | | | |
| | MSCI ALL COUNTRY WORLD EX-US INDEX | | | 1.76 | | | | – | | | | 9.77 | | | | -8.24 | | | | – | | | | 6.28 | |
Returns are annualized for periods greater than 1 year. *Inception of the Institutional and Investor Class, December 17, 2015.
Performance data quoted represents past performance; past performance does not guarantee future results. The investment return and principal value of an investment will fluctuate so that an investor’s shares, when redeemed, may be worth more or less than their original cost. Current performance of the Portfolio may be lower or higher than the performance quoted. Performance data current to the most recent month end may be obtained by calling (877) 435-8105 or visiting www.hardingloevnerfunds.com. Performance data shown does not reflect the 2.00% redemption fee imposed on shares held 90 days or less; otherwise, total returns would be reduced.
The charts below illustrate the hypothetical return of an investment made in the corresponding share classes. Investment return reflects voluntary fee waivers in effect. Absent such waivers, total return would be reduced. The performance provided in the table and charts above do not reflect the deduction of taxes that a shareholder would pay on Portfolio distributions or the redemption of Portfolio shares.

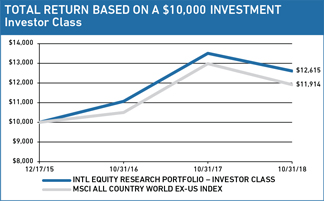
in the final three months of the fiscal year. The most-expensive stocks also outperformed strongly, with a similar reversal. The highest-quality cohort performed the best, but there was not a clear preference for higher quality across the market.
PERFORMANCE ATTRIBUTION
Stock selection, dictated as always by our analysts’ recommendations, was the primary cause of our outperformance in the fiscal year. Strong holdings in IT, Consumer Discretionary, and Materials were the main contributors to relative returns. In IT, we saw good performance in the software and services industry, particularly Dassault Systèmes, a 3D-design software developer that has enjoyed robust demand for its software platform. Japanese e-commerce platform Kakaku.com also contributed. The company has benefited from strengthening ad revenues and web traffic. In Consumer Discretionary, our strongest contributors were three Japanese companies: advertising agency Hakuhodo, shoe retailer ABC-MART, and clothing retailer Fast Retailing. In Materials, Danish producer of cultures, enzymes, and natural food ingredients Chr. Hansen, German industrial-gas producer Linde, and German flavors and fragrances supplier Symrise contributed the most. Our stocks in Telecom Services (Bharti Infratel and Telecom Argentina) and Real Estate (Emaar Properties) detracted from relative returns.
By region, our stocks in the eurozone, especially France and Germany, contributed the most to relative returns. Our EM stocks also contributed, though our overweight to this underperforming region detracted. Indian technology consultant Infosys and Chinese online job-search portal 51job Inc. helped performance. Our single holding in the Middle East, security-software company Check Point, detracted from performance.
PERSPECTIVE AND OUTLOOK
Among the biggest contributors to China’s decline this year has been the fall in the shares of its internet giants—Alibaba, Baidu, and Tencent. The reasons for their decline are not so obvious. They serve domestic rather than foreign customers, so they have little direct exposure to the ongoing trade war. They have no need to borrow, generating very strong free cash flow, as do the largest US internet companies. Yet this year, the share prices of the counterparts have diverged, the Chinese IT sector falling sharply and US IT continuing upward. The share price divergence appears to be greater than warranted by the relative deterioration evident in the Chinese companies’ competitive situation.
Indeed, the business models of the largest internet companies in China and the US are remarkably similar, as are the competitive structures of their industries in their respective home markets. They have also achieved similar growth over the last decade.
Their profitability arises from having achieved dominance with their core platforms, building on the network effects that accelerate once they reach a critical mass of users. Search results on either Google or Baidu are superior to less-used rivals because more user searches can be analyzed to improve the efficacy of the search engine. Socializing on Facebook or Tencent’s WeChat platforms becomes more appealing as more friends use the platform. Likewise, Instagram or Weibo becomes more attractive to users as more opinion leaders choose it to establish their presence, and more valuable to advertisers as more followers join the audience. Once that self-reinforcing process is in place, the businesses can increase customer stickiness and bolster profits by pursuing additional value enhancements, such as reinvesting profits in service improvements created using machine learning to analyze users’ experience across billions of interactions. Other competitive strategies can include seeking to achieve economies of scale rapidly (i.e., spreading fixed costs over a larger revenue base) and employing product bundling strategies that increase customer loyalty, reflected in the manifold benefits of membership in Amazon’s Prime or Alibaba’s 88 VIP programs.
The US and Chinese internet companies also face similar challenges from regulators. The challenge, however, has been greater in China, where the government and Communist Party impose requirements to support their policies and restrict any material that may undercut their legitimacy. In August, for example, the General Administration of Press and Publication suspended approvals of new video games amid public officials’ concern about game addiction and eyesight impairment in young people. With games accounting for 35–40% of its revenues and an even larger percentage of profits, Tencent would be hurt if the license approval process becomes permanently contentious, curtailing its ability to keep its core constituency engaged with new products. For Weibo, the tighter regulatory environment is leading to higher operational costs. The regulator now requires that content feeds pass through government servers before being broadcast, and that in-house teams that monitor and censor material be expanded. Weibo’s key opinion leaders have been intimidated by aggressive government policing of behavior such as voicing unsanctioned political views. The effect of such state
GEOGRAPHIC EXPOSURE (%) at October 31, 2018
| | | | | | | | |
| | | | |
| | | COUNTRY/REGION | | PORTFOLIO | | BENCHMARK1 | | |
| | | | |
| | CANADA | | 2.8 | | 6.7 | | |
| | | | |
| | EMERGING MARKETS | | 31.1 | | 24.6 | | |
| | | | |
| | EUROPE EMU | | 14.1 | | 21.8 | | |
| | | | |
| | EUROPE EX-EMU | | 24.9 | | 21.6 | | |
| | | | |
| | FRONTIER MARKETS2 | | 1.6 | | – | | |
| | | | |
| | JAPAN | | 16.5 | | 16.9 | | |
| | | | |
| | MIDDLE EAST | | 0.9 | | 0.4 | | |
| | | | |
| | PACIFIC EX-JAPAN | | 5.7 | | 8.0 | | |
| | | | |
| | CASH | | 1.3 | | – | | |
| | | | |
| | OTHER3 | | 1.1 | | – | | |
1MSCI All Country World Index; 2Includes countries with less-developed markets outside the Index; 3Includes countries classified in countries outside the Index.
SECTOR EXPOSURE (%) at October 31, 2018
| | | | | | | | |
| | | | |
| | | SECTOR | | PORTFOLIO | | BENCHMARK1 | | |
| | | | |
| | CONSUMER DISCRETIONARY | | 14.8 | | 10.7 | | |
| | | | |
| | CONSUMER STAPLES | | 14.6 | | 9.8 | | |
| | | | |
| | ENERGY | | 4.7 | | 7.8 | | |
| | | | |
| | FINANCIALS | | 19.5 | | 22.3 | | |
| | | | |
| | HEALTH CARE | | 8.3 | | 8.6 | | |
| | | | |
| | INDUSTRIALS | | 16.0 | | 11.8 | | |
| | | | |
| | INFORMATION TECHNOLOGY | | 10.8 | | 11.1 | | |
| | | | |
| | MATERIALS | | 6.1 | | 7.8 | | |
| | | | |
| | REAL ESTATE | | 1.7 | | 3.1 | | |
| | | | |
| | TELECOM SERVICES | | 1.2 | | 3.9 | | |
| | | | |
| | UTILITIES | | 1.0 | | 3.1 | | |
| | | | |
| | CASH | | 1.3 | | – | | |
1MSCI All Country World Index.
intrusion may be to suppress content production and dull user engagement, degrading the platform’s vitality and its attractiveness to advertisers. This kind of regulatory intervention in China, which occurs without warning and for which there is no legal recourse, is more arbitrary and potentially more damaging than the fines levied on Google by the European Union, or the expensive content monitoring efforts that Facebook has been forced to adopt after public shaming.
Along with more-damaging regulatory actions, we have witnessed an intensification of rivalry among internet companies in China that has not been, so far, nearly as virulent in the US. We suspect (without hard evidence) that there is greater propensity among Chinese internet users to switch platforms to the “new, new thing” than in the US. (After all, half of the 800 million mobile internet users in China are under the age of 30.) This willingness to switch enables new entrants, making profitability hard to sustain. Weibo and Tencent both have lost some user attention to an emergent short video platform, Douyin, whose active users has swelled fourfold just since last December, to 225 million.
Another factor intensifying the rivalry among China’s online leaders is that after many years of rapid internet adoption, growth in new users is harder to come by, prompting greater competition for the attention of the existing users. As a result, China’s internet companies have increased spending on new services that they bundle with their existing products at no extra cost to users. They have also stepped up investments in additional areas of commerce, hoping not only to defend their existing market dominance but also to achieve new network effects. Alibaba, for example, has steadily invested in logistics and delivery, bringing its e-commerce closer to the offline last mile, trying to keep its customers happily tied to its platform by increasing convenience. Tencent, having declared 2018 a “year of investment,” has invested in major new games for its core platform, short-video and newsfeed platforms, expanding cloud services, its WeChat Pay mobile payment platform, and in various e-commerce businesses that compete directly with Alibaba. These company strategies appear to be designed specifically to attract and lock in consumers through the convenience and economy of bundled services.
Offsetting this more-intense competition between the leading online players in China is an important difference that they enjoy relative to their US peers. The existing brick-and-mortar incumbents in China’s retailing, entertainment/media, and information/publishing industries are far less powerful than the incumbents in the US. Amazon must do battle with Walmart, whose revenues are three times as large and whose balance sheet resources match Amazon’s; Alibaba’s revenues are more than double those of its nearest offline competitor, while its operating cash flow is at least 10 times larger, generated from 17 times the gross merchandise value. Facebook and Netflix face off against Disney, Comcast, and Viacom, which have powerful content franchises. In China, these legacy industries were far more fragmented, if they even existed at all in private-sector form, as the mobile internet took hold over the past decade. Thus, the leading Chinese companies face a much smaller or weaker set of potential substitutes, leaving them greater firepower to direct at their online rivals or the ability to conform to government directives without irretrievably dashing profitability.
PORTFOLIO HIGHLIGHTS
The International Equity Research Portfolio’s holdings are directly determined by analysts’ recommendations among Harding Loevner’s collection of companies under active research coverage. As we executed these Portfolio changes in response to analyst ratings, we continued to adjust individual position weights to maintain our desired risk profile (moderately lower volatility compared with the benchmark and restrained tracking error). Our exposure to certain sectors and regions shifted but remained well within our self-imposed risk limits.
The most significant change occurred in IT, where we moved from an overweight to underweight position for the first time since our Portfolio’s inception nearly three years ago. Our analysts recommended selling several Chinese technology companies due to China’s slowing economy and escalating trade war with the US, including NetEase, an online gaming company, and Hangzhou Hikvision, a manufacturer of video-surveillance equipment. We also sold Indian technology consultant Infosys after strong share-price performance.
We decreased our exposure to Industrials by 175 basis points. We sold the Australian online jobsite SEEK and UK technical-services provider Diploma after both became expensive following stock price rises. We also sold Brazilian toll road operator CCR out of growth concerns. The company has several significant road concessions expiring in three years and appears unlikely to replace them without taking on more debt.
Although our absolute weight in Health Care changed only modestly, turnover was high in the sector. We sold Japanese clinical laboratory equipment manufacturer Sysmex, following recent stock outperformance. We also sold Shire, a UK-based
TEN LARGEST HOLDINGS at October 31, 2018
| | | | | | | | | | | | |
| | | | | |
| | | COMPANY | | SECTOR | | COUNTRY | | % | | | |
| | | | | |
| | DIAGEO | | CONS STAPLES | | UK | | | 1.2 | | | |
| | | | | |
| | LINDE | | MATERIALS | | US | | | 1.1 | | | |
| | | | | |
| | ROYAL DUTCH SHELL | | ENERGY | | UK | | | 1.1 | | | |
| | | | | |
| | CANADIAN NATIONAL RAILWAY | | INDUSTRIALS | | CANADA | | | 1.1 | | | |
| | | | | |
| | ALLIANZ | | FINANCIALS | | GERMANY | | | 1.1 | | | |
| | | | | |
| | SM PRIME HOLDINGS | | REAL ESTATE | | PHILIPPINES | | | 1.1 | | | |
| | | | | |
| | SHIMANO | | CONS DISCRETIONARY | | JAPAN | | | 1.1 | | | |
| | | | | |
| | ASSA ABLOY | | INDUSTRIALS | | SWEDEN | | | 1.1 | | | |
| | | | | |
| | ROCHE | | HEALTH CARE | | SWITZERLAND | | | 1.1 | | | |
| | | | | |
| | ABC-MART | | CONS DISCRETIONARY | | JAPAN | | | 1.0 | | | |
biopharmaceutical manufacturer, after Japan’s Takeda Pharmaceutical made a formal bid for the company, sending Shire’s shares to our analyst’s estimate of their fair value. Among our Health Care purchases were Japan’s Chugai Pharmaceutical, German dialysis company Fresenius Medical Care, and two manufacturers of equipment for the hearing impaired—Australia’s Cochlear (a specialist in cochlear implants), and Switzerland’s Sonova Holding (a producer of hearing aids).
Another notable change was the 4% increase of our weight in Consumer Staples. Our purchases in this sector included four Japanese companies (cosmetics companies Kao and Shiseido, diaper company Unicharm, and drugstore chain operator Sugi Holdings). Our weight in Financials also increased. Our new purchases included UK-based Rathbone Bros and Jardine Lloyd Thompson and Italy’s Fineco. We added to other underperforming Financials, including India’s Max Financial, the UK’s St. James’s Place, and the Philippines’ Security Bank.
Viewed by region, our most significant change was a 5% increase in our weight in Europe Ex-EMU. New purchases in this region included Switzerland’s Temenos Group, which specializes in banking software that helps financial institutions automate processes and provide online services to their customers. In February, our analyst downgraded the shares after Temenos made an expensive bid for a UK financial-software company. When the deal fell through in April, the analyst upgraded the stock.
Please read the separate disclosures page for important information, including the risks of investing in the Portfolio.

PORTFOLIO MANAGEMENT TEAM

| | |
MOON SURANA, CFA PORTFOLIO MANAGER ANDREW WEST, CFA PORTFOLIO MANAGER | | |
PERFORMANCE SUMMARY
The Emerging Markets Research Portfolio – Institutional Class fell 10.24% and the Investor Class fell 10.51% (net of fees and expenses) in the fiscal year ended October 31, 2018. The Portfolios’ benchmark, the MSCI Emerging + Frontier Markets Index, fell 12.51% (net of source taxes) in this period.
MARKET REVIEW
The fiscal year began positively, with emerging markets (EMs) up about 14% through the end of January. But EMs fell nearly 25% during much of the rest of the period as global trade tensions escalated, US interest rates rose, the dollar strengthened, and investors grew concerned about the prospects for continued growth, notably in China. In the end, every sector except Energy fell, and over two-thirds of the markets in the index posted losses.
The Chinese market—the largest by far in the index—fell over 30% from its high in January. China’s economic momentum slowed for much of the year as a side effect of the government’s efforts to reduce its reliance on borrowed money and to clamp down especially on unregulated “shadow” lending. An escalating trade war with the US started to have an impact, too, as Chinese firms postponed new capital investments. Arguably the most critical factor was a tightening of regulations impacting businesses in key industries such as health care, online games, and social media—home to some of China’s fastest-growing businesses. The sharp reduction in growth expectations and shares prices for large and growing Chinese companies also dampened confidence in EMs more broadly.
In Europe, Turkey’s financial stresses erupted into a full-blown crisis. The lira fell just over 30% in the fiscal year as lenders and equity investors were repulsed by the erratic, unorthodox policies of the increasingly authoritarian president, Recep Tayyip Erdoğan, whose expressed economic views include that higher interest rates cause inflation. In Russia, rising oil prices helped buoy the economy and the equity market, and offset the negative impact on shares of the sanctions imposed on Russia by the US and Europe.
| | | | | | |
| |
FUND FACTS at October 31, 2018 | | |
| | | |
TOTAL NET ASSETS | | | | $6.5M | | |
| | | |
SALES CHARGE | | | | NONE | | |
| | | |
NUMBER OF HOLDINGS | | | | 121 | | |
| | | |
TURNOVER (5 YR. AVG.) | | | | — | | |
| | | |
REDEMPTION FEE | | | | 2% FIRST 90 DAYS | | |
| | | |
DIVIDEND POLICY | | | | ANNUAL | | |
| | | |
| | INSTITUTIONAL INVESTORS | | INDIVIDUAL INVESTORS | | |
| | | |
| | INSTITUTIONAL CLASS | | INVESTOR CLASS | | |
| | | |
TICKER | | HLREX | | HLENX | | |
| | | |
CUSIP | | 412295776 | | 412295784 | | |
| | | |
INCEPTION DATE | | 12/19/2016 | | 12/19/2016 | | |
| | | |
MINIMUM INVESTMENT1 | | $100,000 | | $5,000 | | |
| | | |
NET EXPENSE RATIO2 | | 1.30% | | 1.55% | | |
| | | |
GROSS EXPENSE RATIO | | 3.72% | | 12.64% | | |
1Lower minimums available through certain brokerage firms; 2Shown net of Harding Loevner’s contractual agreement through February 28, 2019.
All Expense Ratios are as of the Prospectus dated February 28, 2018 unless otherwise noted.
Latin America, the best-performing major region, was led by Peru and Brazil. At the end of the year, investors welcomed the election of Jair Bolsonaro to Brazil’s presidency, hoping his hardline approach will reduce crime and corruption, and that he will cut the fiscal deficit by reducing social spending.
Higher oil prices were not a positive for India, which began to feel the burden of more costly energy imports. The rising cost of diesel exacerbated a farming crisis started by high fertilizer prices and low crop prices. India’s banking system was also shaken when IL&FS, a large infrastructure lender, defaulted on US$13 billion of debt in September.
By sector, Energy was the only source of positive returns in this period. Oil prices were bolstered by an agreement by OPEC members in June to boost production only moderately, falling oil production in Venezuela, and pending US sanctions against Iran. The Materials sector, while negative, outperformed the index, led by iron and steel companies in Brazil and chemical companies in Asia. Financials also outperformed, with strong share prices for banks in Brazil and Taiwan.
Consumer Discretionary declined the most in the fiscal year partly due to weakness in China’s automotive and e-commerce stocks, as well as shares of South Africa’s Naspers, a major shareholder of Chinese online-game giant Tencent. Information Technology (IT) was also weak, with declines in Chinese internet and hardware stocks. Furthermore, Industrials lagged the index as confidence in the outlook for global EM growth waned.
PERFORMANCE ATTRIBUTION
The Portfolio declined in absolute terms but outperformed the
PERFORMANCE (% TOTAL RETURN)
| | | | | | | | | | | | | | | | | | | | | | | | | | |
| | | |
| | | | | for periods ended September 30, 2018 | | | for periods ended October 31, 2018 | |
| | | | | | | |
| | | | | 1 YEAR | | | 3 YEAR | | | SINCE
INCEPTION* | | | 1 YEAR | | | 3
YEAR | | | SINCE
INCEPTION* | |
| | | | | | | |
| | EMERGING MARKETS RESEARCH PORTFOLIO - INSTL CLASS | | | -1.75 | | | | – | | | | 13.89 | | | | -10.24 | | | | – | | | | 8.67 | |
| | | | | | | |
| | EMERGING MARKETS RESEARCH PORTFOLIO - INVESTOR CLASS | | | -2.01 | | | | – | | | | 13.62 | | | | -10.51 | | | | – | | | | 8.40 | |
| | | | | | | |
| | MSCI EMERGING + FRONTIER MARKETS INDEX | | | -0.97 | | | | – | | | | 15.09 | | | | -12.51 | | | | – | | | | 8.98 | |
Returns are annualized for periods greater than 1 year. *Inception of the Institutional and Investor Class, December 19, 2016.
Performance data quoted represents past performance; past performance does not guarantee future results. The investment return and principal value of an investment will fluctuate so that an investor’s shares, when redeemed, may be worth more or less than their original cost. Current performance of the Portfolio may be lower or higher than the performance quoted. Performance data current to the most recent month end may be obtained by calling (877) 435-8105 or visiting www.hardingloevnerfunds.com. Performance data shown does not reflect the 2.00% redemption fee imposed on shares held 90 days or less; otherwise, total returns would be reduced.
The charts below illustrate the hypothetical return of an investment made in the corresponding share classes. Investment return reflects voluntary fee waivers in effect. Absent such waivers, total return would be reduced. The performance provided in the table and charts above do not reflect the deduction of taxes that a shareholder would pay on Portfolio distributions or the redemption of Portfolio shares.
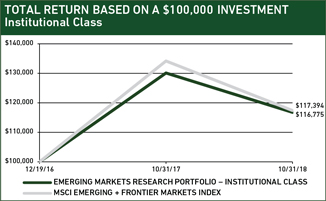
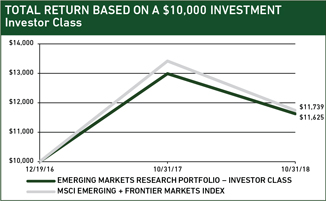
benchmark due to both good stocks and favorable allocations among sectors and markets. Stock selection was dictated as always by our analysts’ recommendations. Key contributors included our Consumer Discretionary holdings and our underweight in IT. But relative returns were hurt by our overweight in Consumer Discretionary and weak stocks in IT.
Chinese textile manufacturer Shenzhou International and Indo-nesian conglomerate Astra International were strong holdings in Consumer Discretionary. Shenzhou International has been improving its efficiency by increasing the level of automation in its operations, expanding its Vietnamese factory, and upgrading its production facilities at its Ningbo, China headquarters. These investments are expected to further strengthen the company’s competitive position by accelerating the development and delivery of products to key global clients such as Nike. Astra International, which manufactures and distributes Honda motorcycles and Toy-ota cars, had strong operating results during the year amid rising demand for automobiles. Profits also rose for the company’s heavy equipment division.
Poor holdings in IT included three companies that supply specialty components to smartphone manufacturers: China’s Sunny Optical (optical components) and AAC Technologies (speakers and acoustic equipment) as well as Taiwan’s Largan Precision (high-quality lenses). All three suffered a slowdown in sales; AAC and Largan are suppliers to Apple and were hurt by weak iPhone sales. South Korean internet search and social media platform NAVER also de-tracted, as its investments in redesigning and promoting its apps to combat rising competition have cut into earnings.
From a geographic perspective, we outperformed the lagging Chinese market, due partly to Shenzhou International and drug manufacturer Sino Biopharmaceutical. Shares of the latter rose sharply as successful drug trials and regulatory approvals led to an acceleration in revenue projections. In South Africa, Clicks Group, a leading health and beauty retail chain, enjoyed solid profit growth and has been expanding its number of stores. In Frontier Markets, Jarir Marketing—Saudia Arabia’s leading retailer of office supplies, books, and electronic products—was also a positive contributor.
By far the largest detractor by country was Brazil. Shares of energy conglomerate Ultrapar fell as the company faced a number of issues related to its fuel distribution business, including weak sales and concerns that regulators may seek to increase competition in the industry. Beer giant Ambev’s stock fell on concerns about declining sales growth.
INVESTMENT PERSPECTIVES
At the start of 2018, investors cheered the return of synchronized global growth: in 2017, all 45 OECD economies expanded simultaneously for the first time since the global financial crisis. As of the end of October, the mood has darkened, with much of the concern focused on China. Risks to growth in the world’s sec-
ond-largest economy appear to be rising amid the escalating trade war and the Chinese government’s policies to reduce the country’s reliance on debt. If China stumbles, other EMs that have benefited from the country’s demand will follow. Global economic growth will become increasingly dependent on growth in the US, which is running out of available labor and where the Federal Reserve is raising interest rates.
Economic expansion, of course, helps businesses’ revenues and profits. But it isn’t the only source of a company’s potential growth. Some industries expand faster than others, and some businesses grow faster than the rest of their industry. Companies that have competitive advantages like strong bargaining power over suppliers, differentiated products with pricing power over customers, and strong management teams tend to sustain faster growth. Some companies are innovative, deploying technology creatively to take advantage of changes in their industries—or even to refashion those industries. These competitive qualities do not immunize companies from the ill effects of economic malaise, but they do help them better to withstand it and better to position themselves to resume fast growth in a more favorable environment in the future.
Ultimately, a company’s ability to generate free cash flow over time is what matters for long-term returns to owners of its equity. Our research process is designed to uncover resilient companies that can sustain cash-flow growth in a variety of environments. In recent years, we have owned fast-growing Chinese IT, e-commerce, and health care businesses. But we have also found durable growth in industries and geographies as diverse and challenging as retailing in Mexico and telecommunications in Kenya. Amid the challenging economies and industries in which they operate, these companies are enhancing their competitive positions, tapping into new growth opportunities, and generating cash.
Walmart de México (Walmex) is using technology and management lessons from its US parent Walmart to reshape retailing in
GEOGRAPHIC EXPOSURE (%) at October 31, 2018
| | | | | | | | |
| | | | |
| | | COUNTRY/REGION | | PORTFOLIO | | BENCHMARK1 | | |
| | | | |
| | BRAZIL | | 8.2 | | 7.8 | | |
| | | | |
| | CHINA | | 21.8 | | 29.4 | | |
| | | | |
| | INDIA | | 10.6 | | 8.5 | | |
| | | | |
| | MEXICO | | 7.0 | | 2.8 | | |
| | | | |
| | RUSSIA | | 6.0 | | 3.8 | | |
| | | | |
| | SOUTH AFRICA | | 4.6 | | 5.8 | | |
| | | | |
| | SOUTH KOREA | | 6.5 | | 13.6 | | |
| | | | |
| | TAIWAN | | 5.6 | | 11.6 | | |
| | | | |
| | SMALL EMERGING MARKETS2 | | 17.4 | | 14.4 | | |
| | | | |
| | FRONTIER MARKETS | | 10.7 | | 2.3 | | |
| | | | |
| | DEVELOPED MARKET LISTED3 | | 0.4 | | – | | |
| | | | |
| | CASH | | 1.2 | | – | | |
1MSCI Emerging + Frontier Markets Index; 2Includes the remaining emerging markets which, individually, comprise less than 5% of the Index; 3Includes emerging markets or frontier markets companies listed in developed markets.
SECTOR EXPOSURE (%) at October 31, 2018
| | | | | | | | |
| | | | |
| | | SECTOR | | PORTFOLIO | | BENCHMARK1 | | |
| | | | |
| | CONSUMER DISCRETIONARY | | 16.7 | | 8.5 | | |
| | | | |
| | CONSUMER STAPLES | | 18.5 | | 6.6 | | |
| | | | |
| | ENERGY | | 8.1 | | 8.6 | | |
| | | | |
| | FINANCIALS | | 26.9 | | 24.9 | | |
| | | | |
| | HEALTH CARE | | 1.8 | | 2.9 | | |
| | | | |
| | INDUSTRIALS | | 4.5 | | 5.4 | | |
| | | | |
| | INFORMATION TECHNOLOGY | | 11.3 | | 24.9 | | |
| | | | |
| | MATERIALS | | 3.1 | | 7.7 | | |
| | | | |
| | REAL ESTATE | | 2.2 | | 3.0 | | |
| | | | |
| | TELECOM SERVICES | | 4.1 | | 4.9 | | |
| | | | |
| | UTILITIES | | 1.6 | | 2.6 | | |
| | | | |
| | CASH | | 1.2 | | – | | |
1MSCI Emerging + Frontier Markets Index.
Mexico. The company has been consistently growing faster than its peers; in first quarter 2018 Walmex’s same-store sales growth was 10%, beating its peers overall by five percentage points.
Like its parent, Walmex keeps prices low by finding efficiencies and maximizing returns from every inch of its store space. In 2016, the company announced it would spend US$1.3 billion on logistics over three years to increase further the automation of its stores and warehouses. Proprietary mobile apps help managers train new workers, monitor product sales, and improve store operations. When scoping out locations for a new store, district managers use in-house software that estimates the competition it would face and how much of Walmex’s existing stores’ business it would cannibalize. In addition, Walmex is deploying free Wi-Fi, product-information kiosks, and self-service checkouts to enhance shoppers’ experiences.
E-commerce currently makes up only 3% of retail sales in Mexico, but the percentage is rising. Walmex’s management is aware of the potential opportunity—and the potential to be disrupted by Amazon.com and other online platforms. Walmex initially focused on building out the infrastructure for its online grocery business, which it hopes will get its customers accustomed to shopping online. Paradoxically, one of Walmex’s biggest advantages in e-commerce may well be its 2,390 physical stores. Because of the difficulties of last-mile package delivery in Mexico, e-commerce cannot succeed (as Amazon itself realizes) without physical infrastructure, which Walmex holds in abundance.
Growth investors are rarely attracted to the wireless communications industry, for good reason. The companies must spend heavily to build, maintain, and upgrade their vast networks, but due to intense competition the rates they can charge for voice and data are in near-constant decline. Safaricom, Kenya’s largest mobile telecom operator, has figured out how to escape the doldrums: by leveraging its underlying technology to move beyond mobile telephony to offer services typically provided by firms in other sectors. In 2007, Safaricom launched M-Pesa, a data platform that supports person-to-person money transfer services via cell phones.
M-Pesa was designed to solve the problem of how to transfer cash easily and cheaply across long distances in a country where cash dominates daily transactions and millions of consumers lack bank accounts or, in rural areas, even access to bank branches. The company has since extended this business with other services, notably business-to-business and person-to-business money transfers. There is ample room for continued growth in electronic payments as nationally eight out of ten transactions are still settled in cash.
Safaricom is taking initiatives to capitalize on M-Pesa’s huge customer base, which now encompasses 27 million registered users. Among the more promising is MaSoko, an e-commerce platform launched at the end of 2017 where small businesses can sell their products and get paid through M-Pesa. Another service under development is Digifarm, which will help farmers obtain higher prices by connecting them directly to markets, bypassing middlemen. The company is also rolling out a health care application called M-Tiba, which guides people to high-quality primary care centers that accept M-Pesa.
While Safaricom’s voice business has matured, its overall revenue and profits should grow at double-digit rates in coming years thanks to its mobile data business, M-Pesa, and related products. The company has nearly completed building out its network, allowing free cash flow to grow even as Safaricom continues to invest in new businesses. In 2017, Kenya’s GDP grew by 4.9%, well below the previous year’s rate of 5.9%, as the economy was affected by a disputed presidential election, tight credit, and a prolonged drought. Despite these headwinds, Safaricom’s free cash flow rose 27% for its fiscal year ended March 31.
PORTFOLIO HIGHLIGHTS
The Emerging Markets Research Portfolio’s holdings are directly determined by analysts’ recommendations among Harding Lo-evner’s collection of companies under active research coverage. As we executed changes in response to changes in the analysts’ ratings, we continued to adjust individual position weights to maintain our desired risk profile (moderately lower volatility compared with the benchmark and restrained tracking error). Our exposures to certain sectors and regions shifted during the fiscal year but remained well within our self-imposed risk limits.
Among the largest changes to the Portfolio’s structure in the year were an increased allocation to the Consumer sectors and a reduction in our Health Care weight. Our analysts upgraded several Consumer Discretionary companies that appeared undervalued after periods of stock-price underperformance, for example, including Astra International of Indonesia and Clicks Group of South Africa. We also bought Coway, a South Korean air- and water-purifier manufacturer that sells through a unique army of 13,000 door-to-door salespeople. Its sales are growing, and it continues to command a higher selling price for its appliances compared with competitors due to its premium brand.
In Health Care, the Portfolio went from having an overweight relative to the index to being underweight in part due to our sales of two Chinese holdings, Sino Biopharmaceutical and Jiangsu
TEN LARGEST HOLDINGS at October 31, 2018
| | | | | | | | | | | | | |
| | | | | |
| | | COMPANY | | SECTOR | | COUNTRY | | % | | |
| | | | | |
| | ASTRA INTERNATIONAL | | CONS DISCRETIONARY | | INDONESIA | | | | 2.1 | | | |
| | | | | |
| | HERO MOTOCORP | | CONS DISCRETIONARY | | INDIA | | | | 2.1 | | | |
| | | | | |
| | NOVATEK | | ENERGY | | RUSSIA | | | | 2.0 | | | |
| | | | | |
| | LUKOIL | | ENERGY | | RUSSIA | | | | 2.0 | | | |
| | | | | |
| | BANK CENTRAL ASIA | | FINANCIALS | | INDONESIA | | | | 2.0 | | | |
| | | | | |
| | HDFC CORP | | FINANCIALS | | INDIA | | | | 2.0 | | | |
| | | | | |
| | CHINA MOBILE | | TELECOM SERVICES | | CHINA | | | | 1.9 | | | |
| | | | | |
| | PING AN INSURANCE | | FINANCIALS | | CHINA | | | | 1.9 | | | |
| | | | | |
| | TSMC | | INFO TECHNOLOGY | | TAIWAN | | | | 1.9 | | | |
| | | | | |
| | CLICKS GROUP | | CONS STAPLES | | SOUTH AFRICA | | | | 1.8 | | | |
Hengrui Medicine. Starting in late 2017, the Chinese government instituted new regulations designed to tighten the approval process for new drugs and weed out manufacturers of poor quality, ineffective drugs. Shares of both companies rose strongly in anticipation they would enjoy faster revenue growth and stronger competitive positions as a result of the reforms. Then in mid-2018, the government set a new priority of lowering drug costs and established a centralized drug procurement agency to achieve that goal. Our analyst changed her recommendation for both Sino Bio-pharmaceutical and Jiangsu Hengrui to sell in light of their recent strong share performance and the threat the new regulations may pose to their revenue growth prospects.
Geographically, the Portfolio’s weight in China fell about six percentage points over the past 12 months due to a combination of sales and the market’s decline. However, we also added some new Chinese holdings, including Ping An Insurance, a leading Chinese insurance company. Ping An has invested heavily to be at the forefront among Chinese insurers in deploying technology, including artificial intelligence. Its AI-powered tools help the company’s more than one million agents sell products tailored to specific types of customers. China’s rising household wealth, and consequent rising demand for insurance products, provide Ping An significant long-term growth opportunities.
The Portfolio’s weight in Mexico increased in part through our purchase of Consumer Staples company Grupo Bimbo, the world’s largest bread manufacturer with a successful record of accelerating its growth globally by making smart acquisitions, including Sara Lee USA. While our weight in Frontier Markets did not change significantly in this period, we made adjustments to holdings based on analysts’ recommendations, including buying Nigeria’s leading food and beverage company, Nestlé Nigeria. The analyst thinks the company’s numerous strong brands provide a competitive advantage that will help it grow as Nigerian consumers’ incomes rise and they increasingly shift toward more-convenient packaged foods.
Please read the separate disclosures page for important information, including the risks of investing in the Portfolio.
 DISCLOSURES
The Portfolios invest in foreign securities, which will involve greater volatility and political, economic, and currency risks and differences in accounting methods. They also invest in emerging markets, which involve unique risks, such as exposure to economies less diverse and mature than the US or other more established foreign markets. Economic and political instability may cause larger price changes in emerging markets securities than other foreign securities.
Investments in small- and mid-cap companies involve additional risks such as limited liquidity and greater volatility.
Diversification does not guarantee a profit or prevent a loss in a declining market.
Long-term earnings growth and earnings per share growth are not a forecast of the Portfolios’ future performance.
Companies held in the Portfolios during the fiscal year appear in bold type; only the first reference to a particular holding appears in bold. The Portfolios are actively managed; therefore holdings shown may not be current. Portfolio holdings and sector and geographic allocations should not be considered recommendations to buy or sell any security. Please refer to the Portfolios of Investments in this report for complete Portfolio holdings. Current and future Portfolio holdings are subject to risk.
While the Portfolios have no sales charge, management fees and other expenses still apply. Please see the Prospectus for further details.
Sector & Geographic Exposure data is sourced from: FactSet, Harding Loevner Funds Portfolios, and MSCI Barra. Differences may exist between this source data and similar information reported in the financial statements due to timing differences and/or adjustments required pursuant to Generally Accepted Accounting Principles (GAAP).
Expense Ratios: Differences may exist between the commentary data and similar information reported in the financial statements due to timing differences. Unless otherwise stated, the expense ratios presented are shown as of the most recent Prospectus date, February 28, 2018.
Five year average turnover data is calculated using a simple average of annual turnover figures for the past five fiscal years. These annual turnover figures utilize purchase, sales, and market value data which is not reflective of adjustments required pursuant to Generally Accepted Accounting Principles (GAAP). Accordingly, differences may exist between this data and similar information reported in the financial statements.
Quasar Distributors, LLC, Distributor.
INDEX DEFINITIONS
The MSCI All Country World Index is a free float-adjusted market capitalization index that is designed to measure equity market performance in the global developed and emerging markets. The Index consists of 47 developed and emerging market countries. Net dividends reinvested.
The MSCI All Country World ex-US Index is a free float-adjusted market capitalization index that is designed to measure equity market performance in the global developed and emerging markets, excluding the US. The Index consists of 46 developed and emerging market countries. Net dividends reinvested.
The MSCI All Country World ex-US Small Cap Index is a free-float market capitalization index that is designed to measure small cap developed and emerging market equity performance. The Index consists of 46 developed and emerging markets countries and targets companies within a market capitalization range of USD 62–12,687 million (as of September 30, 2018) in terms of the companies’ full market capitalization. Net dividends reinvested.
The MSCI Emerging Markets Index is a free float-adjusted market capitalization index that is designed to measure equity market performance in the global emerging markets. The Index consists of 24 emerging market countries. Net dividends reinvested.
The MSCI Emerging + Frontier Markets Index is a free float-adjusted market capitalization index that is designed to measure equity market performance in the global emerging markets and frontier markets. The Index consists of 24 emerging markets countries and 29 frontier markets countries. Net dividends reinvested.
The MSCI Frontier Emerging Markets Index is a free float-adjusted market capitalization index designed to measure equity market performance in all countries from the MSCI Frontier Markets Index and the lower size spectrum of the MSCI Emerging Markets Index. The Index consists of 29 frontier markets and 5 emerging markets. Net dividends reinvested.
You cannot invest directly in these Indexes.
TERM DEFINITIONS
Basis Points are a common measurement used chiefly for interest rates and other percentages in finance. A basis point is one hundredth of one percent.
Beta measures the portfolio’s sensitivity to the market.
Cash Flow measures the cash generating capability of a company by adding non-cash charges (e.g. depreciation) and interest expense to pretax income.
Economies of scale is the cost advantage that arises with increased output of a product.
Free cash flow is a measure of a company’s financial performance, calculated as operating cash flow minus capital expenditures.
Gross Domestic Product (GDP) is the monetary value of all finished goods and services produced within a country’s borders in a specific time period (usually calculated on an annual basis).
Market Capitalization is the total dollar market value of all of a company’s outstanding shares.
Return on Capital (ROC) is a calculation used to assess a company’s efficiency at allocating the capital under its control to profitable investments.
Tracking Error is a measure of how closely a portfolio follows the index to which it is benchmarked.
Turnover is calculated by dividing the lesser of Purchases or Sales by Average Capital.
Harding, Loevner Funds, Inc.
Table of Contents
For use only when preceded or accompanied by a prospectus. Read the prospectus carefully before you invest or send money.
Harding, Loevner Funds, Inc.
Expense Example
October 31, 2018 (unaudited)
As a shareholder of a Harding Loevner Portfolio, you incur ongoing costs, including management fees; and to the extent applicable, distribution (12b-1) fees, and/or shareholder services fees and other fund expenses. The following examples are intended to help you understand your ongoing costs (in dollars and cents) of investing in a Portfolio and to compare these costs with the ongoing costs of investing in other mutual funds.
The examples are based on an investment of $1,000 invested at the beginning of a six month period and held through the period ended October 31, 2018.
Actual Expenses
The first line under each Portfolio in the table below provides information about actual account values and actual expenses. You may use the information in this line, together with the amount you invested, to estimate the expenses that you paid over the period. Simply divide your account value by $1,000 (for example, an $8,600 account value divided by $1,000 = 8.6), then multiply the result by the number in the first line for your Portfolio under the heading entitled “Expenses Paid During Period” to estimate the expenses you paid on your account during this period.
Hypothetical Example for Comparison Purposes
The second line under each Portfolio in the table below provides information about hypothetical account values and hypothetical expenses based on the Portfolio’s actual expense ratio and an assumed rate of return of 5% per year before expenses, which is not the Portfolio’s actual return. The hypothetical account values and expenses may not be used to estimate the actual ending account balance or expenses you paid for the period. You may use this information to compare the ongoing costs of investing in your Portfolio and other funds. To do so, compare this 5% hypothetical example with the 5% hypothetical examples that appear in the shareholder reports of the other funds. Please note that the expenses shown in the table are meant to highlight your ongoing costs only. Therefore, the second line under each Portfolio in the table is useful in comparing ongoing costs only, and will not help you determine the relative total costs of owning different funds.
| | | | | | | | | | | | | | | | | | | | |
| Portfolio | | Beginning Account Value May 1, 2018 | | Ending Account Value October 31, 2018 | | Annualized Expense Ratio | | Expenses Paid During Period* (May 1, 2018 to October 31, 2018) |
Global Equity Portfolio — Institutional Class | | | | | | | | | | | | | | | | | | | | |
Actual | | | $ | 1,000.00 | | | | $ | 943.90 | | | | | 0.93 | % | | | $ | 4.56 | |
Hypothetical (5% annual return before expenses) | | | | 1,000.00 | | | | | 1,020.52 | | | | | 0.93 | | | | | 4.74 | |
Global Equity Portfolio — Institutional Class Z | | | | | | | | | | | | | | | | | | | | |
Actual | | | | 1,000.00 | | | | | 944.40 | | | | | 0.90 | | | | | 4.41 | |
Hypothetical (5% annual return before expenses) | | | | 1,000.00 | | | | | 1,020.67 | | | | | 0.90 | | | | | 4.58 | |
Global Equity Portfolio — Advisor Class | | | | | | | | | | | | | | | | | | | | |
Actual | | | | 1,000.00 | | | | | 942.80 | | | | | 1.16 | | | | | 5.68 | |
Hypothetical (5% annual return before expenses) | | | | 1,000.00 | | | | | 1,019.36 | | | | | 1.16 | | | | | 5.90 | |
International Equity Portfolio — Institutional Class | | | | | | | | | | | | | | | | | | | | |
Actual | | | | 1,000.00 | | | | | 895.90 | | | | | 0.82 | | | | | 3.92 | |
Hypothetical (5% annual return before expenses) | | | | 1,000.00 | | | | | 1,021.07 | | | | | 0.82 | | | | | 4.18 | |
International Equity Portfolio — Institutional Class Z | | | | | | | | | | | | | | | | | | | | |
Actual | | | | 1,000.00 | | | | | 896.30 | | | | | 0.74 | | | | | 3.54 | |
Hypothetical (5% annual return before expenses) | | | | 1,000.00 | | | | | 1,021.48 | | | | | 0.74 | | | | | 3.77 | |
International Equity Portfolio — Investor Class | | | | | | | | | | | | | | | | | | | | |
Actual | | | | 1,000.00 | | | | | 894.30 | | | | | 1.15 | | | | | 5.49 | |
Hypothetical (5% annual return before expenses) | | | | 1,000.00 | | | | | 1,019.41 | | | | | 1.15 | | | | | 5.85 | |
International Small Companies Portfolio — Institutional Class | | | | | | | | | | | | | | | | | | | | |
Actual | | | | 1,000.00 | | | | | 891.50 | | | | | 1.15 | | | | | 5.48 | |
Hypothetical (5% annual return before expenses) | | | | 1,000.00 | | | | | 1,019.41 | | | | | 1.15 | | | | | 5.85 | |
* Expenses are calculated using each Portfolio’s annualized expense ratio (as disclosed in the table), multiplied by the average account value for the period, multiplied by the number of days in the period (184 days), and divided by the number of days in the year (365 days).
2
Harding, Loevner Funds, Inc.
Expense Example (continued)
October 31, 2018 (unaudited)
| | | | | | | | | | | | | | | | | | | | |
| Portfolio | | Beginning Account Value May 1, 2018 | | Ending Account Value October 31, 2018 | | Annualized Expense Ratio | | Expenses Paid During Period* (May 1, 2018 to October 31, 2018) |
International Small Companies Portfolio — Investor Class | | | | | | | | | | | | | | | | | | | | |
Actual | | | $ | 1,000.00 | | | | $ | 890.20 | | | | | 1.40 | % | | | $ | 6.67 | |
Hypothetical (5% annual return before expenses) | | | | 1,000.00 | | | | | 1,018.15 | | | | | 1.40 | | | | | 7.12 | |
Institutional Emerging Markets Portfolio — Class I | | | | | | | | | | | | | | | | | | | | |
Actual | | | | 1,000.00 | | | | | 813.30 | | | | | 1.29 | | | | | 5.90 | |
Hypothetical (5% annual return before expenses) | | | | 1,000.00 | | | | | 1,018.70 | | | | | 1.29 | | | | | 6.56 | |
Institutional Emerging Markets Portfolio — Class II | | | | | | | | | | | | | | | | | | | | |
Actual | | | | 1,000.00 | | | | | 814.20 | | | | | 1.11 | | | | | 5.08 | |
Hypothetical (5% annual return before expenses) | | | | 1,000.00 | | | | | 1,019.61 | | | | | 1.11 | | | | | 5.65 | |
Emerging Markets Portfolio — Advisor Class | | | | | | | | | | | | | | | | | | | | |
Actual | | | | 1,000.00 | | | | | 812.90 | | | | | 1.42 | | | | | 6.49 | |
Hypothetical (5% annual return before expenses) | | | | 1,000.00 | | | | | 1,018.05 | | | | | 1.42 | | | | | 7.22 | |
Frontier Emerging Markets Portfolio — Institutional Class I | | | | | | | | | | | | | | | | | | | | |
Actual | | | | 1,000.00 | | | | | 836.60 | | | | | 1.63 | | | | | 7.55 | |
Hypothetical (5% annual return before expenses) | | | | 1,000.00 | | | | | 1,016.99 | | | | | 1.63 | | | | | 8.29 | |
Frontier Emerging Markets Portfolio — Institutional Class II | | | | | | | | | | | | | | | | | | | | |
Actual | | | | 1,000.00 | | | | | 836.60 | | | | | 1.35 | | | | | 6.25 | |
Hypothetical (5% annual return before expenses) | | | | 1,000.00 | | | | | 1,018.40 | | | | | 1.35 | | | | | 6.87 | |
Frontier Emerging Markets Portfolio — Investor Class | | | | | | | | | | | | | | | | | | | | |
Actual | | | | 1,000.00 | | | | | 834.60 | | | | | 2.00 | | | | | 9.25 | |
Hypothetical (5% annual return before expenses) | | | | 1,000.00 | | | | | 1,015.12 | | | | | 2.00 | | | | | 10.16 | |
Global Equity Research Portfolio — Institutional Class | | | | | | | | | | | | | | | | | | | | |
Actual | | | | 1,000.00 | | | | | 970.20 | | | | | 0.90 | | | | | 4.47 | |
Hypothetical (5% annual return before expenses) | | | | 1,000.00 | | | | | 1,020.67 | | | | | 0.90 | | | | | 4.58 | |
Global Equity Research Portfolio — Investor Class | | | | | | | | | | | | | | | | | | | | |
Actual | | | | 1,000.00 | | | | | 969.30 | | | | | 1.15 | | | | | 5.71 | |
Hypothetical (5% annual return before expenses) | | | | 1,000.00 | | | | | 1,019.41 | | | | | 1.15 | | | | | 5.85 | |
International Equity Research Portfolio — Institutional Class | | | | | | | | | | | | | | | | | | | | |
Actual | | | | 1,000.00 | | | | | 894.30 | | | | | 0.90 | | | | | 4.30 | |
Hypothetical (5% annual return before expenses) | | | | 1,000.00 | | | | | 1,020.67 | | | | | 0.90 | | | | | 4.58 | |
International Equity Research Portfolio — Investor Class | | | | | | | | | | | | | | | | | | | | |
Actual | | | | 1,000.00 | | | | | 892.90 | | | | | 1.15 | | | | | 5.49 | |
Hypothetical (5% annual return before expenses) | | | | 1,000.00 | | | | | 1,019.41 | | | | | 1.15 | | | | | 5.85 | |
Emerging Markets Research Portfolio — Institutional Class | | | | | | | | | | | | | | | | | | | | |
Actual | | | | 1,000.00 | | | | | 849.30 | | | | | 1.30 | | | | | 6.06 | |
Hypothetical (5% annual return before expenses) | | | | 1,000.00 | | | | | 1,018.65 | | | | | 1.30 | | | | | 6.61 | |
Emerging Markets Research Portfolio — Investor Class | | | | | | | | | | | | | | | | | | | | |
Actual | | | | 1,000.00 | | | | | 848.00 | | | | | 1.55 | | | | | 7.22 | |
Hypothetical (5% annual return before expenses) | | | | 1,000.00 | | | | | 1,017.39 | | | | | 1.55 | | | | | 7.88 | |
* Expenses are calculated using each Portfolio’s annualized expense ratio (as disclosed in the table), multiplied by the average account value for the period, multiplied by the number of days in the period (184 days), and divided by the number of days in the year (365 days).
3
Harding, Loevner Funds, Inc.
Global Equity Portfolio
Portfolio of Investments
October 31, 2018
| | | | | | | | |
| | |
| | | Shares | | | Value | |
| COMMON STOCKS - 93.3% | | | | | | |
| | |
China - 4.5% | | | | | | | | |
| | |
AAC Technologies Holdings Inc. (Technology Hardware & Equipment)† | | | 1,288,000 | | | | $9,857,567 | |
| | |
Alibaba Group Holding Ltd. - Sponsored ADR (Software & Services)* | | | 47,391 | | | | 6,742,791 | |
| | |
Baidu Inc. - Sponsored ADR (Software &
Services)* | | | 43,900 | | | | 8,343,634 | |
| | |
Weibo Corp. - Sponsored ADR (Software & Services)* | | | 46,405 | | | | 2,738,359 | |
| | |
Wuxi Biologics Cayman Inc. (Pharmaceuticals, Biotechnology & Life Sciences)*† | | | 1,507,000 | | | | 10,794,905 | |
| | |
| | | | | | | 38,477,256 | |
| | |
Denmark - 2.6% | | | | | | | | |
| | |
Chr Hansen Holding A/S (Materials)† | | | 128,127 | | | | 12,937,145 | |
| | |
Novozymes A/S, Class B (Materials)† | | | 187,563 | | | | 9,264,483 | |
| | |
| | | | | | | 22,201,628 | |
| | |
Finland - 1.4% | | | | | | | | |
| | |
Kone OYJ, Class B (Capital Goods)† | | | 244,766 | | | | 11,923,563 | |
| | |
France - 3.3% | | | | | | | | |
| | |
Air Liquide SA (Materials)† | | | 70,210 | | | | 8,504,771 | |
| | |
EssilorLuxottica SA (Health Care Equipment & Services)† | | | 83,930 | | | | 11,474,442 | |
| | |
L’Oreal SA (Household & Personal Products)† | | | 36,578 | | | | 8,237,113 | |
| | |
| | | | | | | 28,216,326 | |
| | |
Germany - 3.3% | | | | | | | | |
| | |
Bayerische Motoren Werke AG (Automobiles & Components)† | | | 85,210 | | | | 7,350,176 | |
| | |
Symrise AG (Materials)† | | | 244,379 | | | | 20,523,468 | |
| | |
| | | | | | | 27,873,644 | |
| | |
Hong Kong - 2.4% | | | | | | | | |
| | |
AIA Group Ltd. (Insurance)† | | | 2,632,005 | | | | 20,019,086 | |
| | |
India - 2.3% | | | | | | | | |
| | |
HDFC Bank Ltd. - ADR (Banks) | | | 83,216 | | | | 7,398,735 | |
| | |
ICICI Bank Ltd. - Sponsored ADR (Banks) | | | 1,315,231 | | | | 12,481,542 | |
| | |
| | | | | | | 19,880,277 | |
| | |
Indonesia - 1.3% | | | | | | | | |
| | |
Bank Central Asia Tbk PT (Banks)† | | | 7,045,954 | | | | 10,971,536 | |
| | |
Israel - 1.0% | | | | | | | | |
| | |
Check Point Software Technologies Ltd. (Software & Services)* | | | 77,055 | | | | 8,553,105 | |
| | | | | | | | |
| | |
| | | Shares | | | Value | |
| COMMON STOCKS - 93.3% (continued) | | | | |
| | |
Italy - 2.0% | | | | | | | | |
| | |
Luxottica Group SpA (Consumer Durables & Apparel)† | | | 171,372 | | | | $10,757,953 | |
| | |
Tenaris SA - ADR (Energy) | | | 225,227 | | | | 6,583,385 | |
| | |
| | | | | | | 17,341,338 | |
| | |
Japan - 8.6% | | | | | | | | |
| | |
FANUC Corp. (Capital Goods)† | | | 39,245 | | | | 6,820,337 | |
| | |
Keyence Corp. (Technology Hardware & Equipment)† | | | 25,202 | | | | 12,278,518 | |
| | |
Kubota Corp. (Capital Goods)† | | | 673,335 | | | | 10,584,364 | |
| | |
M3 Inc. (Health Care Equipment & Services)† | | | 500,390 | | | | 8,121,222 | |
| | |
Makita Corp. (Capital Goods)† | | | 203,035 | | | | 6,995,076 | |
| | |
MonotaRO Co., Ltd. (Capital Goods)† | | | 465,960 | | | | 10,235,777 | |
| | |
Park24 Co., Ltd. (Commercial & Professional Services)† | | | 230,700 | | | | 6,057,622 | |
| | |
Sysmex Corp. (Health Care Equipment & Services)† | | | 169,265 | | | | 11,844,025 | |
| | |
| | | | | | | 72,936,941 | |
| | |
Mexico - 1.0% | | | | | | | | |
| | |
Grupo Televisa SAB - Sponsored ADR (Media) | | | 582,064 | | | | 8,370,080 | |
| | |
Russia - 1.2% | | | | | | | | |
| | |
Yandex NV, Class A (Software & Services)* | | | 352,020 | | | | 10,606,363 | |
| | |
South Africa - 2.9% | | | | | | | | |
| | |
Naspers Ltd., Class N (Media)† | | | 99,020 | | | | 17,343,881 | |
| | |
Sasol Ltd. (Materials)† | | | 213,989 | | | | 7,012,505 | |
| | |
| | | | | | | 24,356,386 | |
| | |
South Korea - 1.0% | | | | | | | | |
| | |
Samsung Electronics Co., Ltd. - GDR (Technology Hardware & Equipment)† | | | 8,780 | | | | 8,172,825 | |
| | |
Spain - 0.9% | | | | | | | | |
| | |
Banco Bilbao Vizcaya Argentaria SA (Banks)† | | | 1,344,726 | | | | 7,423,295 | |
| | |
Sweden - 1.9% | | | | | | | | |
| | |
Atlas Copco AB, Class A (Capital Goods)† | | | 240,089 | | | | 5,935,135 | |
| | |
Epiroc AB, Class A (Capital Goods)*† | | | 244,398 | | | | 2,143,605 | |
| | |
Intrum AB (Commercial & Professional Services)† | | | 313,517 | | | | 7,987,125 | |
| | |
| | | | | | | 16,065,865 | |
| | |
Switzerland - 5.5% | | | | | | | | |
| | |
Lonza Group AG, Reg S (Pharmaceuticals, Biotechnology & Life Sciences)*† | | | 90,597 | | | | 28,407,785 | |
| | |
Nestle SA - Sponsored ADR (Food Beverage & Tobacco) | | | 126,550 | | | | 10,665,634 | |
See Notes to Financial Statements
4
Harding, Loevner Funds, Inc.
Global Equity Portfolio
Portfolio of Investments
October 31, 2018 (continued)
| | | | | | | | |
| | |
| | | Shares | | | Value | |
| COMMON STOCKS - 93.3% (continued) | | | | |
| | |
Switzerland - 5.5% (continued) | | | | | | | | |
| | |
Sonova Holding AG, Reg S (Health Care Equipment & Services)† | | | 48,989 | | | | $7,990,409 | |
| | |
| | | | | | | 47,063,828 | |
| | |
United Kingdom - 3.5% | | | | | | | | |
| | |
Abcam plc (Pharmaceuticals, Biotechnology & Life Sciences)† | | | 514,146 | | | | 7,877,677 | |
| | |
Reckitt Benckiser Group plc (Household & Personal Products)† | | | 122,710 | | | | 9,922,164 | |
| | |
Standard Chartered plc (Banks)† | | | 1,736,637 | | | | 12,190,291 | |
| | |
| | | | | | | 29,990,132 | |
| | |
United States - 42.7% | | | | | | | | |
| | |
3M Co. (Capital Goods) | | | 37,647 | | | | 7,162,718 | |
| | |
Abbott Laboratories (Health Care Equipment & Services) | | | 148,812 | | | | 10,259,099 | |
| | |
Amazon.com Inc. (Retailing)* | | | 8,125 | | | | 12,983,831 | |
| | |
AmerisourceBergen Corp. (Health Care Equipment & Services) | | | 103,484 | | | | 9,106,592 | |
| | |
Apple Inc. (Technology Hardware & Equipment) | | | 77,472 | | | | 16,955,522 | |
| | |
Booking Holdings Inc. (Retailing)* | | | 11,369 | | | | 21,312,100 | |
| | |
Cognex Corp. (Technology Hardware & Equipment) | | | 179,646 | | | | 7,696,035 | |
| | |
Cognizant Technology Solutions Corp., Class A (Software & Services) | | | 123,484 | | | | 8,524,101 | |
| | |
Colgate-Palmolive Co. (Household & Personal Products) | | | 154,110 | | | | 9,177,250 | |
| | |
eBay Inc. (Software & Services)* | | | 227,642 | | | | 6,608,447 | |
| | |
Exxon Mobil Corp. (Energy) | | | 98,514 | | | | 7,849,596 | |
| | |
First Republic Bank (Banks) | | | 239,558 | | | | 21,797,382 | |
| | |
IPG Photonics Corp. (Technology Hardware & Equipment)* | | | 56,430 | | | | 7,536,226 | |
| | |
Linde plc (Materials)* | | | 80,714 | | | | 13,242,370 | |
| | |
Mastercard Inc., Class A (Software & Services) | | | 79,168 | | | | 15,649,139 | |
| | |
Microsoft Corp. (Software & Services) | | | 88,097 | | | | 9,409,641 | |
| | |
NIKE Inc., Class B (Consumer Durables & Apparel) | | | 191,372 | | | | 14,360,555 | |
| | |
NVIDIA Corp. (Semiconductors & Semiconductor Equipment) | | | 46,869 | | | | 9,881,391 | |
| | |
PayPal Holdings Inc. (Software & Services)* | | | 378,072 | | | | 31,829,882 | |
| | |
Regeneron Pharmaceuticals Inc (Pharmaceuticals, Biotechnology & Life Sciences)* | | | 40,298 | | | | 13,670,694 | |
| | | | | | | | |
| | |
| | | Shares | | | Value | |
| COMMON STOCKS - 93.3% (continued) | | | | |
| | |
United States - 42.7% (continued) | | | | | | | | |
| | |
Roper Technologies Inc. (Capital Goods) | | | 93,900 | | | | $26,564,310 | |
| | |
Schlumberger Ltd. (Energy) | | | 257,891 | | | | 13,232,387 | |
| | |
SVB Financial Group (Banks)* | | | 34,227 | | | | 8,119,671 | |
| | |
Verisk Analytics Inc. (Commercial & Professional Services)* | | | 186,015 | | | | 22,292,038 | |
| | |
WABCO Holdings Inc. (Capital Goods)* | | | 60,485 | | | | 6,499,113 | |
| | |
Walgreens Boots Alliance Inc. (Food & Staples Retailing) | | | 140,895 | | | | 11,239,194 | |
| | |
Walt Disney Co. (Media) | | | 83,751 | | | | 9,617,127 | |
| | |
Waters Corp. (Pharmaceuticals, Biotechnology & Life Sciences)* | | | 56,013 | | | | 10,625,106 | |
| | |
| | | | | | | | 363,201,517 | |
| |
Total Common Stocks (Cost $585,016,235) | | | | $793,644,991 | |
| |
| | | | | |
| PREFERRED STOCKS - 2.5% | | | | | | |
| | |
Brazil - 1.2% | | | | | | | | |
| | |
Itau Unibanco Holding SA - Sponsored ADR, 0.34% (Banks)+ | | | 739,477 | | | | 9,738,912 | |
| | |
Spain - 1.3% | | | | | | | | |
| | |
Grifols SA - ADR, 2.36% (Pharmaceuticals, Biotechnology & Life Sciences)+ | | | 560,010 | | | | 11,435,404 | |
| |
Total Preferred Stocks (Cost $15,057,068) | | | | $21,174,316 | |
| |
| | | | | |
| SHORT TERM INVESTMENTS - 5.1% | | | | |
| | |
Northern Institutional Funds - Prime Obligations Portfolio, 2.26% (Money Market Funds) | | | 17,198,280 | | | | 17,200,000 | |
| | |
Northern Institutional Funds - Treasury Portfolio, 2.03% (Money Market Funds) | | | 25,832,073 | | | | 25,832,073 | |
| |
Total Short Term Investments (Cost $43,032,073) | | | | $43,032,073 | |
| |
| | | | | | |
| | |
Total Investments - 100.9% | | | | | | | | |
| | |
(Cost $643,105,376) | | | | | | | $857,851,380 | |
| | |
Liabilities Less Other Assets - (0.9)% | | | | | | | (7,577,967 | ) |
| | |
Net Assets - 100.0% | | | | | | | $850,273,413 | |
See Notes to Financial Statements
5
Harding, Loevner Funds, Inc.
Global Equity Portfolio
Portfolio of Investments
October 31, 2018 (continued)
Summary of Abbreviations
| ADR | American Depositary Receipt. |
| GDR | Global Depository Receipt. |
| Reg S | Security sold outside United States without registration under the Securities Act of 1933. |
| † | Investment categorized as level 2 security as disclosed in Note 2 of the Notes to Financial Statements. |
| * | Non-income producing security. |
| + | Current yield is disclosed. Dividends are calculated based on a percentage of the issuer’s net income. |
| | | | | |
| Industry | | |
| Percentage of
Net Assets |
|
| |
Automobiles & Components | | | | 0.9 | % |
| |
Banks | | | | 10.6 | |
| |
Capital Goods | | | | 11.2 | |
| |
Commercial & Professional Services | | | | 4.3 | |
| |
Consumer Durables & Apparel | | | | 2.9 | |
| |
Energy | | | | 3.2 | |
| |
Food & Staples Retailing | | | | 1.3 | |
| |
Food Beverage & Tobacco | | | | 1.3 | |
| |
Health Care Equipment & Services | | | | 6.9 | |
| |
Household & Personal Products | | | | 3.2 | |
| |
Insurance | | | | 2.4 | |
| |
Materials | | | | 8.4 | |
| |
Media | | | | 4.2 | |
| |
Pharmaceuticals, Biotechnology & Life Sciences | | | | 9.7 | |
| |
Retailing | | | | 4.0 | |
| |
Semiconductors & Semiconductor Equipment | | | | 1.2 | |
| |
Software & Services | | | | 12.8 | |
| |
Technology Hardware & Equipment | | | | 7.3 | |
| |
Money Market Funds | | | | 5.1 | |
Total Investments | | | | 100.9 | |
Liabilities Less Other Assets | | | | (0.9 | ) |
Net Assets | | | | 100.0 | % |
See Notes to Financial Statements
6
Harding, Loevner Funds, Inc.
International Equity Portfolio
Portfolio of Investments
October 31, 2018
| | | | | | | | |
| | |
| | | Shares | | | Value | |
| COMMON STOCKS - 92.2% | | | | | | |
| | |
Australia - 1.3% | | | | | | | | |
| | |
CSL Ltd. (Pharmaceuticals, Biotechnology & Life Sciences)† | | | 1,305,864 | | | | $175,135,070 | |
| | |
Brazil - 1.0% | | | | | | | | |
| | |
Ambev SA - ADR (Food Beverage & Tobacco) | | | 30,236,857 | | | | 130,925,591 | |
| | |
Canada - 2.4% | | | | | | | | |
| | |
Canadian National Railway Co. (Transportation) | | | 3,847,460 | | | | 328,880,881 | |
| | |
China - 3.5% | | | | | | | | |
| | |
Baidu Inc. - Sponsored ADR (Software & Services)* | | | 1,707,722 | | | | 324,569,643 | |
| | |
Weibo Corp. - Sponsored ADR (Software & Services)* | | | 2,609,624 | | | | 153,993,912 | |
| | |
| | | | | | | 478,563,555 | |
| | |
Denmark - 1.0% | | | | | | | | |
| | |
Novozymes A/S, Class B (Materials)† | | | 2,811,606 | | | | 138,876,408 | |
| | |
France - 8.9% | | | | | | | | |
| | |
Air Liquide SA (Materials)† | | | 2,769,526 | | | | 335,481,897 | |
| | |
Dassault Systemes SE (Software & Services)† | | | 2,572,454 | | | | 321,671,902 | |
| | |
L’Oreal SA (Household & Personal Products)† | | | 1,612,343 | | | | 363,088,498 | |
| | |
LVMH Moet Hennessy Louis Vuitton SE (Consumer Durables & Apparel)† | | | 687,998 | | | | 208,433,529 | |
| | |
| | | | | | | 1,228,675,826 | |
| | |
Germany - 14.3% | | | | | | | | |
| | |
adidas AG (Consumer Durables & Apparel)† | | | 598,229 | | | | 140,919,600 | |
| | |
Allianz SE, Reg S (Insurance)† | | | 2,318,575 | | | | 484,155,912 | |
| | |
Bayer AG, Reg S (Pharmaceuticals, Biotechnology & Life Sciences)† | | | 4,900,147 | | | | 376,214,501 | |
| | |
Bayerische Motoren Werke AG (Automobiles & Components)† | | | 1,764,530 | | | | 152,207,558 | |
| | |
Fresenius Medical Care AG & Co. KGaA (Health Care Equipment & Services)† | | | 2,178,311 | | | | 171,461,407 | |
| | |
FUCHS PETROLUB SE (Materials)† | | | 619,921 | | | | 26,869,811 | |
| | |
Infineon Technologies AG (Semiconductors & Semiconductor Equipment)† | | | 6,346,977 | | | | 127,238,850 | |
| | |
SAP SE - Sponsored ADR (Software & Services) | | | 2,757,604 | | | | 295,780,605 | |
| | |
Symrise AG (Materials)† | | | 2,244,235 | | | | 188,475,629 | |
| | |
| | | | | | | 1,963,323,873 | |
| | |
Hong Kong - 4.0% | | | | | | | | |
| | |
AIA Group Ltd. (Insurance)† | | | 71,968,474 | | | | 547,393,739 | |
| | | | | | | | |
| | |
| | | Shares | | | Value | |
| COMMON STOCKS - 92.2% (continued) | | | | |
| | |
India - 2.2% | | | | | | | | |
| | |
HDFC Bank Ltd. - ADR (Banks) | | | 1,518,365 | | | | $134,997,832 | |
| | |
ICICI Bank Ltd. - Sponsored ADR (Banks) | | | 18,131,314 | | | | 172,066,170 | |
| | |
| | | | | | | 307,064,002 | |
| | |
Israel - 2.8% | | | | | | | | |
| | |
Check Point Software Technologies Ltd. (Software & Services)* | | | 3,455,420 | | | | 383,551,620 | |
| | |
Italy - 0.8% | | | | | | | | |
| | |
Tenaris SA - ADR (Energy) | | | 3,504,513 | | | | 102,436,915 | |
| | |
Japan - 12.7% | | | | | | | | |
| | |
FANUC Corp. (Capital Goods)† | | | 2,109,200 | | | | 366,555,088 | |
| | |
JGC Corp. (Capital Goods)† | | | 8,461,600 | | | | 163,628,488 | |
| | |
Keyence Corp. (Technology Hardware & Equipment)† | | | 423,627 | | | | 206,392,812 | |
| | |
Komatsu Ltd. (Capital Goods)† | | | 5,070,700 | | | | 131,483,503 | |
| | |
Kubota Corp. (Capital Goods)† | | | 10,036,700 | | | | 157,770,035 | |
| | |
M3 Inc. (Health Care Equipment & Services)† | | | 16,457,209 | | | | 267,096,960 | |
| | |
MonotaRO Co., Ltd. (Capital Goods)† | | | 6,302,800 | | | | 138,454,063 | |
| | |
Park24 Co., Ltd. (Commercial & Professional Services)† | | | 4,573,600 | | | | 120,091,638 | |
| | |
Sysmex Corp. (Health Care Equipment & Services)† | | | 2,855,107 | | | | 199,781,174 | |
| | |
| | | | | | | 1,751,253,761 | |
| | |
Mexico - 0.8% | | | | | | | | |
| | |
Grupo Financiero Banorte SAB de CV, Series O (Banks) | | | 20,914,624 | | | | 115,068,656 | |
| | |
Russia - 1.0% | | | | | | | | |
| | |
Yandex NV, Class A (Software & Services)* | | | 4,652,579 | | | | 140,182,205 | |
| | |
Singapore - 2.7% | | | | | | | | |
| | |
DBS Group Holdings Ltd. (Banks)† | | | 21,752,283 | | | | 369,090,348 | |
| | |
South Africa - 3.4% | | | | | | | | |
| | |
Aspen Pharmacare Holdings Ltd. (Pharmaceuticals, Biotechnology & Life Sciences)† | | | 6,928,374 | | | | 73,213,026 | |
| | |
Naspers Ltd., Class N (Media)† | | | 1,516,261 | | | | 265,581,192 | |
| | |
Sasol Ltd. (Materials)† | | | 3,922,502 | | | | 128,541,962 | |
| | |
| | | | | | | 467,336,180 | |
| | |
South Korea - 1.4% | | | | | | | | |
| | |
Samsung Electronics Co., Ltd. - GDR (Technology Hardware & Equipment)† | | | 208,994 | | | | 194,541,167 | |
| | |
Spain - 2.4% | | | | | | | | |
| | |
Banco Bilbao Vizcaya Argentaria SA (Banks)† | | | 47,361,071 | | | | 261,447,472 | |
See Notes to Financial Statements
7
Harding, Loevner Funds, Inc.
International Equity Portfolio
Portfolio of Investments
October 31, 2018 (continued)
| | | | | | | | |
| | |
| | | Shares | | | Value | |
| COMMON STOCKS - 92.2% (continued) | | | | |
| | |
Spain - 2.4% (continued) | | | | | | | | |
| | |
Grifols SA (Pharmaceuticals, Biotechnology & Life Sciences)† | | | 2,392,915 | | | | $68,254,026 | |
| | |
| | | | | | | 329,701,498 | |
| | |
Sweden - 2.9% | | | | | | | | |
| | |
Alfa Laval AB (Capital Goods)† | | | 7,556,760 | | | | 192,888,846 | |
| | |
Atlas Copco AB, Class A (Capital Goods)† | | | 6,222,843 | | | | 153,832,181 | |
| | |
Epiroc AB, Class A (Capital Goods)*† | | | 6,222,843 | | | | 54,580,308 | |
| | |
| | | | | | | 401,301,335 | |
| | |
Switzerland - 10.4% | | | | | | | | |
| | |
Lonza Group AG, Reg S (Pharmaceuticals, Biotechnology & Life Sciences)*† | | | 814,030 | | | | 255,248,946 | |
| | |
Nestle SA - Sponsored ADR (Food Beverage & Tobacco) | | | 5,947,222 | | | | 501,231,870 | |
| | |
Roche Holding AG, Genusschein (Pharmaceuticals, Biotechnology & Life Sciences)† | | | 1,362,671 | | | | 330,649,596 | |
| | |
Sonova Holding AG, Reg S (Health Care Equipment & Services)† | | | 955,202 | | | | 155,799,363 | |
| | |
Temenos AG, Reg S (Software & Services)*† | | | 1,338,125 | | | | 182,812,073 | |
| | |
| | | | | | | 1,425,741,848 | |
| | |
Taiwan - 2.7% | | | | | | | | |
| | |
Taiwan Semiconductor Manufacturing Co., Ltd. (Semiconductors & Semiconductor Equipment)† | | | 10,837,125 | | | | 80,515,875 | |
| | |
Taiwan Semiconductor Manufacturing Co., Ltd. - Sponsored ADR (Semiconductors & Semiconductor Equipment) | | | 7,605,659 | | | | 289,775,608 | |
| | |
| | | | | | | 370,291,483 | |
| | |
United Kingdom - 6.5% | | | | | | | | |
| | |
BBA Aviation plc (Transportation)† | | | 14,917,867 | | | | 45,732,719 | |
| | |
HSBC Holdings plc (Banks)† | | | 19,807,477 | | | | 163,178,929 | |
| | |
Royal Dutch Shell plc, Class B (Energy)† | | | 14,130,965 | | | | 460,099,646 | |
| | |
Unilever plc (Household & Personal Products)† | | | 4,307,528 | | | | 228,098,932 | |
| | |
| | | | | | | 897,110,226 | |
| | |
United States - 3.1% | | | | | | | | |
| | |
Linde plc (Materials)* | | | 1,513,566 | | | | 248,322,229 | |
| | | | | | | | |
| | |
| | | Shares | | | Value | |
| COMMON STOCKS - 92.2% (continued) | | | | |
| |
United States - 3.1% (continued) | | | | | |
| | |
Schlumberger Ltd. (Energy) | | | 3,448,407 | | | | $176,937,763 | |
| | |
| | | | | | | | 425,259,992 | |
| |
Total Common Stocks (Cost $11,278,831,322) | | | | $12,671,706,179 | |
| |
| | | | | |
| PREFERRED STOCKS - 4.5% | | | | | | |
| | |
Brazil - 1.7% | | | | | | | | |
| | |
Itau Unibanco Holding SA - Sponsored ADR, 0.34% (Banks)+ | | | 18,407,635 | | | | 242,428,553 | |
| | |
Germany - 0.6% | | | | | | | | |
| | |
FUCHS PETROLUB SE, 2.14% (Materials)+† | | | 1,890,768 | | | | 87,656,412 | |
| | |
South Korea - 1.7% | | | | | | | | |
| | |
Samsung Electronics Co., Ltd. - GDR, Reg S, 3.90% (Technology Hardware & Equipment)+† | | | 292,452 | | | | 228,738,172 | |
| | |
Spain - 0.5% | | | | | | | | |
| | |
Grifols SA - ADR, 2.36% (Pharmaceuticals, Biotechnology & Life Sciences)+ | | | 3,184,008 | | | | 65,017,443 | |
| |
Total Preferred Stocks (Cost $501,445,210) | | | | $623,840,580 | |
| |
| | | | | |
| SHORT TERM INVESTMENTS - 3.5% | |
| | |
Northern Institutional Funds - Prime Obligations Portfolio, 2.26% (Money Market Funds) | | | 430,280,988 | | | | 430,324,016 | |
| | |
Northern Institutional Funds - Treasury Portfolio, 2.03% (Money Market Funds) | | | 45,838,762 | | | | 45,838,762 | |
| |
Total Short Term Investments (Cost $476,113,315) | | | | $476,162,778 | |
| | |
| | | | | | | | | |
| | |
Total Investments — 100.2% | | | | | | | | |
| | |
(Cost $12,256,389,847) | | | | | | | $13,771,709,537 | |
| | |
Liabilities Less Other Assets - (0.2)% | | | | | | | (21,601,960 | ) |
| | |
Net Assets — 100.0% | | | | | | | $13,750,107,577 | |
Summary of Abbreviations
| ADR | American Depositary Receipt. |
| GDR | Global Depository Receipt. |
| Reg S | Security sold outside United States without registration under the Securities Act of 1933. |
See Notes to Financial Statements
8
Harding, Loevner Funds, Inc.
International Equity Portfolio
Portfolio of Investments
October 31, 2018 (continued)
| † | Investment categorized as level 2 security as disclosed in Note 2 of the Notes to Financial Statements. |
| * | Non-income producing security. |
| + | Current yield is disclosed. Dividends are calculated based on a percentage of the issuer’s net income. |
| | | | | |
| Industry | | |
| Percentage of
Net Assets |
|
| |
Automobiles & Components | | | | 1.1 | % |
| |
Banks | | | | 10.6 | |
| |
Capital Goods | | | | 9.9 | |
| |
Commercial & Professional Services | | | | 0.9 | |
| |
Consumer Durables & Apparel | | | | 2.5 | |
| |
Energy | | | | 5.4 | |
| |
Food Beverage & Tobacco | | | | 4.6 | |
| |
Health Care Equipment & Services | | | | 5.8 | |
| |
Household & Personal Products | | | | 4.3 | |
| |
Insurance | | | | 7.5 | |
| |
Materials | | | | 8.4 | |
| |
Media | | | | 1.9 | |
| |
Pharmaceuticals, Biotechnology & Life Sciences | | | | 9.8 | |
| |
Semiconductors & Semiconductor Equipment | | | | 3.6 | |
| |
Software & Services | | | | 13.1 | |
| |
Technology Hardware & Equipment | | | | 4.6 | |
| |
Transportation | | | | 2.7 | |
| |
Money Market Funds | | | | 3.5 | |
Total Investments | | | | 100.2 | |
Liabilities Less Other Assets | | | | (0.2 | ) |
Net Assets | | | | 100.0 | % |
See Notes to Financial Statements
9
Harding, Loevner Funds, Inc.
International Small Companies Portfolio
Portfolio of Investments
October 31, 2018
| | | | | | | | |
| | |
| | | Shares | | | Value | |
| COMMON STOCKS - 96.9% | | | | | | |
| | |
Argentina - 2.3% | | | | | | | | |
| | |
Globant SA (Software & Services)* | | | 61,494 | | | | $3,165,711 | |
| | |
Loma Negra Cia Industrial Argentina SA - Sponsored ADR (Materials)* | | | 172,897 | | | | 1,557,802 | |
| | |
| | | | | | | 4,723,513 | |
| | |
Australia - 1.2% | | | | | | | | |
| | |
DuluxGroup Ltd. (Materials)† | | | 482,191 | | | | 2,530,729 | |
| | |
Bangladesh - 0.8% | | | | | | | | |
| | |
BRAC Bank Ltd. (Banks)*† | | | 984,245 | | | | 828,882 | |
| | |
Square Pharmaceuticals Ltd. (Pharmaceuticals, Biotechnology & Life Sciences)† | | | 288,485 | | | | 919,188 | |
| | |
| | | | | | | 1,748,070 | |
| | |
Canada - 1.2% | | | | | | | | |
| | |
Kinaxis Inc. (Software & Services)* | | | 38,300 | | | | 2,585,821 | |
| | |
China - 1.8% | | | | | | | | |
| | |
51job Inc. - ADR (Commercial & Professional Services)* | | | 18,693 | | | | 1,147,937 | |
| | |
Haitian International Holdings Ltd. (Capital
Goods)† | | | 1,057,000 | | | | 2,086,945 | |
| | |
Suofeiya Home Collection Co., Ltd., Class A (Consumer Durables & Apparel)† | | | 223,489 | | | | 578,299 | |
| | |
| | | | | | | 3,813,181 | |
| | |
Denmark - 0.8% | | | | | | | | |
| | |
Chr Hansen Holding A/S (Materials)† | | | 15,755 | | | | 1,590,802 | |
| | |
Egypt - 1.1% | | | | | | | | |
| | |
Integrated Diagnostics Holdings plc (Health Care Equipment & Services)† | | | 638,426 | | | | 2,199,849 | |
| | |
Finland - 1.5% | | | | | | | | |
| | |
Vaisala OYJ, Class A (Technology Hardware & Equipment)† | | | 155,596 | | | | 3,049,233 | |
| | |
France - 6.2% | | | | | | | | |
| | |
Alten SA (Software & Services)† | | | 50,862 | | | | 4,903,191 | |
| | |
Chargeurs SA (Consumer Durables & Apparel)† | | | 38,151 | | | | 824,013 | |
| | |
IPSOS (Media)† | | | 79,146 | | | | 2,109,625 | |
| | |
LISI (Capital Goods)† | | | 73,924 | | | | 2,155,766 | |
| | |
Rubis SCA (Utilities)† | | | 57,787 | | | | 2,989,251 | |
| | |
| | | | | | | 12,981,846 | |
| | |
Germany - 12.0% | | | | | | | | |
| | |
Bechtle AG (Software & Services)† | | | 55,539 | | | | 4,938,175 | |
| | |
Bertrandt AG (Commercial & Professional Services)† | | | 16,835 | | | | 1,393,734 | |
| | | | | | | | |
| | |
| | | Shares | | | Value | |
| COMMON STOCKS - 96.9% (continued) | | | | |
| | |
Germany - 12.0% (continued) | | | | | | | | |
| | |
Carl Zeiss Meditec AG (Bearer) (Health Care Equipment & Services)† | | | 81,315 | | | | $6,672,676 | |
| | |
FUCHS PETROLUB SE (Materials)† | | | 39,571 | | | | 1,715,163 | |
| | |
KWS Saat SE (Food Beverage & Tobacco)† | | | 6,806 | | | | 2,312,652 | |
| | |
Pfeiffer Vacuum Technology AG
(Capital Goods)† | | | 13,007 | | | | 1,620,071 | |
| | |
Rational AG (Capital Goods)† | | | 821 | | | | 476,007 | |
| | |
RIB Software SE (Software & Services)† | | | 173,351 | | | | 3,000,302 | |
| | |
STRATEC Biomedical AG (Health Care Equipment & Services)† | | | 45,441 | | | | 2,983,817 | |
| | |
| | | | | | | 25,112,597 | |
| | |
Hong Kong - 2.0% | | | | | | | | |
| | |
ASM Pacific Technology Ltd. (Semiconductors & Semiconductor Equipment)† | | | 145,000 | | | | 1,255,881 | |
| | |
Pico Far East Holdings Ltd. (Media)† | | | 6,461,000 | | | | 2,180,832 | |
| | |
Vitasoy International Holdings Ltd. (Food Beverage & Tobacco)† | | | 216,900 | | | | 689,252 | |
| | |
| | | | | | | 4,125,965 | |
| | |
India - 3.1% | | | | | | | | |
| | |
Bharti Infratel Ltd. (Telecommunication
Services)† | | | 223,345 | | | | 812,048 | |
| | |
Emami Ltd. (Household & Personal Products)† | | | 92,360 | | | | 494,773 | |
| | |
Max Financial Services Ltd. (Insurance)*† | | | 655,987 | | | | 3,355,731 | |
| | |
SH Kelkar & Co., Ltd. (Materials)† | | | 816,127 | | | | 1,855,568 | |
| | |
| | | | | | | 6,518,120 | |
| | |
Indonesia - 0.8% | | | | | | | | |
| | |
Tower Bersama Infrastructure Tbk PT (Telecommunication Services)† | | | 5,282,100 | | | | 1,621,657 | |
| | |
Israel - 1.4% | | | | | | | | |
| | |
CyberArk Software Ltd. (Software & Services)* | | | 44,195 | | | | 3,016,751 | |
| | |
Italy - 3.0% | | | | | | | | |
| | |
Danieli & C Officine Meccaniche SpA (RSP) (Capital Goods)† | | | 50,640 | | | | 747,096 | |
| | |
DiaSorin SpA (Health Care Equipment & Services)† | | | 12,584 | | | | 1,194,161 | |
| | |
Reply SpA (Software & Services)† | | | 76,844 | | | | 4,261,243 | |
| | |
| | | | | | | 6,202,500 | |
See Notes to Financial Statements
10
Harding, Loevner Funds, Inc.
International Small Companies Portfolio
Portfolio of Investments
October 31, 2018 (continued)
| | | | | | | | |
| | |
| | | Shares | | | Value | |
| COMMON STOCKS - 96.9% (continued) | | | | |
| | |
Japan - 13.6% | | | | | | | | |
| | |
ABC-Mart Inc. (Retailing)† | | | 6,300 | | | | $369,069 | |
| | |
Ariake Japan Co., Ltd. (Food Beverage &
Tobacco)† | | | 56,500 | | | | 5,030,430 | |
| | |
BML Inc. (Health Care Equipment & Services)† | | | 69,100 | | | | 1,895,076 | |
| | |
Cosmos Pharmaceutical Corp. (Food & Staples Retailing)† | | | 3,600 | | | | 733,223 | |
| | |
FINDEX Inc. (Health Care Equipment &
Services)† | | | 171,900 | | | | 979,759 | |
| | |
GMO Payment Gateway Inc. (Software & Services)† | | | 44,300 | | | | 2,141,239 | |
| | |
Infomart Corp. (Software & Services)† | | | 338,900 | | | | 3,499,006 | |
| | |
MISUMI Group Inc. (Capital Goods)† | | | 41,500 | | | | 840,039 | |
| | |
MonotaRO Co., Ltd. (Capital Goods)† | | | 26,800 | | | | 588,718 | |
| | |
Nakanishi Inc. (Health Care Equipment & Services)† | | | 260,500 | | | | 6,089,371 | |
| | |
Rinnai Corp. (Consumer Durables & Apparel)† | | | 9,200 | | | | 667,722 | |
| | |
SMS Co., Ltd. (Commercial & Professional Services)† | | | 174,300 | | | | 2,909,579 | |
| | |
Stanley Electric Co., Ltd. (Automobiles & Components)† | | | 89,700 | | | | 2,647,358 | |
| | |
| | | | | | | 28,390,589 | |
| | |
Kenya - 0.6% | | | | | | | | |
| | |
East African Breweries Ltd. (Food Beverage & Tobacco)† | | | 368,400 | | | | 628,991 | |
| | |
Equity Group Holdings Ltd. (Banks)† | | | 1,394,000 | | | | 536,030 | |
| | |
| | | | | | | 1,165,021 | |
| | |
Kuwait - 0.5% | | | | | | | | |
| | |
Mabanee Co. SAK (Real Estate)† | | | 559,529 | | | | 1,122,317 | |
| | |
Malaysia - 1.2% | | | | | | | | |
| | |
Dialog Group Bhd. (Energy)† | | | 3,118,740 | | | | 2,529,756 | |
| | |
Mexico - 1.0% | | | | | | | | |
| | |
Grupo Herdez SAB de CV (Food Beverage & Tobacco) | | | 1,098,538 | | | | 2,040,974 | |
| | |
Netherlands - 2.0% | | | | | | | | |
| | |
Arcadis NV (Capital Goods)† | | | 198,217 | | | | 2,682,090 | |
| | |
ASM International NV (Semiconductors & Semiconductor Equipment)† | | | 23,607 | | | | 1,016,009 | |
| | |
Brunel International NV (Commercial & Professional Services)† | | | 38,210 | | | | 473,450 | |
| | |
| | | | | | | 4,171,549 | |
| | |
Nigeria - 0.6% | | | | | | | | |
| | |
Nestle Nigeria plc (Food Beverage & Tobacco)† | | | 301,990 | | | | 1,148,062 | |
| | | | | | | | |
| | |
| | | Shares | | | Value | |
| COMMON STOCKS - 96.9% (continued) | | | | |
| | |
Norway - 1.5% | | | | | | | | |
| | |
Tomra Systems ASA (Commercial & Professional Services)† | | | 127,516 | | | | $3,155,639 | |
| | |
Peru - 0.3% | | | | | | | | |
| | |
Alicorp SAA (Food Beverage & Tobacco) | | | 218,164 | | | | 630,906 | |
| | |
Philippines - 1.3% | | | | | | | | |
| | |
International Container Terminal Services Inc. (Transportation)† | | | 1,278,940 | | | | 2,163,790 | |
| | |
Security Bank Corp. (Banks)† | | | 209,470 | | | | 565,713 | |
| | |
| | | | | | | 2,729,503 | |
| | |
Romania - 1.1% | | | | | | | | |
| | |
Societatea Nationala de Gaze Naturale ROMGAZ SA (Energy)† | | | 273,987 | | | | 2,265,068 | |
| | |
Russia - 1.3% | | | | | | | | |
| | |
Moscow Exchange MICEX-RTS PJSC (Diversified Financials)† | | | 1,984,047 | | | | 2,652,840 | |
| | |
South Africa - 0.6% | | | | | | | | |
| | |
Tiger Brands Ltd. (Food Beverage & Tobacco)† | | | 65,665 | | | | 1,171,352 | |
| | |
South Korea - 1.6% | | | | | | | | |
| | |
Cheil Worldwide Inc. (Media)† | | | 64,573 | | | | 1,288,111 | |
| | |
Coway Co., Ltd. (Consumer Durables & Apparel)† | | | 8,801 | | | | 544,006 | |
| | |
Hankook Tire Co., Ltd. (Automobiles & Components)† | | | 44,102 | | | | 1,604,651 | |
| | |
| | | | | | | 3,436,768 | |
| | |
Sweden - 2.6% | | | | | | | | |
| | |
Alfa Laval AB (Capital Goods)† | | | 92,185 | | | | 2,353,053 | |
| | |
Intrum AB (Commercial & Professional
Services)† | | | 124,473 | | | | 3,171,061 | |
| | |
| | | | | | | 5,524,114 | |
| | |
Switzerland - 2.4% | | | | | | | | |
| | |
Bossard Holding AG, Class A, Reg S (Capital Goods)† | | | 10,057 | | | | 1,640,190 | |
| | |
LEM Holding SA, Reg S (Technology Hardware & Equipment)† | | | 2,042 | | | | 2,330,424 | |
| | |
Temenos AG, Reg S (Software & Services)*† | | | 7,666 | | | | 1,047,314 | |
| | |
| | | | | | | 5,017,928 | |
| | |
Taiwan - 2.0% | | | | | | | | |
| | |
Advantech Co., Ltd. (Technology Hardware & Equipment)† | | | 72,517 | | | | 497,056 | |
| | |
Chipbond Technology Corp. (Semiconductors & Semiconductor Equipment)† | | | 1,111,700 | | | | 2,057,895 | |
See Notes to Financial Statements
11
Harding, Loevner Funds, Inc.
International Small Companies Portfolio
Portfolio of Investments
October 31, 2018 (continued)
| | | | | | | | |
| | |
| | | Shares | | | Value | |
| COMMON STOCKS - 96.9% (continued) | | | | |
| | |
Taiwan - 2.0% (continued) | | | | | | | | |
| | |
Eclat Textile Co., Ltd. (Consumer Durables & Apparel)† | | | 89,000 | | | | $1,051,970 | |
| | |
Silergy Corp. (Semiconductors & Semiconductor Equipment)† | | | 53,000 | | | | 670,906 | |
| | |
| | | | | | | 4,277,827 | |
| | |
Tanzania - 0.4% | | | | | | | | |
| | |
Tanzania Breweries Ltd. (Food Beverage & Tobacco) | | | 164,733 | | | | 926,960 | |
| | |
Turkey - 0.7% | | | | | | | | |
| | |
Anadolu Hayat Emeklilik AS (Insurance)† | | | 1,402,805 | | | | 1,468,280 | |
| | |
Ukraine - 1.1% | | | | | | | | |
| | |
Kernel Holding SA (Food Beverage & Tobacco)† | | | 181,333 | | | | 2,320,206 | |
| | |
United Arab Emirates - 0.9% | | | | | | | | |
| | |
Agthia Group PJSC (Food Beverage & Tobacco)† | | | 1,734,540 | | | | 1,936,098 | |
| | |
United Kingdom - 17.5% | | | | | | | | |
| | |
Abcam plc (Pharmaceuticals, Biotechnology & Life Sciences)† | | | 328,316 | | | | 5,030,414 | |
| | |
Bank of Georgia Group plc (Banks)† | | | 102,624 | | | | 2,045,434 | |
| | |
BBA Aviation plc (Transportation)† | | | 654,700 | | | | 2,007,071 | |
| | |
Britvic plc (Food Beverage & Tobacco)† | | | 192,105 | | | | 1,941,389 | |
| | |
Clarkson plc (Transportation)† | | | 87,394 | | | | 2,657,415 | |
| | |
Dechra Pharmaceuticals plc (Pharmaceuticals, Biotechnology & Life Sciences)† | | | 125,082 | | | | 3,652,634 | |
| | |
Diploma plc (Capital Goods)† | | | 158,048 | | | | 2,654,852 | |
| | |
EMIS Group plc (Health Care Equipment & Services)† | | | 182,452 | | | | 2,109,374 | |
| | |
Nostrum Oil & Gas plc (Energy)*† | | | 1,238,341 | | | | 3,260,327 | |
| | |
Rathbone Brothers plc (Diversified Financials)† | | | 91,103 | | | | 2,679,740 | |
| | |
RPC Group plc (Materials)† | | | 323,220 | | | | 3,146,843 | |
| | |
RPS Group plc (Commercial & Professional Services)† | | | 502,414 | | | | 1,006,167 | |
| | |
Senior plc (Capital Goods)† | | | 1,296,057 | | | | 4,518,009 | |
| | |
| | | | | | | 36,709,669 | |
| | |
United States - 0.8% | | | | | | | | |
| | |
Core Laboratories NV (Energy) | | | 11,461 | | | | 976,936 | |
| | |
Sensata Technologies Holding plc (Capital
Goods)* | | | 14,850 | | | | 696,465 | |
| | |
| | | | | | | 1,673,401 | |
| | | | | | | | |
| | |
| | | Shares | | | Value | |
| COMMON STOCKS - 96.9% (continued) | | | | |
| | |
Vietnam - 2.1% | | | | | | | | |
| | |
Hoa Phat Group JSC (Materials)*† | | | 2,521,186 | | | | $4,361,380 | |
| |
Total Common Stocks (Cost $190,119,340) | | | | $202,646,841 | |
| | |
| | | | | | | | |
| PARTICIPATION NOTES - 1.1% | | | | | | |
| | |
Saudi Arabia - 1.1% | | | | | | | | |
| | |
Jarir Marketing Co., Issued by HSBC BANK PLC, Maturity Date 1/19/21 (Retailing)^† | | | 60,396 | | | | 2,376,636 | |
| | |
Total Participation Notes (Cost $2,105,099) | | | | | | | $2,376,636 | |
| | |
| | | | | | | | |
| SHORT TERM INVESTMENTS - 2.1% | | | | |
| | |
Northern Institutional Funds - Treasury Portfolio, 2.03% (Money Market Funds) | | | 4,376,843 | | | | 4,376,843 | |
| |
Total Short Term Investments (Cost $4,376,843) | | | | $4,376,843 | |
| | |
| | | | | | | | | |
| | |
Total Investments - 100.1% | | | | | | | | |
| | |
(Cost $196,601,282) | | | | | | | $209,400,320 | |
| | |
Liabilities Less Other Assets - (0.1)% | | | | | | | (205,306 | ) |
| | |
Net Assets - 100.0% | | | | | | | $209,195,014 | |
Summary of Abbreviations
| ADR | American Depositary Receipt. |
| Reg S | Security sold outside United States without registration under the Securities Act of 1933. |
| * | Non-income producing security. |
| † | Investment categorized as level 2 security as disclosed in Note 2 of the Notes to Financial Statements. |
| ^ | Security exempt from registration pursuant to Rule 144A of the Securities Act of 1933. These securities, which represent 1.1% of net assets as of October 31, 2018, are considered liquid and may be resold in transactions exempt from registration, normally to qualified buyers. |
See Notes to Financial Statements
12
Harding, Loevner Funds, Inc.
International Small Companies Portfolio
Portfolio of Investments
October 31, 2018 (continued)
| | | | | |
| Industry | | |
| Percentage of
Net Assets |
|
| |
Automobiles & Components | | | | 2.0 | % |
| |
Banks | | | | 1.9 | |
| |
Capital Goods | | | | 11.0 | |
| |
Commercial & Professional Services | | | | 6.3 | |
| |
Consumer Durables & Apparel | | | | 1.8 | |
| |
Diversified Financials | | | | 2.6 | |
| |
Energy | | | | 4.3 | |
| |
Food & Staples Retailing | | | | 0.4 | |
| |
Food Beverage & Tobacco | | | | 9.9 | |
| |
Health Care Equipment & Services | | | | 11.5 | |
| |
Household & Personal Products | | | | 0.2 | |
| |
Insurance | | | | 2.3 | |
| |
Materials | | | | 8.0 | |
| |
Media | | | | 2.7 | |
| |
Pharmaceuticals, Biotechnology & Life Sciences | | | | 4.6 | |
| |
Real Estate | | | | 0.5 | |
| |
Retailing | | | | 1.3 | |
| |
Semiconductors & Semiconductor Equipment | | | | 2.4 | |
| |
Software & Services | | | | 15.6 | |
| |
Technology Hardware & Equipment | | | | 2.8 | |
| |
Telecommunication Services | | | | 1.2 | |
| |
Transportation | | | | 3.3 | |
| |
Utilities | | | | 1.4 | |
| |
Money Market Fund | | | | 2.1 | |
Total Investments | | | | 100.1 | |
Liabilities Less Other Assets | | | | (0.1 | ) |
Net Assets | | | | 100.0 | % |
See Notes to Financial Statements
13
Harding, Loevner Funds, Inc.
Institutional Emerging Markets Portfolio
Portfolio of Investments
October 31, 2018
| | | | | | | | |
| | |
| | | Shares | | | Value | |
| COMMON STOCKS - 90.9% | | | | | | |
| | |
Argentina - 0.3% | | | | | | | | |
| | |
Banco Macro SA - ADR (Banks) | | | 337,595 | | | | $15,087,121 | |
| | |
Brazil - 3.8% | | | | | | | | |
| | |
Ambev SA - ADR (Food Beverage & Tobacco) | | | 10,117,719 | | | | 43,809,723 | |
| | |
B3 SA - Brasil Bolsa Balcao (Diversified Financials)* | | | 7,197,200 | | | | 51,327,069 | |
| | |
Raia Drogasil SA (Food & Staples Retailing)* | | | 1,326,200 | | | | 22,386,641 | |
| | |
WEG SA (Capital Goods) | | | 9,939,070 | | | | 48,072,890 | |
| | |
| | | | | | | 165,596,323 | |
| | |
Chile - 0.7% | | | | | | | | |
| | |
Banco Santander Chile - ADR (Banks) | | | 968,940 | | | | 28,544,972 | |
| | |
China - 24.0% | | | | | | | | |
| | |
51job Inc. - ADR (Commercial & Professional Services)* | | | 1,140,926 | | | | 70,064,266 | |
| | |
AAC Technologies Holdings Inc. (Technology Hardware & Equipment)† | | | 4,075,000 | | | | 31,187,566 | |
| | |
Alibaba Group Holding Ltd. - Sponsored ADR (Software & Services)* | | | 904,707 | | | | 128,721,712 | |
| | |
Baidu Inc. - Sponsored ADR (Software & Services)* | | | 241,652 | | | | 45,928,379 | |
| | |
CNOOC Ltd. - Sponsored ADR (Energy) | | | 444,298 | | | | 75,197,437 | |
| | |
CSPC Pharmaceutical Group Ltd. (Pharmaceuticals, Biotechnology & Life Sciences)† | | | 19,066,000 | | | | 40,089,122 | |
| | |
Ctrip.com International Ltd. - ADR (Retailing)* | | | 1,080,343 | | | | 35,953,815 | |
| | |
ENN Energy Holdings Ltd. (Utilities)† | | | 10,425,200 | | | | 88,877,213 | |
| | |
Hangzhou Hikvision Digital Technology Co., Ltd., Class A (Technology Hardware & Equipment)† | | | 12,243,443 | | | | 42,736,033 | |
| | |
Han’s Laser Technology Industry Group Co., Ltd., Class A (Capital Goods)† | | | 5,485,477 | | | | 24,789,914 | |
| | |
JD.com Inc. - ADR (Retailing)* | | | 677,712 | | | | 15,939,786 | |
| | |
Jiangsu Hengrui Medicine Co., Ltd., Class A (Pharmaceuticals, Biotechnology & Life Sciences)† | | | 4,469,426 | | | | 39,393,858 | |
| | |
Midea Group Co., Ltd., Class A (Consumer Durables & Apparel)† | | | 9,473,154 | | | | 50,330,166 | |
| | |
Ping An Insurance Group Co., of China Ltd., Class H (Insurance)† | | | 4,845,000 | | | | 45,852,902 | |
| | |
Shenzhou International Group Holdings Ltd. (Consumer Durables & Apparel)† | | | 6,990,000 | | | | 77,004,888 | |
| | | | | | | | |
| | |
| | | Shares | | | Value | |
| COMMON STOCKS - 90.9% (continued) | | | | |
| | |
China - 24.0% (continued) | | | | | | | | |
| | |
Sino Biopharmaceutical Ltd. (Pharmaceuticals, Biotechnology & Life Sciences)† | | | 47,069,757 | | | | $42,510,294 | |
| | |
Sunny Optical Technology Group Co., Ltd. (Technology Hardware & Equipment)† | | | 3,249,100 | | | | 28,433,162 | |
| | |
Tencent Holdings Ltd. (Software &
Services)† | | | 4,138,100 | | | | 140,261,116 | |
| | |
Weibo Corp. - Sponsored ADR (Software & Services)* | | | 412,442 | | | | 24,338,203 | |
| | |
| | | | | | | 1,047,609,832 | |
| | |
Czech Republic - 1.1% | | | | | | | | |
| | |
Komercni banka AS (Banks)† | | | 1,235,871 | | | | 46,950,010 | |
| | |
Egypt - 0.7% | | | | | | | | |
| | |
Commercial International Bank Egypt SAE - GDR, Reg S (Banks)† | | | 6,944,758 | | | | 30,136,020 | |
| | |
Hong Kong - 5.9% | | | | | | | | |
| | |
AIA Group Ltd. (Insurance)† | | | 13,139,215 | | | | 99,937,148 | |
| | |
ASM Pacific Technology Ltd. (Semiconductors & Semiconductor Equipment)† | | | 3,113,669 | | | | 26,968,246 | |
| | |
Hong Kong Exchanges & Clearing Ltd. (Diversified Financials)† | | | 2,456,649 | | | | 65,508,411 | |
| | |
Sands China Ltd. (Consumer Services)† | | | 16,350,938 | | | | 64,848,113 | |
| | |
| | | | | | | 257,261,918 | |
| | |
India - 4.2% | | | | | | | | |
| | |
Housing Development Finance Corp., Ltd. (Banks)† | | | 3,844,436 | | | | 92,170,976 | |
| | |
Kotak Mahindra Bank Ltd. (Banks)† | | | 3,034,157 | | | | 45,926,385 | |
| | |
Maruti Suzuki India Ltd. (Automobiles & Components)† | | | 491,538 | | | | 43,987,745 | |
| | |
| | | | | | | 182,085,106 | |
| | |
Indonesia - 3.4% | | | | | | | | |
| | |
Astra International Tbk PT (Automobiles & Components)† | | | 90,371,800 | | | | 47,052,278 | |
| | |
Bank Central Asia Tbk PT (Banks)† | | | 24,965,633 | | | | 38,874,985 | |
| | |
Bank Rakyat Indonesia Persero Tbk PT (Banks)† | | | 298,709,300 | | | | 62,013,713 | |
| | |
| | | | | | | 147,940,976 | |
| | |
Italy - 1.5% | | | | | | | | |
| | |
Tenaris SA - ADR (Energy) | | | 2,290,171 | | | | 66,941,698 | |
| | |
Kenya - 1.2% | | | | | | | | |
| | |
East African Breweries Ltd. (Food Beverage & Tobacco)† | | | 5,973,465 | | | | 10,198,851 | |
See Notes to Financial Statements
14
Harding, Loevner Funds, Inc.
Institutional Emerging Markets Portfolio
Portfolio of Investments
October 31, 2018 (continued)
| | | | | | | | |
| | |
| | | Shares | | | Value | |
| COMMON STOCKS - 90.9% (continued) | | | | |
| | |
Kenya - 1.2% (continued) | | | | | | | | |
| | |
Safaricom plc (Telecommunication Services)† | | | 188,899,827 | | | | $42,997,380 | |
| | |
| | | | | | | 53,196,231 | |
| | |
Mexico - 4.5% | | | | | | | | |
| | |
Fomento Economico Mexicano SAB de CV - Sponsored ADR (Food Beverage & Tobacco) | | | 326,198 | | | | 27,749,664 | |
| | |
Grupo Aeroportuario del Sureste SAB de CV - ADR (Transportation) | | | 291,014 | | | | 48,023,130 | |
| | |
Grupo Financiero Banorte SAB de CV, Series O (Banks) | | | 12,211,300 | | | | 67,184,468 | |
| | |
Wal-Mart de Mexico SAB de CV (Food & Staples Retailing) | | | 21,589,800 | | | | 55,140,306 | |
| | |
| | | | | | | 198,097,568 | |
| | |
Panama - 0.8% | | | | | | | | |
| | |
Copa Holdings SA, Class A (Transportation) | | | 513,927 | | | | 37,223,733 | |
| | |
Peru - 1.5% | | | | | | | | |
| | |
Credicorp Ltd. (Banks) | | | 288,481 | | | | 65,113,047 | |
| | |
Russia - 8.2% | | | | | | | | |
| | |
LUKOIL PJSC - Sponsored ADR (Energy) | | | 1,574,425 | | | | 117,515,082 | |
| | |
Novatek PJSC - Sponsored GDR, Reg S (Energy)† | | | 641,737 | | | | 108,524,023 | |
| | |
Sberbank of Russia PJSC - Sponsored ADR (Banks)† | | | 8,997,404 | | | | 105,758,492 | |
| | |
Yandex NV, Class A (Software & Services)* | | | 859,588 | | | | 25,899,386 | |
| | |
| | | | | | | 357,696,983 | |
| | |
South Africa - 6.0% | | | | | | | | |
| | |
Aspen Pharmacare Holdings Ltd. (Pharmaceuticals, Biotechnology & Life Sciences)† | | | 1,992,588 | | | | 21,055,936 | |
| | |
Discovery Ltd. (Insurance)† | | | 6,078,184 | | | | 64,941,078 | |
| | |
Naspers Ltd., Class N (Media)† | | | 340,136 | | | | 59,576,632 | |
| | |
Sasol Ltd. (Materials)† | | | 1,643,104 | | | | 53,845,177 | |
| | |
Standard Bank Group Ltd. (Banks)† | | | 5,631,251 | | | | 62,243,831 | |
| | |
| | | | | | | 261,662,654 | |
| | |
South Korea - 8.4% | | | | | | | | |
| | |
Amorepacific Corp. (Household & Personal Products)† | | | 204,586 | | | | 27,370,512 | |
| | |
Coway Co., Ltd. (Consumer Durables & Apparel)† | | | 536,345 | | | | 33,152,488 | |
| | |
Hankook Tire Co., Ltd. (Automobiles & Components)† | | | 1,630,397 | | | | 59,321,977 | |
| | |
LG Household & Health Care Ltd. (Household & Personal Products)† | | | 88,908 | | | | 81,845,930 | |
| | | | | | | | |
| | |
| | | Shares | | | Value | |
| COMMON STOCKS - 90.9% (continued) | | | | |
| | |
South Korea - 8.4% (continued) | | | | | | | | |
| | |
Samsung Electronics Co., Ltd. - GDR (Technology Hardware & Equipment)† | | | 176,752 | | | | $164,528,840 | |
| | |
| | | | | | | 366,219,747 | |
| | |
Taiwan - 8.1% | | | | | | | | |
| | |
Airtac International Group (Capital Goods)† | | | 3,151,515 | | | | 27,513,079 | |
| | |
Eclat Textile Co., Ltd. (Consumer Durables & Apparel)† | | | 4,739,752 | | | | 56,023,367 | |
| | |
Hon Hai Precision Industry Co., Ltd. (Technology Hardware & Equipment)† | | | 9,030,031 | | | | 23,087,632 | |
| | |
Largan Precision Co., Ltd. (Technology Hardware & Equipment)† | | | 375,000 | | | | 40,717,351 | |
| | |
Taiwan Semiconductor Manufacturing Co., Ltd. (Semiconductors & Semiconductor Equipment)† | | | 27,609,277 | | | | 205,126,830 | |
| | |
| | | | | | | 352,468,259 | |
| | |
Thailand - 1.7% | | | | | | | | |
| | |
Siam Commercial Bank pcl, Reg S (Banks)† | | | 18,020,070 | | | | 74,743,880 | |
| | |
United Arab Emirates - 2.0% | | | | | | | | |
| | |
DP World Ltd. (Transportation)† | | | 2,688,009 | | | | 48,393,164 | |
| | |
Emaar Properties PJSC (Real Estate)† | | | 29,463,956 | | | | 40,971,740 | |
| | |
| | | | | | | 89,364,904 | |
| | |
United Kingdom - 1.6% | | | | | | | | |
| | |
Bank of Georgia Group plc (Banks)† | | | 854,652 | | | | 17,034,356 | |
| | |
Coca-Cola HBC AG - CDI (Food Beverage & Tobacco)*† | | | 1,754,480 | | | | 51,784,558 | |
| | |
| | | | | | | 68,818,914 | |
| | |
United States - 1.3% | | | | | | | | |
| | |
EPAM Systems Inc. (Software & Services)* | | | 491,478 | | | | 58,716,877 | |
| |
Total Common Stocks (Cost $3,648,662,680) | | | | $3,971,476,773 | |
| |
| | | | | |
| PREFERRED STOCKS - 6.4% | | | | | | |
| | |
Brazil - 4.4% | | | | | | | | |
| | |
Banco Bradesco SA - ADR (Banks)* | | | 7,281,744 | | | | 66,773,592 | |
| | |
Cia Brasileira de Distribuicao - Sponsored ADR (Food & Staples Retailing)* | | | 1,246,046 | | | | 26,054,822 | |
| | |
Itau Unibanco Holding SA - Sponsored ADR, 0.34% (Banks)+ | | | 7,562,809 | | | | 99,602,195 | |
| | |
| | | | | | | 192,430,609 | |
See Notes to Financial Statements
15
Harding, Loevner Funds, Inc.
Institutional Emerging Markets Portfolio
Portfolio of Investments
October 31, 2018 (continued)
| | | | | | | | |
| | |
| | | Shares | | | Value | |
| PREFERRED STOCKS - 6.4% (continued) | | | | |
| | |
Colombia - 1.0% | | | | | | | | |
| | |
Bancolombia SA - Sponsored ADR, 3.46% (Banks)+ | | | 1,217,962 | | | | $44,991,516 | |
| | |
South Korea - 1.0% | | | | | | | | |
| | |
Samsung Electronics Co., Ltd. - GDR, Reg S, 3.90% (Technology Hardware & Equipment)+† | | | 51,987 | | | | 40,661,070 | |
| |
Total Preferred Stocks (Cost $200,499,409) | | | | $278,083,195 | |
| |
| | | | | |
| SHORT TERM INVESTMENTS - 2.5% | | | | |
| | |
Northern Institutional Funds - Prime Obligations Portfolio, 2.26% (Money Market Funds) | | | 67,821,238 | | | | 67,828,020 | |
| | |
Northern Institutional Funds - Treasury Portfolio, 2.03% (Money Market Funds) | | | 43,888,521 | | | | 43,888,521 | |
| | |
Total Short Term Investments (Cost $111,716,352) | | | | | | | $111,716,541 | |
| | |
| | | | | | | | | |
| | |
Total Investments - 99.8% | | | | | | | | |
| | |
(Cost $3,960,878,441) | | | | | | | $4,361,276,509 | |
| | |
Other Assets Less Liabilities - 0.2% | | | | | | | 8,627,908 | |
| | |
Net Assets - 100.0% | | | | | | | $4,369,904,417 | |
Summary of Abbreviations
| ADR | American Depositary Receipt. |
| CDI | Chess Depository Interest. |
| GDR | Global Depository Receipt. |
| Reg S | Security sold outside United States without registration under the Securities Act of 1933. |
| * | Non-income producing security. |
| † | Investment categorized as level 2 security as disclosed in Note 2 of the Notes to Financial Statements. |
| + | Current yield is disclosed. Dividends are calculated based on a percentage of the issuer’s net income. |
| | | | | |
| Industry | | |
| Percentage of
Net Assets |
|
| |
Automobiles & Components | | | | 3.4 | % |
| |
Banks | | | | 22.0 | |
| |
Capital Goods | | | | 2.3 | |
| |
Commercial & Professional Services | | | | 1.6 | |
| |
Consumer Durables & Apparel | | | | 5.0 | |
| |
Consumer Services | | | | 1.5 | |
| |
Diversified Financials | | | | 2.7 | |
| |
Energy | | | | 8.4 | |
| |
Food & Staples Retailing | | | | 2.4 | |
| |
Food Beverage & Tobacco | | | | 3.1 | |
| |
Household & Personal Products | | | | 2.5 | |
| |
Insurance | | | | 4.8 | |
| |
Materials | | | | 1.2 | |
| |
Media | | | | 1.4 | |
| |
Pharmaceuticals, Biotechnology & Life Sciences | | | | 3.3 | |
| |
Real Estate | | | | 0.9 | |
| |
Retailing | | | | 1.2 | |
| |
Semiconductors & Semiconductor Equipment | | | | 5.3 | |
| |
Software & Services | | | | 9.7 | |
| |
Technology Hardware & Equipment | | | | 8.5 | |
| |
Telecommunication Services | | | | 1.0 | |
| |
Transportation | | | | 3.1 | |
| |
Utilities | | | | 2.0 | |
| |
Money Market Funds | | | | 2.5 | |
Total Investments | | | | 99.8 | |
Other Assets Less Liabilities | | | | 0.2 | |
Net Assets | | | | 100.0 | % |
See Notes to Financial Statements
16
Harding, Loevner Funds, Inc.
Emerging Markets Portfolio
Portfolio of Investments
October 31, 2018
| | | | | | | | |
| | |
| | | Shares | | | Value | |
| COMMON STOCKS - 91.5% | | | | | | |
| | |
Argentina - 0.4% | | | | | | | | |
| | |
Banco Macro SA - ADR (Banks) | | | 269,943 | | | | $12,063,753 | |
| | |
Brazil - 3.8% | | | | | | | | |
| | |
Ambev SA - ADR (Food Beverage & Tobacco) | | | 8,163,705 | | | | 35,348,843 | |
| | |
B3 SA - Brasil Bolsa Balcao (Diversified Financials)* | | | 5,799,000 | | | | 41,355,760 | |
| | |
Raia Drogasil SA (Food & Staples Retailing)* | | | 1,069,000 | | | | 18,045,030 | |
| | |
WEG SA (Capital Goods) | | | 7,930,030 | | | | 38,355,647 | |
| | |
| | | | | | | 133,105,280 | |
| | |
Chile - 0.7% | | | | | | | | |
| | |
Banco Santander Chile - ADR (Banks) | | | 782,030 | | | | 23,038,604 | |
| | |
China - 24.2% | | | | | | | | |
| | |
51job Inc. - ADR (Commercial & Professional Services)* | | | 912,225 | | | | 56,019,737 | |
| | |
AAC Technologies Holdings Inc. (Technology Hardware & Equipment)† | | | 3,238,000 | | | | 24,781,678 | |
| | |
Alibaba Group Holding Ltd. - Sponsored ADR (Software & Services)* | | | 721,135 | | | | 102,603,088 | |
| | |
Baidu Inc. - Sponsored ADR (Software & Services)* | | | 192,232 | | | | 36,535,614 | |
| | |
CNOOC Ltd. - Sponsored ADR (Energy) | | | 354,147 | | | | 59,939,380 | |
| | |
CSPC Pharmaceutical Group Ltd. (Pharmaceuticals, Biotechnology & Life Sciences)† | | | 15,164,000 | | | | 31,884,582 | |
| | |
Ctrip.com International Ltd. - ADR (Retailing)* | | | 859,884 | | | | 28,616,939 | |
| | |
ENN Energy Holdings Ltd. (Utilities)† | | | 8,296,700 | | | | 70,731,264 | |
| | |
Hangzhou Hikvision Digital Technology Co., Ltd., Class A (Technology Hardware & Equipment)† | | | 9,876,700 | | | | 34,474,860 | |
| | |
Han’s Laser Technology Industry Group Co., Ltd., Class A (Capital Goods)† | | | 4,425,080 | | | | 19,997,778 | |
| | |
JD.com Inc. - ADR (Retailing)* | | | 543,026 | | | | 12,771,971 | |
| | |
Jiangsu Hengrui Medicine Co., Ltd., Class A (Pharmaceuticals, Biotechnology & Life Sciences)† | | | 3,554,105 | | | | 31,326,150 | |
| | |
Midea Group Co., Ltd., Class A (Consumer Durables & Apparel)† | | | 7,737,400 | | | | 41,108,234 | |
| | |
Ping An Insurance Group Co., of China Ltd., Class H (Insurance)† | | | 3,901,500 | | | | 36,923,653 | |
| | |
Shenzhou International Group Holdings Ltd. (Consumer Durables & Apparel)† | | | 5,560,000 | | | | 61,251,385 | |
| | | | | | | | |
| | |
| | | Shares | | | Value | |
| COMMON STOCKS - 91.5% (continued) | | | | |
| | |
China - 24.2% (continued) | | | | | | | | |
| | |
Sino Biopharmaceutical Ltd. (Pharmaceuticals, Biotechnology & Life Sciences)† | | | 37,437,788 | | | | $33,811,336 | |
| | |
Sunny Optical Technology Group Co., Ltd. (Technology Hardware & Equipment)† | | | 2,617,200 | | | | 22,903,349 | |
| | |
Tencent Holdings Ltd. (Software & Services)† | | | 3,298,500 | | | | 111,802,830 | |
| | |
Weibo Corp. - Sponsored ADR (Software & Services)* | | | 328,754 | | | | 19,399,774 | |
| | |
| | | | | | | 836,883,602 | |
| | |
Czech Republic - 1.1% | | | | | | | | |
| | |
Komercni banka AS (Banks)† | | | 985,104 | | | | 37,423,520 | |
| | |
Egypt - 0.7% | | | | | | | | |
| | |
Commercial International Bank Egypt SAE - GDR, Reg S (Banks)† | | | 5,174,084 | | | | 22,452,374 | |
| | |
Hong Kong - 6.0% | | | | | | | | |
| | |
AIA Group Ltd. (Insurance)† | | | 10,708,589 | | | | 81,449,755 | |
| | |
ASM Pacific Technology Ltd. (Semiconductors & Semiconductor Equipment)† | | | 2,481,523 | | | | 21,493,076 | |
| | |
Hong Kong Exchanges & Clearing Ltd. (Diversified Financials)† | | | 1,951,951 | | | | 52,050,256 | |
| | |
Sands China Ltd. (Consumer Services)† | | | 13,012,944 | | | | 51,609,568 | |
| | |
| | | | | | | 206,602,655 | |
| | |
India - 4.2% | | | | | | | | |
| | |
Housing Development Finance Corp., Ltd.
(Banks)† | | | 3,055,918 | | | | 73,266,129 | |
| | |
Kotak Mahindra Bank Ltd. (Banks)† | | | 2,411,830 | | | | 36,506,559 | |
| | |
Maruti Suzuki India Ltd. (Automobiles & Components)† | | | 391,802 | | | | 35,062,369 | |
| | |
| | | | | | | 144,835,057 | |
| | |
Indonesia - 3.4% | | | | | | | | |
| | |
Astra International Tbk PT (Automobiles & Components)† | | | 72,902,500 | | | | 37,956,848 | |
| | |
Bank Central Asia Tbk PT (Banks)† | | | 19,333,110 | | | | 30,104,358 | |
| | |
Bank Rakyat Indonesia Persero Tbk PT
(Banks)† | | | 237,433,990 | | | | 49,292,618 | |
| | |
| | | | | | | 117,353,824 | |
| | |
Italy - 1.5% | | | | | | | | |
| | |
Tenaris SA - ADR (Energy) | | | 1,825,479 | | | | 53,358,751 | |
| | |
Kenya - 1.2% | | | | | | | | |
| | |
East African Breweries Ltd. (Food Beverage & Tobacco)† | | | 4,883,650 | | | | 8,338,145 | |
See Notes to Financial Statements
17
Harding, Loevner Funds, Inc.
Emerging Markets Portfolio
Portfolio of Investments
October 31, 2018 (continued)
| | | | | | | | |
| | |
| | | Shares | | | Value | |
| COMMON STOCKS - 91.5% (continued) | | | | |
| | |
Kenya - 1.2% (continued) | | | | | | | | |
| | |
Safaricom plc (Telecommunication Services)† | | | 150,570,701 | | | | $34,272,904 | |
| | |
| | | | | | | 42,611,049 | |
| | |
Mexico - 4.5% | | | | | | | | |
| | |
Fomento Economico Mexicano SAB de CV - Sponsored ADR (Food Beverage & Tobacco) | | | 222,422 | | | | 18,921,440 | |
| | |
Grupo Aeroportuario del Sureste SAB de CV - ADR (Transportation) | | | 234,359 | | | | 38,673,922 | |
| | |
Grupo Financiero Banorte SAB de CV, Series O (Banks) | | | 9,733,540 | | | | 53,552,259 | |
| | |
Wal-Mart de Mexico SAB de CV (Food & Staples Retailing) | | | 17,436,700 | | | | 44,533,297 | |
| | |
| | | | | | | 155,680,918 | |
| | |
Panama - 0.9% | | | | | | | | |
| | |
Copa Holdings SA, Class A (Transportation) | | | 408,505 | | | | 29,588,017 | |
| | |
Peru - 1.5% | | | | | | | | |
| | |
Credicorp Ltd. (Banks) | | | 229,404 | | | | 51,778,777 | |
| | |
Russia - 8.2% | | | | | | | | |
| | |
LUKOIL PJSC - Sponsored ADR (Energy) | | | 1,254,963 | | | | 93,670,438 | |
| | |
Novatek PJSC - Sponsored GDR, Reg S (Energy)† | | | 511,524 | | | | 86,503,727 | |
| | |
Sberbank of Russia PJSC - Sponsored ADR (Banks)† | | | 7,167,521 | | | | 84,249,436 | |
| | |
Yandex NV, Class A (Software & Services)* | | | 683,094 | | | | 20,581,622 | |
| | |
| | | | | | | 285,005,223 | |
| | |
South Africa - 6.0% | | | | | | | | |
| | |
Aspen Pharmacare Holdings Ltd. (Pharmaceuticals, Biotechnology & Life Sciences)† | | | 1,593,282 | | | | 16,836,468 | |
| | |
Discovery Ltd. (Insurance)† | | | 4,873,673 | | | | 52,071,734 | |
| | |
Naspers Ltd., Class N (Media)† | | | 270,534 | | | | 47,385,472 | |
| | |
Sasol Ltd. (Materials)† | | | 1,309,707 | | | | 42,919,623 | |
| | |
Standard Bank Group Ltd. (Banks)† | | | 4,332,678 | | | | 47,890,331 | |
| | |
| | | | | | | 207,103,628 | |
| | |
South Korea - 8.4% | | | | | | | | |
| | |
Amorepacific Corp. (Household & Personal Products)† | | | 164,757 | | | | 22,041,995 | |
| | |
Coway Co., Ltd. (Consumer Durables & Apparel)† | | | 428,864 | | | | 26,508,886 | |
| | |
Hankook Tire Co., Ltd. (Automobiles & Components)† | | | 1,294,722 | | | | 47,108,446 | |
| | |
LG Household & Health Care Ltd. (Household & Personal Products)† | | | 71,805 | | | | 66,101,442 | |
| | | | | | | | |
| | |
| | | Shares | | | Value | |
| COMMON STOCKS - 91.5% (continued) | | | | |
| | |
South Korea - 8.4% (continued) | | | | | | | | |
| | |
Samsung Electronics Co., Ltd. - GDR (Technology Hardware & Equipment)† | | | 139,918 | | | | $130,242,069 | |
| | |
| | | | | | | 292,002,838 | |
| | |
Taiwan - 8.1% | | | | | | | | |
| | |
Airtac International Group (Capital Goods)† | | | 2,539,397 | | | | 22,169,221 | |
| | |
Eclat Textile Co., Ltd. (Consumer Durables & Apparel)† | | | 3,778,216 | | | | 44,658,113 | |
| | |
Hon Hai Precision Industry Co., Ltd. (Technology Hardware & Equipment)† | | | 7,182,136 | | | | 18,363,006 | |
| | |
Largan Precision Co., Ltd. (Technology Hardware & Equipment)† | | | 299,001 | | | | 32,465,410 | |
| | |
Taiwan Semiconductor Manufacturing Co., Ltd. (Semiconductors & Semiconductor Equipment)† | | | 22,006,637 | | | | 163,501,263 | |
| | |
| | | | | | | 281,157,013 | |
| | |
Thailand - 1.7% | | | | | | | | |
| | |
Siam Commercial Bank pcl, Reg S (Banks)† | | | 14,377,700 | | | | 59,636,011 | |
| | |
United Arab Emirates - 2.0% | | | | | | | | |
| | |
DP World Ltd. (Transportation)† | | | 2,135,985 | | | | 38,454,883 | |
| | |
Emaar Properties PJSC (Real Estate)† | | | 23,166,373 | | | | 32,214,500 | |
| | |
| | | | | | | 70,669,383 | |
| | |
United Kingdom - 1.6% | | | | | | | | |
| | |
Bank of Georgia Group plc (Banks)† | | | 688,210 | | | | 13,716,945 | |
| | |
Coca-Cola HBC AG - CDI (Food Beverage & Tobacco)*† | | | 1,416,090 | | | | 41,796,769 | |
| | |
| | | | | | | 55,513,714 | |
| | |
United States - 1.4% | | | | | | | | |
| | |
EPAM Systems Inc. (Software & Services)* | | | 392,988 | | | | 46,950,276 | |
| |
Total Common Stocks (Cost $2,704,003,376) | | | | $3,164,814,267 | |
| |
| | | | | |
| PREFERRED STOCKS - 6.4% | | | | | | |
| | |
Brazil - 4.4% | | | | | | | | |
| | |
Banco Bradesco SA - ADR (Banks)* | | | 5,841,911 | | | | 53,570,324 | |
| | |
Cia Brasileira de Distribuicao - Sponsored ADR (Food & Staples Retailing)* | | | 1,000,252 | | | | 20,915,269 | |
| | |
Itau Unibanco Holding SA - Sponsored ADR, 0.34% (Banks)+ | | | 6,006,591 | | | | 79,106,803 | |
| | |
| | | | | | | 153,592,396 | |
See Notes to Financial Statements
18
Harding, Loevner Funds, Inc.
Emerging Markets Portfolio
Portfolio of Investments
October 31, 2018 (continued)
| | | | | | | | |
| | |
| | | Shares | | | Value | |
| PREFERRED STOCKS - 6.4% (continued) | | | | |
| | |
Colombia - 1.0% | | | | | | | | |
| | |
Bancolombia SA - Sponsored ADR, 3.46% (Banks)+ | | | 973,888 | | | | $35,975,423 | |
| | |
South Korea - 1.0% | | | | | | | | |
| | |
Samsung Electronics Co., Ltd. - GDR, Reg S, 3.90% (Technology Hardware & Equipment)+† | | | 41,904 | | | | 32,774,761 | |
| |
Total Preferred Stocks (Cost $139,688,874) | | | | $222,342,580 | |
| |
| | | | | |
| SHORT TERM INVESTMENTS - 2.0% | | | | |
| | |
Northern Institutional Funds - Prime Obligations Portfolio, 2.26% (Money Market Funds) | | | 23,303,619 | | | | 23,305,949 | |
| | |
Northern Institutional Funds - Treasury Portfolio, 2.03% (Money Market Funds) | | | 44,483,370 | | | | 44,483,370 | |
| |
Total Short Term Investments (Cost $67,785,477) | | | | $67,789,319 | |
| |
| | | | | | |
| | |
Total Investments - 99.9% | | | | | | | | |
| | |
(Cost $2,911,477,727) | | | | | | | $3,454,946,166 | |
| | |
Other Assets Less Liabilities - 0.1% | | | | | | | 4,210,845 | |
| | |
Net Assets - 100.0% | | | | | | | $3,459,157,011 | |
Summary of Abbreviations
| ADR | American Depositary Receipt. |
| CDI | Chess Depository Interest. |
| GDR | Global Depository Receipt. |
| Reg S | Security sold outside United States without registration under the Securities Act of 1933. |
| * | Non-income producing security. |
| † | Investment categorized as level 2 security as disclosed in Note 2 of the Notes to Financial Statements. |
| + | Current yield is disclosed. Dividends are calculated based on a percentage of the issuer’s net income. |
| | | | | |
| Industry | | |
| Percentage of
Net Assets |
|
| |
Automobiles & Components | | | | 3.5 | % |
| |
Banks | | | | 22.1 | |
| |
Capital Goods | | | | 2.3 | |
| |
Commercial & Professional Services | | | | 1.6 | |
| |
Consumer Durables & Apparel | | | | 5.0 | |
| |
Consumer Services | | | | 1.5 | |
| |
Diversified Financials | | | | 2.7 | |
| |
Energy | | | | 8.5 | |
| |
Food & Staples Retailing | | | | 2.4 | |
| |
Food Beverage & Tobacco | | | | 3.0 | |
| |
Household & Personal Products | | | | 2.6 | |
| |
Insurance | | | | 4.9 | |
| |
Materials | | | | 1.2 | |
| |
Media | | | | 1.4 | |
| |
Pharmaceuticals, Biotechnology & Life Sciences | | | | 3.3 | |
| |
Real Estate | | | | 0.9 | |
| |
Retailing | | | | 1.2 | |
| |
Semiconductors & Semiconductor Equipment | | | | 5.3 | |
| |
Software & Services | | | | 9.8 | |
| |
Technology Hardware & Equipment | | | | 8.6 | |
| |
Telecommunication Services | | | | 1.0 | |
| |
Transportation | | | | 3.1 | |
| |
Utilities | | | | 2.0 | |
| |
Money Market Funds | | | | 2.0 | |
Total Investments | | | | 99.9 | |
Other Assets Less Liabilities | | | | 0.1 | |
Net Assets | | | | 100.0 | % |
See Notes to Financial Statements
19
Harding, Loevner Funds, Inc.
Frontier Emerging Markets Portfolio
Portfolio of Investments
October 31, 2018
| | | | | | | | |
| | |
| | | Shares | | | Value | |
| COMMON STOCKS - 90.3% | | | | | | |
| | |
Argentina - 8.9% | | | | | | | | |
| | |
Banco Macro SA - ADR (Banks) | | | 188,096 | | | | $8,406,010 | |
| | |
Cablevision Holding SA - Sponsored GDR
(Media)#*† | | | 256,348 | | | | 2,061,141 | |
| | |
Globant SA (Software & Services)* | | | 219,192 | | | | 11,284,004 | |
| | |
Grupo Financiero Galicia SA - ADR (Banks) | | | 298,452 | | | | 6,882,303 | |
| | |
Loma Negra Cia Industrial Argentina SA - Sponsored ADR (Materials)* | | | 259,537 | | | | 2,338,428 | |
| | |
Telecom Argentina SA - Sponsored ADR (Telecommunication Services) | | | 309,187 | | | | 5,599,377 | |
| | |
| | | | | | | 36,571,263 | |
| | |
Bangladesh - 3.4% | | | | | | | | |
| | |
BRAC Bank Ltd. (Banks)*† | | | 905,250 | | | | 762,357 | |
| | |
GrameenPhone Ltd. (Telecommunication
Services)† | | | 368,674 | | | | 1,672,885 | |
| | |
Square Pharmaceuticals Ltd. (Pharmaceuticals, Biotechnology & Life Sciences)† | | | 3,639,408 | | | | 11,596,100 | |
| | |
| | | | | | | 14,031,342 | |
| | |
Colombia - 6.2% | | | | | | | | |
| | |
Cementos Argos SA - Sponsored ADR
(Materials)#† | | | 499,040 | | | | 5,440,684 | |
| | |
Ecopetrol SA - Sponsored ADR (Energy) | | | 762,826 | | | | 17,743,333 | |
| | |
Grupo Nutresa SA (Food Beverage & Tobacco) | | | 312,300 | | | | 2,163,155 | |
| | |
| | | | | | | 25,347,172 | |
| | |
Croatia - 0.6% | | | | | | | | |
| | |
Ericsson Nikola Tesla (Technology Hardware & Equipment)† | | | 14,550 | | | | 2,316,756 | |
| | |
Egypt - 3.8% | | | | | | | | |
| | |
Commercial International Bank Egypt SAE - GDR, Reg S (Banks)† | | | 2,501,224 | | | | 10,853,789 | |
| | |
Integrated Diagnostics Holdings plc (Health Care Equipment & Services)† | | | 1,361,519 | | | | 4,691,439 | |
| | |
| | | | | | | 15,545,228 | |
| | |
Estonia - 0.7% | | | | | | | | |
| | |
Tallink Grupp AS (Transportation)† | | | 2,564,107 | | | | 2,817,661 | |
| | |
Kazakhstan - 1.1% | | | | | | | | |
| | |
Halyk Savings Bank of Kazakhstan JSC - GDR, Reg S (Banks)† | | | 399,373 | | | | 4,539,398 | |
| | | | | | | | |
| | |
| | | Shares | | | Value | |
| COMMON STOCKS - 90.3% (continued) | | | | |
| | |
Kenya - 4.3% | | | | | | | | |
| | |
East African Breweries Ltd. (Food Beverage & Tobacco)† | | | 935,700 | | | | $1,597,576 | |
| | |
Safaricom plc (Telecommunication Services)† | | | 70,218,850 | | | | 15,983,215 | |
| | |
| | | | | | | 17,580,791 | |
| | |
Kuwait - 3.8% | | | | | | | | |
| | |
Kuwait Projects Co. Holding KSCP (Banks)† | | | 712,110 | | | | 485,423 | |
| | |
Mabanee Co. SAK (Real Estate)† | | | 1,761,282 | | | | 3,532,822 | |
| | |
National Bank of Kuwait SAKP (Banks)† | | | 4,289,438 | | | | 11,608,003 | |
| | |
| | | | | | | 15,626,248 | |
| | |
Morocco - 2.9% | | | | | | | | |
| | |
Attijariwafa Bank (Banks)† | | | 109,862 | | | | 4,784,038 | |
| | |
Maroc Telecom (Telecommunication Services)† | | | 230,485 | | | | 3,329,953 | |
| | |
Societe d’Exploitation des Ports (Transportation)† | | | 209,782 | | | | 3,665,370 | |
| | |
| | | | | | | 11,779,361 | |
| | |
Nigeria - 5.8% | | | | | | | | |
| | |
Access Bank plc (Banks) | | | 121,738,600 | | | | 2,649,408 | |
| | |
Dangote Cement plc (Materials)† | | | 6,715,130 | | | | 3,865,800 | |
| | |
Guaranty Trust Bank plc (Banks)† | | | 75,496,489 | | | | 7,799,052 | |
| | |
Lafarge Africa plc (Materials)† | | | 1,100,000 | | | | 53,032 | |
| | |
Nestle Nigeria plc (Food Beverage & Tobacco)† | | | 551,600 | | | | 2,096,994 | |
| | |
Nigerian Breweries plc (Food Beverage & Tobacco) | | | 3,894,100 | | | | 883,950 | |
| | |
Zenith Bank plc (Banks) | | | 98,572,496 | | | | 6,381,415 | |
| | |
| | | | | | | 23,729,651 | |
| | |
Pakistan - 2.0% | | | | | | | | |
| | |
Engro Corp., Ltd. (Materials)† | | | 532,092 | | | | 1,346,439 | |
| | |
MCB Bank Ltd. (Banks)† | | | 1,393,700 | | | | 2,082,994 | |
| | |
Oil & Gas Development Co., Ltd. (Energy)† | | | 1,173,400 | | | | 1,408,930 | |
| | |
Pakistan Petroleum Ltd. (Energy)† | | | 2,500,671 | | | | 3,527,859 | |
| | |
| | | | | | | 8,366,222 | |
| | |
Peru - 7.9% | | | | | | | | |
| | |
Alicorp SAA (Food Beverage & Tobacco) | | | 4,450,921 | | | | 12,871,565 | |
| | |
Credicorp Ltd. (Banks) | | | 77,067 | | | | 17,394,793 | |
| | |
Ferreycorp SAA (Capital Goods) | | | 3,366,100 | | | | 2,106,620 | |
| | |
| | | | | | | 32,372,978 | |
| | |
Philippines - 16.2% | | | | | | | | |
| | |
Bank of the Philippine Islands (Banks)† | | | 5,371,634 | | | | 8,257,156 | |
| | |
BDO Unibank Inc. (Banks)† | | | 2,979,318 | | | | 6,813,218 | |
See Notes to Financial Statements
20
Harding, Loevner Funds, Inc.
Frontier Emerging Markets Portfolio
Portfolio of Investments
October 31, 2018 (continued)
| | | | | | | | |
| | |
| | | Shares | | | Value | |
| COMMON STOCKS - 90.3% (continued) | | | | |
| | |
Philippines - 16.2% (continued) | | | | | | | | |
| | |
International Container Terminal Services Inc. (Transportation)† | | | 2,650,730 | | | | $4,484,669 | |
| | |
Jollibee Foods Corp. (Consumer Services)† | | | 3,598,090 | | | | 18,542,594 | |
| | |
Robinsons Retail Holdings Inc. (Food & Staples Retailing)† | | | 5,041,400 | | | | 7,136,502 | |
| | |
Security Bank Corp. (Banks)† | | | 2,395,370 | | | | 6,469,149 | |
| | |
SM Prime Holdings Inc. (Real Estate)† | | | 19,563,500 | | | | 12,355,042 | |
| | |
Universal Robina Corp. (Food Beverage & Tobacco)† | | | 1,034,550 | | | | 2,512,069 | |
| | |
| | | | | | | 66,570,399 | |
| | |
Romania - 3.4% | | | | | | | | |
| | |
Banca Transilvania SA (Banks)† | | | 16,233,805 | | | | 9,146,568 | |
| | |
Societatea Nationala de Gaze Naturale ROMGAZ SA (Energy)† | | | 573,210 | | | | 4,738,764 | |
| | |
| | | | | | | 13,885,332 | |
| | |
Senegal - 0.4% | | | | | | | | |
| | |
Sonatel SA (Telecommunication Services) | | | 44,294 | | | | 1,453,178 | |
| | |
Slovenia - 0.7% | | | | | | | | |
| | |
Krka dd Novo mesto (Pharmaceuticals, Biotechnology & Life Sciences)† | | | 46,124 | | | | 2,842,854 | |
| | |
Sri Lanka - 0.5% | | | | | | | | |
| | |
Commercial Bank of Ceylon plc (Banks)† | | | 1,271,674 | | | | 853,815 | |
| | |
John Keells Holdings plc (Capital Goods)† | | | 1,257,142 | | | | 1,071,716 | |
| | |
| | | | | | | 1,925,531 | |
| | |
Tanzania - 0.2% | | | | | | | | |
| | |
Tanzania Breweries Ltd. (Food Beverage & Tobacco) | | | 135,066 | | | | 760,022 | |
| | |
Thailand - 1.6% | | | | | | | | |
| | |
Home Product Center pcl, Reg S (Retailing)† | | | 11,044,794 | | | | 4,964,327 | |
| | |
Siam Commercial Bank pcl, Reg S (Banks)† | | | 393,600 | | | | 1,632,579 | |
| | |
| | | | | | | 6,596,906 | |
| | |
Turkey - 0.2% | | | | | | | | |
| | |
Turkiye Garanti Bankasi AS (Banks)† | | | 674,500 | | | | 848,556 | |
| | |
Ukraine - 1.5% | | | | | | | | |
| | |
Kernel Holding SA (Food Beverage & Tobacco)† | | | 275,747 | | | | 3,528,259 | |
| | |
MHP SE - GDR (Food Beverage & Tobacco)† | | | 217,243 | | | | 2,553,392 | |
| | |
| | | | | | | 6,081,651 | |
| | | | | | | | |
| | |
| | | Shares | | | Value | |
| COMMON STOCKS - 90.3% (continued) | | | | |
| | |
United Arab Emirates - 4.4% | | | | | | | | |
| | |
Agthia Group PJSC (Food Beverage &
Tobacco)† | | | 5,293,209 | | | | $5,908,294 | |
| | |
DP World Ltd. (Transportation)† | | | 237,109 | | | | 4,268,756 | |
| | |
Emaar Properties PJSC (Real Estate)† | | | 5,632,715 | | | | 7,832,694 | |
| | |
| | | | | | | 18,009,744 | |
| | |
United Kingdom - 1.5% | | | | | | | | |
| | |
Bank of Georgia Group plc (Banks)† | | | 96,323 | | | | 1,919,846 | |
| | |
Nostrum Oil & Gas plc (Energy)*† | | | 1,637,192 | | | | 4,310,430 | |
| | |
| | | | | | | 6,230,276 | |
| | |
Vietnam - 8.3% | | | | | | | | |
| | |
Hoa Phat Group JSC (Materials)*† | | | 11,577,452 | | | | 20,027,745 | |
| | |
Masan Group Corp. (Food Beverage &
Tobacco)*† | | | 930,250 | | | | 3,321,618 | |
| | |
Vietnam Dairy Products JSC (Food Beverage & Tobacco)† | | | 2,154,700 | | | | 10,756,871 | |
| | |
| | | | | | | | 34,106,234 | |
| |
Total Common Stocks (Cost $356,042,752) | | | | $369,934,754 | |
| |
| | | | | |
| PREFERRED STOCKS - 2.2% | | | | | | |
| | |
Colombia - 2.2% | | | | | | | | |
| | |
Bancolombia SA - Sponsored ADR, 3.46% (Banks)+ | | | 240,857 | | | | 8,897,258 | |
| |
Total Preferred Stocks (Cost $8,642,025) | | | | $8,897,258 | |
| |
| | | | | |
| PARTICIPATION NOTES - 7.7% | | | | | | |
| | |
Saudi Arabia - 7.7% | | | | | | | | |
| | |
Al Rajhi Bank, Issued by JP Morgan Structured Products, Maturity Date 12/5/19 (Banks)^† | | | 554,958 | | | | 12,945,504 | |
| | |
Herfy Food Services Co., Issued by JP Morgan Structured Products, Maturity Date 1/14/19 (Consumer Services)^† | | | 104,620 | | | | 1,243,324 | |
| | |
Jarir Marketing Co., Issued by HSBC BANK PLC, Maturity Date 1/19/21 (Retailing)^† | | | 440,754 | | | | 17,344,060 | |
| | |
| | | | | | | | 31,532,888 | |
| | |
Total Participation Notes (Cost $25,673,910) | | | | | | | $31,532,888 | |
| | |
| | | | | | | | |
| SHORT TERM INVESTMENTS - 0.6% | | | | |
| | |
Northern Institutional Funds - Treasury Portfolio, 2.03% (Money Market Funds) | | | 2,623,615 | | | | 2,623,615 | |
See Notes to Financial Statements
21
Harding, Loevner Funds, Inc.
Frontier Emerging Markets Portfolio
Portfolio of Investments
October 31, 2018 (continued)
| | | | |
| |
| Shares | | Value | |
| SHORT TERM INVESTMENTS - 0.6% (continued) | | | |
| |
Total Short Term Investments (Cost $2,623,615) | | | $2,623,615 | |
| |
| | | | |
| | |
Total Investments - 100.8% | | | | |
| |
(Cost $392,982,302) | | | $412,988,515 | |
| |
Liabilities Less Other Assets - (0.8)% | | | (3,440,688 | ) |
| |
Net Assets - 100.0% | | | $409,547,827 | |
Summary of Abbreviations
| ADR | American Depositary Receipt. |
| GDR | Global Depository Receipt. |
| Reg S | Security sold outside United States without registration under the Securities Act of 1933. |
| # | Security valued at fair value as determined in good faith under policies and procedures established by and under the supervision of the Portfolio’s Board of Directors as disclosed in Note 2 of the Notes to Financial Statements. |
| * | Non-income producing security. |
| † | Investment categorized as level 2 security as disclosed in Note 2 of the Notes to Financial Statements. |
| + | Current yield is disclosed. Dividends are calculated based on a percentage of the issuer’s net income. |
| ^ | Security exempt from registration pursuant to Rule 144A of the Securities Act of 1933. These securities, which represent 7.7% of net assets as of October 31, 2018, are considered liquid and may be resold in transactions exempt from registration, normally to qualified buyers. |
| | | | | |
| Industry | | |
| Percentage of
Net Assets |
|
| |
Banks | | | | 34.8 | % |
| |
Capital Goods | | | | 0.8 | |
| |
Consumer Services | | | | 4.8 | |
| |
Energy | | | | 7.8 | |
| |
Food & Staples Retailing | | | | 1.7 | |
| |
Food Beverage & Tobacco | | | | 12.0 | |
| |
Health Care Equipment & Services | | | | 1.1 | |
| |
Materials | | | | 8.1 | |
| |
Media | | | | 0.5 | |
| |
Pharmaceuticals, Biotechnology & Life Sciences | | | | 3.5 | |
| |
Real Estate | | | | 5.8 | |
| |
Retailing | | | | 5.4 | |
| |
Software & Services | | | | 2.8 | |
| |
Technology Hardware & Equipment | | | | 0.6 | |
| |
Telecommunication Services | | | | 6.8 | |
| |
Transportation | | | | 3.7 | |
| |
Money Market Fund | | | | 0.6 | |
Total Investments | | | | 100.8 | |
Liabilities Less Other Assets | | | | (0.8 | ) |
Net Assets | | | | 100.0 | % |
See Notes to Financial Statements
22
Harding, Loevner Funds, Inc.
Global Equity Research Portfolio
Portfolio of Investments
October 31, 2018
| | | | | | | | |
| | |
| | | Shares | | | Value | |
| COMMON STOCKS - 97.8% | | | | | | |
| | |
Argentina - 0.7% | | | | | | | | |
| | |
Banco Macro SA - ADR (Banks) | | | 250 | | | | $11,173 | |
| | |
Globant SA (Software & Services)* | | | 290 | | | | 14,929 | |
| | |
Telecom Argentina SA - Sponsored ADR (Telecommunication Services) | | | 938 | | | | 16,987 | |
| | |
| | | | | | | 43,089 | |
| | |
Australia - 0.6% | | | | | | | | |
| | |
Cochlear Ltd. (Health Care Equipment & Services)† | | | 83 | | | | 10,485 | |
| | |
DuluxGroup Ltd. (Materials)† | | | 4,340 | | | | 22,778 | |
| | |
| | | | | | | 33,263 | |
| | |
Belgium - 0.6% | | | | | | | | |
| | |
Anheuser-Busch InBev SA (Food Beverage & Tobacco)† | | | 463 | | | | 34,117 | |
| | |
Brazil - 0.7% | | | | | | | | |
| | |
Ambev SA - ADR (Food Beverage & Tobacco) | | | 1,430 | | | | 6,192 | |
| | |
B3 SA - Brasil Bolsa Balcao (Diversified Financials)* | | | 1,200 | | | | 8,558 | |
| | |
Raia Drogasil SA (Food & Staples Retailing)* | | | 400 | | | | 6,752 | |
| | |
Ultrapar Participacoes SA - Sponsored ADR (Energy) | | | 936 | | | | 11,045 | |
| | |
WEG SA (Capital Goods) | | | 1,900 | | | | 9,190 | |
| | |
| | | | | | | 41,737 | |
| | |
Canada - 1.9% | | | | | | | | |
| | |
Alimentation Couche-Tard Inc. (Food & Staples Retailing) | | | 800 | | | | 38,303 | |
| | |
Canadian National Railway Co. (Transportation) | | | 600 | | | | 51,288 | |
| | |
Cenovus Energy Inc. (Energy) | | | 1,500 | | | | 12,693 | |
| | |
Encana Corp. (Energy) | | | 1,110 | | | | 11,367 | |
| | |
| | | | | | | 113,651 | |
| | |
China - 4.5% | | | | | | | | |
| | |
51job Inc. - ADR (Commercial & Professional Services)* | | | 133 | | | | 8,168 | |
| | |
AAC Technologies Holdings Inc. (Technology Hardware & Equipment)† | | | 1,670 | | | | 12,781 | |
| | |
Alibaba Group Holding Ltd. - Sponsored ADR (Software & Services)* | | | 55 | | | | 7,825 | |
| | |
ANTA Sports Products Ltd. (Consumer Durables & Apparel)† | | | 3,000 | | | | 12,296 | |
| | |
China Mobile Ltd. - Sponsored ADR (Telecommunication Services) | | | 984 | | | | 45,805 | |
| | |
CNOOC Ltd. - Sponsored ADR (Energy) | | | 119 | | | | 20,141 | |
| | | | | | | | |
| | |
| | | Shares | | | Value | |
| COMMON STOCKS - 97.8% (continued) | | | | | | |
| | |
China - 4.5% (continued) | | | | | | | | |
| | |
CSPC Pharmaceutical Group Ltd. (Pharmaceuticals, Biotechnology & Life Sciences)† | | | 4,000 | | | | $8,411 | |
| | |
Ctrip.com International Ltd. - ADR (Retailing)* | | | 481 | | | | 16,008 | |
| | |
ENN Energy Holdings Ltd. (Utilities)† | | | 2,000 | | | | 17,051 | |
| | |
Gree Electric Appliances Inc. of Zhuhai, Class A (Consumer Durables & Apparel)*† | | | 1,700 | | | | 9,352 | |
| | |
Haitian International Holdings Ltd. (Capital Goods)† | | | 4,000 | | | | 7,898 | |
| | |
Inner Mongolia Yili Industrial Group Co., Ltd., Class A (Food Beverage & Tobacco)† | | | 2,200 | | | | 6,993 | |
| | |
JD.com Inc. - ADR (Retailing)* | | | 270 | | | | 6,350 | |
| | |
Midea Group Co., Ltd., Class A (Consumer Durables & Apparel)† | | | 1,500 | | | | 7,969 | |
| | |
New Oriental Education & Technology Group Inc. - Sponsored ADR (Consumer Services)* | | | 213 | | | | 12,463 | |
| | |
Ping An Insurance Group Co. of China Ltd., Class A (Insurance)† | | | 1,100 | | | | 10,021 | |
| | |
Shenzhou International Group Holdings Ltd. (Consumer Durables & Apparel)† | | | 1,000 | | | | 11,016 | |
| | |
Sunny Optical Technology Group Co., Ltd. (Technology Hardware & Equipment)† | | | 1,100 | | | | 9,626 | |
| | |
TAL Education Group - ADR (Consumer Services)* | | | 333 | | | | 9,650 | |
| | |
Tencent Holdings Ltd. (Software & Services)† | | | 300 | | | | 10,169 | |
| | |
Tingyi Cayman Islands Holding Corp. (Food Beverage & Tobacco)† | | | 6,000 | | | | 8,915 | |
| | |
Wuxi Biologics Cayman Inc. (Pharmaceuticals, Biotechnology & Life Sciences)*† | | | 2,000 | | | | 14,326 | |
| | |
| | | | | | | 273,234 | |
| | |
Colombia - 0.6% | | | | | | | | |
| | |
Cementos Argos SA - Sponsored ADR (Materials)#† | | | 743 | | | | 8,101 | |
| | |
Ecopetrol SA - Sponsored ADR (Energy) | | | 800 | | | | 18,608 | |
| | |
Grupo Nutresa SA (Food Beverage & Tobacco) | | | 1,370 | | | | 9,489 | |
| | |
| | | | | | | 36,198 | |
| | |
Denmark - 1.0% | | | | | | | | |
| | |
Chr Hansen Holding A/S (Materials)† | | | 150 | | | | 15,146 | |
See Notes to Financial Statements
23
Harding, Loevner Funds, Inc.
Global Equity Research Portfolio
Portfolio of Investments
October 31, 2018 (continued)
| | | | | | | | |
| | |
| | | Shares | | | Value | |
| COMMON STOCKS - 97.8% (continued) | | | | | | |
| | |
Denmark - 1.0% (continued) | | | | | | | | |
| | |
Coloplast A/S, Class B (Health Care Equipment & Services)† | | | 318 | | | | $29,643 | |
| | |
Novozymes A/S, Class B (Materials)† | | | 290 | | | | 14,324 | |
| | |
| | | | | | | 59,113 | |
| | |
Egypt - 0.4% | | | | | | | | |
| | |
Commercial International Bank Egypt SAE - GDR, Reg S (Banks)† | | | 6,189 | | | | 26,856 | |
| | |
France - 1.2% | | | | | | | | |
| | |
Air Liquide SA (Materials)† | | | 105 | | | | 12,719 | |
| | |
Dassault Systemes SE (Software & Services)† | | | 130 | | | | 16,256 | |
| | |
EssilorLuxottica SA (Health Care Equipment &
Services)† | | | 320 | | | | 43,748 | |
| | |
| | | | | | | 72,723 | |
| | |
Germany - 2.8% | | | | | | | | |
| | |
adidas AG (Consumer Durables & Apparel)† | | | 60 | | | | 14,134 | |
| | |
Allianz SE, Reg S (Insurance)† | | | 60 | | | | 12,529 | |
| | |
Bayer AG, Reg S (Pharmaceuticals, Biotechnology & Life Sciences)† | | | 403 | | | | 30,941 | |
| | |
Bayerische Motoren Werke AG (Automobiles & Components)† | | | 350 | | | | 30,191 | |
| | |
Fresenius SE & Co. KGaA (Health Care Equipment & Services)† | | | 172 | | | | 10,961 | |
| | |
FUCHS PETROLUB SE (Materials)† | | | 220 | | | | 9,536 | |
| | |
Henkel AG & Co. KGaA (Household & Personal Products)† | | | 90 | | | | 8,823 | |
| | |
Infineon Technologies AG (Semiconductors & Semiconductor Equipment)† | | | 1,190 | | | | 23,856 | |
| | |
SAP SE - Sponsored ADR (Software & Services) | | | 110 | | | | 11,799 | |
| | |
Symrise AG (Materials)† | | | 160 | | | | 13,437 | |
| | |
| | | | | | | 166,207 | |
| | |
Hong Kong - 1.1% | | | | | | | | |
| | |
AIA Group Ltd. (Insurance)† | | | 1,600 | | | | 12,170 | |
| | |
ASM Pacific Technology Ltd. (Semiconductors & Semiconductor Equipment)† | | | 1,000 | | | | 8,661 | |
| | |
Hong Kong Exchanges & Clearing Ltd. (Diversified Financials)† | | | 400 | | | | 10,666 | |
| | |
Sands China Ltd. (Consumer Services)† | | | 6,400 | | | | 25,382 | |
| | | | | | | | |
| | |
| | | Shares | | | Value | |
| COMMON STOCKS - 97.8% (continued) | | | | | | |
| | |
Hong Kong - 1.1% (continued) | | | | | | | | |
| | |
Techtronic Industries Co., Ltd. (Consumer Durables & Apparel)† | | | 2,500 | | | | $11,737 | |
| | |
| | | | | | | 68,616 | |
| | |
India - 2.2% | | | | | | | | |
| | |
Asian Paints Ltd. (Materials)† | | | 460 | | | | 7,672 | |
| | |
Bharti Infratel Ltd. (Telecommunication Services)† | | | 4,020 | | | | 14,616 | |
| | |
Emami Ltd. (Household & Personal Products)† | | | 2,197 | | | | 11,769 | |
| | |
Hero Motocorp Ltd. (Automobiles & Components)† | | | 1,041 | | | | 38,936 | |
| | |
Housing Development Finance Corp., Ltd. (Banks)† | | | 390 | | | | 9,350 | |
| | |
ICICI Bank Ltd. - Sponsored ADR (Banks) | | | 1,034 | | | | 9,813 | |
| | |
ITC Ltd. (Food Beverage & Tobacco)† | | | 2,090 | | | | 7,932 | |
| | |
Kotak Mahindra Bank Ltd. (Banks)† | | | 590 | | | | 8,930 | |
| | |
Max Financial Services Ltd. (Insurance)*† | | | 1,630 | | | | 8,338 | |
| | |
Pidilite Industries Ltd. (Materials)† | | | 1,120 | | | | 14,525 | |
| | |
| | | | | | | 131,881 | |
| | |
Indonesia - 1.6% | | | | | | | | |
| | |
Astra International Tbk PT (Automobiles &
Components)† | | | 69,100 | | | | 35,977 | |
| | |
Bank Central Asia Tbk PT (Banks)† | | | 28,000 | | | | 43,600 | |
| | |
Unilever Indonesia Tbk PT (Household & Personal Products)† | | | 5,500 | | | | 15,653 | |
| | |
| | | | | | | 95,230 | |
| | |
Israel - 0.8% | | | | | | | | |
| | |
Check Point Software Technologies Ltd. (Software & Services)* | | | 450 | | | | 49,950 | |
| | |
Italy - 0.8% | | | | | | | | |
| | |
FinecoBank Banca Fineco SpA (Banks)† | | | 2,542 | | | | 26,604 | |
| | |
Tenaris SA - ADR (Energy) | | | 720 | | | | 21,046 | |
| | |
| | | | | | | 47,650 | |
| | |
Japan - 9.4% | | | | | | | | |
| | |
ABC-Mart Inc. (Retailing)† | | | 700 | | | | 41,008 | |
| | |
Chugai Pharmaceutical Co., Ltd. (Pharmaceuticals, Biotechnology & Life Sciences)† | | | 300 | | | | 17,582 | |
| | |
Dentsu Inc. (Media)† | | | 500 | | | | 23,174 | |
| | |
FANUC Corp. (Capital Goods)† | | | 200 | | | | 34,758 | |
See Notes to Financial Statements
24
Harding, Loevner Funds, Inc.
Global Equity Research Portfolio
Portfolio of Investments
October 31, 2018 (continued)
| | | | | | | | |
| | |
| | | Shares | | | Value | |
| COMMON STOCKS - 97.8% (continued) | | | | | | |
| | |
Japan - 9.4% (continued) | | | | | | | | |
| | |
Fast Retailing Co., Ltd. (Retailing)† | | | 30 | | | | $15,138 | |
| | |
Hakuhodo DY Holdings Inc. (Media)† | | | 3,100 | | | | 51,582 | |
| | |
Hoshizaki Corp. (Capital Goods)† | | | 200 | | | | 16,095 | |
| | |
Kakaku.com Inc. (Software & Services)† | | | 600 | | | | 10,837 | |
| | |
Komatsu Ltd. (Capital Goods)† | | | 900 | | | | 23,337 | |
| | |
Kubota Corp. (Capital Goods)† | | | 1,600 | | | | 25,151 | |
| | |
M3 Inc. (Health Care Equipment & Services)† | | | 800 | | | | 12,984 | |
| | |
Makita Corp. (Capital Goods)† | | | 1,200 | | | | 41,343 | |
| | |
MISUMI Group Inc. (Capital Goods)† | | | 400 | | | | 8,097 | |
| | |
NGK Insulators Ltd. (Capital Goods)† | | | 700 | | | | 9,896 | |
| | |
Nomura Research Institute Ltd. (Software & Services)† | | | 330 | | | | 14,691 | |
| | |
Park24 Co., Ltd. (Commercial & Professional Services)† | | | 1,000 | | | | 26,258 | |
| | |
Rinnai Corp. (Consumer Durables & Apparel)† | | | 540 | | | | 39,192 | |
| | |
Shimano Inc. (Consumer Durables & Apparel)† | | | 400 | | | | 54,901 | |
| | |
Shiseido Co., Ltd. (Household & Personal Products)† | | | 200 | | | | 12,580 | |
| | |
SMC Corp. (Capital Goods)† | | | 40 | | | | 12,724 | |
| | |
Stanley Electric Co., Ltd. (Automobiles & Components)† | | | 500 | | | | 14,757 | |
| | |
Sugi Holdings Co., Ltd. (Food & Staples Retailing)† | | | 500 | | | | 22,853 | |
| | |
Unicharm Corp. (Household & Personal Products)† | | | 1,000 | | | | 27,135 | |
| | |
ZOZO Inc. (Retailing)† | | | 400 | | | | 9,592 | |
| | |
| | | | | | | 565,665 | |
| | |
Mexico - 0.9% | | | | | | | | |
| | |
Banco Santander Mexico SA Institucion de Banca Multiple Grupo Financiero Santand - ADR (Banks) | | | 1,000 | | | | 6,280 | |
| | |
Coca-Cola Femsa SAB de CV - Sponsored ADR (Food Beverage & Tobacco) | | | 110 | | | | 6,269 | |
| | |
Fomento Economico Mexicano SAB de CV - Sponsored ADR (Food Beverage & Tobacco) | | | 90 | | | | 7,656 | |
| | |
Grupo Bimbo SAB de CV, Series A (Food Beverage & Tobacco) | | | 4,200 | | | | 7,867 | |
| | |
Grupo Financiero Banorte SAB de CV, Series O (Banks) | | | 1,400 | | | | 7,703 | |
| | |
Grupo Televisa SAB - Sponsored ADR (Media) | | | 710 | | | | 10,210 | |
| | | | | | | | |
| | |
| | | Shares | | | Value | |
| COMMON STOCKS - 97.8% (continued) | | | | | | |
| | |
Mexico - 0.9% (continued) | | | | | | | | |
| | |
Wal-Mart de Mexico SAB de CV (Food & Staples Retailing) | | | 3,700 | | | | $9,450 | |
| | |
| | | | | | | 55,435 | |
| | |
Netherlands - 0.3% | | | | | | | | |
| | |
ASML Holding NV, Reg S (Semiconductors & Semiconductor Equipment) | | | 90 | | | | 15,512 | |
| | |
Pakistan - 1.1% | | | | | | | | |
| | |
Engro Corp., Ltd. (Materials)† | | | 3,800 | | | | 9,616 | |
| | |
Lucky Cement Ltd. (Materials)† | | | 5,450 | | | | 20,452 | |
| | |
MCB Bank Ltd. (Banks)† | | | 5,700 | | | | 8,519 | |
| | |
Oil & Gas Development Co., Ltd. (Energy)† | | | 7,400 | | | | 8,886 | |
| | |
Pakistan Petroleum Ltd. (Energy)† | | | 6,325 | | | | 8,923 | |
| | |
United Bank Ltd. (Banks)† | | | 6,800 | | | | 7,707 | |
| | |
| | | | | | | 64,103 | |
| | |
Panama - 0.2% | | | | | | | | |
| | |
Copa Holdings SA, Class A (Transportation) | | | 198 | | | | 14,341 | |
| | |
Peru - 0.6% | | | | | | | | |
| | |
Alicorp SAA (Food Beverage & Tobacco) | | | 9,290 | | | | 26,866 | |
| | |
Credicorp Ltd. (Banks) | | | 50 | | | | 11,285 | |
| | |
| | | | | | | 38,151 | |
| | |
Philippines - 1.3% | | | | | | | | |
| | |
BDO Unibank Inc. (Banks)† | | | 3,320 | | | | 7,592 | |
| | |
International Container Terminal Services Inc. (Transportation)† | | | 16,230 | | | | 27,459 | |
| | |
Jollibee Foods Corp. (Consumer Services)† | | | 1,710 | | | | 8,812 | |
| | |
Robinsons Retail Holdings Inc. (Food & Staples Retailing)† | | | 10,510 | | | | 14,878 | |
| | |
Security Bank Corp. (Banks)† | | | 3,360 | | | | 9,074 | |
| | |
SM Prime Holdings Inc. (Real Estate)† | | | 12,800 | | | | 8,084 | |
| | |
| | | | | | | 75,899 | |
| | |
Qatar - 0.5% | | | | | | | | |
| | |
Qatar Electricity & Water Co. QSC (Utilities)† | | | 260 | | | | 13,410 | |
| | |
Qatar National Bank QPSC (Banks)† | | | 290 | | | | 15,510 | |
| | |
| | | | | | | 28,920 | |
| | |
Russia - 0.8% | | | | | | | | |
| | |
LUKOIL PJSC - Sponsored ADR (Energy) | | | 130 | | | | 9,703 | |
| | |
Moscow Exchange MICEX-RTS PJSC (Diversified Financials)† | | | 9,963 | | | | 13,321 | |
| | |
Novatek PJSC - Sponsored GDR, Reg S (Energy)† | | | 50 | | | | 8,455 | |
See Notes to Financial Statements
25
Harding, Loevner Funds, Inc.
Global Equity Research Portfolio
Portfolio of Investments
October 31, 2018 (continued)
| | | | | | | | |
| | |
| | | Shares | | | Value | |
| COMMON STOCKS - 97.8% (continued) | | | | | | |
| | |
Russia - 0.8% (continued) | | | | | | | | |
| | |
Sberbank of Russia PJSC - Sponsored ADR (Banks)† | | | 620 | | | | $7,288 | |
| | |
Yandex NV, Class A (Software & Services)* | | | 274 | | | | 8,256 | |
| | |
| | | | | | | 47,023 | |
| | |
Singapore - 1.0% | | | | | | | | |
| | |
DBS Group Holdings Ltd. (Banks)† | | | 2,400 | | | | 40,723 | |
| | |
Oversea-Chinese Banking Corp. Ltd. (Banks)† | | | 2,635 | | | | 20,480 | |
| | |
| | | | | | | 61,203 | |
| | |
South Africa - 0.6% | | | | | | | | |
| | |
Clicks Group Ltd. (Food & Staples Retailing)† | | | 851 | | | | 10,845 | |
| | |
Discovery Ltd. (Insurance)† | | | 850 | | | | 9,082 | |
| | |
Standard Bank Group Ltd. (Banks)† | | | 640 | | | | 7,074 | |
| | |
Tiger Brands Ltd. (Food Beverage & Tobacco)† | | | 670 | | | | 11,952 | |
| | |
| | | | | | | 38,953 | |
| | |
South Korea - 0.8% | | | | | | | | |
| | |
Amorepacific Corp. (Household & Personal Products)† | | | 40 | | | | 5,352 | |
| | |
Coway Co., Ltd. (Consumer Durables & Apparel)† | | | 90 | | | | 5,563 | |
| | |
Hankook Tire Co., Ltd. (Automobiles & Components)† | | | 447 | | | | 16,264 | |
| | |
LG Household & Health Care Ltd. (Household & Personal Products)† | | | 9 | | | | 8,285 | |
| | |
NAVER Corp. (Software & Services)† | | | 125 | | | | 12,615 | |
| | |
| | | | | | | 48,079 | |
| | |
Spain - 1.4% | | | | | | | | |
| | |
Banco Bilbao Vizcaya Argentaria SA (Banks)† | | | 3,607 | | | | 19,912 | |
| | |
Banco Santander SA (Banks)† | | | 5,049 | | | | 23,936 | |
| | |
Bankinter SA (Banks)† | | | 4,810 | | | | 39,443 | |
| | |
| | | | | | | 83,291 | |
| | |
Sweden - 2.3% | | | | | | | | |
| | |
Alfa Laval AB (Capital Goods)† | | | 520 | | | | 13,273 | |
| | |
Assa Abloy AB, Class B (Capital Goods)† | | | 1,220 | | | | 24,320 | |
| | |
Atlas Copco AB, Class A (Capital Goods)† | | | 544 | | | | 13,448 | |
| | |
Hexagon AB, Class B (Technology Hardware & Equipment)† | | | 270 | | | | 13,218 | |
| | |
Intrum AB (Commercial & Professional Services)† | | | 823 | | | | 20,967 | |
| | | | | | | | |
| | |
| | | Shares | | | Value | |
| COMMON STOCKS - 97.8% (continued) | | | | | | |
| | |
Sweden - 2.3% (continued) | | | | | | | | |
| | |
Skandinaviska Enskilda Banken AB, Class A (Banks)† | | | 5,250 | | | | $54,254 | |
| | |
| | | | | | | 139,480 | |
| | |
Switzerland - 4.3% | | | | | | | | |
| | |
Cie Financiere Richemont SA, Reg S (Consumer Durables & Apparel)† | | | 140 | | | | 10,209 | |
| | |
Kuehne + Nagel International AG, Reg S
(Transportation)† | | | 285 | | | | 39,578 | |
| | |
Lonza Group AG, Reg S (Pharmaceuticals, Biotechnology & Life Sciences)*† | | | 60 | | | | 18,814 | |
| | |
Nestle SA - Sponsored ADR (Food Beverage & Tobacco) | | | 540 | | | | 45,511 | |
| | |
Novartis AG - Sponsored ADR (Pharmaceuticals, Biotechnology & Life Sciences) | | | 540 | | | | 47,228 | |
| | |
Roche Holding AG, Genusschein (Pharmaceuticals, Biotechnology & Life Sciences)† | | | 225 | | | | 54,596 | |
| | |
SGS SA, Reg S (Commercial & Professional Services)† | | | 8 | | | | 18,954 | |
| | |
Sonova Holding AG, Reg S (Health Care Equipment & Services)† | | | 65 | | | | 10,602 | |
| | |
Temenos AG, Reg S (Software & Services)*† | | | 98 | | | | 13,389 | |
| | |
| | | | | | | 258,881 | |
| | |
Taiwan - 1.6% | | | | | | | | |
| | |
Advantech Co., Ltd. (Technology Hardware & Equipment)† | | | 4,000 | | | | 27,417 | |
| | |
Airtac International Group (Capital Goods)† | | | 1,044 | | | | 9,114 | |
| | |
Eclat Textile Co., Ltd. (Consumer Durables & Apparel)† | | | 714 | | | | 8,439 | |
| | |
Largan Precision Co., Ltd. (Technology Hardware & Equipment)† | | | 70 | | | | 7,601 | |
| | |
President Chain Store Corp. (Food & Staples Retailing)† | | | 1,000 | | | | 11,304 | |
| | |
Taiwan Semiconductor Manufacturing Co., Ltd. (Semiconductors & Semiconductor Equipment)† | | | 4,000 | | | | 29,719 | |
| | |
| | | | | | | 93,594 | |
| | |
Thailand - 0.1% | | | | | | | | |
| | |
Siam Commercial Bank pcl, Reg S (Banks)† | | | 1,800 | | | | 7,466 | |
| | |
United Arab Emirates - 0.8% | | | | | | | | |
| | |
DP World Ltd. (Transportation)† | | | 1,836 | | | | 33,054 | |
See Notes to Financial Statements
26
Harding, Loevner Funds, Inc.
Global Equity Research Portfolio
Portfolio of Investments
October 31, 2018 (continued)
| | | | | | | | |
| | |
| | | Shares | | | Value | |
| COMMON STOCKS - 97.8% (continued) | | | | | | |
| | |
United Arab Emirates - 0.8% (continued) | | | | | | | | |
| | |
Emaar Properties PJSC (Real Estate)† | | | 9,900 | | | | $13,767 | |
| | |
| | | | | | | 46,821 | |
| | |
United Kingdom - 5.8% | | | | | | | | |
| | |
Abcam plc (Pharmaceuticals, Biotechnology & Life Sciences)† | | | 970 | | | | 14,862 | |
| | |
ASOS plc (Retailing)*† | | | 180 | | | | 12,511 | |
| | |
Bank of Georgia Group plc (Banks)† | | | 320 | | | | 6,378 | |
| | |
BBA Aviation plc (Transportation)† | | | 2,830 | | | | 8,676 | |
| | |
Diageo plc (Food Beverage & Tobacco)† | | | 1,040 | | | | 35,971 | |
| | |
HSBC Holdings plc - Sponsored ADR (Banks) | | | 920 | | | | 37,803 | |
| | |
Jardine Lloyd Thompson Group plc (Insurance)† | | | 1,462 | | | | 35,252 | |
| | |
Rathbone Brothers plc (Diversified Financials)† | | | 363 | | | | 10,677 | |
| | |
Reckitt Benckiser Group plc (Household & Personal Products)† | | | 567 | | | | 45,847 | |
| | |
Rightmove plc (Software & Services)† | | | 2,000 | | | | 11,553 | |
| | |
Royal Dutch Shell plc, Class B - Sponsored ADR (Energy) | | | 172 | | | | 11,302 | |
| | |
Spirax-Sarco Engineering plc (Capital Goods)† | | | 634 | | | | 52,378 | |
| | |
St. James’s Place plc (Diversified Financials)† | | | 750 | | | | 9,703 | |
| | |
Standard Chartered plc (Banks)† | | | 1,190 | | | | 8,353 | |
| | |
Unilever plc (Household & Personal Products)† | | | 898 | | | | 47,552 | |
| | |
| | | | | | | 348,818 | |
| | |
United States - 42.5% | | | | | | | | |
| | |
Abbott Laboratories (Health Care Equipment & Services) | | | 220 | | | | 15,167 | |
| | |
Accenture plc, Class A (Software & Services) | | | 380 | | | | 59,896 | |
| | |
Adobe Inc. (Software & Services)* | | | 90 | | | | 22,118 | |
| | |
Air Products & Chemicals Inc. (Materials) | | | 320 | | | | 49,392 | |
| | |
Allegion plc (Capital Goods) | | | 450 | | | | 38,579 | |
| | |
Alphabet Inc., Class A (Software & Services)* | | | 45 | | | | 49,076 | |
| | |
Amazon.com Inc. (Retailing)* | | | 20 | | | | 31,960 | |
| | |
AmerisourceBergen Corp. (Health Care Equipment & Services) | | | 130 | | | | 11,440 | |
| | |
Amphenol Corp., Class A (Technology Hardware & Equipment) | | | 700 | | | | 62,650 | |
| | |
Apple Inc. (Technology Hardware & Equipment) | | | 350 | | | | 76,601 | |
| | | | | | | | |
| | |
| | | Shares | | | Value | |
| COMMON STOCKS - 97.8% (continued) | | | | | | |
| | |
United States - 42.5% (continued) | | | | | | | | |
| | |
Automatic Data Processing Inc. (Software & Services) | | | 540 | | | | $77,803 | |
| | |
Booking Holdings Inc. (Retailing)* | | | 7 | | | | 13,122 | |
| | |
BorgWarner Inc. (Automobiles & Components) | | | 235 | | | | 9,261 | |
| | |
Cerner Corp. (Health Care Equipment & Services)* | | | 448 | | | | 25,661 | |
| | |
Church & Dwight Co., Inc. (Household & Personal Products) | | | 1,080 | | | | 64,120 | |
| | |
Cisco Systems Inc. (Technology Hardware & Equipment) | | | 845 | | | | 38,659 | |
| | |
Cognizant Technology Solutions Corp., Class A (Software & Services) | | | 170 | | | | 11,735 | |
| | |
Colgate-Palmolive Co. (Household & Personal Products) | | | 950 | | | | 56,572 | |
| | |
CVS Health Corp. (Health Care Equipment & Services) | | | 870 | | | | 62,979 | |
| | |
Danaher Corp. (Health Care Equipment & Services) | | | 605 | | | | 60,137 | |
| | |
Deere & Co. (Capital Goods) | | | 200 | | | | 27,088 | |
| | |
eBay Inc. (Software & Services)* | | | 1,070 | | | | 31,062 | |
| | |
Ecolab Inc. (Materials) | | | 400 | | | | 61,260 | |
| | |
Emerson Electric Co. (Capital Goods) | | | 185 | | | | 12,558 | |
| | |
EnerSys (Capital Goods) | | | 200 | | | | 15,914 | |
| | |
EPAM Systems Inc. (Software & Services)* | | | 150 | | | | 17,921 | |
| | |
Facebook Inc., Class A (Software & Services)* | | | 270 | | | | 40,983 | |
| | |
First Republic Bank (Banks) | | | 660 | | | | 60,053 | |
| | |
Fiserv Inc. (Software & Services)* | | | 900 | | | | 71,370 | |
| | |
Flowserve Corp. (Capital Goods) | | | 530 | | | | 24,327 | |
| | |
Gartner Inc. (Software & Services)* | | | 450 | | | | 66,384 | |
| | |
Guidewire Software Inc. (Software & Services)* | | | 152 | | | | 13,523 | |
| | |
Healthcare Services Group Inc. (Commercial & Professional Services) | | | 622 | | | | 25,247 | |
| | |
HEICO Corp. (Capital Goods) | | | 212 | | | | 17,772 | |
| | |
Helmerich & Payne Inc. (Energy) | | | 180 | | | | 11,212 | |
| | |
IDEXX Laboratories Inc. (Health Care Equipment & Services)* | | | 70 | | | | 14,848 | |
| | |
Illumina Inc. (Pharmaceuticals, Biotechnology & Life Sciences)* | | | 60 | | | | 18,669 | |
| | |
IPG Photonics Corp. (Technology Hardware &
Equipment)* | | | 100 | | | | 13,355 | |
See Notes to Financial Statements
27
Harding, Loevner Funds, Inc.
Global Equity Research Portfolio
Portfolio of Investments
October 31, 2018 (continued)
| | | | | | | | |
| | |
| | | Shares | | | Value | |
| COMMON STOCKS - 97.8% (continued) | | | | | | |
| | |
United States - 42.5% (continued) | | | | | | | | |
| | |
IQVIA Holdings Inc. (Pharmaceuticals, Biotechnology & Life Sciences)* | | | 580 | | | | $71,299 | |
| | |
JPMorgan Chase & Co. (Banks) | | | 295 | | | | 32,161 | |
| | |
Kansas City Southern (Transportation) | | | 116 | | | | 11,827 | |
| | |
Linde plc (Materials)* | | | 169 | | | | 27,793 | |
| | |
Lululemon Athletica Inc. (Consumer Durables & Apparel)* | | | 290 | | | | 40,812 | |
| | |
Mastercard Inc., Class A (Software & Services) | | | 290 | | | | 57,324 | |
| | |
McDonald’s Corp. (Consumer Services) | | | 390 | | | | 68,991 | |
| | |
Merck & Co., Inc. (Pharmaceuticals, Biotechnology & Life Sciences) | | | 880 | | | | 64,777 | |
| | |
Mettler-Toledo International Inc. (Pharmaceuticals, Biotechnology & Life Sciences)* | | | 30 | | | | 16,405 | |
| | |
Microsoft Corp. (Software & Services) | | | 400 | | | | 42,724 | |
| | |
NVIDIA Corp. (Semiconductors & Semiconductor Equipment) | | | 60 | | | | 12,650 | |
| | |
PayPal Holdings Inc. (Software & Services)* | | | 240 | | | | 20,206 | |
| | |
Procter & Gamble Co. (Household & Personal Products) | | | 769 | | | | 68,195 | |
| | |
Prudential Financial Inc. (Insurance) | | | 460 | | | | 43,139 | |
| | |
Red Hat Inc. (Software & Services)* | | | 120 | | | | 20,597 | |
| | |
Regeneron Pharmaceuticals Inc (Pharmaceuticals, Biotechnology & Life Sciences)* | | | 82 | | | | 27,818 | |
| | |
Reinsurance Group of America Inc. (Insurance) | | | 380 | | | | 54,101 | |
| | |
Rollins Inc. (Commercial & Professional Services) | | | 400 | | | | 23,680 | |
| | |
salesforce.com Inc. (Software & Services)* | | | 130 | | | | 17,841 | |
| | |
Schlumberger Ltd. (Energy) | | | 280 | | | | 14,367 | |
| | |
Signature Bank (Banks) | | | 320 | | | | 35,168 | |
| | |
Texas Instruments Inc. (Semiconductors & Semiconductor Equipment) | | | 110 | | | | 10,211 | |
| | |
Thermo Fisher Scientific Inc. (Pharmaceuticals, Biotechnology & Life Sciences) | | | 60 | | | | 14,019 | |
| | |
Tractor Supply Co. (Retailing) | | | 729 | | | | 66,988 | |
| | | | | | | | |
| | |
| | | Shares | | | Value | |
| COMMON STOCKS - 97.8% (continued) | | | | | | |
| | |
United States - 42.5% (continued) | | | | | | | | |
| | |
UnitedHealth Group Inc. (Health Care Equipment & Services) | | | 230 | | | | $60,110 | |
| | |
Verisk Analytics Inc. (Commercial & Professional Services)* | | | 350 | | | | 41,944 | |
| | |
Vertex Pharmaceuticals Inc. (Pharmaceuticals, Biotechnology & Life Sciences)* | | | 69 | | | | 11,693 | |
| | |
Visa Inc., Class A (Software & Services) | | | 260 | | | | 35,841 | |
| | |
WABCO Holdings Inc. (Capital Goods)* | | | 140 | | | | 15,043 | |
| | |
Walgreens Boots Alliance Inc. (Food & Staples Retailing) | | | 550 | | | | 43,873 | |
| | |
Walt Disney Co. (Media) | | | 460 | | | | 52,822 | |
| | |
Workday Inc., Class A (Software & Services)* | | | 140 | | | | 18,623 | |
| | |
Zoetis Inc. (Pharmaceuticals, Biotechnology & Life Sciences) | | | 380 | | | | 34,257 | |
| | |
| | | | | | | | 2,557,773 | |
| | |
Total Common Stocks (Cost $5,367,775) | | | | | | | $5,882,923 | |
| | |
| | | | | | | | |
| PREFERRED STOCKS - 0.7% | | | | | | |
| | |
Brazil - 0.5% | | | | | | | | |
| | |
Banco Bradesco SA - ADR (Banks)* | | | 1,052 | | | | 9,647 | |
| | |
Cia Brasileira de Distribuicao - Sponsored ADR (Food & Staples Retailing)* | | | 433 | | | | 9,054 | |
| | |
Itau Unibanco Holding SA - Sponsored ADR, 0.34% (Banks)+ | | | 730 | | | | 9,614 | |
| | |
| | | | | | | 28,315 | |
| | |
Colombia - 0.1% | | | | | | | | |
| | |
Bancolombia SA - Sponsored ADR, 3.46% (Banks)+ | | | 187 | | | | 6,908 | |
| | |
South Korea - 0.1% | | | | | | | | |
| | |
Samsung Electronics Co., Ltd. - GDR, Reg S, 3.90% (Technology Hardware & Equipment)+† | | | 9 | | | | 7,039 | |
| | |
Total Preferred Stocks (Cost $41,017) | | | | | | | $42,262 | |
| | |
| | | | | | | | |
| SHORT TERM INVESTMENTS - 2.4% | | | | | | |
| | |
Northern Institutional Funds - Treasury Portfolio, 2.03% (Money Market Funds) | | | 144,671 | | | | 144,671 | |
See Notes to Financial Statements
28
Harding, Loevner Funds, Inc.
Global Equity Research Portfolio
Portfolio of Investments
October 31, 2018 (continued)
| | | | |
| |
| Shares | | Value | |
| SHORT TERM INVESTMENTS - 2.4% (continued) | | | |
| |
Total Short Term Investments (Cost $144,671) | | | $144,671 | |
| |
| | | | | |
| |
Total Investments - 100.9% | | | | |
| |
(Cost $5,553,463) | | | $6,069,856 | |
| |
Liabilities Less Other Assets - (0.9)% | | | (55,515 | ) |
| |
Net Assets - 100.0% | | | $6,014,341 | |
Summary of Abbreviations
| ADR | American Depositary Receipt. |
| GDR | Global Depository Receipt. |
| Reg S | Security sold outside United States without registration under the Securities Act of 1933. |
| * | Non-income producing security. |
| † | Investment categorized as level 2 security as disclosed in Note 2 of the Notes to Financial Statements. |
| # | Security valued at fair value as determined in good faith under policies and procedures established by and under the supervision of the Portfolio’s Board of Directors as disclosed in Note 2 of the Notes to Financial Statements. |
| + | Current yield is disclosed. Dividends are calculated based on a percentage of the issuer’s net income. |
| | | | | |
| Industry | | |
| Percentage of
Net Assets |
|
| |
Automobiles & Components | | | | 2.4 | % |
| |
Banks | | | | 10.6 | |
| |
Capital Goods | | | | 7.5 | |
| |
Commercial & Professional Services | | | | 2.7 | |
| |
Consumer Durables & Apparel | | | | 3.7 | |
| |
Consumer Services | | | | 2.1 | |
| |
Diversified Financials | | | | 0.9 | |
| |
Energy | | | | 2.8 | |
| |
Food & Staples Retailing | | | | 2.8 | |
| |
Food Beverage & Tobacco | | | | 3.6 | |
| |
Health Care Equipment & Services | | | | 6.1 | |
| |
Household & Personal Products | | | | 6.2 | |
| |
Insurance | | | | 3.1 | |
| |
Materials | | | | 4.8 | |
| |
Media | | | | 2.3 | |
| |
Pharmaceuticals, Biotechnology & Life Sciences | | | | 7.7 | |
| |
Real Estate | | | | 0.4 | |
| |
Retailing | | | | 3.5 | |
| |
Semiconductors & Semiconductor Equipment | | | | 1.7 | |
| |
Software & Services | | | | 14.2 | |
| |
Technology Hardware & Equipment | | | | 4.5 | |
| |
Telecommunication Services | | | | 1.3 | |
| |
Transportation | | | | 3.1 | |
| |
Utilities | | | | 0.5 | |
| |
Money Market Fund | | | | 2.4 | |
Total Investments | | | | 100.9 | |
Liabilities Less Other Assets | | | | (0.9 | ) |
Net Assets | | | | 100.0 | % |
See Notes to Financial Statements
29
Harding, Loevner Funds, Inc.
International Equity Research Portfolio
Portfolio of Investments
October 31, 2018
| | | | | | | | |
| | |
| | | Shares | | | Value | |
| COMMON STOCKS - 97.1% | | | | | | |
| | |
Argentina - 1.3% | | | | | | | | |
| | |
Banco Macro SA - ADR (Banks) | | | 673 | | | | $30,076 | |
| | |
Globant SA (Software & Services)* | | | 1,246 | | | | 64,144 | |
| | |
Telecom Argentina SA - Sponsored ADR (Telecommunication Services) | | | 2,290 | | | | 41,472 | |
| | |
| | | | | | | 135,692 | |
| | |
Australia - 1.0% | | | | | | | | |
| | |
Cochlear Ltd. (Health Care Equipment & Services)† | | | 455 | | | | 57,475 | |
| | |
DuluxGroup Ltd. (Materials)† | | | 9,240 | | | | 48,495 | |
| | |
| | | | | | | 105,970 | |
| | |
Belgium - 0.6% | | | | | | | | |
| | |
Anheuser-Busch InBev SA (Food Beverage & Tobacco)† | | | 829 | | | | 61,086 | |
| | |
Brazil - 1.5% | | | | | | | | |
| | |
Ambev SA - ADR (Food Beverage & Tobacco) | | | 6,357 | | | | 27,526 | |
| | |
B3 SA - Brasil Bolsa Balcao (Diversified Financials)* | | | 3,900 | | | | 27,813 | |
| | |
Raia Drogasil SA (Food & Staples Retailing)* | | | 1,800 | | | | 30,385 | |
| | |
Ultrapar Participacoes SA - Sponsored ADR (Energy) | | | 2,965 | | | | 34,987 | |
| | |
WEG SA (Capital Goods) | | | 6,100 | | | | 29,504 | |
| | |
| | | | | | | 150,215 | |
| | |
Canada - 2.8% | | | | | | | | |
| | |
Alimentation Couche-Tard Inc. (Food & Staples Retailing) | | | 2,100 | | | | 100,545 | |
| | |
Canadian National Railway Co. (Transportation) | | | 1,371 | | | | 117,193 | |
| | |
Cenovus Energy Inc. (Energy) | | | 3,000 | | | | 25,387 | |
| | |
Encana Corp. (Energy) | | | 4,560 | | | | 46,694 | |
| | |
| | | | | | | 289,819 | |
| | |
China - 5.8% | | | | | | | | |
| | |
51job Inc. - ADR (Commercial & Professional Services)* | | | 409 | | | | 25,117 | |
| | |
AAC Technologies Holdings Inc. (Technology Hardware & Equipment)† | | | 3,000 | | | | 22,960 | |
| | |
Alibaba Group Holding Ltd. - Sponsored ADR (Software & Services)* | | | 160 | | | | 22,765 | |
| | |
ANTA Sports Products Ltd. (Consumer Durables & Apparel)† | | | 7,600 | | | | 31,149 | |
| | |
China Mobile Ltd. - Sponsored ADR (Telecommunication Services) | | | 670 | | | | 31,188 | |
| | |
CNOOC Ltd. - Sponsored ADR (Energy) | | | 220 | | | | 37,235 | |
| | | | | | | | |
| | |
| | | Shares | | | Value | |
| COMMON STOCKS - 97.1% (continued) | | | | | | |
| | |
China - 5.8% (continued) | | | | | | | | |
| | |
CSPC Pharmaceutical Group Ltd. (Pharmaceuticals, Biotechnology & Life Sciences)† | | | 14,000 | | | | $29,437 | |
| | |
Ctrip.com International Ltd. - ADR (Retailing)* | | | 779 | | | | 25,925 | |
| | |
ENN Energy Holdings Ltd. (Utilities)† | | | 4,000 | | | | 34,101 | |
| | |
Gree Electric Appliances Inc. of Zhuhai, Class A (Consumer Durables & Apparel)*† | | | 4,900 | | | | 26,957 | |
| | |
Haitian International Holdings Ltd. (Capital Goods)† | | | 12,400 | | | | 24,482 | |
| | |
Inner Mongolia Yili Industrial Group Co., Ltd., Class A (Food Beverage & Tobacco)† | | | 6,800 | | | | 21,616 | |
| | |
JD.com Inc. - ADR (Retailing)* | | | 830 | | | | 19,522 | |
| | |
Midea Group Co., Ltd., Class A (Consumer Durables & Apparel)† | | | 4,700 | | | | 24,971 | |
| | |
New Oriental Education & Technology Group Inc. - Sponsored ADR (Consumer Services)* | | | 435 | | | | 25,452 | |
| | |
Ping An Insurance Group Co. of China Ltd., Class A (Insurance)† | | | 3,100 | | | | 28,241 | |
| | |
Shenzhou International Group Holdings Ltd. (Consumer Durables & Apparel)† | | | 3,770 | | | | 41,532 | |
| | |
Sunny Optical Technology Group Co., Ltd. (Technology Hardware & Equipment)† | | | 2,000 | | | | 17,502 | |
| | |
TAL Education Group - ADR (Consumer Services)* | | | 957 | | | | 27,734 | |
| | |
Tencent Holdings Ltd. (Software & Services)† | | | 800 | | | | 27,116 | |
| | |
Tingyi Cayman Islands Holding Corp. (Food Beverage & Tobacco)† | | | 21,150 | | | | 31,426 | |
| | |
Wuxi Biologics Cayman Inc. (Pharmaceuticals, Biotechnology & Life Sciences)*† | | | 3,250 | | | | 23,280 | |
| | |
| | | | | | | 599,708 | |
| | |
Colombia - 1.2% | | | | | | | | |
| | |
Cementos Argos SA - Sponsored ADR (Materials)#† | | | 2,349 | | | | 25,609 | |
| | |
Ecopetrol SA - Sponsored ADR (Energy) | | | 2,280 | | | | 53,033 | |
| | |
Grupo Nutresa SA (Food Beverage & Tobacco) | | | 7,266 | | | | 50,328 | |
| | |
| | | | | | | 128,970 | |
| | |
Denmark - 2.0% | | | | | | | | |
| | |
Chr Hansen Holding A/S (Materials)† | | | 820 | | | | 82,796 | |
See Notes to Financial Statements
30
Harding, Loevner Funds, Inc.
International Equity Research Portfolio
Portfolio of Investments
October 31, 2018 (continued)
| | | | | | | | |
| | |
| | | Shares | | | Value | |
| COMMON STOCKS - 97.1% (continued) | | | | | | |
| | |
Denmark - 2.0% (continued) | | | | | | | | |
| | |
Coloplast A/S, Class B (Health Care Equipment & Services)† | | | 687 | | | | $64,040 | |
| | |
Novozymes A/S, Class B (Materials)† | | | 1,250 | | | | 61,743 | |
| | |
| | | | | | | 208,579 | |
| | |
Egypt - 0.2% | | | | | | | | |
| | |
Commercial International Bank Egypt SAE - GDR, Reg S (Banks)† | | | 5,810 | | | | 25,212 | |
| | |
France - 2.5% | | | | | | | | |
| | |
Air Liquide SA (Materials)† | | | 725 | | | | 87,822 | |
| | |
Dassault Systemes SE (Software & Services)† | | | 530 | | | | 66,274 | |
| | |
EssilorLuxottica SA (Health Care Equipment &
Services)† | | | 780 | | | | 106,637 | |
| | |
| | | | | | | 260,733 | |
| | |
Germany - 7.2% | | | | | | | | |
| | |
adidas AG (Consumer Durables & Apparel)† | | | 369 | | | | 86,922 | |
| | |
Allianz SE, Reg S (Insurance)† | | | 561 | | | | 117,146 | |
| | |
Bayer AG, Reg S (Pharmaceuticals, Biotechnology & Life Sciences)† | | | 840 | | | | 64,492 | |
| | |
Bayerische Motoren Werke AG (Automobiles & Components)† | | | 1,114 | | | | 96,093 | |
| | |
Fresenius SE & Co. KGaA (Health Care Equipment & Services)† | | | 703 | | | | 44,802 | |
| | |
FUCHS PETROLUB SE (Materials)† | | | 510 | | | | 22,106 | |
| | |
Henkel AG & Co. KGaA (Household & Personal Products)† | | | 928 | | | | 90,981 | |
| | |
Infineon Technologies AG (Semiconductors & Semiconductor Equipment)† | | | 1,150 | | | | 23,054 | |
| | |
SAP SE - Sponsored ADR (Software & Services) | | | 1,000 | | | | 107,260 | |
| | |
Symrise AG (Materials)† | | | 1,113 | | | | 93,472 | |
| | |
| | | | | | | 746,328 | |
| | |
Hong Kong - 2.8% | | | | | | | | |
| | |
AIA Group Ltd. (Insurance)† | | | 13,200 | | | | 100,399 | |
| | |
ASM Pacific Technology Ltd. (Semiconductors & Semiconductor Equipment)† | | | 6,400 | | | | 55,432 | |
| | |
Hong Kong Exchanges & Clearing Ltd. (Diversified Financials)† | | | 2,000 | | | | 53,332 | |
| | |
Sands China Ltd. (Consumer Services)† | | | 5,200 | | | | 20,623 | |
| | | | | | | | |
| | |
| | | Shares | | | Value | |
| COMMON STOCKS - 97.1% (continued) | | | | | | |
| | |
Hong Kong - 2.8% (continued) | | | | | | | | |
| | |
Techtronic Industries Co., Ltd. (Consumer Durables & Apparel)† | | | 13,000 | | | | $61,031 | |
| | |
| | | | | | | 290,817 | |
| | |
India - 2.8% | | | | | | | | |
| | |
Asian Paints Ltd. (Materials)† | | | 1,380 | | | | 23,015 | |
| | |
Bharti Infratel Ltd. (Telecommunication Services)† | | | 13,880 | | | | 50,465 | |
| | |
Emami Ltd. (Household & Personal Products)† | | | 4,758 | | | | 25,489 | |
| | |
Hero Motocorp Ltd. (Automobiles & Components)† | | | 702 | | | | 26,256 | |
| | |
Housing Development Finance Corp., Ltd. (Banks)† | | | 1,080 | | | | 25,893 | |
| | |
ICICI Bank Ltd. - Sponsored ADR (Banks) | | | 2,849 | | | | 27,037 | |
| | |
ITC Ltd. (Food Beverage & Tobacco)† | | | 6,040 | | | | 22,923 | |
| | |
Kotak Mahindra Bank Ltd. (Banks)† | | | 1,770 | | | | 26,792 | |
| | |
Max Financial Services Ltd. (Insurance)*† | | | 7,870 | | | | 40,259 | |
| | |
Pidilite Industries Ltd. (Materials)† | | | 2,100 | | | | 27,234 | |
| | |
| | | | | | | 295,363 | |
| | |
Indonesia - 1.6% | | | | | | | | |
| | |
Astra International Tbk PT (Automobiles &
Components)† | | | 79,500 | | | | 41,392 | |
| | |
Bank Central Asia Tbk PT (Banks)† | | | 44,200 | | | | 68,826 | |
| | |
Unilever Indonesia Tbk PT (Household & Personal Products)† | | | 21,100 | | | | 60,052 | |
| | |
| | | | | | | 170,270 | |
| | |
Israel - 1.0% | | | | | | | | |
| | |
Check Point Software Technologies Ltd. (Software & Services)* | | | 900 | | | | 99,900 | |
| | |
Italy - 1.2% | | | | | | | | |
| | |
FinecoBank Banca Fineco SpA (Banks)† | | | 7,295 | | | | 76,348 | |
| | |
Tenaris SA - ADR (Energy) | | | 1,620 | | | | 47,353 | |
| | |
| | | | | | | 123,701 | |
| | |
Japan - 16.5% | | | | | | | | |
| | |
ABC-Mart Inc. (Retailing)† | | | 1,840 | | | | 107,792 | |
| | |
Chugai Pharmaceutical Co., Ltd. (Pharmaceuticals, Biotechnology & Life Sciences)† | | | 600 | | | | 35,164 | |
| | |
Dentsu Inc. (Media)† | | | 2,020 | | | | 93,625 | |
| | |
FANUC Corp. (Capital Goods)† | | | 300 | | | | 52,137 | |
See Notes to Financial Statements
31
Harding, Loevner Funds, Inc.
International Equity Research Portfolio
Portfolio of Investments
October 31, 2018 (continued)
| | | | | | | | | | |
| | |
| | | Shares | | Value |
| COMMON STOCKS - 97.1% (continued) | | | | |
| | |
Japan - 16.5% (continued) | | | | | | | | | | |
| | |
Fast Retailing Co., Ltd. (Retailing)† | | | | 70 | | | | $ | 35,321 | |
| | |
Hakuhodo DY Holdings Inc. (Media)† | | | | 6,190 | | | | | 102,998 | |
| | |
Hoshizaki Corp. (Capital Goods)† | | | | 1,300 | | | | | 104,620 | |
| | |
Kakaku.com Inc. (Software & Services)† | | | | 3,500 | | | | | 63,217 | |
| | |
Komatsu Ltd. (Capital Goods)† | | | | 3,040 | | | | | 78,827 | |
| | |
Kubota Corp. (Capital Goods)† | | | | 6,300 | | | | | 99,032 | |
| | |
M3 Inc. (Health Care Equipment & Services)† | | | | 1,800 | | | | | 29,214 | |
| | |
Makita Corp. (Capital Goods)† | | | | 2,300 | | | | | 79,241 | |
| | |
MISUMI Group Inc. (Capital Goods)† | | | | 2,000 | | | | | 40,484 | |
| | |
MonotaRO Co., Ltd. (Capital Goods)† | | | | 1,400 | | | | | 30,754 | |
| | |
NGK Insulators Ltd. (Capital Goods)† | | | | 4,150 | | | | | 58,671 | |
| | |
Nomura Research Institute Ltd. (Software & Services)† | | | | 2,202 | | | | | 98,027 | |
| | |
Park24 Co., Ltd. (Commercial & Professional Services)† | | | | 2,300 | | | | | 60,392 | |
| | |
Rinnai Corp. (Consumer Durables & Apparel)† | | | | 1,200 | | | | | 87,094 | |
| | |
Shimano Inc. (Consumer Durables & Apparel)† | | | | 800 | | | | | 109,801 | |
| | |
Shiseido Co., Ltd. (Household & Personal Products)† | | | | 900 | | | | | 56,612 | |
| | |
SMC Corp. (Capital Goods)† | | | | 160 | | | | | 50,894 | |
| | |
Stanley Electric Co., Ltd. (Automobiles & Components)† | | | | 2,715 | | | | | 80,129 | |
| | |
Sugi Holdings Co., Ltd. (Food & Staples Retailing)† | | | | 855 | | | | | 39,078 | |
| | |
Unicharm Corp. (Household & Personal Products)† | | | | 3,700 | | | | | 100,401 | |
| | |
ZOZO Inc. (Retailing)† | | | | 900 | | | | | 21,582 | |
| | |
| | | | | | | | | 1,715,107 | |
| | |
Mexico - 1.9% | | | | | | | | | | |
| | |
Banco Santander Mexico SA Institucion de Banca Multiple Grupo Financiero Santand - ADR (Banks) | | | | 4,345 | | | | | 27,287 | |
| | |
Coca-Cola Femsa SAB de CV - Sponsored ADR (Food Beverage & Tobacco) | | | | 502 | | | | | 28,609 | |
| | |
Fomento Economico Mexicano SAB de CV - Sponsored ADR (Food Beverage & Tobacco) | | | | 280 | | | | | 23,820 | |
| | |
Grupo Bimbo SAB de CV, Series A (Food Beverage & Tobacco) | | | | 13,500 | | | | | 25,288 | |
| | |
Grupo Financiero Banorte SAB de CV, Series O (Banks) | | | | 5,800 | | | | | 31,910 | |
| | | | | | | | | | |
| | |
| | | Shares | | Value |
| COMMON STOCKS - 97.1% (continued) | | | | |
| | |
Mexico - 1.9% (continued) | | | | | | | | | | |
| | |
Grupo Televisa SAB - Sponsored ADR (Media) | | | | 1,670 | | | | $ | 24,015 | |
| | |
Wal-Mart de Mexico SAB de CV (Food & Staples Retailing) | | | | 14,400 | | | | | 36,777 | |
| | |
| | | | | | | | | 197,706 | |
| | |
Netherlands - 0.8% | | | | | | | | | | |
| | |
ASML Holding NV, Reg S (Semiconductors & Semiconductor Equipment) | | | | 450 | | | | | 77,562 | |
| | |
Pakistan - 1.3% | | | | | | | | | | |
| | |
Engro Corp., Ltd. (Materials)† | | | | 8,100 | | | | | 20,497 | |
| | |
Lucky Cement Ltd. (Materials)† | | | | 5,900 | | | | | 22,141 | |
| | |
MCB Bank Ltd. (Banks)† | | | | 12,600 | | | | | 18,832 | |
| | |
Oil & Gas Development Co., Ltd. (Energy)† | | | | 17,700 | | | | | 21,253 | |
| | |
Pakistan Petroleum Ltd. (Energy)† | | | | 17,825 | | | | | 25,147 | |
| | |
United Bank Ltd. (Banks)† | | | | 25,600 | | | | | 29,014 | |
| | |
| | | | | | | | | 136,884 | |
| | |
Panama - 0.3% | | | | | | | | | | |
| | |
Copa Holdings SA, Class A (Transportation) | | | | 394 | | | | | 28,537 | |
| | |
Peru - 0.7% | | | | | | | | | | |
| | |
Alicorp SAA (Food Beverage & Tobacco) | | | | 10,540 | | | | | 30,480 | |
| | |
Credicorp Ltd. (Banks) | | | | 180 | | | | | 40,628 | |
| | |
| | | | | | | | | 71,108 | |
| | |
Philippines - 3.1% | | | | | | | | | | |
| | |
BDO Unibank Inc. (Banks)† | | | | 10,450 | | | | | 23,897 | |
| | |
International Container Terminal Services Inc. (Transportation)† | | | | 37,200 | | | | | 62,937 | |
| | |
Jollibee Foods Corp. (Consumer Services)† | | | | 5,870 | | | | | 30,251 | |
| | |
Robinsons Retail Holdings Inc. (Food & Staples Retailing)† | | | | 37,480 | | | | | 53,056 | |
| | |
Security Bank Corp. (Banks)† | | | | 15,220 | | | | | 41,105 | |
| | |
SM Prime Holdings Inc. (Real Estate)† | | | | 174,300 | | | | | 110,077 | |
| | |
| | | | | | | | | 321,323 | |
| | |
Qatar - 1.2% | | | | | | | | | | |
| | |
Qatar Electricity & Water Co. QSC (Utilities)† | | | | 1,383 | | | | | 71,332 | |
| | |
Qatar National Bank QPSC (Banks)† | | | | 920 | | | | | 49,202 | |
| | |
| | | | | | | | | 120,534 | |
| | |
Russia - 1.4% | | | | | | | | | | |
| | |
LUKOIL PJSC - Sponsored ADR (Energy) | | | | 530 | | | | | 39,559 | |
| | |
Moscow Exchange MICEX-RTS PJSC (Diversified Financials)† | | | | 14,560 | | | | | 19,468 | |
See Notes to Financial Statements
32
Harding, Loevner Funds, Inc.
International Equity Research Portfolio
Portfolio of Investments
October 31, 2018 (continued)
| | | | | | | | |
| | |
| | | Shares | | | Value | |
| COMMON STOCKS - 97.1% (continued) | | | | | | |
| | |
Russia - 1.4% (continued) | | | | | | | | |
| | |
Novatek PJSC - Sponsored GDR, Reg S (Energy)† | | | 220 | | | | $37,204 | |
| | |
Sberbank of Russia PJSC - Sponsored ADR (Banks)† | | | 2,020 | | | | 23,744 | |
| | |
Yandex NV, Class A (Software & Services)* | | | 882 | | | | 26,575 | |
| | |
| | | | | | | 146,550 | |
| | |
Singapore - 1.9% | | | | | | | | |
| | |
DBS Group Holdings Ltd. (Banks)† | | | 5,470 | | | | 92,814 | |
| | |
Oversea-Chinese Banking Corp. Ltd. (Banks)† | | | 13,100 | | | | 101,818 | |
| | |
| | | | | | | 194,632 | |
| | |
South Africa - 1.1% | | | | | | | | |
| | |
Clicks Group Ltd. (Food & Staples Retailing)† | | | 2,470 | | | | 31,478 | |
| | |
Discovery Ltd. (Insurance)† | | | 2,580 | | | | 27,565 | |
| | |
Standard Bank Group Ltd. (Banks)† | | | 2,468 | | | | 27,280 | |
| | |
Tiger Brands Ltd. (Food Beverage & Tobacco)† | | | 1,517 | | | | 27,061 | |
| | |
| | | | | | | 113,384 | |
| | |
South Korea - 1.6% | | | | | | | | |
| | |
Amorepacific Corp. (Household & Personal Products)† | | | 140 | | | | 18,730 | |
| | |
Coway Co., Ltd. (Consumer Durables & Apparel)† | | | 670 | | | | 41,414 | |
| | |
Hankook Tire Co., Ltd. (Automobiles & Components)† | | | 1,716 | | | | 62,436 | |
| | |
LG Household & Health Care Ltd. (Household & Personal Products)† | | | 28 | | | | 25,776 | |
| | |
NAVER Corp. (Software & Services)† | | | 190 | | | | 19,175 | |
| | |
| | | | | | | 167,531 | |
| | |
Spain - 1.8% | | | | | | | | |
| | |
Banco Bilbao Vizcaya Argentaria SA (Banks)† | | | 6,144 | | | | 33,917 | |
| | |
Banco Santander SA (Banks)† | | | 13,640 | | | | 64,664 | |
| | |
Bankinter SA (Banks)† | | | 11,130 | | | | 91,268 | |
| | |
| | | | | | | 189,849 | |
| | |
Sweden - 4.1% | | | | | | | | |
| | |
Alfa Laval AB (Capital Goods)† | | | 1,110 | | | | 28,333 | |
| | |
Assa Abloy AB, Class B (Capital Goods)† | | | 5,505 | | | | 109,741 | |
| | |
Atlas Copco AB, Class A (Capital Goods)† | | | 2,690 | | | | 66,498 | |
| | |
Hexagon AB, Class B (Technology Hardware & Equipment)† | | | 1,644 | | | | 80,481 | |
| | |
Intrum AB (Commercial & Professional Services)† | | | 2,520 | | | | 64,199 | |
| | | | | | | | |
| | |
| | | Shares | | | Value | |
| COMMON STOCKS - 97.1% (continued) | | | | | | |
| | |
Sweden - 4.1% (continued) | | | | | | | | |
| | |
Skandinaviska Enskilda Banken AB, Class A (Banks)† | | | 7,530 | | | | $77,816 | |
| | |
| | | | | | | 427,068 | |
| | |
Switzerland - 7.7% | | | | | | | | |
| | |
Cie Financiere Richemont SA, Reg S (Consumer Durables & Apparel)† | | | 1,358 | | | | 99,032 | |
| | |
Kuehne + Nagel International AG, Reg S
(Transportation)† | | | 769 | | | | 106,792 | |
| | |
Lonza Group AG, Reg S (Pharmaceuticals, Biotechnology & Life Sciences)*† | | | 110 | | | | 34,492 | |
| | |
Nestle SA - Sponsored ADR (Food Beverage & Tobacco) | | | 1,132 | | | | 95,405 | |
| | |
Novartis AG - Sponsored ADR (Pharmaceuticals, Biotechnology & Life Sciences) | | | 1,210 | | | | 105,827 | |
| | |
Roche Holding AG, Genusschein (Pharmaceuticals, Biotechnology & Life Sciences)† | | | 450 | | | | 109,192 | |
| | |
SGS SA, Reg S (Commercial & Professional Services)† | | | 45 | | | | 106,615 | |
| | |
Sonova Holding AG, Reg S (Health Care Equipment & Services)† | | | 532 | | | | 86,772 | |
| | |
Temenos AG, Reg S (Software & Services)*† | | | 387 | | | | 52,871 | |
| | |
| | | | | | | 796,998 | |
| | |
Taiwan - 2.1% | | | | | | | | |
| | |
Advantech Co., Ltd. (Technology Hardware & Equipment)† | | | 6,000 | | | | 41,126 | |
| | |
Airtac International Group (Capital Goods)† | | | 3,000 | | | | 26,190 | |
| | |
Eclat Textile Co., Ltd. (Consumer Durables & Apparel)† | | | 2,040 | | | | 24,113 | |
| | |
Largan Precision Co., Ltd. (Technology Hardware & Equipment)† | | | 220 | | | | 23,887 | |
| | |
President Chain Store Corp. (Food & Staples Retailing)† | | | 6,000 | | | | 67,824 | |
| | |
Taiwan Semiconductor Manufacturing Co., Ltd. (Semiconductors & Semiconductor Equipment)† | | | 4,000 | | | | 29,719 | |
| | |
| | | | | | | 212,859 | |
| | |
Thailand - 0.6% | | | | | | | | |
| | |
Siam Commercial Bank pcl, Reg S (Banks)† | | | 15,400 | | | | 63,876 | |
| | |
United Arab Emirates - 1.3% | | | | | | | | |
| | |
Agthia Group PJSC (Food Beverage & Tobacco)† | | | 10,250 | | | | 11,441 | |
| | |
DP World Ltd. (Transportation)† | | | 3,442 | | | | 61,967 | |
See Notes to Financial Statements
33
Harding, Loevner Funds, Inc.
International Equity Research Portfolio
Portfolio of Investments
October 31, 2018 (continued)
| | | | | | | | |
| | |
| | | Shares | | | Value | |
| COMMON STOCKS - 97.1% (continued) | | | | | | |
| | |
United Arab Emirates - 1.3% (continued) | | | | | | | | |
| | |
Emaar Properties PJSC (Real Estate)† | | | 45,410 | | | | $63,146 | |
| | |
| | | | | | | 136,554 | |
| | |
United Kingdom - 11.1% | | | | | | | | |
| | |
Abcam plc (Pharmaceuticals, Biotechnology & Life Sciences)† | | | 4,562 | | | | 69,898 | |
| | |
ASOS plc (Retailing)*† | | | 940 | | | | 65,333 | |
| | |
Bank of Georgia Group plc (Banks)† | | | 1,330 | | | | 26,509 | |
| | |
BBA Aviation plc (Transportation)† | | | 28,010 | | | | 85,868 | |
| | |
Diageo plc (Food Beverage & Tobacco)† | | | 3,623 | | | | 125,309 | |
| | |
HSBC Holdings plc - Sponsored ADR (Banks) | | | 2,120 | | | | 87,111 | |
| | |
Jardine Lloyd Thompson Group plc (Insurance)† | | | 3,294 | | | | 79,427 | |
| | |
Rathbone Brothers plc (Diversified Financials)† | | | 1,747 | | | | 51,387 | |
| | |
Reckitt Benckiser Group plc (Household & Personal Products)† | | | 1,160 | | | | 93,796 | |
| | |
Rightmove plc (Software & Services)† | | | 10,900 | | | | 62,966 | |
| | |
Royal Dutch Shell plc, Class B - Sponsored ADR (Energy) | | | 1,795 | | | | 117,949 | |
| | |
Spirax-Sarco Engineering plc (Capital Goods)† | | | 796 | | | | 65,761 | |
| | |
St. James’s Place plc (Diversified Financials)† | | | 7,306 | | | | 94,517 | |
| | |
Standard Chartered plc (Banks)† | | | 6,710 | | | | 47,101 | |
| | |
Unilever plc (Household & Personal Products)† | | | 1,460 | | | | 77,312 | |
| | |
| | | | | | | 1,150,244 | |
| | |
United States - 1.1% | | | | | | | | |
| | |
Linde plc (Materials)* | | | 719 | | | | 117,992 | |
| | | |
Total Common Stocks (Cost $9,897,758) | | | | | | | $10,078,661 | |
| | |
| | | | | | | | |
| PREFERRED STOCKS - 1.7% | | | | | | |
| | |
Brazil - 1.0% | | | | | | | | |
| | |
Banco Bradesco SA - ADR (Banks)* | | | 4,275 | | | | 39,202 | |
| | |
Cia Brasileira de Distribuicao - Sponsored ADR (Food & Staples Retailing)* | | | 1,300 | | | | 27,183 | |
| | |
Itau Unibanco Holding SA - Sponsored ADR, 0.34% (Banks)+ | | | 2,894 | | | | 38,114 | |
| | |
| | | | | | | 104,499 | |
| | |
Colombia - 0.3% | | | | | | | | |
| | |
Bancolombia SA - Sponsored ADR, 3.46% (Banks)+ | | | 910 | | | | 33,615 | |
| | | | | | | | |
| | |
| | | Shares | | | Value | |
| PREFERRED STOCKS - 1.7% (continued) | | | | |
| | |
South Korea - 0.4% | | | | | | | | |
| | |
Samsung Electronics Co., Ltd. - GDR, Reg S, 3.90% (Technology Hardware & Equipment)+† | | | 44 | | | | $34,414 | |
| | |
Total Preferred Stocks (Cost $154,443) | | | | | | | $172,528 | |
| | |
| | | | | | | | |
| SHORT TERM INVESTMENTS - 1.1% | | | | | | |
| | |
Northern Institutional Funds - Treasury Portfolio, 2.03% (Money Market Funds) | | | 114,363 | | | | 114,363 | |
| |
Total Short Term Investments (Cost $114,363) | | | | $114,363 | |
| |
| | | | | | |
| | |
Total Investments - 99.9% | | | | | | | | |
| | |
(Cost $10,166,564) | | | | | | | $10,365,552 | |
| | |
Other Assets Less Liabilities - 0.1% | | | | | | | 13,249 | |
| | |
Net Assets - 100.0% | | | | | | | $10,378,801 | |
Summary of Abbreviations
| ADR | American Depositary Receipt. |
| GDR | Global Depository Receipt. |
| Reg S | Security sold outside United States without registration under the Securities Act of 1933. |
| * | Non-income producing security. |
| † | Investment categorized as level 2 security as disclosed in Note 2 of the Notes to Financial Statements. |
| # | Security valued at fair value as determined in good faith under policies and procedures established by and under the supervision of the Portfolio’s Board of Directors as disclosed in Note 2 of the Notes to Financial Statements. |
| + | Current yield is disclosed. Dividends are calculated based on a percentage of the issuer’s net income. |
See Notes to Financial Statements
34
Harding, Loevner Funds, Inc.
International Equity Research Portfolio
Portfolio of Investments
October 31, 2018 (continued)
| | | | | |
| Industry | | |
| Percentage of
Net Assets |
|
| |
Automobiles & Components | | | | 3.0 | % |
| |
Banks | | | | 13.4 | |
| |
Capital Goods | | | | 9.1 | |
| |
Commercial & Professional Services | | | | 2.5 | |
| |
Consumer Durables & Apparel | | | | 6.1 | |
| |
Consumer Services | | | | 1.0 | |
| |
Diversified Financials | | | | 2.4 | |
| |
Energy | | | | 4.7 | |
| |
Food & Staples Retailing | | | | 3.7 | |
| |
Food Beverage & Tobacco | | | | 5.6 | |
| |
Health Care Equipment & Services | | | | 3.7 | |
| |
Household & Personal Products | | | | 5.3 | |
| |
Insurance | | | | 3.8 | |
| |
Materials | | | | 6.1 | |
| |
Media | | | | 2.1 | |
| |
Pharmaceuticals, Biotechnology & Life Sciences | | | | 4.5 | |
| |
Real Estate | | | | 1.7 | |
| |
Retailing | | | | 2.7 | |
| |
Semiconductors & Semiconductor Equipment | | | | 1.8 | |
| |
Software & Services | | | | 6.8 | |
| |
Technology Hardware & Equipment | | | | 2.1 | |
| |
Telecommunication Services | | | | 1.2 | |
| |
Transportation | | | | 4.5 | |
| |
Utilities | | | | 1.0 | |
| |
Money Market Fund | | | | 1.1 | |
Total Investments | | | | 99.9 | |
Other Assets Less Liabilities | | | | 0.1 | |
Net Assets | | | | 100.0 | % |
See Notes to Financial Statements
35
Harding, Loevner Funds, Inc.
Emerging Markets Research Portfolio
Portfolio of Investments
October 31, 2018
| | | | | | | | |
| | |
| | | Shares | | | Value | |
| COMMON STOCKS - 91.6% | | | | | | |
| | |
Argentina - 1.2% | | | | | | | | |
| | |
Banco Macro SA - ADR (Banks) | | | 816 | | | | $36,467 | |
| | |
Cablevision Holding SA - Sponsored GDR (Media)#*† | | | 2,087 | | | | 16,780 | |
| | |
Telecom Argentina SA - Sponsored ADR (Telecommunication Services) | | | 1,090 | | | | 19,740 | |
| | |
| | | | | | | 72,987 | |
| | |
Bangladesh - 0.2% | | | | | | | | |
| | |
Square Pharmaceuticals Ltd. (Pharmaceuticals, Biotechnology & Life Sciences)† | | | 4,246 | | | | 13,529 | |
| | |
Brazil - 5.5% | | | | | | | | |
| | |
Ambev SA - ADR (Food Beverage & Tobacco) | | | 20,920 | | | | 90,583 | |
| | |
B3 SA - Brasil Bolsa Balcao (Diversified Financials)* | | | 9,200 | | | | 65,610 | |
| | |
Raia Drogasil SA (Food & Staples Retailing)* | | | 2,800 | | | | 47,265 | |
| | |
Ultrapar Participacoes SA - Sponsored ADR (Energy) | | | 5,710 | | | | 67,378 | |
| | |
WEG SA (Capital Goods) | | | 14,600 | | | | 70,617 | |
| | |
| | | | | | | 341,453 | |
| | |
China - 21.9% | | | | | | | | |
| | |
51job Inc. - ADR (Commercial & Professional Services)* | | | 571 | | | | 35,065 | |
| | |
AAC Technologies Holdings Inc. (Technology Hardware & Equipment)† | | | 4,500 | | | | 34,440 | |
| | |
Alibaba Group Holding Ltd. - Sponsored ADR (Software & Services)* | | | 420 | | | | 59,757 | |
| | |
ANTA Sports Products Ltd. (Consumer Durables & Apparel)† | | | 18,000 | | | | 73,774 | |
| | |
China Mobile Ltd. - Sponsored ADR (Telecommunication Services) | | | 2,609 | | | | 121,449 | |
| | |
CNOOC Ltd. - Sponsored ADR (Energy) | | | 381 | | | | 64,484 | |
| | |
CSPC Pharmaceutical Group Ltd. (Pharmaceuticals, Biotechnology & Life Sciences)† | | | 24,000 | | | | 50,464 | |
| | |
Ctrip.com International Ltd. - ADR (Retailing)* | | | 2,729 | | | | 90,821 | |
| | |
ENN Energy Holdings Ltd. (Utilities)† | | | 9,000 | | | | 76,727 | |
| | |
Gree Electric Appliances Inc. of Zhuhai, Class A (Consumer Durables & Apparel)*† | | | 6,100 | | | | 33,559 | |
| | |
Haitian International Holdings Ltd. (Capital Goods)† | | | 15,000 | | | | 29,616 | |
| | | | | | | | |
| | |
| | | Shares | | | Value | |
| COMMON STOCKS - 91.6% (continued) | | | | | | |
| | |
China - 21.9% (continued) | | | | | | | | |
| | |
Inner Mongolia Yili Industrial Group Co., Ltd., Class A (Food Beverage & Tobacco)† | | | 17,400 | | | | $55,312 | |
| | |
JD.com Inc. - ADR (Retailing)* | | | 1,585 | | | | 37,279 | |
| | |
Midea Group Co., Ltd., Class A (Consumer Durables & Apparel)† | | | 10,800 | | | | 57,380 | |
| | |
New Oriental Education & Technology Group Inc. - Sponsored ADR (Consumer Services)* | | | 435 | | | | 25,452 | |
| | |
Ping An Insurance Group Co. of China Ltd., Class A (Insurance)† | | | 13,300 | | | | 121,161 | |
| | |
Shenzhou International Group Holdings Ltd. (Consumer Durables & Apparel)† | | | 6,000 | | | | 66,099 | |
| | |
Sunny Optical Technology Group Co., Ltd. (Technology Hardware & Equipment)† | | | 5,600 | | | | 49,006 | |
| | |
TAL Education Group - ADR (Consumer Services)* | | | 2,308 | | | | 66,886 | |
| | |
Tencent Holdings Ltd. (Software & Services)† | | | 3,200 | | | | 108,464 | |
| | |
Tingyi Cayman Islands Holding Corp. (Food Beverage & Tobacco)† | | | 40,000 | | | | 59,435 | |
| | |
Wuxi Biologics Cayman Inc. (Pharmaceuticals, Biotechnology & Life Sciences)*† | | | 7,000 | | | | 50,142 | |
| | |
| | | | | | | 1,366,772 | |
| | |
Colombia - 1.1% | | | | | | | | |
| | |
Cementos Argos SA - Sponsored ADR (Materials)#† | | | 1,080 | | | | 11,774 | |
| | |
Ecopetrol SA - Sponsored ADR (Energy) | | | 1,683 | | | | 39,147 | |
| | |
Grupo Nutresa SA (Food Beverage & Tobacco) | | | 2,477 | | | | 17,157 | |
| | |
| | | | | | | 68,078 | |
| | |
Egypt - 0.8% | | | | | | | | |
| | |
Commercial International Bank Egypt SAE - GDR, Reg S (Banks)† | | | 10,800 | | | | 46,865 | |
| | |
India - 10.6% | | | | | | | | |
| | |
Asian Paints Ltd. (Materials)† | | | 2,810 | | | | 46,864 | |
| | |
Bharti Infratel Ltd. (Telecommunication Services)† | | | 24,259 | | | | 88,202 | |
| | |
Emami Ltd. (Household & Personal Products)† | | | 7,944 | | | | 42,556 | |
| | |
Hero Motocorp Ltd. (Automobiles & Components)† | | | 3,434 | | | | 128,439 | |
| | |
Housing Development Finance Corp., Ltd. (Banks)† | | | 5,100 | | | | 122,274 | |
See Notes to Financial Statements
36
Harding, Loevner Funds, Inc.
Emerging Markets Research Portfolio
Portfolio of Investments
October 31, 2018 (continued)
| | | | | | | | |
| | |
| | | Shares | | | Value | |
| COMMON STOCKS - 91.6% (continued) | | | | | | |
| | |
India - 10.6% (continued) | | | | | | | | |
| | |
ICICI Bank Ltd. - Sponsored ADR (Banks) | | | 4,606 | | | | $43,711 | |
| | |
ITC Ltd. (Food Beverage & Tobacco)† | | | 14,150 | | | | 53,702 | |
| | |
Kotak Mahindra Bank Ltd. (Banks)† | | | 4,150 | | | | 62,816 | |
| | |
Max Financial Services Ltd. (Insurance)*† | | | 3,880 | | | | 19,848 | |
| | |
Pidilite Industries Ltd. (Materials)† | | | 4,150 | | | | 53,819 | |
| | |
| | | | | | | 662,231 | |
| | |
Indonesia - 4.7% | | | | | | | | |
| | |
Astra International Tbk PT (Automobiles &
Components)† | | | 247,000 | | | | 128,601 | |
| | |
Bank Central Asia Tbk PT (Banks)† | | | 79,000 | | | | 123,014 | |
| | |
Unilever Indonesia Tbk PT (Household & Personal Products)† | | | 15,300 | | | | 43,545 | |
| | |
| | | | | | | 295,160 | |
| | |
Kazakhstan - 0.3% | | | | | | | | |
| | |
Halyk Savings Bank of Kazakhstan JSC - GDR, Reg S (Banks)† | | | 1,610 | | | | 18,300 | |
| | |
Kenya - 0.2% | | | | | | | | |
| | |
Safaricom plc (Telecommunication Services)† | | | 62,300 | | | | 14,181 | |
| | |
Kuwait - 1.3% | | | | | | | | |
| | |
Kuwait Projects Co. Holding KSCP (Banks)† | | | 19,194 | | | | 13,084 | |
| | |
Mabanee Co. SAK (Real Estate)† | | | 8,345 | | | | 16,739 | |
| | |
National Bank of Kuwait SAKP (Banks)† | | | 19,546 | | | | 52,895 | |
| | |
| | | | | | | 82,718 | |
| | |
Mexico - 7.0% | | | | | | | | |
| | |
Banco Santander Mexico SA Institucion de Banca Multiple Grupo Financiero Santand - ADR (Banks) | | | 4,150 | | | | 26,062 | |
| | |
Coca-Cola Femsa SAB de CV - Sponsored ADR (Food Beverage & Tobacco) | | | 908 | | | | 51,747 | |
| | |
Fomento Economico Mexicano SAB de CV - Sponsored ADR (Food Beverage & Tobacco) | | | 1,105 | | | | 94,002 | |
| | |
Grupo Bimbo SAB de CV, Series A (Food Beverage & Tobacco) | | | 24,900 | | | | 46,642 | |
| | |
Grupo Financiero Banorte SAB de CV, Series O (Banks) | | | 11,500 | | | | 63,271 | |
| | | | | | | | |
| | |
| | | Shares | | | Value | |
| COMMON STOCKS - 91.6% (continued) | | | | | | |
| | |
Mexico - 7.0% (continued) | | | | | | | | |
| | |
Grupo Televisa SAB - Sponsored ADR (Media) | | | 3,790 | | | | $54,500 | |
| | |
Wal-Mart de Mexico SAB de CV (Food & Staples Retailing) | | | 40,300 | | | | 102,926 | |
| | |
| | | | | | | 439,150 | |
| | |
Morocco - 0.4% | | | | | | | | |
| | |
Attijariwafa Bank (Banks)† | | | 320 | | | | 13,934 | |
| | |
Maroc Telecom (Telecommunication Services)† | | | 900 | | | | 13,003 | |
| | |
| | | | | | | 26,937 | |
| | |
Nigeria - 1.6% | | | | | | | | |
| | |
Dangote Cement plc (Materials)† | | | 28,327 | | | | 16,308 | |
| | |
Guaranty Trust Bank plc (Banks)† | | | 305,423 | | | | 31,551 | |
| | |
Nestle Nigeria plc (Food Beverage & Tobacco)† | | | 3,815 | | | | 14,503 | |
| | |
Nigerian Breweries plc (Food Beverage & Tobacco) | | | 81,495 | | | | 18,499 | |
| | |
Zenith Bank plc (Banks) | | | 260,470 | | | | 16,862 | |
| | |
| | | | | | | 97,723 | |
| | |
Pakistan - 2.0% | | | | | | | | |
| | |
Engro Corp., Ltd. (Materials)† | | | 4,900 | | | | 12,399 | |
| | |
Lucky Cement Ltd. (Materials)† | | | 4,400 | | | | 16,512 | |
| | |
MCB Bank Ltd. (Banks)† | | | 8,900 | | | | 13,302 | |
| | |
Oil & Gas Development Co., Ltd. (Energy)† | | | 44,100 | | | | 52,952 | |
| | |
Pakistan Petroleum Ltd. (Energy)† | | | 12,650 | | | | 17,846 | |
| | |
United Bank Ltd. (Banks)† | | | 9,900 | | | | 11,221 | |
| | |
| | | | | | | 124,232 | |
| | |
Panama - 1.0% | | | | | | | | |
| | |
Copa Holdings SA, Class A (Transportation) | | | 869 | | | | 62,942 | |
| | |
Peru - 1.5% | | | | | | | | |
| | |
Alicorp SAA (Food Beverage & Tobacco) | | | 6,050 | | | | 17,496 | |
| | |
Credicorp Ltd. (Banks) | | | 350 | | | | 78,998 | |
| | |
| | | | | | | 96,494 | |
| | |
Philippines - 2.7% | | | | | | | | |
| | |
BDO Unibank Inc. (Banks)† | | | 12,990 | | | | 29,706 | |
| | |
International Container Terminal Services Inc. (Transportation)† | | | 12,000 | | | | 20,302 | |
| | |
Jollibee Foods Corp. (Consumer Services)† | | | 9,090 | | | | 46,845 | |
| | |
Robinsons Retail Holdings Inc. (Food & Staples
Retailing)† | | | 10,620 | | | | 15,033 | |
| | |
Security Bank Corp. (Banks)† | | | 3,720 | | | | 10,047 | |
| | |
SM Prime Holdings Inc. (Real Estate)† | | | 72,700 | | | | 45,913 | |
| | |
| | | | | | | 167,846 | |
See Notes to Financial Statements
37
Harding, Loevner Funds, Inc.
Emerging Markets Research Portfolio
Portfolio of Investments
October 31, 2018 (continued)
| | | | | | | | |
| | |
| | | Shares | | | Value | |
| COMMON STOCKS - 91.6% (continued) | | | | | | |
| | |
Qatar - 1.3% | | | | | | | | |
| | |
Qatar Electricity & Water Co. QSC (Utilities)† | | | 420 | | | | $21,663 | |
| | |
Qatar National Bank QPSC (Banks)† | | | 1,150 | | | | 61,502 | |
| | |
| | | | | | | 83,165 | |
| | |
Romania - 0.5% | | | | | | | | |
| | |
Banca Transilvania SA (Banks)† | | | 29,552 | | | | 16,651 | |
| | |
Societatea Nationala de Gaze Naturale ROMGAZ SA (Energy)† | | | 2,060 | | | | 17,030 | |
| | |
| | | | | | | 33,681 | |
| | |
Russia - 6.0% | | | | | | | | |
| | |
LUKOIL PJSC - Sponsored ADR (Energy) | | | 1,650 | | | | 123,156 | |
| | |
Moscow Exchange MICEX-RTS PJSC (Diversified Financials)† | | | 28,840 | | | | 38,561 | |
| | |
Novatek PJSC - Sponsored GDR, Reg S (Energy)† | | | 745 | | | | 125,987 | |
| | |
Sberbank of Russia PJSC - Sponsored ADR (Banks)† | | | 4,750 | | | | 55,833 | |
| | |
Yandex NV, Class A (Software & Services)* | | | 1,136 | | | | 34,228 | |
| | |
| | | | | | | 377,765 | |
| | |
South Africa - 4.6% | | | | | | | | |
| | |
Clicks Group Ltd. (Food & Staples Retailing)† | | | 8,856 | | | | 112,861 | |
| | |
Discovery Ltd. (Insurance)† | | | 7,600 | | | | 81,201 | |
| | |
Standard Bank Group Ltd. (Banks)† | | | 6,870 | | | | 75,936 | |
| | |
Tiger Brands Ltd. (Food Beverage & Tobacco)† | | | 1,147 | | | | 20,461 | |
| | |
| | | | | | | 290,459 | |
| | |
South Korea - 4.8% | | | | | | | | |
| | |
Amorepacific Corp. (Household & Personal Products)† | | | 230 | | | | 30,770 | |
| | |
Coway Co., Ltd. (Consumer Durables & Apparel)† | | | 650 | | | | 40,178 | |
| | |
Hankook Tire Co., Ltd. (Automobiles & Components)† | | | 1,610 | | | | 58,580 | |
| | |
LG Household & Health Care Ltd. (Household & Personal Products)† | | | 70 | | | | 64,440 | |
| | |
NAVER Corp. (Software & Services)† | | | 1,040 | | | | 104,958 | |
| | |
| | | | | | | 298,926 | |
| | |
Taiwan - 5.6% | | | | | | | | |
| | |
Advantech Co., Ltd. (Technology Hardware &
Equipment)† | | | 8,000 | | | | 54,835 | |
| | |
Airtac International Group (Capital Goods)† | | | 4,178 | | | | 36,474 | |
| | | | | | | | |
| | |
| | | Shares | | | Value | |
| COMMON STOCKS - 91.6% (continued) | | | | | | |
| | |
Taiwan - 5.6% (continued) | | | | | | | | |
| | |
Eclat Textile Co., Ltd. (Consumer Durables &
Apparel)† | | | 4,080 | | | | $48,225 | |
| | |
Largan Precision Co., Ltd. (Technology Hardware & Equipment)† | | | 290 | | | | 31,488 | |
| | |
President Chain Store Corp. (Food & Staples
Retailing)† | | | 5,100 | | | | 57,651 | |
| | |
Taiwan Semiconductor Manufacturing Co., Ltd. (Semiconductors & Semiconductor Equipment)† | | | 16,000 | | | | 118,874 | |
| | |
| | | | | | | 347,547 | |
| | |
Thailand - 1.1% | | | | | | | | |
| | |
Siam Commercial Bank pcl, Reg S (Banks)† | | | 16,100 | | | | 66,780 | |
| | |
United Arab Emirates - 1.7% | | | | | | | | |
| | |
Agthia Group PJSC (Food Beverage & Tobacco)† | | | 6,740 | | | | 7,523 | |
| | |
DP World Ltd. (Transportation)† | | | 1,360 | | | | 24,485 | |
| | |
Emaar Properties PJSC (Real Estate)† | | | 53,680 | | | | 74,646 | |
| | |
| | | | | | | 106,654 | |
| | |
United Kingdom - 0.4% | | | | | | | | |
| | |
Bank of Georgia Group plc (Banks)† | | | 1,170 | | | | 23,320 | |
| | |
Vietnam - 1.6% | | | | | | | | |
| | |
Hoa Phat Group JSC (Materials)*† | | | 21,400 | | | | 37,020 | |
| | |
Masan Group Corp. (Food Beverage & Tobacco)*† | | | 14,550 | | | | 51,953 | |
| | |
Vietnam Dairy Products JSC (Food Beverage & Tobacco)† | | | 2,472 | | | | 12,341 | |
| | |
| | | | | | | | 101,314 | |
| | |
Total Common Stocks (Cost $5,926,490) | | | | | | | $5,727,209 | |
| | |
| | | | | | | | |
| PREFERRED STOCKS - 5.0% | | | | | | |
| | |
Brazil - 2.7% | | | | | | | | |
| | |
Banco Bradesco SA - ADR (Banks)* | | | 7,403 | | | | 67,886 | |
| | |
Cia Brasileira de Distribuicao - Sponsored ADR (Food & Staples Retailing)* | | | 1,620 | | | | 33,874 | |
| | |
Itau Unibanco Holding SA - Sponsored ADR, 0.34% (Banks)+ | | | 5,125 | | | | 67,496 | |
| | |
| | | | | | | 169,256 | |
| | |
Colombia - 0.5% | | | | | | | | |
| | |
Bancolombia SA - Sponsored ADR, 3.46% (Banks)+ | | | 940 | | | | 34,723 | |
See Notes to Financial Statements
38
Harding, Loevner Funds, Inc.
Emerging Markets Research Portfolio
Portfolio of Investments
October 31, 2018 (continued)
| | | | | | | | |
| | |
| | | Shares | | | Value | |
| PREFERRED STOCKS - 5.0% (continued) | | | | |
| | |
South Korea - 1.8% | | | | | | | | |
| | |
Samsung Electronics Co., Ltd. - GDR, Reg S, 3.90% (Technology Hardware & Equipment)+† | | | 142 | | | | $111,064 | |
| | |
Total Preferred Stocks (Cost $321,690) | | | | | | | $315,043 | |
| | |
| | | | | | | | |
| PARTICIPATION NOTES - 2.3% | | | | | | |
| | |
Saudi Arabia - 2.3% | | | | | | | | |
| | |
Al Rajhi Bank, Issued by JP Morgan Structured Products, Maturity Date 12/5/19 (Banks)^† | | | 3,108 | | | | 72,500 | |
| | |
Jarir Marketing Co., Issued by HSBC BANK PLC, Maturity Date 1/19/21 (Retailing)^† | | | 1,784 | | | | 70,202 | |
| | |
| | | | | | | | 142,702 | |
| | |
Total Participation Notes (Cost $115,844) | | | | | | | $142,702 | |
| | |
| | | | | | | | |
| SHORT TERM INVESTMENTS - 0.2% | | | | | | |
| | |
Northern Institutional Funds - Treasury Portfolio, 2.03% (Money Market Funds) | | | 11,005 | | | | 11,005 | |
| |
Total Short Term Investments (Cost $11,005) | | | | $11,005 | |
| |
| | | | | | |
| | |
Total Investments - 99.1% | | | | | | | | |
| | |
(Cost $6,375,029) | | | | | | | $6,195,959 | |
| | |
Other Assets Less Liabilities - 0.9% | | | | | | | 55,867 | |
| | |
Net Assets - 100.0% | | | | | | | $6,251,826 | |
Summary of Abbreviations
| ADR | American Depositary Receipt. |
| GDR | Global Depository Receipt. |
| Reg S | Security sold outside United States without registration under the Securities Act of 1933. |
| # | Security valued at fair value as determined in good faith under policies and procedures established by and under the supervision of the Portfolio’s Board of Directors as disclosed in Note 2 of the Notes to Financial Statements. |
| * | Non-income producing security. |
| † | Investment categorized as level 2 security as disclosed in Note 2 of the Notes to Financial Statements. |
| + | Current yield is disclosed. Dividends are calculated based on a percentage of the issuer’s net income. |
| ^ | Security exempt from registration pursuant to Rule 144A of the Securities Act of 1933. These securities, which represent 2.3% of net assets as of October 31, 2018, are considered liquid and may be resold in transactions exempt from registration, normally to qualified buyers. |
| | | | | |
| Industry | | |
| Percentage of
Net Assets |
|
| |
Automobiles & Components | | | | 5.0 | % |
| |
Banks | | | | 21.7 | |
| |
Capital Goods | | | | 2.2 | |
| |
Commercial & Professional Services | | | | 0.6 | |
| |
Consumer Durables & Apparel | | | | 5.1 | |
| |
Consumer Services | | | | 2.2 | |
| |
Diversified Financials | | | | 1.7 | |
| |
Energy | | | | 8.1 | |
| |
Food & Staples Retailing | | | | 5.9 | |
| |
Food Beverage & Tobacco | | | | 9.8 | |
| |
Household & Personal Products | | | | 2.9 | |
| |
Insurance | | | | 3.6 | |
| |
Materials | | | | 3.1 | |
| |
Media | | | | 1.1 | |
| |
Pharmaceuticals, Biotechnology & Life Sciences | | | | 1.8 | |
| |
Real Estate | | | | 2.2 | |
| |
Retailing | | | | 3.2 | |
| |
Semiconductors & Semiconductor Equipment | | | | 1.9 | |
| |
Software & Services | | | | 4.9 | |
| |
Technology Hardware & Equipment | | | | 4.5 | |
| |
Telecommunication Services | | | | 4.1 | |
| |
Transportation | | | | 1.7 | |
| |
Utilities | | | | 1.6 | |
| |
Money Market Fund | | | | 0.2 | |
Total Investments | | | | 99.1 | |
Other Assets Less Liabilities | | | | 0.9 | |
Net Assets | | | | 100.0 | % |
See Notes to Financial Statements
39
Harding, Loevner Funds, Inc.
Statements of Assets and Liabilities
October 31, 2018
| | | | | | | | | | | | |
| | | Global Equity Portfolio | | | International Equity Portfolio | | | International Small Companies Portfolio | |
| | | |
ASSETS: | | | | | | | | | | | | |
Investments (cost $643,105,376, $12,256,389,847 and $196,601,282, respectively) | | | $857,851,380 | | | | $13,771,709,537 | | | | $209,400,320 | |
Dividends and interest receivable | | | 1,077,918 | | | | 24,731,487 | | | | 169,619 | |
Foreign currency (cost $147,005, $0 and $110,914, respectively) | | | 147,005 | | | | — | | | | 110,836 | |
Receivable for investments sold | | | — | | | | 7,548,377 | | | | 497,364 | |
Receivable for Fund shares sold | | | 1,732,442 | | | | 29,779,576 | | | | 52,279 | |
Tax reclaim receivable | | | 348,589 | | | | 20,005,079 | | | | 201,721 | |
Prepaid expenses | | | 17,336 | | | | 44,207 | | | | 78,510 | |
Total Assets: | | | 861,174,670 | | | | 13,853,818,263 | | | | 210,510,649 | |
| | | |
LIABILITIES: | | | | | | | | | | | | |
Payable to Investment Adviser | | | (597,447 | ) | | | (8,102,464 | ) | | | (214,853 | ) |
Payable for investments purchased | | | (9,887,102 | ) | | | (69,502,950 | ) | | | (692,131 | ) |
Payable for Fund shares redeemed | | | (177,769 | ) | | | (22,094,347 | ) | | | (164,492 | ) |
Payable for distribution fees | | | — | | | | (348,096 | ) | | | (27,084 | ) |
Deferred capital gains tax | | | — | | | | — | | | | (105,823 | ) |
Other liabilities | | | (238,939 | ) | | | (3,662,829 | ) | | | (111,252 | ) |
Total Liabilities | | | (10,901,257 | ) | | | (103,710,686 | ) | | | (1,315,635 | ) |
Net Assets | | | $850,273,413 | | | | $13,750,107,577 | | | | $209,195,014 | |
| | | |
ANALYSIS OF NET ASSETS: | | | | | | | | | | | | |
Paid in capital | | | $550,626,294 | | | | $12,151,847,646 | | | | $185,664,600 | |
Distributable earnings | | | 299,647,119 | | | | 1,598,259,931 | | | | 23,530,414 | |
Net Assets | | | $850,273,413 | | | | $13,750,107,577 | | | | $209,195,014 | |
| | | |
Net Assets: | | | | | | | | | | | | |
Institutional Class | | | $619,347,162 | | | | $11,995,591,717 | | | | $151,283,365 | |
Institutional Class Z | | | 140,359,163 | | | | 1,342,803,993 | | | | — | |
Investor Class | | | — | | | | 411,711,867 | | | | 57,911,649 | |
Advisor Class | | | 90,567,088 | | | | — | | | | — | |
Total Shares Outstanding: | | | | | | | | | | | | |
Institutional Class (400,000,000, 500,000,000 and 400,000,000, respectively, $.001 par value shares authorized) | | | 17,356,744 | | | | 578,338,177 | | | | 9,891,190 | |
Institutional Class Z (200,000,000, 200,000,000 and — , respectively, $.001 par value shares authorized) | | | 3,935,416 | | | | 64,728,565 | | | | — | |
Investor Class ( — , 400,000,000 and 400,000,000, respectively, $.001 par value shares authorized) | | | — | | | | 19,935,864 | | | | 3,819,753 | |
Advisor Class (400,000,000, — and — , respectively, $.001 par value shares authorized) | | | 2,544,038 | | | | — | | | | — | |
Net Asset Value, Offering Price and Redemption Price Per Share: | | | | | | | | | | | | |
Institutional Class | | | $35.68 | | | | $20.74 | | | | $15.29 | |
Institutional Class Z | | | 35.67 | | | | 20.75 | | | | — | |
Investor Class | | | — | | | | 20.65 | | | | 15.16 | |
Advisor Class | | | 35.60 | | | | — | | | | — | |
See Notes to Financial Statements
40
Harding, Loevner Funds, Inc.
Statements of Assets and Liabilities (continued)
October 31, 2018
| | | | | | | | | | | | |
| | | Institutional Emerging Markets Portfolio | | | Emerging Markets Portfolio | | | Frontier Emerging Markets Portfolio | |
| | | |
ASSETS: | | | | | | | | | | | | |
Investments (cost $3,960,878,441, $2,911,477,727 and $392,982,302, respectively) | | | $4,361,276,509 | | | | $3,454,946,166 | | | | $412,988,515 | |
Dividends and interest receivable | | | 2,852,069 | | | | 2,345,295 | | | | 72,232 | |
Foreign currency (cost $597,111, $2,227,873 and $506,521, respectively) | | | 596,679 | | | | 2,227,525 | | | | 506,417 | |
Receivable for investments sold | | | 4,456,184 | | | | 6,068,444 | | | | 1,167,221 | |
Receivable for Fund shares sold | | | 19,894,203 | | | | 2,913,739 | | | | 611,448 | |
Tax reclaim receivable | | | 1,184,992 | | | | 270,540 | | | | 10,800 | |
Prepaid expenses | | | 58,436 | | | | 20,682 | | | | 4,659 | |
Total Assets: | | | 4,390,319,072 | | | | 3,468,792,391 | | | | 415,361,292 | |
| | | |
LIABILITIES: | | | | | | | | | | | | |
Payable to Investment Adviser | | | (4,278,036 | ) | | | (3,437,963 | ) | | | (485,989 | ) |
Payable for investments purchased | | | (323 | ) | | | — | | | | (1,918,504 | ) |
Payable for Fund shares redeemed | | | (14,691,233 | ) | | | (4,129,502 | ) | | | (1,763,238 | ) |
Payable for distribution fees | | | — | | | | — | | | | (19,111 | ) |
Deferred capital gains tax | | | — | | | | — | | | | (1,433,235 | ) |
Other liabilities | | | (1,445,063 | ) | | | (2,067,915 | ) | | | (193,388 | ) |
Total Liabilities | | | (20,414,655 | ) | | | (9,635,380 | ) | | | (5,813,465 | ) |
Net Assets | | | $4,369,904,417 | | | | $3,459,157,011 | | | | $409,547,827 | |
| | | |
ANALYSIS OF NET ASSETS: | | | | | | | | | | | | |
Paid in capital | | | $4,116,356,205 | | | | $2,928,625,385 | | | | $490,186,440 | |
Distributable earnings | | | 253,548,212 | | | | 530,531,626 | | | | (80,638,613 | ) |
Net Assets | | | $4,369,904,417 | | | | $3,459,157,011 | | | | $409,547,827 | |
| | | |
Net Assets: | | | | | | | | | | | | |
Institutional Class I | | | $— | | | | $— | | | | $220,366,742 | |
Institutional Class II | | | — | | | | — | | | | 163,793,539 | |
Class I | | | 3,978,320,937 | | | | — | | | | — | |
Class II | | | 391,583,480 | | | | — | | | | — | |
Investor Class | | | — | | | | — | | | | 25,387,546 | |
Advisor Class | | | — | | | | 3,459,157,011 | | | | — | |
Total Shares Outstanding: | | | | | | | | | | | | |
Institutional Class I ( — , — and 400,000,000, respectively, $.001 par value shares authorized) | | | — | | | | — | | | | 28,903,420 | |
Institutional Class II ( — , — and 200,000,000, respectively, $.001 par value shares authorized) | | | — | | | | — | | | | 21,463,353 | |
Class I (500,000,000, — and — , respectively, $.001 par value shares authorized) | | | 215,839,615 | | | | — | | | | — | |
Class II (400,000,000, — and — , respectively, $.001 par value shares authorized) | | | 21,223,825 | | | | — | | | | — | |
Investor Class ( — , — and 400,000,000, respectively, $.001 par value shares authorized) | | | — | | | | — | | | | 3,355,740 | |
Advisor Class ( — , 500,000,000 and — , respectively, $.001 par value shares authorized) | | | — | | | | 71,747,735 | | | | — | |
Net Asset Value, Offering Price and Redemption Price Per Share: | | | | | | | | | | | | |
Institutional Class I | | | $— | | | | $— | | | | $7.62 | |
Institutional Class II | | | — | | | | — | | | | 7.63 | |
Class I | | | 18.43 | | | | — | | | | — | |
Class II | | | 18.45 | | | | — | | | | — | |
Investor Class | | | — | | | | — | | | | 7.57 | |
Advisor Class | | | — | | | | 48.21 | | | | — | |
See Notes to Financial Statements
41
Harding, Loevner Funds, Inc.
Statements of Assets and Liabilities (continued)
October 31, 2018
| | | | | | | | | | | | |
| | | Global Equity Research Portfolio | | | International Equity Research Portfolio | | | Emerging Markets Research Portfolio | |
| | | |
ASSETS: | | | | | | | | | | | | |
Investments (cost $5,553,463, $10,166,564 and $6,375,029, respectively) | | | $6,069,856 | | | | $10,365,552 | | | | $6,195,959 | |
Dividends and interest receivable | | | 7,954 | | | | 15,555 | | | | 5,279 | |
Foreign currency (cost $7,994, $1,730 and $1,525, respectively) | | | 7,997 | | | | 1,730 | | | | 1,527 | |
Receivable for investments sold | | | 50,628 | | | | — | | | | 85,520 | |
Tax reclaim receivable | | | 1,798 | | | | 11,746 | | | | 177 | |
Prepaid expenses | | | 25,403 | | | | 22,584 | | | | 24,287 | |
Total Assets: | | | 6,163,636 | | | | 10,417,167 | | | | 6,312,749 | |
| | | |
LIABILITIES: | | | | | | | | | | | | |
Payable to Investment Adviser | | | (5,462 | ) | | | (6,853 | ) | | | (7,686 | ) |
Payable for investments purchased | | | (115,104 | ) | | | — | | | | (21,966 | ) |
Payable for distribution fees | | | (1,133 | ) | | | (1,704 | ) | | | (1,359 | ) |
Deferred capital gains tax | | | (312 | ) | | | — | | | | — | |
Other liabilities | | | (27,284 | ) | | | (29,809 | ) | | | (29,912 | ) |
Total Liabilities | | | (149,295 | ) | | | (38,366 | ) | | | (60,923 | ) |
Net Assets | | | $6,014,341 | | | | $10,378,801 | | | | $6,251,826 | |
| | | |
ANALYSIS OF NET ASSETS: | | | | | | | | | | | | |
Paid in capital | | | $4,985,925 | | | | $9,381,168 | | | | $5,924,831 | |
Distributable earnings | | | 1,028,416 | | | | 997,633 | | | | 326,995 | |
Net Assets | | | $6,014,341 | | | | $10,378,801 | | | | $6,251,826 | |
| | | |
Net Assets: | | | | | | | | | | | | |
Institutional Class | | | $5,452,288 | | | | $9,304,502 | | | | $5,702,490 | |
Investor Class | | | 562,053 | | | | 1,074,299 | | | | 549,336 | |
Total Shares Outstanding: | | | | | | | | | | | | |
Institutional Class (300,000,000, 300,000,000 and 300,000,000, respectively, $.001 par value shares authorized) | | | 452,099 | | | | 802,966 | | | | 526,909 | |
Investor Class (200,000,000, 300,000,000 and 200,000,000, respectively, $.001 par value shares authorized) | | | 46,797 | | | | 93,367 | | | | 50,987 | |
Net Asset Value, Offering Price and Redemption Price Per Share: | | | | | | | | | | | | |
Institutional Class | | | $12.06 | | | | $11.59 | | | | $10.82 | |
Investor Class | | | 12.01 | | | | 11.51 | | | | 10.77 | |
See Notes to Financial Statements
42
Harding, Loevner Funds, Inc.
Statements of Operations
For the Fiscal Year Ended October 31, 2018
| | | | | | | | | | | | | | | | | | | | |
| | | Global Equity Portfolio | | | International Equity Portfolio | | | International Small Companies Portfolio | | | Institutional Emerging Markets Portfolio | | | Emerging Markets Portfolio | |
| | | | | |
INVESTMENT INCOME | | | | | | | | | | | | | | | | | | | | |
Dividends (net of foreign withholding taxes of $828,222, $30,889,065, $405,695, $11,383,449 and $8,587,246, respectively) | | | $11,106,522 | | | | $301,299,699 | | | | $4,610,169 | | | | $107,508,805 | | | | $88,472,369 | |
Total investment income | | | 11,106,522 | | | | 301,299,699 | | | | 4,610,169 | | | | 107,508,805 | | | | 88,472,369 | |
| | | | | |
EXPENSES | | | | | | | | | | | | | | | | | | | | |
Investment advisory fees (Note 3) | | | 6,898,262 | | | | 92,970,216 | | | | 2,762,657 | | | | 56,605,295 | | | | 46,483,551 | |
Administration fees (Note 3) | | | 306,734 | | | | 3,675,847 | | | | 103,654 | | | | 1,411,810 | | | | 1,173,743 | |
Distribution fees, Investor Class | | | — | | | | 1,286,933 | | | | 161,002 | | | | — | | | | — | |
Custody and accounting fees (Note 3) | | | 186,748 | | | | 2,543,359 | | | | 152,418 | | | | 2,024,790 | | | | 1,650,845 | |
Directors’ fees and expenses | | | 24,211 | | | | 395,710 | | | | 6,884 | | | | 143,879 | | | | 117,498 | |
Transfer agent fees and expenses (Note 3) | | | 67,514 | | | | 470,162 | | | | 44,501 | | | | 94,309 | | | | 521,063 | |
Printing and postage fees | | | 28,055 | | | | 912,495 | | | | 20,236 | | | | 273,485 | | | | 349,154 | |
State registration filing fees | | | 106,304 | | | | 816,969 | | | | 52,428 | | | | 126,859 | | | | 95,831 | |
Professional fees | | | 45,134 | | | | 334,020 | | | | 52,422 | | | | 141,324 | | | | 120,900 | |
Shareholder servicing fees (Note 3) | | | 552,683 | | | | 9,405,618 | | | | 211,300 | | | | 3,416,685 | | | | 7,367,150 | |
Compliance officers’ fees and expenses (Note 3) | | | 2,714 | | | | 43,859 | | | | 762 | | | | 16,083 | | | | 13,140 | |
Other fees and expenses | | | 31,077 | | | | 343,142 | | | | 6,974 | | | | 128,658 | | | | 103,602 | |
Total Expenses | | | 8,249,436 | | | | 113,198,330 | | | | 3,575,238 | | | | 64,383,177 | | | | 57,996,477 | |
Less Waiver of investment advisory fee and/or reimbursement of other operating expenses (Note 3) | | | (14,982 | ) | | | — | | | | (649,688 | ) | | | (435,252 | ) | | | — | |
Less waiver of transfer agent fee and expenses (Note 3) | | | (7,945 | ) | | | (9,965 | ) | | | — | | | | — | | | | — | |
Net expenses | | | 8,226,509 | | | | 113,188,365 | | | | 2,925,550 | | | | 63,947,925 | | | | 57,996,477 | |
Net investment income | | | 2,880,013 | | | | 188,111,334 | | | | 1,684,619 | | | | 43,560,880 | | | | 30,475,892 | |
| | | | | |
REALIZED AND UNREALIZED GAIN (LOSS) | | | | | | | | | | | | | | | | | | | | |
Net realized gain (loss) | | | | | | | | | | | | | | | | | | | | |
Investment transactions | | | 84,182,259 | | | | (98,310,836 | ) | | | 9,970,112 | | | | (65,702,185 | ) | | | (10,760,793 | ) |
Foreign currency transactions | | | (116,666 | ) | | | (1,303,890 | ) | | | (150,328 | ) | | | (1,391,170 | ) | | | (707,335 | ) |
Net realized gain (loss) | | | 84,065,593 | | | | (99,614,726 | ) | | | 9,819,784 | | | | (67,093,355 | ) | | | (11,468,128 | ) |
Change in unrealized appreciation (depreciation) | | | | | | | | | | | | | | | | | | | | |
Investments (net of increase (decrease) in deferred foreign taxes of $—, $—, $(283,168), $— and $—, respectively) | | | (94,320,919 | ) | | | (1,197,411,731 | ) | | | (29,993,757 | ) | | | (776,187,194 | ) | | | (665,382,565 | ) |
Translation of assets and liabilities denominated in foreign currencies | | | (23,124 | ) | | | (853,031 | ) | | | 1,921 | | | | (35,262 | ) | | | 16,224 | |
Net change in unrealized depreciation | | | (94,344,043 | ) | | | (1,198,264,762 | ) | | | (29,991,836 | ) | | | (776,222,456 | ) | | | (665,366,341 | ) |
Net realized and unrealized loss | | | (10,278,450 | ) | | | (1,297,879,488 | ) | | | (20,172,052 | ) | | | (843,315,811 | ) | | | (676,834,469 | ) |
| | | | | |
NET DECREASE IN NET ASSETS RESULTING FROM OPERATIONS | | | $(7,398,437 | ) | | | $(1,109,768,154 | ) | | | $(18,487,433 | ) | | | $(799,754,931 | ) | | | $(646,358,577 | ) |
See Notes to Financial Statements
43
Harding, Loevner Funds, Inc.
Statements of Operations (continued)
For the Fiscal Year Ended October 31, 2018
| | | | | | | | | | | | | | | | |
| | | Frontier Emerging Markets Portfolio | | | Global Equity Research Portfolio | | | International Equity Research Portfolio | | | Emerging Markets Research Portfolio | |
| | | | |
INVESTMENT INCOME | | | | | | | | | | | | | | | | |
Dividends (net of foreign withholding taxes of $1,029,967, $6,590, $21,591 and $13,165, respectively) | | | $13,702,458 | | | | $103,696 | | | | $220,905 | | | | $155,487 | |
Total investment income | | | 13,702,458 | | | | 103,696 | | | | 220,905 | | | | 155,487 | |
| | | | |
EXPENSES | | | | | | | | | | | | | | | | |
Investment advisory fees (Note 3) | | | 6,474,039 | | | | 50,051 | | | | 84,282 | | | | 80,257 | |
Administration fees (Note 3) | | | 188,116 | | | | 4,490 | | | | 6,922 | | | | 4,796 | |
Distribution fees, Investor Class | | | 79,326 | | | | 1,463 | | | | 2,811 | | | | 1,572 | |
Custody and accounting fees (Note 3) | | | 555,453 | | | | 12,768 | | | | 11,821 | | | | 17,011 | |
Directors’ fees and expenses | | | 13,533 | | | | 186 | | | | 324 | | | | 204 | |
Transfer agent fees and expenses (Note 3) | | | 72,488 | | | | 40,646 | | | | 40,757 | | | | 40,626 | |
Printing and postage fees | | | 22,669 | | | | — | | | | 510 | | | | — | |
State registration filing fees | | | 87,136 | | | | 42,826 | | | | 40,446 | | | | 42,849 | |
Professional fees | | | 46,813 | | | | 41,963 | | | | 39,897 | | | | 44,989 | |
Shareholder servicing fees (Note 3) | | | 228,640 | | | | — | | | | 1,501 | | | | — | |
Compliance officers’ fees and expenses
(Note 3) | | | 1,514 | | | | 21 | | | | 37 | | | | 23 | |
Offering fees | | | — | | | | 2,775 | | | | — | | | | 2,775 | |
Other fees and expenses | | | 21,785 | | | | 5,586 | | | | 10,408 | | | | 5,691 | |
Total Expenses | | | 7,791,512 | | | | 202,775 | | | | 239,716 | | | | 240,793 | |
Less Waiver of investment advisory fee and/or reimbursement of other operating expenses (Note 3) | | | (392,222 | ) | | | (145,005 | ) | | | (135,606 | ) | | | (148,549 | ) |
Less waiver of transfer agent fee and expenses (Note 3) | | | — | | | | — | | | | — | | | | — | |
Net expenses | | | 7,399,290 | | | | 57,770 | | | | 104,110 | | | | 92,244 | |
Net investment income | | | 6,303,168 | | | | 45,926 | | | | 116,795 | | | | 63,243 | |
| | | | |
REALIZED AND UNREALIZED GAIN (LOSS) | | | | | | | | | | | | | | | | |
Net realized gain (loss) | | | | | | | | | | | | | | | | |
Investment transactions | | | 9,871,318 | | | | 469,883 | | | | 698,313 | | | | 454,335 | |
Foreign currency transactions | | | (392,880 | ) | | | (1,229 | ) | | | (5,303 | ) | | | (5,206 | ) |
Net realized gain | | | 9,478,438 | | | | 468,654 | | | | 693,010 | | | | 449,129 | |
Change in unrealized appreciation (depreciation)
Investments (net of increase (decrease) in deferred foreign taxes of $(1,543,396), $(2,279), $(4,190) and $(12,479), respectively) | | | (55,996,659 | ) | | | (356,700 | ) | | | (1,542,215 | ) | | | (1,255,031 | ) |
Translation of assets and liabilities denominated in foreign currencies | | | 26,868 | | | | 55 | | | | (275 | ) | | | 378 | |
Net change in unrealized depreciation | | | (55,969,791 | ) | | | (356,645 | ) | | | (1,542,490 | ) | | | (1,254,653 | ) |
Net realized and unrealized gain (loss) | | | (46,491,353 | ) | | | 112,009 | | | | (849,480 | ) | | | (805,524 | ) |
| | | | |
NET INCREASE (DECREASE) IN NET ASSETS RESULTING FROM OPERATIONS | | | $(40,188,185 | ) | | | $157,935 | | | | $(732,685 | ) | | | $(742,281 | ) |
See Notes to Financial Statements
44
Harding, Loevner Funds, Inc.
Statements of Changes in Net Assets
For the Fiscal Years Ended October 31
| | | | | | | | | | | | | | | | | | | | | | | | |
| | | Global Equity Portfolio | | | International Equity Portfolio | | | International Small Companies
Portfolio | |
| | | 2018 | | | 2017(1) | | | 2018 | | | 2017(1) | | | 2018 | | | 2017(1) | |
INCREASE (DECREASE) IN NET ASSETS FROM OPERATIONS | | | | | | | | | | | | | | | | | | | | | | | | |
Net investment income | | | $2,880,013 | | | | $2,072,840 | | | | $188,111,334 | | | | $108,279,538 | | | | $1,684,619 | | | | $872,266 | |
Net realized gain (loss) on investments and foreign currency transactions | | | 84,065,593 | | | | 99,351,243 | | | | (99,614,726 | ) | | | 109,122,767 | | | | 9,819,784 | | | | 2,061,321 | |
Net change in unrealized appreciation (depreciation) on investments and translation of assets and liabilities denominated in foreign currencies | | | (94,344,043 | ) | | | 121,677,405 | | | | (1,198,264,762 | ) | | | 1,804,465,888 | | | | (29,991,836 | ) | | | 31,502,151 | |
Net increase (decrease) in net assets resulting from operations | | | (7,398,437 | ) | | | 223,101,488 | | | | (1,109,768,154 | ) | | | 2,021,868,193 | | | | (18,487,433 | ) | | | 34,435,738 | |
DISTRIBUTIONS TO SHAREHOLDERS: | | | | | | | | | | | | | | | | | | | | | | | | |
Institutional Class | | | (75,945,675 | ) | | | (12,631,004 | ) | | | (187,967,105 | ) | | | (61,948,722 | ) | | | (2,045,986 | ) | | | (2,753,409 | ) |
Institutional Class Z | | | (16,353,510 | ) | | | — | | | | (3,458,977 | ) | | | — | | | | — | | | | — | |
Investor Class | | | — | | | | — | | | | (7,760,428 | ) | | | (2,877,064 | ) | | | (557,242 | ) | | | (1,759,216 | ) |
Advisor Class | | | (9,422,593 | ) | | | (742,682 | ) | | | — | | | | — | | | | — | | | | — | |
Total distributions to shareholders | | | (101,721,778 | ) | | | (13,373,686 | ) | | | (199,186,510 | ) | | | (64,825,786 | ) | | | (2,603,228 | ) | | | (4,512,625 | ) |
TRANSACTIONS IN SHARES OF COMMON STOCK | | | | | | | | | | | | | | | | | | | | | | | | |
Institutional Class | | | (93,043,196 | ) | | | (182,801,422 | ) | | | 1,969,136,424 | | | | 2,919,220,272 | | | | 21,866,504 | | | | 59,600,587 | |
Institutional Class Z | | | 112,530,952 | | | | 45,129,498 | | | | 1,369,945,673 | | | | 163,450,051 | | | | — | | | | — | |
Investor Class | | | — | | | | — | | | | (198,921,542 | ) | | | 90,614,374 | | | | 13,956,662 | | | | (2,209,932 | ) |
Advisor Class | | | 28,071,937 | | | | 4,059,653 | | | | — | | | | — | | | | — | | | | — | |
Net Increase (Decrease) in net assets from portfolio share transactions | | | 47,559,693 | | | | (133,612,271 | ) | | | 3,140,160,555 | | | | 3,173,284,697 | | | | 35,823,166 | | | | 57,390,655 | |
NET INCREASE (DECREASE) IN NET ASSETS | | | (61,560,522 | ) | | | 76,115,531 | | | | 1,831,205,891 | | | | 5,130,327,104 | | | | 14,732,505 | | | | 87,313,768 | |
NET ASSETS | | | | | | | | | | | | | | | | | | | | | | | | |
At beginning of year | | | 911,833,935 | | | | 835,718,404 | | | | 11,918,901,686 | | | | 6,788,574,582 | | | | 194,462,509 | | | | 107,148,741 | |
At end of year | | | $850,273,413 | | | | $911,833,935 | | | | $13,750,107,577 | | | | $11,918,901,686 | | | | $209,195,014 | | | | $194,462,509 | |
| (1) | The Funds adopted the U.S. Securities and Exchange Commission (“SEC”) Disclosure Update and Simplification as stated on Note 14. The Funds presented the following distributions to shareholders for the fiscal year ended October 31, 2017: |
| | | | | | | | | | | | |
Distributions to Shareholders from: | | Global Equity Portfolio | | | International
Equity
Portfolio | | | International
Small
Companies
Portfolio | |
Net investment income | | | | | | | | | | | | |
Institutional Class | | | $(3,192,599 | ) | | | $(61,948,722 | ) | | | $(758,218 | ) |
Investor Class | | | — | | | | (2,877,064 | ) | | | (455,833 | ) |
Advisor Class | | | (71,969 | ) | | | — | | | | — | |
Net realized gain from investments and foreign-currency related transactions | | | | | | | | | | | | |
Institutional Class | | | (9,438,405 | ) | | | — | | | | (1,995,191 | ) |
Investor Class | | | — | | | | — | | | | (1,303,383 | ) |
Advisor Class | | | (670,713 | ) | | | — | | | | — | |
Total distributions to shareholders | | | (13,373,686 | ) | | | (64,825,786 | ) | | | (4,512,625 | ) |
| | The accumulated undistributed net investment income included in net assets for the fiscal year ended October 31, 2017 was $2,699,422, $104,884,439 and $705,573 for the Global Equity Portfolio, International Equity Portfolio and International Small Companies Portfolio, respectively. |
See Notes to Financial Statements
45
Harding, Loevner Funds, Inc.
Statements of Changes in Net Assets (continued)
For the Fiscal Years Ended October 31
| | | | | | | | | | | | | | | | | | | | | | | | |
| | | Institutional Emerging Markets
Portfolio | | | Emerging Markets Portfolio | | | Frontier Emerging Markets
Portfolio | |
| | | 2018 | | | 2017(1) | | | 2018 | | | 2017(1) | | | 2018 | | | 2017(1) | |
INCREASE (DECREASE) IN NET ASSETS FROM OPERATIONS | | | | | | | | | | | | | | | | | | | | | | | | |
Net investment income | | | $43,560,880 | | | | $39,784,285 | | | | $30,475,892 | | | | $29,181,162 | | | | $6,303,168 | | | | $3,547,034 | |
Net realized gain (loss) on investments and foreign currency transactions | | | (67,093,355 | ) | | | 17,200,140 | | | | (11,468,128 | ) | | | 59,611,118 | | | | 9,478,438 | | | | (5,120,521 | ) |
Net change in unrealized appreciation (depreciation) on investments and translation of assets and liabilities denominated in foreign currencies | | | (776,222,456 | ) | | | 868,787,971 | | | | (665,366,341 | ) | | | 698,935,059 | | | | (55,969,791 | ) | | | 67,483,381 | |
Net increase (decrease) in net assets resulting from operations | | | (799,754,931 | ) | | | 925,772,396 | | | | (646,358,577 | ) | | | 787,727,339 | | | | (40,188,185 | ) | | | 65,909,894 | |
DISTRIBUTIONS TO SHAREHOLDERS: | | | | | | | | | | | | | | | | | | | | | | | | |
Institutional Class I | | | — | | | | — | | | | — | | | | — | | | | (5,147,342 | ) | | | (3,512,132 | ) |
Institutional Class II | | | — | | | | — | | | | — | | | | — | | | | (3,499,694 | ) | | | — | |
Class I | | | (34,875,251 | ) | | | (18,225,386 | ) | | | — | | | | — | | | | — | | | | — | |
Class II | | | (3,886,186 | ) | | | (4,287,811 | ) | | | — | | | | — | | | | — | | | | — | |
Investor Class | | | — | | | | — | | | | — | | | | — | | | | (491,328 | ) | | | (165,442 | ) |
Advisor Class | | | — | | | | — | | | | (30,340,225 | ) | | | (17,343,528 | ) | | | — | | | | — | |
Total distributions to shareholders | | | (38,761,437 | ) | | | (22,513,197 | ) | | | (30,340,225 | ) | | | (17,343,528 | ) | | | (9,138,364 | ) | | | (3,677,574 | ) |
TRANSACTIONS IN SHARES OF COMMON STOCK | | | | | | | | | | | | | | | | | | | | | | | | |
Institutional Class I | | | — | | | | — | | | | — | | | | — | | | | (19,849,297 | ) | | | (113,854,561 | ) |
Institutional Class II | | | — | | | | — | | | | — | | | | — | | | | 16,504,134 | | | | 147,539,455 | |
Class I | | | 355,101,774 | | | | 521,998,725 | | | | — | | | | — | | | | — | | | | — | |
Class II | | | 8,520,318 | | | | (12,909,702 | ) | | | — | | | | — | | | | — | | | | — | |
Investor Class | | | — | | | | — | | | | — | | | | — | | | | (2,303,970 | ) | | | (6,278,013 | ) |
Advisor Class | | | — | | | | — | | | | 120,879,281 | | | | 246,108,743 | | | | — | | | | — | |
Net Increase (Decrease) in net assets from portfolio share transactions | | | 363,622,092 | | | | 509,089,023 | | | | 120,879,281 | | | | 246,108,743 | | | | (5,649,133 | ) | | | 27,406,881 | |
NET INCREASE (DECREASE) IN | | | | | | | | | | | | | | | | | | | | | | | | |
NET ASSETS | | | (474,894,276 | ) | | | 1,412,348,222 | | | | (555,819,521 | ) | | | 1,016,492,554 | | | | (54,975,682 | ) | | | 89,639,201 | |
NET ASSETS | | | | | | | | | | | | | | | | | | | | | | | | |
At beginning of year | | | 4,844,798,693 | | | | 3,432,450,471 | | | | 4,014,976,532 | | | | 2,998,483,978 | | | | 464,523,509 | | | | 374,884,308 | |
At end of year | | | $4,369,904,417 | | | | $4,844,798,693 | | | | $3,459,157,011 | | | | $4,014,976,532 | | | | $409,547,827 | | | | $464,523,509 | |
| (1) | The Funds adopted the U.S. Securities and Exchange Commission (“SEC”) Disclosure Update and Simplification as stated on Note 14. The Funds presented the following distributions to shareholders for the fiscal year ended October 31, 2017: |
| | | | | | | | | | | | |
Distributions to Shareholders from: | | Institutional
Emerging
Markets
Portfolio | | | Emerging
Markets
Portfolio | | | Frontier
Emerging
Markets
Portfolio | |
Net investment income | | | | | | | | | | | | |
Institutional Class I | | | $— | | | | $— | | | | $(3,512,132 | ) |
Class I | | | (18,225,386 | ) | | | — | | | | — | |
Class II | | | (4,287,811 | ) | | | — | | | | — | |
Investor Class | | | — | | | | — | | | | (165,442 | ) |
Advisor Class | | | — | | | | (17,343,528 | ) | | | — | |
| Total distributions to shareholders | | | (22,513,197 | ) | | | (17,343,528 | ) | | | (3,677,574 | ) |
| | The accumulated undistributed net investment income included in net assets for the fiscal year ended October 31, 2017 was $38,774,466, $28,518,437 and $3,585,808 for the Institutional Emerging Markets Portfolio, Emerging Markets Portfolio and Frontier Emerging Markets Portfolio, respectively. |
See Notes to Financial Statements
46
Harding, Loevner Funds, Inc.
Statements of Changes in Net Assets (continued)
For the Fiscal Years Ended October 31
| | | | | | | | | | | | | | | | | | | | | | | | |
| | | Global Equity Research Portfolio | | | International Equity
Research Portfolio | | | Emerging Markets Research Portfolio | |
| | | 2018 | | | 2017(1), (2) | | | 2018 | | | 2017(2) | | | 2018 | | | 2017(1), (2) | |
INCREASE (DECREASE) IN NET ASSETS FROM OPERATIONS | | | | | | | | | | | | | | | | | | | | | | | | |
Net investment income | | | $45,926 | | | | $35,575 | | | | $116,795 | | | | $87,413 | | | | $63,243 | | | | $51,064 | |
Net realized gain on investments and foreign currency transactions | | | 468,654 | | | | 156,804 | | | | 693,010 | | | | 510,004 | | | | 449,129 | | | | 375,486 | |
Net change in unrealized appreciation (depreciation) on investments and translation of assets and liabilities denominated in foreign currencies | | | (356,645 | ) | | | 872,627 | | | | (1,542,490 | ) | | | 1,271,834 | | | | (1,254,653 | ) | | | 1,076,058 | |
Net increase (decrease) in net assets resulting from operations | | | 157,935 | | | | 1,065,006 | | | | (732,685 | ) | | | 1,869,251 | | | | (742,281 | ) | | | 1,502,608 | |
DISTRIBUTIONS TO SHAREHOLDERS: | | | | | | | | | | | | | | | | | | | | | | | | |
Institutional Class | | | (219,334 | ) | | | — | | | | (531,221 | ) | | | (227,662 | ) | | | (435,447 | ) | | | — | |
Investor Class | | | (22,701 | ) | | | — | | | | (63,122 | ) | | | (27,249 | ) | | | (45,523 | ) | | | — | |
Total distributions to shareholders | | | (242,035 | ) | | | — | | | | (594,343 | ) | | | (254,911 | ) | | | (480,970 | ) | | | — | |
TRANSACTIONS IN SHARES OF COMMON STOCK | | | | | | | | | | | | | | | | | | | | | | | | |
Institutional Class | | | 219,158 | | | | 4,341,525 | | | | 1,018,199 | | | | 1,790,387 | | | | 935,446 | | | | 4,518,305 | |
Investor Class | | | 22,877 | | | | 449,875 | | | | 84,604 | | | | 127,794 | | | | 45,523 | | | | 473,195 | |
Net Increase in net assets from portfolio share transactions | | | 242,035 | | | | 4,791,400 | | | | 1,102,803 | | | | 1,918,181 | | | | 980,969 | | | | 4,991,500 | |
NET INCREASE (DECREASE) IN NET ASSETS | | | 157,935 | | | | 5,856,406 | | | | (224,225 | ) | | | 3,532,521 | | | | (242,282 | ) | | | 6,494,108 | |
NET ASSETS | | | | | | | | | | | | | | | | | | | | | | | | |
At beginning of year | | | 5,856,406 | | | | — | | | | 10,603,026 | | | | 7,070,505 | | | | 6,494,108 | | | | — | |
At end of year | | | $6,014,341 | | | | $5,856,406 | | | | $10,378,801 | | | | $10,603,026 | | | | $6,251,826 | | | | $6,494,108 | |
| (1) | For the period from December 19, 2016 (commencement of class operations) through October 31, 2017. |
| (2) | The Funds adopted the U.S. Securities and Exchange Commission (“SEC”) Disclosure Update and Simplification as stated on Note 14. The Funds presented the following distributions to shareholders for the fiscal year ended October 31, 2017: |
| | | | | | | | | | | | |
Distributions to Shareholders from: | | Global
Equity
Research
Portfolio | | | International
Equity
Research
Portfolio | | | Emerging
Markets
Research
Portfolio | |
Net investment income | | | | | | | | | | | | |
Institutional Class | | | $— | | | | $(106,029 | ) | | | $— | |
Investor Class | | | — | | | | (12,691 | ) | | | — | |
Net realized gain from investments and foreign-currency related transactions | | | | | | | | | | | | |
Institutional Class | | | — | | | | (121,633 | ) | | | — | |
Investor Class | | | — | | | | (14,558 | ) | | | — | |
| Total distributions to shareholders | | | — | | | | (254,911 | ) | | | — | |
| | The accumulated undistributed net investment income included in net assets for the fiscal year ended October 31, 2017 was $86,427, $107,310 and $107,347 for the Global Equity Research Portfolio, International Equity Research Portfolio and Emerging Markets Research Portfolio, respectively. |
See Notes to Financial Statements
47
Harding, Loevner Funds, Inc.
Financial Highlights
For the Fiscal Year Ended October 31
| | | | | | | | | | | | | | | | | | | | | | | | | | | | | | | | | | | | | | | | | | | | | | | | | | | | | | | | |
| | | | | | INCREASE (DECREASE) IN NET ASSETS FROM OPERATIONS: | | | DISTRIBUTIONS TO SHAREHOLDERS FROM: | | | | | | | | | RATIOS/SUPPLEMENTAL DATA: | | | | |
| | | Net asset value, beginning of year | | | Net investment income (loss)(1) | | | Net realized and unrealized gain (loss) on investments and foreign currency- related transactions | | | Net increase (decrease) from investment operations | | | Net investment income | | | Net realized gain from
investments | | | Total distributions | | | Net asset value, end of
year | | | Total Return | | | Net assets, end of year (000’s) | | | Expenses to average net assets | | | Expenses to average net assets (net of fees waived/ reimbursed) | | | Net investment income to average net assets | | | Portfolio turnover rate | |
Global Equity Portfolio–Institutional Class | |
10/31/18 | | | $40.84 | | | | $0.13 | | | | $(0.13 | ) | | | $— | | | | $(0.14 | ) | | | $(5.02 | ) | | | $(5.16 | ) | | | $35.68 | | | | (0.35 | )% | | | $619,347 | | | | 0.94 | % | | | 0.94 | % | | | 0.34 | % | | | 42 | % |
10/31/17 | | | 32.53 | | | | 0.09 | | | | 8.74 | | | | 8.83 | | | | (0.13 | ) | | | (0.39 | ) | | | (0.52 | ) | | | 40.84 | | | | 27.58 | | | | 790,097 | | | | 0.93 | | | | 0.93 | | | | 0.25 | | | | 33 | |
10/31/16 | | | 32.44 | | | | 0.13 | | | | 0.92 | | | | 1.05 | | | | (0.12 | ) | | | (0.84 | ) | | | (0.96 | ) | | | 32.53 | | | | 3.43 | | | | 779,020 | | | | 0.92 | | | | 0.92 | | | | 0.42 | | | | 24 | |
10/31/15 | | | 32.98 | | | | 0.13 | | | | 0.68 | | | | 0.81 | | | | (0.12 | ) | | | (1.23 | ) | | | (1.35 | ) | | | 32.44 | | | | 2.51 | | | | 805,291 | | | | 0.92 | | | | 0.92 | | | | 0.41 | | | | 45 | |
10/31/14 | | | 29.84 | | | | 0.13 | | | | 3.27 | | | | 3.40 | | | | (0.13 | ) | | | (0.13 | ) | | | (0.26 | ) | | | 32.98 | | | | 11.47 | | | | 731,897 | | | | 0.97 | | | | 0.95 | | | | 0.43 | | | | 30 | |
Global Equity Portfolio–Institutional Class Z | |
10/31/18 | | | 40.84 | | | | 0.17 | | | | (0.15 | ) | | | 0.02 | | | | (0.17 | ) | | | (5.02 | ) | | | (5.19 | ) | | | 35.67 | | | | (0.26 | ) | | | 140,359 | | | | 0.91 | | | | 0.90 | | | | 0.43 | | | | 42 | |
10/31/17(2)(3) | | | 39.33 | | | | (0.01 | ) | | | 1.52 | | | | 1.51 | | | | — | | | | — | | | | — | | | | 40.84 | | | | 3.80 | (A) | | | 46,493 | | | | 1.21 | (B) | | | 0.90 | (B) | | | (0.05 | )(B) | | | 33 | (A) |
Global Equity Portfolio–Advisor Class | |
10/31/18 | | | 40.78 | | | | 0.07 | | | | (0.15 | ) | | | (0.08 | ) | | | (0.08 | ) | | | (5.02 | ) | | | (5.10 | ) | | | 35.60 | | | | (0.57 | ) | | | 90,567 | | | | 1.14 | | | | 1.14 | | | | 0.18 | | | | 42 | |
10/31/17 | | | 32.47 | | | | 0.01 | | | | 8.73 | | | | 8.74 | | | | (0.04 | ) | | | (0.39 | ) | | | (0.43 | ) | | | 40.78 | | | | 27.28 | | | | 75,244 | | | | 1.14 | | | | 1.14 | | | | 0.02 | | | | 33 | |
10/31/16 | | | 32.38 | | | | 0.05 | | | | 0.91 | | | | 0.96 | | | | (0.03 | ) | | | (0.84 | ) | | | (0.87 | ) | | | 32.47 | | | | 3.12 | | | | 56,698 | | | | 1.19 | | | | 1.19 | | | | 0.15 | | | | 24 | |
10/31/15 | | | 32.92 | | | | 0.04 | | | | 0.68 | | | | 0.72 | | | | (0.03 | ) | | | (1.23 | ) | | | (1.26 | ) | | | 32.38 | | | | 2.28 | | | | 64,726 | | | | 1.18 | | | | 1.18 | | | | 0.13 | | | | 45 | |
10/31/14 | | | 29.80 | | | | 0.05 | | | | 3.27 | | | | 3.32 | | | | (0.07 | ) | | | (0.13 | ) | | | (0.20 | ) | | | 32.92 | | | | 11.19 | | | | 81,507 | | | | 1.20 | | | | 1.20 | | | | 0.16 | | | | 30 | |
International Equity Portfolio–Institutional Class | |
10/31/18 | | | 22.64 | | | | 0.31 | | | | (1.83 | ) | | | (1.52 | ) | | | (0.20 | ) | | | (0.18 | ) | | | (0.38 | ) | | | 20.74 | | | | (6.86 | ) | | | 11,995,592 | | | | 0.81 | | | | 0.81 | | | | 1.34 | | | | 10 | |
10/31/17 | | | 18.37 | | | | 0.23 | | | | 4.22 | | | | 4.45 | | | | (0.18 | ) | | | — | | | �� | (0.18 | ) | | | 22.64 | | | | 24.47 | | | | 11,107,736 | | | | 0.82 | | | | 0.82 | | | | 1.22 | | | | 12 | |
10/31/16 | | | 17.69 | | | | 0.21 | | | | 0.64 | | | | 0.85 | | | | (0.17 | ) | | | — | | | | (0.17 | ) | | | 18.37 | | | | 4.91 | | | | 6,354,810 | | | | 0.84 | | | | 0.84 | | | | 1.20 | | | | 22 | |
10/31/15 | | | 18.30 | | | | 0.20 | | | | (0.63 | ) | | | (0.43 | ) | | | (0.18 | ) | | | — | | | | (0.18 | ) | | | 17.69 | | | | (2.40 | ) | | | 4,591,802 | | | | 0.85 | | | | 0.85 | | | | 1.11 | | | | 12 | |
10/31/14 | | | 17.97 | | | | 0.18 | | | | 0.29 | | | | 0.47 | | | | (0.14 | ) | | | — | | | | (0.14 | ) | | | 18.30 | | | | 2.65 | | | | 3,819,491 | | | | 0.87 | | | | 0.87 | | | | 1.01 | | | | 10 | |
International Equity Portfolio–Institutional Class Z | |
10/31/18 | | | 22.64 | | | | 0.40 | | | | (1.90 | ) | | | (1.50 | ) | | | (0.21 | ) | | | (0.18 | ) | | | (0.39 | ) | | | 20.75 | | | | (6.79 | ) | | | 1,342,804 | | | | 0.74 | | | | 0.74 | | | | 1.77 | | | | 10 | |
10/31/17(3)(4) | | | 21.35 | | | | 0.02 | | | | 1.27 | | | | 1.29 | | | | — | | | | — | | | | — | | | | 22.64 | | | | 6.00 | (A) | | | 166,923 | | | | 0.99 | (B) | | | 0.80 | (B) | | | 0.33 | (B) | | | 12 | (A) |
International Equity Portfolio–Investor Class | |
10/31/18 | | | 22.55 | | | | 0.21 | | | | (1.80 | ) | | | (1.59 | ) | | | (0.13 | ) | | | (0.18 | ) | | | (0.31 | ) | | | 20.65 | | | | (7.16 | ) | | | 411,712 | | | | 1.14 | | | | 1.14 | | | | 0.92 | | | | 10 | |
10/31/17 | | | 18.30 | | | | 0.19 | | | | 4.18 | | | | 4.37 | | | | (0.12 | ) | | | — | | | | (0.12 | ) | | | 22.55 | | | | 24.04 | | | | 644,243 | | | | 1.14 | | | | 1.14 | | | | 0.95 | | | | 12 | |
10/31/16 | | | 17.62 | | | | 0.14 | | | | 0.66 | | | | 0.80 | | | | (0.12 | ) | | | — | | | | (0.12 | ) | | | 18.30 | | | | 4.63 | | | | 433,765 | | | | 1.15 | | | | 1.15 | | | | 0.83 | | | | 22 | |
10/31/15 | | | 18.23 | | | | 0.15 | | | | (0.64 | ) | | | (0.49 | ) | | | (0.12 | ) | | | — | | | | (0.12 | ) | | | 17.62 | | | | (2.76 | ) | | | 405,101 | | | | 1.17 | | | | 1.17 | | | | 0.83 | | | | 12 | |
10/31/14 | | | 17.89 | | | | 0.13 | | | | 0.29 | | | | 0.42 | | | | (0.08 | ) | | | — | | | | (0.08 | ) | | | 18.23 | | | | 2.36 | | | | 443,029 | | | | 1.17 | | | | 1.17 | | | | 0.72 | | | | 10 | |
International Small Companies Portfolio–Institutional Class | |
10/31/18 | | | 16.67 | | | | 0.13 | | | | (1.30 | ) | | | (1.17 | ) | | | (0.06 | ) | | | (0.15 | ) | | | (0.21 | ) | | | 15.29 | | | | (7.15 | ) | | | 151,283 | | | | 1.39 | | | | 1.15 | | | | 0.75 | | | | 52 | |
10/31/17 | | | 13.72 | | | | 0.11 | | | | 3.41 | | | | 3.52 | | | | (0.16 | ) | | | (0.41 | ) | | | (0.57 | ) | | | 16.67 | | | | 26.98 | | | | 144,170 | | | | 1.41 | | | | 1.15 | | | | 0.72 | | | | 19 | |
10/31/16 | | | 13.40 | | | | 0.20 | | | | 0.34 | | | | 0.54 | | | | (0.09 | ) | | | (0.13 | ) | | | (0.22 | ) | | | 13.72 | | | | 4.15 | | | | 62,785 | | | | 1.60 | | | | 1.25 | | | | 1.51 | | | | 49 | |
10/31/15 | | | 13.85 | | | | 0.11 | | | | (0.25 | ) | | | (0.14 | ) | | | (0.05 | ) | | | (0.26 | ) | | | (0.31 | ) | | | 13.40 | | | | (0.98 | ) | | | 47,276 | | | | 1.64 | | | | 1.30 | | | | 0.79 | | | | 38 | |
10/31/14 | | | 14.47 | | | | 0.08 | | | | 0.23 | | | | 0.31 | | | | (0.06 | ) | | | (0.87 | ) | | | (0.93 | ) | | | 13.85 | | | | 2.28 | | | | 28,711 | | | | 1.59 | | | | 1.30 | | | | 0.58 | | | | 36 | |
| (1) | Net investment income per share was calculated using the average shares outstanding method. |
| (2) | For the period from August 1, 2017 (commencement of class operations) through October 31, 2017. |
| (3) | All per share amounts and net asset values have been adjusted as a result of the reverse share split effected after the close of business on December 1, 2017. (See Note 1). |
| (4) | For the period from July 17, 2017 (commencement of class operations) through October 31, 2017. |
See Notes to Financial Statements
48
Harding, Loevner Funds, Inc.
Financial Highlights (continued)
For the Fiscal Year Ended October 31
| | | | | | | | | | | | | | | | | | | | | | | | | | | | | | | | | | | | | | | | | | | | | | | | | | | | | | | | |
| | | | | | INCREASE (DECREASE) IN NET ASSETS FROM OPERATIONS: | | | DISTRIBUTIONS TO SHAREHOLDERS FROM: | | | | | | | | | RATIOS/SUPPLEMENTAL DATA: | | | | |
| | | Net asset value, beginning of year | | | Net investment income (loss)(1) | | | Net realized and unrealized gain (loss) on investments and foreign currency- related transactions | | | Net increase (decrease) from investment operations | | | Net investment income | | | Net realized gain from investments | | | Total distributions | | | Net asset value, end of year | | | Total Return | | | Net assets, end of year (000’s) | | | Expenses to average net assets | | | Expenses to average net assets (net of fees waived/ reimbursed) | | | Net investment income to average net assets | | | Portfolio turnover rate | |
| International Small Companies Portfolio–Investor Class | |
10/31/18 | | | $16.55 | | | | $0.10 | | | | $(1.29 | ) | | | $(1.19 | ) | | | $(0.05 | ) | | | $(0.15 | ) | | | $(0.20 | ) | | | $15.16 | | | | (7.35 | )% | | | $57,912 | | | | 1.75 | % | | | 1.40 | % | | | 0.58 | % | | | 52 | % |
10/31/17 | | | 13.64 | | | | 0.05 | | | | 3.42 | | | | 3.47 | | | | (0.15 | ) | | | (0.41 | ) | | | (0.56 | ) | | | 16.55 | | | | 26.71 | | | | 50,292 | | | | 1.80 | | | | 1.40 | | | | 0.37 | | | | 19 | |
10/31/16 | | | 13.33 | | | | 0.16 | | | | 0.35 | | | | 0.51 | | | | (0.07 | ) | | | (0.13 | ) | | | (0.20 | ) | | | 13.64 | | | | 3.92 | | | | 44,363 | | | | 1.90 | | | | 1.50 | | | | 1.18 | | | | 49 | |
10/31/15 | | | 13.80 | | | | 0.08 | | | | (0.26 | ) | | | (0.18 | ) | | | (0.03 | ) | | | (0.26 | ) | | | (0.29 | ) | | | 13.33 | | | | (1.29 | ) | | | 50,164 | | | | 1.93 | | | | 1.55 | | | | 0.58 | | | | 38 | |
10/31/14 | | | 14.45 | | | | 0.05 | | | | 0.22 | | | | 0.27 | | | | (0.05 | ) | | | (0.87 | ) | | | (0.92 | ) | | | 13.80 | | | | 1.97 | | | | 62,828 | | | | 1.88 | | | | 1.55 | | | | 0.32 | | | | 36 | |
| Institutional Emerging Markets Portfolio–Class I | |
10/31/18 | | | 21.94 | | | | 0.19 | | | | (3.53 | ) | | | (3.34 | ) | | | (0.17 | ) | | | — | | | | (0.17 | ) | | | 18.43 | | | | (15.33 | ) | | | 3,978,321 | | | | 1.27 | | | | 1.27 | | | | 0.84 | | | | 24 | |
10/31/17 | | | 17.65 | | | | 0.19 | | | | 4.20 | | | | 4.39 | | | | (0.10 | ) | | | — | | | | (0.10 | ) | | | 21.94 | | | | 25.08 | | | | 4,386,511 | | | | 1.28 | | | | 1.28 | | | | 0.97 | | | | 17 | |
10/31/16 | | | 16.04 | | | | 0.14 | | | | 1.56 | | | | 1.70 | | | | (0.09 | ) | | | — | | | | (0.09 | ) | | | 17.65 | | | | 10.74 | | | | 3,051,419 | | | | 1.29 | | | | 1.29 | | | | 0.88 | | | | 20 | |
10/31/15 | | | 18.60 | | | | 0.13 | | | | (2.56 | ) | | | (2.43 | ) | | | (0.13 | ) | | | — | | | | (0.13 | ) | | | 16.04 | | | | (13.14 | ) | | | 1,876,495 | | | | 1.31 | | | | 1.30 | | | | 0.77 | | | | 23 | |
10/31/14 | | | 18.07 | | | | 0.20 | | | | 0.48 | | | | 0.68 | | | | (0.15 | ) | | | — | | | | (0.15 | ) | | | 18.60 | | | | 3.80 | | | | 1,521,194 | | | | 1.31 | | | | 1.30 | | | | 1.12 | | | | 26 | |
| Institutional Emerging Markets Portfolio–Class II | |
10/31/18 | | | 21.94 | | | | 0.22 | | | | (3.52 | ) | | | (3.30 | ) | | | (0.19 | ) | | | — | | | | (0.19 | ) | | | 18.45 | | | | (15.21 | ) | | | 391,583 | | | | 1.20 | | | | 1.11 | | | | 1.00 | | | | 24 | |
10/31/17(2) | | | 17.71 | | | | 0.22 | | | | 4.21 | | | | 4.43 | | | | (0.20 | ) | | | — | | | | (0.20 | ) | | | 21.94 | | | | 25.43 | | | | 458,288 | | | | 1.23 | | | | 1.12 | | | | 1.12 | | | | 17 | |
10/31/16(2) | | | 16.14 | | | | 0.16 | | | | 1.59 | | | | 1.75 | | | | (0.18 | ) | | | — | | | | (0.18 | ) | | | 17.71 | | | | 11.06 | | | | 381,031 | | | | 1.24 | | | | 1.13 | | | | 0.96 | | | | 20 | |
10/31/15(2) | | | 18.81 | | | | 0.16 | | | | (2.60 | ) | | | (2.44 | ) | | | (0.23 | ) | | | — | | | | (0.23 | ) | | | 16.14 | | | | (13.06 | ) | | | 241,425 | | | | 1.27 | | | | 1.14 | | | | 0.96 | | | | 23 | |
10/31/14(2)(3) | | | 17.58 | | | | 0.17 | | | | 1.06 | | | | 1.23 | | | | — | | | | — | | | | — | | | | 18.81 | | | | 7.00 | (A) | | | 194,477 | | | | 1.30 | (B) | | | 1.14 | (B) | | | 1.36 | (B) | | | 26 | (A) |
| Emerging Markets Portfolio–Advisor Class | |
10/31/18 | | | 57.46 | | | | 0.42 | | | | (9.24 | ) | | | (8.82 | ) | | | (0.40 | ) | | | (0.03 | ) | | | (0.43 | ) | | | 48.21 | | | | (15.47 | ) | | | 3,459,157 | | | | 1.40 | | | | 1.40 | | | | 0.73 | | | | 24 | |
10/31/17 | | | 46.27 | | | | 0.43 | | | | 11.02 | | | | 11.45 | | | | (0.26 | ) | | | — | | | | (0.26 | ) | | | 57.46 | | | | 24.93 | | | | 4,014,977 | | | | 1.42 | | | | 1.42 | | | | 0.84 | | | | 17 | |
10/31/16 | | | 42.02 | | | | 0.30 | | | | 4.17 | | | | 4.47 | | | | (0.22 | ) | | | — | (4) | | | (0.22 | ) | | | 46.27 | | | | 10.73 | | | | 2,998,484 | | | | 1.42 | | | | 1.42 | | | | 0.72 | | | | 26 | |
10/31/15 | | | 50.88 | | | | 0.26 | | | | (6.80 | ) | | | (6.54 | ) | | | (0.39 | ) | | | (1.93 | ) | | | (2.32 | ) | | | 42.02 | | | | (13.17 | ) | | | 2,381,671 | | | | 1.45 | | | | 1.45 | | | | 0.57 | | | | 30 | |
10/31/14 | | | 50.76 | | | | 0.49 | | | | 1.32 | | | | 1.81 | | | | (0.40 | ) | | | (1.29 | ) | | | (1.69 | ) | | | 50.88 | | | | 3.79 | | | | 2,545,517 | | | | 1.45 | | | | 1.45 | | | | 0.98 | | | | 28 | |
| Frontier Emerging Markets Portfolio–Institutional Class I | |
10/31/18 | | | 8.50 | | | | 0.11 | | | | (0.82 | ) | | | (0.71 | ) | | | (0.17 | ) | | | — | | | | (0.17 | ) | | | 7.62 | | | | (8.47 | ) | | | 220,367 | | | | 1.62 | | | | 1.62 | | | | 1.24 | | | | 20 | |
10/31/17 | | | 7.35 | | | | 0.05 | | | | 1.17 | | | | 1.22 | | | | (0.07 | ) | | | — | | | | (0.07 | ) | | | 8.50 | | | | 16.82 | | | | 266,844 | | | | 1.71 | | | | 1.71 | | | | 0.69 | | | | 28 | |
10/31/16 | | | 7.62 | | | | 0.10 | | | | (0.29 | ) | | | (0.19 | ) | | | (0.08 | ) | | | — | | | | (0.08 | ) | | | 7.35 | | | | (2.43 | ) | | | 342,114 | | | | 1.79 | | | | 1.79 | | | | 1.41 | | | | 47 | |
10/31/15 | | | 9.50 | | | | 0.11 | | | | (1.84 | ) | | | (1.73 | ) | | | (0.05 | ) | | | (0.10 | ) | | | (0.15 | ) | | | 7.62 | | | | (18.35 | ) | | | 451,646 | | | | 1.79 | | | | 1.79 | | | | 1.29 | | | | 38 | |
10/31/14 | | | 8.46 | | | | 0.09 | | | | 0.97 | | | | 1.06 | | | | (0.02 | ) | | | — | | | | (0.02 | ) | | | 9.50 | | | | 12.60 | | | | 474,838 | | | | 1.77 | | | | 1.77 | | | | 1.01 | | | | 37 | |
| (1) | Net investment income per share was calculated using the average shares outstanding method. |
| (2) | All per share amounts and net asset values have been adjusted as a result of the reverse share split effected after the close of business on December 1, 2017. (See Note 1). |
| (3) | For the period from March 5, 2014 (commencement of class operations) through October 31, 2014. |
| (4) | Amount was less than $0.005 per share. |
See Notes to Financial Statements
49
Harding, Loevner Funds, Inc.
Financial Highlights (continued)
For the Fiscal Year Ended October 31
| | | | | | | | | | | | | | | | | | | | | | | | | | | | | | | | | | | | | | | | | | | | | | | | | | | | | | | | |
| | | | | | INCREASE (DECREASE) IN NET ASSETS FROM OPERATIONS: | | | DISTRIBUTIONS TO SHAREHOLDERS FROM: | | | | | | | | | RATIOS/SUPPLEMENTAL DATA: | | | | |
| | | Net asset value, beginning of year | | | Net investment income (loss)(1) | | | Net realized and unrealized gain (loss) on investments and foreign currency- related transactions | | | Net increase (decrease) from investment operations | | | Net investment income | | | Net realized gain from investments | | | Total distributions | | | Net asset value, end of year | | | Total Return | | | Net assets, end of year (000’s) | | | Expenses to average net assets | | | Expenses to average net assets (net of fees waived/ reimbursed) | | | Net investment income to average net assets | | | Portfolio turnover rate | |
| Frontier Emerging Markets Portfolio–Institutional Class II | |
10/31/18 | | | $8.50 | | | | $0.14 | | | | $(0.83 | ) | | | $(0.69 | ) | | | $(0.18 | ) | | | $— | | | | $(0.18 | ) | | | $7.63 | | | | (8.31 | )% | | | $163,794 | | | | 1.56 | % | | | 1.35 | % | | | 1.51 | % | | | 20 | % |
10/31/17(2)(3) | | | 7.43 | | | | 0.08 | | | | 0.99 | | | | 1.07 | | | | — | | | | — | | | | — | | | | 8.50 | | | | 14.40 | (A) | | | 166,698 | | | | 1.58 | (B) | | | 1.35 | (B) | | | 1.47 | (B) | | | 28 | (A) |
| Frontier Emerging Markets Portfolio–Investor Class | |
10/31/18 | | | 8.43 | | | | 0.07 | | | | (0.79 | ) | | | (0.72 | ) | | | (0.14 | ) | | | — | | | | (0.14 | ) | | | 7.57 | | | | (8.75 | ) | | | 25,388 | | | | 2.06 | | | | 2.00 | | | | 0.87 | | | | 20 | |
10/31/17 | | | 7.28 | | | | 0.04 | | | | 1.15 | | | | 1.19 | | | | (0.04 | ) | | | — | | | | (0.04 | ) | | | 8.43 | | | | 16.40 | | | | 30,981 | | | | 2.13 | | | | 2.00 | | | | 0.48 | | | | 28 | |
10/31/16 | | | 7.55 | | | | 0.07 | | | | (0.30 | ) | | | (0.23 | ) | | | (0.04 | ) | | | — | | | | (0.04 | ) | | | 7.28 | | | | (3.01 | ) | | | 32,771 | | | | 2.23 | | | | 2.23 | | | | 1.02 | | | | 47 | |
10/31/15 | | | 9.41 | | | | 0.06 | | | | (1.80 | ) | | | (1.74 | ) | | | (0.02 | ) | | | (0.10 | ) | | | (0.12 | ) | | | 7.55 | | | | (18.64 | ) | | | 45,622 | | | | 2.20 | | | | 2.20 | | | | 0.75 | | | | 38 | |
10/31/14 | | | 8.40 | | | | 0.04 | | | | 0.98 | | | | 1.02 | | | | (0.01 | ) | | | — | | | | (0.01 | ) | | | 9.41 | | | | 12.15 | | | | 78,712 | | | | 2.22 | | | | 2.22 | | | | 0.38 | | | | 37 | |
| Global Equity Research Portfolio–Institutional Class | |
10/31/18 | | | 12.23 | | | | 0.10 | | | | 0.23 | | | | 0.33 | | | | (0.18 | ) | | | (0.32 | ) | | | (0.50 | ) | | | 12.06 | | | | 2.74 | | | | 5,452 | | | | 2.64 | | | | 0.90 | | | | 0.76 | | | | 45 | |
10/31/17(4) | | | 10.00 | | | | 0.08 | | | | 2.15 | | | | 2.23 | | | | — | | | | — | | | | — | | | | 12.23 | | | | 22.30 | (A) | | | 5,308 | | | | 3.49 | (B) | | | 0.90 | (B) | | | 0.80 | (B) | | | 36 | (A) |
| Global Equity Research Portfolio–Investor Class | |
10/31/18 | | | 12.21 | | | | 0.06 | | | | 0.24 | | | | 0.30 | | | | (0.18 | ) | | | (0.32 | ) | | | (0.50 | ) | | | 12.01 | | | | 2.49 | | | | 562 | | | | 9.10 | | | | 1.15 | | | | 0.51 | | | | 45 | |
10/31/17(4) | | | 10.00 | | | | 0.05 | | | | 2.16 | | | | 2.21 | | | | — | | | | — | | | | — | | | | 12.21 | | | | 22.10 | (A) | | | 548 | | | | 13.36 | (B) | | | 1.15 | (B) | | | 0.55 | (B) | | | 36 | (A) |
| International Equity Research Portfolio–Institutional Class | |
10/31/18 | | | 13.11 | | | | 0.14 | | | | (0.93 | ) | | | (0.79 | ) | | | (0.14 | ) | | | (0.59 | ) | | | (0.73 | ) | | | 11.59 | | | | (6.43 | ) | | | 9,305 | | | | 1.78 | | | | 0.90 | | | | 1.07 | | | | 43 | |
10/31/17 | | | 11.10 | | | | 0.12 | | | | 2.26 | | | | 2.38 | | | | (0.17 | ) | | | (0.20 | ) | | | (0.37 | ) | | | 13.11 | | | | 22.26 | | | | 9,479 | | | | 2.26 | | | | 0.90 | | | | 0.99 | | | | 55 | |
10/31/16(5) | | | 10.00 | | | | 0.14 | | | | 0.96 | | | | 1.10 | | | | — | | | | — | | | | — | | | | 11.10 | | | | 11.00 | (A) | | | 6,244 | | | | 3.54 | (B) | | | 0.90 | (B) | | | 1.51 | (B) | | | 33 | (A) |
| International Equity Research Portfolio–Investor Class | |
10/31/18 | | | 13.05 | | | | 0.10 | | | | (0.91 | ) | | | (0.81 | ) | | | (0.14 | ) | | | (0.59 | ) | | | (0.73 | ) | | | 11.51 | | | | (6.63 | ) | | | 1,074 | | | | 5.31 | | | | 1.15 | | | | 0.78 | | | | 43 | |
10/31/17 | | | 11.07 | | | | 0.08 | | | | 2.27 | | | | 2.35 | | | | (0.17 | ) | | | (0.20 | ) | | | (0.37 | ) | | | 13.05 | | | | 22.05 | | | | 1,124 | | | | 6.49 | | | | 1.15 | | | | 0.71 | | | | 55 | |
10/31/16(5) | | | 10.00 | | | | 0.11 | | | | 0.96 | | | | 1.07 | | | | — | | | | — | | | | — | | | | 11.07 | | | | 10.70 | (A) | | | 826 | | | | 10.91(B | ) | | | 1.15 | (B) | | | 1.20 | (B) | | | 33 | (A) |
| Emerging Markets Research Portfolio–Institutional Class | |
10/31/18 | | | 13.01 | | | | 0.12 | | | | (1.34 | ) | | | (1.22 | ) | | | (0.23 | ) | | | (0.74 | ) | | | (0.97 | ) | | | 10.82 | | | | (10.24 | ) | | | 5,702 | | | | 2.90 | | | | 1.30 | | | | 0.93 | | | | 55 | |
10/31/17(4) | | | 10.00 | | | | 0.10 | | | | 2.91 | | | | 3.01 | | | | — | | | | — | | | | — | | | | 13.01 | | | | 30.10 | (A) | | | 5,880 | | | | 3.72 | (B) | | | 1.30 | (B) | | | 1.04 | (B) | | | 46 | (A) |
| Emerging Markets Research Portfolio–Investor Class | |
10/31/18 | | | 12.99 | | | | 0.08 | | | | (1.33 | ) | | | (1.25 | ) | | | (0.23 | ) | | | (0.74 | ) | | | (0.97 | ) | | | 10.77 | | | | (10.51 | ) | | | 549 | | | | 8.97 | | | | 1.55 | | | | 0.66 | | | | 55 | |
10/31/17(4) | | | 10.00 | | | | 0.08 | | | | 2.91 | | | | 2.99 | | | | — | | | | — | | | | — | | | | 12.99 | | | | 29.90 | (A) | | | 614 | | | | 12.64 | (B) | | | 1.55 | (B) | | | 0.78 | (B) | | | 46 | (A) |
| (1) | Net investment income per share was calculated using the average shares outstanding method. |
| (2) | For the period from March 1, 2017 (commencement of class operations) through October 31, 2017. |
| (3) | All per share amounts and net asset values have been adjusted as a result of the share dividend effected after the close of business on December 1, 2017. (See Note 1). |
| (4) | For the period from December 19, 2016 (commencement of class operations) through October 31, 2017. |
| (5) | For the period from December 17, 2015 (commencement of class operations) through October 31, 2016. |
See Notes to Financial Statements
50
Harding, Loevner Funds, Inc.
Notes to Financial Statements
October 31, 2018
1. Organization
Harding, Loevner Funds, Inc. (the “Fund”) was organized as a Maryland corporation on July 31, 1996, and is registered under the Investment Company Act of 1940, as amended (the “1940 Act”), as an open-end management investment company. The Fund currently has nine separate diversified Portfolios, all of which were active as of October 31, 2018 (individually, a “Portfolio”, collectively, the “Portfolios”). The Fund is managed by Harding Loevner LP (the “Investment Adviser”).
| | | | |
Portfolio | | Inception Date | | Investment Objective |
Global Equity Portfolio
(“Global Equity”) | | Institutional Class: November 3, 2009 Institutional Class Z: August 1, 2017 Advisor Class: December 1, 1996 | | to seek long-term capital appreciation through investments in equity securities of companies based both inside and outside the United States |
International Equity Portfolio (“International Equity”) | | Institutional Class: May 11, 1994* Institutional Class Z: July 17, 2017 Investor Class: September 30, 2005 | | to seek long-term capital appreciation through investments in equity securities of companies based outside the United States |
International Small Companies Portfolio (“International Small Companies”) | | Institutional Class: June 30, 2011 Investor Class: March 26, 2007 | | to seek long-term capital appreciation through investments in equity securities of small companies based outside the United States |
Institutional Emerging Markets Portfolio**
(“Institutional Emerging Markets”) | | Class I: October 17, 2005 Class II: March 5, 2014 | | to seek long-term capital appreciation through investments in equity securities of companies based in emerging markets |
Emerging Markets Portfolio**
(“Emerging Markets”) | | Advisor Class: November 9, 1998 | | to seek long-term capital appreciation through investments in equity securities of companies based in emerging markets |
Frontier Emerging Markets Portfolio (“Frontier Emerging Markets”) | | Institutional Class I: May 27, 2008 Institutional Class II: March 1, 2017 Investor Class: December 31, 2010 | | to seek long-term capital appreciation through investments in equity securities of companies based in frontier and smaller emerging markets |
Global Equity Research Portfolio
(“Global Equity Research”) | | Institutional Class: December 19, 2016 Investor Class: December 19, 2016 | | to seek long-term capital appreciation through investments in equity securities of companies based both inside and outside the United States |
International Equity Research Portfolio (“International Equity Research”) | | Institutional Class: December 17, 2015 Investor Class: December 17, 2015 | | to seek long-term capital appreciation through investments in equity securities of companies based outside the United States |
Emerging Markets Research Portfolio (“Emerging Markets Research”) | | Institutional Class: December 19, 2016 Investor Class: December 19, 2016 | | to seek long-term capital appreciation through investments in equity securities of companies based in emerging markets |
* The International Equity Portfolio is the successor to the HLM International Equity Portfolio of AMT Capital Fund, Inc., pursuant to a reorganization that took place on October 31, 1996. Information for periods prior to October 31, 1996, is historical information for the predecessor portfolio.
** The Institutional Emerging Markets and Emerging Markets Portfolios are generally closed to new investors.
On November 24, 2017, the Board of Directors (the “Board”) of the Fund approved reverse share splits (the “Reverse Splits”) of the outstanding Institutional Class Z shares of the Global Equity Portfolio, Institutional Class Z shares of the International Equity Portfolio, and Class II shares of the Institutional Emerging Markets Portfolio (each, a “Split Impacted Portfolio”) at the ratios indicated below.
| | | | | |
| Portfolio | | Reverse Share
Split Ratio |
Global Equity Portfolio – Institutional Class Z | | | | 1 for 3.933146 | |
International Equity Portfolio – Institutional Class Z | | | | 1 for 2.135356 | |
Institutional Emerging Markets Portfolio – Class II | | | | 1 for 1.758429 | |
The Reverse Splits were effected after the close of business on December 1, 2017. Institutional Class Z shares and Class II shares of the Split Impacted Portfolios began trading on a split-adjusted basis on December 4, 2017.
51
Harding, Loevner Funds, Inc.
Notes to Financial Statements (continued)
October 31, 2018
1. Organization (continued)
The total dollar value of each shareholder’s investment in a Split Impacted Portfolio remained unchanged by the Reverse Splits. While the Reverse Splits reduced the number of outstanding Institutional Class Z or Class II shares of the Split Impacted Portfolios, they proportionately increased the net asset value (“NAV”) per share of Institutional Class Z shares and Class II shares of the Split Impacted Portfolio such that the aggregate market value of each Split Impacted Portfolio’s Institutional Class Z shares or Class II shares, as applicable, remained the same. The Reverse Splits did not affect the voting rights of a shareholder’s investment in a Split Impacted Portfolio, and was not a taxable event for the Split Impacted Portfolio’s shareholders.
On November 24, 2017, the Board also declared a share dividend (the “Share Dividend”) with respect to the Institutional Class II shares of the Frontier Emerging Markets Portfolio equal to 0.346467 shares on each outstanding Institutional Class II share. The Share Dividend was paid to the Portfolio’s Institutional Class II shareholders of record as of the close of business on December 1, 2017. The total dollar value of each shareholder’s investment in the Portfolio remained unchanged by the Share Dividend. While the Share Dividend increased the number of outstanding Institutional Class II shares of the Portfolio, it proportionately decreased the NAV per share of Institutional Class II shares of the Portfolio such that the aggregate market value of the Portfolio’s Institutional Class II shares remained the same. The Share Dividend did not affect the voting rights of a shareholder’s investment in the Portfolio, and was not a taxable event for the Portfolio’s shareholders.
The Board approved the Reverse Splits in order to bring the NAV per share of the Institutional Class Z shares of the Global Equity Portfolio and International Equity Portfolio and Class II shares of the Institutional Emerging Markets Portfolio into line with the NAV per share of the other share classes of the Split Impacted Portfolios. The Board also declared the Share Dividend in order to bring the NAV per share of the Institutional Class II shares of the Frontier Emerging Markets Portfolio into line with the NAV per share of the other share classes of the Portfolio. The Reverse Splits and the Share Dividend are intended to create a general level of parity of required distributions across the Fund’s share classes by increasing the NAV per share and reducing the number of outstanding shares of the share classes subject to the Reverse Splits and decreasing the NAV per share and increasing the number of outstanding shares of the Institutional Class II shares of the Frontier Emerging Markets Portfolio through the Share Dividend.
Per share data, including the proportionate impact to NAV, in the Financial Highlights and Capital Share activity presented in the Capital Share Transactions disclosure (see Note 7) have been restated to reflect the Reverse Splits and the Share Dividend, respectively.
2. Summary of Significant Accounting Policies
The accounting policies of the Fund are in conformity with accounting principles generally accepted in the United States (“GAAP”) for investment companies. Accordingly, the Fund follows accounting and reporting guidance under FASB Accounting Standards Codification Topic 946, “Financial Services - Investment Companies”. The following is a summary of the Fund’s significant accounting policies:
Estimates
The preparation of financial statements in accordance with GAAP requires management to make estimates and assumptions that affect the reported amounts and disclosures in the financial statements. Actual results could differ from those estimates.
Valuation
The Board has adopted procedures (“Procedures”) to govern the valuation of the securities held by each Portfolio of the Fund in accordance with the 1940 Act. The Procedures incorporate principles set forth in relevant pronouncements of the Securities and Exchange Commission (“SEC”) and its staff, including guidance on the obligations of the Portfolios and their Directors to determine, in good faith, the fair value of the Portfolios’ securities when market quotations are not readily available.
In determining a Portfolio’s NAV, each equity security traded on a securities exchange, including the NASDAQ Stock Market, and over-the-counter securities, are first valued at the closing price on the exchange or market designated by the Fund’s accounting agent as the principal exchange (each, a “principal exchange”). The closing price provided by the Fund’s accounting agent for a principal exchange may differ from the price quoted elsewhere and may represent information such as last sales price, an official closing price, a closing auction price or other information, depending on exchange or market convention. Shares of open-end mutual funds including money market funds are valued at NAV. Such securities are typically categorized as “Level 1” pursuant to the hierarchy described below.
Participation notes are valued based upon the closing or last traded price of their underlying local shares. Such securities are typically categorized as “Level 2” pursuant to the hierarchy described below.
52
Harding, Loevner Funds, Inc.
Notes to Financial Statements (continued)
October 31, 2018
2. Summary of Significant Accounting Policies (continued)
Since trading in many foreign securities is normally completed before the time at which a Portfolio calculates its NAV, the effect on the value of such securities held by a Portfolio of events that occur between the close of trading in the security and the time at which the Portfolio prices its securities would not be reflected in the Portfolio’s calculation of its NAV if foreign securities were generally valued at their closing prices. To address this issue, the Board has approved the daily use of independently provided quantitative models that may adjust the closing prices of certain foreign equity securities based on information that becomes available after the foreign market closes, through the application of an adjustment factor to such securities’ closing price. Adjustment factors may be greater than, less than, or equal to 1. Thus, use of these quantitative models could cause a Portfolio to value a security higher, lower or equal to its closing market price, which in turn could cause the Portfolio’s NAV per share to differ significantly from that which would have been calculated using closing market prices. The use of these quantitative models is also intended to decrease the opportunities for persons to engage in “time zone arbitrage,” i.e., trading intended to take advantage of stale closing prices in foreign markets that could affect the NAV of the Portfolios. Securities subjected to an adjustment factor due to the use of these quantitative models are not specifically designated on the Portfolios’ Portfolio of Investments as being “fair valued”. Securities with an adjustment factor greater than or less than 1, which are absent the use of significant unobservable inputs into their valuation, are categorized as “Level 2” and securities with an adjustment factor equal to 1, which are absent the use of significant unobservable inputs into their valuation, are categorized as “Level 1” pursuant to the hierarchy described below.
Any securities for which market quotations are not readily available or for which available prices are deemed unreliable are priced by the Investment Adviser at “fair value as determined in good faith”, in accordance with the Procedures. Such securities are identified on the Portfolios’ Portfolio of Investments as securities valued at “fair value as determined in good faith” and absent the use of significant unobservable inputs into their valuation, such securities would be categorized as “Level 2” pursuant to the hierarchy described below.
GAAP has established a hierarchy for NAV determination purposes in which various inputs are used in determining the value of each Portfolio’s assets or liabilities. GAAP defines fair value as the price that the Portfolio would receive upon selling an investment in a timely transaction to an independent buyer in the principal or most advantageous market of the investment. GAAP establishes a three-tier hierarchy to maximize the use of observable market data and minimize the use of unobservable inputs and to establish classification of fair value measurements for disclosure purposes. Inputs may be observable or unobservable and refer broadly to the assumptions that market participants would use in pricing the asset or liability including assumptions about risk. Such risks include the inherent risk in a particular valuation technique which is used to measure fair value. This may include the quantitative models and/or the inputs to the quantitative models used in the valuation technique described above. Observable inputs are inputs that reflect the assumptions market participants would use in pricing the asset or liability developed based on market data obtained from sources independent of the reporting entity. Unobservable inputs are inputs that reflect the reporting entity’s own assumptions about the assumptions market participants would use in pricing the asset or liability developed based on the best information available in the circumstances. The three-tier hierarchy of inputs is summarized in the three broad levels listed below.
| | |
| Level 1 | | unadjusted quoted prices in active markets for identical assets |
| Level 2 | | other significant observable inputs (including quoted prices for similar investments, interest rates, prepayment speeds, credit risk, etc.) |
| Level 3 | | significant unobservable inputs (including the Portfolio’s own assumptions in determining the fair value of investments) |
GAAP provides additional guidance for estimating fair value when the volume and level of activity for the asset or liability have significantly decreased as well as guidance on identifying circumstances that indicate when a transaction is not orderly.
53
Harding, Loevner Funds, Inc.
Notes to Financial Statements (continued)
October 31, 2018
2. Summary of Significant Accounting Policies (continued)
The following is a summary of the Portfolios’ investments classified by Level 1, Level 2 and Level 3 and security type as of October 31, 2018. Please refer to each Portfolio’s Portfolio of Investments to view individual securities classified by industry type and country.
| | | | | | | | | | | | | | | | | | | | |
| Portfolio | | Unadjusted Quoted Prices
in Active Markets for
Identical Assets (Level 1) | | Other Significant
Observable Inputs
(Level 2) | | Significant
Unobservable Inputs
(Level 3) | | Total |
Global Equity | | | | | | | | | | | | | | | | | | | | |
Common Stocks | | | $ | 445,685,145 | | | | $ | 347,959,846 | | | | $ | — | | | | $ | 793,644,991 | |
Preferred Stocks | | | | 21,174,316 | | | | | — | | | | | — | | | | | 21,174,316 | |
Short Term Investments | | | | 43,032,073 | | | | | — | | | | | — | | | | | 43,032,073 | |
| | | | | | | | | | | | | | | | | | | | |
Total Investments | | | $ | 509,891,534 | | | | $ | 347,959,846 | | | | $ | — | | | | $ | 857,851,380 | |
| | | | | | | | | | | | | | | | | | | | |
International Equity | | | | | | | | | | | | | | | | | | | | |
Common Stocks | | | $ | 3,498,721,500 | | | | $ | 9,172,984,679 | | | | $ | — | | | | $ | 12,671,706,179 | |
Preferred Stocks | | | | 307,445,996 | | | | | 316,394,584 | | | | | — | | | | | 623,840,580 | |
Short Term Investments | | | | 476,162,778 | | | | | — | | | | | — | | | | | 476,162,778 | |
| | | | | | | | | | | | | | | | | | | | |
Total Investments | | | $ | 4,282,330,274 | | | | $ | 9,489,379,263 | | | | $ | — | | | | $ | 13,771,709,537 | |
| | | | | | | | | | | | | | | | | | | | |
International Small Companies | | | | | | | | | | | | | | | | | | | | |
Common Stocks | | | $ | 16,746,263 | | | | $ | 185,900,578 | | | | $ | — | | | | $ | 202,646,841 | |
Participation Notes | | | | — | | | | | 2,376,636 | | | | | — | | | | | 2,376,636 | |
Short Term Investments | | | | 4,376,843 | | | | | — | | | | | — | | | | | 4,376,843 | |
| | | | | | | | | | | | | | | | | | | | |
Total Investments | | | $ | 21,123,106 | | | | $ | 188,277,214 | | | | $ | — | | | | $ | 209,400,320 | |
| | | | | | | | | | | | | | | | | | | | |
Institutional Emerging Markets | | | | | | | | | | | | | | | | | | | | |
Common Stocks | | | $ | 1,174,879,405 | | | | $ | 2,796,597,368 | | | | $ | — | | | | $ | 3,971,476,773 | |
Preferred Stocks | | | | 237,422,125 | | | | | 40,661,070 | | | | | — | | | | | 278,083,195 | |
Short Term Investments | | | | 111,716,541 | | | | | — | | | | | — | | | | | 111,716,541 | |
| | | | | | | | | | | | | | | | | | | | |
Total Investments | | | $ | 1,524,018,071 | | | | $ | 2,837,258,438 | | | | $ | — | | | | $ | 4,361,276,509 | |
| | | | | | | | | | | | | | | | | | | | |
Emerging Markets | | | | | | | | | | | | | | | | | | | | |
Common Stocks | | | $ | 935,702,939 | | | | $ | 2,229,111,328 | | | | $ | — | | | | $ | 3,164,814,267 | |
Preferred Stocks | | | | 189,567,819 | | | | | 32,774,761 | | | | | — | | | | | 222,342,580 | |
Short Term Investments | | | | 67,789,319 | | | | | — | | | | | — | | | | | 67,789,319 | |
| | | | | | | | | | | | | | | | | | | | |
Total Investments | | | $ | 1,193,060,077 | | | | $ | 2,261,886,089 | | | | $ | — | | | | $ | 3,454,946,166 | |
| | | | | | | | | | | | | | | | | | | | |
Frontier Emerging Markets | | | | | | | | | | | | | | | | | | | | |
Common Stocks | | | $ | 98,917,561 | | | | $ | 271,017,193 | | | | $ | — | | | | $ | 369,934,754 | |
Preferred Stocks | | | | 8,897,258 | | | | | — | | | | | — | | | | | 8,897,258 | |
Participation Notes | | | | — | | | | | 31,532,888 | | | | | — | | | | | 31,532,888 | |
Short Term Investments | | | | 2,623,615 | | | | | — | | | | | — | | | | | 2,623,615 | |
| | | | | | | | | | | | | | | | | | | | |
Total Investments | | | $ | 110,438,434 | | | | $ | 302,550,081 | | | | $ | — | | | | $ | 412,988,515 | |
| | | | | | | | | | | | | | | | | | | | |
Global Equity Research | | | | | | | | | | | | | | | | | | | | |
Common Stocks | | | $ | 3,286,607 | | | | $ | 2,596,316 | | | | $ | — | | | | $ | 5,882,923 | |
Preferred Stocks | | | | 35,223 | | | | | 7,039 | | | | | — | | | | | 42,262 | |
Short Term Investments | | | | 144,671 | | | | | — | | | | | — | | | | | 144,671 | |
| | | | | | | | | | | | | | | | | | | | |
Total Investments | | | $ | 3,466,501 | | | | $ | 2,603,355 | | | | $ | — | | | | $ | 6,069,856 | |
| | | | | | | | | | | | | | | | | | | | |
International Equity Research | | | | | | | | | | | | | | | | | | | | |
Common Stocks | | | $ | 2,140,906 | | | | $ | 7,937,755 | | | | $ | — | | | | $ | 10,078,661 | |
Preferred Stocks | | | | 138,114 | | | | | 34,414 | | | | | — | | | | | 172,528 | |
Short Term Investments | | | | 114,363 | | | | | — | | | | | — | | | | | 114,363 | |
| | | | | | | | | | | | | | | | | | | | |
Total Investments | | | $ | 2,393,383 | | | | $ | 7,972,169 | | | | $ | — | | | | $ | 10,365,552 | |
| | | | | | | | | | | | | | | | | | | | |
Emerging Markets Research | | | | | | | | | | | | | | | | | | | | |
Common Stocks | | | $ | 1,790,199 | | | | $ | 3,937,010 | | | | $ | — | | | | $ | 5,727,209 | |
Preferred Stocks | | | | 203,979 | | | | | 111,064 | | | | | — | | | | | 315,043 | |
Participation Notes | | | | — | | | | | 142,702 | | | | | — | | | | | 142,702 | |
Short Term Investments | | | | 11,005 | | | | | — | | | | | — | | | | | 11,005 | |
| | | | | | | | | | | | | | | | | | | | |
Total Investments | | | $ | 2,005,183 | | | | $ | 4,190,776 | | | | $ | — | | | | $ | 6,195,959 | |
| | | | | | | | | | | | | | | | | | | | |
As of October 31, 2018, there were no Level 3 investments held within the Portfolios.
54
Harding, Loevner Funds, Inc.
Notes to Financial Statements (continued)
October 31, 2018
2. Summary of Significant Accounting Policies (continued)
Securities
For financial reporting purposes, all securities transactions are recorded on a trade date basis, as of the last business day in the reporting period. Throughout the reporting period, securities transactions are typically accounted for on a trade date – plus one business day basis. Interest income and expenses are recorded on an accrual basis. Dividend income is recorded on the ex-dividend date (except for certain foreign dividends that may be recorded as soon as the Portfolio is informed of such dividends). The Portfolios use the specific identification method for determining realized gains or losses from sales of securities.
Dividends to Shareholders
It is the policy of the Portfolios to declare dividends from net investment income annually. Net short-term and long-term capital gains distributions for the Portfolios, if any, are also normally distributed on an annual basis.
Dividends from net investment income and distributions from net realized gains from investment transactions have been determined in accordance with income tax regulations and may differ from net investment income and realized gains recorded by the Portfolios for financial reporting purposes. Differences result primarily from foreign currency transactions and timing differences related to recognition of income, and gains and losses from investment transactions. In general, to the extent that any differences, which are permanent in nature, result in over distributions to shareholders, the amount of the over distribution is reclassified within the capital accounts based on its federal tax basis treatment and may be reported as return of capital. Temporary differences do not require reclassification.
Currency Translation
Assets and liabilities denominated in foreign currencies and commitments under forward foreign currency exchange contracts are translated into U.S. dollars at the mean of the quoted bid and asked prices of such currencies against the U.S. dollar. Purchases and sales of the Portfolios’ securities are translated at the rates of exchange prevailing when such securities were acquired or sold. Income and expenses are translated at exchange rates prevailing when accrued. The Portfolios do not isolate that portion of the results of operations resulting from changes in foreign exchange rates on investments from the fluctuations arising from changes in market prices of securities held. Such fluctuations are included with the Net realized gain (loss) on investment transactions and Change in unrealized appreciation (depreciation) on investments on the Statements of Operations.
Net realized gains and losses from foreign currency-related transactions arise from sales of foreign currency, currency gains or losses realized between the trade and settlement dates on securities transactions, and the difference between the amounts of dividends, interest, and foreign withholding taxes recorded on the Portfolios’ books, and the U.S. dollar equivalent of the amounts actually received or paid. Net unrealized appreciation or depreciation on translation of assets and liabilities denominated in foreign currencies arise from changes in the value of assets and liabilities other than investments in securities at the period end, resulting from changes in the exchange rates.
Organization and Offering Fees
Costs incurred by the Global Equity Research Portfolio and the Emerging Markets Research Portfolio in connection with their organization were expensed as they were incurred. Costs related to the offering of shares were deferred and amortized on a straight line basis over the twelve-month period from the date of commencement of operations of the Portfolios.
Expenses
Most expenses of the Fund can be directly attributed to a particular Portfolio. Expenses which cannot be directly attributed are apportioned among the Portfolios based upon relative net assets or other appropriate measures. If an expense is incurred at the Portfolio level, it is generally apportioned among the classes of that Portfolio based upon relative net assets of each respective class. Certain expenses are incurred at the class level and charged only to that particular class. These expenses may be class specific (i.e., Distribution fees charged only to a particular class) or they may be identifiable to a particular class (i.e., the costs related to mailing shareholder reports to shareholders of a particular class).
55
Harding, Loevner Funds, Inc.
Notes to Financial Statements (continued)
October 31, 2018
2. Summary of Significant Accounting Policies (continued)
Redemption Fees
The Fund has established fees on short-term redemptions to discourage frequent trading in Portfolio shares. Redemptions of Portfolio shares made within 90 days of purchase may be subject to a redemption fee equal to 2% of the amount redeemed. For the years ended October 31, 2018 and October 31, 2017, the Portfolios received the following redemption fees. These amounts are netted against “Payments for Shares Redeemed” in Note 7 - Capital Share Transactions.
| | | | | | | | | | | | | | | | | | | | | | | | | | | | | | | | | | | | | | | | |
| | | Institutional Class | | Institutional Class I | | Institutional Class II | | Class I |
| Portfolio | | Year Ended
October 31, 2018 | | Year Ended
October 31, 2017 | | Year Ended
October 31, 2018 | | Year Ended
October 31, 2017 | | Year Ended
October 31, 2018 | | Year Ended October 31, 2017 | | Year Ended October 31, 2018 | | Year Ended October 31, 2017 |
Global Equity | | | $ | 14,174 | | | | $ | 1,918 | | | | $ | — | | | | $ | — | | | | $ | — | | | | $ | — | | | | $ | — | | | | $ | — | |
International Equity | | | | 465,416 | | | | | 658,145 | | | | | — | | | | | — | | | | | — | | | | | — | | | | | — | | | | | — | |
International Small Companies | | | | 5,178 | | | | | 20,596 | | | | | — | | | | | — | | | | | — | | | | | — | | | | | — | | | | | — | |
Institutional Emerging Markets | | | | — | | | | | — | | | | | — | | | | | — | | | | | — | | | | | — | | | | | 98,733 | | | | | 102,466 | |
Emerging Markets | | | | — | | | | | — | | | | | — | | | | | — | | | | | — | | | | | — | | | | | — | | | | | — | |
Frontier Emerging Markets | | | | — | | | | | — | | | | | 15,128 | | | | | 11,410 | | | | | — | | | | | — | | | | | — | | | | | — | |
Global Equity Research | | | | — | | | | | — | | | | | — | | | | | — | | | | | — | | | | | — | | | | | — | | | | | — | |
International Equity Research | | | | — | | | | | — | | | | | — | | | | | — | | | | | — | | | | | — | | | | | — | | | | | — | |
Emerging Markets Research | | | | — | | | | | — | | | | | — | | | | | — | | | | | — | | | | | — | | | | | — | | | | | — | |
| | | | |
| | | Class II | | Investor Class | | Advisor Class | | Institutional Class Z |
| Portfolio | | Year Ended
October 31,
2018 | | Year Ended
October 31,
2017 | | Year Ended
October 31,
2018 | | Year Ended
October 31,
2017 | | Year Ended
October 31,
2018 | | Year Ended
October 31,
2017 | | Year Ended
October 31,
2018 | | Year Ended
October 31,
2017 |
Global Equity | | | $ | — | | | | $ | — | | | | $ | — | | | | $ | — | | | | $ | 14,265 | | | | $ | 4,375 | | | | $ | — | | | | $ | — | |
International Equity | | | | — | | | | | — | | | | | 58,517 | | | | | 42,489 | | | | | — | | | | | — | | | | | 119 | | | | | — | |
International Small Companies | | | | — | | | | | — | | | | | 5,609 | | | | | 4,790 | | | | | — | | | | | — | | | | | — | | | | | — | |
Institutional Emerging Markets | | | | — | | | | | — | | | | | — | | | | | — | | | | | — | | | | | — | | | | | — | | | | | — | |
Emerging Markets | | | | — | | | | | — | | | | | — | | | | | — | | | | | 98,576 | | | | | 166,320 | | | | | — | | | | | — | |
Frontier Emerging Markets | | | | — | | | | | — | | | | | 2,538 | | | | | 4,709 | | | | | — | | | | | — | | | | | — | | | | | — | |
Global Equity Research | | | | — | | | | | — | | | | | — | | | | | — | | | | | — | | | | | — | | | | | — | | | | | — | |
International Equity Research | | | | — | | | | | — | | | | | 2 | | | | | 8 | | | | | — | | | | | — | | | | | — | | | | | — | |
Emerging Markets Research | | | | — | | | | | — | | | | | — | | | | | — | | | | | — | | | | | — | | | | | — | | | | | — | |
Indemnifications
Under the Fund’s organizational document, its officers and Board are indemnified against certain liability arising out of the performance of their duties to the Portfolios. In the normal course of business, the Fund may enter into contracts that contain a variety of representations or that provide indemnification for certain liabilities. The Fund’s maximum exposure under these arrangements is unknown, as this would involve future claims that may be made against the Fund that have not yet occurred. However, the Fund has not had prior claims or losses pursuant to these contracts and expects the risk of loss to be remote.
3. Transactions with Affiliates and Significant Agreements
The Board has approved investment advisory agreements with the Investment Adviser. Advisory fees are computed daily and paid monthly based on the average daily net assets of each Portfolio. The Investment Adviser has contractually agreed to reduce its fee and/or reimburse the Portfolios for other operating expenses to the extent that aggregate expenses, excluding certain non-operating expenses, exceed certain annual rates of the average daily net assets of each class.
56
Harding, Loevner Funds, Inc.
Notes to Financial Statements (continued)
October 31, 2018
3. Transactions with Affiliates and Significant Agreements (continued)
The following annualized advisory fees and contractual expense limits were in effect for the year ended October 31, 2018. The advisory fees are charged at the Portfolio level as a whole and expense limitations are at the class specific level.
| | | | | | | | | | | | | | | | | | | | | | | | | | | | | | | | | | | |
| Portfolio | | First $1 billion
of assets | | Next $1 billion of assets | | Next $1 billion of assets | | Over $3 billion of assets | | Over $4 billion of assets | | Over $5 billion of assets | | Contractual Expense
Limit* |
Global Equity – Institutional Class | | | | 0.80% | | | | | 0.78% | | | | | 0.76% | | | | | 0.74% | | | | | 0.74% | | | | | 0.74% | | | | | 0.95% | |
Global Equity – Institutional Class Z | | | | 0.80% | | | | | 0.78% | | | | | 0.76% | | | | | 0.74% | | | | | 0.74% | | | | | 0.74% | | | | | 0.90% | |
Global Equity – Advisor Class | | | | 0.80% | | | | | 0.78% | | | | | 0.76% | | | | | 0.74% | | | | | 0.74% | | | | | 0.74% | | | | | 1.25% | |
International Equity – Institutional Class | | | | 0.75% | | | | | 0.73% | | | | | 0.71% | | | | | 0.69% | | | | | 0.67% | | | | | 0.65% | | | | | 1.00% | |
International Equity – Institutional Class Z | | | | 0.75% | | | | | 0.73% | | | | | 0.71% | | | | | 0.69% | | | | | 0.67% | | | | | 0.65% | | | | | 0.80% | |
International Equity – Investor Class | | | | 0.75% | | | | | 0.73% | | | | | 0.71% | | | | | 0.69% | | | | | 0.67% | | | | | 0.65% | | | | | 1.25% | |
International Small Companies – Institutional Class | | | | 1.15% | | | | | 1.15% | | | | | 1.15% | | | | | 1.15% | | | | | 1.15% | | | | | 1.15% | | | | | 1.15% | |
International Small Companies – Investor Class | | | | 1.15% | | | | | 1.15% | | | | | 1.15% | | | | | 1.15% | | | | | 1.15% | | | | | 1.15% | | | | | 1.40% | |
Institutional Emerging Markets – Class I | | | | 1.15% | | | | | 1.13% | | | | | 1.11% | | | | | 1.09% | | | | | 1.09% | | | | | 1.09% | | | | | 1.30% | |
Institutional Emerging Markets – Class II | | | | 1.15% | | | | | 1.13% | | | | | 1.11% | | | | | 1.09% | | | | | 1.09% | | | | | 1.09% | | | | | 1.15% | ** |
Emerging Markets – Advisor Class | | | | 1.15% | | | | | 1.13% | | | | | 1.11% | | | | | 1.09% | | | | | 1.09% | | | | | 1.09% | | | | | 1.75% | |
Frontier Emerging Markets – Institutional Class I | | | | 1.35% | | | | | 1.35% | | | | | 1.35% | | | | | 1.35% | | | | | 1.35% | | | | | 1.35% | | | | | 1.75% | |
Frontier Emerging Markets – Institutional Class II | | | | 1.35% | | | | | 1.35% | | | | | 1.35% | | | | | 1.35% | | | | | 1.35% | | | | | 1.35% | | | | | 1.35% | |
Frontier Emerging Markets – Investor Class | | | | 1.35% | | | | | 1.35% | | | | | 1.35% | | | | | 1.35% | | | | | 1.35% | | | | | 1.35% | | | | | 2.00% | |
Global Equity Research – Institutional Class | | | | 0.80% | | | | | 0.80% | | | | | 0.80% | | | | | 0.80% | | | | | 0.80% | | | | | 0.80% | | | | | 0.90% | |
Global Equity Research – Investor Class | | | | 0.80% | | | | | 0.80% | | | | | 0.80% | | | | | 0.80% | | | | | 0.80% | | | | | 0.80% | | | | | 1.15% | |
International Equity Research – Institutional Class | | | | 0.75% | | | | | 0.75% | | | | | 0.75% | | | | | 0.75% | | | | | 0.75% | | | | | 0.75% | | | | | 0.90% | |
International Equity Research – Investor Class | | | | 0.75% | | | | | 0.75% | | | | | 0.75% | | | | | 0.75% | | | | | 0.75% | | | | | 0.75% | | | | | 1.15% | |
Emerging Markets Research – Institutional Class | | | | 1.15% | | | | | 1.15% | | | | | 1.15% | | | | | 1.15% | | | | | 1.15% | | | | | 1.15% | | | | | 1.30% | |
Emerging Markets Research – Investor Class | | | | 1.15% | | | | | 1.15% | | | | | 1.15% | | | | | 1.15% | | | | | 1.15% | | | | | 1.15% | | | | | 1.55% | |
| * | Effective through February 29, 2020. |
| ** | The Investment Adviser has contractually agreed to waive a portion of its management fee and/or reimburse the Portfolio’s Class II shares for their other operating expenses to the extent that the aggregate operating expenses of Class II exceed the applicable contractual management fee, currently 1.15% on the first $1 billion of average daily net assets, 1.13% on the next $1 billion, 1.11% on the next $1 billion and 1.09% for average daily net assets over $3 billion. |
For the year ended October 31, 2018, the Investment Adviser waived and/or reimbursed the following amounts pursuant to the contractual expense limits described above:
| | | | | |
| Portfolio | | Fees waived and/or reimbursed by the Investment Adviser |
Global Equity – Institutional Class Z | | | $ | 14,982 | |
International Small Companies – Institutional Class | | | | 423,446 | |
International Small Companies – Investor Class | | | | 226,242 | |
Institutional Emerging Markets – Class I | | | | 8,754 | |
Institutional Emerging Markets – Class II | | | | 426,498 | |
Frontier Emerging Markets – Institutional Class II | | | | 373,427 | |
Frontier Emerging Markets – Investor Class | | | | 18,795 | |
Global Equity Research – Institutional Class | | | | 98,464 | |
Global Equity Research – Investor Class | | | | 46,541 | |
International Equity Research – Institutional Class | | | | 88,838 | |
International Equity Research – Investor Class | | | | 46,768 | |
Emerging Markets Research – Institutional Class | | | | 101,915 | |
Emerging Markets Research – Investor Class | | | | 46,634 | |
The Fund has an administration agreement with The Northern Trust Company (“Northern Trust”), which provides certain accounting, clerical and bookkeeping services, Blue Sky, corporate secretarial services and assistance in the preparation and filing of tax returns and reports to shareholders and the SEC.
57
Harding, Loevner Funds, Inc.
Notes to Financial Statements (continued)
October 31, 2018
3. Transactions with Affiliates and Significant Agreements (continued)
Northern Trust also serves as custodian of each Portfolio’s securities and cash, transfer agent, dividend disbursing agent and agent in connection with any accumulation, open-account or similar plans provided to the shareholders of the Portfolios. Northern Trust has agreed to waive certain transfer agent fees and expenses for Institutional Class Z of the Global Equity and International Equity Portfolios for a period of six months from the commencement of each class (through January 31, 2018 and January 16, 2018, respectively). The amounts waived are captioned as “Less Waiver of transfer agent fees and expenses” on the Statements of Operations.
Effective January 1, 2018, Foreside Fund Officer Services, LLC provides compliance support to the Fund’s Chief Compliance Officer. Prior to January 1, 2018, these services were provided by Alaric Compliance Services, LLC. Fees paid pursuant to these services are shown as “Compliance officers’ fees and expenses” on the Statements of Operations.
The Fund has adopted an Amended Plan of Distribution pursuant to Rule 12b-1 under the 1940 Act (“Distribution Plan”). Under the Distribution Plan, the Investor Class of each of the International Equity, International Small Companies, Frontier Emerging Markets, Global Equity Research, International Equity Research and Emerging Markets Research Portfolios may pay underwriters, distributors, dealers or brokers a fee at an annual rate of up to 0.25% of the average daily net assets of the Portfolio’s Investor Class shares for services or expenses arising in connection with activities primarily intended to result in the sale of Investor Class shares of the Portfolios or for Shareholder Services (defined below) consistent with those described under the Shareholder Servicing Plan.
The Fund, on behalf of the Portfolios, has agreements with various financial intermediaries and “mutual fund supermarkets”, under which customers of these intermediaries may purchase and hold Portfolio shares. These intermediaries assess fees in consideration for providing certain account maintenance, record keeping and transactional and other shareholder services (collectively, “Shareholder Services”). With the exception of Institutional Class Z, each Portfolio or class is authorized, pursuant to a Shareholder Servicing Plan, to pay to each intermediary an annual rate of up to 0.25% of its average daily net assets attributable to that intermediary (subject to the contractual expense limits described above) for such Shareholder Services. Because of the contractual expense limits on certain Portfolios’ fees and expenses, the Investment Adviser paid a portion of the Portfolios’ share of these fees during the year ended October 31, 2018. Such payments, if any, are included in the table above under the caption “Fees waived and/or reimbursed by the Investment Adviser”.
A Portfolio may purchase securities from, or sell securities to, an affiliated fund provided the affiliation is due solely to having a common investment adviser, common officers, or common Trustees. For the year ended October 31, 2018, no Portfolios engaged in purchases and/or sales of securities from an affiliated portfolio in compliance with Rule 17a-7 of the 1940 Act.
4. Class Specific Expenses
The class level expenses for the year ended October 31, 2018, were as follows for each Portfolio:
| | | | | | | | | | | | | | | | | | | | | | | | | |
| Portfolio | | Distribution
Fees | | State Registration Filing Fees | | Printing and
Postage Fees | | Transfer Agent
Fees and Expenses | | Shareholder
Servicing Fees |
Global Equity – Institutional Class | | | $ | — | | | | $ | 44,575 | | | | $ | 19,602 | | | | $ | 25,110 | | | | $ | 341,052 | |
Global Equity – Institutional Class Z | | | | — | | | | | 40,530 | | | | | 2,498 | | | | | 19,917 | | | | | — | |
Global Equity – Advisor Class | | | | — | | | | | 21,199 | | | | | 5,955 | | | | | 22,487 | | | | | 211,631 | |
International Equity – Institutional Class | | | | — | | | | | 695,801 | | | | | 797,852 | | | | | 365,153 | | | | | 8,729,499 | |
International Equity – Institutional Class Z | | | | — | | | | | 73,740 | | | | | 52,036 | | | | | 33,407 | | | | | — | |
International Equity – Investor Class | | | | 1,286,933 | | | | | 47,428 | | | | | 62,607 | | | | | 71,602 | | | | | 676,119 | |
International Small Companies – Institutional Class | | | | — | | | | | 29,589 | | | | | 13,045 | | | | | 21,766 | | | | | 124,105 | |
International Small Companies – Investor Class | | | | 161,002 | | | | | 22,839 | | | | | 7,191 | | | | | 22,735 | | | | | 87,195 | |
Institutional Emerging Markets – Class I | | | | — | | | | | 101,809 | | | | | 259,480 | | | | | 63,900 | | | | | 3,416,685 | |
Institutional Emerging Markets – Class II | | | | — | | | | | 25,050 | | | | | 14,005 | | | | | 30,409 | | | | | — | |
Frontier Emerging Markets – Institutional Class I | | | | — | | | | | 28,799 | | | | | 16,441 | | | | | 28,194 | | | | | 187,458 | |
Frontier Emerging Markets – Institutional Class II | | | | — | | | | | 36,651 | | | | | 2,309 | | | | | 20,778 | | | | | — | |
Frontier Emerging Markets – Investor Class | | | | 79,326 | | | | | 21,686 | | | | | 3,919 | | | | | 23,516 | | | | | 41,182 | |
Global Equity Research – Institutional Class | | | | — | | | | | 21,640 | | | | | — | | | | | 20,313 | | | | | — | |
Global Equity Research – Investor Class | | | | 1,463 | | | | | 21,186 | | | | | — | | | | | 20,333 | | | | | — | |
International Equity Research – Institutional Class | | | | — | | | | | 19,872 | | | | | 297 | | | | | 20,453 | | | | | 1,126 | |
International Equity Research – Investor Class | | | | 2,811 | | | | | 20,574 | | | | | 213 | | | | | 20,304 | | | | | 375 | |
Emerging Markets Research – Institutional Class | | | | — | | | | | 21,660 | | | | | — | | | | | 20,291 | | | | | — | |
Emerging Markets Research – Investor Class | | | $ | 1,572 | | | | $ | 21,189 | | | | $ | — | | | | $ | 20,335 | | | | $ | — | |
58
Harding, Loevner Funds, Inc.
Notes to Financial Statements (continued)
October 31, 2018
5. Investment Transactions
Cost of purchases and proceeds from sales of investment securities, other than short-term investments and in-kind transactions, for the year ended October 31, 2018, were as follows for each Portfolio:
| | | | | | | | | | |
| Portfolio | | Purchase Cost of
Investment Securities | | Proceeds from Sales of
Investment Securities |
Global Equity | | | $ | 354,313,179 | | | | $ | 418,758,580 | |
International Equity | | | | 4,585,009,176 | | | | | 1,368,580,897 | |
International Small Companies | | | | 158,614,317 | | | | | 120,040,502 | |
Institutional Emerging Markets | | | | 1,516,247,653 | | | | | 1,166,305,083 | |
Emerging Markets | | | | 1,102,215,773 | | | | | 972,204,711 | |
Frontier Emerging Markets | | | | 96,180,038 | | | | | 102,482,643 | |
Global Equity Research | | | | 2,830,748 | | | | | 2,777,520 | |
International Equity Research | | | | 5,475,725 | | | | | 4,705,284 | |
Emerging Markets Research | | | | 4,374,379 | | | | | 3,790,575 | |
6. In-Kind Redemptions
During the year ended October 31, 2018, the International Equity Portfolio delivered portfolio securities rather than cash in exchange for the redemption of shares for certain investors (in-kind redemptions). These investors received readily marketable securities that were valued on the redemption date using the same method employed in calculating the Portfolio’s NAV per share. The International Equity Portfolio had in-kind redemptions of approximately $61,058,983. The redemption amounts are included in Net increase (decrease) in net assets from portfolio share transactions on the Statements of Changes in Net Assets. Net loss of approximately $(10,565,679) on the securities resulting from such in-kind redemptions are included in Net realized gain (loss) on investments in the Statements of Operations. For financial reporting purposes, these transactions are treated as sales of securities and the resulting gains and losses are recognized based on the market value of the securities on the date of the redemption. For tax purposes, no gains or losses are recognized.
7. Capital Share Transactions
Transactions in capital shares for the year ended October 31, 2018, were as follows for each Portfolio:
| | | | | | | | | | | | | | | | | | | | | | | | | | | | | | | | | | | | | | | | |
| | | Shares
Sold | | Proceeds From Shares Sold | | Shares From
Reinvested
Dividends | | Reinvestment
of Dividends | | Shares
Redeemed | | Payments for Shares
Redeemed | | Net Increase
(Decrease) in Shares | | Net Increase
(Decrease) in Net Assets |
Global Equity | | | | | | | | | | | | | | | | | | | | | | | | | | | | | | | | | | | | | | | | |
Institutional Class | | | | 4,222,061 | | | | $ | 163,660,655 | | | | | 1,985,000 | | | | $ | 72,809,813 | | | | | (8,196,322 | ) | | | $ | (329,513,664 | ) | | | | (1,989,261 | ) | | | $ | (93,043,196 | ) |
Institutional Class Z* | | | | 3,022,161 | | | | | 122,288,781 | | | | | 446,208 | | | | | 16,353,512 | | | | | (671,382 | ) | | | | (26,111,341 | ) | | | | 2,796,987 | | | | | 112,530,952 | |
Advisor Class | | | | 1,328,597 | | | | | 51,385,900 | | | | | 246,019 | | | | | 9,021,500 | | | | | (875,815 | ) | | | | (32,335,463 | ) | | | | 698,801 | | | | | 28,071,937 | |
International Equity | | | | | | | | | | | | | | | | | | | | | | | | | | | | | | | | | | | | | | | | |
Institutional Class | | | | 232,296,256 | | | | | 5,334,395,433 | | | | | 7,307,212 | | | | | 163,096,976 | | | | | (151,929,905 | ) | | | | (3,528,355,985 | ) | | | | 87,673,563 | | | | | 1,969,136,424 | |
Institutional Class Z* | | | | 63,032,179 | | | | | 1,500,188,135 | | | | | 155,042 | | | | | 3,458,969 | | | | | (5,832,124 | ) | | | | (133,701,431 | ) | | | | 57,355,097 | | | | | 1,369,945,673 | |
Investor Class | | | | 8,607,082 | | | | | 196,360,751 | | | | | 300,709 | | | | | 6,702,815 | | | | | (17,543,028 | ) | | | | (401,985,108 | ) | | | | (8,635,237 | ) | | | | (198,921,542 | ) |
International Small Companies | | | | | | | | | | | | | | | | | | | | | | | | | | | | | | | | | | | | |
Institutional Class | | | | 4,414,710 | | | | | 75,558,465 | | | | | 101,227 | | | | | 1,699,608 | | | | | (3,275,521 | ) | | | | (55,391,569 | ) | | | | 1,240,416 | | | | | 21,866,504 | |
Investor Class | | | | 2,098,944 | | | | | 36,291,266 | | | | | 32,401 | | | | | 540,442 | | | | | (1,350,567 | ) | | | | (22,875,046 | ) | | | | 780,778 | | | | | 13,956,662 | |
59
Harding, Loevner Funds, Inc.
Notes to Financial Statements (continued)
October 31, 2018
7. Capital Share Transactions (continued)
| | | | | | | | | | | | | | | | | | | | | | | | | | | | | | | | | | | | | | | | |
| | | Shares Sold | | Proceeds From Shares Sold | | Shares From
Reinvested
Dividends | | Reinvestment
of Dividends | | Shares
Redeemed | | Payments for Shares
Redeemed | | Net Increase
(Decrease) in Shares | | Net Increase
(Decrease) in Net Assets |
Institutional Emerging Markets | | | | | | | | | | | | | | | | | | | | | | | | | | | | | | | | | | | | |
Class I | | | | 50,336,127 | | | | $ | 1,108,172,151 | | | | | 1,419,754 | | | | $ | 31,021,590 | | | | | (35,863,143 | ) | | | $ | (784,091,967 | ) | | | | 15,892,738 | | | | $ | 355,101,774 | |
Class II* | | | | 5,107,867 | | | | | 111,057,625 | | | | | 148,910 | | | | | 3,252,204 | | | | | (4,923,508 | ) | | | | (105,789,511 | ) | | | | 333,269 | | | | | 8,520,318 | |
Emerging Markets | | | | | | | | | | | | | | | | | | | | | | | | | | | | | | | | | | | | | | | | |
Advisor Class | | | | 15,590,502 | | | | | 898,061,610 | | | | | 491,096 | | | | | 28,100,532 | | | | | (14,208,794 | ) | | | | (805,282,861 | ) | | | | 1,872,804 | | | | | 120,879,281 | |
Frontier Emerging Markets | | | | | | | | | | | | | | | | | | | | | | | | | | | | | | | | | | | | |
Institutional Class I | | | | 5,301,424 | | | | | 46,483,198 | | | | | 494,375 | | | | | 4,202,186 | | | | | (8,293,448 | ) | | | | (70,534,681 | ) | | | | (2,497,649 | ) | | | | (19,849,297 | ) |
Institutional Class II** | | | | 1,432,965 | | | | | 13,004,440 | | | | | 411,729 | | | | | 3,499,694 | | | | | — | | | | | — | | | | | 1,844,694 | | | | | 16,504,134 | |
Investor Class | | | | 1,021,089 | | | | | 8,777,456 | | | | | 52,964 | | | | | 448,605 | | | | | (1,391,249 | ) | | | | (11,530,031 | ) | | | | (317,196 | ) | | | | (2,303,970 | ) |
Global Equity Research | | | | | | | | | | | | | | | | | | | | | | | | | | | | | | | | | | | | | | | | |
Institutional Class | | | | — | | | | | — | | | | | 18,157 | | | | | 219,334 | | | | | — | | | | | (176 | ) | | | | 18,157 | | | | | 219,158 | |
Investor Class | | | | — | | | | | 176 | | | | | 1,884 | | | | | 22,701 | | | | | — | | | | | — | | | | | 1,884 | | | | | 22,877 | |
International Equity Research | | | | | | | | | | | | | | | | | | | | | | | | | | | | | | | | | | | | |
Institutional Class | | | | 50,153 | | | | | 653,962 | | | | | 42,396 | | | | | 531,220 | | | | | (12,791 | ) | | | | (166,983 | ) | | | | 79,758 | | | | | 1,018,199 | |
Investor Class | | | | 12,181 | | | | | 153,036 | | | | | 5,062 | | | | | 63,122 | | | | | (10,025 | ) | | | | (131,554 | ) | | | | 7,218 | | | | | 84,604 | |
Emerging Markets Research | | | | | | | | | | | | | | | | | | | | | | | | | | | | | | | | | | | | |
Institutional Class | | | | 39,249 | | | | | 500,000 | | | | | 35,810 | | | | | 435,446 | | | | | — | | | | | — | | | | | 75,059 | | | | | 935,446 | |
Investor Class | | | | — | | | | | — | | | | | 3,750 | | | | | 45,523 | | | | | — | | | | | — | | | | | 3,750 | | | | | 45,523 | |
| * | Share amounts have been adjusted as a result of the reverse share split effected after the close of business on December 1, 2017. (See Note 1). |
| ** | Share amounts have been adjusted as a result of the share dividend effected after the close of business on December 1, 2017. (See Note 1). |
Transactions in capital shares for the year ended October 31, 2017, were as follows for each Portfolio:
| | | | | | | | | | | | | | | | | | | | | | | | | | | | | | | | | | | | | | | | |
| | | Shares Sold | | Proceeds From Shares Sold | | Shares From
Reinvested
Dividends | | Reinvestment
of Dividends | | Shares
Redeemed | | Payments for Shares
Redeemed | | Net
Increase
(Decrease)
in Shares | | Net Increase
(Decrease) in Net Assets |
Global Equity | | | | | | | | | | | | | | | | | | | | | | | | | | | | | | | | | | | | | | | | |
Institutional Class | | | | 3,557,207 | | | | $ | 126,591,078 | | | | | 380,579 | | | | $ | 12,167,114 | | | | | (8,538,488 | ) | | | $ | (321,559,614 | ) | | | | (4,600,702 | ) | | | $ | (182,801,422 | ) |
Institutional Class Z* | | | | 1,138,429 | | | | | 45,129,498 | | | | | — | | | | | — | | | | | — | | | | | — | | | | | 1,138,429 | | | | | 45,129,498 | |
Advisor Class | | | | 591,509 | | | | | 21,937,118 | | | | | 22,083 | | | | | 706,436 | | | | | (514,528 | ) | | | | (18,583,901 | ) | | | | 99,064 | | | | | 4,059,653 | |
International Equity | | | | | | | | | | | | | | | | | | | | | | | | | | | | | | | | | | | | |
Institutional Class | | | | 212,768,400 | | | | | 4,289,975,391 | | | | | 3,099,381 | | | | | 54,673,082 | | | | | (71,189,657 | ) | | | | (1,425,428,201 | ) | | | | 144,678,124 | | | | | 2,919,220,272 | |
Institutional Class Z* | | | | 7,386,891 | | | | | 163,751,319 | | | | | — | | | | | — | | | | | (13,423 | ) | | | | (301,268 | ) | | | | 7,373,468 | | | | | 163,450,051 | |
Investor Class | | | | 16,523,590 | | | | | 330,104,697 | | | | | 142,696 | | | | | 2,514,304 | | | | | (11,801,255 | ) | | | | (242,004,627 | ) | | | | 4,865,031 | | | | | 90,614,374 | |
International Small Companies | | | | | | | | | | | | | | | | | | | | | | | | | | | | | | | | | | | | |
Institutional Class | | | | 4,711,720 | | | | | 69,203,857 | | | | | 198,337 | | | | | 2,518,889 | | | | | (836,485 | ) | | | | (12,122,159 | ) | | | | 4,073,572 | | | | | 59,600,587 | |
Investor Class | | | | 738,353 | | | | | 11,215,961 | | | | | 136,919 | | | | | 1,729,291 | | | | | (1,088,280 | ) | | | | (15,155,184 | ) | | | | (213,008 | ) | | | | (2,209,932 | ) |
Institutional Emerging Markets | | | | | | | | | | | | | | | | | | | | | | | | | | | | | | | | | | | | |
Class I | | | | 54,560,688 | | | | | 1,038,641,937 | | | | | 980,891 | | | | | 16,341,647 | | | | | (28,454,918 | ) | | | | (532,984,859 | ) | | | | 27,086,661 | | | | | 521,998,725 | |
Class II* | | | | 1,043,057 | | | | | 20,705,438 | | | | | 214,790 | | | | | 3,569,199 | | | | | (1,888,130 | ) | | | | (37,184,339 | ) | | | | (630,283 | ) | | | | (12,909,702 | ) |
Emerging Markets | | | | | | | | | | | | | | | | | | | | | | | | | | | | | | | | | | | | |
Advisor Class | | | | 19,627,835 | | | | | 977,092,988 | | | | | 367,978 | | | | | 16,069,613 | | | | | (14,929,149 | ) | | | | (747,053,858 | ) | | | | 5,066,664 | | | | | 246,108,743 | |
Frontier Emerging Markets | | | | | | | | | | | | | | | | | | | | | | | | | | | | | | | | | | | | |
Institutional Class I | | | | 10,785,448 | | | | | 81,054,731 | | | | | 416,181 | | | | | 2,975,698 | | | | | (26,327,254 | ) | | | | (197,884,990 | ) | | | | (15,125,625 | ) | | | | (113,854,561 | ) |
Institutional Class II** | | | | 19,618,659 | | | | | 147,539,455 | | | | | — | | | | | — | | | | | — | | | | | — | | | | | 19,618,659 | | | | | 147,539,455 | |
Investor Class | | | | 1,172,765 | | | | | 8,931,159 | | | | | 21,332 | | | | | 151,672 | | | | | (2,020,534 | ) | | | | (15,360,844 | ) | | | | (826,437 | ) | | | | (6,278,013 | ) |
60
Harding, Loevner Funds, Inc.
Notes to Financial Statements (continued)
October 31, 2018
7. Capital Share Transactions (continued)
| | | | | | | | | | | | | | | | | | | | | | | | | | | | | | | | | | | | | | | | |
| | | Shares
Sold | | Proceeds
From
Shares Sold | | Shares From
Reinvested
Dividends | | Reinvestment
of Dividends | | Shares
Redeemed | | Payments
for Shares
Redeemed | | Net
Increase
(Decrease)
in Shares | | Net Increase
(Decrease)
in Net Assets |
Global Equity Research | | | | | | | | | | | | | | | | | | | | | | | | | | | | | | | | | | | | | | | | |
Institutional Class | | | | 433,942 | | | | $ | 4,341,525 | | | | | — | | | | $ | — | | | | | — | | | | $ | — | | | | | 433,942 | | | | $ | 4,341,525 | |
Investor Class | | | | 44,913 | | | | | 449,875 | | | | | — | | | | | — | | | | | — | | | | | — | | | | | 44,913 | | | | | 449,875 | |
International Equity Research | | | | | | | | | | | | | | | | | | | | | | | | | | | | | | | | | | | | |
Institutional Class | | | | 206,473 | | | | | 2,385,238 | | | | | 21,912 | | | | | 227,662 | | | | | (67,783 | ) | | | | (822,513 | ) | | | | 160,602 | | | | | 1,790,387 | |
Investor Class | | | | 27,569 | | | | | 319,632 | | | | | 2,630 | | | | | 27,249 | | | | | (18,674 | ) | | | | (219,087 | ) | | | | 11,525 | | | | | 127,794 | |
Emerging Markets Research | | | | | | | | | | | | | | | | | | | | | | | | | | | | | | | | | | | | |
Institutional Class | | | | 451,850 | | | | | 4,518,305 | | | | | — | | | | | — | | | | | — | | | | | — | | | | | 451,850 | | | | | 4,518,305 | |
Investor Class | | | | 47,237 | | | | | 473,195 | | | | | — | | | | | — | | | | | — | | | | | — | | | | | 47,237 | | | | | 473,195 | |
| * | All share amounts have been adjusted as a result of the reverse share split effected after the close of business on December 1, 2017. (See Note 1). |
| ** | All share amounts have been adjusted as a result of the share dividend effected after the close of business on December 1, 2017. (See Note 1). |
8. Income Tax
The cost of investments for federal income tax purposes and the components of net unrealized appreciation (depreciation) on investments at October 31, 2018, for each of the Portfolios were as follows:
| | | | | | | | | | | | | | | | | | | | |
| Portfolio | | Gross
Unrealized
Appreciation | | Gross
Unrealized
Depreciation | | Net Unrealized
Appreciation /
(Depreciation) | | Cost |
Global Equity | | | $ | 238,712,921 | | | | $ | (28,125,631 | ) | | | $ | 210,587,290 | | | | $ | 647,264,090 | |
International Equity | | | | 2,154,579,375 | | | | | (656,459,543 | ) | | | | 1,498,119,832 | | | | | 12,273,589,705 | |
International Small Companies | | | | 35,813,102 | | | | | (23,907,995 | ) | | | | 11,905,107 | | | | | 197,495,213 | |
Institutional Emerging Markets | | | | 780,606,089 | | | | | (406,076,568 | ) | | | | 374,529,521 | | | | | 3,986,746,988 | |
Emerging Markets | | | | 812,168,797 | | | | | (293,755,949 | ) | | | | 518,412,848 | | | | | 2,936,533,318 | |
Frontier Emerging Markets | | | | 84,290,573 | | | | | (69,981,559 | ) | | | | 14,309,014 | | | | | 398,679,501 | |
Global Equity Research | | | | 849,190 | | | | | (333,671 | ) | | | | 515,519 | | | | | 5,554,337 | |
International Equity Research | | | | 1,089,313 | | | | | (895,222 | ) | | | | 194,091 | | | | | 10,171,461 | |
Emerging Markets Research | | | | 591,231 | | | | | (780,253 | ) | | | | (189,022 | ) | | | | 6,384,981 | |
It is the policy of each Portfolio of the Fund to qualify as a regulated investment company by complying with the applicable provisions of the Internal Revenue Code, and to make distributions of taxable income sufficient to relieve it from substantially all federal income and excise taxes; therefore, no federal income tax provision is required.
The Portfolios may be subject to taxes imposed by countries in which they invest. Such taxes are generally based on income and/or capital gains earned. Taxes are accrued based on net investment income, net realized gains and net unrealized appreciation as such income and/or gains are recorded. Taxes accrued on unrealized gains are reflected as a liability on the Statements of Assets and Liabilities under the caption “Deferred capital gains tax” and as a reduction in “Distributable earnings”. When assets subject to capital gains tax are sold, accrued taxes are relieved, and the actual amount of the taxes paid is reflected on the Statements of Operations as a reduction in “Net realized gain (loss) on Investment Transactions”. The Portfolios seek to recover a portion of foreign withholding taxes applied to income earned in jurisdictions where favorable treaty rates for US investors are available. The portion of such taxes believed to be recoverable is reflected as an asset on the Statements of Assets and Liabilities under the caption “Tax reclaim receivable”.
Management has performed an analysis of each Portfolio’s tax positions for the open tax years as of October 31, 2018, and has concluded that no provisions for income tax are required. The Portfolios’ federal tax returns for the prior three fiscal years (open tax years: October 31, 2015; October 31, 2016; October 31, 2017) remain subject to examination by the Portfolios’ major tax jurisdictions, which include the United States, the State of New Jersey and the State of Maryland. Management is not aware of any events that are reasonably possible to occur in the next twelve
61
Harding, Loevner Funds, Inc.
Notes to Financial Statements (continued)
October 31, 2018
8. Income Tax (continued)
months that would result in the amounts of any unrecognized tax benefits significantly increasing or decreasing for the Portfolios. However, management’s conclusions regarding tax positions taken may be subject to review and adjustment at a later date based on factors including, but not limited to, new tax laws and accounting regulations and interpretations thereof.
The tax character of distributions paid during the fiscal years ended October 31, 2018 and 2017 were as follows:
| | | | | | | | | | | | | | | | | | | | |
| | | Distributions From |
| Portfolio | | Ordinary
Income
2018 | | Long-Term
Capital Gains
2018 | | Ordinary
Income
2017 | | Long-Term
Capital Gains
2017 |
Global Equity | | | | 12,438,660 | | | | $ | 89,283,118 | | | | $ | 3,264,568 | | | | $ | 10,109,118 | |
International Equity | | | | 109,614,020 | | | | | 89,572,490 | | | | | 64,825,786 | | | | | — | |
International Small Companies | | | | 1,712,845 | | | | | 890,383 | | | | | 1,214,051 | | | | | 3,298,574 | |
Institutional Emerging Markets | | | | 38,761,437 | | | | | — | | | | | 22,513,197 | | | | | — | |
Emerging Markets | | | | 28,497,360 | | | | | 1,842,865 | | | | | 17,343,528 | | | | | — | |
Frontier Emerging Markets | | | | 9,138,364 | | | | | — | | | | | 3,677,574 | | | | | — | |
Global Equity Research | | | | 242,035 | | | | | — | | | | | — | | | | | — | |
International Equity Research | | | | 345,365 | | | | | 248,978 | | | | | 254,911 | | | | | — | |
Emerging Markets Research | | | | 480,970 | | | | | — | | | | | — | | | | | — | |
As of October 31, 2018, the components of distributable earnings/ (deficit) on a tax basis were as follows:
| | | | | | | | | | | | | | | | | | | | | | | | | |
| Portfolio | | Undistributed
Ordinary
Income | | Undistributed
Long-Term
Capital Gains | | Accumulated
Capital and
Other Losses | | Unrealized
Appreciation
(Depreciation)* | | Total
Accumulated
Earnings/(Deficit) |
Global Equity | | | $ | 5,037,890 | | | | $ | 84,041,831 | | | | $ | — | | | | $ | 210,567,398 | | | | $ | 299,647,119 | |
International Equity | | | | 186,807,511 | | | | | — | | | | | (86,041,554 | ) | | | | 1,497,493,974 | | | | | 1,598,259,931 | |
International Small Companies | | | | 1,201,702 | | | | | 10,538,794 | | | | | — | | | | | 11,789,918 | | | | | 23,530,414 | |
Institutional Emerging Markets | | | | 42,169,310 | | | | | — | | | | | (163,150,683 | ) | | | | 374,529,585 | | | | | 253,548,212 | |
Emerging Markets | | | | 29,768,286 | | | | | — | | | | | (17,667,551 | ) | | | | 518,430,891 | | | | | 530,531,626 | |
Frontier Emerging Markets | | | | 4,808,254 | | | | | — | | | | | (98,310,049 | ) | | | | 12,863,182 | | | | | (80,638,613 | ) |
Global Equity Research | | | | 229,787 | | | | | 283,521 | | | | | — | | | | | 515,108 | | | | | 1,028,416 | |
International Equity Research | | | | 301,958 | | | | | 507,992 | | | | | (6,554 | ) | | | | 194,237 | | | | | 997,633 | |
Emerging Markets Research | | | | 171,739 | | | | | 343,803 | | | | | — | | | | | (188,547 | ) | | | | 326,995 | |
* The difference between book basis and tax basis net unrealized appreciation is attributable primarily to the tax deferral of losses on certain sale of securities. Unrealized Appreciation (Depreciation) includes amounts related to foreign currency and currency translations.
The Regulated Investment Company Modernization Act of 2010 (the “Act”) changed various technical rules governing the tax treatment of regulated investment companies and became effective for the Portfolios for the fiscal year ended October 31, 2012. Under the Act, each Portfolio is permitted to carry forward capital losses incurred in taxable years beginning after the date of enactment for an unlimited period. However, any losses incurred during post-enactment years are required to be utilized prior to the losses incurred in pre-enactment taxable years, which carry
62
Harding, Loevner Funds, Inc.
Notes to Financial Statements (continued)
October 31, 2018
8. Income Tax (continued)
an expiration date. As a result of this ordering rule, pre-enactment capital loss carryforwards may be more likely to expire unused. Additionally, post-enactment capital loss carryforwards will retain their character as either short-term or long-term capital losses rather than being considered all short-term as permitted under previous regulation.
At October 31, 2018, capital losses incurred that will be carried forward indefinitely under provisions of the Act are as follows:
| | | | | | | | | | |
| Portfolio | | Short-Term
Capital Loss
Carryforward | | Long-Term
Capital Loss
Carryforward |
International Equity | | | $ | (41,247,982 | ) | | | $ | (44,793,573 | ) |
Institutional Emerging Markets | | | | (46,112,271 | ) | | | | (113,203,439 | ) |
Emerging Markets | | | | (17,667,551 | ) | | | | — | |
Frontier Emerging Markets | | | | (12,659,255 | ) | | | | (85,650,794 | ) |
At October 31, 2018, the pre-enactment capital loss carryforwards and their respective years of expiration were as follows:
| | | | | |
| Portfolio | | October 31,
2019 |
Institutional Emerging Markets | | | $ | (3,834,973 | ) |
During the fiscal year ended October 31, 2018, the Frontier Emerging Markets Portfolio utilized $4,359,303 in short-term capital loss carryforwards.
9. Foreign Exchange Contracts
The Portfolios do not generally hedge foreign currency exposure, however, the Portfolios may enter into forward foreign exchange contracts in order to hedge their exposure to changes in foreign currency exchange rates on their foreign portfolio holdings. Each Portfolio will conduct its currency transactions either on a spot (cash) basis at the rate prevailing in the currency exchange market, or by entering into forward contracts to purchase or sell currency. Foreign currency transactions entered into on the spot markets serve to pay for foreign investment purchases or to convert to dollars, the proceeds from foreign investment sales or dividend and interest receipts. The Portfolios will disclose open forward currency contracts, if any, on the Portfolios of Investments. The Portfolios do not separately disclose open spot market transactions on the Portfolios of Investments. Such realized gain (loss) and unrealized appreciation (depreciation) on spot market transactions is included in “net realized gain (loss) on foreign currency transactions” and “change in unrealized appreciation (depreciation) on translation of assets and liabilities denominated in foreign currencies”, respectively, on the Portfolios’ Statements of Operations. The Portfolios held no open forward currency contracts as of or during the fiscal year ended October 31, 2018.
10. Participation Notes
Each Portfolio may invest in participation notes. Participation notes are promissory notes that are designed to replicate the return of a particular underlying equity or debt security, currency or market. Participation notes are issued by banks or broker-dealers or their affiliates and allow a Portfolio to gain exposure to common stocks in markets where direct investment may not be allowed. Participation notes are generally traded over-the-counter. In addition to carrying the same risks associated with a direct investment in the underlying security, participation notes are subject to the risk that the broker-dealer or bank that issues them will not fulfill its contractual obligation to complete the transaction with a Portfolio. Participation notes constitute general unsecured contractual obligations of the banks or broker-dealers that issue them, and a Portfolio would be relying on the creditworthiness of such banks or broker-dealers and would have no rights under a participation note against the issuer(s) of the underlying security(ies). Participation notes may be more volatile and less liquid than other investments held by the Portfolios.
63
Harding, Loevner Funds, Inc.
Notes to Financial Statements (continued)
October 31, 2018
11. Concentration of Ownership
At October 31, 2018, the percentage of total shares outstanding held by record shareholders each owning 10% or greater of the aggregate shares outstanding of each Portfolio were as follows:
| | | | | | | | | | |
| | | No. of
Shareholders | | %
Ownership |
Global Equity | | | | 2 | | | | | 33.88 | %* |
International Equity | | | | 3 | | | | | 52.79 | %* |
International Small Companies | | | | 4 | | | | | 68.80 | %* |
Institutional Emerging Markets | | | | 2 | | | | | 52.54 | %* |
Emerging Markets | | | | 3 | | | | | 64.36 | %* |
Frontier Emerging Markets | | | | 2 | | | | | 49.48 | %* |
Global Equity Research | | | | 2 | | | | | 83.53 | % |
International Equity Research | | | | 2 | | | | | 61.12 | % |
Emerging Markets Research | | | | 2 | | | | | 74.70 | % |
| * | Includes omnibus positions of broker-dealers representing numerous shareholder accounts. |
Investment activities of these shareholders may have a material effect on the Portfolios.
12. Concentration of Risk
Investing in securities of foreign issuers and currency transactions may involve certain considerations and risks not typically associated with investments in U.S. issuers. These risks include revaluation of currencies, adverse fluctuations in foreign currency values and possible adverse political, social and economic developments, including those particular to a specific industry, country or region, which could cause the securities and their markets to be less liquid and prices more volatile than those of comparable U.S. companies and U.S. government securities. These risks are greater with respect to securities of issuers located in emerging market countries in which the Portfolios are authorized to invest.
Frontier Emerging Markets is permitted to invest up to 35% of its total assets in companies in the same industry, if, at the time of investment, that industry represents 20% or more of the Portfolio’s benchmark index. During periods when the Portfolio has invested more than 25% of its total assets in companies in the same industry, it will operate as a concentrated portfolio and be subject to additional risks and greater volatility. Such additional risks include increased competition within the industry, or changes in legislation, or government regulations affecting the industry. The value of the Portfolio’s shares may be particularly vulnerable to factors affecting the banking industry, such as the availability and cost of capital funds, changes in interest rates, the rate of corporate and consumer debt defaults, extensive government regulation, and price competition. Such risks may be magnified with respect to securities of issuers in Frontier Emerging Markets. At October 31, 2018, the Portfolio’s investment in the Banking industry amounted to 34.29% of its total assets.
13. Line of Credit
The Fund has a $150 million line of credit agreement with Northern Trust. Borrowings are made solely to facilitate the handling of redemptions or unusual or unanticipated short-term cash requirements. Because several Portfolios participate and collateral requirements apply, there is no assurance that an individual Portfolio will have access to the entire $150 million at any particular time. Interest is charged to each Portfolio based on its borrowings at an amount above the Federal Funds rate, subject to a minimum rate. In addition, a facility fee is computed at an annual rate of 0.15% on the line of credit and is allocated among the Portfolios.
For the year ended October 31, 2018, Frontier Emerging Markets had an outstanding balance for one day of $100,000 at an average weighted interest rate of 3.50%.
14. New Accounting Pronouncements
Amendments to ASC 820
In August 2018, the FASB issued Accounting Standards Update (“ASU”) 2018-13, “Disclosure Framework - Changes to the Disclosure Requirements for Fair Value Measurement,” which amends the fair value measurement disclosure requirements of ASC 820. The amendments of ASU 2018-13 are intended to improve the effectiveness of security valuation disclosures. The ASU is effective for all entities for fiscal years beginning after December 15, 2019, including interim periods therein. Early adoption is permitted and the Fund has early adopted ASU 2018-13 for the year ended October 31, 2018.
64
Harding, Loevner Funds, Inc.
Notes to Financial Statements (continued)
October 31, 2018
14. New Accounting Pronouncements (continued)
Amendments to Regulation S-X
In August 2018, the U.S. Securities and Exchange Commission (“SEC”) issued final rule 33-10532 (“33-10532”) “Disclosure Update and Simplification,” which includes amendments to certain disclosure requirements that have become redundant, duplicative, overlapping, outdated, or superseded, in light of other SEC disclosure requirements, U.S. GAAP or changes in the information environment. The rule became effective on November 5, 2018. The Fund has adopted 33-10532 for the year ended October 31, 2018.
15. Subsequent Events
Subsequent events occurring after the date of this report have been evaluated for potential impact, for purposes of recognition or disclosure in the financial statements, through the date the report was issued and it has been determined that no other adjustments or disclosures are required beyond what is already included in the financial statements and accompanying footnotes.
65
| | |
 | | |
| | KPMG LLP |
| | Aon Center |
| | Suite 5500 |
| | 200 E. Randolph Street |
| | Chicago, IL 60601-6436 |
Report of Independent Registered Public Accounting Firm
To the Shareholders and Board of Directors
Harding, Loevner Funds, Inc.:
Opinion on the Financial Statements
We have audited the accompanying statements of assets and liabilities of Global Equity Portfolio, International Equity Portfolio, International Small Companies Portfolio, Institutional Emerging Markets Portfolio, Emerging Markets Portfolio, Frontier Emerging Markets Portfolio, Global Equity Research Portfolio, International Equity Research Portfolio, and Emerging Markets Research Portfolio (each a portfolio of the Harding, Loevner Funds, Inc.) (the Portfolios), including the portfolios of investments, as of October 31, 2018, the related statements of operations for the year then ended, the statements of changes in net assets for each of the years in the two-year period then ended, except for Global Equity Research Portfolio and Emerging Markets Research Portfolio for which the period covered is the year ended October 31, 2018 and the period from December 19, 2016 (commencement of operations) through October 31, 2017, and the related notes (collectively, the financial statements) and the financial highlights for each of the years or periods presented therein for the five-year period ended October 31, 2018. In our opinion, the financial statements and financial highlights present fairly, in all material respects, the financial position of the Portfolios as of October 31, 2018, the results of their operations for the year then ended, the changes in their net assets for each of the years or periods in the two-year period then ended, and the financial highlights for each of the years or periods in the five-year period then ended, in conformity with U.S. generally accepted accounting principles.
Basis for Opinion
These financial statements and financial highlights are the responsibility of the Portfolios management. Our responsibility is to express an opinion on these financial statements and financial highlights based on our audits. We are a public accounting firm registered with the Public Company Accounting Oversight Board (United States) (
 PCAOB
PCAOB ) and are required to be independent with respect to the Portfolios in accordance with the U.S. federal securities laws and the applicable rules and regulations of the Securities and Exchange Commission and the PCAOB.
We conducted our audits in accordance with the standards of the PCAOB. Those standards require that we plan and perform the audit to obtain reasonable assurance about whether the financial statements and financial highlights are free of material misstatement, whether due to error or fraud. Our audits included performing procedures to assess the risks of material misstatement of the financial statements and financial highlights, whether due to error or fraud, and performing procedures that respond to those risks. Such procedures included examining, on a test basis, evidence regarding the amounts and disclosures in the financial statements and financial highlights. Such procedures also included confirmation of securities owned as of October 31, 2018, by correspondence with the custodian and brokers or by other appropriate auditing procedures when broker confirmations were not received. Our audits also included evaluating the accounting principles used and significant estimates made by management, as well as evaluating the overall presentation of the financial statements and financial highlights. We believe that our audits provide a reasonable basis for our opinion.

We have served as the Harding, Loevner Funds, Inc. Portfolios auditor since 2006.
Chicago, Illinois
December 14, 2018
KPMG LLP is a Delaware limited liability partnership and the U.S. member
firm of the KPMG network of independent member firms affiliated with
KPMG International Cooperative (“KPMG International”), a Swiss entity.
Harding, Loevner Funds, Inc.
Supplemental Tax Information
(unaudited)
Global Equity, International Equity, International Small Companies, Institutional Emerging Markets, Emerging Markets, Frontier Emerging Markets, Global Equity Research, International Equity Research, and Emerging Markets Research paid qualifying foreign taxes of $738,377, $29,201,880, $716,497, $9,253,280, $7,568,432, $1,959,874, $5,637, $19,638, and $14,008 and earned $2,812,023, $213,930,117, $2,042,536, $53,849,884, $38,302,649, $7,310,652, $36,467, $136,154, and $75,494 from foreign source income during the fiscal year ended October 31, 2018, respectively. Pursuant to Section 853 of the Internal Revenue Code, Global Equity, International Equity, International Small Companies, Institutional Emerging Markets, Emerging Markets, Frontier Emerging Markets, Global Equity Research, International Equity Research, and Emerging Markets Research designated $0.0310, $0.0440, $0.0523, $0.0390, $0.1055, $0.0365, $0.0113, $0.0219, and $0.0242 per share as foreign taxes paid and $0.1180, $0.3227, $0.1490, $0.2272, $0.5339, $0.1361, $0.0731, $0.1519, and $0.1306 as income earned from foreign sources for the fiscal year ended October 31, 2018, respectively.
Global Equity, International Equity, International Small Companies, Institutional Emerging Markets, Emerging Markets, Frontier Emerging Markets, Global Equity Research, International Equity Research, and Emerging Markets Research had qualifying dividend income of $9,665,802, $282,588,960, $4,019,378, $80,925,824, $66,168,678, $7,970,694, $90,816, $193,415, and $117,205, respectively, during the fiscal year ended October 31, 2018.
For the fiscal year ended October 31, 2018, Global Equity designated 89.70% of the distributions from net investment income as qualifying for the 70% corporate dividend received deduction.
For the fiscal year ended October 31, 2018, International Equity designated 3.29% of the distributions from net investment income as qualifying for the 70% corporate dividend received deduction.
For the fiscal year ended October 31, 2018, Emerging Markets designated 0.38% of the distributions from net investment income as qualifying for the 70% corporate dividend received deduction.
For the fiscal year ended October 31, 2018, Global Equity Research designated 14.52% of the distributions from net investment income as qualifying for the 70% corporate dividend received deduction.
Pursuant to Section 852 of the Internal Revenue Code, Global Equity designated $84,041,831 as a long term capital gain dividend for the fiscal year ended October 31, 2018.
Pursuant to Section 852 of the Internal Revenue Code, International Small Companies designated $10,538,794 as a long term capital gain dividend for the fiscal year ended October 31, 2018.
Pursuant to Section 852 of the Internal Revenue Code, Global Equity Research designated $283,521 as a long term capital gain dividend for the fiscal year ended October 31, 2018.
Pursuant to Section 852 of the Internal Revenue Code, International Equity Research designated $507,992 as a long term capital gain dividend for the fiscal year ended October 31, 2018.
Pursuant to Section 852 of the Internal Revenue Code, Emerging Markets Research designated $343,803 as a long term capital gain dividend for the fiscal year ended October 31, 2018.
67
Harding, Loevner Funds, Inc.
Approval of Investment Advisory Agreement
(unaudited)
Approval of Investment Advisory Agreements
At an in-person meeting of the board of directors (the “Board”) of Harding, Loevner Funds, Inc. (the “Fund”) held on June 8, 2018 (the “June Meeting”), the Board, including a majority of those directors who are not “interested persons” of the Fund, as defined in the Investment Company Act of 1940, as amended (the “Independent Directors”), considered and approved the continuation of three investment advisory agreements (the “Advisory Agreements”): the first, between Harding Loevner LP (“Harding Loevner” or the “Adviser”) and the Fund on behalf of the Global Equity Portfolio, the International Equity Portfolio, the International Small Companies Portfolio, the Institutional Emerging Markets Portfolio, the Emerging Markets Portfolio, and the Frontier Emerging Markets Portfolio (collectively, the “Legacy Portfolios”); the second between the Adviser and the Fund on behalf of the International Equity Research Portfolio (the “IER Portfolio”); and the third between the Adviser and the Fund on behalf of the Global Equity Research Portfolio and Emerging Markets Research Portfolio (the “Research Portfolios” and together with the Legacy Portfolios and the IER Portfolio, each a “Portfolio” and together the “Portfolios”).
Overview of the Review Process
Prior to the June Meeting, the Board established a subcommittee of the Governance Committee comprised of three Independent Directors (the “Subcommittee”) to conduct a preliminary review of the materials provided to the Board by the Adviser in connection with consideration of the Advisory Agreements, to assist the Board in its deliberations, and to liaise with the Adviser. In addition, the Board requested, and the Adviser furnished, materials that the Board believed necessary to evaluate the terms of the Advisory Agreements, including information on, among other things: (i) the investment performance, expenses and advisory fees of each Portfolio relative to other mutual funds and benchmark indices, as set forth in reports prepared by Strategic Insight, a third party fund analytics provider engaged as part of the Advisory Agreement review process (the “Strategic Insight Reports”); (ii) the Adviser’s profitability and costs arising from services provided to the Fund; (iii) the qualifications of the Adviser and portfolio management personnel with respect to services provided to the Portfolios; and (iv) the Adviser’s investment research capabilities and resources.
The Subcommittee reviewed the materials and discussed the materials during a telephonic meeting with representatives of the Adviser on May 21, 2018. Following the Subcommittee’s review, the Adviser distributed revised materials in final form to the full Board. The Board also received and considered a memorandum regarding the Board’s responsibilities in connection with renewal of the Advisory Agreements prepared by the legal counsel to the Independent Directors (“Independent Counsel”). Independent Counsel assisted the Independent Directors throughout the process.
At the June Meeting, the Board considered and discussed the materials presented by the Adviser. During the presentation, the Adviser expanded on those materials and responded to specific questions from the Board. Among other things, the Adviser focused on the long-term performance records of the Portfolios and the competitiveness of the Portfolios’ advisory fees and total expense ratios. The Adviser also focused on the quality of the services provided to the Portfolios and its continued investment in personnel, technology and other investment management products that service the Fund. The Independent Directors met in executive session with Independent Counsel prior to the commencement of the June Meeting to discuss the materials provided by the Adviser and met in executive session again following the Adviser’s presentation on the Advisory Agreements and further discussed the information presented during the meeting.
In evaluating continuance of the Advisory Agreements with respect to each Portfolio, among other things, the Board considered the various factors and information discussed below. The following discussion is not intended to be all-inclusive, as the Board reviewed a variety of factors and considered a significant amount of information.
Nature, Extent and Quality of Services
The Board evaluated the information it deemed necessary to assess the nature, extent and quality of investment advisory services provided to the Portfolios by the Adviser. The Board also considered the nature, extent and quality of the extensive non-advisory services provided to the Portfolios by the Adviser, including portfolio trading; the resources devoted to, and the record of compliance with, each Portfolio’s compliance policies and procedures; the resources devoted to the supervision of third-party service providers; and the quality and quantity of administrative and shareholder servicing. The Board noted that it received information in connection with quarterly Board and committee meetings throughout the year regarding the services rendered by the Adviser concerning the management of each Portfolio’s affairs and the Adviser’s role in coordinating providers of other services to the Portfolios.
The Adviser presented and discussed with the Board the qualifications, backgrounds and responsibilities of the Adviser’s management team and information regarding the members of each Portfolio’s portfolio management team. The Board evaluated the Adviser’s ability to attract and retain qualified investment advisory and non-advisory personnel and engaged in a discussion with the Adviser regarding its recruitment, retention and professional development programs and strategies.
68
Harding, Loevner Funds, Inc.
Approval of Investment Advisory Agreement (continued)
(unaudited)
The Board also considered the adequacy of the Adviser’s financial and operational resources committed to each Portfolio, and how well the Adviser utilizes those resources to meet the Portfolio’s investment needs, to oversee non-investment services and to satisfy compliance requirements.
The Board further noted that, as of March 31, 2018, the Adviser had approximately $65.52 billion in assets under management and that the Fund was the Adviser’s largest client, with assets of approximately $25.18 billion. The Board took into account the benefits realized by the Portfolios from the Adviser’s affiliation with Affiliated Managers Group, Inc., an established global asset management company.
The Board considered annual and periodic reports of the Fund’s Chief Compliance Officer (the “CCO”) with respect to the effectiveness and adequacy of the Fund’s and the Adviser’s compliance programs, including program enhancements related to information security and financial intermediary oversight and noted the additional compliance services that will be provided, including liquidity risk management. The Board noted the CCO’s determination that the Adviser’s compliance program is reasonably designed to prevent violations of the federal securities laws.
Based on these considerations, the Board concluded that it was satisfied with the nature, extent and quality of services historically provided and to be provided to each Portfolio under its Advisory Agreement.
Performance of the Adviser
For each Portfolio, the Board considered, among other things, the historical performance for multiple time periods ended as of March 31, 2018, including the one-year, three-year, five-year and ten-year periods (or shorter for newer Portfolios) included in the Strategic Insight Reports, compared against each Portfolio’s Morningstar Category and benchmark index. The Board considered the Portfolios’ risk-adjusted performance and the high active share (i.e., low overlap with benchmark indices) inherent in the Adviser’s investment process.
With respect to the recent performance of the Portfolios, the Board noted that for the one-year period ended March 31, 2018: each share class of the Global Equity Portfolio, Institutional Emerging Markets Portfolio, Emerging Markets Portfolio, Frontier Emerging Markets Portfolio, Global Equity Research Portfolio, Emerging Markets Research Portfolio, and the Institutional Class of the International Equity Research Portfolio outperformed its respective Morningstar Category and benchmark index; each share class of the International Equity Portfolio and International Small Companies Portfolio, and the Investor Class of the International Equity Research Portfolio, underperformed compared to its respective Morningstar Category while outperforming its respective benchmark index.
In assessing longer term performance by the Portfolios, for the five-year period ended March 31, 2018, the Board noted that each share class of all Portfolios, except the Investor Class of the Frontier Emerging Markets Portfolio and each share class of the International Small Companies Portfolio, with at least five years of operations, outperformed its respective Morningstar Category and benchmark index. The Investor Class of the Frontier Markets Portfolio and each share class of the International Small Companies Portfolio outperformed their respective benchmark index, but underperformed their respective Morningstar Category.
For the ten-year period ended March 31, 2018, the Board noted that each share class of all Portfolios with at least ten years of operations outperformed its respective Morningstar Category and benchmark index.
In addition, the Board reviewed the Adviser’s investment philosophy used to manage the Portfolios, as well as the effectiveness of the Adviser’s use of portfolio management teams for the day-to-day management of Portfolios. The Board noted the Adviser’s bottom-up, business-focused approach based on a study of individual companies and the competitive dynamics of the global industries in which those companies participate. The Board considered the Adviser’s disciplined adherence to its investment philosophy and process as well as the evolutionary enhancements to the methodology used in its implementation.
In evaluating the investment performance of the Portfolios, the Board acknowledged that the Adviser’s investment style may result in periods of underperformance, but has generally produced outperformance over longer time periods and that the Portfolios generally performed well relative to their respective benchmark index. The Board also considered the Adviser’s ongoing efforts to identify the causes of any underperformance and the effectiveness of the Adviser’s efforts to address underperformance. Finally, the Board considered that the Morningstar Category performance data provided within the Strategic Insight Reports was less useful with respect to the Frontier Emerging Markets Portfolio, as Morningstar did not have a Frontier category at March 31, 2018 and instead compared the Portfolio to the Diversified Emerging Markets category.
Based on these considerations, the Board concluded that each Portfolio’s performance was consistent with the Adviser’s investment discipline.
69
Harding, Loevner Funds, Inc.
Approval of Investment Advisory Agreement (continued)
(unaudited)
Costs of the Services and Profitability of the Adviser
The Board considered information regarding the Adviser’s costs to provide investment management services to the Portfolios and the profitability to the Adviser from managing the Portfolios. In evaluating the Adviser’s profitability, the Board considered the Adviser’s profitability analyses for calendar years 2016 and 2017, noting that the Adviser’s profitability was slightly higher in 2017 than the prior year. The Board also considered profitability adjusted, on a pro forma basis, for estimated provisions for federal and state corporate income taxes; each Portfolio’s expense ratio; the allocation methodology used by the Adviser to compute such profitability; and the Adviser’s contractual fee waivers and expense reimbursements with respect to the applicable Portfolios. The Board further considered profitability on a Portfolio-by-Portfolio basis, focusing on the Adviser’s profit both with and without taking into account those costs borne by the Adviser with respect to its efforts to expand the Portfolios’ shareholder base.
The Adviser also presented its profitability analyses for calendar years 2016 and 2017 on an adjusted basis to reflect the equity-related compensation received by certain senior personnel of the Adviser who are limited partners of the Adviser. In the adjusted profitability analyses, the Adviser stated that it had adjusted the Adviser’s personnel expenses to an amount that more closely resembled the compensation paid to similarly situated personnel at peer firms, noting that the salaries and bonuses paid to the Adviser’s limited partners are lower than the compensation paid at peer firms because the limited partners also receive equity-related compensation. The Board noted that this adjusted profitability information was useful in its consideration and assessment of the Adviser’s profitability.
The Board took note of the costs the Adviser has incurred that are intended to assure the continued delivery of high-quality services to its clients, including the Portfolios, and the future costs the Adviser plans to incur, including hiring additional qualified personnel and further investing in technology, including with respect to cybersecurity as well as enhancing its operational infrastructure. The Board considered the Adviser’s need to accommodate changing regulatory requirements and to adapt to structural changes in the mutual fund marketplace. The Board also noted that future profitability to the Adviser from managing the Portfolios would depend on the level of assets in the Portfolios and investment returns, as well as the Adviser’s total assets under management, and may be limited as certain Portfolios’ investment strategies encounter their capacity limitations. In assessing profitability, the Board considered each Portfolio’s profitability in the context of the services provided, the reasonableness of the fees charged for those services and the continued growth of assets through new investments.
Based upon these considerations, the Board concluded that the profits historically realized by the Adviser, and the profits the Adviser anticipates will be realized from its continued relationship with the Portfolios, are not excessive in light of the nature, extent and quality of the services provided to the Portfolios.
Comparison of Fees and Services Provided by the Adviser
The Board reviewed the contractual advisory fees that are payable by the Portfolios to the Adviser and the actual investment advisory fees realized by the Adviser taking into account the fee waiver and/or expense reimbursement arrangements for certain of the Portfolios. The Board considered the fact that the Adviser’s waiver/expense reimbursement arrangements are not subject to recapture and that the proposed fee reductions and breakpoints were contractual in nature, noting that in fiscal-year 2017 the Adviser waived a portion of its advisory fees for the following Portfolios: Global Equity Portfolio (Institutional Class Z), International Equity Portfolio (Institutional Class Z), Institutional Emerging Markets Portfolio (Class II), Frontier Emerging Markets Portfolio (Investor and Institutional Class II), International Small Companies Portfolio, International Equity Research Portfolio, Global Equity Research Portfolio and Emerging Markets Research Portfolio. In addition, the Board compared the Adviser’s separate account fee schedule with the advisory fees payable by the Portfolios to the Adviser. Finally, the Board considered the Strategic Insight Reports, which included information comparing each Portfolio’s management fee and overall expenses with those of funds in a group of peer funds selected by Strategic Insight (the “Expense Group”).
The Board noted that the net operating expenses of each Portfolio (expenses other than the fees pursuant to the Advisory Agreements and distribution and service fees) were at or below the median of their respective Expense Groups and of their respective Morningstar Category-derived universe (the “Expense Universe”), with the exception of both classes of the Global Equity Research Portfolio, International Equity Research Portfolio, and Emerging Markets Research Portfolio, which had net operating expenses above their respective Expense Group and Expense Universe medians due to the small asset size of the Portfolios although this was partially offset by the voluntary subsidy of the Portfolios by the Adviser. The Board also observed that, except as noted below, the total expense ratio of each class of each Portfolio, after any applicable waiver of advisory fees and reimbursement of expenses, was below its respective Expense Group and Expense Universe medians. Exceptions included the International Small Companies Portfolio (Institutional Class), which had a total expense ratio slightly above its Expense Universe median; Institutional Emerging Markets Portfolio (Class I), which had a total expense ratio above both its Expense Group median and its Expense Universe median; and both classes of the Emerging Markets Research Portfolio, which had total expense ratios above the median of their respective Expense Groups and Expense Universes. The Board did not consider any of these differences to be material.
70
Harding, Loevner Funds, Inc.
Approval of Investment Advisory Agreement (continued)
(unaudited)
The Board noted that the net management fee for each class of each Portfolio was at or below the median of its Expense Group, except for the Emerging Markets Portfolio (Advisor Class), both classes of the Institutional Emerging Markets Portfolio and the Frontier Emerging Markets Portfolio (Institutional Class I), which were above the median for their respective Expense Groups. The Board also noted that, for each Portfolio with an Expense Universe, the net management fee was above the median of its Expense Universe, except for the International Equity Portfolio (Investor Class), International Small Companies Portfolio (Investor Class) and both classes of the Global Equity Research Portfolio, International Equity Research Portfolio, and Emerging Markets Research Portfolio, which were below the median for their respective Expense Universes. In its consideration of each Portfolio’s net management fee, the Board considered each Portfolio’s performance record and the extensive scope of non-advisory services provided by the Adviser, which it performs without additional compensation, and that such additional services contribute directly to below-median net operating expenses because the Adviser is effectively absorbing a portion of the Portfolios’ operating expenses.
The Board recognized that the Adviser’s separate account and collective trust clients require fewer services from the Adviser than the Fund. The Board additionally recognized the Adviser’s efforts to increase institutional account minimums and direct more institutional investors into pooled vehicles, including the Portfolios. Further, the Board took note that many sophisticated institutional investors, after reviewing similar investment vehicles with the assistance of their consultants, had determined and continue to invest in the Portfolios, which further supported the reasonableness of the advisory fees charged by the Adviser. The Board also noted the Adviser’s commitment to periodically review the fees charged to the Portfolio and propose management fee reductions, if appropriate, as it has done in the past, to ensure that the fees remain competitive.
Based on these considerations, the Board concluded that each Portfolio’s fee, in light of the services provided by the Adviser, was reasonable.
Economies of Scale
The Board considered the extent to which economies of scale have been realized as the Portfolios’ assets grew, whether there is potential for realization of further economies of scale for the Portfolios, and whether material economies of scale are being shared with shareholders. The Board also considered that the Portfolios have benefitted both from asset growth in the Portfolios and even more from asset growth in the Adviser’s other accounts, each of which have resulted in certain expenses becoming a smaller percentage of overall assets.
The Board acknowledged that other aspects of the Portfolios’ investment strategies may limit the realization of economies of scale, including a particular strategy’s capacity limitations. The Board noted that, as of April 10, 2017, the Emerging Markets Portfolio and Institutional Emerging Markets Portfolio are generally closed to new investors because of capacity constraints and that the Adviser is closely monitoring the International Equity Portfolio’s capacity. The Board also acknowledged the Adviser’s considerable and continued reinvestment in its business and its business plans for the Research Portfolios and paying for the associated expenses out of its own profits, including through revenue sharing payments.
The Board considered that the Adviser assumes substantial business risk each time it sponsors a new Portfolio and that it had recently launched several new Portfolios for which it had agreed to limit expenses and waive fees that were not subject to recoupment. The Board also noted that the Adviser continues to provide the same high quality services to the International Small Companies Portfolio that has not yet achieved profitability due to its smaller level of assets.
Based on these considerations, the Board concluded that it was satisfied with the extent to which economies of scale currently are and will be realized for the benefit of the Portfolios’ shareholders, and recognized its obligation to consider the same annually based on changing circumstances.
Other Benefits
The Board considered other benefits derived or to be derived by the Adviser from the relationship with the Portfolios as part of its consideration of continuance of the Advisory Agreements. In this regard, the Board noted that the only tangible material indirect benefit from the Adviser’s relationship with the Portfolios is from the receipt of research products and services obtained through soft dollars in connection with Portfolio brokerage transactions. The Board also considered the extent to which the Adviser and its clients, including the Portfolios, benefitted from receipt of these research products and services.
The Board also considered the benefits that the Portfolios derived from their association with the Adviser. In this regard, the Board considered the competitive nature of the mutual fund marketplace and that many of the Portfolios’ shareholders invested in the Portfolios because of the Fund’s relationship with the Investment Adviser.
71
Harding, Loevner Funds, Inc.
Approval of Investment Advisory Agreement (continued)
(unaudited)
Conclusion
Following extensive discussion, both in general session and in executive sessions of the Independent Directors meeting alone with Independent Counsel, the Board determined that it had received sufficient information to take action on the proposed resolutions regarding continuance of the Advisory Agreements and that all of its questions had been addressed to its satisfaction. The Board, including a majority of the Independent Directors, concluded with respect to each Portfolio that its investment advisory fees were sufficiently supported by their review of the factors described above.
In light of all the foregoing, the Board, and separately, a majority of the Independent Directors, approved the continuance of each Advisory Agreement on behalf of the respective Portfolio(s). The Board’s approval determinations were made on the basis of each director’s business judgment after consideration of all the information presented. The Board’s decision was based on all of the above-mentioned factors and their related conclusions, with no single factor or conclusion being determinative and with each director not necessarily attributing the same weight to each factor.
72
Harding, Loevner Funds, Inc.
Privacy Notice
(unaudited)
HARDING, LOEVNER FUNDS, INC.
PRIVACY NOTICE
The Fund collects nonpublic personal information about you from the following sources:
| | • | | Information, such as your name, address, social security number, assets and income, submitted by you on applications, forms, or in other written or verbal customer communications. This information may also be provided by a consultant or intermediary acting on your behalf. |
| | • | | Information that results from any transaction performed by us for you. |
The Fund will not disclose any nonpublic personal information about you or its former customers to anyone except as permitted or required by law.
If you decide to close your account(s) or become an inactive customer, the Fund will adhere to the privacy policies and practices as described in this notice.
The Fund restricts access to your personal and account information to only those employees who need to know that information to provide products or services to you. The Fund maintains physical, administrative and technical safeguards to protect your nonpublic personal information.
73
Harding, Loevner Funds, Inc.
Directors and Principal Officers
(unaudited)
Independent Directors:
| | | | | | | | | | |
Name, Address and Age | | Position with
the Fund | | Term of Office
and Length of
Time Served* | | Principal Occupation
During Past Five Years | | Number of
Portfolios
in Fund
Complex
Overseen
By Director | | Other Directorships |
Carolyn N. Ainslie c/o Harding Loevner LP 400 Crossing Boulevard Fourth Floor Bridgewater, NJ 08807 Age, 60 | | Director | | Indefinite; Director since 2014; Member of the Audit Committee since 2015 – Present and Co – Chairperson June – December, 2017 and Chairperson since 2018; Member of the Governance Committee since March 2018 | | Princeton University, Vice President for Finance and Treasurer, 2008 – 2018; Bill & Melinda Gates Foundation, Chief Financial Officer, 2018-present. | | 9 | | None. |
| | | | | |
Jill R. Cuniff c/o Harding Loevner LP 400 Crossing Boulevard Fourth Floor Bridgewater, NJ 08807 Age, 54 | | Director | | Indefinite; since 2018; Member of the Governance Committee since March 2018 | | Edge Asset Management, President and Director, 2009 – 2016. | | 9 | | None. |
| | | | | |
R. Kelly Doherty c/o Harding Loevner LP 400 Crossing Boulevard Fourth Floor Bridgewater, NJ 08807 Age, 60 | | Director | | Indefinite; Director since 2004; Lead Independent Director since 2014; Member of the Governance Committee since March 2018 | | Caymen Partners (private investment vehicles), Managing Partner, 1998 – present. | | 9 | | Selective Insurance Group, Inc. (SIGI). |
| | | | | |
Charles W. Freeman, III c/o Harding Loevner LP 400 Crossing Boulevard Fourth Floor Bridgewater, NJ 08807 Age, 54 | | Director | | Indefinite; Director since 2008; Member of the Governance Committee since March 2018 | | U.S. Chamber of Commerce, Senior Vice President for Asia, 2018 – present; Bower Group Asia, Managing Director, China, December 2016 – 2017; Forbes-Tate, LLC, International Principal, 2014 – 2016; Rock Creek Global Advisors, LLC, Vice President, 2013 – 2014; PepsiCo, Vice President Global Public Policy and Government Relations, 2011 – 2013; National Committee on US-China Relations (non-profit), Board Member, 2007 – 2009 and 2010 – present. | | 9 | | None. |
74
Harding, Loevner Funds, Inc.
Directors and Principal Officers
(unaudited)
Independent Directors (continued):
| | | | | | | | | | |
Name, Address and Age | | Position with
the Fund | | Term of Office
and Length of
Time Served* | | Principal Occupation
During Past Five Years | | Number of
Portfolios
in Fund
Complex
Overseen
By Director | | Other Directorships |
Samuel R. Karetsky c/o Harding Loevner LP 400 Crossing Boulevard Fourth Floor Bridgewater, NJ 08807 Age, 73 | | Director | | Indefinite; Director since 1998; Member of the Audit Committee since 1998; Member of the Governance Committee since March 2018 | | The Karetsky Group LLC (advisory firm), Managing Member, 2003 – present; Wetherby Asset Management, Wealth Manager, 2004 – present. | | 9 | | None. |
| | | | | |
Eric Rakowski c/o Harding Loevner LP 400 Crossing Boulevard Fourth Floor Bridgewater, NJ 08807 Age, 60 | | Director | | Indefinite; Director since 2008; Chair of the Governance Committee since 2018; Chairman of the Governance Committee since March 2018 | | University of California at Berkeley School of Law, Professor, 1990 – present. | | 9 | | Third Avenue Trust (5 portfolios); Third Avenue Variable Trust (1 portfolio); AMG Funds (61 portfolios); AMG Pantheon Private Equity Fund (1 portfolio); AMG Pantheon Private Equity Master Fund (1 portfolio). |
75
Harding, Loevner Funds, Inc.
Directors and Principal Officers
(unaudited)
Interested Directors:
| | | | | | | | | | |
Name, Address and Age | | Position with
the Fund | | Term of Office
and Length of
Time Served* | | Principal Occupation
During Past Five Years | | Number of
Portfolios
in Fund
Complex
Overseen
By Director | | Other Directorships |
David R. Loevner** Harding Loevner LP Fish Creek Center 1230 Ida Dr. Ste. 31⁄2 PO Box 383 Wilson, WY 83014 Age, 64 | | Director and Chairman of the Board of Directors | | Indefinite; Director and Chairman of the Board since 1996 | | Harding Loevner LP, Chairman and Chief Executive Officer, 1989 – present; Harding Loevner Funds, plc, Director, 2007 – present. | | 9 | | None. |
| | | | | |
Christine C. Carsman*** Affiliated Managers Group, Inc. 600 Hale Street Prides Crossing, MA 01965 Age, 66 | | Director | | Indefinite; Director beginning 2017 | | Affiliated Managers Group, Inc., Executive Vice President, Deputy General Counsel and Chief Regulatory Counsel 2017 – present; Senior Vice President and Deputy General Counsel 2011 – 2016; Senior Vice President and Chief Regulatory Counsel 2007 – 2011; Vice President and Chief Regulatory Counsel 2004 – 2007; AMG Funds plc. Chair of the Board of Directors, 2015 – present; Director, 2010 – present. | | 9 | | AMG Funds (69 portfolios). |
* Each of Mr. Loevner and Ms. Carsman is elected to serve in accordance with the Articles of Incorporation and By-Laws of the Fund until their respective successor is duly elected and qualified.
** Mr. Loevner is considered an “interested person” of the Fund as defined in the 1940 Act, because he serves as President of Harding Loevner LP, the Fund’s investment advisor.
*** Ms. Carsman is considered an “interested person” of the Fund as defined in the 1940 Act, as a result of her position with, and interest in securities of, AMG, a control person of Harding Loevner.
The Funds’ Statement of Additional Information contains additional information about the Directors and is available upon request and without charge by calling (877) 435-8105.
76
Harding, Loevner Funds, Inc.
Directors and Principal Officers
(unaudited)
Principal Officers of the Fund:
| | | | | | |
Name, Address and Age | | Position(s) with the Fund | | Term of Office
and Length of Time Served* | | Principal Occupation During Past Five Years |
Richard T. Reiter Harding Loevner LP 400 Crossing Boulevard Fourth Floor Bridgewater, NJ 08807 Age, 52 | | President | | 1 year; since 2011 | | Harding Loevner LP, President and Chief Operating Officer, 1996 – present. |
| | | |
Charles S. Todd Foreside Management Services, LLC Three Canal Plaza, Suite 100 Portland, ME 04101 Age, 47 | | Chief Financial Officer and Treasurer | | 1 year; since 2010 | | Foreside Fund Officer & Compliance Services, Business Head, 2015 – present; Foreside, Business Head, Treasurer Services, 2012 – 2015, Director, 2008 – 2012. |
| | | |
Aaron J. Bellish Harding Loevner LP 400 Crossing Boulevard Fourth Floor Bridgewater, NJ 08807 Age, 39 | | Assistant Treasurer | | 1 year; since 2012 | | Harding Loevner LP, Chief Financial Officer, 2012 – present. |
| | | |
Derek A. Jewusiak The Northern Trust Company 50 South LaSalle Street Chicago, IL 60603 Age, 47 | | Assistant Treasurer | | 1 year; since 2013 | | The Northern Trust Company, Vice President, 2012 – present, Second Vice President, 2008 – 2012. |
| | | |
Lori M. Renzulli Harding Loevner LP 400 Crossing Boulevard Fourth Floor Bridgewater, NJ 08807 Age 52 | | Assistant Secretary | | 1 year; since 2008 | | Harding Loevner LP, Chief Counsel and Chief Compliance Officer, 2006 – present. |
| | | |
Brian D. Simon Harding Loevner LP 400 Crossing Boulevard Fourth Floor Bridgewater, NJ 08807 Age, 56 | | Chief Compliance Officer, Anti-Money Laundering Compliance Officer and Assistant Secretary | | 1 year, since 2016, 2016 and 2015 respectively | | Harding Loevner LP, General Counsel, 2014 – present; Lazard Asset Management LLC, Director of Legal Affairs and Chief Compliance Officer, 2002 – 2014. |
| | | |
Marcia Y. Lucas The Northern Trust Company 50 South LaSalle Street Chicago, IL 60603 Age, 51 | | Secretary, December 2018 – Present; Assistant Secretary, 2011 – November 2018 | | 1 year; since 2011 | | The Northern Trust Company, Senior Vice President, 2015 – present; Vice President, 2011 – 2014, Second Vice President, 2010. |
* Officers are elected to hold such office until their successor is elected and qualified to carry out the duties and responsibilities of their office, or until he or she resigns or is removed from office.
There is no family relationship among any of the Directors or officers listed above.
77
Harding, Loevner Funds, Inc.
Supplemental Information
(unaudited)
Quarterly Form N-Q Portfolio Schedule
Each Portfolio will file its complete portfolio of investments with the SEC on Form N-Q at the end of the first and third fiscal quarters within 60 days of the end of the quarter to which it relates. The Portfolios’ Form N-Q will be available on the SEC’s website at www.sec.gov. Additionally, they are available upon request by calling (877) 435-8105.
Proxy Voting Record
The Fund’s proxy voting record relating to the Portfolios’ securities during the most recent 12-month period ended June 30 is available on the Fund’s website at www.hardingloevnerfunds.com and on the SEC’s website at www.sec.gov, on Form N-PX.
Proxy Voting Policies and Procedures
The Fund’s proxy voting policies and procedures are included in Appendix B to Statement of Additional Information and is available without charge, upon request, by calling (877) 435-8105 or on the SEC’s website at www.sec.gov.
Additional Information
The Adviser updates Fact Sheets for the Portfolios each calendar quarter, which are posted to the Fund’s website at www.hardingloevnerfunds.com. This information, along with the Adviser’s commentaries on its various strategies, is available without charge, upon request, by calling (877) 435-8105.
78
This report is intended for shareholders of Harding, Loevner Funds, Inc. It may not be used as sales literature unless preceded or accompanied by the current Prospectus, which gives details about charges, expenses, investment objectives, risks and policies of the Portfolios.

Item 2. Code of Ethics.
| (a) | As of October 31, 2018, the Registrant has adopted a code of ethics that applies to the Registrant’s President/Chief Executive Officer and Treasurer/Chief Financial Officer (the “Code of Ethics”). |
| (c) | For the fiscal year ended October 31, 2018, there were no amendments to a provision of the Registrant’s Code of Ethics. |
| (d) | For the fiscal year ended October 31, 2018, there were no waivers granted from a provision of the Registrant’s Code of Ethics. |
Item 3. Audit Committee Financial Expert.
As of October 31, 2018, the Registrant’s Board of Directors has determined that the following members of the Audit Committee are audit committee financial experts and independent: Carolyn N. Ainslie and Jill R. Cuniff.
Item 4. Principal Accountant Fees and Services.
(a) Audit Fees: The aggregate fees billed for each of the last two fiscal years for professional services rendered by KPMG LLP, the Registrant’s principal accountant, for the audit of the Registrant’s annual financial statements in connection with statutory and regulatory filings or engagements for those fiscal years are $217,700 in 2018 and $213,300 in 2017.
(b) Audit-Related Fees: The aggregate fees billed in each of the last two fiscal years for assurance and related services by KPMG LLP that are reasonably related to the performance of the audit of the Registrant financial statements and are not reported under paragraph (a) of this Item are None.
(c) Tax Fees: The aggregate fees billed in each of the last two fiscal years for professional services rendered by KPMG LLP for the review of domestic tax returns were $74,115 in 2018 and $74,675 in 2017.
(d) All Other Fees: The aggregate fees billed in each of the last two fiscal years for products and services provided by KPMG LLP, other than the services reported in paragraphs (a) through (c) of this Item are $1,500 in 2018; and $18,450 in 2017, related to research, preparation and filing of tax returns in certain foreign jurisdictions.
(e)(1) Disclose the audit committee pre-approval policies and procedures described in paragraph (c)(7) of Rule 2-01 of Regulation S-X.
A copy of the Audit Committee’s Pre-Approval Policies and Procedures is filed with this Form N-CSR under Item 13(c).
(e)(2) The percentage of services described in each of paragraphs (b) through (d) of this Item that were approved by the audit committee pursuant to paragraph (c)(7)(i)(C) of Rule 2-01 of Regulation S-X are as follows:
Paragraph (b) Audit-Related Fees: Not applicable
Paragraph (c) Tax Fees: 100%
Paragraph (d): All Other Fees: 100%
(f) Not applicable.
(g) Not applicable.
(h) Not applicable.
Item 5. Audit Committee of Listed Registrants.
Not applicable.
Item 6. Investments.
| (a) | Schedule I is included as part of the report to shareholders filed under Item 1 of this report on Form N-CSR. |
Item 7. Disclosure of Proxy Voting Policies and Procedures for Closed-End Management Investment Companies.
Not applicable.
Item 8. Portfolio Managers of Closed-End Management Investment Companies.
Not applicable.
Item 9. Purchases of Equity Securities by Closed-End Management Investment Company and Affiliated Purchasers.
Not applicable.
Item 10. Submission of Matters to a Vote of Security Holders.
Not applicable.
Item 11. Controls and Procedures.
| (a) | The Registrant’s Principal Executive Officer and Principal Financial Officer, or persons performing similar functions, have concluded that the Registrant’s disclosure controls and procedures (as defined in Rule 30a-3(c) under the Investment Company Act of 1940, as amended (the “1940 Act”)) were effective as of a date within 90 days prior to the filing date of this report, based on their evaluation of the effectiveness of the Registrant’s disclosure controls and procedures as of the evaluation date. |
| (b) | There were no significant changes in the Registrant’s internal control over financial reporting (as defined in Rule 30a-3(d) under the 1940 Act) that occurred during the second fiscal quarter of the period covered by this report that have materially affected, or are reasonably likely to materially affect, the Registrant’s internal control over financial reporting. |
Item 12. Disclosure of Securities Lending Activities for Closed-End Management Investment Companies.
Not applicable.
Item 13. Exhibits.
| (a)(1) | Exhibit 99.12.A: Incorporated by reference to Exhibit 12(a)(1) to the report filed on Form N-CSR on January 7, 2013 (Accession No. 0001193125-13-005151). |
| (a)(2) | Exhibit 99.CERT: Certifications pursuant to Rule 30a-2(a) of the Act are attached. |
| (b) | Exhibit 99.906: Certifications pursuant to Rule 30a-2(b) of the Act are attached hereto. |
| (c) | Incorporated by reference to Exhibit 12(c) to the report filed on Form N-CSR on January 6, 2016 (Accession No. 0001193125-16-422394). |
SIGNATURES
Pursuant to the requirements of the Securities Exchange Act of 1934 and the Investment Company Act of 1940, the Registrant has duly caused this report to be signed on its behalf by the undersigned, thereunto duly authorized.
| | | | |
Harding, Loevner Funds, Inc. | | |
| | |
By | | /s/ Richard T. Reiter | | |
| | Richard T. Reiter (Principal Executive Officer) | | |
| |
Date: January 3, 2019 | | |
|
Pursuant to the requirements of the Securities Exchange Act of 1934 and the Investment Company Act of 1940, this report has been signed below by the following persons on behalf of the Registrant and in the capacities and on the dates indicated. |
| | |
By | | /s/ Richard T. Reiter | | |
| | Richard T. Reiter (Principal Executive Officer) | | |
| |
Date: January 3, 2019 | | |
| | |
By | | /s/ Charles S. Todd | | |
| | Charles S. Todd (Principal Financial Officer) | | |
| |
Date: January 3, 2019 | | |