UNITED STATES
SECURITIES AND EXCHANGE COMMISSION
Washington, D.C. 20549
FORM N-CSR
CERTIFIED SHAREHOLDER REPORT OF REGISTERED
MANAGEMENT INVESTMENT COMPANIES
Investment Company Act file number 811-07739
Harding, Loevner Funds, Inc.
(Exact name of registrant as specified in charter)
400 Crossing Boulevard
Fourth Floor
Bridgewater, NJ 08807
(Address of principal executive offices) (Zip code)
Marcia Y. Lucas
The Northern Trust Company
333 South Wabash Avenue
Chicago, IL 60604
With a copy to:
Stephen H. Bier, Esq.
Dechert LLP
1095 Avenue of the Americas
New York, NY 10036
(Name and address of agent for service)
Registrant’s telephone number, including area code: (877) 435-8105
Date of fiscal year end: 10/31
Date of reporting period: 10/31/2021
Item 1. Reports to Stockholders.
| (a) | The following is a copy of the report transmitted to shareholders pursuant to Rule 30e-1 under the Investment Company Act of 1940 (17 CFR 270.30e-1) |

| | | | |
| Global Equity Portfolio | | Institutional Emerging Markets Portfolio | | Global Equity Research Portfolio |
| | |
| International Equity Portfolio | | Emerging Markets Portfolio | | International Equity Research Portfolio |
| | |
| International Small Companies Portfolio | | Frontier Emerging Markets Portfolio | | Emerging Markets Research Portfolio |
| | |
| Chinese Equity Portfolio | | | | |
Harding Loevner Funds
Global equity investing is Harding Loevner’s exclusive focus. Through Harding Loevner Funds it offers distinct global strategies based on its quality-and-growth investment philosophy. It seeks to purchase shares of growing, financially strong, well-managed companies at favorable prices. Harding Loevner manages each of the Funds’ Portfolios according to a disciplined, research-based investment process. It identifies companies with sustainable competitive advantages and assesses the durability of their earnings growth by conducting in-depth fundamental research into global industries. In constructing portfolios, Harding Loevner diversifies carefully to limit risk.
Receive Investor Materials Electronically
Shareholders may sign up for electronic delivery of investor materials. By doing so, you will receive the information faster and help us reduce the impact on the environment of providing these materials. To enroll in electronic delivery,
| | 1. | Go to http://www.icsdelivery.com |
| | 2. | Select the first letter of your brokerage firm’s name. |
| | 3. | From the list that follows, select your brokerage firm. If your brokerage firm is not listed, electronic delivery may not be available. Please contact your brokerage firm. |
| | 4. | Complete the information requested, including the e-mail address where you would like to receive notifications for electronic documents. |
Your information will be kept confidential and will not be used for any purpose other than electronic delivery. If you change your mind, you can cancel electronic delivery at any time and revert to physical delivery of your materials. Just go to http://www.icsdelivery.com, perform the first three steps above, and follow the instructions for cancelling electronic delivery. If you have any questions, please contact your brokerage firm.
Table of Contents
Contact
| | | | | | |
| Harding, Loevner Funds, Inc. | | | | | | |
| c/o Northern Trust | | | | | | |
| Attn: Funds Center, Floor 38 | | | | | | |
| 333 South Wabash Avenue | | | | | | |
| Chicago, IL 60604 | | | | | | |
| | | |
| Phone: (877) 435-8105 | | | | | | |
| Fax: (312) 267-3657 | | | | | | Must be preceded or accompanied by a current Prospectus. |
| www.hardingloevnerfunds.com | | | | | | Quasar Distributors, LLC, Distributor |
Letter To Our Shareholders
October 31, 2021

David Loevner, CFA, CIC
Chairman of the Funds
and Chief Executive Officer of the Adviser
Ferrill Roll, CFA
Chief Investment Officer of the Adviser
Simon Hallett, CFA
Vice Chairman of the Adviser
The fiscal year just ended began with two market-moving events that continue to reverberate: one, the approval of the first COVID-19 vaccine, delivered a positive shock. It launched an immediate resurgence in the stocks of more cyclical, more leveraged, and slower-growing companies whose beaten-down share prices had fallen far behind those of rapidly growing, high-quality companies since the onset of the pandemic, but whose prospects now brightened. We wrote in our letter to you a year ago of our skepticism concerning the much-ballyhooed demise of value investing but could not have anticipated how quickly the tables would turn. The renewed attention to cheaper stocks of companies with murky growth prospects has been a headwind for our investment strategies for much of these last twelve months, with returns of the respective “value” indexes significantly outpacing those of the corresponding “growth” indexes. We have delivered a mixed set of results relative to the strong returns of the broad market benchmarks in the year. But, given the headwinds for our growth-oriented investment style, turning in results close to those of the benchmarks, let alone modest outperformance, is a welcome relief.
The other event was a negative shock to markets: the eleventh-hour quashing by China’s regulators of the huge initial public offering of Ant Financial, the fintech affiliate of e-commerce giant Alibaba. Though not apparent at the time, the scuppering of Ant’s IPO turned out to be the first of a succession of jump scares in the shape of unexpected Chinese governmental interventions that progressively soured sentiment toward Chinese stocks. The regulatory assault on the for-profit tutoring industry vaporized the equity value of an entire industry in the summer. Anti-trust sanctions, data security requirements, and tighter restrictions on online gaming by minors came hard and fast in the following months, hitting the shares of many of China’s previous market darlings in e-commerce, ridesharing, online games, and social media.
The property sector has played an outsized role in China’s economy for many years, as a key driver of capital spending and employment growth and as a major store of wealth, accounting for 70% to 80% of household wealth according to Moody’s. (Even in the home-ownership-obsessed US, the comparable figure is only 50%.) The government’s efforts to de-emphasize fixed asset investment as the main source of economic growth, including shrinking its bloated property sector, may yet deliver the biggest horror scene of all. A tightening of financial regulations in December 2020 finally caught up with Chinese property developers. China Evergrande, the country’s second-largest developer by sales and a poster child for excessive leverage, was left scrambling to meet its obligations by the end of September (and ultimately defaulted), with the effects rippling out to building supply chains, the financial and industrial sectors, and retail spending.
Naturally, such perturbing of the economy and consequent roiling of the Chinese stock and credit markets brought out a mix of opinions in the investor community, from cries of Communist Party treachery to post hoc social justifications for the swingeing actions taken by government actors. As those who know our investment culture would expect, our colleagues offered their own wide range of opinion and analysis. Our embrace of dissent is displayed in a panel discussion among six colleagues in August, as well as in the Third Quarter 2021 investment reports for eight of our strategies.
We have resisted any temptation to follow those critics who have advised turning away from China as an investment destination. We made our view of the long-term opportunity clear by launching the Chinese Equity Portfolio, our first single-country fund, last year; the events of this year have, if anything, reinforced our view that some investors will want the means to regulate their exposure to the opportunities and risks in the largest emerging market independently.
The irony is that amid the disquieting regulatory changes we are finding more high-quality businesses in China that meet our investment criteria now than at any point in our firm’s history. Descriptions of such companies are sprinkled throughout the commentaries collected in this report. What the turmoil has done is renewed our analysts’ investigation of the forces—including regulatory forces—shaping the competitive industry structures for the Chinese companies we research and own. We’ve spent time trying to grasp the long-term goals behind the regulatory interventions and concluded that a number of these goals—reducing wealth disparities, promoting healthier lifestyles, curbing the lopsided economic power for the very largest and most disruptive companies in China that might challenge the political power centers and social norms—would not, on their face, be out of place in the US or other developed markets. In short, we view the parsing of issues and risks for Chinese companies as problems of analysis that are common to varying degrees to all companies. Many businesses
worldwide are subject to regulatory fiat in one form or another and thus exposed to shifts in the regulatory winds; we believe that our fundamental process acquits itself well in discriminating between degrees of risk. Whether intentional or not, Chinese regulators have certainly succeeded in blowing the froth off the top of the Chinese stock market. We believe the more risk-aware environment in China should reward our sustained quest to identify companies with resilient businesses and strong growth prospects.
With widening access to vaccines and new drug treatments fostering a return to more normal economic activity in many countries, and the spread between the prices of the most- and
least-expensive quintiles of stocks diminishing in most markets, there are indications that indifference to price and risk may be losing its fizz globally as well. Assuming the style headwinds eventually settle down, this more grounded approach to assessing value should advantage our focus on the business fundamentals enabling companies’ long-term growth. Still, with the challenge of nascent inflation and the potential for central banks acting to counter it, not to mention the pandemic’s undiminished ability to deliver unpleasant surprises, we look ahead to the coming year with a cautious eye.
As always, we thank you for your trust in us.
| | | | |
| Sincerely, | | | | |
| | |
 | |  | |  |
| | |
| David R. Loevner, CFA, CIC | | Ferrill D. Roll, CFA | | Simon Hallett, CFA |
Opinions expressed are those of Harding Loevner and are not intended to be forecasts of future events, a guarantee of future results, nor investment advice. Please read the separate disclosure page for important information, including the risks of investing in the Portfolios. Past performance is not a guarantee of future results.
Global Equity Portfolio
Institutional Investors: HLMVX & HLGZX | Individual Investors: HLMGX
Portfolio Management Team
| | |
 | | Peter Baughan, CFA Co-Lead Portfolio Manager Jingyi Li Co-Lead Portfolio Manager Scott Crawshaw Portfolio Manager Christopher Mack, CFA Portfolio Manager Richard Schmidt, CFA Portfolio Manager |
Performance Summary
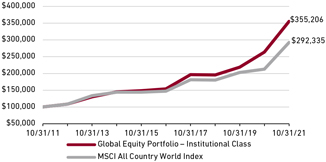
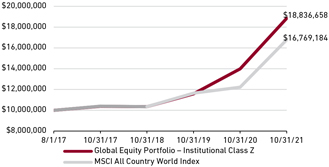
For the Global Equity Portfolio, the Institutional Class gained 34.57%, the Institutional Class Z gained 34.66%, and the Advisor Class gained 34.28% (net of fees and expenses) in the twelve-month period ended October 31, 2021. The Portfolio’s benchmark, the MSCI All Country World Index, gained 37.28% (net of source taxes).
Fund Facts at October 31, 2021
| | | | | | |
| Total Net Assets | | $1,788.2M |
| |
| Sales Charge | | None |
| |
| Number of Holdings | | 72 |
| |
| Turnover (5 Yr. Avg.) | | 48% |
| |
| Dividend Policy | | Annual |
| | Institutional Investors | | Individual Investors |
| | | Inst. Class | | Inst. Class Z | | Advisor Class |
| | | |
| Ticker | | HLMVX | | HLGZX | | HLMGX |
| | | |
| CUSIP | | 412295602 | | 412295727 | | 412295206 |
| | | |
| Inception Date | | 11/3/2009 | | 8/1/2017 | | 12/1/1996 |
| | | |
| Minimum Investment1 | | $100,000 | | $10,000,000 | | $5,000 |
| | | |
| Net Expense Ratio2 | | 0.88%3 | | 0.80%4 | | 1.07%5 |
| | | |
| Gross Expense Ratio2 | | 0.88% | | 0.83% | | 1.07% |
1Lower minimums available through certain brokerage firms. 2As of the most recent Prospectus and based on expenses for the fiscal year end. 3Harding Loevner has contractually agreed to cap the expense ratio at 0.90% through February 28, 2022. The expense ratio (without cap) is applicable to investors. 4The Net Expense Ratio is shown net of Harding Loevner’s contractual agreement through February 28, 2022. Harding Loevner’s contractual agreement caps the expense ratio at 0.80%. The Net Expense Ratio is applicable to investors. 5Harding Loevner has contractually agreed to cap the expense ratio at 1.20% through February 28, 2022. The expense ratio (without cap) is applicable to investors.
Market Review
Global stock markets increased in the twelve months ended October 31, with all sectors and regions finishing in positive territory.
The period began with a dramatic rise in global stock markets as vaccinations were approved and rolled out, unleashing demand that had been pent up throughout the pandemic. In the first three months of 2021, US retail sales climbed to the strongest level on record. The incoming Biden administration also passed a colossal US$1.9 trillion relief package, sending direct payments to millions of Americans and extending unemployment insurance. In China, electricity generation and rail cargo volume rose substantially year over year, though consumer spending remained subdued despite much of daily life having returned to normal. The European Union (EU) approved an €800 billion recovery fund aimed at infrastructure investment and support for businesses.
But while the economic recovery continued for most of the period several underlying pressures came to the fore during its final few months. Inflation expectations ballooned as tight labor markets, pandemic-mangled supply chains, and the resumption of more normal consumer and business activity led to shortages across industries. Additionally, commodity prices accelerated as economic
activity increased. In response to these inflationary pressures, central banks began to signal the impending end of unprecedented monetary support and, in some cases, acted by reducing bond buying or raising interest rates. Meanwhile, an aggressive series of interventions by Chinese regulators heightened the regulatory malaise. The crackdowns, which began in November 2020 with the tabling of the Ant Financial initial public offering (IPO), expanded with the remanding of the entire after-school tutoring sector to non-for-profit status, the adoption of anti-monopoly measures against the country’s internet giants, and new rules to limit the time spent by minors playing video games, among other provisions. Combined with the apparent impending debt default (later avoided) by the property giant Evergrande—itself the result of policy moves designed to force the heavily indebted sector to de-lever—the regulatory sweep savaged Chinese share prices, leaving them down 9% for the period.
On a sector basis, Energy was the strongest performer, surging in lockstep with rising oil prices. Financials also performed strongly, aided by a steepening yield curve and surprisingly low credit defaults. Information Technology (IT) also outperformed despite heightened scrutiny from regulators in Europe, China, and the US. Less-cyclical sectors—Consumer Staples, Health Care, and Utilities—all underperformed for the period.
Performance (% Total Return)
| | | | | | | | | | | | | | | | | | | | | | | | | | | | |
| | | For periods ended September 30, 2021 | | For periods ended October 31, 2021 |
| | | | | |
| | | 1 | | 3 | | 5 | | 10 | | Since Inception* | | 1 | | 3 | | 5 | | 10 | | Since Inception* |
| | | Year | | Years | | Years | | Years | | Nov-09 | | Aug-17 | | Dec-96 | | Year | | Years | | Years | | Years | | Nov-09 | | Aug-17 | | Dec-96 |
| | | | | | | | | | | | | | |
| Global Equity Portfolio – Inst Class | | 24.93 | | 15.83 | | 16.48 | | 13.99 | | 12.10 | | | | | | 34.57 | | 22.00 | | 18.22 | | 13.51 | | 12.51 | | | | |
| | | | | | | | | | | | | | |
| Global Equity Portfolio – Inst Class Z | | 25.02 | | 15.92 | | – | | – | | | | 14.95 | | | | 34.66 | | 22.08 | | – | | – | | | | 16.07 | | |
| | | | | | | | | | | | | | |
| Global Equity Portfolio - Advisor Class | | 24.67 | | 15.60 | | 16.23 | | 13.72 | | | | | | 8.42 | | 34.28 | | 21.76 | | 17.97 | | 13.24 | | | | | | 8.62 |
| | | | | | | | | | | | | | |
| MSCI All Country World Index | | 27.44 | | 12.58 | | 13.20 | | 11.90 | | 10.25 | | 11.87 | | – | | 37.28 | | 17.47 | | 14.72 | | 11.32 | | 10.64 | | 12.94 | | – |
Returns are annualized for periods greater than 1 year. *Inception of the Institutional Class, November 3, 2009. Inception of the Institutional Class Z, August 1, 2017. Inception of the Advisor Class, December 1, 1996. Index performance prior to January 1, 2001 cannot be shown since it relies on back-filled data.
Performance data quoted represents past performance; past performance does not guarantee future results. The investment return and principal value of an investment will fluctuate so that an investor’s shares, when redeemed, may be worth more or less than their original cost. Current performance of the Portfolio may be lower or higher than the performance quoted. Performance data current to the most recent month end may be obtained by calling (877) 435-8105 or visiting www.hardingloevnerfunds.com.
Viewed by geography, the eurozone outperformed as some of the countries hit hardest by the virus, such as Spain and Italy, began to recover. Canada performed strongly, helped by its large weighting in banks and Energy. Japan significantly underperformed as the country instituted a new, more stringent state of emergency in response to another virus wave in late summer and early fall. Emerging Markets (EMs) underperformed due to the weakness in China following its regulatory crackdowns.
Performance Attribution
The Portfolio underperformed due to both poor stock selection and negative sector and regional allocations. Weak stocks in Communication Services, Materials, and Real Estate detracted the most during the period. In Communication Services, Polish video game producer, CD Projekt, declined as the highly anticipated launch of Cyberpunk 2077 late in 2020 was marred by bugs and as a ransomware attack delayed the company’s efforts to patch the game. In Materials, German flavors and fragrance supplier Symrise lagged as the company experienced slower organic sales growth in its beverage and sweets segments and faced rising raw material prices. In Real Estate, Country Garden Services, a leading Chinese property manager, detracted as China’s regulatory crackdowns and turmoil in the sector left few companies unscathed. The Portfolio’s underweight in Energy and overweight in Health Care also weighed on relative returns.
Strong stocks in Industrials and Health Care contributed. In Industrials, shares of Protolabs, a US-based provider of 3D printing and other rapid prototyping and mold machining services, soared early in January after the company announced an acquisition of another on-demand digital manufacturing platform. In Health Care, shares of US-based life science products and services company Illumina gained as the company announced strong first-quarter results accompanied by upbeat forward guidance for 2021. The Portfolio’s underweights in Consumer Staples and Utilities were also helpful.
Geographically, weak stocks in EMs (Poland, Brazil, and China) and the eurozone (Germany) dragged on relative returns. In
Total Return Based on a $100,000 Investment
Institutional Class
Total Return Based on a $10,000,000 Investment
Institutional Class Z
Total Return Based on a $10,000 Investment
Advisor Class
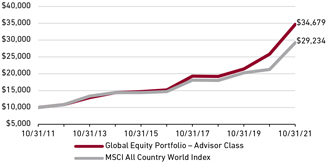
The charts above illustrate the hypothetical return of an investment made in the corresponding share classes. Investment return reflects waivers in effect. Absent such waivers, total return would be reduced. The performance provided in the table and charts above do not reflect the deduction of taxes that a shareholder would pay on Portfolio distributions or the redemption of Portfolio shares.
China, e-commerce giant Alibaba faced a slew of regulatory headwinds, starting with the blocking of its Ant Group IPO and ultimately encompassing guidelines on the utilization of user data and restricting the exclusivity arrangements it could demand from merchants on its platform. In the eurozone, German provider of remote connectivity software TeamViewer detracted as investors reacted negatively to the company’s results for the quarter ended in September. The Portfolio’s small cash weight also dragged on relative performance. Strong stocks in the US contributed, particularly SVB Financial Group and First Republic Bank. SVB, which focuses on the tech and biotech communities, benefited from rising expectations for increased deal activity, higher interest rates, and strong loan and deposit growth. The company also reported exceptional earnings growth during the period. First Republic, with its focus on high-net-worth individuals, posted strong earnings during the period, benefiting from its low levels of underperforming loans, the ongoing economic rebound, and the prospect of higher rates.
Perspective and Outlook
In our 2020 first quarter letter, at the early stage of the global pandemic, we marveled at the resiliency of the Chinese stock market, which we ascribed to the country’s success in containing the domestic spread of the coronavirus through draconian lockdowns, whose efficacy was made possible by its authoritarian political system. Eighteen months later, a similarly authoritarian intervention has left investors reeling. While government intervention is not uncommon in China, the scale and pace of this latest crop of reforms is unprecedented. Is Xi Jinping, China’s most powerful leader since Chairman Mao, revealing his allegiance to a collectivist ideology long thought to be discredited? Or is he boldly grasping the nettle of reform to redress economic imbalances and social ills before they become more entrenched and undermine the Chinese Communist Party’s (CCP’s) legitimacy?
Despite headlines conjuring memories of the CCP’s gruesome past, we accept that on balance the policy changes are intended to benefit the long-term health of Chinese society and economy, especially its middle class. The message the Party is sending to business leaders across China is clear: compete on a level playing field and pay a fair wage. For instance, much of the coverage of Ant Group’s canceled IPO focused on the ostensible desire of the CCP to clip the wings of its tech oligarchs. More persuasive in our view is that having observed and learned from the West’s subprime debacle a decade prior, Chinese financial regulators are not keen to allow loan origination to be divorced from the underlying credit risks of the loans—a source of moral hazard that would potentially destabilize a financial system still dominated by lumbering state-owned banks with weak credit cultures and poor management systems. Antitrust interventions targeting the largest e-commerce platforms echo the statements (if not yet the achievements) of many Western policymakers to improve competition by increasing the bargaining power of smaller businesses versus the giants.
Meanwhile, although the gutting of the private educational tutoring sector may seem disproportionate, it has with the stroke of a pen stigmatized one of the educational advantages of affluence while
inhibiting the exam preparation arms race that many middle-class families feel has spiraled out of control. Actions taken to strengthen the data privacy protections of social media companies, tighten local ownership of Macau casinos, and rein in speculation in the high-end liquor market would not be out of place in Europe or the US. Not to minimize the serious consequences of these abrupt and radical reforms for private businesses; as investors we are viewing these actions mainly as problems requiring further analysis rather than as indications that China has become too unpredictable to be investable.
More troubling for China’s long-term prospects (although less of an immediate danger to our portfolio) is the near-collapse of Evergrande. For years, the Chinese government has promised to wean the economy from fixed asset investments in favor of consumption, with little to show for the rhetoric. Regional governments have continued to rely on a red-hot property sector to provide their funding and achieve their mandated growth targets. Alarmed by the outsized role of property development in the economy, and the associated risks to the financial system of too much property speculation, the central government pushed through a series of policies last year to force the property sector to deleverage. Evergrande’s plight looks like the direct consequence
Portfolio Positioning (% Weight) at October 31, 2021
| | | | | | |
| Geography | | Portfolio | | | Benchmark1 |
| | |
| Canada | | | 0.0 | | | 2.9 |
| | |
| Emerging Markets | | | 15.0 | | | 11.5 |
| | |
| Europe EMU | | | 5.7 | | | 8.3 |
| | |
| Europe ex-EMU | | | 8.0 | | | 7.9 |
| | |
| Frontier Markets2 | | | 0.0 | | | – |
| | |
| Japan | | | 2.5 | | | 5.7 |
| | |
| Middle East | | | 0.0 | | | 0.2 |
| | |
| Pacific ex-Japan | | | 1.5 | | | 2.9 |
| | |
| United States | | | 65.4 | | | 60.6 |
| | |
| Cash | | | 1.9 | | | – |
| | |
| Sector | | Portfolio | | | Benchmark1 |
| | |
| Comm Services | | | 12.7 | | | 8.9 |
| | |
| Consumer Discretionary | | | 8.0 | | | 12.8 |
| | |
| Consumer Staples | | | 1.0 | | | 6.6 |
| | |
| Energy | | | 2.1 | | | 3.6 |
| | |
| Financials | | | 13.7 | | | 14.5 |
| | |
| Health Care | | | 23.1 | | | 11.5 |
| | |
| Industrials | | | 11.1 | | | 9.6 |
| | |
| Information Technology | | | 24.1 | | | 22.7 |
| | |
| Materials | | | 0.0 | | | 4.6 |
| | |
| Real Estate | | | 1.8 | | | 2.6 |
| | |
| Utilities | | | 0.5 | | | 2.6 |
| | |
| Cash | | | 1.9 | | | – |
1MSCI All Country World Index; 2Includes countries with less-developed markets outside the index.
of those blunt top-down mandates as the heavily indebted company started to find itself cut off from its usual credit lines. While the government may be happy to make an example of the company, the spillover effects to the rest of the economy will be hard to contain and likely to require yet more interventions.
Equally disturbing to us are the rolling power outages afflicting as many as 20 provinces. Dueling top-down mandates with competing objectives seem to be playing a role here. Earlier in the year, the central government renewed its commitment to “dual control,” a mandate to curb carbon emissions by limiting both energy usage and the intensity (i.e., the amount of energy used per unit of GDP). That directive was issued, however, without anticipating this year’s spike in industrial output, whose emissions far exceed those from less energy-intensive sectors. Once they met their local growth targets, regional administrators rushed to institute power shutdowns to avoid breaching stipulated emission ceilings. To be sure, there are other factors contributing to the power crisis—not least, skyrocketing coal prices whose rise was exacerbated by China’s boycott of Australian coal imports in retaliation for that country’s insistence on re-opening the inquiry into the origins of the COVID-19 virus—but the policy disconnects didn’t help.
Nobel Prize-winning economist Friedrich Hayek would have predicted that the Chinese government would ultimately fail to manage its economy by mandate, because officials can’t foresee and prevent every unintended consequence of their own actions. If China’s growth slows further, more such shortcomings are likely to surface. The Chinese authorities exhibited competence at virus management, but even when their intentions are good, leaders inevitably miscalculate. When the views of authoritarians are subjected to little debate and their mandates are implemented without checks and balances, miscalculations can have outsized consequences. It’s unclear to us when a greater trust in the spontaneous order spawned by private actors and market forces, however well-mitigated by regulation and taxation, will take hold in China. Likely not as soon as we had hoped.
Portfolio Highlights
The prospects for our Chinese holdings have recently dominated our internal debates and garnered a disproportionate share of client questions. In China we face a somewhat daunting paradox. Despite the disquieting regulatory changes, we are finding more high-quality growing businesses that meet our investment criteria in China than at any point in our firm’s history.
During the period we sold Alibaba and bought Baidu. Alibaba has withstood several rounds of regulatory change in the past, but the expanded regulatory focus now puts almost every aspect of its business in the line of fire. Smaller, faster-growing competitors such as JD.com, Meituan, and Pinduoduo have been quick to adapt to the new standards while continuing to grow their market share at Alibaba’s expense. Rivalry, in both its core e-commerce business and in new business areas such as community-based purchasing, it seems will only be getting fiercer. In contrast, Baidu undertook and is now emerging from a much-needed branching out from
Ten Largest Holdings by Weight at October 31, 2021
| | | | | | |
| Company | | Sector | | Market | | % |
| | | |
| First Republic Bank | | Financials | | US | | 3.9 |
| | | |
| Alphabet | | Comm Services | | US | | 3.6 |
| | | |
| SVB Financial Group | | Financials | | US | | 3.4 |
| | | |
| Amazon.com | | Cons Discretionary | | US | | 2.9 |
| | | |
| John Deere | | Industrials | | US | | 2.5 |
| | | |
| Microsoft | | Info Technology | | US | | 2.5 |
| | | |
| Adobe Systems | | Info Technology | | US | | 2.2 |
| | | |
| Illumina | | Health Care | | US | | 2.2 |
| | | |
| Nike | | Cons Discretionary | | US | | 2.2 |
| | | |
| Wuxi Biologics | | Health Care | | China | | 2.2 |
its original business of internet search, which has faced waves of regulatory threats and ferocious competition from other new online ad formats. Over the past several years it has invested heavily in the next long-term growth opportunities in AI, what it sees as its real core competency. Baidu’s AI initiatives—including in autonomous driving, which has led to a robo electric taxi service that has already taken to the streets in four Chinese cities—should be viewed favorably by regulators because they align with overarching central government objectives around technology leadership and reducing carbon emissions.
The growing importance of AI across industries, the increasing uptake of electric vehicles, and broad adoption of the internet of things (IoT) and fifth-generation (5G) mobile networks are all enabled by advanced semiconductors. In addition to Taiwan-based semiconductor manufacturer TSMC and South Korea’s Samsung Electronics, the Portfolio also holds positions in several companies that supply the pair of dominant foundries. These include Dutch semiconductor lithography company ASML, US-based computer-aided design software company Synopsys, and US-based specialized semiconductor equipment manufacturer Applied Materials. Furthermore, the proliferation of devices using chips, whether EVs, “things” in IoT, or embedded systems more generally, results in the generation of oceans of data that need to be processed and analyzed. NVIDIA, the US-based chip designer known for its graphic processing units, is at the forefront of harnessing the foundries’ most advanced fabrication technologies to provide the platforms needed to analyze the full potential of all that data.
During the period we sold cosmetic producer Estée Lauder, which we bought in March 2020. As the stock has since appreciated, the resulting valuation now leaves no room for error, such as a potential shift of Chinese consumers’ tastes away from US brands. We purchased US-based CoStar, the dominant player in information services for the commercial real estate industry and online classified ads for commercial property. Its online marketplace business owns valuable websites including Apartments.com and the business listing service LoopNet. Over 80% of its revenue is recurring, as its offerings are typically integrated with the workflow of its customers.
Please read the separate disclosures page for important information, including the risks of investing in the Portfolio.
International Equity Portfolio
Institutional Investors: HLMIX & HLIZX | Individual Investors: HLMNX
Portfolio Management Team
| | |
 | | Ferrill Roll, CFA Co-Lead Portfolio Manager Andrew West, CFA Co-Lead Portfolio Manager Bryan Lloyd, CFA Portfolio Manager Babatunde Ojo, CFA Portfolio Manager Patrick Todd, CFA Portfolio Manager |
Performance Summary
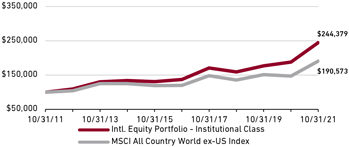
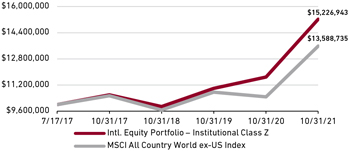
For the International Equity Portfolio, the Institutional Class gained 30.16%, the Institutional Class Z gained 30.25%, and the Investor Class gained 29.74% (net of fees and expenses) in the twelve-month period ended October 31, 2021. The Portfolio’s benchmark, the MSCI All Country World ex-US Index, gained 29.66% (net of source taxes).
Market Review
International stock markets increased in the twelve months ended October 31, with all sectors and regions finishing in positive territory.
The period began with a dramatic rise in global stock markets as vaccinations were approved and rolled out, unleashing demand that had been pent up throughout the pandemic. In the first three months of 2021, US retail sales climbed to the strongest level on record and restaurant bookings and the number of airline passengers improved. The incoming Biden administration also passed a colossal US$1.9 trillion relief package, sending direct payments to millions of Americans and extending unemployment insurance. In China, electricity generation and rail cargo volume rose substantially year over year, though consumer spending remained subdued despite much of daily life having returned to normal. The EU approved an €800 billion recovery fund aimed at infrastructure investment and support for businesses.
But while the economic recovery continued at a steady (albeit regionally uneven) pace for most of the period, several underlying pressures came to the fore in the period’s final few months. Inflation expectations, which had hit rock bottom in May 2020, ballooned
Fund Facts at October 31, 2021
| | | | | | |
| Total Net Assets | | $21,912.8 M |
| |
| Sales Charge | | None |
| |
| Number of Holdings | | 60 |
| |
| Turnover (5 yr. avg.) | | 17% |
| |
| Dividend Policy | | Annual |
| | Institutional Investors | | Individual Investors |
| | | Inst. Class | | Inst. Class Z | | Investor Class |
| | | |
| Ticker | | HLMIX | | HLIZX | | HLMNX |
| | | |
| CUSIP | | 412295107 | | 412295719 | | 412295503 |
| | | |
| Inception Date | | 5/11/1994 | | 7/17/2017 | | 9/30/2005 |
| | | |
| Minimum Investment1 | | $100,000 | | $10,000,000 | | $5,000 |
| | | |
| Expense Ratio2 | | 0.81%3 | | 0.73%4 | | 1.13%5 |
1Lower minimums available through certain brokerage firms; 2As of the most recent Prospectus and based on expenses for the fiscal year end. The Expense Ratio is shown net of Harding Loevner’s contractual agreement through February 28, 2022. 3Harding Loevner’s contractual agreement caps the Net Expense Ratio at 1.00%. 4Harding Loevner’s contractual agreement caps the net expense ratio at 0.80%. 5Harding Loevner’s contractual agreement caps the net expense ratio at 1.25%. The Expense Ratio (without cap) is applicable to investors.
as tight labor markets, pandemic-mangled supply chains, and the resumption of more normal consumer and business activity led to shortages across industries. Additionally, commodity prices—particularly those linked with industrial activity such as copper and Brent crude—accelerated as economic activity increased. In response to these inflationary pressures, central banks turned more hawkish. Many began to signal the impending end of unprecedented monetary support and, in some cases, acted by reducing bond buying or raising interest rates. Meanwhile, an aggressive series of interventions by Chinese regulators heightened the regulatory malaise. The crackdowns, which began in November 2020 with the tabling of the IPO for Alibaba subsidiary Ant Group, expanded with the remanding of the entire after-school tutoring sector to not-for-profit status, the adoption of anti-monopoly measures against the country’s internet giants, and new rules to strengthen the data security of social media platforms and limit the time spent by minors playing video games, among other provisions. Combined with the apparent impending debt default (later avoided) by the property giant Evergrande—itself the result of policy moves designed to force the heavily indebted sector to de-lever—the regulatory sweep savaged Chinese share prices, leaving them down 9% for the period.
On a sector basis, Energy was the strongest performer, surging in lockstep with rising oil prices. Financials also performed strongly, aided by a steepening yield curve and surprisingly low credit defaults. Information Technology (IT) also outperformed despite heightened scrutiny from regulators in Europe, China, and the US. Less-cyclical sectors—Consumer Staples, Health Care, and Utilities—all underperformed for the period.
Performance (% Total Return)
| | | | | | | | | | | | | | | | | | | | | | | | | | | | |
| | | For periods ended September 30, 2021 | | For periods ended October 31, 2021 |
| | | | | |
| | | 1 | | 3 | | 5 | | 10 | | Since Inception* | | 1 | | 3 | | 5 | | 10 | | | | Since Inception* |
| | | Year | | Years | | Years | | Years | | May-94 | | Jul-17 | | Sep-05 | | Year | | Years | | Years | | Years | | May-94 | | Jul-17 | | Sep-05 |
| | | | | | | | | | | | | | |
| Intl. Equity Portfolio – Inst. Class | | 20.50 | | 9.93 | | 10.78 | | 9.98 | | 6.83 | | | | | | 30.16 | | 15.42 | | 12.26 | | 9.35 | | 6.96 | | | | |
| | | | | | | | | | | | | | |
| Intl. Equity Portfolio – Inst. Class Z | | 20.58 | | 10.01 | | – | | – | | | | 9.47 | | | | 30.25 | | 15.51 | | – | | – | | | | 10.30 | | |
| | | | | | | | | | | | | | |
| Intl. Equity Portfolio – Investor Class | | 20.09 | | 9.57 | | 10.40 | | 9.62 | | | | | | 7.22 | | 29.74 | | 15.04 | | 11.89 | | 8.98 | | | | | | 7.44 |
| | | | | | | | | | | | | | |
| MSCI All Country World ex-US Index | | 23.91 | | 8.03 | | 8.94 | | 7.48 | | – | | 6.96 | | 5.25 | | 29.66 | | 12.00 | | 9.77 | | 6.66 | | – | | 7.41 | | 5.37 |
Returns are annualized for periods greater than 1 year. *Inception of the Institutional Class, May 11, 1994. Inception of the Institutional Class Z, July 17, 2017. Inception of the Investor Class, September 30, 2005. Index performance prior to January 1, 2001 cannot be shown since it relies on back-filled data.
Performance data quoted represents past performance; past performance does not guarantee future results. The investment return and principal value of an investment will fluctuate so that an investor’s shares, when redeemed, may be worth more or less than their original cost. Current performance of the Portfolio may be lower or higher than the performance quoted. Performance data current to the most recent month end may be obtained by calling (877) 435-8105 or visiting www.hardingloevnerfunds.com.
Viewed by geography, the eurozone outperformed as some of the countries hit hardest by the virus, such as Spain and Italy, began to recover. Canada also performed strongly, helped by its large weighting in banks and Energy. Japan significantly underperformed as the country instituted a new, more stringent state of emergency in response to another virus wave in late summer and early fall. Emerging Markets (EMs) also underperformed due to the weakness in China following its regulatory crackdowns.
Performance Attribution
The Portfolio outperformed due to both strong stock selection and positive sector allocation. Strong stocks in Health Care, Consumer Staples, and Industrials contributed the most during the period. In Health Care, Swiss hearing aid manufacturer Sonova Holding benefitted; business rebounded strongly from 2020’s lockdown as management raised earnings guidance for 2021. Sonova also announced the acquisition of the consumer audio division of Sennheiser, intended as a line of defense against the recent entry into the hearing aid market by Bose and potentially other consumer audio brands. In Consumer Staples, French cosmetics manufacturer L’Oréal rose as the company has continued to demonstrate strong sales growth in both its e-commerce segment and in China. In Industrials, Swedish manufacturer of heat transfer and fluid separation machines Alfa Laval contributed; strong order growth through September suggests its business momentum is accelerating. The Portfolio’s underweight in Consumer Discretionary and overweight in IT were also helpful.
Poor stocks in Consumer Discretionary and Materials detracted. In Consumer Discretionary, shares of Chinese e-commerce company Alibaba fell as the company faced both increased industry rivalry and regulatory pressures throughout the year. In Materials, Australia-based BHP—which engages in the exploration, development, production, and processing of iron ore, metallurgical coal, and copper—detracted as plummeting iron ore prices in the third quarter weighed on the company’s stock.
Geographically, strong stocks in Emerging Markets (EMs) and the eurozone boosted relative returns. In the former, shares of Russian oil and gas company Lukoil were helped by surging energy prices.
Total Return Based On a $100,000 Investment
Institutional Class
Total Return Based On a $10,000,000 Investment
Institutional Class Z
Total Return Based On a $10,000 Investment
Investor Class
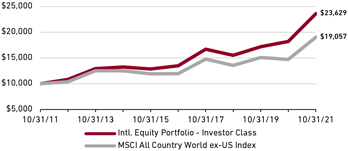
The charts above illustrate the hypothetical return of an investment made in the corresponding share classes. Investment return reflects waivers in effect. Absent such waivers, total return would be reduced. The performance provided in the table and charts above do not reflect the deduction of taxes that a shareholder would pay on Portfolio distributions or the redemption of Portfolio shares.
In the eurozone, Spanish bank BBVA benefitted as the company announced the sale of its anemic US business for a healthy price. Additionally, the bank’s Mexican subsidiary proved resilient due to generous loss provisions front-loaded into first and second quarters of 2021, and to recovering transaction and lending activity. Weak stocks in Japan detracted, especially manufacturer of hygiene and household cleaning products Unicharm. Shares declined in response to rising input costs (like oil) and a market style shift to stocks of more-cyclical companies. The Portfolio’s underweight in Canada and small cash weight also dragged on relative performance.
Perspective and Outlook
In our 2020 first quarter letter, at the early stage of the global pandemic, we marveled at the resiliency of the Chinese stock market, which we ascribed to the country’s success in containing the domestic spread of the coronavirus through draconian lockdowns, whose efficacy was made possible by its authoritarian political system. Eighteen months later, a similarly authoritarian intervention has left investors reeling. While government intervention is not uncommon in China, the scale and pace of this latest crop of reforms is unprecedented. Is Xi Jinping, China’s most powerful leader since Chairman Mao, revealing his allegiance to a collectivist ideology long thought to be discredited? Or is he boldly grasping the nettle of reform to redress economic imbalances and social ills before they become more entrenched and undermine the Chinese Communist Party’s (CCP’s) legitimacy?
Despite headlines conjuring memories of the CCP’s gruesome past, we accept that on balance the policy changes are intended to benefit the long-term health of Chinese society and economy, especially its middle class. The message the Party is sending to business leaders across China is clear: compete on a level playing field and pay a fair wage. For instance, much of the coverage of Ant Group’s canceled IPO focused on the ostensible desire of the CCP to clip the wings of its tech oligarchs. More persuasive in our view is that having observed and learned from the West’s subprime debacle a decade prior, Chinese financial regulators are not keen to allow loan origination to be divorced from the underlying credit risks of the loans—a source of moral hazard that would potentially destabilize a financial system still dominated by lumbering state-owned banks with weak credit cultures and poor management systems. Antitrust interventions targeting the largest e-commerce platforms echo the statements (if not yet the achievements) of many Western policymakers to improve competition by increasing the bargaining power of smaller businesses versus the giants.
Meanwhile, although the gutting of the private educational tutoring sector may seem disproportionate, it has with the stroke of a pen stigmatized one of the educational advantages of affluence while inhibiting the exam preparation arms race that many middle-class families feel has spiraled out of control.
Actions taken to strengthen the data privacy protections of social media companies, tighten local ownership of Macau casinos, and rein in speculation in the high-end liquor market would not be out of place in Europe or the US. Not to minimize the serious consequences of these abrupt and radical reforms for private businesses; as investors we are viewing these actions mainly as problems requiring further analysis rather than as indications that China has become too unpredictable to be investable.
More troubling for China’s long-term prospects (although less of an immediate danger to our portfolio) is the near-collapse of Evergrande. For years, the Chinese government has promised to wean the economy from fixed asset investments in favor of consumption, with little to show for the rhetoric. Regional governments have continued to rely on a red-hot property sector to provide their funding and achieve their mandated growth targets. Alarmed by the outsized role of property development in the economy, and the associated risks to the financial system of too much property speculation, the central government pushed through a series of policies last year to force the property sector to deleverage. Evergrande’s plight looks like the direct consequence of those blunt top-down mandates as the heavily indebted company
Portfolio Positioning (% Weight) at October 30, 2021
| | | | | | |
| Geography | | Portfolio | | | Benchmark1 |
| | |
| Canada | | | 2.1 | | | 7.4 |
| | |
| Emerging Markets | | | 25.2 | | | 29.2 |
| | |
| Europe EMU | | | 21.5 | | | 21.2 |
| | |
| Europe ex-EMU | | | 26.0 | | | 20.1 |
| | |
| Frontier Markets2 | | | 0.0 | | | – |
| | |
| Japan | | | 12.6 | | | 14.5 |
| | |
| Middle East | | | 1.2 | | | 0.4 |
| | |
| Pacific ex-Japan | | | 7.2 | | | 7.2 |
| | |
| Other3 | | | 1.1 | | | – |
| | |
| Cash | | | 3.1 | | | – |
| | |
| Sector | | Portfolio | | | Benchmark1 |
| | |
| Comm Services | | | 5.3 | | | 6.2 |
| | |
| Consumer Discretionary | | | 2.4 | | | 12.9 |
| | |
| Consumer Staples | | | 12.5 | | | 8.5 |
| | |
| Energy | | | 3.4 | | | 5.0 |
| | |
| Financials | | | 15.8 | | | 19.5 |
| | |
| Health Care | | | 13.7 | | | 9.4 |
| | |
| Industrials | | | 16.2 | | | 12.1 |
| | |
| Information Technology | | | 18.5 | | | 13.1 |
| | |
| Materials | | | 8.2 | | | 7.9 |
| | |
| Real Estate | | | 0.0 | | | 2.4 |
| | |
| Utilities | | | 0.9 | | | 3.0 |
| | |
| Cash | | | 3.1 | | | – |
1MSCI All Country World ex-US Index; 2Includes countries with less-developed markets outside the index. 3Includes companies classified in countries outside the index.
started to find itself cut off from its usual credit lines. While the government may be happy to make an example of the company, the spillover effects to the rest of the economy will be hard to contain and likely to require yet more interventions.
Equally disturbing to us are the rolling power outages afflicting as many as 20 provinces. Dueling top-down mandates with competing objectives seem to be playing a role here. Earlier in the year, the central government renewed its commitment to “dual control,” a mandate to curb carbon emissions by limiting both energy usage and the intensity (i.e., the amount of energy used per unit of GDP). That directive was issued, however, without anticipating this year’s spike in industrial output, whose emissions far exceed those from less energy-intensive sectors. Once they met their local growth targets, regional administrators rushed to institute power shutdowns to avoid breaching stipulated emission ceilings. To be sure, there are other factors contributing to the power crisis—not least, skyrocketing coal prices whose rise was exacerbated by China’s boycott of Australian coal imports in retaliation for that country’s insistence on re-opening the inquiry into the origins of the COVID-19 virus—but the policy disconnects didn’t help.
Nobel Prize-winning economist Friedrich Hayek would have predicted that the Chinese government would ultimately fail to manage its economy by mandate, because officials can’t foresee and prevent every unintended consequence of their own actions. If China’s growth slows further, more such shortcomings are likely to surface. The Chinese authorities exhibited competence at virus management, but even when their intentions are good, leaders inevitably miscalculate. When the views of authoritarians are subjected to little debate and their mandates are implemented without checks and balances, miscalculations can have outsized consequences. It’s unclear to us when a greater trust in the spontaneous order spawned by private actors and market forces, however well-mitigated by regulation and taxation, will take hold in China. Likely not as soon as we had hoped.
Portfolio Highlights
Although our Chinese holdings comprise only 8% of the portfolio, their prospects have recently been dominating our internal discourse and sparking a disproportionate share of clients’ questions. In China, we face a daunting paradox. Despite disquieting regulatory changes, we are finding more high-quality growing businesses that meet our investment criteria than at any point in our firm’s history. Our persistent underweight over the past 12 years has reflected, in part, our effort to limit portfolio risk from that source. But as other investors appear to be waking up to Chinese country risk, our inclination is to invest in otherwise-solid Chinese companies on share price weakness. To mitigate the potential impact of stricter regulation or reprisals on any one company or sector, we maintain substantial stock-level and industry-level diversification within China. And even while hunting for new opportunities, we are scrutinizing our existing Chinese holdings to make sure they continue to meet our investment criteria.
Ten Largest Holdings by Weight at October 30, 2021
| | | | | | |
| Company | | Sector | | Market | | % |
| | | |
| Atlas Copco | | Industrials | | Sweden | | 3.6 |
| | | |
| L’Oréal | | Cons Staples | | France | | 3.4 |
| | | |
| TSMC | | Info Technology | | Taiwan | | 3.4 |
| | | |
| Infineon Technologies | | Info Technology | | Germany | | 3.4 |
| | | |
| Tencent | | Comm Services | | China | | 3.2 |
| | | |
| Samsung Electronics | | Info Technology | | South Korea | | 3.1 |
| | | |
| Adyen | | Info Technology | | Netherlands | | 2.8 |
| | | |
| Roche | | Health Care | | Switzerland | | 2.8 |
| | | |
| AIA Group | | Financials | | Hong Kong | | 2.7 |
| | | |
| Schneider Electric | | Industrials | | France | | 2.7 |
One of the high-quality, growing companies we identified is Sanhua Intelligent Controls, a Chinese manufacturer of thermal management components. Its main business is making parts for home appliances, particularly HVAC systems, where it has scale and technological advantages in higher-value valves, pumps, and high-efficiency components. These advantages are also flowing into its smaller, but faster-growing, automotive parts business, which is growing explosively in heating and cooling systems for electric vehicles. We expect rising volumes to lead this division to achieve 30% annualized revenue growth for years to come.
To put the size of our exposure to China in perspective, our approximate 8% weight is exceeded by our 11% weight in Switzerland and similar to our weights in each of France, Germany, and Sweden. Our notional exposure to these countries is a byproduct of the multinational companies domiciled in these countries that we’ve identified for investment. No doubt these companies chose to remain in their historical birthplaces in large part because of the stable and hospitable business climate provided by their home countries. We are very rarely asked about the political and regulatory risks that companies based in these countries face—likely because these risks stem primarily from their operations outside their borders.
Our three Swedish industrial companies—Atlas Copco, Alfa Laval, Epiroc—each derive less than 5% of their global sales in Sweden; they have used their stable domestic environment as a base from which to expand their technological and competitive advantages abroad. Our other Swedish holding, SE Banken, generates most of its revenues domestically, but mostly by serving the banking needs of multinational corporations headquartered in Sweden. Our six Swiss companies also generate an inordinate amount of their sales outside the country. Contract drug manufacturer Lonza is the most domestically focused, generating 10% of its revenues in Switzerland, while the other five each generate less than 5% at home.
Please read the separate disclosures page for important information, including the risks of investing in the Portfolio.
International Small Companies Portfolio
Institutional Investors: HLMRX | Individual Investors: HLMSX
Portfolio Management Team

Jafar Rizvi, CFA
Co-Lead Portfolio Manager
Anix Vyas, CFA
Co-Lead Portfolio Manager
Performance Summary
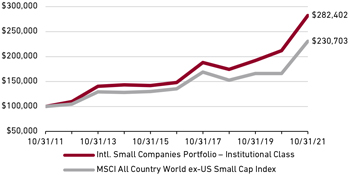
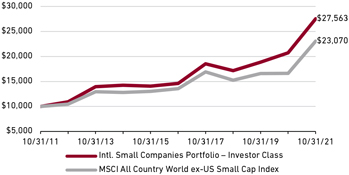
For the International Small Companies Equity Portfolio, the Institutional Class gained 33.16% and the Investor Class gained 32.84% (net of fees and expenses) in the twelve-month period ended October 31, 2021. The Portfolio’s benchmark, the MSCI ACWI ex-US Small Cap Index, gained 38.83% (net of source taxes).
Fund Facts at October 31, 2021
| | | | |
| Total Net Assets | | $599.7M |
| |
| Sales Charge | | None |
| |
| Number of Holdings | | 81 |
| |
| Turnover (5 Yr. Avg.) | | 30% |
| |
| Dividend Policy | | Annual |
| | Institutional Investors | | Individual Investors |
| | | Institutional Class | | Investor Class |
| | |
| Ticker | | HLMRX | | HLMSX |
| | |
| CUSIP | | 412295875 | | 412295883 |
| | |
| Inception Date | | 6/30/2011 | | 3/26/2007 |
| | |
| Minimum Investment1 | | $100,000 | | $5,000 |
| | |
| Net Expense Ratio2 | | 1.15%3 | | 1.40%4 |
| | |
| Gross Expense Ratio2 | | 1.18% | | 1.50% |
1Lower minimums available through certain brokerage firms; 2As of the most recent Prospectus and based on the fiscal year ended October 31, 2021. The Net Expense Ratio is shown net of Harding Loevner’s contractual agreement through February 28, 2022. 3Harding Loevner’s contractual agreement caps the net expense ratio at 1.15%. 4Harding Loevner’s contractual agreement caps the net expense ratio at 1.40%. The Net Expense Ratio is applicable to investors.
Market Review
International small cap shares rose strongly in the 12 months ended October 31, buoyed by easy monetary policy, worldwide fiscal stimulus, and steady vaccine rollouts worldwide that facilitated a return to relative normalcy. Investors were also optimistic about the ability of corporate capital expenditures to underpin a global economic rebound. Much of this newf investment has been expected to come from spending on information technology (IT); The Economist projected that IT capital spending for 2021 would eclipse 2019’s figures by 42 percent.
The pace of economic recovery slowed toward the end of the fund year, however, due to the spread of the COVID-19 Delta variant and supply chain bottlenecks including a semiconductor shortage that hobbled automobile and consumer electronics manufacturers. Labor shortages contributed to a surge in inflation and brought forward the inevitable prospect of higher interest rates. In response, central banks began signaling the impending end of unprecedented monetary support and, in some cases, acted by reducing bond buying (European Central Bank) or directly raising interest rates (Norway, Brazil, and Russia). The US Federal Reserve also adopted a more hawkish tone following its September 2021 meeting, suggesting it could soon begin to scale back its monthly bond purchases.
Every region posted large positive returns. Europe, both inside and outside the monetary union, was a key outperformer, with some of the markets most impacted by the pandemic last year surging after vaccines became available. Emerging Markets (EMs) was also among the strongest regions, despite the underperformance of Chinese stocks in the wake of sweeping new regulations and investor concerns over its heavily leveraged real estate sector. Japan, which struggled to contain COVID cases in the lead-up to the postponed Summer Olympics, was the weakest-performing region. Its market has begun bouncing back in recent months, however, in reaction to an increased focus on vaccination and expectations that newly appointed prime minister Fumio Kishida would continue predecessor Shinzō Abe’s fiscal stimulus and structural reforms.
Every sector posted positive returns during the period, with Energy, Industrials, and Financials leading. Financials companies, particularly banks based in emerging markets, enjoyed strong economic recoveries in their home markets, bolstered by monetary policy support. Energy company stocks surged due to a spike in oil prices, with Brent crude trading just over US$80 at the end of October, the highest price since 2018. Consumer Staples stocks lagged as public uncertainty over the spread of the Delta variant hampered the retail sector in the second half of the fund year.
Performance (% Total Return)
| | | | | | | | | | | | | | | | | | | | | | | | |
| | | For periods ended September 30, 2021 | | For periods ended October 31, 2021 |
| | | | | |
| | | 1 | | 3 | | 5 | | 10 | | Since Inception* | | 1 | | 3 | | 5 | | 10 | | Since Inception* |
| | | Year | | Years | | Years | | Years | | Jun-11 | | Mar-07 | | Year | | Years | | Years | | Years | | Jun-11 | | Mar-07 |
| | | | | | | | | | | | |
| Intl Small Companies Portfolio – Inst Class | | 26.92 | | 12.11 | | 12.61 | | 11.52 | | 8.68 | | | | 33.16 | | 17.40 | | 13.79 | | 10.94 | | 8.93 | | |
| | | | | | | | | | | | |
| Intl Small Companies Portfolio – Investor Class | | 26.60 | | 11.84 | | 12.34 | | 11.24 | | | | 7.60 | | 32.84 | | 17.10 | | 13.52 | | 10.67 | | | | 7.78 |
| | | | | | | | | | | | |
| MSCI All Country World ex-US Small Cap Index | | 33.07 | | 10.33 | | 10.28 | | 9.44 | | 6.84 | | – | | 38.83 | | 14.75 | | 11.21 | | 8.72 | | 6.94 | | – |
Returns are annualized for periods greater than 1 year. *Inception of the Institutional Class, June 30, 2011. Inception of the Investor Class, March 26, 2007. Index performance prior to June 1, 2007 cannot be shown since it relies on back-filled data.
Performance data quoted represents past performance; past performance does not guarantee future results. The investment return and principal value of an investment will fluctuate so that an investor’s shares, when redeemed, may be worth more or less than their original cost. Current performance of the Portfolio may be lower or higher than the performance quoted. Performance data current to the most recent month end may be obtained by calling (877) 435-8105 or visiting www.hardingloevnerfunds.com.
The charts below illustrate the hypothetical return of an investment made in the corresponding share classes. Investment return reflects waivers in effect. Absent such waivers, total return would be reduced. The performance provided in the table and charts above do not reflect the deduction of taxes that a shareholder would pay on Portfolio distributions or the redemption of Portfolio shares.
Total Return Based On a $100,000 Investment
Institutional Class
Total Return Based On a $10,000 Investment
Investor Class
Performance Attribution
The Portfolio trailed the index in this 12-month period primarily due to weak holdings in Consumer Staples and Communication Services. In the former, Japanese manufacturer of seasoning products Ariake suffered from deteriorating restaurant sales caused by extended lockdowns in its home country, with sales of its home meal kits in supermarkets and convenience stores failing to offset this decline. In Communication Services, shares of Swedish videogame maker Paradox Interactive fell as it continued to work through the repercussions of delayed and cancelled rollouts earlier this year. Recent controversies in the video game industry also weighed on the company, as reports describing toxic workplace cultures at high-profile rivals Activision Blizzard and Ubisoft paralleled a scandal surrounding Paradox’s CEO, Fredrik Wester, who apologized for an incident of self-described “inappropriate behavior” from 2018.
We had strong relative returns in Materials due to Vietnamese steelmaker Hoa Phat Group, which benefited from a combination of rising global steel prices, strong demand inside Vietnam, and a new, state-of-the-art production complex that is helping the company grow export sales to China.
By region, holdings in the Economic and Monetary Union (EMU) and EMs detracted the most. In Germany, software company TeamViewer saw the COVID-19-related tailwind for its remote work products abate. In France, Rubis, a storage terminal and petroleum products distributor, detracted as sales fell in several regions where tourism rates remain low due to the pandemic, especially the Caribbean. In EMs, Malaysian oil & gas services provider Dialog Group Berhad fell as it was unable to continue the development of its Pengerang refinery due to COVID restrictions. The stock of Polish videogame developer CD Projekt was weighed down by its botched December rollout of the much-anticipated Cyberpunk 2077, which included the game being pulled from the PlayStation Store due to technical issues.
In ex-EMU countries, where our stock selection fared slightly better, Swiss distributor of fasteners Bossard reported strong sales growth, driven in part by newly won customer projects in the railway, construction, and medical technology industries. Shares of UK-based aerospace technology producer Senior rose sharply in late May after a private equity firm made an unsuccessful offer to purchase the company.
Perspective and Outlook
Semiconductor chip shortages have resulted in automotive production cuts around the globe. Toyota’s recently announced 40% cut in production follows similar cuts by established carmakers Volkswagen, General Motors, and Nissan, as well as newer entrants such as China’s Nio. As dramatic as its effects have been, the chip shortage should be transitory: we expect that the worst of the backlogs should be cleared by mid-2022. We are more focused on fundamental changes like the adoption of electric vehicles (EVs) and autonomous driving that could impact the structure of the industry.
The legacy auto industry has benefited from massive economies of scale, including steep capital requirements, learning curves, and design costs, which historically have represented significant barriers to entry for new auto component suppliers. But the shift to EVs, while creating opportunity for existing suppliers, also opens the door to new entrants specializing in components previously not used in cars. The pace of adoption of autonomous driving is hard to predict given its earlier stage of development, but we estimate that increasingly stringent emissions regulations could drive EV unit sales to 50% of total industry sales within 15 years. Suppliers stand to benefit from a combination of faster overall segment growth and increased fragmentation in their customer base as aspirants seek to enter the auto manufacturing business.
As small cap investors looking for durable growth, we focus on identifying leading makers of components that are critical but nonetheless represent only a small portion of an end-product’s total bill of materials, which better insulates them from pricing pressure. We insist on management foresight and financial strength since they underpin a company’s ability to navigate significant market changes.
Fuchs Petrolub is an example of a longtime auto supplier whose management is investing to extend its competitive advantage. The company, headquartered in Germany, makes lubricants for automotive and other industrial applications and is the largest wholly dedicated lubricant supplier in the world. Fuchs’s legacy automotive products, which represent about 30% of its total sales, were developed for use in internal combustion engines (ICEs). However, the company is expanding its focus to EVs, having opened a new plant in Germany to produce polyurea grease, a specialty product with the high-temperature, noise-reducing properties needed in EV lubricants.
Historically, the company’s competitive advantages have been its dense distribution networks around its plants and its close relationships with customers in niche product areas too small to attract big rivals like the major oil companies. Fuchs has invested to secure this advantage in recent years. Its new German plant is the final piece of a US$350 million investment program launched in 2016 to expand and update its manufacturing and R&D facilities worldwide, including in the US, China, Australia, and Sweden.
Not everything changes in the transition to EVs: all cars need things like tires and lights. Japan-based Stanley Electric has been
manufacturing headlamps and tail lamps for 100 years. Originally part of the vertically integrated auto supply chain for Honda (which still owns 5.3% of Stanley and buys 40% of its output), Stanley has diversified its customer base over the years. It now ranks second (with a 26% share) in the Japanese car lamp market.
A rule of thumb among automotive suppliers is that prices for their products decline 5% a year on average. But car lamps are one of the few components that have risen in average price as light sources have evolved for greater energy efficiency and, more recently, for features such as adaptive driving beams (ADB) that rotate or shine brighter in the direction the car signals it is about to turn. Stanley’s key competitive advantages—its relationships with auto manufacturers and its technical know-how—position it as a partner to its customers as they seek to develop the next generation of head and tail lamps. For example, in order to optimize EVs’ battery life, there will be great pressure for the lights to get smaller and even more efficient. ADBs, already valued by safety-conscious end consumers, should become an important frontier in
Portfolio Positioning (% Weight) at October 31, 2021
| | | | | | |
| Geography | | Portfolio | | | Benchmark1 |
| | |
| Canada | | | 2.1 | | | 6.8 |
| | |
| Emerging Markets | | | 18.8 | | | 24.2 |
| | |
| Europe EMU | | | 20.7 | | | 14.5 |
| | |
| Europe ex-EMU | | | 31.3 | | | 23.9 |
| | |
| Frontier Markets2 | | | 7.5 | | | – |
| | |
| Japan | | | 13.7 | | | 18.9 |
| | |
| Middle East | | | 1.8 | | | 2.1 |
| | |
| Pacific ex-Japan | | | 0.4 | | | 9.6 |
| | |
| Other3 | | | 1.0 | | | – |
| | |
| Cash | | | 2.7 | | | – |
| | |
| Sector | | Portfolio | | | Benchmark1 |
| | |
| Communication Services | | | 8.8 | | | 4.2 |
| | |
| Consumer Discretionary | | | 4.3 | | | 11.8 |
| | |
| Consumer Staples | | | 8.9 | | | 5.5 |
| | |
| Energy | | | 1.4 | | | 2.8 |
| | |
| Financials | | | 6.6 | | | 10.5 |
| | |
| Health Care | | | 12.7 | | | 7.3 |
| | |
| Industrials | | | 18.9 | | | 21.2 |
| | |
| Information Technology | | | 26.1 | | | 12.2 |
| | |
| Materials | | | 7.2 | | | 10.6 |
| | |
| Real Estate | | | 0.9 | | | 10.5 |
| | |
| Utilities | | | 1.5 | | | 3.4 |
| | |
| Cash | | | 2.7 | | | – |
1MSCI All Country World ex-US Small Cap Index; 2Includes countries with less-developed markets outside the index; 3Includes companies classified in countries outside the index.
the development of self-driving cars, since lights occupy the four corners of a vehicle, meaning that future generations of lights could also incorporate sensors.
Where headlamps help the driver see better, sensors help the car see better. Sensata Technologies is a leader in the US$10 billion automotive market for high-value sensors, where it has about 20% market share. In some niches within the sensor market, Sensata has extremely high market share, such as its 70% share of the market for tire pressure sensors, which are still needed in EVs. In the short term, Sensata expects the number of its existing sensors per vehicle to increase as car makers respond to stricter fuel standards and the rising demand for safety and comfort-related control systems including electronic stability control and driver assistance.
The US-based1 company also plans to meet the need for new products and already has more content per vehicle on EVs than it does on Internal Combustion Engine (ICE) cars. For example, the transition from traditional hydraulic brakes to EVs’ electromechanical braking and regenerative braking systems requires more, and different types of, pressure and force sensing. The company recently acquired adjacent technologies with which it can expand its product line. In 2018, it acquired Gigavac, a leading manufacturer of high-voltage contactors, a mechanical device used in EV powertrains. The acquisition gives Sensata visibility at the early stage of EV development into new sensor types and enabling technologies—and an additional route to engage in that process.
LEM Holdings, though not widely viewed as an “automotive supplier,” is taking advantage of its core competency to grab a share of what it, too, sees as a major long-term growth opportunity. The Swiss company’s main product, transducers, are used for measuring and regulating electrical parameters such as current and voltage. They have a wide range of applications, including renewable energy systems, but the automotive industry represents about 30% of LEM’s sales, of which transducers for electric and hybrid powertrains represent the vast majority of revenues. EVs are full of transducers: motor control transducers calibrate the voltage and current sent to the motor, while other transducers help manage the high voltages of the battery. In 2020, LEM introduced transducers for EV charging stations that support advanced integrated functions, including more accurate measurement—for billing purposes—of the amount of electricity used. Charging infrastructure represents a large, addressable market for LEM, as most countries are just beginning to address the coming need.
Portfolio Highlights
Beside the global chip shortage and its impact on supply chains, another focus for global investors has been the changing economic environment in China. Following several years of rapid economic growth and expansion of its property and internet sectors, which
1Though headquartered in the US, Sensata’s extensive operations and share of its revenue generated in Brazil, Europe, and Asia qualify it for classification in our rubric as “international.”
Ten Largest Holdings by Weight at October 31, 2021
| | | | | | |
| Company | | Sector | | Market | | % |
| | | |
| Reply | | Info Technology | | Italy | | 3.9 |
| | | |
| Hoa Phat Group | | Materials | | Vietnam | | 3.8 |
| | | |
| STRATEC | | Health Care | | Germany | | 2.7 |
| | | |
| Dechra | | Health Care | | UK | | 2.6 |
| | | |
| TOMRA | | Industrials | | Norway | | 2.4 |
| | | |
| Alten | | Info Technology | | France | | 2.4 |
| | | |
| Globant | | Info Technology | | Argentina | | 2.2 |
| | | |
| Bechtle | | Info Technology | | Germany | | 2.2 |
| | | |
| Abcam | | Health Care | | UK | | 2.2 |
| | | |
| Senior | | Industrials | | UK | | 2.2 |
have led China’s stock market to be among the world’s best performing, the spate of national policy changes since the end of 2020 has rattled Chinese stocks. But the sell-off has mostly affected large cap stocks, especially those directly in the regulatory crosshairs. There has been less of an impact on small cap stocks, where China represents a smaller portion globally. In our own small cap Portfolio, the exposure to China is lower still.
In recent years, rich valuations of high-quality Chinese growth companies, both in an absolute and relative sense, have been the biggest impediment to our adding to our exposure. Sharply lower valuations in the wake of the recent regulatory actions have caused us to reassess the trade-offs between risk and prospective returns for existing and new holdings, potentially changing that picture. In most cases, the reforms have little direct adverse impact on small companies and may even improve their competitive positioning vis-a-vis larger rivals. But that is not to say small companies aren’t feeling adverse indirect effects. Haitian International is the leading plastic injection molding equipment company in China. The company has been gaining market share from higher-end German and Japanese firms through steady improvement of its machines, whose increasing energy efficiency also aligns nicely with China’s carbon emission reduction goals. Yet, knock-on effects of recent policy changes like the rolling power curbs and the Evergrande collapse have dented consumer and manufacturer confidence. After a sharp uptick in new orders over the past year, Haitan’s business may cool down and could be in for a few bumpy quarters, a concern that has weighed on its stock price.
Our aim is to construct a well-diversified portfolio that can withstand the full spectrum of unknowns. We do this by investing in businesses, like Haitian, that have durable competitive advantages in industries we understand, the financial strength to weather unforeseen challenges, and management teams that operate with incentives that are aligned with sustained long-term returns. With their valuations looking more attractive, we expect to add more such businesses in China. In the meantime, we adjusted our internal guidelines by raising the ceiling for permitted exposure to China, from 10% to 20%.
Please read the separate disclosures page for important information, including the risks of investing in the Portfolio.
Emerging Markets Portfolio
Institutional Investors: HLMEX & HLEZX | Individual Investors: HLEMX
Portfolio Management Team
| | |
 | | Scott Crawshaw Co-Lead Portfolio Manager Craig Shaw, CFA Co-Lead Portfolio Manager Pradipta Chakrabortty Portfolio Manager Richard Schmidt, CFA Portfolio Manager |
The Institutional Emerging Markets Portfolio (Institutional Class and Institutional Class Z) and the Emerging Markets Portfolio (Advisor Class)—collectively, the “Portfolios”—are both managed in strict accordance with Harding Loevner’s Emerging Markets Equity strategy model portfolio. Therefore, the Portfolios have highly similar holdings and characteristics. We have provided a single commentary to cover both Portfolios. The specific performance and characteristics of each are presented separately in the tables that follow.
Fund Facts at October 31, 2021
| | | | | | |
| Sales Charge | | None |
| |
| Number of Holdings | | 78 |
| |
| Dividend Policy | | Annual |
| | | Institutional Investors | | Individual Investors |
| | |
| Total Net Assets | | $6,493.9M | | $3,813.3M |
| | |
| Turnover (5 Yr. Avg.) | | 19% | | 19% |
| | | |
| | | Inst. Class | | Inst. Class Z | | Advisor |
| | | |
| Ticker | | HLMEX | | HLEZX | | HLEMX |
| | | |
| CUSIP | | 412295701 | | 412295693 | | 412295305 |
| | | |
| Inception Date | | 10/17/2005 | | 3/5/2014 | | 11/9/1998 |
| | | |
| Minimum Investment1 | | $500,000 | | $10,000,000 | | $5,000 |
| | | |
| Net Expense Ratio2 | | 1.10%3 | | 1.00%4 | | 1.20%5 |
| | | |
| Gross Expense Ratio2 | | 1.12% | | 1.04% | | 1.20% |
1Lower minimums available through certain brokerage firms; 2As of the most recent Prospectus and based on expenses for the fiscal year end; The Net Expense Ratio is shown net of Harding Loevner’s contractual agreement through February 28, 2023; ³Harding Loevner’s contractual agreement caps the net expense ratio at 1.10%; 4Harding Loevner’s contractual agreement caps the net expense ratio at 1.00%; 5Harding Loevner’s contractual agreement caps the net expense ratio at 1.30%. The Net Expense Ratio is applicable to investors.
Performance Summary
For the Institutional Emerging Markets Portfolio, the Institutional Class rose 21.03% and Class Z rose 21.11% (net of fees and expenses) in the twelve-month period ended October 31, 2021. For the Emerging Markets Portfolio, the Advisor Class rose 21.04% (net of fees and expenses). The Portfolios’ benchmark, the MSCI Emerging Markets Index, rose 16.96% (net of source taxes).
Market Review
Stocks in Emerging Markets (EMs) surged upward in the first four months of the fiscal year, sustaining their remarkable recovery from the sharp decline in early 2020 caused by the initial shock of the COVID-19 outbreak. The discovery and broadening global distribution of effective vaccines helped accelerate economic activity, which boosted commodity prices and stoked enthusiasm for EM assets.
Investor enthusiasm for EMs appeared to wane after February 2021 due to the new threat posed by the COVID-19 Delta variant and then due to increasing concern about regulatory changes in China. These regulatory actions have included pushing to increase competition among internet businesses, new proposals to rein in private tutoring, curtailing the country’s cryptocurrency industry (including measures to prohibit banks from transacting in them), and restricting video game playing by young people.
Inflation concerns also weighed on EMs. Sporadic flare-ups of the COVID-19 Delta variant impeded a full recovery in global supply chains, causing acute shortages in shipping capacity and raw materials. Long-dated bond yields increased across EM countries, particularly those where inflation inflamed by pandemic-related costs collided with fiscal weakness. Central banks in several major countries, including Brazil, Russia, Mexico, and the Czech Republic, raised interest rates.
Europe (especially Russia) and the Middle East were the strongest regions in the index, buoyed by the increasing demand for oil and other refined products. Brent crude prices rose nearly 120% during the past twelve months to just above US$80 per barrel, with support from continued supply discipline by OPEC+ and expectations of increasing oil demand. The CE3 markets (Poland, Hungary, and the Czech Republic) also soared amid evidence of a European economic recovery.
Asia lagged the index, largely due to China’s significant decline in a year when many markets enjoyed double-digit returns. New regulations were a threat to the growth prospects of multiple industries and companies, including the country’s giant internet platforms. Revelations late in the fiscal year of financial stress at Evergrande, one of China’s largest property companies, also hurt sentiment. By contrast, the other large Asian markets—South Korea, Taiwan, and India—all rallied.
Performance (% Total Return)
| | | | | | | | | | | | | | | | | | | | | | | | | | | | |
| | | For periods ended September 30, 2021 | | For periods ended October 31, 2021 |
| | | | | |
| | | 1 | | 3 | | 5 | | 10 | | Since Inception* | | 1 | | 3 | | 5 | | 10 | | Since Inception* |
| | | Year | | Years | | Years | | Years | | Oct-05 | | Mar-14 | | Nov-98 | | Year | | Years | | Years | | Years | | Oct-05 | | Mar-14 | | Nov-98 |
| | | | | | | | | | | | | | |
| Inst. Emerging Markets Portfolio – Inst. Class | | 21.01 | | 8.28 | | 8.18 | | 7.44 | | 7.16 | | | | | | 21.03 | | 12.63 | | 8.63 | | 6.32 | | 7.21 | | | | |
| | | | | | | | | | | | | | |
| Inst. Emerging Markets Portfolio – Class Z | | 21.09 | | 8.43 | | 8.36 | | – | | | | 6.01 | | | | 21.11 | | 12.77 | | 8.81 | | – | | | | 6.12 | | |
| | | | | | | | | | | | | | |
| Emerging Markets Portfolio – Advisor Class | | 20.99 | | 8.15 | | 8.05 | | 7.32 | | | | | | 10.74 | | 21.04 | | 12.54 | | 8.52 | | 6.20 | | | | | | 10.76 |
| | | | | | | | | | | | | | |
| MSCI Emerging Markets Index | | 18.20 | | 8.58 | | 9.23 | | 6.09 | | 6.98 | | 6.10 | | – | | 16.96 | | 12.30 | | 9.39 | | 4.88 | | 7.00 | | 6.17 | | – |
Returns are annualized for periods greater than 1 year. *Inception of Institutional Class, October 17, 2005. Inception of Class Z, March 5, 2014. Inception of the Advisor Class, November 9, 1998. Index performance prior to January 1, 2001 cannot be shown since it relies on back-filled data.
Performance data quoted represents past performance; past performance does not guarantee future results. The investment return and principal value of an investment will fluctuate so that an investor’s shares, when redeemed, may be worth more or less than their original cost. Current performance of the Portfolio may be lower or higher than the performance quoted. Performance data current to the most recent month end may be obtained by calling (877) 435-8105 or visiting www.hardingloevnerfunds.com.
The cyclical Energy and Materials sectors were the leading performers thanks to higher prices for oil, industrial metals, agricultural products, and other commodities. In addition, Information Technology (IT) outperformed, helped by semiconductor and other hardware manufacturers.
Consumer Discretionary was the weakest sector, reflecting sharp declines by ecommerce stocks in the large markets of China and Brazil. Also, Chinese regulators’ demands in July 2021 that tutoring companies operate as non-profits caused a collapse in shares of the country’s education companies. The Real Estate sector, dominated by Chinese developers, was weighed down by the prospect of China’s tightening liquidity conditions and Evergrande’s travails.
Performance Attribution
The Portfolio’s outperformance in the year was primarily due to strong stocks in IT, Energy, and Consumer Staples. Allocation effects were also helpful, particularly our overweight in IT and underweight in the lagging Consumer Discretionary sector.
In IT, technology services company EPAM benefitted from elevated demand for digital transformation projects while Silergy, a manufacturer of power management circuits for a variety of consumer electronics and specialized industrial applications, also reported strong results. Moreover, the company has been capitalizing on the global chip shortage to gain a bigger foothold in the automotive supply chain. Shares of two Russian Energy holdings, gas producer Novatek and integrated oil-and-gas giant Lukoil, surged alongside energy prices. And in Consumer Staples, Coca-Cola HBC benefitted from continued strength in Nigeria and Russia. The company’s energy drinks category posted impressive year-over-year revenue growth of nearly 70% in the first half of 2021.
The Portfolio lagged within Industrials, where Brazil’s leading rental-car agency Localiza faced higher costs and struggled to meet demand due to supply-chain issues that made it difficult to obtain new cars. The Portfolio’s lack of holdings in the strong Materials sector also hurt.
Total Return Based On a $500,000 Investment
Institutional Emerging Markets Portfolio – Institutional Class
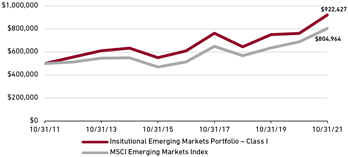
Total Return Based On a $10,000,000 Investment
Institutional Emerging Markets Portfolio – Inst. Class Z
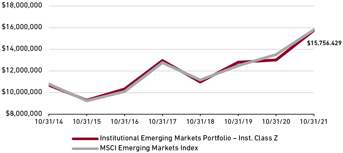
Total Return Based On a $10,000 Investment
Emerging Markets Portfolio – Advisor Class
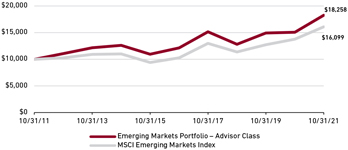
The charts above illustrate the hypothetical return of an investment made in the corresponding share classes. Investment return reflects waivers in effect. Absent such waivers, total return would be reduced. The performance provided in the table and charts above do not reflect the deduction of taxes that a shareholder would pay on Portfolio distributions or the redemption of Portfolio shares.
By region, the Portfolio’s allocations were the main sources of outperformance. Our underweight in China and overweight in Russia were especially helpful. The Portfolio’s lack of investments in the Middle East was a detractor.
Perspective and Outlook
China’s economic advancement over the past 20 years has been an outstanding humanitarian success. GDP growth averaging a remarkable 9% per annum has elevated nearly 800 million Chinese out of poverty. But sustaining this progress will require the country to overcome formidable challenges, including an inevitable decline in returns on investment, a rapidly aging population, and soured international relations. Another hurdle is the massive public and private debt accumulated for infrastructure and real estate development since the 2008 global financial crisis.
China’s leaders are acutely aware of these obstacles to growth and are planning meticulously to overcome them. A central component of their strategy is to use regulation to foster more competition in key sectors, thereby guiding markets to send capital to those firms that the government considers to be most productive and innovative. Another core focus is the promotion of “common prosperity,” a reaction to the capture by a small, ultra-wealthy cohort of so much of the wealth created in the country in recent years. These intersecting objectives have drawn the country’s internet services giants into the glower of state authorities, leading many of the companies and their CEOs and founders to pledge billions of dollars toward common prosperity initiatives.
Another item on the government’s agenda is receiving less attention: the extension of the state’s tentacles more deeply into private businesses. There’s evidence that state-owned enterprises (SOEs) have increasingly been taking direct equity stakes in private businesses, such as Bytedance, the parent company of TikTok and domestic short-video app Douyin. The state’s stealthy intrusion into private enterprises, combined with the rapid-fire regulatory actions, have led some to wonder if the investment risks in the largest EM now outweigh the possible rewards.
We believe China presents varied attractive opportunities for long-term investors. Our analysts have identified more than 50 businesses across industries that meet our quality and durable growth criteria. We are not in denial about risks to industries and individual businesses of seismic policy change. For example, early this year as evidence mounted that regulatory changes in the conduct of for-profit tutoring were in the cards—a risk that was later realized—we sold our holding in New Oriental Education.
More often, signs of policy change risk are less definitive and simply add an extra layer of fuzziness to the already challenging task of forecasting business fundamentals. Sometimes policy changes may even put some businesses on more positive trajectories. Two elements of China’s economic reform agenda that we foresee increasing opportunities, or at least not posing existential threats, are data reform and the push for industrial innovation.
China is intent on significantly reforming the digital economy by setting new, world-leading standards for data collection and dissemination to fuel more productive capital allocation in internet-based industries. The walls of the major online gardens, most significantly those of Alibaba and Tencent, are to be breached, providing greater access to consumer data to foster competition. (Sadly, a side effect will be greater access to consumer data by regulators or state entities.) The exclusive network effects that Alibaba and Tencent enjoy from their closed platforms, among their key competitive advantages, will be blunted by new rules around customer data, as well as companion directives that will allow users to jump to competitors’ apps more easily.
In the past, both Alibaba and Tencent have proven highly capable in reacting to regulatory challenges. Their cultures of innovation and technological leadership, reinforced with gargantuan economies of scale, provide solid bases on which to sustain long-term growth and respectable returns on capital. The fact that their giant platforms play valuable roles within the fabric of the economy and could not be replicated other than in the lax regulatory climate in which they
Portfolio Positioning (% Weight) at October 31, 2021
| | | | | | | | | | |
| Geography | | Institutional HLMEX / HLEZX | | | Advisor HLEMX | | | Benchmark1 |
| | | |
| Brazil | | | 5.7 | | | | 5.7 | | | 4.0 |
| | | |
| China + Hong Kong2 | | | 29.7 | | | | 30.0 | | | 34.7 |
| | | |
| India | | | 8.9 | | | | 9.0 | | | 12.0 |
| | | |
| Mexico | | | 5.6 | | | | 5.7 | | | 1.9 |
| | | |
| Russia | | | 10.2 | | | | 10.3 | | | 4.0 |
| | | |
| South Africa | | | 1.6 | | | | 1.6 | | | 3.1 |
| | | |
| South Korea | | | 8.0 | | | | 8.1 | | | 12.2 |
| | | |
| Taiwan | | | 11.6 | | | | 11.6 | | | 14.7 |
| | | |
| Small Emerging Markets3 | | | 6.6 | | | | 6.6 | | | 13.4 |
| | | |
| Frontier Markets4 | | | 1.7 | | | | 1.7 | | | – |
| | | |
| Developed Markets Listed5 | | | 8.1 | | | | 8.1 | | | – |
| | | |
| Cash | | | 2.3 | | | | 1.6 | | | – |
| | | |
| Sector | | Institutional HLMEX / HLEZX | | | Advisor HLEMX | | | Benchmark1 |
| | | |
| Comm Services | | | 8.9 | | | | 9.0 | | | 10.6 |
| | | |
| Consumer Discretionary | | | 13.0 | | | | 13.0 | | | 15.6 |
| | | |
| Consumer Staples | | | 8.3 | | | | 8.4 | | | 5.8 |
| | | |
| Energy | | | 6.2 | | | | 6.2 | | | 5.8 |
| | | |
| Financials | | | 23.0 | | | | 23.2 | | | 19.6 |
| | | |
| Health Care | | | 3.0 | | | | 3.0 | | | 4.6 |
| | | |
| Industrials | | | 9.6 | | | | 9.6 | | | 4.7 |
| | | |
| Information Technology | | | 23.5 | | | | 23.7 | | | 20.6 |
| | | |
| Materials | | | 0.0 | | | | 0.0 | | | 8.5 |
| | | |
| Real Estate | | | 0.6 | | | | 0.7 | | | 2.0 |
| | | |
| Utilities | | | 1.6 | | | | 1.6 | | | 2.2 |
| | | |
| Cash | | | 2.3 | | | | 1.6 | | | – |
1MSCI Emerging Markets Index; 2The Benchmark does not include Hong Kong; 3Includes the remaining emerging markets which, individually, comprise less than 5% of the index; 4Includes countries with less-developed markets outside the 5Includes emerging markets or frontier markets companies listed in developed markets.
were born and matured suggests that regulators do not intend to exterminate them.
In more material domains, China is doubling down on its long-term manufacturing strategy—unveiled in 2015 as the “Made in China 2025” (MIC25) plan—to improve its capabilities in critical technology sectors where it feels vulnerable amid the ongoing conflict with the US. Policymakers are also wary of a too-rapid tilt away from manufacturing toward services that has been the downfall of many EMs as they sought to advance beyond middle-income status. A revised plan that supersedes the MIC25 roadmap targets nine emerging industries, including biotech, new energy, advanced materials, and environmental protection, that will receive government subsidies and loans to promote investment. In early July 2021, a joint announcement from six Chinese ministries detailed the country’s aim to develop “hidden champions,” small- and medium-sized companies that potentially can forge dominant global positions in their industrial niches. So, while tax incentives and subsidies enjoyed by some internet-enabled service companies are expected to be withdrawn, the manufacturing sector should continue to receive the government’s full support.
Sanhua Intelligent Controls, China’s global leader in thermal controls, is an example of such a hidden champion. Its technical know-how and local low-cost advantage have allowed it to build a dominant global position supplying home-appliance manufacturers while steadily increasing its share in the auto sector. It recently won a patent infringement case in South Korea where a competitor had copied the design of one of Sanhua’s high-specification components, a sign of its technological leadership in this niche industry. Electric vehicles (EVs) represent a massive growth opportunity for Sanhua because they need more thermal control components than vehicles with internal combustion engines. In manufactured products the threat of state meddling is secondary to the threat of increasing competition. We expect Sanhua will undoubtedly face a slew of competitors given the large scale of the market opportunity. However, we believe Sanhua is set to take the lion’s share of the potential profit.
We remain intently focused on the evolution of individual businesses and their industries. We don’t have foresight into future policy changes or know how long this current burst of regulatory action in China will continue, although we suspect that its pace will abate. It is almost a cliché that the Chinese government’s highest goal is to preserve social stability, but we don’t think there should be official interest in maintaining a state of regulatory flux and economic turmoil if the main objective is to facilitate more productive capital allocation.
Portfolio Highlights
During this year, our bottom-up investment decisions have shifted the portfolio’s largest overweight from Financials to Industrials, which has now reached 10% of the portfolio. Our Industrials holdings represent diverse businesses, including airport operations, optical sorting machines, express delivery, and power tools. In a world where industrial manufacturing continues to leap ahead through innovation and the adoption of new technologies, we favor industry leaders leveraging their competitive advantages into
Ten Largest Holdings by Weight at October 31, 2021
| | | | | | | | |
| Company | | Sector | | Market | | Institutional HLMEX / HLEZX | | Advisor HLEMX |
| | | | |
| TSMC | | Info Technology | | Taiwan | | 5.4 | | 5.4 |
| | | | |
| Samsung Electronics | | Info Technology | | South Korea | | 4.6 | | 4.6 |
| | | | |
| EPAM | | Info Technology | | US | | 4.5 | | 4.5 |
| | | | |
| Tencent | | Comm Services | | China | | 3.8 | | 3.8 |
| | | | |
| Alibaba | | Cons Discretionary | | China | | 3.4 | | 3.4 |
| | | | |
| Sberbank | | Financials | | Russia | | 2.9 | | 2.9 |
| | | | |
| HDFC Corp | | Financials | | India | | 2.6 | | 2.6 |
| | | | |
| Novatek | | Energy | | Russia | | 2.6 | | 2.6 |
| | | | |
| Lukoil | | Energy | | Russia | | 2.6 | | 2.6 |
| | | | |
| Techtronic | | Industrials | | Hong Kong | | 2.5 | | 2.6 |
expanded growth opportunities. One of them is AirTAC, Taiwan-listed but with extensive operations in China, which produces pneumatic components commonly used in factory automation. In the past year AirTAC has successfully navigated COVID-19 outbreaks and supply chain shortages. The accelerating trend toward automation of manufacturing represents a long-tailed opportunity for AirTAC to create cost-effective solutions for diverse industries. Other Industrials purchases this year include Sanhua, discussed above, and Meyer Optoelectronic, China’s leading supplier of dental imaging equipment and automated sorting systems for food. That may seem a strange combination, but they both leverage Meyer’s core competency: building optical sensor systems governed by custom software. We see a good long-term growth prospects, with a big opportunity for Meyer’s machine vision and sorting technologies in recycling facilities.
Rapid advances in industrial and manufacturing technology are occurring worldwide. The portfolio’s Brazilian holdings include two innovative Industrials businesses: WEG, Brazil’s dominant manufacturer of industrial motors and generators for power plants, and Localiza, the country’s largest car rental and fleet management company. WEG’s initiatives include leveraging its experience in industrial-scale solar energy farms to develop distributed solar energy systems for households. WEG has also applied its expertise in energy systems to make a line of EV charging stations, which, helped by the cost advantages of WEG’s local integrated manufacturing platform, is capturing significant market share.
Localiza is using digital technology to enhance the customer experience in the country’s rental car industry while also reducing costs. For example, it has installed smart telematics equipment in thousands of its rental cars to provide real-time information about vehicle status, such as the vehicle’s location and battery health. The company has also been developing an AI system that can predict when a car is at risk of being stolen and then deactivate the vehicle. Localiza has also launched a cost-effective car rental subscription service that provides access to a diverse fleet of vehicles, which has been particularly popular with ride-sharing drivers.
Chinese Equity Portfolio
Institutional Investors: HLMCX
Portfolio Management Team

Pradipta Chakrabortty
Lead Portfolio Manager
Jingyi Li
Portfolio Manager
Wenting Shen, CFA
Portfolio Manager
Performance Summary
The Chinese Equity Portfolio was launched on December 16, 2020. The Institutional Class fell 6.40% (net of fees and expenses) since launch through October 31, 2021. The Portfolio’s benchmark, the MSCI China All Shares Index, fell 5.22% in this period (net of source taxes).
Market Review
The most extensive series of regulatory changes in years made the 10 months since the Portfolio’s inception turbulent for businesses across China. Among other reforms, policymakers mandated that most of the after-school tutoring industry become not-for-profit, pressed antitrust and labor regulations against online businesses, limited the time children could spend playing online games, and lowered government procurement prices for medical products. The sectors most affected—Consumer Discretionary, Communication Services, and Real Estate—all underperformed the broad China market. Industrials, relatively unscathed by the new regulations, fared better. Utilities, Materials, and Energy rose strongly, buoyed by increased industrial demand for power and commodities such as oil, steel, lithium, and aluminum.
Policies implemented since the start of 2021 to curb an overheated real estate market brought Evergrande, China’s second-largest real estate developer, to the brink of default. Markets quickly priced in contagion risk for other property developers, banks, building-materials suppliers, and to the consumer sectors, which are exposed to the knock-on effects of a potential fall in home prices.
Fund Facts at October 31, 2021
| | |
| Total Net Assets | | $3.9M |
| |
| Sales Charge | | None |
| |
| Number of Holdings | | 38 |
| |
| Turnover (5 Yr. Avg.) | | – |
| |
| Dividend Policy | | Annual |
| |
| | | Institutional Class |
| |
| Ticker | | HLMCX |
| |
| CUSIP | | 412295685 |
| |
| Inception Date | | 12/16/2020 |
| |
| Minimum Investment1 | | $100,000 |
| |
| Net Expense Ratio2 | | 1.15% |
| |
| Gross Expense Ratio2 | | 4.75% |
1Lower minimums available through certain brokerage firms; 2As of the most recent Prospectus. The Net Expense Ratio is shown net of Harding Loevner’s contractual agreement through February 28, 2022; Harding Loevner’s contractual agreement caps the expense ratio at 1.15%. The Net Expense Ratio is applicable to investors.
What has tied many of the government’s wide-ranging regulatory policies together are its renewed focus on achieving “common prosperity,” and its pursuit of a more inclusive development model—goals critical to its plan for achieving a high-enough per capita GDP to become a moderately developed country by 2035. Policymakers appear especially focused on ensuring that the middle class enjoys rising disposable income, a key ingredient for consumption-led growth, which has faltered due to structural impediments such as high real estate prices. Persistent income inequality higher than that of any major developed market, as well as social spending and fiscal redistribution below those of even many emerging markets, have begun to threaten social mobility and stability.
While attention has been largely focused on the recent torrent of regulations, several key areas have seen significant deregulation in line with the government’s long-term policy objectives. This was particularly the case in the sizable financial and automotive sectors. In early September 2021, for example, President Xi Jinping announced the creation of a new stock exchange in Beijing to help smaller companies access capital markets, the third such platform created in recent years to lower hurdles for public listing of relatively small businesses.
Such financial reforms follow a series of actions over the past couple of years loosening restrictions on foreign investment at the corporate level. In August, Tesla, the first foreign automaker to have a wholly owned China business, designated its Shanghai
Performance (% Total Return)
| | | | | | | | | | | | | | | | | | | | | | | | |
| | | For periods ended September 30, 2021 | | | For periods ended October 31, 2021 | |
| | | | | | |
| | | Calendar YTD | | | 1 Year | | | Since Inception* | | | Calendar YTD | | | 1 Year | | | Since Inception* | |
| | | | | | |
| Chinese Equity Portfolio – Institutional Class | | | -11.81 | | | | – | | | | -7.40 | | | | -10.86 | | | | – | | | | -6.40 | |
| | | | | | |
| MSCI China All Shares Index | | | -10.65 | | | | – | | | | -7.78 | | | | -8.17 | | | | – | | | | -5.22 | |
Returns are annualized for periods greater than 1 year. *Inception date: December 16, 2020.
Performance data quoted represents past performance; past performance does not guarantee future results. The investment return and principal value of an investment will fluctuate so that an investor’s shares, when redeemed, may be worth more or less than their original cost. Current performance of the Portfolio may be lower or higher than the performance quoted. Performance data current to the most recent month end may be obtained by calling (877) 435-8105 or visiting www.hardingloevnerfunds.com.
Gigafactory as its new primary global export hub, taking over from its original factory in Fremont, California, in supplying most of the completed vehicles bound for markets lacking their own production facilities. Tesla now makes in China three times as many cars as it sells locally, taking advantage of China’s extensive supply chain, readily available engineering talent, and lower manufacturing costs—without having to share those economics with a joint venture partner. The rise of an export market for Chinese-made automobiles expands the addressable market dramatically for Chinese parts suppliers, several of which are owned in the Portfolio.
Performance Attribution
The Portfolio trailed behind the index this reporting period primarily due to lagging holdings in Consumer Discretionary and our overweight to the sector. Weak stocks in Industrials and the Portfolio’s lack of holdings in Materials and Energy also hurt. Relative returns were helped by strong holdings in Health Care and Information Technology (IT) and by the Portfolio’s overweight in Industrials.
In Consumer Discretionary, shares of e-commerce giant Alibaba were weighed down by the expanded regulatory focus on many of its businesses. Shares of tutoring company New Oriental Education collapsed as regulators in July moved to remand the industry to non-profit status. We sold the holding before the hammer fell. Meanwhile, custom-wardrobe manufacturer Suofeiya struggled to make progress on its product expansion into kitchen cabinets. The shares were also dampened by the reports of financial trouble at Evergrande, a major customer.
In Industrials, holdings in two transportation-related companies were significant detractors. Despite improving cash flows from a modest recovery in international traffic, Shanghai International Airport suffered from domestic travel curbs, as well as a temporary shutdown of its air-cargo operations in August, due to sporadic COVID-19 outbreaks. Shares of delivery and logistics business SF Holding dropped after it unexpectedly announced
net losses in first quarter 2021 caused, in part, by greater transportation costs due to the company’s increased investments in high-frequency truck routes.
The key contributors in Health Care included contract development and manufacturing organizations (CDMOs) WuXi AppTec and WuXi Biologics and contract research organization (CRO) Tigermed. WuXi Biologics added new capacity and capabilities as its project backlog has grown. In IT, Silergy, a semiconductor manufacturer that makes power management integrated circuits, saw increasing demand from a variety of end markets, including a new foothold in automotive.
Perspective and Outlook
Though the lack of Western-style public debate around proposed regulations and the suddenness with which they can be implemented in China can be destabilizing to companies and entire industries, we do not believe these recent regulatory changes are capricious or random. Reforms in areas such as carbon emissions, data security, and social equality are consistent with Beijing’s desire to shift the economy toward more sustainable growth, with an explicit focus on balancing social and environmental goals.
We routinely integrate regulatory risks and impacts into our assessment of the growth and profitability potential of individual businesses and their industries no matter the country. In particular, we closely examine their effects on the level of rivalry and competitive landscape, the threat of new entrants, the ease with which a company’s products might be substituted, and the bargaining power of a company’s buyers and its suppliers, which together form Harvard professor Michael Porter’s “Five Forces,” our workhorse template for analyzing business strategy.
Below, we offer illustrations of how our analysts are using the Porter framework to evaluate the impact of the latest regulatory changes on companies in three industries that have been most affected.
E-commerce
The e-commerce industry, among the first to be scrutinized by Chinese regulators, has been under pressure on multiple fronts. Antitrust investigations resulted late last year in fines against several companies—most notably Alibaba (to the tune of US$2.8 billion)—for requiring exclusivity arrangements from the merchants on their platforms. We had been worried about the escalating rivalry Alibaba faced from other large companies such as Pinduoduo, Meituan, and JD.com. But by forcing the unwinding of exclusivity, regulators also toppled a key barrier to a group of smaller players gaining access to Alibaba-featured merchants. Antitrust investigators also concluded that market leaders in community group buying (CGB),1 such as Meituan, used illegal subsidies and deceptive pricing to lure customers from local brick-and-mortar stores onto their platforms. The irony here is that, in addition to raising industry rivalry from incumbent brick-and-mortar retailers, the unwinding of these practices could help Alibaba and JD.com, which have been looking to increase their toeholds in online grocery.
| | |
 | | The irony is that, in addition to raising industry rivalry from incumbent brick-and-mortar retailers, the unwinding of antitrust practices against online grocery leader Meituan could help Alibaba and JD.com, which have been looking to increase their toeholds in the area. |
We have maintained a position in Alibaba, though we trimmed our exposure toward the end of the period. The company remains the market leader in e-commerce and has several other attractive and fast-growing businesses such as cloud services with significant scale advantages compared to rivals. We expect Alibaba to generate more than 15% cash flow returns on investment over the next five years. And after its recent price decline, its shares looked attractive relative to our assessment of their fair value.
Online Games
Over the past several years, Chinese regulators concerned with the ill effects of online games on kids have issued a series of rules governing how children can access games and the amount of time they can spend playing them. During this period the government took more radical action by limiting minors’ playing time to a maximum of three hours per week and their in-game weekly purchases (the largest source of game revenue) to US$30–60, depending on the player’s age.
1CGB is a popular new business model whereby shoppers’ online grocery orders are aggregated and delivered in bulk to neighborhood pickup locations, allowing economies of scale and cheaper prices.
Looking at these changes through the Porter framework, we see a significant increase in buyer power (that is, the bargaining power of the children playing the games, as they will be operating on a strict time budget), relative to the pricing power of industry participants. The regulations also include antitrust elements that may prevent large firms from continuing to gobble up small studios, which would increase the threat of new entrants and intensify rivalry. Stricter data security regulations will also likely make it harder for game companies to collect personal data, and lead to higher compliance costs. Moreover, the industry’s effective tax rates will likely increase as China claws back certain favorable tax arrangements.
In our Portfolio, we own Tencent and NetEase, two of China’s largest companies developing and operating online games. The unfavorable regulatory changes will likely slow growth for both firms. But while we have reduced our exposure, the slowdown does not negate the fact that these remain high-quality businesses whose management should be able to continue taking advantage of growth opportunities. For instance, NetEase’s latest blockbuster release, Harry Potter: Magic Awakened, has been more successful than projected earlier this summer, a testament to either the enduring adult appeal of Harry Potter or enduring ability of certain games to catch fire.
Portfolio Positioning (% Weight) at October 31, 2021
| | | | | | |
| Market | | Portfolio | | | Benchmark1 |
| | |
| Mainland China + Hong Kong | | | 88.9 | | | 100.0 |
| | |
| Other Emerging Markets | | | 6.8 | | | – |
| | |
| Cash | | | 4.3 | | | – |
| | |
| Sector | | Portfolio | | | Benchmark1 |
| | |
| Comm Services | | | 10.6 | | | 11.6 |
| | |
| Consumer Discretionary | | | 23.2 | | | 23.3 |
| | |
| Consumer Staples | | | 5.6 | | | 9.1 |
| | |
| Energy | | | 0.0 | | | 1.6 |
| | |
| Financials | | | 5.1 | | | 15.1 |
| | |
| Health Care | | | 15.3 | | | 8.5 |
| | |
| Industrials | | | 19.3 | | | 9.3 |
| | |
| Information Technology | | | 13.0 | | | 9.6 |
| | |
| Materials | | | 0.0 | | | 6.2 |
| | |
| Real Estate | | | 1.8 | | | 3.2 |
| | |
| Utilities | | | 1.8 | | | 2.5 |
| | |
| Cash | | | 4.3 | | | – |
1MSCI China All Shares Index.
Health Care
The overarching purposes of regulatory actions in health care are two-fold: to increase affordability through expanding access to generic drugs, and to encourage the local biotech and pharmaceutical industries to innovate more in order to compete more effectively with their Western competitors. As China expands public health care coverage, the government has been using centralized procurement programs and bulk bargaining power to drive down health care costs, including prices for generics. In the first half of this year, China conducted two rounds of large-scale open tenders covering more than 100 drugs and devices, which on average have resulted in prices for the tendered drugs being cut by over half. For Jiangsu Hengrui Medicine, the effect of centralized procurement has significantly compressed sales for the company’s generic drugs: revenues for six of them dropped by 57% in the first half of this year.
We have remained invested in Hengrui because of its impressive research and development (R&D) pipeline in innovative new drugs. The company’s new-drug revenue grew over 43% in the first half of 2021 and now accounts for nearly 40% of its total sales. This part of its business actually benefits from some of the recent regulations, which raise the bar for what is considered an innovative new drug. The new rules will also benefit contract development and manufacturing organizations (CDMOs) and contract research organizations (CROs), including WuXi Apptec, WuXi Biologics, and Tigermed, which comprise 80% of our Portfolio’s Health Care investments. Not only are such companies spared the pricing compression seen in generics, but they stand to benefit from the increased pressure on their customers to develop world-class drugs.
Portfolio Highlights
Taking a long-term perspective of the blizzard of regulatory changes, we cannot help but view the heightened risks against the background of new investment opportunities in China arising from innovation and economic growth. We have generally become less constructive on the largest internet companies in the index, and the Portfolio is now underweight online media, entertainment, and e-commerce, a notable difference from the beginning of this year. Outside of e-commerce, we sold our position in Suofeiya, a maker of custom wardrobes and kitchen cabinets, because we saw its growth potentially slowing due to the disruption in the new-home market caused by Evergrande’s financial woes.
We have maintained our large overweight in Industrials, which reflects the superior opportunities in a sector that is less affected and, in some respects, directly aided by recent regulatory action. Several companies in the sector, such as Inovance and AirTAC, are domestic leaders expected to benefit from the increasing penetration of industrial automation in China, as well as from increasing global market share due to their competitive cost structures and customized service offerings.
Ten Largest Holdings by Weight at October 31, 2021
| | | | | | |
| Company | | Sector | | Market | | % |
| | | |
| Tencent | | Comm Services | | Mainland China | | 5.7 |
| | | |
| WuXi Biologics | | Health Care | | Mainland China | | 5.2 |
| | | |
| Alibaba | | Cons Discretionary | | Mainland China | | 4.7 |
| | | |
| China Tourism Group Duty Free | | Cons Discretionary | | Mainland China | | 4.5 |
| | | |
| Techtronic Industries | | Industrials | | Hong Kong | | 4.2 |
| | | |
| WuXi AppTec | | Health Care | | Mainland China | | 4.0 |
| | | |
| Silergy | | Info Technology | | Taiwan | | 3.6 |
| | | |
| Sunny Optical | | Info Technology | | Mainland China | | 3.5 |
| | | |
| AIA Group | | Financials | | Hong Kong | | 3.2 |
| | | |
| AirTAC | | Industrials | | Taiwan | | 3.2 |
This period we also purchased new positions in high-quality companies whose long-term structural growth outlooks have recently improved.
For instance, we bought Hong Kong Exchanges (HKEx), the highly profitable holding company that operates the stock exchange, futures exchange, and securities clearinghouse of its namesake city, including the Stock Connect program that links to the primary exchanges in Shanghai and Shenzhen trading in mainland-listed (“A-share”) stocks. The potential expansion of HKEx’s fixed income and currency trading businesses, as well as new products such as A-share index futures, should help support the company’s long-term growth.
We also bought ANTA Sports, China’s largest sportswear company, which holds the Chinese marketing rights for Fila among other brands. The company’s ongoing transition from a wholesaler-driven distribution to a direct-to-consumer strategy should improve efficiency and facilitate more premium product sales at its own stores. We think a cultural shift toward health and wellness also has the potential to sustain ANTA’s domestic growth. The government is not just forcing kids off their video games—it has made more regular exercise an explicit national goal, supported by higher spending on fitness-related infrastructure.
Fuyao Glass is China’s largest automotive-glass manufacturer and the leading player in a global glass oligopoly. Its integrated supply chain and economies of scale provide Fuyao with a cost advantage over peers that leads to superior margins. Fuyao’s long-term growth should be aided by increasing penetration of automobile ownership in China from a current level of around 20%, compared to 80% penetration in developed countries such as the US.
Please read the separate disclosures page for important information, including the risks of investing in the Portfolio.
Frontier Emerging Markets Portfolio
Institutional Investors: HLFMX & HLFFX | Individual Investors: HLMOX
Portfolio Management Team

Pradipta Chakrabortty
Co-Lead Portfolio Manager
Babatunde Ojo, CFA
Co-Lead Portfolio Manager
Performance Summary
For the Frontier Emerging Markets Portfolio, the Institutional Class I gained 31.74%, the Institutional Class II gained 32.18%, and the Investor Class gained 31.14% (net of fees and expenses) in the twelve-month period ended October 31, 2021. The Portfolio’s benchmark, the MSCI Frontier Emerging Markets Index, gained 23.72% (net of source taxes).
Market Review
Frontier Emerging Markets (FEMs) posted strong overall performances for the trailing 12 months ended October 31, with much of these returns concentrated in the beginning and end of the period. In the first three months, markets surged in response to the discovery and broadening global distribution of effective vaccines; in the last three months, FEM performance was lifted by the easing of pandemic-related restrictions and the further surge in oil prices. In the middle six months of the period, however, FEMs declined, held back in part by concerns over vaccine access in developing countries.
The strongest-performing region by far in the fund year was Europe, which experienced less pandemic-related and political hiccups than other regions in the index. Kazakhstan was up triple digits, boosted by the oil price rebound. Prices of Brent Crude rose over 120% in the trailing 12 months to just over US$80 per barrel. Latin America outperformed, with Colombian markets also buoyed by the oil price. Peru, however, faltered. In June 2021, it elected leftist president Pedro Castillo in a bitterly contested race; Castillo has vowed to change Peru’s constitution to increase government royalties on mining and energy companies and has been in constant battle with the opposition-dominated legislature, diminishing hopes for stimulus and reform needed to lift the country out of its economic doldrums.
Fund Facts at October 31, 2021
| | | | | | |
| Total Net Assets | | $224.1M |
| |
| Sales Charge | | None |
| |
| Number of Holdings | | 57 |
| |
| Turnover (5 Yr. Avg.) | | 26% |
| |
| Dividend Policy | | Annual |
| | Institutional Investors | | Individual Investors |
| | | Inst. Class I | | Inst. Class II | | Investor Class |
| | | |
| Ticker | | HLFMX | | HLFFX | | HLMOX |
| | | |
| CUSIP | | 412295867 | | 412295735 | | 412295859 |
| | | |
| Inception Date | | 5/27/2008 | | 3/1/2017 | | 12/31/2010 |
| | | |
| Minimum Investment1 | | $100,000 | | $10,000,000 | | $5,000 |
| | | |
| Net Expense Ratio2 | | 1.68%3 | | 1.35%4 | | 2.00%5 |
| | | |
| Gross Expense Ratio2 | | 1.68% | | 1.60% | | 2.12% |
1Lower minimums available through certain brokerage firms. 2As of the most recent Prospectus and based on expenses for the fiscal year end. 3Harding Loevner has contractually agreed to cap the expense ratio at 1.75% through February 28, 2022. The expense ratio (without cap) is applicable to investors. 4The Net Expense Ratio is shown net of Harding Loevner’s contractual agreement through February 28, 2022. Harding Loevner’s contractual agreement caps the expense ratio at 1.35%. The Net Expense Ratio is applicable to investors. 5The Net Expense Ratio is shown net of Harding Loevner’s contractual agreement through February 28, 2022. Harding Loevner’s contractual agreement caps the expense ratio at 2.00%. The Net Expense Ratio is applicable to investors.
The Asian region lagged FEMs overall, primarily due to the Philippines, which represents over 25% of the index by weight. COVID-19 had an especially severe impact on the economy of this densely populated country of over 7,600 islands, including widespread shutdowns of major manufacturers and transportation networks. The tiny Middle East region was the poorest performer. The collapse of the Lebanese market that began in March 2020, when the country defaulted on its foreign debt obligations, continued. In February 2021, MSCI removed Lebanon from the FEM Index.
Energy was the strongest sector this period, reflecting the sharp rise in oil prices over the past year. Information Technology (IT) outperformed due to Argentine software company Globant, which reported strong revenue growth on broad-based demand from its consumer retail, manufacturing, and financial services segments. Rising commodity prices boosted the Materials sector. Real Estate and Consumer Staples shares fell behind the broad market. Real estate was dragged by Philippines real estate companies as the severe pandemic-related lockdown in the country adversely impacted traffic to malls and their ability to sell new residential properties. Similarly, consumer staples companies in the Philippines and Vietnam were impacted by weak consumption because of the COVID-19 lockdowns.
Performance (% Total Return)
| | | | | | | | | | | | | | | | | | | | | | | | | | | | |
| | | For periods ended September 30, 2021 | | For periods ended October 31, 2021 |
| | | | | |
| | | 1 | | 3 | | 5 | | 10 | | Since Inception* | | 1 | | 3 | | 5 | | 10 | | Since Inception* |
| | | Year | | Years | | Years | | Years | | May-08 | | Mar-17 | | Dec-10 | | Year | | Years | | Years | | Years | | May-08 | | Mar-17 | | Dec-10 |
| | | | | | | | | | | | | | |
| Frontier EM Portfolio – Inst. Class I | | 25.90 | | 4.15 | | 4.57 | | 4.52 | | -0.07 | | | | | | 31.74 | | 7.29 | | 5.72 | | 4.49 | | 0.28 | | | | |
| | | | | | | | | | | | | | |
| Frontier EM Portfolio – Inst. Class II | | 26.22 | | 4.43 | | – | | – | | | | 4.95 | | | | 32.18 | | 7.65 | | – | | – | | | | 5.93 | | |
| | | | | | | | | | | | | | |
| Frontier EM Portfolio – Investor Class | | 25.30 | | 3.73 | | 4.21 | | – | | | | | | 1.64 | | 31.14 | | 6.93 | | 5.36 | | 4.10 | | | | | | 2.07 |
| | | | | | | | | | | | | | |
| MSCI Frontier EM Index | | 20.13 | | 2.94 | | 3.32 | | 3.65 | | – | | 3.42 | | 1.52 | | 23.72 | | 6.14 | | 4.56 | | 3.63 | | – | | 4.49 | | 1.98 |
Returns are annualized for periods greater than 1 year. *Inception of the Institutional Class I, May 27, 2008. Inception of the Institutional Class II, March 1, 2017. Inception of the Investor Class, December 31, 2010. Index performance prior to December 2, 2008 cannot be shown since it relies on back-filled data.
Performance data quoted represents past performance; past performance does not guarantee future results. The investment return and principal value of an investment will fluctuate so that an investor’s shares, when redeemed, may be worth more or less than their original cost. Current performance of the Portfolio may be lower or higher than the performance quoted. Performance data current to the most recent month end may be obtained by calling (877) 435-8105 or visiting www.hardingloevnerfunds.com.
Performance Attribution
By sector, strong stock selection in Materials and Financials was a key reason for the Portfolio’s outperformance in the trailing 12 months. In Materials, Vietnamese steelmaker Hoa Phat Group benefitted from rising steel prices and a stimulus-aided domestic building boom. The company also reaped operating efficiencies from a new state-of-the-art manufacturing plant. In Financials, Georgian banks TBC Bank and Bank of Georgia both generated returns on equity of over 20%. Their duopoly—a joint 74% market share of the country’s highly consolidated banking industry—has kept their rivalry in check and resulted in healthy profitability over the past few years.
Stocks in Consumer Staples hurt relative returns, as several Vietnamese food & beverage companies, including Vietnam Dairy Products and Sabeco, suffered from outbreaks of the Delta variant in their home country and resulting supply-chain issues. The Portfolio’s overweight in this sector was also a detractor.
By region, Asian holdings were the biggest source of strength for the Portfolio. In the Philippines, big-box furniture retailer Wilcon Depot proved to be an outlier among the Delta-battered consumer companies in Southeast Asia. In spite of occasional restrictions on mobility due to outbreaks of the virus, domestic demand for its products rose from do-it-yourselfers and small contractors, which made up for continued weakness in larger-scale construction activity. Another strong performer in the Southeast Asian country was Jollibee Foods; stock of the fast-food restaurant company rose after the Philippine government eased COVID-19 restrictions in Metro Manila and adjacent provinces. Strong stocks in Latin America also contributed; Colombian oil company Ecopetrol was one of the key beneficiaries of the rise in oil prices over the course of 2021.
Weak stocks in Africa detracted from performance over the past 12 months. Egyptian packaged snack food company Edita Food Industries is still recovering from the closure of Egyptian schools and universities from March to October of last year, which severed it from its youthful customer base.
Total Return Based on a $100,000 Investment
Institutional Class I
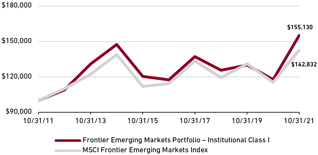
Total Return Based on a $10,000,000 Investment
Institutional Class II
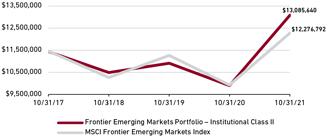
Total Return Based on a $10,000 Investment
Investor Class
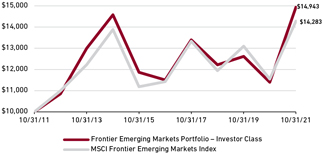
The charts above illustrate the hypothetical return of an investment made in the corresponding share classes. Investment return reflects waivers in effect. Absent such waivers, total return would be reduced. The performance provided in the table and charts above do not reflect the deduction of taxes that a shareholder would pay on Portfolio distributions or the redemption of Portfolio shares.
Perspective and Outlook
In FEMs, many people and small businesses do not participate in the formal financial system. They transact primarily in cash and have no access to bank credit. Even bank customers often have limited choices between providers and pay high fees. At the same time, mobile phones have become ubiquitous, now possessed by more than 65% of the FEM population. E-commerce, online payments, and digital lending are emerging and consolidating—as they did in China—into shopping and banking “super apps.” The ease of use, speed, and convenience of these apps is driving near-ubiquitous adoption.
Banks that fail to keep up with innovation are under ever-increasing competitive threat from such developments. But the type of banks we own in our FEM portfolio have powerful advantages to leverage in this race to adapt. Indonesia’s Bank Central Asia (BCA) is an example of a company that has seized the opportunity to disrupt itself and raise the ceiling for its business.
BCA has established a wide network of branches, ATMs, and cash recycling machines in high-trafficked malls, campuses, and supermarkets, as well as strong online and mobile banking capabilities that came in handy during the pandemic, when it signed up 1.6 million new digital customers and handled 83% of its transactions virtually. By making it easy for customers to transact anytime and anywhere, BCA has built the leading deposit franchise in Indonesia and a mountain of low-interest deposits. These cheap deposits comprise approximately 80% of its total deposit base, the highest among its peers. This translates into the lowest funding cost, which in turn allows the bank to be more selective in its lending.
According to a recent report, 92 million Indonesians—more than a third of the population—either had no bank account or minimal access to banking services as of 2019.1 At the same time, the country is young (over half of population is under the age of 30), increasingly urbanized, and attuned to technology, with smartphone adoption exceeding 74%. Not coincidentally, Indonesia has become home to several tech juggernauts centered around super apps. These include ride-hailing and food delivery app Grab, online retailer Shopee, e-commerce portal Bukalapak, and the biggest of all: Go-To, which has 100 million monthly active customers, two million registered drivers, and more than 11 million merchants on its platform.
When an e-commerce platform wants to start operating as a bank, it’s not as simple as adding features. The company must secure a banking license and offer customers high-interest, zero-fee deposit accounts to attract enough new users to build up their deposit base, which can cut deeply into margins before lending activity scales. This is where a large bank like BCA, entering the fintech space from the other direction, has a distinct advantage. It already has a large established presence and deposit base, giving it an important leg up.
1Google, Temasek, Bain & Company.
BCA has been circling around the opportunity for several years, working as the back-end banking partner with a handful of e-commerce super apps. Then in July, BCA launched Blu, a digitally native bank targeting young Indonesians and small merchants, to establish a branded presence within the super app ecosystem of its e-commerce partners. In less than two months, Blu gained over 100,000 verified customers with 350 billion rupia (~US$25 million) of deposits. Blu pays higher interest rates on deposit than BCA but, thanks to the halo effect of the BCA brand, lower rates than what most digital-only banks must offer. Blu, like its parent, can also choose to be more selective with its lending, skimming off the top tier of the unbanked market with lower rates on borrowing.
Our new portfolio holding, Kaspi Bank, the third largest bank in Kazakhstan, is also on the forefront of the fintech revolution in FEMs. As with Indonesia, the super app model has also taken hold in Kazakhstan. Kaspi began laying the groundwork for its super app a decade ago when it set up kiosks in electronics stores and other big-ticket merchant locations where customers could quickly finance their purchases. Consumers’ affinity for the service helped the bank sign up more merchants and broaden its offerings to include bill pay and online shopping. Over the last few years Kaspi transitioned most of this activity to its mobile app.
Portfolio Positioning (% Weight) at October 31, 2021
| | | | | | |
| Geography | | Portfolio | | | Benchmark1 |
| | |
| Africa | | | 20.3 | | | 15.8 |
| | |
| Asia | | | 39.2 | | | 42.8 |
| | |
| Europe | | | 13.2 | | | 14.3 |
| | |
| Gulf States | | | 6.2 | | | 4.8 |
| | |
| Latin America | | | 11.6 | | | 21.6 |
| | |
| Middle East | | | 0.0 | | | 0.7 |
| | |
| Developed Markets Listed2 | | | 8.4 | | | – |
| | |
| Cash | | | 1.1 | | | – |
| | |
| Sector | | Portfolio | | | Benchmark1 |
| | |
| Communication Services | | | 5.8 | | | 7.9 |
| | |
| Consumer Discretionary | | | 8.3 | | | 1.2 |
| | |
| Consumer Staples | | | 13.5 | | | 6.7 |
| | |
| Energy | | | 4.1 | | | 5.2 |
| | |
| Financials | | | 35.2 | | | 34.5 |
| | |
| Health Care | | | 5.5 | | | 2.9 |
| | |
| Industrials | | | 5.1 | | | 13.2 |
| | |
| Information Technology | | | 11.9 | | | 6.4 |
| | |
| Materials | | | 4.5 | | | 8.5 |
| | |
| Real Estate | | | 5.0 | | | 10.9 |
| | |
| Utilities | | | 0.0 | | | 2.6 |
| | |
| Cash | | | 1.1 | | | – |
1MSCI Frontier Emerging Markets Index; 2Includes frontier or small emerging markets companies listed in developed markets.
The move from in-person kiosk to self-serve app has ironically raised the credit quality of Kaspi’s loans. As consumers make payments and transact on the app’s e-commerce marketplace, Kaspi collects a huge amount of proprietary data, which it pairs with traditional credit bureau information to assess a prospective borrower’s creditworthiness. Coupled with a low average consumer loan maturity of seven months and fraud prevention systems utilizing biometric and face recognition, this data helps Kaspi keep credit risk in check.
Today, Kaspi’s super app is used by more than 10 million Kazakhs who complete an average of 39 transactions per user monthly, among the highest rates of super-app engagement in the world. Importantly, the bank has achieved this without becoming mired in logistics. Instead, the company lets third-party providers do the heavy lifting (and driving) while making them plug into Kaspi’s back-end tech so that the company still has visibility into package tracking and delivery times, and ultimate control over the customer experience.
Two years ago, the bank launched another feature: a proprietary QR-based payment solution that charges merchants a fee of just 0.95% of each transaction vs. the 2%-3% charged by Visa- or Mastercard-branded cards. Within a year, Kaspi captured 66% of electronic payments in Kazakhstan.
Portfolio Highlights
The opportunities we have identified at BCA and Kaspi are illustrative of a significant change in our portfolio over the past three years. We increasingly find that many of the best opportunities for investing in high-quality, faster-growing companies fall into new economy industries like IT services, e-commerce, digital payments, mobile commerce, and fintech. Over 17% of the Portfolio is currently invested in these digital businesses, up from 7% in 2018.
Safaricom, the leading Kenyan telecommunication services company, has carved out a unique exposure to mobile commerce and fintech through its pioneering mobile payment system, M-Pesa. Safaricom customers with M-Pesa accounts can send money to one another instantaneously, pay bills, and purchase goods and services from merchants. The company has a network of about 250,000 M-Pesa agents, typically mom-and-pop shops, to handle the cash for its 28 million customers’ deposits and withdrawals, and it has been broadening the scope of its financial offerings to include savings, loans, insurance, and wealth management products. Safaricom launched the M-Pesa app in June; within three months, the super app had recorded about 4 million downloads, and management intends to roll out M-Pesa across Africa.
Like Safaricom, Network International, a UAE-based digital payment processor present across the Middle East and Africa, is positioned to benefit from the rapid secular growth in digital payments in the region. Even with the gains of Safaricom, the Middle East and Africa are the most underpenetrated digital payments markets in the world, with cash still dominating daily transactions. But
Ten Largest Holdings by Weight at October 31, 2021
| | | | | | |
| Company | | Sector | | Market | | % |
| | | |
| EPAM | | Info Technology | | US | | 4.9 |
| | | |
| Commercial International Bank | | Financials | | Egypt | | 4.6 |
| | | |
| Globant | | Info Technology | | Argentina | | 4.5 |
| | | |
| Hoa Phat Group | | Materials | | Vietnam | | 4.3 |
| | | |
| Safaricom | | Comm Services | | Kenya | | 4.0 |
| | | |
| Wilcon Depot | | Cons Discretionary | | Philippines | | 3.9 |
| | | |
| Halyk Savings Bank | | Financials | | Kazakhstan | | 3.8 |
| | | |
| Banca Transilvania | | Financials | | Romania | | 3.5 |
| | | |
| Vietcombank | | Financials | | Vietnam | | 3.5 |
| | | |
| Ecopetrol | | Energy | | Colombia | | 3.1 |
government-led financial inclusion initiatives, like a recent central bank financing of point-of-sales machines in rural areas of Egypt, together with increasing access to the internet and smartphones, the rapid growth of e-commerce, and a young population, are beginning to speed up the transition.
In recent months, we also established a position in another new economy champion in Allegro, the dominant online retailer in Poland. Its 36% market share, ten times the size of its next largest competitor, allows it to offer the broadest selection and lowest prices in Poland as well as some of the fastest delivery times, including free delivery to the subscribers of its SMART program. With Amazon’s recent launch of its signature Prime offering in Poland, competition is set to intensify. Allegro’s management has spent several years preparing for Amazon’s entry into the market, beefing up its delivery capabilities and introduced Saturday delivery and a nationwide network of pick-up/drop-off lockers. It has also launched an in-house payment platform, Allegro Pay, that makes it easier for customers to pay for purchases, process returns, and (if desired) obtain financing. There is a misperception that Amazon has taken over in every market it has entered. We think that Allegro’s strong user experience and deep customer engagement could make Poland another exception.
Global Equity Research Portfolio
Institutional Investors: HLRGX
Portfolio Management Team

Moon Surana, CFA
Portfolio Manager
Andrew West, CFA
Portfolio Manager
Performance Summary
For the Global Equity Research Portfolio, the Institutional Class gained 33.45% (net of fees and expenses) in the twelve-month period ended October 31, 2021. The Portfolio’s benchmark, the MSCI All Country World Index, gained 37.28% (net of source taxes).
Market Review
Global stock markets increased in the twelve months ended October 31, with all sectors and regions finishing in positive territory.
The period began with a dramatic rise in global stock markets as vaccinations were approved and rolled out, unleashing demand that had been pent up throughout the pandemic. In the first three months of 2021, US retail sales climbed to the strongest level on record. The incoming Biden administration also passed a colossal US$1.9 trillion relief package, sending direct payments to millions of Americans and extending unemployment insurance. In China, electricity generation and rail cargo volume rose substantially year over year, though consumer spending remained subdued despite much of daily life having returned to normal. The EU approved an €800 billion recovery fund aimed at infrastructure investment and support for businesses.
But while the economic recovery continued for most of the period several underlying pressures came to the fore during its final few months. Inflation expectations ballooned as tight labor markets, pandemic-mangled supply chains, and the resumption of more normal consumer and business activity led to shortages across industries. Additionally, commodity prices accelerated as economic
Fund Facts at October 31, 2021
| | |
| Total Net Assets | | $9.9M |
| |
| Sales Charge | | None |
| |
| Number of Holdings | | 326 |
| |
| Turnover (5 Yr. Avg.) | | – |
| |
| Dividend Policy | | Annual |
| |
| | | Institutional Investors |
| |
| Ticker | | HLRGX |
| |
| CUSIP | | 412295792 |
| |
| Inception Date | | 12/19/2016 |
| |
| Minimum Investment1 | | $100,000 |
| |
| Net Expense Ratio2 | | 0.80%3 |
| |
| Gross Expense Ratio2 | | 2.04% |
1Lower minimums available through certain brokerage firms; 2The Expense Ratios are as of the most recent Prospectus and are based on expenses for the most recent fiscal year end. The Net Expense Ratio is shown net of Harding Loevner’s contractual agreement through February 28, 2022. 3Harding Loevner’s contractual agreement caps the net expense ratio at 0.80%. The Net Expense Ratio is applicable to investors.
activity increased. In response to these inflationary pressures, central banks began to signal the impending end of unprecedented monetary support and, in some cases, acted by reducing bond buying or raising interest rates. Meanwhile, an aggressive series of interventions by Chinese regulators heightened the regulatory malaise. The crackdowns, which began in November 2020 with the tabling of the Ant Financial IPO, expanded with the remanding of the entire after-school tutoring sector to not-for-profit status, the adoption of anti-monopoly measures against the country’s internet giants, and new rules to limit the time spent by minors playing video games, among other provisions. Combined with the apparent impending debt default (later avoided) by the property giant Evergrande—itself the result of policy moves designed to force the heavily indebted sector to de-lever—the regulatory sweep savaged Chinese share prices, leaving them down 9% for the period.
On a sector basis, Energy was the strongest performer, surging in lockstep with rising oil prices. Financials also performed strongly, aided by a steepening yield curve and surprisingly low credit defaults. Information Technology (IT) also outperformed despite heightened scrutiny from regulators in Europe, China, and the US. Less-cyclical sectors—Consumer Staples, Health Care, and Utilities—all underperformed for the period.
Viewed by geography, the eurozone outperformed as some of the countries hit hardest by the virus, such as Spain and Italy, began to recover. Canada performed strongly, helped by its large weighting
Performance (% Total Return)
| | | | | | | | | | | | | | | | | | | | | | | | | | | | | | | | |
| | | For periods ended September 30, 2021 | | | For periods ended October 31, 2021 | |
| | | | | | | | |
| | | Calendar YTD | | | 1 Year | | | 3 Years | | | Since Inception* | | | Calendar YTD | | | 1 Year | | | 3 Years | | | Since Inception* | |
| | | | | | | | |
| Global Equity Research Portfolio – Institutional Class | | | 8.97 | | | | 26.11 | | | | 13.17 | | | | 15.24 | | | | 13.63 | | | | 33.45 | | | | 17.82 | | | | 15.95 | |
| | | | | | | | |
| MSCI All Country World Index | | | 11.12 | | | | 27.44 | | | | 12.58 | | | | 13.52 | | | | 16.79 | | | | 37.28 | | | | 17.47 | | | | 14.43 | |
Returns are annualized for periods greater than 1 year. *Inception date: December 19, 2016.
Performance data quoted represents past performance; past performance does not guarantee future results. The investment return and principal value of an investment will fluctuate so that an investor’s shares, when redeemed, may be worth more or less than their original cost. Current performance of the Portfolio may be lower or higher than the performance quoted. Performance data current to the most recent month end may be obtained by calling (877) 435-8105 or visiting www.hardingloevnerfunds.com.
The chart below illustrates the hypothetical return of an investment made in the Institutional share class. Investment return reflects waivers in effect. Absent such waivers, total return would be reduced. The performance provided in the table and chart do not reflect the deduction of taxes that a shareholder would pay on Portfolio distributions or the redemption of Portfolio shares.
in banks and Energy. Japan significantly underperformed as the country instituted a new, more stringent state of emergency in response to another virus wave in late summer and early fall. Emerging Markets (EMs) underperformed due to the weakness in China following its regulatory crackdowns.
Performance Attribution
The Portfolio’s underperformance was caused primarily by weak stocks and negative effects of regional allocations. By sector, Consumer Discretionary was by far the largest detractor as some of our companies were hit by various supply chain issues. Rinnai, a Japanese gas appliances manufacturer, was impacted by the rise in the price of copper, a key input cost; since first soaring in March, copper prices have remained over 33% higher than they were at the start of the fund year. Also in Consumer Discretionary, Japanese manufacturing company Stanley Electric, a large exporter of automobile lighting and instruments, grappled with a shortage of, and a rise in freight rates for, shipping containers. Weak stocks in Energy also detracted; Dutch chemicals storage company Vopak took a sizeable impairment charge on its Panama storage terminals and suffered further from subdued management outlooks throughout the fund year.
By region, Japan was the largest drag on relative returns, with aforementioned supply-chain issues heavily impacting importers and exporters of consumer durables. Also in Japan, disposable hygiene products manufacturer Unicharm saw a decline in the sales of masks and wet wipes from last year as worldwide COVID-19 containment measures eased. Eurozone countries detracted to a lesser extent; French storage terminal and petroleum products distributor Rubis detracted as it experienced a lull in sales across several tourism-dependent regions, especially the Caribbean. The Portfolio’s underweight in US companies also detracted from relative returns.
EMs were a bright spot in terms of stock selection, with good stocks in China contributing to performance. Hong Kong-listed Chinese energy distributor ENN Energy reported strong growth across its businesses in 2021 due to higher gas volumes and increased pricing as the country rebounded from last year’s pandemic-related pressures.
Total Return Based On a $100,000 Investment
Institutional Class
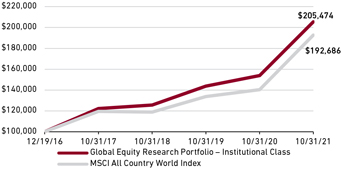
Perspective and Outlook
In our 2020 first quarter report for our sister Global Equity strategy, at the early stage of the global pandemic, we marveled at the resiliency of the Chinese stock market, which we ascribed to the country’s success in containing the domestic spread of the coronavirus through draconian lockdowns, whose efficacy was made possible by its authoritarian political system. Eighteen months later, a similarly authoritarian intervention has left investors reeling. While government intervention is not uncommon in China, the scale and pace of this latest crop of reforms is unprecedented. Is Xi Jinping, China’s most powerful leader since Chairman Mao, revealing his allegiance to a collectivist ideology long thought to be discredited? Or is he boldly grasping the nettle of reform to redress economic imbalances and social ills before they become more entrenched and undermine the Chinese Communist Party’s (CCP’s) legitimacy?
Despite headlines conjuring memories of the CCP’s gruesome past, we accept that on balance the policy changes are intended to benefit the long-term health of Chinese society and economy, especially its middle class. The message the Party is sending to business leaders across China is clear: compete on a level playing field and pay a fair wage. For instance, much of the coverage of Ant Group’s canceled IPO focused on the ostensible desire of the CCP to clip the wings of its tech oligarchs. More persuasive in our view is that having observed and learned from
the West’s subprime debacle a decade prior, Chinese financial regulators are not keen to allow loan origination to be divorced from the underlying credit risks of the loans—a source of moral hazard that would potentially destabilize a financial system still dominated by lumbering state-owned banks with weak credit cultures and poor management systems. Antitrust interventions targeting the largest e-commerce platforms echo the statements (if not yet the achievements) of many Western policymakers to improve competition by increasing the bargaining power of smaller businesses versus the giants.
Meanwhile, although the gutting of the private educational tutoring sector may seem disproportionate, it has with the stroke of a pen stigmatized one of the educational advantages of affluence while inhibiting the exam preparation arms race that many middle-class families feel has spiraled out of control. Actions taken to strengthen the data privacy protections of social media companies, tighten local ownership of Macau casinos, and rein in speculation in the high-end liquor market would not be out of place in Europe or the US. Not to minimize the serious consequences of these abrupt and radical reforms for private businesses; as investors we are viewing these actions mainly as problems requiring further analysis rather than as indications that China has become too unpredictable to be investable.
More troubling for China’s long-term prospects (although less of an immediate danger to our portfolio) is the near-collapse of Evergrande. For years, the Chinese government has promised to wean the economy from fixed asset investments in favor of consumption, with little to show for the rhetoric. Regional governments have continued to rely on a red-hot property sector to provide their funding and achieve their mandated growth targets. Alarmed by the outsized role of property development in the economy, and the associated risks to the financial system of too much property speculation, the central government pushed through a series of policies last year to force the property sector to deleverage. Evergrande’s plight looks like the direct consequence of those blunt top-down mandates as the heavily indebted company started to find itself cut off from its usual credit lines. While the government may be happy to make an example of the company, the spillover effects to the rest of the economy will be hard to contain and likely to require yet more interventions.
Equally disturbing to us are the rolling power outages afflicting as many as 20 provinces. Dueling top-down mandates with competing objectives seem to be playing a role here. Earlier in the year, the central government renewed its commitment to “dual control,” a mandate to curb carbon emissions by limiting both energy usage and the intensity (i.e., the amount of energy used per unit of GDP). That directive was issued, however, without anticipating this year’s spike in industrial output, whose emissions far exceed those from less energy-intensive sectors. Once they met their local growth targets, regional
administrators rushed to institute power shutdowns to avoid breaching stipulated emission ceilings. To be sure, there are other factors contributing to the power crisis—not least, skyrocketing coal prices whose rise was exacerbated by China’s boycott of Australian coal imports in retaliation for that country’s insistence on re-opening the inquiry into the origins of the COVID-19 virus—but the policy disconnects didn’t help.
Nobel Prize-winning economist Friedrich Hayek would have predicted that the Chinese government would ultimately fail to manage its economy by mandate, because officials can’t foresee and prevent every unintended consequence of their own actions. If China’s growth slows further, more such shortcomings are likely to surface. The Chinese authorities exhibited competence at virus management, but even when their intentions are good, leaders inevitably miscalculate. When the views of authoritarians are subjected to little debate and their mandates are implemented without checks and balances, miscalculations can have outsized consequences. It’s unclear to us when a greater trust in the spontaneous order spawned by private actors and market forces, however well-mitigated by regulation and taxation, will take hold in China. Likely not as soon as we had hoped.
Portfolio Positioning (% Weight) at October 31, 2021
| | | | | | |
| Geography | | Portfolio | | | Benchmark1 |
| | |
| Canada | | | 1.1 | | | 2.9 |
| | |
| Emerging Markets | | | 21.0 | | | 11.5 |
| | |
| Europe EMU | | | 12.3 | | | 8.3 |
| | |
| Europe ex-EMU | | | 11.6 | | | 7.9 |
| | |
| Frontier Markets2 | | | 0.8 | | | – |
| | |
| Japan | | | 9.0 | | | 5.7 |
| | |
| Middle East | | | 0.3 | | | 0.2 |
| | |
| Pacific ex-Japan | | | 2.6 | | | 2.9 |
| | |
| United States | | | 40.2 | | | 60.6 |
| | |
| Cash | | | 1.1 | | | – |
| | |
| Sector | | Portfolio | | | Benchmark1 |
| | |
| Comm Services | | | 5.9 | | | 8.9 |
| | |
| Consumer Discretionary | | | 11.7 | | | 12.8 |
| | |
| Consumer Staples | | | 6.4 | | | 6.6 |
| | |
| Energy | | | 4.2 | | | 3.6 |
| | |
| Financials | | | 13.2 | | | 14.5 |
| | |
| Health Care | | | 17.6 | | | 11.5 |
| | |
| Industrials | | | 15.1 | | | 9.6 |
| | |
| Information Technology | | | 19.6 | | | 22.7 |
| | |
| Materials | | | 4.3 | | | 4.6 |
| | |
| Real Estate | | | 0.5 | | | 2.6 |
| | |
| Utilities | | | 0.4 | | | 2.6 |
| | |
| Cash | | | 1.1 | | | – |
1MSCI All Country World Index; 2Includes countries with less-developed markets outside the index.
Portfolio Highlights
The Global Equity Research portfolio’s holdings follow analysts’ recommendations from Harding Loevner’s collection of researched companies. During this twelve-month period ending October 31, 2021, Portfolio turnover was 39%, driven by analyst recommendations, recent analyst promotions and new analysts joining the team, as well as new small cap holdings. We ended the fund year with 326 holdings in the Portfolio. This increase in small cap holdings has led us to implement new portfolio construction rules to manage valuation risk and our exposure to small cap holdings; companies below US$5 billion in market cap are now allowed to enter the portfolio only if they score in the cheaper half of relative valuations using our proprietary value rankings.
During the period, the Portfolio’s exposure in Consumer Staples declined the most, due in equal parts to analyst recommendations and market movements. Meanwhile, we purchased several new positions in Consumer Discretionary companies due to analyst upgrades. By region, our exposure to the eurozone increased the most, due to analyst recommendations, while our exposure to the US decreased the most, due to analyst concerns about elevated valuations.
In Consumer Staples, we sold several holdings, including Japan-based household and personal care manufacturer Kao, whose growth prospects are being challenged from several directions. Chinese diaper sales, once among the company’s largest drivers of growth, have slumped in the face of stiffer competition (both from other international and Chinese home-grown players) while facing an even more uncertain future from China’s declining birth rates. Our analyst is also skeptical that Kao’s new global cosmetics platform will be able to gain traction against stronger multi-national brands such as Shiseido. We also sold several positions due to excessive valuations, including Japanese drug store operator Cosmos Pharmaceutical, Japanese infant care products manufacturer Pigeon, Germany-based plant breeder KWS, and South Korea-based cosmetics conglomerate Amorepacific. Additionally, we trimmed our positions in Proctor & Gamble, Walmart de México, Church & Dwight (the US-based maker of Arm & Hammer), and Colgate-Palmolive due to valuation concerns.
In Consumer Discretionary, we purchased several new positions due to analyst upgrades. One new addition was Haier Smart Home, one of the world’s largest home-appliance makers. Though it has yet to establish a strong presence in the high-end consumer market outside of its home country of China, the company’s lean manufacturing and growing strength in design and innovation should help it expand its global share in this area. We also purchased NITORI, Japan’s largest home furnishing retailer. The analyst upgraded the stock after a period of underperformance, believing that it was an opportune time to buy given the company’s more attractive valuation and the expansion of its retail footprint through its recent acquisition of competitor Shimachu, which should drive sales.
Ten Largest Holdings by Weight at October 31, 2021
| | | | | | |
| Company | | Sector | | Market | | % |
| | | |
| Teradyne | | Info Technology | | US | | 1.2 |
| | | |
| Microsoft | | Info Technology | | US | | 1.2 |
| | | |
| Thermo Fisher Scientific | | Health Care | | US | | 1.1 |
| | | |
| Broadcom | | Info Technology | | US | | 1.1 |
| | | |
| JPMorgan Chase | | Financials | | US | | 1.1 |
| | | |
| Alphabet | | Comm Services | | US | | 1.1 |
| | | |
| UnitedHealth Group | | Health Care | | US | | 1.0 |
| | | |
| AbbVie | | Health Care | | US | | 1.0 |
| | | |
| ExxonMobil | | Energy | | US | | 1.0 |
| | | |
| Applied Materials | | Info Technology | | US | | 0.9 |
In the US, industrial automation conglomerate Rockwell and Domino’s, the pizza chain, were sold after downgrades by analysts due to valuation concerns following strong performance. We also trimmed our positions in online shopping and payments solutions provider eBay, specialty chemicals manufacture Ecolab, and medical technology company Edwards Lifesciences due to elevated valuations.
Our increased investments in the eurozone were largely the result of purchasing newly eligible smaller-cap holdings such as Nemetschek, a provider of specialty software for the architect, engineering, and construction community, and Germany-based IT consultancy Bechtle. We also had analyst upgrades of larger-cap companies, including Spanish airline-reservation-management software business Amadeus, German household products manufacturer Henkel, and French energy storage and distribution company Rubis.
Please read the separate disclosures page for important information, including the risks of investing in the Portfolio.
International Equity Research Portfolio
Institutional Investors: HLIRX
Portfolio Management Team

Moon Surana, CFA
Portfolio Manager
Andrew West, CFA
Portfolio Manager
Performance Summary
For the International Equity Research Portfolio, the Institutional Class gained 26.76% (net of fees and expenses) in the twelve-month period ended October 31, 2021. The Portfolio’s benchmark, the MSCI All Country World ex-US Index, gained 29.66% (net of source taxes).
Market Review
International stock markets increased in the twelve months ended October 31, with all sectors and regions finishing in positive territory.
The period began with a dramatic rise in global stock markets as vaccinations were approved and rolled out, unleashing demand that had been pent up throughout the pandemic. In the first three months of 2021, US retail sales climbed to the strongest level on record and restaurant bookings and the number of airline passengers improved. The incoming Biden administration also passed a colossal US$1.9 trillion relief package, sending direct payments to millions of Americans and extending unemployment insurance. In China, electricity generation and rail cargo volume rose substantially year over year, though consumer spending remained subdued despite much of daily life having returned to normal. The EU approved an €800 billion recovery fund aimed at infrastructure investment and support for businesses.
But while the economic recovery continued at a steady (albeit regionally uneven) pace for most of the period, several underlying pressures came to the fore in the period’s final few months. Inflation expectations, which had hit rock bottom in May 2020, ballooned as tight labor markets, pandemic-mangled supply chains, and the
Fund Facts at October 31, 2021
| | |
| Total Net Assets | | $15.3M |
| |
| Sales Charge | | None |
| |
| Number of Holdings | | 229 |
| |
| Turnover (5 yr. avg.) | | 46% |
| |
| Dividend Policy | | Annual |
| |
| | | Institutional Investors |
| |
| Ticker | | HLIRX |
| |
| CUSIP | | 412295826 |
| |
| Inception Date | | 12/17/2015 |
| |
| Minimum Investment1 | | $100,000 |
| |
| Net Expense Ratio2 | | 0.75%3 |
| |
| Gross Expense Ratio2 | | 1.40% |
1Lower minimums available through certain brokerage firms. 2As of the most recent Prospectus and based on expenses for the most recent fiscal year end. 3The Net Expense Ratio is shown net of Harding Loevner’s contractual agreement through February 28, 2022. Harding Loevner’s contractual agreement caps the net expense ratio at 0.75%. The Net Expense Ratio is applicable to investors.
resumption of more normal consumer and business activity led to shortages across industries. Additionally, commodity prices—particularly those linked with industrial activity such as copper and Brent crude—accelerated as economic activity increased. In response to these inflationary pressures, central banks turned more hawkish. Many began to signal the impending end of unprecedented monetary support and, in some cases, acted by reducing bond buying or raising interest rates. Meanwhile, an aggressive series of interventions by Chinese regulators heightened the regulatory malaise. The crackdowns, which began in November 2020 with the tabling of the IPO for Alibaba subsidiary Ant Group, expanded with the remanding of the entire after-school tutoring sector to not-for-profit status, the adoption of anti-monopoly measures against the country’s internet giants, and new rules to strengthen the data security of social media platforms and limit the time spent by minors playing video games, among other provisions. Combined with the apparent impending debt default (later avoided) by the property giant Evergrande—itself the result of policy moves designed to force the heavily indebted sector to de-lever—the regulatory sweep savaged Chinese share prices, leaving them down 9% for the period.
On a sector basis, Energy was the strongest performer, surging in lockstep with rising oil prices. Financials also performed strongly, aided by a steepening yield curve and surprisingly low credit
Performance (% Total Return)
| | | | | | | | | | | | | | | | | | | | | | | | | | | | | | | | |
| | | For periods ended September 30, 2021 | | | For periods ended October 31, 2021 | |
| | | | | | | | |
| | | 1 Year | | | 3 Years | | | 5 Years | | | Since Inception* | | | 1 Year | | | 3 Years | | | 5 Years | | | Since Inception* | |
| | | | | | | | |
| Intl. Equity Research Portfolio – Institutional Class | | | 21.97 | | | | 8.97 | | | | 9.85 | | | | 10.78 | | | | 26.76 | | | | 13.35 | | | | 10.75 | | | | 11.03 | |
| | | | | | | | |
| MSCI All Country World ex-US Index | | | 23.91 | | | | 8.03 | | | | 8.94 | | | | 8.86 | | | | 29.66 | | | | 12.00 | | | | 9.77 | | | | 9.17 | |
Returns are annualized for periods greater than 1 year. *Inception date: December 17, 2015.
Performance data quoted represents past performance; past performance does not guarantee future results. The investment return and principal value of an investment will fluctuate so that an investor’s shares, when redeemed, may be worth more or less than their original cost. Current performance of the Portfolio may be lower or higher than the performance quoted. Performance data current to the most recent month end may be obtained by calling (877) 435-8105 or visiting www.hardingloevnerfunds.com.
The chart below illustrates the hypothetical return of an investment made in the Institutional share class. Investment return reflects waivers in effect. Absent such waivers, total return would be reduced. The performance provided in the table and chart do not reflect the deduction of taxes that a shareholder would pay on Portfolio distributions or the redemption of Portfolio shares.
Total Return Based on a $100,000 Investment
Institutional Class
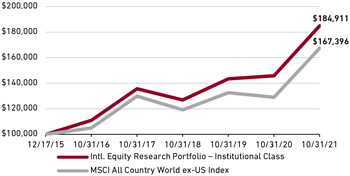
defaults. Information Technology (IT) also outperformed despite heightened scrutiny from regulators in Europe, China, and the US. Less-cyclical sectors—Consumer Staples, Health Care, and Utilities—all underperformed for the period.
Viewed by geography, the eurozone outperformed as some of the countries hit hardest by the virus, such as Spain and Italy, began to recover. Canada also performed strongly, helped by its large weighting in banks and Energy. Japan significantly underperformed as the country instituted a new, more stringent state of emergency in response to another virus wave in late summer and early fall. Emerging Markets (EMs) also underperformed due to the weakness in China following its regulatory crackdowns.
Performance Attribution
The Portfolio underperformed due largely to weak stock selection. Stocks in Materials, Consumer Staples, and Energy detracted the most during the period. In the former, Danish natural food ingredients producer Chr. Hansen, which had outperformed during the start of the pandemic, gave back some of those gains during the closing months of 2020. In Consumer Staples, Unicharm, a Japanese
manufacturer of hygiene and household cleaning products, fell in response to rising input costs (like oil) and year-over-year decline in sales in Japan. In Energy, Dutch energy storage and handling company Vopak fell as lower occupancy rates for the company’s storage business (due to energy production shortages during the period) led to muted profit and revenue growth. The Portfolio’s underweight in Financials and overweight in Consumer Staples also hurt relative returns.
Strong stocks in Health Care and Financials contributed. In Health Care, Japanese pharmaceuticals manufacturer Shionogi gained due to positive results for its COVID-19 antiviral medication and to rising hopes for its reformulated COVID-19 vaccine. In Financials, shares of Spanish bank BBVA rose following the announcement of the sale of its lackluster US business for a healthy premium. The Portfolio’s underweight in Communication Services was also helpful.
Geographically, weak stocks in the eurozone and Japan detracted from relative performance. In the eurozone, shares of German provider of remote connectivity software TeamViewer declined as the company announced a string of disappointing earnings in 2021 and lowered guidance for the year. In Japan, drug and consumer goods manufacturer Kobayashi Pharma detracted as sales suffered from the collapse of tourism (pre-pandemic, Kobayashi derived around 10% of its sales from mainland China and from Chinese tourists visiting Japan and loading up on the company’s cosmetics, hygiene, and other products) and management offered weak 2021 guidance. The Portfolio’s underweight in Canada also hurt. Strong stocks in EMs contributed, particularly Silergy, a Taiwanese manufacturer of power management integrated circuits for a variety of specialized industries. The company has taken advantage of more established suppliers’ inability to keep up with automotive industry demand during the chip shortage, which has allowed Silergy to gain a foothold in an important new segment. Our holdings in Europe outside the eurozone were also helpful, especially UK-incorporated oil and gas producer Royal Dutch Shell, which benefitted as energy prices surged during the period due to rising worldwide demand and natural gas shortages.
Perspective and Outlook
In our 2020 first quarter letter, at the early stage of the global pandemic, we marveled at the resiliency of the Chinese stock market, which we ascribed to the country’s success in containing the domestic spread of the coronavirus through draconian lockdowns, whose efficacy was made possible by its authoritarian political system. Eighteen months later, a similarly authoritarian intervention has left investors reeling. While government intervention is not uncommon in China, the scale and pace of this latest crop of reforms is unprecedented. Is Xi Jinping, China’s most powerful leader since Chairman Mao, revealing his allegiance to a collectivist ideology long thought to be discredited? Or is he boldly grasping the nettle of reform to redress economic imbalances and social ills before they become more entrenched and undermine the Chinese Communist Party’s (CCP’s) legitimacy?
Despite headlines conjuring memories of the CCP’s gruesome past, we accept that on balance the policy changes are intended to benefit the long-term health of Chinese society and economy, especially its middle class. The message the Party is sending to business leaders across China is clear: compete on a level playing field and pay a fair wage. For instance, much of the coverage of Ant Group’s canceled IPO focused on the ostensible desire of the CCP to clip the wings of its tech oligarchs. More persuasive in our view is that having observed and learned from the West’s subprime debacle a decade prior, Chinese financial regulators are not keen to allow loan origination to be divorced from the underlying credit risks of the loans—a source of moral hazard that would potentially destabilize a financial system still dominated by lumbering state-owned banks with weak credit cultures and poor management systems. Antitrust interventions targeting the largest e-commerce platforms echo the statements (if not yet the achievements) of many Western policymakers to improve competition by increasing the bargaining power of smaller businesses versus the giants.
Meanwhile, although the gutting of the private educational tutoring sector may seem disproportionate, it has with the stroke of a pen stigmatized one of the educational advantages of affluence while inhibiting the exam preparation arms race that many middle-class families feel has spiraled out of control. Actions taken to strengthen the data privacy protections of social media companies, tighten local ownership of Macau casinos, and rein in speculation in the high-end liquor market would not be out of place in Europe or the US. Not to minimize the serious consequences of these abrupt and radical reforms for private businesses; as investors we are viewing these actions mainly as problems requiring further analysis rather than as indications that China has become too unpredictable to be investable.
More troubling for China’s long-term prospects (although less of an immediate danger to our Portfolio) is the near-collapse of Evergrande. For years, the Chinese government has promised to wean the economy from fixed asset investments in favor of consumption, with little to show for the rhetoric. Regional governments have continued to rely on a red-hot property sector to provide their funding and achieve their mandated growth
targets. Alarmed by the outsized role of property development in the economy, and the associated risks to the financial system of too much property speculation, the central government pushed through a series of policies last year to force the property sector to deleverage. Evergrande’s plight looks like the direct consequence of those blunt top-down mandates as the heavily indebted company started to find itself cut off from its usual credit lines. While the government may be happy to make an example of the company, the spillover effects to the rest of the economy will be hard to contain and likely to require yet more interventions.
Equally disturbing to us are the rolling power outages afflicting as many as 20 provinces. Dueling top-down mandates with competing objectives seem to be playing a role here. Earlier in the year, the central government renewed its commitment to “dual control,” a mandate to curb carbon emissions by limiting both energy usage and the intensity (i.e., the amount of energy used per unit of GDP). That directive was issued, however, without anticipating this year’s spike in industrial output, whose emissions far exceed those from less energy-intensive sectors. Once they met their local growth targets, regional administrators rushed to institute power shutdowns to avoid breaching stipulated emission ceilings. To be sure, there are other factors contributing to the power crisis—not
Portfolio Positioning (%) at October 31, 2021
| | | | | | |
| Geography | | Portfolio | | | Benchmark1 |
| | |
| Canada | | | 1.9 | | | 7.4 |
| | |
| Emerging Markets | | | 31.6 | | | 29.2 |
| | |
| Europe EMU | | | 22.2 | | | 21.2 |
| | |
| Europe ex-EMU | | | 21.4 | | | 20.1 |
| | |
| Frontier Markets2 | | | 1.1 | | | – |
| | |
| Japan | | | 14.8 | | | 14.5 |
| | |
| Middle East | | | 0.3 | | | 0.4 |
| | |
| Pacific ex-Japan | | | 5.0 | | | 7.2 |
| | |
| Cash | | | 1.7 | | | – |
| | |
| Sector | | Portfolio | | | Benchmark1 |
| | |
| Communication Services | | | 5.4 | | | 6.2 |
| | |
| Consumer Discretionary | | | 11.8 | | | 12.9 |
| | |
| Consumer Staples | | | 9.4 | | | 8.5 |
| | |
| Energy | | | 4.3 | | | 5.0 |
| | |
| Financials | | | 16.4 | | | 19.5 |
| | |
| Health Care | | | 12.9 | | | 9.4 |
| | |
| Industrials | | | 19.4 | | | 12.1 |
| | |
| Information Technology | | | 11.5 | | | 13.1 |
| | |
| Materials | | | 5.4 | | | 7.9 |
| | |
| Real Estate | | | 1.1 | | | 2.4 |
| | |
| Utilities | | | 0.7 | | | 3.0 |
| | |
| Cash | | | 1.7 | | | – |
1MSCI All Country World ex-US Index; 2Includes countries with less-developed markets outside the index.
least, skyrocketing coal prices whose rise was exacerbated by China’s boycott of Australian coal imports in retaliation for that country’s insistence on re-opening the inquiry into the origins of the COVID-19 virus—but the policy disconnects didn’t help.
Nobel Prize-winning economist Friedrich Hayek would have predicted that the Chinese government would ultimately fail to manage its economy by mandate, because officials can’t foresee and prevent every unintended consequence of their own actions. If China’s growth slows further, more such shortcomings are likely to surface. The Chinese authorities exhibited competence at virus management, but even when their intentions are good, leaders inevitably miscalculate. When the views of authoritarians are subjected to little debate and their mandates are implemented without checks and balances, miscalculations can have outsized consequences. It’s unclear to us when a greater trust in the spontaneous order spawned by private actors and market forces, however well-mitigated by regulation and taxation, will take hold in China. Likely not as soon as we had hoped.
Portfolio Highlights
The International Equity Research Portfolio’s holdings follow analysts’ recommendations from Harding Loevner’s collection of researched companies. During this twelve-month period ending October 31, 2021, Portfolio turnover was 38%, driven by analyst recommendations, recent analyst promotions and new analysts joining the team, as well as new small cap holdings; we ended the fund year with 229 holdings in the Portfolio. This increase in small cap holdings has led us to implement new portfolio construction rules to manage valuation risk and our exposure to small cap holdings; companies below US$5 billion in market cap are now allowed to enter the Portfolio only if they score in the cheaper half of relative valuations using our proprietary value rankings.
During the period, the Portfolio’s exposure in Consumer Staples declined the most, due in equal parts to analyst recommendations and market movements. The Portfolio’s exposure to Financials increased the most (largely due to market movements), and analyst recommendations also led to an increase in exposure in Communication Services. By region, our exposure in Japan declined the most, due to both analyst recommendations and market movements. Our exposure to the eurozone increased the most, due to analyst recommendations.
In Consumer Staples, we sold several holdings, including Japan-based household and personal care manufacturer Kao, whose growth prospects are being challenged from several directions. Chinese diaper sales, once among the company’s largest drivers of growth, have slumped in the face of stiffer competition (both from other international and Chinese home-grown players) while facing an even more uncertain future from China’s declining birth rates. Our analyst is also skeptical that Kao’s new global cosmetics platform will be able to gain traction against stronger multi-national brands such as Shiseido. We also sold several positions due to excessive valuations, including Japanese drug store
Ten Largest Holdings by Weight at October 31, 2021
| | | | | | |
| Company | | Sector | | Market | | % |
| | | |
| SE Banken | | Financials | | Sweden | | 1.2 |
| | | |
| DBS Group | | Financials | | Singapore | | 1.1 |
| | | |
| Reply | | Info Technology | | Italy | | 1.1 |
| | | |
| ASML | | Info Technology | | Netherlands | | 1.1 |
| | | |
| OCBC Bank | | Financials | | Singapore | | 1.0 |
| | | |
| Alfa Laval | | Industrials | | Sweden | | 1.0 |
| | | |
| Genmab | | Health Care | | Denmark | | 1.0 |
| | | |
| Hakuhodo | | Comm Services | | Japan | | 1.0 |
| | | |
| Alcon | | Health Care | | Switzerland | | 1.0 |
| | | |
| Diploma | | Industrials | | UK | | 1.0 |
operator Cosmos Pharmaceutical, Japanese infant care products manufacturer Pigeon, Germany-based plant breeder KWS SAAT, and South Korea-based cosmetics conglomerate Amorepacific. Additionally, we trimmed our positions in French cosmetic maker L’Oréal, Mexican grocery retail chain Walmart de México, Indian consumer goods company Godrej Consumer, Chinese alcoholic beverage producers Wuliangye Yibin and Jiangsu Yanghe Brewery, and Kobayashi Pharmaceutical due to valuation concerns.
In Communication Services, we purchased several new positions because of analyst upgrades, including two online real estate portals, Germany’s Scout24 and UK-based Rightmove. Scout24 operates the leading real estate platform in Germany where agents, landlords, and individual sellers can list and display their properties for sale or rent. (Think of it as a mashup of Realtor.com, Apartments. com, and Craigslist.) The company has over 70% market share and enjoys a strong network effect. In a similar vein, Rightmove is the UK’s leading real estate portal, with around 90% market share of users in the UK. As the dominant player in the market, the company has historically utilized its pricing power to sell its customers on additional products and increase prices for subscription packages. Rightmove’s low capital intensity and high level of free cash flow generation further add to the attractiveness of the business.
In Japan, we sold our positions in factory-materials supplier MonotaRO and machine-vision specialist Keyence due to valuation concerns following strong performance. We also trimmed our positions in economic research and consulting firm Nomura Research Institute and retail chain operator Fast Retailing due to valuation concerns. Our increased investments in the eurozone were largely the result of purchasing newly eligible smaller-cap holdings such as Germany-based IT consultancy Bechtle. We also had analyst upgrades of larger-cap companies, including Spanish airline-reservation-management software business Amadeus, German household products manufacturer Henkel, and French energy storage and distribution company Rubis.
Emerging Markets Research Portfolio
Institutional Investors: HLREX
Portfolio Management Team

Moon Surana CFA
Portfolio Manager
Andrew West, CFA
Portfolio Manager
Performance Summary
For the Emerging Markets Research Portfolio, the Institutional Class rose 19.18% (net of fees and expenses) in the twelve-month period ended October 31, 2021. The Portfolio’s benchmark, the MSCI Emerging + Frontier Markets Index, rose 17.13% (net of source taxes).
Market Review
Stocks in Emerging Markets (EMs) surged upward in the first four months of the fiscal year, sustaining their remarkable recovery from the sharp decline in early 2020 caused by the initial shock of the COVID-19 outbreak. The discovery and broadening global distribution of effective vaccines helped accelerate economic activity, which boosted commodity prices and stoked enthusiasm for EM assets.
Investor enthusiasm for EMs appeared to wane after February 2021 due to the new threat posed by the COVID-19 Delta variant and then due to increasing concern about regulatory changes in China. These regulatory actions have included pushing to increase competition among internet businesses, new proposals to rein in private tutoring, curtailing the country’s cryptocurrency industry (including measures to prohibit banks from transacting in them), and restricting video game playing by young people.
Inflation concerns also weighed on EMs. Sporadic flare-ups of the COVID-19 Delta variant impeded a full recovery in global supply chains, causing acute shortages in shipping capacity and raw materials. Long-dated bond yields increased across EM countries, particularly those where inflation inflamed by pandemic-related
Fund Facts at October 31, 2021
| | |
| Total Net Assets | | $9.1M |
| |
| Sales Charge | | None |
| |
| Number of Holdings | | 135 |
| |
| Turnover (5 Yr. Avg.) | | – |
| |
| Dividend Policy | | Annual |
| |
| | | Institutional Investors |
| |
| Ticker | | HLREX |
| |
| CUSIP | | 412295776 |
| |
| Inception Date | | 12/19/2016 |
| |
| Minimum Investment1 | | $100,000 |
| |
| Net Expense Ratio2 | | 1.15%3 |
| |
| Gross Expense Ratio2 | | 2.40% |
1Lower minimums available through certain brokerage firms. 2The Expense Ratios are are as of the most recent Prospectus and are based on expenses for the most recent fiscal year end. The Net Expense Ratio is shown net of Harding Loevner’s contractual agreement through February 28, 2022. 3Harding Loevner’s contractual agreement caps the Net Expense Ratio at 1.15%. The Net Expense Ratio is applicable to investors.
costs collided with fiscal weakness. Central banks in several major countries, including Brazil, Russia, Mexico, and the Czech Republic, raised interest rates.
Europe (especially Russia) and the Middle East were the strongest regions in the index, buoyed by the increasing demand for oil and other refined products. The CE3 markets (Poland, Hungary, and the Czech Republic) also soared amid evidence of a European economic recovery.
Asia lagged the index, largely due to China’s significant decline in a year when many markets enjoyed double-digit returns. New regulations were a threat to the growth prospects of multiple industries and companies, including the country’s giant internet platforms. Revelations late in the fiscal year of financial stress at Evergrande, one of China’s largest property companies, also hurt sentiment. By contrast, the other large Asian markets—South Korea, Taiwan, and India—all rallied.
The cyclical Energy and Materials sectors were the leading performers thanks to higher prices for oil and other commodities. Brent crude prices rose nearly 120% during the past twelve months to just above US$80 per barrel. Prices of industrial metals, agricultural products, and other commodities also made significant gains. In addition, Information Technology (IT) outperformed, helped by semiconductor and other hardware manufacturers.
Performance (% Total Return)
| | | | | | | | | | | | | | | | | | | | | | | | |
| | | For periods ended September 30, 2021 | | | For periods ended October 31, 2021 | |
| | | | | | |
| | | 1 Year | | | 3 Years | | | Since Inception* | | | 1 Year | | | 3 Years | | | Since Inception* | |
| | | | | | |
| Emerging Markets Research Portfolio – Instl. Class | | | 19.86 | | | | 8.84 | | | | 10.69 | | | | 19.18 | | | | 11.90 | | | | 10.65 | |
| | | | | | |
| MSCI Emerging + Frontier Markets Index | | | 18.31 | | | | 8.60 | | | | 10.97 | | | | 17.13 | | | | 12.28 | | | | 11.00 | |
Returns are annualized for periods greater than 1 year. *Inception date: December 19, 2016.
Performance data quoted represents past performance; past performance does not guarantee future results. The investment return and principal value of an investment will fluctuate so that an investor’s shares, when redeemed, may be worth more or less than their original cost. Current performance of the Portfolio may be lower or higher than the performance quoted. Performance data current to the most recent month end may be obtained by calling (877) 435-8105 or visiting www.hardingloevnerfunds.com.
The chart below illustrates the hypothetical return of an investment made in the Institutional share class. Investment return reflects waivers in effect. Absent such waivers, total return would be reduced. The performance provided in the table and chart do not reflect the deduction of taxes that a shareholder would pay on Portfolio distributions or the redemption of Portfolio shares.
Consumer Discretionary was the weakest sector, reflecting sharp declines by ecommerce stocks in the large markets of China and Brazil. Also, Chinese regulators’ demands in July 2021 that tutoring companies operate as non-profits caused a collapse in shares of the country’s education companies. The Real Estate sector, dominated by Chinese developers, was weighed down by the prospect of China’s tightening liquidity conditions and Evergrande’s travails.
Performance Attribution
Strong stocks in the Consumer Discretionary and Financials sectors were key contributors to the Portfolio’s outperformance in the trailing 12 months. The Portfolio’s underweight in the former and overweight in the latter, as well our underweight in Communication Services, were also beneficial.
In Consumer Discretionary, Taiwan-based Eclat Textile, a leader in the development and manufacturing of performance-based fabrics, benefited from a recent wave of supplier consolidation and strong consumer demand for athleisure apparel (e.g., yoga pants). The Portfolio’s relatively low weight versus the index in ecommerce giant Alibaba (which we discuss further in the next section) was also helpful. In Financials, Thailand’s Siam Commercial Bank (SCB) and Russia’s Sberbank were strong contributors. Shares of SCB rallied on news of a corporate restructuring to accelerate growth of its fintech businesses.
We had poor stock selection in IT, where Taiwanese mobile-device lens manufacturer Largan Precision posted sluggish revenue growth as mobile phone camera lens specifications weren’t upgraded as quickly as expected; such delays can increase competitive intensity and weaken margins. Our underweights in IT and Materials also weighed on relative returns.
Regionally, we had strong holdings in Latin America, where the re-mobilization of consumers helped revive the shares of Mexican beverage producer FEMSA and Brazilian convenience store operator CBD. The Portfolio’s investments in Frontier Emerging Markets further boosted returns, led by Vietnamese steelmaker Hoa Phat
Total Return Based On a $100,000 Investment
Institutional Class
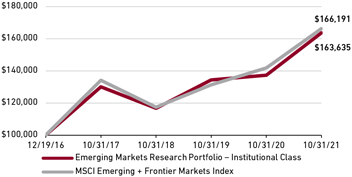
Group as demand for steel in Vietnam remained high, while the company’s new production complex has helped it grow export sales to China.
Weak stocks in South Korea dragged down returns in Asia. Shares of video game producer NCSOFT slid following underwhelming sales of its new game Blade and Soul 2. Consumer products company LG Household and Health Care has seen slowing growth of its WHOO brand and declining cosmetic sales in China. The Portfolio’s underweights in the strong markets of Taiwan and India also dampened relative returns, though this effect was mitigated by our underweight in China.
Perspective and Outlook
China’s economic advancement over the past 20 years has been an outstanding humanitarian success. GDP growth averaging a remarkable 9% per annum has elevated nearly 800 million Chinese out of poverty. But sustaining this progress will require the country to overcome formidable challenges, including an inevitable decline in returns on investment, a rapidly aging population, and the massive public and private debt accumulated for infrastructure and real estate development since the 2008 global financial crisis.
China’s leaders are acutely aware of these obstacles to growth and are planning meticulously to overcome them. A central component of their strategy is to use regulation to foster more competition in key sectors, thereby guiding markets to send capital to those firms that the government considers to be most productive and innovative. Another core focus is the promotion of “common prosperity,” a reaction to the capture by a small, ultra-wealthy cohort of so much of the wealth created in the country in recent years. These intersecting objectives have drawn the country’s internet services giants into the glower of state authorities, leading many of the companies and their CEOs and founders to pledge billions of dollars toward common prosperity initiatives. The rapid-fire regulatory actions have led some to wonder if the investment risks in the largest EM now outweigh the possible rewards.
We believe China presents varied attractive opportunities for long-term investors. Our analysts have identified more than 50 businesses across industries that meet our quality and durable growth criteria. We are not in denial about risks to industries and individual businesses of seismic policy change. For example, during this period as evidence mounted that regulatory changes in the conduct of for-profit tutoring were in the cards—a risk that was later realized—we sold our holding in New Oriental Education.
More often, signs of policy change risk are less definitive and simply add an extra layer of fuzziness to the already challenging task of forecasting business fundamentals. Sometimes policy changes may even put some businesses on more positive trajectories. Two elements of China’s economic reform agenda that we foresee increasing opportunities, or at least not posing existential threats, are data reform and the push for industrial innovation.
China is intent on significantly reforming the digital economy by setting new, world-leading standards for data collection and dissemination to fuel more productive capital allocation in internet-based industries. The walls of the major online gardens, most significantly those of Alibaba and Tencent, are to be breached, providing greater access to consumer data to foster competition. (Sadly, a side effect will be greater access to consumer data by regulators or state entities.) The exclusive network effects that Alibaba and Tencent enjoy from their closed platforms, among their key competitive advantages, will be blunted by new rules around customer data, as well as companion directives that will allow users to jump to competitors’ apps more easily.
In the past, both Alibaba and Tencent have proven highly capable in reacting to regulatory challenges. Their cultures of innovation and technological leadership, reinforced with gargantuan economies of scale, provide solid bases on which to sustain long-term growth and respectable returns on capital. The fact that their giant platforms play valuable roles within the fabric of the economy and could not be replicated other than in the lax
regulatory climate in which they were born and matured suggests that regulators do not intend to exterminate them.
In more material domains, China is doubling down on its long-term manufacturing strategy—unveiled in 2015 as the “Made in China 2025” (MIC25) plan—to improve its capabilities in critical technology sectors where it feels vulnerable amid the ongoing conflict with the US. Policymakers are also wary of a too-rapid tilt away from manufacturing toward services that has been the downfall of many EMs as they sought to advance beyond middle-income status. A revised plan that supersedes the MIC25 roadmap targets nine emerging industries, including biotech, new energy, advanced materials, and environmental protection, that will receive government subsidies and loans to promote investment. In early July 2021, a joint announcement from six Chinese ministries detailed the country’s aim to develop “hidden champions,” small- and medium-sized companies that potentially can forge dominant global positions in their industrial niches. So, while tax incentives and subsidies enjoyed by some internet-enabled service companies are expected to be withdrawn, the manufacturing sector should continue to receive the government’s full support.
Portfolio Positioning (% Weight) at October 31, 2021
| | | | | | |
| Geography | | Portfolio | | | Benchmark1 |
| | |
| Brazil | | | 5.3 | | | 3.9 |
| | |
| China + Hong Kong2 | | | 29.6 | | | 34.3 |
| | |
| India | | | 8.0 | | | 11.8 |
| | |
| Mexico | | | 4.2 | | | 1.9 |
| | |
| Russia | | | 6.1 | | | 4.0 |
| | |
| South Africa | | | 0.8 | | | 3.1 |
| | |
| South Korea | | | 7.7 | | | 12.1 |
| | |
| Taiwan | | | 11.2 | | | 14.5 |
| | |
| Small Emerging Markets3 | | | 18.1 | | | 13.2 |
| | |
| Frontier Markets | | | 7.4 | | | 1.2 |
| | |
| Cash | | | 1.6 | | | – |
| | |
| Sector | | Portfolio | | | Benchmark1 |
| | |
| Communication Services | | | 7.2 | | | 10.6 |
| | |
| Consumer Discretionary | | | 16.1 | | | 15.3 |
| | |
| Consumer Staples | | | 11.2 | | | 5.9 |
| | |
| Energy | | | 6.7 | | | 5.8 |
| | |
| Financials | | | 22.3 | | | 19.9 |
| | |
| Health Care | | | 5.6 | | | 4.6 |
| | |
| Industrials | | | 8.8 | | | 4.8 |
| | |
| Information Technology | | | 14.9 | | | 20.4 |
| | |
| Materials | | | 3.9 | | | 8.5 |
| | |
| Real Estate | | | 1.7 | | | 2.1 |
| | |
| Utilities | | | 0.0 | | | 2.1 |
| | |
| Cash | | | 1.6 | | | – |
1MSCI Emerging + Frontier Markets Index; 2The Emerging Markets Research Portfolio’s end weight in China at October 31, 2021 is 29.6% and Hong Kong is 0.0%. The Benchmark does not include Hong Kong; 3Includes the remaining emerging markets which, individually, comprise less than 5% of the index.
Sanhua Intelligent Controls, China’s global leader in thermal controls, is an example of such a hidden champion. Its technical know-how and local low-cost advantage have allowed it to build a dominant global position supplying home-appliance manufacturers while steadily increasing its share in the auto sector. It recently won a patent infringement case in South Korea where a competitor had copied the design of one of Sanhua’s high-specification components, a sign of its technological leadership in this niche industry. Electric vehicles (EVs) represent a massive growth opportunity for Sanhua because they need more thermal control components than vehicles with internal combustion engines. In manufactured products the threat of state meddling is secondary to the threat of increasing competition. We expect Sanhua will undoubtedly face a slew of competitors given the large scale of the market opportunity. However, we believe Sanhua is set to take the lion’s share of the potential profit.
We remain intently focused on the evolution of individual businesses and their industries. We don’t have foresight into future policy changes or know how long this current burst of regulatory action in China will continue, although we suspect that its pace will abate. It is almost a cliché that the Chinese government’s highest goal is to preserve social stability, but we don’t think there should be official interest in maintaining a state of regulatory flux and economic turmoil if the main objective is to facilitate more productive capital allocation.
Portfolio Highlights
The Emerging Markets Equity Research Portfolio’s holdings are directly determined by analysts’ recommendations among Harding Loevner’s collection of researched companies. In addition to responding to changes in analysts’ ratings, we also adjust individual position weights to maintain our desired risk profile (moderately lower expected volatility compared with the benchmark and constrained tracking error). We ended the year with 135 holdings in the Portfolio, an increase of 12, driven by upgrades and new companies added to our research universe. The Portfolio’s turnover in the period was 45%.
By sector, the Portfolio’s allocation to Energy and Industrials increased the most, while Consumer Staples fell the most. By geography, the Portfolio’s weights increased the most in Russia and Taiwan and decreased the most in China and India.
In Energy, we added to our holdings Russian-based oil giant, Lukoil, and Colombian integrated oil-and-gas company, Ecopetrol, due to their attractive valuations. In Industrials, we made several purchases, including Sanhua and Hongfa Technology, the largest global maker of electoral relays used in multiple applications including EVs. Similar to Sanhua, Hongfa should benefit from the transition away from internal combustion engines.
Our exposure to Consumer Staples fell due to net sales in the sector. Walmart de México was trimmed due to relatively high
Top Ten Holdings by Weight at October 31, 2021
| | | | | | |
| Company | | Sector | | Market | | % |
| | | |
| NCSOFT | | Comm Services | | South Korea | | 2.2 |
| | | |
| Lukoil | | Energy | | Russia | | 2.1 |
| | | |
| AirTAC | | Industrials | | Taiwan | | 2.0 |
| | | |
| FEMSA | | Cons Staples | | Mexico | | 1.9 |
| | | |
| Sberbank | | Financials | | Russia | | 1.9 |
| | | |
| Hon Hai Precision | | Info Technology | | Taiwan | | 1.9 |
| | | |
| Hoa Phat Group | | Materials | | Vietnam | | 1.9 |
| | | |
| TSMC | | Info Technology | | Taiwan | | 1.9 |
| | | |
| Chipbond Technology | | Info Technology | | Taiwan | | 1.8 |
| | | |
| Hero Motocorp | | Cons Discretionary | | India | | 1.8 |
valuations and a low growth profile. We sold Amorepacific, a South Korean cosmetics company, and Dabur, an Indian consumer goods distributor, when the analyst downgraded the stocks on valuation grounds.
Russia was one of the best-performing countries in the Portfolio. Along with increasing our position in Lukoil, in the first half of the year we added to our holding of Sberbank, whose shares went on to outperform.
We modestly increased the Portfolio’s number of investments in China, where our analysts continue to identify numerous attractive investment candidates even amid the fraught regulatory environment. Recent additions include, alongside Sanhua and Hongfa Technology, Haier Smart Home, which is among the world’s largest home-appliance makers, though it has yet to establish a strong presence in the high-end market outside of China. Haier’s lean manufacturing and growing strength in design and innovation should help it expand its global share. Meyer Optoelectronic makes systems incorporating optical sensors and software algorithms to accomplish things that human eyes and hands cannot. Already the leading supplier of dental-imaging equipment and food-sorting systems in China, the company has a significant long-term growth opportunity in recycling, where machine vision has yet to be deployed at scale. Shandong Sinocera makes nano-sized ceramics used in dental implants and in multilayer ceramic capacitors (MLCCs). The latter are sometimes referred to as the “blood vessels” of electric vehicles, smartphones, computers, and industrial automation equipment. The company has 70-90% share of the dental ceramic and MLCC markets in mainland China and 20-30% share of the markets globally, generating superior margins due to its proprietary synthesis process that is considerably more efficient than those of most competitors.
In India, HDFC Corp., Max Financial, and Dabur were sold after the analyst downgraded them on valuation concerns. We also trimmed Asian Paints and Tata Consultancy Services due to elevated relative valuations.
Disclosures
The Portfolios invest in foreign securities, which will involve greater volatility and political, economic, and currency risks and differences in accounting methods. They also invest in emerging markets, which involve unique risks, such as exposure to economies less diverse and mature than the US or other more established foreign markets. Economic and political instability may cause larger price changes in emerging markets securities than other foreign securities.
Investments in small- and mid-cap companies involve additional risks such as limited liquidity and greater volatility.
Diversification does not guarantee a profit or prevent a loss in a declining market.
Long-term earnings growth and earnings per share growth are not a forecast of the Portfolios’ future performance.
The value of securities may fluctuate in response to various factors including, but not limited to, public health risks; these may be magnified if conditions and events adversely impact the global economy.
Companies held in the Portfolios at the end of the fiscal year appear in bold type; only the first reference to a particular holding appears in bold. The Portfolios are actively managed; therefore holdings shown may not be current. Portfolio holdings and top ten holdings should not be considered recommendations to buy or sell any security. Please refer to the Portfolios of Investments in this report for complete Portfolio holdings. Current and future Portfolio holdings are subject to risk.
While the Portfolios have no sales charge, management fees and other expenses still apply. Please see the Prospectus for further details.
Sector & Geographic Positioning data is sourced from: Northern Trust, Harding Loevner Funds Portfolios, and MSCI Barra.
Expense Ratios: Differences may exist between the commentary data and similar information reported in the financial statements due to timing differences. Unless otherwise stated, the expense ratios presented are shown as of the most recent Prospectus date, February 28, 2021.
Five year average turnover data is calculated using a simple average of annual turnover figures for the past five fiscal years. These annual turnover figures utilize purchase, sales, and market value data which is not reflective of adjustments required pursuant to Generally Accepted Accounting Principles (GAAP). Accordingly, differences may exist between this data and similar information reported in the financial statements.
Quasar Distributors, LLC, Distributor.
Index Definitions
The MSCI All Country World Index is a free float-adjusted market capitalization index that is designed to measure equity market performance in the global developed and emerging markets. The Index consists of 49 developed and emerging market countries. Net dividends reinvested.
The MSCI All Country World ex-US Index is a free float-adjusted market capitalization index that is designed to measure equity market performance in the global developed and emerging markets, excluding the US. The index consists of 48 developed and emerging market countries. Net dividends reinvested.
The MSCI All Country World ex-US Small Cap Index is a free-float market capitalization index that is designed to measure small cap developed and emerging market equity performance. The index consists of 49 developed and emerging market countries, and is comprised of companies that fall within a market capitalization range of USD 34-12,128 million (as of September 30, 2021). You cannot invest directly in this index.
The MSCI Emerging Markets Index is a free float-adjusted market capitalization index that is designed to measure equity market performance in the global emerging markets. The index consists of 26 emerging market countries. Net dividends reinvested.
The MSCI China All Shares Index is a free float-adjusted market capitalization index that is designed to reflect an opportunity set capturing large and mid-cap China share classes listed in Hong Kong, Shanghai, Shenzhen, and outside of China.
The MSCI Emerging + Frontier Markets Index is a free float-adjusted market capitalization index that is designed to measure equity market performance in the global emerging markets and frontier markets. The index consists of 26 emerging markets countries and 28 frontier markets countries. Net dividends reinvested.
The MSCI Frontier Emerging Markets Index is a free float-adjusted market capitalization index designed to measure equity market performance in all countries from the MSCI Frontier Markets Index and the lower size spectrum of the MSCI Emerging Markets Index. The index consists of 28 frontier markets and 6 emerging markets. Net dividends reinvested.
The S&P 500 Index is an unmanaged index commonly used to measure performance of US stocks.
You cannot invest directly in these indexes.
Term Definitions
Basis points are a common measurement used chiefly for interest rates and other percentages in finance. A basis point is one hundredth of one percent.
Dividend yield is the annual dividends per share divided by current price per share, expressed as a percent.
Economies of scale is the cost advantage that arises with increased output of a product.
Gross Domestic Product (GDP) is the monetary value of all finished goods and services produced within a country’s borders in a specific time period (usually calculated on an annual basis).
Market Capitalization is the total dollar market value of all of a company’s outstanding shares.
Return on Capital (ROC) is a calculation used to assess a company’s efficiency at allocating the capital under its control to profitable investments.
Tracking Error is a measure of how closely a portfolio follows the index to which it is benchmarked.
Turnover is calculated by dividing the lesser of Purchases or Sales by Average Capital.
| | | | |
| Global Equity Portfolio | | Institutional Emerging Markets Portfolio | | Global Equity Research Portfolio |
| | |
| International Equity Portfolio | | Emerging Markets Portfolio | | International Equity Research Portfolio |
| | |
| International Small Companies Portfolio | | Frontier Emerging Markets Portfolio | | Emerging Markets Research Portfolio |
| | |
| Chinese Equity Portfolio | | | | |
This page intentionally left blank.
Harding, Loevner Funds, Inc.
Table of Contents
For use only when preceded or accompanied by a prospectus. Read the prospectus carefully before you invest or send money.
Harding, Loevner Funds, Inc.
Expense Example
October 31, 2021 (unaudited)
As a shareholder of a Harding Loevner Portfolio, you incur ongoing costs, including management fees; to the extent applicable, distribution (12b-1) fees and/or shareholder services fees; and other fund expenses. The following examples are intended to help you understand your ongoing costs (in dollars and cents) of investing in a Portfolio and to compare these costs with the ongoing costs of investing in other mutual funds.
The examples are based on an investment of $1,000 invested at the beginning of a six month period and held through the period ended October 31, 2021.
Actual Expenses
The first line under each Portfolio in the table below provides information about actual account values and actual expenses. You may use the information in this line, together with the amount you invested, to estimate the expenses that you paid over the period. Simply divide your account value by $1,000 (for example, an $8,600 account value divided by $1,000 = 8.6), then multiply the result by the number in the first line for your Portfolio under the heading entitled “Expenses Paid During Period” to estimate the expenses you paid on your account during this period.
Hypothetical Example for Comparison Purposes
The second line under each Portfolio in the table below provides information about hypothetical account values and hypothetical expenses based on the Portfolio’s actual expense ratio and an assumed rate of return of 5% per year before expenses, which is not the Portfolio’s actual return. The hypothetical account values and expenses may not be used to estimate the actual ending account balance or expenses you paid for the period. You may use this information to compare the ongoing costs of investing in your Portfolio and other funds. To do so, compare this 5% hypothetical example with the 5% hypothetical examples that appear in the shareholder reports of the other funds. Please note that the expenses shown in the table are meant to highlight your ongoing costs only. Therefore, the second line under each Portfolio in the table is useful in comparing ongoing costs only, and will not help you determine the relative total costs of owning different funds.
| | | | | | | | | | | | | | | | |
| Portfolio | | Beginning Account Value
May 1, 2021 | | | Ending
Account Value
October 31, 2021 | | | Annualized
Expense Ratio | | | Expenses Paid
During Period*
(May 1, 2021 to
October 31, 2021) | |
Global Equity Portfolio — Institutional Class | | | | | | | | | | | | | | | | |
Actual | | $ | 1,000.00 | | | $ | 1,084.90 | | | | 0.87 | % | | $ | 4.57 | |
Hypothetical (5% annual return before expenses) | | | 1,000.00 | | | | 1,020.82 | | | | 0.87 | | | | 4.43 | |
Global Equity Portfolio — Institutional Class Z | | | | | | | | | | | | | | | | |
Actual | | | 1,000.00 | | | | 1,085.30 | | | | 0.80 | | | | 4.20 | |
Hypothetical (5% annual return before expenses) | | | 1,000.00 | | | | 1,021.17 | | | | 0.80 | | | | 4.08 | |
Global Equity Portfolio — Advisor Class | | | | | | | | | | | | | | | | |
Actual | | | 1,000.00 | | | | 1,083.80 | | | | 1.08 | | | | 5.67 | |
Hypothetical (5% annual return before expenses) | | | 1,000.00 | | | | 1,019.76 | | | | 1.08 | | | | 5.50 | |
International Equity Portfolio — Institutional Class | | | | | | | | | | | | | | | | |
Actual | | | 1,000.00 | | | | 1,047.40 | | | | 0.80 | | | | 4.13 | |
Hypothetical (5% annual return before expenses) | | | 1,000.00 | | | | 1,021.17 | | | | 0.80 | | | | 4.08 | |
International Equity Portfolio — Institutional Class Z | | | | | | | | | | | | | | | | |
Actual | | | 1,000.00 | | | | 1,047.80 | | | | 0.72 | | | | 3.72 | |
Hypothetical (5% annual return before expenses) | | | 1,000.00 | | | | 1,021.58 | | | | 0.72 | | | | 3.67 | |
International Equity Portfolio — Investor Class | | | | | | | | | | | | | | | | |
Actual | | | 1,000.00 | | | | 1,045.40 | | | | 1.13 | | | | 5.83 | |
Hypothetical (5% annual return before expenses) | | | 1,000.00 | | | | 1,019.51 | | | | 1.13 | | | | 5.75 | |
International Small Companies Portfolio — Institutional Class | | | | | | | | | | | | | | | | |
Actual | | | 1,000.00 | | | | 1,088.80 | | | | 1.14 | | | | 6.00 | |
Hypothetical (5% annual return before expenses) | | | 1,000.00 | | | | 1,019.46 | | | | 1.14 | | | | 5.80 | |
* Expenses are calculated using each Portfolio’s annualized expense ratio (as disclosed in the table), multiplied by the average account value for the period, multiplied by the number of days in the period (184 days), and divided by the number of days in the year (365 days).
2
Harding, Loevner Funds, Inc.
Expense Example (continued)
October 31, 2021 (unaudited)
| | | | | | | | | | | | | | | | |
| Portfolio | | Beginning
Account Value
May 1, 2021 | | | Ending
Account Value
October 31, 2021 | | | Annualized
Expense Ratio | | | Expenses Paid
During Period*
(May 1, 2021 to
October 31, 2021) | |
| | | | |
International Small Companies Portfolio — Investor Class | | | | | | | | | | | | | | | | |
Actual | | $ | 1,000.00 | | | $ | 1,087.40 | | | | 1.40 | % | | $ | 7.37 | |
Hypothetical (5% annual return before expenses) | | | 1,000.00 | | | | 1,018.15 | | | | 1.40 | | | | 7.12 | |
Institutional Emerging Markets Portfolio — Institutional Class | | | | | | | | | | | | | | | | |
Actual | | | 1,000.00 | | | | 967.80 | | | | 1.12 | | | | 5.56 | |
Hypothetical (5% annual return before expenses) | | | 1,000.00 | | | | 1,019.56 | | | | 1.12 | | | | 5.70 | |
Institutional Emerging Markets Portfolio — Institutional Class Z | | | | | | | | | | | | | | | | |
Actual | | | 1,000.00 | | | | 967.90 | | | | 1.04 | | | | 5.16 | |
Hypothetical (5% annual return before expenses) | | | 1,000.00 | | | | 1,019.96 | | | | 1.04 | | | | 5.30 | |
Emerging Markets Portfolio — Advisor Class | | | | | | | | | | | | | | | | |
Actual | | | 1,000.00 | | | | 968.60 | | | | 1.25 | | | | 6.20 | |
Hypothetical (5% annual return before expenses) | | | 1,000.00 | | | | 1,018.90 | | | | 1.25 | | | | 6.36 | |
Frontier Emerging Markets Portfolio — Institutional Class I | | | | | | | | | | | | | | | | |
Actual | | | 1,000.00 | | | | 1,128.30 | | | | 1.67 | | | | 8.96 | |
Hypothetical (5% annual return before expenses) | | | 1,000.00 | | | | 1,016.79 | | | | 1.67 | | | | 8.49 | |
Frontier Emerging Markets Portfolio — Institutional | | | | | | | | | | | | | | | | |
Class II | | | | | | | | | | | | | | | | |
Actual | | | 1,000.00 | | | | 1,130.20 | | | | 1.35 | | | | 7.25 | |
Hypothetical (5% annual return before expenses) | | | 1,000.00 | | | | 1,018.40 | | | | 1.35 | | | | 6.87 | |
Frontier Emerging Markets Portfolio — Investor Class | | | | | | | | | | | | | | | | |
Actual | | | 1,000.00 | | | | 1,126.30 | | | | 2.00 | | | | 10.72 | |
Hypothetical (5% annual return before expenses) | | | 1,000.00 | | | | 1,015.12 | | | | 2.00 | | | | 10.16 | |
Global Equity Research Portfolio — Institutional Class | | | | | | | | | | | | | | | | |
Actual | | | 1,000.00 | | | | 1,058.70 | | | | 0.80 | | | | 4.15 | |
Hypothetical (5% annual return before expenses) | | | 1,000.00 | | | | 1,021.17 | | | | 0.80 | | | | 4.08 | |
International Equity Research Portfolio — Institutional Class | | | | | | | | | | | | | | | | |
Actual | | | 1,000.00 | | | | 1,017.30 | | | | 0.75 | | | | 3.81 | |
Hypothetical (5% annual return before expenses) | | | 1,000.00 | | | | 1,021.42 | | | | 0.75 | | | | 3.82 | |
Emerging Markets Research Portfolio — Institutional Class | | | | | | | | | | | | | | | | |
Actual | | | 1,000.00 | | | | 975.50 | | | | 1.15 | | | | 5.73 | |
Hypothetical (5% annual return before expenses) | | | 1,000.00 | | | | 1,019.41 | | | | 1.15 | | | | 5.85 | |
Chinese Equity Portfolio — Institutional Class | | | | | | | | | | | | | | | | |
Actual | | | 1,000.00 | | | | 873.10 | | | | 1.15 | | | | 5.43 | |
Hypothetical (5% annual return before expenses) | | | 1,000.00 | | | | 1,019.41 | | | | 1.15 | | | | 5.85 | |
* Expenses are calculated using each Portfolio’s annualized expense ratio (as disclosed in the table), multiplied by the average account value for the period, multiplied by the number of days in the period (184 days), and divided by the number of days in the year (365 days).
3
Harding, Loevner Funds, Inc.
Global Equity Portfolio
Portfolio of Investments
October 31, 2021
| | | | | | | | |
| | |
| | | Shares | | | Value | |
| COMMON STOCKS - 98.1% | | | | | | |
| | |
Australia - 0.5% | | | | | | | | |
| | |
Xero Ltd. (Software & Services)*† | | | 81,937 | | | | $9,266,805 | |
Brazil - 0.5% | | | | | | | | |
XP Inc., Class A (Diversified Financials)* | | | 294,800 | | | | 9,672,388 | |
China - 9.4% | | | | | | | | |
Baidu Inc. - Sponsored ADR (Media & Entertainment)* | | | 115,235 | | | | 18,695,726 | |
| | |
Country Garden Services Holdings Co., Ltd. (Real Estate)† | | | 4,129,000 | | | | 31,969,036 | |
| | |
ENN Energy Holdings Ltd. (Utilities)† | | | 497,400 | | | | 8,619,958 | |
| | |
NetEase Inc. (Media & Entertainment)† | | | 1,108,300 | | | | 21,675,887 | |
| | |
Sangfor Technologies Inc., Class A (Software & Services)† | | | 437,450 | | | | 13,860,950 | |
| | |
Tencent Holdings Ltd. (Media & Entertainment)† | | | 304,200 | | | | 18,886,636 | |
| | |
WuXi AppTec Co., Ltd., Class A (Pharmaceuticals, Biotechnology & Life Sciences)† | | | 757,200 | | | | 16,315,843 | |
| | |
Wuxi Biologics Cayman Inc. (Pharmaceuticals, Biotechnology & Life Sciences)*^† | | | 2,531,500 | | | | 38,663,867 | |
| | |
| | | | | | | 168,687,903 | |
Denmark - 0.9% | | | | | | | | |
Genmab A/S (Pharmaceuticals, Biotechnology & Life Sciences)*† | | | 35,549 | | | | 16,003,404 | |
Finland - 0.8% | | | | | | | | |
| | |
Neste OYJ (Energy)† | | | 250,852 | | | | 14,006,067 | |
France - 2.2% | | | | | | | | |
L’Oreal SA (Household & Personal Products)† | | | 40,554 | | | | 18,544,993 | |
| | |
Schneider Electric SE (Capital Goods)† | | | 118,642 | | | | 20,521,785 | |
| | | | | | 39,066,778 | |
Hong Kong - 1.0% | | | | | | | | |
AIA Group Ltd. (Insurance)† | | | 1,553,605 | | | | 17,557,037 | |
India - 1.2% | | | | | | | | |
HDFC Bank Ltd. - ADR (Banks) | | | 292,805 | | | | 21,055,608 | |
Indonesia - 1.2% | | | | | | | | |
Bank Central Asia Tbk PT (Banks)† | | | 39,356,270 | | | | 20,769,712 | |
Japan - 2.5% | | | | | | | | |
Chugai Pharmaceutical Co., Ltd. (Pharmaceuticals, Biotechnology & Life Sciences)† | | | 328,800 | | | | 12,262,270 | |
| | | | | | | | |
| | |
| | | Shares | | | Value | |
| COMMON STOCKS - 98.1% (continued) | | | | | | |
| | |
Japan - 2.5% (continued) | | | | | | | | |
| | |
MISUMI Group Inc. (Capital Goods)† | | | 215,800 | | | | $9,034,870 | |
| | |
Sysmex Corp. (Health Care Equipment & Services)† | | | 195,065 | | | | 24,245,720 | |
| | |
| | | | | | | 45,542,860 | |
Netherlands - 2.7% | | | | | | | | |
Adyen NV (Software & Services)*^† | | | 7,135 | | | | 21,552,705 | |
| | |
ASML Holding NV, Reg S (Semiconductors & Semiconductor Equipment) | | | 33,522 | | | | 27,249,363 | |
| | |
| | | | | | | 48,802,068 | |
Poland - 0.8% | | | | | | | | |
CD Projekt SA (Media & Entertainment)† | | | 312,222 | | | | 13,623,026 | |
Sweden - 1.8% | | | | | | | | |
Atlas Copco AB, Class A (Capital Goods)† | | | 280,145 | | | | 17,971,273 | |
| | |
Epiroc AB, Class A (Capital Goods)† | | | 563,184 | | | | 13,991,417 | |
| | |
| | | | | | | 31,962,690 | |
Switzerland - 3.4% | | | | | | | | |
Alcon Inc. (Health Care Equipment & Services) | | | 250,559 | | | | 20,886,598 | |
| | |
Roche Holding AG, Genusschein (Pharmaceuticals, Biotechnology & Life Sciences)† | | | 57,381 | | | | 22,230,140 | |
| | |
VAT Group AG (Capital Goods)^† | | | 35,744 | | | | 17,028,902 | |
| | |
| | | | | | | 60,145,640 | |
Taiwan - 1.9% | | | | | | | | |
Taiwan Semiconductor Manufacturing Co., Ltd. (Semiconductors & Semiconductor Equipment)† | | | 542,000 | | | | 11,470,153 | |
| | |
Taiwan Semiconductor Manufacturing Co., Ltd. - Sponsored ADR (Semiconductors & Semiconductor Equipment) | | | 198,565 | | | | 22,576,841 | |
| | |
| | | | | | | 34,046,994 | |
United Kingdom - 1.9% | | | | | | | | |
Abcam plc (Pharmaceuticals, Biotechnology & Life Sciences)*† | | | 1,080,470 | | | | 24,581,518 | |
| | |
Spirax-Sarco Engineering plc (Capital Goods)† | | | 45,918 | | | | 9,811,303 | |
| | |
| | | | | | | 34,392,821 | |
United States - 65.4% | | | | | | | | |
Accenture plc, Class A (Software & Services) | | | 72,243 | | | | 25,920,066 | |
Adobe Inc. (Software & Services)* | | | 59,947 | | | | 38,987,131 | |
See Notes to Financial Statements
4
Harding, Loevner Funds, Inc.
Global Equity Portfolio
Portfolio of Investments (continued)
October 31, 2021
| | | | | | | | |
| | |
| | | Shares | | | Value | |
| COMMON STOCKS - 98.1% (continued) | |
| | |
United States - 65.4% (continued) | | | | | | | | |
| | |
Align Technology Inc. (Health Care Equipment & Services)* | | | 48,684 | | | | $30,396,829 | |
| | |
Alphabet Inc., Class A (Media & Entertainment)* | | | 21,560 | | | | 63,837,435 | |
| | |
Amazon.com Inc. (Retailing)* | | | 15,262 | | | | 51,470,027 | |
| | |
AMETEK Inc. (Capital Goods) | | | 123,657 | | | | 16,372,187 | |
| | |
Apple Inc. (Technology Hardware & Equipment) | | | 128,180 | | | | 19,201,364 | |
| | |
Applied Materials Inc. (Semiconductors & Semiconductor Equipment) | | | 131,553 | | | | 17,976,717 | |
| | |
CME Group Inc. (Diversified Financials) | | | 113,963 | | | | 25,134,540 | |
| | |
CoStar Group Inc. (Commercial & Professional Services)* | | | 205,061 | | | | 17,645,499 | |
| | |
Danaher Corp. (Health Care Equipment & Services) | | | 84,337 | | | | 26,293,747 | |
| | |
Deere & Co. (Capital Goods) | | | 131,824 | | | | 45,124,673 | |
| | |
eBay Inc. (Retailing) | | | 404,869 | | | | 31,061,550 | |
| | |
Edwards Lifesciences Corp. (Health Care Equipment & Services)* | | | 174,477 | | | | 20,905,834 | |
| | |
EPAM Systems Inc. (Software & Services)* | | | 28,579 | | | | 19,240,526 | |
| | |
Etsy Inc. (Retailing)* | | | 88,971 | | | | 22,304,140 | |
| | |
Facebook Inc., Class A (Media & Entertainment)* | | | 118,862 | | | | 38,460,177 | |
| | |
First Republic Bank (Banks) | | | 319,796 | | | | 69,181,469 | |
| | |
Illumina Inc. (Pharmaceuticals, Biotechnology & Life Sciences)* | | | 93,570 | | | | 38,837,164 | |
| | |
Intuitive Surgical Inc. (Health Care Equipment & Services)* | | | 56,556 | | | | 20,424,068 | |
| | |
IQVIA Holdings Inc. (Pharmaceuticals, Biotechnology & Life Sciences)* | | | 65,246 | | | | 17,056,609 | |
| | |
Mastercard Inc., Class A (Software & Services) | | | 39,865 | | | | 13,375,505 | |
| | |
Microsoft Corp. (Software & Services) | | | 134,690 | | | | 44,665,898 | |
| | |
Netflix Inc. (Media & Entertainment)* | | | 32,640 | | | | 22,531,718 | |
| | |
NIKE Inc., Class B (Consumer Durables & Apparel) | | | 231,125 | | | | 38,664,901 | |
| | |
NVIDIA Corp. (Semiconductors & Semiconductor Equipment) | | | 90,365 | | | | 23,103,620 | |
| | |
PayPal Holdings Inc. (Software & Services)* | | | 135,090 | | | | 31,420,583 | |
| | |
Pinterest Inc., Class A (Media & Entertainment)* | | | 303,069 | | | | 13,529,000 | |
| | |
Roper Technologies Inc. (Capital Goods) | | | 31,613 | | | | 15,423,034 | |
| | | | | | | | |
| | |
| | | Shares | | | Value | |
| COMMON STOCKS - 98.1% (continued) | |
| | |
United States - 65.4% (continued) | | | | | | | | |
| | |
salesforce.com Inc. (Software & Services)* | | | 96,617 | | | | $28,955,149 | |
| | |
Schlumberger NV (Energy) | | | 724,532 | | | | 23,373,402 | |
| | |
SVB Financial Group (Banks)* | | | 84,239 | | | | 60,433,059 | |
| | |
Synopsys Inc. (Software & Services)* | | | 79,841 | | | | 26,601,424 | |
| | |
Thermo Fisher Scientific Inc. (Pharmaceuticals, Biotechnology & Life Sciences) | | | 53,583 | | | | 33,921,790 | |
| | |
Trade Desk Inc., Class A (Software & Services)* | | | 229,758 | | | | 17,211,172 | |
| | |
Tradeweb Markets Inc., Class A (Diversified Financials) | | | 232,848 | | | | 20,746,757 | |
| | |
UnitedHealth Group Inc. (Health Care Equipment & Services) | | | 47,169 | | | | 21,719,909 | |
| | |
Verisk Analytics Inc. (Commercial & Professional Services) | | | 71,873 | | | | 15,112,736 | |
| | |
Vertex Pharmaceuticals Inc. (Pharmaceuticals, Biotechnology & Life Sciences)* | | | 156,849 | | | | 29,006,086 | |
| | |
Walt Disney Co. (Media & Entertainment)* | | | 93,264 | | | | 15,768,145 | |
| | |
Workday Inc., Class A (Software & Services)* | | | 65,479 | | | | 18,987,600 | |
| | | |
| | | | | | | | 1,170,383,240 | |
| | |
Total Common Stocks (Cost $1,129,898,935) | | | | $1,754,985,041 | |
| | |
| | | | | | | | |
| SHORT TERM INVESTMENTS - 3.1% | | | | |
| | |
Northern Institutional Funds - Treasury Portfolio (Premier Shares), 0.01% (Money Market Funds) | | | 54,785,140 | | | | 54,785,140 | |
| | |
Total Short Term Investments (Cost $54,785,140) | | | | $54,785,140 | |
| | |
| | | | | | | | | |
| | | |
Total Investments — 101.2% | | | | | | | | |
| | | |
(Cost $1,184,684,075) | | | | | | | $1,809,770,181 | |
| | |
Liabilities Less Other Assets - (1.2)% | | | | | | | (21,587,929 | ) |
| | | |
Net Assets — 100.0% | | | | | | | $1,788,182,252 | |
See Notes to Financial Statements
5
Harding, Loevner Funds, Inc.
Global Equity Portfolio
Portfolio of Investments (continued)
October 31, 2021
Summary of Abbreviations
| | |
| |
| ADR | | American Depositary Receipt |
| |
| Reg S | | Security sold outside United States without registration under the Securities Act of 1933. |
| |
| * | | Non-income producing security. |
| |
| † | | Investment categorized as level 2 security as disclosed in Note 2 of the Notes to Financial Statements. |
| |
| ^ | | Security exempt from registration pursuant to Rule 144A of the Securities Act of 1933. These securities, which represent 4.3% of net assets as of October 31, 2021, are considered liquid and may be resold in transactions exempt from registration, normally to qualified buyers. |
| | | | |
| Industry | |
| Percentage of
Net Assets |
|
| |
Banks | | | 9.6 | % |
| |
Capital Goods | | | 9.2 | |
| |
Commercial & Professional Services | | | 1.8 | |
| |
Consumer Durables & Apparel | | | 2.2 | |
| |
Diversified Financials | | | 3.1 | |
| |
Energy | | | 2.1 | |
| |
Health Care Equipment & Services | | | 9.2 | |
| |
Household & Personal Products | | | 1.0 | |
| |
Insurance | | | 1.0 | |
| |
Media & Entertainment | | | 12.7 | |
| |
Pharmaceuticals, Biotechnology & Life Sciences | | | 13.9 | |
| |
Real Estate | | | 1.8 | |
| |
Retailing | | | 5.9 | |
| |
Semiconductors & Semiconductor Equipment | | | 5.7 | |
| |
Software & Services | | | 17.3 | |
| |
Technology Hardware & Equipment | | | 1.1 | |
| |
Utilities | | | 0.5 | |
| |
Money Market Fund | | | 3.1 | |
| | |
Total Investments | | | 101.2 | |
| |
Liabilities Less Other Assets | | | (1.2 | ) |
| | |
Net Assets | | | 100.0 | % |
See Notes to Financial Statements
6
Harding, Loevner Funds, Inc.
International Equity Portfolio
Portfolio of Investments
October 31, 2021
| | | | | | | | |
| | |
| | | Shares | | | Value | |
| COMMON STOCKS - 95.4% | | | | | | |
| | |
Australia - 2.1% | | | | | | | | |
| | |
BHP Group Ltd. - Sponsored ADR (Materials) | | | 8,481,846 | | | | $465,144,435 | |
| | |
Brazil - 1.2% | | | | | | | | |
| | |
Ambev SA - ADR (Food Beverage & Tobacco) | | | 77,019,760 | | | | 227,978,490 | |
| | |
XP Inc., Class A (Diversified Financials)* | | | 1,233,298 | | | | 40,464,512 | |
| | |
| | | | | | | 268,443,002 | |
| | |
Canada - 2.1% | | | | | | | | |
| | |
Alimentation Couche-Tard Inc., Class B (Food & Staples Retailing) | | | 5,754,000 | | | | 215,821,493 | |
| | |
Canadian National Railway Co. (Transportation) | | | 1,848,879 | | | | 245,734,508 | |
| | |
| | | | | | | 461,556,001 | |
| | |
China - 8.2% | | | | | | | | |
| | |
Alibaba Group Holding Ltd. - Sponsored ADR (Retailing)* | | | 1,425,164 | | | | 235,066,550 | |
| | |
CSPC Pharmaceutical Group Ltd. (Pharmaceuticals, Biotechnology & Life Sciences)† | | | 242,388,000 | | | | 253,987,507 | |
| | |
ENN Energy Holdings Ltd. (Utilities)† | | | 11,842,100 | | | | 205,223,976 | |
| | |
Ping An Insurance Group Co. of China Ltd., Class H (Insurance)† | | | 25,894,500 | | | | 186,467,091 | |
| | |
Tencent Holdings Ltd. (Media & Entertainment)† | | | 11,176,100 | | | | 693,882,108 | |
| | |
Zhejiang Sanhua Intelligent Controls Co., Ltd., Class A (Capital Goods)† | | | 62,770,197 | | | | 232,076,628 | |
| | |
| | | | | | | 1,806,703,860 | |
| | |
Denmark - 1.0% | | | | | | | | |
| | |
Novozymes A/S, Class B (Materials)† | | | 2,870,178 | | | | 210,945,371 | |
France - 8.6% | | | | | | | | |
| | |
Air Liquide SA (Materials)† | | | 1,168,470 | | | | 195,314,971 | |
| | |
Dassault Systemes SE (Software & Services)† | | | 5,910,801 | | | | 344,729,273 | |
| | |
L’Oreal SA (Household & Personal Products)† | | | 1,651,739 | | | | 755,325,926 | |
| | |
Schneider Electric SE (Capital Goods)† | | | 3,384,935 | | | | 585,500,149 | |
| | |
| | | | | | | 1,880,870,319 | |
Germany - 8.5% | | | | | | | | |
| | |
Allianz SE, Reg S (Insurance)† | | | 2,035,068 | | | | 473,269,455 | |
| | |
Infineon Technologies AG (Semiconductors & Semiconductor Equipment)† | | | 15,982,779 | | | | 747,051,531 | |
| | |
SAP SE - Sponsored ADR (Software & Services) | |
| 2,217,149
|
| | | 320,998,832 | |
| | | | | | | | |
| | |
| | | Shares | | | Value | |
| COMMON STOCKS - 95.4% (continued) | | | | |
| | |
Germany - 8.5% (continued) | | | | | | | | |
| | |
Symrise AG (Materials)† | | | 2,291,077 | | | | $316,755,252 | |
| | |
| | | | | | | 1,858,075,070 | |
| | |
Hong Kong - 2.7% | | | | | | | | |
| | |
AIA Group Ltd. (Insurance)† | | | 52,362,074 | | | | 591,735,288 | |
| | |
India - 3.0% | | | | | | | | |
| | |
HDFC Bank Ltd. - ADR (Banks) | | | 3,667,640 | | | | 263,739,993 | |
| | |
ICICI Bank Ltd. - Sponsored ADR (Banks) | | | 18,510,015 | | | | 391,486,817 | |
| | |
| | | | | | | 655,226,810 | |
| | |
Indonesia - 1.2% | | | | | | | | |
| | |
Telkom Indonesia Persero Tbk PT (Telecommunication Services)† | | | 956,064,400 | | | | 256,316,402 | |
| | |
Israel - 1.2% | | | | | | | | |
| | |
Check Point Software Technologies Ltd. (Software & Services)* | | | 2,165,126 | | | | 258,949,070 | |
| | |
Japan - 12.6% | | | | | | | | |
| | |
Chugai Pharmaceutical Co., Ltd. (Pharmaceuticals, Biotechnology & Life Sciences)† | | | 8,230,600 | | | | 306,952,056 | |
| | |
FANUC Corp. (Capital Goods)† | | | 830,300 | | | | 163,168,464 | |
| | |
Keyence Corp. (Technology Hardware & Equipment)† | | | 541,454 | | | | 326,502,189 | |
| | |
Komatsu Ltd. (Capital Goods)† | | | 10,102,800 | | | | 263,900,748 | |
| | |
Kubota Corp. (Capital Goods)† | | | 15,924,600 | | | | 339,506,685 | |
| | |
Nitori Holdings Co., Ltd. (Retailing)† | | | 1,605,200 | | | | 294,556,010 | |
| | |
Shionogi & Co., Ltd. (Pharmaceuticals, Biotechnology & Life Sciences)† | | | 4,784,800 | | | | 311,535,760 | |
| | |
Sysmex Corp. (Health Care | | | | | | | | |
| | |
Equipment & Services)† | | | 2,916,007 | | | | 362,446,828 | |
| | |
Unicharm Corp. (Household & Personal Products)† | | | 9,666,700 | | | | 389,934,619 | |
| | |
| | | | | | | 2,758,503,359 | |
| | |
Mexico - 1.0% | | | | | | | | |
| | |
Fomento Economico Mexicano SAB de CV - Sponsored ADR (Food Beverage & Tobacco) | | | 2,813,363 | | | | 231,230,305 | |
| | |
Netherlands - 2.8% | | | | | | | | |
| | |
Adyen NV (Software & Services)*^† | | | 206,040 | | | | 622,385,323 | |
| | |
Russia - 3.0% | | | | | | | | |
| | |
LUKOIL PJSC - Sponsored ADR (Energy) | | | 4,282,336 | | | | 436,926,742 | |
| | |
Yandex NV, Class A (Media & Entertainment)* | | | 2,611,431 | | | | 216,330,944 | |
| | |
| | | | | | | 653,257,686 | |
See Notes to Financial Statements
7
Harding, Loevner Funds, Inc.
International Equity Portfolio
Portfolio of Investments (continued)
October 31, 2021
| | | | | | | | |
| | |
| | | Shares | | | Value | |
| COMMON STOCKS - 95.4% (continued) | | | | |
Singapore - 2.4% | | | | | | | | |
| | |
DBS Group Holdings Ltd. (Banks)† | | | 22,272,808 | | | | $519,012,230 | |
| | |
South Korea - 2.7% | | | | | | | | |
| | |
Samsung Electronics Co., Ltd. - GDR, Reg S (Technology Hardware & Equipment)† | | | 390,767 | | | | 586,573,157 | |
| | |
Spain - 1.5% | | | | | | | | |
| | |
Banco Bilbao Vizcaya Argentaria SA (Banks)† | | | 48,229,674 | | | | 338,377,902 | |
| | |
Sweden - 8.3% | | | | | | | | |
| | |
Alfa Laval AB (Capital Goods)† | | | 9,227,284 | | | | 394,410,346 | |
| | |
Atlas Copco AB, Class A (Capital Goods)† | | | 12,211,093 | | | | 783,340,375 | |
| | |
Epiroc AB, Class A (Capital Goods)† | | | 14,175,655 | | | | 352,171,769 | |
| | |
Skandinaviska Enskilda Banken AB, Class A (Banks)† | | | 18,760,548 | | | | 293,713,518 | |
| | |
| | | | | | | 1,823,636,008 | |
| | |
Switzerland - 10.9% | | | | | | | | |
| | |
Alcon Inc. (Health Care Equipment & Services) | | | 4,029,065 | | | | 335,862,858 | |
| | |
Lonza Group AG, Reg S (Pharmaceuticals, Biotechnology & Life Sciences)† | | | 646,184 | | | | 530,716,446 | |
| | |
Nestle SA - Sponsored ADR (Food Beverage & Tobacco) | | | 3,331,543 | | | | 439,163,998 | |
| | |
Roche Holding AG, Genusschein (Pharmaceuticals, Biotechnology & Life Sciences)† | | | 1,591,501 | | | | 616,568,033 | |
| | |
SGS SA, Reg S (Commercial & Professional Services)† | | | 60,922 | | | | 179,974,599 | |
| | |
Sonova Holding AG, Reg S (Health Care Equipment & Services)† | | | 699,576 | | | | 289,641,010 | |
| | |
| | | | | | | 2,391,926,944 | |
| | |
Taiwan - 3.4% | | | | | | | | |
| | |
Taiwan Semiconductor Manufacturing Co., Ltd. - Sponsored ADR (Semiconductors & Semiconductor Equipment) | | | 6,602,163 | | | | 750,665,933 | |
| | |
United Kingdom - 5.9% | | | | | | | | |
| | |
Diageo plc (Food Beverage & Tobacco)† | | | 5,027,090 | | | | 250,263,790 | |
| | |
Rio Tinto plc (Materials)† | | | 5,639,733 | | | | 351,404,360 | |
| | |
Royal Dutch Shell plc, Class B (Energy)† | | | 13,015,400 | | | | 298,463,976 | |
| | |
Standard Chartered plc (Banks)† | | | 21,912,063 | | | | 148,529,324 | |
| | |
Unilever plc (Household & Personal Products)† | | | 4,398,019 | | | | 235,367,205 | |
| | |
| | | | | | | 1,284,028,655 | |
| | | | | | | | |
| | |
| | | Shares | | | Value | |
| COMMON STOCKS - 95.4% (continued) | | | | |
United States - 1.1% | | | | | | | | |
| | |
Linde plc (Materials)† | | | 757,760 | | | | $244,100,273 | |
| |
Total Common Stocks (Cost $13,083,365,390) | | | | $20,917,663,403 | |
| |
| | | | | |
| PREFERRED STOCKS - 1.5% | | | | | | |
Brazil - 1.0% | | | | | | | | |
| | |
Itau Unibanco Holding SA - Sponsored ADR, 0.78% (Banks)+ | | | 53,417,626 | | | | 217,409,738 | |
| | |
Germany^^ - 0.0% | | | | | | | | |
| | |
FUCHS PETROLUB SE, 2.41% (Materials)+† | | | 131,733 | | | | 6,311,177 | |
| | |
South Korea - 0.5% | | | | | | | | |
| | |
Samsung Electronics Co., Ltd. - GDR, Reg S, 2.18% (Technology Hardware & Equipment)+† | | | 74,447 | | | | 102,539,357 | |
| | |
Total Preferred Stocks (Cost $223,530,423) | | | | $326,260,272 | |
| | | | | |
| SHORT TERM INVESTMENTS - 2.9% | | | | |
Northern Institutional Funds - Treasury Portfolio (Premier Shares), 0.01% (Money Market Funds) | | | 626,589,387 | | | | 626,589,387 | |
| | |
Total Short Term Investments (Cost $626,589,387) | | | | | | | $626,589,387 | |
| | |
| | | | | | | | | |
| | |
Total Investments — 99.8% | | | | | | | | |
| | |
(Cost $13,933,485,200) | | | | | | | $21,870,513,062 | |
| | |
Other Assets Less Liabilities - 0.2% | | | | | | | 42,276,627 | |
| | |
Net Assets — 100.0% | | | | | | | $21,912,789,689 | |
See Notes to Financial Statements
8
Harding, Loevner Funds, Inc.
International Equity Portfolio
Portfolio of Investments (continued)
October 31, 2021
| | |
| Summary of Abbreviations |
| |
| ADR | | American Depositary Receipt |
| |
| GDR | | Global Depositary Receipt |
| |
| Reg S | | Security sold outside United States without registration under the Securities Act of 1933. |
| |
| * | | Non-income producing security. |
| |
| † | | Investment categorized as level 2 security as disclosed in Note 2 of the Notes to Financial Statements. |
| |
| ^ | | Security exempt from registration pursuant to Rule 144A of the Securities Act of 1933. These securities, which represent 2.8% of net assets as of October 31, 2021, are considered liquid and may be resold in transactions exempt from registration, normally to qualified buyers. |
| |
| + | | Current yield is disclosed. Dividends are calculated based on a percentage of the issuer’s net income. |
| |
| ^^ | | Amount is less than 0.005%. |
| | | | |
| Industry | |
| Percentage of
Net Assets |
|
| |
Banks | | | 9.9 | % |
| |
Capital Goods | | | 14.2 | |
| |
Commercial & Professional Services | | | 0.8 | |
| |
Diversified Financials | | | 0.2 | |
| |
Energy | | | 3.4 | |
| |
Food & Staples Retailing | | | 1.0 | |
| |
Food Beverage & Tobacco | | | 5.2 | |
| |
Health Care Equipment & Services | | | 4.5 | |
| |
Household & Personal Products | | | 6.3 | |
| |
Insurance | | | 5.7 | |
| |
Materials | | | 8.2 | |
| |
Media & Entertainment | | | 4.2 | |
| |
Pharmaceuticals, Biotechnology & Life Sciences | | | 9.2 | |
| |
Retailing | | | 2.4 | |
| |
Semiconductors & Semiconductor Equipment | | | 6.8 | |
| |
Software & Services | | | 7.1 | |
| |
Technology Hardware & Equipment | | | 4.6 | |
| |
Telecommunication Services | | | 1.2 | |
| |
Transportation | | | 1.1 | |
| |
Utilities | | | 0.9 | |
| |
Money Market Fund | | | 2.9 | |
| |
Total Investments | | | 99.8 | |
| |
Other Assets Less Liabilities | | | 0.2 | |
| |
Net Assets | | | 100.0 | % |
See Notes to Financial Statements
9
Harding, Loevner Funds, Inc.
International Small Companies Portfolio
Portfolio of Investments
October 31, 2021
| | | | | | | | |
| | |
| | | Shares | | | Value | |
| COMMON STOCKS - 97.3% | | | | | | |
| | |
Argentina - 2.2% | | | | | | | | |
| | |
Globant SA (Software & Services)* | | | 42,310 | | | | $13,504,928 | |
| | |
Bangladesh - 0.7% | | | | | | | | |
| | |
Square Pharmaceuticals Ltd. (Pharmaceuticals, Biotechnology & Life Sciences)† | | | 1,648,840 | | | | 4,190,835 | |
| | |
Canada - 2.1% | | | | | | | | |
| | |
Kinaxis Inc. (Software & Services)* | | | 79,700 | | | | 12,369,729 | |
| | |
China - 1.1% | | | | | | | | |
| | |
Haitian International Holdings Ltd. (Capital Goods)† | | | 2,167,000 | | | | 6,344,150 | |
| | |
Denmark - 0.6% | | | | | | | | |
| | |
SimCorp A/S (Software & Services)† | | | 28,498 | | | | 3,445,557 | |
| | |
Egypt - 1.4% | | | | | | | | |
| | |
Edita Food Industries SAE (Food Beverage & Tobacco)† | | | 9,945,617 | | | | 4,424,680 | |
| | |
Integrated Diagnostics Holdings plc (Health Care Equipment & Services)^† | | | 3,199,577 | | | | 3,960,154 | |
| | |
| | | | | | | 8,384,834 | |
| | |
Finland - 2.0% | | | | | | | | |
| | |
Vaisala OYJ, Class A (Technology Hardware & Equipment)† | | | 220,524 | | | | 11,727,851 | |
| | |
France - 4.6% | | | | | | | | |
| | |
Alten SA (Software & Services)† | | | 89,652 | | | | 14,453,866 | |
| | |
LISI (Capital Goods)† | | | 130,962 | | | | 3,643,452 | |
| | |
Rubis SCA (Utilities)† | | | 289,797 | | | | 9,280,973 | |
| | |
| | | | | | | 27,378,291 | |
| | |
Germany - 9.7% | | | | | | | | |
| | |
Bechtle AG (Software & Services)† | | | 176,395 | | | | 13,215,388 | |
| | |
FUCHS PETROLUB SE (Materials)† | | | 262,673 | | | | 9,666,587 | |
| | |
KWS Saat SE & Co. KGaA (Food Beverage & Tobacco)† | | | 89,081 | | | | 7,600,456 | |
| | |
Pfeiffer Vacuum Technology AG (Capital Goods)† | | | 22,805 | | | | 5,694,124 | |
| | |
STRATEC SE (Health Care Equipment & Services)† | | | 102,250 | | | | 16,312,603 | |
| | |
TeamViewer AG (Software & Services)*^† | | | 372,836 | | | | 5,560,619 | |
| | |
| | | | | | | 58,049,777 | |
| | |
Hong Kong - 0.5% | | | | | | | | |
| | |
ASM Pacific Technology Ltd. (Semiconductors & Semiconductor Equipment)† | | | 252,400 | | | | 2,739,698 | |
| | | | | | | | |
| | |
| | | Shares | | | Value | |
| COMMON STOCKS - 97.3% (continued) | | | | |
| | |
India - 2.1% | | | | | | | | |
| | |
Max Financial Services Ltd. (Insurance)*† | | | 662,751 | | | | $8,621,085 | |
| | |
SH Kelkar & Co., Ltd. (Materials)^† | | | 1,914,241 | | | | 4,072,574 | |
| | |
| | | | | | | 12,693,659 | |
| | |
Indonesia - 2.0% | | | | | | | | |
| | |
Sarana Menara Nusantara Tbk PT (Telecommunication Services)† | | | 110,023,100 | | | | 9,014,177 | |
| | |
Tower Bersama Infrastructure Tbk PT (Telecommunication Services)† | | | 15,395,900 | | | | 3,198,205 | |
| | |
| | | | | | | 12,212,382 | |
| | |
Israel - 1.8% | | | | | | | | |
| | |
CyberArk Software Ltd. (Software & Services)* | | | 58,673 | | | | 10,567,594 | |
| | |
Italy - 3.9% | | | | | | | | |
| | |
Reply SpA (Software & Services)† | | | 120,451 | | | | 23,399,438 | |
| | |
Japan - 13.7% | | | | | | | | |
| | |
ABC-Mart Inc. (Retailing)† | | | 30,000 | | | | 1,437,456 | |
| | |
Ariake Japan Co., Ltd. (Food Beverage & Tobacco)† | | | 147,900 | | | | 9,623,115 | |
| | |
BML Inc. (Health Care Equipment & Services)† | | | 121,000 | | | | 4,249,266 | |
| | |
Cosmos Pharmaceutical Corp. (Food & Staples Retailing)† | | | 47,100 | | | | 7,206,021 | |
| | |
Infomart Corp. (Software & Services)† | | | 787,900 | | | | 7,697,750 | |
| | |
JCU Corp. (Materials)† | | | 173,900 | | | | 6,967,244 | |
| | |
MISUMI Group Inc. (Capital Goods)† | | | 73,000 | | | | 3,056,281 | |
| | |
Nihon M&A Center Holdings Inc. (Commercial & Professional Services)† | | | 117,900 | | | | 3,614,131 | |
| | |
Pigeon Corp. (Household & Personal Products)† | | | 35,800 | | | | 829,626 | |
| | |
Rinnai Corp. (Consumer Durables & Apparel)† | | | 36,900 | | | | 3,784,816 | |
| | |
Rohto Pharmaceutical Co., Ltd. (Household & Personal Products)† | | | 106,000 | | | | 3,237,130 | |
| | |
Santen Pharmaceutical Co., Ltd. (Pharmaceuticals, Biotechnology & Life Sciences)† | | | 528,200 | | | | 7,432,526 | |
| | |
SMS Co., Ltd. (Commercial & Professional Services)† | | | 306,200 | | | | 11,899,529 | |
| | |
Solasto Corp. (Health Care Equipment & Services)† | | | 274,800 | | | | 3,326,380 | |
| | |
Stanley Electric Co., Ltd. (Automobiles & Components)† | | | 306,900 | | | | 7,739,862 | |
| | |
| | | | | | | 82,101,133 | |
See Notes to Financial Statements
10
Harding, Loevner Funds, Inc.
International Small Companies Portfolio
Portfolio of Investments (continued)
October 31, 2021
| | | | | | | | |
| | |
| | | Shares | | | Value | |
| COMMON STOCKS - 97.3% (continued) | | | | |
Kuwait - 0.9% | | | | | | | | |
| | |
Mabanee Co. KPSC (Real Estate)† | | | 2,011,426 | | | | $5,252,389 | |
| | |
Lithuania - 1.8% | | | | | | | | |
| | |
Siauliu Bankas AB (Banks)† | | | 12,084,014 | | | | 10,800,661 | |
| | |
Malaysia - 1.2% | | | | | | | | |
| | |
Dialog Group Bhd. (Energy)† | | | 5,460,640 | | | | 3,734,956 | |
| | |
TIME dotCom Bhd. (Telecommunication Services)† | | | 3,289,500 | | | | 3,590,977 | |
| | |
| | | | | | | 7,325,933 | |
| | |
Mexico - 1.6% | | | | | | | | |
| | |
Grupo Herdez SAB de CV (Food Beverage & Tobacco) | | | 2,703,638 | | | | 4,971,815 | |
| | |
Megacable Holdings SAB de CV (Media & Entertainment) | | | 1,650,600 | | | | 4,863,289 | |
| | |
| | | | | | | 9,835,104 | |
| | |
Norway - 2.4% | | | | | | | | |
| | |
Tomra Systems ASA (Commercial & Professional Services)† | | | 225,628 | | | | 14,585,571 | |
| | |
Poland - 0.4% | | | | | | | | |
| | |
CD Projekt SA (Media & Entertainment)† | | | 58,864 | | | | 2,568,383 | |
| | |
Romania - 0.3% | | | | | | | | |
| | |
Societatea Nationala de Gaze Naturale ROMGAZ SA (Energy)† | | | 241,357 | | | | 2,102,683 | |
| | |
Saudi Arabia - 1.0% | | | | | | | | |
| | |
Jarir Marketing Co. (Retailing)† | | | 105,890 | | | | 5,723,359 | |
| | |
South Africa - 0.6% | | | | | | | | |
| | |
Clicks Group Ltd. (Food & Staples Retailing)† | | | 90,627 | | | | 1,656,842 | |
| | |
Discovery Ltd. (Insurance)*† | | | 210,024 | | | | 1,932,548 | |
| | |
| | | | | | | 3,589,390 | |
| | |
South Korea - 1.4% | | | | | | | | |
| | |
Cheil Worldwide Inc. (Media & Entertainment)† | | | 407,840 | | | | 8,352,188 | |
| | |
Spain - 0.6% | | | | | | | | |
| | |
Bankinter SA (Banks)† | | | 664,201 | | | | 3,664,539 | |
| | |
Sweden - 2.7% | | | | | | | | |
| | |
Intrum AB (Commercial & Professional Services)† | | | 219,400 | | | | 6,216,471 | |
| | |
Paradox Interactive AB (Media & Entertainment)† | | | 396,384 | | | | 5,830,059 | |
| | |
Thule Group AB (Consumer Durables & Apparel)^† | | | 69,398 | | | | 4,004,890 | |
| | |
| | | | | | | 16,051,420 | |
| | |
Switzerland - 4.8% | | | | | | | | |
| | |
Bossard Holding AG, Class A, Reg S (Capital Goods)† | | | 30,282 | | | | 11,115,383 | |
| | | | | | | | |
| | |
| | | Shares | | | Value | |
| COMMON STOCKS - 97.3% (continued) | | | | |
Switzerland - 4.8% (continued) | | | | | | | | |
| | |
LEM Holding SA, Reg S (Technology Hardware & Equipment)† | | | 4,425 | | | | $10,751,518 | |
| | |
VAT Group AG (Capital Goods)^† | | | 15,186 | | | | 7,234,806 | |
| | |
| | | | | | | 29,101,707 | |
| | |
Taiwan - 2.0% | | | | | | | | |
| | |
Advantech Co., Ltd. (Technology Hardware & Equipment)† | | | 236,645 | | | | 3,097,666 | |
| | |
Chipbond Technology Corp. (Semiconductors & Semiconductor Equipment)† | | | 2,484,700 | | | | 5,776,713 | |
| | |
Eclat Textile Co., Ltd. (Consumer Durables & Apparel)† | | | 154,909 | | | | 3,391,263 | |
| | |
| | | | | | | 12,265,642 | |
| | |
Ukraine - 0.8% | | | | | | | | |
| | |
Kernel Holding SA (Food Beverage & Tobacco)† | | | 321,186 | | | | 4,861,365 | |
| | |
| | | | | | | | |
| | |
United Arab Emirates - 0.8% | | | | | | | | |
| | |
Agthia Group PJSC (Food Beverage & Tobacco)† | | | 3,039,785 | | | | 4,920,631 | |
| | |
United Kingdom - 20.8% | | | | | | | | |
| | |
Abcam plc (Pharmaceuticals, Biotechnology & Life Sciences)*† | | | 578,702 | | | | 13,165,913 | |
| | |
Bank of Georgia Group plc (Banks)† | | | 477,398 | | | | 9,930,384 | |
| | |
Clarkson plc (Transportation)† | | | 153,393 | | | | 8,411,223 | |
| | |
Cranswick plc (Food Beverage & Tobacco)† | | | 84,691 | | | | 4,011,846 | |
| | |
Dechra Pharmaceuticals plc (Pharmaceuticals, Biotechnology & Life Sciences)† | | | 218,633 | | | | 15,331,283 | |
| | |
Diploma plc (Capital Goods)† | | | 279,804 | | | | 11,537,336 | |
| | |
EMIS Group plc (Health Care Equipment & Services)† | | | 439,550 | | | | 8,122,320 | |
| | |
HomeServe plc (Commercial & Professional Services)† | | | 285,907 | | | | 3,353,801 | |
| | |
Keywords Studios plc (Software & Services)† | | | 300,772 | | | | 11,676,249 | |
| | |
Network International Holdings plc (Software & Services)*^† | | | 1,440,921 | | | | 6,377,571 | |
| | |
Rathbone Brothers plc (Diversified Financials)† | | | 161,351 | | | | 4,358,246 | |
| | |
Rightmove plc (Media & Entertainment)† | | | 532,092 | | | | 5,038,342 | |
| | |
Senior plc (Capital Goods)*† | | | 5,959,386 | | | | 13,079,284 | |
| | |
YouGov plc (Media & Entertainment)† | | | 566,247 | | | | 10,239,464 | |
| | |
| | | | | | | 124,633,262 | |
| | |
United States - 1.0% | | | | | | | | |
| | |
Core Laboratories NV (Energy) | | | 103,535 | | | | 2,692,945 | |
See Notes to Financial Statements
11
Harding, Loevner Funds, Inc.
International Small Companies Portfolio
Portfolio of Investments (continued)
October 31, 2021
| | | | | | |
| | |
| | | Shares | | Value | |
| COMMON STOCKS - 97.3% (continued) | | | |
United States - 1.0% (continued) | | | | | | |
| | |
Sensata Technologies Holding
plc (Capital Goods)* | | 60,940 | | | $3,357,794 | |
| | |
| | | | | 6,050,739 | |
| | |
Vietnam - 3.8% | | | | | | |
| | |
Hoa Phat Group JSC
(Materials)† | | 9,076,696 | | | 22,788,368 | |
| | | | | | |
| | | |
Total Common Stocks (Cost $397,269,653) | | | | | $583,583,190 | |
| | | | | | |
| SHORT TERM INVESTMENTS - 2.7% | | | |
Northern Institutional Funds -
Treasury Portfolio (Premier
Shares), 0.01% (Money
Market Funds) | | 16,367,527 | | | 16,367,527 | |
| | | | | | |
| | | |
Total Short Term Investments (Cost $16,367,527) | | | | | $16,367,527 | |
| | |
| | | | | | | |
| | | |
Total Investments — 100.0% | | | | | | |
| | |
(Cost $413,637,180) | | | | | $599,950,717 | |
| | |
Liabilities Less Other Assets - (0.0)%^^ | | | | | (298,505 | ) |
| | |
Net Assets — 100.0% | | | | | $599,652,212 | |
Summary of Abbreviations
| Reg S | Security sold outside United States without registration under the Securities Act of 1933. |
| * | Non-income producing security. |
| † | Investment categorized as level 2 security as disclosed in Note 2 of the Notes to Financial Statements. |
| ^ | Security exempt from registration pursuant to Rule 144A of the Securities Act of 1933. These securities, which represent 5.2% of net assets as of October 31, 2021, are considered liquid and may be resold in transactions exempt from registration, normally to qualified buyers. |
| ^^ | Amount is less than 0.005%. |
| | | | |
| |
Industry | | Percentage of
Net Assets | |
Automobiles & Components | | | 1.3 | % |
| |
Banks | | | 4.1 | |
| |
Capital Goods | | | 10.8 | |
| |
Commercial & Professional Services | | | 6.6 | |
| |
Consumer Durables & Apparel | | | 1.9 | |
| |
Diversified Financials | | | 0.7 | |
| |
Energy | | | 1.4 | |
| |
Food & Staples Retailing | | | 1.5 | |
| |
Food Beverage & Tobacco | | | 6.7 | |
| |
Health Care Equipment & Services | | | 6.0 | |
| |
Household & Personal Products | | | 0.7 | |
| |
Insurance | | | 1.8 | |
| |
Materials | | | 7.3 | |
| |
Media & Entertainment | | | 6.1 | |
| |
Pharmaceuticals, Biotechnology & Life Sciences | | | 6.7 | |
| |
Real Estate | | | 0.9 | |
| |
Retailing | | | 1.2 | |
| |
Semiconductors & Semiconductor Equipment | | | 1.4 | |
| |
Software & Services | | | 20.4 | |
| |
Technology Hardware & Equipment | | | 4.3 | |
| |
Telecommunication Services | | | 2.6 | |
| |
Transportation | | | 1.4 | |
| |
Utilities | | | 1.5 | |
| |
Money Market Fund | | | 2.7 | |
| | |
Total Investments | | | 100.0 | |
| |
Liabilities Less Other Assets | | | (0.0 | )^^ |
| | |
Net Assets | | | 100.0 | % |
| |
^^ Amount is less than 0.005%. | | | | |
See Notes to Financial Statements
12
Harding, Loevner Funds, Inc.
Institutional Emerging Markets Portfolio
Portfolio of Investments
October 31, 2021
| | | | | | | | | | |
| | |
| | | Shares | | Value |
| COMMON STOCKS - 95.6% | | | | |
| | |
Brazil - 4.6% | | | | | | | | | | |
| | |
Ambev SA - ADR (Food Beverage & Tobacco) | | | | 21,639,901 | | | | | $64,054,107 | |
| | |
B3 SA - Brasil Bolsa Balcao (Diversified Financials) | | | | 18,988,800 | | | | | 40,071,691 | |
| | |
Cia Brasileira de Distribuicao - ADR (Food & Staples Retailing) | | | | 1,301,993 | | | | | 5,937,088 | |
| | |
Localiza Rent a Car SA (Transportation) | | | | 5,585,870 | | | | | 44,835,024 | |
| | |
Lojas Renner SA (Retailing) | | | | 3,800,700 | | | | | 21,704,625 | |
| | |
Magazine Luiza SA (Retailing)* | | | | 12,256,500 | | | | | 23,475,808 | |
| | |
Ultrapar Participacoes SA (Energy) | | | | 6,647,078 | | | | | 15,369,852 | |
| | |
WEG SA (Capital Goods) | | | | 6,425,292 | | | | | 42,123,357 | |
| | |
XP Inc., Class A (Diversified Financials)* | | | | 1,235,316 | | | | | 40,530,713 | |
| | |
| | | | | | | | | 298,102,265 | |
| | |
Chile - 0.2% | | | | | | | | | | |
| | |
Banco Santander Chile - ADR (Banks) | | | | 823,352 | | | | | 14,589,797 | |
| | |
China - 24.1% | | | | | | | | | | |
| | |
51job Inc. - ADR (Commercial & Professional Services)* | | | | 596,059 | | | | | 35,501,274 | |
| | |
Alibaba Group Holding Ltd. (Retailing)*† | | | | 6,992,516 | | | | | 144,670,111 | |
| | |
Alibaba Group Holding Ltd. - Sponsored ADR (Retailing)* | | | | 454,828 | | | | | 75,019,330 | |
| | |
Baidu Inc., Class A (Media & Entertainment)*† | | | | 2,388,258 | | | | | 48,850,565 | |
| | |
China Tourism Group Duty Free Corp., Ltd., Class A (Retailing)† | | | | 1,479,100 | | | | | 61,733,074 | |
| | |
Country Garden Services Holdings Co., Ltd. (Real Estate)† | | | | 5,358,504 | | | | | 41,488,547 | |
| | |
CSPC Pharmaceutical Group Ltd. (Pharmaceuticals, Biotechnology & Life Sciences)† | | | | 69,154,080 | | | | | 72,463,457 | |
| | |
ENN Energy Holdings Ltd. (Utilities)† | | | | 6,017,300 | | | | | 104,280,003 | |
| | |
Fuyao Glass Industry Group Co., Ltd., Class H (Automobiles & Components)^† | | | | 11,549,400 | | | | | 66,936,503 | |
| | |
Hefei Meiya Optoelectronic Technology Inc., Class A (Capital Goods)† | | | | 8,134,816 | | | | | 51,148,055 | |
| | |
Jiangsu Hengrui Medicine Co., Ltd., Class A (Pharmaceuticals, Biotechnology & Life Sciences)† | | | | 2,500,920 | | | | | 19,206,989 | |
| | |
Midea Group Co., Ltd., Class A (Consumer Durables & Apparel)† | | | | 9,391,364 | | | | | 100,417,915 | |
| | | | | | | | | | |
| | |
| | | Shares | | Value |
| COMMON STOCKS - 95.6% (continued) |
| | |
China - 24.1% (continued) | | | | | | | | | | |
| | |
Ping An Insurance Group Co. of China Ltd., Class H (Insurance)† | | | | 9,886,000 | | | | | $71,189,390 | |
| | |
Sangfor Technologies Inc., Class A (Software & Services)† | | | | 1,431,100 | | | | | 45,345,538 | |
| | |
SF Holding Co., Ltd., Class A (Transportation)† | | | | 3,107,800 | | | | | 31,294,013 | |
| | |
Shenzhou International Group Holdings Ltd. (Consumer Durables & Apparel)† | | | | 3,844,000 | | | | | 83,347,974 | |
| | |
Sino Biopharmaceutical Ltd. (Pharmaceuticals, Biotechnology & Life Sciences)† | | | | 23,978,135 | | | | | 17,787,095 | |
| | |
Sunny Optical Technology Group Co., Ltd. (Technology Hardware & Equipment)† | | | | 3,304,700 | | | | | 89,118,228 | |
| | |
Tencent Holdings Ltd. (Media & Entertainment)† | | | | 3,937,300 | | | | | 244,452,181 | |
| | |
Wuxi Biologics Cayman Inc. (Pharmaceuticals, Biotechnology & Life Sciences)*^† | | | | 5,523,500 | | | | | 84,360,998 | |
| | |
Zhejiang Sanhua Intelligent Controls Co., Ltd., Class A (Capital Goods)† | | | | 17,324,383 | | | | | 64,052,442 | |
| | |
ZTO Express Cayman Inc. - ADR (Transportation) | | | | 424,155 | | | | | 12,440,466 | |
| | |
| | | | | | | | | 1,565,104,148 | |
| | |
Czech Republic - 0.8% | | | | | | | | | | |
| | |
Komercni banka AS (Banks)*† | | | | 1,280,874 | | | | | 49,681,952 | |
| | |
Egypt - 0.6% | | | | | | | | | | |
| | |
Commercial International Bank Egypt SAE - GDR, Reg S (Banks)*† | | | | 12,353,866 | | | | | 38,293,155 | |
| | |
Hong Kong - 5.6% | | | | | | | | | | |
| | |
AIA Group Ltd. (Insurance)† | | | | 13,291,215 | | | | | 150,201,860 | |
| | |
ASM Pacific Technology Ltd. (Semiconductors & Semiconductor Equipment)† | | | | 4,569,869 | | | | | 49,604,040 | |
| | |
Techtronic Industries Co., Ltd. (Capital Goods)† | | | | 8,034,301 | | | | | 165,086,239 | |
| | |
| | | | | | | | | 364,892,139 | |
| | |
India - 8.9% | | | | | | | | | | |
| | |
HDFC Bank Ltd. - ADR (Banks) | | | | 1,036,826 | | | | | 74,558,158 | |
| | |
Housing Development Finance Corp., Ltd. (Banks)† | | | | 4,420,226 | | | | | 168,350,975 | |
| | |
Kotak Mahindra Bank Ltd. (Banks)† | | | | 3,612,258 | | | | | 97,793,890 | |
| | |
Maruti Suzuki India Ltd. (Automobiles & Components)† | | | | 758,255 | | | | | 75,847,008 | |
See Notes to Financial Statements
13
Harding, Loevner Funds, Inc.
Institutional Emerging Markets Portfolio
Portfolio of Investments (continued)
October 31, 2021
| | | | | | | | | | |
| | |
| | | Shares | | Value |
| COMMON STOCKS - 95.6% (continued) |
| | |
India - 8.9% (continued) | | | | | | | | | | |
| | |
Tata Consultancy Services Ltd. (Software & Services)† | | | | 3,558,150 | | | | | $161,638,971 | |
| | |
| | | | | | | | | 578,189,002 | |
| | |
Indonesia - 2.8% | | | | | | | | | | |
| | |
Astra International Tbk PT (Automobiles & Components)† | | | | 81,567,800 | | | | | 34,743,454 | |
| | |
Bank Central Asia Tbk PT (Banks)† | | | | 129,373,665 | | | | | 68,275,114 | |
| | |
Bank Rakyat Indonesia Persero Tbk PT (Banks)† | | | | 259,836,900 | | | | | 77,669,073 | |
| | |
| | | | | | | | | 180,687,641 | |
| | |
Italy - 0.8% | | | | | | | | | | |
| | |
Tenaris SA - ADR (Energy) | | | | 2,373,565 | | | | | 52,883,028 | |
| | |
Kenya - 1.3% | | | | | | | | | | |
| | |
East African Breweries Ltd. (Food Beverage & Tobacco)*† | | | | 6,241,665 | | | | | 9,318,726 | |
| | |
Safaricom plc (Telecommunication Services)† | | | | 195,778,327 | | | | | 75,188,707 | |
| | |
| | | | | | | | | 84,507,433 | |
| | |
Mexico - 5.6% | | | | | | | | | | |
| | |
Fomento Economico Mexicano SAB de CV - Sponsored ADR (Food Beverage & Tobacco) | | | | 1,025,025 | | | | | 84,246,805 | |
| | |
Grupo Aeroportuario del Sureste SAB de CV - ADR (Transportation) | | | | 342,345 | | | | | 69,033,869 | |
| | |
Grupo Financiero Banorte SAB de CV, Series O (Banks) | | | | 16,899,200 | | | | | 106,994,886 | |
| | |
Wal-Mart de Mexico SAB de CV (Food & Staples Retailing) | | | | 30,197,000 | | | | | 105,325,752 | |
| | |
| | | | | | | | | 365,601,312 | |
| | |
Panama - 0.4% | | | | | | | | | | |
| | |
Copa Holdings SA, Class A (Transportation)* | | | | 370,214 | | | | | 27,381,027 | |
| | |
Poland - 0.4% | | | | | | | | | | |
| | |
CD Projekt SA (Media & Entertainment)† | | | | 586,190 | | | | | 25,576,934 | |
| | |
Russia - 10.3% | | | | | | | | | | |
| | |
LUKOIL PJSC - Sponsored ADR (Energy) | | | | 1,631,755 | | | | | 166,487,963 | |
| | |
Novatek PJSC - Sponsored GDR, Reg S (Energy)† | | | | 660,418 | | | | | 167,891,424 | |
| | |
Sberbank of Russia PJSC - Sponsored ADR (Banks)† | | | | 9,325,033 | | | | | 187,014,237 | |
| | |
Yandex NV, Class A (Media & Entertainment)* | | | | 1,736,204 | | | | | 143,827,139 | |
| | |
| | | | | | | | | 665,220,763 | |
| | |
South Africa - 1.6% | | | | | | | | | | |
| | |
Discovery Ltd. (Insurance)*† | | | | 6,221,961 | | | | | 57,251,739 | |
| | | | | | | | | | |
| | |
| | | Shares | | Value |
| COMMON STOCKS - 95.6% (continued) |
| | |
South Africa - 1.6% (continued) | | | | | | | | | | |
| | |
Standard Bank Group Ltd. (Banks)† | | | | 5,372,816 | | | | | $47,744,933 | |
| | |
| | | | | | | | | 104,996,672 | |
| | |
South Korea - 7.7% | | | | | | | | | | |
| | |
Amorepacific Corp. (Household & Personal Products)† | | | | 137,340 | | | | | 21,419,951 | |
| | |
Coway Co., Ltd. (Consumer Durables & Apparel)† | | | | 678,915 | | | | | 46,250,671 | |
| | |
LG Household & Health Care Ltd. (Household & Personal Products)† | | | | 115,872 | | | | | 116,315,005 | |
| | |
NCSoft Corp. (Media & Entertainment)† | | | | 72,687 | | | | | 39,070,456 | |
| | |
Samsung Electronics Co., Ltd. - GDR, Reg S (Technology Hardware & Equipment)† | | | | 185,170 | | | | | 277,955,282 | |
| | |
| | | | | | | | | 501,011,365 | |
| | |
Taiwan - 11.6% | | | | | | | | | | |
| | |
Airtac International Group (Capital Goods)† | | | | 2,627,633 | | | | | 78,911,455 | |
| | |
Eclat Textile Co., Ltd. (Consumer Durables & Apparel)† | | | | 4,912,031 | | | | | 107,534,020 | |
| | |
Hon Hai Precision Industry Co., Ltd. (Technology Hardware & Equipment)† | | | | 26,538,031 | | | | | 102,690,124 | |
| | |
Largan Precision Co., Ltd. (Technology Hardware & Equipment)† | | | | 552,000 | | | | | 41,264,719 | |
| | |
Silergy Corp. (Semiconductors & Semiconductor Equipment)† | | | | 436,122 | | | | | 72,013,598 | |
| | |
Taiwan Semiconductor Manufacturing Co., Ltd. (Semiconductors & Semiconductor Equipment)† | | | | 16,414,277 | | | | | 347,369,509 | |
| | |
| | | | | | | | | 749,783,425 | |
| | |
Thailand - 1.1% | | | | | | | | | | |
| | |
Siam Commercial Bank pcl, Reg S (Banks)† | | | | 18,694,470 | | | | | 70,986,310 | |
| | |
United Kingdom - 2.7% | | | | | | | | | | |
| | |
Bank of Georgia Group plc (Banks)† | | | | 713,964 | | | | | 14,851,207 | |
| | |
Coca-Cola HBC AG - CDI (Food Beverage & Tobacco)*† | | | | 3,834,085 | | | | | 133,019,114 | |
| | |
Network International Holdings plc (Software & Services)*^† | | | | 6,717,463 | | | | | 29,731,746 | |
| | |
| | | | | | | | | 177,602,067 | |
| | |
United States - 4.5% | | | | | | | | | | |
| | |
EPAM Systems Inc. (Software & Services)* | | | | 434,114 | | | | | 292,262,909 | |
| |
Total Common Stocks (Cost $4,020,831,459) | | | | $ | 6,207,353,344 | |
See Notes to Financial Statements
14
Harding, Loevner Funds, Inc.
Institutional Emerging Markets Portfolio
Portfolio of Investments (continued)
October 31, 2021
| | | | | | | | | | |
| | |
| | | Shares | | Value |
| PREFERRED STOCKS - 2.2% |
| | |
Brazil - 1.2% | | | | | | | | | | |
| | |
Banco Bradesco SA - ADR (Banks)* | | | | 5,946,797 | | | | | $20,813,790 | |
| | |
Itau Unibanco Holding SA - Sponsored ADR, 0.78% (Banks)+ | | | | 12,956,121 | | | | | 52,731,412 | |
| | |
| | | | | | | | | 73,545,202 | |
| | |
Colombia - 0.7% | | | | | | | | | | |
| | |
Bancolombia SA - Sponsored ADR, 0.68% (Banks)+ | | | | 1,271,207 | | | | | 45,674,467 | |
| | |
South Korea - 0.3% | | | | | | | | | | |
| | |
Samsung Electronics Co., Ltd. - GDR, Reg S, 2.18% (Technology Hardware & Equipment)+† | | | | 14,823 | | | | | 20,416,416 | |
| |
Total Preferred Stocks (Cost $123,221,242) | | | | | $139,636,085 | |
| | |
| | | | | | | | | | |
| RIGHTS^^ - 0.0% |
| | |
Brazil^^ - 0.0% | | | | | | | | | | |
| | |
Ultrapar Participacoes SA (Energy)* | | | | 476,424 | | | | | $844 | |
| | |
| | | | | | | | | | | |
| |
Total Rights (Cost $0) | | | | | $844 | |
| | |
| | | | | | | | | | |
| SHORT TERM INVESTMENTS - 2.5% |
| | |
Northern Institutional Funds - Treasury Portfolio (Premier Shares), 0.01% (Money Market Funds) | | | | 164,486,140 | | | | | 164,486,140 | |
| |
Total Short Term Investments
(Cost $164,486,140) | | | | | $164,486,140 | |
| | |
| | | | | | | | | | | |
| |
Total Investments — 100.3% | | | | | | |
| |
(Cost $4,308,538,841) | | | | | $6,511,476,413 | |
| | |
Liabilities Less Other Assets - (0.3)% | | | | | | | | | (17,590,372 | ) |
| |
Net Assets — 100.0% | | | | | $6,493,886,041 | |
| | |
Summary of Abbreviations |
| ADR | | American Depositary Receipt |
| |
| CDI | | Chess Depositary Interest |
| |
| GDR | | Global Depositary Receipt |
| |
| Reg S | | Security sold outside United States without registration under the Securities Act of 1933. |
| |
| * | | Non-income producing security. |
| |
| † | | Investment categorized as level 2 security as disclosed in Note 2 of the Notes to Financial Statements. |
| |
| ^ | | Security exempt from registration pursuant to Rule 144A of the Securities Act of 1933. These securities, which represent 2.8% of net assets as of October 31, 2021, are considered liquid and may be resold in transactions exempt from registration, normally to qualified buyers. |
| |
| + | | Current yield is disclosed. Dividends are calculated based on a percentage of the issuer’s net income. |
| |
| ^^ | | Amount is less than 0.005%. |
| | | | |
| Industry | |
| Percentage of
Net Assets |
|
| |
Automobiles & Components | | | 2.7 | % |
| |
Banks | | | 17.5 | |
| |
Capital Goods | | | 6.2 | |
| |
Commercial & Professional Services | | | 0.6 | |
| |
Consumer Durables & Apparel | | | 5.2 | |
| |
Diversified Financials | | | 1.2 | |
| |
Energy | | | 6.2 | |
| |
Food & Staples Retailing | | | 1.7 | |
| |
Food Beverage & Tobacco | | | 4.5 | |
| |
Household & Personal Products | | | 2.1 | |
| |
Insurance | | | 4.3 | |
| |
Media & Entertainment | | | 7.7 | |
| |
Pharmaceuticals, Biotechnology & Life Sciences | | | 3.0 | |
| |
Real Estate | | | 0.6 | |
| |
Retailing | | | 5.0 | |
| |
Semiconductors & Semiconductor Equipment | | | 7.2 | |
| |
Software & Services | | | 8.2 | |
| |
Technology Hardware & Equipment | | | 8.2 | |
| |
Telecommunication Services | | | 1.2 | |
| |
Transportation | | | 2.9 | |
| |
Utilities | | | 1.6 | |
| |
Money Market Fund | | | 2.5 | |
| | |
Total Investments | | | 100.3 | |
| |
Liabilities Less Other Assets | | | (0.3 | ) |
| | |
Net Assets | | | 100.0 | % |
See Notes to Financial Statements
15
Harding, Loevner Funds, Inc.
Emerging Markets Portfolio
Portfolio of Investments
October 31, 2021
| | | | | | | | | | |
| | |
| | | Shares | | Value |
| COMMON STOCKS - 96.2% | | | | |
| | |
Brazil - 4.6% | | | | | | | | | | |
| | |
Ambev SA - ADR (Food Beverage & Tobacco) | | | | 12,806,554 | | | | | $37,907,400 | |
| | |
B3 SA - Brasil Bolsa Balcao (Diversified Financials) | | | | 11,112,600 | | | | | 23,450,701 | |
| | |
Cia Brasileira de Distribuicao - ADR (Food & Staples Retailing) | | | | 764,265 | | | | | 3,485,048 | |
| | |
Localiza Rent a Car SA (Transportation) | | | | 3,305,755 | | | | | 26,533,666 | |
| | |
Lojas Renner SA (Retailing) | | | | 2,228,800 | | | | | 12,727,989 | |
| | |
Magazine Luiza SA (Retailing)* | | | | 7,201,000 | | | | | 13,792,624 | |
| | |
Ultrapar Participacoes SA (Energy) | | | | 3,901,800 | | | | | 9,022,022 | |
| | |
WEG SA (Capital Goods) | | | | 3,802,560 | | | | | 24,929,076 | |
| | |
XP Inc., Class A (Diversified Financials)* | | | | 722,927 | | | | | 23,719,245 | |
| | |
| | | | | | | | | 175,567,771 | |
| | |
Chile - 0.2% | | | | | | | | | | |
| | |
Banco Santander Chile - ADR (Banks) | | | | 482,839 | | | | | 8,555,907 | |
| | |
China - 24.3% | | | | | | | | | | |
| | |
51job Inc. - ADR (Commercial & Professional Services)* | | | | 352,749 | | | | | 21,009,730 | |
| | |
Alibaba Group Holding Ltd. (Retailing)*† | | | | 4,138,164 | | | | | 85,615,628 | |
| | |
Alibaba Group Holding Ltd. - Sponsored ADR (Retailing)* | | | | 269,168 | | | | | 44,396,570 | |
| | |
Baidu Inc., Class A (Media & Entertainment)*† | | | | 1,461,794 | | | | | 29,900,229 | |
| | |
China Tourism Group Duty Free Corp., Ltd., Class A (Retailing)† | | | | 869,007 | | | | | 36,269,673 | |
| | |
Country Garden Services Holdings Co., Ltd. (Real Estate)† | | | | 3,159,000 | | | | | 24,458,752 | |
| | |
CSPC Pharmaceutical Group Ltd. (Pharmaceuticals, Biotechnology & Life Sciences)† | | | | 40,924,560 | | | | | 42,883,010 | |
| | |
ENN Energy Holdings Ltd. (Utilities)† | | | | 3,560,700 | | | | | 61,707,046 | |
| | |
Fuyao Glass Industry Group Co., Ltd., Class H (Automobiles & Components)^† | | | | 6,834,900 | | | | | 39,612,820 | |
| | |
Hefei Meiya Optoelectronic Technology Inc., Class A (Capital Goods)† | | | | 4,797,734 | | | | | 30,165,988 | |
| | |
Jiangsu Hengrui Medicine Co., Ltd., Class A (Pharmaceuticals, Biotechnology & Life Sciences)† | | | | 1,467,960 | | | | | 11,273,888 | |
| | |
Midea Group Co., Ltd., Class A (Consumer Durables & Apparel)† | | | | 5,557,768 | | | | | 59,426,881 | |
| | | | | | | | | | |
| | |
| | | Shares | | Value |
| COMMON STOCKS - 96.2% (continued) | | | | |
| | |
China - 24.3% (continued) | | | | | | | | | | |
| | |
Ping An Insurance Group Co. of China Ltd., Class H (Insurance)† | | | | 5,850,500 | | | | | $42,129,630 | |
| | |
Sangfor Technologies Inc., Class A (Software & Services)† | | | | 847,000 | | | | | 26,837,866 | |
| | |
SF Holding Co., Ltd., Class A (Transportation)† | | | | 1,822,500 | | | | | 18,351,676 | |
| | |
Shenzhou International Group Holdings Ltd. (Consumer Durables & Apparel)† | | | | 2,275,000 | | | | | 49,327,950 | |
| | |
Sino Biopharmaceutical Ltd. (Pharmaceuticals, Biotechnology & Life Sciences)† | | | | 14,190,182 | | | | | 10,526,345 | |
| | |
Sunny Optical Technology Group Co., Ltd. (Technology Hardware & Equipment)† | | | | 1,955,700 | | | | | 52,739,589 | |
| | |
Tencent Holdings Ltd. (Media & Entertainment)† | | | | 2,330,100 | | | | | 144,667,165 | |
| | |
Wuxi Biologics Cayman Inc. (Pharmaceuticals, Biotechnology & Life Sciences)*^† | | | | 3,269,000 | | | | | 49,927,782 | |
| | |
Zhejiang Sanhua Intelligent Controls Co., Ltd., Class A (Capital Goods)† | | | | 10,217,610 | | | | | 37,776,980 | |
| | |
ZTO Express Cayman Inc. - ADR (Transportation) | | | | 248,737 | | | | | 7,295,456 | |
| | |
| | | | | | | | | 926,300,654 | |
| | |
Czech Republic - 0.8% | | | | | | | | | | |
| | |
Komercni banka AS (Banks)*† | | | | 758,025 | | | | | 29,401,925 | |
| | |
Egypt - 0.6% | | | | | | | | | | |
| | |
Commercial International Bank Egypt SAE - GDR, Reg S (Banks)*† | | | | 7,204,169 | | | | | 22,330,691 | |
| | |
Hong Kong - 5.7% | | | | | | | | | | |
| | |
AIA Group Ltd. (Insurance)† | | | | 7,863,789 | | | | | 88,867,402 | |
| | |
ASM Pacific Technology Ltd. (Semiconductors & Semiconductor Equipment)† | | | | 2,694,423 | | | | | 29,246,848 | |
| | |
Techtronic Industries Co., Ltd. (Capital Goods)† | | | | 4,755,000 | | | | | 97,704,214 | |
| | |
| | | | | | | | | 215,818,464 | |
| | |
India - 9.0% | | | | | | | | | | |
| | |
HDFC Bank Ltd. - ADR (Banks) | | | | 613,597 | | | | | 44,123,760 | |
| | |
Housing Development Finance Corp., Ltd. (Banks)† | | | | 2,615,902 | | | | | 99,630,574 | |
| | |
Kotak Mahindra Bank Ltd. (Banks)† | | | | 2,137,744 | | | | | 57,874,687 | |
| | |
Maruti Suzuki India Ltd. (Automobiles & Components)† | | | | 447,066 | | | | | 44,719,281 | |
See Notes to Financial Statements
16
Harding, Loevner Funds, Inc.
Emerging Markets Portfolio
Portfolio of Investments (continued)
October 31, 2021
| | | | | | | | | | |
| | |
| | | Shares | | Value |
| COMMON STOCKS - 96.2% (continued) |
| | |
India - 9.0% (continued) | | | | | | | | | | |
| | |
Tata Consultancy Services Ltd. (Software & Services)† | | | | 2,105,723 | | | | | $95,658,390 | |
| | |
| | | | | | | | | 342,006,692 | |
| | |
Indonesia - 2.8% | | | | | | | | | | |
| | |
Astra International Tbk PT (Automobiles & Components)† | | | | 47,833,900 | | | | | 20,374,644 | |
| | |
Bank Central Asia Tbk PT (Banks)† | | | | 76,563,550 | | | | | 40,405,326 | |
| | |
Bank Rakyat Indonesia Persero Tbk PT (Banks)† | | | | 153,772,190 | | | | | 45,964,770 | |
| | |
| | | | | | | | | 106,744,740 | |
| | |
Italy - 0.8% | | | | | | | | | | |
| | |
Tenaris SA - ADR (Energy) | | | | 1,394,535 | | | | | 31,070,240 | |
| | |
Kenya - 1.3% | | | | | | | | | | |
| | |
East African Breweries Ltd. (Food Beverage & Tobacco)*† | | | | 3,663,850 | | | | | 5,470,082 | |
| | |
Safaricom plc (Telecommunication Services)† | | | | 115,862,201 | | | | | 44,496,902 | |
| | |
| | | | | | | | | 49,966,984 | |
| | |
Mexico - 5.7% | | | | | | | | | | |
| | |
Fomento Economico Mexicano SAB de CV - Sponsored ADR (Food Beverage & Tobacco) | | | | 606,613 | | | | | 49,857,522 | |
| | |
Grupo Aeroportuario del Sureste SAB de CV - ADR (Transportation) | | | | 202,601 | | | | | 40,854,492 | |
| | |
Grupo Financiero Banorte SAB de CV, Series O (Banks) | | | | 10,000,940 | | | | | 63,319,532 | |
| | |
Wal-Mart de Mexico SAB de CV (Food & Staples Retailing) | | | | 17,870,700 | | | | | 62,332,182 | |
| | |
| | | | | | | | | 216,363,728 | |
| | |
Panama - 0.4% | | | | | | | | | | |
| | |
Copa Holdings SA, Class A (Transportation)* | | | | 219,094 | | | | | 16,204,192 | |
| | |
Poland - 0.4% | | | | | | | | | | |
| | |
CD Projekt SA (Media & Entertainment)† | | | | 340,158 | | | | | 14,841,943 | |
| | |
Russia - 10.3% | | | | | | | | | | |
| | |
LUKOIL PJSC - Sponsored ADR (Energy) | | | | 958,701 | | | | | 97,816,263 | |
| | |
Novatek PJSC - Sponsored GDR, Reg S (Energy)† | | | | 389,212 | | | | | 98,945,451 | |
| | |
Sberbank of Russia PJSC - Sponsored ADR (Banks)† | | | | 5,518,580 | | | | | 110,675,536 | |
| | |
Yandex NV, Class A (Media & Entertainment)* | | | | 1,027,490 | | | | | 85,117,272 | |
| | |
| | | | | | | | | 392,554,522 | |
| | |
South Africa - 1.6% | | | | | | | | | | |
| | |
Discovery Ltd. (Insurance)*† | | | | 3,682,174 | | | | | 33,881,740 | |
| | | | | | | | | | |
| | |
| | | Shares | | Value |
| COMMON STOCKS - 96.2% (continued) |
| | |
South Africa - 1.6% (continued) | | | | | | | | | | |
| | |
Standard Bank Group Ltd. (Banks)† | | | | 3,179,647 | | | | | $28,255,580 | |
| | |
| | | | | | | | | 62,137,320 | |
| | |
South Korea - 7.8% | | | | | | | | | | |
| | |
Amorepacific Corp. (Household & Personal Products)† | | | | 81,278 | | | | | 12,676,356 | |
| | |
Coway Co., Ltd. (Consumer Durables & Apparel)† | | | | 401,784 | | | | | 27,371,291 | |
| | |
LG Household & Health Care Ltd. (Household & Personal Products)† | | | | 68,574 | | | | | 68,836,174 | |
| | |
NCSoft Corp. (Media & Entertainment)† | | | | 42,488 | | | | | 22,837,997 | |
| | |
Samsung Electronics Co., Ltd. - GDR, Reg S (Technology Hardware & Equipment)† | | | | 109,283 | | | | | 164,042,702 | |
| | |
| | | | | | | | | 295,764,520 | |
| | |
Taiwan - 11.6% | | | | | | | | | | |
| | |
Airtac International Group (Capital Goods)† | | | | 1,555,023 | | | | | 46,699,493 | |
| | |
Eclat Textile Co., Ltd. (Consumer Durables & Apparel)† | | | | 2,907,216 | | | | | 63,644,676 | |
| | |
Hon Hai Precision Industry Co., Ltd. (Technology Hardware & Equipment)† | | | | 15,705,136 | | | | | 60,771,741 | |
| | |
Largan Precision Co., Ltd. (Technology Hardware & Equipment)† | | | | 327,001 | | | | | 24,444,935 | |
| | |
Silergy Corp. (Semiconductors & Semiconductor Equipment)† | | | | 258,000 | | | | | 42,601,631 | |
| | |
Taiwan Semiconductor Manufacturing Co., Ltd. (Semiconductors & Semiconductor Equipment)† | | | | 9,713,637 | | | | | 205,566,247 | |
| | |
| | | | | | | | | 443,728,723 | |
| | |
Thailand - 1.1% | | | | | | | | | | |
| | |
Siam Commercial Bank pcl, Reg S (Banks)† | | | | 11,063,500 | | | | | 42,010,126 | |
| | |
United Kingdom - 2.7% | | | | | | | | | | |
| | |
Bank of Georgia Group plc (Banks)† | | | | 419,094 | | | | | 8,717,599 | |
| | |
Coca-Cola HBC AG - CDI (Food Beverage & Tobacco)*† | | | | 2,269,022 | | | | | 78,721,076 | |
| | |
Network International Holdings plc (Software & Services)*^† | | | | 3,975,414 | | | | | 17,595,333 | |
| | |
| | | | | | | | | 105,034,008 | |
| | |
United States - 4.5% | | | | | | | | | | |
| | |
EPAM Systems Inc. (Software & Services)* | | | | 256,537 | | | | | 172,710,970 | |
| |
Total Common Stocks (Cost $2,129,445,502) | | | | $ | 3,669,114,120 | |
See Notes to Financial Statements
17
Harding, Loevner Funds, Inc.
Emerging Markets Portfolio
Portfolio of Investments (continued)
October 31, 2021
| | | | | | | | | | |
| | |
| | | Shares | | Value |
| PREFERRED STOCKS - 2.2% |
| | |
Brazil - 1.2% | | | | | | | | | | |
| | |
Banco Bradesco SA - ADR (Banks)* | | | | 3,480,166 | | | | | $12,180,581 | |
| | |
Itau Unibanco Holding SA - Sponsored ADR, 0.78% (Banks)+ | | | | 7,667,469 | | | | | 31,206,599 | |
| | |
| | | | | | | | | 43,387,180 | |
| | |
Colombia - 0.7% | | | | | | | | | | |
| | |
Bancolombia SA - Sponsored ADR, 0.68% (Banks)+ | | | | 752,304 | | | | | 27,030,283 | |
| | |
South Korea - 0.3% | | | | | | | | | | |
| | |
Samsung Electronics Co., Ltd. - GDR, Reg S, 2.18% (Technology Hardware & Equipment)+† | | | | 8,692 | | | | | 11,971,900 | |
| | |
| | | | | | | | | | | |
| |
Total Preferred Stocks (Cost $65,243,076) | | | | | $82,389,363 | |
| | |
| | | | | | | | | | |
| RIGHTS^^ - 0.0% | | | | |
| | |
Brazil^^ - 0.0% | | | | | | | | | | |
| | |
Ultrapar Participacoes SA (Energy)* | | | | 279,659 | | | | | $496 | |
| |
Total Rights (Cost $0) | | | | | $496 | |
| | |
| | | | | | | | | | |
| SHORT TERM INVESTMENTS - 1.9% | | |
| | |
Northern Institutional Funds - Treasury Portfolio (Premier Shares), 0.01% (Money Market Funds) | | | | 72,004,554 | | | | | 72,004,554 | |
| | |
| | | | | | | | | | | |
| |
Total Short Term Investments (Cost $72,004,554) | | | | | $72,004,554 | |
| | |
| | | | | | | | | | | |
| |
Total Investments — 100.3% | | | | | | |
| |
(Cost $2,266,693,132) | | | | | $3,823,508,533 | |
| | |
Liabilities Less Other Assets - (0.3)% | | | | | | | | | (10,177,686) | |
| |
Net Assets — 100.0% | | | | | $3,813,330,847 | |
| | |
Summary of Abbreviations |
| ADR | | American Depositary Receipt |
| |
| CDI | | Chess Depositary Interest |
| |
| GDR | | Global Depositary Receipt |
| |
| Reg S | | Security sold outside United States without registration under the Securities Act of 1933. |
| |
| * | | Non-income producing security. |
| |
| † | | Investment categorized as level 2 security as disclosed in Note 2 of the Notes to Financial Statements. |
| |
| ^ | | Security exempt from registration pursuant to Rule 144A of the Securities Act of 1933. These securities, which represent 2.8% of net assets as of October 31, 2021, are considered liquid and may be resold in transactions exempt from registration, normally to qualified buyers. |
| |
| + | | Current yield is disclosed. Dividends are calculated based on a percentage of the issuer’s net income. |
| |
| ^^ | | Amount is less than 0.005%. |
| | | | | |
| Industry | | |
| Percentage of
Net Assets |
|
| |
Automobiles & Components | | | | 2.8 | % |
| |
Banks | | | | 17.6 | |
| |
Capital Goods | | | | 6.2 | |
| |
Commercial & Professional Services | | | | 0.6 | |
| |
Consumer Durables & Apparel | | | | 5.2 | |
| |
Diversified Financials | | | | 1.2 | |
| |
Energy | | | | 6.2 | |
| |
Food & Staples Retailing | | | | 1.7 | |
| |
Food Beverage & Tobacco | | | | 4.5 | |
| |
Household & Personal Products | | | | 2.1 | |
| |
Insurance | | | | 4.3 | |
| |
Media & Entertainment | | | | 7.8 | |
| |
Pharmaceuticals, Biotechnology & Life Sciences | | | | 3.0 | |
| |
Real Estate | | | | 0.7 | |
| |
Retailing | | | | 5.1 | |
| |
Semiconductors & Semiconductor Equipment | | | | 7.3 | |
| |
Software & Services | | | | 8.2 | |
| |
Technology Hardware & Equipment | | | | 8.2 | |
| |
Telecommunication Services | | | | 1.2 | |
| |
Transportation | | | | 2.9 | |
| |
Utilities | | | | 1.6 | |
| |
Money Market Fund | | | | 1.9 | |
| |
Total Investments | | | | 100.3 | |
| |
Liabilities Less Other Assets | | | | (0.3 | ) |
| |
Net Assets | | | | 100.0 | % |
See Notes to Financial Statements
18
Harding, Loevner Funds, Inc.
Frontier Emerging Markets Portfolio
Portfolio of Investments
October 31, 2021
| | | | | | | | | | |
| | |
| | | Shares | | Value |
| COMMON STOCKS - 95.9% | | | | |
| | |
Argentina - 4.5% | | | | | | | | | | |
| | |
Globant SA (Software & Services)* | | | | 31,511 | | | | | $10,057,996 | |
| | |
Bangladesh - 2.4% | | | | | | | | | | |
| | |
GrameenPhone Ltd. (Telecommunication Services)† | | | | 147,326 | | | | | 611,251 | |
| | |
Square Pharmaceuticals Ltd. (Pharmaceuticals, Biotechnology & Life Sciences)† | | | | 1,853,645 | | | | | 4,711,385 | |
| | |
| | | | | | | | | 5,322,636 | |
| | |
Colombia - 3.5% | | | | | | | | | | |
| | |
Cementos Argos SA - Sponsored ADR (Materials)#† | | | | 31,227 | | | | | 263,284 | |
| | |
Ecopetrol SA - Sponsored ADR (Energy) | | | | 457,446 | | | | | 6,930,307 | |
| | |
Grupo Nutresa SA (Food Beverage & Tobacco) | | | | 123,147 | | | | | 719,771 | |
| | |
| | | | | | | | | 7,913,362 | |
| | |
Croatia - 0.2% | | | | | | | | | | |
| | |
Ericsson Nikola Tesla (Technology Hardware & Equipment)† | | | | 1,848 | | | | | 512,617 | |
| | |
Egypt - 6.2% | | | | | | | | | | |
| | |
Commercial International Bank Egypt SAE - GDR, Reg S (Banks)*† | | | | 3,320,346 | | | | | 10,292,043 | |
| | |
Edita Food Industries SAE (Food Beverage & Tobacco)† | | | | 2,214,224 | | | | | 985,081 | |
| | |
Integrated Diagnostics Holdings plc (Health Care Equipment & Services)^† | | | | 2,211,271 | | | | | 2,736,916 | |
| | |
| | | | | | | | | 14,014,040 | |
| | |
Iceland - 1.1% | | | | | | | | | | |
| | |
Marel HF (Capital Goods)^† | | | | 363,387 | | | | | 2,435,835 | |
| | |
Indonesia - 2.9% | | | | | | | | | | |
| | |
Bank Central Asia Tbk PT (Banks)† | | | | 12,188,200 | | | | | 6,432,149 | |
| | |
Kazakhstan - 5.7% | | | | | | | | | | |
| | |
Halyk Savings Bank of Kazakhstan JSC - GDR, Reg S (Banks)† | | | | 475,701 | | | | | 8,566,788 | |
| | |
Kaspi.KZ JSC - GDR, Reg S (Diversified Financials)† | | | | 28,725 | | | | | 4,162,622 | |
| | |
| | | | | | | | | 12,729,410 | |
| | |
Kenya - 5.8% | | | | | | | | | | |
| | |
East African Breweries Ltd. (Food Beverage & Tobacco)*† | | | | 620,700 | | | | | 926,697 | |
| | |
Equity Group Holdings plc (Banks)*† | | | | 7,080,400 | | | | | 3,163,623 | |
| | | | | | | | | | |
| | |
| | | Shares | | Value |
| COMMON STOCKS - 95.9% (continued) | | |
| | |
Kenya - 5.8% (continued) | | | | | | | | | | |
| | |
Safaricom plc (Telecommunication Services)† | | | | 23,403,550 | | | | | $8,988,138 | |
| | |
| | | | | | | | | 13,078,458 | |
| | |
Morocco - 2.7% | | | | | | | | | | |
| | |
Itissalat Al-Maghrib (Telecommunication Services)† | | | | 159,501 | | | | | 2,513,451 | |
| | |
Societe d’Exploitation des Ports (Transportation)† | | | | 111,050 | | | | | 3,488,994 | |
| | |
| | | | | | | | | 6,002,445 | |
| | |
Nigeria - 5.6% | | | | | | | | | | |
| | |
Guaranty Trust Holding Co., plc (Banks) | | | | 48,903,727 | | | | | 3,386,324 | |
| | |
Nestle Nigeria plc (Food Beverage & Tobacco) | | | | 1,394,492 | | | | | 4,718,523 | |
| | |
Zenith Bank plc (Banks) | | | | 71,417,980 | | | | | 4,358,439 | |
| | |
| | | | | | | | | 12,463,286 | |
| | |
Pakistan - 0.6% | | | | | | | | | | |
| | |
MCB Bank Ltd. (Banks)† | | | | 1,169,700 | | | | | 1,120,342 | |
| | |
Oil & Gas Development Co., Ltd. (Energy)† | | | | 515,000 | | | | | 256,500 | |
| | |
| | | | | | | | | 1,376,842 | |
| | |
Peru - 0.7% | | | | | | | | | | |
| | |
Alicorp SAA (Food Beverage & Tobacco) | | | | 750,417 | | | | | 1,212,959 | |
| | |
Cementos Pacasmayo SAA (Materials) | | | | 222,899 | | | | | 276,501 | |
| | |
| | | | | | | | | 1,489,460 | |
| | |
Philippines - 19.3% | | | | | | | | | | |
| | |
Bank of the Philippine Islands (Banks)† | | | | 2,562,954 | | | | | 4,420,771 | |
| | |
BDO Unibank Inc. (Banks)† | | | | 1,222,448 | | | | | 3,013,378 | |
| | |
International Container Terminal Services Inc. (Transportation)† | | | | 794,670 | | | | | 2,835,558 | |
| | |
Jollibee Foods Corp. (Consumer Services)† | | | | 1,247,030 | | | | | 5,813,234 | |
| | |
Robinsons Retail Holdings Inc. (Food & Staples Retailing)† | | | | 1,646,340 | | | | | 2,033,209 | |
| | |
Security Bank Corp. (Banks)† | | | | 1,388,080 | | | | | 3,331,576 | |
| | |
SM Prime Holdings Inc. (Real Estate)† | | | | 10,483,500 | | | | | 6,893,599 | |
| | |
Universal Robina Corp. (Food Beverage & Tobacco)† | | | | 2,211,740 | | | | | 6,057,896 | |
| | |
Wilcon Depot Inc. (Retailing)† | | | | 14,205,000 | | | | | 8,798,227 | |
| | |
| | | | | | | | | 43,197,448 | |
| | |
Poland - 0.7% | | | | | | | | | | |
| | |
Allegro.eu SA (Retailing)*^† | | | | 61,608 | | | | | 696,973 | |
| | |
CD Projekt SA (Media & Entertainment)† | | | | 22,412 | | | | | 977,892 | |
| | |
| | | | | | | | | 1,674,865 | |
See Notes to Financial Statements
19
Harding, Loevner Funds, Inc.
Frontier Emerging Markets Portfolio
Portfolio of Investments (continued)
October 31, 2021
| | | | | | | | | | |
| | |
| | | Shares | | Value |
| COMMON STOCKS - 95.9% (continued) | | |
| | |
Romania - 4.4% | | | | | | | | | | |
| | |
Banca Transilvania SA (Banks)† | | | | 13,420,913 | | | | | $7,870,196 | |
| | |
Societatea Nationala de Gaze Naturale ROMGAZ SA (Energy)† | | | | 228,909 | | | | | 1,994,237 | |
| | |
| | | | | | | | | 9,864,433 | |
| | |
Saudi Arabia - 2.7% | | | | | | | | | | |
| | |
Bupa Arabia for Cooperative Insurance Co. (Insurance)† | | | | 41,163 | | | | | 1,586,725 | |
| | |
Jarir Marketing Co. (Retailing)† | | | | 37,555 | | | | | 2,029,849 | |
| | |
Mouwasat Medical Services Co. (Health Care Equipment & Services)† | | | | 52,337 | | | | | 2,511,204 | |
| | |
| | | | | | | | | 6,127,778 | |
| | |
Slovenia - 1.1% | | | | | | | | | | |
| | |
Krka dd Novo mesto (Pharmaceuticals, Biotechnology & Life Sciences)† | | | | 18,539 | | | | | 2,378,039 | |
| | |
Sri Lanka - 0.1% | | | | | | | | | | |
| | |
Commercial Bank of Ceylon plc (Banks)† | | | | 313,399 | | | | | 137,906 | |
| | |
Thailand - 0.5% | | | | | | | | | | |
| | |
Home Product Center pcl, Reg S (Retailing)† | | | | 2,620,494 | | | | | 1,152,994 | |
| | |
United Arab Emirates - 3.4% | | | | | | | | | | |
| | |
Agthia Group PJSC (Food Beverage & Tobacco)† | | | | 2,119,592 | | | | | 3,431,075 | |
| | |
Emaar Properties PJSC (Real Estate)† | | | | 3,886,103 | | | | | 4,250,144 | |
| | |
| | | | | | | | | 7,681,219 | |
| | |
United Kingdom - 3.5% | | | | | | | | | | |
| | |
Bank of Georgia Group plc (Banks)† | | | | 70,511 | | | | | 1,466,703 | |
| | |
Network International Holdings plc (Software & Services)*^† | | | | 1,159,338 | | | | | 5,131,274 | |
| | |
TBC Bank Group plc (Banks)† | | | | 54,947 | | | | | 1,180,522 | |
| | |
| | | | | | | | | 7,778,499 | |
| | |
United States - 4.9% | | | | | | | | | | |
| | |
EPAM Systems Inc. (Software & Services)* | | | | 16,424 | | | | | 11,057,294 | |
| | |
Vietnam - 13.4% | | | | | | | | | | |
| | |
Bank for Foreign Trade of Vietnam JSC (Banks)† | | | | 1,798,010 | | | | | 7,742,974 | |
| | |
Hoa Phat Group JSC (Materials)† | | | | 3,838,862 | | | | | 9,638,022 | |
| | |
Sai Gon Cargo Service Corp. (Transportation)† | | | | 449,970 | | | | | 2,649,175 | |
| | |
Saigon Beer Alcohol Beverage Corp. (Food Beverage & Tobacco)† | | | | 467,910 | | | | | 3,299,053 | |
| | | | | | | | | | |
| | |
| | | Shares | | Value |
| COMMON STOCKS - 95.9% (continued) | | |
| | |
Vietnam - 13.4% (continued) | | | | | | | | | | |
| | |
Vietnam Dairy Products JSC (Food Beverage & Tobacco)† | | | | 1,698,094 | | | | | $6,770,052 | |
| | |
| | | | | | | | | | 30,099,276 | |
| |
Total Common Stocks (Cost $154,587,050) | | | | | $214,978,287 | |
| | |
| | | | | | | | | | |
| PREFERRED STOCKS - 2.9% | | | | |
| | |
Colombia - 2.9% | | | | | | | | | | |
| | |
Bancolombia SA - Sponsored ADR, 0.68% (Banks)+ | | | | 183,280 | | | | | 6,585,250 | |
| | |
| | | | | | | | | | | |
| |
Total Preferred Stocks (Cost $5,340,087) | | | | | $6,585,250 | |
| | |
| | | | | | | | | | |
| SHORT TERM INVESTMENTS - 1.2% | | |
| | |
Northern Institutional Funds - Treasury Portfolio (Premier Shares), 0.01% (Money Market Funds) | | | | 2,557,487 | | | | | 2,557,487 | |
| | |
| | | | | | | | | | | |
| |
Total Short Term Investments (Cost $2,557,487) | | | | | $2,557,487 | |
| | |
| | | | | | | | | | | |
| | |
Total Investments — 100.0% | | | | | | | | | | |
| | |
(Cost $162,484,624) | | | | | | | | | $224,121,024 | |
| |
Other Assets Less Liabilities - 0.0%^^ | | | | | 14,777 | |
| | |
Net Assets — 100.0% | | | | | | | | | $224,135,801 | |
| | |
Summary of Abbreviations |
| ADR | | American Depositary Receipt |
| |
| GDR | | Global Depositary Receipt |
| |
| Reg S | | Security sold outside United States without registration under the Securities Act of 1933. |
| |
| * | | Non-income producing security. |
| |
| † | | Investment categorized as level 2 security as disclosed in Note 2 of the Notes to Financial Statements. |
| |
| # | | Security valued at fair value as determined in good faith under policies and procedures established by and under the supervision of the Portfolio’s Board of Directors as disclosed in Note 2 of the Notes to Financial Statements. |
| |
| ^ | | Security exempt from registration pursuant to Rule 144A of the Securities Act of 1933. These securities, which represent 4.9% of net assets as of October 31, 2021, are considered liquid and may be resold in transactions exempt from registration, normally to qualified buyers. |
| |
| + | | Current yield is disclosed. Dividends are calculated based on a percentage of the issuer’s net income. |
| |
| ^^ | | Amount is less than 0.005%. |
See Notes to Financial Statements
20
Harding, Loevner Funds, Inc.
Frontier Emerging Markets Portfolio
Portfolio of Investments (continued)
October 31, 2021
| | | | | |
| |
| Industry | | |
| Percentage of
Net Assets |
|
| |
Banks | | | | 32.6 | % |
| |
Capital Goods | | | | 1.1 | |
| |
Consumer Services | | | | 2.6 | |
| |
Diversified Financials | | | | 1.9 | |
| |
Energy | | | | 4.1 | |
| |
Food & Staples Retailing | | | | 0.9 | |
| |
Food Beverage & Tobacco | | | | 12.6 | |
| |
Health Care Equipment & Services | | | | 2.3 | |
| |
Insurance | | | | 0.7 | |
| |
Materials | | | | 4.5 | |
| |
Media & Entertainment | | | | 0.4 | |
| |
Pharmaceuticals, Biotechnology & Life Sciences | | | | 3.2 | |
| |
Real Estate | | | | 5.0 | |
| |
Retailing | | | | 5.7 | |
| |
Software & Services | | | | 11.7 | |
| |
Technology Hardware & Equipment | | | | 0.2 | |
| |
Telecommunication Services | | | | 5.4 | |
| |
Transportation | | | | 4.0 | |
| |
Money Market Fund | | | | 1.1 | |
| |
Total Investments | | | | 100.0 | |
| |
Other Assets Less Liabilities | | | | 0.0 | ^^ |
| |
Net Assets | | | | 100.0 | % |
^^ Amount is less than 0.005%.
See Notes to Financial Statements
21
Harding, Loevner Funds, Inc.
Global Equity Research Portfolio
Portfolio of Investments
October 31, 2021
| | | | | | | | | | |
| | |
| | | Shares | | Value |
| COMMON STOCKS - 98.0% | | | | |
Australia - 0.3% | | | | | | | | | | |
| | |
BHP Group Ltd. (Materials)† | | | | 676 | | | | | $18,543 | |
| | |
Cochlear Ltd. (Health Care Equipment & Services)† | | | | 83 | | | | | 13,823 | |
| | |
| | | | | | | | | 32,366 | |
| | |
Brazil - 1.1% | | | | | | | | | | |
| | |
Ambev SA - ADR (Food Beverage & Tobacco) | | | | 7,484 | | | | | 22,153 | |
| | |
B3 SA - Brasil Bolsa Balcao (Diversified Financials) | | | | 7,000 | | | | | 14,772 | |
| | |
Cia Brasileira de Distribuicao - ADR (Food & Staples Retailing) | | | | 2,433 | | | | | 11,095 | |
| | |
Localiza Rent a Car SA (Transportation) | | | | 1,100 | | | | | 8,829 | |
| | |
Magazine Luiza SA (Retailing)* | | | | 3,900 | | | | | 7,470 | |
| | |
Raia Drogasil SA (Food & Staples Retailing)* | | | | 2,500 | | | | | 10,299 | |
| | |
Ultrapar Participacoes SA - Sponsored ADR (Energy) | | | | 6,271 | | | | | 14,611 | |
| | |
WEG SA (Capital Goods) | | | | 1,600 | | | | | 10,489 | |
| | |
XP Inc., Class A (Diversified Financials)* | | | | 394 | | | | | 12,924 | |
| | |
| | | | | | | | | 112,642 | |
| | |
Canada - 1.1% | | | | | | | | | | |
| | |
Alimentation Couche-Tard Inc. (Food & Staples Retailing) | | | | 1,600 | | | | | 60,892 | |
| | |
Imperial Oil Ltd. (Energy) | | | | 1,500 | | | | | 50,784 | |
| | |
| | | | | | | | | 111,676 | |
| | |
Chile - 0.2% | | | | | | | | | | |
| | |
Banco Santander Chile - ADR (Banks) | | | | 1,149 | | | | | 20,360 | |
| | |
China - 7.1% | | | | | | | | | | |
| | |
51job Inc. - ADR (Commercial & Professional Services)* | | | | 150 | | | | | 8,934 | |
| | |
AAC Technologies Holdings Inc. (Technology Hardware & Equipment)† | | | | 5,670 | | | | | 24,872 | |
| | |
Baidu Inc., Class A (Media & Entertainment)*† | | | | 1,050 | | | | | 21,477 | |
| | |
China Tourism Group Duty Free Corp., Ltd., Class A (Retailing)† | | | | 500 | | | | | 20,869 | |
| | |
Country Garden Services Holdings Co., Ltd. (Real Estate)† | | | | 2,000 | | | | | 15,485 | |
| | |
CSPC Pharmaceutical Group Ltd. (Pharmaceuticals, Biotechnology & Life Sciences)† | | | | 15,360 | | | | | 16,095 | |
| | |
Fuyao Glass Industry Group Co., Ltd., Class H (Automobiles & Components)^† | | | | 3,600 | | | | | 20,864 | |
| | |
Glodon Co., Ltd., Class A (Software & Services)† | | | | 2,000 | | | | | 23,206 | |
| | | | | | | | | | |
| | |
| | | Shares | | Value |
| COMMON STOCKS - 98.0% (continued) | | | | |
China - 7.1% (continued) | | | | | | | | | | |
| | |
Gree Electric Appliances Inc. of Zhuhai, Class A (Consumer Durables & Apparel)† | | | | 2,600 | | | | | $14,833 | |
| | |
Haier Smart Home Co., Ltd., Class H (Consumer Durables & Apparel)† | | | | 4,000 | | | | | 14,927 | |
| | |
Hangzhou Tigermed Consulting Co., Ltd., Class H (Pharmaceuticals, Biotechnology & Life Sciences)^† | | | | 700 | | | | | 13,664 | |
| | |
Hefei Meiya Optoelectronic Technology Inc., Class A (Capital Goods)† | | | | 1,800 | | | | | 11,318 | |
| | |
Hongfa Technology Co., Ltd., Class A (Capital Goods)† | | | | 2,700 | | | | | 31,278 | |
| | |
Inner Mongolia Yili Industrial Group Co., Ltd., Class A (Food Beverage & Tobacco)† | | | | 2,600 | | | | | 17,517 | |
| | |
JD.com Inc., Class A (Retailing)*† | | | | 414 | | | | | 16,260 | |
| | |
Jiangsu Expressway Co., Ltd., Class H (Transportation)† | | | | 12,000 | | | | | 11,344 | |
| | |
Jiangsu Hengrui Medicine Co., Ltd., Class A (Pharmaceuticals, Biotechnology & Life Sciences)† | | | | 2,408 | | | | | 18,493 | |
| | |
Jiangsu Yanghe Brewery Joint-Stock Co., Ltd., Class A (Food Beverage & Tobacco)† | | | | 600 | | | | | 17,349 | |
| | |
Kweichow Moutai Co., Ltd., Class A (Food Beverage & Tobacco)† | | | | 100 | | | | | 28,585 | |
| | |
Meituan, Class B (Retailing)*^† | | | | 300 | | | | | 10,466 | |
| | |
Midea Group Co., Ltd., Class A (Consumer Durables & Apparel)† | | | | 1,200 | | | | | 12,831 | |
| | |
NetEase Inc. - ADR (Media & Entertainment) | | | | 205 | | | | | 20,006 | |
| | |
Ping An Insurance Group Co. of China Ltd., Class H (Insurance)† | | | | 2,000 | | | | | 14,402 | |
| | |
Qingdao Haier Biomedical Co., Ltd., Class A (Health Care Equipment & Services)† | | | | 900 | | | | | 13,231 | |
| | |
Sangfor Technologies Inc., Class A (Software & Services)† | | | | 400 | | | | | 12,674 | |
| | |
SF Holding Co., Ltd., Class A (Transportation)† | | | | 1,900 | | | | | 19,132 | |
| | |
Shandong Sinocera Functional Material Co., Ltd., Class A (Materials)† | | | | 2,000 | | | | | 13,305 | |
| | |
Shanghai International Airport Co., Ltd., Class A (Transportation)*† | | | | 2,300 | | | | | 18,956 | |
See Notes to Financial Statements
22
Harding, Loevner Funds, Inc.
Global Equity Research Portfolio
Portfolio of Investments (continued)
October 31, 2021
| | | | | | | | | | |
| | |
| | | Shares | | Value |
| COMMON STOCKS - 98.0% (continued) | | | | |
China - 7.1% (continued) | | | | | | | | | | |
| | |
Shenzhen Inovance Technology Co., Ltd., Class A (Capital Goods)† | | | | 1,350 | | | | | $13,692 | |
| | |
Shenzhou International Group Holdings Ltd. (Consumer Durables & Apparel)† | | | | 1,000 | | | | | 21,683 | |
| | |
Sino Biopharmaceutical Ltd. (Pharmaceuticals, Biotechnology & Life Sciences)† | | | | 13,500 | | | | | 10,014 | |
| | |
Songcheng Performance Development Co., Ltd., Class A (Consumer Services)† | | | | 4,200 | | | | | 9,153 | |
| | |
Sunny Optical Technology Group Co., Ltd. (Technology Hardware & Equipment)† | | | | 600 | | | | | 16,180 | |
| | |
Suofeiya Home Collection Co., Ltd., Class A (Consumer Durables & Apparel)† | | | | 4,000 | | | | | 10,611 | |
| | |
Tencent Holdings Ltd. (Media & Entertainment)† | | | | 200 | | | | | 12,417 | |
| | |
TravelSky Technology Ltd., Class H (Software & Services)† | | | | 11,000 | | | | | 20,600 | |
| | |
Trip.com Group Ltd. (Consumer Services)*† | | | | 514 | | | | | 14,826 | |
| | |
Wuliangye Yibin Co., Ltd., Class A (Food Beverage & Tobacco)† | | | | 500 | | | | | 16,964 | |
| | |
WuXi AppTec Co., Ltd., Class A (Pharmaceuticals, Biotechnology & Life Sciences)† | | | | 686 | | | | | 14,782 | |
| | |
Wuxi Biologics Cayman Inc. (Pharmaceuticals, Biotechnology & Life Sciences)*^† | | | | 1,500 | | | | | 22,910 | |
| | |
Yonyou Network Technology Co., Ltd., Class A (Software & Services)† | | | | 3,500 | | | | | 17,329 | |
| | |
Zhejiang Sanhua Intelligent Controls Co., Ltd., Class A (Capital Goods)† | | | | 4,400 | | | | | 16,268 | |
| | |
| | | | | | | | | 699,802 | |
| | |
Colombia - 0.9% | | | | | | | | | | |
| | |
Cementos Argos SA (Materials) | | | | 9,486 | | | | | 15,996 | |
| | |
Ecopetrol SA - Sponsored ADR (Energy) | | | | 3,708 | | | | | 56,176 | |
| | |
Grupo Nutresa SA (Food Beverage & Tobacco) | | | | 2,782 | | | | | 16,260 | |
| | |
| | | | | | | | | 88,432 | |
| | |
Czech Republic - 0.2% | | | | | | | | | | |
| | |
Komercni banka AS (Banks)*† | | | | 493 | | | | | 19,122 | |
| | | | | | | | | | |
| | |
| | | Shares | | Value |
| COMMON STOCKS - 98.0% (continued) | | | | |
Denmark - 0.9% | | | | | | | | | | |
| | |
Ambu A/S, Class B (Health Care Equipment & Services)† | | | | 494 | | | | | $14,122 | |
| | |
Chr Hansen Holding A/S (Materials)† | | | | 129 | | | | | 10,264 | |
| | |
Coloplast A/S, Class B (Health Care Equipment & Services)† | | | | 193 | | | | | 31,476 | |
| | |
Genmab A/S (Pharmaceuticals, Biotechnology & Life Sciences)*† | | | | 39 | | | | | 17,557 | |
| | |
Novozymes A/S, Class B (Materials)† | | | | 254 | | | | | 18,668 | |
| | |
| | | | | | | | | 92,087 | |
| | |
Egypt - 0.2% | | | | | | | | | | |
| | |
Commercial International Bank Egypt SAE - GDR, Reg S (Banks)*† | | | | 6,085 | | | | | 18,862 | |
| | |
Finland - 0.3% | | | | | | | | | | |
| | |
Kone OYJ, Class B (Capital Goods)† | | | | 211 | | | | | 14,361 | |
| | |
Neste OYJ (Energy)† | | | | 314 | | | | | 17,532 | |
| | |
| | | | | | | | | 31,893 | |
| | |
France - 3.9% | | | | | | | | | | |
| | |
Air Liquide SA (Materials)† | | | | 330 | | | | | 55,161 | |
| | |
Dassault Systemes SE (Software & Services)† | | | | 650 | | | | | 37,909 | |
| | |
IPSOS (Media & Entertainment)† | | | | 1,082 | | | | | 50,869 | |
| | |
Kering SA (Consumer Durables & Apparel)† | | | | 60 | | | | | 45,016 | |
| | |
LISI (Capital Goods)† | | | | 1,514 | | | | | 42,121 | |
| | |
L’Oreal SA (Household & Personal Products)† | | | | 49 | | | | | 22,407 | |
| | |
Rubis SCA (Utilities)† | | | | 1,135 | | | | | 36,349 | |
| | |
Safran SA (Capital Goods)† | | | | 327 | | | | | 43,968 | |
| | |
Sartorius Stedim Biotech (Pharmaceuticals, Biotechnology & Life Sciences)† | | | | 41 | | | | | 22,638 | |
| | |
Schneider Electric SE (Capital Goods)† | | | | 159 | | | | | 27,503 | |
| | |
| | | | | | | | | 383,941 | |
| | |
Germany - 3.6% | | | | | | | | | | |
| | |
adidas AG (Consumer Durables & Apparel)† | | | | 60 | | | | | 19,650 | |
| | |
Allianz SE, Reg S (Insurance)† | | | | 230 | | | | | 53,488 | |
| | |
Bayerische Motoren Werke AG (Automobiles & Components)† | | | | 778 | | | | | 78,477 | |
| | |
Bechtle AG (Software & Services)† | | | | 246 | | | | | 18,430 | |
| | |
Brenntag SE (Capital Goods)† | | | | 257 | | | | | 24,436 | |
| | |
Carl Zeiss Meditec AG (Bearer) (Health Care Equipment & Services)† | | | | 134 | | | | | 26,947 | |
See Notes to Financial Statements
23
Harding, Loevner Funds, Inc.
Global Equity Research Portfolio
Portfolio of Investments (continued)
October 31, 2021
| | | | | | | | | | |
| | |
| | | Shares | | Value |
| COMMON STOCKS - 98.0% (continued) | | | | |
Germany - 3.6% (continued) | | | | | | | | | | |
| | |
Evotec SE (Pharmaceuticals, Biotechnology & Life Sciences)*† | | | | 458 | | | | | $22,159 | |
| | |
FUCHS PETROLUB SE (Materials)† | | | | 375 | | | | | 13,800 | |
| | |
HelloFresh SE (Retailing)*† | | | | 213 | | | | | 17,237 | |
| | |
Infineon Technologies AG (Semiconductors & Semiconductor Equipment)† | | | | 438 | | | | | 20,472 | |
| | |
SAP SE - Sponsored ADR (Software & Services) | | | | 110 | | | | | 15,926 | |
| | |
Scout24 SE (Media & Entertainment)^† | | | | 235 | | | | | 16,355 | |
| | |
Symrise AG (Materials)† | | | | 160 | | | | | 22,121 | |
| | |
TeamViewer AG (Software & Services)*^† | | | | 366 | | | | | 5,459 | |
| | |
| | | | | | | | | 354,957 | |
| | |
Hong Kong - 0.9% | | | | | | | | | | |
| | |
AIA Group Ltd. (Insurance)† | | | | 1,600 | | | | | 18,082 | |
| | |
ASM Pacific Technology Ltd. (Semiconductors & Semiconductor Equipment)† | | | | 1,800 | | | | | 19,538 | |
| | |
Techtronic Industries Co., Ltd. (Capital Goods)† | | | | 2,500 | | | | | 51,369 | |
| | |
| | | | | | | | | 88,989 | |
| | |
Iceland - 0.2% | | | | | | | | | | |
| | |
Marel HF (Capital Goods)^† | | | | 2,669 | | | | | 17,891 | |
| | |
India - 1.5% | | | | | | | | | | |
| | |
Asian Paints Ltd. (Materials)† | | | | 460 | | | | | 19,064 | |
| | |
Godrej Consumer Products Ltd. (Household & Personal Products)*† | | | | 1,225 | | | | | 15,705 | |
| | |
HDFC Bank Ltd. - ADR (Banks) | | | | 204 | | | | | 14,670 | |
| | |
Hero MotoCorp Ltd. (Automobiles & Components)† | | | | 419 | | | | | 14,901 | |
| | |
ICICI Bank Ltd. - Sponsored ADR (Banks) | | | | 1,034 | | | | | 21,869 | |
| | |
Kotak Mahindra Bank Ltd. (Banks)† | | | | 608 | | | | | 16,460 | |
| | |
Marico Ltd. (Household & Personal Products)† | | | | 2,072 | | | | | 15,773 | |
| | |
Pidilite Industries Ltd. (Materials)† | | | | 572 | | | | | 17,711 | |
| | |
Tata Consultancy Services Ltd. (Software & Services)† | | | | 327 | | | | | 14,855 | |
| | |
| | | | | | | | | 151,008 | |
| | |
Indonesia - 0.6% | | | | | | | | | | |
| | |
Astra International Tbk PT (Automobiles & Components)† | | | | 33,400 | | | | | 14,226 | |
| | |
Bank Central Asia Tbk PT (Banks)† | | | | 35,000 | | | | | 18,471 | |
| | |
Bank Rakyat Indonesia Persero Tbk PT (Banks)† | | | | 53,600 | | | | | 16,022 | |
| | | | | | | | | | |
| | |
| | | Shares | | Value |
| COMMON STOCKS - 98.0% (continued) | | | | |
Indonesia - 0.6% (continued) | | | | | | | | | | |
| | |
Unilever Indonesia Tbk PT (Household & Personal Products)† | | | | 38,500 | | | | | $12,019 | |
| | |
| | | | | | | | | 60,738 | |
| | |
Israel - 0.3% | | | | | | | | | | |
| | |
CyberArk Software Ltd. (Software & Services)* | | | | 140 | | | | | 25,215 | |
| | |
Italy - 0.9% | | | | | | | | | | |
| | |
Amplifon SpA (Health Care Equipment & Services)† | | | | 387 | | | | | 19,679 | |
| | |
DiaSorin SpA (Health Care Equipment & Services)† | | | | 82 | | | | | 18,520 | |
| | |
FinecoBank Banca Fineco SpA (Banks)*† | | | | 1,194 | | | | | 22,828 | |
| | |
Reply SpA (Software & Services)† | | | | 131 | | | | | 25,449 | |
| | |
| | | | | | | | | 86,476 | |
| | |
Japan - 9.0% | | | | | | | | | | |
| | |
ABC-Mart Inc. (Retailing)† | | | | 700 | | | | | 33,541 | |
| | |
Benefit One Inc. (Commercial & Professional Services)† | | | | 1,000 | | | | | 50,576 | |
| | |
BML Inc. (Health Care Equipment & Services)† | | | | 1,100 | | | | | 38,630 | |
| | |
Chugai Pharmaceutical Co., Ltd. (Pharmaceuticals, Biotechnology & Life Sciences)† | | | | 600 | | | | | 22,376 | |
| | |
FANUC Corp. (Capital Goods)† | | | | 100 | | | | | 19,652 | |
| | |
Fast Retailing Co., Ltd. (Retailing)† | | | | 20 | | | | | 13,286 | |
| | |
Hakuhodo DY Holdings Inc. (Media & Entertainment)† | | | | 3,100 | | | | | 50,703 | |
| | |
Kakaku.com Inc. (Media & Entertainment)† | | | | 500 | | | | | 16,569 | |
| | |
Kobayashi Pharmaceutical Co., Ltd. (Household & Personal Products)† | | | | 150 | | | | | 12,009 | |
| | |
Komatsu Ltd. (Capital Goods)† | | | | 900 | | | | | 23,509 | |
| | |
Kubota Corp. (Capital Goods)† | | | | 2,600 | | | | | 55,431 | |
| | |
M3 Inc. (Health Care Equipment & Services)† | | | | 300 | | | | | 17,704 | |
| | |
Makita Corp. (Capital Goods)† | | | | 1,200 | | | | | 55,036 | |
| | |
MISUMI Group Inc. (Capital Goods)† | | | | 700 | | | | | 29,307 | |
| | |
Nitori Holdings Co., Ltd. (Retailing)† | | | | 400 | | | | | 73,400 | |
| | |
Nomura Research Institute Ltd. (Software & Services)† | | | | 890 | | | | | 35,752 | |
| | |
Rinnai Corp. (Consumer Durables & Apparel)† | | | | 540 | | | | | 55,387 | |
| | |
Shimano Inc. (Consumer Durables & Apparel)† | | | | 80 | | | | | 22,295 | |
See Notes to Financial Statements
24
Harding, Loevner Funds, Inc.
Global Equity Research Portfolio
Portfolio of Investments (continued)
October 31, 2021
| | | | | | | | | | |
| | |
| | | Shares | | Value |
| COMMON STOCKS - 98.0% (continued) | | | | |
Japan - 9.0% (continued) | | | | | | | | | | |
| | |
Shionogi & Co., Ltd. (Pharmaceuticals, Biotechnology & Life Sciences)† | | | | 900 | | | | | $58,598 | |
| | |
Shiseido Co., Ltd. (Household & Personal Products)† | | | | 300 | | | | | 19,984 | |
| | |
SMC Corp. (Capital Goods)† | | | | 40 | | | | | 23,923 | |
| | |
Stanley Electric Co., Ltd. (Automobiles & Components)† | | | | 2,600 | | | | | 65,571 | |
| | |
Sugi Holdings Co., Ltd. (Food & Staples Retailing)† | | | | 500 | | | | | 35,854 | |
| | |
Sysmex Corp. (Health Care Equipment & Services)† | | | | 200 | | | | | 24,859 | |
| | |
Unicharm Corp. (Household & Personal Products)† | | | | 900 | | | | | 36,304 | |
| | |
| | | | | | | | | 890,256 | |
| | |
Kazakhstan - 0.5% | | | | | | | | | | |
| | |
Halyk Savings Bank of Kazakhstan JSC - GDR, Reg S (Banks)† | | | | 1,120 | | | | | 20,170 | |
| | |
Kaspi.KZ JSC - GDR, Reg S (Diversified Financials)† | | | | 170 | | | | | 24,635 | |
| | |
| | | | | | | | | 44,805 | |
| | |
Mexico - 0.7% | | | | | | | | | | |
| | |
Fomento Economico Mexicano SAB de CV - Sponsored ADR (Food Beverage & Tobacco) | | | | 192 | | | | | 15,780 | |
| | |
Grupo Financiero Banorte SAB de CV, Series O (Banks) | | | | 3,300 | | | | | 20,894 | |
| | |
Wal-Mart de Mexico SAB de CV (Food & Staples Retailing) | | | | 8,100 | | | | | 28,252 | |
| | |
| | | | | | | | | 64,926 | |
| | |
Netherlands - 1.6% | | | | | | | | | | |
| | |
Adyen NV (Software & Services)*^† | | | | 8 | | | | | 24,166 | |
| | |
ASM International NV (Semiconductors & Semiconductor Equipment)† | | | | 37 | | | | | 16,766 | |
| | |
ASML Holding NV, Reg S (Semiconductors & Semiconductor Equipment) | | | | 90 | | | | | 73,159 | |
| | |
Koninklijke Vopak NV (Energy)† | | | | 653 | | | | | 25,985 | |
| | |
Prosus NV (Retailing)*† | | | | 166 | | | | | 14,707 | |
| | |
| | | | | | | | | 154,783 | |
| | |
Norway - 0.2% | | | | | | | | | | |
| | |
Tomra Systems ASA (Commercial & Professional Services)† | | | | 375 | | | | | 24,242 | |
| | |
Pakistan - 0.4% | | | | | | | | | | |
| | |
MCB Bank Ltd. (Banks)† | | | | 10,800 | | | | | 10,344 | |
| | | | | | | | | | |
| | |
| | | Shares | | Value |
| COMMON STOCKS - 98.0% (continued) | | | | |
Pakistan - 0.4% (continued) | | | | | | | | | | |
| | |
Oil & Gas Development Co., Ltd. (Energy)† | | | | 48,700 | | | | | $24,256 | |
| | |
| | | | | | | | | 34,600 | |
| | |
Philippines - 1.3% | | | | | | | | | | |
| | |
Bank of the Philippine Islands (Banks)† | | | | 12,490 | | | | | 21,544 | |
| | |
BDO Unibank Inc. (Banks)† | | | | 10,070 | | | | | 24,823 | |
| | |
International Container Terminal Services Inc. (Transportation)† | | | | 4,970 | | | | | 17,734 | |
| | |
Robinsons Retail Holdings Inc. (Food & Staples Retailing)† | | | | 10,510 | | | | | 12,980 | |
| | |
Security Bank Corp. (Banks)† | | | | 4,340 | | | | | 10,416 | |
| | |
SM Prime Holdings Inc. (Real Estate)† | | | | 27,500 | | | | | 18,083 | |
| | |
Universal Robina Corp. (Food Beverage & Tobacco)† | | | | 6,400 | | | | | 17,529 | |
| | |
| | | | | | | | | 123,109 | |
| | |
Poland - 0.4% | | | | | | | | | | |
| | |
Allegro.eu SA (Retailing)*^† | | | | 908 | | | | | 10,272 | |
| | |
ING Bank Slaski SA (Banks)*† | | | | 426 | | | | | 29,049 | |
| | |
| | | | | | | | | 39,321 | |
| | |
Russia - 0.9% | | | | | | | | | | |
| | |
LUKOIL PJSC - Sponsored ADR (Energy) | | | | 278 | | | | | 28,364 | |
| | |
Novatek PJSC - Sponsored GDR, Reg S (Energy)† | | | | 89 | | | | | 22,626 | |
| | |
Sberbank of Russia PJSC - Sponsored ADR (Banks)† | | | | 1,278 | | | | | 25,630 | |
| | |
Yandex NV, Class A (Media & Entertainment)* | | | | 188 | | | | | 15,574 | |
| | |
| | | | | | | | | 92,194 | |
| | |
Saudi Arabia - 1.0% | | | | | | | | | | |
| | |
Al Rajhi Bank (Banks)† | | | | 631 | | | | | 23,317 | |
| | |
Jarir Marketing Co. (Retailing)† | | | | 252 | | | | | 13,621 | |
| | |
Saudi National Bank (Banks)† | | | | 3,383 | | | | | 59,451 | |
| | |
| | | | | | | | | 96,389 | |
| | |
Singapore - 1.4% | | | | | | | | | | |
| | |
DBS Group Holdings Ltd. (Banks)† | | | | 2,418 | | | | | 56,345 | |
| | |
Oversea-Chinese Banking Corp., Ltd. (Banks)† | | | | 9,224 | | | | | 80,944 | |
| | |
| | | | | | | | | 137,289 | |
| | |
Slovenia - 0.2% | | | | | | | | | | |
| | |
Krka dd Novo mesto (Pharmaceuticals, Biotechnology & Life Sciences)† | | | | 152 | | | | | 19,714 | |
| | |
South Africa - 0.2% | | | | | | | | | | |
| | |
Discovery Ltd. (Insurance)*† | | | | 1,831 | | | | | 16,848 | |
See Notes to Financial Statements
25
Harding, Loevner Funds, Inc.
Global Equity Research Portfolio
Portfolio of Investments (continued)
October 31, 2021
| | | | | | | | | | |
| | |
| | | Shares | | Value |
| COMMON STOCKS - 98.0% (continued) | | | | |
South Korea - 0.8% | | | | | | | | | | |
| | |
Cheil Worldwide Inc. (Media & Entertainment)† | | | | 1,001 | | | | | $20,500 | |
| | |
Coway Co., Ltd. (Consumer Durables & Apparel)† | | | | 184 | | | | | 12,535 | |
| | |
LG Household & Health Care Ltd. (Household & Personal Products)† | | | | 9 | | | | | 9,034 | |
| | |
NAVER Corp. (Media & Entertainment)† | | | | 55 | | | | | 19,251 | |
| | |
NCSoft Corp. (Media & Entertainment)† | | | | 38 | | | | | 20,426 | |
| | |
| | | | | | | | | 81,746 | |
| | |
Spain - 1.6% | | | | | | | | | | |
| | |
Amadeus IT Group SA (Software & Services)*† | | | | 248 | | | | | 16,619 | |
| | |
Banco Bilbao Vizcaya Argentaria SA (Banks)† | | | | 6,148 | | | | | 43,134 | |
| | |
Banco Santander SA - Sponsored ADR (Banks) | | | | 14,529 | | | | | 55,065 | |
| | |
Bankinter SA (Banks)† | | | | 8,132 | | | | | 44,866 | |
| | |
| | | | | | | | | 159,684 | |
| | |
Sweden - 2.6% | | | | | | | | | | |
| | |
Alfa Laval AB (Capital Goods)† | | | | 887 | | | | | 37,914 | |
| | |
Assa Abloy AB, Class B (Capital Goods)† | | | | 664 | | | | | 19,479 | |
| | |
Atlas Copco AB, Class A (Capital Goods)† | | | | 544 | | | | | 34,898 | |
| | |
Epiroc AB, Class A (Capital Goods)† | | | | 1,467 | | | | | 36,445 | |
| | |
Evolution AB (Consumer Services)^† | | | | 112 | | | | | 18,138 | |
| | |
Hexagon AB, Class B (Technology Hardware & Equipment)† | | | | 1,890 | | | | | 30,465 | |
| | |
Intrum AB (Commercial & Professional Services)† | | | | 1,097 | | | | | 31,082 | |
| | |
Skandinaviska Enskilda Banken AB, Class A (Banks)† | | | | 1,670 | | | | | 26,145 | |
| | |
Thule Group AB (Consumer Durables & Apparel)^† | | | | 390 | | | | | 22,507 | |
| | |
| | | | | | | | | 257,073 | |
| | |
Switzerland - 2.9% | | | | | | | | | | |
| | |
Alcon Inc. (Health Care Equipment & Services) | | | | 661 | | | | | 55,101 | |
| | |
Cie Financiere Richemont SA, Class A, Reg S (Consumer Durables & Apparel)† | | | | 244 | | | | | 30,254 | |
| | |
Lonza Group AG, Reg S (Pharmaceuticals, Biotechnology & Life Sciences)† | | | | 60 | | | | | 49,278 | |
| | |
SGS SA, Reg S (Commercial & Professional Services)† | | | | 8 | | | | | 23,633 | |
| | | | | | | | | | |
| | |
| | | Shares | | Value |
| COMMON STOCKS - 98.0% (continued) | | | | |
Switzerland - 2.9% (continued) | | | | | | | | | | |
| | |
Sonova Holding AG, Reg S (Health Care Equipment & Services)† | | | | 68 | | | | | $28,154 | |
| | |
Straumann Holding AG, Reg S (Health Care Equipment & Services)† | | | | 15 | | | | | 31,227 | |
| | |
Temenos AG, Reg S (Software & Services)† | | | | 98 | | | | | 14,967 | |
| | |
VAT Group AG (Capital Goods)^† | | | | 96 | | | | | 45,736 | |
| | |
Vifor Pharma AG (Pharmaceuticals, Biotechnology & Life Sciences)† | | | | 91 | | | | | 11,753 | |
| | |
| | | | | | | | | 290,103 | |
| | |
Taiwan - 2.2% | | | | | | | | | | |
| | |
Advantech Co., Ltd. (Technology Hardware & Equipment)† | | | | 999 | | | | | 13,077 | |
| | |
Airtac International Group (Capital Goods)† | | | | 418 | | | | | 12,553 | |
| | |
Chipbond Technology Corp. (Semiconductors & Semiconductor Equipment)† | | | | 14,000 | | | | | 32,549 | |
| | |
Eclat Textile Co., Ltd. (Consumer Durables & Apparel)† | | | | 600 | | | | | 13,135 | |
| | |
Hon Hai Precision Industry Co., Ltd. (Technology Hardware & Equipment)† | | | | 17,000 | | | | | 65,782 | |
| | |
Largan Precision Co., Ltd. (Technology Hardware & Equipment)† | | | | 100 | | | | | 7,475 | |
| | |
Silergy Corp. (Semiconductors & Semiconductor Equipment)† | | | | 200 | | | | | 33,025 | |
| | |
Taiwan Semiconductor Manufacturing Co., Ltd. (Semiconductors & Semiconductor Equipment)† | | | | 2,000 | | | | | 42,325 | |
| | |
| | | | | | | | | 219,921 | |
| | |
Thailand - 0.2% | | | | | | | | | | |
| | |
Siam Commercial Bank pcl, Reg S (Banks)† | | | | 6,200 | | | | | 23,542 | |
| | |
Turkey - 0.2% | | | | | | | | | | |
| | |
BIM Birlesik Magazalar AS (Food & Staples Retailing)† | | | | 2,570 | | | | | 16,614 | |
| | |
United Arab Emirates - 0.4% | | | | | | | | | | |
| | |
Agthia Group PJSC (Food Beverage & Tobacco)† | | | | 8,681 | | | | | 14,052 | |
| | |
Emaar Properties PJSC (Real Estate)† | | | | 18,834 | | | | | 20,599 | |
| | |
| | | | | | | | | 34,651 | |
| | |
United Kingdom - 4.9% | | | | | | | | | | |
| | |
Coca-Cola HBC AG - CDI (Food Beverage & Tobacco)*† | | | | 751 | | | | | 26,055 | |
See Notes to Financial Statements
26
Harding, Loevner Funds, Inc.
Global Equity Research Portfolio
Portfolio of Investments (continued)
October 31, 2021
| | | | | | | | | | |
| | |
| | | Shares | | Value |
| COMMON STOCKS - 98.0% (continued) | | | | |
| | |
United Kingdom - 4.9% (continued) | | | | | | | | | | |
| | |
Compass Group plc (Consumer Services)*† | | | | 967 | | | | | $20,540 | |
| | |
Dechra Pharmaceuticals plc (Pharmaceuticals, Biotechnology & Life Sciences)† | | | | 780 | | | | | 54,696 | |
| | |
Diploma plc (Capital Goods)† | | | | 1,860 | | | | | 76,694 | |
| | |
Grafton Group plc (Capital Goods)† | | | | 2,919 | | | | | 53,638 | |
| | |
HomeServe plc (Commercial & Professional Services)† | | | | 3,499 | | | | | 41,045 | |
| | |
Intertek Group plc (Commercial & Professional Services)† | | | | 242 | | | | | 16,178 | |
| | |
Reckitt Benckiser Group plc (Household & Personal Products)† | | | | 152 | | | | | 12,329 | |
| | |
Rightmove plc (Media & Entertainment)† | | | | 2,075 | | | | | 19,648 | |
| | |
Rio Tinto plc (Materials)† | | | | 1,083 | | | | | 67,480 | |
| | |
Royal Dutch Shell plc, Class B - Sponsored ADR (Energy) | | | | 790 | | | | | 36,214 | |
| | |
Spirax-Sarco Engineering plc (Capital Goods)† | | | | 154 | | | | | 32,905 | |
| | |
Standard Chartered plc (Banks)† | | | | 3,634 | | | | | 24,633 | |
| | |
| | | | | | | | | 482,055 | |
| | |
United States - 40.2% | | | | | | | | | | |
| | |
Abbott Laboratories (Health Care Equipment & Services) | | | | 390 | | | | | 50,267 | |
| | |
AbbVie Inc. (Pharmaceuticals, Biotechnology & Life Sciences) | | | | 847 | | | | | 97,125 | |
| | |
ABIOMED Inc. (Health Care Equipment & Services)* | | | | 55 | | | | | 18,262 | |
| | |
Accenture plc, Class A (Software & Services) | | | | 70 | | | | | 25,115 | |
| | |
Adobe Inc. (Software & Services)* | | | | 90 | | | | | 58,532 | |
| | |
Air Products and Chemicals Inc. (Materials) | | | | 253 | | | | | 75,852 | |
| | |
Align Technology Inc. (Health Care Equipment & Services)* | | | | 32 | | | | | 19,980 | |
| | |
Allegion plc (Capital Goods) | | | | 136 | | | | | 17,449 | |
| | |
Alphabet Inc., Class A (Media & Entertainment)* | | | | 36 | | | | | 106,593 | |
| | |
Altair Engineering Inc., Class A (Software & Services)* | | | | 277 | | | | | 21,548 | |
| | |
Amazon.com Inc. (Retailing)* | | | | 14 | | | | | 47,214 | |
| | |
AMETEK Inc. (Capital Goods) | | | | 147 | | | | | 19,463 | |
| | |
Amphenol Corp., Class A (Technology Hardware & Equipment) | | | | 288 | | | | | 22,110 | |
| | |
ANSYS Inc. (Software & Services)* | | | | 78 | | | | | 29,607 | |
| | |
Apple Inc. (Technology Hardware & Equipment) | | | | 260 | | | | | 38,948 | |
| | | | | | | | | | |
| | |
| | | Shares | | Value |
| COMMON STOCKS - 98.0% (continued) | | | | |
| | |
United States - 40.2% (continued) | | | | | | | | | | |
| | |
Applied Materials Inc. (Semiconductors & Semiconductor Equipment) | | | | 670 | | | | | $91,556 | |
| | |
Atlassian Corp. plc, Class A (Software & Services)* | | | | 117 | | | | | 53,601 | |
| | |
Automatic Data Processing Inc. (Software & Services) | | | | 92 | | | | | 20,653 | |
| | |
BorgWarner Inc. (Automobiles & Components) | | | | 919 | | | | | 41,419 | |
| | |
Broadcom Inc. (Semiconductors & Semiconductor Equipment) | | | | 208 | | | | | 110,587 | |
| | |
Church & Dwight Co., Inc. (Household & Personal Products) | | | | 214 | | | | | 18,695 | |
| | |
Cisco Systems Inc. (Technology Hardware & Equipment) | | | | 907 | | | | | 50,765 | |
| | |
CME Group Inc. (Diversified Financials) | | | | 88 | | | | | 19,408 | |
| | |
Cognex Corp. (Technology Hardware & Equipment) | | | | 230 | | | | | 20,146 | |
| | |
Cognizant Technology Solutions Corp., Class A (Software & Services) | | | | 263 | | | | | 20,538 | |
| | |
Colgate-Palmolive Co. (Household & Personal Products) | | | | 231 | | | | | 17,600 | |
| | |
CoStar Group Inc. (Commercial & Professional Services)* | | | | 220 | | | | | 18,931 | |
| | |
Danaher Corp. (Health Care Equipment & Services) | | | | 80 | | | | | 24,942 | |
| | |
Deere & Co. (Capital Goods) | | | | 200 | | | | | 68,462 | |
| | |
eBay Inc. (Retailing) | | | | 259 | | | | | 19,870 | |
| | |
Ecolab Inc. (Materials) | | | | 84 | | | | | 18,666 | |
| | |
Edwards Lifesciences Corp. (Health Care Equipment & Services)* | | | | 212 | | | | | 25,402 | |
| | |
Elanco Animal Health Inc. (Pharmaceuticals, Biotechnology & Life Sciences)* | | | | 585 | | | | | 19,235 | |
| | |
Electronic Arts Inc. (Media & Entertainment) | | | | 143 | | | | | 20,056 | |
| | |
Emerson Electric Co. (Capital Goods) | | | | 188 | | | | | 18,238 | |
| | |
EnerSys (Capital Goods) | | | | 200 | | | | | 16,008 | |
| | |
EPAM Systems Inc. (Software & Services)* | | | | 31 | | | | | 20,870 | |
| | |
Estee Lauder Cos., Inc., Class A (Household & Personal Products) | | | | 60 | | | | | 19,460 | |
| | |
Etsy Inc. (Retailing)* | | | | 183 | | | | | 45,876 | |
| | |
Exponent Inc. (Commercial & Professional Services) | | | | 167 | | | | | 19,172 | |
| | |
Exxon Mobil Corp. (Energy) | | | | 1,474 | | | | | 95,029 | |
| | |
Facebook Inc., Class A (Media & Entertainment)* | | | | 270 | | | | | 87,364 | |
See Notes to Financial Statements
27
Harding, Loevner Funds, Inc.
Global Equity Research Portfolio
Portfolio of Investments (continued)
October 31, 2021
| | | | | | | |
| | |
| | | Shares | | Value |
| COMMON STOCKS - 98.0% (continued) | | | | |
| | |
United States - 40.2% (continued) | | | | | | | |
| | |
First Republic Bank (Banks) | | 119 | | | | $25,743 | |
| | |
Guidewire Software Inc. (Software & Services)* | | 152 | | | | 19,111 | |
| | |
Healthcare Services Group Inc. (Commercial & Professional Services) | | 622 | | | | 11,936 | |
| | |
HEICO Corp. (Capital Goods) | | 290 | | | | 40,423 | |
| | |
IDEXX Laboratories Inc. (Health Care Equipment & Services)* | | 70 | | | | 46,630 | |
| | |
Illumina Inc. (Pharmaceuticals, Biotechnology & Life Sciences)* | | 60 | | | | 24,904 | |
| | |
Intuitive Surgical Inc. (Health Care Equipment & Services)* | | 63 | | | | 22,751 | |
| | |
IPG Photonics Corp. (Technology Hardware & Equipment)* | | 95 | | | | 15,106 | |
| | |
IQVIA Holdings Inc. (Pharmaceuticals, Biotechnology & Life Sciences)* | | 100 | | | | 26,142 | |
| | |
Jack Henry & Associates Inc. (Software & Services) | | 115 | | | | 19,145 | |
| | |
Johnson & Johnson (Pharmaceuticals, Biotechnology & Life Sciences) | | 501 | | | | 81,603 | |
| | |
JPMorgan Chase & Co. (Banks) | | 641 | | | | 108,899 | |
| | |
Linde plc (Materials)† | | 169 | | | | 54,441 | |
| | |
Malibu Boats Inc., Class A (Consumer Durables & Apparel)* | | 517 | | | | 36,505 | |
| | |
Mastercard Inc., Class A (Software & Services) | | 52 | | | | 17,447 | |
| | |
McDonald’s Corp. (Consumer Services) | | 85 | | | | 20,872 | |
| | |
Merck & Co., Inc. (Pharmaceuticals, Biotechnology & Life Sciences) | | 734 | | | | 64,629 | |
| | |
Mettler-Toledo International Inc. (Pharmaceuticals, Biotechnology & Life Sciences)* | | 19 | | | | 28,137 | |
| | |
Microsoft Corp. (Software & Services) | | 363 | | | | 120,378 | |
| | |
Monster Beverage Corp. (Food Beverage & Tobacco)* | | 204 | | | | 17,340 | |
| | |
Netflix Inc. (Media & Entertainment)* | | 76 | | | | 52,464 | |
| | |
Neurocrine Biosciences Inc. (Pharmaceuticals, Biotechnology & Life Sciences)* | | 445 | | | | 46,907 | |
| | |
NIKE Inc., Class B (Consumer Durables & Apparel) | | 156 | | | | 26,097 | |
| | | | | | | |
| | |
| | | Shares | | Value |
| COMMON STOCKS - 98.0% (continued) | | | | |
| | |
United States - 40.2% (continued) | | | | | | | |
| | |
Ollie’s Bargain Outlet Holdings Inc. (Retailing)* | | 815 | | | | $55,143 | |
| | |
Palo Alto Networks Inc. (Software & Services)* | | 52 | | | | 26,473 | |
| | |
PayPal Holdings Inc. (Software & Services)* | | 161 | | | | 37,447 | |
| | |
Penumbra Inc. (Health Care Equipment & Services)* | | 62 | | | | 17,146 | |
| | |
Pinterest Inc., Class A (Media & Entertainment)* | | 290 | | | | 12,946 | |
| | |
Planet Fitness Inc., Class A (Consumer Services)* | | 203 | | | | 16,149 | |
| | |
Procter & Gamble Co. (Household & Personal Products) | | 137 | | | | 19,590 | |
| | |
Reinsurance Group of America Inc. (Insurance) | | 697 | | | | 82,302 | |
| | |
Republic Services Inc. (Commercial & Professional Services) | | 185 | | | | 24,901 | |
| | |
ResMed Inc. (Health Care Equipment & Services) | | 81 | | | | 21,296 | |
| | |
Rollins Inc. (Commercial & Professional Services) | | 1,132 | | | | 39,880 | |
| | |
Roper Technologies Inc. (Capital Goods) | | 47 | | | | 22,930 | |
| | |
salesforce.com Inc. (Software & Services)* | | 130 | | | | 38,960 | |
| | |
Schlumberger NV (Energy) | | 698 | | | | 22,517 | |
| | |
Sensata Technologies Holding plc (Capital Goods)* | | 328 | | | | 18,073 | |
| | |
ServiceNow Inc. (Software & Services)* | | 54 | | | | 37,679 | |
| | |
Signature Bank (Banks) | | 150 | | | | 44,673 | |
| | |
Starbucks Corp. (Consumer Services) | | 578 | | | | 61,308 | |
| | |
Stryker Corp. (Health Care Equipment & Services) | | 73 | | | | 19,423 | |
| | |
SVB Financial Group (Banks)* | | 102 | | | | 73,175 | |
| | |
Synopsys Inc. (Software & Services)* | | 269 | | | | 89,625 | |
| | |
Teradyne Inc. (Semiconductors & Semiconductor Equipment) | | 877 | | | | 121,236 | |
| | |
Texas Instruments Inc. (Semiconductors & Semiconductor Equipment) | | 115 | | | | 21,560 | |
| | |
Texas Pacific Land Corp. (Energy) | | 13 | | | | 16,558 | |
| | |
Thermo Fisher Scientific Inc. (Pharmaceuticals, Biotechnology & Life Sciences) | | 176 | | | | 111,420 | |
| | |
UnitedHealth Group Inc. (Health Care Equipment & Services) | | 220 | | | | 101,303 | |
See Notes to Financial Statements
28
Harding, Loevner Funds, Inc.
Global Equity Research Portfolio
Portfolio of Investments (continued)
October 31, 2021
| | | | | | | | | | |
| | |
| | | Shares | | Value |
| COMMON STOCKS - 98.0% (continued) | | | | |
| | |
United States - 40.2% (continued) | | | | | | | | | | |
| | |
Verisk Analytics Inc. (Commercial & Professional Services) | | | | 103 | | | | | $21,658 | |
| | |
Vertex Pharmaceuticals Inc. (Pharmaceuticals, Biotechnology & Life Sciences)* | | | | 433 | | | | | 80,075 | |
| | |
Visa Inc., Class A (Software & Services) | | | | 76 | | | | | 16,095 | |
| | |
Walt Disney Co. (Media & Entertainment)* | | | | 98 | | | | | 16,569 | |
| | |
Workday Inc., Class A (Software & Services)* | | | | 140 | | | | | 40,597 | |
| | |
Zoetis Inc. (Pharmaceuticals, Biotechnology & Life Sciences) | | | | 261 | | | | | 56,428 | |
| | |
| | | | | | | | | | 3,963,359 | |
| | |
Total Common Stocks (Cost $6,971,091) | | | | | | | | | $9,663,681 | |
| | |
| | | | | | | | | | |
| PREFERRED STOCKS - 0.9% |
| | |
Brazil - 0.2% | | | | | | | | | | |
| | |
Itau Unibanco Holding SA - Sponsored ADR, 0.78% (Banks)+ | | | | 3,374 | | | | | 13,732 | |
| | |
Colombia - 0.1% | | | | | | | | | | |
| | |
Bancolombia SA - Sponsored ADR, 0.68% (Banks)+ | | | | 360 | | | | | 12,935 | |
| | |
Germany - 0.4% | | | | | | | | | | |
| | |
Henkel AG & Co. KGaA, 2.34% (Household & Personal Products)+† | | | | 187 | | | | | 16,728 | |
| | |
Sartorius AG, 0.12% (Health Care Equipment & Services)+† | | | | 33 | | | | | 21,415 | |
| | |
| | | | | | | | | 38,143 | |
| | |
South Korea - 0.2% | | | | | | | | | | |
| | |
Samsung Electronics Co., Ltd. - GDR, Reg S, 2.18% (Technology Hardware & Equipment)+† | | | | 17 | | | | | 23,415 | |
| | |
| | | | | | | | | | | |
| | |
Total Preferred Stocks (Cost $78,138) | | | | | | | | | $88,225 | |
| | |
| | | | | | | | | | |
| SHORT TERM INVESTMENTS - 1.0% |
| | |
Northern Institutional Funds - Treasury Portfolio (Premier Shares), 0.01% (Money Market Funds) | | | | 93,132 | | | | | 93,132 | |
| | |
| | | | | | | | | | | |
| | | | | | | | | | |
| | |
| | | Shares | | Value |
| SHORT TERM INVESTMENTS - 1.0% (continued) |
| | |
Total Short Term Investments (Cost $93,132) | | | | | | | | | $93,132 | |
| | |
| | | | | | | | | | | |
| | |
Total Investments — 99.9% | | | | | | | | | | |
| | |
(Cost $7,142,361) | | | | | | | | | $9,845,038 | |
| | |
Other Assets Less Liabilities - 0.1% | | | | | | | | | 11,351 | |
| | |
Net Assets — 100.0% | | | | | | | | | $9,856,389 | |
| | |
| Summary of Abbreviations |
| |
| ADR | | American Depositary Receipt |
| |
| CDI | | Chess Depositary Interest |
| |
| GDR | | Global Depositary Receipt |
| |
| Reg S | | Security sold outside United States without registration under the Securities Act of 1933. |
| |
| † | | Investment categorized as level 2 security as disclosed in Note 2 of the Notes to Financial Statements. |
| |
| * | | Non-income producing security. |
| |
| ^ | | Security exempt from registration pursuant to Rule 144A of the Securities Act of 1933. These securities, which represent 2.3% of net assets as of October 31, 2021, are considered liquid and may be resold in transactions exempt from registration, normally to qualified buyers. |
| |
| + | | Current yield is disclosed. Dividends are calculated based on a percentage of the issuer’s net income. |
See Notes to Financial Statements
29
Harding, Loevner Funds, Inc.
Global Equity Research Portfolio
Portfolio of Investments (continued)
October 31, 2021
| | | | |
| Industry | | Percentage of
Net Assets | |
| |
Automobiles & Components | | | 2.4 | % |
| |
Banks | | | 10.6 | |
| |
Capital Goods | | | 11.0 | |
| |
Commercial & Professional Services | | | 3.4 | |
| |
Consumer Durables & Apparel | | | 3.6 | |
| |
Consumer Services | | | 1.6 | |
| |
Diversified Financials | | | 0.7 | |
| |
Energy | | | 4.2 | |
| |
Food & Staples Retailing | | | 1.8 | |
| |
Food Beverage & Tobacco | | | 2.1 | |
| |
Health Care Equipment & Services | | | 7.3 | |
| |
Household & Personal Products | | | 2.5 | |
| |
Insurance | | | 1.9 | |
| |
Materials | | | 4.3 | |
| |
Media & Entertainment | | | 5.9 | |
| |
Pharmaceuticals, Biotechnology & Life Sciences | | | 10.3 | |
| |
Real Estate | | | 0.5 | |
| |
Retailing | | | 4.1 | |
| |
Semiconductors & Semiconductor Equipment | | | 5.9 | |
| |
Software & Services | | | 10.4 | |
| |
Technology Hardware & Equipment | | | 3.3 | |
| |
Transportation | | | 0.8 | |
| |
Utilities | | | 0.4 | |
| |
Money Market Fund | | | 0.9 | |
| | |
Total Investments | | | 99.9 | |
| |
Other Assets Less Liabilities | | | 0.1 | |
| | |
Net Assets | | | 100.0 | % |
See Notes to Financial Statements
30
Harding, Loevner Funds, Inc.
International Equity Research Portfolio
Portfolio of Investments
October 31, 2021
| | | | | | | | | | |
| | |
| | | Shares | | Value |
| COMMON STOCKS - 96.3% | | | | |
| | |
Australia - 1.2% | | | | | | | | | | |
| | |
BHP Group Ltd. (Materials)† | | | | 4,069 | | | | | $111,611 | |
| | |
Cochlear Ltd. (Health Care Equipment & Services)† | | | | 427 | | | | | 71,115 | |
| | |
| | | | | | | | | 182,726 | |
| | |
Brazil - 1.8% | | | | | | | | | | |
| | |
Ambev SA - ADR (Food Beverage & Tobacco) | | | | 13,956 | | | | | 41,310 | |
| | |
B3 SA - Brasil Bolsa Balcao (Diversified Financials) | | | | 14,500 | | | | | 30,599 | |
| | |
Cia Brasileira de Distribuicao - ADR (Food & Staples Retailing) | | | | 6,733 | | | | | 30,703 | |
| | |
Localiza Rent a Car SA (Transportation) | | | | 3,100 | | | | | 24,882 | |
| | |
Magazine Luiza SA (Retailing)* | | | | 10,200 | | | | | 19,537 | |
| | |
Raia Drogasil SA (Food & Staples Retailing)* | | | | 6,500 | | | | | 26,777 | |
| | |
Ultrapar Participacoes SA - Sponsored ADR (Energy) | | | | 10,307 | | | | | 24,015 | |
| | |
WEG SA (Capital Goods) | | | | 6,200 | | | | | 40,646 | |
| | |
XP Inc., Class A (Diversified Financials)* | | | | 1,029 | | | | | 33,761 | |
| | |
| | | | | | | | | 272,230 | |
| | |
Canada - 1.9% | | | | | | | | | | |
| | |
Alimentation Couche-Tard Inc. (Food & Staples Retailing) | | | | 3,600 | | | | | 137,007 | |
| | |
Imperial Oil Ltd. (Energy) | | | | 4,500 | | | | | 152,351 | |
| | |
| | | | | | | | | 289,358 | |
| | |
Chile - 0.3% | | | | | | | | | | |
| | |
Banco Santander Chile - ADR (Banks) | | | | 2,474 | | | | | 43,839 | |
| | |
China - 10.7% | | | | | | | | | | |
| | |
51job Inc. - ADR (Commercial & Professional Services)* | | | | 694 | | | | | 41,335 | |
| | |
AAC Technologies Holdings Inc. (Technology Hardware & Equipment)† | | | | 8,500 | | | | | 37,285 | |
| | |
Baidu Inc., Class A (Media & Entertainment)*† | | | | 2,200 | | | | | 45,000 | |
| | |
China Tourism Group Duty Free Corp., Ltd., Class A (Retailing)† | | | | 800 | | | | | 33,390 | |
| | |
Country Garden Services Holdings Co., Ltd. (Real Estate)† | | | | 4,000 | | | | | 30,970 | |
| | |
CSPC Pharmaceutical Group Ltd. (Pharmaceuticals, Biotechnology & Life Sciences)† | | | | 37,600 | | | | | 39,399 | |
| | |
Fuyao Glass Industry Group Co., Ltd., Class H (Automobiles & Components)^† | | | | 6,800 | | | | | 39,411 | |
| | |
Glodon Co., Ltd., Class A (Software & Services)† | | | | 3,480 | | | | | 40,379 | |
| | | | | | | | | | |
| | |
| | | Shares | | Value |
| COMMON STOCKS - 96.3% (continued) | | | | |
| | |
China - 10.7% (continued) | | | | | | | | | | |
| | |
Gree Electric Appliances Inc. of Zhuhai, Class A (Consumer Durables & Apparel)† | | | | 8,600 | | | | | $49,063 | |
| | |
Haier Smart Home Co., Ltd., Class H (Consumer Durables & Apparel)† | | | | 10,800 | | | | | 40,304 | |
| | |
Hangzhou Tigermed Consulting Co., Ltd., Class H (Pharmaceuticals, Biotechnology & Life Sciences)^† | | | | 1,700 | | | | | 33,183 | |
| | |
Hefei Meiya Optoelectronic Technology Inc., Class A (Capital Goods)† | | | | 4,800 | | | | | 30,180 | |
| | |
Hongfa Technology Co., Ltd., Class A (Capital Goods)† | | | | 4,400 | | | | | 50,972 | |
| | |
Inner Mongolia Yili Industrial Group Co., Ltd., Class A (Food Beverage & Tobacco)† | | | | 10,100 | | | | | 68,046 | |
| | |
JD.com Inc., Class A (Retailing)*† | | | | 1,176 | | | | | 46,188 | |
| | |
Jiangsu Expressway Co., Ltd., Class H (Transportation)† | | | | 32,000 | | | | | 30,250 | |
| | |
Jiangsu Hengrui Medicine Co., Ltd., Class A (Pharmaceuticals, Biotechnology & Life Sciences)† | | | | 5,564 | | | | | 42,731 | |
| | |
Jiangsu Yanghe Brewery Joint-Stock Co., Ltd., Class A (Food Beverage & Tobacco)† | | | | 1,100 | | | | | 31,806 | |
| | |
Kweichow Moutai Co., Ltd., Class A (Food Beverage & Tobacco)† | | | | 100 | | | | | 28,585 | |
| | |
Meituan, Class B (Retailing)*^† | | | | 900 | | | | | 31,397 | |
| | |
Midea Group Co., Ltd., Class A (Consumer Durables & Apparel)† | | | | 3,400 | | | | | 36,355 | |
| | |
NetEase Inc. - ADR (Media & Entertainment) | | | | 571 | | | | | 55,724 | |
| | |
Ping An Insurance Group Co. of China Ltd., Class H (Insurance)† | | | | 6,000 | | | | | 43,206 | |
| | |
Qingdao Haier Biomedical Co., Ltd., Class A (Health Care Equipment & Services)† | | | | 2,400 | | | | | 35,284 | |
| | |
Sangfor Technologies Inc., Class A (Software & Services)† | | | | 1,100 | | | | | 34,854 | |
| | |
SF Holding Co., Ltd., Class A (Transportation)† | | | | 3,800 | | | | | 38,264 | |
| | |
Shandong Sinocera Functional Material Co., Ltd., Class A (Materials)† | | | | 5,300 | | | | | 35,259 | |
| | |
Shanghai International Airport Co., Ltd., Class A (Transportation)*† | | | | 5,100 | | | | | 42,033 | |
See Notes to Financial Statements
31
Harding, Loevner Funds, Inc.
International Equity Research Portfolio
Portfolio of Investments (continued)
October 31, 2021
| | | | | | | | | | |
| | |
| | | Shares | | Value |
| COMMON STOCKS - 96.3% (continued) | | | | |
| | |
China - 10.7% (continued) | | | | | | | | | | |
| | |
Shenzhen Inovance Technology Co., Ltd., Class A (Capital Goods)† | | | | 4,050 | | | | | $41,075 | |
| | |
Shenzhou International Group Holdings Ltd. (Consumer Durables & Apparel)† | | | | 2,000 | | | | | 43,365 | |
| | |
Sino Biopharmaceutical Ltd. (Pharmaceuticals, Biotechnology & Life Sciences)† | | | | 54,500 | | | | | 40,428 | |
| | |
Songcheng Performance Development Co., Ltd., Class A (Consumer Services)† | | | | 11,800 | | | | | 25,716 | |
| | |
Sunny Optical Technology Group Co., Ltd. (Technology Hardware & Equipment)† | | | | 1,700 | | | | | 45,844 | |
| | |
Suofeiya Home Collection Co., Ltd., Class A (Consumer Durables & Apparel)† | | | | 11,600 | | | | | 30,773 | |
| | |
Tencent Holdings Ltd. (Media & Entertainment)† | | | | 600 | | | | | 37,252 | |
| | |
TravelSky Technology Ltd., Class H (Software & Services)† | | | | 23,000 | | | | | 43,073 | |
| | |
Trip.com Group Ltd. (Consumer Services)*† | | | | 1,251 | | | | | 36,085 | |
| | |
Wuliangye Yibin Co., Ltd., Class A (Food Beverage & Tobacco)† | | | | 800 | | | | | 27,142 | |
| | |
WuXi AppTec Co., Ltd., Class A (Pharmaceuticals, Biotechnology & Life Sciences)† | | | | 1,790 | | | | | 38,570 | |
| | |
Wuxi Biologics Cayman Inc. (Pharmaceuticals, Biotechnology & Life Sciences)*^† | | | | 2,500 | | | | | 38,183 | |
| | |
Yonyou Network Technology Co., Ltd., Class A (Software & Services)† | | | | 7,700 | | | | | 38,123 | |
| | |
Zhejiang Sanhua Intelligent Controls Co., Ltd., Class A (Capital Goods)† | | | | 11,900 | | | | | 43,997 | |
| | |
| | | | | | | | | 1,640,479 | |
| | |
Colombia - 0.9% | | | | | | | | | | |
| | |
Cementos Argos SA (Materials) | | | | 26,196 | | | | | 44,173 | |
| | |
Ecopetrol SA - Sponsored ADR (Energy) | | | | 3,713 | | | | | 56,252 | |
| | |
Grupo Nutresa SA (Food Beverage & Tobacco) | | | | 7,328 | | | | | 42,831 | |
| | |
| | | | | | | | | 143,256 | |
| | |
Czech Republic - 0.4% | | | | | | | | | | |
| | |
Komercni banka AS (Banks)*† | | | | 1,394 | | | | | 54,070 | |
| | | | | | | | | | |
| | |
| | | Shares | | Value |
| COMMON STOCKS - 96.3% (continued) | | | | |
| | |
Denmark - 2.3% | | | | | | | | | | |
| | |
Ambu A/S, Class B (Health Care Equipment & Services)† | | | | 1,023 | | | | | $29,246 | |
| | |
Chr Hansen Holding A/S (Materials)† | | | | 702 | | | | | 55,855 | |
| | |
Coloplast A/S, Class B (Health Care Equipment & Services)† | | | | 377 | | | | | 61,484 | |
| | |
Genmab A/S (Pharmaceuticals, Biotechnology & Life Sciences)*† | | | | 350 | | | | | 157,563 | |
| | |
Novozymes A/S, Class B (Materials)† | | | | 598 | | | | | 43,950 | |
| | |
| | | | | | | | | 348,098 | |
| | |
Egypt - 0.7% | | | | | | | | | | |
| | |
Commercial International Bank Egypt SAE - GDR, Reg S (Banks)*† | | | | 33,598 | | | | | 104,143 | |
| | |
Finland - 0.5% | | | | | | | | | | |
| | |
Kone OYJ, Class B (Capital Goods)† | | | | 601 | | | | | 40,904 | |
| | |
Neste OYJ (Energy)† | | | | 665 | | | | | 37,130 | |
| | |
| | | | | | | | | 78,034 | |
| | |
France - 5.6% | | | | | | | | | | |
| | |
Air Liquide SA (Materials)† | | | | 723 | | | | | 120,853 | |
| | |
Dassault Systemes SE (Software & Services)† | | | | 975 | | | | | 56,864 | |
| | |
IPSOS (Media & Entertainment)† | | | | 2,185 | | | | | 102,726 | |
| | |
Kering SA (Consumer Durables & Apparel)† | | | | 104 | | | | | 78,028 | |
| | |
LISI (Capital Goods)† | | | | 3,059 | | | | | 85,103 | |
| | |
L’Oreal SA (Household & Personal Products)† | | | | 100 | | | | | 45,729 | |
| | |
Rubis SCA (Utilities)† | | | | 3,120 | | | | | 99,920 | |
| | |
Safran SA (Capital Goods)† | | | | 590 | | | | | 79,331 | |
| | |
Sartorius Stedim Biotech (Pharmaceuticals, Biotechnology & Life Sciences)† | | | | 103 | | | | | 56,870 | |
| | |
Schneider Electric SE (Capital Goods)† | | | | 737 | | | | | 127,481 | |
| | |
| | | | | | | | | 852,905 | |
| | |
Germany - 7.6% | | | | | | | | | | |
| | |
adidas AG (Consumer Durables & Apparel)† | | | | 99 | | | | | 32,422 | |
| | |
Allianz SE, Reg S (Insurance)† | | | | 531 | | | | | 123,488 | |
| | |
Bayerische Motoren Werke AG (Automobiles & Components)† | | | | 1,486 | | | | | 149,893 | |
| | |
Bechtle AG (Software & Services)† | | | | 1,176 | | | | | 88,105 | |
| | |
Brenntag SE (Capital Goods)† | | | | 1,528 | | | | | 145,284 | |
| | |
Carl Zeiss Meditec AG (Bearer) (Health Care Equipment & Services)† | | | | 256 | | | | | 51,482 | |
See Notes to Financial Statements
32
Harding, Loevner Funds, Inc.
International Equity Research Portfolio
Portfolio of Investments (continued)
October 31, 2021
| | | | | | | | | | |
| | |
| | | Shares | | Value |
| COMMON STOCKS - 96.3% (continued) | | | | |
| | |
Germany - 7.6% (continued) | | | | | | | | | | |
| | |
Evotec SE (Pharmaceuticals, Biotechnology & Life Sciences)*† | | | | 948 | | | | | $45,865 | |
| | |
FUCHS PETROLUB SE (Materials)† | | | | 2,480 | | | | | 91,266 | |
| | |
HelloFresh SE (Retailing)*† | | | | 415 | | | | | 33,584 | |
| | |
Infineon Technologies AG (Semiconductors & Semiconductor Equipment)† | | | | 1,274 | | | | | 59,548 | |
| | |
SAP SE - Sponsored ADR (Software & Services) | | | | 717 | | | | | 103,807 | |
| | |
Scout24 SE (Media & Entertainment)^† | | | | 1,132 | | | | | 78,784 | |
| | |
Symrise AG (Materials)† | | | | 935 | | | | | 129,269 | |
| | |
TeamViewer AG (Software & Services)*^† | | | | 1,749 | | | | | 26,085 | |
| | |
| | | | | | | | | 1,158,882 | |
| | |
Hong Kong - 1.7% | | | | | | | | | | |
| | |
AIA Group Ltd. (Insurance)† | | | | 8,600 | | | | | 97,187 | |
| | |
ASM Pacific Technology Ltd. (Semiconductors & Semiconductor Equipment)† | | | | 9,600 | | | | | 104,204 | |
| | |
Techtronic Industries Co., Ltd. (Capital Goods)† | | | | 2,500 | | | | | 51,369 | |
| | |
| | | | | | | | | 252,760 | |
| | |
Iceland - 0.2% | | | | | | | | | | |
| | |
Marel HF (Capital Goods)^† | | | | 5,278 | | | | | 35,379 | |
| | |
India - 2.7% | | | | | | | | | | |
| | |
Asian Paints Ltd. (Materials)† | | | | 998 | | | | | 41,360 | |
| | |
Godrej Consumer Products Ltd. (Household & Personal Products)*† | | | | 3,680 | | | | | 47,178 | |
| | |
HDFC Bank Ltd. - ADR (Banks) | | | | 541 | | | | | 38,903 | |
| | |
Hero MotoCorp Ltd. (Automobiles & Components)† | | | | 1,194 | | | | | 42,464 | |
| | |
ICICI Bank Ltd. - Sponsored ADR (Banks) | | | | 3,149 | | | | | 66,602 | |
| | |
Kotak Mahindra Bank Ltd. (Banks)† | | | | 1,697 | | | | | 45,943 | |
| | |
Marico Ltd. (Household & Personal Products)† | | | | 5,430 | | | | | 41,335 | |
| | |
Pidilite Industries Ltd. (Materials)† | | | | 1,367 | | | | | 42,327 | |
| | |
Tata Consultancy Services Ltd. (Software & Services)† | | | | 1,001 | | | | | 45,473 | |
| | |
| | | | | | | | | 411,585 | |
| | |
Indonesia - 1.2% | | | | | | | | | | |
| | |
Astra International Tbk PT (Automobiles & Components)† | | | | 122,700 | | | | | 52,264 | |
| | |
Bank Central Asia Tbk PT (Banks)† | | | | 93,000 | | | | | 49,079 | |
| | |
Bank Rakyat Indonesia Persero Tbk PT (Banks)† | | | | 141,200 | | | | | 42,207 | |
| | | | | | | | | | |
| | |
| | | Shares | | Value |
| COMMON STOCKS - 96.3% (continued) | | | | |
| | |
Indonesia - 1.2% (continued) | | | | | | | | | | |
| | |
Unilever Indonesia Tbk PT (Household & Personal Products)† | | | | 147,500 | | | | | $46,046 | |
| | |
| | | | | | | | | 189,596 | |
| | |
Israel - 0.3% | | | | | | | | | | |
| | |
CyberArk Software Ltd. (Software & Services)* | | | | 241 | | | | | 43,407 | |
| | |
Italy - 2.0% | | | | | | | | | | |
| | |
Amplifon SpA (Health Care Equipment & Services)† | | | | 767 | | | | | 39,001 | |
| | |
DiaSorin SpA (Health Care Equipment & Services)† | | | | 281 | | | | | 63,466 | |
| | |
FinecoBank Banca Fineco SpA (Banks)*† | | | | 2,153 | | | | | 41,163 | |
| | |
Reply SpA (Software & Services)† | | | | 866 | | | | | 168,234 | |
| | |
| | | | | | | | | 311,864 | |
| | |
Japan - 14.7% | | | | | | | | | | |
| | |
ABC-Mart Inc. (Retailing)† | | | | 1,740 | | | | | 83,372 | |
| | |
Benefit One Inc. (Commercial & Professional Services)† | | | | 1,200 | | | | | 60,692 | |
| | |
BML Inc. (Health Care Equipment & Services)† | | | | 2,300 | | | | | 80,771 | |
| | |
Chugai Pharmaceutical Co., Ltd. (Pharmaceuticals, Biotechnology & Life Sciences)† | | | | 2,500 | | | | | 93,235 | |
| | |
FANUC Corp. (Capital Goods)† | | | | 350 | | | | | 68,781 | |
| | |
Fast Retailing Co., Ltd. (Retailing)† | | | | 40 | | | | | 26,571 | |
| | |
Hakuhodo DY Holdings Inc. (Media & Entertainment)† | | | | 9,490 | | | | | 155,215 | |
| | |
Kakaku.com Inc. (Media & Entertainment)† | | | | 2,700 | | | | | 89,472 | |
| | |
Kobayashi Pharmaceutical Co., Ltd. (Household & Personal Products)† | | | | 800 | | | | | 64,047 | |
| | |
Komatsu Ltd. (Capital Goods)† | | | | 4,740 | | | | | 123,816 | |
| | |
Kubota Corp. (Capital Goods)† | | | | 6,400 | | | | | 136,446 | |
| | |
M3 Inc. (Health Care Equipment & Services)† | | | | 500 | | | | | 29,506 | |
| | |
Makita Corp. (Capital Goods)† | | | | 2,400 | | | | | 110,073 | |
| | |
MISUMI Group Inc. (Capital Goods)† | | | | 2,000 | | | | | 83,734 | |
| | |
Nitori Holdings Co., Ltd. (Retailing)† | | | | 800 | | | | | 146,801 | |
| | |
Nomura Research Institute Ltd. (Software & Services)† | | | | 1,106 | | | | | 44,429 | |
| | |
Rinnai Corp. (Consumer Durables & Apparel)† | | | | 1,200 | | | | | 123,083 | |
| | |
Shimano Inc. (Consumer Durables & Apparel)† | | | | 170 | | | | | 47,377 | |
See Notes to Financial Statements
33
Harding, Loevner Funds, Inc.
International Equity Research Portfolio
Portfolio of Investments (continued)
October 31, 2021
| | | | | | | | | | |
| | |
| | | Shares | | Value |
| COMMON STOCKS - 96.3% (continued) | | | | |
| | |
Japan - 14.7% (continued) | | | | | | | | | | |
| | |
Shionogi & Co., Ltd. (Pharmaceuticals, Biotechnology & Life Sciences)† | | | | 2,300 | | | | | $149,752 | |
| | |
Shiseido Co., Ltd. (Household & Personal Products)† | | | | 600 | | | | | 39,967 | |
| | |
SMC Corp. (Capital Goods)† | | | | 160 | | | | | 95,693 | |
| | |
Stanley Electric Co., Ltd. (Automobiles & Components)† | | | | 4,615 | | | | | 116,388 | |
| | |
Sugi Holdings Co., Ltd. (Food & Staples Retailing)† | | | | 1,655 | | | | | 118,676 | |
| | |
Sysmex Corp. (Health Care Equipment & Services)† | | | | 500 | | | | | 62,148 | |
| | |
Unicharm Corp. (Household & Personal Products)† | | | | 2,600 | | | | | 104,879 | |
| | |
| | | | | | | | | 2,254,924 | |
| | |
Kazakhstan - 0.6% | | | | | | | | | | |
| | |
Halyk Savings Bank of Kazakhstan JSC - GDR, Reg S (Banks)† | | | | 2,211 | | | | | 39,817 | |
| | |
Kaspi.KZ JSC - GDR, Reg S (Diversified Financials)† | | | | 338 | | | | | 48,981 | |
| | |
| | | | | | | | | 88,798 | |
| | |
Mexico - 1.0% | | | | | | | | | | |
| | |
Fomento Economico Mexicano SAB de CV - Sponsored ADR (Food Beverage & Tobacco) | | | | 655 | | | | | 53,835 | |
| | |
Grupo Financiero Banorte SAB de CV, Series O (Banks) | | | | 9,600 | | | | | 60,781 | |
| | |
Wal-Mart de Mexico SAB de CV (Food & Staples Retailing) | | | | 11,100 | | | | | 38,716 | |
| | |
| | | | | | | | | 153,332 | |
| | |
Netherlands - 3.0% | | | | | | | | | | |
| | |
Adyen NV (Software & Services)*^† | | | | 18 | | | | | 54,373 | |
| | |
ASM International NV (Semiconductors & Semiconductor Equipment)† | | | | 172 | | | | | 77,939 | |
| | |
ASML Holding NV, Reg S (Semiconductors & Semiconductor Equipment) | | | | 201 | | | | | 163,389 | |
| | |
Koninklijke Vopak NV (Energy)† | | | | 2,522 | | | | | 100,359 | |
| | |
Prosus NV (Retailing)*† | | | | 710 | | | | | 62,902 | |
| | |
| | | | | | | | | 458,962 | |
| | |
Norway - 0.3% | | | | | | | | | | |
| | |
Tomra Systems ASA (Commercial & Professional Services)† | | | | 804 | | | | | 51,974 | |
| | |
Pakistan - 0.4% | | | | | | | | | | |
| | |
MCB Bank Ltd. (Banks)† | | | | 32,100 | | | | | 30,746 | |
| | | | | | | | | | |
| | |
| | | Shares | | Value |
| COMMON STOCKS - 96.3% (continued) | | | | |
| | |
Pakistan - 0.4% (continued) | | | | | | | | | | |
| | |
Oil & Gas Development Co., Ltd. (Energy)† | | | | 47,100 | | | | | $23,458 | |
| | |
| | | | | | | | | 54,204 | |
| | |
Philippines - 2.2% | | | | | | | | | | |
| | |
Bank of the Philippine Islands (Banks)† | | | | 27,440 | | | | | 47,331 | |
| | |
BDO Unibank Inc. (Banks)† | | | | 18,870 | | | | | 46,515 | |
| | |
International Container Terminal Services Inc. (Transportation)† | | | | 14,190 | | | | | 50,633 | |
| | |
Robinsons Retail Holdings Inc. (Food & Staples Retailing)† | | | | 39,680 | | | | | 49,004 | |
| | |
Security Bank Corp. (Banks)† | | | | 19,210 | | | | | 46,107 | |
| | |
SM Prime Holdings Inc. (Real Estate)† | | | | 83,300 | | | | | 54,775 | |
| | |
Universal Robina Corp. (Food Beverage & Tobacco)† | | | | 14,560 | | | | | 39,879 | |
| | |
| | | | | | | | | 334,244 | |
| | |
Poland - 0.6% | | | | | | | | | | |
| | |
Allegro.eu SA (Retailing)*^† | | | | 2,455 | | | | | 27,774 | |
| | |
ING Bank Slaski SA (Banks)*† | | | | 980 | | | | | 66,825 | |
| | |
| | | | | | | | | 94,599 | |
| | |
Russia - 1.5% | | | | | | | | | | |
| | |
LUKOIL PJSC - Sponsored ADR (Energy) | | | | 603 | | | | | 61,524 | |
| | |
Novatek PJSC - Sponsored GDR, Reg S (Energy)† | | | | 190 | | | | | 48,302 | |
| | |
Sberbank of Russia PJSC - Sponsored ADR (Banks)† | | | | 3,389 | | | | | 67,967 | |
| | |
Yandex NV, Class A (Media & Entertainment)* | | | | 541 | | | | | 44,816 | |
| | |
| | | | | | | | | 222,609 | |
| | |
Saudi Arabia - 0.9% | | | | | | | | | | |
| | |
Al Rajhi Bank (Banks)† | | | | 1,801 | | | | | 66,551 | |
| | |
Jarir Marketing Co. (Retailing)† | | | | 724 | | | | | 39,132 | |
| | |
Saudi National Bank (Banks)† | | | | 2,214 | | | | | 38,908 | |
| | |
| | | | | | | | | 144,591 | |
| | |
Singapore - 2.2% | | | | | | | | | | |
| | |
DBS Group Holdings Ltd. (Banks)† | | | | 7,414 | | | | | 172,765 | |
| | |
Oversea-Chinese Banking Corp., Ltd. (Banks)† | | | | 18,238 | | | | | 160,044 | |
| | |
| | | | | | | | | 332,809 | |
| | |
Slovenia - 0.3% | | | | | | | | | | |
| | |
Krka dd Novo mesto (Pharmaceuticals, Biotechnology & Life Sciences)† | | | | 303 | | | | | 39,298 | |
| | |
South Africa - 0.2% | | | | | | | | | | |
| | |
Discovery Ltd. (Insurance)*† | | | | 4,148 | | | | | 38,168 | |
See Notes to Financial Statements
34
Harding, Loevner Funds, Inc.
International Equity Research Portfolio
Portfolio of Investments (continued)
October 31, 2021
| | | | | | | | | | |
| | |
| | | Shares | | Value |
| COMMON STOCKS - 96.3% (continued) | | | | |
| | |
South Korea - 1.3% | | | | | | | | | | |
| | |
Cheil Worldwide Inc. (Media & Entertainment)† | | | | 2,148 | | | | | $43,989 | |
| | |
Coway Co., Ltd. (Consumer Durables & Apparel)† | | | | 524 | | | | | 35,697 | |
| | |
LG Household & Health Care Ltd. (Household & Personal Products)† | | | | 29 | | | | | 29,111 | |
| | |
NAVER Corp. (Media & Entertainment)† | | | | 111 | | | | | 38,853 | |
| | |
NCSoft Corp. (Media & Entertainment)† | | | | 105 | | | | | 56,439 | |
| | |
| | | | | | | | | 204,089 | |
| | |
Spain - 2.5% | | | | | | | | | | |
| | |
Amadeus IT Group SA (Software & Services)*† | | | | 528 | | | | | 35,382 | |
| | |
Banco Bilbao Vizcaya Argentaria SA (Banks)† | | | | 17,279 | | | | | 121,229 | |
| | |
Banco Santander SA - Sponsored ADR (Banks) | | | | 36,306 | | | | | 137,600 | |
| | |
Bankinter SA (Banks)† | | | | 15,831 | | | | | 87,343 | |
| | |
| | | | | | | | | 381,554 | |
| | |
Sweden - 6.0% | | | | | | | | | | |
| | |
Alfa Laval AB (Capital Goods)† | | | | 3,699 | | | | | 158,110 | |
| | |
Assa Abloy AB, Class B (Capital Goods)† | | | | 4,911 | | | | | 144,069 | |
| | |
Atlas Copco AB, Class A (Capital Goods)† | | | | 998 | | | | | 64,021 | |
| | |
Epiroc AB, Class A (Capital Goods)† | | | | 5,084 | | | | | 126,304 | |
| | |
Evolution AB (Consumer Services)^† | | | | 550 | | | | | 89,071 | |
| | |
Hexagon AB, Class B (Technology Hardware & Equipment)† | | | | 2,300 | | | | | 37,074 | |
| | |
Intrum AB (Commercial & Professional Services)† | | | | 2,391 | | | | | 67,746 | |
| | |
Skandinaviska Enskilda Banken AB, Class A (Banks)† | | | | 11,998 | | | | | 187,840 | |
| | |
Thule Group AB (Consumer Durables & Apparel)^† | | | | 769 | | | | | 44,378 | |
| | |
| | | | | | | | | 918,613 | |
| | |
Switzerland - 5.0% | | | | | | | | | | |
| | |
Alcon Inc. (Health Care Equipment & Services) | | | | 1,857 | | | | | 154,799 | |
| | |
Cie Financiere Richemont SA, Class A, Reg S (Consumer Durables & Apparel)† | | | | 502 | | | | | 62,244 | |
| | |
Lonza Group AG, Reg S (Pharmaceuticals, Biotechnology & Life Sciences)† | | | | 117 | | | | | 96,093 | |
| | |
SGS SA, Reg S (Commercial & Professional Services)† | | | | 25 | | | | | 73,854 | |
| | | | | | | | | | |
| | |
| | | Shares | | Value |
| COMMON STOCKS - 96.3% (continued) | | | | |
| | |
Switzerland - 5.0% (continued) | | | | | | | | | | |
| | |
Sonova Holding AG, Reg S (Health Care Equipment & Services)† | | | | 140 | | | | | $57,963 | |
| | |
Straumann Holding AG, Reg S (Health Care Equipment & Services)† | | | | 29 | | | | | 60,373 | |
| | |
Temenos AG, Reg S (Software & Services)† | | | | 306 | | | | | 46,733 | |
| | |
VAT Group AG (Capital Goods)^† | | | | 207 | | | | | 98,617 | |
| | |
Vifor Pharma AG (Pharmaceuticals, Biotechnology & Life Sciences)† | | | | 928 | | | | | 119,854 | |
| | |
| | | | | | | | | 770,530 | |
| | |
Taiwan - 2.5% | | | | | | | | | | |
| | |
Advantech Co., Ltd. (Technology Hardware & Equipment)† | | | | 2,998 | | | | | 39,244 | |
| | |
Airtac International Group (Capital Goods)† | | | | 1,046 | | | | | 31,413 | |
| | |
Chipbond Technology Corp. (Semiconductors & Semiconductor Equipment)† | | | | 21,000 | | | | | 48,823 | |
| | |
Eclat Textile Co., Ltd. (Consumer Durables & Apparel)† | | | | 2,000 | | | | | 43,784 | |
| | |
Hon Hai Precision Industry Co., Ltd. (Technology Hardware & Equipment)† | | | | 9,000 | | | | | 34,826 | |
| | |
Largan Precision Co., Ltd. (Technology Hardware & Equipment)† | | | | 300 | | | | | 22,426 | |
| | |
Silergy Corp. (Semiconductors & Semiconductor Equipment)† | | | | 500 | | | | | 82,561 | |
| | |
Taiwan Semiconductor Manufacturing Co., Ltd. (Semiconductors & Semiconductor Equipment)† | | | | 4,000 | | | | | 84,651 | |
| | |
| | | | | | | | | 387,728 | |
| | |
Thailand - 0.4% | | | | | | | | | | |
| | |
Siam Commercial Bank pcl, Reg S (Banks)† | | | | 16,000 | | | | | 60,755 | |
| | |
Turkey - 0.2% | | | | | | | | | | |
| | |
BIM Birlesik Magazalar AS (Food & Staples Retailing)† | | | | 4,402 | | | | | 28,458 | |
| | |
United Arab Emirates - 0.7% | | | | | | | | | | |
| | |
Agthia Group PJSC (Food Beverage & Tobacco)† | | | | 23,110 | | | | | 37,409 | |
| | |
Emaar Properties PJSC (Real Estate)† | | | | 70,076 | | | | | 76,641 | |
| | |
| | | | | | | | | 114,050 | |
| | |
United Kingdom - 7.8% | | | | | | | | | | |
| | |
Coca-Cola HBC AG - CDI (Food Beverage & Tobacco)*† | | | | 1,189 | | | | | 41,251 | |
See Notes to Financial Statements
35
Harding, Loevner Funds, Inc.
International Equity Research Portfolio
Portfolio of Investments (continued)
October 31, 2021
| | | | | | | | | | |
| | |
| | | Shares | | Value |
| COMMON STOCKS - 96.3% (continued) | | | | |
| | |
United Kingdom - 7.8% (continued) | | | | | | | | | | |
| | |
Compass Group plc (Consumer Services)*† | | | | 1,938 | | | | | $41,164 | |
| | |
Dechra Pharmaceuticals plc (Pharmaceuticals, Biotechnology & Life Sciences)† | | | | 1,894 | | | | | 132,814 | |
| | |
Diploma plc (Capital Goods)† | | | | 3,718 | | | | | 153,307 | |
| | |
Grafton Group plc (Capital Goods)† | | | | 5,899 | | | | | 108,397 | |
| | |
HomeServe plc (Commercial & Professional Services)† | | | | 9,439 | | | | | 110,723 | |
| | |
Intertek Group plc (Commercial & Professional Services)† | | | | 804 | | | | | 53,749 | |
| | |
Reckitt Benckiser Group plc (Household & Personal Products)† | | | | 736 | | | | | 59,699 | |
| | |
Rightmove plc (Media & Entertainment)† | | | | 8,520 | | | | | 80,675 | |
| | |
Rio Tinto plc (Materials)† | | | | 1,881 | | | | | 117,203 | |
| | |
Royal Dutch Shell plc, Class B - Sponsored ADR (Energy) | | | | 3,282 | | | | | 150,447 | |
| | |
Spirax-Sarco Engineering plc (Capital Goods)† | | | | 248 | | | | | 52,990 | |
| | |
Standard Chartered plc (Banks)† | | | | 12,421 | | | | | 84,195 | |
| | |
| | | | | | | | | | 1,186,614 | |
| | |
Total Common Stocks (Cost $11,369,652) | | | | | | | | | $14,733,514 | |
| | | | | | | | | | |
| PREFERRED STOCKS - 2.0% | | | | |
| | |
Brazil - 0.2% | | | | | | | | | | |
| | |
Itau Unibanco Holding SA - Sponsored ADR, 0.78% (Banks)+ | | | | 7,362 | | | | | 29,963 | |
| | |
Colombia - 0.4% | | | | | | | | | | |
| | |
Bancolombia SA - Sponsored ADR, 0.68% (Banks)+ | | | | 1,501 | | | | | 53,931 | |
| | |
Germany - 1.0% | | | | | | | | | | |
| | |
Henkel AG & Co. KGaA, 2.34% (Household & Personal Products)+† | | | | 1,274 | | | | | 113,968 | |
| | |
Sartorius AG, 0.12% (Health Care Equipment & Services)+† | | | | 70 | | | | | 45,426 | |
| | |
| | | | | | | | | 159,394 | |
| | |
South Korea - 0.4% | | | | | | | | | | |
| | |
Samsung Electronics Co., Ltd. - GDR, Reg S, 2.18% (Technology Hardware & Equipment)+† | | | | 42 | | | | | 57,849 | |
| | |
| | | | | | | | | | | |
| | |
Total Preferred Stocks (Cost $283,475) | | | | | | | | | $301,137 | |
| | | | | | | | | | |
| | |
| | | Shares | | Value |
| SHORT TERM INVESTMENTS - 1.5% | | |
| | |
Northern Institutional Funds - Treasury Portfolio (Premier Shares), 0.01% (Money Market Funds) | | | | 232,005 | | | | | $232,005 | |
| |
Total Short Term Investments (Cost $232,005) | | | | | $232,005 | |
| | | | | | | | | | | |
| | |
Total Investments — 99.8% | | | | | | | | | | |
| | |
(Cost $11,885,132) | | | | | | | | | $15,266,656 | |
| | |
Other Assets Less Liabilities - 0.2% | | | | | | | | | 28,115 | |
| | |
Net Assets — 100.0% | | | | | | | | | $15,294,771 | |
| | |
| Summary of Abbreviations |
| |
| ADR | | American Depositary Receipt |
| |
| CDI | | Chess Depositary Interest |
| |
| GDR | | Global Depositary Receipt |
| |
| Reg S | | Security sold outside United States without registration under the Securities Act of 1933. |
| |
| † | | Investment categorized as level 2 security as disclosed in Note 2 of the Notes to Financial Statements. |
| |
| * | | Non-income producing security. |
| |
| ^ | | Security exempt from registration pursuant to Rule 144A of the Securities Act of 1933. These securities, which represent 3.9% of net assets as of October 31, 2021, are considered liquid and may be resold in transactions exempt from registration, normally to qualified buyers. |
| |
| + | | Current yield is disclosed. Dividends are calculated based on a percentage of the issuer’s net income. |
See Notes to Financial Statements
36
Harding, Loevner Funds, Inc.
International Equity Research Portfolio
Portfolio of Investments (continued)
October 31, 2021
| | | | | |
| |
| Industry | | |
| Percentage of
Net Assets |
|
| |
Automobiles & Components | | | | 2.6 | % |
| |
Banks | | | | 13.7 | |
| |
Capital Goods | | | | 15.2 | |
| |
Commercial & Professional Services | | | | 3.0 | |
| |
Consumer Durables & Apparel | | | | 4.4 | |
| |
Consumer Services | | | | 1.3 | |
| |
Diversified Financials | | | | 0.7 | |
| |
Energy | | | | 4.3 | |
| |
Food & Staples Retailing | | | | 2.8 | |
| |
Food Beverage & Tobacco | | | | 2.7 | |
| |
Health Care Equipment & Services | | | | 5.5 | |
| |
Household & Personal Products | | | | 3.9 | |
| |
Insurance | | | | 2.0 | |
| |
Materials | | | | 5.4 | |
| |
Media & Entertainment | | | | 5.4 | |
| |
Pharmaceuticals, Biotechnology & Life Sciences | | | | 7.3 | |
| |
Real Estate | | | | 1.1 | |
| |
Retailing | | | | 3.6 | |
| |
Semiconductors & Semiconductor Equipment | | | | 4.1 | |
| |
Software & Services | | | | 5.7 | |
| |
Technology Hardware & Equipment | | | | 1.8 | |
| |
Transportation | | | | 1.2 | |
| |
Utilities | | | | 0.6 | |
| |
Money Market Fund | | | | 1.5 | |
| |
Total Investments | | | | 99.8 | |
| |
Other Assets Less Liabilities | | | | 0.2 | |
| |
Net Assets | | | | 100.0 | % |
See Notes to Financial Statements
37
Harding, Loevner Funds, Inc.
Emerging Markets Research Portfolio
Portfolio of Investments
October 31, 2021
| | | | | | | | | | |
| | |
| | | Shares | | Value |
| COMMON STOCKS - 95.8% | | | | |
| | |
Argentina - 0.7% | | | | | | | | | | |
| | |
Globant SA (Software & Services)* | | | | 207 | | | | | $66,072 | |
| | |
Bangladesh - 0.5% | | | | | | | | | | |
| | |
GrameenPhone Ltd. (Telecommunication Services)† | | | | 5,493 | | | | | 22,790 | |
| | |
Square Pharmaceuticals Ltd. (Pharmaceuticals, Biotechnology & Life Sciences)† | | | | 10,847 | | | | | 27,570 | |
| | |
| | | | | | | | | 50,360 | |
| | |
Brazil - 4.9% | | | | | | | | | | |
| | |
Ambev SA - ADR (Food Beverage & Tobacco) | | | | 20,505 | | | | | 60,695 | |
| | |
B3 SA - Brasil Bolsa Balcao (Diversified Financials) | | | | 55,900 | | | | | 117,965 | |
| | |
Cia Brasileira de Distribuicao - ADR (Food & Staples Retailing) | | | | 8,181 | | | | | 37,305 | |
| | |
Localiza Rent a Car SA (Transportation) | | | | 3,800 | | | | | 30,501 | |
| | |
Magazine Luiza SA (Retailing)* | | | | 20,300 | | | | | 38,882 | |
| | |
Raia Drogasil SA (Food & Staples Retailing)* | | | | 8,000 | | | | | 32,956 | |
| | |
Ultrapar Participacoes SA - Sponsored ADR (Energy) | | | | 15,872 | | | | | 36,982 | |
| | |
WEG SA (Capital Goods) | | | | 7,200 | | | | | 47,202 | |
| | |
XP Inc., Class A (Diversified Financials)* | | | | 1,254 | | | | | 41,152 | |
| | |
| | | | | | | | | 443,640 | |
| | |
Chile - 0.9% | | | | | | | | | | |
| | |
Banco Santander Chile - ADR (Banks) | | | | 4,584 | | | | | 81,229 | |
| | |
China - 29.6% | | | | | | | | | | |
| | |
51job Inc. - ADR (Commercial & Professional Services)* | | | | 764 | | | | | 45,504 | |
| | |
AAC Technologies Holdings Inc. (Technology Hardware & Equipment)† | | | | 18,500 | | | | | 81,151 | |
| | |
Baidu Inc., Class A (Media & Entertainment)*† | | | | 3,200 | | | | | 65,454 | |
| | |
China Tourism Group Duty Free Corp., Ltd., Class A (Retailing)† | | | | 1,700 | | | | | 70,953 | |
| | |
Country Garden Services Holdings Co., Ltd. (Real Estate)† | | | | 5,000 | | | | | 38,713 | |
| | |
CSPC Pharmaceutical Group Ltd. (Pharmaceuticals, Biotechnology & Life Sciences)† | | | | 132,080 | | | | | 138,401 | |
| | |
Fuyao Glass Industry Group Co., Ltd., Class H (Automobiles & Components)^† | | | | 8,400 | | | | | 48,684 | |
| | | | | | | | | | |
| | |
| | | Shares | | Value |
| COMMON STOCKS - 95.8% (continued) | | | | |
| | |
China - 29.6% (continued) | | | | | | | | | | |
| | |
Glodon Co., Ltd., Class A (Software & Services)† | | | | 3,400 | | | | | $39,450 | |
| | |
Gree Electric Appliances Inc. of Zhuhai, Class A (Consumer Durables & Apparel)† | | | | 21,000 | | | | | 119,805 | |
| | |
Haier Smart Home Co., Ltd., Class H (Consumer Durables & Apparel)† | | | | 30,400 | | | | | 113,448 | |
| | |
Hangzhou Tigermed Consulting Co., Ltd., Class H (Pharmaceuticals, Biotechnology & Life Sciences)^† | | | | 2,100 | | | | | 40,991 | |
| | |
Hefei Meiya Optoelectronic Technology Inc., Class A (Capital Goods)† | | | | 3,700 | | | | | 23,264 | |
| | |
Hongfa Technology Co., Ltd., Class A (Capital Goods)† | | | | 5,300 | | | | | 61,398 | |
| | |
Inner Mongolia Yili Industrial Group Co., Ltd., Class A (Food Beverage & Tobacco)† | | | | 11,300 | | | | | 76,130 | |
| | |
JD.com Inc., Class A (Retailing)*† | | | | 3,552 | | | | | 139,508 | |
| | |
Jiangsu Expressway Co., Ltd., Class H (Transportation)† | | | | 60,000 | | | | | 56,719 | |
| | |
Jiangsu Hengrui Medicine Co., Ltd., Class A (Pharmaceuticals, Biotechnology & Life Sciences)† | | | | 6,480 | | | | | 49,766 | |
| | |
Jiangsu Yanghe Brewery Joint-Stock Co., Ltd., Class A (Food Beverage & Tobacco)† | | | | 2,200 | | | | | 63,612 | |
| | |
Kweichow Moutai Co., Ltd., Class A (Food Beverage & Tobacco)† | | | | 100 | | | | | 28,585 | |
| | |
Meituan, Class B (Retailing)*^† | | | | 1,200 | | | | | 41,862 | |
| | |
Midea Group Co., Ltd., Class A (Consumer Durables & Apparel)† | | | | 15,600 | | | | | 166,804 | |
| | |
NetEase Inc. - ADR (Media & Entertainment) | | | | 684 | | | | | 66,752 | |
| | |
Ping An Insurance Group Co. of China Ltd., Class H (Insurance)† | | | | 20,000 | | | | | 144,021 | |
| | |
Qingdao Haier Biomedical Co., Ltd., Class A (Health Care Equipment & Services)† | | | | 2,900 | | | | | 42,634 | |
| | |
Sangfor Technologies Inc., Class A (Software & Services)† | | | | 1,400 | | | | | 44,360 | |
| | |
SF Holding Co., Ltd., Class A (Transportation)† | | | | 5,900 | | | | | 59,410 | |
| | |
Shandong Sinocera Functional Material Co., Ltd., Class A (Materials)† | | | | 6,300 | | | | | 41,911 | |
See Notes to Financial Statements
38
Harding, Loevner Funds, Inc.
Emerging Markets Research Portfolio
Portfolio of Investments (continued)
October 31, 2021
| | | | | | | | | | |
| | |
| | | Shares | | Value |
| COMMON STOCKS - 95.8% (continued) | | | | |
| | |
China - 29.6% (continued) | | | | | | | | | | |
| | |
Shanghai International Airport Co., Ltd., Class A (Transportation)*† | | | | 6,400 | | | | | $52,748 | |
| | |
Shenzhen Inovance Technology Co., Ltd., Class A (Capital Goods)† | | | | 4,800 | | | | | 48,682 | |
| | |
Shenzhou International Group Holdings Ltd. (Consumer Durables & Apparel)† | | | | 3,000 | | | | | 65,048 | |
| | |
Sino Biopharmaceutical Ltd. (Pharmaceuticals, Biotechnology & Life Sciences)† | | | | 45,000 | | | | | 33,381 | |
| | |
Songcheng Performance Development Co., Ltd., Class A (Consumer Services)† | | | | 19,100 | | | | | 41,626 | |
| | |
Sunny Optical Technology Group Co., Ltd. (Technology Hardware & Equipment)† | | | | 2,000 | | | | | 53,934 | |
| | |
Suofeiya Home Collection Co., Ltd., Class A (Consumer Durables & Apparel)† | | | | 13,700 | | | | | 36,344 | |
| | |
Tencent Holdings Ltd. (Media & Entertainment)† | | | | 800 | | | | | 49,669 | |
| | |
TravelSky Technology Ltd., Class H (Software & Services)† | | | | 23,000 | | | | | 43,073 | |
| | |
Trip.com Group Ltd. (Consumer Services)*† | | | | 2,161 | | | | | 62,333 | |
| | |
Wuliangye Yibin Co., Ltd., Class A (Food Beverage & Tobacco)† | | | | 1,400 | | | | | 47,498 | |
| | |
WuXi AppTec Co., Ltd., Class A (Pharmaceuticals, Biotechnology & Life Sciences)† | | | | 3,727 | | | | | 80,308 | |
| | |
Wuxi Biologics Cayman Inc. (Pharmaceuticals, Biotechnology & Life Sciences)*^† | | | | 3,000 | | | | | 45,819 | |
| | |
Yonyou Network Technology Co., Ltd., Class A (Software & Services)† | | | | 9,600 | | | | | 47,529 | |
| | |
Zhejiang Sanhua Intelligent Controls Co., Ltd., Class A (Capital Goods)† | | | | 16,800 | | | | | 62,114 | |
| | |
| | | | | | | | | 2,679,396 | |
| | |
Colombia - 2.2% | | | | | | | | | | |
| | |
Cementos Argos SA (Materials) | | | | 15,277 | | | | | 25,761 | |
| | |
Ecopetrol SA - Sponsored ADR (Energy) | | | | 9,800 | | | | | 148,470 | |
| | |
Grupo Nutresa SA (Food Beverage & Tobacco) | | | | 3,657 | | | | | 21,374 | |
| | |
| | | | | | | | | 195,605 | |
| | |
Czech Republic - 0.3% | | | | | | | | | | |
| | |
Komercni banka AS (Banks)*† | | | | 706 | | | | | 27,384 | |
| | | | | | | | | | |
| | |
| | | Shares | | Value |
| COMMON STOCKS - 95.8% (continued) | | | | |
| | |
Egypt - 0.5% | | | | | | | | | | |
| | |
Commercial International Bank Egypt SAE - GDR, Reg S (Banks)*† | | | | 15,603 | | | | | $48,364 | |
| | |
Iceland - 0.2% | | | | | | | | | | |
| | |
Marel HF (Capital Goods)^† | | | | 3,210 | | | | | 21,517 | |
| | |
India - 8.0% | | | | | | | | | | |
| | |
Asian Paints Ltd. (Materials)† | | | | 1,186 | | | | | 49,151 | |
| | |
Godrej Consumer Products Ltd. (Household & Personal Products)*† | | | | 3,039 | | | | | 38,961 | |
| | |
HDFC Bank Ltd. - ADR (Banks) | | | | 2,301 | | | | | 165,465 | |
| | |
Hero MotoCorp Ltd. (Automobiles & Components)† | | | | 4,698 | | | | | 167,082 | |
| | |
ICICI Bank Ltd. - Sponsored ADR (Banks) | | | | 4,443 | | | | | 93,969 | |
| | |
Kotak Mahindra Bank Ltd. (Banks)† | | | | 1,950 | | | | | 52,792 | |
| | |
Marico Ltd. (Household & Personal Products)† | | | | 3,148 | | | | | 23,964 | |
| | |
Pidilite Industries Ltd. (Materials)† | | | | 2,034 | | | | | 62,979 | |
| | |
Tata Consultancy Services Ltd. (Software & Services)† | | | | 1,502 | | | | | 68,233 | |
| | |
| | | | | | | | | 722,596 | |
| | |
Indonesia - 2.1% | | | | | | | | | | |
| | |
Astra International Tbk PT (Automobiles & Components)† | | | | 116,400 | | | | | 49,580 | |
| | |
Bank Central Asia Tbk PT (Banks)† | | | | 108,000 | | | | | 56,996 | |
| | |
Bank Rakyat Indonesia Persero Tbk PT (Banks)† | | | | 164,300 | | | | | 49,112 | |
| | |
Unilever Indonesia Tbk PT (Household & Personal Products)† | | | | 105,000 | | | | | 32,778 | |
| | |
| | | | | | | | | 188,466 | |
| | |
Kazakhstan - 0.7% | | | | | | | | | | |
| | |
Halyk Savings Bank of Kazakhstan JSC - GDR, Reg S (Banks)† | | | | 1,819 | | | | | 32,758 | |
| | |
Kaspi.KZ JSC - GDR, Reg S (Diversified Financials)† | | | | 198 | | | | | 28,693 | |
| | |
| | | | | | | | | 61,451 | |
| | |
Kenya - 0.3% | | | | | | | | | | |
| | |
Safaricom plc (Telecommunication Services)† | | | | 62,300 | | | | | 23,926 | |
| | |
Malaysia - 0.5% | | | | | | | | | | |
| | |
Dialog Group Bhd. (Energy)† | | | | 63,800 | | | | | 43,638 | |
See Notes to Financial Statements
39
Harding, Loevner Funds, Inc.
Emerging Markets Research Portfolio
Portfolio of Investments (continued)
October 31, 2021
| | | | | | | | | | |
| | |
| | | Shares | | Value |
| COMMON STOCKS - 95.8% (continued) | | | | |
| | |
Mexico - 4.2% | | | | | | | | | | |
| | |
Fomento Economico Mexicano SAB de CV - Sponsored ADR (Food Beverage & Tobacco) | | | | 2,132 | | | | | $175,229 | |
| | |
Grupo Financiero Banorte SAB de CV, Series O (Banks) | | | | 25,600 | | | | | 162,083 | |
| | |
Wal-Mart de Mexico SAB de CV (Food & Staples Retailing) | | | | 13,300 | | | | | 46,390 | |
| | |
| | | | | | | | | 383,702 | |
| | |
Morocco - 0.5% | | | | | | | | | | |
| | |
Attijariwafa Bank (Banks)† | | | | 430 | | | | | 23,181 | |
| | |
Itissalat Al-Maghrib (Telecommunication Services)† | | | | 1,491 | | | | | 23,495 | |
| | |
| | | | | | | | | 46,676 | |
| | |
Nigeria - 0.5% | | | | | | | | | | |
| | |
Guaranty Trust Holding Co., plc (Banks) | | | | 261,863 | | | | | 18,133 | |
| | |
Zenith Bank plc (Banks) | | | | 414,394 | | | | | 25,289 | |
| | |
| | | | | | | | | 43,422 | |
| | |
Pakistan - 0.4% | | | | | | | | | | |
| | |
MCB Bank Ltd. (Banks)† | | | | 17,600 | | | | | 16,857 | |
| | |
Oil & Gas Development Co., Ltd. (Energy)† | | | | 41,800 | | | | | 20,819 | |
| | |
| | | | | | | | | 37,676 | |
| | |
Panama - 0.5% | | | | | | | | | | |
| | |
Copa Holdings SA, Class A (Transportation)* | | | | 607 | | | | | 44,894 | |
| | |
Philippines - 3.7% | | | | | | | | | | |
| | |
Bank of the Philippine Islands (Banks)† | | | | 13,720 | | | | | 23,665 | |
| | |
BDO Unibank Inc. (Banks)† | | | | 30,810 | | | | | 75,948 | |
| | |
International Container Terminal Services Inc. (Transportation)† | | | | 18,410 | | | | | 65,691 | |
| | |
Jollibee Foods Corp. (Consumer Services)† | | | | 6,330 | | | | | 29,508 | |
| | |
Robinsons Retail Holdings Inc. (Food & Staples Retailing)† | | | | 24,910 | | | | | 30,764 | |
| | |
Security Bank Corp. (Banks)† | | | | 10,700 | | | | | 25,681 | |
| | |
SM Prime Holdings Inc. (Real Estate)† | | | | 88,800 | | | | | 58,392 | |
| | |
Universal Robina Corp. (Food Beverage & Tobacco)† | | | | 8,270 | | | | | 22,651 | |
| | |
| | | | | | | | | 332,300 | |
| | |
Poland - 0.7% | | | | | | | | | | |
| | |
Allegro.eu SA (Retailing)*^† | | | | 2,942 | | | | | 33,283 | |
| | |
ING Bank Slaski SA (Banks)*† | | | | 505 | | | | | 34,436 | |
| | |
| | | | | | | | | 67,719 | |
| | |
Romania - 0.6% | | | | | | | | | | |
| | |
Banca Transilvania SA (Banks)† | | | | 38,734 | | | | | 22,714 | |
| | | | | | | | | | |
| | |
| | | Shares | | Value |
| COMMON STOCKS - 95.8% (continued) | | | | |
| | |
Romania - 0.6% (continued) | | | | | | | | | | |
| | |
Societatea Nationala de Gaze Naturale ROMGAZ SA (Energy)† | | | | 3,372 | | | | | $29,377 | |
| | |
| | | | | | | | | 52,091 | |
| | |
Russia - 6.1% | | | | | | | | | | |
| | |
LUKOIL PJSC - Sponsored ADR (Energy) | | | | 1,859 | | | | | 189,674 | |
| | |
Novatek PJSC - Sponsored GDR, Reg S (Energy)† | | | | 531 | | | | | 134,991 | |
| | |
Sberbank of Russia PJSC - Sponsored ADR (Banks)† | | | | 8,719 | | | | | 174,860 | |
| | |
Yandex NV, Class A (Media & Entertainment)* | | | | 681 | | | | | 56,414 | |
| | |
| | | | | | | | | 555,939 | |
| | |
Saudi Arabia - 2.7% | | | | | | | | | | |
| | |
Al Rajhi Bank (Banks)† | | | | 2,128 | | | | | 78,634 | |
| | |
Bupa Arabia for Cooperative Insurance Co. (Insurance)† | | | | 621 | | | | | 23,938 | |
| | |
Jarir Marketing Co. (Retailing)† | | | | 1,292 | | | | | 69,833 | |
| | |
Mouwasat Medical Services Co. (Health Care Equipment & Services)† | | | | 471 | | | | | 22,599 | |
| | |
Saudi National Bank (Banks)† | | | | 2,666 | | | | | 46,851 | |
| | |
| | | | | | | | | 241,855 | |
| | |
Slovenia - 0.3% | | | | | | | | | | |
| | |
Krka dd Novo mesto (Pharmaceuticals, Biotechnology & Life Sciences)† | | | | 179 | | | | | 23,216 | |
| | |
South Africa - 0.8% | | | | | | | | | | |
| | |
Discovery Ltd. (Insurance)*† | | | | 7,600 | | | | | 69,932 | |
| | |
South Korea - 5.9% | | | | | | | | | | |
| | |
Cheil Worldwide Inc. (Media & Entertainment)† | | | | 3,865 | | | | | 79,152 | |
| | |
Coway Co., Ltd. (Consumer Durables & Apparel)† | | | | 1,180 | | | | | 80,387 | |
| | |
LG Household & Health Care Ltd. (Household & Personal Products)† | | | | 116 | | | | | 116,443 | |
| | |
NAVER Corp. (Media & Entertainment)† | | | | 181 | | | | | 63,355 | |
| | |
NCSoft Corp. (Media & Entertainment)† | | | | 370 | | | | | 198,881 | |
| | |
| | | | | | | | | 538,218 | |
| | |
Taiwan - 11.2% | | | | | | | | | | |
| | |
Advantech Co., Ltd. (Technology Hardware & Equipment)† | | | | 6,499 | | | | | 85,071 | |
| | |
Airtac International Group (Capital Goods)† | | | | 6,069 | | | | | 182,260 | |
| | |
Chipbond Technology Corp. (Semiconductors & Semiconductor Equipment)† | | | | 72,000 | | | | | 167,394 | |
See Notes to Financial Statements
40
Harding, Loevner Funds, Inc.
Emerging Markets Research Portfolio
Portfolio of Investments (continued)
October 31, 2021
| | | | | | | | | | |
| | |
| | | Shares | | Value |
| COMMON STOCKS - 95.8% (continued) | | | | |
| | |
Taiwan - 11.2% (continued) | | | | | | | | | | |
| | |
Eclat Textile Co., Ltd. (Consumer Durables & Apparel)† | | | | 4,000 | | | | | $87,568 | |
| | |
Hon Hai Precision Industry Co., Ltd. (Technology Hardware & Equipment)† | | | | 45,000 | | | | | 174,130 | |
| | |
Largan Precision Co., Ltd. (Technology Hardware & Equipment)† | | | | 700 | | | | | 52,328 | |
| | |
Silergy Corp. (Semiconductors & Semiconductor Equipment)† | | | | 600 | | | | | 99,074 | |
| | |
Taiwan Semiconductor Manufacturing Co., Ltd. (Semiconductors & Semiconductor Equipment)† | | | | 8,000 | | | | | 169,301 | |
| | |
| | | | | | | | | 1,017,126 | |
| | |
Thailand - 1.3% | | | | | | | | | | |
| | |
Siam Commercial Bank pcl, Reg S (Banks)† | | | | 32,000 | | | | | 121,510 | |
| | |
Turkey - 0.8% | | | | | | | | | | |
| | |
BIM Birlesik Magazalar AS (Food & Staples Retailing)† | | | | 11,148 | | | | | 72,069 | |
| | |
United Arab Emirates - 0.9% | | | | | | | | | | |
| | |
Agthia Group PJSC (Food Beverage & Tobacco)† | | | | 13,882 | | | | | 22,471 | |
| | |
Emaar Properties PJSC (Real Estate)† | | | | 53,031 | | | | | 57,999 | |
| | |
| | | | | | | | | 80,470 | |
| | |
Vietnam - 3.3% | | | | | | | | | | |
| | |
Bank for Foreign Trade of Vietnam JSC (Banks)† | | | | 15,240 | | | | | 65,630 | |
| | |
Hoa Phat Group JSC (Materials)† | | | | 67,966 | | | | | 170,638 | |
| | |
Saigon Beer Alcohol Beverage Corp. (Food Beverage & Tobacco)† | | | | 2,320 | | | | | 16,357 | |
| | |
Vietnam Dairy Products JSC (Food Beverage & Tobacco)† | | | | 11,810 | | | | | 47,085 | |
| | |
| | | | | | | | | | 299,710 | |
| | |
Total Common Stocks (Cost $7,634,691) | | | | | | | | | $8,682,169 | |
| | | | | | | | | | |
| PREFERRED STOCKS - 2.6% | | | | |
| | |
Brazil - 0.4% | | | | | | | | | | |
| | |
Itau Unibanco Holding SA - Sponsored ADR, 0.78% (Banks)+ | | | | 8,370 | | | | | 34,066 | |
| | |
Colombia - 0.5% | | | | | | | | | | |
| | |
Bancolombia SA - Sponsored ADR, 0.68% (Banks)+ | | | | 1,139 | | | | | 40,924 | |
| | | | | | | | | | |
| | |
| | | Shares | | Value |
| PREFERRED STOCKS - 2.6% (continued) | | |
| | |
South Korea - 1.7% | | | | | | | | | | |
| | |
Samsung Electronics Co., Ltd. - GDR, Reg S, 2.18% (Technology Hardware & Equipment)+† | | | | 115 | | | | | $158,395 | |
| | |
Total Preferred Stocks (Cost $182,169) | | | | | | | | | $233,385 | |
| | |
| | | | | | | | | | |
| SHORT TERM INVESTMENTS - 1.0% | | | | |
| | |
Northern Institutional Funds - Treasury Portfolio (Premier Shares), 0.01% (Money Market Funds) | | | | 91,914 | | | | | 91,914 | |
| |
Total Short Term Investments (Cost $91,914) | | | | | $91,914 | |
| | |
| | | | | | | | | | |
| | |
Total Investments — 99.4% | | | | | | | | | | |
| | |
(Cost $7,908,774) | | | | | | | | | $9,007,468 | |
| | |
Other Assets Less Liabilities - 0.6% | | | | | | | | | 57,099 | |
| | |
Net Assets — 100.0% | | | | | | | | | $9,064,567 | |
| | |
| Summary of Abbreviations |
| |
| ADR | | American Depositary Receipt |
| |
| GDR | | Global Depositary Receipt |
| |
| Reg S | | Security sold outside United States without registration under the Securities Act of 1933. |
| |
| * | | Non-income producing security. |
| |
| † | | Investment categorized as level 2 security as disclosed in Note 2 of the Notes to Financial Statements. |
| |
| ^ | | Security exempt from registration pursuant to Rule 144A of the Securities Act of 1933. These securities, which represent 2.6% of net assets as of October 31, 2021, are considered liquid and may be resold in transactions exempt from registration, normally to qualified buyers. |
| |
| + | | Current yield is disclosed. Dividends are calculated based on a percentage of the issuer’s net income. |
See Notes to Financial Statements
41
Harding, Loevner Funds, Inc.
Emerging Markets Research Portfolio
Portfolio of Investments (continued)
October 31, 2021
| | | | | |
| Industry | | |
| Percentage of
Net Assets |
|
| |
Automobiles & Components | | | | 2.9 | % |
| |
Banks | | | | 17.6 | |
| |
Capital Goods | | | | 4.9 | |
| |
Commercial & Professional Services | | | | 0.5 | |
| |
Consumer Durables & Apparel | | | | 7.4 | |
| |
Consumer Services | | | | 1.5 | |
| |
Diversified Financials | | | | 2.1 | |
| |
Energy | | | | 6.7 | |
| |
Food & Staples Retailing | | | | 2.4 | |
| |
Food Beverage & Tobacco | | | | 6.4 | |
| |
Health Care Equipment & Services | | | | 0.7 | |
| |
Household & Personal Products | | | | 2.3 | |
| |
Insurance | | | | 2.6 | |
| |
Materials | | | | 3.9 | |
| |
Media & Entertainment | | | | 6.4 | |
| |
Pharmaceuticals, Biotechnology & Life Sciences | | | | 4.9 | |
| |
Real Estate | | | | 1.7 | |
| |
Retailing | | | | 4.4 | |
| |
Semiconductors & Semiconductor Equipment | | | | 4.8 | |
| |
Software & Services | | | | 3.4 | |
| |
Technology Hardware & Equipment | | | | 6.7 | |
| |
Telecommunication Services | | | | 0.8 | |
| |
Transportation | | | | 3.4 | |
| |
Money Market Fund | | | | 1.0 | |
| |
Total Investments | | | | 99.4 | |
| |
Other Assets Less Liabilities | | | | 0.6 | |
| |
Net Assets | | | | 100.0 | % |
See Notes to Financial Statements
42
Harding, Loevner Funds, Inc.
Chinese Equity Portfolio
Portfolio of Investments
October 31, 2021
| | | | | | | | | | |
| | |
| | | Shares | | Value |
| COMMON STOCKS - 95.7% | | | | |
| | |
China - 80.3% | | | | | | | | | | |
| | |
Alibaba Group Holding Ltd. (Retailing)*† | | | | 9,000 | | | | | $186,204 | |
| | |
ANTA Sports Products Ltd. (Consumer Durables & Apparel)† | | | | 5,000 | | | | | 77,979 | |
| | |
Baidu Inc., Class A (Media & Entertainment)*† | | | | 4,008 | | | | | 81,982 | |
| | |
China Tourism Group Duty Free Corp., Ltd., Class A (Retailing)† | | | | 4,300 | | | | | 179,469 | |
| | |
Country Garden Services Holdings Co., Ltd. (Real Estate)† | | | | 9,000 | | | | | 69,683 | |
| | |
CSPC Pharmaceutical Group Ltd. (Pharmaceuticals, Biotechnology & Life Sciences)† | | | | 60,000 | | | | | 62,871 | |
| | |
ENN Energy Holdings Ltd. (Utilities)† | | | | 4,000 | | | | | 69,320 | |
| | |
Foshan Haitian Flavouring & Food Co., Ltd., Class A (Food Beverage & Tobacco)† | | | | 3,190 | | | | | 58,380 | |
| | |
Fuyao Glass Industry Group Co., Ltd., Class H (Automobiles & Components)^† | | | | 10,000 | | | | | 57,957 | |
| | |
Gree Electric Appliances Inc. of Zhuhai, Class A (Consumer Durables & Apparel)† | | | | 9,800 | | | | | 55,909 | |
| | |
Haitian International Holdings Ltd. (Capital Goods)† | | | | 28,020 | | | | | 82,032 | |
| | |
Hangzhou Tigermed Consulting Co., Ltd., Class A (Pharmaceuticals, Biotechnology & Life Sciences)† | | | | 4,500 | | | | | 120,034 | |
| | |
Hefei Meiya Optoelectronic Technology Inc., Class A (Capital Goods)† | | | | 8,000 | | | | | 50,300 | |
| | |
Inner Mongolia Yili Industrial Group Co., Ltd., Class A (Food Beverage & Tobacco)† | | | | 9,400 | | | | | 63,329 | |
| | |
JD.com Inc., Class A (Retailing)*† | | | | 2,750 | | | | | 108,009 | |
| | |
Jiangsu Hengrui Medicine Co., Ltd., Class A (Pharmaceuticals, Biotechnology & Life Sciences)† | | | | 7,440 | | | | | 57,139 | |
| | |
Midea Group Co., Ltd., Class A (Consumer Durables & Apparel)† | | | | 8,800 | | | | | 94,095 | |
| | |
NetEase Inc. (Media & Entertainment)† | | | | 5,700 | | | | | 111,479 | |
| | |
Ping An Insurance Group Co. of China Ltd., Class H (Insurance)† | | | | 3,500 | | | | | 25,204 | |
| | |
Sangfor Technologies Inc., Class A (Software & Services)† | | | | 2,329 | | | | | 73,796 | |
| | | | | | | | | | |
| | |
| | | Shares | | Value |
| COMMON STOCKS - 95.7% (continued) | | | | |
| | |
China - 80.3% (continued) | | | | | | | | | | |
| | |
SF Holding Co., Ltd., Class A (Transportation)† | | | | 10,300 | | | | | $103,716 | |
| | |
Shanghai International Airport Co., Ltd., Class A (Transportation)*† | | | | 7,000 | | | | | 57,693 | |
| | |
Shenzhen Inovance Technology Co., Ltd., Class A (Capital Goods)† | | | | 7,400 | | | | | 75,051 | |
| | |
Shenzhou International Group Holdings Ltd. (Consumer Durables & Apparel)† | | | | 5,000 | | | | | 108,413 | |
| | |
Sunny Optical Technology Group Co., Ltd. (Technology Hardware & Equipment)† | | | | 5,100 | | | | | 137,532 | |
| | |
Tencent Holdings Ltd. (Media & Entertainment)† | | | | 3,600 | | | | | 223,510 | |
| | |
TravelSky Technology Ltd., Class H (Software & Services)† | | | | 50,000 | | | | | 93,637 | |
| | |
Trip.com Group Ltd. (Consumer Services)*† | | | | 1,646 | | | | | 47,478 | |
| | |
Wuliangye Yibin Co., Ltd., Class A (Food Beverage & Tobacco)† | | | | 2,900 | | | | | 98,388 | |
| | |
WuXi AppTec Co., Ltd., Class A (Pharmaceuticals, Biotechnology & Life Sciences)† | | | | 7,360 | | | | | 158,590 | |
| | |
Wuxi Biologics Cayman Inc. (Pharmaceuticals, Biotechnology & Life Sciences)*^† | | | | 13,500 | | | | | 206,187 | |
| | |
Yonyou Network Technology Co., Ltd., Class A (Software & Services)† | | | | 14,000 | | | | | 69,314 | |
| | |
Zhejiang Sanhua Intelligent Controls Co., Ltd., Class A (Capital Goods)† | | | | 27,300 | | | | | 100,935 | |
| | |
| | | | | | | | | 3,165,615 | |
| | |
Hong Kong - 8.6% | | | | | | | | | | |
| | |
AIA Group Ltd. (Insurance)† | | | | 11,200 | | | | | 126,569 | |
| | |
Hong Kong Exchanges & Clearing Ltd. (Diversified Financials)† | | | | 800 | | | | | 48,552 | |
| | |
Techtronic Industries Co., Ltd. (Capital Goods)† | | | | 8,000 | | | | | 164,381 | |
| | |
| | | | | | | | | 339,502 | |
| | |
Taiwan - 6.8% | | | | | | | | | | |
| | |
Airtac International Group (Capital Goods)† | | | | 4,185 | | | | | 125,682 | |
| | |
Silergy Corp. (Semiconductors & Semiconductor Equipment)† | | | | 850 | | | | | 140,354 | |
| | |
| | | | | | | | | | 266,036 | |
| | |
Total Common Stocks (Cost $3,930,272) | | | | | | | | | $3,771,153 | |
See Notes to Financial Statements
43
Harding, Loevner Funds, Inc.
Chinese Equity Portfolio
Portfolio of Investments
October 31, 2021
| | | | | | | | | | |
| | |
| | | Shares | | Value |
| SHORT TERM INVESTMENTS - 2.9% | | |
| | |
Northern Institutional Funds - Treasury Portfolio (Premier Shares), 0.01% (Money Market Funds) | | | | 115,797 | | | | | $115,797 | |
| | |
| | | | | | | | | | |
| |
Total Short Term Investments (Cost $115,797) | | | | | $115,797 | |
| | |
| | | | | | | | | | |
| | |
Total Investments — 98.6% | | | | | | | | | | |
| | | |
(Cost $4,046,069) | | | | | | | | | $3,886,950 | |
| | |
Other Assets Less Liabilities - 1.4% | | | | | | | | | 55,355 | |
| | |
Net Assets — 100.0% | | | | | | | | | $3,942,305 | |
| * | Non-income producing security. |
| † | Investment categorized as level 2 security as disclosed in Note 2 of the Notes to Financial Statements. |
| ^ | Security exempt from registration pursuant to Rule 144A of the Securities Act of 1933. These securities, which represent 6.7% of net assets as of October 31, 2021, are considered liquid and may be resold in transactions exempt from registration, normally to qualified buyers. |
| | | | | |
| Industry | | |
| Percentage of
Net Assets |
|
| |
Automobiles & Components | | | | 1.5 | % |
| |
Capital Goods | | | | 15.2 | |
| |
Consumer Durables & Apparel | | | | 8.5 | |
| |
Consumer Services | | | | 1.2 | |
| |
Diversified Financials | | | | 1.2 | |
| |
Food Beverage & Tobacco | | | | 5.6 | |
| |
Insurance | | | | 3.8 | |
| |
Media & Entertainment | | | | 10.6 | |
| |
Pharmaceuticals, Biotechnology & Life Sciences | | | | 15.3 | |
| |
Real Estate | | | | 1.8 | |
| |
Retailing | | | | 12.0 | |
| |
Semiconductors & Semiconductor Equipment | | | | 3.6 | |
| |
Software & Services | | | | 6.0 | |
| |
Technology Hardware & Equipment | | | | 3.5 | |
| |
Transportation | | | | 4.1 | |
| |
Utilities | | | | 1.8 | |
| |
Money Market Fund | | | | 2.9 | |
| |
Total Investments | | | | 98.6 | |
| |
Other Assets Less Liabilities | | | | 1.4 | |
| |
Net Assets | | | | 100.0 | % |
See Notes to Financial Statements
44
Harding, Loevner Funds, Inc.
Statements of Assets and Liabilities
October 31, 2021
| | | | | | | | | | | | |
| | | Global Equity Portfolio | | | International Equity Portfolio | | | International Small Companies Portfolio | |
ASSETS: | | | | | | | | | | | | |
Investments (cost $1,184,684,075, $13,933,485,200 and $413,637,180, respectively) | | | $1,809,770,181 | | | | $21,870,513,062 | | | | $599,950,717 | |
Dividends and interest receivable | | | 571,591 | | | | 13,293,705 | | | | 732,572 | |
Foreign currency (cost $—, $539,254 and $7, respectively) | | | — | | | | 534,955 | | | | 7 | |
Receivable for investments sold | | | — | | | | 13,277,638 | | | | — | |
Receivable for Fund shares sold | | | 252,670 | | | | 31,107,257 | | | | 164,195 | |
Tax reclaims receivable | | | 473,105 | | | | 23,448,557 | | | | 320,439 | |
Prepaid expenses | | | 38,584 | | | | 103,604 | | | | 47,198 | |
Total Assets: | | | 1,811,106,131 | | | | 21,952,278,778 | | | | 601,215,128 | |
LIABILITIES: | | | | | | | | | | | | |
Payable to Investment Adviser | | | (1,111,974 | ) | | | (12,092,774 | ) | | | (474,175 | ) |
Payable for investments purchased | | | (1,738,968 | ) | | | (12,876,411 | ) | | | — | |
Payable for Fund shares redeemed | | | (19,426,561 | ) | | | (7,891,932 | ) | | | (320,535 | ) |
Payable for directors’ fees and expenses | | | (13,053 | ) | | | (157,471 | ) | | | (4,421 | ) |
Payable for distribution fees | | | — | | | | (236,911 | ) | | | (32,793 | ) |
Deferred capital gains tax | | | — | | | | — | | | | (454,451 | ) |
Other liabilities | | | (633,323 | ) | | | (6,233,590 | ) | | | (276,541 | ) |
Total Liabilities | | | (22,923,879 | ) | | | (39,489,089 | ) | | | (1,562,916 | ) |
Net Assets | | | $1,788,182,252 | | | | $21,912,789,689 | | | | $599,652,212 | |
ANALYSIS OF NET ASSETS: | | | | | | | | | | | | |
Paid in capital | | | $924,051,547 | | | | $13,583,358,724 | | | | $402,282,148 | |
Distributable earnings | | | 864,130,705 | | | | 8,329,430,965 | | | | 197,370,064 | |
Net Assets | | | $1,788,182,252 | | | | $21,912,789,689 | | | | $599,652,212 | |
Net Assets: | | | | | | | | | | | | |
Institutional Class | | | $1,354,918,024 | | | | $18,268,497,458 | | | | $549,894,685 | |
Institutional Class Z | | | 379,780,950 | | | | 3,235,427,855 | | | | — | |
Investor Class | | | — | | | | 408,864,376 | | | | 49,757,527 | |
Advisor Class | | | 53,483,278 | | | | — | | | | — | |
Total Shares Outstanding: | | | | | | | | | | | | |
Institutional Class (500,000,000, 700,000,000 and 500,000,000, respectively, $.001 par value shares authorized) | | | 25,121,394 | | | | 595,345,577 | | | | 24,120,943 | |
Institutional Class Z (200,000,000, 300,000,000 and —, respectively, $.001 par value shares authorized) | | | 7,038,982 | | | | 105,421,552 | | | | — | |
Investor Class (—, 100,000,000 and 400,000,000, respectively, $.001 par value shares authorized) | | | — | | | | 13,356,507 | | | | 2,210,954 | |
Advisor Class (400,000,000, — and —, respectively, $.001 par value shares authorized) | | | 993,822 | | | | — | | | | — | |
Net Asset Value, Offering Price and Redemption Price Per Share: | | | | | | | | | | | | |
Institutional Class | | | $53.93 | | | | $30.69 | | | | $22.80 | |
Institutional Class Z | | | 53.95 | | | | 30.69 | | | | — | |
Investor Class | | | — | | | | 30.61 | | | | 22.51 | |
Advisor Class | | | 53.82 | | | | — | | | | — | |
See Notes to Financial Statements
45
Harding, Loevner Funds, Inc.
Statements of Assets and Liabilities (continued)
October 31, 2021
| | | | | | | | | | | | |
| | | Institutional Emerging Markets Portfolio | | | Emerging Markets Portfolio | | | Frontier Emerging Markets Portfolio | |
ASSETS: | | | | | | | | | | | | |
Investments (cost $4,308,538,841, $2,266,693,132 and $162,484,624, respectively) | | | $6,511,476,413 | | | | $3,823,508,533 | | | | $224,121,024 | |
Dividends and interest receivable | | | 4,615,867 | | | | 2,727,807 | | | | 36,898 | |
Foreign currency (cost $220,220, $121,547 and $2,781,160, respectively) | | | 220,220 | | | | 121,547 | | | | 2,738,235 | |
Receivable for investments sold | | | 491,011 | | | | 301,032 | | | | 135,387 | |
Receivable for Fund shares sold | | | 3,411,635 | | | | 3,346,640 | | | | 29,710 | |
Tax reclaims receivable | | | 29,357 | | | | 17,823 | | | | 1,437 | |
Capital gain tax refund receivable | | | 1,034 | | | | — | | | | — | |
Prepaid expenses | | | 41,488 | | | | 36,155 | | | | 56,387 | |
Total Assets: | | | 6,520,287,025 | | | | 3,830,059,537 | | | | 227,119,078 | |
LIABILITIES: | | | | | | | | | | | | |
Payable to Investment Adviser | | | (5,418,332 | ) | | | (3,151,275 | ) | | | (253,151 | ) |
Payable for investments purchased | | | — | | | | — | | | | (1,953,312 | ) |
Payable for Fund shares redeemed | | | (3,115,655 | ) | | | (1,728,328 | ) | | | (38,547 | ) |
Payable for directors’ fees and expenses | | | (46,939 | ) | | | (27,587 | ) | | | (1,584 | ) |
Payable for distribution fees | | | — | | | | — | | | | (15,213 | ) |
Deferred capital gains tax | | | (15,291,995 | ) | | | (9,493,942 | ) | | | (519,683 | ) |
Other liabilities | | | (2,528,063 | ) | | | (2,327,558 | ) | | | (201,787 | ) |
Total Liabilities | | | (26,400,984 | ) | | | (16,728,690 | ) | | | (2,983,277 | ) |
Net Assets | | | $6,493,886,041 | | | | $3,813,330,847 | | | | $224,135,801 | |
ANALYSIS OF NET ASSETS: | | | | | | | | | | | | |
Paid in capital | | | $4,444,632,905 | | | | $2,031,431,562 | | | | $271,723,080 | |
Distributable earnings | | | 2,049,253,136 | | | | 1,781,899,285 | | | | (47,587,279 | ) |
Net Assets | | | $6,493,886,041 | | | | $3,813,330,847 | | | | $224,135,801 | |
Net Assets: | | | | | | | | | | | | |
Institutional Class | | | $5,774,485,913 | | | | $— | | | | $— | |
Institutional Class I | | | — | | | | — | | | | 96,905,519 | |
Institutional Class II | | | — | | | | — | | | | 117,688,685 | |
Institutional Class Z | | | 719,400,128 | | | | — | | | | — | |
Investor Class | | | — | | | | — | | | | 9,541,597 | |
Advisor Class | | | — | | | | 3,813,330,847 | | | | — | |
Total Shares Outstanding: | | | | | | | | | | | | |
Institutional Class (500,000,000, — and —, respectively, $.001 par value shares authorized) | | | 225,632,756 | | | | — | | | | — | |
Institutional Class I (—, — and 400,000,000, respectively, $.001 par value shares authorized) | | | — | | | | — | | | | 10,807,522 | |
Institutional Class II (—, — and 200,000,000, respectively, $.001 par value shares authorized) | | | — | | | | — | | | | 13,039,458 | |
Institutional Class Z (500,000,000, — and —, respectively, $.001 par value shares authorized) | | | 28,043,117 | | | | — | | | | — | |
Investor Class (—, — and 400,000,000, respectively, $.001 par value shares authorized) | | | — | | | | — | | | | 1,070,165 | |
Advisor Class (—, 500,000,000 and —, respectively, $.001 par value shares authorized) | | | — | | | | 56,977,702 | | | | — | |
Net Asset Value, Offering Price and Redemption Price Per Share: | | | | | | | | | | | | |
Institutional Class | | | $25.59 | | | | $— | | | | $— | |
Institutional Class I | | | — | | | | — | | | | 8.97 | |
Institutional Class II | | | — | | | | — | | | | 9.03 | |
Institutional Class Z | | | 25.65 | | | | — | | | | — | |
Investor Class | | | — | | | | — | | | | 8.92 | |
Advisor Class | | | — | | | | 66.93 | | | | — | |
See Notes to Financial Statements
46
Harding, Loevner Funds, Inc.
Statements of Assets and Liabilities (continued)
October 31, 2021
| | | | | | | | | | | | | | | | |
| | | Global
Equity
Research
Portfolio | | | International
Equity
Research
Portfolio | | | Emerging
Markets
Research
Portfolio | | | Chinese
Equity
Portfolio | |
ASSETS: | | | | | | | | | | | | | | | | |
Investments (cost $7,142,361, $11,885,132, $7,908,774 and $4,046,069, respectively) | | | $9,845,038 | | | | $15,266,656 | | | | $9,007,468 | | | | $3,886,950 | |
Dividends and interest receivable | | | 8,894 | | | | 14,798 | | | | 3,307 | | | | 1 | |
Foreign currency (cost $90, $40,278, $89,634 and $—, respectively) | | | 90 | | | | 40,280 | | | | 88,791 | | | | — | |
Receivable for investments sold | | | 27,075 | | | | — | | | | — | | | | — | |
Receivable for Fund shares sold | | | — | | | | 1,485 | | | | 1,973 | | | | — | |
Tax reclaims receivable | | | 3,030 | | | | 13,189 | | | | — | | | | — | |
Capital gain tax refund receivable | | | — | | | | — | | | | 1,681 | | | | — | |
Prepaid offering fees | | | — | | | | — | | | | — | | | | 31,929 | |
Prepaid expenses | | | 26,300 | | | | 34,402 | | | | 31,074 | | | | 49,331 | |
Total Assets: | | | 9,910,427 | | | | 15,370,810 | | | | 9,134,294 | | | | 3,968,211 | |
LIABILITIES: | | | | | | | | | | | | | | | | |
Payable to Investment Adviser | | | (5,735 | ) | | | (8,991 | ) | | | (7,747 | ) | | | (3,174 | ) |
Payable for investments purchased | | | — | | | | (5 | ) | | | (9 | ) | | | — | |
Payable for directors’ fees and expenses | | | (71 | ) | | | (112 | ) | | | (66 | ) | | | (28 | ) |
Deferred capital gains tax | | | (5,022 | ) | | | (11,542 | ) | | | (15,315 | ) | | | — | |
Other liabilities | | | (43,210 | ) | | | (55,389 | ) | | | (46,590 | ) | | | (22,704 | ) |
Total Liabilities | | | (54,038 | ) | | | (76,039 | ) | | | (69,727 | ) | | | (25,906 | ) |
Net Assets | | | $9,856,389 | | | | $15,294,771 | | | | $9,064,567 | | | | $3,942,305 | |
ANALYSIS OF NET ASSETS: | | | | | | | | | | | | | | | | |
Paid in capital | | | $6,115,186 | | | | $10,361,598 | | | | $7,189,265 | | | | $4,279,226 | |
Distributable earnings | | | 3,741,203 | | | | 4,933,173 | | | | 1,875,302 | | | | (336,921 | ) |
Net Assets | | | $9,856,389 | | | | $15,294,771 | | | | $9,064,567 | | | | $3,942,305 | |
Net Assets: | | | | | | | | | | | | | | | | |
Institutional Class | | | $9,856,389 | | | | $15,294,771 | | | | $9,064,567 | | | | $3,942,305 | |
Total Shares Outstanding: | | | | | | | | | | | | | | | | |
Institutional Class (400,000,000, 400,000,000, 400,000,000 and 500,000,000, respectively, $.001 par value shares authorized) | | | 594,183 | | | | 1,039,750 | | | | 689,539 | | | | 421,003 | |
Net Asset Value, Offering Price and Redemption Price Per Share: | | | | | | | | | | | | | | | | |
Institutional Class | | | $16.59 | | | | $14.71 | | | | $13.15 | | | | $9.36 | |
See Notes to Financial Statements
47
Harding, Loevner Funds, Inc.
Statements of Operations
For the Fiscal Year Ended October 31, 2021
| | | | | | | | | | | | | | | | | | | | |
| | | Global
Equity
Portfolio | | | International
Equity
Portfolio | | | International
Small
Companies
Portfolio | | | Institutional
Emerging
Markets
Portfolio | | | Emerging
Markets
Portfolio | |
INVESTMENT INCOME | | | | | | | | | | | | | | | | | | | | |
Dividends (net of foreign withholding taxes of $633,813, $40,962,304, $762,333, $13,566,625 and $9,094,071, respectively) | | | $10,160,582 | | | | $405,614,126 | | | | $6,709,512 | | | | $99,362,438 | | | | $62,277,083 | |
Non-cash dividends | | | — | | | | — | | | | 634,945 | | | | — | | | | — | |
Total investment income | | | 10,160,582 | | | | 405,614,126 | | | | 7,344,457 | | | | 99,362,438 | | | | 62,277,083 | |
EXPENSES | | | | | | | | | | | | | | | | | | | | |
Investment advisory fees (Note 3) | | | 12,574,579 | | | | 136,790,622 | | | | 5,049,738 | | | | 70,803,476 | | | | 45,506,566 | |
Administration fees (Note 3) | | | 508,585 | | | | 6,062,974 | | | | 160,635 | | | | 1,985,877 | | | | 1,267,623 | |
Distribution fees, Investor Class | | | — | | | | 961,029 | | | | 117,246 | | | | — | | | | — | |
Custody and accounting fees (Note 3) | | | 232,160 | | | | 2,227,218 | | | | 216,914 | | | | 1,872,354 | | | | 1,244,503 | |
Directors’ fees and expenses | | | 50,501 | | | | 595,893 | | | | 15,028 | | | | 193,348 | | | | 123,390 | |
Transfer agent fees and expenses (Note 3) | | | 10,580 | | | | 432,836 | | | | 10,821 | | | | 47,333 | | | | 436,767 | |
Printing and postage fees | | | 26,389 | | | | 728,222 | | | | 20,722 | | | | 271,342 | | | | 357,882 | |
State registration filing fees | | | 74,787 | | | | 152,236 | | | | 44,527 | | | | 72,610 | | | | 58,066 | |
Professional fees | | | 163,672 | | | | 517,864 | | | | 80,415 | | | | 211,690 | | | | 158,709 | |
Shareholder servicing fees (Note 3) | | | 1,035,509 | | | | 14,723,814 | | | | 368,923 | | | | 5,294,632 | | | | 5,990,614 | |
Compliance officers’ fees and expenses (Note 3) | | | 4,162 | | | | 48,971 | | | | 1,255 | | | | 15,766 | | | | 9,931 | |
Other fees and expenses | | | 54,507 | | | | 792,864 | | | | 25,263 | | | | 266,352 | | | | 283,024 | |
Total Expenses | | | 14,735,431 | | | | 164,034,543 | | | | 6,111,487 | | | | 81,034,780 | | | | 55,437,075 | |
Less Waiver of investment advisory fee and/or reimbursement of other operating expenses (Note 3) | | | (29,813 | ) | | | — | | | | (105,484 | ) | | | (4,871,288 | ) | | | (886,208 | ) |
Net expenses | | | 14,705,618 | | | | 164,034,543 | | | | 6,006,003 | | | | 76,163,492 | | | | 54,550,867 | |
Net investment income (loss) | | | (4,545,036 | ) | | | 241,579,583 | | | | 1,338,454 | | | | 23,198,946 | | | | 7,726,216 | |
REALIZED AND UNREALIZED GAIN (LOSS) | | | | | | | | | | | | | | | | | | | | |
Net realized gain (loss) | | | | | | | | | | | | | | | | | | | | |
Investment transactions | | | 250,744,051 | | | | 792,034,475 | | | | 20,592,020 | | | | 131,078,180 | | | | 321,310,657 | |
Foreign currency transactions | | | (317,496 | ) | | | 124,819 | | | | (73,250 | ) | | | (79,598 | ) | | | (326,732 | ) |
Net realized gain | | | 250,426,555 | | | | 792,159,294 | | | | 20,518,770 | | | | 130,998,582 | | | | 320,983,925 | |
Change in unrealized appreciation (depreciation) | | | | | | | | | | | | | | | | | | | | |
Investments (net of increase (decrease) in deferred foreign taxes of $—, $—, $(466,922), $(12,352,780) and $(7,933,193), respectively) | | | 230,191,908 | | | | 3,880,313,763 | | | | 111,528,178 | | | | 1,002,780,187 | | | | 482,789,858 | |
Translation of assets and liabilities denominated in foreign currencies | | | (3,851 | ) | | | (781,400 | ) | | | 3,777 | | | | 236,655 | | | | 149,107 | |
Net change in unrealized appreciation | | | 230,188,057 | | | | 3,879,532,363 | | | | 111,531,955 | | | | 1,003,016,842 | | | | 482,938,965 | |
Net realized and unrealized gain | | | 480,614,612 | | | | 4,671,691,657 | | | | 132,050,725 | | | | 1,134,015,424 | | | | 803,922,890 | |
NET INCREASE IN NET ASSETS RESULTING FROM OPERATIONS | | | $476,069,576 | | | | $4,913,271,240 | | | | $133,389,179 | | | | $1,157,214,370 | | | | $811,649,106 | |
See Notes to Financial Statements
48
Harding, Loevner Funds, Inc.
Statements of Operations (continued)
For the Fiscal Year Ended October 31, 2021
| | | | | | | | | | | | | | | | | | | | |
| | | Frontier
Emerging
Markets
Portfolio | | | Global
Equity
Research
Portfolio | | | International
Equity
Research
Portfolio | | | Emerging
Markets
Research
Portfolio | | | Chinese
Equity
Portfolio(1) | |
INVESTMENT INCOME | | | | | | | | | | | | | | | | | | | | |
Dividends (net of foreign withholding taxes of $550,233, $11,074, $31,689, $23,783 and $1,517, respectively) | | | $5,407,538 | | | | $134,980 | | | | $263,100 | | | | $171,198 | | | | $32,328 | |
Total investment income | | | 5,407,538 | | | | 134,980 | | | | 263,100 | | | | 171,198 | | | | 32,328 | |
EXPENSES | | | | | | | | | | | | | | | | | | | | |
Investment advisory fees (Note 3) | | | 3,049,582 | | | | 64,247 | | | | 105,581 | | | | 89,567 | | | | 33,260 | |
Administration fees (Note 3) | | | 76,652 | | | | 12,698 | | | | 14,445 | | | | 12,637 | | | | 10,225 | |
Distribution fees, Investor Class | | | 25,199 | | | | — | | | | — | | | | — | | | | — | |
Custody and accounting fees (Note 3) | | | 253,292 | | | | 14,534 | | | | 20,989 | | | | 18,561 | | | | 7,501 | |
Directors’ fees and expenses | | | 6,542 | | | | 298 | | | | 439 | | | | 294 | | | | 101 | |
Transfer agent fees and expenses (Note 3) | | | 3,234 | | | | 482 | | | | 577 | | | | 502 | | | | 746 | |
Printing and postage fees | | | 6,532 | | | | 126 | | | | 182 | | | | 104 | | | | 2,201 | |
State registration filing fees | | | 57,780 | | | | 23,192 | | | | 19,915 | | | | 22,944 | | | | 2,041 | |
Professional fees | | | 58,848 | | | | 40,551 | | | | 42,086 | | | | 57,359 | | | | 36,860 | |
Shareholder servicing fees (Note 3) | | | 76,735 | | | | — | | | | 7,361 | | | | 1 | | | | 58 | |
Compliance officers’ fees and expenses (Note 3) | | | 533 | | | | 24 | | | | 34 | | | | 24 | | | | 8 | |
Offering fees | | | — | | | | — | | | | — | | | | — | | | | 148,851 | |
Other fees and expenses | | | 20,351 | | | | 4,342 | | | | 7,366 | | | | 4,062 | | | | 3,776 | |
Total Expenses | | | 3,635,280 | | | | 160,494 | | | | 218,975 | | | | 206,055 | | | | 245,628 | |
Less Waiver of investment advisory fee and/or reimbursement of other operating expenses (Note 3) | | | (263,700 | ) | | | (87,073 | ) | | | (105,857 | ) | | | (103,057 | ) | | | (205,365 | ) |
Net expenses | | | 3,371,580 | | | | 73,421 | | | | 113,118 | | | | 102,998 | | | | 40,263 | |
Net investment income (loss) | | | 2,035,958 | | | | 61,559 | | | | 149,982 | | | | 68,200 | | | | (7,935 | ) |
REALIZED AND UNREALIZED GAIN (LOSS) | | | | | | | | | | | | | | | | | | | | |
Net realized gain (loss) | | | | | | | | | | | | | | | | | | | | |
Investment transactions | | | 19,098,669 | | | | 992,924 | | | | 1,550,320 | | | | 772,614 | | | | (169,681 | ) |
Foreign currency transactions | | | (115,819 | ) | | | 397 | | | | (720 | ) | | | (1,298 | ) | | | (1,460 | ) |
Net realized gain (loss) | | | 18,982,850 | | | | 993,321 | | | | 1,549,600 | | | | 771,316 | | | | (171,141 | ) |
Change in unrealized appreciation (depreciation) | | | | | | | | | | | | | | | | | | | | |
Investments (net of increase (decrease) in deferred foreign taxes of $(17,950), $(2,016), $(2,086), $(4,798) and $—, respectively) | | | 40,028,435 | | | | 1,413,992 | | | | 1,625,804 | | | | 564,659 | | | | (159,119 | ) |
Translation of assets and liabilities denominated in foreign currencies | | | (37,934 | ) | | | — | | | | (201 | ) | | | (541 | ) | | | — | |
Net change in unrealized appreciation (depreciation) | | | 39,990,501 | | | | 1,413,992 | | | | 1,625,603 | | | | 564,118 | | | | (159,119 | ) |
Net realized and unrealized gain (loss) | | | 58,973,351 | | | | 2,407,313 | | | | 3,175,203 | | | | 1,335,434 | | | | (330,260 | ) |
NET INCREASE (DECREASE) IN NET ASSETS RESULTING FROM OPERATIONS | | | $61,009,309 | | | | $2,468,872 | | | | $3,325,185 | | | | $1,403,634 | | | | $(338,195 | ) |
| (1) | For the period from December 16, 2020 (commencement of operations) through October 31, 2021. |
See Notes to Financial Statements
49
Harding, Loevner Funds, Inc.
Statements of Changes in Net Assets
For the Fiscal Years Ended October 31
| | | | | | | | | | | | | | | | | | | | | | | | |
| | | Global Equity Portfolio | | | International Equity Portfolio | | | International Small Companies Portfolio | |
| | | 2021 | | | 2020 | | | 2021 | | | 2020 | | | 2021 | | | 2020 | |
| INCREASE (DECREASE) IN NET ASSETS FROM OPERATIONS | | | | | | | | | | | | | | | | | | | | | | | | |
Net investment income (loss) | | | $(4,545,036 | ) | | | $(1,352,788 | ) | | | $241,579,583 | | | | $159,954,853 | | | | $1,338,454 | | | | $1,559,394 | |
Net realized gain (loss) on investments and foreign currency transactions | | | 250,426,555 | | | | 110,956,573 | | | | 792,159,294 | | | | (443,646,886 | ) | | | 20,518,770 | | | | (4,067,129 | ) |
Net change in unrealized appreciation on investments and translation of assets and liabilities denominated in foreign currencies | | | 230,188,057 | | | | 72,903,102 | | | | 3,879,532,363 | | | | 1,117,466,328 | | | | 111,531,955 | | | | 35,452,939 | |
Net increase in net assets resulting from operations | | | 476,069,576 | | | | 182,506,887 | | | | 4,913,271,240 | | | | 833,774,295 | | | | 133,389,179 | | | | 32,945,204 | |
| DISTRIBUTIONS TO SHAREHOLDERS: | | | | | | | | | | | | | | | | | | | | | | | | |
Institutional Class | | | (65,209,713 | ) | | | (4,316,797 | ) | | | (123,781,067 | ) | | | (230,105,321 | ) | | | (609,752 | ) | | | (1,807,612 | ) |
Institutional Class Z | | | (17,916,242 | ) | | | (1,747,501 | ) | | | (21,728,233 | ) | | | (34,291,239 | ) | | | — | | | | — | |
Investor Class | | | — | | | | — | | | | (1,685,707 | ) | | | (5,139,836 | ) | | | (12,869 | ) | | | (315,070 | ) |
Advisor Class | | | (3,368,857 | ) | | | (135,973 | ) | | | — | | | | — | | | | — | | | | — | |
Total distributions to shareholders | | | (86,494,812 | ) | | | (6,200,271 | ) | | | (147,195,007 | ) | | | (269,536,396 | ) | | | (622,621 | ) | | | (2,122,682 | ) |
| TRANSACTIONS IN SHARES OF COMMON STOCK | | | | | | | | | | | | | | | | | | | | | | | | |
Institutional Class | | | 18,309,218 | | | | 243,439,192 | | | | 646,601,165 | | | | (630,807,060 | ) | | | 92,733,830 | | | | 36,814,201 | |
Institutional Class Z | | | 7,371,412 | | | | 7,571,877 | | | | 422,221,016 | | | | 135,625,446 | | | | — | | | | — | |
Investor Class | | | — | | | | — | | | | (21,699,734 | ) | | | (70,443,766 | ) | | | (2,710,589 | ) | | | (20,120,767 | ) |
Advisor Class | | | (13,246,523 | ) | | | (3,444,298 | ) | | | — | | | | — | | | | — | | | | — | |
Net Increase (Decrease) in net assets from portfolio share transactions | | | 12,434,107 | | | | 247,566,771 | | | | 1,047,122,447 | | | | (565,625,380 | ) | | | 90,023,241 | | | | 16,693,434 | |
NET INCREASE (DECREASE) IN NET ASSETS | | | 402,008,871 | | | | 423,873,387 | | | | 5,813,198,680 | | | | (1,387,481 | ) | | | 222,789,799 | | | | 47,515,956 | |
NET ASSETS | | | | | | | | | | | | | | | | | | | | | | | | |
At beginning of year | | | 1,386,173,381 | | | | 962,299,994 | | | | 16,099,591,009 | | | | 16,100,978,490 | | | | 376,862,413 | | | | 329,346,457 | |
At end of year | | | $1,788,182,252 | | | | $1,386,173,381 | | | | $21,912,789,689 | | | | $16,099,591,009 | | | | $599,652,212 | | | | $376,862,413 | |
| | | | | | | | | | | | | | | | | | | | | | | | | |
See Notes to Financial Statements
50
Harding, Loevner Funds, Inc.
Statements of Changes in Net Assets (continued)
For the Fiscal Years Ended October 31
| | | | | | | | | | | | | | | | | | | | | | | | |
| | | Institutional Emerging Markets Portfolio | | | Emerging Markets Portfolio | | | Frontier Emerging Markets Portfolio | |
| | | 2021 | | | 2020 | | | 2021 | | | 2020 | | | 2021 | | | 2020 | |
| INCREASE (DECREASE) IN NET ASSETS FROM OPERATIONS | | | | | | | | | | | | | | | | | | | | | | | | |
Net investment income | | | $23,198,946 | | | | $32,486,504 | | | | $7,726,216 | | | | $19,174,342 | | | | $2,035,958 | | | | $3,878,583 | |
Net realized gain (loss) on investments and foreign currency transactions | | | 130,998,582 | | | | (73,626,689 | ) | | | 320,983,925 | | | | (40,331,776 | ) | | | 18,982,850 | | | | (831,046 | ) |
Net change in unrealized appreciation | | | | | | | | | | | | | | | | | | | | | | | | |
(depreciation) on investments and translation of assets and liabilities denominated in foreign currencies | | | 1,003,016,842 | | | | 110,468,671 | | | | 482,938,965 | | | | 21,905,626 | | | | 39,990,501 | | | | (33,493,549 | ) |
Net increase (decrease) in net assets resulting from operations | | | 1,157,214,370 | | | | 69,328,486 | | | | 811,649,106 | | | | 748,192 | | | | 61,009,309 | | | | (30,446,012 | ) |
DISTRIBUTIONS TO SHAREHOLDERS: | | | | | | | | | | | | | | | | | | | | | | | | |
Institutional Class | | | (23,061,824 | ) | | | (76,149,087 | ) | | | — | | | | — | | | | — | | | | — | |
Institutional Class I | | | — | | | | — | | | | — | | | | — | | | | (1,305,371 | ) | | | (2,815,425 | ) |
Institutional Class II | | | — | | | | — | | | | — | | | | — | | | | (2,278,483 | ) | | | (2,717,575 | ) |
Institutional Class Z | | | (3,583,856 | ) | | | (9,138,400 | ) | | | — | | | | — | | | | — | | | | — | |
Investor Class | | | — | | | | — | | | | — | | | | — | | | | (146,250 | ) | | | (292,150 | ) |
Advisor Class | | | — | | | | — | | | | (14,604,731 | ) | | | (63,406,861 | ) | | | — | | | | — | |
Total distributions to shareholders | | | (26,645,680 | ) | | | (85,287,487 | ) | | | (14,604,731 | ) | | | (63,406,861 | ) | | | (3,730,104 | ) | | | (5,825,150 | ) |
TRANSACTIONS IN SHARES OF COMMON STOCK | | | | | | | | | | | | | | | | | | | | | | | | |
Institutional Class | | | (72,145,922 | ) | | | (12,857,492 | ) | | | — | | | | — | | | | — | | | | — | |
Institutional Class I | | | — | | | | — | | | | — | | | | — | | | | 1,089,776 | | | | (51,623,798 | ) |
Institutional Class II | | | — | | | | — | | | | — | | | | — | | | | (31,446,987 | ) | | | 2,717,575 | |
Institutional Class Z | | | (38,875,745 | ) | | | 80,529,077 | | | | — | | | | — | | | | — | | | | — | |
Investor Class | | | — | | | | — | | | | — | | | | — | | | | (3,400,547 | ) | | | (8,252,656 | ) |
Advisor Class | | | — | | | | — | | | | (722,922,763 | ) | | | (472,445,897 | ) | | | — | | | | — | |
Net Increase (Decrease) in net assets from portfolio share transactions | | | (111,021,667 | ) | | | 67,671,585 | | | | (722,922,763 | ) | | | (472,445,897 | ) | | | (33,757,758 | ) | | | (57,158,879 | ) |
NET INCREASE (DECREASE) IN NET ASSETS | | | 1,019,547,023 | | | | 51,712,584 | | | | 74,121,612 | | | | (535,104,566 | ) | | | 23,521,447 | | | | (93,430,041 | ) |
NET ASSETS | | | | | | | | | | | | | | | | | | | | | | | | |
At beginning of year | | | 5,474,339,018 | | | | 5,422,626,434 | | | | 3,739,209,235 | | | | 4,274,313,801 | | | | 200,614,354 | | | | 294,044,395 | |
At end of year | | | $6,493,886,041 | | | | $5,474,339,018 | | | | $3,813,330,847 | | | | $3,739,209,235 | | | | $224,135,801 | | | | $200,614,354 | |
| | | | | | | | | | | | | | | | | | | | | | | | | |
See Notes to Financial Statements
51
Harding, Loevner Funds, Inc.
Statements of Changes in Net Assets (continued)
For the Fiscal Years Ended October 31
| | | | | | | | | | | | | | | | | | | | | | | | |
| | | Global Equity Research
Portfolio | | | International Equity
Research Portfolio | | | Emerging Markets
Research Portfolio | |
| | | 2021 | | | 2020 | | | 2021 | | | 2020 | | | 2021 | | | 2020 | |
INCREASE (DECREASE) IN NET ASSETS FROM OPERATIONS | | | | | | | | | | | | | | | | | | | | | | | | |
Net investment income | | | $61,559 | | | | $55,729 | | | | $149,982 | | | | $214,094 | | | | $68,200 | | | | $58,056 | |
Net realized gain on investments and foreign currency transactions | | | 993,321 | | | | 162,841 | | | | 1,549,600 | | | | 198,640 | | | | 771,316 | | | | 46,259 | |
Net change in unrealized appreciation on investments and translation of assets and liabilities denominated in foreign currencies | | | 1,413,992 | | | | 273,547 | | | | 1,625,603 | | | | 163,973 | | | | 564,118 | | | | 58,967 | |
Net increase in net assets resulting from operations | | | 2,468,872 | | | | 492,117 | | | | 3,325,185 | | | | 576,707 | | | | 1,403,634 | | | | 163,282 | |
DISTRIBUTIONS TO SHAREHOLDERS: | | | | | | | | | | | | | | | | | | | | | | | | |
Institutional Class | | | (217,846 | ) | | | (379,881 | ) | | | (489,632 | ) | | | (374,600 | ) | | | (134,267 | ) | | | (299,717 | ) |
Total distributions to shareholders | | | (217,846 | ) | | | (379,881 | ) | | | (489,632 | ) | | | (374,600 | ) | | | (134,267 | ) | | | (299,717 | ) |
TRANSACTIONS IN SHARES OF COMMON STOCK | | | | | | | | | | | | | | | | | | | | | | | | |
Institutional Class | | | 218,347 | | | | 379,881 | | | | (34,784 | ) | | | (7,165,689 | ) | | | 428,228 | | | | 305,718 | |
Net Increase (Decrease) in net assets from portfolio share transactions | | | 218,347 | | | | 379,881 | | | | (34,784 | ) | | | (7,165,689 | ) | | | 428,228 | | | | 305,718 | |
NET INCREASE (DECREASE) IN NET ASSETS | | | 2,469,373 | | | | 492,117 | | | | 2,800,769 | | | | (6,963,582 | ) | | | 1,697,595 | | | | 169,283 | |
NET ASSETS | | | | | | | | | | | | | | | | | | | | | | | | |
At beginning of year | | | 7,387,016 | | | | 6,894,899 | | | | 12,494,002 | | | | 19,457,584 | | | | 7,366,972 | | | | 7,197,689 | |
At end of year | | | $9,856,389 | | | | $7,387,016 | | | | $15,294,771 | | | | $12,494,002 | | | | $9,064,567 | | | | $7,366,972 | |
| | | | | | | | | | | | | | | | | | | | | | | | | |
See Notes to Financial Statements
52
Harding, Loevner Funds, Inc.
Statements of Changes in Net Assets (continued)
For the Fiscal Years Ended October 31
| | | | |
| | | Chinese Equity
Portfolio(1) | |
| | | 2021 | |
INCREASE (DECREASE) IN NET ASSETS FROM OPERATIONS | | | | |
Net investment loss | | | $(7,935 | ) |
Net realized loss on investments and foreign currency transactions | | | (171,141 | ) |
Net change in unrealized depreciation on investments and translation of assets and liabilities denominated in foreign currencies | | | (159,119 | ) |
Net decrease in net assets resulting from operations | | | (338,195 | ) |
DISTRIBUTIONS TO SHAREHOLDERS: | | | | |
Institutional Class | | | — | |
Total distributions to shareholders | | | — | |
TRANSACTIONS IN SHARES OF COMMON STOCK | | | | |
Institutional Class | | | 4,280,500 | |
Net Increase in net assets from portfolio share transactions | | | 4,280,500 | |
NET INCREASE IN NET ASSETS | | | 3,942,305 | |
NET ASSETS | | | | |
Beginning of year | | | — | |
End of year | | | $3,942,305 | |
| | | | | |
| (1) | For the period from December 16, 2020 (commencement of operations) through October 31, 2021. |
See Notes to Financial Statements
53
Harding, Loevner Funds, Inc.
Financial Highlights
For the Fiscal Years Ended October 31
| | | | | | | | | | | | | | | | | | | | |
| | | Global Equity Portfolio
Institutional Class | |
| | | 2021 | | | 2020 | | | 2019 | | | 2018 | | | 2017 | |
Net asset value, beginning of year | | $ | 42.41 | | | $ | 35.38 | | | $ | 35.68 | | | $ | 40.84 | | | $ | 32.53 | |
Increase (Decrease) in Net Assets from Operations | | | | | | | | | | | | | | | | | | | | |
Net investment income (loss)(1) | | | (0.14 | ) | | | (0.06 | ) | | | 0.09 | | | | 0.13 | | | | 0.09 | |
Net realized and unrealized gain (loss) on investments and foreign currency-related transactions | | | 14.30 | | | | 7.33 | | | | 3.45 | | | | (0.13 | ) | | | 8.74 | |
Net increase (decrease) from investment operations | | | 14.16 | | | | 7.27 | | | | 3.54 | | | | — | | | | 8.83 | |
Distributions to Shareholders from: | | | | | | | | | | | | | | | | | | | | |
Net investment income | | | — | | | | (0.24 | ) | | | (0.12 | ) | | | (0.14 | ) | | | (0.13 | ) |
Net realized gain from investments | | | (2.64 | ) | | | — | | | | (3.72 | ) | | | (5.02 | ) | | | (0.39 | ) |
Total distributions | | | (2.64 | ) | | | (0.24 | ) | | | (3.84 | ) | | | (5.16 | ) | | | (0.52 | ) |
Net asset value, end of year | | $ | 53.93 | | | $ | 42.41 | | | $ | 35.38 | | | $ | 35.68 | | | $ | 40.84 | |
Total Return | | | 34.57 | % | | | 20.63 | % | | | 11.86 | % | | | (0.35 | )% | | | 27.58 | % |
Ratios/Supplemental Data: | | | | | | | | | | | | | | | | | | | | |
Net assets, end of year (000’s) | | $ | 1,354,918 | | | $ | 1,043,741 | | | $ | 684,764 | | | $ | 619,347 | | | $ | 790,097 | |
Expenses to average net assets | | | 0.88 | % | | | 0.92 | % | | | 0.93 | % | | | 0.94 | % | | | 0.93 | % |
Expenses to average net assets (net of fees waived/reimbursed) | | | 0.88 | % | | | 0.92 | % | | | 0.93 | % | | | 0.94 | % | | | 0.93 | % |
Net investment income (loss) to average net assets | | | (0.28 | )% | | | (0.15 | )% | | | 0.28 | % | | | 0.34 | % | | | 0.25 | % |
Portfolio turnover rate | | | 59 | % | | | 63 | % | | | 39 | % | | | 42 | % | | | 33 | % |
| (1) | Net investment income per share was calculated using the average shares outstanding method. |
See Notes to Financial Statements
54
Harding, Loevner Funds, Inc.
Financial Highlights (continued)
For the Fiscal Years Ended October 31
| | | | | | | | | | | | | | | | | | | | |
| | | Global Equity Portfolio
Institutional Class Z | |
| | | 2021 | | | 2020 | | | 2019 | | | 2018 | | | 2017(1)(2) | |
Net asset value, beginning of year | | $ | 42.39 | | | $ | 35.36 | | | $ | 35.67 | | | $ | 40.84 | | | $ | 39.33 | |
Increase (Decrease) in Net Assets from Operations | | | | | | | | | | | | | | | | | | | | |
Net investment income (loss)(3) | | | (0.10 | ) | | | (0.02 | ) | | | 0.11 | | | | 0.17 | | | | (0.01 | ) |
Net realized and unrealized gain (loss) on investments and foreign currency-related transactions | | | 14.30 | | | | 7.31 | | | | 3.44 | | | | (0.15 | ) | | | 1.52 | |
Net increase (decrease) from investment operations | | | 14.20 | | | | 7.29 | | | | 3.55 | | | | 0.02 | | | | 1.51 | |
Distributions to Shareholders from: | | | | | | | | | | | | | | | | | | | | |
Net investment income | | | — | | | | (0.26 | ) | | | (0.14 | ) | | | (0.17 | ) | | | — | |
Net realized gain from investments | | | (2.64 | ) | | | — | | | | (3.72 | ) | | | (5.02 | ) | | | — | |
Total distributions | | | (2.64 | ) | | | (0.26 | ) | | | (3.86 | ) | | | (5.19 | ) | | | — | |
Net asset value, end of year | | $ | 53.95 | | | $ | 42.39 | | | $ | 35.36 | | | $ | 35.67 | | | $ | 40.84 | |
Total Return | | | 34.66 | % | | | 20.76 | % | | | 11.89 | % | | | (0.26 | )% | | | 3.80 | %(A) |
Ratios/Supplemental Data: | | | | | | | | | | | | | | | | | | | | |
Net assets, end of year (000’s) | | $ | 379,781 | | | $ | 289,320 | | | $ | 229,355 | | | $ | 140,359 | | | $ | 46,493 | |
Expenses to average net assets | | | 0.81 | % | | | 0.85 | % | | | 0.88 | % | | | 0.91 | % | | | 1.21 | %(B) |
Expenses to average net assets (net of fees waived/reimbursed) | | | 0.80 | % | | | 0.84 | % | | | 0.88 | % | | | 0.90 | % | | | 0.90 | %(B) |
Net investment income (loss) to average net assets | | | (0.20 | )% | | | (0.05 | )% | | | 0.32 | % | | | 0.43 | % | | | (0.05 | )%(B) |
Portfolio turnover rate | | | 59 | % | | | 63 | % | | | 39 | % | | | 42 | % | | | 33 | %(A) |
| (1) | For the period from August 1, 2017 (commencement of class operations) through October 31, 2017. |
| (2) | All per share amounts and net asset values have been adjusted as a result of the reverse share split effected after the close of business on December 1, 2017. |
| (3) | Net investment income per share was calculated using the average shares outstanding method. |
See Notes to Financial Statements
55
Harding, Loevner Funds, Inc.
Financial Highlights (continued)
For the Fiscal Years Ended October 31
| | | | | | | | | | | | | | | | | | | | |
| | | Global Equity Portfolio
Advisor Class | |
| | | 2021 | | | 2020 | | | 2019 | | | 2018 | | | 2017 | |
Net asset value, beginning of year | | $ | 42.41 | | | $ | 35.30 | | | $ | 35.60 | | | $ | 40.78 | | | $ | 32.47 | |
Increase (Decrease) in Net Assets from Operations | | | | | | | | | | | | | | | | | | | | |
Net investment income (loss)(1) | | | (0.24 | ) | | | (0.12 | ) | | | 0.03 | | | | 0.07 | | | | 0.01 | |
Net realized and unrealized gain (loss) on investments and foreign currency-related transactions | | | 14.29 | | | | 7.33 | | | | 3.43 | | | | (0.15 | ) | | | 8.73 | |
Net increase (decrease) from investment operations | | | 14.05 | | | | 7.21 | | | | 3.46 | | | | (0.08 | ) | | | 8.74 | |
Distributions to Shareholders from: | | | | | | | | | | | | | | | | | | | | |
Net investment income | | | — | | | | (0.10 | ) | | | (0.04 | ) | | | (0.08 | ) | | | (0.04 | ) |
Net realized gain from investments | | | (2.64 | ) | | | — | | | | (3.72 | ) | | | (5.02 | ) | | | (0.39 | ) |
Total distributions | | | (2.64 | ) | | | (0.10 | ) | | | (3.76 | ) | | | (5.10 | ) | | | (0.43 | ) |
Net asset value, end of year | | $ | 53.82 | | | $ | 42.41 | | | $ | 35.30 | | | $ | 35.60 | | | $ | 40.78 | |
Total Return | | | 34.28 | % | | | 20.47 | % | | | 11.60 | % | | | (0.57 | )% | | | 27.28 | % |
Ratios/Supplemental Data: | | | | | | | | | | | | | | | | | | | | |
Net assets, end of year (000’s) | | $ | 53,483 | | | $ | 53,112 | | | $ | 48,181 | | | $ | 90,567 | | | $ | 75,244 | |
Expenses to average net assets | | | 1.09 | % | | | 1.11 | % | | | 1.12 | % | | | 1.14 | % | | | 1.14 | % |
Expenses to average net assets (net of fees waived/reimbursed) | | | 1.09 | % | | | 1.11 | % | | | 1.12 | % | | | 1.14 | % | | | 1.14 | % |
Net investment income (loss) to average net assets | | | (0.48 | )% | | | (0.32 | )% | | | 0.09 | % | | | 0.18 | % | | | 0.02 | % |
Portfolio turnover rate | | | 59 | % | | | 63 | % | | | 39 | % | | | 42 | % | | | 33 | % |
| (1) | Net investment income per share was calculated using the average shares outstanding method. |
See Notes to Financial Statements
56
Harding, Loevner Funds, Inc.
Financial Highlights (continued)
For the Fiscal Years Ended October 31
| | | | | | | | | | | | | | | | | | | | |
| | | International Equity Portfolio Institutional Class | |
| | | 2021 | | | 2020 | | | 2019 | | | 2018 | | | 2017 | |
Net asset value, beginning of year | | $ | 23.76 | | | $ | 22.72 | | | $ | 20.74 | | | $ | 22.64 | | | $ | 18.37 | |
Increase (Decrease) in Net Assets from Operations | | | | | | | | | | | | | | | | | | | | |
Net investment income(1) | | | 0.34 | | | | 0.23 | | | | 0.29 | | | | 0.31 | | | | 0.23 | |
Net realized and unrealized gain (loss) on investments and foreign currency-related transactions | | | 6.80 | | | | 1.19 | | | | 1.98 | | | | (1.83 | ) | | | 4.22 | |
Net increase (decrease) from investment operations | | | 7.14 | | | | 1.42 | | | | 2.27 | | | | (1.52 | ) | | | 4.45 | |
Distributions to Shareholders from: | | | | | | | | | | | | | | | | | | | | |
Net investment income | | | (0.21 | ) | | | (0.38 | ) | | | (0.29 | ) | | | (0.20 | ) | | | (0.18 | ) |
Net realized gain from investments | | | — | | | | — | | | | — | | | | (0.18 | ) | | | — | |
Total distributions | | | (0.21 | ) | | | (0.38 | ) | | | (0.29 | ) | | | (0.38 | ) | | | (0.18 | ) |
Net asset value, end of year | | $ | 30.69 | | | $ | 23.76 | | | $ | 22.72 | | | $ | 20.74 | | | $ | 22.64 | |
Total Return | | | 30.16 | % | | | 6.25 | % | | | 11.19 | % | | | (6.86 | )% | | | 24.47 | % |
Ratios/Supplemental Data: | | | | | | | | | | | | | | | | | | | | |
Net assets, end of year (000’s) | | $ | 18,268,498 | | | $ | 13,596,900 | | | $ | 13,766,876 | | | $ | 11,995,592 | | | $ | 11,107,736 | |
Expenses to average net assets | | | 0.80 | % | | | 0.81 | % | | | 0.81 | % | | | 0.81 | % | | | 0.82 | % |
Expenses to average net assets (net of fees waived/reimbursed) | | | 0.80 | % | | | 0.81 | % | | | 0.81 | % | | | 0.81 | % | | | 0.82 | % |
Net investment income to average net assets | | | 1.17 | % | | | 1.01 | % | | | 1.35 | % | | | 1.34 | % | | | 1.22 | % |
Portfolio turnover rate | | | 14 | % | | | 17 | % | | | 30 | % | | | 10 | % | | | 12 | % |
| (1) | Net investment income per share was calculated using the average shares outstanding method. |
See Notes to Financial Statements
57
Harding, Loevner Funds, Inc.
Financial Highlights (continued)
For the Fiscal Years Ended October 31
| | | | | | | | | | | | | | | | | | | | |
| | | International Equity Portfolio
Institutional Class Z | |
| | | 2021 | | | 2020 | | | 2019 | | | 2018 | | | 2017(1)(2) | |
Net asset value, beginning of year | | $ | 23.76 | | | $ | 22.72 | | | $ | 20.75 | | | $ | 22.64 | | | $ | 21.35 | |
Increase (Decrease) in Net Assets from Operations | | | | | | | | | | | | | | | | | | | | |
Net investment income(3) | | | 0.37 | | | | 0.25 | | | | 0.30 | | | | 0.40 | | | | 0.02 | |
Net realized and unrealized gain (loss) on investments and foreign currency-related transactions | | | 6.79 | | | | 1.18 | | | | 1.98 | | | | (1.90 | ) | | | 1.27 | |
Net increase (decrease) from investment operations | | | 7.16 | | | | 1.43 | | | | 2.28 | | | | (1.50 | ) | | | 1.29 | |
Distributions to Shareholders from: | | | | | | | | | | | | | | | | | | | | |
Net investment income | | | (0.23 | ) | | | (0.39 | ) | | | (0.31 | ) | | | (0.21 | ) | | | — | |
Net realized gain from investments | | | — | | | | — | | | | — | | | | (0.18 | ) | | | — | |
Total distributions | | | (0.23 | ) | | | (0.39 | ) | | | (0.31 | ) | | | (0.39 | ) | | | — | |
Net asset value, end of year | | $ | 30.69 | | | $ | 23.76 | | | $ | 22.72 | | | $ | 20.75 | | | $ | 22.64 | |
Total Return | | | 30.25 | % | | | 6.32 | % | | | 11.29 | % | | | (6.79 | )% | | | 6.00 | %(A) |
Ratios/Supplemental Data: | | | | | | | | | | | | | | | | | | | | |
Net assets, end of year (000’s) | | $ | 3,235,428 | | | $ | 2,165,343 | | | $ | 1,938,763 | | | $ | 1,342,804 | | | $ | 166,923 | |
Expenses to average net assets | | | 0.72 | % | | | 0.73 | % | | | 0.75 | % | | | 0.74 | % | | | 0.99 | %(B) |
Expenses to average net assets (net of fees waived/reimbursed) | | | 0.72 | % | | | 0.73 | % | | | 0.75 | % | | | 0.74 | % | | | 0.80 | %(B) |
Net investment income to average net assets | | | 1.25 | % | | | 1.08 | % | | | 1.42 | % | | | 1.77 | % | | | 0.33 | %(B) |
Portfolio turnover rate | | | 14 | % | | | 17 | % | | | 30 | % | | | 10 | % | | | 12 | %(A) |
| (1) | All per share amounts and net asset values have been adjusted as a result of the reverse share split effected after the close of business on December 1, 2017. |
| (2) | For the period from July 17, 2017 (commencement of operations) through October 31, 2017. |
| (3) | Net investment income per share was calculated using the average shares outstanding method. |
See Notes to Financial Statements
58
Harding, Loevner Funds, Inc.
Financial Highlights (continued)
For the Fiscal Years Ended October 31
| | | | | | | | | | | | | | | | | | | | |
| | | International Equity Portfolio
Investor Class | |
| | | 2021 | | | 2020 | | | 2019 | | | 2018 | | | 2017 | |
Net asset value, beginning of year | | $ | 23.70 | | | $ | 22.66 | | | $ | 20.65 | | | $ | 22.55 | | | $ | 18.30 | |
Increase (Decrease) in Net Assets from Operations | | | | | | | | | | | | | | | | | | | | |
Net investment income (loss)(1) | | | 0.24 | | | | 0.16 | | | | 0.22 | | | | 0.21 | | | | 0.19 | |
Net realized and unrealized gain (loss) on investments and foreign currency-related transactions | | | 6.80 | | | | 1.18 | | | | 1.98 | | | | (1.80 | ) | | | 4.18 | |
Net increase (decrease) from investment operations | | | 7.04 | | | | 1.34 | | | | 2.20 | | | | (1.59 | ) | | | 4.37 | |
Distributions to Shareholders from: | | | | | | | | | | | | | | | | | | | | |
Net investment income | | | (0.13 | ) | | | (0.30 | ) | | | (0.19 | ) | | | (0.13 | ) | | | (0.12 | ) |
Net realized gain from investments | | | — | | | | — | | | | — | | | | (0.18 | ) | | | — | |
Total distributions | | | (0.13 | ) | | | (0.30 | ) | | | (0.19 | ) | | | (0.31 | ) | | | (0.12 | ) |
Net asset value, end of year | | $ | 30.61 | | | $ | 23.70 | | | $ | 22.66 | | | $ | 20.65 | | | $ | 22.55 | |
Total Return | | | 29.74 | % | | | 5.91 | % | | | 10.79 | % | | | (7.16 | )% | | | 24.04 | % |
Ratios/Supplemental Data: | | | | | | | | | | | | | | | | | | | | |
Net assets, end of year (000’s) | | $ | 408,864 | | | $ | 337,348 | | | $ | 395,339 | | | $ | 411,712 | | | $ | 644,243 | |
Expenses to average net assets | | | 1.12 | % | | | 1.13 | % | | | 1.13 | % | | | 1.14 | % | | | 1.14 | % |
Expenses to average net assets (net of fees waived/reimbursed) | | | 1.12 | % | | | 1.13 | % | | | 1.13 | % | | | 1.14 | % | | | 1.14 | % |
Net investment income to average net assets | | | 0.83 | % | | | 0.69 | % | | | 1.03 | % | | | 0.92 | % | | | 0.95 | % |
Portfolio turnover rate | | | 14 | % | | | 17 | % | | | 30 | % | | | 10 | % | | | 12 | % |
| (1) | Net investment income per share was calculated using the average shares outstanding method. |
See Notes to Financial Statements
59
Harding, Loevner Funds, Inc.
Financial Highlights (continued)
For the Fiscal Years Ended October 31
| | | | | | | | | | | | | | | | | | | | |
| | | International Small Companies Portfolio
Institutional Class | |
| | | 2021 | | | 2020 | | | 2019 | | | 2018 | | | 2017 | |
Net asset value, beginning of year | | $ | 17.14 | | | $ | 15.64 | | | $ | 15.29 | | | $ | 16.67 | | | $ | 13.72 | |
Increase (Decrease) in Net Assets from Operations | | | | | | | | | | | | | | | | | | | | |
Net investment income(1) | | | 0.06 | | | | 0.08 | | | | 0.12 | | | | 0.13 | | | | 0.11 | |
Net realized and unrealized gain (loss) on investments and foreign currency-related transactions | | | 5.63 | | | | 1.53 | | | | 1.24 | | | | (1.30 | ) | | | 3.41 | |
Net increase (decrease) from investment operations | | | 5.69 | | | | 1.61 | | | | 1.36 | | | | (1.17 | ) | | | 3.52 | |
Distributions to Shareholders from: | | | | | | | | | | | | | | | | | | | | |
Net investment income | | | (0.03 | ) | | | (0.11 | ) | | | (0.13 | ) | | | (0.06 | ) | | | (0.16 | ) |
Net realized gain from investments | | | — | | | | — | | | | (0.88 | ) | | | (0.15 | ) | | | (0.41 | ) |
Total distributions | | | (0.03 | ) | | | (0.11 | ) | | | (1.01 | ) | | | (0.21 | ) | | | (0.57 | ) |
Net asset value, end of year | | $ | 22.80 | | | $ | 17.14 | | | $ | 15.64 | | | $ | 15.29 | | | $ | 16.67 | |
Total Return | | | 33.16 | % | | | 10.34 | % | | | 10.14 | % | | | (7.15 | )% | | | 26.98 | % |
Ratios/Supplemental Data: | | | | | | | | | | | | | | | | | | | | |
Net assets, end of year (000’s) | | $ | 549,895 | | | $ | 337,166 | | | $ | 272,252 | | | $ | 151,283 | | | $ | 144,170 | |
Expenses to average net assets | | | 1.16 | % | | | 1.34 | % | | | 1.38 | % | | | 1.39 | % | | | 1.41 | % |
Expenses to average net assets (net of fees waived/reimbursed) | | | 1.14 | % | | | 1.15 | % | | | 1.15 | % | | | 1.15 | % | | | 1.15 | % |
Net investment income to average net assets | | | 0.29 | % | | | 0.50 | % | | | 0.78 | % | | | 0.75 | % | | | 0.72 | % |
Portfolio turnover rate | | | 13 | % | | | 30 | % | | | 37 | % | | | 52 | % | | | 19 | % |
| (1) | Net investment income per share was calculated using the average shares outstanding method. |
See Notes to Financial Statements
60
Harding, Loevner Funds, Inc.
Financial Highlights (continued)
For the Fiscal Years Ended October 31
| | | | | | | | | | | | | | | | | | | | |
| | | International Small Companies Portfolio
Investor Class | |
| | | 2021 | | | 2020 | | | 2019 | | | 2018 | | | 2017 | |
Net asset value, beginning of year | | $ | 16.94 | | | $ | 15.48 | | | $ | 15.16 | | | $ | 16.55 | | | $ | 13.64 | |
Increase (Decrease) in Net Assets from Operations | | | | | | | | | | | | | | | | | | | | |
Net investment income (loss)(1) | | | — | (2) | | | 0.04 | | | | 0.09 | | | | 0.10 | | | | 0.05 | |
Net realized and unrealized gain (loss) on investments and foreign currency-related transactions | | | 5.58 | | | | 1.51 | | | | 1.21 | | | | (1.29 | ) | | | 3.42 | |
Net increase (decrease) from investment operations | | | 5.58 | | | | 1.55 | | | | 1.30 | | | | (1.19 | ) | | | 3.47 | |
Distributions to Shareholders from: | | | | | | | | | | | | | | | | | | | | |
Net investment income | | | (0.01 | ) | | | (0.09 | ) | | | (0.10 | ) | | | (0.05 | ) | | | (0.15 | ) |
Net realized gain from investments | | | — | | | | — | | | | (0.88 | ) | | | (0.15 | ) | | | (0.41 | ) |
Total distributions | | | (0.01 | ) | | | (0.09 | ) | | | (0.98 | ) | | | (0.20 | ) | | | (0.56 | ) |
Net asset value, end of year | | $ | 22.51 | | | $ | 16.94 | | | $ | 15.48 | | | $ | 15.16 | | | $ | 16.55 | |
Total Return | | | 32.84 | % | | | 10.07 | % | | | 9.82 | % | | | (7.35 | )% | | | 26.71 | % |
Ratios/Supplemental Data: | | | | | | | | | | | | | | | | | | | | |
Net assets, end of year (000’s) | | $ | 49,757 | | | $ | 39,696 | | | $ | 57,095 | | | $ | 57,912 | | | $ | 50,292 | |
Expenses to average net assets | | | 1.50 | % | | | 1.67 | % | | | 1.70 | % | | | 1.75 | % | | | 1.80 | % |
Expenses to average net assets (net of fees waived/reimbursed) | | | 1.40 | % | | | 1.40 | % | | | 1.40 | % | | | 1.40 | % | | | 1.40 | % |
Net investment income to average net assets | | | 0.01 | % | | | 0.28 | % | | | 0.63 | % | | | 0.58 | % | | | 0.37 | % |
Portfolio turnover rate | | | 13 | % | | | 30 | % | | | 37 | % | | | 52 | % | | | 19 | % |
| (1) | Net investment income per share was calculated using the average shares outstanding method. |
| (2) | Amount was less than $0.005 per share. |
See Notes to Financial Statements
61
Harding, Loevner Funds, Inc.
Financial Highlights (continued)
For the Fiscal Years Ended October 31
| | | | | | | | | | | | | | | | | | | | |
| | | Institutional Emerging Markets Portfolio
Institutional Class | |
| | | 2021 | | | 2020 | | | 2019 | | | 2018 | | | 2017 | |
Net asset value, beginning of year | | $ | 21.23 | | | $ | 21.25 | | | $ | 18.43 | | | $ | 21.94 | | | $ | 17.65 | |
Increase (Decrease) in Net Assets from Operations | | | | | | | | | | | | | | | | | | | | |
Net investment income(1) | | | 0.09 | | | | 0.12 | | | | 0.24 | | | | 0.19 | | | | 0.19 | |
Net realized and unrealized gain (loss) on investments and foreign currency-related transactions | | | 4.37 | | | | 0.19 | | | | 2.76 | | | | (3.53 | ) | | | 4.20 | |
Net increase (decrease) from investment operations | | | 4.46 | | | | 0.31 | | | | 3.00 | | | | (3.34 | ) | | | 4.39 | |
Distributions to Shareholders from: | | | | | | | | | | | | | | | | | | | | |
Net investment income | | | (0.10 | ) | | | (0.33 | ) | | | (0.18 | ) | | | (0.17 | ) | | | (0.10 | ) |
Net realized gain from investments | | | — | | | | — | | | | — | | | | — | | | | — | |
Total distributions | | | (0.10 | ) | | | (0.33 | ) | | | (0.18 | ) | | | (0.17 | ) | | | (0.10 | ) |
Net asset value, end of year | | $ | 25.59 | | | $ | 21.23 | | | $ | 21.25 | | | $ | 18.43 | | | $ | 21.94 | |
Total Return | | | 21.03 | % | | | 1.38 | % | | | 16.43 | % | | | (15.33 | )% | | | 25.08 | % |
Ratios/Supplemental Data: | | | | | | | | | | | | | | | | | | | | |
Net assets, end of year (000’s) | | $ | 5,774,486 | | | $ | 4,847,707 | | | $ | 4,864,702 | | | $ | 3,978,321 | | | $ | 4,386,511 | |
Expenses to average net assets | | | 1.22 | % | | | 1.28 | % | | | 1.27 | % | | | 1.27 | % | | | 1.28 | % |
Expenses to average net assets (net of fees waived/reimbursed) | | | 1.15 | % | | | 1.28 | % | | | 1.27 | % | | | 1.27 | % | | | 1.28 | % |
Net investment income to average net assets | | | 0.33 | % | | | 0.59 | % | | | 1.18 | % | | | 0.84 | % | | | 0.97 | % |
Portfolio turnover rate | | | 13 | % | | | 23 | % | | | 17 | % | | | 24 | % | | | 17 | % |
| (1) | Net investment income per share was calculated using the average shares outstanding method. |
See Notes to Financial Statements
62
Harding, Loevner Funds, Inc.
Financial Highlights (continued)
For the Fiscal Years Ended October 31
| | | | | | | | | | | | | | | | | | | | |
| | | Institutional Emerging Markets Portfolio
Institutional Class Z | |
| | | 2021 | | | 2020 | | | 2019 | | | 2018 | | | 2017(1) | |
Net asset value, beginning of year | | $ | 21.28 | | | $ | 21.28 | | | $ | 18.45 | | | $ | 21.94 | | | $ | 17.71 | |
Increase (Decrease) in Net Assets from Operations | | | | | | | | | | | | | | | | | | | | |
Net investment income(2) | | | 0.11 | | | | 0.15 | | | | 0.27 | | | | 0.22 | | | | 0.22 | |
Net realized and unrealized gain (loss) on investments and foreign currency-related transactions | | | 4.38 | | | | 0.20 | | | | 2.76 | | | | (3.52 | ) | | | 4.21 | |
Net increase (decrease) from investment operations | | | 4.49 | | | | 0.35 | | | | 3.03 | | | | (3.30 | ) | | | 4.43 | |
Distributions to Shareholders from: | | | | | | | | | | | | | | | | | | | | |
Net investment income | | | (0.12 | ) | | | (0.35 | ) | | | (0.20 | ) | | | (0.19 | ) | | | (0.20 | ) |
Net realized gain from investments | | | — | | | | — | | | | — | | | | — | | | | — | |
Total distributions | | | (0.12 | ) | | | (0.35 | ) | | | (0.20 | ) | | | (0.19 | ) | | | (0.20 | ) |
Net asset value, end of year | | $ | 25.65 | | | $ | 21.28 | | | $ | 21.28 | | | $ | 18.45 | | | $ | 21.94 | |
Total Return | | | 21.11 | % | | | 1.55 | % | | | 16.61 | % | | | (15.21 | )% | | | 25.43 | % |
Ratios/Supplemental Data: | | | | | | | | | | | | | | | | | | | | |
Net assets, end of year (000’s) | | $ | 719,400 | | | $ | 626,632 | | | $ | 557,924 | | | $ | 391,583 | | | $ | 458,288 | |
Expenses to average net assets | | | 1.13 | % | | | 1.19 | % | | | 1.19 | % | | | 1.20 | % | | | 1.23 | % |
Expenses to average net assets (net of fees waived/reimbursed) | | | 1.07 | % | | | 1.11 | % | | | 1.11 | % | | | 1.11 | % | | | 1.12 | % |
Net investment income to average net assets | | | 0.41 | % | | | 0.76 | % | | | 1.34 | % | | | 1.00 | % | | | 1.12 | % |
Portfolio turnover rate | | | 13 | % | | | 23 | % | | | 17 | % | | | 24 | % | | | 17 | % |
| (1) | All per share amounts and net asset values have been adjusted as a result of the reverse share split effected after the close of business on December 1, 2017. |
| (2) | Net investment income per share was calculated using the average shares outstanding method. |
See Notes to Financial Statements
63
Harding, Loevner Funds, Inc.
Financial Highlights (continued)
For the Fiscal Years Ended October 31
| | | | | | | | | | | | | | | | | | | | |
| | | Emerging Markets Portfolio
Advisor Class | |
| | | 2021 | | | 2020 | | | 2019 | | | 2018 | | | 2017 | |
Net asset value, beginning of year | | $ | 55.48 | | | $ | 55.65 | | | $ | 48.21 | | | $ | 57.46 | | | $ | 46.27 | |
Increase (Decrease) in Net Assets from Operations | | | | | | | | | | | | | | | | | | | | |
Net investment income(1) | | | 0.12 | | | | 0.26 | | | | 0.58 | | | | 0.42 | | | | 0.43 | |
Net realized and unrealized gain (loss) on investments and foreign currency-related transactions | | | 11.55 | | | | 0.40 | | | | 7.28 | | | | (9.24 | ) | | | 11.02 | |
Net increase (decrease) from investment operations | | | 11.67 | | | | 0.66 | | | | 7.86 | | | | (8.82 | ) | | | 11.45 | |
Distributions to Shareholders from: | | | | | | | | | | | | | | | | | | | | |
Net investment income | | | (0.22 | ) | | | (0.83 | ) | | | (0.42 | ) | | | (0.40 | ) | | | (0.26 | ) |
Net realized gain from investments | | | — | | | | — | | | | — | | | | (0.03 | ) | | | — | |
Total distributions | | | (0.22 | ) | | | (0.83 | ) | | | (0.42 | ) | | | (0.43 | ) | | | (0.26 | ) |
Net asset value, end of year | | $ | 66.93 | | | $ | 55.48 | | | $ | 55.65 | | | $ | 48.21 | | | $ | 57.46 | |
Total Return | | | 21.04 | % | | | 1.11 | % | | | 16.46 | % | | | (15.47 | )% | | | 24.93 | % |
Ratios/Supplemental Data: | | | | | | | | | | | | | | | | | | | | |
Net assets, end of year (000’s) | | $ | 3,813,331 | | | $ | 3,739,209 | | | $ | 4,274,314 | | | $ | 3,459,157 | | | $ | 4,014,977 | |
Expenses to average net assets | | | 1.31 | % | | | 1.36 | % | | | 1.37 | % | | | 1.40 | % | | | 1.42 | % |
Expenses to average net assets (net of fees waived/reimbursed) | | | 1.28 | % | | | 1.36 | % | | | 1.37 | % | | | 1.40 | % | | | 1.42 | % |
Net investment income to average net assets | | | 0.18 | % | | | 0.49 | % | | | 1.10 | % | | | 0.73 | % | | | 0.84 | % |
Portfolio turnover rate | | | 15 | % | | | 18 | % | | | 19 | % | | | 24 | % | | | 17 | % |
| (1) | Net investment income per share was calculated using the average shares outstanding method. |
See Notes to Financial Statements
64
Harding, Loevner Funds, Inc.
Financial Highlights (continued)
For the Fiscal Years Ended October 31
| | | | | | | | | | | | | | | | | | | | |
| | | Frontier Emerging Markets Portfolio
Institutional Class I | |
| | | 2021 | | | 2020 | | | 2019 | | | 2018 | | | 2017 | |
Net asset value, beginning of year | | $ | 6.92 | | | $ | 7.80 | | | $ | 7.62 | | | $ | 8.50 | | | $ | 7.35 | |
Increase (Decrease) in Net Assets from Operations | | | | | | | | | | | | | | | | | | | | |
Net investment income(1) | | | 0.06 | | | | 0.10 | | | | 0.14 | | | | 0.11 | | | | 0.05 | |
Net realized and unrealized gain (loss) on investments and foreign currency-related transactions | | | 2.12 | | | | (0.82 | ) | | | 0.14 | | | | (0.82 | ) | | | 1.17 | |
Net increase (decrease) from investment operations | | | 2.18 | | | | (0.72 | ) | | | 0.28 | | | | (0.71 | ) | | | 1.22 | |
Distributions to Shareholders from: | | | | | | | | | | | | | | | | | | | | |
Net investment income | | | (0.13 | ) | | | (0.16 | ) | | | (0.10 | ) | | | (0.17 | ) | | | (0.07 | ) |
Net asset value, end of year | | $ | 8.97 | | | $ | 6.92 | | | $ | 7.80 | | | $ | 7.62 | | | $ | 8.50 | |
Total Return | | | 31.74 | % | | | (9.50 | )% | | | 3.59 | % | | | (8.47 | )% | | | 16.82 | % |
Ratios/Supplemental Data: | | | | | | | | | | | | | | | | | | | | |
Net assets, end of year (000’s) | | $ | 96,905 | | | $ | 73,376 | | | $ | 144,742 | | | $ | 220,367 | | | $ | 266,844 | |
Expenses to average net assets | | | 1.64 | % | | | 1.68 | % | | | 1.63 | % | | | 1.62 | % | | | 1.71 | % |
Expenses to average net assets (net of fees waived/reimbursed) | | | 1.64 | % | | | 1.68 | % | | | 1.63 | % | | | 1.62 | % | | | 1.71 | % |
Net investment income to average net assets | | | 0.75 | % | | | 1.44 | % | | | 1.72 | % | | | 1.24 | % | | | 0.69 | % |
Portfolio turnover rate | | | 30 | % | | | 21 | % | | | 31 | % | | | 20 | % | | | 28 | % |
| (1) | Net investment income per share was calculated using the average shares outstanding method. |
See Notes to Financial Statements
65
Harding, Loevner Funds, Inc.
Financial Highlights (continued)
For the Fiscal Years Ended October 31
| | | | | | | | | | | | | | | | | | | | |
| | | Frontier Emerging Markets Portfolio Institutional Class II | |
| | | 2021 | | | 2020 | | | 2019 | | | 2018 | | | 2017(1)(2) | |
Net asset value, beginning of year | | $ | 6.95 | | | $ | 7.82 | | | $ | 7.63 | | | $ | 8.50 | | | $ | 7.43 | |
Increase (Decrease) in Net Assets from Operations | | | | | | | | | | | | | | | | | | | | |
Net investment income(3) | | | 0.09 | | | | 0.14 | | | | 0.17 | | | | 0.14 | | | | 0.08 | |
Net realized and unrealized gain (loss) on investments and foreign currency-related transactions | | | 2.13 | | | | (0.84 | ) | | | 0.13 | | | | (0.83 | ) | | | 0.99 | |
Net increase (decrease) from investment operations | | | 2.22 | | | | (0.70 | ) | | | 0.30 | | | | (0.69 | ) | | | 1.07 | |
Distributions to Shareholders from: | | | | | | | | | | | | | | | | | | | | |
Net investment income | | | (0.14 | ) | | | (0.17 | ) | | | (0.11 | ) | | | (0.18 | ) | | | — | |
Net asset value, end of year | | $ | 9.03 | | | $ | 6.95 | | | $ | 7.82 | | | $ | 7.63 | | | $ | 8.50 | |
Total Return | | | 32.18 | % | | | (9.26 | )% | | | 4.01 | % | | | (8.31 | )% | | | 14.40 | %(A) |
Ratios/Supplemental Data: | | | | | | | | | | | | | | | | | | | | |
Net assets, end of year (000’s) | | $ | 117,689 | | | $ | 116,911 | | | $ | 128,742 | | | $ | 163,794 | | | $ | 166,698 | |
Expenses to average net assets | | | 1.55 | % | | | 1.60 | % | | | 1.55 | % | | | 1.56 | % | | | 1.58 | %(B) |
Expenses to average net assets (net of fees waived/reimbursed) | | | 1.35 | % | | | 1.35 | % | | | 1.35 | % | | | 1.35 | % | | | 1.35 | %(B) |
Net investment income to average net assets | | | 1.05 | % | | | 1.95 | % | | | 2.19 | % | | | 1.51 | % | | | 1.47 | %(B) |
Portfolio turnover rate | | | 30 | % | | | 21 | % | | | 31 | % | | | 20 | % | | | 28 | %(A) |
| (1) | For the period from March 1, 2017 (commencement of class operations) through October 31, 2017. |
| (2) | All per share amounts and net asset values have been adjusted as a result of the share dividend effected after the close of business on December 1, 2017. |
| (3) | Net investment income per share was calculated using the average shares outstanding method. |
See Notes to Financial Statements
66
Harding, Loevner Funds, Inc.
Financial Highlights (continued)
For the Fiscal Years Ended October 31
| | | | | | | | | | | | | | | | | | | | |
| | | Frontier Emerging Markets Portfolio
Investor Class | |
| | | 2021 | | | 2020 | | | 2019 | | | 2018 | | | 2017 | |
Net asset value, beginning of year | | $ | 6.88 | | | $ | 7.75 | | | $ | 7.57 | | | $ | 8.43 | | | $ | 7.28 | |
Increase (Decrease) in Net Assets from Operations | | | | | | | | | | | | | | | | | | | | |
Net investment income (loss)(1) | | | 0.03 | | | | 0.08 | | | | 0.11 | | | | 0.07 | | | | 0.04 | |
Net realized and unrealized gain (loss) on investments and foreign currency-related transactions | | | 2.11 | | | | (0.83 | ) | | | 0.13 | | | | (0.79 | ) | | | 1.15 | |
Net increase (decrease) from investment operations | | | 2.14 | | | | (0.75 | ) | | | 0.24 | | | | (0.72 | ) | | | 1.19 | |
Distributions to Shareholders from: | | | | | | | | | | | | | | | | | | | | |
Net investment income | | | (0.10 | ) | | | (0.12 | ) | | | (0.06 | ) | | | (0.14 | ) | | | (0.04 | ) |
Net asset value, end of year | | $ | 8.92 | | | $ | 6.88 | | | $ | 7.75 | | | $ | 7.57 | | | $ | 8.43 | |
Total Return | | | 31.14 | % | | | (9.70 | )% | | | 3.24 | % | | | (8.75 | )% | | | 16.40 | % |
Ratios/Supplemental Data: | | | | | | | | | | | | | | | | | | | | |
Net assets, end of year (000’s) | | $ | 9,542 | | | $ | 10,327 | | | $ | 20,560 | | | $ | 25,388 | | | $ | 30,981 | |
Expenses to average net assets | | | 2.14 | % | | | 2.12 | % | | | 2.00 | % | | | 2.06 | % | | | 2.13 | % |
Expenses to average net assets (net of fees waived/reimbursed) | | | 2.00 | % | | | 2.00 | % | | | 2.00 | % | | | 2.00 | % | | | 2.00 | % |
Net investment income to average net assets | | | 0.35 | % | | | 1.17 | % | | | 1.38 | % | | | 0.87 | % | | | 0.48 | % |
Portfolio turnover rate | | | 30 | % | | | 21 | % | | | 31 | % | | | 20 | % | | | 28 | % |
| (1) | Net investment income per share was calculated using the average shares outstanding method. |
See Notes to Financial Statements
67
Harding, Loevner Funds, Inc.
Financial Highlights (continued)
For the Fiscal Years Ended October 31
| | | | | | | | | | | | | | | | | | | | |
| | | Global Equity Research Portfolio Institutional Class | |
| | | 2021 | | | 2020 | | | 2019 | | | 2018 | | | 2017(1) | |
Net asset value, beginning of year | | $ | 12.76 | | | $ | 12.57 | | | $ | 12.06 | | | $ | 12.23 | | | $ | 10.00 | |
Increase (Decrease) in Net Assets from Operations | | | | | | | | | | | | | | | | | | | | |
Net investment income(2) | | | 0.10 | | | | 0.10 | | | | 0.14 | | | | 0.10 | | | | 0.08 | |
Net realized and unrealized gain (loss) on investments and foreign currency-related transactions | | | 4.11 | | | | 0.78 | | | | 1.40 | | | | 0.23 | | | | 2.15 | |
Net increase (decrease) from investment operations | | | 4.21 | | | | 0.88 | | | | 1.54 | | | | 0.33 | | | | 2.23 | |
Distributions to Shareholders from: | | | | | | | | | | | | | | | | | | | | |
Net investment income | | | (0.09 | ) | | | (0.15 | ) | | | (0.09 | ) | | | (0.18 | ) | | | — | |
Net realized gain from investments | | | (0.29 | ) | | | (0.54 | ) | | | (0.94 | ) | | | (0.32 | ) | | | — | |
Total distributions | | | (0.38 | ) | | | (0.69 | ) | | | (1.03 | ) | | | (0.50 | ) | | | — | |
Net asset value, end of year | | $ | 16.59 | | | $ | 12.76 | | | $ | 12.57 | | | $ | 12.06 | | | $ | 12.23 | |
Total Return | | | 33.45 | % | | | 7.15 | % | | | 14.36 | % | | | 2.74 | % | | | 22.30 | %(A) |
Ratios/Supplemental Data: | | | | | | | | | | | | | | | | | | | | |
Net assets, end of year (000’s) | | $ | 9,856 | | | $ | 7,387 | | | $ | 6,895 | | | $ | 5,452 | | | $ | 5,308 | |
Expenses to average net assets | | | 1.75 | % | | | 2.04 | % | | | 1.96 | % | | | 2.64 | % | | | 3.49 | %(B) |
Expenses to average net assets (net of fees waived/reimbursed) | | | 0.80 | % | | | 0.80 | % | | | 0.83 | % | | | 0.90 | % | | | 0.90 | %(B) |
Net investment income to average net assets | | | 0.67 | % | | | 0.80 | % | | | 1.18 | % | | | 0.76 | % | | | 0.80 | %(B) |
Portfolio turnover rate | | | 39 | % | | | 44 | % | | | 44 | % | | | 45 | % | | | 36 | %(A) |
| (1) | For the period from December 19, 2016 (commencement of class operations) through October 31, 2017. |
| (2) | Net investment income per share was calculated using the average shares outstanding method. |
See Notes to Financial Statements
68
Harding, Loevner Funds, Inc.
Financial Highlights (continued)
For the Fiscal Years Ended October 31
| | | | | | | | | | | | | | | | | | | | |
| | | International Equity Research Portfolio
Institutional Class | |
| | | 2021 | | | 2020 | | | 2019 | | | 2018 | | | 2017 | |
Net asset value, beginning of year | | $ | 12.01 | | | $ | 12.03 | | | $ | 11.59 | | | $ | 13.11 | | | $ | 11.10 | |
Increase (Decrease) in Net Assets from Operations | | | | | | | | | | | | | | | | | | | | |
Net investment income(1) | | | 0.14 | | | | 0.14 | | | | 0.18 | | | | 0.14 | | | | 0.12 | |
Net realized and unrealized gain (loss) on investments and foreign currency-related transactions | | | 3.03 | | | | 0.07 | | | | 1.17 | | | | (0.93 | ) | | | 2.26 | |
Net increase (decrease) from investment operations | | | 3.17 | | | | 0.21 | | | | 1.35 | | | | (0.79 | ) | | | 2.38 | |
Distributions to Shareholders from: | | | | | | | | | | | | | | | | | | | | |
Net investment income | | | (0.15 | ) | | | (0.14 | ) | | | (0.13 | ) | | | (0.14 | ) | | | (0.17 | ) |
Net realized gain from investments | | | (0.32 | ) | | | (0.09 | ) | | | (0.78 | ) | | | (0.59 | ) | | | (0.20 | ) |
Total distributions | | | (0.47 | ) | | | (0.23 | ) | | | (0.91 | ) | | | (0.73 | ) | | | (0.37 | ) |
Net asset value, end of year | | $ | 14.71 | | | $ | 12.01 | | | $ | 12.03 | | | $ | 11.59 | | | $ | 13.11 | |
Total Return | | | 26.76 | % | | | 1.73 | % | | | 12.93 | % | | | (6.43 | )% | | | 22.26 | % |
Ratios/Supplemental Data: | | | | | | | | | | | | | | | | | | | | |
Net assets, end of year (000’s) | | $ | 15,295 | | | $ | 12,494 | | | $ | 19,458 | | | $ | 9,305 | | | $ | 9,479 | |
Expenses to average net assets | | | 1.45 | % | | | 1.40 | % | | | 1.42 | % | | | 1.78 | % | | | 2.26 | % |
Expenses to average net assets (net of fees waived/reimbursed) | | | 0.75 | % | | | 0.75 | % | | | 0.79 | % | | | 0.90 | % | | | 0.90 | % |
Net investment income to average net assets | | | 0.99 | % | | | 1.20 | % | | | 1.62 | % | | | 1.07 | % | | | 0.99 | % |
Portfolio turnover rate | | | 38 | % | | | 51 | % | | | 44 | % | | | 43 | % | | | 55 | % |
| (1) | Net investment income per share was calculated using the average shares outstanding method. |
See Notes to Financial Statements
69
Harding, Loevner Funds, Inc.
Financial Highlights (continued)
For the Fiscal Years Ended October 31
| | | | | | | | | | | | | | | | | | | | |
| | | Emerging Markets Research Portfolio
Institutional Class | |
| | | 2021 | | | 2020 | | | 2019 | | | 2018 | | | 2017(1) | |
Net asset value, beginning of year | | $ | 11.21 | | | $ | 11.42 | | | $ | 10.82 | | | $ | 13.01 | | | $ | 10.00 | |
Increase (Decrease) in Net Assets from Operations | | | | | | | | | | | | | | | | | | | | |
Net investment income(2) | | | 0.10 | | | | 0.09 | | | | 0.15 | | | | 0.12 | | | | 0.10 | |
Net realized and unrealized gain (loss) on investments and foreign currency-related transactions | | | 2.04 | | | | 0.17 | | | | 1.35 | | | | (1.34 | ) | | | 2.91 | |
Net increase (decrease) from investment operations | | | 2.14 | | | | 0.26 | | | | 1.50 | | | | (1.22 | ) | | | 3.01 | |
Distributions to Shareholders from: | | | | | | | | | | | | | | | | | | | | |
Net investment income | | | (0.07 | ) | | | (0.14 | ) | | | (0.09 | ) | | | (0.23 | ) | | | — | |
Net realized gain from investments | | | (0.13 | ) | | | (0.33 | ) | | | (0.81 | ) | | | (0.74 | ) | | | — | |
Total distributions | | | (0.20 | ) | | | (0.47 | ) | | | (0.90 | ) | | | (0.97 | ) | | | — | |
Net asset value, end of year | | $ | 13.15 | | | $ | 11.21 | | | $ | 11.42 | | | $ | 10.82 | | | $ | 13.01 | |
Total Return | | | 19.18 | % | | | 2.19 | % | | | 15.05 | % | | | (10.24 | )% | | | 30.10 | %(A) |
Ratios/Supplemental Data: | | | | | | | | | | | | | | | | | | | | |
Net assets, end of year (000’s) | | $ | 9,065 | | | $ | 7,367 | | | $ | 7,198 | | | $ | 5,702 | | | $ | 5,880 | |
Expenses to average net assets | | | 2.30 | % | | | 2.40 | % | | | 2.29 | % | | | 2.90 | % | | | 3.72 | %(B) |
Expenses to average net assets (net of fees waived/reimbursed) | | | 1.15 | % | | | 1.15 | % | | | 1.19 | % | | | 1.30 | % | | | 1.30 | %(B) |
Net investment income to average net assets | | | 0.76 | % | | | 0.83 | % | | | 1.35 | % | | | 0.93 | % | | | 1.04 | %(B) |
Portfolio turnover rate | | | 45 | % | | | 67 | % | | | 58 | % | | | 55 | % | | | 46 | %(A) |
| (1) | For the period from December 19, 2016 (commencement of class operations) through October 31, 2017. |
| (2) | Net investment income per share was calculated using the average shares outstanding method. |
See Notes to Financial Statements
70
Harding, Loevner Funds, Inc.
Financial Highlights (continued)
For the Fiscal Years Ended October 31
| | | | |
| | | Chinese Equity
Portfolio
Institutional
Class | |
| | | 2021(1) | |
Net asset value, beginning of year | | $ | 10.00 | |
Increase (Decrease) in Net Assets from Operations | | | | |
Net investment income (loss)(2) | | | (0.02 | ) |
Net realized and unrealized gain (loss) on investments and foreign currency-related transactions | | | (0.62 | ) |
Net increase (decrease) from investment operations | | | (0.64 | ) |
Distributions to Shareholders from: | | | | |
Net investment income | | | — | |
Net realized gain from investments | | | — | |
Net asset value, end of year | | $ | 9.36 | |
Total Return | | | (6.40 | )%(A) |
Ratios/Supplemental Data: | | | | |
Net assets, end of year (000’s) | | $ | 3,942 | |
Expenses to average net assets | | | 7.00 | %(B) |
Expenses to average net assets (net of fees waived/reimbursed) | | | 1.15 | %(B) |
Net investment income (loss) to average net assets | | | (0.23 | )%(B) |
Portfolio turnover rate | | | 17 | %(A) |
| (1) | For the period from December 16, 2020 (commencement of operations) through October 31, 2021. |
| (2) | Net investment income per share was calculated using the average shares outstanding method. |
See Notes to Financial Statements
71
Harding, Loevner Funds, Inc.
Notes to Financial Statements
October 31, 2021
1. Organization
Harding, Loevner Funds, Inc. (the “Fund”) was organized as a Maryland corporation on July 31, 1996, and is registered under the Investment Company Act of 1940, as amended (the “1940 Act”), as an open-end management investment company. The Fund currently has nine separate diversified Portfolios and one non-diversified Portfolio, all of which were active as of October 31, 2021 (individually, a “Portfolio”, collectively, the “Portfolios”). The Fund is managed by Harding Loevner LP (the “Investment Adviser”).
| | | | |
| Portfolio | | Inception Date | | Investment Objective |
Global Equity Portfolio (“Global Equity”) | | Institutional Class: November 3, 2009 Institutional Class Z: August 1, 2017 Advisor Class: December 1, 1996 | | to seek long-term capital appreciation through investments in equity securities of companies based both inside and outside the United States |
International Equity Portfolio (“International Equity”) | | Institutional Class: May 11, 1994* Institutional Class Z: July 17, 2017 Investor Class: September 30, 2005 | | to seek long-term capital appreciation through investments in equity securities of companies based outside the United States |
International Small Companies Portfolio (“International Small Companies”) | | Institutional Class: June 30, 2011 Investor Class: March 26, 2007 | | to seek long-term capital appreciation through investments in equity securities of small companies based outside the United States |
Institutional Emerging Markets Portfolio** (“Institutional Emerging Markets”) | | Institutional Class (Formerly Class I): October 17, 2005 Institutional Class Z (Formerly Class II): March 5, 2014 | | to seek long-term capital appreciation through investments in equity securities of companies based in emerging markets |
Emerging Markets Portfolio** (“Emerging Markets”) | | Advisor Class: November 9, 1998 | | to seek long-term capital appreciation through investments in equity securities of companies based in emerging markets |
Frontier Emerging Markets Portfolio (“Frontier Emerging Markets”) | | Institutional Class I: May 27, 2008 Institutional Class II: March 1, 2017 Investor Class: December 31, 2010 | | to seek long-term capital appreciation through investments in equity securities of companies based in frontier and smaller emerging markets |
Global Equity Research Portfolio (“Global Equity Research”) | | Institutional Class: December 19, 2016 | | to seek long-term capital appreciation through investments in equity securities of companies based both inside and outside the United States |
International Equity Research Portfolio (“International Equity Research”) | | Institutional Class: December 17, 2015 | | to seek long-term capital appreciation through investments in equity securities of companies based outside the United States |
Emerging Markets Research Portfolio (“Emerging Markets Research”) | | Institutional Class: December 19, 2016 | | to seek long-term capital appreciation through investments in equity securities of companies based in emerging markets |
Chinese Equity Portfolio (“Chinese Equity”) | | Institutional Class: December 16, 2020 | | to seek long-term capital appreciation through investments in equity securities of Chinese companies |
* The International Equity Portfolio is the successor to the HLM International Equity Portfolio of AMT Capital Fund, Inc., pursuant to a reorganization that took place on October 31, 1996. Information for periods prior to October 31, 1996, is historical information for the predecessor portfolio.
** Effective March 1, 2019, the Institutional Emerging Markets and Emerging Markets Portfolios’ shares are generally available for purchase by new and existing shareholders, subject to certain limitations that may apply at the Fund’s discretion.
2. Summary of Significant Accounting Policies
The accounting policies of the Fund are in conformity with accounting principles generally accepted in the United States (“GAAP”) for investment companies. Accordingly, the Fund follows accounting and reporting guidance under Financial Accounting Standards Board (“FASB”) Accounting Standards Codification Topic 946, “Financial Services - Investment Companies”. The following is a summary of the Fund’s significant accounting policies:
72
Harding, Loevner Funds, Inc.
Notes to Financial Statements (continued)
October 31, 2021
2. Summary of Significant Accounting Policies (continued)
Estimates
The preparation of financial statements in accordance with GAAP requires management to make estimates and assumptions that affect the reported amounts and disclosures in the financial statements. Actual results could differ from those estimates.
Valuation
The Board of Directors of the Fund (the “Board” or the “Directors”) has adopted procedures (“Procedures”) to govern the valuation of the securities held by each Portfolio of the Fund in accordance with the 1940 Act. The Procedures incorporate principles set forth in relevant pronouncements of the Securities and Exchange Commission (“SEC”) and its staff, including guidance on the obligations of the Portfolios and their Directors to determine, in good faith, the fair value of the Portfolios’ securities when market quotations are not readily available.
In determining a Portfolio’s net asset value per share (“NAV”), each equity security traded on a securities exchange, including the NASDAQ Stock Market, and over-the-counter securities, are first valued at the closing price on the exchange or market designated by the Fund’s accounting agent as the principal exchange (each, a “principal exchange”). The closing price provided by the Fund’s accounting agent for a principal exchange may differ from the price quoted elsewhere and may represent information such as last sales price, an official closing price, a closing auction price or other information, depending on exchange or market convention. Shares of open-end mutual funds including money market funds are valued at NAV. Such securities are typically categorized as “Level 1” pursuant to the hierarchy described below.
Since trading in many foreign securities is normally completed before the time at which a Portfolio calculates its NAV, the effect on the value of such securities held by a Portfolio of events that occur between the close of trading in the security and the time at which the Portfolio prices its securities would not be reflected in the Portfolio’s calculation of its NAV if foreign securities were generally valued at their closing prices. To address this issue, the Board has approved the daily use of independently provided quantitative models that may adjust the closing prices of certain foreign equity securities based on information that becomes available after the foreign market closes, through the application of an adjustment factor to such securities’ closing price. Adjustment factors may be greater than, less than, or equal to 1. Thus, use of these quantitative models could cause a Portfolio to value a security higher, lower or equal to its closing market price, which in turn could cause the Portfolio’s NAV per share to differ significantly from that which would have been calculated using closing market prices. The use of these quantitative models is also intended to decrease the opportunities for persons to engage in ‘‘time zone arbitrage,’’ i.e., trading intended to take advantage of stale closing prices in foreign markets that could affect the NAV of the Portfolios. Securities subjected to an adjustment factor due to the use of these quantitative models are not specifically designated on the Portfolios’ Portfolio of Investments as being “fair valued”. Securities with an adjustment factor greater than or less than 1, which are absent the use of significant unobservable inputs into their valuation, are categorized as “Level 2” and securities with an adjustment factor equal to 1, which are absent the use of significant unobservable inputs into their valuation, are categorized as “Level 1” pursuant to the hierarchy described below.
Any securities for which market quotations are not readily available or for which available prices are deemed unreliable are priced by the Investment Adviser at “fair value as determined in good faith”, in accordance with the Procedures. Such securities are identified on the Portfolios’ Portfolio of Investments as securities valued at “fair value as determined in good faith” and absent the use of significant unobservable inputs into their valuation, such securities would be categorized as “Level 2” pursuant to the hierarchy described below.
GAAP has established a hierarchy for NAV determination purposes in which various inputs are used in determining the value of each Portfolio’s assets or liabilities. GAAP defines fair value as the price that the Portfolio would receive upon selling an investment in a timely transaction to an independent buyer in the principal or most advantageous market of the investment. GAAP establishes a three-tier hierarchy to maximize the use of observable market data and minimize the use of unobservable inputs and to establish classification of fair value measurements for disclosure purposes. Inputs may be observable or unobservable and refer broadly to the assumptions that market participants would use in pricing the asset or liability including assumptions about risk. Such risks include the inherent risk in a particular valuation technique which is used to measure fair value. This may include the quantitative models and/or the inputs to the quantitative models used in the valuation technique described above. Observable inputs are inputs that reflect the assumptions market participants would use in pricing the asset or liability developed based on market data obtained from sources independent of the reporting entity. Unobservable inputs are inputs that reflect the reporting entity’s own assumptions about the assumptions market participants would use in pricing the asset or liability developed based on the best information available in the circumstances. The three-tier hierarchy of inputs is summarized in the three broad levels listed below.
73
Harding, Loevner Funds, Inc.
Notes to Financial Statements (continued)
October 31, 2021
2. Summary of Significant Accounting Policies (continued)
| | |
| Level 1 | | unadjusted quoted prices in active markets for identical assets |
| Level 2 | | other significant observable inputs (including quoted prices for similar investments, interest rates, prepayment speeds, credit risk, etc.) |
| Level 3 | | significant unobservable inputs (including the Portfolio’s own assumptions in determining the fair value of investments) |
GAAP provides additional guidance for estimating fair value when the volume and level of activity for the asset or liability have significantly decreased as well as guidance on identifying circumstances that indicate when a transaction is not orderly.
The following is a summary of the Portfolios’ investments classified by Level 1, Level 2 and Level 3 and security type as of October 31, 2021. Please refer to each Portfolio’s Portfolio of Investments to view individual securities classified by industry type and country.
| | | | | | | | | | | | | | | | |
| | | Unadjusted Quoted Prices | | | Other Significant | | | Significant | | | | |
| | | in Active Markets for | | | Observable Inputs | | | Unobservable Inputs | | | | |
| Portfolio | | Identical Assets (Level 1) | | | (Level 2) | | | (Level 3) | | | Total | |
| |
Global Equity | | | | | | | | | | | | | | | | |
Common Stocks | | $ | 1,290,519,764 | | | $ | 464,465,277 | | | $ | — | | | $ | 1,754,985,041 | |
Short Term Investments | | | 54,785,140 | | | | — | | | | — | | | | 54,785,140 | |
| |
Total Investments | | $ | 1,345,304,904 | | | $ | 464,465,277 | | | $ | — | | | $ | 1,809,770,181 | |
| |
International Equity | | | | | | | | | | | | | | | | |
Common Stocks | | $ | 5,075,565,480 | | | $ | 15,842,097,923 | | | $ | — | | | $ | 20,917,663,403 | |
Preferred Stocks | | | 217,409,738 | | | | 108,850,534 | | | | — | | | | 326,260,272 | |
Short Term Investments | | | 626,589,387 | | | | — | | | | — | | | | 626,589,387 | |
| |
Total Investments | | $ | 5,919,564,605 | | | $ | 15,950,948,457 | | | $ | — | | | $ | 21,870,513,062 | |
| |
International Small Companies | | | | | | | | | | | | | | | | |
Common Stocks | | $ | 52,328,094 | | | $ | 531,255,096 | | | $ | — | | | $ | 583,583,190 | |
Short Term Investments | | | 16,367,527 | | | | — | | | | — | | | | 16,367,527 | |
| |
Total Investments | | $ | 68,695,621 | | | $ | 531,255,096 | | | $ | — | | | $ | 599,950,717 | |
| |
Institutional Emerging Markets | | | | | | | | | | | | | | | | |
Common Stocks | | $ | 1,558,654,668 | | | $ | 4,648,698,676 | | | $ | — | | | $ | 6,207,353,344 | |
Preferred Stocks | | | 119,219,669 | | | | 20,416,416 | | | | — | | | | 139,636,085 | |
Rights | | | 844 | | | | — | | | | — | | | | 844 | |
Short Term Investments | | | 164,486,140 | | | | — | | | | — | | | | 164,486,140 | |
| |
Total Investments | | $ | 1,842,361,321 | | | $ | 4,669,115,092 | | | $ | — | | | $ | 6,511,476,413 | |
| |
Emerging Markets | | | | | | | | | | | | | | | | |
Common Stocks | | $ | 920,231,859 | | | $ | 2,748,882,261 | | | $ | — | | | $ | 3,669,114,120 | |
Preferred Stocks | | | 70,417,463 | | | | 11,971,900 | | | | — | | | | 82,389,363 | |
Rights | | | 496 | | | | — | | | | — | | | | 496 | |
Short Term Investments | | | 72,004,554 | | | | — | | | | — | | | | 72,004,554 | |
| |
Total Investments | | $ | 1,062,654,372 | | | $ | 2,760,854,161 | | | $ | — | | | $ | 3,823,508,533 | |
| |
Frontier Emerging Markets | | | | | | | | | | | | | | | | |
Common Stocks | | $ | 42,718,114 | | | $ | 172,260,173 | | | $ | — | | | $ | 214,978,287 | |
Preferred Stocks | | | 6,585,250 | | | | — | | | | — | | | | 6,585,250 | |
Short Term Investments | | | 2,557,487 | | | | — | | | | — | | | | 2,557,487 | |
| |
Total Investments | | $ | 51,860,851 | | | $ | 172,260,173 | | | $ | — | | | $ | 224,121,024 | |
| |
74
Harding, Loevner Funds, Inc.
Notes to Financial Statements (continued)
October 31, 2021
2. Summary of Significant Accounting Policies (continued)
| | | | | | | | | | | | | | | | |
| | | Unadjusted Quoted Prices | | | Other Significant | | | Significant | | | | |
| | | in Active Markets for | | | Observable Inputs | | | Unobservable Inputs | | | | |
| Portfolio | | Identical Assets (Level 1) | | | (Level 2) | | | (Level 3) | | | Total | |
| |
Global Equity Research | | | | | | | | | | | | | | | | |
Common Stocks | | $ | 4,677,051 | | | $ | 4,986,630 | | | $ | — | | | $ | 9,663,681 | |
Preferred Stocks | | | 26,667 | | | | 61,558 | | | | — | | | | 88,225 | |
Short Term Investments | | | 93,132 | | | | — | | | | — | | | | 93,132 | |
| |
Total Investments | | $ | 4,796,850 | | | $ | 5,048,188 | | | $ | — | | | $ | 9,845,038 | |
| |
International Equity Research | | | | | | | | | | | | | | | | |
Common Stocks | | $ | 1,964,368 | | | $ | 12,769,146 | | | $ | — | | | $ | 14,733,514 | |
Preferred Stocks | | | 83,894 | | | | 217,243 | | | | — | | | | 301,137 | |
Short Term Investments | | | 232,005 | | | | — | | | | — | | | | 232,005 | |
| |
Total Investments | | $ | 2,280,267 | | | $ | 12,986,389 | | | $ | — | | | $ | 15,266,656 | |
| |
Emerging Markets Research | | | | | | | | | | | | | | | | |
Common Stocks | | $ | 1,876,342 | | | $ | 6,805,827 | | | $ | — | | | $ | 8,682,169 | |
Preferred Stocks | | | 74,990 | | | | 158,395 | | | | — | | | | 233,385 | |
Short Term Investments | | | 91,914 | | | | — | | | | — | | | | 91,914 | |
| |
Total Investments | | $ | 2,043,246 | | | $ | 6,964,222 | | | $ | — | | | $ | 9,007,468 | |
| |
Chinese Equity | | | | | | | | | | | | | | | | |
Common Stocks | | $ | — | | | $ | 3,771,153 | | | $ | — | | | $ | 3,771,153 | |
Short Term Investments | | | 115,797 | | | | — | | | | — | | | | 115,797 | |
| |
Total Investments | | $ | 115,797 | | | $ | 3,771,153 | | | $ | — | | | $ | 3,886,950 | |
| |
As of October 31, 2021, there were no Level 3 investments held within the Portfolios.
Securities
For financial reporting purposes, all securities transactions are recorded on a trade date basis, as of the last business day in the reporting period. Throughout the reporting period, securities transactions are typically accounted for on a trade date – plus one business day basis. Interest income and expenses are recorded on an accrual basis. Dividend income is recorded on the ex-dividend date (except for certain foreign dividends that may be recorded as soon as the Portfolio is informed of such dividends). The Portfolios use the specific identification method for determining realized gains or losses from sales of securities.
Dividends to Shareholders
It is the policy of the Portfolios to declare dividends from net investment income annually. Net short-term and long-term capital gains distributions for the Portfolios, if any, are also normally distributed on an annual basis.
Dividends from net investment income and distributions from net realized gains from investment transactions have been determined in accordance with income tax regulations and may differ from net investment income and realized gains recorded by the Portfolios for financial reporting purposes. Differences result primarily from foreign currency transactions and timing differences related to recognition of income, and gains and losses from investment transactions. In general, to the extent that any differences, which are permanent in nature, result in over distributions to shareholders, the amount of the over distribution is reclassified within the capital accounts based on its federal tax basis treatment and may be reported as return of capital. Temporary differences do not require reclassification.
75
Harding, Loevner Funds, Inc.
Notes to Financial Statements (continued)
October 31, 2021
2. Summary of Significant Accounting Policies (continued)
Currency Translation
Assets and liabilities denominated in foreign currencies and commitments under forward foreign currency exchange contracts are translated into U.S. dollars at the mean of the quoted bid and asked prices of such currencies against the U.S. dollar. Purchases and sales of the Portfolios’ securities are translated at the rates of exchange prevailing when such securities were acquired or sold. Income and expenses are translated at exchange rates prevailing when accrued. The Portfolios do not isolate that portion of the results of operations resulting from changes in foreign exchange rates on investments from the fluctuations arising from changes in market prices of securities held. Such fluctuations are included with the “Net realized gain (loss) on investment transactions” and “Change in unrealized appreciation (depreciation) on investments” on the Statements of Operations.
Net realized gains and losses from foreign currency-related transactions arise from sales of foreign currency, currency gains or losses realized between the trade and settlement dates on securities transactions, and the difference between the amounts of dividends, interest, and foreign withholding taxes recorded on the Portfolios’ books, and the U.S. dollar equivalent of the amounts actually received or paid. Net unrealized appreciation or depreciation on translation of assets and liabilities denominated in foreign currencies arise from changes in the value of assets and liabilities other than investments in securities at the period end, resulting from changes in the exchange rates.
Expenses
Most expenses of the Fund can be directly attributed to a particular Portfolio. Expenses which cannot be directly attributed are apportioned among the Portfolios based upon relative net assets or other appropriate measures. If an expense is incurred at the Portfolio level, it is generally apportioned among the classes of that Portfolio based upon relative net assets of each respective class. Certain expenses are incurred at the class level and charged only to that particular class. These expenses may be class specific (i.e., distribution fees charged only to a particular class) or they may be identifiable to a particular class (i.e., the costs related to mailing shareholder reports to shareholders of a particular class).
Organization and Offering Fees
Costs incurred by the Chinese Equity Portfolio in connection with its organization were expensed as they were incurred. Costs related to the offering of shares were deferred and amortized on a straight line basis over the twelve-month period from the date of commencement of operations of the Portfolios.
Redemption Fees
Prior to February 28, 2020, the Fund had established fees on short-term redemptions to discourage frequent trading in Portfolio shares. Redemptions of Portfolio shares made within 90 days of purchase may have been subject to a redemption fee equal to 2% of the amount redeemed. For the year ended October 31, 2020 the Portfolios received the following redemption fees. These amounts are netted against “Payments for Shares Redeemed” in Note 7 - Capital Share Transactions.
| | | | | | | | | | | | |
| | | Institutional | | | Institutional | | | Institutional | |
| | | Class | | | Class I | | | Class II | |
| | | | |
| | | Year Ended | | | Year Ended | | | Year Ended | |
| | | October 31, | | | October 31, | | | October 31, | |
| Portfolio | | 2020 | | | 2020 | | | 2020 | |
| | | |
Global Equity | | $ | 18,908 | | | $ | — | | | $ | — | |
International Equity | | | 132,379 | | | | — | | | | — | |
International Small Companies | | | 974 | | | | — | | | | — | |
Institutional Emerging Markets | | | 27,951 | * | | | — | | | | — | |
Frontier Emerging Markets | | | — | | | | 1,471 | | | | — | |
| | | |
* Formerly Class I | | | | | | | | | | | | |
| | | |
| | | Investor | | | Advisor | | | Institutional | |
| | | Class | | | Class | | | Class Z | |
| | | | |
| | | Year Ended | | | Year Ended | | | Year Ended | |
| | | October 31, | | | October 31, | | | October 31, | |
| Portfolio | | 2020 | | | 2020 | | | 2020 | |
| |
| | | |
Global Equity | | $ | — | | | $ | 1,561 | | | $ | — | |
76
Harding, Loevner Funds, Inc.
Notes to Financial Statements (continued)
October 31, 2021
2. Summary of Significant Accounting Policies (continued)
| | | | | | | | | | | | |
| | | |
| | | Investor | | | Advisor | | | Institutional | |
| | | Class | | | Class | | | Class Z | |
| | | | |
| | | Year Ended | | | Year Ended | | | Year Ended | |
| | | October 31, | | | October 31, | | | October 31, | |
| Portfolio | | 2020 | | | 2020 | | | 2020 | |
| |
| | | |
International Equity | | $ | 4,924 | | | $ | — | | | $ | 26 | |
International Small Companies | | | 1,582 | | | | — | | | | — | |
Emerging Markets | | | — | | | | 36,279 | | | | — | |
Frontier Emerging Markets | | | 1,292 | | | | — | | | | — | |
Indemnifications
Under the Fund’s organizational document, its officers and Board are indemnified against certain liability arising out of the performance of their duties to the Portfolios. In the normal course of business, the Fund may enter into contracts that contain a variety of representations or that provide indemnification for certain liabilities. The Fund’s maximum exposure under these arrangements is unknown, as this would involve future claims that may be made against the Fund that have not yet occurred. However, the Fund has not had prior claims or losses pursuant to these contracts and expects the risk of loss to be remote.
3.�� Transactions with Affiliates and Significant Agreements
The Board has approved investment advisory agreements with the Investment Adviser. Advisory fees are computed daily and paid monthly based on the average daily net assets of each Portfolio. The Investment Adviser has contractually agreed to reduce its fee and/or reimburse the Portfolios for other operating expenses to the extent that aggregate expenses, excluding certain non-operating expenses, exceed certain annual rates of the average daily net assets of each class.
The following annualized advisory fees and contractual expense limits were in effect for the year ended October 31, 2021. The advisory fees are charged at the Portfolio level as a whole and expense limitations are at the class specific level.
| | | | | | | | | | | | | | | | | | | | | | | | | | | | | | | | | | | |
| Portfolio | | First $1 billion of
assets | | Next $1 billion of
assets | | Next $1 billion of
assets | | Over $3 billion of
assets | | Over $4 billion of
assets | | Over $5 billion of
assets | | Contractual
Expense Limit(a) |
Global Equity–Institutional Class | | | | 0.75% | | | | | 0.73% | | | | | 0.71% | | | | | 0.69% | | | | | 0.69% | | | | | 0.69% | | | | | 0.90% | |
Global Equity–Institutional Class Z | | | | 0.75% | | | | | 0.73% | | | | | 0.71% | | | | | 0.69% | | | | | 0.69% | | | | | 0.69% | | | | | 0.80% | |
Global Equity–Advisor Class | | | | 0.75% | | | | | 0.73% | | | | | 0.71% | | | | | 0.69% | | | | | 0.69% | | | | | 0.69% | | | | | 1.20% | |
International Equity–Institutional Class | | | | 0.75% | | | | | 0.73% | | | | | 0.71% | | | | | 0.69% | | | | | 0.67% | | | | | 0.65% | | | | | 1.00% | |
International Equity–Institutional Class Z | | | | 0.75% | | | | | 0.73% | | | | | 0.71% | | | | | 0.69% | | | | | 0.67% | | | | | 0.65% | | | | | 0.80% | |
International Equity–Investor Class | | | | 0.75% | | | | | 0.73% | | | | | 0.71% | | | | | 0.69% | | | | | 0.67% | | | | | 0.65% | | | | | 1.25% | |
International Small Companies–Institutional Class(b) | | | | 0.95% | | | | | 0.95% | | | | | 0.95% | | | | | 0.95% | | | | | 0.95% | | | | | 0.95% | | | | | 1.15% | |
International Small Companies–Investor Class(b) | | | | 0.95% | | | | | 0.95% | | | | | 0.95% | | | | | 0.95% | | | | | 0.95% | | | | | 0.95% | | | | | 1.40% | |
Institutional Emerging Markets–Institutional Class(c) | | | | 1.00% | | | | | 0.98% | | | | | 0.96% | | | | | 0.94% | | | | | 0.94% | | | | | 0.94% | | | | | 1.10% | (d),(e) |
Institutional Emerging Markets–Institutional Class Z(c) | | | | 1.00% | | | | | 0.98% | | | | | 0.96% | | | | | 0.94% | | | | | 0.94% | | | | | 0.94% | | | | | 1.00% | (d),(f) |
Emerging Markets–Advisor Class(c) | | | | 1.00% | | | | | 0.98% | | | | | 0.96% | | | | | 0.94% | | | | | 0.94% | | | | | 0.94% | | | | | 1.30% | (d),(g) |
Frontier Emerging Markets–Institutional Class I | | | | 1.35% | | | | | 1.35% | | | | | 1.35% | | | | | 1.35% | | | | | 1.35% | | | | | 1.35% | | | | | 1.75% | |
Frontier Emerging Markets–Institutional Class II | | | | 1.35% | | | | | 1.35% | | | | | 1.35% | | | | | 1.35% | | | | | 1.35% | | | | | 1.35% | | | | | 1.35% | |
Frontier Emerging Markets–Investor Class | | | | 1.35% | | | | | 1.35% | | | | | 1.35% | | | | | 1.35% | | | | | 1.35% | | | | | 1.35% | | | | | 2.00% | |
Global Equity Research–Institutional Class | | | | 0.70% | | | | | 0.70% | | | | | 0.70% | | | | | 0.70% | | | | | 0.70% | | | | | 0.70% | | | | | 0.80% | |
International Equity Research–Institutional Class | | | | 0.70% | | | | | 0.70% | | | | | 0.70% | | | | | 0.70% | | | | | 0.70% | | | | | 0.70% | | | | | 0.75% | |
Emerging Markets Research–Institutional Class | | | | 1.00% | | | | | 1.00% | | | | | 1.00% | | | | | 1.00% | | | | | 1.00% | | | | | 1.00% | | | | | 1.15% | |
Chinese Equity–Institutional Class | | | | 0.95% | | | | | 0.95% | | | | | 0.95% | | | | | 0.95% | | | | | 0.95% | | | | | 0.95% | | | | | 1.15% | |
77
Harding, Loevner Funds, Inc.
Notes to Financial Statements (continued)
October 31, 2021
3. Transactions with Affiliates and Significant Agreements (continued)
| (a) | Effective through February 28, 2022 for each Portfolio except Institutional Emerging Markets and Emerging Markets. |
| (b) | Prior to July 1, 2021, International Small Companies Contractual management fee was 1.00% of all assets. |
| (c) | Prior to July 1, 2021, Institutional Emerging Markets and Emerging Markets contractual management fees were 1.15% on the first $1 billion of assets, 1.13% on the next $1 billion of assets, 1.11% on the next $1 billion of assets, and 1.09% for assets over $3 billion. |
| (d) | Effective through February 28, 2023. |
| (e) | Prior to July 1, 2021, the Investment Adviser had contractually agreed to cap the expenses for the Institutional Emerging Markets Portfolio’s Institutional Class at 1.17%. |
| (f) | Prior to July 1, 2021, the Investment Adviser had contractually agreed to cap the expenses for the Institutional Emerging Markets Portfolio’s Institutional Class Z at 1.15% on the first $1 Billion of assets. |
| (g) | Prior to July 1, 2021 the Investment Adviser had contractually agreed to cap expenses for the Emerging Markets Portfolio’s Advisor Class at 1.32%. |
For the year ended October 31, 2021, the Investment Adviser waived and/or reimbursed the following amounts pursuant to the contractual expense limits described above:
| | |
| Portfolio | | Fees waived and/or reimbursed by the Investment Adviser |
Global Equity-Institutional Class Z | | $ 29,813 |
International Small Companies-Institutional Class | | 59,818 |
International Small Companies-Investor Class | | 45,666 |
Institutional Emerging Markets-Institutional Class | | 4,398,629 |
Institutional Emerging Markets-Institutional Class Z | | 472,659 |
Emerging Markets-Advisor Class | | 886,208 |
Frontier Emerging Markets-Institutional Class II | | 249,317 |
Frontier Emerging Markets-Investor Class | | 14,383 |
Global Equity Research-Institutional Class | | 87,073 |
International Equity Research-Institutional Class | | 105,857 |
Emerging Markets Research-Institutional Class | | 103,057 |
Chinese Equity-Institutional Class | | 205,365 |
The Fund has an administration agreement with The Northern Trust Company (“Northern Trust”), which provides certain accounting, clerical and bookkeeping services, Blue Sky, corporate secretarial services and assistance in the preparation and filing of tax returns and reports to shareholders and the SEC.
Northern Trust also serves as custodian of each Portfolio’s securities and cash, transfer agent, dividend disbursing agent and agent in connection with any accumulation, open-account or similar plans provided to the shareholders of the Portfolios.
Foreside Management Services, LLC provides compliance support to the Fund’s Chief Compliance Officer. Fees paid pursuant to these services are shown as “Compliance officers’ fees and expenses” on the Statements of Operations.
The Fund has adopted an Amended Plan of Distribution pursuant to Rule 12b-1 under the 1940 Act (“Distribution Plan”). Under the Distribution Plan, the Investor Class of each of the International Equity, International Small Companies and Frontier Emerging Markets Portfolios may pay underwriters, distributors, dealers or brokers a fee at an annual rate of up to 0.25% of the average daily net assets of the Portfolio’s Investor Class shares for services or expenses arising in connection with activities primarily intended to result in the sale of Investor Class shares of the Portfolios or for Shareholder Services (defined below) consistent with those described under the Shareholder Servicing Plan.
The Fund, on behalf of the Portfolios, has agreements with various financial intermediaries and “mutual fund supermarkets”, under which customers of these intermediaries may purchase and hold Portfolio shares. These intermediaries assess fees in consideration for providing certain account maintenance, recordkeeping and transactional and other shareholder services (collectively, “Shareholder Services”). With the exception of Institutional Class Z, each Portfolio or class is authorized, pursuant to a Shareholder Servicing Plan, to pay to each intermediary an annual rate of up to 0.25% of its average daily net assets attributable to that intermediary (subject to the contractual expense limits described above) for such Shareholder Services. Because of the contractual expense limits on certain Portfolios’ fees and expenses, the Investment Adviser paid a portion of the Portfolios’ share of these fees during the year ended October 31, 2021. Such payments, if any, are included in the table above under the caption “Fees waived and/or reimbursed by the Investment Adviser”.
78
Harding, Loevner Funds, Inc.
Notes to Financial Statements (continued)
October 31, 2021
3. Transactions with Affiliates and Significant Agreements (continued)
A Portfolio may purchase securities from, or sell securities to, an affiliated fund provided the affiliation is due solely to having a common investment adviser, common officers, or common Directors. For the year ended October 31, 2021, no Portfolios engaged in purchases and/or sales of securities from an affiliated portfolio in compliance with Rule 17a-7 of the 1940 Act.
4. Class Specific Expenses
The class level expenses for the year ended October 31, 2021, were as follows for each Portfolio:
| | | | | | | | | | | | | | | | | | | | |
| | | Distribution | | | State Registration | | | Printing and | | | Transfer Agent | | | Shareholder | |
| Portfolio | | Fees | | | Filing Fees | | | Postage Fees | | | Fees and Expenses | | | Servicing Fees | |
| |
| | | | | |
Global Equity–Institutional Class | | $ | — | | | $ | 35,918 | | | $ | 16,104 | | | $ | 5,925 | | | $ | 901,239 | |
| |
Global Equity–Institutional Class Z | | | — | | | | 19,938 | | | | 1,585 | | | | 1,602 | | | | — | |
| |
Global Equity–Advisor Class | | | — | | | | 18,931 | | | | 8,700 | | | | 3,053 | | | | 134,270 | |
| |
International Equity–Institutional Class | | | — | | | | 100,229 | | | | 617,953 | | | | 393,920 | | | | 14,197,154 | |
| |
International Equity–Institutional Class Z | | | — | | | | 26,929 | | | | 72,069 | | | | 17,936 | | | | — | |
| |
International Equity–Investor Class | | | 961,029 | | | | 25,078 | | | | 38,200 | | | | 20,980 | | | | 526,660 | |
| |
International Small Companies–Institutional Class | | | — | | | | 24,817 | | | | 17,715 | | | | 7,870 | | | | 315,214 | |
| |
International Small Companies–Investor Class | | | 117,246 | | | | 19,710 | | | | 3,007 | | | | 2,951 | | | | 53,709 | |
| |
Institutional Emerging Markets–Institutional Class | | | — | | | | 49,487 | | | | 259,906 | | | | 38,682 | | | | 5,294,632 | |
| |
Institutional Emerging Markets–Institutional Class Z | | | — | | | | 23,123 | | | | 11,436 | | | | 8,651 | | | | — | |
| |
Emerging Markets–Advisor Class | | | — | | | | 58,066 | | | | 357,882 | | | | 436,767 | | | | 5,990,614 | |
| |
Frontier Emerging Markets–Institutional Class I | | | — | | | | 20,065 | | | | 4,978 | | | | 1,925 | | | | 61,744 | |
| |
Frontier Emerging Markets–Institutional Class II | | | — | | | | 18,775 | | | | 104 | | | | 307 | | | | — | |
| |
Frontier Emerging Markets–Investor Class | | | 25,199 | | | | 18,940 | | | | 1,450 | | | | 1,002 | | | | 14,991 | |
| |
Global Equity Research–Institutional Class | | | — | | | | 23,192 | | | | 126 | | | | 482 | | | | — | |
| |
International Equity Research–Institutional Class | | | — | | | | 19,915 | | | | 182 | | | | 577 | | | | 7,361 | |
| |
Emerging Markets Research–Institutional Class | | | — | | | | 22,944 | | | | 104 | | | | 502 | | | | 1 | |
| |
Chinese Equity–Institutional Class* | | | — | | | | 2,041 | | | | 2,201 | | | | 746 | | | | 58 | |
| |
* For the period from December 16, 2020 (commencement of operations) through October 31, 2021.
5. Investment Transactions
Cost of purchases and proceeds from sales of investment securities, other than short-term investments, for the year ended October 31, 2021, were as follows for each Portfolio:
| | | | | | | | | | | | | | | | |
| | | Purchase Cost of | | | | | | Proceeds from Sales of | | | | |
| Portfolio | | Investment Securities | | | | | | Investment Securities | | | | |
Global Equity | | $ | 960,866,670 | | | | | | | $ | 1,022,572,110 | | | | | |
International Equity | | | 3,789,621,160 | | | | | | | | 2,663,580,322 | | | | | |
International Small Companies | | | 154,095,356 | | | | | | | | 63,782,442 | | | | | |
Institutional Emerging Markets | | | 864,780,262 | | | | | | | | 1,025,655,849 | | | | | |
Emerging Markets | | | 612,976,182 | | | | | | | | 1,341,715,211 | | | | | |
Frontier Emerging Markets | | | 65,039,839 | | | | | | | | 101,308,024 | | | | | |
Global Equity Research | | | 3,572,342 | | | | | | | | 3,506,986 | | | | | |
International Equity Research | | | 5,511,787 | | | | | | | | 5,900,604 | | | | | |
Emerging Markets Research | | | 4,163,969 | | | | | | | | 3,874,355 | | | | | |
Chinese Equity* | | | 4,765,392 | | | | | | | | 665,457 | | | | | |
* For the period from December 16, 2020 (commencement of operations) through October 31, 2021.
6. In-Kind Redemptions
During the year ended October 31, 2020, the Global Equity Portfolio delivered portfolio securities rather than cash in exchange for the redemption of shares for certain investors (in-kind redemptions). These investors received readily marketable securities that were valued on the redemption date using the same method employed in calculating the Portfolio’s NAV per share. The Global Equity Portfolio had in-kind
79
Harding, Loevner Funds, Inc.
Notes to Financial Statements (continued)
October 31, 2021
6. In-Kind Redemptions (continued)
redemptions of approximately $38,788,196. The redemption amounts are included in “Net increase (decrease) in net assets from portfolio share transactions” on the Statements of Changes in Net Assets. Net gain of approximately $17,420,766 on the securities resulting from such in-kind redemptions are included in “Net realized gain (loss) on investments and foreign currency transactions” in the Statements of Changes in Net Assets. For financial reporting purposes, these transactions are treated as sales of securities and the resulting gains and losses are recognized based on the market value of the securities on the date of the redemption. For tax purposes, no gains or losses are recognized.
7. Capital Share Transactions
Transactions in capital shares for the year ended October 31, 2021, were as follows for each Portfolio:
| | | | | | | | | | | | | | | | | | | | | | | | | | | | | | | | |
| | | | | | | | | | | | | | | | | | | | | Net | | | Net | |
| | | | | | Proceeds | | | Shares From | | | Reinvestment | | | | | | Payments | | | Increase | | | Increase | |
| | | Shares | | | From | | | Reinvested | | | of | | | Shares | | | for Shares | | | (Decrease) | | | (Decrease) | |
| | | Sold | | | Shares Sold | | | Dividends | | | Dividends | | | Redeemed | | | Redeemed | | | in Shares | | | in Net Assets | |
Global Equity | | | | | | | | | | | | | | | | | | | | | | | | | | | | | | | | |
Institutional Class | | | 2,755,173 | | | $ | 134,959,470 | | | | 1,350,884 | | | | $61,262,574 | | | | (3,594,707 | ) | | $ | (177,912,826 | ) | | | 511,350 | | | $ | 18,309,218 | |
Institutional Class Z | | | 1,253,152 | | | | 60,994,104 | | | | 296,046 | | | | 13,419,766 | | | | (1,334,691 | ) | | | (67,042,458 | ) | | | 214,507 | | | | 7,371,412 | |
Advisor Class | | | 260,555 | | | | 12,723,575 | | | | 72,150 | | | | 3,270,573 | | | | (591,279 | ) | | | (29,240,671 | ) | | | (258,574 | ) | | | (13,246,523 | ) |
International Equity | | | | | | | | | | | | | | | | | | | | | | | | | | | | | | | | |
Institutional Class | | | 135,837,628 | | | | 3,960,640,326 | | | | 3,415,990 | | | | 94,725,399 | | | | (116,226,503 | ) | | | (3,408,764,560 | ) | | | 23,027,115 | | | | 646,601,165 | |
Institutional Class Z | | | 40,762,511 | | | | 1,210,064,860 | | | | 756,652 | | | | 20,966,814 | | | | (27,234,972 | ) | | | (808,810,658 | ) | | | 14,284,191 | | | | 422,221,016 | |
Investor Class | | | 3,429,544 | | | | 101,106,880 | | | | 59,184 | | | | 1,641,770 | | | | (4,364,393 | ) | | | (124,448,384 | ) | | | (875,665 | ) | | | (21,699,734 | ) |
International Small Companies | | | | | | | | | | | | | | | | | | | | | | | | | | | | | |
Institutional Class | | | 7,747,074 | | | | 162,134,735 | | | | 29,893 | | | | 569,448 | | | | (3,321,648 | ) | | | (69,970,353 | ) | | | 4,455,319 | | | | 92,733,830 | |
Investor Class | | | 178,402 | | | | 3,648,929 | | | | 661 | | | | 12,455 | | | | (310,774 | ) | | | (6,371,973 | ) | | | (131,711 | ) | | | (2,710,589 | ) |
Institutional Emerging Markets | | | | | | | | | | | | | | | | | | | | | | | | | | | | | |
Institutional Class | | | 39,751,528 | | | | 1,033,720,059 | | | | 773,359 | | | | 19,248,905 | | | | (43,255,578 | ) | | | (1,125,114,886 | ) | | | (2,730,691 | ) | | | (72,145,922 | ) |
Institutional Class Z | | | 6,828,128 | | | | 178,141,359 | | | | 126,142 | | | | 3,145,987 | | | | (8,363,042 | ) | | | (220,163,091 | ) | | | (1,408,772 | ) | | | (38,875,745 | ) |
Emerging Markets | | | | | | | | | | | | | | | | | | | | | | | | | | | | | | | | |
Advisor Class | | | 11,237,277 | | | | 764,954,443 | | | | 203,160 | | | | 13,223,728 | | | | (21,865,322 | ) | | | (1,501,100,934 | ) | | | (10,424,885 | ) | | | (722,922,763 | ) |
Frontier Emerging Markets | | | | | | | | | | | | | | | | | | | | | | | | | | | | | |
Institutional Class I | | | 3,693,948 | | | | 29,496,185 | | | | 132,190 | | | | 1,028,440 | | | | (3,620,253 | ) | | | (29,434,849 | ) | | | 205,885 | | | | 1,089,776 | |
Institutional Class II | | | — | | | | — | | | | 291,739 | | | | 2,278,483 | | | | (4,064,425 | ) | | | (33,725,470 | ) | | | (3,772,686 | ) | | | (31,446,987 | ) |
Investor Class | | | 152,653 | | | | 1,225,142 | | | | 17,809 | | | | 138,196 | | | | (600,304 | ) | | | (4,763,885 | ) | | | (429,842 | ) | | | (3,400,547 | ) |
Global Equity Research | | | | | | | | | | | | | | | | | | | | | | | | | | | | | |
Institutional Class | | | 34 | | | | 501 | | | | 15,309 | | | | 217,846 | | | | — | | | | — | | | | 15,343 | | | | 218,347 | |
International Equity Research | | | | | | | | | | | | | | | | | | | | | | | | | | | | | |
Institutional Class | | | 14,627 | | | | 208,669 | | | | 36,323 | | | | 489,632 | | | | (51,422 | ) | | | (733,085 | ) | | | (472 | ) | | | (34,784 | ) |
Emerging Markets Research | | | | | | | | | | | | | | | | | | | | | | | | | | | | | |
Institutional Class | | | 22,627 | | | | 302,608 | | | | 10,514 | | | | 134,267 | | | | (653 | ) | | | (8,647 | ) | | | 32,488 | | | | 428,228 | |
Chinese Equity | | | | | | | | | | | | | | | | | | | | | | | | | | | | | | | | |
Institutional Class* | | | 421,003 | | | | 4,280,500 | | | | — | | | | — | | | | — | | | | — | | | | 421,003 | | | | 4,280,500 | |
* For the period from December 16, 2020 (commencement of operations) through October 31, 2021.
Transactions in capital shares for the year ended October 31, 2020, were as follows for each Portfolio:
| | | | | | | | | | | | | | | | | | | | | | | | | | | | | | | | |
| | | | | | | | | | | | | | | | | | | | | Net | | | Net | |
| | | | | | Proceeds | | | Shares From | | | Reinvestment | | | | | | Payments | | | Increase | | | Increase | |
| | | Shares | | | From | | | Reinvested | | | of | | | Shares | | | for Shares | | | (Decrease) | | | (Decrease) | |
| | | Sold | | | Shares Sold | | | Dividends | | | Dividends | | | Redeemed | | | Redeemed | | | in Shares | | | in Net Assets | |
| Global Equity | | | | | | | | | | | | | | | | | | | | | | | | |
Institutional Class | | | 12,675,160 | | | $ | 516,679,441 | | | | 99,937 | | | $ | 3,750,633 | | | | (7,521,201 | ) | | $ | (276,990,882 | ) | | | 5,253,896 | | | $ | 243,439,192 | |
Institutional Class Z | | | 1,214,016 | | | | 46,104,062 | | | | 34,033 | | | | 1,275,910 | | | | (909,670 | ) | | | (39,808,095 | ) | | | 338,379 | | | | 7,571,877 | |
Advisor Class | | | 324,320 | | | | 12,635,875 | | | | 3,494 | | | | 131,272 | | | | (440,185 | ) | | | (16,211,445 | ) | | | (112,371 | ) | | | (3,444,298 | ) |
International Equity | | | | | | | | | | | | | | | | | | | | | | | | | | | | | | | | |
Institutional Class | | | 186,458,188 | | | | 4,129,832,968 | | | | 7,739,005 | | | | 182,950,087 | | | | (227,702,716 | ) | | | (4,943,590,115 | ) | | | (33,505,523 | ) | | | (630,807,060 | ) |
80
Harding, Loevner Funds, Inc.
Notes to Financial Statements (continued)
October 31, 2021
7. Capital Share Transactions (continued)
| | | | | | | | | | | | | | | | | | | | | | | | | | | | | | | | |
| | | | | | | | | | | | | | | | | | | | | Net | | | Net | |
| | | | | | Proceeds | | | Shares From | | | Reinvestment | | | | | | Payments | | | Increase | | | Increase | |
| | | Shares | | | From | | | Reinvested | | | of | | | Shares | | | for Shares | | | (Decrease) | | | (Decrease) | |
| | | Sold | | | Shares Sold | | | Dividends | | | Dividends | | | Redeemed | | | Redeemed | | | in Shares | | | in Net Assets | |
Institutional Class Z | | | 27,006,575 | | | $ | 623,067,400 | | | | 1,367,636 | | | $ | 32,317,240 | | | | (22,561,293 | ) | | $ | (519,759,194 | ) | | | 5,812,918 | | | $ | 135,625,446 | |
Investor Class | | | 4,328,969 | | | | 95,529,374 | | | | 213,471 | | | | 5,048,578 | | | | (7,754,318 | ) | | | (171,021,718 | ) | | | (3,211,878 | ) | | | (70,443,766 | ) |
International Small Companies | | | | | | | | | | | | | | | | | | | | | | | | | | | | | |
Institutional Class | | | 7,221,258 | | | | 109,689,074 | | | | 98,894 | | | | 1,656,470 | | | | (5,059,225 | ) | | | (74,531,343 | ) | | | 2,260,927 | | | | 36,814,201 | |
Investor Class | | | 609,402 | | | | 9,503,676 | | | | 18,570 | | | | 308,083 | | | | (1,972,802 | ) | | | (29,932,526 | ) | | | (1,344,830 | ) | | | (20,120,767 | ) |
Institutional Emerging Markets | | | | | | | | | | | | | | | | | | | | | | | | | | | | | |
Institutional Class | | | 80,055,144 | | | | 1,550,781,076 | | | | 2,860,129 | | | | 63,923,895 | | | | (83,498,478 | ) | | | (1,627,562,463 | ) | | | (583,205 | ) | | | (12,857,492 | ) |
Institutional Class Z | | | 7,951,385 | | | | 170,473,905 | | | | 364,763 | | | | 8,156,096 | | | | (5,085,941 | ) | | | (98,100,924 | ) | | | 3,230,207 | | | | 80,529,077 | |
Emerging Markets | | | | | | | | | | | | | | | | | | | | | | | | | | | | | | | | |
Advisor Class | | | 16,535,208 | | | | 833,799,789 | | | | 963,746 | | | | 56,465,950 | | | | (26,896,624 | ) | | | (1,362,711,636 | ) | | | (9,397,670 | ) | | | (472,445,897 | ) |
Frontier Emerging Markets | | | | | | | | | | | | | | | | | | | | | | | | | | | | | |
Institutional Class I | | | 4,237,438 | | | | 28,199,937 | | | | 272,401 | | | | 2,132,906 | | | | (12,462,963 | ) | | | (81,956,641 | ) | | | (7,953,124 | ) | | | (51,623,798 | ) |
Institutional Class II | | | — | | | | — | | | | 346,188 | | | | 2,717,575 | | | | — | | | | — | | | | 346,188 | | | | 2,717,575 | |
Investor Class | | | 573,612 | | | | 3,560,115 | | | | 35,821 | | | | 279,761 | | | | (1,762,337 | ) | | | (12,092,532 | ) | | | (1,152,904 | ) | | | (8,252,656 | ) |
Global Equity Research | | | | | | | | | | | | | | | | | | | | | | | | | | | | | | | | |
Institutional Class | | | — | | | | — | | | | 30,488 | | | | 379,881 | | | | — | | | | — | | | | 30,488 | | | | 379,881 | |
International Equity Research | | | | | | | | | | | | | | | | | | | | | | | | | | | | | |
Institutional Class | | | 152,365 | | | | 1,688,521 | | | | 30,406 | | | | 374,600 | | | | (760,187 | ) | | | (9,228,810 | ) | | | (577,416 | ) | | | (7,165,689 | ) |
Emerging Markets Research | | | | | | | | | | | | | | | | | | | | | | | | | | | | | |
Institutional Class | | | 660 | | | | 6,001 | | | | 25,882 | | | | 299,717 | | | | — | | | | — | | | | 26,542 | | | | 305,718 | |
8. Income Tax
The cost of investments for federal income tax purposes and the components of net unrealized appreciation (depreciation) on investments at October 31, 2021, for each of the Portfolios were as follows:
| | | | | | | | | | | | | | | | |
| | | Gross | | | Gross | | | Net Unrealized | | | | |
| Portfolio | | Unrealized | | | Unrealized | | | Appreciation / | | | | |
| | Appreciation | | | Depreciation | | | (Depreciation) | | | Cost | |
Global Equity | | $ | 642,824,112 | | | $ | (21,970,152 | ) | | $ | 620,853,960 | | | $ | 1,188,916,221 | |
International Equity | | | 8,286,074,902 | | | | (467,085,189 | ) | | | 7,818,989,713 | | | | 14,051,523,349 | |
International Small Companies | | | 202,304,549 | | | | (21,992,167 | ) | | | 180,312,382 | | | | 419,638,335 | |
Institutional Emerging Markets | | | 2,415,018,178 | | | | (292,930,826 | ) | | | 2,122,087,352 | | | | 4,389,389,061 | |
Emerging Markets | | | 1,622,389,733 | | | | (114,677,044 | ) | | | 1,507,712,689 | | | | 2,315,795,844 | |
Frontier Emerging Markets | | | 66,180,966 | | | | (11,210,934 | ) | | | 54,970,032 | | | | 169,150,992 | |
Global Equity Research | | | 3,045,880 | | | | (347,194 | ) | | | 2,698,686 | | | | 7,146,352 | |
International Equity Research | | | 3,852,915 | | | | (585,366 | ) | | | 3,267,549 | | | | 11,999,107 | |
Emerging Markets Research | | | 1,891,882 | | | | (805,527 | ) | | | 1,086,355 | | | | 7,921,113 | |
Chinese Equity | | | 342,144 | | | | (501,432 | ) | | | (159,288 | ) | | | 4,046,238 | |
It is the policy of each Portfolio of the Fund to qualify as a regulated investment company by complying with the applicable provisions of the Internal Revenue Code, and to make distributions of taxable income sufficient to relieve it from substantially all federal income and excise taxes; therefore, no federal income tax provision is required.
The Portfolios may be subject to taxes imposed by countries in which they invest. Such taxes are generally based on income and/or capital gains earned. Taxes are accrued based on net investment income, net realized gains and net unrealized appreciation as such income and/or gains are recorded. Taxes accrued on unrealized gains are reflected as a liability on the Statements of Assets and Liabilities under the caption “Deferred capital gains tax” and as a reduction in “Distributable earnings”. When assets subject to capital gains tax are sold, accrued taxes are relieved, and the actual amount of the taxes paid is reflected on the Statements of Operations as a reduction in “Net realized gain (loss) on Investment
81
Harding, Loevner Funds, Inc.
Notes to Financial Statements (continued)
October 31, 2021
8. Income Tax (continued)
Transactions”. The Portfolios seek to recover a portion of foreign withholding taxes applied to income earned in jurisdictions where favorable treaty rates for US investors are available. The portion of such taxes believed to be recoverable is reflected as an asset on the Statements of Assets and Liabilities under the caption “Tax reclaims receivable”.
Management has performed an analysis of each Portfolio’s tax positions for the open tax years as of October 31, 2021, and has concluded that no provisions for income tax are required. The Portfolios’ federal tax returns for the prior three fiscal years (open tax years: October 31, 2019; October 31, 2020; October 31, 2021) remain subject to examination by the Portfolios’ major tax jurisdictions, which include the United States, the State of New Jersey and the State of Maryland. Management is not aware of any events that are reasonably possible to occur in the next twelve months that would result in the amounts of any unrecognized tax benefits significantly increasing or decreasing for the Portfolios. However, management’s conclusions regarding tax positions taken may be subject to review and adjustment at a later date based on factors including, but not limited to, new tax laws and accounting regulations and interpretations thereof.
The tax character of distributions paid during the fiscal years ended October 31, 2021 and 2020 were as follows:
| | | | | | | | | | | | | | | | |
| | | | | | Distributions From | | | | |
| | | Ordinary | | | Long-Term | | | Ordinary | | | Long-Term | |
| | | Income | | | Capital Gains | | | Income | | | Capital Gains | |
| Portfolio | | 2021 | | | 2021 | | | 2020 | | | 2020 | |
Global Equity | | | 10,667,822 | | | $ | 75,826,990 | | | $ | 6,200,271 | | | $ | — | |
International Equity | | | 147,195,007 | | | | — | | | | 269,536,396 | | | | — | |
International Small Companies | | | 622,621 | | | | — | | | | 2,122,682 | | | | — | |
Institutional Emerging Markets | | | 26,645,680 | | | | — | | | | 85,287,487 | | | | — | |
Emerging Markets | | | 14,604,731 | | | | — | | | | 63,406,861 | | | | — | |
Frontier Emerging Markets | | | 3,730,104 | | | | — | | | | 5,825,150 | | | | — | |
Global Equity Research | | | 190,800 | | | | 27,046 | | | | 83,862 | | | | 296,019 | |
International Equity Research | | | 489,632 | | | | — | | | | 232,264 | | | | 142,336 | |
Emerging Markets Research | | | 66,856 | | | | 67,411 | | | | 145,125 | | | | 154,592 | |
As of October 31, 2021, the components of distributable earnings/(deficit) on a tax basis were as follows:
| | | | | | | | | | | | | | | | | | | | |
| | | Undistributed | | | Undistributed | | | Accumulated | | | Unrealized | | | Total | |
| | | Ordinary | | | Long-Term | | | Capital and | | | Appreciation | | | Accumulated | |
| Portfolio | | Income | | | Capital Gains | | | Other Losses | | | (Depreciation)(1) | | | Earnings/(Deficit) | |
Global Equity | | | $ 25,226,683 | | | $ | 218,044,847 | | | $ | — | | | $ | 620,859,175 | | | $ | 864,130,705 | |
International Equity | | | 280,427,730 | | | | 229,955,619 | | | | — | | | | 7,819,047,616 | | | | 8,329,430,965 | |
International Small Companies | | | 1,591,567 | | | | 15,922,140 | | | | — | | | | 179,856,357 | | | | 197,370,064 | |
Institutional Emerging Markets | | | 34,566,494 | | | | — | | | | (92,085,458 | ) | | | 2,106,772,100 | | | | 2,049,253,136 | |
Emerging Markets | | | 14,625,660 | | | | 269,068,722 | | | | — | | | | 1,498,204,903 | | | | 1,781,899,285 | |
Frontier Emerging Markets | | | 1,827,703 | | | | — | | | | (103,813,638 | ) | | | 54,398,656 | | | | (47,587,279 | ) |
Global Equity Research | | | 266,842 | | | | 780,662 | | | | — | | | | 2,693,699 | | | | 3,741,203 | |
International Equity Research | | | 622,513 | | | | 1,059,361 | | | | (4,934 | ) | | | 3,256,233 | | | | 4,933,173 | |
Emerging Markets Research | | | 264,618 | | | | 540,505 | | | | — | | | | 1,070,179 | | | | 1,875,302 | |
Chinese Equity* | | | 11,045 | | | | — | | | | (188,678 | ) | | | (159,288 | ) | | | (336,921 | ) |
* For the period from December 16, 2020 (commencement of operations) through October 31, 2021.
(1) The difference between book basis and tax basis net unrealized appreciation is attributable primarily to the tax deferral of losses on certain sale of securities. Unrealized Appreciation (Depreciation) includes amounts related to foreign currency and currency translations.
82
Harding, Loevner Funds, Inc.
Notes to Financial Statements (continued)
October 31, 2021
8. Income Tax (continued)
Under the Regulated Investment Company Modernization Act of 2010 (the “Act”), each Portfolio is permitted to carry forward capital losses incurred in taxable years beginning after the date of enactment for an unlimited period. Additionally, post-enactment capital loss carryforwards will retain their character as either short-term or long-term capital losses.
At October 31, 2021, capital losses incurred that will be carried forward indefinitely under provisions of the Act were as follows:
| | | | | | | | |
Portfolio | | Short-Term Capital Loss Carryforward | | | Long-Term Capital Loss Carryforward | |
Institutional Emerging Markets | | $ | (82,711,940 | ) | | $ | (9,373,518 | ) |
Frontier Emerging Markets | | | (19,505,546 | ) | | | (84,308,092 | ) |
Chinese Equity* | | | (169,512 | ) | | | — | |
* For the period from December 16, 2020 (commencement of operations) through October 31, 2021.
Primarily as a result of differing book/tax treatment of foreign currency transactions and foreign capital gain tax expenses, the Portfolios made reclassifications among certain capital accounts. The reclassifications have no impact on the net assets of the Portfolios. As of October 31, 2021, the following reclassifications were made to the Statements of Assets and Liabilities:
| | | | | | | | |
| | | |
| Portfolio | | Paid-in Capital | | | Distributable earnings | |
| | |
Chinese Equity* | | $ | (1,274 | ) | | $ | 1,274 | |
* For the period from December 16, 2020 (commencement of operations) through October 31, 2021.
During the fiscal year ended October 31, 2021, the International Equity, International Small Companies, Institutional Emerging Markets, Emerging Markets and Frontier Emerging Markets Portfolios utilized $556,130,928, $4,712,316, $113,764,086, $36,752,112 and $19,167,471, respectively, in capital loss carryforwards.
9. Foreign Exchange Contracts
The Portfolios do not generally hedge foreign currency exposure, however, the Portfolios may enter into forward foreign exchange contracts in order to hedge their exposure to changes in foreign currency exchange rates on their foreign portfolio holdings. Each Portfolio will conduct its currency transactions either on a spot (cash) basis at the rate prevailing in the currency exchange market, or by entering into forward contracts to purchase or sell currency. Foreign currency transactions entered into on the spot markets serve to pay for foreign investment purchases or to convert to dollars, the proceeds from foreign investment sales or dividend and interest receipts. The Portfolios will disclose open forward currency contracts, if any, on the Portfolios of Investments. The Portfolios do not separately disclose open spot market transactions on the Portfolios of Investments. Such realized gain (loss) and unrealized appreciation (depreciation) on spot market transactions is included in “Net realized gain (loss) on foreign currency transactions” and “Change in unrealized appreciation (depreciation) on translation of assets and liabilities denominated in foreign currencies”, respectively, on the Portfolios’ Statements of Operations. The Portfolios held no open forward currency contracts as of or during the fiscal year ended October 31, 2021.
The Central Bank of Nigeria has implemented currency controls that significantly limit the ability to convert Nigerian Naira (NGN) to U.S. dollars. As of October 31, 2021, the Frontier Emerging Markets Portfolio had 6.4% of Nigeria exposure (comprised of 0.8% NGN and 5.6% Nigerian equities) and the Emerging Markets Research Portfolio had 0.7% of Nigeria exposure (comprised of 0.2% NGN and 0.5% Nigerian equities). The NGN has been valued based on an established foreign currency benchmark rate and the Nigerian equity securities have been valued at their closing price on the Nigerian Stock Exchange. These valuation methodologies are in accordance with the Procedures and GAAP. However, the conversion rate from NGN to U.S. dollars does not reflect the impact of the aforementioned currency controls. As a result, the value of NGN currently held, any proceeds from the sale of Nigerian equities received by the Frontier Emerging Markets and Emerging Markets Research Portfolios, or dividends received by the Portfolios in connection with their investment in such Nigerian equities, may differ materially once converted from NGN to U.S. dollars.
10. Participation Notes
Each Portfolio may invest in participation notes. Participation notes are promissory notes that are designed to replicate the return of a particular underlying equity or debt security, currency or market. Participation notes are issued by banks or broker-dealers or their affiliates and allow a Portfolio to gain exposure to common stocks in markets where direct investment may not be allowed. Participation notes are generally traded over-the-counter. In addition to carrying the same risks associated with a direct investment in the underlying security, participation notes are
83
Harding, Loevner Funds, Inc.
Notes to Financial Statements (continued)
October 31, 2021
10. Participation Notes (continued)
subject to the risk that the broker-dealer or bank that issues them will not fulfill its contractual obligation to complete the transaction with a Portfolio. Participation notes constitute general unsecured contractual obligations of the banks or broker-dealers that issue them, and a Portfolio would be relying on the creditworthiness of such banks or broker-dealers and would have no rights under a participation note against the issuer(s) of the underlying security(ies). Participation notes may be more volatile and less liquid than other investments held by the Portfolios.
11. Concentration of Ownership
At October 31, 2021, the percentage of total shares outstanding held by record shareholders each owning 10% or greater of the aggregate shares outstanding of each Portfolio were as follows:
| | | | | | | | | | | | | | | | |
| | | No. of | | | | | | % | | | | |
| | | Shareholders | | | | | | Ownership | | | | |
Global Equity | | | 2 | | | | | | | | 32.78 | %* | | | | |
International Equity | | | 2 | | | | | | | | 25.56 | %* | | | | |
International Small Companies | | | 4 | | | | | | | | 58.76 | %* | | | | |
Institutional Emerging Markets | | | 2 | | | | | | | | 57.13 | %* | | | | |
Emerging Markets | | | 4 | | | | | | | | 77.06 | %* | | | | |
Frontier Emerging Markets | | | 3 | | | | | | | | 45.39 | %* | | | | |
Global Equity Research | | | 2 | | | | | | | | 83.34 | % | | | | |
International Equity Research | | | 3 | | | | | | | | 71.82 | %* | | | | |
Emerging Markets Research | | | 2 | | | | | | | | 72.15 | % | | | | |
Chinese Equity | | | 2 | | | | | | | | 47.51 | % | | | | |
* Includes omnibus positions of broker-dealers representing numerous shareholder accounts.
Investment activities of these shareholders may have a material effect on the Portfolios.
12. Concentration of Risk
Investing in securities of foreign issuers and currency transactions may involve certain considerations and risks not typically associated with investments in U.S. issuers. These risks include revaluation of currencies, adverse fluctuations in foreign currency values and possible adverse political, social and economic developments, including those particular to a specific industry, country or region, which could cause the securities and their markets to be less liquid and prices more volatile than those of comparable U.S. companies and U.S. government securities. These risks are greater with respect to securities of issuers located in emerging market countries in which the Portfolios are authorized to invest.
The Frontier Emerging Markets Portfolio is permitted to invest up to 35% of its total assets in companies in the same industry, if, at the time of investment, that industry represents 20% or more of the Frontier Emerging Markets Portfolio’s benchmark index. During periods when the Frontier Emerging Markets Portfolio has invested more than 25% of its total assets in companies in the same industry, it will operate as a concentrated portfolio and be subject to additional risks and greater volatility. Such additional risks include increased competition within the industry, or changes in legislation, or government regulations affecting the industry. The value of the Frontier Emerging Markets Portfolio’s shares may be particularly vulnerable to factors affecting the banking industry, such as the availability and cost of capital funds, changes in interest rates, the rate of corporate and consumer debt defaults, extensive government regulation, and price competition. Such risks may be magnified with respect to securities of issuers in Frontier Emerging Markets. At October 31, 2021, the Frontier Emerging Markets Portfolio’s investment in the Banking industry amounted to 32.17% of its total assets.
As a non-diversified fund, the Chinese Equity Portfolio has the ability to invest a larger percentage of its assets in the securities of a smaller number of issuers than a diversified fund. As a result, poor performance by a single issuer could adversely affect the Chinese Equity Portfolio’s performance more than if the Chinese Equity Portfolio were invested in a larger number of issuers.
84
Harding, Loevner Funds, Inc.
Notes to Financial Statements (continued)
October 31, 2021
13. Pandemic Risk
The outbreak of the novel coronavirus (“COVID-19”) and subsequent global pandemic has significantly impacted the global economy, individual companies, and financial markets in general and throughout the world has created significant uncertainty. The duration and extent of COVID-19 over the long-term cannot be reasonably estimated at this time. The ultimate impact of COVID-19 and the extent to which COVID-19 impacts the Fund’s normal course of business, results of operations, investments, and cash flows will depend on future developments, which are highly uncertain and difficult to predict.
14. Line of Credit
The Fund has a $150 million line of credit agreement with Northern Trust. Borrowings are made solely to facilitate the handling of redemptions or unusual or unanticipated short-term cash requirements. Because several Portfolios participate and collateral requirements apply, there is no assurance that an individual Portfolio will have access to the entire $150 million at any particular time. Interest is charged to each Portfolio based on its borrowings at an amount above the Federal Funds rate, subject to a minimum rate. In addition, a facility fee is computed at an annual rate of 0.15% on the line of credit and is allocated among the Portfolios.
For the year ended October 31, 2021, Emerging Markets had an outstanding balance for two days with a maximum balance of $81,000,000 at an average weighted interest rate of 1.75%. International Equity Research had an outstanding balance for one day with a maximum balance of $200,000 at an average weighted interest rate of 1.75%.
15. Subsequent Events
Subsequent events occurring after the date of this report have been evaluated for potential impact, for purposes of recognition or disclosure in the financial statements, through the date the report was issued.
85
| | |
 | | |
| | KPMG LLP 345 Park Avenue |
| | New York, NY 10154-0102 |
Report of Independent Registered Public Accounting Firm
To the Shareholders and Board of Directors
Harding, Loevner Funds, Inc.:
Opinion on the Financial Statements
We have audited the accompanying statements of assets and liabilities of Global Equity Portfolio, International Equity Portfolio, International Small Companies Portfolio, Institutional Emerging Markets Portfolio, Emerging Markets Portfolio, Frontier Emerging Markets Portfolio, Global Equity Research Portfolio, International Equity Research Portfolio, Emerging Markets Research Portfolio, and Chinese Equity Portfolio (each a portfolio of the Harding, Loevner Funds, Inc.) (the Portfolios), including the portfolios of investments, as of October 31, 2021, the related statements of operations for the year then ended (the period from December 16, 2020 (commencement of operations) to October 31, 2021 for Chinese Equity Portfolio), the statements of changes in net assets for each of the years in the two-year period then ended (the period from December 16, 2020 (commencement of operations) to October 31, 2021 for Chinese Equity Portfolio), and the related notes (collectively, the financial statements) and the financial highlights for each of the years in the five-year period then ended (the period from December 16, 2020 (commencement of operations) to October 31, 2021 for Chinese Equity Portfolio). In our opinion, the financial statements and financial highlights present fairly, in all material respects, the financial position of the Portfolios as of October 31, 2021, the results of their operations for the year then ended (the period from December 16, 2020 (commencement of operations) to October 31, 2021 for Chinese Equity Portfolio), the changes in their net assets for each of the years in the two-year period then ended (the period from December 16, 2020 (commencement of operations) to October 31, 2021 for Chinese Equity Portfolio), and the financial highlights for each of the years in the five-year period then ended (the period from December 16, 2020 (commencement of operations) to October 31, 2021 for Chinese Equity Portfolio), in conformity with U.S. generally accepted accounting principles.
Basis for Opinion
These financial statements and financial highlights are the responsibility of the Portfolios’ management. Our responsibility is to express an opinion on these financial statements and financial highlights based on our audits. We are a public accounting firm registered with the Public Company Accounting Oversight Board (United States) (PCAOB) and are required to be independent with respect to the Portfolios in accordance with the U.S. federal securities laws and the applicable rules and regulations of the Securities and Exchange Commission and the PCAOB.
We conducted our audits in accordance with the standards of the PCAOB. Those standards require that we plan and perform the audit to obtain reasonable assurance about whether the financial statements and financial highlights are free of material misstatement, whether due to error or fraud. Our audits included performing procedures to assess the risks of material misstatement of the financial statements and financial highlights, whether due to error or fraud, and performing procedures that respond to those risks. Such procedures included examining, on a test basis, evidence regarding the amounts and disclosures in the financial statements and financial highlights. Such procedures also included confirmation of securities owned as of October 31, 2021, by correspondence with custodians and brokers. Our audits also included evaluating the accounting principles used and significant estimates made by management, as well as evaluating the overall presentation of the financial statements and financial highlights. We believe that our audits provide a reasonable basis for our opinion.

We have served as the auditor of Harding, Loevner Funds, Inc. Portfolios since 2006.
New York, New York
December 17, 2021
| | | | |
| | KPMG LLP, a Delaware limited liability partnership and a member firm of the KPMG global organization of independent member firms affiliated with KPMG International Limited, a private English company limited by guarantee. | | |
86
Harding, Loevner Funds, Inc.
Supplemental Tax Information
(unaudited)
International Equity, International Small Companies, Institutional Emerging Markets, Emerging Markets, Frontier Emerging Markets, Global Equity Research, International Equity Research, and Emerging Markets Research paid qualifying foreign taxes of $40,962,304, $805,743, $13,569,569, $9,094,071, $518,012, $12,315, $37,976, and $28,727 and earned $496,883,528, $2,100,581, $48,856,165, $24,044,001, $2,586,125, $75,811, $188,599, and $99,955 from foreign source income during the fiscal year ended October 31, 2021, respectively. Pursuant to Section 853 of the Internal Revenue Code, International Equity, International Small Companies, Institutional Emerging Markets, Emerging Markets, Frontier Emerging Markets, Global Equity Research, International Equity Research, and Emerging Markets Research designated $0.0574, $0.0306, $0.0535, $0.1596, $0.0208, $0.0207, $0.0365, and $0.0417 per share as foreign taxes paid and $0.6958, $0.0798, $0.1926, $0.4220, $0.1038, $0.1276, $0.1814, and $0.1450 per share as income earned from foreign sources for the fiscal year ended October 31, 2021, respectively.
Global Equity, International Equity, International Small Companies, Institutional Emerging Markets, Emerging Markets, Frontier Emerging Markets, Global Equity Research, International Equity Research, Emerging Markets Research, and Chinese Equity had qualifying dividend income of $8,609,966, $462,399,169, $5,807,715, $90,980,200, $57,948,430, $2,979,929, $127,421, $251,398, $143,393, and $14,933, respectively, during the fiscal year ended October 31, 2021.
For the fiscal year ended October 31, 2021, Global Equity designated 16.57% of the distributions from net investment income as qualifying for the 100% corporate dividend received deduction.
For the fiscal year ended October 31, 2021, Global Equity Research designated 16.06% of the distributions from net investment income as qualifying for the 100% corporate dividend received deduction.
Pursuant to Section 852 of the Internal Revenue Code, Global Equity designated $218,044,847 as a long term capital gain dividend for the fiscal year ended October 31, 2021.
Pursuant to Section 852 of the Internal Revenue Code, International Equity designated $229,955,619 as a long term capital gain dividend for the fiscal year ended October 31, 2021.
Pursuant to Section 852 of the Internal Revenue Code, International Small Companies designated $15,922,140 as a long term capital gain dividend for the fiscal year ended October 31, 2021.
Pursuant to Section 852 of the Internal Revenue Code, Emerging Markets designated $269,068,722 as a long term capital gain dividend for the fiscal year ended October 31, 2021.
Pursuant to Section 852 of the Internal Revenue Code, Global Equity Research designated $780,662 as a long term capital gain dividend for the fiscal year ended October 31, 2021.
Pursuant to Section 852 of the Internal Revenue Code, International Equity Research designated $1,059,361 as a long term capital gain dividend for the fiscal year ended October 31, 2021.
Pursuant to Section 852 of the Internal Revenue Code, Emerging Markets Research designated $540,505 as a long term capital gain dividend for the fiscal year ended October 31, 2021.
87
Harding, Loevner Funds, Inc.
Approval of Investment Advisory Agreement
(unaudited)
Approval of Investment Advisory Agreement
At a meeting of the board of directors (collectively, the “Board” or “Directors” and, each, a “Director”) of Harding, Loevner Funds, Inc. (the “Fund”) held on June 11, 2021 (the “Meeting”), the Board, including a majority of those Directors who are not “interested persons” of the Fund (the “Independent Directors”), as defined in the Investment Company Act of 1940, as amended (the “1940 Act”) considered and approved the continuation of three investment advisory agreements (the “Advisory Agreements”): the first, between Harding Loevner LP (“Harding Loevner” or the “Adviser”) and the Fund, on behalf of the Global Equity Portfolio, the International Equity Portfolio, the International Small Companies Portfolio, the Institutional Emerging Markets Portfolio, the Emerging Markets Portfolio, and the Frontier Emerging Markets Portfolio (collectively, the “Traditional Portfolios”); the second, between the Adviser and the Fund, on behalf of the International Equity Research Portfolio (the “IER Portfolio”); and the third, between the Adviser and the Fund on behalf of the Global Equity Research Portfolio (the “GER Portfolio”) and Emerging Markets Research Portfolio (the “EMR Portfolio” and together with the IER Portfolio and GER Portfolio, the “Research Portfolios,” and together with the Traditional Portfolios, each a “Portfolio” and collectively, the “Portfolios”). The Meeting was held via videoconference, with telephonic participation optional, in accordance with exemptive relief from certain in-person meeting requirements issued by the SEC in an exemptive order under Section 6(c) and Section 38(a) of the 1940 Act.
Overview of the Review Process
Prior to the Meeting, the Board established a subcommittee of the Governance Committee of the Board comprised of three Independent Directors (the “Subcommittee”) to conduct a preliminary review of the materials provided to the Board by the Adviser in connection with consideration of the Advisory Agreements, to assist the Board in its deliberations, and to liaise with the Adviser. In addition, legal counsel to the Independent Directors (“Independent Counsel”), on behalf of the Independent Directors, delivered to the Adviser a written request for information that the Board believed necessary to evaluate the terms of the Advisory Agreements. In response, the Adviser furnished materials to facilitate the Board’s evaluation of the terms of the Advisory Agreements (the “Renewal Materials”), including information on, among other things: (i) the investment performance, expenses and advisory fees of each Portfolio relative to other mutual funds and benchmark indices, as set forth in reports prepared by Institutional Shareholder Services (the “ISS Reports”), a third-party fund analytics provider engaged as part of the Advisory Agreement review process; (ii) the Adviser’s profitability and costs arising from services provided to the Fund; (iii) the qualifications of the Adviser and portfolio management personnel with respect to services provided to the Portfolios; and (iv) the Adviser’s investment research capabilities and resources. The Adviser also sought to provide the foregoing information in the context of the unprecedented circumstances faced by the industry as a whole, given the reality of the continuing COVID-19 pandemic.
In preparation for the Meeting, the Adviser provided the Subcommittee with a preliminary version of the Renewal Materials for review and comment. The Subcommittee and representatives of the Adviser discussed the preliminary Renewal Materials during a telephonic meeting on May 20, 2021. Following this meeting, the Adviser revised the Renewal Materials in response to the Subcommittee’s comments and distributed the Renewal Materials in final form to the full Board. The Board also received and considered a memorandum regarding the Board’s responsibilities in connection with renewal of the Advisory Agreements prepared by Independent Counsel and Independent Counsel assisted the Independent Directors throughout the process.
At the Meeting, both in general and executive sessions, the Board considered and discussed the materials presented by the Adviser. During the presentations, the Adviser expanded on those materials and responded to specific questions from the Board. Among other things, the Adviser focused on the long-term performance records of the Portfolios and the competitiveness of the Portfolios’ advisory fees and total expense ratios. The Adviser also focused on the quality of the services provided to the Portfolios and its continued investment in personnel, technology and other resources that service the Fund. The Independent Directors met in executive session with Independent Counsel prior to the commencement of the Meeting and during the course of the Meeting to discuss the materials provided and information presented by the Adviser.
In evaluating continuance of the Advisory Agreements with respect to each Portfolio, among other things, the Board considered the various factors and information discussed below. The following discussion is not intended to be all-inclusive, as the Board reviewed a variety of factors and considered a significant amount of information.
Nature, Extent and Quality of Services
The Board evaluated the information it deemed necessary to assess the nature, extent and quality of investment advisory services provided to the Portfolios by the Adviser. The Board also considered the nature, extent and quality of the extensive non-advisory services provided to the Portfolios by the Adviser, including portfolio trading; the resources devoted to, and the record of compliance with, each Portfolio’s compliance policies and procedures; the resources devoted to the supervision of third-party service providers; and the quality and quantity of administrative and shareholder servicing. The Board noted that it received information in connection with quarterly Board and committee meetings throughout the year regarding the services rendered by the Adviser concerning the management of each Portfolio’s affairs and the Adviser’s role in coordinating providers of other services to the Portfolios.
88
Harding, Loevner Funds, Inc.
Approval of Investment Advisory Agreement (continued)
(unaudited)
The Adviser presented and discussed with the Board the qualifications, backgrounds and responsibilities of the Adviser’s management team and information regarding the members of each Portfolio’s portfolio management team. The Board evaluated the Adviser’s ability to attract and retain qualified investment advisory and non-advisory personnel and engaged in a discussion with the Adviser regarding its recruitment, retention and professional development programs and strategies.
The Board also considered the adequacy of the Adviser’s financial and operational resources committed to each Portfolio, and how well the Adviser utilized those resources to meet the Portfolio’s investment needs, to oversee non-investment services and to satisfy compliance requirements. The Board also considered the nature and extent of the steps taken by the Adviser to deliver the same quality of service to its clients, including the Fund, under the remote work conditions brought about by the COVID-19 pandemic and the Adviser’s operation of its business continuity plan and cybersecurity policies during this remote work environment.
The Board further noted that, as of March 31, 2021, the Adviser had approximately $84.0 billion in assets under management and that the Fund was the Adviser’s largest client, with assets of approximately $33.5 billion. The Board took into account the benefits realized by the Portfolios from the Adviser’s affiliation with Affiliated Managers Group, Inc., an established global asset management company.
The Board considered annual and periodic reports of the Fund’s Chief Compliance Officer (the “CCO”) with respect to the effectiveness and adequacy of the Fund’s and the Adviser’s compliance programs, including program enhancements related to information security and financial intermediary oversight and noted the additional compliance services that are provided, including liquidity risk management. The Board noted the CCO’s determination that the Adviser’s compliance program is reasonably designed to prevent violations of the federal securities laws. Based on these considerations, the Board concluded that it was satisfied with the nature, extent and quality of services historically provided and to be provided to each Portfolio under its Advisory Agreements.
Performance of the Adviser
For each Portfolio, the Board considered, among other things, the historical performance for multiple time periods ended as of March 31, 2021, including the one-year, three-year, five-year and ten-year periods (or shorter for newer Portfolios) included in the ISS Reports, compared against each Portfolio’s Morningstar Category and benchmark index. The Board considered the Portfolios’ risk-adjusted performance and the high active share (i.e., low overlap with benchmark indices) inherent in the Adviser’s investment process.
With respect to the recent performance of the Portfolios, the Board noted that for the one-year period ended March 31, 2021: each class of the Global Equity Portfolio, International Equity Portfolio, Institutional Emerging Markets Portfolio, Emerging Markets Portfolio, Frontier Emerging Markets Portfolio, Global Equity Research Portfolio and International Equity Research Portfolio outperformed its respective benchmark index; each class of the International Small Companies Portfolio, and Emerging Markets Research Portfolio underperformed its respective benchmark index; and all Portfolios, except the Global Equity Portfolio, performed below the median of their respective Morningstar Category.
In assessing longer term performance by the Portfolios, for the five-year period ended March 31, 2021, the Board noted that each class of the Global Equity Portfolio, International Equity Portfolio, International Small Companies Portfolio, Frontier Emerging Markets Portfolio and International Equity Research Portfolio, with at least five years of operations, outperformed its respective benchmark index; and each class of the Global Equity Portfolio with at least five years of operations was above the median of its Morningstar Category. Each class of the Emerging Markets Portfolio and Institutional Emerging Markets Portfolio with at least five years of operations underperformed its respective benchmark index; and each class of the International Equity Portfolio, Institutional Emerging Markets Portfolio, Emerging Markets Portfolio, Frontier Emerging Markets Portfolio, International Small Companies Portfolio and International Equity Research Portfolio with at least five years of operations was below the median of its respective Morningstar Category. The Board noted in their review that the Global Equity Research Portfolio and Emerging Markets Research Portfolios had not yet completed five years of operations.
For the ten-year period ended March 31, 2021, the Board noted that each class of all Portfolios with at least ten years of operations had performance above the median of its respective Morningstar Category and outperformed its benchmark index, except each class of the International Equity Portfolio and the International Small Companies Portfolio, and the Institutional Class of the Frontier Emerging Markets Portfolio, outperformed their respective benchmark indices but performed below the median of their respective Morningstar Categories; and the Investor Class of the Frontier Emerging Markets Portfolio, which underperformed the Portfolio’s benchmark index and was below the median of its Morningstar Category.
In addition, the Board reviewed the Adviser’s investment philosophy used to manage the Portfolios, as well as the effectiveness of the Adviser’s use of portfolio management teams for the day-to-day management of Portfolios. The Board noted the Adviser’s bottom-up, business-focused approach based on the study of individual companies and the competitive dynamics of the global industries in which those companies
89
Harding, Loevner Funds, Inc.
Approval of Investment Advisory Agreement (continued)
(unaudited)
participate. The Board considered the Adviser’s disciplined adherence to its investment philosophy and process as well as the evolutionary enhancements to the methodology used in its implementation. The Board also took note of the Adviser’s integration of environmental, social and governance (“ESG”) factors in its investment process.
In evaluating the investment performance of the Portfolios, the Board acknowledged that the Adviser’s investment style may result in periods of underperformance, but has generally produced outperformance over longer time periods and that the Portfolios generally performed well relative to their respective benchmark indices. The Board also considered the Adviser’s ongoing efforts to identify the causes of any underperformance and the effectiveness of these efforts. Finally, the Board considered that the Morningstar Category performance data provided within the ISS Reports was less useful with respect to the Frontier Emerging Markets Portfolio, as Morningstar did not have a Frontier Markets category at March 31, 2021 and instead compared the Portfolio to the Diversified Emerging Markets category.
Based on these considerations, the Board concluded that each Portfolio’s performance was consistent with the Adviser’s investment discipline.
Costs of the Services and Profitability of the Adviser
The Board considered information regarding the Adviser’s costs to provide investment management services to the Portfolios and the profitability to the Adviser from managing the Portfolios. In evaluating the Adviser’s profitability, the Board considered the Adviser’s profitability analyses for calendar years 2019 and 2020, noting that the Adviser’s profit margin after assumed tax, in relation to its management of the Portfolios, was approximately equal in 2019 and 2020. The Board also considered profitability adjusted, on a pro forma basis, for estimated provisions for federal and state corporate income taxes; each Portfolio’s expense ratio; the allocation methodology used by the Adviser to compute such profitability; and the Adviser’s contractual fee waivers and expense reimbursements with respect to the applicable Portfolios. The Board further considered profitability on a Portfolio-by-Portfolio basis, focusing on the Adviser’s profit both with and without taking into account those costs borne by the Adviser with respect to its efforts to expand the Portfolios’ shareholder base.
The Adviser also presented its profitability analyses for calendar years 2019 and 2020 on an adjusted basis to reflect the equity-related compensation received by certain senior personnel of the Adviser who are limited partners of the Adviser. In the adjusted profitability analyses, the Adviser stated that it had adjusted the Adviser’s personnel expenses to an amount that more closely resembled the compensation paid to similarly situated personnel at peer firms, noting that the salaries and bonuses paid to the Adviser’s limited partners are lower than the compensation paid at peer firms because the limited partners also receive equity related compensation. The Board noted that this adjusted profitability information was useful in its consideration and assessment of the Adviser’s profitability.
The Board took note of the costs the Adviser has incurred that are intended to assure the continued delivery of high-quality services to its clients, including the Portfolios, and the future costs the Adviser plans to incur, including hiring additional qualified personnel and further investing in technology, including with respect to cybersecurity as well as enhancing its operational infrastructure. The Board considered the Adviser’s need to accommodate changing regulatory requirements and to adapt to structural changes in the mutual fund marketplace. The Board also noted that future profitability to the Adviser from managing the Portfolios would depend on the level of assets in the Portfolios and investment returns, as well as the Adviser’s total assets under management, and may be limited as certain Portfolios’ investment strategies encounter their capacity limitations. In assessing profitability, the Board considered each Portfolio’s profitability in the context of the services provided, the reasonableness of the fees charged for those services and the continued growth of assets through new investments.
Based upon these considerations, the Board concluded that the profits historically realized by the Adviser, and the profits the Adviser anticipates will be realized from its continued relationship with the Portfolios, are not excessive in light of the nature, extent and quality of the services provided to the Portfolios.
Comparison of Fees and Services Provided by the Adviser
The Board reviewed the contractual advisory fees that are payable by the Portfolios to the Adviser and the actual investment advisory fees realized by the Adviser taking into account the fee waiver and/or expense reimbursement arrangements for certain of the Portfolios. The Board considered the fact that the Adviser’s waiver/expense reimbursement arrangements are not subject to recapture and that the proposed fee reductions and breakpoints were contractual in nature, noting that in fiscal year 2020, the Adviser waived a portion of its advisory fees for the following Portfolios: the Institutional Class Z of the Global Equity Portfolio and the Institutional Class Z of the Institutional Emerging Markets Portfolio; the Investor Class and Institutional Class II of the Frontier Emerging Markets Portfolio; the Investor Class and Institutional Class of the International Small Companies Portfolio; and the Institutional Class of the International Equity Research Portfolio, the Global Equity Research Portfolio and the Emerging Markets Research Portfolio. In addition, the Board compared the Adviser’s separate account fee schedule with the advisory fees payable by the Portfolios to the Adviser. Further, the Board took note that the fee waivers in place for the Global Equity
90
Harding, Loevner Funds, Inc.
Approval of Investment Advisory Agreement (continued)
(unaudited)
Research Portfolio and Emerging Markets Research Portfolio exceeded the Adviser’s advisory fee. Finally, the Board considered the ISS Reports, which included information comparing each Portfolio’s management fee and overall expenses with those of funds in a group of peer funds selected by Institutional Shareholder Services (the “Expense Group”).
The Board noted that the net operating expenses of each Portfolio (expenses other than the fees pursuant to the Advisory Agreements and distribution and service fees) (the “Net Operating Expenses”) were below the median of their respective Expense Groups with the exception of the Research Portfolios, and were above the median of their respective Morningstar Category-derived universe (the “Expense Universe”), with the exception of the Emerging Markets Research Portfolio. With respect to the Research Portfolios, the Board took note that Net Operating Expenses exceed the median of their respective Expense Universe median due to the small asset size of these Portfolios, although this was partially offset by the voluntary subsidy of those Portfolios by the Adviser. The Board also observed that, except as noted below, the total expense ratio of each class of each Portfolio, after any applicable waiver of advisory fees and reimbursement of expenses, was at or below its respective Expense Group and Expense Universe medians. Exceptions included: the Institutional Class of the Institutional Emerging Markets Portfolio and the Institutional Class of the International Small Companies Portfolio, each of which had a total expense ratio above the median for its Expense Group and Expense Universe; and the Institutional Class of the Emerging Markets Research Portfolio, which had a total expense ratio above the median for its Expense Universe. The Board did not consider any of these differences to be material.
The Board noted that the net management fee for each class of each Portfolio was at or below the median of its Expense Group, except the Advisor Class of the Emerging Markets Portfolio; both classes of the Institutional Emerging Markets Portfolio and International Small Companies Portfolio; the Emerging Markets Research Portfolio; and all classes of the Frontier Emerging Markets Portfolio, each of which were above the median for their respective Expense Groups. The Board also noted that, for each Portfolio with an Expense Universe, the net management fee was at or below the median of its Expense Universe, except all classes of the Global Equity Portfolio, International Equity Portfolio and International Small Companies Portfolio; the Advisor Class of the Emerging Markets Portfolio; and both classes of the Institutional Emerging Markets Portfolio, each of which were above the median for their respective Expense Universes.
The Board noted that it did not consider the Expense Universe to be an appropriate comparator for the Frontier Emerging Markets Portfolio, as it was comprised of the Diversified Emerging Markets Morningstar Category, which is not limited exclusively to funds primarily investing in equity securities of companies based in the frontier emerging markets.. In its consideration of each Portfolio’s net management fee, the Board considered each Portfolio’s performance record and the extensive scope of non-advisory services provided by the Adviser, which it performs without additional compensation.
The Board recognized that the Adviser’s separate account and collective trust clients require fewer services from the Adviser than the Fund. The Board additionally recognized the Adviser’s efforts to direct more institutional investors into pooled vehicles, including the Portfolios, to the extent possible. Further, the Board took note that many sophisticated institutional investors, after reviewing similar investment vehicles with the assistance of their consultants, had determined and continue to, invest in the Portfolios, which further supported the reasonableness of the advisory fees charged by the Adviser.
The Board also noted the Adviser’s commitment to review periodically the fees charged to the Portfolios and the proposed management fee reductions for the Institutional Emerging Markets Portfolio, Emerging Markets Portfolio and International Small Companies Portfolio as part of the 2021 Advisory Agreements renewal process, to ensure that the fees remain competitive.
Based on these considerations, the Board concluded that each Portfolio’s fee, in light of the services provided by the Adviser, was reasonable.
Economies of Scale
The Board considered the extent to which economies of scale have been realized as the Portfolios’ assets grew, whether there is potential for realization of further economies of scale for the Portfolios, and whether material economies of scale are being shared with shareholders. The Board also considered that the Portfolios have benefitted both from asset growth in the Portfolios and even more from asset growth in the Adviser’s other accounts, each of which have resulted in certain expenses becoming a smaller percentage of overall assets.
The Board acknowledged that other aspects of the Portfolios’ investment strategies may limit the realization of economies of scale, including a particular strategy’s capacity limitations. The Board noted the strategies utilized by the Adviser to manage the high level of capacity utilization in the International Equity Portfolio, Emerging Markets Portfolio and Institutional Emerging Markets Portfolio. The Board also acknowledged the Adviser’s considerable and continued reinvestment in its business; its business plans for the Research Portfolios and payment of the associated expenses out of its own profits, including through revenue sharing payments.
91
Harding, Loevner Funds, Inc.
Approval of Investment Advisory Agreement (continued)
(unaudited)
The Board considered that the Adviser assumes substantial business risk each time it sponsors a new Portfolio. The Board also noted that the Adviser provides the same high-quality services to the International Small Companies Portfolio and Research Portfolios, which have not yet achieved profitability due to their smaller level of assets.
Based on these considerations, the Board concluded that it was satisfied with the extent to which any economies of scale currently are and will be realized for the benefit of the Portfolios’ shareholders, and recognized its obligation to consider the same annually based on changing circumstances.
Other Benefits
The Board considered other benefits derived or to be derived by the Adviser from the relationship with the Portfolios as part of its consideration of continuance of the Advisory Agreements. In this regard, the Board noted that the only tangible material indirect benefit from the Adviser’s relationship with the Portfolios is from the receipt of research products and services obtained through soft dollars in connection with Portfolio brokerage transactions. The Board also considered the extent to which the Adviser and its clients, including the Portfolios, benefitted from receipt of these research products and services.
The Board also considered the benefits that the Portfolios derived from their association with the Adviser. In this regard, the Board considered the competitive nature of the mutual fund marketplace and that the Portfolios’ shareholders invested in the Portfolios because of the Fund’s relationship with the Investment Adviser.
Conclusion
Following extensive discussion, both in general session and in an executive session of the Independent Directors meeting alone with Independent Counsel, the Board determined that it had received sufficient information to take action on the proposed resolutions regarding continuance of the Advisory Agreements and that all of its questions had been addressed to its satisfaction. The Board, including a majority of the Independent Directors, concluded with respect to each Portfolio that its investment advisory fees were sufficiently supported by their review of the factors described above.
In light of all the foregoing, the Board, and separately, a majority of the Independent Directors, approved the continuance of each Advisory Agreement on behalf of the respective Portfolio(s). The Board’s approval determinations were made on the basis of each Director’s business judgment after consideration of all the information presented. The Board’s decision was based on all of the above-mentioned factors and their related conclusions, with no single factor or conclusion being determinative and with each Director not necessarily attributing the same weight to each factor.
92
Harding, Loevner Funds, Inc.
Privacy Notice
(unaudited)
HARDING, LOEVNER FUNDS, INC.
PRIVACY NOTICE
The Fund collects nonpublic personal information about you from the following sources:
| | • | | Information, such as your name, address, social security number, assets and income, submitted by you on applications, forms, or in other written or verbal customer communications. This information may also be provided by a consultant or intermediary acting on your behalf. |
| | • | | Information that results from any transaction performed by us for you. |
The Fund will not disclose any nonpublic personal information about you or its former customers to anyone except as permitted or required by law.
If you decide to close your account(s) or become an inactive customer, the Fund will adhere to the privacy policies and practices as described in this notice.
The Fund restricts access to your personal and account information to only those employees who need to know that information to provide products or services to you. The Fund maintains physical, administrative and technical safeguards to protect your nonpublic personal information.
93
Harding, Loevner Funds, Inc.
Directors and Principal Officers
(unaudited)
Independent Directors:
| | | | | | | | | | |
Name, Address and Year of Birth | | Position
with the Fund | | Term of Office
and Length of
Time Served | | Principal Occupation
During Past Five Years | | Number of
Portfolios in
Fund
Complex
Overseen By
Director | | Other Directorships |
| | | | | |
Carolyn N. Ainslie c/o Harding Loevner LP 400 Crossing Boulevard Fourth Floor Bridgewater, NJ 08807 1958 | | Director | | Indefinite; Director since 2014; Member of the Audit Committee since 2015 - Present and Co - Chairperson June - December, 2017 and Chairperson since 2018; Member of the Governance Committee since March 2018 | | Bill & Melinda Gates Foundation, Chief Financial Officer, 2018-present; Princeton University, Vice President for Finance and Treasurer, 2008 – 2018. | | 10 | | None. |
| | | | | |
Jill R. Cuniff c/o Harding Loevner LP 400 Crossing Boulevard Fourth Floor Bridgewater, NJ 08807 1964 | | Director | | Indefinite; Director since 2018; Member of the Audit Committee since 2018; Member of the Governance Committee since March 2018 | | Edge Asset Management, President and Director, 2009 - 2016. | | 10 | | None. |
| | | | | |
R. Kelly Doherty c/o Harding Loevner LP 400 Crossing Boulevard Fourth Floor Bridgewater, NJ 08807 1958 | | Director | | Indefinite; Director since 2004; Lead Independent Director since 2014; Member of the Governance Committee since March 2018 | | Caymen Partners (private investment vehicles), Managing Partner, 1999 – present. | | 10 | | Selective Insurance Group, Inc. (SIGI). |
| | | | | |
Charles W. Freeman, III c/o Harding Loevner LP 400 Crossing Boulevard Fourth Floor Bridgewater, NJ 08807 1964 | | Director | | Indefinite; Director since 2008; Member of the Governance Committee since March 2018 | | U.S. Chamber of Commerce, Senior Vice President for Asia, 2018 - present; Bower Group Asia, Managing Director, China, December 2016 – 2017; Forbes-Tate, LLC, International Principal, 2014 – 2016. | | 10 | | None. |
94
Harding, Loevner Funds, Inc.
Directors and Principal Officers
(unaudited)
Independent Directors (continued):
| | | | | | | | | | |
Name, Address and Year of Birth | | Position with the Fund | | Term of Office
and Length of
Time Served | | Principal Occupation
During Past Five Years | | Number of
Portfolios in
Fund
Complex
Overseen By
Director | | Other Directorships |
| | | | | |
Jason Lamin c/o Harding Loevner LP 400 Crossing Boulevard Fourth Floor Bridgewater, NJ 08807 1974 | | Director | | Indefinite; Director since 2021; Member of the Audit Committee since 2021; Member of the Governance Committee beginning March 2021. | | Lenox Park Solutions, Inc. (FinTech Company), Founder and Chief Executive Officer, 2009 – present. | | 10 | | None. |
| | | | | |
Eric Rakowski c/o Harding Loevner LP 400 Crossing Boulevard Fourth Floor Bridgewater, NJ 08807 1958 | | Director | | Indefinite; Director since 2008; Chairman of the Governance Committee since March 2018 | | University of California at Berkeley School of Law, Professor, 1990 – present. | | 10 | | AMG Funds (46 portfolios); AMG Pantheon Private Equity Fund (1 portfolio); AMG Pantheon Private Equity Master Fund (1 portfolio); AMG Pantheon Subsidiary Fund, LLC (1 portfolio). |
| | | | | |
Samuel R. Karetsky* c/o Harding Loevner LP 400 Crossing Boulevard Fourth Floor Bridgewater, NJ 08807 1945 | | Director Emeritus | | One year; Director Emeritus since 2021; Director 1998-2020 | | The Karetsky Group LLC (advisory firm), Managing Member, 2003 – present; Wetherby Asset Management, Wealth Manager, 2004 – present | | None. | | None. |
*Mr. Karetsky retired as a voting member of the Board and was elected to the position of “Director Emeritus” with a one-year term, effective January 1, 2021. His term as Director Emeritus concludes on December 31, 2021. Directors Emeritus do not vote with the Board and do not serve on any of the committees.
95
Harding, Loevner Funds, Inc.
Directors and Principal Officers
(unaudited)
Interested Directors:
| | | | | | | | | | |
Name, Address and Year of Birth | | Position with the Fund | | Term of Office and Length of Time Served* | | Principal Occupation During Past Five Years | | Number of
Portfolios
in Fund
Complex
Overseen
By Director | | Other Directorships |
| | | | | |
David R. Loevner** Harding Loevner LP Fish Creek Center 1230 Ida Dr. Ste. 31⁄2 PO Box 383 Wilson, WY 83014 1954 | | Director and Chairman of the Board of Directors | | Indefinite; Director and Chairman of the Board since 1996 | | Harding Loevner LP, Chairman and Chief Executive Officer, 1989 – present; Harding Loevner Funds, plc, Director, 2007 - present. | | 10 | | None. |
| | | | | |
Alexandra K. Lynn*** Affiliated Managers Group, Inc. 777 South Flagler Drive West Palm Beach, FL 33401 1979 | | Director | | Indefinite; Director since 2021. | | Affiliated Managers Group, Inc., 2009– present (Chief Administrative Officer, 2018 – present) | | 10 | | None. |
| | | | | |
Christine C. Carsman**** Affiliated Managers Group, Inc. 777 South Flagler Drive West Palm Beach, FL 33477 1952 | | Director Emeritus | | One year; Director Emeritus since 2021; Director 2017-2020 | | Affiliated Managers Group, Inc., Senior Policy Advisor, 2019 – present; Executive Vice President, Deputy General Counsel and Chief Regulatory Counsel 2017 – 2018; Senior Vice President and Deputy General Counsel 2011-2016; AMG Funds plc. Chair of the Board of Directors, 2015 – 2018; Director, 2010-2018. | | None. | | AMG Funds (46 portfolios); AMG Pantheon Fund (1 portfolio); AMG Pantheon Master Fund (1 portfolio); AMG Pantheon Subsidiary Fund, LLC (1 portfolio). |
* Each of Mr. Loevner and Ms. Lynn is elected to serve in accordance with the Articles of Incorporation and By-Laws of the Fund until their respective successor is duly elected and qualified.
** Mr. Loevner is considered an “interested person” of the Fund as defined in 1940 Act, because he serves as Chairman of Harding Loevner LP, the Fund’s investment advisor.
*** Ms. Lynn is considered an “interested person” of the Fund as defined in the 1940 Act, as a result of her position with, and interest in securities of, AMG, a control person of Harding Loevner.
****Ms. Carsman is considered an “interested person” of the Fund as defined in the 1940 Act, as a result of her position with, and interest in securities of, AMG, a control person of Harding Loevner. Ms. Carsman retired as a voting member of the Board and was elected to the position of “Director Emeritus” with a one-year term, effective January 1, 2021. Her term as Director Emeritus concludes on December 31, 2021. Directors Emeritus do not vote with the Board and do not serve on any committees.
The Funds’ Statement of Additional Information contains additional information about the Directors and is available upon request and without charge by calling (877) 435-8105.
96
Harding, Loevner Funds, Inc.
Directors and Principal Officers
(unaudited)
Principal Officers of the Fund:
| | | | | | |
Name, Address and Year of Birth | | Position(s) with the Fund | | Term of Office and Length of Time Served* | | Principal Occupation During Past Five Years |
| | | |
Richard T. Reiter Harding Loevner LP 400 Crossing Boulevard Fourth Floor Bridgewater, NJ 08807 1966 | | President | | 1 year; since 2011 | | Harding Loevner LP, President and Chief Operating Officer, 1996 - present. |
| | | |
Tracy L. Dotolo Foreside Management Services, LLC 10 High Street, Suite 302 Boston, MA 02110 1976 | | Chief Financial Officer and Treasurer | | 1 year; since 2019 | | Director at Foreside, Inc. 2016 – present; Vice President – Global Fund Services at JPMorgan Chase 2009 – 2016. |
| | | |
Aaron J. Bellish Harding Loevner LP 400 Crossing Boulevard Fourth Floor Bridgewater, NJ 08807 1979 | | Assistant Treasurer | | 1 year; since 2012 | | Harding Loevner LP, Chief Operating Officer, 2021 – present; Chief Financial Officer, 2012 – 2021. |
| | | |
Derek A. Jewusiak The Northern Trust Company 333 South Wabash Chicago, IL 60604 1971 | | Assistant Treasurer | | 1 year; since 2013 | | The Northern Trust Company, Vice President, 2012 – present. |
| | | |
Lisa Togneri Harding Loevner LP 400 Crossing Boulevard Fourth Floor Bridgewater, NJ 08807 1976 | | Assistant Treasurer | | 1 year; since 2021 | | Harding Loevner LP, Chief Financial Officer, 2021 – present; Deputy Chief Financial Officer, 2019 – 2021; Soundlink Partners, Chief Financial Officer and Chief Operating Officer, 2015-2019. |
| | | |
Ryan Bowles Harding Loevner LP 400 Crossing Boulevard Fourth Floor Bridgewater, NJ 08807 1988 | | Assistant Treasurer | | 1 year; since 2019 | | Harding Loevner LP, Product Manager, 2010 – present. |
| | | |
Lisa R. Price Harding Loevner LP 400 Crossing Boulevard Fourth Floor Bridgewater, NJ 08807 1979 | | Assistant Secretary | | 1 year; since 2019 | | Harding Loevner LP, Counsel, 2019 – present; Oak Hill Advisors, LP, Principal, Associate General Counsel and Chief Compliance Officer (OHAI), January 2019 – August 2019, Vice President, Associate General Counsel and Chief Compliance Officer (OHAI), 2015 – 2018. |
| | | |
Brian D. Simon Harding Loevner LP 400 Crossing Boulevard Fourth Floor Bridgewater, NJ 08807 1962 | | Chief Compliance Officer, Anti-Money Laundering Compliance Officer and Assistant Secretary | | 1 year, since 2016, 2016 and 2015 respectively | | Harding Loevner LP, General Counsel, 2014 – present. |
97
Harding, Loevner Funds, Inc.
Directors and Principal Officers
(unaudited)
Principal Officers of the Fund (continued):
| | | | | | |
Name, Address and Year of Birth | | Position(s) with the Fund | | Term of Office and Length of Time Served* | | Principal Occupation During Past Five Years |
| | | |
Marcia Y. Lucas The Northern Trust Company 333 South Wabash Avenue Chicago, IL 60604 1967 | | Secretary, December 2018 - Present; Assistant Secretary, 2011-November 2018 | | 1 year; since 2011 | | The Northern Trust Company, Senior Vice President, 2015 – present. |
* Officers are elected to hold such office until their successor is elected and qualified to carry out the duties and responsibilities of their office, or until he or she resigns or is removed from office.
There is no family relationship among any of the Directors or officers listed above.
98
Harding, Loevner Funds, Inc.
Supplemental Information
(unaudited)
Quarterly Portfolio Schedules of Investments
Each Portfolio files its complete portfolio of investments with the SEC for the first and third quarters of each fiscal year as an exhibit to its reports on Form N-PORT. The Portfolios’ Forms N-PORT are available on the SEC’s website at www.sec.gov. Additionally, they are available upon request by calling (877) 435-8105.
Proxy Voting Record
The Fund’s proxy voting record relating to the Portfolios’ securities during the most recent 12-month period ended June 30 is available on the Fund’s website at www.hardingloevnerfunds.com and on the SEC’s website at www.sec.gov, on Form N-PX.
Proxy Voting Policies and Procedures
The Fund’s proxy voting policies and procedures are included in Appendix B to the Fund’s Statement of Additional Information and is available without charge, upon request, by calling (877) 435-8105 or on the SEC’s website at www.sec.gov.
Additional Information
The Adviser updates Fact Sheets for the Portfolios each calendar quarter that are posted to the Fund’s website at www.hardingloevnerfunds.com. This information, along with the Adviser’s commentaries on its various strategies, is available without charge, upon request, by calling (877) 435-8105.
99
Client Name
Address Line 1
Address Line 2
City, State Zip
(877) 435-8105
www.hardingloevnerfunds.com
Item 1. Reports to Stockholders (cont.).
Item 2. Code of Ethics.
| (a) | As of October 31, 2021, the Registrant has adopted a code of ethics that applies to the Registrant’s President/Chief Executive Officer and Treasurer/Chief Financial Officer (the “Code of Ethics”). |
| (c) | For the fiscal year ended October 31, 2021, there were no amendments to a provision of the Registrant’s Code of Ethics. |
| (d) | For the fiscal year ended October 31, 2021, there were no waivers granted from a provision of the Registrant’s Code of Ethics. |
Item 3. Audit Committee Financial Expert.
As of October 31, 2021, the Registrant’s Board of Directors has determined that the following members of the Audit Committee are audit committee financial experts and independent: Carolyn N. Ainslie and Jill R. Cuniff.
Item 4. Principal Accountant Fees and Services.
(a) Audit Fees: The aggregate fees billed for each of the last two fiscal years for professional services rendered by KPMG LLP, the Registrant’s principal accountant, for the audit of the Registrant’s annual financial statements in connection with statutory and regulatory filings or engagements for those fiscal years are $249,570 in 2021 and $226,280 in 2020.
(b) Audit-Related Fees: The aggregate fees billed in each of the last two fiscal years for assurance and related services by KPMG LLP that are reasonably related to the performance of the audit of the Registrant financial statements and are not reported under paragraph (a) of this Item are None.
(c) Tax Fees: The aggregate fees billed in each of the last two fiscal years for professional services rendered by KPMG LLP for the review of domestic tax returns were $86,630 in 2021 and $76,590 in 2020.
(d) All Other Fees: The aggregate fees billed in each of the last two fiscal years for products and services provided by KPMG LLP, other than the services reported in paragraphs (a) through (c) of this Item are $0 in 2021 and $15,000 in 2020, related to research, preparation and filing of tax returns in certain foreign jurisdictions.
(e)(1) Disclose the audit committee pre-approval policies and procedures described in paragraph (c)(7) of Rule 2-01 of Regulation S-X.
A copy of the Audit Committee’s Pre-Approval Policies and Procedures is filed with this Form N-CSR under Item 13(c).
(e)(2) There were no amounts that were pre-approved by the Audit Committee pursuant to paragraph (c)(7)(i)(C) of Rule 2-01 of Regulation S-X.
2
(f) Not applicable.
(g) Not applicable.
(h) Not applicable.
(i) Not applicable.
(j) Not applicable.
Item 5. Audit Committee of Listed Registrants.
Not applicable.
Item 6. Investments.
| (a) | Schedule I is included as part of the report to shareholders filed under Item 1 of this report on Form N-CSR. |
Item 7. Disclosure of Proxy Voting Policies and Procedures for Closed-End Management Investment Companies.
Not applicable.
Item 8. Portfolio Managers of Closed-End Management Investment Companies.
Not applicable.
Item 9. Purchases of Equity Securities by Closed-End Management Investment Company and Affiliated Purchasers.
Not applicable.
Item 10. Submission of Matters to a Vote of Security Holders.
Not applicable.
Item 11. Controls and Procedures.
| (a) | The Registrant’s Principal Executive Officer and Principal Financial Officer, or persons performing similar functions, have concluded that the Registrant’s disclosure controls and procedures (as defined in Rule 30a-3(c) under the Investment Company Act of 1940, as amended (the “1940 Act”)) were effective as of a date within 90 days prior to the filing date of this report, based on their evaluation of the effectiveness of the Registrant’s disclosure controls and procedures as of the evaluation date. |
| (b) | There were no significant changes in the Registrant’s internal control over financial reporting (as defined in Rule 30a-3(d) under the 1940 Act) that occurred during the period covered by this report that have materially affected, or are reasonably likely to materially affect, the Registrant’s internal control over financial reporting. |
Item 12. Disclosure of Securities Lending Activities for Closed-End Management Investment Companies.
Not applicable.
3
Item 13. Exhibits.
(a)(2) Exhibit 99.CERT: Certifications pursuant to Rule 30a-2(a) of the Investment Company Act of 1940, as amended, are attached.
(a)(3) Not applicable.
(a)(4) Not applicable.
(b) Exhibit 99.906: Certifications pursuant to Rule 30a-2(b) of the Investment Company Act of 1940, as amended, are attached hereto.
4
SIGNATURES
Pursuant to the requirements of the Securities Exchange Act of 1934 and the Investment Company Act of 1940, the Registrant has duly caused this report to be signed on its behalf by the undersigned, thereunto duly authorized.
Harding, Loevner Funds, Inc.
| | |
| By | | /s/ Richard T. Reiter |
| | Richard T. Reiter |
| | President |
| | (Principal Executive Officer) |
Date: January 5, 2022
Pursuant to the requirements of the Securities Exchange Act of 1934 and the Investment Company Act of 1940, this report has been signed below by the following persons on behalf of the Registrant and in the capacities and on the dates indicated.
| | |
| By | | /s/ Richard T. Reiter |
| | Richard T. Reiter |
| | President |
| | (Principal Executive Officer) |
Date: January 5, 2022
| | |
| By | | /s/ Tracy L. Dotolo |
| | Tracy L. Dotolo |
| | Chief Financial Officer and Treasurer |
| | (Principal Financial Officer) |
Date: January 5, 2022
5