UNITED STATES
SECURITIES AND EXCHANGE COMMISSION
Washington, D.C. 20549
FORM N-CSR
CERTIFIED SHAREHOLDER REPORT OF REGISTERED
MANAGEMENT INVESTMENT COMPANIES
Investment Company Act file number 811-7739
Harding, Loevner Funds, Inc.
(Exact name of registrant as specified in charter)
50 Division Street
Somerville, NJ 08876
(Address of principal executive offices) (Zip code)
Owen T. Meacham, Esq.
The Northern Trust Company
50 South LaSalle Street, B-9
Chicago, IL 60603
(Name and address of agent for service)
Registrant’s telephone number, including area code: (877) 435-8105
Date of fiscal year end: 10/31/2010
Date of reporting period: 10/31/2010
Item 1. Reports to Stockholders.
Harding, Loevner Funds, Inc.
Table of Contents
Harding, Loevner Funds, Inc.
Expense Example
October 31, 2010 (unaudited)
As a shareholder of a Harding Loevner Portfolio, you incur two types of costs: (1) transaction costs, including brokerage commissions on purchases and sales of fund shares; and (2) ongoing costs, including management fees and other fund expenses. The following example is intended to help you understand your ongoing costs (in dollars and cents) of investing in the Portfolio and to compare these costs with the ongoing costs of investing in other mutual funds. The example is based on an investment of $1,000 invested on May 1, 2010 and held for the entire six month period from May 1, 2010 to October 31, 2010 for the Global Equity Portfolio—Institutional Class, International Equity Portfolio—Institutional Class, Institutional Emerging Markets Portfolio and Frontier Emerging Markets Portfolio—Institutional Class.
Actual Expenses
The first line under the Portfolio in the table below provides information about actual account values and actual expenses. You may use the information in this line, together with the amount you invested, to estimate the expenses that you paid over the period. Simply divide your account value by $1,000 (for example, an $8,600 account value divided by $1,000 = 8.6), then multiply the result by the number in the first line for the Portfolio under the heading entitled “Expenses Paid During Period” to estimate the expenses you paid on your account during this period.
Hypothetical Example for Comparison Purposes
The second line under each Portfolio in the table below provides information about hypothetical account values and hypothetical expenses based on the Portfolio’s actual expense ratio and an assumed rate of return of 5% per year before expenses, which is not the Portfolio’s actual return. The hypothetical account values and expenses may not be used to estimate the actual ending account balance or expenses you paid for the period. You may use this information to compare the ongoing costs of investing in the Portfolio and other funds. To do so, compare this 5% hypothetical example with the 5% hypothetical examples that appear in the shareholder reports of the other funds. Please note that the expenses shown in the table are meant to highlight your ongoing costs only and do not reflect any transactional costs, such as brokerage commissions paid on purchases and sales of fund shares. Therefore, the second line under the Portfolio in the table is useful in comparing ongoing costs only, and will not help you determine the relative total costs of owning different funds. In addition, if these transactional costs were included, your costs would have been higher.
| | | | | | | | | | | | | | | | |
| | | | | | | | | | | | | |
| | | Beginning Account Value May 1, 2010 | | | Ending Account Value October 31, 2010 | | | Annualized Expense Ratio | | | Expenses Paid During Period* (May 1, 2010 to October 31, 2010) | |
Global Equity Portfolio—Institutional Class | | | | | | | | | | | | | | | | |
Actual | | $ | 1,000.00 | | | $ | 1,055.63 | | | | 1.00% | | | $ | 5.18 | |
Hypothetical (5% annual return before expenses) | | | 1,000.00 | | | | 1,020.16 | | | | 1.00% | | | | 5.09 | |
International Equity Portfolio—Institutional Class | | | | | | | | | | | | | | | | |
Actual | | | 1,000.00 | | | | 1,095.92 | | | | 0.93% | | | | 4.91 | |
Hypothetical (5% annual return before expenses) | | | 1,000.00 | | | | 1,020.52 | | | | 0.93% | | | | 4.74 | |
Institutional Emerging Markets Portfolio | | | | | | | | | | | | | | | | |
Actual | | | 1,000.00 | | | | 1,111.85 | | | | 1.30% | | | | 6.92 | |
Hypothetical (5% annual return before expenses) | | | 1,000.00 | | | | 1,018.65 | | | | 1.30% | | | | 6.61 | |
Frontier Emerging Markets Portfolio | | | | | | | | | | | | | | | | |
Actual | | | 1,000.00 | | | | 1,100.56 | | | | 2.00% | | | | 10.59 | |
Hypothetical (5% annual return before expenses) | | | 1,000.00 | | | | 1,015.12 | | | | 2.00% | | | | 10.16 | |
| | | | | | | | | | | | | |
* Expenses are calculated using each Portfolio’s annualized expense ratio (as disclosed in the table), multiplied by the average account value for the period, multiplied by number of days in the period (184 days), and divided by the number of days in the year (365 days).
Harding, Loevner Funds, Inc.
Global Equity Portfolio (Institutional Class) — Overview
(unaudited)
October 31, 2010
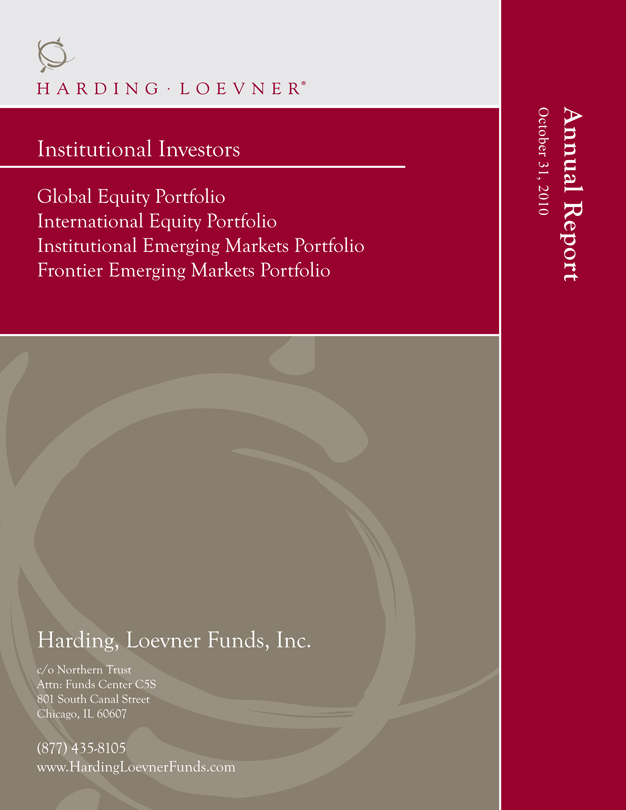
Hypothetical Comparison Of Changes In Value Of $10,000 Investment In Harding, Loevner Funds, Inc. -
Global Equity Portfolio And The Lipper Global Equity Fund Index
(Net Dividends Reinvested)
And The MSCI All Country World Index (Net Dividend)
| | | | |
| | | | | |
| | | Returns for the Year Ended October 31, 2010 | | |
| | | |
| | | Cumulative Total Returns | | |
FUND NAME | | Inception | | |
Global Equity Portfolio—Institutional Class (Inception date 11/3/09) | | 15.39% | | |
MSCI All Country World Index (Net Dividends) | | 13.87% | | |
Lipper Global Equity Fund Index | | 14.59% | | |
| | | | | |
Performance data quoted represents past performance and does not guarantee future results. The investment return and principal value of an investment will fluctuate so that an investor’s shares, when redeemed, may be worth more or less than their original cost. Performance current to the most recent month end may be lower or higher than the performance quoted and may be obtained by visiting the website at www.hardingloevnerfunds.com.
Investment return reflects voluntary fee waivers in effect. Absence such waivers, total return would be reduced. The performance provided does not reflect the deduction of taxes that a shareholder would pay on Portfolio distributions.
3
Harding, Loevner Funds, Inc.
Global Equity Portfolio (Institutional Class) - Overview
(unaudited)
October 31, 2010
The Global Equity Portfolio gained 15.39% since inception (November 3, 2009) through the fiscal year ending October 31, 2010. In comparison, its benchmark, the MSCI All Country World Index, rose 13.87%.
Consistent with its investment objectives and policies, the Portfolio was invested in the securities of global companies that exhibit the fundamental characteristics of sustainable growth, financial strength, management quality, and durable competitive advantage.
The Portfolio’s relative outperformance derived from both stock selection and the resulting sector allocations. Our continued bias against—and resulting small weighting in—the Financials sector was the biggest contributor from sector allocation, and our preference for Emerging Markets-oriented banks, which translated as good stock selection, augmented that contribution. We also saw excellent performance within the Health Care sector, including from diabetes specialists Novo Nordisk and Fresenius, and from Genzyme and Talecris Biotherapeutics, both of which are the subject of ongoing acquisition bids from other Health Care companies. In addition, our Consumer Discretionary and Information Technology holdings made positive contributions. The main detractor was the Portfolio’s dreadful relative performance within Consumer Staples and Materials. The former was due to poor returns from two agriculture-related stocks, Bunge and Olam International (sold early in the year), as well as Walgreen. Disappointing performance from Monsanto hurt returns in Materials.
Geographically, the Portfolio enjoyed strong relative returns in Europe, both in the eurozone and in the non-European Monetary Union countries. Good stock selection in these regions was due in large part to our preference for multinational consumer-oriented companies—such as Swatch Group, LVMH Moët Hennessy, and L’Oréal—and to a small weighting in domestically-oriented Financials. We also enjoyed strong stock selection in Japan, led by robot manufacturer Fanuc. Our stocks in the US lagged, however, especially Adobe Systems and the aforementioned Monsanto and Walgreen. The US holdings outperformed the benchmark Index overall, however, the Portfolio’s large overweight in the US was beneficial.
Past performance does not guarantee future results.
The Portfolio invests in foreign securities, which will involve greater volatility and political, economic, and currency risks and differences in accounting methods. It also invests in emerging markets, which involve unique risks, such as exposure to economies less diverse and mature than the U.S. or other more established foreign markets. Economic and political instability may cause larger price changes in emerging markets securities than other foreign securities. Investments in debt securities typically decrease in value when interest rates rise. This risk is usually greater for longer-term debt securities. Investment by the Portfolio in lower rated and non-rated securities presents a greater risk of loss to principal and interest than higher-rated securities.
Please see the Statement of Net Assets on page 5 for fund holdings as of October 31, 2010. Fund holdings and sector allocations are subject to change and are not recommendations to buy or sell any security.
The MSCI All Country World Index is a free float-adjusted market capitalization index that is designed to measure equity market performance in the global developed and emerging markets. The Index consists of 45 developed and emerging market countries. The Index is net of foreign withholding taxes on dividends. You cannot invest directly in this Index.
4
Harding, Loevner Funds, Inc.
Global Equity Portfolio
Statement of Net Assets
October 31, 2010
| | | | | | |
| Industry | | Percentage of Net Assets |
Agriculture | | | 1.1 | % | | |
Apparel | | | 3.0 | | | |
Banks | | | 9.2 | | | |
Beverages | | | 0.9 | | | |
Biotechnology | | | 2.4 | | | |
Chemicals | | | 8.6 | | | |
Commercial Services | | | 2.1 | | | |
Computers | | | 6.1 | | | |
Cosmetics/Personal Care | | | 8.5 | | | |
Distribution/Wholesale | | | 3.0 | | | |
Diversified Financial Services | | | 2.0 | | | |
Electrical Components & Equipment | | | 2.7 | | | |
Electronics | | | 1.8 | | | |
Food | | | 2.2 | | | |
Healthcare - Products | | | 2.6 | | | |
Holding Companies - Diversified | | | 0.9 | | | |
Internet | | | 8.2 | | | |
Machinery - Diversified | | | 2.4 | | | |
Media | | | 1.1 | | | |
Miscellaneous Manufacturing | | | 1.8 | | | |
Mutual Funds | | | 1.4 | | | |
Office/Business Equipment | | | 1.0 | | | |
Oil & Gas | | | 4.1 | | | |
Oil & Gas Services | | | 1.9 | | | |
Pharmaceuticals | | | 4.1 | | | |
Retail | | | 8.9 | | | |
Software | | | 6.5 | | | |
Telecommunications | | | 1.4 | | | |
| | | | | | |
Total Investments | | | 99.9 | | | |
Other Assets Less Liabilities | | | 0.1 | | | |
| | | | | | |
Net Assets | | | 100.0 | % | | |
| | | | | | |
See Notes to Financial Statements
5
Harding, Loevner Funds, Inc.
Global Equity Portfolio
Statement of Net Assets
October 31, 2010 (continued)
| | | | | | | | |
| | | Shares | | | Value (1) | |
Common Stocks - 98.4% | | | | | | | | |
| | |
Australia - 0.9% | | | | | | | | |
Cochlear Ltd. (Healthcare - Products) | | | 19,930 | | | $ | 1,386,950 | |
| | | | | | | | |
| | |
Austria - 0.8% | | | | | | | | |
Erste Group Bank AG (Banks) | | | 27,900 | | | | 1,258,192 | |
| | | | | | | | |
| | |
Bermuda - 1.1% | | | | | | | | |
Bunge Ltd. (Agriculture) | | | 27,870 | | | | 1,674,151 | |
| | | | | | | | |
| | |
Canada - 0.9% | | | | | | | | |
Encana Corp. (Oil & Gas) | | | 47,090 | | | | 1,328,880 | |
| | | | | | | | |
| | |
China - 0.9% | | | | | | | | |
China Merchants Holdings International Co., Ltd. (Holding Companies - Diversified) | | | 398,000 | | | | 1,393,225 | |
| | | | | | | | |
| | |
Denmark - 1.4% | | | | | | | | |
Novo Nordisk AS, Class B (Pharmaceuticals) | | | 19,500 | | | | 2,048,261 | |
| | | | | | | | |
| | |
France - 7.5% | | | | | | | | |
Air Liquide SA (Chemicals) | | | 18,737 | | | | 2,428,390 | |
Dassault Systemes SA (Software) | | | 32,450 | | | | 2,487,213 | |
L’Oreal SA (Cosmetics/Personal Care) | | | 29,910 | | | | 3,514,166 | |
Schlumberger Ltd. (Oil & Gas Services) | | | 40,590 | | | | 2,836,835 | |
| | | | | | | | |
| | | | | | | 11,266,604 | |
| | | | | | | | |
| | |
Germany - 1.5% | | | | | | | | |
Hamburger Hafen und Logistik AG (Commercial Services) | | | 39,100 | | | | 1,713,139 | |
Qiagen NV (Healthcare - Products)* | | | 27,278 | | | | 517,652 | |
| | | | | | | | |
| | | | | | | 2,230,791 | |
| | | | | | | | |
| | |
Hong Kong - 3.0% | | | | | | | | |
Li & Fung Ltd. (Distribution/Wholesale) | | | 855,800 | | | | 4,538,696 | |
| | | | | | | | |
| | |
India - 1.8% | | | | | | | | |
ICICI Bank Ltd. - Sponsored ADR (Banks) | | | 51,300 | | | | 2,697,354 | |
| | | | | | | | |
| | |
Indonesia - 1.4% | | | | | | | | |
Bank Central Asia Tbk PT (Banks) | | | 2,654,000 | | | | 2,080,752 | |
| | | | | | | | |
| | |
Israel - 0.7% | | | | | | | | |
Teva Pharmaceutical Industries Ltd. - Sponsored ADR (Pharmaceuticals) | | | 21,600 | | | | 1,121,040 | |
| | | | | | | | |
| | |
Japan - 9.2% | | | | | | | | |
ABC-Mart, Inc. (Retail) | | | 37,000 | | | | 1,258,398 | |
Canon Inc. - Sponsored ADR (Office/Business Equipment) | | | 31,200 | | | | 1,435,200 | |
Fanuc Ltd. (Machinery - Diversified) | | | 24,900 | | | | 3,623,180 | |
See Notes to Financial Statements
6
Harding, Loevner Funds, Inc.
Global Equity Portfolio
Statement of Net Assets
October 31, 2010 (continued)
| | | | | | | | |
| | |
| | | Shares | | | Value (1) | |
| | |
Japan - 9.2% - (continued) | | | | | | |
Keyence Corp. (Electronics) | | | 10,760 | | | $ | 2,652,654 | |
M3 Inc. (Internet) | | | 327 | | | | 1,497,550 | |
Unicharm Corp. (Cosmetics/Personal Care) | | | 89,400 | | | | 3,407,241 | |
| | | | | | | | |
| | | | | | | 13,874,223 | |
| | | | | | | | |
| | |
Mexico - 0.9% | | | | | | |
Coca-Cola Femsa SAB de CV - Sponsored ADR (Beverages) | | | 17,500 | | | | 1,390,725 | |
| | | | | | | | |
| | |
Russia - 1.3% | | | | | | |
Gazprom OAO - Sponsored ADR (Oil & Gas) | | | 72,200 | | | | 1,580,611 | |
Wimm-Bill-Dann Foods OJSC - ADR (Food) | | | 13,456 | | | | 341,244 | |
| | | | | | | | |
| | | | | | | 1,921,855 | |
| | | | | | | | |
| | |
South Africa - 0.9% | | | | | | |
Sasol Ltd. (Oil & Gas) | | | 31,730 | | | | 1,429,061 | |
| | | | | | | | |
| | |
Switzerland - 9.0% | | | | | | |
Lonza Group AG, Reg S (Chemicals) | | | 29,700 | | | | 2,604,943 | |
Nestle SA - Sponsored ADR, Reg S (Food) | | | 53,255 | | | | 2,921,037 | |
Novartis AG, Reg S (Pharmaceuticals) | | | 29,620 | | | | 1,717,712 | |
Sonova Holding AG, Reg S (Healthcare - Products) | | | 17,980 | | | | 2,084,037 | |
Swatch Group AG, Bearer (Retail) | | | 11,070 | | | | 4,234,867 | |
| | | | | | | | |
| | | | | | | 13,562,596 | |
| | | | | | | | |
| | |
United Kingdom - 5.3% | | | | | | |
Autonomy Corp. plc (Software)* | | | 55,800 | | | | 1,308,054 | |
RPS Group plc (Commercial Services) | | | 460,000 | | | | 1,514,430 | |
Standard Chartered plc (Banks) | | | 118,300 | | | | 3,424,391 | |
WPP plc (Media) | | | 143,370 | | | | 1,669,566 | |
| | | | | | | | |
| | | | | | | 7,916,441 | |
| | | | | | | | |
| | |
United States - 49.9% | | | | | | |
3M Co. (Miscellaneous Manufacturing) | | | 31,670 | | | | 2,667,247 | |
Abbott Laboratories (Pharmaceuticals) | | | 26,380 | | | | 1,353,822 | |
Adobe Systems Inc. (Software)* | | | 41,690 | | | | 1,173,574 | |
Amazon.com, Inc. (Internet)* | | | 11,200 | | | | 1,849,568 | |
Apple Inc. (Computers)* | | | 8,900 | | | | 2,677,743 | |
Charles Schwab Corp. (Diversified Financial Services) | | | 84,700 | | | | 1,304,380 | |
Cisco Systems Inc. (Telecommunications)* | | | 94,915 | | | | 2,166,909 | |
Citrix Systems, Inc. (Software)* | | | 25,200 | | | | 1,614,564 | |
Coach Inc. (Apparel) | | | 91,600 | | | | 4,580,000 | |
Colgate-Palmolive Co. (Cosmetics/Personal Care) | | | 28,250 | | | | 2,178,640 | |
eBay Inc. (Internet)* | | | 172,100 | | | | 5,130,301 | |
EMC Corp. (Computers)* | | | 164,250 | | | | 3,450,893 | |
Emerson Electric Co. (Electrical Components & Equipment) | | | 73,370 | | | | 4,028,013 | |
Exxon Mobil Corp. (Oil & Gas) | | | 27,890 | | | | 1,853,848 | |
See Notes to Financial Statements
7
Harding, Loevner Funds, Inc.
Global Equity Portfolio
Statement of Net Assets
October 31, 2010 (continued)
| | | | | | | | |
| | | Shares | | | Value (1) | |
| | |
United States - 49.9% - (continued) | | | | | | | | |
Genzyme Corp. (Biotechnology)* | | | 28,300 | | | $ | 2,041,279 | |
Google Inc., Class A (Internet)* | | | 6,247 | | | | 3,829,349 | |
Greenhill & Co., Inc. (Diversified Financial Services) | | | 21,600 | | | | 1,677,672 | |
JPMorgan Chase & Co. (Banks) | | | 46,300 | | | | 1,742,269 | |
McDonald’s Corp. (Retail) | | | 18,900 | | | | 1,469,853 | |
Monsanto Co. (Chemicals) | | | 51,700 | | | | 3,072,014 | |
Oracle Corp. (Software) | | | 109,210 | | | | 3,210,774 | |
Praxair Inc. (Chemicals) | | | 20,520 | | | | 1,874,297 | |
Procter & Gamble Co. (Cosmetics/Personal Care) | | | 57,600 | | | | 3,661,632 | |
Sigma-Aldrich Corp. (Chemicals) | | | 47,600 | | | | 3,018,792 | |
Staples Inc. (Retail) | | | 161,910 | | | | 3,314,298 | |
Talecris Biotherapeutics Holdings Corp. (Biotechnology)* | | | 66,200 | | | | 1,623,224 | |
Teradata Corp. (Computers)* | | | 79,000 | | | | 3,109,440 | |
Walgreen Co. (Retail) | | | 91,900 | | | | 3,113,572 | |
Wells Fargo & Co. (Banks) | | | 94,760 | | | | 2,471,341 | |
| | | | | | | | |
| | | | | | | 75,259,308 | |
| | | | | | | | |
| | |
Total Common Stocks (Cost $119,670,724) | | | | | | | 148,379,105 | |
| | | | | | | | |
| | |
Rights - 0.1% | | | | | | | | |
| | |
United Kingdom - 0.1% | | | | | | | | |
Standard Chartered PLC (Banks)* | | | 14,787 | | | | 124,508 | |
| | | | | | | | |
| | |
Total Rights (Cost $88,560) | | | | | | | 124,508 | |
| | | | | | | | |
| | |
Cash Equivalent - 1.4% | | | | | | | | |
Northern Institutional Funds - Diversified Assets Portfolio (Mutual Funds) | | | 2,059,862 | | | | 2,059,862 | |
| | | | | | | | |
Total Cash Equivalent (Cost $2,059,862) | | | | | | | 2,059,862 | |
| | | | | | | | |
| | |
Total Investments — 99.9% (Cost $ 121,819,146) | | | | | | $ | 150,563,475 | |
| | | | | | | | |
Summary of Abbreviations
| | |
ADR | | American Depository Receipt |
Reg S | | Security sold outside United States without registration under the Securities Act of 1933. |
| (1) | See Note 2 to Financial Statements. |
| * | Non-income producing security. |
See Notes to Financial Statements
8
Harding, Loevner Funds, Inc.
Global Equity Portfolio
Statement of Net Assets
October 31, 2010
| | | | |
| | | Value (1) | |
Other Assets, Net of Liabilities - 0.1% | | | |
Cash | | $ | 2,315 | |
Dividends and interest receivable | | | 146,262 | |
Foreign currency (cost $2,731) | | | 3,017 | |
Receivable for Fund shares sold | | | 147,916 | |
Tax reclaim receivable | | | 38,957 | |
Prepaid expenses | | | 23,658 | |
Payable to Investment Advisor | | | (123,550 | ) |
Payable for Fund shares redeemed | | | (11,861 | ) |
Other liabilities | | | (64,694 | ) |
| | | | |
| | | 162,020 | |
| | | | |
Net Assets - 100% | | | |
Institutional Class | | | | |
Applicable to 4,432,600 outstanding $.001 par value shares (authorized 200,000,000 shares) | | $ | 104,275,890 | |
| | | | |
| |
Net Asset Value, Offering Price and Redemption Price Per Share | | $ | 23.52 | |
| | | | |
| |
Advisor Class | | | | |
Applicable to 1,978,267 outstanding $.001 par value shares (authorized 200,000,000 shares) | | $ | 46,449,605 | |
| | | | |
| |
Net Asset Value, Offering Price and Redemption Price Per Share | | $ | 23.48 | |
| | | | |
| |
Components of Net Assets as of October 31, 2010 were as follows: | | | |
Paid-in capital | | $ | 121,854,102 | |
Accumulated undistributed net investment income | | | 288,950 | |
Accumulated net realized loss from investment transactions | | | (168,006 | ) |
Net unrealized appreciation on investments and on assets and liabilities denominated in foreign currencies | | | 28,750,449 | |
| | | | |
| | $ | 150,725,495 | |
| | | | |
See Notes to Financial Statements
9
Harding, Loevner Funds, Inc.
International Equity Portfolio (Institutional Class) — Overview
(unaudited)
October 31, 2010
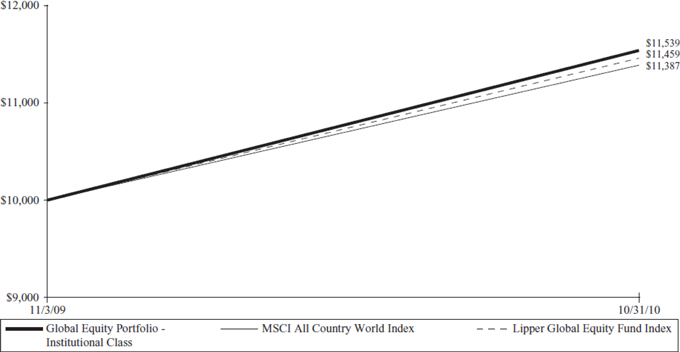
Hypothetical Comparison Of Changes In Value Of $10,000 Investment In Harding, Loevner Funds, Inc. -
International Equity Portfolio - Institutional Class And The Lipper International Equity Fund Index
(Net Dividends Reinvested)
And The MSCI All Country World ex-US Index
| | | | | | | | | | | | | | | | | | | | | | | | |
| | | | | | | | | | | | | | | | | | | |
| | | Returns for the Year Ended October 31, 2010 | |
| | | Cumulative Total Returns | | | | | | Average Annualized Total Return | |
| FUND NAME | | Last 12 Months | | | 5YR | | | 10YR | | | | | | 5YR | | | 10YR | |
International Equity Portfolio— Institutional Class (Inception date 11/1/94) | | | 21.50% | | | | 46.97% | | | | 58.46% | | | | | | | | 8.00% | | | | 4.71% | |
MSCI All Country World ex-US Index (Net dividends) | | | 12.65% | | | | 32.23% | | | | 63.47% | | | | | | | | 5.75% | | | | 5.04% | |
Lipper International Fund Index | | | 12.98% | | | | 26.78% | | | | 51.39% | | | | | | | | 4.86% | | | | 4.23% | |
| | | | | | | | | | | | | | | | | | | | | | | | | |
Performance data quoted represents past performance and does not guarantee future results. The investment return and principal value of an investment will fluctuate so that an investor’s shares, when redeemed, may be worth more or less than their original cost. Performance current to the most recent month end may be lower or higher than the performance quoted and may be obtained by visiting the website at www.hardingloevnerfunds.com.
Investment return reflects voluntary fee waivers in effect. Absence such waivers, total return would be reduced. The performance provided does not reflect the deduction of taxes that a shareholder would pay on Portfolio distributions.
10
Harding, Loevner Funds, Inc.
International Equity Portfolio (Institutional Class) – Overview
(unaudited)
October 31, 2010
The International Equity Portfolio gained 21.50% for the fiscal year ending October 31, 2010. In comparison, its benchmark, the MSCI All Country World ex-US Index, rose 12.65%.
Consistent with its investment objectives and policies, the Portfolio was invested in the securities of non-US companies that exhibit the fundamental characteristics of sustainable growth, financial strength, management quality, and durable competitive advantage.
The Portfolio’s relative outperformance derived from both stock selection and the resulting sector allocations. Our continued bias against—and resulting small weighting in—the Financials sector was the biggest contributor from sector allocation, while an even larger contribution came from stock selection due to our preference for Emerging Markets-oriented banks. We also saw good performance within the Consumer Discretionary sector (luxury goods makers LVMH Moët Hennessy and Swatch Group were stand outs), in Information Technology (notably ARM Holdings), within Industrials (especially from capital goods producers such as Japan’s Fanuc and Sweden’s Atlas Copco), and finally in Health Care (led by the diabetes specialists Fresenius and Novo Nordisk). These strong results were slightly offset by our underweight in the out-performing Materials sector, and by poor stock selection within both Materials and Consumer Staples.
Geographically, the Portfolio enjoyed strong relative returns in Europe, both in the eurozone and in the non-European Monetary Union countries. Good stock selection in these regions was due in large part to our preference for multinational consumer-oriented companies—such as Swatch, LVMH, WPP, and L’Oréal—and to a small weighting in domestically-oriented Financials. Our holdings in Japan also outperformed, led by robot manufacturer Fanuc. Portfolio returns were hurt, however, by our lagging stocks within the best-performing region, Emerging Markets, as well as within Canada, whose resource-rich market nearly matched the returns of Emerging Markets.
Past performance does not guarantee future results.
The Portfolio invests in foreign securities, which will involve greater volatility and political, economic, and currency risks. It also invests in emerging markets, which involve unique risks, such as exposure to economies less diverse and mature than the U.S. or other more established foreign markets. Economic and political instability may cause larger price changes in emerging markets securities than other foreign securities. Investments in debt securities typically decrease in value when interest rates rise. This risk is usually greater for longer-term debt securities. Investment by the Portfolio in lower-rated and non-rated securities presents a greater risk of loss to principal and interest than higher-rated securities. The portfolio invests in smaller companies which involve additional risks such as limited liquidity and greater volatility.
Please see the Statement of Net Assets on page 12 for fund holdings as of October 31, 2010. Fund holdings and sector allocations are subject to change and are not recommendations to buy or sell any security.
The MSCI All Country World ex-US Index is a free float-adjusted market capitalization index that is designed to measure equity market performance in the global developed and emerging markets, excluding the US. The Index consists of 44 developed and emerging market countries. The Index is net of foreign withholding taxes on dividends. You cannot invest directly in this Index.
11
Harding, Loevner Funds, Inc.
International Equity Portfolio
Statement of Net Assets
October 31, 2010
| | | | |
| Industry | | Percentage of Net Assets |
| | | | | | |
Agriculture | | | 1.0 | % | | |
Auto Parts & Equipment | | | 1.2 | | | |
Banks | | | 10.0 | | | |
Biotechnology | | | 1.1 | | | |
Chemicals | | | 4.7 | | | |
Computers | | | 1.1 | | | |
Cosmetics/Personal Care | | | 4.0 | | | |
Distribution/Wholesale | | | 2.3 | | | |
Electrical Components & Equipment | | | 2.5 | | | |
Electronics | | | 2.8 | | | |
Food | | | 5.9 | | | |
Healthcare - Products | | | 6.5 | | | |
Holding Companies - Diversified | | | 3.8 | | | |
Insurance | | | 3.7 | | | |
Internet | | | 1.0 | | | |
Leisure Time | | | 1.3 | | | |
Machinery - Construction & Mining | | | 1.5 | | | |
Machinery - Diversified | | | 2.7 | | | |
Media | | | 4.5 | | | |
Metal Fabrication/Hardware | | | 1.0 | | | |
Mutual Funds | | | 7.6 | | | |
Oil & Gas | | | 7.8 | | | |
Oil & Gas Services | | | 1.6 | | | |
Pharmaceuticals | | | 3.5 | | | |
Retail | | | 4.3 | | | |
Semiconductors | | | 5.6 | | | |
Software | | | 5.9 | | | |
Telecommunications | | | 6.0 | | | |
| | | | | | |
Total Investments | | | 104.9 | | | |
Liabilities Less Other Assets | | | (4.9 | ) | | |
| | | | | | |
Net Assets | | | 100.0 | % | | |
| | | | | | |
See Notes to Financial Statements
12
Harding, Loevner Funds, Inc.
International Equity Portfolio
Statement of Net Assets
October 31, 2010 (continued)
| | | | | | | | |
| | |
| | | Shares | | | Value (1) | |
Common Stocks - 93.5% | | | | | | |
| | |
Australia - 2.2% | | | | | | |
Cochlear Ltd. (Healthcare - Products) | | | 92,900 | | | $ | 6,465,012 | |
CSL Ltd. (Biotechnology) | | | 209,800 | | | | 6,755,622 | |
| | | | | | | | |
| | | | | | | 13,220,634 | |
| | | | | | | | |
| | |
Austria - 1.9% | | | | | | |
Erste Group Bank AG (Banks) | | | 255,720 | | | | 11,532,071 | |
| | | | | | | | |
| | |
Bermuda - 1.0% | | | | | | |
Bunge Ltd. (Agriculture) | | | 103,380 | | | | 6,210,037 | |
| | | | | | | | |
| | |
Brazil - 0.2% | | | | | | |
Petroleo Brasileiro SA - ADR (Oil & Gas) | | | 43,988 | | | | 1,500,871 | |
| | | | | | | | |
| | |
Canada - 2.1% | | | | | | |
Encana Corp. (Oil & Gas) | | | 136,882 | | | | 3,862,810 | |
Imperial Oil Ltd. (Oil & Gas) | | | 226,290 | | | | 8,775,526 | |
| | | | | | | | |
| | | | | | | 12,638,336 | |
| | | | | | | | |
| | |
Cayman Islands - 1.2% | | | | | | |
Xinyi Glass Holdings Ltd. (Auto Parts & Equipment) | | | 9,224,000 | | | | 7,386,697 | |
| | | | | | | | |
| | |
China - 1.1% | | | | | | |
China Resources Enterprise Ltd. (Holding Companies - Diversified) | | | 1,536,000 | | | | 6,470,488 | |
| | | | | | | | |
| | |
Denmark - 1.3% | | | | | | |
Novo Nordisk A/S, Class B (Pharmaceuticals) | | | 77,700 | | | | 8,161,533 | |
| | | | | | | | |
| | |
France - 16.3% | | | | | | |
Air Liquide SA (Chemicals) | | | 172,602 | | | | 22,369,911 | |
Dassault Systemes SA (Software) | | | 280,700 | | | | 21,514,964 | |
L’Oreal SA (Cosmetics/Personal Care) | | | 111,770 | | | | 13,132,007 | |
LVMH Moet Hennessy Louis Vuitton SA (Holding Companies - Diversified) | | | 106,930 | | | | 16,768,969 | |
Schlumberger Ltd. (Oil & Gas Services) | | | 143,000 | | | | 9,994,270 | |
Schneider Electric SA (Electrical Components & Equipment) | | | 109,050 | | | | 15,466,744 | |
| | | | | | | | |
| | | | | | | 99,246,865 | |
| | | | | | | | |
| | |
Germany - 5.6% | | | | | | |
Allianz SE, Reg S (Insurance) | | | 121,500 | | | | 15,219,880 | |
Fresenius SE (Healthcare - Products) | | | 125,768 | | | | 11,099,696 | |
QIAGEN NV (Healthcare - Products)* | | | 415,470 | | | | 7,884,341 | |
| | | | | | | | |
| | | | | | | 34,203,917 | |
| | | | | | | | |
| | |
Hong Kong - 2.3% | | | | | | |
Li & Fung Ltd. (Distribution/Wholesale) | | | 2,652,200 | | | | 14,065,821 | |
| | | | | | | | |
See Notes to Financial Statements
13
Harding, Loevner Funds, Inc.
International Equity Portfolio
Statement of Net Assets
October 31, 2010 (continued)
| | | | | | | | |
| | | Shares | | | Value (1) | |
| | |
India - 1.8% | | | | | | | | |
ICICI Bank Ltd. - Sponsored ADR (Banks) | | | 206,300 | | | $ | 10,847,254 | |
| | | | | | | | |
| | |
Indonesia - 1.8% | | | | | | | | |
Telekomunikasi Indonesia Tbk PT - Sponsored ADR (Telecommunications) | | | 265,540 | | | | 10,725,161 | |
| | | | | | | | |
| | |
Israel - 0.6% | | | | | | | | |
Teva Pharmaceutical Industries Ltd. - Sponsored ADR (Pharmaceuticals) | | | 75,360 | | | | 3,911,184 | |
| | | | | | | | |
| | |
Japan - 10.6% | | | | | | | | |
Fanuc Ltd. (Machinery - Diversified) | | | 111,900 | | | | 16,282,483 | |
Hoya Corp. (Electronics) | | | 437,600 | | | | 10,179,047 | |
Jupiter Telecommunications Co., Ltd. (Media) | | | 6,855 | | | | 7,413,396 | |
Keyence Corp. (Electronics) | | | 28,765 | | | | 7,091,412 | |
M3 Inc. (Internet) | | | 1,350 | | | | 6,182,548 | |
MISUMI Group Inc. (Metal Fabrication/Hardware) | | | 297,600 | | | | 6,353,761 | |
Unicharm Corp. (Cosmetics/Personal Care) | | | 294,700 | | | | 11,231,700 | |
| | | | | | | | |
| | | | | | | 64,734,347 | |
| | | | | | | | |
| | |
Mexico - 5.0% | | | | | | | | |
America Movil SAB de CV, Series L - ADR (Telecommunications) | | | 238,200 | | | | 13,639,332 | |
Wal-Mart de Mexico SAB de CV, Class V - Sponsored ADR (Retail) | | | 609,840 | | | | 16,715,714 | |
| | | | | | | | |
| | | | | | | 30,355,046 | |
| | | | | | | | |
| | |
Panama - 1.3% | | | | | | | | |
Carnival Corp. (Leisure Time) | | | 178,500 | | | | 7,705,845 | |
| | | | | | | | |
| | |
Poland - 0.9% | | | | | | | | |
Bank Pekao SA - GDR, Reg S (Banks)# | | | 89,060 | | | | 5,821,202 | |
| | | | | | | | |
| | |
Russia - 1.7% | | | | | | | | |
Gazprom OAO - Sponsored ADR (Oil & Gas) | | | 484,270 | | | | 10,601,696 | |
| | | | | | | | |
| | |
Singapore - 0.9% | | | | | | | | |
DBS Group Holdings Ltd. (Banks) | | | 504,083 | | | | 5,424,239 | |
| | | | | | | | |
| | |
South Africa - 2.7% | | | | | | | | |
MTN Group Ltd. (Telecommunications) | | | 661,800 | | | | 11,889,549 | |
Sasol Ltd. (Oil & Gas) | | | 95,641 | | | | 4,307,494 | |
| | | | | | | | |
| | | | | | | 16,197,043 | |
| | | | | | | | |
| | |
South Korea - 0.9% | | | | | | | | |
Samsung Electronics Co., Ltd. - GDR, Reg S (Semiconductors) | | | 16,920 | | | | 5,655,780 | |
| | | | | | | | |
| | |
Sweden - 1.5% | | | | | | | | |
Atlas Copco AB, Class A (Machinery - Construction & Mining) | | | 431,200 | | | | 9,016,704 | |
| | | | | | | | |
See Notes to Financial Statements
14
Harding, Loevner Funds, Inc.
International Equity Portfolio
Statement of Net Assets
October 31, 2010 (continued)
| | | | | | | | |
| | | Shares | | | Value (1) | |
| | |
Switzerland - 10.8% | | | | | | | | |
Alcon Inc. (Healthcare - Products) | | | 84,570 | | | $ | 14,184,080 | |
Logitech International SA, Reg S (Computers)* | | | 343,400 | | | | 6,452,486 | |
Lonza Group AG, Reg S (Chemicals) | | | 74,000 | | | | 6,490,431 | |
Nestle SA - Sponsored ADR, Reg S (Food) | | | 362,150 | | | | 19,863,928 | |
Roche Holding AG, Genusschein (Pharmaceuticals) | | | 63,750 | | | | 9,360,524 | |
Swatch Group AG, Bearer (Retail) | | | 25,380 | | | | 9,709,208 | |
| | | | | | | | |
| | | | | | | 66,060,657 | |
| | | | | | | | |
| | |
Taiwan - 0.9% | | | | | | | | |
Taiwan Semiconductor Manufacturing Co., Ltd. (Semiconductors) | | | 2,834,125 | | | | 5,822,190 | |
| | | | | | | | |
| | |
United Kingdom - 16.9% | | | | | | | | |
Admiral Group plc (Insurance) | | | 273,300 | | | | 7,137,944 | |
ARM Holdings plc (Semiconductors) | | | 2,907,100 | | | | 17,063,729 | |
Autonomy Corp. plc (Software)* | | | 606,900 | | | | 14,226,847 | |
BG Group plc (Oil & Gas) | | | 612,880 | | | | 11,922,944 | |
Standard Chartered plc (Banks) | | | 563,810 | | | | 16,320,424 | |
Tesco plc (Food) | | | 1,499,380 | | | | 10,254,934 | |
Unilever plc (Food) | | | 205,725 | | | | 5,933,212 | |
WPP plc (Media) | | | 1,720,320 | | | | 20,033,390 | |
| | | | | | | | |
| | | | | | | 102,893,424 | |
| | | | | | | | |
| | |
Total Common Stocks (Cost $435,258,637) | | | | | | | 570,409,042 | |
| | | | | | | | |
| | |
Preferred Stocks - 3.7% | | | | | | | | |
| | |
Brazil - 2.8% | | | | | | | | |
Itau Unibanco Holding SA - ADR (Banks) | | | 412,600 | | | | 10,133,456 | |
Petroleo Brasileiro SA - Sponsored ADR (Oil & Gas) | | | 211,300 | | | | 6,590,447 | |
| | | | | | | | |
| | | | | | | 16,723,903 | |
| | | | | | | | |
| | |
South Korea - 0.9% | | | | | | | | |
Samsung Electronics Co., Ltd. - GDR, Reg S (Semiconductors) | | | 23,200 | | | | 5,691,213 | |
| | | | | | | | |
| | |
Total Preferred Stocks (Cost $19,957,840) | | | | | | | 22,415,116 | |
| | | | | | | | |
| | |
Rights - 0.1% | | | | | | | | |
| | |
United Kingdom - 0.1% | | | | | | | | |
Standard Chartered plc (Banks)* | | | 68,351 | | | | 575,524 | |
| | | | | | | | |
| | |
Total Rights (Cost $403,547) | | | | | | | 575,524 | |
| | | | | | | | |
See Notes to Financial Statements
15
Harding, Loevner Funds, Inc.
International Equity Portfolio
Statement of Net Assets
October 31, 2010 (continued)
| | | | | | | | |
| | | Shares | | | Value (1) | |
Cash Equivalent - 7.6% | | | | | | | | |
Northern Institutional Funds - Diversified Assets Portfolio (Mutual Funds) | | | 46,293,164 | | | $ | 46,293,164 | |
| | | | | | | | |
Total Cash Equivalent (Cost $46,293,164) | | | | | | | 46,293,164 | |
| | | | | | | | |
| | |
Total Investments — 104.9% | | | | | | | | |
(Cost $ 501,913,188) | | | | | | $ | 639,692,846 | |
| | | | | | | | |
Summary of Abbreviations
| | |
ADR | | American Depository Receipt |
GDR | | Global Depositary Receipt |
Reg S | | Security sold outside United States without registration under the Securities Act of 1933. |
| (1) | See Note 2 to Financial Statements. |
| # | Security valued at fair value as determined in good faith under policies and procedures established by and under the supervision of the Portfolio’s Board of Directors. |
| * | Non-income producing security. |
See Notes to Financial Statements
16
Harding, Loevner Funds, Inc.
International Equity Portfolio
Statement of Net Assets
October 31, 2010 (continued)
| | | | |
| | | Value (1) | |
Liabilities, Net of Other Assets - (4.9)% | | | | |
Dividends and interest receivable | | $ | 665,290 | |
Foreign currency (cost $533,862) | | | 533,516 | |
Receivable for Fund shares sold | | | 2,254,726 | |
Tax reclaim receivable | | | 298,125 | |
Prepaid expenses | | | 8,076 | |
Payable to Investment Advisor | | | (358,999 | ) |
Payable for investments purchased | | | (32,778,081 | ) |
Payable for Fund shares redeemed | | | (266,393 | ) |
Payable for distribution fees | | | (77,468 | ) |
Other liabilities | | | (156,901 | ) |
| | | | |
| | $ | (29,878,109 | ) |
| | | | |
Net Assets - 100% | | | | |
Institutional Class | | | | |
Applicable to 34,011,256 outstanding $.001 par value shares (authorized 200,000,000 shares) | | $ | 493,349,666 | |
| | | | |
| |
Net Asset Value, Offering Price and Redemption Price Per Share | | $ | 14.51 | |
| | | | |
| |
Investor Class | | | | |
Applicable to 8,050,174 outstanding $.001 par value shares (authorized 200,000,000 shares) | | $ | 116,465,071 | |
| | | | |
| |
Net Asset Value, Offering Price and Redemption Price Per Share | | $ | 14.47 | |
| | | | |
| |
Components of Net Assets as of October 31, 2010 were as follows: | | | | |
Paid-in capital | | $ | 473,875,065 | |
Accumulated undistributed net investment income | | | 2,516,364 | |
Accumulated net realized loss from investment transactions | | | (4,367,531 | ) |
Net unrealized appreciation on investments and on assets and liabilities denominated in foreign currencies | | | 137,790,839 | |
| | | | |
| | $ | 609,814,737 | |
| | | | |
See Notes to Financial Statements
17
Harding, Loevner Funds, Inc.
Institutional Emerging Markets Portfolio — Overview
(unaudited)
October 31, 2010
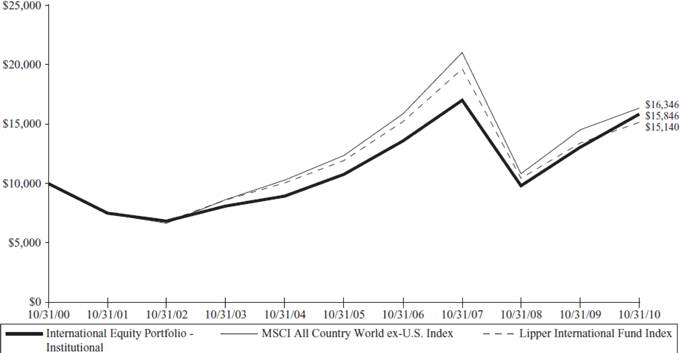
Hypothetical Comparison Of Changes In Value Of $10,000 Investment In Harding, Loevner Funds, Inc. -
Institutional Emerging Markets Portfolio And The Lipper Emerging Markets Fund Index
And The MSCI Emerging Markets Index
| | | | | | | | | | | | | | | | | | | | |
| | | | | | | | | | | | | | | | | | | | |
| | | Returns for the Year Ended October 31, 2010 | |
| | | Cumulative Total Returns | | | Average Annualized
Total Return | |
| FUND NAME | | Last 12 Months | | | 5 YR | | | Inception | | | 5 YR | | | Inception | |
Institutional Emerging Markets Portfolio
(Inception date 10/17/05) | | | 26.50% | | | | 84.33 | % | | | 83.05% | | | | 13.01 | % | | | 12.75 | % |
MSCI Emerging Markets (Net dividend) | | | 23.51% | | | | 100.41 | % | | | 99.15% | | | | 14.92 | % | | | 14.64 | % |
Lipper Emerging Markets Funds Index | | | 26.36% | | | | 86.36 | % | | | 86.04% | | | | 13.26 | % | | | 13.10 | % |
| | | | | | | | | | | | | | | | | | | | | |
Performance data quoted represents past performance and does not guarantee future results. The investment return and principal value of an investment will fluctuate so that an investor’s shares, when redeemed, may be worth more or less than their original cost. Performance current to the most recent month end may be lower or higher than the performance quoted and may be obtained by visiting the website at www.hardingloevnerfunds.com.
Investment return reflects voluntary fee waivers in effect. Absence such waivers, total return would be reduced. The performance provided does not reflect the deduction of taxes that a shareholder would pay on Portfolio distributions.
18
Harding, Loevner Funds, Inc.
Institutional Emerging Markets Portfolio - Overview
(unaudited)
October 31, 2010
The Institutional Emerging Markets Portfolio gained 26.50% for the fiscal year ending October 31, 2010, as compared to a gain of 23.51% for its benchmark, the MSCI Emerging Markets Index.
Consistent with its investment objectives and policies, the Portfolio was invested in the securities of emerging markets companies that exhibit the fundamental characteristics of durable growth, financial strength, management quality, and sustainable competitive advantage.
The Portfolio’s outperformance derived in part from strong selection within four sectors (Financials, Health Care, Materials, and Telecom Services), where our focus on high-quality companies with, in our opinion, strong secular (as opposed to cyclical) growth trends served us well this period. Our sector weighting decisions were also beneficial, as over 25% of the Portfolio was held in the outperforming Consumer Staples and Consumer Discretionary sectors while we were underweight the lagging Energy sector.
Stock selection was strongest within the Financials sector, where we enjoyed significant gains from well-capitalized banks in smaller countries such as Banco Santander Chile and Credicorp of Peru, Bancolombia of Colombia, and Bank Rakyat of Indonesia. These banks are experiencing falling levels of non-performing loans and are benefitting from solid growth in their domestic economies. Stock selection was the weakest in Industrials. Both China Communications Construction and Egypt’s Orascom Construction declined, as their results failed to live up to investors’ profit growth expectations.
From a geographic perspective, our approach to China—one of the worst-performing markets this period—was the most notable contributor to returns. Both our underweight and stock selection added value. China’s market is dominated by large, state-controlled enterprises, but we favored smaller, private-sector companies focused on the domestic market, a number of which were positive contributors, including New Oriental, Hengan International, Shandong Weigao, and Wumart.
Past performance does not guarantee future results.
The Portfolio invests in foreign securities, which will involve greater volatility and political, economic, and currency risks and differences in accounting methods. It also invests in emerging markets, which involve unique risks, such as exposure to economies less diverse and mature than the U.S. or other more established foreign markets. Economic and political instability may cause larger price changes in emerging markets securities than other foreign securities. Investments in debt securities typically decrease in value when interest rates rise. This risk is usually greater for longer-term debt securities. Investment by the Portfolio in lower-rated and non-rated securities presents a greater risk of loss to principal and interest than higher-rated securities.
Please see the Schedule of Net Assets on page 20 for fund holdings as of October 31, 2010. Fund holdings and sector allocations are subject to change and are not recommendations to buy or sell any security.
The MSCI Emerging Markets Index is a free float-adjusted market capitalization index that is designed to measure equity market performance in the global emerging markets. The Index consists of 21 emerging market countries. The Index is net of foreign withholding taxes on dividends. You cannot invest directly in this Index.
19
Harding, Loevner Funds, Inc.
Institutional Emerging Markets Portfolio
Statement of Net Assets
October 31, 2010
| | |
| Industry | | Percentage of Net Assets |
| | | | |
Airlines | | | 0.4 | % |
Auto Parts & Equipment | | | 0.7 | |
Banks | | | 19.2 | |
Beverages | | | 3.2 | |
Beverages, Food & Tobacco | | | 1.0 | |
Building Materials | | | 4.1 | |
Chemicals | | | 1.5 | |
Commercial Services | | | 4.4 | |
Computers | | | 1.3 | |
Cosmetics & Personal Care | | | 2.7 | |
Distribution/Wholesale | | | 1.1 | |
Diversified Financial Services | | | 0.6 | |
Electric | | | 0.9 | |
Electrical Components & Equipment | | | 2.6 | |
Electronics | | | 3.0 | |
Engineering & Construction | | | 1.3 | |
Food | | | 2.1 | |
Healthcare - Products | | | 3.6 | |
Home Furnishings | | | 1.8 | |
Insurance | | | 2.4 | |
Internet | | | 1.3 | |
Iron & Steel | | | 0.5 | |
Leisure Time | | | 2.0 | |
Media | | | 0.7 | |
Mining | | | 3.1 | |
Miscellaneous Manufacturing | | | 0.6 | |
Mutual Funds | | | 2.0 | |
Oil & Gas | | | 8.6 | |
Pharmaceuticals | | | 3.2 | |
Pipelines | | | 1.1 | |
Real Estate | | | 0.9 | |
Retail | | | 2.9 | |
Semiconductors | | | 7.2 | |
Telecommunications | | | 8.0 | |
| | | | |
Total Investments | | | 100.0 | |
Liabilities Less Other Assets | | | 0.0 | |
| | | | |
Net Assets | | | 100.0 | % |
| | | | |
See Notes to Financial Statements
20
Harding, Loevner Funds, Inc.
Institutional Emerging Markets Portfolio
Statement of Net Assets
October 31, 2010 (continued)
| | | | | | | | |
| | | Shares | | | Value (1) | |
Common Stocks - 90.0% | | | | | | | | |
| | |
Argentina - 0.5% | | | | | | | | |
Banco Macro SA - ADR (Banks) | | | 38,220 | | | $ | 1,905,267 | |
| | | | | | | | |
| | |
Brazil - 11.5% | | | | | | | | |
Anhanguera Educacional Participacoes SA (Commercial Services) | | | 326,956 | | | | 6,480,278 | |
Banco Bradesco SA - ADR (Banks) | | | 401,478 | | | | 8,350,742 | |
Cyrela Brazil Realty SA Empreendimentos e Participacoes (Real Estate) | | | 250,800 | | | | 3,466,330 | |
Hypermarcas SA (Pharmaceuticals)* | | | 264,900 | | | | 4,362,289 | |
Natura Cosmeticos SA (Cosmetics & Personal Care) | | | 217,700 | | | | 6,235,364 | |
Petroleo Brasileiro SA - ADR (Oil & Gas) | | | 168,446 | | | | 5,747,378 | |
Usinas Siderurgicas de Minas Gerais SA (Iron & Steel) | | | 114,400 | | | | 1,668,600 | |
Vale SA - Sponsored ADR (Mining) | | | 208,740 | | | | 6,708,904 | |
| | | | | | | | |
| | | | | | | 43,019,885 | |
| | | | | | | | |
| | |
Chile - 3.1% | | | | | | | | |
Banco Santander Chile - ADR (Banks) | | | 63,536 | | | | 5,885,975 | |
Sociedad Quimica y Minera de Chile SA - Sponsored ADR (Chemicals) | | | 110,800 | | | | 5,739,440 | |
| | | | | | | | |
| | | | | | | 11,625,415 | |
| | | | | | | | |
| | |
China - 13.4% | | | | | | | | |
Anhui Conch Cement Co., Ltd., Class H (Building Materials) | | | 970,000 | | | | 4,109,407 | |
ASM Pacific Technology Ltd. (Semiconductors) | | | 444,900 | | | | 4,016,544 | |
China Mobile Ltd. - Sponsored ADR (Telecommunications) | | | 111,000 | | | | 5,702,070 | |
China Taiping Insurance Holdings Co., Ltd. (Insurance)* | | | 1,236,000 | | | | 4,537,340 | |
CNOOC Ltd. - ADR (Oil & Gas) | | | 19,900 | | | | 4,157,508 | |
Hengan International Group Co., Ltd. (Healthcare - Products) | | | 811,500 | | | | 7,707,839 | |
Jiangsu Expressway Co., Ltd., Class H (Commercial Services) | | | 4,707,000 | | | | 5,648,000 | |
New Oriental Education & Technology Group - Sponsored ADR (Commercial Services)* | | | 40,000 | | | | 4,294,800 | |
Shandong Weigao Group Medical Polymer Co., Ltd., Class H (Healthcare - Products) | | | 1,303,000 | | | | 3,417,606 | |
Tencent Holdings Ltd. (Internet) | | | 216,000 | | | | 4,970,172 | |
Wumart Stores Inc. (Retail) | | | 788,000 | | | | 1,859,583 | |
| | | | | | | | |
| | | | | | | 50,420,869 | |
| | | | | | | | |
| | |
Colombia - 1.5% | | | | | | | | |
BanColombia SA - Sponsored ADR (Banks) | | | 84,370 | | | | 5,690,757 | |
| | | | | | | | |
| | |
Czech Republic - 0.4% | | | | | | | | |
Central European Media Enterprises Ltd., Class A (Media)* | | | 62,530 | | | | 1,441,316 | |
| | | | | | | | |
| | |
Egypt - 0.8% | | | | | | | | |
Orascom Construction Industries - GDR (Engineering & Construction) | | | 63,800 | | | | 2,957,727 | |
| | | | | | | | |
| | |
Greece - 0.7% | | | | | | | | |
Coca Cola Hellenic Bottling Co. SA (Beverages) | | | 99,830 | | | | 2,582,767 | |
| | | | | | | | |
See Notes to Financial Statements
21
Harding, Loevner Funds, Inc.
Institutional Emerging Markets Portfolio
Statement of Net Assets
October 31, 2010 (continued)
| | | | | | | | |
| | | Shares | | | Value (1) | |
| | |
Hong Kong - 1.1% | | | | | | | | |
Li & Fung Ltd. (Distribution/Wholesale) | | | 770,000 | | | $ | 4,083,660 | |
| | | | | | | | |
| | |
Hungary - 0.5% | | | | | | | | |
Richter Gedeon Nyrt. (Pharmaceuticals) | | | 7,620 | | | | 1,813,164 | |
| | | | | | | | |
| | |
India - 9.0% | | | | | | | | |
Ambuja Cements Ltd. (Building Materials) | | | 1,757,300 | | | | 5,536,817 | |
Axis Bank Ltd. (Banks) | | | 191,900 | | | | 6,375,166 | |
Bajaj Auto Ltd. (Leisure Time) | | | 223,600 | | | | 7,598,517 | |
Dabur India Ltd. (Cosmetics & Personal Care) | | | 1,801,000 | | | | 4,042,373 | |
HDFC Bank Ltd. - ADR (Banks) | | | 26,503 | | | | 4,583,959 | |
Jain Irrigation Systems Ltd. (Miscellaneous Manufacturing) | | | 446,500 | | | | 2,330,308 | |
NTPC Ltd. (Electric) | | | 789,400 | | | | 3,467,800 | |
| | | | | | | | |
| | | | | | | 33,934,940 | |
| | | | | | | | |
| | |
Indonesia - 1.6% | | | | | | | | |
Bank Rakyat Indonesia Persero Tbk PT (Banks) | | | 4,738,000 | | | | 6,043,316 | |
| | | | | | | | |
| | |
Luxembourg - 1.3% | | | | | | | | |
Millicom International Cellular SA (Telecommunications) | | | 51,400 | | | | 4,862,440 | |
| | | | | | | | |
| | |
Mexico - 8.5% | | | | | | | | |
America Movil SAB de CV, Series L - ADR (Telecommunications) | | | 192,877 | | | | 11,044,154 | |
Coca-Cola Femsa SAB de CV - Sponsored ADR (Beverages, Food & Tobacco) | | | 45,400 | | | | 3,607,938 | |
Grupo Aeroportuario del Sureste SAB de CV - ADR (Engineering & Construction) | | | 40,905 | | | | 2,061,612 | |
Grupo Financiero Banorte SAB de CV, Class O (Banks) | | | 925,080 | | | | 3,945,362 | |
Grupo Televisa SA - Sponsored ADR (Media) | | | 47,600 | | | | 1,068,620 | |
Urbi Desarrollos Urbanos SAB de CV (Building Materials)* | | | 1,256,800 | | | | 2,677,511 | |
Wal-Mart de Mexico SAB de CV - Sponsored ADR (Retail) | | | 267,230 | | | | 7,324,774 | |
| | | | | | | | |
| | | | | | | 31,729,971 | |
| | | | | | | | |
| | |
Panama - 0.4% | | | | | | | | |
Copa Holdings SA, Class A (Airlines) | | | 32,300 | | | | 1,638,579 | |
| | | | | | | | |
| | |
Peru - 1.6% | | | | | | | | |
Credicorp Ltd. (Banks) | | | 48,000 | | | | 6,042,240 | |
| | | | | | | | |
| | |
Philippines - 0.4% | | | | | | | | |
Philippine Long Distance Telephone Co. - Sponsored ADR (Telecommunications) | | | 23,155 | | | | 1,438,620 | |
| | | | | | | | |
| | |
Poland - 1.0% | | | | | | | | |
Bank Pekao SA (Banks) | | | 55,454 | | | | 3,624,931 | |
Central European Distribution Corp. (Beverages)* | | | 11,460 | | | | 286,156 | |
| | | | | | | | |
| | | | | | | 3,911,087 | |
| | | | | | | | |
See Notes to Financial Statements
22
Harding, Loevner Funds, Inc.
Institutional Emerging Markets Portfolio
Statement of Net Assets
October 31, 2010 (continued)
| | | | | | | | |
| | | Shares | | | Value (1) | |
| | |
Russia - 6.6% | | | | | | | | |
Gazprom OAO - Sponsored ADR, United States Exchange (Oil & Gas) | | | 13,000 | | | $ | 284,050 | |
Gazprom OAO - Sponsored ADR, London Exchange (Oil & Gas) | | | 290,500 | | | | 6,359,660 | |
Lukoil OAO - Sponsored ADR (Oil & Gas) | | | 116,078 | | | | 6,482,956 | |
Sberbank of Russia (Banks) | | | 1,082,000 | | | | 3,580,064 | |
Wimm-Bill-Dann Foods OJSC - ADR (Food) | | | 34,450 | | | | 873,652 | |
X5 Retail Group NV - GDR, Reg S (Food)* | | | 168,156 | | | | 7,048,181 | |
| | | | | | | | |
| | | | | | | 24,628,563 | |
| | | | | | | | |
| | |
South Africa - 5.1% | | | | | | | | |
Aspen Pharmacare Holdings Ltd. (Healthcare - Products)* | | | 172,800 | | | | 2,304,113 | |
MTN Group Ltd. (Telecommunications) | | | 384,250 | | | | 6,903,232 | |
Pretoria Portland Cement Co., Ltd. (Building Materials) | | | 646,800 | | | | 3,081,732 | |
SABMiller plc (Beverages) | | | 128,300 | | | | 4,151,088 | |
Standard Bank Group Ltd. (Banks) | | | 185,732 | | | | 2,734,384 | |
| | | | | | | | |
| | | | | | | 19,174,549 | |
| | | | | | | | |
| | |
South Korea - 4.7% | | | | | | | | |
Hankook Tire Co., Ltd. (Auto Parts & Equipment) | | | 93,600 | | | | 2,429,658 | |
KB Financial Group Inc. - ADR (Diversified Financial Services) | | | 47,591 | | | | 2,136,836 | |
LG Electronics Inc. (Electrical Components & Equipment) | | | 31,600 | | | | 2,789,508 | |
Samsung Electronics Co., Ltd. - GDR, Reg S (Semiconductors) | | | 17,330 | | | | 5,792,830 | |
Samsung Fire & Marine Insurance Co., Ltd. (Insurance) | | | 26,460 | | | | 4,544,932 | |
| | | | | | | | |
| | | | | | | 17,693,764 | |
| | | | | | | | |
| | |
Taiwan - 9.0% | | | | | | | | |
Delta Electronics Inc. (Electrical Components & Equipment) | | | 1,688,189 | | | | 6,986,312 | |
Hon Hai Precision Industry Co., Ltd. (Electronics) | | | 1,265,680 | | | | 4,809,104 | |
MediaTek Inc. (Semiconductors) | | | 374,431 | | | | 4,712,294 | |
Quanta Computer Inc. (Computers) | | | 2,547,000 | | | | 4,678,779 | |
Synnex Technology International Corp. (Electronics) | | | 2,683,351 | | | | 6,571,677 | |
Taiwan Semiconductor Manufacturing Co., Ltd. (Semiconductors) | | | 2,974,577 | | | | 6,110,723 | |
| | | | | | | | |
| | | | | | | 33,868,889 | |
| | | | | | | | |
| | |
Thailand - 2.5% | | | | | | | | |
PTT Exploration & Production pcl, Class F (Oil & Gas) | | | 917,000 | | | | 5,230,082 | |
Siam Commercial Bank pcl, Class F (Banks) | | | 1,203,170 | | | | 4,113,333 | |
| | | | | | | | |
| | | | | | | 9,343,415 | |
| | | | | | | | |
| | |
Turkey - 3.3% | | | | | | | | |
Arcelik A/S (Home Furnishings) | | | 1,203,800 | | | | 6,628,879 | |
Turkiye Garanti Bankasi A/S (Banks) | | | 921,700 | | | | 5,597,331 | |
| | | | | | | | |
| | | | | | | 12,226,210 | |
| | | | | | | | |
See Notes to Financial Statements
23
Harding, Loevner Funds, Inc.
Institutional Emerging Markets Portfolio
Statement of Net Assets
October 31, 2010 (continued)
| | | | | | | | |
| | | Shares | | | Value (1) | |
| | |
United Kingdom - 1.5% | | | | | | | | |
Hikma Pharmaceuticals plc (Pharmaceuticals) | | | 462,620 | | | $ | 5,825,449 | |
| | | | | | | | |
| | |
Total Common Stocks (Cost $251,395,587) | | | | | | | 337,902,859 | |
| | | | | | | | |
| | |
Preferred Stocks - 7.6% | | | | | | | | |
| | |
Brazil - 4.7% | | | | | | | | |
Cia de Bebidas das Americas - ADR (Beverages) | | | 35,700 | | | | 4,970,868 | |
Itau Unibanco Holding SA - ADR (Banks) | | | 149,495 | | | | 3,671,597 | |
Petroleo Brasileiro SA - Sponsored ADR (Oil & Gas) | | | 130,200 | | | | 4,060,938 | |
Vale SA - Sponsored ADR (Mining) | | | 175,300 | | | | 5,036,369 | |
| | | | | | | | |
| | | | | | | 17,739,772 | |
| | | | | | | | |
| | |
Russia - 1.1% | | | | | | | | |
AK Transneft OAO (Pipelines) | | | 3,429 | | | | 4,149,090 | |
| | | | | | | | |
| | |
South Korea - 1.8% | | | | | | | | |
Samsung Electronics Co., Ltd. - 144A - GDR (Semiconductors)(2) | | | 4,177 | | | | 1,023,365 | |
Samsung Electronics Co., Ltd. - GDR (Semiconductors) | | | 22,547 | | | | 5,531,025 | |
| | | | | | | | |
| | | | | | | 6,554,390 | |
| | | | | | | | |
| | |
Total Preferred Stocks (Cost $22,354,833) | | | | | | | 28,443,252 | |
| | | | | | | | |
| | |
Participation Notes - 0.4% | | | | | | | | |
| | |
Saudi Arabia - 0.4% | | | | | | | | |
Jarir Marketing Co., Issued by HSBC Bank plc, Maturity Date 6/4/12 (Retail)(2)* | | | 39,000 | | | | 1,608,015 | |
| | | | | | | | |
| | |
Total Participation Notes (Cost $1,641,430) | | | | | | | 1,608,015 | |
| | | | | | | | |
| | |
Cash Equivalent - 2.0% | | | | | | | | |
Northern Institutional Funds - Diversified Assets Portfolio (Mutual Funds) | | | 7,539,311 | | | | 7,539,311 | |
| | | | | | | | |
Total Cash Equivalent (Cost $7,539,311) | | | | | | | 7,539,311 | |
| | | | | | | | |
| | |
Total Investments - 100.0% | | | | | | | | |
(Cost $ 282,931,161) | | | | | | $ | 375,493,437 | |
| | | | | | | | |
See Notes to Financial Statements
24
Harding, Loevner Funds, Inc.
Institutional Emerging Markets Portfolio
Statement of Net Assets
October 31, 2010 (continued)
Summary of Abbreviations
| | |
ADR | | American Depository Receipt |
GDR | | Global Depositary Receipt |
Reg S | | Security sold outside United States without registration under the Securities Act of 1933. |
| (1) | See Note 2 to Financial Statements. |
| (2) | Security exempt from registration pursuant to Rule 144A of the Securities Act of 1933. This security, which represents 0.3% of net assets as of October 31, 2010, is considered liquid and may be resold in transactions exempt from registration, normally to qualified buyers. |
| * | Non-income producing security. |
See Notes to Financial Statements
25
Harding, Loevner Funds, Inc.
Institutional Emerging Markets Portfolio
Statement of Net Assets
October 31, 2010 (continued)
| | | | |
| | | Value (1) | |
Liabilities, Net of Other Assets - (0.0)% | | | | |
Dividends and interest receivable | | $ | 270,903 | |
Foreign currency (cost $94,138) | | | 94,113 | |
Receivable for Fund shares sold | | | 674,730 | |
Tax reclaim receivable | | | 15,481 | |
Prepaid expenses | | | 48,303 | |
Payable to Investment Advisor | | | (386,217 | ) |
Payable for investments purchased | | | (515,926 | ) |
Payable for Fund shares redeemed | | | (7,936 | ) |
Payable for capital gains tax | | | (209,295 | ) |
Other liabilities | | | (103,939 | ) |
| | | | |
| | $ | (119,783 | ) |
| | | | |
Net Assets - 100% | | | | |
Applicable to 22,474,386 outstanding $.001 par value shares (authorized 450,000,000 shares) | | $ | 375,373,654 | |
| | | | |
| |
Net Asset Value, Offering Price and Redemption Price Per Share | | $ | 16.70 | |
| | | | |
| |
Components of Net Assets as of October 31, 2010 were as follows: | | | | |
Paid-in capital | | $ | 334,998,411 | |
Accumulated undistributed net investment income | | | 1,078,294 | |
Accumulated net realized loss from investment transactions | | | (53,055,122 | ) |
Net unrealized appreciation on investments and on assets and liabilities denominated in foreign currencies | | | 92,352,071 | |
| | | | |
| | $ | 375,373,654 | |
| | | | |
See Notes to Financial Statements
26
Harding, Loevner Funds, Inc.
Frontier Emerging Markets Portfolio — Overview
(unaudited)
October 31, 2010
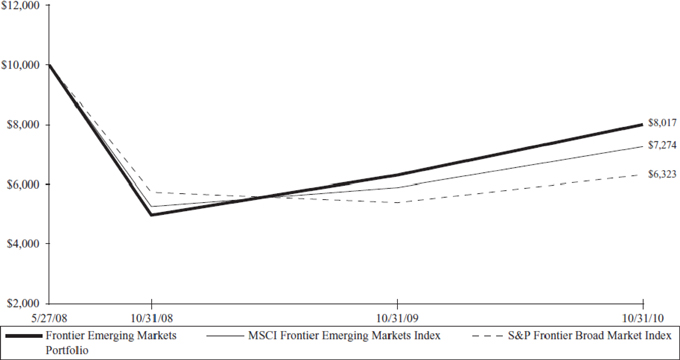
Hypothetical Comparison Of Changes In Value Of $10,000 Investment In Harding, Loevner Funds, Inc. -
Frontier Emerging Markets Portfolio - Institutional Class And The MSCI Frontier Emerging Markets Index
(Net Dividends)
And S&P Frontier Broad Market Index
| | | | | | |
| | | | | | | |
| | | Returns for the Year Ended October 31,2010 |
| | | Cumulative Total Returns | | Average Annualized
Total Return |
| FUND NAME | | Last 12 Months | | Inception | | Inception |
Frontier Emerging Markets Portfolio (Inception date 5/27/08) | | 27.04% | | -19.83% | | -8.69% |
MSCI Frontier Emerging Markets Index (Net dividends) | | 23.21% | | -27.26% | | -12.27% |
S&P Frontier Broad Market Index | | 17.18% | | -36.77% | | -17.19% |
| | | | | | | |
Performance data quoted represents past performance and does not guarantee future results. The investment return and principal value of an investment will fluctuate so that an investor’s shares, when redeemed, may be worth more or less than their original cost. Performance current to the most recent month end may be lower or higher than the performance quoted and may be obtained by visiting the website at www.hardingloevnerfunds.com.
Investment return reflects voluntary fee waivers in effect. Absence such waivers, total return would be reduced. The performance provided does not reflect the deduction of taxes that a shareholder would pay on Portfolio distributions.
27
Harding, Loevner Funds, Inc.
Frontier Emerging Markets Portfolio - Overview
(unaudited)
October 31, 2010
The Frontier Emerging Markets Portfolio gained 27.04% for the fiscal year ending October 31, 2010, as compared to a gain of 23.21% for its benchmark, the MSCI Frontier Emerging Markets Index.
Consistent with its investment objectives and policies, the Portfolio was invested in the securities of companies with strong growth prospects in frontier and smaller emerging markets countries that we regard as both economically stable and offering attractive long-term investment potential.
Strong stock selection in Asia, Europe, and Africa was the major reason for the Portfolio’s outperformance this period. Standout stocks included Ukrainian food company Astarta, Thailand’s Home Product Center, a do-it-yourself retailer, and Kenya’s Equity Bank. Our overweights in Kenya and Sri Lanka and relatively small exposure to the Gulf region also helped returns.
The main detractor was the Portfolio’s underweight in Latin America, the strongest region in the Index, as well as weak stock selection in Argentina and Colombia. Holdings in both countries performed well on an absolute basis—including Colombia’s Cementos Argos, the country’s largest cement company in terms of tonnage—but still did not match the extraordinary rise of the country’s overall market. The poor returns from our Nigerian bank stocks hurt overall performance in Africa. For much of the year, these stocks were hurt by uncertainty amidst the Nigerian government’s severe restructuring of the banking industry. We maintained exposure to Nigeria and its local banks, however, as we feel valuations are attractive, the economic situation is improving, and economic growth should re-emerge.
Finally, Portfolio returns benefitted from a large weighting in the outperforming Consumer Staples sector, but suffered from its overweights in Health Care (the only sector to decline this period) and Industrials.
Past performance does not guarantee future results.
Foreign investments involve additional risks, including greater volatility and political, economic, and currency risks and differences in accounting methods. Emerging markets countries involve greater risks, such as immature economic structures, national policies restricting investments by foreigners, and different legal systems. Such risks may be magnified with respect to securities of issuers in frontier emerging markets. The Portfolio can have significant concentration in a single industry, and investment opportunities in frontier markets may be concentrated in the banking industry. The Portfolio will be vulnerable to factors affecting an industry in which it is concentrated. Investments in debt securities typically decrease in value when interest rates rise. This risk is usually greater for longer-term debt securities. Investment in lower-rated and non-rated securities presents a greater risk of loss of principal and interest than higher-rated securities. Mutual fund investing involves risk. Principal loss is possible.
Please see the Statement of Net Assets on page 29 for fund holdings as of October 31, 2010. Fund holdings and sector allocations are subject to change and are not recommendations to buy or sell any security.
The MSCI Frontier Emerging Markets Index is a free float-adjusted market capitalization index designed to measure equity market performance in all countries from the MSCI Frontier Markets Index and the lower size spectrum of the MSCI Emerging Markets Index. The Index consists of 26 frontier markets and 5 emerging markets. The Index is net of foreign withholding taxes on dividends. You cannot invest directly in this Index.
28
Harding, Loevner Funds, Inc.
Frontier Emerging Markets Portfolio
Statement of Net Assets
October 31, 2010
| | |
| Industry | | Percentage of Net Assets |
| | | | |
Agriculture | | | 2.8 | % |
Airlines | | | 0.6 | |
Auto Manufacturers | | | 1.5 | |
Banks | | | 32.4 | |
Beverages | | | 1.3 | |
Building Materials | | | 3.5 | |
Chemicals | | | 2.0 | |
Commercial Services | | | 3.2 | |
Distribution/Wholesale | | | 2.0 | |
Diversified Financial Services | | | 1.3 | |
Electric | | | 3.3 | |
Electrical Components & Equipment | | | 1.0 | |
Engineering & Construction | | | 2.2 | |
Food | | | 3.4 | |
Holding Companies - Diversified | | | 3.7 | |
Home Furnishings | | | 1.6 | |
Internet | | | 0.5 | |
Investment Companies | | | 1.9 | |
Iron/Steel | | | 0.4 | |
Lodging | | | 0.4 | |
Machinery - Construction & Mining | | | 0.4 | |
Media | | | 1.1 | |
Mining | | | 4.1 | |
Mutual Funds | | | 10.0 | |
Oil & Gas | | | 4.5 | |
Pharmaceuticals | | | 4.9 | |
Real Estate | | | 0.5 | |
Retail | | | 1.8 | |
Telecommunications | | | 5.9 | |
Textiles | | | 1.3 | |
Transportation | | | 1.2 | |
| | | | |
Total Investments | | | 104.7 | |
Liabilities Less Other Assets | | | (4.7 | ) |
| | | | |
Net Assets | | | 100.0 | % |
| | | | |
See Notes to Financial Statements
29
Harding, Loevner Funds, Inc.
Frontier Emerging Markets Portfolio
Statement of Net Assets
October 31, 2010 (continued)
| | | | | | | | |
| | | Shares | | | Value (1) | |
Common Stocks - 87.8% | | | | | | | | |
| | |
Argentina - 5.3% | | | | | | | | |
Banco Macro SA - ADR (Banks) | | | 30,100 | | | $ | 1,500,485 | |
Cresud SACIF y A - Sponsored ADR (Agriculture) | | | 60,600 | | | | 1,192,002 | |
Molinos Rio de la Plata SA (Food) | | | 201,118 | | | | 1,024,918 | |
| | | | | | | | |
| | | | | | | 3,717,405 | |
| | | | | | | | |
| | |
Bangladesh - 3.9% | | | | | | | | |
Lafarge Surma Cement Ltd. (Building Materials)* | | | 48,900 | | | | 478,802 | |
Power Grid Co. of Bangladesh Ltd. (Electric) | | | 40,600 | | | | 725,318 | |
Square Pharmaceuticals Ltd. (Pharmaceuticals) | | | 28,983 | | | | 1,546,272 | |
| | | | | | | | |
| | | | | | | 2,750,392 | |
| | | | | | | | |
| | |
Colombia - 8.9% | | | | | | | | |
BanColombia SA - Sponsored ADR (Banks) | | | 30,580 | | | | 2,062,621 | |
Cementos Argos SA - Sponsored ADR (Building Materials)# | | | 38,740 | | | | 1,337,460 | |
Ecopetrol SA - Sponsored ADR (Oil & Gas) | | | 16,100 | | | | 768,614 | |
Grupo de Inversiones Suramericana SA - Sponsored ADR (Investment Companies)# | | | 30,800 | | | | 1,373,132 | |
Interconexion Electrica SA - ADR (Electric)# | | | 3,700 | | | | 734,247 | |
| | | | | | | | |
| | | | | | | 6,276,074 | |
| | | | | | | | |
| | |
Croatia - 2.7% | | | | | | | | |
Atlantic Grupa (Distribution/Wholesale) | | | 9,267 | | | | 1,444,681 | |
Ericsson Nikola Tesla (Telecommunications) | | | 1,771 | | | | 429,725 | |
| | | | | | | | |
| | | | | | | 1,874,406 | |
| | | | | | | | |
| | |
Democratic Republic of Congo - 1.8% | | | | | | | | |
Katanga Mining Ltd. (Mining)* | | | 895,575 | | | | 1,281,970 | |
| | | | | | | | |
| | |
Egypt - 5.7% | | | | | | | | |
ElSwedy Electric Co. (Electrical Components & Equipment)* | | | 75,300 | | | | 704,004 | |
Ghabbour Auto (Auto Manufacturers) | | | 121,540 | | | | 1,023,488 | |
Orascom Construction Industries - GDR (Engineering & Construction) | | | 19,050 | | | | 883,146 | |
Orascom Telecom Holding SAE - GDR, Reg S, London Exchange (Telecommunications)* | | | 119,769 | | | | 464,076 | |
Orascom Telecom Holding SAE - GDR, Reg S, United States Exchange (Telecommunications)* | | | 18,000 | | | | 69,822 | |
Oriental Weavers (Textiles) | | | 162,852 | | | | 901,845 | |
| | | | | | | | |
| | | | | | | 4,046,381 | |
| | | | | | | | |
| | |
Estonia - 1.2% | | | | | | | | |
Tallink Group plc (Transportation)* | | | 881,120 | | | | 858,411 | |
| | | | | | | | |
| | |
Ghana - 0.4% | | | | | | | | |
Ghana Commercial Bank Ltd. (Banks) | | | 216,151 | | | | 286,393 | |
| | | | | | | | |
| | |
Indonesia - 1.3% | | | | | | | | |
Bank Rakyat Indonesia (Banks) | | | 725,903 | | | | 925,889 | |
| | | | | | | | |
See Notes to Financial Statements
30
Harding, Loevner Funds, Inc.
Frontier Emerging Markets Portfolio
Statement of Net Assets
October 31, 2010 (continued)
| | | | | | | | |
| | | Shares | | | Value (1) | |
Jordan - 1.5% | | | | | | | | |
Arab Bank plc (Banks) | | | 50,565 | | | $ | 746,591 | |
Arab Potash Co. (Mining) | | | 5,618 | | | | 283,774 | |
| | | | | | | | |
| | | | | | | 1,030,365 | |
| | | | | | | | |
| | |
Kazakhstan - 2.1% | | | | | | | | |
Halyk Savings Bank of Kazakhstan JSC - GDR, Reg S (Banks)* | | | 105,899 | | | | 984,424 | |
KazMunaiGas Exploration Production - GDR (Oil & Gas) | | | 26,650 | | | | 458,702 | |
Steppe Cement Ltd. (Building Materials)* | | | 72,320 | | | | 48,120 | |
| | | | | | | | |
| | | | | | | 1,491,246 | |
| | | | | | | | |
| | |
Kenya - 7.8% | | | | | | | | |
AccessKenya (Internet) | | | 1,730,400 | | | | 370,536 | |
East African Breweries Ltd. (Beverages) | | | 361,800 | | | | 949,857 | |
Equity Bank Ltd. (Banks) | | | 4,612,200 | | | | 1,499,313 | |
KenolKobil Ltd. Group (Oil & Gas) | | | 3,237,000 | | | | 431,190 | |
Kenya Airways Ltd. (Airlines) | | | 771,500 | | | | 427,995 | |
Nation Media Group Ltd. (Media) | | | 376,340 | | | | 764,366 | |
Safaricom Ltd. (Telecommunications) | | | 18,139,400 | | | | 1,089,444 | |
| | | | | | | | |
| | | | | | | 5,532,701 | |
| | | | | | | | |
| | |
Lebanon - 0.7% | | | | | | | | |
Banque Audi sal- Audi Saradar Group - GDR, Reg S (Banks)* | | | 59,090 | | | | 492,637 | |
| | | | | | | | |
| | |
Mauritius - 1.4% | | | | | | | | |
Mauritius Commercial Bank (Banks) | | | 137,680 | | | | 673,309 | |
Sun Resorts Ltd., Class A (Lodging) | | | 158,700 | | | | 315,794 | |
| | | | | | | | |
| | | | | | | 989,103 | |
| | | | | | | | |
| | |
Morocco - 2.2% | | | | | | | | |
Douja Promotion Groupe Addoha SA (Real Estate) | | | 26,588 | | | | 354,578 | |
Managem (Mining)* | | | 7,552 | | | | 490,345 | |
Maroc Telecom (Telecommunications) | | | 36,005 | | | | 681,298 | |
| | | | | | | | |
| | | | | | | 1,526,221 | |
| | | | | | | | |
| | |
Nigeria - 6.1% | | | | | | | | |
Access Bank plc (Banks) | | | 17,992,430 | | | | 999,845 | |
Dangote Sugar Refinery plc (Food) | | | 4,164,070 | | | | 461,417 | |
Diamond Bank plc (Banks)* | | | 17,511,872 | | | | 917,399 | |
First Bank of Nigeria plc (Banks) | | | 10,247,784 | | | | 876,634 | |
UAC of Nigeria plc (Holding Companies - Diversified) | | | 4,090,080 | | | | 1,084,902 | |
| | | | | | | | |
| | | | | | | 4,340,197 | |
| | | | | | | | |
| | |
Pakistan - 2.1% | | | | | | | | |
Engro Corp. Ltd. (Chemicals) | | | 234,316 | | | | 478,761 | |
MCB Bank Ltd. (Banks) | | | 55,415 | | | | 130,736 | |
See Notes to Financial Statements
31
Harding, Loevner Funds, Inc.
Frontier Emerging Markets Portfolio
Statement of Net Assets
October 31, 2010 (continued)
| | | | | | | | |
| | | Shares | | | Value (1) | |
| | |
Pakistan - 2.1% - (continued) | | | | | | | | |
Pakistan Petroleum Ltd. (Oil & Gas) | | | 389,672 | | | $ | 848,180 | |
| | | | | | | | |
| | | | | | | 1,457,677 | |
| | | | | | | | |
| | |
Peru - 4.2% | | | | | | | | |
Cementos Lima SA (Building Materials) | | | 34,742 | | | | 515,202 | |
Credicorp Ltd. (Banks) | | | 17,580 | | | | 2,212,970 | |
Ferreyros SA (Machinery - Construction & Mining) | | | 195,105 | | | | 268,413 | |
| | | | | | | | |
| | | | | | | 2,996,585 | |
| | | | | | | | |
| | |
Philippines - 1.6% | | | | | | | | |
Philippine Long Distance Telephone Co. - Sponsored ADR (Telecommunications) | | | 17,760 | | | | 1,103,429 | |
| | | | | | | | |
| | |
Qatar - 5.4% | | | | | | | | |
Commercial Bank of Qatar (Banks) | | | 37,630 | | | | 861,933 | |
Industries Qatar (Chemicals) | | | 29,100 | | | | 927,260 | |
Qatar Electricity & Water Co. (Electric) | | | 27,550 | | | | 865,649 | |
Qatar National Bank SAQ (Banks) | | | 25,130 | | | | 1,132,183 | |
| | | | | | | | |
| | | | | | | 3,787,025 | |
| | | | | | | | |
| | |
Senegal - 0.4% | | | | | | | | |
Sonatel (Telecommunications) | | | 995 | | | | 306,121 | |
| | | | | | | | |
| | |
Serbia - 0.4% | | | | | | | | |
AIK Banka AD (Banks)* | | | 4,000 | | | | 159,044 | |
Energoprojekt Holding ad Beograd (Holding Companies - Diversified)* | | | 11,650 | | | | 141,643 | |
| | | | | | | | |
| | | | | | | 300,687 | |
| | | | | | | | |
| | |
Slovenia - 2.9% | | | | | | | | |
Gorenje Velenje (Home Furnishings)* | | | 59,214 | | | | 1,094,111 | |
Krka dd Novo mesto (Pharmaceuticals) | | | 10,860 | | | | 950,477 | |
| | | | | | | | |
| | | | | | | 2,044,588 | |
| | | | | | | | |
| | |
Sri Lanka - 1.9% | | | | | | | | |
John Keells Holdings plc (Commercial Services) | | | 488,900 | | | | 1,312,436 | |
| | | | | | | | |
| | |
Thailand - 4.7% | | | | | | | | |
Home Product Center pcl (Retail) | | | 3,989,395 | | | | 1,284,037 | |
PTT Exploration & Production pcl (Oil & Gas) | | | 118,500 | | | | 675,861 | |
Siam Commercial Bank pcl (Banks) | | | 141,100 | | | | 482,385 | |
Thai Vegetable Oil pcl (Food) | | | 966,000 | | | | 902,149 | |
| | | | | | | | |
| | | | | | | 3,344,432 | |
| | | | | | | | |
| | |
Trinidad & Tobago - 0.8% | | | | | | | | |
Neal & Massy Holdings Ltd. (Holding Companies - Diversified) | | | 42,570 | | | | 254,974 | |
Republic Bank Ltd. (Banks) | | | 21,250 | | | | 239,550 | |
See Notes to Financial Statements
32
Harding, Loevner Funds, Inc.
Frontier Emerging Markets Portfolio
Statement of Net Assets
October 31, 2010 (continued)
| | | | | | | | |
| | | Shares | | | Value (1) | |
| | |
Trinidad & Tobago - 0.8% - (continued) | | | | | | | | |
Trinidad Cement Ltd. (Building Materials)#* | | | 150,480 | | | $ | 70,681 | |
| | | | | | | | |
| | | | | | | 565,205 | |
| | | | | | | | |
| | |
Turkey - 1.2% | | | | | | | | |
Turkiye Garanti Bankasi AS (Banks) | | | 142,700 | | | | 866,593 | |
| | | | | | | | |
| | |
Ukraine - 3.1% | | | | | | | | |
Astarta Holding NV (Holding Companies - Diversified)* | | | 41,720 | | | | 1,127,127 | |
Ferrexpo plc (Iron/Steel) | | | 50,930 | | | | 264,377 | |
Kernel Holding SA (Agriculture)* | | | 36,180 | | | | 793,226 | |
| | | | | | | | |
| | | | | | | 2,184,730 | |
| | | | | | | | |
| | |
United Arab Emirates - 3.5% | | | | | | | | |
Arabtec Holding Co. (Engineering & Construction)* | | | 1,060,470 | | | | 654,764 | |
Depa Ltd. (Commercial Services) | | | 1,372,370 | | | | 933,212 | |
Dubai Financial Market (Diversified Financial Services) | | | 1,909,510 | | | | 914,157 | |
| | | | | | | | |
| | | | | | | 2,502,133 | |
| | | | | | | | |
| | |
United Kingdom - 2.6% | | | | | | | | |
Hikma Pharmaceuticals plc (Pharmaceuticals) | | | 78,790 | | | | 992,147 | |
Kazakhmys plc (Mining) | | | 39,420 | | | | 832,150 | |
| | | | | | | | |
| | | | | | | 1,824,297 | |
| | | | | | | | |
| | |
Total Common Stocks (Cost $54,899,722) | | | | | | | 62,015,729 | |
| | | | | | | | |
| | |
Participation Notes - 6.9% | | | | | | | | |
| | |
Kuwait - 3.3% | | | | | | | | |
Kuwait Projects Co. Holdings, Issued by HSBC Bank plc, Maturity Date 3/5/12 (Banks)* | | | 1,331,500 | | | | 2,306,557 | |
| | | | | | | | |
| | |
Saudi Arabia - 3.6% | | | | | | | | |
Almarai Co., Ltd., Issued by HSBC Bank plc, Maturity Date 3/27/12 (Banks)* | | | 23,870 | | | | 1,364,495 | |
Jarir Marketing Co., Issued by HSBC Bank plc, Maturity Date 6/4/12 (Banks)* | | | 28,210 | | | | 1,163,131 | |
| | | | | | | | |
| | | | | | | 2,527,626 | |
| | | | | | | | |
| | |
Total Participation Notes (Cost $4,396,780) | | | | | | | 4,834,183 | |
| | | | | | | | |
See Notes to Financial Statements
33
Harding, Loevner Funds, Inc.
Frontier Emerging Markets Portfolio
Statement of Net Assets
October 31, 2010 (continued)
| | | | | | | | |
| | | Shares | | | Value (1) | |
Warrants - 0.0% | | | | | | | | |
| | |
Thailand - 0.0% | | | | | | | | |
Thai Vegetable Oil pcl, Expires 05/18/2012 (Food)* | | | 34,520 | | | $ | 21,070 | |
| | | | | | | | |
| | |
Total Warrants (Cost $2,237) | | | | | | | 21,070 | |
| | | | | | | | |
| | |
Cash Equivalent - 10.0% | | | | | | | | |
Northern Institutional Funds - Diversified Assets Portfolio (Mutual Funds) | | | 7,091,738 | | | | 7,091,738 | |
| | | | | | | | |
Total Cash Equivalent (Cost $7,091,738) | | | | | | | 7,091,738 | |
| | | | | | | | |
| | |
Total Investments — 104.7% (Cost $ 66,390,477) | | | | | | | 73,962,720 | |
| | | | | | | | |
Summary of Abbreviations
| | |
ADR | | American Depository Receipt |
GDR | | Global Depositary Receipt |
Reg S | | Security sold outside United States without registration under the Securities Act of 1933. |
| (1) | See Note 2 to Financial Statements. |
| # | Security valued at fair value as determined in good faith under policies and procedures established by and under the supervision of the Portfolio’s Board of Directors. |
| * | Non-income producing security. |
See Notes to Financial Statements
34
Harding, Loevner Funds, Inc.
Frontier Emerging Markets Portfolio
Statement of Net Assets
October 31, 2010 (continued)
| | | | |
| | | Value (1) | |
Liabilities, Net of Other Assets - (4.7)% | | | | |
Dividends and interest receivable | | $ | 58,919 | |
Foreign currency (cost $982,449) | | | 975,219 | |
Receivable for Fund shares sold | | | 374,356 | |
Tax reclaim receivable | | | 2,634 | |
Prepaid expenses | | | 31,590 | |
Payable to Investment Advisor | | | (80,715 | ) |
Payable for investments purchased | | | (4,591,892 | ) |
Payable for capital gains tax | | | (36,500 | ) |
Other liabilities | | | (51,384 | ) |
| | | | |
| | $ | (3,317,773 | ) |
| | | | |
Net Assets - 100% | | | | |
Applicable to 8,961,314 outstanding $.001 par value shares (authorized 400,000,000 shares) | | $ | 70,644,947 | |
| | | | |
| |
Net Asset Value, Offering Price and Redemption Price Per Share | | $ | 7.88 | |
| | | | |
| |
Components of Net Assets as of October 31, 2010 were as follows: | | | | |
Paid-in capital | | $ | 64,660,540 | |
Accumulated undistributed net investment (loss) | | | (245,101 | ) |
Accumulated net realized loss from investment transactions | | | (1,294,329 | ) |
Net unrealized appreciation on investments and on assets and liabilities denominated in foreign currencies | | | 7,523,837 | |
| | | | |
| | $ | 70,644,947 | |
| | | | |
See Notes to Financial Statements
35
Harding, Loevner Funds, Inc.
Statements of Operations
Year Ended October 31, 2010
| | | | | | | | |
| | | Global
Equity
Portfolio | | | International
Equity
Portfolio | |
Investment Income | | | | | | | | |
Interest | | $ | 4,155 | | | $ | 3,227 | |
Dividends (net of foreign withholding taxes of $68,211 and $673,069, respectively) | | | 1,599,458 | | | | 7,285,951 | |
| | | | | | | | |
Total investment income | | | 1,603,613 | | | | 7,289,178 | |
| | | | | | | | |
| | |
Expenses | | | | | | | | |
Investment advisory fees (Note 3) | | | 1,102,310 | | | | 2,942,207 | |
Administration fees (Note 3) | | | 54,474 | | | | 191,910 | |
Distribution fees, Investor Class | | | - | | | | 180,796 | |
Custody and accounting fees (Note 3) | | | 81,441 | | | | 212,260 | |
Directors’ fees and expenses (Note 3) | | | 11,796 | | | | 42,252 | |
Transfer agent fees and expenses (Note 3) | | | 62,084 | | | | 88,178 | |
Printing and postage fees | | | 16,467 | | | | 40,876 | |
State registration filing fees | | | 17,037 | | | | 36,486 | |
Professional fees | | | 63,719 | | | | 96,776 | |
Shareholder servicing fees (Note 3) | | | 46,705 | | | | 62,845 | |
Other fees and expenses | | | 19,584 | | | | 52,397 | |
| | | | | | | | |
Total Expenses | | | 1,475,617 | | | | 3,946,983 | |
| | | | | | | | |
| | |
Less Waiver of investment advisory fee (Note 3) | | | (291,938 | ) | | | (52,453 | ) |
Less Custodian credits (Note 3) | | | (1,362 | ) | | | (11,658 | ) |
| | | | | | | | |
Net expenses | | | 1,182,317 | | | | 3,882,872 | |
| | | | | | | | |
| | |
Net investment income | | | 421,296 | | | | 3,406,306 | |
| | | | | | | | |
| | |
Realized and Unrealized Gain (Loss) | | | | | | | | |
Net realized gain (loss) — | | | | | | | | |
Investment transactions | | | 1,458,229 | | | | 7,929,353 | |
Foreign currency transactions | | | (132,241 | ) | | | (725,149 | ) |
| | | | | | | | |
Net realized gain | | | 1,325,988 | | | | 7,204,204 | |
| | | | | | | | |
| | |
Change in unrealized appreciation (depreciation) — | | | | | | | | |
Investments | | | 13,564,331 | | | | 78,078,060 | |
Translation of assets and liabilities denominated in foreign currencies | | | 4,778 | | | | 47 | |
| | | | | | | | |
Net change in unrealized appreciation | | | 13,569,109 | | | | 78,078,107 | |
| | | | | | | | |
Net realized and unrealized gain | | | 14,895,097 | | | | 85,282,311 | |
| | | | | | | | |
| | |
Net increase in net assets resulting from operations | | $ | 15,316,393 | | | $ | 88,688,617 | |
| | | | | | | | |
See Notes to Financial Statements
36
Harding, Loevner Funds, Inc.
Statements of Operations (continued)
Year Ended October 31, 2010
| | | | | | | | |
| | | Institutional
Emerging
Markets
Portfolio | | | Frontier
Emerging
Markets
Portfolio | |
Investment Income | | | | | | | | |
Interest | | $ | 6,358 | | | $ | 28,548 | |
Dividends (net of foreign withholding taxes of $565,553, and $29,589, respectively) | | | 4,928,270 | | | | 395,525 | |
| | | | | | | | |
Total investment income | | | 4,934,628 | | | | 424,073 | |
| | | | | | | | |
| | |
Expenses | | | | | | | | |
Investment advisory fees (Note 3) | | | 3,016,311 | | | | 330,742 | |
Administration fees (Note 3) | | | 121,420 | | | | 12,938 | |
Custody and accounting fees (Note 3) | | | 227,099 | | | | 84,373 | |
Directors’ fees and expenses (Note 3) | | | 25,679 | | | | 2,137 | |
Transfer agent fees and expenses (Note 3) | | | 31,588 | | | | 28,734 | |
Printing and postage fees | | | 17,350 | | | | 1,739 | |
State registration filing fees | | | 23,002 | | | | 12,488 | |
Professional fees | | | 66,118 | | | | 39,725 | |
Shareholder servicing fees (Note 3) | | | 3,447 | | | | 76 | |
Other fees and expenses | | | 34,007 | | | | 12,090 | |
| | | | | | | | |
Total Expenses | | | 3,566,021 | | | | 525,042 | |
| | | | | | | | |
| | |
Less Waiver of investment advisory fee (Note 3) | | | (423,871 | ) | | | (80,739 | ) |
Less Custodian credits (Note 3) | | | (5,185 | ) | | | (1,831 | ) |
| | | | | | | | |
Net expenses | | | 3,136,965 | | | | 442,472 | |
| | | | | | | | |
Net investment income (loss) | | | 1,797,663 | | | | (18,399 | ) |
| | | | | | | | |
| | |
Realized and Unrealized Gain (Loss) | | | | | | | | |
Net realized gain (loss) - | | | | | | | | |
Investment transactions | | | 8,955,973 | | | | 283,043 | |
Foreign currency transactions | | | (490,600 | ) | | | (166,013 | ) |
| | | | | | | | |
Net realized gain | | | 8,465,373 | | | | 117,030 | |
| | | | | | | | |
| | |
Change in unrealized appreciation (depreciation) - | | | | | | | | |
Investments | | | 52,689,151 | | | | 7,744,512 | |
Translation of assets and liabilities denominated in foreign currencies | | | (2,275 | ) | | | (13,078 | ) |
| | | | | | | | |
Net change in unrealized appreciation | | | 52,686,876 | | | | 7,731,434 | |
| | | | | | | | |
Net realized and unrealized gain | | | 61,152,249 | | | | 7,848,464 | |
| | | | | | | | |
| | |
Net increase in net assets resulting from operations | | $ | 62,949,912 | | | $ | 7,830,065 | |
| | | | | | | | |
See Notes to Financial Statements
37
Harding, Loevner Funds, Inc.
Statements of Changes in Net Assets
| | | | | | | | |
| | | Global Equity Portfolio | |
| | | Year Ended
October 31,
2010 | | | Year Ended
October 31,
2009 | |
Increase in Net Assets From Operations | | | | | | | | |
Net investment income | | $ | 421,296 | | | $ | 187,248 | |
Net realized gain (loss) on investments and foreign currency transactions | | | 1,325,988 | | | | (1,603,345 | ) |
Net change in unrealized appreciation on investments and translation of assets and liabilities denominated in foreign currencies | | | 13,569,109 | | | | 16,795,335 | |
| | | | | | | | |
Net increase in net assets resulting from operations | | | 15,316,393 | | | | 15,379,238 | |
| | | | | | | | |
| | |
Distributions to Shareholders from: | | | | | | | | |
Net investment income | | | | | | | | |
Advisor Class | | | (50,029 | ) | | | (140,635 | ) |
Institutional Class | | | (99,325 | ) | | | — | |
| | | | | | | | |
Total distributions to shareholders | | | (149,354 | ) | | | (140,635 | ) |
| | | | | | | | |
| | |
Transactions in shares of Common Stock | | | | | | | | |
Proceeds from sale of shares | | | | | | | | |
Advisor Class | | | 28,868,395 | | | | 29,033,478 | |
Institutional Class(1) | | | 100,707,733 | | | | — | |
Net Asset Value of shares issued to shareholders upon reinvestment of dividends | | | | | | | | |
Advisor Class | | | 93,525 | | | | 76,577 | |
Institutional Class(1) | | | 50,029 | | | | — | |
Cost of shares redeemed | | | | | | | | |
Advisor Class | | | (55,305,981 | ) | | | (3,752,668 | ) |
Institutional Class(1) | | | (5,887,335 | ) | | | — | |
Redemption fees | | | | | | | | |
Advisor Class | | | 2,461 | | | | 6,503 | |
Institutional Class(1) | | | 219,316 | | | | — | |
| | | | | | | | |
Net increase in net assets from Fund share transactions | | | 68,748,143 | | | | 25,363,890 | |
| | | | | | | | |
| | |
Net increase in net assets | | | 83,915,182 | | | | 40,602,493 | |
| | |
Net Assets | | | | | | | | |
At beginning of year | | | 66,810,313 | | | | 26,207,820 | |
| | | | | | | | |
At end of year | | $ | 150,725,495 | | | $ | 66,810,313 | |
| | | | | | | | |
| | |
Accumulated undistributed net investment income included in net assets | | $ | 288,950 | | | $ | 149,249 | |
| | | | | | | | |
| (1) | The Institutional Class shares commenced operations on November 3, 2009. |
See Notes to Financial Statements
38
Harding, Loevner Funds, Inc.
Statements of Changes in Net Assets (continued)
| | | | | | | | |
| | | International Equity Portfolio | |
| | | Year Ended
October 31,
2010 | | | Year Ended
October 31,
2009 | |
Increase in Net Assets From Operations | | | | | | | | |
Net investment income | | $ | 3,406,306 | | | $ | 2,856,596 | |
Net realized gain (loss) on investments and foreign currency transactions | | | 7,204,204 | | | | (11,943,588 | ) |
Net change in unrealized appreciation on investments and translation of assets and liabilities denominated in foreign currencies | | | 78,078,107 | | | | 76,759,308 | |
| | | | | | | | |
Net increase in net assets resulting from operations | | | 88,688,617 | | | | 67,672,316 | |
| | | | | | | | |
| | |
Distributions to Shareholders from: | | | | | | | | |
Net investment income | | | | | | | | |
Investor Class | | | (290,844 | ) | | | (160,740 | ) |
Institutional Class | | | (2,239,441 | ) | | | (3,101,928 | ) |
Net realized gain (loss) from investments and foreign-currency related transactions | | | | | | | | |
Investor Class | | | — | | | | (2,318,758 | ) |
Institutional Class | | | — | | | | (36,230,389 | ) |
| | | | | | | | |
Total distributions to shareholders | | | (2,530,285 | ) | | | (41,811,815 | ) |
| | | | | | | | |
| | |
Transactions in shares of Common Stock | | | | | | | | |
Proceeds from sale of shares | | | | | | | | |
Investor Class | | | 90,915,148 | | | | 24,524,810 | |
Institutional Class | | | 248,771,466 | | | | 37,754,041 | |
Net Asset Value of shares issued to shareholders upon reinvestment of dividends | | | | | | | | |
Investor Class | | | 275,089 | | | | 2,337,103 | |
Institutional Class | | | 2,164,593 | | | | 38,985,473 | |
Cost of shares redeemed | | | | | | | | |
Investor Class | | | (28,647,976 | ) | | | (5,664,340 | ) |
Institutional Class | | | (87,480,052 | ) | | | (29,797,831 | ) |
Redemption fees | | | | | | | | |
Investor Class | | | 33,275 | | | | 2,232 | |
Institutional Class | | | 41,527 | | | | 9,202 | |
| | | | | | | | |
Net increase in net assets from Fund share transactions | | | 226,073,070 | | | | 68,150,690 | |
| | | | | | | | |
| | |
Net increase in net assets | | | 312,231,402 | | | | 94,011,191 | |
| | |
Net Assets | | | | | | | | |
At beginning of year | | | 297,583,335 | | | | 203,572,144 | |
| | | | | | | | |
At end of year | | $ | 609,814,737 | | | $ | 297,583,335 | |
| | | | | | | | |
| | |
Accumulated undistributed net investment income included in net assets | | $ | 2,516,364 | | | $ | 2,365,492 | |
| | | | | | | | |
See Notes to Financial Statements
39
Harding, Loevner Funds, Inc.
Statements of Changes in Net Assets (continued)
| | | | | | | | |
| | | Institutional Emerging Markets Portfolio | |
| | |
| | | Year Ended
October 31,
2010 | | | Year Ended
October 31,
2009 | |
Increase in Net Assets From Operations | | | | | | | | |
Net investment income | | $ | 1,797,663 | | | $ | 1,500,759 | |
Net realized gain (loss) on investments and foreign currency transactions | | | 8,465,373 | | | | (34,215,275 | ) |
Net change in unrealized appreciation on investments and translation of assets and liabilities denominated in foreign currencies | | | 52,686,876 | | | | 101,836,498 | |
| | | | | | | | |
Net increase in net assets resulting from operations | | | 62,949,912 | | | | 69,121,982 | |
| | | | | | | | |
| | |
Distributions to Shareholders from: | | | | | | | | |
Net investment income | | | (1,329,181 | ) | | | (5,277,778 | ) |
| | | | | | | | |
Total distributions to shareholders | | | (1,329,181 | ) | | | (5,277,778 | ) |
| | | | | | | | |
| | |
Transactions in Shares of Common Stock | | | | | | | | |
Proceeds from sale of shares | | | 149,070,226 | | | | 45,649,131 | |
Net Asset Value of shares issued to shareholders upon reinvestment of dividends | | | 1,026,968 | | | | 4,205,119 | |
Cost of shares redeemed | | | (39,900,035 | ) | | | (42,223,167 | ) |
Redemption fees | | | | | | | | |
Institutional Class | | | 7,808 | | | | 35,508 | |
| | | | | | | | |
Net increase (decrease) in net assets from Fund share transactions | | | 110,204,967 | | | | 7,666,591 | |
| | | | | | | | |
| | |
Net increase (decrease) in net assets | | | 171,825,698 | | | | 71,510,795 | |
| | |
Net Assets | | | | | | | | |
At beginning of year | | | 203,547,957 | | | | 132,037,162 | |
| | | | | | | | |
At end of year | | $ | 375,373,655 | | | $ | 203,547,957 | |
| | | | | | | | |
Accumulated undistributed net investment income included in net assets | | $ | 1,078,294 | | | $ | 1,100,413 | |
| | | | | | | | |
See Notes to Financial Statements
40
Harding, Loevner Funds, Inc.
Statements of Changes in Net Assets (continued)
| | | | | | | | |
| | | Frontier Emerging Markets Portfolio | |
| | |
| | | Year Ended
October 31,
2010 | | | Year Ended
October 31,
2009 | |
Increase in Net Assets From Operations | | | | | | | | |
Net investment income (loss) | | $ | (18,399 | ) | | $ | 88,595 | |
Net realized gain (loss) on investments and foreign currency transactions | | | 117,030 | | | | (1,589,119 | ) |
Net change in unrealized appreciation on investments and translation of assets and liabilities denominated in foreign currencies | | | 7,731,434 | | | | 3,621,154 | |
| | | | | | | | |
Net increase in net assets resulting from operations | | | 7,830,065 | | | | 2,120,630 | |
| | | | | | | | |
| | |
Distributions to Shareholders from: | | | | | | | | |
Net investment income | | | | | | | | |
Institutional Class | | | (127,946 | ) | | | (15,259 | ) |
| | | | | | | | |
Total distributions to shareholders | | | (127,946 | ) | | | (15,259 | ) |
| | | | | | | | |
| | |
Transactions in Shares of Common Stock | | | | | | | | |
Proceeds from sale of shares | | | | | | | | |
Institutional Class | | | 55,027,776 | | | | 2,540,000 | |
Net Asset Value of shares issued to shareholders upon reinvestment of dividends | | | | | | | | |
Institutional Class | | | 42,693 | | | | 4,708 | |
Cost of shares redeemed | | | | | | | | |
Institutional Class | | | (1,201,661 | ) | | | (454,197 | ) |
Redemption fees | | | | | | | | |
Institutional Class | | | 2,717 | | | | — | |
| | | | | | | | |
Net increase in net assets from Fund share transactions | | | 53,871,525 | | | | 2,090,511 | |
| | | | | | | | |
| | |
Net increase in net assets | | | 61,573,644 | | | | 4,195,882 | |
| | |
Net Assets | | | | | | | | |
At beginning of year | | | 9,071,303 | | | | 4,875,421 | |
| | | | | | | | |
At end of year | | $ | 70,644,947 | | | $ | 9,071,303 | |
| | | | | | | | |
Accumulated undistributed net investment income included in net assets | | $ | (245,101 | ) | | $ | 67,258 | |
| | | | | | | | |
See Notes to Financial Statements
41
Harding, Loevner Funds, Inc.
Financial Highlights
| | | | | | | | |
| | | Global Equity Portfolio - Institutional Class |
| |
| | | For the Period Ended Oct. 31, 2010(1) |
Per Share Data | | | | | | | | |
Net asset value, beginning of period | | | | $ | 20.43 | | | |
| | | | | | | | |
| | | |
Increase (Decrease) in Net Assets from
Operations | | | | | | | | |
Net investment income | | | | | 0.10 | | | |
Net realized and unrealized gain (loss) on investments and foreign currency-related transactions | | | | | 3.04 | | | |
| | | | | | | | |
| | | |
Net increase (decrease) from investment operations | | | | | 3.14 | | | |
| | | | | | | | |
| | | | | | | | |
| | | |
Distributions to Shareholders from: | | | | | | | | |
Net investment income | | | | | (0.05 | ) | | |
Net realized gain from investments and foreign
currency-related transactions | | | | | — | | | |
| | | | | | | | |
Total distributions | | | | | (0.05 | ) | | |
| | | | | | | | |
Net asset value, end of year | | | | $ | 23.52 | | | |
| | | | | | | | |
| | | |
Total Return | | | | | 15.39 | %(A) | | |
| | | |
Ratios/Supplemental Data: | | | | | | | | |
| | | |
Net assets, end of year (000’s) | | | | $ | 104,276 | | | |
| | | |
Net expenses to average net assets | | | | | 1.00 | %(B) | | |
| | | |
Net investment income to average net assets | | | | | 0.43 | %(B) | | |
| | | |
Decrease reflected in above expense ratios due to expense reductions | | | | | 0.27 | %(B) | | |
| | | |
Portfolio turnover rate | | | | | 35 | %(A) | | |
| (1) | For the period November 3, 2009 (commencement of operations) through October 31, 2010. |
See Notes to Financial Statements
42
Harding, Loevner Funds, Inc.
Financial Highlights (continued)
| | | | | | | | | | | | | | | | | | | | |
| | | International Equity Portfolio - Institutional Class | |
| | | | | |
| | | For the Year
Ended
Oct. 31, 2010 | | | For the Year
Ended
Oct. 31, 2009 | | | For the Year
Ended
Oct. 31, 2008 | | | For the Year
Ended
Oct. 31, 2007 | | | For the Year
Ended
Oct. 31, 2006 | |
Per Share Data | | | | | | | | | | | | | | | | | | | | |
Net asset value, beginning of year | | $ | 12.04 | | | $ | 11.44 | | | $ | 21.71 | | | $ | 18.68 | | | $ | 14.90 | |
| | | | | | | | | | | | | | | | | | | | |
| | | | | |
Increase (Decrease) in Net Assets from Operations | | | | | | | | | | | | | | | | | | | | |
Net investment income | | | 0.08 | | | | 0.13 | | | | 0.20 | | | | 0.14 | | | | 0.12 | (1) |
Net realized and unrealized gain (loss) on investments and foreign currency-related transactions | | | 2.49 | | | | 2.86 | | | | (8.63 | ) | | | 4.33 | | | | 3.75 | |
| | | | | | | | | | | | | | | | | | | | |
Net increase (decrease) from investment operations | | | 2.57 | | | | 2.99 | | | | (8.43 | ) | | | 4.47 | | | | 3.87 | |
| | | | | | | | | | | | | | | | | | | | |
| | | | | |
Distributions to Shareholders from: | | | | | | | | | | | | | | | | | | | | |
Net investment income | | | (0.10 | ) | | | (0.19 | ) | | | (0.15 | ) | | | (0.10 | ) | | | (0.08 | ) |
Net realized gain from investments and foreign currency-related transactions | | | — | | | | (2.20 | ) | | | (1.69 | ) | | | (1.34 | ) | | | (0.01 | ) |
| | | | | | | | | | | | | | | | | | | | |
Total distributions | | | (0.10 | ) | | | (2.39 | ) | | | (1.84 | ) | | | (1.44 | ) | | | (0.09 | ) |
| | | | | | | | | | | | | | | | | | | | |
| | | | | |
Net asset value, end of year | | $ | 14.51 | | | $ | 12.04 | | | $ | 11.44 | | | $ | 21.71 | | | $ | 18.68 | |
| | | | | | | | | | | | | | | | | | | | |
| | | | | |
Total Return | | | 21.50 | % | | | 32.77 | % | | | (42.33 | )% | | | 25.24 | % | | | 26.06 | % |
| | | | | |
Ratios/Supplemental Data: | | | | | | | | | | | | | | | | | | | | |
Net assets, end of year (000’s) | | | $493,350 | | | | $259,450 | | | | $191,450 | | | | $390,659 | | | | $343,965 | |
Net expenses to average net assets | | | 0.93 | % | | | 1.00 | % | | | 0.98 | % | | | 0.98 | % | | | 1.00 | % |
Net investment income to average net assets | | | 0.91 | % | | | 1.31 | % | | | 1.05 | % | | | 0.70 | % | | | 0.69 | % |
Decrease reflected in above expense ratios due to expense reductions | | | — | | | | 0.04 | % | | | — | | | | — | | | | 0.01 | % |
Portfolio turnover rate | | | 33 | % | | | 22 | % | | | 18 | % | | | 19 | % | | | 35 | % |
| (1) Computed | using average shares outstanding throughout the year. |
See Notes to Financial Statements
43
Harding, Loevner Funds, Inc.
Financial Highlights (continued)
| | | | | | | | | | | | | | | | | | | | |
| | | Institutional Emerging Markets Portfolio | |
| | | | | |
| | | For the Year
Ended
Oct. 31, 2010 | | | For the Year
Ended
Oct. 31, 2009 | | | For the Year
Ended
Oct. 31, 2008 | | | For the Year
Ended
Oct. 31, 2007 | | | For the Year
Ended
Oct. 31, 2006 | |
Per Share Data | | | | | | | | | | | | | | | | | | | | |
Net asset value, beginning of year | | $ | 13.29 | | | $ | 9.29 | | | $ | 21.20 | | | $ | 13.42 | | | $ | 9.92 | |
| | | | | | | | | | | | | | | | | | | | |
| | | | | |
Increase (Decrease) in Net Assets from Operations | | | | | | | | | | | | | | | | | | | | |
Net investment income (loss) | | | 0.09 | | | | 0.10 | | | | 0.44 | | | | 0.10 | | | | 0.07 | |
Net realized and unrealized gain (loss) on investments and foreign currency-related transactions | | | 3.41 | | | | 4.27 | | | | (11.53 | ) | | | 7.70 | | | | 3.45 | |
| | | | | | | | | | | | | | | | | | | | |
Net increase (decrease) from investment operations | | | 3.50 | | | | 4.37 | | | | (11.09 | ) | | | 7.80 | | | | 3.52 | |
| | | | | | | | | | | | | | | | | | | | |
| | | | | |
Distributions to Shareholders from: | | | | | | | | | | | | | | | | | | | | |
Net investment income | | | (0.09 | ) | | | (0.37 | ) | | | (0.09 | ) | | | (0.02 | ) | | | (0.02 | ) |
Net realized gain from investments and foreigncurrency-related transactions | | | — | | | | — | | | | (0.73 | ) | | | — | | | | — | |
| | | | | | | | | | | | | | | | | | | | |
Total distributions | | | (0.09 | ) | | | (0.37 | ) | | | (0.82 | ) | | | (0.02 | ) | | | (0.02 | ) |
| | | | | | | | | | | | | | | | | | | | |
| | | | | |
Net asset value, end of year | | $ | 16.70 | | | $ | 13.29 | | | $ | 9.29 | | | $ | 21.20 | | | $ | 13.42 | |
| | | | | | | | | | | | | | | | | | | | |
| | | | | |
Total Return | | | 26.50 | % | | | 48.92 | % | | | (54.33 | )% | | | 58.18 | % | | | 35.38 | % |
| | | | | |
Ratios/Supplemental Data: | | | | | | | | | | | | | | | | | | | | |
| | | | | |
Net assets, end of period (000’s) | | | $375,374 | | | | $203,548 | | | | $132,037 | | | | $245,061 | | | | $85,930 | |
| | | | | |
Net expenses to average net assets | | | 1.30 | % | | | 1.30 | % | | | 1.30 | % | | | 1.30 | % | | | 1.30 | % |
| | | | | |
Net investment income to average net assets | | | 0.74 | % | | | 0.93 | % | | | 2.56 | % | | | 0.72 | % | | | 0.88 | % |
| | | | | |
Decrease reflected in above expense ratios due toexpense reductions | | | 0.18 | % | | | 0.25 | % | | | 0.22 | % | | | 0.25 | % | | | 0.51 | % |
| | | | | |
Portfolio turnover rate | | | 34 | % | | | 57 | % | | | 51 | % | | | 32 | % | | | 38 | % |
See Notes to Financial Statements
44
Harding, Loevner Funds, Inc.
Financial Highlights (continued)
| | | | | | | | | | | | |
| | | Frontier Emerging Markets Portfolio | |
| | | |
| | | For the Year
Ended
Oct. 31, 2010 | | | For the Year
Ended
Oct. 31, 2009 | | | For the Period
Ended
Oct. 31, 2008 (1) | |
Per Share Data | | | | | | | | | | | | |
Net asset value, beginning of year | | $ | 6.29 | | | $ | 4.98 | | | $ | 10.00 | |
| | | | | | | | | | | | |
| | | |
Increase (Decrease) in Net Assets from Operations | | | | | | | | | | | | |
Net investment income | | | 0.03 | | | | 0.07 | | | | 0.01 | |
Net realized and unrealized gain (loss) on investments and foreign currency-related transactions | | | 1.65 | | | | 1.26 | | | | (5.03 | ) |
| | | | | | | | | | | | |
Net increase (decrease) from investment operations | | | 1.68 | | | | 1.33 | | | | (5.02 | ) |
| | | | | | | | | | | | |
| | | |
Distributions to Shareholders from: | | | | | | | | | | | | |
Net investment income | | | (0.09 | ) | | | (0.02 | ) | | | — | |
| | | | | | | | | | | | |
Total distributions | | | (0.09 | ) | | | (0.02 | ) | | | — | |
| | | | | | | | | | | | |
| | | |
Net asset value, end of year | | $ | 7.88 | | | $ | 6.29 | | | $ | 4.98 | |
| | | | | | | | | | | | |
| | | |
Total Return | | | 27.04 | % | | | 26.71 | % | | | (50.20 | )%(A) |
| | | |
Ratios/Supplemental Data: | | | | | | | | | | | | |
Net assets, end of period (000’s) | | $ | 70,645 | | | $ | 9,071 | | | $ | 4,875 | |
| | | |
Net expenses to average net assets | | | 2.00 | % | | | 2.00 | % | | | 2.00 | %(B) |
| | | |
Net investment income to average net assets | | | (0.08 | )% | | | 1.39 | % | | | 0.42 | %(B) |
| | | |
Decrease reflected in above expense ratios due to expense reductions | | | 0.37 | % | | | 2.08 | % | | | 6.92 | %(B) |
| | | |
Portfolio turnover rate | | | 17 | % | | | 55 | % | | | 1 | %(A) |
(1) For the period from May 27, 2008 (commencement of operations) through October 31, 2008.
(A) Not Annualized.
(B) Annualized.
See Notes to Financial Statements
45
Harding, Loevner Funds, Inc.
Notes to Financial Statements
October 31, 2010
1. Organization
Harding, Loevner Funds, Inc. (the “Fund”) was organized as a Maryland corporation on July 31, 1996 and is registered under the Investment Company Act of 1940, as amended (“1940 Act”), as an open-end diversified management investment company. The Fund currently has six Portfolios, all of which were active as of October 31, 2010: Global Equity Portfolio (“Global Equity”); International Equity Portfolio (“International Equity”); Institutional Emerging Markets Portfolio (“Institutional Emerging Markets”); International Small Companies Portfolio (“International Small Companies”); Emerging Markets Portfolio (“Emerging Markets”); and Frontier Emerging Markets Portfolio (“Frontier Emerging Markets”). Information presented in these financial statements pertains to Institutional Class shares of Global Equity, Institutional Class shares of International Equity, Institutional Emerging Markets and Frontier Emerging Markets (individually, “Portfolio”; collectively, “Portfolios”). Information pertaining to the Advisor Class shares of Global Equity, the Investor Class shares of International Equity, the Investor Class shares of International Small Companies and Emerging Markets is presented in a separate report. The investment objective of each Portfolio is as follows: Global Equity - to seek long-term capital appreciation through investments in equity securities of companies based both inside and outside the United States; International Equity - to seek long-term capital appreciation through investments in equity securities of companies based outside the United States; Institutional Emerging Markets - to seek long-term capital appreciation through investments in equity securities of companies based in emerging markets; Frontier Emerging Markets - to seek long-term capital appreciation through investments in equity securities of companies based in frontier and smaller emerging markets.
International Equity commenced operations on October 31, 1996 after acquiring the net assets of Harding Loevner LP’s AMT Capital Fund, Inc. Global Equity commenced operations on December 1, 1996 following the acquisition of net assets of HLM Global Equity Limited Partnership, a limited partnership, in a tax-free reorganization. Effective August 5, 2005, International Equity launched Investor Class shares and converted existing shareholders to the Institutional Class. Institutional Emerging Markets commenced operations on October 17, 2005. Institutional Class of Frontier Emerging Markets commenced operations on May 27, 2008. Effective November 3, 2009, Global Equity launched Institutional Class shares and re-designated existing shares as Advisor Class shares.
The Fund is managed by Harding Loevner LP (the “Investment Advisor”).
2. Summary of Significant Accounting Policies
The accounting policies of the Fund are in conformity with accounting principles generally accepted in the United States (“GAAP”) for investment companies. The following is a summary of the Fund’s significant accounting policies:
Indemnifications
Under the Fund’s organizational document, its officers and Board of Directors (“Board”) are indemnified against certain liability arising out of the performance of their duties to the Portfolios. In the normal course of business, the Fund may enter into contracts that contain a variety of representations or that provide indemnification for certain liabilities. The Fund’s maximum exposure under these arrangements is unknown, as this would involve future claims that may be made against the Fund that have not yet occurred. However, the Fund has not had prior claims or losses pursuant to these contracts and expects the risk of loss to be remote.
Estimates
The preparation of financial statements in accordance with GAAP requires management to make estimates and assumptions that affect the reported amounts and disclosures in the financial statements. Actual results could differ from those estimates.
Valuation
The Board has adopted procedures (“Procedures”) to govern the valuation of the securities held by each Portfolio of the Fund in accordance with the 1940 Act. The Procedures incorporate principles set forth in relevant pronouncements of the Securities and Exchange Commission (“SEC”) and its staff, including guidance on the obligations of the Portfolios and the Board to determine, in good faith, the fair value of the Portfolios’ securities when market quotations are not readily available.
In determining a Portfolio’s net asset value (“NAV”), each equity security traded on a securities exchange, including the NASDAQ Stock Market, and over-the-counter securities, are first valued at the closing price on the exchange or market designated by the Fund’s accounting agent as the principal exchange (each, a “principal exchange”). The closing price provided by the Fund’s accounting agent for a principal exchange may differ from the price quoted elsewhere and may represent information such as last sales price, an official closing price, a closing auction price or other information, depending on exchange or market convention. Shares of open-end mutual funds are valued at NAV.
46
Harding, Loevner Funds, Inc.
Notes to Financial Statements
October 31, 2010
2. Summary of Significant Accounting Policies (continued)
Since trading in many foreign securities is normally completed before the time at which a Portfolio calculates its NAV, the effect on the value of such securities held by a Portfolio of events that occur between the close of trading in the security and the time at which the Portfolio prices its securities would not be reflected in the Portfolio’s calculation of its NAV if foreign securities were generally valued at their closing prices.
To address this issue, the Board has approved daily fair value pricing of certain foreign equity securities. The fair value pricing utilizes quantitative models developed by an independent pricing service, which may provide an adjustment to the closing prices described above. Use of fair value pricing could cause a Portfolio to value a security higher or lower than its closing market price, which could cause the Portfolio’s NAV per share to differ significantly from that which would have been calculated using closing market prices. The use of fair value pricing is intended to decrease the opportunities for persons to engage in “time zone arbitrage,” i.e. trading intended to take advantage of stale closing prices in foreign markets that could affect the NAV of the Portfolios. Securities priced in this manner are not specifically designated on the Portfolios’ Schedules of Investments as being “fair valued”.
Any securities for which market quotations are not readily available or for which available prices are deemed unreliable are priced by the Investment Advisor at “fair value”, in accordance with the Procedures. Such securities are identified on the Portfolios’ Schedules of Investments as securities valued at “fair value”.
GAAP includes a topic which establishes a hierarchy for NAV determination purposes in which various inputs are used in determining the value of each Portfolio’s assets or liabilities. This topic defines fair value as the price that the Portfolio would receive upon selling an investment in a timely transaction to an independent buyer in the principal or most advantageous market of the investment. This topic establishes a three-tier hierarchy to maximize the use of observable market data and minimize the use of unobservable inputs and to establish classification of fair value measurements for disclosure purposes. Inputs may be observable or unobservable and refer broadly to the assumptions that market participants would use in pricing the asset or liability including assumptions about risk. Such risks include the inherent risk in a particular valuation technique which is used to measure fair value. This may include the pricing model and/or the inputs to the pricing model used in the valuation technique. Observable inputs are inputs that reflect the assumptions market participants would use in pricing the asset or liability developed based on market data obtained from sources independent of the reporting entity. Unobservable inputs are inputs that reflect the reporting entity’s own assumptions about the assumptions market participants would use in pricing the asset or liability developed based on the best information available in the circumstances. The three-tier hierarchy of inputs is summarized in the three broad levels listed below.
| | |
Level 1 | | quoted prices in active markets for identical investments |
Level 2 | | other significant observable inputs (including quoted prices for similar investments, interest rates, prepayment speeds, credit risk, etc.) |
Level 3 | | significant unobservable inputs (including the Portfolio’s own assumptions in determining the fair value of investments) |
The Portfolios disclose significant transfers between levels based on valuations at the end of each reporting period. GAAP provides additional guidance for estimating fair value when the volume and level of activity for the asset or liability have significantly decreased as well as guidance on identifying circumstances that indicate when a transaction is not orderly.
47
Harding, Loevner Funds, Inc.
Notes to Financial Statements
October 31, 2010
2. Summary of Significant Accounting Policies (continued)
The following is a summary of the inputs used as of October 31, 2010 in valuing the Portfolio’s investments:
| | | | | | | | | | | | | | | | |
| Global Equity | | | | | | | | | | | | |
ASSET VALUATION INPUT | | | | | | | | | | | | | | | | |
| Description | | Quoted Prices
in Active
Markets for
Identical Assets (Level 1) | | | Significant
Other
Observable
Inputs (Level 2) | | | Significant
Unobservable
Inputs (Level 3) | | | Total | |
Common Stocks | | | $91,005,772 | | | | $57,373,333 | | | | $— | | | | $148,379,105 | |
Rights | | | — | | | | 124,508 | | | | — | | | | 124,508 | |
Cash Equivalents | | | 2,059,862 | | | | — | | | | — | | | | 2,059,862 | |
| | | | | | | | | | | | | | | | |
Total Investments | | | $93,065,634 | | | | $57,497,841 | | | | $— | | | | $150,563,475 | |
| | | | | | | | | | | | | | | | |
| International Equity | | | | | | | | | | | | |
ASSET VALUATION INPUT | | | | | | | | | | | | | | | | |
| Description | | Quoted Prices
in Active
Markets for
Identical Assets (Level 1) | | | Significant
Other
Observable
Inputs (Level 2) | | | Significant
Unobservable
Inputs (Level 3) | | | Total | |
Common Stocks | | | $134,388,498 | | | | $436,020,544 | | | | $— | | | | $570,409,042 | |
Preferred Stocks | | | 16,723,903 | | | | 5,691,213 | | | | — | | | | 22,415,116 | |
Rights | | | — | | | | 575,524 | | | | — | | | | 575,524 | |
Cash Equivalents | | | 46,293,164 | | | | — | | | | — | | | | 46,293,164 | |
| | | | | | | | | | | | | | | | |
Total Investments | | | $197,405,565 | | | | $442,287,281 | | | | $— | | | | $639,692,846 | |
| | | | | | | | | | | | | | | | |
| Institutional Emerging Markets | | | | | | | | | | | | |
ASSET VALUATION INPUT | | | | | | | | | | | | | | | | |
| Description | | Quoted Prices
in Active
Markets for
Identical Assets (Level 1) | | | Significant
Other
Observable
Inputs (Level 2) | | | Significant
Unobservable
Inputs (Level 3) | | | Total | |
Common Stocks | | | $130,580,178 | | | | $207,322,681 | | | | $— | | | | $337,902,859 | |
Preferred Stocks | | | 17,739,772 | | | | 10,703,480 | | | | — | | | | 28,443,252 | |
Participation Notes | | | — | | | | 1,608,015 | | | | — | | | | 1,608,015 | |
Cash Equivalents | | | 7,539,311 | | | | — | | | | — | | | | 7,539,311 | |
| | | | | | | | | | | | | | | | |
Total Investments | | | $155,859,261 | | | | $219,634,176 | | | | $— | | | | $375,493,437 | |
| | | | | | | | | | | | | | | | |
| Frontier Emerging Markets | | | | | | | | | | | | |
ASSET VALUATION INPUT | | | | | | | | | | | | | | | | |
| Description | | Quoted Prices
in Active
Markets for
Identical Assets (Level 1) | | | Significant
Other
Observable
Inputs (Level 2) | | | Significant
Unobservable
Inputs (Level 3) | | | Total | |
Common Stocks | | | $18,354,943 | | | | $43,660,786 | | | | $— | | | | $62,015,729 | |
Participation Notes | | | — | | | | 4,834,183 | | | | — | | | | 4,834,183 | |
Warrants | | | 21,070 | | | | — | | | | — | | | | 21,070 | |
Cash Equivalents | | | 7,091,738 | | | | — | | | | — | | | | 7,091,738 | |
| | | | | | | | | | | | | | | | |
Total Investments | | | $25,467,751 | | | | $48,494,969 | | | | $— | | | | $73,962,720 | |
| | | | | | | | | | | | | | | | |
48
Harding, Loevner Funds, Inc.
Notes to Financial Statements
October 31, 2010
2. Summary of Significant Accounting Policies (continued)
Following is a reconciliation of investments for which significant unobservable inputs (Level 3) were used in determining value:
ASSET VALUATION INPUT
| | | | | | | | | | | | | | | | | | | | | | | | | | | | | | | | | | | | | | | | |
| | | | | | | | | | | | Investments in Securities | | | | | | | | | | | | | |
| | | Balance as of October 31,
2009 | | | Accrued Discounts (Premiums) | | | Realized Gain (Loss) | | | Change in Unrealized Appreciation (Depreciation) | | | Purchases | | | Sales | | | Transfers in to Level 3 | | | Transfers out of Level 3 | | | Balance as of October 31, 2010 | | | Change in Unrealized Appreciation (Depreciation) from Investments Held at October 31, 2010 | |
International Equity | | | | | | | | | | | | | | | | | | | | | | | | | | | | | | | | | | | | | | | | |
Common Stocks | | | $2,857,825 | | | | $0 | | | | ($44,295 | ) | | | $945,543 | | | | $2,322,188 | | | | ($260,059 | ) | | | $0 | | | | ($5,821,202 | ) | | | $0 | | | | $0 | |
Frontier Emerging Markets | | | | | | | | | | | | | | | | | | | | | | | | | | | | | | | | | | | | | | | | |
Common Stocks | | | $520,558 | | | | $0 | | | | $0 | | | | $523,996 | | | | $2,655,259 | | | | $0 | | | | $0 | | | | ($3,699,813 | ) | | | $0 | | | | $0 | |
Securities
All securities transactions are recorded on a trade date basis. Interest income and expenses are recorded on an accrual basis. Dividend income is recorded on the ex-dividend date (except for certain foreign dividends that may be recorded as soon as the Portfolio is informed of such dividends). The Portfolios accrete discount or amortize premium using the effective interest method on a daily basis as adjustments to interest income and the cost of investments. The Portfolios use the specific identification method for determining realized gains or losses from sales of securities.
Expenses
Expenses directly attributed to a specific Portfolio of the Fund are charged to that Portfolio’s operations; expenses not directly attributable to a specific Portfolio are allocated among all the Portfolios of the Fund either based on their average daily net assets or by other equitable measures. Pursuant to the Fund’s multiple class expense allocation plan, certain expenses are allocated to particular classes of the Portfolios.
Dividends to Shareholders
It is the policy of the Portfolios to declare dividends from net investment income annually. Net short-term and long-term capital gains distributions for the Portfolios, if any, normally are distributed on an annual basis.
Dividends from net investment income and distributions from net realized gains from investment transactions have been determined in accordance with income tax regulations and may differ from net investment income and realized gains recorded by the Portfolios for financial reporting purposes. Differences result primarily from foreign currency transactions and timing differences related to recognition of income, and gains and losses from investment transactions. In general, to the extent that any differences which are permanent in nature result in over distributions to shareholders, the amount of the over distribution is reclassified within the capital accounts based on its federal tax basis treatment and may be reported as return of capital. Temporary differences do not require reclassification.
Currency Translation
Assets and liabilities denominated in foreign currencies and commitments under forward foreign currency exchange contracts are translated into U.S. dollars at the mean of the quoted bid and asked prices of such currencies against the U.S. dollar. Purchases and sales of the Portfolios’ securities are translated at the rates of exchange prevailing when such securities were acquired or sold. Income and expenses are translated at exchange rates prevailing when accrued. The Portfolios do not isolate that portion of the results of operations resulting from changes in foreign exchange rates on investments from the fluctuations arising from changes in market prices of securities held. Such fluctuations are included with the net realized and unrealized gain or loss from investments.
49
Harding, Loevner Funds, Inc.
Notes to Financial Statements
October 31, 2010
2. Summary of Significant Accounting Policies (continued)
Net realized gains and losses from foreign currency-related transactions arise from sales of foreign currency, currency gains or losses realized between the trade and settlement dates on securities transactions, and the difference between the amounts of dividends, interest, and foreign withholding taxes recorded on the Portfolios’ books, and the U.S. dollar equivalent of the amounts actually received or paid. Net unrealized appreciation or depreciation on translation of assets and liabilities denominated in foreign currencies arise from changes in the value of assets and liabilities other than investments in securities at the period end, resulting from changes in the exchange rates.
3. Significant Agreements and Transactions with Affiliates
The Board has approved an investment advisory agreement (the “Agreement”) with the Investment Advisor. The advisory fees are computed daily and paid monthly at an annual rate of 1.00%, 0.75%, 1.25% and 1.50% of the average daily net assets of Global Equity, International Equity, Institutional Emerging Markets, Frontier Emerging Markets, and, respectively.
The Investment Advisor has voluntarily agreed to reduce its fee to the extent that aggregate expenses, excluding certain non-operating expenses, exceed an annual rate of 1.00%, 1.00%, 1.30%, and 2.00%, respectively, of the average daily net assets of Institutional Class shares of Global Equity, Institutional Class shares of International Equity, Institutional Emerging Markets and Institutional Class shares of Frontier Emerging Markets, respectively, through December 31, 2011. For the year ended October 31, 2010, the Investment Advisor voluntarily waived and/or reimbursed $291,938, $52,453, $423,871 and $80,739 in investment advisory fees from Global Equity, International Equity, Institutional Emerging Markets, and Frontier Emerging Markets, respectively.
Effective December 31, 2010, the Investment Adviser contractually agreed to extend the above-mentioned expense limitations until at least December 31, 2011.
The Fund entered into an administration agreement effective June 14, 2010 with The Northern Trust Company (“Northern Trust”), which provides certain accounting, clerical and bookkeeping services, Blue Sky, corporate secretarial services and assistance in the preparation and filing of tax returns and reports to shareholders and the SEC. Prior to June 14, 2010, State Street Bank and Trust Company (“State Street”) served as the Fund’s administrator pursuant to an Administration Agreement dated June 1, 1999, as amended, with the Fund.
As of June 14, 2010, Northern Trust serves as custodian of each Portfolio’s securities and cash, transfer agent, dividend disbursing agent and agent in connection with any accumulation, open-account or similar plans provided to the shareholders of the Portfolios. Prior to June 14, 2010, State Street served in such capacity. The Fund has an agreement with its custodian under which custody fees may be reduced by balance credits. These credits are recorded as a reduction of total expenses on the Statements of Operations. The Portfolios could have invested a portion of the assets utilized in connection with the expense offset arrangement in other income-producing assets if the Fund had not entered into such an agreement.
As of March 8, 2010, Foreside Compliance Services, LLC serves as chief compliance officer of the Portfolios. Prior to March 8, 2010, State Street served in such capacity. Effective September 8, 2010, the Fund contracted with Foreside Management Services, LLC to obtain the services of a chief financial officer and treasurer. Fees paid to Foreside related to these services amounted to $9,730 for Global Equity, $19,855 for International Equity, $13,731 for Institutional Emerging Markets and $6,070 for Frontier Emerging Markets. These expenses are shown as part of Other fees and expenses on the Statements of Operations.
The Fund, on behalf of the Portfolios, has agreements with various financial intermediaries and “mutual fund supermarkets”, under which customers of these intermediaries may purchase and hold Portfolio shares. These of the savings of expenses to the Fund arising from the intermediaries’ assumption of functions that the Fund would otherwise perform, such as providing sub-accounting and related shareholder services, each Portfolio or class is authorized, pursuant to a shareholder services plan, to pay to each intermediary up to 0.15% of its average daily net assets attributable to that intermediary (subject to the voluntary expense cap). The balance of the intermediaries’ fees after payments made pursuant to the plan of distribution adopted pursuant to Rule 12b-1 under the 1940 Act, if applicable, is paid by the Investment Advisor. Because of voluntary caps on the Portfolios’ fees and expenses, the Investment Advisor paid a portion of the Portfolios’ share of these fees during the year ended October 31, 2010.
50
Harding, Loevner Funds, Inc.
Notes to Financial Statements
October 31, 2010
4. Investment Transactions
Cost of purchases and proceeds from sales of investment securities, other than short-term investments, for the year ended October 31, 2010, were as follows for each Portfolio:
| | | | |
| Portfolio | | Purchase Cost of Investment Securities | | Proceeds from Sales of Investment Securities |
Global Equity | | $ 105,647,642 | | $ 38,676,226 |
International Equity | | 345,387,419 | | 130,356,903 |
Institutional Emerging Markets | | 189,520,138 | | 82,691,116 |
Frontier Emerging Markets | | 53,807,875 | | 3,958,759 |
The cost of investments for federal income tax purposes and the components of net unrealized appreciation/ (depreciation) on investments at October 31, 2010, for each of the Portfolios were as follows:
| | | | | | | | | | | | | | | | |
Portfolio | | Gross
Unrealized
Appreciation | | | Gross
Unrealized
Depreciation | | | Net Unrealized
Appreciation | | | Cost | |
Global Equity | | $ | 28,730,562 | | | $ | (1,206,374) | | | $ | 27,524,188 | | | $ | 123,039,287 | |
International Equity | | | 140,974,488 | | | | (5,131,322) | | | | 135,843,166 | | | | 503,849,680 | |
Institutional Emerging Markets | | | 80,009,597 | | | | (2,131,309) | | | | 77,878,288 | | | | 297,615,149 | |
Frontier Emerging Markets | | | 8,626,692 | | | | (1,487,471) | | | | 7,139,221 | | | | 66,823,499 | |
The unrealized appreciation (depreciation) on foreign currency for Global Equity, International Equity, Institutional Emerging Markets and Frontier Emerging Markets was $6,120, $11,181, $(210,205), and $(48,406), respectively, for the year ended October 31, 2010.
5. Income Tax
It is the policy of each Portfolio of the Fund to qualify as a regulated investment company by complying with the applicable provisions of the Internal Revenue Code, and to make distributions of taxable income sufficient to relieve it from substantially all federal income and excise taxes therefore, no federal income tax provision is required.
Management has performed an analysis of each Portfolio’s tax positions for the open tax years as of October 31, 2010 and has concluded that no provisions for income tax are required. The Portfolios’ federal tax returns for the prior three fiscal years (open tax years: October 31, 2007; October 31, 2008; October 31, 2009) remain subject to examination by the Portfolios’ major tax jurisdictions, which include the United States and the state of Maryland. Management is not aware of any events that are reasonably possible to occur in the next twelve months that would result in the amounts of any unrecognized tax benefits significantly increasing or decreasing for the Portfolios. However, management’s conclusions regarding tax positions taken may be subject to review and adjustment at a later date based on factors including, but not limited to, new tax laws and accounting regulations and interpretations thereof.
During the year ended October 31, 2010, the tax character of distributions paid from ordinary income was $149,354, $2,530,285, $1,329,181 and $127,946 for Global Equity, International Equity, Institutional Emerging Markets and Frontier Emerging Markets, respectively.
During the year ended October 31, 2009, the tax character of distributions paid from ordinary income was $140,635, $3,260,397, $5,277,778 and $15,259 for Global Equity, International Equity, Institutional Emerging Markets and Frontier Emerging Markets, respectively.
As of October 31, 2010 the components of accumulated earnings/ (deficit) on a tax basis were as follows:
| | | | | | | | | | | | | | | | | | | | |
| Portfolio | | Undistributed Ordinary Income | | | Undistributed Long-Term Capital Gains | | | Accumulated Capital and Other Losses | | | Unrealized Appreciation (Depreciation)* | | | Total Accumulated Earnings/(Deficit) | |
Global Equity | | $ | 288,950 | | | $ | 1,052,136 | | | $ | - | | | $ | 27,530,307 | | | $ | 28,871,393 | |
International Equity | | | 2,497,976 | | | | - | | | | (2,431,039) | | | | 135,872,735 | | | | 135,939,672 | |
Institutional Emerging Markets | | | 1,078,294 | | | | - | | | | (38,371,134) | | | | 77,668,083 | | | | 40,375,243 | |
Frontier Emerging Markets | | | 145,845 | | | | - | | | | (1,252,470) | | | | 7,091,032 | | | | 5,984,407 | |
* The difference between book basis and tax basis net unrealized appreciation is attributable primarily to the tax deferral of losses on certain sales of securities.
51
Harding, Loevner Funds, Inc.
Notes to Financial Statements
October 31, 2010
5. Income Tax (continued)
At October 31, 2010, Institutional Emerging Markets had $13,631,817 available as capital loss carryforwards which expire in 2016. International Equity, Institutional Emerging Markets and Frontier Emerging Markets had $2,431,039, $29,793,794 and $1,252,470, respectively, available as capital loss carryforwards which expire in 2017.
Primarily as a result of differing book/tax treatment of foreign currency transactions and foreign capital gain tax expenses, the Fund made reclassifications among certain capital accounts. The reclassifications have no impact on the net assets of the Portfolios. As of October 31, 2010, the following reclassifications were made to the Statement of Net Assets:
| | | | | | | | | | | | |
| Portfolio | | Paid-in Capital | | | Accumulated Undistributed Net Realized Gain/Loss on Investment & Foreign Currency Related Transactions | | | Accumulated Undistributed Net Investment Income | |
Global Equity | | $ | - | | | | $ 132,241 | | | $ | (132,241 | ) |
International Equity | | | - | | | | 725,149 | | | | (725,149 | ) |
Institutional Emerging Markets | | | - | | | | 490,600 | | | | (490,600 | ) |
Frontier Emerging Markets | | | - | | | | 166,014 | | | | (166,014 | ) |
6. Foreign Exchange Contracts
The Portfolios, on occasion, enter into forward foreign exchange contracts in order to hedge their exposure to changes in foreign currency exchange rates on their foreign portfolio holdings. A forward foreign exchange contract is a commitment to purchase or sell a foreign currency at a future date at a negotiated forward rate. The gain or loss arising from the difference between the cost of the original contracts and the closing of such contracts is included in net realized gains or losses on foreign currency-related transactions. Fluctuations in the value of forward foreign exchange contracts are recorded for book purposes as unrealized appreciation or depreciation on assets and liabilities denominated in foreign currencies by the Portfolios. The Portfolios are also exposed to credit risk associated with counterparty nonperformance on these forward foreign exchange contracts which is typically limited to the unrealized gain on each open contract.
The Portfolios enter into foreign currency transactions on the spot markets in order to pay for foreign investment purchases or to convert to dollars the proceeds from foreign investment sales or coupon interest receipts. The Portfolios held no open forward foreign currency exchange contracts on October 31, 2010.
7. Participation Notes
Each Portfolio may invest in participation notes. Participation notes are promissory notes that are designed to offer a return linked to the performance of a particular underlying equity security or market. Participation notes are issued by banks or broker-dealers and allow a Portfolio to gain exposure to common stocks in markets where direct investment may not be allowed. Participation notes are generally traded over-the-counter and are subject to the risk that the broker-dealer or bank that issues them will not fulfill its contractual obligation to complete the transaction with a Portfolio. Participation notes constitute general unsecured contractual obligations of the banks or broker-dealers that issue them, and a Portfolio would be relying on the creditworthiness of such banks or broker-dealers and would have no rights under a participation note against the issuer of the underlying assets. These securities may be more volatile and less liquid than other investments held by the Portfolios.
8. Capital Share Transactions
Transactions in capital stock for Global Equity—Advisor Class were as follows for the periods indicated:
| | | | | | | | | | | | | | | | |
| | | Year Ended
October 31, 2010 | | | Year Ended
October 31, 2009 | |
| | | | Shares | | | | Amount | | | | Shares | | | | Amount | |
Shares sold | | | 1,334,358 | | | $ | 28,868,395 | | | | 1,872,104 | | | $ | 29,033,478 | |
Shares issued upon reinvestment of dividends | | | 4,460 | | | | 93,525 | | | | 5,005 | | | | 76,577 | |
| | | | | | | | | | | | | | | | |
| | | 1,338,818 | | | | 28,961,920 | | | | 1,877,109 | | | | 29,110,055 | |
Shares redeemed | | | (2,656,193 | ) | | | (55,305,981 | ) | | | (227,787 | ) | | | (3,752,668 | ) |
| | | | | | | | | | | | | | | | |
Net increase | | | (1,317,375 | ) | | $ | (26,344,061 | ) | | | 1,649,322 | | | $ | 25,357,387 | |
| | | | | | | | | | | | | | | | |
52
Harding, Loevner Funds, Inc.
Notes to Financial Statements
October 31, 2010
8. Capital Share Transactions (continued)
Transactions in capital stock for Global Equity—Institutional Class were as follows for the periods indicated:
| | | | | | | | | | | | | | | | |
| | | Period From November 3, 2009
to October 31, 2010 | | | | | | | |
| | | Shares | | | Amount | | | | | | | |
| | | | | | | | | | |
Shares sold | | | 4,706,217 | | | $ | 100,707,733 | | | | | | | | | |
Shares issued upon reinvestment of dividends | | | 2,387 | | | | 50,029 | | | | | | | | | |
| | | | | | | | | | | | | | | | |
| | | 4,708,604 | | | | 100,757,762 | | | | | | | | | |
Shares redeemed | | | (276,004 | ) | | | (5,887,335 | ) | | | | | | | | |
| | | | | | | | | | | | | | | | |
Net increase | | | 4,432,600 | | | $ | 94,870,427 | | | | | | | | | |
| | | | | | | | | | | | | | | | |
Transactions in capital stock for International Equity—Investor Class were as follows for the periods indicated: | |
| | | Year Ended
October 31, 2010 | | | Year Ended
October 31, 2009 | |
| | | Shares | | | Amount | | | Shares | | | Amount | |
| | |
Shares sold | | | 7,028,647 | | | $ | 90,915,148 | | | | 2,406,941 | | | $ | 24,524,810 | |
Shares issued upon reinvestment of dividends | | | 21,972 | | | | 275,089 | | | | 256,261 | | | | 2,337,103 | |
| | | | | | | | | | | | | | | | |
| | | 7,050,619 | | | | 91,190,237 | | | | 2,663,202 | | | | 26,861,913 | |
Shares redeemed | | | (2,173,688 | ) | | | (28,647,976 | ) | | | (551,993 | ) | | | (5,664,340 | ) |
| | | | | | | | | | | | | | | | |
Net increase | | | 4,876,931 | | | $ | 62,542,261 | | | | 2,111,209 | | | $ | 21,197,573 | |
| | | | | | | | | | | | | | | | |
Transactions in capital stock for International Equity—Institutional Class were as follows for the periods indicated: | |
| | | Year Ended
October 31, 2010 | | | Year Ended
October 31, 2009 | |
| | | Shares | | | Amount | | | Shares | | | Amount | |
| | |
Shares sold | | | 19,022,485 | | | $ | 248,771,466 | | | | 3,607,416 | | | $ | 37,754,041 | |
Shares issued upon reinvestment of dividends | | | 172,753 | | | | 2,164,593 | | | | 4,274,140 | | | | 38,985,473 | |
| | | | | | | | | | | | | | | | |
| | | 19,195,238 | | | | 250,936,059 | | | | 7,881,556 | | | | 76,739,514 | |
Shares redeemed | | | (6,733,420 | ) | | | (87,480,052 | ) | | | (3,062,169 | ) | | | (29,797,831 | ) |
| | | | | | | | | | | | | | | | |
Net increase | | | 12,461,818 | | | $ | 163,456,007 | | | | 4,819,387 | | | $ | 46,941,683 | |
| | | | | | | | | | | | | | | | |
Transactions in capital stock for Institutional Emerging Markets were as follows for the periods indicated: | |
| | | Year Ended
October 31, 2010 | | | Year Ended
October 31, 2009 | |
| | | Shares | | | Amount | | | Shares | | | Amount | |
| | |
Shares sold | | | 9,882,476 | | | $ | 149,070,226 | | | | 4,770,185 | | | $ | 45,649,131 | |
Shares issued upon reinvestment of dividends | | | 73,829 | | | | 1,026,968 | | | | 471,426 | | | | 4,205,119 | |
| | | | | | | | | | | | | | | | |
| | | 9,956,305 | | | | 150,097,194 | | | | 5,241,611 | | | | 49,854,250 | |
Shares redeemed | | | (2,801,715 | ) | | | (39,900,035 | ) | | | (4,136,224 | ) | | | (42,223,167 | ) |
| | | | | | | | | | | | | | | | |
Net increase | | | 7,154,590 | | | $ | 110,197,159 | | | | 1,105,387 | | | $ | 7,631,083 | |
| | | | | | | | | | | | | | | | |
Transactions in capital stock for Frontier Emerging Markets—Institutional Class were as follows for the periods indicated: | |
| | | Year Ended
October 31, 2010 | | | Year Ended
October 31, 2009 | |
| | | Shares | | | Amount | | | Shares | | | Amount | |
| | |
Shares sold | | | 7,681,583 | | | $ | 55,027,776 | | | | 553,912 | | | $ | 2,540,000 | |
Shares issued upon reinvestment of dividends | | | 6,777 | | | | 42,693 | | | | 1,017 | | | | 4,708 | |
| | | | | | | | | | | | | | | | |
| | | 7,688,360 | | | | 55,070,469 | | | | 554,929 | | | | 2,544,708 | |
Shares redeemed | | | (169,494 | ) | | | (1,201,661 | ) | | | (90,850 | ) | | | (454,197 | ) |
| | | | | | | | | | | | | | | | |
Net increase | | | 7,518,866 | | | $ | 53,868,808 | | | | 464,079 | | | $ | 2,090,511 | |
| | | | | | | | | | | | | | | | |
53
Harding, Loevner Funds, Inc.
Notes to Financial Statements
October 31, 2010
8. Capital Share Transactions (continued)
Redemptions made within 90 days of purchase may be subject to a redemption fee equal to 2% of the amount redeemed. For the year ended October 31, 2010, Advisor Class of Global Equity, Institutional Class of Global Equity, Investor Class of International Equity, Institutional Class of International Equity, Institutional Emerging Markets and Institutional Class of Frontier Emerging Markets received $2,461, $219,316, $33,275, $41,527, $7,808, and $2,717, respectively, in redemption fees related to transactions in shares of common stock as disclosed in the Portfolios’ Statements of Changes in Net Assets.
9. Concentration of Ownership
At October 31, 2010, the percentage of total shares outstanding held by record shareholders each owning 10% or greater of the aggregate total shares outstanding for each Portfolio or for the share classes listed of each Portfolio was as follows:
| | | | | | | | | | |
| | | | | No. of Shareholders | | | | % Ownership | | |
Global Equity | | | | 4 | | | | 78.29% * | | |
International Equity | | | | 3 | | | | 59.72% * | | |
Institutional Emerging Markets | | | | 1 | | | | 30.66% * | | |
Frontier Emerging Markets | | | | 1 | | | | 30.98% * | | |
*Represents omnibus position of broker-dealer representing numerous shareholder accounts.
Investment activities of these shareholders may have a material effect on the Portfolios.
10. Concentration of Risk
Investing in securities of foreign issuers and currency transactions may involve certain considerations and risks not typically associated with investments in U.S. issuers. These risks include revaluation of currencies, adverse fluctuations in foreign currency values and possible adverse political, social and economic developments, including those particular to a specific industry, country or region, which could cause the securities and their markets to be less liquid and prices more volatile than those of comparable U.S. companies and U.S. government securities. These risks are greater with respect to securities of issuers located in emerging market countries in which the Portfolios are authorized to invest.
Effective April 29, 2009, shareholders of Frontier Emerging Markets approved a change in the Portfolio’s fundamental investment policy regarding concentration which may, under certain conditions, permit the Portfolio to invest up to 35% of its net assets in companies in the same industry. During periods when the Portfolio makes use of its ability to so invest, it will operate as a concentrated portfolio and be subject to additional risks and greater volatility. At October 31, 2010, the Portfolio’s investment in the Banking industry amounted to 32.4% of net assets.
11. Line of Credit
The Fund entered into a $50 million line of credit agreement effective June 14, 2010 with Northern Trust. Borrowings would be made solely to facilitate the handling of redemptions or unusual or unanticipated short-term cash requirements. Because several Portfolios participated there was no assurance that an individual Portfolio would have access to the entire $50 million at any particular time. Interest is charged to each Portfolio based on its borrowings at an amount above the Federal Funds rate. In addition, a facility fee is computed at an annual rate of 0.10% on the line of credit and was allocated among the Portfolios. From June 14, 2010 through October 31, 2010 none of the Portfolios’ utilized the line of credit.
Prior to June 14, 2010 the Fund participated in a $50 million line of credit agreement with State Street Bank and Trust. Borrowings would be made solely to facilitate the handling of redemptions or unusual or unanticipated short-term cash requirements. Because several Portfolios participated there was no assurance that an individual Portfolio would have access to the entire $50 million at any particular time. Borrowings for International Equity were limited to the lesser of the remaining available credit or 25% of net assets. Borrowings for Institutional Emerging Markets and Frontier Emerging Markets were limited to the lesser of the remaining available credit or 15% of net assets. Interest was charged to each Portfolio based on its borrowings at an amount above the Federal Funds rate. In addition, a commitment fee computed at an annual rate of 0.10% on the line of credit that was allocated among the Portfolios. During the year ended October 31, 2010, International Equity Portfolio had borrowings on one day with a maximum balance of $2,365,583 at an average weighted interest rate of 1.48% and Institutional Emerging Markets had borrowings on six days with a maximum balance of $7,139,883, at an average weighted interest rate of 1.43%.
54
Harding, Loevner Funds, Inc.
Notes to Financial Statements
October 31, 2010
12. Recently Issued Accounting Pronouncements
On January 21, 2010, the Financial Accounting Standards Board (“FASB”) issued Accounting Standards Update No. 2010-06, Improving Disclosures about Fair Value Measurements (“ASU 2010-06”). ASU 2010-06 amends Accounting Standards Codification 820 (“ASC 820”), Fair Value Measurements and Disclosures (formerly FASB Statement No. 157). Specifically, ASU 2010-06 requires entities to disclose a) the amounts of significant transfers between Level 1 and Level 2 of the fair value hierarchy and the reasons for these transfers, b) the reasons for any transfers in or out of Level 3 and c) information in the reconciliation of recurring Level 3 measurements about purchases, sales, issuances and settlements on a gross basis. In addition, ASU 2010-06 clarifies the requirement for entities to disclose information about both the valuation techniques and inputs used in estimating Level 2 and Level 3 fair value measurements. Except for the requirement to disclose information about purchases, sales, issuances and settlements in the reconciliation of recurring Level 3 measurements on a gross basis, all ASU 2010-06 disclosure requirements are effective for financial statements issued for interim and annual reporting periods beginning after December 15, 2009. The requirement to separately disclose purchases, sales, issuances and settlements of recurring Level 3 measurements is effective for financial statements issued for interim and annual reporting periods beginning after December 15, 2010. At this time, management is evaluating the implications of ASU 2010-06 and the impact it will have to the Portfolios’ financial statement disclosures.
13. Subsequent Events
Subsequent events occurring after the date of this report have been evaluated for potential impact, for purposes of recognition or disclosure in the financial statements, through the date the report was issued.
55
Harding, Loevner Funds, Inc.
Report of Independent Registered Public Accounting Firm
The Board of Directors and Shareholders
Harding, Loevner Funds, Inc.
We have audited the accompanying statements of net assets of the Harding, Loevner Funds, Inc. (comprising, the Global Equity Portfolio, International Equity Portfolio, Institutional Emerging Markets Portfolio, and Frontier Emerging Markets Portfolio), (collectively the “Portfolios”) as of October 31, 2010, and the related statements of operations for the year then ended, statements of changes in net assets for each of the years in the two-year period then ended, and the financial highlights for each of the years or periods in the five-year period then ended. These financial statements and financial highlights are the responsibility of the Portfolios’ management. Our responsibility is to express an opinion on these financial statements and financial highlights based on our audits.
We conducted our audits in accordance with the standards of the Public Company Accounting Oversight Board (United States). Those standards require that we plan and perform the audits to obtain reasonable assurance about whether the financial statements and financial highlights are free of material misstatement. An audit includes examining, on a test basis, evidence supporting the amounts and disclosures in the financial statements. Our procedures included confirmation of securities owned as of October 31, 2010, by correspondence with the custodian and brokers or other appropriate auditing procedures. An audit also includes assessing the accounting principles used and significant estimates made by management, as well as evaluating the overall financial statement presentation. We believe that our audits provide a reasonable basis for our opinion.
In our opinion, the financial statements and financial highlights referred to above present fairly, in all material respects, the financial position of each of the aforementioned Portfolios of the Harding, Loevner Funds, Inc. as of October 31, 2010, the results of their operations for the year then ended, the changes in their net assets for each of the years in the two-year period then ended, and the financial highlights for each of the years or periods in the five-year period then ended, in conformity with U.S. generally accepted accounting principles.
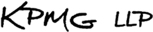
Philadelphia, Pennsylvania
December 17, 2010
56
Harding, Loevner Funds, Inc.
Supplemental Tax Information
(unaudited)
During the year ended October 31, 2010, none of the Portfolios designated a percentage of distributions from net investment income as qualifying for the dividend received deduction for corporations.
International Equity, Institutional Emerging Markets, and Frontier Emerging Markets paid qualifying foreign taxes of $571,310, $484,184, and $24,352, and earned $4,005,407, $2,261,549, and $189,255 from foreign source income during the year ended October 31, 2010, respectively. Pursuant to Section 853 of the Internal Revenue Code, International Equity, Institutional Emerging Markets, and Frontier Emerging Markets designated $0.0952, $0.1006, and $0.0211 per share as income earned from foreign sources for the year ended October 31, 2010, respectively.
Global Equity, International Equity, Institutional Emerging Markets, and Frontier Emerging Markets had qualifying dividend income of $1,409,148, $6,289,182 $3,151,588 and $191,075 respectively during the year ended October 31, 2010.
Pursuant to Section 852 of the Internal Revenue Code, Global Equity designated $1,052,136 as long term capital gain dividends for the year ended October 31, 2010.
57
Harding, Loevner Funds, Inc.
Directors and Principal Officers of the Fund
Disinterested Directors:
| | | | | | | | | | |
Name, Address and Age | | Position with the Fund | | Term of Office and Length of Time Served | | Principal Occupation During Past Five Years | | Number of Portfolios in Fund Complex Overseen By Director | | Other Directorships |
William E. Chapman, II c/o Harding Loevner LP 50 Division Street Fourth Floor Somerville, NJ 08876 Age, 69 | | Director | | Indefinite; Director since 2008; Chairperson of the Audit Committee since 2009 | | President and Owner, Longboat Retirement Planning Solutions (1998- present); Trustee of Bowdoin College (2002- present); Hewitt Associates, LLC (part time) (provider of retirement and investment education seminars) (2000 -2009) | | 6 | | Trustee of Third Avenue Trust (5 portfolios); Trustee of Third Avenue Variable Trust (1 portfolio); Trustee of Aston Funds (26 Portfolios); Trustee of The Managers Funds, Managers AMG Funds, Managers Trust I and Managers Trust II (33 portfolios) |
R. Kelly Doherty c/o Harding Loevner LP 50 Division Street Fourth Floor Somerville, NJ 08876 Age, 52 | | Director | | Indefinite; Director since 2004 | | Cayman Partners (private investment vehicles), Managing Partner, 1999 –present. | | 6 | | Morristown Memorial Hospital; The Peck School |
58
Harding, Loevner Funds, Inc.
Directors and Principal Officers of the Fund
| | | | | | | | | | |
| Name, Address and Age | | Position with the Fund | | Term of Office and Length of Time Served | | Principal Occupation During Past Five Years | | Number of
Portfolios in
Fund
Complex
Overseen By Director | | Other Directorships |
Charles Freeman c/o Harding Loevner LP 50 Division Street Fourth Floor Somerville, NJ 08876 Age, 46 | | Director | | Indefinite; Director since 2008 | | Center for Strategic and International Studies, Freeman Chair in China Studies, 2007 – present; China Alliance (legal and government relations group), Managing Director, 2005 – 2007; Assistant U.S. Trade Representative, prior to 2005. | | 6 | | National Committee for U.S. – China Relations |
Jane A. Freeman c/o Harding Loevner LP 50 Division Street Fourth Floor Somerville, NJ 08876 Age, 57 | | Director | | Indefinite; Director since 1996; Chairperson of the Audit Committee 2005-2008 and Lead Independent Director since 2008 | | Scientific Learning Corporation (Education Software), Executive Vice President and Chief Financial Officer, 1/00 – 2008; Treasurer and Vice President, Finance & Business Development, 1999 – 2000. | | 6 | | Taproot Foundation (Non- Profit), Director, 2010- present |
Samuel R. Karetsky c/o Harding Loevner LP 50 Division Street Fourth Floor Somerville, NJ 08876 Age, 65 | | Director | | Indefinite; Director since 1998; member of the audit committee since 1998 | | The Karetsky Group LLC (Advisory Firm), Managing Member, 2003 -present; Wetherby Asset Management, Wealth Manager, 2004 – present; European Investors Inc., Managing Director, 1998 - 2002. | | 6 | | None |
59
Harding, Loevner Funds, Inc.
Directors and Principal Officers of the Fund
| | | | | | | | | | |
| Name, Address and Age | | Position with the Fund | | Term of Office and Length of Time Served | | Principal Occupation During Past Five Years | | Number of
Portfolios in
Fund
Complex
Overseen By Director | | Other Directorships |
Eric Rakowski c/o Harding Loevner LP 50 Division Street Fourth Floor Somerville, NJ 08876 Age, 52 | | Director | | Indefinite; Director since 2008 | | University of California at Berkeley School of Law, Professor, 1990 – present. | | 6 | | Trustee of Third Avenue Trust (5 portfolios); Trustee of Third Avenue Variable Trust (1 portfolio); Trustee of The Managers Funds, Managers AMG Funds, Managers Trust I and Managers Trust II (33 portfolios) |
Interested Director: | | | | | | | | | | |
David R. Loevner Harding Loevner LP 50 Division Street, Fourth Floor Somerville, NJ 08876 Age, 56 | | Director, President and Chairman of the Board of Directors | | Indefinite; Director, President and Chairman of the Board since 1996 | | Harding Loevner LP, President and Chief Executive Officer 1989 – present; Parks Tennant Corporation (real estate), President, 2001 - present. | | 6 | | Director, Harding, Loevner Funds, plc (4 portfolios) |
Jennifer M. Borggaard Affiliated Managers Group, Inc. 600 Hale Street Prides Crossing, MA 01965 Age, 41 | | Director | | Indefinite; Director since 2008 | | Affiliated Managers Group, Inc. (“AMG”) (asset management firm), Senior Vice President, 2007 – present, Vice President, 2004 – 2007, Director and Senior Counsel, 2001 –2004. | | 6 | | Beautel, Goodman & Company LTD; Genesis Asset Managers, LLP- Member of the Governing Board; Montrusco Bolton Investments Inc.; Arrow Bidco Ltd. |
60
Harding, Loevner Funds, Inc.
Directors and Principal Officers of the Fund
Principal Officers of the Fund
| | | | | | |
| Name, Address and Age | | Position with the Fund | | Term of Office and Length of Time Servedw | | Principal Occupation During Past Five Years |
Richard Reiter Harding Loevner LP 50 Division Street, Fourth Floor Somerville, NJ 08876 Age, 44 | | Vice President | | 1 year; Vice President since 2007 | | Harding Loevner LP, Chief Operating Officer, 1996 – present. |
Susan Mosher Foreside Compliance Services, LLC Three Canal Plaza, Suite 100 Portland, ME 04101 Age, 55 | | Chief Compliance Officer of the Funds | | 1 year; Chief Compliance Officer since 2010 | | Foreside Alternative Investment Services, LLC, President, 2009 - present; Coast Asset Management, LLC, Chief Compliance Officer, 2007 - 2009; Investors Bank & Trust Company, Senior Director and Chief Counsel/Director, 1995 - 2007. |
Charles S. Todd Foreside Management Services, LLC Three Canal Plaza, Suite 100 Portland, ME 04101 Age, 39 | | Chief Financial Officer and Treasurer | | 1 year; Chief Financial Officer and Treasurer since 2010 | | Foreside Management Services, LLC, Director/Treasurer and Principal Financial Officer, 2008 – Present; JPMorgan Investor Services Co., Vice President within the Fund Administration Department, formerly serving as Assistant Vice President, 2000 –2008. |
Patrick Keniston Foreside Compliance Services, LLC Three Canal Plaza, Suite 100 Portland, ME 04101 Age, 46 | | Anti-Money Laundering Compliance Officer | | 1 year; Anti-Money Laundering Compliance Officer since 2010 | | Foreside Compliance Services, LLC, Director, 2008 - present; Citi Fund Services Ohio, Inc., Vice President, 2005 - 2008; Citigroup Global Transaction Services, Attorney, 2001 - 2005. |
Thomas A. Dula The Northern Trust Company 50 South LaSalle Street Chicago, IL 60603 Age, 36 | | Assistant Treasurer | | 1 year; Assistant Treasurer since 2010 | | The Northern Trust Company, Vice President and Client Service Delivery Manager, 2010 - present, Relationship Manager, 2009 - 2010, and Institutional Trust Account Administrator, 2004 - 2009. |
w Officers are elected to hold such office until their successor is elected and qualified to carry out the duties and responsibilities of their office, or until he or she resigns or is removed from office.
The Fund’s Statement of Additional Information contains available, without charge, upon request, by calling 1-877-435-8105.
61
Harding, Loevner Funds, Inc.
Directors and Principal Officers of the Fund
| | | | | | |
Name, Address and Age | | Position with
the Fund | | Term of Office
and Length of
Time Servedw | | Principal Occupation During Past Five Years |
Owen T. Meacham The Northern Trust Company 50 South LaSalle Street Chicago, IL 60603 Age, 39 | | Secretary | | 1 year; Secretary since 2010 | | The Northern Trust Company, Vice President and Senior Regulatory Administration Attorney, 2007 - present; ABN AMRO Asset Management, Product Strategy and Development Manager, 2005 - 2007. |
Puran Dulani Harding Loevner LP 50 Division Street, Fourth Floor Somerville, NJ 08876 Age, 52 | | Assistant Treasurer | | 1 year; Assistant Treasurer since 2010; Treasurer and Chief Financial Officer from 2007 to 2010 | | Harding Loevner LP, Chief of Operations and Accounting, 2002 – present. |
Lori M. Renzulli Harding Loevner LP 50 Division Street Fourth Floor Somerville, NJ 08876 Age, 44 | | Assistant Secretary | | 1 year, Assistant Secretary since 2008 | | Harding Loevner LP, Chief Counsel and Chief Compliance Officer, 2006 - present; MetLife, Director, Corporate Ethics and Compliance, 2006; CitiStreet Retirement Services, Vice President and Counsel, 1989 - 2005. |
Shanna Palmersheim The Northern Trust Company 50 South LaSalle Street Chicago, IL 60603 Age, 33 | | Assistant Secretary | | 1 year; Assistant Secretary since 2010 | | The Northern Trust Company, Second Vice President and Regulatory Administration Attorney, 2008 – Present; Peregrine Financial Group, Associate Counsel, 2007 – 2008; Harley-Davidson Financial Services, Senior Treasury Analyst, 2005 – 2007; Paul McAndrew Law Firm, Law Clerk, 2004 – 2005; State Street Corporation, Senior Accountant, 1999 – 2002. |
62
Harding, Loevner Funds, Inc.
Supplemental Information
(unaudited)
Quarterly Form N-Q Portfolio Schedule
Each Portfolio will file its complete schedule of investments with the SEC on Form N-Q at the end of the first and third fiscal quarters within 60 days of the end of the quarter to which it relates. The Portfolios’ Form N-Q will be available on the SEC’s website at www.sec.gov and may also be reviewed and copied at the SEC’s Public Reference Room whose telephone number is 1-800-SEC-0330. Additionally, they are available upon request by calling 1-877-435-8105.
Proxy Voting Record
The Fund’s proxy voting record relating to the Portfolios’ securities during the most recent 12-month period ended June 30 is available on the Fund’s website at www.hardingloevnerfunds.com and on the SEC’s website at www.sec.gov, on Form N-PX.
Proxy Voting Policies and Procedures
A description of the Fund proxy voting policies and procedures are located in the Statement of Additional Information and is available without charge, upon request, by calling 1-877-435-8105 or on the SEC’s website at www.sec.gov.
Additional Information
The Adviser updates Fact Sheets for the Portfolios each calendar quarter, which are posted to the Fund’s website - www.hardingloevnerfunds.com. This information, along with the Adviser’s commentaries on its various strategies, is available without charge, upon request, by calling 1-877-435-8105.
63
Harding, Loevner Funds, Inc.
Officers & Directors and Other Pertinent Information
OFFICERSAND DIRECTORS
David R. Loevner
Director, President and Chairman of the Board of the Funds
Jane A. Freeman
Director of the Funds
Jennifer M. Borggaard
Director of the Funds
William E. Chapman II
Director of the Funds
R. Kelly Doherty
Director of the Funds
Charles Freeman
Director of the Funds
Samuel R. Karetsky
Director of the Funds
Eric Rakowski
Director of the Funds
Charles S. Todd
Chief Financial Officer and Treasurer of the Funds
Susan Mosher
Chief Compliance Officer of the Funds
Richard Reiter
Vice President of the Funds
Owen T. Meacham
Secretary of the Funds
Patrick Kenniston
Anti-Money Laundering Compliance Officer of the Funds
Thomas A. Dula
Assistant Treasurer of the Funds
Puran Dulani
Assistant Treasurer of the Funds
Shanna Palmersheim
Assistant Secretary of the Funds
Lori Renzulli
Assistant Secretary of the Funds
64


Harding, Loevner Funds, Inc.
Table of Contents
For use only when preceded or accompanied by a prospectus. Read the prospectus carefully before you invest or send money.
Harding, Loevner Funds, Inc.
Expense Example
October 31, 2010 (unaudited)
As a shareholder of a Harding Loevner Portfolio, you incur two types of costs: (1) transaction costs, including brokerage commissions on purchases and sales of fund shares; and (2) ongoing costs, including management fees and other fund expenses. The following example is intended to help you understand your ongoing costs (in dollars and cents) of investing in a Portfolio and to compare these costs with the ongoing costs of investing in other mutual funds.
The example is based on an investment of $1,000 invested on May 1, 2010 and held for the entire six month period from May 1, 2010 to October 31, 2010 for the Global Equity Portfolio—Advisor Class, International Equity Portfolio—Investor Class, International Small Companies Portfolio—Investor Class and Emerging Markets Portfolio.
Actual Expenses
The first line under each Portfolio in the table below provides information about actual account values and actual expenses. You may use the information in this line, together with the amount you invested, to estimate the expenses that you paid over the period. Simply divide your account value by $1,000 (for example, an $8,600 account value divided by $1,000 = 8.6), then multiply the result by the number in the first line for your Portfolio under the heading entitled “Expenses Paid During Period” to estimate the expenses you paid on your account during this period.
Hypothetical Example for Comparison Purposes
The second line under each Portfolio in the table below provides information about hypothetical account values and hypothetical expenses based on each Portfolio’s actual expense ratio and an assumed rate of return of 5% per year before expenses, which is not the Portfolio’s actual return. The hypothetical account values and expenses may not be used to estimate the actual ending account balance or expenses you paid for the period. You may use this information to compare the ongoing costs of investing in your Portfolio and other funds. To do so, compare this 5% hypothetical example with the 5% hypothetical examples that appear in the shareholder reports of the other funds. Please note that the expenses shown in the table are meant to highlight your ongoing costs only and do not reflect any transactional costs, such as brokerage commissions paid on purchases and sales of fund shares. Therefore, the second line under each Portfolio in the table is useful in comparing ongoing costs only, and will not help you determine the relative total costs of owning different funds. In addition, if these transactional costs were included, your costs would have been higher.
| | | | | | | | | | | | | | | | |
| | |
| | | Beginning
Account Value
May 1, 2010 | | | Ending Account
Value
October 31, 2010 | | | Annualized
Expense Ratio | | | Expenses Paid
During Period*
(May 1, 2010 to
October 31, 2010) | |
Global Equity Portfolio—Advisor Class | | | | | | | | | | | | | | | | |
Actual | | $ | 1,000.00 | | | $ | 1,053.86 | | | | 1.19 | % | | $ | 6.16 | |
Hypothetical (5% annual return before expenses) | | | 1,000.00 | | | | 1,019.21 | | | | 1.19 | % | | | 6.06 | |
| International Equity Portfolio—Investor Class | | | | | | | | | | | | | | | | |
Actual | | | 1,000.00 | | | | 1,095.38 | | | | 1.25 | % | | | 6.60 | |
Hypothetical (5% annual return before expenses) | | | 1,000.00 | | | | 1,018.90 | | | | 1.25 | % | | | 6.36 | |
| International Small Companies Portfolio—Investor Class | | | | | | | | | | | | | | | | |
Actual | | | 1,000.00 | | | | 1,110.77 | | | | 1.75 | % | | | 9.31 | |
Hypothetical (5% annual return before expenses) | | | 1,000.00 | | | | 1,016.38 | | | | 1.75 | % | | | 8.89 | |
Emerging Markets Portfolio | | | | | | | | | | | | | | | | |
Actual | | | 1,000.00 | | | | 1,113.11 | | | | 1.58 | % | | | 8.42 | |
Hypothetical (5% annual return before expenses) | | | 1,000.00 | | | | 1,017.24 | | | | 1.58 | % | | | 8.03 | |
| | | | | | | | | | | | | | | | | |
* Expenses are calculated using each Portfolio’s annualized expense ratio (as disclosed in the table), multiplied by the average account value for the period, multiplied by number of days in the period (184 days), and divided by the number of days in the year (365 days).
Harding, Loevner Funds, Inc.
Global Equity Portfolio (Advisor Class) — Overview
(unaudited)
October 31, 2010
Hypothetical Comparison Of Changes In Value Of $10,000 Investment In Harding, Loevner Funds, Inc. -
Global Equity Portfolio And The Lipper Global Equity Fund Index
(Net Dividends Reinvested)
And The MSCI All Country World Index (Net Dividend)
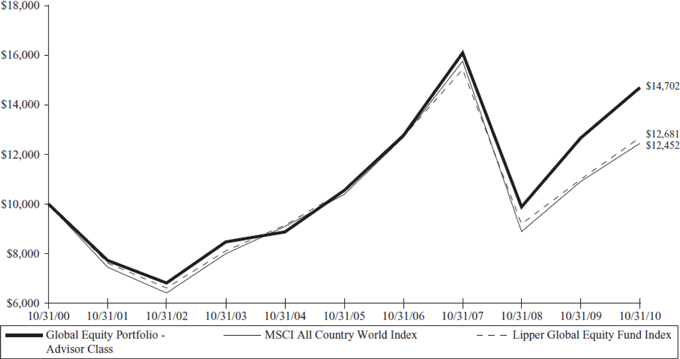
| | | | | | | | | | | | | | | | | | | | | | | | |
| | | | | | | |
| | | | | | | | | | | | | | | | | | | | | | | | | |
| | | Returns for the Year Ended October 31, 2010 | |
| | | Cumulative Total Returns | | | | | | Average Annualized
Total Return | |
| FUND NAME | | Last 12 Months | | | 5 YR | | | 10 YR | | | | | | 5 YR | | | 10 YR | |
| Global Equity Portfolio—Advisor Class (Inception date 12/1/96) | | | 16.07% | | | | 39.38% | | | | 47.02% | | | | | | | | 6.87% | | | | 3.93% | |
MSCI All Country World Index (Net Dividends) | | | 14.10% | | | | 19.80% | | | | 24.52% | | | | | | | | 3.68% | | | | 2.22% | |
Lipper Global Equity Fund Index | | | 15.28% | | | | 20.31% | | | | 26.82% | | | | | | | | 3.77% | | | | 2.40% | |
| | | | | | | | | | | | | | | | | | | |
Performance data quoted represents past performance and does not guarantee future results. The investment return and principal value of an investment will fluctuate so that an investor’s shares, when redeemed, may be worth more or less than their original cost. Performance current to the most recent month end may be lower or higher than the performance quoted and may be obtained by visiting the website at www.hardingloevnerfunds.com.
Investment return reflects voluntary fee waivers in effect. Absence such waivers, total return would be reduced. The performance provided does not reflect the deduction of taxes that a shareholder would pay on Portfolio distributions.
3
Harding, Loevner Funds, Inc.
Global Equity Portfolio (Advisor Class) - Overview
(unaudited)
October 31, 2010
The Global Equity Portfolio gained 16.07% for the fiscal year ending October 31, 2010. In comparison, its benchmark, the MSCI All Country World Index, rose 14.10%.
Consistent with its investment objectives and policies, the Portfolio was invested in the securities of global companies that exhibit the fundamental characteristics of sustainable growth, financial strength, management quality, and durable competitive advantage. The Portfolio’s relative outperformance derived from both stock selection and the resulting sector allocations. Our continued bias against—and resulting small weighting in—the Financials sector was the biggest contributor from sector allocation, and our preference for Emerging Markets-oriented banks, which translated as good stock selection, augmented that contribution. We also saw excellent performance within the Health Care sector, including from diabetes specialists Novo Nordisk and Fresenius, and from Genzyme and Talecris Biotherapeutics, both of which are the subject of ongoing acquisition bids from other Health Care companies. In addition, our Consumer Discretionary and Information Technology holdings made positive contributions. The main detractor was the Portfolio’s dreadful relative performance within Consumer Staples and Materials. The former was due to poor returns from two agriculture-related stocks, Bunge and Olam (sold early in the year), as well as Walgreen. Disappointing performance from Monsanto hurt returns in Materials.
Geographically, the Portfolio enjoyed strong relative returns in Europe, both in the eurozone and in the non-European Monetary Union countries. Good stock selection in these regions was due in large part to our preference for multinational consumer-oriented companies—such as Swatch Group, LVMH Moët Hennessy, and L’Oréal—and to a small weighting in domestically-oriented Financials. We also enjoyed strong stock selection in Japan, led by robot manufacturer Fanuc. Our stocks in the US lagged, however, especially Adobe Systems and the aforementioned Monsanto and Walgreen. The US holdings outperformed the benchmark Index overall, however, so the Portfolio’s large overweight in the US was beneficial.
Past performance does not guarantee future results.
The Portfolio invests in foreign securities, which will involve greater volatility and political, economic, and currency risks and differences in accounting methods. It also invests in emerging markets, which involve unique risks, such as exposure to economies less diverse and mature than the U.S. or other more established foreign markets. Economic and political instability may cause larger price changes in emerging markets securities than other foreign securities. Investments in debt securities typically decrease in value when interest rates rise. This risk is usually greater for longer-term debt securities. Investment by the Portfolio in lower rated and non-rated securities presents a greater risk of loss to principal and interest than higher-rated securities.
Please see the Statement of Net Assets on page 5 for fund holdings as of October 31, 2010. Fund holdings and sector allocations are subject to change and are not recommendations to buy or sell any security.
The MSCI All Country World Index is a free float-adjusted market capitalization index that is designed to measure equity market performance in the global developed and emerging markets. The Index consists of 45 developed and emerging market countries. The Index is net of foreign withholding taxes on dividends. You cannot invest directly in this Index.
4
Harding, Loevner Funds, Inc.
Global Equity Portfolio
Statement of Net Assets
October 31, 2010
| | |
| Industry | | Percentage of
Net Assets |
| | | | |
Agriculture | | | 1.1 | % |
Apparel | | | 3.0 | |
Banks | | | 9.2 | |
Beverages | | | 0.9 | |
Biotechnology | | | 2.4 | |
Chemicals | | | 8.6 | |
Commercial Services | | | 2.1 | |
Computers | | | 6.1 | |
Cosmetics/Personal Care | | | 8.5 | |
Distribution/Wholesale | | | 3.0 | |
Diversified Financial Services | | | 2.0 | |
Electrical Components & Equipment | | | 2.7 | |
Electronics | | | 1.8 | |
Food | | | 2.2 | |
Healthcare - Products | | | 2.6 | |
Holding Companies - Diversified | | | 0.9 | |
Internet | | | 8.2 | |
Machinery - Diversified | | | 2.4 | |
Media | | | 1.1 | |
Miscellaneous Manufacturing | | | 1.8 | |
Mutual Funds | | | 1.4 | |
Office/Business Equipment | | | 1.0 | |
Oil & Gas | | | 4.1 | |
Oil & Gas Services | | | 1.9 | |
Pharmaceuticals | | | 4.1 | |
Retail | | | 8.9 | |
Software | | | 6.5 | |
Telecommunications | | | 1.4 | |
| | | | |
Total Investments | | | 99.9 | |
Other Assets Less Liabilities | | | 0.1 | |
| | | | |
Net Assets | | | 100.0 | % |
| | | | |
See Notes to Financial Statements
5
Harding, Loevner Funds, Inc.
Global Equity Portfolio
Statement of Net Assets
October 31, 2010 (continued)
| | | | | | | | |
| | | Shares | | | Value (1) | |
Common Stocks - 98.4% | | | | | | | | |
| | |
Australia - 0.9% | | | | | | | | |
Cochlear Ltd. (Healthcare - Products) | | | 19,930 | | | $ | 1,386,950 | |
| | | | | | | | |
| | |
Austria - 0.8% | | | | | | | | |
Erste Group Bank AG (Banks) | | | 27,900 | | | | 1,258,192 | |
| | | | | | | | |
| | |
Bermuda - 1.1% | | | | | | | | |
Bunge Ltd. (Agriculture) | | | 27,870 | | | | 1,674,151 | |
| | | | | | | | |
| | |
Canada - 0.9% | | | | | | | | |
Encana Corp. (Oil & Gas) | | | 47,090 | | | | 1,328,880 | |
| | | | | | | | |
| | |
China - 0.9% | | | | | | | | |
China Merchants Holdings International Co., Ltd. (Holding Companies - Diversified) | | | 398,000 | | | | 1,393,225 | |
| | | | | | | | |
| | |
Denmark - 1.4% | | | | | | | | |
Novo Nordisk AS, Class B (Pharmaceuticals) | | | 19,500 | | | | 2,048,261 | |
| | | | | | | | |
| | |
France - 7.5% | | | | | | | | |
Air Liquide SA (Chemicals) | | | 18,737 | | | | 2,428,390 | |
Dassault Systemes SA (Software) | | | 32,450 | | | | 2,487,213 | |
L’Oreal SA (Cosmetics/Personal Care) | | | 29,910 | | | | 3,514,166 | |
Schlumberger Ltd. (Oil & Gas Services) | | | 40,590 | | | | 2,836,835 | |
| | | | | | | | |
| | | | | | | 11,266,604 | |
| | | | | | | | |
| | |
Germany - 1.5% | | | | | | | | |
Hamburger Hafen und Logistik AG (Commercial Services) | | | 39,100 | | | | 1,713,139 | |
Qiagen NV (Healthcare - Products)* | | | 27,278 | | | | 517,652 | |
| | | | | | | | |
| | | | | | | 2,230,791 | |
| | | | | | | | |
| | |
Hong Kong - 3.0% | | | | | | | | |
Li & Fung Ltd. (Distribution/Wholesale) | | | 855,800 | | | | 4,538,696 | |
| | | | | | | | |
| | |
India - 1.8% | | | | | | | | |
ICICI Bank Ltd. - Sponsored ADR (Banks) | | | 51,300 | | | | 2,697,354 | |
| | | | | | | | |
| | |
Indonesia - 1.4% | | | | | | | | |
Bank Central Asia Tbk PT (Banks) | | | 2,654,000 | | | | 2,080,752 | |
| | | | | | | | |
| | |
Israel - 0.7% | | | | | | | | |
Teva Pharmaceutical Industries Ltd. - Sponsored ADR (Pharmaceuticals) | | | 21,600 | | | | 1,121,040 | |
| | | | | | | | |
| | |
Japan - 9.2% | | | | | | | | |
ABC-Mart, Inc. (Retail) | | | 37,000 | | | | 1,258,398 | |
Canon Inc. - Sponsored ADR (Office/Business Equipment) | | | 31,200 | | | | 1,435,200 | |
Fanuc Ltd. (Machinery - Diversified) | | | 24,900 | | | | 3,623,180 | |
See Notes to Financial Statements
6
Harding, Loevner Funds, Inc.
Global Equity Portfolio
Statement of Net Assets
October 31, 2010 (continued)
| | | | | | | | |
| | | Shares | | | Value (1) | |
| | |
Japan - 9.2% - (continued) | | | | | | | | |
Keyence Corp. (Electronics) | | | 10,760 | | | $ | 2,652,654 | |
M3 Inc. (Internet) | | | 327 | | | | 1,497,550 | |
Unicharm Corp. (Cosmetics/Personal Care) | | | 89,400 | | | | 3,407,241 | |
| | | | | | | | |
| | | | | | | 13,874,223 | |
| | | | | | | | |
| | |
Mexico - 0.9% | | | | | | | | |
Coca-Cola Femsa SAB de CV - Sponsored ADR (Beverages) | | | 17,500 | | | | 1,390,725 | |
| | | | | | | | |
| | |
Russia - 1.3% | | | | | | | | |
Gazprom OAO - Sponsored ADR (Oil & Gas) | | | 72,200 | | | | 1,580,611 | |
Wimm-Bill-Dann Foods OJSC - ADR (Food) | | | 13,456 | | | | 341,244 | |
| | | | | | | | |
| | | | | | | 1,921,855 | |
| | | | | | | | |
| | |
South Africa - 0.9% | | | | | | | | |
Sasol Ltd. (Oil & Gas) | | | 31,730 | | | | 1,429,061 | |
| | | | | | | | |
| | |
Switzerland - 9.0% | | | | | | | | |
Lonza Group AG, Reg S (Chemicals) | | | 29,700 | | | | 2,604,943 | |
Nestle SA - Sponsored ADR, Reg S (Food) | | | 53,255 | | | | 2,921,037 | |
Novartis AG, Reg S (Pharmaceuticals) | | | 29,620 | | | | 1,717,712 | |
Sonova Holding AG, Reg S (Healthcare - Products) | | | 17,980 | | | | 2,084,037 | |
Swatch Group AG, Bearer (Retail) | | | 11,070 | | | | 4,234,867 | |
| | | | | | | | |
| | | | | | | 13,562,596 | |
| | | | | | | | |
| | |
United Kingdom - 5.3% | | | | | | | | |
Autonomy Corp. plc (Software)* | | | 55,800 | | | | 1,308,054 | |
RPS Group plc (Commercial Services) | | | 460,000 | | | | 1,514,430 | |
Standard Chartered plc (Banks) | | | 118,300 | | | | 3,424,391 | |
WPP plc (Media) | | | 143,370 | | | | 1,669,566 | |
| | | | | | | | |
| | | | | | | 7,916,441 | |
| | | | | | | | |
| | |
United States - 49.9% | | | | | | | | |
3M Co. (Miscellaneous Manufacturing) | | | 31,670 | | | | 2,667,247 | |
Abbott Laboratories (Pharmaceuticals) | | | 26,380 | | | | 1,353,822 | |
Adobe Systems Inc. (Software)* | | | 41,690 | | | | 1,173,574 | |
Amazon.com, Inc. (Internet)* | | | 11,200 | | | | 1,849,568 | |
Apple Inc. (Computers)* | | | 8,900 | | | | 2,677,743 | |
Charles Schwab Corp. (Diversified Financial Services) | | | 84,700 | | | | 1,304,380 | |
Cisco Systems Inc. (Telecommunications)* | | | 94,915 | | | | 2,166,909 | |
Citrix Systems, Inc. (Software)* | | | 25,200 | | | | 1,614,564 | |
Coach Inc. (Apparel) | | | 91,600 | | | | 4,580,000 | |
Colgate-Palmolive Co. (Cosmetics/Personal Care) | | | 28,250 | | | | 2,178,640 | |
eBay Inc. (Internet)* | | | 172,100 | | | | 5,130,301 | |
EMC Corp. (Computers)* | | | 164,250 | | | | 3,450,893 | |
Emerson Electric Co. (Electrical Components & Equipment) | | | 73,370 | | | | 4,028,013 | |
Exxon Mobil Corp. (Oil & Gas) | | | 27,890 | | | | 1,853,848 | |
See Notes to Financial Statements
7
Harding, Loevner Funds, Inc.
Global Equity Portfolio
Statement of Net Assets
October 31, 2010 (continued)
| | | | | | | | |
| | | Shares | | | Value (1) | |
| | |
United States - 49.9% - (continued) | | | | | | | | |
Genzyme Corp. (Biotechnology)* | | | 28,300 | | | $ | 2,041,279 | |
Google Inc., Class A (Internet)* | | | 6,247 | | | | 3,829,349 | |
Greenhill & Co., Inc. (Diversified Financial Services) | | | 21,600 | | | | 1,677,672 | |
JPMorgan Chase & Co. (Banks) | | | 46,300 | | | | 1,742,269 | |
McDonald’s Corp. (Retail) | | | 18,900 | | | | 1,469,853 | |
Monsanto Co. (Chemicals) | | | 51,700 | | | | 3,072,014 | |
Oracle Corp. (Software) | | | 109,210 | | | | 3,210,774 | |
Praxair Inc. (Chemicals) | | | 20,520 | | | | 1,874,297 | |
Procter & Gamble Co. (Cosmetics/Personal Care) | | | 57,600 | | | | 3,661,632 | |
Sigma-Aldrich Corp. (Chemicals) | | | 47,600 | | | | 3,018,792 | |
Staples Inc. (Retail) | | | 161,910 | | | | 3,314,298 | |
Talecris Biotherapeutics Holdings Corp. (Biotechnology)* | | | 66,200 | | | | 1,623,224 | |
Teradata Corp. (Computers)* | | | 79,000 | | | | 3,109,440 | |
Walgreen Co. (Retail) | | | 91,900 | | | | 3,113,572 | |
Wells Fargo & Co. (Banks) | | | 94,760 | | | | 2,471,341 | |
| | | | | | | | |
| | | | | | | 75,259,308 | |
| | | | | | | | |
| | |
Total Common Stocks (Cost $119,670,724) | | | | | | | 148,379,105 | |
| | | | | | | | |
| | |
Rights - 0.1% | | | | | | | | |
| | |
United Kingdom - 0.1% | | | | | | | | |
Standard Chartered PLC (Banks)* | | | 14,787 | | | | 124,508 | |
| | | | | | | | |
| | |
Total Rights (Cost $88,560) | | | | | | | 124,508 | |
| | | | | | | | |
| | |
Cash Equivalent - 1.4% | | | | | | | | |
Northern Institutional Funds - Diversified Assets Portfolio (Mutual Funds) | | | 2,059,862 | | | | 2,059,862 | |
| | | | | | | | |
Total Cash Equivalent (Cost $2,059,862) | | | | | | | 2,059,862 | |
| | | | | | | | |
| | |
Total Investments — 99.9% (Cost $ 121,819,146) | | | | | | $ | 150,563,475 | |
| | | | | | | | |
| | |
Summary of Abbreviations |
| |
ADR | | American Depository Receipt |
Reg S | | Security sold outside United States without registration under the Securities Act of 1933. |
(1) See Note 2 to Financial Statements. |
* Non-income producing security. |
See Notes to Financial Statements
8
Harding, Loevner Funds, Inc.
Global Equity Portfolio
Statement of Net Assets
October 31, 2010
| | | | |
| | | Value (1) | |
Other Assets, Net of Liabilities - 0.1% | | | | |
Cash | | $ | 2,315 | |
Dividends and interest receivable | | | 146,262 | |
Foreign currency (cost $2,731) | | | 3,017 | |
Receivable for Fund shares sold | | | 147,916 | |
Tax reclaim receivable | | | 38,957 | |
Prepaid expenses | | | 23,658 | |
Payable to Investment Advisor | | | (123,550 | ) |
Payable for Fund shares redeemed | | | (11,861 | ) |
Other liabilities | | | (64,694 | ) |
| | | | |
| | | 162,020 | |
| | | | |
Net Assets - 100% | | | | |
Institutional Class | | | | |
Applicable to 4,432,600 outstanding $.001 par value shares (authorized 200,000,000 shares) | | $ | 104,275,890 | |
| | | | |
| |
Net Asset Value, Offering Price and Redemption Price Per Share | | $ | 23.52 | |
| | | | |
| |
Advisor Class | | | | |
Applicable to 1,978,267 outstanding $.001 par value shares (authorized 200,000,000 shares) | | $ | 46,449,605 | |
| | | | |
| |
Net Asset Value, Offering Price and Redemption Price Per Share | | $ | 23.48 | |
| | | | |
| |
Components of Net Assets as of October 31, 2010 were as follows: | | | | |
Paid-in capital | | $ | 121,854,102 | |
Accumulated undistributed net investment income | | | 288,950 | |
Accumulated net realized loss from investment transactions | | | (168,006 | ) |
Net unrealized appreciation on investments and on assets and liabilities denominated in foreign currencies | | | 28,750,449 | |
| | | | |
| | $ | 150,725,495 | |
| | | | |
See Notes to Financial Statements
9
Harding, Loevner Funds, Inc.
International Equity Portfolio (Investor Class) — Overview
(unaudited)
October 31, 2010
Hypothetical Comparison Of Changes In Value Of $10,000 Investment In Harding, Loevner Funds, Inc. -
International Equity Portfolio - Investor Class And The Lipper International Equity Fund Index
(Net Dividends Reinvested)
And The MSCI All Country World ex-US Index
| | | | | | | | | | |
| | | | | | | | | | | |
| | | Returns for the Year Ended October 31, 2010 |
| | | Cumulative Total Returns | | Average Annualized
Total Return |
| FUND NAME | | Last 12 Months | | 5 YR | | Inception | | 5 YR | | Inception |
| International Equity Portfolio—Investor Class (Inception date 09/30/05) | | 21.18% | | 45.21% | | 38.53% | | 7.75% | | 6.62% |
MSCI All Country World ex-US (Net dividends) | | 12.65% | | 32.23% | | 27.81% | | 5.75% | | 4.94% |
Lipper International Fund Index | | 12.98% | | 26.78% | | 22.87% | | 4.86% | | 4.13% |
| | | | | | | | | | | |
Performance data quoted represents past performance and does not guarantee future results. The investment return and principal value of an investment will fluctuate so that an investor’s shares, when redeemed, may be worth more or less than their original cost. Performance current to the most recent month end may be lower or higher than the performance quoted and may be obtained by visiting the website at www.hardingloevnerfunds.com.
Investment return reflects voluntary fee waivers in effect. Absence such waivers, total return would be reduced. The performance provided does not reflect the deduction of taxes that a shareholder would pay on Portfolio distributions.
10
Harding, Loevner Funds, Inc.
International Equity Portfolio (Investor Class) - - Overview
October 31, 2010
The International Equity Portfolio gained 21.18% for the fiscal year ending October 31, 2010. In comparison, its benchmark, the MSCI All Country World ex-US Index, rose 12.65%.
Consistent with its investment objectives and policies, the Portfolio was invested in the securities of non-US companies that exhibit the fundamental characteristics of sustainable growth, financial strength, management quality, and durable competitive advantage.
The Portfolio’s relative outperformance derived from both our stock selection and the resulting sector allocations. Our continued bias against—and consequent small weighting in—the Financials sector was the biggest contributor from sector allocation, while an even larger contribution came from stock selection due to our preference for Emerging Markets-oriented banks. We also saw good performance within the Consumer Discretionary sector (where luxury goods makers LVMH Moët Hennessy and Swatch Group were stand outs), in Information Technology (where ARM Holdings, Dassault Systemes, and Keyence were notables), within Industrials (especially from capital goods producers such as Japan’s Fanuc and Sweden’s Atlas Copco), and finally in Health Care (led by the diabetes specialists Fresenius and Novo Nordisk). These strong results were slightly offset by our underweight in the out-performing Materials sector, and by poor stock selection within both Materials and Consumer Staples.
Geographically, the Portfolio enjoyed strong relative returns in Europe, both in the eurozone and in the non-European Monetary Union countries. Good stock selection in these regions was due in large part to our preference for multinational consumer-oriented companies—such as Swatch, LVMH, WPP, and L’Oréal—and to a small weighting in domestically-oriented Financials. Our holdings in Japan also outperformed, led by robot manufacturer Fanuc. Portfolio returns were hurt, however, by lagging stocks within the top-performing region, Emerging Markets, as well as within Canada, whose resource-rich market nearly matched the returns of Emerging Markets.
Past performance does not guarantee future results.
The Portfolio invests in foreign securities, which will involve greater volatility and political, economic, and currency risks. It also invests in emerging markets, which involve unique risks, such as exposure to economies less diverse and mature than the U.S. or other more established foreign markets. Economic and political instability may cause larger price changes in emerging markets securities than other foreign securities. Investments in debt securities typically decrease in value when interest rates rise. This risk is usually greater for longer-term debt securities. Investment by the Portfolio in lower-rated and non-rated securities presents a greater risk of loss to principal and interest than higher-rated securities. The portfolio invests in smaller companies which involve additional risks such as limited liquidity and greater volatility.
Please see the Statement of Net Assets on page 12 for fund holdings as of October 31, 2010. Fund holdings and sector allocations are subject to change and are not recommendations to buy or sell any security.
The MSCI All Country World ex-US Index is a free float-adjusted market capitalization index that is designed to measure equity market performance in the global developed and emerging markets, excluding the US. The Index consists of 44 developed and emerging market countries. The Index is net of foreign withholding taxes on dividends. You cannot invest directly in this Index.
11
Harding, Loevner Funds, Inc.
International Equity Portfolio
Statement of Net Assets
October 31, 2010
| | |
| Industry | | Percentage of
Net Assets |
| | | | |
Agriculture | | | 1.0 | % |
Auto Parts & Equipment | | | 1.2 | |
Banks | | | 10.0 | |
Biotechnology | | | 1.1 | |
Chemicals | | | 4.7 | |
Computers | | | 1.1 | |
Cosmetics/Personal Care | | | 4.0 | |
Distribution/Wholesale | | | 2.3 | |
Electrical Components & Equipment | | | 2.5 | |
Electronics | | | 2.8 | |
Food | | | 5.9 | |
Healthcare - Products | | | 6.5 | |
Holding Companies - Diversified | | | 3.8 | |
Insurance | | | 3.7 | |
Internet | | | 1.0 | |
Leisure Time | | | 1.3 | |
Machinery - Construction & Mining | | | 1.5 | |
Machinery - Diversified | | | 2.7 | |
Media | | | 4.5 | |
Metal Fabrication/Hardware | | | 1.0 | |
Mutual Funds | | | 7.6 | |
Oil & Gas | | | 7.8 | |
Oil & Gas Services | | | 1.6 | |
Pharmaceuticals | | | 3.5 | |
Retail | | | 4.3 | |
Semiconductors | | | 5.6 | |
Software | | | 5.9 | |
Telecommunications | | | 6.0 | |
| | | | |
Total Investments | | | 104.9 | |
Liabilities Less Other Assets | | | (4.9 | ) |
| | | | |
Net Assets | | | 100.0 | % |
| | | | |
See Notes to Financial Statements
12
Harding, Loevner Funds, Inc.
International Equity Portfolio
Statement of Net Assets
October 31, 2010 (continued)
| | | | | | | | |
| | | Shares | | | Value (1) | |
Common Stocks - 93.5% | | | | | | | | |
| | |
Australia - 2.2% | | | | | | | | |
Cochlear Ltd. (Healthcare - Products) | | | 92,900 | | | $ | 6,465,012 | |
CSL Ltd. (Biotechnology) | | | 209,800 | | | | 6,755,622 | |
| | | | | | | | |
| | | | | | | 13,220,634 | |
| | | | | | | | |
| | |
Austria - 1.9% | | | | | | | | |
Erste Group Bank AG (Banks) | | | 255,720 | | | | 11,532,071 | |
| | | | | | | | |
| | |
Bermuda - 1.0% | | | | | | | | |
Bunge Ltd. (Agriculture) | | | 103,380 | | | | 6,210,037 | |
| | | | | | | | |
| | |
Brazil - 0.2% | | | | | | | | |
Petroleo Brasileiro SA - ADR (Oil & Gas) | | | 43,988 | | | | 1,500,871 | |
| | | | | | | | |
| | |
Canada - 2.1% | | | | | | | | |
Encana Corp. (Oil & Gas) | | | 136,882 | | | | 3,862,810 | |
Imperial Oil Ltd. (Oil & Gas) | | | 226,290 | | | | 8,775,526 | |
| | | | | | | | |
| | | | | | | 12,638,336 | |
| | | | | | | | |
| | |
Cayman Islands - 1.2% | | | | | | | | |
Xinyi Glass Holdings Ltd. (Auto Parts & Equipment) | | | 9,224,000 | | | | 7,386,697 | |
| | | | | | | | |
| | |
China - 1.1% | | | | | | | | |
China Resources Enterprise Ltd. (Holding Companies - Diversified) | | | 1,536,000 | | | | 6,470,488 | |
| | | | | | | | |
| | |
Denmark - 1.3% | | | | | | | | |
Novo Nordisk A/S, Class B (Pharmaceuticals) | | | 77,700 | | | | 8,161,533 | |
| | | | | | | | |
| | |
France - 16.3% | | | | | | | | |
Air Liquide SA (Chemicals) | | | 172,602 | | | | 22,369,911 | |
Dassault Systemes SA (Software) | | | 280,700 | | | | 21,514,964 | |
L’Oreal SA (Cosmetics/Personal Care) | | | 111,770 | | | | 13,132,007 | |
LVMH Moet Hennessy Louis Vuitton SA (Holding Companies - Diversified) | | | 106,930 | | | | 16,768,969 | |
Schlumberger Ltd. (Oil & Gas Services) | | | 143,000 | | | | 9,994,270 | |
Schneider Electric SA (Electrical Components & Equipment) | | | 109,050 | | | | 15,466,744 | |
| | | | | | | | |
| | | | | | | 99,246,865 | |
| | | | | | | | |
| | |
Germany - 5.6% | | | | | | | | |
Allianz SE, Reg S (Insurance) | | | 121,500 | | | | 15,219,880 | |
Fresenius SE (Healthcare - Products) | | | 125,768 | | | | 11,099,696 | |
QIAGEN NV (Healthcare - Products)* | | | 415,470 | | | | 7,884,341 | |
| | | | | | | | |
| | | | | | | 34,203,917 | |
| | | | | | | | |
| | |
Hong Kong - 2.3% | | | | | | | | |
Li & Fung Ltd. (Distribution/Wholesale) | | | 2,652,200 | | | | 14,065,821 | |
| | | | | | | | |
See Notes to Financial Statements
13
Harding, Loevner Funds, Inc.
International Equity Portfolio
Statement of Net Assets
October 31, 2010 (continued)
| | | | | | | | |
| | | Shares | | | Value (1) | |
| | |
India - 1.8% | | | | | | | | |
ICICI Bank Ltd. - Sponsored ADR (Banks) | | | 206,300 | | | $ | 10,847,254 | |
| | | | | | | | |
| | |
Indonesia - 1.8% | | | | | | | | |
Telekomunikasi Indonesia Tbk PT - Sponsored ADR (Telecommunications) | | | 265,540 | | | | 10,725,161 | |
| | | | | | | | |
| | |
Israel - 0.6% | | | | | | | | |
Teva Pharmaceutical Industries Ltd. - Sponsored ADR (Pharmaceuticals) | | | 75,360 | | | | 3,911,184 | |
| | | | | | | | |
| | |
Japan - 10.6% | | | | | | | | |
Fanuc Ltd. (Machinery - Diversified) | | | 111,900 | | | | 16,282,483 | |
Hoya Corp. (Electronics) | | | 437,600 | | | | 10,179,047 | |
Jupiter Telecommunications Co., Ltd. (Media) | | | 6,855 | | | | 7,413,396 | |
Keyence Corp. (Electronics) | | | 28,765 | | | | 7,091,412 | |
M3 Inc. (Internet) | | | 1,350 | | | | 6,182,548 | |
MISUMI Group Inc. (Metal Fabrication/Hardware) | | | 297,600 | | | | 6,353,761 | |
Unicharm Corp. (Cosmetics/Personal Care) | | | 294,700 | | | | 11,231,700 | |
| | | | | | | | |
| | | | | | | 64,734,347 | |
| | | | | | | | |
| | |
Mexico - 5.0% | | | | | | | | |
America Movil SAB de CV, Series L - ADR (Telecommunications) | | | 238,200 | | | | 13,639,332 | |
Wal-Mart de Mexico SAB de CV, Class V - Sponsored ADR (Retail) | | | 609,840 | | | | 16,715,714 | |
| | | | | | | | |
| | | | | | | 30,355,046 | |
| | | | | | | | |
| | |
Panama - 1.3% | | | | | | | | |
Carnival Corp. (Leisure Time) | | | 178,500 | | | | 7,705,845 | |
| | | | | | | | |
| | |
Poland - 0.9% | | | | | | | | |
Bank Pekao SA - GDR, Reg S (Banks)# | | | 89,060 | | | | 5,821,202 | |
| | | | | | | | |
| | |
Russia - 1.7% | | | | | | | | |
Gazprom OAO - Sponsored ADR (Oil & Gas) | | | 484,270 | | | | 10,601,696 | |
| | | | | | | | |
| | |
Singapore - 0.9% | | | | | | | | |
DBS Group Holdings Ltd. (Banks) | | | 504,083 | | | | 5,424,239 | |
| | | | | | | | |
| | |
South Africa - 2.7% | | | | | | | | |
MTN Group Ltd. (Telecommunications) | | | 661,800 | | | | 11,889,549 | |
Sasol Ltd. (Oil & Gas) | | | 95,641 | | | | 4,307,494 | |
| | | | | | | | |
| | | | | | | 16,197,043 | |
| | | | | | | | |
| | |
South Korea - 0.9% | | | | | | | | |
Samsung Electronics Co., Ltd. - GDR, Reg S (Semiconductors) | | | 16,920 | | | | 5,655,780 | |
| | | | | | | | |
| | |
Sweden - 1.5% | | | | | | | | |
Atlas Copco AB, Class A (Machinery - Construction & Mining) | | | 431,200 | | | | 9,016,704 | |
| | | | | | | | |
See Notes to Financial Statements
14
Harding, Loevner Funds, Inc.
International Equity Portfolio
Statement of Net Assets
October 31, 2010 (continued)
| | | | | | | | |
| | | Shares | | | Value (1) | |
| | |
Switzerland - 10.8% | | | | | | | | |
Alcon Inc. (Healthcare - Products) | | | 84,570 | | | $ | 14,184,080 | |
Logitech International SA, Reg S (Computers)* | | | 343,400 | | | | 6,452,486 | |
Lonza Group AG, Reg S (Chemicals) | | | 74,000 | | | | 6,490,431 | |
Nestle SA - Sponsored ADR, Reg S (Food) | | | 362,150 | | | | 19,863,928 | |
Roche Holding AG, Genusschein (Pharmaceuticals) | | | 63,750 | | | | 9,360,524 | |
Swatch Group AG, Bearer (Retail) | | | 25,380 | | | | 9,709,208 | |
| | | | | | | | |
| | | | | | | 66,060,657 | |
| | | | | | | | |
| | |
Taiwan - 0.9% | | | | | | | | |
Taiwan Semiconductor Manufacturing Co., Ltd. (Semiconductors) | | | 2,834,125 | | | | 5,822,190 | |
| | | | | | | | |
| | |
United Kingdom - 16.9% | | | | | | | | |
Admiral Group plc (Insurance) | | | 273,300 | | | | 7,137,944 | |
ARM Holdings plc (Semiconductors) | | | 2,907,100 | | | | 17,063,729 | |
Autonomy Corp. plc (Software)* | | | 606,900 | | | | 14,226,847 | |
BG Group plc (Oil & Gas) | | | 612,880 | | | | 11,922,944 | |
Standard Chartered plc (Banks) | | | 563,810 | | | | 16,320,424 | |
Tesco plc (Food) | | | 1,499,380 | | | | 10,254,934 | |
Unilever plc (Food) | | | 205,725 | | | | 5,933,212 | |
WPP plc (Media) | | | 1,720,320 | | | | 20,033,390 | |
| | | | | | | | |
| | | | | | | 102,893,424 | |
| | | | | | | | |
| | |
Total Common Stocks (Cost $435,258,637) | | | | | | | 570,409,042 | |
| | | | | | | | |
| | |
Preferred Stocks - 3.7% | | | | | | | | |
| | |
Brazil - 2.8% | | | | | | | | |
Itau Unibanco Holding SA - ADR (Banks) | | | 412,600 | | | | 10,133,456 | |
Petroleo Brasileiro SA - Sponsored ADR (Oil & Gas) | | | 211,300 | | | | 6,590,447 | |
| | | | | | | | |
| | | | | | | 16,723,903 | |
| | | | | | | | |
| | |
South Korea - 0.9% | | | | | | | | |
Samsung Electronics Co., Ltd. - GDR, Reg S (Semiconductors) | | | 23,200 | | | | 5,691,213 | |
| | | | | | | | |
| | |
Total Preferred Stocks (Cost $19,957,840) | | | | | | | 22,415,116 | |
| | | | | | | | |
| | |
Rights - 0.1% | | | | | | | | |
| | |
United Kingdom - 0.1% | | | | | | | | |
Standard Chartered plc (Banks)* | | | 68,351 | | | | 575,524 | |
| | | | | | | | |
| | |
Total Rights (Cost $403,547) | | | | | | | 575,524 | |
| | | | | | | | |
See Notes to Financial Statements
15
Harding, Loevner Funds, Inc.
International Equity Portfolio
Statement of Net Assets
October 31, 2010 (continued)
| | | | | | | | |
Cash Equivalent - 7.6% | | | | | | | | |
Northern Institutional Funds - Diversified Assets Portfolio (Mutual Funds) | | | 46,293,164 | | | | 46,293,164 | |
| | | | | | | | |
Total Cash Equivalent (Cost $46,293,164) | | | | | | | 46,293,164 | |
| | | | | | | | |
| | |
Total Investments — 104.9% (Cost $ 501,913,188) | | | | | | $ | 639,692,846 | |
| | | | | | | | |
Summary of Abbreviations
| | |
ADR | | American Depository Receipt |
GDR | | Global Depositary Receipt |
Reg S | | Security sold outside United States without registration under the Securities Act of 1933. |
| (1) | See Note 2 to Financial Statements. |
| # | Security valued at fair value as determined in good faith under policies and procedures established by and under the supervision of the Portfolio’s Board of Directors. |
| * | Non-income producing security. |
See Notes to Financial Statements
16
Harding, Loevner Funds, Inc.
International Equity Portfolio
Statement of Net Assets
October 31, 2010
| | | | |
| | | Value (1) | |
Liabilities, Net of Other Assets - (4.9)% | | | | |
Dividends and interest receivable | | $ | 665,290 | |
Foreign currency (cost $533,862) | | | 533,516 | |
Receivable for Fund shares sold | | | 2,254,726 | |
Tax reclaim receivable | | | 298,125 | |
Prepaid expenses | | | 8,076 | |
Payable to Investment Advisor | | | (358,999 | ) |
Payable for investments purchased | | | (32,778,081 | ) |
Payable for Fund shares redeemed | | | (266,393 | ) |
Payable for distribution fees | | | (77,468 | ) |
Other liabilities | | | (156,901 | ) |
| | | | |
| | | (29,878,109 | ) |
| | | | |
Net Assets - 100% | | | | |
Institutional Class | | | | |
Applicable to 34,011,256 outstanding $.001 par value shares (authorized 200,000,000 shares) | | $ | 493,349,666 | |
| | | | |
| |
Net Asset Value, Offering Price and Redemption Price Per Share | | $ | 14.51 | |
| | | | |
| |
Investor Class | | | | |
Applicable to 8,050,174 outstanding $.001 par value shares (authorized 200,000,000 shares) | | $ | 116,465,071 | |
| | | | |
| |
Net Asset Value, Offering Price and Redemption Price Per Share | | $ | 14.47 | |
| | | | |
| |
Components of Net Assets as of October 31, 2010 were as follows: | | | | |
Paid-in-capital | | $ | 473,875,065 | |
Accumulated undistributed net investment income | | | 2,516,364 | |
Accumulated net realized loss from investment transactions | | | (4,367,531 | ) |
Net unrealized appreciation on investments and on assets and liabilities denominated in foreign currencies | | | 137,790,839 | |
| | | | |
| | $ | 609,814,737 | |
| | | | |
See Notes to Financial Statements
17
Harding, Loevner Funds, Inc.
International Small Companies Portfolio — Overview
(unaudited)
October 31, 2010
Hypothetical Comparison Of Changes In Value Of $10,000 Investment In Harding, Loevner Funds, Inc. -
International Small Companies Portfolio - Investor Class And The Lipper International Small Cap Index
(Net Dividends Reinvested)
And The MSCI All Country World ex-US Small Cap
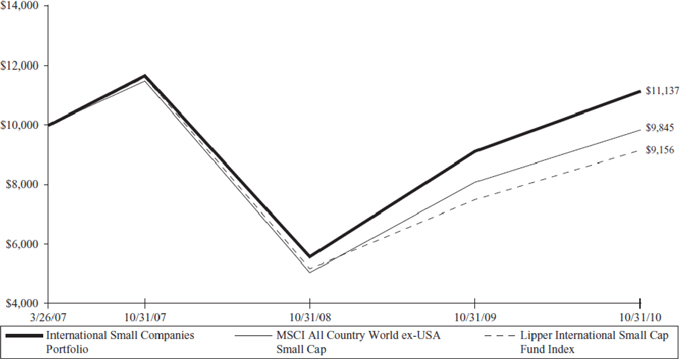
| | | | | | | | | | | | |
| | | | | | | | | | | | | |
| | | Returns for the Year Ended October 31, 2010 |
| | | Cumulative Total Returns | | | | Average Annualized
Total Return | | |
| FUND NAME | | Last 12 Months | | | | Inception | | | | Inception | | |
International Small Companies— Portfolio (Inception date 03/26/07) | | 21.93% | | | | 11.37% | | | | 3.04% | | |
MSCI All Country World ex-US Small Cap | | 21.66% | | | | -1.55% | | | | -0.43% | | |
Lipper International Small Cap Index | | 21.91% | | | | -8.44% | | | | -2.42% | | |
| | | | | | | | | | | | | |
Performance data quoted represents past performance and does not guarantee future results. The investment return and principal value of an investment will fluctuate so that an investor’s shares, when redeemed, may be worth more or less than their original cost. Performance current to the most recent month end may be lower or higher than the performance quoted and may be obtained by visiting the website at www.hardingloevnerfunds.com.
Investment return reflects voluntary fee waivers in effect. Absence such waivers, total return would be reduced. The performance provided does not reflect the deduction of taxes that a shareholder would pay on Portfolio distributions.
18
Harding, Loevner Funds, Inc.
International Small Companies Portfolio (Individual) - Overview
October 31, 2010
The International Small Companies Portfolio gained 21.93% for the fiscal year ending October 31, 2010. In comparison, its benchmark, the MSCI All Country World ex-US Small Cap Index, rose 21.66%.
Consistent with its investment objectives and policies, the Portfolio was invested in the securities of non-US smaller capitalization companies that exhibit the fundamental characteristics of sustainable growth, financial strength, management quality, and durable competitive advantage.
The Portfolio’s modest outperformance was a result of our stock selection, which overcame the drag from sector and region allocations. Our strongest holdings this period were within Consumer Staples (including Vinda International in the household and personal products segment), Health Care (equipment and consumables providers Draegerwerk and Supermax Corporation), and Industrials (capital goods companies Asahi Diamond, Huber+Suhner, and NAK Sealing Tech). Stock selection was poor in Financials (mainly due to KAS Bank and FBD Holdings) and Materials (Stella Chemifa and C. Uyemura).
From a geographic perspective, our eurozone stocks were the standouts, especially in Germany (Draegerwerk) and Italy (food services company MARR). The Portfolio’s investments in Japan were also positive contributors overall, led by Asahi Diamond. Our holdings in Canada lagged, however, as GLV encountered difficulties in its European water treatment business.
The Portfolio’s underweight in the underperforming Financials sector boosted relative returns, but this was overcome by the negative impact of our overweight in the lagging Health Care sector and underweight in the surging Materials sector. Finally, while our overweight in the eurozone and underweight in Emerging Markets detracted, our underweight in Japan and overweight in the Pacific region outside Japan were both beneficial.
Past performance does not guarantee future results.
The Portfolio invests in foreign securities, which will involve greater volatility and political, economic, and currency risks. It also invests in emerging markets, which involve unique risks, such as exposure to economies less diverse and mature than the U.S. or other more established foreign markets. Economic and political instability may cause larger price changes in emerging markets securities than other foreign securities. The portfolio invests in smaller companies which involve additional risks such as limited liquidity and greater volatility.
Please see the Statement of Net Assets on page 20 for fund holdings as of October 31, 2010. Fund holdings and sector allocations are subject to change and are not recommendations to buy or sell any security.
The MSCI All Country World ex-US Small Cap Index is a free-float market capitalization index that is designed to measure small cap developed and emerging market equity performance. The Index consists of 44 developed and emerging markets countries and targeting companies market capitalization range of USD 170–4,200 million in terms of the company’s full market capitalization. The Index is net of foreign withholding taxes on dividends. You cannot invest directly in this Index.
19
Harding, Loevner Funds, Inc.
International Small Companies Portfolio
Statement of Net Assets
October 31, 2010
| | |
| Industry | | Percentage of
Net Assets |
| | | | |
Agriculture | | | 1.6 | % |
Auto Parts & Equipment | | | 2.9 | |
Banks | | | 4.8 | |
Beverages | | | 1.5 | |
Chemicals | | | 7.3 | |
Commercial Services | | | 3.1 | |
Computer Software & Processing | | | 1.4 | |
Computers | | | 1.2 | |
Cosmetics/Personal Care | | | 2.7 | |
Distribution/Wholesale | | | 2.6 | |
Diversified Financial Services | | | 3.4 | |
Electrical Components & Equipment | | | 3.1 | |
Electronics | | | 5.0 | |
Engineering & Construction | | | 2.8 | |
Environmental Control | | | 0.8 | |
Food | | | 7.5 | |
Gas | | | 1.4 | |
Hand/Machine Tools | | | 2.4 | |
Healthcare - Products | | | 4.3 | |
Healthcare - Services | | | 3.3 | |
Insurance | | | 1.0 | |
Leisure Time | | | 1.3 | |
Machinery - Diversified | | | 4.8 | |
Media | | | 1.4 | |
Mining | | | 1.6 | |
Miscellaneous Manufacturing | | | 6.2 | |
Mutual Funds | | | 1.8 | |
Oil & Gas Services | | | 1.0 | |
Packaging & Containers | | | 1.2 | |
Pharmaceuticals | | | 2.2 | |
Retail | | | 3.0 | |
Semiconductors | | | 3.6 | |
Shipbuilding | | | 1.4 | |
Telecommunications | | | 1.7 | |
Transportation | | | 3.0 | |
Trucking & Leasing | | | 1.5 | |
| | | | |
Total Investments | | | 99.8 | |
Other Assets Less Liabilities | | | 0.2 | |
| | | | |
Net Assets | | | 100.0 | % |
| | | | |
See Notes to Financial Statements
20
Harding, Loevner Funds, Inc.
International Small Companies Portfolio
Statement of Net Assets
October 31, 2010 (continued)
| | | | | | | | |
| | | Shares | | | Value (1) | |
Common Stocks - 96.7% | | | | | | | | |
| | |
Australia - 5.6% | | | | | | | | |
Bank of Queensland Ltd. (Banks) | | | 15,680 | | | $ | 160,339 | |
Bradken Ltd. (Engineering & Construction) | | | 26,100 | | | | 210,400 | |
Imdex Ltd. (Mining)* | | | 179,430 | | | | 217,447 | |
SAI Global Ltd. (Media) | | | 45,897 | | | | 197,012 | |
| | | | | | | | |
| | | | | | | 785,198 | |
| | | | | | | | |
| | |
Austria - 2.0% | | | | | | | | |
BWT AG (Environmental Control) | | | 4,186 | | | | 116,914 | |
Semperit AG Holding (Miscellaneous Manufacturing) | | | 3,830 | | | | 167,878 | |
| | | | | | | | |
| | | | | | | 284,792 | |
| | | | | | | | |
| | |
Brazil - 1.2% | | | | | | | | |
Fleury SA (Healthcare - Services)* | | | 12,900 | | | | 166,912 | |
| | | | | | | | |
| | |
Canada - 1.9% | | | | | | | | |
GLV Inc., Class A (Machinery - Diversified)* | | | 15,900 | | | | 110,215 | |
Laurentian Bank of Canada (Banks) | | | 3,700 | | | | 160,523 | |
| | | | | | | | |
| | | | | | | 270,738 | |
| | | | | | | | |
| | |
China - 2.9% | | | | | | | | |
Dalian Refrigeration Co., Ltd., Class B (Machinery - Diversified) | | | 185,000 | | | | 183,969 | |
Vinda International Holdings Ltd. (Cosmetics/Personal Care) | | | 170,000 | | | | 221,223 | |
| | | | | | | | |
| | | | | | | 405,192 | |
| | | | | | | | |
| | |
Denmark - 3.0% | | | | | | | | |
NKT Holding A/S (Miscellaneous Manufacturing) | | | 2,150 | | | | 115,721 | |
Topsil Semiconductor Materials (Semiconductors)* | | | 1,050,000 | | | | 301,664 | |
| | | | | | | | |
| | | | | | | 417,385 | |
| | | | | | | | |
| | |
Finland - 2.3% | | | | | | | | |
Vacon Oyj (Hand/Machine Tools) | | | 3,377 | | | | 176,041 | |
Vaisala Oyj, Class A (Electronics) | | | 4,633 | | | | 142,554 | |
| | | | | | | | |
| | | | | | | 318,595 | |
| | | | | | | | |
| | |
France - 3.9% | | | | | | | | |
Boiron SA (Pharmaceuticals) | | | 4,173 | | | | 157,900 | |
Rubis (Gas) | | | 1,830 | | | | 202,769 | |
Touax SA (Transportation) | | | 5,000 | | | | 182,315 | |
| | | | | | | | |
| | | | | | | 542,984 | |
| | | | | | | | |
| | |
Germany - 5.6% | | | | | | | | |
Bijou Brigitte Modische Accessoires AG (Retail) | | | 932 | | | | 150,742 | |
Carl Zeiss Meditec AG (Healthcare - Products) | | | 9,770 | | | | 169,974 | |
Draegerwerk AG & Co. KGaA (Healthcare - Products) | | | 654 | | | | 47,239 | |
Drillisch AG (Telecommunications) | | | 28,510 | | | | 243,526 | |
See Notes to Financial Statements
21
Harding, Loevner Funds, Inc.
International Small Companies Portfolio
Statement of Net Assets
October 31, 2010 (continued)
| | | | | | | | |
| | | Shares | | | Value (1) | |
| | |
Germany - 5.6% - (continued) | | | | | | | | |
Gerresheimer AG (Packaging & Containers)* | | | 4,120 | | | $ | 162,969 | |
| | | | | | | | |
| | | | | | | 774,450 | |
| | | | | | | | |
| | |
Hong Kong - 7.3% | | | | | | | | |
Chen Hsong Holdings (Machinery - Diversified) | | | 300,000 | | | | 141,231 | |
Chong Hing Bank Ltd. (Banks) | | | 80,000 | | | | 198,896 | |
Pico Far East Holdings Ltd. (Commercial Services) | | | 704,000 | | | | 137,942 | |
Vitasoy International Holdings Ltd. (Beverages) | | | 238,000 | | | | 207,640 | |
Wasion Group Holdings Ltd. (Electronics) | | | 180,000 | | | | 131,012 | |
Yip’s Chemical Holdings Ltd. (Chemicals) | | | 170,000 | | | | 202,872 | |
| | | | | | | | |
| | | | | | | 1,019,593 | |
| | | | | | | | |
| | |
Indonesia - 2.5% | | | | | | | | |
Bank Bukopin Tbk PT (Banks) | | | 2,000,000 | | | | 156,341 | |
Wijaya Karya PT (Engineering & Construction) | | | 2,320,000 | | | | 187,227 | |
| | | | | | | | |
| | | | | | | 343,568 | |
| | | | | | | | |
| | |
Ireland - 2.2% | | | | | | | | |
FBD Holdings plc (Insurance) | | | 17,066 | | | | 145,762 | |
Grafton Group plc (Dublin Stock Exchange) (Retail) | | | 29,000 | | | | 123,720 | |
Grafton Group plc (London Stock Exchange) (Retail) | | | 10,000 | | | | 42,603 | |
| | | | | | | | |
| | | | | | | 312,085 | |
| | | | | | | | |
| | |
Italy - 4.3% | | | | | | | | |
Cembre S.p.A (Electrical Components & Equipment) | | | 27,327 | | | | 207,941 | |
MARR S.p.A (Distribution/Wholesale) | | | 18,163 | | | | 197,066 | |
SOL S.p.A (Chemicals) | | | 29,541 | | | | 195,270 | |
| | | | | | | | |
| | | | | | | 600,277 | |
| | | | | | | | |
| | |
Japan - 11.5% | | | | | | | | |
Asahi Diamond Industrial Co., Ltd. (Hand/Machine Tools) | | | 9,000 | | | | 159,443 | |
ASKUL Corp. (Retail) | | | 4,900 | | | | 102,062 | |
BML Inc. (Healthcare - Services) | | | 5,400 | | | | 134,317 | |
C. Uyemura & Co., Ltd. (Chemicals) | | | 3,000 | | | | 105,291 | |
Lintec Corp. (Chemicals) | | | 8,300 | | | | 185,615 | |
Miura Co. Ltd. (Machinery - Diversified) | | | 4,200 | | | | 94,814 | |
Nakanishi Inc. (Healthcare - Products) | | | 1,800 | | | | 193,239 | |
Pigeon Corp. (Cosmetics/Personal Care) | | | 5,200 | | | | 154,695 | |
Stella Chemifa Corp. (Chemicals) | | | 3,800 | | | | 164,502 | |
Tsumura & Co. (Pharmaceuticals) | | | 5,000 | | | | 153,585 | |
Vic Tokai Corp. (Computers) | | | 18,000 | | | | 164,102 | |
| | | | | | | | |
| | | | | | | 1,611,665 | |
| | | | | | | | |
| | |
Malaysia - 4.2% | | | | | | | | |
Coastal Contracts Berhad (Shipbuilding) | | | 262,000 | | | | 191,339 | |
Supermax Corp. Berhad (Miscellaneous Manufacturing) | | | 111,500 | | | | 161,505 | |
See Notes to Financial Statements
23
Harding, Loevner Funds, Inc.
International Small Companies Portfolio
Statement of Net Assets
October 31, 2010 (continued)
| | | | | | | | |
| | |
| | | Shares | | | Value (1) | |
| | |
Malaysia - 4.2% - (continued) | | | | | | |
United Plantations Berhad (Agriculture) | | | 41,500 | | | $ | 227,745 | |
| | | | | | | | |
| | | | | | | 580,589 | |
| | | | | | | | |
| | |
Netherlands - 1.9% | | | | | | |
Brunel International NV (Commercial Services) | | | 3,527 | | | | 108,246 | |
KAS Bank NV - CVA (Diversified Financial Services) | | | 9,238 | | | | 161,753 | |
| | | | | | | | |
| | | | | | | 269,999 | |
| | | | | | | | |
| | |
New Zealand - 1.3% | | | | | | |
Sanford Ltd. (Food) | | | 52,153 | | | | 182,923 | |
| | | | | | | | |
Singapore - 3.6% | | | | | | | | |
Goodpack Ltd. (Trucking & Leasing) | | | 129,000 | | | | 203,900 | |
KS Energy Services Ltd. (Oil & Gas Services)* | | | 167,000 | | | | 134,398 | |
Tat Hong Holdings Ltd. (Distribution/Wholesale) | | | 198,000 | | | | 163,619 | |
| | | | | | | | |
| | | | | | | 501,917 | |
| | | | | | | | |
| | |
South Korea - 4.0% | | | | | | |
Binggrae Co., Ltd. (Food) | | | 3,700 | | | | 178,905 | |
Han Kuk Carbon Co., Ltd. (Chemicals) | | | 27,800 | | | | 160,436 | |
Samwha Capacitor Co., Ltd. (Electronics) | | | 18,600 | | | | 211,638 | |
| | | | | | | | |
| | | | | | | 550,979 | |
| | | | | | | | |
| | |
Spain - 1.7% | | | | | | |
Construcciones y Auxiliar de Ferrocarriles SA (Transportation) | | | 412 | | | | 232,087 | |
| | | | | | | | |
| | |
Sweden - 4.3% | | | | | | |
Industrial & Financial Systems, Class B (Computer Software & Processing) | | | 13,736 | | | | 195,357 | |
Kabe Husvagnar AB, Class B (Miscellaneous Manufacturing) | | | 12,600 | | | | 200,878 | |
Mekonomen AB (Auto Parts & Equipment) | | | 6,300 | | | | 198,418 | |
| | | | | | | | |
| | | | | | | 594,653 | |
| | | | | | | | |
| | |
Switzerland - 4.8% | | | | | | |
Huber & Suhner AG, Reg S (Electrical Components & Equipment) | | | 3,800 | | | | 231,278 | |
Huegli Holding AG - Bearer (Food) | | | 330 | | | | 223,544 | |
Lem Holding SA, Reg S (Electronics) | | | 496 | | | | 218,694 | |
| | | | | | | | |
| | | | | | | 673,516 | |
| | | | | | | | |
| | |
Taiwan - 5.7% | | | | | | |
Merida Industry Co., Ltd. (Leisure Time) | | | 103,000 | | | | 178,752 | |
Nak Sealing Technologies Corp. (Auto Parts & Equipment) | | | 135,000 | | | | 203,451 | |
Taiwan Paiho Ltd. (Miscellaneous Manufacturing) | | | 192,559 | | | | 214,336 | |
Youngtek Electronics Corp. (Semiconductors) | | | 75,188 | | | | 203,185 | |
| | | | | | | | |
| | | | | | | 799,724 | |
| | | | | | | | |
See Notes to Financial Statements
23
Harding, Loevner Funds, Inc.
International Small Companies Portfolio
Statement of Net Assets
October 31, 2010 (continued)
| | | | | | | | |
| | | Shares | | | Value (1) | |
| | |
Thailand - 1.2% | | | | | | | | |
Khon Kaen Sugar Industry pcl, Reg S (Food) | | | 403,800 | | | $ | 171,046 | |
| | | | | | | | |
| | |
United Kingdom - 7.8% | | | | | | | | |
Greggs plc (Food) | | | 22,000 | | | | 161,510 | |
Hamworthy plc (Machinery - Diversified) | | | 23,152 | | | | 145,749 | |
PayPoint plc (Diversified Financial Services) | | | 27,697 | | | | 141,895 | |
Rathbone Brothers plc (Diversified Financial Services) | | | 12,230 | | | | 174,469 | |
Robert Wiseman Dairies plc (Food) | | | 24,451 | | | | 127,877 | |
RPS Group plc (Commercial Services) | | | 54,860 | | | | 180,612 | |
Synergy Health plc (Healthcare - Services) | | | 12,313 | | | | 155,256 | |
| | | | | | | | |
| | | | | | | 1,087,368 | |
| | | | | | | | |
| | |
Total Common Stocks (Cost $11,494,882) | | | | | | | 13,498,235 | |
| | | | | | | | |
| | |
Preferred Stocks - 1.3% | | | | | | | | |
| | |
Germany - 1.3% | | | | | | | | |
Draegerwerk AG & Co. KGaA (Healthcare - Products) | | | 2,182 | | | | 183,187 | |
| | | | | | | | |
| | |
Total Preferred Stocks (Cost $100,186) | | | | | | | 183,187 | |
| | | | | | | | |
| | |
Warrants - 0.0% | | | | | | | | |
| | |
Thailand - 0.0% | | | | | | | | |
Khon Kaen Sugar Industry pcl, Expires 03/15/2013 (Food)* | | | 28,380 | | | | 3,427 | |
| | | | | | | | |
| | |
Total Warrants (Cost $ — ) | | | | | | | 3,427 | |
| | | | | | | | |
| | |
Cash Equivalent - 1.8% | | | | | | | | |
Northern Institutional Funds - Diversified Assets Portfolio (Mutual Funds) | | | 245,466 | | | | 245,466 | |
| | | | | | | | |
Total Cash Equivalent (Cost $245,466) | | | | | | | 245,466 | |
| | | | | | | | |
| | |
Total Investments — 99.8% (Cost $ 11,840,534) | | | | | | $ | 13,930,315 | |
| | | | | | | | |
Summary of Abbreviations
Reg S Security sold outside United States without registration under the Securities Act of 1933.
| (1) | See Note 2 to Financial Statements. |
| * | Non-income producing security. |
See Notes to Financial Statements
24
Harding, Loevner Funds, Inc.
International Small Companies Portfolio
Statement of Net Assets
October 31, 2010
| | | | |
| | | Value (1) | |
| |
Other Assets, Net of Liabilities - 0.2% | | | |
Dividends and interest receivable | | $ | 11,857 | |
Foreign currency (cost $3,479) | | | 3,614 | |
Receivable for Fund shares sold | | | 47,500 | |
Tax reclaim receivable | | | 10,085 | |
Prepaid expenses | | | 21,442 | |
Payable to Investment Advisor | | | (13,938 | ) |
Payable for distribution fees | | | (4,125 | ) |
Payable for capital gains tax | | | (3,963 | ) |
Other liabilities | | | (38,105 | ) |
| | | | |
| | | 34,367 | |
| | | | |
Net Assets - 100% | | | | |
Applicable to 1,290,332 outstanding $.001 par value shares (authorized 400,000,000 shares) | | $ | 13,964,682 | |
| | | | |
| |
Net Asset Value, Offering Price and Redemption Price Per Share | | $ | 10.82 | |
| | | | |
| |
Paid-in capital | | $ | 12,435,122 | |
Accumulated undistributed net investment income | | | 46,011 | |
Accumulated net realized loss from investment transactions | | | (603,400 | ) |
Net unrealized appreciation on investments and on assets and liabilities denominated in foreign currencies | | | 2,086,949 | |
| | | | |
| | $ | 13,964,682 | |
| | | | |
See Notes to Financial Statements
25
Harding, Loevner Funds, Inc.
Emerging Markets Portfolio — Overview
(unaudited)
October 31, 2010
Hypothetical Comparison Of Changes In Value Of $10,000 Investment In Harding, Loevner Funds, Inc. -
Emerging Markets Portfolio And The Lipper Emerging Markets Funds Index
(Net Dividends Reinvested)
And The MSCI Emerging Markets Index
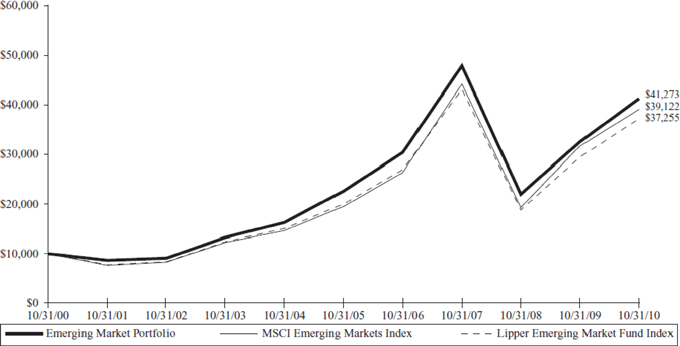
| | | | | | | | | | | | |
| | | Returns for the Year Ended October 31, 2010 |
| | | Cumulative Total Returns | | | | Average Annualized
Total Return |
| FUND NAME | | Last 12 Months | | 5 YR | | 10 YR | | | | 5 YR | | 10 YR |
Emerging Markets Portfolio (Inception date 11/9/98) | | 26.77% | | 82.56% | | 312.73% | | | | 12.79% | | 15.23% |
MSCI Emerging Markets Index (Net dividend) | | 23.51% | | 100.41% | | 291.25% | | | | 14.92% | | 14.62% |
Lipper Emerging Markets Fund Index | | 26.36% | | 86.36% | | 272.54% | | | | 13.26% | | 14.06% |
| | | | | | | | | | | | |
Performance data quoted represents past performance and does not guarantee future results. The investment return and principal value of an investment will fluctuate so that an investor’s shares, when redeemed, may be worth more or less than their original cost. Performance current to the most recent month end may be lower or higher than the performance quoted and may be obtained by visiting the website at www.hardingloevnerfunds.com.
Investment return reflects voluntary fee waivers in effect. Absence such waivers, total return would be reduced. The performance provided does not reflect the deduction of taxes that a shareholder would pay on Portfolio distributions.
26
Harding, Loevner Funds, Inc.
Emerging Markets Portfolio - Overview
October 31, 2010
The Emerging Markets Portfolio gained 26.77% for the fiscal year ending October 31, 2010, as compared to a gain of 23.51% for its benchmark, the MSCI Emerging Markets Index.
Consistent with its investment objectives and policies, the Portfolio was invested in the securities of emerging markets companies that exhibit the fundamental characteristics of durable growth, financial strength, management quality, and sustainable competitive advantage.
The Portfolio’s outperformance derived in part from strong selection within four sectors (Financials, Health Care, Materials, and Telecom Services), where our focus on high-quality companies with, in our opinion, strong secular (as opposed to cyclical) growth trends served us well this period. Our sector weighting decisions were also beneficial, as over 25% of the Portfolio was held in the outperforming Consumer Staples and Consumer Discretionary sectors while we were underweight the lagging Energy sector.
Stock selection was strongest within Financials, where we enjoyed significant gains from well-capitalized banks in smaller countries such as Banco Santander Chile and Credicorp of Peru, Bancolombia of Colombia, and Bank Rakyat of Indonesia. These banks are experiencing falling levels of non-performing loans and are benefitting from solid growth in their domestic economies. Stock selection was the weakest in Industrials. Both China Communications Construction and Egypt’s Orascom Construction declined, as their results failed to live up to investors’ profit growth expectations.
From a geographic perspective, our approach to China—one of the worst-performing markets this period—was the most notable contributor to returns. Both our underweight and stock selection added value. China’s market is dominated by large, state-controlled enterprises, but we favored smaller, private-sector companies focused on the domestic market, a number of which were positive contributors, including New Oriental, Hengan International, Shandong Weigao, and Wumart.
Past performance does not guarantee future results.
The Portfolio invests in foreign securities, which will involve greater volatility and political, economic, and currency risks and differences in accounting methods. It also invests in emerging markets, which involve unique risks, such as exposure to economies less diverse and mature than the U.S. or other more established foreign markets. Economic and political instability may cause larger price changes in emerging markets securities than other foreign securities. Investments in debt securities typically decrease in value when interest rates rise. This risk is usually greater for longer-term debt securities. Investment by the Portfolio in lower-rated and non-rated securities presents a greater risk of loss to principal and interest than higher-rated securities.
Please see the Statement of Net Assets on page 29 for fund holdings as of October 31, 2010. Fund holdings and sector allocations are subject to change and are not recommendations to buy or sell any security.
The MSCI Emerging Markets Index is a free float-adjusted market capitalization index that is designed to measure equity market performance in the global emerging markets. The Index consists of 21 emerging market countries. The Index is net of foreign withholding taxes on dividends. You cannot invest directly in this Index.
27
Harding, Loevner Funds, Inc.
Emerging Markets Portfolio
Statement of Net Assets
October 31, 2010
| | |
| Industry | | Percentage of Net Assets |
| | | | |
Airlines | | | 0.4 | % |
Auto Parts & Equipment | | | 0.7 | |
Banks | | | 19.1 | |
Beverages | | | 3.1 | |
Beverages, Food & Tobacco | | | 1.0 | |
Building Materials | | | 4.1 | |
Chemicals | | | 1.5 | |
Commercial Services | | | 4.3 | |
Computers | | | 1.3 | |
Cosmetics/Personal Care | | | 2.7 | |
Distribution/Wholesale | | | 1.1 | |
Diversified Financial Services | | | 0.6 | |
Electric | | | 0.9 | |
Electrical Components & Equipment | | | 2.7 | |
Electronics | | | 3.2 | |
Engineering & Construction | | | 1.3 | |
Food | | | 1.9 | |
Food Retailers | | | 0.2 | |
Healthcare - Products | | | 3.6 | |
Home Furnishings | | | 1.8 | |
Insurance | | | 2.5 | |
Internet | | | 1.3 | |
Iron/Steel | | | 0.4 | |
Leisure Time | | | 2.0 | |
Media | | | 0.6 | |
Mining | | | 3.0 | |
Miscellaneous Manufacturing | | | 0.6 | |
Mutual Funds | | | 3.0 | |
Oil & Gas | | | 8.7 | |
Pharmaceuticals | | | 3.1 | |
Pipelines | | | 1.1 | |
Real Estate | | | 1.0 | |
Retail | | | 3.0 | |
Semiconductors | | | 7.1 | |
Telecommunications | | | 8.0 | |
| | | | |
Total Investments | | | 100.9 | |
Liabilities Less Other Assets | | | -0.9 | |
| | | | |
Net Assets | | | 100.0 | % |
| | | | |
See Notes to Financial Statements
28
Harding, Loevner Funds, Inc.
Emerging Markets Portfolio
Statement of Net Assets
October 31, 2010 (continued)
| | | | | | | | |
| | | Shares | | | Value (1) | |
Common Stocks - 93.0% | | | | | | | | |
| | |
Argentina - 0.5% | | | | | | | | |
Banco Macro SA - ADR (Banks) | | | 210,497 | | | $ | 10,493,275 | |
| | | | | | | | |
| | |
Brazil - 13.4% | | | | | | | | |
Anhanguera Educacional Participacoes SA (Commercial Services) | | | 1,743,882 | | | | 34,563,797 | |
Banco Bradesco SA - ADR (Banks) | | | 2,172,202 | | | | 45,181,802 | |
Cyrela Brazil Realty SA Empreendimentos e Participacoes (Real Estate) | | | 1,485,000 | | | | 20,524,319 | |
Hypermarcas SA (Pharmaceuticals)* | | | 1,480,000 | | | | 24,372,170 | |
Natura Cosmeticos SA (Cosmetics/Personal Care) | | | 1,188,900 | | | | 34,052,479 | |
Petroleo Brasileiro SA - ADR (Oil & Gas) | | | 1,457,084 | | | | 49,715,706 | |
Usinas Siderurgicas de Minas Gerais SA (Iron/Steel) | | | 611,800 | | | | 8,923,508 | |
Vale SA - Sponsored ADR (Mining) | | | 1,856,200 | | | | 59,658,268 | |
| | | | | | | | |
| | | | | | | 276,992,049 | |
| | | | | | | | |
| | |
Cayman Islands - 1.3% | | | | | | | | |
Tencent Holdings Ltd. (Internet) | | | 1,133,000 | | | | 26,070,393 | |
| | | | | | | | |
| | |
Chile - 3.1% | | | | | | | | |
Banco Santander Chile - ADR (Banks) | | | 343,244 | | | | 31,798,124 | |
Sociedad Quimica y Minera de Chile SA - Sponsored ADR (Chemicals) | | | 610,500 | | | | 31,623,900 | |
| | | | | | | | |
| | | | | | | 63,422,024 | |
| | | | | | | | |
| | |
China - 12.0% | | | | | | | | |
Anhui Conch Cement Co., Ltd., Class H (Building Materials) | | | 5,360,000 | | | | 22,707,649 | |
ASM Pacific Technology Ltd. (Semiconductors) | | | 2,336,100 | | | | 21,090,242 | |
China Mobile Ltd. - Sponsored ADR (Telecommunications) | | | 610,000 | | | | 31,335,700 | |
China Taiping Insurance Holdings Co., Ltd. (Insurance)* | | | 6,721,600 | | | | 24,674,909 | |
CNOOC Ltd. - ADR (Oil & Gas) | | | 108,300 | | | | 22,626,036 | |
Hengan International Group Co., Ltd. (Healthcare - Products) | | | 4,397,000 | | | | 41,763,853 | |
Jiangsu Expressway Co., Ltd., Class H (Commercial Services) | | | 25,884,000 | | | | 31,058,602 | |
New Oriental Education & Technology Group - Sponsored ADR (Commercial Services)* | | | 219,500 | | | | 23,567,715 | |
Shandong Weigao Group Medical Polymer Co., Ltd., Class H (Healthcare - Products) | | | 7,134,000 | | | | 18,711,592 | |
Wumart Stores Inc., Class H (Retail) | | | 4,348,000 | | | | 10,260,747 | |
| | | | | | | | |
| | | | | | | 247,797,045 | |
| | | | | | | | |
| | |
Colombia - 1.5% | | | | | | | | |
BanColombia SA - Sponsored ADR (Banks) | | | 476,300 | | | | 32,126,435 | |
| | | | | | | | |
| | |
Czech Republic - 0.4% | | | | | | | | |
Central European Media Enterprises Ltd., Class A (Media)* | | | 341,000 | | | | 7,860,050 | |
| | | | | | | | |
| | |
Egypt - 0.8% | | | | | | | | |
Orascom Construction Industries - GDR (Engineering & Construction) | | | 363,200 | | | | 16,837,718 | |
| | | | | | | | |
| | |
Greece - 0.7% | | | | | | | | |
Coca Cola Hellenic Bottling Co., SA (Beverages) | | | 575,200 | | | | 14,881,375 | |
| | | | | | | | |
See Notes to Financial Statements
29
Harding, Loevner Funds, Inc.
Emerging Markets Portfolio
Statement of Net Assets
October 31, 2010 (continued)
| | | | | | | | |
| | |
| | | Shares | | | Value (1) | |
| | |
Hong Kong - 1.1% | | | | | | |
Li & Fung Ltd. (Distribution/Wholesale) | | | 4,146,000 | | | $ | 21,988,121 | |
| | | | | | | | |
| | |
Hungary - 0.5% | | | | | | |
Richter Gedeon Nyrt. (Pharmaceuticals) | | | 40,500 | | | | 9,636,896 | |
| | | | | | | | |
| | |
India - 8.9% | | | | | | |
Ambuja Cements Ltd. (Building Materials) | | | 9,697,400 | | | | 30,554,104 | |
Axis Bank Ltd. (Banks) | | | 1,039,400 | | | | 34,530,210 | |
Bajaj Auto Ltd. (Leisure Time) | | | 1,196,000 | | | | 40,643,231 | |
Dabur India Ltd. (Cosmetics/Personal Care) | | | 9,820,000 | | | | 22,041,145 | |
HDFC Bank Ltd. - ADR (Banks) | | | 147,597 | | | | 25,528,377 | |
Jain Irrigation Systems Ltd. (Miscellaneous Manufacturing) | | | 2,290,000 | | | | 11,951,634 | |
NTPC Ltd. (Electric) | | | 4,325,900 | | | | 19,003,494 | |
| | | | | | | | |
| | | | | | | 184,252,195 | |
| | | | | | | | |
| | |
Indonesia - 1.6% | | | | | | |
Bank Rakyat Indonesia (Banks) | | | 25,259,000 | | | | 32,217,837 | |
| | | | | | | | |
| | |
Luxembourg - 1.3% | | | | | | |
Millicom International Cellular SA (Telecommunications) | | | 275,700 | | | | 26,081,220 | |
| | | | | | | | |
| | |
Mexico - 8.5% | | | | | | |
America Movil SAB de CV, Class L - ADR (Telecommunications) | | | 1,062,547 | | | | 60,841,464 | |
Coca-Cola Femsa SAB de CV, Class F - ADR (Beverages, Food & Tobacco) | | | 272,000 | | | | 21,615,840 | |
Grupo Aeroportuario del Sureste SAB de CV - ADR (Engineering & Construction) | | | 209,598 | | | | 10,563,739 | |
Grupo Financiero Banorte SAB de CV, Class O (Banks) | | | 5,001,840 | | | | 21,332,287 | |
Grupo Televisa SA - Sponsored ADR (Media) | | | 250,100 | | | | 5,614,745 | |
Urbi Desarrollos Urbanos SAB de CV (Building Materials)* | | | 6,778,500 | | | | 14,441,049 | |
Wal-Mart de Mexico SAB de CV, Class V - Sponsored ADR (Retail) | | | 1,482,414 | | | | 40,632,968 | |
| | | | | | | | |
| | | | | | | 175,042,092 | |
| | | | | | | | |
| | |
Panama - 0.4% | | | | | | |
Copa Holdings SA, Class A (Airlines) | | | 174,900 | | | | 8,872,677 | |
| | | | | | | | |
| | |
Peru - 1.6% | | | | | | |
Credicorp Ltd. (Banks) | | | 266,600 | | | | 33,559,608 | |
| | | | | | | | |
| | |
Philippines - 0.4% | | | | | | |
Philippine Long Distance Telephone Co. - Sponsored ADR (Telecommunications) | | | 127,215 | | | | 7,903,868 | |
| | | | | | | | |
| | |
Poland - 1.0% | | | | | | |
Bank Pekao SA (Banks) | | | 304,861 | | | | 19,928,228 | |
Central European Distribution Corp. (Beverages)* | | | 61,221 | | | | 1,528,688 | |
| | | | | | | | |
| | | | | | | 21,456,916 | |
| | | | | | | | |
See Notes to Financial Statements
30
Harding, Loevner Funds, Inc.
Emerging Markets Portfolio
Statement of Net Assets
October 31, 2010 (continued)
| | | | | | | | |
| | |
| | | Shares | | | Value (1) | |
| | |
Russia - 6.5% | | | | | | |
Gazprom OAO - Sponsored ADR (Oil & Gas) | | | 1,679,785 | | | $ | 36,774,051 | |
Lukoil OAO - Sponsored ADR (Oil & Gas) | | | 629,894 | | | | 35,179,580 | |
Sberbank of Russia (Banks) | | | 5,829,000 | | | | 19,286,686 | |
Wimm-Bill-Dann Foods OJSC - ADR (Food Retailers) | | | 195,645 | | | | 4,961,557 | |
X5 Retail Group NV - GDR, Reg S (Food)* | | | 925,985 | | | | 38,812,235 | |
| | | | | | | | |
| | | | | | | 135,014,109 | |
| | | | | | | | |
| | |
South Africa - 5.2% | | | | | | |
Aspen Pharmacare Holdings Ltd. (Healthcare - Products)* | | | 1,038,000 | | | | 13,840,680 | |
MTN Group Ltd. (Telecommunications) | | | 2,132,700 | | | | 38,314,959 | |
Pretoria Portland Cement Co. Ltd. (Building Materials) | | | 3,549,000 | | | | 16,909,502 | |
SABMiller plc (Beverages) | | | 690,600 | | | | 22,344,047 | |
Standard Bank Group Ltd. (Banks) | | | 1,044,033 | | | | 15,370,465 | |
| | | | | | | | |
| | | | | | | 106,779,653 | |
| | | | | | | | |
| | |
South Korea - 5.6% | | | | | | |
Hankook Tire Co., Ltd. (Auto Parts & Equipment) | | | 544,000 | | | | 14,121,089 | |
KB Financial Group Inc. - ADR (Diversified Financial Services) | | | 266,337 | | | | 11,958,531 | |
LG Electronics Inc. (Electrical Components & Equipment) | | | 180,500 | | | | 15,933,742 | |
Samsung Electronics Co., Ltd. - GDR, Reg S (Semiconductors) | | | 143,080 | | | | 47,826,777 | |
Samsung Fire & Marine Insurance Co., Ltd. (Insurance) | | | 155,700 | | | | 26,743,988 | |
| | | | | | | | |
| | | | | | | 116,584,127 | |
| | | | | | | | |
| | |
Taiwan - 9.3% | | | | | | |
Delta Electronics Inc. (Electrical Components & Equipment) | | | 9,405,751 | | | | 38,924,260 | |
Hon Hai Precision Industry Co., Ltd. (Electronics) | | | 7,383,040 | | | | 28,052,752 | |
MediaTek Inc. (Semiconductors) | | | 2,120,175 | | | | 26,682,852 | |
Quanta Computer Inc. (Computers) | | | 14,184,000 | | | | 26,055,673 | |
Synnex Technology International Corp. (Electronics) | | | 15,353,947 | | | | 37,602,679 | |
Taiwan Semiconductor Manufacturing Co., Ltd. (Semiconductors) | | | 16,404,637 | | | | 33,700,319 | |
| | | | | | | | |
| | | | | | | 191,018,535 | |
| | | | | | | | |
| | |
Thailand - 2.6% | | | | | | |
PTT Exploration & Production pcl, Class F (Oil & Gas) | | | 5,366,800 | | | | 30,609,381 | |
Siam Commercial Bank pcl (Banks) | | | 6,567,300 | | | | 22,451,933 | |
| | | | | | | | |
| | | | | | | 53,061,314 | |
| | | | | | | | |
| | |
Turkey - 3.3% | | | | | | |
Arcelik A/S (Home Furnishings) | | | 6,629,700 | | | | 36,507,292 | |
Turkiye Garanti Bankasi A/S (Banks) | | | 5,113,300 | | | | 31,052,222 | |
| | | | | | | | |
| | | | | | | 67,559,514 | |
| | | | | | | | |
See Notes to Financial Statements
31
Harding, Loevner Funds, Inc.
Emerging Markets Portfolio
Statement of Net Assets
October 31, 2010 (continued)
| | | | | | | | |
| | | Shares | | | Value (1) | |
| | |
United Kingdom - 1.5% | | | | | | | | |
Hikma Pharmaceuticals plc (Pharmaceuticals) | | | 2,424,123 | | | $ | 30,525,280 | |
| | | | | | | | |
| | |
Total Common Stocks (Cost $1,272,448,620) | | | | | | | 1,918,034,326 | |
| | | | | | | | |
| | |
Preferred Stocks - 4.5% | | | | | | | | |
| | |
Brazil - 2.6% | | | | | | | | |
Cia de Bebidas das Americas - ADR (Beverages) | | | 189,000 | | | | 26,316,360 | |
Itau Unibanco Holding SA - ADR (Banks) | | | 818,857 | | | | 20,111,131 | |
Petroleo Brasileiro SA - Sponsored ADR (Oil & Gas) | | | 130,000 | | | | 4,054,700 | |
Vale SA - Sponsored ADR (Mining) | | | 100,000 | | | | 2,873,000 | |
| | | | | | | | |
| | | | | | | 53,355,191 | |
| | | | | | | | |
| | |
Russia - 1.1% | | | | | | | | |
AK Transneft OAO (Pipelines) | | | 18,100 | | | | 21,901,000 | |
| | | | | | | | |
| | |
South Korea - 0.8% | | | | | | | | |
Samsung Electronics Co., Ltd. - GDR, Reg S (Semiconductors) | | | 69,359 | | | | 17,014,519 | |
| | | | | | | | |
| | |
Total Preferred Stocks (Cost $47,998,135) | | | | | | | 92,270,710 | |
| | | | | | | | |
| | |
Participation Notes - 0.5% | | | | | | | | |
| | |
Saudi Arabia - 0.5% | | | | | | | | |
Jarir Marketing Co., Issued by HSBC Bank plc, Maturity Date 6/4/12 (Retail)* | | | 246,000 | | | | 10,142,863 | |
| | | | | | | | |
| | |
Total Participation Notes (Cost $10,376,242) | | | | | | | 10,142,863 | |
| | | | | | | | |
| | |
Cash Equivalent - 2.9% | | | | | | | | |
Northern Institutional Funds - Diversified Assets Portfolio (Mutual Funds) | | | 60,985,089 | | | | 60,985,089 | |
| | | | | | | | |
Total Cash Equivalent (Cost $60,985,089) | | | | | | | 60,985,089 | |
| | | | | | | | |
| | |
Total Investments — 100.9% (Cost $ 1,391,808,086) | | | | | | $ | 2,081,432,988 | |
| | | | | | | | |
See Notes to Financial Statements
32
Harding, Loevner Funds, Inc.
Emerging Markets Portfolio
Statement of Net Assets
October 31, 2010 (continued)
Summary of Abbreviations
| | | | |
ADR | | American Depository Receipt |
GDR | | Global Depositary Receipt |
Reg S | | Security sold outside United States without registration under the Securities Act of 1933. |
(1) See Note 2 to Financial Statements.
* Non-income producing security.
See Notes to Financial Statements
33
Harding, Loevner Funds, Inc.
Emerging Markets Portfolio
Statement of Net Assets
October 31, 2010
| | | | |
| | | Value (1) | |
Liabilities, Net of Other Assets - (0.9)% | | | | |
Cash | | $ | 4,069 | |
Dividends and interest receivable | | | 1,773,329 | |
Foreign currency (cost $506,932) | | | 506,501 | |
Receivable for Fund shares sold | | | 4,383,231 | |
Tax reclaim receivable | | | 156,561 | |
Prepaid expenses | | | 4,284 | |
Payable to Investment Advisor | | | (2,173,034 | ) |
Payable for investments purchased | | | (19,277,397 | ) |
Payable for Fund shares redeemed | | | (1,713,243 | ) |
Payable for capital gains tax | | | (1,661,182 | ) |
Other liabilities | | | (1,181,491 | ) |
| | | | |
| | | (19,178,372 | ) |
| | | | |
Net Assets - 100% | | | | |
Applicable to 41,170,671 outstanding $.001 par value shares (authorized 450,000,000 shares) | | $ | 2,062,254,616 | |
| | | | |
| |
Net Asset Value, Offering Price and Redemption Price Per Share | | $ | 50.09 | |
| | | | |
| |
Components of Net Assets as of October 31, 2010 were as follows: | | | | |
Paid-in capital | | $ | 1,421,958,386 | |
Accumulated undistributed net investment income | | | 8,429,226 | |
Accumulated net realized loss from investment transactions | | | (56,096,108 | ) |
Net unrealized appreciation on investments and on assets and liabilities denominated in foreign currencies | | | 687,963,112 | |
| | | | |
| | $ | 2,062,254,616 | |
| | | | |
See Notes to Financial Statements
34
Harding, Loevner Funds, Inc.
Statements of Operations
Year Ended October 31, 2010
| | | | | | | | |
| | | Global
Equity
Portfolio | | | International
Equity
Portfolio | |
Investment Income | | | | | | | | |
Interest | | $ | 4,155 | | | $ | 3,227 | |
Dividends (net of foreign withholding taxes of $68,211 and $673,069, respectively) | | | 1,599,458 | | | | 7,285,951 | |
| | | | | | | | |
Total investment income | | | 1,603,613 | | | | 7,289,178 | |
| | | | | | | | |
| | |
Expenses | | | | | | | | |
Investment advisory fees (Note 3) | | | 1,102,310 | | | | 2,942,207 | |
Administration fees (Note 3) | | | 54,474 | | | | 191,910 | |
Distribution fees, Investor Class | | | — | | | | 180,796 | |
Custody and accounting fees (Note 3) | | | 81,441 | | | | 212,260 | |
Directors’ fees and expenses (Note 3) | | | 11,796 | | | | 42,252 | |
Transfer agent fees and expenses (Note 3) | | | 62,084 | | | | 88,178 | |
Printing and postage fees | | | 16,467 | | | | 40,876 | |
State registration filing fees | | | 17,037 | | | | 36,486 | |
Professional fees | | | 63,719 | | | | 96,776 | |
Shareholder servicing fees (Note 3) | | | 46,705 | | | | 62,845 | |
Other fees and expenses | | | 19,584 | | | | 52,397 | |
| | | | | | | | |
Total Expenses | | | 1,475,617 | | | | 3,946,983 | |
| | | | | | | | |
| | |
Less Waiver of investment advisory fee (Note 3) | | | (291,938 | ) | | | (52,453 | ) |
Less Custodian credits (Note 3) | | | (1,362 | ) | | | (11,658 | ) |
| | | | | | | | |
Net expenses | | | 1,182,317 | | | | 3,882,872 | |
| | | | | | | | |
| | |
Net investment income | | | 421,296 | | | | 3,406,306 | |
| | | | | | | | |
| | |
Realized and Unrealized Gain (Loss) | | | | | | | | |
Net realized gain (loss) — Investment transactions | | | 1,458,229 | | | | 7,929,353 | |
Foreign currency transactions | | | (132,241 | ) | | | (725,149 | ) |
| | | | | | | | |
Net realized gain | | | 1,325,988 | | | | 7,204,204 | |
| | | | | | | | |
| | |
Change in unrealized appreciation (depreciation) — Investments | | | 13,564,331 | | | | 78,078,060 | |
Translation of assets and liabilities denominated in foreign currencies | | | 4,778 | | | | 47 | |
| | | | | | | | |
Net change in unrealized appreciation | | | 13,569,109 | | | | 78,078,107 | |
| | | | | | | | |
Net realized and unrealized gain | | | 14,895,097 | | | | 85,282,311 | |
| | | | | | | | |
| | |
Net increase in net assets resulting from operations | | $ | 15,316,393 | | | $ | 88,688,617 | |
| | | | | | | | |
See Notes to Financial Statements
35
Harding, Loevner Funds, Inc.
Statements of Operation (continued)
Year Ended October 31, 2010
| | | | | | | | |
| | | International
Small
Companies
Portfolio | | | Emerging
Markets
Portfolio | |
Investment Income | | | | | | | | |
Interest | | $ | 11 | | | $ | 91,791 | |
Dividends (net of foreign withholding taxes of $25,605 and $4,269,374, respectively) | | | 231,014 | | | | 37,601,970 | |
| | | | | | | | |
Total investment income | | | 231,025 | | | | 37,693,761 | |
| | | | | | | | |
| | |
Expenses | | | | | | | | |
Investment advisory fees (Note 3) | | | 115,274 | | | | 21,638,791 | |
Administration fees (Note 3) | | | 7,730 | | | | 806,930 | |
Distribution fees, Investor Class | | | 23,055 | | | | — | |
Custody and accounting fees (Note 3) | | | 51,019 | | | | 1,305,069 | |
Directors’ fees and expenses (Note 3) | | | 999 | | | | 190,935 | |
Transfer agent fees and expenses (Note 3) | | | 30,356 | | | | 196,282 | |
Printing and postage fees | | | 2,596 | | | | 417,235 | |
State registration filing fees | | | 13,813 | | | | 40,611 | |
Professional fees | | | 32,506 | | | | 342,046 | |
Shareholder servicing fees (Note 3) | | | 4,689 | | | | 2,167,163 | |
Other fees and expenses | | | 7,427 | | | | 210,871 | |
| | | | | | | | |
Total Expenses | | | 289,464 | | | | 27,315,933 | |
| | | | | | | | |
| | |
Less Waiver of investment advisory fee and reimbursement of other operating expenses (Note 3) | | | (127,940 | ) | | | — | |
Less Custodian credits (Note 3) | | | (146 | ) | | | (27,096 | ) |
| | | | | | | | |
Net expenses | | | 161,378 | | | | 27,288,837 | |
| | | | | | | | |
| | |
Net investment income | | | 69,647 | | | | 10,404,924 | |
| | | | | | | | |
| | |
Realized and Unrealized Gain (Loss) | | | | | | | | |
Net realized gain (loss) — | | | | | | | | |
Investment transactions | | | (262,837 | ) | | | 111,097,356 | |
Foreign currency transactions | | | (23,581 | ) | | | (1,686,171 | ) |
| | | | | | | | |
Net realized gain (loss) | | | (286,418 | ) | | | 109,411,185 | |
| | | | | | | | |
| | |
Change in unrealized appreciation (depreciation) — | | | | | | | | |
Investments | | | 2,359,588 | | | | 300,597,854 | |
Translation of assets and liabilities denominated in foreign currencies | | | 1,511 | | | | 58,073 | |
| | | | | | | | |
Net change in unrealized appreciation | | | 2,361,099 | | | | 300,655,927 | |
| | | | | | | | |
Net realized and unrealized gain | | | 2,074,681 | | | | 410,067,112 | |
| | | | | | | | |
| | |
Net increase in net assets resulting from operations | | $ | 2,144,328 | | | $ | 420,472,036 | |
| | | | | | | | |
See Notes to Financial Statements
36
Harding, Loevner Funds, Inc.
Statements of Changes in Net Assets
| | | | | | | | |
| | | Global Equity Portfolio | |
| | |
| | | Year Ended
October 31,
2010 | | | Year Ended
October 31,
2009 | |
Increase in Net Assets From Operations | | | | | | | | |
Net investment income | | $ | 421,296 | | | $ | 187,248 | |
Net realized gain (loss) on investments and foreign currency transactions | | | 1,325,988 | | | | (1,603,345 | ) |
Net change in unrealized appreciation on investments and translation of assets and liabilities denominated in foreign currencies | | | 13,569,109 | | | | 16,795,335 | |
| | | | | | | | |
Net increase in net assets resulting from operations | | | 15,316,393 | | | | 15,379,238 | |
| | | | | | | | |
| | |
Distributions to Shareholders from: | | | | | | | | |
Net investment income | | | | | | | | |
Advisor Class | | | (50,029 | ) | | | (140,635 | ) |
Institutional Class | | | (99,325 | ) | | | — | |
| | | | | | | | |
Total distributions to shareholders | | | (149,354 | ) | | | (140,635 | ) |
| | | | | | | | |
| | |
Transactions in shares of Common Stock | | | | | | | | |
Proceeds from sale of shares | | | | | | | | |
Advisor Class | | | 28,868,395 | | | | 29,033,478 | |
Institutional Class(1) | | | 100,707,733 | | | | — | |
Net Asset Value of shares issued to shareholders upon reinvestment of dividends | | | | | | | | |
Advisor Class | | | 93,525 | | | | 76,577 | |
Institutional Class(1) | | | 50,029 | | | | — | |
Cost of shares redeemed | | | | | | | | |
Advisor Class | | | (55,305,981 | ) | | | (3,752,668 | ) |
Institutional Class(1) | | | (5,887,335 | ) | | | — | |
Redemption fees | | | | | | | | |
Advisor Class | | | 2,461 | | | | 6,503 | |
Institutional Class(1) | | | 219,316 | | | | — | |
| | | | | | | | |
| | |
Net increase in net assets from Fund share transactions | | | 68,748,143 | | | | 25,363,890 | |
| | | | | | | | |
| | |
Net increase in net assets | | | 83,915,182 | | | | 40,602,493 | |
| | |
Net Assets | | | | | | | | |
At beginning of year | | | 66,810,313 | | | | 26,207,820 | |
| | | | | | | | |
At end of year | | $ | 150,725,495 | | | $ | 66,810,313 | |
| | | | | | | | |
| | |
Accumulated undistributed net investment income included in net assets | | $ | 288,950 | | | $ | 149,249 | |
| | | | | | | | |
(1) The Institutional Class shares commenced operations on November 3, 2009.
See Notes to Financial Statements
37
Harding, Loevner Funds, Inc.
Statements of Changes in Net Assets (continued)
| | | | | | | | |
| | | International Equity Portfolio | |
| | |
| | | Year Ended
October 31,
2010 | | | Year Ended
October 31,
2009 | |
Increase in Net Assets From Operations | | | | | | | | |
Net investment income | | $ | 3,406,306 | | | $ | 2,856,596 | |
Net realized gain (loss) on investments and foreign currency transactions | | | 7,204,204 | | | | (11,943,588 | ) |
Net change in unrealized appreciation on investments and translation of assets and liabilities denominated in foreign currencies | | | 78,078,107 | | | | 76,759,308 | |
| | | | | | | | |
Net increase in net assets resulting from operations | | | 88,688,617 | | | | 67,672,316 | |
| | | | | | | | |
| | |
Distributions to Shareholders from: | | | | | | | | |
Net investment income | | | | | | | | |
Investor Class | | | (290,844 | ) | | | (160,740 | ) |
Institutional Class | | | (2,239,441 | ) | | | (3,101,928 | ) |
Net realized gain (loss) from investments and foreign-currency related transactions | | | | | | | | |
Investor Class | | | — | | | | (2,318,758 | ) |
Institutional Class | | | — | | | | (36,230,389 | ) |
| | | | | | | | |
Total distributions to shareholders | | | (2,530,285 | ) | | | (41,811,815 | ) |
| | | | | | | | |
| | |
Transactions in shares of Common Stock | | | | | | | | |
Proceeds from sale of shares | | | | | | | | |
Investor Class | | | 90,915,148 | | | | 24,524,810 | |
Institutional Class | | | 248,771,466 | | | | 37,754,041 | |
Net Asset Value of shares issued to shareholders upon reinvestment of dividends | | | | | | | | |
Investor Class | | | 275,089 | | | | 2,337,103 | |
Institutional Class | | | 2,164,593 | | | | 38,985,473 | |
Cost of shares redeemed | | | | | | | | |
Investor Class | | | (28,647,976 | ) | | | (5,664,340 | ) |
Institutional Class | | | (87,480,052 | ) | | | (29,797,831 | ) |
Redemption fees | | | | | | | | |
Investor Class | | | 33,275 | | | | 2,232 | |
Institutional Class | | | 41,527 | | | | 9,202 | |
| | |
| | | | | | | | |
Net increase in net assets from Fund share transactions | | | 226,073,070 | | | | 68,150,690 | |
| | | | | | | | |
| | |
Net increase in net assets | | | 312,231,402 | | | | 94,011,191 | |
| | |
Net Assets | | | | | | | | |
At beginning of year | | | 297,583,335 | | | | 203,572,144 | |
| | | | | | | | |
At end of year | | $ | 609,814,737 | | | $ | 297,583,335 | |
| | | | | | | | |
Accumulated undistributed net investment income included in net assets | | $ | 2,516,364 | | | $ | 2,365,492 | |
| | | | | | | | |
See Notes to Financial Statements
38
Harding, Loevner Funds, Inc.
Statements of Changes in Net assets (continued)
| | | | | | | | |
| | | International Small Companies Portfolio | |
| | |
| | | Year Ended
October 31,
2010 | | | Year Ended
October 31,
2009 | |
Increase in Net Assets From Operations | | | | | | | | |
Net investment income | | $ | 69,647 | | | $ | 40,295 | |
Net realized loss on investments and foreign currency transactions | | | (286,418 | ) | | | (276,304 | ) |
Net change in unrealized appreciation on investments and translation of assets and liabilities denominated in foreign currencies | | | 2,361,099 | | | | 2,407,963 | |
| | | | | | | | |
Net increase in net assets resulting from operations | | | 2,144,328 | | | | 2,171,954 | |
| | | | | | | | |
| | |
Distributions to Shareholders from: | | | | | | | | |
Net investment income | | | | | | | | |
Investor Class | | | (37,613 | ) | | | (35,907 | ) |
| | | | | | | | |
Total distributions to shareholders | | | (37,613 | ) | | | (35,907 | ) |
| | | | | | | | |
| | |
Transactions in shares of Common Stock | | | | | | | | |
Proceeds from sale of shares | | | | | | | | |
Investor Class | | | 6,382,332 | | | | 1,954,457 | |
Net Asset Value of shares issued to shareholders upon reinvestment of dividends | | | | | | | | |
Investor Class | | | 34,099 | | | | 35,907 | |
Cost of shares redeemed | | | | | | | | |
Investor Class | | | (774,124 | ) | | | (687,371 | ) |
Redemption fees | | | | | | | | |
Investor Class | | | 267 | | | | — | |
| | |
| | | | | | | | |
Net increase in net assets from Fund share transactions | | | 5,642,574 | | | | 1,302,993 | |
| | | | | | | | |
| | |
Net increase in net assets | | | 7,749,289 | | | | 3,439,040 | |
| | |
Net Assets | | | | | | | | |
At beginning of year | | | 6,215,393 | | | | 2,776,353 | |
| | | | | | | | |
At end of year | | $ | 13,964,682 | | | $ | 6,215,393 | |
| | | | | | | | |
| | |
Accumulated undistributed net investment income included in net assets | | $ | 46,011 | | | $ | 37,558 | |
| | | | | | | | |
See Notes to Financial Statements
39
Harding, Loevner Funds, Inc.
Statements of Changes in Net Assets (continued)
| | | | | | | | |
| | | Emerging Markets Portfolio | |
| | |
| | | Year Ended
October 31,
2010 | | | Year Ended
October 31,
2009 | |
Increase in Net Assets From Operations | | | | | | | | |
Net investment income | | $ | 10,404,924 | | | $ | 6,648,537 | |
Net realized gain (loss) on investments and foreign currency transactions | | | 109,411,185 | | | | (144,092,064 | ) |
Net change in unrealized appreciation on investments and translation of assets and liabilities denominated in foreign currencies | | | 300,655,927 | | | | 632,325,109 | |
| | | | | | | | |
Net increase in net assets resulting from operations | | | 420,472,036 | | | | 494,881,582 | |
| | | | | | | | |
| | |
Distributions to Shareholders from: | | | | | | | | |
Net investment income | | | (4,884,029 | ) | | | (36,974,029 | ) |
| | | | | | | | |
Total distributions to shareholders | | | (4,884,029 | ) | | | (36,974,029 | ) |
| | | | | | | | |
| | |
Transactions in shares of Common Stock | | | | | | | | |
Proceeds from sale of shares | | | 529,347,127 | | | | 522,043,263 | |
Net Asset Value of shares issued to shareholders upon reinvestment of dividends | | | 4,437,332 | | | | 30,745,773 | |
Cost of shares redeemed | | | (428,112,438 | ) | | | (556,153,126 | ) |
Redemption fees | | | 172,841 | | | | 154,275 | |
| | | | | | | | |
Net increase (decrease) in net assets from Fund share transactions | | | 105,844,862 | | | | (3,209,815 | ) |
| | | | | | | | |
| | |
Net increase in net assets | | | 521,432,869 | | | | 454,697,738 | |
| | |
Net Assets | | | | | | | | |
At beginning of year | | | 1,540,821,747 | | | | 1,086,124,009 | |
| | | | | | | | |
At end of year | | $ | 2,062,254,616 | | | $ | 1,540,821,747 | |
| | | | | | | | |
Accumulated undistributed net investment income included in net assets | | $ | 8,429,226 | | | $ | 4,594,502 | |
| | | | | | | | |
See Notes to Financial Statements
40
Harding Loevner Funds, Inc.
Financial Highlights
| | | | | | | | | | | | | | | | | | | | | | | | | | | | | | | | | | | | | | | | | | | | | | | | | | | | | | | | | | | | |
| | | Global Equity Portfolio - Advisor Class | |
| | | For the Year
Ended
Oct. 31, 2010 | | | For the Year
Ended
Oct. 31, 2009 | | | For the Year
Ended
Oct. 31, 2008 | | | For the Year
Ended
Oct. 31, 2007 | | | For the Year
Ended
Oct. 31, 2006 | |
Per Share Data | | | | | | | | | | | | | | | | | | | | | | | | | | | | | | | | | | | | | | | | | | | | | | | | | | | | | | | | | | | | |
Net asset value, beginning of year | | | | | | $ | 20.27 | | | | | | | | | | | $ | 15.92 | | | | | | | | | | | $ | 28.03 | | | | | | | | | | | $ | 24.04 | | | | | | | | | | | $ | 20.36 | | | | | |
| | | | | | | | | | | | | | | | | | | | | | | | | | | | | | | | | | | | | | | | | | | | | | | | | | | | | | | | | | | | |
| | | | | | | | | | | | | | | |
Increase (Decrease) in Net Assets from Operations | | | | | | | | | | | | | | | | | | | | | | | | | | | | | | | | | | | | | | | | | | | | | | | | | | | | | | | | | | | | |
Net investment income | | | | | | | 0.10 | | | | | | | | | | | | 0.06 | | | | | | | | | | | | 0.12 | | | | | | | | | | | | 0.09 | | | | | | | | | | | | 0.08 | | | | | |
Net realized and unrealized gain (loss) on investments and foreign currency-related transactions | | | | | | | 3.15 | | | | | | | | | | | | 4.38 | | | | | | | | | | | | (10.15 | ) | | | | | | | | | | | 5.78 | | | | | | | | | | | | 4.14 | | | | | |
| | | | | | | | | | | | | | | | | | | | | | | | | | | | | | | | | | | | | | | | | | | | | | | | | | | | | | | | | | | | |
Net increase (decrease) from investment operations | | | | | | | 3.25 | | | | | | | | | | | | 4.44 | | | | | | | | | | | | (10.03 | ) | | | | | | | | | | | 5.87 | | | | | | | | | | | | 4.22 | | | | | |
| | | | | | | | | | | | | | | | | | | | | | | | | | | | | | | | | | | | | | | | | | | | | | | | | | | | | | | | | | | | |
| | | | | | | | | | | | | | | |
Distributions to Shareholders from: | | | | | | | | | | | | | | | | | | | | | | | | | | | | | | | | | | | | | | | | | | | | | | | | | | | | | | | | | | | | |
Net investment income | | | | | | | (0.04 | ) | | | | | | | | | | | (0.09 | ) | | | | | | | | | | | (0.08 | ) | | | | | | | | | | | (0.08 | ) | | | | | | | | | | | (0.06 | ) | | | | |
Net realized gain from investments and foreign currency-related transactions | | | | | | | — | | | | | | | | | | | | — | | | | | | | | | | | | (2.00 | ) | | | | | | | | | | | (1.80 | ) | | | | | | | | | | | (0.48 | ) | | | | |
| | | | | | | | | | | | | | | | | | | | | | | | | | | | | | | | | | | | | | | | | | | | | | | | | | | | | | | | | | | | |
Total distributions | | | | | | | (0.04 | ) | | | | | | | | | | | (0.09 | ) | | | | | | | | | | | (2.08 | ) | | | | | | | | | | | (1.88 | ) | | | | | | | | | | | (0.54 | ) | | | | |
| | | | | | | | | | | | | | | | | | | | | | | | | | | | | | | | | | | | | | | | | | | | | | | | | | | | | | | | | | | | |
Net asset value, end of year | | | | | | $ | 23.48 | | | | | | | | | | | $ | 20.27 | | | | | | | | | | | $ | 15.92 | | | | | | | | | | | $ | 28.03 | | | | | | | | | | | $ | 24.04 | | | | | |
| | | | | | | | | | | | | | | | | | | | | | | | | | | | | | | | | | | | | | | | | | | | | | | | | | | | | | | | | | | | |
| | | | | | | | | | | | | | | |
Total Return | | | | | | | 16.07 | % | | | | | | | | | | | 28.05 | % | | | | | | | | | | | (38.54 | )% | | | | | | | | | | | 26.01 | % | | | | | | | | | | | 21.08 | % | | | | |
| | | | | | | | | | | | | | | |
Ratios/Supplemental Data: | | | | | | | | | | | | | | | | | | | | | | | | | | | | | | | | | | | | | | | | | | | | | | | | | | | | | | | | | | | | |
Net assets, end of year (000’s) | | | | | | $ | 46,450 | | | | | | | | | | | $ | 66,810 | | | | | | | | | | | $ | 26,208 | | | | | | | | | | | $ | 39,802 | | | | | | | | | | | $ | 31,106 | | | | | |
| | | | | | | | | | | | | | | |
Net expenses to average net assets | | | | | | | 1.17 | % | | | | | | | | | | | 1.25 | % | | | | | | | | | | | 1.25 | % | | | | | | | | | | | 1.25 | % | | | | | | | | | | | 1.25 | % | | | | |
| | | | | | | | | | | | | | | |
Net investment income to average net assets | | | | | | | 0.31 | % | | | | | | | | | | | 0.43 | % | | | | | | | | | | | 0.51 | % | | | | | | | | | | | 0.34 | % | | | | | | | | | | | 0.37 | % | | | | |
| | | | | | | | | | | | | | | |
Decrease reflected in above expense ratios due to expense reductions | | | | | | | 0.24 | % | | | | | | | | | | | 0.38 | % | | | | | | | | | | | 0.20 | % | | | | | | | | | | | 0.18 | % | | | | | | | | | | | 0.35 | % | | | | |
| | | | | | | | | | | | | | | |
Portfolio turnover rate | | | | | | | 35 | % | | | | | | | | | | | 31 | % | | | | | | | | | | | 38 | % | | | | | | | | | | | 16 | % | | | | | | | | | | | 27 | % | | | | |
See Notes to Financial Statements
41
Harding Loevner Funds, Inc.
Financial Highlights
(continued)
| | | | | | | | | | | | | | | | | | | | | | | | | | | | | | | | | | | | | | | | | | | | | | | | | | | | | | | | | | | | |
| | | International Equity
Portfolio - Investor Class | |
| | | For the Year
Ended
Oct. 31, 2010 | | | For the Year
Ended
Oct. 31, 2009 | | | For the Year
Ended
Oct. 31, 2008 | | | For the Year
Ended
Oct. 31, 2007 | | | For the Year
Ended
Oct. 31, 2006 | |
Per Share Data | | | | | | | | | | | | | | | | | | | | | | | | | | | | | | | | | | | | | | | | | | | | | | | | | | | | | | | | | | | | |
Net asset value, beginning of year | | | | | | $ | 12.02 | | | | | | | | | | | $ | 11.41 | | | | | | | | | | | $ | 21.66 | | | | | | | | | | | $ | 18.65 | | | | | | | | | | | $ | 14.91 | | | | | |
| | | | | | | | | | | | | | | | | | | | | | | | | | | | | | | | | | | | | | | | | | | | | | | | | | | | | | | | | | | | |
| | | | | | | | | | | | | | | |
Increase (Decrease) in Net Assets from Operations | | | | | | | | | | | | | | | | | | | | | | | | | | | | | | | | | | | | | | | | | | | | | | | | | | | | | | | | | | | | |
Net investment income | | | | | | | 0.09 | | | | | | | | | | | | 0.13 | | | | | | | | | | | | 0.13 | | | | | | | | | | | | 0.09 | | | | | | | | | | | | 0.11 | (1) | | | | |
Net realized and unrealized gain (loss) on investments and foreign currency-related transactions | | | | | | | 2.44 | | | | | | | | | | | | 2.83 | | | | | | | | | | | | (8.58 | ) | | | | | | | | | | | 4.32 | | | | | | | | | | | | 3.71 | | | | | |
| | | | | | | | | | | | | | | | | | | | | | | | | | | | | | | | | | | | | | | | | | | | | | | | | | | | | | | | | | | | |
Net increase (decrease) from investment operations | | | | | | | 2.53 | | | | | | | | | | | | 2.96 | | | | | | | | | | | | (8.45 | ) | | | | | | | | | | | 4.41 | | | | | | | | | | | | 3.82 | | | | | |
| | | | | | | | | | | | | | | | | | | | | | | | | | | | | | | | | | | | | | | | | | | | | | | | | | | | | | | | | | | | |
| | | | | | | | | | | | | | | |
Distributions to Shareholders from: | | | | | | | | | | | | | | | | | | | | | | | | | | | | | | | | | | | | | | | | | | | | | | | | | | | | | | | | | | | | |
Net investment income | | | | | | | (0.08 | ) | | | | | | | | | | | (0.15 | ) | | | | | | | | | | | (0.11 | ) | | | | | | | | | | | (0.06 | ) | | | | | | | | | | | (0.07 | ) | | | | |
Net realized gain from investments and foreign currency-related transactions | | | | | | | — | | | | | | | | | | | | (2.20 | ) | | | | | | | | | | | (1.69 | ) | | | | | | | | | | | (1.34 | ) | | | | | | | | | | | (0.01 | ) | | | | |
| | | | | | | | | | | | | | | | | | | | | | | | | | | | | | | | | | | | | | | | | | | | | | | | | | | | | | | | | | | | |
Total distributions | | | | | | | (0.08 | ) | | | | | | | | | | | (2.35 | ) | | | | | | | | | | | (1.80 | ) | | | | | | | | | | | (1.40 | ) | | | | | | | | | | | (0.08 | ) | | | | |
| | | | | | | | | | | | | | | | | | | | | | | | | | | | | | | | | | | | | | | | | | | | | | | | | | | | | | | | | | | | |
Net asset value, end of year | | | | | | $ | 14.47 | | | | | | | | | | | $ | 12.02 | | | | | | | | | | | $ | 11.41 | | | | | | | | | | | $ | 21.66 | | | | | | | | | | | $ | 18.65 | | | | | |
| | | | | | | | | | | | | | | | | | | | | | | | | | | | | | | | | | | | | | | | | | | | | | | | | | | | | | | | | | | | |
| | | | | | | | | | | | | | | |
Total Return | | | | | | | 21.18 | % | | | | | | | | | | | 32.48 | % | | | | | | | | | | | (42.46 | )% | | | | | | | | | | | 24.95 | % | | | | | | | | | | | 25.74 | % | | | | |
| | | | | | | | | | | | | | | |
Ratios/Supplemental Data: | | | | | | | | | | | | | | | | | | | | | | | | | | | | | | | | | | | | | | | | | | | | | | | | | | | | | | | | | | | | |
Net assets, end of year (000’s) | | | | | | $ | 116,465 | | | | | | | | | | | $ | 38,134 | | | | | | | | | | | $ | 12,122 | | | | | | | | | | | $ | 16,637 | | | | | | | | | | | $ | 9,884 | | | | | |
| | | | | | | | | | | | | | | |
Net expenses to average net assets | | | | | | | 1.25 | % | | | | | | | | | | | 1.25 | % | | | | | | | | | | | 1.23 | % | | | | | | | | | | | 1.23 | % | | | | | | | | | | | 1.25 | % | | | | |
| | | | | | | | | | | | | | | |
Net investment income to average net assets | | | | | | | 0.69 | % | | | | | | | | | | | 1.03 | % | | | | | | | | | | | 0.81 | % | | | | | | | | | | | 0.48 | % | | | | | | | | | | | 0.61 | % | | | | |
| | | | | | | | | | | | | | | |
Decrease reflected in above expense ratios due to expense reductions | | | | | | | 0.07 | % | | | | | | | | | | | 0.14 | % | | | | | | | | | | | — | % | | | | | | | | | | | — | % | | | | | | | | | | | 0.01 | % | | | | |
| | | | | | | | | | | | | | | |
Portfolio turnover rate | | | | | | | 33 | % | | | | | | | | | | | 22 | % | | | | | | | | | | | 18 | % | | | | | | | | | | | 19 | % | | | | | | | | | | | 35 | % | | | | |
(1) Computed using average shares outstanding throughout the year.
See Notes to Financial Statements
42
Harding, Loevner Funds, Inc.
Financial Highlights
(continued)
| | | | | | | | | | | | | | | | |
| | | International Small Companies
Portfolio - - Investor Class | |
| | | | |
| | | For the Year
Ended
Oct. 31, 2010 | | | For the Year
Ended
Oct. 31, 2009 | | | For the Year
Ended
Oct. 31, 2008 | | | For the Year
Ended
Oct. 31, 2007(1) | |
Per Share Data | | | | | | | | | | | | | | | | |
Net asset value, beginning of year | | $ | 8.92 | | | $ | 5.53 | | | $ | 11.67 | | | $ | 10.00 | |
| | | | | | | | | | | | | | | | |
| | | | |
Increase (Decrease) in Net Assets from Operations | | | | | | | | | | | | | | | | |
Net investment income | | | 0.05 | | | | 0.06 | | | | 0.11 | | | | 0.02 | |
Net realized and unrealized gain (loss) on investments and foreign currency-related transactions | | | 1.90 | | | | 3.40 | | | | (6.15 | ) | | | 1.65 | |
| | | | | | | | | | | | | | | | |
Net increase (decrease) from investment operations | | | 1.95 | | | | 3.46 | | | | (6.04 | ) | | | 1.67 | |
| | | | | | | | | | | | | | | | |
| | | | |
Distributions to Shareholders from: | | | | | | | | | | | | | | | | |
Net investment income | | | (0.05 | ) | | | (0.07 | ) | | | (0.03 | ) | | | — | |
Net realized gain from investments and foreign currency-related transactions | | | — | | | | — | | | | (0.07 | ) | | | — | |
| | | | | | | | | | | | | | | | |
Total distributions | | | (0.05 | ) | | | (0.07 | ) | | | (0.10 | ) | | | — | |
| | | | | | | | | | | | | | | | |
Net asset value, end of year | | $ | 10.82 | | | $ | 8.92 | | | $ | 5.53 | | | $ | 11.67 | |
| | | | | | | | | | | | | | | | |
| | | | |
Total Return | | | 21.93 | % | | | 63.47 | % | | | (52.17 | )% | | | 16.70 | %(A) |
| | | | |
Ratios/Supplemental Data: | | | | | | | | | | | | | | | | |
Net assets, end of year (000’s) | | $ | 13,972 | | | $ | 6,215 | | | $ | 2,776 | | | $ | 5,204 | |
| | | | |
Net expenses to average net assets | | | 1.75 | % | | | 1.75 | % | | | 1.75 | % | | | 1.75 | %(B) |
| | | | |
Net investment income to average net assets | | | 0.76 | % | | | 1.04 | % | | | 1.22 | % | | | 0.56 | %(B) |
| | | | |
Decrease reflected in above expense ratios due to expense reductions | | | 1.39 | % | | | 3.46 | % | | | 2.47 | % | | | 8.19 | %(B) |
| | | | |
Portfolio turnover rate | | | 11 | % | | | 24 | % | | | 26 | % | | | 12 | %(A) |
(1) For the period from March 26, 2007 (commencement of operations) through October 31, 2007.
(A) Not Annualized.
(B) Annualized.
See Notes to Financial Statements
43
Harding, Loevner Funds, Inc.
Financial Highlights
(continued)
| | | | | | | | | | | | | | | | | | | | |
| | | Emerging Markets Portfolio | |
| | | | | |
| | | For the Year
Ended
Oct. 31, 2010 | | | For the Year
Ended
Oct. 31, 2009 | | | For the Year
Ended
Oct. 31, 2008 | | | For the Year
Ended
Oct. 31, 2007 | | | For the Year
Ended
Oct. 31, 2006 | |
Per Share Data | | | | | | | | | | | | | | | | | | | | |
Net asset value, beginning of year | | $ | 39.64 | | | $ | 27.73 | | | $ | 64.07 | | | $ | 40.67 | | | $ | 30.41 | |
| | | | | | | | | | | | | | | | | | | | |
| | | | | |
Increase (Decrease) in Net Assets from Operations | | | | | | | | | | | | | | | | | | | | |
Net investment income | | | 0.25 | | | | 0.26 | | | | 1.12 | | | | 0.16 | | | | 0.22 | |
Net realized and unrealized gain (loss) on investments and foreign currency-related transactions | | | 10.33 | | | | 12.68 | | | | (34.06 | ) | | | 23.26 | | | | 10.19 | |
| | | | | | | | | | | | | | | | | | | | |
Net increase (decrease) from investment operations | | | 10.58 | | | | 12.94 | | | | (32.94 | ) | | | 23.42 | | | | 10.41 | |
| | | | | | | | | | | | | | | | | | | | |
| | | | | |
Distributions to Shareholders from: | | | | | | | | | | | | | | | | | | | | |
Net investment income | | | (0.13 | ) | | | (1.03 | ) | | | (0.12 | ) | | | (0.02 | ) | | | (0.09 | ) |
Net realized gain from investments and foreign currency-related transactions | | | — | | | | — | | | | (3.28 | ) | | | — | | | | (0.06 | ) |
| | | | | | | | | | | | | | | | | | | | |
Total distributions | | | (0.13 | ) | | | (1.03 | ) | | | (3.40 | ) | | | (0.02 | ) | | | (0.15 | ) |
| | | | | | | | | | | | | | | | | | | | |
Net asset value, end of year | | $ | 50.09 | | | $ | 39.64 | | | $ | 27.73 | | | $ | 64.07 | | | $ | 40.67 | |
| | | | | | | | | | | | | | | | | | | | |
| | | | | |
Total Return | | | 26.77 | % | | | 48.44 | % | | | (54.17 | )% | | | 57.62 | % | | | 34.29 | % |
| | | | | |
Ratios/Supplemental Data: | | | | | | | | | | | | | | | | | | | | |
Net assets, end of year (000’s) | | $ | 2,062,255 | | | $ | 1,540,822 | | | $ | 1,086,124 | | | $ | 2,562,957 | | | $ | 1,452,468 | |
| | | | | |
Net expenses to average net assets | | | 1.58 | % | | | 1.64 | % | | | 1.61 | % | | | 1.60 | % | | | 1.63 | % |
| | | | | |
Net investment income to average net assets | | | 0.60 | % | | | 0.56 | % | | | 2.10 | % | | | 0.36 | % | | | 0.61 | % |
| | | | | |
Portfolio turnover rate | | | 25 | % | | | 48 | % | | | 46 | % | | | 29 | % | | | 59 | % |
See Notes to Financial Statements
44
Harding, Loevner Funds, Inc.
Notes to Financial Statements
October 31, 2010
1. Organization
Harding, Loevner Funds, Inc. (the “Fund”) was organized as a Maryland corporation on July 31, 1996 and is registered under the Investment Company Act of 1940, as amended, (“1940 Act”), as an open-end diversified management investment company. The Fund currently has six Portfolios all of which were active as of October 31, 2010: Global Equity Portfolio (“Global Equity”); International Equity Portfolio (“International Equity”); Institutional Emerging Markets Portfolio (“Institutional Emerging Markets”); International Small Companies Portfolio (“International Small Companies”); Emerging Markets Portfolio (“Emerging Markets”) and Frontier Emerging Markets Portfolio (“Frontier Emerging Markets”). Information presented in these financial statements pertains to the Advisor Class shares of Global Equity, the Investor Class shares of International Equity, the Investor Class shares of International Small Companies and Emerging Markets (individually, “Portfolio”; collectively, “Portfolios”). Information pertaining to the Institutional Class shares of Global Equity, the Institutional Class shares of International Equity, Institutional Emerging Markets and Frontier Emerging Markets is presented in a separate report. The investment objective of each Portfolio is as follows: Global Equity—to seek long-term capital appreciation through investments in equity securities of companies based both inside and outside the United States; International Equity—to seek long-term capital appreciation through investments in equity securities of companies based outside the United States; International Small Companies—to seek long-term capital appreciation through investments in equity securities of small companies based outside the United States; Emerging Markets—to seek long-term capital appreciation through investments in equity securities of companies based in emerging markets.
International Equity commenced operations on October 31, 1996 after acquiring the net assets of Harding Loevner LP’s AMT Capital Fund, Inc. Global Equity commenced operations on December 1, 1996 following the acquisition of net assets of HLM Global Equity Limited Partnership, a limited partnership, in a tax-free reorganization. Emerging Markets commenced operations on November 9, 1998. Effective August 5, 2005, International Equity launched Investor Class shares and converted existing shareholders to the Institutional Class. Investor Class of International Small Companies commenced operations on March 26, 2007. Effective November 3, 2009, Global Equity Portfolio launched Institutional Class shares and re-designated existing shares as Advisor Class shares.
The Fund is managed by Harding Loevner LP (the “Investment Advisor”).
2. Summary of Significant Accounting Policies
The accounting policies of the Fund are in conformity with accounting principles generally accepted in the United States (“GAAP”) for investment companies. The following is a summary of the Fund’s significant accounting policies:
Indemnifications
Under the Fund’s organizational document, its officers and Board of Directors (“Board”) are indemnified against certain liability arising out of the performance of their duties to the Portfolios. In the normal course of business, the Fund may enter into contracts that contain a variety of representations or that provide indemnification for certain liabilities. The Fund’s maximum exposure under these arrangements is unknown, as this would involve future claims that may be made against the Fund that have not yet occurred. However, the Fund has not had prior claims or losses pursuant to these contracts and expects the risk of loss to be remote.
Estimates
The preparation of financial statements in accordance with GAAP requires management to make estimates and assumptions that affect the reported amounts and disclosures in the financial statements. Actual results could differ from those estimates.
Valuation
The Board has adopted procedures (“Procedures”) to govern the valuation of the securities held by each Portfolio of the Fund in accordance with the 1940 Act. The Procedures incorporate principles set forth in relevant pronouncements of the Securities and Exchange Commission (“SEC”) and its staff, including guidance on the obligations of the Portfolios and the Board to determine, in good faith, the fair value of the Portfolios’ securities when market quotations are not readily available.
In determining a Portfolio’s net asset value (“NAV”), each equity security traded on a securities exchange, including the NASDAQ Stock Market, and over-the-counter securities, are first valued at the closing price on the exchange or market designated by the Fund’s accounting agent as the principal exchange (each, a “principal exchange”). The closing price provided by the Fund’s accounting agent for a principal exchange may differ from the price quoted elsewhere and may represent information such as last sales price, an official closing price, a closing auction price or other information, depending on exchange or market convention. Shares of open-end mutual funds are valued at NAV.
45
Harding, Loevner Funds, Inc.
Notes to Financial Statements
October 31, 2010
2. Summary of Significant Accounting Policies (continued)
Since trading in many foreign securities is normally completed before the time at which a Portfolio calculates its NAV, the effect on the value of such securities held by a Portfolio of events that occur between the close of trading in the security and the time at which the Portfolio prices its securities would not be reflected in the Portfolio’s calculation of its NAV if foreign securities were generally valued at their closing prices.
To address this issue, the Board has approved daily fair value pricing of certain foreign equity securities. The fair value pricing utilizes quantitative models developed by an independent pricing service, which may provide an adjustment to the closing prices described above. Use of fair value pricing could cause a Portfolio to value a security higher or lower than its closing market price, which could cause the Portfolio’s NAV per share to differ significantly from that which would have been calculated using closing market prices. The use of fair value pricing is intended to decrease the opportunities for persons to engage in “time zone arbitrage,” i.e. trading intended to take advantage of stale closing prices in foreign markets that could affect the NAV of the Portfolios. Securities priced in this manner are not specifically designated on the Portfolios’ Schedules of Investments as being “fair valued”.
Any securities for which market quotations are not readily available or for which available prices are deemed unreliable are priced by the Investment Advisor at “fair value”, in accordance with the Procedures. Such securities are identified on the Portfolios’ Schedules of Investments as securities valued at “fair value”.
GAAP includes a topic which establishes a hierarchy for NAV determination purposes in which various inputs are used in determining the value of each Portfolio’s assets or liabilities. This topic defines fair value as the price that the Portfolio would receive upon selling an investment in a timely transaction to an independent buyer in the principal or most advantageous market of the investment. This topic establishes a three-tier hierarchy to maximize the use of observable market data and minimize the use of unobservable inputs and to establish classification of fair value measurements for disclosure purposes. Inputs may be observable or unobservable and refer broadly to the assumptions that market participants would use in pricing the asset or liability including assumptions about risk. Such risks include the inherent risk in a particular valuation technique which is used to measure fair value. This may include the pricing model and/or the inputs to the pricing model used in the valuation technique. Observable inputs are inputs that reflect the assumptions market participants would use in pricing the asset or liability developed based on market data obtained from sources independent of the reporting entity. Unobservable inputs are inputs that reflect the reporting entity’s own assumptions about the assumptions market participants would use in pricing the asset or liability developed based on the best information available in the circumstances. The three-tier hierarchy of inputs is summarized in the three broad levels listed below.
| | |
Level 1 | | quoted prices in active markets for identical investments |
Level 2 | | other significant observable inputs (including quoted prices for similar investments, interest rates, prepayment speeds, credit risk, etc.) |
Level 3 | | significant unobservable inputs (including the Portfolio’s own assumptions in determining the fair value of investments) |
The Portfolios disclose significant transfers between levels based on valuations at the end of each reporting period. GAAP provides additional guidance for estimating fair value when the volume and level of activity for the asset or liability have significantly decreased as well as guidance on identifying circumstances that indicate when a transaction is not orderly.
46
Harding, Loevner Funds, Inc.
Notes to Financial Statements
October 31, 2010
2. Summary of Significant Accounting Policies (continued)
The following is a summary of the inputs used as of October 31, 2010 in valuing the Portfolio’s investments:
Global Equity
| | | | | | | | | | | | | | | | |
ASSET VALUATION INPUT | | | | | | | | | | | | | | | | |
| Description | | Quoted Prices
in Active
Markets for
Identical Assets
(Level 1) | | | Significant
Other
Observable
Inputs (Level 2) | | | Significant
Unobservable
Inputs
(Level 3) | | | Total | |
Common Stocks | | | $91,005,772 | | | | $57,373,333 | | | | $— | | | | $148,379,105 | |
Rights | | | — | | | | 124,508 | | | | — | | | | 124,508 | |
Cash Equivalents | | | 2,059,862 | | | | — | | | | — | | | | 2,059,862 | |
| | | | | | | | | | | | | | | | |
Total Investments | | | $93,065,634 | | | | $57,497,841 | | | | $— | | | | $150,563,475 | |
| | | | | | | | | | | | | | | | |
| | | | |
| International Equity | | | | | | | | | | | | |
| ASSET VALUATION INPUT | | | | | | | | | | | | |
| Description | | Quoted Prices
in Active
Markets for
Identical Assets
(Level 1) | | | Significant
Other
Observable
Inputs (Level 2) | | | Significant
Unobservable
Inputs
(Level 3) | | | Total | |
Common Stocks | | | $134,388,498 | | | | $436,020,544 | | | | $— | | | | $570,409,042 | |
Preferred Stocks | | | 16,723,903 | | | | 5,691,213 | | | | — | | | | 22,415,116 | |
Rights | | | — | | | | 575,524 | | | | — | | | | 575,524 | |
Cash Equivalents | | | 46,293,164 | | | | — | | | | — | | | | 46,293,164 | |
| | | | | | | | | | | | | | | | |
Total Investments | | | $197,405,565 | | | | $442,287,281 | | | | $— | | | | $639,692,846 | |
| | | | | | | | | | | | | | | | |
| | | | |
| International Small Companies | | | | | | | | | | | | |
| ASSET VALUATION INPUT | | | | | | | | | | | | |
| Description | | Quoted Prices
in Active
Markets for
Identical Assets
(Level 1) | | | Significant
Other
Observable
Inputs (Level 2) | | | Significant
Unobservable
Inputs
(Level 3) | | | Total | |
Common Stocks | | | $437,650 | | | | $13,060,585 | | | | $— | | | | $13,498,235 | |
Preferred Stocks | | | — | | | | 183,187 | | | | — | | | | 183,187 | |
Warrants | | | 3,427 | | | | — | | | | — | | | | 3,427 | |
Cash Equivalents | | | 245,466 | | | | — | | | | — | | | | 245,466 | |
| | | | | | | | | | | | | | | | |
Total Investments | | | $686,543 | | | | $13,243,772 | | | | $— | | | | $13,930,315 | |
| | | | | | | | | | | | | | | | |
| | | | |
| Emerging Markets | | | | | | | | | | | | |
| ASSET VALUATION INPUT | | | | | | | | | | | | |
| Description | | Quoted Prices
in Active
Markets for
Identical Assets
(Level 1) | | | Significant
Other
Observable
Inputs (Level 2) | | | Significant
Unobservable
Inputs
(Level 3) | | | Total | |
Common Stocks | | | $755,903,000 | | | | $1,162,131,326 | | | | $— | | | | $1,918,034,326 | |
Preferred Stocks | | | 53,355,191 | | | | 38,915,519 | | | | — | | | | 92,270,710 | |
Participation Notes | | | — | | | | 10,142,863 | | | | — | | | | 10,142,863 | |
Cash Equivalents | | | 60,985,089 | | | | — | | | | — | | | | 60,985,089 | |
| | | | | | | | | | | | | | | | |
Total Investments | | | $870,243,280 | | | | $1,211,189,708 | | | | $— | | | | $2,081,432,988 | |
| | | | | | | | | | | | | | | | |
47
Harding, Loevner Funds, Inc.
Notes to Financial Statements
October 31, 2010
2. Summary of Significant Accounting Policies (continued)
Following is a reconciliation of investments for which significant unobservable inputs (Level 3) were used in determining value:
| | | | | | | | | | | | | | | | | | | | |
ASSET VALUATION INPUT |
| Investments in Securities |
| | | Balance as of
October 31,
2009 | | Accrued
Discounts
(Premiums) | | Realized
Gain (Loss) | | Change in
Unrealized
Appreciation
(Depreciation) | | Purchases | | Sales | | Transfers in to Level 3 | | Transfers
out of Level 3 | | Balance
as of
October 31,
2010 | | Change in
Unrealized
Appreciation
(Depreciation)
from
Investments
Held at
October 31,
2010 |
| |
International Equity | | | | | | | | | | | | | | | | | | | | |
Common Stocks | | $2,857,825 | | $0 | | ($44,295) | | $945,543 | | $2,322,188 | | ($260,059) | | $0 | | ($5,821,202) | | $0 | | $0 |
Securities
All securities transactions are recorded on a trade date basis. Interest income and expenses are recorded on an accrual basis. Dividend income is recorded on the ex-dividend date (except for certain foreign dividends that may be recorded as soon as the Portfolio is informed of such dividends). The Portfolios accrete discount or amortize premium using the effective interest method on a daily basis as adjustments to interest income and the cost of investments. The Portfolios use the specific identification method for determining realized gains or losses from sales of securities.
Expenses
Expenses directly attributed to a specific Portfolio of the Fund are charged to that Portfolio’s operations; expenses not directly attributable to a specific Portfolio are allocated among all the Portfolios of the Fund either based on their average daily net assets or by other equitable measures. Pursuant to the Fund’s multiple class expense allocation plan, certain expenses are allocated to particular classes of the Portfolios.
Dividends to Shareholders
It is the policy of the Portfolios to declare dividends from net investment income annually. Net short-term and long-term capital gains distributions for the Portfolios, if any, normally are distributed on an annual basis.
Dividends from net investment income and distributions from net realized gains from investment transactions have been determined in accordance with income tax regulations and may differ from net investment income and realized gains recorded by the Portfolios for financial reporting purposes. Differences result primarily from foreign currency transactions and timing differences related to recognition of income, and gains and losses from investment transactions. In general, to the extent that any differences which are permanent in nature result in over distributions to shareholders, the amount of the over distribution is reclassified within the capital accounts based on its federal tax basis treatment and may be reported as return of capital. Temporary differences do not require reclassification.
Currency Translation
Assets and liabilities denominated in foreign currencies and commitments under forward foreign currency exchange contracts are translated into U.S. dollars at the mean of the quoted bid and asked prices of such currencies against the U.S. dollar. Purchases and sales of the Portfolios’ securities are translated at the rates of exchange prevailing when such securities were acquired or sold. Income and expenses are translated at exchange rates prevailing when accrued. The Portfolios do not isolate that portion of the results of operations resulting from changes in foreign exchange rates on investments from the fluctuations arising from changes in market prices of securities held. Such fluctuations are included with the net realized and unrealized gain or loss from investments.
48
Harding, Loevner Funds, Inc.
Notes to Financial Statements
October 31, 2010
2. Summary of Significant Accounting Policies (continued)
Net realized gains and losses from foreign currency-related transactions arise from sales of foreign currency, currency gains or losses realized between the trade and settlement dates on securities transactions, and the difference between the amounts of dividends, interest, and foreign withholding taxes recorded on the Portfolios’ books, and the U.S. dollar equivalent of the amounts actually received or paid. Net unrealized appreciation or depreciation on translation of assets and liabilities denominated in foreign currencies arise from changes in the value of assets and liabilities other than investments in securities at the period end, resulting from changes in the exchange rates.
3. Significant Agreements and Transactions with Affiliates
The Board has approved an investment and advisory agreement (the “Agreement”) with the Investment Advisor. The advisory fees are computed daily and paid monthly at an annual rate of 1.00%, 0.75%, 1.25% and 1.25%, respectively, of the average daily net assets of Global Equity, International Equity, International Small Companies and Emerging Markets.
The Investment Advisor has voluntarily agreed to reduce its fee to the extent that aggregate expenses, excluding certain non-operating expenses, exceed an annual rate of 1.25%, 1.25%, and 1.75%, respectively, of the average daily net assets of Advisor Class shares of Global Equity, Investor Class shares of International Equity and Investor Class shares of International Small Companies. For the year ended October 31, 2010, the Investment Advisor voluntarily waived and/or reimbursed $291,938, $52,453 and $127,940 which came from investment advisory fees and other class-specific expenses from Global Equity, International Equity and International Small Companies, respectively.
Effective December 31, 2010, the Investment Advisor contractually agreed to extend the above-mentioned expense limitations until at least December 31, 2011.
The Fund entered into an administration agreement effective June 14, 2010 with The Northern Trust Company (“Northern Trust”), which provides certain accounting, clerical and bookkeeping services, Blue Sky, corporate secretarial services and assistance in the preparation and filing of tax returns and reports to shareholders and the SEC. Prior to June 14, 2010, State Street Bank and Trust Company (“State Street”) served as the Fund’s administrator pursuant to an Administration Agreement dated June 1, 1999, as amended, with the Fund.
As of June 14, 2010, Northern Trust serves as custodian of each Portfolio’s securities and cash, transfer agent, dividend disbursing agent and agent in connection with any accumulation, open-account or similar plans provided to the shareholders of the Portfolios. Prior to June 14, 2010, State Street served in such capacity. The Fund has an agreement with its custodian under which custody fees may be reduced by balance credits. These credits are recorded as a reduction of total expenses on the Statements of Operations. The Portfolios could have invested a portion of the assets utilized in connection with the expense offset arrangement in other income-producing assets if the Fund had not entered into such an agreement.
As of March 8, 2010, Foreside Compliance Services, LLC serves as chief compliance officer of the Portfolios. Prior to March 8, 2010, State Street served in such capacity. Effective September 8, 2010, the Fund contracted with Foreside Management Services, LLC to obtain the services of a chief financial officer and treasurer. Fees paid to Foreside related to these services amounted to $9,730 for Global Equity, $19,855 for International Equity, $5,474 for International Small Companies and $66,178 for Emerging Markets. These expenses are shown as part of Other fees and expenses on the Statements of Operations.
The Fund, on behalf of the Portfolios, has agreements with various financial intermediaries and “mutual fund supermarkets” under which customers of these intermediaries may purchase and hold Portfolio shares. These intermediaries assess fees in consideration for providing certain distribution, account maintenance, record keeping and transactional services. In recognition of the savings of expenses to the Fund arising from the intermediaries’ assumption of functions that the Fund would otherwise perform, such as providing sub-accounting and related shareholder services, each Portfolio or class is authorized, pursuant to a shareholder services plan, to pay to each intermediary up to 0.15% of its average daily net assets attributable to that intermediary (subject to the voluntary expense cap).
The balance of the intermediaries’ fees, after payments made pursuant to the plan of distribution adopted pursuant to Rule 12b-1 under the 1940 Act, if applicable, is paid by the Investment Advisor. Because of voluntary caps on certain Portfolios’ fees and expenses, the Investment Advisor paid a portion of the Portfolios’ share of these fees during the year ended October 31, 2010.
49
Harding, Loevner Funds, Inc.
Notes to Financial Statements
October 31, 2010
4. Investment Transactions
Cost of purchases and proceeds from sales of investment securities, other than short-term investments, for the year ended October 31, 2010, were as follows for each Portfolio:
| | | | | | | | |
| Portfolio | | Purchase Cost of
Investment Securities | | | Proceeds from Sales of
Investment Securities | |
Global Equity | | $ | 105,647,642 | | | $ | 38,676,226 | |
International Equity | | | 345,387,419 | | | | 130,356,903 | |
International Small Companies | | | 6,426,970 | | | | 1,044,875 | |
Emerging Markets | | | 522,488,295 | | | | 419,970,512 | |
The cost of investments for federal income tax purposes and the components of net unrealized appreciation/ (depreciation) on investments at October 31, 2010, for each of the Portfolios were as follows:
| | | | | | | | | | | | | | | | |
Portfolio | | Gross Unrealized
Appreciation | | | Gross Unrealized
Depreciation | | | Net Unrealized
Appreciation | | | Cost | |
Global Equity | | $ | 28,730,562 | | | $ | (1,206,374 | ) | | $ | 27,524,188 | | | $ | 123,039,287 | |
International Equity | | | 140,974,488 | | | | (5,131,322 | ) | | | 135,843,166 | | | | 503,849,680 | |
| | | | |
International Small Companies | | | 2,430,202 | | | | (368,661 | ) | | | 2,061,541 | | | | 11,868,774 | |
Emerging Markets | | | 692,451,065 | | | | (16,005,883 | ) | | | 676,445,182 | | | | 1,404,987,806 | |
The unrealized appreciation (depreciation) on foreign currency for Global Equity, International Equity, International Small Companies and Emerging Markets was $6,120, $11,181, $(2,832), and $(1,661,790), respectively, for the year ended October 31, 2010.
5. Income Tax
It is the policy of each Portfolio of the Fund to qualify as a regulated investment company by complying with the applicable provisions of the Internal Revenue Code, and to make distributions of taxable income sufficient to relieve it from substantially all federal income and excise taxes therefore, no federal income tax provision is required.
Management has performed an analysis of each Portfolio’s tax positions for the open tax years as of October 31, 2010 and has concluded that no provisions for income tax are required. The Portfolios’ federal tax returns for the prior three fiscal years (open tax years: October 31, 2007; October 31, 2008; October 31, 2009) remain subject to examination by the Portfolios’ major tax jurisdictions, which include the United States and the State of Maryland. Management is not aware of any events that are reasonably possible to occur in the next twelve months that would result in the amounts of any unrecognized tax benefits significantly increasing or decreasing for the Portfolios. However, management’s conclusions regarding tax positions taken may be subject to review and adjustment at a later date based on factors including, but not limited to, new tax laws and accounting regulations and interpretations thereof.
During the year ended October 31, 2010, the tax character of distributions paid from ordinary income was $149,354, $2,530,285, $37,613 and $4,884,029, respectively, for Global Equity, International Equity, International Small Companies, and Emerging Markets.
During the year ended October 31, 2009, the tax character of distributions paid from ordinary income was $140,635, $3,260,397, $35,907 and $36,974,029, respectively, for Global Equity, International Equity, International Small Companies, and Emerging Markets. The tax character of distributions paid from long-term capital gains was $38,551,418 for International Equity.
50
Harding, Loevner Funds, Inc.
Notes to Financial Statements
October 31, 2010
5. Income Tax (continued)
As of October 31, 2010, the components of accumulated earnings/ (deficit) on a tax basis were as follows:
| | | | | | | | | | | | | | | | | | | | |
| Portfolio | | Undistributed
Ordinary
Income | | | Undistributed
Long-Term
Capital Gains | | | Accumulated
Capital and
Other Losses | | | Unrealized
Appreciation
(Depreciation)* | | | Total
Accumulated
Earnings/(Deficit) | |
Global Equity | | $ | 288,950 | | | $ | 1,052,136 | | | $ | - | | | $ | 27,530,307 | | | $ | 28,871,393 | |
International Equity | | | 2,497,976 | | | | - | | | | (2,431,039 | ) | | | 135,872,735 | | | | 135,939,672 | |
| | | | | |
International Small Companies | | | 46,013 | | | | - | | | | (575,162 | ) | | | 2,058,709 | | | | 1,529,560 | |
Emerging M arkets | | | 8,429,223 | | | | - | | | | (42,916,385 | ) | | | 674,783,392 | | | | 640,296,230 | �� |
* The difference between book basis and tax basis net unrealized appreciation is attributable primarily to the tax deferral of losses on certain sales of securities.
At October 31, 2010, International Small Companies had $64,733 available as capital loss carryforwards which expire in 2016. International Equity, International Small Companies and Emerging Markets had $2,431,039, $250,946 and $42,916,385, respectively, available as capital loss carryforwards which expire in 2017. International Small Companies had $259,484 available as capital loss carryforwards which expire in 2018.
Primarily as a result of differing book/tax treatment of foreign currency transactions and foreign capital gain tax expenses, the Fund made reclassifications among certain capital accounts. The reclassifications have no impact on the net assets of the Portfolio. As of October 31, 2010, the following reclassifications were made to the Statement of Net Assets:
| | | | | | | | | | | | |
| Portfolio | | Paid-in Capital | | | Accumulated Undistributed
Net Realized Gain/Loss on
Investment & Foreign
Currency Related
Transactions | | | Accumulated
Undistributed
Net Investment
Income | |
Global Equity | | $ | - | | | | $ 132,241 | | | $ | (132,241 | ) |
International Equity | | | - | | | | 725,149 | | | | (725,149 | ) |
| | | |
International Small Companies | | | - | | | | 23,581 | | | | (23,581 | ) |
Emerging Markets | | | - | | | | 1,686,171 | | | | (1,686,171 | ) |
6. Foreign Exchange Contracts
The Portfolios, on occasion, enter into forward foreign exchange contracts in order to hedge their exposure to changes in foreign currency exchange rates on their foreign portfolio holdings. A forward foreign exchange contract is a commitment to purchase or sell a foreign currency at a future date at a negotiated forward rate. The gain or loss arising from the difference between the cost of the original contracts and the closing of such contracts is included in net realized gains or losses on foreign currency-related transactions. Fluctuations in the value of forward foreign exchange contracts are recorded for book purposes as unrealized appreciation or depreciation on assets and liabilities denominated in foreign currencies by the Portfolios. The Portfolios are also exposed to credit risk associated with counterparty nonperformance on these forward foreign exchange contracts which is typically limited to the unrealized gain on each open contract.
The Portfolios enter into foreign currency transactions on the spot markets in order to pay for foreign investment purchases or to convert to dollars the proceeds from foreign investment sales or coupon interest receipts. The Portfolios held no open forward foreign currency exchange contracts on October 31, 2010.
7. Participation Notes
Each Portfolio may invest in participation notes. Participation notes are promissory notes that are designed to offer a return linked to the performance of a particular underlying equity security or market. Participation notes are issued by banks or broker-dealers and allow a Portfolio to gain exposure to common stocks in markets where direct investment may not be allowed. Participation notes are generally traded over-the-counter and are subject to the risk that the broker-dealer or bank that issues them will not fulfill its contractual obligation to complete the transaction with a Portfolio. Participation notes constitute general unsecured contractual obligations of the banks or broker-dealers that issue them, and a Portfolio would be relying on the creditworthiness of such banks or broker-dealers and would have no rights under a participation note against the issuer of the underlying assets. These securities may be more volatile and less liquid than other investments held by the Portfolios.
51
Harding, Loevner Funds, Inc.
Notes to Financial Statements
October 31, 2010
8. Capital Share Transactions
Transactions in capital stock for Global Equity—Advisor Class were as follows for the periods indicated:
| | | | | | | | | | | | | | | | |
| | | Year Ended
October 31, 2010 | | | Year Ended
October 31, 2009 | |
| | | Shares | | | Amount | | | Shares | | | Amount | |
Shares sold | | | 1,334,358 | | | $ | 28,868,395 | | | | 1,872,104 | | | $ | 29,033,478 | |
Shares issued upon reinvestment of dividends | | | 4,460 | | | | 93,525 | | | | 5,005 | | | | 76,577 | |
| | | | | | | | | | | | | | | | |
| | | 1,338,818 | | | | 28,961,920 | | | | 1,877,109 | | | | 29,110,055 | |
Shares redeemed | | | (2,656,193 | ) | | | (55,305,981 | ) | | | (227,787 | ) | | | (3,752,668 | ) |
| | | | | | | | | | | | | | | | |
Net increase | | | (1,317,375 | ) | | $ | (26,344,061 | ) | | | 1,649,322 | | | $ | 25,357,387 | |
| | | | | | | | | | | | | | | | |
|
Transactions in capital stock for Global Equity—Institutional Class were as follows for the periods indicated: | |
| | | | | | | | |
| | | Period From November 3, 2009
to October 31, 2010 | |
| | | Shares | | | Amount | |
Shares sold | | | 4,706,217 | | | $ | 100,707,733 | |
Shares issued upon reinvestment of dividends | | | 2,387 | | | | 50,029 | |
| | | | | | | | |
| | | 4,708,604 | | | | 100,757,762 | |
Shares redeemed | | | (276,004 | ) | | | (5,887,335 | ) |
| | | | | | | | |
Net increase | | | 4,432,600 | | | $ | 94,870,427 | |
| | | | | | | | |
| | | | | | | | | | | | | | | | |
|
Transactions in capital stock for International Equity—Investor Class were as follows for the periods indicated: | |
| | | Year Ended
October 31, 2010 | | | Year Ended
October 31, 2009 | |
| | | Shares | | | Amount | | | Shares | | | Amount | |
Shares sold | | | 7,028,647 | | | $ | 90,915,148 | | | | 2,406,941 | | | $ | 24,524,810 | |
Shares issued upon reinvestment of dividends | | | 21,972 | | | | 275,089 | | | | 256,261 | | | | 2,337,103 | |
| | | | | | | | | | | | | | | | |
| | | 7,050,619 | | | | 91,190,237 | | | | 2,663,202 | | | | 26,861,913 | |
Shares redeemed | | | (2,173,688 | ) | | | (28,647,976 | ) | | | (551,993 | ) | | | (5,664,340 | ) |
| | | | | | | | | | | | | | | | |
Net increase | | | 4,876,931 | | | $ | 62,542,261 | | | | 2,111,209 | | | $ | 21,197,573 | |
| | | | | | | | | | | | | | | | |
|
Transactions in capital stock for International Equity—Institutional Class were as follows for the periods indicated: | |
| | | Year Ended
October 31, 2010 | | | Year Ended
October 31, 2009 | |
| | | Shares | | | Amount | | | Shares | | | Amount | |
Shares sold | | | 19,022,485 | | | $ | 248,771,466 | | | | 3,607,416 | | | $ | 37,754,041 | |
Shares issued upon reinvestment of dividends | | | 172,753 | | | | 2,164,593 | | | | 4,274,140 | | | | 38,985,473 | |
| | | | | | | | | | | | | | | | |
| | | 19,195,238 | | | | 250,936,059 | | | | 7,881,556 | | | | 76,739,514 | |
Shares redeemed | | | (6,733,420 | ) | | | (87,480,052 | ) | | | (3,062,169 | ) | | | (29,797,831 | ) |
| | | | | | | | | | | | | | | | |
Net increase | | | 12,461,818 | | | $ | 163,456,007 | | | | 4,819,387 | | | $ | 46,941,683 | |
| | | | | | | | | | | | | | | | |
52
Harding, Loevner Funds, Inc.
Notes to Financial Statements
October 31, 2010
8. Capital Share Transactions (continued)
Transactions in capital stock for International Small Companies were as follows for the periods indicated:
| | | | | | | | | | | | | | | | |
| | | Year Ended
October 31, 2010 | | | Year Ended
October 31, 2009 | |
| | | Shares | | | Amount | | | Shares | | | Amount | |
Shares sold | | | 674,027 | | | $ | 6,382,332 | | | | 287,938 | | | $ | 1,954,457 | |
Shares issued upon reinvestment of dividends | | | 3,719 | | | | 34,099 | | | | 6,686 | | | | 35,907 | |
| | | | | | | | | | | | | | | | |
| | | 677,746 | | | | 6,416,431 | | | | 294,624 | | | | 1,990,364 | |
Shares redeemed | | | (84,148 | ) | | | (774,124 | ) | | | (100,105 | ) | | | (687,371 | ) |
| | | | | | | | | | | | | | | | |
Net increase | | | 593,598 | | | $ | 5,642,307 | | | | 194,519 | | | $ | 1,302,993 | |
| | | | | | | | | | | | | | | | |
|
Transactions in capital stock for Emerging Markets were as follows for the periods indicated: | |
| | | Year Ended
October 31, 2010 | | | Year Ended
October 31, 2009 | |
| | | Shares | | | Amount | | | Shares | | | Amount | |
Shares sold | | | 12,042,181 | | | $ | 529,347,127 | | | | 16,825,424 | | | $ | 522,043,263 | |
Shares issued upon reinvestment of dividends | | | 106,476 | | | | 4,437,332 | | | | 1,149,520 | | | | 30,745,773 | |
| | | | | | | | | | | | | | | | |
| | | 12,148,657 | | | | 533,784,459 | | | | 17,974,944 | | | | 552,789,036 | |
Shares redeemed | | | (9,846,530 | ) | | | (428,112,438 | ) | | | (18,269,280 | ) | | | (556,153,126 | ) |
| | | | | | | | | | | | | | | | |
Net increase | | | 2,302,127 | | | $ | 105,672,021 | | | | (294,336 | ) | | $ | (3,364,090 | ) |
| | | | | | | | | | | | | | | | |
Redemptions made within 90 days of purchase may be subject to a redemption fee equal to 2% of the amount redeemed. For the year ended October 31, 2010, Advisor Class of Global Equity, Institutional Class of Global Equity, Investor Class of International Equity, Institutional Class of International Equity, International Small Companies Investor Class and Emerging Markets received $2,461, $219,316, $33,275, $41,527, $267 and $172,841, respectively, in redemption fees related to transactions in shares of common stock as disclosed in the Portfolios’ Statements of Changes in Net Assets.
9. Concentration of Ownership
At October 31, 2010, the percentage of total shares outstanding held by record shareholders each owning 10% or greater of the aggregate total shares outstanding for each Portfolio or for the share classes listed of each Portfolio was as follows:
| | | | | | | | | | | | | | |
| | | No. of
Shareholders | | | | | %
Ownership | | | | |
Global Equity | | | 4 | | | | | | 78.29 | % * | | | | |
International Equity | | | 3 | | | | | | 59.72 | % * | | | | |
International Small Companies | | | 2 | | | | | | 53.83 | % * | | | | |
Emerging Markets | | | 2 | | | | | | 68.67 | % * | | | | |
*Represents omnibus position of broker-dealer representing numerous shareholder accounts.
Investment activities of these shareholders may have a material effect on the Portfolios.
10. Concentration of Risk
Investing in securities of foreign issuers and currency transactions may involve certain considerations and risks not typically associated with investments in U.S. issuers. These risks include revaluation of currencies, adverse fluctuations in foreign currency values and possible adverse political, social and economic developments, including those particular to a specific industry, country or region, which could cause the securities and their markets to be less liquid and prices more volatile than those of comparable U.S. companies and U.S. government securities. These risks are greater with respect to securities of issuers located in emerging market countries in which the Portfolios are authorized to invest.
53
Harding, Loevner Funds, Inc.
Notes to Financial Statements
October 31, 2010
11. Line of Credit
The Fund entered into a $50 million line of credit agreement effective June 14, 2010 with Northern Trust. Borrowings would be made solely to facilitate the handling of redemptions or unusual or unanticipated short-term cash requirements. Because several Portfolios participated there was no assurance that an individual Portfolio would have access to the entire $50 million at any particular time. Interest is charged to each Portfolio based on its borrowings at an amount above the Federal Funds rate. In addition, a facility fee is computed at an annual rate of 0.10% on the line of credit and was allocated among the Portfolios. From June 14, 2010 through October 31, 2010 none of the Portfolios’ utilized the line of credit.
Prior to June 14, 2010, the Fund participated in a $50 million line of credit agreement with State Street Bank and Trust. Borrowings would be made solely to facilitate the handling of redemptions or unusual or unanticipated short-term cash requirements. Because several Portfolios participated there is no assurance that an individual Portfolio will have access to the entire $50 million at any particular time. Borrowings for International Equity and Global Equity were limited to the lesser of the remaining available credit or 25% of net assets. Borrowings for Emerging Markets and International Small Companies were limited to the lesser of the remaining available credit or 15% of net assets. Interest was charged to each Portfolio based on its borrowings at an agreed upon contractual rate. In addition, a commitment fee was computed at an annual rate of 0.10% on the line of credit that was allocated among the Portfolios. During the period ended October 31, 2010, International Equity had borrowings on one day with a maximum balance of $2,365,583 at an average weighted interest rate of 1.48% and International Small Companies had borrowings on five days with a maximum balance of $33,364, at an average weighted interest rate of 1.43%.
12. Recently Issued Accounting Pronouncements
On January 21, 2010, the Financial Accounting Standards Board (“FASB”) issued Accounting Standards Update No. 2010-06, Improving Disclosures about Fair Value Measurements (“ASU 2010-06”). ASU 2010-06 amends Accounting Standards Codification 820 (“ASC 820”), Fair Value Measurements and Disclosures (formerly FASB Statement No. 157). Specifically, ASU 2010-06 requires entities to disclose a) the amounts of significant transfers between Level 1 and Level 2 of the fair value hierarchy and the reasons for these transfers, b) the reasons for any transfers in or out of Level 3 and c) information in the reconciliation of recurring Level 3 measurements about purchases, sales, issuances and settlements on a gross basis. In addition, ASU 2010-06 clarifies the requirement for entities to disclose information about both the valuation techniques and inputs used in estimating Level 2 and Level 3 fair value measurements. Except for the requirement to disclose information about purchases, sales, issuances and settlements in the reconciliation of recurring Level 3 measurements on a gross basis, all ASU 2010-06 disclosure requirements are effective for financial statements issued for interim and annual reporting periods beginning after December 15, 2009. The requirement to separately disclose purchases, sales, issuances and settlements of recurring Level 3 measurements is effective for financial statements issued for interim and annual reporting periods beginning after December 15, 2010. At this time, management is evaluating the implications of ASU 2010-06 and the impact it will have to the Portfolios’ financial statement disclosures.
13. Subsequent Events
Subsequent events occurring after the date of this report have been evaluated for potential impact, for purposes of recognition or disclosure in the financial statements, through the date the report was issued.
54
Harding, Loevner Funds, Inc.
Report of Independent Registered Public Accounting Firm
The Board of Directors and Shareholders
Harding, Loevner Funds, Inc.
We have audited the accompanying statements of net assets of the Harding, Loevner Funds, Inc. (comprising, the Emerging Markets Portfolio, Global Equity Portfolio, International Equity Portfolio, and International Small Companies Portfolio), (collectively the “Portfolios”) as of October 31, 2010, and the related statements of operations for the year then ended, statements of changes in net assets for each of the years in the two-year period then ended, and the financial highlights for each of the years or periods in the five-year period then ended. These financial statements and financial highlights are the responsibility of the Portfolios’ management. Our responsibility is to express an opinion on these financial statements and financial highlights based on our audits.
We conducted our audits in accordance with the standards of the Public Company Accounting Oversight Board (United States). Those standards require that we plan and perform the audits to obtain reasonable assurance about whether the financial statements and financial highlights are free of material misstatement. An audit includes examining, on a test basis, evidence supporting the amounts and disclosures in the financial statements. Our procedures included confirmation of securities owned as of October 31, 2010, by correspondence with the custodian and brokers or other appropriate auditing procedures. An audit also includes assessing the accounting principles used and significant estimates made by management, as well as evaluating the overall financial statement presentation. We believe that our audits provide a reasonable basis for our opinion.
In our opinion, the financial statements and financial highlights referred to above present fairly, in all material respects, the financial position of each of the aforementioned Portfolios of the Harding, Loevner Funds, Inc. as of October 31, 2010, the results of their operations for the year then ended, the changes in their net assets for each of the years in the two-year period then ended, and the financial highlights for each of the years or periods in the five-year period then ended, in conformity with U.S. generally accepted accounting principles.
Philadelphia, Pennsylvania
December 17, 2010
55
Harding, Loevner Funds, Inc.
Supplemental Tax Information
(unaudited)
During the year ended October 31, 2010, none of the Portfolios designated a percentage of distributions from net investment income as qualifying for the dividend received deduction for corporations.
International Equity, International Small Companies, and Emerging Markets paid qualifying foreign taxes of $571,310, $22,415, and $3,730,333, and earned $4,005,407, $96,895, and $14,117,328 from foreign source income during the year ended October 31, 2010, respectively. Pursuant to Section 853 of the Internal Revenue Code, International Equity, International Small Companies, and Emerging Markets designated $0.0952, $0.0751, and $0.3429 per share as income earned from foreign sources for the year ended October 31, 2010, respectively.
Global Equity, International Equity, International Small Companies, and Emerging Markets had qualifying dividend income of $1,409,148, $6,289,182, $179,751, and $23,512,441 respectively during the year ended October 31, 2010.
Pursuant to Section 852 of the Internal Revenue Code, Global Equity designated $1,052,136 as long term capital gain dividends for the year ended October 31, 2010.
56
Harding, Loevner Funds, Inc.
Directors and Principal Officers of the Fund
Disinterested Directors:
| | | | | | | | | | |
| Name, Address and Age | | Position with the Fund | | Term of Office and Length of Time Served | | Principal Occupation During Past Five Years | | Number of Portfolios in Fund Complex Overseen By Director | | Other Directorships |
William E. Chapman, II c/o Harding Loevner LP 50 Division Street Fourth Floor Somerville, NJ 08876 Age, 69 | | Director | | Indefinite; Director since 2008; Chairperson of the Audit Committee since 2009 | | President and Owner, Longboat Retirement Planning Solutions (1998- present); Trustee of Bowdoin College (2002- present); Hewitt Associates, LLC (part time) (provider of retirement and investment education seminars) (2000 -2009) | | 6 | | Trustee of Third Avenue Trust (5 portfolios); Trustee of Third Avenue Variable Trust (1 portfolio); Trustee of Aston Funds (26 Portfolios); Trustee of The Managers Funds, Managers AMG Funds, Managers Trust I and Managers Trust II (33 portfolios) |
R. Kelly Doherty c/o Harding Loevner LP 50 Division Street Fourth Floor Somerville, NJ 08876 Age, 52 | | Director | | Indefinite; Director since 2004 | | Cayman Partners (private investment vehicles), Managing Partner, 1999 –present. | | 6 | | Morristown Memorial Hospital; The Peck School |
57
Harding, Loevner Funds, Inc.
Directors and Principal Officers of the Fund
| | | | | | | | | | |
| Name, Address and Age | | Position with
the Fund | | Term of
Office and
Length of
Time
Served | | Principal Occupation
During Past Five Years | | Number of
Portfolios in
Fund
Complex
Overseen By
Director | | Other Directorships |
Charles Freeman c/o Harding Loevner LP 50 Division Street Fourth Floor Somerville, NJ 08876 Age, 46 | | Director | | Indefinite; Director since 2008 | | Center for Strategic and International Studies, Freeman Chair in China Studies, 2007 – present; China Alliance (legal and government relations group), Managing Director, 2005 – 2007; Assistant U.S. Trade Representative, prior to 2005. | | 6 | | National Committee for U.S. – China Relations |
Jane A. Freeman c/o Harding Loevner LP 50 Division Street Fourth Floor Somerville, NJ 08876 Age, 57 | | Director | | Indefinite; Director since 1996; Chairperson of the Audit Committee 2005-2008 and Lead Independent Director since 2008 | | Scientific Learning Corporation (Education Software), Executive Vice President and Chief Financial Officer, 1/00 – 2008; Treasurer and Vice President, Finance & Business Development, 1999 – 2000. | | 6 | | Taproot Foundation (Non-Profit), Director, 2010-present |
Samuel R. Karetsky c/o Harding Loevner LP 50 Division Street Fourth Floor Somerville, NJ 08876 Age, 65 | | Director | | Indefinite; Director since 1998; member of the audit committee since 1998 | | The Karetsky Group LLC (Advisory Firm), Managing Member, 2003 -present; Wetherby Asset Management, Wealth Manager, 2004 – present; European Investors Inc., Managing Director, 1998 – 2002. | | 6 | | None |
58
Harding, Loevner Funds, Inc.
Directors and Principal Officers of the Fund
| | | | | | | | | | |
| Name, Address and Age | | Position with the Fund | | Term of Office and Length of Time Served | | Principal Occupation
During Past Five Years | | Number of
Portfolios in
Fund
Complex
Overseen By
Director | | Other Directorships |
Eric Rakowski c/o Harding Loevner LP 50 Division Street Fourth Floor Somerville, NJ 08876 Age, 52 | | Director | | Indefinite; Director since 2008 | | University of California at Berkeley School of Law, Professor, 1990 –present. | | 6 | | Trustee of Third Avenue Trust (5 portfolios); Trustee of Third Avenue Variable Trust (1 portfolio); Trustee of The Managers Funds, Managers AMG Funds, Managers Trust I and Managers Trust II (33 portfolios) |
Interested Director: | | | | | | | | | | |
David R. Loevner Harding Loevner LP 50 Division Street, Fourth Floor Somerville, NJ 08876 Age, 56 | | Director, President and Chairman of the Board of Directors | | Indefinite; Director, President and Chairman of Tennant the Board since 1996 | | Harding Loevner LP, President and Chief Executive Officer 1989 –present; Parks Corporation (real estate), President, 2001 - present. | | 6 | | Director, Harding, Loevner Funds, plc (4 portfolios) |
Jennifer M. Borggaard Affiliated Managers Group, Inc. 600 Hale Street Prides Crossing, MA 01965 Age, 41 | | Director | | Indefinite; Director since 2008 | | Affiliated Managers Group, Inc. (“AMG”) (asset management firm), Senior Vice President, 2007 – present, Vice President, 2004 – 2007, Director and Senior Counsel, 2001 – 2004. | | 6 | | Beautel, Goodman & Company LTD; Genesis Asset Managers, LLP- Member of the Governing Board; Montrusco Bolton Investments Inc.; Arrow Bidco Ltd. |
59
Harding, Loevner Funds, Inc.
Directors and Principal Officers of the Fund
Principal Officers of the Fund
| | | | | | |
| Name, Address and Age | | Position with the Fund | | Term of Office
and Length of
Time Servedw | | Principal Occupation During Past Five Years |
Richard Reiter Harding Loevner LP 50 Division Street, Fourth Floor Somerville, NJ 08876 Age, 44 | | Vice President | | 1 year; Vice President since 2007 | | Harding Loevner LP, Chief Operating Officer, 1996 – present. |
Susan Mosher Foreside Compliance Services, LLC Three Canal Plaza, Suite 100 Portland, ME 04101 Age, 55 | | Chief Compliance Officer of the Funds | | 1 year; Chief Compliance Officer since 2010 | | Foreside Alternative Investment Services, LLC, President, 2009 - present; Coast Asset Management, LLC, Chief Compliance Officer, 2007 - 2009; Investors Bank & Trust Company, Senior Director and Chief Counsel/Director, 1995 - 2007. |
Charles S. Todd Foreside Management Services, LLC Three Canal Plaza, Suite 100 Portland, ME 04101 Age, 39 | | Chief Financial Officer and Treasurer | | 1 year; Chief Financial Officer and Treasurer since 2010 | | Foreside Management Services, LLC, Director/Treasurer and Principal Financial Officer, 2008 – Present; JPMorgan Investor Services Co., Vice President within the Fund Administration Department, formerly serving as Assistant Vice President, 2000 –2008. |
Patrick Keniston Foreside Compliance Services, LLC Three Canal Plaza, Suite 100 Portland, ME 04101 Age, 46 | | Anti-Money Laundering Compliance Officer | | 1 year; Anti-Money Laundering Compliance Officer since 2010 | | Foreside Compliance Services, LLC, Director, 2008 - present; Citi Fund Services Ohio, Inc., Vice President, 2005 - 2008; Citigroup Global Transaction Services, Attorney, 2001 - 2005. |
Thomas A. Dula The Northern Trust Company 50 South LaSalle Street Chicago, IL 60603 Age, 36 | | Assistant Treasurer | | 1 year; Assistant Treasurer since 2010 | | The Northern Trust Company, Vice President and Client Service Delivery Manager, 2010 - present, Relationship Manager, 2009 - 2010, and Institutional Trust Account Administrator, 2004 - 2009. |
w Officers are elected to hold such office until their successor is elected and qualified to carry out the duties and responsibilities of their office, or until he or she resigns or is removed from office.
The Fund’s Statement of Additional Information contains additional information about the Directors of the Fund and is available, without charge, upon request, by calling 1-877-435-8105.
60
Harding, Loevner Funds, Inc.
Directors and Principal Officers of the Fund
| | | | | | |
| Name, Address and Age | | Position with the Fund | | Term of Office and Length of Time Servedw | | Principal Occupation During Past Five Years |
Owen T. Meacham The Northern Trust Company 50 South LaSalle Street Chicago, IL 60603 Age, 39 | | Secretary | | 1 year; Secretary since 2010 | | The Northern Trust Company, Vice President and Senior Regulatory Administration Attorney, 2007 - present; ABN AMRO Asset Management, Product Strategy and Development Manager, 2005 - 2007. |
Puran Dulani Harding Loevner LP 50 Division Street, Fourth Floor Somerville, NJ 08876 Age, 52 | | Assistant Treasurer | | 1 year; Assistant Treasurer since 2010; Treasurer and Chief Financial Officer from 2007 to 2010 | | Harding Loevner LP, Chief of Operations and Accounting, 2002 – present. |
Lori M. Renzulli Harding Loevner LP 50 Division Street Fourth Floor Somerville, NJ 08876 Age, 44 | | Assistant Secretary | | 1 year, Assistant Secretary since 2008 | | Harding Loevner LP, Chief Counsel and Chief Compliance Officer, 2006 - present; MetLife, Director, Corporate Ethics and Compliance, 2006; CitiStreet Retirement Services, Vice President and Counsel, 1989 - 2005. |
Shanna Palmersheim The Northern Trust Company 50 South LaSalle Street Chicago, IL 60603 Age, 33 | | Assistant Secretary | | 1 year; Assistant Secretary since 2010 | | The Northern Trust Company, Second Vice President and Regulatory Administration Attorney, 2008 – Present; Peregrine Financial Group, Associate Counsel, 2007 – 2008; Harley-Davidson Financial Services, Senior Treasury Analyst, 2005 – 2007; Paul McAndrew Law Firm, Law Clerk, 2004 – 2005; State Street Corporation, Senior Accountant, 1999 – 2002. |
61
Harding, Loevner Funds, Inc.
Supplemental Information
(unaudited)
Quarterly Form N-Q Portfolio Schedule
Each Portfolio will file its complete schedule of investments with the SEC on Form N-Q at the end of the first and third fiscal quarters within 60 days of the end of the quarter to which it relates. The Portfolios’ Form N-Q will be available on the SEC’s website at www.sec.gov and may also be reviewed and copied at the SEC’s Public Reference Room whose telephone number is 1-800-SEC-0330. Additionally, they are available upon request by calling 1-877-435-8105.
Proxy Voting Record
The Fund’s proxy voting record relating to the Portfolios’ securities during the most recent 12-month period ended June 30 is available on the Fund’s website at www.hardingloevnerfunds.com and on the SEC’s website at www.sec.gov, on Form N-PX.
Proxy Voting Policies and Procedures
A description of the Fund proxy voting policies and procedures are located in the Statement of Additional Information and is available without charge, upon request, by calling 1-877-435-8105 or on the SEC’s website at www.sec.gov.
Additional Information
The Adviser updates Fact Sheets for the Portfolios each calendar quarter, which are posted to the Fund’s website - www.hardingloevnerfunds.com. This information, along with the Adviser’s commentaries on its various strategies, is available without charge, upon request, by calling 1-877-435-8105.
62
Harding, Loevner Funds, Inc.
Officers & Directors and Other Pertinent Information
OFFICERSAND DIRECTORS
David R. Loevner
Director, President and Chairman of the Board of the Funds
Jane A. Freeman
Director of the Funds
Jennifer M. Borggaard
Director of the Funds
William E. Chapman II
Director of the Funds
R. Kelly Doherty
Director of the Funds
Charles Freeman
Director of the Funds
Samuel R. Karetsky
Director of the Funds
Eric Rakowski
Director of the Funds
Charles S. Todd
Chief Financial Officer and Treasurer of the Funds
Susan Mosher
Chief Compliance Officer of the Funds
Richard Reiter
Vice President of the Funds
Owen T. Meacham
Secretary of the Funds
Patrick Kenniston
Anti-Money Laundering Compliance Officer of the Funds
Thomas A. Dula
Assistant Treasurer of the Funds
Puran Dulani
Assistant Treasurer of the Funds
Shanna Palmersheim
Assistant Secretary of the Funds
Lori Renzulli
Assistant Secretary of the Funds
63

Item 2. Code of Ethics.
As of October 31, 2010, the Registrant has adopted a code of ethics that applies to the Registrant’s President/Chief Executive Officer and Treasurer/Chief Financial Officer. For the fiscal year ended October 31, 2010, the Code of Ethics was amended to make certain administrative changes. A copy of its code of ethics is filed with this Form N-CSR under Item 12(a)(1).
Item 3. Audit Committee Financial Expert.
The Registrant’s Board of Directors has determined that the following members of the Audit Committee are audit committee financial experts and independent: William Chapman and Jane Freeman.
Item 4. Principal Accountant Fees and Services.
(a) AUDIT FEES: The aggregate fees billed for each of the last two fiscal years for professional services rendered by KPMG LLP for the audit of the registrant annual financial statements or services that are normally provided by the accountant in connection with statutory and regulatory filings or engagements for those fiscal years are $140,070 in 2010 and $128,225 in 2009.
(b) AUDIT-RELATED FEES: The aggregate fees billed in each of the last two fiscal years for assurance and related services by KPMG LLP that are reasonably related to the performance of the audit of the registrant financial statements and are not reported under paragraph (a) of this Item are NONE.
(c) TAX FEES: The aggregate fees billed in each of the last two fiscal years for professional services rendered by KPMG LLP for the review of domestic tax returns was $39,000 in 2010 and $38,100 in 2009.
(d) ALL OTHER FEES: The aggregate fees billed in each of the last two fiscal years for products and services provided by KPMG LLP, other than the services reported in paragraphs (a) through (c) of this Item are NONE.
(e)(1) Disclose the audit committee pre-approval policies and procedures described in paragraph (c)(7) of Rule 2-01 of Regulation S-X.
A copy of the Audit Committee’s Pre-Approval Policies and Procedures is filed with this Form N-CSR under Item 12(c).
(e)(2) The percentage of services described in each of paragraphs (b) through (d) of this Item that were approved by the audit committee pursuant to paragraph (c)(7)(i)(C) of Rule 2-01 of Regulation S-X are as follows:
(b) Not applicable
(c) 100%
(d) Not applicable
(f) Not applicable.
(g) Not applicable.
(h) Not applicable.
Item 5. Audit Committee of Listed Registrants.
Not applicable.
Item 6. Investments.
| (a) | Schedule of Investments is included as part of the report to shareholders filed under Item 1 of this report on Form N-CSR. |
Item 7. Disclosure of Proxy Voting Policies and Procedures for Closed-End Management Investment Companies.
Not applicable to this registrant.
Item 8. Portfolio Managers of Closed-End Management Investment Companies.
Not applicable to this registrant.
Item 9. Purchases of Equity Securities by Closed-End Management Investment Company and Affiliated Purchasers.
Not applicable to this registrant.
Item 10. Submission of Matters to a Vote of Security Holders.
Not applicable.
Item 11. Controls and Procedures.
| (a) | The Registrant’s Principal Executive Officer and Principal Financial Officer have concluded that the Registrant’s disclosure controls and procedures (as defined in Rule 30a-3(c) under the Investment Company Act of 1940, as amended (the “1940 Act”)) were effective as of a date within 90 days prior to the filing date of this report, based on their evaluation of the effectiveness of the Registrant’s disclosure controls and procedures as of the Evaluation Date. |
| (b) | There were no significant changes in the Registrant’s internal control over financial reporting (as defined in Rule 30a-3(d) under the 1940 Act) that occurred during the second fiscal quarter of the period covered by this report that have materially affected, or are reasonably likely to materially affect, the Registrant’s internal control over financial reporting. |
Item 12. Exhibits.
(a)(1) Code of Ethics for Senior Officers Pursuant to the Sarbanes-Oxley Act of 2002 is attached.
(a)(2) Section 302 Certifications are attached.
(b) Section 906 Certifications are attached.
(c) Audit Committee Pre-Approval Policies and Procedures are attached.
SIGNATURES
Pursuant to the requirements of the Securities Exchange Act of 1934 and the Investment Company Act of 1940, the registrant has duly caused this report to be signed on its behalf by the undersigned, thereunto duly authorized.
| | |
Harding, Loevner Funds, Inc. |
| |
By | | /s/ David R. Loevner |
| | David R. Loevner, President |
|
Date: January 10, 2011 |
Pursuant to the requirements of the Securities Exchange Act of 1934 and the Investment Company Act of 1940, this report has been signed below by the following persons on behalf of the registrant and in the capacities and on the dates indicated.
| | |
By | | /s/ David R. Loevner |
| | David R. Loevner, President |
|
Date: January 10, 2011 |
| |
By | | /s/ Charles S. Todd |
| | Charles S. Todd, Treasurer and Chief Financial Officer |
|
Date: January 10, 2011 |